Embed Size (px)
Citation preview

JR(先)OS
13-072
July 2013
Japan International Cooperation Agency (JICA)
Nippon Koei Co., Ltd. (NK)Marubeni Corporation (MC)
KRI International Corporation (KRI)
Republic of the PhilippinesMaynilad Water Service Inc.
Republic of the PhilippinesPreparatory Survey on Water Supply and Sewerage
Development in the West Zone of Metro Manila
Final Report

Exchange Rate
USD 1.00 = JPY 92.07
PHP 1.00 = JPY 2.26
USD 1.00 = PHP 40.74
(As of End of February 2013)

イメージを表示できません。メモリ不足のためにイメージを…Location Map
Luzon
Visayas
Mindanao
West Zone of Metro Manila (Target Area of NRW Reduction Project
Priority Sewerage Improvement Area– 2(Marilao River Basin)
Priority Sewerage Improvement Area– 1(Marikina River Basin)
Location Map of Study Area

Republic of the Philippines Preparatory Survey on Water Supply and Sewerage Development in the West Zone of Metro Manila Final Report Table of Contents
- i -
Republic of the Philippines Preparatory Survey on Water Supply and Sewerage Development
in the West Zone of Metro Manila
Final Report
Table of Contents
Chapter 1 Introduction
1.1 Background of the Study ......................................................................................................... 1-1 1.2 Objectives of the Study............................................................................................................ 1-2 1.3 Scope of the Study ................................................................................................................... 1-3 1.4 Study Area ............................................................................................................................... 1-4 1.5 Natural and Physical Conditions of the Study Area ................................................................ 1-5
1.5.1 Study Area Limits, Topography, Geology ........................................................................ 1-5 1.5.2 Climate – Weather Patterns .............................................................................................. 1-7 1.5.3 Rainfall – from Gauging Stations Nearby ....................................................................... 1-8 1.5.4 Climate Change ............................................................................................................... 1-9 1.5.5 Natural Environmental Conditions in Metro Manila ..................................................... 1-10
1.6 Social and Environmental Conditions of Metro Manila ........................................................ 1-12 1.6.1 Social and Economic Conditions ................................................................................... 1-12 1.6.2 Pollution Conditions of Metro Manila ........................................................................... 1-16
1.7 Relevant Laws and Regulations to Water Sector ................................................................... 1-20 1.7.1 General ........................................................................................................................... 1-20 1.7.2 Environmental Impact Statement System ...................................................................... 1-23 1.7.3 Land Acquisition and Resettlement ............................................................................... 1-26
Chapter 2 Outline of the Water Sector in the Study Area
2.1 Current Roles of the Public and Private Partnership in the Water Business ............................ 2-1 2.1.1 National Policy on Water Sector in the Philippines ......................................................... 2-1 2.1.2 Current Water Service Providers and Water-Related Authorities in the Philippines ....... 2-3 2.1.3 History of the Water Sector in the Philippines and in Metro Manila ............................... 2-5 2.1.4 Present Development Status of the Water Sector in the Philippines ................................ 2-9
2.2 Institutional Framework of the Water Service in Metro Manila ............................................ 2-11 2.2.1 Current Roles of Public and Private Sectors .................................................................. 2-11
Chapter 3 Outline of the Proposed Project in the Study
3.1 Priority Sewerage Projects ...................................................................................................... 3-1

Republic of the Philippines Preparatory Survey on Water Supply and Sewerage Development in the West Zone of Metro Manila Final Report Table of Contents
- ii -
3.1.1 Outline of the Sewerage Projects ..................................................................................... 3-1 3.1.2 Implementation of the Projects ........................................................................................ 3-3 3.1.3 Estimation of the Project Cost ......................................................................................... 3-3
3.2 Other Possible Japan’s Assistance in the Study Area .............................................................. 3-4 3.2.1 Basic Policy of JICA on PPP ........................................................................................... 3-4 3.2.2 Possible Fund from JICA ................................................................................................. 3-4 3.2.3 Necessity of PSIF ............................................................................................................ 3-5 3.2.4 Technical Cooperation Project of JICA ........................................................................... 3-5
Chapter 4 Feasibility Study of NRW Reduction Project
4.1 Social and Environmental Considerations in the NRW Reduction Project .......................... 4-1 4.5.1 Summary of the Project Content ...................................................................................... 4-1 4.5.2 Alternative Examination .................................................................................................. 4-1 4.5.3 General Environmental Condition in the Study Area ...................................................... 4-2 4.5.4 Previous Environmental Impact Assessment for Water Supply Service Recovery
Project .............................................................................................................................. 4-3 4.5.5 Preliminary Scoping of the Environmental and Social Impacts ...................................... 4-4 4.5.6 Environmental and Social Considerations Study ............................................................. 4-7 4.5.7 Environmental Management Plan and Environmental Monitoring Plan ......................... 4-9 4.5.8 Informal Disclosure ....................................................................................................... 4-12 4.5.9 Draft Environmental Checklist ...................................................................................... 4-12
Chapter 5 Feasibility Study of Priority Sewerage Projects
5.1 Basic Considerations of Sewerage System Planning ............................................................ 5-1 5.1.1 Selection of Study Area ................................................................................................... 5-1 5.1.2 Planning Criteria .............................................................................................................. 5-5 5.1.3 Catchment Delineation .................................................................................................... 5-8 5.1.4 Demographics .................................................................................................................. 5-8 5.1.5 Flows ................................................................................................................................ 5-9 5.1.6 Interception Facilities .................................................................................................... 5-13 5.1.7 Sewer Network .............................................................................................................. 5-17 5.1.8 Environmental and Discharge Standards ....................................................................... 5-25 5.1.9 Sewage Treatment Methods ........................................................................................... 5-33 5.1.10 Sludge Treatment Methods ............................................................................................ 5-40 5.1.11 Construction Methods .................................................................................................... 5-44 5.1.12 Site Surveys ................................................................................................................... 5-46
5.2 Preliminary Design of the Marikina River Basin ................................................................ 5-51 5.2.1 Scope of the Project ....................................................................................................... 5-51

Republic of the Philippines Preparatory Survey on Water Supply and Sewerage Development in the West Zone of Metro Manila Final Report Table of Contents
- iii -
5.2.2 Demand Projection ........................................................................................................ 5-55 5.2.3 Preliminary Design of the Marikina River Basin........................................................... 5-58 5.2.4 Selection of Recommended Option for the Marikina River Basin ................................ 5-77 5.2.5 Design Detail of the Recommended Option .................................................................. 5-81
5.3 Preliminary Design of the Marilao River Basin .................................................................. 5-91 5.3.1 Scope of the Project ....................................................................................................... 5-91 5.3.2 Demand Prediction ........................................................................................................ 5-94 5.3.3 Preliminary Design of the Marilao River Basin........................................................... 5-100 5.3.4 Selection of Recommended Option for the Marilao River Basin ................................ 5-122 5.3.5 Design Details of the Recommended Option ............................................................... 5-126
5.4 Environmental and Social Considerations ........................................................................ 5-136 5.4.1 Summary of the Project Contents ................................................................................ 5-136 5.4.2 Alternative Examination .............................................................................................. 5-136 5.4.3 Draft Scoping of Impact .............................................................................................. 5-137 5.4.4 Prediction of Impacts and Proposed Mitigation Measures .......................................... 5-139 5.4.5 Environmental Management Plan and Monitoring Plan .............................................. 5-142 5.4.6 Public Participation ...................................................................................................... 5-146 5.4.7 Formulation of Basic Resettlement Action Plan (RAP) ............................................... 5-146 5.4.8 Draft Environmental Checklist .................................................................................... 5-153
Republic of the Philippines Preparatory Survey on Water Supply and Sewerage Development in the West Zone of Metro Manila Final Report List of Figures
-F- i -
List of Figures
Figure 1.4.1 Location Map of Maynilad’s Service Area .............................................................. 1-5 Figure 1.5.1 Average Monthly Temperature ................................................................................. 1-7 Figure 1.5.2 Average Monthly Humidity ..................................................................................... 1-8 Figure 1.5.3 Average Monthly Rainfall ........................................................................................ 1-8 Figure 1.6.1 Trend of Household Units Growth in NCR from 1975 to 2010 ............................. 1-13 Figure 1.6.2 Main Source of Water Supply for Drinking and/or Cooking as of 2000 ................ 1-14 Figure 1.6.3 Kinds of Toilet Facilities as of 2000 ...................................................................... 1-15 Figure 1.6.4 PM10 and PM2.5 Annual Mean Levels in the PNRI Metro Manila Sampling
Sites ........................................................................................................................ 1-18 Figure 1.7.1 Summary Flowchart of the PEISS Process ............................................................ 1-24 Figure 1.7.2 Process of Screening and Project Grouping for EIA .............................................. 1-25
Figure 2.1.1 Relation of Water Service Providers and Key Water-Related Agencies .................. 2-3 Figure 2.1.2 History of Maynilad ................................................................................................. 2-9 Figure 2.1.3 Water Access in the Philippines ............................................................................. 2-10 Figure 2.2.1 Regulatory Framework of the Water Business in Metro Manila ............................ 2-11 Figure 2.2.2 Structure of the Water Concession in Metro Manila .............................................. 2-12
Figure 3.2.1 Location of the Priority Sewerage Projects .............................................................. 3-1 Figure 3.3.1 Proposed Schedule and Manning Plan of the Cooperation Program for NRW
Reduction and Water Distribution System Improvement ......................................... 3-8
Figure 5.1.1 Location of Study Area and Catchment Basins ........................................................ 5-2 Figure 5.1.2 Alternative Options for Selection of Priority Areas for the Study ........................... 5-3 Figure 5.1.3 Basic IC Image ....................................................................................................... 5-14 Figure 5.1.4 Creek Interception Example ................................................................................... 5-14 Figure 5.1.5 Arrangement of IC (Option 1)................................................................................ 5-15 Figure 5.1.6 Arrangement of IC (Option 2)................................................................................ 5-16 Figure 5.1.7 WSC Device ........................................................................................................... 5-16 Figure 5.1.8 Pressure Main Profile ............................................................................................. 5-17 Figure 5.1.9 H2S Corrosion ........................................................................................................ 5-19 Figure 5.1.10 Example of Manhole .............................................................................................. 5-20 Figure 5.1.11 Typical Manhole Configuration ............................................................................. 5-20 Figure 5.1.12 Typical Manhole Configuration for Large Sewers ................................................. 5-21 Figure 5.1.13 Inline Check Valve ................................................................................................. 5-22 Figure 5.1.14 Ductile Iron Flap Valve .......................................................................................... 5-22 Figure 5.1.15 Circular Manhole PS .............................................................................................. 5-23

Republic of the Philippines Preparatory Survey on Water Supply and Sewerage Development in the West Zone of Metro Manila Final Report List of Figures
-F- ii -
Figure 5.1.16 Intermediate Underground PS ................................................................................ 5-23 Figure 5.1.17 Large-Scale PS ....................................................................................................... 5-24 Figure 5.1.18 STP Flow Diagram ................................................................................................. 5-34 Figure 5.1.19 CAS Layout............................................................................................................ 5-35 Figure 5.1.20 SBR Process Cycle ................................................................................................. 5-36 Figure 5.1.21 OD Layout.............................................................................................................. 5-37 Figure 5.1.22 MBBR Layout ........................................................................................................ 5-38 Figure 5.1.23 MBR Layout with Nutrient Removal ..................................................................... 5-38 Figure 5.1.24 Proposed Sewage Treatment Process Diagram ...................................................... 5-39 Figure 5.1.25 Sludge Treatment Process in the First Phase .......................................................... 5-41 Figure 5.1.26 Sludge Treatment Process in the Second Phase ..................................................... 5-42 Figure 5.1.27 Sludge Treatment Process in the Long Term.......................................................... 5-42 Figure 5.1.28 Increase of Sludge and Sludge Management ......................................................... 5-43 Figure 5.2.1 Target Area, land Use, Sub-Catchment Basin and Candidate STP Sites ................ 5-51 Figure 5.2.2 Location of the Marikina Fault Line ...................................................................... 5-52 Figure 5.2.3 Maximum Flood Depth Due to Typhoon Ondoy ................................................... 5-53 Figure 5.2.4 Trend of Population Growth in Quezon City from 1975 to 2010 .......................... 5-56 Figure 5.2.5 Design Route of Pipelines for Option 1 ................................................................. 5-61 Figure 5.2.6 Design Route of Pipelines for Option 2 ................................................................. 5-62 Figure 5.2.7 Design Route of Pipelines for Option 3 ................................................................. 5-63 Figure 5.2.8 Design Location of ICs in the Marikina River Basin ............................................. 5-65 Figure 5.2.9 Location of Payatas Landfill and Commercial Facilities in the Marikina
River Basin ............................................................................................................. 5-66 Figure 5.2.10 Facilities Layout of STP in the Marikina River Basin (Option 1) ......................... 5-73 Figure 5.2.11 Facilities Layout of STP in the Marikina River Basin (Option 1A) ....................... 5-74 Figure 5.2.12 Facilities Layout of STP in the Marikina River Basin (Option 2) ......................... 5-75 Figure 5.2.13 Facilities Layout of STP in the Marikina River Basin (Option 3) ......................... 5-76 Figure 5.2.14 Mechanical Process Diagram ................................................................................. 5-86 Figure 5.2.15 Power Riser Single-line Diagram 1 ........................................................................ 5-87 Figure 5.2.16 Power Riser Single-line Diagram 2 ........................................................................ 5-88 Figure 5.3.1 Target Area, Land Use, Sub-Catchment basin and Candidate Sites of STP ........... 5-91 Figure 5.3.2 Trend of Population Growth in Caloocan City from 1975 to 2010 ........................ 5-95 Figure 5.3.3 Pipeline Route for Option 1 ................................................................................. 5-101 Figure 5.3.4 Pipeline Route for Option 2 ................................................................................. 5-102 Figure 5.3.5 Pipeline Route for Option 3 ................................................................................. 5-103 Figure 5.3.6 Pipeline Route for Option 4 ................................................................................. 5-104 Figure 5.3.7 Design Location of ICs in the Marilao River Basin ............................................. 5-106 Figure 5.3.8 Location of Industrial and Commercial Facilities in the Marilao River Basin .... 5-107 Figure 5.3.9 Facility Layout of STP in the Marilao River Basin (Option 1) ............................ 5-116

Republic of the Philippines Preparatory Survey on Water Supply and Sewerage Development in the West Zone of Metro Manila Final Report List of Figures
-F- iii -
Figure 5.3.10 Facility Layout of STP in the Marilao River Basin (Option 2) ............................ 5-117 Figure 5.3.11 Facility Layout of STP in the Marilao River Basin (Option 3A) ......................... 5-118 Figure 5.3.12 Facility Layout of STP in the Marilao River Basin (Option 3B) ......................... 5-119 Figure 5.3.13 Facility Layout of STP in the Marilao River Basin (Option 4A) ......................... 5-120 Figure 5.3.14 Facility Layout of STP in the Marilao River Basin (Option 4B) ......................... 5-121 Figure 5.3.15 Mechanical Process Diagram ............................................................................... 5-130 Figure 5.3.16 Power Riser Single Line Diagram 1 ..................................................................... 5-131 Figure 5.3.17 Power Riser Single Line Diagram 2 ..................................................................... 5-132 Figure 5.3.18 Power Riser Single Line Diagram 3 ..................................................................... 5-133
Republic of the Philippines Preparatory Survey on Water Supply and Sewerage Development in the West Zone of Metro Manila Final Report List of Tables
- T-i -
List of Tables
Table 1.5.1 Meteorological Data ................................................................................................. 1-8 Table 1.5.2 Seasonal Temperature Changes (in °C) in 2020 and 2050 under
Medium-Range Emission Scenario in Cities and Municipalities in NCR ............. 1-10 Table 1.5.3 Seasonal Rainfall Change (in %) in 2020 and 2050 under Medium-Range
Emission Scenario in Cities and Municipalities in NCR ....................................... 1-10 Table 1.5.4 Frequency of Extreme Events in 2020 and 2050 under Medium-Range
Emission Scenario in Cities and Municipalities in NCR ....................................... 1-10 Table 1.5.5 Status of Forest Land Classification as of 2006 ..................................................... 1-11 Table 1.5.6 NIPAS in NCR ....................................................................................................... 1-11 Table 1.6.1 Current Population of the Study Area .................................................................... 1-12 Table 1.6.2 Family Income and Expenditure, 2009 in the Philippines ..................................... 1-13 Table 1.6.3 Health Indicators in the Philippines ....................................................................... 1-13 Table 1.6.4 Basic and Functional Literacy Rates of Household Population 10-64 Years
Old .......................................................................................................................... 1-14 Table 1.6.5 Number of Business Establishments and Industries in the Philippines as of
2010 ........................................................................................................................ 1-15 Table 1.6.6 Summary of DO Results for the 19 Priority Rivers ............................................... 1-17 Table 1.6.7 Summary of BOD Results for the 19 Priority Rivers ............................................. 1-17 Table 1.6.8 Annual Geometric Mean of Roadside TSP Level in the NCR Monitoring
Stations: 2000-2008 (ug/Ncm) ............................................................................... 1-18 Table 1.6.9 Waste Generation Estimates in 2007 and 2010 (million tons/years) ...................... 1-19 Table 1.7.1 General Regulations and Policies on the Environmental and Social
Considerations ........................................................................................................ 1-22 Table 1.7.2 Related Laws for Water Supply and Sewerage Improvement Projects .................. 1-22 Table 1.7.3 Relevant Regulations on Land Acquisition and Involuntary Resettlement ............ 1-27 Table 1.7.4 Manuals and Policies on Land Acquisition and Involuntary Resettlement to
Water Sector ........................................................................................................... 1-28
Table 2.1.1 Functions of Key Water Providers and Water-Related Agencies and Their Relations with Maynilad’s Water Business .............................................................. 2-4
Table 2.1.2 Concessionaires of MWSS in 1997 .......................................................................... 2-7 Table 2.1.3 Service Levels of Water Supply in the Philippines ................................................ 2-10
Table 3.2.1 Outline of the Priority Sewerage Projects ................................................................ 3-2 Table 3.2.2 Cost Estimates for the Projects ................................................................................ 3-3
Table 4.1.1 Alternative Examination on the Countermeasure for Water Supply ........................ 4-2 Table 4.1.2 Preliminary Scoping of the Environmental and Social Impacts on the NWR
Reduction Program .................................................................................................. 4-4

Republic of the Philippines Preparatory Survey on Water Supply and Sewerage Development in the West Zone of Metro Manila Final Report List of Tables
- T-ii -
Table 4.1.3 List of Studies for EIA on the NRW Reduction Program ........................................ 4-7 Table 4.1.4 Prediction of Impacts and Proposed Mitigation Measures ....................................... 4-8 Table 4.1.5 Environmental Management Plan .......................................................................... 4-10 Table 4.1.6 Environmental Monitoring Plan ............................................................................. 4-11
Table 5.1.1 Characteristics of Each Catchment Basin ................................................................ 5-2 Table 5.1.2 Comparison of the Four Options .............................................................................. 5-4 Table 5.1.3 Delineation of Staged Implementation ..................................................................... 5-7 Table 5.1.4 Census (2010) and Housing Population ................................................................... 5-8 Table 5.1.5 Population Projection ............................................................................................... 5-9 Table 5.1.6 Population and Domestic Demand in BP 2013 (March 2012) ................................. 5-9 Table 5.1.7 Domestic Water Consumption in the Study ............................................................. 5-9 Table 5.1.8 Minimum Slopes in the Maynilad Standard ........................................................... 5-11 Table 5.1.9 minimum Slopes Adopted in this Study ................................................................. 5-12 Table 5.1.10 Comparative Features of Gravity Sewers .............................................................. 5-17 Table 5.1.11 Comparative Features of Pressure Mains ............................................................... 5-18 Table 5.1.12 Comparison of Pipe Materials ................................................................................ 5-18 Table 5.1.13 Requirements for Internal Diameter of Manholes .................................................. 5-20 Table 5.1.14 Internal Dimensions Required for Rectangular Sections (for Pipe Diameters
Greater than 1500 mm) .......................................................................................... 5-21 Table 5.1.15 Design Parameters and Criteria for PSs ................................................................. 5-25 Table 5.1.16 Relevant Laws and Regulations on Effluent and Emissions from STP ................. 5-26 Table 5.1.17 Current Classification of Water Bodies for Fresh Surface Water According to
Beneficial Use ........................................................................................................ 5-27 Table 5.1.18 Current Water Quality Criteria for Conventional and Other Pollutants
Contributing to Aesthetics and Oxygen Demand of Fresh Waters (1/2) ................ 5-28 Table 5.1.19 Current Water Quality Criteria for Conventional and Other Pollutants
Contributing to Aesthetics and Oxygen Demand of Fresh Waters (2/2) ................ 5-29 Table 5.1.20 Current Effluent Standards: Toxic and Other Deleterious Substances
(Maximum Limits for Public Health) .................................................................... 5-29 Table 5.1.21 Current Effluent Standards: Conventional and Other Pollutants in Protected
Water Categories I and II and Inland Waters Class C ............................................ 5-30 Table 5.1.22 Environmental Permit Requirements for STP ........................................................ 5-31 Table 5.1.23 Effluent Quality Standards for Each Category (DAO 35) ..................................... 5-32 Table 5.1.24 New Effluent Standards for Each Category ........................................................... 5-33 Table 5.1.25 Process Variations and Modifications on CAS ...................................................... 5-36 Table 5.1.26 Comparison of Sewage Treatment Methods .......................................................... 5-39 Table 5.1.27 Typical Sludge Treatment Methods ....................................................................... 5-40 Table 5.1.28 Comparison of Pipe Installation Methods .............................................................. 5-45 Table 5.1.29 Summary of Geotechnical Survey ......................................................................... 5-48

Republic of the Philippines Preparatory Survey on Water Supply and Sewerage Development in the West Zone of Metro Manila Final Report List of Tables
- T-iii -
Table 5.1.30 Summary of Water Quality Survey Scope ............................................................. 5-49 Table 5.2.1 Land Use Classification in Quezon City ................................................................ 5-54 Table 5.2.2 Features of Each Candidate Site for STP ............................................................... 5-55 Table 5.2.3 Population and Average Households in the Marikina River Basin ........................ 5-55 Table 5.2.4 Health Indicators in Quezon City ........................................................................... 5-56 Table 5.2.5 Estimated Population in the Marikina River Basin ................................................ 5-57 Table 5.2.6 Estimated Water Consumption in Quezon City ..................................................... 5-57 Table 5.2.7 Prediction on Wastewater Amount ......................................................................... 5-58 Table 5.2.8 Summary of Sewer Design..................................................................................... 5-59 Table 5.2.9 Applicable Pipe Materials ...................................................................................... 5-60 Table 5.2.10 Designed Depth of Sewer Pipes in the Marikina River Basin ............................... 5-64 Table 5.2.11 Required Capacity of PSs in the Marikina River Basin ......................................... 5-64 Table 5.2.12 Water Quality of the Marikina River Tributaries (August 2012) ........................... 5-67 Table 5.2.13 Design Criteria of STP in the Marikina River Basin .............................................. 5-68 Table 5.2.14 Design Parameters for Preliminary Treatment Facilities ....................................... 5-69 Table 5.2.15 Design Parameters for Sewage Treatment Facilities .............................................. 5-70 Table 5.2.16 Design Parameters for Disinfection Tanks ............................................................. 5-70 Table 5.2.17 Design Parameters of Sludge Treatment Facilities ................................................ 5-71 Table 5.2.18 Summarized Design Comparison of Each Option ................................................. 5-77 Table 5.2.19 Environmental and Social Consideration in the Marikina River Basin ................. 5-79 Table 5.2.20 Comparison of Preliminary Construction and O&M Cost for Each Option .......... 5-80 Table 5.2.21 Evaluation of Each Option in the Marikina River Basin ....................................... 5-81 Table 5.2.22 Design Diameter and Length for Each Material and Construction Method ........... 5-82 Table 5.2.23 Facilities List and Design Quantities ..................................................................... 5-83 Table 5.2.24 List of Equipment and Design Requirements ........................................................ 5-84 Table 5.2.25 Load Calculation for Essential Loads .................................................................... 5-89 Table 5.2.26 Load Calculation for Non-Essential Loads ............................................................ 5-89 Table 5.3.1 Land Use Distribution of North Caloocan in 2001 and 2003 ................................ 5-93 Table 5.3.2 Features of Each Candidate Site for STP ............................................................... 5-94 Table 5.3.3 Population, Number of Households and Average Household Size in the
Marilao River Basin ............................................................................................... 5-95 Table 5.3.4 Health Indicators in Caloocan City ........................................................................ 5-96 Table 5.3.5 Estimated Population in the Marilao River Basin (1/2) ......................................... 5-96 Table 5.3.6 Estimated Population in the Marilao River Basin (2/2) ......................................... 5-97 Table 5.3.7 Estimated Water Consumption in the Marilao River Basin ................................... 5-98 Table 5.3.8 Predictions of Wastewater Amount ........................................................................ 5-99 Table 5.3.9 Summary of Sewer Designs ................................................................................. 5-100 Table 5.3.10 Applied Pipe Materials ......................................................................................... 5-100 Table 5.3.11 Designed Depth of Sewer Pipes in the Marilao River Basin ............................... 5-105

Republic of the Philippines Preparatory Survey on Water Supply and Sewerage Development in the West Zone of Metro Manila Final Report List of Tables
- T-iv -
Table 5.3.12 Pumping Stations in the Marilao River Basin ...................................................... 5-105 Table 5.3.13 Water Quality of the Marilao River Tributaries (August 2012) ........................... 5-108 Table 5.3.14 Design Criteria for the STP in the Marilao River Basin ...................................... 5-109 Table 5.3.15 Design Parameters for Preliminary Treatment Facilities of Options 1 and 2 ....... 5-110 Table 5.3.16 Design Parameters for Preliminary Treatment Facilities of Options 3 and 4 ........ 5-111 Table 5.3.17 Design Parameters for Sewage Treatment Facilities under Options 1 and 2 ....... 5-112 Table 5.3.18 Design Parameters for Sewage Treatment Facilities under Options 3 and 4 ....... 5-112 Table 5.3.19 Design Parameters for Disinfection Tanks under Options 1 and 2 ...................... 5-113 Table 5.3.20 Design Parameters for Disinfection Tanks under Options 3 and 4 ...................... 5-113 Table 5.3.21 Design Parameters for Sludge Treatment Facilities under Options 1 and 2 ......... 5-114 Table 5.3.22 Design Parameters for Sludge Treatment Facilities under Options 3 and 4 ......... 5-114 Table 5.3.23 Comparison of Summary of Preliminary Design for Each Option ...................... 5-122 Table 5.3.24 Environmental and Social Considerations in the Marilao River Basin ................ 5-124 Table 5.2.25 Comparison of Preliminary Construction and O&M Costs for each Option ....... 5-125 Table 5.3.26 Evaluation of Each Option ................................................................................... 5-126 Table 5.3.27 Design Diameters and Lengths for Each Material and Construction Method...... 5-127 Table 5.3.28 List of Facilities and Design Quantities ............................................................... 5-128 Table 5.3.29 List of Equipment and Design Requirements ...................................................... 5-129 Table 5.3.30 Load Calculation for Essential Loads .................................................................. 5-134 Table 5.3.31 Load Calculation for Non-Essential Loads .......................................................... 5-134 Table 5.4.1 Draft Preliminary Scoping of Environmental and Social Impacts of STP ........... 5-137 Table 5.4.2 List of Studies for EIA on Sewerage Projects ...................................................... 5-140 Table 5.4.3 Prediction of Impacts and Proposed Mitigation Measurements ........................... 5-140 Table 5.4.4 Environmental Management Plan ........................................................................ 5-143 Table 5.4.5 Environmental Monitoring Plan ........................................................................... 5-145 Table 5.4.6 Summary of RPF under ESSF for MWMP .......................................................... 5-147 Table 5.4.7 Status of LAR and ARAP under MPWP .............................................................. 5-149
Republic of the Philippines Preparatory Survey on Water Supply and Sewerage Development in the West Zone of Metro Manila Final Report Abbreviations
Ab-i
Abbreviations
ACP Asbestos Cement Pipe ADR Appropriate Discount Rate AMSL Above Mean Sea Level ATRCC Advanced Technology Resources Construction Corporation AWSOP Angat Water Supply Optimization Project BA Business Area BOD Biological Oxygen Demand BOT Build-Operate-Transfer BWSA Barangay Water Supply Association CA Concession Agreement Ca Calcium CAPEX Capital Expenditures CBO Community-Based Organization CEO Chief Executive Officer CF Concession Fee CIP Cast Iron Pipe Cl Chlorine CMS Cubic Meter per Second CNC Certificate of Non-Coverage CNMD Central NRW Management Department COD Chemical Oxygen Demand CON Concrete Pipe CPF Common Purpose Facilities CSO Combined Sewer Overflow DAF Dissolved Air Floatation DENR Department of Environment and Natural Resources DILG Department of Interior and Local Government DIP Ductile Iron Pipe DMA District Metered Area DOF Department of Finance DOH Department of Health DPWH Department of Public Works and Highway EC Electric Conductivity ECA Environmentally Critical Area ECC Environmental Compliance Certificate ECP Environmentally Critical Project EIS Environmental Impact Statement EMB Environmental Management Bureau ENRO Environment and Natural Resources Office FRP Fiber Reinforced Pipe FS Feasibility Study FTE Full Time Equivalent GIP Galvanized Iron Pipe

Republic of the Philippines Preparatory Survey on Water Supply and Sewerage Development in the West Zone of Metro Manila Final Report Abbreviations
Ab-ii
GIS Geographical Information System GOP Government of Philippines GSP Galvanized Steel Pipe HA Hydraulic Area HDPE High Density Polyethylene Pipe IMS Integrated Management System IP Investment Plan 2008-2037 ISO International Organization for Standardization IT Information Technology JICA Japan International Agency km kilometer KPI Key Performance Indicator L Litter LGU Local Government Unit LLDA Laguna Lake Development Authority LMTP La Mesa Treatment Plant LWUA Local Water Utilities Administration m meter MF Micro Filter MFRO Micro Filter Reverse Osmosis Mg Magnesium MLD Million Litter per Day mm millimeter Mn Manganese MOA Memorandum of Agreement MP Master Plan MPIC Metro-Pacific Investment Corporation MPN Most Probable Number MSSP Manila Second Sewerage Project MSWDP Manila South Water Distribution Project MW Mega Watt MWCI Manila Water Company, Inc. MWSI Maynilad Water Service, Inc. MWSS Metropolitan Waterworks and Sewerage System
MWSS BoT Metropolitan Waterworks and Sewerage System Board of Trustees
ND Not Detected NEDA National Economic and Development Authority NRW Non-Revenue Water NSO National Statistics Office NTU Nephelometric Turbidity Units NWRB National Water Resources Board O&M Operation and Maintenance ODA Official Development Assistance OHSAS Occupational Health and Safety Assessment Series

Republic of the Philippines Preparatory Survey on Water Supply and Sewerage Development in the West Zone of Metro Manila Final Report Abbreviations
Ab-iii
OPEX Operational Expenditures p/c person per connection PAWS Public Assessment of Water Services PB Polybutylene Pipe PD Presidential Decree PE Polyethylene Pipe PFD Process Flow Diagram PHP Philippine Peso PLC Programme Logic Controller PNSDW Philippine National Standards for Drinking Water PO Private Operator PRV Pressure Reducing Valve psi Pond per Square Inch PVC Polyvinyl Chloride Pipe QA Quality Assurance QC Quality Control QESH Quality Environment Safety and Health RO Regulatory Office ROW Right of Way RWDC Rural Waterworks Development Corporation RWSA Rural Water Supply Association SCADA Supervisory Control and Data Acquisition SKM Sinclair Knight Merz SLRB San Lorenzo Ruiz Builders SMWC Sierra Madre Water Corporation SP Steel Pipe SPC Special Purpose Company SS Suspended Solids STP Sewage Treatment Plant TATD Talent Acquisition and Training Department TDS Total Dissolved Solids TSS Total Suspended Solids UATP Uniray-Angat Transbasin Project UK United Kingdom UNDP United Nations Development Programme UP University of the Philippines VAT Vale Added Tax WB World Bank WD Water District WRC Water Regulatory Commission WSP Water Service Provider WTP Water Treatment Plant
Republic of the Philippines Preparatory Survey on Water Supply and Sewerage Chapter 1 Development in the West Zone of Metro Manila Final Report Introduction
1 - 1
Chapter 1 Introduction
1.1 Background of the Study
Metropolitan Manila (Metro Manila) or also known as the National Capital Region (NCR) of the Republic of the Philippines is one of the largest metropolitan areas in the world. The water supply and sewerage services (hereinafter referred to as the “water services”) were formerly operated and managed by the Metropolitan Waterworks and Sewerage System (MWSS) under the supervision of the Department of Public Works and Highways (DPWH). However, in the 1990s, the progress rate of water services in Metro Manila was significantly behind the region’s overall development, which caused serious social issues. Aiming to resolve these issues, the water services were privatized in 1997 and the service area was divided into two zones, i.e., the West Zone and East Zone. This privatization was directed by the Philippine government with the assistance of the International Finance Corporation (IFC). The West Zone, which is the subject area of the Study, is being operated by the Maynilad Water Service Inc. (Maynilad), whereas the East Zone is being handled by the Manila Water Company, Inc. (Manila Water) under concession agreements with MWSS.
The level of water services in the East Zone is higher than the West Zone. This is due to the Asian economic crisis in 1997 which resulted in the bankruptcy of Maynilad. Maynilad was temporarily nationalized by MWSS before its reprivatization in 2007. The Non-Revenue Water (NRW) ratio in the West Zone was 48% in 2011. It is required that the ratio be reduced to address the lack of water source and improve operational cost. Moreover, as far as sewerage service coverage ratio is concerned, both West and East areas are still low. Both areas have approximately 10% coverage ratios at the end of 2011. Hence, the improvement of the sewerage service is urgently required.
The water management conducted by the Philippine government is being improved with the priority policy proposed in the Philippine Development Plan 2011–2016 (5-year Medium-Term Plan) for its citizenry to have improved access to safe drinking water. In addition, the government, which is represented mainly by the Department of Environment and Natural Resources (DENR), concentrates its endeavor to improve water quality on water bodies such as Manila Bay from waste water effluent, as well as to improve discharge standards.
The Philippine President expressed his great expectation for Public Private Partnership (PPP) projects to manage huge infrastructural facilities that are urgently required and decided to establish the PPP Center under the National Economic and Development

Republic of the Philippines Preparatory Survey on Water Supply and Sewerage Chapter 1 Development in the West Zone of Metro Manila Final Report Introduction
1 - 2
Authority (NEDA) in 2010. Hence, the demand for the improvement of sewerage system and NRW reduction projects are increasing in concurrence with the adaptation of PPP in the Philippines.
Considering the above situations, the Japanese government and the Japan International Cooperation Agency (JICA) decided to improve the access to safe water as an important development agenda in support to poverty alleviation as well as to improve the living environment.
Under these circumstances, the Preparatory Survey on Water Supply and Sewerage Development in the West Zone of Metro Manila (hereinafter referred to as the “Study”) commenced in late March 2012 and has been completed.
1.2 Objectives of the Study
The objectives of the Study are set as follows:
To contribute to the improvement of water service management, effective utilization of water source, and stable water supply with reasonable water tariff through the reduction of NRW;
To contribute to the improvement of public health and water quality on water bodies by the expansion of sewerage coverage ratio through implementation of priority sewerage projects;
To contribute to the improvement of sustainable water services and the development of the region, by raising water service levels with effective utilization of operation and maintenance management technologies and know-how in water services management;
To contribute to the improvement of living standards in poverty stricken areas with the advancement of water service coverage to the poor class; and
To contribute to the reduction of poverty and economic burden of the citizenry by realizing the aforementioned objectives through the technical and financial assistance provided by PPP from the Japanese side.
The Study shall implement the project formulation and feasibility studies as mentioned above considering that the Japanese Yen loan and/or Private Sector Investment Finance (PSIF) will be utilized, as well as technical know-how and technology transfer are to be formulated and implemented through the Technical Cooperation Project of JICA.

Republic of the Philippines Preparatory Survey on Water Supply and Sewerage Chapter 1 Development in the West Zone of Metro Manila Final Report Introduction
1 - 3
1.3 Scope of the Study
The main scope of the Study is presented below:
A. Preparatory Works
╴ Collection and review of relevant information, data, reports ╴ Consideration of basic policy, methodology, work schedule, and work flow of
the Study
╴ Preparation of the inception report
B. Study on the Water Sector in Study Area
╴ Overview of the water sector in the Philippines ╴ Review of water service in the Study area ╴ Review of the current status of PPP and possible Japanese’s assistance
C. Feasibility Study on NRW Reduction Project - Review of the present condition of NRW of Maynilad - Study on target setting of NRW reduction - Preliminary design of NRW management projects - Study on the implementation plan - Study on the social and environmental considerations in NRW reduction
projects - Study on the cost estimates of NRW reduction projects - Study on fund procurement plan - Financial and economic analyses of NRW reduction projects - Study on risk management
D. Feasibility Study on Priority Sewerage Projects
╴ Review of relevant existing study reports, data, information ╴ Selection of priority sewerage projects from alternative studies ╴ Preliminary planning and design of the sewerage system and major facilities
╴ Preparation of project implementation plan for the proposed projects ╴ Study on preliminary considerations regarding environmental and social
impacts
╴ Study on cost estimation of the projects ╴ Study on fund procurement plan ╴ Financial and economic analyses ╴ Study on risk management

Republic of the Philippines Preparatory Survey on Water Supply and Sewerage Chapter 1 Development in the West Zone of Metro Manila Final Report Introduction
1 - 4
E. Study on Overall Management System and Financial Situation of Maynilad - Review of organization of Maynilad - Review of social and environmental management of Maynilad - Review of water tariff setting - Review of Business Plan 2013 - Financial analysis and projection of Maynilad - Study on financial risk management
F. Report Preparation
╴ Preparation of inception report, interim report, draft final report, and final report
1.4 Study Area
The Study area covers the West Zone of Metro Manila, as shown in Figure 1.4.1 Location Map. The area comprises most of the cities and municipalities of Metro Manila and some municipalities of Cavite. To the east of the Study area is the Cordillera Mountains, Laguna de Bay in the southeast, Central Luzon in the north and Southern Tagalog Region in the south. The total land area includes zones for residential, industrial, institutional, and agricultural uses as well as unclassified public forests.
The Study area is also located in a region with adequate facilities and services in terms of mass transportation, housing and commercial infrastructure, communications, power supply, and recreational facilities. It has excellent seaport facilities of international standards situated in Batangas City and Subic Bay in Olongapo City, and an aviation center by the Diosdado Macapagal International Airport in Angeles City. The government has envisioned an integrated road network and rail-based mass transport system within the metropolis. Moreover, it has a world-class malls and commercial centers.
Details of natural and physical conditions, as well as social and environmental conditions are described in Sections 1.5 and 1.6, respectively.

Republic of the Philippines Preparatory Survey on Water Supply and Sewerage Chapter 1 Development in the West Zone of Metro Manila Final Report Introduction
1 - 5
Location Map
Luzon
Visayas
Mindanao
Maynilad’s Service Area
Source: JICA Study Team
Figure 1.4.1 Location Map of Maynilad’s Service Area
1.5 Natural and Physical Conditions of the Study Area
1.5.1 Study Area Limits, Topography, Geology On April 23, 2010, Maynilad and MWSS signed a 15-year concession agreement term extension for the former to continue providing water and wastewater services in the West Zone until 2037. The West Zone includes Caloocan, Las Piñas, Malabon, Manila, Muntinlupa, Navotas, Pasay, Parañaque, Valenzuela, some parts of Quezon City, a part of Makati, Cavite City, municipalities of Rosario, Imus, Noveleta, Bacoor, and Kawit in Cavite.

Republic of the Philippines Preparatory Survey on Water Supply and Sewerage Chapter 1 Development in the West Zone of Metro Manila Final Report Introduction
1 - 6
(1) Study Area Limits For the feasibility study of NRW reduction projects, the Study area is limited to the whole West Zone. Meanwhile, for the feasibility study of sewerage projects, the Study area covers only the Marikina River basin located in the northern part of Quezon City and the Marilao River basin in the northern part of Caloocan City.
(2) Topography Majority of the Study area lies entirely in a neck of swampland with an average elevation of 10 m above mean sea level (AMSL), while the municipalities of Bacoor, Kawit, Noveleta, and Rosario have extremely low ground elevation ranging from 0 to 2 m above AMSL. Towards the Quezon City area, the topography becomes largely rolling with alternating ridges and lowlands. Steep portions are evident in the eastern part of the city which runs parallel with the Marikina River and West Valley Fault.
The topography in northern Caloocan is characterized by gentle to steep, undulating to rolling terrain with slopes ranging from 3% to 18%. This landscape is noted in the northern and central portions and gradually transforming into a southward trend of flat lands down to the southwestern tip of the boundary. The highest elevation is 120 m above AMSL, which was determined in the Tala Estate, Pangarap Village.
(3) Geology According to the Mines and Geosciences Bureau (MGB), Metro Manila and its adjoining vicinity is underlain by recent alluvial deposits, a clastic sequence of conglomerates, mudstones, and sandstones (Alat Conglomerate), and a pyroclastic– sedimentary unit (Diliman Tuff). The eastern portion of Metro Manila is underlain by Angat Ophiolitic Complex, composed of basalts, diabases, and gabbros.
The Quaternary (Recent) alluvial deposits are made up of unconsolidated and poorly sorted pebbles/cobbles and boulders of older rocks, sand, silt, and mud. These were deposited along the Manila deltaic plain and Marikina Valley alluvial plain. The thicknesses of these alluvial deposits vary from 50 m for the coastal area of the Manila deltaic plain to over 130 m in the Marikina area and even up to 200 m in the Cainta-Pasig area.
For the Pleistocene Guadalupe Formation, most of the deposits are believed to be water-laid. The Alat Conglomerate which is about 100 m thick is mapped to be made up of massive conglomerates, deeply weathered silty mudstone, and tuffaceous sandstone. The Diliman Tuff, with thickness of 1300 m to 2000 m, is composed predominantly of fine-grained vitric tuff and welded volcanic breccia with subordinate amount of fine to
Republic of the Philippines Preparatory Survey on Water Supply and Sewerage Chapter 1 Development in the West Zone of Metro Manila Final Report Introduction
1 - 7
medium grained tuffaceous sandstone. The Alat Conglomerate and Diliman Tuff are considered members of the Pleistocene Guadalupe Formation which extends from Bulacan to the north, all the way to Cavite to the south.
1.5.2 Climate – Weather Patterns The Philippines has a tropical maritime climate. It is characterized by relatively high temperature, high humidity, and abundant rainfall. Based on Modified Coronas Climate Classification of PAGASA1, the climate in the Study area belongs to Type 1, that is, dry from November to April and wet during the rest of the year. Typhoons have a great influence on the climate and weather conditions in the Philippines. A great portion of the rainfall, humidity, and cloudiness are due to the influence of typhoons. These typhoons generally originate from the region of the Marianas and Caroline Islands of the Pacific Ocean which have the same latitudinal location as Mindanao. Their movements follow a northwesterly direction.
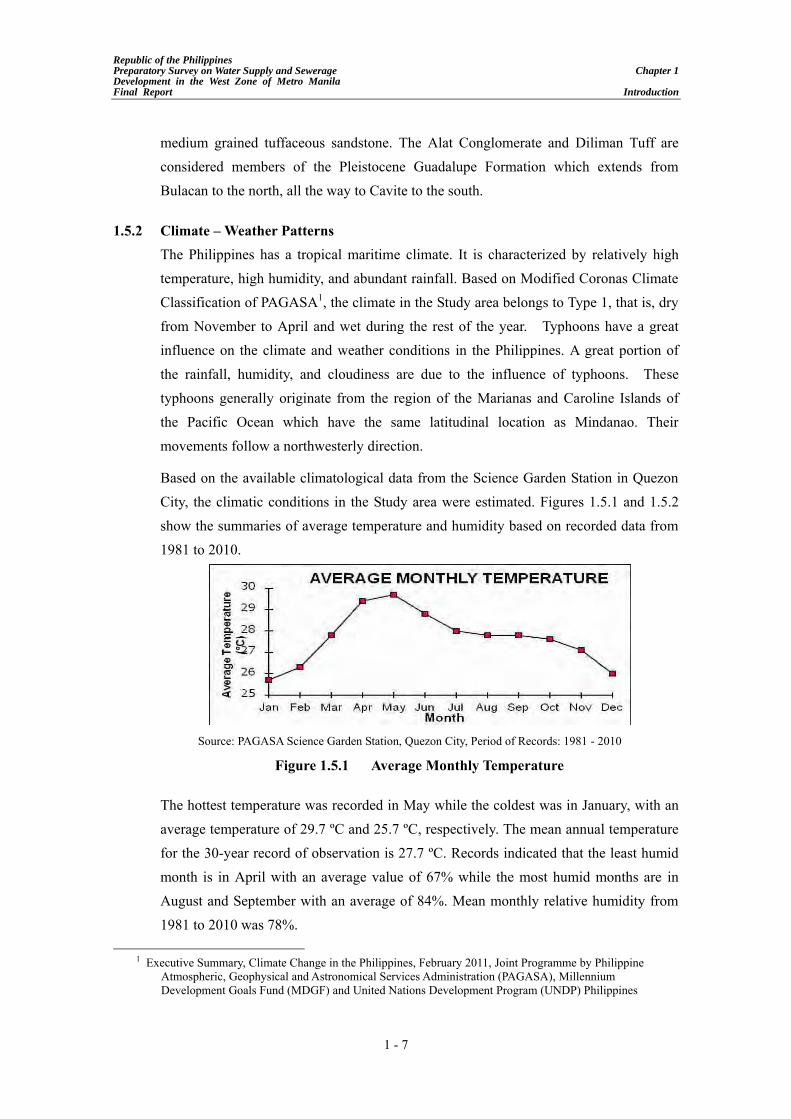
Based on the available climatological data from the Science Garden Station in Quezon City, the climatic conditions in the Study area were estimated. Figures 1.5.1 and 1.5.2 show the summaries of average temperature and humidity based on recorded data from 1981 to 2010.
Source: PAGASA Science Garden Station, Quezon City, Period of Records: 1981 - 2010
Figure 1.5.1 Average Monthly Temperature
The hottest temperature was recorded in May while the coldest was in January, with an average temperature of 29.7 ºC and 25.7 ºC, respectively. The mean annual temperature for the 30-year record of observation is 27.7 ºC. Records indicated that the least humid month is in April with an average value of 67% while the most humid months are in August and September with an average of 84%. Mean monthly relative humidity from 1981 to 2010 was 78%.
1 Executive Summary, Climate Change in the Philippines, February 2011, Joint Programme by Philippine
Atmospheric, Geophysical and Astronomical Services Administration (PAGASA), Millennium Development Goals Fund (MDGF) and United Nations Development Program (UNDP) Philippines

Republic of the Philippines Preparatory Survey on Water Supply and Sewerage Chapter 1 Development in the West Zone of Metro Manila Final Report Introduction
1 - 8
Source: PAGASA Science Garden Station, Quezon City, and Period of Records: 1981 - 2010
Figure 1.5.2 Average Monthly Humidity
1.5.3 Rainfall – from Gauging Stations Nearby Climatological data from the Science Garden Station in Quezon City includes historical rainfall from 1981 to 2010. Figure 1.5.3 is a summary of monthly average rainfall based on the said data.
Source: PAGASA Science Garden Station, Quezon City, and Period of Records: 1981 - 2010
Figure 1.5.3 Average Monthly Rainfall
Table 1.5.1 Meteorological Data
Month Rainfall
(mm) Number of Rainy Days
Temperature (°C)
Relative Humidity (%)
January 18.5 4 25.7 76 February 14.6 3 26.3 73 March 24.8 4 27.8 69April 40.4 5 29.4 67 May 186.7 12 29.7 72 June 316.5 18 28.8 79 July 493.3 22 28.0 83 August 504.2 23 27.8 84 September 451.2 22 27.8 84October 296.6 18 27.6 83 November 148.8 14 27.1 82 December 78.7 8 26.0 79 Total 2,574.3 153 - -Average - 27.7 78
Source: PAGASA Science Garden Station, Quezon City, Period of Records: 1981 - 2010

Republic of the Philippines Preparatory Survey on Water Supply and Sewerage Chapter 1 Development in the West Zone of Metro Manila Final Report Introduction
1 - 9
The annual rainfall in the area averages to 2,574.4 mm. Maximum precipitation occurs during the month of August with an average of 504.2 mm while the minimum precipitation recorded during the month of February has an average of 14.6 mm, as shown in Table 1.5.1.
1.5.4 Climate Change According to the report from PAGASA, climate change scenarios provide characteristics of possible future climate and are constructed using climate models. These are either global or regional climate models and are mathematical representations of the climate system which simulate the physical and dynamical processes that determine global/regional climate. There is no certainty as to how emission pathways in the future would go, inasmuch as development pathways in both the developed and developing countries all over the globe are defined by factors such as population and demographic characteristics, access to technology, economic development, energy use, and policies pursued, including outcomes of negotiations on greenhouse gas emission reductions.
The projected seasonal temperature changes, seasonal rainfall changes, and frequency of extreme events in 2020 and 2050 under the medium-range emission scenario in the cities/municipalities in NCR are presented in Table 1.5.2, Table 1.5.3, and Table 1.5.4, respectively.
To use the tables and arrive at values of seasonal mean temperature and seasonal rainfall in 2020 and 2050 in any of the cities/municipalities, the projections are added to the observed values (presented in each table).
For example, in Metro Manila, the projected values in 2020 are:
a. DJF mean temperature = (26.1 °C+1.0 °C) = 27.1 °C;
b. DJF rainfall = {107.5 mm+107.5(-12.8%) mm} = (107.5-13.8) mm or 93.7 mm;
c. Number of days with Tmax>35 °C in Quezon City during the 2006-2035 period (centered in 2020) = 1984 days;
d. Number of dry days in Quezon City during the 2006-2035 period (centered in 2020) = 6302 days; and
e. Number of days with rainfall > 300 mm in Quezon City during the 2006-2035 period (centered in 2020) = 8 days.

Republic of the Philippines Preparatory Survey on Water Supply and Sewerage Chapter 1 Development in the West Zone of Metro Manila Final Report Introduction
1 - 10
Table 1.5.2 Seasonal Temperature Changes (in °C) in 2020 and 2050 under Medium-Range Emission Scenario in Cities and Municipalities in NCR
Source: JICA Study Team
Table 1.5.3 Seasonal Rainfall Change (in %) in 2020 and 2050 under Medium-Range Emission Scenario in Cities and Municipalities in NCR
Source: JICA Study Team
Table 1.5.4 Frequency of Extreme Events in 2020 and 2050 under Medium-Range Emission Scenario in Cities and Municipalities in NCR
Source: JICA Study Team
1.5.5 Natural Environmental Conditions in Metro Manila (1) Forest
The status of land classification in the Philippines and NCR are shown in Table 1.5.5. Over 50% of the land area in the Philippines is classified as forest land in contrast to only 24% in NCR. At present, the forest cover may be reduced as the figure below show the land classification as of 2006.
OBSERVED BASELINE
(1971-2000), °C CHANGE IN 2020
(2006-2035), °C CHANGE IN 2050
(2036-2065), °C Months DJF MAM JJA SON DJF MAM JJA SON DJF MAM JJA SON
Metro Manila 26.1 28.8 28.0 27.4 1.0 1.1 0.9 1.0 2.0 2.1 1.8 1.9
Observed Baseline(1971-2000), mm
Change in 2020 (2006-2035), %
Change in 2050 (2036-2065), %
Months DJF MAM JJA SON DJF MAM JJA SON DJF MAM JJA SON
Metro Manila 107.5 198.5 1,170.2 758.7 -12.8 -33.3 8.5 0.0 -17.3 -38.5 21.3 3.7
Months Stations No. of Days with Tmax>35 oC No. of Dry Days No. of Days with
Rainfall > 200 mm OBS
(1971-2000) 2020 2050 OBS 2020 2050 OBS 2020 2050
Metro Manila
Port Area 299 1,176 2,118 7,380 6,445 6,382 12 12 13Science Garden 1,095 1,984 3,126 7,476 6,302 6,220 9 13 17

Republic of the Philippines Preparatory Survey on Water Supply and Sewerage Chapter 1 Development in the West Zone of Metro Manila Final Report Introduction
1 - 11
Table 1.5.5 Status of Forest Land Classification as of 2006
Philippines NCR Area (km2)
Rate to Total
Area (km2)
Rate to Total
Total Land Area 30,000,000 100.0% 63,600 100.0%
Land
Cla
ssifi
catio
n
Alienable and Disposable Land 14,207,582 47.4% 48,232 75.8%Total Forest Land 15,792,418 52.6% 15,368 24.2% Unclassified Forest Land 753,427 2.5% 14,740 23.2% Total Classified Public Forest 15,038,991 50.1% 628 1.0% Forest Reserves 3,222,358 10.7% 0.0% Established Timberland 10,090,897 33.6% 237 0.4% National Parks GRBS/WA 1,342,579 4.5% 59 0.1% Military and Naval Reservation 126,130 0.4% 0.0% Civil Reservation 165,946 0.6% 0.0% Fishpond Development 91,077 0.3% 332 0.5%
Note: GBRS - Game Refuge and Bird Sanctuaries; WA - Wilderness Areas Source: National Statics Office
(2) Protected Areas 1) National Integrated Protected Areas System (NIPAS)
NIPAS Act of 1992 provides the legal framework for the establishment and management of protected areas in the Philippines. The NIPAS Act identified 202 initial components comprising proclaimed national parks, game refuge and wildlife sanctuaries, nature reserves, wilderness areas, mangrove reserves, watershed reservations, fish sanctuaries, protected landscapes and seascapes, among others, prior to the effectivity of the NIPAS Act. There is only one protected area in NCR under NIPAS Act and that is the Ninoy Aquino Parks and Wildlife Center, as shown in Table 1.5.6.
Table 1.5.6 NIPAS in NCR Name of Protected Area Location Legislation Area (ha.)
Quezon Memorial National Park (Ninoy Aquino Parks and Wildlife Center)
Quezon Avenue Diliman, Quezon City
Proc.723 22.7
Source: Protected Area Wildlife Bureau, DENR
2) Ramsar Convention Wetlands There are four internationally recognized important wetlands, namely, Agusan Marsh Wildlife Sanctuary (Mindanao), Naujan Lake National Park (Oriental Mindoro), Olango Island Wildlife Sanctuary (Cebu), and Tubbataha Reefs National Marine Park (Sulu Sea). These wetlands are important habitats for water birds and are registered as Ramsar Convention wetlands. These four wetlands are all outside of the Study area.

Republic of the Philippines Preparatory Survey on Water Supply and Sewerage Chapter 1 Development in the West Zone of Metro Manila Final Report Introduction
1 - 12
3) Important Birds Areas (IBAs) The program of IBAs has been conducted by the Bird Life International over the entire world. Around 117 IBAs have been identified and documented in the Philippines, 114 of which are considered to be important for the conservation of globally threatened bird species. Twenty-three of these were selected as outstanding IBAs. These IBAs are all outside of the Study area.
1.6 Social and Environmental Conditions of Metro Manila
1.6.1 Social and Economic Conditions (1) Study Area
The Study area of water supply services covers the West Zone of Metro Manila. It consists of 11 cities, namely, Manila, parts of Quezon City, Caloocan, Malabon, Navotas, Valenzuela, Las Piñas, Muntinlupa, Parañaque, Pasay, and Cavite. Ten cities except Cavite are located in the NCR. The Study area of sewerage service covers the Marikina River basin in the northern part of Quezon City, and the Marilao River basin situated in the north of Caloocan City.
(2) Population Population, land area, and population density in the West Zone of Metro Manila are shown in Table 1.6.1. The populations in the cities of Manila and Pasay in 2010 are less than those of 2007.
Table 1.6.1 Current Population of the Study Area
City/Municipality
2010 Census 2007 Census
Population (2010)
Population (2007) Land Density
(2007) Number of Barangayskm2 person/km2
Philippines 92,337,852 88,546,087 343448.3 258 42,027NCR 11,855,975 11,547,959 619.5 18,641 1,706Manila City 1,652,171 1,660,714 25 66,482 897Quezon City 2,761,720 2,679,450 171.7 15,605 142Caloocan City 1,489,040 1,381,610 55.8 24,760 188Malabon City 353,337 363,681 15.7 23,150 21Navotas City 249,131 245,344 8.9 27,443 14Valenzuela City 575,356 568,928 47 12,100 33Las Piñas City 552,573 532,330 32.7 16,284 20Muntinlupa City 459,941 452,943 39.8 11,395 9Parañaque City 588,126 552,660 46.6 11,867 16Pasay City 392,869 403,064 14 28,852 201Cavite 2,987,891 2,856,765 1574.2 1,815 829
Source: 2010 and 2007 Census of Population, National Statistics Office

Republic of the Philippines Preparatory Survey on Water Supply and Sewerage Chapter 1 Development in the West Zone of Metro Manila Final Report Introduction
1 - 13
(3) Household Figure 1.6.1 shows the trend of households in NCR from 1960 to 2007. The number of households in 2007 was approximately 2.5 million, which showed a growth of 6.5 times in comparison with the figures in 1960. The average household size in NCR in 2007 was 4.4 persons.
0
500,000
1,000,000
1,500,000
2,000,000
2,500,000
1960 1970 1980 1990 2000 2007
National Capital Region
Housing unit
Census year Source: 2007 Census of population, National Capital Region
Figure 1.6.1 Trend of Household Units Growth in NCR from 1975 to 2010
Table 1.6.2 shows the average family income and expenditure of Filipino families in 2009. The annual average family income in NCR is PHP 356,000, which is higher than the national average in general.
Table 1.6.2 Family Income and Expenditure, 2009 in the Philippines
Family Income and Expenditure 2009
Philippines NCR Annual average family income (in thousand PHP) 206 356Annual average family expenditure (in thousand PHP) 176 309Annual average family saving (in thousand PHP) 31 47
Source: 2009 Family Income and Expenditure Survey, National Statistics Office
(4) Health Table 1.6.3 shows the health indicators in the Philippines. It can be deduced from the following table that there is a decreasing trend of infant mortality, under-five mortality, child mortality, and maternal mortality.
Table 1.6.3 Health Indicators in the Philippines Indicator 2000 2005 2008
Fertility rate, total (births per woman) 3.5 3.3* -Crude birth rate (CBR) per 1000 population 23.1 20.1 -Crude death rate (CDR) per 1000 population 4.8 5.1 -Adolescent pregnancy rate (per 1000 women aged 15-19) 53 54 -Infant mortality rate (IMR), per 1000 live births 35 29 25Under-five mortality rate, per 1000 live births 48 40 34Maternal mortality rate, per 100 000 live births 172 162 -HIV, Number of Positive Cases 123 210 342
Note: *2006 Source: The Philippines Health System Review

Republic of the Philippines Preparatory Survey on Water Supply and Sewerage Chapter 1 Development in the West Zone of Metro Manila Final Report Introduction
1 - 14
(5) Education Table 1.6.4 shows the basic and functional literacy rates of household population aged 10-64 years old in 2003. In terms of basic and functional literacy, females scored higher rates than males.
Table 1.6.4 Basic and Functional Literacy Rates of Household Population 10-64 Years Old
Area 2003 Basic Literacy Rate* 2003 Functional Literacy Rate**
Total Female Male Total Female Male Philippines 93.4 94.3 92.6 84.1 86.3 81.9 NCR 99.0 99.1 98.9 94.6 95.2 94.0
*Basic Literacy Rate – % of population 10-64 years old who can read, write, a simple message in any language or dialect ** Functional Literacy Rate - % of population who can read, write, compute, and/or comprehend Source, 2003 FLEMMS, National Statistics Office and Department of Education
(6) Water Supply and Toilet Facility The main sources of water supply for drinking and/or cooking in the Philippines and NCR are shown in Figure 1.6.2. Over 50% of households in NCR have their own faucet, in contrast to only 27% in the country, in general.
27.3%
50.8%
19.3%
24.3%
9.1%
4.0%
15.7%
9.7%
7.2%
0.6%7.9%
8.8%2.3%
6.3%0.4% 1.3%
1.9% 2.2%
0%
10%
20%
30%
40%
50%
60%
70%
80%
90%
100%
Philippines NCR
Others
Bottled water
Peddler
Spring, Lake, river, Rain
Dug well
Tubed/Piped shallow well
Shared Tubed/ Piped deep well
Own use Tubed/ Piped deep well
Shared faucet, Community Water system
Own use faucet, community Water system Source: National Statics Office
Figure 1.6.2 Main Source of Water Supply for Drinking and/or Cooking as of 2000
The different kinds of toilet facilities in the Philippines and NCR are shown in Figure 1.6.3. Around 84% of the households in NCR use water-sealed, sewer/septic tank toilet, in contrast to 47% in the country in general.

Republic of the Philippines Preparatory Survey on Water Supply and Sewerage Chapter 1 Development in the West Zone of Metro Manila Final Report Introduction
1 - 15
42.0%
67.8%
8.4%
16.5%
16.5%
7.2%
6.2%
4.5%
8.9%
7.5%1.8%8.7%
0%
10%
20%
30%
40%
50%
60%
70%
80%
90%
100%
Philippines NCR
None
Others (Pail System, and the like)
Open Pit
Closed Pit
Water‐sealed, Other Depository, Shared with Other Households
Water‐sealed, Other Depository, Used Exclusively by Households
Water‐sealed, Sewer/Septic Tank, Shared with Other Households
Water‐sealed, Sewer/Septic Tank, Used Excusively by Households
Source: National Statistics Office
Figure 1.6.3 Kinds of Toilet Facilities as of 2000
(7) Business and Industry
The number of business establishments and industries in the Philippines as of 2010 is shown in Table 1.6.5. As indicated in the table below, the category “wholesale and retail trade along with repair of motor vehicles and motorcycles” is the major business and industry, representing 47% of the total number of establishments.
Table 1.6.5 Number of Business Establishments and Industries in the Philippines as of 2010
Category of Business and Industry Number of Establishment Philippine NCR
1 Agriculture, Forestry, and Fishing 5,096 2272 Mining and Quarrying 559 1703 Manufacturing 112,766 21,7424 Electricity Gas Stream and Air Conditioning Supply 768 1305 Water Supply; Sewerage Waste Management and Remediation Activities 1,055 1876 Construction 2,972 1,4537 Wholesale and Retail Trade; Repair of Motor Vehicles, and Motorcycles 383,723 93,2098 Transportation and Storage 6,220 2,7349 Accommodation and Food Services Activities 105,105 27,39410 Information and Communication 19,805 5,09811 Financial and Insurance Activities 28,593 7,96412 Real Estate Activities 6,476 3,35713 Professional Scientific and Technical Activities 18,365 7,30014 Administrative and Support Services Activities 18,754 9,01715 Education 15,199 4,41316 Human Health and Social Work Activities 30,858 11,10017 Arts Entertainment and Recreation 12,758 2,18818 Other Services Activities 49,758 15,595
Total 818,830 213,278Source: 2011 List of Establishment (preliminary results)

Republic of the Philippines Preparatory Survey on Water Supply and Sewerage Chapter 1 Development in the West Zone of Metro Manila Final Report Introduction
1 - 16
(8) Traffic Circumferential and radial trunk roads are formed in Metro Manila’s road network. Metro Manila is primarily dependent on roads for transportation due to its underdeveloped rail network system, though one Metro Rail Transit (MRT) and two lines of Light Rail Transit (LRT) are running in Metro Manila as mass transport system of the city. The traffic volume for the majority of main roads has exceeded its capacity, making roads seriously congested. The common types of vehicles used for public transport are jeepneys, buses, tricycles, and taxis. Jeepneys are more dominant means of public transport within the city.
(9) Heritage and Cultural There are three internationally recognized important cultural heritage sites and two natural heritage sites in the Philippines which are registered as world heritage by the United Nations Educational, Scientific, and Cultural Organization (UNESCO). One of them is the Baroque Churches of the Philippines, which is located in Metro Manila.
It is for this reason that the Philippine government, through the National Commission for Culture and the Arts (NCCA), has begun the restoration work on 37 churches that have been identified as National Cultural Treasures for their cultural significance and distinctive architecture. Two of these churches are located in NCR, namely La Inmaculada Concepción and Nuestra Señora de los Desmaparados.
1.6.2 Pollution Conditions of Metro Manila (1) Water Quality
Tables 1.6.6 and 1.6.7 show the monitoring results for the 19 priority rivers initially identified by the Environmental Management Bureau (EMB) for its Sagip Ilog Program in 2003-2008. The results of assessment revealed that all 19 priority rivers have improved significantly from 2003 to 2008 in terms of dissolved oxygen (DO) level. Of which, only two rivers, namely, the Anayan River and the Sapangdaku River were assessed to confirm compliance with both DO and biochemical oxygen demand (BOD) criteria standard in 2008. Almost all of the rivers that run into the Manila Bay failed the DENR criteria standards for both DO and BOD.

Republic of the Philippines Preparatory Survey on Water Supply and Sewerage Chapter 1 Development in the West Zone of Metro Manila Final Report Introduction
1 - 17
Table 1.6.6 Summary of DO Results for the 19 Priority Rivers
Region Water Body ClassAverage DO (mg/L) Passed/Failed
in 2008 Connected River/Bay 2003 2006 2008
NCR Marikina River C 3.1 2.2 2.6 Failed Pasig River San Juan River C 2.4 1.1 1.9 Failed Pasig River Paranaque River C 2.5 1.6 1.6 Failed Manila Bay Pasig River C 3.1 2.5 3.2 Failed Manila Bay CAR Balili River A 4.6 6.9 4.6 Failed Naguilian River III Meycauayan River C 0.0 2.5 Failed Manila Bay Marilao River A 0.8 1.0 2.4 Failed Manila Bay Bocaue River C 1.9 1.9 5.0 Failed Manila Bay IV-A Imus River C 3.0 4.7 4.1 Failed Manila Bay Ylang-Ylang River C 4.5 5.1 4.0 Failed Manila Bay IV-B Mogpong River C 4.9 7.9 Calcancan Bay Calacan River C 7.3 2.2 3.1 Failed Calapan Bay V Anayan River D 5.6 6.7 6.5 Passed Bico River Malaguit River C 4.6 6.3 7.4 Passed Malaguit Bay Panique River C 2.7 7.9 6.9 Passed Balawing Cove VI Iloilo River C 4.2 5.3 4.5 Failed Iloilo Strait VII Luyang River C 7.5 6.9 Passed Coastal Water of Cebu Sapangdaku River C 7.6 6.9 Passed Tanon Strait X Cagayan de Oro River A 8.6 8.1 Passed Macajalar Bay
Note: Blank means no available data. Dissolved oxygen is an indicator of how well the water can support aquatic life. DO criteria standard is 5.0 mg/L (minimum) for Class ‘AA to C’ and 3.0 mg/L (minimum) for Class D.
Bold-faced number means that it failed to reach the criteria standard. Source: Compendium of Basic ENR Statistics for Operations and Management (Second Edition) (2000-2008), DENR (2011)
Table 1.6.7 Summary of BOD Results for the 19 Priority Rivers
Region Water Body Class Average BOD (mg/L) Passed/Failed
in 2008 Connected River/Bay 2003 2006 2008
NCR Marikina River C 18.2 15.0 18.2 Failed Pasig River San Juan River C 54.8 33.4 44.2 Failed Pasig River Paranaque River C 42.0 41.0 38.2 Failed Manila Bay Pasig River C 10.7 13.6 20.5 Failed Manila Bay CAR Balili River - 23.3 37.4 Failed Naguilian River III Meycauayan River C 38.2 144.1 35.6 Failed Manila Bay Marilao River A 32.3 21.9 11.1 Failed Manila Bay Bocaue River C 12.2 7.2 11.8 Failed Manila Bay IV-A Imus River C 8.0 9.1 11.1 Failed Manila Bay Ylang-Ylang River C 24.4 8.7 63.76 Failed Manila Bay IV-B Mogpong River C Calcancan Bay Calapan River C 5.1 3.8 Passed Calapan Bay V Anayan River D 8.9 1.5 2.8 Passed Bico River Malaguit River C 2.3 Malaguit Bay Panique River C 1.5 Balawing Cove VI Iloilo River C 2.4 2.1 4.4 Failed Iloilo Strait VII Luyang River C 1.1 1.4 Passed Coastal Water of Cebu Sapangdaku River C 0.7 1.1 Passed Tanon Strait X Cagayan de Oro River A 1.2 Macajalar Bay
Note: Blank means no available data. BOD criteria standard is 5.0 mg/L (maximum) for Class ‘A’ and ‘B’, 7.0 mg/L (maximum) for Class ‘C’ and 10.0 mg/L (maximum) for Class ‘D’.
Bold-faced number means that it failed to reach the criteria standard. Source; Compendium of Basic ENR Statistics for Operations and Management (Second Edition) (2000-2008), DENR (2011)

Republic of the Philippines Preparatory Survey on Water Supply and Sewerage Chapter 1 Development in the West Zone of Metro Manila Final Report Introduction
1 - 18
(2) Air Quality Based on the assessment results gathered from the monitoring stations in Metro Manila, air quality has gradually improved in terms of total suspended particulates (TSP) level, from an annual geometric mean of 162 ug/Ncm in 2003 to 138 ug/Ncm in 2008 (Table 1.6.8). However, despite the said reduction, the long-term guideline value of 90 ug/Ncm for TSP has exceeded in almost all monitoring stations. Furthermore, PM10 annual mean levels in the NCR are in compliance with the annual ambient air quality long-term guideline value of 60 μg/m3, as shown in Figure 1.6.4. On the other hand, PM 2.5 annual mean levels in all the PNRI Metro Manila sampling sites, have been consistently in exceedance of the US EPA long-term guideline value of 15 μg/m3.
Table 1.6.8 Annual Geometric Mean of Roadside TSP Level in the NCR Monitoring Stations: 2000-2008 (ug/Ncm)
Monitoring Station 2000 2001 2002 2003 2004 2005 2006 2007 2008 EDSA NPO 215 133 149 157 165 163 138 125 144EDSA East Avenue 169 205 167 179 170 129 104 102 107Ateneo 86 94 93 83 105 87 72 65 74Valenzuela 214 222 206 247 206 152 157 146 156Makati City 129 157 157 198 211 183 153 146 134Pasig 129 110 90 101 109 106 90 92 85Las Piñas 91 73 80 - - - - - - EDSA Congressional Ave
359 227 206 - - - - - -
Mandaluyong 147 132 145 136 133 124 121 134 125Manila - 171 143 180 134 138 111 110 138Pasay - 136 166 178 135 134 159 140 Marikina - - - - - - - - 138EDSA MRT - - - - 236 323 316 257 282Average 171 151 146 162 160 154 142 132 138
Note: - No available data, Source: Compendium of Basic ENR Statistics for Operations and Management (Second Edition) (2000-2008),
DENR (2011)
0
10
20
30
40
50
60
70
ADMU POVEDA Valenzula ADMU POVEDA Valenzula
2004
2005
2006
2007
PM10 PM2.5
μg/㎥
National Ambient Air Quality Guideline Values 60 μg/㎥
US National Ambient Air Quality Guideline Values15 μg/㎥
Source: National Air Quality Status Report (2005-2007), Environmental Management Bureau, DENR
Figure 1.6.4 PM10 and PM2.5 Annual Mean Levels in the PNRI Metro Manila Sampling Sites

Republic of the Philippines Preparatory Survey on Water Supply and Sewerage Chapter 1 Development in the West Zone of Metro Manila Final Report Introduction
1 - 19
(3) Waste Solid In 2010, the reported solid waste contribution based on a national scale revealed that NCR has the highest waste generation amounting to 3.14 million tons per year, which increased at an average of 3.3% per year since 1997 as shown in Table 1.6.9.
Table 1.6.9 Waste Generation Estimates in 2007 and 2010 (million tons/years)
Region Volume (2007)
Volume(2010)
2010 % of Total Volume (Philippines)
Increase Rate (%) per year 2007-2010
NCR 2.86 3.14 22.97 3.26
Source: National State of the Brown Environment Report (2005-2007), EMB (2009)

Republic of the Philippines Preparatory Survey on Water Supply and Sewerage Chapter 1 Development in the West Zone of Metro Manila Final Report Introduction
1 - 20
1.7 Relevant Laws and Regulations to Water Sector
1.7.1 General The relevant laws and regulations relevant to the water supply and sewerage concession in Metro Manila are mainly comprised of the following: environmental laws, water right law, health and sanitation law, and investment laws.
Environmental laws consist of the following three laws: Environmental Impact Statement (EIS) System, Philippine Clean Water Act, and Laguna Lake Development Authority (LLDA).
PD1586 was enacted to establish the Philippine EIS System in 1978 to facilitate the attainment and maintenance of a rational and orderly balance between socioeconomic growth and environment protection. The Philippine Clean Water Act was established and implemented, among others, to regulate the permission and authorization of a wastewater charge system in all management areas through the collection of wastewater charges/fees, and wastewater discharge. The Philippine Clean Water Act applies to water quality management in all bodies of water, of which primary objective is to the abatement and control of pollution from land based sources. The LLDA is empowered to, among others, pass upon and approve or disapprove proposed plans, programs, and projects related to the development of the Laguna de Bay region, issue the necessary clearance, if approved, for proposed plans, programs and projects. It also institutes necessary legal proceedings against any person who will commence to implement or continue the implementation of any project, plan, or program within the Laguna de Bay region without costly clearance, as well as to issue permits for the use of the lake water for any projects or activities in or affecting the Laguna de Bay. The LLDA is also given the right to impose necessary safeguards for the lake quality control and management and to collect necessary fees for the said activities and projects.
The Philippine Water Code was enacted in 1976 with the following objectives: (a) to establish the basic principles and framework relating to the appropriation, control, and conservation of water resources to achieve the optimum development and rational utilization of these resources; (b) to define the extent of the rights and obligations of water users and owners including the protection and regulation of such rights; and (c) to adopt a basic law governing the ownership, appropriation, utilization, exploitation, development, conservation, and protection of water resources and rights to land related thereto.
The PD 856 or the Philippine Sanitation Code was enacted for the protection and promotion of health in 1975. The Department of Health (DOH) is the primary agency

Republic of the Philippines Preparatory Survey on Water Supply and Sewerage Chapter 1 Development in the West Zone of Metro Manila Final Report Introduction
1 - 21
tasked with implementing PD 856. The Philippine National Drinking Water Quality Standards of the DOH set the following three criteria: (1) Microbiological Standards; (2) Chemical and Physical Quality Standards; and (3) Radiation Quality Standards.
The Investments Code was enacted to encourage investments through tax exemptions and other benefits in preferred areas of economic activity specified in the Investment Priorities Plan (IPP) in 1987. The IPP lists the priority activities for investments. On 5 July 2011, Memorandum Order No.20, approved the 2011 IPP, issued by the President of the Philippines. Notably, as specified under the Philippine Clean Water Act, the establishment of wastewater treatment facilities, sewage collection integrated with treatment facilities, and the adoption of water pollution control technology are included in the mandatory list of priority investment areas.
Other laws which regulate water supply and sewerage business in Metro Manila are MWSS Charter, RA8041, the National Water Crisis Act, and Concession Agreement (CA). RA 6234 or MWSS Charter was enacted in 1971 establishing the MWSS, which was given the right of jurisdiction, supervision, and control over all waterworks and sewerage system in the territory, comprising Metro Manila, the province of Rizal, and a portion of the province of Cavite. Moreover, RA8041 was enacted in 1995 to take urgent and effective measures to address the nationwide water crisis. The law also called for the re-organization, repair, rehabilitation, improvement, and operation of water supply, treatment and distribution facilities and sewerage system, as well. The CA was concluded on 21 February 1997 between MWSS and the concessionaires (Maynilad and Manila Water). The powers and function of MWSS are exercised by the Board of Trustees. Certain powers and functions of MWSS, particularly the operation and maintenance of water supply and sewerage systems were delegated and assigned to the concessionaires, while the regulatory functions were transferred to the newly established MWSS Regulatory Office (MWSS RO). The MWSS RO derives its mandate primarily from the CA and amendments thereto, to monitor, control, and ensure the Concessionaire’s compliance with the CA.
Table 1.7.1 shows the general regulations and policies on the environmental and social considerations during the plan, design, construction, and operation stages. In addition, Table 1.7.2 shows related laws for water supply and sewerage improvement projects.

Republic of the Philippines Preparatory Survey on Water Supply and Sewerage Chapter 1 Development in the West Zone of Metro Manila Final Report Introduction
1 - 22
Table 1.7.1 General Regulations and Policies on the Environmental and Social Considerations
Regulation Year Name/ Regulation Contents General/Basic Policy Presidential Decree 1152 1977 Philippine Environmental PolicyExecutive Order No.192 1987 Reorganization of the DENRNatural Environment Presidential Decree No.705 1975 Revised Forestry Code of the Philippines, Permit to Cut TreesPresidential Decree No.1067 1976 Water Code of the Philippines, Water Right Republic Act No.9147 2001 Wildlife Resources Conservation and Protection Act Pollution Control Presidential Act No.984 1976 Pollution Control LawRepublic Act No.9275 2004 Clean Water Act, Obtain the Discharge Permit Republic Act No.8749 1999 Clean Air Act, Permit to Operate Generator Republic Act No.9003 2001 Ecological Solid Waste Management Act Republic Act No.6969 1990 Toxic Substances, Hazardous and Nuclear Wastes Control ActRepublic Act No. 856 1975 Sanitation Code of the PhilippinesDAO No.1992-26 1992 Appointment/Designation of Pollution Control Officers DAO No.2003-27 2003 Self-monitoring ReportEnvironmental Standard DAO No.1990-34 1990 Water Quality Criteria and Water Quality Criteria DAO No.1990-35 1990 Effluent StandardDOH AO No.2007-0012 2007 National Standard for Drinking Water DAO No.2000-81 2000 National Ambient Air Quality Standards, National Emission
Standards for Source Specific Air Pollutants 1978 Rules and Regulations of NPCC
1978 Noise Standard
Environmental Impact Statement SystemPresidential Decree 1586 1978 Establishing An Environmental Impact Statement System DAONo.30 series of 2003 2003 Regulation for Philippines Environmental Impact System Land Acquisition/Involuntary ResettlementPresidential Decree No. 1533 1978 Regulation for Determining Compensation Republic Act No.7279 1992 Urban Development and Housing ActRepublic Act No.8974 2000 An Act to Facilitate the Acquisition of Right-of-Way, Site or
Location for National Government Infrastructure Projects and for Other Purposes
Note: 1 DAO; DENR (Department of Environment and Natural Resources) Administrative Order 2 DPWH; Department of Public Works and Highways 3 NPCC; National Pollution Control Commission 4 DOH AO; Department of Health Administrative Oder
Table 1.7.2 Related Laws for Water Supply and Sewerage Improvement Projects Name Issued Contents
Republic Act No.4850 1978
Creating the Laguna Lake Development Authority which was tasked to promote, and accelerate the development and balanced growth of the Laguna de Bay region, within the context of the national and regional plans and policies for social and economic development and with due regard to and adequate provisions for environmental management.
Presidential Decree No.1067 or the Water Code of the Philippines
1976
(1) Establishing the basic principles and framework relating to the appropriation, control, and conservation of water resources to achieve the optimum development and rational utilization of these resources. (2) Defining the extent of the rights and obligations of water users and owners including the protection and regulation of such rights. (3) Adopting a basic law governing the ownership, appropriation, utilization, exploitation, development,

Republic of the Philippines Preparatory Survey on Water Supply and Sewerage Chapter 1 Development in the West Zone of Metro Manila Final Report Introduction
1 - 23
conservation, and protection of water resources and rights to land related thereto.
Republic Act No.6234 1971 MWSS Charter. Creating the Metropolitan Waterworks and Sewerage System and dissolving the National Waterworks and Sewerage Authority.
Republic Act No.8041 1995 The National Water Crisis Act. Mandating the government to address the issues related to the water crisis.
Memorandum Order No.20 2011 Approving the development of sewerage treatment system and water pollutant removal technology as priority investment areas.
Source: JICA Study Team
1.7.2 Environmental Impact Statement System (1) Environmental Compliance Certificate (ECC)
The Philippine Environment Impact Statement System (PEISS) requires new projects, which will cause significant negative environmental impact, to obtain an ECC from DENR before any construction and operation activities are undertaken. DENR’s evaluation of the ECC application shall be based on the submitted Environmental Impact Assessment (EIA) document. For projects not covered by the PEISS, a Certificate of Non-Coverage (CNC) may be issued by DENR.
(2) PEISS 1) Process of the PEISS
Figure 1.7.1 shows the complete process of the PEISS. At first, the proponent shall screen the project using the EIA Coverage and Requirements Screening Checklist (ECRSC) under the Revised Procedural Manual for DAO 2003-30, to confirm the necessity of conducting the EIA process and required reports to be submitted to EMB. Then, each project shall be subject to three sequential stages: (1) Scoping, (2) EIA studies and report preparation, and (3) EIA review and evaluation.
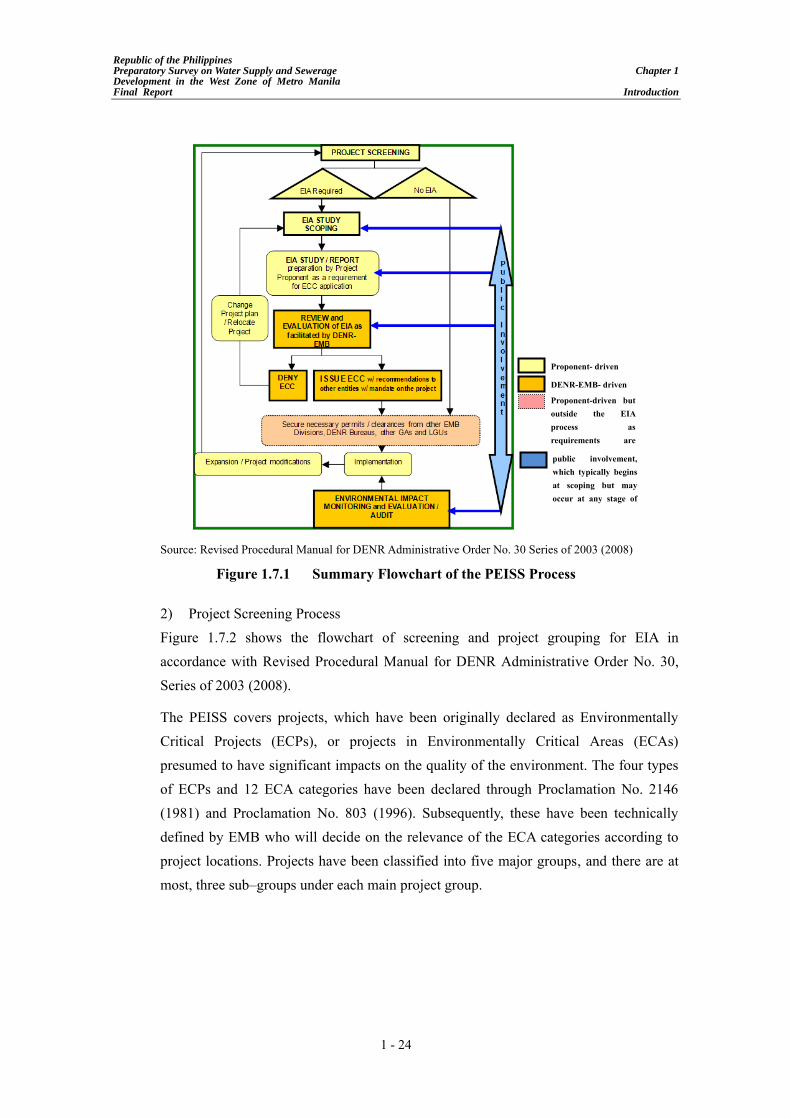
Republic of the Philippines Preparatory Survey on Water Supply and Sewerage Chapter 1 Development in the West Zone of Metro Manila Final Report Introduction
1 - 24
Source: Revised Procedural Manual for DENR Administrative Order No. 30 Series of 2003 (2008)
Figure 1.7.1 Summary Flowchart of the PEISS Process
2) Project Screening Process Figure 1.7.2 shows the flowchart of screening and project grouping for EIA in accordance with Revised Procedural Manual for DENR Administrative Order No. 30, Series of 2003 (2008).
The PEISS covers projects, which have been originally declared as Environmentally Critical Projects (ECPs), or projects in Environmentally Critical Areas (ECAs) presumed to have significant impacts on the quality of the environment. The four types of ECPs and 12 ECA categories have been declared through Proclamation No. 2146 (1981) and Proclamation No. 803 (1996). Subsequently, these have been technically defined by EMB who will decide on the relevance of the ECA categories according to project locations. Projects have been classified into five major groups, and there are at most, three sub–groups under each main project group.
Proponent- driven
DENR-EMB- driven
Proponent-driven but outside the EIA process as requirements are moderate of other entitles public involvement, which typically begins at scoping but may occur at any stage of the EIA process

Republic of the Philippines Preparatory Survey on Water Supply and Sewerage Chapter 1 Development in the West Zone of Metro Manila Final Report Introduction
1 - 25
Group Ⅰ
Environmentally Critical Project
(ECP)
Project Design
1. Heavy Industrial2. Resource Extractive
Industries3. Infrastructure Projects4. Golf Course
Environmentally Critical Area
(ECA)
1. National Parks, water shed reserves, wild life sanctuary2. Aesthetic potential tourist spots3. Habitat for any endangered or threatened species of
indigenous Philippine Wildlife4. Unique historic, archaeological, or scientific interests 5. Traditionally occupied by cultural communities or tribes6. Frequency visited and/or hard-hit by natural climates
geologic hazards, floods, typhoons, volcanic activity, etc.7. Critical slopes8. Prime Agricultural land9. Researched areas of aquifers10. Water bodies11. Mangrove area12. Coral reef
EIA Document
Certificates
No
Yes
Group GroupⅠ-A
GroupⅠ-B
GroupⅠ-C
EIS EPRMP EPRMP
New Expansion Operatingwithout ECC
ECC ECC ECC
GroupⅡ-A
GroupⅡ-B
GroupⅡ-C
New Expansion Operatingwithout ECC
No
Yes
GroupⅢ-A
GroupⅤ-A
SingleNew
Unclassified
GroupⅣ-A
GroupⅣ-B
GroupⅣ-C
New Expansion Operatingwithout ECC
Group Ⅱ Ⅲ ⅤGroup Ⅳ
EIS/IEE/PDR
EPRMP/PDR
EPRMP/PDR
ECC/CNC ECC/CNC ECC/CNC
PEIS PEPRMP PEPRMP
ECC ECC ECC
PDR
CNC
PEIS
CNC
Singleproject
Co‐locatedproject
ECP: Environmentally Critical Project (4 Projects)
ECA: Environmentally Critical Area (12 Critical Areas)
Certificates
ECC: Environmental Compliance Certificates
CNC: Certificates of Non ‐Coverage
DocumentEIS: Environmental Impact
StatementPEIS: Programmatic EISIEER: Initial Environmental
Examination ReportIEEC: IEE ChecklistPDR: Project Description
ReportEPRMP: Environmental
Performance Report and Management Plan
Condition 1
Condition 2
ECP
ECA
Source: JICA Study Team based on the Revised Procedural Manual for DENR Administrative Order No. 30
Series of 2003 (2008)
Figure 1.7.2 Process of Screening and Project Grouping for EIA
3) EIA Document Type EIA-covered projects listed above are required to follow the process depending on a number of factors, namely, project type, location, magnitude of potential impacts, and project threshold. The project proponent is required to submit the EIA report for ECC application depending on the project group. Under the PEISS, reports are classified into seven types as follows:
1) Environmental Impact Statement (EIS), 2) Programmatic EIS (PEIS), 3) Initial Environmental Examination Report (IEER), 4) IEE Checklist (IEEC), 5) Environmental Performance Report and Management Plan (EPRMP), 6) Programmatic Environmental Performance Report and Management Plan (PEPRMP), and 7) Project Description Report (PDR).
(3) EIA Evaluation of the Proposed Projects Based on DAO No. 30 Series of 2003, Water Supply and Sewerage Development Project in the West Zone of Metro Manila is expected to be categorized under “Group II-A”, Non-environmental Critical Project (NECP) located in ECA, as among the Environmental Enhancement and Environmental Mitigation Projects, Waste

Republic of the Philippines Preparatory Survey on Water Supply and Sewerage Chapter 1 Development in the West Zone of Metro Manila Final Report Introduction
1 - 26
Management Project, and/or Water Supply, Irrigation or Flood Control Project. The project location, in the West Zone of Metro Manila, is expected to fall under ECA as it is located in areas frequently suffering from and/or hit hard by natural calamities (geologic hazards, floods, typhoon, volcanic activity, etc.), judging from the past experiences of the Environmental Management Department (EMD) in Maynilad. Since the project is required to provide pollution control devices or similar facilities needed to prevent emissions and/or discharges beyond allowable limits (e.g., for compliance with the Clean Air Act or Clean Water Code), it should proceed with the official procedure for obtaining EIA certificates prescribed under Philippine legislation.
Therefore, it is suggested that Maynilad, as the project proponent, should follow the necessary steps for EIA before implementation of the project.
(4) Screening and Categorization of the Project in accordance with JICA Guidelines Category A projects defined by the JICA Guidelines for Environmental and Social Considerations, April 2010 (JICA guidelines) generally include i) vital sectors, such as transportation, having sensitive characteristics, or ii) projects located in or around sensitive areas. Moreover, a project causing large-scale involuntary resettlement is classified under Category A. Projects of Category A are classified as Category B if potential adverse impacts on the environment and society are less adverse than those of Category A.
Based on above guidelines, Water Supply and the Sewerage Development Projects in the West Zone of Metro Manila are classified as Category B by JICA. Because the projects are not considered a large-scale water supply, sewerage, and wastewater treatment project; is not located in a sensitive area; and has no sensitive characteristics under the JICA guidelines, it is unlikely to cause significant adverse impacts to the environment.
1.7.3 Land Acquisition and Resettlement (1) Regulation and Policy for Land Acquisition and Involuntary Resettlement
Major regulations and policy at the national level related to land acquisition and involuntary resettlement in the Philippines are shown in Table 1.7.3
.

Republic of the Philippines Preparatory Survey on Water Supply and Sewerage Chapter 1 Development in the West Zone of Metro Manila Final Report Introduction
1 - 27
Table 1.7.3 Relevant Regulations on Land Acquisition and Involuntary Resettlement Regulation Brief Description
Executive Order No. 1035 of 1985
Provides the procedures and guidelines for expeditious acquisition by the government, of private real properties or rights thereon for infrastructure and other government development projects.
The Philippine Constitution of 1987
-Private property shall not be taken for public use without just compensation. (Article III, Section 9) -The State shall, by law, and for the common good, undertake, in cooperation with the private sector, a continuing program of urban land reform and housing which will make available at affordable cost, decent housing and basic services to under-privileged and homeless citizens in urban centers and resettlement areas. (Article VIII, Section 9) -No resettlement of urban or rural dwellers shall be undertaken without adequate consultation with them and the communities where they are to be relocated. (Article VIII, Section 10).
Republic Act No. 7160: Local Government Code of 1991
The act defines that a local government unit (LGU) may exercise the power of eminent domain for public use, purpose, or welfare of the poor and the landless, such as for socialized housing, upon payment of just compensation pursuant to the provisions of the Constitution and pertinent laws.
Republic Act No. 7279: Urban Development and Housing Act (UDHA) of 1992
-This act provides policy to undertake, in cooperation with the private sector, a comprehensive and continuing Urban Development and Housing Program. The program is aimed to uplift the conditions of the underprivileged and homeless citizens in urban areas and in resettlement areas by making available to them decent housing at affordable cost, basic services, and employment opportunities. The program covers lands in urban and urbanizable areas, including existing areas for priority development, zonal improvement sites, slum improvement, and resettlement sites.
Republic Act No. 8974: An Act to Facilitate the Acquisition of Right-of-Way (2000)
This act declares the policy of the State to ensure that owners of real property acquired for national government infrastructure projects are promptly paid just compensation. Under the Act, the National Housing Authority (NHA) shall establish squatter relocation sites, including the provision of adequate utilities and services in coordination with the concerned LGUs, the Housing and Urban Development Coordinating Council, the implementing agency, and other government agencies. This is the revision of the Executive Order No.1035 of 1985. The Implementing Rules and Regulations of RA No.8970 were also enacted in 2000.
Source: JICA Study Team
(2) Manual and Policy to Water Sector in Maynilad Table1.7.4 shows Maynilad’s manuals and policies on land acquisition and involuntary resettlement to water management project, which include Environment and Social Safeguards Framework (ESSF) for the Metro Manila Wastewater Management Project 2012 prepared by the World Bank’s Metro Manila Wastewater Management Project (MWMP).

Republic of the Philippines Preparatory Survey on Water Supply and Sewerage Chapter 1 Development in the West Zone of Metro Manila Final Report Introduction
1 - 28
Table 1.7.4 Manuals and Policies on Land Acquisition and Involuntary Resettlement to Water Sector
Manual and Policy Brief Description ESSF for the Metro Manila Wastewater Management Project 2012, Land Bank of the Philippines
ESSF has been prepared for the World Bank’s Metro Manila Wastewater Management Project. The ESSF is responsive to the relevant national and local laws and regulations and the World Bank Safeguards Policies. The safeguards requirements for the project will build upon national guidelines and requirements in order to streamline the documents required for each subproject without compromising in any manner the safeguard requirements of either the government or the World Bank.
Land Acquisition, Resettlement and Rehabilitation Policy 2006, Maynilad
This document sets forth the policies and guidelines involved in the conduct of an effective land acquisition, resettlement and rehabilitation of areas/people affected by Maynilad infrastructure. This policy shall be applicable to all personnel involved in the land acquisition, resettlement, and rehabilitation process. Such personnel shall not be involved in any fraud or irregularities.
Source: JICA Study Team
(3) Land Acquisition and Resettlement Action Plan of the Proposed Projects Resettlement Policy Framework (RPF) in ESSF is prepared for MWMP to address the gaps between the provisions of the World Bank’s Policy on Involuntary Resettlement (OP 4.12) and local laws and regulations. It is suggested that Maynilad, as the project proponent, should follow the necessary steps for land acquisition and involuntary resettlement in reference to ESSF before implementation of the project, if any land acquisitions/project affected people are confirmed.

Republic of the Philippines Preparatory Survey on Water Supply and Sewerage Chapter 2 Development in the West Zone of Metro Manila Final Report Outline of the Water Sector in the Study Area
2-1
Chapter 2 Outline of the Water Sector in the Study Area
2.1 Current Roles of the Public and Private Partnership in the Water Business
2.1.1 National Policy on Water Sector in the Philippines The national policy provides the development policy on Water Services which serves as a basic guide for the Water Sector in the Study Area. The Philippine government presented the Philippine Development Plan 2011-2016 (hereinafter referred to as the Plan) in late 2011, which was published by the National Economic and Development Authority (NEDA). This plan serves as a guide in formulating and implementing development policies of various sectors. Hence, it is currently referred to by relevant social development sectors in the Philippines.
1) Plan’s vision for the Philippines will be achieved through:
Rapid and sustainable high economic growth of 7% to 8% per year for at least six
consecutive years;
Economic growth, to generate massive employment; and
Economic growth, to reduce poverty including the achievement of MDGs.
2) Plan’s key strategies are:
Massive investment in infrastructure
Transparent and responsive government
Human development and improved social services
Competitiveness to generate employment
Access to financing
3) One of the MDGs indicators listed by the United Nations is shown below, and is directly applicable to Maynilad’s business as detailed in Section 7 – Ensure Environmental Sustainability.
To halve the proportion of people without sustainable access to safe drinking
water and basic sanitation by 2015. The indicator for this is ‘the proportion of the
population using an improved drinking water source’.
(1) Relevant Water Services 1) Water Supply
Considering the UN Report, the Plan is drawn up for the entire country. In Chapter 8, Social Development, Subsection 8.8 entitled Health, Nutrition, and Population targets

Republic of the Philippines Preparatory Survey on Water Supply and Sewerage Chapter 2 Development in the West Zone of Metro Manila Final Report Outline of the Water Sector in the Study Area
2-2
for the proportion of population with access to safe water as shown in the table below:
Proportion of Population with Access to Safe Water
Base LineActual 2008 2012 2013 2014 2015 2016
National Target 82.3% 84% 85% 86% 86.9% 89%Maynilad: Target 86% 88% 91% 93% 95.1%Maynilad: Actual 82% 96%
Source: Philippine Development Plan 2011-2016, and Maynilad Business Plan 2013
As can be seen from the above table, Maynilad was just below the national target for 2008 by 0.3%, but managed to surpass the national target for 2012 by 12%. In fact, the actual accomplishment for 2012 surpassed the Maynilad’s target for 2016.
2) Sanitation and Sewerage With reference to wastewater and effluent standards, the Plan does not specifically mention targets for individual provinces or cities. However, in Chapter 10 – Conservation, Protection, and Rehabilitation of the Environment and Natural Resources, there is a specific note made for Manila Bay.
The Supreme Court in 2008 issued a continuing mandamus for the government to
clean up the waterways, especially those flowing into Manila Bay in order to
improve the water quality to Standard of “Class SB”.
There are no time frames mentioned, and as Manila Bay receives many sources of pollutants, e.g., industrial effluents, natural pollutants following heavy rains, sewage discharges from surrounding provinces, etc., there are no targets for Maynilad to achieve the objective. However, Maynilad’s aggressive approach to the Construction of Wastewater Treatment Plants is going to have a huge positive effect for water quality in the bay. Others are encouraged to take the same approach as what Maynilad is doing to ensure that water quality in Manila Bay is improved to the ‘SB’ standard specified in the Plan.
3) Way forward So far, the Water Services of Maynilad is being implemented in line with or better than the set targets of the national policy in the Plan. Maynilad, however, should refer to the national policy, which will be updated every five years or from time to time, as required. The Plan shall serve as a guide in the preparation of Maynilad’s Business Plan which will be updated basically every five years.

Republic of the Philippines Preparatory Survey on Water Supply and Sewerage Chapter 2 Development in the West Zone of Metro Manila Final Report Outline of the Water Sector in the Study Area
2-3
2.1.2 Current Water Service Providers and Water-Related Authorities in the Philippines It was during the Spanish colonial period that the first water supply system was developed in Manila in 1878. After the World War II, the Centraol Government has carried out frequent reforms in water-related organizations. Consequently, various water service providers (WSPs) and government agencies from different departments of the central government were involved in the water sector.
The existing WSPs include the local government units (LGUs), MWSS, water districts (WDs), community-based organizations (CBOs), and private operators (POs). MWSS is sometimes excluded from the WSPs because its systems are being operated by private concessionaires under concession agreements.
Relations between WSPs and key water-related agencies are illustrated in Figure 2.1.1, and the functions of the WSPs and agencies are described in Table 2.1.1.
PRESIDENT
NEDANational Economy and Development Authority
DOFDepartment of
Finace
DOHDepartment of Health
DENRDepartment of Environment
and Natural Resources
DILGDepartment of Interior and
Local Government
Office of the President
LWUALocal Water Utilities
Administration
WDsWater Districts
EMBEnvironmental
Management Bureau
NWRBNationalWater Resources Board
LGUsLocal Government Units
MWSSMetropolitan Waterworks and Sewerage System
DPWHDepartment of Public Works
and Highway
RWSAsRural Water Service
Associations
BWSAsBarangay Water
Service Associations
POsPrivate Operaters(For Metro Manila)
CBOsCommunity‐BasedOrganizations
Policy Making
Cordination/Regulatory
Regulatory/Lending
Regulatory/Provider
Regulatory(Originally Provider)
Provider Provider Provider Provider Provider
Water Providers and their Regulators
Source: JICA Study Team
Figure 2.1.1 Relation of Water Service Providers and Key Water-Related Agencies

Republic of the Philippines Preparatory Survey on Water Supply and Sewerage Chapter 2 Development in the West Zone of Metro Manila Final Report Outline of the Water Sector in the Study Area
2-4
Table 2.1.1 Functions of Key Water Providers and Water-Related Agencies and Their Relations with Maynilad’s Water Business
Agencies and Providers Functions and Relations with Maynilad’s BusinessNEDA National Economic
and Development Authority
- Prepares the national development plan and investment programs on water sector (and on other sectors).
- Monitors implementation of the prepared policies, programs, and projects.
- Maynilad should follow the development plan and investment programs developed by NEDA.
- ODA projects offered by JICA and other aid agencies, including those in water supply and sewerage projects in Metro Manila, should be evaluated by NEDA.
DOH Department of Health
- Monitors drinking water quality- Formulates and implements programs and strategies to
avoid environment-related diseases. - Maynilad should satisfy the drinking water quality
standards and needs to submit its water quality monitoring data to DOH.
LWUA Local Water Utilities Administration
- Regulates WDs.- Financially supports WDs. - Supports capacity building of LGUs and other WSPs
upon request.WDs Water Districts - Provide water services mostly in urban areas outside of
Metro ManilaDENR Department of
Environment and Natural Resources
- Promulgates the rules and regulations for pollution control of water, air, and land.
- Monitoring and regulation of groundwater exploitation. - Monitoring of water quality of individual wastewater
and sewerage systems. - Effluent qualities from WWTPs of Maynilad are
monitored by DENR.EMB Environmental
Management Bureau
- Formulates environment quality standards for water, air, land, noise, and radiation.
- Approves EIAs and issues environmental compliance certificates.
- Maynilad’s projects also need to satisfy the environment-related procedures managed by EMB.
NWRB National Water Resources Board
- Formulates policies on water resources. - Coordinate and regulates water-related activities of
WSPs in the country.DILG Department of
Interior and Local Government
- Supports water supply and sewerage services of theLGUs.
LGUs Local Government Units
- Provide water services through their water supply and sewerage systems.
- Regulate and support RWSAs, BWSAs, and CBOs. - Promote development of infrastructure such as
irrigation, electric power, and roads. RWSAs Rural Water Supply
Associations - Provide water services to rural areas under LGUs.
BWSAs Barangay Water Supply Associations
- Provide water services to barangays under LGUs.
CBOs Community-Based Organizations
- Provide water services in areas not covered by other WSPs.
DPWH Department of Public Works and Highway
- Provides technical support to LGUs upon request. - Line agency of MWSS, the regulator of Maynilad’s water
business.MWSS Metropolitan
Waterworks and Sewerage System
- Original Function: Constructs, maintains, and operates water supply and sewerage systems in Metro Manila.
- Present Function: Regulates private operators, which are Maynilad and Manila Water, under concession agreements.
POs Private Operators - Provide water service in Metro Manila. (Maynilad and

Republic of the Philippines Preparatory Survey on Water Supply and Sewerage Chapter 2 Development in the West Zone of Metro Manila Final Report Outline of the Water Sector in the Study Area
2-5
(For Metro Manila) Manila Water)DOF Department of
Finance - Financially supports the water sector. - Jointly evaluates offered ODA projects, including those
in water sector in Metro Manila, with NEDA in financial viewpoint.
*: Italic description describes major relations of water-related agencies with Maynilad’s water business.
Source: Philippine Water Supply Sector Roadmap 2nd Edition (NEDA)
2.1.3 History of the Water Sector in the Philippines and in Metro Manila (1) Beginning of Urban Water Supply System (Before 1965)
The first urban water supply system in the Philippines was developed in 1878, under Spanish colonization. It is the oldest urban water supply system in Asia. In the beginning, the system supplied 16,000 m3/day water from the Marikina River to 300,000 residents of Manila City.
Later, its capacity was improved to 200,000 m3/day when Ipo Dam was constructed in the 1920s. Subsequently, its service population grew to as large as 900,000 people in Metro Manila in 1954.
In 1955, the central government established the National Waterworks and Sewerage Authority. It was organized to manage and control the water supply system in Metro Manila, as well as other water supply systems outside of Metro Manila, which were being constructed at an increasing rate. These other water supply systems outside Metro Manila are operated by the LGUs.
(2) Establishment of Key Water Agencies (1965–1986: Marcos Administration) In 1971, the central government abolished the National Waterworks and Sewerage Authority. Instead, MWSS was established to manage the water supply and sewerage system in Metro Manila. Meanwhile, the local water supply and sewerage systems in other areas were returned to LGU’s administration.
However, in 1973, the LGUs did not operate the water supply systems well, therefore, the central government restructured the water sector system. Operation of water supply and sewerage in rural areas were taken over by newly established WDs, which are public corporations and have independent rights from LGUs to some degree. Moreover, LWUA was established to provide financial and technical supports to LGUs. LWUA was an affiliated organization of NEDA at that time.
For rural areas, the Rural Waterworks Development Corporation (RWDC) was established to support the construction, operation, and maintenance in areas outside of the coverage areas of MWSS and LWUA. On the other hand, not all the water supply and sewerage systems were transferred to WDs and RWDC; in fact many of them

Republic of the Philippines Preparatory Survey on Water Supply and Sewerage Chapter 2 Development in the West Zone of Metro Manila Final Report Outline of the Water Sector in the Study Area
2-6
remained under the LGU’s control.
In this period, the necessity for an integrated water resource management began to be widely acknowledged. In order to coordinate water-related issues nationwide, NWRB was established as an affiliated organization of DENR in 1976.
(3) Decentralization (1986–1992: Aquino Administration) During this period, a restructure of administrative organizations was implemented to streamline the complicated mechanism and decentralize the authorities. In this trend, RWDC was demolished and, in effect, LWUA expanded its administration to rural areas.
In 1991, the Local Government Code was issued, which authorized LGUs to manage the water supply and sewerage systems in the local areas. Meanwhile, WDs remained to operate their systems under the regulation of LWUA.
(4) Privatization of MWSS (1992–1998: Ramos Administration) As Metro Manila grew and expanded rapidly, the slow development of water supply systems operated by MWSS became a big social concern. Water service coverage was only 30%, service hour was less than 16 hours a day in vast areas, the non-revenue water (NRW) ratio was more than 60%, and service coverage for sewerage was only a small percentage.
MWSS had a very weak financial base, thus, it relied on large amounts of government subsidy, official development assistance (ODA) from developed countries, and loans from international financial institutions.
The central government initiated privatization of the water and sewerage works in Metro Manila in 1994. Through various discussions and studies, the privatization model was decided to become a semi-privatization, wherein a private company concludes a concession agreement with MWSS. In addition, the concession was divided into West Zone and East Zone.
After some modifications on the legal system to enable the privatization, open biddings for the two concessions were implemented. Both biddings were won by consortiums composed of domestic and foreign companies as shown in Table 2.1.2.
Concession agreements were concluded on February 21, 1997. The concession period was set for 25 years or until 2022. Later in 2008, the concession period was extended by another 15 years until 2037.

Republic of the Philippines Preparatory Survey on Water Supply and Sewerage Chapter 2 Development in the West Zone of Metro Manila Final Report Outline of the Water Sector in the Study Area
2-7
Table 2.1.2 Concessionaires of MWSS in 1997 West Zone East Zone
Concessionaire Maynilad Water Services, Inc. Manila Water Company, Inc. Consortium Companies and the Capital Ratios
Benpres Holdings Corporation (Philippines): 60% Lyonnaise des Eaux (France): 40%
Ayala Corporation (Philippines): 55% United Utilities (UK): 20% Bechtel Corporation (USA): 15% Mitsubishi Corporation (Japan): 10%
Source: Privatization of Water Supply (Japan Water Supply Journal, 2003) Note: The percentages are the shareholding ratios.
(5) Status of the Water Sector since 1998 Since 1998, there have been movements to streamline or rationalize the mechanism of the water sector but none necessarily succeeded.
For example, the establishment of the Water Regulatory Commission (WRC) was proposed by NEDA in 1998, to consolidate all water regulatory functions from several authorities into a single authority. However, this proposal has not been realized yet.
In 2002, the central government tried to address the conflicting roles of LWUA as both the financing institution and regulator, by transferring the regulatory function, as well as the approval right of water tariff, from WDs to NWRB. However, the transferred regulatory function was returned to LWUA in 2010. In 2008, LWUA was placed under the Department of Health (DOH) considering that water supply is a primary health-related concern.
(6) Failure of Maynilad and Introduction of Corporate Rehabilitation in 2005 During the first year after privatization, Maynilad was affected by the devaluation of peso (falling around 100% against the US dollar due to the Asian economic crisis) as it shouldered 90% or USD 810.0 million out of the USD 900.0 million debt of MWSS. Although the concession agreement provides for the collection of currency exchange rate adjustment (CERA), the provision does not allow Maynilad to recover from foreign exchange losses immediately but recover within the remaining life of the contract.
In addition, during the said period, Maynilad’s water supply experienced a shortage of 40.0% due to El Niño, which, when combined with the sharp devaluation of peso, produced significant negative effects on the company’s net cash flows. In March 1998, both Manila Water and Maynilad petitioned for an increase in the water rate. However, only a small adjustment was granted because the water shortage caused by El Nino was considered as a recurrent phenomenon that should have been accounted by the concessionaires.
From PHP 26.0 per USD 1.0 as of 1996, the peso fell to PHP 50.0 per USD 1.0 by the

Republic of the Philippines Preparatory Survey on Water Supply and Sewerage Chapter 2 Development in the West Zone of Metro Manila Final Report Outline of the Water Sector in the Study Area
2-8
end of 2000, causing Maynilad to record a loss of PHP 2.7 billion from additional and unexpected foreign exchange costs.
The external economic situation added misery to the company, furthermore, water leakage problems still remained unsolved or rather worsened. Maynilad’s water losses rose from 57.4% in 1997 to 67.0% in 2000.
In January 2002, MWSS-RO approved the charging of the foreign currency differential adjustment (FCDA) on top of the CERA to help Maynilad recover from the losses caused by the devaluation of peso and mitigate future fluctuations in the foreign exchange. The FCDA functions as a recovery mechanism where Maynilad would charge (reimburse) its foreign exchange losses (gains) to its customers.
However, the financial situation of Maynilad had worsened too severely to recover the losses by FCDA. When Maynilad’s rate hike petition was initially disapproved, the company opted to stop paying for its concession fees of PHP 2.0 billion per year and by the end of 2004, unpaid concession fees totaled PHP 10.0 billion.
In April 2005, by virtue of the Debt Capital and Restructuring Agreement (DCRA), Maynilad, unable to meet its obligation, entered into corporate rehabilitation. The capital restructuring provisions in the DCRA mainly involve writing-off of shareholder advances into equity and the dilution of the 59.0% equity interest of Benpres Holding’s in Maynilad.
Under Section 24 of the DCRA, upon the approval of Maynilad’s lenders and the Suez Group, MWSS has the right to subscribe to 83.97% of the shares of Maynilad or to assign any portion or all of the said shares (in the event the subscription has been exercised), provided that the assignee of the MWSS would assume all the obligations and undertakings of MWSS under the DCRA. In September 2005, the MWSS Board of Trustees resolved that MWSS would assign its right and obligation to subscribe to shares in Maynilad by way of competitive bidding.
(7) Re-privatization of Maynilad and Exit from the Rehabilitation under DMWC in 2007 In December 2006, by virtue of the Assignment and Assumption Agreement (AAA), DMCI-MPIC Water Company (DMWC), a 50-50 consortium between D.M Consunji, Inc. (DMCI) and Metro Pacific Investments Corporation (MPIC) was created to bid for the re-privatization of Maynilad. They decided to make sponsor contributions to Maynilad for the purpose of pre-paving Maynilad’s indebtedness under the DCRA, to pave way for Maynilad’s early exit from corporate rehabilitation proceedings. Currently, DMWC is a 45-55 consortium between DMCI and MPIC.

Republic of the Philippines Preparatory Survey on Water Supply and Sewerage Chapter 2 Development in the West Zone of Metro Manila Final Report Outline of the Water Sector in the Study Area
2-9
In January 2007, with a total bid of USD 503.9 million, DMWC emerged as the new owners of Maynilad (83.79% of the outstanding capital stock of Maynilad was transferred to DMWC).
In August 2007, the Prepayment and Settlement Agreement (PSA) was executed between Maynilad and its lenders. In accordance with the PSA, Maynilad needed to pay various loans amounting to USD 205.1 million and PHP 1.2 billion as well as settle with contractor and supplier and other fee obligations amounting to PHP 175.4 million in order to exit from the corporate rehabilitation.
Exactly one year later, Maynilad paid off and settled all the loans and obligations allowing the company to exit the rehabilitation ahead of the 2013 deadline.
(8) Participation of Marubeni Corporation in Maynilad in 2012 In December 2012, Marubeni Corporation announced that it will purchase 20% of Maynilad’s shares. Reportedly, the transaction will amount to about JPY 40 billion or PHP 20 billion.
Figure 2.1.2 summarizes the history of Maynilad.
On 27 December 2012, Marubeni
Corporation published it will
purchase 20% of the Maynilad's shares.
2012 2013
Source: JICA Study Team
Figure 2.1.2 History of Maynilad
2.1.4 Present Development Status of the Water Sector in the Philippines As explained in Section 2.1.2, there are various kinds of WSPs totaling to 5000 or 6000 at present.
Due to lack of comprehensive monitoring system, there is no trusted statistics, which shows exact access or coverage of water supply in the country. LWUA, Department of the Interior and Local Government (DILG), and National Statistics Office (NSO) have prepared some statistics in different methodologies and time frames, but there are

Republic of the Philippines Preparatory Survey on Water Supply and Sewerage Chapter 2 Development in the West Zone of Metro Manila Final Report Outline of the Water Sector in the Study Area
2-10
discrepancies or inconsistencies due to lack of comprehensive monitoring system. Figure 2.1.3 presents the access to water services by means of service level and service provider compiled by the World Bank. Table 2.1.3 presents the definition of service levels as shown in Figure 2.1.3.
As also shown in Figure 2.1.3, only 45% of the people have access to Level 3 service. Nonetheless, 80% of the people have formal access to water supply. However, the report entitled Benchmarking Performance of Small Town Water Supply (DILG, 2008), shows the coverage ratios of most WSPs are at around 60%. It implies that the actual service coverage will be much smaller than 80% or around 50%.
In addition, other key performance indicators of WSPs such as service hours and NRW ratios are also at insufficient levels according to the Benchmarking Performance of Small Town Water Supply. The service quality of water supply providers in the Philippines still needs to be improved.
Source: Philippine Water Supply Sector Roadmap (NEDA) and Meeting Infrastructure Challenges, 2005 (World Bank) Note: WDs refer to Water Districts, POs to Private Operators, LGUs to Local Government Units, CBOs to
Community-Based Organizations, SSIP to Small Scale Independent Providers Service Levels: See Table 2.1.3.
Figure 2.1.3 Water Access in the Philippines
Table 2.1.3 Service Levels of Water Supply in the Philippines Level Definition Description
Level 1 Point source A protected well or a developed spring with an outlet but without a distribution system as it is generally adaptable for rural areas where the houses are thinly scattered serving an average of 15 households. People have to fetch water from up to 250 m distance.
Level 2 Communal faucet system or stand post
A piped system with communal or public faucets usually serving 4–6 households within 25 m distance
Level 3 Waterworks system A fully reticulated system with individual house connections based on a daily water demand of more than 100 L/person
Source: NEDA Board Resolution No. 12, Series of 1995
ACCESS TO FORMAL WATER SERVICE: 80% INFORMAL ACCESS: 20%
LEVEL 3: 45% LEVEL 2: 10% LEVEL 1: 25%Private wells, tanked or
vended water supply, etc.: 20%WDs: 20% POs:
5%LGUs&CBOs:
20%LGUs&CBOs: 35%

Republic of the Philippines Preparatory Survey on Water Supply and Sewerage Chapter 2 Development in the West Zone of Metro Manila Final Report Outline of the Water Sector in the Study Area
2-11
2.2 Institutional Framework of the Water Service in Metro Manila
2.2.1 Current Roles of Public and Private Sectors Under the Concession Agreement (CA), the MWSS Board of Trustees established the Regulatory Office (RO) to be funded from the concession fees paid by the concessionaires. The RO has the following four divisions, i.e., Technical Regulation Division, Secretary and Legal Adviser Division, Financial Regulation Division, and Quality and Customer Services Regulation Division. Each division is headed by a member of the RO. The RO’s main functions include: (1) Monitoring and implementing the Concession Agreement, (2) Implementing the extraordinary price adjustment (EPA) and the rate rebasing provisions, (3) Arranging the regular and ad hoc technical audit of the activities of the concessionaires, (4) Enforcing service standards, and (5) Contract an external experts and consultants with international experience to provide information and guidance, especially on the EPA and rate rebasing and appropriate discount rate. The regulation of water and sewerage service is beyond the RO. The RO’s primary task is the determination of water tariffs and the enforcement of service standards. The concessionaires are liable to other government agencies. DENR monitors the pollution control standards, while the Department of Health (DOH) monitors the drinking water quality.
Figure 2.2.1 illustrates the regulatory environment on the water supply and sewerage business in Metro Manila.
Concession Agreement
Metropolitan Water works and Seerage System (MWSS)
Department of Environment and Natural
Resources(DENR)
Regulatory Office
Board of Trustee
Department of Health(DOH)
Concessionaires
Department of Public Works and Highway
(DPWH)
Prices, Service Standards Drinking Water QualityPollution Control Standards
Source: JICA Study Team Figure 2.2.1 Regulatory Framework of the Water Business in Metro Manila

Republic of the Philippines Preparatory Survey on Water Supply and Sewerage Chapter 2 Development in the West Zone of Metro Manila Final Report Outline of the Water Sector in the Study Area
2-12
Under the CA, Maynilad was granted the following rights; a) to provide water service, including water supply and sewerage to the service area and b) to bill and collect water charges from customers. Also it was granted the obligation to pay concession fees to MWSS. Figure 2.2.2 illustrates the structure of the general framework of the water concession under the CA.
Concession Agreement
Metropolitan Water works and Seerage System (MWSS)
Regulatory Office
Board of Trustee
Concessionaires
Concession Right Concession Fee
Customers
Water ChargeService of Water Supply and Sewerage
Source: JICA Study Team Figure 2.2.2 Structure of the Water Concession in Metro Manila

Republic of the Philippines Preparatory Survey on Water Supply and Sewerage Chapter 3 Development in the West Zone of Metro Manila Final Report Outline of the Proposed Project in the Study
3-1
Chapter 3 Outline of the Proposed Project in the Study
3.1 Priority Sewerage Projects
3.1.1 Outline of the Sewerage Projects Two catchment basins are proposed as the priority sewerage projects. One is the Marikina River basin, and the other is the Marilao River basin. Figure 3.1.1 shows the location map of the priority sewerage projects.
The Marikina River basin is located in the northeastern part of Quezon City. On the other hand, the Marilao River basin is located in the northern area of Caloocan City, which is the northernmost part of Metro Manila. The outline of the priority sewerage projects is shown in Table 3.1.1.
Source: JICA Study Team, based on Google Earth Pro
Figure 3.1.1 Location of the Priority Sewerage Projects

Republic of the Philippines Preparatory Survey on Water Supply and Sewerage Chapter 3 Development in the West Zone of Metro Manila Final Report Outline of the Proposed Project in the Study
3-2
Table 3.1.1 Outline of the Priority Sewerage Projects
Marikina MarilaoSite 3 Site 1
3.3 5.556,000 151,000
831 2,619294,000 846,000
Diameter Open-Cut Trenchless Open-Cut Trenchless(mm) (m) (m) (m) (m)200 930 775 1,450 3,590 250 312 45 1,615 3,080 300 1,363 350 2,350 3,095 350 884 240 170 1,490 400 2,437 650 2,165 3,705 450 830 40 - 70 500 195 95 1,745 4,460 600 216 130 645 1,540 700 331 - 675 2,455 800 - 816 530 2,015 900 1,513 1,138 - 1,380 1000 - 552 365 1,190 1100 - 2,605 650 2,990 1200 - 656 630 3,105 1350 - - - 1,335 1500 - - - - 1650 - - - - 1800 - - - 550 1900 - - - - 2000 - - - - 2100 - - - 60
9,011 8,092 12,990 36,110
MHMediumLargeTotal
49,100
Treatment Capacity (m3/d)Sewage Treatment Process
Specification (in 2037)
Location of STPSTP Area (ha)
Sub-Total
Class SB
Sewer Pipe(Gravity Flow)
Facility Design Criteria
CAS MethodSludge Treatment Process Thickening-Dewatering
Facilitiy
PS
STP
Effluent StandardDesigned Covered Area (ha)Designed Served Population
Grand Total 17,103
Marikina
River Basin Marikina (Option 3) Marilao (Option 1)
- 1 6 6
13
Marikina Marilao(Option 3) (Option 1)
- - -
Marilao(Option 3) (Option 1)
MHsICs
216 612 60 128
Facilitiy
Source: JICA Study Team

Republic of the Philippines Preparatory Survey on Water Supply and Sewerage Chapter 3 Development in the West Zone of Metro Manila Final Report Outline of the Proposed Project in the Study
3-3
3.1.2 Implementation of the Projects The project in the Marikina River basin has a higher priority than the Marilao River Basin in order to achieve improvement of water quality of the Marikina River as requested by MWSS. The Manila Water is forward to conduct the sewerage project along the Marikina River. Therefore, Maynilad shall conduct the project earlier. The project of the Marikina River is planned to be implemented from 2017 to 2021.
On the other hand, the project area of the Marilao River basin is approximately 2,620 ha, and is with design sewer length of 49 km. The implementation of the project for the Marilao River shall be divided into two phases. The first phase is planned to be implemented from 2019 to 2024, while the second phase will be from 2024 to 2028.
3.1.3 Estimation of the Project Cost Construction works is divided into two packages, which is the construction of STPs and sewer networks for each project. The estimated cost is shown in Table 3.1.2. The cost of STP construction includes site development, civil works, mechanical and electrical works, support facilities, and inlet pipe to the STP. On the other hand, the cost of sewer network construction includes installation of sewer pipes by open-cut and trenchless methods, manholes, interceptor chambers, and pumping facilities. Total project cost is JPY 16,188 million for the Marikina River basin and JPY 50,330 for the Marilao River basin. The project cost includes price escalation, physical contingency, consulting service cost, land acquisition cost, administration cost, commitment charge, and taxes.
Table 3.1.2 Cost Estimates for the Projects River Basin
Marikina Marilao Inclusive Items JPY million PHP million JPY million PHP million
STP 3,957 1,751 9,459 4,185
- Site development - Civil works - Mechanical and electrical
works - Support facilities - Inlet pipe to the STP
Sewer network 4,778 2,114 17,356 7,657
- Pipe installation by open cut method
- Pipe installation by trenchless method
- Manholes - Interceptor chambers - Pumping facilities
Other Costs 7,453 3,298 23,515 10,428
- Price escalation - Physical contingency - Consulting service - Land acquisition - Administration cost - Value added tax (VAT) - Import tax - Commitment charge
Total Project
Cost 16,188 7,163 50,330 22,270
Source: JICA Study Team

Republic of the Philippines Preparatory Survey on Water Supply and Sewerage Chapter 3 Development in the West Zone of Metro Manila Final Report Outline of the Proposed Project in the Study
3-4
3.2 Other Possible Japan’s Assistance in the Study Area
3.2.1 Basic Policy of JICA on PPP JICA considers that the primary factor of PPP is the participation of private sectors for the sustainable development and economic growth in developing countries. The objectives of PPP cannot be realized by ODAs alone, but can be accomplished through the participation of the private sector. Moreover, a well-organized partnership between ODA and private companies is indispensable for the development and economic growth in the developing countries.
Hence, JICA’s basic policy for PPP will be to formulate a triangular relationship composed of the developing countries, private companies, and JICA. This should beneficial for all sectors by supporting to arrange an environment for efficient and effective activities for private companies in the developing countries through reinforcing a partnership with private companies and private business sectors.
3.2.2 Possible Fund from JICA There are two kinds of funds available from JICA, which are considered useful for Maynilad projects. One is ODA loan which is generally provided to official governments of developing countries, while the other is the PSIF which is provided for private sectors who will execute development projects in developing countries. JICA suggested to Maynilad the possibility of providing PSIF loan for the NRW reduction projects, and ODA loan for the priority sewerage projects, if these will meet the requirements of JICA to provide financial assistance.
With respect to the profitability of the projects, JICA PSIF will be provided when the project is expected to be financially viable, requires funding from JICA as complementary, creates catalytic effects to commercial banks, and contributes to economic and social development of the countries concerned.
Basic requirements to provide ODA loan from JICA are as follows:
1) ODA loan aims mainly in contributing to the economic development, upgrading of welfare, and mitigation of poverty in developing countries.
2) ODA loan is provided to and through the central government and governmental organizations of developing countries.
3) ODA loan is provided to developing countries which are in a category authorized by JICA.
The priority sewerage projects will fulfill the requirements stated above. Hence, Maynilad may request ODA loan from JICA through MWSS and through government financial institutions such as the Land Bank of the Philippines (under a two-step loan). This will contribute to the improvement of the financial constitution of Maynilad as well because the sewerage projects are relatively less profitable.

Republic of the Philippines Preparatory Survey on Water Supply and Sewerage Chapter 3 Development in the West Zone of Metro Manila Final Report Outline of the Proposed Project in the Study
3-5
3.2.3 Necessity of PSIF The Study Team considers that the provision of PSIF is necessary to the proposed NRW reduction project for the following reasons:
Equity IRR of the NRW reduction project by commercial loan (16.7%) will be less than
the cost of equity (18%). Moreover the IRR is very sensitive to the future composition of physical and commercial losses, which are prone to vary from the current projection. Even a 1% variance of commercial loss ratio will draw down the IRR to 9.9%
The low equity IRR is derived from the huge amount of investment required to recover the physical loss to utilize limited water source. Physical loss reduction brings only
little amount of financial benefit to Maynilad. Maynilad can invest only on water meter management which is economically efficient to reduce commercial loss. However, Maynilad plans to conduct an integrated program to reduce physical and commercial losses.
The target NRW ratio has been accelerated in 10 years to satisfy the increasing water demand. However the acceleration of the NRW reduction target may not have been
necessary if the expected water source project were being executed by MWSS, which is responsible for timely development of water sources.
The NRW reduction project is a result of the social requirement for sufficient water.
However, there is a financial viability gap if it is funded by commercial loan and the gap has a risk of being expanded seriously.
It is noted that there are some possibilities that the NRW reduction programs and
projects will not be executed in accordance with the schedule established, and hence,
there may be a case that the financial arrangement might be possibly short if the
implementation is delayed.
PSIF is expected to fill the abovementioned gap and to mitigate the risks. PSIF will
improve the equity IRR to 31.5% in the base case, and to 23.3 % in the case of 1%
variance in commercial loss ratio.
Technical assistances by JICA are expected to be combined or collaborated with the
fund provision to assure the project’s successful execution.
3.2.4 Technical Cooperation Project of JICA (1) Possible Areas of JICA’s Cooperation
In order to execute and operate successfully the NRW reduction projects as well as the priority sewerage projects effectively and efficiently, it is best to consider request for a technical cooperation project of JICA. The technical cooperation will possibly be able to provide various technical schemes such as dispatching of various experts, receiving trainees for various fields,
Republic of the Philippines Preparatory Survey on Water Supply and Sewerage Chapter 3 Development in the West Zone of Metro Manila Final Report Outline of the Proposed Project in the Study
3-6
and provision of equipment and materials, which will be indispensable for private business and projects. These include policy making, institutional improvement, and capacity building of personnel for the water supply and sewerage systems, NRW reduction projects, and overall management of Maynilad. If the basic requirements as stated above for the ODA loan and PSIF are satisfied, the technical cooperation project will possibly be provided by JICA.
Expected fields where JICA can support Maynilad are as follows:
Improvement of water distribution network especially for cost-effective and easy-operation pressure management (which contributes to efficient NRW reduction)
Sewerage treatment process (which increases the amount of STPs that should be operated in the West Zone.)
Quality management of combined sewer such as mitigation of combined sewer overflow (CSO), which Japan has pertinent experiences and skills in this field.
Hence, Maynilad may also request JICA to provide such technical cooperation project for water supply, NRW reduction projects, and the proposed priority sewerage projects.
(2) Proposals on JICA’s Cooperation for NRW Reduction and Improvement of Water Distribution Network In order to achieve the expected accomplishment by the PSIF project proposed in the Study, among the possible areas of the JICA’s cooperation, is a technical cooperation program for NRW reduction and improvement of water distribution network, which Maynilad has been focused on its water supply services, is proposed below:
1) Name: Technical Cooperation for NRW Reduction and Water Distribution Network Improvement in the West Zone of Metro Manila
2) Duration: 12 months
3) Objective: The experiences, advanced technologies, and know-how of water suppliers in Japan will be introduced and transferred to the West Zone of Metro Manila, in order to contribute in the improvement of people’s life in the region as well as to have a sustainable development in the region.
4) Program: a. Cooperation in Water Leak Detection and Repair
After the present situation of NRW in the West Zone of Metro Manila, Japan’s technologies and know-how in water leak detection and repair will be presented and, through discussions and studies by Maynilad and the cooperation team, some of the technologies will be introduced to the West Zone. Technologies and know-how

Republic of the Philippines Preparatory Survey on Water Supply and Sewerage Chapter 3 Development in the West Zone of Metro Manila Final Report Outline of the Proposed Project in the Study
3-7
expected to be presented and introduced include structure of leak detection and repair units, frequency of leak detection, and materials and equipment for leak detection and repair. A pilot project to demonstrate the presented technologies and know-how in selected DMAs will be carried out.
b. Cooperation in Meter Management and Tariff Collection
Practices and technologies in Japan, which include selection, maintenance, and reading of water meters will be presented to Maynilad. Tariff collection system in Japan will also be presented. Presentation of Japan’s cases above will be followed by discussions between Maynilad and the cooperation team to develop further the improvement plan of meter management and tariff collection system.
c. Cooperation for Introduction of Advanced Monitoring System of Water Distribution Network
Water pressure management and quick identification of extraordinary conditions in the water distribution system are very important in NRW reduction. To enable Maynilad, these important tasks, technology, and skill transfer from Japan for the plan and introduction of supervisory control and data acquisition (SCADA) will be carried out.
Maynilad is implementing the pilot project of SCADA at the local area but full-scale introduction has not been achieved yet. In this cooperation program, the technical difficulties in planning and introduction of SCADA that Maynilad is facing will be analyzed and the cooperation team will help the company plan and introduce SCADA.
d. Cooperation for Development of Disaster-Resistant Water Distribution Network Metro Manila is subject to natural disasters such as earthquakes and floods. For development of disaster-resistant network of water distribution, Japan’s technologies and know-how in this field will be presented to Maynilad. The technologies and know-how that will be presented are the design of water distribution system which is resistant against earthquake, liquefaction, and flood. Expected output is a design guideline on disaster-resistant water distribution network which will be prepared by Maynilad through the program.
e. Training in Japan In order to enhance effectiveness of the cooperation programs mentioned above, the training program in Japan will be implemented. Engineers from Maynilad will stay in one of the water supply authorities in Japan for about two weeks to experience and learn the technologies and systems adopted in Japan. Ten engineers consisting of one

Republic of the Philippines Preparatory Survey on Water Supply and Sewerage Chapter 3 Development in the West Zone of Metro Manila Final Report Outline of the Proposed Project in the Study
3-8
manager, five mid-level engineers, and four junior engineers from the company’s divisions for NRW management and facility design will participate in the program.
5) Schedule and Manning Plan Schedule and manning plan for the proposed program is shown in Figure 3.2.1. The
training program in Japan will be carried out for NRW reduction and distribution system improvement separately. After completion of the activities in the Philippines and training program in Japan, as activity report will be prepared to review and wrap up the entire activities.
MMTeam Leader/Water Supply Specialist 7.0NRW Management Expert 5.5Leak Detection & Repair Expert 4.5Distribution System Planner 5.0Operation Expert 5.0SCADA Expert 3.5Coordinator 7.0
Total 37.5(Training in Japan) -
: Activities in Japan : Activities in Manila
7 8 9 10 11 12Members
Month1 2 3 4 5 6
Source: JICA Study Team
Figure 3.2.1 Proposed Schedule and Manning Plan of the Cooperation Program for NRW Reduction and Water Distribution System Improvement
6) Cost Total Cost of the Cooperation program proposed above will be USD 1.5 million including personnel expenses, direct expenses such as accommodation and transportation, expenses for training program in Japan, etc.

Republic of the Philippines Preparatory Survey on Water Supply and Sewerage Chapter 4 Development in the West Zone of Metro Manila Final Report Feasibility Study of NRW Reduction Program
4-1
Chapter 4 Feasibility Study of NRW Reduction Project
4.1 Social and Environmental Considerations in the NRW Reduction Project
4.1.1 Summary of the Project Content The Project includes the following site works:
Reconfiguration of the existing distribution network to set up DMAs, which includes installation of new pipes, valves, and meters;
Leak detection and repair works; and
Replacement of the existing pipes, service connections, and water meters.
In general, when the pipeline is replaced, existing pipes are not removed but the section is closed by valves at both ends. The existing service connections are newly installed to divert from the new distribution pipeline, and the existing connections will be left and closed. There are no resettlement and land acquisition expected in the implementation of the rehabilitation of distribution water pipes as a basic policy in the current NRW reduction management.
4.1.2 Alternative Examination (1) No-project scenario
The analysis of alternatives for the preparatory survey is broadly divided into “Do it” or “Do nothing”. In this study, “Do nothing” refers to no countermeasure for water supply and keeping the current water supply condition, system, and equipment. As shown below, the “Do nothing” alternative is obviously not acceptable because of the projected negative impacts caused by the said alternative:
For many consumers, access to drinking water will be difficult since water demand volume will exceed the potential water supply volume soon; and
Difficulty of access to safe and healthy water makes the general public sanitary level worse and may generate diseases because of the unavailability of clean water.
(2) Alternative Plans The possible countermeasures to correspond to the future water demand will be the following: (i) Development of the new water resource and (ii) Improvement of the existing water supply system. The “Development of the new water resource” alternative will have two options i.e., dam projects and seawater or brackish water desalination projects. Table 4.1.1 shows the alternative examination on the countermeasure for water

Republic of the Philippines Preparatory Survey on Water Supply and Sewerage Chapter 4 Development in the West Zone of Metro Manila Final Report Feasibility Study of NRW Reduction Program
4-2
supply.
Although development of the new water resource is appropriate to correspond to the future large volume requirement, it would take a long time and construction cost will be high. Additionally, there is a possibility of large-scale land acquisition and resettlement, which may further extend the project completion or sometimes would make the project infeasible. The other option in the “Development of new water resource” alternative, the desalination of seawater or brackish water, may not require large-scale resettlement but construction and O&M costs are very high. Moreover, high energy consumption of desalination plant is a significant environmental problem of this option.
On the other hand, improvement of the existing facilities which is planned as part of the NRW reduction program in the Study can be implemented in short term, and would not require resettlement and as much investment as the dam project option. Moreover, the development of the new water resources cannot be an efficient or a reasonable project under the conditions that a huge amount of produced water is being lost in the distribution network.
As a result of the alternative examination above, the NRW reduction program can be evaluated as the preferable and prioritized project for Maynilad to secure sufficient water.
Table 4.1.1 Alternative Examination on the Countermeasure for Water Supply Alternative Project
Item
Development of new water resource Improvement of existing water supply system
- Dam Project- Desalination Project (Seawater or
brackish water)
- Reducing non-revenue water management
Natural Environment - There is a possibility of large-scale cutting of trees (Dam Project)
- Desalination plant consumes large amounts of energy (Desalination Project)
- No cutting of trees
Social Environment - There is a possibility of large-scale resettlement and land acquisition
- No resettlement and landacquisition
Economy - High cost - Low costEvaluation for priority countermeasure ○ ◎
Source: JICA Study Team
4.1.3 General Environmental Condition in the Study Area Descriptions of the existing environmental conditions are presented in Sections 1.5 and 1.6. The study area covers almost the whole area of the West Zone of Metro Manila, where the water distribution network has been installed. Said area is already developed and urbanized. Existing pipelines have been distributed to residential, industrial, and commercial areas. Thus, there are no indigenous people/communities and protected

Republic of the Philippines Preparatory Survey on Water Supply and Sewerage Chapter 4 Development in the West Zone of Metro Manila Final Report Feasibility Study of NRW Reduction Program
4-3
areas identified as biological sensitive areas within the excavation sites. Most of the pipes are underlying city roads.
4.1.4 Previous Environmental Impact Assessment for Water Supply Service Recovery Project
(1) Water Supply Services Recovery Project (WSSRP) Maynilad had proposed a ten-year development plan (2006 to 2015) designed to improve its services and fulfill its commitment in 2006. The proposed project entitled WSSRP covered a total of 540 km2 consisting of nine cities and two municipalities in the National Capital Region and one city and five municipalities in the province of Cavite. The WSSRP has three major components, as follows:
1) Rehabilitation of the La Mesa Water Treatment Plants
Improvement/maximization of the treatment plant capacity;
Improvement of the quality of treated water;
Improvement of the operational efficiency and reliability; and
Acceptable sludge management.
2) Rehabilitation and Reconfiguration of the Primary Distribution System
Installation of a new primary water main to be located adjacent to the existing primary lines;
Improvement of the secondary and tertiary distribution lines through NRW reduction zones;
Measurement of hydraulic zoning or the District Metered Zone (DMZ);
Improvement of pumping stations; and
Procurement of instruments and equipment, as well as provision of trainings.
3) Construction of a new reservoir in the New Bilibid, Muntinlupa City
(2) EIA Approach of the WSSRP The WSSRP required an environmental impact assessment (EIA) study and an environmental performance report and management plan (EPRMP) to support the application for an environmental compliance certificate (ECC) with the Department of Environment and Natural Resources (DENR). Field visits were conducted on September 6 and 7, 2006, while primary data collection at the proposed reservoir site in Muntinlupa City was conducted on October 11, 2006. The first official stakeholders’ consultation to present the project was conducted on September 20, 2006. The second meeting to

Republic of the Philippines Preparatory Survey on Water Supply and Sewerage Chapter 4 Development in the West Zone of Metro Manila Final Report Feasibility Study of NRW Reduction Program
4-4
present the EIA study was conducted on October 27, 2006. Secondary data collection was conducted from September to October 2006. All phases of the project were considered and evaluated in the impact identification and assessment section. Mitigation and enhancement strategies were recommended to address the impacts. The EPRMP for WSSRP was submitted in December 2006 and the ECC was issued by DENR in June 2007. Appendix 10 shows the ECC for WSSRP.
(3) Relation between WSSRP and NRW Reduction Program Rehabilitation and reconfiguration of the primary distribution system of the three major project components in WWSRP covers the NWR reduction program in this Study. Maynilad forwarded a letter to DENR regarding the amendment of the WSSRP ECC, because the project component of NRW reduction in the latest business plan of the company would be revised from the original WSSRP. DENR allowed it and asked Maynilad to provide the description/component of the proposed modification or expansion for the amendment of the ECC. There are no significant differences in these regulations between WSSRP procedure by Maynilad and JICA Guidelines for Environmental and Social Considerations (April, 2010).
4.1.5 Preliminary Scoping of the Environmental and Social Impacts Potential impacts on the natural and social environment during the pre-construction, construction, and operational stages of the project have been initially identified using the environmental scoping list. The results are shown in Table 4.1.2.
Table 4.1.2 Preliminary Scoping of the Environmental and Social Impacts on the NWR Reduction Program
Item Pre-Construction / Construction Stage
OperationalStage Description
Pollution control 1. Air pollution
B- D Some negative impacts on air quality are expected due to the operation of heavy equipment/vehicles as well as traffic jam incidental to construction works.
2. Water pollution
B- D Some impacts on water quality would be caused by the turbid water generated from the construction yards of digging works.
3. Soil Contamination
D D There are no project components or activitiesthat may result to soil pollution.
4. Solid waste and/or industrial discharge
B- D It is expected that the project will generate construction wastes during the construction stage.
5. Noise and vibration
B- D Some noise and vibration impacts are expected due to the operation of heavy equipment/vehicles during the construction stage.
6. Ground subsidence
D D There are no project components or activities that may cause negative impacts on the ground

Republic of the Philippines Preparatory Survey on Water Supply and Sewerage Chapter 4 Development in the West Zone of Metro Manila Final Report Feasibility Study of NRW Reduction Program
4-5
Item Pre-Construction / Construction Stage
OperationalStage Description
subsidence since there will be digging activitiesonly to replace the existing pipelines.
7. Odor D D There are no project components or activities that may cause offensive odor.
8. Bottom sediment
D D There are no project components or activities that may cause negative impacts on the water bottom/sediment.
Natural Environment 9. Geographical conditions and geological conditions
D D Since replacement of water pipes will be proposed along the existing water pipes underlying the city roads, it is not expected that the project will bring about significant changes or impacts on the geographical and geological conditions
10. Soil erosion
D D Since replacement of water pipes will be proposed along the existing water pipes underlying the city roads, it is not expected that the project will cause soil erosion.
11. Flora D D Since most of the existing pipes are underlyingthe city roads in the developed urban area, negative impacts are not expected on the floral ecology to be protected.
12. Fauna D D Since most of the construction areas aredesigned in the developed urban area, negative impacts are not expected on the fauna ecology that will be protected.
13. Ground water
D D There is no project component or activity which would cause significant changes or impacts on the ground water in and around the project area.
14. Water body (rivers, lakes, etc.)
D D There is no effect on the water body in and around the project area.
15. Coastal environment
D D There is no effect on the coastal environment in and around the project area.
16. Oceanographic
D D There is no effect on the oceanography in and around the project area.
17. Natural/ecological reserves and sanctuaries
D D Negative impacts are not expected since the project is designed in developed urban area and there are no ecological reserves and sanctuaries in the project area.
Social Environment18.Involuntary resettlement
D D Since replacement of water pipes will be proposed along the existing water pipes underlying the city roads in the already developed area, there will be no involuntary resettlement involved in the project area.
19. Local economies (employment, livelihood, etc.)
D B+ Some positive effects on the local economy areexpected because of the provision of continuous safety water supply service due to the repair of water pipe leak points.
20. Water right
D D No impact on water use or water right is expected due to project implementation.
21. Land use and utilization of local resources
D D Since replacement of water pipes will be proposed along the existing water pipes underlying the city roads, there is no effect on the land use.
22. Social institutions
D D Since replacement of water pipes will be proposed along the existing water pipes

Republic of the Philippines Preparatory Survey on Water Supply and Sewerage Chapter 4 Development in the West Zone of Metro Manila Final Report Feasibility Study of NRW Reduction Program
4-6
Item Pre-Construction / Construction Stage
OperationalStage Description
and community
underlying the city roads, no significant part of the local community would be divided by the project.
23. Existing social infrastructures and services
B- A+ Some negative impacts on the existing traffic conditions are expected due to traffic jams caused by construction activities, although the expected impacts will be temporary during the construction stage. It is expected to improve the water supply service through the project since it aims to improve the existing water pipe during the operational stage.
24. Poor, indigenous, or ethnic people
D D Since replacement of water pipes will be proposed along the existing water pipes underlying the city roads, there is no project component or activity that may cause negative impacts to the poor, indigenous, or ethnic people.
25.Misdistribution of benefits and damages
D D Since the purpose of the project is for the improvement of the water supply service, there is no project component or activity that may cause misdistribution of benefits and damage.
26. Local conflicts of interest
D D Since the purpose of the project is for the improvement of the water supply service, there is no project component or activity that may cause local conflicts of interest.
27. Gender and children’s rights
D D Since the purpose of the project is for the improvement of the water supply service, there is no project component or activity which would cause negative impacts.
28. Cultural heritage
D D
Since replacement of water pipes will be proposed along the existing water pipes underlying the city roads, there are no project components or activities that may cause negative impacts on cultural heritage.
29.Landscape D D Since replacement of water pipes will be proposed along the existing water pipes underlying the city roads, there will be no effect on the landscape.
30. Infectious diseases such as HIV/AIDS
D D The replacement of water pipe at leak point is one of the regular maintenance construction activities in the urban area. Since there is no significant/large-scale construction that will require the provision of welfare facilities for construction workers, there is no possible transmission of infectious diseases such as HIV/AIDS in the project site.
31. Public hygiene
B- D During construction, sanitary condition will be deteriorated due to wastewater, dust, and solid waste from the construction sites.
32. Working conditions (including occupational safety)
B- D Increment of safety risks in the workplace areexpected due to the operation of heavy equipment and heavy vehicles during the construction stage.
Others 33. Accident and hazard
D D Since replacement of water pipe leak points areone of the regular maintenance construction activities, there is no possibility of remarkable potential accidents and hazards by the project implementation.
34. Local D D It is not expected that the project will cause

Republic of the Philippines Preparatory Survey on Water Supply and Sewerage Chapter 4 Development in the West Zone of Metro Manila Final Report Feasibility Study of NRW Reduction Program
4-7
Item Pre-Construction / Construction Stage
OperationalStage Description
climate significant change on the regional meteorological condition.
35. Global warming
B- B+ The possibility of increased greenhouse gas (GHG) emission is expected due to the operation of heavy equipment and vehicles as well as traffic jams incidental to construction works, although the expected probability will be temporary during the construction stage. The possibility of decreased GHG emission is expected due to water supply with no-waste pumped up during operational stage.
Note: * Regarding the impacts on “Gender” and “Children’s Right”, might be related to all criteria of Social Environment.
Rating
A+/-: Significant positive/negative impact is expected. B+/-: Positive/negative impact is expected to some extent. C+/-: Extent of positive/negative impact is unknown. (A further examination is needed, and the impact could be clarified as the
study progress) D: No impact is expected Source: JICA Study Team
4.1.6 Environmental and Social Considerations Study (1) Contents of the Study
Contents of the environmental and social considerations study are the following: 1) Prediction of impacts caused by the project on scoped items as shown in Table 4.1.3; 2) Proposal on the environmental mitigation measures; 3) Proposal on the environmental management and monitoring plans; and 4) Proposal for information disclosure.
Table 4.1.3 List of Studies for EIA on the NRW Reduction Program
Category Items of Study Pre-Construction / Construction Stage
Operational Stage
Pollution Control Air pollution Water pollution Solid waste and/or industrial discharge
Noise and vibration Social Environment
Existing social infrastructures and services
Public hygiene Working conditions (including occupational safety)
Others Global warming Source: JICA Study Team
(2) Prediction of Impact and Proposed Mitigation Measures The negative impact was predicted qualitatively in consideration of the project features, construction methodology, and secondary data that were collected based on the

Republic of the Philippines Preparatory Survey on Water Supply and Sewerage Chapter 4 Development in the West Zone of Metro Manila Final Report Feasibility Study of NRW Reduction Program
4-8
published data on land use, natural environment conditions, socio-economics, and demography.
Table 4.1.4 shows the impact and proposed mitigation measures. Environmental and social impacts are expected during the construction stage only. Air pollution, noise and vibration, water pollution, and solid waste due to construction activities, and traffic congestion around replacing water pipes are expected during the construction stage. Adequate and effective mitigation measures against these negative impacts should be proposed.
Table 4.1.4 Prediction of Impacts and Proposed Mitigation Measures S. No
Environmental Attributes Effect Factor Estimated Potential
Impact Proposed Mitigation Measures Construction Phase1. Air quality - Dust emissions from
site preparation, excavation, material handling, and other construction activities at the site.
- Minor and short-term negative impacts within the construction area only.
- Regular water sprinkling on the exposed surfaces to reduce dust emission.
- Proper maintenance of all equipment at regular intervals.
2. Water quality - Excavation works- Oil/fuel and waste
spills from construction area due to repair and maintenance works of equipment/vehicles at the site.
- Excavation works will induce erosion/siltation and may clog waterways.
- Clogging of waterways may result to flooding during rainy season.
- Excavation can also cause mud pools.
- Minor and short-term negative impacts near the construction area only.
- Maintenance and cleanliness in the work place will be strictly observed.
- Water from excavations will be discharged to the nearest gutters and canals with provision of effective erosion controls (e.g., silt traps, catch pits)
- Used oil will be dispensed in a controlled manner.
- Avoid excavation during heavy rains.
3. Solid waste
- Digging activities for the replacement of damaged or old pipes.
- Diggings would generate excavated soil and construction wastes.
- Minor negative impact.
- Good housekeeping will be strictly observed.
- Generally, existing pipes will not be removed and left underground in order to reduce and minimize construction wastes.
- Excavated soil will also be reused as backfill materials, if practical.
- Proper solid waste management should be designed and executed for construction. A designated place will be identified for the disposal of excess excavated soils and construction materials.
4. Noise and vibration
- Noise and vibration generated from construction activities, operation of construction machinery, equipment, and their movement
- Noise and vibration generation sources confined within the construction area only.
- Minor and short-term negative impacts near the activities.
- Regular servicing of the construction machinery and vehicles, with particular attention to silencers and mufflers in order to keep construction noise at the minimum level.
- Notify the local people in case of plants and machinery with high intensity of noise and vibration are used.
- Permissions from local authorities should be obtained in case of night time activities.
- Avoid scheduling heavy noise and vibration–generating activities at night time.
5. Existing social - Excavation and other - Construction activities - Traffic permit and other related

Republic of the Philippines Preparatory Survey on Water Supply and Sewerage Chapter 4 Development in the West Zone of Metro Manila Final Report Feasibility Study of NRW Reduction Program
4-9
S. No
Environmental Attributes Effect Factor Estimated Potential
Impact Proposed Mitigation Measures infrastructures and services
construction activities. may occupy portions of the road that may lead to temporary road closure and traffic congestion.
- Minor and short-term negative impacts near construction site.
permits will be secured prior to any clearing/excavation works.
- The traffic management plan will also be prepared with the approval of the local government and other concerned agencies.
- Plan of rerouting (if necessary) should be approved by the local traffic management or the barangay. Rerouting of vehicles will be announced with adequate lead time through print and broadcast media, and if available, through cyber media for the public to be able to understand and learn the rerouting plan.
- Schedule hauling of construction materials during off-peak hours.
- For busy highways, work will be done during non-rush hours or at night time.
6. Public hygiene - Public hygiene due to dust emission, noise, and waste water from construction site.
- Minor and short-term negative impacts
- Mitigation for pollution controlwill be strictly observed.
- Temporary toilets will be provided.
7. Working conditions (including occupational safety)
- Excavation and otherconstruction activities.
- There will be risks of accidents to workers, pedestrians, and vehicles
- Minor and short-term negative impacts
- Provide personal security facilities (protective helmet, ear-plug, gloves, and safety shoes).
- Provision of first-aid stations safety equipment, and warning signals
- Fencing of the work area, as long as practicable will also be done while informative warning signs, including danger signs will be installed at strategic locations around the construction site.
8. Global warming - Emissions from construction activities, operation of construction machinery and equipment, and their movements
- Minor and short-term negative impacts
- Regular maintenance of construction machinery and equipment.
- Carry out training of technicians and operators of construction machinery and drivers of vehicles.
Source: JICA Study Team
4.1.7 Environmental Management Plan and Environmental Monitoring Plan Environmental management plan (EMP) and environmental monitoring plan (EMOP) are formulated to achieve the proponent’s compliance with DENR requirements and other environmental regulations.
(1) Environmental Management Plan (EMP) The EMP is designed based on the impact assessment which covers all aspects of the natural and social environment so that adverse impacts, if any, are taken care of. Moreover, it ensures that the project does not create any hazards or will not affect the quality of life of the present and future generations. The mitigating measures to address adverse environmental impacts consist of activities and plans that are presented in Table 4.1.5.

Republic of the Philippines Preparatory Survey on Water Supply and Sewerage Chapter 4 Development in the West Zone of Metro Manila Final Report Feasibility Study of NRW Reduction Program
4-10
Table 4.1.5 Environmental Management Plan Activity/Potential
Environmental Impact Mitigation/Enhancement Responsibility Cost A. Pre-Construction Phase Pre-construction meeting
Conduct pre-construction meeting with Maynilad representatives to discuss the project including the implementation of the environmental management and monitoring plan.
Contractor No incremental cost
B. Construction PhaseIncreased dust emission - Regular water sprinkling on the exposed surfaces
to reduce dust emission. -Proper maintenance of all equipment at regular intervals.
Contractor Contractor
No incremental cost
Increased noise and vibration level
- Regular servicing of the construction machinery and vehicles, with particular attention to silencers and mufflers in order to keep construction noise at the minimum level.
- Notify the local people in case of plants and machinery with high intensity of noise and vibrations will be used.
- Permissions from local authorities should be obtained in case of night time activities.
- Avoid scheduling heavy noise and vibration–generating activities at night time.
Contractor Contractor Maynilad/Contractor Contractor
No incremental cost
Generation of wastewater from project site
- Maintenance and cleanliness in the work place will be strictly observed.
- Water from excavations will be discharged to the nearest gutters and canals with provision of effective erosion controls (e.g., silt traps, catch pits).
- Used oil will be dispensed in a controlled manner. - Avoid excavation during heavy rains.
Contractor Contractor Contractor Contractor
No incremental cost
Generation of solid waste
- Good housekeeping will be strictly observed. - Existing pipes will not be removed and left
underground in order to reduce and minimize construction wastes.
- Excavated soil will also be reused as backfill materials, if practical.
- Proper solid waste management should be designed.
Contractor Contractor Contractor Maynilad/Contractor
No incremental cost
Traffic congestion due to movement of construction vehicles, social impact disturbance due to loss of access/closure of road sections due to road diggings along the right–of-way
- Traffic permit and other related permits will be secured prior to any clearing/excavation works.
- A traffic management plan will also be prepared with the approval of the local government and other concerned agencies.
- Plan of rerouting (if necessary) should be approved by the local traffic management or the barangay. Rerouting of vehicles will be announced with adequate lead time through print and broadcast media, and if available, through cyber media for the public to be able to understand and learn the project, duration of work, and traffic rerouting scheme and rerouting plan.
- For busy highways, work will be done during non-rush hours or at night time.
Contractor Maynilad/Contractor Contractor Contractor
No incremental cost
Open excavations may cause accidents
- Provide personal security facilities (protective helmet, ear-plugs, gloves, and safety shoes).
- Provision of first-aid stations safety equipment, and warning signals
- Fencing of the work area, as long as practicable, will also be done while informative warning signs, including danger signs will be installed at strategic locations around the construction site.
Contractor Contractor Contractor
No incremental cost
Source: JICA Study Team

Republic of the Philippines Preparatory Survey on Water Supply and Sewerage Chapter 4 Development in the West Zone of Metro Manila Final Report Feasibility Study of NRW Reduction Program
4-11
(2) Environmental Monitoring Plan (EMOP) The EMOP provides a basis for monitoring the potentially adverse environmental impacts of the project during its execution. The information derived from environmental monitoring activities can be used to mitigate and reduce environmental impacts and enhance project benefits through adaptive management. The EMOP will assist in detecting the development of any unexpected environmental or social situation, and thus, provide opportunities for adopting appropriate control, management, or mitigation measures.
The major construction works in the NRW reduction project are installation of valves and meters and replacement of damaged or old pipes, service connections, and water meters. The necessary excavation works are mostly 1.0 m to 2.5 m deep and 1.0 m to 2.0 m wide, which is not a significant/large-scale construction. Therefore, routine supervision of the work is proposed as EMOP. Observation of construction works during routine site inspections to ensure that mitigation measures are being implemented. This work will be conducted as general operation working/maintenance progress including daily work. The proposed EMOP is shown in Table 4.1.6.
Table 4.1.6 Environmental Monitoring Plan
Parameters Location Method Frequency Responsibility Estimated Cost
Construction Phase Volume of overburden soils and construction wastes
Project site, manhole stations, etc.
- A monthly inspection of the disposal sites along with the review of the design plan is a better way of assessment.
During transport of wastes
Contractor Part of construction cost
Visual monitoring of storm water runoff
Project site, manhole stations, etc.
- Visit site and check drain provision if functioning well
Rainy days Contractor Part of construction cost
Visual monitoring of construction machinery and yard conditions
Project site, manhole stations, etc.
- Check if the Contractor is performing mitigation measures.
- This can be achieved by interviewing the locals and through site inspection.
Monthly Contractor Part of construction cost
Monitor the implementation of the EMoP
Project site, manhole stations, etc.
- Environment ManagementDepartment will conduct regular inspection and monitoring of EMoP will be implemented by the Contractor. Issuance of notice of non-compliance and/or imposition of penalty if conditions are not met.
Monthly Maynilad No incremental cost
Source: JICA Study Team

Republic of the Philippines Preparatory Survey on Water Supply and Sewerage Chapter 4 Development in the West Zone of Metro Manila Final Report Feasibility Study of NRW Reduction Program
4-12
4.1.8 Informal Disclosure During the EIA study for WSSRP, stakeholder’s consultation was conducted twice. Since the detailed plan of the pipe replacement works will be identified only after the leak detection survey and the diagnostic works, it is impossible to inform the detailed schedule of the project components to the public in the early stage. Consumers are one of the most important stakeholders of the projects since the service area is the entire West Zone of Metro Manila. In respect to sharing information on NRW reduction activities to all consumers in the soonest possible time, information should be uploaded in the Maynilad website when the detailed schedule is finalized. Before construction, the construction schedule including period and methodology should be consulted to the local government.
Subcontractors during construction will also be in charge of service cooperation with customers and their complaints against construction implementation during the construction stage. Maynilad has a section that deals with complaints which is under the Consumer Relations Department to address all complaints and grievances received from the public. This section is in charge of all complaints during the operational stage.
4.1.9 Draft Environmental Checklist The key points obtained in the course of environmental and social considerations study as preparatory survey stage of the NRW reduction program has been summarized by using the format of the Environmental Checklist, No. 14 for Water Supply, defined in the JICA Guidelines for Confirmation of Environmental and Social Considerations (April, 2010).

Republic of the Philippines Preparatory Survey on Water Supply and Sewerage Chapter 5 Development in the West Zone of Metro Manila Final Report Feasibility Study of Priority Sewerage Projects
5 - 1
Chapter 5 Feasibility Study of Priority Sewerage Projects
5.1 Basic Considerations of Sewerage System Planning
The feasibility study of priority sewerage project consists of the following four major tasks: 1) Review of previous studies and the Maynilad 2013 Business Plan (BP 2013), 2) Selection of study areas, 3) Preliminary design, and 4) Determination of feasibility and evaluation of the proposed projects.
5.1.1 Selection of Study Area (1) Catchment Basin
North Quezon, North Caloocan, and East Valenzuela Cities were nominated by Maynilad as potential areas for the Study because there are no feasibility studies for sewerage projects in these areas. Maynilad wants to install at least one STP in each municipality as soon as possible. In order to select the priority areas among the three cities for the Study, it is required to divide the areas by hydraulic catchment basin since sewerage systems will be constructed in accordance with the hydraulic catchment basin. The catchment basins were divided based on the contour map provided by the GIS division of Maynilad. The potential areas of North Quezon, North Caloocan, and East Valenzuela were divided into four main river basins, namely, the Marilao River basin, the Meycauayan River basin, the Marikina River basin, and the Tullahan River basin, as shown in Figure 5.1.1. The characteristics of each catchment basin are listed in order to determine the priority area in terms of population, population density, and urbanization, as shown in Table 5.1.1.
Wastewater collection systems shall be planned basically in accordance with the above catchment basin. Therefore, it is possible to convey wastewater from one municipality to other municipalities for wastewater treatment.
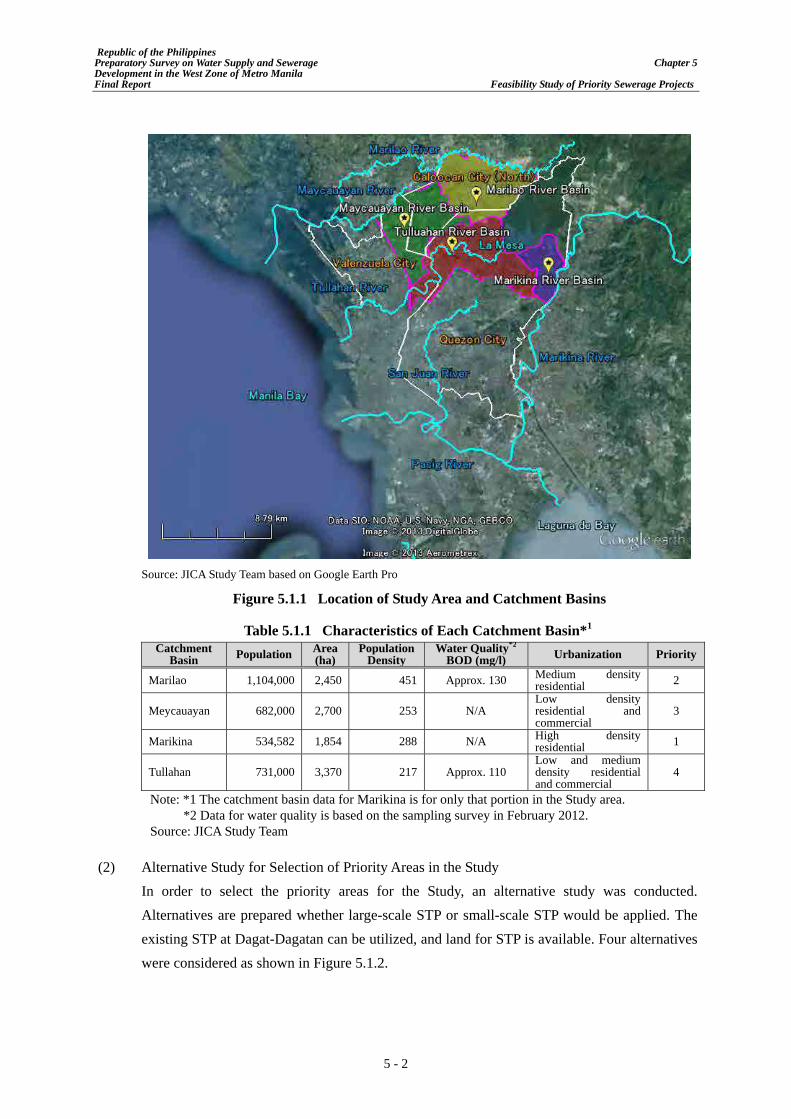
Republic of the Philippines Preparatory Survey on Water Supply and Sewerage Chapter 5 Development in the West Zone of Metro Manila Final Report Feasibility Study of Priority Sewerage Projects
5 - 2
Source: JICA Study Team based on Google Earth Pro
Figure 5.1.1 Location of Study Area and Catchment Basins
Table 5.1.1 Characteristics of Each Catchment Basin*1 Catchment
Basin Population Area(ha)
Population Density
Water Quality*2
BOD (mg/l) Urbanization Priority
Marilao 1,104,000 2,450 451 Approx. 130 Medium density residential 2
Meycauayan 682,000 2,700 253 N/A Low density residential and commercial
3
Marikina 534,582 1,854 288 N/A High density residential 1
Tullahan 731,000 3,370 217 Approx. 110 Low and medium density residential and commercial
4
Note: *1 The catchment basin data for Marikina is for only that portion in the Study area. *2 Data for water quality is based on the sampling survey in February 2012. Source: JICA Study Team
(2) Alternative Study for Selection of Priority Areas in the Study In order to select the priority areas for the Study, an alternative study was conducted. Alternatives are prepared whether large-scale STP or small-scale STP would be applied. The existing STP at Dagat-Dagatan can be utilized, and land for STP is available. Four alternatives were considered as shown in Figure 5.1.2.

Republic of the Philippines Preparatory Survey on Water Supply and Sewerage Chapter 5 Development in the West Zone of Metro Manila Final Report Feasibility Study of Priority Sewerage Projects
5 - 3
Option-1: Sewerage system will be constructed with a large number of small-scale STPs.
Option-2: Sewerage system will be constructed by large-scale STP.
Option-3: Sewerage system will be constructed by large-scale STP. The option is to use the Dagat-Dagatan STP.
Option-4: Sewerage system will be constructed by large-scale STP. The option is to use the Dagat-Dagatan STP and the new STP which is required to be constructed in the reclamation area along the coastal side.
Marikina River Basin
Marilao River Basin
Maycauayan River Basin
Tullahan River Basin
La Mesa
STP2
STP4
STP4
STP1
STP3
STP4
STP4
STP7
STP1
STP2
STP3
STP5
STP6
STP2
STP5
STP6
STP1
STP3
STP2
STP3
STP1
Option-1
Marikina River Basin
Marilao River Basin
Maycauayan River Basin
Tullahan River Basin
La Mesa
STP
STP
STP
STP
Option-2
Marikina River Basin
Marilao River Basin
Maycauayan River Basin
Tullahan River Basin
La Mesa
Option-3
STP
Dagat-dagatan STP: 200,000 m3/d
STP
STP
STP
Marikina River Basin
Marilao River Basin
Maycauayan River Basin
Tullahan River Basin
La Mesa
STP
STP
7.8 kmNew STP (at Reclamation area)
Dagat-dagatan STP: 200,000m3/d
Option-4
Source: JICA Study Team
Figure 5.1.2 Alternative Options for Selection of Priority Areas for the Study
(3) Conditions for Alternative Study For the purpose of comparing the above alternatives, design parameters were temporarily set as follows:
Target year: 2037
Sewage Volume: Water Consumption (160 LPCD) x 80% + Groundwater Infiltration
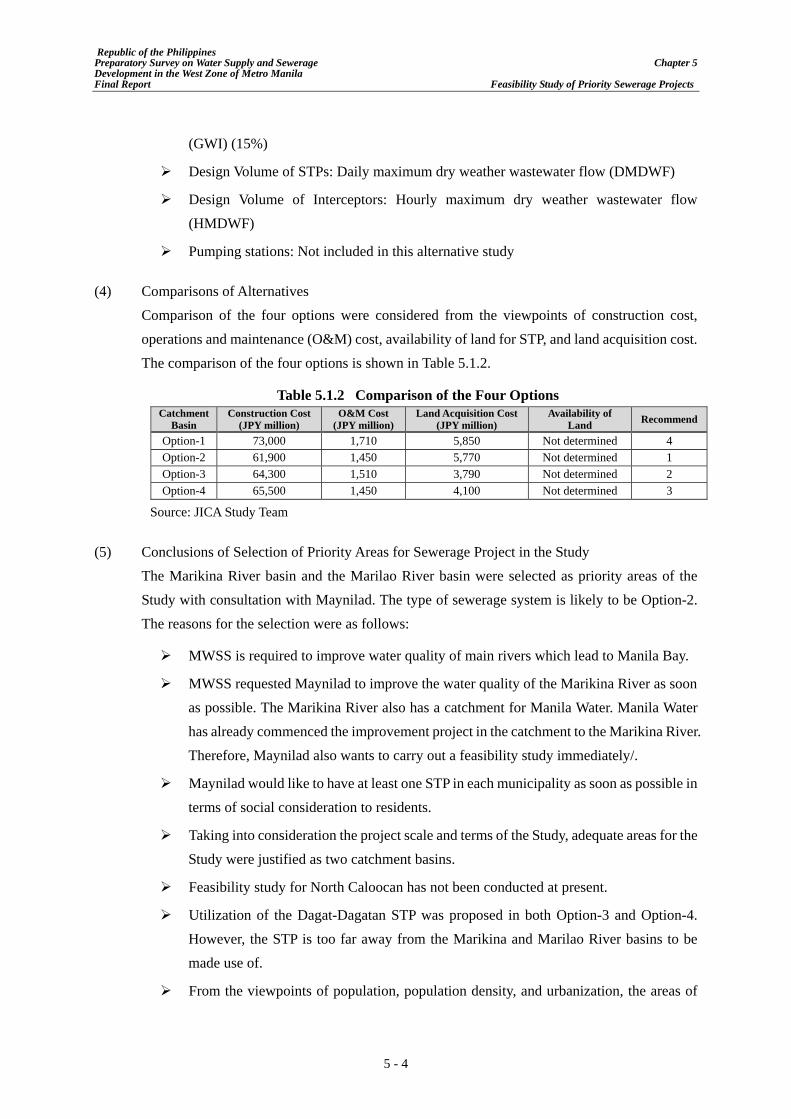
Republic of the Philippines Preparatory Survey on Water Supply and Sewerage Chapter 5 Development in the West Zone of Metro Manila Final Report Feasibility Study of Priority Sewerage Projects
5 - 4
(GWI) (15%)
Design Volume of STPs: Daily maximum dry weather wastewater flow (DMDWF)
Design Volume of Interceptors: Hourly maximum dry weather wastewater flow (HMDWF)
Pumping stations: Not included in this alternative study
(4) Comparisons of Alternatives Comparison of the four options were considered from the viewpoints of construction cost, operations and maintenance (O&M) cost, availability of land for STP, and land acquisition cost. The comparison of the four options is shown in Table 5.1.2.
Table 5.1.2 Comparison of the Four Options Catchment
Basin Construction Cost
(JPY million) O&M Cost
(JPY million) Land Acquisition Cost
(JPY million) Availability of
Land Recommend
Option-1 73,000 1,710 5,850 Not determined 4 Option-2 61,900 1,450 5,770 Not determined 1 Option-3 64,300 1,510 3,790 Not determined 2 Option-4 65,500 1,450 4,100 Not determined 3
Source: JICA Study Team
(5) Conclusions of Selection of Priority Areas for Sewerage Project in the Study The Marikina River basin and the Marilao River basin were selected as priority areas of the Study with consultation with Maynilad. The type of sewerage system is likely to be Option-2. The reasons for the selection were as follows:
MWSS is required to improve water quality of main rivers which lead to Manila Bay.
MWSS requested Maynilad to improve the water quality of the Marikina River as soon as possible. The Marikina River also has a catchment for Manila Water. Manila Water has already commenced the improvement project in the catchment to the Marikina River. Therefore, Maynilad also wants to carry out a feasibility study immediately/.
Maynilad would like to have at least one STP in each municipality as soon as possible in terms of social consideration to residents.
Taking into consideration the project scale and terms of the Study, adequate areas for the Study were justified as two catchment basins.
Feasibility study for North Caloocan has not been conducted at present.
Utilization of the Dagat-Dagatan STP was proposed in both Option-3 and Option-4. However, the STP is too far away from the Marikina and Marilao River basins to be made use of.
From the viewpoints of population, population density, and urbanization, the areas of

Republic of the Philippines Preparatory Survey on Water Supply and Sewerage Chapter 5 Development in the West Zone of Metro Manila Final Report Feasibility Study of Priority Sewerage Projects
5 - 5
Marikina and Marilao could be prioritized, as shown in Table 5.1.1.
5.1.2 Planning Criteria (1) Implementation Strategies of the Prioritized Sewerage Projects 1) Centralized Sewerage System
In the past, the sewerage projects of Maynilad were planned for small-scale treatment systems. However, this led to numerous small STPs for which land acquisition were proven difficult. Metro Manila’s population is rapidly increasing, and O&M of many smaller sewerage facilities is daunting. For such reasons, centralized medium to large sized sewerage systems are now regarded as more desirable and effective than distributed systems.
2) Focus on Population Centers Sewer pipes routing will be prioritized to collect flows from the population centers. The sewer mains to be installed in early phases will have capacity to accommodate the extension of the network per natural growth toward outlying areas.
3) Provide Early Maximum Coverage Maynilad made a concession agreement with MWSS stating that sewerage coverage should be raised to 100% by 2036. Sewerage coverage in concession areas of Maynilad was only 9% in 2011 according to the Maynilad BP 2013, and needs to increase quickly toward the ultimate goal. The cleanup of certain water bodies such as the Marikina River is considered a priority. The previous sewerage projects of Maynilad seemed to have applied separated sewer systems, but the implementation rate of separated systems is slow. Therefore, in order to provide maximum coverage quickly, interceptor sewer systems which can be utilized existing drainage will be applied.
4) Consideration of Advanced Treatment Process In order to clean up the Manila Bay, advanced treatment processes, such as nitrogen and phosphorus removal, will be required based on the upgrading of environmental guidelines. Maynilad will require in its future projects to include design of nitrogen and phosphorus removal, but such will not be implemented until the new guidelines are promulgated by the Department of Environment and Natural Resources (DENR). Realistically it is far easier to include the advanced process if provisions are made in planning and designing, rather than after construction of STPs. Therefore, for the Study, nitrogen and phosphorus removal will be taken as “given” parameters.
5) Necessity of Sewerage Project From the above reasons, the sewerage projects in the Marikina River basin and the Marilao

Republic of the Philippines Preparatory Survey on Water Supply and Sewerage Chapter 5 Development in the West Zone of Metro Manila Final Report Feasibility Study of Priority Sewerage Projects
5 - 6
River basin shall be conducted as soon as possible. The population in these areas is increasing and available sites for STPs are also limited. Additionally, the improvement of water quality of the Manila Bay will be required, and the projects of Maynilad need to be conducted as soon as financing becomes available.
(2) Target Year The target year of the Study is 2037, which is the expiration of the concession contract of Maynilad with MWSS. Although it is important to continue sewerage projects in the West Zone of Metro Manila after 2037, the time horizon considered in the Study is 25 years from the present.
(3) Staged Implementation The efficient use of resources dictates staged implementation or stepwise sewerage system development in Metro Manila. At first, installation of interceptor pipes that would collect wastewater through existing drainage systems will be implemented. Then, the interceptor systems will be converted to a separate system in prioritized areas. A delineation of the staged implementation is shown in Table 5.1.3.

Republic of the Philippines Preparatory Survey on Water Supply and Sewerage Chapter 5 Development in the West Zone of Metro Manila Final Report Feasibility Study of Priority Sewerage Projects
5 - 7
Table 5.1.3 Delineation of Staged Implementation Images Delineation
First Phase ╴ Sewerage system to be installed will continue
to receive drainage flows and interceptor pipelines originating at intercepting chambers (IC) and will be built to convey flows to the STPs that will also be built during this phase
Second Phase ╴ Lateral sewers and house connections will be
constructed. ╴ Some interceptor sewers will be converted
step-by-step to separate sewerage systems. ╴ Separate sewers are installed, and individual
houses are then connected to the new sewer with decommissioning septic tanks.
╴ STPs may be needed to upgrade capacity. Long Term ╴ Interceptor sewerage systems will be
completely converted to separate systems. ╴ All flows from households should be directly
connected to the sewer network.
Sources: JICA Study Team
(4) Other trends Due to the long study horizon and uncertainty of financing over the long term, there are a few trends that would impact the sewerage system which are difficult to predict.
1) Lifestyle Changes Water demand may increase due to lifestyle change, resulting in more wastewater being generated. Trends could shift towards a lower demand if water saving methods are adopted.
2) System Maintenance, Renewal and Replacement The lack of maintenance of system hardware or failure to perform renewal and replacement of pipelines over the long term may result in increased infiltration and inflow, which would result to the decrease of available capacity to convey sanitary flows to the STPs.

Republic of the Philippines Preparatory Survey on Water Supply and Sewerage Chapter 5 Development in the West Zone of Metro Manila Final Report Feasibility Study of Priority Sewerage Projects
5 - 8
5.1.3 Catchment Delineation The catchment areas of wastewater flows shall be determined by taking into account hydraulic conditions, existing drainage systems, and roads.
1) Hydraulic Condition The magnitude and flow direction of runoff from rain events are caused by vertical differences in topography. In the determination of the catchment area of wastewater flow in combined systems, it is important at first to figure out the topographical conditions using a contour map and/or topographical survey.
2) Existing Drainage System and Road Defining the catchment boundaries must also consider the existing drainage system, which accommodates a mixture of storm runoff and sanitary flows. The drainage system is usually installed under or nearby roads. Sometimes, the road surface itself serves as the only drainage pathway. The drainage installation already exists, and the sewerage system will need to accommodate the drainage pathways. Therefore, in order to figure out the catchment of sub-basins of existing drainage systems, it is necessary to determine the catchment area of wastewater flow.
5.1.4 Demographics Initially, the 2013-2037 projected population in Quezon City and Caloocan City were obtained from the Maynilad BP 2013. However, Maynilad has to update their population projection after the National Statistics Office (NSO) released the results of its 2010 Census of Population and Housing. Table 5.1.4 shows that Caloocan City registered a growth rate of 3.39% from 1990 to 2010, while Quezon City had a 2.55% growth rate for the same period.
Table 5.1.4 Census (2010) and Housing Population
Country/Region/Highly Urbanized City
Total Population Total Growth Rate
1 May 1990 1 May 2000 1 May 2010 1990-2000
2000-2010
1990-2010
Philippines 60,703,810 76,506,928 92,337,852 2.34 1.90 2.12National Capital Region 7,948,392 9,932,560 11,855,975 2.25 1.78 2.02Caloocan City 763,415 1,177,604 1,489,040 4.43 2.37 3.39Quezon City 1,669,776 2,173,831 2,761,720 2.67 2.42 2.55Source: Population and Annual Growth Rates for the Philippines and its Regions, and Highly Urbanized Cities based
on the 1990, 2000, and 2010 Censuses
The population projections shown in Table 5.1.5 were agreed upon to be applied in preparation of the Study based on revival of Maynilad.

Republic of the Philippines Preparatory Survey on Water Supply and Sewerage Chapter 5 Development in the West Zone of Metro Manila Final Report Feasibility Study of Priority Sewerage Projects
5 - 9
Table 5.1.5 Population Projection City Projected Population
2013 2017 2022 2027 2030 2037Quezon City 1,958,034 2,054,986 2,162,739 2,251,782 2,297,872 2,363,877Caloocan City 1,559,011 1,620,993 1,693,583 1,751,308 1,780,731 1,817,060
Source: Maynilad, June 2012
5.1.5 Flows Generated sewage flows are mainly composed of domestic wastewater, commercial wastewater, industrial wastewater, and GWI.
(1) ADWF Wastewater strength is highest during the dry season, and thus, the STP must have sufficient capacity for required treatment process. ADWF is the most significant target flow rate for the steady operations of the STP. It is calculated based on population and sanitary flows generated per capita, which in turn is based on water consumption. The maximum STP capacity would be provided to meet the peak flow. ADWF includes infiltration/inflow of groundwater into the sewerage system.
1) Domestic Wastewater Flows Shown in Table 5.1.6 are the population, service coverage and water demand of Quezon City and Caloocan City as derived from the Maynilad BP 2013, and the water consumption for each city.
Table 5.1.6 Population and Domestic Demand in BP 2013 (March 2012) City Population
in 2037 Service Coverage
in 2037Domestic Demand
in 2037 (MLD)Calculated Water Consumption
(LPCD) Quezon City 2,253,660 100% 429 190
Caloocan City 1,724,450 100% 320 186 Source: Maynilad BP 2013 (March)
The 2037 populations presented in Table 5.1.6 are not the same as those in the BP 2013, as of its preparation through March 2012. The BP 2013 is currently under revision, so the populations from Table 5.1.5 are adopted for the Study. For the assumed billed volume, Maynilad estimated the water consumption separately, as shown in Table 5.1.7. The JICA Study Team will use the water consumption estimated by Maynilad for the preliminary design.
Table 5.1.7 Domestic Water Consumption in the Study
City Water Consumption (LPCD)
2013 2017 2022 2027 2030 2037 Quezon City 129 134 145 160 160 160
Caloocan City 126 131 142 160 160 160
Source: Maynilad

Republic of the Philippines Preparatory Survey on Water Supply and Sewerage Chapter 5 Development in the West Zone of Metro Manila Final Report Feasibility Study of Priority Sewerage Projects
5 - 10
2) Commercial Wastewater Flows Commercial demand was estimated in the University of the Philippines (UP) report. Water consumption for commercial population in each LGU shall be estimated. According to the UP report, commercial population of Caloocan was estimated. However, Caloocan consists of North and South Caloocan, which are away each other. Since the features of land use, such as residential and commercial, are different, the commercial demand of North Caloocan was then estimated at 10.88 MLD in 2037 based on the rate of actual billed volume in 2011 and April 2012. On the other hand, the commercial demand of Quezon City was estimated at 108.903 MLD in 2037 based on the rate of actual billed volume. For commercial wastewater, it is considered for each sub-catchment area to determine pipe profiles such as diameter.
3) Industrial Wastewater Flows Wastewater from industries will not be treated by Maynilad’s facilities. Therefore, water consumption for industrial use was not considered for the Study.
4) GWI Estimating GWI volume before the installation of sewers will lead to inaccurate results without any surveys. Infiltration or inflow is the result of leakage into the sewerage system. Its magnitude will depend on the conditions of the piping, proper sealing of the network and groundwater level, which declines during the dry season. Due to many uncertainties, the infiltration or inflow will be assumed at 15% of the above domestic and commercial wastewater for purposes of preliminary design.
5) Sewage Generation Factor The sewage generation factor was estimated at 90% according to the guidelines of the World Health Organization (WHO), entitled “A Guideline to the Development of On-site Sanitation”. The generally accepted common range of sewage generation factor is from 80% to 95%. Previous feasibility studies of Maynilad assumed a value of 80%. Therefore, in the Study, sewage generation factor was estimated at 80% based on the agreement with Maynilad.
6) Formula of ADWF Calculation The volume of sewage generated was estimated at 80% of the domestic and commercial water consumption and GWI. ADWF is estimated using the following formula:
ADWF = (DWC x P+ CWC x A) x 80% + GWI
GWI = (DWC x P+ CWC x A) x 80% x 15%

Republic of the Philippines Preparatory Survey on Water Supply and Sewerage Chapter 5 Development in the West Zone of Metro Manila Final Report Feasibility Study of Priority Sewerage Projects
5 - 11
Where;
DWC: Domestic Water Consumption
CWC: Commercial Water Consumption
P: Population
A: Area
80%: Sewage Generation Factor
(2) Design Parameters for Sewer Design Design sewage flow is applied with hourly peak flow, the factor of which is 1.8 (= 1.2 x 1.5) against ADWF, as shown below:
Design Sewage Flow = 1.8 x (DWC x P + CWC x A) x 80% +GWI
Other parameters for sewer design are described below.
1) Equation for Hydraulic Calculation The following are the equations related to hydraulic calculation:
Manning’s equation Kutter’s equation Hazen-Williams equation
For the Study, the adopted equation for hydraulic calculation is the Manning’s equation, which is commonly used in hydraulic calculations and indicated in the Maynilad Standard. Manning’s equation is as follows:
V = 1/n x R 2/3 x I 1/2
Where;
V: velocity (m/s)
n: Manning’s roughness coefficient
R: hydraulic radius
I: pipe gradient
Manning’s roughness coefficient adopted is 0.013.
2) Minimum Pipe Gradient In the Maynilad Standard, the minimum slopes are as shown in Table 5.1.8.
Table 5.1.8 Minimum Slopes in the Maynilad Standard Diameter (mm) 200 300 450 600 750 900
Minimum Slope (‰) 4.00 2.20 1.20 0.80 0.58 0.46
Source: Maynilad Standard

Republic of the Philippines Preparatory Survey on Water Supply and Sewerage Chapter 5 Development in the West Zone of Metro Manila Final Report Feasibility Study of Priority Sewerage Projects
5 - 12
However, it also mentions that pipe gradients greater than the above are desirable. Thus, in this Study, the minimum pipe gradient will be considered as the inverse of pipe diameter (1/diameter (mm)) as shown in Table 5.1.9.
Table 5.1.9 Minimum Slopes Adopted in this Study Diameter (mm) 200 300 450 600 750 900
Minimum Slope (‰) 4.00 2.20 1.20 0.80 0.58 0.46
Source: JICA Study Team
3) Minimum and Maximum Velocities of Sewage Flow The minimum velocity should be considered based on the minimum slope. Such velocity should be determined taking into consideration that sediments will not be accumulated in the sewers. On the other hand, the maximum velocity should be determined considering that erosions are avoided in sewers and manholes due to excessively high velocity. Therefore, the minimum and maximum velocities were determined as follows:
Minimum Velocity: 0.8 m/s
Maximum Velocity: 3.0 m/s
4) Water Depth of Sewers Water depth of sewers shall be considered in order to ensure that wastewater remains gravity flow. According to the Maynilad Standard, 18 inches in diameter and larger shall be designed not to exceed 75% of the pipe diameter, and less than 18 inches in diameter shall be designed not to exceed 50% of the pipe diameter. However, interceptors will be converted to separate sewers. Thus, significant allowance should be avoided in order not to raise the construction cost. Therefore, in the Study, the water depths of sewers are determined as follows:
250 mm and smaller: 50% of the pipe diameter
Less than 400 mm : 60% of the pipe diameter
Less than 500 mm : 70% of the pipe diameter
500 mm and larger : 75% of the pipe diameter
5) Earth Covering Earth covering (burial depth to top of pipe) varies based on existing drainage system discharge levels and road conditions, such as loads and road bed thickness. In the Maynilad Standard, the covering thickness recommended 2.0 m for pipes with diameters from 600 mm to 3,000 mm. Therefore, in the Study, the minimum earth covering depth considered is as follows:.
Minimum earth covering: 2.0 m

Republic of the Philippines Preparatory Survey on Water Supply and Sewerage Chapter 5 Development in the West Zone of Metro Manila Final Report Feasibility Study of Priority Sewerage Projects
5 - 13
However, interceptor pipes should be installed at a depth appropriate to receive wastewater from branch sewers or drainage.
6) Interval between Manholes Upon reviewing both the Maynilad Standard and Japanese standards for manhole intervals, the following criteria have been formulated:
Pipe Diameter (D) < 350 mm: Not greater than 75 m
350 ≤ D < 500 mm: Not greater than 100 m
500 ≤ D < 1000 mm: Not greater than 150 m
1000 mm ≤ D: Not greater than 200 m
5.1.6 Interception Facilities (1) Purpose of Interception Facilities
The purpose of interception facilities is to collect wastewater from existing drainages and in some instances, creeks downstream of population centers, to reduce pollution load to public water bodies especially during the dry season.
(2) Layout of the System The general layout of the system consists of interception of the maximum hourly dry weather flow from existing drainage systems and sewers to convey these flows to STPs. Provisions for CSO are to be included. The system will be constructed for gravity flow wherever possible to reduce maintenance. PSs will be needed to capture sanitary flows in low-lying areas, and send such flows to the main sewers which are connected to the STP. PSs will also be needed to boost pressure in the main sewers due to head losses in pipes and topography. Sewer pipes may be installed at considerable depth depending on geological conditions. In this way, the quantity of booster PSs may be considerably lessened.
(3) General Requirements The infrastructure for interception must be arranged efficiently and must be capable of removing and capturing grit and other solid materials. Basic needs at the point of interception, which is ICs, include trash protection, grit removal, and provisions for controlled discharges when overflow occurs.
1) Trash Provisions and Screening The intercepted flow may pass through screens to remove coarse solids and solid wastes, preventing blockages and damage to sewerage facilities. Manually cleaned bar screens may be installed prior to or after the inlet of the grit chamber. The screenings can be easily taken out without hampering normal operations of the system. The ICs are also likely the best location to

Republic of the Philippines Preparatory Survey on Water Supply and Sewerage Chapter 5 Development in the West Zone of Metro Manila Final Report Feasibility Study of Priority Sewerage Projects
5 - 14
Figure 5.1.4 Creek Interception Example
capture and remove rubbish accumulated in the drainage network prior to its discharge to water bodies. It was proposed to leave space in the ICs for future addition of screens.
2) Grid Removal Grit is normally present in the drainage network. Ideally all grit would be carried along to the STP for removal. However, it will accumulate steadily throughout the year and must be manually removed from low points in the network, during the dry season or no rain days. The ICs may be constructed with an allowance to retain grit to remove sand, silts, and other heavy solids.
3) Controlled Discharge The outlet and outlet piping of the CSO need to be of adequate size in order to prevent backup in the network, and prevent any uncontrolled spillage of flow into the area around the interception point or upstream.
(4) Method of Interception 1) Basic Interception
The IC is constructed on top of existing storm drainage, typically shallow and located in the sidewalks. The current piping downstream of the ICs and points of discharge should remain intact wherever possible. The interceptor piping is necessarily beneath the storm drainage to receive flow by gravity. Figure 5.1.3 shows a basic IC image.
2) Creek Interception Based on field inspections, there are some areas in the Study area where creek capture is applicable and recommended. Such are especially at areas upstream of the tributaries that are not served by existing drainage. Also, existing areas where many informal settlers are present are potentially subject to creek capture. In these areas, a large number of ICs prior to entering the creek would be needed, which would be quite difficult to construct considering the presence of informal settlers and property encroachments. In addition, some construction improvements must be done on the creek itself such as improvement of slopes and creek bed. Figure 5.1.4 shows the configuration of the creek
Source: JICA Study Team
Figure 5.1.3 Basic IC Image
Source: JICA Study Team

Republic of the Philippines Preparatory Survey on Water Supply and Sewerage Chapter 5 Development in the West Zone of Metro Manila Final Report Feasibility Study of Priority Sewerage Projects
5 - 15
interception scheme. In order to capture dry season flows, the creek bed must be modified to add a weir, and an inlet at the lowest point. A screen is needed to prevent garbage from entering the sewer network. The profile of the screened inlet must be quite low, as wet season flows in the creek must not be hindered.
(5) Arrangement of ICs Two cases of ICs were likely considered. The first case involves interceptors which are parallel to existing drains, while the second case involves interceptors which are perpendicular to existing drains. An arrangement is also offered, but may have limited applicability in the Metro Manila area due to the high volume of solid waste present.
1) Option 1 - Interceptor Line Perpendicular to Existing Drainage Option 1 as shown in Figure 5.1.5 is the case in which the interceptor passes beneath and perpendicular to the existing drainage. When such a situation does arise, the following design may be used. A basket screen is placed prior to the interceptor pipe to prevent clogging. A weir can also be an option if it is desired to retain the grit inside the IC. Additional space for grit retention is not necessary.
Type (a) Type (b) Source: JICA Study Team
Figure 5.1.5 Arrangement of IC (Option 1)
2) Option 2 - Parallel Connection to Existing Drainage Option 2 is the case in which the interceptor pipe is connected parallel to the existing drainage from the ICs. Figure 5.1.6 shows that the IC is installed on top of the existing storm drainage. The inclusion of a weir within the IC is not desirable as it would be a hydraulic obstruction, leading to a likely backflow upstream in the storm drainage network. The screens are purposefully wide to ensure continued flow to the interceptors during the dry season, assuming

Republic of the Philippines Preparatory Survey on Water Supply and Sewerage Chapter 5 Development in the West Zone of Metro Manila Final Report Feasibility Study of Priority Sewerage Projects
5 - 16
a reasonable maintenance interval.
3) Alternative Arrangement of IC Accumulated debris (high level of suspended solids) in the IC may be discharged at the time of CSO, leading to public sanitation concerns. The configuration of the IC may be done to accommodate debris without screening. This is known as a water surface control (WSC) device since flows at the water surface are managed in the diversion chamber. Figure 5.1.7 shows an illustration of the WSC device. The WSC device is composed of an H-baffle and V-baffle, which are installed in the existing diversion chamber. The H-baffle is installed in front of the overflow weir at some distance that leads debris to the interceptor. The V-baffle is installed at a proper position in front of the interceptor in order to make vortex flow and lead debris into the interceptor.
The main feature of the WSC device is the inclusion of only two baffles. Vortex flow is induced to pull floating debris into the interceptor rather than out the CSO, even at high flows. It would consist of a simple structure without power requirements, and be easily maintained at reasonable costs. The WSC device can be provided with a trash rack or a screen on the CSO discharge pipe, and a capture pipe which discharges into the interceptor. The WSC device was envisaged to be constructed at the downstream end of an existing combined sewer just before it discharges into a stream, creek, or river. The sheer volume of solid waste in the Metro Manila area presents a major risk, and it may be a more desirable strategy to focus on the removal of waste at the shallower IC rather than encourage solid waste to enter the deeper interceptor piping to be carried to the next PS.
H‐baffle
H‐baffle
V‐baffleV‐baffle
Source: JICA Study Team
Figure 5.1.7 WSC Device
Figure 5.1.6 Arrangement of IC (Option 2)
Source: JICA Study Team
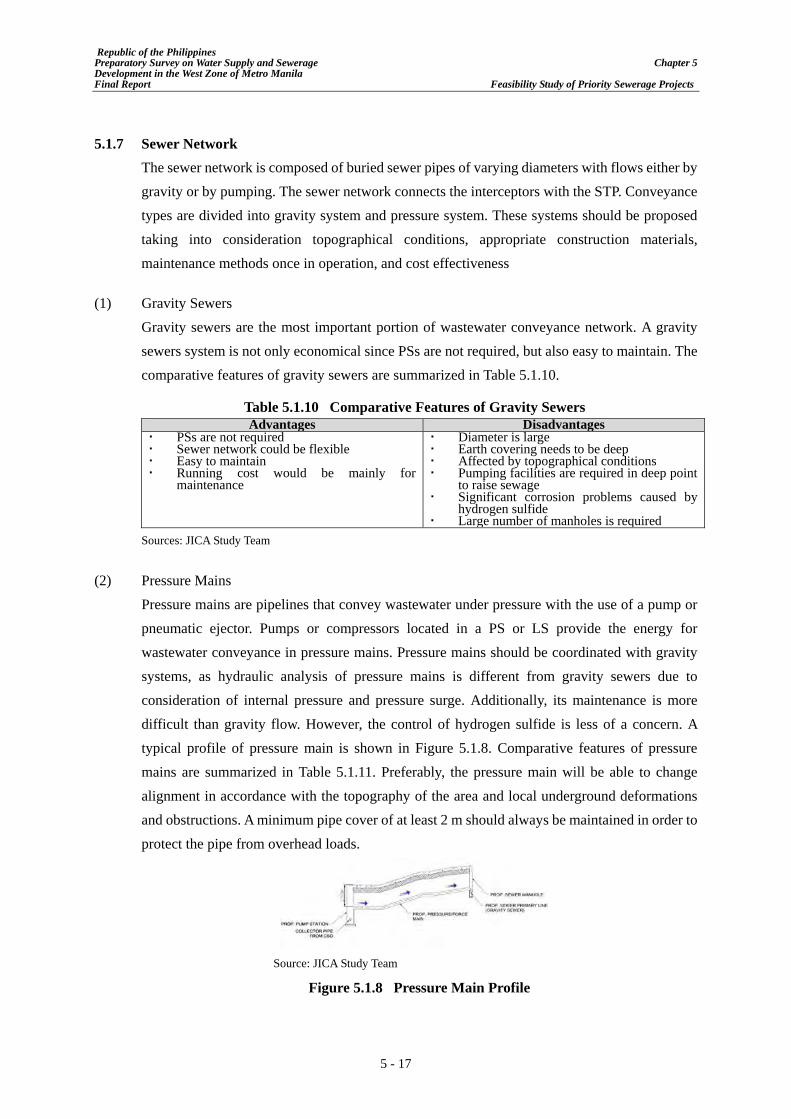
Republic of the Philippines Preparatory Survey on Water Supply and Sewerage Chapter 5 Development in the West Zone of Metro Manila Final Report Feasibility Study of Priority Sewerage Projects
5 - 17
5.1.7 Sewer Network The sewer network is composed of buried sewer pipes of varying diameters with flows either by gravity or by pumping. The sewer network connects the interceptors with the STP. Conveyance types are divided into gravity system and pressure system. These systems should be proposed taking into consideration topographical conditions, appropriate construction materials, maintenance methods once in operation, and cost effectiveness
(1) Gravity Sewers Gravity sewers are the most important portion of wastewater conveyance network. A gravity sewers system is not only economical since PSs are not required, but also easy to maintain. The comparative features of gravity sewers are summarized in Table 5.1.10.
Table 5.1.10 Comparative Features of Gravity Sewers Advantages Disadvantages
PSs are not required Sewer network could be flexible Easy to maintain Running cost would be mainly for
maintenance
Diameter is large Earth covering needs to be deep Affected by topographical conditions Pumping facilities are required in deep point
to raise sewage Significant corrosion problems caused by
hydrogen sulfide Large number of manholes is required
Sources: JICA Study Team
(2) Pressure Mains Pressure mains are pipelines that convey wastewater under pressure with the use of a pump or pneumatic ejector. Pumps or compressors located in a PS or LS provide the energy for wastewater conveyance in pressure mains. Pressure mains should be coordinated with gravity systems, as hydraulic analysis of pressure mains is different from gravity sewers due to consideration of internal pressure and pressure surge. Additionally, its maintenance is more difficult than gravity flow. However, the control of hydrogen sulfide is less of a concern. A typical profile of pressure main is shown in Figure 5.1.8. Comparative features of pressure mains are summarized in Table 5.1.11. Preferably, the pressure main will be able to change alignment in accordance with the topography of the area and local underground deformations and obstructions. A minimum pipe cover of at least 2 m should always be maintained in order to protect the pipe from overhead loads.
Source: JICA Study Team
Figure 5.1.8 Pressure Main Profile

Republic of the Philippines Preparatory Survey on Water Supply and Sewerage Chapter 5 Development in the West Zone of Metro Manila Final Report Feasibility Study of Priority Sewerage Projects
5 - 18
Table 5.1.11 Comparative Features of Pressure Mains Advantages Disadvantages
Pipe size is smaller due to full flow Corrosion problems caused by hydrogen
sulfide not an issue as for gravity sewer Will function in varying topography Construction period is short
Pumping facilities are required Difficult to maintain Weak link in sewer network functioning Additional pipes and some kinds of valves
are required for maintenance
Source: JICA Study Team
(3) Pipe Materials and Corrosion 1) Pipe Materials Concrete pipes are most popular for sewers. However, concrete pipes have the disadvantage of
corrosion by hydrogen sulfide or force main. Therefore, proper material should be selected considering the sewer type, either gravity or pressure type, and the laying environment of sewers. Table 5.1.12 shows a comparison of pipe materials.
Table 5.1.12 Comparison of Pipe Materials Material Features Applicability
Reinforced Concrete Pipe
(RCP)
╴ RCP is divided into two types by the methods of compaction which are vibration and centrifugal force (CF).
╴ RCP made by vibrated compaction has advantages in work site construction and particular shapes.
╴ RCP is made by FC is called hume pipe (HP), and quality is better than other types of RCP.
╴ Easily corroded by hydrogen sulfide. ╴ Requires countermeasures against corrosion.
【 】Method of Installation╴ Open cut ╴ Pipe jacking ╴ Shield tunneling ╴ Work site construction【 】Sewer type ╴ Gravity sewer
Polyvinyl Chloride Pipe
(PVC)
╴ PVC has the advantages of being lightweight and easy in construction, but it has the disadvantage of being weak to vibration such as earthquake.
╴ PVC is unfit for pressure sewer.
【 】Method of Installation╴ Open cut 【 】Sewer type ╴ Gravity sewer ╴ Pressure sewer
Clay Pipe (CP)
╴ CP is strong against acid and alkaline conditions as well as abrasion, but this material is weak against impact loads.
╴ Requires careful treatment and construction. ╴ CP can apply recycled products such as sludge incineration
ash.
【 】Method of Installation╴ Open cut ╴ Pipe jacking 【 】Sewer type ╴ Gravity sewer
Fiberglass Reinforced Plastic
Mortar Pipe (FRP)
╴ FRP is commonly applied for bigger pipes of gravity sewer.╴ Main materials of FRP are fiberglass, unsaturated polyester
resin and aggregates. ╴ FRP’s inside and outside layers are reinforced fiberglass,
and its intermediate layer is resin mortar. ╴ FRP has high mechanical strength, anticorrosion and easy
in construction.
【 】Method of Installation╴ Open cut 【 】Sewer type ╴ Gravity sewer
Resin Concrete Pipe(REC)
╴ REC uses resin instead of the cement of HP, and has advantages of high acid resistance, abrasion resistance and seismicity.
╴ Construction period can be reduced since REC is lightweight and easy in construction
╴ Cost is high.
【 】Method of Installation╴ Open cut ╴ Pipe jacking 【 】Sewer type ╴ Gravity sewer
Polyethylene Pipe (PE) and
High Density Polyethylene Pipe
(HDPE)
╴ PE has the advantages of flexibility, contractility and abrasion resistance.
╴ PE can be applied at places of land subsidence, cold weather areas and fast velocity.
╴ PE can be applied as pressure sewer. ╴ Cost is high, but PE can last longer.
【 】Method of Installation╴ Open cut ╴ Pipe jacking 【 】Sewer type ╴ Gravity sewer ╴ Pressure sewer
Ductile Iron Pipe (DCIP)
╴ DCIP is commonly used for pressure sewer. ╴ DCIP is a flexible pipe with the advantages of pressure
tightness, abrasion resistance, high mechanical strength and toughness.
╴ Depreciation period is about 20 to 25 years with internal lining.
╴
【 】Method of Installation╴ Open cut ╴ Pipe jacking 【 】Sewer type ╴ Pressure sewer

Republic of the Philippines Preparatory Survey on Water Supply and Sewerage Chapter 5 Development in the West Zone of Metro Manila Final Report Feasibility Study of Priority Sewerage Projects
5 - 19
Steel Pipe (SP)
╴ SP can be available in a wide range of pipe sizes. ╴ SP is a flexible pipe with the advantages of water tightness,
high strength, toughness and extensibility. ╴ SP is commonly applied as pressure sewer.
【 】Method of Installation╴ Open cut ╴ Pipe jacking ╴ Shield tunneling 【 】Sewer type ╴ Gravity sewer ╴ Pressure sewer
Source: JICA Study Team
2) Pipe Corrosion It is not only in gravity sewers that the formation of hydrogen sulfide can arise, as shown Figure 5.1.9. In pressure mains that are operated intermittently, the upper sections of the main can be alternately completely full and then suddenly empty. If sewage is retained for a certain period of time, there can be considerable sulfide buildup as strictly anaerobic conditions are most likely to prevail. Then, when sections of the pipe are exposed to air, sulfuric acid can be formed as in gravity pipes. Therefore, countermeasures for hydrogen sulfide such as lining should be considered in the design.
(4) Manholes Manholes are constructed in a sewer system as a means of access to sewers for inspection, cleaning and repairs. They are also employed as transition structures for changes in shape, size, grade or alignment of sewers and as junction chambers for two or more sewers.
1) Sizes A manhole should permit inspections and cleaning operations without difficulty. The inside dimension should not be less than 900 mm in diameter and may be as large as 1,800 mm, depending on the diameter of the outflow pipe. The opening of the manhole must be large enough to provide easy access to the sewer. The minimum clear opening should not be less than 0.6 m. It may be installed at the center over the manhole or may be off-center, thus providing vertical side for the entire depth. The cover hinge placement is also important for equipment access when the cover is open.
The arrangement and sizing of manholes may be divided into smaller and larger installations. For pipes with diameters of up to 1,500 mm, a circular manhole is recommended, and preferably a prefabricated manhole. Using a precast manhole will lessen the construction period, hence, lesser obstruction to the public. The upper portion is an eccentric section with
Source: JICA Study Team
Figure 5.1.9 H2S Corrosion

Republic of the Philippines Preparatory Survey on Water Supply and Sewerage Chapter 5 Development in the West Zone of Metro Manila Final Report Feasibility Study of Priority Sewerage Projects
5 - 20
dimensions of 600 mm x 900 mm, and then followed by 900 mm x diameter (D). The bottom section with D, if possible, shall have sufficient headspace for a person to work during maintenance. The requirements for the internal diameter of manholes are shown in Figure 5.1.10 and Table 5.1.13. In addition, Figure 5.1.11 shows a typical manhole configuration.
Table 5.1.13 Requirements for Internal Diameter of Manholes Maximum Pipe Size with 45° and
below Deflection Angle Maximum Pipe Size with above 45°
up to 90° Deflection AngleManhole Internal Diameter
(D) 600 mm 450mm 900 mm 900mm 600 mm 1200 mm
1200 mm 800 mm 1500 mm 1500 mm 900 mm 1800 mm
Source: JICA Study Team
Source: JICA Study Team
Figure 5.1.11 Typical Manhole Configuration
For sewer mains with diameters greater than 1500 mm, adaptation of the Japanese standard’s rectangular bottom section is recommended, as shown in Figure 5.1.12. This allows a sufficient area for maintenance, without having to occupy a lot of space. The representative dimensions for large sewer manholes are given in Table 5.1.14.
Source: JICA Study Team
Figure 5.1.10 Example of Manhole

Republic of the Philippines Preparatory Survey on Water Supply and Sewerage Chapter 5 Development in the West Zone of Metro Manila Final Report Feasibility Study of Priority Sewerage Projects
5 - 21
Source: JICA Study Team
Figure 5.1.12 Typical Manhole Configuration for Large Sewers
Table 5.1.14 Internal Dimensions Required for Rectangular Sections (for Pipe Diameters Greater than 1500 mm)
Pipe Diameter D1 D2 1500 mm < D ≤ 1800 mm 2100 mm 1200 mm 1800 mm< D ≤ 2200 mm 2600 mm 1200 mm 2200 mm < D ≤ 2400 mm 3000 mm 1200 mm
Source: JICA Study Team
2) Location of Manholes Manholes should be installed at every junction and at each change in sewer shape, size, grade, or direction. Where possible, manholes should not be located at low-lying spots where surface water can drain into them. Surface water entering sanitary sewers is undesirable as it can cause sewers to surcharge, reducing their capacity to transport wastewater.
3) Outfalls ICs have an overflow structure to discharge excess design flow of the interceptor network during wet weather. In most, if not all cases, the existing storm drain will be used as the overflow pipe. The outfalls of theses pipe to the watercourse are usually fitted with a ductile iron flap gate to prevent ingress of water during high flows. However, due to the condition of watercourses in Metro Manila, flap gates would tend to be clogged often preventing proper operation. Theft is also an issue when installing a flap gate on outfalls. Installation may also be a problem especially on outfalls that have restricted space or that present difficulty to construct. However, in very rare instances when existing storm drain cannot be utilized as overflow pipe and installation of a discharge pipe is necessary, a duckbill check valve may be considered in place of the conventional flap gate at the outfall to prevent backflow. Examples of inline check valve and ductile iron flap valve are shown in Figure 5.1.13 and 5.1.14, respectively.
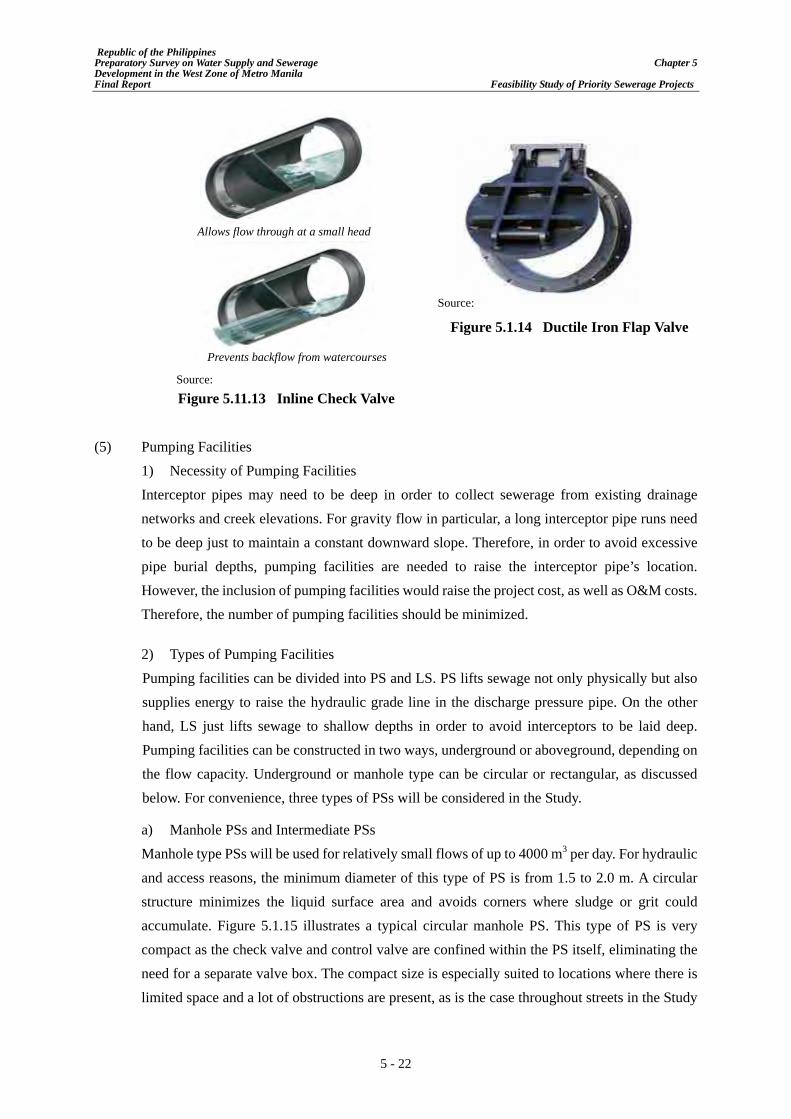
Republic of the Philippines Preparatory Survey on Water Supply and Sewerage Chapter 5 Development in the West Zone of Metro Manila Final Report Feasibility Study of Priority Sewerage Projects
5 - 22
(5) Pumping Facilities 1) Necessity of Pumping Facilities
Interceptor pipes may need to be deep in order to collect sewerage from existing drainage networks and creek elevations. For gravity flow in particular, a long interceptor pipe runs need to be deep just to maintain a constant downward slope. Therefore, in order to avoid excessive pipe burial depths, pumping facilities are needed to raise the interceptor pipe’s location. However, the inclusion of pumping facilities would raise the project cost, as well as O&M costs. Therefore, the number of pumping facilities should be minimized.
2) Types of Pumping Facilities Pumping facilities can be divided into PS and LS. PS lifts sewage not only physically but also supplies energy to raise the hydraulic grade line in the discharge pressure pipe. On the other hand, LS just lifts sewage to shallow depths in order to avoid interceptors to be laid deep. Pumping facilities can be constructed in two ways, underground or aboveground, depending on the flow capacity. Underground or manhole type can be circular or rectangular, as discussed below. For convenience, three types of PSs will be considered in the Study.
a) Manhole PSs and Intermediate PSs Manhole type PSs will be used for relatively small flows of up to 4000 m3 per day. For hydraulic and access reasons, the minimum diameter of this type of PS is from 1.5 to 2.0 m. A circular structure minimizes the liquid surface area and avoids corners where sludge or grit could accumulate. Figure 5.1.15 illustrates a typical circular manhole PS. This type of PS is very compact as the check valve and control valve are confined within the PS itself, eliminating the need for a separate valve box. The compact size is especially suited to locations where there is limited space and a lot of obstructions are present, as is the case throughout streets in the Study
Source:
Figure 5.1.14 Ductile Iron Flap Valve
Allows flow through at a small head
Source:
Figure 5.11.13 Inline Check Valve
Prevents backflow from watercourses

Republic of the Philippines Preparatory Survey on Water Supply and Sewerage Chapter 5 Development in the West Zone of Metro Manila Final Report Feasibility Study of Priority Sewerage Projects
5 - 23
area. The pump’s local control panel is mounted on a concrete pad, at a height above the highest historical flood level in the area.
On the other hand, a rectangular type, underground manhole type PS or ‘intermediate underground PS’ may accommodate flows up to 40,000 m3 per day. This particular maximum size range is selected to ensure that the wet well dimensions result in correct pump starts per hour, and ensures that this PS can be constructed within a single lane (3.5 m wide) of a roadway. The sides of the bottom section are inclined to avoid buildup of sludge in the wet well. Check valves and control valves have a separate chamber after the wet well, giving the PS a longer structure.
Figure 5.1.16 shows an illustration of an intermediate underground PS.
b) Large-Scale PS For flows more than 40,000 m3 per day, an aboveground PS with a large capacity shall be constructed. With this flow, the wet well needs a width of more than 3.5 m, which is more than a standard single lane of roadway. With such a high flow, the screenings and grit retention area shall be incorporated prior to the wet well due to the expected large amount of debris and grit coming into the PS. This type of PS requires land acquisition which is a major issue especially if the area is already densely populated. The aboveground structure will include an electrical/power supply and control room, a provision for odor control (activated carbon or biotrickling), and an office if desired. The exterior of the structure is often disguised with architectural components added for better acceptability by the surrounding community. Figure 5.1.17 shows an illustration of a large-scale PS.
Source: JICA Study Team
Figure 5.1.15 Circular Manhole PS
Source: JICA Study Team
Figure 5.1.16 Intermediate Underground PS

Republic of the Philippines Preparatory Survey on Water Supply and Sewerage Chapter 5 Development in the West Zone of Metro Manila Final Report Feasibility Study of Priority Sewerage Projects
5 - 24
3) Design Parameters and Criteria for PS The design parameters and criteria are shown in Table 5.1.15. When designing PSs or LSs, many factors must be considered. First is the design flow, which is the hourly peak flow same as the sewer pipe. In addition, odor prevention or mitigation measures shall be devised in order to ensure the safety of the operators and/or maintenance personnel. Also, ventilation systems must be provided to ensure that the temperature inside the PS can be tolerable. If needed, anticorrosion coating or lining shall be required at places where hydrogen sulfide can occur, such as in the air portion of pump wells.
PSs should have at least two pumps or two sets of pumps, which should both have the capacity to handle maximum design flow. This is to ensure that when one pump malfunctions or is out of service, a backup pump can still accommodate the maximum design flow and thus, continue its operation. In PSs with three or more pump units, one unit should be at standby at maximum design flow.
Source: JICA Study Team
Figure 5.1.17 Large-Scale PS

Republic of the Philippines Preparatory Survey on Water Supply and Sewerage Chapter 5 Development in the West Zone of Metro Manila Final Report Feasibility Study of Priority Sewerage Projects
5 - 25
Table 5.1.15 Design Parameters and Criteria for PSs Design Parameters Choices Remarks
Operating Conditions Dry season, rainy days, floods (short and sustained)
Regularly discharges at CSOs. The sewer network and STP would not operate during sustained floods.
PS Type Manhole, intermediate and large-scale PSs
May need to design aesthetics of the plant if in an urban setting.
Flow Rate, Q Hourly maximum flow Easier to build PS to accommodate future peak, add pumps later.
Pumps Configuration Wet and dry pit , or submersible Larger PSs would more likely be wet or dry pit.Number of Pumps and Operating Sequence
Number of duty or standby, and desired cycling; wet well size
Maximum retention time of 30 min at average discharge. Ten starts per hour (min. of six starts and 15 maximum)
Hydraulics Bypass, redundancy, expansion, overflows
Provision of penstock and stop logs
Grit Removal Grit retention area Grit removal required throughout network; Required to protect pumps and grinder, if added.
Trash Handling Screens, possible compactor; possible grinder at small PS
Manual versus climber screen, for small or large PS. (Minimum of two duties, one bypass)
Odor Control Biotrickling, activated carbon filter likely
May add activated carbon at first, leaving space for biotrickling.
Electric Service, Backup Power
Three-phase power, switchgear, diesel generator
Small PS do not warrant backup power but need reserve tank
Monitoring and Controls
Remote or manual Possibly monitor at STP. ID reporting requirements.
Flood Protection Elevation of electrical, controls, odor control
Plan level based on recorded flood level plus freeboard
O&M and Access Frequency of visits; planned replacement intervals; lifting devices (davit or A frame, mechanical travelling crane).
Operator entry and grit/trash removal via hatches, stairs, ladders. Must account for flood.
Sources: JICA Study Team
5.1.8 Environmental and Discharge Standards (1) Relevant Laws and Regulations on Effluent and Emissions from STP
The project component must comply with the local environmental laws and regulations on effluent and emissions from STPs, as shown in Table 5.1.16. Effluent and emissions from STPs must comply with the national effluent and emission standards.

Republic of the Philippines Preparatory Survey on Water Supply and Sewerage Chapter 5 Development in the West Zone of Metro Manila Final Report Feasibility Study of Priority Sewerage Projects
5 - 26
Table 5.1.16 Relevant Laws and Regulations on Effluent and Emissions from STP Relevant Activities
in STPs Relevant Law, Rule and /or
Regulation Remarks
Effluents of STPs
-PA 9275 / Clean Water Act (DAO No. 34 and 35) -PD 981 /Pollution Control Law(DAO No.1992-26)
Effluent must comply with the Revised Water Quality Criteria of 1990 and the Revised Effluent Standards.
Solids from STPs
-PA 9275 / Clean Water Act (DAO No. 34 and 35) - PD 856 / Sanitation Code
The Department of Agriculture through the Bureau of Soils and Water Management shall establish allowable and acceptable limits for nutrients, heavy metals and pathogens.
Solids from STPs -PA9003 / Ecological Solid Waste Management Act (DAO 2001-34)
Compliance to disposal and transport to sanitary landfills. Preliminary
treatment residues*
Emission from STPs (Air pollutants**)
-PA 8749 - Clean Air Act (DAO2000-81) -1978 Rules and Regulations of NPCC -PD 981 /Pollution Control Law(DAO No.1992-26)
Emission due to the implementation of STPs must comply with the National Emission Standard for source specific air pollutants and ambient noise standards. Firms required to have full-time pollution control offices are should submit regular self-monitoring reports.
Note: PA: Presidential Act, PD: Presidential Decree, DAO: DENR Administrative Order *: Residues (e.g., oil and grease, grits and screenings) * *: Air pollutants from air emission (e.g., PM, CO, SO2, NOx from generator), odor (methane) and noise Source : JICA Study Team
1) Water Quality Standard Water quality standards are applied according to classification of all water bodies based on use, with limits for parameters and chemicals established for fresh water, and for effluent discharged to each water body.
a) Classification of Water Bodies in the Philippines Surface waters are classified to maintain its safe quality and satisfactory condition according to their best usages. For the purpose of maintaining water quality according to the intended 22 beneficial uses, the classification of water bodies shall be revised. Table 5.1.17 shows the current and revised classification for fresh surface water, and coastal and marine waters, respectively.

Republic of the Philippines Preparatory Survey on Water Supply and Sewerage Chapter 5 Development in the West Zone of Metro Manila Final Report Feasibility Study of Priority Sewerage Projects
5 - 27
Table 5.1.17 Current Classification of Water Bodies for Fresh Surface Water According to Beneficial Use
Classification Beneficial Use Inland Surface Water Class AA Public Water Supply Class I. This class is intended primarily for waters having watersheds which are
uninhabited and otherwise protected and which require only approved disinfection in order to meet the Philippine National Standards for Drinking Water (PNSDW)
Class A Public Water Supply Class II. For sources of water supply that will require complete treatment (coagulation, sedimentation, filtration and disinfection) in order to meet the PNSDW
Class B Recreational Water Class I. For primary contact recreation such as bathing, swimming, skin diving, etc. (particularly those designated for tourism purposes)
Class C 1) Fishery Water for the propagation and growth of fish and other aquatic resources; 2) Recreational Water Class II (e.g. boating, etc.) 3) Industrial Water Supply Class I (For manufacturing processes after treatment).
Class D 1) For agriculture, irrigation, livestock watering, etc. 2) Industrial Water Supply Class II (e.g. cooling, etc.) 3) Other inland waters, by their quality, belong to this classification
Marine Water Class SA 1) Waters suitable for the propagation, survival and harvesting of shellfish for commercial purposes.
2) Tourist zones and national marine parks and reserves established under Presidential Proclamation No. 1801; existing laws and/or declared as such by appropriate government agencies. 3) Coral reef parks and reserves designated by law and concerned authorities.
Class SB 1) Recreational Water Class I (Areas regularly used by the public for bathing, swimming, skin diving, etc.). 2) Fishery Water Class I (Spawning areas for Chanos chanos or "Bangus" and similar species).
Class SC 1) Recreational Water Class II (e.g. boating, etc.) 2) Fishery Water Class II (Commercial and sustenance fishing) 3) Marshes and/or mangrove areas declared as fish and wildlife sanctuaries
Class SD 1) Industrial Water Supply Class II (e.g. cooling, etc.); 2) Other coastal and marine waters, by their quality, belong to this classification.
Source: DAO No. 1990 – 34, Revised Water Usage and Classification Water Quality Criteria Amending Section Nos. 68 and 69, Chapter III of the 1978 NPCC Rules and Regulations
b) Quality Criteria for Fresh Water Quality of fresh water is regulated by DAO in accordance with the classifications of water bodies as shown in Tables 5.1.18 and 5.1.19.

Republic of the Philippines Preparatory Survey on Water Supply and Sewerage Chapter 5 Development in the West Zone of Metro Manila Final Report Feasibility Study of Priority Sewerage Projects
5 - 28
Table 5.1.18 Current Water Quality Criteria for Conventional and Other Pollutants Contributing to Aesthetics and Oxygen Demand of Fresh Waters (a) (1/2) Parameter unit Class AA Class A Class B Class C Class D(b)
Color PCU 15 50 (c) (c) (c) Temperature (d) oC rise 3 3 3 3 3 pH mg/L 6.5-8.5 6.5-8.5 6.5-8.5 6.5-8.5 6.0-9.0 Dissolved Oxygen(e) (minimum)
% satn mg/L
70 5.0
70 5.0
70 5.0
60 5.0
40 3.0
BOD (5-days, 20oC) mg/L 1 5 5 7(10) 7(15) Total Suspended Solid mg/L 25 50 (f) (g) (h) Total Dissolved Solids mg/L 500(i) 1000(i) - - 1000(i) Surfactants (MBAS) mg/L nil 0.2(0.5) 0.3(0.5) 0.5 - Oil/Grease (Petroleum Ether Extracts)
mg/L nil 1 1 2 5
Nitrate as Nitrogen mg/L 1.0 10 nr 10(j) - Phosphate as Phosphorus mg/L nil 0.1(k) 0.2(k) 0.4(k) - Phenolic Substances as Phenols
mg/L nil 0.02 0,005(l) 0.002(l) -
Total Coliforms MPM/100mL
50(m) 1,000(m) 1,000(m) 5,000(m) -
Or Fecal Coliforms MPN MPM/100mL
20(m) 100(m) 200(m) -
Chloride as Cl mg/L 250 250 - 350 - Copper mg/L 1.0 1.0 - 0.05(o) - (a) - Except as otherwise indicated, the numerical limits in Tables 1 and 3 are yearly average values. Values enclosed in
parentheses are maximum values. (b) - For irrigation purposes, SAR should have a minimum value of 8 and a maximum value not to exceed 18. Boron should not
exceed 0.75 mg/L. (c) - No abnormal discoloration from unnatural causes. (d) - The allowable temperature increase over the average ambient temperature for each month. This rise shall be based on the
average of the maximum daily temperature readings recorded at the site but upstream of the mixing zone over a period of one month.
(e) - Sampling taken between 9:00 a.m. and 4:00 p.m.. (f) - Not more than 30% increase. (g) - Not more than 30 mg/L increase. (h) - Not more than 60 mg/L increase. (i) - Do not apply if natural background is higher in concentration. The latter will prevail and will be used as baseline (j) - Applicable only to lakes or reservoirs, and similarly impounded water. (k) - When applied to lakes or reservoirs, the Phosphate as P concentration should not exceed an average of 0.05 mg/L nor a
maximum of 0.1 mg/L. (l) - Not present in concentrations to affect fish flavor/taste. (m) - These values refer to the geometric mean of the most probable number of coliform organism during a three-month period and
that the limit indicated shall not be exceeded in 20% of the samples taken during the same period. (n) - For spawning areas for Chanos chanos and other similar species. (o) - Limit is in terms of dissolved copper. nil - Extremely low concentration and not detectable by existing equipment --- - Means the standard of these substances are not considered necessary for the present time, considering the stage of the
country's development and DENR’s capabilities, equipment and resources. nr - Means no recommendation made.
Source: DAO No. 1990 – 34, Revised Water Usage and Classification/Water Quality Criteria Amending Section Nos. 68 and 69, Chapter III of the 1978 NPCC Rules and Regulations

Republic of the Philippines Preparatory Survey on Water Supply and Sewerage Chapter 5 Development in the West Zone of Metro Manila Final Report Feasibility Study of Priority Sewerage Projects
5 - 29
Table 5.1.19 Current Water Quality Criteria for Conventional and Other Pollutants Contributing to Aesthetics and Oxygen Demand of Fresh Waters (2/2) Parameter unit Class AA Class A Class B Class C Class D
Arsenic (i) mg/L 0.05 0.05 0.05 0.05 0.01 Cadmium (i) mg/L 0.01 0.01 0.01 0.01 0.05 Chromium (i) (hexavalent) mg/L 0.05 0.05 0.05 0.05 --- Cyanide mg/L 0.05 0.05 0.05 0.05 --- Lead (i) mg/L 0.05 0.05 0.05 0.05 --- Total Mercury (i) mg/L 0.002 0.002 0.002 0.002 0.002 Organophosphate mg/L nil nil nil nil nil Aldrin mg/L 0.001 0.001 DDT mg/L 0.05 0.05 Dieldrin mg/L 0.001 0.001 Heptachlor mg/L nil nil Lindane mg/L 0.004 0.004 Toxaphane mg/L 0.005 0.005 Methoxychlor mg/L 0.10 0.10 Chlordane mg/L 0.003 0.003 Endrin mg/L nil nil PCB mg/L 0.001 0.001 Notes: 1. Limiting values of organophosphates and organochlorines may in the meantime serve as guidelines in the interim period pending
the procurement and availability of necessary laboratory equipment. For Barium, Cobalt, Fluoride, Iron, Lithium, Manganese, Nickel, Selenium, Silver and Vanadium, the 1978 NPCC Rules and Regulations, Section 69 may be considered.
2. For footnotes please refer to Table 2.1.5-2. Source: DAO No. 1990 – 34, Revised Water Usage and Classification/Water Quality Criteria Amending Section Nos.
68 and 69, Chapter III of the 1978 NPCC Rules and Regulations
3) Effluent Standards Effluent standards are regulated by DENR in accordance with the classifications of water bodies as shown Tables 5.1.20 and 5.1.21.
Table 5.1.20 Current Effluent Standards: Toxic and Other Deleterious Substances (Maximum Limits for Public Health)(a)
Parameter unit
Protected Water Inland Water Marine Water
Category I (Class AA and SA)
Category II(Class A, B and
SB) Class C Class
SC Class SD
Arsenic mg/L (b) 0.1 0.2 0.5 0.5Cadmium mg/L (b) 0.02 0.05 0.1 0.2Chromium mg/L (b) 0.05 0.1 0.2 0.5Cyanide (hexiavalent) mg/L (b) 0.1 0.2 0.2 -
Lead mg/L (b) 0.1 0.3 0.5 - Total Mercury mg/L (b) 0.005 0.005 0.005 0.01PCB mg/L (b) 0.003 0.003 0.003 -Formaldehyde mg/L (b) 1.0 1.0 1.0 -(a) Except as otherwise indicated, all limiting values in Table 1 (Section 4) are maximum and therefore shall not be
exceeded. (b) Discharge of sewage and/or trade effluents are prohibited or not allowed.
Source: DENR Administrative Order No. 35 Series of 1990

Republic of the Philippines Preparatory Survey on Water Supply and Sewerage Chapter 5 Development in the West Zone of Metro Manila Final Report Feasibility Study of Priority Sewerage Projects
5 - 30
Table 5.1.21 Current Effluent Standards: Conventional and Other Pollutants in Protected Water Categories I and II and Inland Waters Class C
Parameter unit
Protected Water Inland Water Coastal Water
Class SD and Other
Coastal Waters
Category I
(Class AA &SA)
Category II
(Class A, B & SB)
Class C(a)
Class D
Class SC
Not Classified
Color PCU (b) 100 150(c) - - - Temperature oC rise (b) 3 3 3 3 3 pH (b) 6.0-9.0 6.5-9.0 6.0-9.0 6.0-9.0 5.0-9.0 COD mg/L (b) 60 100 200 200 200 Settleable Solids (1-hour) mg/L (b) 0.3 0.5 - - - BOD (5-days, 20oC) mg/L (b) 30 50 120 100 120 Total Suspended Solid mg/L (b) 50 70 150 150 (d)
Total Dissolved Solids mg/L (b) 1,000 - 1,500(e) - - Surfactants (MBAS) mg/L (b) 2.0 5.0 - 10 - Oil/Grease (Petroleum Ether Extract)
mg/L (b) 5.0 5.0 - 10 15
Phonomic Substances as Phenols
mg/L (b) 0.05 0.1 - 0.5(f) 1.0
Total Coliforms MPN/ 100 mL
(b) 3,000 10,000 (g) - -
(a) Except as otherwise indicated, all limiting values in Tables 2A and 2B are 90th percentile values. This is applicable only when the discharger undertakes daily monitoring of its effluent quality, otherwise, the numerical values in the tables represent maximum values not to be exceeded once a year.
(b) Discharging of sewage and/or trade effluents is prohibited or not allowed. (c) Discharge shall not cause abnormal discoloration in the receiving waters outside of the mixing zone. (d) Not more than 30 mg/L increase (dry season). (e) If effluent is the sole source of supply for irrigation, the maximum limits are 1500 mg/L and 1000 mg/L,
respectively, for old industries and new industries. (f) Not present in concentration to affect fish flavor or taste or tainting. (g) If effluent is used to irrigate vegetable and fruit crops which may be eaten raw, Fecal Coliforms should be less
than 500 MPN/100 mL. Source: DENR Administrative Order No. 35 Series of 1990
2) Environmental Permission for STPs Before the construction of STPs, contacts with relevant agencies and approval of environmental permissions in accordance with local environmental laws and regulations are required. The general environmental permitting requirements for implementation of an STP are shown in Table 5.1.22.

Republic of the Philippines Preparatory Survey on Water Supply and Sewerage Chapter 5 Development in the West Zone of Metro Manila Final Report Feasibility Study of Priority Sewerage Projects
5 - 31
Table 5.1.22 Environmental Permit Requirements for STP
Regulatory Permit / Contact Main Issuing Agency
Remark/Purpose (Relevant Laws, Rules and
Regulations)
Project Stage
Plan
ning
/
Pre-
Con
stru
ctio
n
Con
stru
ctio
n
Ope
ratio
n
Environmental Compliance Certificate (ECC)
DENR-EMB
In accordance with the Philippines Environmental Impact Status System (PD 1586)
●
Water Permit Natural Water Resources Board (NWRB)
Regulates the use of ground and surface waters by the project (RD 1067) ●
Permit to Cut Trees Regional DENR-Forest Management Bureau
Under the Forestry Code of the Philippines (PD 705), the permit to cut trees is issued for any type of tree
●
Permit to Cut Coconut Trees
Philippine Coconut Authority (PCA)
Ask permission when cutting coconut trees (RA 8048) ●
LLDA Clearance Laguna Lake Development Authority (LLDA)
Especially when the area is under the jurisdiction of LLDA, LLDA requires treatments plants to secure an LLDA Clearance before construction of any treatment plant.
● ● ●
Fire Protection Permit, Solid Waste Disposal, Building Permit, Business Clearance, Etc.
Local Government Unit(LGU)
All other permits and clearances are needed to be secured from them depending on the location of the project. ●
Certificate of Compliance
Energy Regulatory Commission (ERC)
Pursuant to the Electric Power Industry Reform Act of 2001 (RA 9136 or EPIRA) and the Energy Regulatory Commission (ERC) Guidelines for the Issuance of Certificate of Compliance for Generation Companies/Facilities, all establishments are required to secure certificates of compliance (COC) from ERC.
● ●
Location Clearance Metro Manila Development Authority (MMDA)
For traffic management plan, and other concerns. ● ●
Permit to Operate Generators
Energy Regulatory Commission (ERC)
Certification of generator sets use in STP (PA 9136).
● DENR All facilities with generators are required
to secure a permit to operate under the Clean Air Act of 1999 (RA 8749).
Discharge Permit LLDA, DENR-EMB-NCR or DENR-EMB-Region IV-A (Depending on the location of the treatment plant.)
Obtain a discharge permit for all wastewater discharges (RA 9275). Discharge permits are valid for three years, subject to yearly revalidations. The specific treatment plants are required to secure discharge permits upon completion of the project.
●
Hazardous Waste Generators ID
DENR-EMB
Facilities and establishments that generate hazardous wastes are required to secure a hazardous waste generator ID (RA 6969). Maynilad is an accredited transporter of hazardous waste. Only registered vehicles can transport generated hazardous waste.
●
Certification of Sludge
Fertilizer and Pesticides Authority (FPA)
Obtain the certification allowing the safe reuse of sludge for purposes of irrigation ●

Republic of the Philippines Preparatory Survey on Water Supply and Sewerage Chapter 5 Development in the West Zone of Metro Manila Final Report Feasibility Study of Priority Sewerage Projects
5 - 32
Regulatory Permit / Contact Main Issuing Agency
Remark/Purpose (Relevant Laws, Rules and
Regulations)
Project Stage
Plan
ning
/
Pre-
Con
stru
ctio
n
Con
stru
ctio
n
Ope
ratio
n
and other agricultural uses Self-Monitoring Report
DENR-EMB Firms required to have full-time pollution control offices should submit regular self-monitoring reports. (DAO 2003-27, DAO No. 1992-26 )
●
Conveyance Department of Public Works and Highways (DPWH)
To contact especially for conveyance of the STP. ● ●
Earthquakes Philippine Institute of Volcanology and Seismology (PHILVOCS)
To know if the proposed site is located near any faults (prone to damage during earthquakes).
● ●
Rain Data Philippine Atmospheric, Geophysical and Astronomical Services Administration (PAGASA)
To gather rain data, and other data regarding weather.
● ●
Source : Study Team
(2) Discharge Standard The Water Quality Criteria (DAO. 34) and the Effluent Standards (DAO No. 35) were revised and issued in 1990. In March 2010, DENR issued an order which stated that effluent into the Manila Bay should be categorized as Class SB under the category of protected water bodies, instead of Class SC under the category of usual coastal waters. The allowable limits of effluent for Class SB Protected Waters, Class SC Coastal Waters, and Class SC Inland Waters are summarized in Table 5.1.23. Under the current law, the water bodies in the Study area would be categorized as Class SC Inland Waters.
Table 5.1.23 Effluent Quality Standards for Each Category (DAO 35)
Parameters Category of Receiving Water Body
Protected Waters(Class SB)
Coastal Waters (Class SC)
Inland Waters (Class SC)
Color 100 PCU - 150 PCU Temperature (max. rise in °C in RBW) 3 3 3
pH 6.0 – 9.0 6.0 – 9.0 6.5 – 9.0 Chemical Oxygen Demand (COD) 60 mg/L 200 mg/L 100 mg/L
Biochemical Oxygen Demand (BOD) 30 mg/L 100 mg/L 50 mg/L Total Suspended Solids (TSS) 50 mg/L 150 mg/L 70 mg/L
Total Coliform 3,000 MPN/100 mL - 10,000 MPN/100 mLNote: PCU means “Platinum Cobalt Units”, MPN means “most probable number”
Inland water means an interior body of water or watercourse such as lakes, reservoir, rivers, streams, creeks, etc., that has beneficial usage other than public water supply or primary contact recreation. Tidal affected rivers or streams are considered inland waters for purposes of the standards.
Source: Department of Environment and Natural Resources (DENR) of 1990

Republic of the Philippines Preparatory Survey on Water Supply and Sewerage Chapter 5 Development in the West Zone of Metro Manila Final Report Feasibility Study of Priority Sewerage Projects
5 - 33
In addition, the new effluent standards are currently with DENR awaiting their approval. There has been no progress for many months now regarding their approval. In the new standards, the allowable concentration of nitrogen and phosphorus will be introduced. Once the new effluent standards are officially published, all of the new sewage treatment facilities should meet the new requirements. The new effluent standards are shown in Table 5.1.24.
Table 5.1.24 New Effluent Standards for Each Category
Parameters DAO 35 Draft DAO 2008
Protected Waters(Class SB)
Class SB Class SC
Color 100 PCU 100 PCU 150 PCU Temperature (max. rise in °C in RBW) 3 3 3
pH 6.0 – 9.0 6.5 – 9.0 6.0 – 9.0 Chemical Oxygen Demand (COD) 60 mg/L 60 mg/L 200 mg/L
Biochemical Oxygen Demand (BOD) 30 mg/L 30 mg/L 100 mg/L Total Suspended Solids (TSS) 50 mg/L 70 mg/L 100 mg/L
Total Coliform 3,000 MPN/100 mL 3,000 MPN/100 mL 10,000 MPN/100 mLNitrogen - 20 mg/L 20 mg/L
Phosphorus - 1 mg/L 1 mg/L Note: PCU means “Platinum Cobalt Units”, MPN means “most probable number” Source: DAO 35 and Draft DAO2008 (awaiting signing)
(3) Proposed Treatment Standard According to the current standards mentioned above, Class SC Inland Waters should be applied for discharges into rivers and creeks from the STPs, which are to be designed in the Study. Also, the new standards which will be issued stipulate the same category to be applied. However, taking into consideration the feasibility study target of 2037, it may be reasonable to apply Class SB and also make provisions for future modification regarding nitrogen and phosphorus removal in the preliminary design of the STP. DENR Memorandum Circular No. 2010-08 issued on March 22, 2010 states that “in compliance with the Supreme Court Decision, Manila Bay is hereby classified as SB fit for swimming, skin diving, and other primary contact recreational purposes.”
5.1.9 Sewage Treatment Methods (1) Preliminary Treatment Process
Preliminary treatment is required to remove course materials from the influent wastewater to protect the influent pumps needed to drive the flow through a series of process steps. Shown in Figure 5.1.18 is a basic STP flow diagram. Preliminary treatment units consist of screening and grit removal. Flow balancing is also a method of preliminary treatment that is sometimes employed.

Republic of the Philippines Preparatory Survey on Water Supply and Sewerage Chapter 5 Development in the West Zone of Metro Manila Final Report Feasibility Study of Priority Sewerage Projects
5 - 34
Source: JICA Study Team
Figure 5.1.18 STP Flow Diagram
(2) Primary Treatment Process Primary treatment, typically circular or rectangular sedimentation/settlement tanks or primary clarifiers, is designed to remove excess suspended solids, by up to 60%. It also removes typically about 30% of BOD. The primary clarifiers are sized so that wastewater and settled sludge retention times in the tank are limited in order to avoid the onset of anaerobic conditions with the release of nitrogen gas (from denitrification) and methane. Sludge is continuously removed using a scraper arm with scum skimming.
Diluted wastewater is expected in the early years of operation, even in the dry season. Since BOD will need to be conserved in order to ensure a stable activated sludge system, provisions will be added to allow influent flow directly to the aeration tanks, as is commonly done in Southeast Asia and China. For sequencing batch reactors (SBR) secondary treatment, the primary clarifiers are omitted, as they typically have a built-in equalization basin.
The primary tanks are especially important during the rainy season and high storm events to capture the first flush through of sediment from the sewer network to the STP which often overloads the grit trap and is then deposited in downstream tanks.
(3) Secondary Treatment Process The secondary biological treatment process is the most common method of aeration followed by sedimentation, the latter of which occurs in a secondary clarifier (refer to Figure 5.1.21 above). The aeration component is usually a tank with air diffusers arranged at the bottom or with mechanical aerating mechanism at the top. It is sized to treat the maximum daily influent flow and any recycle required from the secondary clarifiers. As for the primary clarifiers, sludge is continuously removed using a scraper arm and the surface scum skimmed off. In order to maintain biological treatment, sludge is returned from the secondary clarifier to the aeration tanks. Membranes are also employed in one technology that may eliminate the need for any clarification process. A brief description of several secondary biological treatment processes is provided herein to include the following:

Republic of the Philippines Preparatory Survey on Water Supply and Sewerage Chapter 5 Development in the West Zone of Metro Manila Final Report Feasibility Study of Priority Sewerage Projects
5 - 35
Activated Sludge Process
SBR
Oxidation Ditch (OD)
Mixed Bed Biofilm Reactor (MBBR)
Membrane Bioreactors (MBR)
1) Conventional Activated Sludge (CAS) The CAS process is well-known and extensively used mainly due to its efficiency in reducing organic matter, and suspended solids. Moreover, by simple modifications in the unit facilities it can also remove nutrients in the wastewater. Activated sludge is an aerobic, suspended growth process. It involves the growth of microorganisms in the aeration tank wherein these microorganisms stabilize the organic waste present in the substrate. Typical wastewater treatment by activated sludge is accomplished by mixing waste with the activated sludge at the end of a long narrow aeration basin wherein mixing conditions are nominally plug flow, and then followed by the separation step or sedimentation/clarification, as shown in Figure 5.1.19.
Source: JICA Study Team
Figure 5.1.19 CAS Layout
2) Modified CAS Methods A review conducted by the JICA Study Team on the existing and prevailing STPs in the Metro Manila area revealed that CAS and SBR predominate. CAS has a proven track record, but there is still room for improvement. There are numerous operational problems inherent in such design. As the sludge is being recycled back to the head of the aeration basin and contacted with the incoming substrate, the oxygen requirements frequently exceed the capacity of the aeration system, whereas at the exit zone, the air supply was excessive.
In an attempt to address and correct the deficiencies of an original CAS, numerous scientists have initiated design modifications. Some of the well-known modifications on CAS are listed in Table 5.1.25 and described in the sections below. It has to be mentioned that step feed and SBR are the most applicable modifications of activated sludge treatments for Maynilad.

Republic of the Philippines Preparatory Survey on Water Supply and Sewerage Chapter 5 Development in the West Zone of Metro Manila Final Report Feasibility Study of Priority Sewerage Projects
5 - 36
Table 5.1.25 Process Variations and Modifications on CAS No. Name of the
Process Brief Description Remarks 1 Tapered
Aeration Flow pattern is the same as that of CAS. The difference consists of an adjustment in the air diffusers so that air supply corresponds to the demand so that more air is provided at the end than at the exit of the aeration. Benefits of the modification include reduced cap-ex and op-ex, avoidance of over-aeration which inhibits the growth of nitrifying organisms.
Limited space for adjustment to take care of biological nutrient removal (BNR).
2 Step Feed It was introduced in order to solve problems of uneven oxygen requirements in the conventional aeration tank. The substrate is fed into the aeration tank at several stages along its length and RAS is introduced at the head end of the tank.
Applicable to the Maynilad setup and the process can be upgraded to take care of BNR.
3 Complete Mix
The substrate and RAS are dispersed almost instantly throughout the aeration basin as they reach it. The process can handle shock loads and uniform oxygen demand throughout the aeration tank.
CAS is a complete mix activated sludge treatment plant.
4 Contact Stabilization
This is based on the adsorptive property of organics in activated sludge. Two steps occur during treatment i.e. the colloidal and finely suspended organic materials are adsorbed in the activated sludge and the absorbed organics are stabilized.
Complicated to upgrade if BNR will be included.
5 Extended Aeration
The sludge in suspension is aerated over a long period, and maintained in the endogenous phase of growth. The system can handle shock loads, and with low sludge production but this is for small municipal treatment plants.
Typical plants of Maynilad, with capability to remove BNR.
6 High Rate The detention time in the aeration tank is low and the F/M is high. The specific growth and the substrate utilization rate are high. Primarily used as a preliminary treatment process for high strength wastes, or when no strict effluent standards have to be achieved.
New regulations will include BNR scheme. Not recommended for the Maynilad setup.
7 OD This process consists of a circular pathway or “oval race track” where the wastewater is aerated, mixed and recirculated by horizontal brush aerators. This process operates as an extended aeration process in an intermittent or continuous mode.
With ability to take care of BNR.
8 Kraus Process
This process was developed to cope with the problems associated to wastes having nitrogen deficiency. Benefits obtained include correction of the nitrogen deficiency and improved settleability of the mixed liquor.
Not recommended to Maynilad, domestic wastes have sufficient nutrients and purely organics.
9 High Purity Oxygen
Pure oxygen is used instead of compressed air to improve the rate of oxygen transfer. The tank is generally covered and the oxygen recirculated.
O&M costs are quite high, and not economical to Maynilad
10 SBR The original activated sludge was a single tank operated in batch mode. This process consists of five cycle steps: fill, react, settle, decant, and idle.
Typical plants of Maynilad especially when the space is limited.
Source: JICA Study Team
3) SBR Method SBR is considered a fill-and-draw activated sludge system. The processes of equalization, aeration, and clarification are all achieved in the same tank, unlike a conventional activated sludge system, in which the same processes are accomplished in separate tanks. Wastewater is added to the tank, treated to remove undesirable components, and then discharged. As shown in Figure 5.1.20, an SBR system consists of five
Source: JICA Study Team Figure 5.1.20 SBR Process Cycle

Republic of the Philippines Preparatory Survey on Water Supply and Sewerage Chapter 5 Development in the West Zone of Metro Manila Final Report Feasibility Study of Priority Sewerage Projects
5 - 37
common steps carried out in sequence: 1) fill, 2) react (aeration), 3) settle (sedimentation/clarification), 4) draw (the effluent is decanted), and 5) idle.
Sludge wasting usually occurs during the settling phase. The SBR acts as an equalization basin when filled with wastewater, enabling the system to tolerate peak flows or loads. After passing through a screen to remove grit, the effluent enters a partially filled reactor. Once the reactor is full, it performs like a conventional activated sludge system without continuous influent or effluent flow. Aeration and mixing are discontinued after the biological reactions are complete, the solids are allowed to settle, and the treated effluent (supernatant) is removed. Excess solids are removed at any time during the cycle. Due to their relatively small footprints, these are useful in areas where available land is limited. In addition, it is easy to modify cycles within the system for nutrient and phosphorus removal, if necessary.
4) OD Method OD is a simplified and effective variation of the activated sludge process, consisting of a ring or oval shaped channel equipped with mechanical aeration devices, such as brush rotors or disc aerators. ODs typically operate in an extended aeration mode with long solids retention times (SRTs). Solids are maintained in suspension as the mixed liquor circulates around the ditch. Secondary sedimentation tanks are used for most applications. Re-aeration may be necessary prior to final discharge. Figure 5.1.21 shows an OD configuration with extended aeration is presented. Many other configurations are possible.
Source: JICA Study Team
Figure 5.1.21 OD Layout
5) MBBR Method MBBR systems are based on reactors that are filled with plastic carriers (media) to provide a surface that is colonized by bacteria that grow into a biofilm. The reactors can be operated under aerobic conditions for BOD removal and nitrification or under anoxic conditions for denitrification. During operation, the carriers are kept in constant circulation. In an aerobic reactor, circulation is induced through the action of air bubbles injected into the tank by a coarse bubble diffuser system. In an anoxic reactor, a submerged mixer is typically supplied. The carriers can occupy up to 70% of the reactor volume on a bulk volume basis. Experience has

Republic of the Philippines Preparatory Survey on Water Supply and Sewerage Chapter 5 Development in the West Zone of Metro Manila Final Report Feasibility Study of Priority Sewerage Projects
5 - 38
shown that mixing efficiency decreases at higher percentage fills. Figure 5.1.22 shows a typical MBBR layout.
Source: JICA Study Team
Figure 5.1.22 MBBR Layout
6) MBR An MBR is an activated sludge reactor system that utilizes a single complete mix reactor in which all the steps of the activated sludge process occur with a membrane filter system submerged in the reactor. The membrane filter system filters the water continuously from the reactor by the suction of a pump. As with the SBR, the activated sludge mixed liquor remains in the reactor during all cycles, thereby eliminating the need for a separate secondary sedimentation tank. In addition, the filtration system is located within the reactor, thereby eliminating the extra space required for a filter system. To carry out nitrogen removal an anoxic stage is added for denitrification. Figure 5.1.23 shows a typical MBR layout.
Source: JICA Study Team
Figure 5.1.23 MBR Layout with Nutrient Removal
(4) Disinfection Disinfection is required prior to discharge to the receiving water body. Two common options are using a chlorine contact tank or an ultraviolet light reactor.
(6) Recommended Treatment Process Table 5.1.26 shows comparison of sewage treatment methods. Having discussed above the different STP technology options, the selection of the most economical, relevant, and efficient option was made with due considerations of the effluent standards, economy of site size,

Republic of the Philippines Preparatory Survey on Water Supply and Sewerage Chapter 5 Development in the West Zone of Metro Manila Final Report Feasibility Study of Priority Sewerage Projects
5 - 39
practicability and requirements of the client, environmental friendliness, and flexibility in upgrading the system. The detailed account of selection is discussed below. The wastewater treatment process is proposed to comply with Class SB standards which are currently being studied by DENR. Nitrogen and phosphorus limits will be assumed considering the long timeframe for implementation of the project. The recommended treatment process is shown in Figure 5.1.24.
Table 5.1.26 Comparison of Sewage Treatment Methods Method CAS SMR OD
Nutrient and Phosphorus Removal
Modified CAS method can be
adopted
Depend on cycles。 2 cycles:good 4 cycles:poor
Possible due to long HRT
Required Area This method can be save area
2cycles can be save area, but 4 cycle will be required
large area Large area will be required.
Hydraulic Retention Time (HRT) 12 hours 2 cycles: 24 hours
4 cycles: 12 hours 36 hours
Application for Large Scale STP Good Good Difficult
Application for Small Scale STP
Difficult due to high load variation。 Possible Most applicable method for
small scale STP
Modification Easy Difficult to install replacement facilities Easy
Evaluation Excellent Good Poor
Source: JICA Study Team
Source: JICA Study Team
Figure 5.1.24 Proposed Sewage Treatment Process Diagram

Republic of the Philippines Preparatory Survey on Water Supply and Sewerage Chapter 5 Development in the West Zone of Metro Manila Final Report Feasibility Study of Priority Sewerage Projects
5 - 40
5.1.10 Sludge Treatment Methods (1) Sludge Treatment Methods
Sludge treatment and disposal is a major consideration in choosing the appropriate primary treatment technology. Sludge is mainly due to the production of excess sludge during the biological treatment process. In order to prevent nuisances related to odor, sludge must be stabilized, dewatered and disposed of properly in landfills as soon as possible. Sludge may be stabilized and used after as soil conditioners or fertilizers. The available separation technologies considered are presented in Table 5.1.27.
Table 5.1.27 Typical Sludge Treatment Methods Option Remarks
Sludge Thickening Gravity thickener, dissolved air floatation, belt thickener or centrifuge
Aerobic / Anaerobic Digestion Stabilization of sludge, less biological solids Mechanical Dewatering Belt filter press or centrifuge; produces 20% dry solid
cakeThermal (Solar) Drying Substantial reduction in moisture using natural/low
cost energyGreenhouse Drying Substantial reduction using natural/low cost energy,
appropriate in high humid climate Composting Stabilization of sludge, less biological solids Mechanical Drying High cost of energy but space saving Source: JICA Study Team
1) Sludge Thickening Sludge resulting from primary clarification, and mixed with waste activated sludge normally has a solids concentration of about 1%. This sludge should be thickened to over 3-5% solids prior to mechanical dewatering. Waste activated sludge is difficult for gravitational sedimentation. A large STP normally applies separate thickening of crude sludge and waste activated sludge. The gravity thickener is usually a circular tank with a recessed trough at its center similar to a circular clarifier. Mechanical thickeners are principally dissolved air floatation, centrifugal and belt thickening. Polymer, ferric sulfate, or ferric chloride is usually added to promote consolidation.
2) Aerobic and Anaerobic Digestion The aim of digestion whether aerobic or anaerobic is the destruction of volatile solids, and hence stabilization of the sludge. Destruction of volatile solids is also processed by composting and incineration. Such competitive processes are selectively chosen. The aerobic process has historically been used in smaller plants and has higher operational costs due to the blowers, though the volatile solids content of sludge may be similar in the anaerobic case.
3) Mechanical Dewatering Reduction of sludge volume leads to lower transportation costs. Dewatering devices require

Republic of the Philippines Preparatory Survey on Water Supply and Sewerage Chapter 5 Development in the West Zone of Metro Manila Final Report Feasibility Study of Priority Sewerage Projects
5 - 41
chemical agents for coagulation and periodical maintenance. Type of dewatering machine is carefully chosen in accordance with dewatering efficiency and availability of O&M.
4) Drying of Sludge Drying is useful for sludge recycling such as soil conditioning and sewage sludge fuel use. Handling is also improved due to eliminated nuisance and reduced volume. Thermal (solar) drying could be applied for dry climates. Mechanical drying and greenhouse drying are applicable in climates with high humidity.
5) Composting Composting is normally preceded by either solar or greenhouse drying. The energy content of composted pile provides substrate that sustains thermophilic organisms earlier in the process, achieving pathogen and seed inactivation. Mesophilic organisms dominate later in the cycle, resulting in a stable compost and disinfection of harmful microbes.
(2) Stepwise Development of Sludge Treatment Sludge treatment shall consider sewerage service expansion, upgrading sewage treatment and environmental concerns as stepwise development.
1) First Phase As shown in Figure 5.1.25, individual sludge dewatering facilities shall be installed. Dewatered sludge can be applied to land.
STP Wastewater treatment
STP Sludge
dewatering
STP Sludge
dewatering
Truck/pipe transportation Sludge
Land-filling
Composting & Soil
conditioner
Source: JICA Study Team
Figure 5.1.25 Sludge Treatment Process in the First Phase
2) Second Phase Sewage and sludge volume would increase as sewerage services are expanded. Also the capacity of land filling would gradually decreased. Therefore, as shown in Figure 5.1.26, a sludge recycling plant shall be installed, and dewatered sludge will be reduced and recycled.

Republic of the Philippines Preparatory Survey on Water Supply and Sewerage Chapter 5 Development in the West Zone of Metro Manila Final Report Feasibility Study of Priority Sewerage Projects
5 - 42
Truck transportation
Truck transportation
STP Wastewater treatment
STP Sludge
dewatering
STP Sludge
dewatering
Truck/pipe transportation Sludge
Incineration & Recycling plant
STP Sludge
dewatering
Source: JICA Study Team
Figure 5.1.26 Sludge Treatment Process in the Second Phase
3) Long Term As wastewater flows increase, wastewater treatment shall be expanded as shown in Figure 5.1.27. The upgrading of wastewater treatment attributes to the increase of produced sludge. Land reclamation of dewatered sludge becomes restricted due to enhanced environmental concerns. Accordingly, sludge recycling and reduction of sludge volume will be applied. Dewatering facilities are replaced to pipe transportation in accordance with cost, environment or upgrading treatment performance.
STP
Wastewater treatment
STP Wastewater treatment
STP Wastewater treatment
Pipe transportation
Sludge Dewatering & Incineration,
Recycling plant Pipe transportation
Pipe transportation
STP Wastewater treatment
Source: JICA Study Team
Figure 5.1.27 Sludge Treatment Process in the Long Term
4) Summary of Stepwise Sludge Treatment A preferred strategy of stepwise sludge management results in varying sludge processes:
First phase: dewatering drying / composting land application
Medium to long term: dewatering drying / composting bio-solid reuse
Figure 5.1.28 shows the increase of sludge volume and sludge management.

Republic of the Philippines Preparatory Survey on Water Supply and Sewerage Chapter 5 Development in the West Zone of Metro Manila Final Report Feasibility Study of Priority Sewerage Projects
5 - 43
Source: JICA Study Team
Figure 5.1.28 Increase of Sludge and Sludge Management
(3) Recommended Sludge Treatment Process and Disposal The components of sludge treatment comprise of sludge blending, sludge thickening, and dewatering machines, which are proposed to be used in all STPs.
1) Sludge Blending Tank (SBT) The excess sludge from the bottom of the primary and secondary tanks shall be extracted by pumps and will be transferred to a combined SBT. The sludge must be blended thoroughly in order to achieve a consistent feed to the thickener. It is expected that within one hour, the combined sludge are blended and can be transferred to the thickening tanks. This SBT shall be provided with the required number of mixers or agitators to fully mix or blend the sludge. This SBT also provides an excellent place for meter dilution water, add pH adjusters, thickening aids, flocculants and other chemicals.
2) Sludge Thickening Tank (STT) Gravity thickening is accomplished in circular clarifiers similar to those used for primary and secondary clarification of liquid wastes. The solids entering the STT separate into three distinct zones: the top layer zone which is the clear liquid zone, the second layer zone which is the sedimentation zone usually containing a stream of denser sludge moving from the influent toward the third zone, which is the thickening zone. In the thickening zone, the individual particles of the sludge agglomerate. The sludge blanket is maintained in this zone where the mass of sludge is compressed by material continuously added to the top. Water is squeezed out of interstitial spaces and flows upward to the channels. Deep trusses are provided to gently stir the sludge blanket and move the gases and liquid toward the surface. The supernatant from the STT passes over an effluent weir and is returned to the primary clarifier. The thickened sludge is withdrawn from the bottom.
Mechanical drying
Greenhouse
drying

Republic of the Philippines Preparatory Survey on Water Supply and Sewerage Chapter 5 Development in the West Zone of Metro Manila Final Report Feasibility Study of Priority Sewerage Projects
5 - 44
3) Mechanical Sludge Dewatering Mechanic sludge dewatering will be used to remove moisture so that the sludge cake can be transported by truck and can be composted or disposed by landfilling.
4) Sludge Disposal The sludge that will be produced as a by-product of the CAS or by the retrofitted step feed BNR process, and the required treatment and ultimate disposal must also be considered in selecting the appropriate technology. There are some disposal methods such as landfilling, soil conditioner, and so on.
5.1.11 Construction Methods (1) Sewer Network
The two methods for the installation of new sewer pipelines are by open trench and trenchless construction. The selection of method to be used depends on a number of factors, including pipe diameter, installation depth, type of soil, depth of water table, available space on the surface, conflict with other underground utilities, and the amount of traffic. Table 5.1.28 shows a comparison of pipe installation methods.
1) Open-Cut Method Open-cut method is the most common construction method for the installation of drainage and sewer pipelines especially in shallow depths. Open-cut excavation through the materials found across the proposed two project areas should be possible down to the groundwater table. However, for safety purposes, temporary support will be required for any excavation. In addition, this method is also difficult when the sewer pipeline has to be installed below the water table as the trench needs to be kept dewatered while the sewer line is being installed. There is also an increased risk of damage to existing overhead electrical power and telecommunication lines and underground water, drainage and sewer utilities even after taking into account the various efforts of collecting such information from utility agencies and from field surveying. Although this method is relatively straightforward and inexpensive, this type of construction is inappropriate where space is limited or when there is heavy traffic.
2) Trenchless Method Trenchless methods are more cost effective and can overcome most of the major difficulties and constraints of open trench construction for deep sewer lines below the water table, particularly where space is limited and traffic disruption is likely to be significant.

Republic of the Philippines Preparatory Survey on Water Supply and Sewerage Chapter 5 Development in the West Zone of Metro Manila Final Report Feasibility Study of Priority Sewerage Projects
5 - 45
Table 5.1.28 Comparison of Pipe Installation Methods Method Open Trench Method Trenchless Method
Pipe Jacking Shield Tunneling
Description
╴ Method of installing pipes in the trench is by manual or mechanical excavation, and the earth is backfilled.
╴ This is the easiest method and most economical.
╴ In case pipe laying depth is deep, this method is not economical.
╴ It requires bracing or sheeting.
╴ All works is conducted on land.
╴ Applicable depth will be up to 6 m.
╴ One of trenchless methods to install a prefabricated pipe through the ground from a drive shaft to a reception shaft.
╴ The pipe is propelled by jacks installed in the drive shaft.
╴ Excavation work for shaft construction is necessary.
╴ For over 700 mm in diameter, it can be classified open and closed type.
╴ One of trenchless methods to construct tunnel at the work station of vertical shaft as well as pipe jacking method.
╴ Shield is advanced in accordance with excavation of face ground, and progressing pre-built section of tunnel wall which is called segment are assembled to formulate the tunnel structure.
╴ This method is suitable for long distance drive and large diameter pipe installation.
Applicable Pipe Size ╴ Up to 3000 mm ╴ 150 mm to 3000 mm
╴ 1350 mm to more than 10,000 mm
╴ In Japan, 14 m is maximum
Maximum Length ╴ No limit
╴ Approximately 1000 m by one drive.
╴ Commonly, 150 m to 500 m.
╴ Approximately 2000 m by one drive
╴ Longer drive is possible by a particular machine
Cost ╴ This is most economical in
case the laying depth is shallow.
╴ More cost-effective than open trench method in case pipe laying depth is deep.
╴ In case unstable ground or high groundwater level, soil reinforcement work is required and construction cost is raised.
╴ Generally, installing pipes with diameters smaller than 2000 mm is more economical than shield tunneling method.
╴ Generally, construction cost is higher than open trench method and pipe jacking method.
Impact to Ambient
Surroundings
╴ In case of heavy traffic or narrow road, impact to traffic is a big issue.
╴ This method is noisy and causes big vibration when earth is being excavated.
╴ Impact to traffic can be minimized.
╴ Noise and vibration can be reduced except in sites for vertical shafts.
╴ Ground settlement can be caused in case ground condition is unstable.
╴ Impact to traffic can be minimized.
╴ Noise and vibration can be reduced except in sites for vertical shafts.
╴ Ground settlement can be caused in case ground condition is unstable.
Difficulty of Construction
Works
╴ This is most common and easiest.
╴ It is easy to take countermeasures for changing soil condition or renewal.
╴ It is difficult to install pipe in case the groundwater level is high.
╴ Excavation amount is the smallest.
╴ Required area for shafts is smaller than shield tunneling method.
╴ It is difficult to accommodate unexpected condition after commencement of construction.
╴ Required area for shafts and amount of excavation are larger than pipe jacking method.
╴ It is difficult to accommodate unexpected condition after commencement of construction.
╴ Long distance and sharp curving are possible.
Construction Period
╴ Generally, the construction period is shorter than trenchless method in case there are no obstructions.
╴ The construction period is shorter than shield tunneling since prefabricated pipe is used.
╴ The construction period is longer than pipe jacking method.
Others ╴ This method cannot be
applied in case of crossing under rivers or large structures.
╴ Jacking method for smaller than 800 mm in diameter is called microtunneling method.
╴ This method is classified into open and closed type.
Source: JICA Study Team

Republic of the Philippines Preparatory Survey on Water Supply and Sewerage Chapter 5 Development in the West Zone of Metro Manila Final Report Feasibility Study of Priority Sewerage Projects
5 - 46
(2) STP and PS Construction For the STP as well as the PS, probable constructability issues that may be encountered are generally straightforward with regards to the availability of standard engineering practices to address such issues. Proper identification of the geotechnical conditions is crucial for the design of the STPs and PSs.
The candidate sites for STPs and PSs in the North Caloocan area are situated in the Guadalupe Formation, whose upper layer (Diliman Tuff) is composed of thin to medium bedded, fine-grained vitric tuffs and welded volcanic breccias with subordinate amount of tuffaceous, fine- to medium-grained sandstone. No special requirements are foreseen with regard to foundation strengthening, piling or preloading. However, there may be a need to raise the site elevations depending on the location and elevation requirements of the candidate sites.
On the other hand, the Marikina area is located very near the Marikina River. They are near the boundary of the Guadalupe Formation and quaternary alluvium, whose upper layer is made up of detrital deposits, mostly silt and gravel. The STP sites in this area may have potential issues on site flooding because of the prevalence of overflowing of the Marikina River during periods of heavy rains and typhoons. The STP site may have to be raised above the river flood level to protect the mechanical and electrical equipment of the plant. The STP site may also require either concrete piling or preloading of underlying soil if the soil is not stable or if the soil bearing capacity is not enough to support the STP infrastructure. The final design recommendations will depend on the results of geotechnical investigation during the detailed design stage of the project.
Another factor to consider that will greatly affect the design of the STPs is the fact that the candidate STP sites in the Commonwealth area are located on top of a major fault line (the Marikina Fault) and this will need to be studied in detail during the design stage. There are some countermeasures for resistance to earthquake such as modification of manhole in order not to float caused by liquefaction or to be flexible at the connection point with pipes in sewer system. In addition, it is important for STP to keep minimal treatment function to conduct sedimentation and disinfection.
5.1.12 Site Surveys Site surveys are conducted for topography, geology and water quality. The scopes of the surveys are described below.
(1) Topographic Survey 1) Objective of the Survey The objectives of the topographic survey are to define the boundaries of STP sites and PSs, to

Republic of the Philippines Preparatory Survey on Water Supply and Sewerage Chapter 5 Development in the West Zone of Metro Manila Final Report Feasibility Study of Priority Sewerage Projects
5 - 47
identify the quantity and location of the discharge points along rivers and creeks, and to conduct route survey of the proposed sewer lines.
2) Scope of the Survey The scope of the topographic surveys covers the following activities:
Route Survey of Proposed Sewer Lines: (about 70 km in total) Discharge Point Survey River Cross-section Survey Perimeter Survey of Candidate STP Sites and PSs
3) Methodology of the Survey a) Coordinate and Elevation For all survey works, coordinates and elevations shall be tied to the national coordinate grid system and elevation of national benchmarks installed by the National Mapping and Resource Information Authority (NAMRIA) of the Republic of the Philippines. The latest certified GPS coordinates and elevations shall be acquired from NAMRIA prior to commencement of the works, and will be the basis of the elevations.
b) Horizontal Ground Control Horizontal ground controls shall be established at or near an acceptable vicinity of the project using at least secondary traverse precision and accuracy. Previously established or existing bench marks shall be made part of the control.
c) Vertical Ground Control Vertical ground control shall be established for the entire survey, which will be connected and referred to at least two existing NAMRIA benchmarks.
d) Accuracy of the Survey Before commencement of the survey works and topographic mapping, the survey team shall check and calibrate their instruments to ensure that the following tolerances are not exceeded:
Differential accuracy of GPS observation: 100 mm – 2 ppm x L (where L = length of baseline in meters)
Precision for Horizontal Control: 1:5000 Limit of closure of error for leveling: 20 mm √L (where L = length of leveling route in
km)

Republic of the Philippines Preparatory Survey on Water Supply and Sewerage Chapter 5 Development in the West Zone of Metro Manila Final Report Feasibility Study of Priority Sewerage Projects
5 - 48
(2) Geotechnical Survey 1) Objective of the Survey The objectives of the geotechnical investigation are to identify the conditions of the underlying soil strata and to gather information on the geotechnical design parameters that will affect the design and construction of the STPs and PS as well as the construction of the sewer pipelines in the two project areas. In particular, the geotechnical investigation and analysis will focus on the possible impacts of the geotechnical conditions to the methodology of construction for the sewer pipelines that will be proposed and adopted by the Study, particularly the viability of implementing trenchless excavation for pipeline construction in the two project areas.
2) Scope of the Survey The scope of the geotechnical survey includes drilling works and laboratory tests. Table 5.1.29 shows a summary of the geotechnical survey.
Table 5.1.29 Summary of Geotechnical Survey Contents Items Quantity
1. Boring Survey (site) Drilling 3 sites Soil Sampling 43 samples Groundwater Level Survey 3 sites
2. In Situ Test Standard Penetration Test 63 samples
2. Laboratory Tests
Natural Moisture Content 43 samples Particle Size Analysis 43 samples Atterberg Limits 43 samples Soil Classification 43 samples Specific Gravity 43 samples
Source: JICA Study Team
3) Methodology of the Survey a) Drilling Works Drilling works are conducted in two sites in the Marikina River basin and one site in the Marilao River basin. The borehole depth is 20 m, 15 m for the Marikina River basin, and 25 m for the Marilao River basin. The drilling was conducted using a method of rotary drilling.
b) Groundwater Level Survey The groundwater level is determined by directly lowering a weighted tape into the borehole. Periodic readings were made after water was allowed to stand for a minimum period of 12 hours and/or following completion of the drilling and also before the drilling. A reading made during this period is assumed as the groundwater level.
c) Standard Penetration Test (ASTM D1586) Standard penetration test (SPT) is conducted every one meter depth interval using a donut type

Republic of the Philippines Preparatory Survey on Water Supply and Sewerage Chapter 5 Development in the West Zone of Metro Manila Final Report Feasibility Study of Priority Sewerage Projects
5 - 49
hammer until the bedrock is encountered which is hard enough to require more than 30 blows of the
standard test hammer in sand strata. and more than 20 blows in clay strata for 300 mm penetration of
a split-tube sampler. It is better to require more than 50 blows in any stratum.
d) Laboratory Tests The purpose of the laboratory tests is to determine the significant engineering characteristics and
properties of the foundations for the sewerage facilities. The items of the laboratory tests are as
follows:
Natural Moisture Content ASTM D2216 Particle Size Analysis ASTM D422 Atterberg Limits ASTM D4318 Classification of Soils ASTM D2487 Specific Gravity ASTM D854
(3) Water Quality Survey 1) Objective of the Survey
The objectives of the water quality survey are to determine the water quality of the rivers and streams in the Study area, and to provide data about the conditions of such water bodies for the preliminary design of the STPs.
2) Scope of the Survey The water quality surveys are conducted at four sites in the Marikina River basin, and six sites in the
Marilao River basin. Table 5.1.30 shows a summary of the water quality survey scope.
Table 5.1.30 Summary of Water Quality Survey Scope Contents Items Quantity
1. Water Sampling Marikina River Basin 4 sites Marilao River Basin 6 sites
2. Water Quality Tests
pH (in situ) 30 samples Temperature (in situ) 30 samples DO (in situ) 30 samples BOD 30 samples COD 30 samples SS 30 samples Nitrate Nitrogen 30 samples Ammoniac Nitrogen 30 samples
Source: JICA Study Team

Republic of the Philippines Preparatory Survey on Water Supply and Sewerage Chapter 5 Development in the West Zone of Metro Manila Final Report Feasibility Study of Priority Sewerage Projects
5 - 50
3) Methodology of the Survey
a) Water Sampling
Water sampling is conducted three times for each site on three different days at the rivers. In addition,
the sampling is conducted in the morning between 7 a.m. and 9 a.m. For shallow rivers and streams
within 2.5 m depth, one grab water sample is collected at the center of the streams. For wide rivers,
water samples are collected from both sides of the rivers.
b) Water Quality Analysis
Results of the mentioned parameters in Table 5.1.30 are required for the determination of sewage
treatment method and process. However, in the early stage of the consultants’ services, the
consultant will collect and check the latest treated wastewater discharge regulation in the
Philippines.

Republic of the Philippines Preparatory Survey on Water Supply and Sewerage Chapter 5 Development in the West Zone of Metro Manila Final Report Feasibility Study of Priority Sewerage Projects
5 - 51
5.2 Preliminary Design of the Marikina River Basin
5.2.1 Scope of the Project (1) Description of the Marikina River Basin
The Marikina River basin is located in the southern part of La Mesa Reservoir, and most areas of this basin are located in Quezon City, as shown in Figure 5.2.1. Figure 5.2.1 also shows land use, sub-catchment basin and location of candidate STP sites.
Source: JICA Study Team (land use was edited information gathered from Quezon City Hall)
Figure 5.2.1 Target Area, Land Use, Sub-Catchment Basin and Candidate STP Sites

Republic of the Philippines Preparatory Survey on Water Supply and Sewerage Chapter 5 Development in the West Zone of Metro Manila Final Report Feasibility Study of Priority Sewerage Projects
5 - 52
1) Study Area It encompasses the portions of some barangays such as Commonwealth, Payatas, Bagong Silangan, and Batasan Hills.
2) Geological and Topographical Conditions The Marikina River basin is underlain by quaternary (recent) alluvial deposits and Pleistocene Guadalupe formation. The alluvium consists of unconsolidated and poorly sorted pebbles, cobbles, old boulders, sand, silt, and mud deposited along the Marikina Valley alluvial plain. The thickness of these alluvial deposits vary from about 130 m in the Marikina area up to 200 m in the Cainta-Pasig area. The Diliman Tuff of the Pleistocene Guadalupe formation, with thickness of 1300-2000 m, is composed predominantly of fine-grained vitric tuff and welded volcanic breccia with subordinate amount of fine- to medium-grained tuffaceous sandstone. The Marikina Valley fault line, located on the eastern side of the Marikina River, passes through Payatas, Bagong Silangan, and other areas along the eastern boundary of Quezon City. Should there be development along or near the fault line, it must be in accordance with existing building standards and regulations to ensure safety against earthquake and reduce the risks. Figure 5.2.2 shows location of the Marikina Fault Line.
Source: JICA Study Team based on Philippines Institute of Volcanology and Seismology
Figure 5.2.2 Location of the Marikina Fault Line

Republic of the Philippines Preparatory Survey on Water Supply and Sewerage Chapter 5 Development in the West Zone of Metro Manila Final Report Feasibility Study of Priority Sewerage Projects
5 - 53
The city’s topography mostly undulates with alternating ridges and lowlands. The southern region of the city has low-grade terrain while the northern half is rolling and culminates at the La Mesa Reservoir. Steep portions are evident in the eastern part of the city, which runs parallel to the Marikina River and the Marikina Valley Fault line.
3) Flood Condition There are no expected effects from tidal fluctuations to floods in the Marikina River basin as it is far from the sea as well as the ground elevation in the Study area. However, flash floods can still happen in several places, particularly during heavy rains and occurrence of typhoons along the Marikina River because the waterways, drainage inlets, and drainage pipes are clogged with garbage and plastic materials. The World Bank prepared an inundation map that shows the maximum flood depth caused by Typhoon Ondoy as shown in Figure 5.2.3. In addition, according to the residents in the Marikina River basin, the flood level reached 6.0-9.0 m above river level during the typhoon event.
Source: Metro Manila Flood Management Master Plan (2012), World Bank
Figure 5.2.3 Maximum Flood Depth Due to Typhoon Ondoy
4) River Water Levels Available river level data of the Nanka River Gauging Station from 2006 to 2011 was reviewed. Nanka is an area roughly 1 km downstream of Batasan-San Mateo Bridge, which is near the southern boundary of the Marikina River basin. The location of the actual gauging station is unknown. The lowest water level was 15.75 m, while the highest was 22.47 m

Republic of the Philippines Preparatory Survey on Water Supply and Sewerage Chapter 5 Development in the West Zone of Metro Manila Final Report Feasibility Study of Priority Sewerage Projects
5 - 54
5) Drainage System Population centers, subdivisions, and streets are laid with reinforced concrete pipes (RCPs) and reinforced concrete box culverts (RCBCs), which drain towards the sides of bridges atop rivers and creeks. The presence of a network of rivers and creeks creates an efficient drainage except for some portions where flash floods occur due to the worsening conditions of waterways. Creeks and waterways in the Marikina River basin flow in the easterly and southeasterly directions, drain towards Marikina River, and then join the Pasig River.
Information regarding the existing drainage networks provided by Quezon City has been identified. However, the drawings of drainage systems do not show piping layouts and sizes. There are no clear or complete records of the drainage network because of the number of government agencies involved. Maynilad does not manage the drainage systems. Recognizing the lack of information needed to conduct the feasibility study, it was necessary to confirm the discharge points through the topographical survey in order to find out the proper intercepting points for a new system.
6) Land Use At present, land use classification and land use plan in Quezon City is as shown in Table 5.2.1. The land use plan for Quezon City is dictated in the Ordinance No. SP-1369, S-2004, which amends the sections of the Quezon City Comprehensive Zoning Ordinance No. SP-918, S-2000.
Table 5.2.1 Land Use Classification in Quezon City
Classification Area (ha)
Percentage (%)
Residential 8,502.82 56.29Commercial 255.87 1.70Industrial 870.80 5.76Institutional 725.58 4.80Military 226.50 1.50Parks/Recreational Sites 161.05 1.07Open Lands 1,759.88 11.65Waterways 138.00 0.91(La Mesa Reservoir) 2,465.50 16.32
Total 15,106.00 100
Source: Quezon City Hall
(2) Outline of Project Scope 1) Catchment Boundary The catchment boundaries are determined based on the contour map provided by the GIS division of Maynilad, and based on surveys on existing drainage systems and roads. Since the available information on the drainage systems of Quezon City is insufficient, it was supplemented by identifying existing outfalls in the Study area during the topographic survey.

Republic of the Philippines Preparatory Survey on Water Supply and Sewerage Chapter 5 Development in the West Zone of Metro Manila Final Report Feasibility Study of Priority Sewerage Projects
5 - 55
2) Candidate Sites of STP In the Marikina River basin, STP can be installed at one place in order to efficiently collect and treat sewerage coming from the basin. Features of each candidate site are shown in Table 5.2.2.
Table 5.2.2 Features of Each Candidate Site for STP Candidate
Sites Area (ha) Features
Site 1 2.4
╴ Northernmost site among candidates ╴ Located upstream and beside the Marikina River ╴ Sewers will be installed against land gradient ╴ PSs will be required. ╴ Landfill will be required.
Site 1 Alternative 2.3 ╴ Near Site 1 but farther away from the river.
Site 2 3.4 ╴ Located in the central area of the catchment basin. ╴ Ground level is high, so landfill will not be required.
Site 3 3.3 ╴ Southernmost site among candidates ╴ Located downstream and near the Marikina River ╴ Ground level is high, so landfill will not be required.
Source: JICA Study Team
3) Sewer Network Sewer network was designed for each STP candidate site. Sewer route shall be chosen under public roads or lands in order to avoid land acquisition. In addition, the necessity and location of interceptor chambers (ICs) and pumping stations (PSs) were designed based on the results of topographic survey.
5.2.2 Demand Projection (1) Demography 1) Population and Households (2007 Census)
The population and average households of the Marikina River basin is shown in Table 5.2.3, which was based from 2007 Census.
Table 5.2.3 Population and Average Households in the Marikina River Basin
Province/City/Municipality/Barangay
2007 Census 2010 Census
Population Household Population
Number of Households
Average Household Size
Population
Quezon City (Marikina River basin)
1 Commonwealth 172,834 172,790 38,198 4.5 186,5432 Payatas 17,001 116,791 24,193 4.8 119,0533 Bagong Silangan 73,612 73,592 15,176 4.8 78,2224 Batasan Hills 148,624 148,553 31,667 4.7 150,764
Total 412,071 511,726 109,234 4.7 534,582
Source: 2007 and 2010 Census of Population, National Capital Region, National Statistics Office
2) Population Growth Figure 5.2.4 shows the trend of population growth in Quezon City from 1975 to 2010. The

Republic of the Philippines Preparatory Survey on Water Supply and Sewerage Chapter 5 Development in the West Zone of Metro Manila Final Report Feasibility Study of Priority Sewerage Projects
5 - 56
population in 2010 was recorded approximately at 2.76 million, which was 2.4 times of that in 1975.
965,8641,165,865
1,669,776
1,989,4192,173,831
2,679,450 2,761,720
0
500,000
1,000,000
1,500,000
2,000,000
2,500,000
3,000,000
1975 1980 1990 1995 2000 2007 2010
Quezon city
Population (persons)
Census year Source: 2007 and 2010 Census of Population, National Capital Region, National Statistics Office
Figure 5.2.4 Trend of Population Growth in Quezon City from 1975 to 2010
3) Birth and Mortality Rates Table 5.2.4 shows the health indicators in Quezon City as of 2007. Crude birth rate is at 15.7 per 1,000 persons.
Table 5.2.4 Health Indicators in Quezon City Category Number
Crude Birth Rate (CBR) 15.7* Crude Death Rate (CDR) 4.0* Infant Mortality Rate (IMR) 21.5** Maternal Mortality Rate (MMR) 0.7**
*Per 1,000 population, ** Per 1000 Live Birth
Source: Field Health Service Information Annual 2007, National Epidemiology Center, Department of Health
(2) Population Projection The overall population of each barangay was part of the 2010 Census. The population projection from 2013 to 2037, which Maynilad estimated in its Business Plan 2013, is used for the Study. However, the data projected for each barangay is not available. Therefore, the population growth rate increase of Quezon City is used in the population projection of each barangay. The rate of increase from 2013 to 2027 is about 4.7%, and that from 2028 to 2037 is about 2.5%, respectively. Table 5.2.5 shows estimated future population in the Marikina River Basin.

Republic of the Philippines Preparatory Survey on Water Supply and Sewerage Chapter 5 Development in the West Zone of Metro Manila Final Report Feasibility Study of Priority Sewerage Projects
5 - 57
Table 5.2.5 Estimated Population in the Marikina River Basin Area(ha) 2013 2014 2015 2016 2017 2018 2019 2020
Commonwealth 95.3 53,792 54,501 55,219 55,834 56,455 57,063 57,671 58,278Payatas 226.9 88,163 89,325 90,503 91,510 92,529 93,525 94,521 95,517Bagong Silangan 264.6 36,456 36,936 37,423 37,839 38,261 38,673 39,085 39,496Batasan Hills 244.4 65,197 66,056 66,927 67,672 68,425 69,162 69,899 70,635
Total 831.2 243,608 246,818 250,071 252,855 255,670 258,422 261,175 263,927
2021 2022 2023 2024 2025 2026 2027 2028 2029Commonwealth 58,886 59,415 59,923 60,430 60,938 61,445 61,861 62,284 62,706Payatas 96,514 97,381 98,212 99,044 99,876 100,707 101,390 102,081 102,773Bagong Silangan 39,908 40,267 40,611 40,955 41,299 41,643 41,925 42,211 42,497Batasan Hills 71,372 72,013 72,628 73,243 73,858 74,474 74,978 75,490 76,001
Total 266,680 269,076 271,374 273,672 275,971 278,269 280,154 282,066 283,977
2030 2031 2032 2033 2034 2035 2036 2037Commonwealth 63,128 63,423 63,694 63,965 64,237 64,508 64,779 64,892Payatas 103,465 103,949 104,393 104,838 105,283 105,727 106,172 106,438Bagong Silangan 42,783 42,983 43,167 43,351 43,535 43,718 43,902 43,957Batasan Hills 76,513 76,871 77,200 77,528 77,857 78,186 78,515 78,707
Total 285,889 287,225 288,454 289,682 290,911 292,140 293,368 293,994
Population of Target Area
Population of Target Area
Population of Target Area
MarikinaRiverBasin
RiverBasin
Barangy
MarikinaRiverBasin
RiverBasin
Barangy
MarikinaRiverBasin
RiverBasin Barangy
Source: JICA Study Team, based on Maynilad Business Plan 2013
(3) Prediction of Water Consumption As shown in Section 5.1.5, water consumption considers both domestic and commercial water. Table 5.2.6 shows the estimated water consumption in Quezon City, which is estimated based on billed volume records of Maynilad.
Table 5.2.6 Estimated Water Consumption in Quezon City 2013 2014 2015 2016 2017 2018 2019 2020 2021
Domestic (LPCD) 129 131 132 133 134 137 140 143 145Commercial (MLD) 30.7 32.3 34.0 36.1 38.1 40.1 42.1 44.1 46.8
2022 2023 2024 2025 2026 2027 2028 2029 2030Domestic (LPCD) 148 151 154 157 160 160 160 160 160Commercial (MLD) 49.4 52.1 54.7 57.4 60.9 64.4 67.8 71.3 74.8
2031 2032 2033 2034 2035 2036 2037Domestic (LPCD) 160 160 160 160 160 160 160Commercial (MLD) 79.4 84.0 88.6 93.2 97.8 103.3 108.9
Source: JICA Study Team, based on billed volume estimated by Maynilad
(4) Prediction of Wastewater Amount Based on population and water consumption predictions, wastewater amount is estimated as shown in Table 5.2.7. Sewage generation is assumed at 80% of water consumption, and GWI is added, which is assumed as 15% of sewage.

Republic of the Philippines Preparatory Survey on Water Supply and Sewerage Chapter 5 Development in the West Zone of Metro Manila Final Report Feasibility Study of Priority Sewerage Projects
5 - 58
Table 5.2.7 Prediction on Wastewater Amount Year 2013 2014 2015 2016 2017 2018 2019 2020 2021
Population of Target Area 243,608 246,818 250,071 252,855 255,670 258,422 261,175 263,927 266,680
Domestic Water Consumption (LPCD) 129 131 132 133 134 137 140 143 145
Commercial Water Consumption (MLD) 30.7 32.3 34.0 36.1 38.1 40.1 42.1 44.1 46.8
Sewage from Domestic (m3 per day) 25,140 25,867 26,408 26,904 27,408 28,323 29,252 30,193 30,935
Sewage from Commercial (m3 per day) 1,188 1,251 1,318 1,396 1,475 1,553 1,631 1,709 1,812
Daily Average Sewage Flow (m3 per day) 26,329 27,118 27,725 28,300 28,882 29,876 30,883 31,903 32,747
Daily Average GWI (m3 per day) 3,949 4,068 4,159 4,245 4,332 4,481 4,632 4,785 4,912
Daily average Wastewater Flow (m3 per day) 30,300 31,200 31,900 32,500 33,200 34,400 35,500 36,700 37,700
Daily Maximum Wastewater Flow (m3 per day) 35,500 36,600 37,400 38,200 39,000 40,300 41,700 43,100 44,200
Hourly Maximum Wastewater Flow (m3 per day) 51,300 52,900 54,100 55,200 56,300 58,300 60,200 62,200 63,900
Year 2022 2023 2024 2025 2026 2027 2028 2029 2030
Population of Target Area 269,076 271,374 273,672 275,971 278,269 280,154 282,066 283,977 285,889
Domestic Water Consumption (LPCD) 148 151 154 157 160 160 160 160 160
Commercial Water Consumption (MLD) 49.4 52.1 54.7 57.4 60.9 64.4 67.8 71.3 74.8
Sewage from Domestic (m3 per day) 31,859 32,782 33,716 34,662 35,618 35,860 36,104 36,349 36,594
Sewage from Commercial (m3 per day) 1,915 2,017 2,120 2,223 2,358 2,493 2,627 2,762 2,897
Daily Average Sewage Flow (m3 per day) 33,773 34,799 35,836 36,885 37,976 38,352 38,732 39,111 39,491
Daily Average GWI (m3 per day) 5,066 5,220 5,375 5,533 5,696 5,753 5,810 5,867 5,924
Daily average Wastewater Flow (m3 per day) 38,800 40,000 41,200 42,400 43,700 44,100 44,500 45,000 45,400
Daily Maximum Wastewater Flow (m3 per day) 45,600 47,000 48,400 49,800 51,300 51,800 52,300 52,800 53,300
Hourly Maximum Wastewater Flow (m3 per day) 65,900 67,900 69,900 71,900 74,100 74,800 75,500 76,300 77,000
Year 2031 2032 2033 2034 2035 2036 2037
Population of Target Area 287,225 288,454 289,682 290,911 292,140 293,368 293,994
Domestic Water Consumption (LPCD) 160 160 160 160 160 160 160
Commercial Water Consumption (MLD) 79.4 84.0 88.6 93.2 97.8 103.3 108.9
Sewage from Domestic (m3 per day) 36,765 36,922 37,079 37,237 37,394 37,551 37,631
Sewage from Commercial (m3 per day) 3,075 3,253 3,431 3,609 3,787 4,002 4,309
Daily Average Sewage Flow (m3 per day) 39,840 40,175 40,510 40,845 41,180 41,553 41,940
Daily Average GWI (m3 per day) 5,976 6,026 6,077 6,127 6,177 6,233 6,291
Daily average Wastewater Flow (m3 per day) 45,800 46,200 46,600 47,000 47,400 47,800 48,200
Daily Maximum Wastewater Flow (m3 per day) 53,800 54,200 54,700 55,100 55,600 56,100 56,600
Hourly Maximum Wastewater Flow (m3 per day) 77,700 78,300 79,000 79,600 80,300 81,000 81,800 Source: JICA Study Team
Calculation of commercial Sewage is below:
Commercial Water Volume = Area (ha) x Commercial Water Demand / Area of Quezon City
Commercial Sewage Volume = Commercial Water Volume x 0.8
Where,
Area: 831.2 ha, which is area of the Marikina River Basin
Commercial Water Demand: yearly water demand volume
Area of Quezon City: 171.7 km2 = 17,170 ha
5.2.3 Preliminary Design of the Marikina River Basin (1) Preliminary Design of Sewer Network
Sewer networks were designed based on the criteria described in Section 5.1.5. Designed

Republic of the Philippines Preparatory Survey on Water Supply and Sewerage Chapter 5 Development in the West Zone of Metro Manila Final Report Feasibility Study of Priority Sewerage Projects
5 - 59
parameters of the sewer networks are as follows:
Sewer routes Sewer pipes: Diameter, length gradient, velocity, flow rate, water depth, installation
depth, materials, and construction method PS locations and capacities IC locations and numbers Manhole (MH) locations and numbers
1) Sewer Diameter and Construction Method Each STP candidate site has its respective preliminary design of sewer pipes. The summary of design of sewer pipe diameters and construction method, which is either open-cut or trenchless, is shown in Table 5.2.8.
Table 5.2.8 Summary of Sewer Design
Open-Cut Trenchless Open-Cut Trenchless Open-Cut Trenchless(m) (m) (m) (m) (m) (m)
200 950 700 950 700 930 775 250 380 196 380 196 312 45 300 1,155 560 1,155 560 1,363 350 350 814 310 814 310 884 240 400 2,100 679 2,125 360 2,437 650 450 830 40 830 40 830 40 500 515 407 515 407 195 95 600 46 232 46 232 216 130 700 331 1,460 331 1,190 331 - 800 465 1,741 315 501 - 816 900 2,071 580 2,071 580 1,513 1,138
1000 - 258 - 552 - 552 1100 735 - - 1,415 - 2,605 1200 - 50 - 50 - 656
10,392 7,213 9,532 7,093 9,011 8,092 Pipe Diameter
(mm)(Pressure Pipe)
100 - 370 - 370 - -
- 370 - 370 - -
Sewer Line
Pipe Diameter(mm)
(Gravity Flow)
Sub-Total
Total
Option 1
17,975 16,995 17,103 Sub-Total
Location of STPOption 2 Option 3
Site 1 Site 2 Site 3
Source: JICA Study Team
2) Pipe Materials Applicable pipe materials are shown in Table 5.2.9. RCPs are mainly used for gravity sewer pipes. However, since the flow of steep slopes can damage the RCPs, polyethylene pipes (PE) are applied. In addition, Maynilad uses polyvinyl chloride pipes (PVC) for sewers with diameter

Republic of the Philippines Preparatory Survey on Water Supply and Sewerage Chapter 5 Development in the West Zone of Metro Manila Final Report Feasibility Study of Priority Sewerage Projects
5 - 60
of 450 mm or less. Therefore, PVC is applied to smaller diameter pipes for easy maintenance. For pressure pipes, high density polyethylene pipes (HDPE) are selected due to longer service life.
Table 5.2.9 Applicable Pipe Materials Material Sewer Type Application Remarks
RC Gravity Open-cut and trenchless - Most pipes can be applied PVC Gravity Open- cut - Especially small pipes of 450 mm or less PE Gravity Open-cut and trenchless - Applied for steep slope flow over a velocity of
2.0 m3/s HDPE Pressure Open-cut and trenchless - Maintenance of pressure pipes can be difficult
- Advantage of abrasion resistance
Source: JICA Study Team
3) Sewer Route Sewer route is basically recommended to be installed along public roads or in vacant spaces beside creeks and rivers in order to avoid land acquisition. In addition, based on the discharge point survey, sewer route is selected in consideration of efficient wastewater collection. The sewer route is almost the same for STP candidate sites. Figures 5.2.5 to 5.2.7 show the design route of pipelines for each option.

Rep
ubl
ic o
f th
e P
hil
ippi
nes
P
repa
rato
ry S
urv
ey o
n W
ater
Su
pply
an
d S
ewer
age
C
hap
ter
5 D
evel
opm
ent i
n th
e W
est Z
one
of M
etro
Man
ila
F
inal
Rep
ort
Fea
sibi
lity
Stu
dy o
f P
rior
ity
Sew
erag
e P
roje
cts
5 - 6
1
So
urce
: JIC
A S
tudy
Tea
m
Figu
re 5
.2.5
D
esig
n R
oute
of P
ipel
ines
for
Opt
ion
1

Rep
ubl
ic o
f th
e P
hil
ippi
nes
P
repa
rato
ry S
urv
ey o
n W
ater
Su
pply
an
d S
ewer
age
C
hap
ter
5 D
evel
opm
ent i
n th
e W
est Z
one
of M
etro
Man
ila
F
inal
Rep
ort
Fea
sibi
lity
Stu
dy o
f P
rior
ity
Sew
erag
e P
roje
cts
5 - 6
2
So
urce
: JIC
A S
tudy
Tea
m
Figu
re 5
.2.6
D
esig
n R
oute
of P
ipel
ines
for
Opt
ion
2

Rep
ubl
ic o
f th
e P
hil
ippi
nes
P
repa
rato
ry S
urv
ey o
n W
ater
Su
pply
an
d S
ewer
age
C
hap
ter
5 D
evel
opm
ent i
n th
e W
est Z
one
of M
etro
Man
ila
F
inal
Rep
ort
Fea
sibi
lity
Stu
dy o
f P
rior
ity
Sew
erag
e P
roje
cts
5 - 6
3
Sour
ce: J
ICA
Stu
dy T
eam
Figu
re 5
.2.7
D
esig
n R
oute
of P
ipel
ines
for
Opt
ion
3

Republic of the Philippines Preparatory Survey on Water Supply and Sewerage Chapter 5 Development in the West Zone of Metro Manila Final Report Feasibility Study of Priority Sewerage Projects
5 - 64
4) Pipe Depth (Earth Cover) Though minimum earth cover is determined to be 2.0 m as described in Section 5.1.5, sewer pipes should be installed in order to collect wastewater from existing drainage facilities. Therefore, the starting point of sewer lines might be deep because it will be located at the intercepting point. In addition, since open-cut method has been mainly applied to previous sewerage projects of Maynilad because of easy maintenance, the maximum depth of sewer will be around 5-7 m. However, the elevations within the Marikina River basin are varying that some portions of sewer lines require trenchless method. By deeper installation of pipes, the number of PSs can be reduced, while the maintenance will be mainly for sewer only. For the Marilao River basin, as shown in Table 5.2.8, approximately 40% of sewers shall be constructed by trenchless method. The design depth of sewer for each option is shown in Table 5.2.10.
The ranges of minimum and maximum depth of sewers are the same for each option, with Option 3 having the shallowest average depth.
Table 5.2.10 Designed Depth of Sewer Pipes in the Marikina River Basin Average (m)
Option 1 2.0 ~ 23.6 8.3Option 2 2.0 ~ 23.6 8.2Option 3 2.0 ~ 23.6 7.5
Range (m)
Source: JICA Study Team
5) Pumping Station (PS) Two PSs will be required for Options 1 and 2, while none is required for Option 3. One is large scale, while the other is manhole type. Table 5.2.11 shows the required capacity of PSs. Location of PSs along sewer routes is shown in Figures 5.2.5 to 5.2.7.
Table 5.2.11 Required Capacity of PSs in the Marikina River Basin
Flow (m3/s) TDH (m) PS Type Load per Pump
(kW) No. Duty/ Standby
PS1 0.215 11.0 Medium 22 2 / 1 PS2 0.131 2.3 MH 7.5 1 / 1 Source: JICA Study Team
6) Interceptor Chamber (IC) IC locations and numbers are the same for each option. The total number of ICs for the Marikina River basin is 60. As shown in Figure 5.2.8, the location of ICs is determined based on existing outfall points identified in the topographic survey. Locations of ICs were designed based on drainage discharge points identified in the topographic survey and site visit.
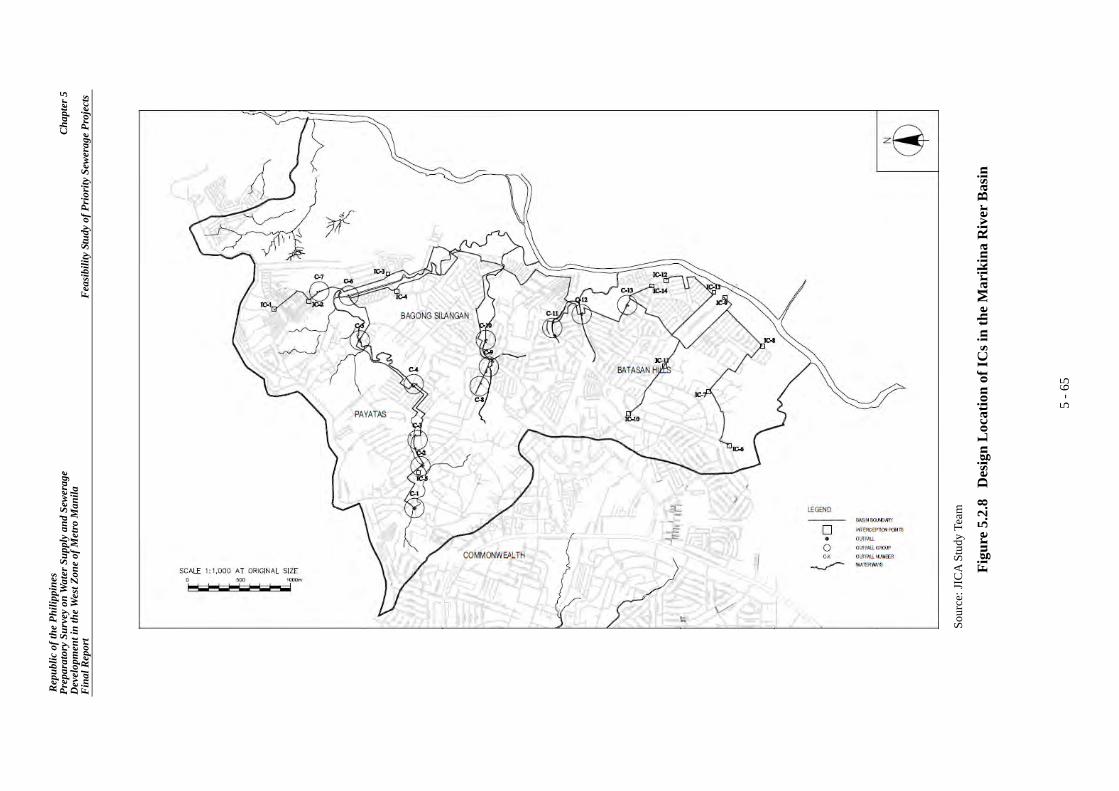
Rep
ubl
ic o
f th
e P
hil
ippi
nes
P
repa
rato
ry S
urv
ey o
n W
ater
Su
pply
an
d S
ewer
age
C
hap
ter
5 D
evel
opm
ent i
n th
e W
est Z
one
of M
etro
Man
ila
F
inal
Rep
ort
Fea
sibi
lity
Stu
dy o
f P
rior
ity
Sew
erag
e P
roje
cts
5 - 6
5
So
urce
: JIC
A S
tudy
Tea
m
Figu
re 5
.2.8
D
esig
n L
ocat
ion
of IC
s in
the
Mar
ikin
a R
iver
Bas
in

Republic of the Philippines Preparatory Survey on Water Supply and Sewerage Chapter 5 Development in the West Zone of Metro Manila Final Report Feasibility Study of Priority Sewerage Projects
5 - 66
(2) Pollutant Loading 1) Pollutant Source Based on the population and sewer load calculations, 37,600 m3/day will represent loads from domestic consumers and around 4,300 m3/day will cater commercial consumers. These values represent 78% and 9% of the ADWF in 2037, respectively.
During the site visits in the service areas, it was observed that the color of water at the outfalls were sometimes blackish and nearly in the septic stage. There were also outfalls where waters are colored such as blue and pink, which possibly indicates wastewater load coming from commercial and industrial establishments. However, Industrial wastewater shall be managed by the Environmental Management Bureau (EMB) of DENR, and Maynilad will monitors influent water quality to STP and indicates that DENR manages the industrial wastewater in case influent water quality goes down. Pre-treatment as well as the hydraulic load from industries must be monitored by EMB of DENR.
In addition, a dominant feature of the Marikina River basin is the Payatas Landfill that discharges leachate directly to tributaries of the Marikina River. The sewer network is not intended to collect leachate from the landfill. Location of the Payatas landfill and other commercial facilities are shown in Figure 5.2.9.
Source: JICA Study Team
Figure 5.2.9 Location of Payatas Landfill and Commercial Facilities in the Marikina River Basin

Republic of the Philippines Preparatory Survey on Water Supply and Sewerage Chapter 5 Development in the West Zone of Metro Manila Final Report Feasibility Study of Priority Sewerage Projects
5 - 67
2) Water Quality of the Marikina River Basin
Table 5.2.12 shows the results of water quality survey in the Marikina River basin. The results indicate that water quality during the rainy season is generally good, with the exception of Site 3, which is located in the tributary of the Marikina River that receives leachate from the Payatas Landfill and drainage from other upstream populations. The acrid odor noticeable in the river at this location suggests the presence of volatile solids from decomposing solid wastes. The intended points of interception would exclude leachate from the Payatas Landfill, and therefore the influent to the STP would be diluted, similar to the other data points. It is noted that the average influent BOD at the three sampling site is below Class SB effluent discharge standards.
Table 5.2.12 Water Quality of the Marikina River Tributaries (August 2012)
Parameter/ Location Site 1 Site 2 Site 3 Site 4 Max Min
pH 7.3 7.2 7.6 7.3 7.9 6.8 Temp (ºC) 25.7 25.1 26.9 26.1 28.9 24.7 DO (ppm) 1.8 1.1 0.2 2.8 2.9 0.2
BOD5 (mg/L) 17.7 21.0 147.7 8.3 204.0 5.0 COD (mg/L) 32.7 45.7 227.7 14.0 324.0 8.0 SS, (ml/L) 0.2 0.1 0.8 0.6 1.2 0.1
N-nitrate (mg/L) <0.5 <0.5 <0.5 <0.5 <0.5 <0.5 N-ammonia (mg/L) 12.2 12.5 95.1 6.2 126.8 3.4
Note: All reported values are average, except for maximum and minimum, which are individual grab samples
Source: JICA Study Team
3) Assumed Pollutant Loading The results of water quality survey in the Marikina River basin indicated that the influent wastewater BOD5 ranges from 20 mg/L to 175 mg/L, with a median value of 120 mg/L. TSS is assumed to be 200 mg/L. For purposes of feasibility study, influent COD, T-N, and T-P is roughly estimated at 235, 60, and 6, respectively.
(3) Preliminary Design of STP 1) Scope of STP Design For each candidate site of STP, preliminary design and layout plan are conducted. In this Study, sewage treatment process is designed based on CAS process, while sludge treatment process is made by gravity thickening and mechanical dewatering. In addition, the effluent water quality is considered as Class SB, but will require sufficient T-N and T-P removal in the future. Table 5.2.13 shows the summary of STP design criteria.

Republic of the Philippines Preparatory Survey on Water Supply and Sewerage Chapter 5 Development in the West Zone of Metro Manila Final Report Feasibility Study of Priority Sewerage Projects
5 - 68
Table 5.2.13 Design Criteria of STP in the Marikina River Basin STP Design Option 1 Option 1A Option 2 Option 3
Location of STP Site 1 Site 1A Site 2 Site 3STP Area (ha) 2.4 2.3 3.4 3.3Treatment Capacity (MLD) 56 56 56 56Sewage Treatment ProcessSludge Treatment Process Gravity Thickening - Mechanical Dewatering
CAS Process
Effluent Standard
Class SBBOD: 30 mg/LCOD: 60 mg/ L
SS: 50 mg/L
Planned Influent Quality
BOD: 120 mg/LCOD: 235 mg/LSS: 200 mg /LT-N: 60 mg/LT-P: 6 mg/L
Source: JICA Study Team
2) Preliminary Design of STP a) Necessity of Landfill The STP site for Option 1 is located beside the Marikina River. Therefore, landfill and land reclamation are required. On the other hand, the sites for Options 2 and 3 are located at higher grounds than Option 1, and quantity of landfill will be less as well.
b) Preliminary Treatment Facilities Preliminary treatment facilities consist of bar screens, influent PS, parshall flumes, and grit chambers. The design parameters for preliminary treatment facilities are shown in Table 5.2.14.

Republic of the Philippines Preparatory Survey on Water Supply and Sewerage Chapter 5 Development in the West Zone of Metro Manila Final Report Feasibility Study of Priority Sewerage Projects
5 - 69
Table 5.2.14 Design Parameters for Preliminary Treatment Facilities Process Facilities Design Parameter Quantity
Assumed velocity 0.9 m/sClear area through rack opening 0.53 m2
Clear width opening 0.7 mNumber of duty bar racks, mechanical bar screen 2 unitsStand-by bar racks, manual bar screen 1 unitSlope from vertical, degrees 15 - 45 degreeRetention time 3 minutesTotal volume 173 m3
Number of tank 2 tanksVolume per tank 86 m3
Side water depth 4 mArea per tank 21.5 m2
Length and width of tank 4.65 mNumber of duty parshall flume 2 unitsStand-by parshall flume 1 unitUpstream channel depth 230 mmUpstream channel width 845 mmThroat width 305 mmDownstream channel width 610 mmFlume length 2,870 mmDownstream channel depth 990 mmSurface load 1,800 m3/m2/dSettling velocity 0.2 m/sNumber of duty grit chamber 2 chambersStand-by grit chamber 1 chamberWidth 1.0 mLength 14.7 mWater depth 1.55 m
Bar Screens
Influent PS
Parshall Flume
Grit Chamber
Preliminary Treatment
Source; JICA Study Team
c) Sewage Treatment Facilities The sewage treatment facilities consist of primary clarifiers, aeration tanks, and secondary clarifiers. As for aeration tanks, anaerobic and aerobic tanks are designed in case T-N and T-P removal will be required in the future. The design parameters for sewage treatment facilities are shown in Table 5.2.15.

Republic of the Philippines Preparatory Survey on Water Supply and Sewerage Chapter 5 Development in the West Zone of Metro Manila Final Report Feasibility Study of Priority Sewerage Projects
5 - 70
Table 5.2.15 Design Parameters for Sewage Treatment Facilities
Process Facilities Design Parameter QuantityOverflow rate 40 m3/m2/dLiquid depth 3 mSurface area, m^2 1,400 m2
Diameter 30 mNumber of tanks 2 tanksDetention time 1.8 hoursAeration time 5 hoursTotal tank volume 11,460 m3
Number of tanks 2 tanksArea per tank, m^2 1,150 m2
Length x width 50 m x 23 mAeration time 3 hoursTotal tank volume 6,875 m3
Number of tanks 1 tankArea per tank 1,375 m2
Length x width 60 m x 23 mHydraulic loading rate 20 m3/m2/dLiquid depth 3 mSurface area 2,820 m2
Total tank volume 8,430 m3
Number of tanks 4 tanksArea per tank 705 m2
Diameter 30 m
Primary Clarifier
Aeration Tank
Anaerobic Tankand Aerobic Tank(future design for
T-N and T-Prmoval)
Secondary Clarifier
Sewage Treatment
Source; JICA Study Team
d) Disinfection Tanks Disinfection is required prior to discharging treated wastewater. The design parameters for disinfection are shown in Table 5.2.16.
Table 5.2.16 Design Parameters for Disinfection Tanks Process Facilities Design Parameter Quantity
Contact time 15 minutesTotal volume required 880 m3
Total area required 295 m2
Number of tanks 2 tanksLength x width 17 m x 9 mSide water depth 3 m
Disinfection TankDisinfection
Source; JICA Study Team
e) Sludge Treatment Facilities The sludge from the primary and secondary clarifiers shall be combined and blended in a common sludge tank, and then will flow to a gravity thickener. From the gravity thickener, the thickened sludge shall be pumped into a mechanical screw press dewatering machine. The screw press dewatering process reduces the volume of sludge through removing water content,
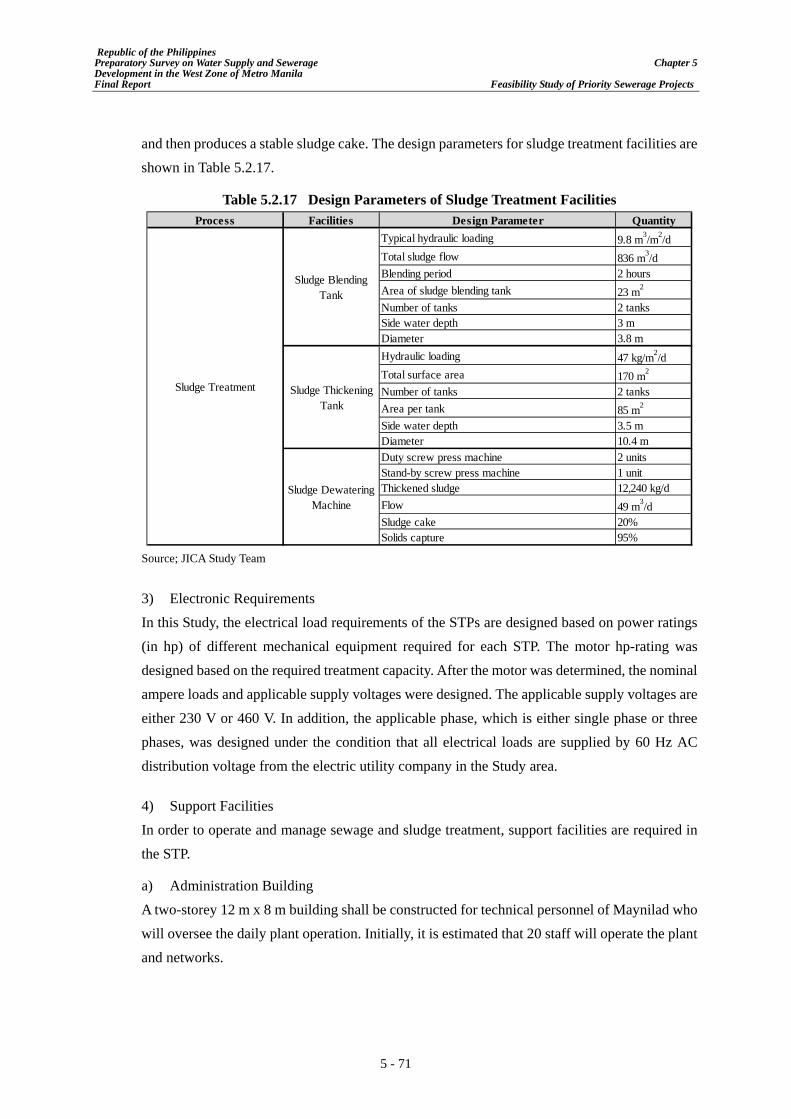
Republic of the Philippines Preparatory Survey on Water Supply and Sewerage Chapter 5 Development in the West Zone of Metro Manila Final Report Feasibility Study of Priority Sewerage Projects
5 - 71
and then produces a stable sludge cake. The design parameters for sludge treatment facilities are shown in Table 5.2.17.
Table 5.2.17 Design Parameters of Sludge Treatment Facilities Process Facilities Design Parameter Quantity
Typical hydraulic loading 9.8 m3/m2/dTotal sludge flow 836 m3/dBlending period 2 hoursArea of sludge blending tank 23 m2
Number of tanks 2 tanksSide water depth 3 mDiameter 3.8 mHydraulic loading 47 kg/m2/dTotal surface area 170 m2
Number of tanks 2 tanksArea per tank 85 m2
Side water depth 3.5 mDiameter 10.4 mDuty screw press machine 2 unitsStand-by screw press machine 1 unitThickened sludge 12,240 kg/dFlow 49 m3/dSludge cake 20%Solids capture 95%
Sludge ThickeningTank
Sludge BlendingTank
Sludge DewateringMachine
Sludge Treatment
Source; JICA Study Team
3) Electronic Requirements In this Study, the electrical load requirements of the STPs are designed based on power ratings (in hp) of different mechanical equipment required for each STP. The motor hp-rating was designed based on the required treatment capacity. After the motor was determined, the nominal ampere loads and applicable supply voltages were designed. The applicable supply voltages are either 230 V or 460 V. In addition, the applicable phase, which is either single phase or three phases, was designed under the condition that all electrical loads are supplied by 60 Hz AC distribution voltage from the electric utility company in the Study area.
4) Support Facilities In order to operate and manage sewage and sludge treatment, support facilities are required in the STP.
a) Administration Building A two-storey 12 m x 8 m building shall be constructed for technical personnel of Maynilad who will oversee the daily plant operation. Initially, it is estimated that 20 staff will operate the plant and networks.

Republic of the Philippines Preparatory Survey on Water Supply and Sewerage Chapter 5 Development in the West Zone of Metro Manila Final Report Feasibility Study of Priority Sewerage Projects
5 - 72
b) Laboratory Building A 6 m x 4 m building shall be constructed for the laboratory personnel and installation of tools, apparatus, and other laboratory equipment for efficient plant control and monitoring.
c) Power Building A 13 m x 6 m building shall be constructed to install the minimum back-up generating set that will supply power to the plant on its minimum flow rate. Emergency mechanical equipment shall be operated during power outage.
d) Blower Building A 28 m x 6 m building shall be constructed to install the required number of blowers that will provide the design oxygen requirements of the CAS process.
e) Return Activated Sludge Building An 8 m x 6 m building shall be constructed to install the required number of pumps that will return the activated sludge accumulated from the bottom of the secondary clarifiers.
f) Waste Activated Sludge Building A 10 m x 6 m building shall be constructed to install the required number of pumps that will remove excess or waste activated sludge accumulated from the bottom of the secondary clarifiers. The sludge shall be transferred to the sludge blending tanks.
g) Dewatering Building A building with a size of 16 m x 6 m shall be constructed to install the screw press machine that will dewater the sludge from the primary and secondary clarifiers.
(4) Facilities layout of the STP Figures 5.2.10 to 5.2.13 show the facilities layout plan for each design option.

Repu
blic of the P
hilippin
es P
reparatory Su
rvey on W
ater Su
pply and S
ewerage
C
hapter 5
Developm
ent in
the W
est Zon
e of Metro M
anila
F
inal R
eport F
easibility Study of P
riority Sew
erage Projects
5 - 73
Source: JIC
A Study Team
Figure 5.2.10 Facilities Layout of ST
P in the Marikina R
iver Basin (O
ption 1)

Repu
blic of the P
hilippin
es P
reparatory Su
rvey on W
ater Su
pply and S
ewerage
C
hapter 5
Developm
ent in
the W
est Zon
e of Metro M
anila
F
inal R
eport F
easibility Study of P
riority Sew
erage Projects
5 - 74
Source: JIC
A Study Team
Figure 5.2.11 Facilities Layout of ST
P in the Marikina R
iver Basin (O
ption 1A)

Repu
blic of the P
hilippin
es P
reparatory Su
rvey on W
ater Su
pply and S
ewerage
C
hapter 5
Developm
ent in
the W
est Zon
e of Metro M
anila
F
inal R
eport F
easibility Study of P
riority Sew
erage Projects
5 - 75
Source: JIC
A Study Team
Figure 5.2.12 Facilities Layout of ST
P in the Marikina R
iver Basin (O
ption 2)

Repu
blic of the P
hilippin
es P
reparatory Su
rvey on W
ater Su
pply and S
ewerage
C
hapter 5
Developm
ent in
the W
est Zon
e of Metro M
anila
F
inal R
eport F
easibility Study of P
riority Sew
erage Projects
5 - 76
Source: JIC
A Study Team
Figure 5.2.13 Facilities Layout of ST
P in the Marikina R
iver Basin (O
ption 3)

Republic of the Philippines Preparatory Survey on Water Supply and Sewerage Chapter 5 Development in the West Zone of Metro Manila Final Report Feasibility Study of Priority Sewerage Projects
5 - 77
5.2.4 Selection of Recommended Option for the Marikina River Basin
Preliminary designs were conducted for all options. The reasons are as follows:
The sewerage system of the Marikina River basin will be implemented starting in 2017 based on the upcoming business plan of Maynilad for 2017-2021;
Therefore, determining the STP location shall be avoided at present in case the chosen location is not available; and
Design options shall be compared considering not only the location of STP but also the costs (inclusive of O&M) and environmental impacts after preliminary design.
In this section, a recommended design will be selected to proceed preparation of the implementation plan, project cost estimates, and financial and economical analysis for the project on the Marikina River basin.
(1) Summary of the Preliminary Design The design summary for all options is shown in Table 5.2.18.
Table 5.2.18 Summarized Design Comparison of Each Option Component Unit Option 1 Option 2 Option 3
A. STP STP Site - Site 1 Site 2 Site 3STP Area ha 2.4 3.4 3.3STP Capacity MLD 56 56 56
B. Network (1) Open-Cut Method m 10,392 9,532 9,011
1) RCP m 7,093 6,233 5,6222) PVC m 3,113 3,113 2,9933) PE m 186 186 3964) HDPE m 0 0 0
(2) Pipe-Jacking Method m 7,583 7,463 8,0921) RCP m 6,183 6,093 7,2722) PVC m 0 0 03) PE m 1,030 1,030 8204) HDPE m 370 370 0
(3) Average Diameter mm 560 570 630(4) Average Depth of Sewer m 8.3 8.2 7.5(5) Interception Chambers units 60 60 60(6) Manholes units 225 216 216(7) PSs units 2 2 0
1) Large PS units 0 0 02) Medium PS units 1 1 03) Manhole PS units 1 1 0
Source: JICA Study Team
(2) Comparative Study for the Selection of Recommended Option 1) Location and Construction of STP
Location of STP varies for each option. Option 1 is in the upstream of the Marikina River, Option 2 is in the middle, and Option 3 is in the downstream. From the perspective of
Republic of the Philippines Preparatory Survey on Water Supply and Sewerage Chapter 5 Development in the West Zone of Metro Manila Final Report Feasibility Study of Priority Sewerage Projects
5 - 78
wastewater collection, Option 3 can collect by gravity flow. Therefore, PSs will not be required at the intermediate sections of sewer lines. On the other hand, Options 1 and 2 require sewer pipe against topography. Hence, only a few PSs will be required, while maintenance work on PSs will increase.
From the perspective of constructability, Option 1 is located in lowland areas beside the Marikina River. Therefore, more landfill will be required in order to prevent the flood from affecting the STP facilities, especially mechanical and electronic equipment. In addition, there are no access roads enough to transport construction materials. Hence, additional work such as construction of roads and land acquisition for access roads and electronic facilities will be required. As for Option 3, the site is located beside the main road. Therefore, the construction vehicles will have easy access. In addition, World Bank and DPWH are conducting study for flood control master plan in Metro Manila. In the study, beside the Marikina River such as Option 1 and Option 3 are seemed to be considered as candidate sites of flood control basins.
2) Construction of Sewer Network For the design of sewer networks, the quantity of open-cut and trenchless method is almost similar for all options. However, with respect to the number of manholes and average depth of sewer pipes, Option 3 is most advantageous. In addition, pipeline routes are also similar in each option. Therefore, the difference of sewer network for each option is insignificant compared with the location of STPs.
3) Environmental Impacts In the case of Option 1, there are no residents and no structure found within the site. Soil erosion and flood extent during typhoon events were noted along the river. Soil characteristics and river water level should be confirmed before the detailed design in order to design the adequate countermeasures. There might be a possibility of cutting trees due to the implementation of the project. Moreover, there is no access road to Site 1. As for Site 1A, there are no residents and structures found within the site, with soil conditions similar to Site 1. Access to this site will pass through narrow roads within residential areas.
In the case of Option 2, there were some abandoned buildings confirmed in the northern side of Site 2. There might be a possibility of cutting trees due to the implementation of the project. This site is in the center of relatively peaceful residential area, and the access road to this site will pass by residential areas.
In the case of Option 3, one caretaker designated by the respective landowners was living in temporary houses at the entrance of Site 3. Backfill materials have been stored in Site 3. Moreover, some permanent structures for worksite were noted at the eastern edge of Site 3.

Republic of the Philippines Preparatory Survey on Water Supply and Sewerage Chapter 5 Development in the West Zone of Metro Manila Final Report Feasibility Study of Priority Sewerage Projects
5 - 79
Table 5.2.19 shows the result of the alternative study for environmental and social considerations. Potential negative environmental impacts due to the implementation of the project are compared relatively according to three ranks, namely excellent, good, and poor, in each aspect based on the site inspection and satellite images.
Table 5.2.19 Environmental and Social Consideration in the Marikina River Basin
Land
Acq
uisit
ion
and
Res
ettle
men
t
Traf
ficC
onsid
erat
ions
Envi
ronm
enta
lIm
pact
1 Site 1 2.40
・The carabaowere left tograze.・On going soilerosion due to theturbulent of theriver wasobserved .・Access road tothe near site wasnot found
・No resettlement・No affeted Structure・Removal of vegetation(approximately 0.5 ha)・Frequent flooding/eroding・Individual / government landsneed to be acquired/transferredfor the site of STP.・Difficult to access to the sitebecause there is no paved roadto the site.
Excellent Poor good
1Alt
Site 1A 2.29
・Used/preparedfor planting field・Flooding traceby typhoon wasobserved.・Access road tothe near site isfeeder urbanroad.
・No resettlement・No affected Structure・No Felling trees・Frequent flooding/eroding・Individual / government landneeds to beacquired/transferred for the siteof STP.
Excellent Poor Excellent
2 Site 2 3.38
・ResidentialArea・Located athigher groundthan river bank・Concrete wallwas erectedsince there wasan on going court.・No one living
・No resettlement・Permanent structure isClubhouse only, no living.・Clearing of trees(approximately 0.3 ha)・Individual land needs to beacquired for the site of STP.
Good Good Good
・Flat vacant feild・Backfillmaterials havebeen stored.
・There is One caretaker.・Two Permanent structure・Clearing of trees (less than0.1 ha)・Individual land needs to beacquired for the site of STP.
・Flat vacant fieldcovered withgrass
・No resettlement・No Structure・Clearing of trees(approximately 0.1 ha)・Individual land needs to beacquired for the site of STP.
EnvironmentalRemark/Potential Impact
Loca
tion
Area(ha) Land Use Current situation
(July, 2012)
3 3.27
Option/No.
Evaluation(Excellent > Good > Poor)
GoodGood ExcellentSite 3
Source: JICA Study Team

Republic of the Philippines Preparatory Survey on Water Supply and Sewerage Chapter 5 Development in the West Zone of Metro Manila Final Report Feasibility Study of Priority Sewerage Projects
5 - 80
4) Preliminary Construction and O&M Cost This section describes the cost comparison in order to recommend a design option. Table 5.2.20 compares the costs of each option. Construction cost is divided into STP and sewer network. O&M costs include staffing and variable costs which are estimated for 15 years. As a result, the total cost of Option 1 is the cheapest, while Option 3 is the most expensive. However, cost estimates are focused only on sewerage facilities, as subconstruction works such as access roads are not considered. Therefore, Option 1 will be more expensive because land acquisition and construction for access roads will be required. Construction of access road is roughly estimated PHP 4 million for 1 km length with 4 m width.
Table 5.2.20 Comparison of Preliminary Construction and O&M Cost for Each Option
Option 1 Option 2 Option 3PHP PHP PHP
Site Development 173,033,000 102,708,000 130,589,000 Civil Works for Treatment Facilities 1,136,631,000 1,136,631,000 1,136,631,000 Mechanical and Electrical Works 332,819,000 332,819,000 336,194,000 Support Facilities 28,840,000 28,840,000 28,840,000
Sub-Total 1,671,323,000 1,600,998,000 1,632,254,000
Sewer NetworkOption 1 Option 2 Option 3
PHP PHP PHP
Open Cut Method 758,699,000 685,794,000 690,764,000 Pipe Jacking Method 823,806,000 996,264,000 1,255,993,000 Interception Chambers 12,870,000 12,870,000 12,870,000 Manholes 81,292,000 83,775,000 96,717,000 Pumping Stations 16,114,000 16,114,000 -
Sub-Total 1,692,781,000 1,794,817,000 2,056,344,000
O & M and Land AcquisitionOption 1 Option 2 Option 3
PHP PHP PHP
Staffing Cost/m3 2.27 2.27 2.27 Variable Cost (power, chemicals, etc.) 3.08 3.08 3.08 Total O & M Cost/m3 5.35 5.35 5.35 Total O & M Cost/day 300,000 300,000 300,000 Total O & M Cost/year 109,500,000 109,500,000 109,500,000
Total Cost at 15 year Operation 1,642,500,000 1,642,500,000 1,642,500,000 Land Acquisition Cost 177,600,000 251,600,000 654,000,000
Sub-Total 1,820,100,000 1,894,100,000 2,296,500,000
Grand Total 5,184,204,000 5,289,915,000 5,985,098,000 ※Construction cost of access road for Option 1 is estimated about PHP 4 million.
Item
Item
Item
STP
Source: JICA Study Team

Republic of the Philippines Preparatory Survey on Water Supply and Sewerage Chapter 5 Development in the West Zone of Metro Manila Final Report Feasibility Study of Priority Sewerage Projects
5 - 81
(3) Selection of Recommended Design Option for the Marikina River basin The design option shall be recommended based on conditions of constructability, environmental impacts, and preliminary cost estimates. Table 5.2.21 shows the evaluation of each design option. From the result of the evaluation, the Study Team recommended Option 3 as the project for the Marikina River basin.
Table 5.2.21 Evaluation of Each Option for the Marikina River Basin Option 1 Option 2 Option 3
Constructability ofSTP
Poor(require much landfill, and high flood risk)
Good(Not required landfilling)
Good(Basically landfilling is not required, but
southern part beside the Marikina River maybe required it)
Constructability ofSewer Network
Fair(Depth becomes deep, but can be reduce
sizes)
Fair(Depth becomes deep, but can be reduce
sizes)
Good(No PSs, and shallower pipe laying)
EnvironmentalImpact
Poor(No residents, but there are utilized as farm
land)
Poor(Located at residential area)
Good(Located nearby residential area, but no
residents)
Construction andO&M Cost
Good(Cheapest, but it is required construction of
access road and power supply facilities)
Good(Cheaper than Option 3 and not required otherconstruction such as road and power supply
facilities)
Fair(Most expensive because of high cost for big
size pipes installation)
Land AcquisitionCost
Excellent( Cheaest)
Good( Cheaper than Option 3)
Fair(Most expensive)
Access to STP Poor(No wide access roads and electronic facilities)
Good(Need to pass some security guards in
residential area)Excellent
ConcernedAdditional Works
Need to construct access roadNeed to serve electronic sources
Need to get approval from residentialowners or developers
None
TotalEvaluation
Fair Fair Good
Source: JICA Study Team
5.2.5 Design Detail of the Recommended Option (1) Sewer Network 1) Pipe Diameter, Materials, and Construction Method
Table 5.2.22 shows the design pipe diameter and length for each material and construction method.

Republic of the Philippines Preparatory Survey on Water Supply and Sewerage Chapter 5 Development in the West Zone of Metro Manila Final Report Feasibility Study of Priority Sewerage Projects
5 - 82
Table 5.2.22 Design Diameter and Length for Each Material and Construction Method
Open-Cut Trenchless Open-Cut Trenchless Open-Cut Trenchless(m) (m) (m) (m) (m) (m)
200 100 775 - - 830 - 250 - 45 - - 312 - 300 - 140 140 210 1,223 - 350 - - 256 240 628 - 400 2,437 280 - 370 - - 450 830 40 - - - - 500 195 95 - - - - 600 216 130 - - - - 700 331 - - - - - 800 - 816 - - - - 900 1,513 1,138 - - - -
1000 - 552 - - - - 1100 - 2,605 - - - - 1200 - 656 - - - -
5,622 7,272 396 820 2,993 - Sub-TotalTotal 12,894
Grand Total
Location of STP
17,103
Option 3
1,216 2,993
Site 3
Sewer LineRC PE PVC
Pipe Diameter(mm)
(Gravity Flow)
Source: JICA Study Team
2) Plan and Profile Plan and profile, which include MHs and ICs, are prepared as preliminary design. The figures are shown in annex report of the Preliminary Design Drawings.
3) PSs PSs are not required based on the recommended option.
(2) STP 1) Treatment and Support Facilities Table 5.2.23 summarizes the list of facilities and design quantities for the STP. The treatment capacity of the STP is 56,000 m3/d, which will be the daily maximum volume in 2037. CAS method will be applied for sewage treatment, while thickening and dewatering with applied for sludge treatment. The layout plan is shown in Figure 5.2.14.

Republic of the Philippines Preparatory Survey on Water Supply and Sewerage Chapter 5 Development in the West Zone of Metro Manila Final Report Feasibility Study of Priority Sewerage Projects
5 - 83
Table 5.2.23 Facilities List and Design Quantities
Unit Quantity Remarks
m3 4.6 3 Units
m3 11.6 3 Units
m3 101 3 Units
m3 202 2 Units
m3 5,060 2 Units
m3 13,119 2 Units
m3 7,871 1 Unit
m3 10,120 4 Units
m3 83.6 2 Units
m3 699 2 Units
m3 1,054 2 Units
m3 192 12 m x 8 m x 2 floor
m3 24 6 m x 4 m
m3 16 4 m x 4 m
m3 48 8 m x 6 m
m3 60 10 m x 6 m
m3 108 28 m x 6 m
m3 78 13 m x 6 m
m3 96 16 m x 6 m
m3 18 6 m x 3 m
m3 200
1-1. Treatment Facilities
1-2. Support Facilities
Administration/Control/Workshop Building
Laboratory Building
Guard House
RAS Building
Dewatering Building
Pump House/Shelter
WAS Building
Blower Building
Power House & Genset Building
Parking Area
Treatment Facilities / Support Facilities
1. Facilities
Bar Rack Chamber
Parshall Flume
Aeration Tanks
Anaerobic/Anoxic Tank
Secondary Clarifiers
Grit Chambers
Influent Pumping Station
Primary Clarifiers
Sludge Blending Tanks
Thickener Tanks
Disinfection Tank
Source: JICA Study Team
2) Mechanical and Electrical Equipment Mechanical equipment such as scrapers and pumps are required for sewage and sludge treatment. The quantity of the mechanical equipment and applicable motor sizes were designed based on the required capacity. Based on these mechanical requirements, the electrical requirements such as the electrical service scheme, panelboard load schedule, voltage drop, and power riser diagrams were designed as well. Table 5.2.24 shows the list of equipment and design requirements.

Republic of the Philippines Preparatory Survey on Water Supply and Sewerage Chapter 5 Development in the West Zone of Metro Manila Final Report Feasibility Study of Priority Sewerage Projects
5 - 84
Table 5.2.24 List of Equipment and Design Requirements
Unit Quantity Remarks
unit 2
unit 1
SP-1A, SP-1B, SP-1C, SP-1D, SP-1E, SP-1F (Duty) unit 6
SP-2A, SP-2B (Stand by) unit 2
CDU-1 unit 1
CDU-2 unit 1
SP-2A (Duty) unit 1
SP-2B (Stand by) unit 1
SP-3A (Duty) unit 1
SP-3B (Stand by) unit 1
BL-1A, BL-1B, BL-1C (Duty) unit 3
BL-1D (Stand by) unit 1
unit 3,287
CDU-4 unit 1
CDU-5 unit 1
CDU-6 unit 1
CDU-7 unit 1
SP-4A (Duty) unit 1
SP-4B (Stand by) unit 1
SP-5A (Duty) unit 1
SP-5B (Stand by) unit 1
SP-6A (Duty) unit 1
SP-6B (Stand by) unit 1
SP-7A (Duty) unit 1
SP-7B (Stand by) unit 1
SBM-1 (Duty) unit 1
SBM-2 (Stand by) unit 1
2-6. Sludge Blending Tanks
Sludge Transfer PumpsFlow capacity: 1.64 m3/min, TDH: 10 m,Motor: 7.5 hp, 460 v-3 ph-60 Hz
2-2. Influent PS
Sludge Blend Mixer
Motor: 1.5 hp, 230 v-3 ph-60 Hz
Sludge Pumps (centrifugal end-suction non-clog type) For WAS buildingFlow capacity: 1.22 m3/hr, TDH: 10 m,Motor: 5 hp, 460 v-3 ph-60 Hz
Sludge Pumps (centrifugal end-suction non-clog type) For RAS buildingFlow capacity: 583 m3/hr, TDH: 10 m,Motor: 40 hp, 460 v-3 ph-60 Hz
Travelling Scraper (with skimmer and motor drive unit)
Motor: 3 hp, 230 v-3 ph-60 Hz
Scum Pumps (submersible non-clog type)Flow capacity: 0.23 m3/hr, TDH: 10 mMotor: 0.5 hp, 230 v-1 ph-60 Hz
Blower PowerRequirement capacity: 193.8 m3/minMotor: 100 hp, 460 v- 3 ph- 60 Hz
Fine Bubble Membrane Diffusers
2-5. Secondary Clarifier
2-4. Aeration Tank
Scum Pumps (submersible non-clog type)Flow capacity: 0.23 m3/hr, TDH: 10 m,Motor: 0.5 hp, 230 v-1 ph-60 Hz
Sludge Pumps (centrifugal end-suction non-clog type) For WAS buildingFlow capacity: 1.28 m3/min, TDH: 10 m,Motor: 5 hp, 460 v-3 ph-60 Hz
Bar Rack (Duty, mechanical type)
Bar Rack (Stand by, manual type)
Transfer Pump (Submersible non-clog type) Flow capacity: 3500 m3/hr, Pumps: 583.3m3/hr,TDH: 30 m, Motor: 100 hp, 460 v-3 ph-60 Hz
Travelling Scraper (with skimmer and motor drive unit)
Motor: 3 hp, 230 v-3 ph-60 Hz
2. Mechanical and Electrical Equipments
Bar rack chamber
Facilities / Equipment
2-1. Bar Rack Chamber
2-3. Primary Clarifier

Republic of the Philippines Preparatory Survey on Water Supply and Sewerage Chapter 5 Development in the West Zone of Metro Manila Final Report Feasibility Study of Priority Sewerage Projects
5 - 85
Unit Quantity Remarks
SP-8A (Duty) unit 1
SP-8B (Stand by) unit 1
TDU-1 (Duty) unit 1
TDU-2 (Stand by) unit 1
unit 2Pump capacity: 583.33 m3/ hr (25% of treatedwastewater), TDH: 20 m,Motor: 75 hp, 460 v-3 ph-60 Hz
unit 2Thickened sludge: 32,876 kg/day,Flow capacity: 133 m3/ daySludge cake: 20%, Solid capture: 95%
unit 2Capacity: 0 - 150 L/H,Discharge Pressure=3 kg/cm2,Power: 0. 5 hp, 230 v-1 ph-60 Hz
unit 2Capacity= 10-20 L/H,Discharge Pressure=3 kg/cm2,Power: 0. 5 hp, 230 v-1 ph-60 Hz
unit 1 Velocity gradient= 50 s-1,Power: 0. 5 hp, 230 v-1 ph-60 Hz
unit 2 TDH: 10 m, Motor: 3 hp, 230v-3 ph-60 Hz
unit 2 Flow capacity: 0.19 m3/ min,TDH: 25 m, Motor: 2 hp, 230 v-1 ph-60 Hz
lot 1
lot 1
lot 1
lot 1
set 1
set 1
set 1
500 KVA rating, 3 Ph, 60 Hz, 460 v primary - 230 v secondary
250 KVA, 3 ph, 60 hz, 460 v Primary- 230 v Secondary,
75 KVA, 3 ph, 60 hz, 460 v Primary- 230 v Secondary,
Facilities / Equipments
Transfer Pump for domestic water, submersible type (TP-1A, TP-1B)
2-11. Electrical Equipment
Wires and Conduits
MCC for STP
Distribution Panels
1 MVA, 34.5 KV or 13.8 KVA - 460 v, 3 Ph, 60 Hz Pad Mounted Type
UREA Feed Pump (UP-1A, UP-1B)
Polymer Dosing Pump (PP-1A, PP-1B)
Polymer Tank Mixer (PM-1)
Drain Pump (DP-1A, DP-1B)
Flow capacity: 1.64 m3/min, TDH: 10 m,Motor: 7.5 hp, 460 v-3 ph-60 Hz
2-10. Administrative Building
2-8. Disinfection Tank
Recycle Pump (RP-1A, RP-1B)
2-9. Sludge Dewatering Facility
Screw Press Dewatering Machine with screw conveyor
2-7. Sludge Thickener Tanks
Sludge Transfer Pumps
Sludge Thickener Tank
Motor: 1.5 hp, 230 v-3 ph-60 Hz
Source: JICA Study Team
a) Mechanical Process Diagram Figure 5.2.14 shows the mechanical process diagram. This figure is also included in the Preliminary Design Drawings.

Republic of the Philippines Preparatory Survey on Water Supply and Sewerage Chapter 5 Development in the West Zone of Metro Manila Final Report Feasibility Study of Priority Sewerage Projects
5 - 86
Source: JICA Study Team
Figure 5.2.14 Mechanical Process Diagram
b) Power Supply of the STP For the power supply of the STP, a power riser single-line diagram is designed as shown in Figure 5.2.15. The diagram consists of 460 VAC low voltage switchgears with all the connected loads being supplied by the outgoing feeders. The automatic switch panel contains electrical and mechanical interlocking interconnections of the ATS circuit breakers to the proposed 500 kVA standby diesel generator that will supply power to all essential loads in the system in case of power outage. The wires for the interconnections between the switchgear were properly sized and indicated on the riser diagram.
In addition, another power single-line diagram is designed as shown in Figure 5.2.16. This diagram consists of 460 VAC non-essential load switchgear. The wires for the interconnection between the switchgear were properly sized and indicated on the riser diagram.
These figures are also included in the Preliminary Design Drawings.

Repu
blic of the P
hilippin
es P
reparatory Su
rvey on W
ater Su
pply and S
ewerage
C
hapter 5
Developm
ent in
the W
est Zon
e of Metro M
anila
F
inal R
eport F
easibility Study of P
riority Sew
erage Projects
5 - 87
Source: JIC
A Study Team
Figure 5.2.15 Power R
iser Single-line Diagram
1

Repu
blic of the P
hilippin
es P
reparatory Su
rvey on W
ater Su
pply and S
ewerage
C
hapter 5
Developm
ent in
the W
est Zon
e of Metro M
anila
F
inal R
eport F
easibility Study of P
riority Sew
erage Projects
5 - 88
Source: JIC
A Study Team
Figure 5.2.16 Power R
iser Single-line Diagram
2

Republic of the Philippines Preparatory Survey on Water Supply and Sewerage Chapter 5 Development in the West Zone of Metro Manila Final Report Feasibility Study of Priority Sewerage Projects
5 - 89
c) Load Calculation Design loads are calculated as shown in Table 5.2.25 for essential loads, and Table 5.2.26 for non-essential loads. The total load is calculated as 500 kVA for essential loads, and 1000 kVA for non-essential loads.
Table 5.2.25 Load Calculation for Essential Loads Load Schedule: 460 VAC Outgoing Feeders Panel Site 3 e Plinth Mounted, Nema 1 Enclo. Volts: 460 PHASE: 3
AB BC CA 3Ø AT AF POLE1 Submersible Pump, SP-1A 1 100,390.00 460 126.00 300 400 3P 3-125 mm² THHN 1-30 mm² TW 80 mm Ø PVC
2 Submersible Pump, SP-1D 1 100,390.00 460 126.00 300 400 3P 3-125 mm² THHN 1-30 mm² TW 80 mm Ø PVC
3 Blower Motor, BL-1A 1 100,390.00 460 126.00 300 400 3P 3-125 mm² THHN 1-30 mm² TW 80 mm Ø PVC
4 Recycle Pump, RP-1 1 76,567.00 460 96.10 200 225 3P 3-80 mm² THHN 1-22 mm² TW 63 mm Ø PVC
5 75 KVA 460-230 V Transformer 1 39,262.50 460 64.82 64.19 49.19 225 225 3P 3-100.0 mm² THHN 1-30.0 mm² TW 80 mm Ø PVC
6 SPARE 1 3,984.00 460 5.00 20 100 3P - - -
TOTAL 420,984 64.82 64.19 49.19 479.10
Load Schedule: 230 VAC Outgoing Feeders Panel Site 3 e Plinth Mounted, Nema 1 Enclo. Volts: 230 PHASE: 3
AB BC CA 3Ø AT AF POLE1 Admin Building, Panel LP-1A 1 13,342.00 230 21.50 23.00 22.25 70 100 3P 3-22.0 mm² THHN 1-8.0 mm² TW 40 mm Ø PVC
2 Admin Building, Panel PP-1A 1 20,353.00 230 32.04 30.05 27.07 125 225 3P 3-38.0 mm² THHN 1-14.0 mm² TW 50 mm Ø PVC
3 External Lighting, LP-EX2 1 13,226.00 230 19.20 19.20 19.20 40 100 3P 3-8.0 mm² THHN 1-8.0 mm² TW 25 mm Ø PVC
4 Powerhouse Bldg., LP-PH 1 12,434.00 230 18.41 17.63 15.46 70 100 3P 3-14.0 mm² THHN 1-8.0 mm² TW 32 mm Ø PVC
5 Powerhouse Bldg., PP-PH 1 15,720.00 230 33.50 33.50 10.00 70 100 3P 3-14.0 mm² THHN 1-8.0 mm² TW 32 mm Ø PVC
6 SPARE 1 1,150.00 230 5.00 20 100 2P - - -
7 SPARE 1 1,150.00 230 5.00 20 100 2P - - -
8 SPARE 1 1,150.00 230 5.00 20 100 2P - - -
TOTAL 78,525 129.65 128.38 98.98
AMPERAGE PROTECTIONSERVICE WIRE NEUTRAL WIRE CONDUIT SIZE
ESSENTIAL LOADS
Ckt.No.
CONNECTED LOAD QTY. VA LOAD AC Volts
AMPERAGE PROTECTIONSERVICE WIRE NEUTRAL WIRE CONDUIT SIZE
ESSENTIAL LOADS
Ckt.No.
CONNECTED LOAD QTY. VA LOAD AC Volts
Source: JICA Study Team
Table 5.2.26 Load Calculation for Non-Essential Loads Load Schedule: 460 VAC Outgoing Feeders Panel Site 3 Concrete Plinth Mounted, Nema 1 Enclo. Volts: 460 PHASE: 3
AB BC CA 3Ø AT AF POLE
1 Submersible Pump, SP-1B 1 100,390.00 460 126.00 300 400 3P 3-125 mm² THHN 1-30 mm² TW 80 mm Ø PVC
2 Submersible Pump, SP-1C 1 100,390.00 460 126.00 300 400 3P 3-125 mm² THHN 1-30 mm² TW 80 mm Ø PVC
3 Submersible Pump, SP-1E 1 100,390.00 460 126.00 300 400 3P 3-125 mm² THHN 1-30 mm² TW 80 mm Ø PVC
4 Submersible Pump, SP-1F 1 100,390.00 460 126.00 300 400 3P 3-125 mm² THHN 1-30 mm² TW 80 mm Ø PVC
5 Submersible Pump, SP-1G 1 (100,390.00) 460 (126.00) 300 400 3P 3-125 mm² THHN 1-30 mm² TW 80 mm Ø PVC
6 Submersible Pump, SP-1H 1 (100,390.00) 460 (126.00) 300 400 3P 3-125 mm² THHN 1-30 mm² TW 80 mm Ø PVC
7 Blower Motor, BL-1B 1 100,390.00 460 126.00 300 400 3P 3-125 mm² THHN 1-30 mm² TW 80 mm Ø PVC
8 Blower Motor, BL-1C 1 100,390.00 460 126.00 300 400 3P 3-125 mm² THHN 1-30 mm² TW 80 mm Ø PVC
9 Blower Motor, BL-2 1 (100,390.00) 460 (126.00) 300 400 3P 3-125 mm² THHN 1-30 mm² TW 80 mm Ø PVC
10 Recycle Pump, RP-2 1 76,567.00 460 96.10 200 225 3p 3-80 mm² THHN 1-22 mm² TW 63 mm Ø PVC
11 Sludge Pump RAS, SP-6 1 41,829.00 460 52.50 100 100 3P 3-30 mm² THHN 1-8.0 mm² TW 40 mm Ø PVC
12 Sludge Pump RAS, SP-6 1 (41,829.00) 460 (52.50) 100 100 3P 3-30 mm² THHN 1-8.0 mm² TW 40 mm Ø PVC
13 Sludge Pump WAS, SP-3 1 6,294.00 460 7.90 20 100 3P 3-3.5 mm² THHN 1-2.0 mm² TW 20 mm Ø PVC
14 Sludge Pump WAS, SP-3 1 (6,294.00) 460 (7.90) 20 100 3P 3-3.5 mm² THHN 1-2.0 mm² TW 20 mm Ø PVC
15 Sludge Pump WAS, SP-5 1 6,294.00 460 7.90 20 100 3P 3-3.5 mm² THHN 1-2.0 mm² TW 20 mm Ø PVC
16 Sludge Pump WAS, SP-5 1 (6,294.00) 460 (7.90) 20 100 3P 3-3.5 mm² THHN 1-2.0 mm² TW 20 mm Ø PVC
17 Sludge Transfer Pump, SP-7 1 9,003.00 460 11.30 30 100 3P 3-5.5 mm² THHN 1-3.5 mm² TW 25 mm Ø PVC
18 Sludge Transfer Pump, SP-7 1 (9003.00) 460 (11.30) 30 100 3P 3-5.5 mm² THHN 1-3.5 mm² TW 25 mm Ø PVC
19 Sludge Transfer Pump, SP-8 1 9,003.00 460 11.30 30 100 3P 3-5.5 mm² THHN 1-3.5 mm² TW 25 mm Ø PVC
20 Sludge Transfer Pump, SP-8 1 (9003.00) 460 (11.30) 30 100 3P 3-5.5 mm² THHN 1-3.5 mm² TW 25 mm Ø PVC
21 Screw Press Machine, SPM-1 1 21,831.00 460 27.40 60 100 3P 3-8.0 mm² THHN 1-5.5 mm² TW 25 mm Ø PVC
22 Screw Press Machine, SPM-1 1 (21,831.00) 460 (27.40) 60 100 3P 3-8.0 mm² THHN 1-5.5 mm² TW 25 mm Ø PVC
23 Screw Conveyor Machine, SCM-1 1 11,553.00 460 14.50 30 100 3P 3-5.5 mm² THHN 1-3.5 mm² TW 25 mm Ø PVC
24 Screw Conveyor Machine, SCM-1 1 (11,553.00) 460 (14.30) 30 100 3P 3-5.5 mm² THHN 1-3.5 mm² TW 25 mm Ø PVC
25 SPARE 1 3,984.00 460 5.00 20 100 3P - - -
26 SPARE 1 3,984.00 460 5.00 20 100 3P - - -
27 SPARE 1 3,984.00 460 5.00 20 100 3P - - -
28 250 KVA, 460-230V Transformer 1 68,128.50 460 55.92 56.30 52.15 50.24 300 400 3P 2(3-100 mm²) THHN 1-30 mm² TW 80 mm Ø PVC
TOTAL 864,795 55.92 56.30 52.15 1,050.14
AMPERAGE PROTECTIONSERVICE WIRE NEUTRAL WIRE CONDUIT SIZE
NON-ESSENTIAL LOADS
Ckt.No.
CONNECTED LOAD QTY. VA LOAD AC Volts

Republic of the Philippines Preparatory Survey on Water Supply and Sewerage Chapter 5 Development in the West Zone of Metro Manila Final Report Feasibility Study of Priority Sewerage Projects
5 - 90
Load Schedule: 230 VAC Outgoing Feeders Panel Site 3 Concrete Plinth Mounted, Nema 1 Enclo. Volts: 230 PHASE: 3
AB BC CA 3Ø AT AF POLE
1 Drain Pump, DP-1 1 3,976.00 230 9.98 30 100 3P 3-5.5 mm² THHN 1-3.5 mm² TW 20 mm Ø PVC
2 Drain Pump, DP-1 1 3,976.00 230 9.98 30 100 3P 3-5.5 mm² THHN 1-3.5 mm² TW 20 mm Ø PVC
3 Clarifier Drive Unit, CDU-1 1 3,976.00 230 9.98 30 100 3P 3-5.5 mm² THHN 1-3.5 mm² TW 20 mm Ø PVC
4 Clarifier Drive Unit, CDU-2 1 3,976.00 230 9.98 30 100 3P 3-5.5 mm² THHN 1-3.5 mm² TW 20 mm Ø PVC
5 Clarifier Drive Unit, CDU-3 1 3,976.00 230 9.98 30 100 3P 3-5.5 mm² THHN 1-3.5 mm² TW 20 mm Ø PVC
6 Clarifier Drive Unit, CDU-4 1 3,976.00 230 9.98 30 100 3P 3-5.5 mm² THHN 1-3.5 mm² TW 20 mm Ø PVC
7 Clarifier Drive Unit, CDU-5 1 3,976.00 230 9.98 30 100 3P 3-5.5 mm² THHN 1-3.5 mm² TW 20 mm Ø PVC
8 Clarifier Drive Unit, CDU-6 1 3,976.00 230 9.98 30 100 3P 3-5.5 mm² THHN 1-3.5 mm² TW 20 mm Ø PVC
9 Thickener Drive Unit, TDU-1 1 2,055.00 230 5.16 30 100 3P 3-5.5 mm² THHN 1-3.5 mm² TW 20 mm Ø PVC
10 Thickener Drive Unit, TDU-1 1 2,055.00 230 5.16 30 100 3P 3-5.5 mm² THHN 1-3.5 mm² TW 20 mm Ø PVC
11 Sludge Blend Mixer, SBM-1 1 2,055.00 230 5.16 30 100 3P 3-5.5 mm² THHN 1-3.5 mm² TW 20 mm Ø PVC
12 Sludge Blend Mixer, SBM-1 1 2,055.00 230 5.16 30 100 3P 3-5.5 mm² THHN 1-3.5 mm² TW 20 mm Ø PVC
13 Urea Feed Pump, UP-1 1 855.000 230 3.72 20 100 2P 2-3.5 mm² THHN 1-2.0 mm² TW 20 mm Ø PVC
14 Urea Feed Pump, UP-1 1 855.000 230 3.72 20 100 2P 2-3.5 mm² THHN 1-2.0 mm² TW 20 mm Ø PVC
15 Polymer Dosing Pump, PP-1 1 855.000 230 3.72 20 100 2P 2-3.5 mm² THHN 1-2.0 mm² TW 20 mm Ø PVC
16 Polymer Dosing Pump, PP-1 1 855.000 230 3.72 20 100 2P 2-3.5 mm² THHN 1-2.0 mm² TW 20 mm Ø PVC
17 Polymer Tank Mixer, PM-1 1 855.000 230 3.72 20 100 2P 2-3.5 mm² THHN 1-2.0 mm² TW 20 mm Ø PVC
18 Scum Pump, SP-4A 1 855.000 230 3.72 20 100 2P 2-3.5 mm² THHN 1-2.0 mm² TW 20 mm Ø PVC
19 Scum Pump, SP-4B 1 (855.00) 230 .(3.72) 20 100 2P 2-3.5 mm² THHN 1-2.0 mm² TW 20 mm Ø PVC
20 Scum Pump, SP-4C 1 855.000 230 3.72 20 100 2P 2-3.5 mm² THHN 1-2.0 mm² TW 20 mm Ø PVC
21 Scum Pump, SP-4D 1 (855.00) 230 .(3.72) 20 100 2P 2-3.5 mm² THHN 1-2.0 mm² TW 20 mm Ø PVC
22 Scum Pump, SP-2A 1 855.000 230 3.72 20 100 2P 2-3.5 mm² THHN 1-2.0 mm² TW 20 mm Ø PVC
23 Scum Pump, SP-2B 1 (855.00) 230 .(3.72) 20 100 2P 2-3.5 mm² THHN 1-2.0 mm² TW 20 mm Ø PVC
24 Admin Building, Panel LP-1 1 19,440.00 230 22.50 24.00 23.25 100 100 3P 3-30.0 mm² THHN 1-8.0 mm² TW 40 mm Ø PVC
25 Admin Building, Panel PP-1 1 21,428.00 230 33.73 31.64 28.50 175 225 3P 3-38.0 mm² THHN 1-14.0 mm² TW 63 mm Ø PVC
26 Laboratory Bldg., LP-LAB 1 1 12,468.00 230 20.25 21.60 20.92 175 225 3P 3-60.0 mm² THHN 1-14.0 mm² TW 50 mm Ø PVC
27 External Lighting, LP-EX 1 13,226.00 230 19.20 19.20 19.20 70 100 3P 3-22.0 mm² THHN 1-8.0 mm² TW 40 mm Ø PVC
28 Blower Building, LP-BL 1 7,609.00 230 13.29 13.29 8.60 40 100 3P 3-8.0 mm² THHN 1-8.0 mm² TW 25 mm Ø PVC
29 RAS Building, LP-RAS 1 7,609.00 230 13.29 13.29 8.60 40 100 3P 3-8.0 mm² THHN 1-8.0 mm² TW 25 mm Ø PVC
30 WAS Building, LP-WAS 1 7,609.00 230 13.29 13.29 8.60 40 100 3P 3-8.0 mm² THHN 1-8.0 mm² TW 25 mm Ø PVC
31 Dewatering Building, LP-DEWA 1 7,609.00 230 13.29 13.29 8.60 40 100 3P 3-8.0 mm² THHN 1-8.0 mm² TW 25 mm Ø PVC
32 SPARE 1 1,150.00 230 5.00 20 100 2P - - -
33 SPARE 1 1,150.00 230 5.00 20 100 2P - - -
34 SPARE 1 1,150.00 230 5.00 20 100 2P - - -
TOTAL 136,257.00 146.71 147.47 125.11 100.48
PROTECTIONSERVICE WIRE NEUTRAL WIRE CONDUIT SIZE
Ckt.No.
CONNECTED LOAD QTY. VA LOAD AC VoltsAMPERAGE
NON-ESSENTIAL LOADS
Source: JICA Study Team
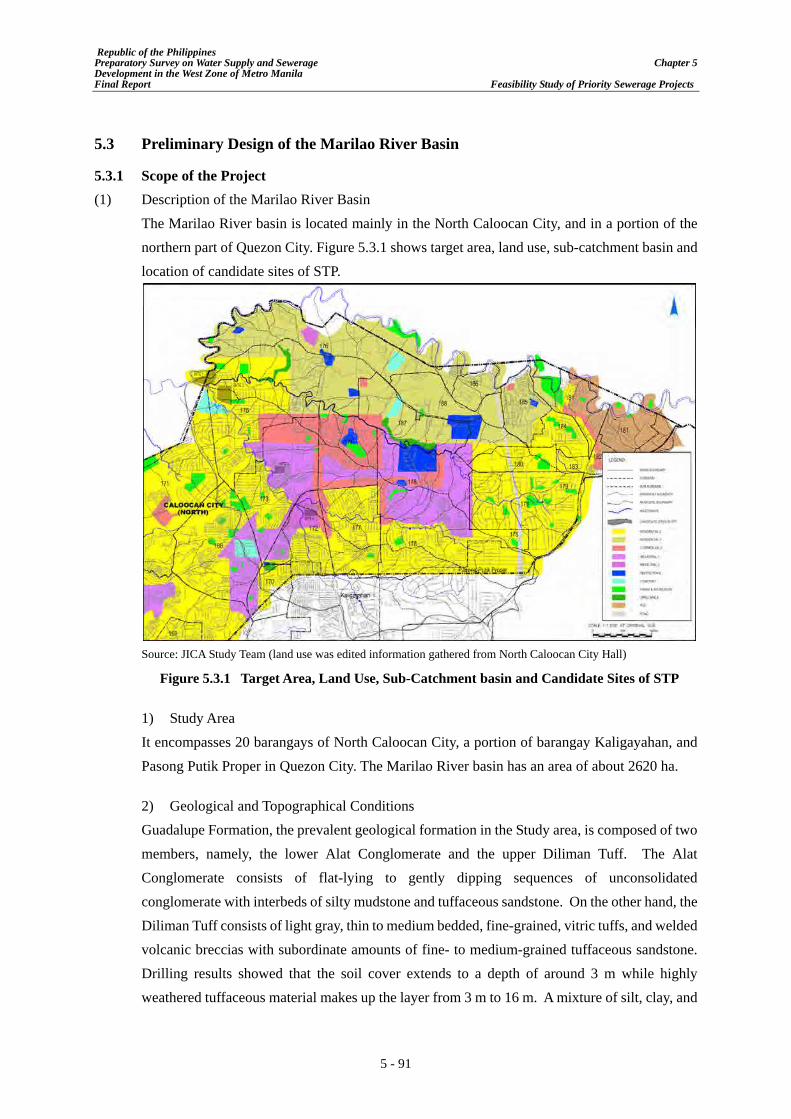
Republic of the Philippines Preparatory Survey on Water Supply and Sewerage Chapter 5 Development in the West Zone of Metro Manila Final Report Feasibility Study of Priority Sewerage Projects
5 - 91
5.3 Preliminary Design of the Marilao River Basin
5.3.1 Scope of the Project (1) Description of the Marilao River Basin
The Marilao River basin is located mainly in the North Caloocan City, and in a portion of the northern part of Quezon City. Figure 5.3.1 shows target area, land use, sub-catchment basin and location of candidate sites of STP.
Source: JICA Study Team (land use was edited information gathered from North Caloocan City Hall)
Figure 5.3.1 Target Area, Land Use, Sub-Catchment basin and Candidate Sites of STP
1) Study Area It encompasses 20 barangays of North Caloocan City, a portion of barangay Kaligayahan, and Pasong Putik Proper in Quezon City. The Marilao River basin has an area of about 2620 ha.
2) Geological and Topographical Conditions Guadalupe Formation, the prevalent geological formation in the Study area, is composed of two members, namely, the lower Alat Conglomerate and the upper Diliman Tuff. The Alat Conglomerate consists of flat-lying to gently dipping sequences of unconsolidated conglomerate with interbeds of silty mudstone and tuffaceous sandstone. On the other hand, the Diliman Tuff consists of light gray, thin to medium bedded, fine-grained, vitric tuffs, and welded volcanic breccias with subordinate amounts of fine- to medium-grained tuffaceous sandstone. Drilling results showed that the soil cover extends to a depth of around 3 m while highly weathered tuffaceous material makes up the layer from 3 m to 16 m. A mixture of silt, clay, and

Republic of the Philippines Preparatory Survey on Water Supply and Sewerage Chapter 5 Development in the West Zone of Metro Manila Final Report Feasibility Study of Priority Sewerage Projects
5 - 92
sand was encountered at depths between 16 m to 25 m.
Out of the total land area of North Caloocan, 58.49% or 2322.70 ha have gently to steeply undulating to rolling topography with slopes ranging from 3% to 18%. This terrain is noted in the northern and central portions and gradually transforms into a southward trend of flat lands down to the southwestern tip of the boundary. It is with the contours of Tala Estate (part of Pangarap Village) that the highest point of elevation was determined to be 120 m above mean sea level, while the old district of Kaybiga covers the lowest part at about 25 m above the same index. The route survey for the North Caloocan area shows that the topography is very uneven. Though generally the eastern part has a higher elevation than the western part where the proposed STP sites are located, the slope is not as uniform as in the Marikina River Basin.
3) Flood Condition The flood level of the Marilao River basin ranges from 1.5 m to 3.0 m above normal river water levels according to residents. The design of the STP must take flood levels into account. On the other hand, as shown in Figure 5.2.3, Word Bank prepared an inundation map which shows the maximum flood depth caused by Typhoon Ondoy. Results of the survey show that the flood level is estimated from 3 m to 5 m above normal river water level.
4) River Water Level For the Marilao River basin, the available data on the river water level could not be obtained in this Study. Therefore, as indicated in the WB study, the water level is assumed to reach 3 m to 5 m above river water level.
5) Drainage System Two major creeks, namely, Matarik and Camarin, the Sapang Alat River, and its tributaries drain naturally to the Study area. The three waterways merge with the Marilao River at the boundary of Caloocan City and Meycauayan, Bulacan. The presence of a network of rivers and creeks makes the area efficiently drained except for some portions which experience flash floods caused by the worsening condition of the waterways. The creeks and waterways in the Marilao River basin drain in a westerly direction towards the Tullahan River that later discharge to Pasig River and the Manila Bay. Population centers, subdivisions, and streets are laid with reinforced concrete pipes (RCPs) and reinforced concrete box culverts (RCBCs) which drain towards the river and creeks. Thus, similar to Quezon City, the existing drainage networks in Caloocan City are unclear because of insufficient data from relevant official agencies of the city. Therefore, it is necessary to confirm the discharge points by conducting a topographic survey in order to locate the proper interception points.

Republic of the Philippines Preparatory Survey on Water Supply and Sewerage Chapter 5 Development in the West Zone of Metro Manila Final Report Feasibility Study of Priority Sewerage Projects
5 - 93
6) Land Use Table 5.3.1 shows the previous (2001) and approved (2003) land use distribution of North Caloocan. The table shows that for year 2003 revision, the allocation for residential use was reduced to 60.1% while the allotment for industrial and commercial uses were increased to 17.2% and 7.7%, respectively. The Study Team was not able to locate a graphic illustration of the future land use plan, but there are indications that an urban core area is desired along major road corridors.
Table 5.3.1 Land Use Distribution of North Caloocan in 2001 and 2003
Source: ComprSource: Comprehensive Land Use Plan Report, City of Caloocan (1995-2020)
(2) Outline of Project Scope 1) Catchment Boundary
The catchment basins were divided based on the contour map provided by the GIS division of Maynilad. Since the available information on the drainage systems of Caloocan City is insufficient, it was supplemented by identifying the existing outfalls in the Study area during the topographic survey.
2) Candidate Sites of STP Four sites have been considered as candidate sites for the STPs in the Marilao River basin. Figure 5.3.3 shows the locations of the candidate sites for the STPs, designated as Site 1, 2, 3, and 4. The sites were selected because, currently, they are vacant or have minimal number of houses in the vicinity. The real estate market often changes abruptly, and so it is possible that additional sites may become available by the time the project will be implemented. Moreover, it is also possible that sites currently occupied may become available, such as abandoned
Land Use Land Use Distribution
(2001) Land Use Distribution
(January 2003 Revision) Difference % Change Land Area (ha) % Share Land Area (ha) % Share
Residential 2,597.10 65.4% 2,387.32 60.1% (209.78) -8.1%
Commercial 47.72 1.2% 307.66 7.7% 259.94 544.7%
Industrial 171.45 4.3% 683.03 17.2% 511.59 298.4%
Institutional 64.97 1.6% 73.95 1.9% 8.98 13.8%
Utilities 57.70 1.5% 1.78 2.1% 24.08 41.7%
Agro-Industrial 9.78 0.2% - 0.0% (9.78) -100.0%
Cemetery 30.34 0.8% 32.35 0.8% 2.00 6.6%Parks and Recreation 9.77 0.2% 125.90 3.2% 116.12 1,188.1%
Open Space - 0.0% 125.08 3.1% 125.08 0.0%
Vacant Land 982.07 24.7% - 0.0% (982.07) -100.0%
Planned - 0.0% 153.84 3.9% 153.84 0.0%
TOTAL 3,970.90 100.0% 3,970.90 100.0% 0.00 -

Republic of the Philippines Preparatory Survey on Water Supply and Sewerage Chapter 5 Development in the West Zone of Metro Manila Final Report Feasibility Study of Priority Sewerage Projects
5 - 94
industrial sites. In addition, the features of each candidate site are shown in Table 5.3.2.
Table 5.3.2 Features of Each Candidate Site for STP Candidate
Sites Area (ha) Features
Site 1 5.5 ╴ Located at the meeting point of main rivers in the area. ╴ Wastewater collection seems easy. ╴ This land is divided into two municipalities with two land owners
Site 2 5.6 ╴ The largest site among the candidate sites. ╴ Located at the meeting point of main rivers in the area. ╴ Located in North Caloocan City.
Site 3 1.9 ╴ Located at the middle point of the area. ╴ Additional land for STP will be required because the land area is not
enough to cover the sewage amount of the basin.
Site 4 1.9 ╴ Located at the middle point of the area. ╴ Additional land for STP will be required because the land area is not
enough to cover the sewage amount of the basin. Source: JICA Study Team
2) Sewer Network A sewer network was designed for each STP candidate site and their combinations. Sewer route shall be located and installed along public roads or lands in order to avoid land acquisition. In addition, the necessity and location of interceptor chambers (ICs) and pumping stations (PSs) shall be designed based on the results of the topographic survey.
5.3.2 Demand Prediction (1) Demography 1) Population and Households (2007 Census)
The population, number of households and average household size in the Marilao River basin are shown in Table 5.3.3 below, which is based on the 2007 Census of Population.

Republic of the Philippines Preparatory Survey on Water Supply and Sewerage Chapter 5 Development in the West Zone of Metro Manila Final Report Feasibility Study of Priority Sewerage Projects
5 - 95
Table 5.3.3 Population, Number of Households and Average Household Size in the Marilao River Basin
Province/City/Municipality/Barangay
2007 Census 2010 Census
PopulationHousehold Population
Number of Households
Average Household
Size Population
Caloocan City
(North)
1 Barangay 168 24,913 24,873 6,078 4.1 27,7362 Barangay 170 9,177 9,177 1,996 4.6 9,5933 Barangay 171 65,223 65,223 14,407 4.5 80,9314 Barangay 172 19,393 19,372 4,047 4.8 20,5095 Barangay 173 12,793 12,793 2,871 4.5 15,0246 Barangay 174 18,083 18,083 3,889 4.6 19,0527 Barangay 175 49,995 49,808 11,064 4.5 52,7798 Barangay 176 221,874 221,874 46,890 4.7 243,8909 Barangay 177 66,741 66,733 14,337 4.7 75,548
10 Barangay 178 85,851 85,851 18,083 4.7 97,06811 Barangay 179 30,511 30,472 6,368 4.8 31,82512 Barangay 180 9,231 9,231 2,031 4.5 14,12013 Barangay 181 20,064 20,064 4,376 4.6 23,92414 Barangay 182 10,505 10,505 2,195 4.8 9,72915 Barangay 183 3,668 3,658 811 4.5 3,64016 Barangay 184 2,363 2,363 534 4.4 2,67717 Barangay 185 23,956 23,956 5,107 4.7 26,30918 Barangay 186 16,375 16,285 3,832 4.2 18,16819 Barangay 187 17,358 17,314 3,647 4.7 20,04020 Barangay 188 22,397 22,389 4,474 5.0 24,567
Sub-Total 730,471 730,024 157,037 4.6 817,129
Quezon City
21 Kaligayahan 44,018 43,974 9,255 4.8 48,43322 Pasong Putik Proper 28,848 28,743 5,993 4.8 31,931
Sub-Total 72,866 72,717 15,248 4.8 80,364Total 803,337 802,741 172,285 4.7 897,493
Source: 2007 Census of Population, National Capital Region, National Statistics Office
2) Population Growth Figure 5.3.2 shows the trend of population growth in Caloocan City from 1975 to 2010. The population in 2010 was recorded approximately at 1.49 million, which shows a growth of 3.8 times the population in 1975.
397,201 467,816
763,415
1,023,1591,177,604
1,381,6101,489,949
0
500,000
1,000,000
1,500,000
2,000,000
1975 1980 1990 1995 2000 2007 2010
Caloocan city
Census year
Population (persons)
Source: 2010 and 2007 Census of Population, National Capital Region, National Statistics Office
Figure 5.3.2 Trend of Population Growth in Caloocan City from 1975 to 2010

Republic of the Philippines Preparatory Survey on Water Supply and Sewerage Chapter 5 Development in the West Zone of Metro Manila Final Report Feasibility Study of Priority Sewerage Projects
5 - 96
3) Birth and Mortality Rate Table 5.3.4 shows the health indicators in Caloocan City. The crude birth rate is 23.84 births per 1,000 persons.
Table 5.3.4 Health Indicators in Caloocan City Category Number
Crude Birth Rate (CBR) 23.84*Crude Death Rate (CDR) 3.02*Infant Mortality Rate (IMR) 2.50**Maternal Mortality Rate (MMR) 0.09**
Note: *Per 1000 Population, ** Per 1000 Live Births Source: Caloocan City Citizen’s Chapter 2011
(2) Population Projection The overall population of each barangay was part of the 2010 Census. The population projection from 2013 to 2037, which Maynilad estimated in its BP 2013, is used for the Study. However, the data projected for each barangay is not available. Therefore, the population growth rate of Caloocan City is used in the population projection of each barangay. The growth rate from 2013 to 2027 is about 4.1%, and that from 2028 to 2037 is about 1.9%. Table 5.3.5 and 5.3.6 shows the estimated future population in the Marilao River basin.
Table 5.3.5 Estimated Population in the Marilao River Basin (1/2)
Area(ha) 2013 2014 2015 2016 2017 2018 2019 2020
Barangy 168 32.0 4,413 4,456 4,501 4,544 4,588 4,630 4,673 4,715Barangy 170 25.7 4,339 4,382 4,425 4,468 4,511 4,553 4,595 4,637Barangy 171 19.3 4,283 4,325 4,368 4,410 4,453 4,494 4,536 4,577Barangy 172 70.6 16,298 16,459 16,622 16,783 16,945 17,102 17,259 17,415Barangy 173 198.5 15,730 15,886 16,044 16,199 16,355 16,507 16,658 16,809Barangy 174 111.0 17,982 18,160 18,340 18,518 18,696 18,870 19,043 19,216Barangy 175 175.2 50,226 50,724 51,227 51,723 52,222 52,706 53,189 53,672Barangy 176 365.2 232,798 235,108 237,440 239,735 242,054 244,293 246,532 248,772Barangy 177 118.5 68,623 69,304 69,992 70,668 71,352 72,012 72,672 73,332Barangy 178 292.2 84,510 85,348 86,195 87,028 87,870 88,682 89,496 90,309Barangy 179 185.0 29,838 30,134 30,434 30,727 31,025 31,312 31,599 31,886Barangy 180 57.3 14,784 14,930 15,078 15,224 15,371 15,513 15,656 15,798Barangy 181 73.4 25,048 25,297 25,548 25,795 26,044 26,285 26,526 26,767Barangy 182 58.7 10,186 10,287 10,389 10,490 10,591 10,689 10,787 10,885Barangy 183 70.5 3,811 3,849 3,887 3,925 3,963 3,999 4,036 4,073Barangy 184 27.2 2,803 2,831 2,859 2,886 2,914 2,941 2,968 2,995Barangy 185 70.3 27,545 27,819 28,094 28,366 28,640 28,905 29,170 29,435Barangy 186 38.6 19,022 19,210 19,401 19,589 19,778 19,961 20,144 20,327Barangy 187 113.4 18,415 18,598 18,782 18,964 19,147 19,325 19,502 19,678Barangy 188 134.4 25,721 25,977 26,234 26,488 26,744 26,991 27,239 27,486
Sub-Total 1 2237.0 676,374 683,085 689,860 696,532 703,264 709,771 716,278 722,784
Kaligayahan 116.5 24,590 24,817 25,063 25,305 25,807 26,085 26,363 26,640Pasong Putik Proper 165.0 23,058 23,271 23,502 23,729 24,199 24,460 24,720 24,981
Sub-Total 2 281.5 47,647 48,088 48,565 49,035 50,006 50,545 51,083 51,621
Total 2,518.5 724,021 731,172 738,425 745,566 753,270 760,315 767,361 774,405
Population of Target AreaRiverBasin
Barangy
MarilaoRiverBasin
Source: JICA Study Team

Republic of the Philippines Preparatory Survey on Water Supply and Sewerage Chapter 5 Development in the West Zone of Metro Manila Final Report Feasibility Study of Priority Sewerage Projects
5 - 97
Table 5.3.6 Estimated Population in the Marilao River Basin (2/2)
2021 2022 2023 2024 2025 2026 2027 2028 2029Barangy 168 4,758 4,793 4,828 4,861 4,895 4,929 4,957 4,985 5,012Barangy 170 4,679 4,714 4,747 4,780 4,814 4,847 4,874 4,901 4,929Barangy 171 4,618 4,653 4,686 4,718 4,751 4,784 4,811 4,838 4,865Barangy 172 17,573 17,704 17,830 17,955 18,080 18,206 18,307 18,410 18,512Barangy 173 16,961 17,088 17,209 17,330 17,451 17,572 17,670 17,769 17,868Barangy 174 19,389 19,534 19,673 19,811 19,950 20,088 20,200 20,313 20,426Barangy 175 54,155 54,561 54,948 55,335 55,722 56,108 56,421 56,737 57,052Barangy 176 251,011 252,893 254,686 256,478 258,272 260,064 261,513 262,977 264,442Barangy 177 73,992 74,547 75,076 75,604 76,132 76,661 77,087 77,520 77,952Barangy 178 91,121 91,805 92,456 93,106 93,757 94,408 94,934 95,465 95,997Barangy 179 32,173 32,414 32,644 32,874 33,103 33,333 33,519 33,707 33,895Barangy 180 15,940 16,060 16,173 16,287 16,401 16,515 16,607 16,700 16,793Barangy 181 27,008 27,210 27,403 27,596 27,789 27,982 28,138 28,295 28,453Barangy 182 10,983 11,065 11,144 11,222 11,301 11,379 11,443 11,507 11,571Barangy 183 4,109 4,140 4,169 4,199 4,228 4,257 4,281 4,305 4,329Barangy 184 3,022 3,045 3,066 3,088 3,109 3,131 3,149 3,166 3,184Barangy 185 29,700 29,923 30,135 30,347 30,559 30,771 30,943 31,116 31,289Barangy 186 20,510 20,664 20,810 20,957 21,103 21,250 21,368 21,488 21,607Barangy 187 19,856 20,005 20,146 20,288 20,430 20,572 20,687 20,803 20,918Barangy 188 27,734 27,942 28,140 28,338 28,536 28,734 28,894 29,056 29,218
Sub-Total 1 729,290 734,759 739,967 745,175 750,384 755,593 759,803 764,057 768,313
Kaligayahan 26,919 27,160 27,392 27,624 27,856 28,088 28,278 28,471 28,665Pasong Putik Proper 25,241 25,468 25,686 25,903 26,121 26,339 26,517 26,698 26,879
Sub-Total 2 52,160 52,629 53,078 53,527 53,977 54,427 54,795 55,169 55,544
Total 781,450 787,388 793,045 798,702 804,361 810,019 814,598 819,226 823,857
Population of Target AreaRiverBasin
Barangy
MarilaoRiverBasin
2030 2031 2032 2033 2034 2035 2036 2037Barangy 168 5,040 5,057 5,073 5,089 5,104 5,120 5,135 5,145Barangy 170 4,956 4,973 4,988 5,003 5,019 5,034 5,049 5,058Barangy 171 4,892 4,909 4,924 4,939 4,954 4,969 4,984 4,994Barangy 172 18,615 18,679 18,736 18,794 18,851 18,908 18,966 19,003Barangy 173 17,967 18,029 18,084 18,140 18,195 18,250 18,306 18,352Barangy 174 20,539 20,609 20,673 20,737 20,800 20,863 20,927 20,966Barangy 175 57,369 57,566 57,743 57,919 58,097 58,273 58,450 58,555Barangy 176 265,906 266,821 267,640 268,460 269,279 270,100 270,919 271,365Barangy 177 78,383 78,653 78,894 79,136 79,377 79,619 79,861 80,001Barangy 178 96,529 96,861 97,158 97,456 97,754 98,051 98,348 98,526Barangy 179 34,082 34,199 34,304 34,410 34,514 34,619 34,725 34,792Barangy 180 16,886 16,944 16,996 17,048 17,100 17,152 17,204 17,231Barangy 181 28,611 28,709 28,797 28,885 28,973 29,062 29,150 29,197Barangy 182 11,635 11,675 11,711 11,747 11,782 11,818 11,854 11,872Barangy 183 4,353 4,368 4,381 4,395 4,408 4,422 4,435 4,442Barangy 184 3,201 3,212 3,222 3,232 3,242 3,252 3,262 3,268Barangy 185 31,463 31,571 31,668 31,765 31,862 31,959 32,056 32,109Barangy 186 21,727 21,802 21,869 21,936 22,003 22,070 22,137 22,175Barangy 187 21,034 21,106 21,171 21,236 21,301 21,366 21,430 21,470Barangy 188 29,379 29,480 29,571 29,662 29,752 29,843 29,933 29,983
Sub-Total 1 772,567 775,223 777,604 779,988 782,367 784,750 787,132 788,504
Kaligayahan 28,857 28,992 29,116 29,240 29,364 29,488 29,612 29,701Pasong Putik Proper 27,060 27,186 27,302 27,419 27,535 27,651 27,767 27,850
Sub-Total 2 55,917 56,179 56,418 56,659 56,899 57,139 57,380 57,551
Total 828,484 831,402 834,023 836,647 839,267 841,889 844,512 846,055
Population of Target AreaRiverBasin
Barangy
MarilaoRiverBasin
Source: JICA Study Team

Republic of the Philippines Preparatory Survey on Water Supply and Sewerage Chapter 5 Development in the West Zone of Metro Manila Final Report Feasibility Study of Priority Sewerage Projects
5 - 98
(3) Prediction of Water Consumption As shown in Section 5.1.5, water consumption for domestic and commercial uses are considered in the Study. The estimated water consumption in Caloocan City is shown in Table 5.3.7 based on billed volume estimated by Maynilad. For the barangays in Quezon City, the water consumption volume of barangay Kaligayahan and Pasong Putik Proper is applied in Quezon City as shown in Table 5.3.7.
Table 5.3.7 Estimated Water Consumption in the Marilao River Basin 2013 2014 2015 2016 2017 2018 2019 2020 2021
Domestic in Quezon City (LPCD) 129 131 132 133 134 137 140 143 145Domestic in Caloocan City (LPCD) 126 126 126 126 131 131 131 131 142Commercial in Quezon City (MLD) 30.7 32.3 34.0 36.1 38.1 40.1 42.1 44.1 46.8Commercial in North Caloocan City (MLD) 3.1 3.2 3.4 3.6 3.8 4.0 4.2 4.4 4.7
2022 2023 2024 2025 2026 2027 2028 2029 2030Domestic in Quezon City (LPCD) 148 151 154 157 160 160 160 160 160Domestic in Caloocan City (LPCD) 142 142 142 142 142 160 160 160 160Commercial in Quezon City (MLD) 49.4 52.1 54.7 57.4 60.9 64.4 67.8 71.3 74.8Commercial in North Caloocan City (MLD) 4.9 5.2 5.5 5.7 6.1 6.4 6.8 7.1 7.5
2031 2032 2033 2034 2035 2036 2037Domestic in Quezon City (LPCD) 160 160 160 160 160 160 160Domestic in Caloocan City (LPCD) 160 160 160 160 160 160 160Commercial in Quezon City (MLD) 79.4 84.0 88.6 93.2 97.8 103.3 108.9Commercial in North Caloocan City (MLD) 7.9 8.4 8.9 9.3 9.8 10.3 10.9
Source: JICA Study Team, based on Maynilad estimation
(4) Prediction of Wastewater Amount Based on the population and water consumption predictions, wastewater amount is estimated as shown in Table 5.3.8. Sewage generation is assumed at 80% of water consumption, and GWI assumed at 15% of sewage amount is added.

Republic of the Philippines Preparatory Survey on Water Supply and Sewerage Chapter 5 Development in the West Zone of Metro Manila Final Report Feasibility Study of Priority Sewerage Projects
5 - 99
Table 5.3.8 Predictions of Wastewater Amount Year 2013 2014 2015 2016 2017 2018 2019 2020 2021
Population of Target Area (North Caloocan City) 676,374 683,085 689,860 696,532 703,264 709,771 716,278 722,784 729,290
Population of Target Area (Quezon City) 47,647 48,088 48,565 49,035 50,006 50,545 51,083 51,621 52,160
Domestic Water Consumption (LPCD) (North Caloocan Dity) 126 126 126 126 131 131 131 131 142
Domestic Water Consumption (LPCD) (Quezon Ciry) 129 131 132 133 134 137 140 143 145
Commercial Water Consumption (MLD) (North Caloocan City) 3.1 3.2 3.4 3.6 3.8 4.0 4.2 4.4 4.7
Commercial Water Consumption (MLD) (Quezon City) 30.7 32.3 34.0 36.1 38.1 40.1 42.1 44.1 46.8
Sewage from Domestic (m3 per day) 73,096 73,895 74,666 75,428 79,063 79,924 80,787 81,653 88,898
Sewage from Commercial (m3 per day) 1,091 1,149 1,210 1,282 1,353 1,425 1,497 1,569 1,663
Daily Average Sewage Flow (m3 per day) 74,187 75,043 75,876 76,709 80,416 81,349 82,284 83,222 90,561
Daily Average GWI (m3 per day) 11,128 11,256 11,381 11,506 12,062 12,202 12,343 12,483 13,584
Daily average Wastewater Flow (m3 per day) 85,300 86,300 87,300 88,200 92,500 93,600 94,600 95,700 104,100
Daily Maximum Wastewater Flow (m3 per day) 100,200 101,300 102,400 103,600 108,600 109,800 111,100 112,300 122,300
Hourly Maximum Wastewater Flow (m3 per day) 144,700 146,300 148,000 149,600 156,800 158,600 160,500 162,300 176,600
Year 2022 2023 2024 2025 2026 2027 2028 2029 2030
Population of Target Area (North Caloocan City) 734,759 739,967 745,175 750,384 755,593 759,803 764,057 768,313 772,567
Population of Target Area (Quezon City) 52,160 52,629 53,078 53,527 53,977 54,427 54,795 55,169 55,917
Domestic Water Consumption (LPCD) (North Caloocan Dity) 142 142 142 142 142 160 160 160 160
Domestic Water Consumption (LPCD) (Quezon Ciry) 148 151 154 157 160 160 160 160 160
Commercial Water Consumption (MLD) (North Caloocan City) 4.9 5.2 5.5 5.7 6.1 6.4 6.8 7.1 7.5
Commercial Water Consumption (MLD) (Quezon City) 49.4 52.1 54.7 57.4 60.9 64.4 67.8 71.3 74.8
Sewage from Domestic (m3 per day) 89,644 90,418 91,191 91,967 92,744 104,221 104,813 105,406 106,046
Sewage from Commercial (m3 per day) 1,757 1,852 1,946 2,040 2,164 2,288 2,412 2,535 2,659
Daily Average Sewage Flow (m3 per day) 91,402 92,269 93,137 94,007 94,908 106,509 107,225 107,941 108,705
Daily Average GWI (m3 per day) 13,710 13,840 13,971 14,101 14,236 15,976 16,084 16,191 16,306
Daily average Wastewater Flow (m3 per day) 105,100 106,100 107,100 108,100 109,100 122,500 123,300 124,100 125,000
Daily Maximum Wastewater Flow (m3 per day) 123,400 124,600 125,700 126,900 128,100 143,800 144,800 145,700 146,800
Hourly Maximum Wastewater Flow (m3 per day) 178,200 179,900 181,600 183,300 185,100 207,700 209,100 210,500 212,000
Year 2031 2032 2033 2034 2035 2036 2037
Population of Target Area (North Caloocan City) 775,223 777,604 779,988 782,367 784,750 787,132 788,504
Population of Target Area (Quezon City) 56,179 56,418 56,659 56,899 57,139 57,380 57,551
Domestic Water Consumption (LPCD) (North Caloocan Dity) 160 160 160 160 160 160 160
Domestic Water Consumption (LPCD) (Quezon Ciry) 160 160 160 160 160 160 160
Commercial Water Consumption (MLD) (North Caloocan City) 7.9 8.4 8.9 9.3 9.8 10.3 10.9
Commercial Water Consumption (MLD) (Quezon City) 79.4 84.0 88.6 93.2 97.8 103.3 108.9
Sewage from Domestic (m3 per day) 106,419 106,755 107,091 107,426 107,762 108,098 108,295
Sewage from Commercial (m3 per day) 2,822 2,986 3,149 3,312 3,475 3,673 3,871
Daily Average Sewage Flow (m3 per day) 109,242 109,741 110,240 110,738 111,237 111,771 112,166
Daily Average GWI (m3 per day) 16,386 16,461 16,536 16,611 16,686 16,766 16,825
Daily average Wastewater Flow (m3 per day) 125,600 126,200 126,800 127,300 127,900 128,500 129,000
Daily Maximum Wastewater Flow (m3 per day) 147,500 148,100 148,800 149,500 150,200 150,900 151,400
Hourly Maximum Wastewater Flow (m3 per day) 213,000 214,000 215,000 215,900 216,900 218,000 218,700 Source: JICA Study Team
Calculation of commercial Sewage is below:
Commercial Water Volume = Area (ha) x Commercial Water Demand / Area of Quezon City
Commercial Sewage Volume = Commercial Water Volume x 0.8
Where,
Area: 2,337 ha, which is area of the Marilao River Basin
Commercial Water Demand: yearly water demand volume
Area of Quezon City: 55.8 km2 = 5,580 ha

Republic of the Philippines Preparatory Survey on Water Supply and Sewerage Chapter 5 Development in the West Zone of Metro Manila Final Report Feasibility Study of Priority Sewerage Projects
5 - 100
5.3.3 Preliminary Design of the Marilao River Basin (1) Preliminary Design of Sewer Network 1) Sewer Diameter and Construction Method
Preliminary design of sewer pipes was conducted for each STP candidate site. Summary of design of the sewer pipes on diameter and construction methods, which is either open-cut or trenchless, is shown in Table 5.3.9.
Table 5.3.9 Summary of Sewer Designs
Open-Cut Trenchless Open-Cut Trenchless Open-Cut Trenchless Open-Cut Trenchless200 1,450 3,590 1,450 3,590 1,595 4,130 1,450 3,590 250 1,615 3,080 2,010 2,880 1,615 3,080 1,785 2,900 300 2,350 3,095 2,110 3,130 2,280 2,935 2,180 3,895 350 170 1,490 170 1,485 170 1,490 820 2,490 400 2,165 3,705 2,225 4,000 2,920 4,635 2,165 3,840 450 - 70 - 70 - 70 - 450 500 1,745 4,460 1,745 4,455 1,745 4,325 2,370 4,570 600 645 1,540 645 1,415 645 2,135 1,055 1,540 700 675 2,455 675 2,450 675 2,455 675 3,055 800 530 2,015 530 2,020 530 2,015 530 2,015 900 - 1,380 - 1,385 - 1,380 - 810
1000 365 1,190 365 1,190 370 1,185 365 1,350 1100 650 2,990 665 2,975 510 2,305 60 1,310 1200 630 3,105 630 3,105 - 2,480 - 2,480 1350 - 1,335 - 1,070 - 1,285 - 1,290 1500 - - - - - - - - 1650 - - - - - - - - 1800 - 550 345 - 60 - 60 1900 - - - - - - - - 2000 - - - - - - - - 2100 - 60 - 80 - - - -
12,990 36,110 13,220 35,645 13,055 35,965 13,455 35,645
Option 4Option 1 Option 2
49,100
Option 3Site 1 and Site 3
49,020
Sewer LineLocation of STP Site 1 Site 2 Site 1 and Site 4
Pipe Diameter(mm)
(Gravity Flow)
Sub-Total
Total 48,865 49,100 Source: JICA Study Team
2) Pipe Materials Suitable pipe materials are applied as shown in Table 5.3.10. Reinforced concrete pipes (RCPs) are mainly used for gravity sewer pipes. Since Maynilad applies polyvinyl chloride (PVC) pipes for sewer in diameter of 450 mm or less, PVC is applied to smaller diameter pipes for easy maintenance.
Table 5.3.10 Applied Pipe Materials Material Sewer Type Application Remarks
RC Gravity Open-cut and trenchless - Most pipe can be applied PVC Gravity Open-cut - Especially small pipes of 450 mm diameter or less
Source: JICA Study Team
3) Pipeline Route Figures 5.3.3 to 5.3.6 show the pipeline route for each option. In consideration of the Marilao River basin, sewer routes are suggested to be located along public roads or vacant spaces beside

Repu
blic of the P
hilippin
es P
reparatory Su
rvey on W
ater Su
pply and S
ewerage
C
hapter 5
Developm
ent in
the W
est Zon
e of Metro M
anila
F
inal R
eport F
easibility Study of P
riority Sew
erage Projects
5 - 101
creeks or rivers in accordance with the M
arikina River basin.
Source: JIC
A Study Team
Figure 5.3.3 Pipeline Route for O
ption 1

Repu
blic of the P
hilippin
es P
reparatory Su
rvey on W
ater Su
pply and S
ewerage
C
hapter 5
Developm
ent in
the W
est Zon
e of Metro M
anila
F
inal R
eport F
easibility Study of P
riority Sew
erage Projects
5 - 102
Source: JIC
A Study Team
Figure 5.3.4 Pipeline Route for O
ption 2

Repu
blic of the P
hilippin
es P
reparatory Su
rvey on W
ater Su
pply and S
ewerage
C
hapter 5
Developm
ent in
the W
est Zon
e of Metro M
anila
F
inal R
eport F
easibility Study of P
riority Sew
erage Projects
5 - 103
Source: JIC
A Study Team
Figure 5.3.5 Pipeline Route for O
ption 3

Repu
blic of the P
hilippin
es P
reparatory Su
rvey on W
ater Su
pply and S
ewerage
C
hapter 5
Developm
ent in
the W
est Zon
e of Metro M
anila
F
inal R
eport F
easibility Study of P
riority Sew
erage Projects
5 - 104
Source: JIC
A Study Team
Figure 5.3.6 Pipeline Route for O
ption 4

Republic of the Philippines Preparatory Survey on Water Supply and Sewerage Chapter 5 Development in the West Zone of Metro Manila Final Report Feasibility Study of Priority Sewerage Projects
5 - 105
4) Pipe Depth (Earth Covering) The topography of the Marilao River basin is undulated. Hence, the installation of sewer pipes in higher portion will be deep. In addition, installation of the pump facilities can be quite inconvenient because the ground elevation varies. For the Marilao River basin, approximately 70% of the sewer pipes shall be installed by trenchless method as shown in Table 5.3.9. Designed depth of sewer pipes for each option is shown in Table 5.3.11. In contrast with the Marikina River basin, since direction of sewerage flow is almost the same for each option, the average pipe depth is basically the same.
Table 5.3.11 Designed Depth of Sewer Pipes in the Marilao River Basin Average (m)
Option 1 2.1 ~ 22.5 8.7Option 2 2.1 ~ 20.0 8.7Option 3 2.2 ~ 22.5 8.7Option 4 2.2 ~ 22.4 8.6
Range (m)
Source: JICA Study Team
5) Pumping Station (PS) PSs will be required for all options, and Table 5.3.12 shows the required capacity of PSs. Locations of the PSs is shown in Figures 5.3.3 to 5.3.6. For Option 3, only PS10 will be required. The required capacities of each pump are the same for each option.
Table 5.3.12 Pumping Stations in the Marilao River Basin
No. PS Flow (m3/s) TDH (m) PS Type Load per Pump
(kW) No. Duty/ Standby Remarks
PS1 0.577 6.0 Large 55 3 / 1 PS2 0.024 8.0 Medium 22 2 / 1 PS3 0.007 10.0 MH 7.5 1 / 1 PS4 0.200 5.3 Medium 22 2 / 1 PS5 0.015 6.0 MH 7.5 1 / 1 PS6 0.023 5.0 MH 7.5 1 / 1 PS7 0.038 5.0 MH 7.5 1 / 1 PS8 0.015 12.0 MH 7.5 1 / 1 PS9 0.056 10.0 Medium 22 2 / 1 PS10 0.006 5.0 MH 7.5 1 / 1 Only Option 3 PS11 0.061 5.0 Medium 22 2 / 1 PS12 0.072 5.0 Medium 22 2 / 1 PS13 0.033 4.0 MH 7.5 1 / 1 PS14 0.340 10.0 Medium 22 2 / 1
Source: JICA Study Team
6) Interceptor Chamber (IC) ICs locations and quantities are same for each option. The total number of ICs for the Marilao River Basin is 128. Location of the ICs is determined based on the drainage discharge points identified in the topographic survey and site visit. Locations of the ICs are shown in Figure 5.3.7.

Repu
blic of the P
hilippin
es P
reparatory Su
rvey on W
ater Su
pply and S
ewerage
C
hapter 5
Developm
ent in
the W
est Zon
e of Metro M
anila
F
inal R
eport F
easibility Study of P
riority Sew
erage Projects
5 - 106
Source: JICA
Study Team
Figure 5.3.7 Location of IC
s in the Marilao R
iver Basin

Republic of the Philippines Preparatory Survey on Water Supply and Sewerage Chapter 5 Development in the West Zone of Metro Manila Final Report Feasibility Study of Priority Sewerage Projects
5 - 107
(2) Pollutant Loading 1) Pollution Source
Based on the population and sewer load calculations, 108,300 m3/d will represent the loads from domestic consumers and approximately 3,900 m3/d will cater for commercial consumers. These values represent 84% and 3% of year 2037 ADWF, respectively.
During the site visits in the service areas, it was observed that the color of the water at the outfalls were sometimes blackish and nearly in the septic stage. There were also outfalls wherein water appears to be color blue or pink, possibly indicating wastewater loads from commercial and industrial establishments. However, Industrial wastewater shall be managed by the Environmental Management Bureau (EMB) of DENR, and Maynilad will monitors influent water quality to STP and indicates that DENR manages the industrial wastewater in case influent water quality goes down. Figure 5.3.8 shows location of industrial and commercial facilities in the Marilao River basin.
Source: JICA Study Team
Figure 5.3.8 Location of Industrial and Commercial Facilities in the Marilao River Basin
2) Water Quality of the Marilao River Basin Table 5.3.13 shows the result of water quality survey in the Marilao River basin. The results indicate that water quality during rainy season is generally good, with the highest BOD found at Site 3 which is located just downstream of a large public market at Sampaguita Ave and Market

Republic of the Philippines Preparatory Survey on Water Supply and Sewerage Chapter 5 Development in the West Zone of Metro Manila Final Report Feasibility Study of Priority Sewerage Projects
5 - 108
St. Wastewater influent at the STP resulting from interception at these locations is expected to be diluted.
Table 5.3.13 Water Quality of the Marilao River Tributaries (August 2012) Parameter/
Location Site 1 Site 2 Site 3 Site 4 Site 5 Site 6 Max Min
pH 7.6 7.4 7.7 7.7 7.6 7.4 7.9 6.8 Temp (ºC) 26.2 26.2 27.1 26.5 26.4 26.1 27.1 25.5 DO (ppm) 2.3 1.0 3.0 2.5 1.6 2.0 4.2 0.3
BOD5 (mg/L) 19.0 48.7 13.7 26.7 17.7 64.7 102.0 8.0 COD (mg/L) 35.7 71.3 24.7 59.3 30.0 115.7 168.0 19.0 SS, (ml/L) 0.4 0.6 0.5 0.8 0.3 1.5 3.5 0.2
N-nitrate (mg/L) <0.5 <0.5 <0.5 <0.5 <0.5 <0.5 <0.5 <0.5 N-ammonia (mg/L) 9.4 18.8 17.5 13.6 13.3 10.8 35.9 2.2
Note all reported values are average, except Max and Min which are individual grab samples
Source: JICA Study Team.
3) Assumed Pollutant Loading The results of the water quality survey in the Marilao River basin indicated that the influent wastewater BOD5 will be assumed to range between 20 mg/L to 175 mg/L, with a median value of 120 mg/L. TSS will be assumed to be 200 mg/L. For purposes of the feasibility study, COD, T-N, and T-P will be roughly estimated at 235, 60, and 6, respectively. These estimated concentrations are the same as those of the Marikina River basin.
(3) Preliminary Design of the STP 1) Scope of the STP Design For each STP candidate site, preliminary design including layout plan are conducted. The sewage treatment process is designed based on the CAS method, and the sludge treatment process is done by gravity thickening and mechanical dewatering. In addition, the effluent water quality is considered Class SB, but requires removal of T-N and T-P in acceptable level in the future. Table 5.3.14 summarizes the design criteria of the STP.

Republic of the Philippines Preparatory Survey on Water Supply and Sewerage Chapter 5 Development in the West Zone of Metro Manila Final Report Feasibility Study of Priority Sewerage Projects
5 - 109
Table 5.3.14 Design Criteria for the STP in the Marilao River Basin
STP Design Option 1 Option 2Location of STP Site 1 Site 2 Site 1 Site3 Site1 Site 4STP Area (ha) 5.5 6.6 5.5 1.9 5.5 1.9Treatment Capacity (MLD) 151 151 112 39 115 36Sewage Treatment ProcessSludge Treatment Process
Option 3 Option 4
CAS ProcessGravity Thickening - Mechanical Dewatering
Planned Influent Quality
BOD: 120 mg/LCOD: 235 mg/LSS: 200 mg /LT-N: 60 mg/LT-P: 6 mg/L
Effluent Standard
Class SBBOD: 30 mg/LCOD: 60 mg/ L
SS: 50 mg/L Source: JICA Study Team
2) Preliminary Design of STP a) Necessity of Landfill The STP sites for Options 1 and 2 are located at meeting points of major rivers in the Marilao River basin. The ground elevation is about 30 m to 40 m, which is higher than the river bed. Therefore, significant landfill will not be required. On the other hand, Sites 3 and 4 are located at the middle points of the rivers, and the ground elevation is about 40 m to 50 m. However, since such ground level is not higher than the river bed, it is considered that countermeasures against flooding will be required.
b) Preliminary Treatment Facilities Preliminary treatment facilities consist of bar screens, influent PS, parshall flumes, and grit chambers. The design parameters for the preliminary treatment facilities are shown in Tables 5.3.15 and 5.3.16.

Republic of the Philippines Preparatory Survey on Water Supply and Sewerage Chapter 5 Development in the West Zone of Metro Manila Final Report Feasibility Study of Priority Sewerage Projects
5 - 110
Table 5.3.15 Design Parameters for Preliminary Treatment Facilities of Options 1 and 2 Process Facilities Design Parameter Quantity
Assumed velocity 0.9 m/sClear area through rack opening 0.53 m2
Clear width opening 1.7 mNumber of duty bar racks, mechanical bar screen 2 unitsStand-by bar racks, manual bar screen 1 unitSlope from vertical, degrees 15 - 45 degreeRetention time 3 minutesTotal volume 472 m3
Number of tank 2 tanksVolume per tank 236 m3
Side water depth 4 mArea per tank 58.98 m2
Length and width of tank 7.68 mNumber of duty parshall flume 2 unitsStand-by parshall flume 1 unitUpstream channel depth 230 mmUpstream channel width 1570 mmThroat width 915 mmDownstream channel width 1,220 mmFlume length 2,870 mmDownstream channel depth 990 mmSurface load 1,800 m3/m2/dSettling velocity 0.2 m/sNumber of duty grit chamber 3 chambersStand-by grit chamber 1 chamberWidth 1.4 mLength 20 mWater depth 2.1 m
Preliminary Treatment
Bar Screens
Influent PS
Parshall Flume
Grit Chamber
Source; JICA Study Team

Republic of the Philippines Preparatory Survey on Water Supply and Sewerage Chapter 5 Development in the West Zone of Metro Manila Final Report Feasibility Study of Priority Sewerage Projects
5 - 111
Table 5.3.16 Design Parameters for Preliminary Treatment Facilities of Options 3 and 4
Site 1 Site 3 Site 1 Site 4Assumed velocity 0.9 m/s 0.9 m/s 0.9 m/s 0.9 m/sClear area through rack opening 1.08 m2 0.38 m2 1.11 m2 0.35 m2
Clear width opening 0.95 m 0.4 m 0.95 m 0.40 mNumber of duty bar racks, mechanical bar screen 2 units 2 units 2 units 2 unitsStand-by bar racks, manual bar screen 1 unit 1 unit 1 unit 1 unitSlope from vertical, degrees 15 - 45 degree 15 - 45 degree 15 - 45 degree 15 - 45 degreeRetention time 3 minutes 3 minutes 3 minutes 3 minutesTotal volume 350 m3 122 m3 359 m3 113 m3
Number of tank 2 tanks 2 tanks 2 tanks 2 tanksVolume per tank 175 m3 61 m3 180 m3 56 m3
Side water depth 4 m 4 m 4 m 4 mArea per tank 43.75 m2 15.23 m2 44.92 m2 14.06 m2
Length and width of tank 6.61 m 3.90 m 6.70 m 3.75 mNumber of duty parshall flume 2 units 2 units 2 units 2 unitsStand-by parshall flume 1 unit 1 unit 1 unit 1 unitUpstream channel depth 230 mm 230 mm 230 mm 230 mmUpstream channel width 1570 mm 845 mm 1570 mm 845 mmThroat width 915 mm 305 mm 915 mm 305 mmDownstream channel width 1,220 mm 610 mm 1,220 mm 610 mmFlume length 3,169 mm 2,870 mm 3,169 mm 2,870 mmDownstream channel depth 990 mm 990 mm 990 mm 990 mmSurface load 1,800 m3/m2/d 1,800 m3/m2/d 1,800 m3/m2/d 1,800 m3/m2/dSettling velocity 0.2 m/s 0.2 m/s 0.2 m/s 0.2 m/sNumber of duty grit chamber 3 chambers 2 chambers 3 chambers 2 chambersStand-by grit chamber 1 chamber 1 chamber 1 chamber 1 chamberWidth 2.08 m 0.87 m 2.11 m 0.83 mLength 44.54m 12.40 m 45.14m 11.90 mWater depth 1.80 m 1.3 m 1.85 m 1.25 m
Preliminary Treatment
Bar Screens
Influent PS
Parshall Flume
Grit Chamber
Process Facilities Design ParameterQuantity
Option 3 Option 4
Source; JICA Study Team
c) Sewage Treatment Facilities The sewage treatment facilities consist of primary clarifiers, aeration tanks, and secondary clarifiers. For aeration tank, anaerobic and aerobic tanks are designed in case nitrogen and phosphorus removal will be required in the future. Design parameters for sewage treatment facilities for each option are shown in Tables 5.3.17 and 5.3.18.

Republic of the Philippines Preparatory Survey on Water Supply and Sewerage Chapter 5 Development in the West Zone of Metro Manila Final Report Feasibility Study of Priority Sewerage Projects
5 - 112
Table 5.3.17 Design Parameters for Sewage Treatment Facilities under Options 1 and 2
Process Facilities Design Parameter QuantityOverflow rate 40 m3/m2/dLiquid depth 3 mSurface area, m2 3,775 m2
Diameter 34 mNumber of tanks 4 tanksDetention time 1.8 hoursAeration time 5 hoursTotal tank volume 31,460 m3
Number of tanks 4 tanksArea per tank, m2 7,865 m2
Length x width 51 m x 31 mAeration time 3 hoursTotal tank volume 18,875 m3
Number of tanks 3 tanksArea per tank 6,290 m2
Length x width 50 m x 25 mHydraulic loading rate 20 m3/m2/dLiquid depth 3 mSurface area 7,550 m2
Total tank volume 22,650 m3
Number of tanks 8 tanksArea per tank 945 m2
Diameter 35 m
Sewage Treatment
Primary Clarifier
Aeration Tank
Anaerobic Tankand Aerobic Tank(future design for
T-N and T-Premoval)
Secondary Clarifier
Source; JICA Study Team
Table 5.3.18 Design Parameters for Sewage Treatment Facilities under Options 3 and 4
Site 1 Site 3 Site 1 Site 4Overflow rate 40 m3/m2/d 40 m3/m2/d 40 m3/m2/d 40 m3/m2/dLiquid depth 3 m 3 m 3 m 3 mSurface area, m2 2,800 m2 9755 m2 2,875 m2 900 m2
Diameter 30 m 25 m 30 m 25 mNumber of tanks 4 tanks 2 tanks 4 tanks 2 tanksDetention time 1.8 hours 1.8 hours 1.8 hours 1.8 hoursAeration time 5 hours 5 hours 5 hours 5 hoursTotal tank volume 23,333 m3 8,125 m3 23,958 m3 7,500 m3
Number of tanks 4 tanks 2 tanks 4 tanks 2 tanksArea per tank, m2 1,167 m2 813 m2 1,198 m2 750 m2
Length x width 50 m x 23.50m 50 m x 16 m 50 m x 24 m 50 m x 15 mAeration time 3 hours 3 hours 3 hours 3 hoursTotal tank volume 14,000 m3 4,875 m3 14,375 m3 4,500 m3
Number of tanks 2 tanks 1 tank 2 tanks 1 tankArea per tank 1,400 m2 975 m2 1,438 m2 900 m2
Length x width 50 m x 28 m 50 m x 20 m 50 m x 28.75m 50 m x 18 mHydraulic loading rate 20 m3/m2/d 20 m3/m2/d 20 m3/m2/d 20 m3/m2/dLiquid depth 3 m 3 m 3 m 3 mSurface area 5,600 m2 1,950 m2 5,750 m2 1,800 m2
Total tank volume 16,800 m3 5,850 m3 17,250 m3 5,400 m3
Number of tanks 6 tanks 2 tanks 6 tanks 2 tanksArea per tank 933 m2 975 m2 958 m2 900 m2
Diameter 34 m 35 m 35 m 34 m
Sewage Treatment
Primary Clarifier
Aeration Tank
Anaerobic Tankand Aerobic Tank(future design for
T-N and T-Premoval)
Secondary Clarifier
Process Facilities Design ParameterQuantity
Option 3 Option 4
Source; JICA Study Team
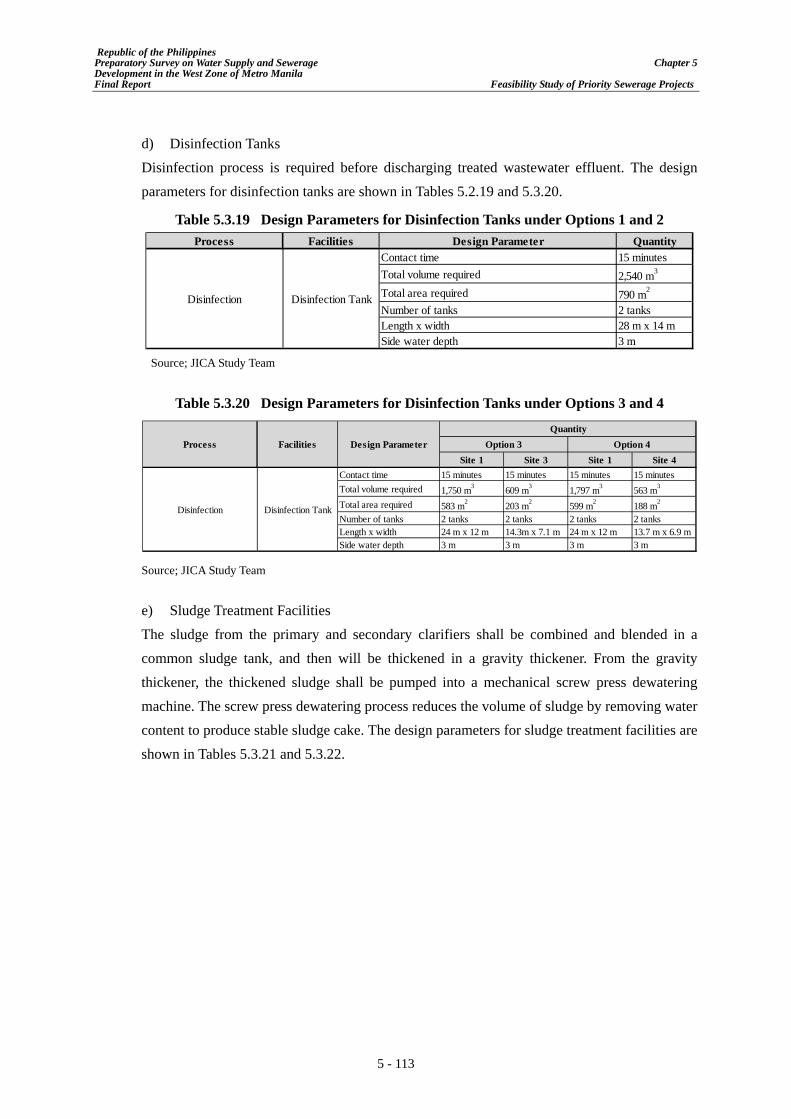
Republic of the Philippines Preparatory Survey on Water Supply and Sewerage Chapter 5 Development in the West Zone of Metro Manila Final Report Feasibility Study of Priority Sewerage Projects
5 - 113
d) Disinfection Tanks Disinfection process is required before discharging treated wastewater effluent. The design parameters for disinfection tanks are shown in Tables 5.2.19 and 5.3.20.
Table 5.3.19 Design Parameters for Disinfection Tanks under Options 1 and 2 Process Facilities Design Parameter Quantity
Contact time 15 minutesTotal volume required 2,540 m3
Total area required 790 m2
Number of tanks 2 tanksLength x width 28 m x 14 mSide water depth 3 m
Disinfection Disinfection Tank
Source; JICA Study Team
Table 5.3.20 Design Parameters for Disinfection Tanks under Options 3 and 4
Site 1 Site 3 Site 1 Site 4Contact time 15 minutes 15 minutes 15 minutes 15 minutesTotal volume required 1,750 m3 609 m3 1,797 m3 563 m3
Total area required 583 m2 203 m2 599 m2 188 m2
Number of tanks 2 tanks 2 tanks 2 tanks 2 tanksLength x width 24 m x 12 m 14.3m x 7.1 m 24 m x 12 m 13.7 m x 6.9 mSide water depth 3 m 3 m 3 m 3 m
Disinfection Disinfection Tank
Process Facilities Design ParameterQuantity
Option 3 Option 4
Source; JICA Study Team
e) Sludge Treatment Facilities The sludge from the primary and secondary clarifiers shall be combined and blended in a common sludge tank, and then will be thickened in a gravity thickener. From the gravity thickener, the thickened sludge shall be pumped into a mechanical screw press dewatering machine. The screw press dewatering process reduces the volume of sludge by removing water content to produce stable sludge cake. The design parameters for sludge treatment facilities are shown in Tables 5.3.21 and 5.3.22.

Republic of the Philippines Preparatory Survey on Water Supply and Sewerage Chapter 5 Development in the West Zone of Metro Manila Final Report Feasibility Study of Priority Sewerage Projects
5 - 114
Table 5.3.21 Design Parameters for Sludge Treatment Facilities under Options 1 and 2
Process Facilities Design Parameter QuantityTypical hydraulic loading 9.8 m3/m2/dTotal sludge flow 3,435 m3/dBlending period 1 hoursArea of sludge blending tank 48 m2
Number of tanks 2 tanksSide water depth 3 mDiameter 7.8 mHydraulic loading 47 kg/m2/dTotal surface area 700 m2
Number of tanks 2 tanksArea per tank 350 m2
Side water depth 3.5 mDiameter 21.1 mDuty screw press machine 2 unitsStand-by screw press machine 1 unitThickened sludge 32,880 kg/dFlow 133 m3/dSludge cake 20%Solids capture 95%
Sludge Treatment
Sludge BlendingTank
Sludge ThickeningTank
Sludge DewateringMachine
Source; JICA Study Team
Table 5.3.22 Design Parameters for Sludge Treatment Facilities under Options 3 and 4
Site 1 Site 3 Site 1 Site 4Typical hydraulic loading 9.8 m3/m2/d 9.8 m3/m2/d 9.8 m3/m2/d 9.8 m3/m2/dTotal sludge flow 24,385 m3/d 8,491 m3/d 25,038 m3/d 7,837.92 m3/dBlending period 2 hours 2 hours 2 hours 2 hoursArea of sludge blending tank 35.38 m2 8.05 m2 36.33m2 7.43 m2
Number of tanks 2 tanks 2 tanks 2 tanks 2 tanksSide water depth 3 m 3 m 3 m 3 mDiameter 6.71 m 3.20 m 6.8 m 3.08 mHydraulic loading 47 kg/m2/d 47 kg/m2/d 47 kg/m2/d 47 kg/m2/dTotal surface area 520 m2 118 m2 534 m2 109 m2
Number of tanks 2 tanks 2 tanks 2 tanks 2 tanksArea per tank 260 m2 59 m2 267 m2 55 m2
Side water depth 3.5 m 3.5 m 3.5 m 3.5 mDiameter 18.20 m 9 m 18.44 m 8 mDuty screw press machine 2 units 2 units 2 units 2 unitsStand-by screw press machine 1 unit 1 unit 1 unit 1 unitThickened sludge 24,385 kg/d 8,491 m3/d 25,038 kg/d 7,837.92kg/dFlow 98 m3/d 34 m3/d 101 m3/d 32 m3/dSludge cake 20% 20% 20% 20%Solids capture 95% 95% 95% 95%
Design ParameterQuantity
Option 3 Option 4
Sludge Treatment
Sludge BlendingTank
Sludge ThickeningTank
Sludge DewateringMachine
Process Facilities
Source; JICA Study Team
3) Electronic Requirements As discussed in Section 5.2, Preliminary Design of the Marikina River basin, the electrical load requirements for the STPs are designed based on the different mechanical equipment required for each STP. The motor was designed based on the required treatment capacity in which the nominal ampere loads and the applicable supply voltages were determined and designed. The applicable supply voltages are either 230 V or 460 V. In addition, the applicable phase, which is

Republic of the Philippines Preparatory Survey on Water Supply and Sewerage Chapter 5 Development in the West Zone of Metro Manila Final Report Feasibility Study of Priority Sewerage Projects
5 - 115
either single-phase or three-phase, was designed under the condition that all electrical loads are supplied by 60 Hz AC distribution voltage from the electric utility company in the Study area.
4) Support Facilities In order to operate and manage the sewage and sludge treatment plants, support facilities are required in the STP.
a) Administration Office A 12 m x 8 m two-storey building shall be constructed for the technical personnel of Maynilad who will oversee the daily operation of the plant. Initially, it is estimated that 20 staff will operate the plant and network.
b) Laboratory Building A 6 m x 4 m building shall be constructed for the laboratory personnel and tools, apparatus, and other laboratory equipment for the efficient control and monitoring of the plant.
c) Power Building A 14 m x 6 m building shall be constructed to install the back-up generator set which can run the plant on its minimum flow rate during power outages. Emergency mechanical equipment shall be put into operation during power outage.
d) Blower Building A 28 m x 6 m building shall be constructed to install the required number of blowers that will provide for the design oxygen requirements of the CAS process.
e) Return Activated Sludge Building An 8 m x 6 m building shall be constructed to install the required number of pumps intended to return the activated sludge accumulated at the bottom of the secondary clarifiers.
f) Waste Activated Sludge Building A10 m x 6 m building shall be constructed to install the required number of pumps intended to waste the activated sludge accumulated at the bottom of the secondary clarifiers. The sludge shall be transferred to the sludge blending tanks.
g) Dewatering Building A16 m x 6 m building shall be constructed to install the screw press machine that will dewater the sludge from the primary and secondary clarifiers.
(4) Facility layout of the STP Figures 5.3.9 to 5.3.14 show the facility layout plan for each design option.
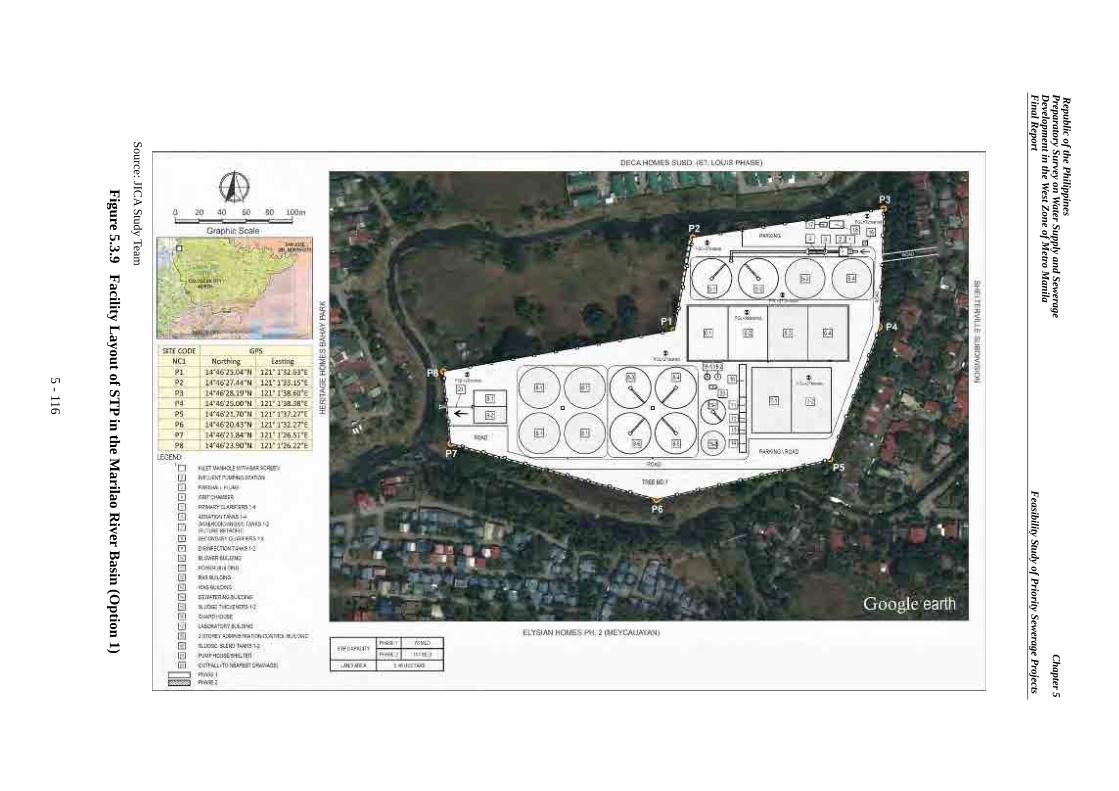
Repu
blic of the P
hilippin
es P
reparatory Su
rvey on W
ater Su
pply and S
ewerage
C
hapter 5
Developm
ent in
the W
est Zon
e of Metro M
anila
F
inal R
eport F
easibility Study of P
riority Sew
erage Projects
5 - 116
Source: JICA
Study Team Figure 5.3.9 Facility L
ayout of STP in the M
arilaoR
iver Basin (O
ption 1)

Repu
blic of the P
hilippin
es P
reparatory Su
rvey on W
ater Su
pply and S
ewerage
C
hapter 5
Developm
ent in
the W
est Zon
e of Metro M
anila
F
inal R
eport F
easibility Study of P
riority Sew
erage Projects
5 - 117
Source: JICA
Study Team Figure 5.3.10 Facility L
ayout of STP in the
Marilao
River B
asin (Option 2)
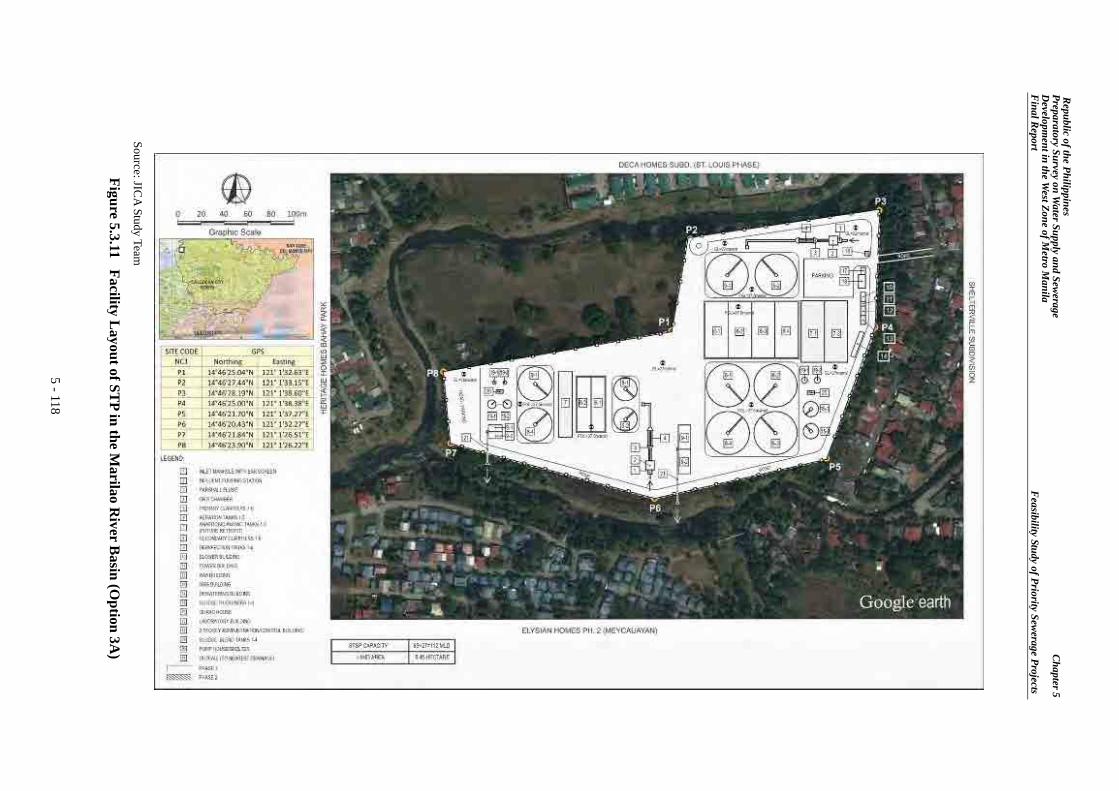
Repu
blic of the P
hilippin
es P
reparatory Su
rvey on W
ater Su
pply and S
ewerage
C
hapter 5
Developm
ent in
the W
est Zon
e of Metro M
anila
F
inal R
eport F
easibility Study of P
riority Sew
erage Projects
5 - 118
Source: JICA
Study Team Figure 5.3.11 Facility L
ayout of STP in the M
arilaoR
iver Basin (O
ption 3A)

Repu
blic of the P
hilippin
es P
reparatory Su
rvey on W
ater Su
pply and S
ewerage
C
hapter 5
Developm
ent in
the W
est Zon
e of Metro M
anila
F
inal R
eport F
easibility Study of P
riority Sew
erage Projects
5 - 119
Source: JICA
Study Team Figure 5.3.12 Facility L
ayout of STP in the M
arilaoR
iver Basin (O
ption 3B)

Repu
blic of the P
hilippin
es P
reparatory Su
rvey on W
ater Su
pply and S
ewerage
C
hapter 5
Developm
ent in
the W
est Zon
e of Metro M
anila
F
inal R
eport F
easibility Study of P
riority Sew
erage Projects
5 - 120
Source: JICA
Study Team Figure 5.3.13 Facility L
ayout of STP in the M
arilaoR
iver Basin (O
ption 4A)

Repu
blic of the P
hilippin
es P
reparatory Su
rvey on W
ater Su
pply and S
ewerage
C
hapter 5
Developm
ent in
the W
est Zon
e of Metro M
anila
F
inal R
eport F
easibility Study of P
riority Sew
erage Projects
5 - 121
Source: JICA
Study Team
Figure 5.3.14 Facility Layout of ST
P in the Marilao
River B
asin (Option 4B)

Republic of the Philippines Preparatory Survey on Water Supply and Sewerage Chapter 5 Development in the West Zone of Metro Manila Final Report Feasibility Study of Priority Sewerage Projects
5 - 122
5.3.4 Selection of Recommended Option for the Marilao River Basin
The preliminary designs were conducted for all options based on the following conditions:
The sewerage system of the Marilao River basin will be implemented by year 2020 based on the next Business Plan of Maynilad for 2017-2021.
Therefore, determination of the STP locations shall be avoided at present in case the selected location will not be available.
Comparison of design options shall be conducted considering not only the location of the STP but also the cost inclusive of O&M and environmental impacts after preliminary design.
In this section, a recommended design will be selected to prepare the implementation plan, project cost estimates, and financial and economical analysis for the Marilao River basin project.
(1) Summary of the Preliminary Design The summary of preliminary design for all the options is shown in Table 5.3.23.
Table 5.3.23 Comparison of Summary of Preliminary Design for Each Option Component Unit Option 1 Option 2 Option 3 Option 4
A. STP STP Site - Site 1 Site 2 Site 1 Site 3 Site 1 Site 4STP Area ha 5.5 5.6 5.5 1.9 5.5 1.9 STP Capacity MLD 151 151 112 39 115 36
B. Network (1) Open-Cut Method m 12,990 13,220 13,055 13,455
1) RCP m 8,040 8,045 8,105 8,5052) PVC m 4,950 5.175 4,950 4,950
(2) Pipe-Jacking Method m 36,110 35,645 35,965 35,6451) RCP m 36,110 35,645 35,965 35,6452) PVC m 0 0 0 0
(3) Average Diameter mm 600 590 550 530(4) Average Depth of Sewer m 8.7 8.7 8.7 8.6(5) Interception Chambers units 128 128 128 128(6) Manholes units 600 599 612 617(7) PSs units 13 13 14 12
1) Large PS units 1 1 1 12) Medium PS units 5 5 5 53) Manhole PS units 7 7 8 7
Source: JICA Study Team
(2) Comparative Study for the Selection of Recommended Option 1) Location and Construction of the STP
There will be only one STP for each site under Options 1 and 2. These STP sites are located at

Republic of the Philippines Preparatory Survey on Water Supply and Sewerage Chapter 5 Development in the West Zone of Metro Manila Final Report Feasibility Study of Priority Sewerage Projects
5 - 123
the most downstream points to meet with the main streams of the Marilao River basin. In addition, although the area is planned for residential houses, there are many vacant spaces at present, and population density is very low. Since access roads to the site exist, construction works for the STP will be easier. Further, land elevations are higher than river bed, so significant landfill will not be required.
There will be two STPs for each site under Options 3 and 4. One site is the same as that for Option 1, and another site is located at the middle of the Marilao River basin. Therefore, the sewage treatment area can be divided into two areas, which are the northwestern area and the southwestern area. For Option 3, Site 3 is located in a residential area, where access roads are narrow. On the other hand, Site 4 of Option 4 is located beside the main road. Therefore, access to the site is easy.
2) Construction of the Sewer Network The quantities of pipeline, PSs, and manholes are similar among the options, and significant differences are no seen. However, Options 3 and 4 have an advantage considering the reduced pipe diameters since the treatment area will be divided into two areas, even if the number of manholes will be increased. The biggest concern in the construction of the sewer networks is that soil condition is harder than that of the Marikina River basin. Therefore, the construction work will be difficult in all options.
3) Environmental Impacts In the case of Option 1, three temporary houses of caretakers are confirmed in Site 1. There might be a possibility of removing approximately 3.4 ha of bushes and trees for the implementation of the project. This site is in a residential area.
In the case of Option 2, there might be a possibility of removing approximately 0.9 ha of vegetation for the implementation of the project, though there are no residents in the area.
In the case of Option 3, one temporary house of a caretaker was confirmed at the edge of Site 3. This site is in a residential area.
In the case of Option 4, one temporary house of a caretaker was confirmed at the edge of Site 4. This site is along a heavy traffic road.
Table 5.3.24 shows the results of the alternative study for environmental and social considerations in the Marilao River basin. Potential negative environmental impacts due to the implementation of the project are compared relatively according to three ranks, namely, excellent, good, and poor in each aspect based on the site inspection and satellite imagery.

Republic of the Philippines Preparatory Survey on Water Supply and Sewerage Chapter 5 Development in the West Zone of Metro Manila Final Report Feasibility Study of Priority Sewerage Projects
5 - 124
Table 5.3.24 Environmental and Social Considerations in the Marilao River Basin
Land
Acq
uisit
ion
and
Res
ettle
men
t
Tra
ffic
Con
sider
atio
ns
Envi
ronm
enta
lIm
pact
1,3,4 Site 1 5.45
・Proposed areais surrounded bya river.・Thereis abush/forestbetweenproposed areaand residenntialarea.
・Families of three caretakermight be affected.・Clearing of trees(approximately 2.2 ha)・Private land needs to beacquired for the site of STP. Good Good Poor
2 Site 2 6.61
・Next toGraveyard andresidential area・Slope Land
・No resettlement・Clearing of trees(approximately 1.0 ha)・Owned by Forest Park・Private land needs to beacquired for the site of STP. Good Good Poor
3 Site 3 1.92・Slope Land・Rice Field
・The family of onecaretakermight be affected.・Clearing of trees(approximately 0.4 ha)・Private land needs to beacquired for the site of STP. Good Good Good
4 Site 4 1.93・Slope Land・Concrete wallwas erected.
・The family of onecaretaker might be affected.・Clearing of trees(approximately 0.2 ha)・Individual land needs to beacquired for the site of STP. Good Excellent Good
Option
/No. Loca
tion
Area(ha) Land Use Current situation
(July, 2012)Environmental
Remark/Potential Impact
Evaluation(Excellent > Good > Poor)
Source: JICA Study Team
4) Preliminary Estimates of Construction and O&M Costs In this section, a cost comparison is discussed to select the recommended design option. Table 5.3.25 shows the cost comparison for each option. The construction cost is divided into STPs and sewer network. The O&M cost includes staffing cost and variable cost for 15 years. As a result, Option 4 is found to be the least costly, while Option 3 is the most costly. However, no notable differences are observed for the estimated 15-year operation in all options, except for land acquisition cost.

Republic of the Philippines Preparatory Survey on Water Supply and Sewerage Chapter 5 Development in the West Zone of Metro Manila Final Report Feasibility Study of Priority Sewerage Projects
5 - 125
Table 5.2.25 Comparison of Preliminary Construction and O&M Costs for each Option
Option 1 Option 2 Option 3 Option 4PHP PHP PHP PHP
Site Development 165,000,000 206,563,000 224,925,000 225,161,000 Civil Works for Treatment Facilities 3,252,431,000 3,252,431,000 3,212,743,000 3,230,602,000 Mechanical and Electrical Works 737,869,000 737,869,000 1,124,103,000 1,115,943,000 Support Facilities 31,125,000 31,125,000 62,250,000 62,250,000
Sub-Total 4,186,425,000 4,227,988,000 4,624,021,000 4,633,956,000
Option 1 Option 2 Option 3 Option 4PHP PHP PHP PHP
Open Cut Method 2,943,891,000 2,962,344,000 2,946,075,000 2,934,939,000 Pipe Jacking Method 3,068,733,000 2,879,202,000 2,590,253,000 2,323,955,000 Interception Chambers 27,457,000 27,457,000 27,457,000 27,457,000 Manholes 251,272,000 216,417,000 221,114,000 222,920,000 Pumping Stations 76,555,000 76,555,000 78,459,000 74,650,000
Sub-Total 6,367,908,000 6,161,975,000 5,863,358,000 5,583,921,000
Option 1 Option 2 Option 3 Option 4PHP PHP PHP PHP
Staffing Cost/m3 1.72 1.72 1.72 1.72 Variable Cost (power, chemicals, etc.) 3.08 3.08 3.08 3.08 Total O & M Cost/m3 4.80 4.80 4.80 4.80 Total O & M Cost/day 270,000 270,000 270,000 270,000 Total O & M Cost/year 98,550,000 98,550,000 98,550,000 98,550,000
Total Cost at 15-year Operation 1,478,250,000 1,478,250,000 1,478,250,000 1,478,250,000 Land Acquisition Cost 264,000,000 462,700,000 465,600,000 466,650,000
Sub-Total 1,742,250,000 1,940,950,000 1,943,850,000 1,944,900,000
Grand Total 12,296,583,000 12,330,913,000 12,431,229,000 12,162,777,000
Sewer Network
O & M and Land Acquisition
Item
Item
STP
Item
Source: JICA Study Team
(3) Selection of the Recommended Design Option for the Marilao River basin The recommended design option shall be selected based on the conditions of constructability, environmental impacts, and preliminary cost estimates. Table 5.3.26 shows the evaluation of each design option. From the result of the selection study based on mentioned conditions, the Study Team recommended Option 1 as the project for the Marilao River basin.

Republic of the Philippines Preparatory Survey on Water Supply and Sewerage Chapter 5 Development in the West Zone of Metro Manila Final Report Feasibility Study of Priority Sewerage Projects
5 - 126
Table 5.3.26 Evaluation of Each Option Option 1 Option 2 Option 3 Option 4
Constructability ofSTP
Good(Enogh Space for STP)
Good(Enogh Space for STP)
Fair(Located nearby residential area and it
seems to be took much time forconstruction rocedure)
Fair(Located at river side and it can be affected
by flood)
Constructability ofSewer Network
Fair(Pipe size seems to be big because of one
STP)
Fair(Pipe size seems to be big because of one
STP)
Good(Pipe size can be smallar than Option 1 and2 because of 2 STPs, and phaising is easy)
Good(Pipe size can be smallar than Option 1 and2 because of 2 STPs, and phaising is easy)
EnvironmentalImpact
Fair(laying down of trees, and a few
resettlement will be required)
Fair(laying down of trees, and a few
resettlement will be required)
Fair(It is concerned for smelling and noising
because of residential area)
Good(There is no concern for environmental
impact)
Construction andO&M Cost
Land AcquisitionCost
Excellent( Cheapest)
Fair( One site will be for STP, but kand cost is
higher than Option 1)
Poor(Required two sites)
Poor(Required two sites)
Accessto STP
Good(There are some wide road and vacant land.
So, access is eas)
Fair( There are many road , but not so wide)
Fair(Road is narrow because of residential area)
Good( Located beside main road)
ConcernedAdditional Works
None Nnne None None
TotalEvaluation Good Fair Fair Fair
Fair(Construction cost is huge because of project amount, but differencies among each options are none. So evaluation is same level)
Source: JICA Study Team
5.3.5 Design Details of the Recommended Option (1) Sewer Network 1) Pipe Diameter, Material, and Construction Method
Table 5.3.27 shows the design pipe diameters and lengths for each material and construction method.
2) Plan and Profile Plan and profile inclusive of MHs and ICs are prepared as preliminary design. The figures are shown in a separate document for the preliminary design drawings.
3) Pumping Stations As shown in Table 5.3.12, there will be 13 PSs required in the Marilao River basin. Locations of these PSs are shown in Figure 5.3.5.
Table 5.3.27 Design Diameters and Lengths for Each Material and Construction Method
Open-Cut Trenchless Open-Cut Trenchless200 105 3,590 1,345 - 250 250 3,080 1,365 - 300 170 3,095 2,180 - 350 110 1,490 60 - 400 2,165 3,705 - - 450 - 70 - - 500 1,745 4,460 - - 600 645 1,540 - - 700 675 2,455 - - 800 530 2,015 - - 900 - 1,380 - -
1000 365 1,190 - - 1100 650 2,990 - - 1200 630 3,105 - - 1350 - 1,335 - - 1500 - - - - 1650 - - - - 1800 - 550 - - 1900 - - - - 2000 - - - - 2100 - 60 - -
8,040 36,110 4,950 - 4,950
Location of STP
Pipe Diameter(mm)
(Gravity Flow)
Sub-TotalTotal 44,150
Site 1
Total 49,100
Option 1
Sewer LineRC PVC
Source: JICA Study Team

Republic of the Philippines Preparatory Survey on Water Supply and Sewerage Chapter 5 Development in the West Zone of Metro Manila Final Report Feasibility Study of Priority Sewerage Projects
5 - 127
(2) STP 1) Treatment and Support Facilities
Table 5.3.28 shows the list of facilities and design quantities for the STP. The treatment capacity of the STP is 151,000 m3/d, which is the daily maximum volume in 2037. CAS method will be used for the sewage treatment process, while thickening and dewatering will be the sludge treatment process. The layout plan is shown in Figure 5.3.9 above.
Table 5.3.28 List of Facilities and Design Quantities
Unit Quantity Remarks
m3 31.9 3 Units
m3 23.8 3 Units
m3 299 4 Units
m3 543 2 Units
m3 13,590 4 Units
m3 35,233 4 Units
m3 21,140 3 Unit
m3 27,180 8 Units
m3 343 2 Units
m3 2,874 2 Units
m3 2,831 2 Units
m3 192 12 m x 8 m x 2 floor
m3 24 6 m x 4 m
m3 16 4 m x 4 m
m3 48 8 m x 6 m
m3 60 10 m x 6 m
m3 108 28 m x 6 m
m3 78 13 m x 6 m
m3 96 16 m x 6 m
m3 18 6 m x 3 m
m3 200
1. Treatment and Support Facilities
Treatment Facilities / Support Facilities
1-1. Treatment Facilities
Bar Rack Chamber
Parshall Flume
Grit Chambers
Influent Pumping Station
Anaerobic/Anoxic Tank
Secondary Clarifiers
Sludge Blending Tanks
Thickener Tanks
Primary Clarifiers
Aeration Tanks
Disinfection Tank
1-2. Support Facilities
RAS Building
WAS Building
Blower Building
Power House & Genset Building
Laboratory Building
Guard House
Parking Area
Administration/Control/Workshop Building
Dewatering Building
Pump House/Shelter
Source: JICA Study Team
2) Mechanical and Electrical Equipment Mechanical equipment such scrapers and pumps are required for sewage and sludge treatment. Based on the required capacity, the quantity of the mechanical equipment and applicable motor sizes were designed. Consequently, based on these mechanical requirements, the electrical requirements such as the electrical service scheme, the panel board load schedule, the voltage drop, and power riser diagrams were determined. Table 5.3.29 shows the list of equipment and design requirements.

Republic of the Philippines Preparatory Survey on Water Supply and Sewerage Chapter 5 Development in the West Zone of Metro Manila Final Report Feasibility Study of Priority Sewerage Projects
5 - 128
Table 5.3.29 List of Equipment and Design Requirements
Unit Quantity Remarks
unit 2
unit 1
SP-1A, SP-1B, SP-1C, SP-1D (Duty) unit 4
SP-1E (Stand by) unit 1
SP-1F, SP-1G, SP-1H, SP-1I (Duty) unit 4
SP-1J (Stand by) unit 1
SP-1K, SP-1L, SP-1M, SP-1N, SP-1O, SP-1P (Duty) unit 6
CDU-1 unit 1
CDU-2 unit 1
CDU-3 unit 1
CDU-4 unit 1
SP-2A (Duty) unit 1
SP-2B (Stand by) unit 1
SP-2C (Duty) unit 1
SP-2D (Stand by) unit 1
SP-3A (Duty) unit 1
SP-3B (Stand by) unit 1
BL-1A, BL-1B, BL-1C, BL-1D, BL-1E, BL-1F (Duty) unit 6
BL-2 (Stand by) unit 1
BL-1G, BL-1H (Duty) unit 2
unit 9,026
CDU-5 unit 1
CDU-6 unit 1
CDU-7 unit 1
CDU-8 unit 1
CDU-9 unit 1
CDU-10 unit 1
CDU-11 unit 1
CDU-12 unit 1
SP-4A (Duty) unit 1
SP-4B (Stand by) unit 1
SP-4C (Duty) unit 1
SP-4D (Stand by) unit 1
SP-5A (Duty) unit 1
SP-5B (Stand by) unit 1
SP-5C (Duty) unit 1
SP-5D (Stand by) unit 1
SP-6A (Duty) unit 1
SP-6B (Stand by) unit 1
SP-6C (Duty) unit 1
SP-6D (Stand by) unit 1
2. Mechanical and Electrical Equipment
Facilities / Equipments
2-1. Bar Rack Chamber
Bar Rack (Duty, mechanical type)Bar rack chamber
Bar Rack (Stand by, manual type)
2-2. Influent PS
Transfer Pump, Submersible non-clog type
Flow capacity: 9,437.5 m3/ hr, Pumps: 674.1m^3/hr,TDH: 30 m, Motor: 100 hp, 460 v-3 ph-60 Hz
2-3. Primary Clarifier
Travelling Scraper with skimmer and motor drive unit
Motor: 3 hp, 230 v-3 ph-60 Hz
Scum Pumps, submersible non-clog type
Flow capacity: 0.64 m3/hr, TDH: 10 m,Motor: 0.5 hp, 230 v-1 ph-60 Hz
Sludge Pumps, centrifugal end-suction non-clog type, For WAS buildingFlow capacity: 3.28 m3/min, TDH: 10 m,Motor: 15 hp, 460 v-3 ph-60 Hz
Sludge Pumps, centrifugal end-suction non-clog type,
For WAS buildingFlow capacity: 2.63 m3/hr, TDH: 10 m,Motor: 15 hp, 460 v-3 ph-60 Hz
2-4. Aeration Tank
Blower Power
Requirement capacity: 96.87 m3/minMotor: 125 hp 460 v- 3 ph- 60 Hz
Fine Bubble Membrane Diffusers
2-5. Secondary Clarifier
Travelling Scraper with skimmer and motor drive unit
Motor: 3 hp, 230 v-3 ph-60 Hz
Scum Pumps, submersible non-clog type
Flow capacity: 0.64 m3/hr, TDH: 10 mMotor: 0.5 hp, 230 v-1 ph-60 Hz
Sludge Pumps, centrifugal end-suction non-clog type,
For RAS buildingFlow capacity: 786.5 m3/hr, TDH: 10 m,Motor: 50 hp, 460 v-3 ph-60 Hz

Republic of the Philippines Preparatory Survey on Water Supply and Sewerage Chapter 5 Development in the West Zone of Metro Manila Final Report Feasibility Study of Priority Sewerage Projects
5 - 129
Unit Quantity Remarks
SP-7A (Duty) unit 1
SP-7B (Stand by) unit 1
SBM-1 (Duty) unit 1
SBM-2 (Stand by) unit 1
SP-8A (Duty) unit 1
SP-8B (Stand by) unit 1
TDU-1 (Duty) unit 1
TDU-2 (Stand by) unit 1
unit 3Pump capacity: 1573 m3/ hr (25% of treatedwastewater), TDH: 20 m,Motor: 50 hp, 460 v-3 ph-60 Hz
unit 2Thickened sludge: 32,876 kg/day,Flow capacity: 133 m3/ daySludge cake: 20%, Solid capture: 95%
unit 2Capacity: 150 L/H,Discharge Pressure=3 kc/cm2,Power: 0. 5 hp, 230 v-1 ph-60 Hz
unit 2Capacity: 10-20 L/H,Discharge Pressure:3 kg/cm2,Power: 0. 5 hp, 230 v-1 ph-60 Hz
unit 1 Velocity gradient= 50 s-1,Power: 0. 5 hp, 230 v-1 ph-60 Hz
unit 2 Capacity: 30 m3/hrTDH: 10 m, Motor: 3 hp, 230v-3 ph-60 Hz
unit 2 Flow capacity: 0.19 m3/ min,TDH: 25 m, Motor: 2 hp, 230 v-1 ph-60 Hz
lot 1
lot 1
lot 1
lot 1
set 1
set 1
set 1
Facilities / Equipments
Sludge Blend Mixer
Motor: 1.5 hp, 230 v-3 ph-60 Hz
2-6. Sludge Blending Tanks
Sludge Transfer PumpsFlow capacity: 4.43 m3/min, THD: 10 mMotor: 20 hp, 460 v-3 ph-60 Hz
Polymer Tank Mixer (PM-1)
Drain Pump (DP-1)
Motor: 1.5 hp, 230 v-3 ph-60 Hz
2-7. Sludge Thickener Tanks
Sludge Transfer PumpsFlow capacity: 4.43 m3/min, TDH: 10 m,Motor: 20 hp, 460 v-3 ph-60 Hz
Sludge Thickener Tank Mortor Drive Unit
3 MVA, 34.5 KV or 13.8 KV - 460V, 3 Ph., 60 Hz Pad Mounted Type
500 KVA rating, 3 Ph, 60 Hz, 460 v primary - 230 v secondary
150 KVA, 3 ph, 60 hz, 460 v Primary- 230 v Secondary,
2-8. Disinfection Tank
Recycle Pump (RP-1, RP-2, RP-3)
2-9. Sludge Dewatering Facility
Screw Press Dewatering Machine with screw conveyor
UREA Feed Pump (UP-1)
Polymer Dosing Pump (PP-1)
75 KVA, 3 ph, 60 hz, 460 v Primary- 230 v Secondary,
2-10. Administrative Building
Transfer Pump for domestic water, submersible type (TP-1)
2-11. Electrical Equipment
Wires and Conduits
MCC for STP
Distribution Panels
Source: JICA Study Team
a) Mechanical Process Diagram Figure 5.3.15 shows the mechanical process diagram. This figure is also included in a separate document for the preliminary design drawings.

Republic of the Philippines Preparatory Survey on Water Supply and Sewerage Chapter 5 Development in the West Zone of Metro Manila Final Report Feasibility Study of Priority Sewerage Projects
5 - 130
Source: JICA Study Team
Figure 5.3.15 Mechanical Process Diagram
b) Power Supply of the STP For the power supply of the STP, the power single-line diagram of the 460 VAC low voltage main switchgear and all the connected loads supplied by the outgoing feeders, is designed as shown in Figure 5.3.16. The automatic switch panel containing the electrical and mechanical interlock interconnection of the ATS circuit breakers of the proposed 500 kVA stand-by diesel generator unit will run in case of power outage to supply power to all essential loads in the system. The wire sizes for the interconnection between the switchgear were properly sized and indicated on the riser diagram.
In addition, the power single-line diagram of the 460 VAC non-essential loads switchgear 1A, is designed as shown in Figure 5.3.17. The wire sizes for the interconnection between the switchgear were properly sized and indicated on the riser diagram.
Figure 5.3.18 shows the Power Single-line Diagram, which is the 460 VAC non-essential loads switchgear 1B. The wire sizes for the interconnection between the switchgear were properly sized and indicated on the riser diagram.
These figures are also included in a separate document for the preliminary design drawings.
Repu
blic of the P
hilippin
es P
reparatory Su
rvey on W
ater Su
pply and S
ewerage
C
hapter 5
Developm
ent in
the W
est Zon
e of Metro M
anila
F
inal R
eport F
easibility Study of P
riority Sew
erage Projects
5 - 131
Source: JIC
A Study Team
Figure 5.3.16 Power R
iser Single Line D
iagram 1

Repu
blic of the P
hilippin
es P
reparatory Su
rvey on W
ater Su
pply and S
ewerage
C
hapter 5
Developm
ent in
the W
est Zon
e of Metro M
anila
F
inal R
eport F
easibility Study of P
riority Sew
erage Projects
5 - 132
Source: JIC
A Study Team
Figure 5.3.17 Power R
iser Single Line D
iagram 2
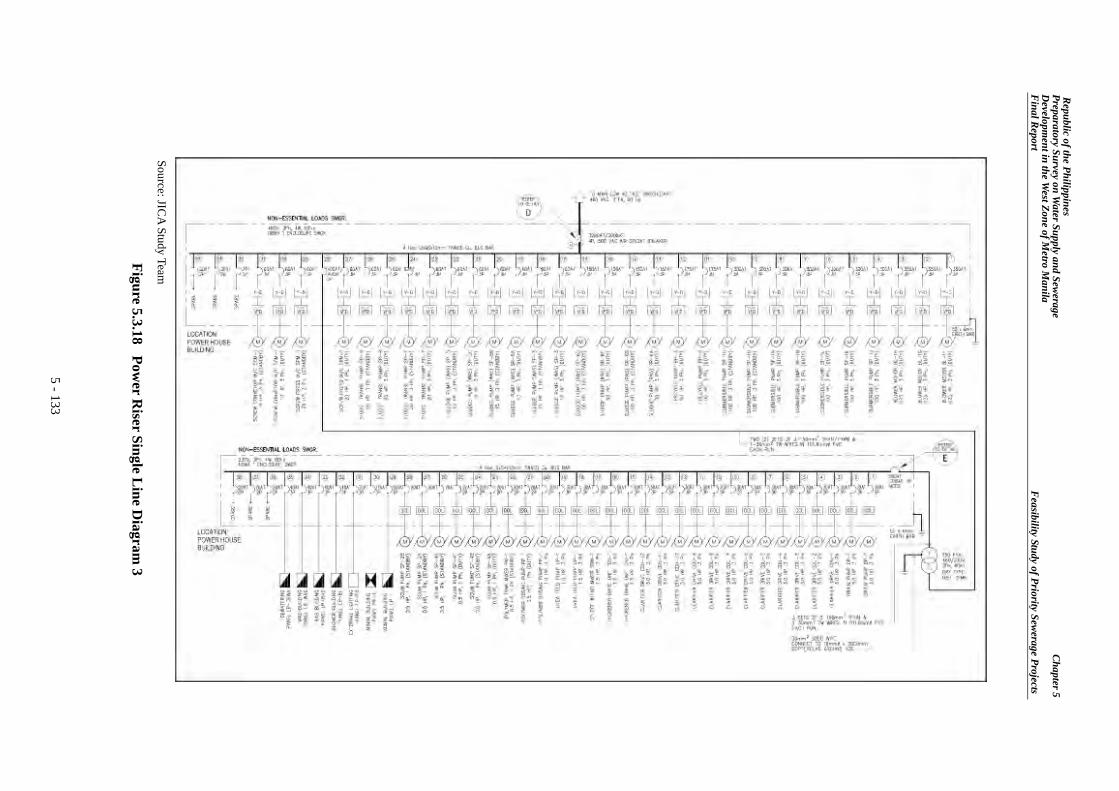
Repu
blic of the P
hilippin
es P
reparatory Su
rvey on W
ater Su
pply and S
ewerage
C
hapter 5
Developm
ent in
the W
est Zon
e of Metro M
anila
F
inal R
eport F
easibility Study of P
riority Sew
erage Projects
5 - 133
Source: JIC
A Study Team
Figure 5.3.18 Power R
iser Single Line D
iagram 3

Republic of the Philippines Preparatory Survey on Water Supply and Sewerage Chapter 5 Development in the West Zone of Metro Manila Final Report Feasibility Study of Priority Sewerage Projects
5 - 134
c) Load Calculation The design load is calculated for essential and non-essential loads as shown in Table 5.3.30 and Table 5.3.31, respectively. The total load calculated is 430 kVA for essential loads, and 921 kVA for non-essential loads.
Table 5.3.30 Load Calculation for Essential Loads Load Schedule: 460 VAC Outgoing Feeders Panel Site 1 Concrete Pedestal-Mounted, Nema 1 Enclo. Volts: 460 PHASE: 3
AB BC CA 3Ø AT AF POLE
1 Submersible Pump, SP-1A 1 100,390.00 460 126.00 300 400 3P 3-125 mm²THHN
1-30 mm² TW 80 mm Ø PVC
2 Submersible Pump, SP-1D 1 100,390.00 460 126.00 300 400 3P 3-125 mm²THHN
1-30 mm² TW 80 mm Ø PVC
3 Blower Motor, BL-1A 1 100,390.00 460 126.00 300 400 3P 3-125 mm²THHN
1-30 mm² TW 80 mm Ø PVC
4 Recycle Pump, RP-1 1 76,567.00 460 96.10 200 225 3P 3-80 mm²THHN
1-22 mm² TW 63 mm Ø PVC
5 50 KVA 460-230V Transformer 1 16,120.00 460 35.31 25.90 32.35 125 225 3P 3-38 mm²THHN
1-14 mm² TW 50 mm Ø PVC
6 SPARE 1 3,984.00 460 5.00 20 100 3P - - -
397,841 35.31 25.90 32.35 479.10
Load Schedule: 230 VAC Outgoing Feeders Panel Site 1 Concrete Pedestal-Mounted, Nema 1 Enclo. Volts: 230 PHASE: 3
AB BC CA 3Ø AT AF POLE
1 Admin Building, Panel LP-1 1 7,188.00 230 17.25 18.40 17.85 100 100 3P 3-30.0 mm²THHN
1-8.0 mm² TW 40 mm Ø PVC
2 Admin Building, Panel PP-1 1 14,975.00 230 38.78 18.80 32.25 125 225 3P3-38.0 mm²
THHN 1-14.0 mm² TW 50 mm Ø PVC
3 External Lighting, LP-EX 1 6,627.00 230 9.6 9.60 9.60 40 100 3P 3-8.0 mm²THHN
1-5.5 mm² TW 25 mm Ø PVC
4 SPARE 1 1,150.00 230 5.00 20 100 2P - - -
5 SPARE 1 1,150.00 230 5.00 20 100 2P - - -
6 SPARE 1 1,150.00 230 5.00 20 100 2P - - -
32,240.00 70.63 51.80 64.70
AMPERAGE PROTECTIONSERVICE WIRE NEUTRAL
WIRECONDUIT
SIZE
TOTAL
ESSENTIAL LOADS
Ckt.No.
CO NNECTED LO AD QTY. VA LOAD AC Volts
AMPERAGE PROTECTIONSERVICE WIRE NEUTRAL
WIRECONDUIT
SIZE
TOTAL
ESSENTIAL LOADS
Ckt.No.
CONNECTED LOAD QTY. VA LOAD AC Volts
Source: JICA Study Team
Table 5.3.31 Load Calculation for Non-Essential Loads
Load Schedule: 460 VAC Outgoing Feeders Panel Site 1 Concrete Pedestal-Mounted, Nema 1 Enclo. Volts: 460 PHASE: 3
AB BC CA 3Ø AT AF POLE
1 Submersible Pump, SP-1B 1 100,390.00 460 126.00 300 400 3P 3-125 mm²)THHN
1-30 mm² TW 80 mm Ø PVC
2 Submersible Pump, SP-1C 1 100,390.00 460 126.00 300 400 3P 3-125 mm²)THHN
1-30 mm² TW 80 mm Ø PVC
3 Submersible Pump, SP-1E 1 100,390.00 460 126.00 300 400 3P 3-125 mm²)THHN
1-30 mm² TW 80 mm Ø PVC
4 Submersible Pump, SP-1F 1 100,390.00 460 126.00 300 400 3P 3-125 mm²)THHN
1-30 mm² TW 80 mm Ø PVC
5 Blower Motor, BL-1B 1 100,390.00 460 126.00 300 400 3P 3-125 mm²)THHN
1-30 mm² TW 80 mm Ø PVC
6 Blower Motor, BL-1C 1 100,390.00 460 126.00 300 400 3P 3-125 mm²)THHN
1-30 mm² TW 80 mm Ø PVC
7 Blower Motor, BL-2 1 (100,390.00) 460 (126.00) 300 400 3P 3-125 mm²)THHN
1-30 mm² TW 80 mm Ø PVC
8 Recycle Pump, RP-2 1 76,567.00 460 96.10 200 225 3P 3-80 mm²THHN
1-22 mm² TW 63 mm Ø PVC
9 Sludge Pump RAS, SP-6 1 41,829.00 460 52.50 100 100 3P 3-30 mm²THHN
1-8.0 mm² TW 40 mm Ø PVC
10 Sludge Pump RAS, SP-6 1 (41,829.00) 460 (52.50) 100 100 3P 3-30 mm²THHN
1-8.0 mm² TW 40 mm Ø PVC
11 Sludge Pump WAS, SP-3 1 6,294.00 460 7.90 20 100 3P 3-3.5 mm²THHN
1-2.0 mm² TW 20 mm Ø PVC
12 Sludge Pump WAS, SP-3 1 (6,294.00) 460 (7.90) 20 100 3P 3-3.5 mm²THHN
1-2.0 mm² TW 20 mm Ø PVC
13 Sludge Pump WAS, SP-5 1 6,294.00 460 7.90 20 100 3P 3-3.5 mm²THHN
1-2.0 mm² TW 20 mm Ø PVC
14 Sludge Pump WAS, SP-5 1 (6,294.00) 460 (7.90) 20 100 3P 3-3.5 mm²THHN
1-2.0 mm² TW 20 mm Ø PVC
15 Sludge Transfer Pump, SP-7 1 9,003.00 460 11.30 30 100 3P 3-5.5 mm²THHN
1-3.5 mm² TW 25 mm Ø PVC
16 Sludge Transfer Pump, SP-7 1 (9,003.00) 460 (11.30) 30 100 3P 3-5.5 mm²THHN
1-3.5 mm² TW 25 mm Ø PVC
17 Sludge Transfer Pump, SP-8 1 9,003.00 460 11.30 30 100 3P 3-5.5 mm²THHN
1-3.5 mm² TW 25 mm Ø PVC
18 Sludge Transfer Pump, SP-8 1 (9,003.00) 460 (11.30) 30 100 3P 3-5.5 mm²THHN
1-3.5 mm² TW 25 mm Ø PVC
19 Screw Press Machine, SPM-1 1 21,831.00 460 27.40 60 100 3P 3-8.0 mm²THHN
1-5.5 mm² TW 25 mm Ø PVC
AMPERAGE PROTECTION SERVICEWIRE
NEUTRALWIRE
CONDUITSIZE
NON-ESSENTIAL LOADS
Ckt.No. CONNECTED LOAD QTY. VA LOAD AC Volts

Republic of the Philippines Preparatory Survey on Water Supply and Sewerage Chapter 5 Development in the West Zone of Metro Manila Final Report Feasibility Study of Priority Sewerage Projects
5 - 135
Load Schedule: 460 VAC Outgoing Feeders Panel Site 1 Concrete Pedestal-Mounted, Nema 1 Enclo. Volts: 460 PHASE: 3
AB BC CA 3Ø AT AF POLE
20 Screw Press Machine, SPM-1 1 (21,831.00) 460 (27.40) 60 100 3P 3-8.0 mm²THHN
1-5.5 mm² TW 25 mm Ø PVC
21 Screw Conveyor Machine, SCM-1 1 11,553.00 460 14.50 30 100 3P 3-5.5 mm²THHN
1-3.5 mm² TW 25 mm Ø PVC
22 Screw Conveyor Machine, SCM-1 1 (11,553.00) 460 (14.30) 30 100 3P 3-5.5 mm²THHN
1-3.5 mm² TW 25 mm Ø PVC
23 SPARE 1 3,984.00 460 5.00 20 100 3P - - -24 SPARE 1 3,984.00 460 5.00 20 100 3P - - -25 SPARE 1 3,984.00 460 5.00 20 100 3P - - -
26 100 KVA, 460-230V Transformer 1 41,596.00 460 40.18 39.64 37.82 200 225 3P 2(3-100 mm²)THHN
1-30 mm² TW 80 mm Ø PVC
838,262 40.18 39.64 37.82 999.90
Load Schedule: 230 VAC Outgoing Feeders Panel NQ1A Concrete Pedestal-Mounted, Nema 1 Enclo. Volts: 230 PHASE: 3
AB BC CA 3Ø AT AF POLE
1 Drain Pump, DP-1 1 3,976.00 230 9.98 30 100 3P 3-5.5 mm²THHN
1-3.5 mm² TW 20 mm Ø PVC
2 Drain Pump, DP-1 1 3,976.00 230 9.98 30 100 3P 3-5.5 mm²THHN
1-3.5 mm² TW 20 mm Ø PVC
3 Clarifier Drive Unit, CDU-1 1 3,976.00 230 9.98 30 100 3P 3-5.5 mm²THHN
1-3.5 mm² TW 20 mm Ø PVC
4 Clarifier Drive Unit, CDU-2 1 3,976.00 230 9.98 30 100 3P 3-5.5 mm²THHN
1-3.5 mm² TW 20 mm Ø PVC
5 Clarifier Drive Unit, CDU-3 1 3,976.00 230 9.98 30 100 3P 3-5.5 mm²THHN
1-3.5 mm² TW 20 mm Ø PVC
6 Clarifier Drive Unit, CDU-4 1 3,976.00 230 9.98 30 100 3P 3-5.5 mm²THHN
1-3.5 mm² TW 20 mm Ø PVC
7 Clarifier Drive Unit, CDU-5 1 3,976.00 230 9.98 30 100 3P 3-5.5 mm²THHN
1-3.5 mm² TW 20 mm Ø PVC
8 Clarifier Drive Unit, CDU-6 1 3,976.00 230 9.98 30 100 3P 3-5.5 mm²THHN
1-3.5 mm² TW 20 mm Ø PVC
9 Thickener Drive Unit, TDU-1 1 2,055.00 230 5.16 30 100 3P 3-5.5 mm²THHN
1-3.5 mm² TW 20 mm Ø PVC
10 Thickener Drive Unit, TDU-1 1 2,055.00 230 5.16 30 100 3P 3-5.5 mm²THHN
1-3.5 mm² TW 20 mm Ø PVC
11 Sludge Blend Mixer, SBM-1 1 2,055.00 230 5.16 30 100 3P 3-5.5 mm²THHN
1-3.5 mm² TW 20 mm Ø PVC
12 Sludge Blend Mixer, SBM-1 1 2,055.00 230 5.16 30 100 3P 3-5.5 mm²THHN
1-3.5 mm² TW 20 mm Ø PVC
13 Sludge Blend Mixer, SBM-2 1 2,055.00 230 5.16 30 100 3P 3-5.5 mm²THHN
1-3.5 mm² TW 20 mm Ø PVC
14 Urea Feed Pump, UP-1 1 855.000 230 3.72 20 100 2P 2-3.5 mm²THHN
1-2.0 mm² TW 20 mm Ø PVC
15 Urea Feed Pump, UP-1 1 855.000 230 3.72 20 100 2P 2-3.5 mm²THHN
1-2.0 mm² TW 20 mm Ø PVC
16 Polymer Tank Mixer, PM-1 1 855.000 230 3.72 20 100 2P 2-3.5 mm²THHN
1-2.0 mm² TW 20 mm Ø PVC
17 Scum Pump, SP-4A 1 855.000 230 3.72 20 100 2P 2-3.5 mm²THHN
1-2.0 mm² TW 20 mm Ø PVC
18 Scum Pump, SP-4B 1 (855.00) 230 .(3.72) 20 100 2P 2-3.5 mm²THHN
1-2.0 mm² TW 20 mm Ø PVC
19 Scum Pump, SP-4C 1 855.000 230 3.72 20 100 2P 2-3.5 mm²THHN
1-2.0 mm² TW 20 mm Ø PVC
20 Scum Pump, SP-4D 1 (855.00) 230 .(3.72) 20 100 2P 2-3.5 mm²THHN
1-2.0 mm² TW 20 mm Ø PVC
21 Scum Pump, SP-2A 1 855.000 230 3.72 20 100 2P 2-3.5 mm²THHN
1-2.0 mm² TW 20 mm Ø PVC
22 Scum Pump, SP-2B 1 (855.00) 230 .(3.72) 20 100 2P 2-3.5 mm²THHN
1-2.0 mm² TW 20 mm Ø PVC
23 Admin Building, Panel LP-1 1 6,250.00 230 15.00 16.00 15.50 100 100 3P 3-30.0 mm²THHN
1-8.0 mm² TW 40 mm Ø PVC
24 Admin Building, Panel PP-1 1 13,025.00 230 33.73 31.64 28.50 175 225 3P 3-80.0 mm²THHN
1-22.0 mm² TW 63 mm Ø PVC
25 External Lighting, LP-EX 1 13,254.00 230 19.20 19.20 19.20 70 100 3P 3-22.0 mm²THHN
1-8.0 mm² TW 40 mm Ø PVC
26 SPARE 1 1,150.00 230 5.00 20 100 2P - - -27 SPARE 1 1,150.00 230 5.00 20 100 2P - - -28 SPARE 1 1,150.00 230 5.00 20 100 2P - - -
TOTAL 83,192.00 80.37 79.28 75.64 105.64
NEUTRALWIRE
CONDUITSIZE
CONDUITSIZE
NON-ESSENTIAL LOADS
Ckt.No. CO NNECTED LO AD QTY. VA LOAD AC Volts
AMPERAGE PROTECTIONSERVICE WIRE
Ckt.No. CONNECTED LOAD QTY. VA LOAD AC Volts
AMPERAGE
TOTAL
NON-ESSENTIAL LOADS
PROTECTION SERVICEWIRE
NEUTRALWIRE
Source: JICA Study Team

Republic of the Philippines Preparatory Survey on Water Supply and Sewerage Chapter 5 Development in the West Zone of Metro Manila Final Report Feasibility Study of Priority Sewerage Projects
5 - 136
5.4 Environmental and Social Considerations
5.4.1 Summary of the Project Contents Priority sewerage projects are proposed in the Marikina River basin and in the Marilao River basin. The sewerage projects include the construction of STPs and sewer network, such as sewer pipes, interceptor facilities, and pumping facilities and pumping facilities. The candidate sites for the STPs are selected among several vacant lands in consideration of the land conditions, such as land use and topography. The PSs in the sewer network are designed to minimize its number and sizes (e.g., manhole type PS) as much as possible so as not to require modification of the private land. Basically, new sewer pipes will be laid within public roads by open trench and trenchless construction. The descriptions of the Projects are presented in Section 5.1. The EIA regulations and procedures are presented in Section 1.7.2.
5.4.2 Alternative Examination (1) No-Project Scenario
The analysis of alternatives for the priority sewerage projects is generally divided into the “Do it” or “Do nothing” cases. However, in the “Do nothing” case there is no countermeasure against water pollutants, thus, keeping the current water sewerage system.
The results of assessment revealed that all 19 priority rivers in the Philippines have improved significantly from 2003 to 2008 in terms of dissolved oxygen (DO) level. Almost all the rivers that run into the Manila Bay do not satisfy the DENR criteria standards in terms of DO and biochemical oxygen demand (BOD). According to the National State of the Brown Environment Report (2005-2007) published by EMB in 2009, a rapid inventory of pollution sources from 2001 to 2005 revealed that domestic wastes are the major source of pollution (33%), followed by agriculture including livestock (29%), and industrial sources (27%). Pollutants from non-point sources account for 11% of organic load in water bodies. The low sanitation coverage rate is the leading cause of water pollution in the Philippines. The Department of Public Works and Highways (DPWH) reported that more than 90% of sewage generated nationwide are not treated properly, and less than 10% of the population have access to sewerage systems.
Since it is clear that domestic wastewater is one of the main contributors of water pollutants, it is impossible to improve public water quality without implementing countermeasures against wastewater. Furthermore, the necessity of increasing the coverage rate by installing sewerage systems in Metro Manila is particularly important to achieve the deadline of the Clean Water Act and a mandamus made by the Supreme Court to improve the water quality of the Manila Bay. This is why the “Do nothing” case is obviously unacceptable.

Republic of the Philippines Preparatory Survey on Water Supply and Sewerage Chapter 5 Development in the West Zone of Metro Manila Final Report Feasibility Study of Priority Sewerage Projects
5 - 137
(2) Alternative Plans of STPs In the “Do it” case, recommended options for the Marikina River basin and Marilao river basin were selected among several candidate STPs in consideration of the conditions of constructability, environmental impact, and preliminary cost estimation. The alternative study for the proposed project from the perspective of environmental and social considerations was presented in Sections 5.2.4 and 5.3.4.
5.4.3 Draft Scoping of Impact The comprehensive potential impacts to the natural and social environment during the preconstruction, construction and operation stages of the projects have been initially identified using the environmental scoping list shown in Table 5.4.1.
Table 5.4.1 Draft Preliminary Scoping of Environmental and Social Impacts of STP Item Preconstruction /
Construction StageOperation
Stage Description
Pollution Control 1. Air Pollution B- B- Some negative impacts on air quality are expected due
to operations of heavy equipment/vehicles as well as traffic jam incidents caused by construction works. However, the expected impacts during the construction stage will only be temporary. During the operation stage, there are some negative impacts on air quality due to the operations of relevant equipment, generators, and vehicle exhaust emission.
2. Water Pollution B- A+ Some impacts on water quality would be caused by turbid water generated from construction yards during excavation works. However, the expected impacts during the construction stage will only be temporary.Public water quality will be improved during the operation stage of the installed STPs.
3. Soil Contamination D D There are no project components or activities whichmay cause soil pollution.
4. Solid Waste and/or Industrial Discharge
B- B- It is expected that the Project will generate construction wastes during the construction stage. During the operation stage, sludge will be generated in the process of waste water treatment.
5. Noise and Vibration B- B- Noise and vibration are expected due to the operation of heavy equipment/vehicles. However, the expected impacts during the construction stage will only be temporary. During the operation stage, noise and vibration will be generated due to the operation of relevant equipment, generators, and vehicles.
6. Ground Subsidence D D There are no project components or activities which may cause negative impacts to ground subsidence.
7. Odor D B- There are no project components or activities which may cause offensive odor during the construction stage. There is a possibility that negative odor would be generated from sewage and sludge.
8. Bottom Sediment D B+ During the construction stage, there are no project components or activities which may cause negative impacts to the water bottom/sediment. It is possible that there would be positive impacts to the bottom sediment for aquatic life, since public water quality will be improved during the operation stage of the installed STPs.
Natural Environment9. Geographical Conditions and Geological Conditions
D D The Project is not expected to cause significant change or impacts to geographical and geological conditions.

Republic of the Philippines Preparatory Survey on Water Supply and Sewerage Chapter 5 Development in the West Zone of Metro Manila Final Report Feasibility Study of Priority Sewerage Projects
5 - 138
Item Preconstruction / Construction Stage
OperationStage Description
10. Soil Erosion D D Option 3 of the candidate STPs for the Marikina River basin and Option 1 of the candidate STPs for the Marilao River basin are on flat terrains and traces of soil erosion are not present. Thus, there is no possibility of soil erosion.
11. Flora B- B+ There are some trees present in the sites. Landclearing during the construction stage is a negative impact on vegetation. During the operations of the STPs, there is a possibility to cause positive impacts to aquatic plants since the river water quality would be improved.
12. Fauna B- B+ There are some trees present in the sites. Althoughmost candidate sites are proposed to be in developed urban locations away from protected areas, clearing of vegetation will affect the site’s biodiversity. During the operations of the STPs, there is a possibility to cause positive impacts to aquatic animals since the river water quality would be improved.
13. Ground Water D D There are no project components or activities which may cause significant change or impacts to groundwater in and around the project area.
14. Water Body (River, Lakes, etc.)
D D The existing drainage within the Marikina and Marilao River basins will be intercepted before flowing into each river and transported to the STPs by the Project. Since treated water in the STPs will be discharged into identified rivers, there is no impact to water bodies.
15. Coastal Environment
D D There is no effect on the coastal environment in and around the project area.
16. Oceanographic D D There is no effect on oceanographic conditions in and around the project area.
17. Natural/Ecological Reserves and Sanctuaries
D D Negative impacts are not expected since the project is proposed to be located in developed urban areas where there are no ecological reserves and sanctuaries. Moreover, current lands are mostly vacant.
Social Environment 18.Involuntary Resettlement
B- D There might be a possibility that involuntary resettlement would be caused due to the development of the STPs.
19. Local Economies(Employment, Livelihood, etc.)
B+ B+ The Project will generate employment and business opportunities to local residents during the construction stage. After the operations of the STPs, some positive effects to local residents’ livelihood are expected due to the improvement of public water quality.
20. Water Rights D D No impact on water use or water rights is expected due to the project implementation.
21. Land Use and Utilization of Local Resources
D D There are no project components or activities whichmay affect land use since the candidate sites are vacant lands.
22. Social Institutions and Community
D D There are no significant impacts on the local community during the operation stage.
23. Existing Social Infrastructure and Services
B- B- Some negative impacts to existing traffic conditions are expected due to traffic congestion caused by the construction activities, especially in narrow roads. However, such expected impacts during the construction stage will only be temporary. There is a possibility that vehicles and trucks would increase traffic volume within the residential areas especially during the operations of the STPs.
24. Poor, Indigenous, or Ethnic People
D D There are no project components or activities that may cause negative impacts to poor, indigenous, or ethnic people.
25.Misdistribution of Benefits and Damages
D D Since the purpose of the Project is to improve public water quality, there are no project components or activities which may cause misdistribution of benefits

Republic of the Philippines Preparatory Survey on Water Supply and Sewerage Chapter 5 Development in the West Zone of Metro Manila Final Report Feasibility Study of Priority Sewerage Projects
5 - 139
Item Preconstruction / Construction Stage
OperationStage Description
and damages.26. Local Conflicts of Interest
D D Since the purpose of the Project is to improve public water quality, there are no project components or activities which may cause local conflicts of interest.
27. Gender and Children’s Rights
D D Since the purpose of the Project is to improve public water quality, there are no project components or activities which may cause negative impacts on gender and children’s rights.
28. Cultural Heritage D D
Since the STPs will be constructed on vacant/forest lands in residential areas, there are no project components or activities which may cause negative impacts to cultural heritage.
29.Landscape D B- Since the STPs will be constructed on vacant/forest lands in residential areas, landscape features would change.
30. Infectious Diseases such as HIV/AIDS
B- D During the construction stage, increments of risks are probably expected from infectious diseases among the construction workforce.
31. Public Hygiene B- B+ During the construction stage, sanitary conditions will deteriorate due to wastewater, dust, and solid wastes from the construction sites. Since the purpose of the Project is to improve public water quality, public hygiene will also be improved.
32. Working Conditions (including Occupational Safety)
B- B- Increment of risks on traffic safety is expected due to operations of heavy equipment and heavy vehicles during the construction stage. Increased risks to occupational safety are expected in the operation stage.
Others 33. Accident and Hazard
D D During the construction and operations of the STPs, significant accidents and hazards are not expected to occur.
34. Local Climate D D The Project is not expected to cause significant change to the regional meteorological conditions.
35. Global Warming B- B- The possibility of increased greenhouse gas (GHG) emission is expected due to the operations of heavy vehicles as well as traffic jam incidents during construction works. However, the expected impacts during the construction stage will only be temporary.The possibility of increased GHG emission is expected due to the operations of generator and pumps in the STPs, and emission from vehicles and trucks during the operation stage.
Note: * The impacts on Gender and Children’s Rights may be related to all criteria of Social Environment. Rating A+/-: Significant positive / negative impact is expected. B+/-: Positive / negative impact is expected to some extent. C+/-: Extent of positive / negative impact is unknown. (Further examination is needed, and the impacts could be clarified as the Study
progresses) D: No impact is expected
Source: Study Team
5.4.4 Prediction of Impacts and Proposed Mitigation Measures (1) Contents of the Study Regarding Environmental and Social Considerations
The contents of the environmental and social considerations study are as follows: 1) Prediction of impacts caused by the Project on scoped items, as shown in Table 5.4.2; 2) Proposal for environmental mitigation measures; 3) Proposal for environmental management and monitoring plans; and 4) Proposal for information disclosure.

Republic of the Philippines Preparatory Survey on Water Supply and Sewerage Chapter 5 Development in the West Zone of Metro Manila Final Report Feasibility Study of Priority Sewerage Projects
5 - 140
Table 5.4.2 List of Studies for EIA on Sewerage Projects
Category Items of Study Preconstruction / Construction Stage
OperationStage
Pollution Control - Air pollution - Water pollution - Solid waste and/or industrial discharge - Noise and vibration - Oder
Natural Environment - Flora and fauna Social Environment - Involuntary resettlement
- Existing social infrastructures and services - Landscape - Public hygiene - Working conditions (including occupational safety)
- Infectious diseases such as HIV/AIDS
Others - Global warming
Source: JICA Study Team
(2) Prediction of Impacts and Proposed Mitigation Measurements The negative impacts were predicted qualitatively in consideration of the project features, construction methodology, and secondary data that were collected based on the published data for land use, natural environment conditions, socioeconomics, and demography. Table 5.4.3 shows the impact and proposed mitigation measurements.
Table 5.4.3 Prediction of Impacts and Proposed Mitigation Measurements S. No
Environmental Attributes Effect Factor Potential Impact Proposed Mitigation Measures
Preconstruction Phase 1. Involuntary
resettlement - Development of
private land for the STPs. (It should be confirmed whether there is involuntary resettlement or not based on the final design.)
- There is a possibility of involuntary resettlement of caretakers.
- Permanent negative impacts to project affected people. (It should be confirmed whether there is involuntary resettlement or not based on final design)
- In the examination of the final design, review the arrangement of relevant facilities and reduce the development area based on current land use.
- The detour pipe line should be designed (if necessary).
- If the presence of informal settlers is confirmed in the proposed project site, a resettlement action plan must be prepared in accordance with JICA guidelines.
Construction Phase 1. Air quality - Dust emissions from
site preparation, excavation, material handling and other construction activities at the site.
- Minor and short-term negative impacts within the construction area only.
- Regular water sprinkling on exposed surfaces to reduce dust emission.
- Proper maintenance of all equipment at regular intervals.
2. Water quality - Excavation works.- Oil/fuel and waste
spills from the construction area due to the repairing and maintenance works of equipment/vehicles
- Excavation works would induce erosion/siltation and may clog waterways.
- Clogging of waterways may result to flooding during the rainy season.
- Excavation can also cause
- Maintenance and cleanliness in the work place will be strictly observed.
- Water from excavations will be discharged to the nearest gutters and canals while providing erosion control (e.g., silt traps, catch pits).

Republic of the Philippines Preparatory Survey on Water Supply and Sewerage Chapter 5 Development in the West Zone of Metro Manila Final Report Feasibility Study of Priority Sewerage Projects
5 - 141
S. No
Environmental Attributes Effect Factor Potential Impact Proposed Mitigation Measures
on-site. mud pools.- Minor and short-term
negative impacts near the construction area only.
- Used oil will be dispensed in a controlled manner.
- Avoid excavation during the heavy rainy season.
3. Solid waste
- Excavation activities for setting the facilities.
- Excavation would generate mass of soil and construction wastes.
- Minor negative impacts.
- Good housekeeping will be strictly observed.
- Excavated soil will also be reused as backfill material, if practical.
- Proper solid waste management should be designed and executed for the construction. A designated place will be identified for the disposal of excess excavated soils and construction materials.
4. Noise and vibration
- Noise and vibration generated from construction activities, operations of construction machinery, equipment, and their movement.
- Noise and vibration generation sources are confined within the construction area only.
- Minor and short-term negative impacts near the activities.
- Regular service of construction machinery and vehicles, with particular attention to silencers and mufflers in order to keep construction noise levels at a minimum level.
- Notify the local people in case plants and machinery with heavy noise and vibration would be used.
- Permissions from local authorities should be obtained in case of nighttime activities.
- Avoid scheduling heavy noise and vibration generating activities during nighttime.
5. Flora and fauna - Removal of trees and other vegetation during site clearing
- Total of 2.4 ha (2.2ha in the Marikina River basin site, and 0.2 ha in the Marilao River basin site) vegetation area might be cleared.
- Long-term negative impacts.
- Avoid cutting of existing trees as much as possible.
- Identify the number and species of trees to be cut.
- Secure permission to cut trees (for any affected tree) from DENR.
- Move or replant green belt around the site.
6. Existing social infrastructure and services
- Excavation and otherconstruction activities.
- Construction activities may occupy portions of road that may lead to temporary road closure and traffic congestion.
- Minor and short-term negative impacts near the construction site.
- Traffic permit and other related permits will be secured prior to any clearing/excavation works.
- Trenchless Pipe installation method should be selected to minimize the impacts on traffic flow.
- Plan of rerouting (if necessary) should be approved by the local traffic management or the barangay. Rerouting of vehicles will be announced with adequate lead time through print and broadcast media, and if available, through cyber media for the public to be able to understand and learn the rerouting plan.
- Schedule hauling of construction materials during off-peak hours.
- For busy highways, work will be done during non-rush hours or at nighttime.
7. Public hygiene - Public hygiene due to dust emission, noise, and wastewater from the construction site.
- Minor and short-term negative impacts.
- Mitigation for pollution control will be strictly observed.
- Temporary toilets will be provided.
8. Working conditions (including occupational safety)
- Excavation and otherconstruction activities.
- There will be a risk of accidents to workers, pedestrians and vehicles.
- Minor and short-term negative impacts.
- Provide personal safety gear (protective helmets, earplugs, gloves, and safety shoes).
- Provision of first-aid stations, safety equipment, and warning signals.
- Fencing of the work area, as long

Republic of the Philippines Preparatory Survey on Water Supply and Sewerage Chapter 5 Development in the West Zone of Metro Manila Final Report Feasibility Study of Priority Sewerage Projects
5 - 142
S. No
Environmental Attributes Effect Factor Potential Impact Proposed Mitigation Measures
as practical, will also be done while informative warning signs, including danger signs will be installed at strategic locations around the construction site.
9. Infectious diseases such as HIV/AIDS
- Arising with influx of construction workers.
- Increments of risks are probably expected from construction workforce infected with such diseases.
- Mass awareness campaigns and education on HIV/AIDS, malaria and dengue.
10 Global warming - Emissions from construction activities, operations of construction machinery and equipment, and their movement.
- Minor and short-term negative impacts.
- Regular maintenance of construction machinery and equipment.
- Preparing effective adequate schedule of construction and heavy machinery.
- Carry out training of technicians, operators of construction machinery, and drivers of vehicles.
Operation Phase 1. Air quality - Dust emissions from
relevant equipment, generators and vehicles.
- Long-term and minor negative impacts.
- Proper maintenance of all equipment at regular intervals.
2. Solid waste and/or industrial discharge
- Generation of sludge from STP.
- Long-term and minor negative impacts.
- Segregation of hazardous wastes from regular water.
- Stabilize sludge prior to disposal through certified sludge treaters.
3. Noise and vibration
- Noise and vibration generated from generators, equipment, and their movement.
- Minor and short-term negative impacts near the source of noise.
- Proper maintenance of all equipment at regular intervals.
4. Odor - Generation of sludge from STP
- Minor negative impactsnear the STP site.
- Reduction of odor system.- Proper maintenance of all
equipment at regular intervals.5. Existing social
infrastructure and services
- Increase of vehicles and trucks may lead to traffic congestion.
- Minor negative impactsnear the STP site.
- Traffic operators should guard the entrance.
6. Landscape - Modification of the landscape around the STP site.
- Minor negative impactsnear the STP site.
-Plant a green belt around the STP site.
7. Working conditions (including occupational safety)
- Increased risks to occupational safety.
- Long-term and minor negative impacts.
- Provide personnel with personal protective equipment (PPE).
- Extensive training for selected personnel in handling and operating chemicals.
8. Global warming - Emissions from operations of generators and equipment, and their movement
- Long-term and minor negative impacts.
- Proper maintenance of all equipment at regular intervals.
- Carry out training of technicians and operators of all equipment, and drivers of vehicles.
Source: JICA Study Team
5.4.5 Environmental Management Plan and Monitoring Plan (1) Environmental Management Plan (EMP)
The mitigating measures that would address the adverse environmental impacts consist of the activities and plans summarized in Table 5.4.4.

Republic of the Philippines Preparatory Survey on Water Supply and Sewerage Chapter 5 Development in the West Zone of Metro Manila Final Report Feasibility Study of Priority Sewerage Projects
5 - 143
Table 5.4.4 Environmental Management Plan Activity/Potential
Environmental Impact Mitigation/Enhancement Responsibility Cost
A. Preconstruction Phase Involuntary resettlement -Review the arrangement of relevant facilities and
reduce the development area based on current land use. -If the presence of informal settlers is confirmed in the proposed project site, a resettlement action plan must be prepared.
Maynilad WMD Maynilad CQESH
Part of Planning cost
Removal of trees and other vegetation during site clearing
-Avoid cutting of existing trees as much as possible. -Identify the number and species of trees to be cut. -Secure permission to cut trees (for any affected tree) from DENR.
Maynilad /Contractor Contractor Maynilad
Part of Planning cost
Site cleaning -All existing buildings/establishments must be removed from the site prior to turnover to Maynilad.
Seller -
Preconstruction meeting -Conduct preconstruction meetings with Maynilad representatives to discuss the Project including implementation of the environmental management and monitoring plan.
Contractor No incremental cost
B. Construction Phase Increased dust emission - Regular water sprinkling on exposed surfaces to
reduce dust emission. -Proper maintenance of all equipment at regular intervals.
Contractor Contractor
No incremental cost
Increased noise and vibration levels
- Regularly service construction machinery and vehicles, with particular attention to silencers and mufflers in order to keep construction noise levels at a minimum level.
- Notify the local people in case plants and machinery with heavy noise and vibration would be used.
- Permissions from local authorities should be obtained in case of nighttime activities.
- Avoid scheduling of heavy noise and vibration generating activities during nighttime.
Contractor Contractor Maynilad/Contractor Contractor
No incremental cost
Generation of wastewater from project site
- Maintenance and cleanliness in the work place will be strictly observed.
- Water from excavations will be discharged to the nearest gutters and canals while providing erosion control (e.g., silt traps, catch pits).
- Used oil will be dispended in a controlled manner. - Avoid excavation during the heavy rainy season.
Contractor Contractor Contractor Contractor
No incremental cost
Generation of wastewater from workers’ camp
- Require contractor to set up sanitation facilities (e.g., temporary toilets)
Contractor
No incremental cost
Generation of solid waste
- Good housekeeping will be strictly observed. - Trenchless pipe installation method should be
selected to minimize the generation of solid waste. - Excavated soil will also be reused as backfill
materials, if practical. - Proper solid waste management plan should be
designed.
Contractor Contractor Contractor Maynilad/Contractor
No incremental cost
Traffic congestion due to movement of construction vehicles; Social impact disturbance due to loss of access/closure of road sections due to road excavations along the ROW
- Traffic permit and other related permits will be secured prior to any clearing/excavation works.
- Trenchless pipe installation method should be selected to minimize the impact on traffic flow.
- A traffic management plan will also be prepared with the approval of the local government and other concerned agencies.
- Plan of rerouting (if necessary) should be approved by the local traffic management or the barangay. Rerouting of vehicles will be announced with adequate lead time through print and broadcast
Contractor Maynilad /Contractor Maynilad /Contractor Contractor
No incremental cost

Republic of the Philippines Preparatory Survey on Water Supply and Sewerage Chapter 5 Development in the West Zone of Metro Manila Final Report Feasibility Study of Priority Sewerage Projects
5 - 144
Activity/Potential Environmental Impact Mitigation/Enhancement Responsibility Cost
media, and if available, through cyber media for the public to be able to understand and learn the project, duration of work, and traffic rerouting scheme and rerouting plan.
- For busy highways, work will be done during non-rush hours or at nighttime.
Contractor
Increase the risk of infectious diseases such as HIV/AIDS
- Mass awareness campaigns and education on HIV/AIDS, malaria and dengue.
Contractor
No incremental cost
Open excavations may cause accidents
- Provide personal safety gear (protective helmets, earplugs, gloves, and safety shoes).
- Provision of first-aid stations, safety equipment, and warning signals.
- Fencing of the work area, as long as practical, will also be done while informative warning signs, including danger signs will be installed at the strategic locations around the construction site.
Contractor Contractor Contractor
No incremental cost
Monitor EMP implementation
- Conduct regular inspection and monitoring if the EMP is being implemented by the contractor and issue notice of non-compliance and/or penalize if conditions are not met.
Maynilad CQESH
No incremental cost
C. Operation Phase Increase in air emission and noise levels
-Proper maintenance of all equipment at regular intervals.
Maynilad WMD
Part of operation cost
Possible contamination of nearby water bodies
-Proper operations of the STPs to ensure that discharge shall meet standards.
Maynilad WMD
Part of operation cost
Generation of hazardous of wastes
-Segregation of hazardous wastes from regular water. Maynilad WMD
Part of operation cost
Generation excess sludge
-Stabilize sludge prior to disposal through certified sludge treaters.
Maynilad WMD
Part of operation cost
Traffic congestion due to the operation vehicles
- Traffic operator should guard the entrance. Maynilad WMD
Part of operation cost
Landscape - Plant a green belt around the STP site. Maynilad WMD
Part of operation cost
Increased risks to occupational safety
-Provide personnel with personal protective equipment (PPE).
-Extensive training for selected personnel in handling and operating chemicals.
Maynilad WMD
Part of operation cost
Note CQESH: Corporate QESH (Quality, Environment, Safety and Health) Division WMD: Wastewater Management Division
Source: JICA Study Team
(2) Environmental Monitoring Plan (EMOP) Environmental monitoring reports shall be submitted by Maynilad to DENR during the preconstruction up to the construction phases of the Project. Compliance monitoring reports (CMRs) shall also be submitted to DENR on a semiannual basis following the requirements of DENR Administrative Order 2003-30.
The monitoring reports shall be prepared by the pollution control officer (PCO) of Maynilad. During the construction phase, the PCO shall make sure that the contractors submit their

Republic of the Philippines Preparatory Survey on Water Supply and Sewerage Chapter 5 Development in the West Zone of Metro Manila Final Report Feasibility Study of Priority Sewerage Projects
5 - 145
environmental compliance report to Maynilad, and the PCO shall verify the findings described in the report prepared by the contractors. The proposed environmental monitoring plan is summarized in Table 5.4.5.
Table 5.4.5 Environmental Monitoring Plan
Parameters Location Method Frequency Responsibility Estimated Cost
A. Preconstruction Phase Inventory of trees Project site Confirm the species
and number of trees Once, prior to construction
Contractor Part of construction cost
B. Construction Phase Dust (total suspended particulates)
Project site Sampling and analysisin accordance with regulations
At times of major dust emission, but only if complaints continue after implementing all the actions listed in the EMP
Contractor Part of construction cost
Visual monitoring of stormwater runoff
Project site Visit site and check drain provision/functioning
Rain events Contractor Part of construction cost
Volume of overburden soils and construction wastes
Project site A monthly inspection of the disposal sites along with review of the design plan is a better way of assessment.
During transport of wastes
Contractor Part of construction cost
Noise Project site Measure using a noise level meter in accordance with regulations
At times of major noise emission, but only if complaints continue after implementing all the actions listed in the EMP
Contractor Part of construction cost
Monitor EMoP implementation
Project site Conduct regular inspection and monitoring if EMoP is being implemented by the contractor and issue notice of non-compliance and/or penalize if conditions are not met
Monthly Maynilad QESH
Part of construction cost
C. Operation Phase Air quality (NO2)
Emission from generator
Sampling and analysisin accordance with regulations
Annually Maynilad CQESH
Part of operation cost
Volume of discharge (m3/day)
Discharge from wastewater treatment plant
Meter reading Daily Maynilad WMD
Part of operation cost
Wastewater characteristics (BOD, COD, TSS, color, temperature, pH, oil and grease, coliform)
Influent point, and effluent point
Laboratory analysis
Weekly Maynilad CQESH
Part of operation cost

Republic of the Philippines Preparatory Survey on Water Supply and Sewerage Chapter 5 Development in the West Zone of Metro Manila Final Report Feasibility Study of Priority Sewerage Projects
5 - 146
Parameters Location Method Frequency Responsibility Estimated Cost
Noise STP site Measure using noise level meter in accordance with regulations
Annually Maynilad CQESH
Part of operation cost
Sludge (volume in m3, moisture content, heavy metal)
STP site Laboratory analysis Monthly Maynilad WMD
Part of operation cost
Monitor EMoP implementation
Project site Conduct regular inspection and monitoring if EMoP is being implemented by the PCO and issue notice of non-compliance and/or penalize if conditions are not met.
Monthly Maynilad WMD /QESH
Part of operation cost
Note CQESH: Corporate QESH (Quality, Environment, Safety and Health) Division WMD: Wastewater Management Division
Source: JICA Study Team
5.4.6 Public Participation In accordance with EIA regulations in the Philippines, public consultations should be conducted with the affected public in the Project area, based on the EIA procedure. DENR-EMB conducts public hearings for projects which are categorized by EMB to require EIA.
The proponents should initiate the public consultations early in order to ensure that relevant environmental concerns of stakeholders are considered in the EIA study and the management plan is prepared. All public consultations and public hearings conducted during the EIA study shall be documented. The process report for public hearing and consultation shall be validated by EMB/EMB RD and shall constitute part of the records of the EIA study. The legal background and required procedures are explained in Section 1.7.2.
5.4.7 Formulation of Basic Resettlement Action Plan (RAP) (1) Approach by Maynilad to Land Acquisition and Resettlement
1) Activities under the World Bank’s Finance Project The Land Bank of the Philippines (LBP), Maynilad, and Manila Water Company, Inc. had
established the Environmental and Social Safeguard Framework (ESSF) for the Metro Manila
Waste Water Project (MWMP) financed by the World Bank. The ESSF is responsive to relevant
national and local laws and regulations as well as to the World Bank Safeguard Policies. The draft
ESSF was an object of public consultation with key institutional stakeholders in October 2010. It
was disclosed to the public through the website and was finalized in December 2012. The
Resettlement Policy Framework (RPF), which is consistent with the provisions of the World Bank’s
OP 4.12 and the national laws and regulations in the Philippines, is included as part of ESSF. The

Republic of the Philippines Preparatory Survey on Water Supply and Sewerage Chapter 5 Development in the West Zone of Metro Manila Final Report Feasibility Study of Priority Sewerage Projects
5 - 147
summary of RPF under ESSF for MWMP is shown in Table 5.4.6.
Table 5.4.6 Summary of RPF under ESSF for MWMP Items/Step Brief Description
1.Objectives of the RPF
The scope and key objectives of the RPF include: To establish clear procedures and methodologies for social screening, review,
approval, and implementation of the Project; and To specify appropriate roles and responsibilities, and outline the necessary
reporting procedures, for managing and monitoring environmental and social concerns related to the projects.
2.Legal Framework
The key gaps between the local laws and regulations and provisions of the World Bank’s Policy on Involuntary Resettlement (OP 4.12) include:
The Philippine Constitution, Article XIII, Section 10: Urban or rural poor dwellers shall not be evicted nor their dwellings demolished, except in accordance with the law and in a just humane manner. Focus is given on urban poor under the provisions of the Urban Development and Housing Act (UDHA). Limited assistance or protection is given to the rural poor unless they are tenured agricultural tenants.
R.A. No. 8974, Sections 8, 9, 10, and 13 provides compensation of affected properties based on fair market value. However, land donation is the first approach to the acquisition of private land.
Notwithstanding the ruling of the Supreme Court, none of the laws and regulations clearly provides for compensation at replacement cost.
Income restoration/rehabilitation assistance is available only for resettled beneficiaries of the government’s socialized housing.
There is no policy for displaced vendors and employees of micro/small enterprises that have to shut down their business/to be relocated.
The RPF includes specific provisions to ensure that compensation for affected lands and other assets is provided at replacement value to all the displaced persons (DPs) including those who may lose access to livelihood due to the project. In the unlikely event of physical displacement of 200 or more households due to the project, the government and non-government agencies will work closely and coordinate their efforts for livelihood restoration, and rehabilitation assistance in accordance with the provisions of the RPF, and in compliance with the provisions of the World Bank’s OP 4.12.
3. Compensation Policy
The RPF clarifies the DPs, principles of resettlement, key elements of the RPF, and eligibility criteria for entitlement to compensation, relocation, and rehabilitation assistance.
DPs eligible for compensation and rehabilitation will include: (a) those who have formal legal rights to land or other assets; (b) those who initially do not have formal legal rights to land or other assets but have a claim to legal rights based upon the laws of the country; upon the possession of documents such as land tax receipts and residence certificates; or upon permission of local authorities to occupy or use the project affected plots; and (c) those who have no recognizable legal right or claim to the land they are occupying.
The general principles of compensations provided are: Compensation at replacement cost for houses and other affected structures. Compensation in terms of land for land of equal productive capacity acceptable
to the DPs for agricultural land (where land is not available, compensation is to be provided in cash at replacement cost).
Replacement of premise/residential land of equal size acceptable to the DPs. Transfer and subsistence allowance. Entitlements and compensation for the types of losses and DP categories shall
be guided by the Resettlement Entitlement Matrix shown in the RPF.

Republic of the Philippines Preparatory Survey on Water Supply and Sewerage Chapter 5 Development in the West Zone of Metro Manila Final Report Feasibility Study of Priority Sewerage Projects
5 - 148
Items/Step Brief Description 4. Institutional Arrangement
The social safeguard issues will be handled by the Environment Management Department (EMD). The Right of Way (ROW) Unit is responsible in locating/identifying land needed for the construction of project structures and facilities. Once a potential land area has been located, the Wastewater Management Division conducts community consultation to introduce the project to the community and gather their reactions. If the community accepts the concept of the project, the potential land area is listed and the ROW unit undertakes further investigation of the potential land and its landowner.
5. Resettlement Planning and Implementation Process
The key steps in the implementation of resettlement and land acquisition are as follows:
Where in a subproject OP 4.12 is triggered, Maynilad will carry out necessary studies (census, inventory of assets, etc.) and prepare necessary documents (Resettlement Action Plan (RAP)/Abbreviated Resettlement Action Plans (ARAP).
The scope and contents of the RAP or an ARAP will follow the provisions of the World Bank’s OP 4.12 Annex A.
Each RAP, ARAP, and RCR will include detailed cost estimates for compensation and relocation of DPs disaggregated by category of DPs and types of impacts and assets lost. Cost estimates will make adequate provisions for contingencies.
Maynilad will provide funds in a timely manner to ensure that the implementation of involuntary resettlement activities is completed according to the schedule.
Land acquisition for the projects will be carried out mainly through two modes of land acquisition depending upon the ownership of potential sites for the projects.
Involuntary Resettlement (Land Acquisition invoking OP 4.12); Land acquisition will trigger WB’s OP 4.12. Maynilad would be required to conduct necessary field investigations/surveys in accordance with the provisions of the RPF for resettlement plan preparation and implementation.
Open Market Purchase – OP 4.12 is not triggered; Current procedures consisting of ‘open market purchase’ from the land owners, either through the brokers or in direct negotiations based on Willing Buyer-Willing Seller basis, are borne out of experiences from previous projects. However, where open market purchase fail, other forms of land acquisition will be considered.
The RPF provides for compensation for land and other affected assets at replacement cost. To meet the above objectives, Maynilad will follow the valuation procedures for different types of affected assets.
6. Public Participation, Consultation and Grievance Mechanism
The draft ESSF, incorporating RPF, was an object of public consultation with key institutional stakeholders on October 5, 2010.
Documents to be disclosed include the ESSF incorporating RPF, social assessment, RAP or ARAP. These documents are made publicly available in public places accessible to project-affected-groups, NGOs, and other interested stakeholders through the World Bank InfoShop. Documents will also be posted in the websites of Maynilad.
Maynilad has a Public Complaints Section in their Consumer Relations Department to address all complaints and grievances received from members of the public.
7. Resettlement Implementation
Land acquisition and relocation of affected households cannot commence until the RAP or ARAP has been reviewed by the Borrower and the Bank. The RAP or an ARAP will include implementation schedule wherein all resettlement activities will be coordinated with the civil works schedule. Where the land has already been

Republic of the Philippines Preparatory Survey on Water Supply and Sewerage Chapter 5 Development in the West Zone of Metro Manila Final Report Feasibility Study of Priority Sewerage Projects
5 - 149
Items/Step Brief Description acquired, the construction activities will begin.
8. Supervision and Monitoring
Maynilad will monitor resettlement implementation activities regularly to ensure that implementation of resettlement is carried out in accordance with the approved RAP or ARAP. Maynilad will submit a periodic Social and Environmental Compliance Report (SECR), which will include an Environmental Monitoring Plan (EMoP) and a Self-monitoring Report (SMR) on a semi-annual frequency.
Source: Environmental and Social Safeguard Framework for the Metro Manila Waste Water Project, February 2012 (summarized by the JICA Study Team)
Maynilad had prepared either a Land Acquisition Report (LAR) or Abbreviated Resettlement
Action Plan (ARAP) for all projects under the MWMP. The kind of report that needs to be prepared
depends on how the land was acquired. If no individual is removed from the land, only the LAR will
be prepared. If resettlement is required, the ARAP should be prepared. Table 5.4.7 presents the
breakdown of the reports submitted to the World Bank per project. All reports on land acquisition
and resettlement except those for submission were approved by the World Bank.
The agreement of a contract of land sale is reached through a negotiation between Maynilad and the land owners. This is the Open Market Purchase mode (OP 4.12 is not triggered), which is proposed in the RPF. The LAR of the two projects (No.1 and No.2 in Table 5.4.7) has already been uploaded in Maynilad’s homepage. The proposed project site, presentation materials, results of public consultation, and process of the agreement are disclosed on the website, in accordance with the RPF. As for the resettlement, the household survey, including profile of the household members, educational attainment, occupation, income and inventory of structures, was conducted to determine the economic impacts of the displacement in accordance with the RPF. To minimize the impact due to the transfer of affected households, the relocation site is nearer than the previous location, as possible, and the transfer assistance was provided. Each impact and procedure, as well as public consultation, is mentioned in the Abbreviated Resettlement Action Plan
Table 5.4.7 Status of LAR and ARAP under MPWP No. Project Report Status (as of June 2013) 1 Talayan STP LAR Submitted and approved by the WB 2 Pasay STP LAR Submitted and approved by the WB 3 Valenzuela STP LAR Submitted and approved by the WB 4 Muntinlupa STP (Cupang) ARAP Submitted and approved by the WB 5 Muntinlupa STP (Tunasan) A RAP For submission 6 South Septage LAR For submission
Note; LAR: Land Acquisition Report, ARAP: Abbreviated Resettlement Action Plan Source: Environment Management Department in Maynilad (arranged by the JICA Study Team)
Maynilad has an Environment Management Department (EMD) which will handle the social safeguard issues. This department will implement the procedure of land acquisition and

Republic of the Philippines Preparatory Survey on Water Supply and Sewerage Chapter 5 Development in the West Zone of Metro Manila Final Report Feasibility Study of Priority Sewerage Projects
5 - 150
resettlement, in cooperation with other relevant departments in Maynilad such as Wastewater Management Division.
2) Approach in Accordance with the JICA Guidelines to Land Acquisition and Resettlement Based on the result of the social safeguard approach for MEMP by Maynilad, the following points were clarified: i)Maynilad has the ESSF in accordance with the World Bank’s OP 4.12, and ii) Maynilad can prepare either LAR or ARAP in time, and with enough contents to be approved by the World Bank. In addition, implementation structure and its roles had been established in Maynilad through experiences. According to the JICA Guidelines For Environmental and Social Considerations, when the project will be financed by JICA , it will be required that the resettlement action plan includes the elements laid out in the World Bank Safeguard Policy, OP 4.12, Annex A. In consideration of these circumstances, the survey for LAR or ARAP based on RPF in ESSF will be conducted by Maynilad with appropriate procedure when the project location, scale of land acquisition, and resettlement are clarified (during detailed design). It is expected that the requirement of JICA guideline will be filled. Therefore, the survey for LAR or ARAP is not yet prepared by the JICA Study Team during this preliminary design stage.
(2) Confirmation of the Possibility of Resettlement on the Priority Sewerage Projects It is expected that modification of existing permanent buildings and/or caretakers’ temporary houses shall be avoided in the proposed sites by the review of the shape/scale of sites and the arrangement of the facilities in the STPs.
The PSs in the sewer network are designed to minimize its number and sizes (e.g., manhole type PS) as much as possible. There is no PS which requires the modification of private land development and/or resettlement in all options.
Basically, new sewer pipes would be laid within public roads/space through open trench and trenchless methods. In case there are illegal settlers along the creek, a detour sewer route and/or adequate construction method should be studied based on the current land use.
Due to the adequate mitigation as mentioned above, involuntary resettlement could be avoided. However, the STP’s exact area and arrangement of facilities have not been finalized yet at the time of this preparatory survey. Therefore, during the implementation of the conceptual and detailed design, Maynilad shall confirm the possibility and scale of the resettlement and land acquisition in detail through location survey and socioeconomic survey in accordance with the design works.
(3) Attention on the Preparation of ARAP for Priority Sewerage Projects In case small-scale resettlement and/or land acquisition are required, an ARAP shall be prepared

Republic of the Philippines Preparatory Survey on Water Supply and Sewerage Chapter 5 Development in the West Zone of Metro Manila Final Report Feasibility Study of Priority Sewerage Projects
5 - 151
by Maynilad in accordance with the ESSF and the JICA guidelines before implementation of construction works. The contents of the A RAP should follow items 1) to 10) below.
1) Socioeconomic census and living conditions survey A socioeconomic census should be conducted to gather socioeconomic information, particularly in the areas affected by the implementation of the sewerage projects. The survey items should include population, inventory of assets, land use, domestic accounts, and living conditions.
2) Scope of Resettlement Impact The necessity of resettlement and scale of affected area including the following items should be confirmed.
The project components which are the causes of resettlement and the scale of affected area.
The alternative plans which were studied in avoiding/minimizing the resettlement by the Project.
The mitigation measurement can minimize the resettlement scale during the implementation of the Project.
3) Specific Compensation and Assistance for Resettled Residents Entitlement and compensation for the types of losses as well as DPs categories shall be guided by the Resettlement Entitlement Matrix refering to the Resettlement Policy Framework (RPF) in the ESSF, which has been prepared in accordance with the WB guidelines. Procedures of compensation for loss of assets will be carried out based on reacquisition price. The general principles of compensation are provided below:
Compensation at replacement cost for houses and other affected structures.
Compensation in terms of land for land of equal productive capacity acceptable to the DPs for agricultural land (where land is not available, compensation is to be provided in cash at replacement cost).
Replacement of premise/residential land of equal size acceptable to the DPs.
Transfer and subsistence allowance.
The ESSF (and the RPF) provides valuation procedures of compensation for land and other affected assets at replacement cost. Maynilad will follow the valuation procedures for different types of affected assets.

Republic of the Philippines Preparatory Survey on Water Supply and Sewerage Chapter 5 Development in the West Zone of Metro Manila Final Report Feasibility Study of Priority Sewerage Projects
5 - 152
4) Improvements of domestic accounts and living conditions compared to before, based on needs survey for reconstruction of livelihood and minimum action of improvement
Based on the situation of the project site, a rehabilitation plan should be prepared with reference to the RPF in the ESSF.
5) Power and procedure which are given to organizations in charge of claims management Maynilad has a Public Complaints Section in the Consumer Relations Department to address all complaints and grievances received from members of the public.
6) Definition of responsible authority such as implementation agency, local authority, consultant, NGO, etc. for resettlement
The social safeguard issues will be handled by the Environment Management Department (EMD). The Right of Way (ROW) Unit is responsible for locating/identifying land required for the constructions of the facilities. Once a potential land area has been located, the Wastewater Management Division conducts community consultation to introduce the project to the communities and gather their opinions. If the community accepts the concept of the project, the potential land is listed as a candidate site and the ROW Unit will conduct a detailed investigation of the site and its landowner. The negotiations for land acquisition will also be carried out during the investigation (mentioned in section 90 of the ESSF).
7) Implementation schedule to commence the resettlement plan after the completion of compensation for loss on assets
A compensation procedure must be done before the implementation of the Projects. A weekly or monthly implementation schedule on resettlement and compensation shall be prepared by Maynilad.
8) Cost and financial source Maynilad will make funds available to implement the ESSF for the duration of the Project for the following three activities: 1) preparation of EIA, EMP, and necessary instruments related to land acquisition and resettlement of displaced persons; 2) conducting public consultation; and 3) securing necessary permits, training, EMP implementation and monitoring, an environmental management system, and environmental health and safety certification (mentioned in section 91 of the ESSF).
9) Monitoring system and format constructed by the implementation agency Social safeguard issues will be handled by the EMD of Maynilad (mentioned in section 90 of the ESSF).
Republic of the Philippines Preparatory Survey on Water Supply and Sewerage Chapter 5 Development in the West Zone of Metro Manila Final Report Feasibility Study of Priority Sewerage Projects
5 - 153
10) Preliminary design and the results of meeting on the alternative study for reconstruction of livelihood
The result of the meeting with project affected persons will be disclosed in Maynilad’s website.
5.4.8 Draft Environmental Checklist During the preparatory survey, various environmental and social considerations were examined through the EIA studies and incorporated into the plan and design of the Project. The key points obtained in the course of the environmental and social considerations studies have been summarized by using the format of the Environmental Checklists, No. 15 for Wastewater Treatment Project which is defined in the JICA Guidelines for Confirmation of Environmental and Social Considerations (April 2010).