Embed Size (px)
Citation preview
1
Republic of the Philippines
Ex-Post Evaluation of Japanese ODA Loan
“KAMANAVA Area Flood Control & Drainage System Improvement Project”
External Evaluator: Akemi Serizawa, Sanshu Engineering Consultant
0.Summary
The objective of this project was to improve flood control and drainage systems in
KAMANAVA area, Metro Manila by constructing or rehabilitating flood control facilities
including a polder dike, river walls, pumping stations, flood gates, control gates, a
navigation gate and drainage channels and by procuring hydrological and meteorological
observation instruments, thereby contributing to the reduction of floods and improvement
of living conditions and environmental health as well as economic development in the
area.
This project has been highly relevant with the Philippines’ development plan and
development needs, as well as with Japan’s ODA policies. Therefore its relevance is high.
While the project outputs were produced as planned, both the project cost and project
period significantly exceeded the plan. Therefore, efficiency of the project is low. This
project has reduced floods to a certain extent and produced impacts such as the
improvement of living conditions in the project target area, development of regional
economy, improvement of waste management and enhanced awareness of residents about
flood control. In total, effectiveness and impact of the project are high as it has largely
achieved its objectives. No major problems have been observed in the institutional,
technical and financial aspects of the operation and maintenance system of the
Department of Public Works and Highways (DPWH), which is currently responsible for
the operation and maintenance of the project facilities, and those of Metro Manila
Development Authority (MMDA), the organization to which the project facilities will be
transferred in the second half of 2015 or in 2016. Therefore, the sustainability of the
project effects is high.
In light of the above, this project is evaluated to be satisfactory.

2
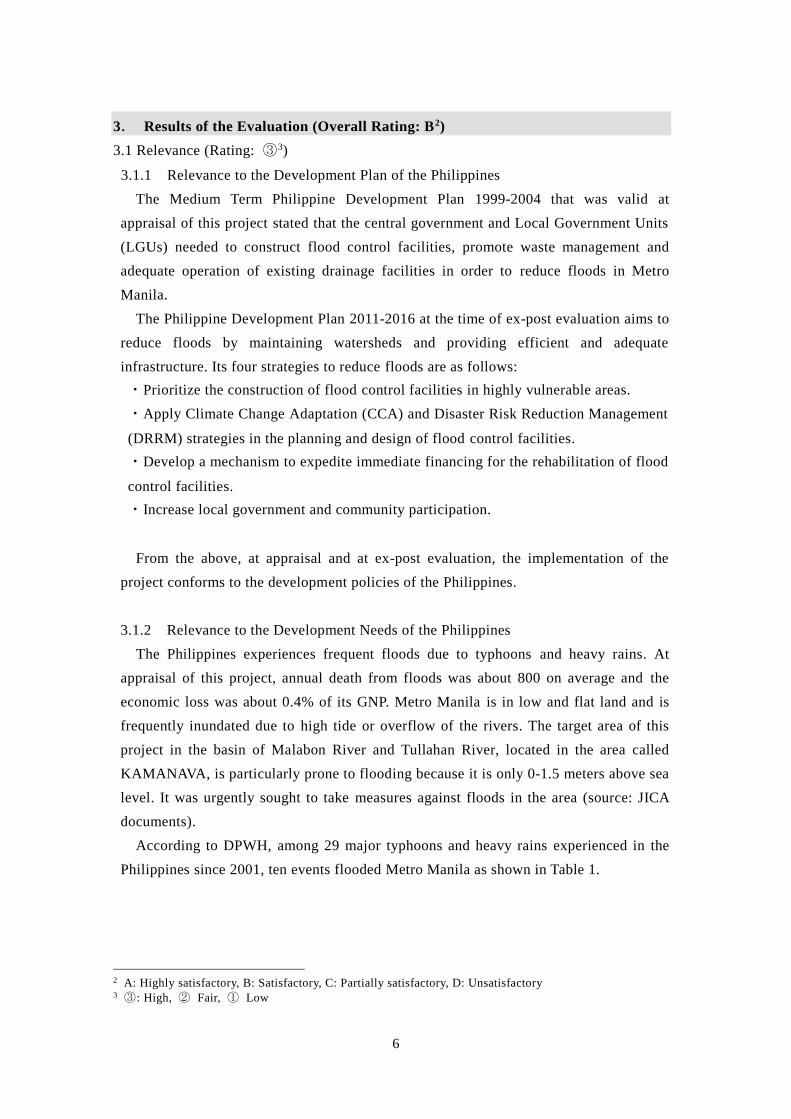
1. Project Description
Project location Pumping station constructed by this
project
1.1 Background
The Philippines experiences frequent floods due to typhoons and heavy rains. Back in
1999 when this project was designed, annual death from floods was about 800 on average
and the economic loss was about 0.4% of its Gross National Product (GNP). The target
area of this project is in the basin of Malabon River and Tullahan River and located in the
cities of Kalookan, Malabon and Navotas in Metro Manila. These three cities and
neighboring Valenzuela City are called KAMANAVA. The project target area is only
0-1.5 meters above sea level and particularly prone to flooding. It was urgently sought to
take measures to reduce floods in the area.
1.2 Project Outline
The objective of this project was to improve flood control and drainage systems in
KAMANAVA area, Metro Manila by constructing or rehabilitating flood control facilities
including a polder dike, river walls, pumping stations, flood gates, control gates, a
navigation gate and drainage channels and by procuring hydrological and meteorological
observation instruments, thereby contributing to the reduction of floods and improvement
of living conditions as well as economic development in the area.
The project site is shown in Figure 1 and 2 below.

3
Figure 1. Project site1 (Source: JICA documents)
1 “KAMANAVA Boundary” of the maps of Figure 1 and Figure 2 means the target area of this project and
not KAMANAVA area in the usual sense.

4
Figure 2. Project site (Source: JICA documents)
Loan Approved Amount/
Disbursed Amount
8,929 million yen / 8,786 million yen
Exchange of Notes Date/ Loan
Agreement Signing Date
April 2000 / April 2000
Terms and Conditions Interest rate 1.0% (0.75% for consulting services)
Repayment period 40 years
(Grace period 10 years)
Conditions for procurement: Tied
(Special Terms for Economic
Partnerships (STEP))

5
Borrower / Executing Agencies The Government of the Republic of the Philippines /
Department of Public Works and Highways (DPWH)
Final Disbursement Date September 2009
Main Contractor
(Over 1 billion yen) Nishimatsu Construction Co., Ltd. (Japan)
Main Consultant
(Over 100 million yen)
CTI Engineering Co., Ltd. (Japan) / Nippon Koei Co., Ltd.
(Japan) / Philkoei International Incorporated (Philippines) /
Pertconsult (Philippines) / Woodfields Consultants,
Incorporated (Philippines)
Feasibility Studies, etc. F/S “Study on Flood Control Planning in Metro
Manila”(1988-1990)
Special Assistance for Project Sustainability (SAPS) for
KAMANAVA Area Flood Control and Drainage System
Improvement Project (2014)
Related Projects JICA technical cooperation:
Expert on flood control (DPWH)
Study on Flood Control Planning in Metro Manila (1990)
The Project for Enhancement of Capabilities in Flood
Control and Sabo Engineering of the Department of Public
Works and Highways (2000-2005)
Strengthening the Flood Management Function of DPWH
(2005-2010)
JICA loan projects:
Pasig River Flood Warning System Project (1983)
Flood Control and Drainage Project in Metro Manila (II)
(1987)
Metro Manila - West Manggahan Flood Control Project
(1996)
Pasig Marikina River Improvement Project (I) (1999), (II)
(2007), (III) (2012)
Special Assistance for Project Sustainability (SAPS) for
KAMANAVA Area Flood Control and Drainage System
Improvement Project (2014)
International Organizations:
World Bank: Flood management master plan for Metro
Manila and surrounding areas
2. Outline of the Evaluation Study
2.1 External Evaluator
Akemi Serizawa, Sanshu Engineering Consultant
2.2 Duration of Evaluation Study
Duration of the Study: October 2014 - October 2015
Duration of the Field Study: January 4-23 and April 5-23, 2015
6
3. Results of the Evaluation (Overall Rating: B2)
3.1 Relevance (Rating: ③3)
3.1.1 Relevance to the Development Plan of the Philippines
The Medium Term Philippine Development Plan 1999-2004 that was valid at
appraisal of this project stated that the central government and Local Government Units
(LGUs) needed to construct flood control facilities, promote waste management and
adequate operation of existing drainage facilities in order to reduce floods in Metro
Manila.
The Philippine Development Plan 2011-2016 at the time of ex-post evaluation aims to
reduce floods by maintaining watersheds and providing efficient and adequate
infrastructure. Its four strategies to reduce floods are as follows:
・Prioritize the construction of flood control facilities in highly vulnerable areas.
・Apply Climate Change Adaptation (CCA) and Disaster Risk Reduction Management
(DRRM) strategies in the planning and design of flood control facilities.
・Develop a mechanism to expedite immediate financing for the rehabilitation of flood
control facilities.
・Increase local government and community participation.
From the above, at appraisal and at ex-post evaluation, the implementation of the
project conforms to the development policies of the Philippines.
3.1.2 Relevance to the Development Needs of the Philippines
The Philippines experiences frequent floods due to typhoons and heavy rains. At
appraisal of this project, annual death from floods was about 800 on average and the
economic loss was about 0.4% of its GNP. Metro Manila is in low and flat land and is
frequently inundated due to high tide or overflow of the rivers. The target area of this
project in the basin of Malabon River and Tullahan River, located in the area called
KAMANAVA, is particularly prone to flooding because it is only 0-1.5 meters above sea
level. It was urgently sought to take measures against floods in the area (source: JICA
documents).
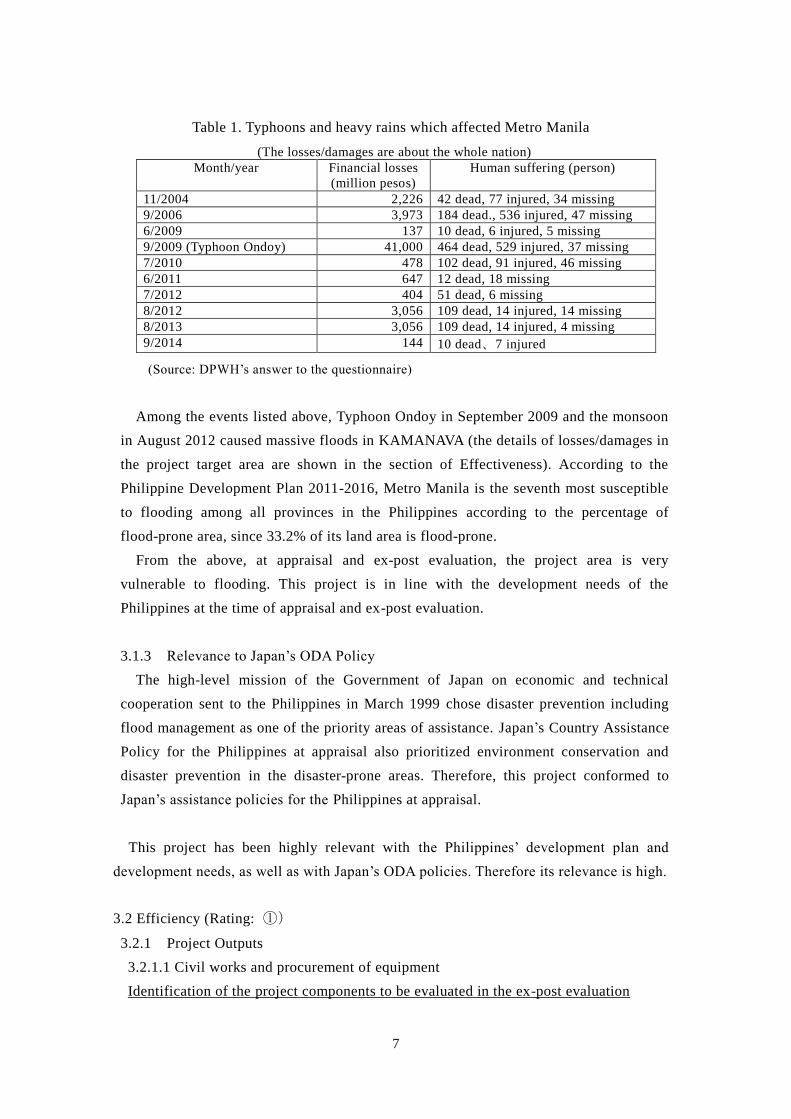
According to DPWH, among 29 major typhoons and heavy rains experienced in the
Philippines since 2001, ten events flooded Metro Manila as shown in Table 1.
2 A: Highly satisfactory, B: Satisfactory, C: Partially satisfactory, D: Unsatisfactory 3 ③: High, ② Fair, ① Low
7
Table 1. Typhoons and heavy rains which affected Metro Manila
(The losses/damages are about the whole nation)
Month/year Financial losses
(million pesos)
Human suffering (person)
11/2004 2,226 42 dead, 77 injured, 34 missing
9/2006 3,973 184 dead., 536 injured, 47 missing
6/2009 137 10 dead, 6 injured, 5 missing
9/2009 (Typhoon Ondoy) 41,000 464 dead, 529 injured, 37 missing
7/2010 478 102 dead, 91 injured, 46 missing
6/2011 647 12 dead, 18 missing
7/2012 404 51 dead, 6 missing
8/2012 3,056 109 dead, 14 injured, 14 missing
8/2013 3,056 109 dead, 14 injured, 4 missing
9/2014 144 10 dead、7 injured
(Source: DPWH’s answer to the questionnaire)
Among the events listed above, Typhoon Ondoy in September 2009 and the monsoon
in August 2012 caused massive floods in KAMANAVA (the details of losses/damages in
the project target area are shown in the section of Effectiveness). According to the
Philippine Development Plan 2011-2016, Metro Manila is the seventh most susceptible
to flooding among all provinces in the Philippines according to the percentage of
flood-prone area, since 33.2% of its land area is flood-prone.
From the above, at appraisal and ex-post evaluation, the project area is very
vulnerable to flooding. This project is in line with the development needs of the
Philippines at the time of appraisal and ex-post evaluation.
3.1.3 Relevance to Japan’s ODA Policy
The high-level mission of the Government of Japan on economic and technical
cooperation sent to the Philippines in March 1999 chose disaster prevention including
flood management as one of the priority areas of assistance. Japan’s Country Assistance
Policy for the Philippines at appraisal also prioritized environment conservation and
disaster prevention in the disaster-prone areas. Therefore, this project conformed to
Japan’s assistance policies for the Philippines at appraisal.
This project has been highly relevant with the Philippines’ development plan and
development needs, as well as with Japan’s ODA policies. Therefore its relevance is high.
3.2 Efficiency (Rating: ①)
3.2.1 Project Outputs
3.2.1.1 Civil works and procurement of equipment
Identification of the project components to be evaluated in the ex-post evaluation

8
Four activities were identified as “related activities” of this project to be carried out
by the Philippines. They were 1) dredging of Malabon river bed, 2) raising bridges, 3)
improvement of secondary and tertiary drainage channels and 4) solid waste
management. They were not included in the cost calculation of this project and it was
not clear whether they had to be evaluated as a part of it. JICA documents at appraisal
mentioned that “the secondary and tertiary drainage channels have to be improved by
LGUs in coordination with this project so that this project can produce the expected
outcomes. Illegal waste disposal should be controlled so that the drainage channels of
this project can keep functioning”, and that “some bridges on Malabon River are not
high enough and they might prevent safe flow of flood water from upstream. JICA
requested DPWH to raise the bridges as the work is not covered by JICA funding.”4
The study of “Special Assistance for Project Sustainability (SAPS) for KAMANAVA
Area Flood Control and Drainage System Improvement Project” in 2014 confirmed that
JICA and DPWH had agreed through the discussions and the detailed design before the
commencement of this project that these “related activities” were prerequisite for
achievement of the project objectives and to sustain project outcomes. In this ex-post
evaluation, it was examined through the review of the documents at appraisal and
interviews of the persons involved in the project whether the “related activities” were
indispensable for the achievement of the project objectives and whether they should be
included in the project components to be evaluated. The conclusion is that the portions
to be evaluated should be only those funded by JICA and the “relevant activities” of the
Philippines are not included. The reasons are as follows:
According to the DPWH staff and Japanese consultants involved in this project and
the JICA flood control expert dispatched to DPWH, this project were originally
designed as one of the prioritized “drainage improvement” projects in the target area
following the JICA Study on Flood Control Planning in Metro Manila (1988-1990).
“Drainage improvement” aims at rapid drainage of flood water caused mainly by inland
water (heavy rains in the area). This project had “drainage improvement” components
such as construction and rehabilitation of drainage channels and construction of
pumping stations. These “drainage improvement” facilities were designed based on the
rainfall with a 10-year return period in the project target area. In addition to the
drainage improvement, the project also had “flood control” components such as polder
dike, elevation of river walls and construction of flood gates and a navigation gate to
protect the target area from floods by external water, which means high tide and
overflow of rivers due to heavy rains in the upstream. These “flood control” facilities
were designed based on the one-day or two-day rainfall with a 30-year return period in
4 This document did not mention about dredging of riverbed.
9
the upstream. The “relevant activities” by the Philippines were designed in order to
reinforce both “drainage improvement” and “flood control” in addition to the expected
protection by this project against rainfall with a 10-year return period in the project
target area (drainage improvement) and one-day or two-day rainfall with a 30-year
return period in the upstream (flood control). Improvement of secondary and tertiary
drainage channels is a part of “drainage improvement” to reduce the incidence of
localized inundations and to shorten the time for the flood water to drain. The scope of
the improvement of secondary and tertiary drainage channels was not identified either
at appraisal or ex-post evaluation, and the LGUs are supposed to design and implement
it. This activity is to reinforce drainage improvement in addition to what this project
provided. The dredging of Malabon River and raising bridges are a part of “flood
control” to increase the volume of river flow. Therefore, these three “relevant
activities” are to provide additional drainage improvement and flood control capacity to
the protection provided by this project. Waste management, including garbage
collection from rivers and awareness raising activities for the communities about waste
disposal, aims at maintaining appropriate functioning of the flood gates, pumping
stations and drainage channels. It is difficult to evaluate waste management as one of
the project outputs in the ex-post evaluation as it is daily and continuous maintenance
activities and its scope and degree of work are not fixed. The LGUs in the project target
area are not able to fully control the garbage because many of them are from upstream
or the sea (LGUs’ waste management activities are mentioned in detail in the section of
Sustainability). In conclusion, these four “relevant activities” by the Philippine are not
included in the project components to be evaluated.
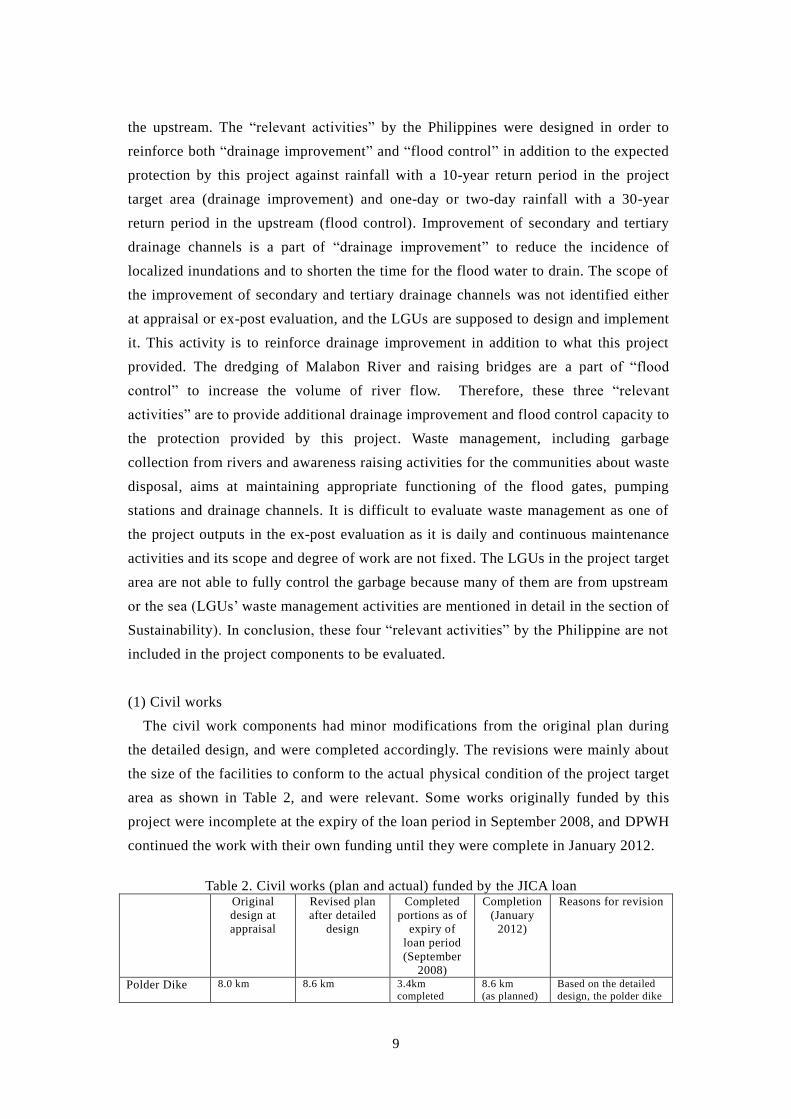
(1) Civil works
The civil work components had minor modifications from the original plan during
the detailed design, and were completed accordingly. The revisions were mainly about
the size of the facilities to conform to the actual physical condition of the project target
area as shown in Table 2, and were relevant. Some works originally funded by this
project were incomplete at the expiry of the loan period in September 2008, and DPWH
continued the work with their own funding until they were complete in January 2012.
Table 2. Civil works (plan and actual) funded by the JICA loan
Original
design at
appraisal
Revised plan
after detailed
design
Completed
portions as of
expiry of
loan period
(September
2008)
Completion
(January
2012)
Reasons for revision
Polder Dike 8.0 km 8.6 km 3.4km
completed
8.6 km
(as planned)
Based on the detailed
design, the polder dike

10
The balance was
complete by
the local contractors
by January
2012.
was extended to
include the northwest part of the project
target area.
River Walls
Raisings
12.4 km
10.5km
(Malabon River
6.6km, Malala River 3.9km)
Those along
Malala River
were complete. Those along
Malabon River
were partially complete.
10.5km
(as planned)
The
remaining
parts were completed
by the local
contractors by January
2012.
Based on the detailed
design, the length was
reduced as some areas already had appropriate
river walls or had
sufficient altitude.
Navigation
lock /
Navigation
gate
(Navotas
River North)
1 navigation lock
(Boats can
pass even during the high
tide)
1 navigation gate (Boats can pass
only during low
tide)
Complete 1 navigation gate
(as planned)
Boat users and DPWH agreed on the
navigation gate. Boats
can pass the navigation gate only during low
tide (closed during
high tide). Therefore navigation gate is more
effective for flood
control than the navigation lock.
Pumping
station without
flood gates
incorporated
with
navigation
lock
(Navotas
River North)
1
(next to the
navigation lock)
1
(next to the
navigation gate)
Complete 1
(next to the
navigation gate)
(as planned)
Independent
flood gates
6 6
Complete 6
(as planned)
Control gates
2
0 None None They were cancelled
because it was
confirmed by the detailed design that
there were no major
development plans in the area, and that the
polder dike and the
existing control gates could provide
sufficient protection.
Pumping
station with
ancillary flood
gates
6 4
Complete 4
(as planned)
Two pumping stations
were cancelled as the control gates above
were cancelled.
Rehabilitation
of existing
drainage
channels
6.4 km 5.6 km Incomplete 5.6 km
(as planned)
Completed by the
Philippine
funding
Based on the detailed
design, distance was
reduced.
Construction
of drainage
channels
1.8 km 2.1 km Complete 2.1 km
(as planned)
Based on the detailed
design, distance was
increased.
(Source: JICA documents)
11
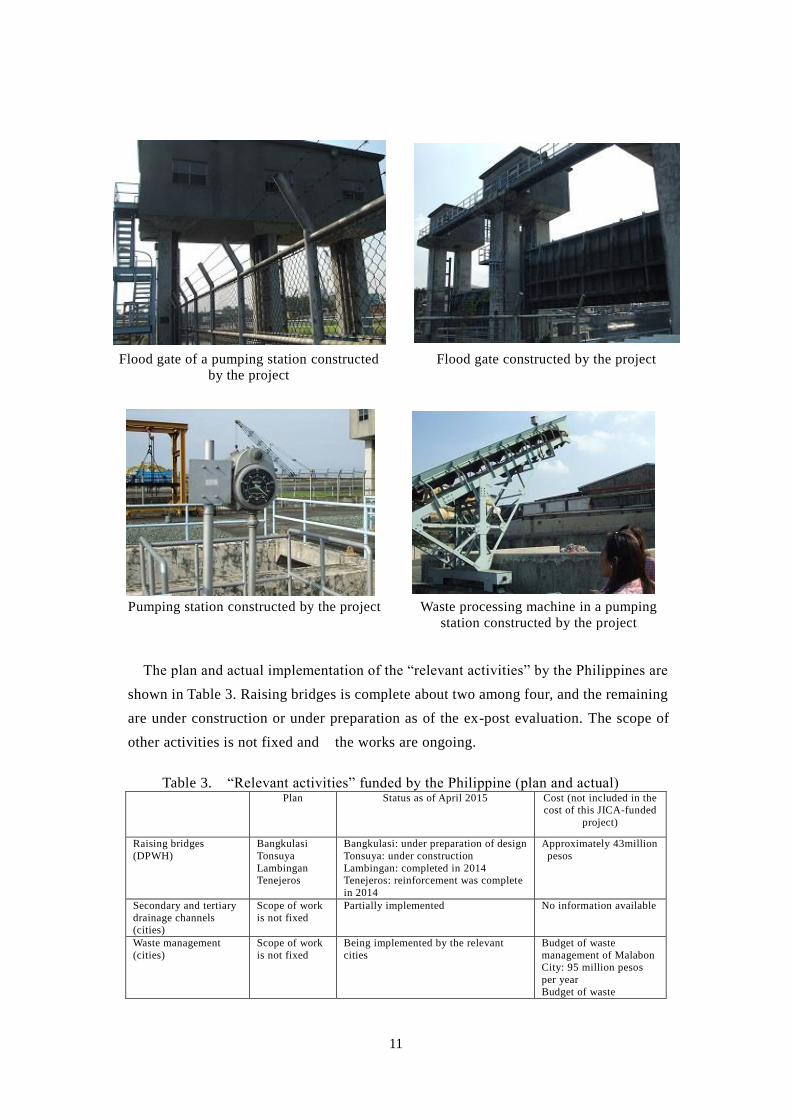
Flood gate of a pumping station constructed
by the project
Flood gate constructed by the project
Pumping station constructed by the project Waste processing machine in a pumping
station constructed by the project
The plan and actual implementation of the “relevant activities” by the Philippines are
shown in Table 3. Raising bridges is complete about two among four, and the remaining
are under construction or under preparation as of the ex-post evaluation. The scope of
other activities is not fixed and the works are ongoing.
Table 3. “Relevant activities” funded by the Philippine (plan and actual) Plan Status as of April 2015 Cost (not included in the
cost of this JICA-funded
project)
Raising bridges
(DPWH)
Bangkulasi
Tonsuya
Lambingan Tenejeros
Bangkulasi: under preparation of design
Tonsuya: under construction
Lambingan: completed in 2014 Tenejeros: reinforcement was complete
in 2014
Approximately 43million
pesos
Secondary and tertiary
drainage channels (cities)
Scope of work
is not fixed
Partially implemented No information available
Waste management
(cities)
Scope of work
is not fixed
Being implemented by the relevant
cities
Budget of waste
management of Malabon City: 95 million pesos
per year
Budget of waste

12
management of Navotas
City: 19.2 million pesos per year
Dredging of Malabon
River (DPWH)
Scope of work
is not fixed
DPWH is to dredge 2.86km of the river
in 2015 using the budget of 2014. The remaining parts are under
examination and to be dredged in 2015
or after, using the budget of 2015.
Budget of 2014: 202
million pesos Budget of 2015: 124
million pesos
(Source: JICA documents. DPWH answer to the questionnaire and interviews about current
status)
In the project target area, the following flood control activities were carried out using
the Philippines’ funds without direct relationship with this project (source: JICA
documents).
・Raising of river walls (from 12.6m to 13.5m above sea level for 2,954m length in
total along Malabon River), construction of banks of Catmon Creek (1,800m in total),
improvement of Longos Creek (36.6m) and U-shape open channels of concrete
(64.4m). They were designed after the major flood in 2012 and constructed in 2013.
・Installation of 39 pumps in Navotas City
・Construction of river walls (13.5m above sea level) along Meycauayan River,
stretching to 3.2km in total
・Construction of river walls (13.5m above sea level) along Palasan and Meycauayan
Rivers, stretching to 9.0km in total
・Exfoliation of sludge of Meycauayan River
・Rehabilitation of river walls along Meycauayan River
・Construction of dikes around Navotas City (500m)
(2) Procurement of equipment
The following equipment was procured as planned:
・Hydrological and meteorological observation instruments
・Dust removal equipment for pumping stations
3.2.1.2 Consulting services
Consulting services as follows were carried out as planned:
・Basic study of topography and soils, and review of the basic design of flood control
facilities
・Detailed design of flood control facilities
・Assistance for bidding
・Environmental management including monitoring of observation of Environmental
Compliance Certificate and supervision of contractors
・Assistance for report preparation on resettlement and land acquisition and for the

13
activities about livelihood of resettled persons
3.2.1.3 External monitoring of resettlement and land acquisition
External monitoring of the following was carried out as planned:
・Monitoring of resettlement and land acquisition processes by DPWH
・Monitoring of social and economic conditions of the resettled persons and of related
activities by the relevant governmental agencies
・Advice for the relevant governmental agencies
(Source: JICA documents)
3.2.2 Project Inputs
3.2.2.1 Project Cost
The project cost was significantly higher than planned. The planned project cost was
11,786 million yen. The actual project cost was 17,858 million yen in total, which was
152% of the plan.
Table 4. Project cost (Unit: million yen)
Planned Actual
Foreign
currency
Local
currency
Total Foreign currency Local currency Total
Total JICA
loan
Total JICA
loan
Total JICA
loan
Total JICA
loan
Total JICA
loan
Total JICA
loan
Civil works and
procurement of
equipment
5,863 5,863 1,281 1,281 7,144 7,144 4,987 4,987 5,468 2,670 10,455 7,657
Contingencies 586 586 128 128 714 714 - - - - - -
Consulting
services
714 714 357 357 1,071 1,071 799 799 445 321 1,244 1,120
Land acquisition and
compensation
0 0 2,576 0 2,576 0 0 0 2,977 0 2,977 0
Administration
cost
0 0 242 0 242 0 0 0 477 0 477 0
Tax 0 0 39 0 39 0 0 0 2,696 0 2,696 0
Service charges 0 0 0 0 0 0 9 9 0 0 9 9
Total 7,163 7,163 4,623 1,766 11,786 8,929 5,795 5,795 12,063 2,991 17,858 8,786
(Source: JICA documents)
At appraisal: US$1=JPY114、Philippines Peso1=JPY3
Price escalation: 1.2% per year for foreign currency and 1.2% per year for local currency
Contingencies: 10% per year
Cost calculation: August 1999
Average exchange rate in the project implementation period (from January 2000 to January 2012):
Philippines Peso1=JPY2.16
The total project cost includes the cost for the portions which were not complete at
the expiry of loan period in 2009 and were completed by the funding of the Philippines.
They were remaining parts of the polder dike and elevation of river walls as well as
rehabilitation of drainage channels. All costs of the civil works and procurement of

14
equipment were to be funded by this project in the original plan, but 2,798 million yen
were funded by the Philippines to cover these remaining works5. According to DPWH,
while the land acquisition process finished physically, final cost of land acquisition is
not fixed because some land owners took legal action demanding increase of
compensation based on the increase of land price and the process would take several
years. The figures in Table 4 and Table 13 (land acquisition) were estimate as of the
ex-post evaluation, and therefore the final project cost might increase.
The reasons for the increase of the project cost were as follows6.
・Cost for civil works increased due to price escalation during the extended project
period. Because of the expiry of loan period in September 2008 and the change of
contractors to finish the incomplete works, extra cost was incurred for the
installation and removal of the construction machines compared to the case that the
same contractor completed all works. The reason for the change of contractors was
that the works by the international contractor was delayed and its contract finished
with some incomplete portions (it is explained in the section of Project Period
below). The portions that would not be complete by the end of contract were
excluded from the contract of the international contractor one year before its
termination. Therefore, the revised contract was totally accomplished.
・The flood in September 2009 damaged some facilities of this project. The local
contractors repaired them and it led to the increase of the project cost. Exact cost for
these repairs is not known because their account did not separate repair and
construction costs.
3.2.2.2 Project Period
The project period was significantly longer than planned. The original project period
was from April 2000 (L/A7) to December 2006 (completion of civil works) of 81
months in total. The actual project period was from April 2000 (L/A) to January 2012
(completion of civil works) of 142 months in total, which was 175% of the plan.
Table 5. Project Period
Plan Actual
Selection of consultant November 1999-October 2000 November 1999-October 2000
Detailed design November 2000-October 2001 November 2000-October 2001
5 Actual cost for the civil works and procurement of equipment was 5,468 million yen, among which 2,670
million yen was funded by the Japanese loan. The balance was funded by the Philippines. 6 From JICA documents, DPWH’s response to the questionnaire and interviews. 7 Resettlement of informal settlers and land acquisition had started before L/A and the relevant cost was
also included in the project cost. L/A is defined as the commencement of this project as other ex-post
evaluations because exact commencement dates of resettlement and land acquisition are not known.

15
Tendering November 2001-October 2002 November 2001-June 2003
Civil works (Whole process)
November 2002-April 2006
(Whole process)
June 2003-January 2012
Contract 1
(international
contractor)
June 2003-September 2008
Contract 2 (local
contractor)
February-August 2009
Contract 3 (local
contactor)
May-October 2010
Contract 4 (local
contactor)
September 2011-January 2012
Procurement of
equipment
May 2003-July 2005 May 2003-July 2005
Resettlement of informal
settlers
-December 1999 -January 20008
Land acquisition -October 2001 Physical acquisition was
complete, but the
compensation was not
complete as of April 2015.
Supervision of works and
technical assistance
February-August 2000,
November 2002-December
2006
June 2003-December 2009
External monitoring Every August between
2000-2004
Three times between
2000-2004
(Source: JICA documents)
The reasons for the delay were as follows according to JICA documents:
・Tendering was delayed for eight months because DPWH needed long period for
Pre-Qualification of contractors and confirmation of bidding criteria.
・While the resettlement of informal settlers had almost been complete when the
project started, new informal settlers came in during the delay of the tendering
process. It took time for DPWH to make decision on the resettlement of the new
settlers and to obtain budget, and some civil works started late as a result.
・The civil works were to be carried out by one international contractor during the
period between June 2003 and June 2007. They were delayed as there were
problems such as not being able to prevent fishing boats from entering into the
construction sites and difficulty in relocation of electricity and water supply
facilities, and it took time to agree with the local communities on these matters. The
contract with the international contractor was extended until September 2008,
which was the original expiry date of the Japanese loan. This contract was revised
in June 2007 to cancel the portions that were difficult to complete by September
2008. After the end of this contract, three local contractors completed the remaining
8 The situation of informal settlers was examined in 1997. The persons to be resettled were identified by
February 1998, and DPWH and LGUs agreed on the resettlement and support activities in November 1998.
Resettlement was complete by January 2000 (JICA documents).

16
portions. In July 2008, the expiry of loan period was extended for 12 months until
September 2009.
3.2.3 Results of Calculations of Internal Rates of Return
The Economic Internal Rate of Return (EIRR) calculated at appraisal was 10.8%. The
conditions for the calculation were as follows:
Cost: Construction and rehabilitation cost and operation and maintenance cost of flood control
facilities.
Benefit: Estimated reduction of losses/damages due to floods (30-year return period) and
benefit on the community by the improvement of living conditions
Project life: 30 years
The construction and rehabilitation cost would to be incurred from the first year to the eighth
year of the project life.
The operation and maintenance cost would be incurred from the sixth year, and annual
operation and maintenance cost would be 22.5 million pesos from the eighth year.
The benefit would be produced from the second year, and annual benefit would be 330.3
million pesos from the fifth year.
(Source: JICA documents)
After the project completion, DPWH re-calculated EIRR as 16.1% taking the delay of
construction and price escalation into account, without obtaining actual data of benefits.
・The project was complete in January 2012.
・The construction and rehabilitation cost was incurred for 13 years between 1998 and 2010.
・The annual operation and maintenance cost was estimated as 21 million pesos from 2009 to
2029. 742 million pesos would be needed in 2013 for a large repair and regular operation and
maintenance. The annual operation and maintenance cost would be 31.6 million pesos after
that.
・The benefit would be produced in 2009 (11th year of the project life) and would increase
every year. The annual benefit would be 1,442.3 million pesos from 2011. The expected benefit
would be larger than the calculation at appraisal because of price escalation.
・Project life: 45 years, based on the service life of the facilities.
(Source: JICA documents)
The EIRR calculated at project completion (16.1%) was higher than that at appraisal
(10.8%) because of the increased benefits due to price escalation during the extended
construction period. It is not possible to calculate exact EIRR because actual data of
benefits are not available.
The project outputs were produced as planned. Both the project cost and project period
significantly exceeded the plan. Therefore, efficiency of the project is low.
3.3 Effectiveness9 (Rating: ③)
9 Sub-rating for Effectiveness is to be put with consideration of Impact.
17
3.3.1 Quantitative Effects (Operation and Effect Indicators)
No indicators were set at appraisal to measure the reduction of floods.
3.3.1.1 Operation Indicators
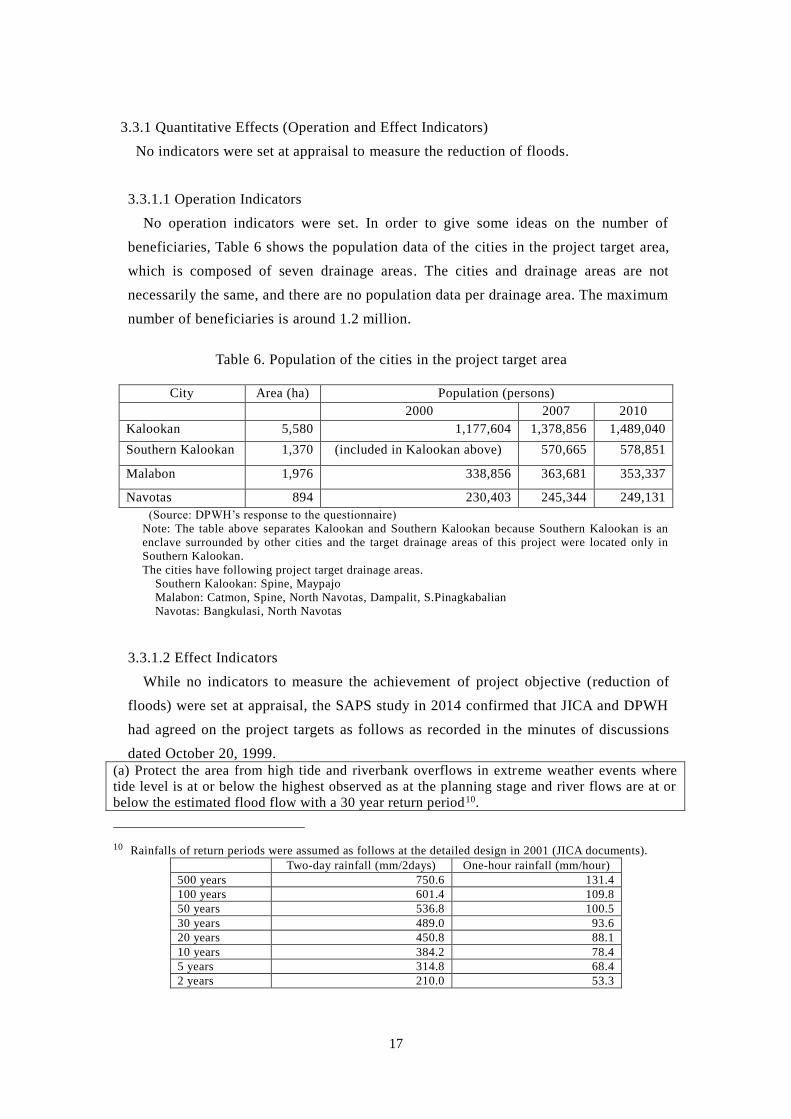
No operation indicators were set. In order to give some ideas on the number of
beneficiaries, Table 6 shows the population data of the cities in the project target area,
which is composed of seven drainage areas. The cities and drainage areas are not
necessarily the same, and there are no population data per drainage area. The maximum
number of beneficiaries is around 1.2 million.
Table 6. Population of the cities in the project target area
City Area (ha) Population (persons)
2000 2007 2010
Kalookan 5,580 1,177,604 1,378,856 1,489,040
Southern Kalookan 1,370 (included in Kalookan above) 570,665 578,851
Malabon 1,976 338,856 363,681 353,337
Navotas 894 230,403 245,344 249,131
(Source: DPWH’s response to the questionnaire)
Note: The table above separates Kalookan and Southern Kalookan because Southern Kalookan is an
enclave surrounded by other cities and the target drainage areas of this project were located only in
Southern Kalookan.
The cities have following project target drainage areas.
Southern Kalookan: Spine, Maypajo
Malabon: Catmon, Spine, North Navotas, Dampalit, S.Pinagkabalian
Navotas: Bangkulasi, North Navotas
3.3.1.2 Effect Indicators
While no indicators to measure the achievement of project objective (reduction of
floods) were set at appraisal, the SAPS study in 2014 confirmed that JICA and DPWH
had agreed on the project targets as follows as recorded in the minutes of discussions
dated October 20, 1999.
(a) Protect the area from high tide and riverbank overflows in extreme weather events where
tide level is at or below the highest observed as at the planning stage and river flows are at or
below the estimated flood flow with a 30 year return period10.
10 Rainfalls of return periods were assumed as follows at the detailed design in 2001 (JICA documents).
Two-day rainfall (mm/2days) One-hour rainfall (mm/hour)
500 years 750.6 131.4
100 years 601.4 109.8
50 years 536.8 100.5
30 years 489.0 93.6
20 years 450.8 88.1
10 years 384.2 78.4
5 years 314.8 68.4
2 years 210.0 53.3

18
(b) Decrease the affected area of the inland flooding (inundation) from 90% (the baseline value
at appraisal) of the area to less than 15% during a 10-year rainfall/flood event with water
depths exceeding 20 cm.
(c) Reduce the flood damages by 500 million Pesos in every year.
The “target year” for the above planning was year 2020.
The project facilities were designed as follows in 2001 based on the above
assumptions: High tide Highest observed: 1.625m above the Mean Sea Level (MSL)
= DPWH Datum 12.10m
River flow Rainfall: 30-year return period (two-day rainfall in the upstream of
Tullahan and Malabon Rivers: 489.0mm/2days)
River flow: between 290m3/s and 450 m3/s (varying from place to
place)
Inundation 10-year return period (one-hour rainfall in the project target area:
78.4mm)
(Source: JICA documents)
As there were no indicators set at appraisal, the following indicators were examined
for the ex-post evaluation based on the agreement between JICA and DPWH mentioned
above.
(1) Reduction of inundated areas
According to DPWH and the cities in the project target area, KAMANAVA were
flooded three times after the commencement of this project. They were Typhoon Ondoy
in September 2009, the monsoon (habagat) in August 2012 and the heavy rains in
September 2014. During Typhoon Ondoy, most part of the project target area was
inundated because the tide and river flow from the upstream exceeded the assumptions
at the facility design while the rainfalls in the project target area did not exceed the
assumption of 10-year return period. During the monsoon in August 2012, most part of
the project target area was inundated because the rainfalls in the project target area, tide
and river flow from the upstream exceeded the assumptions at the facility design. These
were two major flood events (detailed data are shown in (5) With-Without analysis by
SAPS study). By the heavy rains in September 2014 during which the one-hour rainfall
exceeded the 10-year return period in the project target area, some places were
inundated in the depth between 6cm and 50cm, which was not as serious as the other
two events. There is no evidence to show that flooding did not occur in other times,
because the losses/damages are not examined when the residents do not report the
incidence. However, it can be concluded that the losses/damages were likely to be none
or minor in other weather events as there were no reports on incidence.
The first target in the JICA-DPWH minute (a) “Protect the area from high tide and

19
riverbank overflows in extreme weather events where tide level is at or below the
highest observed as at the planning stage and river flows are at or below the estimated
flood flow with a 30-year return period” was achieved because the area were not
flooded by high tide or overflow from the rivers except for the two major events
(Ondoy and the monsoon August 2012) which exceeded the assumptions of facility
design. The flood by the heavy rains in September 2014 was due to inland flooding
caused by the rainfalls in the target area that exceeded the assumption at facility design
(the second target in the JICA-DPWH minute (b)), and does not contradict with the
achievement of target (a).
Regarding the target (b) “Decrease the affected area of the inland flooding
(inundation) from 90% of the area to less than 15% during a 10-year rainfall/flood
event with water depths exceeding 20 cm”, it was assumed that 84% of the total surface
of the project target area (1,472.1ha out of1,750.5ha) was flood-prone before the
project started, and the flood-prone areas would be reduced only to 10.7% (187.6ha) by
the contribution of the project facilities (Table 7). However, the reduction of
flood-prone areas could not be confirmed due to lack of actual data. No systematic
examination is carried out after floods to classify flooded areas according to flood
depth, while ad-hoc interviews with the affected people and observation of inundated
houses have taken place after major flood events.
Table 7. Expected reduction of flooded areas
(Unit: ha)
Without this project With this project (expectations)
Drainage
area
Whole
area
No
flood
Flood
of
0-0.5m
0.5-1m 1m or
more
No
flood
Flood
of
0-0.5m
0.5-1m 1m or
more
Bangkulasi 75.4 16.9 23.7 34.8 0.0 68.3 7.1 0.0 0.0
Catmon 355.5 160.3 21.5 92.4 81.3 326.6 28.9 0.0 0.0
Spine 173.1 42.5 69.0 61.2 0.4 156.7 16.4 0.0 0.0
Maypajo 241.2 50.2 95.4 95.6 0.0 227.9 13.3 0.0 0.0
North
Navotas
417.6 8.5 107.4 193.0 108.7 380.3 37.3 0.0 0.0
Dampalit 233.1 0.0 0.0 38.4 194.7 188.0 45.1 0.0 0.0
S.Pinagkab
alian
254.6 0.0 0.0 66.3 188.3 215.1 39.5 0.0 0.0
Total 1,750.5 278.4 317.0 581.7 573.4 1,562.9 187.6 0.0 0.0
(Source: JICA documents)
(2) Average duration of inundation
Such data were not available. However, staff of Malabon City stated that currently it
takes only several hours for flood water to drain while it used to take about three days
before the completion of this project.

20
(3) Number of flooded houses
DPWH provided data on losses/damages by city caused by major weather events
(shown from Table 8 to Table 11). Due to lack of sufficient data, it is not possible to
examine the relationship between the scale of the events and number of flooded houses
or to capture the contribution of this project to the reduction of losses/damages.
(4) Financial losses/damages by flood
DPWH reported that this project contributed to the reduction of financial
losses/damages by flood by at least 500 million pesos per year, but without sources of
calculation. It is not possible to confirm it as the data shown in Table 8 to Table 11 are
not sufficient.
From the above, there were no data of these indicators such as reduction of flooded
areas, average time of inundation, number of flooded houses and financial
losses/damages by flood. Therefore, it is not possible to show the contribution of this
project to the reduction of losses/damages by flood.
Table 8. Losses/damages in the project target area by Typhoon Ondoy, September 2009 Number of people affected Number of damaged
houses
Financial
losses/damages
(million pesos)
Barangay11 Number of
household
Number of
people
Totally
damaged
Partially
damaged
Kalookan 23 18,116 90,580 0 0 No data
Malabon 11 1,381 8,736 159 0 No data
Navotas 3 62 355 6,748 85 No data
Metro Manila No data No data No data No data No data 1,128
Table 9. Losses/damages in the project target area by the monsoon in August 2012 Number of people affected Number of damaged
houses
Financial
losses/damages
(million pesos)
Barangay Number of
household
Number of
people
Totally
damaged
Partially
damaged
Kalookan 13 5,371 26,761 No data No data No data
Malabon 18 4,613 20,474 No data No data No data
Navotas 12 1,630 7,698 No data No data No data
Metro Manila No data No data No data No data No data 412
Table 10. Losses/damages in the project target area by the heavy rains in August 2013
(rainfall: 30mm/hour, 290 mm/day) Number of people affected Number of damaged
houses
Financial
losses/damages
(million pesos)
11 Barangay is the smallest local government unit in the Philippines. It is under a City or Municipality.
21
Barangay Number of
household
Number of
people
Totally
damaged
Partially
damaged
Kalookan 9 5,162 25,171 0 0 No data
Malabon 17 7,631 35,406 0 0 No data
Navotas 2 86 365 0 0 No data
Metro Manila No data No data No data No data No data No data
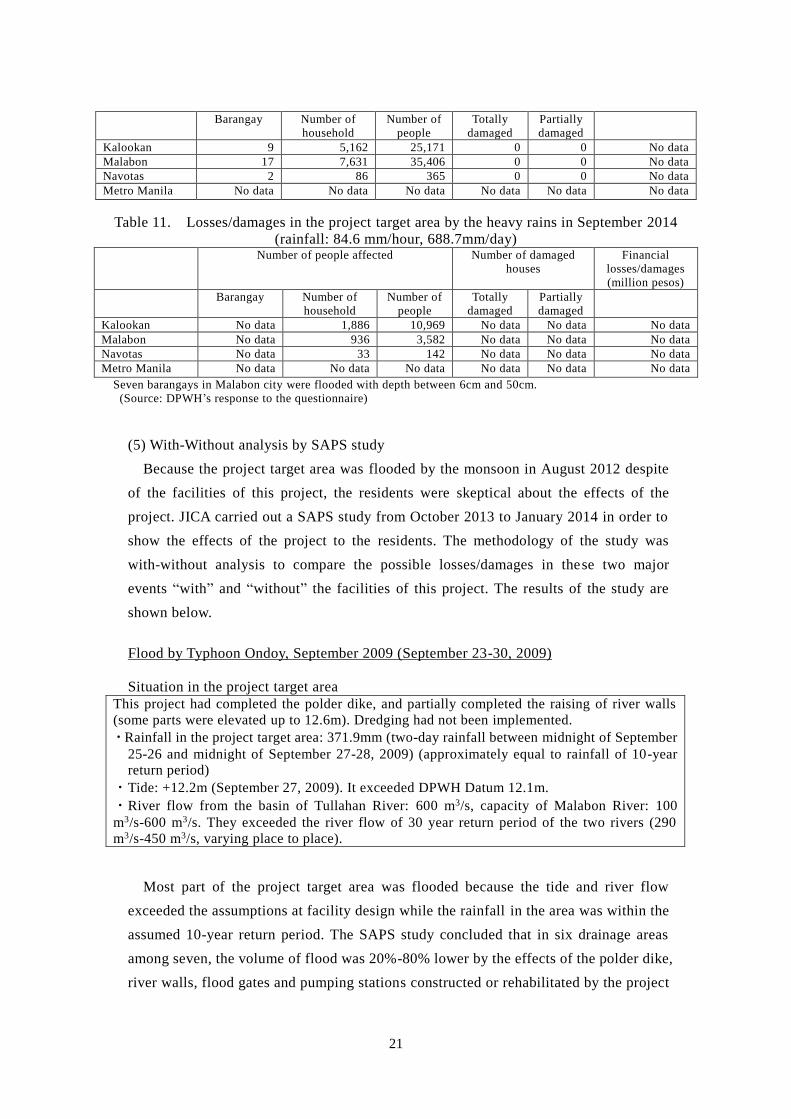
Table 11. Losses/damages in the project target area by the heavy rains in September 2014
(rainfall: 84.6 mm/hour, 688.7mm/day) Number of people affected Number of damaged
houses
Financial
losses/damages
(million pesos)
Barangay Number of
household
Number of
people
Totally
damaged
Partially
damaged
Kalookan No data 1,886 10,969 No data No data No data
Malabon No data 936 3,582 No data No data No data
Navotas No data 33 142 No data No data No data
Metro Manila No data No data No data No data No data No data
Seven barangays in Malabon city were flooded with depth between 6cm and 50cm.
(Source: DPWH’s response to the questionnaire)
(5) With-Without analysis by SAPS study
Because the project target area was flooded by the monsoon in August 2012 despite
of the facilities of this project, the residents were skeptical about the effects of the
project. JICA carried out a SAPS study from October 2013 to January 2014 in order to
show the effects of the project to the residents. The methodology of the study was
with-without analysis to compare the possible losses/damages in these two major
events “with” and “without” the facilities of this project. The results of the study are
shown below.
Flood by Typhoon Ondoy, September 2009 (September 23-30, 2009)
Situation in the project target area
This project had completed the polder dike, and partially completed the raising of river walls
(some parts were elevated up to 12.6m). Dredging had not been implemented.
・Rainfall in the project target area: 371.9mm (two-day rainfall between midnight of September
25-26 and midnight of September 27-28, 2009) (approximately equal to rainfall of 10-year
return period)
・Tide: +12.2m (September 27, 2009). It exceeded DPWH Datum 12.1m.
・River flow from the basin of Tullahan River: 600 m3/s, capacity of Malabon River: 100
m3/s-600 m3/s. They exceeded the river flow of 30 year return period of the two rivers (290
m3/s-450 m3/s, varying place to place).
Most part of the project target area was flooded because the tide and river flow
exceeded the assumptions at facility design while the rainfall in the area was within the
assumed 10-year return period. The SAPS study concluded that in six drainage areas
among seven, the volume of flood was 20%-80% lower by the effects of the polder dike,
river walls, flood gates and pumping stations constructed or rehabilitated by the project

22
compared to the hypothetical situation without these facilities. The river walls had been
elevated up to 12.6m and protected effectively the downstream of Malabon River and
the area along Malala River from the high tide of 12.2m. The polder dike also protected
some of the project target area from flooding, but its northern section was flooded
because some parts of the polder dike were lower than 12.6m.
Navotas City in monsoon, August 3, 2012
(Source: Inquirer)
Malabon City in monsoon, August 7, 2012
(Source: Reuters/Stringer)
Flood by monsoon in August 2012 (August 1-8, 2012)
Situation in the project target area
This project was complete.
・Rainfall in the project target area: 737.5 mm (two-day rainfall between 17hours of August 6,
and 17 hours of August 8, 2012) (approximately equal to rainfall of 500-year return period)
・Tide: +12.65 m (August 2, 2012). It exceeded DPWH Datum 12.1m.
・River flow from the basin of Tullahan River: 600 m3/s, capacity of Malabon River: 350
m3/s-600 m3/s. They exceeded the river flow of 30 year return period of the two rivers (290
m3/s-450 m3/s, varying place to place).
Most part of the project target area was flooded because the rainfall, river flow and
tide exceeded the assumptions at facility design. However, the SAPS study concluded
that the volume of flood was 10%-80% lower by the effects of the polder dike, river
walls, flood gates and pumping stations constructed or rehabilitated by the project
compared to the hypothetical situation without these facilities . It also estimated that the
average flood volume was reduced by 68% in the project target area, and the project
delayed reaching of the flood water to the dangerous elevations by one day at most.
Some areas were protected from flood by the river walls and polder dike. However,
the river walls were 12.6m above sea level and could not prevent the tide of 12.65m
from entering into the area. As some parts of the polder dike were lower than 12.6m,
three parts of the walls were destroyed and allowed flood water to overflow (source:
JICA documents).
23
From the results of With-Without analysis of the SAPS study, it can be confirmed
that the floods were reduced to a certain extent even though the scale of events
exceeded the assumptions at the facility design. The Philippine also has implemented
flood control projects using their own funding, which also have contributed to the
reduction of floods.
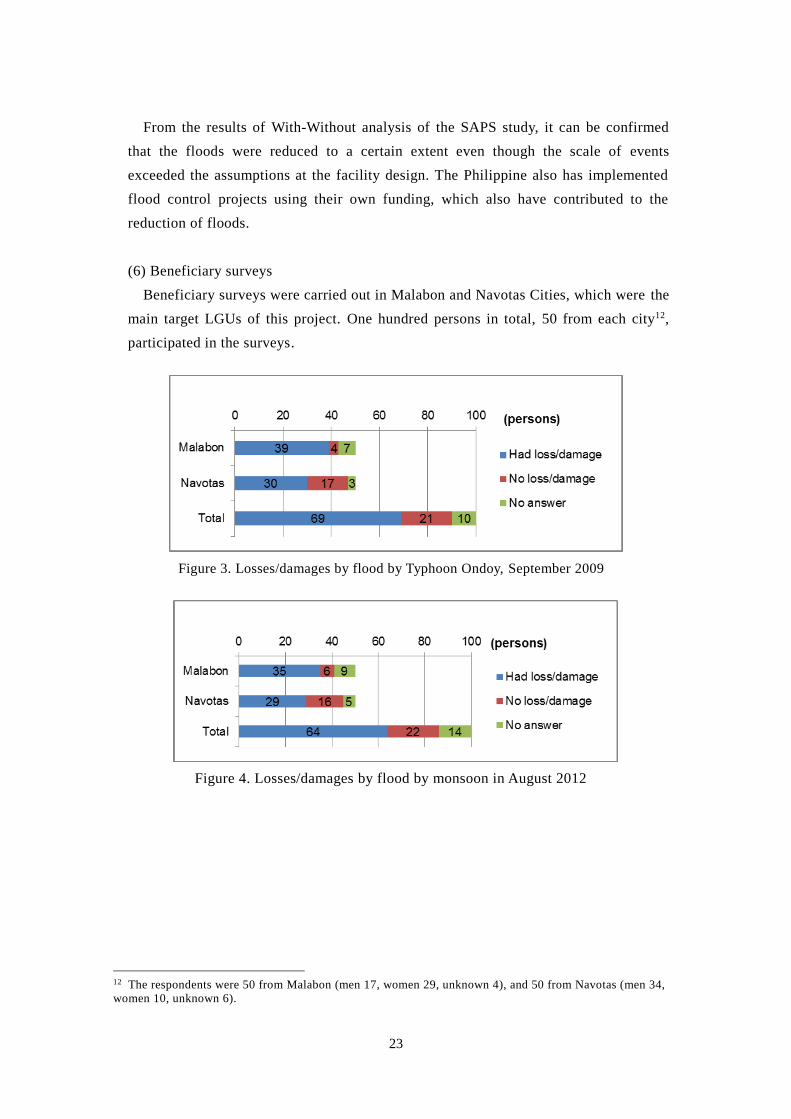
(6) Beneficiary surveys
Beneficiary surveys were carried out in Malabon and Navotas Cities, which were the
main target LGUs of this project. One hundred persons in total, 50 from each city12,
participated in the surveys.
Figure 3. Losses/damages by flood by Typhoon Ondoy, September 2009
Figure 4. Losses/damages by flood by monsoon in August 2012
12 The respondents were 50 from Malabon (men 17, women 29, unknown 4), and 50 from Navotas (men 34,
women 10, unknown 6).

24
Figure 5. Inundation by Typhoon Ondoy in September 2009
Figure 6. Inundation by monsoon in August 2012
Figure 7. Financial losses/damages by Typhoon Ondoy in September 2009

25
Figure 8. Financial losses/damages by monsoon in August 2012
Figure 9. Observation whether the flood control facilities constructed/rehabilitated by this
project were useful for the reduction of flood
There were no significant differences between the two events in 2009 and 2012
regarding the losses/damages by flood, inundation and financial losses/damages as
shown in Table 3-Table 9. However, it can be concluded that the project facilities,
which had been completed before the monsoon in August 2012, contributed to the
reduction of losses/damages by flood to a certain extent because the scale of the event
was larger in August 2012 than that in September 2009.
About 70% of the participants in the beneficiary surveys felt that the flood control
facilities of this project contributed to the reduction of floods to a large or certain
extent. Many chose “to a certain extent” because they were likely to be aware of the
other flood control activities and of the fact that flood could never be zero despite of
the facilities. The respondents in Navotas tended to be more positive than those in
Malabon, the reason of which could be that Navotas is located downstream and the
residents might be more conscious about the effect of the project facilities on the

26
reduction of floods than Malabon residents.
3.3.1.3 Other effects (qualitative effects, etc.)
According to the results of the beneficiary surveys, about 40-50% of the respondents
were aware of the improvement of the safety in the areas, landscape, waste
management and community participation in flood control activities.
Figure 10. Improvements brought about by this project
From the above, effectiveness of this project is high. Flood did not occur or was minor
during the weather events of the scale below the assumptions at the facility design. In
addition, the project facilities contributed to the reduction of floods to a certain extent
even in the major weather events exceeding the assumptions at the facility design
compared to the hypothetical situation without these facilities.
3.4 Impacts
3.4.1 Intended Impacts
(1) Improvement of living conditions
According to the results of the beneficiary surveys above, about 40-50% of the
respondents were aware of the improvement of hygiene status, waste management and
landscape.
(2) Development of regional economy
According to DPWH’s response to the questionnaire, people in the project target area
27
are more willing to participate in the economic activities and investment as well as in the
development of residential areas compared to the period before the project. As the
project target area is in downtown of Metro Manila where many houses and shops are
congested, there are no large development projects. Nonetheless, people feel safer to
operate businesses as the flood risks were reduced. About 40-50% of respondents in the
beneficiary surveys feel that economic activities are more active in the area than before.
3.4.2 Other Impacts
(1) Impacts on the natural environment
At appraisal, this project was classified as Category B of “JBIC Guidelines for
Confirmation of Environmental and Social Considerations” (April 2002), as its potential
adverse environmental impact was not considered serious. Initial Environmental
Examination (IEE) was carried out, and the Department of Environment and Natural
Resources issued an Environmental Compliance Certificate of the Philippines.
To avoid negative impacts on environment, following actions were planned and
implemented (source: JICA documents, DPWH).
・Removal of trees were minimized and trees were replanted in nearby vacant public
lands. Some areas in the pumping stations were landscaped.
・In order to prevent noise, sound absorbent materials were provided. Traffic was
eased by using service roads. Roadways and construction sites were sprinkled with
water during dry seasons.
・In order to prevent water pollution due to reduced exchange of water by the
construction of the polder dike, sluice gates were incorporated to promote exchange
of water.
・Construction debris and dredged materials were properly disposed. After the
completion of dredging, dredging sites were closed quickly and adequately.
・In order to minimize smokes from heating up of diesel engines, operation of the
pumping stations were performed only in intense rains. Smoke vents were installed
high enough to prevent smokes from affecting people. Sound-deadening materials
were installed to reduce noise from the pumping stations.
・Temporarily removed facilities such as water supply, sewerage, roads, electric power
and telephone lines were restored to their original positions after construction works
without reduction of scale or level of services.
According to DPWH and the project target cities, the volume of waste in and around
the rivers and channels were reduced because the waste management was strengthened
and there were less illegal disposal of waste after the relocation of informal settlers.

28
However, waste keeps arriving from the sea or upstream. The waste management
activities of the project target cities are described in detail in the section of
Sustainability.
No specific negative impacts on environment were observed. Only one respondent to
the beneficiary surveys pointed out the noise from the flood control facilities.
(2) Land Acquisition and Resettlement
Resettlement
DPWH relocated all identified informal settlers (6,206 households) by January 2000
in accordance with the laws and regulations of the Philippines to the three sites prepared
by the government13. According to JICA documents, however, some of these persons
returned and new informal settlers were identified since then, and the number of
households to be resettled increased to 7,200 by April 2000 (at L/A), including those
who had once been resettled. DPWH developed the “comprehensive resettlement
follow-up plan” on May 2001. Skill training for resettled persons was conducted by
NGOs in the areas such as sewing to enhance their employability in consideration of
main industries in the relocation sites and the skills and educational attainment of the
resettled persons.
The consultants employed by DPWH conducted surveys of resettled persons three
times during the project period. The result of the last survey in May-June 2004 was
shown in Table 12. The surveyed persons were 22.5 years old on average, less than one
third of them had completed secondary education or above, and many of them were
unskilled workers. Many of them felt that housing conditions, environment and peace
and order of life had improved after relocation. On the other hand, they were negative
about the access to transport and other facilities as well as about level of income after
relocation. The reasons were as follows:
・The relocation sites were far from the workplaces in Metro Manila. People had to
pay more for transportation.
・Employment opportunities in the relocated sites were limited. There were factories
such as sewing plants, but academic qualifications and skills of the resettled persons
limited their options. The majority of them were in the early twenties with children,
and could not allocate enough time for work.
・For self-employed, the market size and number of customers were smaller in the
relocated sites than in Metro Manila.
・If they were given lands only, they had to pay for construction of houses. The
payment was large even in cases of lease contracts.
13 They were Pabahay2000, Towerville and North Hill, which were all outside of the project target area.

29
DPWH had lost contact with the resettled persons by the time of ex-post evaluation
and it did not know their current situations.
Table 12. Perceptions of resettled persons
(comparison before and after relocation)
(Unit: %)
Better Same Worse
Housing 79.6 6.7 13.8
Water supply 37.8 30.4 31.8
Electricity 29.3 38.2 32.4
Transport 12.4 12.4 75.3
Access to schools 36.0 26.9 37.1
Access to health facilities 8.7 39.8 51.6
Peace and order 74.7 12.4 12.9
Income 7.8 19.1 73.1
Quality of environment 94.2 3.3 2.4
Quantity and quality of foods 11.6 34.0 54.4
Health situation 35.8 51.6 12.7
(Source: Socio-economic survey of Project Affected Persons, 2004)
One hundred fifty household per site were surveyed (may-June 2004).
Land acquisition
According to DPWH, land acquisition was implemented in accordance with the laws
and regulations and physically completed. There was no problem in acquisition itself or
its process. However, the final compensation is not fixed because some land owners took
legal actions demanding increase of compensation based on the increase of land price
and the process would take several years. The figures in Table 13 were estimate as of the
ex-post evaluation (the actual project cost of Table 4 in section 3.2.2.1 “Project Cost” is
based on this amount).
Table 13. Cost of land acquisition and compensation Cost of land acquisition and compensation
Land
acquisition
288 lots14 248,270.96 pesos per lot x 288 = 71,502,037 pesos
Compensation 495
houses
21,632.61 pesos per house x 495 = 10,708,144 pesos
(Source: DPWH’s response to the questionnaire)
(3) Other positive and negative impacts
The social survey in the SAPS study (implemented in November 2013) found out that
76% of respondents were willing to participate in the activities to improve flood control
14 The land acquisition process for all 288 lots was complete physically by April 2015. Compensation was
also complete for 176 lots, but the remaining 112 lots received partial payment. All 495 houses received
compensation (interview of DPWH).
30
in the project target area. Also at the ex-post evaluation, they were active in flood
control activities (other than construction or rehabilitation of flood control facilities)
such as awareness raising in prevention of waste disposal into the rivers ( source:
DPWH’s response to the questionnaire).
This project has reduced floods to a certain extent, and produced impacts such as
improvement of living conditions in the project target area, development of regional
economy, improvement of waste management and enhanced awareness of residents about
flood control. In total, effectiveness and impact of the project are high as it has largely
achieved its objectives.
3.5 Sustainability (Rating: ③)
3.5.1 Institutional Aspects of Operation and Maintenance
DPWH Unified Project Management Office-Flood Control Management Cluster
(UPMO-FCMC) is responsible for the operation and maintenance of the facilities of this
project. The unit has four teams consisting of several engineers, and each team is
responsible for several projects. The team responsible for the operation and maintenance
of the facilities of this project has six engineers. The pumping stations and flood gates
are operated and maintained by the National Capital Region-Pumping Stations and
Floodgates Division (NCR-PSFGD) of DPWH. The pumping stations and flood gates are
functioning for 24 hours by the operators working at three shifts (eight hours each), with
about three persons in one shift.
Metro Manila Development Authority (MMDA) was created by Republic Act No.
7924 in 1994 and mandated to plan and implement flood control policies and strategies
in Metro Manila. According to this Act, the facilities of this project should also be under
MMDA. Therefore, on July 2002, DPWH and MMDA agreed on the transfer of the
project facilities from DPWH and MMDA. However, DPWH continued to be the
executing agency until the project completion based on the agreement of this project.
According to DPWH and MMDA, the project facilities will be transferred from DPWH
to MMDA in the second half of 2015 or in 2016, and the first discussion took place in
February 2015. They are going to continue discussions on transfer including preparation
of inventory of the facilities and equipment. In MMDA, the Flood Control and Sewerage
Management Office (FCSMO) will be responsible for the operation and maintenance of
the project facilities. The mandate of MMDA-FCSMO is to prevent flooding in Metro
Manila and ensure all roads to be passable any time (source: DPWH’s response to the
questionnaire). MMDA-FCSMO manages 54 pumping stations in Metro Mania and has
13 staff, 139 pumping station operators and 215 workers. When the project facilities are

31
transferred from DPWH, all DPWH operators working there (about 30 persons) would
also be transferred to MMDA. The pumping stations of MMDA are also functioning for
24 hours by the operators working at three shifts (eight hours each), with two or three
persons in one shift (source: interview of MMDA).
From the above, no major problems were observed in the institutional aspects of
DPWH in the operation and maintenance of the project facilities, as well as those of
MMDA.
3.5.2 Technical Aspects of Operation and Maintenance
DPWH UPMO-FCMC has about 90 staff and it has operated flood control projects for
long years even before the commencement of this project. There is no problem in the
number and skill levels of the staff. UPMO-FCMC has conducted training for the
operation and maintenance staff, including one-week instruction session by the project
contractor during the project period on operation of facilities and troubleshooting
training for four days after the completion of the project. DPWH uses operation and
maintenance manuals of the pumping stations and flood gates (source: JICA documents,
DPWH’s response to the questionnaire).
There is no problem with the skill levels of MMDA’s operation and maintenance staff
as they operate its existing flood control facilities without particular troubles.
3.5.3 Financial Aspects of Operation and Maintenance
DPWH’s budget is shown in Table 14. Its whole and flood control budgets both have
increased.
Table 14. Budget of DPWH
(Unit: billion pesos)
2011 2012 2013 2014 2015
Roads 68.0 78.1 100.9 129.4 170.4
Flood control 11.3 10.8 15.9 33.6 45.9
Others 11.3 10.6 27.6 27.9 57.7
Total 90.7 99.5 144.3 190.9 273.9
(Source: DPWH documents)
DPWH’s budget for operation and maintenance of the project facilities is shown in
Table 15. From 2011 to 2013, the annual budget was 40 million pesos (20 million pesos
each for operation and maintenance), and the expenditures were almost within the
budget. The budget of 2014 was increased to 70 million pesos (35 million pesos each for
operation and maintenance), and the expenditure was within the budget. The budget of
2015 largely increased compared to those of the previous years. The budget of 2016 is
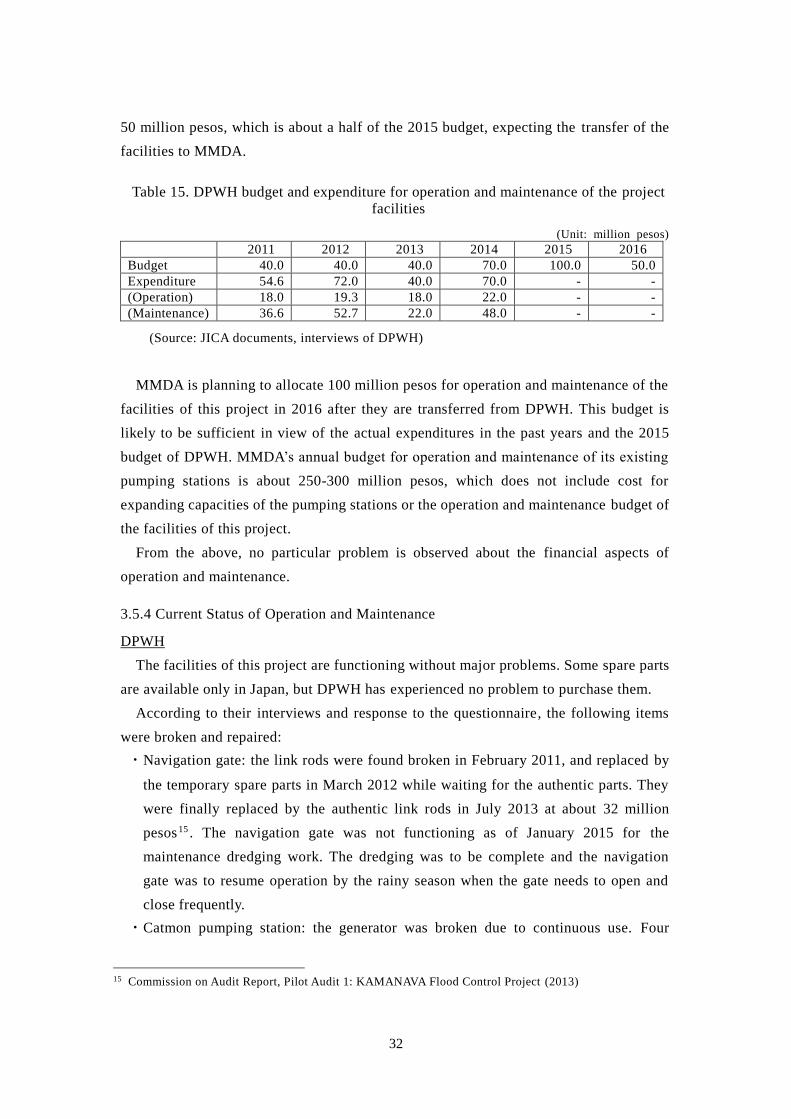
32
50 million pesos, which is about a half of the 2015 budget, expecting the transfer of the
facilities to MMDA.
Table 15. DPWH budget and expenditure for operation and maintenance of the project
facilities
(Unit: million pesos)
2011 2012 2013 2014 2015 2016
Budget 40.0 40.0 40.0 70.0 100.0 50.0
Expenditure 54.6 72.0 40.0 70.0 - -
(Operation) 18.0 19.3 18.0 22.0 - -
(Maintenance) 36.6 52.7 22.0 48.0 - -
(Source: JICA documents, interviews of DPWH)
MMDA is planning to allocate 100 million pesos for operation and maintenance of the
facilities of this project in 2016 after they are transferred from DPWH. This budget is
likely to be sufficient in view of the actual expenditures in the past years and the 2015
budget of DPWH. MMDA’s annual budget for operation and maintenance of its existing
pumping stations is about 250-300 million pesos, which does not include cost for
expanding capacities of the pumping stations or the operation and maintenance budget of
the facilities of this project.
From the above, no particular problem is observed about the financial aspects of
operation and maintenance.
3.5.4 Current Status of Operation and Maintenance
DPWH
The facilities of this project are functioning without major problems. Some spare parts
are available only in Japan, but DPWH has experienced no problem to purchase them.
According to their interviews and response to the questionnaire, the following items
were broken and repaired:
・Navigation gate: the link rods were found broken in February 2011, and replaced by
the temporary spare parts in March 2012 while waiting for the authentic parts. They
were finally replaced by the authentic link rods in July 2013 at about 32 million
pesos15 . The navigation gate was not functioning as of January 2015 for the
maintenance dredging work. The dredging was to be complete and the navigation
gate was to resume operation by the rainy season when the gate needs to open and
close frequently.
・Catmon pumping station: the generator was broken due to continuous use. Four
15 Commission on Audit Report, Pilot Audit 1: KAMANAVA Flood Control Project (2013)

33
backup generators were installed in 2014 at about 30 million pesos.
MMDA
Three among four pumping stations in West Manggahan (Taguig City, Metro Manila)
constructed by a JICA loan project and transferred from DPWH to MMDA were visited
during this ex-post evaluation. All three pumping stations are functioning without major
problem. MMDA plans to enhance the capacity of all three, and allocated budget of
about 420 million pesos to install new pumps and generators.
MMDA’s pumping station
West Manggahan
Pumps in a MMDA’s pumping station,
West Manggahan
MMDA’s flood gate, West Manggahan MMDA’s waste processing machine,
West Manggahan
LGU
Malabon City is active in flood control as it is considered prerequisite for the
development of the city. It has about 60 pumping stations including those constructed by
this project. The city constructed 29 among these 60 pumping stations. Its annual
operation and maintenance budget of the flood control facilities is about 20 million
34
pesos. The city receives about 400 million pesos per year from the central government
for flood control, including funding from development partners. The city is
implementing flood control projects formulated by the World Bank’s masterplan project
and is to rehabilitate its existing pumping stations. The flood control facilities in
Navotas City, including those constructed by this project, are also functioning without
major problems. According to the interview with Navotas City, it is planning to
construct 42 additional small pumping stations by its own funding.
Regarding waste management, both cities have installed garbage traps in the rivers
and major channels. As garbage from upstream still comes in, the cities requested
upstream LGUs to reduce waste disposal into the rivers. Also, based on the resolution of
the Supreme Court dated February 15, 2011 for the improvement of environment in and
around Manila Bay16, MMDA continues relocation of informal settlers along the rivers
and channels in cooperation with LGUs in the area. Malabon and Navotas have installed
garbage collection points in the cities and implemented the antilittering ordinance
(source: JICA documents). Malabon City collects garbage three times a week, and raises
awareness in the community through the waste management campaigns at schools and
clean barangay contests. Malabon City’s annual budget for waste management is about
95 million pesos. According to the interview with Navotas City, it cleans the rivers and
channels once or twice per month. It has a 10-year Solid Waste Management Plan
(2007-), and its budget for the year 2014 was 19.2 million pesos.
From the above, no major problems were observed about the current situations of the
facilities constructed by this project as well as the facilities operated by MMDA to
which the project facilities will be transferred. Malabon and Navotas Cities continue
flood control and waste management activities by their own funding, and there is no
problem about the sustainability of these activities.
No major problems have been observed in the institutional, technical and financial
aspects of the operation and maintenance system. Therefore, the sustainability of the
project effects is high.
4.Conclusions, Recommendations and Lessons Learned
4.1 Conclusions
The objective of this project was to improve flood control and drainage systems in
16
http://www.law.pace.edu/sites/default/files/IJIEA/PhilippineSupremeCourt_2-15-2011_per_recommendation
_of_Manila_Bay_Advisory_Committee.pdf

35
KAMANAVA area, Metro Manila by constructing or rehabilitating flood control facilities
including a polder dike, river walls, pumping stations, flood gates, control gates, a
navigation gate and drainage channels and by procuring hydrological and meteorological
observation instruments, thereby contributing to the reduction of floods and improvement
of living conditions and environmental health as well as economic development in the
area.
This project has been highly relevant with the Philippines’ development plan and
development needs, as well as with Japan’s ODA policies. Therefore its relevance is high.
While the project outputs were produced as planned, both the project cost and project
period significantly exceeded the plan. Therefore, efficiency of the project is low. This
project has reduced floods to a certain extent and produced impacts such as the
improvement of living conditions in the project target area, development of regional
economy, improvement of waste management and enhanced awareness of residents about
flood control. In total, effectiveness and impact of the project are high as it has largely
achieved its objectives. No major problems have been observed in the institutional,
technical and financial aspects of the operation and maintenance system of DPWH, which
is currently responsible for the operation and maintenance of the project facilities, and
those of MMDA, the organization to which the project facilities will be transferred in the
second half of 2015 or in 2016. Therefore, the sustainability of the project effects is high.
In light of the above, this project is evaluated to be satisfactory.
4.2 Recommendations
4.2.1 Recommendations to the Executing Agencies
None.
4.2.2 Recommendations to JICA
None.
4.3 Lessons learned
Flood control facilities could reduce floods, but they are not able to alleviate floods
completely. However, the residents tend to expect the facilities to make the area
flood-free. When the project target area was flooded in the recent major weather events,
some people were skeptical about the effects of the project facilities as they had expected
more. The SAPS study showed the flood control effects to the residents and they were
convinced. In the design phase of flood control projects, it would be necessary to explain
to the target populations about the expected degree of reduction of floods and the
assumptions at the facility design (such as scale of rainfalls) and the fact that the flood

36
could be effectively controlled in coordination with other flood control activities by the
relevant stakeholders such as LGUs.

37
Comparison of the Original and Actual Scope of the Project
Item Original Actual
1. Project Outputs
Civil engineering
・Polder Dike: 8.0km
・River Walls Raisings: 12.4km
・Navigation lock: 1
・Pumping stations without flood gates
incorporated with navigation lock: 1
・Independent flood gates: 6
・Control gates: 2
・Pumping stations with ancillary flood gates:
6
・Rehabilitation of existing drainage channels:
6.4km
・Construction of drainage channels: 1.8km
As planned with slight modification from the
original plan as a result of the detailed
design.
・Polder Dike: 8.6km
・River Walls Raisings: 10.5km
・Navigation gate 1: (replaced Navigation
lock)
・Pumping stations without flood gates
incorporated with navigation gate: 1
・Independent flood gates: 6
・Pumping stations with ancillary flood gates:
4 (two were cancelled together with the
cancellation of control gates)
・Rehabilitation of existing drainage channels:
5.6km
・Construction of drainage channels: 2.1km
Procurement of
equipment ・Hydrological and meteorological
observation instruments
・Dust removal equipment for pumping
stations
As planned.
Consulting services ・Basic study of topography and soils and
review of basic design of flood control
facilities
・Detailed design of flood control facilities
・Assistance for bidding
・Environmental management including
monitoring of observation of Environmental
Compliance Certificate and supervision of
contractors
・Assistance for development of report on
resettlement and land acquisition and for
livelihood of resettled persons
As planned.
External monitoring
of resettlement and
land acquisit ion
・Monitoring of resettlement and land
acquisition processes by the executing agency
・Monitoring of social and economic
conditions of the resettled persons and of
related activities by the relevant
governmental agencies
・Advice for the relevant governmental
agencies
As planned.
2. Project Period
April 2000 – December 2006
(81 months)
April 2000 – January 2012
(142 months)
3. Project Cost
Amount paid in
Foreign currency
Amount paid in
Local currency
Total
Japanese ODA loan
portion
Exchange rate
7,163 million yen
4,623 million yen
(1,541 million Philippine pesos)
11,786 million yen
8,929 million yen
1 Philippine pesos=3 yen
(As of August 1999)
5,795million yen
12,063 million yen
(5,585 million Philippine pesos)
17,858 million yen
8,786 million yen
1 Philippine pesos=2.16yen
(Average between April 2000 and
January 2012)