Embed Size (px)
Citation preview
1
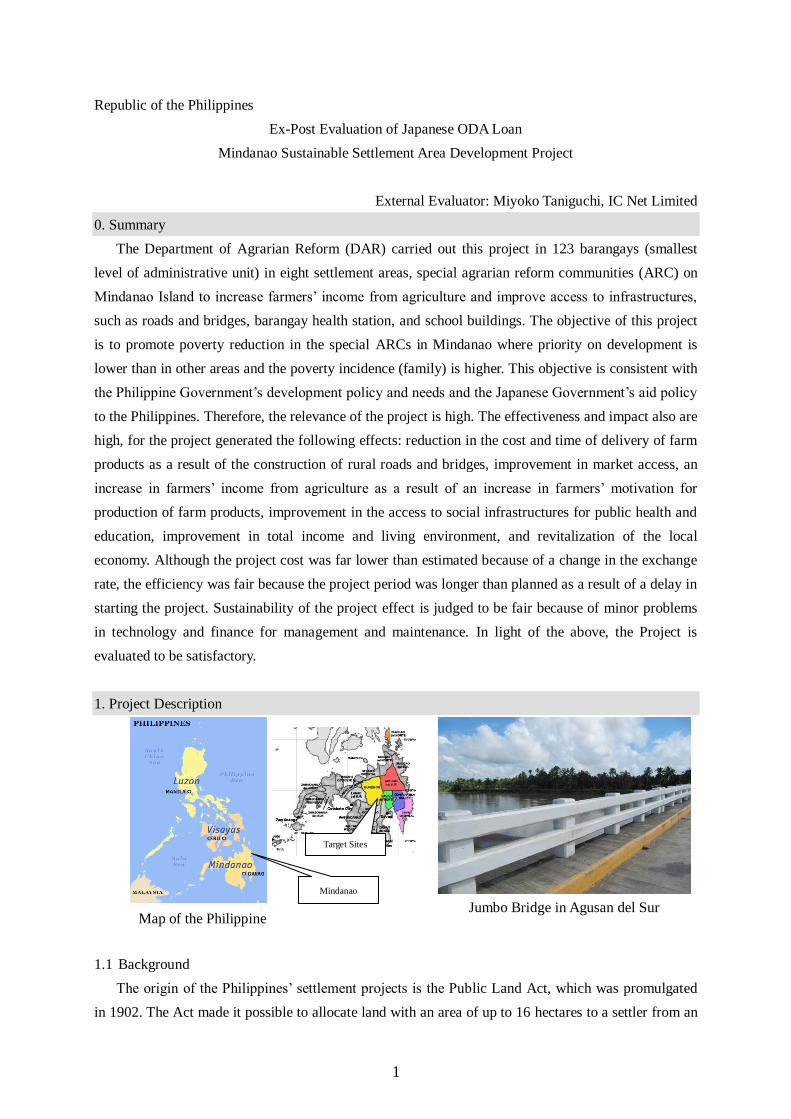
Republic of the Philippines
Ex-Post Evaluation of Japanese ODA Loan
Mindanao Sustainable Settlement Area Development Project
External Evaluator: Miyoko Taniguchi, IC Net Limited
0. Summary
The Department of Agrarian Reform (DAR) carried out this project in 123 barangays (smallest
level of administrative unit) in eight settlement areas, special agrarian reform communities (ARC) on
Mindanao Island to increase farmers’ income from agriculture and improve access to infrastructures,
such as roads and bridges, barangay health station, and school buildings. The objective of this project
is to promote poverty reduction in the special ARCs in Mindanao where priority on development is
lower than in other areas and the poverty incidence (family) is higher. This objective is consistent with
the Philippine Government’s development policy and needs and the Japanese Government’s aid policy
to the Philippines. Therefore, the relevance of the project is high. The effectiveness and impact also are
high, for the project generated the following effects: reduction in the cost and time of delivery of farm
products as a result of the construction of rural roads and bridges, improvement in market access, an
increase in farmers’ income from agriculture as a result of an increase in farmers’ motivation for
production of farm products, improvement in the access to social infrastructures for public health and
education, improvement in total income and living environment, and revitalization of the local
economy. Although the project cost was far lower than estimated because of a change in the exchange
rate, the efficiency was fair because the project period was longer than planned as a result of a delay in
starting the project. Sustainability of the project effect is judged to be fair because of minor problems
in technology and finance for management and maintenance. In light of the above, the Project is
evaluated to be satisfactory.
1. Project Description
1.1 Background
The origin of the Philippines’ settlement projects is the Public Land Act, which was promulgated
in 1902. The Act made it possible to allocate land with an area of up to 16 hectares to a settler from an
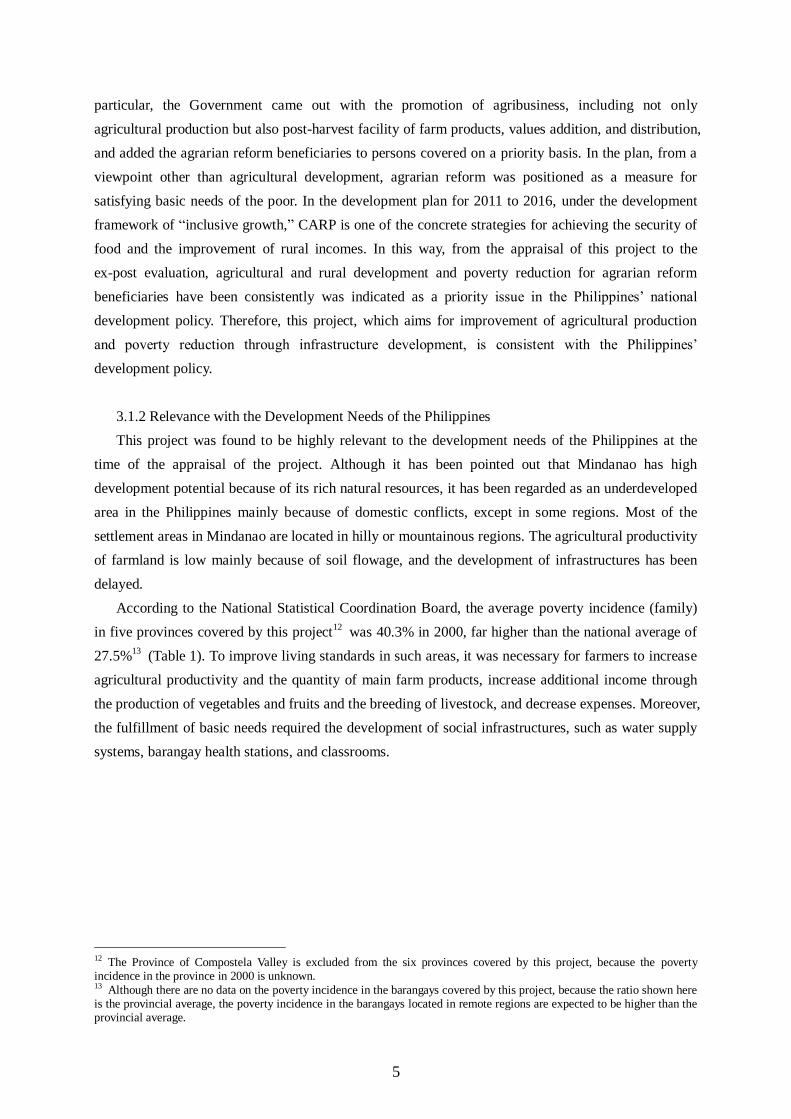
Target Sites
Mindanao
Jumbo Bridge in Agusan del Sur Map of the Philippine
2
overpopulated area to an underpopulated area. After that, the Philippines’ resettlement programs were
carried out by the US colonial government at the beginning of the project and by the National Land
Reform Council and others after independence. After the Department of Agrarian Reform (DAR) was
established according to the Republic Law No. 6389 in 1971, settlement projects were integrated
under the Department.
When the Comprehensive Agrarian Reform Law (CARL) was enacted in 1988, DAR formulated
the Comprehensive Agrarian Reform Program (CARP) to increase the incomes of farmers without
land. Since 1993, to promote the program effectively and efficiently, DAR has authorized Agrarian
Reform Community (ARC)1 as the basic unit of development and has promoted development,
centering on the communities. However, because the total area of settlements located in 56 places all
over the country is as large as 5,000 hectares, the development under CARP only covered ARCs dotted
in settlement areas and did not cover the entire settlement areas. Thus, in 1997, DAR authorized all the
settlement areas as “Special ARCs”2 according to the Executive Order No. 429 and decided to
develop them within the framework of CARP.
Of the 56 settlement areas throughout the country, 26 are located on Mindanao Island and account
for about 60% of the total area of all the settlement areas and the total number of beneficiary farmers
in the settlement areas.3 Most of the settlement areas on Mindanao Island are located in frontier areas
and have many hilly and mountainous regions. Most of the cultivated land is bare and inclined.
Because they have rain-fall intensity peculiar to the tropics, soil flowage has occurred. As a result,
agricultural productivity is low and agricultural activities other than rice cropping have been needed
for securing additional revenues. Moreover, because roads and other basic infrastructures have not
been established, it is difficult to transport products and inputs, and the development of social and
educational infrastructure has been delayed. In this situation, it was imminently necessary to carry out
comprehensive measures for supporting beneficiary farmers according to the local characteristics of
Mindanao Island.
1.2 Project Outline
The objective of this project is to improve farmers’ income and access to infrastructures in 123
barangays in eight settlement areas4 on Mindanao Island by development of infrastructures, support
for agricultural technology, support for organization of farmers, and strengthening of local
1 A community that consists of one or more barangays where agrarian reform beneficiary farmers live. Each ARC member is a farmer who owns land, with an average area of 2 hectares. 2 The Settlement Management Committee (SMC) and the Settlement Development and Coordinating Unit (SDCU) were established. The SMC plays a role in promoting and coordinating development to make settlement areas vital agrarian reform settlements through the SDCU. The SMC aims for comprehensive development of settlement areas and provides programs on the following themes: (1) establishment of distributed land ownership; (2) organization development and strengthening; (3) education and training; (4) industrial development; (5) development of social infrastructures; (6) productivity improvement; and (7) agrarian finance, investments, and marketing. 3 500,000 hectares in area; about 84,000 beneficiary farmers 4 Bukidnon Settlement (Province of Bukidnon), Davao Settlement 1 (Province of Davao del Norte), Davao Settlement 2
(Province of Compostela Valley), Cateel Settlement (Province of Davao Oriental), Surigao del Norte Settlement 1 (Province of Surigao del Norte), Surigao del Norte Settlement 2 (Province of Surigao del Norte), Agusan del Sur Settlement 1 (Province of Agusan del Sur), Agusan del Sur Settlement 2 (Province of Agusan del Sur)

3
governments, thereby contributing to the poverty reduction of the people on the target areas.
Loan Approved Amount/
Disbursed Amount
6,515 Million yen/ 5,791 Million yen
Exchange of Notes Date
Loan Agreement Signing Date
March, 30, 2001/ March 30, 2001
Terms and Conditions Interest Rate: 2.2%, Repayment Period 30 years (Grace period: 10 years): General untied Consulting service: Interest Rate: 0.75%, Repayment Period40 years (Grace period: 10 years): Tied between two countries
Borrower/Executing Agency The Government of the Republic of the Philippines/Department of
Agrarian Reform
Final Disbursement Date September, 2009
Main Contractor None
Main Consultants Sanyu Consultants Inc. Nippon Jogesuido Sekkei, Co, Ltd,Katahira
& Engineers International, Inc, Engineering and Development
Corporation of the Philippines, Pacific Rim Innovation and
Management Exponents, Inc, Desarollo International Consultant,
Inc, Center for Integrated Development and Social Marketing, Inc.
Feasibility Study, etc None
Related Projects <Japanese ODA loan project> Agrarian Reform Infrastructure
Support Project (I), L/A: 1998
<Japanese ODA loan project> Agrarian Reform Infrastructure
Support Project (II), L/A: 1999
<Japanese ODA loan project> Agrarian Reform Infrastructure
Support Project (III), L/A: 2007
<Japanese ODA loan project> Agrarian Reform Infrastructure
Support Project (III), L/A: 2007
<Japanese ODA loan project>Mindanao Sustainable Agrarian and
Agriculture Development Project, L/A: 2012
2. Outline of the Evaluation Study
2.1 External Evaluator
Miyoko Taniguchi, IC Net Limited
2.2 Duration of Evaluation Study
The study for this ex-post evaluation was carried out as follows:
Duration of the Study: August 2012–June 2013
Duration of the Field Study: November 11–December 1, 2012; April 3–11, 2013
2.3 Constraints during the Evaluation Study
The settlements covered by this project are scattered among six provinces, 16 municipalities, and
123 barangays in Mindanao. The contents of this project vary, ranging from small-scale infrastructure
development for better living to agricultural infrastructure development, agricultural technology
training, and people’s organization (PO). The total number of subprojects is 986. Of the subprojects,

4
770 aim for infrastructure development5
and 216 aim for agricultural and environmental
development.6 Given constraints in time and other aspects, it was impossible to conduct field studies
for all the subprojects. Moreover, the areas covered by this project are characterized by a variety of
natural conditions and social and economic conditions.
Accordingly, a beneficiary survey and an interview survey in the field were conducted in two
provinces, four municipalities, and four barangays7 (sample size: 122).
8 With regard to information
on all the subprojects, in order to improve the accuracy of the surveys, the effect of the project as a
whole was grasped from a variety of information sources, including the following: (1) interviews with
the head and provincial offices of DAR; (2) a questionnaire survey on the head office of DAR and the
provincial offices of DAR in the six provinces covered by the project; (3) a simplified beneficiary
survey on 104 barangays where the evaluator was unable to conduct field surveys9; and (4) literature
reviews.
When this project was appraised, operation and effect indicators were not set completely and the
standard and target values for each indicator were neither set nor measured. Thus it was decided that,
in this survey, operation and effect indicators should be arranged and the effectiveness and impact of
the project were measured by reference to the logframe that was established during this project and
was agreed upon between DAR and JICA.
3. Results of the Evaluation (Overall Rating: B10
)
3.1 Relevance (Rating: ③11)
3.1.1 Relevance with the Development Plan of the Philippines
When this project was appraised, the Philippine Government declared an objective in the
Mid-Term Development Plan for 1999 to 2004: sustainable development based on social equality –
especially, poverty reduction and improvement of unequal income distribution in rural areas. In the
Mid-Term Development Plan for 2005 to 2010, the Philippine Government declared poverty reduction
as the development objective. As a comprehensive approach to poverty reduction in rural areas in
5 Rural roads, 113; bridges, 55; irrigation, 27; post-harvest facilities, 111; water supply, 39; schools, 218; barangay health stations , 96; multipurpose buildings, 20; multipurpose roads 6 Agro-forestry, 65; home forestation, 64; forestation, 26; livestock, 62; demonstration farm, 66; nursery of seedling, 8 7 The evaluator conducted surveys in the following barangays: (1) Bukidnon, Malamag, Kuya; (2) Bukidnon, Kalilangan, Kinura; (3) Agusan del Sur, Prosperida, San Vicente; and (4) Agsan del Sur, Veruela, San Gabriela. 8 The settlements covered by the beneficiary survey were selected according to the following criteria: (1) security situation; (2) provinces other than those where DAR previously conducted surveys for similar projects; (3) variety of social and economic conditions; and (4) covering as many subprojects as possible. The respondents of the survey in each barangay were selected by random sampling in principle. The stratified sampling method was used for those subprojects that covered only some beneficiaries. The number of samples in each barangay was planned to be about 30 and determined based on the investment size of the subproject (Kuya, 25; Kinura, 35; San Vicente, 30; San Gabriela, 32). 9 The survey consisted of the evaluator’s preparation of questionnaires, orientation to and explanation about the survey method to the provincial offices of DAR, and data input and analysis. Enumerators hired by DAR gained responses through
group discussions in each barangay. Although, of the 123 barangays covered by the project, the survey was planned to be carried out in 119 barangays, or all except for the four barangays where the evaluator conducted field surveys, the survey became impossible in 15 barangays in the Province of Davao Oriental due to a typhoon in December 2012 which brought about a big damage in the special ARCs, when administration of the survey had been planned. As a result, the survey was conducted in 104 barangays in total. 10 A: Highly satisfactory; B: Satisfactory; C: Partially satisfactory; D: Unsatisfactory 11 ③: High;②: Fair;①: Low
5
particular, the Government came out with the promotion of agribusiness, including not only
agricultural production but also post-harvest facility of farm products, values addition, and distribution,
and added the agrarian reform beneficiaries to persons covered on a priority basis. In the plan, from a
viewpoint other than agricultural development, agrarian reform was positioned as a measure for
satisfying basic needs of the poor. In the development plan for 2011 to 2016, under the development
framework of “inclusive growth,” CARP is one of the concrete strategies for achieving the security of
food and the improvement of rural incomes. In this way, from the appraisal of this project to the
ex-post evaluation, agricultural and rural development and poverty reduction for agrarian reform
beneficiaries have been consistently was indicated as a priority issue in the Philippines’ national
development policy. Therefore, this project, which aims for improvement of agricultural production
and poverty reduction through infrastructure development, is consistent with the Philippines’
development policy.
3.1.2 Relevance with the Development Needs of the Philippines
This project was found to be highly relevant to the development needs of the Philippines at the
time of the appraisal of the project. Although it has been pointed out that Mindanao has high
development potential because of its rich natural resources, it has been regarded as an underdeveloped
area in the Philippines mainly because of domestic conflicts, except in some regions. Most of the
settlement areas in Mindanao are located in hilly or mountainous regions. The agricultural productivity
of farmland is low mainly because of soil flowage, and the development of infrastructures has been
delayed.
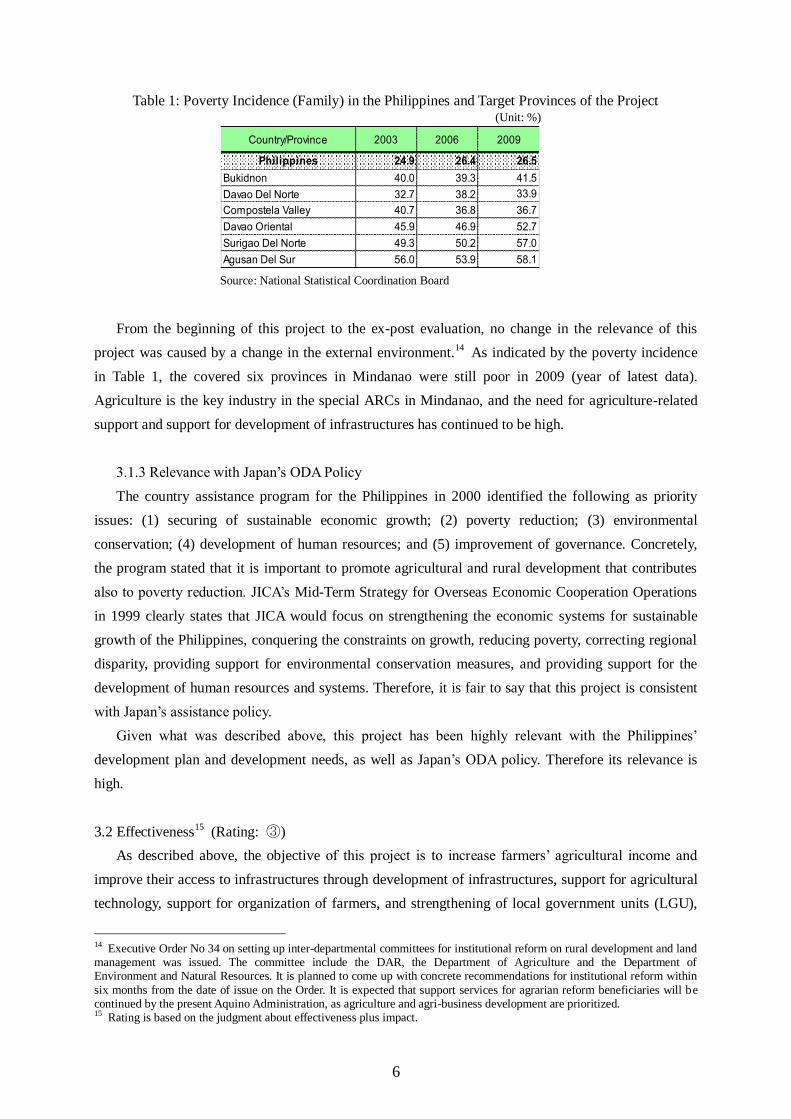
According to the National Statistical Coordination Board, the average poverty incidence (family)
in five provinces covered by this project12
was 40.3% in 2000, far higher than the national average of
27.5%13
(Table 1). To improve living standards in such areas, it was necessary for farmers to increase
agricultural productivity and the quantity of main farm products, increase additional income through
the production of vegetables and fruits and the breeding of livestock, and decrease expenses. Moreover,
the fulfillment of basic needs required the development of social infrastructures, such as water supply
systems, barangay health stations, and classrooms.
12 The Province of Compostela Valley is excluded from the six provinces covered by this project, because the poverty incidence in the province in 2000 is unknown. 13 Although there are no data on the poverty incidence in the barangays covered by this project, because the ratio shown here is the provincial average, the poverty incidence in the barangays located in remote regions are expected to be higher than the provincial average.
6
Table 1: Poverty Incidence (Family) in the Philippines and Target Provinces of the Project (Unit: %)
Source: National Statistical Coordination Board
From the beginning of this project to the ex-post evaluation, no change in the relevance of this
project was caused by a change in the external environment.14
As indicated by the poverty incidence
in Table 1, the covered six provinces in Mindanao were still poor in 2009 (year of latest data).
Agriculture is the key industry in the special ARCs in Mindanao, and the need for agriculture-related
support and support for development of infrastructures has continued to be high.
3.1.3 Relevance with Japan’s ODA Policy
The country assistance program for the Philippines in 2000 identified the following as priority
issues: (1) securing of sustainable economic growth; (2) poverty reduction; (3) environmental
conservation; (4) development of human resources; and (5) improvement of governance. Concretely,
the program stated that it is important to promote agricultural and rural development that contributes
also to poverty reduction. JICA’s Mid-Term Strategy for Overseas Economic Cooperation Operations
in 1999 clearly states that JICA would focus on strengthening the economic systems for sustainable
growth of the Philippines, conquering the constraints on growth, reducing poverty, correcting regional
disparity, providing support for environmental conservation measures, and providing support for the
development of human resources and systems. Therefore, it is fair to say that this project is consistent
with Japan’s assistance policy.
Given what was described above, this project has been highly relevant with the Philippines’
development plan and development needs, as well as Japan’s ODA policy. Therefore its relevance is
high.
3.2 Effectiveness15
(Rating: ③)
As described above, the objective of this project is to increase farmers’ agricultural income and
improve their access to infrastructures through development of infrastructures, support for agricultural
technology, support for organization of farmers, and strengthening of local government units (LGU),
14 Executive Order No 34 on setting up inter-departmental committees for institutional reform on rural development and land management was issued. The committee include the DAR, the Department of Agriculture and the Department of Environment and Natural Resources. It is planned to come up with concrete recommendations for institutional reform within
six months from the date of issue on the Order. It is expected that support services for agrarian reform beneficiaries will be continued by the present Aquino Administration, as agriculture and agri-business development are prioritized. 15 Rating is based on the judgment about effectiveness plus impact.
Country/Province 2003 2006 2009
Philippines 24.9 26.4 26.5
Bukidnon 40.0 39.3 41.5
Davao Del Norte 32.7 38.2 33.9
Compostela Valley 40.7 36.8 36.7
Davao Oriental 45.9 46.9 52.7
Surigao Del Norte 49.3 50.2 57.0
Agusan Del Sur 56.0 53.9 58.1

7
thereby promoting poverty reduction. Regarding poverty reduction as the main objective of this
project, this evaluation examined improvement in farmers’ agricultural income and their access to
infrastructures in terms of effectiveness and examined improvement in their income and living
standard in terms of impact.
The evaluation of effectiveness is usually based on comparison between the initial plan (at the time
of the appraisal) and the actual results. However, comparison with the Settlement Area Development
Plan and the Project Investment Plan is judged to be relevant because of the following: (1) there is no
standard value at the time of the appraisal; (2) in this project, the plan has been reviewed based on the
Settlement Area Development Plan and the Project Investment Plan for each of the special ARCs
established in 2004 after the beginning of the project; and (3) in 2004, when the project was being
carried out in earnest, a logframe, which included operation and effect indicators different from those
at the time of the appraisal, was established between the Philippine government and JICA, and project
management has been consistently carried out during the implementation of the project. Therefore, in
this ex-post evaluation, the operation and effect indicators were arranged based on the plans and the
logframe, and evaluation indicators were set up as follows:
3.2.1 Quantitative Effects (Operation and Effect Indicators)
(1) Annual average agricultural income of farm household and total income16
Because agricultural income is one of the project objectives in the logframe, it is the main indicator
for judging effectiveness. In addition, total income is an indicator for judging impact. However, in the
case of household income and expenditure surveys, the survey results often differ greatly because of
the number of samples and the sampling and other survey methods. In this survey, in order to increase
the reliability of the evaluation results, the consistency of data was examined based on three
information sources on income17
, and survey results from different information sources were used
complementarily.
1) Farm households’ annual average agricultural income and total income (information source:
Assessment of the Level of Development of Agrarian Reform Communities (ALDA)18
)
According to data extracted from the Assessment of the Level of Development of Agrarian Reform
16 This section deals also with total income, which is an indicator for “impact.” 17 The information sources for this indicator include the following: (1) the Assessment of the Level of Development of Agrarian Reform Communities (ALDA) by DAR; (2) the beneficiary survey by the evaluator; and (3) the simplified beneficiary survey (awareness survey). They have the following characteristics: (1) because the ALDA has no data on each
item of income sources, detailed analysis is impossible concerning the causal relationship with the project effect; however, it is possible to quantitatively observe secular changes in the income in the special ARCs covered by this project; (2) Although the beneficiary survey enables detailed analysis of each item of income resources, only four barangays are covered among the 123 barangays covered by this project; although the four barangays were selected to grasp the whole image of the project effect, because the number of samples (122) is small compared with the population, it is hard to say that representativeness for all the barangays covered by the project has been secured; and (3) although the simplified beneficiary survey covers 104 barangays among the 123 barangays, no household income and expenditure survey (amount of income) is included, because it is a questionnaire survey in the form of group discussion in each of the target barangays. 18 DAR has been monitoring the ARCs, using the following six items as indicators: (1) improvement of land ownership relations; (2) organization maturity level; (3) economic infrastructure support; (4) agricultural productivity and income; (5) basic social services; and (6) gender development.

8
Communities (ALDA), which DAR has conducted every year, farm households’ annual average
agricultural income (price-adjusted) in the ARCs covered by this project is 121% of the planned
income at the time of completion (target value: 20% increase). As shown in Table 2, the rate of
increase varies greatly among settlements. Because the settlements covered by this project are located
in remote regions, even if some of them are located in the same province, agricultural potential, market
access, and the content and cost of each subproject of this project differ because of geographical
features.
Table 2: Farm Households’ Annual Average Income
Agricultural
Income
Non-
agricultural
Income
Total
Income
Agricultural
Income
Non-
agricultural
Income
Total
Income
Agricultural
Income
Non-
agricultural
Income
Total
Income
(2004-
2009)
(2009-
2012
Peso Peso Peso Peso Peso Peso % Peso Peso Peso % %
Bukidonon South
South Pangantucan 45,000 20,000 65,000 38,462 17,094 55,556 71 54,189 57,994 112,183 73 102
Bacusanon 80,000 40,000 120,000 70,940 35,897 106,838 74 60,843 22,451 83,294 -31 -22
Kalilangan 57,330 10,000 67,330 44,872 32,051 76,923 65 79,332 32,347 111,680 66 45
Lelar n.a n.a n.a n.a n.a n.a n.a 72,208 51,879 124,086 n.a. n.a.
Compostela Valley
Davao Settlement No.2 53,364 8,256 61,620 176,068 13,675 189,744 275 43,456 14,852 58,308 -5 -69
Davao del Norte
Davao Settlement No.1 86,280 8,000 94,280 74,359 27,350 101,709 72 115,763 38,182 153,946 63 51
B.E. Dujali Cluster 50,000 10,000 60,000 102,564 25,641 128,205 171 180,940 7,079 188,019 213 47
Davao Oriental
Cateel Settlement 66,279 24,091 90,370 65,046 19,833 84,879 82 46,629 56,091 102,720 14 21
Agusan del Sur
Agusan Resettlement 41,700 26,325 68,025 37,534 65,086 102,620 75 48,127 34,035 82,162 21 -20
Kaunlaran 42,000 26,525 68,525 61,859 60,331 122,191 123 63,680 42,064 105,743 54 -13
Surigao del Norte
Dinagat 14,400 21,000 35,400 68,930 45,692 114,622 399 50,742 37,674 88,415 150 -23
San Jose 21,500 29,550 51,050 49,564 101,054 150,618 192 39,897 115,016 154,913 203 3
Tubajon 14,300 21,874 36,174 39,658 59,701 99,359 231 76,872 67,348 144,220 299 45
47,679 21,469 68,148 69,155 41,951 111,105 121 71,744 45,268 116,130 70 5
ARC
2004
Average
Increase Rate
Unit
2011(adusted Consumer Price
Index, 2004=100, 2011=133)
2009(adusted Consumer Price
Index) 2004=100, 2009=117)
Actual
Agricultural
Income
Increase
Rate
against
Plan (20%
Increase)*
*In the logframe of the Project, the target upon the completion of the Project (2009) is 20% increase. Thus, the rates in Table
2 are the achievement rate against the plan (GDP deflator-Consumer Price Index: 100 in 2004, 117 in 2009) Source: DAR
Generally, it can be said that the rate of income increase is higher in settlements where the standard
income of farm households was lower in 2004 (before this project). In the provinces as a whole,
although the poverty incidence has been on an upward trend, the amount of agricultural income has
been increasing in the ARCs covered by this project. It can be inferred that one of the reasons is the
effect of this project.19
In these settlements, the poverty incidence is higher than that in the other
settlements in Mindanao or the national average (Table 1). This seems to be because the infrastructure
development rate in the settlements where the poverty incidence is high is lower than in the other
settlements and, to satisfy needs, the number of subprojects and the amount of investments became
19 However, because no data exist about the average agricultural income in the provinces as a whole, it is impossible to show correlativity statistically.

9
higher than in the other target areas. On the other hand, as in the case of Davao Settlement 2, there are
cases where no consistent trends are shown in changes in the amount of income among the years of
measurement. This seems to be because, even in the same settlement, the areas covered by this project
are vulnerable to natural disasters, such as floods and landslides, and the production of farm products
changes according to each year’s weather conditions.
The average increment in farm households’ annual average total income in all the areas covered by
this project increased from 68,148 pesos in 2004, before the implementation of this project, to 111,105
pesos in 2009 (when this project was completed), up by 63%, and 116,139 pesos in 2011, up by 70%
(Table 2). The average total income increased by 5% between the completion and 2011. While the
average total income annually increased by 13% during the project period (2004 to 2009), it increased
by 2% between 2009, when the project was completed, and 2011. Therefore, the total income greatly
increased during the project period, which can be recognized as a direct effect of this project.
2) Farm households’ annual average agricultural income and total income (information source:
beneficiary survey)
As a result of a survey on 122 beneficiaries in four barangays in Bukidnon Settlement and Agusan
del Sur Settlement (special ARCs), as shown in Table 3, the annual average agricultural income in the
four barangays increased by 27% over the course of this project.
Table 3: Farm Household’s Annual Average Income (before and after the Project)
*Adjusted based on the Consumer Price Index, 100 in 2004 against 133 in 2012
Source: Beneficiary survey at ex-post evaluation
Given what has been described above, it can be confirmed that the effect of this project has
Before
(peso)
After
(peso)*
Increase
Rate (%)
Before
(peso)
After
(peso)*
Increase
Rate (%)
Before
(peso)
After
(peso)*
Increase
Rate (%)
Before
(peso)
After
(peso)*
Increase
Rate (%)
Peso Peso % Peso Peso % Peso Peso % Peso Peso %
Rice 16,019 19,076 19 4,145 2,018 -51 22,605 43,921 94 28,990 44,166 52 29
Corn 17,032 13,115 -23 26,094 21,219 -19 0 0 0 94 0 n.a. -14
Sugercane 53,400 63,068 18 14,086 12,256 -13 0 0 0 0 0 0 1
Vegetables 160 180 13 523 1,130 116 24 90 276 0 2 n.a. 135
Fruits 20 9 -55 1,029 1,319 28 37 634 1,629 0 79 n.a. 534
Livestock 3,352 4,962 48 4,348 3,579 -18 480 1,102 130 794 1,089 37 49
Fish 0 0 0 0 0 0 256 0 n.a. 94 70 -25 -8
Others 720 1,624 126 7,976 6,405 -20 15,757 16,491 5 670 2,162 223 83
Sub-Total 90,703 102,034 12 58,200 47,926 -18 39,159 62,238 59 30,641 47,568 55 27
Trade 160 150 -6 0 1,289 n.a. 17 2,341 13,945 2,250 2,227 -1 4,646
Handi-craft 0 0 0 0 0 0 0 0 0 0 153 n.a. 0
Carpentery 240 2,075 765 3,669 3,313 -10 0 0 0 0 592 n.a. 252
Mining 0 3,089 n.a. 0 0 0 0 0 0 0 0 0 0
Public officers 1,680 0 -100 2,661 5,860 120 3,720 3,489 -6 32,653 22,056 -32 -5
Private company 3,782 3,429 -9 291 1,485 410 0 0 0 2,250 1,410 -37 91
Emigration 200 0 -100 857 2,170 153 0 802 n.a. 4,221 4,229 0 18
Agricultural labor 1,660 2,526 52 4,937 5,368 9 10,509 8,361 -20 9,494 5,146 -46 -1
Remittance 3,920 3,789 -3 5,486 4,855 -11 4,800 6,720 40 0 3,745 n.a. 8
Others 5,280 8,499 61 12,503 14,751 18 6,288 6,071 -3 10,039 11,438 14 22
Sub-Total 16,922 23,558 39 30,405 39,091 29 25,334 27,783 10 60,907 50,996 -16 15
Total Income 107,626 125,593 17 88,605 87,017 -2 64,493 90,022 40 91,548 98,564 8 16
Increase
Rate (%)
Agricultural Income
Non-agricultural Income
Kuya (Bukidnon) Kinura (Bukidnon)San Vicente
(Agsan Del Sur)
San Gabriela
(Agusan Del Sur)
10
continued even after the end of this project. Although the rate of increase differs among the barangays,
there are the following general trends. The Province of Bukidnon is advanced in agricultural
development in Mindanao and the agricultural income in the province before the project was higher
than in two barangays in the Province of Agusan del Sur. On the other hand, the rate of income
increase after the project is higher in Agusan del Sur. This is because of the following reasons in two
barangays in the Province of Bukidnon: (1) areas where irrigation facilities can be provided are limited
because of geographical or technical conditions; and (2) land productivity has declined because of soil
erosion and acidification caused by deforestation and constant cultivation.20
There have been changes
in the social and economic circumstances of farm households, resulting in a decline in farm
households’ incentive for agricultural production. In the areas surrounding Barangay Kuya, around
2005, multinational companies such as Delmonte, Dole established pineapple and banana plantations.
Because farm households can stably gain income, farmers tend to lend farmland to companies and
work as day laborers.21
The rate of increase in agricultural income has been decreasing in Barangay
Kinura. This seems to be because agricultural expenditure has increased, while the prices of sugarcane
declined.
On the other hand, because logging has been traditionally prosperous in the Province of Agusan
del Norte, agricultural development has been delayed there, compared with the other areas in
Mindanao. According to the Municipality Agricultural Office of the LGU, because the total logging
ban to prohibit deforestation totally came into force recently, the inhabitants have become more
interested in agriculture than before. The results of the beneficiary survey in both barangays revealed
that all the respondents answered “road and bridge construction was effective for an increase in our
agricultural income.” The beneficiary survey and interviews with LGU officer showed that the
construction of farm to market road led to the expansion of farmers’ access to farm product markets
and sales channels, reduction in the cost and time of transportation, and improvement in traders’ access
to the barangays, resulting in an increase in farmers’ motivation for production.22
On the other hand,
because irrigation and other infrastructure support, which contributes directly to agricultural
development, agricultural technology promotion, and marketing, and other soft-type support was
provided to a limited number of beneficiaries, the contribution of these support programs is limited.
The results of the beneficiary survey show that farm households’ annual average income changed
as follows. The rate of increase over the course of this project was 16% (Table 3). As in the case of
agricultural income, the status of achievement has varied among barangays. While the ratio of
agricultural income decreased over the course of this project in the two covered barangays in the
20 To deal with these issues, in this project, training was held on the production of organic vegetables and the production of livestock, and seeds and saplings were distributed. However, because the number of target farmers was limited, these efforts have not led to an increase in agricultural income. The interviews with the participants of the two barangays in the training on the production of organic vegetables reveal that they have not continued to cultivate vegetables. This is because organic farming takes labor and time, while production volumes are small and selling prices are low. During the project period, no support was provided for the marketing of produced farm products. 21 While companies give 275 pesos as the daily wage for a day laborer, the daily wage for assistance to a neighboring farmer
is about 200 pesos. 22 Because roads were underdeveloped and access to the barangays was difficult before this project, no traders visited the barangays to buy farm products.
11
Province of Bukidnon, the ratio increased in the two covered barangays in the Province of Agusan del
Sur. Non-agricultural income increased over the course of this project in all the barangays other than
San Gabriela. This is because the construction of farm to market road activated not only agriculture
but also local economic activities through the development of the road networks within the barangays.
In Barangay Kinura, improvement in access to the urban settlement through the market access road
has increased job opportunities in peddling and the private sector and has compensated for the decline
in agricultural income. In the two target barangays in the Province of Bukidnon, land prices have
increased because of the construction of the farm to market road, and farmland lease fees have become
a source of additional income.23
3) Farm households’ annual average agricultural income and total income (information source:
simplified beneficiary survey)
In the simplified beneficiary survey, 89% (93 barangays) of the surveyed barangays answered
“agricultural income increased” after the project. The main reasons are as follows: (1) expansion of the
area planted with farm products; (2) an increase in the volume of farm products; (3) improvement in
market access; (4) application of new agricultural technologies (farm products and livestock); and (5)
increases in the prices of some farm products, such as rubber, coffee, and banana. Subprojects that
greatly contributed to an increase in the amount of agricultural income were those for (1) roads and
bridges (40%); (2) livestock revolving scheme24
(13%); and (3) agricultural training (9%) and
irrigation (6%). The construction of roads and bridges in particular has led to an increase in the
motivation for production through a reduction in the cost of transporting farm products and the
securing of markets (traders’ purchase of farm products in barangays).
The above-described results are relevant to the results of the beneficiary survey. Given that the
construction of roads and bridges in particular has been carried out in almost all the target barangays,
it is possible to certify that improvement in market access has contributed to the expansion of the area
planted with farm products, an increase in the volume of farm products, and the diversification of farm
products.
The following results have been attained by an awareness survey on total income based on the
simplified beneficiary survey. Of the target 104 barangays, 92% answered “total income increased”
after the project, with 61% answering “highly increased” and 31% answering “somewhat increased,”
23 As a result of the construction of farm to market road, land prices in the target barangays have been on an upward trend. Because of temporary financial demand, some agrarian reform beneficiaries have partially leased or resold their land. Article
27 of the Republic Act No. 6658 provides that agrarian reform beneficiaries may not transfer land titles obtained through the agrarian reform to anyone other than the following: (1) inheritance to family members; (2) Land Bank of the Philippines; and (3) other agrarian reform beneficiaries who have lived on the land for 10 or more years. However, they have transferred land titles to other people by clandestine agreement. The interviews with beneficiaries revealed that, in Barangay Kuya, where Delmonte and Dole have been expanding plantations, about 95% of the farm households have leased land acquired through agrarian reform. For example, in Barangay Kuya, farmers lease farmland at an annual fee of about 15,000 pesos per hectares and sell farmland at 60,000 pesos per hectares. 24 The livestock rotation scheme consists of the following processes: (1) distribution of livestock to beneficiaries, such as
water buffaloes, milk cows, pigs, goats, chickens, and ducks; (2) beneficiaries’ breeding of distributed livestock; and (4) beneficiaries’ delivery of born offspring to other beneficiaries. During the implementation of this project, by support of an NGO, each PO established operation rules. At present, the POs are operating the scheme according to the established rules.
12
which indicates this project’s effect of increasing income. Because these results are consistent with the
above-described results, an increase in total income can be recognized in all the target areas of this
project.
Therefore, increases in agricultural income and total income, central indicators for effectiveness
and impact, can be recognized.
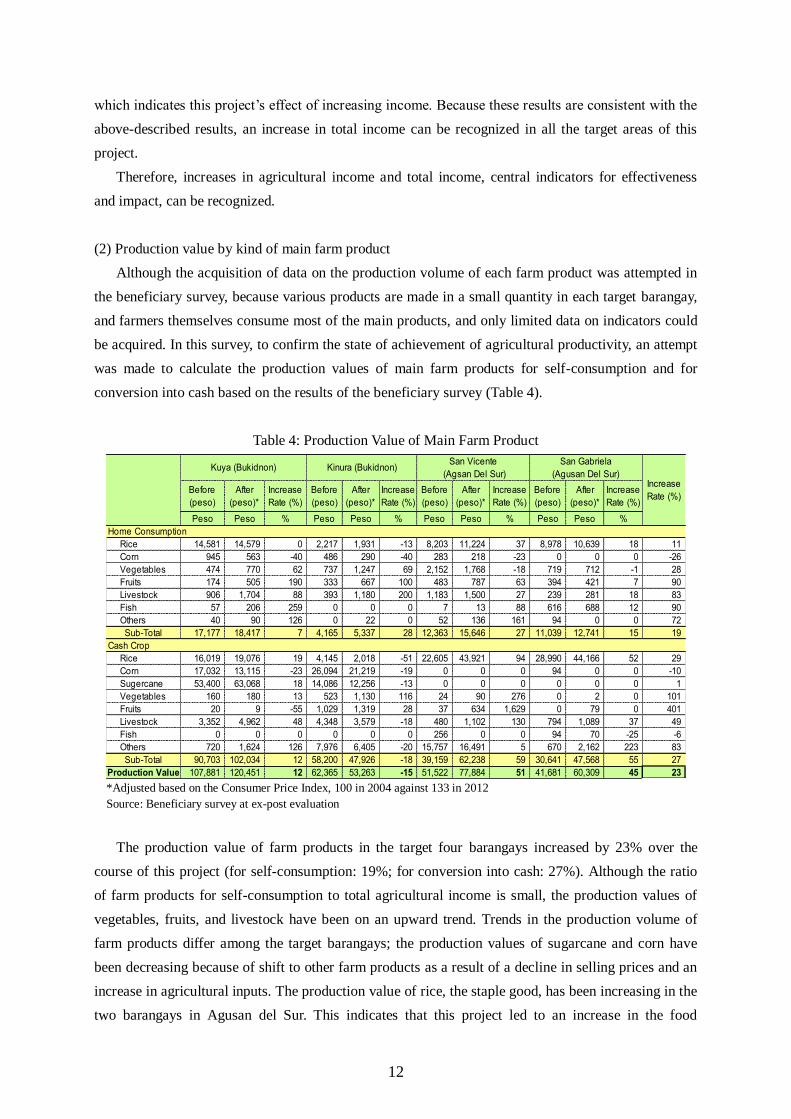
(2) Production value by kind of main farm product
Although the acquisition of data on the production volume of each farm product was attempted in
the beneficiary survey, because various products are made in a small quantity in each target barangay,
and farmers themselves consume most of the main products, and only limited data on indicators could
be acquired. In this survey, to confirm the state of achievement of agricultural productivity, an attempt
was made to calculate the production values of main farm products for self-consumption and for
conversion into cash based on the results of the beneficiary survey (Table 4).
Table 4: Production Value of Main Farm Product
*Adjusted based on the Consumer Price Index, 100 in 2004 against 133 in 2012
Source: Beneficiary survey at ex-post evaluation
The production value of farm products in the target four barangays increased by 23% over the
course of this project (for self-consumption: 19%; for conversion into cash: 27%). Although the ratio
of farm products for self-consumption to total agricultural income is small, the production values of
vegetables, fruits, and livestock have been on an upward trend. Trends in the production volume of
farm products differ among the target barangays; the production values of sugarcane and corn have
been decreasing because of shift to other farm products as a result of a decline in selling prices and an
increase in agricultural inputs. The production value of rice, the staple good, has been increasing in the
two barangays in Agusan del Sur. This indicates that this project led to an increase in the food
Before
(peso)
After
(peso)*
Increase
Rate (%)
Before
(peso)
After
(peso)*
Increase
Rate (%)
Before
(peso)
After
(peso)*
Increase
Rate (%)
Before
(peso)
After
(peso)*
Increase
Rate (%)
Peso Peso % Peso Peso % Peso Peso % Peso Peso %
Rice 14,581 14,579 0 2,217 1,931 -13 8,203 11,224 37 8,978 10,639 18 11
Corn 945 563 -40 486 290 -40 283 218 -23 0 0 0 -26
Vegetables 474 770 62 737 1,247 69 2,152 1,768 -18 719 712 -1 28
Fruits 174 505 190 333 667 100 483 787 63 394 421 7 90
Livestock 906 1,704 88 393 1,180 200 1,183 1,500 27 239 281 18 83
Fish 57 206 259 0 0 0 7 13 88 616 688 12 90
Others 40 90 126 0 22 0 52 136 161 94 0 0 72
Sub-Total 17,177 18,417 7 4,165 5,337 28 12,363 15,646 27 11,039 12,741 15 19
Rice 16,019 19,076 19 4,145 2,018 -51 22,605 43,921 94 28,990 44,166 52 29
Corn 17,032 13,115 -23 26,094 21,219 -19 0 0 0 94 0 0 -10
Sugercane 53,400 63,068 18 14,086 12,256 -13 0 0 0 0 0 0 1
Vegetables 160 180 13 523 1,130 116 24 90 276 0 2 0 101
Fruits 20 9 -55 1,029 1,319 28 37 634 1,629 0 79 0 401
Livestock 3,352 4,962 48 4,348 3,579 -18 480 1,102 130 794 1,089 37 49
Fish 0 0 0 0 0 0 256 0 0 94 70 -25 -6
Others 720 1,624 126 7,976 6,405 -20 15,757 16,491 5 670 2,162 223 83
Sub-Total 90,703 102,034 12 58,200 47,926 -18 39,159 62,238 59 30,641 47,568 55 27
Production Value 107,881 120,451 12 62,365 53,263 -15 51,522 77,884 51 41,681 60,309 45 23
Home Consumption
Cash Crop
Kuya (Bukidnon) Kinura (Bukidnon)San Vicente
(Agsan Del Sur)
San Gabriela
(Agusan Del Sur)Increase
Rate (%)

13
self-sufficiency ratio and a decrease in household expenditure. It can be inferred that the production
value of fishes has been decreasing in the barangays because an increase in agricultural production has
reduced the incentives to fish production.
(3) Irrigation area
Of the 123 barangays covered by this project, irrigation facilities were constructed in 27 barangays.
According to DAR, although the planned irrigation area was 1,717 hectares when the detailed plan
was reviewed in 2004, the irrigation area increased to 2,732 hectares. Therefore, the achievement rate
is 159%. This is because the number of subprojects increased from six at the time of planning to 27 in
reality, and the irrigation area increased accordingly (for the reasons for this increase, see
“Efficiency.”)
(4) Degree of maturity of irrigation associations
The irrigation association (IA) maturity level is monitored every year by the National Irrigation
Administration (NIA) as the level of organizational maturity of the IAs all over the country. This level
of maturity is calculated mainly from the following indicators: (1) the number of IA members; (2)
agricultural production volume and amount of expenditure; (3) net revenue; and (4) the loan
repayment rate to NIA. Because it is assumed that a correlation exists between agricultural
productivity and the maturity and functionality of an IA as an organization, the IA maturity level is
used also as the indicator for the effect of an irrigation project. According to the results of the latest
survey on 12 irrigation associations of the 27 associations covered by this project, the overall
evaluation is “satisfactory,” the second from the bottom on the four grades.25
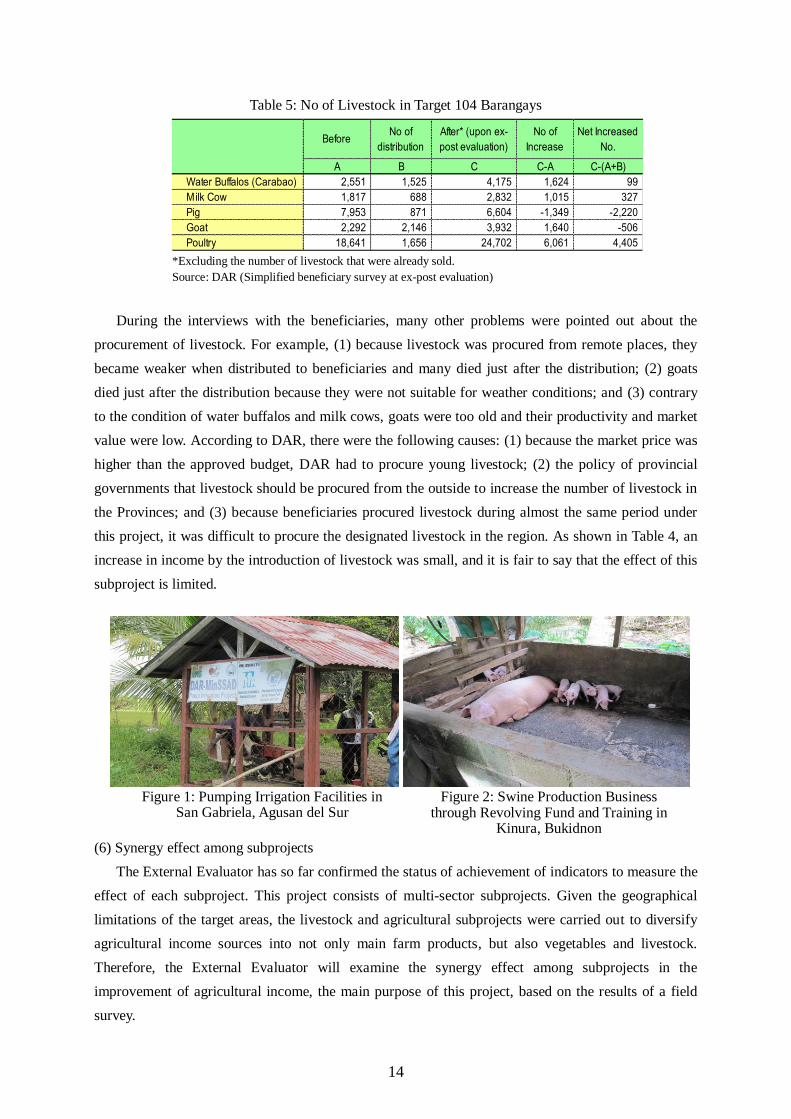
(5) Total number of livestock (information source: simplified beneficiary survey)
The results of the simplified beneficiary survey show that a change in the number of livestock in
the barangays covered by the project (104 barangays) over the course of the project differs according
to types of livestock (Table 5). A change in the number of livestock has been influenced also by the
condition of procurement of livestock. For example, distributed water buffalos (carabao) and milk
cows are different from those designated by beneficiaries. Their ages are low and several years’
breeding is necessary until they can be used for farming (water buffalos) and dairy farming. Thus, at
the time of the ex-post evaluation, both the increasing number and the number of beneficiaries through
the revolving scheme were limited.
25 Four-point scale: “Excellent,” “Highly satisfactory,” “Satisfactory,” and “Failed”
14
Table 5: No of Livestock in Target 104 Barangays
*Excluding the number of livestock that were already sold.
Source: DAR (Simplified beneficiary survey at ex-post evaluation)
During the interviews with the beneficiaries, many other problems were pointed out about the
procurement of livestock. For example, (1) because livestock was procured from remote places, they
became weaker when distributed to beneficiaries and many died just after the distribution; (2) goats
died just after the distribution because they were not suitable for weather conditions; and (3) contrary
to the condition of water buffalos and milk cows, goats were too old and their productivity and market
value were low. According to DAR, there were the following causes: (1) because the market price was
higher than the approved budget, DAR had to procure young livestock; (2) the policy of provincial
governments that livestock should be procured from the outside to increase the number of livestock in
the Provinces; and (3) because beneficiaries procured livestock during almost the same period under
this project, it was difficult to procure the designated livestock in the region. As shown in Table 4, an
increase in income by the introduction of livestock was small, and it is fair to say that the effect of this
subproject is limited.
(6) Synergy effect among subprojects
The External Evaluator has so far confirmed the status of achievement of indicators to measure the
effect of each subproject. This project consists of multi-sector subprojects. Given the geographical
limitations of the target areas, the livestock and agricultural subprojects were carried out to diversify
agricultural income sources into not only main farm products, but also vegetables and livestock.
Therefore, the External Evaluator will examine the synergy effect among subprojects in the
improvement of agricultural income, the main purpose of this project, based on the results of a field
survey.
BeforeNo of
distribution
After* (upon ex-
post evaluation)
No of
Increase
Net Increased
No.
A B C C-A C-(A+B)
Water Buffalos (Carabao) 2,551 1,525 4,175 1,624 99
Milk Cow 1,817 688 2,832 1,015 327
Pig 7,953 871 6,604 -1,349 -2,220
Goat 2,292 2,146 3,932 1,640 -506
Poultry 18,641 1,656 24,702 6,061 4,405
Figure 1: Pumping Irrigation Facilities in San Gabriela, Agusan del Sur
Figure 2: Swine Production Business through Revolving Fund and Training in
Kinura, Bukidnon

15
Because geographical conditions differ among the target barangays, and the type and period also
differ among the subprojects, it is difficult to generalize the condition of occurrence of synergy effects.
However, it was confirmed through the field survey that some target barangays did not take an
implementing approach that can generate synergy effect. For example, when technical training was
held about farm products other than main ones such as rice and corn, the introduced agricultural
technologies were not firmly established due to the following reasons. First, farm products were not
selected from the viewpoint of marketing. Second, the training period lasted only one cropping period.
Third, promotion service or market support was lacking. If training is given to farmers, there is no
guarantee that they can soon apply the acquired skills and abilities. Although it was necessary for the
executing agency, other relevant agencies, and contracted NGOs to continue technical monitoring,
such monitoring was not fully carried out in this project. In addition, there was no system that would
promote organic farming through matching vegetable farmers with livestock producers.
Improvement in the ability of POs did not lead to the promotion of agricultural development.
Although the subproject period was two to three years in the target areas because of a delay in the
beginning of the subprojects, each barangay in the target areas simultaneously carried out ten or more
subprojects on average. It was planned that PO would be evaluated a level of competency by
contracted NGOs according to the Implementation Manual and, if they satisfies the standards, they
would serve as executing organizations. However, because only a small number of POs in the target
areas satisfied the standards, it was necessary to organize and strengthen new POs. However, because
many subprojects were carried out in the target areas and there were time constraints, there were
limitations in the absorptive capacity of POs engaged in agricultural development. Moreover, because
it was unclear what function to be given to POs, training on the abilities necessary for them could not
be provided and group activities about agricultural development, such as trading, could not be carried
out.
Although this project contributed to improvement in markets of main farm products through the
farm to market road and bridge, effect was not fully gained for diversification of agricultural income
sources. This seems to be because the structure, contents, and processes of the subprojects and the
support period were not designed enough in some areas so as to produce synergy effect among the
subprojects.
3.2.2 Qualitative Effects
(1) Access to safe water
According to the results of the simplified beneficiary survey, access to safe water has been
improved in all the target barangays, and 80% of the barangays answered that water quality was
improved (number of valid responses: 39). The concrete effects after this project include the
following: (1) reduction in time and labor for carrying water; (2) improvement in access to drinking
water; (3) improvement in convenience; and (4) improvement in the hygienic environment. The
reduced time for fetching water every day differs among the target barangays, ranging from about five
minutes to three hours. In the Barangay Kinura in the Province of Bukidnon, because children were in
16
charge of carrying water before this project, it was confirmed that the establishment of the facilities
has increased children’s time for study and leisure. In this way, this project contributes to the
improvement of children’s educational environment and the quality of living, such as improvement in
families’ hygiene environment.
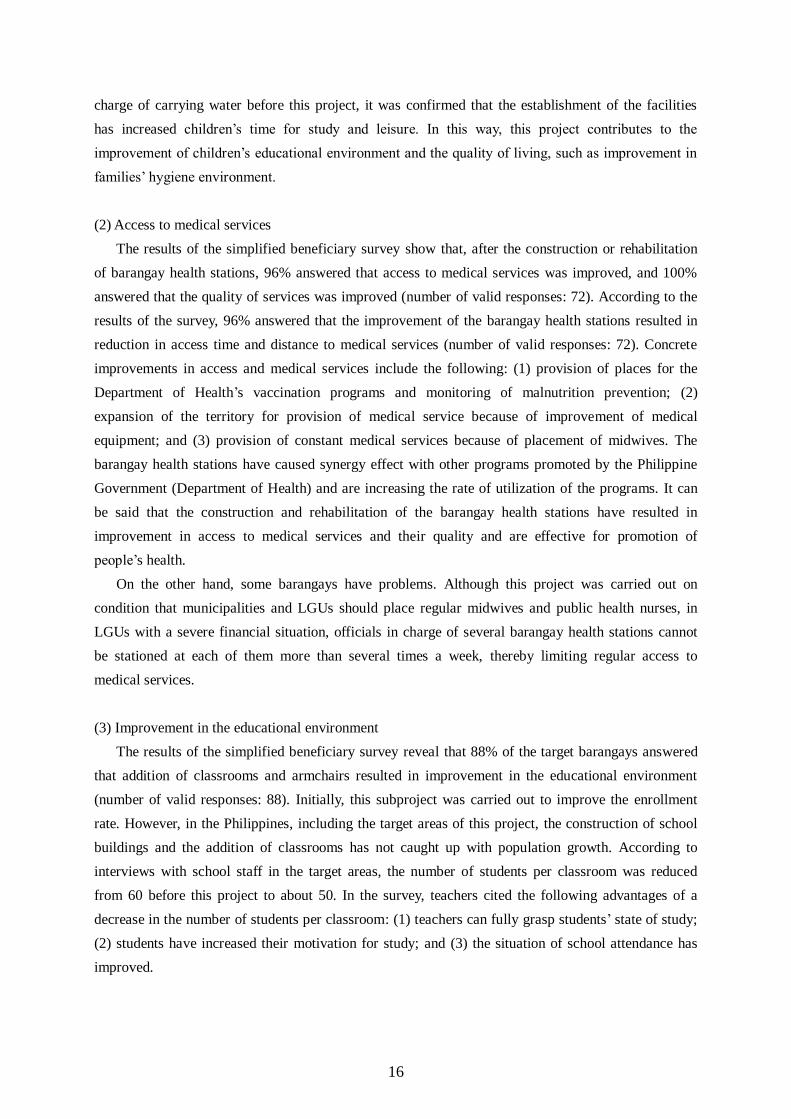
(2) Access to medical services
The results of the simplified beneficiary survey show that, after the construction or rehabilitation
of barangay health stations, 96% answered that access to medical services was improved, and 100%
answered that the quality of services was improved (number of valid responses: 72). According to the
results of the survey, 96% answered that the improvement of the barangay health stations resulted in
reduction in access time and distance to medical services (number of valid responses: 72). Concrete
improvements in access and medical services include the following: (1) provision of places for the
Department of Health’s vaccination programs and monitoring of malnutrition prevention; (2)
expansion of the territory for provision of medical service because of improvement of medical
equipment; and (3) provision of constant medical services because of placement of midwives. The
barangay health stations have caused synergy effect with other programs promoted by the Philippine
Government (Department of Health) and are increasing the rate of utilization of the programs. It can
be said that the construction and rehabilitation of the barangay health stations have resulted in
improvement in access to medical services and their quality and are effective for promotion of
people’s health.
On the other hand, some barangays have problems. Although this project was carried out on
condition that municipalities and LGUs should place regular midwives and public health nurses, in
LGUs with a severe financial situation, officials in charge of several barangay health stations cannot
be stationed at each of them more than several times a week, thereby limiting regular access to
medical services.
(3) Improvement in the educational environment
The results of the simplified beneficiary survey reveal that 88% of the target barangays answered
that addition of classrooms and armchairs resulted in improvement in the educational environment
(number of valid responses: 88). Initially, this subproject was carried out to improve the enrollment
rate. However, in the Philippines, including the target areas of this project, the construction of school
buildings and the addition of classrooms has not caught up with population growth. According to
interviews with school staff in the target areas, the number of students per classroom was reduced
from 60 before this project to about 50. In the survey, teachers cited the following advantages of a
decrease in the number of students per classroom: (1) teachers can fully grasp students’ state of study;
(2) students have increased their motivation for study; and (3) the situation of school attendance has
improved.

17
However, even after the implementation of this project, the number of students per classroom has
not reached the number recommended by the Department of Education (45 students in one classroom).
Although all the schools were required to add classrooms in the four target barangays where the field
survey was carried out, it can be said that this project contributed to preventing the deterioration of the
educational environment.
3.3 Impact
3.3.1 Intended Impacts
(1) Farm households’ annual average total income
As shown in the section on effectiveness, as a result of examination of farm households’ annual
average income from three information sources, an increase in the total income can be recognized.
(2) Changes in the living environment and the local economy as a result of construction of farm to
market road
According to the results of the simplified beneficiary survey and the beneficiary survey, the
construction of farm to market road led to the activation of economic activities, including agriculture,
the convenience of life, and the improvement of quality – concretely, (1) reduction in the
transportation cost and time (opportunity cost) of farm products; (2) expansion of the planted area of
farm products and an increase in the production volume as a result of improvement in market access
and securing of markets; (3) traders’ advance into barangays as a result of improvement in access and
the rise of a farm price; (4) an increase in job opportunities (peddling, retailing, farming, etc.) as a
result of activation of economic activities, and an increase in retailing sales as a result of improvement
in purchasing power26
; and (5) an increase in the number of private companies, public works, and
assistance services as a result of improvement in access to barangays through the construction of
roads.
It should be noted that, because of the development of infrastructures and the activation of local
economic activities in the barangays, the number of people who moved in from other areas exceeded
the number of those who moved out to other areas, resulting in an increase in the population (field
26 The results of the surveys and the beneficiary survey in the above-mentioned four barangays have also confirmed that improvement in purchasing power led to an increase in the number of small grocery stores, which are called “Sari-Sari Stores” by people, and their sales.
Figure 3: Barangay Health Station in Kinura, Bukidnon
Figure 4: Classroom and Armchair, Kuya, Bukidnon

18
survey). This caused the following: (1) an increase in the amount of internal revenue allowance
granted from the central government (the Department of Budget and Management) to the barangay
LGUs; (2) an increase in the amount of taxes to the barangay LGUs as a result of an increase in
household incomes; (3) as a result of (1) and (2), an increase in development project funds in the
barangay LGUs; and (4) as a result of (3), improvement in the governance capacity (provision of
public services and security) of the barangay LGUs.
Accordingly, it is fair to say that this project has contributed not only to economic effects, such as
improvement in household incomes, but also to improvement in living convenience as a result of
improvement in mobility, activation of local economic activities, and improvement in the quality of
life, and has produced synergy effect in social and political aspects both inside and outside of the
barangays.
According to interviews with DAR and LGUs, many of the project target areas were hideaways for
communist guerillas. The New Peoples Army (NPA), a communist guerilla group,27
established a base
in a mountainous area and recruited soldiers and supporters from among the inhabitants. Because of
the security problem, the government’s provision of public investments and services was limited, and
the inhabitants increased their dependence on the NPA. After this project, the development of roads
resulted in improvement in access to barangays, strengthening of the connection between isolated poor
areas and outside society, and activation of economic activities. This decreased the inhabitants’
dependence on the guerilla army and greatly contributed to the stability of people’s livelihoods. In this
sense, this project’s contribution to social and political stability can be recognized.
BOX 1: Effect of Construction of Farm to Market Road and Bridge
In most of the target areas of this project, the largest factor for hindrance of agricultural development
lies in reduction of the time and cost of transportation of farm products. The target farm households
produced, transported, and sold main farm products, such as rice and sugarcane, to gain cash
necessary for a minimum level of living. This is because, even if they increase production volume,
transportation cost is considerable. Given the geographical features of the target areas, an increase in
the production volume of main farm products requires not only the fulfillment of the conditions for
production, such as the securing of farmland, agricultural water, and agricultural technology, but also
the improvement of physical market access and the expansion of sales channels. Because the
Department of Agrarian Reform, the executing agency, paid attention to this point and effectively
selected target areas, the beneficiaries became able to expand sales channels, which enhanced their
motivations for increasing production. The construction of farm to market road and bridge contributed
to the development of value chains of farm products, in terms of not only the development of
production, but also the development of physical market access and sales channels.
27 In 1969, the New Peoples Army (NPA) was formed by communist forces in the Philippines to organize a revolution and change the regime under Maoism in barangays in the central part of Luzon Island. NPA has carried out activities all over the country, has repeated armed attacks against the armed forces, the police, infrastructures, and private companies in the
Philippines, and has collected “revolution tax” even from farmers in poor rural areas. At the time of the ex-post evaluation (in May 2013), preliminary peace negotiations had been conducted repeatedly between the Philippine Government and the National Democratic Front, the political arm of NPA.

19
(3) Value added by post-harvest facilities28
According to the results of the simplified beneficiary survey, 45% of the target barangays (67
barangays) answered that post-harvest facilities are “good enough.” According to the results of the
beneficiary survey, which covered four barangays, the number of users was limited to 37% (45) of the
target farmers (122). Interviews with beneficiaries confirmed that the users of the facilities are limited
to farmers around the facilities. The interviews with the users also confirmed that the facilities were
effective for securing rice for self-consumption and for gaining cash from rice in case of emergency to
respond to crisis.
(4) Hygiene and health conditions
According to the results of the simplified beneficiary survey, 80% of the target barangays where
supply systems were constructed in this project answered that water-borne diseases decreased.
According to interviews with beneficiaries, this decrease in water-borne diseases has led to reduction
in medical expenses and improvement in labor productivity. Of the target barangays, 93% answered
that living conditions “improved” as a result of the construction of the facilities. This result indicates a
positive impact of the construction of the water supply systems on hygiene and health conditions.
3.3.2 Other Impacts
At the appraisal, environmental impact was not expected through this project. It was planned that
the Environment Compliance Certificate or the Certificate of Non-Coverage would be issued for
infrastructure related sub-projects according to the JBIC Environmental Guidelines for ODA Loans
(October 1999). In practice, necessary certificates were issued. During the project period and also even
after the completion of the Project, environmental monitoring has been carried out. The results show
that the natural environment received no negative impact. During the project period, there was no
problem about land acquisition and resettlement.
This project has largely achieved its objective. Therefore, its effectiveness and impact are high.
3.4 Efficiency (Rating: ②)
3.4.1 Project Outputs
(1) Review of plan29
The unit and indicator of the quantity of each component at the appraisal in 2001 were corrected
according to the settlement area development plan and the project investment plan revised in 2004
28 Concreted level land (facilities) where harvested paddy rice is dried. If there are no such facilities, paddy rice is usually dried on roads. However, because impurities are mixed with paddy rice, the selling price drops. 29 The final right to select subprojects was held by the Project Coordination Committee established in the head office of the DAR. The selection procedure is as follows: each target area consulted with the residents, the local government, and relevant organizations based on the local government’s development plan, revised the existing the settlement area development plan, and submitted it to the Project Coordination Committee through the DAR’s settlement area office (at a municipality level), together with a short-list of project that showed the order of priority. The list included the following: (1) profiles of barangays,
municipalities, and settlement areas; (2) the short-list for subprojects; (3) written approval of the state and central project management offices; and (4) written approval for the settlement area development plan. In July 2004, the plan, which included revised planned values, was submitted to JICA after approval by the Project Coordination Committee.
20
after the beginning of this project (Table 6). The main reasons for the revision of the plan are the
following: (1) if the operation and effect indicators set at the time of the appraisal are used, it was
difficult to measure the achievement of each component; (2) the estimates prepared by DAR before the
appraisal were rough; (3) the residents’ and the LGUs’ needs and the order of priority for the
subprojects were changed; and (4) no technical feasibility study was carried out at the time of the
appraisal. However, the unit and indicator of the quantity of subprojects were corrected without any
change in the target barangays. Although there was no great change in main project components and
scope, a multipurpose pavement was added (which was also used as post-harvest facilities).
Given that this project aims for the residents’ poverty reduction based on the participatory
approach, it was appropriate to formulate a detailed plan and change and realize the plan through
another consultation with residents and DAR in the target areas after the beginning of this project.
Moreover, it can be said that the changes in quantities and indicators to grasp the achievement
concretely were necessary for managing this project appropriately.

21
Table 6: Project Output (Plan and Actual)
Source: DAR
(2) The responsible agency of each component
When the project was carried out, DAR served as the “executing agency,” while the Department of
Public Works and Highway (DPWH), the National Irrigation Administration (NIA), and local
government unit (LGU) took change of infrastructure development as collaborating agencies.30
The
NIA constructed and repaired small irrigation and drainage facilities and organizationally developed
and strengthened post-harvest facilities and IA. The DPWH constructed and repaired farm to market
road and bridge and classrooms. The LGUs that have jurisdiction over the target areas took charge of
30 In addition, the following agencies were to participate in this project: the Department of Education, Culture and Sport; the Department of Agriculture; the Department of Health; the Department of Environment and Natural Resources; and the Department of Interior and Local Government.
Sub-Project Unit
Plan at the
Appraisal in
2001
Plan at the in-
depth survey in
2004
Actual
Achievement
(Before revision)
(%)
Achievement
(After revision)
(%)
1) Farm to Market Road and Bridge
Road: No of sub-project No of site 94 119 113 120 95
Road: km km NA 313 354 NA 113
Bridges: No of subproject No of site 6 34 55 917 162
Bridges: lm lm NA 1,587 1,749 NA 110
2) Water Supply System (Level 1&2)No of sub-project No of site 61 41 39 64 95
3) Irrigation Facilities
Communal Irrigation: No of sub-project No of site 6 16 27 450 169
Communal Irrigation: Areas ha NA 1,717 2,732 NA 159
4) Baranagay Health Station
No of sub-project No of site 52 89 96 185 108
5) Multipurpose Building No of site 12 16 20 167 125
6) Postharvest Facilities: No of subproject No of site 77 74 111 144 150
7) School (Classroom)
No of sub-project No of site 142 142 218 154 154
No of classroom No of classroom NA 405 632 NA 156
8) Multipurpose Pavement and Postharvest Facilities No of site NA 91 91 NA 100
Total 450 622 770 NA NA
1) Capacity Building for POs and Farmers No of Pos NA
No of POs trained (gross) Person NA 587 1,792 NA 305
No of Farmer Para-technicians trained (gross) Person NA 246 290 NA 118
Nof Farmers trained (gross) 44,251 72,193 NA 163
Project Management Units trained Unit NA 26 26 NA 100
Individuals trained Person NA 1,662 4,599 NA 277
1) Reforestation: No of subproject No of site 26 26 10 38 38
2) Agro-forestry: No of subproject No of site NA 65 10 NA 15
3) Fruits-tree plantation: No of subproject No of site NA 64 27 NA 42
4) Demonstration Farm: No of subproject No of site NA 66 100 NA 152
5) Community Nursery: No of subproject No of site NA 8 10 NA 125
6) Livestock Development: No of subproject No of site 8 62 59 738 95
1) Office Equipment of PMU No of site 8 11 11 138 100
2) Office Equipment of the Settlement Management Unit No of site NA 16 16 NA 100
3) Equipment of the Settlement Management Unit No of site NA 16 16 NA 100
4) School Armchair Unit NA 18,225 24,750 NA 136
5) Medical Equipment No of site NA 89 94 NA 106
6) O&M Equipment of LGU No of site NA 16 16 NA 100
(5) Consulting Service (Man/Month: M/M)
1) Foreign Consultant M/M 200 184 152.8 76 83
2) Local Consultant M/M 480 468 540.57 113 116
(2) Institutional Development
2) Capacity Building for Project Implementers (DAR, related agencies, LGUs, others)
(3) Agricultural and Environmental Development
(4) Procurement of Equipment
(1) Infrastructure Development

22
the construction of water supply systems and multipurpose buildings. Training for the organizational
development and strengthening of cooperatives and water user’s associations, both of which are POs,
were held by local NGOs under commission from the DAR. Agricultural and environmental
development was planned and carried out jointly by NGOs and LGUs. When this project was carried
out, each DAR project management office31
tried to improve the efficiency of the operations carried
out in cooperation with various relevant organizations.
(3) Output of each component
1) Infrastructure development
Table 6 shows the outputs and results of the infrastructure development components based on the
detailed plan at the time of the appraisal and after revision. They can be outlined as follows: For
concrete effects (results), see the section on effectiveness.
Construction of farm to market road and bridge: Compared with the revised plan, the roads show an
achievement of 95% in terms of the number of subprojects and an achievement of 113% in terms of
distance. The bridges show an achievement of 162% in terms of the number of subprojects and an
achievement of 110% in terms of distance. The number of road sites decreased because of the
following: (1) the necessary documents were not fully submitted by the executing agencies of
subprojects; (2) the selection criteria were not fulfilled based on the results of the feasibility study
of this project; (3) the cost exceeded the fixed maximum; and (4) the amount of cost shared by
LGUs was not provided. On the other hand, the total distance increased in response to beneficiaries’
demands, and the resultant increments were covered by a cost reduction through a decrease in the
number of sites unless this influenced other projects. The number of subprojects for bridges and the
total distance increased because beneficiaries’ needs were high, feasibility was secured, and the
criteria for selecting subprojects, such as LGUs’ sharing of costs, were fulfilled.
Water supply systems: Compared with the revised plan, an achievement of 95% was confirmed.
This is because, as a result of a geo resistivity test at the time of detailed design, the water source
was found to be insufficient at two sites, with the result that the implementation of the subprojects
was discontinued.
Irrigation facilities: Compared with the revised plan, achievement rate reached 169% in terms of the
number of subprojects and 159% in terms of irrigation area. The reason is as follows: when NIA
made the detailed design, shallow tube well irrigation was changed to inexpensive surface irrigation
in view of technical feasibility and efficiency, resulting in cost reduction and distribution among a
greater number of sites.
School (classroom): Compared with the revised plan, an achievement of 154% was confirmed. At
the time of planning, Agusan del Sur was not covered by this project because it was a target area of
another JICA education related project. In 2006, however, because the province was excluded from
31 To carry out this project, the Central Project Management Office was established in the head office of the Department of Agrarian Reform, while the Regional Project management Offices, the Provincial Project Management Office, and the Settlement Management Unit were established at each administrative level.

23
the target areas of the other project, the provincial government requested the DAR for support.
Because effect was expected to emerge, the Central Project Management Office added the province
to the target areas of this project.
Multipurpose pavement (used also as post-harvest facilities): Although their construction was not
included in the original plan, because the beneficiaries’ additional request for the construction was
great, the Project Coordination Committee approved the construction.
Barangay health stations, multipurpose buildings, post-harvest facilities: Compared with the revised
plan, the achievement rate was 108% for barangay health stations and 125% for multipurpose
buildings. They were constructed because residents’ needs were higher than at the time of planning,
and effect could be expected to emerge.
2) Organization and capacity building
For organization and capacity building in this project, the following were planned and carried out:
(1) organizing and strengthening of POs (IA, water user’s associations, cooperatives); (2) capacity
building of farmer-paratechnicians; (3) capacity building of farmers; (4) capacity building of project
management offices; and (5) preparations for a sustainability plan and construction of a monitoring
system (Table 6 shows the plan and results of organization development based on the detailed plans at
the time of the appraisal and after revision).
(1) to (3) above were entrusted to NGOs,32
except for IA. The agency in charge of IAs was the
NIA, whose scope of work ranges from design of irrigation to organization development. The training
periods were one to five days, depending on the contents of training. Main contents were as follows:
(1) conduct of the baseline survey; (2) identification of the PO as the executing agency of each
subproject; (3) identification of beneficiaries of agricultural and environmental development
components; and (4) capacity building for operation management (organizational, technical, and
financial) of both components of infrastructure development and agricultural and environmental
development.33
The total numbers of the POs, farmers, and farmer-paratechnicians that received training by the
end of this project were 1,792, 72,193, and 290, respectively. Compared with the revised plan, the
achievement rates are 305%, 118%, and 163%, respectively. Although the initial plan was to use
existing POs, the number of those that need training increased because there were few functional POs
and therefore it was necessary to form organizations. An increase in the number of subprojects was
also a factor for an increase in the number of those that needed training. With regard to training
farmer-paratechnicians, although the initial plan was to train farmers as paratechnicians to supplement
lack of LGUs’ agricultural extension workers, agricultural extension workers were included in
32 NGOs were selected for each settlement area by the bidding committee established in a Regional or Provincial Project Management Office under Republic Act No. 9148 of the Philippines (Procurement Guidelines Law). As a result, eight NGOs were placed in eight settlement areas. A two-year contract was concluded first, and the renewal of a contract was decided according to the Central and Provincial Project Management Offices’ capability evaluation of NGOs and the status of
achievements. 33 Agricultural and environmental development was partially entrusted to universities and other government-related organizations.
24
participants at the request of the LGUs. Consequently, the numbers of POs and farmers became far
greater than planned.
The interviews with the LGUs and the beneficiaries demonstrated that they were highly satisfied
with NGOs’ project support (social preparation of residents, POs, and preparation of necessary
documents). However, some of the POs and farmers participating in the training had problems at the
time of the ex-post evaluation, such as lack of the ability to manage water supply systems and the
sustainability of application of agricultural technology. This seems to have been caused by lack of
practical lectures and monitoring, because most of the training sessions lasted for only several days.
Next, training of Project Management Offices at each of the central, regional, provincial, and
municipal levels was held by the Central Project Management Office and consultant staff. The
contents of the training included the following: (1) orientation to this project; (2) management of this
project (implementation system, procedure, financial management); (3) technical training (agricultural
technology, water supply, organization development, and water quality inspection); and (4)
formulation of a sustainability plan after the end of the project. The ratio against the revised plan for
the training participants was 227%. This is because the number of staff of the Project Management
Offices increased as a result of increases in the number of subprojects and the number of beneficiaries.
The DAR’s provincial office and the LGU’s staff said that they became able to acquire knowledge and
technical skill in the implementation and management of this project through the series of training
sessions, resulting in the smooth implementation of this project and construction of a monitoring
system after completion.
3) Agricultural and environmental development
The number of subprojects for agricultural and environmental development was 291 in the revised
plan and 216 in reality, making the ratio against the plan 74%. Main reasons include the following: (1)
subprojects that were highly needed initially were already carried out by other agencies because of a
delay in the start; (2) the beneficiaries’ interests changed because of the delay; (3) the farmland where
development of demonstration farms was planned were used for cultivation of other farm products; (4)
POs’ cost sharing that was prescribed in the operation manual was not secured; and (5) LGUs’ cost
sharing and technical support were secured. In this way, it can be confirmed that the delay in starting
the project influenced the production of outputs.
Farm forestry and reforestation in particular achieved lower results than the revised plan (ratio
against plan: farm forestry, 15%; reforestation, 38%). According to the DAR, main reasons include the
following: (1) settlement areas became private land, and public land where many trees could be
planted was limited; (2) access to public land was geographically difficult and greatly increased the
cost; and (3) the area of farm households’ land was limited and farm households were not interested in
reforestation or farm forestry that did not produce profits soon. To cope with these factors, seeds and
saplings were distributed to applicants free of charge and the “Green Earth Project,” whose purpose is
to plant trees in vacant lots in schools, was carried out in cooperation with schools in settlement

25
areas.34
This project was commended as a good example of sustainable development strategy by the
National Economic and Development Authority, which is in charge of coordinating with donors for
official development assistance. The beneficiary survey has also confirmed that this subproject had the
effect of preventing soil flowage (89% of valid responses) and the effect on environmental
conservation (96% of valid responses).
4) Procurement of equipment
Based on the needs of both the central and local offices of the DAR, vehicles, motorbikes, video
equipment, and office furniture were provided to the Project Management Offices at the regional,
provincial, and municipal levels according to plan to carry out and manage this project. The ratio
against the revised plan is 100%. With regard to other equipment, the ratio is 106% for the provision
of medical equipment to the barangay health stations in the target barangays and 134% for the
provision of armchairs to schools. This is because of an increase in the number of subprojects.
Although provision of equipment for operation and maintenance (O&M) to the LGUs was not
planned initially, it was decided to be provided so that the LGUs could continue to maintain the roads
and the bridges after the end of this project. The ratio against the revised plan is 100%.
5) Consulting service
With regard to consulting service, the following were planned and carried out: (1) support for
project management; (2) support for infrastructure development; (3) support for organization
development; (4) support for agricultural and environmental development; (5) support for procurement
of equipment; (6) support for environmental monitoring; and (7) provision of training to government
officials. However, because of a delay in starting the project and an extension of the project period (for
the reasons, see the next section), it became necessary to extend the service period accordingly. To
minimize an increase in the cost caused by the extension of the project period, it was decided that, to
provide necessary services, the amount of business of foreign consultants, whose unit cost is high,
would be reduced, while that of local consultants would be increased (the ratio against the revised
plan: foreign consultants, 83%; local consultants, 116%). According to the results of the questionnaires
to the DAR, the consultants were highly evaluated and rated 4 or more on a 5-point scale in all support
fields. This is because they flexibly dealt with the implementation and management in order to
eliminate a delay at the beginning.
3.4.2 Project Inputs
3.4.2.1. Project Cost
The total project cost was 8,687 million yen (including a Japanese ODA loan of 6,515 million yen)
34 With the cooperation of the principal, the pupils or students of each school planted six nursery trees distributed free of
charge (four trees and two fruit trees). The cost was shared for the pupils or students’ preparations for a forestation site,
forestation, and daily maintenance. The pupils or students were expected to serve as guards. The Department of Education
participated in the planning, preparation, and implementation of the program, and LGU selected forestation sites and
produced and distributed seeds and saplings of trees.

26
at the time of the appraisal, while the actual cost was 6,872 million yen (including a Japanese ODA
loan of 5,791 million yen). The ratio against the plan was 79%. A decrease in the cost was mainly
because of exchange gains (appreciation of Japanese yen).35
On the other hand, the total project cost
increased slightly (2.06%) in terms of pesos. During the four years between 2003 and 2007 especially,
because domestic currency occupied 95% of the total project cost, the project cost was influenced by a
slightly higher price increase than expected, and it can be said that the project cost as a whole was
almost appropriate.
Compared with the plan at the time of the appraisal, the portions of the project cost related to
organizational development, equipment procurement, and consulting service was almost in accordance
with the plan; and those related to infrastructure development and agricultural and environment
development were lower than planned. This is because (1) the number of subprojects for infrastructure
development decreased as a result of the feasibility study; (2) some subprojects were carried out by
LGU at lower costs; and (3) the cost decreased as a result of decrease in the number of subprojects for
agricultural and environmental development. The farm to market road and the classrooms in particular
were planned to be carried out by the DPWH. In the Province of Bukidnon (36 barangays) and the
Province of Agusan del Sur (27 barangays), because there were many target barangays and subprojects,
and human resources in DPWH were insufficient because of “Tulay ng Pangulo” (a priority project
led by the Office of the President), there was a delay in carrying out this project. To cope with this, the
Project Management Offices assessed the LGUs’ technical levels and concluded agreements with those
LGUs judged to be able to carry out this project. The LGUs directly carried out construction work.
Because the LGUs’ construction expenses were lower than the DPWH’s, they contributed to cost
reduction.
3.4.2.2 Project Period
At the time of the appraisal, the project period was scheduled for 76 months between March 30,
2001 and June 30, 2007. Actually, it was 101 months between March 30, 2001 and September 25,
2009, and the ratio against the plan was 133%, far greater than the plan. This is caused by a delay in
the procurement of consulting service. Concretely, because, when consulting service was procured, the
amount proposed by the primarily selected consultant exceeded the expected maximum amount, it
took time to examine whether the DAR was appropriate to serve as the contract partner under
domestic laws in the Philippines. Ultimately, negotiations with the primarily selected consultant
proceeded.
As a result, the start of this project was delayed for two years. With regard to infrastructure
development, the project period was scheduled from June 2002 to December 2006 (43 months), but it
actually became longer than planned, from December 2003 to August 2009 (69 months). Main reasons
include the following: (1) in the Province of Agusan del Sur and the Province of Bukidnon, where the
number of subprojects was high, DPWH staff members engaged in this project were insufficient; (2)
35 The exchange rate was 2.8 yen per peso at the time of the appraisal, while the average rate during the project was 2.17 yen per peso.

27
technical appraisal of water supply systems took time; and (3) the Provincial Project Management
Offices were short of infrastructure-related technical staff members.
3.4.3 Internal Rates of Return (IRR)
Although the internal rate of return was calculated at the time of the appraisal, the source of the
data was unknown. At the time of the ex-post evaluation, actual data could not be obtained in the
target sites because the type and cost of subproject differed among the target barangays. Thus no
internal rate of return was calculated or analyzed.
Although the project cost was within the plan, the project period was exceeded, therefore
efficiency of the project is fair.
3.5 Sustainability (Rating: ②)
3.5.1 Structural Aspects of Operation and Maintenance
At the time of the appraisal, it was agreed that, under the Local Government Code 1991, the
operation and maintenance of the facilities constructed in this project were to be carried out by the
following: (1) farm to market road and bridge by LGUs (municipality); (2) irrigation facilities by IAs;
(3) post-harvest facilities by cooperatives; (4) water systems by water user’s associations; (5) barangay
health stations and multipurpose buildings by municipality LGUs; (6) school classrooms and
incidental equipment by municipality LGUs; (7) nursery and demonstration farms by municipality
LGUs; and (8) livestock revolving fund by cooperatives and POs. The DAR, the executing agency for
this project, was to monitor maintenance. With regard to the duties related to the maintenance of the
facilities developed in this project, agreements were concluded with the agencies and organization in
charge before the completion of this project, and the duties were officially transferred to the
above-mentioned agencies and organizations in charge of operation and maintenance. The facilities
have been maintained according to the “sustainability plan” prepared by LGUs before the completion
of this project. According to the results of a questionnaire survey on the beneficiaries and interviews
with stakeholders, the operation and maintenance of the facilities constructed in this project have been
basically carried out according to plan (Table 7).

28
Table 7: Current Condition of the Operation and Maintenance System
(At the Time of the Ex-Post Evaluation)
Facilities Operation and maintenance
agency/organization * Role
Farm to market
road/bridge LGU (municipality)
Regular inspection of constructed roads,
cleaning, repair
Irrigation facilities Irrigation association (IA), members
(pump-style)
Collection of water charges (NIA),
cleaning, repair
Post-harvest
facilities IA, cooperative, PO, barangay/LGU Collection of charges, repair, cleaning
Water supply
systems
Water user’s association, LGUs
(there are also cases of joint
management)
Collection of water charges,
management of water supply systems,
repair
Barangay health
stations
LGUs and, if necessary, Dept. of
Health
Dispatch of midwives and health
volunteers, payment of electricity/water
charges for facilities, repair, collection of
expenses for childbirth (usage fees)
(Elementary/junior
high) school
classroom/
incidental equipment
School, LGU (municipality), Dept. of
Education, Parent-Teachers
Association (PTA), etc.
Regular inspection of classrooms, repair
Multipurpose
building LGU, DAR, IA Collection of usage fees, repair
Nursery,
demonstration firm LGU (municipality)
Production of seeds and saplings,
distribution of caretaker’s personnel cost
Livestock extension
service
Municipality/barangay LGUs,
cooperative, PO
Management of revolving scheme (grasp
of number of distributed livestock and
health condition)
Source: Questionnaire survey on DAR; beneficiary survey (November, 2012); simplified beneficiary survey (December,
2012)
LGUs’ maintenance systems and commitment in particular determine the condition of maintenance
after transfer. In this project, from the stage of preparations, the settlement area development plan was
formulated together with LGUs of representative residents. After the beginning of this project also, the
detailed plan and the list of subprojects were formulated. During the project period, settlement area
management offices were established at the municipality level and regular management of this project
was carried out among the DAR, the related agencies, the heads of the LGUs, the responsible officers
of relevant departments, and commissioned NGOs. When this project was completed and the
maintenance of the facilities was transferred, the “sustainability plan” was attached to the written
agreement to formulate the LGUs’ maintenance liability. The four municipalities covered by the field
survey at the time of the ex-post evaluation have maintained the commitment to the maintenance of
the infrastructure facilities provided through this project and included road maintenance expenses in
their annual investment plans. In Prosperidad in the Province of Agusan del Sur, the municipality LGU
specified how to use roads36
and enacted an ordinance that authorizes the Barangay Council (barangay
level of LGU) to collect a penalty from a violating vehicle and allot it for maintenance. In the places
36 Such as prohibition against running of vehicles with a volume that exceeds a certain standard after a flood.
29
covered by the field survey, it was confirmed that monitoring and budget allocation under the LGUs’
maintenance systems has successfully maintained facilities and roads.
On the other hand, the results of the field survey revealed that there are technical and financial
problems in some irrigation or water supply systems which have been managed by POs after transfer
(for details, see the next section). Because the POs that are operating and maintaining these facilities
participated in the training for strengthening the maintenance capacity during the project period, it was
assumed that they acquired full capacity after the transfer. However, since practical techniques will be
acquired through the operation of the facilities after completion, it is necessary to strengthen the
monitoring and support systems, including the LGUs.
With regard to the barangays covered by the agricultural technology support and the livestock
revolving fund scheme, agricultural extension workers belonging to each LGU (municipality) will give
technical support and carry out monitoring, regularly visiting the barangays under their charge.
However, some LGUs cannot provide full extension services to the residents because of lack of
agricultural extension workers and transportation expenses. Agricultural extension was decentralized
to LGUs, because personnel distribution (by area of expertise; number of staff members) and budget
allocation to extension services differ according to the policy of the head of each LGU.
Although the duties of operation and maintenance have been transferred to the executing agencies
and organizations, under the leadership of the DAR’s Foreign Assisted Projects Office, the joint survey
team that consists of DAR’s regional and provincial offices, POs, the Commission on Audit, the
National Economic and Development Authority, and LGUs carries out a “Sustainability Monitoring
and Evaluation Study”37
once a year to grasp the status of operation and maintenance of the
infrastructure facilities developed by official development assistance. In this project, among the 770
subprojects (limited to those related to infrastructures), the survey covered six municipalities and 82
subprojects in 2011 and seven municipalities and 110 subprojects in 2012 (for the results of the survey,
see “Status of Operation and Maintenance”). Therefore, no major problems have been observed in the
operation and maintenance system.
3.5.2 Technical Aspects of Operation and Maintenance
According to interviews with DAR and relevant agencies and questionnaire surveys on POs, the
LGUs and POs in charge of the operation and maintenance of the facilities developed by this project
have basic skills in daily necessary maintenance. Table 8 below shows the current technical status of
the operation and maintenance of each facility.
37 The survey includes the following: (1) physical aspect (physical status of infrastructures); (2) functional aspect (frequency of use and function); (3) social aspect (water associations and other POs’ operation and maintenance system, local
governments’ allocation of operation and maintenance expenses and support, rules and guidelines on operation and management). Weighting of rating is 30% for the physical aspect, 40% for the functional aspect, and 30% for the social aspect. The evaluation is quantitative and qualitative. For the strengthening of monitoring, see “Recommendations.”
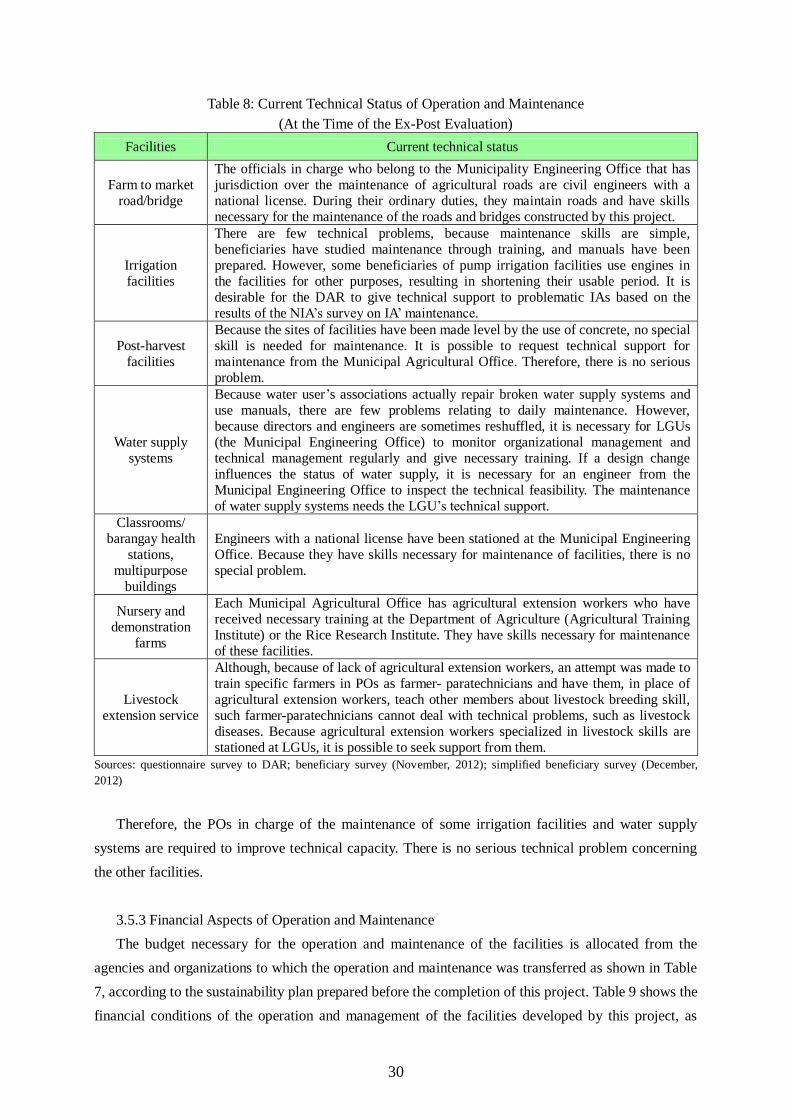
30
Table 8: Current Technical Status of Operation and Maintenance
(At the Time of the Ex-Post Evaluation)
Facilities Current technical status
Farm to market
road/bridge
The officials in charge who belong to the Municipality Engineering Office that has
jurisdiction over the maintenance of agricultural roads are civil engineers with a
national license. During their ordinary duties, they maintain roads and have skills
necessary for the maintenance of the roads and bridges constructed by this project.
Irrigation
facilities
There are few technical problems, because maintenance skills are simple,
beneficiaries have studied maintenance through training, and manuals have been
prepared. However, some beneficiaries of pump irrigation facilities use engines in
the facilities for other purposes, resulting in shortening their usable period. It is
desirable for the DAR to give technical support to problematic IAs based on the
results of the NIA’s survey on IA’ maintenance.
Post-harvest
facilities
Because the sites of facilities have been made level by the use of concrete, no special
skill is needed for maintenance. It is possible to request technical support for
maintenance from the Municipal Agricultural Office. Therefore, there is no serious
problem.
Water supply
systems
Because water user’s associations actually repair broken water supply systems and
use manuals, there are few problems relating to daily maintenance. However,
because directors and engineers are sometimes reshuffled, it is necessary for LGUs
(the Municipal Engineering Office) to monitor organizational management and
technical management regularly and give necessary training. If a design change
influences the status of water supply, it is necessary for an engineer from the
Municipal Engineering Office to inspect the technical feasibility. The maintenance
of water supply systems needs the LGU’s technical support.
Classrooms/
barangay health
stations,
multipurpose
buildings
Engineers with a national license have been stationed at the Municipal Engineering
Office. Because they have skills necessary for maintenance of facilities, there is no
special problem.
Nursery and
demonstration
farms
Each Municipal Agricultural Office has agricultural extension workers who have
received necessary training at the Department of Agriculture (Agricultural Training
Institute) or the Rice Research Institute. They have skills necessary for maintenance
of these facilities.
Livestock
extension service
Although, because of lack of agricultural extension workers, an attempt was made to
train specific farmers in POs as farmer- paratechnicians and have them, in place of
agricultural extension workers, teach other members about livestock breeding skill,
such farmer-paratechnicians cannot deal with technical problems, such as livestock
diseases. Because agricultural extension workers specialized in livestock skills are
stationed at LGUs, it is possible to seek support from them.
Sources: questionnaire survey to DAR; beneficiary survey (November, 2012); simplified beneficiary survey (December,
2012)
Therefore, the POs in charge of the maintenance of some irrigation facilities and water supply
systems are required to improve technical capacity. There is no serious technical problem concerning
the other facilities.
3.5.3 Financial Aspects of Operation and Maintenance
The budget necessary for the operation and maintenance of the facilities is allocated from the
agencies and organizations to which the operation and maintenance was transferred as shown in Table
7, according to the sustainability plan prepared before the completion of this project. Table 9 shows the
financial conditions of the operation and management of the facilities developed by this project, as
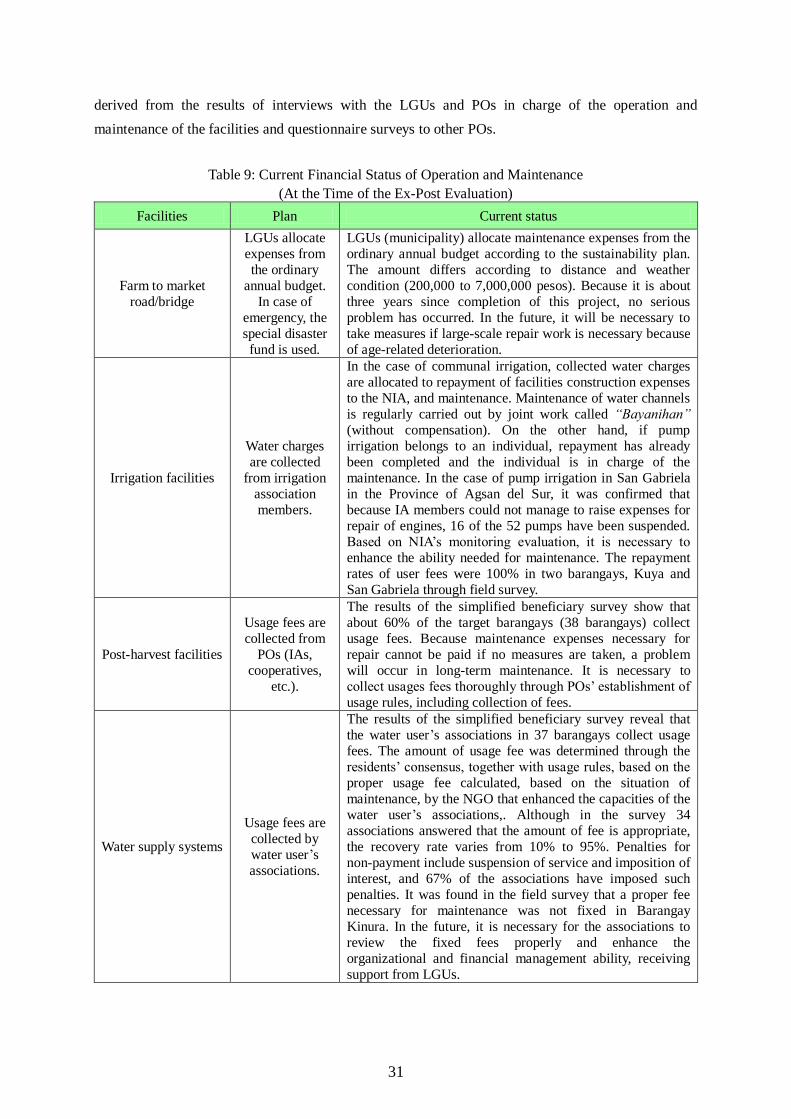
31
derived from the results of interviews with the LGUs and POs in charge of the operation and
maintenance of the facilities and questionnaire surveys to other POs.
Table 9: Current Financial Status of Operation and Maintenance
(At the Time of the Ex-Post Evaluation)
Facilities Plan Current status
Farm to market
road/bridge
LGUs allocate
expenses from
the ordinary
annual budget.
In case of
emergency, the
special disaster
fund is used.
LGUs (municipality) allocate maintenance expenses from the
ordinary annual budget according to the sustainability plan.
The amount differs according to distance and weather
condition (200,000 to 7,000,000 pesos). Because it is about
three years since completion of this project, no serious
problem has occurred. In the future, it will be necessary to
take measures if large-scale repair work is necessary because
of age-related deterioration.
Irrigation facilities
Water charges
are collected
from irrigation
association
members.
In the case of communal irrigation, collected water charges
are allocated to repayment of facilities construction expenses
to the NIA, and maintenance. Maintenance of water channels
is regularly carried out by joint work called “Bayanihan” (without compensation). On the other hand, if pump
irrigation belongs to an individual, repayment has already
been completed and the individual is in charge of the
maintenance. In the case of pump irrigation in San Gabriela
in the Province of Agsan del Sur, it was confirmed that
because IA members could not manage to raise expenses for
repair of engines, 16 of the 52 pumps have been suspended.
Based on NIA’s monitoring evaluation, it is necessary to
enhance the ability needed for maintenance. The repayment
rates of user fees were 100% in two barangays, Kuya and
San Gabriela through field survey.
Post-harvest facilities
Usage fees are
collected from
POs (IAs,
cooperatives,
etc.).
The results of the simplified beneficiary survey show that
about 60% of the target barangays (38 barangays) collect
usage fees. Because maintenance expenses necessary for
repair cannot be paid if no measures are taken, a problem
will occur in long-term maintenance. It is necessary to
collect usages fees thoroughly through POs’ establishment of
usage rules, including collection of fees.
Water supply systems
Usage fees are
collected by
water user’s
associations.
The results of the simplified beneficiary survey reveal that
the water user’s associations in 37 barangays collect usage
fees. The amount of usage fee was determined through the
residents’ consensus, together with usage rules, based on the
proper usage fee calculated, based on the situation of
maintenance, by the NGO that enhanced the capacities of the
water user’s associations,. Although in the survey 34
associations answered that the amount of fee is appropriate,
the recovery rate varies from 10% to 95%. Penalties for
non-payment include suspension of service and imposition of
interest, and 67% of the associations have imposed such
penalties. It was found in the field survey that a proper fee
necessary for maintenance was not fixed in Barangay
Kinura. In the future, it is necessary for the associations to
review the fixed fees properly and enhance the
organizational and financial management ability, receiving
support from LGUs.
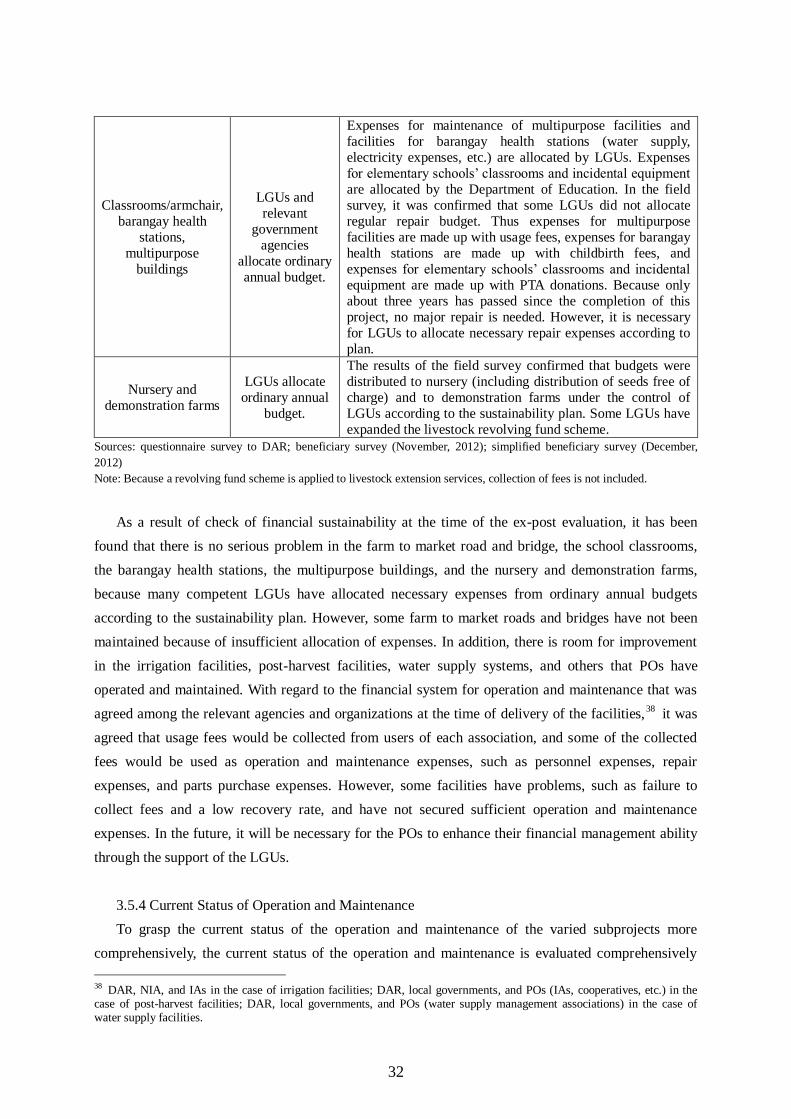
32
Classrooms/armchair,
barangay health
stations,
multipurpose
buildings
LGUs and
relevant
government
agencies
allocate ordinary
annual budget.
Expenses for maintenance of multipurpose facilities and
facilities for barangay health stations (water supply,
electricity expenses, etc.) are allocated by LGUs. Expenses
for elementary schools’ classrooms and incidental equipment
are allocated by the Department of Education. In the field
survey, it was confirmed that some LGUs did not allocate
regular repair budget. Thus expenses for multipurpose
facilities are made up with usage fees, expenses for barangay
health stations are made up with childbirth fees, and
expenses for elementary schools’ classrooms and incidental
equipment are made up with PTA donations. Because only
about three years has passed since the completion of this
project, no major repair is needed. However, it is necessary
for LGUs to allocate necessary repair expenses according to
plan.
Nursery and
demonstration farms
LGUs allocate
ordinary annual
budget.
The results of the field survey confirmed that budgets were
distributed to nursery (including distribution of seeds free of
charge) and to demonstration farms under the control of
LGUs according to the sustainability plan. Some LGUs have
expanded the livestock revolving fund scheme.
Sources: questionnaire survey to DAR; beneficiary survey (November, 2012); simplified beneficiary survey (December,
2012)
Note: Because a revolving fund scheme is applied to livestock extension services, collection of fees is not included.
As a result of check of financial sustainability at the time of the ex-post evaluation, it has been
found that there is no serious problem in the farm to market road and bridge, the school classrooms,
the barangay health stations, the multipurpose buildings, and the nursery and demonstration farms,
because many competent LGUs have allocated necessary expenses from ordinary annual budgets
according to the sustainability plan. However, some farm to market roads and bridges have not been
maintained because of insufficient allocation of expenses. In addition, there is room for improvement
in the irrigation facilities, post-harvest facilities, water supply systems, and others that POs have
operated and maintained. With regard to the financial system for operation and maintenance that was
agreed among the relevant agencies and organizations at the time of delivery of the facilities,38
it was
agreed that usage fees would be collected from users of each association, and some of the collected
fees would be used as operation and maintenance expenses, such as personnel expenses, repair
expenses, and parts purchase expenses. However, some facilities have problems, such as failure to
collect fees and a low recovery rate, and have not secured sufficient operation and maintenance
expenses. In the future, it will be necessary for the POs to enhance their financial management ability
through the support of the LGUs.
3.5.4 Current Status of Operation and Maintenance
To grasp the current status of the operation and maintenance of the varied subprojects more
comprehensively, the current status of the operation and maintenance is evaluated comprehensively
38 DAR, NIA, and IAs in the case of irrigation facilities; DAR, local governments, and POs (IAs, cooperatives, etc.) in the case of post-harvest facilities; DAR, local governments, and POs (water supply management associations) in the case of water supply facilities.

33
based on the following: (1) the results of the already-described “Sustainability Monitoring and
Evaluation Survey” that DAR conducts every year; (2) the results of the simplified beneficiary survey
and the beneficiary survey; and (3) the results of field interviews and the evaluator’s observation.
Table 10 shows the results of the Sustainable Monitoring and Evaluation Survey conducted in 2011
and 2012. The current status of the operation and maintenance of the infrastructure facilities can be
grasped as relative and objective data. Because the target areas differed between 2011 and 2012, the
results of evaluation of each subproject also differed. Generally, however, the current status was
evaluated at the second point, “Fair,” on a four-point scale.
Table 10: Results of Sustainability Monitoring and Evaluation
*Rating: Good: 0-0.99, Fair: 1-2.49, Bad: 2.50-3.49, Seriously Bad: 3.5-4.0
Source: DAR (2012) Foreign-Assisted Projects: Sustainability Monitoring and Evaluation Report: Status of Completed
Physical Infrastructures CY 2011 and CY 2012
Because the results of the survey in 2011 were obtained, they can be shown in detail here. While
classrooms were highly evaluated, farm to market road and water supply systems were somewhat
unfavorably evaluated. This is because of the following: (1) caves-in on the surface of pavement; (2)
growth of plants on road shoulders; and (3) accumulation of sand and fragments on excretory passages.
Because roads differ according to weather conditions and deterioration, it is necessary to allocate
appropriate budget according to the current status of roads. With regard to the water supply systems,
the following problems have arisen: (1) a decrease in the volume of water; (2) non-collection of fees;
and (3) breakdown. Because water supply systems require civil engineering ability and management
ability, the training given during this project is insufficient. Therefore, LGUs’ monitoring and technical
guidance and other support will become necessary in the future.
The results of a survey on beneficiaries’ awareness conducted as a part of the simplified
beneficiary survey are almost the same as the results of the above-described survey by the DAR (Table
11). The degree of beneficiaries’ satisfaction with the current status of maintenance of farm to market
road tends to be relatively low. The answers concerning the degree of satisfaction with the
maintenance of farm to market road are divided into “Satisfactory” and “Unsatisfactory.” The reasons
for the latter include the following: (1) construction was problematic; (2) broken by landslide; and (3)
inappropriate maintenance of roads because of insufficient allocation of expenses by LGUs.
No of subproject Index Rating No of subproject Index Rating
Farm to Market Road and Bridge 36 2.19 Fair 34 1.65 FairIrrigation Facilities 2 1.87 Fair 2 1.98 FairWater Supply Systems 6 2.14 Fair 6 1.75 FairBarangay Health Stations 12 1.52 Fair 21 1.49 FairSchool (Classroom) 20 1.00 Good 34 1.62 FairMulti-purpose Building 7 1.78 Fair 2 1.95 FairPostharvest Facilities 0 NA NA 11 1.64 Fair
Total No of subproject/Average 83 1.75 Fair 110 1.73 Fair
Subproject2011 2012
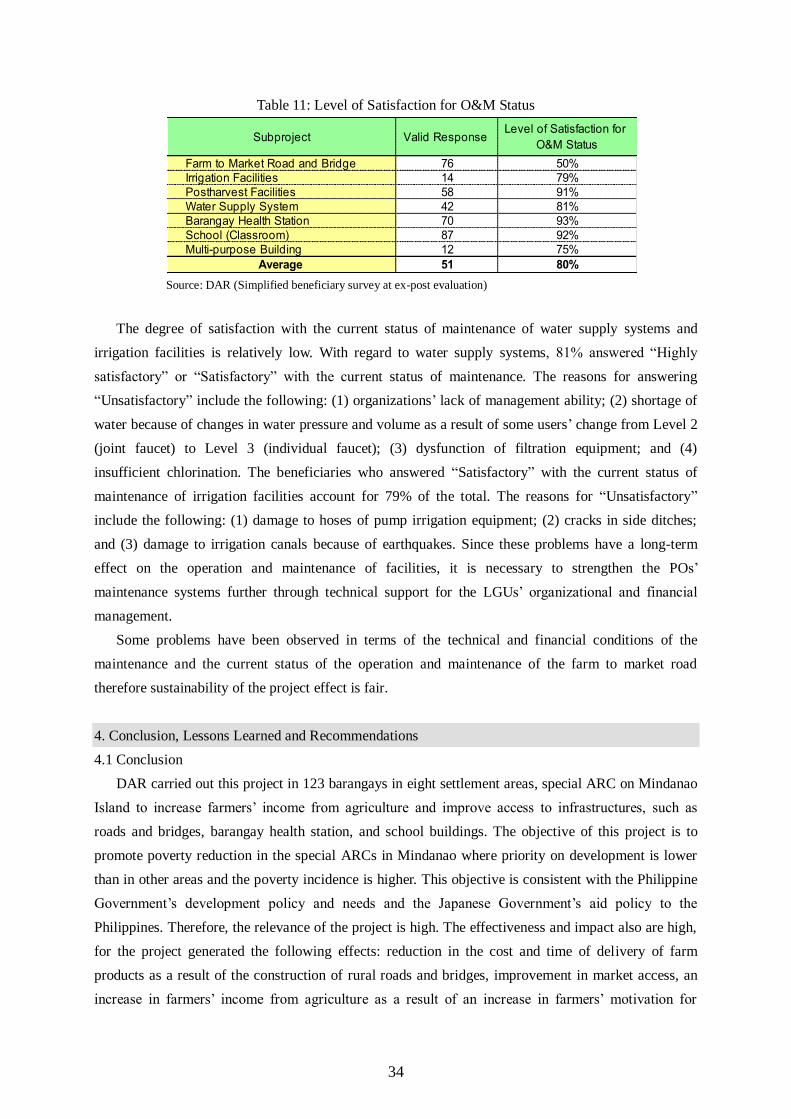
34
Table 11: Level of Satisfaction for O&M Status
Source: DAR (Simplified beneficiary survey at ex-post evaluation)
The degree of satisfaction with the current status of maintenance of water supply systems and
irrigation facilities is relatively low. With regard to water supply systems, 81% answered “Highly
satisfactory” or “Satisfactory” with the current status of maintenance. The reasons for answering
“Unsatisfactory” include the following: (1) organizations’ lack of management ability; (2) shortage of
water because of changes in water pressure and volume as a result of some users’ change from Level 2
(joint faucet) to Level 3 (individual faucet); (3) dysfunction of filtration equipment; and (4)
insufficient chlorination. The beneficiaries who answered “Satisfactory” with the current status of
maintenance of irrigation facilities account for 79% of the total. The reasons for “Unsatisfactory”
include the following: (1) damage to hoses of pump irrigation equipment; (2) cracks in side ditches;
and (3) damage to irrigation canals because of earthquakes. Since these problems have a long-term
effect on the operation and maintenance of facilities, it is necessary to strengthen the POs’
maintenance systems further through technical support for the LGUs’ organizational and financial
management.
Some problems have been observed in terms of the technical and financial conditions of the
maintenance and the current status of the operation and maintenance of the farm to market road
therefore sustainability of the project effect is fair.
4. Conclusion, Lessons Learned and Recommendations
4.1 Conclusion
DAR carried out this project in 123 barangays in eight settlement areas, special ARC on Mindanao
Island to increase farmers’ income from agriculture and improve access to infrastructures, such as
roads and bridges, barangay health station, and school buildings. The objective of this project is to
promote poverty reduction in the special ARCs in Mindanao where priority on development is lower
than in other areas and the poverty incidence is higher. This objective is consistent with the Philippine
Government’s development policy and needs and the Japanese Government’s aid policy to the
Philippines. Therefore, the relevance of the project is high. The effectiveness and impact also are high,
for the project generated the following effects: reduction in the cost and time of delivery of farm
products as a result of the construction of rural roads and bridges, improvement in market access, an
increase in farmers’ income from agriculture as a result of an increase in farmers’ motivation for
Subproject Valid Response Level of Satisfaction for
O&M Status
Farm to Market Road and Bridge 76 50%
Irrigation Facilities 14 79%
Postharvest Facilities 58 91%
Water Supply System 42 81%
Barangay Health Station 70 93%
School (Classroom) 87 92%
Multi-purpose Building 12 75%
Average 51 80%

35
production of farm products, improvement in the access to social infrastructures for public health and
education, improvement in total income and living environment, and revitalization of the local
economy. Although the project cost was far lower than estimated because of a change in the exchange
rate, the efficiency was fair because the project period was longer than planned as a result of a delay in
starting the project. Sustainability in the future is judged to be fair because of minor problems in
technology and finance for management and maintenance. In light of the above, the Project is
evaluated to be satisfactory.
4.2 Recommendations
4.2.1 Recommendations to the Executing Agency
(1) Strengthening of the monitoring system for the whole project
In this project, the “sustainability plan” was prepared to specify the transferee/responsible agency,
period, budget allocation, and activities of each subproject, was attached to the facilities and project
completion report at the time of the completion, and was agreed upon and signed by the DAR and the
LGUs. The attempt to secure the sustainability of the facilities and the project transferred to the LGUs
based on lessons learned from past similar projects in the Philippines is worthy of evaluation.
On the other hand, the maintenance of the subprojects has been carried out by LGUs or POs
according to the “sustainability plan,” but some of the subprojects have technical and financial
problems. Although the DAR has regularly carried out sampling-like sustainability monitoring and
evaluation study on infrastructure facilities only, the number and frequency of surveys are small and
resultant information has not been fully shared among the persons concerned. Therefore, the DAR and
the responsible agencies such as LGUs and POs should strengthen the monitoring system by the
following measures: (1) carrying out regular monitoring according to the “sustainability plan,”
including agricultural and environmental development; (2) arranging problems and issues based on the
results of the monitoring and sharing information with relevant agencies (NIA and DPWH) and LGUs;
and (3) encouraging relevant agencies and LGUs to take necessary measures for maintenance.
(2) Strengthening of the operation and maintenance system for water supply systems
In the Philippines, it has been stipulated that water user’s associations are responsible for
maintaining barangay water supply. In reality, however, this survey also found that water user’s
associations have constraints in their technical and financial capabilities. Practical training was not
included in the operation training held by an NGO during the project period. Therefore, the DAR
should survey the current status of maintenance of the water supply systems developed by this project,
specify the role of LGUs in the facilities with which municipality LGUs are not concerned at all, have
the Municipal Engineering Office monitor facilities and associations regularly, and establish a system
for giving technical advice.
4.2.2 Recommendations to JICA
None
36
4.3 Lessons Learned
(1) Formulation of a strategic plan that produces synergetic effect among subprojects
This project has the following characteristics: the purpose is poverty reduction; the project deals
with development issue in rural society and local diversity; it applies “comprehensive approach” and
“site-specific approach”; and subprojects in various sectors are selected and carried out based on the
needs of beneficiaries and relevant agencies, such as LGUs and government agencies in each sector. In
this project, however, the project approach did not fully produce synergetic effect in some target
barangays. For example, when technical training was held concerning farm products other than main
ones, the introduced agricultural technology was not firmly established, for farm products were not
selected from the viewpoint of marketing, the training period lasted for only one cropping period, and
extension services and market support were insufficient.
To bring about synergetic effect among the subprojects, it is necessary to formulate a more
strategic plan, including not only the beneficiaries’ needs but also the composition of the subprojects,
the implementation process, and the selection of target beneficiaries. For example, even if farm to
market road is constructed and agricultural technology training is provided concerning farm products
other than main ones, in the absence of any market viewpoint or support, this will not lead to an
increase in production volume, sales of farm products outside the area, and an increase in income from
main farm products and others. If individual farmers produce a small quantity of commercial crops,
because they do not have buyers and negotiation capacity/skill that lead to an increase in income, it is
desirable to formulate a strategic plan that provides subprojects that connect production with market,
including the following: the identification of commercial crops based on technical feasibility, such as
marketing, weather, and soil39
; the strengthening of organization for joint trade; the development of
joint markets.
(2) Development of LGUs’ commitment to ensuring of sustainability
In similar projects in the Philippines, LGUs’ commitment is the determining factor for ensuring the
sustainability of the project effect. In the Philippines, facilities are maintained by LGUs and POs
according to the Local Government Code. In this project, a development plan was formulated with the
participation of LGUs and representative residents, and subprojects were identified. During the project
period, the implementation of this project was regularly managed among the executing and other
relevant agencies, including municipality LGUs. Moreover, when the maintenance of the facilities was
transferred, the “sustainability plan” was attached to the written agreement with the LGUs to specify
roles and responsibilities in operation and maintenance of LGUs. Thus it was confirmed that, in the
four municipalities covered by the field survey for the ex-post evaluation, road maintenance expenses
were included in municipality and LGUs’ annual investment plans, and the status of maintenance of
facilities and roads was kept well. However, because the POs in charge of the operation and
maintenance had constraints in their technical and financial capacities, the operation and maintenance
39 In addition, technical inspection based on the local characteristics (weather, soil, etc.) is needed.

37
of facilities were insufficient. Consequently, even when the POs maintain facilities, the LGUs’
technical guidance and monitoring are important for ensuring the sustainability.
In this way, in order to increase the LGUs’ commitment, it is desirable for the LGUs to actively
participate in the planning, implementation, and monitoring evaluation of the project from the
beginning and, after the completion, integrate the sustainability plan prepared in this plan into the
LGUs’ development plans and annual investment plans.
(3) Project design that considers i the assistance absorptive capacity of the POs in the target areas
In a poverty reduction and rural development project that consists of many small-scale subprojects,
it is necessary to select subprojects by taking into consideration the absorptive capacity of the POs in
the target areas. This project deals with various matters, ranging from the improvement of
infrastructures, such as roads, irrigation, and water supply, to agricultural support, such as agricultural
technology, livestock revolving fund scheme, and agro-forestry. In some cases, a PO carried out more
than 10 subprojects during the course of two to three years. At the time of planning, it was planned that
the POs would receive a capacity assessment by NGO according to the Implementation Manual and
could become executing agencies if they satisfied the standards. However, because the number of POs
that satisfied the standards was small in the target areas, it was necessary to form or strengthen POs
newly. Although training on the strengthening of organizations was held in this project, the occurrence
of project effect and impact had negative influence because of time constraints and lack of capacities
of organizations, such as IAs and cooperatives. Moreover, in the case of cooperatives, because it was
not clear what function was given to them, necessary capacity development could not be held, and
group activities were not carried out concerning agricultural development, such as joint trade.
Therefore, when subprojects are selected, it is necessary to include in the selection standards not only
needs of the residents and technical and financial feasibility but also the evaluation of the existing
capacities of the POs, to construct a support system, and to continuously enhance their capacities if
needed.
(4) Securing of the quality of input materials for earlier emergence of effect
With regard to the quality of input materials for agricultural production (such as livestock), to
determine the time of emergence of project effect and the beneficiaries’ motivation for production, the
executing agency should procure and distribute such kinds (age, genealogy, etc., in the case of
livestock) of materials that would allow project effect to emerge earlier according to the beneficiaries’
needs. At the time of planning, because the target areas of this project had low agricultural productivity,
the introduction of a livestock revolving fund scheme was determined to secure farmers’ additional
income. However, procured or distributed livestock had many problems. For example, it would take a
few years to reach the breeding season, or the breeding season had already passed. As a result, the
estimated effect of increasing income was limited. According to the DAR, although the main reasons
include a rise in market prices, earlier emergence and actual feeling of effect will lead to not only the
beneficiaries’ motivation for production but also the POs’ continuation of their activities. Therefore,
38
the executing agency is required to carry out flexible project management, including adjustment of
quantity after full understanding of effect, and request for an additional fund from the project
management office.
(5) Setting up of the operation effect indicator (income) in the poverty reduction project, and the
measuring method
If income is used as an operation and effect indicator, it is desirable to design and carry out a
baseline survey based also on the budgetary and technical feasibility of the impact survey. Because
this project meets the needs of the residents in the target areas, the beneficiaries’ degree of satisfaction
is high. On the other hand, because subprojects differ among the target areas, it is difficult to set up
operation effect indicators common to the target areas. In addition, because there are many indicators
on an output basis for each subproject, monitoring on an outcome basis is difficult. Income is one of
the central indicators for measuring the effect of this project whose purpose is poverty reduction, and
data analysis of income requires a household survey that has statistical significance. Accordingly, at
the time of planning, it is necessary to take the following measures to create survey designs that enable
direct use of baseline survey data for succeeding surveys: (1) applying the same sampling method to
both the baseline survey and succeeding surveys; (2) securing samples, which would provide statistical
significance to the extent possible; and (3) carrying out longitudinal study of the persons covered by
the baseline survey. Succeeding surveys should be carried out even after the completion of this
project.40
40 Although the baseline survey and the impact survey were carried out in this project, they differed in survey method, such as the number of samples. Because the impact survey was carried out during this project in 2007, it is not considered the real “impact survey,” which is carried out when no input is made after the project.

39
Comparison of the Original and Actual Scope of the Project
Item Original Actual
1. Project Output
< Infrastructure Development>
Farm to Market Road 313 km 354 km
Farm to Market Bridge 1,587 lm 1,749 lm
Water Supply System 41 sites 39 sites
Irrigation Facilities 1,717 ha 2,732 ha
Barangay Health Station 89 sites 96 sites
Multi-purpose Building 16 sites 20 sites
Postharvest Facility 74 sites 111 sites
School(Classroom) 405 rooms 632 rooms
Multi-purpose Pavement 91 sites 91 sites
< Institutional Development>
No of Organization 587 organizations 1,792 organizations
Farmer Para-Technician Trained 246 persons 290 persons
Farmers Trained 44,251 persons 72,193 persons
Training for PMU 26 sites 26 sites
Training for PMU officers 1,662 persons 4,599 persons
<Agricultural and Environmental Development>
Reforestation 26 sites 10 sites
Agro-forestry 65 sites 10 sites
Fruits-tree 64 sites 27 sites
Demo Farm 66 sites 100 sites
Nursery 8 sites 10 sites
Livestock Development 62 sites 59 siets
<Procurement of Equipment>
Equipment of PMU 11 sites 11 sites
Equipment of Settlement Management Unit 16 sites 16 sites
School Armchair 18,225 units 24,750 units
Medical Equipment 89 sites 94 sites
O&M Equipment of LGU 16 sites 16 sites
<Consulting Service>
Foreign experts: 184M/M
Local expert: 468M/M
Foreign experts: 153M/M
Local expert: 541M/M
2. Project period
March, 2001~ June, 2007
(76 months)
March, 2001~September,
2009
(101months)
3. Project Cost
Amount paid in Foreign currency 2,928 million yen 1,638 million yen
Amount paid in Local currency 5,759 million yen 5,225 million yen
Total 8,687 million yen 6,872 million yen
(Japanese ODA loan portion) 6,515 million yen 5,791 million yen
Exchange Rate 1 Philippine peso= 2.8
yen (January, 2000)
1 Philippine peso =
2.17 yen (2003-2008
average)