Embed Size (px)
Citation preview

REPUBLIC OF SINGAPORE
THE
REVENUE AND EXPENDITURE ESTIMATES FOR THE
FINANCIAL YEAR 2020/2021
Cmd. 24 of 2020 Ministry of Finance


THE
REVENUE AND EXPENDITURE ESTIMATES FOR THE
FINANCIAL YEAR 2020/2021


i
TABLE OF CONTENTS Page
Explanatory Notes ... ... ... ... ... ... ... iii OVERVIEW Overview of the Budget for Financial Year 2020 ... ... ... ... ... xix Review of Financial Year 2019... ... ... ... ... ... … xxi I SUMMARY TABLES OF REVENUE AND EXPENDITURE ESTIMATES Revenue Estimates … … … … ... … … 1 Expenditure Estimates … ... ... ... ... … … 5 II STATEMENT OF ASSETS AND LIABILITIES Statement of Assets and Liabilities as at 31st March 2019 … … … … 13 III EXPENDITURE ESTIMATES BY HEAD OF EXPENDITURE Head A Civil List for the President of the Republic of Singapore ... ... ... 15 Head B Attorney-General’s Chambers ... ... ... ... ... 19 Head C Auditor-General’s Office ... ... ... ... ... ... 25 Head D Cabinet Office ... ... ... ... ... ... 31 Head E Judicature ... ... ... ... ... ... 35 Head F Parliament ... ... ... ... ... ... 41 Head G Presidential Councils ... ... ... ... ... ... 45 Head H Public Service Commission ... ... ... ... ... 49 Head I Ministry of Social and Family Development ... ... ... ... 53 Head J Ministry of Defence ... ... ... ... ... ... 63 Head K Ministry of Education ... ... ... ... ... ... 69 Head L Ministry of The Environment and Water Resources ... ... ... 81 Head M Ministry of Finance ... ... ... ... ... ... 95 Head N Ministry of Foreign Affairs ... ... ... ... ... 103 Head O Ministry of Health ... ... ... ... ... ... 121 Head P Ministry of Home Affairs ... ... ... ... ... ... 131 Head Q Ministry of Communications and Information ... ... ... ... 143 Head R Ministry of Law … … ... ... ... ... 149 Head S Ministry of Manpower ... ... ... ... ... ... 155 Head T Ministry of National Development ... ... ... ... ... 161 Head U Prime Minister’s Office ... ... ... ... ... ... 173 Head V Ministry of Trade and Industry ... ... ... ... ... 183 Head W Ministry of Transport ... ... ... ... ... ... 193 Head X Ministry of Culture, Community and Youth ... ... ... ... 201 Head Z Financial Transfers ... ... ... ... ... ... 209

ii
Table of Contents - continued IV ANNEX TO THE EXPENDITURE ESTIMATES PROGRAMME DETAILS Head A Civil List for the President of the Republic of Singapore ... ... ... 211 Head B Attorney-General’s Chambers ... ... ... ... ... 213 Head C Auditor-General’s Office ... ... ... ... ... ... 215 Head D Cabinet Office ... ... ... ... ... ... 217 Head E Judicature ... ... ... ... ... ... 219 Head F Parliament ... ... ... ... ... ... 221 Head G Presidential Councils ... ... ... ... ... ... 223 Head H Public Service Commission ... ... ... ... ... 227 Head I Ministry of Social and Family Development ... ... ... ... 229 Head J Ministry of Defence ... ... ... ... ... ... 247 Head K Ministry of Education ... ... ... ... ... ... 249 Head L Ministry of The Environment and Water Resources ... ... ... 281 Head M Ministry of Finance ... ... ... ... ... ... 287 Head N Ministry of Foreign Affairs ... ... ... ... ... 295 Head O Ministry of Health ... ... ... ... ... ... 297 Head P Ministry of Home Affairs ... ... ... ... ... ... 305 Head Q Ministry of Communications and Information ... ... ... ... 319 Head R Ministry of Law ... ... ... ... ... ... 327 Head S Ministry of Manpower ... ... ... ... ... ... 339 Head T Ministry of National Development ... ... ... ... ... 347 Head U Prime Minister’s Office ... ... ... ... ... ... 357 Head V Ministry of Trade and Industry ... ... ... ... ... 373 Head W Ministry of Transport ... ... ... ... ... ... 387 Head X Ministry of Culture, Community and Youth ... ... ... ... 393 Head Z Financial Transfers ... ... ... ... ... ... 413

iii
EXPLANATORY NOTES
The Revenue and Expenditure Estimates for the Financial Year 2020/2021 comprises four sections: I Summary Tables of Revenue and Expenditure Estimates II Statement of Assets and Liabilities III Expenditure Estimates by Head of Expenditure IV Annex to the Expenditure Estimates The presentation of each Head of Expenditure in Section III is in two parts: (a) Overview - This commences with a statement outlining the mission of the Head.
(b) FY2020 Expenditure Estimates - This contains the following:
(i) Expenditure Estimates by Object Class - This is a summary table giving the breakdown of the FY2020 expenditure estimates by object classes. Details of the revenue and expenditure classification, coding and control systems are provided at the end of these Explanatory Notes.
(ii) Establishment List - This shows the authorised manpower for the Head by
Personnel Group.
(iii) The FY2019 Budget - This gives the highlights of the major trends and changes in expenditure for FY2019.
(iv) The FY2020 Budget - This gives the highlights of the major trends and changes in allocations for
FY2020.
(v) Distribution by Programme - This provides a summary of the distribution of expenditure among the programmes. Details for the programmes are contained in the Annex to the Expenditure Estimates Document.
(vi) Development Expenditure by Project - The development expenditure requirements for the
programme are shown by project. .
(vii) Other Consolidated Fund Outlays - These are outlays which do not form part of operating expenditure.
(viii) Other Development Fund Outlays - These are outlays which do not form part of
development expenditure.
(ix) Key Performance Indicators - A list of selected indicators is given in this section.
All percentages are computed based on absolute figures. Due to the rounding of data, sub-totals in the columns of the various summary tables may not necessarily add up to totals. Unless otherwise stated, all comparisons of increases and decreases are relative to the revised FY2019 estimates.

iv
Explanatory Notes - continued
COMMON ABBREVIATIONS
Abbreviation Phrase APEC - Asia-Pacific Economic Cooperation ASEAN - Association of South East Asian Nations CPF - Central Provident Fund CPI - Consumer Price Index CY - Calendar Year EU - European Union
FY - Financial Year. The Government’s financial year is from 1st April of the calendar year to 31st March of the following calendar year. FY2020 refers to the Financial Year 1st April 2020 to 31st March 2021.
G20 - The Group of Twenty GDP - Gross Domestic Product GST - Goods and Services Tax ha - hectare HQ - Headquarters ICT - Infocomm Technology IMF - International Monetary Fund IMD - Institute for Management Development ISO - International Organisation for Standardisation IT - Information Technology KPI - Key Performance Indicator n.a. - not applicable NA - Not Available OECD - Organisation for Economic Co-Operation and Development R&D - Research and Development SQC - Singapore Quality Class UN - United Nations US - United States WEF - World Economic Forum w.e.f. - with effect from

v
Explanatory Notes - continued
REVENUE CLASSIFICATION AND CODING SYSTEM To facilitate the analysis of revenue collection, Operating Revenue is monitored by account and classified by type (e.g. Tax Revenue, Fees and Charges). Revenue accounts are grouped by object, objects by object group, object groups by object class, and object classes by object category as shown in the following table: Level Example Code
(1) OBJECT CATEGORY Tax Revenue B00.000
(2) OBJECT CLASS Customs, Excise and Carbon Taxes B30.000
(3) OBJECT GROUP Excise Duties B31.000
(4) OBJECT Petroleum Products B31.100
(5) ACCOUNT Gasoline B31.101
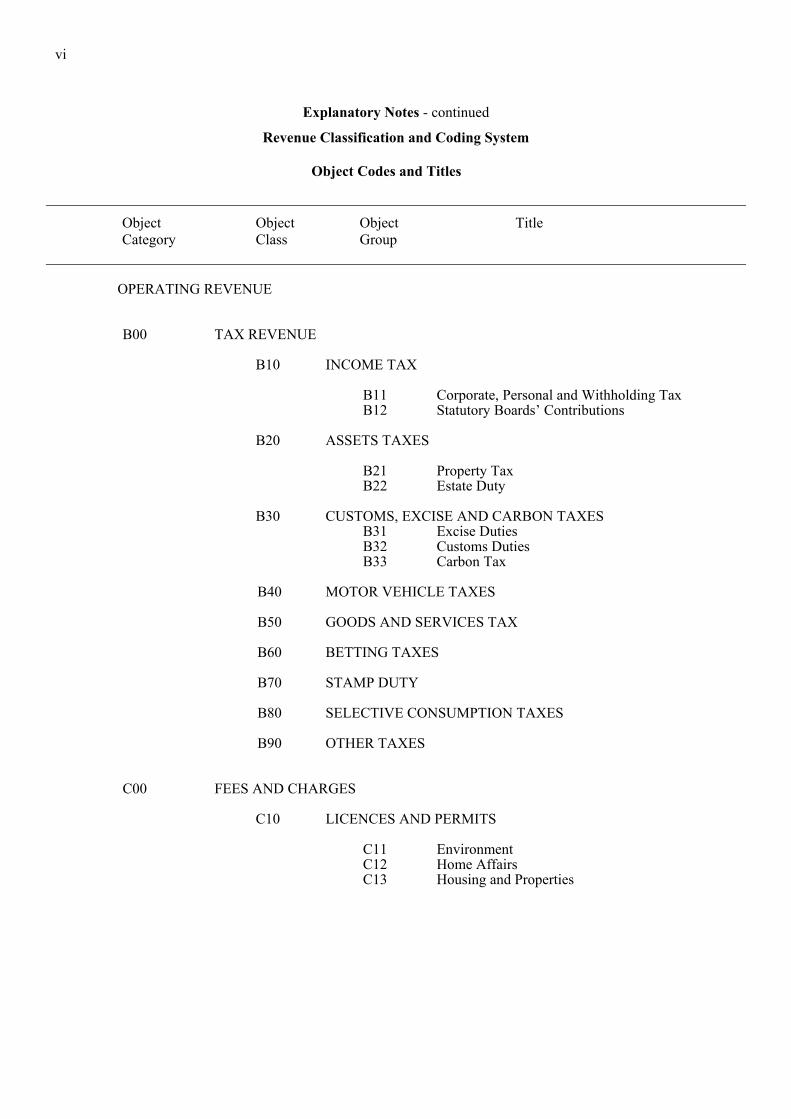
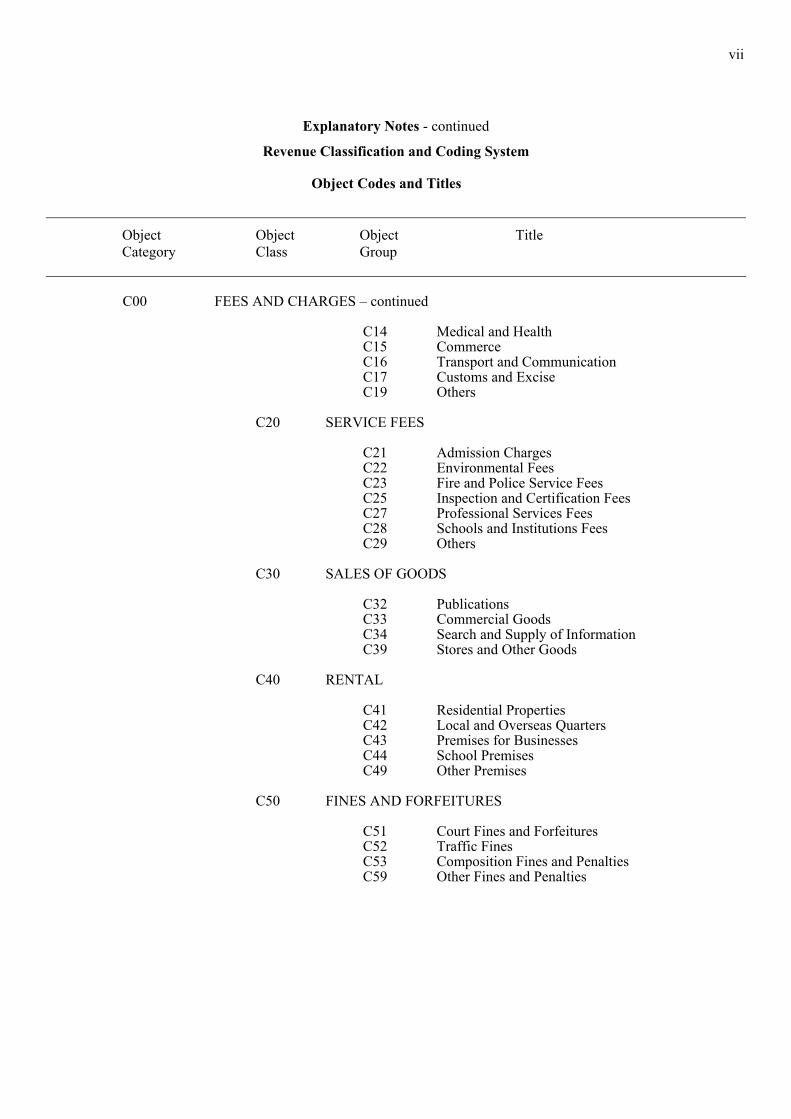
There are three object categories (Tax Revenue, Fees and Charges and Others) for Operating Revenue. The Tax Revenue category comprises nine object classes: Income Tax, Assets Taxes, Customs, Excise and Carbon Taxes, Motor Vehicle Taxes, Goods and Services Tax, Betting Taxes, Stamp Duty, Selective Consumption Taxes and Other Taxes. The Fees and Charges category comprises seven object classes: Licences and Permits, Service Fees, Sales of Goods, Rental, Fines and Forfeitures, Reimbursements and Other Fees and Charges. Details of the codes and titles of the different revenue object groups, object classes and object categories are given in the table at the end of these Explanatory Notes.
vi
Explanatory Notes - continued
Revenue Classification and Coding System Object Codes and Titles
Object Object Object Title Category Class Group OPERATING REVENUE B00 TAX REVENUE B10 INCOME TAX B11 Corporate, Personal and Withholding Tax B12 Statutory Boards’ Contributions B20 ASSETS TAXES B21 Property Tax B22 Estate Duty B30 CUSTOMS, EXCISE AND CARBON TAXES B31 Excise Duties B32 Customs Duties B33 Carbon Tax B40 MOTOR VEHICLE TAXES B50 GOODS AND SERVICES TAX B60 BETTING TAXES B70 STAMP DUTY B80 SELECTIVE CONSUMPTION TAXES B90 OTHER TAXES C00 FEES AND CHARGES C10 LICENCES AND PERMITS C11 Environment C12 Home Affairs C13 Housing and Properties
vii
Explanatory Notes - continued
Revenue Classification and Coding System Object Codes and Titles
Object Object Object Title Category Class Group C00 FEES AND CHARGES – continued C14 Medical and Health C15 Commerce C16 Transport and Communication C17 Customs and Excise C19 Others C20 SERVICE FEES C21 Admission Charges C22 Environmental Fees C23 Fire and Police Service Fees C25 Inspection and Certification Fees C27 Professional Services Fees C28 Schools and Institutions Fees C29 Others C30 SALES OF GOODS C32 Publications C33 Commercial Goods C34 Search and Supply of Information C39 Stores and Other Goods C40 RENTAL C41 Residential Properties C42 Local and Overseas Quarters C43 Premises for Businesses C44 School Premises C49 Other Premises C50 FINES AND FORFEITURES C51 Court Fines and Forfeitures C52 Traffic Fines C53 Composition Fines and Penalties C59 Other Fines and Penalties

viii
Explanatory Notes - continued
Revenue Classification and Coding System Object Codes and Titles
Object Object Object Title Category Class Group C00 FEES AND CHARGES – continued C60 REIMBURSEMENTS C61 Recovery of Costs/Expenses C62 Reimbursement for Services C63 Secondment/Loan of Staff C69 Others C90 OTHER FEES AND CHARGES
J00 OTHERS J10 FINANCIAL RECEIPTS OTHER RECEIPTS L00 INVESTMENT AND INTEREST INCOME L10 INTEREST L11 Interest on Investments L13 Interest on Banks Accounts L20 DIVIDENDS L21 Government-owned Companies L22 Statutory Boards L29 Other Investments L40 INTEREST ON LOANS
ix
Explanatory Notes - continued
Revenue Classification and Coding System Object Codes and Titles
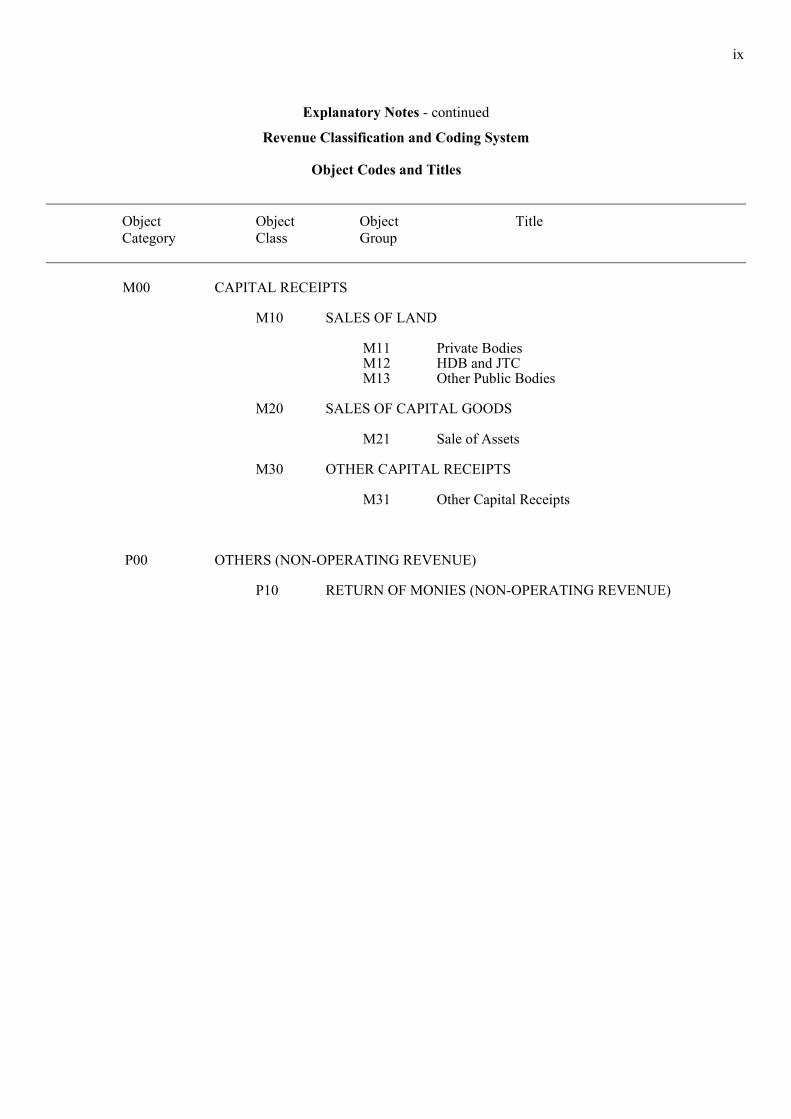
Object Object Object Title Category Class Group M00 CAPITAL RECEIPTS
M10 SALES OF LAND M11 Private Bodies M12 HDB and JTC M13 Other Public Bodies M20 SALES OF CAPITAL GOODS M21 Sale of Assets M30 OTHER CAPITAL RECEIPTS M31 Other Capital Receipts
P00 OTHERS (NON-OPERATING REVENUE) P10 RETURN OF MONIES (NON-OPERATING REVENUE)

x
Explanatory Notes - continued
EXPENDITURE CLASSIFICATION, CODING AND CONTROL SYSTEM The Expenditure Estimates of the Government of Singapore are classified by Head of Expenditure and further subdivided by programme, then by activity and finally by account as shown in the following table: Level Example Code (1) HEADS OF EXPENDITURE Ministry of Home Affairs P
(2) PROGRAMMES Police PC
(3) ACTIVITIES Crime Control PC01
(4) ACCOUNTS Office Supplies 213101
Section III (the Expenditure Estimates) contains summary information of expenditure estimates by Head of Expenditure. Information on expenditure at the programme level is contained in Section IV (the Annex to the Expenditure Estimates) while more detailed information on expenditure at the activity level is contained in the FY2020 Expenditure Control Document. To facilitate budget analysis and control, the individual accounts are also classified by type of expenditure (e.g. Expenditure on Manpower, Other Operating Expenditure). Accounts are grouped by object, objects by object groups, object groups by object class, and object classes by object category. This is illustrated in the following table: Level Example Code (1) OBJECT CATEGORY Other Operating Expenditure 200000
(2) OBJECT CLASS Supplies and Services 210000
(3) OBJECT GROUP Supplies 213000
(4) OBJECT Supplies 213100
(5) ACCOUNTS Office Supplies 213101
Details of the codes and titles of the different expenditure object groups, object classes and object categories are given in the table at the end of these Explanatory Notes. For control purposes, the allocation for each Head of Expenditure is distributed among a number of subheads of expenditure. For FY2020, the total allocation under each object category consolidated for the entire Head of Expenditure constitutes a subhead under the Main or Development Estimates. In the course of the financial year, Ministries and Organs of State might find that the approved allocations for certain programmes and projects are no longer adequate due to changed circumstances. Transfers of funds within a subhead and between subheads may be approved by the Accounting Officer of a Ministry or Organ of State. Where transfers within a particular subhead or between subheads are inadequate to meet new expenditure needs, the Ministry or Organ of State concerned has to seek Parliament's approval for Supplementary Estimates.

xi
Explanatory Notes - continued Operating Expenditure is sub-classified into Running Costs and Transfers. Running Costs represent the day-to-day operating expenditure of the Ministries and Organs of State in providing services. The main components of Running Costs are expenditure on manpower, other operating expenditure, and operating grants to Statutory Boards and other organisations. Transfers are payments made out by the Government to members of the public and outside organisations. These include public assistance, subsidies and government contributions to local and external organisations.
Expenditure Classification, Coding and Control System Object Codes and Titles
Object Object Object Title Category Class Group EXPENDITURE ON MANPOWER 1100 CIVIL LIST (MANPOWER) 1110 The Privy Purse 1120 Acting President's allowance 1130 Personal staff 1200 POLITICAL APPOINTMENTS 1210 Political appointments 1300 PARLIAMENTARY APPOINTMENTS 1310 Speaker of Parliament 1320 Members of Parliament 1400 OTHER STATUTORY APPOINTMENTS 1410 Other Statutory Appointments (statutory expenditure) 1420 Other Statutory Appointments (non-statutory expenditure) 1500 PERMANENT STAFF 1510 Permanent staff 1600 TEMPORARY, DAILY-RATED AND OTHER STAFF 1610 Temporary, daily-rated and other staff 1800 PERSONNEL CENTRAL VOTE 1810 Personnel central vote

xii
Explanatory Notes - continued
Expenditure Classification, Coding and Control System
Object Codes and Titles
Object Object Object Title Category Class Group OTHER OPERATING EXPENDITURE 2100 CONSUMPTION OF PRODUCTS AND SERVICES 2110 Maintenance 2120 Rental 2130 Other supplies 2140 Communications and transport 2160 Research, innovation and review 2170 Payment of services to Statutory Boards 2180 Payment of services to Non-Statutory Boards 2200 CIVIL LIST (OTHERS) 2210 Civil List (Others) 2300 MANPOWER DEVELOPMENT 2310 Staff development 2320 Staff well-being and subsidy 2400 INTERNATIONAL AND PUBLIC RELATIONS, PUBLIC
COMMUNICATIONS 2410 Entertainment 2420 Official visits – international relations 2430 Conferences and seminars 2440 Ceremonies, campaigns and national exercises 2450 Mass media expenses 2490 Other representational expenses 2600 PROGRAMMES CENTRAL VOTE 2610 Programmes central vote 2700 ASSET ACQUISITION 2710 Purchase of tangible assets 2720 Purchase of intangible assets

xiii
Explanatory Notes - continued
Expenditure Classification, Coding and Control System
Object Codes and Titles
Object Object Object Title Category Class Group 2800 MISCELLANEOUS 2810 Financial claims and refunds 2820 Legal expenses and settlements 2900 MILITARY EXPENDITURE 2910 Military expenditure

xiv
Explanatory Notes - continued
Expenditure Classification, Coding and Control System
Object Codes and Titles
Object Object Object Title Category Class Group GRANTS, SUBVENTIONS AND CAPITAL INJECTIONS TO ORGANISATIONS 3100 GRANTS, SUBVENTIONS AND CAPITAL INJECTIONS TO
STATUTORY BOARDS 3110 Subvention for operating cost 3120 Capital injections 3190 Others 3200 GRANTS, SUBVENTIONS AND CAPITAL INJECTIONS TO
EDUCATIONAL INSTITUTIONS 3210 Subvention for operating cost 3220 Capital injections 3290 Others 3400 GRANTS, SUBVENTIONS AND CAPITAL INJECTIONS TO
OTHER ORGANISATIONS 3410 Subvention for operating cost 3420 Capital injections 3490 Others
xv
Explanatory Notes - continued
Expenditure Classification, Coding and Control System
Object Codes and Titles
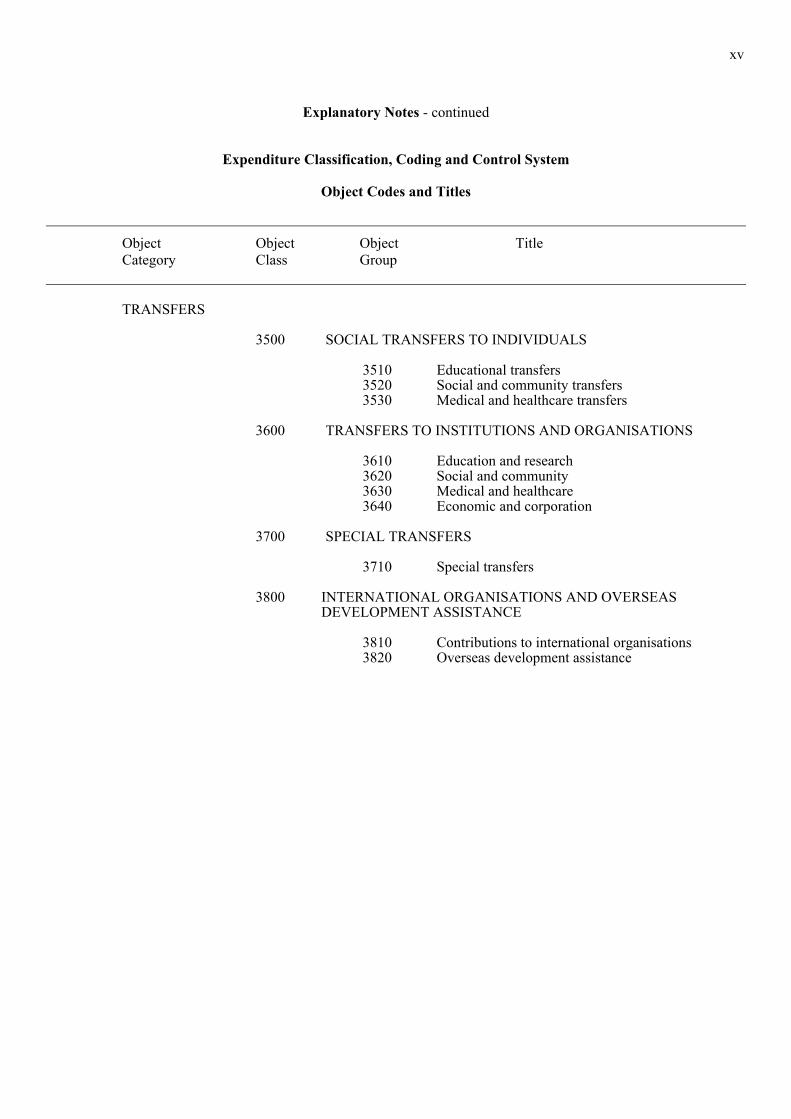
Object Object Object Title Category Class Group TRANSFERS 3500 SOCIAL TRANSFERS TO INDIVIDUALS 3510 Educational transfers 3520 Social and community transfers 3530 Medical and healthcare transfers 3600 TRANSFERS TO INSTITUTIONS AND ORGANISATIONS 3610 Education and research 3620 Social and community 3630 Medical and healthcare 3640 Economic and corporation 3700 SPECIAL TRANSFERS 3710 Special transfers 3800 INTERNATIONAL ORGANISATIONS AND OVERSEAS
DEVELOPMENT ASSISTANCE 3810 Contributions to international organisations 3820 Overseas development assistance

xvi
Explanatory Notes - continued
Expenditure Classification, Coding and Control System
Object Codes and Titles
Object Object Object Title Category Class Group OTHER CONSOLIDATED FUND OUTLAYS 4100 EXPENSES ON LAND SALES 4110 Expenses on land sales 4200 EXPENSES ON INVESTMENTS 4210 Expenses on investments 4500 TRANSFERS FROM CONSOLIDATED REVENUE ACCOUNT
4510 Transfers to Government Funds 4520 Transfers to Endowment Funds 4530 Transfers to Trust Funds 4540 Transfers to Trust Funds Two 4550 Transfers to Trust Funds Three 4590 Other Fund Transfers 4600 LOANS AND ADVANCES (DISBURSEMENT) 4610 Advances 4620 Loans 4630 Financial Assistance Schemes

xvii
Explanatory Notes - continued
Expenditure Classification, Coding and Control System
Object Codes and Titles
Object Object Object Title Category Class Group DEVELOPMENT EXPENDITURE 5100 GOVERNMENT DEVELOPMENT 5110 Government development (capitalised) 5120 Government development (non-capitalised) 5130 Government Research and development 5200 GRANTS AND CAPITAL INJECTIONS TO ORGANISATIONS 5210 Grant and capital injections to Statutory Boards 5220 Grant and capital injections to Educational
Institutions 5230 Grant and capital injections to other organisations OTHER DEVELOPMENT FUND OUTLAYS 5500 LAND-RELATED EXPENDITURE 5510 Land-related Expenditure 5600 LOANS 5610 Housing Loans 5620 Economic Development Assistance Loans 5630 Educational Loans 5690 Other Loans 5900 TRANSFER FROM DEVELOPMENT FUND
5910 Transfers from Development Fund


OVERVIEW


xix
OVERVIEW OF THE BUDGET FOR FINANCIAL YEAR 2020
Budget for FY2020 The FY2020 Budget is summarised in Table 1.1. Operating Revenue Operating Revenue is estimated to be $76.01 billion, $1.28 billion or 1.7% higher than the Revised FY2019 estimate. This is mainly due to an increase in estimated collections from Statutory Boards’ Contributions, Corporate Income Tax and Personal Income Tax, partially offset by lower Vehicle Quota Premiums and Motor Vehicle Taxes. Corporate Income Tax collections are projected to be $17.10 billion, $0.34 billion or 2.0% higher than the Revised FY2019 estimate. Personal Income Tax collections are estimated to be $12.51 billion, $0.31 billion or 2.6% higher than the Revised FY2019 estimate. Statutory Boards' Contributions are projected to be $2.59 billion, $0.79 billion or 44.0% higher than the Revised FY2019 estimate. Assets Taxes are projected to be $4.65 billion, $0.10 billion or 2.1% lower than the Revised FY2019 estimate. Stamp Duty collections are estimated to be $4.29 billion, $0.01 billion or 0.3% lower than the Revised FY2019 estimate. Goods and Services Tax collections are projected to be $11.27 billion, $0.09 billion or 0.8% higher than the Revised FY2019 estimate. Motor Vehicle Taxes are projected to be $2.27 billion, $0.19 billion or 7.7% lower than the Revised FY2019 estimate. Vehicle Quota Premiums are estimated to be $2.64 billion, $0.27 billion or 9.2% lower than the Revised FY2019 estimate. Other Taxes, which include the Foreign Worker Levy, Water Conservation Tax, Development Charge and Annual Tonnage Tax, are estimated to be $6.67 billion, $0.15 billion or 2.3% lower than the Revised FY2019 estimate. Total Expenditure Total Expenditure is projected to be $83.61 billion, $5.45 billion or 7.0% higher than the Revised FY2019 estimate. Operating Expenditure is estimated to be $64.60 billion, $5.05 billion or 8.5% higher than the Revised FY2019 estimate. Development Expenditure is estimated to be $19.01 billion, $0.39 billion or 2.1% higher than the Revised FY2019 estimate. Special Transfers Budget 2020 will provide $21.98 billion for Special Transfers including Top-ups to Endowment and Trust Funds. Net Investment Returns Contribution (NIRC) NIRC for FY2020 is estimated to be $18.63 billion. Budget Position Before taking into account Top-ups to Endowment and Trust Funds and before NIRC, a basic deficit of $12.26 billion is projected for FY2020. After factoring in the Top-ups to Endowment and Trust Funds of $17.32 billion and NIRC of $18.63 billion, the estimated outturn for FY2020 is an overall budget deficit of $10.95 billion.

xx
TABLE 1.1 BUDGET FOR FY2020
BLANK Revised Estimated Change Over
Revised FY2019 FY2019 FY2020 BLANK $billion $billion $billion % change OPERATING REVENUE 74.73 76.01 1.28 1.7 Corporate Income Tax 16.75 17.10 0.34 2.0 Personal Income Tax 12.20 12.51 0.31 2.6 Withholding Tax 1.66 1.70 0.04 2.5 Statutory Boards' Contributions1 1.80 2.59 0.79 44.0 Assets Taxes 4.75 4.65 (0.10) (2.1) Customs, Excise and Carbon Taxes 3.32 3.60 0.28 8.4 Goods and Services Tax 11.18 11.27 0.09 0.8 Motor Vehicle Taxes 2.46 2.27 (0.19) (7.7) Vehicle Quota Premiums 2.90 2.64 (0.27) (9.2) Betting Taxes 2.64 2.63 (0.00) (0.1) Stamp Duty 4.30 4.29 (0.01) (0.3) Other Taxes2 6.83 6.67 (0.15) (2.3) Fees and Charges (Excluding Vehicle Quota Premiums) 3.48 3.62 0.14 4.0 Others 0.47 0.48 0.01 2.9 BLANK Less: 0.0 TOTAL EXPENDITURE 78.16 83.61 5.45 7.0 Operating Expenditure 59.55 64.60 5.05 8.5 Development Expenditure 18.62 19.01 0.39 2.1
PRIMARY SURPLUS / DEFICIT3 (3.44) (7.60)
Less:
SPECIAL TRANSFERS4 15.26 21.98 6.72 44.0 Blank Special Transfers Excluding Top-ups to Endowment and Trust Funds 1.70 4.66 Wage Credit Scheme 0.65 1.60 Jobs Support Scheme - 1.33 Care and Support Package – Cash Payout - 0.83 GST Voucher Special Payment5 0.44 0.36 PAssion Card Top-Up - 0.15 Workfare Special Bonus6 0.08 0.14 Service and Conservancy Charges Rebates 0.13 0.13 Other Transfers7 0.40 0.12 BLANK BASIC SURPLUS / DEFICIT8 (5.13) (12.26)
BLANK Top-ups to Endowment and Trust Funds 13.57 17.32 GST Voucher Fund - 6.00 Coastal and Flood Protection Fund - 5.00 National Research Fund - 2.00 Skills Development Fund - 2.00 ElderCare Fund - 0.75 Special Employment Credit Fund 0.37 0.70 Community Care Endowment Fund - 0.50 Other Funds9 13.20 0.37 Add: NET INVESTMENT RETURNS CONTRIBUTION 17.05 18.63 1.58 9.3
OVERALL BUDGET SURPLUS / DEFICIT (1.65) (10.95)
Note: Due to rounding, figures may not add up. Negative figures are shown in parentheses.
1 From FY2019 onwards, Statutory Boards’ Contributions (SBC) from the Monetary Authority of Singapore (MAS) in a given financial year are calculated as the average of “Contribution to Consolidated Fund” (in lieu of corporate income tax) reported in MAS’ financial statements for the preceding three years. This is to reduce the volatility in MAS’ annual contributions. MAS’ SBC in FY2019 should thus comprise one-third of “Contribution to Consolidated Fund” reported in MAS’ financial statements for FY2016/17, FY2017/18 and FY2018/19. As MAS’ “Contribution to Consolidated Fund” for FY2016/17 and FY2017/18 have been paid in full in FY2017 and FY2018 respectively, MAS’ SBC in FY2019 comprises only one-third of MAS’ “Contribution to Consolidated Fund” for FY2018/19. MAS’ SBC in FY2020 will in turn comprise one-third of MAS’ “Contribution to Consolidated Fund” for FY2018/19 and FY2019/20, and MAS’ SBC in FY2021 will comprise one-third of MAS’ “Contribution to Consolidated Fund” for FY2018/19, FY2019/20 and FY2020/21.
2
3
Other Taxes include the Foreign Worker Levy, Water Conservation Tax, Development Charge and Annual Tonnage Tax. Surplus / Deficit before Special Transfers (including Top-ups to Endowment and Trust Funds) and Net Investment Returns Contribution.
4 Special Transfers including Top-ups to Endowment and Trust Funds. 5 The GST Voucher Special Payment committed in Budget 2019 comprises the GST Voucher – Cash (Bicentennial Payment). The GST Voucher Special Payment committed in
Budget 2020 comprises the GST Voucher – U-Save Special Payments (with additional U-Save for larger households) under the Care and Support Package. 6 The Workfare Special Bonus committed in Budget 2019 comprises the Workfare Bicentennial Bonus. The Workfare Special Bonus committed in Budget 2020 comprises the
Workfare Special Payment under the Care and Support Package. 7 Consists of CPF MediSave Top-ups, Productivity and Innovation Credit, Productivity and Innovation Credit Bonus, Grocery Vouchers, Funding for Self-Help Groups, Merdeka
Generation Package, Rebate for School Buses, CPF Top-Up, CPF Transition Offset, SG Bonus, SME Cash Grant, Top-ups to Child Development Accounts and Top-ups to Post-Secondary Education Accounts.
8 Surplus / Deficit before Top-ups to Endowment and Trust Funds, and Net Investment Returns Contribution. 9 Consists of MediFund, Community Capability Trust, Public Transport Fund, Rail Infrastructure Fund, Merdeka Generation Fund and Long-Term Care Support Fund.

xxi
REVIEW OF FINANCIAL YEAR 2019
The Revised FY2019 fiscal position is summarised in Table 2.1.
Operating Revenue
Operating Revenue is estimated to be $74.73 billion, $0.17 billion or 0.2% lower than the budgeted estimate. This increase is mainly due to lower-than-expected revenues from Motor Vehicle Taxes, Vehicle Quota Premiums and Goods and Services Tax, partially offset by higher-than-expected Statutory Boards' Contributions, Personal Income Tax and Stamp Duty.
Corporate Income Tax collections are projected to be $16.75 billion, $0.03 billion or 0.2% higher than the budgeted estimate. Personal Income Tax collections are estimated to be $12.20 billion, $0.40 billion or 3.4% higher than the budgeted estimate.
Statutory Boards' Contributions are projected to be $1.80 billion. This is $0.50 billion or 38.9% higher the budgeted estimate.
Assets Taxes are projected to be $4.75 billion, $0.06 billion or 1.2% higher than the budgeted estimate. Stamp Duty collections are estimated to be $4.30 billion, $0.27 billion or 6.8% higher than the budgeted estimate.
Goods and Services Tax collections are projected to be $11.18 billion, $0.51 billion or 4.3% lower than the budgeted estimate.
Motor Vehicle Taxes are projected to be $2.46 billion, $0.64 billion or 20.5% lower than the budgeted estimate. Vehicle Quota Premiums are estimated to be $2.90 billion, $0.52 billion or 15.1% lower than the budgeted estimate.
Other Taxes, which include the Foreign Worker Levy, Water Conservation Tax, Development Charge and Annual Tonnage Tax, are estimated to be $6.83 billion, $0.13 billion or 2.0% higher than the budgeted estimate.
Total Expenditure
Total Expenditure is projected to be $78.16 billion, $2.09 billion or 2.6% lower than the budgeted estimate.
Special Transfers
Special Transfers including Top-ups to Endowment and Trust Funds are estimated to total $15.26 billion.
Net Investment Returns Contribution (NIRC)
NIRC is estimated to be $17.05 billion, $0.12 billion or 0.7% lower than the budgeted estimate.
Budget for FY2019
Before taking into account Top-ups to Endowment and Trust Funds and before NIRC, the basic deficit is projected to be $5.13 billion, which is smaller than the budgeted deficit of $7.09 billion. After factoring in Top-ups to Endowment and Trust Funds of $13.57 billion, and NIRC of $17.05 billion, the Revised FY2019 outturn is estimated to be an overall budget deficit of $1.65 billion.

xxii
TABLE 2.1: FISCAL POSITION IN FY2018 AND FY2019
BLANK Revised FY2019 BLANK Actual Estimated Revised Compared to
BLANK FY2018 FY2019 FY2019 Actual Estimated
BLANK FY2018 FY2019
BLANK $billion $billion $billion % change % change OPERATING REVENUE 73.74 74.90 74.73 1.3 (0.2) Corporate Income Tax 16.03 16.72 16.75 4.5 0.2 Personal Income Tax 11.71 11.80 12.20 4.2 3.4 Withholding Tax 1.59 1.54 1.66 4.4 7.7 Statutory Boards' Contributions1 1.49 1.29 1.80 20.6 38.9 Assets Taxes 4.65 4.69 4.75 2.1 1.2 Customs, Excise and Carbon Taxes 3.08 3.50 3.32 7.9 (5.2) Goods and Services Tax 11.14 11.69 11.18 0.4 (4.3) Motor Vehicle Taxes 2.62 3.09 2.46 (6.3) (20.5) Vehicle Quota Premiums 3.62 3.42 2.90 (19.8) (15.1) Betting Taxes 2.66 2.67 2.64 (1.0) (1.4) Stamp Duty 4.61 4.02 4.30 (6.7) 6.8 Other Taxes2 6.63 6.69 6.83 3.0 2.0 Fees and Charges (Excluding Vehicle Quota Premiums) 3.49 3.38 3.48 (0.3) 3.1 Others 0.43 0.38 0.47 9.1 23.6 BLANK Less: 0 0 TOTAL EXPENDITURE 77.82 80.25 78.16 0.4 (2.6) Operating Expenditure 57.56 60.79 59.55 3.4 (2.0) Development Expenditure 20.26 19.47 18.62 (8.1) (4.4)
PRIMARY SURPLUS / DEFICIT3 (4.09) (5.36) (3.44) Less: SPECIAL TRANSFERS4 8.99 15.30 15.26 69.8 (0.2) BLANK Special Transfers Excluding Top-ups to Endowment and Trust Funds 1.69 1.74 1.70
Wage Credit Scheme 0.64 0.65 0.65 GST Voucher Special Payment5 0.00 0.44 0.44 CPF Top-Up - 0.23 0.23 Service and Conservancy Charges Rebates 0.13 0.13 0.13 Workfare Special Bonus6 - 0.08 0.08 Top-ups to Post-Secondary Education Accounts - 0.08 0.07 CPF MediSave Top-ups 0.09 0.06 0.06 Other Transfers7 0.82 0.06 0.03 BLANK BASIC SURPLUS / DEFICIT8 (5.77) (7.09) (5.13) BLANK Top-ups to Endowment and Trust Funds 7.30 13.56 13.57 Merdeka Generation Fund - 6.10 6.10 Long-Term Care Support Fund - 5.08 5.08 Rail Infrastructure Fund 5.00 2.00 2.00 Special Employment Credit Fund - 0.37 0.37 Other Funds9 2.30 0.01 0.02 BLANK Add: 0 17,168,734,000.0
0 0
NET INVESTMENT RETURNS CONTRIBUTION 16.41 17.17 17.05 3.9 (0.7) OVERALL BUDGET SURPLUS / DEFICIT 3.34 (3.48) (1.65)
Note: Due to rounding, figures may not add up. Negative figures are shown in parentheses.
1 From FY2019 onwards, Statutory Boards’ Contributions (SBC) from the Monetary Authority of Singapore (MAS) in a given financial year are calculated as the average of “Contribution to Consolidated Fund” (in lieu of corporate income tax) reported in MAS’ financial statements for the preceding three years. This is to reduce the volatility in MAS’ annual contributions. MAS’ SBC in FY2019 should thus comprise one-third of “Contribution to Consolidated Fund” reported in MAS’ financial statements for FY2016/17, FY2017/18 and FY2018/19. As MAS’ “Contribution to Consolidated Fund” for FY2016/17 and FY2017/18 have been paid in full in FY2017 and FY2018 respectively, MAS’ SBC in FY2019 comprises only one-third of MAS’ “Contribution to Consolidated Fund” for FY2018/19. MAS’ SBC in FY2020 will in turn comprise one-third of MAS’ “Contribution to Consolidated Fund” for FY2018/19 and FY2019/20, and MAS’ SBC in FY2021 will comprise one-third of MAS’ “Contribution to Consolidated Fund” for FY2018/19, FY2019/20 and FY2020/21.
2 Other Taxes include the Foreign Worker Levy, Water Conservation Tax, Development Charge and Annual Tonnage Tax. 3 Surplus / Deficit before Special Transfers (including Top-ups to Endowment and Trust Funds) and Net Investment Returns Contribution. 4 Special Transfers including Top-ups to Endowment and Trust Funds. 5 The GST Voucher Special Payment committed in Budget 2018 comprises the Additional GST Voucher – U-Save with payments starting in late FY2018. The GST Voucher
Special Payment committed in Budget 2019 comprises the GST Voucher – Cash (Bicentennial Payment) and the Additional GST Voucher – U-Save. 6 The Workfare Special Bonus committed in Budget 2019 comprises the Workfare Bicentennial Bonus. 7 Consists of Productivity and Innovation Credit, Rebate for School Buses, SG Bonus, Productivity and Innovation Credit Bonus, SME Cash Grant, Funding for Self-Help Groups
and Top-ups to Child Development Accounts. 8 Surplus / Deficit before Top-ups to Endowment and Trust Funds, and Net Investment Returns Contribution. 9 Consists of Public Transport Fund, Community Silver Trust and GST Voucher Fund.

I
_____
SUMMARY TABLES OF REVENUE AND EXPENDITURE
ESTIMATES

REVENUE ESTIMATES


1
TOTAL ESTIMATED RECEIPTS FOR FY2020 BY OBJECT CLASS
Account BLANK Actual Estimated Revised Estimated Code Revenue Item FY2018 FY2019 FY2019 FY2020 Change Over FY2019
BLANK $ $ $ $ $ % BLANK
B00 TAX REVENUE 66,202,572,871 67,720,651,000 67,877,366,000 69,273,402,000 1,396,036,000 2.1
B10 INCOME TAX 30,818,144,450 31,354,473,000 32,411,796,000 33,898,935,000 1,487,139,000 4.6
B11 CORPORATE, PERSONAL AND WITHHOLDING TAX 29,327,662,122 30,060,061,000 30,613,712,000 31,309,804,000 696,092,000 2.3
B111 Corporate income tax 16,031,955,620 16,722,061,000 16,753,712,000 17,095,204,000 341,492,000 2.0
B112 Personal income tax 11,705,808,274 11,797,000,000 12,200,000,000 12,513,600,000 313,600,000 2.6
B113 Withholding tax 1,589,898,228 1,541,000,000 1,660,000,000 1,701,000,000 41,000,000 2.5
B12 STATUTORY BOARDS' CONTRIBUTIONS 1,490,482,328 1,294,412,000 1,798,084,000 2,589,131,000 791,047,000 44.0
B120 Statutory Boards' contributions 1,490,482,328 1,294,412,000 1,798,084,000 2,589,131,000 791,047,000 44.0
B20 ASSETS TAXES 4,649,146,395 4,690,047,000 4,746,250,000 4,646,103,000 -100,147,000 -2.1
B21 PROPERTY TAX 4,648,899,121 4,690,000,000 4,746,000,000 4,646,023,000 -99,977,000 -2.1
B211 Private properties 4,283,087,593 4,343,132,000 4,392,276,000 4,292,841,000 -99,435,000 -2.3
B212 Statutory boards 365,771,397 346,828,000 353,517,000 353,058,000 -459,000 -0.1
B219 Other properties 40,131 40,000 207,000 124,000 -83,000 -40.1
B22 ESTATE DUTY 247,273 47,000 250,000 80,000 -170,000 -68.0
B221 Estate duty 247,273 47,000 250,000 80,000 -170,000 -68.0
B30 CUSTOMS, EXCISE AND CARBON TAXES 3,075,009,376 3,501,664,000 3,318,845,000 3,596,856,000 278,011,000 8.4
B31 EXCISE DUTIES 3,066,804,294 3,492,505,000 3,310,066,000 3,396,261,000 86,195,000 2.6
B311 Petroleum products 783,996,936 988,486,000 993,222,000 1,003,154,000 9,932,000 1.0
B312 Tobacco 1,121,577,815 1,235,102,000 1,259,474,000 1,322,448,000 62,974,000 5.0
B313 Liquors 669,398,951 727,899,000 665,976,000 705,935,000 39,959,000 6.0
B314 Motor vehicles 486,318,094 535,305,000 386,285,000 359,488,000 -26,797,000 -6.9
B315 CNG unit duty 53,024 54,000 27,000 27,000 0 0.0
B318 Other excise duty 5,459,475 5,659,000 5,082,000 5,209,000 127,000 2.5
B32 CUSTOMS DUTIES 8,205,081 9,159,000 8,779,000 9,305,000 526,000 6.0
B323 Liquors 8,199,156 9,153,000 8,772,000 9,298,000 526,000 6.0
B329 Other customs duties 5,925 6,000 7,000 7,000 0 0.0
B33 CARBON TAX 0 0 0 191,290,000 191,290,000 n.a
B331 Carbon Tax 0 0 0 191,290,000 191,290,000 n.a
B40 MOTOR VEHICLE TAXES 2,623,385,570 3,093,507,000 2,458,093,000 2,268,359,000 -189,734,000 -7.7
B401 Additional registration fees 1,818,912,856 2,330,249,000 1,651,538,000 1,475,543,000 -175,995,000 -10.7
B402 Road tax 719,168,044 693,946,000 744,971,000 741,390,000 -3,581,000 -0.5
B403 Special tax on heavy oil engines 73,998,607 59,911,000 49,266,000 39,266,000 -10,000,000 -20.3
B404 Non-motor vehicle licences 4,098,741 4,064,000 4,107,000 4,107,000 0 0.0
B405 Passenger vehicle seating fees 0 1,000 1,000 1,000 0 0.0
B406 Conversion premium 7,207,323 5,336,000 8,210,000 8,052,000 -158,000 -1.9

2
Account BLANK Actual Estimated Revised Estimated Code Revenue Item FY2018 FY2019 FY2019 FY2020 Change Over FY2019
BLANK $ $ $ $ $ %
BLANK B50 GOODS AND SERVICES TAX 11,137,142,943 11,690,732,000 11,183,262,000 11,272,792,000 89,530,000 0.8
B60 BETTING TAXES 2,663,864,698 2,673,000,000 2,636,637,000 2,634,001,000 -2,636,000 -0.1
B70 STAMP DUTY 4,606,949,118 4,023,913,000 4,297,420,000 4,285,690,000 -11,730,000 -0.3
B701 Stamp Duty 4,606,949,118 4,023,913,000 4,297,420,000 4,285,690,000 -11,730,000 -0.3
B80 SELECTIVE CONSUMPTION TAXES 292,294,620 340,611,000 330,528,000 333,579,000 3,051,000 0.9
B802 Water conservation tax 292,294,620 340,611,000 330,528,000 333,579,000 3,051,000 0.9
B90 OTHER TAXES 6,336,635,701 6,352,704,000 6,494,535,000 6,337,087,000 -157,448,000 -2.4
C00 FEES AND CHARGES 7,106,113,297 6,795,068,000 6,380,991,000 6,254,635,000 -126,356,000 -2.0
C10 LICENCES AND PERMITS 4,257,474,451 4,061,007,000 3,610,782,000 3,364,982,000 -245,800,000 -6.8
C11 Environment 1,365,209 1,307,000 1,332,000 1,371,000 39,000 2.9
C12 Home Affairs 242,526,960 241,821,000 274,873,000 284,633,000 9,760,000 3.6
C13 Housing and Properties 5,322,657 2,176,000 1,958,000 2,012,000 54,000 2.8
C14 Medical and Health 3,028,767 2,915,000 2,475,000 2,546,000 71,000 2.9
C15 Commerce 16,388,792 17,503,000 16,484,000 16,964,000 480,000 2.9
C16 Transport and Communication 3,877,541,021 3,680,302,000 3,171,465,000 2,911,135,000 -260,330,000 -8.2
C17 Customs and Excise 17,698,534 18,442,000 24,156,000 24,856,000 700,000 2.9
C19 Others 93,602,511 96,541,000 118,039,000 121,465,000 3,426,000 2.9
C20 SERVICE FEES 702,767,276 645,863,000 676,703,000 679,135,000 2,432,000 0.4
C21 Admission Charges 3,057,988 2,828,000 4,518,000 4,647,000 129,000 2.9
C22 Environmental Fees 216,184,677 210,820,000 226,353,000 215,721,000 -10,632,000 -4.7
C23 Fire and Police Services Fees 49,148,507 30,143,000 19,064,000 19,617,000 553,000 2.9
C25 Inspection and Certification Fees 6,823,984 7,177,000 7,845,000 8,073,000 228,000 2.9
C27 Professional Services Fees 66,288,623 72,509,000 70,538,000 72,583,000 2,045,000 2.9
C28 Schools and Institutions Fees 234,870,929 228,780,000 244,590,000 251,690,000 7,100,000 2.9
C29 Others 126,392,569 93,606,000 103,795,000 106,804,000 3,009,000 2.9
C30 SALES OF GOODS 170,999,295 198,934,000 182,990,000 205,408,000 22,418,000 12.3
C32 Publications 5,761,367 4,861,000 4,354,000 4,480,000 126,000 2.9
C33 Commercial Goods 99,495,049 109,596,000 89,767,000 109,464,000 19,697,000 21.9
C34 Search and Supply of Information 228,904 235,000 259,000 281,000 22,000 8.5
C39 Stores and Other Goods 65,513,974 84,242,000 88,610,000 91,183,000 2,573,000 2.9
C40 RENTAL 1,435,977,887 1,395,023,000 1,391,918,000 1,477,812,000 85,894,000 6.2
C41 Residential Properties 936,425,646 897,815,000 864,582,000 919,447,000 54,865,000 6.3
C42 Local and Overseas Quarters 935,496 995,000 1,064,000 1,094,000 30,000 2.8
C43 Premises for Businesses 167,014,750 161,388,000 178,559,000 183,743,000 5,184,000 2.9
C44 School Premises 6,276,021 6,190,000 6,744,000 6,939,000 195,000 2.9
C49 Other Premises 325,325,974 328,635,000 340,969,000 366,589,000 25,620,000 7.5
3
Account BLANK Actual Estimated Revised Estimated Code Revenue Item FY2018 FY2019 FY2019 FY2020 Change Over FY2019
BLANK $ $ $ $ $ %
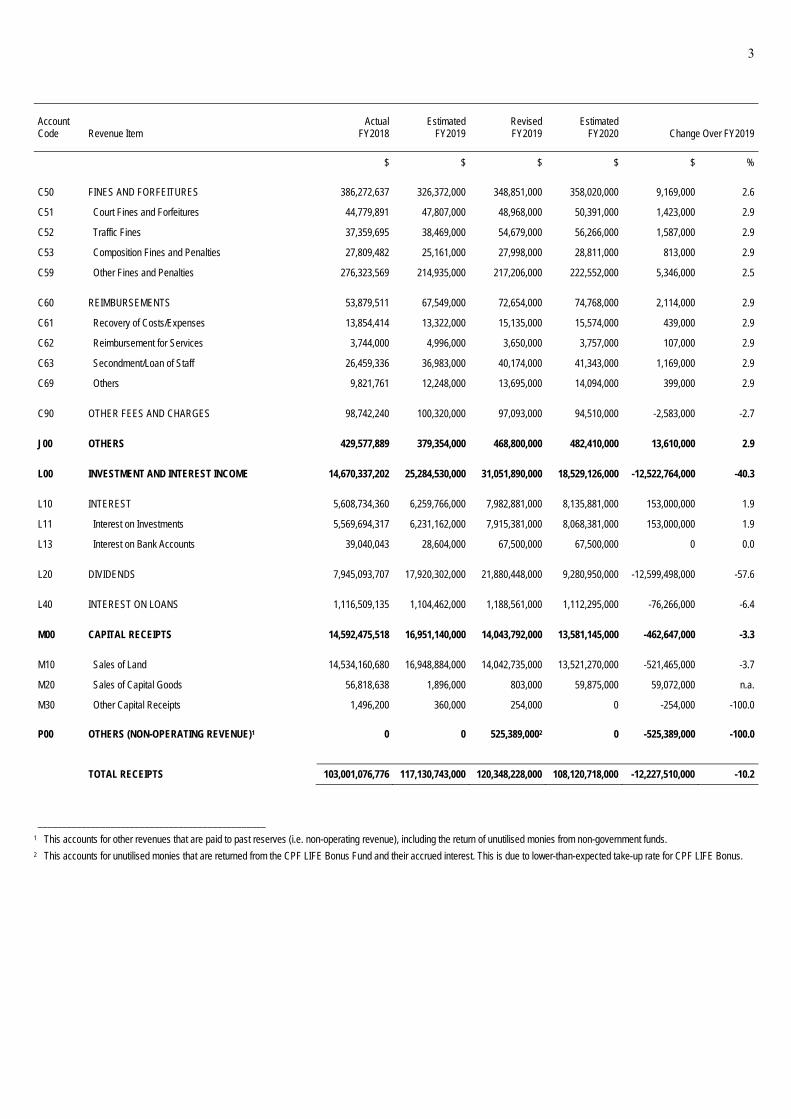
BLANK C50 FINES AND FORFEITURES 386,272,637 326,372,000 348,851,000 358,020,000 9,169,000 2.6
C51 Court Fines and Forfeitures 44,779,891 47,807,000 48,968,000 50,391,000 1,423,000 2.9
C52 Traffic Fines 37,359,695 38,469,000 54,679,000 56,266,000 1,587,000 2.9
C53 Composition Fines and Penalties 27,809,482 25,161,000 27,998,000 28,811,000 813,000 2.9
C59 Other Fines and Penalties 276,323,569 214,935,000 217,206,000 222,552,000 5,346,000 2.5
C60 REIMBURSEMENTS 53,879,511 67,549,000 72,654,000 74,768,000 2,114,000 2.9
C61 Recovery of Costs/Expenses 13,854,414 13,322,000 15,135,000 15,574,000 439,000 2.9
C62 Reimbursement for Services 3,744,000 4,996,000 3,650,000 3,757,000 107,000 2.9
C63 Secondment/Loan of Staff 26,459,336 36,983,000 40,174,000 41,343,000 1,169,000 2.9
C69 Others 9,821,761 12,248,000 13,695,000 14,094,000 399,000 2.9
C90 OTHER FEES AND CHARGES 98,742,240 100,320,000 97,093,000 94,510,000 -2,583,000 -2.7
J00 OTHERS 429,577,889 379,354,000 468,800,000 482,410,000 13,610,000 2.9
L00 INVESTMENT AND INTEREST INCOME 14,670,337,202 25,284,530,000 31,051,890,000 18,529,126,000 -12,522,764,000 -40.3
L10 INTEREST 5,608,734,360 6,259,766,000 7,982,881,000 8,135,881,000 153,000,000 1.9
L11 Interest on Investments 5,569,694,317 6,231,162,000 7,915,381,000 8,068,381,000 153,000,000 1.9
L13 Interest on Bank Accounts 39,040,043 28,604,000 67,500,000 67,500,000 0 0.0
L20 DIVIDENDS 7,945,093,707 17,920,302,000 21,880,448,000 9,280,950,000 -12,599,498,000 -57.6
L40 INTEREST ON LOANS 1,116,509,135 1,104,462,000 1,188,561,000 1,112,295,000 -76,266,000 -6.4
M00 CAPITAL RECEIPTS 14,592,475,518 16,951,140,000 14,043,792,000 13,581,145,000 -462,647,000 -3.3
M10 Sales of Land 14,534,160,680 16,948,884,000 14,042,735,000 13,521,270,000 -521,465,000 -3.7
M20 Sales of Capital Goods 56,818,638 1,896,000 803,000 59,875,000 59,072,000 n.a.
M30 Other Capital Receipts 1,496,200 360,000 254,000 0 -254,000 -100.0
P00 OTHERS (NON-OPERATING REVENUE)1 0 0 525,389,0002 0 -525,389,000 -100.0
TOTAL RECEIPTS 103,001,076,776 117,130,743,000 120,348,228,000 108,120,718,000 -12,227,510,000 -10.2
_______________________________________________ 1 This accounts for other revenues that are paid to past reserves (i.e. non-operating revenue), including the return of unutilised monies from non-government funds. 2 This accounts for unutilised monies that are returned from the CPF LIFE Bonus Fund and their accrued interest. This is due to lower-than-expected take-up rate for CPF LIFE Bonus.

4
TOTAL ESTIMATED RECEIPTS FOR FY2020 BY CATEGORY AND HEAD OF EXPENDITURE BLANK Investment BLANK Operating Revenue and BLANK Tax Fees and Interest Capital Total Code Head of Expenditure Revenue Charges Others Total Income Receipts Receipts
BLANK $ $ $ $ $ $ $ BLANK B Attorney-General's Chambers 0 4,842,000 0 4,842,000 0 0 4,842,000
C Auditor-General's Office 0 3,682,000 0 3,682,000 0 0 3,682,000 E Judicature 0 104,283,000 0 104,283,000 0 0 104,283,000 F Parliament 0 876,000 0 876,000 0 0 876,000 I Ministry of Social and Family
Development 0 5,628,000 0 5,628,000 0 0 5,628,000
J Ministry of Defence 0 50,210,000 0 50,210,000 340,000 1,000,000 51,550,000 K Ministry of Education 0 268,244,000 0 268,244,000 0 0 268,244,000 L Ministry of The Environment
and Water Resources 524,869,000 434,780,000 0 959,649,000 0 0 959,649,000
M Ministry of Finance 66,270,721,000 415,217,000 480,901,000 67,166,839,000 18,519,405,000 0 85,686,244,000 N Ministry of Foreign Affairs 0 63,094,000 1,356,000 64,450,000 0 762,000 65,212,000 O Ministry of Health 0 27,502,000 0 27,502,000 0 0 27,502,000 P Ministry of Home Affairs 0 239,454,000 93,000 239,547,000 0 0 239,547,000 Q Ministry of Communications
and Information 0 2,747,000 0 2,747,000 0 0 2,747,000
R Ministry of Law 0 1,165,447,000 0 1,165,447,000 9,381,000 13,520,750,000 14,695,578,000 S Ministry of Manpower 0 199,336,000 0 199,336,000 0 0 199,336,000 T Ministry of National
Development 200,000,000 115,093,000 37,000 315,130,000 0 642,000 315,772,000
U Prime Minister's Office 0 7,088,000 0 7,088,000 0 37,961,000 45,049,000 V Ministry of Trade and Industry 0 25,244,000 23,000 25,267,000 0 20,030,000 45,297,000
W Ministry of Transport 2,277,812,000 3,072,460,000 0 5,350,272,000 0 0 5,350,272,000 X Ministry of Culture, Community
and Youth 0 49,408,000 0 49,408,000 0 0 49,408,000
Total 69,273,402,000 6,254,635,000 482,410,000 76,010,447,000 18,529,126,000 13,581,145,000 108,120,718,000

EXPENDITURE ESTIMATES


5
TOTAL ESTIMATES OUTLAYS FOR FY2020 BY HEAD OF EXPENDITURE
BLANK Main EstimatesBLANK Development
Code Head of Expenditure Running Costs Transfers Other Outlays Total Estimates Total
BLANK $ $ $ $ $ $A Civil List for the President of the Republic of Singapore 9,491,100 0 0 9,491,100 0 9,491,100 B Attorney-General's Chambers 198,719,500 16,500 100,000 198,836,000 5,764,000 204,600,000 C Auditor-General's Office 37,986,200 180,500 5,900 38,172,600 2,275,000 40,447,600 D Cabinet Office 1,167,400 0 0 1,167,400 313,400 1,480,800E Judicature 296,872,500 0 0 296,872,500 83,564,900 380,437,400F Parliament 38,707,200 352,400 0 39,059,600 2,603,600 41,663,200 G Presidential Councils 806,000 0 0 806,000 0 806,000H Public Service Commission 1,755,200 0 0 1,755,200 0 1,755,200 I Ministry of Social and Family Development 481,140,300 2,666,738,300 22,193,300 3,170,071,900 102,581,800 3,272,653,700 J Ministry of Defence 14,535,304,800 9,095,700 16,755,000 14,561,155,500 889,200,000 15,450,355,500 K Ministry of Education 8,786,419,900 3,849,580,100 225,226,400 12,861,226,400 644,000,000 13,505,226,400 L Ministry of The Environment and Water Resources 1,718,248,300 9,752,200 100,000 1,728,100,500 1,243,512,600 2,971,613,100 M Ministry of Finance 863,156,000 77,181,000 3,806,500,300 4,746,837,300 158,428,400 4,905,265,700 N Ministry of Foreign Affairs 343,057,100 92,872,000 14,180,000 450,109,100 11,500,000 461,609,100 O Ministry of Health 2,376,766,000 9,320,069,300 30,900 11,696,866,200 1,713,083,800 13,409,950,000 P Ministry of Home Affairs 6,126,754,200 43,407,300 14,520,000 6,184,681,500 814,275,900 6,998,957,400 Q Ministry of Communications and Information 986,461,400 18,291,000 166,000 1,004,918,400 37,103,300 1,042,021,700 R Ministry of Law 221,793,700 21,870,100 39,630,000 283,293,800 145,379,100 428,672,900 S Ministry of Manpower 609,182,900 1,823,881,800 0 2,433,064,700 50,791,200 2,483,855,900T Ministry of National Development 2,735,747,200 273,786,900 0 3,009,534,100 9,992,249,700 13,001,783,800U Prime Minister's Office 791,903,200 31,668,900 10,000 823,582,100 226,169,400 1,049,751,500 V Ministry of Trade and Industry 1,266,860,400 49,545,000 126,000 1,316,531,400 6,541,521,000 7,858,052,400 W Ministry of Transport 1,972,220,800 20,616,700 0 1,992,837,500 9,484,729,700 11,477,567,200X Ministry of Culture, Community and Youth 1,636,066,700 253,111,200 0 1,889,177,900 390,036,800 2,279,214,700
Ministries and Organs of State 46,036,588,000 18,562,016,900 4,139,543,800 68,738,148,700 32,539,083,600 101,277,232,300
Z Financial Transfers 0 4,662,329,700 38,890,544,900 43,552,874,600 0 43,552,874,600
Total 46,036,588,000 23,224,346,600 43,030,088,700 112,291,023,300 32,539,083,600 144,830,106,900

6
MAIN ESTIMATES OUTLAYS FOR FY2020 BY HEAD OF EXPENDITURE
BLANK Statutory Expenditure
Amount to be voted BLANK Estimated Revised Estimated
Code Head of Expenditure FY2019 FY2019 FY2020 FY2020 FY2020 BLANK $ $ $ $ $ A Civil List for the President of the Republic of Singapore 9,491,100 9,491,100 9,491,100 9,491,100 0 B Attorney-General's Chambers 196,019,700 181,019,700 198,836,000 1,722,500 197,113,500 C Auditor-General's Office 32,819,500 32,760,000 38,172,600 158,300 38,014,300 D Cabinet Office 1,312,300 1,257,300 1,167,400 0 1,167,400 E Judicature 281,254,000 273,654,000 296,872,500 9,743,000 287,129,500 F Parliament 39,470,600 37,625,100 39,059,600 752,800 38,306,800 G Presidential Councils 802,400 775,400 806,000 0 806,000 H Public Service Commission 1,747,700 1,658,800 1,755,200 1,755,200 0 I Ministry of Social and Family Development 2,902,846,300 2,882,547,400 3,170,071,900 0 3,170,071,900 J Ministry of Defence 14,981,206,800 14,133,687,500 14,561,155,500 0 14,561,155,500 K Ministry of Education 12,705,098,400 12,255,124,200 12,861,226,400 0 12,861,226,400 L Ministry of The Environment and Water Resources 1,589,796,200 1,544,532,400 1,728,100,500 0 1,728,100,500 M Ministry of Finance 3,480,415,200 4,522,979,400 4,746,837,300 3,869,300,000 877,537,300 N Ministry of Foreign Affairs 474,995,400 457,055,500 450,109,100 0 450,109,100 O Ministry of Health 10,023,750,700 10,023,750,700 11,696,866,200 0 11,696,866,200 P Ministry of Home Affairs 5,777,979,300 5,747,531,500 6,184,681,500 0 6,184,681,500 Q Ministry of Communications and Information 987,540,000 1,052,760,000 1,004,918,400 0 1,004,918,400 R Ministry of Law 269,697,500 260,286,100 283,293,800 0 283,293,800 S Ministry of Manpower 1,910,685,500 1,960,728,200 2,433,064,700 0 2,433,064,700 T Ministry of National Development 2,494,963,300 2,646,071,000 3,009,534,100 0 3,009,534,100 U Prime Minister's Office 827,594,400 786,678,200 823,582,100 0 823,582,100 V Ministry of Trade and Industry 1,032,517,000 1,128,845,300 1,316,531,400 0 1,316,531,400 W Ministry of Transport 2,033,424,400 1,897,980,500 1,992,837,500 0 1,992,837,500 X Ministry of Culture, Community and Youth 1,670,579,200 1,675,769,800 1,889,177,900 0 1,889,177,900 Z Financial Transfers 41,359,697,300 41,328,077,200 43,552,874,600 0 43,552,874,600 BLANK
Total, MAIN ESTIMATES 105,085,704,200 104,842,646,300 112,291,023,300 3,892,922,900 108,398,100,400
Less: Expenses on Land Sales 37,522,200 32,626,000 39,630,000 0 39,630,000 Expenses on Investments 2,607,000,000 3,660,000,000 3,802,000,000 3,802,000,000 0 Transfers from Consolidated Revenue Account 39,623,193,700 39,631,193,700 38,890,544,900 0 38,890,544,900 Loans and Advances (Disbursement) 295,737,400 275,786,400 297,913,800 0 297,913,800 BLANK
Total, OPERATING EXPENDITURE 62,522,250,900 61,243,040,200 69,260,934,600 90,922,900 69,170,011,700

7
DEVELOPMENT ESTIMATES OUTLAYS FOR FY2020 BY HEAD OF EXPENDITURE
BLANK Amount to be voted Estimated BLANK Estimated Revised
Code Head of Expenditure FY2019 FY2019 FY2020
BLANK $ $ $ B Attorney-General's Chambers 12,545,000 12,545,000 5,764,000 C Auditor-General's Office 176,700 236,300 2,275,000 D Cabinet Office 283,200 0 313,400 E Judicature 205,926,500 205,926,500 83,564,900 F Parliament 1,635,000 1,593,800 2,603,600 I Ministry of Social and Family Development 115,657,400 112,107,700 102,581,800 J Ministry of Defence 761,800,000 761,800,000 889,200,000 K Ministry of Education 710,000,000 791,300,000 644,000,000 L Ministry of The Environment and Water Resources 1,170,516,600 1,090,261,600 1,243,512,600 M Ministry of Finance 152,563,600 60,208,400 158,428,400 N Ministry of Foreign Affairs 16,000,000 16,000,000 11,500,000 O Ministry of Health 1,698,806,800 1,514,878,000 1,713,083,800 P Ministry of Home Affairs 978,638,600 971,595,300 814,275,900 Q Ministry of Communications and Information 54,080,000 69,509,300 37,103,300 R Ministry of Law 323,398,500 322,866,700 145,379,100 S Ministry of Manpower 67,940,200 67,940,200 50,791,200 T Ministry of National Development 7,848,052,800 7,648,909,300 9,992,249,700 U Prime Minister's Office 196,666,600 178,996,000 226,169,400 V Ministry of Trade and Industry 4,755,830,400 4,357,171,900 6,541,521,000 W Ministry of Transport 9,513,685,300 9,066,569,700 9,484,729,700 X Ministry of Culture, Community and Youth 396,490,600 210,485,200 390,036,800
Total, DEVELOPMENT ESTIMATES 28,980,693,800 27,460,900,900 32,539,083,600
Less: Land-Related Expenditure 2,334,248,000 2,106,732,600 2,255,559,500
Loans 7,179,981,600 6,737,534,300 11,274,000,000
Loan Repayments 3,841,263,900 3,945,738,800 3,608,226,400
Net Lending 3,338,717,700 2,791,795,500 7,665,773,600
Total, DEVELOPMENT EXPENDITURE 19,466,464,200 18,616,634,000 19,009,524,100

8
ESTIMATED OUTLAYS FOR FY2020 BY OBJECT CLASS
BLANK Actual Estimated Revised Estimated
Code Object Class FY2018 FY2019 FY2019 FY2020 Change Over FY2019
BLANK MAIN ESTIMATES OUTLAYS $97,472,417,183 $105,085,704,200 $104,842,646,300 $112,291,023,300 $7,448,377,000 7.1%
OPERATING EXPENDITURE $59,249,188,101 $62,522,250,900 $61,243,040,200 $69,260,934,600 $8,017,894,400 13.1%
RUNNING COSTS $41,884,885,917 $44,209,921,400 $43,451,589,600 $46,036,588,000 $2,584,998,400 5.9%
Expenditure on Manpower $9,227,182,383 $9,577,513,700 $9,077,290,400 $9,542,992,900 $465,702,500 5.1%
1100 Civil List (Manpower) 6,427,322 5,856,900 5,856,900 5,856,900 0 0.0
1200 Political Appointments 44,533,512 47,823,900 47,068,800 46,802,500 -266,300 -0.6
1300 Parliamentary Appointments 21,812,818 21,674,000 20,276,400 21,217,100 940,700 4.6
1400 Other Statutory Appointments 57,711,057 59,571,600 59,404,300 59,372,400 -31,900 -0.1
1500 Permanent Staff 8,782,196,110 9,074,561,000 8,603,755,800 9,087,180,200 483,424,400 5.6
1600 Temporary, Daily-Rated & Other Staff 314,501,565 363,026,300 340,928,200 317,563,800 -23,364,400 -6.9
1800 Personnel Central Vote 0 5,000,000 0 5,000,000 5,000,000 n.a.
Other Operating Expenditure $19,615,351,320 $21,379,584,400 $20,897,946,600 $22,050,150,700 $1,152,204,100 5.5%
2100 Consumption of Products & Services 5,192,716,606 5,770,674,000 6,147,920,700 6,899,988,700 752,068,000 12.2
2200 Civil List (Others) 2,405,574 3,634,200 3,634,200 3,634,200 0 0.0
2300 Manpower Development 203,187,188 222,332,500 220,227,900 228,520,200 8,292,300 3.8
2400 International & Public Relations, Public Communications
305,990,415 336,738,700 367,178,600 315,421,300 -51,757,300 -14.1
2600 Programmes Central Vote 0 10,000,000 0 10,000,000 10,000,000 n.a.
2700 Asset Acquisition 126,008,370 129,445,600 98,354,500 100,933,300 2,578,800 2.6
2800 Miscellaneous 18,073,279 19,699,000 19,420,800 14,825,500 -4,595,300 -23.7
2900 Military Expenditure 13,766,969,888 14,887,060,400 14,041,209,900 14,476,827,500 435,617,600 3.1
Grants, Subventions & Capital Injections to Organisations
$13,042,352,214 $13,252,823,300 $13,476,352,600 $14,443,444,400 $967,091,800 7.2%
3100 Grants, Subventions & Capital Injections to Statutory Boards
8,861,938,967 8,834,756,800 8,754,156,700 9,540,201,300 786,044,600 9.0
3200 Grants, Subventions & Capital Injections to Educational Institutions
3,452,665,136 3,481,501,900 3,336,641,400 3,399,487,600 62,846,200 1.9
3400 Grants, Subventions & Capital Injections to Other Organisations
727,748,110 936,564,600 1,385,554,500 1,503,755,500 118,201,000 8.5
TRANSFERS $17,364,302,184 $18,312,329,500 $17,791,450,600 $23,224,346,600 $5,432,896,000 30.5%
3500 Social Transfers to Individuals 3,916,320,171 4,264,889,500 4,079,291,200 4,754,136,300 674,845,100 16.5
3600 Transfers to Institutions & Organisations 11,584,214,669 12,151,452,300 11,854,238,700 13,616,273,000 1,762,034,300 14.9
3700 Special Transfers 1,688,594,299 1,736,503,600 1,696,883,500 4,662,329,700 2,965,446,200 174.8
3800 International Organisations & Overseas Development Assistance
175,173,045 159,484,100 161,037,200 191,607,600 30,570,400 19.0
OTHER CONSOLIDATED FUND OUTLAYS $38,223,229,082 $42,563,453,300 $43,599,606,100 $43,030,088,700 -$569,517,400 -1.3%
4100 Expenses on Land Sales 31,953,999 37,522,200 32,626,000 39,630,000 7,004,000 21.5
4200 Expenses on Investments 2,360,415,362 2,607,000,000 3,660,000,000 3,802,000,000 142,000,000 3.9
4500 Transfers from Consolidated Revenue Account
35,830,859,721 39,623,193,700 39,631,193,700 38,890,544,900 -740,648,800 -1.9
4600 Loans and Advances (Disbursement) 0 295,737,400 275,786,400 297,913,800 22,127,400 8.0

9
BLANK Actual Estimated Revised Estimated
Code Object Class FY2018 FY2019 FY2019 FY2020 Change Over FY2019
BLANK DEVELOPMENT ESTIMATES OUTLAYS $27,195,820,504 $28,980,693,800 $27,460,900,900 $32,539,083,600 $5,078,182,700 18.5%
DEVELOPMENT EXPENDITURE $20,263,332,934 $19,466,464,200 $18,616,634,000 $19,009,524,100 $392,890,100 2.1%
5100 Government Development 5,852,334,100 6,968,485,700 6,324,049,800 7,230,466,200 906,416,400 14.3
5200 Grants & Capital Injections to Organisations 14,410,998,834 12,497,978,500 12,292,584,200 11,779,057,900 -513,526,300 -4.2
OTHER DEVELOPMENT FUND OUTLAYS $6,932,487,571 $9,514,229,600 $8,844,266,900 $13,529,559,500 $4,685,292,600 53.0%
5500 Land-Related Expenditure 2,235,303,375 2,334,248,000 2,106,732,600 2,255,559,500 148,826,900 7.1
5600 Loans 4,697,184,195 7,179,981,600 6,737,534,300 11,274,000,000 4,536,465,700 67.3
Loan Repayments1 4,904,225,002 3,841,263,900 3,945,738,800 3,608,226,400 -337,512,400 -8.6
Net Lending -207,040,807 3,338,717,700 2,791,795,500 7,665,773,600 4,873,978,100 174.6
TOTAL OUTLAYS $124,668,237,687 $134,066,398,000 $132,303,547,200 $144,830,106,900 $12,526,559,700 9.5%
Less: 0 0 0 0 0 0.0%
Other Consolidated Fund Outlays $38,223,229,082 $42,563,453,300 $43,599,606,100 $43,030,088,700 -$569,517,400 -1.3
Other Development Fund Outlays $6,932,487,571 $9,514,229,600 $8,844,266,900 $13,529,559,500 $4,685,292,600 53.0
BLANK
TOTAL EXPENDITURE $79,512,521,035 $81,988,715,100 $79,859,674,200 $88,270,458,700 $8,410,784,500 10.5%
_______________________________________________ 1 Repayments of government loans by Statutory Boards and public enterprises.

10
TOTAL EXPENDITURE FOR FY2020 BY SECTOR AND MINISTRY
BLANK Operating Expenditure Development Expenditure Total Expenditure Sector/Ministry $ % Allocation $ % Allocation $ % Allocation
Social Development 36,051,340,300 55.8 5,538,368,900 29.1 41,589,709,200 49.7
Health 11,696,835,300 18.1 1,713,083,800 9.0 13,409,919,100 16.0
Education 12,636,000,000 19.6 644,000,000 3.4 13,280,000,000 15.9
National Development 3,009,534,100 4.7 1,448,518,400 7.6 4,458,052,500 5.3
Social and Family Development 3,147,878,600 4.9 102,581,800 0.5 3,250,460,400 3.9
The Environment and Water Resources 1,728,000,500 2.7 1,215,988,500 6.4 2,943,989,000 3.5
Culture, Community and Youth 1,889,177,900 2.9 390,036,800 2.1 2,279,214,700 2.7
Manpower1 1,449,527,100 2.2 0 n.a. 1,449,527,100 1.7
Communications and Information 494,386,800 0.8 24,159,600 0.1 518,546,400 0.6
Security & External Relations 21,150,491,100 32.7 1,366,975,900 7.2 22,517,467,000 26.9
Defence 14,544,400,500 22.5 541,200,000 2.8 15,085,600,500 18.0
Home Affairs 6,170,161,500 9.6 814,275,900 4.3 6,984,437,400 8.4
Foreign Affairs 435,929,100 0.7 11,500,000 0.1 447,429,100 0.5
Economic Development 4,803,146,100 7.4 11,479,681,500 60.4 16,282,827,600 19.5
Transport 1,992,837,500 3.1 8,919,695,900 46.9 10,912,533,400 13.1
Trade and Industry 1,316,405,400 2.0 2,496,250,700 13.1 3,812,656,100 4.6
Manpower3 983,537,600 1.5 50,791,200 0.3 1,034,328,800 1.2
Communications and Information2 510,365,600 0.8 12,943,700 0.1 523,309,300 0.6
Government Administration 2,593,627,400 4.0 624,497,800 3.3 3,218,125,200 3.8
Finance 940,337,000 1.5 158,428,400 0.8 1,098,765,400 1.3
Prime Minister's Office 823,572,100 1.3 226,169,400 1.2 1,049,741,500 1.3
Organs Of State 586,054,500 0.9 94,520,900 0.5 680,575,400 0.8
Law 243,663,800 0.4 145,379,100 0.8 389,042,900 0.5
TOTAL EXPENDITURE 64,598,604,900 100.0 19,009,524,100 100.0 83,608,129,000 100.0
_______________________________________________ 1 Manpower expenditure under the Social Development sector refers to expenditure under the Financial Security for Singaporeans programme. 2 Communications and Information expenditure under the Economic Development sector refers to expenditure under the Info-communications Media Development Authority and
Cyber Security Agency of Singapore programmes.

11
_______________________________________________ 1 Manpower expenditure under the Social Development sector refers to expenditure under the Financial Security for Singaporeans programme. 2 Communications and Information expenditure under the Economic Development sector refers to expenditure under the Info-communications Media Development Authority and
Cyber Security Agency of Singapore programmes. 3 Combined expenditure in respect of Heads A to H.
0
1
2
3
4
5
6
7
8
9
10
11
12
13
14
15
16
17
$
BILLION
TOTAL EXPENDITURE FOR FY2020 BY SECTOR AND MINISTRY
Social Development Security and External Relations
Economic Development
Government Administration
Ed
uca
tion
He
alth
La
w
Na
tion
al D
eve
lop
me
nt Ho
me
Affa
irs
De
fen
ce
Tra
nsp
ort
Fo
reig
n A
ffairs
Fin
anc
e
Tra
de
and
Ind
ustr
y
Pri
me
Min
iste
r's O
ffic
e
Org
ans
of S
tate
3
Cul
ture
, C
omm
un
ity a
nd
You
th
So
cia
l an
d F
amily
De
velo
pm
en
t
Ma
npo
we
r1
Co
mm
unic
atio
ns a
nd I
nfo
rrm
atio
n2
The
Env
iron
men
t a
nd
Wa
ter
Re
sou
rce
s
Man
pow
er
Co
mm
unic
atio
ns a
nd In
form
atio
n

12
COMPARISON ESTIMATED FY2020 AND REVISED FY2019 TOTAL EXPENDITURE
BLANK Revised 2019 Estimated 2020 Change over FY2019 Sector/Ministry $ % Allocation $ % Allocation $ %
BLANK
Social Development 37,138,881,900 47.5 41,589,709,200 49.7 4,450,827,300 12.0
Health 11,537,735,700 14.8 13,409,919,100 16.0 1,872,183,400 16.2
Education 12,830,300,000 16.4 13,280,000,000 15.9 449,700,000 3.5
National Development 3,647,827,300 4.7 4,458,052,500 5.3 810,225,200 22.2
Social and Family Development 2,994,655,100 3.8 3,250,460,400 3.9 255,805,300 8.5
The Environment and Water Resources 2,626,828,300 3.4 2,943,989,000 3.5 317,160,700 12.1
Culture, Community and Youth 1,886,250,100 2.4 2,279,214,700 2.7 392,964,600 20.8
Manpower1 1,066,371,200 1.4 1,449,527,100 1.7 383,155,900 35.9
Communications and Information 548,914,200 0.7 518,546,400 0.6 -30,367,800 -5.5
Security & External Relations 21,775,741,700 27.9 22,517,467,000 26.9 741,725,300 3.4
Defence 14,622,621,400 18.7 15,085,600,500 18.0 462,979,100 3.2
Home Affairs 6,702,924,800 8.6 6,984,437,400 8.4 281,512,600 4.2
Foreign Affairs 450,195,500 0.6 447,429,100 0.5 -2,766,400 -0.6
Economic Development 16,054,351,500 20.5 16,282,827,600 19.5 228,476,100 1.4
Transport 10,187,466,700 13.0 10,912,533,400 13.1 725,066,700 7.1
Trade and Industry 4,331,352,500 5.5 3,812,656,100 4.6 -518,696,400 -12.0
Manpower 962,297,200 1.2 1,034,328,800 1.2 72,031,600 7.5
Communications and Information2 573,235,100 0.7 523,309,300 0.6 -49,925,800 -8.7
Government Administration 3,193,815,600 4.1 3,218,125,200 3.8 24,309,600 0.8
Finance 919,187,500 1.2 1,098,765,400 1.3 179,577,900 19.5
Prime Minister's Office 965,664,200 1.2 1,049,741,500 1.3 84,077,300 8.7
Organs of State 758,437,100 1.0 680,575,400 0.8 -77,861,700 -10.3
Law 550,526,800 0.7 389,042,900 0.5 -161,483,900 -29.3 BLANK
TOTAL EXPENDITURE 78,162,790,700 100 83,608,129,000 100 5,445,338,300 7.0
_______________________________________________
1 Manpower expenditure under the Social Development sector refers to expenditure under the Financial Security for Singaporeans programme. 2 Communications and Information expenditure under the Economic Development sector refers to expenditure under the Info-communications Media Development Authority and Cyber
Security Agency of Singapore programmes.
II _____
STATEMENT OF ASSETS AND
LIABILITIES


13
STATEMENT OF ASSETS AND LIABILITIES AS AT 31ST MARCH 2019
Actual FY2018
$ASSETS
CASH 44,301,964,431
INVESTMENTS 1,130,006,111,832
Government Stocks 382,451,404,802 Other Investments – Quoted 429,573,915,898 Other Investments – Unquoted 310,523,835,455 Deposits with Investment Agents 7,456,955,677
1,174,308,076,263
LIABILITIES
DEPOSIT ACCOUNTS 41,215,377,690
FUND SET ASIDE FOR SPECIFIC PURPOSES 795,159,164,627
Development Fund 119,536,551,308 Revolving Fund - Contingencies Fund 1,000,000,000 Development Contingencies Fund 2,000,000,000 Government Securities Fund 609,404,916,051 Developmental Investment Fund 10,911,557,612 Pension Fund 12,857,437,451 Saver - Premium Fund 1,761,078,867 INVEST Fund 1,313,334,705 Edusave Endowment Fund 6,728,202,460 LifeLong Learning Endowment Fund 4,953,882,864 Medical Endowment Fund 4,652,379,071 ElderCare Fund 2,907,892,616 CONNECT Fund 574,693,396 Community Care Endowment Fund 1,925,324,947 National Research Fund 2,166,011,633 Goods and Services Tax Voucher Fund 5,424,573,939 Pioneer Generation Fund 7,036,760,035 Public Transport Fund 4,567,671
GENERAL BALANCE
Consolidated Fund 337,933,533,946
1,174,308,076,263
_______________________________________ Note: Due to rounding, figures may not add up.


III _____
EXPENDITURE ESTIMATES BY HEAD OF EXPENDITURE


Organs of State
_____________
Head A Civil List for the President of the Republic of Singapore
Head B Attorney-General's Chambers
Head C Auditor-General's Office
Head D Cabinet Office
Head E Judicature
Head F Parliament
Head G Presidential Councils
Head H Public Service Commission


15
HEAD A
CIVIL LIST FOR THE PRESIDENT OF THE REPUBLIC OF SINGAPORE
OVERVIEW
Mission Statement
To enable the President of the Republic of Singapore to perform his Constitutional, Ceremonial and Community role.
FY2020 EXPENDITURE ESTIMATES
Expenditure Estimates by Object Class
BLANK Actual Estimated Revised Estimated Code Object Class FY2018 FY2019 FY2019 FY2020 Change Over FY2019
BLANK
TOTAL EXPENDITURE $8,832,896 $9,491,100 $9,491,100 $9,491,100 $0 0.0%
Main Estimates $8,832,896 $9,491,100 $9,491,100 $9,491,100 $0 0.0%
OPERATING EXPENDITURE1 $8,832,896 $9,491,100 $9,491,100 $9,491,100 $0 0.0%
RUNNING COSTS $8,832,896 $9,491,100 $9,491,100 $9,491,100 $0 0.0%
Expenditure on Manpower $6,427,322 $5,856,900 $5,856,900 $5,856,900 $0 0.0%
1100 Civil List (Manpower) 6,427,322 5,856,900 5,856,900 5,856,900 0 0.0
Other Operating Expenditure $2,405,574 $3,634,200 $3,634,200 $3,634,200 $0 0.0%
2200 Civil List (Others) 2,405,574 3,634,200 3,634,200 3,634,200 0 0.0
_______________________________________________ 1 Statutory Expenditure.

16
Establishment List
BLANK Actual Estimated Revised Estimated Category/Personnel FY2018 FY2019 FY2019 FY2020
BLANK
CIVIL LIST 56 67 67 67
President 1 1 1 1
Administrative 1 1 1 1
Aide-de-Camp 3 3 3 3
Butler (2013) 20 26 26 26
Cook (2013) 3 4 4 4
Corporate Support 1 1 1 1
Driving 3 4 4 4
Information Service (2008) 2 4 4 4
Management Executive Scheme (2008) 15 15 17 17
Management Support Scheme (2008) 5 5 3 3
Operations Support 1 1 1 1
Shorthand Writers 1 2 2 2
TOTAL 56 67 67 67
17
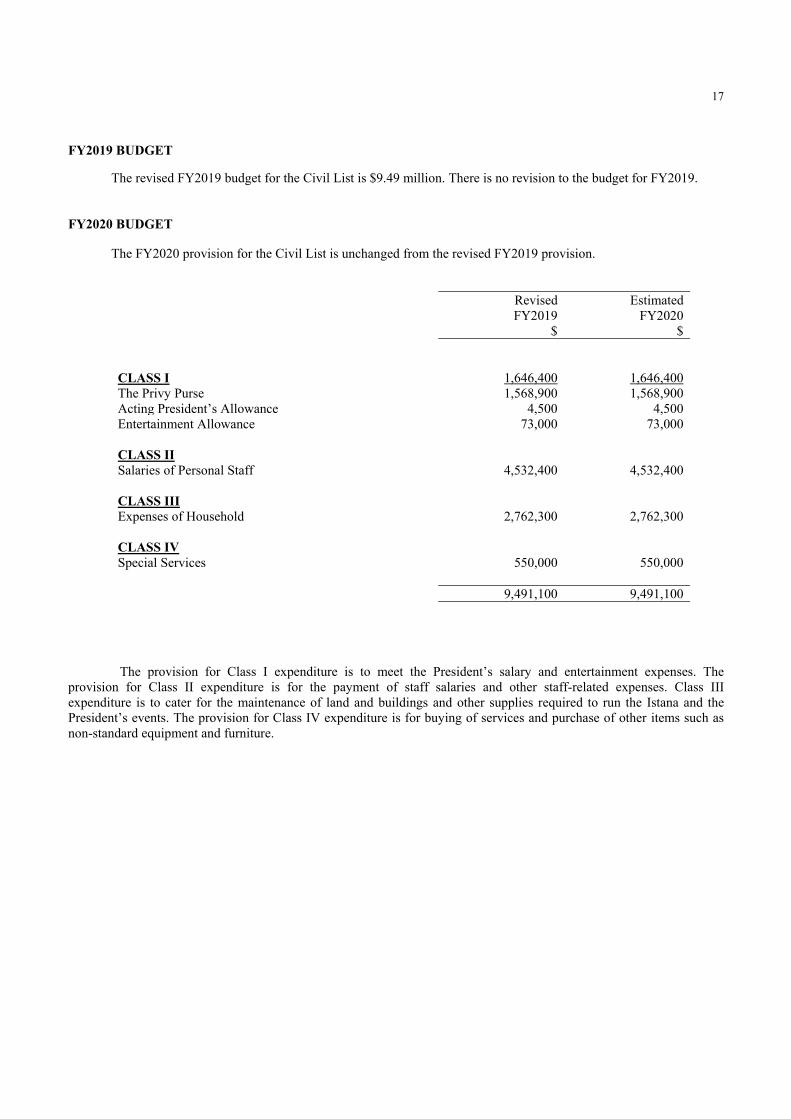
FY2019 BUDGET
The revised FY2019 budget for the Civil List is $9.49 million. There is no revision to the budget for FY2019. FY2020 BUDGET
The FY2020 provision for the Civil List is unchanged from the revised FY2019 provision.
Revised Estimated FY2019 FY2020 $ $ CLASS I 1,646,400 1,646,400 The Privy Purse 1,568,900 1,568,900 Acting President’s Allowance 4,500 4,500 Entertainment Allowance 73,000 73,000 CLASS II Salaries of Personal Staff 4,532,400 4,532,400 CLASS III Expenses of Household 2,762,300 2,762,300 CLASS IV Special Services 550,000 550,000 9,491,100 9,491,100
The provision for Class I expenditure is to meet the President’s salary and entertainment expenses. The provision for Class II expenditure is for the payment of staff salaries and other staff-related expenses. Class III expenditure is to cater for the maintenance of land and buildings and other supplies required to run the Istana and the President’s events. The provision for Class IV expenditure is for buying of services and purchase of other items such as non-standard equipment and furniture.

18
Total Expenditure by Programme
BLANK Running Operating Development Total Code Programme Costs Transfers Expenditure Expenditure Expenditure
BLANK
A-A Civil List 9,491,100 0 9,491,100 0 9,491,100
Total $9,491,100 $0 $9,491,100 $0 $9,491,100

19
HEAD B
ATTORNEY-GENERAL'S CHAMBERS
OVERVIEW
Mission Statement
Serving Singapore's interests and upholding the rule of law through sound advice, effective representation, fair and independent prosecution and accessible legislation.
FY2020 EXPENDITURE ESTIMATES
Expenditure Estimates by Object Class
BLANK Actual Estimated Revised Estimated Code Object Class FY2018 FY2019 FY2019 FY2020 Change Over FY2019
BLANK
TOTAL EXPENDITURE $169,079,053 $208,464,700 $193,464,700 $204,500,000 $11,035,300 5.7%
Main Estimates $161,775,113 $196,019,700 $181,019,700 $198,836,000 $17,816,300 9.8%
OPERATING EXPENDITURE1 $161,775,113 $195,919,700 $180,919,700 $198,736,000 $17,816,300 9.8%
RUNNING COSTS $161,713,328 $195,854,200 $180,903,200 $198,719,500 $17,816,300 9.8%
Expenditure on Manpower $129,488,444 $150,795,300 $136,942,500 $146,778,900 $9,836,400 7.2%
1400 Other Statutory Appointments 5,782,583 6,072,000 6,072,000 6,072,000 0 0.0
1500 Permanent Staff 123,701,393 144,718,300 130,817,500 140,651,900 9,834,400 7.5
1600 Temporary, Daily-Rated & Other Staff 4,468 5,000 53,000 55,000 2,000 3.8
Other Operating Expenditure $28,564,884 $41,398,900 $40,300,700 $48,280,600 $7,979,900 19.8%
2100 Consumption of Products & Services 21,632,136 28,512,600 28,428,300 36,284,600 7,856,300 27.6
2300 Manpower Development 4,080,429 5,687,100 5,001,100 6,871,100 1,870,000 37.4
2400 International & Public Relations, Public Communications
863,513 1,233,200 824,900 1,540,900 716,000 86.8
2700 Asset Acquisition 149,738 1,966,000 2,046,400 1,534,000 -512,400 -25.0
2800 Miscellaneous 1,839,069 4,000,000 4,000,000 2,050,000 -1,950,000 -48.8
Grants, Subventions & Capital Injections to Organisations
$3,660,000 $3,660,000 $3,660,000 $3,660,000 $0 0.0%
3200 Grants, Subventions & Capital Injections to Educational Institutions
3,660,000 3,660,000 3,660,000 3,660,000 0 0.0
TRANSFERS $61,784 $65,500 $16,500 $16,500 $0 0.0%
3500 Social Transfers to Individuals 41,440 49,000 0 0 0 n.a.
3600 Transfers to Institutions & Organisations 5,000 0 0 0 0 n.a.
3800 International Organisations & Overseas Development Assistance
15,344 16,500 16,500 16,500 0 0.0

20
BLANK Actual Estimated Revised Estimated Code Object Class FY2018 FY2019 FY2019 FY2020 Change Over FY2019
BLANK
OTHER CONSOLIDATED FUND OUTLAYS $0 $100,000 $100,000 $100,000 $0 0.0%
4600 Loans and Advances (Disbursement) 0 100,000 100,000 100,000 0 0.0
Development Estimates $7,303,940 $12,545,000 $12,545,000 $5,764,000 -$6,781,000 -54.1%
DEVELOPMENT EXPENDITURE $7,303,940 $12,545,000 $12,545,000 $5,764,000 -$6,781,000 -54.1%
5100 Government Development 7,303,940 12,545,000 12,545,000 5,764,000 -6,781,000 -54.1
_______________________________________________ 1 Estimated FY2020 includes $1,722,500 Statutory Expenditure ($1,660,000 Expenditure on Manpower and $62,500 Other Operating Expenditure).
Establishment List
BLANK Actual Estimated Revised Estimated Category/Personnel FY2018 FY2019 FY2019 FY2020
BLANK
OTHER STATUTORY APPOINTMENTS 3 3 3 3
Attorney-General 1 1 1 1
Deputy Attorney-General 2 2 2 2
PERMANENT STAFF 604 649 654 674
Accounting Profession (2008) 0 0 1 1
Corporate Support 10 12 8 8
Information Service (2008) 0 0 2 2
Legal 343 356 376 394
Management Executive Scheme (2008) 196 198 215 217
Management Support Scheme (2008) 40 67 39 39
Operations Support 14 15 13 13
Shorthand Writers 1 1 0 0
TOTAL 607 652 657 677

21
FY2019 BUDGET
The revised FY2019 expenditure of the Attorney-General's Chambers (AGC) is $193.46 million, an increase of $24.38 million or 14.4% over the actual FY2018 expenditure of $169.08 million. Of this, $180.92 million or 93.5% is for operating expenditure and $12.54 million or 6.5% is for development expenditure.
Operating Expenditure
The revised FY2019 operating expenditure of $180.92 million is an increase of $19.14 million or 11.8% over the actual FY2018 operating expenditure of $161.78 million. This is mainly due to an increase in expenditure on manpower and other operating expenditure. Development Expenditure
The revised FY2019 development expenditure of $12.55 million is an increase of $5.25 million over the actual FY2018 development expenditure of $7.30 million. This is mainly due to the increase in minor development works for AGC’s office expansion and satellite offices.
FY2020 BUDGET
The FY2020 total expenditure of AGC is projected to be $204.50 million, an increase of $11.04 million or 5.7% over the revised FY2019 estimate of $193.46 million. Of this, $198.74 million or 97.2% is for operating expenditure and $5.76 million or 2.8% is for development expenditure. Operating Expenditure
FY2020 operating expenditure is projected to be $198.74 million, an increase of $17.82 million or 9.8% over the revised FY2019 operating expenditure. This is mainly due to an increase in expenditure on manpower and other operating expenditure.
Development Expenditure
FY2020 development expenditure is projected to be $5.76 million, as compared to $12.55 million in revised FY2019 due to the completion of minor development works for AGC’s office expansion and satellite offices in FY2019.
Other Consolidated Fund Outlays Advances for FY2020 are projected to be $100,000, mainly to cater to travel-related needs for AGC officers.

22
Total Expenditure by Programme
BLANK Running Operating Development Total Code Programme Costs Transfers Expenditure Expenditure Expenditure
BLANK
B-A Legal Services 198,719,500 16,500 198,736,000 5,764,000 204,500,000
Total $198,719,500 $16,500 $198,736,000 $5,764,000 $204,500,000
Development Expenditure by Project
BLANK Actual
Expenditure Up to end of
BLANK
BLANK Total Actual Estimated Revised Estimated Project Title Project Cost FY2017 FY2018 FY2019 FY2019 FY2020
BLANK
DEVELOPMENT EXPENDITURE … … $7,303,940 $12,545,000 $12,545,000 $5,764,000
GOVERNMENT DEVELOPMENT … … 7,303,940 12,545,000 12,545,000 5,764,000
Legal Services Programme … … 2 2 2 2
AGC Intelligent Workspace 12,400,000 0 4,752,699 4,000,000 4,000,000 1,300,000
Minor Development Projects … … 2,551,241 8,545,000 8,545,000 4,464,000

23
KEY PERFORMANCE INDICATORS
Desired Outcomes
• Effective, sound, efficient and modern legislative framework
• Decisions and actions of public officers that comply with legal principles
• A Government which is effectively and professionally represented in all legal matters
• A just and effective criminal prosecutorial system
• A nation which abides by international law
• A rule-based regional and multilateral trading system as well as bilateral arrangements with key or strategic trading partners which safeguards and enhances Singapore’s interests
Key Performance Indicators Actual Actual Revised Estimated
Desired Outcome Performance Indicator FY2017 FY2018 FY2019 FY2020
Effective, sound, efficient and modern legislative framework
Ranking of Singapore’s legal framework in the IMD’s World Competitiveness Yearbook
2nd
2nd
1st 2nd
Decisions and actions of public officers that comply with legal principles
Number of successful Judicial Reviews of decisions/actions of public officers when taken/acting in accordance with AGC’s legal advice
0
0
0 0
A Government which is effectively and professionally represented in all legal matters
Number of instances of justifiable complaint by Government Ministries/Departments about the lack of legal support by AGC where AGC has the resources to provide the required support
0
0
0 0
A just and effective criminal prosecutorial system
% of all criminal cases (both in the High Court and the State Courts) that are proceeded with as scheduled
99.9
99.9
99.9 99.9
Number of findings/determinations by any competent
court or tribunal that there has been any frivolous or vexatious prosecution
0
0
0 0

24
Actual Actual Revised Estimated
Desired Outcome Performance Indicator FY2017 FY2018 FY2019 FY2020
A nation which abides by international law
Number of instances of justifiable allegations by any sovereign government or state or any international organisation confirmed by a determinative finding of a competent and reputable international tribunal that Singapore has breached any rule of international law, including treaties or conventions, in relation to any matter where AGC’s legal advice has been accepted and applied
0 0
0
0
Number of instances of determinative finding by a
competent and reputable international tribunal that Singapore has breached any rule of international law including treaties and conventions, in relation to any matter where AGC’s legal advice has been accepted and applied
0 0
0
0
Number of instances of determinative finding by a
competent court in Singapore that Singapore has failed to honour its legal obligations contained in any international, bilateral or regional treaty or convention by means of domestic laws, in relation to any matter where AGC’s legal advice has been accepted and applied
0 0
0
0
A rule-based regional and multilateral trading system as well as bilateral arrangements with key or strategic trading partners which safeguards and enhances Singapore’s interests
% of participation at international and/or regional negotiations of trade agreements at forums such as WTO, ASEAN and APEC as well as bilateral negotiations with key or strategic trading partners participated in by AGC, at the request of the Ministry of Trade & Industry and other relevant agencies, to safeguard and enhance Singapore’s interests
99.0 99.11 99.22 95.03
1 Figure updated based on actual FY2018 statistics 2 Figure revised based on data for Apr – Oct 2019 3 Figure estimated based on benchmark

25
HEAD C
AUDITOR-GENERAL'S OFFICE
OVERVIEW
Mission Statement
To audit and report to the President and Parliament on the proper accounting and use of public resources so as to enhance public accountability and help strengthen the financial governance of the public service.
FY2020 EXPENDITURE ESTIMATES
Expenditure Estimates by Object Class
BLANK Actual Estimated Revised Estimated Code Object Class FY2018 FY2019 FY2019 FY2020 Change Over FY2019
BLANK
TOTAL EXPENDITURE $32,162,238 $32,990,400 $32,990,400 $40,441,700 $7,451,300 22.6%
Main Estimates $31,997,447 $32,819,500 $32,760,000 $38,172,600 $5,412,600 16.5%
OPERATING EXPENDITURE1 $31,997,447 $32,813,700 $32,754,100 $38,166,700 $5,412,600 16.5%
RUNNING COSTS $31,921,924 $32,699,200 $32,580,600 $37,986,200 $5,405,600 16.6%
Expenditure on Manpower $26,982,002 $27,473,100 $26,674,100 $29,114,200 $2,440,100 9.1%
1400 Other Statutory Appointments 1,071,420 1,007,300 928,900 937,300 8,400 0.9
1500 Permanent Staff 25,897,433 26,454,800 25,736,000 28,158,900 2,422,900 9.4
1600 Temporary, Daily-Rated & Other Staff 13,149 11,000 9,200 18,000 8,800 95.7
Other Operating Expenditure $4,939,922 $5,226,100 $5,906,500 $8,872,000 $2,965,500 50.2%
2100 Consumption of Products & Services 4,232,252 4,342,700 4,862,200 7,120,500 2,258,300 46.4
2300 Manpower Development 402,765 516,000 662,200 903,600 241,400 36.5
2400 International & Public Relations, Public Communications
47,564 99,300 81,800 87,500 5,700 7.0
2700 Asset Acquisition 257,342 268,100 300,300 760,400 460,100 153.2
TRANSFERS $75,523 $114,500 $173,500 $180,500 $7,000 4.0%
3500 Social Transfers to Individuals 65,142 103,000 162,000 169,000 7,000 4.3
3600 Transfers to Institutions & Organisations 1,500 1,500 1,500 1,500 0 0.0
3800 International Organisations & Overseas Development Assistance
8,881 10,000 10,000 10,000 0 0.0
OTHER CONSOLIDATED FUND OUTLAYS
$0 $5,800 $5,900 $5,900 $0 0.0%
4600 Loans and Advances (Disbursement) 0 5,800 5,900 5,900 0 0.0
Development Estimates $164,791 $176,700 $236,300 $2,275,000 $2,038,700 862.8%
DEVELOPMENT EXPENDITURE $164,791 $176,700 $236,300 $2,275,000 $2,038,700 862.8%
5100 Government Development 164,791 176,700 236,300 2,275,000 2,038,700 862.8
_______________________________________________ 1 Estimated FY2020 includes $158,300 Statutory Expenditure (Expenditure on Manpower).

26
Establishment List
BLANK Actual Estimated Revised Estimated Category/Personnel FY2018 FY2019 FY2019 FY2020
BLANK
OTHER STATUTORY APPOINTMENTS 1 1 1 1
Auditor-General 1 1 1 1
PERMANENT STAFF 185 205 205 205
Auditing Service (2011) 159 179 178 179
Management Executive Scheme (2008) 12 11 15 17
Management Support Scheme (2008) 11 12 9 6
Operations Support 3 3 3 3
TOTAL 186 206 206 206

27
FY2019 BUDGET
The revised FY2019 expenditure of the Auditor-General’s Office (AGO) is projected to be $32.99 million. This is an increase of $0.83 million or 2.6% over the actual FY2018 expenditure of $32.16 million.
FY2020 BUDGET
The total expenditure of AGO in FY2020 is expected to be $40.44 million, an increase of $7.45 million or 22.6% over the revised FY2019 expenditure of $32.99 million. Of this, $38.17 million or 94.4% is for operating expenditure and $2.28 million or 5.6% is for development expenditure. Operating Expenditure
The provision of $38.17 million for FY2020 operating expenditure is an increase of $5.42 million or 16.5% over the revised FY2019 operating expenditure of $32.75 million. The increase in Expenditure on Manpower is mainly due to the filling up of vacancies. The increase in Other Operating Expenditure is mainly due to higher information and communication technology (ICT) costs, higher expenditure on professional training and development, and renewal of software licences.
Development Expenditure
The provision of $2.28 million for FY2020 development expenditure is an increase of $2.04 million over the revised FY2019 development expenditure of $0.24 million. The increase is mainly to fund the development of new IT systems and renovation works.
Other Consolidated Fund Outlays
Advances to public officers on official duty overseas are projected to be $5,900 for FY2020.

28
Total Expenditure by Programme
BLANK Running Operating Development Total Code Programme Costs Transfers Expenditure Expenditure Expenditure
BLANK
C-A Audit 37,986,200 180,500 38,166,700 2,275,000 40,441,700
TOTAL $37,986,200 $180,500 $38,166,700 $2,275,000 $40,441,700
Development Expenditure by Project
BLANK Actual
Expenditure Up to end of
BLANK
BLANK Total Actual Estimated Revised Estimated Project Title Project Cost FY2017 FY2018 FY2019 FY2019 FY2020
BLANK
DEVELOPMENT EXPENDITURE … … $164,791 $176,700 $236,300 $2,275,000
GOVERNMENT DEVELOPMENT … … 164,791 176,700 236,300 2,275,000
Audit Programme … … 1 1 1 1
Minor Development Projects … … 164,791 176,700 236,300 2,275,000

29
KEY PERFORMANCE INDICATORS
Desired Outcomes
• Enhanced accountability of Statutory Boards and Funds
• Timely submission of the Annual Report of the Auditor-General to the President
• Timely completion of audits of the Government Financial Statements and other accounts audited by the Auditor-General
Key Performance Indicators Actual Actual Revised Estimated
Desired Outcome Performance Indicator FY2017 FY2018 FY2019 FY2020 Enhanced accountability of Statutory Boards and Funds
Total number of Statutory Boards and Funds1 audited each year
133 143 133 133
% of 10 largest Statutory Boards and 3 largest Funds2
audited at least once in 5 years 100 100 100 100
% of other Statutory Boards and Funds audited at least
once in 7 years 100 100 100 100
Timely submission of the Annual Report of the Auditor-General to the President
Submission of the Annual Report of the Auditor-General to the President by the second working day of July
3 Jul 2018 2 Jul 2019 2 Jul 2020 2 Jul 2021
Timely completion of audits of the Government Financial Statements and other accounts audited by the Auditor-General
% of audit reports signed within 3 months of the close of the financial year
100 100 100 100
1 Funds whose enabling Acts provide for the Auditor-General to audit the accounts and for the accounts to be presented to Parliament. 2 The 10 largest Statutory Boards and 3 largest Funds are determined based on auditable dollars, which reflects the size and complexity of the operations of the entity. Auditable dollars are the sum of the revenue, expenditure, assets and liabilities of an entity. 3 This does not include thematic audits which AGO started conducting in FY2017/18. A thematic audit may involve more than one public sector entity. For example, the first thematic audit conducted in FY2017/18 was on selected Research and Development grant programmes managed by the Agency for Science, Technology and Research and the National Research Foundation. The second thematic audit conducted in FY2018/19 was on selected social grant programmes managed by the Ministry of Health and the Ministry of Social and Family Development.


31
HEAD D
CABINET OFFICE
OVERVIEW
Mission Statement
To provide secretariat and administrative support to the Cabinet.
FY2020 EXPENDITURE ESTIMATES
Expenditure Estimates by Object Class
BLANK Actual Estimated Revised Estimated Code Object Class FY2018 FY2019 FY2019 FY2020 Change Over FY2019
BLANK
TOTAL EXPENDITURE $1,006,492 $1,595,500 $1,257,300 $1,480,800 $223,500 17.8%
Main Estimates $1,006,492 $1,312,300 $1,257,300 $1,167,400 -$89,900 -7.2%
OPERATING EXPENDITURE $1,006,492 $1,312,300 $1,257,300 $1,167,400 -$89,900 -7.2%
RUNNING COSTS $1,006,492 $1,312,300 $1,257,300 $1,167,400 -$89,900 -7.2%
Expenditure on Manpower $784,013 $792,700 $752,700 $750,000 -$2,700 -0.4%
1500 Permanent Staff 784,013 792,700 752,700 750,000 -2,700 -0.4
Other Operating Expenditure $222,478 $519,600 $504,600 $417,400 -$87,200 -17.3%
2100 Consumption of Products & Services 196,196 491,600 393,600 380,900 -12,700 -3.2
2300 Manpower Development 26,282 28,000 26,000 23,500 -2,500 -9.6
2700 Asset Acquisition 0 0 85,000 13,000 -72,000 -84.7
Development Estimates $0 $283,200 $0 $313,400 $313,400 n.a.
DEVELOPMENT EXPENDITURE $0 $283,200 $0 $313,400 $313,400 n.a.
5100 Government Development 0 283,200 0 313,400 313,400 n.a.

32
Establishment List
BLANK Actual Estimated Revised Estimated Category/Personnel FY2018 FY2019 FY2019 FY2020
BLANK
PERMANENT STAFF 11 12 10 12
Administrative 1 2 1 2
Corporate Support 3 3 2 3
Management Executive Scheme (2008) 2 2 2 2
Management Support Scheme (2008) 2 2 2 2
Operations Support 2 2 2 2
Operations Support Scheme (Driving) 1 1 1 1
TOTAL 11 12 10 12

33
FY2019 BUDGET
The revised FY2019 total expenditure for the Cabinet Office is $1.26 million, an increase of $0.25 million or 24.9% over the actual FY2018 expenditure of $1.01 million. The increase is due to higher operating expenditure. FY2020 BUDGET The total expenditure of the Cabinet Office for FY2020 is expected to be $1.48 million, an increase of $0.22 million or 17.8% over the revised FY2019 total expenditure. Of this, $1.17 million or 78.8% is for operating expenditure, and $0.31 million or 21.2% is for development expenditure.
Operating Expenditure The provision of $1.17 million for operating expenditure is a decrease of $0.09 million or 7.2% over the revised FY2019 operating expenditure. The decrease is due mainly to lower expenditure on consumption of products and services.
Development Expenditure The provision of $0.31 million is required for system upgrades and technology refresh of Cabinet Office’s records system software and hardware, which was re-scheduled from FY2019.

34
Total Expenditure by Programme
BLANK Running Operating Development Total Code Programme Costs Transfers Expenditure Expenditure Expenditure
BLANK
D-A Administration 1,167,400 0 1,167,400 313,400 1,480,800
Total $1,167,400 $0 $1,167,400 $313,400 $1,480,800
Development Expenditure by Project
BLANK Actual
Expenditure Up to end of
BLANK
BLANK Total Actual Estimated Revised Estimated Project Title Project Cost FY2017 FY2018 FY2019 FY2019 FY2020
BLANK
DEVELOPMENT EXPENDITURE … … $0 $283,200 $0 $313,400
GOVERNMENT DEVELOPMENT … … 0 283,200 0 313,400
Administration Programme … … 1 1 1 1
Minor Development Projects … … 0 283,200 0 313,400

35
HEAD E
JUDICATURE
OVERVIEW
Mission Statement
To provide an effective and accessible system of justice, inspiring public trust and confidence.
FY2020 EXPENDITURE ESTIMATES
Expenditure Estimates by Object Class
BLANK Actual Estimated Revised Estimated Code Object Class FY2018 FY2019 FY2019 FY2020 Change Over FY2019
BLANK
TOTAL EXPENDITURE $425,028,498 $487,180,500 $479,580,500 $380,437,400 -$99,143,100 -20.7%
Main Estimates $250,100,135 $281,254,000 $273,654,000 $296,872,500 $23,218,500 8.5%
OPERATING EXPENDITURE1 $250,100,135 $281,254,000 $273,654,000 $296,872,500 $23,218,500 8.5%
RUNNING COSTS $250,100,135 $281,254,000 $273,654,000 $296,872,500 $23,218,500 8.5%
Expenditure on Manpower $186,346,928 $196,533,400 $196,533,400 $210,868,600 $14,335,200 7.3%
1400 Other Statutory Appointments 48,784,671 50,744,600 50,744,600 50,607,900 -136,700 -0.31500 Permanent Staff 137,457,372 145,613,100 145,613,100 160,117,200 14,504,100 10.0 1600 Temporary, Daily-Rated & Other Staff 104,885 175,700 175,700 143,500 -32,200 -18.3
Other Operating Expenditure $63,753,207 $84,720,600 $77,120,600 $86,003,900 $8,883,300 11.5%
2100 Consumption of Products & Services 58,373,805 76,244,600 69,177,300 78,207,400 9,030,100 13.12300 Manpower Development 2,198,903 3,754,600 3,552,300 3,915,700 363,400 10.22400 International & Public Relations, Public
Communications 1,612,903 2,624,600 2,455,100 2,855,200 400,100 16.3
2700 Asset Acquisition 355,826 773,800 727,900 470,600 -257,300 -35.32800 Miscellaneous 1,211,770 1,323,000 1,208,000 555,000 -653,000 -54.1
Development Estimates $174,928,363 $205,926,500 $205,926,500 $83,564,900 -$122,361,600 -59.4%
DEVELOPMENT EXPENDITURE $174,928,363 $205,926,500 $205,926,500 $83,564,900 -$122,361,600 -59.4%
5100 Government Development 174,928,363 205,926,500 205,926,500 83,564,900 -122,361,600 -59.4
_______________________________________________ 1 Estimated FY2020 includes $9,743,000 Statutory Expenditure (Expenditure on Manpower).

36
Establishment List BLANK Actual Estimated Revised Estimated Category/Personnel FY2018 FY2019 FY2019 FY2020
BLANK
OTHER STATUTORY APPOINTMENTS 26 26 28 28
Chief Justice 1 1 1 1
Judge of Appeal 4 4 4 4
Judge 21 21 23 23
PERMANENT STAFF 988 993 981 1,007
Corporate Support 16 16 16 16
Language Executive Scheme (2008) 41 41 42 42
Legal 226 229 231 241
Management Executive Scheme (2008) 511 516 504 514
Management Support Scheme (2008) 67 64 65 65
Management Support Scheme (Language Officer) 61 63 64 70
Operations Support 55 53 48 48
Shorthand Writers 10 10 10 10
Technical Support Scheme (2008) 1 1 1 1
TOTAL 1,014 1,019 1,009 1,035

37
FY2019 BUDGET
The revised FY2019 expenditure of the Judicature is $479.58 million, an increase of $54.55 million or 12.8% over the actual FY2018 expenditure of $425.03 million. Of this, $273.65 million or 57.0% is for operating expenditure and $205.93 million or 43.0% is for development expenditure. Operating Expenditure The revised FY2019 operating expenditure of $273.65 million is an increase of $23.55 million or 9.4% over the actual FY2018 operating expenditure of $250.10 million. This is largely due to an increased expenditure on manpower and an increase in consumption of products and services. Development Expenditure The revised FY2019 development expenditure of $205.93 million is an increase of $31.00 million or 17.7% over the actual FY2018 development expenditure of $174.93 million. This is largely due to the increase in progress payments for the construction of the New State Courts Towers and the addition and alteration works for the Octagon Building. FY2020 BUDGET The FY2020 total expenditure of the Judicature is projected to be $380.44 million, a decrease of $99.14 million or 20.7% over the revised FY2019 estimate. Of this, $296.87 million or 78.0% is for operating expenditure and $83.56 million or 22.0% is for development expenditure. Operating Expenditure FY2020 operating expenditure is projected to be $296.87 million, an increase of $23.22 million or 8.5% over the revised FY2019 operating expenditure. This is largely due to an increased expenditure on manpower and an increase in consumption of products and services. Development Expenditure FY2020 development expenditure is projected to be $83.56 million, a decrease of $122.36 million or 59.4% over the revised FY2019 development expenditure. This is largely due to the decrease in progress payments with the completion of the New State Courts Towers that is partially offset by the increase in progress payments for the addition and alteration works for the Octagon Building.

38
Total Expenditure by Programme
BLANK Running Operating Development Total Code Programme Costs Transfers Expenditure Expenditure Expenditure BLANK E-A Judicature 296,872,500 0 296,872,500 83,564,900 380,437,400
Total $296,872,500 $0 $296,872,500 $83,564,900 $380,437,400
Development Expenditure by Project
BLANK Actual
Expenditure Up to end of
BLANK BLANK Total Actual Estimated Revised Estimated Project Title Project Cost FY2017 FY2018 FY2019 FY2019 FY2020
BLANK
DEVELOPMENT EXPENDITURE … … $174,928,363 $205,926,500 $205,926,500 $83,564,900
GOVERNMENT DEVELOPMENT … … 174,928,363 205,926,500 205,926,500 83,564,900
Judicature Programme … … 14 14 14 14
e-Litigation Technology Refresh … … 3,194,553 3,129,900 3,129,900 223,600
Minor Development Projects (ITD) … … 1,419,142 3,333,300 3,510,500 1,241,300
Integrated Criminal Case Filing and Management System (ICMS)
32,026,000 23,721,416 796,779 1,164,900 1,320,100 882,300
Family Application Management System (FAMS2) 15,606,500 6,002,560 6,196,603 1,862,800 1,401,100 200,800
Regulatory Offences Management System Refresh 3,445,000 206,452 752,311 1,547,600 1,273,300 449,000
Courts of the Future - Tranche 1 14,727,400 0 809,396 2,342,400 2,338,000 2,712,100
A&A Works for Octagon Building 166,920,000 0 0 3,380,000 3,069,900 22,310,000
Supreme Court Facilities Upgrade Projects 3,830,000 0 0 860,000 860,000 1,530,000
Court of the Future (COTF) - Tranche 2 15,740,000 0 0 0 452,300 2,664,200
Establishment of Appellate Court 3,000,000 0 0 0 0 219,900
Upgrading of Air-con System and Building Services 8,339,200 0 0 0 0 105,000
Minor Development Projects (Supreme Court) … … 2,554,636 3,713,800 4,033,300 3,349,700
Minor Development Projects (State Courts) … … 386,308 800,900 800,900 150,000
New State Courts Towers 608,146,800 157,670,750 156,947,493 183,710,900 183,657,200 47,527,000
Completed Projects … … 1,871,143 80,000 80,000 0

39
KEY PERFORMANCE INDICATORS
Desired Outcomes
Public trust and confidence in the dispensation of justice based on the values of:
• Fairness
• Accessibility
• Independence, Integrity and Impartiality
• Responsiveness
Key Performance Indicators
Desired Outcome Performance Indicator Actual FY2017
Actual FY2018
Revised FY2019
Estimated FY2020
Supreme Court Fairness World ranking of Singapore’s fairness in
administration of justice in the Institute of Management Development’s World Competitiveness Yearbook
11th 10th 10th Top 10
Accessibility % of written grounds that are published online within 1 day of delivery of finalised written judgement1
- - 100 100
Uptime of e-Litigation system (%) 99.9 99.9 99.9 >99.5 Independence, Integrity and Impartiality Number of justified complaints about the lack of
independence, integrity and impartiality
0 0 0 0
World ranking of Singapore’s judicial independence in the WEF’s Global Competitiveness Report
19th 19th 14rh Top 20
Responsiveness % of cases heard within service timelines2 99 100 1003 95 State Courts4,5 Fairness % of respondents who agreed that the Courts
administer justice fairly to all regardless of race, language or religion
N.A 100 N.A > 95
% of respondents who agreed that the Courts administer justice fairly to all regardless of whether the party is an individual, company or government institution
N.A 98 N.A > 95
Accessibility % of respondents who agreed that the Courts’
facilities are easily accessible to the public N.A 98 N.A > 95
Independence, Integrity and Impartiality % of respondents who agreed that the Courts
independently carry out justice according to the law N.A 99 N.A > 95
Responsiveness % of respondents who agreed that the Courts are
efficient and deal with cases in a timely manner. N.A 96 N.A > 95
1 This KPI has been changed from “% of written grounds that are published online within 1 week of delivery” to “% of written grounds that are published online within 1 day of delivery of finalised written judgment”. 2 Data are reported on a CY basis and do not include data from cases fixed on special dates. 3 Projected based on data for the period 1 Jan to 31 Jul 2019. 4 Data for the indicators are reported on a CY basis. Figures are rounded to the nearest one percentage point. 5 The survey results are obtained through the Public Perception Survey and Court Users Survey which are conducted once every 2 to 3 years. The 2018 survey results are obtained from the Court Users Survey. There were no surveys conducted in 2017 and 2019.


41
HEAD F
PARLIAMENT
OVERVIEW
Mission Statement
To support Parliament and its Committees in their business and proceedings, facilitate their participation in inter-parliamentary activities, and undertake the management of Parliament House.
Desired Outcomes
• Orderly and expeditious conduct of parliamentary business
• Easy and ready accessibility to official parliamentary debates and other parliamentary information
• Public awareness of the roles and functions of Parliament
• Excellence in administration of Parliament Secretariat
FY2020 EXPENDITURE ESTIMATES
Expenditure Estimates by Object Class
BLANK Actual Estimated Revised Estimated Code Object Class FY2018 FY2019 FY2019 FY2020 Change Over FY2019
BLANK
TOTAL EXPENDITURE $41,006,103 $41,105,600 $39,218,900 $41,663,200 $2,444,300 6.2%
Main Estimates $39,884,458 $39,470,600 $37,625,100 $39,059,600 $1,434,500 3.8%
OPERATING EXPENDITURE1 $39,884,458 $39,470,600 $37,625,100 $39,059,600 $1,434,500 3.8%
RUNNING COSTS $39,621,027 $39,147,600 $37,302,100 $38,707,200 $1,405,100 3.8%
Expenditure on Manpower $26,569,298 $26,697,700 $24,887,900 $26,386,200 $1,498,300 6.0%
1300 Parliamentary Appointments 21,812,818 21,674,000 20,276,400 21,217,100 940,700 4.6
1500 Permanent Staff 4,712,689 4,978,200 4,566,000 5,126,600 560,600 12.3
1600 Temporary, Daily-Rated & Other Staff 43,791 45,500 45,500 42,500 -3,000 -6.6
Other Operating Expenditure $13,051,729 $12,449,900 $12,414,200 $12,321,000 -$93,200 -0.8%
2100 Consumption of Products & Services 10,870,552 10,796,800 10,855,100 11,223,200 368,100 3.4
2300 Manpower Development 114,488 168,000 224,400 207,200 -17,200 -7.7
2400 International & Public Relations, Public Communications
1,619,501 427,100 422,700 470,900 48,200 11.4
2700 Asset Acquisition 445,636 1,046,300 900,300 408,000 -492,300 -54.7
2800 Miscellaneous 1,551 11,700 11,700 11,700 0 0.0
TRANSFERS $263,431 $323,000 $323,000 $352,400 $29,400 9.1%
3600 Transfers to Institutions & Organisations 84,500 140,000 140,000 170,000 30,000 21.4
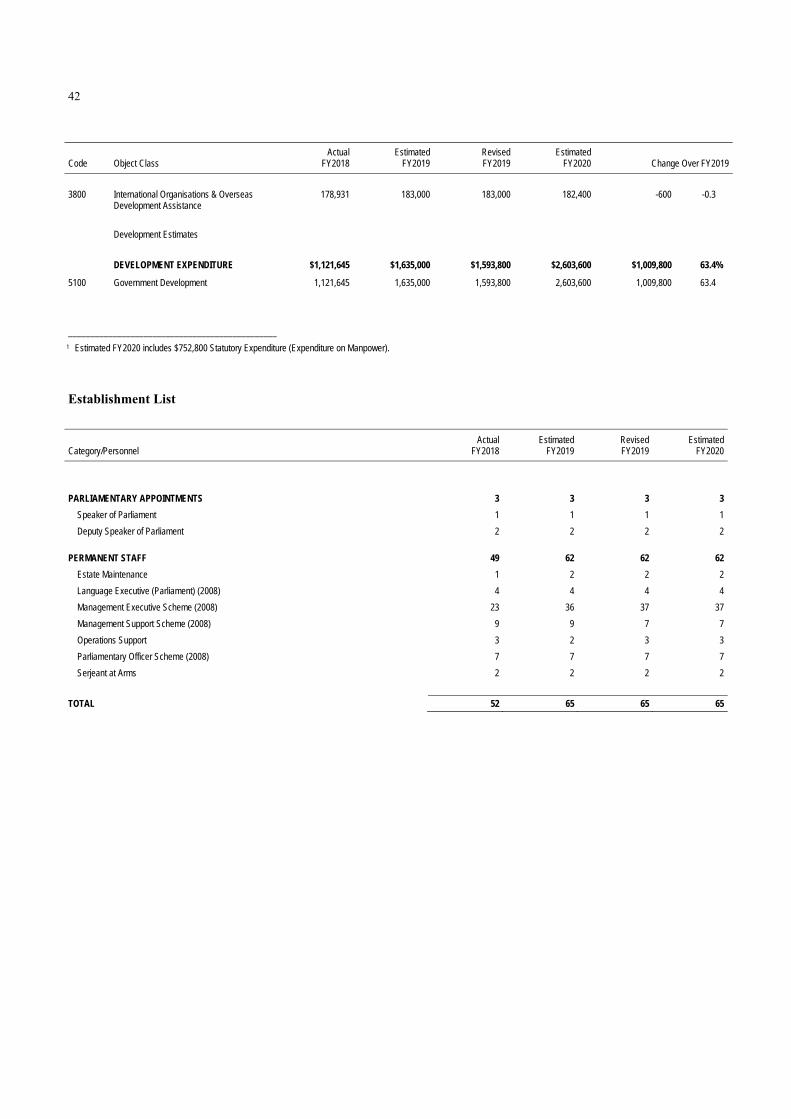
42
BLANK Actual Estimated Revised Estimated Code Object Class FY2018 FY2019 FY2019 FY2020 Change Over FY2019
BLANK 3800 International Organisations & Overseas
Development Assistance 178,931 183,000 183,000 182,400 -600 -0.3
Development Estimates $1,121,645 $1,635,000 $1,593,800 $2,603,600 $1,009,800 63.4%
DEVELOPMENT EXPENDITURE $1,121,645 $1,635,000 $1,593,800 $2,603,600 $1,009,800 63.4%
5100 Government Development 1,121,645 1,635,000 1,593,800 2,603,600 1,009,800 63.4
_______________________________________________ 1 Estimated FY2020 includes $752,800 Statutory Expenditure (Expenditure on Manpower).
Establishment List
BLANK Actual Estimated Revised Estimated Category/Personnel FY2018 FY2019 FY2019 FY2020
BLANK
PARLIAMENTARY APPOINTMENTS 3 3 3 3
Speaker of Parliament 1 1 1 1
Deputy Speaker of Parliament 2 2 2 2
PERMANENT STAFF 49 62 62 62
Estate Maintenance 1 2 2 2
Language Executive (Parliament) (2008) 4 4 4 4
Management Executive Scheme (2008) 23 36 37 37
Management Support Scheme (2008) 9 9 7 7
Operations Support 3 2 3 3
Parliamentary Officer Scheme (2008) 7 7 7 7
Serjeant at Arms 2 2 2 2
TOTAL 52 65 65 65

43
FY2019 BUDGET
The revised FY2019 total expenditure of Parliament is expected to be $39.22 million, a decrease of $1.79 million or 4.4% over the actual FY2018 total expenditure of $41.01 million.
The revised FY2019 operating expenditure is expected to be $37.63 million, a decrease of $2.26 million or 5.7%
over the actual FY2018 operating expenditure of $39.88 million. Development expenditure is expected to be $1.59 million, an increase of $0.47 million or 42.1% over the actual FY2018 development expenditure of $1.12 million.
FY2020 BUDGET
The FY2020 total expenditure of Parliament is projected to be $41.66 million, an increase of $2.44 million or 6.2% over the revised FY2019 total expenditure of $39.22 million. Of this, $39.06 million or 93.8% is for operating expenditure and $2.60 million or 6.2% is for development expenditure.
Operating Expenditure
The projected operating expenditure of $39.06 million for FY2020 is an increase of $1.43 million or 3.8% over
the revised FY2019 operating expenditure.
Development Expenditure The FY2020 development expenditure of $2.60 million is an increase of $1.01 million or 63.4% over the revised
FY2019 development expenditure of $1.59 million. The bulk of the FY2020 development expenditure is to cater for IT development projects.

44
Total Expenditure by Programme
BLANK Running Operating Development Total Code Programme Costs Transfers Expenditure Expenditure Expenditure
BLANK
F-A Parliamentary 38,707,200 352,400 39,059,600 2,603,600 41,663,200
Total $38,707,200 $352,400 $39,059,600 $2,603,600 $41,663,200
Development Expenditure by Project
BLANK Actual
Expenditure Up to end of
BLANK
BLANK Total Actual Estimated Revised Estimated Project Title Project Cost FY2017 FY2018 FY2019 FY2019 FY2020
BLANK
DEVELOPMENT EXPENDITURE … … $1,121,645 $1,635,000 $1,593,800 $2,603,600
GOVERNMENT DEVELOPMENT … … 1,121,645 1,635,000 1,593,800 2,603,600
Parliamentary Programme … … 1 1 1 1
Minor Development Projects … … 1,121,645 1,635,000 1,593,800 2,603,600

45
HEAD G
PRESIDENTIAL COUNCILS
OVERVIEW
Mission Statement
To provide for honorarium payments to the Presidential Council for Minority Rights and the Presidential Council for Religious Harmony, and honorarium payments, secretarial and other administrative support services to the Council of Presidential Advisers.
FY2020 EXPENDITURE ESTIMATES
Expenditure Estimates by Object Class
BLANK Actual Estimated Revised Estimated Code Object Class FY2018 FY2019 FY2019 FY2020 Change Over FY2019
BLANK
TOTAL EXPENDITURE $754,051 $802,400 $775,400 $806,000 $30,600 3.9%
Main Estimates $754,051 $802,400 $775,400 $806,000 $30,600 3.9%
OPERATING EXPENDITURE $754,051 $802,400 $775,400 $806,000 $30,600 3.9%
RUNNING COSTS $754,051 $802,400 $775,400 $806,000 $30,600 3.9%
Expenditure on Manpower $749,518 $794,500 $769,800 $796,200 $26,400 3.4%
1500 Permanent Staff 423,268 430,700 426,000 432,400 6,400 1.5
1600 Temporary, Daily-Rated & Other Staff 326,250 363,800 343,800 363,800 20,000 5.8
Other Operating Expenditure $4,533 $7,900 $5,600 $9,800 $4,200 75.0%
2100 Consumption of Products & Services 482 500 200 500 300 150.0
2300 Manpower Development 932 2,900 2,900 5,300 2,400 82.8
2400 International & Public Relations, Public Communications
3,119 4,500 2,500 4,000 1,500 60.0
Establishment List
BLANK Actual Estimated Revised Estimated Category/Personnel FY2018 FY2019 FY2019 FY2020
BLANK
PERMANENT STAFF 3 6 6 6
Management Executive Scheme (2008) 1 4 4 4
Management Support Scheme (2008) 1 1 1 1
Secretary, Council of Presidential Advisers 1 1 1 1
TOTAL 3 6 6 6

46
FY2019 BUDGET
The revised total expenditure of the Presidential Councils is expected to be $0.78 million in FY2019, an increase of $0.02 million or 2.8% from the actual FY2018 expenditure of $0.75 million. This is mainly due to higher provision for expenditure on manpower. FY2020 BUDGET
The total expenditure of the Presidential Councils in FY2020 is projected to be $0.81 million. The FY2020 provision is to meet the operating costs of the three Presidential Councils: $0.24 million for the Presidential Council for Minority Rights (PCMR); $0.44 million for the Council of Presidential Advisers (CPA); and $0.12 million for the Presidential Council for Religious Harmony (PCRH). The provisions for PCMR and PCRH will cover honorarium payments to the Chairmen and Council members. The provision for CPA will cover honorarium payments to the Chairman and Council members, salaries of staff manning the Secretariat, staff training and other operating expenditure.
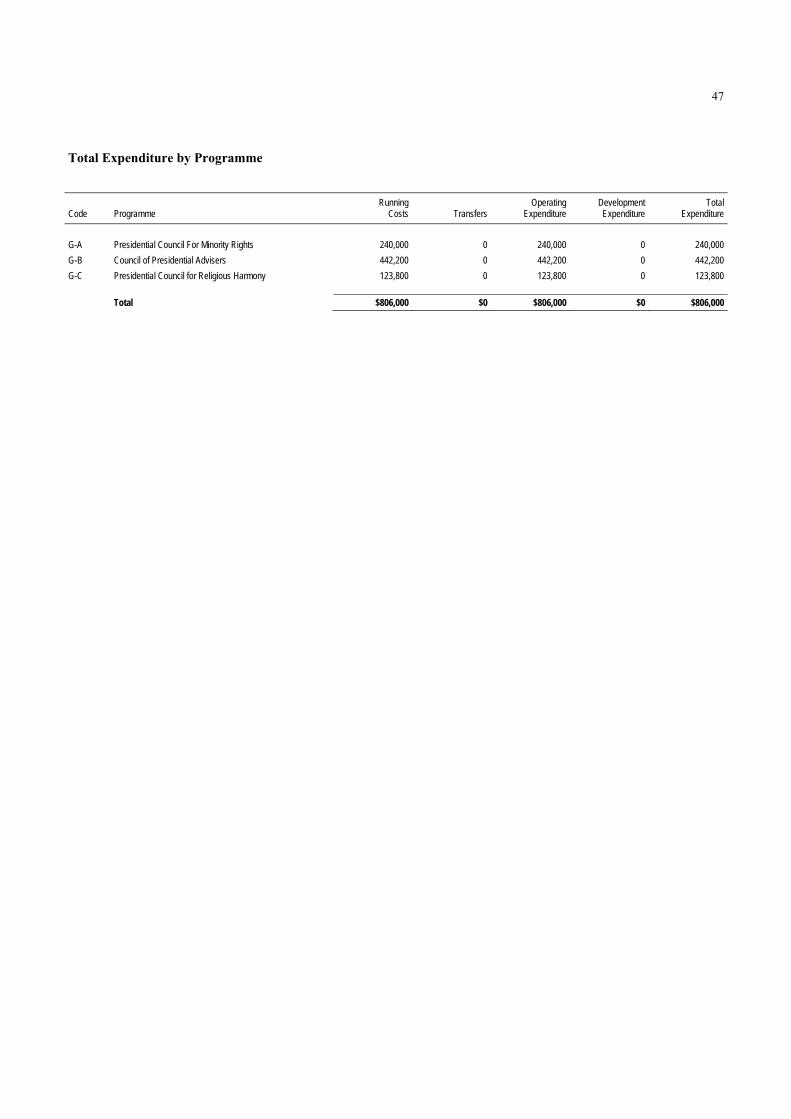
47
Total Expenditure by Programme
BLANK Running Operating Development Total Code Programme Costs Transfers Expenditure Expenditure Expenditure
BLANK
G-A Presidential Council For Minority Rights 240,000 0 240,000 0 240,000
G-B Council of Presidential Advisers 442,200 0 442,200 0 442,200
G-C Presidential Council for Religious Harmony 123,800 0 123,800 0 123,800
Total $806,000 $0 $806,000 $0 $806,000


49
HEAD H
PUBLIC SERVICE COMMISSION
OVERVIEW
Mission Statement
As a neutral and independent body, to safeguard the quality of public sector leadership and maintain the disciplinary standard of the Civil Service.
FY2020 EXPENDITURE ESTIMATES
Expenditure Estimates by Object Class
BLANK Actual Estimated Revised Estimated Code Object Class FY2018 FY2019 FY2019 FY2020 Change Over FY2019
BLANK
TOTAL EXPENDITURE $2,072,384 $1,747,700 $1,658,800 $1,755,200 $96,400 5.8%
Main Estimates $2,072,384 $1,747,700 $1,658,800 $1,755,200 $96,400 5.8%
OPERATING EXPENDITURE1 $2,072,384 $1,747,700 $1,658,800 $1,755,200 $96,400 5.8%
RUNNING COSTS $2,072,384 $1,747,700 $1,658,800 $1,755,200 $96,400 5.8%
Expenditure on Manpower $2,072,384 $1,747,700 $1,658,800 $1,755,200 $96,400 5.8%
1400 Other Statutory Appointments 2,072,384 1,747,700 1,658,800 1,755,200 96,400 5.8
_______________________________________________ 1 Statutory Expenditure (Expenditure on Manpower).
Establishment List
BLANK Actual Estimated Revised Estimated Category/Personnel FY2018 FY2019 FY2019 FY2020
BLANK
OTHER STATUTORY APPOINTMENTS 13 15 14 15
Chairman, Public Service Commission 1 1 1 1
Deputy Chairman, Public Service Commission 2 2 2 2
Member, Public Service Commission 10 12 11 12
TOTAL 13 15 14 15

50
FY2019 BUDGET
The FY2019 expenditure of the Public Service Commission (PSC) is revised to $1.66 million, a decrease of $0.41 million or 20.0% over the FY2018 actual expenditure of $2.07 million. The decrease in expenditure is mainly due to a reduction in expenditure on manpower.
FY2020 BUDGET
The FY2020 expenditure of the PSC is projected to be $1.76 million, an increase of $0.10 million or 5.8% over the FY2019 revised expenditure. The increase in expenditure is mainly due to a higher expenditure on manpower.
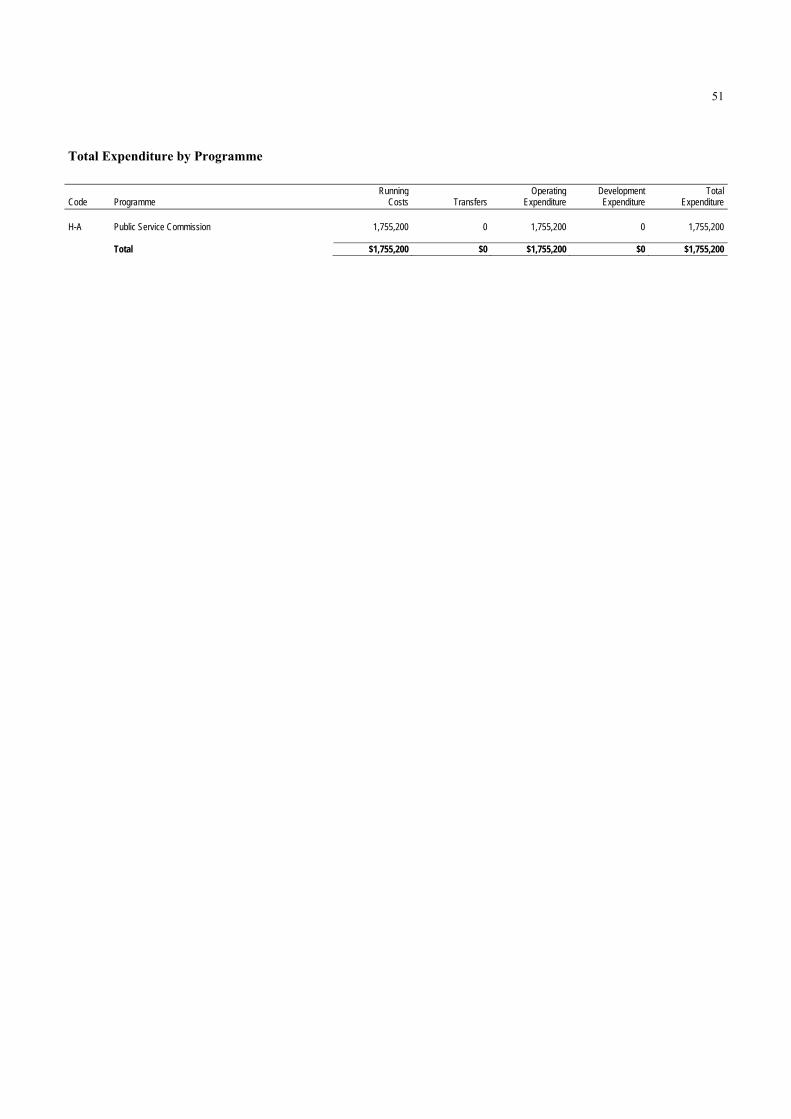
51
Total Expenditure by Programme
BLANK Running Operating Development Total Code Programme Costs Transfers Expenditure Expenditure Expenditure BLANK H-A Public Service Commission 1,755,200 0 1,755,200 0 1,755,200
Total $1,755,200 $0 $1,755,200 $0 $1,755,200


Head I ___________
Ministry of Social and Family Development

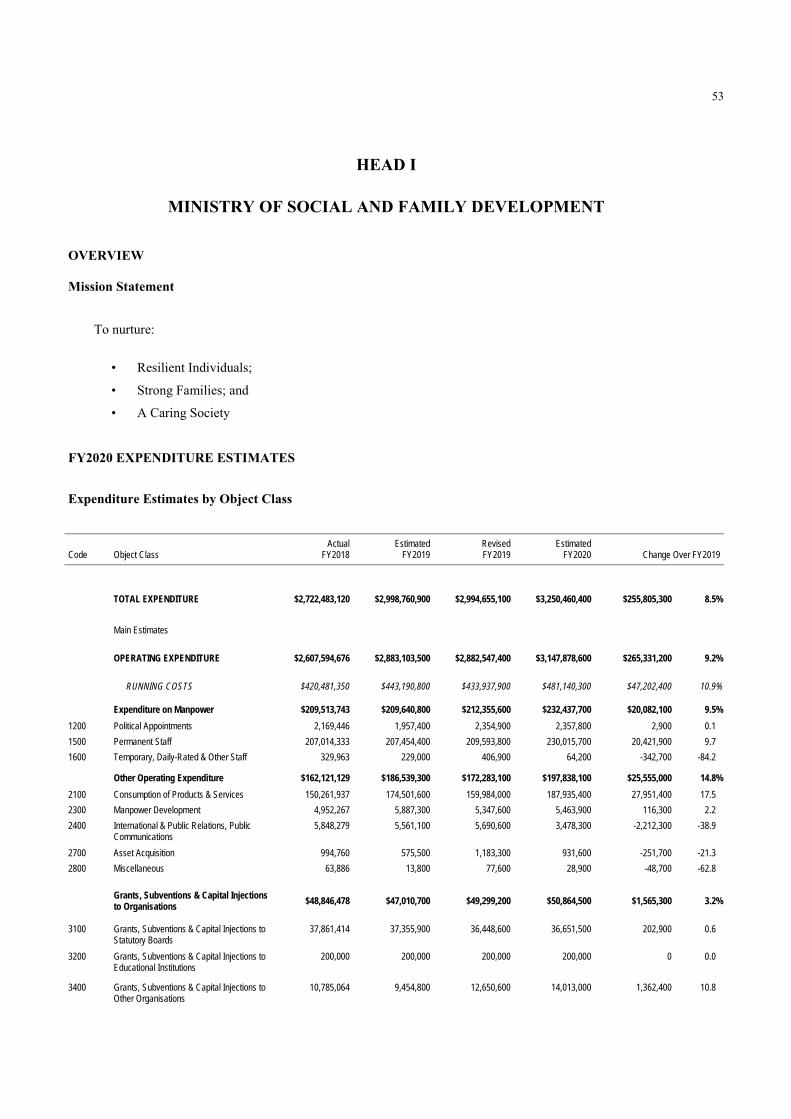
53
HEAD I
MINISTRY OF SOCIAL AND FAMILY DEVELOPMENT
OVERVIEW
Mission Statement
To nurture:
• Resilient Individuals;
• Strong Families; and
• A Caring Society
FY2020 EXPENDITURE ESTIMATES
Expenditure Estimates by Object Class
BLANK Actual Estimated Revised Estimated Code Object Class FY2018 FY2019 FY2019 FY2020 Change Over FY2019
BLANK
TOTAL EXPENDITURE $2,722,483,120 $2,998,760,900 $2,994,655,100 $3,250,460,400 $255,805,300 8.5%
Main Estimates $2,607,594,676 $2,902,846,300 $2,882,547,400 $3,170,071,900 $287,524,500 10.0%
OPERATING EXPENDITURE $2,607,594,676 $2,883,103,500 $2,882,547,400 $3,147,878,600 $265,331,200 9.2%
RUNNING COSTS $420,481,350 $443,190,800 $433,937,900 $481,140,300 $47,202,400 10.9%
Expenditure on Manpower $209,513,743 $209,640,800 $212,355,600 $232,437,700 $20,082,100 9.5%
1200 Political Appointments 2,169,446 1,957,400 2,354,900 2,357,800 2,900 0.1
1500 Permanent Staff 207,014,333 207,454,400 209,593,800 230,015,700 20,421,900 9.7
1600 Temporary, Daily-Rated & Other Staff 329,963 229,000 406,900 64,200 -342,700 -84.2
Other Operating Expenditure $162,121,129 $186,539,300 $172,283,100 $197,838,100 $25,555,000 14.8%
2100 Consumption of Products & Services 150,261,937 174,501,600 159,984,000 187,935,400 27,951,400 17.5
2300 Manpower Development 4,952,267 5,887,300 5,347,600 5,463,900 116,300 2.2
2400 International & Public Relations, Public Communications
5,848,279 5,561,100 5,690,600 3,478,300 -2,212,300 -38.9
2700 Asset Acquisition 994,760 575,500 1,183,300 931,600 -251,700 -21.3
2800 Miscellaneous 63,886 13,800 77,600 28,900 -48,700 -62.8
Grants, Subventions & Capital Injections to Organisations
$48,846,478 $47,010,700 $49,299,200 $50,864,500 $1,565,300 3.2%
3100 Grants, Subventions & Capital Injections to Statutory Boards
37,861,414 37,355,900 36,448,600 36,651,500 202,900 0.6
3200 Grants, Subventions & Capital Injections to Educational Institutions
200,000 200,000 200,000 200,000 0 0.0
3400 Grants, Subventions & Capital Injections to Other Organisations
10,785,064 9,454,800 12,650,600 14,013,000 1,362,400 10.8

54
BLANK Actual Estimated Revised Estimated Code Object Class FY2018 FY2019 FY2019 FY2020 Change Over FY2019
BLANK
TRANSFERS $2,187,113,326 $2,439,912,700 $2,448,609,500 $2,666,738,300 $218,128,800 8.9%
3500 Social Transfers to Individuals 1,466,587,744 1,632,896,800 1,612,192,200 1,699,775,400 87,583,200 5.4
3600 Transfers to Institutions & Organisations 720,525,582 807,015,900 836,417,300 966,962,900 130,545,600 15.6
OTHER CONSOLIDATED FUND OUTLAYS $0 $19,742,800 $0 $22,193,300 $22,193,300 n.a.
4600 Loans and Advances (Disbursement) 0 19,742,800 0 22,193,300 22,193,300 n.a.
Development Estimates $114,888,445 $115,657,400 $112,107,700 $102,581,800 -$9,525,900 -8.5%
DEVELOPMENT EXPENDITURE $114,888,445 $115,657,400 $112,107,700 $102,581,800 -$9,525,900 -8.5%
5100 Government Development 36,283,637 43,715,200 42,464,600 40,913,400 -1,551,200 -3.7
5200 Grants & Capital Injections to Organisations 78,604,808 71,942,200 69,643,100 61,668,400 -7,974,700 -11.5
Establishment List
BLANK Actual Estimated Revised Estimated Category/Personnel FY2018 FY2019 FY2019 FY2020
BLANK
POLITICAL APPOINTMENTS 3 3 3 3
Minister 1 1 1 1
Minister of State 1 1 1 1
Senior Parliamentary Secretary 1 1 1 1
PERMANENT STAFF 1,801 1,927 2,024 2,024
Accounting Profession (2008) 0 0 1 1
Administrative 8 8 11 11
Corporate Support 4 4 4 4
Driving 2 2 2 2
Economist Service 0 0 3 3
Healthcare Support 2 2 2 2
Information Service (2008) 5 5 5 5
Legal 6 6 6 6
Management Executive Scheme (2008) 1,710 1,833 1,937 1,937
Management Support Scheme (2008) 51 54 42 42
Operations Support 11 11 10 10
Shorthand Writers 2 2 1 1
TOTAL 1,804 1,930 2,027 2,027

55
FY2019 BUDGET
The revised FY2019 total expenditure of the Ministry of Social and Family Development (MSF) is $2.99 billion. This is $272.17 million or 10.0% higher than the actual FY2018 total expenditure of $2.72 billion. Of the total expenditure, $2.88 billion or 96.3% is for operating expenditure and $112.11 million or 3.7% is for development expenditure. Operating Expenditure The revised FY2019 operating expenditure of $2.88 billion is $274.95 million or 10.5% higher than the actual FY2018 expenditure. This increase is mainly due to higher expenditure in childcare and infant care subsidies, payouts for Baby Bonus and Government-Paid Maternity Leave Scheme and grants to pre-school operators of childcare centres and kindergartens. Development Expenditure The revised FY2019 development expenditure of $112.11 million is $2.78 million or 2.4% lower than the expenditure incurred in FY2018. The decrease is mainly due to the completion of the development of preschools in the earlier years under the Preschool Master Plan. FY2020 BUDGET The total expenditure for MSF in FY2020 is projected to be $3.25 billion, which is an increase of $255.81 million or 8.5% over the revised FY2019 expenditure. Of this, $3.15 billion or 96.8% is for operating expenditure and $102.58 million or 3.2% is for development expenditure. Operating Expenditure The budget of $3.15 billion for operating expenditure is $265.33 million or 9.2% higher than the revised FY2019 operating expenditure. The Family Development Programme will take up the largest share of MSF’s operating expenditure ($2.33 billion or 74.0%). This is followed by the Social Policy and Services Group Programme ($472.48 million or 15.0%), Rehabilitation and Protection Group Programme ($127.14 million or 4.0%) and Sector Planning and Development Programme ($65.19 million or 2.1%). The balance of $154.22 million (4.9%) will be distributed among five other programmes, comprising Corporate Support Programme, Gambling Safeguards Programme, Strategic Planning, Research and Development Programme, Enforcement and Licensing Group Programme, and Office of the Director of Social Welfare and Office of the Chief Psychologist Programme. Family Development Programme This Programme covers the functions of the Family Development Group and Early Childhood Development Agency (ECDA). Family Development Group is allocated $971.67 million for its operating expenditure. About 95% of the budget is allocated to support marriage and parenthood. This includes the Baby Bonus Scheme and various Government-Paid Leave Schemes. ECDA is allocated $1.36 billion for its operating expenditure, an increase of $272.49 million or 25.1% over the revised FY2019 operating expenditure of $1.08 billion. The increase in budget is due to enhancements to means-tested preschool subsidies, provision of more affordable and quality early childhood services, uplifting the early childhood profession, and taking over the planning and provision of Early Intervention services for preschool children.

56
Social Policy and Services Group Programme The Social Policy and Services Group (SPSG) Programme is allocated $472.48 million for its FY2020 operating expenditure, a decrease of $32.09 million or 6.4% from the revised FY2019 operating expenditure of $504.57 million. The decrease is mainly due to the transfer of Early Intervention services to ECDA from FY2020 to provide ECDA a holistic view of the learning and developmental needs of all children under the age of seven. SPSG’s budget supports funding for over 200 social programmes which focus on strengthening services for the vulnerable, persons with disabilities, children, youth and families. This Programme also supports the administration and provision of social assistance to low-income Singaporeans, and the operations of MSF’s 24 Social Service Offices. Rehabilitation and Protection Group Programme The Rehabilitation and Protection Group Programme is allocated $127.14 million for its operating expenditure, an increase of $2.28 million or 1.8% over the revised FY2019 operating expenditure of $124.86 million. The budget increase is to provide effective rehabilitation and protection services. The services include: funding of Fostering Agencies and Voluntary Children’s Homes; implementation of evidence-based programmes to enable youth offenders to achieve positive outcomes in their rehabilitation; and services for the protection of children and vulnerable adults to break cycles of abuse, neglect and offending. Sector Planning and Development Programme The Sector Planning and Development Programme is allocated $65.19 million for its operating expenditure, an increase of $9.88 million or 17.9% over the revised FY2019 operating expenditure of $55.32 million. This increase is mainly due to additional funding for initiatives to strengthen the sector’s manpower and leadership development, as well as social service agencies’ organisational capacity and capabilities. Development Expenditure The development expenditure for MSF in FY2020 is projected to be $102.58 million, a decrease of $9.53 million or 8.5% from the revised FY2019 development expenditure. The decrease is mainly due to the completion of the development of preschools in the earlier years under Preschool Master Plans. Other Consolidated Fund Outlays Advances for FY2020 are projected to be $22.19 million. About $22 million is required to meet expenditure for co-funded projects before reimbursement of funding from external parties. The balance provision mainly caters for payments of security and rental deposits.

57
Total Expenditure by Programme
BLANK Running Operating Development Total Code Programme Costs Transfers Expenditure Expenditure Expenditure
BLANK
I-A Corporate Support 131,173,700 2,418,400 133,592,100 16,633,600 150,225,700
I-B Strategic Planning, Research and Development 3,937,800 0 3,937,800 0 3,937,800
I-C Enforcement and Licensing Group 8,440,300 85,500 8,525,800 0 8,525,800
I-D Rehabilitation and Protection Group 82,207,000 44,931,200 127,138,200 489,000 127,627,200
I-G Family Development 111,426,500 2,217,412,700 2,328,839,200 69,456,600 2,398,295,800
I-K Office of the Director of Social Welfare and Office of the Chief Psychologist
3,349,500 0 3,349,500 0 3,349,500
I-T Sector Planning and Development 38,667,100 26,525,600 65,192,700 781,800 65,974,500
I-U Social Policy and Services Group 97,232,200 375,252,500 472,484,700 15,220,800 487,705,500
I-V Gambling Safeguards 4,706,200 112,400 4,818,600 0 4,818,600
Total $481,140,300 $2,666,738,300 $3,147,878,600 $102,581,800 $3,250,460,400
Development Expenditure by Project
BLANK Actual
Expenditure Up to end of
BLANK
BLANK Total Actual Estimated Revised Estimated Project Title Project Cost FY2017 FY2018 FY2019 FY2019 FY2020
BLANK
DEVELOPMENT EXPENDITURE … … $114,888,445 $115,657,400 $112,107,700 $102,581,800
GOVERNMENT DEVELOPMENT … … 36,283,637 43,715,200 42,464,600 40,913,400
Corporate Support Programme … … 4 4 4 4
Upgrading of Curam Software and Government-Cloud Migration
19,563,800 0 5,472,363 4,129,700 4,832,900 6,328,600
Migration Application Systems from G-Cloud to Designated Government Compliant Data Centres
6,325,900 0 0 0 5,697,900 628,000
Minor Development Projects … … 4,001,306 9,017,200 5,142,200 2,746,900
New Projects … … 0 7,682,000 66,900 6,930,100
Rehabilitation and Protection Group Programme … … 3 3 3 3
Construction of access road at Bulim Drive 5,153,800 2,254,377 336,311 260,000 71,700 80,000
Implementation of Video Analytics, Facial Recognition and Behavioural Analytics Technology at Voluntary Children's Home
411,500 0 0 246,900 246,900 164,600
Enhancement of systems under RPG's Information Technology Plan
6,224,800 0 1,060,999 278,800 359,100 160,700
Family Development Programme … … 3 3 3 3
Transforming Service Journey at Key Moment of Life (Getting Married)
10,223,600 0 0 0 186,400 1,801,300
Developing a New Government-Paid Leave Schemes (GPLS) System
23,960,000 0 0 0 2,654,500 6,835,700
Pre-Planning and Support Services for Families and Persons without Mental Capacity
8,854,700 0 0 0 254,300 527,700

58
BLANK Actual
Expenditure Up to end of
BLANK
BLANK Total Actual Estimated Revised Estimated Project Title Project Cost FY2017 FY2018 FY2019 FY2019 FY2020
BLANK
Social Policy and Services Group Programme … … 16 16 16 16
5 Full 2 Branch and 1 Interim Family Service Centres from FY2012-FY2019
4,235,800 1,941,935 945,584 33,000 44,500 8,000
3 Day Activity Centres and 1 Early Intervention Programme for Infant and Children Centre at 600 Upper Thomson Road
6,961,600 3,411,049 1,775,335 100,000 373,000 30,000
Development of 8 Day Activity Centres from FY2015-FY2021
7,897,900 3,698,921 69,699 1,555,700 504,700 2,600
2 Full-fledged Family Service Centres and 4 Branch Family Service Centres from FY2016-FY2019
2,675,400 580,863 53,957 397,000 534,000 155,900
Development of SSICT Phase 2 12,738,100 1,875,656 3,424,798 1,277,100 1,543,700 1,293,600
Setting Up of 8 Special Student Care Centres (SSCC)
839,800 0 0 134,600 79,800 760,000
Adult Disability Home for Persons with Autism Spectrum Disorder at Seng Kang and Adult Disability Home for Persons with Physical Disabilities at Pasir Ris
23,740,900 0 4,714,600 10,446,200 10,921,200 6,700,000
Conversion of Vacated Space at Red Cross Home for the Disabled for Adult Disability Home Expansion
632,000 0 0 0 0 200,000
Relocation of Muhammadiyah Welfare Home (MWH) and Methodist Welfare Services (MWS) Girls’ Residence
7,956,400 0 27,033 3,610,800 2,326,300 3,283,700
Setting up of Rental Housing and Social Service Hubs
911,400 0 0 491,000 329,400 582,000
Expansion of Social Service Office @ Kreta Ayer (SSO@KA)
584,000 0 0 0 250,000 180,000
Relocation of Social Service Office at Bukit Merah to the To-be Vacated Bukit Merah Library
3,558,000 0 0 0 200,000 290,000
Relocation of Social Service Office @ Bedok (SSO@Bedok) and Setting Up of Regional Social Services Centre (RSSC) at Vacated Bedok Library
2,153,000 0 0 0 530,000 510,000
Proposed Expansion and relocation of Community Psychology Hub (CPH) to former Bukit Merah Library
348,000 0 0 0 268,000 80,000
Setting Up of a Holding Site for MSF Homes and MSF-funded Homes Undergoing Major Cyclical Maintenance
3,780,200 0 0 0 0 218,000
Expansion and reconfiguration of existing Thye Hua Kwan Family Service Centre at Bukit Panjang
416,000 0 0 0 0 416,000
Completed Projects … … 14,401,651 4,055,200 5,047,200 0
GRANTS & CAPITAL INJECTIONS TO ORGANISATIONS … … 78,604,808 71,942,200 69,643,100 61,668,400
Rehabilitation and Protection Group Programme … … 1 1 1 1
Restructuring residential care for children and young persons
733,500 0 202,993 142,100 39,500 83,700
Family Development Programme … … 5 5 5 5
Development of Preschool at Punggol Town Hub (PTH)
10,633,800 0 1,866,407 3,732,900 3,732,900 1,866,500
Reimbursement to HDB for the development and commissioning of pre-built preschools within HDB developments from 2018 to 2022
243,790,000 0 20,385,045 12,500,000 12,500,000 13,950,000
Development of preschool places by Anchor Operators (AOp) in HDB developments and atypical sites from 2018 to 2022
173,840,000 0 32,531,350 49,361,300 48,361,300 44,200,000

59
BLANK Actual
Expenditure Up to end of
BLANK
BLANK Total Actual Estimated Revised Estimated Project Title Project Cost FY2017 FY2018 FY2019 FY2019 FY2020
BLANK
Development of Preschool Places by VWO under Master Plan 3
1,186,200 0 480,703 300,000 300,000 260,000
Support for Early-Risk, Divorcing and Ageing Families (FSA)
4,676,000 0 0 696,400 179,600 15,400
Sector Planning and Development Programme … … 2 2 2 2
Capital Funding for Sun Ray System 1,400,000 770,000 0 0 0 74,400
NCSS Centre Upgrading 1,863,900 0 450,000 706,500 706,500 707,400
Social Policy and Services Group Programme … … 6 6 6 6
Adult Disability Home for Persons with Intellectual Disabilities at Sembawang Walk
857,000 0 611,113 0 365,300 250,000
Premises for Divorce Support Specialist Agencies 409,200 83,763 6,109 200,000 215,000 104,300
Development of 8 Day Activity Centres from FY2015-FY2021
1,492,700 641,056 199,447 0 28,100 58,900
2 Full-fledged Family Service Centres and 4 Branch Family Service Centres from FY2016-FY2019
143,900 51,039 0 8,700 69,700 34,700
Setting Up of 8 Special Student Care Centres (SSCC)
124,200 0 0 2,300 42,100 30,000
Expansion and reconfiguration of existing Thye Hua Kwan Family Service Centre at Bukit Panjang
33,200 0 0 0 0 33,100
Completed Projects … … 21,871,642 4,292,000 3,103,100 0

60
KEY PERFORMANCE INDICATORS
Desired Outcomes
Resilient Individuals
Needy families assisted
Youth offenders and adult offenders successfully rehabilitated
Persons with disabilities enabled to lead independent and dignified lives in the community
Strong Families
Strong marriages and family ties
Affordable, accessible and quality preschools
A Caring Society
Accessible and effective social services
Key Performance Indicators Actual Actual Revised Estimated
Desired Outcome Performance Indicator FY2017 FY2018 FY2019 FY2020
Resilient Individuals Needy families assisted Citizen households that receive social assistance (%)1 3.5
3.3
(estimate) 3.32
(estimate) NA3
Youth offenders and adult offenders successfully
rehabilitated
3-year recidivism rate of youth offender cases up to 21
years of age (%) 11.18
11.43 14.23 12.28
(estimate) Persons with disabilities enabled to lead
independent and dignified lives in the community
No. of persons with disabilities whose employers
receive Special Employment Credit (SEC)4 8,353
8,668
8,700
(estimate) NA
Strong Families Strong marriages and family ties Respondents who indicate “Singapore is a good place
to raise one's children.” (%)5
846 NA NA NA
Respondents who indicate “I have a close knit family.” (%)5
936 NA NA NA
1 This indicator represents the proportion of citizen household population that was assisted on ComCare Short-to-Medium-Term Assistance (SMTA), ComCare Long-Term Assistance (LTA), ComCare Student Care Fee Assistance (SCFA) and Home Ownership Plus Education (HOPE) scheme in each financial year. 2 As the actual number of unique citizen households that received social assistance in FY2019 and the national count of citizen-headed households in 2019 were not available at time of publication, the proportion of citizen households that receive social assistance was derived by estimating the number of unique citizen households that will receive social assistance in FY2019, over the national count of citizen-headed households in 2018. 3 The estimate for FY2020 is unavailable at the time of publication as the number of citizen households receiving social assistance may vary due to factors including macroeconomic conditions. The estimate for FY2020 will be available in the FY2021 Budget. 4 This indicator is reported on a calendar year (CY) basis, based on the actual number of unique persons with disabilities (PwDs) whose employers had received SEC. SEC is disbursed on a half-yearly basis. The CY2019 figure has been estimated based on the actual disbursement trends up to Jun 2019, while data for CY2020 will be available in the FY2021 Budget Book 5 The data is from a periodic survey conducted every 3-4 years. The indicator is reported on a CY basis. 6 Results are from the survey conducted in 2016.

61
Actual Actual Revised Estimated
Desired Outcome Performance Indicator FY2017 FY2018 FY2019 FY2020
Respondents aged 60 and above who indicate “When
I am faced with financial difficulties, I will turn to my family for help.” (%)5
786 NA NA NA
Cohort dissolution rates7 before the
a) 7th anniversary of marriage
10.5 10.3 9.7 – 11.1 (forecast)
9.1 – 10.6 (forecast)
b) 20th anniversary of marriage
22.0 23.7 22.5 – 23.3
(forecast) 22.9 - 23.9
(forecast) Affordable, accessible and quality preschools Cohort aged 18 months-6 years old with provision for
a full-day child care place (%)8
66.3 73.6 77.1 (forecast)
78.6 (forecast)
Eligible child care centres with at least 24-month license tenure (%)
87.3 92.4 92.4 (forecast)
92.4 (forecast)
Eligible child care centres and kindergartens with the Singapore Pre-school Accreditation Framework (SPARK) certification (%)
45.4 49.0
52.6 (forecast)
55.2 (forecast)
Expenditure of the 20th percentile family on full-day child care as a proportion of gross household income9 (%)
1.8
2.5
2.4 (forecast)
0.1 (forecast)
A Caring Society Accessible and effective social services Funded Voluntary Welfare Organisation (VWO)
programmes meeting targets (%)
92.9 92.0 93.0-97.0 (estimate)
93.0-97.0 (estimate)
Donations raised by Social and Welfare Institutions of Public Character (IPCs) ($ million)10
313 285 NA11 299 (forecast)
7 This indicator is reported on a CY basis. Cohort dissolution rate for FY YYYY refers to the cumulative proportion of marriages registered in calendar year YYYY-n that ended in divorce or annulment before the nth anniversary of marriage. Data is based on resident marriages (at least one party is a Singapore citizen or permanent resident) registered in Singapore with the Registry of Marriages (ROM) and Registry of Muslim Marriages (ROMM). 8 This indicator in the FY2016/2017 Revenue and Expenditure Estimates used total childcare centre capacity, which included both infant and childcare spaces, in computing the percentage of the cohort with provision for a full-day childcare place. For greater precision, the data from the Revenue and Expenditure Estimates for FY2017/2018 onwards only includes child care spaces. The data for FY2017 and onwards in this edition have been revised accordingly. 9 Expenditure excludes offsets from the Child Development Account, and is based on the median fees charged by childcare centres at HDB void-deck premises. Household income refers to the total gross income of the 20th percentile non-retiree citizen-headed household. 10 This indicator is reported on a CY basis. 11 Data will be available in FY2020.


Head J ___________
Ministry of Defence


63
HEAD J
MINISTRY OF DEFENCE
OVERVIEW
Mission Statement
The mission of the Ministry of Defence (MINDEF) and the Singapore Armed Forces (SAF) is to enhance Singapore’s peace and security through deterrence and diplomacy, and should these fail, to secure a swift and decisive victory over the aggressor.
To achieve this mission, MINDEF will strengthen the military, manpower and technological edge of the SAF, whilst fostering close relations with friendly countries in the region and beyond through greater dialogue, confidence building and co-operation.
Desired Outcomes
• A safe and secure environment where Singapore’s territorial integrity and sovereignty are protected andpreserved.
• Safe and secure access to Singapore’s air and sea lines of communications.
• A strong network of defence ties in the region and beyond.
• Committed National Servicemen who are dedicated to Total Defence.
• An operationally ready and well-equipped SAF that can deal with a broad range of threats to Singapore’ssecurity.
• A highly skilled, professional and technologically advanced SAF.
FY2020 EXPENDITURE ESTIMATES
Expenditure Estimates by Object Class
BLANK Actual Estimated Revised Estimated Code Object Class FY2018 FY2019 FY2019 FY2020 Change Over FY2019
BLANK
TOTAL EXPENDITURE $14,306,518,509 $15,468,621,400 $14,622,621,400 $15,085,600,500 $462,979,100 3.2%
Main Estimates $13,824,902,091 $14,981,206,800 $14,133,687,500 $14,561,155,500 $427,468,000 3.0%
OPERATING EXPENDITURE $13,824,902,091 $14,964,421,400 $14,118,421,400 $14,544,400,500 $425,979,100 3.0%
RUNNING COSTS $13,816,876,412 $14,955,959,400 $14,109,717,400 $14,535,304,800 $425,587,400 3.0%
Expenditure on Manpower $18,037,503 $18,471,100 $17,953,600 $18,597,900 $644,300 3.6%
1200 Political Appointments 2,582,781 2,437,200 2,487,800 2,509,900 22,100 0.9 1500 Permanent Staff 15,454,721 16,033,900 15,465,800 16,088,000 622,200 4.0

64
BLANK Actual Estimated Revised Estimated Code Object Class FY2018 FY2019 FY2019 FY2020 Change Over FY2019
BLANK
Other Operating Expenditure $13,798,838,909 $14,937,488,300 $14,091,763,800 $14,516,706,900 $424,943,100 3.0%
2100 Consumption of Products & Services 13,464,555 18,267,000 18,267,000 18,267,000 0 0.0 2300 Manpower Development 164,738 164,400 287,900 223,400 -64,500 -22.4 2400 International & Public Relations, Public
Communications 18,239,729 29,996,500 29,999,000 19,389,000 -10,610,000 -35.4
2800 Miscellaneous 0 2,000,000 2,000,000 2,000,000 0 0.0 2900 Military Expenditure 13,766,969,888 14,887,060,400 14,041,209,900 14,476,827,500 435,617,600 3.1
TRANSFERS $8,025,679 $8,462,000 $8,704,000 $9,095,700 $391,700 4.5%
3600 Transfers to Institutions & Organisations 8,025,679 8,462,000 8,704,000 9,095,700 391,700 4.5
OTHER CONSOLIDATED FUND OUTLAYS
$0 $16,785,400 $15,266,100 $16,755,000 $1,488,900 9.8%
4600 Loans and Advances (Disbursement) 0 16,785,400 15,266,100 16,755,000 1,488,900 9.8
Development Estimates $481,616,417 $504,200,000 $504,200,000 $541,200,000 $37,000,000 7.3%
DEVELOPMENT EXPENDITURE $481,616,417 $504,200,000 $504,200,000 $541,200,000 $37,000,000 7.3%
5100 Government Development 481,616,417 504,200,000 504,200,000 541,200,000 37,000,000 7.3
OTHER DEVELOPMENT FUND OUTLAYS $210,752,881 $257,600,000 $257,600,000 $348,000,000 $90,400,000 35.1%
5500 Land-Related Expenditure 210,752,881 257,600,000 257,600,000 348,000,000 90,400,000 35.1
Establishment List
BLANK Actual Estimated Revised Estimated Category/Personnel FY2018 FY2019 FY2019 FY2020
BLANK
POLITICAL APPOINTMENTS 3 3 3 3
Minister 1 1 1 1
Senior Minister of State 2 2 2 2
PERMANENT STAFF 279 279 279 279
Administrative 12 12 12 12
Education Service (2008) 10 10 10 10
Language Executive Scheme (2008) 1 1 1 1
Legal 11 11 11 11
Management Executive Scheme (2008) 185 185 185 185
Management Support Scheme (2008) 60 60 60 60
TOTAL 282 282 282 282

65
FY2019 BUDGET
The total expenditure of the Ministry of Defence (MINDEF) in FY2019 is projected to be $14.62 billion, an increase of $316.10 million or 2.2% over the actual FY2018 expenditure of $14.31 billion. Operating Expenditure The revised operating expenditure of $14.12 billion is an increase of $293.52 million or 2.1% over the actual FY2018 operating expenditure of $13.82 billion. The increase is due to higher military expenditure. Development Expenditure The revised development expenditure is $504.20 million, an increase of $22.58 million or 4.7% over the actual FY2018 development expenditure of $481.62 million. The increase is mainly attributed to higher construction requirements arising from major development works. Other Consolidated Fund Outlays Loans and Advances (Disbursement) A revised sum of $15.27 million is projected for advance disbursements to meet operational requirements. Other Development Fund Outlays Land-related Expenditure A sum of $257.60 million is allocated for land-related expenditure to make land available for development needs.
FY2020 BUDGET The total expenditure of MINDEF in FY2020 is projected to be $15.09 billion, an increase of $462.98 million or 3.2% over the revised FY2019 expenditure. Of this, $14.54 billion or 96.4% is for operating expenditure and the balance of $541.20 million or 3.6% is for development expenditure. Operating Expenditure The provision of $14.54 billion for FY2020 operating expenditure represents an increase of $425.98 million or 3.0% from the revised FY2019 operating expenditure. A total sum of $14.48 billion or 99.5% of the FY2020 operating expenditure goes towards the Armed Forces. This includes payments for the purchase of military equipment, maintenance of equipment and camps, and the allowances and salaries of full-time national servicemen, operationally ready national servicemen and regular servicemen. Compared with the revised FY2019 expenditure, the projected Armed Forces expenditure for FY2020 shows an increase of $435.62 million. Salaries of civilian personnel and operating costs of MINDEF HQ account for the remaining $67.57 million or 0.5% of operating expenditure.
Development Expenditure The projected development expenditure for FY2020 is $541.20 million, an increase of $37.00 million or 7.3% from the revised FY2019 development expenditure. The increase is mainly attributed to higher construction requirements for development works.

66
Other Consolidated Fund Outlays Loans and Advances (Disbursement) A sum of $16.76 million is projected for advance disbursements to meet operational requirements. Other Development Fund Outlays Land-Related Expenditure A sum of $348.00 million, an increase of $90.40 million or 35.1% from the revised FY2019 land-related expenditure, will be allocated for land-related expenditure to make land available for development needs. The increase is mainly due to higher infrastructure development requirements.
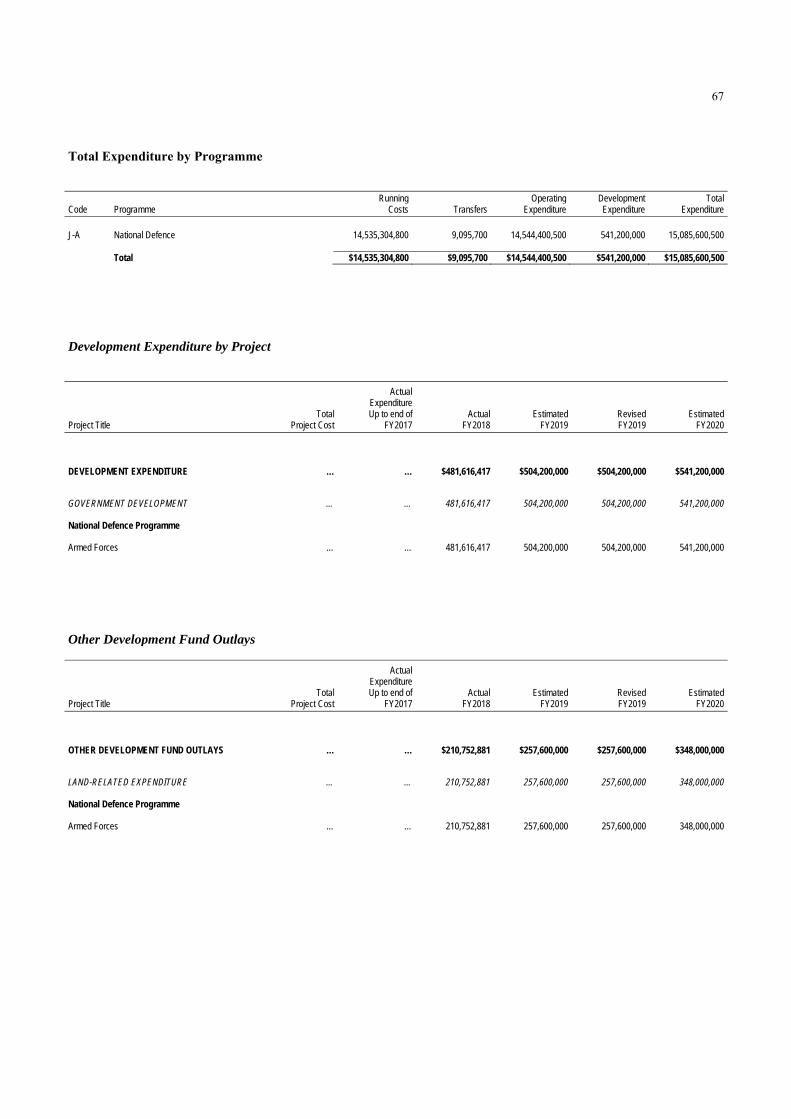
67
Total Expenditure by Programme
BLANK Running Operating Development Total Code Programme Costs Transfers Expenditure Expenditure Expenditure BLANK J-A National Defence 14,535,304,800 9,095,700 14,544,400,500 541,200,000 15,085,600,500
Total $14,535,304,800 $9,095,700 $14,544,400,500 $541,200,000 $15,085,600,500
Development Expenditure by Project
BLANK Actual Expenditure Up to end of
BLANK BLANK Total Actual Estimated Revised Estimated Project Title Project Cost FY2017 FY2018 FY2019 FY2019 FY2020
BLANK
DEVELOPMENT EXPENDITURE … … $481,616,417 $504,200,000 $504,200,000 $541,200,000
GOVERNMENT DEVELOPMENT … … 481,616,417 504,200,000 504,200,000 541,200,000
National Defence Programme … … 1 1 1 1
Armed Forces … … 481,616,417 504,200,000 504,200,000 541,200,000
Other Development Fund Outlays BLANK Actual
Expenditure Up to end of
BLANK BLANK Total Actual Estimated Revised Estimated Project Title Project Cost FY2017 FY2018 FY2019 FY2019 FY2020
BLANK
OTHER DEVELOPMENT FUND OUTLAYS … … $210,752,881 $257,600,000 $257,600,000 $348,000,000
LAND-RELATED EXPENDITURE … … 210,752,881 257,600,000 257,600,000 348,000,000
National Defence Programme … … 1 1 1 1
Armed Forces … … 210,752,881 257,600,000 257,600,000 348,000,000


Head K ___________
Ministry of Education


69
HEAD K
MINISTRY OF EDUCATION
OVERVIEW
Mission Statement
We will provide our children with a balanced and well-rounded education, so as to help them discover their talents and realise their full potential, and nurture them into committed citizens.
FY2020 EXPENDITURE ESTIMATES
Expenditure Estimates by Object Class
BLANK Actual Estimated Revised Estimated Code Object Class FY2018 FY2019 FY2019 FY2020 Change Over FY2019
BLANK
TOTAL EXPENDITURE $12,875,992,251 $13,200,000,000 $12,830,300,000 $13,280,000,000 $449,700,000 3.5%
Main Estimates $12,429,005,811 $12,705,098,400 $12,255,124,200 $12,861,226,400 $606,102,200 4.9%
OPERATING EXPENDITURE $12,429,005,811 $12,490,000,000 $12,039,000,000 $12,636,000,000 $597,000,000 5.0%
RUNNING COSTS $8,495,620,789 $8,751,891,500 $8,270,009,900 $8,786,419,900 $516,410,000 6.2%
Expenditure on Manpower $4,060,075,167 $4,166,220,900 $3,900,348,800 $4,210,464,900 $310,116,100 8.0%
1200 Political Appointments 2,358,343 2,974,100 2,567,400 3,219,100 651,700 25.4 1500 Permanent Staff 3,960,270,872 4,027,168,200 3,780,245,900 4,095,126,300 314,880,400 8.3 1600 Temporary, Daily-Rated & Other Staff 97,445,951 136,078,600 117,535,500 112,119,500 -5,416,000 -4.6
Other Operating Expenditure $738,015,163 $823,342,500 $790,598,400 $880,193,800 $89,595,400 11.3%
2100 Consumption of Products & Services 576,716,402 664,596,700 663,457,100 736,450,300 72,993,200 11.0 2300 Manpower Development 51,526,601 61,150,800 56,946,000 57,961,800 1,015,800 1.8 2400 International & Public Relations, Public
Communications 13,083,042 13,713,600 14,077,700 14,036,700 -41,000 -0.3
2700 Asset Acquisition 92,512,808 80,675,900 53,477,400 69,162,900 15,685,500 29.3 2800 Miscellaneous 4,176,310 3,205,500 2,640,200 2,582,100 -58,100 -2.2
Grants, Subventions & Capital Injections to Organisations $3,697,530,459 $3,762,328,100 $3,579,062,700 $3,695,761,200 $116,698,500 3.3%
3100 Grants, Subventions & Capital Injections to Statutory Boards
299,258,591 338,480,000 298,577,500 355,058,300 56,480,800 18.9
3200 Grants, Subventions & Capital Injections to Educational Institutions
3,398,271,868 3,423,848,100 3,280,485,200 3,340,702,900 60,217,700 1.8
TRANSFERS $3,933,385,022 $3,738,108,500 $3,768,990,100 $3,849,580,100 $80,590,000 2.1%
3500 Social Transfers to Individuals 421,672,184 441,762,900 427,629,500 490,931,300 63,301,800 14.8 3600 Transfers to Institutions & Organisations 3,509,213,874 3,294,322,700 3,339,369,200 3,356,225,900 16,856,700 0.5 3800 International Organisations & Overseas
Development Assistance 2,498,964 2,022,900 1,991,400 2,422,900 431,500 21.7
OTHER CONSOLIDATED FUND OUTLAYS $0 $215,098,400 $216,124,200 $225,226,400 $9,102,200 4.2%
4600 Loans and Advances (Disbursement) 0 215,098,400 216,124,200 225,226,400 9,102,200 4.2

70
BLANK Actual Estimated Revised Estimated Code Object Class FY2018 FY2019 FY2019 FY2020 Change Over FY2019
BLANK
Development Estimates $446,986,440 $710,000,000 $791,300,000 $644,000,000 -$147,300,000 -18.6%
DEVELOPMENT EXPENDITURE $446,986,440 $710,000,000 $791,300,000 $644,000,000 -$147,300,000 -18.6%
5100 Government Development 345,738,774 341,412,900 397,951,600 348,610,200 -49,341,400 -12.4 5200 Grants & Capital Injections to
Organisations 101,247,666 368,587,100 393,348,400 295,389,800 -97,958,600 -24.9
Establishment List
BLANK Actual Estimated Revised Estimated Category/Personnel FY2018 FY2019 FY2019 FY2020
BLANK
POLITICAL APPOINTMENTS 5 5 5 5
Minister 2 2 2 2
Senior Minister of State 1 1 1 1
Senior Parliamentary Secretary 2 2 2 2
PERMANENT STAFF 40,935 40,184 40,937 40,335
Accounting Profession (2008) 3 3 3 3
Administrative 22 22 22 22
Allied Educators Scheme 1,442 1,450 1,372 1,375
Corporate Support 1,001 934 899 900
Education Service (2008) 33,685 32,567 32,914 32,313
Estate Maintenance 3 3 3 3
Information Service (2008) 2 2 2 2
Legal 6 6 6 6
Management Executive Scheme (2008) 1,963 2,186 2,369 2,371
Management Support Scheme (2008) 687 900 1,213 1,201
Management Support Scheme (Language Officer) 2 2 3 3
Mechanical Support 1 1 1 1
Operations Support 1,567 1,568 1,588 1,593
Shorthand Writers 15 15 29 29
Statistician (Trade & Industry) (2008) 1 1 1 1
Technical Support Scheme (2008) 535 523 512 512
Translator (2003) 0 1 0 0
OTHERS 13,589 13,973 13,984 13,798
SkillsFuture Singapore 449 495 437 437
Government-Aided Schools (non-teaching staff) 1,601 1,603 1,777 1,777
Government-Aided Schools (teaching staff) 272 262 242 238
ISEAS - Yusof Ishak Institute 67 101 100 100
Institute of Technical Education 2,573 2,659 2,659 2,648
Nanyang Polytechnic 1,592 1,713 1,694 1,646
Ngee Ann Polytechnic 1,720 1,697 1,577 1,560
Republic Polytechnic 1,601 1,622 1,551 1,557
Science Centre Board 242 239 247 247
Singapore Examination & Assessment Board 211 232 232 232
Singapore Polytechnic 1,754 1,800 1,794 1,748
Temasek Polytechnic 1,507 1,550 1,674 1,608
TOTAL 54,529 54,162 54,926 54,138

71
FY2019 BUDGET
The revised FY2019 total expenditure of the Ministry of Education (MOE) is $12.83 billion. Of the total expenditure, $12.04 billion or 93.8% is for operating expenditure and $791.30 million or 6.2% is for development expenditure. Operating Expenditure
The revised FY2019 operating expenditure of $12.04 billion is $0.39 billion or 3.1% lower than the actual
FY2018 expenditure of $12.43 billion due mainly to lower bonus provision, and lower endowment matching grants to the Autonomous Universities (AUs) due to lower donations raised.
Development Expenditure
The revised FY2019 development expenditure of $791.30 million is $344.31 million or 77.0% higher than the
actual FY2018 expenditure of $446.99 million. This is mainly due to the provision for land and construction costs for the development of Singapore Institute of Technology (SIT)’s permanent campus in FY2019, as well as higher cashflow requirements for building projects for schools.
FY2020 BUDGET
The total expenditure of MOE in FY2020 is projected to be $13.28 billion, which is $0.45 billion or 3.5% higher
than the revised FY2019 total expenditure. $12.64 billion or 95.2% is for operating expenditure and $644.00 million or 4.8% is for development expenditure.
The projected FY2020 operating expenditure of $12.64 billion is an increase of $0.60 billion or 5.0% over the
FY2019 revised expenditure. The higher operating expenditure in FY2020 is mainly due to annual cost adjustments and initiatives to improve the quality of education. The projected FY2020 development expenditure of $644.00 million is a decrease of $147.30 million or 18.6% over the FY2019 revised expenditure. General Education Programme
Under our education system, every child is given the opportunity to complete at least 10 years of formal school
education. The total number of students (including those in the Independent Schools) subsidised by MOE for FY2020 is 419,500. The General Education Programme undertaken by Government, Government-Aided, Special Education, and Independent Schools accounts for $6.71 billion, which is higher than the revised FY2019 expenditure of $6.42 billion by $283.36 million or 4.4%. Operating expenditure, which accounts for $6.43 billion or 95.9%, is projected to increase by $350.22 million, while development expenditure is projected to decrease by $66.86 million. The increase in operating expenditure is mainly due to annual cost adjustments and initiatives to improve the quality of education, while the decrease in development expenditure is mainly due to school building projects, which are nearing completion.
University Programme
A provision of $2.76 billion has been made for the university sector in FY2020 to train high quality graduate
manpower to support Singapore's economic needs, and to support the universities’ research efforts. The total number of students (including both undergraduates and postgraduates) subsidised by MOE at the AUs1 in FY2020 is projected to be 77,600.
Of the total FY2020 provision, $2.55 billion or 92.4% is for operating expenditure and $209.63 million or 7.6% is
for development expenditure. Compared to the FY2019 revised budget, operating expenditure will increase by $25.83 million, while development expenditure will decrease by $93.40 million. The increase in operating expenditure in FY2020 is mainly due to an increase in bursary quanta, and expected higher take-ups arising from the bursary enhancements in FY2020. The decrease in development expenditure is due to the provision for land cost for the development of Singapore Institute of Technology Permanent Campus in FY2019.
1 The Autonomous Universities refer to NUS, NTU, SMU, SUTD, SIT and Singapore University of Social Sciences (SUSS).
72
Polytechnic Programme
A provision of $1.22 billion has been made for the polytechnic sector in FY2020 to deliver industry and technical training for employment and further education to students who have completed their secondary education. The total number of students subsidised by MOE in FY2020 at the polytechnics is projected to be 65,300.
Of the total FY2020 provision, $1.20 billion or 98.0% is for operating expenditure and $24.17 million or 2.0% is
for development expenditure. Compared to the FY2019 revised budget, operating expenditure is projected to increase by $20.12 million, while development expenditure will increase by $5.07 million. The increase in operating expenditure is mainly due to an increase in bursary quanta, and expected higher take-up arising from the bursary enhancements in FY2020; while the increase in development budget is mainly due to higher cashflow needed in FY2020 for Singapore Polytechnic’s campus upgrading and rejuvenation projects.
Institute of Technical Education Programme
A provision of $0.46 billion has been made for ITE in FY2020 to deliver technical and vocational training to
students who have completed secondary education. The total number of students subsidised by MOE in FY2020 at ITE is projected to be 25,600.
The total FY2020 provision of $0.46 billion is for operating expenditure. Compared to the FY2019 revised
budget, operating expenditure is projected to decrease by $8.45 million, mainly due to lower student enrolment. SkillsFuture Programme
The national SkillsFuture movement supports Singaporeans in their lifelong journey to achieve skills mastery and
strengthens the Continuing Education and Training ecosystem in Singapore. A provision of $0.40 billion has been made for SSG in FY2020 to implement plans, policies and strategies to support lifelong learning and skills development under SkillsFuture.
Other Consolidated Fund Outlays
Advances for FY2020 are projected to be $225.23 million, mainly for Tuition Fee Loan and Study Loan to
students from polytechnics and AUs.

73
Total Expenditure by Programme
BLANK Running Operating Development Total Code Programme Costs Transfers Expenditure Expenditure Expenditure BLANK K-A Administration 426,406,200 61,564,600 487,970,800 111,767,400 599,738,200 K-B Higher Education and SkillsFuture 17,474,500 493,407,200 510,881,700 0 510,881,700 K-C School Services and Educational Development 389,581,200 28,883,300 418,464,500 7,811,600 426,276,100 K-D Government Schools and Junior Colleges 4,262,166,800 195,730,600 4,457,897,400 220,424,900 4,678,322,300 K-E Special Education Schools 0 217,793,700 217,793,700 45,099,600 262,893,300 K-F Government-Aided Schools and Junior Colleges 1,358,407,400 0 1,358,407,400 9,841,300 1,368,248,700 K-G Independent Schools 377,124,500 17,708,300 394,832,800 2,489,600 397,322,400 K-H National Institute of Education 0 106,624,300 106,624,300 0 106,624,300 K-I National University of Singapore 0 1,164,447,300 1,164,447,300 0 1,164,447,300 K-J Nanyang Technological University 0 623,805,800 623,805,800 703,800 624,509,600 K-K ISEAS - Yusof Ishak Institute 15,336,400 0 15,336,400 0 15,336,400 K-L Singapore Polytechnic 235,358,200 14,552,000 249,910,200 11,115,000 261,025,200 K-M Ngee Ann Polytechnic 218,015,000 14,964,200 232,979,200 0 232,979,200 K-N Temasek Polytechnic 227,858,000 14,766,500 242,624,500 13,050,400 255,674,900 K-O Institute of Technical Education 432,011,600 29,572,600 461,584,200 0 461,584,200 K-P Science Centre Board 29,275,200 0 29,275,200 8,550,000 37,825,200 K-Q Nanyang Polytechnic 238,004,900 14,880,200 252,885,100 0 252,885,100 K-R Singapore University of Social Sciences 0 116,601,400 116,601,400 0 116,601,400 K-S Singapore Management University 0 190,540,300 190,540,300 6,774,800 197,315,100 K-T Nanyang Academy of Fine Arts 0 23,286,000 23,286,000 0 23,286,000 K-U Lasalle College of the Arts 0 23,989,400 23,989,400 0 23,989,400 K-V Republic Polytechnic 203,276,700 15,095,200 218,371,900 0 218,371,900 K-W Singapore Examinations and Assessment Board 90,000,000 0 90,000,000 4,220,000 94,220,000 K-X Singapore University of Technology And Design 0 119,692,300 119,692,300 0 119,692,300 K-Y Singapore Institute of Technology 0 225,233,500 225,233,500 202,151,600 427,385,100 K-Z SkillsFuture Singapore 266,123,300 136,441,400 402,564,700 0 402,564,700
TOTAL $8,786,419,900 $3,849,580,100 $12,636,000,000 $644,000,000 $13,280,000,000
Development Expenditure by Project
BLANK Actual Expenditure Up to end of
BLANK BLANK Total Actual Estimated Revised Estimated Project Title Project Cost FY2017 FY2018 FY2019 FY2019 FY2020
BLANK
DEVELOPMENT EXPENDITURE … … $446,986,440 $710,000,000 $791,300,000 $644,000,000
GOVERNMENT DEVELOPMENT … … 345,738,774 341,412,900 397,951,600 348,610,200
Administration Programme … … 15 15 15 15
Minor IT Enhancements 0 11,225,106 1,020,735 1,189,600 1,377,300 1,221,700
Development of MOE HQ Phase II 4,090,200 3,705,801 13,600 0 0 144,000
Additions & Alterations to Existing MOE Buildings 6,200,000 4,555,041 219,266 450,000 63,000 878,100
Infrastructure Setup to Support Pervasive Use of ICT in Teaching, Learning & Assessment
23,000,000 116,852 0 170,100 395,700 170,100
Implementation of School-Wide Wireless Infrastructure
167,740,000 52,299,870 19,338,719 7,200,000 14,925,000 604,800
IT Capacity Plan Part 2 30,290,000 14,826,946 4,941,945 3,240,000 3,656,700 585,000
Minor Works & Improvements - MOEHQ 0 885,759 198,434 360,000 360,000 360,000
MOE Network Segregation 25,080,000 6,606,915 150,487 3,086,100 0 270,000
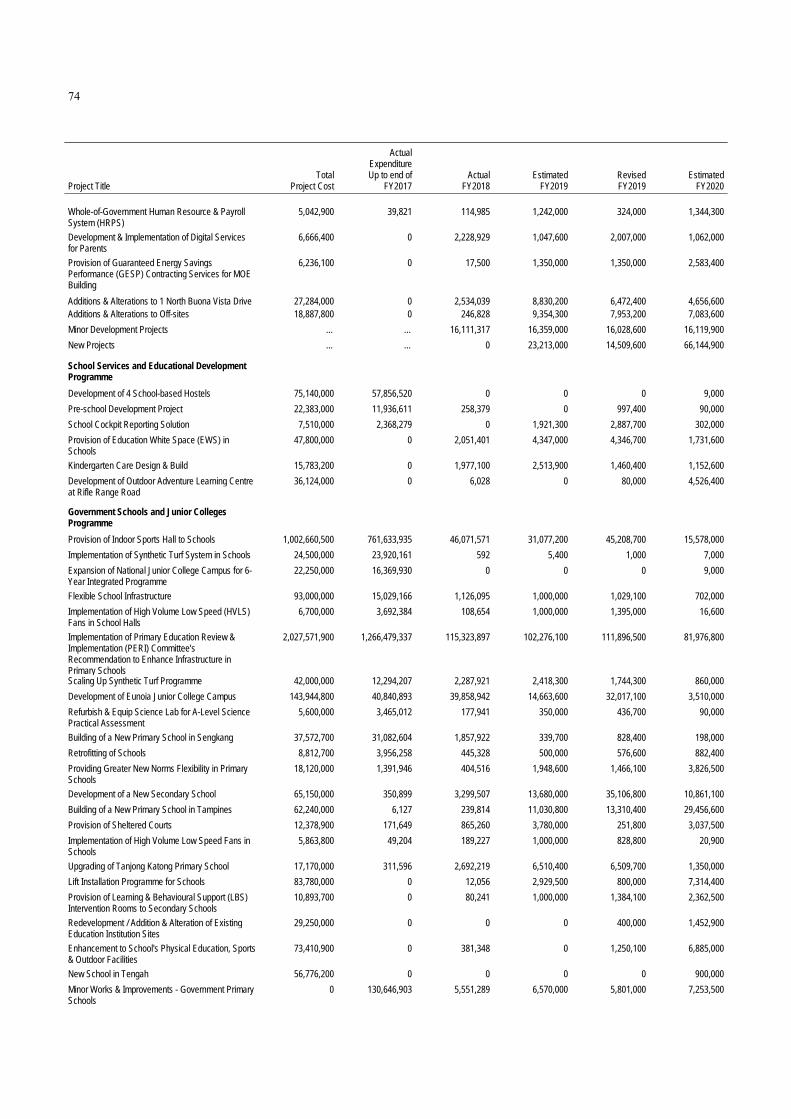
74
BLANK Actual Expenditure Up to end of
BLANK BLANK Total Actual Estimated Revised Estimated Project Title Project Cost FY2017 FY2018 FY2019 FY2019 FY2020
BLANK Whole-of-Government Human Resource & Payroll System (HRPS)
5,042,900 39,821 114,985 1,242,000 324,000 1,344,300
Development & Implementation of Digital Services for Parents
6,666,400 0 2,228,929 1,047,600 2,007,000 1,062,000
Provision of Guaranteed Energy Savings Performance (GESP) Contracting Services for MOE Building
6,236,100 0 17,500 1,350,000 1,350,000 2,583,400
Additions & Alterations to 1 North Buona Vista Drive 27,284,000 0 2,534,039 8,830,200 6,472,400 4,656,600 Additions & Alterations to Off-sites 18,887,800 0 246,828 9,354,300 7,953,200 7,083,600
Minor Development Projects … … 16,111,317 16,359,000 16,028,600 16,119,900
New Projects … … 0 23,213,000 14,509,600 66,144,900
School Services and Educational Development Programme … … 6 6 6 6
Development of 4 School-based Hostels 75,140,000 57,856,520 0 0 0 9,000
Pre-school Development Project 22,383,000 11,936,611 258,379 0 997,400 90,000
School Cockpit Reporting Solution 7,510,000 2,368,279 0 1,921,300 2,887,700 302,000
Provision of Education White Space (EWS) in Schools
47,800,000 0 2,051,401 4,347,000 4,346,700 1,731,600
Kindergarten Care Design & Build 15,783,200 0 1,977,100 2,513,900 1,460,400 1,152,600
Development of Outdoor Adventure Learning Centre at Rifle Range Road
36,124,000 0 6,028 0 80,000 4,526,400
Government Schools and Junior Colleges Programme
… … 27 27 27 27
Provision of Indoor Sports Hall to Schools 1,002,660,500 761,633,935 46,071,571 31,077,200 45,208,700 15,578,000
Implementation of Synthetic Turf System in Schools 24,500,000 23,920,161 592 5,400 1,000 7,000
Expansion of National Junior College Campus for 6-Year Integrated Programme
22,250,000 16,369,930 0 0 0 9,000
Flexible School Infrastructure 93,000,000 15,029,166 1,126,095 1,000,000 1,029,100 702,000
Implementation of High Volume Low Speed (HVLS) Fans in School Halls
6,700,000 3,692,384 108,654 1,000,000 1,395,000 16,600
Implementation of Primary Education Review & Implementation (PERI) Committee’s Recommendation to Enhance Infrastructure in Primary Schools
2,027,571,900 1,266,479,337 115,323,897 102,276,100 111,896,500 81,976,800
Scaling Up Synthetic Turf Programme 42,000,000 12,294,207 2,287,921 2,418,300 1,744,300 860,000
Development of Eunoia Junior College Campus 143,944,800 40,840,893 39,858,942 14,663,600 32,017,100 3,510,000
Refurbish & Equip Science Lab for A-Level Science Practical Assessment
5,600,000 3,465,012 177,941 350,000 436,700 90,000
Building of a New Primary School in Sengkang 37,572,700 31,082,604 1,857,922 339,700 828,400 198,000
Retrofitting of Schools 8,812,700 3,956,258 445,328 500,000 576,600 882,400
Providing Greater New Norms Flexibility in Primary Schools
18,120,000 1,391,946 404,516 1,948,600 1,466,100 3,826,500
Development of a New Secondary School 65,150,000 350,899 3,299,507 13,680,000 35,106,800 10,861,100
Building of a New Primary School in Tampines 62,240,000 6,127 239,814 11,030,800 13,310,400 29,456,600
Provision of Sheltered Courts 12,378,900 171,649 865,260 3,780,000 251,800 3,037,500
Implementation of High Volume Low Speed Fans in Schools
5,863,800 49,204 189,227 1,000,000 828,800 20,900
Upgrading of Tanjong Katong Primary School 17,170,000 311,596 2,692,219 6,510,400 6,509,700 1,350,000
Lift Installation Programme for Schools 83,780,000 0 12,056 2,929,500 800,000 7,314,400
Provision of Learning & Behavioural Support (LBS) Intervention Rooms to Secondary Schools
10,893,700 0 80,241 1,000,000 1,384,100 2,362,500
Redevelopment / Addition & Alteration of Existing Education Institution Sites
29,250,000 0 0 0 400,000 1,452,900
Enhancement to School's Physical Education, Sports & Outdoor Facilities
73,410,900 0 381,348 0 1,250,100 6,885,000
New School in Tengah 56,776,200 0 0 0 0 900,000
Minor Works & Improvements - Government Primary Schools
0 130,646,903 5,551,289 6,570,000 5,801,000 7,253,500

75
BLANK Actual Expenditure Up to end of
BLANK BLANK Total Actual Estimated Revised Estimated Project Title Project Cost FY2017 FY2018 FY2019 FY2019 FY2020
BLANK Minor Works & Improvements - Government Secondary Schools
0 143,121,392 5,544,276 6,660,000 6,659,900 7,227,800
Minor Works & Improvements - Government Junior Colleges
0 36,264,304 625,660 543,600 543,600 504,900
Programme for Rebuilding & Improving Existing Schools - Government Primary Schools
1,206,122,800 1,203,635,672 1,486,207 447,000 122,700 90,000
Programme for Rebuilding & Improving Existing Schools - Government Secondary Schools
1,442,342,000 1,259,168,629 31,446,766 900,600 1,456,700 3,751,200
Special Education Schools Programme … … 5 5 5 5
Sprucing Up of Chong Boon Secondary School 6,742,900 1,311,360 31,461 315,000 1,323,500 450,000
Expansion of AWWA School at Former Bedok West Primary Site (2nd Campus)
23,250,000 6,028 37,046 7,639,800 3,487,500 12,152,100
Expansion of Eden School at Former Hong Kah Primary Site (2nd Campus)
22,670,000 6,028 477,658 6,059,800 3,510,400 11,030,900
Expansion of Rainbow Centre (3rd Campus) 25,360,000 0 10,062 3,037,500 270,600 9,573,400
Redevelopment to an Existing School (Campus II) at Tampines
47,220,000 0 6,028 1,687,500 500,000 10,903,200
Government-Aided Schools and Junior Colleges Programme
… … 5 5 5 5
Minor Works & Improvements - Government-Aided Primary Schools
0 1,862,067 506,881 1,000,000 666,000 390,200
Minor Works & Improvements - Government-Aided Secondary Schools
0 1,153,147 433,149 1,000,000 648,000 411,200
Minor Works & Improvements - Government-Aided Junior Colleges
0 491,161 3,671 72,000 107,900 15,000
Programme for Rebuilding & Improving Existing Schools - Government-Aided Primary Schools
40,000,000 20,895,270 0 100,000 0 20,000
Programme for Rebuilding & Improving Existing Schools - Government-Aided Secondary Schools
10,000,000 31,036,434 221,529 100,000 8,600 450,000
Independent Schools Programme … … 3 3 3 3
Indoor Sports Hall / Equivalent Sports Facilities for Independent Schools
0 377,631 1,166,594 1,687,500 1,657,400 39,000
Redevelopment of Raffles Girls' School (Secondary) (RGS)
90,787,900 8,870,732 22,943,113 20,425,400 34,475,100 2,000,600
Expansion of the Integrated Programme (IP) Landscape
1,480,000 431,034 8,933 100,000 16,100 10,000
Completed Projects … … 8,385,707 1,683,500 1,060,700 0
GRANTS & CAPITAL INJECTIONS TO ORGANISATIONS … … 101,247,666 368,587,100 393,348,400 295,389,800
Administration Programme … … 4 4 4 4
Infrastructure Setup to Support Pervasive Use of ICT in Teaching, Learning & Assessment
0 80,638 0 0 0 170,100
Implementation of School-Wide Wireless 50,001,000 15,531,860 5,892,600 5,031,000 4,975,000 259,200 Minor Development Projects … … 4,175,537 1,006,300 5,342,900 867,500
New Projects … … 0 2,377,800 3,463,700 7,242,200
Government Schools and Junior Colleges Programme
… … 11 11 11 11
Provision of Indoor Sports Hall to Schools 315,508,700 139,901,702 11,002,908 10,359,000 9,259,600 5,192,700
Flexible School Infrastructure 0 2,636,039 512,078 470,200 441,000 175,700
Implementation of Primary Education Review & Implementation (PERI) Committee’s Recommendation to Enhance Infrastructure in Primary Schools
506,338,400 235,087,058 18,544,434 26,555,000 11,066,700 16,400,800
Scaling Up Synthetic Turf Programme 17,000,000 1,675,804 11,714 806,000 747,500 140,200
Retrofitting of Schools 2,803,200 289,827 54,060 202,500 71,300 98,000

76
BLANK Actual Expenditure Up to end of
BLANK BLANK Total Actual Estimated Revised Estimated Project Title Project Cost FY2017 FY2018 FY2019 FY2019 FY2020
BLANK Providing Greater New Norms Flexibility in Primary Schools
4,100,000 166,313 122,525 649,500 127,500 1,275,600
Provision of Sheltered Courts 954,400 0 11,961 1,260,000 107,900 1,012,500
Lift Installation Programme for Schools 6,620,000 0 0 976,500 0 2,438,100
Provision of Learning & Behavioural Support (LBS) Intervention Rooms to Secondary Schools
1,860,900 0 571 629,000 244,200 787,500
Redevelopment / Addition & Alteration of Existing Education Institution Sites
0 0 0 0 0 484,200
Enhancement to School's Physical Education, Sports & Outdoor Facilities
11,439,100 0 0 0 0 2,295,000
Special Education Schools Programme … … 5 5 5 5
Extension of Rainbow Centre - Margaret Drive School (RCMDS)
5,270,000 4,757,425 105,664 90,000 89,900 90,000
Expansion of AWWA School at Former Bedok West Primary Site (2nd Campus)
1,110,000 0 0 2,546,600 0 270,000
Expansion of Eden School at Former Hong Kah Primary Site (2nd Campus)
1,230,000 0 0 2,020,000 0 270,000
Expansion of Rainbow Centre (3rd Campus) 1,320,000 0 0 1,012,500 0 90,000
Redevelopment to an Existing School (Campus II) at Tampines
2,050,000 0 0 562,500 0 270,000
Government-Aided Schools and Junior Colleges Programme
… … 6 6 6 6
Upgrading of St. Margaret's Primary School 9,690,600 0 0 0 121,300 4,050,000
Minor Works & Improvements - Government-Aided Primary Schools
0 59,141,567 1,443,407 665,000 998,900 1,172,000
Minor Works & Improvements - Government-Aided Secondary Schools
0 51,299,822 1,030,290 620,000 971,900 1,240,000
Minor Works & Improvements - Government-Aided Junior Colleges
0 12,316,667 111,635 72,000 36,000 226,200
Programme for Rebuilding & Improving Existing Schools - Government-Aided Primary Schools
520,829,200 539,340,491 54,329 170,000 89,600 70,000
Programme for Rebuilding & Improving Existing Schools - Government-Aided Secondary Schools
624,434,900 491,920,716 108,941 125,000 162,500 1,796,700
Independent Schools Programme … … 2 2 2 2
Redevelopment of Raffles Girls' School (Secondary) (RGS)
770,100 12,772 0 6,808,400 0 90,000
Expansion of the Integrated Programme (IP) Landscape
44,822,200 44,979,497 138,955 170,000 252,200 350,000
Nanyang Technological University Programme … … 1 1 1 1
Start-up Basic Research Set-up for Lee Kong Chian School of Medicine's PhD Programme
3,452,000 244,663 851,783 537,000 515,300 703,800
Singapore Polytechnic Programme … … 2 2 2 2
Rejuvenation of Singapore Polytechnic 89,005,800 60,091,214 3,909,961 4,275,000 4,275,000 6,840,000
Singapore Polytechnic 5th Campus Upgrading & Rejuvenation Programme
35,282,300 0 46,045 5,087,300 2,334,200 4,275,000
Temasek Polytechnic Programme … … 1 1 1 1
Rejuvenation of Temasek Polytechnic 70,046,000 222,215 9,340,038 13,975,700 12,090,000 13,050,400
Science Centre Board Programme … … 1 1 1 1
Development of New Science Centre 47,742,400 0 6,450 384,800 6,840,000 8,550,000
Singapore Management University Programme … … 1 1 1 1
Development of Singapore Management University-X Facility
18,583,800 0 0 0 11,808,900 6,774,800
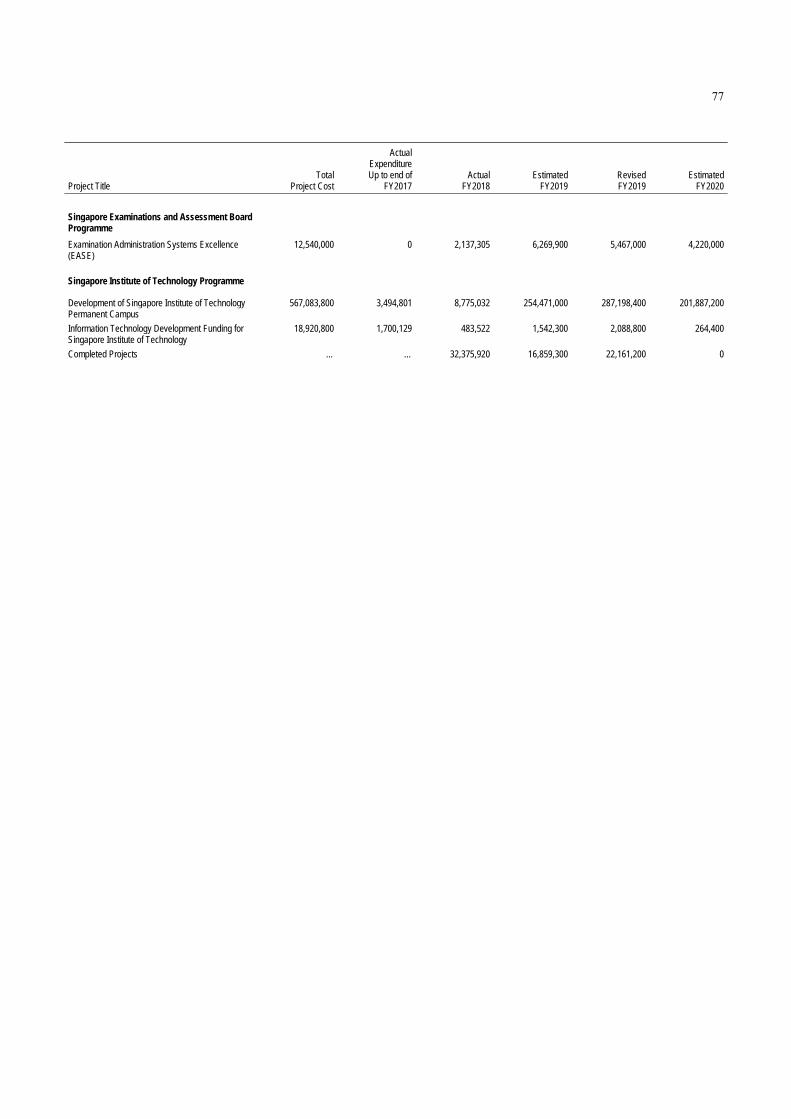
77
BLANK Actual Expenditure Up to end of
BLANK BLANK Total Actual Estimated Revised Estimated Project Title Project Cost FY2017 FY2018 FY2019 FY2019 FY2020
BLANK
Singapore Examinations and Assessment Board Programme
… … 1 1 1 1
Examination Administration Systems Excellence (EASE)
12,540,000 0 2,137,305 6,269,900 5,467,000 4,220,000
Singapore Institute of Technology Programme … … 2 2 2 2
Development of Singapore Institute of Technology Permanent Campus
567,083,800 3,494,801 8,775,032 254,471,000 287,198,400 201,887,200
Information Technology Development Funding for Singapore Institute of Technology
18,920,800 1,700,129 483,522 1,542,300 2,088,800 264,400
Completed Projects … … 32,375,920 16,859,300 22,161,200 0

78
KEY PERFORMANCE INDICATORS Desired Outcomes
A student who has undergone the Singapore Education system will be:
• A confident, motivated person who has a strong sense of right and wrong, is adaptable, can work in teams and across cultures, able to think independently and critically, and communicate effectively;
• A self-directed, lifelong learner who exercises initiative to develop and pursue his passion who strives for skills mastery throughout life;
• An active contributor who is enterprising, innovative, strives for excellence, and perseveres in the face of failures and challenges; and
• A concerned citizen who is rooted to Singapore, with a strong social consciousness and conviction to improve the lives of others around him.
Key Performance Indicators
Actual Actual Revised Estimated
Desired Outcome Performance Indicator FY2017 FY2018 FY2019 FY2020
Opportunities for All to Fulfil their Potential
A Good System of Schools and Institutes of Higher Learning
Since 2018, we have embarked on a new phase in the development of our education system, where the key focus is on laying the foundation for Singaporeans to “Learn for Life”, embrace the future, and seize opportunities in a fast-changing world. Initiatives to continue strengthening our school system include: Nurturing the Joy of Learning: Our schools aim to nurture well-rounded Singaporeans whose passions for learning extend
beyond their time in school. In recent years, we embarked on important structural changes to reduce the over-emphasis on academic results and to nurture in our students a stronger intrinsic motivation to learn. We have reduced the school-based assessment load, to give students the time and space to develop a sense of curiosity, as well as explore and develop their diverse strengths and interests. We will also be making changes to the PSLE scoring system in 2021 to reduce fine differentiation so that students can focus on their own learning and development instead of comparing with each other.
One Education, Multiple Pathways: We are also creating greater flexibility in our education system to better cater to and develop
students’ diverse strengths and interests throughout their education journey. We are implementing Full Subject-Based Banding (FSBB), which will eventually replace secondary school streaming in 2024. FSBB is piloted in 28 secondary schools from 2020, during which the schools will further customise learning to each students’ needs. We have also progressively expanded aptitude-based admissions at the polytechnics and ITE in recent years, and also opened the polytechnic aptitude-based admissions to working adults starting 2019. MOE continues to support students with a range of post-secondary upgrading opportunities at different stages of their careers, to cater to their different learning journeys and profiles. Over the years, more polytechnic graduates have been able to enrol in subsidised full-time degree courses, and by 2030, MOE will provide opportunities for all Nitec graduates to upgrade to at least a Higher Nitec over the course of their careers. At the same time, our Institutes of Higher Learning (IHLs) are scaling up certificate to degree-level SkillsFuture Work-Study Programmes, which provide a more direct nexus with industry. Over 4,500 individuals have benefitted since the launch of the SkillsFuture Work-Study Programmes in 2015.
Education as an Uplifting Force: MOE will also continue to ensure that every Singaporean has access to the opportunities
offered through our education system, and be able to achieve their potential in life. We provide a strong start for every child through access to quality and affordable preschool education, for example, in MOE Kindergartens. In 2019, we set up UPLIFT Programme Office to strengthen the interface and partnership between school and community partners, to better support disadvantaged students. We have also been strengthening after-school care and support for students from low-income families through school-based student care centres in primary schools and the GEAR-UP programme in secondary schools. In addition, we are improving affordability in higher education by enhancing bursaries for Singaporean students in MOE-subsidised undergraduate and diploma courses from AY2020, and also reducing tuition fees for Singaporeans studying in full-time general courses at Singapore Institute of Technology (SIT) and Singapore University of Social Sciences (SUSS).
Learning Language for Life: Bilingualism continues to be a cornerstone of our education policy. With the growth of Asia, language skills are becoming even more important. We are expanding our language programmes to support student to go as far as possible in the learning of their mother tongues. This include expanding Language Elective Programmes to secondary schools, and expanding the number of Junior Colleges offering the programme. We are introducing Language Support Programme in primary schools, and encouraging students who has the aptitude to learn a third language at a conversational level.
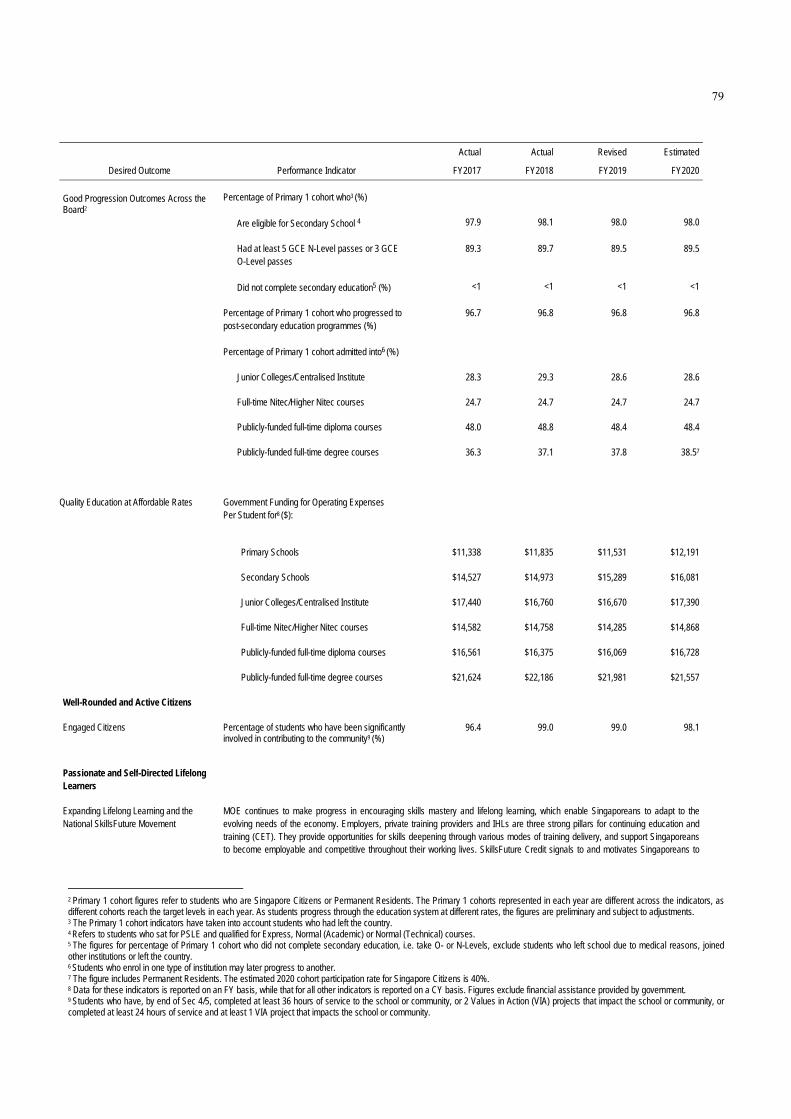
79
Actual Actual Revised Estimated
Desired Outcome Performance Indicator FY2017 FY2018 FY2019 FY2020
Good Progression Outcomes Across the Board2
Percentage of Primary 1 cohort who3 (%)
Are eligible for Secondary School 4 97.9 98.1 98.0 98.0
Had at least 5 GCE N-Level passes or 3 GCE O-Level passes
89.3 89.7 89.5 89.5
Did not complete secondary education5 (%) <1 <1 <1 <1
Percentage of Primary 1 cohort who progressed to post-secondary education programmes (%)
96.7 96.8 96.8 96.8
Percentage of Primary 1 cohort admitted into6 (%)
Junior Colleges/Centralised Institute 28.3 29.3 28.6 28.6
Full-time Nitec/Higher Nitec courses 24.7 24.7 24.7 24.7
Publicly-funded full-time diploma courses 48.0 48.8 48.4 48.4
Publicly-funded full-time degree courses 36.3 37.1 37.8 38.57
Quality Education at Affordable Rates
Government Funding for Operating Expenses Per Student for8 ($):
Primary Schools $11,338 $11,835 $11,531 $12,191
Secondary Schools $14,527 $14,973 $15,289 $16,081
Junior Colleges/Centralised Institute $17,440 $16,760 $16,670 $17,390
Full-time Nitec/Higher Nitec courses $14,582 $14,758 $14,285 $14,868
Publicly-funded full-time diploma courses $16,561 $16,375 $16,069 $16,728
Publicly-funded full-time degree courses $21,624 $22,186 $21,981 $21,557
Well-Rounded and Active Citizens
Engaged Citizens Percentage of students who have been significantly involved in contributing to the community9 (%)
96.4 99.0 99.0 98.1
Passionate and Self-Directed Lifelong Learners
Expanding Lifelong Learning and the National SkillsFuture Movement
MOE continues to make progress in encouraging skills mastery and lifelong learning, which enable Singaporeans to adapt to the evolving needs of the economy. Employers, private training providers and IHLs are three strong pillars for continuing education and training (CET). They provide opportunities for skills deepening through various modes of training delivery, and support Singaporeans to become employable and competitive throughout their working lives. SkillsFuture Credit signals to and motivates Singaporeans to
2 Primary 1 cohort figures refer to students who are Singapore Citizens or Permanent Residents. The Primary 1 cohorts represented in each year are different across the indicators, as different cohorts reach the target levels in each year. As students progress through the education system at different rates, the figures are preliminary and subject to adjustments. 3 The Primary 1 cohort indicators have taken into account students who had left the country. 4 Refers to students who sat for PSLE and qualified for Express, Normal (Academic) or Normal (Technical) courses. 5 The figures for percentage of Primary 1 cohort who did not complete secondary education, i.e. take O- or N-Levels, exclude students who left school due to medical reasons, joined other institutions or left the country. 6 Students who enrol in one type of institution may later progress to another. 7 The figure includes Permanent Residents. The estimated 2020 cohort participation rate for Singapore Citizens is 40%. 8 Data for these indicators is reported on an FY basis, while that for all other indicators is reported on a CY basis. Figures exclude financial assistance provided by government. 9 Students who have, by end of Sec 4/5, completed at least 36 hours of service to the school or community, or 2 Values in Action (VIA) projects that impact the school or community, or completed at least 24 hours of service and at least 1 VIA project that impacts the school or community.
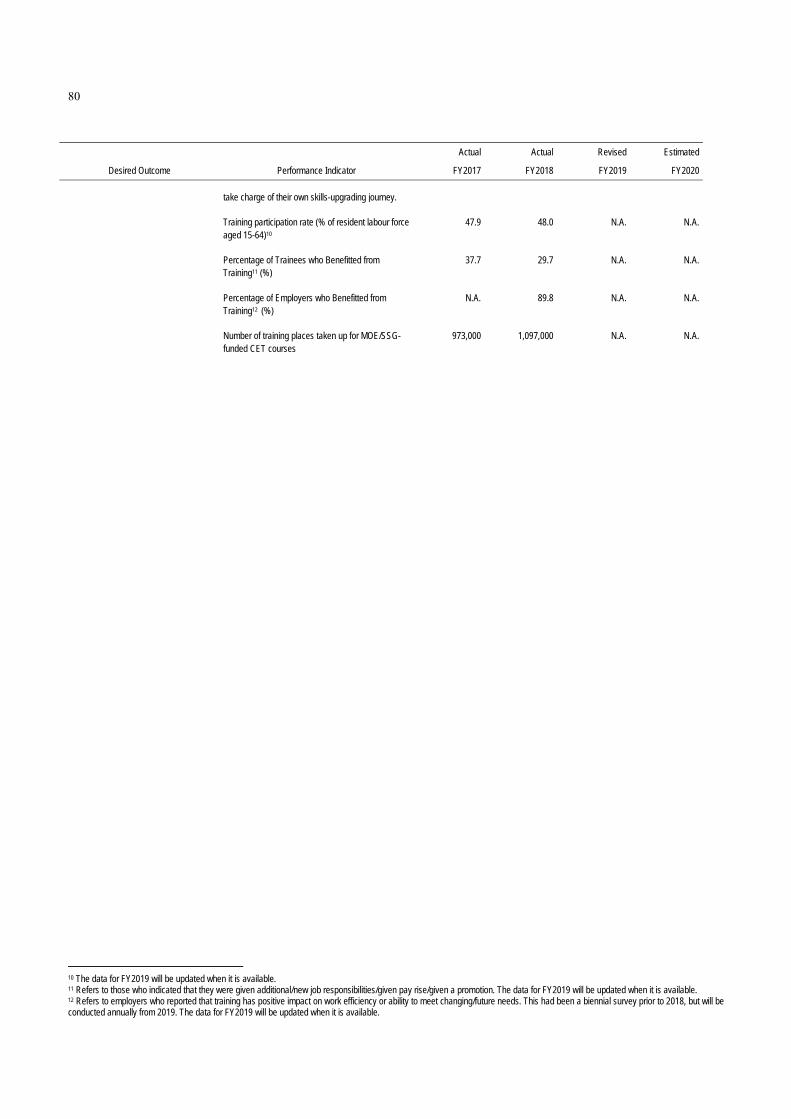
80
Actual Actual Revised Estimated
Desired Outcome Performance Indicator FY2017 FY2018 FY2019 FY2020
take charge of their own skills-upgrading journey.
Training participation rate (% of resident labour force aged 15-64)10
47.9 48.0 N.A. N.A.
Percentage of Trainees who Benefitted from Training11 (%)
37.7 29.7 N.A. N.A.
Percentage of Employers who Benefitted from Training12 (%)
N.A. 89.8 N.A. N.A.
Number of training places taken up for MOE/SSG-funded CET courses
973,000 1,097,000 N.A. N.A.
10 The data for FY2019 will be updated when it is available. 11 Refers to those who indicated that they were given additional/new job responsibilities/given pay rise/given a promotion. The data for FY2019 will be updated when it is available. 12 Refers to employers who reported that training has positive impact on work efficiency or ability to meet changing/future needs. This had been a biennial survey prior to 2018, but will be conducted annually from 2019. The data for FY2019 will be updated when it is available.
Head L ___________
Ministry of The Environment and Water Resources


81
HEAD L
MINISTRY OF THE ENVIRONMENT AND WATER RESOURCES
OVERVIEW
Mission Statement
To ensure a clean, sustainable environment, and supply of water and safe food for Singapore.
FY2020 EXPENDITURE ESTIMATES
Expenditure Estimates by Object Class
BLANK Actual Estimated Revised Estimated Code Object Class FY2018 FY2019 FY2019 FY2020 Change Over FY2019
BLANK
TOTAL EXPENDITURE $2,134,310,230 $2,752,273,400 $2,626,828,300 $2,943,989,000 $317,160,700 12.1%
Main Estimates $1,295,238,846 $1,589,781,200 $1,544,517,400 $1,728,000,500 $183,483,100 11.9%
OPERATING EXPENDITURE $1,295,238,846 $1,589,781,200 $1,544,517,400 $1,728,000,500 $183,483,100 11.9%
RUNNING COSTS $1,289,205,233 $1,580,272,400 $1,534,748,500 $1,718,248,300 $183,499,800 12.0%
Expenditure on Manpower $24,941,550 $28,897,300 $30,134,400 $30,918,400 $784,000 2.6%
1200 Political Appointments 1,040,965 1,141,200 1,141,200 1,157,600 16,400 1.4
1500 Permanent Staff 23,891,246 27,735,400 28,972,500 29,739,200 766,700 2.6
1600 Temporary, Daily-Rated & Other Staff 9,340 20,700 20,700 21,600 900 4.3
Other Operating Expenditure $27,124,135 $54,846,400 $50,008,300 $95,977,100 $45,968,800 91.9%
2100 Consumption of Products & Services 22,655,164 51,295,200 46,237,200 92,069,900 45,832,700 99.1
2300 Manpower Development 475,606 737,200 630,600 707,100 76,500 12.1
2400 International & Public Relations, Public Communications
3,825,523 2,730,000 3,052,300 3,106,000 53,700 1.8
2700 Asset Acquisition 167,842 84,000 88,200 94,100 5,900 6.7
Grants, Subventions & Capital Injections to Organisations
$1,237,139,547 $1,496,528,700 $1,454,605,800 $1,591,352,800 $136,747,000 9.4%
3100 Grants, Subventions & Capital Injections to Statutory Boards
1,237,139,547 1,496,528,700 1,454,605,800 1,591,352,800 136,747,000 9.4
TRANSFERS $6,033,613 $9,508,800 $9,768,900 $9,752,200 -$16,700 -0.2%
3600 Transfers to Institutions & Organisations 226,913 84,300 223,600 20,600 -203,000 -90.8
3800 International Organisations & Overseas Development Assistance
5,806,700 9,424,500 9,545,300 9,731,600 186,300 2.0
OTHER CONSOLIDATED FUND OUTLAYS
$0 $15,000 $15,000 $100,000 $85,000 566.7%
4600 Loans and Advances (Disbursement) 0 15,000 15,000 100,000 85,000 566.7
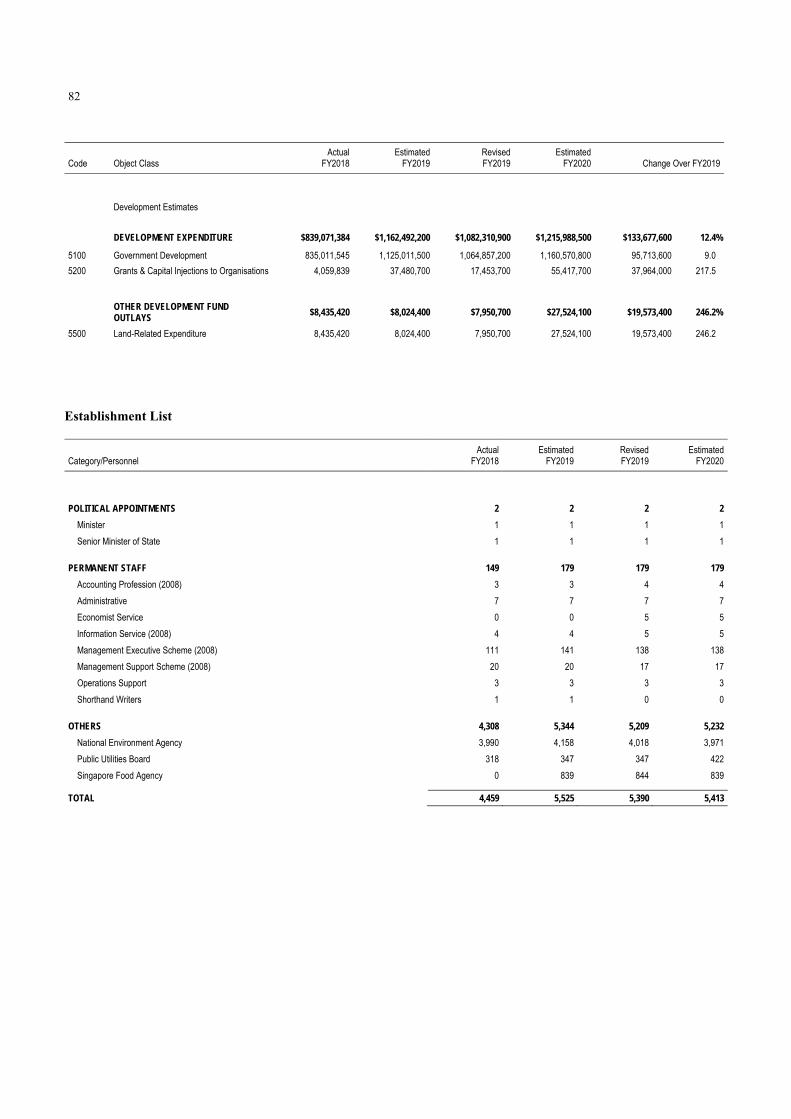
82
BLANK Actual Estimated Revised Estimated Code Object Class FY2018 FY2019 FY2019 FY2020 Change Over FY2019
BLANK
Development Estimates $839,071,384 $1,162,492,200 $1,082,310,900 $1,215,988,500 $133,677,600 12.4%
DEVELOPMENT EXPENDITURE $839,071,384 $1,162,492,200 $1,082,310,900 $1,215,988,500 $133,677,600 12.4%
5100 Government Development 835,011,545 1,125,011,500 1,064,857,200 1,160,570,800 95,713,600 9.0
5200 Grants & Capital Injections to Organisations 4,059,839 37,480,700 17,453,700 55,417,700 37,964,000 217.5
OTHER DEVELOPMENT FUND OUTLAYS
$8,435,420 $8,024,400 $7,950,700 $27,524,100 $19,573,400 246.2%
5500 Land-Related Expenditure 8,435,420 8,024,400 7,950,700 27,524,100 19,573,400 246.2
Establishment List
BLANK Actual Estimated Revised Estimated Category/Personnel FY2018 FY2019 FY2019 FY2020
BLANK
POLITICAL APPOINTMENTS 2 2 2 2
Minister 1 1 1 1
Senior Minister of State 1 1 1 1
PERMANENT STAFF 149 179 179 179
Accounting Profession (2008) 3 3 4 4
Administrative 7 7 7 7
Economist Service 0 0 5 5
Information Service (2008) 4 4 5 5
Management Executive Scheme (2008) 111 141 138 138
Management Support Scheme (2008) 20 20 17 17
Operations Support 3 3 3 3
Shorthand Writers 1 1 0 0
OTHERS 4,308 5,344 5,209 5,232
National Environment Agency 3,990 4,158 4,018 3,971
Public Utilities Board 318 347 347 422
Singapore Food Agency 0 839 844 839
TOTAL 4,459 5,525 5,390 5,413

83
FY2019 BUDGET
The Ministry of the Environment and Water Resources (MEWR)’s revised FY2019 total expenditure is $2.63 billion. This is an increase of $492.52 million or 23.1% higher than the actual FY2018 total expenditure. Of the total expenditure, $1.54 billion or 58.8% is for operating expenditure and $1.08 billion or 41.2% is for development expenditure. Operating Expenditure The revised FY2019 operating expenditure of $1.54 billion is $249.28 million or 19.2% higher than the actual FY2018 operating expenditure of $1.30 billion. This increase is largely due to the formation of the Singapore Food Agency (SFA) under the Ministry, as well as higher operating grants to the Public Utilities Board (PUB) and National Environment Agency (NEA). Development Expenditure The revised FY2019 development expenditure of $1.08 billion is $243.24 million or 29.0% higher than the actual FY2018 development expenditure of $839.07 million. This is largely due to higher expenditure in FY2019 for the Deep Tunnel Sewerage System Phase 2 project. Other Development Fund Outlays The revised FY2019 other development fund outlays of $7.95 million relates to Land-Related Expenditure for the development of drainage and sewerage networks in Changi East and NEA’s exhumation projects at Choa Chu Kang. FY2020 BUDGET
The total expenditure of MEWR in FY2020 is projected to be $2.94 billion, an increase of $317.16 million or 12.1% from the revised FY2019 total expenditure. Of the total expenditure, $1.73 billion or 58.7% is for operating expenditure and $1.22 billion or 41.3% is for development expenditure. Operating Expenditure The provision of $1.73 billion for FY2020 operating expenditure represents an increase of $183.48 million or 11.9% over the revised FY2019 operating expenditure. This is mainly due to higher operating grants to NEA, SFA and PUB, as well as increased funding to drive sustainability initiatives in the community. Out of the total operating expenditure, $1.72 billion or 99.4% is for Running Costs and $9.75 million or 0.6% is for Transfers. The major share of the operating budget, $905.22 million (52.4%), will go towards the National Environment Agency Programme. This is followed by the Public Utilities Board Programme which will take up $499.46 million (28.9%), the Singapore Food Agency Programme with $191.49 million (11.1%) and the Administration Programme with $131.83 million (7.6%). National Environment Agency Programme NEA aims to promote and sustain a clean, green, and sustainable environment for Singapore. For FY2020, NEA is allocated an operating grant of $905.22 million. This grant is mainly for the implementation of key programmes to ensure that Singapore continues to have high standards of public health, a clean and sustainable environment, timely and reliable meteorological services, and to promote resource efficiency and conservation in collaboration with NEA’s partners and the community. Public Utilities Board Programme PUB aims to secure an efficient, adequate and sustainable supply of water. For FY2020, PUB is allocated an operating grant of $499.46 million mainly for the operations and maintenance of drainage systems, the Active, Beautiful and Clean (ABC) Waters Programme, and water infrastructure projects.

84
Singapore Food Agency Programme As the lead agency overseeing food security and safety from farm-to-fork, SFA aims to ensure and secure a supply of safe food for Singapore. For FY2020, SFA is allocated an operating grant of $191.49 million to implement key programmes to strengthen the resilience of Singapore’s food supply and strengthen food safety assurance in partnership with industry and consumers. Other Consolidated Fund Outlays Advances for FY2020 are projected to be $100,000, catered for officers on overseas work trips. Development Expenditure Development expenditure in FY2020 is expected to be $1.22 billion, an increase of $133.68 million or 12.4% from the revised FY2019 figure of $1.08 billion. This is largely due to higher expected expenditure in FY2020 for NEA’s Waste Resource Management Project and for the Development of New Crematorium at Mandai. Major PUB drainage projects to be funded in FY2020 include: 5th Roadside Drains Improvement Programme ($42.55 million), Improvement to Old Roadside Drains under Batch 9 of the Estate Upgrading Programme ($22.49 million) and Improvement of Bedok Canal (Between Upper Changi Road East and Bedok Junction, and between East Coast Parkway and the Sea) ($18.45 million), Improvement to Sungei Tampines (Between Tampines Ave 7 and TPE) ($14.00 million) and Outlet Drains Improvement Programme ($12.72 million). Major PUB sewerage projects to be funded in FY2020 include: Deep Tunnel Sewerage System Phase 2 ($604.66 million), Proposed Expansion of Sewerage Networks in Sengkang and Punggol Areas ($26.53 million), Proposed Sewers in North Woodlands ($24.83 million), Rehabilitation of Sewerage Network System Phase 5 ($19.00 million) and Proposed Expansion of Sewerage Networks in Loyang Avenue and Upper Changi Road East Areas ($16.18 million). Major NEA projects to be funded in FY2020 include: Waste Resource Management Project ($72.53 million), Development of New Crematorium at Mandai ($67.00 million), Development of New Hawker Centres at Fernvale, Bukit Panjang North and Anchorvale ($13.27 million), Redevelopment of Choa Chu Kang Cemetery Phase 3 ($9.00 million) and Development of New Hawker Centres in Woodlands, Sengkang, Pasir Ris, Jurong West, Yishun and Sembawang Housing Estates ($4.72 million). Major SFA projects to be funded in FY2020 include: Upgrading Works for Pasir Panjang Wholesale Centre ($8.75 million) and Transforming SFA’s Food Safety Regulatory Approach Through Smart Technology ($4.80 million). Other Development Fund Outlays The other development fund outlays of $27.52 million for FY2020 relates to Land-Related Expenditure for the development of drainage and sewerage networks in Changi East and NEA’s exhumation projects at Choa Chu Kang.

85
Total Expenditure by Programme
BLANK Running Operating Development Total Code Programme Costs Transfers Expenditure Expenditure Expenditure
BLANK
L-A Administration 126,895,500 4,935,700 131,831,200 1,617,200 133,448,400
L-G Public Utilities Board 499,457,500 0 499,457,500 988,703,700 1,488,161,200
L-H National Environment Agency 903,901,200 1,321,400 905,222,600 198,407,700 1,103,630,300
L-I Singapore Food Agency 187,994,100 3,495,100 191,489,200 27,259,900 218,749,100
Total $1,718,248,300 $9,752,200 $1,728,000,500 $1,215,988,500 $2,943,989,000
Development Expenditure by Project
BLANK Actual
Expenditure Up to end of
BLANK
BLANK Total Actual Estimated Revised Estimated Project Title Project Cost FY2017 FY2018 FY2019 FY2019 FY2020
BLANK
DEVELOPMENT EXPENDITURE … … $839,071,384 $1,162,492,200 $1,082,310,900 $1,215,988,500
GOVERNMENT DEVELOPMENT … … 835,011,545 1,125,011,500 1,064,857,200 1,160,570,800
Administration Programme … … 2 2 2 2
Multi-Disciplinary Consultancy Services for Office Development
26,000,000 0 0 0 0 500,000
Minor Development Projects … … 1,941,988 2,659,500 2,778,300 1,117,200
Public Utilities Board Programme … … 96 96 96 96
Improvement to Bukit Timah First Diversion Canal 335,100,000 236,092,986 32,896,453 17,000,000 16,731,700 12,154,900
Improvement to Outlet Drain from Sin Ming Road to Braddell Road
26,089,000 21,420,005 48,499 150,000 150,000 200,000
Relief Sewers within Marina Reservoir Catchment 8,000,000 4,934,885 0 225,000 117,000 221,900
Improvement to Old Roadside Drains 5-Year Programme FY2006-FY2010
138,000,000 134,023,138 679,319 168,200 130,000 38,200
New Projects … … 0 11,743,300 2,520,000 32,866,000
Active, Beautiful And Clean Waters Programme 101,980,000 91,193,552 65,711 700,000 364,600 170,000
Improvement to Geylang River Phase 1 - From Dunman Road to Guillemard Road
49,700,000 37,122,614 0 10,000 10,000 10,000
Sewer Schemes to Serve Marina South and Pasir Ris/Tampines Areas and Phase Out Nee Soon Pumping Station
287,700,000 245,234,663 6,057,897 4,279,000 4,461,400 5,201,000
Improvement to Old Roadside Drains in Batch 5 of Estate Upgrading Programme
78,200,000 59,479,303 0 0 10,000 10,000
Improvement to Geylang River Phase 2 36,000,000 18,873,454 0 1,318,100 1,318,100 2,900,000
Relief and Replacement Sewers for Jalan Senang, Siglap and Jalan Leban Areas
4,500,000 3,005,577 0 332,000 332,000 22,000
Minor Development Projects … … 2,868,437 1,094,000 2,741,400 2,467,600
Sewer Extensions to Phase Out Sewage Treatment Plants Phase 2
47,800,000 17,846,904 809,579 2,536,000 4,419,000 3,716,000
Relief Sewers at Lavender Street Area, Serangoon Central Area and Kaki Bukit Area
21,000,000 16,913,539 121,031 323,000 363,000 2,000

86
BLANK Actual
Expenditure Up to end of
BLANK
BLANK Total Actual Estimated Revised Estimated Project Title Project Cost FY2017 FY2018 FY2019 FY2019 FY2020
BLANK
Sewerage Development at Jurong Eastern Catchment and Jurong Lake District
184,200,000 167,190,564 1,726,234 580,100 761,100 1,079,000
Improvement to Roadside Drains in Batch 6 of the Estate Upgrading Programme
80,000,000 57,157,575 1,314,819 10,000 905,000 383,800
Improvement to Old Roadside Drains 5 Year Programme (FY2010-FY2014)
303,800,000 257,021,832 5,352,521 8,000,000 4,000,000 3,500,000
Expansion of Sewerage Networks in Siglap Road, Whampoa East/Towner Road and Kaki Bukit Areas and Upgrading of Mugliston Park Pumping Station
26,140,000 8,800,503 513,601 1,524,000 1,396,000 3,695,000
Expansion of Sewerage Networks in Jalan Rajah/Sungei Whampoa area
13,700,000 3,024,362 73,043 158,000 41,900 122,400
Improvement to Old Roadside Drains in Batch 7 of the Estate Upgrading Programme
100,200,000 67,075,209 2,739,373 1,050,000 640,000 261,300
Proposed Expansion of Sewerage Network in Mandai Road Area
25,000,000 13,586,073 1,011,116 915,000 434,200 361,000
Proposed Expansion of Sewerage Network in Kranji Area
26,400,000 21,905,011 315,686 194,000 330,700 27,000
Expansion of Sewerage Networks in Bedok Reservoir and Changi Business Park Areas
23,400,000 13,555,536 1,872,890 54,000 0 86,000
Expansion of Sewerage Networks in Mugliston Park,Buangkok Link and Ang Mo Kio Ave 5 Areas
69,700,000 35,965,361 4,147,748 625,000 631,000 2,350,000
Proposed Diversion Canal and Detention Tank to Enhance Flood Protection of Stamford Canal Catchment
306,400,000 182,725,498 45,210,208 500,000 1,500,000 2,200,000
Expansion of Sewerage Networks in Marina Central Area
17,900,000 7,361,602 1,098,085 539,000 732,000 539,000
Proposed Expansion of Sewerage Networks in Tagore Drive, Mandai Quarry Road and Lorong Lada Hitam Areas
47,700,000 40,593,164 1,381,896 293,900 218,400 23,000
Expansion of Sewerage Networks in Amber Road, Meyer Road and Playfair Road Areas
17,770,000 2,404,794 15,134 22,000 0 54,000
Expansion of Sewerage Networks in Yishun Avenue 7, Sembawang Road and Gambas Avenue Areas
39,300,000 17,531,636 4,488,262 1,435,000 1,164,000 140,000
Implementation of 16 Projects under Phase 2 of Active, Beautiful and Clean Waters (ABC Waters) Programme
20,736,601 5,501,058 1,172,364 1,707,200 1,908,800 1,348,400
Proposed Expansion of Sewerage Networks in Clementi Avenue 4 and Clementi Avenue 6 Areas
9,930,000 6,744,943 1,033,444 55,000 354,000 11,000
Expansion of Sewerage Networks in Cuppage Road and Koek Road Areas
6,210,000 3,493,164 1,566,996 100,000 0 28,000
Improvement to Kallang River (Between Bishan Road and Braddell Road)
112,000,000 57,337,516 23,388,889 5,928,800 5,928,800 1,468,100
Expansion of Sewerage Networks in Sembawang Road and Sembawang Avenue Areas
26,977,000 11,963,306 4,853,857 2,225,000 2,657,000 1,789,200
Expansion of Sewerage Networks in Tuas Avenue 2 and Tuas Avenue 10 Areas
36,722,000 22,155,509 1,999,879 54,000 5,000 54,000
Improvement to Bedok Canal (Between Upper Changi Rd East and Bedok Junction and Between East Coast Parkway and the Sea)
148,800,000 60,802,377 23,220,609 28,367,300 27,447,300 18,450,000

87
BLANK Actual
Expenditure Up to end of
BLANK
BLANK Total Actual Estimated Revised Estimated Project Title Project Cost FY2017 FY2018 FY2019 FY2019 FY2020
BLANK
Proposed Expansion of Sewerage Networks in Sophia Road and Middle Road Areas
3,410,000 236,050 23,618 55,000 61,000 55,000
Proposed Expansion of Sewerage Networks in Cairnhill Circle and Newton Circus Areas
10,510,000 7,127,286 789,964 285,000 559,400 81,000
Improvement to Four Outlet Drains in Singapore 61,200,000 17,343,199 7,137,928 3,000,000 2,000,000 3,500,000
DTSS Phase 2 - Engineering Services for Feasibility Study/Preliminary Design and Programme Management
71,300,000 28,730,438 6,353,305 6,080,900 6,397,700 6,763,700
Implementation of 3 Projects under Phase 2 of Active, Beautiful and Clean Waters (ABC Waters) Programme
23,020,000 11,271,656 5,527,788 840,000 650,000 122,100
5th Roadside Drains Improvement Programme 227,600,000 47,162,542 51,176,994 50,359,100 48,102,600 42,552,300
Improvement to Old Roadside Drains in Batch 8 of the Estate Upgrading Programme
74,500,000 44,240,137 1,651,603 400,000 770,000 130,000
Marina South Drainage Scheme 47,700,000 1,176,867 6,890,857 8,600,000 8,600,000 5,200,000
Proposed Sewerage Scheme to Serve Holland Plain and Holland Woods Areas
18,900,000 5,399,628 4,345,468 2,367,500 1,921,000 2,316,000
Expansion of Sewerage Networks in Loyang Avenue and Upper Changi Road East Areas
135,110,000 12,832,837 24,036,386 24,959,000 19,673,000 16,180,000
Improvement to Bukit Timah Canal (Between Rifle Range Road and Jalan Kampong Chantek)
79,200,000 592,828 0 4,870,000 4,870,000 6,000,000
Urgent Flood Alleviation Programme 77,300,000 48,369,623 4,062,432 2,200,000 2,200,000 700,000
Expansion of Sewerage Networks in Lorong Chuan and Lim Tua Tow Road Areas
13,530,000 6,473,116 5,206,460 355,000 215,000 51,000
Drainage Improvement Works in Tandem with LTA's Rail and Road works
48,500,000 7,516,978 1,799,320 1,961,800 1,961,800 1,670,000
Expansion of Sewerage Networks in East Coast Road and Mountbatten Road Areas
14,610,000 251,514 807,899 2,438,500 868,000 905,000
Proposed Expansion of Sewerage Networks in Bukit Batok East Ave 3 Area
44,900,000 10,234,419 9,145,199 6,268,200 4,948,000 4,954,000
Proposed Sewerage Scheme to Serve Sungei Tengah Agrotechnology Park Area
50,360,000 9,114,929 8,603,035 6,184,400 5,922,000 384,000
Proposed Sewers in North Woodlands 387,500,000 33,711,917 28,316,002 24,297,000 31,698,100 24,831,000
Improvement to Sungei Pandan Kechil (West Coast Road to the Sea)
54,200,000 20,446,118 11,238,930 2,100,000 3,580,000 20,000
Proposed Sewerage Scheme to Serve Lim Chu Kang Area
192,370,000 4,693,632 14,347,171 19,212,800 13,895,500 11,857,000
Proposed Stormwater Retention Pond for Bidadari Estate
40,400,000 0 0 3,674,000 500,000 3,000,000
Fund for Rapid Response Mechanism (RRM) Approved Projects
6,000,000 3,254,078 935,140 550,000 599,600 444,900
Proposed Expansion of Sewerage Networks in Eber Road, Paterson Hill and Pasir Panjang Road Areas
12,880,000 782,760 2,021,301 2,520,000 2,536,000 29,000
Proposed Expansion of Sewerage Networks in Stevens Road Area
8,510,000 113,652 503,540 1,438,000 1,602,400 717,400
Proposed Expansion of Sewerage Networks in Merpati Road Area
12,090,000 138,931 871,942 2,693,000 2,852,000 1,559,000
Proposed Expansion of Sewerage Networks in Sengkang and Punggol Areas
212,100,000 2,194,503 16,554,220 38,662,000 40,584,000 26,527,000

88
BLANK Actual
Expenditure Up to end of
BLANK
BLANK Total Actual Estimated Revised Estimated Project Title Project Cost FY2017 FY2018 FY2019 FY2019 FY2020
BLANK
Expansion of Sewerage Networks along LTA's Proposed Thomson-East Coast Line and North-South Expressway
40,500,000 395,972 799,580 2,163,000 2,040,000 3,443,000
Development of Hydrogeological Map of Singapore 14,630,000 8,281,734 3,792,342 3,043,100 1,255,400 687,500
Improvement to Sungei Tampines (Tampines Avenue 7 to Tampines Expressway)
72,000,000 539,409 6,311,838 10,500,000 13,674,000 14,000,000
Proposed Sewerage Infrastructure at Pulau Punggol Barat
115,900,000 517,364 4,245,986 9,146,000 2,963,000 11,194,600
Expansion of Sewerage Networks in Pasir Ris Drive 3/12 and Jalan Kembangan Areas and Demolition of Pasir Ris and East Coast Parkway Pump Sumps
18,900,000 186,353 76,295 2,719,000 1,966,000 3,075,000
Outlet Drains Improvement Programme 90,500,000 680,640 7,098,788 14,827,000 15,326,400 12,723,800
Phase 3 of the Active, Beautiful, and Clean Waters (ABC Waters) Programme
28,200,000 504,962 2,072,812 3,058,400 2,812,800 2,726,500
Proposed Expansion of Sewerage Networks at Yuan Ching Road
2,410,000 16,203 286,144 1,440,000 841,000 105,000
Deep Tunnel Sewerage System (DTSS) Phase 2 -Land Cost
90,000,000 94,336 188,280 10,000,000 10,000,000 2,000,000
Deep Tunnel Sewerage System (DTSS) Phase 2 -Construction Cost
4,450,000,000 50,274,047 249,329,931 594,387,700 573,607,000 594,898,300
Improvement to Airport Road Outlet Drain (Between Tai Seng Avenue to Pelton Canal)
13,300,000 23,452 111,650 1,900,000 1,900,000 2,000,000
Improvement to Old Roadside Drains in Batch 9 of the Estate Upgrading Programme (EUP 9)
59,700,000 412,187 892,831 16,000,100 13,687,900 22,490,000
Rehabilitation of Sewerage Network System - Phase 5
127,100,000 1,264,142 12,964,358 22,000,000 22,000,000 19,000,000
Upgrading of Sewage Pumping Installations 15,790,000 0 126,009 722,000 775,000 2,429,000
Engineering Services for the Proposed Sewers to Serve Tengah New Town
15,820,000 70,021 799,568 498,700 60,000 152,000
Proposed Sewer along Future Road in Punggol North
6,330,000 0 0 901,000 940,000 719,000
Engineering Services for the Proposed Expansion of Sewerage Network in Ang Mo Kio Avenue 3 and Phasing Out of Thomson Hill Pump Sump
1,790,000 0 58,949 451,000 257,300 44,000
Professional Engineering Services For Preliminary Design of The Inlet Pumping Station And Outfall Component of Jurong Island Water Reclamation Plant
1,420,000 0 0 78,700 0 48,000
Improvement to PA Camp Outlet Drain (Between East Coast Parkway and the Sea)
19,600,000 0 6,000 409,400 409,400 240,000
Consultancy Services for the Implementation of a Detention Tank cum Pumping Facility for Syed Alwi Catchment
42,800,000 0 5,120 549,000 549,000 819,000
Engineering Services for Improvement of Benoi Road Outlet Drain
51,100,000 0 0 1,002,000 1,002,000 384,000
Improvement of Parbury Outlet Drain (At Upper East Coast Road and between East Coast Parkway and the Sea)
22,700,000 0 7,040 618,400 376,000 170,000
Engineering Services for the Improvement of Drains at Pulau Punggol Barat
2,600,000 0 0 802,000 322,000 270,000

89
BLANK Actual
Expenditure Up to end of
BLANK
BLANK Total Actual Estimated Revised Estimated Project Title Project Cost FY2017 FY2018 FY2019 FY2019 FY2020
BLANK
Engineering Services for Proposed Expansion of Sewerage Networks in Senoko Way, Woodlands Avenue 6 and Upper Bukit Timah Areas
3,900,000 0 0 670,000 779,300 280,000
Engineering Services for the Improvement of Sungei Selarang and Sungei Selarang Subsidiary Drain A
3,900,000 0 0 784,000 784,000 736,400
Engineering Services for Improvement of Drains at Admiralty Road West
1,400,000 0 0 47,000 40,000 280,000
Engineering Services for Proposed Sewers in Tuas View Area
9,880,000 0 0 310,000 748,000 107,000
Engineering Services for Improvement of West Coast Road Outlet Drain No. 6 (West Coast Road to the Sea)
2,200,000 0 0 0 144,800 289,600
Construction to Upgrade Drainage Capacities at Poole and Wimborne Pumping Stations
35,500,000 0 0 0 480,000 690,000
Proposed Standby Sewer Provision Arising from LTA's Project
4,000,000 0 0 0 500,000 1,000,000
Engineering Services for the Improvement to Marina East Outlet Drain (Between Fort Road and the Sea)
2,700,000 0 0 0 520,000 667,000
Renewal of Water Reclamation Network Supervisory Control and Data Acquisition System
7,740,000 0 0 0 160,000 3,674,000
Replacement of Lattice Gates at Marina Barrage 5,000,000 0 0 0 75,000 4,675,000
6th Roadside Drain Improvement Programme 163,100,000 0 0 0 562,100 2,133,000
National Environment Agency Programme … … 17 17 17 17
Minor Development Projects … … 877,003 0 0 125,000
New Projects … … 0 268,000 0 72,527,000
Development of New Market/Hawker Centre in Bukit Panjang
38,235,000 35,654,159 199,697 250,000 250,000 350,000
Development of New Hawker Centres at Woodlands, Sengkang, Pasir Ris, Jurong West, Yishun and Sembawang
108,200,000 60,621,693 13,306,128 7,873,600 7,739,800 4,715,100
Development of Replacement Hawker Centre at Woodlands St 12
24,300,000 18,200,335 108,432 624,700 390,000 1,267,400
Development of New Crematorium at Mandai 148,400,000 3,995,051 9,768,671 34,000,000 30,000,000 67,000,000
Development of New Hawker Centres at Dawson and Bidadari
26,500,000 997,710 3,840,671 996,300 2,323,600 3,642,800
Consultancy Study on Development of Storage Sites for Radioactive Contaminated Wastes
10,810,000 0 4,320,796 2,500,000 2,500,000 1,250,000
Development of Road Access to Tuas View Basin Site for IWMF and TWRP
99,000,000 55,668,752 35,195,053 250,000 258,000 237,500
Development of New Hawker Centre at Punggol 9,325,300 235,037 1,818,054 2,726,800 3,636,100 1,818,100
Development of New Hawker Centres at Fernvale, Bukit Panjang North and Anchorvale
59,275,000 170,431 9,021,193 7,179,000 15,525,500 13,271,200
Redevelopment of Choa Chu Kang Cemetery (CCKC) Phase 3
158,870,000 5,496,030 32,850,123 20,000,000 13,000,000 9,000,000
Fitting-out Works for New Hawker Centre at Punggol Digital District
5,059,500 0 0 0 0 117,200
Productive Hawker Centres Programme 17,179,300 586,600 3,045 1,020,000 91,900 335,800
Feasibility Study for Development of a Waste Management Facility
2,400,000 0 0 0 0 1,800,000

90
BLANK Actual
Expenditure Up to end of
BLANK
BLANK Total Actual Estimated Revised Estimated Project Title Project Cost FY2017 FY2018 FY2019 FY2019 FY2020
BLANK
Consultancy Services for NEA’s Waste Resource Management Project
3,050,800 0 0 0 1,300,800 1,750,000
Consultancy Services for Funeral Parlour Complex 3,563,000 0 0 0 3,200 507,900
Singapore Food Agency Programme … … 3 3 3 3
Development Works for Farm Sites in Lim Chu Kang and Sungei Tengah
25,597,500 0 0 5,500,000 4,800,000 1,800,000
Redevelopment of Landing Facility at Lim Chu Kang 7,567,300 0 0 75,000 300,000 2,035,100
Fire Safety and Other Improvement Works and Electrical Upgrading Works for Pasir Panjang Wholesale Centre (PPWC)
20,415,300 0 0 0 702,600 8,753,600
Completed Projects … … 48,197,091 29,474,000 15,409,500 0
GRANTS & CAPITAL INJECTIONS TO ORGANISATIONS … … 4,059,839 37,480,700 17,453,700 55,417,700
Public Utilities Board Programme … … 3 3 3 3
New Projects … … 0 17,200,000 0 17,200,000
PUB's Work Scheduling and Electronic Attendance System (WSEA)
449,400 0 0 0 122,000 272,000
Consultancy Services for Climate Change Adaptation Measures for PUB Coastal Reservoirs
5,500,500 0 0 0 918,700 4,581,800
National Environment Agency Programme … … 14 14 14 14
New Projects … … 0 3,495,600 72,400 1,428,200
Quieter Construction Fund 10,000,000 2,612,494 1,415,999 450,000 1,000,000 3,400,000
Establishment of the NEA Scheme for Technology Translation
4,600,000 0 217,959 1,197,300 1,239,200 1,652,100
Productive Hawker Centres Programme 10,094,700 0 0 450,000 0 347,900
NEA One Stop Portal 1,496,000 0 152,857 940,500 834,200 50,900
Development of NEA Business Intelligence System 3,140,000 0 684,100 1,858,300 863,600 1,105,700
Enhanced Energy Efficiency Fund (E2F) – Energy Efficient Technologies
19,164,700 0 0 229,300 163,200 290,000
Implementation of Meteorological Service Singapore's capability building projects
1,025,000 0 0 0 75,000 605,000
Development of MEWR Family Mobile Application 2,159,400 0 0 0 121,800 791,200
Implementation of the Quieter Construction Innovation Fund
2,000,000 0 0 0 300,000 1,700,000
Development of Scientific Capability in Environmental and Analytical Toxicology (Phase 1)
3,081,600 0 0 0 188,400 2,893,300
Redefining Operations through Digital Reality 1,228,784 0 0 0 0 807,500
Integrated Programme to Combat Antimicrobial Resistance in Environment Sector
1,523,700 0 0 0 0 1,523,700
Strengthening Capability for Chemical Hazard and Pollution Monitoring and Control
6,516,300 0 0 0 4,419,100 2,097,200
Singapore Food Agency Programme … … 9 9 9 9
Transforming SFA's Food Safety Regulatory Approach Through Smart Technology
6,920,000 0 0 5,190,000 2,000,000 4,800,000
National Food Safety Ecosystem Digitalisation Plan 9,880,000 0 0 0 1,400,000 2,467,000
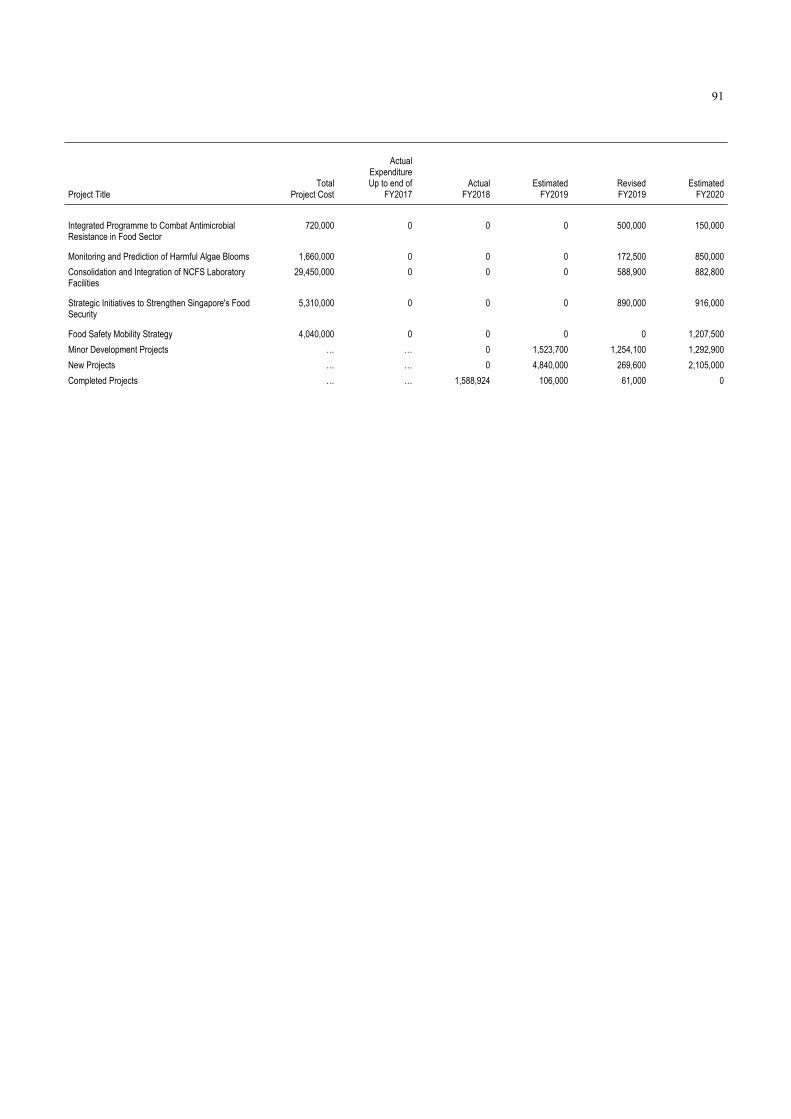
91
BLANK Actual
Expenditure Up to end of
BLANK
BLANK Total Actual Estimated Revised Estimated Project Title Project Cost FY2017 FY2018 FY2019 FY2019 FY2020
BLANK
Integrated Programme to Combat Antimicrobial Resistance in Food Sector
720,000 0 0 0 500,000 150,000
Monitoring and Prediction of Harmful Algae Blooms 1,660,000 0 0 0 172,500 850,000
Consolidation and Integration of NCFS Laboratory Facilities
29,450,000 0 0 0 588,900 882,800
Strategic Initiatives to Strengthen Singapore's Food Security
5,310,000 0 0 0 890,000 916,000
Food Safety Mobility Strategy 4,040,000 0 0 0 0 1,207,500
Minor Development Projects … … 0 1,523,700 1,254,100 1,292,900
New Projects … … 0 4,840,000 269,600 2,105,000
Completed Projects … … 1,588,924 106,000 61,000 0

92
Other Development Fund Outlays
BLANK Actual
Expenditure Up to end of
BLANK
BLANK Total Actual Estimated Revised Estimated Project Title Project Cost FY2017 FY2018 FY2019 FY2019 FY2020
BLANK
OTHER DEVELOPMENT FUND OUTLAYS … … $8,435,420 $8,024,400 $7,950,700 $27,524,100
LAND-RELATED EXPENDITURE … … 8,435,420 8,024,400 7,950,700 27,524,100
Public Utilities Board Programme … … 2 2 2 2
Sewer Network for Changi East Area 149,800,000 3,303,619 4,541,283 2,947,000 3,412,500 18,924,200
Drains at Changi East 0 0 20,142 130,000 130,000 2,150,000
National Environment Agency Programme … … 1 1 1 1
Exhumation Programme Phases 6 and 7 and Related Works
30,810,000 1,135,460 2,832,983 4,631,700 4,146,100 6,449,900
Completed Projects … … 1,041,012 315,700 262,100 0
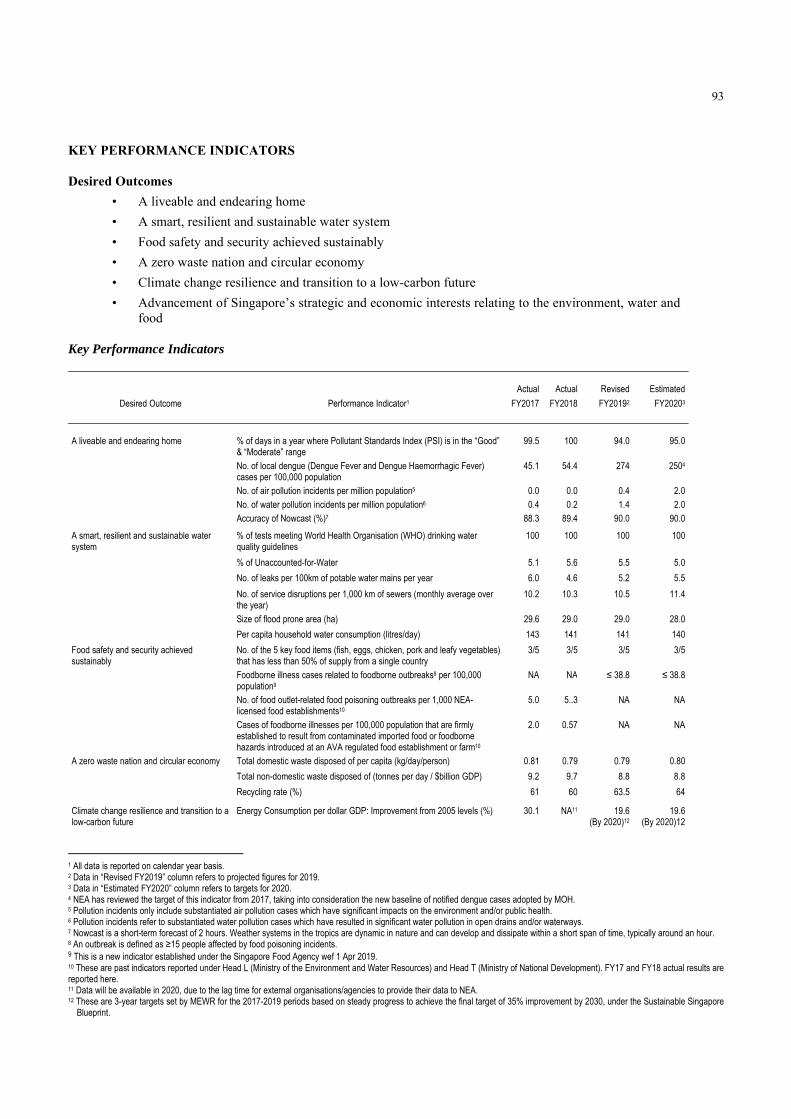
93
KEY PERFORMANCE INDICATORS Desired Outcomes
• A liveable and endearing home
• A smart, resilient and sustainable water system
• Food safety and security achieved sustainably
• A zero waste nation and circular economy
• Climate change resilience and transition to a low-carbon future
• Advancement of Singapore’s strategic and economic interests relating to the environment, water and food
Key Performance Indicators
Actual Actual Revised Estimated
Desired Outcome Performance Indicator1 FY2017 FY2018 FY20192 FY20203
A liveable and endearing home % of days in a year where Pollutant Standards Index (PSI) is in the “Good”
& “Moderate” range 99.5 100 94.0 95.0
No. of local dengue (Dengue Fever and Dengue Haemorrhagic Fever) cases per 100,000 population
45.1 54.4 274 2504
No. of air pollution incidents per million population5 0.0 0.0 0.4 2.0 No. of water pollution incidents per million population6 0.4 0.2 1.4 2.0 Accuracy of Nowcast (%)7 88.3 89.4 90.0 90.0
A smart, resilient and sustainable water system
% of tests meeting World Health Organisation (WHO) drinking water quality guidelines
100 100 100 100
% of Unaccounted-for-Water 5.1 5.6 5.5 5.0
No. of leaks per 100km of potable water mains per year 6.0 4.6 5.2 5.5
No. of service disruptions per 1,000 km of sewers (monthly average over the year)
10.2 10.3 10.5 11.4
Size of flood prone area (ha) 29.6 29.0 29.0 28.0
Per capita household water consumption (litres/day) 143 141 141 140
Food safety and security achieved sustainably
No. of the 5 key food items (fish, eggs, chicken, pork and leafy vegetables) that has less than 50% of supply from a single country
3/5 3/5 3/5 3/5
Foodborne illness cases related to foodborne outbreaks8 per 100,000 population9
NA NA ≤ 38.8 ≤ 38.8
No. of food outlet-related food poisoning outbreaks per 1,000 NEA-licensed food establishments10
5.0 5..3 NA NA
Cases of foodborne illnesses per 100,000 population that are firmly established to result from contaminated imported food or foodborne hazards introduced at an AVA regulated food establishment or farm10
2.0 0.57 NA NA
A zero waste nation and circular economy Total domestic waste disposed of per capita (kg/day/person) 0.81 0.79 0.79 0.80
Total non-domestic waste disposed of (tonnes per day / $billion GDP) 9.2 9.7 8.8 8.8
Recycling rate (%) 61 60 63.5 64
Climate change resilience and transition to a low-carbon future
Energy Consumption per dollar GDP: Improvement from 2005 levels (%) 30.1 NA11 19.6 (By 2020)12
19.6 (By 2020)12
1 All data is reported on calendar year basis. 2 Data in “Revised FY2019” column refers to projected figures for 2019. 3 Data in “Estimated FY2020” column refers to targets for 2020. 4 NEA has reviewed the target of this indicator from 2017, taking into consideration the new baseline of notified dengue cases adopted by MOH. 5 Pollution incidents only include substantiated air pollution cases which have significant impacts on the environment and/or public health. 6 Pollution incidents refer to substantiated water pollution cases which have resulted in significant water pollution in open drains and/or waterways. 7 Nowcast is a short-term forecast of 2 hours. Weather systems in the tropics are dynamic in nature and can develop and dissipate within a short span of time, typically around an hour. 8 An outbreak is defined as ≥15 people affected by food poisoning incidents. 9 This is a new indicator established under the Singapore Food Agency wef 1 Apr 2019. 10 These are past indicators reported under Head L (Ministry of the Environment and Water Resources) and Head T (Ministry of National Development). FY17 and FY18 actual results are reported here. 11 Data will be available in 2020, due to the lag time for external organisations/agencies to provide their data to NEA. 12 These are 3-year targets set by MEWR for the 2017-2019 periods based on steady progress to achieve the final target of 35% improvement by 2030, under the Sustainable Singapore
Blueprint.

94
Key Performance Indicators – continued
Desired Outcome Performance Indicator1 Revised FY2019 Estimated FY2020
Advancement of Singapore’s strategic and economic interests relating to the environment, water and food
Fulfil Singapore’s obligations to regional and international agreements and conventions
Ensured that international commitments are fulfilled to uphold Singapore as a responsible global environmental citizen.
Ensured that international obligations are not inimical to Singapore with regard to our environmental, water and food interests.
Continue to ensure that international commitments are fulfilled. Continue to ensure that international obligations are not inimical to Singapore, with regard to our environmental, water and food interests.
Advance Singapore’s strategic and economic interests relating to the environment, water and food through bilateral, regional and international platforms
Engaged key bilateral partners to pursue strategic interests in addressing environmental, water, food and other transboundary environmental issues. Pursued collaborations with international partners to advance our interests on issues relating to the environment, water and food. Profiled Singapore’s efforts and achievements in sustainable development, water management and food security. Leveraged bilateral, regional and international platforms to strengthen global awareness on Singapore’s environmental, water and food issues including transboundary ones.
Continue to engage key bilateral partners to pursue strategic interests in addressing environmental, water, food and other transboundary environmental issues.
Continue to pursue collaborations with international partners on environment, water and food issues. Continue to profile Singapore’s efforts and achievements in sustainable development, water management and food security. Continue to leverage various platforms to strengthen global awareness on Singapore’s environmental, water and food issues, including transboundary ones.

Head M ___________
Ministry of Finance


95
HEAD M
MINISTRY OF FINANCE
OVERVIEW
Mission Statement To create a better Singapore through Finance.
Vision Statement A forward-looking Ministry of Finance that advances leading ideas, drives synergies across government and ensures
fiscal prudence and sustainability. FY2020 EXPENDITURE ESTIMATES
Expenditure Estimates by Object Class
BLANK Actual Estimated Revised Estimated Code Object Class FY2018 FY2019 FY2019 FY2020 Change Over FY2019
BLANK
TOTAL EXPENDITURE $901,880,991 $1,021,978,800 $919,187,500 $1,098,765,400 $179,577,900 19.5%
Main Estimates $828,009,864 $869,415,200 $858,979,100 $940,337,000 $81,357,900 9.5%
OPERATING EXPENDITURE $828,009,864 $869,415,200 $858,979,100 $940,337,000 $81,357,900 9.5%
RUNNING COSTS $764,016,168 $824,752,400 $814,522,000 $863,156,000 $48,634,000 6.0%
Expenditure on Manpower $177,263,363 $182,362,200 $179,038,000 $194,383,700 $15,345,700 8.6%
1200 Political Appointments 2,171,871 2,323,200 2,637,900 2,444,700 -193,200 -7.3 1500 Permanent Staff 174,896,905 174,646,400 176,093,300 186,603,000 10,509,700 6.0 1600 Temporary, Daily-Rated & Other Staff 194,588 392,600 306,800 336,000 29,200 9.5 1800 Personnel Central Vote 0 5,000,000 0 5,000,000 5,000,000 n.a.
Other Operating Expenditure $581,883,535 $630,563,700 $629,738,900 $661,238,000 $31,499,100 5.0%
2100 Consumption of Products & Services 574,156,842 610,537,100 620,267,900 640,384,300 20,116,400 3.2 2300 Manpower Development 4,892,355 7,087,700 5,631,900 6,783,300 1,151,400 20.4 2400 International & Public Relations, Public
Communications 2,227,187 2,103,600 2,744,100 3,278,500 534,400 19.5
2600 Programmes Central Vote 0 10,000,000 0 10,000,000 10,000,000 n.a. 2700 Asset Acquisition 480,818 693,500 922,200 671,200 -251,000 -27.2 2800 Miscellaneous 126,334 141,800 172,800 120,700 -52,100 -30.2
Grants, Subventions & Capital Injections to Organisations $4,869,269 $11,826,500 $5,745,100 $7,534,300 $1,789,200 31.1%
3100 Grants, Subventions & Capital Injections to Statutory Boards
4,869,269 7,535,800 5,600,800 7,270,000 1,669,200 29.8
3400 Grants, Subventions & Capital Injections to Other Organisations
0 4,290,700 144,300 264,300 120,000 83.2

96
BLANK Actual Estimated Revised Estimated Code Object Class FY2018 FY2019 FY2019 FY2020 Change Over FY2019
BLANK
TRANSFERS $63,993,697 $44,662,800 $44,457,100 $77,181,000 $32,723,900 73.6%
3800 International Organisations & Overseas Development Assistance
63,993,697 44,662,800 44,457,100 77,181,000 32,723,900 73.6
OTHER CONSOLIDATED FUND OUTLAYS
$2,360,415,362 $2,611,000,000 $3,664,000,300 $3,806,500,300 $142,500,000 3.9%
4200 Expenses on Investments 2,360,415,362 2,607,000,000 3,660,000,000 3,802,000,000 142,000,000 3.9 4600 Loans and Advances (Disbursement) 0 4,000,000 4,000,300 4,500,300 500,000 12.5
Development Estimates $73,871,127 $152,563,600 $60,208,400 $158,428,400 $98,220,000 163.1%
DEVELOPMENT EXPENDITURE $73,871,127 $152,563,600 $60,208,400 $158,428,400 $98,220,000 163.1%
5100 Government Development 73,871,127 152,563,600 60,208,400 158,428,400 98,220,000 163.1
Establishment List
BLANK Actual Estimated Revised Estimated Category/Personnel FY2018 FY2019 FY2019 FY2020
BLANK
POLITICAL APPOINTMENTS 3 3 3 3
Minister 3 3 3 3
PERMANENT STAFF 1,837 1,867 1,909 1,926
Accounting Profession (2008) 55 57 52 57
Administrative 16 16 17 17
Corporate Support 25 25 24 24
Management Executive Scheme (2008) 652 686 739 732
Management Support Scheme (2008) 163 157 151 148
Operations Support 3 3 3 3
Singapore Customs Officer (2008) 627 627 627 639
Singapore Customs Specialist (2008) 296 296 296 306
OTHERS 1,879 2,018 2,045 2,045
Inland Revenue Authority of Singapore 1,879 2,018 2,045 2,045
TOTAL 3,719 3,888 3,957 3,974

97
FY2019 BUDGET The revised total expenditure of the Ministry of Finance (MOF) in FY2019 is expected to be $919.19 million, excluding Expenses on Investments (EOI). This is an increase of $17.31 million or 1.9% compared to the actual FY2018 total expenditure of $901.88 million. Revised operating expenditure in FY2019 is expected to be $858.98 million, an increase of $30.97 million or 3.7% over the actual FY2018 expenditure of $828.01 million. This is mainly due to higher provision for operational needs. Revised development expenditure in FY2019 is expected to be $60.21 million, a decrease of $13.66 million or 18.5% from the actual FY2018 development expenditure of $73.87 million. This is primarily due to lower requirement under the Singapore Customs Programme. EOI in FY2019 is expected to be $3.66 billion, $1.30 billion higher than the actual amount incurred in FY2018. This expected increase is due to increased investment activities. FY2020 BUDGET Total expenditure for FY2020 is projected to be $1.10 billion (excluding EOI), which comprises operating expenditure of $940.34 million and development expenditure of $158.43 million. This is an increase of $179.58 million or 19.5% from the revised FY2019 total expenditure of $919.19 million. EOI is projected at $3.80 billion. Operating Expenditure The projected FY2020 operating expenditure of $940.34 million is an increase of $81.36 million or 9.5% over the revised FY2019 operating expenditure of $858.98 million. The increase is mainly due to the $74.55 million increase in operating expenditure for the Finance Programme. The Inland Revenue Authority of Singapore Programme is projected to take up the largest share of operating expenditure ($445.37 million or 47.4%). This is followed by the Finance Programme ($217.58 million or 23.1%), Singapore Customs Programme ($177.44 million or 18.9%), Accounting Services Programme ($55.63 million or 5.9%), and Shared Services Programme ($44.31 million or 4.7%). The highlights of the top three Programmes are as follows: a) Inland Revenue Authority of Singapore Programme The Inland Revenue Authority of Singapore (IRAS) is paid an agency fee to administer, assess, collect and enforce payment of income and property tax, goods and services tax (GST), stamp duties and other taxes on behalf of the Government. Based on the projected tax revenue collection, MOF has allocated an agency fee budget of $445.37 million for FY2020. b) Finance Programme An operating expenditure of $217.58 million is provided for the Finance Programme for FY2020. Of the total sum of $217.58 million, $84.62 million (38.9%) is for transfers as well as grants and subventions, $69.03 million (31.7%) is for other operating expenditure and $63.92 million (29.4%) is for expenditure on manpower. The budgeted $217.58 million is an increase of $74.55 million or 52.1% from the revised FY2019 expenditure of $143.03 million. The higher budgetary requirement for FY2020 is mainly attributed to (i) an increase in contributions to international organisations and (ii) a provision of $15 million being set aside annually in Personnel and Programme Central Votes. c) Singapore Customs Programme Singapore Customs collects customs and excise duties as well as GST on imported goods. It protects Government revenue by preventing leakage of duties and taxes. The department facilitates international trade by maintaining the integrity

98
of Singapore’s trading system through an appropriate trade regulatory system. The operating expenditure of Singapore Customs for FY2020 is projected to be $177.44 million, an increase of $16.67 million or 10.4% over the revised FY2019 expenditure of $160.77 million. The higher requirement for FY2020 is mainly due to maintenance of new IT system and continuous efforts to strengthen IT infrastructure and security. Development Expenditure Development expenditure for FY2020 is projected to be $158.43 million, an increase of $98.22 million or 163.1% over the revised FY2019 development expenditure of $60.21 million. The increase is mainly due to $100 million being set aside in the Central Vote for New Projects. Other Consolidated Fund Outlays Advances for FY2020 are projected to be $4.50 million, mainly for recoverable expenses from tenant ministries in The Treasury building. EOI in FY2020 is budgeted to be $3.80 billion, which is $142.00 million higher than the revised EOI in FY2019. Higher expenses are expected to be incurred with the growth in assets under management.

99
Total Expenditure by Programme
BLANK Running Operating Development Total Code Programme Costs Transfers Expenditure Expenditure Expenditure BLANK M-A Finance 140,490,900 77,090,000 217,580,900 106,121,100 323,702,000 M-C Accounting Services 55,631,000 0 55,631,000 21,523,600 77,154,600 M-G Shared Services 44,310,000 0 44,310,000 353,000 44,663,000 M-O Singapore Customs 177,349,600 91,000 177,440,600 30,430,700 207,871,300 M-P Inland Revenue Authority of Singapore 445,374,500 0 445,374,500 0 445,374,500
Total $863,156,000 $77,181,000 $940,337,000 $158,428,400 $1,098,765,400
Development Expenditure by Project
BLANK Actual
Expenditure Up to end of
BLANK BLANK Total Actual Estimated Revised Estimated Project Title Project Cost FY2017 FY2018 FY2019 FY2019 FY2020
BLANK
DEVELOPMENT EXPENDITURE … … $73,871,127 $152,563,600 $60,208,400 $158,428,400
GOVERNMENT DEVELOPMENT … … 73,871,127 152,563,600 60,208,400 158,428,400
Finance Programme … … 3 3 3 3
Central Vote for New Projects … … 0 100,000,000 0 100,000,000 Minor Development Projects … … 5,061,171 2,713,100 4,868,200 3,921,100 New Projects … … 0 5,517,700 150,000 2,200,000
Accounting Services Programme … … 3 3 3 3
New Projects … … 0 3,000,000 3,000,000 2,969,800 Relocation of AGD's central systems to the government data centre & enhancement to AGD's Public Facing Systems
30,000,000 0 0 6,000,000 12,443,000 15,900,000
Minor Development Projects … … 4,764,455 1,238,000 1,029,300 2,653,800
Shared Services Programme … … 1 1 1 1
Minor Development Projects … … 815,947 3,302,000 406,000 353,000
Singapore Customs Programme … … 5 5 5 5
New Projects … … 0 8,485,500 5,082,300 6,017,300 New Customs Operation Command (COC) Building 94,945,500 26,951,607 39,267,061 4,854,900 5,011,300 1,300,300 New TradeXchange/TradeNet/eCustoms Project 155,861,900 61,371,487 17,064,670 13,695,400 20,400,700 13,363,100 Setting up of a Radiographic Scanning Station for Export Checks Operation at Tuas Megaport
6,573,000 0 0 0 0 3,675,000
Minor Development Projects … … 1,370,747 2,367,000 5,745,400 6,075,000 Completed Projects … … 5,527,076 1,390,000 2,072,200 0

100
KEY PERFORMANCE INDICATORS Desired Outcomes
• Stewardship of Public Good
• Quality and Sustainable Growth
• High Performance Government Key Performance Indicators Actual Actual Revised Estimated
Desired Outcome Performance Indicator FY2017 FY2018 FY2019 FY2020
Stewardship of Public Good Balanced Budget
Overall Budget Balance as a % of GDP (5-year moving average)
0.8
0.7
0.6
0.4
Fiscal Sustainability
Draw on Past Reserves
No No No No
Standard and Poor’s / Moody’s Sovereign Risk Rating AAA / Aaa AAA / Aaa AAA / Aaa AAA / Aaa Budget Marksmanship
Government operating revenue as % of budgeted revenue (excluding Net Investment Returns Contribution)
109.2
101.5
99.8
N.A.
Government expenditure as % of budgeted expenditure (excluding special transfers)
98.0 97.3 97.4 N.A.
Quality and Sustainable Growth Conducive Business Environment
Institute of Management Development (IMD) World
Competitiveness Yearbook: ‘Real Corporate Taxes Do Not Discourage Entrepreneurial Activity’
4th (out of 63 countries)
3rd (out of 63 countries)
N.A.1 N.A.
World Economic Forum (WEF) Global Enabling Trade
Report – ‘Border Administration’ N.A.2 N.A.3 N.A.2 Top 3
World Bank ‘Doing Business’ Report – Starting a
Business 6th
(out of 190 economies)
3rd (out of 190
economies)
4th (out of 190
economies)
3rd (out of 190
economies) Inclusive Growth 20th percentile monthly nominal household income
from work4 per household member among citizen employed households (real annual growth rate in parentheses)
$1,225 (0.3%)5
$1,270 (1.8%)5
$1,326 (3.5%)5
N.A.
Median monthly nominal household income from work4
per household member among citizen employed households (real annual growth rate in parentheses)
$2,535 (2.0%)5
$2,626 (2.2%)5
$2,749 (3.8%)5
N.A.
1 Indicator is not available in the 2019 IMD World Competitiveness Yearbook. 2 The WEF Global Enabling Trade Report is a biennial report.
3 The WEF Global Enabling Trade Report was not published in 2018. 4 Household income from work refers to the sum of income received, including employers’ CPF contributions, by working members of the household from employment and business. Employed households are those with at least one working person. 5 Numbers in parentheses are real annual growth rates (20th percentile deflated by lowest 20% income group CPI excluding imputed rental on owner-occupied accommodation, median deflated by middle 60% income group CPI excluding imputed rental on owner-occupied accommodation).
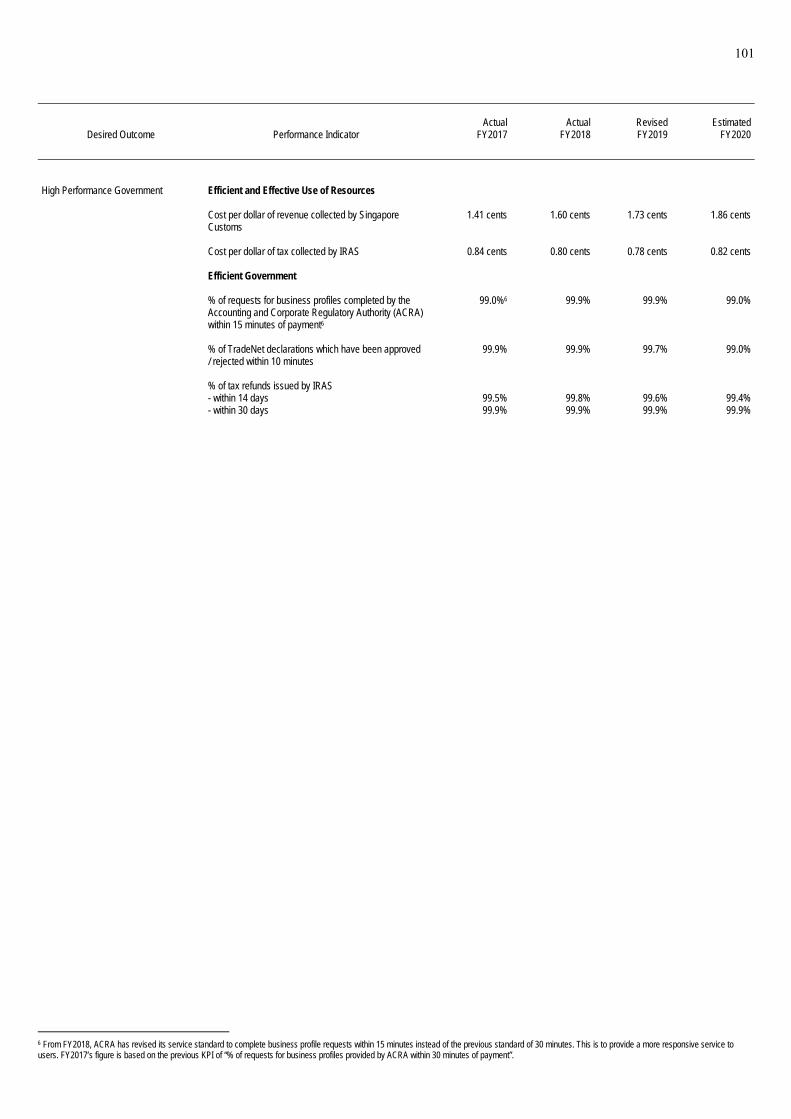
101
Actual Actual Revised Estimated
Desired Outcome Performance Indicator FY2017 FY2018 FY2019 FY2020
High Performance Government
Efficient and Effective Use of Resources
Cost per dollar of revenue collected by Singapore Customs
1.41 cents 1.60 cents 1.73 cents 1.86 cents
Cost per dollar of tax collected by IRAS 0.84 cents 0.80 cents 0.78 cents 0.82 cents Efficient Government
% of requests for business profiles completed by the Accounting and Corporate Regulatory Authority (ACRA) within 15 minutes of payment6
99.0%6
99.9%
99.9%
99.0%
% of TradeNet declarations which have been approved / rejected within 10 minutes
99.9% 99.9% 99.7% 99.0%
% of tax refunds issued by IRAS - within 14 days 99.5% 99.8% 99.6% 99.4% - within 30 days 99.9% 99.9% 99.9% 99.9%
6 From FY2018, ACRA has revised its service standard to complete business profile requests within 15 minutes instead of the previous standard of 30 minutes. This is to provide a more responsive service to users. FY2017’s figure is based on the previous KPI of “% of requests for business profiles provided by ACRA within 30 minutes of payment”.


Head N ___________
Ministry of Foreign Affairs

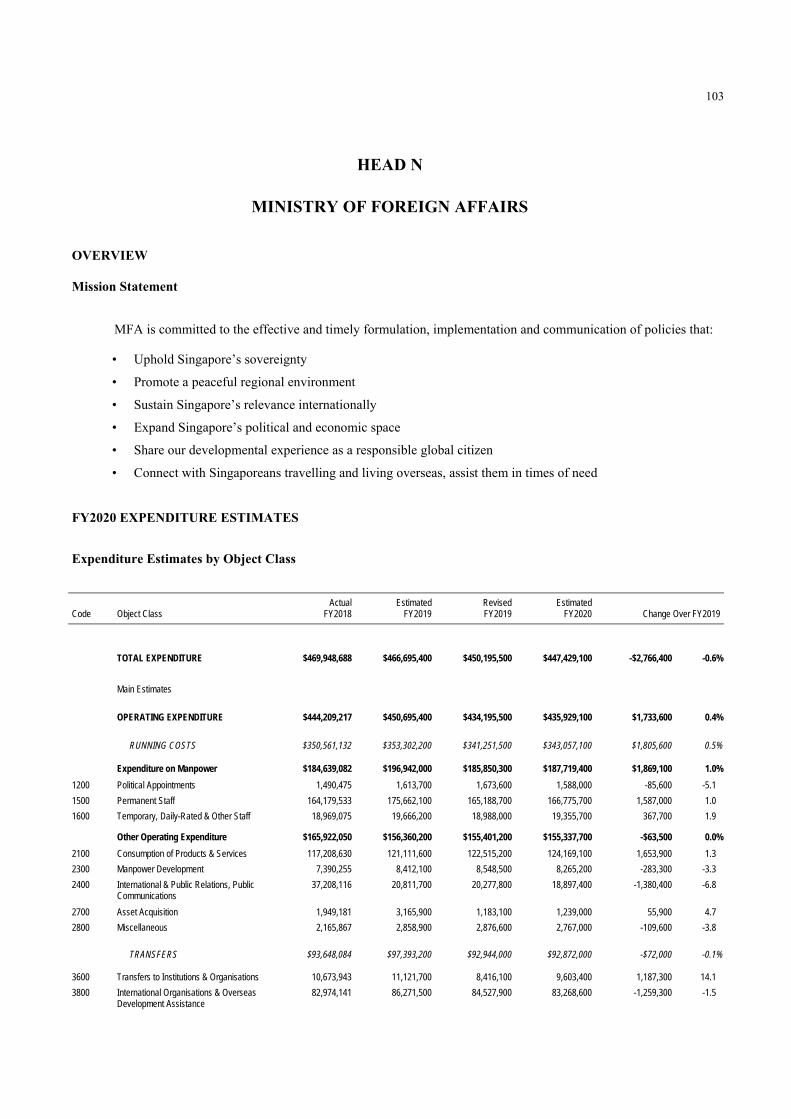
103
HEAD N
MINISTRY OF FOREIGN AFFAIRS
OVERVIEW
Mission Statement
MFA is committed to the effective and timely formulation, implementation and communication of policies that:
• Uphold Singapore’s sovereignty
• Promote a peaceful regional environment
• Sustain Singapore’s relevance internationally
• Expand Singapore’s political and economic space
• Share our developmental experience as a responsible global citizen
• Connect with Singaporeans travelling and living overseas, assist them in times of need
FY2020 EXPENDITURE ESTIMATES
Expenditure Estimates by Object Class
BLANK Actual Estimated Revised Estimated Code Object Class FY2018 FY2019 FY2019 FY2020 Change Over FY2019
BLANK
TOTAL EXPENDITURE $469,948,688 $466,695,400 $450,195,500 $447,429,100 -$2,766,400 -0.6%
Main Estimates $444,209,217 $474,995,400 $457,055,500 $450,109,100 -$6,946,400 -1.5%
OPERATING EXPENDITURE $444,209,217 $450,695,400 $434,195,500 $435,929,100 $1,733,600 0.4%
RUNNING COSTS $350,561,132 $353,302,200 $341,251,500 $343,057,100 $1,805,600 0.5%
Expenditure on Manpower $184,639,082 $196,942,000 $185,850,300 $187,719,400 $1,869,100 1.0%
1200 Political Appointments 1,490,475 1,613,700 1,673,600 1,588,000 -85,600 -5.1
1500 Permanent Staff 164,179,533 175,662,100 165,188,700 166,775,700 1,587,000 1.0
1600 Temporary, Daily-Rated & Other Staff 18,969,075 19,666,200 18,988,000 19,355,700 367,700 1.9
Other Operating Expenditure $165,922,050 $156,360,200 $155,401,200 $155,337,700 -$63,500 0.0%
2100 Consumption of Products & Services 117,208,630 121,111,600 122,515,200 124,169,100 1,653,900 1.3
2300 Manpower Development 7,390,255 8,412,100 8,548,500 8,265,200 -283,300 -3.3
2400 International & Public Relations, Public Communications
37,208,116 20,811,700 20,277,800 18,897,400 -1,380,400 -6.8
2700 Asset Acquisition 1,949,181 3,165,900 1,183,100 1,239,000 55,900 4.7
2800 Miscellaneous 2,165,867 2,858,900 2,876,600 2,767,000 -109,600 -3.8
TRANSFERS $93,648,084 $97,393,200 $92,944,000 $92,872,000 -$72,000 -0.1%
3600 Transfers to Institutions & Organisations 10,673,943 11,121,700 8,416,100 9,603,400 1,187,300 14.1
3800 International Organisations & Overseas Development Assistance
82,974,141 86,271,500 84,527,900 83,268,600 -1,259,300 -1.5
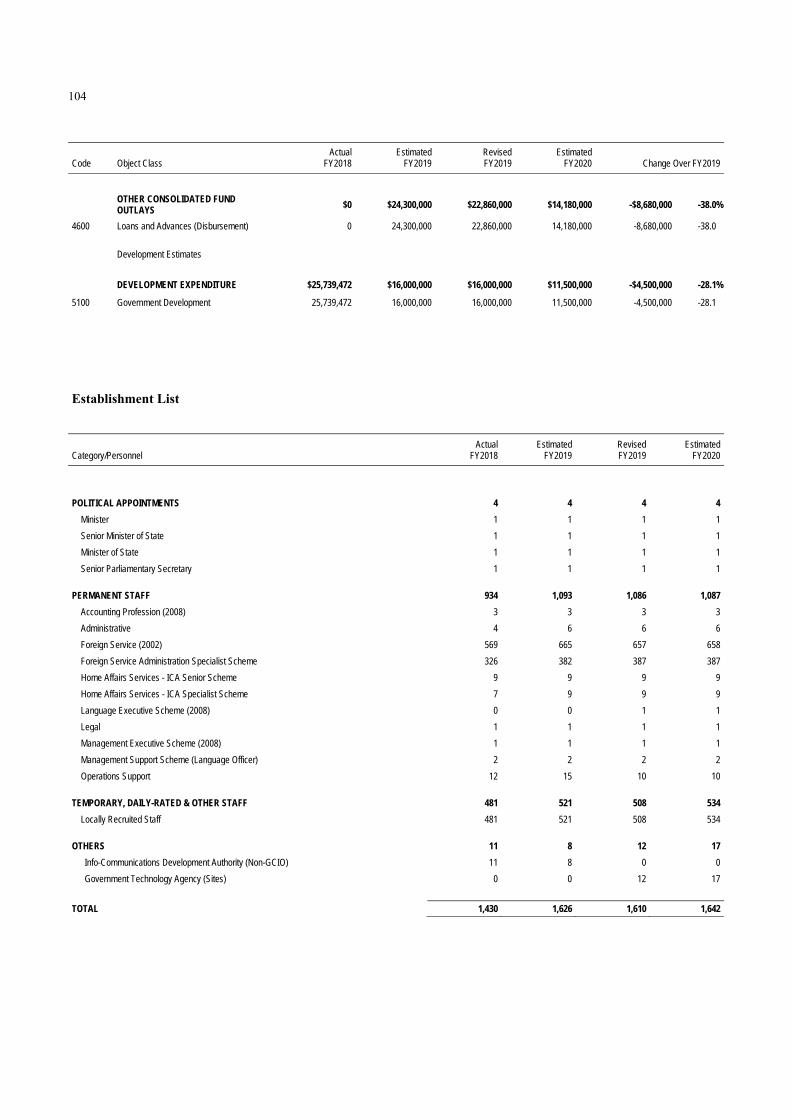
104
BLANK Actual Estimated Revised Estimated Code Object Class FY2018 FY2019 FY2019 FY2020 Change Over FY2019
BLANK
OTHER CONSOLIDATED FUND OUTLAYS $0 $24,300,000 $22,860,000 $14,180,000 -$8,680,000 -38.0%
4600 Loans and Advances (Disbursement) 0 24,300,000 22,860,000 14,180,000 -8,680,000 -38.0
Development Estimates $25,739,472 $16,000,000 $16,000,000 $11,500,000 -$4,500,000 -28.1%
DEVELOPMENT EXPENDITURE $25,739,472 $16,000,000 $16,000,000 $11,500,000 -$4,500,000 -28.1%
5100 Government Development 25,739,472 16,000,000 16,000,000 11,500,000 -4,500,000 -28.1
Establishment List
BLANK Actual Estimated Revised Estimated Category/Personnel FY2018 FY2019 FY2019 FY2020
BLANK
POLITICAL APPOINTMENTS 4 4 4 4
Minister 1 1 1 1
Senior Minister of State 1 1 1 1
Minister of State 1 1 1 1
Senior Parliamentary Secretary 1 1 1 1
PERMANENT STAFF 934 1,093 1,086 1,087
Accounting Profession (2008) 3 3 3 3
Administrative 4 6 6 6
Foreign Service (2002) 569 665 657 658
Foreign Service Administration Specialist Scheme 326 382 387 387
Home Affairs Services - ICA Senior Scheme 9 9 9 9
Home Affairs Services - ICA Specialist Scheme 7 9 9 9
Language Executive Scheme (2008) 0 0 1 1
Legal 1 1 1 1
Management Executive Scheme (2008) 1 1 1 1
Management Support Scheme (Language Officer) 2 2 2 2
Operations Support 12 15 10 10
TEMPORARY, DAILY-RATED & OTHER STAFF 481 521 508 534
Locally Recruited Staff 481 521 508 534
OTHERS 11 8 12 17
Info-Communications Development Authority (Non-GCIO) 11 8 0 0
Government Technology Agency (Sites) 0 0 12 17
TOTAL 1,430 1,626 1,610 1,642

105
FY2019 BUDGET
The revised FY2019 expenditure of the Ministry of Foreign Affairs (MFA) is $450.20 million. This is a decrease of $19.75 million or 4.2% over the actual FY2018 expenditure of $469.95 million.
Operating Expenditure
The revised FY2019 operating expenditure is $434.20 million, a decrease of $10.01 million or 2.3% over the actual FY2018 expenditure of $444.21 million. The decrease in other operating expenditure is mainly due to Singapore’s hosting of the ASEAN Chairmanship in FY2018. Development Expenditure
The revised FY2019 development expenditure is $16 million, a decrease of $9.74 million or 37.8% over the actual FY2018 expenditure of $25.74 million. This decrease is mainly due to the completion of a major project in FY2018. FY2020 BUDGET
The FY2020 total expenditure of MFA is projected to be $447.43 million, a decrease of $2.77 million or 0.6% over the revised FY2019 expenditure of $450.20 million. Of this, $435.93 million or 97.4% is for operating expenditure and $11.5 million or 2.6% is for development expenditure. Operating Expenditure
Operating expenditure for FY2020 is projected to be $435.93 million, which is an increase of $1.73 million or 0.4% over the revised FY2019 expenditure of $434.20 million. Of this, $343.06 million or 78.7% is for running costs and $92.87 million or 21.3% is for transfers. Development Expenditure
Development expenditure for FY2020 is projected to be $11.5 million, a decrease of $4.50 million or 28.1% over the revised FY2019 expenditure of $16 million. This decrease is mainly due to lower budget requirements for HQ projects in FY2020.
Other Consolidated Fund Outlays
Advances for FY2020 are projected to be $14.18 million mainly to meet ad-hoc cashflows required in the overseas operations of the Ministry.

106
Total Expenditure by Programme
BLANK Running Operating Development Total Code Programme Costs Transfers Expenditure Expenditure Expenditure
BLANK
N-A Foreign Affairs 343,057,100 92,872,000 435,929,100 11,500,000 447,429,100
Total $343,057,100 $92,872,000 $435,929,100 $11,500,000 $447,429,100
Development Expenditure by Project
BLANK Actual
Expenditure Up to end of
BLANK
BLANK Total Actual Estimated Revised Estimated Project Title Project Cost FY2017 FY2018 FY2019 FY2019 FY2020
BLANK
DEVELOPMENT EXPENDITURE … … $25,739,472 $16,000,000 $16,000,000 $11,500,000
GOVERNMENT DEVELOPMENT … … 25,739,472 16,000,000 16,000,000 11,500,000
Foreign Affairs Programme … … 3 3 3 3
ICT Projects … … 629,542 1,650,000 4,750,000 1,150,000
Overseas Properties Projects … … 2,427,824 4,000,000 4,000,000 4,500,000
Minor Development Projects … … 7,589,273 6,850,000 3,550,000 5,850,000
Completed Projects … … 15,092,833 3,500,000 3,700,000 0

107
KEY PERFORMANCE INDICATORS
Desired Outcomes
• Advancement of Singapore's national interests through the conduct of our foreign relations and working through regional and international organisations
• Reinforcing international recognition of Singapore as an effective, constructive and reliable partner
• Prompt and effective consular services for Singaporeans
Key Performance Indicators
Desired Outcome Performance Indicator Actual FY2018/ Revised FY2019
Estimated FY2020
Advancement of Singapore's national interests through the conduct of our foreign relations and working through regional and international organisations
1. Maintain stable relations with neighbours, ASEAN and other key countries, and work with economic agencies in continuing engagement of emerging markets
Our leaders travelled widely since April 2018 for bilateral visits, as well as to attend various multilateral meetings. President Halimah Yacob made State Visits to Brunei, the Netherlands, Kuwait, the Kingdom of Saudi Arabia (KSA), and the Philippines, and visited China for the Conference on Dialogue of Asian Civilisations, and Japan for the enthronement ceremony of Emperor Naruhito. PM Lee Hsien Loong visited Armenia, Austria, China, France, Indonesia, Japan, Malaysia, Mexico, Sri Lanka, and the US. PM Lee Hsien Loong attended the 74th United Nations (UN) General Assembly in New York, the US, the 27th World Economic Forum (WEF) on ASEAN in Hanoi, Vietnam, the 26th APEC Economic Leaders’ Meeting (AELM) in Port Moresby, Papua New Guinea, the 13th and 14th G20 Leaders’ Summits in Buenos Aires, Argentina and Osaka, Japan respectively, the 12th ASEM Summit and ASEAN-EU Leaders’ Meeting in Brussels, Belgium, the 25th Commonwealth Heads of Government Meeting (CHOGM) in London, the UK, the 34th and 35th ASEAN Summits in Bangkok, Thailand, the ASEAN-India Commemorative Summit in New Delhi, India, the 2nd Belt & Road Forum for International Cooperation in Beijing, China, the ASEAN-Australia Special Summit in Sydney, Australia, and the ASEAN-ROK Commemorative Summit in Seoul, the ROK. DPM Heng Swee Keat visited Brunei, China, India, Japan, Malaysia, and the US, and chaired the WEF on India meeting in New Delhi. Then-DPM and Coordinating Minister for National Security and subsequently SM Teo Chee Hean visited Brunei, China, France, Indonesia, Israel, Japan, Jordan, Kazakhstan, Malaysia, Morocco, Oman, Qatar, Russia, the US, and Vietnam, and separately visited Hanoi, Vietnam, to attend the State Funeral of President Tran Dai Quang. Then-DPM and Coordinating Minister for Economic and Social Policies and subsequently SM and Coordinating Minister for Social Policies Tharman Shanmugaratnam attended the WEF Annual Meeting in Davos, Switzerland, and visited Argentina, Armenia, China, Côte d’Ivoire, Denmark, Finland, France, Germany, Ghana, India, Japan, Kenya, the ROK, Norway, the Philippines, Russia, Rwanda, KSA, Spain, Switzerland, Turkey, and the UK. ESM Goh Chok Tong’s trips included China, Japan, and Kazakhstan. Minister (Foreign Affairs) Dr Vivian Balakrishnan visited Australia, Argentina, Bangladesh, China, the Democratic People’s Republic of Korea (DPRK), India, Indonesia, Japan, Malaysia, Myanmar, and the US. Minister (Foreign Affairs) Dr Vivian Balakrishnan also attended various multilateral forums such as the 3rd and 4th Indian Ocean Conferences in Hanoi, Vietnam and the Maldives respectively, the G20 Foreign Ministers’ Meetings in Buenos Aires, Argentina and Nagoya, Japan in 2018 and 2019 respectively, the 72nd and 73rd UN General Assemblies in New York, the US, the 2019 WEF Annual
We will continue to maintain a positive and constructive relationship with the Malaysian government and deepen our mutually beneficial cooperation, including through strengthening connectivity and business linkages. We will also continue to build on our engagements at both the Federal and State levels, as well as promote people-to-people and cultural exchanges. Following Indonesian President Joko Widodo’s re-election to a second term, we will build on the bilateral achievements in his first term to deepen security, economic, and people-to-people ties with Indonesia for mutual benefit. We will broaden our ties with various regions in Indonesia by stepping up political exchanges. We will continue to closely engage Brunei to maintain the strong momentum of high-level exchanges, and further enhance our special relationship by exploring new areas of bilateral cooperation, such as through judicial cooperation, as well as in agriculture and aquaculture. We will continue to maintain close relations and strengthen our institutional links with Thailand, Myanmar, Vietnam, Philippines, Cambodia, and Laos to further our strategic and economic interests. We will also keep up the momentum of high-level exchanges through visits, and programmes such as the Lee Kuan Yew Exchange Fellowship. As a longstanding, strategic partner of the US, we will continue to expand cooperation across the economic, defence, security, and people-to-people spheres. We will maintain the momentum of high-level exchanges and strengthen our collaboration with the US on issues of mutual concern and interest, such as counter-terrorism, cybersecurity, and infrastructure development, as well as through institutional mechanisms such as the US-Singapore Strategic Partnership Dialogue. We will continue our active engagement of the People’s Republic of China (PRC) through high-level visits and institutionalised bilateral mechanisms, like the Joint Council for Bilateral Cooperation, Singapore-China Forum on Leadership, the Singapore-China Forum on Social Governance, and the Singapore-China Legal and Judicial Roundtable. We will also continue to facilitate the smooth development of our three government-to-government projects – the China-Singapore Suzhou Industrial Park, the Sino-Singapore Tianjin Eco-city, and the China-Singapore (Chongqing) Demonstration Initiative on Connectivity (CCI) – as well as the China-Singapore Guangzhou Knowledge City (CSGKC) state-level bilateral cooperation project. We will continue to deepen our engagement of the key Chinese provinces/municipalities and participate in China’s regional development strategies (such as the Guangdong-Hong

108
Desired Outcome Performance Indicator Actual FY2018/ Revised FY2019
Estimated FY2020
Meeting in Davos, Switzerland, the 12th ASEM Summit in Brussels, Belgium, the 22nd ASEAN-EU Ministerial Meeting in Brussels, Belgium, the 25th CHOGM in London, the UK, the 52nd ASEAN Foreign Ministers’ Meeting and Related Meetings in Bangkok, Thailand, the 34th and 35th ASEAN Summits in Bangkok, Thailand, as well as the annual Informal ASEAN Foreign Ministers’ Meeting and Related Meetings in New York, the US. SMS (Defence) (Foreign Affairs) Dr Maliki Osman visited Austria, Brunei, Ethiopia, France, Greece, India, Indonesia, Laos, Mexico, Morocco, Nepal, Qatar, Romania, South Africa, Timor-Leste, and Uzbekistan, and attended the 16th Ministerial Meeting of the Asia Cooperation Dialogue in Qatar, the 16th and 17th Indian Ocean Rim Association (IORA) Council of Ministers Meeting in Indonesia and South Africa respectively, the 18th Non-Aligned Movement Summit in Azerbaijan, the 30th APEC Ministerial Meeting in Papua New Guinea, the 28th WEF on Africa in South Africa, the 3rd Conference on Cooperation Among East Asian Countries for Palestinian Development Ministerial Meeting in Thailand, the 9th Forum for East Asia-Latin America Cooperation (FEALAC) Foreign Ministers’ Meeting in the Dominican Republic, the OECD Southeast Asia Regional Programme Ministerial Conference in Japan, as well as the World Economic Forum on Africa in South Africa. MOS (Foreign Affairs) (Social and Family Development) Sam Tan visited China, Finland, Germany, Iceland, Norway, Russia, as well as Japan for the 19th Singapore-Kagoshima Conference. Speaker of Parliament Tan Chuan-Jin made official visits to Indonesia and Turkey and led the Singapore delegation to the 39th General Assembly of the ASEAN Inter-Parliamentary Assembly (AIPA) in Bangkok, Thailand. Chief Justice Sundaresh Menon visited China to co-chair the 3rd Singapore-China Legal and Judicial Roundtable. SPS (Foreign Affairs) (Trade and Industry) Dr Tan Wu Meng visited Indonesia, the DPRK, Ghana, Jordan, as well as the UK. There was a steady stream of visits by foreign dignitaries. Singapore hosted State Visits from Egypt, Jordan, Laos, Panama, Qatar, the ROK, and Russia. We also hosted visits by the Crown Prince of Abu Dhabi Sheikh Mohamed Bin Zayed Al Nahyan, PRC Premier Li Keqiang, DPRK State Affairs Commission Chairman Kim Jong Un (for the US-DPRK Summit), Princess Maha Chakri Sirindhorn of Thailand, Prince Daniel of Sweden, former UN Secretary-General Ban Ki Moon, High Representative of the Union for Foreign Affairs and Security Policy Federica Mogherini, Chairman of the Board of the Eurasian Economic Union Tigran Sargsyan, the Prime Ministers of Armenia, Australia, Austria, the Czech Republic, India, Kazakhstan, Laos, New Zealand, Turkey, Myanmar, State Counsellor Aung San Suu Kyi, PRC Politburo Standing Committee Member and Vice Premier Han Zheng (for the 14th Joint Council for Bilateral Cooperation (JCBC) and Related Joint Steering Council (JSC) Meetings), PRC Vice President Wang Qishan, the Deputy Prime Ministers of Montenegro, Poland, Qatar, Romania, Russia, and Vietnam, and Vice President of the Council of Ministers of Cuba Roberto Morales Ojeda. Other significant visits included that by PRC Supreme People’s Court President Zhou Qiang to co-chair the 2nd Singapore-China Legal and Judicial Roundtable, and those by the foreign ministers of Argentina, Australia, Brazil, Cambodia, Canada, China, Greece, Indonesia, Italy, Japan, Malta, Poland, New Zealand, Norway, Qatar, the ROK, Russia, Turkey, Thailand, Timor-Leste, Ukraine, the UK, the US, and Vietnam, the Canadian Minister of Defence, and the US Secretary of Defence. We maintained intensive diplomatic engagement with our immediate neighbours and other Southeast Asian
Kong-Macao Greater Bay Area), through our eight provincial business councils and new initiatives such as the Smart City Initiative between Singapore and Shenzhen. As we continue to deepen cooperation in existing fields including financial cooperation and human resource development, we will explore new areas of cooperation such as third country cooperation. We will continue to promote greater people-to-people exchanges, including facilitating internships between university students from both sides. We will explore new mutually beneficial projects as we celebrate the 30th anniversary of the establishment of diplomatic relations in 2020. We will continue to build up relations with key regional partners like Japan and the ROK, including through high-level exchanges. We will continue to build our links with Japanese and ROK personalities through our invitation programmes, such as the Temasek Programme, Raffles Programme, and the ROK Directors-General Visit Programme. We will also maintain our bilateral track 1.5 platforms such as the Japan-Singapore Symposium and the Korea-Singapore Forum. We will continue to improve on our joint technical assistance programme, the Japan-Singapore Partnership Programme for the 21st Century (JSPP21), to address emerging development challenges and remain relevant in the coming decades. We will continue to strengthen our high-level engagements with Australia including through the annual leaders’ meeting and the Singapore-Australia Joint Ministerial Committee (SAJMC). We will work closely with Australia to implement the Singapore-Australia Comprehensive Strategic Partnership (CSP) 10-year Roadmap which will reach its halfway mark in 2020. We will continue to identify new mutually beneficial areas of collaboration under the CSP, such as digital economy, food security, renewable energy, and cybersecurity. We will work with New Zealand to implement the Singapore-New Zealand Enhanced Partnership (EP) which was signed in May 2019. We will explore new areas of cooperation under the EP, such as digital economy and food security. We will continue to strengthen relations with India to make progress on the India-Singapore Strategic Partnership, which provides a roadmap for cooperation in defence, economic and cultural cooperation, skills development, smart cities and capacity building among others. We will also deepen collaboration in the area of digital economy and FinTech, and explore ways to expand parliamentary and bureaucratic linkages. We will also continue to build ties with other South Asian countries and explore areas for mutually beneficial collaboration. We will continue to engage and strengthen ties with key EU member states including through exchanges of high-level visits. We will also tap our strong links with European countries to advance our economic interests, and seek new opportunities for cooperation. Following the signing of the EU-Singapore Free Trade Agreement (EUSFTA), EU-Singapore Investment Protection Agreement (EUSIPA) and the EU-Singapore Partnership and Cooperation Agreement (ESPCA) in October 2018, we will continue to work with the EU institutions and EU Member States to push for the ratification of the EUSIPA and the ESPCA. We also hope to conclude negotiations on an EU-ASEAN Comprehensive Air Transport Agreement, which will facilitate greater people flow through enhanced air connectivity between the two regions.

109
Desired Outcome Performance Indicator Actual FY2018/ Revised FY2019
Estimated FY2020
countries. Shortly after the 14th Malaysian General Election, PM Lee Hsien Loong visited Putrajaya on 19 May 2018. He met Malaysian PM Mahathir Mohamad, DPM and Minister of Women, Family and Community Development Wan Azizah Wan Ismail, and Pakatan Harapan Coalition Chief Anwar Ibrahim. Then-DPM Teo Chee Hean visited Kuala Lumpur, Sabah and Sarawak from 4 to 9 September 2018, and met many Malaysian leaders at the Federal and State levels. President Halimah Yacob also visited Kuala Lumpur from 18 to 19 September 2018 to officiate the annual University of Malaya-National University of Singapore Inter-University Tunku Chancellor Golf Tournament Games with the Sultan of Perak Nazrin Shah, and called on then- Yang di-Pertuan Agong Sultan Muhammad V. Minister (Foreign Affairs) Dr Vivian Balakrishnan visited Putrajaya on 14 March 2019, and met Malaysian Foreign Minister Saifuddin Abdullah to discuss maritime issues surrounding the Johor Bahru Port Limits off Tanjung Piai and Singapore Port Limits off Tuas; and, in his capacity as Acting Minister (Transport), met with Malaysian Transport Minister Anthony Loke to discuss airspace issues and the Johor Bahru-Singapore Rapid Transit System (RTS) Link Project. Speaker of Parliament Tan Chuan-Jin also made an Official Visit to Malaysia from 18 to 20 March 2019 with a delegation from Parliament, during which he met Dewan Rakyat Speaker Ariff Yusof and Minister in the Prime Minister’s Department (Legal and Parliamentary Affairs) Liew Vui Keong. Malaysia hosted the 9th Leaders’ Retreat on 9 April 2019, and Singapore is expected to host the 10th Leaders’ Retreat in 2020. DPM Heng Swee Keat and Minister (Foreign Affairs) Dr Vivian Balakrishnan also visited Johor on 5 June 2019 to attend the Sultan of Johor’s Hari Raya Open House. Later in the year, Minister (Foreign Affairs) Dr Vivian Balakrishnan made two working visits to various Malaysian states – the first to Penang and Kedah from 29 to 30 August 2019, and the second to Negeri Sembilan, Pahang and Terengganu from 1 to 3 October 2019. There has also been a high tempo of visits from Malaysian leaders to Singapore from June 2018 to September 2019, including by PM Mahathir Mohamad, Defence Minister Mohamad Sabu, Communications and Multimedia Minister Gobind Singh Deo, Housing and Local Government Minister Zuraida Kamaruddin, Foreign Minister Saifuddin Abdullah, Transport Minister Anthony Loke, Youth and Sports Minister Syed Saddiq, Economic Affairs Minister Azmin Ali, Minister in the Prime Minister's Department (Law) Liew Vui Keong, Deputy Defence Minister Liew Chin Tong, Deputy Minister of Women, Family and Community Development Hannah Yeoh, Deputy Youth and Sports Minister Steven Sim, Deputy International Trade and Industry Minister Ong Kian Ming and PKR President Anwar Ibrahim. The Sultan of Perak Nazrin Shah also visited Singapore from 23 to 24 April 2019 to officiate the annual University of Malaya-National University of Singapore Inter-University Tunku Chancellor Golf Tournament Games with President. During his visit, Sultan Nazrin also met several of our leaders, including PM Lee Hsien Loong, then-DPM Teo Chee Hean and Minister (Foreign Affairs) Dr Vivian Balakrishnan. On 5 September 2018, following bilateral negotiations led by Malaysian Economic Affairs Minister Azmin Ali and Minister (Transport) & Coordinating Minister for Infrastructure Khaw Boon Wan, both Ministers signed Side Letters on the suspension of the construction of the KL-Singapore High Speed Rail Project. We have kept up a steady tempo of high-level exchanges with Indonesia to further broaden our strong bilateral ties. SM Teo Chee Hean, Minister (Foreign Affairs) Dr Vivian Balakrishnan, Minister (Culture, Community and Youth) Grace Fu, Minister (Trade and Industry) Chan Chun Sing,
We will continue to build on our relations with emerging markets such as Russia and Turkey. For Russia, we will continue to strengthen our relations through existing key institutional platforms such as the High-Level Russia-Singapore Inter-Governmental Commission (IGC) and Russia-Singapore Business Forum (RSBF). For Turkey, we will maintain high-level exchanges. We will continue to strengthen our good relations with the Middle Eastern, Central Asian, and North African countries through regular high-level exchanges and government-to-government institutional platforms. We will continue to provide technical assistance where opportune, particularly through study visits and our capacity building centres in Jordan, Oman, and Qatar. We will continue to work closely with our economic agencies to identify new opportunities, leverage on existing platforms such as the Abu Dhabi-Singapore Joint Forum, the Singapore-Qatar Implementation Monitoring Mechanism, and the Singapore-Oman Joint Committee, as well as to ensure that the Gulf Cooperation Council (GCC)-Singapore FTA (GSFTA) is fully implemented. In particular, it will be a milestone year for our relations with the United Arab Emirates (UAE), Kingdom of Saudi Arabia (KSA), and Oman with the forthcoming World Expo in Dubai (UAE), G20 Summit and associated meetings in KSA, and 50th anniversary of bilateral relations, respectively. We are also expecting two high-level visits from Kazakhstan in FY2020, namely President Kassym-Jomart Tokayev and Prime Minister Askar Mamin. We plan to tap on the above events to further deepen our links with these countries. For Latin America and the Caribbean, we will continue to strengthen relations through high-level interactions and by using our existing tools of engagement, including our Pacific Alliance (PA) Candidate Associate State Membership and the ongoing negotiations on a PA-Singapore FTA, a MERCOSUR-Singapore FTA, and the Singapore Cooperation Programme (SCP) to identify new opportunities for collaboration. As our political and economic interests in Sub-Saharan Africa continue to grow, we will continue to deepen our engagement of the region in coordination with our economic agencies and stakeholders.
110
Desired Outcome Performance Indicator Actual FY2018/ Revised FY2019
Estimated FY2020
Minister (Education) Ong Ye Kung, SMS (Defence) (Foreign Affairs) Dr Maliki Osman, and SMS (Trade and Industry) (Education) Chee Hong Tat, were among several Political Office Holders to visit Indonesia in 2019. Notably, PM Lee Hsien Loong visited Jakarta from 19 to 20 October 2019 to attend the inauguration of President Jokowi, for his second term in office. PM Lee Hsien Loong and President Jokowi reaffirmed Singapore’s commitment to further strengthen the existing excellent bilateral relationship. Singapore hosted several high-level visits from Indonesia, including the annual Singapore-Indonesia Leaders’ Retreat on 8 October 2019. During the retreat, PM Lee Hsien Loong and President Jokowi discussed ways to broaden cooperation in investments, human capital development, infrastructure, and civil service reform. The Leaders also welcomed an agreed framework for discussions on airspace management and military training. In addition, President Halimah Yacob had an informal meeting with President Jokowi. Eight leaders from various regions in Indonesia attended the inaugural RISING Fellowship from 18 to 21 November 2019 in Singapore, which seeks to deepen ties between Singapore and Indonesia’s regions. President Halimah Yacob visited Brunei for her first overseas State Visit from 11 to 14 May 2018 at the invitation of the Sultan of Brunei. We kept up our official representation at the Sultan of Brunei’s birthday celebrations, with Minister (Social and Family Development) Desmond Lee attending the Sultan’s 72nd birthday celebrations in July 2018 and DPM Heng Sweet Keat attending the 73rd birthday celebrations in July 2019. SMS (Defence) (Foreign Affairs) Dr Maliki Osman also continued our annual visits to Brunei for Hari Raya in June 2018 and June 2019. We continued our engagement of Brunei’s younger leaders via the Young Leaders’ Programme (YLP), which is aimed at building links between the younger generation of Singaporean and Bruneian leaders. Singapore hosted Crown Prince Al-Muhtadee Billah’s visit for the 6th YLP from 28 October to 2 November 2018, and SM Teo Chee Hean led a delegation of younger Singapore leaders to Brunei for the 7th YLP from 1 to 4 October 2019. There was a steady momentum of visits from and meetings with other Bruneian royals and leaders from April 2018 to September 2019, including Prince ‘Abdul Malik, Prince ‘Abdul Mateen, Minister of Development Suhaimi Gafar, Minister of Energy and Industry Mat Suny, Minister of Defence II Halbi Yussof, Minister of Culture, Youth and Sports Aminuddin Ihsan, and Minister of Foreign Affairs II Erywan Yusof. The Sultan also visited Singapore twice for the 32nd and 33rd ASEAN Summits. On 9 August 2019, the Sultan of Brunei, Indonesian President Joko Widodo, and Malaysian PM Mahathir Mohamad attended Singapore’s Bicentennial National Day Parade with their spouses, at PM Lee Hsien Loong and Mrs Lee’s invitation. We have kept our relations with other partners in Southeast Asia on an even keel by strengthening institutional engagement through mechanisms like the Singapore-Vietnam Connectivity Ministerial Meeting, the Singapore-Myanmar Joint Ministerial Working Committee, and the Informal Consultations on the Philippine-Singapore Action Plan. President Halimah Yacob made a State Visit to the Philippines from 9 to 12 September 2019 to commemorate the 50th anniversary of bilateral relations.

111
Desired Outcome Performance Indicator Actual FY2018/ Revised FY2019
Estimated FY2020
Eight MOUs were signed during the visit. We made progress in deepening economic integration and strengthening people-to-people ties. Our Avoidance of Double Taxation Agreement (DTA) with Cambodia came into force in December 2017. We made headway on our interests in connectivity with the launch of SilkAir stopover flights on the Singapore-Yangon-Mandalay route. We strengthened government-to-government links by signing a MOU on the Vietnam-Singapore Cooperation Centre with Vietnam and an MOU to establish bilateral consultations with Cambodia. We reaffirmed ties of friendship and maintained goodwill by assisting with the flood relief efforts in Attapeu Province, Laos, and sending aid to displaced populations in Rakhine State, Myanmar. Our relations with the US, China, Japan, the ROK, and the EU have also been strengthened. We have continued to strengthen our links with the Donald Trump Administration. We enjoyed a broad slate of high-level bilateral exchanges in 2018 and 2019. Singapore hosted the US-DPRK Summit between President Trump and DPRK Chairman of the State Affairs Commission Kim Jong Un. During President Trump’s visit to Singapore, PM Lee Hsien Loong had separate meetings with President Trump and Chairman Kim. Singapore also welcomed visits by Vice President Michael Pence, Secretary of State Michael Pompeo, and Secretary of Defense James Mattis in 2018. During Vice President Pence’s Official Visit in November 2018 in conjunction with the 6th ASEAN-US Summit and 13th East Asia Summit, we renewed the US-Singapore Collaboration Platform MOU, signed a Tax Information Exchange Agreement and a reciprocal Inter-Governmental Agreement, as well as signed a declaration of intent to jointly develop a Singapore-US Cybersecurity Technical Assistance Programme. During Secretary Pompeo’s introductory visit from 3 to 4 August 2018, we renewed the Singapore-US Third Country Training Programme (TCTP) MOU for its third three-year cycle. PM Lee Hsien Loong had a bilateral meeting with President Trump on the sidelines of the 74th UN General Assembly in September 2019, which marked their fourth meeting since 2017. Both Leaders also signed the Protocol of Amendment to the 1990 Memorandum of Understanding Regarding United States’ Use of Facilities in Singapore, which renews the US’ access to our military facilities for another 15 years until 2034. We also welcomed visits by several Congressional delegations in June and July 2018, as well as in April, June, August, and September 2019. There were also visits to the US by SM Tharman Shanmugaratnam, DPM Heng Swee Keat, Minister (Foreign Affairs) Dr Vivian Balakrishnan, Minister (Defence) Dr Ng Eng Hen, Minister (Communications and Information) S Iswaran, Minister (Environment and Water Resources) Masagos Zulkifli, and Minister (Health) Gan Kim Yong. We have also deepened our relations with Canada. Canadian PM Justin Trudeau visited Singapore at the invitation of PM Lee Hsien Loong to attend the 33rd ASEAN Summit and Related Summits as Guest of the Chair in November 2018, during which he met with PM Lee Hsien Loong and called on President Halimah Yacob. During PM Trudeau’s visit, we signed an agreement between CSA and Global Affairs Canada (GAC) on cybersecurity cooperation, as well as an agreement between Infrastructure Asia and GAC on infrastructure and smart cities cooperation. In 2018, Singapore also welcomed visits by then-Minister of Foreign Affairs Chrystia Freeland, Minister of Defence Harjit Singh Sajjan, then-Minister of International Trade Diversification Jim Carr, and then-Minister of International Trade François-Philippe

112
Desired Outcome Performance Indicator Actual FY2018/ Revised FY2019
Estimated FY2020
Champagne. In terms of representation in Singapore, the British Columbia provincial government also opened a Trade and Investment Office, while the Québec provincial government established a Representative Office. We continued frequent high-level exchanges with China. President Halimah Yacob visited Beijing for the Conference on Dialogue of Asian Civilisations in May 2019. PM Lee Hsien Loong visited China for the Bo’ao Forum for Asia Annual Conference in Hainan in April 2018, and the 2nd Belt and Road Forum for International Cooperation in Beijing in April 2019, during which he had good meetings with President Xi Jinping and Premier Li Keqiang. During Premier Li Keqiang’s official visit to Singapore in November 2018, PM Lee Hsien Loong and Premier Li Keqiang co-witnessed the signing of 11 MOUs, including the conclusion of the upgrade protocol on the China-Singapore Free Trade Agreement (CSFTA), an MOU on the China-Singapore (Chongqing) Demonstration Initiative on Connectivity (CCI)-New International Land-Sea Trade Corridor, and the Framework Agreement on the Elevation of the Guangzhou Knowledge City. In September 2018, then-DPM Teo Chee Hean co-chaired the 14th Joint Council for Bilateral Cooperation (JCBC) and Related Joint Steering Council (JSC) Meetings with PRC Vice Premier Han Zheng in Singapore. Then-DPM Teo Chee Hean and Vice Premier Han Zheng also co-witnessed the signing of seven MOUs. In October 2019, DPM Heng Swee Keat co-chaired the 15th JCBC and Related JSC Meetings with Vice Premier Han Zheng in Chongqing. DPM Heng Swee Keat and Vice Premier Han co-witnessed the signing of nine MOUs and agreements, and announced the entry-into-force of the CSFTA upgrade protocol. We saw a steady stream of bilateral exchanges and further deepened our engagement with Japan during Japan’s G20 Presidency in 2019. PM Lee Hsien Loong visited Osaka for the G20 Leaders’ Summit in June 2018 and met Japan PM Shinzo Abe. ESM Goh Chok Tong visited Yokohama for the 7th Tokyo International Conference on African Development in August 2019. DPM Heng Swee Keat visited Tokyo for the Nikkei Conference in May 2019 while Minister (Foreign Affairs) Dr Vivian Balakrishnan made a working visit to Tokyo in December 2018. Singapore welcomed visits by Japanese Lower House Member Yuko Obuchi as the 10th Temasek Programme participant, and LDP Policy Research Council Chairman Fumio Kishida for the Singapore Summit in September 2019. Singapore maintains good relations with the ROK. Singapore hosted the State Visit of President Moon Jae-in in July 2018. PM Lee Hsien Loong made a bilateral visit to the ROK in conjunction with his attendance at the ASEAN-ROK Commemorative Summit in November 2019, during which 4 MOUs were co-witnessed by PM Lee Hsien Loong and President Moon Jae-in. With the signing of the European Union-Singapore Free Trade Agreement (EUSFTA), European Union-Singapore Investment Protection Agreement (EUSIPA) and the European Union-Singapore Partnership and Cooperation Agreement (ESPCA) on 19 October 2018, its entry into force is now the key priority. To this end, we continue to engage relevant stakeholders. We continue to build on our relations with emerging markets such as the Eurasian economies. The Framework and Non-Services and Investment Agreements of the Eurasian Economic Union (EAEU)-Singapore FTA, and the Singapore-Armenia Services and Investment Agreement were signed in October 2019 in Armenia. After the UK’s decision to leave the EU, Singapore has announced its interest to negotiate an FTA with the UK when the latter is ready.

113
Desired Outcome Performance Indicator Actual FY2018/ Revised FY2019
Estimated FY2020
The ninth and tenth sessions of the High-Level Russia-Singapore Inter-Governmental Commission were held in September 2018 and September 2019 respectively, which saw progress in new collaboration areas in innovation, and transport and logistics, among others. Following the State Visit by then-French President François Hollande to Singapore in March 2017, both countries declared 2018 as the Singapore-France Year of Innovation (YOI), which has helped strengthen our innovation cooperation. PM Lee Hsien Loong made an official visit to France in July 2018 as Guest-of-Honour at the French National Day (Bastille Day) Military Parade, at the invitation of French President Emmanuel Macron. With Australia, there continues to be good momentum in the implementation of the Singapore-Australia Comprehensive Strategic Partnership (CSP) 10-year Roadmap. Australian PM Scott Morrison visited Singapore in June 2019 for the annual leaders’ meeting with PM Lee Hsien Loong. Both sides are working on a Digital Economy Agreement (DEA) that would boost bilateral cooperation in trade facilitation, digital identities, FinTech, and e-payments, among others. We upgraded the bilateral relationship with New Zealand to an Enhanced Partnership in May 2019, which will deepen cooperation across the defence, economic, science and innovation, and people-to-people sectors. We have deepened our engagement of South Asia, the Middle East, Africa, Latin America and the Pacific Island States (PIS)/Timor-Leste. We continued to deepen relations with India, with the official visit of Indian PM Narendra Modi to Singapore in June 2018, where we signed agreements in defence, economic cooperation and FinTech. Following the May 2019 general elections, we established early links with the new Modi government with high-level visits including External Affairs Minister S Jaishankar’s visit to Singapore in September 2019, and DPM Heng Sweet Keat’s visit to India in October 2019. Apart from our engagements with the centre, we continued to work with selected state governments such as Maharashtra. We continued to strengthen bilateral relations with South Asian countries. Minister (Foreign Affairs) Dr Vivian Balakrishnan visited Dhaka and Cox’s Bazar, Bangladesh in November 2018 and we have hosted several visits by Sri Lankan leaders to Singapore in 2018 and 2019. Our political and economic engagement of other growing economies in Sub-Saharan Africa has expanded. In August 2018, we hosted the 3rd Sub-Saharan Africa High-Level Ministerial Exchange Visit, which was attended by Ministers from 12 Sub-Saharan African countries (Djibouti, Ethiopia, Gabon, Ghana, Kenya, Mozambique, Namibia, Nigeria, Rwanda, South Africa, Tanzania and Uganda). SM Tharman Shanmugaratnam visited Kenya in June 2018 and July 2019, and Ghana and Cote d’Ivoire in November 2019. SMS (Defence)(Foreign Affairs) Dr Maliki Osman visited South Africa in September 2019 for the World Economic Forum on Africa. We also hosted a visit by Kenyan President Uhuru Kenyatta to Singapore in September 2019. Abu Dhabi Crown Prince Sheikh Mohamed Bin Zayed Al Nahyan made an Official Visit to Singapore in February 2019. During the visit, the Joint Declaration on the Singapore-UAE Cooperation Partnership and several other Memoranda of Understanding were signed. Jordan King Abdullah II made his third State Visit to Singapore and delivered the keynote address at the International Conference on Cohesive Societies in June 2019. Qatar

114
Desired Outcome Performance Indicator Actual FY2018/ Revised FY2019
Estimated FY2020
DPM and Minister for Foreign Affairs Sheikh Mohammed Bin Abdulrahman Al Thani visited Singapore to co-chair the second Implementation Monitoring Mechanism meeting with Minister (Foreign Affairs) Dr Vivian Balakrishnan in August 2019. Singapore received an invitation from KSA to participate in the G20 Summit, which the latter will be chairing. President Halimah Yacob made a State Visit to the State of Kuwait and KSA in November 2019, the first visit to the Middle East in her current capacity. There has been a significant upswing of our political engagement of key Latin American accounts, including the hosting of several high-level incoming visits. In May 2018, Brazilian Minister of Foreign Affairs Aloysio Nunes Ferreira made an Official Visit to Singapore in lieu of Brazilian President Michel Temer. In August 2018, Argentine Minister of Foreign Affairs and Worship Jorge Faurie made a working visit to Singapore. In October 2018, we hosted Panamanian Vice President and Minister of Foreign Affairs Isabel St Malo. In November 2018, Chilean President Sebastián Piñera visited Singapore to participate in the 33rd ASEAN Summit and Related Summit as a Guest of the Chair. In October 2019, Cuban Vice President of the Council of Ministers Roberto Morales Ojeda also made a visit to Singapore in conjunction with his visit to Japan for the Enthronement Ceremony. Panamanian Foreign Minister Alejandro Ferrer is expected to visit in the first quarter of 2020. In terms of outgoing visits, Minister (Foreign Affairs) Dr Vivian Balakrishnan visited Argentina for the G20 Foreign Ministers’ Meeting in May 2018. PM Lee Hsien Loong made a working visit in conjunction with the G20 Leaders’ Summit in November 2018, as well as an Official Visit to Mexico in November 2019. We have strengthened our bilateral cooperation with key Latin American accounts. Notable developments include the appointment of a resident Ambassador of the Republic of Colombia to Singapore in May 2019, the conclusion of a DTA between Singapore and Brazil in May 2018; the formalisation of the expansion of air traffic rights under the Singapore-Argentina Air Services Agreement and Singapore-Panama Air Services Agreement in August 2018 and October 2018 respectively; Argentina’s accession to the Treaty of Amity and Cooperation in Southeast Asia in August 2018; Chile becoming the second ASEAN Development Partner in June 2019 (after Germany), the progress of negotiations for a MERCOSUR-Singapore FTA in 2019; and the potential conclusion of the Pacific Alliance-Singapore Free Trade Agreement by the end of 2019. We have capitalised on private transits by PIS and Timor-Leste leaders in Singapore and international meetings to arrange for political interactions, and leveraged technical assistance through the Singapore Cooperation Programme to maintain warm relations.

115
Desired Outcome Performance Indicator Actual FY2018/ Revised FY2019
Estimated FY2020
Reinforcing international recognition of Singapore as an effective, constructive and reliable partner
2. Work with relevant agencies for strong and robust international and regional mechanisms e.g. ASEAN, ASEAN Plus Three, ASEAN Regional Forum (ARF), Asia Pacific Economic Cooperation (APEC), East Asia Summit (EAS) and Asia-Europe Meeting (ASEM)
ASEAN remains a cornerstone of our foreign policy. We kept up the momentum of regional integration, made efforts to maintain ASEAN’s relevance and position in the evolving regional architecture, and enhanced its relations with the major powers and external parties. In 2018, we delivered a substantive and forward-looking ASEAN Chairmanship under the themes of “Resilience” and “Innovation”. We met our key objectives of positioning Singapore as a regional thought leader on digital connectivity, smart cities and cybersecurity, as well as protecting our diplomatic and economic space at a time of growing insularity. Under Thailand’s 2019 Chairmanship theme of “Advancing Partnership for Sustainability”, we continued to push for new ideas and initiatives and kept up the momentum of Singapore’s 2018 deliverables, including in our capacity as Shepherd for the ASEAN Smart Cities Network (ASCN). MFA continued to champion economic integration at ASEAN fora and pushed for the conclusion of the Regional Comprehensive Economic Partnership in 2019. We also concluded our term as ASEAN-China Country Coordinator in 2018 with the milestone achievement of a Single Draft Negotiating Text for the Code of Conduct in the South China Sea (COC), and took up the role of Country Coordinator for ASEAN-EU Dialogue Relations. We continue to play a constructive role in the ASEM (Asia-Europe Meeting) process to ensure its continued relevance and sustainability. In October 2018, PM Lee Hsien Loong visited Brussels to attend the 12th ASEM Summit. During PNG and Chile’s 2018 and 2019 APEC Chairmanships, we continued to push for closer regional economic integration, and worked with PNG, Chile and other economies to shape APEC’s agenda and priorities beyond the Bogor Goals of free and open trade and investment in the Asia-Pacific region by 2020.
Against the rise of protectionism, global trade tensions, and major power rivalry, our interest is to continue to advocate ASEAN Centrality, an open and rules-based multilateral trading system, and stepping up cooperation in Singapore’s key strengths, including smart city development and cybersecurity. Under Vietnam’s theme of “Cohesive and Responsive ASEAN” for its 2020 ASEAN Chairmanship, we will continue to table new ideas and initiatives to champion key interests, including economic integration and working towards a Code of Conduct in the South China Sea that is in accordance with international law, including the 1982 United Nations Convention on the Law of the Sea. Singapore will also continue to expand the ASCN beyond ASEAN to our Dialogue Partners. As ASEAN-EU coordinator, Singapore will continue to focus on concluding existing initiatives such as the ASEAN-EU Comprehensive Air Transport Agreement, and restarting negotiations on the ASEAN-EU Free Trade Agreement. Singapore will continue our active participation in the APEC process, working closely with 2020 APEC Chair Malaysia and other APEC economies to realise APEC’s vision of a stable, integrated, and prosperous community in the Asia-Pacific.
3. Advance Singapore’s interests and address emerging global concerns through effective bilateral and international cooperation including constructive and principled positions at key international fora
Singapore encouraged Parties to the Comprehensive and Progressive Agreement for Trans-Pacific Partnership (CPTPP) to ratify and implement the Agreement. Singapore hosted the US-DPRK Summit between US President Donald Trump and DPRK State Affairs Commission Chairman Kim Jong Un in June 2018, at the request of the two countries. Singapore will continue to work with the international community to support positive developments on the Korean Peninsula, including efforts towards the denuclearisation of the Korean Peninsula. Singapore is committed to implementing the UN Security Council Resolutions fully and faithfully. We have maintained Singapore’s active engagement and positive agenda with the UN and key international organisations. PM Lee Hsien Loong led Singapore’s delegation to the 74th United Nations (UN) General Assembly (UNGA) in New York in September 2019, accompanied by Minister (Defence) Dr Ng Eng Hen, Minister (Foreign Affairs) Dr Vivian Balakrishnan, and officials from the Prime Minister’s Office, the Ministry of Communications and Information, the Ministry of Defence, and MFA. PM Lee Hsien Loong delivered Singapore’s national statement and was one of the leaders chosen to address the Climate Action Summit. PM Lee Hsien Loong also hosted a Forum of Small States reception, an informal grouping that Singapore launched in 1992. In addition to meeting US President Donald Trump on the sidelines of the 74th UNGA, PM Lee Hsien Loong also met with the Queen of Netherlands, the Crown Prince of Liechtenstein, the Emir of Qatar, the President of Palau
Singapore will encourage CPTPP parties to ratify and implement the Agreement, and consider the accession of other interested economies to further strengthen the CPTPP. We will maintain our active participation at the United Nations (UN) and other international fora to advance our national interests and enhance our global standing and influence. Singapore’s positive agenda at the UN is now heavily oriented towards the 2030 Agenda for Sustainable Development and its 17 Sustainable Development Goals (SDGs) to showcase our sustainable development approach and achievements. To profile our commitment to achieving the SDGs, Singapore will continue to maintain the positive momentum of our first Voluntary National Review of the SDGs at the 2018 UN High-Level Political Forum. We will follow up on the implementation of our commitments under the Paris Agreement once the modalities, procedures, and guidelines (MPGs) are finalised. We will also continue to coordinate the work of the IMC on Human Rights and the relevant ministries in preparation for Singapore’s 3rd Universal Periodic Review in January/February 2021. We will also continue to participate actively in other climate change fora outside the UN Framework Convention on Climate Change in order to defend our interests. We will build on our engagements with UN development agencies e.g. UN Development Programme (UNDP), UN Human Settlements Programme, and work with the UNDP Global Centre for Technology, Innovation and Sustainable Development (GC-TISD) to leverage Singapore’s experience in areas such as governance, water, smart cities and sustainable solutions to help fellow developing countries achieve the SDGs. Building on Singapore’s chairmanship of the Sixth (Legal) Committee during the 72nd UN General

116
Desired Outcome Performance Indicator Actual FY2018/ Revised FY2019
Estimated FY2020
and the Prime Ministers of Bhutan, Belgium, Barbados and Uganda. SM Tharman Shanmugaratnam co-chaired the inaugural meeting of the Global Education Forum (GEF) and delivered a keynote address at the High-Level Dialogue on Financing for Development as part of the UN High-Level Week during the 74th UNGA. Singapore participated in the negotiations under the UN Framework Convention on Climate Change (UNFCCC). This culminated in the historic signing of the Paris Agreement. The new system established by the Paris Agreement will build upon the existing bifurcated system and incorporate built-in flexibilities (differentiation) based on Parties’ capacities, in a progressive direction of “continuous improvement”. We participated actively in negotiations over the modalities, procedures and guidelines (MPGs) for the Paris Agreement Work Programme, which were mostly finalised at the 24th Conference of the Parties to the UNFCCC in December 2018. We participated actively in negotiations during the 50th Session of the UNFCCC Subsidiary Bodies (SB-50) in Bonn, Germany in June 2019 where we took a constructive approach in negotiations on the Adaptation Fund Board, gender and climate change, programme budget, and other methodological issues under the Enhanced Transparency Framework (ETF). We will participate in the upcoming 25th Conference of Parties to the UNFCCC (COP-25) in December 2019. Discussions on the above-mentioned items will continue at COP-25. We participated in the International Atomic Energy Agency (IAEA) and in international nuclear safety and security related meetings, and played an active and constructive role during our tenure on the IAEA Board of Governors. We assisted in lobbying for Singapore’s successful re-election to the International Civil Aviation Organisation (ICAO) Council for the term 2019 – 2022, at elections held in September 2019 and the upcoming International Maritime Organisation (IMO) Council elections under Category ‘C’ at the 31st Session of the IMO Assembly from 25 November to 4 December 2019. We also lobbied for Singapore’s re-election to the UN Commission on International Trade Law (UNCITRAL) for the term 2019 – 2025, at elections in December 2018, and for Singapore to host the signing ceremony for the UN Convention on International Settlement Agreements Resulting from Mediation (or “Singapore Convention) from 6 – 7 August 2019. We continued to play an active role on oceans issues. We have continued our coordinatorship of the Oceans and the Law of the Sea Omnibus resolution at the 74th UNGA and our presidency of the Intergovernmental Conference on Marine Biodiversity of Areas Beyond National Jurisdiction (BBNJ IGC). Singapore chaired the Sixth Committee of the 72nd UN General Assembly from September 2017 to October 2018. We continued to be actively engaged in international fora such as the International Civil Aviation Organisation (ICAO) and International Maritime Organisation (IMO) as well as in groups such as the Group of 77/China, the Non-Aligned Movement, and the Alliance of Small Island States. We maintained our engagement of fellow Commonwealth States and the Commonwealth process through our participation in various Commonwealth meetings including the Commonwealth Heads of Government Meeting in April 2018. We attended the Ministerial Meeting of the Coordinating Bureau of the Non-Aligned Movement (NAM) in Caracas,
Assembly, we will continue to profile our constructive role on legal issues at the UN including in the areas of international trade law and the law of the sea. We will continue to underscore Singapore’s commitment to upholding international rule of law and a rules-based multilateral order. We will play a constructive role in the International Civil Aviation Organisation Council (ICAO) and UN Commission on International Trade Law (UNCITRAL). We will also continue to play an active and constructive role at the International Atomic Energy Agency, consistent with Singapore’s interests in nuclear safety, security and safeguards. We will work with other agencies to support Singapore's nomination of “Hawker Culture in Singapore, Community Dining and Culinary Practices in a Multicultural Urban Context”. We will continue to play an active role on Ocean issues through our Presidency of the Intergovernmental Conference on Marine Biodiversity of Areas Beyond National Jurisdiction (BBNJ IGC). We will also continue our engagement of fellow Commonwealth states through our participation at the upcoming Commonwealth Heads of Government Meeting in Rwanda in June 2020. We will continue to play an active role in the International Seabed Authority (ISA) as a Member of the ISA Council. This includes constructive participation in the 26th ISA Annual Sessions in Kingston, Jamaica in February and July 2020. We will continue to engage and collaborate with the World Intellectual Property Organisation (WIPO) through membership of WIPO’s key committees such as the Programme and Budget Committee (PBC) and Coordination Committee (CoCo), and our coordinatorship of the Asia-Pacific Group, as well as through the WIPO Singapore Office. We will maintain our constructive participation in the World Trade Organisation (WTO), especially in discussions on reforms to improve the WTO, We are co-convenors with Australia and Japan on the Joint Statement Initiative for E-Commerce, which seeks to develop rules to govern e-commerce. We will continue to uphold the open, rules-based multilateral trading system. Although Singapore is not a member of the G20, we have been invited and will continue to contribute constructively to Saudi Arabia’s G20 Presidency in 2020. We will continue our active engagement of the Arctic Council (AC) as an observer so as to monitor the impact and opportunities arising from a warming Arctic for Singapore. We will continue to participate in the Indian Ocean Rim Association to protect our interests as a maritime and trading nation.

117
Desired Outcome Performance Indicator Actual FY2018/ Revised FY2019
Estimated FY2020
Venezuela from 18 to 21 July 2019 and the 18th NAM Summit in Baku, Azerbaijan from 21 to 26 October 2019. SMS (Defence) (Foreign Affairs) Dr Maliki Osman led Singapore’s delegation to the Summit as Special Envoy of PM Lee Hsien Loong. We are convenors of the Global Governance Group (3G) and the Forum of Small States (FOSS), as well as co-chair of the Group of Friends on Sustainable Cities and have shared our development successes at the UN. We raised awareness of major urban challenges such as water and sanitation issues through events like World Toilet Day. As co-chair of the Inter-Ministry Committee on the Sustainable Development Goals (IMC-SDGs), we worked with MEWR and over 31 agencies to monitor Singapore’s progress towards the SDGs. To profile our commitment to achieving the SDGs, Singapore participated in a Voluntary National Review at the 2018 UN High-Level Political Forum on sustainable development. Singapore’s first Voluntary National Review Report was uploaded onto the UN Department of Economic and Social Affairs (DESA) repository. Singapore collaborates with other countries and key UN development agencies including the UN Development Programme (UNDP) and UN Human Settlements Programme (UN-Habitat), to provide technical assistance and capacity building to developing countries in the areas of leadership and governance, sustainable cities, and water and sanitation solutions. To this end, Singapore has repositioned the UNDP Global Centre in Singapore as the Global Centre for Technology, Innovation and Sustainable Development (GC-TISD). As the Chair of the Inter-Ministry Committee (IMC) on Human Rights, we worked closely with the relevant agencies on Singapore’s social policies and approach to protecting the human rights of our citizens. We are also coordinating the IMC on Human Rights’ preparations for Singapore’s 3rd Universal Periodic Review in January/February 2021 where our human rights record will be reviewed by the Human Rights Council. As the Chair of the IMC on Export Controls, we also worked closely with relevant agencies to ensure Singapore’s compliance with UN Security Council resolutions pertaining to the proliferation of weapons of mass destruction. To advance our interests in deep seabed mining, we participated in the 24th and 25th International Seabed Authority (ISA) Annual Sessions in Kingston, Jamaica respectively in March and July 2018 and February/March and July 2019. During the 24th ISA Annual Session, Singapore was re-elected to Group E of the ISA Council for a four-year term (2019 to 2022). We continue to engage and collaborate with the World Intellectual Property Organisation (WIPO) through membership of WIPO’s key committees such as the Programme and Budget Committee (PBC) and Coordination Committee (CoCo), and our coordinatorship of the Asia-Pacific Group, as well as through the WIPO Singapore Office. At the WTO, we continue to play an active and important role in upholding the multilateral trading system. We participate constructively in discussions on WTO reform. Singapore is also co-convenor, together with Australia and Japan, of the Joint Statement on E-commerce Initiative (JSI), which aims to update the WTO rule-book and help the WTO remain relevant given the growing importance of the digital economy. As an invited guest country during the 2019 Japanese Presidency, we participated actively in the G20 process including the numerous sectoral Ministerial meetings and the Osaka Summit from 28 to 29 June 2019.

118
Desired Outcome Performance Indicator Actual FY2018/ Revised FY2019
Estimated FY2020
Singapore has participated actively in the Arctic Council (AC)’s work, and in both AC and other Arctic-related forums. We will continue to monitor Singapore’s interests in the Arctic, including the impact of new shipping routes and the environmental impact of the changing Arctic. We have also engaged AC member states and Arctic indigenous peoples through bilateral visits and exchanges. MOS (Foreign Affairs) (Social and Family Development) Sam Tan attended the World Reindeer Herders’ Day in Russia (March 2018); 13th Conference of the Parliamentarians of the Arctic Region (CPAR) in Finland (September 2018); 6th Arctic Circle Assembly (ACA) in Iceland (October 2018); and the 2nd Arctic Science Ministerial in Berlin (October 2018). He also attended the 13th Arctic Frontiers Conference in Norway (January 2019); the 5th International Arctic Forum in Russia (April 2019); the 11th Arctic Council Ministerial Meeting in Finland (May 2019); the 8th International Meeting of Representatives from Member States of the Arctic Council, Observer States of the Arctic Council and Foreign Scientific Community in Russia (September 2019); and the 7th Arctic Circle Assembly in Iceland (October 2019). Between 2018 and 2019, we have hosted several Arctic events in Singapore including a sustainable energy workshop with the AC Sustainable Development Working Group (SDWG)’s Arctic Renewable Energy Atlas project (August 2018), a youth outreach event (September 2018), the “Sweden, Singapore and the Arctic” Seminar (November 2018), and the second iteration of the Arctic Frontiers Abroad conference in Singapore (October 2019). We also hosted a coordinator from the Conservation of Arctic Flora and Fauna (CAFF) Working Group at Sungei Buloh Wetland Reserve from 2018 to 2019. Singapore has continued to play a constructive role in the Indian Ocean Rim Association (IORA) and conducted two customised capacity building courses for IORA officials in Port Management and Tourism Management. Minister (Foreign Affairs) Dr Vivian Balakrishnan and SMS (Defence) (Foreign Affairs) Dr Maliki Osman also attended the IORA Council of Ministers Meeting in 2018 and 2019, respectively.
4. Develop goodwill towards Singapore by sharing our developmental experience with partners through our technical assistance programme
More than 128,000 foreign officials from over 170 countries have participated in the Singapore Cooperation Programme (SCP) since 1992. The SCP continues to support the UN 2030 Agenda and developing countries’ efforts to achieve the Sustainable Development Goals (SDGs). In partnership with MEWR, we launched the Climate Action Package, a suite of courses to help developing countries address climate change and build climate resilience. With the Small Island Developing States (SIDS) and the Alliance of Small Island States (AOSIS) constituency, we launched a new technical assistance package named the Singapore Partnership for Samoa Pathway (SPa) at the 74th United Nations General Assembly on 27 September 2019. SPa offers priority placement for SIDS applicants for SCP courses, regional and bilateral customised courses as well as fellowships in civil aviation and maritime courses held in Singapore. In support of these two initiatives, we have expanded our partnerships with international organisations, such as UNICEF and the UN Office for Disaster Risk Reduction. The SCP continued to roll out new programmes to address emerging global challenges. There were new courses on digital economy, FinTech, and cybersecurity to help developing countries navigate the complexities of the Fourth Industrial Revolution. We also partnered with the International Finance Corporation and UN
The suite of capacity building programmes under the Singapore Cooperation Programme (SCP) will continue to evolve to advance Singapore’s international diplomacy and actively profile our contributions to the global community. With an enhanced focus on the Sustainable Development Goals (SDGs) under the UN 2030 Agenda, the SCP will strive to support key SDGs through innovative partnerships with International Organisations and local NGOs. In FY2020, we will continue to roll out programmes that showcase Singapore as an innovative and resilient nation but with added emphasis on smart cities development, connectivity and climate action. We anticipate new projects to be launched at the Singapore Cooperation Centres in Cambodia, Laos, Vietnam, and Myanmar having received interests from third country partners, NGOs, and the private sector to work with us. We intend to renew our MOU with Guangdong on technical cooperation in FY2020. We will continue to profile the SCP through suitable media platforms to support our larger foreign policy objectives.

119
Desired Outcome Performance Indicator Actual FY2018/ Revised FY2019
Estimated FY2020
Environment for the first time on infrastructure-related programmes. Under the Singapore-World Health Organization (WHO) Joint Training Programme, we are supporting the WHO’s first ever Yellow Fever Workshop in Asia in March 2020. These new additions profile Singapore’s expertise in these areas and support our national interests, while broadening the SCP’s range of capacity building programmes. We remain committed to raise the human capital of our ASEAN neighbours. The majority of SCP alumni are from ASEAN countries. Our four Training Centres in Cambodia, Laos, Myanmar, and Vietnam (CLMV) typically deliver over a hundred courses a year under the Initiative for ASEAN Integration (IAI). As announced by PM Lee Hsien Loong during the 51st ASEAN Ministerial Meeting in July 2018, the IAI Centres have been upgraded to the Singapore Cooperation Centres (SCCs), with an expanded capacity building mandate to better address CLMV’s development needs while furthering the goal of narrowing the development gap within ASEAN. The SCCs help coordinate development and technical assistance from various Singapore agencies and NGOs such as RADION International, the Singapore Red Cross, and the Singapore International Foundation. We also partner third countries such as Australia and Japan and international organisations such as the OECD to jointly conduct programmes at the SCCs. Then-DPM Teo Chee Hean and SMS (Defence) (Foreign Affairs) Dr Maliki Osman officially opened the Vietnam and Laos SCCs respectively in 2019. To support development of the Chongqing Connectivity Initiative (CCI), we signed an MOU on Human Resource Development (HRD) cooperation with the Chongqing Organisation Department in September 2018 to promote people-to-people exchanges. We have since hosted two Study Visits by senior Chongqing officials in 2019. In October 2019, we renewed our flagship “Framework Agreement on the Exchange with Middle-To Senior-Level Officials” for the next five years with the Central Organisation Department of the Communist Party of China at the 15th Joint Council for Bilateral Cooperation (JCBC). In August 2018, we renewed the Singapore-US Third Country Training Programme (TCTP) MOU, which targets Southeast Asia, for a third three-year cycle during Secretary of State Mike Pompeo’s introductory visit to Singapore. In 2019, we renewed the MOU on the Japan-Singapore Partnership Programme for the 21st Century (JSPP21) which is the SCP’s longest running TCTP. This was aimed at supporting future-oriented growth in ASEAN and the Asia-Pacific, in areas such as smart cities development, public-private partnerships, digital economy and FinTech, and disaster risk reduction. We also renewed the Singapore-Mexico TCTP in November 2019 for a second three-year cycle, as part of Singapore’s commitment to South-South cooperation. We ran bilateral customised courses in response to requests for development assistance that complemented our foreign policy interests. For example, we hosted delegations from Afghanistan, Armenia, Cambodia, Indonesia, PNA, South Africa, and Vietnam. We conducted a series of leadership and executive education programmes in 2018 and 2019, which provided an avenue to strengthen links with foreign political office holders and senior officials with potential for higher office. In March 2019, we participated in the second UN Conference on South-South Cooperation (BAPA+40)
120
Desired Outcome Performance Indicator Actual FY2018/ Revised FY2019
Estimated FY2020
and took part in the international exhibition held at the sidelines of the conference. It was the first time that the SCP was showcased in such an international setting with more than 160 UN Member States in attendance. To showcase the substantive exchanges between Singapore and China, we profiled our overall relations with China as well as HRD engagement in print and online media in 2019. The SCCs in Cambodia and Vietnam have also been featured in print and online media in both Singapore and the respective countries.
Prompt and effective consular services for Singaporeans
5. Timely and effective consular services for Singaporeans – less than 5% negative feedback on consular cases
MFA’s consular work has increased in volume and complexity as more Singaporeans travel and work abroad. In 2018, Singaporeans made about 8.3 million overseas trips plus almost 16 million overland trips to Malaysia. As of June 2019, more than 217,000 Singaporeans reside overseas. The MFA Consular Service Counter endorsed over 100,000 documents, serving more than 39,000 customers for FY2018. Consular Service Centre plans to introduce PayNow as an additional mode of payment for members of the public who transact at Consular’s counter from 1 December 2019. MFA continues to maintain a high-level of service and operational readiness. Our officers – both in HQ and our Overseas Missions – are rostered 24 hours a day so that distressed Singaporeans overseas can get in touch with MFA and vice versa. For example, we rendered consular assistance to the Singaporean next-of-kin whose loved ones were affected by the Christchurch mosque shootings in New Zealand (March 2019), went missing while kayaking in Mersing, Malaysia (August 2019), and perished in the California diving boat “Conception” fire tragedy in the US (September 2019). In all these instances, MFA officers were deployed on the ground to render close support. MFA has continued to embrace best practices, new technologies and other innovative solutions to deliver timely and efficient consular assistance. For instance, we have integrated MyInfo with eRegister, making it more convenient for Singaporeans to register their overseas travels with MFA. As part of our outreach efforts under the “Be Informed & Be Safe” initiative, we have also extended our coverage of travel information pages on the MFA website to over 130 countries/regions. MFA also participated in the Government Bug Bounty Programme in December 2018/January 2019 involving ethical hackers to test the resilience of the eRegister system, and have made subsequent enhancements to improve our system’s robustness.
MFA will continue to provide prompt and effective consular services for Singaporeans by leveraging technology, expanding partnerships, and adopting consular best practices. As part of the Whole-of-Government approach, MFA will continue to leverage the Smart Nation Initiative via the Service Journey for Overseas Singaporean and work with agencies such as the Government Technology Agency, the Smart Nation and Digital Government Group, the Immigration and Checkpoints Authority, and the Ministry of Home Affairs to transform and digitalise the delivery of consular and immigration-related services to the public.
Upon successful implementation of PayNow at the Consular Service Centre, we will explore expanding PayNow to more transactions at our Overseas Missions.
Head O __________
Ministry of Health


121
HEAD O
MINISTRY OF HEALTH
OVERVIEW
Mission Statement
To be an innovative and people-centred organisation to promote good health and reduce illness, to ensure access to good and affordable healthcare that is appropriate to needs, and to pursue medical excellence.
FY2020 EXPENDITURE ESTIMATES
Expenditure Estimates by Object Class
BLANK Actual Estimated Revised Estimated Code Object Class FY2018 FY2019 FY2019 FY2020 Change Over FY2019
BLANK
TOTAL EXPENDITURE $10,427,480,778 $11,722,557,500 $11,537,735,700 $13,409,919,100 $1,872,183,400 16.2%
Main Estimates $8,937,307,110 $10,023,750,700 $10,023,750,700 $11,696,866,200 $1,673,115,500 16.7%
OPERATING EXPENDITURE $8,937,307,110 $10,023,750,700 $10,022,857,700 $11,696,835,300 $1,673,977,600 16.7%
RUNNING COSTS $1,145,318,700 $1,414,788,000 $1,979,765,700 $2,376,766,000 $397,000,300 20.1%
Expenditure on Manpower $119,180,401 $138,281,200 $134,373,400 $142,068,300 $7,694,900 5.7%
1200 Political Appointments 2,845,669 3,048,800 3,111,000 3,111,000 0 0.0
1500 Permanent Staff 116,198,676 135,152,800 131,101,200 138,796,100 7,694,900 5.9
1600 Temporary, Daily-Rated & Other Staff 136,056 79,600 161,200 161,200 0 0.0
Other Operating Expenditure $190,422,964 $221,317,300 $279,358,400 $511,901,200 $232,542,800 83.2%
2100 Consumption of Products & Services 175,270,028 204,122,200 265,386,500 498,669,500 233,283,000 87.9
2300 Manpower Development 2,992,947 2,644,700 3,341,200 3,581,300 240,100 7.2
2400 International & Public Relations, Public Communications
10,298,640 13,816,800 10,277,100 9,300,300 -976,800 -9.5
2700 Asset Acquisition 631,616 493,900 332,600 329,100 -3,500 -1.1
2800 Miscellaneous 1,229,732 239,700 21,000 21,000 0 0.0
Grants, Subventions & Capital Injections to Organisations
$835,715,335 $1,055,189,500 $1,566,033,900 $1,722,796,500 $156,762,600 10.0%
3100 Grants, Subventions & Capital Injections to Statutory Boards
383,322,723 393,070,400 462,131,200 508,323,800 46,192,600 10.0
3400 Grants, Subventions & Capital Injections to Other Organisations
452,392,612 662,119,100 1,103,902,700 1,214,472,700 110,570,000 10.0
TRANSFERS $7,791,988,411 $8,608,962,700 $8,043,092,000 $9,320,069,300 $1,276,977,300 15.9%
3500 Social Transfers to Individuals 902,707,128 1,002,937,200 871,798,300 943,629,600 71,831,300 8.2
3600 Transfers to Institutions & Organisations 6,886,185,951 7,602,985,900 7,167,949,300 8,373,168,100 1,205,218,800 16.8
3800 International Organisations & Overseas Development Assistance
3,095,332 3,039,600 3,344,400 3,271,600 -72,800 -2.2

122
BLANK Actual Estimated Revised Estimated Code Object Class FY2018 FY2019 FY2019 FY2020 Change Over FY2019
BLANK
OTHER CONSOLIDATED FUND OUTLAYS $0 $0 $893,000 $30,900 -$862,100 -96.5%
4600 Loans and Advances (Disbursement) 0 0 893,000 30,900 -862,100 -96.5
Development Estimates $1,490,173,668 $1,698,806,800 $1,514,878,000 $1,713,083,800 $198,205,800 13.1%
DEVELOPMENT EXPENDITURE $1,490,173,668 $1,698,806,800 $1,514,878,000 $1,713,083,800 $198,205,800 13.1%
5100 Government Development 871,098,833 969,604,400 949,851,700 1,192,853,300 243,001,600 25.6
5200 Grants & Capital Injections to Organisations 619,074,835 729,202,400 565,026,300 520,230,500 -44,795,800 -7.9
Establishment List
BLANK Actual Estimated Revised Estimated Category/Personnel FY2018 FY2019 FY2019 FY2020
BLANK
POLITICAL APPOINTMENTS 5 5 5 5
Minister 1 1 1 1
Senior Minister of State 3 3 3 3
Senior Parliamentary Secretary 1 1 1 1
PERMANENT STAFF 824 844 842 922
Administrative 16 16 16 16
Dental (Officers) 1 1 1 1
Environmental Health 5 5 5 5
Healthcare Support 2 2 2 2
Information Service (2008) 2 2 2 2
Management Executive Scheme (2008) 714 734 732 812
Medical Scheme (2014) 79 79 79 79
Operations Support 4 4 4 4
Pharmaceutical 1 1 1 1
OTHERS 790 790 790 815
Health Promotion Board 790 790 790 815
TOTAL 1,619 1,639 1,637 1,742

123
FY2019 BUDGET
The Ministry of Health (MOH)’s revised FY2019 total expenditure is $11.54 billion. This is $1.11 billion or 10.6% higher than the actual FY2018 expenditure of $10.43 billion. Of the revised FY2019 total expenditure, $10.02 billion or 86.9% is for operating expenditure and $1.51 billion or 13.1% is for development expenditure.
The revised FY2019 operating expenditure of $10.02 billion is $1.09 billion or 12.1% higher than the actual FY2018 amount of $8.94 billion. As the population in Singapore continues to age, there is increasing usage of healthcare services in public healthcare institutions and long-term care facilities. This increased demand means that more funds have been provided to public healthcare institutions, Voluntary Welfare Organisations (VWOs), and private sector partners to expand their reach and implement initiatives under the ambit of Healthcare 2020. In addition, funding increases were required for Health Promotion Board’s (HPB’s) health promotion and disease prevention programmes.
The revised FY2019 development expenditure of $1.51 billion is $24.70 million or 1.7% higher than the actual
FY2018 amount of $1.49 billion. The increase in budget provision for development expenditure in FY2019 is mainly due to higher cashflow required for new healthcare facilities.
FY2020 BUDGET
The total expenditure of MOH in FY2020 is projected to be $13.41 billion, which is $1.87 billion or 16.2% higher than the revised FY2019 total expenditure. The increase is largely due to higher projected operating and development expenditure for FY2020, which are elaborated in the sections below. Of the $13.41 billion, $11.70 billion or 87.2% is for operating expenditure and $1.71 billion or 12.8% is for development expenditure.
Operating Expenditure
The projected FY2020 operating expenditure is $11.70 billion. The budget is mainly to cater for the growth in patient
subsidies as we expand clinical services and capacity, and enhance quality through improved training and retention of healthcare professionals, while improving affordability for Singaporeans through premium support for MediShield Life as well as other forms of grants and financial assistance. It also includes provisional funding for contingency plans and measures for the prevention, containment and control of COVID-19 by the Ministry and the healthcare sector.
The trend of increasing demand for health and aged care services will continue as Singapore’s population ages. Even
as we meet this demand, MOH will continue to manage healthcare costs by ensuring greater cost discipline and driving productivity at MOH HQ, its Statutory Boards and public healthcare institutions.
Of the operating budget of $11.70 billion, $7.54 billion (64.4%) will go towards the Services Programme, followed
by the Ministry of Health Headquarters Programme with $3.45 billion (29.5%), and the Health Promotion and Preventive Healthcare Programme with $0.71 billion (6.1%).
Services Programme
The FY2020 provision of $7.54 billion for the Services Programme is $1.06 billion or 16.3% higher than the revised
FY2019 amount of $6.48 billion. The increase is mainly to provide higher subventions to the public hospitals and healthcare institutions, community hospitals, general practitioners and other institutions, including VWOs in the aged care and long-term care sectors. For FY2020, a total of $7.22 billion out of the $7.54 billion will be given as operating subventions to these entities for the provision of subsidised medical and aged social care services. The increase is also due to provisional funding for contingency plans and measures for the prevention, containment and control of COVID-19 by the healthcare sector. Ministry of Health Headquarters Programme
A sum of $3.45 billion is allocated to the Ministry of Health Headquarters Programme, which includes funding for
existing and new healthcare manpower initiatives, training for the healthcare sector, premium support for MediShield Life as well as other forms of grants and financial assistance. The Programme also provides funding for the integrated care

124
initiatives to ensure accessibility of care and delivery of appropriate treatment to the public healthcare institutions, and the Health Sciences Authority to support health and non-health regulatory and compliance agencies in safeguarding public health. The FY2020 provision also caters for provisional funding for contingency plans and measures for the prevention, containment and control of COVID-19 by the Ministry. Health Promotion and Preventive Healthcare Programme
From FY2020 onwards, funding to Health Promotion Board previously classified under the Health Promotion Programme, and other preventive health services previously classified under the Ministry of Health Headquarters Programme and Services Programme will be re-classified under the new Health Promotion and Preventive Healthcare Programme.
A sum of $710.14 million is allocated to the Health Promotion and Preventive Healthcare Programme, which encapsulates programmes that seek to prevent or reduce the incidence and prevalence of ill health by preventing the development of diseases and promoting early detection and management of diseases.
Development Expenditure
The provision of $1.71 billion for development expenditure in FY2020 is $198.21 million or 13.1% higher than the
revised FY2019 development expenditure of $1.51 billion. The increase in budget provision for development expenditure in FY2020 is mainly due to higher cashflows required for major projects such as Woodlands Health Campus, Singapore General Hospital (SGH) Emergency Medicine Building, SGH Elective Care Centre as well as IT infrastructure of new healthcare facilities and other major IT projects.
Of the $1.71 billion for development expenditure, $1.19 billion (69.6%) is for direct development expenditure and
$520.23 million (30.4%) are for grants and capital injections.
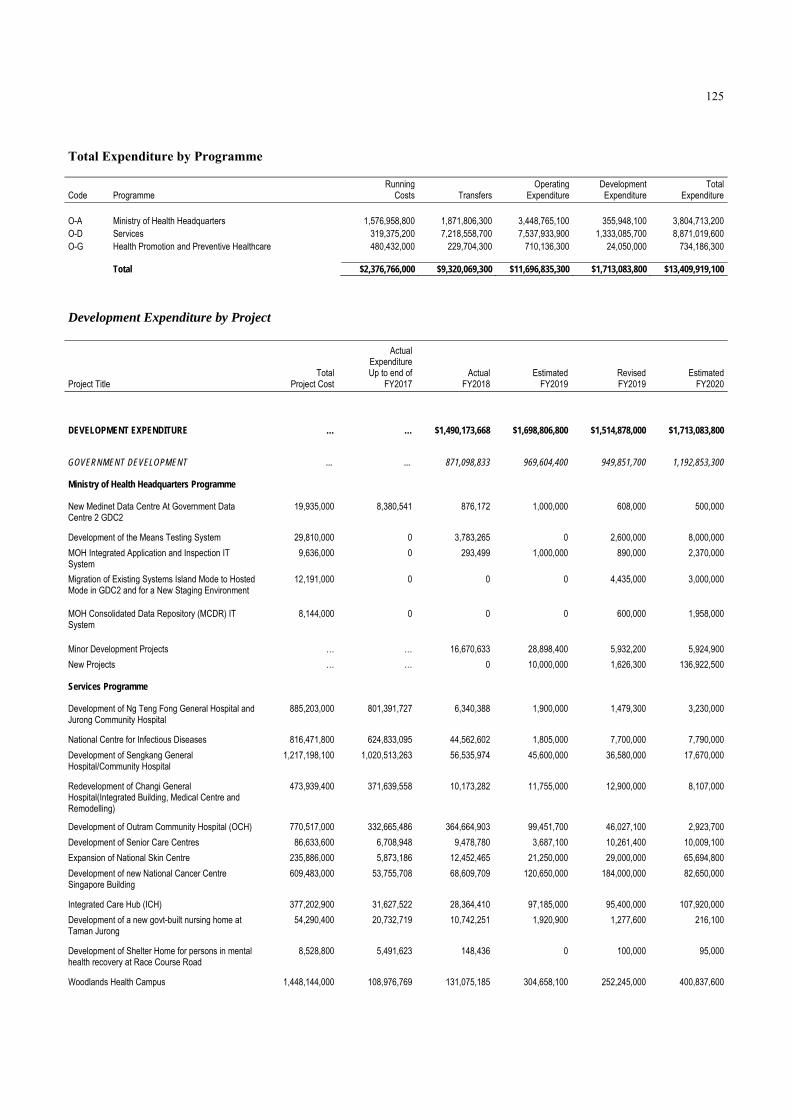
125
Total Expenditure by Programme BLANK Running Operating Development Total Code Programme Costs Transfers Expenditure Expenditure Expenditure BLANK O-A Ministry of Health Headquarters 1,576,958,800 1,871,806,300 3,448,765,100 355,948,100 3,804,713,200 O-D Services 319,375,200 7,218,558,700 7,537,933,900 1,333,085,700 8,871,019,600 O-G Health Promotion and Preventive Healthcare 480,432,000 229,704,300 710,136,300 24,050,000 734,186,300
Total $2,376,766,000 $9,320,069,300 $11,696,835,300 $1,713,083,800 $13,409,919,100
Development Expenditure by Project
BLANK Actual Expenditure Up to end of
BLANK BLANK Total Actual Estimated Revised Estimated Project Title Project Cost FY2017 FY2018 FY2019 FY2019 FY2020
BLANK
DEVELOPMENT EXPENDITURE … … $1,490,173,668 $1,698,806,800 $1,514,878,000 $1,713,083,800
GOVERNMENT DEVELOPMENT … … 871,098,833 969,604,400 949,851,700 1,192,853,300
Ministry of Health Headquarters Programme … … 7 7 7 7
New Medinet Data Centre At Government Data Centre 2 GDC2
19,935,000 8,380,541 876,172 1,000,000 608,000 500,000
Development of the Means Testing System 29,810,000 0 3,783,265 0 2,600,000 8,000,000
MOH Integrated Application and Inspection IT System
9,636,000 0 293,499 1,000,000 890,000 2,370,000
Migration of Existing Systems Island Mode to Hosted Mode in GDC2 and for a New Staging Environment
12,191,000 0 0 0 4,435,000 3,000,000
MOH Consolidated Data Repository (MCDR) IT System
8,144,000 0 0 0 600,000 1,958,000
Minor Development Projects … … 16,670,633 28,898,400 5,932,200 5,924,900
New Projects … … 0 10,000,000 1,626,300 136,922,500
Services Programme … … 41 41 41 41
Development of Ng Teng Fong General Hospital and Jurong Community Hospital
885,203,000 801,391,727 6,340,388 1,900,000 1,479,300 3,230,000
National Centre for Infectious Diseases 816,471,800 624,833,095 44,562,602 1,805,000 7,700,000 7,790,000
Development of Sengkang General Hospital/Community Hospital
1,217,198,100 1,020,513,263 56,535,974 45,600,000 36,580,000 17,670,000
Redevelopment of Changi General Hospital(Integrated Building, Medical Centre and Remodelling)
473,939,400 371,639,558 10,173,282 11,755,000 12,900,000 8,107,000
Development of Outram Community Hospital (OCH) 770,517,000 332,665,486 364,664,903 99,451,700 46,027,100 2,923,700
Development of Senior Care Centres 86,633,600 6,708,948 9,478,780 3,687,100 10,261,400 10,009,100
Expansion of National Skin Centre 235,886,000 5,873,186 12,452,465 21,250,000 29,000,000 65,694,800
Development of new National Cancer Centre Singapore Building
609,483,000 53,755,708 68,609,709 120,650,000 184,000,000 82,650,000
Integrated Care Hub (ICH) 377,202,900 31,627,522 28,364,410 97,185,000 95,400,000 107,920,000
Development of a new govt-built nursing home at Taman Jurong
54,290,400 20,732,719 10,742,251 1,920,900 1,277,600 216,100
Development of Shelter Home for persons in mental health recovery at Race Course Road
8,528,800 5,491,623 148,436 0 100,000 95,000
Woodlands Health Campus 1,448,144,000 108,976,769 131,075,185 304,658,100 252,245,000 400,837,600

126
BLANK Actual Expenditure Up to end of
BLANK BLANK Total Actual Estimated Revised Estimated Project Title Project Cost FY2017 FY2018 FY2019 FY2019 FY2020
BLANK SGH Emergency Medicine Building (EMB) and CUP Project
443,566,000 7,373,239 18,101,217 19,549,500 25,538,100 89,801,700
Creation of a temporary bus interchange, car park and road widening works at Spooner Road
23,300,000 19,189,655 1,428,959 1,586,300 814,500 1,779,700
Development of Healthcare Facilities at Punggol Town Hub
8,690,800 0 798,480 2,358,000 3,457,000 1,642,000
Development of a new government-built nursing home at Bukit Batok West
35,635,000 4,007,598 17,849,699 2,397,600 1,618,200 100,400
New Polyclinic, Nursing Home and Senior Care Centre Integrated Development in Bukit Panjang/Senja
96,454,400 1,189,817 6,922,766 41,201,500 43,500,000 25,374,600
Development of a new government-built nursing home at Ang Mo Kio Ave 3 / St 23
36,257,500 888,542 4,742,820 13,851,400 14,580,400 3,990,600
Development of new polyclinic and chronic sick unit (CSU) in Kallang
68,956,000 1,286,860 7,283,498 19,506,900 33,884,000 17,633,000
Development of new polyclinic and senior care centre in Eunos
50,197,200 642,201 3,482,555 17,960,600 20,040,100 12,712,000
Development of a new government-built nursing home at Jurong West Street 52
45,439,000 0 1,165,180 8,596,500 10,958,100 12,226,200
Development of a new government-built nursing home at Tampines Avenue 2
47,469,600 0 1,035,447 10,536,700 17,735,500 22,536,900
Development of a new government-built nursing home at Punggol East/ Tebing Lane
30,524,400 0 1,075,460 9,758,800 11,481,000 11,113,500
Development of a new government-built nursing home at Potong Pasir Avenue 1
70,848,200 0 1,424,903 9,237,100 8,910,600 25,992,400
Development of a new government-built nursing home at Pasir Ris Drive 3
69,893,700 0 945,517 0 7,304,600 27,806,900
Development of a new government-built nursing home at West Coast Link
53,619,100 0 6,028 1,124,600 1,997,900 11,752,900
Development of a new government-built nursing home at Macpherson Road
48,792,100 0 0 1,024,100 3,261,800 11,289,200
Toa Payoh Polyclinic Redevelopment project 6,446,000 0 0 0 0 268,400
Development of a new Polyclinic at Tampines North 30,643,300 0 6,028 0 356,000 4,922,600
Nursing Home and Kidney Dialysis Centre at the former Henderson Sec Sch
29,219,000 0 0 0 539,400 19,407,900
New government-built on lease (BOL) Nursing Home (NH) and a Senior Care Centre (SCC) at Tampines Street 62
45,226,500 0 6,028 0 1,316,200 5,500,700
Development of New Khatib Polyclinic 35,292,800 0 0 0 640,500 2,975,400
Redevelopment of Jurong Polyclinic and development of a new nursing home in Jurong East Planning area
21,523,200 0 0 0 528,500 383,100
Development of Build-Own-Lease Nursing Homes 360,540,100 243,195,257 3,008,741 450,400 2,674,800 199,500
Health Promotion and Preventive Healthcare Programme … … 1 1 1 1
Integrated Disease Outbreak System IDOS IT System Development
24,800,000 0 0 0 0 17,625,000
Completed Projects … … 37,043,551 59,703,200 45,052,600 0
GRANTS & CAPITAL INJECTIONS TO ORGANISATIONS … … 619,074,835 729,202,400 565,026,300 520,230,500
Ministry of Health Headquarters Programme … … 14 14 14 14
Nursing Home IT Enablement Programme (NHELP) 26,763,000 5,517,946 0 3,000,000 506,000 7,286,000
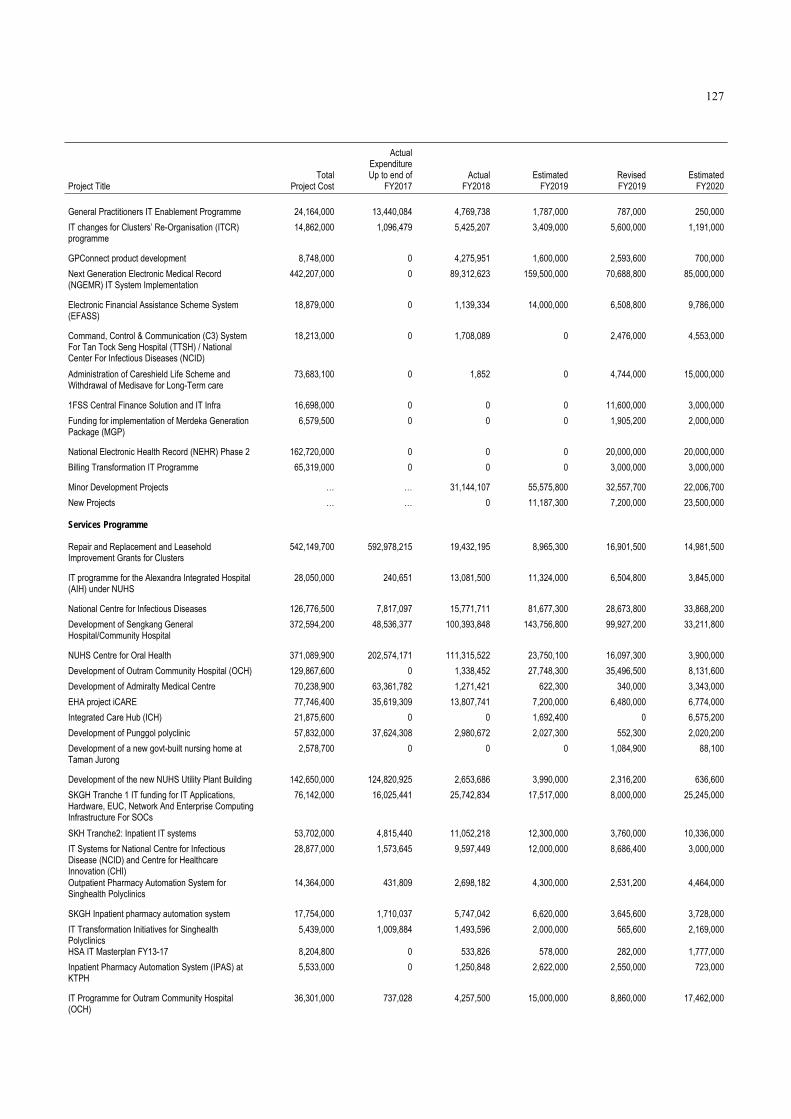
127
BLANK Actual Expenditure Up to end of
BLANK BLANK Total Actual Estimated Revised Estimated Project Title Project Cost FY2017 FY2018 FY2019 FY2019 FY2020
BLANK General Practitioners IT Enablement Programme 24,164,000 13,440,084 4,769,738 1,787,000 787,000 250,000
IT changes for Clusters’ Re-Organisation (ITCR) programme
14,862,000 1,096,479 5,425,207 3,409,000 5,600,000 1,191,000
GPConnect product development 8,748,000 0 4,275,951 1,600,000 2,593,600 700,000
Next Generation Electronic Medical Record (NGEMR) IT System Implementation
442,207,000 0 89,312,623 159,500,000 70,688,800 85,000,000
Electronic Financial Assistance Scheme System (EFASS)
18,879,000 0 1,139,334 14,000,000 6,508,800 9,786,000
Command, Control & Communication (C3) System For Tan Tock Seng Hospital (TTSH) / National Center For Infectious Diseases (NCID)
18,213,000 0 1,708,089 0 2,476,000 4,553,000
Administration of Careshield Life Scheme and Withdrawal of Medisave for Long-Term care
73,683,100 0 1,852 0 4,744,000 15,000,000
1FSS Central Finance Solution and IT Infra 16,698,000 0 0 0 11,600,000 3,000,000
Funding for implementation of Merdeka Generation Package (MGP)
6,579,500 0 0 0 1,905,200 2,000,000
National Electronic Health Record (NEHR) Phase 2 162,720,000 0 0 0 20,000,000 20,000,000
Billing Transformation IT Programme 65,319,000 0 0 0 3,000,000 3,000,000
Minor Development Projects … … 31,144,107 55,575,800 32,557,700 22,006,700
New Projects … … 0 11,187,300 7,200,000 23,500,000
Services Programme … … 47 47 47 47
Repair and Replacement and Leasehold Improvement Grants for Clusters
542,149,700 592,978,215 19,432,195 8,965,300 16,901,500 14,981,500
IT programme for the Alexandra Integrated Hospital (AIH) under NUHS
28,050,000 240,651 13,081,500 11,324,000 6,504,800 3,845,000
National Centre for Infectious Diseases 126,776,500 7,817,097 15,771,711 81,677,300 28,673,800 33,868,200
Development of Sengkang General Hospital/Community Hospital
372,594,200 48,536,377 100,393,848 143,756,800 99,927,200 33,211,800
NUHS Centre for Oral Health 371,089,900 202,574,171 111,315,522 23,750,100 16,097,300 3,900,000
Development of Outram Community Hospital (OCH) 129,867,600 0 1,338,452 27,748,300 35,496,500 8,131,600
Development of Admiralty Medical Centre 70,238,900 63,361,782 1,271,421 622,300 340,000 3,343,000
EHA project iCARE 77,746,400 35,619,309 13,807,741 7,200,000 6,480,000 6,774,000
Integrated Care Hub (ICH) 21,875,600 0 0 1,692,400 0 6,575,200
Development of Punggol polyclinic 57,832,000 37,624,308 2,980,672 2,027,300 552,300 2,020,200
Development of a new govt-built nursing home at Taman Jurong
2,578,700 0 0 0 1,084,900 88,100
Development of the new NUHS Utility Plant Building 142,650,000 124,820,925 2,653,686 3,990,000 2,316,200 636,600
SKGH Tranche 1 IT funding for IT Applications, Hardware, EUC, Network And Enterprise Computing Infrastructure For SOCs
76,142,000 16,025,441 25,742,834 17,517,000 8,000,000 25,245,000
SKH Tranche2: Inpatient IT systems 53,702,000 4,815,440 11,052,218 12,300,000 3,760,000 10,336,000
IT Systems for National Centre for Infectious Disease (NCID) and Centre for Healthcare Innovation (CHI)
28,877,000 1,573,645 9,597,449 12,000,000 8,686,400 3,000,000
Outpatient Pharmacy Automation System for Singhealth Polyclinics
14,364,000 431,809 2,698,182 4,300,000 2,531,200 4,464,000
SKGH Inpatient pharmacy automation system 17,754,000 1,710,037 5,747,042 6,620,000 3,645,600 3,728,000
IT Transformation Initiatives for Singhealth Polyclinics
5,439,000 1,009,884 1,493,596 2,000,000 565,600 2,169,000
HSA IT Masterplan FY13-17 8,204,800 0 533,826 578,000 282,000 1,777,000
Inpatient Pharmacy Automation System (IPAS) at KTPH
5,533,000 0 1,250,848 2,622,000 2,550,000 723,000
IT Programme for Outram Community Hospital (OCH)
36,301,000 737,028 4,257,500 15,000,000 8,860,000 17,462,000

128
BLANK Actual Expenditure Up to end of
BLANK BLANK Total Actual Estimated Revised Estimated Project Title Project Cost FY2017 FY2018 FY2019 FY2019 FY2020
BLANK Funding to National University Health Systems (NUHS) for operating at Alexandra Hospital (AH)
61,574,500 3,509 19,784,251 16,585,300 18,864,100 6,185,300
Fit out Levels 3 and 4 of CGH Medical Centre (MC) 6,283,000 0 0 3,786,300 373,200 3,511,300
Additional physical security enhancements for MOH Institutions
33,425,000 0 1,291,983 7,569,800 10,548,200 2,214,300
Expansion of inpatient capacity through the renovation of NUH Paediatric Wards 45 and 47 at main building Level 4
15,929,000 0 0 325,600 292,200 1,960,000
Expansion and Enhancement of Endoscopy Facilities at Tan Tock Seng Hospital (TTSH)
6,585,100 0 39,922 0 1,592,100 2,980,700
National Electronic Medical Social Worker (NeMSW) IT Implementation
11,179,000 0 4,534,857 3,000,000 5,489,000 326,000
Institute of Mental Health (IMH) Ward Refurbishment 99,230,000 0 1,534,871 17,806,200 6,959,900 24,281,400
Construction cost of new National Large Animal Research Facility (NLARF)
30,000,000 0 0 0 0 19,130,000
Capital funding for expansion of Medical Intensive Care Unit (MICU) in SGH Ward 45
8,076,100 0 190,069 3,932,000 4,577,700 780,000
One-time dementia-friendly improvement works for Nursing Home and Eldercare Centres
49,990,000 0 0 0 10,000,000 22,743,600
IT Infrastructure and Applications for Woodlands Health Campus (WHC)
80,610,000 0 287,638 0 1,355,000 5,800,000
Outpatient Pharmacy Automation System (OPAS) for Ng Teng Fong General Hospital (NTFGH)
6,863,000 0 0 0 1,000,000 1,000,000
Purchase of radiation oncology equipment at the National Cancer Institute Singapore (NCIS)
6,371,800 0 0 0 302,900 2,210,000
Post-Opening Improvement Works at Sengkang General & Community Hospitals
19,380,600 0 0 0 2,842,100 6,698,100
IT Systems for New NCCS Building 54,890,000 0 0 0 6,000,000 6,000,000
Renovation of KKH's Children ICU and setting up of Paediatric Burns Centre at KKH
21,016,800 0 0 0 0 1,563,000
KKH Mental Wellness and Paed Derm at Halifax Road
7,348,900 0 0 0 0 1,206,700
Funding for post-temporary occupation permit (TOP) improvement works for National Centre for Infectious Diseases
4,894,500 0 0 0 500,000 3,250,000
Development of Facilities for Voluntary Welfare Organisations
134,893,584 324,853,648 12,081,840 16,605,600 21,753,000 18,413,200
Health Promotion and Preventive Healthcare Programme
… … 2 2 2 2
IHIS-HPB Healthhub IT implementation 14,683,000 0 0 0 0 3,425,000
Consumer Common Digital Platform (CCDP) IT system
9,306,000 0 0 0 0 3,000,000
Completed Projects … … 97,132,262 23,841,700 49,154,500 0
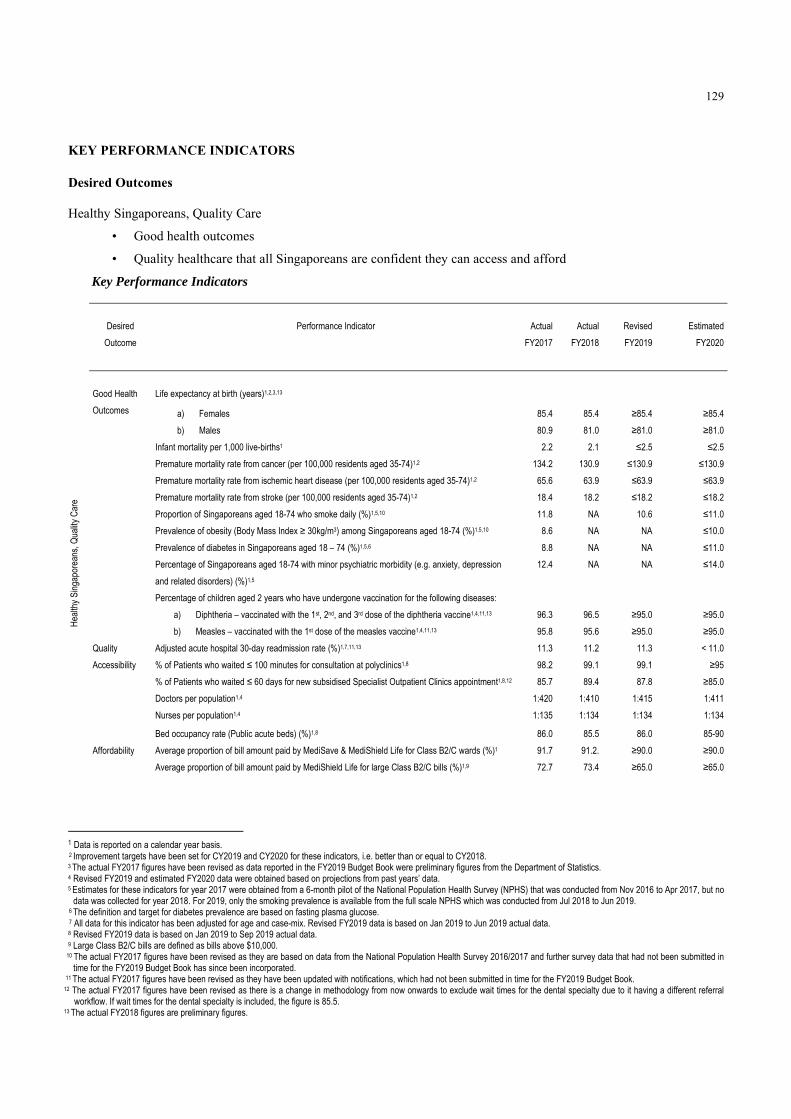
129
KEY PERFORMANCE INDICATORS Desired Outcomes Healthy Singaporeans, Quality Care
• Good health outcomes
• Quality healthcare that all Singaporeans are confident they can access and afford
Key Performance Indicators
Desired
Outcome
Performance Indicator
Actual
FY2017
Actual
FY2018
Revised
FY2019
Estimated
FY2020
Hea
lthy
Sing
apor
eans
, Qua
lity
Car
e
Good Health
Outcomes
Life expectancy at birth (years)1,2,3,13
a) Females 85.4 85.4 ≥85.4 ≥85.4
b) Males 80.9 81.0 ≥81.0 ≥81.0
Infant mortality per 1,000 live-births1 2.2 2.1 ≤2.5 ≤2.5
Premature mortality rate from cancer (per 100,000 residents aged 35-74)1,2 134.2 130.9 ≤130.9 ≤130.9
Premature mortality rate from ischemic heart disease (per 100,000 residents aged 35-74)1,2 65.6 63.9 ≤63.9 ≤63.9
Premature mortality rate from stroke (per 100,000 residents aged 35-74)1,2 18.4 18.2 ≤18.2 ≤18.2
Proportion of Singaporeans aged 18-74 who smoke daily (%)1,5,10 11.8 NA 10.6 ≤11.0
Prevalence of obesity (Body Mass Index ≥ 30kg/m3) among Singaporeans aged 18-74 (%)1,5,10 8.6 NA NA ≤10.0
Prevalence of diabetes in Singaporeans aged 18 – 74 (%)1,5,6 8.8 NA NA ≤11.0
Percentage of Singaporeans aged 18-74 with minor psychiatric morbidity (e.g. anxiety, depression
and related disorders) (%)1,5
12.4 NA NA ≤14.0
Percentage of children aged 2 years who have undergone vaccination for the following diseases:
a) Diphtheria – vaccinated with the 1st, 2nd, and 3rd dose of the diphtheria vaccine1,4,11,13 96.3 96.5 ≥95.0 ≥95.0
b) Measles – vaccinated with the 1st dose of the measles vaccine1,4,11,13 95.8 95.6 ≥95.0 ≥95.0
Quality Adjusted acute hospital 30-day readmission rate (%)1,7,11,13 11.3 11.2 11.3 < 11.0
Accessibility % of Patients who waited ≤ 100 minutes for consultation at polyclinics1,8 98.2 99.1 99.1 ≥95
% of Patients who waited ≤ 60 days for new subsidised Specialist Outpatient Clinics appointment1,8,12 85.7 89.4 87.8 ≥85.0
Doctors per population1,4 1:420 1:410 1:415 1:411
Nurses per population1,4 1:135 1:134 1:134 1:134
Bed occupancy rate (Public acute beds) (%)1,8 86.0 85.5 86.0 85-90
Affordability Average proportion of bill amount paid by MediSave & MediShield Life for Class B2/C wards (%)1 91.7 91.2. ≥90.0 ≥90.0
Average proportion of bill amount paid by MediShield Life for large Class B2/C bills (%)1,9 72.7 73.4 ≥65.0 ≥65.0 1
1 Data is reported on a calendar year basis. 2 Improvement targets have been set for CY2019 and CY2020 for these indicators, i.e. better than or equal to CY2018. 3 The actual FY2017 figures have been revised as data reported in the FY2019 Budget Book were preliminary figures from the Department of Statistics. 4 Revised FY2019 and estimated FY2020 data were obtained based on projections from past years’ data. 5 Estimates for these indicators for year 2017 were obtained from a 6-month pilot of the National Population Health Survey (NPHS) that was conducted from Nov 2016 to Apr 2017, but no
data was collected for year 2018. For 2019, only the smoking prevalence is available from the full scale NPHS which was conducted from Jul 2018 to Jun 2019. 6 The definition and target for diabetes prevalence are based on fasting plasma glucose. 7 All data for this indicator has been adjusted for age and case-mix. Revised FY2019 data is based on Jan 2019 to Jun 2019 actual data. 8 Revised FY2019 data is based on Jan 2019 to Sep 2019 actual data. 9 Large Class B2/C bills are defined as bills above $10,000.
10 The actual FY2017 figures have been revised as they are based on data from the National Population Health Survey 2016/2017 and further survey data that had not been submitted in time for the FY2019 Budget Book has since been incorporated.
11 The actual FY2017 figures have been revised as they have been updated with notifications, which had not been submitted in time for the FY2019 Budget Book. 12 The actual FY2017 figures have been revised as there is a change in methodology from now onwards to exclude wait times for the dental specialty due to it having a different referral
workflow. If wait times for the dental specialty is included, the figure is 85.5. 13 The actual FY2018 figures are preliminary figures.


Head P ____________
Ministry of Home Affairs


131
HEAD P
MINISTRY OF HOME AFFAIRS
OVERVIEW
Mission Statement
To work as a team, in partnership with the community, to make Singapore our safe and secure Best Home.
FY2020 EXPENDITURE ESTIMATES
Expenditure Estimates by Object Class
BLANK Actual Estimated Revised Estimated Code Object Class FY2018 FY2019 FY2019 FY2020 Change Over FY2019
BLANK
TOTAL EXPENDITURE $6,634,271,253 $6,741,519,900 $6,702,924,800 $6,984,437,400 $281,512,600 4.2%
Main Estimates $5,504,836,870 $5,777,979,300 $5,747,531,500 $6,184,681,500 $437,150,000 7.6%
OPERATING EXPENDITURE $5,504,836,870 $5,762,881,300 $5,731,329,500 $6,170,161,500 $438,832,000 7.7%
RUNNING COSTS $5,453,051,291 $5,719,875,100 $5,679,670,200 $6,126,754,200 $447,084,000 7.9%
Expenditure on Manpower $3,261,972,257 $3,410,741,700 $3,222,298,100 $3,267,330,100 $45,032,000 1.4%
1200 Political Appointments 821,895 1,079,700 1,079,700 1,049,900 -29,800 -2.8
1500 Permanent Staff 3,066,290,559 3,207,088,200 3,021,717,700 3,085,507,300 63,789,600 2.1
1600 Temporary, Daily-Rated & Other Staff 194,859,803 202,573,800 199,500,700 180,772,900 -18,727,800 -9.4
Other Operating Expenditure $2,175,756,914 $2,300,271,600 $2,443,582,800 $2,468,325,800 $24,743,000 1.0%
2100 Consumption of Products & Services 1,963,399,228 2,103,027,300 2,229,976,700 2,264,632,200 34,655,500 1.6
2300 Manpower Development 97,587,540 96,985,500 104,461,100 103,085,000 -1,376,100 -1.3
2400 International & Public Relations, Public Communications
85,106,796 58,846,500 74,408,700 74,835,000 426,300 0.6
2700 Asset Acquisition 22,798,946 35,533,600 28,599,700 21,236,200 -7,363,500 -25.7
2800 Miscellaneous 6,864,405 5,878,700 6,136,600 4,537,400 -1,599,200 -26.1
Grants, Subventions & Capital Injections to Organisations
$15,322,120 $8,861,800 $13,789,300 $391,098,300 $377,309,000 n.a.
3100 Grants, Subventions & Capital Injections to Statutory Boards
0 0 0 378,270,000 378,270,000 n.a.
3400 Grants, Subventions & Capital Injections to Other Organisations
15,322,120 8,861,800 13,789,300 12,828,300 -961,000 -7.0
TRANSFERS $51,785,579 $43,006,200 $51,659,300 $43,407,300 -$8,252,000 -16.0%
3500 Social Transfers to Individuals 43,271,213 36,104,200 44,428,300 36,175,300 -8,253,000 -18.6
3600 Transfers to Institutions & Organisations 7,826,566 6,304,300 6,584,400 6,547,400 -37,000 -0.6
3800 International Organisations & Overseas Development Assistance
687,800 597,700 646,600 684,600 38,000 5.9

132
BLANK Actual Estimated Revised Estimated Code Object Class FY2018 FY2019 FY2019 FY2020 Change Over FY2019
BLANK
OTHER CONSOLIDATED FUND OUTLAYS $0 $15,098,000 $16,202,000 $14,520,000 -$1,682,000 -10.4%
4600 Loans and Advances (Disbursement) 0 15,098,000 16,202,000 14,520,000 -1,682,000 -10.4
Development Estimates $1,129,434,383 $978,638,600 $971,595,300 $814,275,900 -$157,319,400 -16.2%
DEVELOPMENT EXPENDITURE $1,129,434,383 $978,638,600 $971,595,300 $814,275,900 -$157,319,400 -16.2%
5100 Government Development 1,075,932,957 933,038,600 848,295,300 779,485,900 -68,809,400 -8.1
5200 Grants & Capital Injections to Organisations
53,501,426 45,600,000 123,300,000 34,790,000 -88,510,000 -71.8
Establishment List
BLANK Actual Estimated Revised Estimated Category/Personnel FY2018 FY2019 FY2019 FY2020
BLANK
POLITICAL APPOINTMENTS 4 4 4 4
Minister 2 2 2 2
Senior Parliamentary Secretary 0 0 2 2
Parliamentary Secretary 2 2 0 0
PERMANENT STAFF 27,753 29,086 28,732 27,786
Accounting Profession (2008) 7 2 2 2
Administrative 16 19 19 19
Commercial Affairs Scheme (2008) 135 155 157 157
Corporate Support 46 0 0 0
Director, Internal Security Department 1 1 1 1
Driving (Testing) 44 45 45 25
Education Service (2008) 13 15 15 15
Engineering Profession (Home Affairs) 1 0 0 0
Estate Maintenance 6 8 8 8
Home Affairs Services (ICA) 2017 5,289 5,358 5,233 5,291
Home Affairs Uniformed Services (Civil Defence) 2017 2,526 2,588 2,614 2,707
Home Affairs Uniformed Services (Narcotics) 2017 706 706 694 703
Home Affairs Uniformed Services (Police) 2016 13,105 13,663 13,298 13,618
Home Affairs Uniformed Services (Prisons) 2017 2,103 2,074 2,076 2,060
Home Team Specialist Scheme (HTSS) 649 1,078 1,151 223
Information Service (2008) 5 2 2 2
Language Executive 12 13 13 13
Language Executive Scheme (2008) 20 43 43 43
Legal 7 8 8 8
Management Executive Scheme (2008) 2,524 2,914 3,045 2,739
Management Support Scheme (2008) 261 164 105 102
Management Support Scheme (Language Officer) 8 3 3 3
Mechanical Support 3 0 7 7
Medical Scheme 2002 5 7 7 7
Operations Support 41 30 24 24
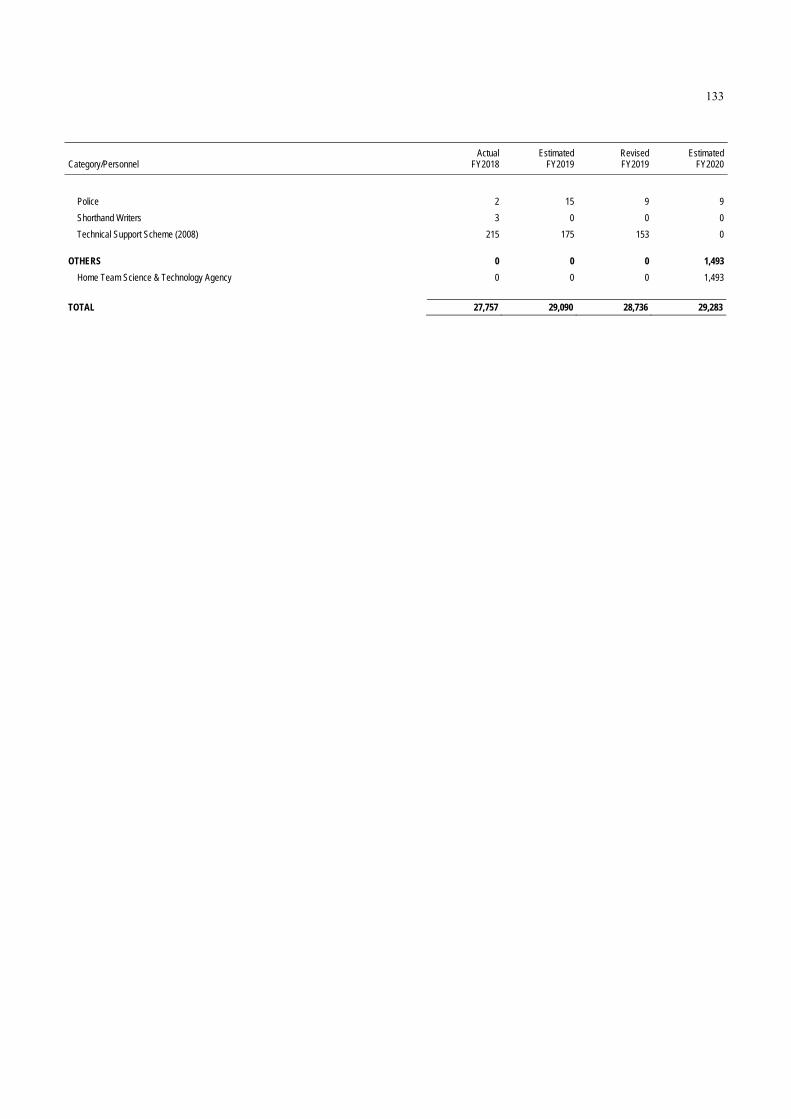
133
BLANK Actual Estimated Revised Estimated Category/Personnel FY2018 FY2019 FY2019 FY2020
BLANK
Police 2 15 9 9
Shorthand Writers 3 0 0 0
Technical Support Scheme (2008) 215 175 153 0
OTHERS 0 0 0 1,493
Home Team Science & Technology Agency 0 0 0 1,493
TOTAL 27,757 29,090 28,736 29,283

134
FY2019 BUDGET The revised total expenditure of the Ministry of Home Affairs (MHA) in FY2019 is projected to be $6.70 billion. This is an increase of $68.65 million or 1.0% over the actual FY2018 expenditure of $6.63 billion.
The revised FY2019 operating expenditure of $5.73 billion is an increase of $226.49 million or 4.1% compared to the actual FY2018 operating expenditure of $5.50 billion. The higher operating expenditure in FY2019 is mainly due to enhanced operational capabilities to address heightened risks in the security environment.
The revised FY2019 development expenditure of $971.60 million is a decrease of $157.84 million or 14.0% compared to the actual FY2018 development expenditure of $1.13 billion. The decrease is mainly due to the completion of large infrastructure projects in FY2018. These projects include Woodlands Division Headquarters, Kallang Fire Station and immigration facilities in Changi Airport Terminal 4 and Seletar Airport.
FY2020 BUDGET
The total expenditure of MHA in FY2020 is projected to be $6.98 billion, an increase of $281.51 million or 4.2% over the revised FY2019 total expenditure. Of this, $6.17 billion or 88.3% is operating expenditure and $814.28 million or 11.7% is development expenditure.
Operating Expenditure
The operating expenditure of $6.17 billion in FY2020 is an increase of $438.83 million or 7.7% over the revised FY2019 operating expenditure. The higher operating expenditure in FY2020 is mainly due to the further development of science and technology capabilities by the new Home Team Science and Technology Agency, and to enhance operational capabilities and effectiveness to address heightened security threats.
The Police Programme will take up the largest share of MHA’s operating expenditure ($3.29 billion or 53.4%). This is followed by the Immigration and Checkpoint Control Programme ($928.30 million or 15.0%), the Treatment of Offenders Programme ($560.72 million or 9.1%) and the Civil Defence Programme ($552.41 million or 9.0%).
Development Expenditure
The development expenditure of $814.28 million in FY2020 is a decrease of $157.32 million or 16.2% lower than the revised FY2019 development expenditure. Some of our large infrastructure and technology projects such as the Selarang Park Complex, and the enhancement of broadband connectivity of Police cameras have been completed in FY2019. In FY2020, MHA will continue to invest in new infrastructure, capabilities and systems. The Immigration and Checkpoints Authority (ICA) will develop a new integrated services centre to meet growing demand. We will also enhance our capabilities in sense-making and analytics to support operations, and further enhance the operational capabilities of the Police Coast Guard.
Other Consolidated Fund Outlays
Advances for FY2020 are projected to be $14.52 million. This is primarily for advance payments to the Gurkha officers when they go on home leave or pre-retirement leave, and for their retirement gratuity.

135
Total Expenditure by Programme
BLANK Running Operating Development Total Code Programme Costs Transfers Expenditure Expenditure Expenditure
BLANK
P-A Administration 253,014,000 0 253,014,000 169,435,400 422,449,400
P-C Police 3,293,502,100 564,500 3,294,066,600 309,895,700 3,603,962,300
P-D Civil Defence 552,284,400 128,100 552,412,500 68,248,700 620,661,200
P-F Treatment of Offenders 518,575,500 42,146,700 560,722,200 50,000,000 610,722,200
P-G Drug Enforcement 166,548,200 168,000 166,716,200 15,596,600 182,312,800
P-H Immigration and Checkpoint Control 927,895,000 400,000 928,295,000 190,614,900 1,118,909,900
P-I Home Team Academy 36,665,000 0 36,665,000 10,484,600 47,149,600
P-J Home Team Science and Technology Agency 378,270,000 0 378,270,000 0 378,270,000
Total $6,126,754,200 $43,407,300 $6,170,161,500 $814,275,900 $6,984,437,400
Development Expenditure by Project
BLANK Actual
Expenditure Up to end of
BLANK
BLANK Total Actual Estimated Revised Estimated Project Title Project Cost FY2017 FY2018 FY2019 FY2019 FY2020
BLANK
DEVELOPMENT EXPENDITURE … … $1,129,434,383 $978,638,600 $971,595,300 $814,275,900
GOVERNMENT DEVELOPMENT … … 1,075,932,957 933,038,600 848,295,300 779,485,900
Administration Programme … … 18 18 18 18
Project HPC 9,600,000 7,357,313 641,200 147,900 397,300 147,900
MHQ Data Centres Renovation 15,207,900 187,807 474,907 1,156,700 1,156,700 248,700
Location-Aware SMS-Based Public Alert System 17,591,500 8,598,799 2,770,961 406,700 406,700 3,836,100
Project TITLIS 8,990,100 1,102,762 6,279,859 49,400 49,400 42,000
Renovation Project 17,374,400 715,398 1,678,150 6,748,000 2,748,000 3,000,000
MHA Mobile Data Network 159,540,200 732,038 33,925,533 23,069,400 23,069,400 42,961,100
Project Stardust 5,690,200 266,183 445,777 1,073,600 1,073,600 82,700
MHA Next Generation Transmission Network 44,991,600 1,022,342 18,374,003 17,917,800 17,917,800 6,016,100
Cross Domain Gateway 9,980,000 21,097 593,753 2,510,100 2,510,100 5,057,200
WOG HRPS 98,540,000 5,103,749 5,706,445 8,644,700 7,583,400 7,583,400
MESON Tech Refresh 14,738,600 0 0 2,850,500 2,850,500 4,560,800
Project Epsilon 14,129,800 0 172,366 1,500,000 1,500,000 10,000,000
MHA-DSTA Block Agreement 50,126,000 3,102,399 4,430,547 4,310,300 4,310,300 4,680,000
MHA Integrated Video Hub 141,100,000 435,362 16,948,217 56,763,200 56,763,200 3,889,900
Consultancy Services for Annex to NPPK 17,760,000 0 1,355 2,400,000 677,900 3,000,000
MHA Perimeter ICT Infrastructure Enhancement 7,400,000 0 0 200,000 200,000 1,600,000
MVMS 8,884,400 0 3,247,792 2,019,200 2,019,200 403,900
Minor Development Projects … … 12,196,212 75,392,800 35,489,500 37,535,600
Police Programme … … 52 52 52 52
Computerised Criminal Intelligence System 2 81,202,700 41,583,536 4,134,439 6,137,200 5,516,400 1,014,800
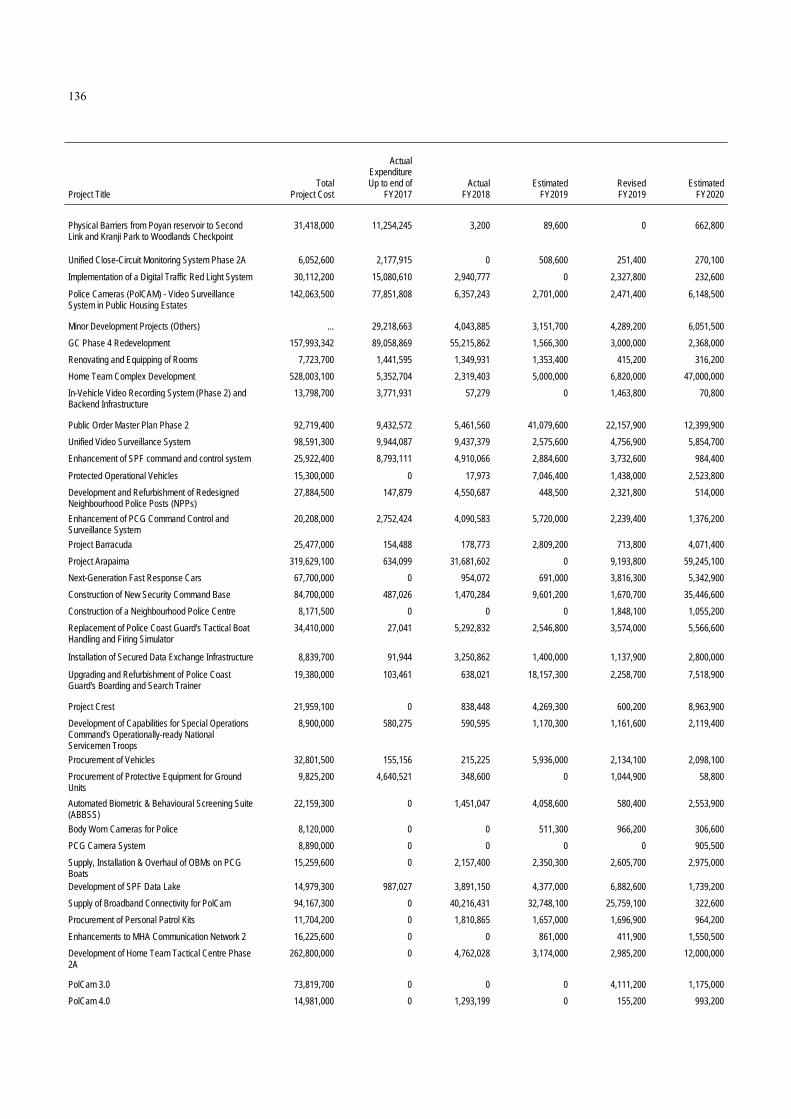
136
BLANK Actual
Expenditure Up to end of
BLANK
BLANK Total Actual Estimated Revised Estimated Project Title Project Cost FY2017 FY2018 FY2019 FY2019 FY2020
BLANK
Physical Barriers from Poyan reservoir to Second Link and Kranji Park to Woodlands Checkpoint
31,418,000 11,254,245 3,200 89,600 0 662,800
Unified Close-Circuit Monitoring System Phase 2A 6,052,600 2,177,915 0 508,600 251,400 270,100
Implementation of a Digital Traffic Red Light System 30,112,200 15,080,610 2,940,777 0 2,327,800 232,600
Police Cameras (PolCAM) - Video Surveillance System in Public Housing Estates
142,063,500 77,851,808 6,357,243 2,701,000 2,471,400 6,148,500
Minor Development Projects (Others) ... 29,218,663 4,043,885 3,151,700 4,289,200 6,051,500
GC Phase 4 Redevelopment 157,993,342 89,058,869 55,215,862 1,566,300 3,000,000 2,368,000
Renovating and Equipping of Rooms 7,723,700 1,441,595 1,349,931 1,353,400 415,200 316,200
Home Team Complex Development 528,003,100 5,352,704 2,319,403 5,000,000 6,820,000 47,000,000
In-Vehicle Video Recording System (Phase 2) and Backend Infrastructure
13,798,700 3,771,931 57,279 0 1,463,800 70,800
Public Order Master Plan Phase 2 92,719,400 9,432,572 5,461,560 41,079,600 22,157,900 12,399,900
Unified Video Surveillance System 98,591,300 9,944,087 9,437,379 2,575,600 4,756,900 5,854,700
Enhancement of SPF command and control system 25,922,400 8,793,111 4,910,066 2,884,600 3,732,600 984,400
Protected Operational Vehicles 15,300,000 0 17,973 7,046,400 1,438,000 2,523,800
Development and Refurbishment of Redesigned Neighbourhood Police Posts (NPPs)
27,884,500 147,879 4,550,687 448,500 2,321,800 514,000
Enhancement of PCG Command Control and Surveillance System
20,208,000 2,752,424 4,090,583 5,720,000 2,239,400 1,376,200
Project Barracuda 25,477,000 154,488 178,773 2,809,200 713,800 4,071,400
Project Arapaima 319,629,100 634,099 31,681,602 0 9,193,800 59,245,100
Next-Generation Fast Response Cars 67,700,000 0 954,072 691,000 3,816,300 5,342,900
Construction of New Security Command Base 84,700,000 487,026 1,470,284 9,601,200 1,670,700 35,446,600
Construction of a Neighbourhood Police Centre 8,171,500 0 0 0 1,848,100 1,055,200
Replacement of Police Coast Guard's Tactical Boat Handling and Firing Simulator
34,410,000 27,041 5,292,832 2,546,800 3,574,000 5,566,600
Installation of Secured Data Exchange Infrastructure 8,839,700 91,944 3,250,862 1,400,000 1,137,900 2,800,000
Upgrading and Refurbishment of Police Coast Guard's Boarding and Search Trainer
19,380,000 103,461 638,021 18,157,300 2,258,700 7,518,900
Project Crest 21,959,100 0 838,448 4,269,300 600,200 8,963,900
Development of Capabilities for Special Operations Command's Operationally-ready National Servicemen Troops
8,900,000 580,275 590,595 1,170,300 1,161,600 2,119,400
Procurement of Vehicles 32,801,500 155,156 215,225 5,936,000 2,134,100 2,098,100
Procurement of Protective Equipment for Ground Units
9,825,200 4,640,521 348,600 0 1,044,900 58,800
Automated Biometric & Behavioural Screening Suite (ABBSS)
22,159,300 0 1,451,047 4,058,600 580,400 2,553,900
Body Worn Cameras for Police 8,120,000 0 0 511,300 966,200 306,600
PCG Camera System 8,890,000 0 0 0 0 905,500
Supply, Installation & Overhaul of OBMs on PCG Boats
15,259,600 0 2,157,400 2,350,300 2,605,700 2,975,000
Development of SPF Data Lake 14,979,300 987,027 3,891,150 4,377,000 6,882,600 1,739,200
Supply of Broadband Connectivity for PolCam 94,167,300 0 40,216,431 32,748,100 25,759,100 322,600
Procurement of Personal Patrol Kits 11,704,200 0 1,810,865 1,657,000 1,696,900 964,200
Enhancements to MHA Communication Network 2 16,225,600 0 0 861,000 411,900 1,550,500
Development of Home Team Tactical Centre Phase 2A
262,800,000 0 4,762,028 3,174,000 2,985,200 12,000,000
PolCam 3.0 73,819,700 0 0 0 4,111,200 1,175,000
PolCam 4.0 14,981,000 0 1,293,199 0 155,200 993,200

137
BLANK Actual
Expenditure Up to end of
BLANK
BLANK Total Actual Estimated Revised Estimated Project Title Project Cost FY2017 FY2018 FY2019 FY2019 FY2020
BLANK
Development of Security Vetting and Clearance System (VACS)
5,070,000 0 0 880,000 460,000 2,231,000
Implementation of Security measures at coastline facilities
16,969,800 0 0 3,070,800 483,300 3,025,400
Provision of workforce scheduling system 6,300,000 0 0 0 752,000 1,361,300
Analytics and Data Management System 6,399,000 0 0 0 567,900 1,650,600
Construction of Perimeter Fence and Gates 14,738,000 0 0 0 65,000 2,295,000
Body Worn Cameras for Police (Batch 2) 11,130,000 0 0 0 1,391,400 448,600
Redevelopment of Building 5,058,300 0 0 0 353,000 334,900
Replacement of Access Management System 32,331,100 0 0 0 130,000 4,635,000
Computerised Investigation Management System 3 (CRIMES3)
60,659,600 0 0 0 0 4,500,000
Equipment for frontline officers 11,186,500 0 0 0 0 874,500
Development of NPPk Complex B – Phase A 8,908,000 0 0 0 1,500,000 2,769,000
Minor Development Projects (Singapore Police Force)
… 644,925,063 42,639,028 88,588,800 43,784,700 29,609,500
Minor Development Projects … … 9,131,375 7,256,700 5,756,700 8,600,000
Civil Defence Programme … … 17 17 17 17
Minor Development Projects (Others) … 4,799,481 1,291,289 0 480,800 2,439,900
SCDF's Vehicle Replacement Programme (FY2015 to FY2017)
41,964,300 15,892,263 5,153,756 3,614,600 4,624,800 1,206,000
Enhanced Equipping of Rescue Battalions 5,213,800 1,915,573 2,229,419 0 0 170,800
Replacement of SCDF Command Vehicles and Engagement of Project Managers
20,267,500 249,032 403,910 455,000 2,991,200 5,552,300
Redevelopment of the CDA Field Training Area 91,591,000 1,114,931 1,100,612 2,787,400 2,790,500 10,000,000
Punggol Fire Station and NPC 62,312,200 703,314 4,184,698 9,246,200 7,718,000 600,000
Development of Operational Medical Networks Informatics Integrator (OMNII) System Phase 1
11,468,500 155,283 698,980 1,449,300 2,109,300 4,207,700
Vehicle Replacement Programme FY2018-FY2020 28,385,300 0 3,516,480 0 0 593,000
Build Up of Emergency Medical Services towards 2025
71,995,000 0 0 0 0 2,000,000
Replacement of Major CD Equipment in NSEW Lines MRT Shelters
17,800,000 0 0 330,000 0 2,000,000
ICT Equipment and Infrastructure for Kallang FS -- HTJF
6,083,000 0 538,702 983,000 1,355,400 329,000
Traffic Priority System for SCDF Ambulances 12,531,200 0 0 0 0 1,000,000
Installation of fixed TIC sensors 6,290,600 0 0 0 0 3,000,000
Development of HazMat Incident Management System (HIMS) 2
16,787,400 0 0 0 401,000 2,566,800
Expansion of SCDF MC HQ Building 24,245,400 0 0 0 0 2,424,600
A&A for Bukit Batok FS 5,827,000 0 0 0 0 618,500
Minor Development Projects … … 20,825,227 18,265,000 9,564,300 29,540,100
Treatment of Offenders Programme … … 14 14 14 14
Redevt of Selarang Park Drug Ctr 200,766,200 90,831,398 66,878,883 32,100,400 40,409,300 2,490,900
Minor Development Projects (Others) … 14,199,228 954,410 0 819,400 1,044,200
Refurbishment of A4 for CWP (ICT) 18,036,500 9,399,850 6,351,788 487,700 259,600 970,400
Visit Management System III 19,796,000 7,495,285 1,486,587 333,600 480,300 55,500
Redevelopment of Selarang Park Drug Centre-ICT 42,464,000 8,808,863 6,730,237 21,156,300 19,472,400 1,360,600
ReplaceVRF@CLA 5,815,700 274,767 808,014 451,800 674,100 150,200
Project Dragonfly 96,500,000 467,692 3,211,254 6,231,500 5,793,500 9,571,100

138
BLANK Actual
Expenditure Up to end of
BLANK
BLANK Total Actual Estimated Revised Estimated Project Title Project Cost FY2017 FY2018 FY2019 FY2019 FY2020
BLANK
DIRECT 24,744,500 2,358,873 3,496,667 4,381,600 3,399,300 2,248,900
Lighting replacement works 14,310,400 0 260,036 13,408,000 998,900 3,560,500
New SCLU and Video Court Dev 16,381,000 0 0 0 1,185,500 1,014,600
CLB Infrastructural Systems Lifecycle Replacement Programme
32,635,600 0 0 0 0 9,132,600
ISS Backend Refresh for SPS 18,300,000 0 0 0 0 3,910,000
Minor Development Projects … … 7,605,095 10,741,600 7,581,800 14,438,900
Redevelopment of Changi Prison Complex 1,131,100,000 897,279,646 6,207,770 968,000 1,088,400 51,600
Drug Enforcement Programme … … 3 3 3 3
Minor Development Projects (Others) … 5,845,461 969,568 773,000 1,355,700 2,247,000
IDEAS II 38,764,600 4,502,637 13,014,567 10,506,200 11,590,800 3,001,800
Minor Development Projects … … 7,857,920 4,009,600 7,838,500 10,347,800
Immigration and Checkpoint Control Programme … … 17 17 17 17
Biometric Screening Capability at all Immigration Counters
18,800,300 13,050,899 1,087,895 0 1,497,700 10,200
Minor Development Projects (Others) … 7,416,580 2,837,661 903,900 2,054,000 3,272,600
Next Generation Biometric Passport System 48,324,500 26,348,949 3,433,693 2,554,300 4,564,400 850,000
Integrated Springboard for the Intelligent Responsive Enterprise
105,239,700 39,891,868 19,450,870 8,493,400 27,904,100 7,121,600
Consultancy Services and Related Preliminary Works for the development of the New Annex to ICA Building
14,058,500 870,271 1,007,328 6,338,600 5,228,000 1,200,000
Enhancing Bus Security Clearance Security At Tuas Checkpoint
25,008,100 10,308,063 6,747,888 604,200 554,100 299,200
Operationalisation of Changi Airport Terminal 4 49,211,000 22,964,738 9,952,582 3,554,200 3,475,600 7,208,700
Integrated Checkpoint Operating Nexus (ICON) Stage 2
82,800,400 4,434,786 8,694,847 12,654,100 13,982,900 41,163,400
Multi-Model Biometrics System with Iris Recognition 52,326,800 3,591,525 13,484,230 532,700 967,000 7,062,300
Replacement of Radiographic Screening System 79,316,600 0 8,992,243 0 6,754,400 17,482,500
Provision of feasibility study for Woodlands Checkpoint
19,600,000 1,560,008 910,035 1,062,300 1,742,800 1,162,000
Tech Refresh of iBorders 62,306,100 508,838 38,207,778 22,751,000 20,847,200 508,900
ICON MCN2 19,914,500 4,167,813 236,492 3,229,600 10,100,300 711,200
Advance Passenger Screening (APS) System 65,256,500 0 2,312,765 27,974,100 20,814,900 18,502,100
Installation of Crash-Rated Walls and Fencing at Woodlands and Tuas Checkpoints
37,900,000 0 208,170 0 242,000 2,261,600
Immigration Facilities at New Seletar Airport 9,920,000 0 8,800,327 1,890,400 0 918,000
Minor Development Projects … … 22,067,503 21,646,000 21,260,700 80,880,600
Home Team Academy Programme … … 2 2 2 2
Minor Development Projects … … 7,770,657 8,814,700 9,994,700 10,468,400
Implementation of a Homefront Training Simulation System
8,577,500 4,451,867 283,567 204,000 204,000 16,200
Completed Projects … … 388,081,375 183,613,800 206,646,400 0

139
BLANK Actual
Expenditure Up to end of
BLANK
BLANK Total Actual Estimated Revised Estimated Project Title Project Cost FY2017 FY2018 FY2019 FY2019 FY2020
BLANK
GRANTS & CAPITAL INJECTIONS TO ORGANISATIONS
… … 53,501,426 45,600,000 123,300,000 34,790,000
Administration Programme … … 2 2 2 2
Development of New HomeTeam NS Clubhouse (E) 56,200,000 700,000 1,530,000 12,800,000 12,800,000 25,790,000
Development of New HomeTeam NS Clubhouse (N) 83,810,000 1,500,000 51,900,000 32,800,000 20,500,000 9,000,000
Completed Projects … … 71,426 0 90,000,000 0

140
KEY PERFORMANCE INDICATORS
Desired Outcomes
• A safe and secure society where life and property are protected
• A successful partnership with the community to maintain a safe and secure society
• A Home Team well prepared for the future
Key Performance Indicators
Desired Outcome Performance Indicator Actual
FY2017 Actual
FY2018 Revised FY2019
Estimated FY2020
A safe and secure society where life and property are protected
Global ranking of Singapore’s safety and security in Gallup’s Law and Order Index
1st
1st
Top 3
Top 3
% of urgent incidents responded to by Police within 15 minutes
94.1 94.0 93.3 90.0
Number of fatalities due to road accidents per 100,000 population
2.19 2.23 1.78 2.3
Global ranking of Singapore’s fire fatalities per 100,000 population in the World Fire Statistics
2nd 1st 1st Top 3
% of fire and rescue calls responded to by SCDF within 8 minutes
92.0 91.7 91.3 90.0
Number of immigration offenders interdicted at Checkpoints per 100,000 travellers
24.43 23.00 20.21 21
Number of other agency cases1 interdicted at Checkpoints per 100,000 arriving traffic
81.40 84.27 76.86 76
Number of prison inmates who manage to escape 0 0 0 0
Ex-offenders’ recidivism rate over 2 years (%) 25.9 23.7 24.5 26.0
Number of drug abusers arrested per 100,000 population 80.9 85.0 86.4 84.0
Number of drug syndicates dismantled 25 26 25 24
A successful partnership with the community to maintain a safe and secure society
Public perception of Home Team’s community partnership efforts to maintain safety and security of Singapore2
4.10 4.05 4.09 4.00
1 Other agency cases refer to cases detected by ICA at the Checkpoints on behalf of other regulatory agencies (e.g. Customs, HSA). These cases will be referred to the relevant regulatory agencies for subsequent follow-up. Other agency cases exclude disposal cases where small quantities of regulated items detected by ICA may be disposed on the spot. 2 Public perception is measured on a scale of 1 to 5, 1 being the least favourable and 5 most favourable.

141
Desired Outcome Performance Indicator Actual FY2017
Actual FY2018
Revised FY2019
Estimated FY2020
A Home Team well prepared for the future
The Home Team continues to invest in science and technology to enhance operational efficiency and effectiveness. The new Home Team Science and Technology Agency (HTX) was officially launched on 2 December 2019. It will develop cutting-edge and transformative capabilities in areas core to the Home Team such as biometrics, forensics, sensors and sense-making, and chemical, biological, radiological, nuclear and explosives (CBRNE) detection and mitigation.
The Home Team is deploying technologies that can help access, analyse and act on data more quickly and effectively. Singapore Police Force (SPF) has developed a one-stop screening platform, Jarvis that allows investigation officers to comb through multiple police databases at the click of a button, cutting down search times from 20 minutes to 5 minutes per search.
Singapore Prison Service (SPS) is leveraging video analytics to enhance the safety and security of prisons and to improve operational efficiency. In FY2020, SPS will expand the pilot of advanced video analytics to detect inmate aggression in cells, and complete the trial of video analytics to detect similar aggression in an open space setting such as the yard.
Immigration & Checkpoints Authority (ICA) is transforming the immigration clearance experience for travellers without compromising on security. Under the New Clearance Concept, all travellers will be subjected to pre-arrival risk assessments based on advance information amalgamated through various data sources such as electronic arrival card, advance passenger information from airlines, and travellers’ past transactions with ICA. The large majority of low-risk travellers will be able to self-clear using the automated gates at immigration halls.
Singapore Civil Defence Force (SCDF) is enhancing the Hazardous Materials (HazMat) Incident Management System, which uses a plume modelling software integrated with real-time data (i.e. sensor data and meteorological data) to provide a holistic chemical, biological and radiological situational picture in a HazMat incident, allowing SCDF to respond effectively to these incidents.
Central Narcotics Bureau (CNB) will be deploying the Mobile Diary during operations. This portable hand-held device enables CNB officers to capture real-time electronic records of seized exhibits and incidents while at the scene. As the records are synchronised to CNB’s case management system, other investigators can access the information instantaneously, and follow up on the cases more effectively and efficiently.
Casino Regulatory Authority (CRA) is looking to develop artificial intelligence capabilities that could value-add to risk assessment, and enhance operational efficiency in CRA’s supervision of casino operations.
Singapore Corporation Of Rehabilitative Enterprises (SCORE) is seeking to digitalise its core data, and link up all its existing operational data and organise them more effectively.
Home Team Academy (HTA) will develop a new learning management system, which will incorporate features such as mobile-based learning, gamification and analytics. It will push training to the frontline and facilitate learning ‘anytime, anywhere’.
Beyond our frontline operations, the Home Team is also streamlining and improving the efficiency of our backend operations through greater automation and business process re-engineering. For example, many of our Finance and Human Resource functions will be enhanced with Robotic Process Automation (RPA) to handle high-volume, repeatable tasks such as certification of invoices, reconciliation of accounts and processing of job applicants’ curriculum vitae.


Head Q ___________
Ministry of Communications and Information


143
HEAD Q
MINISTRY OF COMMUNICATIONS AND INFORMATION
OVERVIEW
Mission Statement
We connect people to community, government and opportunity.
FY2020 EXPENDITURE ESTIMATES
Expenditure Estimates by Object Class
BLANK Actual Estimated Revised Estimated Code Object Class FY2018 FY2019 FY2019 FY2020 Change Over FY2019
BLANK
TOTAL EXPENDITURE $1,154,870,773 $1,041,500,000 $1,122,149,300 $1,041,855,700 -$80,293,600 -7.2%
Main Estimates $1,111,580,604 $987,540,000 $1,052,760,000 $1,004,918,400 -$47,841,600 -4.5%
OPERATING EXPENDITURE $1,111,580,604 $987,420,000 $1,052,640,000 $1,004,752,400 -$47,887,600 -4.5%
RUNNING COSTS $1,090,533,153 $971,431,000 $1,036,651,000 $986,461,400 -$50,189,600 -4.8%
Expenditure on Manpower $95,432,509 $87,037,800 $94,721,800 $100,177,800 $5,456,000 5.8%
1200 Political Appointments 2,156,996 2,073,400 1,950,000 2,000,000 50,000 2.6
1500 Permanent Staff 92,496,604 84,354,400 92,141,300 97,479,400 5,338,100 5.8
1600 Temporary, Daily-Rated & Other Staff 778,909 610,000 630,500 698,400 67,900 10.8
Other Operating Expenditure $140,045,261 $148,276,700 $176,116,700 $173,655,800 -$2,460,900 -1.4%
2100 Consumption of Products & Services 72,067,021 79,752,100 76,254,000 97,407,200 21,153,200 27.7
2300 Manpower Development 6,681,548 5,573,700 4,623,900 6,110,500 1,486,600 32.2
2400 International & Public Relations, Public Communications
59,388,569 61,279,500 93,591,200 68,670,900 -24,920,300 -26.6
2700 Asset Acquisition 1,907,487 1,671,400 1,643,600 1,462,200 -181,400 -11.0
2800 Miscellaneous 635 0 4,000 5,000 1,000 25.0
Grants, Subventions & Capital Injections to Organisations
$855,055,383 $736,116,500 $765,812,500 $712,627,800 -$53,184,700 -6.9%
3100 Grants, Subventions & Capital Injections to Statutory Boards
820,163,619 701,881,500 731,587,300 681,805,800 -49,781,500 -6.8
3400 Grants, Subventions & Capital Injections to Other Organisations
34,891,764 34,235,000 34,225,200 30,822,000 -3,403,200 -9.9
TRANSFERS $21,047,452 $15,989,000 $15,989,000 $18,291,000 $2,302,000 14.4%
3500 Social Transfers to Individuals 1,108,715 58,000 39,700 94,000 54,300 136.8
3600 Transfers to Institutions & Organisations 19,938,737 15,931,000 15,949,300 18,197,000 2,247,700 14.1

144
BLANK Actual Estimated Revised Estimated Code Object Class FY2018 FY2019 FY2019 FY2020 Change Over FY2019
BLANK
OTHER CONSOLIDATED FUND OUTLAYS $0 $120,000 $120,000 $166,000 $46,000 38.3%
4600 Loans and Advances (Disbursement) 0 120,000 120,000 166,000 46,000 38.3
Development Estimates $43,290,169 $54,080,000 $69,509,300 $37,103,300 -$32,406,000 -46.6%
DEVELOPMENT EXPENDITURE $43,290,169 $54,080,000 $69,509,300 $37,103,300 -$32,406,000 -46.6%
5100 Government Development 12,686,019 10,282,600 17,715,600 10,509,100 -7,206,500 -40.7
5200 Grants & Capital Injections to Organisations 30,604,150 43,797,400 51,793,700 26,594,200 -25,199,500 -48.7
Establishment List
BLANK Actual Estimated Revised Estimated Category/Personnel FY2018 FY2019 FY2019 FY2020
BLANK
POLITICAL APPOINTMENTS 3 3 3 3
Minister 1 1 1 1
Senior Minister of State 2 2 2 2
PERMANENT STAFF 648 791 794 770
Administrative 9 9 7 7
Corporate Support 6 6 5 5
Cybersecurity Professional Scheme (2017) 142 244 227 228
Driving 1 1 1 1
Information Service (2008) 106 108 120 117
Language Executive Scheme (2008) 15 17 19 19
Legal 2 2 3 3
Management Executive Scheme (2008) 313 350 362 340
Management Support Scheme (2008) 40 39 35 35
Management Support Scheme (Language Officer) 1 1 1 1
Operations Support 2 2 2 2
Shorthand Writers 2 2 2 2
Technical Support Scheme (2008) 9 10 10 10
OTHERS 1,809 1,935 1,961 2,101
Info-Communications Media Development Authority 815 920 933 1,073
National Library Board 994 1,015 1,028 1,028
TOTAL 2,460 2,729 2,758 2,874

145
FY2019 BUDGET
The Ministry of Communications and Information (MCI)’s revised FY2019 total expenditure is projected to be $1.12 billion. This is a decrease of $32.72 million or 2.8% from FY2018 actual expenditure. The revised FY2019 operating expenditure of $1.05 billion is $58.94 million or 5.3% lower than the actual FY2018 operating expenditure. The decrease in FY2019 is mainly due to lower expenditure on Public Service Broadcast and transfer of DesignSingapore Council to Ministry of Trade and Industry with effect from FY2019. The revised FY2019 development expenditure of $69.51 million is an increase of $26.22 million or 60.6% compared to the actual FY2018 development expenditure. The increase in FY2019 is mainly due to higher expenditure on upgrading of libraries and projects under Cyber Security Agency of Singapore (CSA). FY2020 BUDGET The FY2020 budgetary provision is projected to be $1.04 billion, which is $80.29 million or 7.2% lower than the revised FY2019 total expenditure. Of this, $1.00 billion or 96.4% will be apportioned as operating expenditure and $37.10 million or 3.6% as development expenditure. Operating Expenditure
Out of the FY2020 operating budget of $1.00 billion, $429.13 million or 42.7% will be allocated to the Info-communications Media Development Authority (IMDA) Programme, $252.68 million or 25.1% to the National Library Board (NLB) Programme, $241.71 million or 24.1% to the MCI Headquarters Administration and Information Programmes, and $81.24 million or 8.1% to the CSA Programme. The lower expenditure in FY2020 is mainly due to reduced operating grants to Statutory Boards and programmes completed in FY2019.
Administration and Information Programmes
An operating budget of $125.78 million has been allocated to MCI Headquarters Administration Programme in FY2020. Under this programme, MCI Headquarters sets strategic policy directions for the infocomm and media industries and libraries, and drives the corporate management and planning functions to enable the Ministry to achieve its vision and desired outcomes.
An operating budget of $115.93 million has been allocated to MCI Headquarters Information Programme in FY2020 to carry out its functions to coordinate whole-of-government public communication messages and provide strategic support on media management.
National Library Board Programme
The NLB nurtures readers for life, develops learning communities, builds a knowledgeable nation and encourages appreciation of Singapore’s history and heritage through the National Library and a network of 26 Public Libraries. An operating budget of $252.68 million has been provided to NLB in FY2020 to embark on its functions.
Info-communications Media Development Authority Programme
The IMDA leads Singapore’s digital transformation with infocomm media. An operating budget of $429.13 million has been provided to IMDA in FY2020 to achieve its mission. Cyber Security Agency Programme
The CSA aims to create a resilient and trusted cyber environment for Singapore. An operating budget of $81.24 million has been provided to CSA in FY2020 to carry out its functions.

146
Development Expenditure
The projected development expenditure for FY2020 is $37.10 million, which is $32.41 million or 46.6% lower than the revised FY2019 provision. The decrease is mainly due to projects completed in FY2019. Other Consolidated Fund Outlays
Advances
Advances for FY2020 are projected to be $0.17 million, mainly to cater for officers going on overseas attachment.

147
Total Expenditure by Programme
BLANK Running Operating Development Total Code Programme Costs Transfers Expenditure Expenditure Expenditure BLANK Q-A Administration 125,740,700 37,000 125,777,700 7,353,000 133,130,700 Q-B Information 97,679,200 18,254,000 115,933,200 0 115,933,200 Q-J National Library Board 252,675,900 0 252,675,900 16,806,600 269,482,500 Q-S Info-communications Media Development Authority 429,129,900 0 429,129,900 8,698,400 437,828,300 Q-T Cyber Security Agency of Singapore 81,235,700 0 81,235,700 4,245,300 85,481,000
Total $986,461,400 $18,291,000 $1,004,752,400 $37,103,300 $1,041,855,700
Development Expenditure by Project
BLANK Actual Expenditure Up to end of
BLANK BLANK Total Actual Estimated Revised Estimated Project Title Project Cost FY2017 FY2018 FY2019 FY2019 FY2020
BLANK
DEVELOPMENT EXPENDITURE … … $43,290,169 $54,080,000 $69,509,300 $37,103,300
GOVERNMENT DEVELOPMENT … … 12,686,019 10,282,600 17,715,600 10,509,100
Administration Programme … … 2 2 2 2
Minor Development Projects … … 7,827,984 4,686,100 8,291,600 4,263,800
New Projects … … 0 1,550,000 0 2,000,000
Cyber Security Agency of Singapore Programme … … 2 2 2 2
Minor Development Projects … … 49,001 460,000 6,632,300 870,000 CSA's 5-year Capability Build Up Plan 27,090,000 0 4,500,000 3,586,500 2,791,700 3,375,300
Completed Projects … … 309,034 0 0 0
GRANTS & CAPITAL INJECTIONS TO ORGANISATIONS … … 30,604,150 43,797,400 51,793,700 26,594,200
Administration Programme … … 1 1 1 1
Minor Development Projects … … 0 780,400 503,800 1,089,200
National Library Board Programme … … 3 3 3 3
Punggol Regional Library 61,656,100 6,565,669 5,319,086 15,189,100 21,214,200 7,099,000 Libraries of the Future (LOTF) Masterplan 47,441,300 17,144,110 3,769,437 4,768,900 4,040,300 7,703,900 Collecting and Preserving our Heritage and History 5,159,400 0 0 2,377,300 2,248,800 2,003,700
Info-communications Media Development Authority Programme
… … 3 3 3 3
Infocomm Media 2025 16,250,000 366,600 0 1,655,600 3,775,000 2,950,400 Infocomm Media Operations Centre 40,010,000 1,270,000 2,993,380 12,297,300 16,155,000 5,232,000 PDPC's Common Personal Data Breach Notification System
690,000 0 0 0 40,500 516,000
Completed Projects … … 18,522,247 6,728,800 3,816,100 0

148
KEY PERFORMANCE INDICATORS
Desired Outcomes
• A connected and inclusive Digital Society
• Strong and mutual trust between people and the government
• An open and globally-connected Digital Economy
• A resilient and secure cyberspace for all
Key Performance Indicators
Desired Outcome Performance Indicator Actual
FY2017 Actual
FY2018 Revised FY2019
Estimated FY2020
A connected and inclusive Digital Society
Library Reach Index (%)1 81.4 80.3 72.5 > 70.0
Public Satisfaction with Public Service Broadcast (PSB) (%)2
72 76 75 75
Percentage of Resident Households with Access to Broadband (%)
91 97 TBC3 > 95
Strong and mutual trust between people and the government
Government Communications Index4 NIL 6.2 (out of 9)
NIL
6.5 (out of 9)5
Public Engagement Index6 NIL
5.8 (out of 9)
NIL NIL7
An open and globally-connected Digital Economy
Composite International Infocomm Rankings Index
3rd8
1st
2nd
NIL9
Value-Add of Infocomm and Media (ICM) Sectors ($billion)10
38.3611
39.88
TBC12
TBC13
Value-Add per Worker of ICM Sectors ($)14 180,94915 183,784 TBC16 TBC
1 The survey asked for Singapore residents’ engagement with NLB within a 12-month period from July to June/July the following year. Since FY2016, Library Reach Index has been included to reflect the proportion of unique Singapore residents who have visited our libraries and/or accessed NLB’s content through our programmes and services. 2 This indicator measures public satisfaction levels against key desired attributes of the PSB programmes – programme quality, engagement and informative value, and public service value. 2019 and 2020 figures are targets, not forecasts/estimates. 3 The result for FY2019 is not available before production of the budget document. 4 This indicator measures the perceived effectiveness of government communications. It is tracked through MCI’s Government Communications Study. Next study will be conducted in 2020. 5 This figure is a target. 6 This indicator measures the perceived effectiveness of public engagement. It is tracked through MCI’s Government Communications Study. Next study will be conducted in 2020. 7 MCI has proposed that we share ownership of this indicator with MCCY. As we are still in the midst of discussing this, there are no projections for 2020. 8 Review of the index conducted in 2018. 2017’s ranking is updated based on the revised Composite Index. 9 MCI understands that the International Telecommunication Union is revising its methodology for this index. As such, it will be difficult to provide projections or targets without having sight of the new methodology. 10 The figures are reported on a CY basis and are based on nominal value added. 11 Updated to reflect DOS adjusted figures. 12 2019 and 2020 figures are not available. 13 Due to current economic situation, past data used to project future estimates might not be a good reflection/estimate. 14 The figures are reported on a CY basis and are based on nominal value added. 15 Updated to reflect DOS adjusted figures. 16 2019 and 2020 figures are not available.

Head R ___________
Ministry of Law

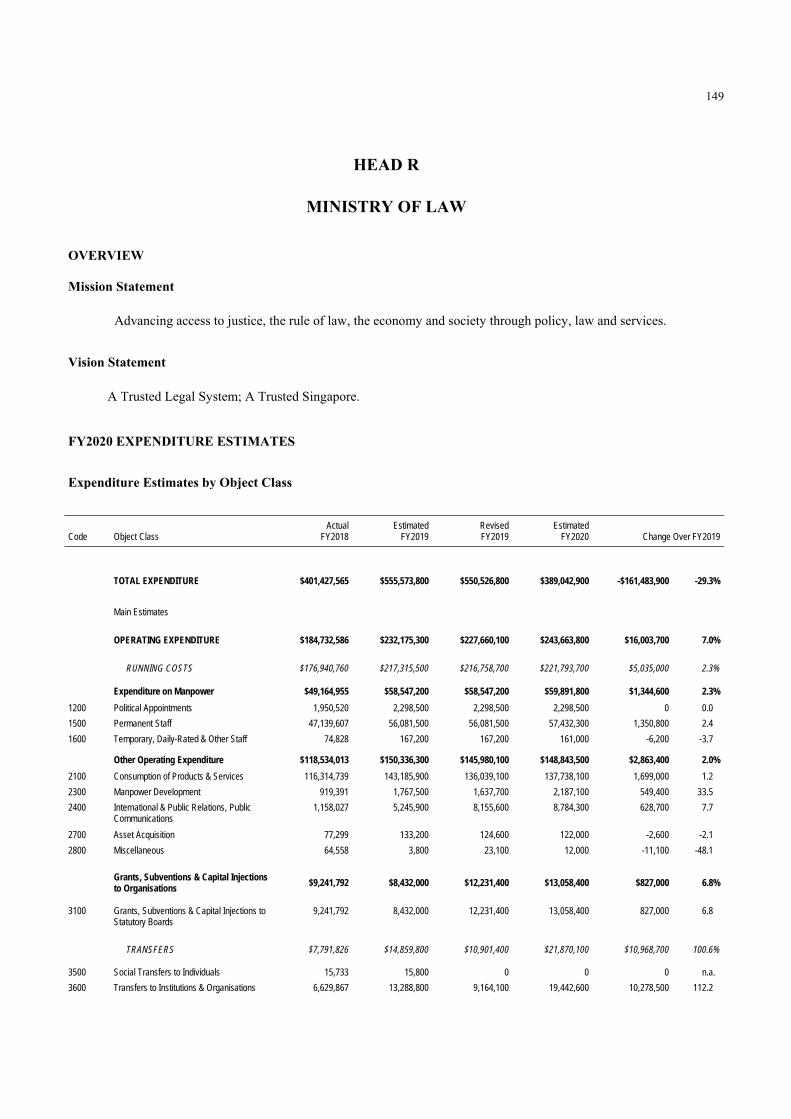
149
HEAD R
MINISTRY OF LAW
OVERVIEW
Mission Statement
Advancing access to justice, the rule of law, the economy and society through policy, law and services.
Vision Statement
A Trusted Legal System; A Trusted Singapore.
FY2020 EXPENDITURE ESTIMATES
Expenditure Estimates by Object Class
BLANK Actual Estimated Revised Estimated Code Object Class FY2018 FY2019 FY2019 FY2020 Change Over FY2019
BLANK
TOTAL EXPENDITURE $401,427,565 $555,573,800 $550,526,800 $389,042,900 -$161,483,900 -29.3%
Main Estimates $184,732,586 $232,175,300 $227,660,100 $243,663,800 $16,003,700 7.0%
OPERATING EXPENDITURE $184,732,586 $232,175,300 $227,660,100 $243,663,800 $16,003,700 7.0%
RUNNING COSTS $176,940,760 $217,315,500 $216,758,700 $221,793,700 $5,035,000 2.3%
Expenditure on Manpower $49,164,955 $58,547,200 $58,547,200 $59,891,800 $1,344,600 2.3%
1200 Political Appointments 1,950,520 2,298,500 2,298,500 2,298,500 0 0.0
1500 Permanent Staff 47,139,607 56,081,500 56,081,500 57,432,300 1,350,800 2.4
1600 Temporary, Daily-Rated & Other Staff 74,828 167,200 167,200 161,000 -6,200 -3.7
Other Operating Expenditure $118,534,013 $150,336,300 $145,980,100 $148,843,500 $2,863,400 2.0%
2100 Consumption of Products & Services 116,314,739 143,185,900 136,039,100 137,738,100 1,699,000 1.2
2300 Manpower Development 919,391 1,767,500 1,637,700 2,187,100 549,400 33.5
2400 International & Public Relations, Public Communications
1,158,027 5,245,900 8,155,600 8,784,300 628,700 7.7
2700 Asset Acquisition 77,299 133,200 124,600 122,000 -2,600 -2.1
2800 Miscellaneous 64,558 3,800 23,100 12,000 -11,100 -48.1
Grants, Subventions & Capital Injections to Organisations
$9,241,792 $8,432,000 $12,231,400 $13,058,400 $827,000 6.8%
3100 Grants, Subventions & Capital Injections to Statutory Boards
9,241,792 8,432,000 12,231,400 13,058,400 827,000 6.8
TRANSFERS $7,791,826 $14,859,800 $10,901,400 $21,870,100 $10,968,700 100.6%
3500 Social Transfers to Individuals 15,733 15,800 0 0 0 n.a.
3600 Transfers to Institutions & Organisations 6,629,867 13,288,800 9,164,100 19,442,600 10,278,500 112.2

150
BLANK Actual Estimated Revised Estimated Code Object Class FY2018 FY2019 FY2019 FY2020 Change Over FY2019
BLANK 3800 International Organisations & Overseas
Development Assistance 1,146,226 1,555,200 1,737,300 2,427,500 690,200 39.7
OTHER CONSOLIDATED FUND OUTLAYS
$31,953,999 $37,522,200 $32,626,000 $39,630,000 $7,004,000 21.5%
4100 Expenses on Land Sales 31,953,999 37,522,200 32,626,000 39,630,000 7,004,000 21.5
Development Estimates $216,694,980 $323,398,500 $322,866,700 $145,379,100 -$177,487,600 -55.0%
DEVELOPMENT EXPENDITURE $216,694,980 $323,398,500 $322,866,700 $145,379,100 -$177,487,600 -55.0%
5100 Government Development 215,951,781 322,470,800 321,939,000 144,201,100 -177,737,900 -55.2
5200 Grants & Capital Injections to Organisations
743,198 927,700 927,700 1,178,000 250,300 27.0
Establishment List
BLANK Actual Estimated Revised Estimated Category/Personnel FY2018 FY2019 FY2019 FY2020
BLANK
POLITICAL APPOINTMENTS 2 2 2 2
Minister 1 1 1 1
Senior Minister of State 1 1 1 1
PERMANENT STAFF 470 468 490 492
Administrative 9 9 9 9
Commissioner of Appeals 1 1 1 1
Information Service (2008) 3 3 3 3
Legal 60 60 69 69
Management Executive Scheme (2008) 190 188 201 203
Management Support Scheme (2008) 207 207 207 207
OTHERS 552 555 557 550
Singapore Land Authority 552 555 557 550
TOTAL 1,024 1,025 1,049 1,044

151
FY2019 BUDGET
The revised total expenditure of the Ministry of Law (MinLaw) (excluding agency fees for land sales and land-related expenditure) in FY2019 is estimated to be $550.53 million, which is $149.10 million or 37.1% higher than the actual FY2018 expenditure of $401.43 million.
Operating Expenditure
The revised operating expenditure in FY2019 is estimated to be $227.66 million, which is $42.93 million or 23.2% higher than the actual FY2018 expenditure of $184.73 million. This increase is mainly due to higher agency fees and higher manpower costs.
Development Expenditure
The Ministry’s development expenditure in FY2019 is estimated to be $322.87 million, which is $106.17 million or 49.0% higher than the actual FY2018 expenditure of $216.69 million. The increase in expenditure is mainly due to higher projected land acquisition expenditure in FY2019.
Other Consolidated Fund Outlays
The revised agency fees for land sales in FY2019 is $32.63 million, an increase of $0.67 million or 2.1% over the actual FY2018 expenditure of $31.95 million.
FY2020 BUDGET
The total expenditure of MinLaw for FY2020 (excluding agency fees for land sales and land-related expenditure) is projected to be $389.04 million, a decrease of $161.48 million or 29.3% from the revised FY2019 expenditure of $550.53 million. Of the total projected FY2020 expenditure, $243.66 million or 62.6% is for operating expenditure whilst $145.38 million or 37.4% is for development expenditure.
Operating Expenditure
The FY2020 provision of $243.66 million is an increase of $16.00 million or 7.0% from the revised FY2019 operating expenditure of $227.66 million. This increase is mainly due to higher agency fees and higher operating grants.
Development Expenditure
The FY2020 development expenditure provision of $145.38 million is a decrease of $177.49 million or 55.0% from the revised FY2019 provision of $322.87 million. The decrease is mainly due to lower land acquisition compensation expenditure anticipated in FY2020 compared to revised FY2019. Other Consolidated Fund Outlays
The total agency fees for land sales projected for FY2020 is $39.63 million, an increase of $7.00 million or 21.5% from the revised FY2019 provision of $32.63 million. The agency fees for land sales is projected to be higher in FY2020 due to more sale sites with higher agency fees.

152
Total Expenditure by Programme
BLANK Running Operating Development Total Code Programme Costs Transfers Expenditure Expenditure Expenditure
BLANK
R-A Management and Policies 40,705,700 21,870,100 62,575,800 7,435,900 70,011,700
R-B Information Technology and Data Management 15,404,100 0 15,404,100 0 15,404,100
R-D Appeals Board 231,100 0 231,100 0 231,100
R-E Public Trustee 1,898,700 0 1,898,700 0 1,898,700
R-F Registries of Moneylenders and Pawnbrokers 3,132,900 0 3,132,900 0 3,132,900
R-G Insolvency 7,228,100 0 7,228,100 0 7,228,100
R-I Legal Aid 7,189,200 0 7,189,200 62,400 7,251,600
R-J Support Services 26,580,000 0 26,580,000 0 26,580,000
R-N Lands and Properties Administration 118,474,600 0 118,474,600 137,880,800 256,355,400
R-O Community Mediation 949,300 0 949,300 0 949,300
Total $221,793,700 $21,870,100 $243,663,800 $145,379,100 $389,042,900
Development Expenditure by Project
BLANK Actual
Expenditure Up to end of
BLANK
BLANK Total Actual Estimated Revised Estimated Project Title Project Cost FY2017 FY2018 FY2019 FY2019 FY2020
BLANK
DEVELOPMENT EXPENDITURE … … $216,694,980 $323,398,500 $322,866,700 $145,379,100
GOVERNMENT DEVELOPMENT … … 215,951,781 322,470,800 321,939,000 144,201,100
Management and Policies Programme … … 3 3 3 3
Refurbishment of 28 Maxwell Road 35,100,000 4,781,569 15,677,121 14,853,600 3,925,000 682,000
Minor Development Projects … … 2,067,735 5,346,900 3,832,600 2,594,700
New Projects … … 0 2,742,200 2,742,200 2,981,200
Legal Aid Programme … … 1 1 1 1
LAB Case System 0 3,572,313 147,989 261,600 261,600 62,400
Lands and Properties Administration Programme … … 10 10 10 10
New Projects … … 0 20,802,500 12,735,700 31,141,100
Remediation of former Kallang Gasworks 26,940,000 245,628 3,178,160 20,000,000 17,956,700 5,130,500
Environmental Site Assessment and Consultancy Services at Pasir Panjang
3,150,000 675,655 20,690 0 12,500 6,000
Restoration of Sultan Properties 6,210,000 1,069,452 1,460,064 0 315,100 1,000,000
Proposed Restoration works at 9 & 15 Stadium Link (former Kallang Airport)
8,981,300 0 1,177,670 0 844,700 3,250,000
Improving infrastructure of offshore islands 20,750,000 0 0 0 7,786,500 108,500
Remediation works at Kampong Bugis (aka: Additional funding for Remediation works at Kampong Bugis)
39,000,000 0 0 0 0 2,869,500
Land Essential Works 39,825,000 0 0 0 445,000 310,000
Land Acquisition for General Development 0 9,220,074,603 184,404,998 258,114,500 268,069,600 91,974,800

153
BLANK Actual
Expenditure Up to end of
BLANK
BLANK Total Actual Estimated Revised Estimated Project Title Project Cost FY2017 FY2018 FY2019 FY2019 FY2020
BLANK
Improvement to State Lands / Provision of Amenities 0 205,713,484 6,423,835 349,500 2,956,200 2,090,400
Completed Projects … … 1,393,520 0 55,600 0
GRANTS & CAPITAL INJECTIONS TO ORGANISATIONS … … 743,198 927,700 927,700 1,178,000
Management and Policies Programme … … 1 1 1 1
Minor Development Projects … … 743,198 927,700 927,700 1,178,000

154
KEY PERFORMANCE INDICATORS
Desired Outcomes
• A sound and progressive legal framework;
• Access to legal help for low income residents;
• Accessible and effective community mediation services;
• An efficient public trustee system;
• A vibrant legal services sector;
• A sound and efficient insolvency regime;
• Optimal use of land resources;
• An efficient and reliable land titles registration system; and
• A robust intellectual property infrastructure. Key Performance Indicators Actual Actual Revised Estimated
Desired Outcome Performance Indicator FY2017 FY2018 FY2019 FY2020 A sound and progressive legal framework World ranking of Singapore's legal framework in the Institute of
Management Development’s World Competitiveness Yearbook
2nd 2nd 1st Top 5
World ranking of Singapore's legal framework in the World Economic Forum’s Global Competitiveness Report - Settling Disputes
1st 1st 1st Top 5
Access to legal help for low income residents
% assistance and aid cases completed by the Legal Aid Bureau within the respective performance standards of the services 1◊
911 931 94^ >95
Accessible and effective community mediation services
Settlement rate of cases mediated by the Community Mediation Centre (%) ◊
78 81 81^ >76
An efficient public trustee system % of beneficiaries of un-nominated CPF monies and small estates who received the distribution from Public Trustee within four weeks of receipt of complete documentation and monies
100 98 100^ >95
A vibrant legal services sector Nominal value-add of the legal services sector ($ billions) ◊ 2.152 2.332 2.39^ 2.48
A sound and efficient insolvency regime % of discharged bankruptcy cases where all dividends are paid to creditors within 4 weeks of discharge
98 38.2 98^ >95
World ranking in Ease of Resolving Insolvency in the World Bank Doing Business Survey
27th
27th
27th
25th
Optimal use of land resources Utilisation rate of State land available for use (%) 95.4 95.1 94.6^ 95
Occupancy rate of usable state properties managed (%) 96.4 96.9
98.1^
95
An efficient and reliable land titles registration system
World ranking in registering properties in the World Bank Doing Business Survey
19th 21st 21st 13th
A robust intellectual property infrastructure World ranking of Singapore's intellectual property protection in the World Economic Forum's Global Competitiveness Report
3rd 3rd 2rd Top 5
1 KPI methodology updated, figures updated to reflect new methodology. 2 Updated with latest figures from Department of Statistics. ^ Current estimates. ◊ KPI published on CY not FY basis

Head S ___________
Ministry of Manpower


155
HEAD S
MINISTRY OF MANPOWER
OVERVIEW
Mission Statement
To develop a productive workforce and progressive workplaces, for Singaporeans to have better jobs and a secure retirement.
FY2020 EXPENDITURE ESTIMATES
Expenditure Estimates by Object Class
BLANK Actual Estimated Revised Estimated Code Object Class FY2018 FY2019 FY2019 FY2020 Change Over FY2019
BLANK
TOTAL EXPENDITURE $1,759,981,643 $1,978,625,700 $2,028,668,400 $2,483,855,900 $455,187,500 22.4%
Main Estimates $1,724,387,937 $1,910,685,500 $1,960,728,200 $2,433,064,700 $472,336,500 24.1%
OPERATING EXPENDITURE $1,724,387,937 $1,910,685,500 $1,960,728,200 $2,433,064,700 $472,336,500 24.1%
RUNNING COSTS $650,252,890 $791,550,700 $826,849,700 $609,182,900 -$217,666,800 -26.3%
Expenditure on Manpower $185,971,004 $185,763,200 $184,235,200 $186,674,900 $2,439,700 1.3%
1200 Political Appointments 1,943,536 1,823,900 1,828,300 1,828,300 0 0.01500 Permanent Staff 184,027,468 183,939,300 182,406,900 184,846,600 2,439,700 1.3
Other Operating Expenditure $226,001,524 $237,258,500 $228,320,400 $228,848,100 $527,700 0.2%
2100 Consumption of Products & Services 213,186,149 208,748,600 215,219,400 216,173,400 954,000 0.42300 Manpower Development 5,048,570 6,489,200 5,146,100 5,407,000 260,900 5.12400 International & Public Relations, Public
Communications 6,537,413 21,154,700 6,789,000 6,106,100 -682,900 -10.1
2700 Asset Acquisition 1,096,107 859,400 1,075,600 1,072,400 -3,200 -0.32800 Miscellaneous 133,285 6,600 90,300 89,200 -1,100 -1.2
Grants, Subventions & Capital Injections to Organisations
$238,280,362 $368,529,000 $414,294,100 $193,659,900 -$220,634,200 -53.3%
3100 Grants, Subventions & Capital Injections to Statutory Boards
238,280,362 368,529,000 414,294,100 193,659,900 -220,634,200 -53.3
TRANSFERS $1,074,135,047 $1,119,134,800 $1,133,878,500 $1,823,881,800 $690,003,300 60.9%
3500 Social Transfers to Individuals 987,766,135 1,045,475,900 1,020,656,900 1,483,724,000 463,067,100 45.4 3600 Transfers to Institutions & Organisations 84,086,087 71,758,900 110,851,500 337,941,100 227,089,600 204.9 3800 International Organisations & Overseas
Development Assistance 2,282,825 1,900,000 2,370,100 2,216,700 -153,400 -6.5
Development Estimates $35,593,706 $67,940,200 $67,940,200 $50,791,200 -$17,149,000 -25.2%
DEVELOPMENT EXPENDITURE $35,593,706 $67,940,200 $67,940,200 $50,791,200 -$17,149,000 -25.2%
5100 Government Development 34,912,787 67,940,200 45,203,500 29,795,100 -15,408,400 -34.15200 Grants & Capital Injections to Organisations 680,919 0 22,736,700 20,996,100 -1,740,600 -7.7

156
Establishment List
BLANK Actual Estimated Revised Estimated Category/Personnel FY2018 FY2019 FY2019 FY2020
BLANK
POLITICAL APPOINTMENTS 3 3 3 3
Minister 2 1 1 1
Minister of State 1 1 1 1
Senior Parliamentary Secretary 0 1 1 1
OTHER STATUTORY APPOINTMENTS 1 1 1 1
President, Industrial Arbitration Court 1 1 1 1
PERMANENT STAFF 1,631 1,610 1,623 1,636
Accounting Profession (2008) 4 4 4 4
Administrative 11 11 11 11
Corporate Support 51 49 43 43
Deputy President, Industrial Arbitration Court 1 1 1 1
Economist Service 4 4 4 4
Engineering Profession (Manpower) 86 89 96 100
Legal 5 5 5 5
Management Executive Scheme (2008) 1,076 1,090 1,110 1,115
Management Support Scheme (2008) 312 280 280 280
Management Support Scheme (Language Officer) 2 2 2 2
Medical Scheme (Manpower) 8 8 8 8
Operations Support 2 1 0 0
Scientific Profession (Manpower) (2008) 1 1 1 1
Shorthand Writers 7 7 7 7
Statistician (Manpower) (2008) 26 26 26 30
Technical Support Scheme (2008) 35 32 25 25
TEMPORARY, DAILY-RATED & OTHER STAFF 197 263 177 193
Engineering Profession (Manpower) 17 20 23 23
Management Executive Scheme (2008) 172 232 142 155
Management Support Scheme (2008) 1 1 3 3
Statistician (Manpower) (2008) 7 10 9 12
OTHERS 391 394 411 427
Workforce Singapore 391 394 411 427
TOTAL 2,223 2,271 2,215 2,260
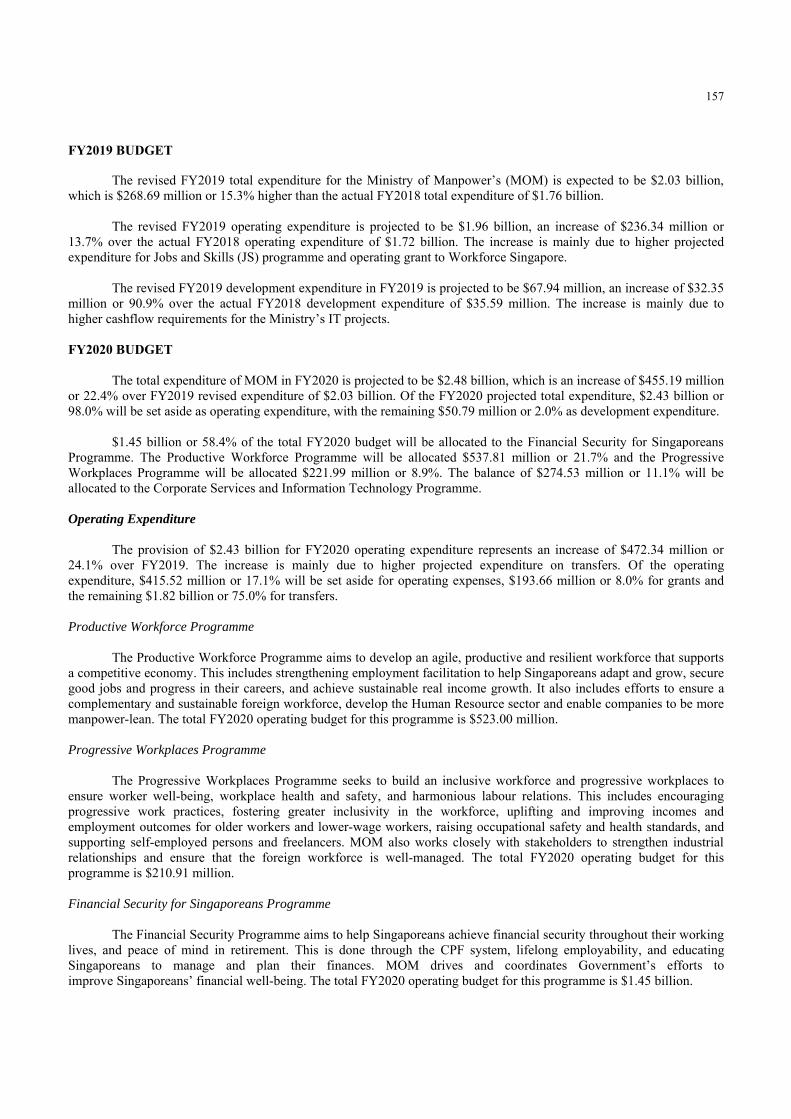
157
FY2019 BUDGET
The revised FY2019 total expenditure for the Ministry of Manpower’s (MOM) is expected to be $2.03 billion, which is $268.69 million or 15.3% higher than the actual FY2018 total expenditure of $1.76 billion.
The revised FY2019 operating expenditure is projected to be $1.96 billion, an increase of $236.34 million or 13.7% over the actual FY2018 operating expenditure of $1.72 billion. The increase is mainly due to higher projected expenditure for Jobs and Skills (JS) programme and operating grant to Workforce Singapore.
The revised FY2019 development expenditure in FY2019 is projected to be $67.94 million, an increase of $32.35 million or 90.9% over the actual FY2018 development expenditure of $35.59 million. The increase is mainly due to higher cashflow requirements for the Ministry’s IT projects.
FY2020 BUDGET
The total expenditure of MOM in FY2020 is projected to be $2.48 billion, which is an increase of $455.19 million or 22.4% over FY2019 revised expenditure of $2.03 billion. Of the FY2020 projected total expenditure, $2.43 billion or 98.0% will be set aside as operating expenditure, with the remaining $50.79 million or 2.0% as development expenditure.
$1.45 billion or 58.4% of the total FY2020 budget will be allocated to the Financial Security for Singaporeans Programme. The Productive Workforce Programme will be allocated $537.81 million or 21.7% and the Progressive Workplaces Programme will be allocated $221.99 million or 8.9%. The balance of $274.53 million or 11.1% will be allocated to the Corporate Services and Information Technology Programme.
Operating Expenditure
The provision of $2.43 billion for FY2020 operating expenditure represents an increase of $472.34 million or 24.1% over FY2019. The increase is mainly due to higher projected expenditure on transfers. Of the operating expenditure, $415.52 million or 17.1% will be set aside for operating expenses, $193.66 million or 8.0% for grants and the remaining $1.82 billion or 75.0% for transfers.
Productive Workforce Programme
The Productive Workforce Programme aims to develop an agile, productive and resilient workforce that supports a competitive economy. This includes strengthening employment facilitation to help Singaporeans adapt and grow, secure good jobs and progress in their careers, and achieve sustainable real income growth. It also includes efforts to ensure a complementary and sustainable foreign workforce, develop the Human Resource sector and enable companies to be more manpower-lean. The total FY2020 operating budget for this programme is $523.00 million.
Progressive Workplaces Programme
The Progressive Workplaces Programme seeks to build an inclusive workforce and progressive workplaces to ensure worker well-being, workplace health and safety, and harmonious labour relations. This includes encouraging progressive work practices, fostering greater inclusivity in the workforce, uplifting and improving incomes and employment outcomes for older workers and lower-wage workers, raising occupational safety and health standards, and supporting self-employed persons and freelancers. MOM also works closely with stakeholders to strengthen industrial relationships and ensure that the foreign workforce is well-managed. The total FY2020 operating budget for this programme is $210.91 million.
Financial Security for Singaporeans Programme
The Financial Security Programme aims to help Singaporeans achieve financial security throughout their working lives, and peace of mind in retirement. This is done through the CPF system, lifelong employability, and educating Singaporeans to manage and plan their finances. MOM drives and coordinates Government’s efforts to improve Singaporeans’ financial well-being. The total FY2020 operating budget for this programme is $1.45 billion.

158
Corporate Services and Information Technology Programme
The Corporate Services and Information Technology Programme covers the setting of broad policy and strategic directions for the Ministry, legal and prosecution services, customer responsiveness and communications. It also includes central management and administration functions, such as information systems and technology, finance, human resource management, internal audit and facilities management, as well as efforts to improve processes and raise productivity. The total FY2020 operating budget for this programme is $249.63 million.
Development Expenditure
The provision of $50.79 million for FY2020 is a decrease of $17.15 million or 25.2% from the revised FY2019 development expenditure of $67.94 million. The decrease is mainly due to lower cashflow requirements for IT projects in the Ministry.

159
Total Expenditure by Programme
BLANK Running Operating Development Total Code Programme Costs Transfers Expenditure Expenditure Expenditure
BLANK S-Q Financial Security for Singaporeans 45,803,100 1,403,724,000 1,449,527,100 0 1,449,527,100 S-R Corporate Services and Information Technology 130,484,100 119,142,500 249,626,600 24,904,700 274,531,300 S-S Productive Workforce 316,444,300 206,555,700 523,000,000 14,808,700 537,808,700 S-T Progressive Workplaces 116,451,400 94,459,600 210,911,000 11,077,800 221,988,800
Total $609,182,900 $1,823,881,800 $2,433,064,700 $50,791,200 $2,483,855,900
Development Expenditure by Project
BLANK Actual Expenditure Up to end of
BLANK BLANK Total Actual Estimated Revised Estimated Project Title Project Cost FY2017 FY2018 FY2019 FY2019 FY2020
BLANK
DEVELOPMENT EXPENDITURE … … $35,593,706 $67,940,200 $67,940,200 $50,791,200
GOVERNMENT DEVELOPMENT … … 34,912,787 67,940,200 45,203,500 29,795,100
Corporate Services and Information Technology Programme
… … 5 5 5 5
MOM Digital Services 2,927,000 2,588,734 0 263,100 129,100 159,800
Development of Real-time Data Infrastructure (RDI) 6,635,200 493,297 3,552,309 2,211,900 1,774,900 651,700
Migration of MOM Applications from Government Cloud (G-cloud) to Government Commercial Cloud (GCC)
5,500,900 0 0 0 4,477,200 819,000
Digital eXperience+ (DX+) 1,646,400 0 0 0 804,600 673,400
Minor Development Projects … … 5,834,373 1,734,900 4,200,500 1,604,700
Productive Workforce Programme … … 3 3 3 3
Purchase of 1 Card Print Laser Engraver for Work Passes
3,106,800 193,695 1,094,380 1,454,700 206,700 589,100
Future-Ready Work Pass Integrated System (WINS) 101,236,500 13,430,768 11,890,476 43,244,800 24,243,800 9,604,600
Development of Survey Management System 7,760,300 0 0 0 1,583,000 4,615,000
Progressive Workplaces Programme … … 4 4 4 4
Labour Relations and Workplaces Division (LRWD) Enforcement Management System
6,607,400 1,327,230 1,598,287 2,980,000 1,225,100 1,965,400
A Future-Ready Fair and Progressive Work Practices System (iWORK)
20,153,400 0 0 0 339,700 8,135,800
Integrated Foreign Manpower Management System 35,620,900 31,556,216 50,250 1,714,200 0 976,600
Completed Projects … … 10,892,712 14,336,600 6,218,900 0
GRANTS & CAPITAL INJECTIONS TO ORGANISATIONS … … 680,919 0 22,736,700 20,996,100
Corporate Services and Information Technology Programme
… … 3 3 3 3
Emerging Cross-Cutting Issues (ECCI) Workgroup Recommendations for Effective & Sustainable Policy Delivery: Development of Citizen Disbursement IT System
44,130,000 0 0 0 5,581,800 10,342,900
Minor Development Projects … … 350,795 0 2,439,100 1,131,600
New Projects … … 0 0 8,224,000 9,521,600
Completed Projects … … 330,124 0 6,491,800 0

160
KEY PERFORMANCE INDICATORS
Desired Outcomes • Productive Workforce
• Financial Security for Singaporeans • Progressive Workplaces
Service Excellence
Key Performance Indicators
Desired Outcome Performance Indicator Actual Actual Revised Estimated
FY2017 FY2018 FY2019 FY2020
Productive Workforce Resident long-term unemployment rate (%)1,2 0.8 0.7 NA NA
Resident employment rate (age 25-64) (%)2,3 80.7 80.3 80.8 NA
Female resident employment rate (aged 25-64) (%)2,3 72.4 72.3 72.9 NA
Labour Force Evaluation Measure by Business Environment Risk Intelligence (BERI)4
1st 1st 1st NA
World Competitiveness Yearbook by Institute for Management Development (IMD), (Labour Market Sub-Factor)4
11th 10th 8th NA
Global Competitiveness Report by World Economic Forum (WEF), (Labour Market Efficiency)4
2nd 2nd 1st NA
No. of job placements5,6 25,601 30,000 30,000 NA
Cohort-based placement rate (%)7,12 59.1 60.0 65.0 65.0
Financial Security for Singaporeans % of active CPF members who are able to meet the required retirement sum at age 55 5,8
57 59 62 64
Resident employment rate (age 60-64) (%)2,3
Resident employment rate (age 65-69) (%)2,3
61.6
41.7
60.4
42.3
62.3
44.6
NA
NA
Progressive Workplaces Workplace fatal injuries per 100,000 employees5 1.2 1.2 1.2 ≤1.15
Major Injuries per 100,000 employees5 16.9 17.4 18.1 ≤16.0
No. of collective disputes per unionised establishment5,9 0.05 0.06 0.05 0.05
No. of individual disputes per 1,000 employees5,9 3.03 2.97 3.27 3.12
Employment offences per 1,000 employed persons5,10 14.63 10.82 13.57 13.06
Service Excellence Customer Satisfaction Index (%)5,11 65 70 74 74
1 This figure is only available annually at the end of CY2019. The actual 2019 figure will be available in mid-Mar 2020. 2 2020 estimate is unavailable as Ministry of Manpower (MOM) does not provide forecasts for employment creation, employment and unemployment rates as they are difficult to project accurately. However, we monitor the trends closely to guide policy interventions. 3 Figures reported are as at June of the CY based on the Comprehensive Labour Force Survey conducted annually. 4 2020 estimates are unavailable as information is provided annually by the respective external sources. 5 Figures are tracked by CY. 6 Figures refer to unique counts of jobseekers placed under the Adapt & Grow initiative, which include placements from WSG’s Careers Connect, NTUC’s e2i centres, Professional Conversion Programmes, P-Max and other A&G programmes. 7 Figures refer to the proportion of jobseekers who were placed within 6 months after registering with WSG/e2i for assistance. 8 The actual CY2019 figure will be available in end Feb 2020. 9 “Collective disputes” refer to disputes of a collective nature and affect a group of union members (e.g. disputes relating to Collective Agreements, NWC implementation, Condition of Service, Retrenchment Benefits, Bonus payments). 10 This KPI tracks the offence rates of MOM’s key legislations, i.e. the Employment Act, the Employment of Foreign Manpower Act, the Workplace Safety and Health Act and the Work Injury Compensation Act. 11 For CY2019, only Jan to Sep data is currently available. 12 Prior to FY2019, the cohort-based placement rate (CPR) calculation included both career centre walk-in clients as well as those who participated in career events. From FY2019, MOM will exclude cases from career events from the computation of CPR, in order to focus the CPR on the performance of career centres, where personalised career coaching with follow-through is provided by career coaches. For comparison, the FY2018 figure based on the revised methodology is 69.0%.

Head T
_______________
Ministry of National Development

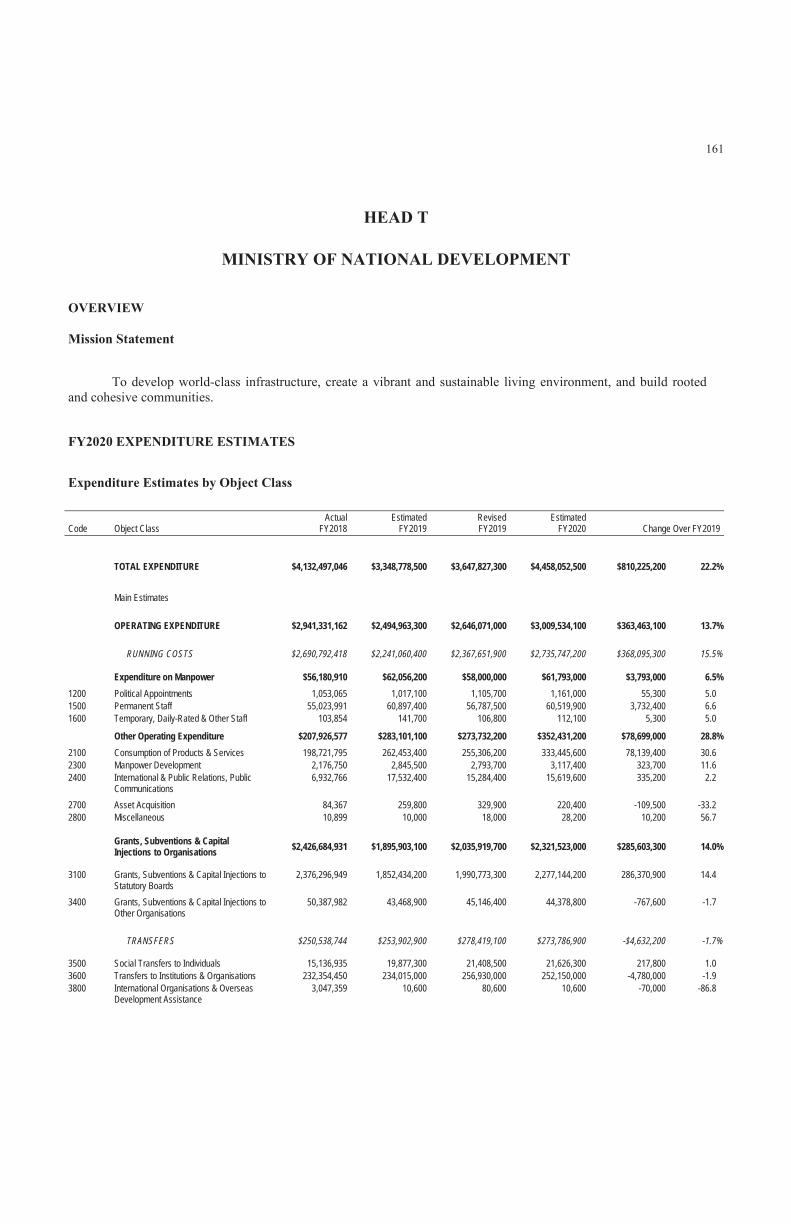
BLANK Actual Estimated Revised Estimated Code Object Class FY2018 FY2019 FY2019 FY2020 Change Over FY2019
BLANK
TOTAL EXPENDITURE $4,132,497,046 $3,348,778,500 $3,647,827,300 $4,458,052,500 $810,225,200 22.2%
Main Estimates $2,941,331,162 $2,494,963,300 $2,646,071,000 $3,009,534,100 $363,463,100 13.7%
OPERATING EXPENDITURE $2,941,331,162 $2,494,963,300 $2,646,071,000 $3,009,534,100 $363,463,100 13.7%
RUNNING COSTS $2,690,792,418 $2,241,060,400 $2,367,651,900 $2,735,747,200 $368,095,300 15.5%
Expenditure on Manpower $56,180,910 $62,056,200 $58,000,000 $61,793,000 $3,793,000 6.5%
1200 Political Appointments 1,053,065 1,017,100 1,105,700 1,161,000 55,300 5.0 1500 Permanent Staff 55,023,991 60,897,400 56,787,500 60,519,900 3,732,400 6.6 1600 Temporary, Daily-Rated & Other Staff 103,854 141,700 106,800 112,100 5,300 5.0
Other Operating Expenditure $207,926,577 $283,101,100 $273,732,200 $352,431,200 $78,699,000 28.8%
2100 Consumption of Products & Services 198,721,795 262,453,400 255,306,200 333,445,600 78,139,400 30.6 2300 Manpower Development 2,176,750 2,845,500 2,793,700 3,117,400 323,700 11.6 2400 International & Public Relations, Public
Communications 6,932,766 17,532,400 15,284,400 15,619,600 335,200 2.2
2700 Asset Acquisition 84,367 259,800 329,900 220,400 -109,500 -33.22800 Miscellaneous 10,899 10,000 18,000 28,200 10,200 56.7
Grants, Subventions & Capital Injections to Organisations
$2,426,684,931 $1,895,903,100 $2,035,919,700 $2,321,523,000 $285,603,300 14.0%
3100 Grants, Subventions & Capital Injections to Statutory Boards
2,376,296,949 1,852,434,200 1,990,773,300 2,277,144,200 286,370,900 14.4
3400 Grants, Subventions & Capital Injections to Other Organisations
50,387,982 43,468,900 45,146,400 44,378,800 -767,600 -1.7
TRANSFERS $250,538,744 $253,902,900 $278,419,100 $273,786,900 -$4,632,200 -1.7%
3500 Social Transfers to Individuals 15,136,935 19,877,300 21,408,500 21,626,300 217,800 1.03600 Transfers to Institutions & Organisations 232,354,450 234,015,000 256,930,000 252,150,000 -4,780,000 -1.93800 International Organisations & Overseas
Development Assistance 3,047,359 10,600 80,600 10,600 -70,000 -86.8
$1,191,165,885 $853,815,200 $1,001,756,300 $1,448,518,400 $446,762,100 44.6%

BLANK Actual Estimated Revised Estimated Code Object Class FY2018 FY2019 FY2019 FY2020 Change Over FY2019 BLANK
Development Estimates
DEVELOPMENT EXPENDITURE $1,191,165,885 $853,815,200 $1,001,756,300 $1,448,518,400 $446,762,100 44.6%
5100 Government Development 561,906,221 537,204,300 474,541,200 769,261,600 294,720,400 62.1 5200 Grants & Capital Injections to
Organisations 629,259,663 316,610,900 527,215,100 679,256,800 152,041,700 28.8
OTHER DEVELOPMENT FUND OUTLAYS $4,823,925,930 $6,994,237,600 $6,647,153,000 $8,543,731,300 $1,896,578,300 28.5%
5500 Land-Related Expenditure 735,068,990 874,237,600 749,618,700 1,019,731,300 270,112,600 36.0 5600 Loans 4,088,856,940 6,120,000,000 5,897,534,300 7,524,000,000 1,626,465,700 27.6
BLANK Actual Estimated Revised Estimated Category/Personnel FY2018 FY2019 FY2019 FY2020
BLANK
POLITICAL APPOINTMENTS 4 4 4 4
Minister 2 2 2 2
Senior Minister of State 1 1 0 0
Minister of State 0 0 1 1
Senior Parliamentary Secretary 1 1 1 1
PERMANENT STAFF 404 416 405 417
Accounting Profession (2008) 2 2 4 4
Administrative 13 13 17 17
Information Service (2008) 10 10 10 10
Legal 2 2 2 2
Management Executive Scheme (2008) 326 338 327 339
Management Support Scheme (2008) 48 48 42 42
Operations Support 3 3 3 3
OTHERS 8,487 8,053 7,947 7,862
Agri-Food and Veterinary Authority 899 0 0 0
Building and Construction Authority 978 1,051 1,068 1,066
Council for Estate Agencies 87 92 92 92
Housing and Development Board 5,554 5,598 5,484 5,401
National Parks Board 969 1,312 1,303 1,303
TOTAL 8,895 8,473 8,356 8,283
Operating Expenditure
Development Expenditure
Other Development Fund Outlays
Operating Expenditure
Development Expenditure

HDB’s Upgrading Programmes
Other Development Fund Outlays
Land-related Expenditure
Loan Provision

BLANK Running Operating Development Total Code Programme Costs Transfers Expenditure Expenditure Expenditure BLANK T-A Administration 292,334,700 10,600 292,345,300 20,616,700 312,962,000 T-E Planning 136,206,700 0 136,206,700 0 136,206,700 T-G Land Development 26,389,800 0 26,389,800 39,626,100 66,015,900 T-I Public Housing Development 1,770,338,400 21,626,300 1,791,964,700 1,222,988,900 3,014,953,600 T-J Housing Estates Management 2,863,700 252,150,000 255,013,700 60,606,200 315,619,900 T-K Building and Construction Authority 101,662,300 0 101,662,300 7,822,000 109,484,300 T-L National Parks Board 405,951,600 0 405,951,600 96,858,500 502,810,100
TOTAL $2,735,747,200 $273,786,900 $3,009,534,100 $1,448,518,400 $4,458,052,500
Development Expenditure by Project
BLANK Actual Expenditure Up to end of
BLANK BLANK Total Actual Estimated Revised Estimated Project Title Project Cost FY2017 FY2018 FY2019 FY2019 FY2020 BLANK
DEVELOPMENT EXPENDITURE … … $1,191,165,885 $853,815,200 $1,001,756,300 $1,448,518,400
GOVERNMENT DEVELOPMENT … … 561,906,221 537,204,300 474,541,200 769,261,600
Administration Programme … … 7 7 7 7
Lift Modernisation At Tower Block, Ministry of National Development (MND) Complex
5,760,000 0 0 1,098,400 1,011,100 322,300
Local Infrastructure Projects (LIP) Scheme 3,600,000 0 14,046 454,600 340,900 56,200 Upgrading of Centralised Air-Conditioning System at MND Complex Tower Blk and Annexe A
8,917,000 0 0 0 0 848,400
To Enhance OneService@SG (OSSG) 12,860,000 0 0 3,460,900 0 334,700 MSO's Municipal Services Productivity Fund (MSPF) 20,000,000 0 166,000 0 0 554,200 Development of Sungei Tengah Pet Cluster Facility 2 1,666,100 0 0 0 750,000 223,100 Minor Development Projects … … 3,186,739 14,454,400 2,093,700 16,354,000
Land Development Programme … … 27 27 27 27
New Projects … … 0 9,250,600 0 2,039,800 Infrastructure Provisions at Marina Bay 816,810,000 567,424,253 11,441,881 12,689,800 7,610,000 800,000 Road Infrastructure Development for Foreign Workers Dormitory Site at Sungei Tengah
30,350,000 23,856,259 111,992 363,800 225,000 357,000
Implementation of Sewer Works at Dairy Farm/Petir Road
3,800,000 2,608,830 524,630 370,400 0 26,800
Implementation of Sewer Works at Jalan Bahar 9,000,000 8,716,568 0 0 0 11,200 Implementation of Basic key Infrastructure Works at Dairy Farm Rd/Petir Road Area
23,700,000 12,467,902 1,103,441 213,100 100,000 44,600
Implementation of Basic Key Infra at Jalan Sendudok/Canberra Link to facilitate Release of GLS Sites
32,050,000 12,711,316 478,407 71,000 33,000 17,900
Proposed Implementation of Infra Works at Lentor Drive/Yio Chu Kang Road Area to Facilitate Release of GLS Sites
97,130,000 35,585,890 13,227,579 12,311,000 14,800,000 4,194,800
Offshore Containment Site Preliminary Studies 20,100,000 5,489,170 3,505,269 1,198,900 0 1,071,000 Repair and Restoration of Pulau Punggol Timor Aggregate Terminal and Tuas Aggregate Terminal
20,800,000 8,646,145 3,996,166 1,799,300 1,100,000 178,500
Funding for Site Investigation Works and Design Development for Road and Sewer Infrastructure Development at Lorong Lada
1,000,000 131,871 32,970 235,800 0 308,600
Proposed Building Of A 66kv Substation At Dairy Farm Area
18,100,000 29,984 808,504 3,788,000 6,700,000 2,945,300
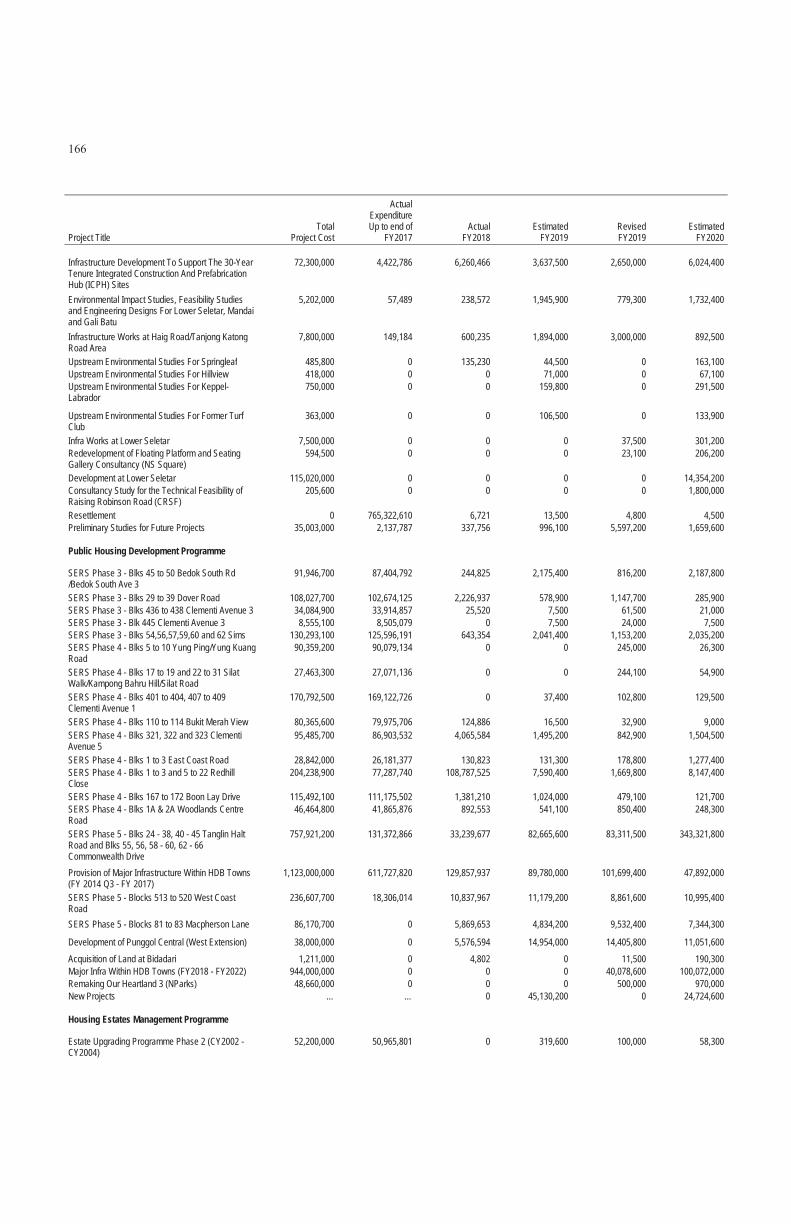
BLANK Actual Expenditure Up to end of
BLANK BLANK Total Actual Estimated Revised Estimated Project Title Project Cost FY2017 FY2018 FY2019 FY2019 FY2020 BLANK Infrastructure Development To Support The 30-Year Tenure Integrated Construction And Prefabrication Hub (ICPH) Sites
72,300,000 4,422,786 6,260,466 3,637,500 2,650,000 6,024,400
Environmental Impact Studies, Feasibility Studies and Engineering Designs For Lower Seletar, Mandai and Gali Batu
5,202,000 57,489 238,572 1,945,900 779,300 1,732,400
Infrastructure Works at Haig Road/Tanjong Katong Road Area
7,800,000 149,184 600,235 1,894,000 3,000,000 892,500
Upstream Environmental Studies For Springleaf 485,800 0 135,230 44,500 0 163,100 Upstream Environmental Studies For Hillview 418,000 0 0 71,000 0 67,100 Upstream Environmental Studies For Keppel-Labrador
750,000 0 0 159,800 0 291,500
Upstream Environmental Studies For Former Turf Club
363,000 0 0 106,500 0 133,900
Infra Works at Lower Seletar 7,500,000 0 0 0 37,500 301,200 Redevelopment of Floating Platform and Seating Gallery Consultancy (NS Square)
594,500 0 0 0 23,100 206,200
Development at Lower Seletar 115,020,000 0 0 0 0 14,354,200 Consultancy Study for the Technical Feasibility of Raising Robinson Road (CRSF)
205,600 0 0 0 0 1,800,000
Resettlement 0 765,322,610 6,721 13,500 4,800 4,500 Preliminary Studies for Future Projects 35,003,000 2,137,787 337,756 996,100 5,597,200 1,659,600
Public Housing Development Programme … … 23 23 23 23
SERS Phase 3 - Blks 45 to 50 Bedok South Rd /Bedok South Ave 3
91,946,700 87,404,792 244,825 2,175,400 816,200 2,187,800
SERS Phase 3 - Blks 29 to 39 Dover Road 108,027,700 102,674,125 2,226,937 578,900 1,147,700 285,900 SERS Phase 3 - Blks 436 to 438 Clementi Avenue 3 34,084,900 33,914,857 25,520 7,500 61,500 21,000 SERS Phase 3 - Blk 445 Clementi Avenue 3 8,555,100 8,505,079 0 7,500 24,000 7,500 SERS Phase 3 - Blks 54,56,57,59,60 and 62 Sims 130,293,100 125,596,191 643,354 2,041,400 1,153,200 2,035,200 SERS Phase 4 - Blks 5 to 10 Yung Ping/Yung Kuang Road
90,359,200 90,079,134 0 0 245,000 26,300
SERS Phase 4 - Blks 17 to 19 and 22 to 31 Silat Walk/Kampong Bahru Hill/Silat Road
27,463,300 27,071,136 0 0 244,100 54,900
SERS Phase 4 - Blks 401 to 404, 407 to 409 Clementi Avenue 1
170,792,500 169,122,726 0 37,400 102,800 129,500
SERS Phase 4 - Blks 110 to 114 Bukit Merah View 80,365,600 79,975,706 124,886 16,500 32,900 9,000 SERS Phase 4 - Blks 321, 322 and 323 Clementi Avenue 5
95,485,700 86,903,532 4,065,584 1,495,200 842,900 1,504,500
SERS Phase 4 - Blks 1 to 3 East Coast Road 28,842,000 26,181,377 130,823 131,300 178,800 1,277,400 SERS Phase 4 - Blks 1 to 3 and 5 to 22 Redhill Close
204,238,900 77,287,740 108,787,525 7,590,400 1,669,800 8,147,400
SERS Phase 4 - Blks 167 to 172 Boon Lay Drive 115,492,100 111,175,502 1,381,210 1,024,000 479,100 121,700 SERS Phase 4 - Blks 1A & 2A Woodlands Centre Road
46,464,800 41,865,876 892,553 541,100 850,400 248,300
SERS Phase 5 - Blks 24 - 38, 40 - 45 Tanglin Halt Road and Blks 55, 56, 58 - 60, 62 - 66 Commonwealth Drive
757,921,200 131,372,866 33,239,677 82,665,600 83,311,500 343,321,800
Provision of Major Infrastructure Within HDB Towns (FY 2014 Q3 - FY 2017)
1,123,000,000 611,727,820 129,857,937 89,780,000 101,699,400 47,892,000
SERS Phase 5 - Blocks 513 to 520 West Coast Road
236,607,700 18,306,014 10,837,967 11,179,200 8,861,600 10,995,400
SERS Phase 5 - Blocks 81 to 83 Macpherson Lane 86,170,700 0 5,869,653 4,834,200 9,532,400 7,344,300
Development of Punggol Central (West Extension) 38,000,000 0 5,576,594 14,954,000 14,405,800 11,051,600
Acquisition of Land at Bidadari 1,211,000 0 4,802 0 11,500 190,300 Major Infra Within HDB Towns (FY2018 - FY2022) 944,000,000 0 0 0 40,078,600 100,072,000 Remaking Our Heartland 3 (NParks) 48,660,000 0 0 0 500,000 970,000 New Projects … … 0 45,130,200 0 24,724,600
Housing Estates Management Programme … … 5 5 5 5
Estate Upgrading Programme Phase 2 (CY2002 - CY2004)
52,200,000 50,965,801 0 319,600 100,000 58,300
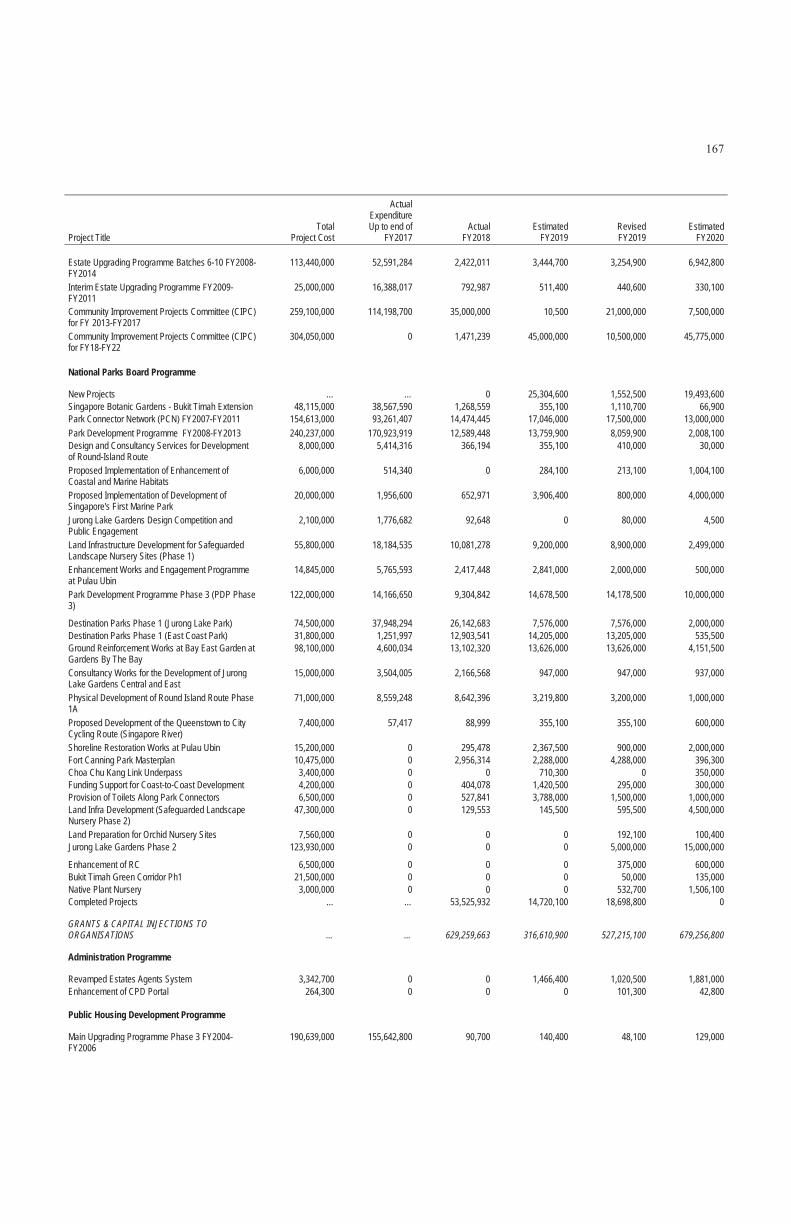
BLANK Actual Expenditure Up to end of
BLANK BLANK Total Actual Estimated Revised Estimated Project Title Project Cost FY2017 FY2018 FY2019 FY2019 FY2020 BLANK Estate Upgrading Programme Batches 6-10 FY2008-FY2014
113,440,000 52,591,284 2,422,011 3,444,700 3,254,900 6,942,800
Interim Estate Upgrading Programme FY2009-FY2011
25,000,000 16,388,017 792,987 511,400 440,600 330,100
Community Improvement Projects Committee (CIPC) for FY 2013-FY2017
259,100,000 114,198,700 35,000,000 10,500 21,000,000 7,500,000
Community Improvement Projects Committee (CIPC) for FY18-FY22
304,050,000 0 1,471,239 45,000,000 10,500,000 45,775,000
National Parks Board Programme … … 28 28 28 28
New Projects … … 0 25,304,600 1,552,500 19,493,600 Singapore Botanic Gardens - Bukit Timah Extension 48,115,000 38,567,590 1,268,559 355,100 1,110,700 66,900 Park Connector Network (PCN) FY2007-FY2011 154,613,000 93,261,407 14,474,445 17,046,000 17,500,000 13,000,000
Park Development Programme FY2008-FY2013 240,237,000 170,923,919 12,589,448 13,759,900 8,059,900 2,008,100 Design and Consultancy Services for Development of Round-Island Route
8,000,000 5,414,316 366,194 355,100 410,000 30,000
Proposed Implementation of Enhancement of Coastal and Marine Habitats
6,000,000 514,340 0 284,100 213,100 1,004,100
Proposed Implementation of Development of Singapore's First Marine Park
20,000,000 1,956,600 652,971 3,906,400 800,000 4,000,000
Jurong Lake Gardens Design Competition and Public Engagement
2,100,000 1,776,682 92,648 0 80,000 4,500
Land Infrastructure Development for Safeguarded Landscape Nursery Sites (Phase 1)
55,800,000 18,184,535 10,081,278 9,200,000 8,900,000 2,499,000
Enhancement Works and Engagement Programme at Pulau Ubin
14,845,000 5,765,593 2,417,448 2,841,000 2,000,000 500,000
Park Development Programme Phase 3 (PDP Phase 3)
122,000,000 14,166,650 9,304,842 14,678,500 14,178,500 10,000,000
Destination Parks Phase 1 (Jurong Lake Park) 74,500,000 37,948,294 26,142,683 7,576,000 7,576,000 2,000,000 Destination Parks Phase 1 (East Coast Park) 31,800,000 1,251,997 12,903,541 14,205,000 13,205,000 535,500 Ground Reinforcement Works at Bay East Garden at Gardens By The Bay
98,100,000 4,600,034 13,102,320 13,626,000 13,626,000 4,151,500
Consultancy Works for the Development of Jurong Lake Gardens Central and East
15,000,000 3,504,005 2,166,568 947,000 947,000 937,000
Physical Development of Round Island Route Phase 1A
71,000,000 8,559,248 8,642,396 3,219,800 3,200,000 1,000,000
Proposed Development of the Queenstown to City Cycling Route (Singapore River)
7,400,000 57,417 88,999 355,100 355,100 600,000
Shoreline Restoration Works at Pulau Ubin 15,200,000 0 295,478 2,367,500 900,000 2,000,000 Fort Canning Park Masterplan 10,475,000 0 2,956,314 2,288,000 4,288,000 396,300 Choa Chu Kang Link Underpass 3,400,000 0 0 710,300 0 350,000 Funding Support for Coast-to-Coast Development 4,200,000 0 404,078 1,420,500 295,000 300,000 Provision of Toilets Along Park Connectors 6,500,000 0 527,841 3,788,000 1,500,000 1,000,000 Land Infra Development (Safeguarded Landscape Nursery Phase 2)
47,300,000 0 129,553 145,500 595,500 4,500,000
Land Preparation for Orchid Nursery Sites 7,560,000 0 0 0 192,100 100,400 Jurong Lake Gardens Phase 2 123,930,000 0 0 0 5,000,000 15,000,000
Enhancement of RC 6,500,000 0 0 0 375,000 600,000 Bukit Timah Green Corridor Ph1 21,500,000 0 0 0 50,000 135,000 Native Plant Nursery 3,000,000 0 0 0 532,700 1,506,100 Completed Projects … … 53,525,932 14,720,100 18,698,800 0
GRANTS & CAPITAL INJECTIONS TO ORGANISATIONS … … 629,259,663 316,610,900 527,215,100 679,256,800
Administration Programme … … 2 2 2 2
Revamped Estates Agents System 3,342,700 0 0 1,466,400 1,020,500 1,881,000 Enhancement of CPD Portal 264,300 0 0 0 101,300 42,800
Public Housing Development Programme … … 27 27 27 27
Main Upgrading Programme Phase 3 FY2004-FY2006
190,639,000 155,642,800 90,700 140,400 48,100 129,000
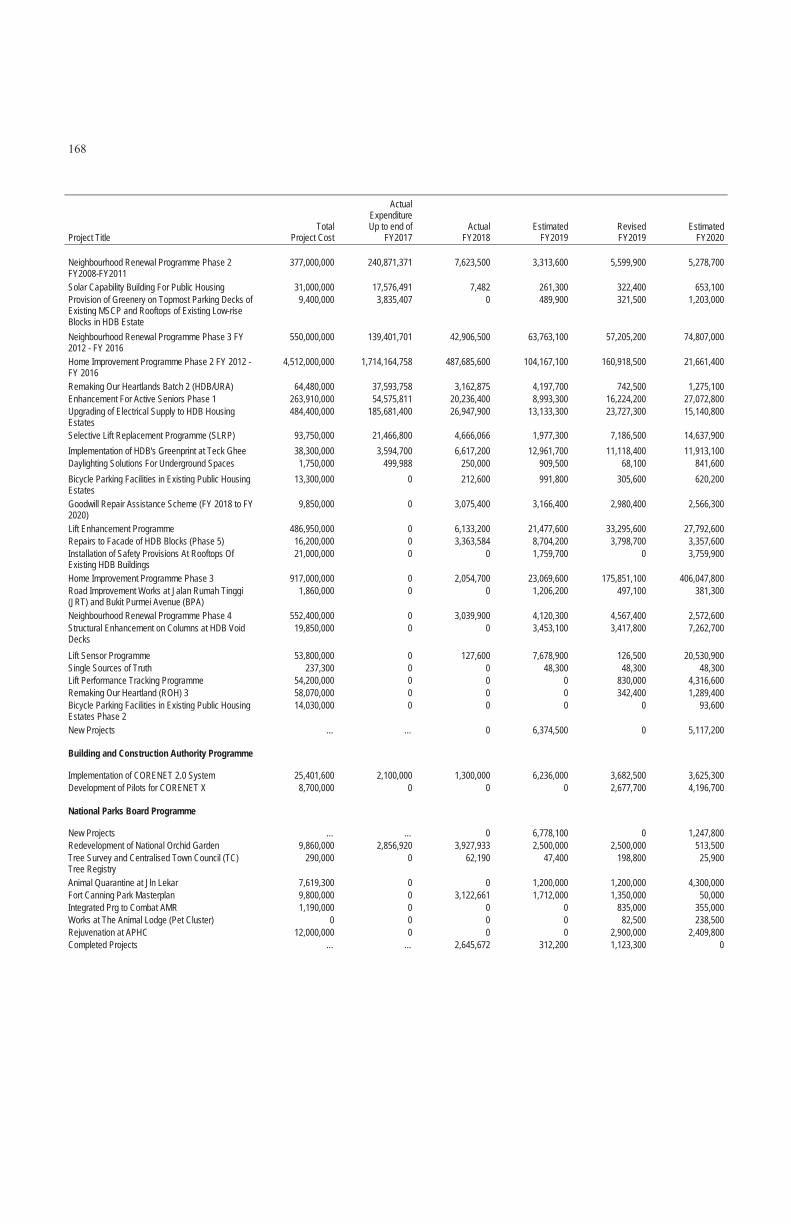
BLANK Actual Expenditure Up to end of
BLANK BLANK Total Actual Estimated Revised Estimated Project Title Project Cost FY2017 FY2018 FY2019 FY2019 FY2020 BLANK Neighbourhood Renewal Programme Phase 2 FY2008-FY2011
377,000,000 240,871,371 7,623,500 3,313,600 5,599,900 5,278,700
Solar Capability Building For Public Housing 31,000,000 17,576,491 7,482 261,300 322,400 653,100 Provision of Greenery on Topmost Parking Decks of Existing MSCP and Rooftops of Existing Low-rise Blocks in HDB Estate
9,400,000 3,835,407 0 489,900 321,500 1,203,000
Neighbourhood Renewal Programme Phase 3 FY 2012 - FY 2016
550,000,000 139,401,701 42,906,500 63,763,100 57,205,200 74,807,000
Home Improvement Programme Phase 2 FY 2012 - FY 2016
4,512,000,000 1,714,164,758 487,685,600 104,167,100 160,918,500 21,661,400
Remaking Our Heartlands Batch 2 (HDB/URA) 64,480,000 37,593,758 3,162,875 4,197,700 742,500 1,275,100 Enhancement For Active Seniors Phase 1 263,910,000 54,575,811 20,236,400 8,993,300 16,224,200 27,072,800 Upgrading of Electrical Supply to HDB Housing Estates
484,400,000 185,681,400 26,947,900 13,133,300 23,727,300 15,140,800
Selective Lift Replacement Programme (SLRP) 93,750,000 21,466,800 4,666,066 1,977,300 7,186,500 14,637,900
Implementation of HDB's Greenprint at Teck Ghee 38,300,000 3,594,700 6,617,200 12,961,700 11,118,400 11,913,100 Daylighting Solutions For Underground Spaces 1,750,000 499,988 250,000 909,500 68,100 841,600
Bicycle Parking Facilities in Existing Public Housing Estates
13,300,000 0 212,600 991,800 305,600 620,200
Goodwill Repair Assistance Scheme (FY 2018 to FY 2020)
9,850,000 0 3,075,400 3,166,400 2,980,400 2,566,300
Lift Enhancement Programme 486,950,000 0 6,133,200 21,477,600 33,295,600 27,792,600 Repairs to Facade of HDB Blocks (Phase 5) 16,200,000 0 3,363,584 8,704,200 3,798,700 3,357,600 Installation of Safety Provisions At Rooftops Of Existing HDB Buildings
21,000,000 0 0 1,759,700 0 3,759,900
Home Improvement Programme Phase 3 917,000,000 0 2,054,700 23,069,600 175,851,100 406,047,800 Road Improvement Works at Jalan Rumah Tinggi (JRT) and Bukit Purmei Avenue (BPA)
1,860,000 0 0 1,206,200 497,100 381,300
Neighbourhood Renewal Programme Phase 4 552,400,000 0 3,039,900 4,120,300 4,567,400 2,572,600 Structural Enhancement on Columns at HDB Void Decks
19,850,000 0 0 3,453,100 3,417,800 7,262,700
Lift Sensor Programme 53,800,000 0 127,600 7,678,900 126,500 20,530,900 Single Sources of Truth 237,300 0 0 48,300 48,300 48,300 Lift Performance Tracking Programme 54,200,000 0 0 0 830,000 4,316,600 Remaking Our Heartland (ROH) 3 58,070,000 0 0 0 342,400 1,289,400 Bicycle Parking Facilities in Existing Public Housing Estates Phase 2
14,030,000 0 0 0 0 93,600
New Projects … … 0 6,374,500 0 5,117,200
Building and Construction Authority Programme … … 2 2 2 2
Implementation of CORENET 2.0 System 25,401,600 2,100,000 1,300,000 6,236,000 3,682,500 3,625,300 Development of Pilots for CORENET X 8,700,000 0 0 0 2,677,700 4,196,700
National Parks Board Programme … … 8 8 8 8
New Projects … … 0 6,778,100 0 1,247,800 Redevelopment of National Orchid Garden 9,860,000 2,856,920 3,927,933 2,500,000 2,500,000 513,500 Tree Survey and Centralised Town Council (TC) Tree Registry
290,000 0 62,190 47,400 198,800 25,900
Animal Quarantine at Jln Lekar 7,619,300 0 0 1,200,000 1,200,000 4,300,000 Fort Canning Park Masterplan 9,800,000 0 3,122,661 1,712,000 1,350,000 50,000 Integrated Prg to Combat AMR 1,190,000 0 0 0 835,000 355,000 Works at The Animal Lodge (Pet Cluster) 0 0 0 0 82,500 238,500 Rejuvenation at APHC 12,000,000 0 0 0 2,900,000 2,409,800 Completed Projects … … 2,645,672 312,200 1,123,300 0

Other Development Fund Outlays
BLANK Actual Expenditure Up to end of
BLANK BLANK Total Actual Estimated Revised Estimated Project Title Project Cost FY2017 FY2018 FY2019 FY2019 FY2020 BLANK
OTHER DEVELOPMENT FUND OUTLAYS … … $4,823,925,930 $6,994,237,600 $6,647,153,000 $8,543,731,300
LAND-RELATED EXPENDITURE … … 735,068,990 874,237,600 749,618,700 1,019,731,300
Land Development Programme … … 7 7 7 7
New Projects … … 0 0 0 70,740,600 Preliminary Studies for Future Projects 24,407,000 0 2,977,098 2,529,300 5,227,600 7,918,100 Ongoing Projects 12,679,300,000 4,067,457,293 572,241,964 770,439,800 638,296,200 583,960,800
Public Housing Development Programme … … 4 4 4 4
SERS Phase 5 - Blks 24 - 38, 40 - 45 Tanglin Halt Road and Blks 55, 56, 58 - 60, 62 - 66 Commonwealth Drive
648,000,000 110,885,143 30,517,687 79,461,900 82,860,300 339,503,700
SERS Phase 5 - Blocks 513 to 520 West Coast Road
191,000,000 13,993,670 9,745,665 9,247,200 7,642,700 9,376,000
SERS Phase 5 - Blocks 81 to 83 Macpherson Lane 75,910,000 0 4,813,799 5,669,400 8,701,900 6,970,800
New Projects … … 0 0 0 1,261,300 Completed Projects … … 114,772,776 6,890,000 6,890,000 0
LOANS … … 4,088,856,940 6,120,000,000 5,897,534,300 7,524,000,000
Public Housing Development Programme … … 4 4 4 4
Housing Development Loan FY2020 3,000,000,000 0 0 0 0 3,000,000,000 Mortgage Financing Loan (CPF) FY2020 4,480,000,000 0 0 0 0 4,480,000,000 Mortgage Financing Loan (Mkt) FY2020 35,000,000 0 0 0 0 35,000,000 Upgrading Financing Loan FY2020 9,000,000 0 0 0 0 9,000,000 Completed Projects … … 4,088,856,940 6,120,000,000 5,897,534,300 0

Key Performance Indicators
Desired Outcome Key Performance IndicatorActual
FY2017Actual
FY2018Revised FY2019
Estimated FY2020
Affordable and Quality Public Housing
Home Ownership rate among resident households in HDB dwellings (%)1
92.1 92.2 91.9 NA
Debt Servicing Ratio (DSR) for first-timer
applicants buying 4-room new flats in non-mature estates (%)2
22 21 222 30
DSR for first-timer applicants buying 4-room resale flats in non-mature estates (%)2
23 22 223 30
Mean Construction Quality Assessment System (CONQUAS) Scores for HDB Flats
90.3 92 88.5 89.4
Rejuvenation of older estates Cumulative % of eligible HDB blocks
selected for Home Improvement Programme (HIP) (%)4
81 100 NA NA
Singapore as a distinctive, attractive and vibrant city
Number of people living and working in the Central Area
- Living 159,400 159,700 159,500 162,100
- Working 858,700 848,400 859,300 872,200
Safe buildings for our people No. of major collapses of buildings or deep excavation works due to defective design, construction and maintenance
0 0 0 0
1 Data is reported on a CY basis. This measures the proportion of resident households who reported owning the HDB flat that they are living in. A resident household refers to a household headed by a Singapore citizen or permanent resident. 2 Data is reported on a CY basis. The DSR refers to the proportion of the monthly household income set aside for housing instalments, and reflects those of 4-room flats in non-mature estates. They assume a 25-year HDB concessionary loan, and factor in prevailing housing grants. The international rule of thumb for housing affordability is 30% - 35%. 3 Based on data in 1H2019. 4 All eligible HIP blocks built up to 1986 that had not undergone the previous MUP have been selected.

Desired Outcome Key Performance Indicator Actual FY2017
Actual FY2018
Revised FY2019
Estimated FY2020
Quality buildings for our people Mean industry CONQUAS scores for
building projects 88.9 88.9 89.1 89.3
Promoting design and construction practices that will create an attractive and environmentally friendly city for our people
% of building projects’ total Gross Floor Areas (GFA) meeting green building standard5
36.1
39.5 43.5 47.0
Singapore as a City in a Garden Park Provision Ratio (ha/1,000 population) 0.79 0.79 0.79 0.79 Attractive leisure and green recreational experience for our people
% of total population who visited parks6 77 NA 80 NA % of users satisfied with parks7 85 NA 85 NA
Healthy flora and fauna free from disease and pests
% of critical animal and plant disease that Singapore is free from7
94.8 94.8 95.0 95.0
5 Prior to FY2019, the number of projects that met Green Mark standards was reported. Given that Singapore targets to have 80% of its buildings’ Gross Floor Area (GFA) meet green building standard by 2030, GFA, which is a better indicator to measure the impact of our efforts, is adopted for reporting from FY2019 onwards. 6 The Parks Usage and Satisfaction Survey has been conducted once every two years since 2007. Data is reported on a CY basis. 7 KPI was previously described as “% of freedom from important animal and plant disease outbreaks”. Description has been re-phrased for greater clarity. The indicator itself continues to be based on the critical animal and plant diseases listed in the Animals and Birds Act and the Control of Plants Act.


Head U ___________
Prime Minister's Office


BLANK Actual Estimated Revised EstimatedCode Object Class FY2018 FY2019 FY2019 FY2020 Change Over FY2019
BLANK
TOTAL EXPENDITURE $829,313,947 $1,024,251,000 $965,664,200 $1,049,741,500 $84,077,300 8.7%
Main Estimates $670,137,990 $827,594,400 $786,678,200 $823,582,100 $36,903,900 4.7%
OPERATING EXPENDITURE $670,137,990 $827,584,400 $786,668,200 $823,572,100 $36,903,900 4.7%
RUNNING COSTS $642,616,036 $798,248,800 $757,545,100 $791,903,200 $34,358,100 4.5%
Expenditure on Manpower $185,851,339 $197,063,800 $185,627,800 $204,619,400 $18,991,600 10.2%
1200 Political Appointments 15,429,954 17,705,900 16,190,200 15,945,100 -245,100 -1.51500 Permanent Staff 170,290,333 179,144,700 169,185,000 188,526,700 19,341,700 11.41600 Temporary, Daily-Rated & Other Staff 131,052 213,200 252,600 147,600 -105,000 -41.6
Other Operating Expenditure $159,754,739 $239,493,300 $385,001,900 $361,450,600 -$23,551,300 -6.1%
2100 Consumption of Products & Services 144,639,943 190,400,100 339,171,800 315,601,500 -23,570,300 -6.92300 Manpower Development 4,819,573 5,891,100 5,152,100 7,051,600 1,899,500 36.92400 International & Public Relations, Public
Communications 9,324,165 42,302,100 39,543,000 38,138,200 -1,404,800 -3.6
2700 Asset Acquisition 931,758 900,000 1,135,000 659,300 -475,700 -41.92800 Miscellaneous 39,300 0 0 0 0 n.a.
Grants, Subventions & Capital Injections to Organisations
$297,009,958 $361,691,700 $186,915,400 $225,833,200 $38,917,800 20.8%
3100 Grants, Subventions & Capital Injections to Statutory Boards
280,512,705 338,853,400 164,726,400 203,340,500 38,614,100 23.4
3400 Grants, Subventions & Capital Injections to Other Organisations
16,497,253 22,838,300 22,189,000 22,492,700 303,700 1.4
TRANSFERS $27,521,954 $29,335,600 $29,123,100 $31,668,900 $2,545,800 8.7%
3500 Social Transfers to Individuals 23,521,954 25,335,600 25,123,100 27,668,900 2,545,800 10.13600 Transfers to Institutions & Organisations 4,000,000 4,000,000 4,000,000 4,000,000 0 0.0

BLANK Actual Estimated Revised EstimatedCode Object Class FY2018 FY2019 FY2019 FY2020 Change Over FY2019
BLANK
OTHER CONSOLIDATED FUND OUTLAYS $0 $10,000 $10,000 $10,000 $0 0.0%
4600 Loans and Advances (Disbursement) 0 10,000 10,000 10,000 0 0.0
Development Estimates $159,175,957 $196,666,600 $178,996,000 $226,169,400 $47,173,400 26.4%
DEVELOPMENT EXPENDITURE $159,175,957 $196,666,600 $178,996,000 $226,169,400 $47,173,400 26.4%
5100 Government Development 79,957,438 139,510,200 127,337,700 145,269,700 17,932,000 14.15200 Grants & Capital Injections to
Organisations79,218,519 57,156,400 51,658,300 80,899,700 29,241,400 56.6
BLANK Actual Estimated Revised Estimated Category/Personnel FY2018 FY2019 FY2019 FY2020
BLANK
POLITICAL APPOINTMENTS 6 6 7 7
Prime Minister 1 1 1 1
Senior Minister (Prime Minister's Office) 0 0 2 2
Deputy Prime Minister 2 2 1 1
Minister 3 3 3 3
PERMANENT STAFF 1,080 1,169 1,171 1,201
Administrative 43 43 44 44
Corporate Support 9 7 7 7
Corrupt Practices Investigation (Range) 111 132 132 132
Corrupt Practices Investigation Assistant (2012) 55 58 58 58
Education Service 3 2 1 1
Information Service (2008) 20 17 17 17
Legal 1 1 1 1
Management Executive (Public Service Division) 111 112 125 125
Management Executive Scheme (2008) 651 726 729 754
Management Support 14 14 11 11
Management Support Scheme (2008) 47 41 31 36
Operations Support 4 4 6 6
Operations Support Scheme (Driving) 3 3 2 2
Shorthand Writers 7 7 5 5
Technical Support 1 1 1 1
Technical Support Scheme (2008) 0 1 1 1
OTHERS 2,020 2,364 2,934 2,780
Government Technology Agency (Non Sites) 1,034 1,041 1,514 1,472
Government Technology Agency (Sites) 986 1,323 1,420 1,308
TOTAL 3,106 3,539 4,112 3,988

Operating Expenditure
Development Expenditure
Operating Expenditure
Government Technology Agency Programme
Workforce and Leadership Development Programme

Smart Nation and Digital Government Office Programme
Corporate Programme
Administration Programme
Strategy Group Programme
Corrupt Practices Investigation Programme
Elections Programme
National Research Foundation Programme
National Security and Intelligence Coordination Programme
Public Sector Transformation Programme
Science & Technology Policy & Plans Office Programme
Development Expenditure

BLANK Running Operating Development Total Code Programme Costs Transfers Expenditure Expenditure Expenditure
BLANK
U-A Administration 55,839,100 0 55,839,100 23,076,100 78,915,200
U-B Elections 46,070,000 0 46,070,000 5,930,000 52,000,000
U-C Corrupt Practices Investigation 47,392,400 0 47,392,400 12,648,000 60,040,400
U-G National Security and Intelligence Coordination 33,028,800 0 33,028,800 200,000 33,228,800
U-H National Research Foundation 42,033,500 0 42,033,500 443,200 42,476,700
U-L Corporate 71,936,700 0 71,936,700 17,101,900 89,038,600
U-M Workforce and Leadership Development 78,006,700 27,668,900 105,675,600 52,796,800 158,472,400
U-N Public Sector Transformation 10,458,400 0 10,458,400 0 10,458,400
U-P Strategy Group 44,013,700 4,000,000 48,013,700 1,095,300 49,109,000
U-Q Smart Nation and Digital Government Office 80,283,600 0 80,283,600 31,953,400 112,237,000
U-R Government Technology Agency 272,752,500 0 272,752,500 80,899,700 353,652,200
U-S Science & Technology Policy & Plans Office 10,087,800 0 10,087,800 25,000 10,112,800
Total $791,903,200 $31,668,900 $823,572,100 $226,169,400 $1,049,741,500
Development Expenditure by Project
BLANK Actual
ExpenditureUp to end of
BLANK
BLANK Total Actual Estimated Revised EstimatedProject Title Project Cost FY2017 FY2018 FY2019 FY2019 FY2020
BLANK
DEVELOPMENT EXPENDITURE … … $159,175,957 $196,666,600 $178,996,000 $226,169,400
GOVERNMENT DEVELOPMENT … … 79,957,438 139,510,200 127,337,700 145,269,700
Administration Programme … … 5 5 5 5
Replacement and Enhancement of Security System in Istana
29,510,000 0 0 0 5,886,900 13,061,000
Istana Restoration Works 124,040,000 0 0 0 411,000 6,270,100
Improvement and Replacement Works in Istana 3,525,000 0 0 0 0 3,525,000
EMAS Tech Refresh - Hardware and software upgrade
120,000 0 0 0 0 120,000
Minor Development Projects … … 3,357,764 199,900 692,000 100,000
Elections Programme … … 1 1 1 1Minor Development Projects … … 630,558 9,452,000 9,452,000 5,930,000
Corrupt Practices Investigation Programme … … 3 3 3 3
Minor Development Projects … … 3,884,997 3,049,000 4,012,600 5,588,000
Intel II System 7,533,300 0 0 3,247,000 2,626,400 1,585,000
C3 Project 6,083,000 0 0 0 0 5,475,000
National Security and Intelligence Coordination Programme
… … 1 1 1 1
National Security Projects … 84,686,831 4,022,933 3,410,000 2,580,000 200,000

BLANK Actual
ExpenditureUp to end of
BLANK
BLANK Total Actual Estimated Revised EstimatedProject Title Project Cost FY2017 FY2018 FY2019 FY2019 FY2020
BLANK
National Research Foundation Programme … … 2 2 2 2
Minor Development Projects … … 89,476 400,000 458,000 265,200
New Projects … … 0 130,000 130,000 178,000
Corporate Programme … … 2 2 2 2
Major renovation of PSD's workplace 5,614,500 0 0 0 140,000 4,950,000
Minor Development Projects … … 1,316,206 10,627,300 4,968,300 12,151,900
Workforce and Leadership Development Programme … … 4 4 4 4
Human Resource Payroll (HRP) system 149,800,000 15,691,449 33,858,516 30,590,400 28,076,900 23,356,600
Standardisation and centralisation of Public Service Human Resource, Payroll and Finance processes and systems
8,454,800 288,539 3,229,858 1,666,200 1,640,100 95,900
On-boarding of Statutory Boards (SBs) onto a cloud-based Finance, Payroll and Human Resource (HR) system
24,434,600 0 0 12,105,100 17,897,800 6,536,800
Phase 1B on-boarding of agencies onto a Cloud ERP system
35,571,500 0 0 0 0 22,807,500
Strategy Group Programme … … 1 1 1 1
Minor Development Projects … … 678,690 2,524,200 3,472,000 1,095,300
Smart Nation and Digital Government Office Programme … … 2 2 2 2
Minor Development Projects … … 20,760 2,001,500 1,780,200 54,700
Minor Development Projects for GCIO … … 1,736,182 2,194,900 18,326,000 31,898,700
Science & Technology Policy & Plans Office Programme … … 1 1 1 1
Minor Development Projects … … 0 0 0 25,000
Completed Projects … … 27,131,498 57,912,700 24,787,500 0
GRANTS & CAPITAL INJECTIONS TO ORGANISATIONS … … 79,218,519 57,156,400 51,658,300 80,899,700
Government Technology Agency Programme … … 7 7 7 7
New Projects … … 0 18,547,000 4,223,400 56,525,500
Minor Development Projects … … 2,026,347 6,182,700 1,740,300 2,994,600
National Digital Identity (NDI) 45,229,300 0 17,709,791 11,741,300 19,958,100 3,155,900
Smart Nation Sensor Platform (SNSP) 44,240,000 0 4,020,441 3,428,500 6,791,900 3,519,000
Establish Whole-Of-Government Centre of Excellence for Information and Communications Technology and Smart Systems
23,770,000 0 0 9,396,800 1,099,300 1,536,900
Digitalising Governance: Smart ICT Regulation 25,340,000 0 0 0 0 3,513,500
National Digital Identity (NDI) Expanded Scope and Tranche 2
18,029,400 0 0 0 7,387,700 9,654,300
Completed Projects … … 55,461,940 7,860,100 10,457,600 0

Key Performance Indicators
Actual Actual Revised Estimated
Desired Outcome Performance Indicator FY2017 FY2018 FY2019 FY2020
High-performing Public Service World Bank’s Worldwide Governance Indicator: Government Effectiveness1
100% 100% NA2 NA3
Officers with the right capabilities and values
% of Public Service workforce mapped to Competency Frameworks4
74% 84% 96% NA3
Public officers who perform to high standards through continuous training and development
No. of Public Officers Trained5 34,760 31,0006 16,8007 31,000
1 ‘Government effectiveness’ as defined by the World Bank measures the quality of public services, the quality of the civil service and the degree of its independence from political pressures, the quality of policy formulation and implementation and the credibility of the government’s commitment to such policies. 2 Actual data will only be available in 2020. 3 This is a monitoring indicator and there are no targets set. 4 These are approximate figures as the development status of competency frameworks has been categorised based on what is representative for majority of the job family. 5 This performance indicator measures how many public officers come to Civil Service College for training and development. It is a proxy to how well Civil Service College is reaching out to the public officers through delivery of timely and effective Learning and Development (L&D) solutions. 6 The drop in number in FY2018 was largely due to conversion of classroom programmes to e-learning programmes as part of strategic transformation plans. 7 The data is reported as of 30 Sep 2019.
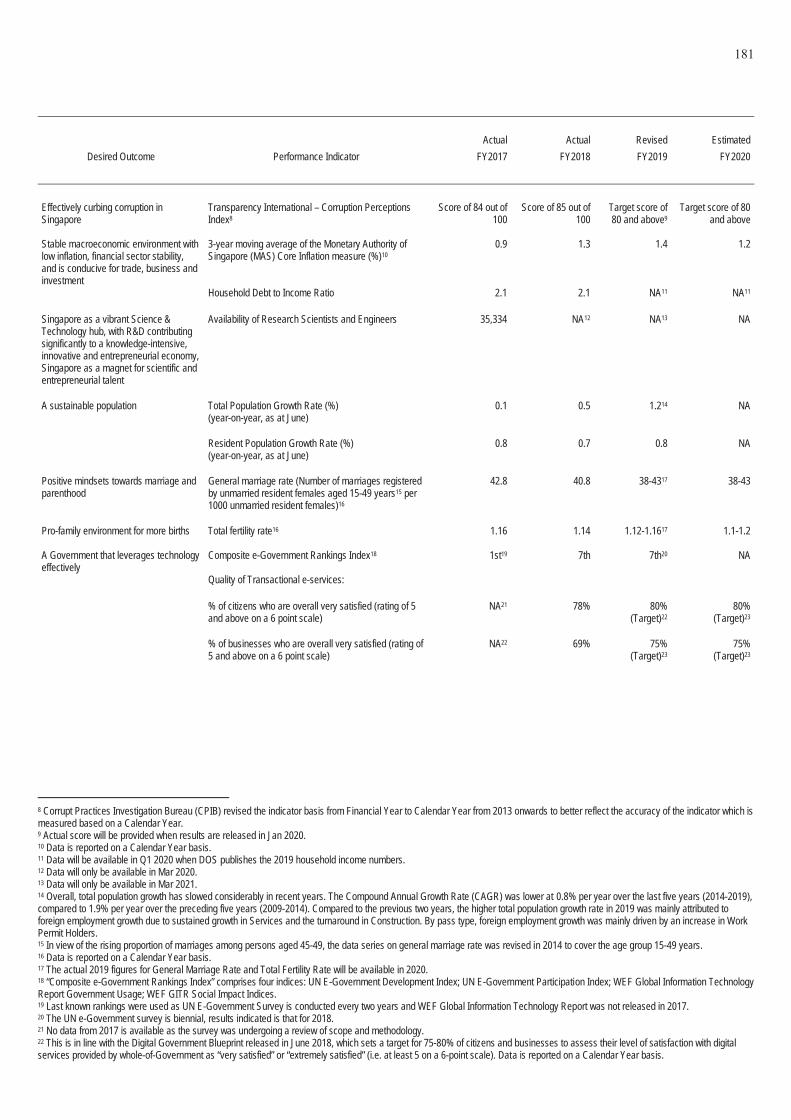
Actual Actual Revised Estimated
Desired Outcome Performance Indicator FY2017 FY2018 FY2019 FY2020
Effectively curbing corruption in Singapore
Transparency International – Corruption Perceptions Index8
Score of 84 out of 100
Score of 85 out of 100
Target score of 80 and above9
Target score of 80 and above
Stable macroeconomic environment with low inflation, financial sector stability, and is conducive for trade, business and investment
3-year moving average of the Monetary Authority of Singapore (MAS) Core Inflation measure (%)10
0.9 1.3 1.4 1.2
Household Debt to Income Ratio 2.1 2.1 NA11 NA11
Singapore as a vibrant Science & Technology hub, with R&D contributing significantly to a knowledge-intensive, innovative and entrepreneurial economy, Singapore as a magnet for scientific and entrepreneurial talent
Availability of Research Scientists and Engineers 35,334 NA12 NA13 NA
A sustainable population Total Population Growth Rate (%)
(year-on-year, as at June) 0.1 0.5 1.214 NA
Resident Population Growth Rate (%) (year-on-year, as at June)
0.8 0.7 0.8 NA
Positive mindsets towards marriage and parenthood
General marriage rate (Number of marriages registered by unmarried resident females aged 15-49 years15 per 1000 unmarried resident females)16
42.8 40.8 38-4317 38-43
Pro-family environment for more births Total fertility rate16 1.16 1.14 1.12-1.1617 1.1-1.2
A Government that leverages technology effectively
Composite e-Government Rankings Index18 1st19 7th 7th20 NA
Quality of Transactional e-services: % of citizens who are overall very satisfied (rating of 5
and above on a 6 point scale) NA21 78% 80%
(Target)22
80%(Target)23
% of businesses who are overall very satisfied (rating of
5 and above on a 6 point scale) NA22 69% 75%
(Target)23
75%(Target)23
8 Corrupt Practices Investigation Bureau (CPIB) revised the indicator basis from Financial Year to Calendar Year from 2013 onwards to better reflect the accuracy of the indicator which is measured based on a Calendar Year. 9 Actual score will be provided when results are released in Jan 2020.10 Data is reported on a Calendar Year basis. 11 Data will be available in Q1 2020 when DOS publishes the 2019 household income numbers. 12 Data will only be available in Mar 2020. 13 Data will only be available in Mar 2021. 14 Overall, total population growth has slowed considerably in recent years. The Compound Annual Growth Rate (CAGR) was lower at 0.8% per year over the last five years (2014-2019), compared to 1.9% per year over the preceding five years (2009-2014). Compared to the previous two years, the higher total population growth rate in 2019 was mainly attributed to foreign employment growth due to sustained growth in Services and the turnaround in Construction. By pass type, foreign employment growth was mainly driven by an increase in Work Permit Holders. 15 In view of the rising proportion of marriages among persons aged 45-49, the data series on general marriage rate was revised in 2014 to cover the age group 15-49 years. 16 Data is reported on a Calendar Year basis. 17 The actual 2019 figures for General Marriage Rate and Total Fertility Rate will be available in 2020. 18 “Composite e-Government Rankings Index” comprises four indices: UN E-Government Development Index; UN E-Government Participation Index; WEF Global Information Technology Report Government Usage; WEF GITR Social Impact Indices. 19 Last known rankings were used as UN E-Government Survey is conducted every two years and WEF Global Information Technology Report was not released in 2017. 20 The UN e-Government survey is biennial, results indicated is that for 2018. 21 No data from 2017 is available as the survey was undergoing a review of scope and methodology. 22 This is in line with the Digital Government Blueprint released in June 2018, which sets a target for 75-80% of citizens and businesses to assess their level of satisfaction with digital services provided by whole-of-Government as “very satisfied” or “extremely satisfied” (i.e. at least 5 on a 6-point scale). Data is reported on a Calendar Year basis.


Head V ___________
Ministry of Trade and Industry


183
HEAD V
MINISTRY OF TRADE AND INDUSTRY
OVERVIEW
Mission Statement
To promote economic growth and create good jobs, to enable Singaporeans to improve their lives.
FY2020 EXPENDITURE ESTIMATES
Expenditure Estimates by Object Class
BLANK Actual Estimated Revised Estimated Code Object Class FY2018 FY2019 FY2019 FY2020 Change Over FY2019
BLANK
TOTAL EXPENDITURE $4,648,865,017 $4,397,218,000 $4,331,352,500 $3,812,656,100 -$518,696,400 -12.0%
Main Estimates $993,154,199 $1,032,517,000 $1,128,845,300 $1,316,531,400 $187,686,100 16.6%
OPERATING EXPENDITURE $993,154,199 $1,032,325,000 $1,128,660,300 $1,316,405,400 $187,745,100 16.6%
RUNNING COSTS $937,205,811 $974,775,600 $1,069,722,300 $1,266,860,400 $197,138,100 18.4%
Expenditure on Manpower $110,649,970 $111,602,000 $108,187,600 $116,294,100 $8,106,500 7.5%
1200 Political Appointments 3,377,044 3,297,200 3,484,900 3,099,000 -385,900 -11.11500 Permanent Staff 106,373,369 106,145,300 102,583,800 110,309,800 7,726,000 7.5 1600 Temporary, Daily-Rated & Other Staff 899,557 2,159,500 2,118,900 2,885,300 766,400 36.2
Other Operating Expenditure $73,004,906 $69,108,300 $126,902,000 $332,383,500 $205,481,500 161.9%
2100 Consumption of Products & Services 51,791,232 57,517,100 110,509,700 321,466,500 210,956,800 190.9 2300 Manpower Development 3,488,353 3,873,700 3,926,400 4,106,500 180,100 4.6 2400 International & Public Relations, Public
Communications 17,472,572 7,654,100 8,700,100 6,480,200 -2,219,900 -25.5
2700 Asset Acquisition 252,691 63,400 3,760,500 325,000 -3,435,500 -91.42800 Miscellaneous 56 0 5,300 5,300 0 0.0
Grants, Subventions & Capital Injections to Organisations $753,550,936 $794,065,300 $834,632,700 $818,182,800 -$16,449,900 -2.0%
3100 Grants, Subventions & Capital Injections to Statutory Boards
753,550,936 794,065,300 834,632,700 818,182,800 -16,449,900 -2.0
TRANSFERS $55,948,388 $57,549,400 $58,938,000 $49,545,000 -$9,393,000 -15.9%
3500 Social Transfers to Individuals 38,607,572 39,567,300 39,567,300 31,648,100 -7,919,200 -20.03600 Transfers to Institutions & Organisations 9,917,112 10,092,600 9,387,000 9,635,600 248,600 2.63800 International Organisations & Overseas
Development Assistance 7,423,705 7,889,500 9,983,700 8,261,300 -1,722,400 -17.3
OTHER CONSOLIDATED FUND OUTLAYS $0 $192,000 $185,000 $126,000 -$59,000 -31.9%
4600 Loans and Advances (Disbursement) 0 192,000 185,000 126,000 -59,000 -31.9

184
BLANK Actual Estimated Revised Estimated Code Object Class FY2018 FY2019 FY2019 FY2020 Change Over FY2019
BLANK
Development Estimates $3,655,710,818 $3,364,893,000 $3,202,692,200 $2,496,250,700 -$706,441,500 -22.1%
DEVELOPMENT EXPENDITURE $3,655,710,818 $3,364,893,000 $3,202,692,200 $2,496,250,700 -$706,441,500 -22.1%
5100 Government Development 137,181,716 150,290,600 108,711,100 108,842,100 131,000 0.1 5200 Grants & Capital Injections to Organisations 3,518,529,101 3,214,602,400 3,093,981,100 2,387,408,600 -706,572,500 -22.8
OTHER DEVELOPMENT FUND OUTLAYS
$873,852,690 $1,390,937,400 $1,154,479,700 $4,045,270,300 $2,890,790,600 250.4%
5500 Land-Related Expenditure 265,525,435 330,955,800 314,479,700 295,270,300 -19,209,400 -6.1 5600 Loans 608,327,255 1,059,981,600 840,000,000 3,750,000,000 2,910,000,000 346.4
Establishment List
BLANK Actual Estimated Revised Estimated Category/Personnel FY2018 FY2019 FY2019 FY2020
BLANK
POLITICAL APPOINTMENTS 5 5 5 5
Minister 2 2 2 2
Senior Minister of State 2 2 2 2
Senior Parliamentary Secretary 1 1 1 1
PERMANENT STAFF 742 742 719 744
Administrative 22 22 14 15
Corporate Support 74 74 73 73
Economist Service 44 44 42 42
Information Service (2008) 11 11 11 11
Management Executive Scheme (2008) 344 344 335 359
Management Support Scheme (2008) 87 87 85 85
Operations Support 7 7 6 6
Shorthand Writers 8 8 8 8
Statistician (Trade & Industry) (2008) 141 141 141 141
Technical Support Scheme (2008) 4 4 4 4
TEMPORARY, DAILY-RATED & OTHER STAFF 18 0 15 15
Management Executive Scheme (2008) 18 0 4 4
Statistician (Trade & Industry) (2008) 0 0 11 11
OTHERS 2,369 2,406 2,398 2,415
Agency for Science, Technology and Research 219 219 223 223
Competition and Consumer Commission of Singapore 75 75 75 75
Economic Development Board 631 668 658 675
Enterprise Singapore 959 959 959 959
Singapore Tourism Board 485 485 483 483
TOTAL 3,134 3,153 3,137 3,179

185
FY2019 BUDGET
The revised FY2019 expenditure for the Ministry of Trade and Industry (MTI) is expected to be $4.33 billion. This represents a decrease of $317.51 million or 6.8% compared to the actual FY2018 expenditure.
MTI’s revised FY2019 operating expenditure is expected to be $1.13 billion, an increase of $135.51 million or 13.6% over the actual FY2018 operating expenditure. This is mainly due to higher other operating expenditure (OOE) of the ministry and higher operating grants to fund the activities of the Statutory Boards.
The revised FY2019 development expenditure of $3.20 billion is $453.02 million or 12.4% less than the actual
development expenditure in FY2018. This is mainly due to lower projected requirements for Economic Development Assistance Scheme 7.
In FY2019, the revised land-related expenditure is $314.48 million. The major reclamation projects are Tuas
Western Coast Reclamation Project ($122.07 million), Tuas View Extension ($44.52 million), Industrial Land Reclamation Resource Expenditure ($44.08 million) and Reclamation between Pulau Ayer Merbau and Pulau Seraya ($43.62 million).
Loans to support the various industrial loan schemes administered by Economic Development Board and
Enterprise Singapore are expected to be $840.00 million for FY2019. This is an increase of $231.67 million or 38.1% compared to the loans disbursed in FY2018. The increase in loans is mainly due to higher expected drawdown for the various industrial loan schemes. FY2020 BUDGET
The FY2020 provision for MTI is $3.81 billion. Of this, 34.5% will go towards operating expenditure and 65.5% to development expenditure. This is a decrease of $518.70 million or 12.0% compared to the revised FY2019 expenditure. Operating Expenditure
Operating expenditure is projected to be $1.32 billion, an increase of $187.75 million or 16.6% compared to the revised FY2019 operating expenditure. The higher expenditure in FY2020 is mainly due to higher other operating expenditure (OOE) of the ministry.
Economic Development Board (EDB) Programme
EDB is the lead government agency for planning and executing strategies to enhance Singapore’s position as a global business centre. Its mission is to create, for Singapore, sustainable economic growth with vibrant business and good job opportunities. To help achieve its target, EDB is provided with an operating budget of $210.77 million. Agency for Science, Technology and Research (A*STAR) Programme
A*STAR’s mission is to advance science and develop innovative technology to further economic growth and improve lives. A*STAR undertakes research to enhance the competitiveness of our industry clusters, seed new areas of growth, and create value for the Singapore economy. A*STAR also plays a central role in developing the national base of PhD research manpower and establishing major research infrastructure. A provision of $51.89 million is allocated to meet A*STAR’s operating expenditure. Singapore Tourism Board (STB) Programme
STB’s vision is to develop a vibrant and inspiring Destination Singapore that we are proud of. Its mission is to shape a dynamic tourism landscape for Singapore in partnership with the industry and community, in pursuit of yield-driven quality growth. To support these efforts, STB is allocated an operating budget of $216.52 million.
186
Enterprise Singapore (ESG) Programme ESG’s mission is to grow stronger Singapore enterprises by strengthening enterprise and innovation capabilities,
transforming industries and facilitating access to global market opportunities, thereby creating good jobs for Singaporeans. To support these efforts, ESG is allocated an operating budget of $238.79 million.
Development Expenditure
MTI’s FY2020 development expenditure is projected to be $2.50 billion, a decrease of $706.44 million or 22.1%
compared to the revised FY2019 development expenditure, mainly due to lower requirements for EDB’s Economic Development Assistance Scheme and STB’s tourism projects. The total expenditure on R&D activities is projected to take up $1.20 billion. The sum will be used to support activities and programmes to strengthen public-private partnerships towards economic impact and value capture, seed new growth clusters, develop R&D manpower capability and enhance knowledge infrastructure. The Enterprise Development Fund is expected to utilise $351.68 million to support Singapore-based enterprises through programmes that support (a) capability development; (b) access to financing; and (c) access to new market opportunities. Overall, this is aimed at building a diverse, resilient and competitive local enterprise landscape that contributes to sustainable economic growth for Singapore and creates good jobs for Singaporeans. The Economic Development Assistance Scheme is projected to take up $434.53 million to support EDB’s Attract, Transform and Create (ATC) strategy for the next phase of economic development, which is in line with the broader focus on industry restructuring to ensure long-term competitiveness and sustainability, as well as the need to promote innovation to generate future economic growth.
Other Consolidated Fund Outlays
Advances Advances for FY2020 are projected to be $0.13 million, a decrease of $0.06 million compared to the revised FY2019 provision. The sum is mainly for overseas trips and attachments, as well as rental deposits. Other Development Fund Outlays Land-related Expenditure
A sum of $295.27 million, a decrease of $19.21 million or 6.1% compared to the revised FY2019 expenditure, has been provided for land-related expenditure. The bulk of the allocation goes towards reclamation projects for industrial land use. Loan Provisions
To assist capital investment by local enterprise and attract overseas investments to Singapore through the provision of loans, a loan provision of $3.75 billion is allocated. This is an increase of $2.91 billion or 346.4% over the revised FY2019 provision, as there is an overall projected increase in loan demand.

187
Total Expenditure by Programme
BLANK Running Operating Development Total Code Programme Costs Transfers Expenditure Expenditure Expenditure BLANK V-A Administration 363,687,100 49,523,000 413,210,100 201,119,400 614,329,500 V-B Statistics 85,850,500 22,000 85,872,500 7,975,300 93,847,800 V-E Economic Development Board 210,774,300 0 210,774,300 640,655,000 851,429,300 V-H Agency for Science, Technology and Research 51,891,600 0 51,891,600 1,000,000,000 1,051,891,600 V-J Sentosa Development Corporation 54,219,700 0 54,219,700 38,165,500 92,385,200 V-L Jurong Town Corporation 17,892,900 0 17,892,900 51,904,300 69,797,200 V-N Singapore Tourism Board 216,521,500 0 216,521,500 153,764,500 370,286,000 V-P Competition and Consumer Commission of Singapore 20,316,300 0 20,316,300 0 20,316,300 V-Q Energy Market Authority 6,912,000 0 6,912,000 2,450,000 9,362,000 V-R Enterprise Singapore 238,794,500 0 238,794,500 400,216,700 639,011,200
Total $1,266,860,400 $49,545,000 $1,316,405,400 $2,496,250,700 $3,812,656,100
Development Expenditure by Project BLANK Actual
Expenditure Up to end of
BLANK BLANK Total Actual Estimated Revised Estimated Project Title Project Cost FY2017 FY2018 FY2019 FY2019 FY2020
BLANK
DEVELOPMENT EXPENDITURE … … $3,655,710,818 $3,364,893,000 $3,202,692,200 $2,496,250,700
GOVERNMENT DEVELOPMENT … … 137,181,716 150,290,600 108,711,100 108,842,100
Administration Programme … … 24 24 24 24
Jurong Rock Cavern Phase 1 844,200,000 695,052,209 31,672,948 30,000,000 14,995,000 20,000,000
Reclamation and Infrastructure Provision at Ayer Chawan Basin of Jurong Island
44,740,000 18,080,847 269,893 4,000,000 3,760,000 300,000
Seletar Airport Infrastructure Upgrade 310,030,000 251,597,299 4,376,198 4,824,600 3,452,200 1,139,400
Provision of Infrastructure for Mediapolis at One-North
95,480,000 67,612,260 1,622,535 1,000,000 1,000,000 1,300,000
WOG Integrated End-to-End Business Licensing System (FRONTIER)
46,482,600 26,475,705 4,430,557 3,144,000 2,500,000 2,500,000
Sand Accretion Test-Bedding 20,000,000 563,257 449,179 0 300,000 3,500,000
Provision of basic infrastructure for dormitory development at Kranji Road
22,150,000 16,991,461 1,133,024 0 450,000 10,000
Artificial Reef Development Phase 2 Project 9,212,500 566,520 2,356,438 1,500,000 300,000 1,200,000
Provision of Basic Infrastructure for IGLS sites at Gambas Crescent and Land next to Tampines Warehouse Retail Scheme (WRS) cluster
42,690,000 12,169,313 5,759,390 3,429,000 3,800,000 500,000
Provision of basic infrastructure for dormitory development at Finger One
4,520,000 3,577,018 5,579 0 378,500 10,000
Sewer Upgrading Works at Tuas-Pioneer and Benoi-Gul Industrial Estates
86,600,000 1,800,096 210,576 3,000,000 770,000 5,000,000
Provision of Basic Infrastructure to Support the Integrated Construction and Prefabrication Hub (ICPH) Site at Jalan Gali Batu
27,200,000 557,655 97,021 3,500,000 1,239,500 3,000,000
Provision of Basic Infrastructure at Tanglin Halt area 47,826,000 428,107 11,338,642 8,000,000 7,710,000 1,500,000
Provision of Basic Infrastructure for IGLS Sites at Kaki Bukit along Bedok Reservoir Road
25,500,000 0 211,188 5,000,000 4,000,000 1,500,000
Provision of Basic Infrastructure at Tuas Western Coast
88,925,000 0 0 7,500,000 2,000,000 13,000,000
Business Grants Portal (BGP) - Phase 3 19,100,000 0 0 0 8,172,200 10,922,700
Minor Development Projects … … 1,731,282 797,400 3,186,200 461,500

188
BLANK Actual Expenditure Up to end of
BLANK BLANK Total Actual Estimated Revised Estimated Project Title Project Cost FY2017 FY2018 FY2019 FY2019 FY2020
BLANK Additional Reclamation and Infrastructure at Tuas View (Tuas Hockey Stick)
675,500,000 668,423,617 487,229 2,800,000 1,300,000 1,500,000
Jurong Island Phase 2 901,000,000 849,041,761 381,658 15,100 383,000 3,000,000
Road Link from Singapore Mainland to Jurong Island and Associated Works
738,100,000 512,078,576 1,484,540 1,510,900 1,510,900 705,000
Reclamation and Infrastructure Development of Jurong Island Phase 3
1,744,520,000 1,258,717,464 3,897,384 3,079,700 3,000,000 600,000
New Projects … … 0 14,631,500 872,700 12,274,700
Tuas View Extension 908,580,000 775,073,964 24,697,876 10,847,000 5,500,000 600,000
Reclamation of Jurong Island Phase 4 447,700,000 359,942,578 3,862,438 8,400,000 17,088,000 8,600,000
Statistics Programme … … 5 5 5 5
Minor Development Projects … … 2,403,645 1,209,300 1,160,700 602,100
Census of Population 2020 5,450,000 0 368,375 2,935,800 3,185,100 1,516,000
More Timely and Comprehensive Data to deepen understanding of overall needs of industries and enterprises, New indicators for the Future Economy
2,042,800 0 0 0 552,500 898,000
Technology Refresh for DOS’ IT Systems (REFRESH 4)
10,783,000 0 0 0 1,510,500 4,659,200
DOS’ Trusted Centre (TC) System for Individual and Business Data
1,444,900 0 0 0 0 300,000
Singapore Tourism Board Programme … … 1 1 1 1
Tourism Development Fund 2 and Tourism Projects 74,400,000 42,035,809 9,844,980 2,000,000 270,400 7,743,500
Completed Projects … … 24,089,141 27,166,300 14,363,700 0
GRANTS & CAPITAL INJECTIONS TO ORGANISATIONS … … 3,518,529,101 3,214,602,400 3,093,981,100 2,387,408,600
Administration Programme … … 3 3 3 3
Minor Development Projects … … 0 400,000 225,000 150,000
Reclamation and Infrastructure Development of Jurong Island Phase 3
138,210,000 20,023,877 31,209,894 31,000,000 9,328,000 12,000
New Projects … … 0 0 400,000 107,834,100
Economic Development Board Programme … … 17 17 17 17
Science and Technology 2010 Plan 2,100,000,000 1,389,727,705 2,171,029 1,104,000 2,127,000 1,105,000
Economic Development Assistance Scheme Phase 5 (FY2006-FY2010)
2,250,000,000 1,617,872,592 18,552,462 16,261,000 21,328,000 1,555,000
International Organisations Programme Office 66,000,000 42,389,621 2,721,012 1,987,000 2,092,000 1,967,000
Solar Capability Scheme 20,000,000 7,680,002 0 0 520,000 563,000
Living Lab Fund 150,500,000 34,353,808 19,626,050 30,005,000 15,617,700 21,274,000
Partnership for Capability Transformation (PACT) Scheme
106,000,000 10,179,931 4,246,776 3,501,000 2,212,000 4,392,000
Research, Innovation and Enterprise 2015 2,636,500,000 1,000,937,780 219,012,098 57,379,000 66,082,000 27,794,000
Economic Development Assistance Scheme (EDAS) 6
2,500,000,000 445,253,827 116,672,939 78,465,000 57,617,000 51,958,000
Arts Marketplace Development 15,000,000 2,300,913 478,643 373,000 373,000 63,000
Land Productivity Grant 37,000,000 0 0 0 156,300 525,000
Solar Testbedding on Reservoirs 12,500,000 5,584,528 427,697 926,000 1,822,000 1,852,000
Space Industry Development Grant 20,000,000 5,224,116 2,093,076 3,785,000 1,965,000 2,351,000
Petroleum Engineering Professorships for Capability Development
10,000,000 730,467 0 890,000 705,000 700,000
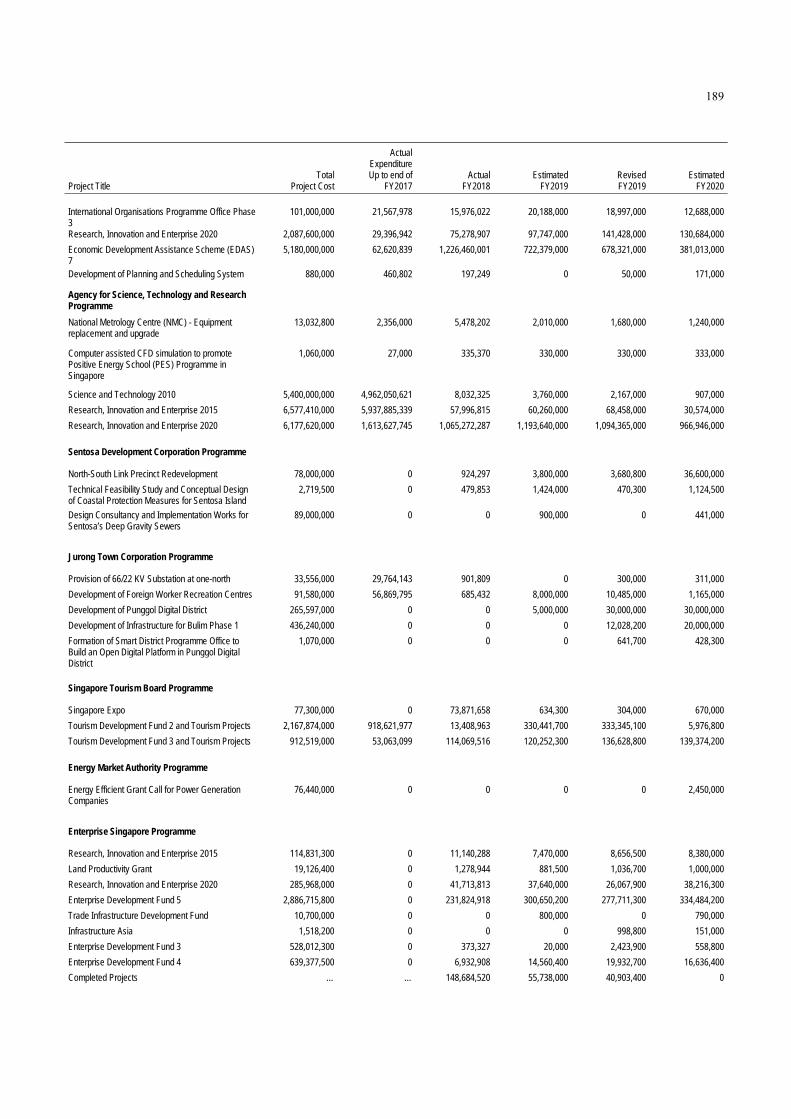
189
BLANK Actual Expenditure Up to end of
BLANK BLANK Total Actual Estimated Revised Estimated Project Title Project Cost FY2017 FY2018 FY2019 FY2019 FY2020
BLANK International Organisations Programme Office Phase 3
101,000,000 21,567,978 15,976,022 20,188,000 18,997,000 12,688,000
Research, Innovation and Enterprise 2020 2,087,600,000 29,396,942 75,278,907 97,747,000 141,428,000 130,684,000
Economic Development Assistance Scheme (EDAS) 7
5,180,000,000 62,620,839 1,226,460,001 722,379,000 678,321,000 381,013,000
Development of Planning and Scheduling System 880,000 460,802 197,249 0 50,000 171,000
Agency for Science, Technology and Research Programme
… … 12 12 12 12
National Metrology Centre (NMC) - Equipment replacement and upgrade
13,032,800 2,356,000 5,478,202 2,010,000 1,680,000 1,240,000
Computer assisted CFD simulation to promote Positive Energy School (PES) Programme in Singapore
1,060,000 27,000 335,370 330,000 330,000 333,000
Science and Technology 2010 5,400,000,000 4,962,050,621 8,032,325 3,760,000 2,167,000 907,000
Research, Innovation and Enterprise 2015 6,577,410,000 5,937,885,339 57,996,815 60,260,000 68,458,000 30,574,000
Research, Innovation and Enterprise 2020 6,177,620,000 1,613,627,745 1,065,272,287 1,193,640,000 1,094,365,000 966,946,000
Sentosa Development Corporation Programme … … 3 3 3 3
North-South Link Precinct Redevelopment 78,000,000 0 924,297 3,800,000 3,680,800 36,600,000
Technical Feasibility Study and Conceptual Design of Coastal Protection Measures for Sentosa Island
2,719,500 0 479,853 1,424,000 470,300 1,124,500
Design Consultancy and Implementation Works for Sentosa’s Deep Gravity Sewers
89,000,000 0 0 900,000 0 441,000
Jurong Town Corporation Programme … … 5 5 5 5
Provision of 66/22 KV Substation at one-north 33,556,000 29,764,143 901,809 0 300,000 311,000
Development of Foreign Worker Recreation Centres 91,580,000 56,869,795 685,432 8,000,000 10,485,000 1,165,000
Development of Punggol Digital District 265,597,000 0 0 5,000,000 30,000,000 30,000,000
Development of Infrastructure for Bulim Phase 1 436,240,000 0 0 0 12,028,200 20,000,000
Formation of Smart District Programme Office to Build an Open Digital Platform in Punggol Digital District
1,070,000 0 0 0 641,700 428,300
Singapore Tourism Board Programme … … 5 5 5 5
Singapore Expo 77,300,000 0 73,871,658 634,300 304,000 670,000
Tourism Development Fund 2 and Tourism Projects 2,167,874,000 918,621,977 13,408,963 330,441,700 333,345,100 5,976,800
Tourism Development Fund 3 and Tourism Projects 912,519,000 53,063,099 114,069,516 120,252,300 136,628,800 139,374,200
Energy Market Authority Programme … … 1 1 1 1
Energy Efficient Grant Call for Power Generation Companies
76,440,000 0 0 0 0 2,450,000
Enterprise Singapore Programme … … 10 10 10 10
Research, Innovation and Enterprise 2015 114,831,300 0 11,140,288 7,470,000 8,656,500 8,380,000
Land Productivity Grant 19,126,400 0 1,278,944 881,500 1,036,700 1,000,000
Research, Innovation and Enterprise 2020 285,968,000 0 41,713,813 37,640,000 26,067,900 38,216,300
Enterprise Development Fund 5 2,886,715,800 0 231,824,918 300,650,200 277,711,300 334,484,200
Trade Infrastructure Development Fund 10,700,000 0 0 800,000 0 790,000
Infrastructure Asia 1,518,200 0 0 0 998,800 151,000
Enterprise Development Fund 3 528,012,300 0 373,327 20,000 2,423,900 558,800
Enterprise Development Fund 4 639,377,500 0 6,932,908 14,560,400 19,932,700 16,636,400
Completed Projects … … 148,684,520 55,738,000 40,903,400 0

190
Other Development Fund Outlays
BLANK Actual Expenditure Up to end of
BLANK BLANK Total Actual Estimated Revised Estimated Project Title Project Cost FY2017 FY2018 FY2019 FY2019 FY2020
BLANK
OTHER DEVELOPMENT FUND OUTLAYS … … $873,852,690 $1,390,937,400 $1,154,479,700 $4,045,270,300
LAND-RELATED EXPENDITURE … … 265,525,435 330,955,800 314,479,700 295,270,300
Administration Programme … … 8 8 8 8
Reclamation and Infrastructure Development between Pulau Ayer Merbau and Pulau Seraya, Jurong Island
316,490,000 172,222,799 58,624,841 60,000,000 43,618,200 19,954,500
Jurong Rock Cavern Phase 1 512,800,000 458,487,313 9,551,486 50,000 1,150,000 50,000
Extraction of Earth from Jalan Gali Batu and Wenya as Reclamation Fill
497,810,000 129,216,838 24,864,903 58,700,000 34,326,700 65,100,000
Tuas Western Coast reclamation project 1,489,230,000 17,968,935 52,086,097 102,022,100 122,070,000 114,923,000
Preparatory Works for the Reclamation of Northern Tuas Basin
13,680,000 0 0 0 1,470,000 6,170,000
Tuas View Extension 9,310,700,000 6,311,944,488 82,772,205 88,553,700 44,516,000 45,150,000
Reclamation of Jurong Island Phase 4 3,750,840,000 1,782,014,344 35,652,837 4,000,000 23,000,000 20,000,000
Industrial Land Reclamation Resource Expenditure 1,610,049,000 1,018,188,407 1,180,458 8,490,000 44,078,800 23,922,800
Completed Projects … … 792,609 9,140,000 250,000 0
LOANS … … 608,327,255 1,059,981,600 840,000,000 3,750,000,000
Administration Programme … … 1 1 1 1
New Projects … … 0 0 0 2,400,000,000
Economic Development Board Programme … … 1 1 1 1
Capital Assistance Scheme 7 8,000,000,000 0 0 550,000,000 50,000,000 600,000,000
Enterprise Singapore Programme … … 1 1 1 1
Enterprise Development Fund 5 2,885,095,300 0 605,257,255 509,981,600 790,000,000 750,000,000
Completed Projects … … 3,070,000 0 0 0
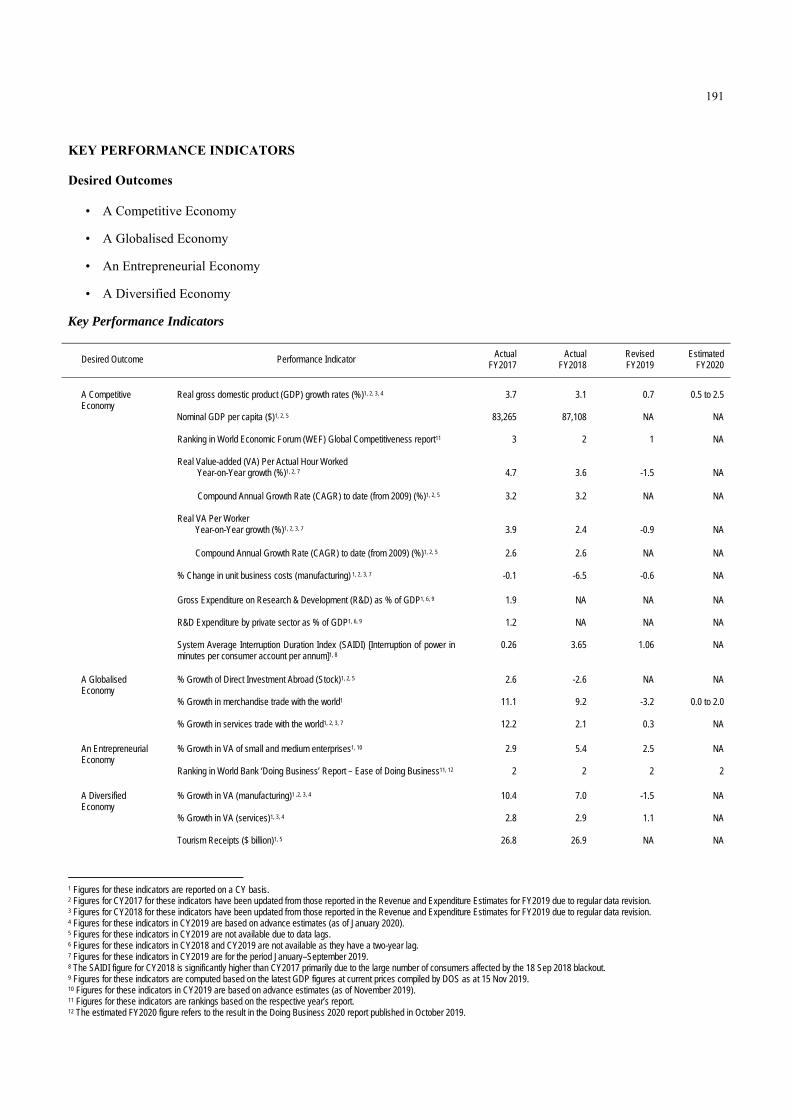
191
KEY PERFORMANCE INDICATORS
Desired Outcomes
• A Competitive Economy
• A Globalised Economy
• An Entrepreneurial Economy
• A Diversified Economy
Key Performance Indicators
Desired Outcome Performance Indicator Actual FY2017
Actual FY2018
Revised FY2019
Estimated FY2020
A Competitive Economy
Real gross domestic product (GDP) growth rates (%)1, 2, 3, 4 3.7 3.1 0.7 0.5 to 2.5
Nominal GDP per capita ($)1, 2, 5
83,265 87,108 NA NA
Ranking in World Economic Forum (WEF) Global Competitiveness report11
3 2 1 NA
Real Value-added (VA) Per Actual Hour Worked Year-on-Year growth (%)1, 2, 7
4.7
3.6
-1.5
NA
Compound Annual Growth Rate (CAGR) to date (from 2009) (%)1, 2, 5
3.2
3.2
NA NA
Real VA Per Worker Year-on-Year growth (%)1, 2, 3, 7
3.9
2.4
-0.9
NA
Compound Annual Growth Rate (CAGR) to date (from 2009) (%)1, 2, 5 2.6 2.6
NA
NA
% Change in unit business costs (manufacturing) 1, 2, 3, 7 -0.1 -6.5 -0.6 NA Gross Expenditure on Research & Development (R&D) as % of GDP1, 6, 9 1.9
NA
NA
NA
R&D Expenditure by private sector as % of GDP1, 6, 9
1.2 NA NA NA
System Average Interruption Duration Index (SAIDI) [Interruption of power in minutes per consumer account per annum]1, 8
0.26 3.65 1.06 NA
A Globalised Economy
% Growth of Direct Investment Abroad (Stock)1, 2, 5 2.6 -2.6 NA NA
% Growth in merchandise trade with the world1 11.1
9.2 -3.2 0.0 to 2.0
% Growth in services trade with the world1, 2, 3, 7 12.2 2.1 0.3 NA An Entrepreneurial Economy
% Growth in VA of small and medium enterprises1, 10
2.9 5.4 2.5 NA
Ranking in World Bank ‘Doing Business’ Report – Ease of Doing Business11, 12 2 2 2 2
A Diversified Economy
% Growth in VA (manufacturing)1 ,2, 3, 4 10.4 7.0 -1.5 NA
% Growth in VA (services)1, 3, 4 2.8 2.9 1.1 NA
Tourism Receipts ($ billion)1, 5 26.8 26.9 NA NA
1 Figures for these indicators are reported on a CY basis. 2 Figures for CY2017 for these indicators have been updated from those reported in the Revenue and Expenditure Estimates for FY2019 due to regular data revision. 3 Figures for CY2018 for these indicators have been updated from those reported in the Revenue and Expenditure Estimates for FY2019 due to regular data revision. 4 Figures for these indicators in CY2019 are based on advance estimates (as of January 2020). 5 Figures for these indicators in CY2019 are not available due to data lags. 6 Figures for these indicators in CY2018 and CY2019 are not available as they have a two-year lag. 7 Figures for these indicators in CY2019 are for the period January–September 2019. 8 The SAIDI figure for CY2018 is significantly higher than CY2017 primarily due to the large number of consumers affected by the 18 Sep 2018 blackout. 9 Figures for these indicators are computed based on the latest GDP figures at current prices compiled by DOS as at 15 Nov 2019. 10 Figures for these indicators in CY2019 are based on advance estimates (as of November 2019). 11 Figures for these indicators are rankings based on the respective year’s report. 12 The estimated FY2020 figure refers to the result in the Doing Business 2020 report published in October 2019.


Head W ___________
Ministry of Transport


193
HEAD W
MINISTRY OF TRANSPORT
OVERVIEW
Mission Statement
To strengthen Singapore’s transportation connectivity and develop the transport sector’s potential to advance our economic competitiveness and the quality of life in Singapore.
FY2020 EXPENDITURE ESTIMATES
Expenditure Estimates by Object Class
BLANK Actual Estimated Revised Estimated Code Object Class FY2018 FY2019 FY2019 FY2020 Change Over FY2019
BLANK
TOTAL EXPENDITURE $11,776,374,113 $10,683,679,500 $10,187,466,700 $10,912,533,400 $725,066,700 7.1%
Main Estimates $1,899,533,073 $2,033,424,400 $1,897,980,500 $1,992,837,500 $94,857,000 5.0%
OPERATING EXPENDITURE $1,899,533,073 $2,033,424,400 $1,897,980,500 $1,992,837,500 $94,857,000 5.0%
RUNNING COSTS $1,881,855,697 $2,010,817,600 $1,879,801,300 $1,972,220,800 $92,419,500 4.9%
Expenditure on Manpower $30,512,497 $29,684,000 $32,580,200 $31,630,000 -$950,200 -2.9%
1200 Political Appointments 1,619,724 1,630,000 1,720,000 1,630,000 -90,000 -5.21500 Permanent Staff 28,854,351 28,004,000 30,810,200 29,950,000 -860,200 -2.81600 Temporary, Daily-Rated & Other Staff 38,421 50,000 50,000 50,000 0 0.0
Other Operating Expenditure $665,085,915 $690,015,600 $705,959,800 $697,941,900 -$8,017,900 -1.1%
2100 Consumption of Products & Services 661,514,949 682,122,700 697,903,200 691,444,400 -6,458,800 -0.92300 Manpower Development 782,783 1,019,400 861,900 848,300 -13,600 -1.62400 International & Public Relations, Public
Communications 2,663,026 6,703,000 6,891,300 5,494,600 -1,396,700 -20.3
2700 Asset Acquisition 125,158 170,500 178,300 154,600 -23,700 -13.32800 Miscellaneous 0 0 125,100 0 -125,100 -100.0
Grants, Subventions & Capital Injections to Organisations
$1,186,257,285 $1,291,118,000 $1,141,261,300 $1,242,648,900 $101,387,600 8.9%
3100 Grants, Subventions & Capital Injections to Statutory Boards
1,186,257,285 1,291,118,000 1,141,261,300 1,242,648,900 101,387,600 8.9
TRANSFERS $17,677,376 $22,606,800 $18,179,200 $20,616,700 $2,437,500 13.4%
3500 Social Transfers to Individuals 15,808,291 20,706,500 16,278,900 18,694,400 2,415,500 14.8 3800 International Organisations & Overseas
Development Assistance 1,869,085 1,900,300 1,900,300 1,922,300 22,000 1.2
Development Estimates $9,876,841,040 $8,650,255,100 $8,289,486,200 $8,919,695,900 $630,209,700 7.6%
DEVELOPMENT EXPENDITURE $9,876,841,040 $8,650,255,100 $8,289,486,200 $8,919,695,900 $630,209,700 7.6%
5100 Government Development 858,961,928 1,391,317,400 1,092,853,900 1,638,155,200 545,301,300 49.9 5200 Grants & Capital Injections to Organisations 9,017,879,112 7,258,937,700 7,196,632,300 7,281,540,700 84,908,400 1.2

194
BLANK Actual Estimated Revised Estimated Code Object Class FY2018 FY2019 FY2019 FY2020 Change Over FY2019
BLANK
OTHER DEVELOPMENT FUND OUTLAYS
$1,015,520,650 $863,430,200 $777,083,500 $565,033,800 -$212,049,700 -27.3%
5500 Land-Related Expenditure 1,015,520,650 863,430,200 777,083,500 565,033,800 -212,049,700 -27.3
Establishment List
BLANK Actual Estimated Revised Estimated Category/Personnel FY2018 FY2019 FY2019 FY2020
BLANK
POLITICAL APPOINTMENTS 4 4 4 4
Minister 1 1 1 1
Senior Minister of State 2 2 2 2
Senior Parliamentary Secretary 1 1 1 1
PERMANENT STAFF 161 167 169 170
Accounting Profession (2008) 2 2 2 2
Administrative 16 16 16 16
Corporate Support 2 2 1 1
Information Service (2008) 8 8 9 9
Management Executive Scheme (2008) 124 130 134 135
Management Support Scheme (2008) 5 5 4 4
Operations Support 2 2 2 2
Shorthand Writers 2 2 1 1
OTHERS 6,832 7,088 6,815 7,031
Land Transport Authority 6,800 7,053 6,780 6,995
Public Transport Council 32 35 35 36
TOTAL 6,997 7,259 6,988 7,205

195
FY2019 BUDGET The revised FY2019 total expenditure for the Ministry of Transport (MOT) is expected to be $10.19 billion. This is a decrease of $1.59 billion or 13.5% compared to the actual FY2018 total expenditure of $11.78 billion. Of the revised FY2019 total expenditure, $1.90 billion or 18.6% is for operating expenditure while $8.29 billion or 81.4% is for development expenditure. Operating Expenditure The revised FY2019 operating expenditure of $1.90 billion is comparable to the actual FY2018 operating expenditure of $1.90 billion. Development Expenditure The revised FY2019 development expenditure of $8.29 billion is $1.59 billion or 16.1% lower than the actual FY2018 development expenditure of $9.88 billion. This decrease is mainly due to lower expenditure requirements for international rail projects. Other Development Fund Outlays Land-related Expenditure The revised FY2019 land-related expenditure of $0.78 billion is $0.24 billion or 23.5% lower than the actual FY2018 land-related expenditure of $1.02 billion. The decrease is mainly due to lower expenditure requirements for land reclamation and related developments at Tuas Port. FY2020 BUDGET
The total expenditure of MOT in FY2020 is projected to be $10.91 billion, of which $1.99 billion or 18.3% is for operating expenditure and $8.92 billion or 81.7% is for development expenditure. The projected FY2020 total expenditure is an increase of $0.73 billion or 7.1% compared to the revised FY2019 total expenditure.
Operating Expenditure
Operating expenditure in FY2020 is expected to increase by $0.09 billion or 5.0% over revised FY2019, from $1.90 billion to $1.99 billion. About 88.9% of the provision or $1.77 billion will be for the Land Transport Authority. Of the remaining operating expenditure of $0.22 billion, a portion will be set aside to fund COVID-19 relief measures and public transport concession schemes for lower-wage workers and persons with disabilities. The remaining will be used to meet the running costs of MOT HQ and the Public Transport Council. Development Expenditure
Development expenditure in FY2020 is projected to increase by $0.63 billion or 7.6% compared to revised FY2019, from $8.29 billion to $8.92 billion. Of the FY2020 development expenditure, about $6.78 billion is earmarked for domestic rail projects. The remaining amount of $2.14 billion is for road improvement works, funding of bus purchases and development of new airport facilities at Changi East. The increase in development expenditure in FY2020 is mainly due to the development of domestic rail projects. Other Development Fund Outlays Land-related Expenditure Land-related expenditure in FY2020 is projected to decrease by $0.21 billion or 27.3%, compared to revised FY2019, from $0.78 billion to $0.57 billion. The decrease is mainly due to lower expenditure requirements for land reclamation and related developments at Tuas Port.

196
Total Expenditure by Programme
BLANK Running Operating Development Total Code Programme Costs Transfers Expenditure Expenditure Expenditure BLANK W-A Administration 1,964,139,600 20,616,700 1,984,756,300 2,269,542,100 4,254,298,400 W-E Public Transport Council 8,081,200 0 8,081,200 6,700 8,087,900 W-G Civil Aviation Authority 0 0 0 274,196,400 274,196,400 W-H Land Transport Authority 0 0 0 6,375,950,700 6,375,950,700
Total $1,972,220,800 $20,616,700 $1,992,837,500 $8,919,695,900 $10,912,533,400
Development Expenditure by Project
BLANK
Actual Expenditure Up to end of
BLANK
BLANK Total Actual Estimated Revised Estimated Project Title Project Cost FY2017 FY2018 FY2019 FY2019 FY2020
BLANK
DEVELOPMENT EXPENDITURE … … $9,876,841,040 $8,650,255,100 $8,289,486,200 $8,919,695,900
GOVERNMENT DEVELOPMENT … … 858,961,928 1,391,317,400 1,092,853,900 1,638,155,200
Administration Programme … … 115 115 115 115
Coral Relocation and Related Works (Tuas Port) 6,000,000 4,045,932 835,036 490,000 248,000 23,800
Land Preparation Works for Future Airport Facilities at Changi East
942,720,000 716,519,695 15,954,316 39,600,000 8,200,000 5,343,900
Self-Driving Road Transportation for Singapore 6,000,000 0 0 1,810,500 600,000 855,000
Building Information Modelling (BIM) and Associated Infrastructure Data Conversion for the Underground Master Plan (UGMP)
1,110,000 47,144 354,558 210,000 105,600 193,500
Reclamation of Tuas Terminal Phase 2 and Related Works
30,840,000 0 72,030 2,502,000 778,000 2,377,100
MOT Technology Development 21,551,000 0 1,528,899 2,110,500 1,503,400 1,910,600
Pilot on Inclusive Land Transport System 6,190,000 0 0 0 30,500 517,700
Provision and Maintenance of Infrastructure 1,139,700 0 0 0 557,000 1,028,700
Minor Development Projects … … 1,579,079 4,404,300 3,786,500 1,516,400
New Projects … … 0 789,852,000 493,644,100 1,090,691,500
Commuter & Road-related Facilities & Traffic Management Programmes
3,189,678,000 1,526,643,422 120,544,568 153,611,800 159,618,100 152,824,000
Bus Depot Projects 648,050,000 146,818,960 13,528,576 21,160,000 14,038,200 23,817,200
Bus Interchange and Integrated Transport Hub Projects
434,617,100 83,111,025 29,292,605 59,623,900 73,821,800 33,306,400
Cycling Path Projects 414,530,000 53,542,029 7,399,327 20,680,600 15,012,600 28,411,100
Expressway Projects 5,841,110,000 4,395,822,051 121,354,161 129,283,700 131,446,400 132,997,200
Other Active Mobility Projects 30,950,000 4,790,088 874,005 4,741,000 1,709,400 6,717,100

197
BLANK Actual
Expenditure Up to end of
BLANK
BLANK Total Actual Estimated Revised Estimated Project Title Project Cost FY2017 FY2018 FY2019 FY2019 FY2020
BLANK
Road Projects 1,294,754,000 575,242,882 108,380,381 112,729,700 103,459,100 93,348,100
Supporting Bus Infrastructure and Related Projects 222,692,900 35,545,985 2,622,725 4,637,900 5,822,800 17,594,800
Supporting Infrastructure for the Expansion of Rail Network and Related Projects
1,436,200,000 586,179,508 31,891,688 16,896,800 35,182,700 26,717,700
Supporting Infrastructure for the Expansion of Rail Network and Related Projects (Incidentals)
105,520,000 42,314 1,310 20,824,500 29,860,900 17,963,400
Completed Projects … … 402,748,665 6,148,200 13,428,800 0
GRANTS & CAPITAL INJECTIONS TO ORGANISATIONS
… … 9,017,879,112 7,258,937,700 7,196,632,300 7,281,540,700
Administration Programme … … 2 2 2 2 Minor Development Projects … … 0 0 566,800 570,400
New Projects … … 0 1,145,087,400 271,408,400 630,816,500
Public Transport Council Programme … … 1 1 1 1
Digital Record System (DRS) 112,200 0 0 56,100 78,900 6,700
Civil Aviation Authority Programme … … 7 7 7 7
Tunnel Network at Changi East 579,349,700 0 0 0 0 1,564,000
Development of new airport facilities at Changi East 7,457,102,400 397,901,609 343,753,342 312,702,200 201,278,400 272,632,400
Land Transport Authority Programme … … 97 97 97 97 Engineering Study and Detailed Design for Cross-Border Rapid Transit System Link
40,640,000 17,043,695 7,930,756 2,304,600 9,485,900 1,351,000
Commuter Facilities and Related Projects 58,820,000 11,007,711 5,085,581 4,590,000 4,590,000 3,084,700
Self-Driving Road Transportation for Singapore 7,440,000 2,921,084 802,940 200,000 165,000 162,900
Non-Design/Construction Pre-Development Works for Johor Bahru-Singapore Rapid Transit System (JB-SG RTS Link)
2,500,000 1,507,657 206,414 252,400 354,200 417,800
Non-Design/Construction Pre-Development Works for Kuala Lumpur-Singapore High Speed Rail (KL-SG HSR)
3,230,000 2,212,595 768,179 323,600 0 250,700
Building Information Modelling (BIM) and Associated Infrastructure Data Conversion for the Underground Master Plan (UGMP)
3,810,000 90,180 457,382 780,000 1,021,300 735,500
Corporate Projects 7,790,000 0 3,378,077 4,976,900 600,600 1,861,300
Railway Sinking Fund 0 1,000,000,000 1,427,134,710 500,000,000 519,109,100 2,476,000,000
Active Mobility Projects 4,110,000 0 32,667 0 1,873,000 1,270,600
Bus Asset and Related System Projects 730,320,000 415,340,745 41,124,550 94,242,900 88,706,900 68,085,200
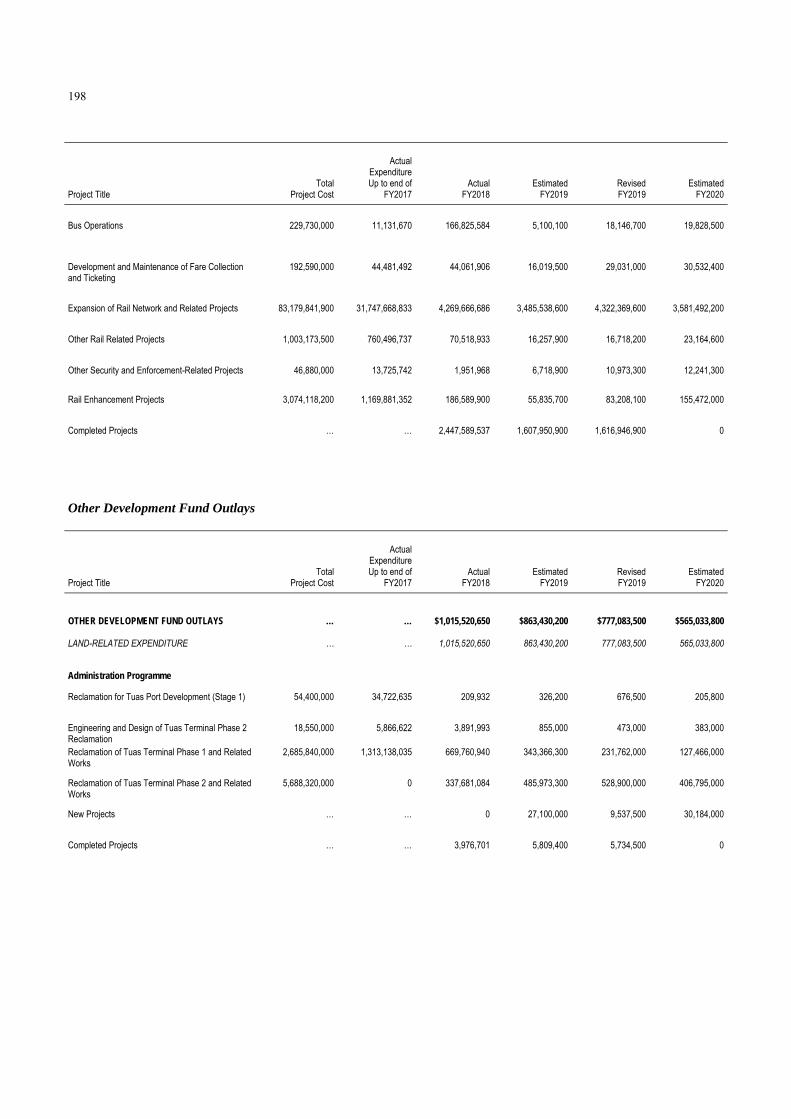
198
BLANK Actual
Expenditure Up to end of
BLANK
BLANK Total Actual Estimated Revised Estimated Project Title Project Cost FY2017 FY2018 FY2019 FY2019 FY2020
BLANK
Bus Operations 229,730,000 11,131,670 166,825,584 5,100,100 18,146,700 19,828,500
Development and Maintenance of Fare Collection and Ticketing
192,590,000 44,481,492 44,061,906 16,019,500 29,031,000 30,532,400
Expansion of Rail Network and Related Projects 83,179,841,900 31,747,668,833 4,269,666,686 3,485,538,600 4,322,369,600 3,581,492,200
Other Rail Related Projects 1,003,173,500 760,496,737 70,518,933 16,257,900 16,718,200 23,164,600
Other Security and Enforcement-Related Projects 46,880,000 13,725,742 1,951,968 6,718,900 10,973,300 12,241,300
Rail Enhancement Projects 3,074,118,200 1,169,881,352 186,589,900 55,835,700 83,208,100 155,472,000
Completed Projects … … 2,447,589,537 1,607,950,900 1,616,946,900 0
Other Development Fund Outlays BLANK
Actual Expenditure Up to end of
BLANK
BLANK Total Actual Estimated Revised Estimated Project Title Project Cost FY2017 FY2018 FY2019 FY2019 FY2020
BLANK
OTHER DEVELOPMENT FUND OUTLAYS … … $1,015,520,650 $863,430,200 $777,083,500 $565,033,800
LAND-RELATED EXPENDITURE … … 1,015,520,650 863,430,200 777,083,500 565,033,800
Administration Programme … … 5 5 5 5
Reclamation for Tuas Port Development (Stage 1) 54,400,000 34,722,635 209,932 326,200 676,500 205,800
Engineering and Design of Tuas Terminal Phase 2 Reclamation
18,550,000 5,866,622 3,891,993 855,000 473,000 383,000
Reclamation of Tuas Terminal Phase 1 and Related Works
2,685,840,000 1,313,138,035 669,760,940 343,366,300 231,762,000 127,466,000
Reclamation of Tuas Terminal Phase 2 and Related Works
5,688,320,000 0 337,681,084 485,973,300 528,900,000 406,795,000
New Projects … … 0 27,100,000 9,537,500 30,184,000
Completed Projects … … 3,976,701 5,809,400 5,734,500 0

199
KEY PERFORMANCE INDICATORS Desired Outcomes
• Develop Singapore as a Global Aviation Hub
• Develop Singapore as an International Maritime Hub
• Develop an Efficient, Sustainable and People-centric Land Transport System
Key Performance Indicators
Actual Actual Revised Estimated
Desired Outcome Performance Indicator 1 FY2017 FY2018 FY2019 FY2020 Develop Singapore as a Global Aviation Hub
Real Growth in Value-Added of Air Transport and Supporting Services Sector (%) 2
5.3 5.7 3.0 1.0 to 3.0
Growth in Air Passenger Movements (%) 6.0 5.2 3.0 to 4.0 1.5 to 3.5
No. of Direct City Air-Links (Averaged) 168 173 173 to 175 175 to 177
World Economic Forum (WEF) Ranking for Air Transport Infrastructure
N.A. 1st 1st Top 3
Develop Singapore as an International Maritime Hub
Real Growth in Value-Added of Maritime Sector (%) 2 8.1 3.5 to 5.5 -1.0 to 1.0 0.5 to 2.5
Growth in Container Throughput (%) 3 8.9 8.7 0.5 to 2.5 2.1 to 4.1
United Nations Conference on Trade and Development (UNCTAD) Liner Shipping Connectivity Index Ranking
2nd 2nd 2nd Top 3
WEF Ranking for Port Infrastructure N.A. 1st 1st Top 3
Develop an Efficient, Sustainable and People-centric Land Transport System
Customer Satisfaction with Public Transport (mean score) 4 7.7 7.9 ≥7.9 ≥7.9
Peak-Period Walk Cycle Ride Journeys Completed within 45 mins (%) 5
N.A. 66.0 66.0 67.0
Peak-Period Mode Share of Walk Cycle Ride (%) 6 N.A. 72.0 72.0 72.5
Public Transport Affordability (%) 7 1.9 1.7 1.7 1.8
Mean Distance Travelled between Delays >5min on MRT Network (train-km)
181,000 690,000 1,000,000 1,000,000
Mean Distance Travelled between Delays >5min on LRT Network (car-km)
77,000 82,000 100,000 ≥100,000
Customer Satisfaction with Point-to-Point Services (mean score) 8
8.1 7.9 ≥7.9 ≥7.9
1 Data is reported on a Calendar Year basis. 2 The 2018 data is an estimate and the 2017 data is a revision from the reported figure in the Revenue and Expenditure Estimates for FY2019/2020. These figures are based on data by the Department of Statistics and are revised as it receives more information from companies. 3 The 2017 data is a revision from the reported figure in the Revenue and Expenditure Estimates for FY2019/FY2020. This data is based on a revised methodology to use unrounded instead of rounded figures. 4 The mean score reflects bus and rail commuters’ satisfaction with the public transport service. It is based on ratings provided by commuters on eight aspects of public transport service quality using a 10-point satisfaction scale. The satisfaction ratings from the annual survey were weighted by commuters’ assessed relative importance to produce the mean satisfaction score. 5 This KPI has been revised from “Peak-hours Public Transport Journeys ≤ 20km which are Completed within 60 minutes (%)”. 6 This KPI has been revised from “Peak-hours Mode Share of Public Transport (%)”. 7 This is the percentage of household income spent on public transport by those in the second quintile of the household income distribution. It is used by the Public Transport Council to assess public transport affordability for the average commuter. 8 The mean score reflects commuters’ satisfaction with taxi and private hire car services. It is based on satisfaction ratings provided by commuters on eight aspects of taxi service attributes and seven aspects of private hire car service attributes using a 10-point satisfaction scale. The satisfaction ratings from the annual survey were weighted by commuters’ assessed relative importance to produce the overall mean satisfaction score for taxi and private hire car services respectively. These were then weighted by the estimated usage proportion to derive a single satisfaction rating for point-to-point transport services as a whole.


Head X ___________
Ministry of Culture, Community and Youth

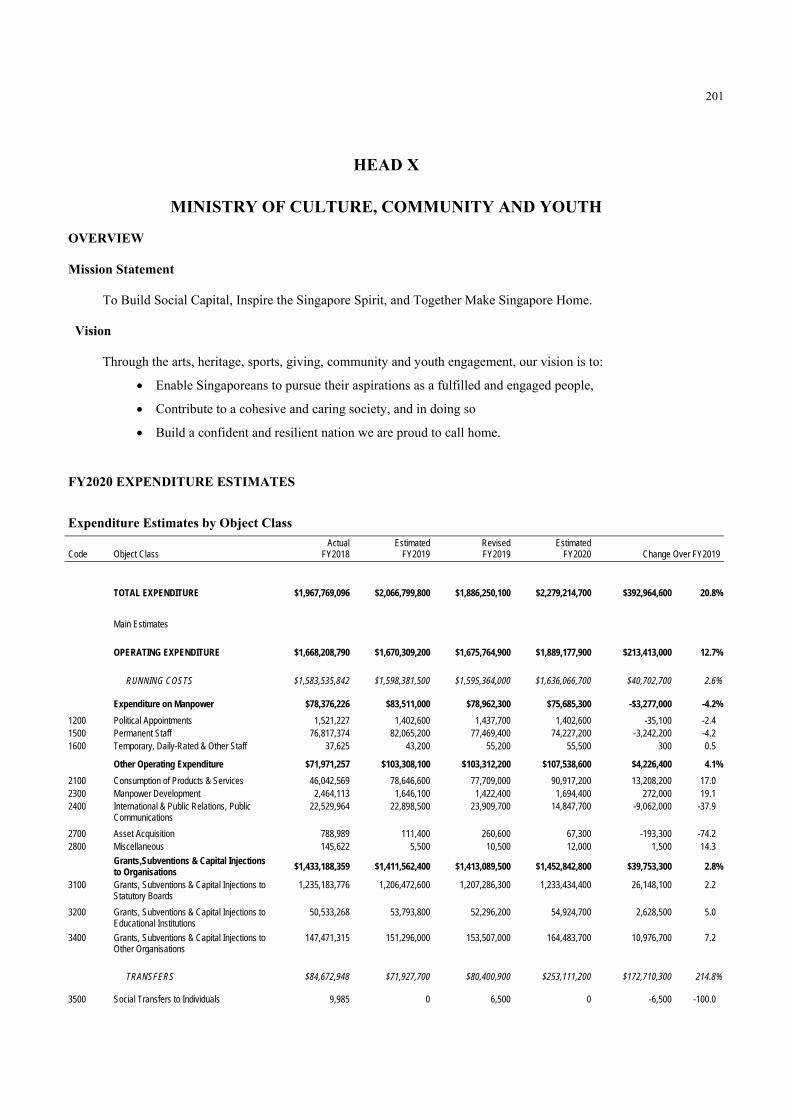
201
HEAD X
MINISTRY OF CULTURE, COMMUNITY AND YOUTH
OVERVIEW
Mission Statement
To Build Social Capital, Inspire the Singapore Spirit, and Together Make Singapore Home.
Vision
Through the arts, heritage, sports, giving, community and youth engagement, our vision is to:
Enable Singaporeans to pursue their aspirations as a fulfilled and engaged people,
Contribute to a cohesive and caring society, and in doing so
Build a confident and resilient nation we are proud to call home.
FY2020 EXPENDITURE ESTIMATES
Expenditure Estimates by Object Class
BLANK Actual Estimated Revised Estimated Code Object Class FY2018 FY2019 FY2019 FY2020 Change Over FY2019
BLANK
TOTAL EXPENDITURE $1,967,769,096 $2,066,799,800 $1,886,250,100 $2,279,214,700 $392,964,600 20.8%
Main Estimates $1,668,208,790 $1,670,579,200 $1,675,769,800 $1,889,177,900 $213,408,100 12.7%
OPERATING EXPENDITURE $1,668,208,790 $1,670,309,200 $1,675,764,900 $1,889,177,900 $213,413,000 12.7%
RUNNING COSTS $1,583,535,842 $1,598,381,500 $1,595,364,000 $1,636,066,700 $40,702,700 2.6%
Expenditure on Manpower $78,376,226 $83,511,000 $78,962,300 $75,685,300 -$3,277,000 -4.2%
1200 Political Appointments 1,521,227 1,402,600 1,437,700 1,402,600 -35,100 -2.41500 Permanent Staff 76,817,374 82,065,200 77,469,400 74,227,200 -3,242,200 -4.21600 Temporary, Daily-Rated & Other Staff 37,625 43,200 55,200 55,500 300 0.5
Other Operating Expenditure $71,971,257 $103,308,100 $103,312,200 $107,538,600 $4,226,400 4.1%
2100 Consumption of Products & Services 46,042,569 78,646,600 77,709,000 90,917,200 13,208,200 17.02300 Manpower Development 2,464,113 1,646,100 1,422,400 1,694,400 272,000 19.12400 International & Public Relations, Public
Communications 22,529,964 22,898,500 23,909,700 14,847,700 -9,062,000 -37.9
2700 Asset Acquisition 788,989 111,400 260,600 67,300 -193,300 -74.22800 Miscellaneous 145,622 5,500 10,500 12,000 1,500 14.3
Grants,Subventions & Capital Injections to Organisations
$1,433,188,359 $1,411,562,400 $1,413,089,500 $1,452,842,800 $39,753,300 2.8%
3100 Grants, Subventions & Capital Injections to Statutory Boards
1,235,183,776 1,206,472,600 1,207,286,300 1,233,434,400 26,148,100 2.2
3200 Grants, Subventions & Capital Injections to Educational Institutions
50,533,268 53,793,800 52,296,200 54,924,700 2,628,500 5.0
3400 Grants, Subventions & Capital Injections to Other Organisations
147,471,315 151,296,000 153,507,000 164,483,700 10,976,700 7.2
TRANSFERS $84,672,948 $71,927,700 $80,400,900 $253,111,200 $172,710,300 214.8%
3500 Social Transfers to Individuals 9,985 0 6,500 0 -6,500 -100.0

202
BLANK Actual Estimated Revised Estimated Code Object Class FY2018 FY2019 FY2019 FY2020 Change Over FY2019
BLANK 3600 Transfers to Institutions & Organisations 84,518,907 71,927,700 80,151,400 253,111,200 172,959,800 215.8 3800 International Organisations & Overseas
Development Assistance 144,056 0 243,000 0 -243,000 -100.0
OTHER CONSOLIDATED FUND OUTLAYS $0 $270,000 $4,900 $0 -$4,900 -100.0%
4600 Loans and Advances (Disbursement) 0 270,000 4,900 0 -4,900 -100.0
Development Estimates $299,560,306 $396,490,600 $210,485,200 $390,036,800 $179,551,600 85.3%
DEVELOPMENT EXPENDITURE $299,560,306 $396,490,600 $210,485,200 $390,036,800 $179,551,600 85.3%
5100 Government Development 21,964,708 43,357,000 31,617,400 56,349,400 24,732,000 78.2 5200 Grants & Capital Injections to Organisations 277,595,598 353,133,600 178,867,800 333,687,400 154,819,600 86.6
Establishment List
BLANK Actual Estimated Revised Estimated Category/Personnel FY2018 FY2019 FY2019 FY2020
BLANK
POLITICAL APPOINTMENTS 3 3 3 3
Minister 1 1 1 1
Senior Minister of State 1 1 1 1
Senior Parliamentary Secretary 1 1 1 1
PERMANENT STAFF 667 769 740 788
Administrative 8 8 8 8
Corporate Support 2 2 2 2
Legal 2 2 2 2
Management Executive Scheme (2008) 300 329 328 334
Management Support Scheme (2008) 43 43 43 41
Operations Support 3 3 3 3
Shorthand Writers 1 1 1 1
Youth Executive 308 381 353 397
OTHERS 4,240 4,314 4,221 4,283
Majlis Ugama Islam Singapura 53 73 70 74
National Arts Council 184 200 204 204
National Heritage Board 358 387 384 398
People's Association 2,618 2,492 2,470 2,488
Singapore Sports Council 1,027 1,162 1,093 1,119
TOTAL 4,910 5,086 4,964 5,074

203
FY2019 BUDGET
The revised FY2019 total expenditure of the Ministry of Culture, Community and Youth (MCCY) is expected to be $1.89 billion. This is a decrease of $81.52 million, or 4.1%, compared with the actual FY2018 expenditure of $1.97 billion. Of the revised FY2019 total expenditure, $1.68 billion or 88.8% is for operating expenditure while $210.49 million or 11.2% is for development expenditure. Operating Expenditure
The revised FY2019 operating expenditure of $1.68 billion is $7.56 million or 0.5% higher than the actual FY2018 expenditure of $1.67 billion. Development Expenditure
The revised FY2019 development expenditure of $210.49 million is $89.08 million or 29.7% lower than the actual FY2018 expenditure of $299.56 million. The decrease is mainly due to lower budget requirements for development projects under Sport Singapore (SportSG) and the People’s Association (PA) in FY2019.
FY2020 BUDGET
The FY2020 budgetary provision is projected to be $2.28 billion, an increase of $392.96 million or 20.8% higher than the revised FY2019 total expenditure of $1.89 billion. Of the FY2020 budget, $1.89 billion or 82.9% is apportioned as operating expenditure and $390.04 million or 17.1% as development expenditure. Operating Expenditure
The provision of $1.89 billion for FY2020 operating expenditure is an increase of $213.41 million or 12.7% higher than the revised FY2019 expenditure, mainly due to projected disbursements for the Bicentennial Community Fund and higher operating expenditure by PA in FY2020.
Of the FY2020 operating expenditure of $1.89 billion, $556.94 million or 29.5% is allocated to the PA
Programme, $410.54 million or 21.7% is allocated to the SportSG Programme, $205.79 million or 10.9% to the Resilience and Engagement Programme, $162.70 million or 8.6% to the Arts and Heritage Programme, $131.33 million or 7.0% to the National Arts Council Programme, $113.39 million or 6.0% to the National Heritage Board Programme, $102.95 million or 5.4% to the Community Relations and Engagement Programme, and $67.40 million or 3.6% to the National Youth Council Programme. The balance of $138.13 million or 7.3% is distributed among six other programmes, including the Corporate Services Programme, Sports Programme, Information Technology Programme, Majlis Ugama Islam Singapura Programme, Youth Programme and Charities and Co-operatives Programme.
People’s Association Programme
The PA’s mission is to build and bridge communities to achieve One People, One Singapore. An operating budget of $556.94 million has been allocated to the PA for FY2020 to organise a wide range of programmes to promote racial harmony and social cohesion. We do this through our network of grassroots organisations and community partners.
Sport Singapore Programme
SportSG aims to inspire the Singapore Spirit and improve lives through sports. SportSG serves the community by working with a growing network of public, private and people sector partners to create access, opportunities and capabilities for people of all abilities to live better through sports. An operating budget of $410.54 million has been allocated to SportSG in FY2020.

204
Resilience and Engagement Programme
The Resilience and Engagement Division (RED) aims to grow a strong civic culture and strengthen social cohesion by promoting shared values, citizen engagement, and national identity. This includes integration partnerships and programmes to strengthen social cohesion. An operating budget of $205.79 million has been allocated to RED in FY2020, of which $160.00 million is set aside for projected disbursements for the Bicentennial Community Fund that matches eligible donations to Institutions of a Public Character (IPC), dollar-for-dollar up to a cap of $400,000 per IPC, from 1 April 2019 to 31 March 2020. Arts and Heritage Programme
The Arts and Heritage Division supports programmes that contribute to the long-term vision of the arts and culture sector – “through the arts and heritage, we see a people fulfilled, communities engaged and a nation proud of our identity and culture.” The Culture Academy supports capability development programmes, cross-sector cultural research and internationalisation efforts of the culture sector. An operating budget of $162.70 million has been allocated in FY2020. This includes funding to MCCY-linked cultural institutions, namely The Esplanade Company Limited, the School of the Arts, the National Gallery Singapore, the Singapore Art Museum and the STPI Creative Workshop and Gallery.
National Arts Council Programme
The National Arts Council (NAC) provides support to strengthen and professionalise a sustainable arts ecosystem. This support includes grants and partnerships, industry facilitation, and arts housing. Under Our SG Arts Plan, which sets out the strategic directions for the arts sector from 2018 to 2022, NAC will continue to champion the creation and appreciation of the arts as an integral part of people’s lives. NAC will increase focus on areas such as audience development, building the diverse capabilities of the sector, internationalisation, as well as digital technology and data analytics to create new possibilities in art-making, outreach and research. An operating budget of $131.33 million has been allocated to NAC in FY2020.
National Heritage Board Programme
The National Heritage Board (NHB) preserves and celebrates the shared heritage of our diverse communities for the purpose of education, nation-building and cultural understanding. Under Our SG Heritage Plan, the first masterplan of its kind to safeguard Singapore’s heritage, NHB is playing a larger role in areas such as the safeguarding of intangible cultural heritage, archaeology, and broadening access to our museums and offerings. An operating budget of $113.39 million has been allocated to NHB in FY2020. Community Relations and Engagement Programme
The Community Relations and Engagement Programme promotes racial and religious harmony, the strengthening of networks among ethnic and religious organisations, and ground-up integration efforts by community organisations. The programme includes the administration of Muslim personal and family law. An operating budget of $102.95 million has been allocated to the Community Relations and Engagement Programme in FY2020.
National Youth Council Programme
The National Youth Council is an autonomous agency under MCCY and runs two key institutions: Outward Bound Singapore (OBS) and Youth Corps Singapore. The agency drives youth engagement and development. An operating budget of $67.40 million has been allocated for youth engagement and development initiatives in FY2020. Development Expenditure
Development expenditure for FY2020 is projected to be $390.04 million, an increase of $179.55 million or 85.3% from the revised FY2019 expenditure of $210.49 million. The increase is mainly due to higher budget requirements for infrastructure projects under SportSG, National Youth Council and the PA in FY2020.

205
Total Expenditure by Programme BLANK Running Operating Development Total Code Programme Costs Transfers Expenditure Expenditure Expenditure BLANK X-A Corporate Services 39,894,700 0 39,894,700 7,528,300 47,423,000 X-B Arts and Heritage 162,700,900 0 162,700,900 27,616,300 190,317,200 X-C Charities and Co-operatives 6,285,200 617,500 6,902,700 0 6,902,700 X-D Resilience and Engagement 45,794,700 160,000,000 205,794,700 2,292,000 208,086,700 X-E Community Relations and Engagement 20,861,300 82,092,100 102,953,400 3,351,200 106,304,600 X-F Information Technology 23,129,100 0 23,129,100 193,500 23,322,600 X-I Sports 37,112,000 0 37,112,000 992,000 38,104,000 X-J Youth 10,094,600 0 10,094,600 557,000 10,651,600 X-P Majlis Ugama Islam Singapura 20,998,300 0 20,998,300 1,891,300 22,889,600 X-Q National Arts Council 131,329,000 0 131,329,000 413,600 131,742,600 X-R National Heritage Board 113,391,300 0 113,391,300 14,583,800 127,975,100 X-S People's Association 556,940,700 0 556,940,700 134,600,400 691,541,100 X-T Sport Singapore 400,537,800 10,000,000 410,537,800 181,105,500 591,643,300 X-U National Youth Council 66,997,100 401,600 67,398,700 14,911,900 82,310,600
Total $1,636,066,700 $253,111,200 $1,889,177,900 $390,036,800 $2,279,214,700
Development Expenditure by Project BLANK Actual
Expenditure Up to end of
BLANK BLANK Total Actual Estimated Revised Estimated Project Title Project Cost FY2017 FY2018 FY2019 FY2019 FY2020
BLANK
DEVELOPMENT EXPENDITURE … … $299,560,306 $396,490,600 $210,485,200 $390,036,800
GOVERNMENT DEVELOPMENT … … 21,964,708 43,357,000 31,617,400 56,349,400
Corporate Services Programme … … 2 2 2 2
Minor Development Projects … … 1,128,394 963,800 631,100 3,015,300 MCCY Family Data Analytics Solution 7,850,000 0 0 0 1,612,100 4,513,000
Arts and Heritage Programme … … 4 4 4 4
New Projects … … 0 10,426,000 589,700 9,572,100 Construction of the Esplanade's Waterfront Theatre 10,000,000 419,665 1,878,003 3,700,000 3,832,700 3,869,600 SAM Retrofit 54,154,000 0 1,559,894 3,539,000 4,650,000 11,330,900 TECL Capex FY18 – 22 34,406,000 0 3,856,161 188,100 8,307,100 2,742,900
Resilience and Engagement Programme … … 1 1 1 1
VM System Development 11,017,000 1,140,640 3,096,841 1,040,300 1,357,300 2,292,000
Community Relations and Engagement Programme … … 2 2 2 2
New Projects … … 0 1,000,000 497,700 2,351,200 Revamping SYC’s website and Case Management System (SCMS)
12,066,000 0 0 0 0 1,000,000
Information Technology Programme … … 1 1 1 1
MCCY Grants Portal (MGP) 7,493,300 983,531 2,933,699 3,127,300 3,382,500 193,500
Youth Programme … … 1 1 1 1
New Projects … … 0 323,800 0 557,000
National Youth Council Programme … … 3 3 3 3
Minor Development Projects … … 1,871,925 0 995,700 227,000 New Projects … … 0 0 0 600,000 OBS@Coney 93,990,000 842,531 3,608,939 15,371,400 5,226,500 14,084,900 Completed Projects … … 2,030,852 3,677,300 535,000 0
GRANTS & CAPITAL INJECTIONS TO ORGANISATIONS
… … 277,595,598 353,133,600 178,867,800 333,687,400
Arts and Heritage Programme … … 1 1 1 1
TECL Capex FY18 – 22 23,550,000 0 2,359,517 2,805,600 2,805,600 100,800

206
BLANK Actual Expenditure Up to end of
BLANK BLANK Total Actual Estimated Revised Estimated Project Title Project Cost FY2017 FY2018 FY2019 FY2019 FY2020
BLANK
Sports Programme … … 1 1 1 1
New Projects … … 0 746,200 355,000 992,000
Majlis Ugama Islam Singapura Programme … … 4 4 4 4
New Projects … … 0 0 0 600,000 ICT Upgrading 2,794,850 1,436,459 36,979 390,400 437,800 297,500 Expansion of MUIS Functions 4,735,700 195,700 761,425 700,000 400,000 618,800 Minor Development Projects … … 0 100,000 0 375,000
National Arts Council Programme … … 1 1 1 1
New Projects … … 0 0 0 413,600
National Heritage Board Programme … … 6 6 6 6
New Projects … … 0 12,842,500 16,105,000 390,000 SPM refurbishment 4,740,000 0 235,000 2,350,000 2,350,000 1,410,000 Redevelopment of RBC and CCM 6,408,300 0 1,036,800 4,971,000 3,600,000 1,500,000 Acquisition Budget (FY18-22) 11,461,000 0 11,461,000 0 0 10,177,500 DigiMuse 1,100,000 0 0 0 275,000 206,300 Enhanced National Monument Fund (FY20-FY24) 15,000,000 0 0 0 0 900,000
People's Association Programme … … 48 48 48 48
New Projects … … 0 16,003,300 4,166,600 10,990,400 Minor Development Projects … … 8,035,980 7,782,400 7,501,900 25,843,400 Redevelopment of PAssion WaVe at Bedok 14,253,500 247,800 4,123,000 445,600 0 6,107,500 Implementation of Green Mark Programme 11,790,000 460,000 1,272,000 3,050,000 837,000 3,530,000 Development and Upgrading of RC Centres 45,578,700 15,047,100 5,632,200 424,000 2,178,000 3,635,200 Construction of New Community Clubs 477,979,300 66,759,000 77,666,300 25,811,000 36,365,800 30,738,000 Upgrading of Community Clubs 238,627,300 48,206,900 33,877,800 18,011,600 20,283,800 53,755,900
Sport Singapore Programme … … 27 27 27 27
New Projects … … 0 119,386,800 1,164,000 4,090,300 Digital Transformation Strategy (RPA) 1,204,700 0 0 0 452,500 112,300 Sports Facilities Master Plan (SFMP) Phase 1 619,104,600 134,113,228 117,019,675 132,295,600 70,394,800 172,858,300 Computer Vision Drowning Detection System 12,642,700 0 0 1,516,800 5,055,800 4,044,600
Completed Projects … … 14,077,921 3,500,800 4,139,200 0

207
KEY PERFORMANCE INDICATORS
Desired Outcomes
A Fulfilled and Engaged People A Cohesive and Caring Society A Confident and Resilient Nation
1 The figures are reported on a calendar year basis. Data is currently available on a biennial basis. 2 The figures are reported on a calendar year basis. 3 The figures are reported on a calendar year basis, and are collected through surveys conducted once every 3 years. 4 The figures are collected through surveys conducted once every 2-4 years. The value range for the index is between 12 to 60 with a higher score indicating higher national identity.
Key Performance Indicators
Desired Outcome Performance Indicator Actual
FY2017 Actual
FY2018 Revised FY2019
Estimated FY2020
A Fulfilled and Engaged People Active participation in the arts
Singapore Residents who attended an arts and culture event (at least once a year) (%)1
54 NA 63 63
Ticketed arts attendances (million)2 1.91 2.20 1.80 1.87
Active participation in heritage
Total museum visitorship (million)2 5.42 5.39 4.99 5.29
Active participation in sport
Population who participated in sports regularly (at least once a week) (%)2
68 66 66 66
Annual attendance at Sport Singapore and dual-use facilities (million)2
16.99 18.12 18.80 20.10
A Cohesive and Caring Society Active contribution through volunteerism
National volunteerism rate (%)1 NA 29.0 NA 40.0
Active contribution through philanthropy
Tax-deductible donations to Institutions of a Public Character (million)2
1,051.9 1,068.8 NA NA
Desire to contribute to society
% of youth who view contributing to society as an important life goal3
90.0 NA NA 90.0
Strong understanding and ties among religions
Religious organisations engaged through Inter-Racial and Religious Confidence Circles (%)2
94.0 95.0 95.0 95.0
Active engagement with community life
Number of participants attending grassroots activities and courses (million)
16.0 15.5 15.5 15.5
A Confident and Resilient Nation Strong sense of national identity
National Identity Index4 NA 46.0 NA NA


Head Z ___________
Financial Transfers


209
HEAD Z
FINANCIAL TRANSFERS
OVERVIEW
Mission Statement
To make appropriations to various Government Funds, Trust Funds, and other approved Schemes and expenditures.
FY2020 EXPENDITURE ESTIMATES
Expenditure Estimates by Object Class
BLANK Actual Estimated Revised Estimated Code Object Class FY2018 FY2019 FY2019 FY2020 Change Over FY2019
BLANK
TOTAL OUTLAYS $37,519,454,020 $41,359,697,300 $41,328,077,200 $43,552,874,600 $2,224,797,400 5.4%
Main Estimates $37,519,454,020 $41,359,697,300 $41,328,077,200 $43,552,874,600 $2,224,797,400 5.4%
OPERATING EXPENDITURE $1,688,594,299 $1,736,503,600 $1,696,883,500 $4,662,329,700 $2,965,446,200 174.8%
TRANSFERS $1,688,594,299 $1,736,503,600 $1,696,883,500 $4,662,329,700 $2,965,446,200 174.8%
3700 Special Transfers 1,688,594,299 1,736,503,600 1,696,883,500 4,662,329,700 2,965,446,200 174.8
OTHER CONSOLIDATED FUND OUTLAYS
$35,830,859,721 $39,623,193,700 $39,631,193,700 $38,890,544,900 -$740,648,800 -1.9%
4500 Transfers from Consolidated Revenue Account
35,830,859,721 39,623,193,700 39,631,193,700 38,890,544,900 -740,648,800 -1.9

210
FY2019 BUDGET
The Revised FY2019 total outlays are $41.33 billion, a decrease of $31.62 million from the Estimated FY2019 total outlays of $41.36 billion. This is due to lower Special Transfers, mainly due to lower-than-expected payouts under the Productivity and Innovation Credit and lower-than-expected top-ups to Post-Secondary Education Accounts. The Revised FY2019 total outlays comprise $1.70 billion in Special Transfers and $39.63 billion in Other Consolidated Fund Outlays.
FY2020 BUDGET
The total outlays under Financial Transfers for FY2020 are projected to be $43.55 billion. This comprises $21.98 billion of Special Transfers including Top-ups to Endowment and Trust Funds, $20.00 billion of transfers to the Government Development Fund and $1.57 billion of transfers to GST Holding Account.
Special Transfers, including Top-ups to Endowment and Trust Funds, comprise $17.32 billion in Top-ups to Endowment and Trust Funds and $4.66 billion in transfers to Singaporeans and businesses.
Top-ups to Endowment Funds and Trust Funds include: (a) GST Voucher Fund ($6.00 billion), (b) Coastal and Flood Protection Fund ($5.00 billion), (c) National Research Fund ($2.00 billion), (d) Skills Development Fund ($2.00 billion), (e) ElderCare Fund ($750.00 million), (f) Special Employment Credit Fund ($700.00 million), (g) Community Care Endowment Fund ($500.00 million), (h) Medical Endowment Fund ($200.00 million), (i) Community Capability Trust ($150.00 million), and (j) Public Transport Fund ($20.00 million).
Special Transfers to Singaporeans and businesses include: (a) Wage Credit Scheme ($1.60 billion), (b) Jobs Support Scheme ($1.33 billion), (c) Care and Support Package – Cash Payout ($825.30 million), (d) GSTV Voucher Special Payment ($362.35 million), (e) PAssion Card Top-up ($151.20 million), (f) Workfare Special Bonus ($140.83 million), (g) Service and Conservancy Charges Rebates ($134.00 million), (h) Grocery Vouchers ($15.59 million), (i) Grant to Self-Help Groups ($10.00 million), (j) CPF Transition Offset ($1.65 million), and (k) other Special Transfers committed in past Budgets ($93.05 million).

IV _____
ANNEX TO THE EXPENDITURE ESTIMATES


PROGRAMME DETAILS
Head A ___________
Civil List for the President of the Republic of Singapore


211
CIVIL LIST PROGRAMME
PROGRAMME DESCRIPTION
Civil List for the President of the Republic of Singapore (Statutory Expenditure) – Provision for the Privy Purse, entertainment expenses, the acting President’s allowance, salaries of the President’s personal staff, household expenses and special services.
Expenditure Estimates by Object Class
BLANK Actual Estimated Revised Estimated Code Object Class FY2018 FY2019 FY2019 FY2020 Change Over FY2019
B BLANK A-A CIVIL LIST PROGRAMME $1 $1 $1 $1 $0 0.0%
TOTAL EXPENDITURE $8,832,896 $9,491,100 $9,491,100 $9,491,100 $0 0.0%
Main Estimates $8,832,896 $9,491,100 $9,491,100 $9,491,100 $0 0.0%
OPERATING EXPENDITURE1 $8,832,896 $9,491,100 $9,491,100 $9,491,100 $0 0.0%
RUNNING COSTS $8,832,896 $9,491,100 $9,491,100 $9,491,100 $0 0.0%
Expenditure on Manpower $6,427,322 $5,856,900 $5,856,900 $5,856,900 $0 0.0%
1100 Civil List (Manpower) 6,427,322 5,856,900 5,856,900 5,856,900 0 0.0
Other Operating Expenditure $2,405,574 $3,634,200 $3,634,200 $3,634,200 $0 0.0%
2200 Civil List (Others) 2,405,574 3,634,200 3,634,200 3,634,200 0 0.0
_______________________________________________ 1 Statutory Expenditure.
Manpower
BLANK Actual Estimated Revised EstimatedCategory FY2018 FY2019 FY2019 FY2020
BLANK
Civil List 56 67 67 67
TOTAL 56 67 67 67


PROGRAMME DETAILS
Head B ___________
Attorney-General's Chambers


213
LEGAL SERVICES PROGRAMME
PROGRAMME DESCRIPTION
This programme comes under the Attorney-General’s Chambers. The functions carried out under this programme include (i) legislative drafting, (ii) law reform and revision, (iii) advising the Government on constitutional, civil, criminal and international law matters, (iv) prosecution, (v) civil litigation, (vi) discharge of statutory duties of the Attorney-General and other duties of a legal nature, as well as (vii) training, knowledge management, strategic planning, information technology and other administrative support related to the provision of such services. Expenses incurred as a result of legal actions taken by or against the Government are also charged to this programme.
Expenditure Estimates by Object Class
BLANK Actual Estimated Revised Estimated Code Object Class FY2018 FY2019 FY2019 FY2020 Change Over FY2019 B BLANK B-A LEGAL SERVICES PROGRAMME $1 $1 $1 $1 $0 0.0%
TOTAL EXPENDITURE $169,079,053 $208,464,700 $193,464,700 $204,500,000 $11,035,300 5.7%
Main Estimates $161,775,113 $196,019,700 $181,019,700 $198,836,000 $17,816,300 9.8%
OPERATING EXPENDITURE1 $161,775,113 $195,919,700 $180,919,700 $198,736,000 $17,816,300 9.8%
RUNNING COSTS $161,713,328 $195,854,200 $180,903,200 $198,719,500 $17,816,300 9.8%
Expenditure on Manpower $129,488,444 $150,795,300 $136,942,500 $146,778,900 $9,836,400 7.2%
1400 Other Statutory Appointments 5,782,583 6,072,000 6,072,000 6,072,000 0 0.0 1500 Permanent Staff 123,701,393 144,718,300 130,817,500 140,651,900 9,834,400 7.5 1600 Temporary, Daily-Rated & Other Staff 4,468 5,000 53,000 55,000 2,000 3.8
Other Operating Expenditure $28,564,884 $41,398,900 $40,300,700 $48,280,600 $7,979,900 19.8%
2100 Consumption of Products & Services 21,632,136 28,512,600 28,428,300 36,284,600 7,856,300 27.6 2300 Manpower Development 4,080,429 5,687,100 5,001,100 6,871,100 1,870,000 37.4 2400 International & Public Relations, Public
Communications 863,513 1,233,200 824,900 1,540,900 716,000 86.8
2700 Asset Acquisition 149,738 1,966,000 2,046,400 1,534,000 -512,400 -25.02800 Miscellaneous 1,839,069 4,000,000 4,000,000 2,050,000 -1,950,000 -48.8
Grants, Subventions & Capital Injections to Organisations $3,660,000 $3,660,000 $3,660,000 $3,660,000 $0 0.0%
3200 Grants, Subventions & Capital Injections to Educational Institutions
3,660,000 3,660,000 3,660,000 3,660,000 0 0.0
TRANSFERS $61,784 $65,500 $16,500 $16,500 $0 0.0%
3500 Social Transfers to Individuals 41,440 49,000 0 0 0 n.a.3600 Transfers to Institutions & Organisations 5,000 0 0 0 0 n.a.3800 International Organisations & Overseas
Development Assistance 15,344 16,500 16,500 16,500 0 0.0
OTHER CONSOLIDATED FUND OUTLAYS $0 $100,000 $100,000 $100,000 $0 0.0%
4600 Loans & Advances(Disbursement) 0 100,000 100,000 100,000 0 0.0
Development Estimates $7,303,940 $12,545,000 $12,545,000 $5,764,000 -$6,781,000 -54.1%
DEVELOPMENT EXPENDITURE $7,303,940 $12,545,000 $12,545,000 $5,764,000 -$6,781,000 -54.1%
5100 Government Development 7,303,940 12,545,000 12,545,000 5,764,000 -6,781,000 -54.1
_______________________________________________ 1 Estimated FY2020 includes $1,722,500 Statutory Expenditure ($1,660,000 Expenditure on Manpower and $62,500 Other Operating Expenditure).

214
Manpower
BLANK Actual Estimated Revised Estimated Category FY2018 FY2019 FY2019 FY2020
BLANK
Other Statutory Appointments 3 3 3 3
Permanent Staff 604 649 654 674
TOTAL 607 652 657 677

PROGRAMME DETAILS
Head C ___________
Auditor-General's Office

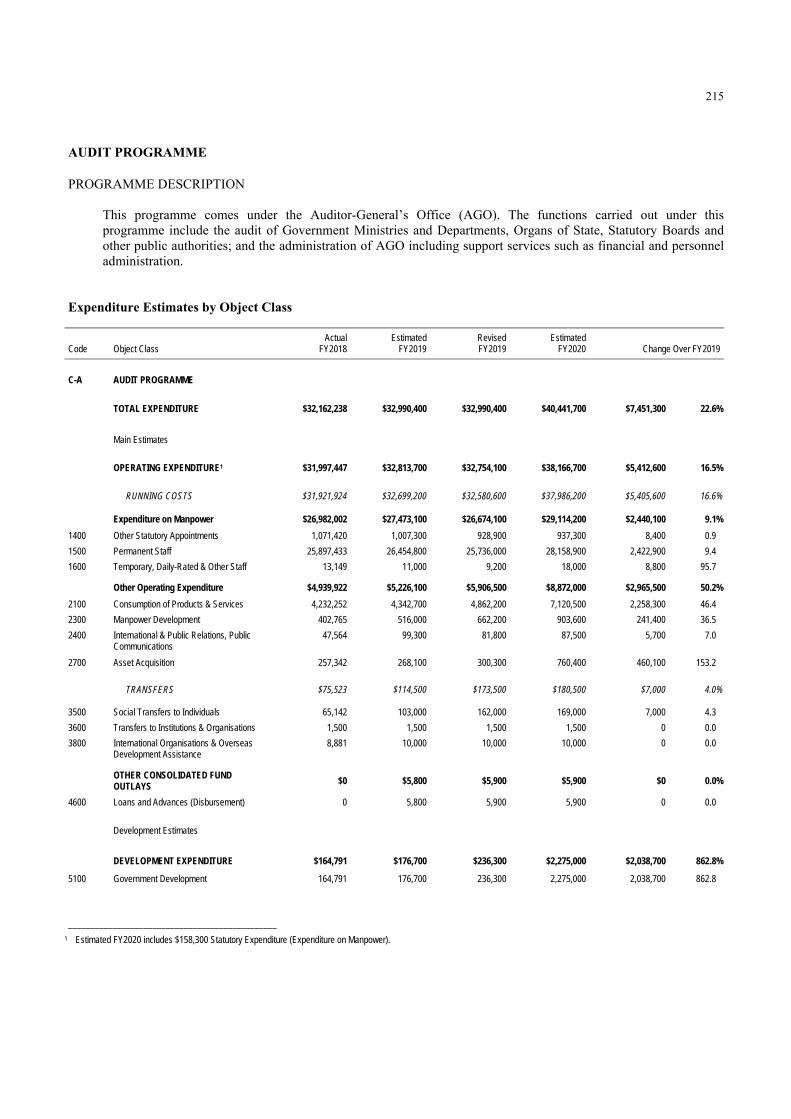
215
AUDIT PROGRAMME
PROGRAMME DESCRIPTION
This programme comes under the Auditor-General’s Office (AGO). The functions carried out under this programme include the audit of Government Ministries and Departments, Organs of State, Statutory Boards and other public authorities; and the administration of AGO including support services such as financial and personnel administration.
Expenditure Estimates by Object Class
BLANK Actual Estimated Revised Estimated Code Object Class FY2018 FY2019 FY2019 FY2020 Change Over FY2019
B BLANK C-A AUDIT PROGRAMME $1 $1 $1 $1 $0 0.0%
TOTAL EXPENDITURE $32,162,238 $32,990,400 $32,990,400 $40,441,700 $7,451,300 22.6%
Main Estimates $31,997,447 $32,819,500 $32,760,000 $38,172,600 $5,412,600 16.5%
OPERATING EXPENDITURE1 $31,997,447 $32,813,700 $32,754,100 $38,166,700 $5,412,600 16.5%
RUNNING COSTS $31,921,924 $32,699,200 $32,580,600 $37,986,200 $5,405,600 16.6%
Expenditure on Manpower $26,982,002 $27,473,100 $26,674,100 $29,114,200 $2,440,100 9.1%
1400 Other Statutory Appointments 1,071,420 1,007,300 928,900 937,300 8,400 0.9
1500 Permanent Staff 25,897,433 26,454,800 25,736,000 28,158,900 2,422,900 9.4
1600 Temporary, Daily-Rated & Other Staff 13,149 11,000 9,200 18,000 8,800 95.7
Other Operating Expenditure $4,939,922 $5,226,100 $5,906,500 $8,872,000 $2,965,500 50.2%
2100 Consumption of Products & Services 4,232,252 4,342,700 4,862,200 7,120,500 2,258,300 46.4
2300 Manpower Development 402,765 516,000 662,200 903,600 241,400 36.5
2400 International & Public Relations, Public Communications
47,564 99,300 81,800 87,500 5,700 7.0
2700 Asset Acquisition 257,342 268,100 300,300 760,400 460,100 153.2
TRANSFERS $75,523 $114,500 $173,500 $180,500 $7,000 4.0%
3500 Social Transfers to Individuals 65,142 103,000 162,000 169,000 7,000 4.3
3600 Transfers to Institutions & Organisations 1,500 1,500 1,500 1,500 0 0.0
3800 International Organisations & Overseas Development Assistance
8,881 10,000 10,000 10,000 0 0.0
OTHER CONSOLIDATED FUND OUTLAYS
$0 $5,800 $5,900 $5,900 $0 0.0%
4600 Loans and Advances (Disbursement) 0 5,800 5,900 5,900 0 0.0
Development Estimates $164,791 $176,700 $236,300 $2,275,000 $2,038,700 862.8%
DEVELOPMENT EXPENDITURE $164,791 $176,700 $236,300 $2,275,000 $2,038,700 862.8%
5100 Government Development 164,791 176,700 236,300 2,275,000 2,038,700 862.8
_______________________________________________ 1 Estimated FY2020 includes $158,300 Statutory Expenditure (Expenditure on Manpower).

216
Manpower
BLANK Actual Estimated Revised Estimated Category FY2018 FY2019 FY2019 FY2020
BLANK BLANK BLANK BLANK BLANK
Other Statutory Appointments 1 1 1 1
Permanent Staff 185 205 205 205
TOTAL 186 206 206 206

PROGRAMME DETAILS
Head D ___________
Cabinet Office


217
ADMINISTRATION PROGRAMME
PROGRAMME DESCRIPTION
General Administration - The administration of the Cabinet Office includes secretariat support to the Cabinet and other support services such as financial and personnel administration.
Expenditure Estimates by Object Class
BLANK Actual Estimated Revised Estimated Code Object Class FY2018 FY2019 FY2019 FY2020 Change Over FY2019
B BLANK D-A ADMINISTRATION PROGRAMME $1 $1 $1 $1 $0 0.0%
TOTAL EXPENDITURE $1,006,492 $1,595,500 $1,257,300 $1,480,800 $223,500 17.8%
Main Estimates $1,006,492 $1,312,300 $1,257,300 $1,167,400 -$89,900 -7.2%
OPERATING EXPENDITURE $1,006,492 $1,312,300 $1,257,300 $1,167,400 -$89,900 -7.2%
RUNNING COSTS $1,006,492 $1,312,300 $1,257,300 $1,167,400 -$89,900 -7.2%
Expenditure on Manpower $784,013 $792,700 $752,700 $750,000 -$2,700 -0.4%
1500 Permanent Staff 784,013 792,700 752,700 750,000 -2,700 -0.4
Other Operating Expenditure $222,478 $519,600 $504,600 $417,400 -$87,200 -17.3%
2100 Consumption of Products & Services 196,196 491,600 393,600 380,900 -12,700 -3.2
2300 Manpower Development 26,282 28,000 26,000 23,500 -2,500 -9.6
2700 Asset Acquisition 0 0 85,000 13,000 -72,000 -84.7
Development Estimates $0 $283,200 $0 $313,400 $313,400 n.a.
DEVELOPMENT EXPENDITURE $0 $283,200 $0 $313,400 $313,400 n.a.
5100 Government Development 0 283,200 0 313,400 313,400 n.a.
Manpower
BLANK Actual Estimated Revised EstimatedCategory FY2018 FY2019 FY2019 FY2020
BLANK
Permanent Staff 11 12 10 12
TOTAL 11 12 10 12

PROGRAMME DETAILS
Head E ___________
Judicature


219
JUDICATURE PROGRAMME
PROGRAMME DESCRIPTION
This programme comprises the following Courts:
Supreme Court - The functions of the Supreme Court include the exercise of original civil and criminal jurisdiction in important cases; exercise of appellate, revisionary and supervisory jurisdiction over inferior courts in civil and criminal matters; serving as the highest court of appeal in Singapore; adjudication upon constitutional disputes between other organs of state and serving as the administrative headquarters for the entire Judiciary.
State Courts - The State Courts are constituted under the State Courts Act and exercise civil and criminal jurisdiction as may be prescribed by law. There are several tribunals set up within the State Courts, namely the Small Claims Tribunals constituted under the Small Claims Tribunals Act to conduct consultation and hearing of prescribed claims, the Community Disputes Resolution Tribunals constituted under the Community Disputes Resolution Act to facilitate resolution of community disputes, and the Employment Claims Tribunals constituted under the Employment Claims Act to conduct case management conferences and hearings for parties to resolve salary disputes.
Family Justice Courts - The Family Justice Courts are constituted under the Family Justice Act and exercise the civil and criminal jurisdiction in family-related cases as may be prescribed by law.
Expenditure Estimates by Object Class
BLANK Actual Estimated Revised Estimated Code Object Class FY2018 FY2019 FY2019 FY2020 Change Over FY2019
B BLANK E-A JUDICATURE PROGRAMME $1 $1 $1 $1 $0 0.0%
TOTAL EXPENDITURE $425,028,498 $487,180,500 $479,580,500 $380,437,400 -$99,143,100 -20.7%
Main Estimates $250,100,135 $281,254,000 $273,654,000 $296,872,500 $23,218,500 8.5%
OPERATING EXPENDITURE1 $250,100,135 $281,254,000 $273,654,000 $296,872,500 $23,218,500 8.5%
RUNNING COSTS $250,100,135 $281,254,000 $273,654,000 $296,872,500 $23,218,500 8.5%
Expenditure on Manpower $186,346,928 $196,533,400 $196,533,400 $210,868,600 $14,335,200 7.3%
1400 Other Statutory Appointments 48,784,671 50,744,600 50,744,600 50,607,900 -136,700 -0.31500 Permanent Staff 137,457,372 145,613,100 145,613,100 160,117,200 14,504,100 10.0 1600 Temporary, Daily-Rated & Other Staff 104,885 175,700 175,700 143,500 -32,200 -18.3
Other Operating Expenditure $63,753,207 $84,720,600 $77,120,600 $86,003,900 $8,883,300 11.5%
2100 Consumption of Products & Services 58,373,805 76,244,600 69,177,300 78,207,400 9,030,100 13.12300 Manpower Development 2,198,903 3,754,600 3,552,300 3,915,700 363,400 10.22400 International & Public Relations, Public
Communications 1,612,903 2,624,600 2,455,100 2,855,200 400,100 16.3
2700 Asset Acquisition 355,826 773,800 727,900 470,600 -257,300 -35.32800 Miscellaneous 1,211,770 1,323,000 1,208,000 555,000 -653,000 -54.1
Development Estimates $174,928,363 $205,926,500 $205,926,500 $83,564,900 -$122,361,600 -59.4%
DEVELOPMENT EXPENDITURE $174,928,363 $205,926,500 $205,926,500 $83,564,900 -$122,361,600 -59.4%
5100 Government Development 174,928,363 205,926,500 205,926,500 83,564,900 -122,361,600 -59.4
_______________________________________________ 1 Estimated FY2020 includes $9,743,000 Statutory Expenditure (Expenditure on Manpower).

220
Manpower
BLANK Actual Estimated Revised Estimated Category FY2018 FY2019 FY2019 FY2020
BLANK BLANK BLANK BLANK BLANK
Other Statutory Appointments 26 26 28 28
Permanent Staff 988 993 981 1,007
TOTAL 1,014 1,019 1,009 1,035

PROGRAMME DETAILS
Head F ___________
Parliament


221
PARLIAMENTARY PROGRAMME
PROGRAMME DESCRIPTION
Speaker and Deputy Speakers of Parliament (Statutory Expenditure) - Provision for the salary and allowances of the Speaker and allowances of the Deputy Speakers, and their respective CPF contributions.
Members of Parliament - Provision for the allowances and CPF contributions of Members of Parliament and their Legislative Assistants and Secretarial Assistants, and for the overseas travel expenses of Members of Parliament.
General Administration - Provision for the administration and management of Parliament House and the Singapore Parliamentary Society including supporting services such as financial and personnel administration, publication of debates, simultaneous interpretation of Chamber proceedings, IT applications, estate and security management of the House precincts, parliamentary education and visit programmes, and library services.
Inter-Parliamentary Relations - Participation by the Singapore Parliament and the Singapore Parliamentary Society in the activities of parliamentary associations and exchanges, including membership of, and participation in: the Inter-Parliamentary Union, Commonwealth Parliamentary Association, ASEAN Inter-Parliamentary Assembly, Asia Pacific parliamentary conferences, and parliamentary friendship groups.
Presidential Council for Minority Rights - Secretarial and other administrative support services for the Presidential Council for Minority Rights.
Expenditure Estimates by Object Class
BLANK Actual Estimated Revised Estimated Code Object Class FY2018 FY2019 FY2019 FY2020 Change Over FY2019
B BLANK F-A PARLIAMENTARY PROGRAMME $1 $1 $1 $1 $0 0.0%
TOTAL EXPENDITURE $41,006,103 $41,105,600 $39,218,900 $41,663,200 $2,444,300 6.2%
Main Estimates $39,884,458 $39,470,600 $37,625,100 $39,059,600 $1,434,500 3.8%
OPERATING EXPENDITURE1 $39,884,458 $39,470,600 $37,625,100 $39,059,600 $1,434,500 3.8%
RUNNING COSTS $39,621,027 $39,147,600 $37,302,100 $38,707,200 $1,405,100 3.8%
Expenditure on Manpower $26,569,298 $26,697,700 $24,887,900 $26,386,200 $1,498,300 6.0%
1300 Parliamentary Appointments 21,812,818 21,674,000 20,276,400 21,217,100 940,700 4.6
1500 Permanent Staff 4,712,689 4,978,200 4,566,000 5,126,600 560,600 12.3
1600 Temporary, Daily-Rated & Other Staff 43,791 45,500 45,500 42,500 -3,000 -6.6
Other Operating Expenditure $13,051,729 $12,449,900 $12,414,200 $12,321,000 -$93,200 -0.8%
2100 Consumption of Products & Services 10,870,552 10,796,800 10,855,100 11,223,200 368,100 3.4
2300 Manpower Development 114,488 168,000 224,400 207,200 -17,200 -7.7
2400 International & Public Relations, Public Communications
1,619,501 427,100 422,700 470,900 48,200 11.4
2700 Asset Acquisition 445,636 1,046,300 900,300 408,000 -492,300 -54.7
2800 Miscellaneous 1,551 11,700 11,700 11,700 0 0.0
TRANSFERS $263,431 $323,000 $323,000 $352,400 $29,400 9.1%
3600 Transfers to Institutions & Organisations 84,500 140,000 140,000 170,000 30,000 21.4
3800 International Organisations & Overseas Development Assistance
178,931 183,000 183,000 182,400 -600 -0.3

222
BLANK Actual Estimated Revised Estimated Code Object Class FY2018 FY2019 FY2019 FY2020 Change Over FY2019
B BLANK
Development Estimates $1,121,645 $1,635,000 $1,593,800 $2,603,600 $1,009,800 63.4%
DEVELOPMENT EXPENDITURE $1,121,645 $1,635,000 $1,593,800 $2,603,600 $1,009,800 63.4%
5100 Government Development 1,121,645 1,635,000 1,593,800 2,603,600 1,009,800 63.4
_______________________________________________ 1 Estimated FY2020 includes $752,800 Statutory Expenditure (Expenditure on Manpower).
Manpower
BLANK Actual Estimated Revised Estimated Category FY2018 FY2019 FY2019 FY2020
BLANK
Parliamentary Appointments 3 3 3 3
Permanent Staff 49 62 62 62
TOTAL 52 65 65 65

PROGRAMME DETAILS
Head G ___________
Presidential Councils


223
PRESIDENTIAL COUNCIL FOR MINORITY RIGHTS PROGRAMME
PROGRAMME DESCRIPTION
Presidential Council for Minority Rights - Provision for honorarium payments to the Chairman and Council Members.
Expenditure Estimates by Object Class
BLANK Actual Estimated Revised Estimated Code Object Class FY2018 FY2019 FY2019 FY2020 Change Over FY2019
B BLANK G-A PRESIDENTIAL COUNCIL FOR
MINORITY RIGHTS PROGRAMME $1 $1 $1 $1 $0 0.0%
TOTAL EXPENDITURE $202,500 $240,000 $220,000 $240,000 $20,000 9.1%
Main Estimates $202,500 $240,000 $220,000 $240,000 $20,000 9.1%
OPERATING EXPENDITURE $202,500 $240,000 $220,000 $240,000 $20,000 9.1%
RUNNING COSTS $202,500 $240,000 $220,000 $240,000 $20,000 9.1%
Expenditure on Manpower $202,500 $240,000 $220,000 $240,000 $20,000 9.1%
1600 Temporary, Daily-Rated & Other Staff 202,500 240,000 220,000 240,000 20,000 9.1

224
COUNCIL OF PRESIDENTIAL ADVISERS PROGRAMME
PROGRAMME DESCRIPTION
Council of Presidential Advisers – Honorarium payments, secretarial and other administrative support services for the Council of Presidential Advisers.
Expenditure Estimates by Object Class
BLANK Actual Estimated Revised Estimated Code Object Class FY2018 FY2019 FY2019 FY2020 Change Over FY2019
B BLANK G-B COUNCIL OF PRESIDENTIAL ADVISERS
PROGRAMME $1 $1 $1 $1 $0 0.0%
TOTAL EXPENDITURE $427,801 $438,600 $431,600 $442,200 $10,600 2.5%
Main Estimates $427,801 $438,600 $431,600 $442,200 $10,600 2.5%
OPERATING EXPENDITURE $427,801 $438,600 $431,600 $442,200 $10,600 2.5%
RUNNING COSTS $427,801 $438,600 $431,600 $442,200 $10,600 2.5%
Expenditure on Manpower $423,268 $430,700 $426,000 $432,400 $6,400 1.5%
1500 Permanent Staff 423,268 430,700 426,000 432,400 6,400 1.5
Other Operating Expenditure $4,533 $7,900 $5,600 $9,800 $4,200 75.0%
2100 Consumption of Products & Services 482 500 200 500 300 150.0
2300 Manpower Development 932 2,900 2,900 5,300 2,400 82.8
2400 International & Public Relations, Public Communications
3,119 4,500 2,500 4,000 1,500 60.0
Manpower
BLANK Actual Estimated Revised Estimated Category FY2018 FY2019 FY2019 FY2020
BLANK
Permanent Staff 3 6 6 6
TOTAL 3 6 6 6

225
PRESIDENTIAL COUNCIL FOR RELIGIOUS HARMONY PROGRAMME
PROGRAMME DESCRIPTION
Presidential Council for Religious Harmony – Provision for honorarium payments to the Chairman and Council Members.
Expenditure Estimates by Object Class
BLANK Actual Estimated Revised Estimated Code Object Class FY2018 FY2019 FY2019 FY2020 Change Over FY2019
B BLANK G-C PRESIDENTIAL COUNCIL FOR
RELIGIOUS HARMONY PROGRAMME $1 $1 $1 $1 $0 0.0%
TOTAL EXPENDITURE $123,750 $123,800 $123,800 $123,800 -$0 0.0%
Main Estimates $123,750 $123,800 $123,800 $123,800 -$0 0.0%
OPERATING EXPENDITURE $123,750 $123,800 $123,800 $123,800 -$0 0.0%
RUNNING COSTS $123,750 $123,800 $123,800 $123,800 -$0 0.0%
Expenditure on Manpower $123,750 $123,800 $123,800 $123,800 -$0 0.0%
1600 Temporary, Daily-Rated & Other Staff 123,750 123,800 123,800 123,800 -0 0.0


PROGRAMME DETAILS
Head H ___________
Public Service Commission


227
PUBLIC SERVICE COMMISSION PROGRAMME
PROGRAMME DESCRIPTION
Public Service Commission (Statutory Expenditure) – Provision for the salaries, CPF contributions, retainer fees and sessional fees for the Chairman, Deputy Chairmen and Members of the Public Service Commission.
Expenditure Estimates by Object Class
BLANK Actual Estimated Revised Estimated Code Object Class FY2018 FY2019 FY2019 FY2020 Change Over FY2019 B BLANK H-A PUBLIC SERVICE COMMISSION
PROGRAMME $1 $1 $1 $1 $0 0.0%
TOTAL EXPENDITURE $2,072,384 $1,747,700 $1,658,800 $1,755,200 $96,400 5.8%
Main Estimates $2,072,384 $1,747,700 $1,658,800 $1,755,200 $96,400 5.8%
OPERATING EXPENDITURE1 $2,072,384 $1,747,700 $1,658,800 $1,755,200 $96,400 5.8%
RUNNING COSTS $2,072,384 $1,747,700 $1,658,800 $1,755,200 $96,400 5.8%
Expenditure on Manpower $2,072,384 $1,747,700 $1,658,800 $1,755,200 $96,400 5.8%
1400 Other Statutory Appointments 2,072,384 1,747,700 1,658,800 1,755,200 96,400 5.8
_______________________________________________ 1 Statutory Expenditure (Expenditure on Manpower).
Manpower
BLANK Actual Estimated Revised EstimatedCategory FY2018 FY2019 FY2019 FY2020
BLANK
Other Statutory Appointments 13 15 14 15
TOTAL 13 15 14 15


PROGRAMME DETAILS
Head I ___________
Ministry of Social and Family Development


229
CORPORATE SUPPORT PROGRAMME
PROGRAMME DESCRIPTION
This programme covers the functions of the following five Divisions in the Ministry of Social and Family Development (MSF):
(a) Human Resource Division - attracts, develops and retains engaged staff through effective resourcing, talentmanagement and capability building, and spearheads organisational development and excellence efforts inthe Ministry;
(b) Communications Division - informs and educates the public on the work of the Ministry, plans andstrategises communications and engagement plans in the Ministry, including outreach to stakeholders, andensures the quality of service delivered to the public;
(c) Women Development and International Relations Division - The Office for Women’s Developmentpromotes an empowering environment for women’s development and their contribution to nation-building.International Relations ensures that the Ministry protects and advances Singapore’s international relationsand socio-cultural interests in bilateral and multilateral fora;
(d) Information Technology Group - drives, formulates and oversees all IT initiatives in the MSF family ofagencies, which includes MSF, Early Childhood Development Agency (ECDA), National Council of SocialServices (NCSS), companies formed under the Ministry and the social service sector, to ensure that acoordinated and holistic approach can be adopted in the strategic use of IT and technology-basedinnovations; and
(e) Finance and Facilities Division - oversees the budget for the Ministry and ensures effective resourceallocation, manages the Ministry’s expenditures and procurement, and provides internal audit andadministrative services for the Ministry.
Expenditure Estimates by Object Class
BLANK Actual Estimated Revised Estimated Code Object Class FY2018 FY2019 FY2019 FY2020 Change Over FY2019
B BLANK I-A CORPORATE SUPPORT PROGRAMME $1 $1 $1 $1 $0 0.0%
TOTAL EXPENDITURE $116,892,520 $137,590,500 $125,091,600 $150,225,700 $25,134,100 20.1%
Main Estimates $104,522,147 $133,504,400 $109,351,700 $152,785,400 $43,433,700 39.7%
OPERATING EXPENDITURE $104,522,147 $116,761,600 $109,351,700 $133,592,100 $24,240,400 22.2%
RUNNING COSTS $103,172,872 $115,336,300 $106,844,800 $131,173,700 $24,328,900 22.8%
Expenditure on Manpower $48,306,522 $44,424,100 $48,159,800 $56,481,500 $8,321,700 17.3%
1200 Political Appointments 2,169,446 1,957,400 2,354,900 2,357,800 2,900 0.1
1500 Permanent Staff 46,131,239 42,466,700 45,799,200 54,119,500 8,320,300 18.2
1600 Temporary, Daily-Rated & Other Staff 5,837 0 5,700 4,200 -1,500 -26.3
Other Operating Expenditure $54,866,350 $70,912,200 $58,685,000 $74,692,200 $16,007,200 27.3%
2100 Consumption of Products & Services 48,886,138 65,993,400 52,639,500 69,058,400 16,418,900 31.2
2300 Manpower Development 3,226,542 3,811,800 3,717,800 3,855,700 137,900 3.7
2400 International & Public Relations, Public Communications
2,148,100 787,100 1,668,000 1,158,700 -509,300 -30.5
2700 Asset Acquisition 598,657 313,100 631,100 612,600 -18,500 -2.9
2800 Miscellaneous 6,914 6,800 28,600 6,800 -21,800 -76.2

230
BLANK Actual Estimated Revised Estimated Code Object Class FY2018 FY2019 FY2019 FY2020 Change Over FY2019
B BLANK
TRANSFERS $1,349,275 $1,425,300 $2,506,900 $2,418,400 -$88,500 -3.5%
3500 Social Transfers to Individuals 1,349,275 1,425,300 1,406,900 1,318,400 -88,500 -6.3
3600 Transfers to Institutions & Organisations 0 0 1,100,000 1,100,000 0 0.0
OTHER CONSOLIDATED FUND OUTLAYS $0 $16,742,800 $0 $19,193,300 $19,193,300 n.a.
4600 Loans and Advances (Disbursement) 0 16,742,800 0 19,193,300 19,193,300 n.a.
Development Estimates $12,370,373 $20,828,900 $15,739,900 $16,633,600 $893,700 5.7%
DEVELOPMENT EXPENDITURE $12,370,373 $20,828,900 $15,739,900 $16,633,600 $893,700 5.7%
5100 Government Development 12,370,373 20,828,900 15,739,900 16,633,600 893,700 5.7
Manpower
BLANK Actual Estimated Revised Estimated Category FY2018 FY2019 FY2019 FY2020
BLANK
Political Appointments 3 3 3 3
Permanent Staff 136 155 173 173
TOTAL 139 158 176 176

231
STRATEGIC PLANNING, RESEARCH AND DEVELOPMENT PROGRAMME
PROGRAMME DESCRIPTION This programme comes under the Strategic Planning, Research and Development Division. The Division’s functions are to:
(a) drive the Ministry’s strategic planning process and outcomes;
(b) drive research and data analysis to support social policies and programmes in partnership with the research
community;
(c) oversee data strategy and management policies in the Ministry;
(d) oversee the Ministry’s enterprise risk management and emergency preparedness; and
(e) drive transformation and innovation in the Ministry. Expenditure Estimates by Object Class
BLANK Actual Estimated Revised Estimated Code Object Class FY2018 FY2019 FY2019 FY2020 Change Over FY2019
B BLANK I-B STRATEGIC PLANNING, RESEARCH
AND DEVELOPMENT PROGRAMME $1 $1 $1 $1 $0 0.0%
TOTAL EXPENDITURE $4,291,857 $4,460,200 $5,032,400 $3,937,800 -$1,094,600 -21.8%
Main Estimates $4,291,857 $4,460,200 $5,032,400 $3,937,800 -$1,094,600 -21.8%
OPERATING EXPENDITURE $4,291,857 $4,460,200 $5,032,400 $3,937,800 -$1,094,600 -21.8%
RUNNING COSTS $4,291,857 $4,460,200 $5,032,400 $3,937,800 -$1,094,600 -21.8%
Expenditure on Manpower $3,302,027 $3,296,400 $3,780,600 $2,749,000 -$1,031,600 -27.3%
1500 Permanent Staff 3,295,004 3,296,400 3,764,400 2,749,000 -1,015,400 -27.0
1600 Temporary, Daily-Rated & Other Staff 7,023 0 16,200 0 -16,200 -100.0
Other Operating Expenditure $789,829 $963,800 $1,051,800 $988,800 -$63,000 -6.0%
2100 Consumption of Products & Services 646,756 808,500 869,000 797,900 -71,100 -8.2
2300 Manpower Development 92,356 88,000 86,600 126,800 40,200 46.4
2400 International & Public Relations, Public Communications
4,373 12,000 12,300 2,000 -10,300 -83.7
2700 Asset Acquisition 46,269 55,300 83,800 62,100 -21,700 -25.9
2800 Miscellaneous 76 0 100 0 -100 -100.0
Grants, Subventions & Capital Injections to Organisations
$200,000 $200,000 $200,000 $200,000 $0 0.0%
3200 Grants, Subventions & Capital Injections to Educational Institutions
200,000 200,000 200,000 200,000 0 0.0

232
Manpower
BLANK Actual Estimated Revised Estimated Category FY2018 FY2019 FY2019 FY2020
BLANK
Permanent Staff 31 35 37 37
TOTAL 31 35 37 37
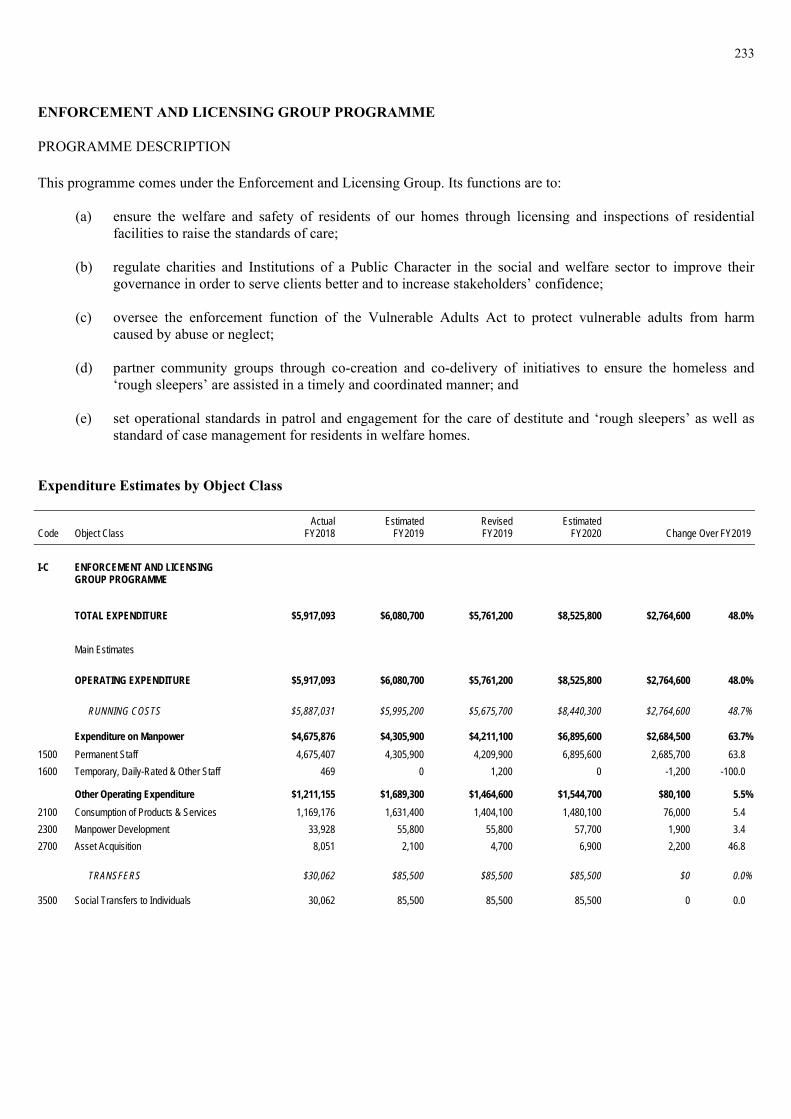
233
ENFORCEMENT AND LICENSING GROUP PROGRAMME
PROGRAMME DESCRIPTION This programme comes under the Enforcement and Licensing Group. Its functions are to:
(a) ensure the welfare and safety of residents of our homes through licensing and inspections of residential
facilities to raise the standards of care; (b) regulate charities and Institutions of a Public Character in the social and welfare sector to improve their
governance in order to serve clients better and to increase stakeholders’ confidence; (c) oversee the enforcement function of the Vulnerable Adults Act to protect vulnerable adults from harm
caused by abuse or neglect; (d) partner community groups through co-creation and co-delivery of initiatives to ensure the homeless and
‘rough sleepers’ are assisted in a timely and coordinated manner; and (e) set operational standards in patrol and engagement for the care of destitute and ‘rough sleepers’ as well as
standard of case management for residents in welfare homes. Expenditure Estimates by Object Class
BLANK Actual Estimated Revised Estimated Code Object Class FY2018 FY2019 FY2019 FY2020 Change Over FY2019
B BLANK I-C ENFORCEMENT AND LICENSING
GROUP PROGRAMME $1 $1 $1 $1 $0 0.0%
TOTAL EXPENDITURE $5,917,093 $6,080,700 $5,761,200 $8,525,800 $2,764,600 48.0%
Main Estimates $5,917,093 $6,080,700 $5,761,200 $8,525,800 $2,764,600 48.0%
OPERATING EXPENDITURE $5,917,093 $6,080,700 $5,761,200 $8,525,800 $2,764,600 48.0%
RUNNING COSTS $5,887,031 $5,995,200 $5,675,700 $8,440,300 $2,764,600 48.7%
Expenditure on Manpower $4,675,876 $4,305,900 $4,211,100 $6,895,600 $2,684,500 63.7%
1500 Permanent Staff 4,675,407 4,305,900 4,209,900 6,895,600 2,685,700 63.8
1600 Temporary, Daily-Rated & Other Staff 469 0 1,200 0 -1,200 -100.0
Other Operating Expenditure $1,211,155 $1,689,300 $1,464,600 $1,544,700 $80,100 5.5%
2100 Consumption of Products & Services 1,169,176 1,631,400 1,404,100 1,480,100 76,000 5.4
2300 Manpower Development 33,928 55,800 55,800 57,700 1,900 3.4
2700 Asset Acquisition 8,051 2,100 4,700 6,900 2,200 46.8
TRANSFERS $30,062 $85,500 $85,500 $85,500 $0 0.0%
3500 Social Transfers to Individuals 30,062 85,500 85,500 85,500 0 0.0
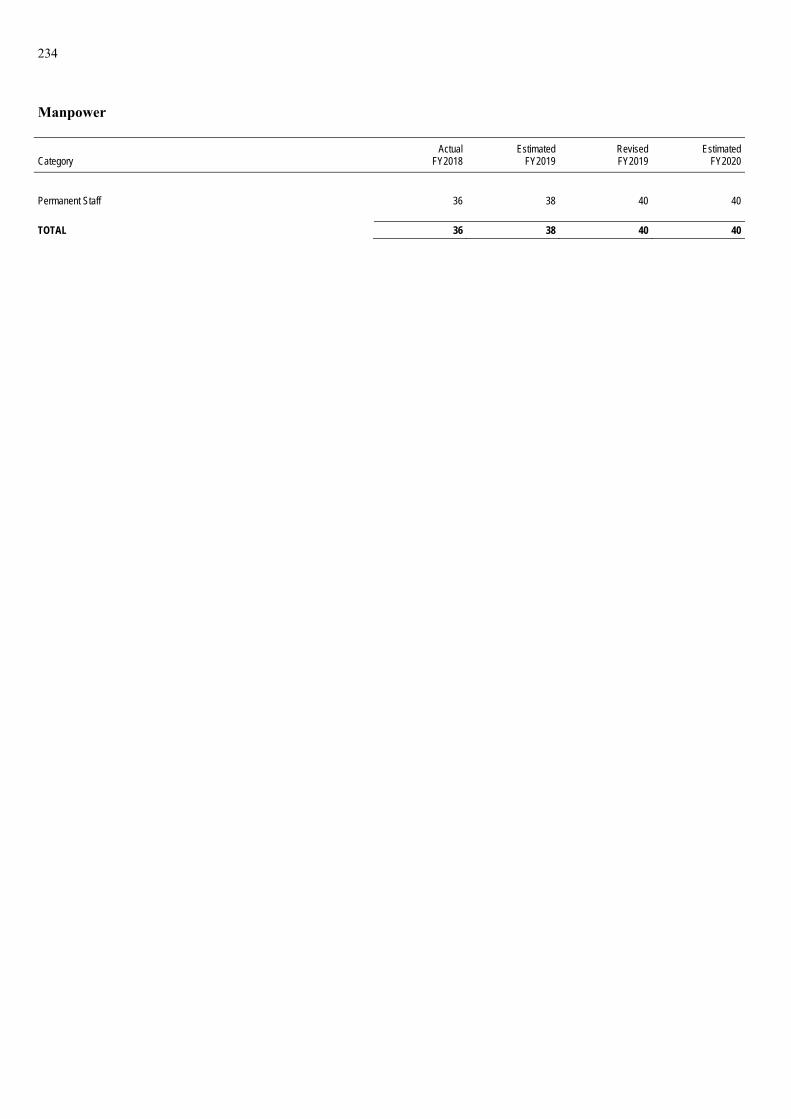
234
Manpower
BLANK Actual Estimated Revised Estimated Category FY2018 FY2019 FY2019 FY2020
BLANK
Permanent Staff 36 38 40 40
TOTAL 36 38 40 40

235
REHABILITATION AND PROTECTION GROUP PROGRAMME
PROGRAMME DESCRIPTION This programme comes under the Rehabilitation and Protection Group. With its mission to empower individuals and families to break cycles of abuse, neglect and offending, the Group engages and partners volunteers, social service agencies, corporates and government organisations to:
(a) foster a safe and stable environment for children, young persons, vulnerable adults, and families at risk of
abuse and neglect through a continuum of services and programmes;
(b) empower children and youths at risk of committing offences and individuals who have committed offences to be socially responsible through services and programmes such as pre-court diversion, probation, community service and youth residential care rehabilitation;
(c) use communications, data and technology as enablers, and build community partnerships, capacity and capabilities to provide comprehensive, convenient and coordinated help; and
(d) drive prevention, early intervention and post-care efforts to break cycles for individuals and families facing
abuse, neglect or offending behaviours. Expenditure Estimates by Object Class
BLANK Actual Estimated Revised Estimated Code Object Class FY2018 FY2019 FY2019 FY2020 Change Over FY2019
B BLANK I-D REHABILITATION AND PROTECTION
GROUP PROGRAMME $1 $1 $1 $1 $0 0.0%
TOTAL EXPENDITURE $135,686,628 $131,047,000 $126,929,200 $127,627,200 $698,000 0.5%
Main Estimates $127,039,286 $128,645,700 $124,862,000 $127,138,200 $2,276,200 1.8%
OPERATING EXPENDITURE $127,039,286 $128,645,700 $124,862,000 $127,138,200 $2,276,200 1.8%
RUNNING COSTS $82,470,913 $83,784,800 $80,848,900 $82,207,000 $1,358,100 1.7%
Expenditure on Manpower $58,977,150 $60,787,100 $57,023,100 $58,805,800 $1,782,700 3.1%
1500 Permanent Staff 58,823,769 60,612,100 56,830,300 58,805,800 1,975,500 3.5
1600 Temporary, Daily-Rated & Other Staff 153,381 175,000 192,800 0 -192,800 -100.0
Other Operating Expenditure $20,285,349 $20,784,800 $22,520,200 $22,812,700 $292,500 1.3%
2100 Consumption of Products & Services 18,907,113 19,214,700 21,212,900 21,837,000 624,100 2.9
2300 Manpower Development 1,110,605 1,237,200 830,600 747,300 -83,300 -10.0
2400 International & Public Relations, Public Communications
80,896 168,900 115,200 99,000 -16,200 -14.1
2700 Asset Acquisition 180,196 157,000 316,600 122,300 -194,300 -61.4
2800 Miscellaneous 6,539 7,000 44,900 7,100 -37,800 -84.2
Grants, Subventions & Capital Injections to Organisations
$3,208,414 $2,212,900 $1,305,600 $588,500 -$717,100 -54.9%
3100 Grants, Subventions & Capital Injections to Statutory Boards
3,208,414 2,212,900 1,305,600 588,500 -717,100 -54.9
TRANSFERS $44,568,374 $44,860,900 $44,013,100 $44,931,200 $918,100 2.1%
3500 Social Transfers to Individuals 13,220,958 13,219,500 11,464,700 11,427,100 -37,600 -0.3
3600 Transfers to Institutions & Organisations 31,347,416 31,641,400 32,548,400 33,504,100 955,700 2.9

236
BLANK Actual Estimated Revised Estimated Code Object Class FY2018 FY2019 FY2019 FY2020 Change Over FY2019
Development Estimates $8,647,341 $2,401,300 $2,067,200 $489,000 -$1,578,200 -76.3%
DEVELOPMENT EXPENDITURE $8,647,341 $2,401,300 $2,067,200 $489,000 -$1,578,200 -76.3%
5100 Government Development 8,379,048 2,259,200 2,027,700 405,300 -1,622,400 -80.0
5200 Grants & Capital Injections to Organisations
268,293 142,100 39,500 83,700 44,200 111.9
Manpower
BLANK Actual Estimated Revised Estimated Category FY2018 FY2019 FY2019 FY2020
BLANK
Permanent Staff 631 651 666 666
TOTAL 631 651 666 666

237
FAMILY DEVELOPMENT PROGRAMME
PROGRAMME DESCRIPTION This programme covers the functions of the Family Development Group and the Early Childhood Development Agency (ECDA).
The Family Development Group is responsible for the formulation and review of policies and programmes, and conduct of research pertaining to marriage, parenthood and family. Its functions are to:
(a) administer the Baby Bonus and Leave Schemes, as well as to cultivate a pro-family environment, in partnership with the community, people and business sectors;
(b) engage singles and promote marriage through the Social Development Network; (c) administer the Registry of Marriages, the Office of Public Guardian, the Tribunal for Maintenance of Parents
and the Office of the Commissioner for the Maintenance of Parents; and
(d) provide support programmes for families undergoing divorce and early risk families.
ECDA is an autonomous agency jointly overseen by the MOE and MSF, and hosted administratively under the MSF. It serves as the regulatory and developmental authority for the early childhood sector in Singapore, overseeing all aspects of the development of children below the age of 7, across both kindergartens and child care centres.
The Agency’s functions are to:
(a) oversee measures to raise quality standards of early childhood programmes, such as through regulation, quality assurance, and the provision of early childhood development resources;
(b) facilitate the training and continuing professional development of early childhood and early intervention
professionals; (c) master-plan the infrastructure and manpower resources to support the early childhood sector; (d) provide subsidies and funding to keep quality pre-school programmes affordable, especially for low- and
middle-income families; (e) conduct public education and outreach to raise parents’ awareness of and support for their children’s
development; (f) support the holistic development of low-income and vulnerable children; and (g) provide subsidies and funding for quality and affordable early intervention services to support pre-school
children with developmental needs.

238
Expenditure Estimates by Object Class
BLANK Actual Estimated Revised Estimated Code Object Class FY2018 FY2019 FY2019 FY2020 Change Over FY2019
B BLANK I-G FAMILY DEVELOPMENT PROGRAMME $1 $1 $1 $1 $0 0.0%
TOTAL EXPENDITURE $1,914,628,437 $2,153,880,000 $2,140,655,200 $2,398,295,800 $257,640,600 12.0%
Main Estimates $1,837,905,459 $2,085,407,100 $2,067,703,200 $2,331,839,200 $264,136,000 12.8%
OPERATING EXPENDITURE $1,837,905,459 $2,082,407,100 $2,067,703,200 $2,328,839,200 $261,136,000 12.6%
RUNNING COSTS $87,403,867 $95,249,200 $97,377,600 $111,426,500 $14,048,900 14.4%
Expenditure on Manpower $43,386,672 $42,682,800 $45,312,100 $48,197,200 $2,885,100 6.4%
1500 Permanent Staff 43,289,314 42,682,800 45,204,000 48,145,200 2,941,200 6.5
1600 Temporary, Daily-Rated & Other Staff 97,357 0 108,100 52,000 -56,100 -51.9
Other Operating Expenditure $43,992,271 $52,566,400 $48,869,700 $58,940,200 $10,070,500 20.6%
2100 Consumption of Products & Services 42,294,021 49,801,100 46,661,300 56,704,000 10,042,700 21.5
2300 Manpower Development 239,446 397,700 424,700 436,200 11,500 2.7
2400 International & Public Relations, Public Communications
1,312,425 2,335,700 1,695,800 1,673,600 -22,200 -1.3
2700 Asset Acquisition 132,023 31,900 83,900 111,400 27,500 32.8
2800 Miscellaneous 14,356 0 4,000 15,000 11,000 275.0
Grants, Subventions & Capital Injections to Organisations $24,924 $0 $3,195,800 $4,289,100 $1,093,300 34.2%
3400 Grants, Subventions & Capital Injections to Other Organisations
24,924 0 3,195,800 4,289,100 1,093,300 34.2
TRANSFERS $1,750,501,592 $1,987,157,900 $1,970,325,600 $2,217,412,700 $247,087,100 12.5%
3500 Social Transfers to Individuals 1,373,336,247 1,514,664,700 1,490,058,800 1,569,476,800 79,418,000 5.3
3600 Transfers to Institutions & Organisations 377,165,345 472,493,200 480,266,800 647,935,900 167,669,100 34.9
OTHER CONSOLIDATED FUND OUTLAYS $0 $3,000,000 $0 $3,000,000 $3,000,000 n.a.
4600 Loans and Advances (Disbursement) 0 3,000,000 0 3,000,000 3,000,000 n.a.
Development Estimates $76,722,978 $71,472,900 $72,952,000 $69,456,600 -$3,495,400 -4.8%
DEVELOPMENT EXPENDITURE $76,722,978 $71,472,900 $72,952,000 $69,456,600 -$3,495,400 -4.8%
5100 Government Development 1,294,924 2,082,300 5,743,200 9,164,700 3,421,500 59.6
5200 Grants & Capital Injections to Organisations
75,428,053 69,390,600 67,208,800 60,291,900 -6,916,900 -10.3
Manpower
BLANK Actual Estimated Revised Estimated Category FY2018 FY2019 FY2019 FY2020
BLANK
Permanent Staff 434 468 496 496
TOTAL 434 468 496 496

239
OFFICE OF THE DIRECTOR OF SOCIAL WELFARE AND OFFICE OF THE CHIEF PSYCHOLOGIST PROGRAMME
PROGRAMME DESCRIPTION This programme covers the functions of two Offices:
The Office of the Director of Social Welfare, whose functions are to:
(a) provide independent, well-informed, and professional practice information and advice on social policies, practice and systems;
(b) engage and work with social service agencies to uphold standards of professional practice; (c) promote professional interfacing and linkages in the social service sector to enhance cross-sharing and
networking; and (d) contribute to the development of social service practitioners and the social service sector.
The Office of the Chief Psychologist, whose functions are to:
(a) provide professional consultation in the field of psychology and mental health with regard to policy, programming, practice and operational matters, within the Ministry and social sector;
(b) support our partners in professional practice through clinical consultation, training and research; (c) develop and implement high-quality, compassionate, evidence-based and client-centred clinical intervention;
and (d) provide thought/practice leadership and strategic direction for psychological services within the Ministry
and social sector. Expenditure Estimates by Object Class
BLANK Actual Estimated Revised Estimated Code Object Class FY2018 FY2019 FY2019 FY2020 Change Over FY2019
B BLANK I-K OFFICE OF THE DIRECTOR OF SOCIAL
WELFARE AND OFFICE OF THE CHIEF PSYCHOLOGIST PROGRAMME
$1 $1 $1 $1 $0 0.0%
TOTAL EXPENDITURE $3,022,951 $3,228,600 $3,310,900 $3,349,500 $38,600 1.2%
Main Estimates $3,022,951 $3,228,600 $3,310,900 $3,349,500 $38,600 1.2%
OPERATING EXPENDITURE $3,022,951 $3,228,600 $3,310,900 $3,349,500 $38,600 1.2%
RUNNING COSTS $3,022,951 $3,228,600 $3,310,900 $3,349,500 $38,600 1.2%
Expenditure on Manpower $2,576,983 $2,624,800 $2,703,900 $2,828,800 $124,900 4.6%
1500 Permanent Staff 2,562,691 2,624,800 2,692,400 2,828,800 136,400 5.1
1600 Temporary, Daily-Rated & Other Staff 14,292 0 11,500 0 -11,500 -100.0
Other Operating Expenditure $445,968 $603,800 $607,000 $520,700 -$86,300 -14.2%
2100 Consumption of Products & Services 414,506 558,100 568,100 471,500 -96,600 -17.0
2300 Manpower Development 8,093 19,700 12,700 19,200 6,500 51.2
2400 International & Public Relations, Public Communications
16,904 25,000 22,500 29,000 6,500 28.9

240
BLANK Actual Estimated Revised Estimated Code Object Class FY2018 FY2019 FY2019 FY2020 Change Over FY2019
B BLANK 2700 Asset Acquisition 6,465 1,000 3,700 1,000 -2,700 -73.0
Manpower
BLANK Actual Estimated Revised Estimated Category FY2018 FY2019 FY2019 FY2020
BLANK
Permanent Staff 17 17 17 17
TOTAL 17 17 17 17

241
SECTOR PLANNING AND DEVELOPMENT PROGRAMME
PROGRAMME DESCRIPTION This programme comes under the Sector Planning and Development Division. The Division’s functions are to:
(a) work with partners in the social service sector on the overall strategy, plans and capability-building for the
sector; (b) formulate and co-ordinate policies relating to funding of social service agencies and sector capability
development; (c) ensure adequate support for the growth and sustainability of the sector; and (d) co-ordinate manpower planning and development for the sector.
Expenditure Estimates by Object Class BLANK Actual Estimated Revised Estimated Code Object Class FY2018 FY2019 FY2019 FY2020 Change Over FY2019
B BLANK I-T SECTOR PLANNING AND
DEVELOPMENT PROGRAMME $1 $1 $1 $1 $0 0.0%
TOTAL EXPENDITURE $77,797,583 $56,485,000 $56,022,800 $65,974,500 $9,951,700 17.8%
Main Estimates $77,347,583 $55,778,500 $55,316,300 $65,192,700 $9,876,400 17.9%
OPERATING EXPENDITURE $77,347,583 $55,778,500 $55,316,300 $65,192,700 $9,876,400 17.9%
RUNNING COSTS $36,830,061 $37,858,900 $36,986,300 $38,667,100 $1,680,800 4.5%
Expenditure on Manpower $1,998,356 $2,158,200 $1,426,900 $1,897,100 $470,200 33.0%
1500 Permanent Staff 1,983,615 2,158,200 1,413,200 1,897,100 483,900 34.2
1600 Temporary, Daily-Rated & Other Staff 14,741 0 13,700 0 -13,700 -100.0
Other Operating Expenditure $178,705 $557,700 $416,400 $707,000 $290,600 69.8%
2100 Consumption of Products & Services 64,227 419,100 276,500 513,400 236,900 85.7
2300 Manpower Development 10,116 17,600 18,900 17,600 -1,300 -6.9
2400 International & Public Relations, Public Communications
101,960 120,000 120,000 175,000 55,000 45.8
2700 Asset Acquisition 2,402 1,000 1,000 1,000 0 0.0
Grants, Subventions & Capital Injections to Organisations
$34,653,000 $35,143,000 $35,143,000 $36,063,000 $920,000 2.6%
3100 Grants, Subventions & Capital Injections to Statutory Boards
34,653,000 35,143,000 35,143,000 36,063,000 920,000 2.6
TRANSFERS $40,517,522 $17,919,600 $18,330,000 $26,525,600 $8,195,600 44.7%
3600 Transfers to Institutions & Organisations 40,517,522 17,919,600 18,330,000 26,525,600 8,195,600 44.7
Development Estimates $450,000 $706,500 $706,500 $781,800 $75,300 10.7%
DEVELOPMENT EXPENDITURE $450,000 $706,500 $706,500 $781,800 $75,300 10.7%
5200 Grants & Capital Injections to Organisations
450,000 706,500 706,500 781,800 75,300 10.7

242
Manpower
BLANK Actual Estimated Revised Estimated Category FY2018 FY2019 FY2019 FY2020
BLANK
Permanent Staff 18 20 19 19
TOTAL 18 20 19 19

243
SOCIAL POLICY AND SERVICES GROUP PROGRAMME
PROGRAMME DESCRIPTION This programme covers the functions of the Social Policy and Services Group and the Disability Office.
The functions of the Social Policy and Services Group are to:
(a) formulate, review and implement social assistance and social support policies, schemes and programmes for
low-income and vulnerable families and individuals; (b) deliver ComCare assistance through the Social Service Offices and work with local partners and community
stakeholders to provide more comprehensive, convenient and coordinated assistance to better meet the needs of Singaporeans;
(c) plan for social services at the national and local levels; (d) oversee the service development, resourcing and management of MSF-funded social services, including
those run by social service agencies; (e) oversee the development, administration and maintenance of systems that support social service delivery,
such as the Social Service Net (SSNet) and ComCare Database; and (f) co-ordinate infrastructure planning, development and maintenance of MSF facilities, as well as other
facilities used by social service agencies to run MSF-funded programmes. The functions of the Disability Office are to:
(a) formulate and review policies and programmes on disability; (b) implement the Enabling Masterplan; and (c) co-ordinate whole-of-government efforts in supporting persons with disabilities in Singapore, in accordance
with the United Nations Convention on the Rights of Persons with Disabilities (UNCRPD). Expenditure Estimates by Object Class
BLANK Actual Estimated Revised Estimated Code Object Class FY2018 FY2019 FY2019 FY2020 Change Over FY2019
B BLANK I-U SOCIAL POLICY AND SERVICES
GROUP PROGRAMME $1 $1 $1 $1 $0 0.0%
TOTAL EXPENDITURE $458,270,377 $499,383,400 $525,214,500 $487,705,500 -$37,509,000 -7.1%
Main Estimates $441,572,624 $479,135,600 $504,572,400 $472,484,700 -$32,087,700 -6.4%
OPERATING EXPENDITURE $441,572,624 $479,135,600 $504,572,400 $472,484,700 -$32,087,700 -6.4%
RUNNING COSTS $91,426,122 $90,672,100 $91,224,000 $97,232,200 $6,008,200 6.6%
Expenditure on Manpower $44,855,199 $46,787,100 $46,878,000 $51,378,400 $4,500,400 9.6%
1500 Permanent Staff 44,825,093 46,733,100 46,824,000 51,378,400 4,554,400 9.7
1600 Temporary, Daily-Rated & Other Staff 30,106 54,000 54,000 0 -54,000 -100.0
Other Operating Expenditure $35,810,782 $34,430,200 $34,891,200 $36,129,900 $1,238,700 3.6%
2100 Consumption of Products & Services 35,427,251 33,969,200 34,464,800 35,631,300 1,166,500 3.4

244
BLANK Actual Estimated Revised Estimated Code Object Class FY2018 FY2019 FY2019 FY2020 Change Over FY2019
B BLANK 2300 Manpower Development 224,928 248,400 187,800 194,800 7,000 3.7
2400 International & Public Relations, Public Communications
138,683 200,000 181,700 290,000 108,300 59.6
2700 Asset Acquisition 19,920 12,600 56,900 13,800 -43,100 -75.7
Grants, Subventions & Capital Injections to Organisations
$10,760,141 $9,454,800 $9,454,800 $9,723,900 $269,100 2.8%
3400 Grants, Subventions & Capital Injections to Other Organisations
10,760,141 9,454,800 9,454,800 9,723,900 269,100 2.8
TRANSFERS $350,146,502 $388,463,500 $413,348,400 $375,252,500 -$38,095,900 -9.2%
3500 Social Transfers to Individuals 78,651,203 103,501,800 109,176,300 117,467,600 8,291,300 7.6
3600 Transfers to Institutions & Organisations 271,495,299 284,961,700 304,172,100 257,784,900 -46,387,200 -15.3
Development Estimates $16,697,753 $20,247,800 $20,642,100 $15,220,800 -$5,421,300 -26.3%
DEVELOPMENT EXPENDITURE $16,697,753 $20,247,800 $20,642,100 $15,220,800 -$5,421,300 -26.3%
5100 Government Development 14,239,291 18,544,800 18,953,800 14,709,800 -4,244,000 -22.4
5200 Grants & Capital Injections to Organisations
2,458,462 1,703,000 1,688,300 511,000 -1,177,300 -69.7
Manpower
BLANK Actual Estimated Revised Estimated Category FY2018 FY2019 FY2019 FY2020
BLANK
Permanent Staff 462 504 537 537
TOTAL 462 504 537 537

245
GAMBLING SAFEGUARDS PROGRAMME
PROGRAMME DESCRIPTION This programme comes under the Gambling Safeguards Division. The Division’s functions are to:
(a) formulate policies, conduct research, implement programmes, and enforce social safeguards on gambling; (b) conduct public education and outreach on problem gambling; (c) plan help services on problem gambling; and (d) act as secretariat to the National Council on Problem Gambling and Responsible Gambling Forum.
Expenditure Estimates by Object Class
BLANK Actual Estimated Revised Estimated Code Object Class FY2018 FY2019 FY2019 FY2020 Change Over FY2019
B BLANK I-V GAMBLING SAFEGUARDS
PROGRAMME $1 $1 $1 $1 $0 0.0%
TOTAL EXPENDITURE $5,975,675 $6,605,500 $6,637,300 $4,818,600 -$1,818,700 -27.4%
Main Estimates $5,975,675 $6,605,500 $6,637,300 $4,818,600 -$1,818,700 -27.4%
OPERATING EXPENDITURE $5,975,675 $6,605,500 $6,637,300 $4,818,600 -$1,818,700 -27.4%
RUNNING COSTS $5,975,675 $6,605,500 $6,637,300 $4,706,200 -$1,931,100 -29.1%
Expenditure on Manpower $1,434,958 $2,574,400 $2,860,100 $3,204,300 $344,200 12.0%
1500 Permanent Staff 1,428,201 2,574,400 2,856,400 3,196,300 339,900 11.9
1600 Temporary, Daily-Rated & Other Staff 6,757 0 3,700 8,000 4,300 116.2
Other Operating Expenditure $4,540,717 $4,031,100 $3,777,200 $1,501,900 -$2,275,300 -60.2%
2100 Consumption of Products & Services 2,452,750 2,106,100 1,887,800 1,441,800 -446,000 -23.6
2300 Manpower Development 6,251 11,100 12,700 8,600 -4,100 -32.3
2400 International & Public Relations, Public Communications
2,044,938 1,912,400 1,875,100 51,000 -1,824,100 -97.3
2700 Asset Acquisition 778 1,500 1,600 500 -1,100 -68.8
2800 Miscellaneous 36,000 0 0 0 0 n.a.
TRANSFERS $0 $0 $0 $112,400 $112,400 n.a.
3600 Transfers to Institutions & Organisations 0 0 0 112,400 112,400 n.a.
Manpower
BLANK Actual Estimated Revised Estimated Category FY2018 FY2019 FY2019 FY2020
BLANK
Permanent Staff 36 39 39 39
TOTAL 36 39 39 39


PROGRAMME DETAILS
Head J ___________
Ministry of Defence


247
NATIONAL DEFENCE PROGRAMME
PROGRAMME DESCRIPTION
This programme comes under the Ministry of Defence. The functions carried out under this programme are:
General Administration - The central management and administration of the Ministry including policy direction by Ministerial offices and support services such as planning; financial, personnel and logistical administration; and legal and engineering services.
Armed Forces - Provision for the Singapore Armed Forces including full-time national servicemen and operationally ready national servicemen.
National Day Celebrations - Provision for the National Day celebrations.
Expenditure Estimates by Object Class
BLANK Actual Estimated Revised Estimated Code Object Class FY2018 FY2019 FY2019 FY2020 Change Over FY2019
B BLANK J-A NATIONAL DEFENCE PROGRAMME DEVELOPMENT
EXPENDITURE $0 $0 $481,616,417 $481,616,417 n.a.
TOTAL EXPENDITURE $14,306,518,509 $15,468,621,400 $14,622,621,400 $15,085,600,500 $462,979,100 3.2%
Main Estimates $13,824,902,091 $14,981,206,800 $14,133,687,500 $14,561,155,500 $427,468,000 3.0%
OPERATING EXPENDITURE $13,824,902,091 $14,964,421,400 $14,118,421,400 $14,544,400,500 $425,979,100 3.0%
RUNNING COSTS $13,816,876,412 $14,955,959,400 $14,109,717,400 $14,535,304,800 $425,587,400 3.0%
Expenditure on Manpower $18,037,503 $18,471,100 $17,953,600 $18,597,900 $644,300 3.6%
1200 Political Appointments 2,582,781 2,437,200 2,487,800 2,509,900 22,100 0.9 1500 Permanent Staff 15,454,721 16,033,900 15,465,800 16,088,000 622,200 4.0
Other Operating Expenditure $13,798,838,909 $14,937,488,300 $14,091,763,800 $14,516,706,900 $424,943,100 3.0%
2100 Consumption of Products & Services 13,464,555 18,267,000 18,267,000 18,267,000 0 0.0 2300 Manpower Development 164,738 164,400 287,900 223,400 -64,500 -22.42400 International & Public Relations, Public
Communications 18,239,729 29,996,500 29,999,000 19,389,000 -10,610,000 -35.4
2800 Miscellaneous 0 2,000,000 2,000,000 2,000,000 0 0.02900 Military Expenditure 13,766,969,888 14,887,060,400 14,041,209,900 14,476,827,500 435,617,600 3.1
TRANSFERS $8,025,679 $8,462,000 $8,704,000 $9,095,700 $391,700 4.5%
3600 Transfers to Institutions & Organisations 8,025,679 8,462,000 8,704,000 9,095,700 391,700 4.5
OTHER CONSOLIDATED FUND OUTLAYS $0 $16,785,400 $15,266,100 $16,755,000 $1,488,900 9.8%
4600 Loans and Advances (Disbursement) 0 16,785,400 15,266,100 16,755,000 1,488,900 9.8
Development Estimates $481,616,417 $504,200,000 $504,200,000 $541,200,000 $37,000,000 7.3%
DEVELOPMENT EXPENDITURE $481,616,417 $504,200,000 $504,200,000 $541,200,000 $37,000,000 7.3%
5100 Government Development 481,616,417 504,200,000 504,200,000 541,200,000 37,000,000 7.3
OTHER DEVELOPMENT FUND OUTLAYS $210,752,881 $257,600,000 $257,600,000 $348,000,000 $90,400,000 35.1%
5500 Land-Related Expenditure 210,752,881 257,600,000 257,600,000 348,000,000 90,400,000 35.1

248
Manpower
BLANK Actual Estimated Revised Estimated Category FY2018 FY2019 FY2019 FY2020
BLANK
Political Appointments 3 3 3 3
Permanent Staff 279 279 279 279
TOTAL 282 282 282 282

PROGRAMME DETAILS
Head K ___________
Ministry of Education


249
ADMINISTRATION PROGRAMME
PROGRAMME DESCRIPTION
This programme covers the functions of the following divisions of the Ministry of Education (MOE) HQ:
Student Placement and Services Division - Oversees the placement of students to schools through placement exercises or ad-hoc admission/transfers; develops, administers and monitors local and international scholarship and tuition grant schemes; develops and implements strategies and initiatives under the MOE Customer Relationship Management (CRM) Framework to improve service delivery across all MOE touchpoints; and manages the Customer Service Centre.
HR Solutions & Capabilities Division - Recruits, deploys and manages employment matters for Education Officers, MOE Kindergarten Educators, Allied Educators and Executive & Administrative Staff; and promotes organisational excellence in HQ divisions and schools.
HR Strategy and Leadership Division - Reviews and formulates strategic HR policies, as well as oversees manpower planning, talent management and leadership development/succession planning; promotes innovation including through inculcating in MOE staff and leadership a stronger innovative culture; strengthens Organisation Development capabilities to support MOE’s transformation efforts; and formulates policies pertaining to the Science Centre Board.
Finance & Procurement Division - Formulates and implements funding fees and financial assistance policies; plans and manages the MOE operating and development budgets; oversees financial operations; administers the Edusave and Post-Secondary Education schemes; provides financial and accounting systems and support to MOE HQ and schools and a centralised service for the billing, collection and accounting of fees and charges from students in schools; develops management reporting in MOE; oversees charities and Institutions of a Public Character in the education sector; and establishes and oversees procurement policies and provides procurement support, advice and training.
Infrastructure & Facility Services Division - Plans the capacity of schools; reviews land use and land policies affecting schools; plans and develops strategies for schools upgrading and development; specifies facility provisions and infrastructure requirements of schools; implements building programmes and oversees facilities management in schools and MOE HQ; and develops and operationalises safety, security and emergency preparedness systems for MOE HQ and schools.
Research and Management Information Division - Conduct and harness research; lead in strategic data management and data exploitation of strategic importance to MOE.
Planning Division - Formulates policies and strategies pertaining to the general education system as a whole, especially for schools, pre-school and Special Education to achieve MOE’s mission and vision; and oversees MOE's strategic planning as well as international relations and protocol-related matters.
Communications Division - Proactively manages strategic messaging and promotes effective communication of education policies and programmes to local and international media, as well as the general public.
Engagement and Research Division - Conceptualises, designs, experiments and co-ordinates MOE’s engagement efforts to build greater trust and confidence in our education system, strengthen stakeholder outreach, build capability across MOE, and support Divisions and schools in their policy engagement efforts. This helps to feed into the policy-making and implementation process and enables consistency in the messages being communicated to stakeholders.

250
Information Technology Division - Oversees the strategic planning and deployment of ICT systems and Digital capabilities and quality services, as well as a secure infrastructure to enable MOE and its schools to achieve excellence in using ICT for administration, management and education.
Expenditure Estimates by Object Class BLANK Actual Estimated Revised Estimated Code Object Class FY2018 FY2019 FY2019 FY2020 Change Over FY2019
B BLANK K-A ADMINISTRATION PROGRAMME $1 $1 $1 $1 $0 0.0%
TOTAL EXPENDITURE $440,911,063 $478,648,800 $450,393,600 $599,738,200 $149,344,600 33.2%
Main Estimates $378,461,525 $414,807,800 $387,881,600 $510,082,300 $122,200,700 31.5%
OPERATING EXPENDITURE $378,461,525 $392,358,300 $366,328,800 $487,970,800 $121,642,000 33.2%
RUNNING COSTS $318,252,964 $335,948,100 $308,668,000 $426,406,200 $117,738,200 38.1%
Expenditure on Manpower $166,971,048 $160,928,000 $151,453,300 $158,657,300 $7,204,000 4.8%
1200 Political Appointments 2,358,343 2,974,100 2,567,400 3,219,100 651,700 25.4 1500 Permanent Staff 164,495,655 157,250,400 148,231,200 155,206,900 6,975,700 4.7 1600 Temporary, Daily-Rated & Other Staff 117,050 703,500 654,700 231,300 -423,400 -64.7
Other Operating Expenditure $148,812,213 $173,096,700 $155,291,300 $266,268,700 $110,977,400 71.5%
2100 Consumption of Products & Services 128,890,947 149,866,000 135,694,400 243,837,100 108,142,700 79.7 2300 Manpower Development 9,747,509 15,004,900 11,701,100 13,465,000 1,763,900 15.1 2400 International & Public Relations, Public
Communications 6,045,375 5,267,900 5,686,800 6,514,700 827,900 14.6
2700 Asset Acquisition 816,034 453,100 349,200 451,500 102,300 29.3 2800 Miscellaneous 3,312,349 2,504,800 1,859,800 2,000,400 140,600 7.6
Grants, Subventions & Capital Injections to Organisations $2,469,703 $1,923,400 $1,923,400 $1,480,200 -$443,200 -23.0%
3200 Grants, Subventions & Capital Injections to Educational Institutions
2,469,703 1,923,400 1,923,400 1,480,200 -443,200 -23.0
TRANSFERS $60,208,560 $56,410,200 $57,660,800 $61,564,600 $3,903,800 6.8%
3500 Social Transfers to Individuals 35,756,296 35,163,700 37,821,600 37,279,300 -542,300 -1.4 3600 Transfers to Institutions & Organisations 21,953,300 19,223,600 17,847,800 21,862,400 4,014,600 22.5 3800 International Organisations & Overseas
Development Assistance 2,498,964 2,022,900 1,991,400 2,422,900 431,500 21.7
OTHER CONSOLIDATED FUND OUTLAYS
$0 $22,449,500 $21,552,800 $22,111,500 $558,700 2.6%
4600 Loans and Advances (Disbursement) 0 22,449,500 21,552,800 22,111,500 558,700 2.6
Development Estimates $62,449,538 $86,290,500 $84,064,800 $111,767,400 $27,702,600 33.0%
DEVELOPMENT EXPENDITURE $62,449,538 $86,290,500 $84,064,800 $111,767,400 $27,702,600 33.0%
5100 Government Development 52,381,401 77,875,400 70,283,200 103,228,400 32,945,200 46.9 5200 Grants & Capital Injections to
Organisations 10,068,137 8,415,100 13,781,600 8,539,000 -5,242,600 -38.0

251
Manpower
BLANK Actual Estimated Revised Estimated Category/Personnel FY2018 FY2019 FY2019 FY2020
BLANK
Political Appointments 5 5 5 5
Permanent Staff 1,216 1,418 1,459 1,459
TOTAL 1,221 1,423 1,464 1,464

252
HIGHER EDUCATION AND SKILLSFUTURE PROGRAMME
PROGRAMME DESCRIPTION
This programme covers the functions of the following divisions of MOE HQ: Higher Education Operations Division - Oversees strategic Human Resource matters (e.g. HR policy, talent management, succession planning), Quality Assurance Frameworks and External Validations, contingency planning and incident management for publicly-funded post-secondary education institutions; and provides administrative and office support to the Higher Education Policy Division, SkillsFuture Division and Academic Research Division.
Higher Education Policy Division - Formulates and implements strategies and policies pertaining to publicly-funded post-secondary education institutions, i.e. universities, polytechnics, the Institute of Technical Education and tertiary arts institutions, including their governance, funding and operations. Also formulates and implements policies relating to private education and oversees the ISEAS – Yusof Ishak Institute.
SkillsFuture Division - Formulates broad directions and policies for the SkillsFuture movement, and works closely with SkillsFuture Singapore, post-secondary education institutions and other stakeholders to implement plans, policies and strategies to support lifelong learning and skills development under SkillsFuture.
Academic Research Division - Formulates and implements strategies and policies for research, innovation and enterprise, as well as research manpower, under the Research, Innovation and Enterprise (RIE) Masterplan for publicly-funded post-secondary education institutions; and formulates strategies and policies pertaining to Social Science and Humanities Research.
Higher Education Planning Office - Drives strategic planning, policy coordination, and data analytics initiatives for the Higher Education and Skills landscape.
Expenditure Estimates by Object Class BLANK Actual Estimated Revised Estimated Code Object Class FY2018 FY2019 FY2019 FY2020 Change Over FY2019
B BLANK K-B HIGHER EDUCATION AND
SKILLSFUTURE PROGRAMME $1 $1 $1 $1 $0 0.0%
TOTAL EXPENDITURE $437,874,718 $469,709,900 $497,002,900 $510,881,700 $13,878,800 2.8%
Main Estimates $437,874,718 $469,709,900 $497,002,900 $510,881,700 $13,878,800 2.8%
OPERATING EXPENDITURE $437,874,718 $469,709,900 $497,002,900 $510,881,700 $13,878,800 2.8%
RUNNING COSTS $17,268,101 $15,795,300 $16,557,100 $17,474,500 $917,400 5.5%
Expenditure on Manpower $13,725,238 $12,952,400 $13,537,300 $14,167,400 $630,100 4.7%
1500 Permanent Staff 13,724,147 12,933,900 13,518,800 14,148,900 630,100 4.7 1600 Temporary, Daily-Rated & Other Staff 1,091 18,500 18,500 18,500 0 0.0
Other Operating Expenditure $3,542,862 $2,842,900 $3,019,800 $3,307,100 $287,300 9.5%
2100 Consumption of Products & Services 3,356,150 2,550,900 2,810,200 3,028,300 218,100 7.8 2300 Manpower Development 76,411 182,700 102,100 180,400 78,300 76.7 2400 International & Public Relations, Public
Communications 108,489 101,400 101,800 91,300 -10,500 -10.3
2700 Asset Acquisition 1,812 7,900 5,700 7,100 1,400 24.6
TRANSFERS $420,606,617 $453,914,600 $480,445,800 $493,407,200 $12,961,400 2.7%
3600 Transfers to Institutions & Organisations 420,606,617 453,914,600 480,445,800 493,407,200 12,961,400 2.7

253
Manpower
BLANK Actual Estimated Revised Estimated Category/Personnel FY2018 FY2019 FY2019 FY2020
BLANK
Permanent Staff 105 121 120 120
TOTAL 105 121 120 120

254
SCHOOL SERVICES AND EDUCATIONAL DEVELOPMENT PROGRAMME
PROGRAMME DESCRIPTION
This programme covers the functions of the following divisions of MOE HQ:
Schools Division ‐ Supports, monitors, supervises and evaluates schools so that schools are of high quality and implement education policies effectively; supervises, advises, and develops School Leaders and other key officers; and uplifts the quality of kindergarten education.
Curriculum Planning and Development Divisions - Oversees the formal curriculum through working with schools, Institutes of Higher Learning, partners and stakeholders to design, review and revise syllabi and develop instructional materials; provides leadership to school staff, including Heads of Departments, Subject Heads, Level Heads, Senior Teachers and teachers, in the effective implementation of syllabi and instructional materials; develops and promotes the use of effective learner-centred pedagogies, curriculum models and assessment modes to better engage students and enhance learning; designs, organises and implements special programmes and projects to complement and enrich the curriculum; conceptualises, plans and conducts professional development for Heads of Departments, Subject Heads, Level Heads, Senior Teachers and teachers related to curriculum; conducts educational research to enhance design and delivery of curriculum; reviews, authorises, and develops textbooks and supplementary materials; develops print and digital learning resources to support implementation of the curriculum, and provides consultancy to schools and MOE Divisions on matters related to curriculum; and oversees the implementation of the strategic directions of the Lee Kuan Yew Fund for Bilingualism to seed the development of resources and programmes to support bilingual learning among the young.
Student Development Curriculum Division - Oversees the formal curriculum and co-curricular programmes in the areas of student well-being, arts, physical, sports and outdoor education, and character and citizenship education; and responsible for Co-curricular Activity policies. Works with schools, Institutes of Higher Learning, partners and stakeholders to design, review and revise syllabi and develop instructional materials; provides leadership to schools in the effective implementation of syllabi and instructional materials; develops and promotes the use of effective learner-centred pedagogies, curriculum models and assessment modes to better engage students and enhance learning; designs, organises and implements special programmes, events and projects to complement and enrich the curriculum; conceptualises, plans and conducts professional development for school staff; conducts educational research to enhance design and delivery of curriculum and co-curriculum; reviews, authorises, and develops textbooks and supplementary materials; provides consultancy to schools on matters related to student development curriculum; and organises national programmes to identify, develop, and recognise talented students in the arts and sports.
Educational Technology Division - Oversees and provides strategic direction in the planning, implementation and management of technology in education for 21st century learning; provides leadership in the effective integration of technology into learning and teaching; oversees the development and implementation of the Singapore Student Learning Space online platform for technology-enabled learning; builds capacity of teachers, key personnel and school leaders to deepen the pedagogical use of technology to transform student learning; promotes the integration of technology into curriculum and champions ethical and responsible digital use among students; leads in active experimentation and reflective practice on innovative use of educational technology , and identifies and translates technology-enabled pedagogical practices and scales such innovative pedagogical practices across the system; nurtures the development of communities and partnerships that advance the use of technology for learning and teaching; and leads in the design, development and use of video to support teaching and learning, assessment, professional development and communications.

255
Special Educational Needs Division - Provides system-level oversight of the educational needs of students with special educational needs (SEN) in mainstream and SPED schools; oversees policies and measures to support students with SEN; and provides thought leadership, expertise and support to raise capabilities of SPED schools and mainstream schools to support students with SEN. This includes ensuring the quality, accessibility and affordability of special education, developing policies, and setting standards for quality assurance in SPED schools; developing and implementing policies and specialised educational programs and services for students with SEN in mainstream schools; and developing school staff capacity to provide support and deliver effective intervention programmes.
Academy of Singapore Teachers - The Academy provides in-service professional learning opportunities for education officers, allied educators, and executive and administration staff. Its mission is to develop a teacher-led culture of professional excellence centred on the holistic development of the child. Through its various touch-points, the Academy seeks to nurture in our teachers pedagogical leadership, and encourages the emergence of networked learning communities in which staff can collaborate with and learn from one another. It also provides other learning opportunities like work attachments, workshops and conferences, blended/e-learning, learning journeys and exchange programmes as part of its mandate to build a quality workforce. It supports the development of the teacher’s identity and pride through the ethos conversations, recognition and awards, and visits to the MOE Heritage Centre. Beyond developing professional competencies in staff, AST also provides counselling, and staff well-being programmes and services through the OLive@MOE Staff Well-Being Centre. MOE staff are supported in their professional learning with learning resources available in the library at READ@Academy and through the online learning and management system OPAL (One Portal, All Learners).
Expenditure Estimates by Object Class BLANK Actual Estimated Revised Estimated Code Object Class FY2018 FY2019 FY2019 FY2020 Change Over FY2019
B BLANK K-C SCHOOL SERVICES AND
EDUCATIONAL DEVELOPMENT PROGRAMME
$1 $1 $1 $1 $0 0.0%
TOTAL EXPENDITURE $396,862,070 $417,869,100 $412,595,600 $426,276,100 $13,680,500 3.3%
Main Estimates $392,569,162 $409,086,900 $402,823,400 $418,464,500 $15,641,100 3.9%
OPERATING EXPENDITURE $392,569,162 $409,086,900 $402,823,400 $418,464,500 $15,641,100 3.9%
RUNNING COSTS $363,278,417 $380,314,100 $371,944,300 $389,581,200 $17,636,900 4.7%
Expenditure on Manpower $286,771,921 $292,403,700 $284,974,300 $307,483,100 $22,508,800 7.9%
1500 Permanent Staff 286,696,566 289,902,800 283,598,700 307,115,600 23,516,900 8.3 1600 Temporary, Daily-Rated & Other Staff 75,355 2,500,900 1,375,600 367,500 -1,008,100 -73.3
Other Operating Expenditure $72,983,217 $85,191,900 $83,865,400 $78,668,300 -$5,197,100 -6.2%
2100 Consumption of Products & Services 50,227,679 58,100,200 57,552,100 54,152,700 -3,399,400 -5.9 2300 Manpower Development 14,835,512 17,854,000 17,122,700 16,307,300 -815,400 -4.8 2400 International & Public Relations, Public
Communications 6,929,179 8,344,300 8,289,100 7,430,700 -858,400 -10.4
2700 Asset Acquisition 962,341 874,500 877,600 774,900 -102,700 -11.7 2800 Miscellaneous 28,506 18,900 23,900 2,700 -21,200 -88.7
Grants, Subventions & Capital Injections to Organisations
$3,523,279 $2,718,500 $3,104,600 $3,429,800 $325,200 10.5%
3200 Grants, Subventions & Capital Injections to Educational Institutions
3,523,279 2,718,500 3,104,600 3,429,800 325,200 10.5

256
BLANK Actual Estimated Revised Estimated Code Object Class FY2018 FY2019 FY2019 FY2020 Change Over FY2019
B BLANK
TRANSFERS $29,290,745 $28,772,800 $30,879,100 $28,883,300 -$1,995,800 -6.5%
3500 Social Transfers to Individuals 2,316,196 2,387,300 2,387,300 2,387,300 0 0.0 3600 Transfers to Institutions & Organisations 26,974,549 26,385,500 28,491,800 26,496,000 -1,995,800 -7.0
Development Estimates $4,292,908 $8,782,200 $9,772,200 $7,811,600 -$1,960,600 -20.1%
DEVELOPMENT EXPENDITURE $4,292,908 $8,782,200 $9,772,200 $7,811,600 -$1,960,600 -20.1%
5100 Government Development 4,292,908 8,782,200 9,772,200 7,811,600 -1,960,600 -20.1
Manpower
BLANK Actual Estimated Revised Estimated Category/Personnel FY2018 FY2019 FY2019 FY2020
BLANK
Permanent Staff 1,926 2,035 2,340 2,340
TOTAL 1,926 2,035 2,340 2,340

257
GOVERNMENT SCHOOLS AND JUNIOR COLLEGES PROGRAMME
PROGRAMME DESCRIPTION
This programme comes under MOE HQ. The functions carried out under this programme include overseeing the administration and operation of Government primary schools, Government secondary schools and Government junior colleges.
Expenditure Estimates by Object Class BLANK Actual Estimated Revised Estimated Code Object Class FY2018 FY2019 FY2019 FY2020 Change Over FY2019
B BLANK K-D GOVERNMENT SCHOOLS AND JUNIOR
COLLEGES PROGRAMME $1 $1 $1 $1 $0 0.0%
TOTAL EXPENDITURE $4,581,919,529 $4,714,844,500 $4,479,902,400 $4,678,322,300 $198,419,900 4.4%
Main Estimates $4,288,873,168 $4,460,291,000 $4,186,370,300 $4,457,897,400 $271,527,100 6.5%
OPERATING EXPENDITURE $4,288,873,168 $4,460,291,000 $4,186,370,300 $4,457,897,400 $271,527,100 6.5%
RUNNING COSTS $4,105,283,830 $4,262,222,800 $3,998,865,800 $4,262,166,800 $263,301,000 6.6%
Expenditure on Manpower $3,592,606,959 $3,699,936,800 $3,450,383,900 $3,730,157,100 $279,773,200 8.1%
1500 Permanent Staff 3,495,354,504 3,567,081,100 3,334,897,200 3,618,654,900 283,757,700 8.5 1600 Temporary, Daily-Rated & Other Staff 97,252,455 132,855,700 115,486,700 111,502,200 -3,984,500 -3.5
Other Operating Expenditure $512,676,871 $562,211,000 $548,421,900 $531,949,700 -$16,472,200 -3.0%
2100 Consumption of Products & Services 394,241,626 454,079,600 467,400,400 435,432,200 -31,968,200 -6.8 2300 Manpower Development 26,867,169 28,109,200 28,020,100 28,009,100 -11,000 0.0 2700 Asset Acquisition 90,732,621 79,340,400 52,244,900 67,929,400 15,684,500 30.0 2800 Miscellaneous 835,455 681,800 756,500 579,000 -177,500 -23.5
Grants, Subventions & Capital Injections to Organisations
$0 $75,000 $60,000 $60,000 $0 0.0%
3200 Grants, Subventions & Capital Injections to Educational Institutions
0 75,000 60,000 60,000 0 0.0
TRANSFERS $183,589,338 $198,068,200 $187,504,500 $195,730,600 $8,226,100 4.4%
3500 Social Transfers to Individuals 182,057,459 196,411,500 185,832,800 194,192,800 8,360,000 4.5 3600 Transfers to Institutions & Organisations 1,531,879 1,656,700 1,671,700 1,537,800 -133,900 -8.0
Development Estimates $293,046,361 $254,553,500 $293,532,100 $220,424,900 -$73,107,200 -24.9%
DEVELOPMENT EXPENDITURE $293,046,361 $254,553,500 $293,532,100 $220,424,900 -$73,107,200 -24.9%
5100 Government Development 262,757,672 211,530,800 271,025,100 190,124,600 -80,900,500 -29.8 5200 Grants & Capital Injections to
Organisations 30,288,689 43,022,700 22,507,000 30,300,300 7,793,300 34.6
Manpower
BLANK Actual Estimated Revised Estimated Category/Personnel FY2018 FY2019 FY2019 FY2020
BLANK
Permanent Staff 29,885 29,094 29,339 28,883
TOTAL 29,885 29,094 29,339 28,883

258
SPECIAL EDUCATION SCHOOLS PROGRAMME
PROGRAMME DESCRIPTION
This programme comes under MOE HQ. The programme is undertaken to administer and operate Special Education Schools.
Expenditure Estimates by Object Class BLANK Actual Estimated Revised Estimated Code Object Class FY2018 FY2019 FY2019 FY2020 Change Over FY2019
B BLANK K-E SPECIAL EDUCATION SCHOOLS
PROGRAMME $1 $1 $1 $1 $0 0.0%
TOTAL EXPENDITURE $183,634,655 $221,093,800 $209,123,000 $262,893,300 $53,770,300 25.7%
Main Estimates $182,966,736 $196,122,600 $199,941,100 $217,793,700 $17,852,600 8.9%
OPERATING EXPENDITURE $182,966,736 $196,122,600 $199,941,100 $217,793,700 $17,852,600 8.9%
TRANSFERS $182,966,736 $196,122,600 $199,941,100 $217,793,700 $17,852,600 8.9%
3600 Transfers to Institutions & Organisations 182,966,736 196,122,600 199,941,100 217,793,700 17,852,600 8.9
Development Estimates $667,919 $24,971,200 $9,181,900 $45,099,600 $35,917,700 391.2%
DEVELOPMENT EXPENDITURE $667,919 $24,971,200 $9,181,900 $45,099,600 $35,917,700 391.2%
5100 Government Development 562,254 18,739,600 9,092,000 44,109,600 35,017,600 385.1 5200 Grants & Capital Injections to
Organisations 105,664 6,231,600 89,900 990,000 900,100 n.a.

259
GOVERNMENT-AIDED SCHOOLS AND JUNIOR COLLEGES PROGRAMME
PROGRAMME DESCRIPTION
This programme comes under MOE HQ. The main functions carried out under this programme include the administration and operation of Government-aided primary schools, Government-aided secondary schools and Government-aided junior colleges.
Expenditure Estimates by Object Class
BLANK Actual Estimated Revised Estimated Code Object Class FY2018 FY2019 FY2019 FY2020 Change Over FY2019
B BLANK K-F GOVERNMENT-AIDED SCHOOLS AND
JUNIOR COLLEGES PROGRAMME $1 $1 $1 $1 $0 0.0%
TOTAL EXPENDITURE $1,317,414,711 $1,366,941,500 $1,305,666,900 $1,368,248,700 $62,581,800 4.8%
Main Estimates $1,313,500,878 $1,363,017,500 $1,301,856,200 $1,358,407,400 $56,551,200 4.3%
OPERATING EXPENDITURE $1,313,500,878 $1,363,017,500 $1,301,856,200 $1,358,407,400 $56,551,200 4.3%
RUNNING COSTS $1,313,500,878 $1,363,017,500 $1,301,856,200 $1,358,407,400 $56,551,200 4.3%
Grants, Subventions & Capital Injections to Organisations
$1,313,500,878 $1,363,017,500 $1,301,856,200 $1,358,407,400 $56,551,200 4.3%
3200 Grants, Subventions & Capital Injections to Educational Institutions
1,313,500,878 1,363,017,500 1,301,856,200 1,358,407,400 56,551,200 4.3
Development Estimates $3,913,832 $3,924,000 $3,810,700 $9,841,300 $6,030,600 158.3%
DEVELOPMENT EXPENDITURE $3,913,832 $3,924,000 $3,810,700 $9,841,300 $6,030,600 158.3%
5100 Government Development 1,165,230 2,272,000 1,430,500 1,286,400 -144,100 -10.1 5200 Grants & Capital Injections to
Organisations 2,748,603 1,652,000 2,380,200 8,554,900 6,174,700 259.4
Manpower
BLANK Actual Estimated Revised Estimated Category/Personnel FY2018 FY2019 FY2019 FY2020
BLANK'
Permanent Staff 7,803 7,516 7,679 7,533
Others 1,873 1,865 2,019 2,015
TOTAL 9,676 9,381 9,698 9,548

260
INDEPENDENT SCHOOLS PROGRAMME
PROGRAMME DESCRIPTION
This programme comes under MOE HQ. The programme is undertaken to administer and operate Independent Schools.
Expenditure Estimates by Object Class BLANK Actual Estimated Revised Estimated Code Object Class FY2018 FY2019 FY2019 FY2020 Change Over FY2019
B BLANK K-G INDEPENDENT SCHOOLS $1 $1 $1 $1 $0 0.0%
TOTAL EXPENDITURE $422,856,402 $420,352,800 $428,731,000 $397,322,400 -$31,408,600 -7.3%
Main Estimates $395,413,447 $390,599,000 $390,537,700 $394,832,800 $4,295,100 1.1%
OPERATING EXPENDITURE $395,413,447 $390,599,000 $390,537,700 $394,832,800 $4,295,100 1.1%
RUNNING COSTS $378,999,787 $370,160,800 $371,292,400 $377,124,500 $5,832,100 1.6%
Grants, Subventions & Capital Injections to Organisations $378,999,787 $370,160,800 $371,292,400 $377,124,500 $5,832,100 1.6%
3200 Grants, Subventions & Capital Injections to Educational Institutions
378,999,787 370,160,800 371,292,400 377,124,500 5,832,100 1.6
TRANSFERS $16,413,660 $20,438,200 $19,245,300 $17,708,300 -$1,537,000 -8.0%
3500 Social Transfers to Individuals 16,413,660 20,438,200 19,245,300 17,708,300 -1,537,000 -8.0
Development Estimates $27,442,955 $29,753,800 $38,193,300 $2,489,600 -$35,703,700 -93.5%
DEVELOPMENT EXPENDITURE $27,442,955 $29,753,800 $38,193,300 $2,489,600 -$35,703,700 -93.5%
5100 Government Development 24,579,309 22,212,900 36,348,600 2,049,600 -34,299,000 -94.4 5200 Grants & Capital Injections to
Organisations 2,863,646 7,540,900 1,844,700 440,000 -1,404,700 -76.1
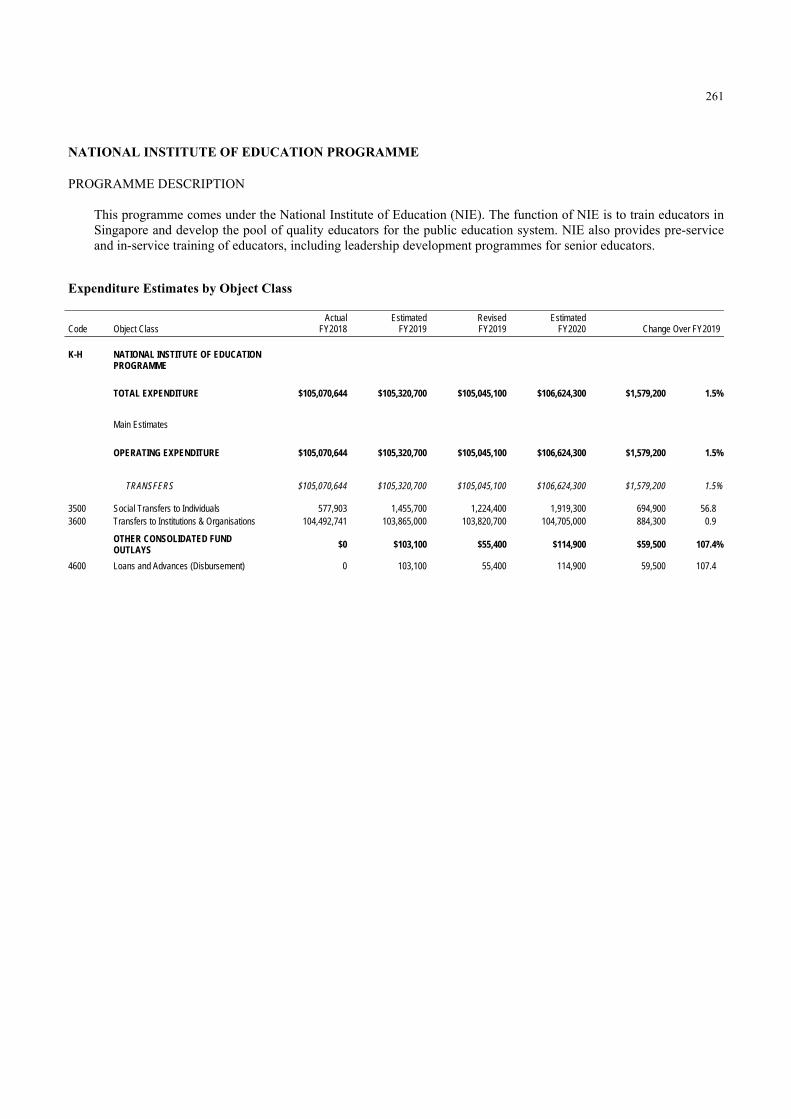
261
NATIONAL INSTITUTE OF EDUCATION PROGRAMME
PROGRAMME DESCRIPTION
This programme comes under the National Institute of Education (NIE). The function of NIE is to train educators in Singapore and develop the pool of quality educators for the public education system. NIE also provides pre-service and in-service training of educators, including leadership development programmes for senior educators.
Expenditure Estimates by Object Class BLANK Actual Estimated Revised Estimated Code Object Class FY2018 FY2019 FY2019 FY2020 Change Over FY2019
B BLANK K-H NATIONAL INSTITUTE OF EDUCATION
PROGRAMME $1 $1 $1 $1 $0 0.0%
TOTAL EXPENDITURE $105,070,644 $105,320,700 $105,045,100 $106,624,300 $1,579,200 1.5%
Main Estimates $105,070,644 $105,423,800 $105,100,500 $106,739,200 $1,638,700 1.6%
OPERATING EXPENDITURE $105,070,644 $105,320,700 $105,045,100 $106,624,300 $1,579,200 1.5%
TRANSFERS $105,070,644 $105,320,700 $105,045,100 $106,624,300 $1,579,200 1.5%
3500 Social Transfers to Individuals 577,903 1,455,700 1,224,400 1,919,300 694,900 56.8 3600 Transfers to Institutions & Organisations 104,492,741 103,865,000 103,820,700 104,705,000 884,300 0.9
OTHER CONSOLIDATED FUND OUTLAYS
$0 $103,100 $55,400 $114,900 $59,500 107.4%
4600 Loans and Advances (Disbursement) 0 103,100 55,400 114,900 59,500 107.4
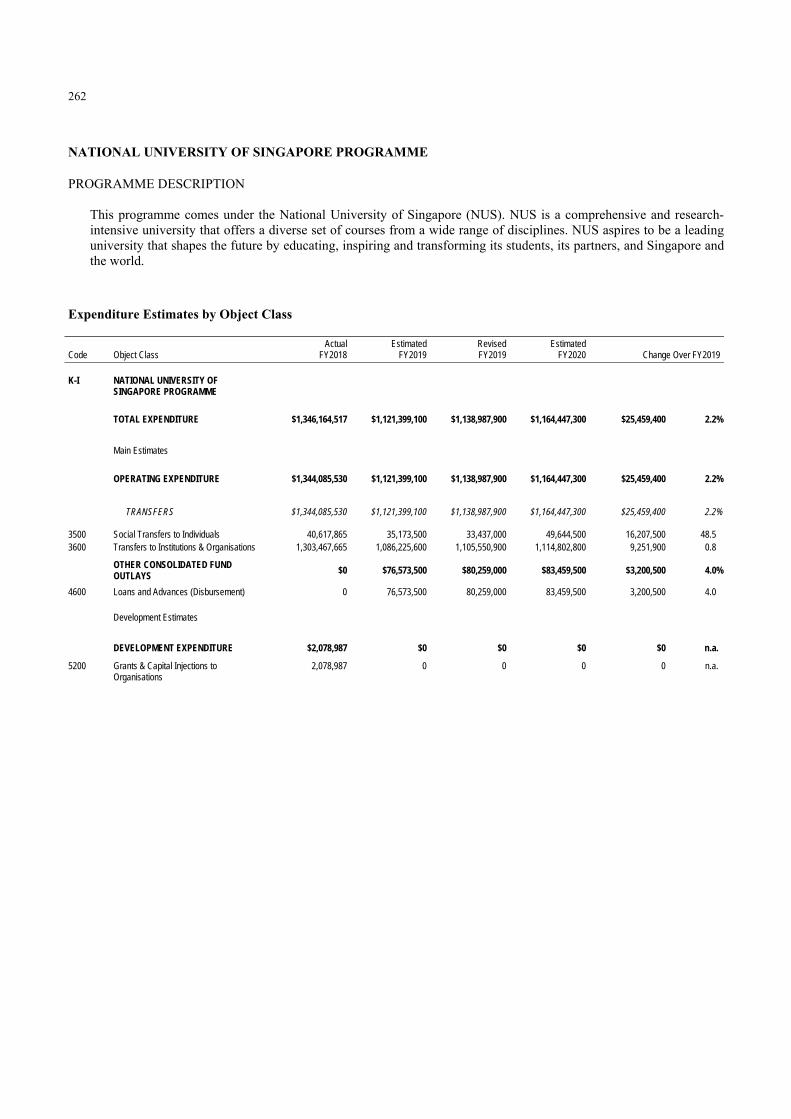
262
NATIONAL UNIVERSITY OF SINGAPORE PROGRAMME
PROGRAMME DESCRIPTION
This programme comes under the National University of Singapore (NUS). NUS is a comprehensive and research-intensive university that offers a diverse set of courses from a wide range of disciplines. NUS aspires to be a leading university that shapes the future by educating, inspiring and transforming its students, its partners, and Singapore and the world.
Expenditure Estimates by Object Class BLANK Actual Estimated Revised Estimated Code Object Class FY2018 FY2019 FY2019 FY2020 Change Over FY2019
B BLANK K-I NATIONAL UNIVERSITY OF
SINGAPORE PROGRAMME $1 $1 $1 $1 $0 0.0%
TOTAL EXPENDITURE $1,346,164,517 $1,121,399,100 $1,138,987,900 $1,164,447,300 $25,459,400 2.2%
Main Estimates $1,344,085,530 $1,197,972,600 $1,219,246,900 $1,247,906,800 $28,659,900 2.4%
OPERATING EXPENDITURE $1,344,085,530 $1,121,399,100 $1,138,987,900 $1,164,447,300 $25,459,400 2.2%
TRANSFERS $1,344,085,530 $1,121,399,100 $1,138,987,900 $1,164,447,300 $25,459,400 2.2%
3500 Social Transfers to Individuals 40,617,865 35,173,500 33,437,000 49,644,500 16,207,500 48.5 3600 Transfers to Institutions & Organisations 1,303,467,665 1,086,225,600 1,105,550,900 1,114,802,800 9,251,900 0.8
OTHER CONSOLIDATED FUND OUTLAYS
$0 $76,573,500 $80,259,000 $83,459,500 $3,200,500 4.0%
4600 Loans and Advances (Disbursement) 0 76,573,500 80,259,000 83,459,500 3,200,500 4.0
Development Estimates $2,078,987 $0 $0 $0 $0 n.a.
DEVELOPMENT EXPENDITURE $2,078,987 $0 $0 $0 $0 n.a.
5200 Grants & Capital Injections to Organisations
2,078,987 0 0 0 0 n.a.

263
NANYANG TECHNOLOGICAL UNIVERSITY PROGRAMME
PROGRAMME DESCRIPTION
This programme comes under the Nanyang Technological University (NTU). NTU aspires to become a great global university founded on Science and Technology. Its mission is to nurture leaders through research and a broad education in diverse disciplines.
Expenditure Estimates by Object Class BLANK Actual Estimated Revised Estimated Code Object Class FY2018 FY2019 FY2019 FY2020 Change Over FY2019
B BLANK K-J NANYANG TECHNOLOGICAL
UNIVERSITY PROGRAMME $1 $1 $1 $1 $0 0.0%
TOTAL EXPENDITURE $789,917,298 $637,547,900 $633,093,700 $624,509,600 -$8,584,100 -1.4%
Main Estimates $786,138,614 $694,110,900 $686,378,400 $678,605,800 -$7,772,600 -1.1%
OPERATING EXPENDITURE $786,138,614 $637,010,900 $632,578,400 $623,805,800 -$8,772,600 -1.4%
TRANSFERS $786,138,614 $637,010,900 $632,578,400 $623,805,800 -$8,772,600 -1.4%
3500 Social Transfers to Individuals 30,781,435 33,211,500 30,277,600 38,815,900 8,538,300 28.2 3600 Transfers to Institutions & Organisations 755,357,179 603,799,400 602,300,800 584,989,900 -17,310,900 -2.9
OTHER CONSOLIDATED FUND OUTLAYS
$0 $57,100,000 $53,800,000 $54,800,000 $1,000,000 1.9%
4600 Loans and Advances (Disbursement) 0 57,100,000 53,800,000 54,800,000 1,000,000 1.9
Development Estimates $3,778,683 $537,000 $515,300 $703,800 $188,500 36.6%
DEVELOPMENT EXPENDITURE $3,778,683 $537,000 $515,300 $703,800 $188,500 36.6%
5200 Grants & Capital Injections to Organisations
3,778,683 537,000 515,300 703,800 188,500 36.6
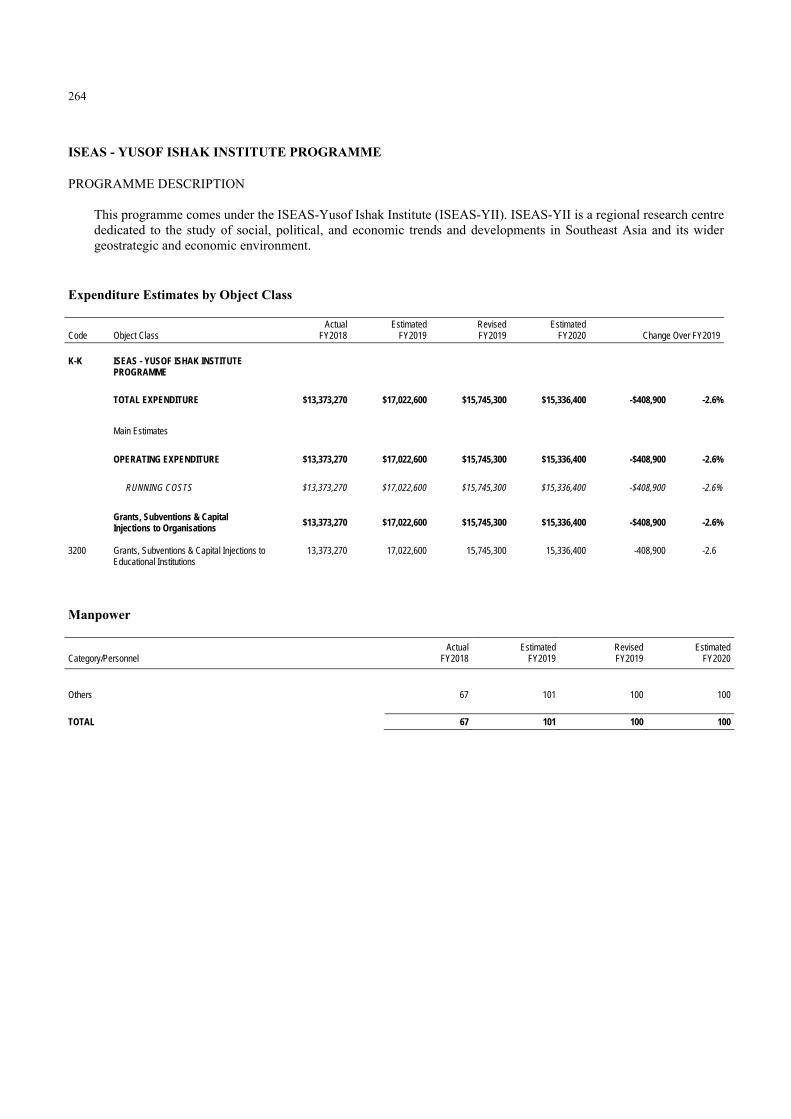
264
ISEAS - YUSOF ISHAK INSTITUTE PROGRAMME
PROGRAMME DESCRIPTION
This programme comes under the ISEAS-Yusof Ishak Institute (ISEAS-YII). ISEAS-YII is a regional research centre dedicated to the study of social, political, and economic trends and developments in Southeast Asia and its wider geostrategic and economic environment.
Expenditure Estimates by Object Class BLANK Actual Estimated Revised Estimated Code Object Class FY2018 FY2019 FY2019 FY2020 Change Over FY2019
B BLANK K-K ISEAS - YUSOF ISHAK INSTITUTE
PROGRAMME $1 $1 $1 $1 $0 0.0%
TOTAL EXPENDITURE $13,373,270 $17,022,600 $15,745,300 $15,336,400 -$408,900 -2.6%
Main Estimates $13,373,270 $17,022,600 $15,745,300 $15,336,400 -$408,900 -2.6%
OPERATING EXPENDITURE $13,373,270 $17,022,600 $15,745,300 $15,336,400 -$408,900 -2.6%
RUNNING COSTS $13,373,270 $17,022,600 $15,745,300 $15,336,400 -$408,900 -2.6%
Grants, Subventions & Capital Injections to Organisations
$13,373,270 $17,022,600 $15,745,300 $15,336,400 -$408,900 -2.6%
3200 Grants, Subventions & Capital Injections to Educational Institutions
13,373,270 17,022,600 15,745,300 15,336,400 -408,900 -2.6
Manpower
BLANK Actual Estimated Revised Estimated Category/Personnel FY2018 FY2019 FY2019 FY2020
BLANK
Others 67 101 100 100
TOTAL 67 101 100 100

265
SINGAPORE POLYTECHNIC PROGRAMME
PROGRAMME DESCRIPTION
This programme comes under Singapore Polytechnic (SP). The main function of SP is to develop a caring community of inspired learners who are committed to serve with mastery, and to prepare their learners to be life-ready, work-ready and world-ready.
Expenditure Estimates by Object Class BLANK Actual Estimated Revised Estimated Code Object Class FY2018 FY2019 FY2019 FY2020 Change Over FY2019
B BLANK K-L SINGAPORE POLYTECHNIC $1 $1 $1 $1 $0 0.0%
TOTAL EXPENDITURE $267,804,998 $276,683,400 $265,550,900 $261,025,200 -$4,525,700 -1.7%
Main Estimates $263,101,104 $269,275,900 $261,521,600 $252,807,300 -$8,714,300 -3.3%
OPERATING EXPENDITURE $263,101,104 $266,940,200 $258,544,100 $249,910,200 -$8,633,900 -3.3%
RUNNING COSTS $250,807,269 $253,790,200 $246,762,100 $235,358,200 -$11,403,900 -4.6%
Grants, Subventions & Capital Injections to Organisations
$250,807,269 $253,790,200 $246,762,100 $235,358,200 -$11,403,900 -4.6%
3200 Grants, Subventions & Capital Injections to Educational Institutions
250,807,269 253,790,200 246,762,100 235,358,200 -11,403,900 -4.6
TRANSFERS $12,293,835 $13,150,000 $11,782,000 $14,552,000 $2,770,000 23.5%
3500 Social Transfers to Individuals 12,293,835 13,150,000 11,782,000 14,552,000 2,770,000 23.5
OTHER CONSOLIDATED FUND OUTLAYS
$0 $2,335,700 $2,977,500 $2,897,100 -$80,400 -2.7%
4600 Loans and Advances (Disbursement) 0 2,335,700 2,977,500 2,897,100 -80,400 -2.7
Development Estimates $4,703,893 $9,743,200 $7,006,800 $11,115,000 $4,108,200 58.6%
DEVELOPMENT EXPENDITURE $4,703,893 $9,743,200 $7,006,800 $11,115,000 $4,108,200 58.6%
5200 Grants & Capital Injections to Organisations
4,703,893 9,743,200 7,006,800 11,115,000 4,108,200 58.6
Manpower
BLANK Actual Estimated Revised Estimated Category/Personnel FY2018 FY2019 FY2019 FY2020
BLANK
Others 1,754 1,800 1,794 1,748
TOTAL 1,754 1,800 1,794 1,748

266
NGEE ANN POLYTECHNIC PROGRAMME
PROGRAMME DESCRIPTION
This programme comes under Ngee Ann Polytechnic (NP). The function of NP is to nurture graduates who are ready for a global workplace, and lifelong learners who are imbued with 21st Century competencies and valued at the workplace and by society.
Expenditure Estimates by Object Class BLANK Actual Estimated Revised Estimated Code Object Class FY2018 FY2019 FY2019 FY2020 Change Over FY2019
B BLANK K-M NGEE ANN POLYTECHNIC $1 $1 $1 $1 $0 0.0%
TOTAL EXPENDITURE $248,631,801 $236,064,500 $219,271,300 $232,979,200 $13,707,900 6.3%
Main Estimates $248,631,801 $237,051,300 $220,131,700 $233,883,300 $13,751,600 6.2%
OPERATING EXPENDITURE $248,631,801 $236,064,500 $219,271,300 $232,979,200 $13,707,900 6.3%
RUNNING COSTS $237,800,326 $223,899,300 $207,870,100 $218,015,000 $10,144,900 4.9%
Grants, Subventions & Capital Injections to Organisations
$237,800,326 $223,899,300 $207,870,100 $218,015,000 $10,144,900 4.9%
3200 Grants, Subventions & Capital Injections to Educational Institutions
237,800,326 223,899,300 207,870,100 218,015,000 10,144,900 4.9
TRANSFERS $10,831,475 $12,165,200 $11,401,200 $14,964,200 $3,563,000 31.3%
3500 Social Transfers to Individuals 10,831,475 12,165,200 11,401,200 14,964,200 3,563,000 31.3
OTHER CONSOLIDATED FUND OUTLAYS
$0 $986,800 $860,400 $904,100 $43,700 5.1%
4600 Loans and Advances (Disbursement) 0 986,800 860,400 904,100 43,700 5.1
Manpower
BLANK Actual Estimated Revised Estimated Category/Personnel FY2018 FY2019 FY2019 FY2020
BLANK
Others 1,720 1,697 1,577 1,560
TOTAL 1,720 1,697 1,577 1,560

267
TEMASEK POLYTECHNIC PROGRAMME
PROGRAMME DESCRIPTION
This programme comes under Temasek Polytechnic (TP). The function of TP is to prepare school leavers and working adults for a future of dynamic change, with relevant knowledge, life-long skills, character, and a thirst for continuous improvement.
Expenditure Estimates by Object Class BLANK Actual Estimated Revised Estimated Code Object Class FY2018 FY2019 FY2019 FY2020 Change Over FY2019
B BLANK K-N TEMASEK POLYTECHNIC $1 $1 $1 $1 $0 0.0%
TOTAL EXPENDITURE $269,762,269 $271,937,100 $252,242,700 $255,674,900 $3,432,200 1.4%
Main Estimates $260,422,231 $260,418,400 $242,726,900 $245,488,500 $2,761,600 1.1%
OPERATING EXPENDITURE $260,422,231 $257,961,400 $240,152,700 $242,624,500 $2,471,800 1.0%
RUNNING COSTS $248,249,591 $243,922,300 $228,219,200 $227,858,000 -$361,200 -0.2%
Grants, Subventions & Capital Injections to Organisations
$248,249,591 $243,922,300 $228,219,200 $227,858,000 -$361,200 -0.2%
3200 Grants, Subventions & Capital Injections to Educational Institutions
248,249,591 243,922,300 228,219,200 227,858,000 -361,200 -0.2
TRANSFERS $12,172,640 $14,039,100 $11,933,500 $14,766,500 $2,833,000 23.7%
3500 Social Transfers to Individuals 12,172,640 14,039,100 11,933,500 14,766,500 2,833,000 23.7
OTHER CONSOLIDATED FUND OUTLAYS $0 $2,457,000 $2,574,200 $2,864,000 $289,800 11.3%
4600 Loans and Advances (Disbursement) 0 2,457,000 2,574,200 2,864,000 289,800 11.3
Development Estimates $9,340,038 $13,975,700 $12,090,000 $13,050,400 $960,400 7.9%
DEVELOPMENT EXPENDITURE $9,340,038 $13,975,700 $12,090,000 $13,050,400 $960,400 7.9%
5200 Grants & Capital Injections to Organisations
9,340,038 13,975,700 12,090,000 13,050,400 960,400 7.9
Manpower
BLANK Actual Estimated Revised Estimated Category/Personnel FY2018 FY2019 FY2019 FY2020
BLANK
Others 1,507 1,550 1,674 1,608
TOTAL 1,507 1,550 1,674 1,608

268
INSTITUTE OF TECHNICAL EDUCATION PROGRAMME
PROGRAMME DESCRIPTION
This programme comes under the Institute of Technical Education (ITE). The function of ITE is to provide pre-employment training to secondary school leavers and continuing education and training to working adults, through a broad-based, multi-disciplinary curriculum with specialisations in a variety of fields, ranging from engineering and infocommunications technology to business and service skills.
Expenditure Estimates by Object Class BLANK Actual Estimated Revised Estimated Code Object Class FY2018 FY2019 FY2019 FY2020 Change Over FY2019
B BLANK K-O INSTITUTE OF TECHNICAL EDUCATION
PROGRAMME $1 $1 $1 $1 $0 0.0%
TOTAL EXPENDITURE $489,277,409 $473,262,800 $470,035,600 $461,584,200 -$8,451,400 -1.8%
Main Estimates $489,277,409 $473,262,800 $470,035,600 $461,584,200 -$8,451,400 -1.8%
OPERATING EXPENDITURE $489,277,409 $473,262,800 $470,035,600 $461,584,200 -$8,451,400 -1.8%
RUNNING COSTS $464,924,469 $451,814,300 $444,443,800 $432,011,600 -$12,432,200 -2.8%
Grants, Subventions & Capital Injections to Organisations
$464,924,469 $451,814,300 $444,443,800 $432,011,600 -$12,432,200 -2.8%
3200 Grants, Subventions & Capital Injections to Educational Institutions
464,924,469 451,814,300 444,443,800 432,011,600 -12,432,200 -2.8
TRANSFERS $24,352,940 $21,448,500 $25,591,800 $29,572,600 $3,980,800 15.6%
3500 Social Transfers to Individuals 24,352,940 21,448,500 25,591,800 29,572,600 3,980,800 15.6
Manpower
BLANK Actual Estimated Revised Estimated Category/Personnel FY2018 FY2019 FY2019 FY2020
BLANK
Others 2,573 2,659 2,659 2,648
TOTAL 2,573 2,659 2,659 2,648

269
SCIENCE CENTRE BOARD PROGRAMME
PROGRAMME DESCRIPTION
This programme comes under the Science Centre Board (SCB). The functions of SCB are: to disseminate knowledge of science and technology to the general public and, in particular, to students, through imaginative and enjoyable means; to establish a centre of excellence and innovation in non-formal science education; and to serve as a catalyst for youth to develop their creativity and to nurture their interest in careers in related fields.
Expenditure Estimates by Object Class BLANK Actual Estimated Revised Estimated Code Object Class FY2018 FY2019 FY2019 FY2020 Change Over FY2019
B BLANK K-P SCIENCE CENTRE BOARD $1 $1 $1 $1 $0 0.0%
TOTAL EXPENDITURE $25,931,140 $27,315,200 $31,991,600 $37,825,200 $5,833,600 18.2%
Main Estimates $23,926,390 $26,930,400 $25,151,600 $29,275,200 $4,123,600 16.4%
OPERATING EXPENDITURE $23,926,390 $26,930,400 $25,151,600 $29,275,200 $4,123,600 16.4%
RUNNING COSTS $23,926,390 $26,930,400 $25,151,600 $29,275,200 $4,123,600 16.4%
Grants, Subventions & Capital Injections to Organisations $23,926,390 $26,930,400 $25,151,600 $29,275,200 $4,123,600 16.4%
3200 Grants, Subventions & Capital Injections to Educational Institutions
23,926,390 26,930,400 25,151,600 29,275,200 4,123,600 16.4
Development Estimates $2,004,750 $384,800 $6,840,000 $8,550,000 $1,710,000 25.0%
DEVELOPMENT EXPENDITURE $2,004,750 $384,800 $6,840,000 $8,550,000 $1,710,000 25.0%
5200 Grants & Capital Injections to Organisations
2,004,750 384,800 6,840,000 8,550,000 1,710,000 25.0
Manpower
BLANK Actual Estimated Revised Estimated Category/Personnel FY2018 FY2019 FY2019 FY2020
BLANK
Others 242 239 247 247
TOTAL 242 239 247 247

270
NANYANG POLYTECHNIC PROGRAMME
PROGRAMME DESCRIPTION
This programme comes under Nanyang Polytechnic (NYP). The function of NYP is to provide quality education and training to prepare students and adult learners for work and life, equipping them to be lifelong learners and to contribute to the technological, economic and social development of Singapore.
Expenditure Estimates by Object Class BLANK Actual Estimated Revised Estimated Code Object Class FY2018 FY2019 FY2019 FY2020 Change Over FY2019
B BLANK K-Q NANYANG POLYTECHNIC $1 $1 $1 $1 $0 0.0%
TOTAL EXPENDITURE $264,753,907 $265,976,100 $248,458,100 $252,885,100 $4,427,000 1.8%
Main Estimates $264,753,907 $267,022,100 $249,550,600 $254,024,400 $4,473,800 1.8%
OPERATING EXPENDITURE $264,753,907 $265,976,100 $248,458,100 $252,885,100 $4,427,000 1.8%
RUNNING COSTS $252,845,042 $253,788,300 $237,062,600 $238,004,900 $942,300 0.4%
Grants, Subventions & Capital Injections to Organisations
$252,845,042 $253,788,300 $237,062,600 $238,004,900 $942,300 0.4%
3200 Grants, Subventions & Capital Injections to Educational Institutions
252,845,042 253,788,300 237,062,600 238,004,900 942,300 0.4
TRANSFERS $11,908,865 $12,187,800 $11,395,500 $14,880,200 $3,484,700 30.6%
3500 Social Transfers to Individuals 11,908,865 12,187,800 11,395,500 14,880,200 3,484,700 30.6
OTHER CONSOLIDATED FUND OUTLAYS
$0 $1,046,000 $1,092,500 $1,139,300 $46,800 4.3%
4600 Loans and Advances (Disbursement) 0 1,046,000 1,092,500 1,139,300 46,800 4.3
Manpower
BLANK Actual Estimated Revised Estimated Category/Personnel FY2018 FY2019 FY2019 FY2020
BLANK
Others 1,592 1,713 1,694 1,646
TOTAL 1,592 1,713 1,694 1,646

271
SINGAPORE UNIVERSITY OF SOCIAL SCIENCES PROGRAMME
PROGRAMME DESCRIPTION
This programme comes under the Singapore University of Social Sciences (SUSS). SUSS is a pioneering university that focuses on the applied degree pathway and lifelong learning. It provides an applied education that targets both fresh school leavers and adult learners, in the domain of the social sciences, as well as in disciplines that have a strong impact on human and community development.
Expenditure Estimates by Object Class BLANK Actual Estimated Revised Estimated Code Object Class FY2018 FY2019 FY2019 FY2020 Change Over FY2019
B BLANK K-R SINGAPORE UNIVERSITY OF SOCIAL
SCIENCES PROGRAMME $1 $1 $1 $1 $0 0.0%
TOTAL EXPENDITURE $170,500,580 $100,400,800 $102,268,500 $116,601,400 $14,332,900 14.0%
Main Estimates $170,500,580 $108,811,100 $111,297,800 $125,662,400 $14,364,600 12.9%
OPERATING EXPENDITURE $170,500,580 $100,400,800 $102,268,500 $116,601,400 $14,332,900 14.0%
TRANSFERS $170,500,580 $100,400,800 $102,268,500 $116,601,400 $14,332,900 14.0%
3500 Social Transfers to Individuals 3,771,185 3,645,100 4,403,200 6,859,800 2,456,600 55.8 3600 Transfers to Institutions & Organisations 166,729,395 96,755,700 97,865,300 109,741,600 11,876,300 12.1
OTHER CONSOLIDATED FUND OUTLAYS
$0 $8,410,300 $9,029,300 $9,061,000 $31,700 0.4%
4600 Loans and Advances (Disbursement) 0 8,410,300 9,029,300 9,061,000 31,700 0.4

272
SINGAPORE MANAGEMENT UNIVERSITY PROGRAMME
PROGRAMME DESCRIPTION
This programme comes under the Singapore Management University (SMU). SMU strives to be a premier university, internationally recognised for its world-class research and distinguished teaching, and to create and disseminate knowledge. SMU aspires to generate leading-edge research with global impact as well as to produce broad-based, creative and entrepreneurial leaders for the knowledge-based economy.
Expenditure Estimates by Object Class BLANK Actual Estimated Revised Estimated Code Object Class FY2018 FY2019 FY2019 FY2020 Change Over FY2019
B BLANK K-S SINGAPORE MANAGEMENT
UNIVERSITY PROGRAMME $1 $1 $1 $1 $0 0.0%
TOTAL EXPENDITURE $172,385,133 $180,279,100 $200,431,500 $197,315,100 -$3,116,400 -1.6%
Main Estimates $172,385,133 $202,866,300 $213,077,500 $216,864,300 $3,786,800 1.8%
OPERATING EXPENDITURE $172,385,133 $180,279,100 $188,622,600 $190,540,300 $1,917,700 1.0%
TRANSFERS $172,385,133 $180,279,100 $188,622,600 $190,540,300 $1,917,700 1.0%
3500 Social Transfers to Individuals 8,302,488 8,817,000 9,667,900 13,434,300 3,766,400 39.0 3600 Transfers to Institutions & Organisations 164,082,645 171,462,100 178,954,700 177,106,000 -1,848,700 -1.0
OTHER CONSOLIDATED FUND OUTLAYS $0 $22,587,200 $24,454,900 $26,324,000 $1,869,100 7.6%
4600 Loans and Advances (Disbursement) 0 22,587,200 24,454,900 26,324,000 1,869,100 7.6
Development Estimates $0 $0 $11,808,900 $6,774,800 -$5,034,100 -42.6%
DEVELOPMENT EXPENDITURE $0 $0 $11,808,900 $6,774,800 -$5,034,100 -42.6%
5200 Grants & Capital Injections to Organisations
0 0 11,808,900 6,774,800 -5,034,100 -42.6

273
NANYANG ACADEMY OF FINE ARTS PROGRAMME
PROGRAMME DESCRIPTION
This programme comes under the Nanyang Academy of Fine Arts (NAFA). NAFA is a private arts institution, which offers certificate, diploma and degree courses in the visuals and performing arts. NAFA’s mission and vision is to be the arts institution of choice in Singapore and a premier arts institution in Asia, producing leaders in their fields; and inspiring learning and growth through the arts.
Expenditure Estimates by Object Class BLANK Actual Estimated Revised Estimated Code Object Class FY2018 FY2019 FY2019 FY2020 Change Over FY2019
B BLANK K-T NANYANG ACADEMY OF FINE ARTS
PROGRAMME $1 $1 $1 $1 $0 0.0%
TOTAL EXPENDITURE $21,770,084 $23,567,200 $21,861,200 $23,286,000 $1,424,800 6.5%
Main Estimates $21,770,084 $23,567,200 $21,861,200 $23,286,000 $1,424,800 6.5%
OPERATING EXPENDITURE $21,770,084 $23,567,200 $21,861,200 $23,286,000 $1,424,800 6.5%
TRANSFERS $21,770,084 $23,567,200 $21,861,200 $23,286,000 $1,424,800 6.5%
3500 Social Transfers to Individuals 1,358,645 1,550,200 1,405,300 1,648,500 243,200 17.3 3600 Transfers to Institutions & Organisations 20,411,439 22,017,000 20,455,900 21,637,500 1,181,600 5.8

274
LASALLE COLLEGE OF THE ARTS PROGRAMME
PROGRAMME DESCRIPTION
This programme comes under the LASALLE College of the Arts (LASALLE). LASALLE is a private arts institution offering certificate, diploma, degree, and postgraduate courses in the visual and performing arts. LASALLE’s mission is to nurture enterprising and employable graduates who will be cultural influencers and leaders; and to be central to the development of the arts and design in Singapore, inspiring innovation in practice and research.
Expenditure Estimates by Object Class BLANK Actual Estimated Revised Estimated Code Object Class FY2018 FY2019 FY2019 FY2020 Change Over FY2019
B BLANK K-U LASALLE COLLEGE OF THE ARTS
PROGRAMME $1 $1 $1 $1 $0 0.0%
TOTAL EXPENDITURE $21,862,016 $22,606,500 $22,599,600 $23,989,400 $1,389,800 6.1%
Main Estimates $21,862,016 $22,606,500 $22,599,600 $23,989,400 $1,389,800 6.1%
OPERATING EXPENDITURE $21,862,016 $22,606,500 $22,599,600 $23,989,400 $1,389,800 6.1%
TRANSFERS $21,862,016 $22,606,500 $22,599,600 $23,989,400 $1,389,800 6.1%
3500 Social Transfers to Individuals 1,631,980 1,605,300 1,661,100 1,971,400 310,300 18.7 3600 Transfers to Institutions & Organisations 20,230,036 21,001,200 20,938,500 22,018,000 1,079,500 5.2

275
REPUBLIC POLYTECHNIC PROGRAMME
PROGRAMME DESCRIPTION
This programme comes under Republic Polytechnic (RP). The function of RP is to nurture innovation, professional competency and entrepreneurial learning. It aims to be an educational institution of choice by nurturing individuals to prepare them for a dynamic world in partnership with stakeholders, leveraging problem-based learning.
Expenditure Estimates by Object Class BLANK Actual Estimated Revised Estimated Code Object Class FY2018 FY2019 FY2019 FY2020 Change Over FY2019
B BLANK K-V REPUBLIC POLYTECHNIC $1 $1 $1 $1 $0 0.0%
TOTAL EXPENDITURE $222,657,680 $230,172,300 $210,222,300 $218,371,900 $8,149,600 3.9%
Main Estimates $222,657,680 $232,183,300 $212,135,100 $220,380,900 $8,245,800 3.9%
OPERATING EXPENDITURE $222,657,680 $230,172,300 $210,222,300 $218,371,900 $8,149,600 3.9%
RUNNING COSTS $207,851,865 $214,785,500 $195,881,600 $203,276,700 $7,395,100 3.8%
Grants, Subventions & Capital Injections to Organisations
$207,851,865 $214,785,500 $195,881,600 $203,276,700 $7,395,100 3.8%
3200 Grants, Subventions & Capital Injections to Educational Institutions
207,851,865 214,785,500 195,881,600 203,276,700 7,395,100 3.8
TRANSFERS $14,805,815 $15,386,800 $14,340,700 $15,095,200 $754,500 5.3%
3500 Social Transfers to Individuals 14,805,815 15,386,800 14,340,700 15,095,200 754,500 5.3
OTHER CONSOLIDATED FUND OUTLAYS
$0 $2,011,000 $1,912,800 $2,009,000 $96,200 5.0%
4600 Loans and Advances (Disbursement) 0 2,011,000 1,912,800 2,009,000 96,200 5.0
Manpower
BLANK Actual Estimated Revised Estimated Category/Personnel FY2018 FY2019 FY2019 FY2020
BLANK
Others 1,601 1,622 1,551 1,557
TOTAL 1,601 1,622 1,551 1,557

276
SINGAPORE EXAMINATIONS AND ASSESSMENT BOARD PROGRAMME
PROGRAMME DESCRIPTION
This programme comes under Singapore Examinations and Assessment Board (SEAB). The functions of SEAB are to develop and conduct national examinations including the Primary School Leaving Examination (PSLE), and Singapore-Cambridge General Certificate of Education (GCE) N(T)-, N(A)-, O- and A-Level examinations; and develop testing instruments and advise schools on assessment matters. SEAB serves as the examining authority for any of the national examinations or such modules or components of any of the national examinations. SEAB also provides advisory, consultancy services and training relating to assessments.
Expenditure Estimates by Object Class BLANK Actual Estimated Revised Estimated Code Object Class FY2018 FY2019 FY2019 FY2020 Change Over FY2019
B BLANK K-W SINGAPORE EXAMINATIONS AND
ASSESSMENT BOARD PROGRAMME $1 $1 $1 $1 $0 0.0%
TOTAL EXPENDITURE $95,707,301 $105,719,400 $108,777,700 $94,220,000 -$14,557,700 -13.4%
Main Estimates $79,541,937 $85,000,000 $85,000,000 $90,000,000 $5,000,000 5.9%
OPERATING EXPENDITURE $79,541,937 $85,000,000 $85,000,000 $90,000,000 $5,000,000 5.9%
RUNNING COSTS $79,541,937 $85,000,000 $85,000,000 $90,000,000 $5,000,000 5.9%
Grants, Subventions & Capital Injections to Organisations
$79,541,937 $85,000,000 $85,000,000 $90,000,000 $5,000,000 5.9%
3100 Grants, Subventions & Capital Injections to Statutory Boards
79,541,937 85,000,000 85,000,000 90,000,000 5,000,000 5.9
Development Estimates $16,165,364 $20,719,400 $23,777,700 $4,220,000 -$19,557,700 -82.3%
DEVELOPMENT EXPENDITURE $16,165,364 $20,719,400 $23,777,700 $4,220,000 -$19,557,700 -82.3%
5200 Grants & Capital Injections to Organisations
16,165,364 20,719,400 23,777,700 4,220,000 -19,557,700 -82.3
Manpower
BLANK Actual Estimated Revised Estimated Category/Personnel FY2018 FY2019 FY2019 FY2020
BLANK
Others 211 232 232 232
TOTAL 211 232 232 232

277
SINGAPORE UNIVERSITY OF TECHNOLOGY AND DESIGN PROGRAMME
PROGRAMME DESCRIPTION
This programme comes under the Singapore University of Technology and Design (SUTD). SUTD’s goal is to advance knowledge and nurture technically-grounded leaders to serve vital societal needs of the nation, region, and the world. The university will accomplish this through a multi-disciplinary approach anchored in the foundations of science, technology and other areas of scholarship, with a focus on Design.
Expenditure Estimates by Object Class BLANK Actual Estimated Revised Estimated Code Object Class FY2018 FY2019 FY2019 FY2020 Change Over FY2019
B BLANK K-X SINGAPORE UNIVERSITY OF
TECHNOLOGY AND DESIGN PROGRAMME
$1 $1 $1 $1 $0 0.0%
TOTAL EXPENDITURE $128,708,755 $122,105,200 $130,527,200 $119,692,300 -$10,834,900 -8.3%
Main Estimates $128,708,755 $126,801,500 $134,182,600 $123,884,300 -$10,298,300 -7.7%
OPERATING EXPENDITURE $128,708,755 $122,105,200 $130,527,200 $119,692,300 -$10,834,900 -8.3%
TRANSFERS $128,708,755 $122,105,200 $130,527,200 $119,692,300 -$10,834,900 -8.3%
3500 Social Transfers to Individuals 1,646,055 2,462,700 1,820,800 3,346,000 1,525,200 83.8 3600 Transfers to Institutions & Organisations 127,062,700 119,642,500 128,706,400 116,346,300 -12,360,100 -9.6
OTHER CONSOLIDATED FUND OUTLAYS
$0 $4,696,300 $3,655,400 $4,192,000 $536,600 14.7%
4600 Loans and Advances (Disbursement) 0 4,696,300 3,655,400 4,192,000 536,600 14.7

278
SINGAPORE INSTITUTE OF TECHNOLOGY PROGRAMME
PROGRAMME DESCRIPTION
This programme comes under the Singapore Institute of Technology (SIT). SIT offers applied, practice-oriented full-time undergraduate programmes that focus on Science & Technology disciplines, and produce graduates who are specialists with deep technical expertise. SIT also offers degree programmes in partnership with overseas universities.
Expenditure Estimates by Object Class BLANK Actual Estimated Revised Estimated Code Object Class FY2018 FY2019 FY2019 FY2020 Change Over FY2019
B BLANK K-Y SINGAPORE INSTITUTE OF
TECHNOLOGY PROGRAMME $1 $1 $1 $1 $0 0.0%
TOTAL EXPENDITURE $220,523,649 $479,169,800 $513,787,800 $427,385,100 -$86,402,700 -16.8%
Main Estimates $203,422,438 $237,147,100 $236,981,500 $240,583,500 $3,602,000 1.5%
OPERATING EXPENDITURE $203,422,438 $222,805,100 $223,081,500 $225,233,500 $2,152,000 1.0%
TRANSFERS $203,422,438 $222,805,100 $223,081,500 $225,233,500 $2,152,000 1.0%
3500 Social Transfers to Individuals 10,075,446 11,063,800 12,000,500 17,893,200 5,892,700 49.1 3600 Transfers to Institutions & Organisations 193,346,992 211,741,300 211,081,000 207,340,300 -3,740,700 -1.8
OTHER CONSOLIDATED FUND OUTLAYS $0 $14,342,000 $13,900,000 $15,350,000 $1,450,000 10.4%
4600 Loans and Advances (Disbursement) 0 14,342,000 13,900,000 15,350,000 1,450,000 10.4
Development Estimates $17,101,211 $256,364,700 $290,706,300 $202,151,600 -$88,554,700 -30.5%
DEVELOPMENT EXPENDITURE $17,101,211 $256,364,700 $290,706,300 $202,151,600 -$88,554,700 -30.5%
5200 Grants & Capital Injections to Organisations
17,101,211 256,364,700 290,706,300 202,151,600 -88,554,700 -30.5

279
SKILLSFUTURE SINGAPORE PROGRAMME
PROGRAMME DESCRIPTION
This programme comes under SkillsFuture Singapore (SSG). SSG drives and coordinates the implementation of the national SkillsFuture movement, promotes a culture of lifelong learning, and strengthens the ecosystem of quality education and training in Singapore. Through a holistic system of national SkillsFuture initiatives, SSG enables Singaporeans to take charge of their learning journey in their pursuit of skills mastery. SSG also works with key stakeholders to ensure that students and adults have access to high quality and industry-relevant training that meets the demands of different sectors of the economy, for an innovative and productive workforce.
Expenditure Estimates by Object Class BLANK Actual Estimated Revised Estimated Code Object Class FY2018 FY2019 FY2019 FY2020 Change Over FY2019
B BLANK K-Z SKILLSFUTURE SINGAPORE $1 $1 $1 $1 $0 0.0%
TOTAL EXPENDITURE $219,716,654 $413,989,900 $355,986,600 $402,564,700 $46,578,100 13.1%
Main Estimates $219,716,654 $413,989,900 $355,986,600 $402,564,700 $46,578,100 13.1%
OPERATING EXPENDITURE $219,716,654 $413,989,900 $355,986,600 $402,564,700 $46,578,100 13.1%
RUNNING COSTS $219,716,654 $253,480,000 $214,689,800 $266,123,300 $51,433,500 24.0%
Grants, Subventions & Capital Injections to Organisations
$219,716,654 $253,480,000 $214,689,800 $266,123,300 $51,433,500 24.0%
3100 Grants, Subventions & Capital Injections to Statutory Boards
219,716,654 253,480,000 213,577,500 265,058,300 51,480,800 24.1
3200 Grants, Subventions & Capital Injections to Educational Institutions
0 0 1,112,300 1,065,000 -47,300 -4.3
TRANSFERS $0 $160,509,900 $141,296,800 $136,441,400 -$4,855,400 -3.4%
3600 Transfers to Institutions & Organisations 0 160,509,900 141,296,800 136,441,400 -4,855,400 -3.4
Manpower
BLANK Actual Estimated Revised Estimated Category/Personnel FY2018 FY2019 FY2019 FY2020
BLANK
Others 449 495 437 437
TOTAL 449 495 437 437

PROGRAMME DETAILS
Head L ___________
Ministry of The Environment and Water Resources


281
ADMINISTRATION PROGRAMME
PROGRAMME DESCRIPTION
This programme comes under the Ministry of the Environment and Water Resources (MEWR) HQ. Its function is to provide overall policy direction for the Statutory Boards and support services to the departments of MEWR. The Ministry HQ also advances Singapore’s interests and international standing on matters relating to the environment, water and food policies, management and technology.
Expenditure Estimates by Object Class
BLANK Actual Estimated Revised Estimated Code Object Class FY2018 FY2019 FY2019 FY2020 Change Over FY2019
BLANK L-A ADMINISTRATION PROGRAMME $1 $1 $1 $1 $0 0.0%
TOTAL EXPENDITURE $68,154,264 $98,337,500 $88,296,600 $133,448,400 $45,151,800 51.1%
Main Estimates $56,689,625 $88,725,400 $85,312,600 $131,931,200 $46,618,600 54.6%
OPERATING EXPENDITURE $56,689,625 $88,710,400 $85,297,600 $131,831,200 $46,533,600 54.6%
RUNNING COSTS $52,065,686 $83,743,700 $80,142,700 $126,895,500 $46,752,800 58.3%
Expenditure on Manpower $24,941,550 $28,897,300 $30,134,400 $30,918,400 $784,000 2.6%
1200 Political Appointments 1,040,965 1,141,200 1,141,200 1,157,600 16,400 1.4
1500 Permanent Staff 23,891,246 27,735,400 28,972,500 29,739,200 766,700 2.6
1600 Temporary, Daily-Rated & Other Staff 9,340 20,700 20,700 21,600 900 4.3
Other Operating Expenditure $27,124,135 $54,846,400 $50,008,300 $95,977,100 $45,968,800 91.9%
2100 Consumption of Products & Services 22,655,164 51,295,200 46,237,200 92,069,900 45,832,700 99.1
2300 Manpower Development 475,606 737,200 630,600 707,100 76,500 12.1
2400 International & Public Relations, Public Communications
3,825,523 2,730,000 3,052,300 3,106,000 53,700 1.8
2700 Asset Acquisition 167,842 84,000 88,200 94,100 5,900 6.7
TRANSFERS $4,623,939 $4,966,700 $5,154,900 $4,935,700 -$219,200 -4.3%
3600 Transfers to Institutions & Organisations 226,913 84,300 223,600 20,600 -203,000 -90.8
3800 International Organisations & Overseas Development Assistance
4,397,026 4,882,400 4,931,300 4,915,100 -16,200 -0.3
OTHER CONSOLIDATED FUND OUTLAYS $0 $15,000 $15,000 $100,000 $85,000 566.7%
4600 Loans and Advances (Disbursement) 0 15,000 15,000 100,000 85,000 566.7
Development Estimates $11,464,639 $9,627,100 $2,999,000 $1,617,200 -$1,381,800 -46.1%
DEVELOPMENT EXPENDITURE $11,464,639 $9,627,100 $2,999,000 $1,617,200 -$1,381,800 -46.1%
5100 Government Development 11,464,639 9,627,100 2,999,000 1,617,200 -1,381,800 -46.1

282
Manpower
BLANK Actual Estimated Revised Estimated Category FY2018 FY2019 FY2019 FY2020
BLANK
Political Appointments 2 2 2 2
Permanent Staff 149 179 179 179
TOTAL 151 181 181 181

283
PUBLIC UTILITIES BOARD PROGRAMME
PROGRAMME DESCRIPTION
This programme covers the drainage and sewerage aspects of the Public Utilities Board (PUB)’s operations (development, operations and maintenance of the drainage systems, and development of sewerage reticulation systems) and regulatory functions under the Sewerage and Drainage Act. It also includes the Active, Beautiful and Clean (ABC) Waters programme which aims to remake our waterways, reservoirs and parks into aesthetically pleasing, vibrant and exciting lifestyle attractions for everyone to enjoy.
Expenditure Estimates by Object Class
BLANK Actual Estimated Revised Estimated Code Object Class FY2018 FY2019 FY2019 FY2020 Change Over FY2019
B BLANK L-G PUBLIC UTILITIES BOARD
PROGRAMME $1 $1 $1 $1 $0 0.0%
TOTAL EXPENDITURE $1,087,224,961 $1,498,564,000 $1,437,530,700 $1,488,161,200 $50,630,500 3.5%
Main Estimates $376,039,285 $461,479,200 $461,008,100 $499,457,500 $38,449,400 8.3%
OPERATING EXPENDITURE $376,039,285 $461,479,200 $461,008,100 $499,457,500 $38,449,400 8.3%
RUNNING COSTS $376,039,285 $461,479,200 $461,008,100 $499,457,500 $38,449,400 8.3%
Grants, Subventions & Capital Injections to Organisations
$376,039,285 $461,479,200 $461,008,100 $499,457,500 $38,449,400 8.3%
3100 Grants, Subventions & Capital Injections to Statutory Boards
376,039,285 461,479,200 461,008,100 499,457,500 38,449,400 8.3
Development Estimates $711,185,676 $1,037,084,800 $976,522,600 $988,703,700 $12,181,100 1.2%
DEVELOPMENT EXPENDITURE $711,185,676 $1,037,084,800 $976,522,600 $988,703,700 $12,181,100 1.2%
5100 Government Development 711,185,676 1,019,884,800 975,481,900 966,649,900 -8,832,000 -0.9
5200 Grants & Capital Injections to Organisations
0 17,200,000 1,040,700 22,053,800 21,013,100 n.a.
OTHER DEVELOPMENT FUND OUTLAYS
$4,561,425 $3,077,000 $3,542,500 $21,074,200 $17,531,700 494.9%
5500 Land-Related Expenditure 4,561,425 3,077,000 3,542,500 21,074,200 17,531,700 494.9
Manpower
BLANK Actual Estimated Revised Estimated Category FY2018 FY2019 FY2019 FY2020
BLANK
Others 318 347 347 422
TOTAL 318 347 347 422

284
NATIONAL ENVIRONMENT AGENCY PROGRAMME
PROGRAMME DESCRIPTION
This programme comes under the National Environment Agency (NEA). The main role of the NEA is to implement policies and conduct operations aimed at promoting and sustaining a clean, green and sustainable environment for Singapore, particularly by ensuring high standards of public health, improving and sustaining a clean environment, providing timely and reliable meteorological services, and promoting resource efficiency and conservation, in collaboration with the NEA’s partners and the community.
Expenditure Estimates by Object Class
BLANK Actual Estimated Revised Estimated Code Object Class FY2018 FY2019 FY2019 FY2020 Change Over FY2019
BLANK L-H NATIONAL ENVIRONMENT AGENCY
PROGRAMME $1 $1 $1 $1 $0 0.0%
TOTAL EXPENDITURE $978,931,006 $962,465,400 $962,818,600 $1,103,630,300 $140,811,700 14.6%
Main Estimates $862,509,936 $876,050,000 $876,458,300 $905,222,600 $28,764,300 3.3%
OPERATING EXPENDITURE $862,509,936 $876,050,000 $876,458,300 $905,222,600 $28,764,300 3.3%
RUNNING COSTS $861,100,262 $874,728,600 $875,136,900 $903,901,200 $28,764,300 3.3%
Grants, Subventions & Capital Injections to Organisations
$861,100,262 $874,728,600 $875,136,900 $903,901,200 $28,764,300 3.3%
3100 Grants, Subventions & Capital Injections to Statutory Boards
861,100,262 874,728,600 875,136,900 903,901,200 28,764,300 3.3
TRANSFERS $1,409,674 $1,321,400 $1,321,400 $1,321,400 $0 0.0%
3800 International Organisations & Overseas Development Assistance
1,409,674 1,321,400 1,321,400 1,321,400 0 0.0
Development Estimates $116,421,070 $86,415,400 $86,360,300 $198,407,700 $112,047,400 129.7%
DEVELOPMENT EXPENDITURE $116,421,070 $86,415,400 $86,360,300 $198,407,700 $112,047,400 129.7%
5100 Government Development 112,361,231 77,688,400 77,022,400 179,715,000 102,692,600 133.3
5200 Grants & Capital Injections to Organisations
4,059,839 8,727,000 9,337,900 18,692,700 9,354,800 100.2
OTHER DEVELOPMENT FUND OUTLAYS
$3,873,995 $4,947,400 $4,408,200 $6,449,900 $2,041,700 46.3%
5500 Land-Related Expenditure 3,873,995 4,947,400 4,408,200 6,449,900 2,041,700 46.3
Manpower
BLANK Actual Estimated Revised Estimated Category FY2018 FY2019 FY2019 FY2020
BLANK
Others 3,990 4,158 4,018 3,971
TOTAL 3,990 4,158 4,018 3,971

285
SINGAPORE FOOD AGENCY PROGRAMME
PROGRAMME DESCRIPTION
This programme comes under the Singapore Food Agency (SFA), which oversees food security and safety from farm-to-fork. SFA develops Singapore’s food supply and industry through partnering food businesses to strengthen capabilities, tap on technologies to raise productivity, undertake research to develop new lines of business, and catalyse industry transformation. SFA oversees food safety regulations and manages foodborne disease outbreaks across the food supply chain to protect public health. The National Centre for Food Science (NCFS) established under the SFA provides food diagnostics and research and development (R&D) in food safety to support SFA’s robust food safety regime.
Expenditure Estimates by Object Class
BLANK Actual Estimated Revised Estimated Code Object Class FY2018 FY2019 FY2019 FY2020 Change Over FY2019
BLANK L-I SINGAPORE FOOD AGENCY PROGRAMME $1 $1 $1 $1 $0 0.0%
TOTAL EXPENDITURE $0 $192,906,500 $138,182,400 $218,749,100 $80,566,700 58.3%
Main Estimates $0 $163,541,600 $121,753,400 $191,489,200 $69,735,800 57.3%
OPERATING EXPENDITURE $0 $163,541,600 $121,753,400 $191,489,200 $69,735,800 57.3%
RUNNING COSTS $0 $160,320,900 $118,460,800 $187,994,100 $69,533,300 58.7%
Grants, Subventions & Capital Injections to Organisations $0 $160,320,900 $118,460,800 $187,994,100 $69,533,300 58.7%
3100 Grants, Subventions & Capital Injections to Statutory Boards
0 160,320,900 118,460,800 187,994,100 69,533,300 58.7
TRANSFERS $0 $3,220,700 $3,292,600 $3,495,100 $202,500 6.2%
3800 International Organisations & Overseas Development Assistance
0 3,220,700 3,292,600 3,495,100 202,500 6.2
Development Estimates $0 $29,364,900 $16,429,000 $27,259,900 $10,830,900 65.9%
DEVELOPMENT EXPENDITURE $0 $29,364,900 $16,429,000 $27,259,900 $10,830,900 65.9%
5100 Government Development 0 17,811,200 9,353,900 12,588,700 3,234,800 34.6
5200 Grants & Capital Injections to Organisations 0 11,553,700 7,075,100 14,671,200 7,596,100 107.4
Manpower
BLANK Actual Estimated Revised Estimated Category FY2018 FY2019 FY2019 FY2020
BLANK
Others 0 839 844 839
TOTAL 0 839 844 839


PROGRAMME DETAILS
Head M ___________
Ministry of Finance


287
FINANCE PROGRAMME
PROGRAMME DESCRIPTION
This programme comes under Ministry of Finance (MOF) HQ and serves the following functions:
• Provide overall policy direction and financial management for the programmes undertaken by the Ministry;
• Formulate financial and budgetary policies and allocate resources to government bodies consistent withthese policies and national objectives;
• Develop and administer fiscal and investment policies to promote national economic, security and socialobjectives and safeguard national wealth;
• Prepare the annual Budget for Parliament’s consideration;
• Formulate procurement policies to ensure that the government procurement system is open, fair, transparentand competitive;
• Formulate tax policies to sustain the government’s revenue sources while ensuring the competitiveness ofthe nation’s tax regime;
• Promote a high-performance government;
• Provide oversight on the process of setting accounting standards in Singapore so as to promote confidencein Singapore’s financial reporting regime; and
• Advise government agencies on development and construction related issues which have significant impacton development cost and time, including professional practice, construction procurement and riskmanagement, technical design and engineering, scheduling and cost estimation, cost and space norms andlife-cycle costing.
Expenditure Estimates by Object Class
BLANK Actual Estimated Revised Estimated Code Object Class FY2018 FY2019 FY2019 FY2020 Change Over FY2019
B BLANK M-A FINANCE PROGRAMME $1 $1 $1 $1 $0 0.0%
TOTAL EXPENDITURE $157,507,733 $284,574,200 $148,469,500 $323,702,000 $175,232,500 118.0%
Main Estimates $152,024,414 $180,343,400 $147,029,100 $222,080,900 $75,051,800 51.0%
OPERATING EXPENDITURE $152,024,414 $176,343,400 $143,029,100 $217,580,900 $74,551,800 52.1%
RUNNING COSTS $88,113,112 $131,764,600 $98,659,500 $140,490,900 $41,831,400 42.4%
Expenditure on Manpower $50,026,588 $57,426,800 $52,217,500 $63,923,100 $11,705,600 22.4%
1200 Political Appointments 2,171,871 2,323,200 2,637,900 2,444,700 -193,200 -7.31500 Permanent Staff 47,798,935 49,923,600 49,479,600 56,378,400 6,898,800 13.91600 Temporary, Daily-Rated & Other Staff 55,783 180,000 100,000 100,000 0 0.01800 Personnel Central Vote 0 5,000,000 0 5,000,000 5,000,000 n.a.
Other Operating Expenditure $33,217,255 $62,511,300 $40,696,900 $69,033,500 $28,336,600 69.6%
2100 Consumption of Products & Services 30,223,760 48,078,900 36,825,500 53,629,200 16,803,700 45.6 2300 Manpower Development 1,183,198 2,550,900 1,489,100 2,501,700 1,012,600 68.0 2400 International & Public Relations, Public
Communications 1,664,878 1,569,500 2,165,900 2,689,200 523,300 24.2
2600 Programmes Central Vote 0 10,000,000 0 10,000,000 10,000,000 n.a.

288
BLANK Actual Estimated Revised Estimated Code Object Class FY2018 FY2019 FY2019 FY2020 Change Over FY2019
B BLANK 2700 Asset Acquisition 143,658 300,000 204,400 201,400 -3,000 -1.5 2800 Miscellaneous 1,761 12,000 12,000 12,000 0 0.0
Grants, Subventions & Capital Injections to Organisations
$4,869,269 $11,826,500 $5,745,100 $7,534,300 $1,789,200 31.1%
3100 Grants, Subventions & Capital Injections to Statutory Boards
4,869,269 7,535,800 5,600,800 7,270,000 1,669,200 29.8
3400 Grants, Subventions & Capital Injections to Other Organisations
0 4,290,700 144,300 264,300 120,000 83.2
TRANSFERS $63,911,302 $44,578,800 $44,369,600 $77,090,000 $32,720,400 73.7%
3800 International Organisations & Overseas Development Assistance
63,911,302 44,578,800 44,369,600 77,090,000 32,720,400 73.7
OTHER CONSOLIDATED FUND OUTLAYS $0 $4,000,000 $4,000,000 $4,500,000 $500,000 12.5%
4600 Loans and Advances (Disbursement) 0 4,000,000 4,000,000 4,500,000 500,000 12.5
Development Estimates $5,483,319 $108,230,800 $5,440,400 $106,121,100 $100,680,700 n.a.
DEVELOPMENT EXPENDITURE $5,483,319 $108,230,800 $5,440,400 $106,121,100 $100,680,700 n.a.
5100 Government Development 5,483,319 108,230,800 5,440,400 106,121,100 100,680,700 n.a.
Manpower
BLANK Actual Estimated Revised Estimated
Category FY2018 FY2019 FY2019 FY2020
BLANK
Political Appointments 3 3 3 3
Permanent Staff 300 305 313 313
TOTAL 303 308 316 316

289
ACCOUNTING SERVICES PROGRAMME
PROGRAMME DESCRIPTION The Accountant-General’s Department assists the President to protect the past reserves of the government. The department is also responsible for ensuring the integrity of the government’s accounting systems. It sets accounting policies, standards and processes to ensure that the government’s revenue, expenditure, assets and liabilities are properly transacted and accounted for.
Expenditure Estimates by Object Class
BLANK Actual Estimated Revised Estimated Code Object Class FY2018 FY2019 FY2019 FY2020 Change Over FY2019
B BLANK M-C ACCOUNTING SERVICES PROGRAMME $1 $1 $1 $1 $0 0.0%
TOTAL EXPENDITURE $46,317,675 $51,486,300 $61,564,400 $77,154,600 $15,590,200 25.3%
Main Estimates $2,399,804,755 $2,647,058,300 $3,703,442,100 $3,857,631,000 $154,188,900 4.2%
OPERATING EXPENDITURE $39,389,393 $40,058,300 $43,442,100 $55,631,000 $12,188,900 28.1%
RUNNING COSTS $39,389,393 $40,058,300 $43,442,100 $55,631,000 $12,188,900 28.1%
Expenditure on Manpower $15,229,395 $15,417,000 $17,167,000 $18,560,000 $1,393,000 8.1%
1500 Permanent Staff 15,190,490 15,342,000 17,092,000 18,431,000 1,339,000 7.8 1600 Temporary, Daily-Rated & Other Staff 38,905 75,000 75,000 129,000 54,000 72.0
Other Operating Expenditure $24,159,999 $24,641,300 $26,275,100 $37,071,000 $10,795,900 41.1%
2100 Consumption of Products & Services 23,256,116 23,086,000 25,006,700 35,668,200 10,661,500 42.6 2300 Manpower Development 785,009 1,366,700 1,146,400 1,271,500 125,100 10.9 2400 International & Public Relations, Public
Communications 12,586 20,500 19,300 26,500 7,200 37.3
2700 Asset Acquisition 15,155 78,100 10,700 10,000 -700 -6.5 2800 Miscellaneous 91,132 90,000 92,000 94,800 2,800 3.0
OTHER CONSOLIDATED FUND OUTLAYS $2,360,415,362 $2,607,000,000 $3,660,000,000 $3,802,000,000 $142,000,000 3.9%
4200 Expenses on Investments 2,360,415,362 2,607,000,000 3,660,000,000 3,802,000,000 142,000,000 3.9
Development Estimates $6,928,281 $11,428,000 $18,122,300 $21,523,600 $3,401,300 18.8%
DEVELOPMENT EXPENDITURE $6,928,281 $11,428,000 $18,122,300 $21,523,600 $3,401,300 18.8%
5100 Government Development 6,928,281 11,428,000 18,122,300 21,523,600 3,401,300 18.8
Manpower
BLANK Actual Estimated Revised Estimated Category FY2018 FY2019 FY2019 FY2020
BLANK
Permanent Staff 114 121 119 121
TOTAL 114 121 119 121

290
SHARED SERVICES PROGRAMME
PROGRAMME DESCRIPTION VITAL provides shared corporate services for the Public Service in the areas of human resource, payroll and claims, officer development management, procurement, travel management, and finance. The department aims to enhance service delivery and achieve greater efficiency in corporate services through economies of scale, process standardisation, technology, and partnership with key stakeholders.
Expenditure Estimates by Object Class
BLANK Actual Estimated Revised Estimated Code Object Class FY2018 FY2019 FY2019 FY2020 Change Over FY2019
B BLANK M-G SHARED SERVICES PROGRAMME $1 $1 $1 $1 $0 0.0%
TOTAL EXPENDITURE $43,412,520 $47,462,000 $43,219,400 $44,663,000 $1,443,600 3.3%
Main Estimates $42,435,458 $43,960,000 $42,813,400 $44,310,000 $1,496,600 3.5%
OPERATING EXPENDITURE $42,435,458 $43,960,000 $42,813,400 $44,310,000 $1,496,600 3.5%
RUNNING COSTS $42,435,458 $43,960,000 $42,813,400 $44,310,000 $1,496,600 3.5%
Expenditure on Manpower $32,654,639 $31,705,000 $32,407,800 $33,584,900 $1,177,100 3.6%
1500 Permanent Staff 32,651,938 31,691,000 32,399,600 33,574,700 1,175,100 3.6 1600 Temporary, Daily-Rated & Other Staff 2,701 14,000 8,200 10,200 2,000 24.4
Other Operating Expenditure $9,780,819 $12,255,000 $10,405,600 $10,725,100 $319,500 3.1%
2100 Consumption of Products & Services 8,906,699 11,240,100 9,554,600 9,887,400 332,800 3.5 2300 Manpower Development 765,710 986,100 749,600 824,100 74,500 9.9 2400 International & Public Relations, Public
Communications 18,937 23,800 11,800 13,600 1,800 15.3
2700 Asset Acquisition 84,807 0 36,800 0 -36,800 -100.0 2800 Miscellaneous 4,665 5,000 52,800 0 -52,800 -100.0
Development Estimates $977,062 $3,502,000 $406,000 $353,000 -$53,000 -13.1%
DEVELOPMENT EXPENDITURE $977,062 $3,502,000 $406,000 $353,000 -$53,000 -13.1%
5100 Government Development 977,062 3,502,000 406,000 353,000 -53,000 -13.1
Manpower
BLANK Actual Estimated Revised Estimated Category FY2018 FY2019 FY2019 FY2020
BLANK
Permanent Staff 436 454 490 483
TOTAL 436 454 490 483

291
SINGAPORE CUSTOMS PROGRAMME
PROGRAMME DESCRIPTION Singapore Customs maintains a robust regulatory regime to ensure the integrity of the trading system, and facilitates legitimate trade. The department collects customs duty, excise duty and GST on imported goods and protects such revenue against evasion. The department also administers the national supply chain security programme.
Expenditure Estimates by Object Class
BLANK Actual Estimated Revised Estimated Code Object Class FY2018 FY2019 FY2019 FY2020 Change Over FY2019
B BLANK M-O SINGAPORE CUSTOMS PROGRAMME $1 $1 $1 $1 $0 0.0%
TOTAL EXPENDITURE $203,635,359 $171,760,300 $197,013,700 $207,871,300 $10,857,600 5.5%
Main Estimates $145,114,390 $142,357,500 $160,774,300 $177,440,900 $16,666,600 10.4%
OPERATING EXPENDITURE $145,114,390 $142,357,500 $160,774,000 $177,440,600 $16,666,600 10.4%
RUNNING COSTS $145,031,995 $142,273,500 $160,686,500 $177,349,600 $16,663,100 10.4%
Expenditure on Manpower $79,352,741 $77,813,400 $77,245,700 $78,315,700 $1,070,000 1.4%
1500 Permanent Staff 79,255,543 77,689,800 77,122,100 78,218,900 1,096,800 1.4 1600 Temporary, Daily-Rated & Other Staff 97,198 123,600 123,600 96,800 -26,800 -21.7
Other Operating Expenditure $65,679,253 $64,460,100 $83,440,800 $99,033,900 $15,593,100 18.7%
2100 Consumption of Products & Services 62,724,057 61,436,100 79,960,600 95,825,000 15,864,400 19.8 2300 Manpower Development 2,158,437 2,184,000 2,246,800 2,186,000 -60,800 -2.7 2400 International & Public Relations, Public
Communications 530,786 489,800 547,100 549,200 2,100 0.4
2700 Asset Acquisition 237,198 315,400 670,300 459,800 -210,500 -31.4 2800 Miscellaneous 28,775 34,800 16,000 13,900 -2,100 -13.1
TRANSFERS $82,395 $84,000 $87,500 $91,000 $3,500 4.0%
3800 International Organisations & Overseas Development Assistance
82,395 84,000 87,500 91,000 3,500 4.0
OTHER CONSOLIDATED FUND OUTLAYS
$0 $0 $300 $300 $0 0.0%
4600 Loans and Advances (Disbursement) 0 0 300 300 0 0.0
Development Estimates $58,520,970 $29,402,800 $36,239,700 $30,430,700 -$5,809,000 -16.0%
DEVELOPMENT EXPENDITURE $58,520,970 $29,402,800 $36,239,700 $30,430,700 -$5,809,000 -16.0%
5100 Government Development 58,520,970 29,402,800 36,239,700 30,430,700 -5,809,000 -16.0
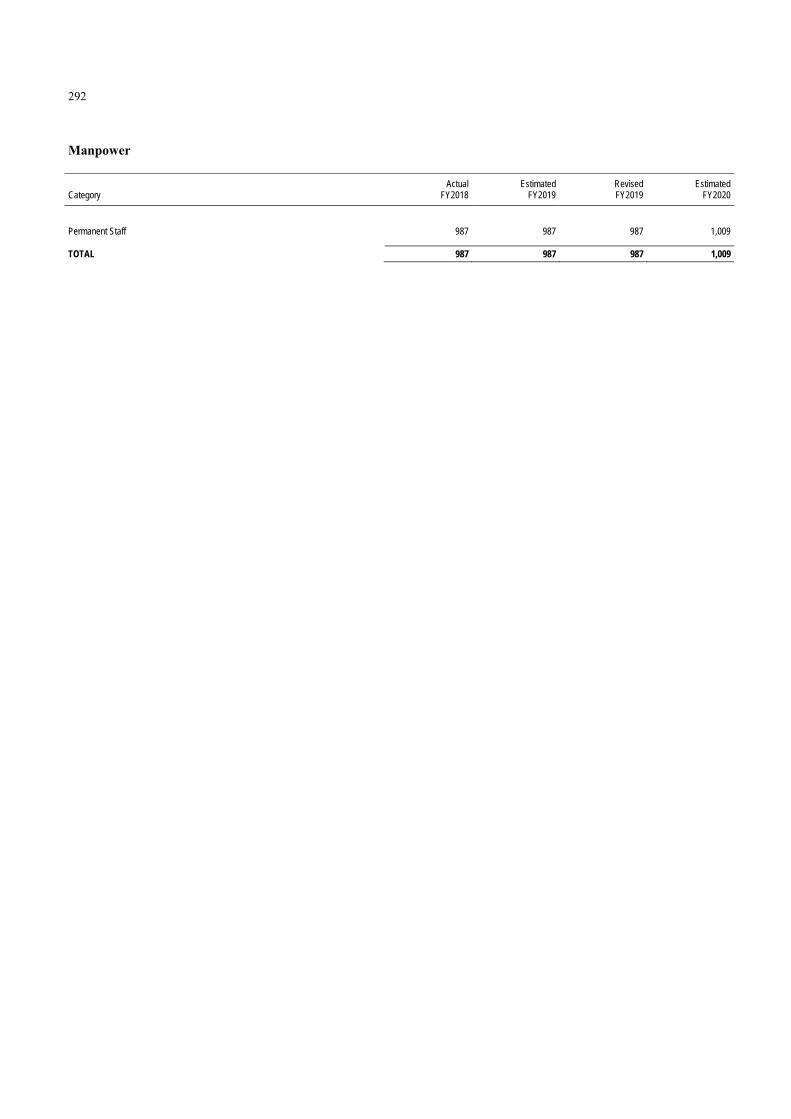
292
Manpower
BLANK Actual Estimated Revised Estimated Category FY2018 FY2019 FY2019 FY2020
BLANK
Permanent Staff 987 987 987 1,009
TOTAL 987 987 987 1,009

293
INLAND REVENUE AUTHORITY OF SINGAPORE PROGRAMME
PROGRAMME DESCRIPTION The Inland Revenue Authority of Singapore is the main tax administration agency in Singapore. It administers, assesses, collects, and enforces the payment of income tax, property tax, goods and services tax, stamp duty, betting duty, and private lotteries duty. It also advises the government and represents Singapore internationally on matters relating to taxation.
Expenditure Estimates by Object Class
BLANK Actual Estimated Revised Estimated Code Object Class FY2018 FY2019 FY2019 FY2020 Change Over FY2019
B BLANK M-P INLAND REVENUE AUTHORITY OF
SINGAPORE PROGRAMME $1 $1 $1 $1 $0 0.0%
TOTAL EXPENDITURE $448,729,000 $466,696,000 $468,920,500 $445,374,500 -$23,546,000 -5.0%
Main Estimates $448,729,000 $466,696,000 $468,920,500 $445,374,500 -$23,546,000 -5.0%
OPERATING EXPENDITURE $448,729,000 $466,696,000 $468,920,500 $445,374,500 -$23,546,000 -5.0%
RUNNING COSTS $448,729,000 $466,696,000 $468,920,500 $445,374,500 -$23,546,000 -5.0%
Other Operating Expenditure $448,729,000 $466,696,000 $468,920,500 $445,374,500 -$23,546,000 -5.0%
2100 Consumption of Products & Services 448,729,000 466,696,000 468,920,500 445,374,500 -23,546,000 -5.0
Manpower
BLANK Actual Estimated Revised Estimated
Category FY2018 FY2019 FY2019 FY2020
BLANK
Others 1,879 2,018 2,045 2,045
TOTAL 1,879 2,018 2,045 2,045

294
INTEGRATION PROGRAMME
PROGRAMME DESCRIPTION The Integration Programme1 was set up to support government projects that lead to improvement in service delivery, cost savings, effective policy design or coordinated delivery across the Whole-of-Government, as well as projects that address centrally driven priority areas.
Expenditure Estimates by Object Class
BLANK Actual Estimated Revised Estimated Code Object Class FY2018 FY2019 FY2019 FY2020 Change Over FY2019
B BLANK M-Q INTEGRATION PROGRAMME $1 $1 $1 $1 $0 0.0%
TOTAL EXPENDITURE $2,278,705 $0 $0 $0 $0 n.a.
Main Estimates $317,209 $0 $0 $0 $0 n.a.
OPERATING EXPENDITURE $317,209 $0 $0 $0 $0 n.a.
RUNNING COSTS $317,209 $0 $0 $0 $0 n.a.
Other Operating Expenditure $317,209 $0 $0 $0 $0 n.a.
2100 Consumption of Products & Services 317,209 0 0 0 0 n.a.
Development Estimates $1,961,495 $0 $0 $0 $0 n.a.
DEVELOPMENT EXPENDITURE $1,961,495 $0 $0 $0 $0 n.a.
5100 Government Development 1,961,495 0 0 0 0 n.a.
1 The Transformation Support Fund (TSF) was ceased from FY2019, and the remaining budgets were transferred to the implementing Ministries and/or Organs of State. Expenditure pertaining to the TSF prior to FY2019 is reflected under the Integration Programme, and expenditure from FY2019 onwards will be reflected under the respective implementing Ministries and/or Organs of State.

PROGRAMME DETAILS
Head N ___________
Ministry of Foreign Affairs

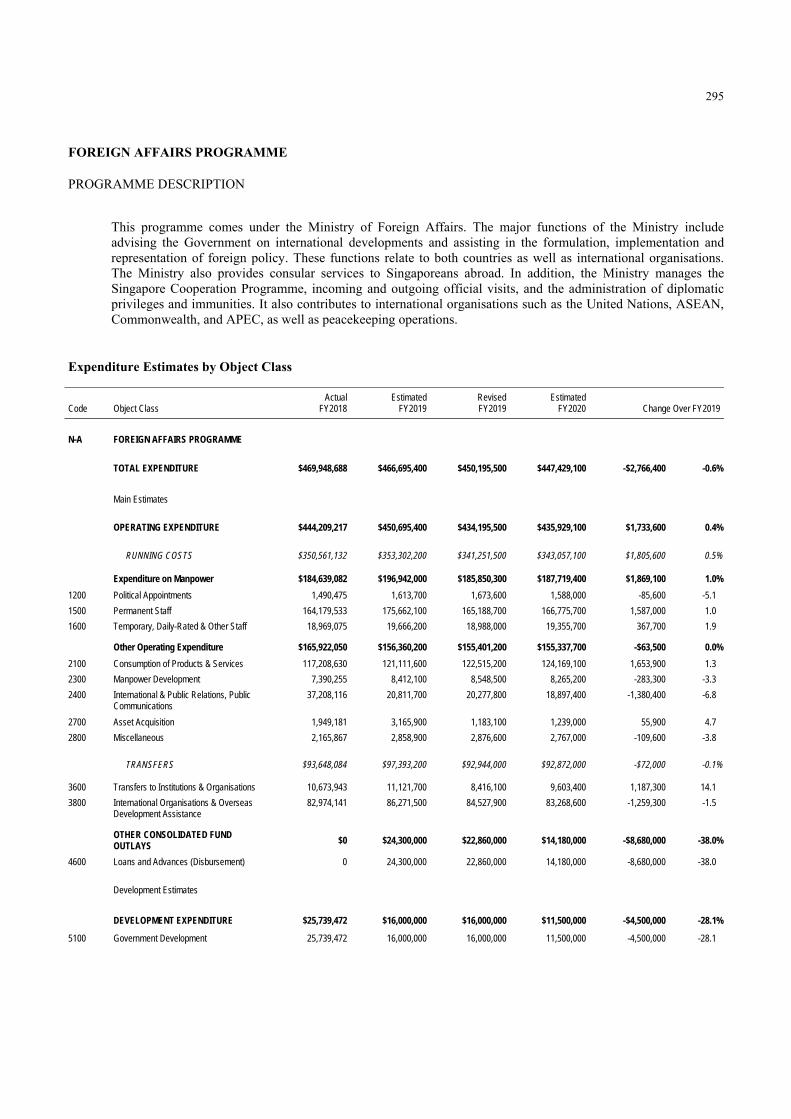
295
FOREIGN AFFAIRS PROGRAMME
PROGRAMME DESCRIPTION
This programme comes under the Ministry of Foreign Affairs. The major functions of the Ministry include advising the Government on international developments and assisting in the formulation, implementation and representation of foreign policy. These functions relate to both countries as well as international organisations. The Ministry also provides consular services to Singaporeans abroad. In addition, the Ministry manages the Singapore Cooperation Programme, incoming and outgoing official visits, and the administration of diplomatic privileges and immunities. It also contributes to international organisations such as the United Nations, ASEAN, Commonwealth, and APEC, as well as peacekeeping operations.
Expenditure Estimates by Object Class
BLANK Actual Estimated Revised Estimated Code Object Class FY2018 FY2019 FY2019 FY2020 Change Over FY2019
B BLANK N-A FOREIGN AFFAIRS PROGRAMME $1 $1 $1 $1 $0 0.0%
TOTAL EXPENDITURE $469,948,688 $466,695,400 $450,195,500 $447,429,100 -$2,766,400 -0.6%
Main Estimates $444,209,217 $474,995,400 $457,055,500 $450,109,100 -$6,946,400 -1.5%
OPERATING EXPENDITURE $444,209,217 $450,695,400 $434,195,500 $435,929,100 $1,733,600 0.4%
RUNNING COSTS $350,561,132 $353,302,200 $341,251,500 $343,057,100 $1,805,600 0.5%
Expenditure on Manpower $184,639,082 $196,942,000 $185,850,300 $187,719,400 $1,869,100 1.0%
1200 Political Appointments 1,490,475 1,613,700 1,673,600 1,588,000 -85,600 -5.1
1500 Permanent Staff 164,179,533 175,662,100 165,188,700 166,775,700 1,587,000 1.0
1600 Temporary, Daily-Rated & Other Staff 18,969,075 19,666,200 18,988,000 19,355,700 367,700 1.9
Other Operating Expenditure $165,922,050 $156,360,200 $155,401,200 $155,337,700 -$63,500 0.0%
2100 Consumption of Products & Services 117,208,630 121,111,600 122,515,200 124,169,100 1,653,900 1.3
2300 Manpower Development 7,390,255 8,412,100 8,548,500 8,265,200 -283,300 -3.3
2400 International & Public Relations, Public Communications
37,208,116 20,811,700 20,277,800 18,897,400 -1,380,400 -6.8
2700 Asset Acquisition 1,949,181 3,165,900 1,183,100 1,239,000 55,900 4.7
2800 Miscellaneous 2,165,867 2,858,900 2,876,600 2,767,000 -109,600 -3.8
TRANSFERS $93,648,084 $97,393,200 $92,944,000 $92,872,000 -$72,000 -0.1%
3600 Transfers to Institutions & Organisations 10,673,943 11,121,700 8,416,100 9,603,400 1,187,300 14.1
3800 International Organisations & Overseas Development Assistance
82,974,141 86,271,500 84,527,900 83,268,600 -1,259,300 -1.5
OTHER CONSOLIDATED FUND OUTLAYS $0 $24,300,000 $22,860,000 $14,180,000 -$8,680,000 -38.0%
4600 Loans and Advances (Disbursement) 0 24,300,000 22,860,000 14,180,000 -8,680,000 -38.0
Development Estimates $25,739,472 $16,000,000 $16,000,000 $11,500,000 -$4,500,000 -28.1%
DEVELOPMENT EXPENDITURE $25,739,472 $16,000,000 $16,000,000 $11,500,000 -$4,500,000 -28.1%
5100 Government Development 25,739,472 16,000,000 16,000,000 11,500,000 -4,500,000 -28.1

296
Manpower
BLANK Actual Estimated Revised Estimated Category FY2018 FY2019 FY2019 FY2020
BLANK
Political Appointments 4 4 4 4
Permanent Staff 934 1,093 1,086 1,087
Temporary, Daily-Rated & Other Staff 481 521 508 534
Others 11 8 12 17
TOTAL 1,430 1,626 1,610 1,642

PROGRAMME DETAILS
Head O __________
Ministry of Health

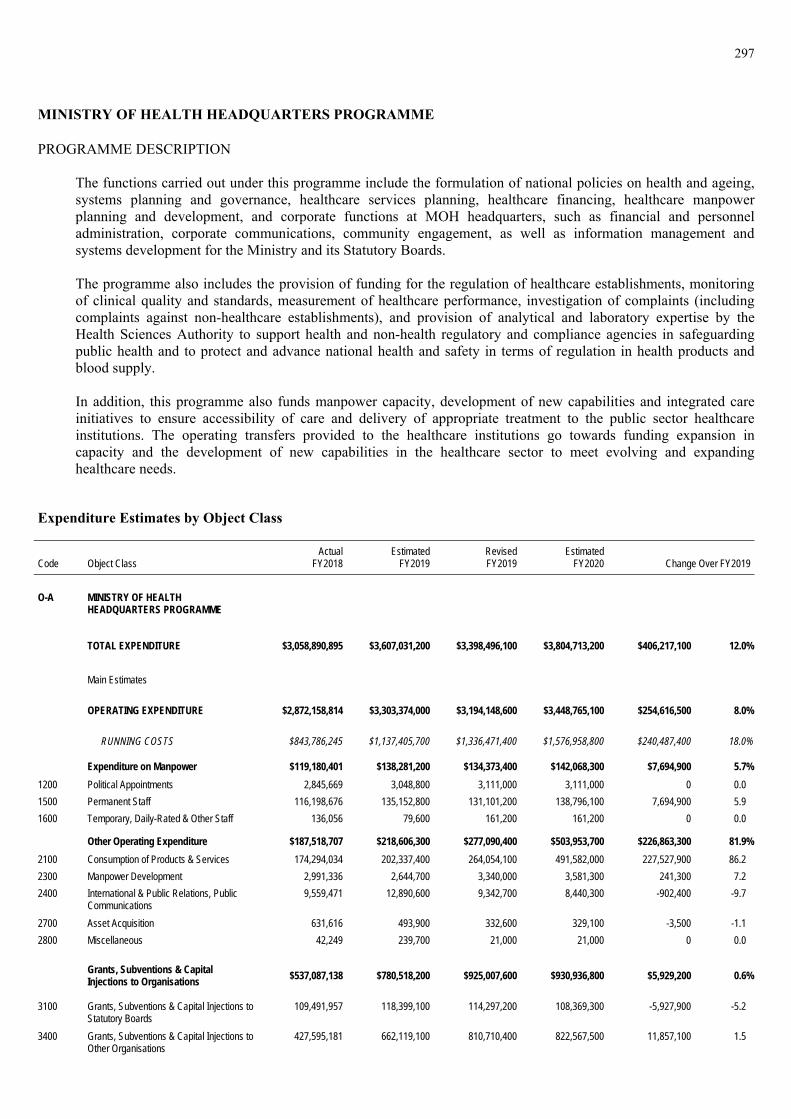
297
MINISTRY OF HEALTH HEADQUARTERS PROGRAMME
PROGRAMME DESCRIPTION
The functions carried out under this programme include the formulation of national policies on health and ageing, systems planning and governance, healthcare services planning, healthcare financing, healthcare manpower planning and development, and corporate functions at MOH headquarters, such as financial and personnel administration, corporate communications, community engagement, as well as information management and systems development for the Ministry and its Statutory Boards.
The programme also includes the provision of funding for the regulation of healthcare establishments, monitoring of clinical quality and standards, measurement of healthcare performance, investigation of complaints (including complaints against non-healthcare establishments), and provision of analytical and laboratory expertise by the Health Sciences Authority to support health and non-health regulatory and compliance agencies in safeguarding public health and to protect and advance national health and safety in terms of regulation in health products and blood supply.
In addition, this programme also funds manpower capacity, development of new capabilities and integrated care initiatives to ensure accessibility of care and delivery of appropriate treatment to the public sector healthcare institutions. The operating transfers provided to the healthcare institutions go towards funding expansion in capacity and the development of new capabilities in the healthcare sector to meet evolving and expanding healthcare needs.
Expenditure Estimates by Object Class
BLANK Actual Estimated Revised Estimated Code Object Class FY2018 FY2019 FY2019 FY2020 Change Over FY2019
B BLANK O-A MINISTRY OF HEALTH
HEADQUARTERS PROGRAMME $1 $1 $1 $1 $0 `
TOTAL EXPENDITURE $3,058,890,895 $3,607,031,200 $3,398,496,100 $3,804,713,200 $406,217,100 12.0%
Main Estimates $2,872,158,814 $3,303,374,000 $3,195,041,600 $3,298,796,000 $103,754,400 3.2%
OPERATING EXPENDITURE $2,872,158,814 $3,303,374,000 $3,194,148,600 $3,448,765,100 $254,616,500 8.0%
RUNNING COSTS $843,786,245 $1,137,405,700 $1,336,471,400 $1,576,958,800 $240,487,400 18.0%
Expenditure on Manpower $119,180,401 $138,281,200 $134,373,400 $142,068,300 $7,694,900 5.7%
1200 Political Appointments 2,845,669 3,048,800 3,111,000 3,111,000 0 0.0
1500 Permanent Staff 116,198,676 135,152,800 131,101,200 138,796,100 7,694,900 5.9
1600 Temporary, Daily-Rated & Other Staff 136,056 79,600 161,200 161,200 0 0.0
Other Operating Expenditure $187,518,707 $218,606,300 $277,090,400 $503,953,700 $226,863,300 81.9%
2100 Consumption of Products & Services 174,294,034 202,337,400 264,054,100 491,582,000 227,527,900 86.2
2300 Manpower Development 2,991,336 2,644,700 3,340,000 3,581,300 241,300 7.2
2400 International & Public Relations, Public Communications
9,559,471 12,890,600 9,342,700 8,440,300 -902,400 -9.7
2700 Asset Acquisition 631,616 493,900 332,600 329,100 -3,500 -1.1
2800 Miscellaneous 42,249 239,700 21,000 21,000 0 0.0
Grants, Subventions & Capital Injections to Organisations
$537,087,138 $780,518,200 $925,007,600 $930,936,800 $5,929,200 0.6%
3100 Grants, Subventions & Capital Injections to Statutory Boards
109,491,957 118,399,100 114,297,200 108,369,300 -5,927,900 -5.2
3400 Grants, Subventions & Capital Injections to Other Organisations
427,595,181 662,119,100 810,710,400 822,567,500 11,857,100 1.5

298
BLANK Actual Estimated Revised Estimated Code Object Class FY2018 FY2019 FY2019 FY2020 Change Over FY2019
B BLANK
TRANSFERS $2,028,372,569 $2,165,968,300 $1,857,677,200 $1,871,806,300 $14,129,100 0.8%
3500 Social Transfers to Individuals 902,707,128 1,002,937,200 871,798,300 943,629,600 71,831,300 8.2
3600 Transfers to Institutions & Organisations 1,122,570,109 1,159,991,500 982,534,500 924,905,100 -57,629,400 -5.9
3800 International Organisations & Overseas Development Assistance
3,095,332 3,039,600 3,344,400 3,271,600 -72,800 -2.2
OTHER CONSOLIDATED FUND OUTLAYS $0 $0 $893,000 $30,900 -$862,100 -96.5%
4600 Loans and Advances (Disbursement) 0 0 893,000 30,900 -862,100 -96.5
Development Estimates $186,732,081 $303,657,200 $204,347,500 $355,948,100 $151,600,600 74.2%
DEVELOPMENT EXPENDITURE $186,732,081 $303,657,200 $204,347,500 $355,948,100 $151,600,600 74.2%
5100 Government Development 21,707,774 40,898,400 19,691,500 158,675,400 138,983,900 705.8
5200 Grants & Capital Injections to Organisations
165,024,307 262,758,800 184,656,000 197,272,700 12,616,700 6.8
Manpower
BLANK Actual Estimated Revised Estimated Category FY2018 FY2019 FY2019 FY2020
BLANK
Political Appointments 5 5 5 5
Permanent Staff 824 844 842 922
TOTAL 829 849 847 927

299
SERVICES PROGRAMME
PROGRAMME DESCRIPTION
This programme comprises:
(a) Government subsidies in the form of operating subvention to public hospitals and institutions for patient care, manpower development, education, medical research, service innovations and initiatives in support of integrated care; and
(b) Government subsidies in the form of operating subvention to non-public sector providers such as Voluntary
Welfare Organisations (VWOs), private sector providers and General Practitioners for aged care social and medical services, intermediate and long-term care services for the terminally ill and renal dialysis patients, and primary care services.
The operating subvention provided to the healthcare institutions goes towards subsidising patient bills to ensure that Singaporeans have access to good and affordable healthcare that is appropriate to needs. Funding for manpower development, education and research goes towards developing clinical and medical capabilities, and improving patient care in the healthcare institutions.
Healthcare services for the elderly sick, terminally ill and those in need of continuing care as well as aged care services are provided by VWOs and a number of private sector providers with subsidies from Government. The Government subsidies go towards funding the capital and operating costs of community hospitals, chronic sick hospitals, nursing homes, hospices, psychiatric rehabilitation homes, and centre-based/home-based services. Private General Practitioners who collaborate with MOH also receive funding to provide subsidised primary care.
Expenditure Estimates by Object Class
BLANK Actual Estimated Revised Estimated Code Object Class FY2018 FY2019 FY2019 FY2020 Change Over FY2019
B BLANK O-D SERVICES PROGRAMME $1 $1 $1 $1 $0 0.0%
TOTAL EXPENDITURE $7,092,203,588 $7,837,800,000 $7,786,555,200 $8,871,019,600 $1,084,464,400 13.9%
Main Estimates $5,791,317,531 $6,445,705,400 $6,480,875,100 $7,287,933,900 $807,058,800 12.5%
OPERATING EXPENDITURE $5,791,317,531 $6,445,705,400 $6,480,875,100 $7,537,933,900 $1,057,058,800 16.3%
RUNNING COSTS $27,701,689 $2,711,000 $295,460,300 $319,375,200 $23,914,900 8.1%
Other Operating Expenditure $2,904,258 $2,711,000 $2,268,000 $1,879,200 -$388,800 -17.1%
2100 Consumption of Products & Services 975,994 1,784,800 1,332,400 1,019,200 -313,200 -23.5
2300 Manpower Development 1,612 0 1,200 0 -1,200 -100.0
2400 International & Public Relations, Public Communications
739,169 926,200 934,400 860,000 -74,400 -8.0
2800 Miscellaneous 1,187,483 0 0 0 0 n.a.
Grants, Subventions & Capital Injections to Organisations $24,797,431 $0 $293,192,300 $317,496,000 $24,303,700 8.3%
3400 Grants, Subventions & Capital Injections to Other Organisations
24,797,431 0 293,192,300 317,496,000 24,303,700 8.3
TRANSFERS $5,763,615,842 $6,442,994,400 $6,185,414,800 $7,218,558,700 $1,033,143,900 16.7%
3600 Transfers to Institutions & Organisations 5,763,615,842 6,442,994,400 6,185,414,800 7,218,558,700 1,033,143,900 16.7

300
BLANK Actual Estimated Revised Estimated Code Object Class FY2018 FY2019 FY2019 FY2020 Change Over FY2019
Development Estimates $1,300,886,057 $1,392,094,600 $1,305,680,100 $1,333,085,700 $27,405,600 2.1%
DEVELOPMENT EXPENDITURE $1,300,886,057 $1,392,094,600 $1,305,680,100 $1,333,085,700 $27,405,600 2.1%
5100 Government Development 849,151,097 928,706,000 930,160,200 1,016,552,900 86,392,700 9.3
5200 Grants & Capital Injections to Organisations
451,734,960 463,388,600 375,519,900 316,532,800 -58,987,100 -15.7

301
HEALTH PROMOTION PROGRAMME1
PROGRAMME DESCRIPTION
The Health Promotion Board (HPB) was established in 2001 as a Statutory Board under the Ministry of Health with the vision of building “A Nation of Healthy People”. HPB aims to empower the people of Singapore to attain optimal health, increase the quality and years of healthy life, and prevent illnesses, disability and premature death. As the key partner of national health promotion and disease prevention programmes, HPB spearheads health education, promotion and prevention programmes as well as creates a health-supportive environment in Singapore. It develops and organises relevant health promotion and disease prevention programmes, reaching out to the healthy, the at-risk and the unhealthy at all stages of life – children, youths, adults and older Singapore residents. HPB’s health promotion programmes include nutrition, mental health, physical activity, tobacco control and communicable disease education. HPB also promotes healthy ageing, evidence-based health screening, and chronic disease education and management. Expenditure Estimates by Object Class
BLANK Actual Estimated Revised Estimated Code Object Class FY2018 FY2019 FY2019 FY2020 Change Over FY2019
B BLANK O-E HEALTH PROMOTION PROGRAMME $1 $1 $1 $1 $0 0.0%
TOTAL EXPENDITURE $276,386,296 $277,726,300 $352,684,400 $0 -$352,684,400 -100.0%
Main Estimates $273,830,765 $274,671,300 $347,834,000 $0 -$347,834,000 -100.0%
OPERATING EXPENDITURE $273,830,765 $274,671,300 $347,834,000 $0 -$347,834,000 -100.0%
RUNNING COSTS $273,830,765 $274,671,300 $347,834,000 $0 -$347,834,000 -100.0%
Grants, Subventions & Capital Injections to Organisations
$273,830,765 $274,671,300 $347,834,000 $0 -$347,834,000 -100.0%
3100 Grants, Subventions & Capital Injections to Statutory Boards
273,830,765 274,671,300 347,834,000 0 -347,834,000 -100.0
Development Estimates $2,555,530 $3,055,000 $4,850,400 $0 -$4,850,400 -100.0%
DEVELOPMENT EXPENDITURE $2,555,530 $3,055,000 $4,850,400 $0 -$4,850,400 -100.0%
5100 Government Development 239,961 0 0 0 0 n.a.
5200 Grants & Capital Injections to Organisations
2,315,569 3,055,000 4,850,400 0 -4,850,400 -100.0
Manpower
BLANK Actual Estimated Revised Estimated Category FY2018 FY2019 FY2019 FY2020
BLANK
Others 790 790 790 0
TOTAL 790 790 790 0
1 The Health Promotion Programme will be subsumed into the new Health Promotion and Preventive Healthcare Programme from FY2020 onwards.
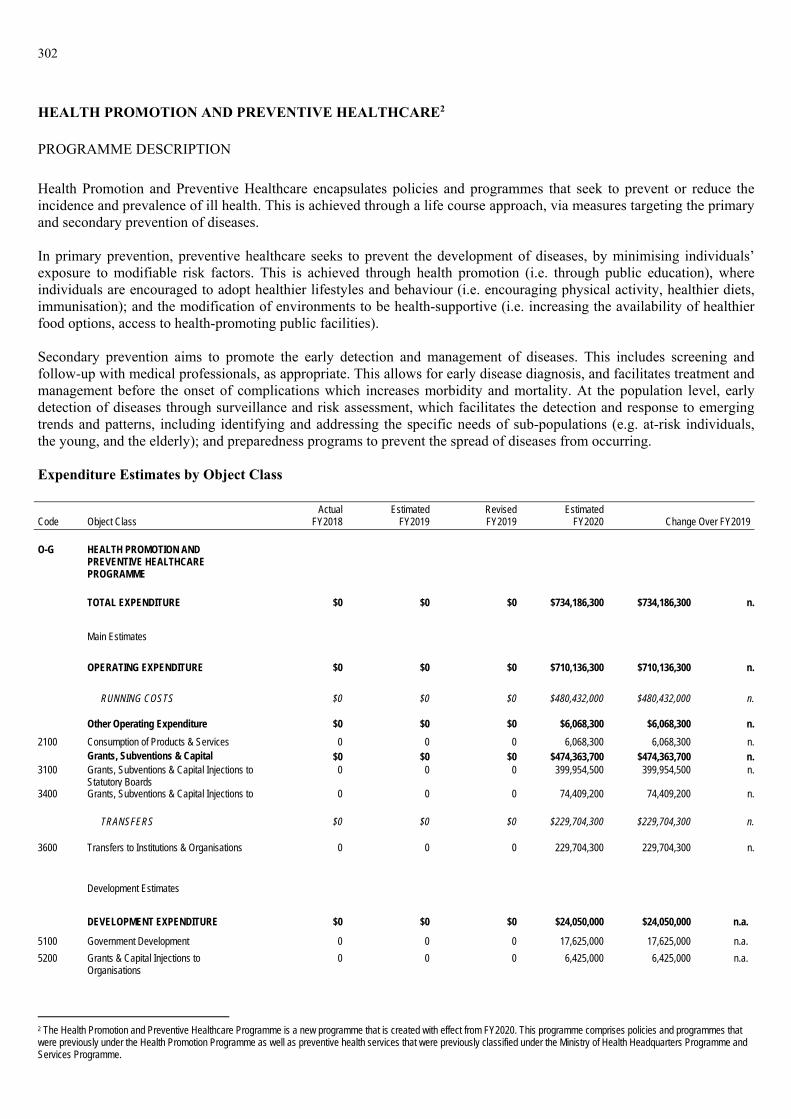
302
HEALTH PROMOTION AND PREVENTIVE HEALTHCARE2
PROGRAMME DESCRIPTION
Health Promotion and Preventive Healthcare encapsulates policies and programmes that seek to prevent or reduce the incidence and prevalence of ill health. This is achieved through a life course approach, via measures targeting the primary and secondary prevention of diseases.
In primary prevention, preventive healthcare seeks to prevent the development of diseases, by minimising individuals’ exposure to modifiable risk factors. This is achieved through health promotion (i.e. through public education), where individuals are encouraged to adopt healthier lifestyles and behaviour (i.e. encouraging physical activity, healthier diets, immunisation); and the modification of environments to be health-supportive (i.e. increasing the availability of healthier food options, access to health-promoting public facilities).
Secondary prevention aims to promote the early detection and management of diseases. This includes screening and follow-up with medical professionals, as appropriate. This allows for early disease diagnosis, and facilitates treatment and management before the onset of complications which increases morbidity and mortality. At the population level, early detection of diseases through surveillance and risk assessment, which facilitates the detection and response to emerging trends and patterns, including identifying and addressing the specific needs of sub-populations (e.g. at-risk individuals, the young, and the elderly); and preparedness programs to prevent the spread of diseases from occurring. Expenditure Estimates by Object Class BLANK Actual Estimated Revised Estimated Code Object Class FY2018 FY2019 FY2019 FY2020 Change Over FY2019
B BLANK O-G HEALTH PROMOTION AND
PREVENTIVE HEALTHCARE PROGRAMME
$1 $1 $1 $1 $0 0.0%
TOTAL EXPENDITURE $0 $0 $0 $734,186,300 $734,186,300 n.
Main Estimates $0 $0 $0 $710,136,300 $710,136,300 n.
OPERATING EXPENDITURE $0 $0 $0 $710,136,300 $710,136,300 n.
RUNNING COSTS $0 $0 $0 $480,432,000 $480,432,000 n.
Other Operating Expenditure $0 $0 $0 $6,068,300 $6,068,300 n.
2100 Consumption of Products & Services 0 0 0 6,068,300 6,068,300 n. Grants, Subventions & Capital $0 $0 $0 $474,363,700 $474,363,700 n.3100 Grants, Subventions & Capital Injections to
Statutory Boards 0 0 0 399,954,500 399,954,500 n.
3400 Grants, Subventions & Capital Injections to 0 0 0 74,409,200 74,409,200 n.
TRANSFERS $0 $0 $0 $229,704,300 $229,704,300 n.
3600 Transfers to Institutions & Organisations 0 0 0 229,704,300 229,704,300 n.
Development Estimates $0 $0 $0 $24,050,000 $24,050,000 n.a.
DEVELOPMENT EXPENDITURE $0 $0 $0 $24,050,000 $24,050,000 n.a.
5100 Government Development 0 0 0 17,625,000 17,625,000 n.a.
5200 Grants & Capital Injections to Organisations
0 0 0 6,425,000 6,425,000 n.a.
2 The Health Promotion and Preventive Healthcare Programme is a new programme that is created with effect from FY2020. This programme comprises policies and programmes that were previously under the Health Promotion Programme as well as preventive health services that were previously classified under the Ministry of Health Headquarters Programme and Services Programme.

303
Manpower
BLANK Actual Estimated Revised Estimated Category FY2018 FY2019 FY2019 FY2020
BLANK
Others 0 0 0 815

PROGRAMME DETAILS
Head P ____________
Ministry of Home Affairs

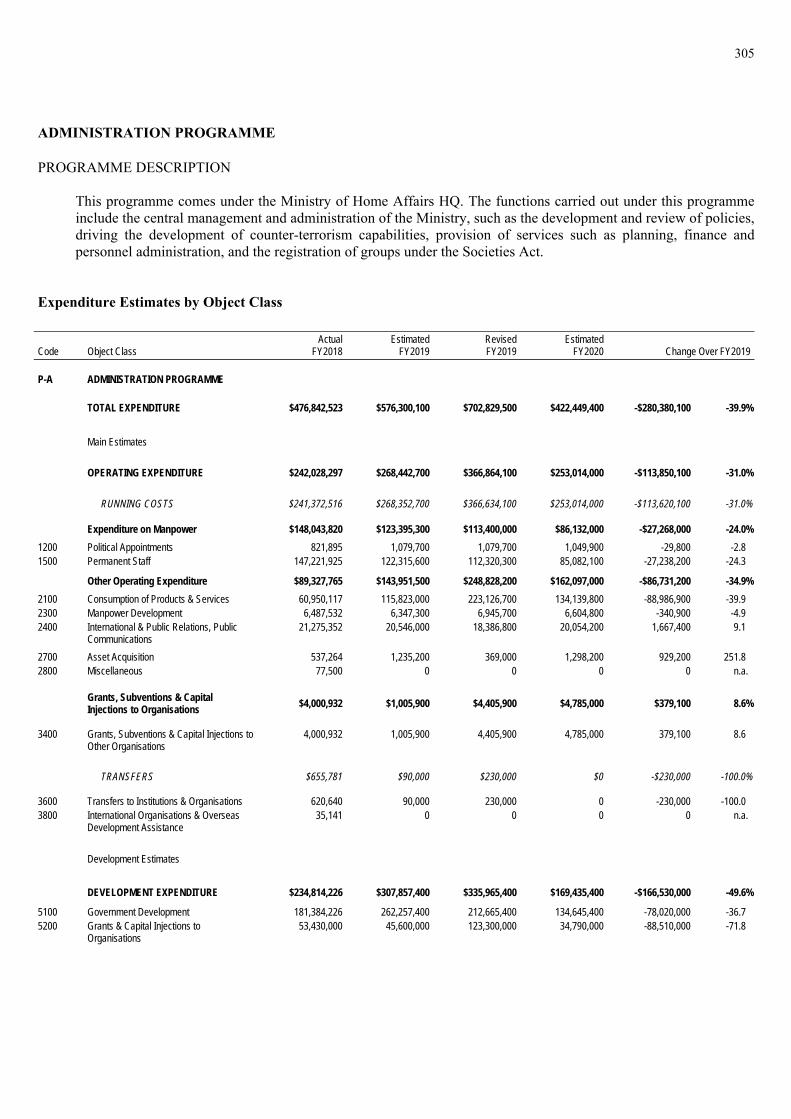
305
ADMINISTRATION PROGRAMME
PROGRAMME DESCRIPTION
This programme comes under the Ministry of Home Affairs HQ. The functions carried out under this programme include the central management and administration of the Ministry, such as the development and review of policies, driving the development of counter-terrorism capabilities, provision of services such as planning, finance and personnel administration, and the registration of groups under the Societies Act.
Expenditure Estimates by Object Class
BLANK Actual Estimated Revised Estimated Code Object Class FY2018 FY2019 FY2019 FY2020 Change Over FY2019
B BLANK P-A ADMINISTRATION PROGRAMME $1 $1 $1 $1 $0 0.0%
TOTAL EXPENDITURE $476,842,523 $576,300,100 $702,829,500 $422,449,400 -$280,380,100 -39.9%
Main Estimates $242,028,297 $268,442,700 $366,864,100 $253,014,000 -$113,850,100 -31.0%
OPERATING EXPENDITURE $242,028,297 $268,442,700 $366,864,100 $253,014,000 -$113,850,100 -31.0%
RUNNING COSTS $241,372,516 $268,352,700 $366,634,100 $253,014,000 -$113,620,100 -31.0%
Expenditure on Manpower $148,043,820 $123,395,300 $113,400,000 $86,132,000 -$27,268,000 -24.0%
1200 Political Appointments 821,895 1,079,700 1,079,700 1,049,900 -29,800 -2.81500 Permanent Staff 147,221,925 122,315,600 112,320,300 85,082,100 -27,238,200 -24.3
Other Operating Expenditure $89,327,765 $143,951,500 $248,828,200 $162,097,000 -$86,731,200 -34.9%
2100 Consumption of Products & Services 60,950,117 115,823,000 223,126,700 134,139,800 -88,986,900 -39.92300 Manpower Development 6,487,532 6,347,300 6,945,700 6,604,800 -340,900 -4.92400 International & Public Relations, Public
Communications 21,275,352 20,546,000 18,386,800 20,054,200 1,667,400 9.1
2700 Asset Acquisition 537,264 1,235,200 369,000 1,298,200 929,200 251.82800 Miscellaneous 77,500 0 0 0 0 n.a.
Grants, Subventions & Capital Injections to Organisations
$4,000,932 $1,005,900 $4,405,900 $4,785,000 $379,100 8.6%
3400 Grants, Subventions & Capital Injections to Other Organisations
4,000,932 1,005,900 4,405,900 4,785,000 379,100 8.6
TRANSFERS $655,781 $90,000 $230,000 $0 -$230,000 -100.0%
3600 Transfers to Institutions & Organisations 620,640 90,000 230,000 0 -230,000 -100.03800 International Organisations & Overseas
Development Assistance 35,141 0 0 0 0 n.a.
Development Estimates $234,814,226 $307,857,400 $335,965,400 $169,435,400 -$166,530,000 -49.6%
DEVELOPMENT EXPENDITURE $234,814,226 $307,857,400 $335,965,400 $169,435,400 -$166,530,000 -49.6%
5100 Government Development 181,384,226 262,257,400 212,665,400 134,645,400 -78,020,000 -36.75200 Grants & Capital Injections to
Organisations 53,430,000 45,600,000 123,300,000 34,790,000 -88,510,000 -71.8

306
Manpower
BLANK Actual Estimated Revised Estimated Category FY2018 FY2019 FY2019 FY2020
BLANK
Political Appointments 4 4 4 4
Permanent Staff 714 954 2,018 551
TOTAL 718 958 2,022 555
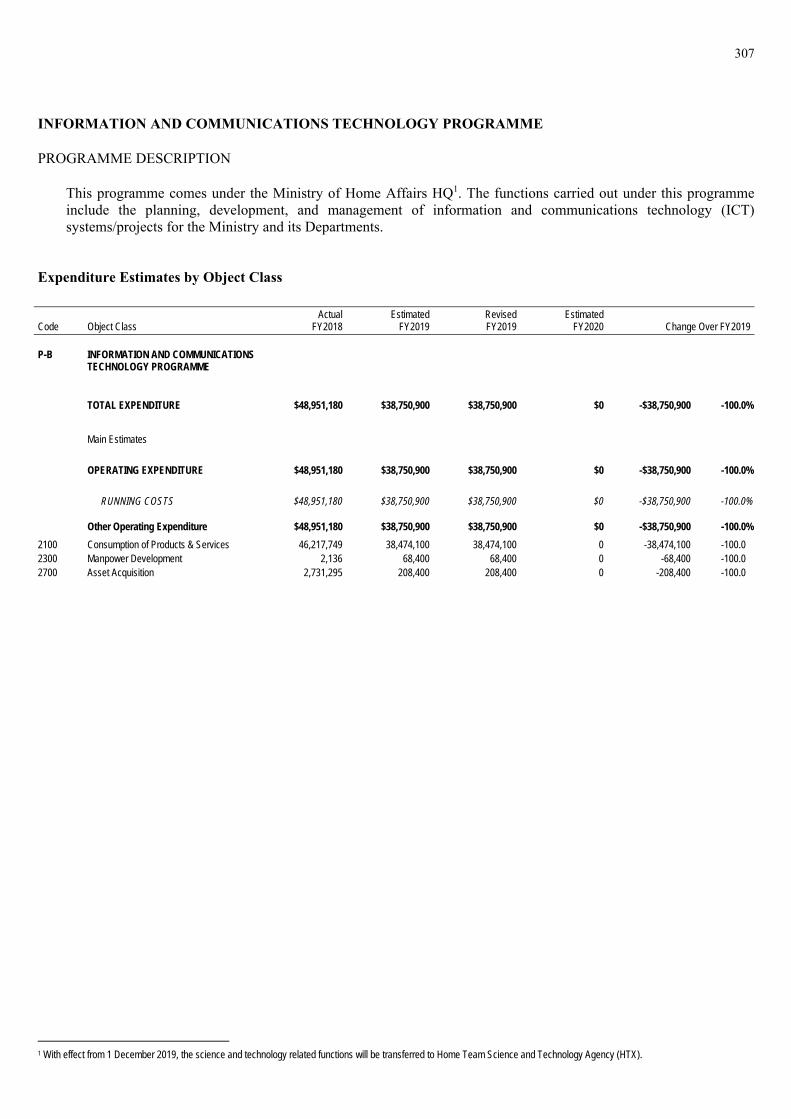
307
INFORMATION AND COMMUNICATIONS TECHNOLOGY PROGRAMME
PROGRAMME DESCRIPTION
This programme comes under the Ministry of Home Affairs HQ1. The functions carried out under this programme include the planning, development, and management of information and communications technology (ICT) systems/projects for the Ministry and its Departments.
Expenditure Estimates by Object Class
BLANK Actual Estimated Revised Estimated Code Object Class FY2018 FY2019 FY2019 FY2020 Change Over FY2019
B BLANK P-B INFORMATION AND COMMUNICATIONS
TECHNOLOGY PROGRAMME $1 $1 $1 $1 $0 0.0%
TOTAL EXPENDITURE $48,951,180 $38,750,900 $38,750,900 $0 -$38,750,900 -100.0%
Main Estimates $48,951,180 $38,750,900 $38,750,900 $0 -$38,750,900 -100.0%
OPERATING EXPENDITURE $48,951,180 $38,750,900 $38,750,900 $0 -$38,750,900 -100.0%
RUNNING COSTS $48,951,180 $38,750,900 $38,750,900 $0 -$38,750,900 -100.0%
Other Operating Expenditure $48,951,180 $38,750,900 $38,750,900 $0 -$38,750,900 -100.0%
2100 Consumption of Products & Services 46,217,749 38,474,100 38,474,100 0 -38,474,100 -100.0 2300 Manpower Development 2,136 68,400 68,400 0 -68,400 -100.0 2700 Asset Acquisition 2,731,295 208,400 208,400 0 -208,400 -100.0
1 With effect from 1 December 2019, the science and technology related functions will be transferred to Home Team Science and Technology Agency (HTX).

308
POLICE PROGRAMME
PROGRAMME DESCRIPTION
This programme comes under the Singapore Police Force. The main functions carried out under this programme include upholding the law, protecting life and property, preventing crime and disorder, detecting and apprehending offenders, and preserving security within mainland Singapore and Singapore Territorial Waters. Other functions include formulating and enforcing road traffic rules and regulations, and testing and licensing motorists.
Expenditure Estimates by Object Class BLANK Actual Estimated Revised Estimated Code Object Class FY2018 FY2019 FY2019 FY2020 Change Over FY2019
B BLANK P-C POLICE PROGRAMME $1 $1 $1 $1 $0 0.0%
TOTAL EXPENDITURE $3,474,093,021 $3,576,378,800 $3,446,064,800 $3,603,962,300 $157,897,500 4.6%
Main Estimates $3,052,413,923 $3,208,398,700 $3,148,778,000 $3,308,551,600 $159,773,600 5.1%
OPERATING EXPENDITURE $3,052,413,923 $3,193,335,700 $3,132,611,000 $3,294,066,600 $161,455,600 5.2%
RUNNING COSTS $3,051,938,403 $3,192,822,800 $3,132,102,600 $3,293,502,100 $161,399,500 5.2%
Expenditure on Manpower $1,846,130,259 $1,953,153,300 $1,838,089,700 $1,857,560,300 $19,470,600 1.1%
1500 Permanent Staff 1,725,233,014 1,821,613,900 1,719,859,700 1,741,174,300 21,314,600 1.2 1600 Temporary, Daily-Rated & Other Staff 120,897,246 131,539,400 118,230,000 116,386,000 -1,844,000 -1.6
Other Operating Expenditure $1,203,240,143 $1,237,412,900 $1,291,756,300 $1,433,527,900 $141,771,600 11.0%
2100 Consumption of Products & Services 1,086,450,701 1,148,513,400 1,173,072,300 1,326,839,400 153,767,100 13.1 2300 Manpower Development 53,968,077 49,438,000 59,091,800 55,408,700 -3,683,100 -6.2 2400 International & Public Relations, Public
Communications 49,522,006 23,581,000 40,932,500 38,893,000 -2,039,500 -5.0
2700 Asset Acquisition 8,657,909 11,618,800 14,189,300 9,600,200 -4,589,100 -32.3 2800 Miscellaneous 4,641,450 4,261,700 4,470,400 2,786,600 -1,683,800 -37.7
Grants, Subventions & Capital Injections to Organisations $2,568,000 $2,256,600 $2,256,600 $2,413,900 $157,300 7.0%
3400 Grants, Subventions & Capital Injections to Other Organisations
2,568,000 2,256,600 2,256,600 2,413,900 157,300 7.0
TRANSFERS $475,520 $512,900 $508,400 $564,500 $56,100 11.0%
3600 Transfers to Institutions & Organisations 27,000 27,000 27,000 25,000 -2,000 -7.4 3800 International Organisations & Overseas
Development Assistance 448,520 485,900 481,400 539,500 58,100 12.1
OTHER CONSOLIDATED FUND OUTLAYS $0 $15,063,000 $16,167,000 $14,485,000 -$1,682,000 -10.4%
4600 Loans and Advances (Disbursement) 0 15,063,000 16,167,000 14,485,000 -1,682,000 -10.4
Development Estimates $421,679,098 $383,043,100 $313,453,800 $309,895,700 -$3,558,100 -1.1%
DEVELOPMENT EXPENDITURE $421,679,098 $383,043,100 $313,453,800 $309,895,700 -$3,558,100 -1.1%
5100 Government Development 421,679,098 383,043,100 313,453,800 309,895,700 -3,558,100 -1.1

309
Manpower
BLANK Actual Estimated Revised Estimated Category FY2018 FY2019 FY2019 FY2020
BLANK
Permanent Staff 14,872 15,762 14,712 15,080
TOTAL 14,872 15,762 14,712 15,080

310
CIVIL DEFENCE PROGRAMME
PROGRAMME DESCRIPTION
This programme comes under the Singapore Civil Defence Force. The main functions carried out under this programme include the provision of firefighting, rescue and emergency medical services. Other functions include formulation and enforcement of fire safety regulations, operation of civil defence shelters and the public warning system, and promotion of emergency preparedness through public education.
Expenditure Estimates by Object Class BLANK Actual Estimated Revised Estimated Code Object Class FY2018 FY2019 FY2019 FY2020 Change Over FY2019
B BLANK P-D CIVIL DEFENCE PROGRAMME $1 $1 $1 $1 $0 0.0%
TOTAL EXPENDITURE $653,289,967 $617,617,400 $628,036,300 $620,661,200 -$7,375,100 -1.2%
Main Estimates $554,210,832 $561,984,700 $562,534,600 $552,447,500 -$10,087,100 -1.8%
OPERATING EXPENDITURE $554,210,832 $561,949,700 $562,499,600 $552,412,500 -$10,087,100 -1.8%
RUNNING COSTS $554,037,319 $561,868,500 $562,365,000 $552,284,400 -$10,080,600 -1.8%
Expenditure on Manpower $358,358,239 $367,129,500 $367,670,700 $352,512,600 -$15,158,100 -4.1%
1500 Permanent Staff 285,579,044 297,256,500 287,895,700 289,514,300 1,618,600 0.6 1600 Temporary, Daily-Rated & Other Staff 72,779,195 69,873,000 79,775,000 62,998,300 -16,776,700 -21.0
Other Operating Expenditure $190,682,573 $191,239,700 $190,040,600 $195,742,400 $5,701,800 3.0%
2100 Consumption of Products & Services 163,464,901 166,691,700 164,335,700 170,664,600 6,328,900 3.9 2300 Manpower Development 14,953,844 15,528,200 15,039,900 15,317,500 277,600 1.8 2400 International & Public Relations, Public
Communications 7,705,414 6,881,100 6,906,500 7,076,400 169,900 2.5
2700 Asset Acquisition 3,559,878 1,438,700 3,063,500 1,936,200 -1,127,300 -36.8 2800 Miscellaneous 998,536 700,000 695,000 747,700 52,700 7.6
Grants, Subventions & Capital Injections to Organisations $4,996,506 $3,499,300 $4,653,700 $4,029,400 -$624,300 -13.4%
3400 Grants, Subventions & Capital Injections to Other Organisations
4,996,506 3,499,300 4,653,700 4,029,400 -624,300 -13.4
TRANSFERS $173,513 $81,200 $134,600 $128,100 -$6,500 -4.8%
3800 International Organisations & Overseas Development Assistance
173,513 81,200 134,600 128,100 -6,500 -4.8
OTHER CONSOLIDATED FUND OUTLAYS
$0 $35,000 $35,000 $35,000 $0 0.0%
4600 Loans and Advances (Disbursement) 0 35,000 35,000 35,000 0 0.0
Development Estimates $99,079,135 $55,667,700 $65,536,700 $68,248,700 $2,712,000 4.1%
DEVELOPMENT EXPENDITURE $99,079,135 $55,667,700 $65,536,700 $68,248,700 $2,712,000 4.1%
5100 Government Development 99,079,135 55,667,700 65,536,700 68,248,700 2,712,000 4.1
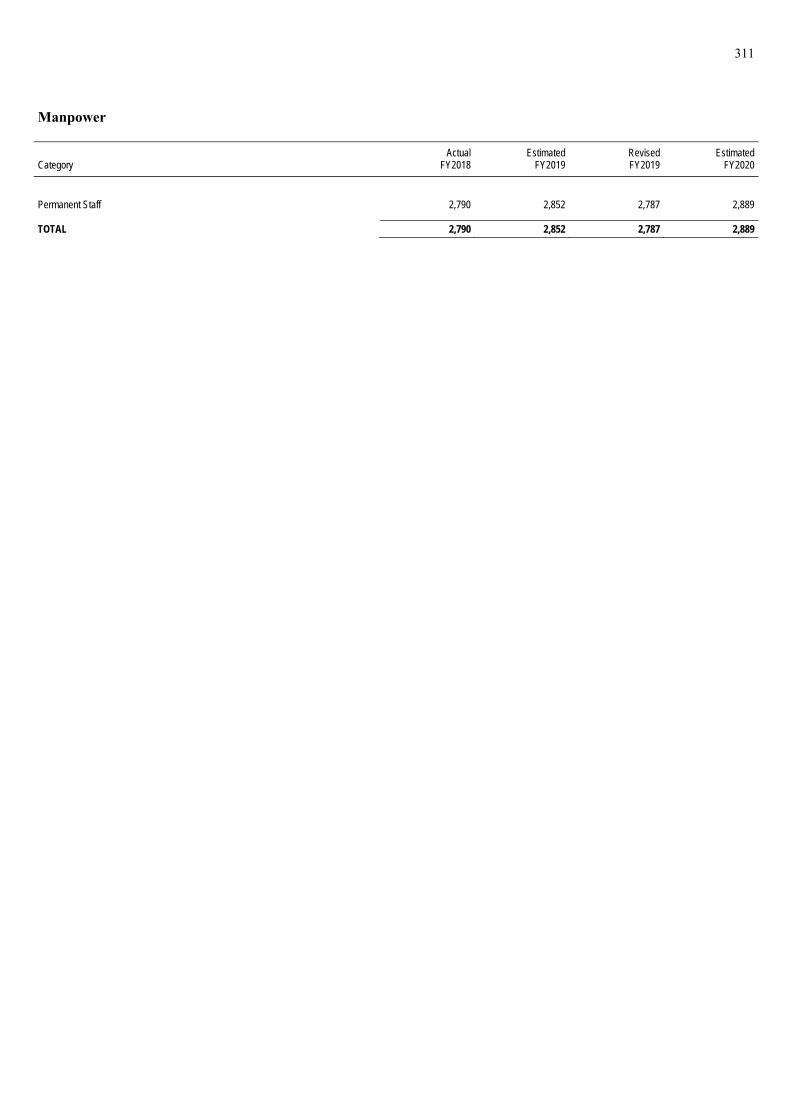
311
Manpower
BLANK Actual Estimated Revised Estimated Category FY2018 FY2019 FY2019 FY2020
BLANK
Permanent Staff 2,790 2,852 2,787 2,889
TOTAL 2,790 2,852 2,787 2,889

312
TREATMENT OF OFFENDERS PROGRAMME
PROGRAMME DESCRIPTION This programme comes under the Prisons Department. The functions carried out under this programme include:
(a) The administration, maintenance and operation of penal institutions for the safe custody and rehabilitation
of offenders;
(b) The administration, maintenance and operation of Drug Rehabilitation Centres for the treatment and rehabilitation of drug addicts;
(c) Partnering the community in the aftercare of offenders to facilitate their reintegration back to society; and
(d) Contributing towards crime prevention efforts through close collaboration with social and enforcement agencies.
Expenditure Estimates by Object Class BLANK Actual Estimated Revised Estimated Code Object Class FY2018 FY2019 FY2019 FY2020 Change Over FY2019
B BLANK P-F TREATMENT OF OFFENDERS
PROGRAMME $1 $1 $1 $1 $0 0.0%
TOTAL EXPENDITURE $659,040,315 $663,361,600 $639,191,400 $610,722,200 -$28,469,200 -4.5%
Main Estimates $552,134,426 $571,961,600 $555,891,400 $560,722,200 $4,830,800 0.9%
OPERATING EXPENDITURE $552,134,426 $571,961,600 $555,891,400 $560,722,200 $4,830,800 0.9%
RUNNING COSTS $501,913,902 $530,067,100 $505,372,800 $518,575,500 $13,202,700 2.6%
Expenditure on Manpower $296,154,916 $321,165,600 $305,095,400 $317,450,100 $12,354,700 4.0%
1500 Permanent Staff 296,154,916 321,165,600 305,095,400 317,450,100 12,354,700 4.0
Other Operating Expenditure $202,002,304 $206,801,500 $197,804,300 $199,525,400 $1,721,100 0.9%
2100 Consumption of Products & Services 187,955,900 194,730,100 185,732,900 185,996,800 263,900 0.1 2300 Manpower Development 8,098,230 8,081,100 8,081,100 8,136,900 55,800 0.7 2400 International & Public Relations, Public
Communications 1,681,702 1,167,900 1,167,900 2,093,700 925,800 79.3
2700 Asset Acquisition 3,837,220 2,599,300 2,599,300 3,102,100 502,800 19.3 2800 Miscellaneous 429,253 223,100 223,100 195,900 -27,200 -12.2
Grants, Subventions & Capital Injections to Organisations
$3,756,682 $2,100,000 $2,473,100 $1,600,000 -$873,100 -35.3%
3400 Grants, Subventions & Capital Injections to Other Organisations
3,756,682 2,100,000 2,473,100 1,600,000 -873,100 -35.3
TRANSFERS $50,220,524 $41,894,500 $50,518,600 $42,146,700 -$8,371,900 -16.6%
3500 Social Transfers to Individuals 43,192,111 35,704,200 44,328,300 35,775,300 -8,553,000 -19.3 3600 Transfers to Institutions & Organisations 7,024,926 6,187,300 6,187,300 6,368,400 181,100 2.9 3800 International Organisations & Overseas
Development Assistance 3,487 3,000 3,000 3,000 0 0.0
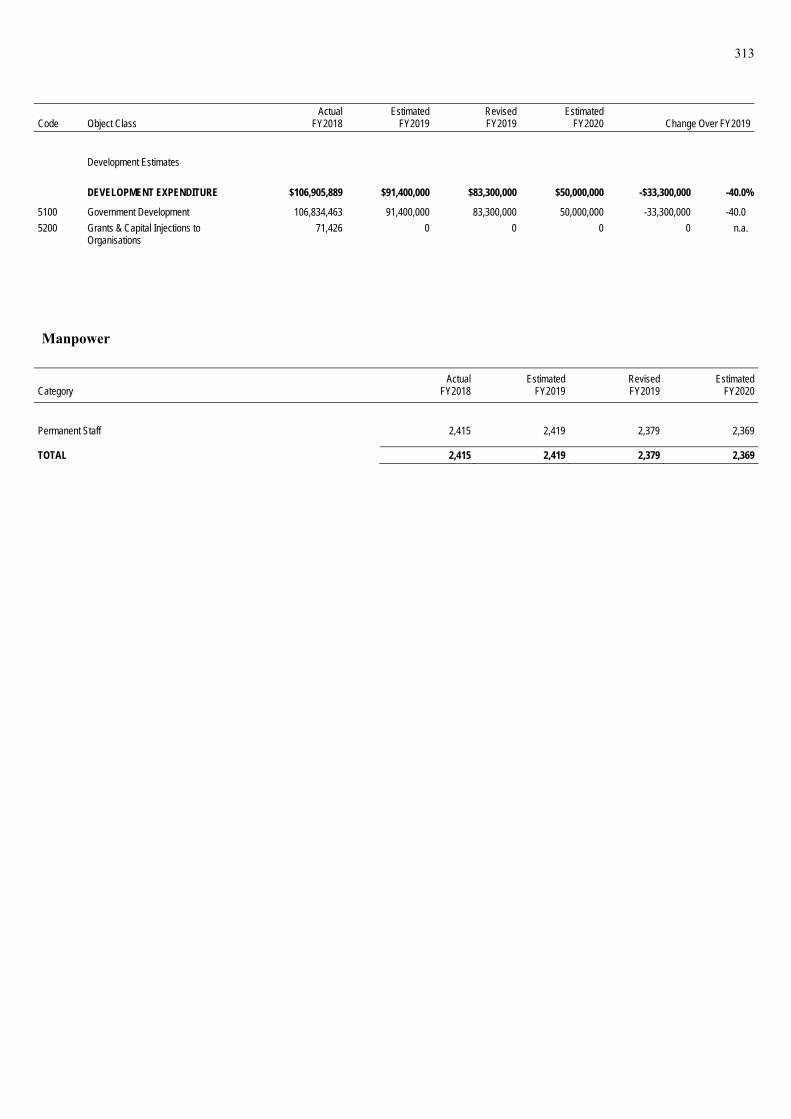
313
BLANK Actual Estimated Revised Estimated Code Object Class FY2018 FY2019 FY2019 FY2020 Change Over FY2019
B BLANK
Development Estimates $106,905,889 $91,400,000 $83,300,000 $50,000,000 -$33,300,000 -40.0%
DEVELOPMENT EXPENDITURE $106,905,889 $91,400,000 $83,300,000 $50,000,000 -$33,300,000 -40.0%
5100 Government Development 106,834,463 91,400,000 83,300,000 50,000,000 -33,300,000 -40.0
5200 Grants & Capital Injections to Organisations
71,426 0 0 0 0 n.a.
Manpower
BLANK Actual Estimated Revised Estimated Category FY2018 FY2019 FY2019 FY2020
BLANK
Permanent Staff 2,415 2,419 2,379 2,369
TOTAL 2,415 2,419 2,379 2,369

314
DRUG ENFORCEMENT PROGRAMME
PROGRAMME DESCRIPTION
This programme comes under the Central Narcotics Bureau. The Bureau conducts enforcement against drug traffickers and abusers, carries out preventive drug education for the community and youths in particular, and engages the community to garner support in building a Singapore free from drugs.
Expenditure Estimates by Object Class
BLANK Actual Estimated Revised Estimated Code Object Class FY2018 FY2019 FY2019 FY2020 Change Over FY2019
B BLANK P-G DRUG ENFORCEMENT PROGRAMME $1 $1 $1 $1 $0 0.0%
TOTAL EXPENDITURE $174,518,677 $174,042,900 $174,868,700 $182,312,800 $7,444,100 4.3%
Main Estimates $152,676,623 $158,754,100 $154,078,700 $166,716,200 $12,637,500 8.2%
OPERATING EXPENDITURE $152,676,623 $158,754,100 $154,078,700 $166,716,200 $12,637,500 8.2%
RUNNING COSTS $152,495,483 $158,726,500 $153,911,000 $166,548,200 $12,637,200 8.2%
Expenditure on Manpower $88,444,702 $91,636,200 $89,660,800 $96,045,300 $6,384,500 7.1%
1500 Permanent Staff 88,430,221 91,613,100 89,638,200 96,029,600 6,391,400 7.1 1600 Temporary, Daily-Rated & Other Staff 14,481 23,100 22,600 15,700 -6,900 -30.5
Other Operating Expenditure $64,050,782 $67,090,300 $64,250,200 $70,502,900 $6,252,700 9.7%
2100 Consumption of Products & Services 57,891,138 59,523,500 56,683,400 62,722,700 6,039,300 10.7 2300 Manpower Development 2,252,859 1,994,200 1,994,200 2,479,800 485,600 24.4 2400 International & Public Relations, Public
Communications 3,517,381 5,357,300 5,357,300 4,871,700 -485,600 -9.1
2700 Asset Acquisition 353,820 215,300 215,300 389,500 174,200 80.9 2800 Miscellaneous 35,583 0 0 39,200 39,200 n.a.
TRANSFERS $181,139 $27,600 $167,700 $168,000 $300 0.2%
3600 Transfers to Institutions & Organisations 154,000 0 140,100 154,000 13,900 9.9 3800 International Organisations & Overseas
Development Assistance 27,139 27,600 27,600 14,000 -13,600 -49.3
Development Estimates $21,842,055 $15,288,800 $20,790,000 $15,596,600 -$5,193,400 -25.0%
DEVELOPMENT EXPENDITURE $21,842,055 $15,288,800 $20,790,000 $15,596,600 -$5,193,400 -25.0%
5100 Government Development 21,842,055 15,288,800 20,790,000 15,596,600 -5,193,400 -25.0
Manpower
BLANK Actual Estimated Revised Estimated Category FY2018 FY2019 FY2019 FY2020
BLANK
Permanent Staff 814 825 800 807
TOTAL 814 825 800 807

315
IMMIGRATION AND CHECKPOINT CONTROL PROGRAMME
PROGRAMME DESCRIPTION This programme comes under the Immigration & Checkpoints Authority. The main functions carried out under this programme include:
(a) Immigration control and safeguarding Singapore's borders against the entry of undesirable persons, goods and conveyances through the air, land and sea checkpoints;
(b) Administration of and upholding the laws on immigration, citizenship and national registration; and
(c) Enforcement against immigration offences through detection, arrest, investigation, prosecution and repatriation of immigration offenders.
Expenditure Estimates by Object Class BLANK Actual Estimated Revised Estimated Code Object Class FY2018 FY2019 FY2019 FY2020 Change Over FY2019
B BLANK P-H IMMIGRATION AND CHECKPOINT
CONTROL PROGRAMME $1 $1 $1 $1 $0 0.0%
TOTAL EXPENDITURE $1,091,920,824 $1,046,422,500 $1,022,807,500 $1,118,909,900 $96,102,400 9.4%
Main Estimates $856,057,212 $930,076,800 $880,474,000 $928,295,000 $47,821,000 5.4%
OPERATING EXPENDITURE $856,057,212 $930,076,800 $880,474,000 $928,295,000 $47,821,000 5.4%
RUNNING COSTS $855,978,109 $929,676,800 $880,374,000 $927,895,000 $47,521,000 5.4%
Expenditure on Manpower $506,295,776 $541,264,300 $496,034,000 $546,240,000 $50,206,000 10.1%
1500 Permanent Staff 505,215,961 540,258,200 494,693,100 545,007,100 50,314,000 10.2 1600 Temporary, Daily-Rated & Other Staff 1,079,816 1,006,100 1,340,900 1,232,900 -108,000 -8.1
Other Operating Expenditure $349,682,333 $388,412,500 $384,340,000 $381,655,000 -$2,685,000 -0.7%
2100 Consumption of Products & Services 335,153,346 354,286,300 362,366,400 360,398,700 -1,967,700 -0.5 2300 Manpower Development 10,948,067 14,809,300 12,521,000 14,797,300 2,276,300 18.2 2400 International & Public Relations, Public
Communications 1,107,155 1,123,000 1,467,500 1,481,000 13,500 0.9
2700 Asset Acquisition 1,791,682 17,500,000 7,237,000 4,210,000 -3,027,000 -41.8 2800 Miscellaneous 682,083 693,900 748,100 768,000 19,900 2.7
TRANSFERS $79,103 $400,000 $100,000 $400,000 $300,000 300.0%
3500 Social Transfers to Individuals 79,103 400,000 100,000 400,000 300,000 300.0
Development Estimates $235,863,612 $116,345,700 $142,333,500 $190,614,900 $48,281,400 33.9%
DEVELOPMENT EXPENDITURE $235,863,612 $116,345,700 $142,333,500 $190,614,900 $48,281,400 33.9%
5100 Government Development 235,863,612 116,345,700 142,333,500 190,614,900 48,281,400 33.9

316
Manpower
BLANK Actual Estimated Revised Estimated Category FY2018 FY2019 FY2019 FY2020
BLANK
Permanent Staff 6,011 6,156 5,947 5,996
TOTAL 6,011 6,156 5,947 5,996

317
HOME TEAM ACADEMY PROGRAMME
PROGRAMME DESCRIPTION
This programme comes under the Home Team Academy. The programme focuses on training and learning (e.g. leadership development, security-related courses) for Home Team officers.
Expenditure Estimates by Object Class BLANK Actual Estimated Revised Estimated Code Object Class FY2018 FY2019 FY2019 FY2020 Change Over FY2019
B BLANK P-I HOME TEAM ACADEMY PROGRAMME $1 $1 $1 $1 $0 0.0%
TOTAL EXPENDITURE $55,614,746 $48,645,700 $50,375,700 $47,149,600 -$3,226,100 -6.4%
Main Estimates $46,364,378 $39,609,800 $40,159,800 $36,665,000 -$3,494,800 -8.7%
OPERATING EXPENDITURE $46,364,378 $39,609,800 $40,159,800 $36,665,000 -$3,494,800 -8.7%
RUNNING COSTS $46,364,378 $39,609,800 $40,159,800 $36,665,000 -$3,494,800 -8.7%
Expenditure on Manpower $18,544,544 $12,997,500 $12,347,500 $11,389,800 -$957,700 -7.8%
1500 Permanent Staff 18,455,478 12,865,300 12,215,300 11,249,800 -965,500 -7.9 1600 Temporary, Daily-Rated & Other Staff 89,066 132,200 132,200 140,000 7,800 5.9
Other Operating Expenditure $27,819,834 $26,612,300 $27,812,300 $25,275,200 -$2,537,100 -9.1%
2100 Consumption of Products & Services 25,315,376 24,985,200 26,185,200 23,870,200 -2,315,000 -8.8 2300 Manpower Development 876,795 719,000 719,000 340,000 -379,000 -52.7 2400 International & Public Relations, Public
Communications 297,786 190,200 190,200 365,000 174,800 91.9
2700 Asset Acquisition 1,329,876 717,900 717,900 700,000 -17,900 -2.5
Development Estimates $9,250,369 $9,035,900 $10,215,900 $10,484,600 $268,700 2.6%
DEVELOPMENT EXPENDITURE $9,250,369 $9,035,900 $10,215,900 $10,484,600 $268,700 2.6%
5100 Government Development 9,250,369 9,035,900 10,215,900 10,484,600 268,700 2.6
Manpower
BLANK Actual Estimated Revised Estimated Category FY2018 FY2019 FY2019 FY2020
BLANK
Permanent Staff 137 118 89 94
TOTAL 137 118 89 94
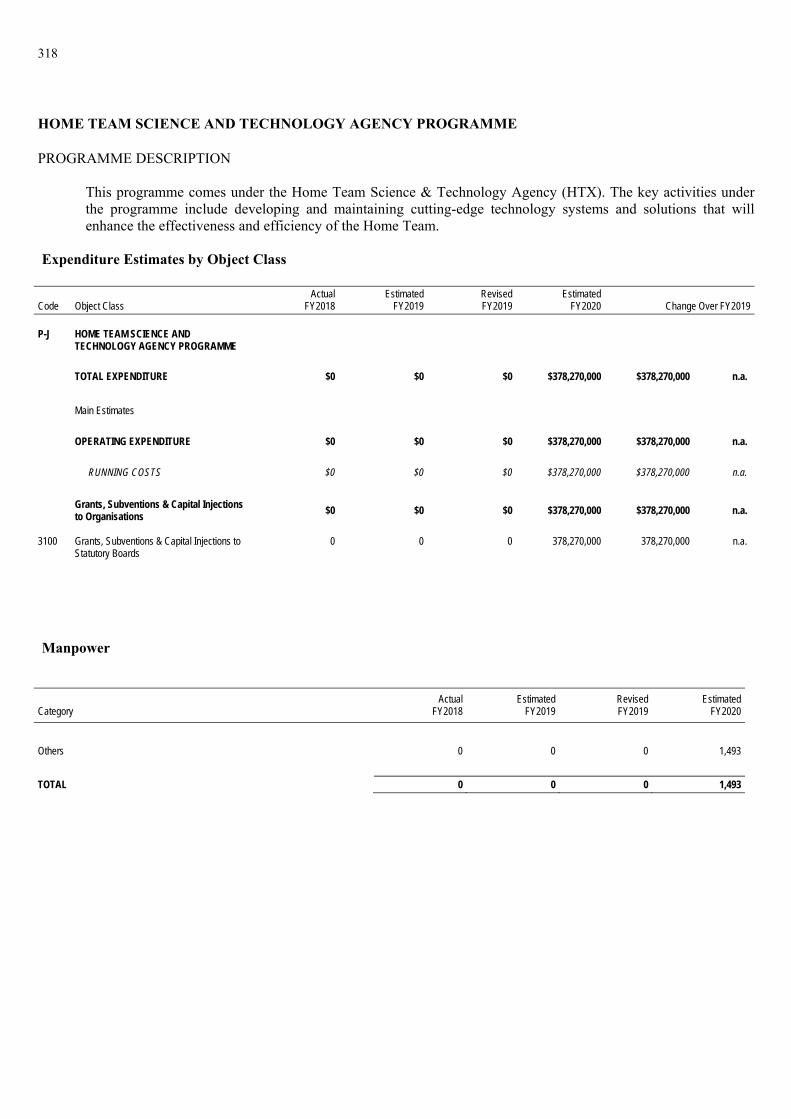
318
HOME TEAM SCIENCE AND TECHNOLOGY AGENCY PROGRAMME
PROGRAMME DESCRIPTION
This programme comes under the Home Team Science & Technology Agency (HTX). The key activities under the programme include developing and maintaining cutting-edge technology systems and solutions that will enhance the effectiveness and efficiency of the Home Team.
Expenditure Estimates by Object Class
BLANK Actual Estimated Revised Estimated Code Object Class FY2018 FY2019 FY2019 FY2020 Change Over FY2019
B BLANK P-J HOME TEAM SCIENCE AND
TECHNOLOGY AGENCY PROGRAMME $1 $1 $1 $1 $0 0.0%
TOTAL EXPENDITURE $0 $0 $0 $378,270,000 $378,270,000 n.a.
Main Estimates $0 $0 $0 $378,270,000 $378,270,000 n.a.
OPERATING EXPENDITURE $0 $0 $0 $378,270,000 $378,270,000 n.a.
RUNNING COSTS $0 $0 $0 $378,270,000 $378,270,000 n.a.
Grants, Subventions & Capital Injections to Organisations
$0 $0 $0 $378,270,000 $378,270,000 n.a.
3100 Grants, Subventions & Capital Injections to Statutory Boards
0 0 0 378,270,000 378,270,000 n.a.
Manpower
BLANK Actual Estimated Revised Estimated Category FY2018 FY2019 FY2019 FY2020
BLANK
Others 0 0 0 1,493
TOTAL 0 0 0 1,493

PROGRAMME DETAILS
Head Q ___________
Ministry of Communications and Information


319
ADMINISTRATION PROGRAMME
PROGRAMME DESCRIPTION
The Administration Programme comes under the Ministry of Communications and Information (MCI) Headquarters. The Programme’s main functions include providing policy directions for the development of the infocomm and media industries and libraries and driving corporate planning, management and governance.
Expenditure Estimates by Object Class
BLANK Actual Estimated Revised Estimated Code Object Class FY2018 FY2019 FY2019 FY2020 Change Over FY2019
B BLANK Q-A ADMINISTRATION PROGRAMME $1 $1 $1 $1 $0 0.0%
TOTAL EXPENDITURE $144,646,961 $132,121,100 $130,673,000 $133,130,700 $2,457,700 1.9%
Main Estimates $136,509,943 $125,224,600 $121,997,600 $125,943,700 $3,946,100 3.2%
OPERATING EXPENDITURE $136,509,943 $125,104,600 $121,877,600 $125,777,700 $3,900,100 3.2%
RUNNING COSTS $126,072,230 $116,867,600 $113,640,600 $125,740,700 $12,100,100 10.6%
Expenditure on Manpower $37,274,263 $28,534,600 $29,098,200 $28,020,600 -$1,077,600 -3.7%
1200 Political Appointments 2,156,996 2,073,400 1,950,000 2,000,000 50,000 2.61500 Permanent Staff 34,566,115 26,101,200 26,648,200 25,570,600 -1,077,600 -4.01600 Temporary, Daily-Rated & Other Staff 551,153 360,000 500,000 450,000 -50,000 -10.0
Other Operating Expenditure $54,086,006 $54,098,000 $50,317,200 $66,898,100 $16,580,900 33.0%
2100 Consumption of Products & Services 44,036,433 44,366,800 41,279,400 59,136,700 17,857,300 43.32300 Manpower Development 4,712,267 3,564,300 3,504,100 4,040,000 535,900 15.32400 International & Public Relations, Public
Communications 4,176,750 5,145,500 4,426,200 2,995,500 -1,430,700 -32.3
2700 Asset Acquisition 1,159,921 1,021,400 1,103,500 720,900 -382,600 -34.72800 Miscellaneous 635 0 4,000 5,000 1,000 25.0
Grants, Subventions & Capital Injections to Organisations
$34,711,960 $34,235,000 $34,225,200 $30,822,000 -$3,403,200 -9.9%
3400 Grants, Subventions & Capital Injections to Other Organisations
34,711,960 34,235,000 34,225,200 30,822,000 -3,403,200 -9.9
TRANSFERS $10,437,714 $8,237,000 $8,237,000 $37,000 -$8,200,000 -99.6%
3500 Social Transfers to Individuals 658,977 0 0 0 0 n.a.3600 Transfers to Institutions & Organisations 9,778,737 8,237,000 8,237,000 37,000 -8,200,000 -99.6
OTHER CONSOLIDATED FUND OUTLAYS $0 $120,000 $120,000 $166,000 $46,000 38.3%
4600 Loans and Advances (Disbursement) 0 120,000 120,000 166,000 46,000 38.3
Development Estimates $8,137,018 $7,016,500 $8,795,400 $7,353,000 -$1,442,400 -16.4%
DEVELOPMENT EXPENDITURE $8,137,018 $7,016,500 $8,795,400 $7,353,000 -$1,442,400 -16.4%
5100 Government Development 8,137,018 6,236,100 8,291,600 6,263,800 -2,027,800 -24.55200 Grants & Capital Injections to
Organisations 0 780,400 503,800 1,089,200 585,400 116.2
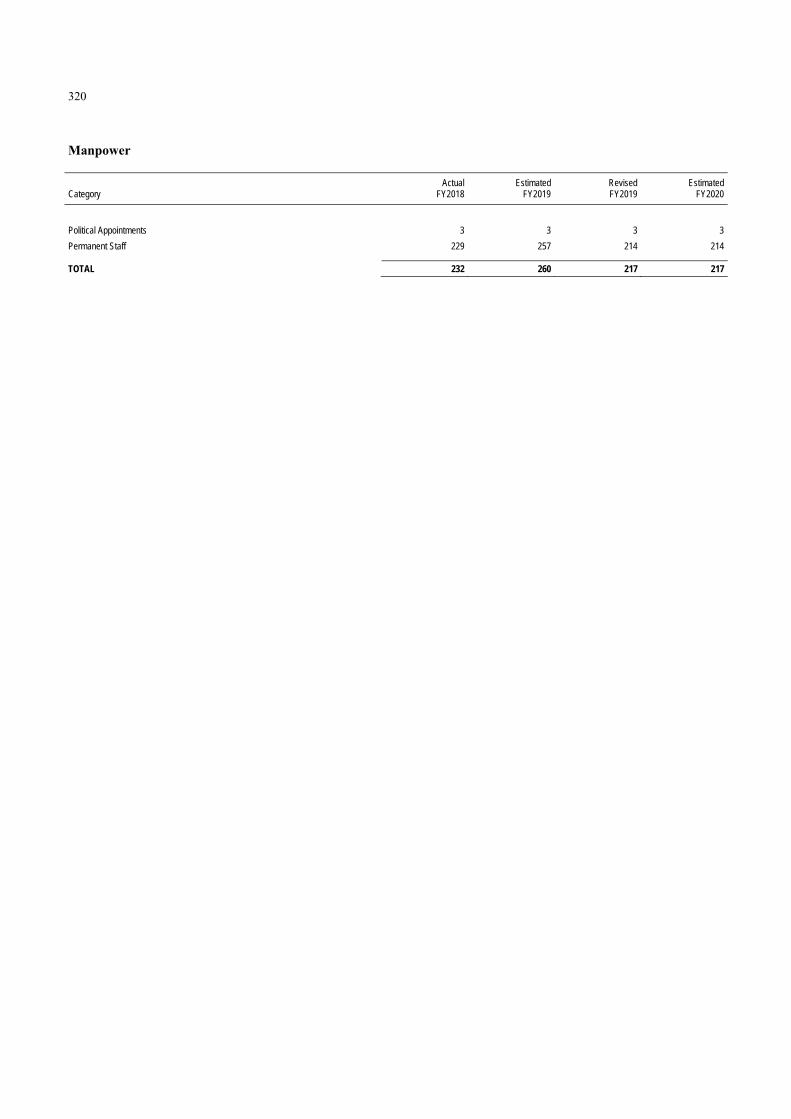
320
Manpower
BLANK Actual Estimated Revised Estimated Category FY2018 FY2019 FY2019 FY2020
BLANK
Political Appointments 3 3 3 3
Permanent Staff 229 257 214 214
TOTAL 232 260 217 217

321
INFORMATION PROGRAMME
PROGRAMME DESCRIPTION
The Information Programme comes under the Ministry of Communications and Information (MCI) Headquarters. The Programme’s main functions include providing Whole-Of-Government (WOG) communication guidance and centralised capabilities such as research, media monitoring, media management, content production, translation, public ground engagement and WOG information coordination to ministries.
Expenditure Estimates by Object Class BLANK Actual Estimated Revised Estimated Code Object Class FY2018 FY2019 FY2019 FY2020 Change Over FY2019
B BLANK Q-B INFORMATION PROGRAMME $1 $1 $1 $1 $0 0.0%
TOTAL EXPENDITURE $102,858,767 $104,326,100 $133,220,100 $115,933,200 -$17,286,900 -13.0%
Main Estimates $102,858,767 $104,326,100 $133,220,100 $115,933,200 -$17,286,900 -13.0%
OPERATING EXPENDITURE $102,858,767 $104,326,100 $133,220,100 $115,933,200 -$17,286,900 -13.0%
RUNNING COSTS $92,685,599 $96,574,100 $125,468,100 $97,679,200 -$27,788,900 -22.1%
Expenditure on Manpower $30,522,492 $28,723,100 $26,138,800 $27,230,600 $1,091,800 4.2%
1500 Permanent Staff 30,522,492 28,723,100 26,138,800 27,230,600 1,091,800 4.2
Other Operating Expenditure $62,163,108 $67,851,000 $99,329,300 $70,448,600 -$28,880,700 -29.1%
2100 Consumption of Products & Services 9,811,072 13,665,100 13,289,000 9,315,800 -3,973,200 -29.9 2300 Manpower Development 8,904 1,900 5,000 0 -5,000 -100.0 2400 International & Public Relations, Public
Communications 52,263,027 54,134,000 85,997,000 61,091,500 -24,905,500 -29.0
2700 Asset Acquisition 80,104 50,000 38,300 41,300 3,000 7.8
TRANSFERS $10,173,168 $7,752,000 $7,752,000 $18,254,000 $10,502,000 135.5%
3500 Social Transfers to Individuals 13,168 58,000 39,700 94,000 54,300 136.8 3600 Transfers to Institutions & Organisations 10,160,000 7,694,000 7,712,300 18,160,000 10,447,700 135.5
Manpower
BLANK Actual Estimated Revised Estimated Category FY2018 FY2019 FY2019 FY2020
BLANK
Permanent Staff 229 243 273 248
TOTAL 229 243 273 248

322
NATIONAL LIBRARY BOARD PROGRAMME
PROGRAMME DESCRIPTION
The National Library Board (NLB) nurtures readers for life, develops learning communities and builds a knowledgeable nation. NLB provides a trusted, accessible and globally-connected library and information service through the National Library and a network of 26 Public Libraries. The National Archives of Singapore oversees the collection, preservation and management of public and private archival records.
Expenditure Estimates by Object Class BLANK Actual Estimated Revised Estimated Code Object Class FY2018 FY2019 FY2019 FY2020 Change Over FY2019
B BLANK Q-J NATIONAL LIBRARY BOARD
PROGRAMME $1 $1 $1 $1 $0 0.0%
TOTAL EXPENDITURE $282,455,670 $272,969,300 $285,021,100 $269,482,500 -$15,538,600 -5.5%
Main Estimates $254,844,900 $247,905,200 $253,701,700 $252,675,900 -$1,025,800 -0.4%
OPERATING EXPENDITURE $254,844,900 $247,905,200 $253,701,700 $252,675,900 -$1,025,800 -0.4%
RUNNING COSTS $254,844,900 $247,905,200 $253,701,700 $252,675,900 -$1,025,800 -0.4%
Grants, Subventions & Capital Injections to Organisations
$254,844,900 $247,905,200 $253,701,700 $252,675,900 -$1,025,800 -0.4%
3100 Grants, Subventions & Capital Injections to Statutory Boards
254,844,900 247,905,200 253,701,700 252,675,900 -1,025,800 -0.4
Development Estimates $27,610,770 $25,064,100 $31,319,400 $16,806,600 -$14,512,800 -46.3%
DEVELOPMENT EXPENDITURE $27,610,770 $25,064,100 $31,319,400 $16,806,600 -$14,512,800 -46.3%
5200 Grants & Capital Injections to Organisations
27,610,770 25,064,100 31,319,400 16,806,600 -14,512,800 -46.3
Manpower
BLANK Actual Estimated Revised Estimated Category FY2018 FY2019 FY2019 FY2020
BLANK
Others 994 1,015 1,028 1,028
TOTAL 994 1,015 1,028 1,028

323
INFO-COMMUNICATIONS MEDIA DEVELOPMENT AUTHORITY PROGRAMME
PROGRAMME DESCRIPTION
The Infocomm Media Development Authority (IMDA) leads Singapore’s digital transformation with infocomm media. To do this, IMDA will develop a dynamic digital economy and a cohesive digital society, driven by a vibrant infocomm media (ICM) ecosystem – by developing talent, strengthening business capabilities, and enhancing Singapore’s ICM infrastructure. IMDA also regulates the telecommunications and media sectors to safeguard consumer interests while fostering a pro-business environment, and enhances Singapore’s data protection regime through the Personal Data Protection Commission.
Expenditure Estimates by Object Class
BLANK Actual Estimated Revised Estimated Code Object Class FY2018 FY2019 FY2019 FY2020 Change Over FY2019
B BLANK Q-S INFO-COMMUNICATIONS MEDIA
DEVELOPMENT AUTHORITY PROGRAMME
$1 $1 $1 $1 $0 0.0%
TOTAL EXPENDITURE $568,312,099 $471,929,200 $497,856,100 $437,828,300 -$60,027,800 -12.1%
Main Estimates $565,318,719 $453,976,300 $477,885,600 $429,129,900 -$48,755,700 -10.2%
OPERATING EXPENDITURE $565,318,719 $453,976,300 $477,885,600 $429,129,900 -$48,755,700 -10.2%
RUNNING COSTS $565,318,719 $453,976,300 $477,885,600 $429,129,900 -$48,755,700 -10.2%
Grants, Subventions & Capital Injections to Organisations
$565,318,719 $453,976,300 $477,885,600 $429,129,900 -$48,755,700 -10.2%
3100 Grants, Subventions & Capital Injections to Statutory Boards
565,318,719 453,976,300 477,885,600 429,129,900 -48,755,700 -10.2
Development Estimates $2,993,380 $17,952,900 $19,970,500 $8,698,400 -$11,272,100 -56.4%
DEVELOPMENT EXPENDITURE $2,993,380 $17,952,900 $19,970,500 $8,698,400 -$11,272,100 -56.4%
5200 Grants & Capital Injections to Organisations
2,993,380 17,952,900 19,970,500 8,698,400 -11,272,100 -56.4
Manpower
BLANK Actual Estimated Revised Estimated Category FY2018 FY2019 FY2019 FY2020
BLANK
Others 815 920 933 1,073
TOTAL 815 920 933 1,073

324
CYBER SECURITY AGENCY OF SINGAPORE PROGRAMME
PROGRAMME DESCRIPTION
The Cyber Security Agency of Singapore (CSA) aims to create a resilient and trusted cyber environment for Singapore. To do so, CSA directs the Critical Information Infrastructures (CII) on the essential cybersecurity measures to be adopted, and works with the owners to further strengthen cybersecurity through regular exercises and extending professional consultancy and direct assistance when necessary. CSA also partners academia and the business community to increase awareness on good cybersecurity practices and develop a vibrant cybersecurity ecosystem. CSA cooperates with international partners to conduct information exchange and cyber drills to aid its capability development, contribute to the shaping of international cyber norms as well as ASEAN capacity building.
Expenditure Estimates by Object Class
BLANK Actual Estimated Revised Estimated Code Object Class FY2018 FY2019 FY2019 FY2020 Change Over FY2019
B BLANK Q-T CYBER SECURITY AGENCY OF
SINGAPORE PROGRAMME $1 $1 $1 $1 $0 0.0%
TOTAL EXPENDITURE1 $56,597,276 $60,154,300 $75,379,000 $85,481,000 $10,102,000 13.4%
Main Estimates $52,048,275 $56,107,800 $65,955,000 $81,235,700 $15,280,700 23.2%
OPERATING EXPENDITURE $52,048,275 $56,107,800 $65,955,000 $81,235,700 $15,280,700 23.2%
RUNNING COSTS $51,611,705 $56,107,800 $65,955,000 $81,235,700 $15,280,700 23.2%
Expenditure on Manpower $27,635,754 $29,780,100 $39,484,800 $44,926,600 $5,441,800 13.8%
1500 Permanent Staff 27,407,997 29,530,100 39,354,300 44,678,200 5,323,900 13.5 1600 Temporary, Daily-Rated & Other Staff 227,757 250,000 130,500 248,400 117,900 90.3
Other Operating Expenditure $23,796,147 $26,327,700 $26,470,200 $36,309,100 $9,838,900 37.2%
2100 Consumption of Products & Services 18,219,516 21,720,200 21,685,600 28,954,700 7,269,100 33.5 2300 Manpower Development 1,960,377 2,007,500 1,114,800 2,070,500 955,700 85.7 2400 International & Public Relations, Public
Communications 2,948,792 2,000,000 3,168,000 4,583,900 1,415,900 44.7
2700 Asset Acquisition 667,462 600,000 501,800 700,000 198,200 39.5
Grants, Subventions & Capital Injections to Organisations $179,804 $0 $0 $0 $0 n.a.
3400 Grants, Subventions & Capital Injections to Other Organisations
179,804 0 0 0 0 n.a.
TRANSFERS $436,570 $0 $0 $0 $0 n.a.
3500 Social Transfers to Individuals 436,570 0 0 0 0 n.a.
Development Estimates $4,549,001 $4,046,500 $9,424,000 $4,245,300 -$5,178,700 -55.0%
DEVELOPMENT EXPENDITURE $4,549,001 $4,046,500 $9,424,000 $4,245,300 -$5,178,700 -55.0%
5100 Government Development 4,549,001 4,046,500 9,424,000 4,245,300 -5,178,700 -55.0
_______________________________________________ 1 Estimates prior to FY2018 were subsumed under the Administration Programme.

325
Manpower
BLANK Actual Estimated Revised Estimated Category FY2018 FY2019 FY2019 FY2020
BLANK
Permanent Staff 190 291 307 308
TOTAL 190 291 307 308

PROGRAMME DETAILS
Head R ___________
Ministry of Law

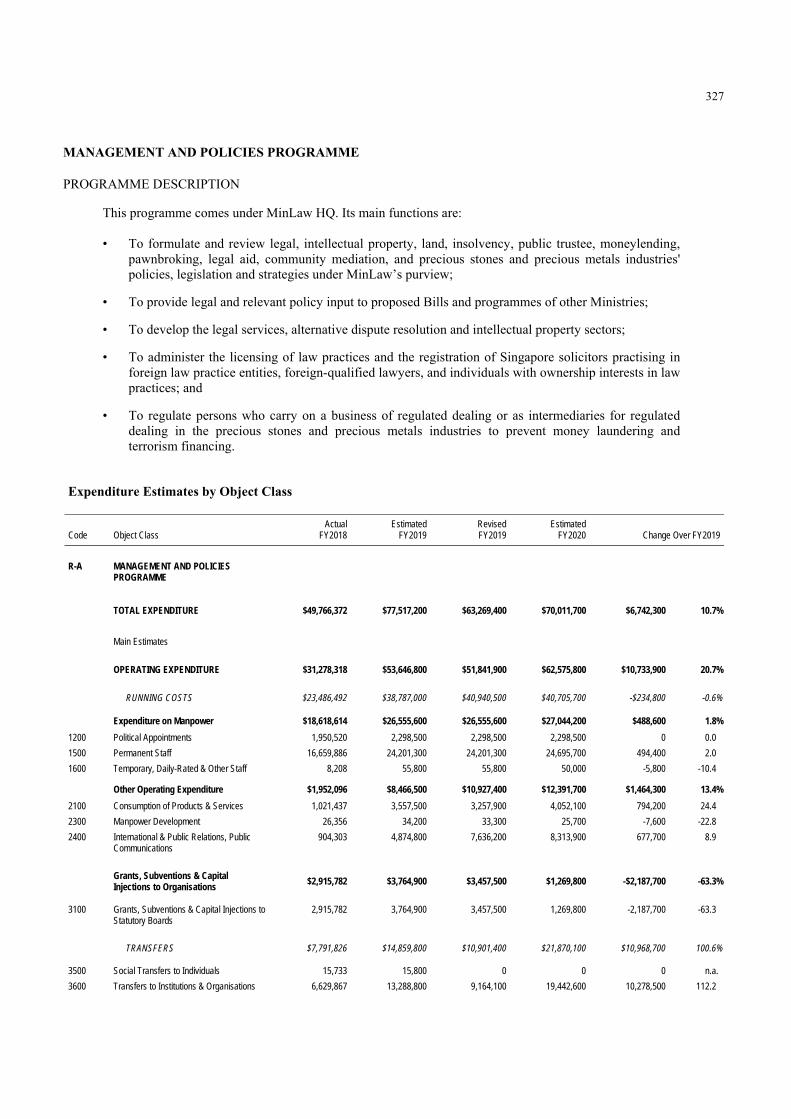
327
MANAGEMENT AND POLICIES PROGRAMME
PROGRAMME DESCRIPTION
This programme comes under MinLaw HQ. Its main functions are:
• To formulate and review legal, intellectual property, land, insolvency, public trustee, moneylending,pawnbroking, legal aid, community mediation, and precious stones and precious metals industries'policies, legislation and strategies under MinLaw’s purview;
• To provide legal and relevant policy input to proposed Bills and programmes of other Ministries;
• To develop the legal services, alternative dispute resolution and intellectual property sectors;
• To administer the licensing of law practices and the registration of Singapore solicitors practising inforeign law practice entities, foreign-qualified lawyers, and individuals with ownership interests in lawpractices; and
• To regulate persons who carry on a business of regulated dealing or as intermediaries for regulateddealing in the precious stones and precious metals industries to prevent money laundering andterrorism financing.
Expenditure Estimates by Object Class
BLANK Actual Estimated Revised Estimated Code Object Class FY2018 FY2019 FY2019 FY2020 Change Over FY2019
B BLANK R-A MANAGEMENT AND POLICIES
PROGRAMME $1 $1 $1 $1 $0 0.0%
TOTAL EXPENDITURE $49,766,372 $77,517,200 $63,269,400 $70,011,700 $6,742,300 10.7%
Main Estimates $31,278,318 $53,646,800 $51,841,900 $62,575,800 $10,733,900 20.7%
OPERATING EXPENDITURE $31,278,318 $53,646,800 $51,841,900 $62,575,800 $10,733,900 20.7%
RUNNING COSTS $23,486,492 $38,787,000 $40,940,500 $40,705,700 -$234,800 -0.6%
Expenditure on Manpower $18,618,614 $26,555,600 $26,555,600 $27,044,200 $488,600 1.8%
1200 Political Appointments 1,950,520 2,298,500 2,298,500 2,298,500 0 0.0
1500 Permanent Staff 16,659,886 24,201,300 24,201,300 24,695,700 494,400 2.0
1600 Temporary, Daily-Rated & Other Staff 8,208 55,800 55,800 50,000 -5,800 -10.4
Other Operating Expenditure $1,952,096 $8,466,500 $10,927,400 $12,391,700 $1,464,300 13.4%
2100 Consumption of Products & Services 1,021,437 3,557,500 3,257,900 4,052,100 794,200 24.4
2300 Manpower Development 26,356 34,200 33,300 25,700 -7,600 -22.8
2400 International & Public Relations, Public Communications
904,303 4,874,800 7,636,200 8,313,900 677,700 8.9
Grants, Subventions & Capital Injections to Organisations
$2,915,782 $3,764,900 $3,457,500 $1,269,800 -$2,187,700 -63.3%
3100 Grants, Subventions & Capital Injections to Statutory Boards
2,915,782 3,764,900 3,457,500 1,269,800 -2,187,700 -63.3
TRANSFERS $7,791,826 $14,859,800 $10,901,400 $21,870,100 $10,968,700 100.6%
3500 Social Transfers to Individuals 15,733 15,800 0 0 0 n.a.
3600 Transfers to Institutions & Organisations 6,629,867 13,288,800 9,164,100 19,442,600 10,278,500 112.2
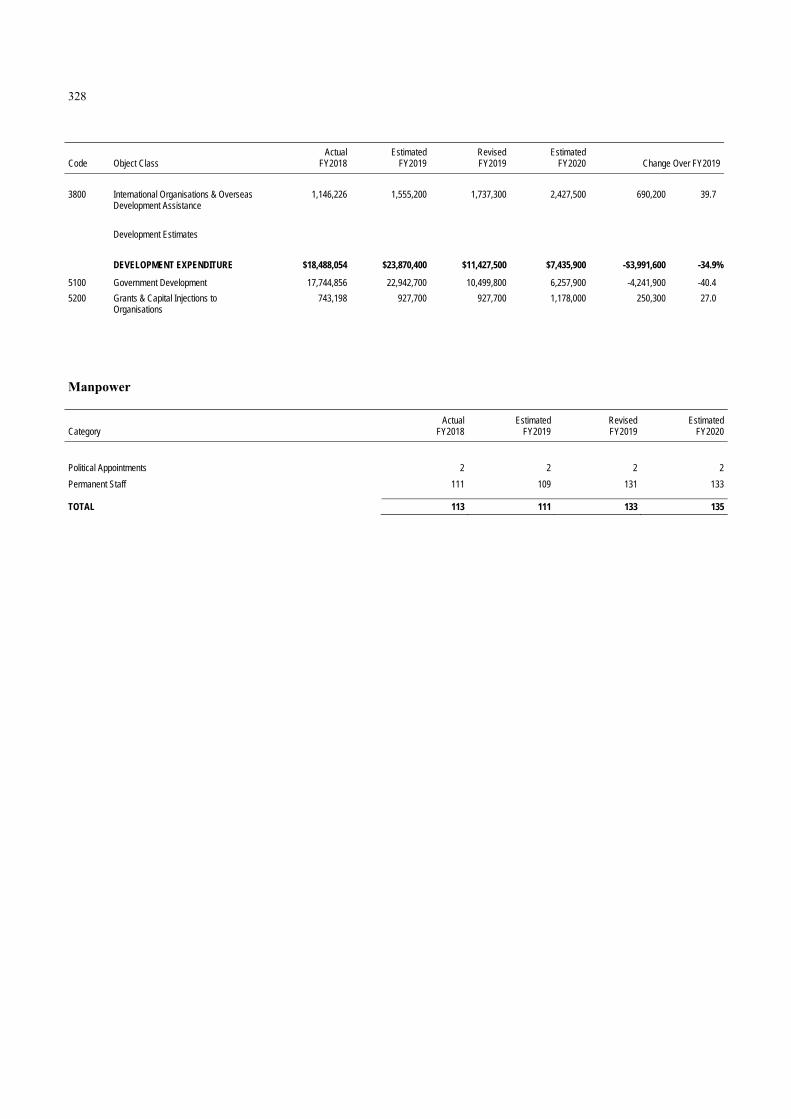
328
BLANK Actual Estimated Revised Estimated Code Object Class FY2018 FY2019 FY2019 FY2020 Change Over FY2019
B BLANK 3800 International Organisations & Overseas
Development Assistance 1,146,226 1,555,200 1,737,300 2,427,500 690,200 39.7
Development Estimates $18,488,054 $23,870,400 $11,427,500 $7,435,900 -$3,991,600 -34.9%
DEVELOPMENT EXPENDITURE $18,488,054 $23,870,400 $11,427,500 $7,435,900 -$3,991,600 -34.9%
5100 Government Development 17,744,856 22,942,700 10,499,800 6,257,900 -4,241,900 -40.4
5200 Grants & Capital Injections to Organisations
743,198 927,700 927,700 1,178,000 250,300 27.0
Manpower
BLANK Actual Estimated Revised Estimated Category FY2018 FY2019 FY2019 FY2020
BLANK
Political Appointments 2 2 2 2
Permanent Staff 111 109 131 133
TOTAL 113 111 133 135

329
INFORMATION TECHNOLOGY AND DATA MANAGEMENT PROGRAMME
PROGRAMME DESCRIPTION
This programme comes under the Information Technology Division. The first function is to provide Information and Communications Technology (ICT) planning and management services for the Ministry. This includes business process reviews to better utilise ICT, formulation of ICT plans, acquisition of ICT resources and ICT services, and management of ICT contracts. The second function is to operationalise data governance, compliance and sharing, and to support the development of data analytics platforms in the Ministry.
Expenditure Estimates by Object Class
BLANK Actual Estimated Revised Estimated Code Object Class FY2018 FY2019 FY2019 FY2020 Change Over FY2019
B BLANK R-B INFORMATION TECHNOLOGY AND
DATA MANAGEMENT PROGRAMME $1 $1 $1 $1 $0 0.0%
TOTAL EXPENDITURE $12,796,093 $15,037,800 $14,529,000 $15,404,100 $875,100 6.0%
Main Estimates $12,796,093 $15,037,800 $14,529,000 $15,404,100 $875,100 6.0%
OPERATING EXPENDITURE $12,796,093 $15,037,800 $14,529,000 $15,404,100 $875,100 6.0%
RUNNING COSTS $12,796,093 $15,037,800 $14,529,000 $15,404,100 $875,100 6.0%
Other Operating Expenditure $12,796,093 $15,037,800 $14,529,000 $15,404,100 $875,100 6.0%
2100 Consumption of Products & Services 12,773,829 14,936,600 14,443,400 15,319,900 876,500 6.1
2700 Asset Acquisition 22,264 101,200 85,600 84,200 -1,400 -1.6

330
APPEALS BOARD PROGRAMME
PROGRAMME DESCRIPTION
This programme comes under the Appeals Board, a tribunal constituted under the Land Acquisition Act to hear appeals in respect of any award of compensation made by the Collector of Land Revenue under the Land Acquisition Act for the compulsory acquisition of land. Its main functions are:
• To accept the filing of appeals in accordance with the Land Acquisition Act and maintain the Register of
Appeals; • To adjudicate on the merits of appeals lodged against compensation awards made by the Collector of Land
Revenue in respect of land acquired under the Land Acquisition Act, which proceed to hearing; and • In suitable cases, to facilitate an amicable settlement on the compensation.
Expenditure Estimates by Object Class BLANK Actual Estimated Revised Estimated Code Object Class FY2018 FY2019 FY2019 FY2020 Change Over FY2019
B BLANK R-D APPEALS BOARD PROGRAMME $1 $1 $1 $1 $0 0.0%
TOTAL EXPENDITURE $209,786 $259,200 $259,000 $231,100 -$27,900 -10.8%
Main Estimates $209,786 $259,200 $259,000 $231,100 -$27,900 -10.8%
OPERATING EXPENDITURE $209,786 $259,200 $259,000 $231,100 -$27,900 -10.8%
RUNNING COSTS $209,786 $259,200 $259,000 $231,100 -$27,900 -10.8%
Expenditure on Manpower $196,697 $241,800 $241,800 $211,900 -$29,900 -12.4%
1500 Permanent Staff 196,697 241,800 241,800 211,900 -29,900 -12.4
Other Operating Expenditure $13,090 $17,400 $17,200 $19,200 $2,000 11.6%
2100 Consumption of Products & Services 10,960 16,000 15,800 17,800 2,000 12.7
2300 Manpower Development 2,130 1,400 1,400 1,400 0 0.0
Manpower
BLANK Actual Estimated Revised Estimated Category FY2018 FY2019 FY2019 FY2020
BLANK
Permanent Staff 4 4 4 4
TOTAL 4 4 4 4

331
PUBLIC TRUSTEE PROGRAMME
PROGRAMME DESCRIPTION
This programme comes under the Public Trustee's Office. Its functions are to administer relevant estates of deceased and other persons and relevant motor accident compensation claims.
Expenditure Estimates by Object Class
BLANK Actual Estimated Revised Estimated Code Object Class FY2018 FY2019 FY2019 FY2020 Change Over FY2019
B BLANK R-E PUBLIC TRUSTEE PROGRAMME $1 $1 $1 $1 $0 0.0%
TOTAL EXPENDITURE $1,813,389 $1,935,400 $1,936,100 $1,898,700 -$37,400 -1.9%
Main Estimates $1,813,389 $1,935,400 $1,936,100 $1,898,700 -$37,400 -1.9%
OPERATING EXPENDITURE $1,813,389 $1,935,400 $1,936,100 $1,898,700 -$37,400 -1.9%
RUNNING COSTS $1,813,389 $1,935,400 $1,936,100 $1,898,700 -$37,400 -1.9%
Expenditure on Manpower $1,782,459 $1,879,500 $1,879,500 $1,833,700 -$45,800 -2.4%
1500 Permanent Staff 1,778,983 1,879,500 1,879,500 1,833,700 -45,800 -2.4
1600 Temporary, Daily-Rated & Other Staff 3,476 0 0 0 0 n.a.
Other Operating Expenditure $30,930 $55,900 $56,600 $65,000 $8,400 14.8%
2100 Consumption of Products & Services 21,574 42,700 41,400 43,100 1,700 4.1
2300 Manpower Development 8,017 8,900 8,900 9,400 500 5.6
2400 International & Public Relations, Public Communications
0 500 500 500 0 0.0
2800 Miscellaneous 1,339 3,800 5,800 12,000 6,200 106.9
Manpower
BLANK Actual Estimated Revised Estimated Category FY2018 FY2019 FY2019 FY2020
BLANK
Permanent Staff 23 23 23 23
TOTAL 23 23 23 23

332
REGISTRIES OF MONEYLENDERS AND PAWNBROKERS PROGRAMME
PROGRAMME DESCRIPTION
This programme comes under the Registries of Moneylenders and Pawnbrokers. Its functions are to license and regulate moneylenders and pawnbrokers.
Expenditure Estimates by Object Class
BLANK Actual Estimated Revised Estimated Code Object Class FY2018 FY2019 FY2019 FY2020 Change Over FY2019
B BLANK R-F REGISTRIES OF MONEYLENDERS AND
PAWNBROKERS PROGRAMME $1 $1 $1 $1 $0 0.0%
TOTAL EXPENDITURE $3,192,504 $3,461,300 $3,477,800 $3,132,900 -$344,900 -9.9%
Main Estimates $3,192,504 $3,461,300 $3,477,800 $3,132,900 -$344,900 -9.9%
OPERATING EXPENDITURE $3,192,504 $3,461,300 $3,477,800 $3,132,900 -$344,900 -9.9%
RUNNING COSTS $3,192,504 $3,461,300 $3,477,800 $3,132,900 -$344,900 -9.9%
Expenditure on Manpower $3,140,845 $3,397,100 $3,397,100 $3,066,200 -$330,900 -9.7%
1500 Permanent Staff 3,140,845 3,397,100 3,397,100 3,066,200 -330,900 -9.7
Other Operating Expenditure $51,659 $64,200 $80,700 $66,700 -$14,000 -17.3%
2100 Consumption of Products & Services 35,153 50,900 51,700 48,700 -3,000 -5.8
2300 Manpower Development 16,506 13,300 18,700 18,000 -700 -3.7
2400 International & Public Relations, Public Communications
0 0 10,300 0 -10,300 -100.0
Manpower
BLANK Actual Estimated Revised Estimated Category FY2018 FY2019 FY2019 FY2020
BLANK
Permanent Staff 37 37 37 37
TOTAL 37 37 37 37
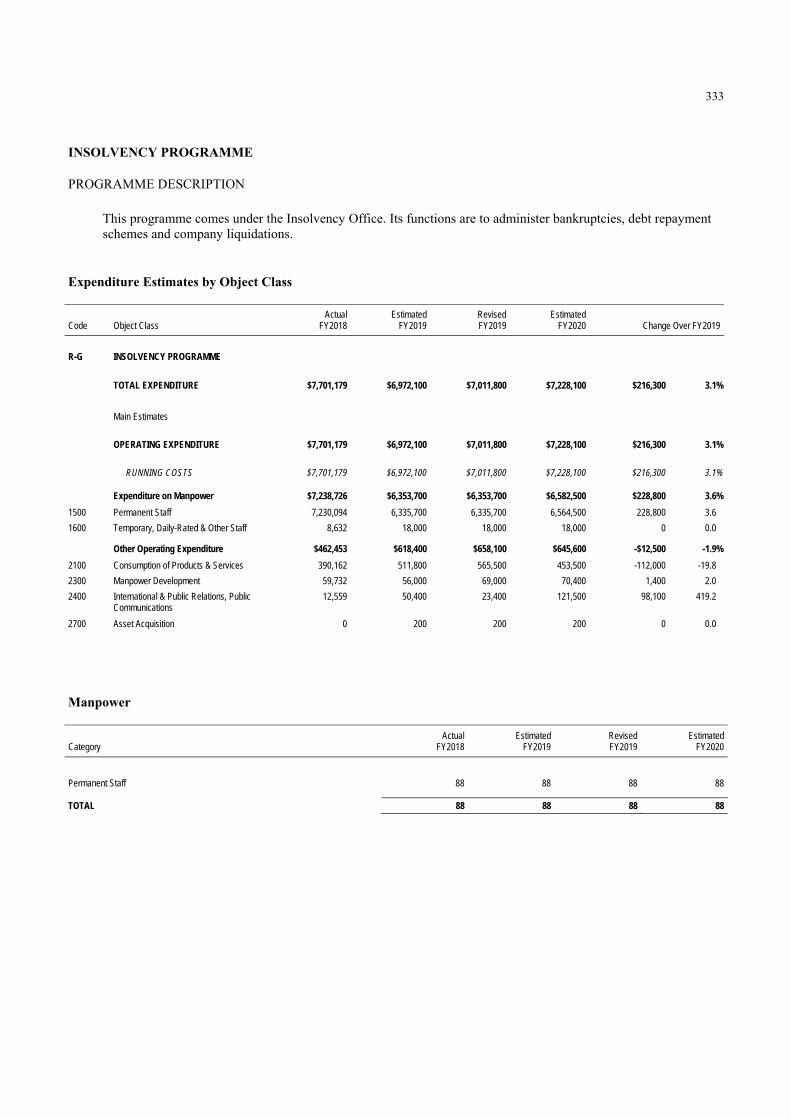
333
INSOLVENCY PROGRAMME
PROGRAMME DESCRIPTION
This programme comes under the Insolvency Office. Its functions are to administer bankruptcies, debt repayment schemes and company liquidations.
Expenditure Estimates by Object Class
BLANK Actual Estimated Revised Estimated Code Object Class FY2018 FY2019 FY2019 FY2020 Change Over FY2019
B BLANK R-G INSOLVENCY PROGRAMME $1 $1 $1 $1 $0 0.0%
TOTAL EXPENDITURE $7,701,179 $6,972,100 $7,011,800 $7,228,100 $216,300 3.1%
Main Estimates $7,701,179 $6,972,100 $7,011,800 $7,228,100 $216,300 3.1%
OPERATING EXPENDITURE $7,701,179 $6,972,100 $7,011,800 $7,228,100 $216,300 3.1%
RUNNING COSTS $7,701,179 $6,972,100 $7,011,800 $7,228,100 $216,300 3.1%
Expenditure on Manpower $7,238,726 $6,353,700 $6,353,700 $6,582,500 $228,800 3.6%
1500 Permanent Staff 7,230,094 6,335,700 6,335,700 6,564,500 228,800 3.6
1600 Temporary, Daily-Rated & Other Staff 8,632 18,000 18,000 18,000 0 0.0
Other Operating Expenditure $462,453 $618,400 $658,100 $645,600 -$12,500 -1.9%
2100 Consumption of Products & Services 390,162 511,800 565,500 453,500 -112,000 -19.8
2300 Manpower Development 59,732 56,000 69,000 70,400 1,400 2.0
2400 International & Public Relations, Public Communications
12,559 50,400 23,400 121,500 98,100 419.2
2700 Asset Acquisition 0 200 200 200 0 0.0
Manpower
BLANK Actual Estimated Revised Estimated Category FY2018 FY2019 FY2019 FY2020
BLANK
Permanent Staff 88 88 88 88
TOTAL 88 88 88 88

334
LEGAL AID PROGRAMME
PROGRAMME DESCRIPTION
This programme comes under the Legal Aid Bureau. Its functions are to provide legal aid, assistance and advice to persons of limited means on a wide range of civil matters including divorce, adoptions, claims for maintenance, custody of children, separation, wrongful dismissals, tenancy disputes, monetary claims, motor and industrial accident claims and estate matters.
Expenditure Estimates by Object Class
BLANK Actual Estimated Revised Estimated Code Object Class FY2018 FY2019 FY2019 FY2020 Change Over FY2019
B BLANK R-I LEGAL AID PROGRAMME $1 $1 $1 $1 $0 0.0%
TOTAL EXPENDITURE $6,812,666 $10,493,800 $10,497,400 $7,251,600 -$3,245,800 -30.9%
Main Estimates $6,664,677 $10,232,200 $10,235,800 $7,189,200 -$3,046,600 -29.8%
OPERATING EXPENDITURE $6,664,677 $10,232,200 $10,235,800 $7,189,200 -$3,046,600 -29.8%
RUNNING COSTS $6,664,677 $10,232,200 $10,235,800 $7,189,200 -$3,046,600 -29.8%
Expenditure on Manpower $6,530,795 $7,124,100 $7,124,100 $7,066,900 -$57,200 -0.8%
1500 Permanent Staff 6,490,309 7,057,100 7,057,100 6,999,900 -57,200 -0.8
1600 Temporary, Daily-Rated & Other Staff 40,487 67,000 67,000 67,000 0 0.0
Other Operating Expenditure $133,882 $3,108,100 $3,111,700 $122,300 -$2,989,400 -96.1%
2100 Consumption of Products & Services 56,497 3,062,000 3,071,200 78,800 -2,992,400 -97.4
2300 Manpower Development 24,101 28,500 30,500 28,500 -2,000 -6.6
2400 International & Public Relations, Public Communications
51,382 14,300 10,000 15,000 5,000 50.0
2700 Asset Acquisition 1,902 3,300 0 0 0 n.a.
Development Estimates $147,989 $261,600 $261,600 $62,400 -$199,200 -76.1%
DEVELOPMENT EXPENDITURE $147,989 $261,600 $261,600 $62,400 -$199,200 -76.1%
5100 Government Development 147,989 261,600 261,600 62,400 -199,200 -76.1
Manpower
BLANK Actual Estimated Revised Estimated Category FY2018 FY2019 FY2019 FY2020
BLANK
Permanent Staff 65 65 65 65
TOTAL 65 65 65 65

335
SUPPORT SERVICES PROGRAMME
PROGRAMME DESCRIPTION
This programme comes under MinLaw HQ. Its function is to provide support services in human resource, staff development, finance, corporate communications, corporate development and planning, audit and enterprise risk management, and general administration, including for the Departments of MinLaw.
Expenditure Estimates by Object Class
BLANK Actual Estimated Revised Estimated Code Object Class FY2018 FY2019 FY2019 FY2020 Change Over FY2019
B BLANK R-J SUPPORT SERVICES PROGRAMME $1 $1 $1 $1 $0 0.0%
TOTAL EXPENDITURE $22,747,976 $25,536,600 $24,708,300 $26,580,000 $1,871,700 7.6%
Main Estimates $22,747,976 $25,536,600 $24,708,300 $26,580,000 $1,871,700 7.6%
OPERATING EXPENDITURE $22,747,976 $25,536,600 $24,708,300 $26,580,000 $1,871,700 7.6%
RUNNING COSTS $22,747,976 $25,536,600 $24,708,300 $26,580,000 $1,871,700 7.6%
Expenditure on Manpower $10,917,624 $12,144,900 $12,144,900 $13,361,500 $1,216,600 10.0%
1500 Permanent Staff 10,903,599 12,118,500 12,118,500 13,335,500 1,217,000 10.0
1600 Temporary, Daily-Rated & Other Staff 14,025 26,400 26,400 26,000 -400 -1.5
Other Operating Expenditure $11,830,352 $13,391,700 $12,563,400 $13,218,500 $655,100 5.2%
2100 Consumption of Products & Services 10,885,240 11,598,700 10,731,000 10,971,200 240,200 2.2
2300 Manpower Development 780,087 1,620,100 1,471,600 2,029,300 557,700 37.9
2400 International & Public Relations, Public Communications
48,673 144,400 304,700 180,400 -124,300 -40.8
2700 Asset Acquisition 53,133 28,500 38,800 37,600 -1,200 -3.1
2800 Miscellaneous 63,219 0 17,300 0 -17,300 -100.0
Manpower
BLANK Actual Estimated Revised Estimated Category FY2018 FY2019 FY2019 FY2020
BLANK
Permanent Staff 128 128 128 128
TOTAL 128 128 128 128

336
LANDS AND PROPERTIES ADMINISTRATION PROGRAMME
PROGRAMME DESCRIPTION
This programme is administered through the Singapore Land Authority. The functions carried out under this programme include the management of State land and properties, sale of State land and compulsory acquisition of private land.
Expenditure Estimates by Object Class
BLANK Actual Estimated Revised Estimated Code Object Class FY2018 FY2019 FY2019 FY2020 Change Over FY2019
B BLANK R-N LANDS AND PROPERTIES
ADMINISTRATION PROGRAMME $1 $1 $1 $1 $0 0.0%
TOTAL EXPENDITURE $295,469,081 $413,282,100 $423,757,800 $256,355,400 -$167,402,400 -39.5%
Main Estimates $129,364,143 $151,537,800 $145,206,200 $158,104,600 $12,898,400 8.9%
OPERATING EXPENDITURE $97,410,144 $114,015,600 $112,580,200 $118,474,600 $5,894,400 5.2%
RUNNING COSTS $97,410,144 $114,015,600 $112,580,200 $118,474,600 $5,894,400 5.2%
Other Operating Expenditure $91,084,134 $109,348,500 $103,806,300 $106,686,000 $2,879,700 2.8%
2100 Consumption of Products & Services 91,084,134 109,348,500 103,806,300 106,686,000 2,879,700 2.8
Grants, Subventions & Capital Injections to Organisations $6,326,010 $4,667,100 $8,773,900 $11,788,600 $3,014,700 34.4%
3100 Grants, Subventions & Capital Injections to Statutory Boards
6,326,010 4,667,100 8,773,900 11,788,600 3,014,700 34.4
OTHER CONSOLIDATED FUND OUTLAYS
$31,953,999 $37,522,200 $32,626,000 $39,630,000 $7,004,000 21.5%
4100 Expenses on Land Sales 31,953,999 37,522,200 32,626,000 39,630,000 7,004,000 21.5
Development Estimates $198,058,937 $299,266,500 $311,177,600 $137,880,800 -$173,296,800 -55.7%
DEVELOPMENT EXPENDITURE $198,058,937 $299,266,500 $311,177,600 $137,880,800 -$173,296,800 -55.7%
5100 Government Development 198,058,937 299,266,500 311,177,600 137,880,800 -173,296,800 -55.7
Manpower
BLANK Actual Estimated Revised Estimated Category FY2018 FY2019 FY2019 FY2020
BLANK
Others 552 555 557 550
TOTAL 552 555 557 550

337
COMMUNITY MEDIATION PROGRAMME
PROGRAMME DESCRIPTION
This programme comes under the Community Mediation Unit. Its main functions are: • To provide community mediation services to the public; and • To promote mediation as a preferred means of dispute resolution for social and relational disputes.
Expenditure Estimates by Object Class
BLANK Actual Estimated Revised Estimated Code Object Class FY2018 FY2019 FY2019 FY2020 Change Over FY2019
B BLANK R-O COMMUNITY MEDIATION PROGRAMME $1 $1 $1 $1 $0 0.0%
TOTAL EXPENDITURE $918,520 $1,078,300 $1,080,200 $949,300 -$130,900 -12.1%
Main Estimates $918,520 $1,078,300 $1,080,200 $949,300 -$130,900 -12.1%
OPERATING EXPENDITURE $918,520 $1,078,300 $1,080,200 $949,300 -$130,900 -12.1%
RUNNING COSTS $918,520 $1,078,300 $1,080,200 $949,300 -$130,900 -12.1%
Expenditure on Manpower $739,196 $850,500 $850,500 $724,900 -$125,600 -14.8%
1500 Permanent Staff 739,196 850,500 850,500 724,900 -125,600 -14.8
Other Operating Expenditure $179,324 $227,800 $229,700 $224,400 -$5,300 -2.3%
2100 Consumption of Products & Services 35,752 61,200 54,900 67,000 12,100 22.0
2300 Manpower Development 2,462 5,100 4,300 4,400 100 2.3
2400 International & Public Relations, Public Communications
141,110 161,500 170,500 153,000 -17,500 -10.3
Manpower
BLANK Actual Estimated Revised Estimated Category FY2018 FY2019 FY2019 FY2020
BLANK
Permanent Staff 14 14 14 14
TOTAL 14 14 14 14


PROGRAMME DETAILS
Head S ___________
Ministry of Manpower


339
FINANCIAL SECURITY FOR SINGAPOREANS PROGRAMME
PROGRAMME DESCRIPTION
MOM aims to help Singaporeans achieve financial security, and peace of mind in retirement through the Central Provident Fund (CPF) system, lifelong employability, and financial education and planning.
This programme comprises the following Division:
Income Security Policy Division The division works closely with the CPF Board, the Monetary Authority of Singapore and other partners in the social and economic sectors to formulate policies and strategies to enhance Singaporeans’ retirement adequacy, and drive and coordinate Government’s efforts to improve Singaporeans’ financial well-being.
Expenditure Estimates by Object Class
BLANK Actual Estimated Revised Estimated Code Object Class FY2018 FY2019 FY2019 FY2020 Change Over FY2019
B BLANK S-Q FINANCIAL SECURITY FOR
SINGAPOREANS PROGRAMME $1 $1 $1 $1 $0 0.0%
TOTAL EXPENDITURE $1,029,219,512 $1,086,680,200 $1,066,371,200 $1,449,527,100 $383,155,900 35.9%
Main Estimates $1,027,326,608 $1,085,488,800 $1,064,453,300 $1,449,527,100 $385,073,800 36.2%
OPERATING EXPENDITURE $1,027,326,608 $1,085,488,800 $1,064,453,300 $1,449,527,100 $385,073,800 36.2%
RUNNING COSTS $39,560,474 $40,012,900 $43,796,400 $45,803,100 $2,006,700 4.6%
Expenditure on Manpower $4,927,762 $4,106,300 $4,884,400 $4,949,700 $65,300 1.3%
1500 Permanent Staff 4,927,762 4,106,300 4,884,400 4,949,700 65,300 1.3
Other Operating Expenditure $34,632,712 $35,906,600 $38,912,000 $40,853,400 $1,941,400 5.0%
2100 Consumption of Products & Services 34,241,783 31,912,900 38,359,400 40,280,200 1,920,800 5.0 2300 Manpower Development 82,982 486,000 56,900 61,900 5,000 8.8 2400 International & Public Relations, Public
Communications 297,572 3,434,800 488,500 503,500 15,000 3.1
2700 Asset Acquisition 10,375 72,900 7,200 7,800 600 8.3
TRANSFERS $987,766,135 $1,045,475,900 $1,020,656,900 $1,403,724,000 $383,067,100 37.5%
3500 Social Transfers to Individuals 987,766,135 1,045,475,900 1,020,656,900 1,403,724,000 383,067,100 37.5
Development Estimates $1,892,904 $1,191,400 $1,917,900 $0 -$1,917,900 -100.0%
DEVELOPMENT EXPENDITURE $1,892,904 $1,191,400 $1,917,900 $0 -$1,917,900 -100.0%
5100 Government Development 1,892,904 1,191,400 1,917,900 0 -1,917,900 -100.0
Manpower
BLANK Actual Estimated Revised EstimatedCategory FY2018 FY2019 FY2019 FY2020
BLANK
Permanent Staff 22 23 21 22
Temporary, Daily-Rated & Other Staff 16 17 19 22
TOTAL 38 40 40 44

340
CORPORATE SERVICES AND INFORMATION TECHNOLOGY PROGRAMME
PROGRAMME DESCRIPTION
This programme deals with the central management and administration of MOM. It includes the corporate services functions of corporate planning, corporate communications, customer responsiveness, legal services, financial, internal audit, information systems and technology, and human resource administration.
Expenditure Estimates by Object Class BLANK Actual Estimated Revised Estimated Code Object Class FY2018 FY2019 FY2019 FY2020 Change Over FY2019
B BLANK S-R CORPORATE SERVICES AND
INFORMATION TECHNOLOGY PROGRAMME
$1 $1 $1 $1 $0 0.0%
TOTAL EXPENDITURE $154,774,781 $151,116,800 $169,162,500 $274,531,300 $105,368,800 62.3%
Main Estimates $139,097,097 $135,609,600 $138,904,600 $249,626,600 $110,722,000 79.7%
OPERATING EXPENDITURE $139,097,097 $135,609,600 $138,904,600 $249,626,600 $110,722,000 79.7%
RUNNING COSTS $131,739,462 $128,783,900 $131,297,300 $130,484,100 -$813,200 -0.6%
Expenditure on Manpower $34,333,414 $33,301,100 $33,932,800 $34,362,000 $429,200 1.3%
1200 Political Appointments 1,943,536 1,823,900 1,828,300 1,828,300 0 0.0 1500 Permanent Staff 32,389,879 31,477,200 32,104,500 32,533,700 429,200 1.3
Other Operating Expenditure $97,406,047 $95,482,800 $97,364,500 $91,619,200 -$5,745,300 -5.9%
2100 Consumption of Products & Services 92,310,578 83,516,600 92,150,800 86,186,400 -5,964,400 -6.5 2300 Manpower Development 2,804,520 3,223,300 2,927,200 3,309,400 382,200 13.1 2400 International & Public Relations, Public
Communications 1,788,230 8,368,000 1,784,600 1,657,500 -127,100 -7.1
2700 Asset Acquisition 502,720 373,200 501,900 465,900 -36,000 -7.2 2800 Miscellaneous 0 1,700 0 0 0 n.a.
Grants, Subventions & Capital Injections to Organisations $0 $0 $0 $4,502,900 $4,502,900 n.a.
3100 Grants, Subventions & Capital Injections to Statutory Boards
0 0 0 4,502,900 4,502,900 n.a.
TRANSFERS $7,357,635 $6,825,700 $7,607,300 $119,142,500 $111,535,200 n.a.
3600 Transfers to Institutions & Organisations 5,074,810 4,925,700 5,237,200 116,925,800 111,688,600 n.a. 3800 International Organisations & Overseas
Development Assistance 2,282,825 1,900,000 2,370,100 2,216,700 -153,400 -6.5
Development Estimates $15,677,684 $15,507,200 $30,257,900 $24,904,700 -$5,353,200 -17.7%
DEVELOPMENT EXPENDITURE $15,677,684 $15,507,200 $30,257,900 $24,904,700 -$5,353,200 -17.7%
5100 Government Development 15,326,889 15,507,200 14,013,000 3,908,600 -10,104,400 -72.1 5200 Grants & Capital Injections to Organisations 350,795 0 16,244,900 20,996,100 4,751,200 29.2

341
Manpower
BLANK Actual Estimated Revised Estimated Category FY2018 FY2019 FY2019 FY2020
BLANK
Political Appointments 3 3 3 3
Permanent Staff 251 260 257 259
Temporary, Daily-Rated & Other Staff 32 37 30 37
TOTAL 286 300 290 299

342
PRODUCTIVE WORKFORCE PROGRAMME
PROGRAMME DESCRIPTION
MOM strives to develop an agile, productive and resilient workforce that supports a competitive economy, where sustainable real income increases are achieved through higher skills and improvements in productivity. This programme comprises the following Divisions/Departments:
Manpower Planning and Policy Division The division formulates and reviews policies to develop a productive and resilient workforce that is agile and responsive to market demand. It supports industry transformation to become more manpower-lean and create good jobs, whilst strengthening the Singaporean core. This includes manpower planning for the local workforce to help Singaporeans take on quality jobs across different industries, provision of employment facilitation and support for individuals to adapt and grow through their careers. Together with Workforce Singapore (WSG) and the National Trades Union Congress Employment and Employability Institute (NTUC’s e2i), the division works to achieve good matches between workers and employers, so as to optimise employment outcomes and meet industry needs. The division works with NTUC and the Singapore National Employers Federation (SNEF) on the annual National Wages Council (NWC) recommendations, which help Singaporeans attain sustainable wage increases while ensuring that businesses stay resilient and competitive. The division formulates and reviews foreign workforce policies to ensure that our foreign workforce complements our local workforce, and supports sustainable economic growth driven by innovation and productivity. The division oversees strategic efforts in the Human Resource (HR) sector, in enabling human capital development in organisations and across industry sectors. It strengthens the HR profession and the HR services cluster, as well as grow the HR ecosystem, in partnership with tripartite partners and HR industry leaders. The division’s policies and strategies are supported by robust labour market analysis and statistical research, which includes the compilation and dissemination of manpower statistical information, to facilitate informed and timely decision making.
Work Pass Division The Work Pass Division (WPD) regulates the numbers and eligibility of foreigners to work in Singapore. To uphold the integrity of our work pass framework, the division puts in place controls, and works with other government agencies to detect and deter fraudulent work pass activities. The Work Pass Integrated System Programme Office (WINS PO) oversees the transformation and redevelopment of MOM’s Work Pass System. This includes the adoption of practices that are anchored on principles of rapid prototyping, continuous integration and iterative builds, to enhance operational effectiveness and enable nimbler and more flexible service and policy delivery.

343
Expenditure Estimates by Object Class BLANK Actual Estimated Revised Estimated Code Object Class FY2018 FY2019 FY2019 FY2020 Change Over FY2019
B BLANK S-S PRODUCTIVE WORKFORCE $1 $1 $1 $1 $0 0.0%
TOTAL EXPENDITURE $375,942,624 $551,381,900 $561,699,900 $537,808,700 -$23,891,200 -4.3%
Main Estimates $361,223,769 $504,834,500 $533,992,100 $523,000,000 -$10,992,100 -2.1%
OPERATING EXPENDITURE $361,223,769 $504,834,500 $533,992,100 $523,000,000 -$10,992,100 -2.1%
RUNNING COSTS $359,219,716 $502,684,500 $532,294,500 $316,444,300 -$215,850,200 -40.6%
Expenditure on Manpower $52,466,513 $51,645,500 $52,004,500 $52,700,300 $695,800 1.3%
1500 Permanent Staff 52,466,513 51,645,500 52,004,500 52,700,300 695,800 1.3
Other Operating Expenditure $68,472,841 $82,510,000 $65,995,900 $74,587,000 $8,591,100 13.0%
2100 Consumption of Products & Services 66,508,027 72,729,400 64,135,500 72,496,600 8,361,100 13.0 2300 Manpower Development 811,389 2,166,800 782,300 881,600 99,300 12.7 2400 International & Public Relations, Public
Communications 597,963 7,288,800 576,500 649,700 73,200 12.7
2700 Asset Acquisition 445,961 325,000 430,000 484,500 54,500 12.7 2800 Miscellaneous 109,501 0 71,600 74,600 3,000 4.2
Grants, Subventions & Capital Injections to Organisations
$238,280,362 $368,529,000 $414,294,100 $189,157,000 -$225,137,100 -54.3%
3100 Grants, Subventions & Capital Injections to Statutory Boards
238,280,362 368,529,000 414,294,100 189,157,000 -225,137,100 -54.3
TRANSFERS $2,004,053 $2,150,000 $1,697,600 $206,555,700 $204,858,100 n.a.
3500 Social Transfers to Individuals 0 0 0 80,000,000 80,000,000 n.a. 3600 Transfers to Institutions & Organisations 2,004,053 2,150,000 1,697,600 126,555,700 124,858,100 n.a.
Development Estimates $14,718,855 $46,547,400 $27,707,800 $14,808,700 -$12,899,100 -46.6%
DEVELOPMENT EXPENDITURE $14,718,855 $46,547,400 $27,707,800 $14,808,700 -$12,899,100 -46.6%
5100 Government Development 14,718,855 46,547,400 27,707,800 14,808,700 -12,899,100 -46.6
Manpower
BLANK Actual Estimated Revised Estimated Category FY2018 FY2019 FY2019 FY2020
BLANK
Permanent Staff 470 462 446 451
Temporary, Daily-Rated & Other Staff 87 107 33 37
Others 391 394 411 427
TOTAL 948 963 890 915

344
PROGRESSIVE WORKPLACES PROGRAMME
PROGRAMME DESCRIPTION
MOM seeks to build an inclusive workforce and progressive workplaces with harmonious labour relations, as well as safe and healthy workplace practices. This programme comprises the following Divisions/Departments:
Workplace Policy and Strategy Division The division develops policies, programmes, and processes to develop Singapore as a great place to work. It covers a wide spectrum of workplace issues, which include ensuring adequate employment protection, championing progressive workplace practices, fostering greater inclusivity in the workforce, uplifting and improving incomes and employment outcomes for older workers and low-wage workers, ensuring safe and healthy workplaces, supporting self-employed persons, and safeguarding the well-being of foreign workers. The division also oversees Singapore's international labour relations. Labour Relations and Workplaces Division The division works closely with various stakeholders to build harmonious industrial relationships that foster conducive workplace environments, founded on strong tripartite cooperation between employers, unions, and the government. It ensures that companies practice good employment standards and safeguard the well-being of all workers through a robust legislative framework and effective enforcement of employment laws. The division works closely with the Tripartite Alliance for Dispute Management (TADM) to facilitate an expeditious dispute resolution between employees and employers and with the Tripartite Alliance for Fair and Progressive Employment Practices (TAFEP) to foster the adoption of fair and progressive workplace practices and raise awareness of employers’ and employees’ rights and obligations under the law. Industrial Arbitration Court The Industrial Arbitration Court takes charge of certifying collective agreements, and settling industrial disputes through mediation and arbitration. Foreign Manpower Management Division The division ensures that the foreign workforce is well-managed, and the integrity of the work pass framework is safeguarded. This is achieved through a combination of effective enforcement and deterrence efforts, based on a robust legislative framework. It also engages and educates foreign workers and their employers so that they are aware of their obligations, responsibilities and rights. Occupational Safety and Health Division The division is responsible for creating a safe and healthy workplace environment in Singapore. This involves preventing work-related injuries, ill-health and protecting employees from the financial impact of work accidents through work injury compensation. It fosters a robust regulatory framework, and collaborates with the Workplace Safety and Health (WSH) Council, companies, unions, and other partners to create a strong safety culture, enhance WSH capabilities, and adopt best practices. Joint Operations Division The Joint Operations Division provides strategic direction for MOM-level enforcement, prepares MOM for emergency and crisis situations, and oversees the ground engagement activities of MOM departments.

345
Expenditure Estimates by Object Class
BLANK Actual Estimated Revised Estimated Code Object Class FY2018 FY2019 FY2019 FY2020 Change Over FY2019
B BLANK S-T PROGRESSIVE WORKPLACES
PROGRAMME $1 $1 $1 $1 $0 0.0%
TOTAL EXPENDITURE $200,044,726 $189,446,800 $231,434,800 $221,988,800 -$9,446,000 -4.1%
Main Estimates $196,740,463 $184,752,600 $223,378,200 $210,911,000 -$12,467,200 -5.6%
OPERATING EXPENDITURE $196,740,463 $184,752,600 $223,378,200 $210,911,000 -$12,467,200 -5.6%
RUNNING COSTS $119,733,239 $120,069,400 $119,461,500 $116,451,400 -$3,010,100 -2.5%
Expenditure on Manpower $94,243,314 $96,710,300 $93,413,500 $94,662,900 $1,249,400 1.3%
1500 Permanent Staff 94,243,314 96,710,300 93,413,500 94,662,900 1,249,400 1.3
Other Operating Expenditure $25,489,924 $23,359,100 $26,048,000 $21,788,500 -$4,259,500 -16.4%
2100 Consumption of Products & Services 20,125,762 20,589,700 20,573,700 17,210,200 -3,363,500 -16.3 2300 Manpower Development 1,349,680 613,100 1,379,700 1,154,100 -225,600 -16.4 2400 International & Public Relations, Public
Communications 3,853,648 2,063,100 3,939,400 3,295,400 -644,000 -16.3
2700 Asset Acquisition 137,050 88,300 136,500 114,200 -22,300 -16.3 2800 Miscellaneous 23,783 4,900 18,700 14,600 -4,100 -21.9
TRANSFERS $77,007,224 $64,683,200 $103,916,700 $94,459,600 -$9,457,100 -9.1%
3600 Transfers to Institutions & Organisations 77,007,224 64,683,200 103,916,700 94,459,600 -9,457,100 -9.1
Development Estimates $3,304,263 $4,694,200 $8,056,600 $11,077,800 $3,021,200 37.5%
DEVELOPMENT EXPENDITURE $3,304,263 $4,694,200 $8,056,600 $11,077,800 $3,021,200 37.5%
5100 Government Development 2,974,139 4,694,200 1,564,800 11,077,800 9,513,000 607.9 5200 Grants & Capital Injections to Organisations 330,124 0 6,491,800 0 -6,491,800 -100.0
Manpower
BLANK Actual Estimated Revised Estimated Category FY2018 FY2019 FY2019 FY2020
BLANK
Other Statutory Appointments 1 1 1 1
Permanent Staff 888 865 899 904
Temporary, Daily-Rated & Other Staff 62 102 95 97
TOTAL 951 968 995 1,002

PROGRAMME DETAILS
Head T
_______________
Ministry of National Development


347
ADMINISTRATION PROGRAMME
PROGRAMME DESCRIPTION
This programme comes under the Ministry of National Development (MND) HQ. It includes functions such as overall policy direction, control and administrative support services for the departments and Statutory Boards under MND, as well as the planning, development, operation and maintenance of application systems and infrastructure for MND HQ.
Expenditure Estimates by Object Class
BLANK Actual Estimated Revised Estimated Code Object Class FY2018 FY2019 FY2019 FY2020 Change Over FY2019 B BLANK T-A ADMINISTRATION PROGRAMME $1 $1 $1 $1 $0 0.0%
TOTAL EXPENDITURE $159,542,306 $235,014,700 $232,806,300 $312,962,000 $80,155,700 34.4%
Main Estimates $155,558,847 $213,817,000 $227,157,600 $292,345,300 $65,187,700 28.7%
OPERATING EXPENDITURE $155,558,847 $213,817,000 $227,157,600 $292,345,300 $65,187,700 28.7%
RUNNING COSTS $155,548,697 $213,806,400 $227,077,000 $292,334,700 $65,257,700 28.7%
Expenditure on Manpower $55,913,300 $62,056,200 $58,000,000 $61,793,000 $3,793,000 6.5%
1200 Political Appointments 1,053,065 1,017,100 1,105,700 1,161,000 55,300 5.0 1500 Permanent Staff 54,756,381 60,897,400 56,787,500 60,519,900 3,732,400 6.6 1600 Temporary, Daily-Rated & Other Staff 103,854 141,700 106,800 112,100 5,300 5.0
Other Operating Expenditure $87,173,532 $134,647,100 $153,008,700 $211,990,900 $58,982,200 38.5%
2100 Consumption of Products & Services 77,968,916 113,999,400 134,582,700 193,005,300 58,422,600 43.4 2300 Manpower Development 2,176,583 2,845,500 2,793,700 3,117,400 323,700 11.6 2400 International & Public Relations, Public
Communications 6,932,766 17,532,400 15,284,400 15,619,600 335,200 2.2
2700 Asset Acquisition 84,367 259,800 329,900 220,400 -109,500 -33.22800 Miscellaneous 10,899 10,000 18,000 28,200 10,200 56.7
Grants, Subventions & Capital Injections to Organisations $12,461,865 $17,103,100 $16,068,300 $18,550,800 $2,482,500 15.4%
3100 Grants, Subventions & Capital Injections to Statutory Boards
11,709,361 15,480,400 10,511,300 13,423,000 2,911,700 27.7
3400 Grants, Subventions & Capital Injections to Other Organisations
752,504 1,622,700 5,557,000 5,127,800 -429,200 -7.7
TRANSFERS $10,151 $10,600 $80,600 $10,600 -$70,000 -86.8%
3800 International Organisations & Overseas Development Assistance
10,151 10,600 80,600 10,600 -70,000 -86.8
Development Estimates $3,983,459 $21,197,700 $5,648,700 $20,616,700 $14,968,000 265.0%
DEVELOPMENT EXPENDITURE $3,983,459 $21,197,700 $5,648,700 $20,616,700 $14,968,000 265.0%
5100 Government Development 3,652,013 19,480,100 4,391,900 18,692,900 14,301,000 325.6 5200 Grants & Capital Injections to
Organisations 331,446 1,717,600 1,256,800 1,923,800 667,000 53.1

348
Manpower
BLANK Actual Estimated Revised Estimated Category FY2018 FY2019 FY2019 FY2020
BLANK
Political Appointments 4 4 4 4
Permanent Staff 404 416 405 417
Others 87 92 92 92
TOTAL 495 512 501 513

349
PLANNING PROGRAMME
PROGRAMME DESCRIPTION
This programme comes under the Urban Redevelopment Authority (URA). The functions carried out under this programme include formulating long-term land use plans to guide the physical development of Singapore, conservation of built heritage, promoting architecture and urban design excellence, and partnering the community to enliven public spaces to create a car-lite, people-friendly and liveable city for all to enjoy.
Expenditure Estimates by Object Class BLANK Actual Estimated Revised Estimated Code Object Class FY2018 FY2019 FY2019 FY2020 Change Over FY2019 B BLANK T-E PLANNING PROGRAMME $1 $1 $1 $1 $0 0.0%
TOTAL EXPENDITURE $114,612,089 $128,702,600 $120,825,300 $136,206,700 $15,381,400 12.7%
Main Estimates $114,612,089 $128,702,600 $120,825,300 $136,206,700 $15,381,400 12.7%
OPERATING EXPENDITURE $114,612,089 $128,702,600 $120,825,300 $136,206,700 $15,381,400 12.7%
RUNNING COSTS $114,612,089 $128,702,600 $120,825,300 $136,206,700 $15,381,400 12.7%
Other Operating Expenditure $106,660,553 $106,951,200 $101,127,100 $106,232,000 $5,104,900 5.0%
2100 Consumption of Products & Services 106,660,553 106,951,200 101,127,100 106,232,000 5,104,900 5.0
Grants, Subventions & Capital Injections to Organisations
$7,951,536 $21,751,400 $19,698,200 $29,974,700 $10,276,500 52.2%
3100 Grants, Subventions & Capital Injections to Statutory Boards
7,951,536 21,751,400 19,698,200 29,974,700 10,276,500 52.2
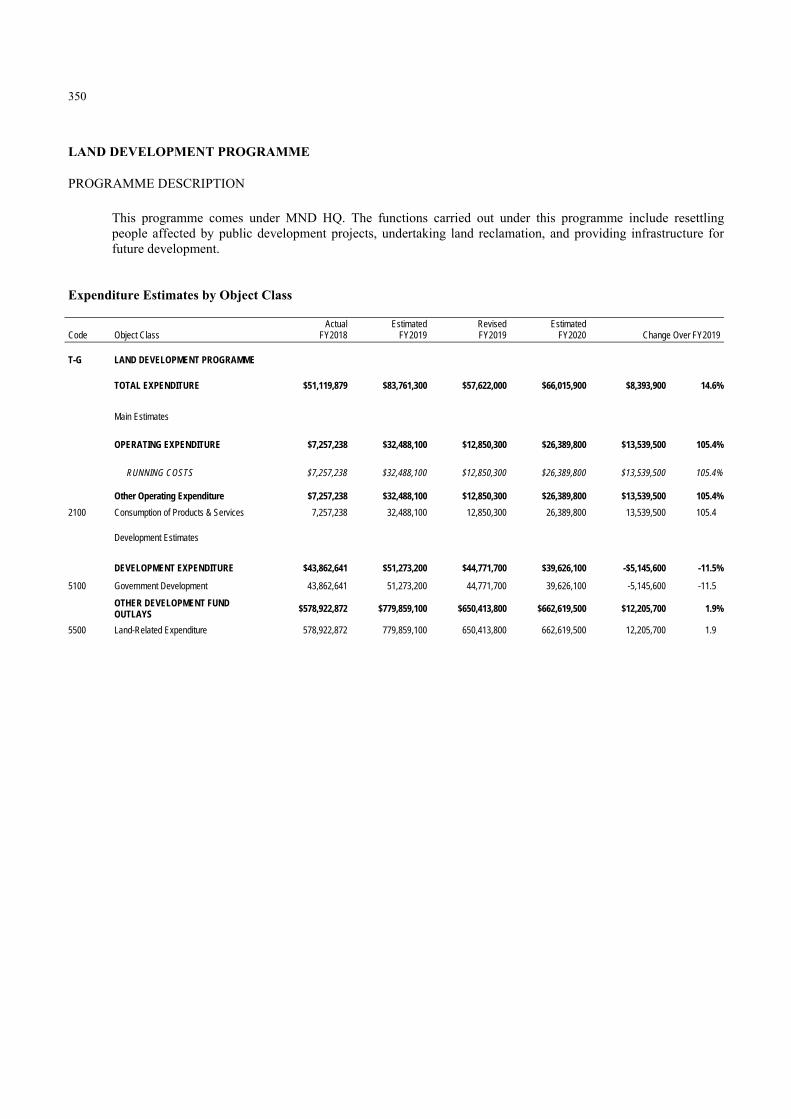
350
LAND DEVELOPMENT PROGRAMME
PROGRAMME DESCRIPTION
This programme comes under MND HQ. The functions carried out under this programme include resettling people affected by public development projects, undertaking land reclamation, and providing infrastructure for future development.
Expenditure Estimates by Object Class BLANK Actual Estimated Revised Estimated Code Object Class FY2018 FY2019 FY2019 FY2020 Change Over FY2019 B BLANK T-G LAND DEVELOPMENT PROGRAMME $1 $1 $1 $1 $0 0.0%
TOTAL EXPENDITURE $51,119,879 $83,761,300 $57,622,000 $66,015,900 $8,393,900 14.6%
Main Estimates $7,257,238 $32,488,100 $12,850,300 $26,389,800 $13,539,500 105.4%
OPERATING EXPENDITURE $7,257,238 $32,488,100 $12,850,300 $26,389,800 $13,539,500 105.4%
RUNNING COSTS $7,257,238 $32,488,100 $12,850,300 $26,389,800 $13,539,500 105.4%
Other Operating Expenditure $7,257,238 $32,488,100 $12,850,300 $26,389,800 $13,539,500 105.4%
2100 Consumption of Products & Services 7,257,238 32,488,100 12,850,300 26,389,800 13,539,500 105.4
Development Estimates $43,862,641 $51,273,200 $44,771,700 $39,626,100 -$5,145,600 -11.5%
DEVELOPMENT EXPENDITURE $43,862,641 $51,273,200 $44,771,700 $39,626,100 -$5,145,600 -11.5%
5100 Government Development 43,862,641 51,273,200 44,771,700 39,626,100 -5,145,600 -11.5
OTHER DEVELOPMENT FUND OUTLAYS
$578,922,872 $779,859,100 $650,413,800 $662,619,500 $12,205,700 1.9%
5500 Land-Related Expenditure 578,922,872 779,859,100 650,413,800 662,619,500 12,205,700 1.9

351
PUBLIC HOUSING DEVELOPMENT PROGRAMME
PROGRAMME DESCRIPTION
This programme comes under the Housing & Development Board (HDB). The main functions under this programme are to provide affordable quality housing, and to rejuvenate and redevelop older estates through various upgrading programmes, the Selective En-bloc Redevelopment Scheme (SERS) and other specific works.
Expenditure Estimates by Object Class BLANK Actual Estimated Revised Estimated Code Object Class FY2018 FY2019 FY2019 FY2020 Change Over FY2019 B BLANK T-I PUBLIC HOUSING DEVELOPMENT
PROGRAMME $1 $1 $1 $1 $0 0.0%
TOTAL EXPENDITURE $2,795,973,677 $1,964,642,800 $2,308,324,900 $3,014,953,600 $706,628,700 30.6%
Main Estimates $1,870,252,127 $1,403,877,600 $1,531,410,900 $1,791,964,700 $260,553,800 17.0%
OPERATING EXPENDITURE $1,870,252,127 $1,403,877,600 $1,531,410,900 $1,791,964,700 $260,553,800 17.0%
RUNNING COSTS $1,855,115,192 $1,384,000,300 $1,510,002,400 $1,770,338,400 $260,336,000 17.2%
Expenditure on Manpower $267,610 $0 $0 $0 $0 n.a.
1500 Permanent Staff 267,610 0 0 0 0 n.a.
Other Operating Expenditure $4,693,256 $7,173,400 $4,245,400 $4,954,800 $709,400 16.7%
2100 Consumption of Products & Services 4,693,089 7,173,400 4,245,400 4,954,800 709,400 16.7 2300 Manpower Development 167 0 0 0 0 n.a.
Grants, Subventions & Capital Injections to Organisations
$1,850,154,326 $1,376,826,900 $1,505,757,000 $1,765,383,600 $259,626,600 17.2%
3100 Grants, Subventions & Capital Injections to Statutory Boards
1,849,077,670 1,376,535,900 1,505,633,400 1,764,873,700 259,240,300 17.2
3400 Grants, Subventions & Capital Injections to Other Organisations
1,076,656 291,000 123,600 509,900 386,300 312.5
TRANSFERS $15,136,935 $19,877,300 $21,408,500 $21,626,300 $217,800 1.0%
3500 Social Transfers to Individuals 15,136,935 19,877,300 21,408,500 21,626,300 217,800 1.0
Development Estimates $925,721,550 $560,765,200 $776,914,000 $1,222,988,900 $446,074,900 57.4%
DEVELOPMENT EXPENDITURE $925,721,550 $560,765,200 $776,914,000 $1,222,988,900 $446,074,900 57.4%
5100 Government Development 306,830,532 264,405,600 266,421,600 562,618,400 296,196,800 111.2 5200 Grants & Capital Injections to
Organisations 618,891,018 296,359,600 510,492,400 660,370,500 149,878,100 29.4
OTHER DEVELOPMENT FUND OUTLAYS $4,245,003,058 $6,214,378,500 $5,996,739,200 $7,881,111,800 $1,884,372,600 31.4%
5500 Land-Related Expenditure 156,146,118 94,378,500 99,204,900 357,111,800 257,906,900 260.0 5600 Loans 4,088,856,940 6,120,000,000 5,897,534,300 7,524,000,000 1,626,465,700 27.6

352
Manpower
BLANK Actual Estimated Revised Estimated Category FY2018 FY2019 FY2019 FY2020
BLANK
Others 5,554 5,598 5,484 5,401
TOTAL 5,554 5,598 5,484 5,401

353
HOUSING ESTATES MANAGEMENT PROGRAMME
PROGRAMME DESCRIPTION
This programme comes under the Town Councils, the Community Improvement Projects Committee and the Estate Upgrading Programme Committee. The functions under this programme are to manage and improve the living environment in public and private housing estates, and to improve public infrastructure facilities.
Expenditure Estimates by Object Class BLANK Actual Estimated Revised Estimated Code Object Class FY2018 FY2019 FY2019 FY2020 Change Over FY2019 B BLANK T-J HOUSING ESTATES MANAGEMENT
PROGRAMME $1 $1 $1 $1 $0 0.0%
TOTAL EXPENDITURE $274,182,685 $285,142,500 $294,726,200 $315,619,900 $20,893,700 7.1%
Main Estimates $234,496,448 $235,856,300 $259,430,700 $255,013,700 -$4,417,000 -1.7%
OPERATING EXPENDITURE $234,496,448 $235,856,300 $259,430,700 $255,013,700 -$4,417,000 -1.7%
RUNNING COSTS $2,141,999 $1,841,300 $2,500,700 $2,863,700 $363,000 14.5%
Other Operating Expenditure $2,141,999 $1,841,300 $2,500,700 $2,863,700 $363,000 14.5%
2100 Consumption of Products & Services 2,141,999 1,841,300 2,500,700 2,863,700 363,000 14.5
TRANSFERS $232,354,450 $234,015,000 $256,930,000 $252,150,000 -$4,780,000 -1.9%
3600 Transfers to Institutions & Organisations 232,354,450 234,015,000 256,930,000 252,150,000 -4,780,000 -1.9
Development Estimates $39,686,237 $49,286,200 $35,295,500 $60,606,200 $25,310,700 71.7%
DEVELOPMENT EXPENDITURE $39,686,237 $49,286,200 $35,295,500 $60,606,200 $25,310,700 71.7%
5100 Government Development 39,686,237 49,286,200 35,295,500 60,606,200 25,310,700 71.7
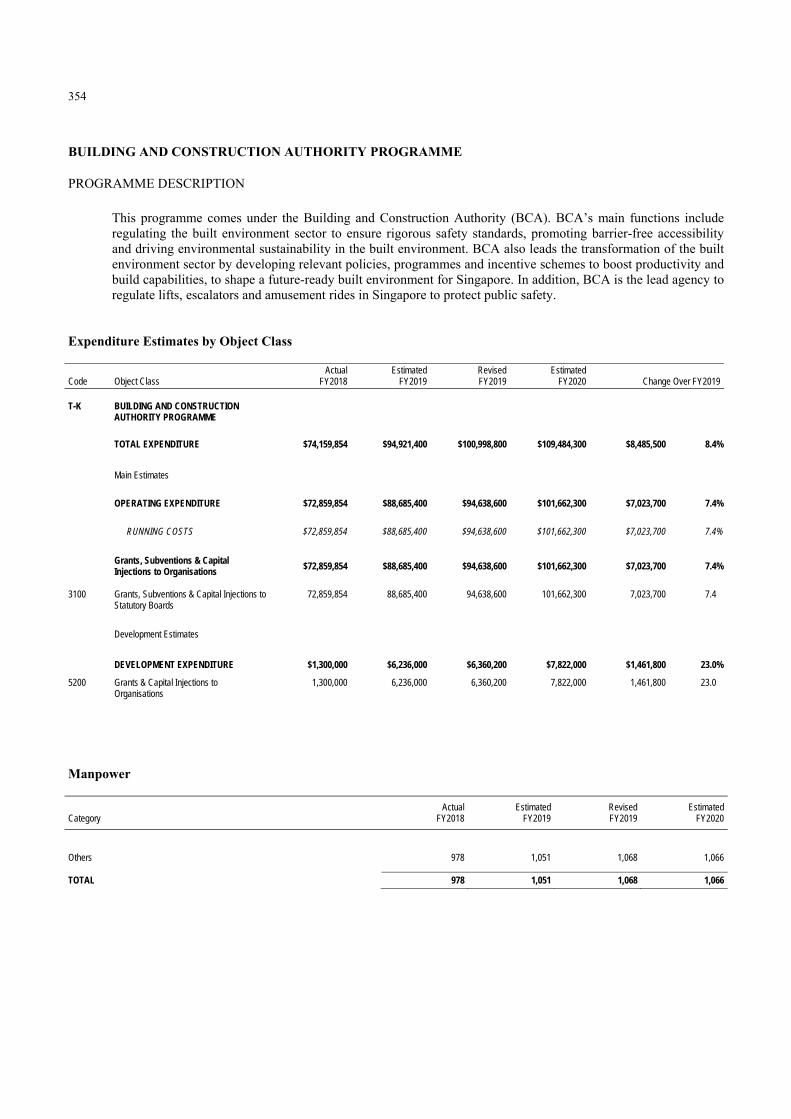
354
BUILDING AND CONSTRUCTION AUTHORITY PROGRAMME
PROGRAMME DESCRIPTION
This programme comes under the Building and Construction Authority (BCA). BCA’s main functions include regulating the built environment sector to ensure rigorous safety standards, promoting barrier-free accessibility and driving environmental sustainability in the built environment. BCA also leads the transformation of the built environment sector by developing relevant policies, programmes and incentive schemes to boost productivity and build capabilities, to shape a future-ready built environment for Singapore. In addition, BCA is the lead agency to regulate lifts, escalators and amusement rides in Singapore to protect public safety.
Expenditure Estimates by Object Class BLANK Actual Estimated Revised Estimated Code Object Class FY2018 FY2019 FY2019 FY2020 Change Over FY2019 B BLANK T-K BUILDING AND CONSTRUCTION
AUTHORITY PROGRAMME $1 $1 $1 $1 $0 0.0%
TOTAL EXPENDITURE $74,159,854 $94,921,400 $100,998,800 $109,484,300 $8,485,500 8.4%
Main Estimates $72,859,854 $88,685,400 $94,638,600 $101,662,300 $7,023,700 7.4%
OPERATING EXPENDITURE $72,859,854 $88,685,400 $94,638,600 $101,662,300 $7,023,700 7.4%
RUNNING COSTS $72,859,854 $88,685,400 $94,638,600 $101,662,300 $7,023,700 7.4%
Grants, Subventions & Capital Injections to Organisations $72,859,854 $88,685,400 $94,638,600 $101,662,300 $7,023,700 7.4%
3100 Grants, Subventions & Capital Injections to Statutory Boards
72,859,854 88,685,400 94,638,600 101,662,300 7,023,700 7.4
Development Estimates $1,300,000 $6,236,000 $6,360,200 $7,822,000 $1,461,800 23.0%
DEVELOPMENT EXPENDITURE $1,300,000 $6,236,000 $6,360,200 $7,822,000 $1,461,800 23.0%
5200 Grants & Capital Injections to Organisations
1,300,000 6,236,000 6,360,200 7,822,000 1,461,800 23.0
Manpower
BLANK Actual Estimated Revised Estimated Category FY2018 FY2019 FY2019 FY2020
BLANK
Others 978 1,051 1,068 1,066
TOTAL 978 1,051 1,068 1,066

355
NATIONAL PARKS BOARD PROGRAMME
PROGRAMME DESCRIPTION
This programme comes under the National Parks Board (NParks). It focuses on enhancing and managing the urban ecosystems of Singapore’s biophilic “City in a Garden” in partnership with the community to provide a highly liveable environment. Key functions include managing Singapore’s greenery, biodiversity conservation, animal health and welfare, and active programming for community ownership and stewardship. Development of the landscape, horticulture, veterinary and animal sectors to enhance productivity and competencies are also key functions under this programme.
Expenditure Estimates by Object Class BLANK Actual Estimated Revised Estimated Code Object Class FY2018 FY2019 FY2019 FY2020 Change Over FY2019 B BLANK T-L NATIONAL PARKS BOARD $1 $1 $1 $1 $0 0.0%
TOTAL EXPENDITURE $506,900,893 $556,593,200 $532,523,800 $502,810,100 -$29,713,700 -5.6%
Main Estimates $348,534,581 $391,536,300 $399,757,600 $405,951,600 $6,194,000 1.5%
OPERATING EXPENDITURE $348,534,581 $391,536,300 $399,757,600 $405,951,600 $6,194,000 1.5%
RUNNING COSTS $348,534,581 $391,536,300 $399,757,600 $405,951,600 $6,194,000 1.5%
Grants, Subventions & Capital Injections to Organisations $348,534,581 $391,536,300 $399,757,600 $405,951,600 $6,194,000 1.5%
3100 Grants, Subventions & Capital Injections to Statutory Boards
302,363,966 349,981,100 360,291,800 367,210,500 6,918,700 1.9
3400 Grants, Subventions & Capital Injections to Other Organisations
46,170,615 41,555,200 39,465,800 38,741,100 -724,700 -1.8
Development Estimates $158,366,312 $165,056,900 $132,766,200 $96,858,500 -$35,907,700 -27.0%
DEVELOPMENT EXPENDITURE $158,366,312 $165,056,900 $132,766,200 $96,858,500 -$35,907,700 -27.0%
5100 Government Development 149,826,767 152,759,200 123,660,500 87,718,000 -35,942,500 -29.1 5200 Grants & Capital Injections to
Organisations 8,539,545 12,297,700 9,105,700 9,140,500 34,800 0.4
Manpower
BLANK Actual Estimated Revised Estimated Category FY2018 FY2019 FY2019 FY2020
BLANK
Others 969 1,312 1,303 1,303
TOTAL 969 1,312 1,303 1,303
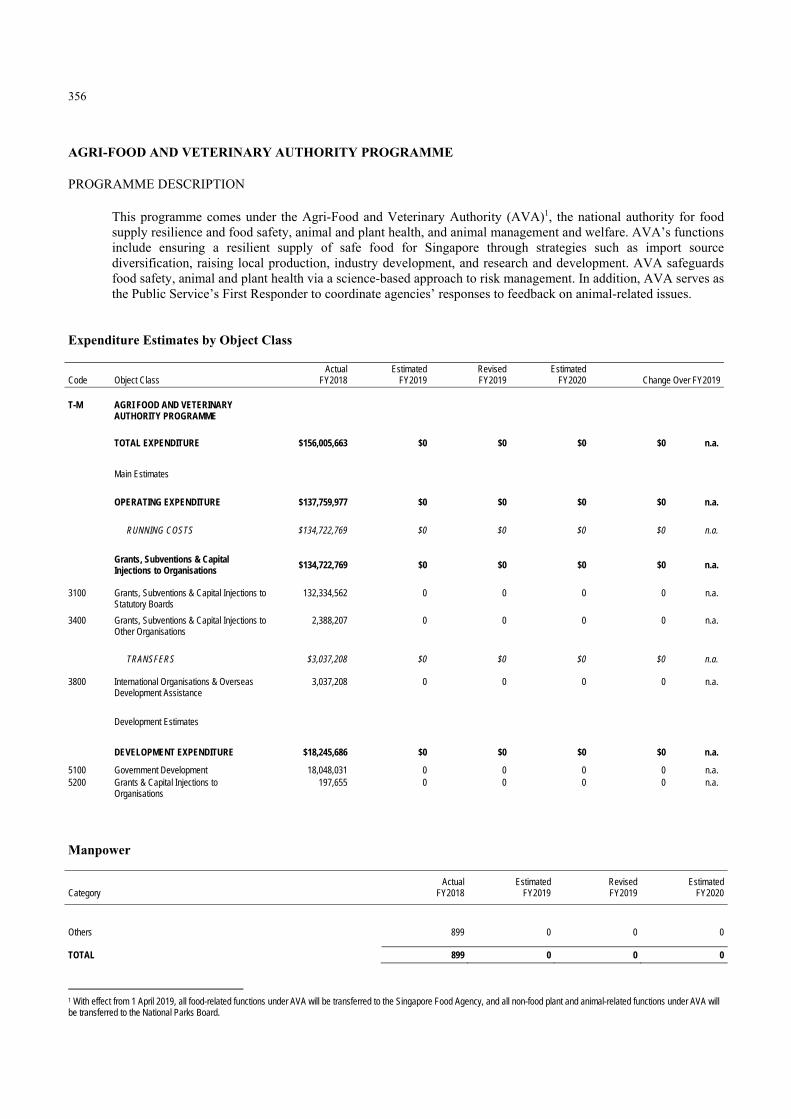
356
AGRI-FOOD AND VETERINARY AUTHORITY PROGRAMME
PROGRAMME DESCRIPTION
This programme comes under the Agri-Food and Veterinary Authority (AVA)1, the national authority for food supply resilience and food safety, animal and plant health, and animal management and welfare. AVA’s functions include ensuring a resilient supply of safe food for Singapore through strategies such as import source diversification, raising local production, industry development, and research and development. AVA safeguards food safety, animal and plant health via a science-based approach to risk management. In addition, AVA serves as the Public Service’s First Responder to coordinate agencies’ responses to feedback on animal-related issues.
Expenditure Estimates by Object Class BLANK Actual Estimated Revised Estimated Code Object Class FY2018 FY2019 FY2019 FY2020 Change Over FY2019 B BLANK T-M AGRI FOOD AND VETERINARY
AUTHORITY PROGRAMME $1 $1 $1 $1 $0 0.0%
TOTAL EXPENDITURE $156,005,663 $0 $0 $0 $0 n.a.
Main Estimates $137,759,977 $0 $0 $0 $0 n.a.
OPERATING EXPENDITURE $137,759,977 $0 $0 $0 $0 n.a.
RUNNING COSTS $134,722,769 $0 $0 $0 $0 n.a.
Grants, Subventions & Capital Injections to Organisations $134,722,769 $0 $0 $0 $0 n.a.
3100 Grants, Subventions & Capital Injections to Statutory Boards
132,334,562 0 0 0 0 n.a.
3400 Grants, Subventions & Capital Injections to Other Organisations
2,388,207 0 0 0 0 n.a.
TRANSFERS $3,037,208 $0 $0 $0 $0 n.a.
3800 International Organisations & Overseas Development Assistance
3,037,208 0 0 0 0 n.a.
Development Estimates $18,245,686 $0 $0 $0 $0 n.a.
DEVELOPMENT EXPENDITURE $18,245,686 $0 $0 $0 $0 n.a.
5100 Government Development 18,048,031 0 0 0 0 n.a. 5200 Grants & Capital Injections to
Organisations 197,655 0 0 0 0 n.a.
Manpower
BLANK Actual Estimated Revised Estimated Category FY2018 FY2019 FY2019 FY2020
BLANK
Others 899 0 0 0
TOTAL 899 0 0 0
1 With effect from 1 April 2019, all food-related functions under AVA will be transferred to the Singapore Food Agency, and all non-food plant and animal-related functions under AVA will be transferred to the National Parks Board.

PROGRAMME DETAILS
Head U ____________
Prime Minister's Office


357
ADMINISTRATION PROGRAMME
PROGRAMME DESCRIPTION
This programme comprises the headquarters of the Prime Minister’s Office. The functions carried out under this programme include coordinating the activities of the Ministries and the general policies of the Government; and providing overall policy direction, control and administrative support services for the programmes undertaken by the Prime Minister’s Office. It oversees the Corrupt Practices Investigation Bureau.
Expenditure Estimates by Object Class
BLANK Actual Estimated Revised Estimated Code Object Class FY2018 FY2019 FY2019 FY2020 Change Over FY2019
B BLANK U-A ADMINISTRATION PROGRAMME $1 $1 $1 $1 $0 0.0%
TOTAL EXPENDITURE $48,516,111 $57,395,500 $59,748,700 $78,915,200 $19,166,500 32.1%
Main Estimates $44,823,959 $57,195,600 $52,758,800 $55,839,100 $3,080,300 5.8%
OPERATING EXPENDITURE $44,823,959 $57,195,600 $52,758,800 $55,839,100 $3,080,300 5.8%
RUNNING COSTS $44,823,959 $57,195,600 $52,758,800 $55,839,100 $3,080,300 5.8%
Expenditure on Manpower $32,163,260 $38,405,500 $35,693,600 $36,667,500 $973,900 2.7%
1200 Political Appointments 15,429,954 17,705,900 16,190,200 15,945,100 -245,100 -1.5
1500 Permanent Staff 16,728,554 20,673,400 19,476,900 20,695,900 1,219,000 6.3
1600 Temporary, Daily-Rated & Other Staff 4,753 26,200 26,500 26,500 0 0.0
Other Operating Expenditure $12,660,698 $18,790,100 $17,065,200 $19,171,600 $2,106,400 12.3%
2100 Consumption of Products & Services 8,833,832 12,903,600 11,892,800 12,241,000 348,200 2.9
2300 Manpower Development 180,919 445,800 214,300 339,300 125,000 58.3
2400 International & Public Relations, Public Communications
3,361,125 4,945,000 4,202,600 6,303,900 2,101,300 50.0
2700 Asset Acquisition 284,823 495,700 755,500 287,400 -468,100 -62.0
Development Estimates $3,692,153 $199,900 $6,989,900 $23,076,100 $16,086,200 230.1%
DEVELOPMENT EXPENDITURE $3,692,153 $199,900 $6,989,900 $23,076,100 $16,086,200 230.1%
5100 Government Development 3,692,153 199,900 6,989,900 23,076,100 16,086,200 230.1
Manpower
BLANK Actual Estimated Revised EstimatedCategory FY2018 FY2019 FY2019 FY2020
BLANK
Political Appointments 6 6 7 7
Permanent Staff 132 137 135 142
TOTAL 138 143 142 149

358
ELECTIONS PROGRAMME
PROGRAMME DESCRIPTION
This programme comprises the Elections Department. Its functions include preparing for and conducting elections in Singapore, as well as maintaining the Registers of Electors and administering the Political Donations Act.
Expenditure Estimates by Object Class BLANK Actual Estimated Revised Estimated Code Object Class FY2018 FY2019 FY2019 FY2020 Change Over FY2019
B BLANK U-B ELECTIONS PROGRAMME $1 $1 $1 $1 $0 0.0%
TOTAL EXPENDITURE $17,001,660 $62,245,400 $62,245,400 $52,000,000 -$10,245,400 -16.5%
Main Estimates $16,371,102 $52,793,400 $52,793,400 $46,070,000 -$6,723,400 -12.7%
OPERATING EXPENDITURE $16,371,102 $52,793,400 $52,793,400 $46,070,000 -$6,723,400 -12.7%
RUNNING COSTS $16,371,102 $52,793,400 $52,793,400 $46,070,000 -$6,723,400 -12.7%
Expenditure on Manpower $4,752,935 $4,257,000 $4,257,000 $4,487,000 $230,000 5.4%
1500 Permanent Staff 4,752,935 4,257,000 4,257,000 4,487,000 230,000 5.4
Other Operating Expenditure $11,618,166 $48,536,400 $48,536,400 $41,583,000 -$6,953,400 -14.3%
2100 Consumption of Products & Services 11,162,502 19,703,300 19,703,300 15,233,300 -4,470,000 -22.7 2300 Manpower Development 448,598 423,100 423,100 208,400 -214,700 -50.7 2400 International & Public Relations, Public
Communications 0 28,380,000 28,380,000 26,111,300 -2,268,700 -8.0
2700 Asset Acquisition 7,066 30,000 30,000 30,000 0 0.0
Development Estimates $630,558 $9,452,000 $9,452,000 $5,930,000 -$3,522,000 -37.3%
DEVELOPMENT EXPENDITURE $630,558 $9,452,000 $9,452,000 $5,930,000 -$3,522,000 -37.3%
5100 Government Development 630,558 9,452,000 9,452,000 5,930,000 -3,522,000 -37.3
Manpower
BLANK Actual Estimated Revised Estimated Category FY2018 FY2019 FY2019 FY2020
BLANK
Permanent Staff 29 31 40 40
TOTAL 29 31 40 40

359
CORRUPT PRACTICES INVESTIGATION PROGRAMME
PROGRAMME DESCRIPTION
This programme is undertaken by the Corrupt Practices Investigation Bureau (CPIB). The functions carried out under this programme include investigation into any act of corruption in the public and private sectors in Singapore, and in the course of doing so, any other offences under any written law. In addition, the Bureau is also involved in the prevention of corruption through outreach efforts such as anti-corruption talks to the public and private sectors, institutes of higher learning, and local and foreign visitors. Should CPIB, in the course of its investigations, come across cases which reveal corruption-prone areas or loopholes in procedures in government departments, the Bureau may work with the departments concerned to review, point out areas of weakness and recommend changes in procedures, etc.
Expenditure Estimates by Object Class BLANK Actual Estimated Revised Estimated Code Object Class FY2018 FY2019 FY2019 FY2020 Change Over FY2019
B BLANK U-C CORRUPT PRACTICES INVESTIGATION
PROGRAMME $1 $1 $1 $1 $16,856,000 n.a.
TOTAL EXPENDITURE $46,187,302 $59,246,100 $50,090,400 $60,040,400 $9,950,000 19.9%
Main Estimates $42,302,305 $48,812,100 $43,461,400 $47,402,400 $3,941,000 9.1%
OPERATING EXPENDITURE $42,302,305 $48,802,100 $43,451,400 $47,392,400 $3,941,000 9.1%
RUNNING COSTS $42,302,305 $48,802,100 $43,451,400 $47,392,400 $3,941,000 9.1%
Expenditure on Manpower $28,701,807 $33,231,500 $28,554,000 $30,148,200 $1,594,200 5.6%
1500 Permanent Staff 28,701,807 33,231,500 28,554,000 30,148,200 1,594,200 5.6
Other Operating Expenditure $13,600,498 $15,570,600 $14,897,400 $17,244,200 $2,346,800 15.8%
2100 Consumption of Products & Services 12,136,530 13,342,800 13,182,500 15,164,000 1,981,500 15.0
2300 Manpower Development 786,026 1,287,000 1,091,600 1,453,000 361,400 33.1
2400 International & Public Relations, Public Communications
503,334 739,300 582,100 497,500 -84,600 -14.5
2700 Asset Acquisition 135,309 201,500 41,200 129,700 88,500 214.8
2800 Miscellaneous 39,300 0 0 0 0 n.a.
OTHER CONSOLIDATED FUND OUTLAYS $0 $10,000 $10,000 $10,000 $0 0.0%
4600 Loans and Advances (Disbursement) 0 10,000 10,000 10,000 0 0.0
Development Estimates $3,884,997 $10,444,000 $6,639,000 $12,648,000 $6,009,000 90.5%
DEVELOPMENT EXPENDITURE $3,884,997 $10,444,000 $6,639,000 $12,648,000 $6,009,000 90.5%
5100 Government Development 3,884,997 10,444,000 6,639,000 12,648,000 6,009,000 90.5

360
Manpower
BLANK Actual Estimated Revised Estimated Category FY2018 FY2019 FY2019 FY2020
BLANK
Permanent Staff 222 234 234 234
TOTAL 222 234 234 234
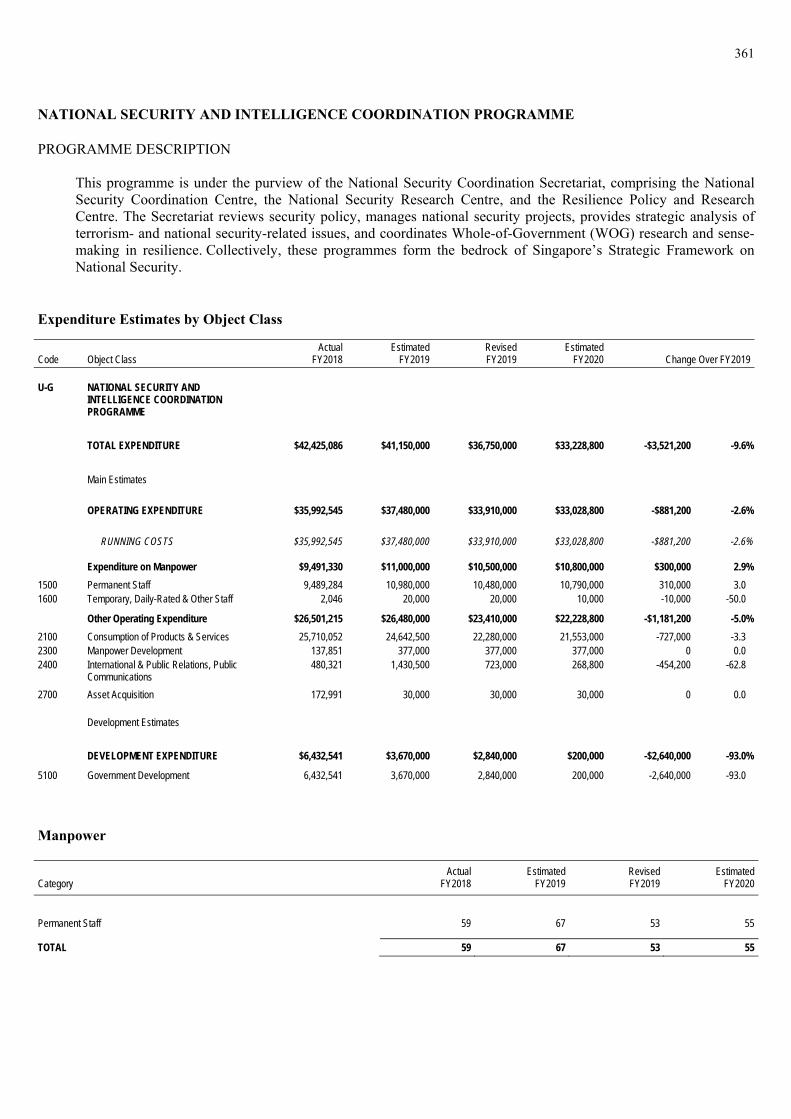
361
NATIONAL SECURITY AND INTELLIGENCE COORDINATION PROGRAMME
PROGRAMME DESCRIPTION
This programme is under the purview of the National Security Coordination Secretariat, comprising the National Security Coordination Centre, the National Security Research Centre, and the Resilience Policy and Research Centre. The Secretariat reviews security policy, manages national security projects, provides strategic analysis of terrorism- and national security-related issues, and coordinates Whole-of-Government (WOG) research and sense-making in resilience. Collectively, these programmes form the bedrock of Singapore’s Strategic Framework on National Security.
Expenditure Estimates by Object Class BLANK Actual Estimated Revised Estimated Code Object Class FY2018 FY2019 FY2019 FY2020 Change Over FY2019
B BLANK U-G NATIONAL SECURITY AND
INTELLIGENCE COORDINATION PROGRAMME
$1 $1 $1 $1 -$3,521,200 n.a.
TOTAL EXPENDITURE $42,425,086 $41,150,000 $36,750,000 $33,228,800 -$3,521,200 -9.6%
Main Estimates $35,992,545 $37,480,000 $33,910,000 $33,028,800 -$881,200 -2.6%
OPERATING EXPENDITURE $35,992,545 $37,480,000 $33,910,000 $33,028,800 -$881,200 -2.6%
RUNNING COSTS $35,992,545 $37,480,000 $33,910,000 $33,028,800 -$881,200 -2.6%
Expenditure on Manpower $9,491,330 $11,000,000 $10,500,000 $10,800,000 $300,000 2.9%
1500 Permanent Staff 9,489,284 10,980,000 10,480,000 10,790,000 310,000 3.0 1600 Temporary, Daily-Rated & Other Staff 2,046 20,000 20,000 10,000 -10,000 -50.0
Other Operating Expenditure $26,501,215 $26,480,000 $23,410,000 $22,228,800 -$1,181,200 -5.0%
2100 Consumption of Products & Services 25,710,052 24,642,500 22,280,000 21,553,000 -727,000 -3.3 2300 Manpower Development 137,851 377,000 377,000 377,000 0 0.0 2400 International & Public Relations, Public
Communications 480,321 1,430,500 723,000 268,800 -454,200 -62.8
2700 Asset Acquisition 172,991 30,000 30,000 30,000 0 0.0
Development Estimates $6,432,541 $3,670,000 $2,840,000 $200,000 -$2,640,000 -93.0%
DEVELOPMENT EXPENDITURE $6,432,541 $3,670,000 $2,840,000 $200,000 -$2,640,000 -93.0%
5100 Government Development 6,432,541 3,670,000 2,840,000 200,000 -2,640,000 -93.0
Manpower
BLANK Actual Estimated Revised Estimated Category FY2018 FY2019 FY2019 FY2020
BLANK
Permanent Staff 59 67 53 55
TOTAL 59 67 53 55
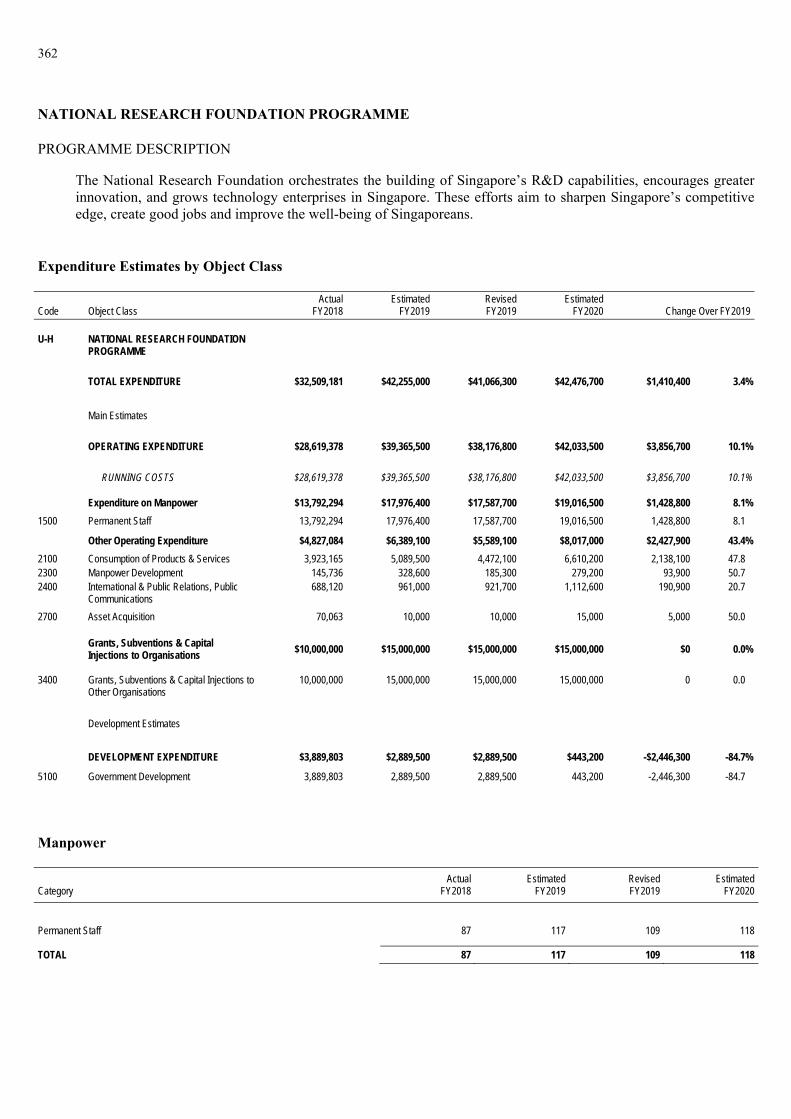
362
NATIONAL RESEARCH FOUNDATION PROGRAMME
PROGRAMME DESCRIPTION
The National Research Foundation orchestrates the building of Singapore’s R&D capabilities, encourages greater innovation, and grows technology enterprises in Singapore. These efforts aim to sharpen Singapore’s competitive edge, create good jobs and improve the well-being of Singaporeans.
Expenditure Estimates by Object Class BLANK Actual Estimated Revised Estimated Code Object Class FY2018 FY2019 FY2019 FY2020 Change Over FY2019
B BLANK U-H NATIONAL RESEARCH FOUNDATION
PROGRAMME $1 $1 $1 $1 $0 0.0%
TOTAL EXPENDITURE $32,509,181 $42,255,000 $41,066,300 $42,476,700 $1,410,400 3.4%
Main Estimates $28,619,378 $39,365,500 $38,176,800 $42,033,500 $3,856,700 10.1%
OPERATING EXPENDITURE $28,619,378 $39,365,500 $38,176,800 $42,033,500 $3,856,700 10.1%
RUNNING COSTS $28,619,378 $39,365,500 $38,176,800 $42,033,500 $3,856,700 10.1%
Expenditure on Manpower $13,792,294 $17,976,400 $17,587,700 $19,016,500 $1,428,800 8.1%
1500 Permanent Staff 13,792,294 17,976,400 17,587,700 19,016,500 1,428,800 8.1
Other Operating Expenditure $4,827,084 $6,389,100 $5,589,100 $8,017,000 $2,427,900 43.4%
2100 Consumption of Products & Services 3,923,165 5,089,500 4,472,100 6,610,200 2,138,100 47.8 2300 Manpower Development 145,736 328,600 185,300 279,200 93,900 50.7 2400 International & Public Relations, Public
Communications 688,120 961,000 921,700 1,112,600 190,900 20.7
2700 Asset Acquisition 70,063 10,000 10,000 15,000 5,000 50.0
Grants, Subventions & Capital Injections to Organisations $10,000,000 $15,000,000 $15,000,000 $15,000,000 $0 0.0%
3400 Grants, Subventions & Capital Injections to Other Organisations
10,000,000 15,000,000 15,000,000 15,000,000 0 0.0
Development Estimates $3,889,803 $2,889,500 $2,889,500 $443,200 -$2,446,300 -84.7%
DEVELOPMENT EXPENDITURE $3,889,803 $2,889,500 $2,889,500 $443,200 -$2,446,300 -84.7%
5100 Government Development 3,889,803 2,889,500 2,889,500 443,200 -2,446,300 -84.7
Manpower
BLANK Actual Estimated Revised Estimated Category FY2018 FY2019 FY2019 FY2020
BLANK
Permanent Staff 87 117 109 118
TOTAL 87 117 109 118
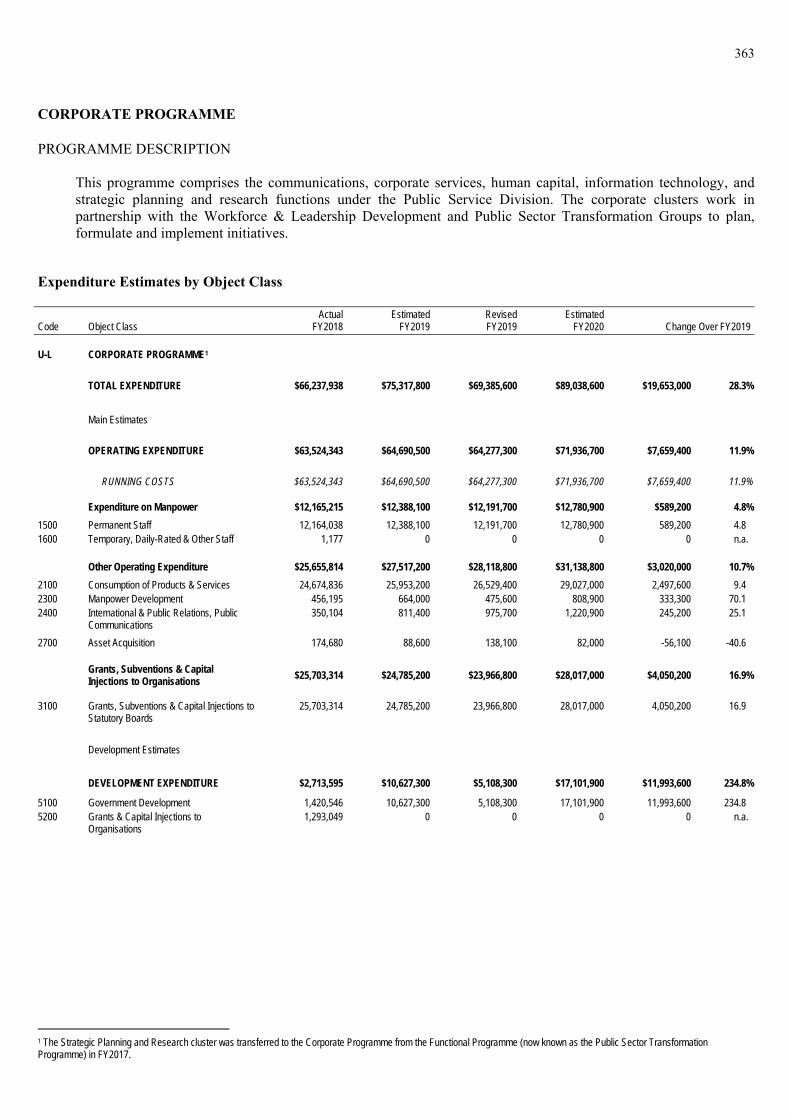
363
CORPORATE PROGRAMME
PROGRAMME DESCRIPTION
This programme comprises the communications, corporate services, human capital, information technology, and strategic planning and research functions under the Public Service Division. The corporate clusters work in partnership with the Workforce & Leadership Development and Public Sector Transformation Groups to plan, formulate and implement initiatives.
Expenditure Estimates by Object Class BLANK Actual Estimated Revised Estimated Code Object Class FY2018 FY2019 FY2019 FY2020 Change Over FY2019
B BLANK U-L CORPORATE PROGRAMME1 $1 $1 $1 $1 $20,909,200 n.a.
TOTAL EXPENDITURE $66,237,938 $75,317,800 $69,385,600 $89,038,600 $19,653,000 28.3%
Main Estimates $63,524,343 $64,690,500 $64,277,300 $71,936,700 $7,659,400 11.9%
OPERATING EXPENDITURE $63,524,343 $64,690,500 $64,277,300 $71,936,700 $7,659,400 11.9%
RUNNING COSTS $63,524,343 $64,690,500 $64,277,300 $71,936,700 $7,659,400 11.9%
Expenditure on Manpower $12,165,215 $12,388,100 $12,191,700 $12,780,900 $589,200 4.8%
1500 Permanent Staff 12,164,038 12,388,100 12,191,700 12,780,900 589,200 4.8 1600 Temporary, Daily-Rated & Other Staff 1,177 0 0 0 0 n.a.
Other Operating Expenditure $25,655,814 $27,517,200 $28,118,800 $31,138,800 $3,020,000 10.7%
2100 Consumption of Products & Services 24,674,836 25,953,200 26,529,400 29,027,000 2,497,600 9.4 2300 Manpower Development 456,195 664,000 475,600 808,900 333,300 70.1 2400 International & Public Relations, Public
Communications 350,104 811,400 975,700 1,220,900 245,200 25.1
2700 Asset Acquisition 174,680 88,600 138,100 82,000 -56,100 -40.6
Grants, Subventions & Capital Injections to Organisations
$25,703,314 $24,785,200 $23,966,800 $28,017,000 $4,050,200 16.9%
3100 Grants, Subventions & Capital Injections to Statutory Boards
25,703,314 24,785,200 23,966,800 28,017,000 4,050,200 16.9
Development Estimates $2,713,595 $10,627,300 $5,108,300 $17,101,900 $11,993,600 234.8%
DEVELOPMENT EXPENDITURE $2,713,595 $10,627,300 $5,108,300 $17,101,900 $11,993,600 234.8%
5100 Government Development 1,420,546 10,627,300 5,108,300 17,101,900 11,993,600 234.8 5200 Grants & Capital Injections to
Organisations 1,293,049 0 0 0 0 n.a.
1 The Strategic Planning and Research cluster was transferred to the Corporate Programme from the Functional Programme (now known as the Public Sector Transformation Programme) in FY2017.

364
Manpower
BLANK Actual Estimated Revised Estimated Category FY2018 FY2019 FY2019 FY2020
BLANK
Permanent Staff 85 85 85 92
TOTAL 85 85 85 92

365
WORKFORCE AND LEADERSHIP DEVELOPMENT PROGRAMME
PROGRAMME DESCRIPTION
The Workforce Development & Management Group consists of the Workforce Development, the HR Policy cluster, the HR Management Information & Systems cluster, the Engineering Programme Office and the Chief HR Officer’s Office. The group aims to bring about high-performing organisations, and engages officers through various workforce development initiatives, people policies and practices, HR & payroll processes and systems, as well as develop capabilities in the science, technology and engineering areas. The Leadership Group comprises the Leadership Development cluster and Public Service Commission (PSC) Secretariat. It aims to build a strong, cohesive public service leadership corps through strengthening our leadership pipelines and systematically identifying and nurturing general and sectoral/specialist leaders across the Service.
Expenditure Estimates by Object Class BLANK Actual Estimated Revised Estimated Code Object Class FY2018 FY2019 FY2019 FY2020 Change Over FY2019
B BLANK U-M WORKFORCE AND LEADERSHIP
DEVELOPMENT PROGRAMME1 $1 $1 $1 $1 $76,561,200 n.a.
TOTAL EXPENDITURE2 $143,178,889 $140,778,700 $145,722,900 $158,472,400 $12,749,500 8.7%
Main Estimates $99,623,332 $95,435,100 $97,820,100 $105,675,600 $7,855,500 8.0%
OPERATING EXPENDITURE $99,623,332 $95,435,100 $97,820,100 $105,675,600 $7,855,500 8.0%
RUNNING COSTS $76,101,379 $70,099,500 $72,697,000 $78,006,700 $5,309,700 7.3%
Expenditure on Manpower $42,306,055 $34,620,900 $35,065,300 $40,843,900 $5,778,600 16.5%
1500 Permanent Staff 42,306,055 34,620,900 35,065,300 40,843,900 5,778,600 16.5
Other Operating Expenditure $28,687,511 $30,545,500 $32,767,200 $32,303,000 -$464,200 -1.4%
2100 Consumption of Products & Services 26,221,730 28,372,500 30,656,600 29,243,700 -1,412,900 -4.6 2300 Manpower Development 1,578,983 1,682,300 1,633,500 2,705,700 1,072,200 65.6 2400 International & Public Relations, Public
Communications 886,799 490,700 477,100 353,600 -123,500 -25.9
Grants, Subventions & Capital Injections to Organisations
$5,107,813 $4,933,100 $4,864,500 $4,859,800 -$4,700 -0.1%
3400 Grants, Subventions & Capital Injections to Other Organisations
5,107,813 4,933,100 4,864,500 4,859,800 -4,700 -0.1
TRANSFERS $23,521,954 $25,335,600 $25,123,100 $27,668,900 $2,545,800 10.1%
3500 Social Transfers to Individuals 23,521,954 25,335,600 25,123,100 27,668,900 2,545,800 10.1
Development Estimates $43,555,557 $45,343,600 $47,902,800 $52,796,800 $4,894,000 10.2%
DEVELOPMENT EXPENDITURE $43,555,557 $45,343,600 $47,902,800 $52,796,800 $4,894,000 10.2%
5100 Government Development 43,555,557 45,343,600 47,902,800 52,796,800 4,894,000 10.2
_______________________________________________
1 Previously known as HR Management Programme. The HR Policy, PSC Secretariat and Leadership Development clusters were transferred to the Workforce and Leadership Development Programme from the Functional Programme (now known as the Public Sector Transformation Programme) in FY2017.
2 The FY2017 and FY2018 Estimates includes expenditure for the Alliance of Corporate Excellence system which was transferred from MOF's Digital Government Directorate with effect from 1 May 2017.

366
Manpower
BLANK Actual Estimated Revised Estimated Category FY2018 FY2019 FY2019 FY2020
BLANK
Permanent Staff 193 193 206 200
TOTAL 193 193 206 200
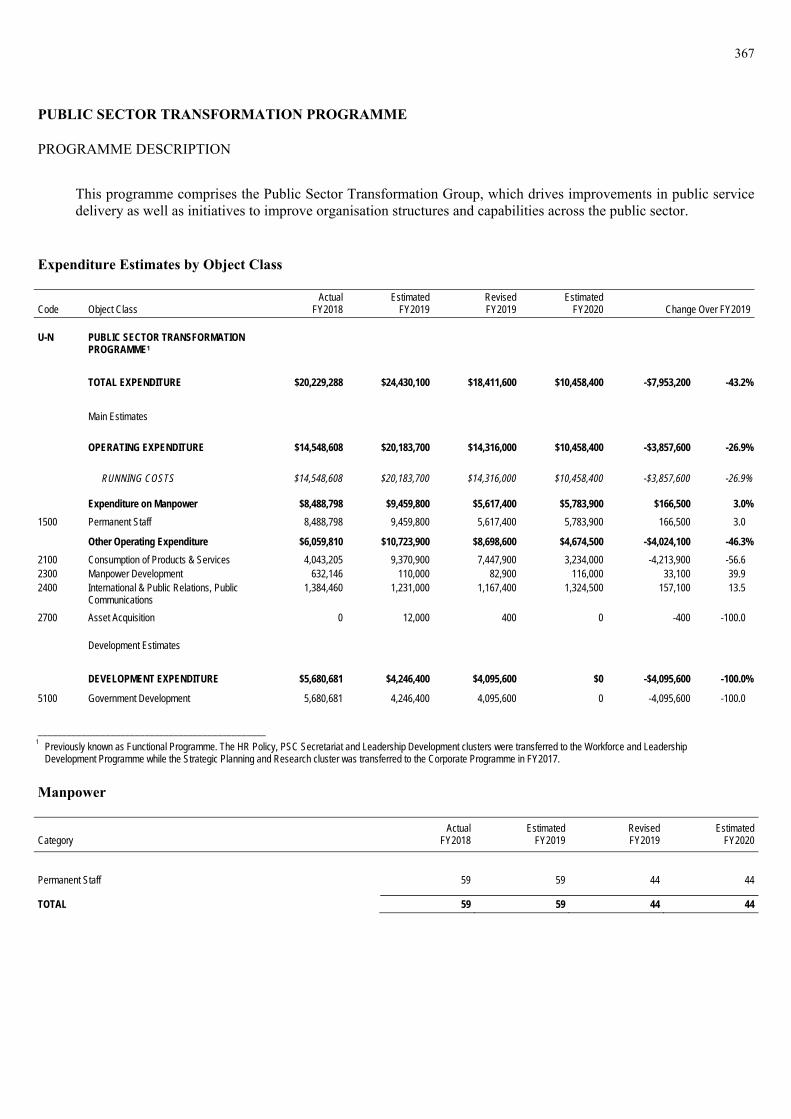
367
PUBLIC SECTOR TRANSFORMATION PROGRAMME
PROGRAMME DESCRIPTION
This programme comprises the Public Sector Transformation Group, which drives improvements in public service delivery as well as initiatives to improve organisation structures and capabilities across the public sector.
Expenditure Estimates by Object Class BLANK Actual Estimated Revised Estimated Code Object Class FY2018 FY2019 FY2019 FY2020 Change Over FY2019
B BLANK U-N PUBLIC SECTOR TRANSFORMATION
PROGRAMME1 $1 $1 $1 $1 $0 0.0%
TOTAL EXPENDITURE $20,229,288 $24,430,100 $18,411,600 $10,458,400 -$7,953,200 -43.2%
Main Estimates $14,548,608 $20,183,700 $14,316,000 $10,458,400 -$3,857,600 -26.9%
OPERATING EXPENDITURE $14,548,608 $20,183,700 $14,316,000 $10,458,400 -$3,857,600 -26.9%
RUNNING COSTS $14,548,608 $20,183,700 $14,316,000 $10,458,400 -$3,857,600 -26.9%
Expenditure on Manpower $8,488,798 $9,459,800 $5,617,400 $5,783,900 $166,500 3.0%
1500 Permanent Staff 8,488,798 9,459,800 5,617,400 5,783,900 166,500 3.0
Other Operating Expenditure $6,059,810 $10,723,900 $8,698,600 $4,674,500 -$4,024,100 -46.3%
2100 Consumption of Products & Services 4,043,205 9,370,900 7,447,900 3,234,000 -4,213,900 -56.6 2300 Manpower Development 632,146 110,000 82,900 116,000 33,100 39.9 2400 International & Public Relations, Public
Communications 1,384,460 1,231,000 1,167,400 1,324,500 157,100 13.5
2700 Asset Acquisition 0 12,000 400 0 -400 -100.0
Development Estimates $5,680,681 $4,246,400 $4,095,600 $0 -$4,095,600 -100.0%
DEVELOPMENT EXPENDITURE $5,680,681 $4,246,400 $4,095,600 $0 -$4,095,600 -100.0%
5100 Government Development 5,680,681 4,246,400 4,095,600 0 -4,095,600 -100.0
_______________________________________________
1 Previously known as Functional Programme. The HR Policy, PSC Secretariat and Leadership Development clusters were transferred to the Workforce and Leadership Development Programme while the Strategic Planning and Research cluster was transferred to the Corporate Programme in FY2017.
Manpower
BLANK Actual Estimated Revised Estimated Category FY2018 FY2019 FY2019 FY2020
BLANK
Permanent Staff 59 59 44 44
TOTAL 59 59 44 44

368
STRATEGY GROUP PROGRAMME
PROGRAMME DESCRIPTION
The Strategy Group in the Prime Minister’s Office drives Whole-of-Government strategic planning, and partners government agencies on policy development. It identifies key priorities and emerging issues over the medium to long term, influences strategic resource allocation and catalyses new functions and capabilities in order to deliver policies that are in the long-term interest of Singapore. This includes driving the holistic development of population strategy across government agencies, and leading and coordinating Singapore’s policies and plans on climate change.
Expenditure Estimates by Object Class BLANK Actual Estimated Revised Estimated Code Object Class FY2018 FY2019 FY2019 FY2020 Change Over FY2019
B BLANK U-P STRATEGY GROUP PROGRAMME $1 $1 $1 $1 $0 0.0%
TOTAL EXPENDITURE $43,200,316 $48,054,200 $47,807,800 $49,109,000 $1,301,200 2.7%
Main Estimates $42,521,627 $45,530,000 $44,335,800 $48,013,700 $3,677,900 8.3%
OPERATING EXPENDITURE $42,521,627 $45,530,000 $44,335,800 $48,013,700 $3,677,900 8.3%
RUNNING COSTS $38,521,627 $41,530,000 $40,335,800 $44,013,700 $3,677,900 9.1%
Expenditure on Manpower $22,581,856 $22,736,600 $21,037,400 $22,157,500 $1,120,100 5.3%
1500 Permanent Staff 22,472,409 22,569,600 20,837,400 22,052,500 1,215,100 5.8 1600 Temporary, Daily-Rated & Other Staff 109,447 167,000 200,000 105,000 -95,000 -47.5
Other Operating Expenditure $14,544,493 $15,881,200 $16,966,900 $19,216,300 $2,249,400 13.3%
2100 Consumption of Products & Services 13,980,998 13,999,400 15,768,600 18,222,100 2,453,500 15.6 2300 Manpower Development 300,224 288,900 359,100 377,900 18,800 5.2 2400 International & Public Relations, Public
Communications 199,268 1,590,700 780,400 554,100 -226,300 -29.0
2700 Asset Acquisition 64,002 2,200 58,800 62,200 3,400 5.8
Grants, Subventions & Capital Injections to Organisations $1,395,279 $2,912,200 $2,331,500 $2,639,900 $308,400 13.2%
3100 Grants, Subventions & Capital Injections to Statutory Boards
5,838 7,000 7,000 7,000 0 0.0
3400 Grants, Subventions & Capital Injections to Other Organisations
1,389,440 2,905,200 2,324,500 2,632,900 308,400 13.3
TRANSFERS $4,000,000 $4,000,000 $4,000,000 $4,000,000 $0 0.0%
3600 Transfers to Institutions & Organisations 4,000,000 4,000,000 4,000,000 4,000,000 0 0.0
Development Estimates $678,690 $2,524,200 $3,472,000 $1,095,300 -$2,376,700 -68.5%
DEVELOPMENT EXPENDITURE $678,690 $2,524,200 $3,472,000 $1,095,300 -$2,376,700 -68.5%
5100 Government Development 678,690 2,524,200 3,472,000 1,095,300 -2,376,700 -68.5

369
Manpower
BLANK Actual Estimated Revised Estimated Category FY2018 FY2019 FY2019 FY2020
BLANK
Permanent Staff 150 150 150 150
TOTAL 150 150 150 150
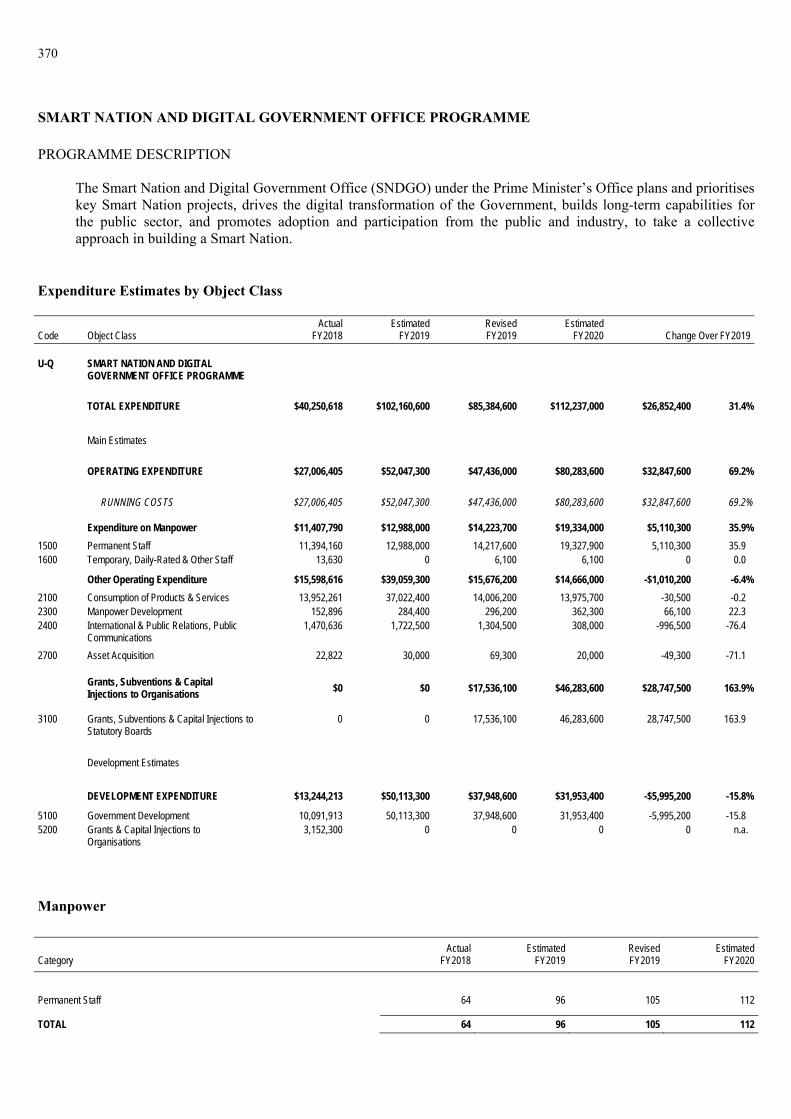
370
SMART NATION AND DIGITAL GOVERNMENT OFFICE PROGRAMME
PROGRAMME DESCRIPTION
The Smart Nation and Digital Government Office (SNDGO) under the Prime Minister’s Office plans and prioritises key Smart Nation projects, drives the digital transformation of the Government, builds long-term capabilities for the public sector, and promotes adoption and participation from the public and industry, to take a collective approach in building a Smart Nation.
Expenditure Estimates by Object Class BLANK Actual Estimated Revised Estimated Code Object Class FY2018 FY2019 FY2019 FY2020 Change Over FY2019
B BLANK U-Q SMART NATION AND DIGITAL
GOVERNMENT OFFICE PROGRAMME $1 $1 $1 $1 $0 0.0%
TOTAL EXPENDITURE $40,250,618 $102,160,600 $85,384,600 $112,237,000 $26,852,400 31.4%
Main Estimates $27,006,405 $52,047,300 $47,436,000 $80,283,600 $32,847,600 69.2%
OPERATING EXPENDITURE $27,006,405 $52,047,300 $47,436,000 $80,283,600 $32,847,600 69.2%
RUNNING COSTS $27,006,405 $52,047,300 $47,436,000 $80,283,600 $32,847,600 69.2%
Expenditure on Manpower $11,407,790 $12,988,000 $14,223,700 $19,334,000 $5,110,300 35.9%
1500 Permanent Staff 11,394,160 12,988,000 14,217,600 19,327,900 5,110,300 35.9 1600 Temporary, Daily-Rated & Other Staff 13,630 0 6,100 6,100 0 0.0
Other Operating Expenditure $15,598,616 $39,059,300 $15,676,200 $14,666,000 -$1,010,200 -6.4%
2100 Consumption of Products & Services 13,952,261 37,022,400 14,006,200 13,975,700 -30,500 -0.2 2300 Manpower Development 152,896 284,400 296,200 362,300 66,100 22.3 2400 International & Public Relations, Public
Communications 1,470,636 1,722,500 1,304,500 308,000 -996,500 -76.4
2700 Asset Acquisition 22,822 30,000 69,300 20,000 -49,300 -71.1
Grants, Subventions & Capital Injections to Organisations $0 $0 $17,536,100 $46,283,600 $28,747,500 163.9%
3100 Grants, Subventions & Capital Injections to Statutory Boards
0 0 17,536,100 46,283,600 28,747,500 163.9
Development Estimates $13,244,213 $50,113,300 $37,948,600 $31,953,400 -$5,995,200 -15.8%
DEVELOPMENT EXPENDITURE $13,244,213 $50,113,300 $37,948,600 $31,953,400 -$5,995,200 -15.8%
5100 Government Development 10,091,913 50,113,300 37,948,600 31,953,400 -5,995,200 -15.8 5200 Grants & Capital Injections to
Organisations 3,152,300 0 0 0 0 n.a.
Manpower
BLANK Actual Estimated Revised Estimated
Category FY2018 FY2019 FY2019 FY2020
BLANK
Permanent Staff 64 96 105 112
TOTAL 64 96 105 112

371
GOVERNMENT TECHNOLOGY AGENCY PROGRAMME
PROGRAMME DESCRIPTION
The Government Technology Agency of Singapore (GovTech) harnesses info-communications technology (ICT) and related engineering for public sector digital transformation. GovTech is also in charge of developing Singapore’s Smart Nation infrastructure and applications. GovTech partners other public agencies to develop and deliver secure digital services and applied technology to individuals and businesses in Singapore. GovTech is also responsible for raising and sustaining the overall capabilities of the Government in ICT and related engineering fields, such as the Internet of Things, Data Science and Application Development.
Expenditure Estimates by Object Class
BLANK Actual Estimated Revised Estimated Code Object Class FY2018 FY2019 FY2019 FY2020 Change Over FY2019
B BLANK U-R GOVERNMENT TECHNOLOGY AGENCY
PROGRAMME $1 $1 $1 $1 $0 0.0%
TOTAL EXPENDITURE $329,577,556 $371,217,600 $347,250,900 $353,652,200 $6,401,300 1.8%
Main Estimates $254,804,386 $314,061,200 $295,592,600 $272,752,500 -$22,840,100 -7.7%
OPERATING EXPENDITURE $254,804,386 $314,061,200 $295,592,600 $272,752,500 -$22,840,100 -7.7%
RUNNING COSTS $254,804,386 $314,061,200 $295,592,600 $272,752,500 -$22,840,100 -7.7%
Other Operating Expenditure $833 $0 $172,376,100 $143,719,600 -$28,656,500 -16.6%
2100 Consumption of Products & Services 833 0 172,376,100 143,719,600 -28,656,500 -16.6
Grants, Subventions & Capital Injections to Organisations
$254,803,553 $314,061,200 $123,216,500 $129,032,900 $5,816,400 4.7%
3100 Grants, Subventions & Capital Injections to Statutory Boards
254,803,553 314,061,200 123,216,500 129,032,900 5,816,400 4.7
Development Estimates $74,773,170 $57,156,400 $51,658,300 $80,899,700 $29,241,400 56.6%
DEVELOPMENT EXPENDITURE $74,773,170 $57,156,400 $51,658,300 $80,899,700 $29,241,400 56.6%
5200 Grants & Capital Injections to Organisations 74,773,170 57,156,400 51,658,300 80,899,700 29,241,400 56.6
Manpower
BLANK Actual Estimated Revised Estimated Category FY2018 FY2019 FY2019 FY2020
BLANK
Others 2,020 2,364 2,934 2,780
TOTAL 2,020 2,364 2,934 2,780

372
SCIENCE & TECHNOLOGY POLICY & PLANS OFFICE PROGRAMME
PROGRAMME DESCRIPTION
Public Sector Science & Technology Policy & Plans Office (S&TPPO) conducts S&T masterplanning and strengthens public sector S&T capabilities. It works with other centre-of-government agencies to identify key public sector S&T capabilities to build, and review how these capabilities are resourced and sited. S&TPPO also supports agencies’ efforts in building up ops-tech capabilities. It also supports the development of S&T talent and the community. S&TPPO also coordinates the planning for selected cross-agency programmes, such as a drones-as-a-service platform.
Expenditure Estimates by Object Class BLANK Actual Estimated Revised Estimated Code Object Class FY2018 FY2019 FY2019 FY2020 Change Over FY2019
B BLANK U-S SCIENCE & TECHNOLOGY POLICY &
PLANS OFFICE PROGRAMME $1 $1 $1 $1 $0 0.0%
TOTAL EXPENDITURE $0 $0 $1,800,000 $10,112,800 $8,312,800 461.8%
Main Estimates $0 $0 $1,800,000 $10,087,800 $8,287,800 460.4%
OPERATING EXPENDITURE $0 $0 $1,800,000 $10,087,800 $8,287,800 460.4%
RUNNING COSTS $0 $0 $1,800,000 $10,087,800 $8,287,800 460.4%
Expenditure on Manpower $0 $0 $900,000 $2,600,000 $1,700,000 188.9%
1500 Permanent Staff 0 0 900,000 2,600,000 1,700,000 188.9
Other Operating Expenditure $0 $0 $900,000 $7,487,800 $6,587,800 732.0%
2100 Consumption of Products & Services 0 0 856,300 7,377,900 6,521,600 761.6 2300 Manpower Development 0 0 13,500 23,900 10,400 77.0 2400 International & Public Relations, Public
Communications 0 0 28,500 83,000 54,500 191.2
2700 Asset Acquisition 0 0 1,700 3,000 1,300 76.5
Development Estimates $0 $0 $0 $25,000 $25,000 n.a.
DEVELOPMENT EXPENDITURE $0 $0 $0 $25,000 $25,000 n.a.
5100 Government Development 0 0 0 25,000 25,000 n.a.
Manpower
BLANK Actual Estimated Revised Estimated Category FY2018 FY2019 FY2019 FY2020
BLANK
Permanent Staff 0 0 10 14
TOTAL 0 0 10 14

PROGRAMME DETAILS
Head V ___________
Ministry of Trade and Industry


373
ADMINISTRATION PROGRAMME
PROGRAMME DESCRIPTION This programme comes under the Ministry of Trade and Industry (MTI) HQ. Its main functions are:
(a) to formulate strategies and policies to enhance Singapore’s value as a destination for businesses, talent and visitors, grow stronger local enterprises with deep capabilities and international presence, support R&D, innovation and enterprise, foster competition and protect consumers against unfair practices, facilitate the provision of economic resources, and strengthen economic security and resilience;
(b) to formulate policies and positions to further Singapore’s interests and improve Singapore’s connectivity at
international and regional economic and trade forums as well as bilateral engagements;
(c) to work closely with other key agencies in formulating strategies to develop key growth sectors, drive industry transformation, and help Singaporeans develop industry-relevant skills to access economic opportunities;
(d) to undertake economic planning, regular monitoring and analysis of the economy; and
(e) to provide support services to departments and statutory boards of MTI,
so as to achieve sustained economic growth and create good jobs for Singaporeans.
Expenditure Estimates by Object Class BLANK Actual Estimated Revised Estimated Code Object Class FY2018 FY2019 FY2019 FY2020 Change Over FY2019
B BLANK V-A ADMINISTRATION PROGRAMME $1 $1 $1 $1 $0 0.0%
TOTAL EXPENDITURE $358,372,467 $327,507,200 $336,235,400 $614,329,500 $278,094,100 82.7%
Main Estimates $170,756,749 $158,995,700 $218,974,700 $413,336,100 $194,361,400 88.8%
OPERATING EXPENDITURE $170,756,749 $158,861,700 $218,872,700 $413,210,100 $194,337,400 88.8%
RUNNING COSTS $114,830,564 $101,334,300 $159,956,700 $363,687,100 $203,730,400 127.4%
Expenditure on Manpower $65,339,753 $63,155,000 $63,286,300 $65,630,700 $2,344,400 3.7%
1200 Political Appointments 3,377,044 3,297,200 3,484,900 3,099,000 -385,900 -11.1 1500 Permanent Staff 61,843,861 59,723,300 59,625,900 62,351,000 2,725,100 4.6 1600 Temporary, Daily-Rated & Other Staff 118,847 134,500 175,500 180,700 5,200 3.0
Other Operating Expenditure $49,490,811 $38,179,300 $95,810,400 $297,196,400 $201,386,000 210.2%
2100 Consumption of Products & Services 29,307,638 27,614,200 84,151,700 287,764,000 203,612,300 242.0 2300 Manpower Development 2,604,680 2,976,200 2,966,800 3,254,200 287,400 9.7 2400 International & Public Relations, Public
Communications 17,366,107 7,525,700 8,555,800 5,940,800 -2,615,000 -30.6
2700 Asset Acquisition 212,330 63,200 135,700 237,400 101,700 74.9 2800 Miscellaneous 56 0 400 0 -400 -100.0
Grants, Subventions & Capital Injections to Organisations
$0 $0 $860,000 $860,000 $0 0.0%
3100 Grants, Subventions & Capital Injections to Statutory Boards
0 0 860,000 860,000 0 0.0
TRANSFERS $55,926,185 $57,527,400 $58,916,000 $49,523,000 -$9,393,000 -15.9%
3500 Social Transfers to Individuals 38,607,572 39,567,300 39,567,300 31,648,100 -7,919,200 -20.0 3600 Transfers to Institutions & Organisations 9,917,112 10,092,600 9,387,000 9,635,600 248,600 2.6

374
BLANK Actual Estimated Revised Estimated Code Object Class FY2018 FY2019 FY2019 FY2020 Change Over FY2019
B BLANK 3800 International Organisations & Overseas
Development Assistance 7,401,501 7,867,500 9,961,700 8,239,300 -1,722,400 -17.3
OTHER CONSOLIDATED FUND OUTLAYS $0 $134,000 $102,000 $126,000 $24,000 23.5%
4600 Loans and Advances (Disbursement) 0 134,000 102,000 126,000 24,000 23.5
Development Estimates $187,615,718 $168,645,500 $117,362,700 $201,119,400 $83,756,700 71.4%
DEVELOPMENT EXPENDITURE $187,615,718 $168,645,500 $117,362,700 $201,119,400 $83,756,700 71.4%
5100 Government Development 124,547,323 119,145,500 100,109,700 93,123,300 -6,986,400 -7.0 5200 Grants & Capital Injections to
Organisations 63,068,395 49,500,000 17,253,000 107,996,100 90,743,100 526.0
OTHER DEVELOPMENT FUND OUTLAYS
$265,524,085 $330,955,800 $314,479,700 $2,695,270,300 $2,380,790,600 757.1%
5500 Land-Related Expenditure 265,524,085 330,955,800 314,479,700 295,270,300 -19,209,400 -6.1 5600 Loans 0 0 0 2,400,000,000 2,400,000,000 n.a.
Manpower
BLANK Actual Estimated Revised Estimated Category FY2018 FY2019 FY2019 FY2020
BLANK
Political Appointments 5 5 5 5
Permanent Staff 370 370 347 372
Temporary, Daily-Rated & Other Staff 18 0 0 0
TOTAL 393 375 352 377

375
STATISTICS PROGRAMME PROGRAMME DESCRIPTION This programme comes under the Department of Statistics (DOS). DOS’s mission is to deliver insightful statistics and trusted statistical services that empower decision-making. The main functions are:
(a) to compile a wide range of economic, business, household and population statistics to enable the monitoring and analysis of Singapore’s changing economic and social landscape;
(b) to provide data access to public sector agencies and the public through digital platforms and customised
statistical services;
(c) to advise on statistical matters, engage data users and suppliers on data requirements, and work with public sector agencies on policy analyses;
(d) to develop and maintain integrated statistical databases comprising data collected from a wide range of data
sources for the production of official statistics, and to support government data analytics projects; and
(e) to develop and promote the observance of national statistical standards by public sector agencies producing data for official statistics compilation.
Expenditure Estimates by Object Class BLANK Actual Estimated Revised Estimated Code Object Class FY2018 FY2019 FY2019 FY2020 Change Over FY2019
B BLANK V-B STATISTICS PROGRAMME $1 $1 $1 $1 $0 0.0%
TOTAL EXPENDITURE $71,618,534 $83,543,100 $84,345,900 $93,847,800 $9,501,900 11.3%
Main Estimates $68,846,514 $79,456,000 $76,097,900 $85,872,500 $9,774,600 12.8%
OPERATING EXPENDITURE $68,846,514 $79,398,000 $76,014,900 $85,872,500 $9,857,600 13.0%
RUNNING COSTS $68,824,311 $79,376,000 $75,992,900 $85,850,500 $9,857,600 13.0%
Expenditure on Manpower $45,310,217 $48,447,000 $44,901,300 $50,663,400 $5,762,100 12.8%
1500 Permanent Staff 44,529,508 46,422,000 42,957,900 47,958,800 5,000,900 11.6 1600 Temporary, Daily-Rated & Other Staff 780,709 2,025,000 1,943,400 2,704,600 761,200 39.2
Other Operating Expenditure $23,514,094 $30,929,000 $31,091,600 $35,187,100 $4,095,500 13.2%
2100 Consumption of Products & Services 22,483,594 29,902,900 26,358,000 33,702,500 7,344,500 27.9 2300 Manpower Development 883,673 897,500 959,600 852,300 -107,300 -11.2 2400 International & Public Relations, Public
Communications 106,466 128,400 144,300 539,400 395,100 273.8
2700 Asset Acquisition 40,361 200 3,624,800 87,600 -3,537,200 -97.6 2800 Miscellaneous 0 0 4,900 5,300 400 8.2
TRANSFERS $22,203 $22,000 $22,000 $22,000 $0 0.0%
3800 International Organisations & Overseas Development Assistance
22,203 22,000 22,000 22,000 0 0.0
OTHER CONSOLIDATED FUND OUTLAYS $0 $58,000 $83,000 $0 -$83,000 -100.0%
4600 Loans and Advances (Disbursement) 0 58,000 83,000 0 -83,000 -100.0

376
BLANK Actual Estimated Revised Estimated Code Object Class FY2018 FY2019 FY2019 FY2020 Change Over FY2019
Development Estimates $2,772,020 $4,145,100 $8,331,000 $7,975,300 -$355,700 -4.3%
DEVELOPMENT EXPENDITURE $2,772,020 $4,145,100 $8,331,000 $7,975,300 -$355,700 -4.3%
5100 Government Development 2,772,020 4,145,100 8,331,000 7,975,300 -355,700 -4.3
Manpower
BLANK Actual Estimated Revised Estimated Category FY2018 FY2019 FY2019 FY2020
BLANK
Permanent Staff 372 372 372 372
Temporary, Daily-Rated & Other Staff 0 0 15 15
TOTAL 372 372 387 387
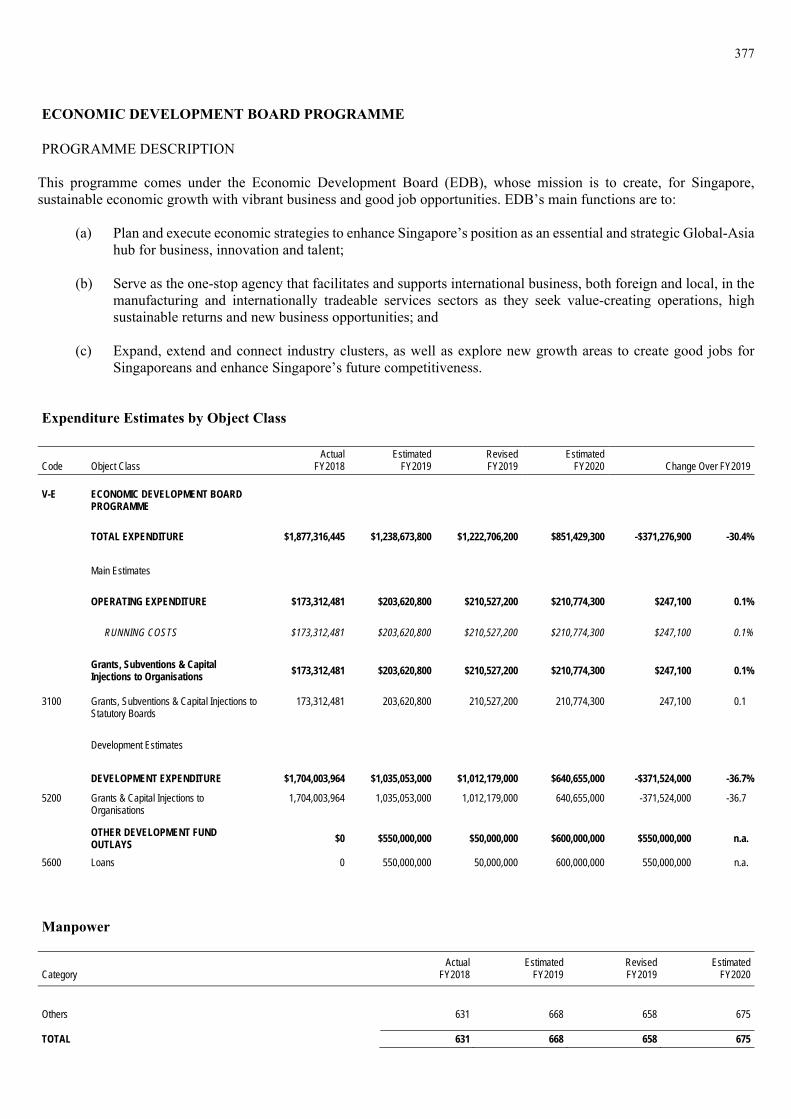
377
ECONOMIC DEVELOPMENT BOARD PROGRAMME
PROGRAMME DESCRIPTION
This programme comes under the Economic Development Board (EDB), whose mission is to create, for Singapore, sustainable economic growth with vibrant business and good job opportunities. EDB’s main functions are to:
(a) Plan and execute economic strategies to enhance Singapore’s position as an essential and strategic Global-Asia hub for business, innovation and talent;
(b) Serve as the one-stop agency that facilitates and supports international business, both foreign and local, in the
manufacturing and internationally tradeable services sectors as they seek value-creating operations, high sustainable returns and new business opportunities; and
(c) Expand, extend and connect industry clusters, as well as explore new growth areas to create good jobs for
Singaporeans and enhance Singapore’s future competitiveness.
Expenditure Estimates by Object Class BLANK Actual Estimated Revised Estimated Code Object Class FY2018 FY2019 FY2019 FY2020 Change Over FY2019
B BLANK V-E ECONOMIC DEVELOPMENT BOARD
PROGRAMME $1 $1 $1 $1 $0 0.0%
TOTAL EXPENDITURE $1,877,316,445 $1,238,673,800 $1,222,706,200 $851,429,300 -$371,276,900 -30.4%
Main Estimates $173,312,481 $203,620,800 $210,527,200 $210,774,300 $247,100 0.1%
OPERATING EXPENDITURE $173,312,481 $203,620,800 $210,527,200 $210,774,300 $247,100 0.1%
RUNNING COSTS $173,312,481 $203,620,800 $210,527,200 $210,774,300 $247,100 0.1%
Grants, Subventions & Capital Injections to Organisations $173,312,481 $203,620,800 $210,527,200 $210,774,300 $247,100 0.1%
3100 Grants, Subventions & Capital Injections to Statutory Boards
173,312,481 203,620,800 210,527,200 210,774,300 247,100 0.1
Development Estimates $1,704,003,964 $1,035,053,000 $1,012,179,000 $640,655,000 -$371,524,000 -36.7%
DEVELOPMENT EXPENDITURE $1,704,003,964 $1,035,053,000 $1,012,179,000 $640,655,000 -$371,524,000 -36.7%
5200 Grants & Capital Injections to Organisations
1,704,003,964 1,035,053,000 1,012,179,000 640,655,000 -371,524,000 -36.7
OTHER DEVELOPMENT FUND OUTLAYS
$0 $550,000,000 $50,000,000 $600,000,000 $550,000,000 n.a.
5600 Loans 0 550,000,000 50,000,000 600,000,000 550,000,000 n.a.
Manpower
BLANK Actual Estimated Revised Estimated Category FY2018 FY2019 FY2019 FY2020
BLANK
Others 631 668 658 675
TOTAL 631 668 658 675

378
AGENCY FOR SCIENCE, TECHNOLOGY AND RESEARCH PROGRAMME
PROGRAMME DESCRIPTION
This programme comes under the Agency for Science, Technology and Research (A*STAR). A*STAR’s mission is to advance science and develop innovative technology to further economic growth and improve lives. A*STAR undertakes research to enhance the competitiveness of our industry clusters, seed new areas of growth, and create value for the Singapore economy. A*STAR also plays a central role in developing the national base of PhD research manpower and establishing major research infrastructure.
Expenditure Estimates by Object Class BLANK Actual Estimated Revised Estimated Code Object Class FY2018 FY2019 FY2019 FY2020 Change Over FY2019
B BLANK V-H AGENCY FOR SCIENCE, TECHNOLOGY
AND RESEARCH PROGRAMME $1 $1 $1 $1 $0 0.0%
TOTAL EXPENDITURE $1,187,825,491 $1,309,516,300 $1,218,377,200 $1,051,891,600 -$166,485,600 -13.7%
Main Estimates $50,675,491 $49,516,300 $51,377,200 $51,891,600 $514,400 1.0%
OPERATING EXPENDITURE $50,675,491 $49,516,300 $51,377,200 $51,891,600 $514,400 1.0%
RUNNING COSTS $50,675,491 $49,516,300 $51,377,200 $51,891,600 $514,400 1.0%
Grants, Subventions & Capital Injections to Organisations
$50,675,491 $49,516,300 $51,377,200 $51,891,600 $514,400 1.0%
3100 Grants, Subventions & Capital Injections to Statutory Boards
50,675,491 49,516,300 51,377,200 51,891,600 514,400 1.0
Development Estimates $1,137,150,000 $1,260,000,000 $1,167,000,000 $1,000,000,000 -$167,000,000 -14.3%
DEVELOPMENT EXPENDITURE $1,137,150,000 $1,260,000,000 $1,167,000,000 $1,000,000,000 -$167,000,000 -14.3%
5200 Grants & Capital Injections to Organisations
1,137,150,000 1,260,000,000 1,167,000,000 1,000,000,000 -167,000,000 -14.3
Manpower
BLANK Actual Estimated Revised Estimated Category FY2018 FY2019 FY2019 FY2020
BLANK
Others 219 219 223 223
TOTAL 219 219 223 223

379
SENTOSA DEVELOPMENT CORPORATION PROGRAMME
PROGRAMME DESCRIPTION
This programme comes under the Sentosa Development Corporation (SDC). SDC undertakes the master planning, development and promotion of Sentosa Island as a leisure destination for tourists and locals. SDC and its wholly owned subsidiaries, Sentosa Leisure Management and Sentosa Cove Resort Management, oversee the day-to-day management of the island and the Sentosa Cove residential precinct. In addition, SDC is the proprietor of the Sentosa Golf Club and owns Mount Faber Leisure Group, which runs the cable car to and from Sentosa, and ancillary services.
Expenditure Estimates by Object Class BLANK Actual Estimated Revised Estimated Code Object Class FY2018 FY2019 FY2019 FY2020 Change Over FY2019
B BLANK V-J SENTOSA DEVELOPMENT
CORPORATION PROGRAMME $1 $1 $1 $1 $0 0.0%
TOTAL EXPENDITURE $55,520,143 $60,031,800 $59,344,900 $92,385,200 $33,040,300 55.7%
Main Estimates $54,115,993 $53,907,800 $55,193,800 $54,219,700 -$974,100 -1.8%
OPERATING EXPENDITURE $54,115,993 $53,907,800 $55,193,800 $54,219,700 -$974,100 -1.8%
RUNNING COSTS $54,115,993 $53,907,800 $55,193,800 $54,219,700 -$974,100 -1.8%
Grants, Subventions & Capital Injections to Organisations $54,115,993 $53,907,800 $55,193,800 $54,219,700 -$974,100 -1.8%
3100 Grants, Subventions & Capital Injections to Statutory Boards
54,115,993 53,907,800 55,193,800 54,219,700 -974,100 -1.8
Development Estimates $1,404,150 $6,124,000 $4,151,100 $38,165,500 $34,014,400 819.4%
DEVELOPMENT EXPENDITURE $1,404,150 $6,124,000 $4,151,100 $38,165,500 $34,014,400 819.4%
5200 Grants & Capital Injections to Organisations
1,404,150 6,124,000 4,151,100 38,165,500 34,014,400 819.4

380
JURONG TOWN CORPORATION PROGRAMME
PROGRAMME DESCRIPTION
The funding under this programme is for Jurong Town Corporation (JTC) to develop strategic, innovative and critical industrial infrastructure/facilities/resources to enhance Singapore’s global competitiveness as an investment location and support industry transformation.
Expenditure Estimates by Object Class BLANK Actual Estimated Revised Estimated Code Object Class FY2018 FY2019 FY2019 FY2020 Change Over FY2019
B BLANK V-L JURONG TOWN CORPORATION
PROGRAMME $1 $1 $1 $1 $0 0.0%
TOTAL EXPENDITURE $125,944,018 $93,456,400 $105,052,500 $69,797,200 -$35,255,300 -33.6%
Main Estimates $17,537,701 $17,881,400 $18,760,200 $17,892,900 -$867,300 -4.6%
OPERATING EXPENDITURE $17,537,701 $17,881,400 $18,760,200 $17,892,900 -$867,300 -4.6%
RUNNING COSTS $17,537,701 $17,881,400 $18,760,200 $17,892,900 -$867,300 -4.6%
Grants, Subventions & Capital Injections to Organisations $17,537,701 $17,881,400 $18,760,200 $17,892,900 -$867,300 -4.6%
3100 Grants, Subventions & Capital Injections to Statutory Boards
17,537,701 17,881,400 18,760,200 17,892,900 -867,300 -4.6
Development Estimates $108,406,317 $75,575,000 $86,292,300 $51,904,300 -$34,388,000 -39.9%
DEVELOPMENT EXPENDITURE $108,406,317 $75,575,000 $86,292,300 $51,904,300 -$34,388,000 -39.9%
5100 Government Development 17,394 25,000,000 0 0 0 n.a. 5200 Grants & Capital Injections to
Organisations 108,388,923 50,575,000 86,292,300 51,904,300 -34,388,000 -39.9

381
SINGAPORE TOURISM BOARD PROGRAMME
PROGRAMME DESCRIPTION
This programme comes under the Singapore Tourism Board (STB). The funding provided under this programme is for STB to champion the development of tourism to shape a dynamic tourism landscape for Singapore, in partnership with the industry and community. Its main roles are:
(a) Marketing Singapore – To market Singapore’s multi-faceted appeal as a premier business and leisure destination, supported by its Destination Brand proposition and visitor-centric strategies.
(b) Industry Development – To develop and sustain the growth of tourism industries through long-term strategic
planning, growing markets, attracting investments, and developing tourism hardware and software.
(c) Capability Development – To support industry partners and enable them to enhance their business capabilities and competitiveness in order to address current challenges whilst preparing for future growth.
(d) Industry Regulation – To maintain a robust regulatory environment for hotels, travel agents and tourist guides
through licensing, ensuring compliance with related Acts and Regulations, and policy and regulatory reviews.
(e) Place-making – To work with government agencies, precinct associations and private stakeholders to spearhead, develop and implement various place-making initiatives, such as festivals, marketing initiatives and infrastructure improvements, that would improve visitor experience and inject vibrancy to bring the precincts to life.
Expenditure Estimates by Object Class
BLANK Actual Estimated Revised Estimated Code Object Class FY2018 FY2019 FY2019 FY2020 Change Over FY2019
B BLANK V-N SINGAPORE TOURISM BOARD
PROGRAMME $1 $1 $1 $1 $0 0.0%
TOTAL EXPENDITURE $422,228,447 $669,038,700 $704,257,700 $370,286,000 -$333,971,700 -47.4%
Main Estimates $211,027,082 $215,710,400 $233,709,400 $216,521,500 -$17,187,900 -7.4%
OPERATING EXPENDITURE $211,027,082 $215,710,400 $233,709,400 $216,521,500 -$17,187,900 -7.4%
RUNNING COSTS $211,027,082 $215,710,400 $233,709,400 $216,521,500 -$17,187,900 -7.4%
Grants, Subventions & Capital Injections to Organisations
$211,027,082 $215,710,400 $233,709,400 $216,521,500 -$17,187,900 -7.4%
3100 Grants, Subventions & Capital Injections to Statutory Boards
211,027,082 215,710,400 233,709,400 216,521,500 -17,187,900 -7.4
Development Estimates $211,201,365 $453,328,300 $470,548,300 $153,764,500 -$316,783,800 -67.3%
DEVELOPMENT EXPENDITURE $211,201,365 $453,328,300 $470,548,300 $153,764,500 -$316,783,800 -67.3%
5100 Government Development 9,844,980 2,000,000 270,400 7,743,500 7,473,100 n.a. 5200 Grants & Capital Injections to
Organisations 201,356,385 451,328,300 470,277,900 146,021,000 -324,256,900 -69.0

382
Manpower
BLANK Actual Estimated Revised Estimated Category FY2018 FY2019 FY2019 FY2020
BLANK
Others 485 485 483 483
TOTAL 485 485 483 483

383
COMPETITION AND CONSUMER COMMISSION OF SINGAPORE PROGRAMME
PROGRAMME DESCRIPTION
This programme comes under the Competition and Consumer Commission of Singapore (CCCS). The funding provided under this programme is for CCCS to administer and enforce the Competition Act (Cap 50B) and Consumer Protection (Fair Trading) Act (Cap 52A). The main functions and duties of CCCS are to:
(a) maintain and enhance efficient market conduct and promote overall productivity, innovation and competitiveness of markets in Singapore;
(b) eliminate or control practices having adverse effect on competition in Singapore;
(c) promote and sustain competition in markets in Singapore;
(d) promote a strong competitive culture and environment throughout the economy in Singapore;
(e) promote fair trading among suppliers and consumers and enable consumers to make informed purchasing decisions in Singapore;
(f) prevent suppliers in Singapore from engaging in unfair practices;
(g) act internationally as the national body representative of Singapore in respect of competition and consumer protection matters; and
(h) advise the Government, any public authority or any consumer protection organisation on national needs and policies in respect of competition and consumer protection matters generally.
Expenditure Estimates by Object Class BLANK Actual Estimated Revised Estimated Code Object Class FY2018 FY2019 FY2019 FY2020 Change Over FY2019
B BLANK V-P COMPETITION AND CONSUMER
COMMISSION OF SINGAPORE PROGRAMME
$1 $1 $1 $1 $0 0.0%
TOTAL EXPENDITURE $18,691,822 $19,357,500 $18,697,500 $20,316,300 $1,618,800 8.7%
Main Estimates $18,691,822 $19,357,500 $18,697,500 $20,316,300 $1,618,800 8.7%
OPERATING EXPENDITURE $18,691,822 $19,357,500 $18,697,500 $20,316,300 $1,618,800 8.7%
RUNNING COSTS $18,691,822 $19,357,500 $18,697,500 $20,316,300 $1,618,800 8.7%
Grants, Subventions & Capital Injections to Organisations
$18,691,822 $19,357,500 $18,697,500 $20,316,300 $1,618,800 8.7%
3100 Grants, Subventions & Capital Injections to Statutory Boards
18,691,822 19,357,500 18,697,500 20,316,300 1,618,800 8.7
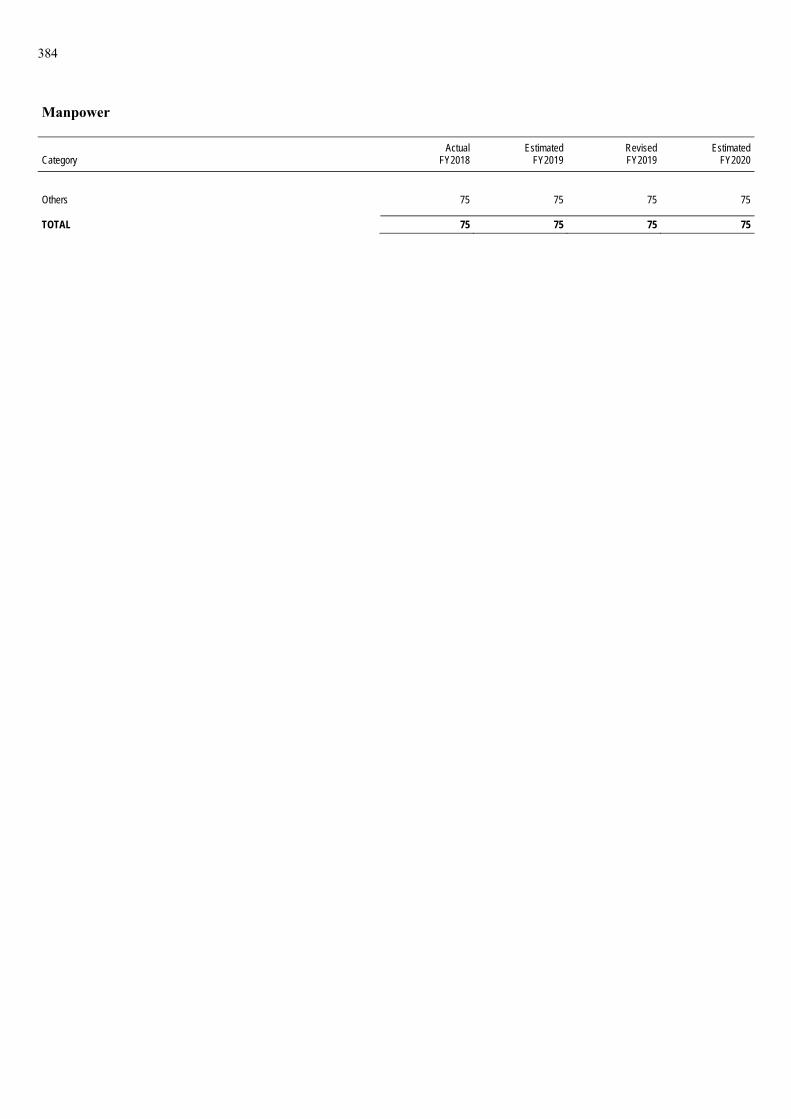
384
Manpower
BLANK Actual Estimated Revised Estimated Category FY2018 FY2019 FY2019 FY2020
BLANK
Others 75 75 75 75
TOTAL 75 75 75 75

385
ENERGY MARKET AUTHORITY PROGRAMME
PROGRAMME DESCRIPTION
This programme comes under the Energy Market Authority (EMA), whose mission is to create an energy sector that contributes to sustained growth for the benefit of all Singaporeans. The main functions of EMA are to:
(a) Ensure a secure and reliable energy supply;
(b) Promote a competitive energy market; and
(c) Develop a dynamic energy sector in Singapore.
Expenditure Estimates by Object Class BLANK Actual Estimated Revised Estimated Code Object Class FY2018 FY2019 FY2019 FY2020 Change Over FY2019
B BLANK V-Q ENERGY MARKET AUTHORITY
PROGRAMME $1 $1 $1 $1 $0 0.0%
TOTAL EXPENDITURE $14,356,172 $3,980,500 $3,617,300 $9,362,000 $5,744,700 158.8%
Main Estimates $4,746,347 $3,980,500 $3,617,300 $6,912,000 $3,294,700 91.1%
OPERATING EXPENDITURE $4,746,347 $3,980,500 $3,617,300 $6,912,000 $3,294,700 91.1%
RUNNING COSTS $4,746,347 $3,980,500 $3,617,300 $6,912,000 $3,294,700 91.1%
Grants, Subventions & Capital Injections to Organisations
$4,746,347 $3,980,500 $3,617,300 $6,912,000 $3,294,700 91.1%
3100 Grants, Subventions & Capital Injections to Statutory Boards
4,746,347 3,980,500 3,617,300 6,912,000 3,294,700 91.1
Development Estimates $9,609,825 $0 $0 $2,450,000 $2,450,000 n.a.
DEVELOPMENT EXPENDITURE $9,609,825 $0 $0 $2,450,000 $2,450,000 n.a.
5200 Grants & Capital Injections to Organisations
9,609,825 0 0 2,450,000 2,450,000 n.a.
OTHER DEVELOPMENT FUND OUTLAYS
$3,071,350 $0 $0 $0 $0 n.a.
5500 Land-Related Expenditure 1,350 0 0 0 0 n.a. 5600 Loans 3,070,000 0 0 0 0 n.a.
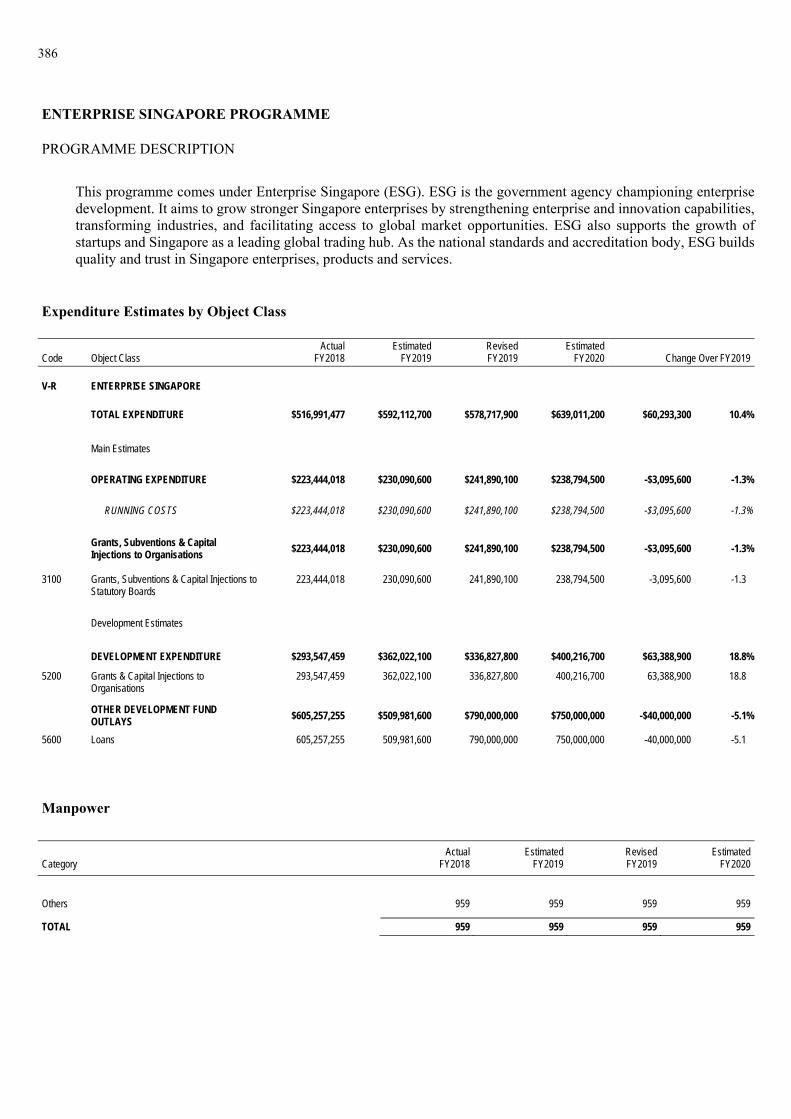
386
ENTERPRISE SINGAPORE PROGRAMME
PROGRAMME DESCRIPTION
This programme comes under Enterprise Singapore (ESG). ESG is the government agency championing enterprise development. It aims to grow stronger Singapore enterprises by strengthening enterprise and innovation capabilities, transforming industries, and facilitating access to global market opportunities. ESG also supports the growth of startups and Singapore as a leading global trading hub. As the national standards and accreditation body, ESG builds quality and trust in Singapore enterprises, products and services.
Expenditure Estimates by Object Class
BLANK Actual Estimated Revised Estimated Code Object Class FY2018 FY2019 FY2019 FY2020 Change Over FY2019
B BLANK V-R ENTERPRISE SINGAPORE $1 $1 $1 $1 $0 0.0%
TOTAL EXPENDITURE $516,991,477 $592,112,700 $578,717,900 $639,011,200 $60,293,300 10.4%
Main Estimates $223,444,018 $230,090,600 $241,890,100 $238,794,500 -$3,095,600 -1.3%
OPERATING EXPENDITURE $223,444,018 $230,090,600 $241,890,100 $238,794,500 -$3,095,600 -1.3%
RUNNING COSTS $223,444,018 $230,090,600 $241,890,100 $238,794,500 -$3,095,600 -1.3%
Grants, Subventions & Capital Injections to Organisations
$223,444,018 $230,090,600 $241,890,100 $238,794,500 -$3,095,600 -1.3%
3100 Grants, Subventions & Capital Injections to Statutory Boards
223,444,018 230,090,600 241,890,100 238,794,500 -3,095,600 -1.3
Development Estimates $293,547,459 $362,022,100 $336,827,800 $400,216,700 $63,388,900 18.8%
DEVELOPMENT EXPENDITURE $293,547,459 $362,022,100 $336,827,800 $400,216,700 $63,388,900 18.8%
5200 Grants & Capital Injections to Organisations
293,547,459 362,022,100 336,827,800 400,216,700 63,388,900 18.8
OTHER DEVELOPMENT FUND OUTLAYS $605,257,255 $509,981,600 $790,000,000 $750,000,000 -$40,000,000 -5.1%
5600 Loans 605,257,255 509,981,600 790,000,000 750,000,000 -40,000,000 -5.1
Manpower
BLANK Actual Estimated Revised Estimated Category FY2018 FY2019 FY2019 FY2020
BLANK
Others 959 959 959 959
TOTAL 959 959 959 959
PROGRAMME DETAILS
Head W ___________
Ministry of Transport


387
ADMINISTRATION PROGRAMME
PROGRAMME DESCRIPTION
This programme comes under the Ministry of Transport Headquarters (MOT HQ). Its main functions are:
(a) to formulate policies to develop and promote Singapore as a premier global air hub;
(b) to formulate policies to develop and promote Singapore as a leading global container hub port andinternational maritime centre;
(c) to formulate policies to develop an efficient, sustainable and world-class land transport system;
(d) to advance MOT’s international interests and relations;
(e) to create a future-ready Ministry through foresight and futures work as well as develop a readinesscapability to manage transport emergencies;
(f) to promote the Ministry’s policies and programmes through public communications activities andengagements;
(g) to provide corporate support services to the Ministry and its statutory boards; and
(h) to undertake investigations related to aviation, maritime, rail and selected bus accidents and incidentswith a view to enhancing the sectors’ safety.
Expenditure Estimates by Object Class
BLANK Actual Estimated Revised Estimated Code Object Class FY2018 FY2019 FY2019 FY2020 Change Over FY2019
B BLANK W-A ADMINISTRATION PROGRAMME $1 $1 $1 $1 $0
TOTAL EXPENDITURE $2,750,131,794 $4,561,965,700 $3,254,835,400 $4,254,298,400 $999,463,000 30.7%
Main Estimates $1,891,169,866 $2,025,560,900 $1,890,006,300 $1,984,756,300 $94,750,000 5.0%
OPERATING EXPENDITURE $1,891,169,866 $2,025,560,900 $1,890,006,300 $1,984,756,300 $94,750,000 5.0%
RUNNING COSTS $1,873,492,490 $2,002,954,100 $1,871,827,100 $1,964,139,600 $92,312,500 4.9%
Expenditure on Manpower $30,512,497 $29,684,000 $32,580,200 $31,630,000 -$950,200 -2.9%
1200 Political Appointments 1,619,724 1,630,000 1,720,000 1,630,000 -90,000 -5.21500 Permanent Staff 28,854,351 28,004,000 30,810,200 29,950,000 -860,200 -2.81600 Temporary, Daily-Rated & Other Staff 38,421 50,000 50,000 50,000 0 0.0
Other Operating Expenditure $665,085,915 $690,015,600 $705,959,800 $697,941,900 -$8,017,900 -1.1%
2100 Consumption of Products & Services 661,514,949 682,122,700 697,903,200 691,444,400 -6,458,800 -0.92300 Manpower Development 782,783 1,019,400 861,900 848,300 -13,600 -1.62400 International & Public Relations, Public
Communications 2,663,026 6,703,000 6,891,300 5,494,600 -1,396,700 -20.3
2700 Asset Acquisition 125,158 170,500 178,300 154,600 -23,700 -13.32800 Miscellaneous 0 0 125,100 0 -125,100 -100.0
Grants, Subventions & Capital Injections to Organisations
$1,177,894,078 $1,283,254,500 $1,133,287,100 $1,234,567,700 $101,280,600 8.9%
3100 Grants, Subventions & Capital Injections to Statutory Boards
1,177,894,078 1,283,254,500 1,133,287,100 1,234,567,700 101,280,600 8.9
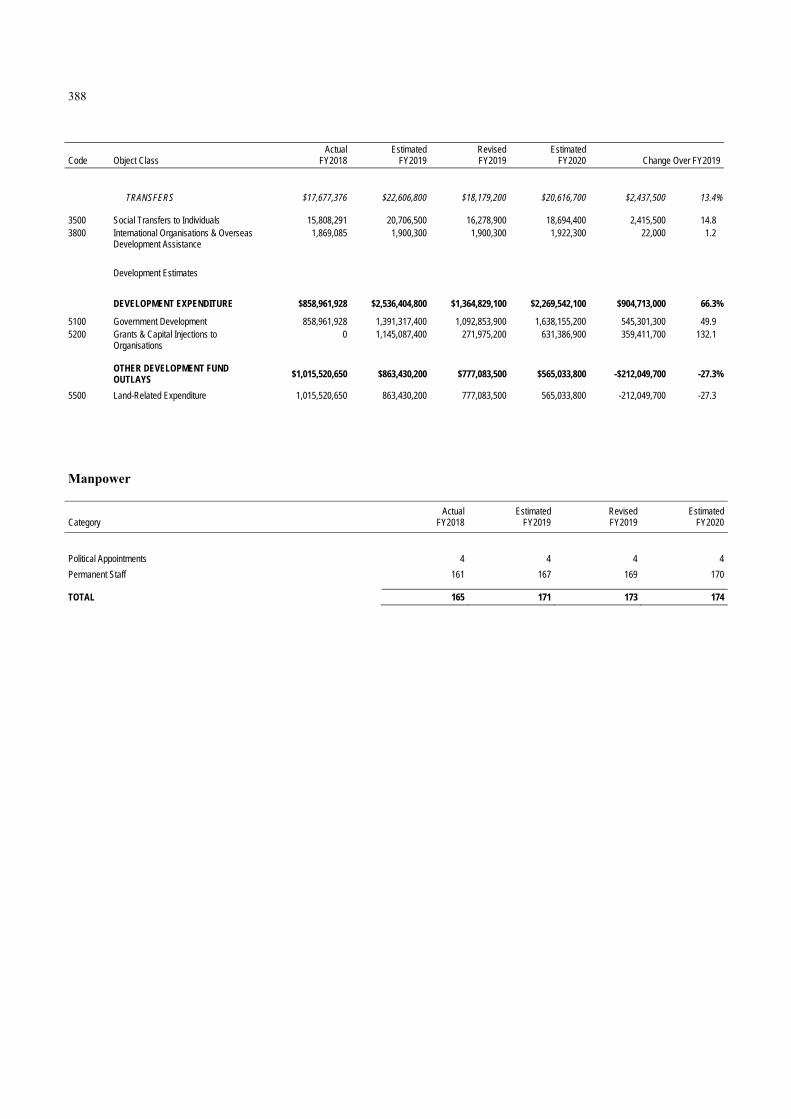
388
BLANK Actual Estimated Revised Estimated Code Object Class FY2018 FY2019 FY2019 FY2020 Change Over FY2019
B BLANK
TRANSFERS $17,677,376 $22,606,800 $18,179,200 $20,616,700 $2,437,500 13.4%
3500 Social Transfers to Individuals 15,808,291 20,706,500 16,278,900 18,694,400 2,415,500 14.8 3800 International Organisations & Overseas
Development Assistance 1,869,085 1,900,300 1,900,300 1,922,300 22,000 1.2
Development Estimates $858,961,928 $2,536,404,800 $1,364,829,100 $2,269,542,100 $904,713,000 66.3%
DEVELOPMENT EXPENDITURE $858,961,928 $2,536,404,800 $1,364,829,100 $2,269,542,100 $904,713,000 66.3%
5100 Government Development 858,961,928 1,391,317,400 1,092,853,900 1,638,155,200 545,301,300 49.9 5200 Grants & Capital Injections to
Organisations 0 1,145,087,400 271,975,200 631,386,900 359,411,700 132.1
OTHER DEVELOPMENT FUND OUTLAYS $1,015,520,650 $863,430,200 $777,083,500 $565,033,800 -$212,049,700 -27.3%
5500 Land-Related Expenditure 1,015,520,650 863,430,200 777,083,500 565,033,800 -212,049,700 -27.3
Manpower
BLANK Actual Estimated Revised Estimated Category FY2018 FY2019 FY2019 FY2020
BLANK
Political Appointments 4 4 4 4
Permanent Staff 161 167 169 170
TOTAL 165 171 173 174

389
PUBLIC TRANSPORT COUNCIL PROGRAMME
PROGRAMME DESCRIPTION
This programme comes under the Public Transport Council (PTC). The funding under this programme is for the regulation of public transport fares and fare payment services, as well as enforcement against fare evasion. The Council also undertakes the role of an independent advisor to the Minister for Transport on public transport matters.
Expenditure Estimates by Object Class
BLANK Actual Estimated Revised Estimated Code Object Class FY2018 FY2019 FY2019 FY2020 Change Over FY2019
B BLANK W-E PUBLIC TRANSPORT COUNCIL
PROGRAMME $1 $1 $1 $1 $0 0.0%
TOTAL EXPENDITURE $8,400,997 $7,919,600 $8,053,100 $8,087,900 $34,800 0.4%
Main Estimates $8,363,207 $7,863,500 $7,974,200 $8,081,200 $107,000 1.3%
OPERATING EXPENDITURE $8,363,207 $7,863,500 $7,974,200 $8,081,200 $107,000 1.3%
RUNNING COSTS $8,363,207 $7,863,500 $7,974,200 $8,081,200 $107,000 1.3%
Grants, Subventions & Capital Injections to Organisations
$8,363,207 $7,863,500 $7,974,200 $8,081,200 $107,000 1.3%
3100 Grants, Subventions & Capital Injections to Statutory Boards
8,363,207 7,863,500 7,974,200 8,081,200 107,000 1.3
Development Estimates $37,790 $56,100 $78,900 $6,700 -$72,200 -91.5%
DEVELOPMENT EXPENDITURE $37,790 $56,100 $78,900 $6,700 -$72,200 -91.5%
5200 Grants & Capital Injections to Organisations
37,790 56,100 78,900 6,700 -72,200 -91.5
Manpower
BLANK Actual Estimated Revised Estimated Category FY2018 FY2019 FY2019 FY2020
BLANK
Others 32 35 35 36
TOTAL 32 35 35 36

390
CIVIL AVIATION AUTHORITY PROGRAMME
PROGRAMME DESCRIPTION
This programme comes under the Civil Aviation Authority of Singapore. The funding provided under this programme is for the development of airport infrastructure.
Expenditure Estimates by Object Class
BLANK Actual Estimated Revised Estimated Code Object Class FY2018 FY2019 FY2019 FY2020 Change Over FY2019
B BLANK W-G CIVIL AVIATION AUTHORITY $1 $1 $1 $1 $0 0.0%
TOTAL EXPENDITURE $343,802,356 $312,702,200 $206,680,900 $274,196,400 $67,515,500 32.7%
Development Estimates $343,802,356 $312,702,200 $206,680,900 $274,196,400 $67,515,500 32.7%
DEVELOPMENT EXPENDITURE $343,802,356 $312,702,200 $206,680,900 $274,196,400 $67,515,500 32.7%
5200 Grants & Capital Injections to Organisations
343,802,356 312,702,200 206,680,900 274,196,400 67,515,500 32.7

391
LAND TRANSPORT AUTHORITY PROGRAMME
PROGRAMME DESCRIPTION
This programme comes under the Land Transport Authority (LTA). The funding provided under this programme is for the implementation of land transport policies and the development and maintenance of land transport infrastructure.
Expenditure Estimates by Object Class BLANK Actual Estimated Revised Estimated Code Object Class FY2018 FY2019 FY2019 FY2020 Change Over FY2019
B BLANK W-H LAND TRANSPORT AUTHORITY
PROGRAMME $1 $1 $1 $1 $0 0.0%
TOTAL EXPENDITURE $8,674,038,966 $5,801,092,000 $6,717,897,300 $6,375,950,700 -$341,946,600 -5.1%
Development Estimates $8,674,038,966 $5,801,092,000 $6,717,897,300 $6,375,950,700 -$341,946,600 -5.1%
DEVELOPMENT EXPENDITURE $8,674,038,966 $5,801,092,000 $6,717,897,300 $6,375,950,700 -$341,946,600 -5.1%
5200 Grants & Capital Injections to Organisations
8,674,038,966 5,801,092,000 6,717,897,300 6,375,950,700 -341,946,600 -5.1
Manpower
BLANK Actual Estimated Revised Estimated Category FY2018 FY2019 FY2019 FY2020
BLANK
Others 6,800 7,053 6,780 6,995
TOTAL 6,800 7,053 6,780 6,995

PROGRAMME DETAILS
Head X ___________
Ministry of Culture, Community and Youth


393
CORPORATE SERVICES PROGRAMME
PROGRAMME DESCRIPTION
This programme comes under the Ministry of Culture, Community and Youth HQ. It includes the corporate services functions of corporate communications, development and corporate administration, human resource, internal audit, legal services, organisational development and strategic planning & finance.
Expenditure Estimates by Object Class
BLANK Actual Estimated Revised Estimated Code Object Class FY2018 FY2019 FY2019 FY2020 Change Over FY2019
B BLANK X-A CORPORATE SERVICES PROGRAMME $1 $1 $1 $1 $0 0.0%
TOTAL EXPENDITURE $31,081,176 $41,933,700 $43,343,900 $47,423,000 $4,079,100 9.4%
Main Estimates $29,952,783 $38,011,400 $41,105,600 $39,894,700 -$1,210,900 -2.9%
OPERATING EXPENDITURE $29,952,783 $37,741,400 $41,100,700 $39,894,700 -$1,206,000 -2.9%
RUNNING COSTS $29,952,783 $37,741,400 $41,100,700 $39,894,700 -$1,206,000 -2.9%
Expenditure on Manpower $16,198,380 $16,856,300 $20,085,500 $19,606,900 -$478,600 -2.4%
1200 Political Appointments 1,521,227 1,402,600 1,437,700 1,402,600 -35,100 -2.41500 Permanent Staff 14,651,390 15,423,700 18,617,800 18,174,300 -443,500 -2.41600 Temporary, Daily-Rated & Other Staff 25,764 30,000 30,000 30,000 0 0.0
Other Operating Expenditure $13,578,682 $20,669,100 $20,907,200 $20,071,800 -$835,400 -4.0%
2100 Consumption of Products & Services 5,671,170 12,003,100 8,090,700 11,966,000 3,875,300 47.9 2300 Manpower Development 1,246,079 1,646,100 1,422,400 1,694,400 272,000 19.1 2400 International & Public Relations, Public
Communications 6,627,681 6,909,400 11,275,000 6,345,900 -4,929,100 -43.7
2700 Asset Acquisition 18,049 105,000 110,100 55,000 -55,100 -50.02800 Miscellaneous 15,704 5,500 9,000 10,500 1,500 16.7
Grants, Subventions & Capital Injections to Organisations
$175,720 $216,000 $108,000 $216,000 $108,000 100.0%
3100 Grants, Subventions & Capital Injections to Statutory Boards
175,720 216,000 108,000 216,000 108,000 100.0
OTHER CONSOLIDATED FUND OUTLAYS
$0 $270,000 $4,900 $0 -$4,900 -100.0%
4600 Loans and Advances (Disbursement) 0 270,000 4,900 0 -4,900 -100.0
Development Estimates $1,128,394 $4,192,300 $2,243,200 $7,528,300 $5,285,100 235.6%
DEVELOPMENT EXPENDITURE $1,128,394 $4,192,300 $2,243,200 $7,528,300 $5,285,100 235.6%
5100 Government Development 1,128,394 4,192,300 2,243,200 7,528,300 5,285,100 235.6

394
Manpower
BLANK Actual Estimated Revised Estimated Category FY2018 FY2019 FY2019 FY2020
BLANK
Political Appointments 3 3 3 3
Permanent Staff 101 108 116 115
TOTAL 104 111 119 118

395
ARTS AND HERITAGE PROGRAMME
PROGRAMME DESCRIPTION
This programme comes under the Arts and Heritage Division and the Culture Academy.
The Arts and Heritage Division aims to enhance the vibrancy of Singapore’s arts and heritage sector to nurture a fulfilled and engaged people, a cohesive and caring society and a confident and resilient nation. It provides policy direction and support to the National Arts Council, the National Heritage Board, The Esplanade Company Limited, the School of the Arts, the National Gallery Singapore, the Singapore Art Museum, and the STPI Creative Workshop and Gallery.
The Culture Academy aims to be a centre of excellence for cultural leadership development and research for the public sector.
Expenditure Estimates by Object Class BLANK Actual Estimated Revised Estimated Code Object Class FY2018 FY2019 FY2019 FY2020 Change Over FY2019
B BLANK X-B ARTS AND HERITAGE PROGRAMME $1 $1 $1 $1 $0 0.0%
TOTAL EXPENDITURE $156,953,010 $166,116,900 $181,801,400 $190,317,200 $8,515,800 4.7%
Main Estimates $144,343,739 $145,345,400 $161,029,900 $162,700,900 $1,671,000 1.0%
OPERATING EXPENDITURE $144,343,739 $145,345,400 $161,029,900 $162,700,900 $1,671,000 1.0%
RUNNING COSTS $144,343,739 $145,345,400 $161,029,900 $162,700,900 $1,671,000 1.0%
Expenditure on Manpower $2,889,816 $2,931,600 $2,336,500 $2,261,800 -$74,700 -3.2%
1500 Permanent Staff 2,889,816 2,931,600 2,336,500 2,261,800 -74,700 -3.2
Other Operating Expenditure $2,524,300 $5,049,400 $4,975,500 $5,519,900 $544,400 10.9%
2100 Consumption of Products & Services 2,401,574 4,745,800 4,671,900 5,314,000 642,100 13.7 2400 International & Public Relations, Public
Communications 122,726 303,600 303,600 205,900 -97,700 -32.2
Grants, Subventions & Capital Injections to Organisations
$138,929,623 $137,364,400 $153,717,900 $154,919,200 $1,201,300 0.8%
3100 Grants, Subventions & Capital Injections to Statutory Boards
15,577,686 16,156,000 15,384,000 7,700,000 -7,684,000 -49.9
3200 Grants, Subventions & Capital Injections to Educational Institutions
20,170,308 20,396,100 20,396,100 20,614,100 218,000 1.1
3400 Grants, Subventions & Capital Injections to Other Organisations
103,181,629 100,812,300 117,937,800 126,605,100 8,667,300 7.3
Development Estimates $12,609,271 $20,771,500 $20,771,500 $27,616,300 $6,844,800 33.0%
DEVELOPMENT EXPENDITURE $12,609,271 $20,771,500 $20,771,500 $27,616,300 $6,844,800 33.0%
5100 Government Development 9,324,910 17,908,900 17,914,500 27,515,500 9,601,000 53.6 5200 Grants & Capital Injections to
Organisations 3,284,361 2,862,600 2,857,000 100,800 -2,756,200 -96.5

396
Manpower
BLANK Actual Estimated Revised Estimated Category FY2018 FY2019 FY2019 FY2020
BLANK
Permanent Staff 19 22 24 25
TOTAL 19 22 24 25

397
CHARITIES AND CO-OPERATIVES PROGRAMME
PROGRAMME DESCRIPTION
This programme comes under the Charities Unit and the Registry of Co-operative Societies and Mutual Benefit Organisations.
The Charities Unit, which is under the purview of the Commissioner of Charities, has both policy and regulatory functions for charities/Institutions of a Public Character and fundraising activities. Together with the Charity Council and the five Sector Administrators, it seeks to promote good governance, ensure regulatory relevance and compliance, and to be a proactive charity advisory. This is to achieve a well-governed and thriving charity sector with strong public support, where members of the public and donors practise informed giving.
The Registry of Co-operative Societies and Mutual Benefit Organisations regulates co-operative societies and mutual benefit organisations (MBOs), so as to protect members’ interests. It formulates, implements and reviews policies relating to co-operatives and MBOs. The Registry also works closely with its stakeholders to strengthen co-operatives’ governance and management capabilities, and improve their prudential standards; so as to safeguard the interests of the members of the co-operatives.
Expenditure Estimates by Object Class
BLANK Actual Estimated Revised Estimated Code Object Class FY2018 FY2019 FY2019 FY2020 Change Over FY2019
B BLANK X-C CHARITIES AND CO-OPERATIVES
PROGRAMME $1 $1 $1 $1 $0 0.0%
TOTAL EXPENDITURE $6,779,210 $7,723,500 $7,101,200 $6,902,700 -$198,500 -2.8%
Main Estimates $6,779,210 $7,723,500 $7,101,200 $6,902,700 -$198,500 -2.8%
OPERATING EXPENDITURE $6,779,210 $7,723,500 $7,101,200 $6,902,700 -$198,500 -2.8%
RUNNING COSTS $6,223,910 $7,138,100 $6,515,800 $6,285,200 -$230,600 -3.5%
Expenditure on Manpower $4,592,769 $4,779,500 $4,683,600 $4,326,600 -$357,000 -7.6%
1500 Permanent Staff 4,592,769 4,779,500 4,683,600 4,326,600 -357,000 -7.6
Other Operating Expenditure $1,631,141 $2,358,600 $1,832,200 $1,958,600 $126,400 6.9%
2100 Consumption of Products & Services 1,595,839 2,340,900 1,766,500 1,912,300 145,800 8.3 2400 International & Public Relations, Public
Communications 35,302 16,100 65,200 45,800 -19,400 -29.8
2700 Asset Acquisition 0 1,600 0 0 0 n.a. 2800 Miscellaneous 0 0 500 500 0 0.0
TRANSFERS $555,300 $585,400 $585,400 $617,500 $32,100 5.5%
3600 Transfers to Institutions & Organisations 555,300 585,400 585,400 617,500 32,100 5.5
Manpower
BLANK Actual Estimated Revised Estimated Category FY2018 FY2019 FY2019 FY2020
BLANK
Permanent Staff 32 31 33 33
TOTAL 32 31 33 33
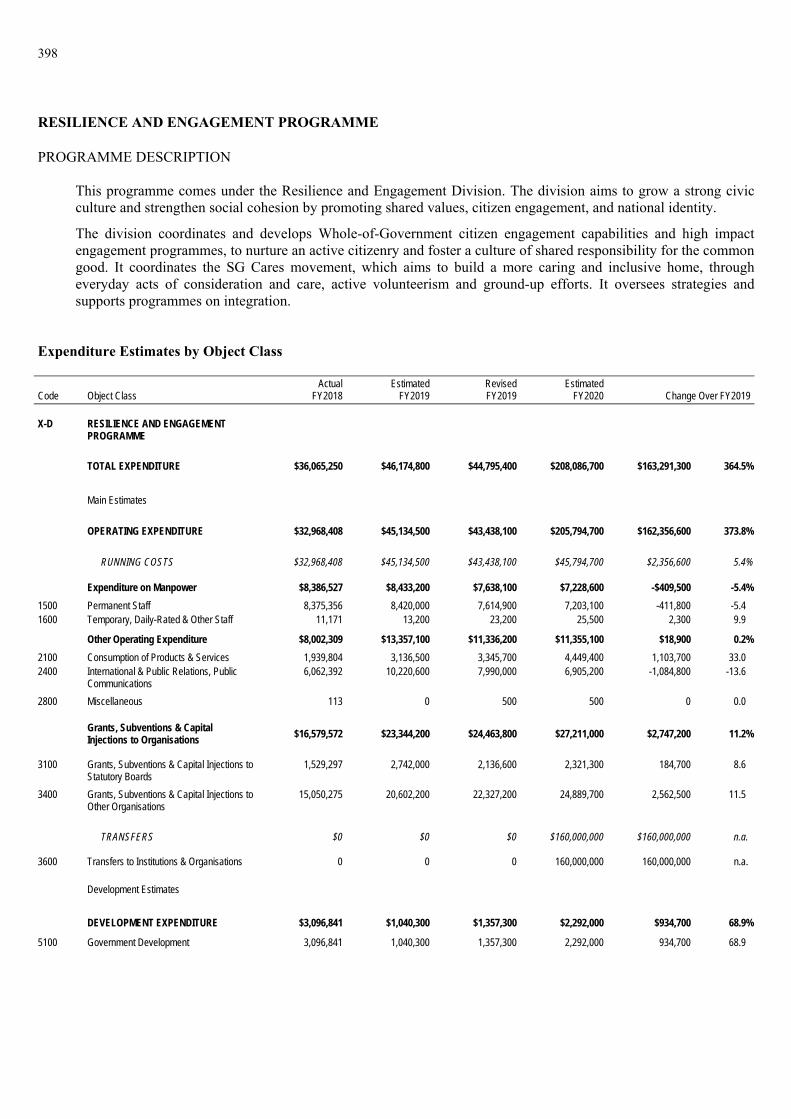
398
RESILIENCE AND ENGAGEMENT PROGRAMME
PROGRAMME DESCRIPTION
This programme comes under the Resilience and Engagement Division. The division aims to grow a strong civic culture and strengthen social cohesion by promoting shared values, citizen engagement, and national identity.
The division coordinates and develops Whole-of-Government citizen engagement capabilities and high impact engagement programmes, to nurture an active citizenry and foster a culture of shared responsibility for the common good. It coordinates the SG Cares movement, which aims to build a more caring and inclusive home, through everyday acts of consideration and care, active volunteerism and ground-up efforts. It oversees strategies and supports programmes on integration.
Expenditure Estimates by Object Class BLANK Actual Estimated Revised Estimated Code Object Class FY2018 FY2019 FY2019 FY2020 Change Over FY2019
B BLANK X-D RESILIENCE AND ENGAGEMENT
PROGRAMME $1 $1 $1 $1 $0 0.0%
TOTAL EXPENDITURE $36,065,250 $46,174,800 $44,795,400 $208,086,700 $163,291,300 364.5%
Main Estimates $32,968,408 $45,134,500 $43,438,100 $205,794,700 $162,356,600 373.8%
OPERATING EXPENDITURE $32,968,408 $45,134,500 $43,438,100 $205,794,700 $162,356,600 373.8%
RUNNING COSTS $32,968,408 $45,134,500 $43,438,100 $45,794,700 $2,356,600 5.4%
Expenditure on Manpower $8,386,527 $8,433,200 $7,638,100 $7,228,600 -$409,500 -5.4%
1500 Permanent Staff 8,375,356 8,420,000 7,614,900 7,203,100 -411,800 -5.4 1600 Temporary, Daily-Rated & Other Staff 11,171 13,200 23,200 25,500 2,300 9.9
Other Operating Expenditure $8,002,309 $13,357,100 $11,336,200 $11,355,100 $18,900 0.2%
2100 Consumption of Products & Services 1,939,804 3,136,500 3,345,700 4,449,400 1,103,700 33.0 2400 International & Public Relations, Public
Communications 6,062,392 10,220,600 7,990,000 6,905,200 -1,084,800 -13.6
2800 Miscellaneous 113 0 500 500 0 0.0
Grants, Subventions & Capital Injections to Organisations $16,579,572 $23,344,200 $24,463,800 $27,211,000 $2,747,200 11.2%
3100 Grants, Subventions & Capital Injections to Statutory Boards
1,529,297 2,742,000 2,136,600 2,321,300 184,700 8.6
3400 Grants, Subventions & Capital Injections to Other Organisations
15,050,275 20,602,200 22,327,200 24,889,700 2,562,500 11.5
TRANSFERS $0 $0 $0 $160,000,000 $160,000,000 n.a.
3600 Transfers to Institutions & Organisations 0 0 0 160,000,000 160,000,000 n.a.
Development Estimates $3,096,841 $1,040,300 $1,357,300 $2,292,000 $934,700 68.9%
DEVELOPMENT EXPENDITURE $3,096,841 $1,040,300 $1,357,300 $2,292,000 $934,700 68.9%
5100 Government Development 3,096,841 1,040,300 1,357,300 2,292,000 934,700 68.9

399
Manpower
BLANK Actual Estimated Revised Estimated Category FY2018 FY2019 FY2019 FY2020
BLANK
Permanent Staff 65 91 73 75
TOTAL 65 91 73 75
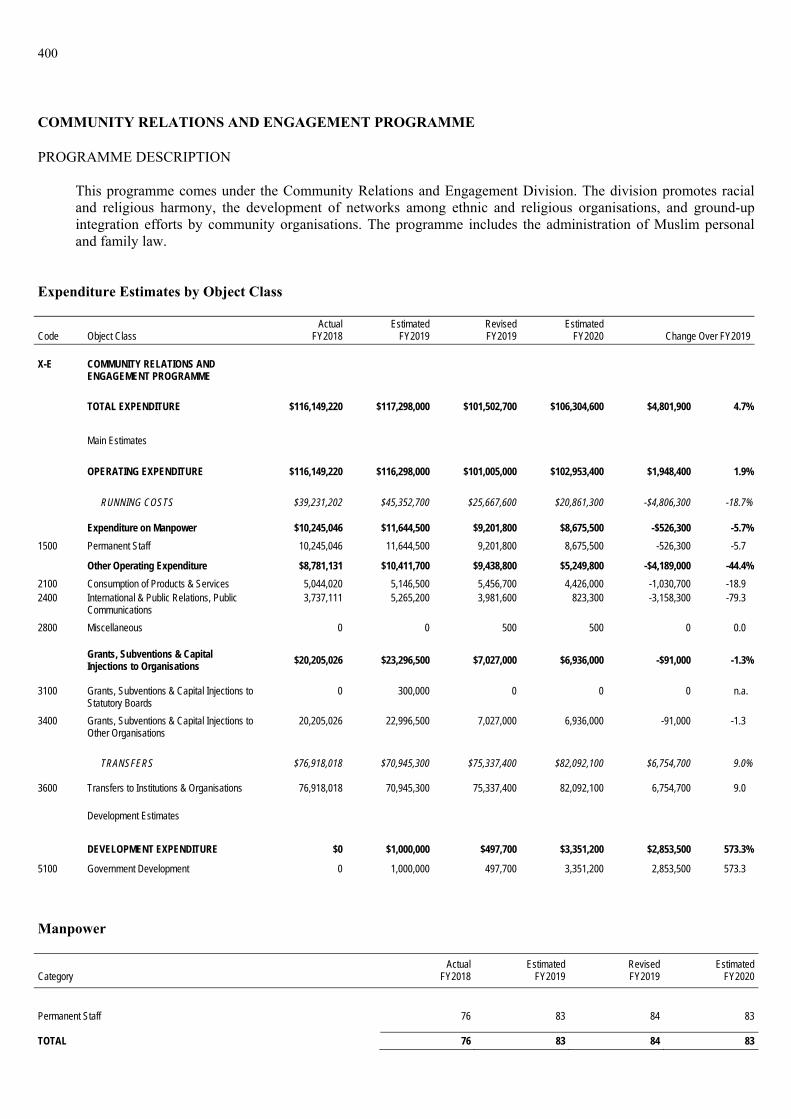
400
COMMUNITY RELATIONS AND ENGAGEMENT PROGRAMME
PROGRAMME DESCRIPTION
This programme comes under the Community Relations and Engagement Division. The division promotes racial and religious harmony, the development of networks among ethnic and religious organisations, and ground-up integration efforts by community organisations. The programme includes the administration of Muslim personal and family law.
Expenditure Estimates by Object Class BLANK Actual Estimated Revised Estimated Code Object Class FY2018 FY2019 FY2019 FY2020 Change Over FY2019
B BLANK X-E COMMUNITY RELATIONS AND
ENGAGEMENT PROGRAMME $1 $1 $1 $1 $0 0.0%
TOTAL EXPENDITURE $116,149,220 $117,298,000 $101,502,700 $106,304,600 $4,801,900 4.7%
Main Estimates $116,149,220 $116,298,000 $101,005,000 $102,953,400 $1,948,400 1.9%
OPERATING EXPENDITURE $116,149,220 $116,298,000 $101,005,000 $102,953,400 $1,948,400 1.9%
RUNNING COSTS $39,231,202 $45,352,700 $25,667,600 $20,861,300 -$4,806,300 -18.7%
Expenditure on Manpower $10,245,046 $11,644,500 $9,201,800 $8,675,500 -$526,300 -5.7%
1500 Permanent Staff 10,245,046 11,644,500 9,201,800 8,675,500 -526,300 -5.7
Other Operating Expenditure $8,781,131 $10,411,700 $9,438,800 $5,249,800 -$4,189,000 -44.4%
2100 Consumption of Products & Services 5,044,020 5,146,500 5,456,700 4,426,000 -1,030,700 -18.9 2400 International & Public Relations, Public
Communications 3,737,111 5,265,200 3,981,600 823,300 -3,158,300 -79.3
2800 Miscellaneous 0 0 500 500 0 0.0
Grants, Subventions & Capital Injections to Organisations
$20,205,026 $23,296,500 $7,027,000 $6,936,000 -$91,000 -1.3%
3100 Grants, Subventions & Capital Injections to Statutory Boards
0 300,000 0 0 0 n.a.
3400 Grants, Subventions & Capital Injections to Other Organisations
20,205,026 22,996,500 7,027,000 6,936,000 -91,000 -1.3
TRANSFERS $76,918,018 $70,945,300 $75,337,400 $82,092,100 $6,754,700 9.0%
3600 Transfers to Institutions & Organisations 76,918,018 70,945,300 75,337,400 82,092,100 6,754,700 9.0
Development Estimates $0 $1,000,000 $497,700 $3,351,200 $2,853,500 573.3%
DEVELOPMENT EXPENDITURE $0 $1,000,000 $497,700 $3,351,200 $2,853,500 573.3%
5100 Government Development 0 1,000,000 497,700 3,351,200 2,853,500 573.3
Manpower
BLANK Actual Estimated Revised Estimated Category FY2018 FY2019 FY2019 FY2020
BLANK
Permanent Staff 76 83 84 83
TOTAL 76 83 84 83

401
INFORMATION TECHNOLOGY PROGRAMME
PROGRAMME DESCRIPTION
Information Technology Division (ITD) aims to utilise IT to strengthen the Ministry’s capabilities in forging a closer community and developing youth through arts, heritage and sports. Using the latest technology, ITD seeks to enhance the security and usability of Information and Communications technology systems, so that the Ministry is able to carry out effective programmes to achieve its goals.
Expenditure Estimates by Object Class BLANK Actual Estimated Revised Estimated Code Object Class FY2018 FY2019 FY2019 FY2020 Change Over FY2019
B BLANK X-F INFORMATION TECHNOLOGY
PROGRAMME $1 $1 $1 $1 $0 0.0%
TOTAL EXPENDITURE $16,348,789 $20,763,900 $23,174,800 $23,322,600 $147,800 0.6%
Main Estimates $13,415,089 $17,636,600 $19,792,300 $23,129,100 $3,336,800 16.9%
OPERATING EXPENDITURE $13,415,089 $17,636,600 $19,792,300 $23,129,100 $3,336,800 16.9%
RUNNING COSTS $13,415,089 $17,636,600 $19,792,300 $23,129,100 $3,336,800 16.9%
Expenditure on Manpower $59,233 $208,100 $64,300 $65,100 $800 1.2%
1500 Permanent Staff 59,233 208,100 64,300 65,100 800 1.2
Other Operating Expenditure $13,355,856 $17,428,500 $19,728,000 $23,064,000 $3,336,000 16.9%
2100 Consumption of Products & Services 13,355,856 17,428,500 19,578,000 23,052,200 3,474,200 17.7 2700 Asset Acquisition 0 0 150,000 11,800 -138,200 -92.1
Development Estimates $2,933,699 $3,127,300 $3,382,500 $193,500 -$3,189,000 -94.3%
DEVELOPMENT EXPENDITURE $2,933,699 $3,127,300 $3,382,500 $193,500 -$3,189,000 -94.3%
5100 Government Development 2,933,699 3,127,300 3,382,500 193,500 -3,189,000 -94.3
Manpower
BLANK Actual Estimated Revised Estimated Category FY2018 FY2019 FY2019 FY2020
BLANK
Permanent Staff 20 23 27 30
TOTAL 20 23 27 30

402
NATIONAL IDENTITY AND RESILIENCE PROGRAMME
PROGRAMME DESCRIPTION
This programme comes under the Resilience Division1. The division aims to strengthen national identity and social resilience. It conducts research to understand citizen sentiments and develop insights on key trends relating to pride, confidence, and commitment to Singapore among citizens. It works with various partners on programmes that foster an appreciation of our shared values, ideals and aspirations. The division is also the secretariat for Our Singapore Fund, launched to support ground-initiated ideas that foster national pride and draw us closer as a community.
Expenditure Estimates by Object Class
BLANK Actual Estimated Revised Estimated Code Object Class FY2018 FY2019 FY2019 FY2020 Change Over FY2019
B BLANK X-H NATIONAL IDENTITY AND RESILIENCE
PROGRAMME $1 $1 $1 $1 $0 0.0%
TOTAL EXPENDITURE $4,927,084 $0 $0 $0 $0 n.a.
Main Estimates $4,927,084 $0 $0 $0 $0 n.a.
OPERATING EXPENDITURE $4,927,084 $0 $0 $0 $0 n.a.
RUNNING COSTS $4,927,084 $0 $0 $0 $0 n.a.
Expenditure on Manpower $1,521,254 $0 $0 $0 $0 n.a.
1500 Permanent Staff 1,521,254 0 0 0 0 n.a.
Other Operating Expenditure $962,934 $0 $0 $0 $0 n.a.
2100 Consumption of Products & Services 14,185 0 0 0 0 n.a. 2400 International & Public Relations, Public
Communications 948,748 0 0 0 0 n.a.
Grants, Subventions & Capital Injections to Organisations $2,442,897 $0 $0 $0 $0 n.a.
3400 Grants, Subventions & Capital Injections to Other Organisations
2,442,897 0 0 0 0 n.a.
Manpower
BLANK Actual Estimated Revised Estimated Category FY2018 FY2019 FY2019 FY2020
BLANK
Permanent Staff 17 0 0 0
TOTAL 17 0 0 0
1 Resilience Division merged with Office for Citizen Engagement to form the Resilience and Engagement Division (RED) with effect from 1 Aug 2018. Expenditure estimates from FY2019 onwards will be reflected under the Resilience and Engagement Programme.
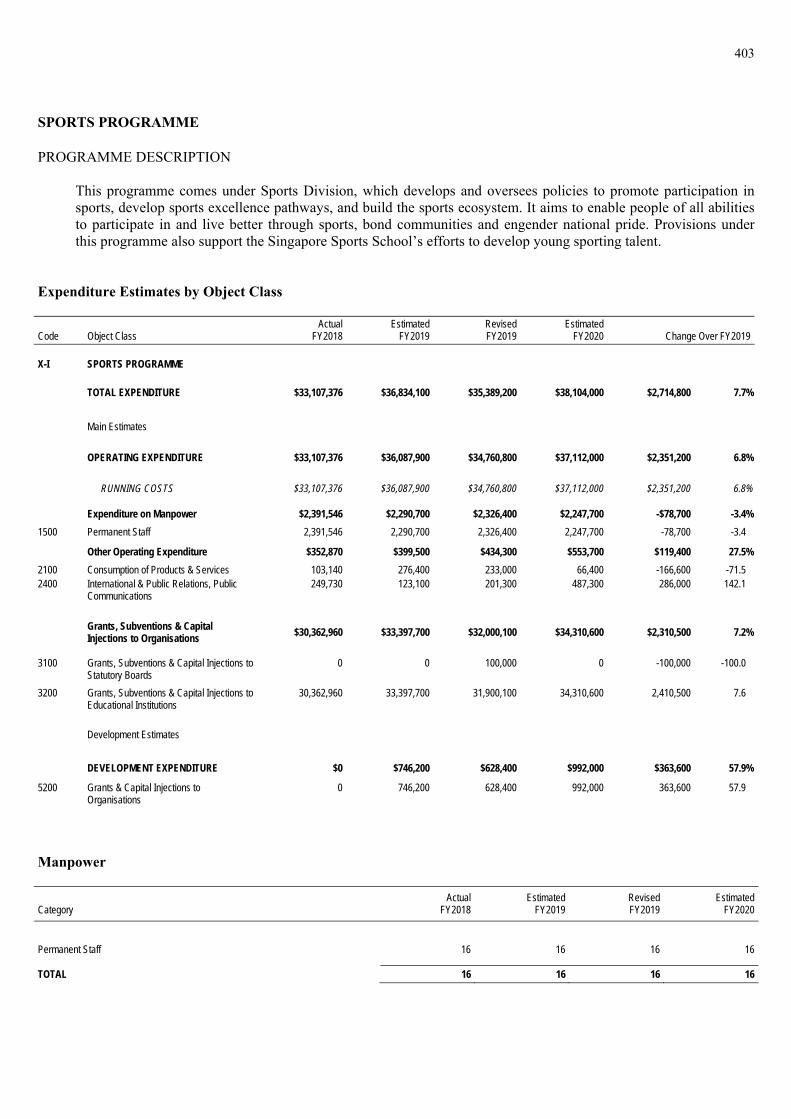
403
SPORTS PROGRAMME
PROGRAMME DESCRIPTION
This programme comes under Sports Division, which develops and oversees policies to promote participation in sports, develop sports excellence pathways, and build the sports ecosystem. It aims to enable people of all abilities to participate in and live better through sports, bond communities and engender national pride. Provisions under this programme also support the Singapore Sports School’s efforts to develop young sporting talent.
Expenditure Estimates by Object Class BLANK Actual Estimated Revised Estimated Code Object Class FY2018 FY2019 FY2019 FY2020 Change Over FY2019
B BLANK X-I SPORTS PROGRAMME $1 $1 $1 $1 $0 0.0%
TOTAL EXPENDITURE $33,107,376 $36,834,100 $35,389,200 $38,104,000 $2,714,800 7.7%
Main Estimates $33,107,376 $36,087,900 $34,760,800 $37,112,000 $2,351,200 6.8%
OPERATING EXPENDITURE $33,107,376 $36,087,900 $34,760,800 $37,112,000 $2,351,200 6.8%
RUNNING COSTS $33,107,376 $36,087,900 $34,760,800 $37,112,000 $2,351,200 6.8%
Expenditure on Manpower $2,391,546 $2,290,700 $2,326,400 $2,247,700 -$78,700 -3.4%
1500 Permanent Staff 2,391,546 2,290,700 2,326,400 2,247,700 -78,700 -3.4
Other Operating Expenditure $352,870 $399,500 $434,300 $553,700 $119,400 27.5%
2100 Consumption of Products & Services 103,140 276,400 233,000 66,400 -166,600 -71.5 2400 International & Public Relations, Public
Communications 249,730 123,100 201,300 487,300 286,000 142.1
Grants, Subventions & Capital Injections to Organisations
$30,362,960 $33,397,700 $32,000,100 $34,310,600 $2,310,500 7.2%
3100 Grants, Subventions & Capital Injections to Statutory Boards
0 0 100,000 0 -100,000 -100.0
3200 Grants, Subventions & Capital Injections to Educational Institutions
30,362,960 33,397,700 31,900,100 34,310,600 2,410,500 7.6
Development Estimates $0 $746,200 $628,400 $992,000 $363,600 57.9%
DEVELOPMENT EXPENDITURE $0 $746,200 $628,400 $992,000 $363,600 57.9%
5200 Grants & Capital Injections to Organisations
0 746,200 628,400 992,000 363,600 57.9
Manpower
BLANK Actual Estimated Revised Estimated Category FY2018 FY2019 FY2019 FY2020
BLANK
Permanent Staff 16 16 16 16
TOTAL 16 16 16 16

404
YOUTH PROGRAMME
PROGRAMME DESCRIPTION
This programme comes under Youth Division. The division coordinates and drives effective Whole-of-Government engagement of youths from 15-35 years old to build young citizens who are well-prepared for the future and contribute to Singapore. To this end, the division provides policy direction and support to the National Youth Council, and works collaboratively with various government agencies, youth sector organisations, and the people, public and private sectors to forge shared experiences, develop strong communities and youth leaders, and engage youths at transition points.
Expenditure Estimates by Object Class BLANK Actual Estimated Revised Estimated Code Object Class FY2018 FY2019 FY2019 FY2020 Change Over FY2019
B BLANK X-J YOUTH PROGRAMME $1 $1 $1 $1 $0 0.0%
TOTAL EXPENDITURE $9,188,271 $9,833,400 $9,173,900 $10,651,600 $1,477,700 16.1%
Main Estimates $8,976,411 $9,509,600 $9,173,900 $10,094,600 $920,700 10.0%
OPERATING EXPENDITURE $8,976,411 $9,509,600 $9,173,900 $10,094,600 $920,700 10.0%
RUNNING COSTS $8,976,411 $9,509,600 $9,173,900 $10,094,600 $920,700 10.0%
Expenditure on Manpower $1,908,052 $2,014,900 $1,850,900 $2,100,200 $249,300 13.5%
1500 Permanent Staff 1,908,052 2,014,900 1,848,900 2,100,200 251,300 13.6 1600 Temporary, Daily-Rated & Other Staff 0 0 2,000 0 -2,000 -100.0
Other Operating Expenditure $476,871 $609,700 $1,108,000 $1,941,500 $833,500 75.2%
2100 Consumption of Products & Services 455,958 544,400 1,014,500 1,906,700 892,200 87.9 2400 International & Public Relations, Public
Communications 20,913 60,500 93,000 34,300 -58,700 -63.1
2700 Asset Acquisition 0 4,800 500 500 0 0.0
Grants, Subventions & Capital Injections to Organisations $6,591,488 $6,885,000 $6,215,000 $6,052,900 -$162,100 -2.6%
3400 Grants, Subventions & Capital Injections to Other Organisations
6,591,488 6,885,000 6,215,000 6,052,900 -162,100 -2.6
Development Estimates $211,860 $323,800 $0 $557,000 $557,000 n.a.
DEVELOPMENT EXPENDITURE $211,860 $323,800 $0 $557,000 $557,000 n.a.
5100 Government Development 0 323,800 0 557,000 557,000 n.a. 5200 Grants & Capital Injections to
Organisations 211,860 0 0 0 0 n.a.
Manpower
BLANK Actual Estimated Revised Estimated Category FY2018 FY2019 FY2019 FY2020
BLANK
Permanent Staff 13 14 14 14
TOTAL 13 14 14 14

405
MAJLIS UGAMA ISLAM SINGAPURA PROGRAMME
PROGRAMME DESCRIPTION
The Majlis Ugama Islam Singapura (MUIS) carries out statutory functions under the Administration of Muslim Law Act. MUIS seeks to forge the Singapore Muslim Identity, shape the religious life of the community by developing dynamic institutions and contribute to strengthening social cohesion. Through its various programmes and services for the community, MUIS envisions a gracious Muslim community of excellence for Singapore.
Expenditure Estimates by Object Class BLANK Actual Estimated Revised Estimated Code Object Class FY2018 FY2019 FY2019 FY2020 Change Over FY2019
B BLANK X-P MAJLIS UGAMA ISLAM SINGAPURA
PROGRAMME $1 $1 $1 $1 $0 0.0%
TOTAL EXPENDITURE $14,635,011 $21,932,800 $17,897,900 $22,889,600 $4,991,700 27.9%
Main Estimates $13,836,607 $20,742,400 $17,060,100 $20,998,300 $3,938,200 23.1%
OPERATING EXPENDITURE $13,836,607 $20,742,400 $17,060,100 $20,998,300 $3,938,200 23.1%
RUNNING COSTS $13,836,607 $20,742,400 $17,060,100 $20,998,300 $3,938,200 23.1%
Grants, Subventions & Capital Injections to Organisations
$13,836,607 $20,742,400 $17,060,100 $20,998,300 $3,938,200 23.1%
3100 Grants, Subventions & Capital Injections to Statutory Boards
13,836,607 20,742,400 17,060,100 20,998,300 3,938,200 23.1
Development Estimates $798,404 $1,190,400 $837,800 $1,891,300 $1,053,500 125.7%
DEVELOPMENT EXPENDITURE $798,404 $1,190,400 $837,800 $1,891,300 $1,053,500 125.7%
5200 Grants & Capital Injections to Organisations
798,404 1,190,400 837,800 1,891,300 1,053,500 125.7
Manpower
BLANK Actual Estimated Revised Estimated Category FY2018 FY2019 FY2019 FY2020
BLANK
Others 53 73 70 74
TOTAL 53 73 70 74
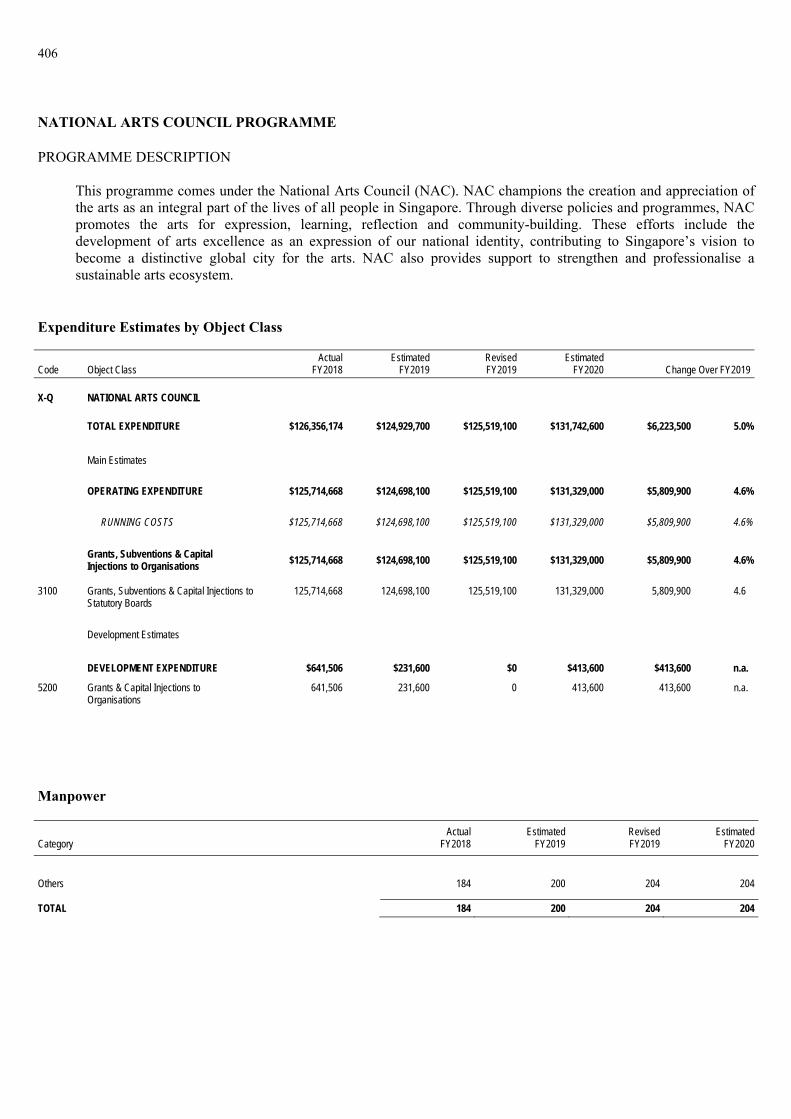
406
NATIONAL ARTS COUNCIL PROGRAMME
PROGRAMME DESCRIPTION
This programme comes under the National Arts Council (NAC). NAC champions the creation and appreciation of the arts as an integral part of the lives of all people in Singapore. Through diverse policies and programmes, NAC promotes the arts for expression, learning, reflection and community-building. These efforts include the development of arts excellence as an expression of our national identity, contributing to Singapore’s vision to become a distinctive global city for the arts. NAC also provides support to strengthen and professionalise a sustainable arts ecosystem.
Expenditure Estimates by Object Class BLANK Actual Estimated Revised Estimated Code Object Class FY2018 FY2019 FY2019 FY2020 Change Over FY2019
B BLANK X-Q NATIONAL ARTS COUNCIL $1 $1 $1 $1 $0 0.0%
TOTAL EXPENDITURE $126,356,174 $124,929,700 $125,519,100 $131,742,600 $6,223,500 5.0%
Main Estimates $125,714,668 $124,698,100 $125,519,100 $131,329,000 $5,809,900 4.6%
OPERATING EXPENDITURE $125,714,668 $124,698,100 $125,519,100 $131,329,000 $5,809,900 4.6%
RUNNING COSTS $125,714,668 $124,698,100 $125,519,100 $131,329,000 $5,809,900 4.6%
Grants, Subventions & Capital Injections to Organisations $125,714,668 $124,698,100 $125,519,100 $131,329,000 $5,809,900 4.6%
3100 Grants, Subventions & Capital Injections to Statutory Boards
125,714,668 124,698,100 125,519,100 131,329,000 5,809,900 4.6
Development Estimates $641,506 $231,600 $0 $413,600 $413,600 n.a.
DEVELOPMENT EXPENDITURE $641,506 $231,600 $0 $413,600 $413,600 n.a.
5200 Grants & Capital Injections to Organisations
641,506 231,600 0 413,600 413,600 n.a.
Manpower
BLANK Actual Estimated Revised Estimated Category FY2018 FY2019 FY2019 FY2020
BLANK
Others 184 200 204 204
TOTAL 184 200 204 204

407
NATIONAL HERITAGE BOARD PROGRAMME
PROGRAMME DESCRIPTION
This programme comes under the National Heritage Board (NHB). NHB is the custodian of Singapore’s heritage. It is responsible for telling the Singapore story, sharing the Singaporean experience and inspiring our Singapore spirit. NHB preserves and celebrates the shared heritage of our diverse communities for the purpose of education, nation-building and cultural understanding. It manages the national museums and heritage institutions, and sets policies relating to heritage sites, monuments and the National Collection. Through the National Collection, NHB curates heritage programmes and presents exhibitions to connect past, present and future generations of Singaporeans.
Expenditure Estimates by Object Class BLANK Actual Estimated Revised Estimated Code Object Class FY2018 FY2019 FY2019 FY2020 Change Over FY2019
B BLANK X-R NATIONAL HERITAGE BOARD
PROGRAMME $1 $1 $1 $1 $0 0.0%
TOTAL EXPENDITURE $131,655,540 $139,291,000 $139,539,200 $127,975,100 -$11,564,100 -8.3%
Main Estimates $116,208,153 $118,015,000 $116,096,700 $113,391,300 -$2,705,400 -2.3%
OPERATING EXPENDITURE $116,208,153 $118,015,000 $116,096,700 $113,391,300 -$2,705,400 -2.3%
RUNNING COSTS $116,208,153 $118,015,000 $116,096,700 $113,391,300 -$2,705,400 -2.3%
Grants, Subventions & Capital Injections to Organisations $116,208,153 $118,015,000 $116,096,700 $113,391,300 -$2,705,400 -2.3%
3100 Grants, Subventions & Capital Injections to Statutory Boards
116,208,153 118,015,000 116,096,700 113,391,300 -2,705,400 -2.3
Development Estimates $15,447,387 $21,276,000 $23,442,500 $14,583,800 -$8,858,700 -37.8%
DEVELOPMENT EXPENDITURE $15,447,387 $21,276,000 $23,442,500 $14,583,800 -$8,858,700 -37.8%
5200 Grants & Capital Injections to Organisations
15,447,387 21,276,000 23,442,500 14,583,800 -8,858,700 -37.8
Manpower
BLANK Actual Estimated Revised Estimated Category FY2018 FY2019 FY2019 FY2020
BLANK
Others 358 387 384 398
TOTAL 358 387 384 398

408
PEOPLE'S ASSOCIATION PROGRAMME
PROGRAMME DESCRIPTION
Provisions under this programme are for financial aid to People’s Association (PA) to:
(a) promote racial harmony and foster social cohesion to build and to bridge communities; (b) support grassroots organisations in reaching out to the community and deepening resident engagement; (c) strengthen links with networks beyond grassroots organisations, support and enable greater community
ownership; (d) communicate government policies and schemes to residents; (e) construct and operate community clubs and other PA facilities for community development; (f) train and develop community leaders and volunteers; and (g) build community emergency response capability.
Expenditure Estimates by Object Class BLANK Actual Estimated Revised Estimated Code Object Class FY2018 FY2019 FY2019 FY2020 Change Over FY2019
B BLANK X-S PEOPLE'S ASSOCIATION PROGRAMME $1 $1 $1 $1 $0 0.0%
TOTAL EXPENDITURE $702,979,132 $588,312,200 $593,197,800 $691,541,100 $98,343,300 16.6%
Main Estimates $565,744,700 $516,399,000 $521,854,700 $556,940,700 $35,086,000 6.7%
OPERATING EXPENDITURE $565,744,700 $516,399,000 $521,854,700 $556,940,700 $35,086,000 6.7%
RUNNING COSTS $565,744,700 $516,399,000 $521,854,700 $556,940,700 $35,086,000 6.7%
Grants, Subventions & Capital Injections to Organisations $565,744,700 $516,399,000 $521,854,700 $556,940,700 $35,086,000 6.7%
3100 Grants, Subventions & Capital Injections to Statutory Boards
565,744,700 516,399,000 521,854,700 556,940,700 35,086,000 6.7
Development Estimates $137,234,432 $71,913,200 $71,343,100 $134,600,400 $63,257,300 88.7%
DEVELOPMENT EXPENDITURE $137,234,432 $71,913,200 $71,343,100 $134,600,400 $63,257,300 88.7%
5200 Grants & Capital Injections to Organisations
137,234,432 71,913,200 71,343,100 134,600,400 63,257,300 88.7
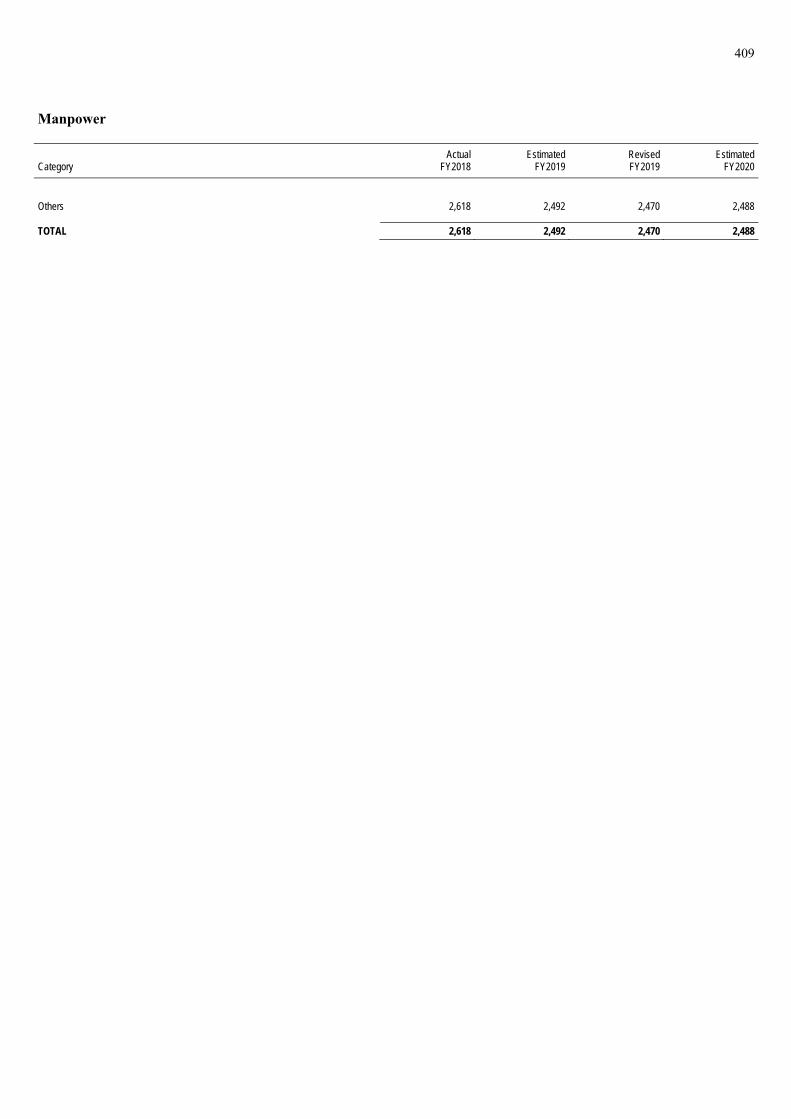
409
Manpower
BLANK Actual Estimated Revised Estimated Category FY2018 FY2019 FY2019 FY2020
BLANK
Others 2,618 2,492 2,470 2,488
TOTAL 2,618 2,492 2,470 2,488

410
SPORT SINGAPORE PROGRAMME
PROGRAMME DESCRIPTION
Sport Singapore (SportSG) seeks to inspire the Singapore Spirit and transform Singapore through sports. SportSG serves the community by working with a broad network of public, private and people sector partners to develop access, opportunities and capabilities for people of all abilities to live better through sports.
Expenditure Estimates by Object Class BLANK Actual Estimated Revised Estimated Code Object Class FY2018 FY2019 FY2019 FY2020 Change Over FY2019
B BLANK X-T SPORT SINGAPORE PROGRAMME $1 $1 $1 $1 $0 0.0%
TOTAL EXPENDITURE $520,324,439 $662,117,700 $491,865,200 $591,643,300 $99,778,100 20.3%
Main Estimates $400,346,792 $407,204,100 $412,106,200 $410,537,800 -$1,568,400 -0.4%
OPERATING EXPENDITURE $400,346,792 $407,204,100 $412,106,200 $410,537,800 -$1,568,400 -0.4%
RUNNING COSTS $396,396,946 $407,204,100 $409,027,100 $400,537,800 -$8,489,300 -2.1%
Grants, Subventions & Capital Injections to Organisations
$396,396,946 $407,204,100 $409,027,100 $400,537,800 -$8,489,300 -2.1%
3100 Grants, Subventions & Capital Injections to Statutory Boards
396,396,946 407,204,100 409,027,100 400,537,800 -8,489,300 -2.1
TRANSFERS $3,949,846 $0 $3,079,100 $10,000,000 $6,920,900 224.8%
3600 Transfers to Institutions & Organisations 3,949,846 0 3,079,100 10,000,000 6,920,900 224.8
Development Estimates $119,977,647 $254,913,600 $79,759,000 $181,105,500 $101,346,500 127.1%
DEVELOPMENT EXPENDITURE $119,977,647 $254,913,600 $79,759,000 $181,105,500 $101,346,500 127.1%
5200 Grants & Capital Injections to Organisations
119,977,647 254,913,600 79,759,000 181,105,500 101,346,500 127.1
Manpower
BLANK Actual Estimated Revised Estimated Category FY2018 FY2019 FY2019 FY2020
BLANK
Others 1,027 1,162 1,093 1,119
TOTAL 1,027 1,162 1,093 1,119

411
NATIONAL YOUTH COUNCIL PROGRAMME
PROGRAMME DESCRIPTION
This programme comes under the National Youth Council (NYC). The NYC is the national co-ordinating body for youth affairs in Singapore and the focal point of international youth affairs. It oversees the Outward Bound Singapore and Youth Corps Singapore, which drive youth development and engagement.
Expenditure Estimates by Object Class BLANK Actual Estimated Revised Estimated Code Object Class FY2018 FY2019 FY2019 FY2020 Change Over FY2019
B BLANK X-U NATIONAL YOUTH COUNCIL $1 $1 $1 $1 $0 0.0%
TOTAL EXPENDITURE $61,219,415 $83,538,100 $71,948,400 $82,310,600 $10,362,200 14.4%
Main Estimates $55,738,551 $67,773,700 $65,726,200 $67,398,700 $1,672,500 2.5%
OPERATING EXPENDITURE $55,738,551 $67,773,700 $65,726,200 $67,398,700 $1,672,500 2.5%
RUNNING COSTS $52,488,767 $67,376,700 $64,327,200 $66,997,100 $2,669,900 4.2%
Expenditure on Manpower $30,183,604 $34,352,200 $30,775,200 $29,172,900 -$1,602,300 -5.2%
1500 Permanent Staff 30,182,914 34,352,200 30,775,200 29,172,900 -1,602,300 -5.2 1600 Temporary, Daily-Rated & Other Staff 690 0 0 0 0 n.a.
Other Operating Expenditure $22,305,164 $33,024,500 $33,552,000 $37,824,200 $4,272,200 12.7%
2100 Consumption of Products & Services 15,461,023 33,024,500 33,552,000 37,824,200 4,272,200 12.7 2300 Manpower Development 1,218,034 0 0 0 0 n.a. 2400 International & Public Relations, Public
Communications 4,725,361 0 0 0 0 n.a.
2700 Asset Acquisition 770,940 0 0 0 0 n.a. 2800 Miscellaneous 129,806 0 0 0 0 n.a.
TRANSFERS $3,249,784 $397,000 $1,399,000 $401,600 -$997,400 -71.3%
3500 Social Transfers to Individuals 9,985 0 6,500 0 -6,500 -100.0 3600 Transfers to Institutions & Organisations 3,095,743 397,000 1,149,500 401,600 -747,900 -65.1 3800 International Organisations & Overseas
Development Assistance 144,056 0 243,000 0 -243,000 -100.0
Development Estimates $5,480,864 $15,764,400 $6,222,200 $14,911,900 $8,689,700 139.7%
DEVELOPMENT EXPENDITURE $5,480,864 $15,764,400 $6,222,200 $14,911,900 $8,689,700 139.7%
5100 Government Development 5,480,864 15,764,400 6,222,200 14,911,900 8,689,700 139.7
Manpower
BLANK Actual Estimated Revised Estimated Category FY2018 FY2019 FY2019 FY2020
BLANK
Permanent Staff 308 381 353 397
TOTAL 308 381 353 397


PROGRAMME DETAILS
Head Z ___________
Financial Transfers


413
FINANCIAL TRANSFERS PROGRAMME
PROGRAMME DESCRIPTION
The functions carried out under this programme include the making of appropriations to Government Funds and Advances.
Expenditure Estimates by Object Class
BLANK Actual Estimated Revised Estimated Code Object Class FY2018 FY2019 FY2019 FY2020 Change Over FY2019
B BLANK Z-A FINANCIAL TRANSFERS PROGRAMME $1 $1 $1 $1 $0 0.0%
TOTAL OUTLAYS $28,530,859,721 $26,063,193,700 $26,063,193,700 $21,570,544,900 -$4,492,648,800 -17.2%
Main Estimates $28,530,859,721 $26,063,193,700 $26,063,193,700 $21,570,544,900 -$4,492,648,800 -17.2%
OTHER CONSOLIDATED FUND OUTLAYS
$28,530,859,721 $26,063,193,700 $26,063,193,700 $21,570,544,900 -$4,492,648,800 -17.2%
4500 Transfers from Consolidated Revenue Account
28,530,859,721 26,063,193,700 26,063,193,700 21,570,544,900 -4,492,648,800 -17.2

414
ENDOWMENT AND TRUST FUNDS PROGRAMME
PROGRAMME DESCRIPTION
The functions carried out under this programme include the making of appropriations to Endowment Funds and Trust Funds.
Expenditure Estimates by Object Class BLANK Actual Estimated Revised Estimated Code Object Class FY2018 FY2019 FY2019 FY2020 Change Over FY2019
B BLANK Z-B ENDOWMENT AND TRUST FUNDS
PROGRAMME $1 $1 $1 $1 $0 0.0%
TOTAL OUTLAYS $7,300,000,000 $13,560,000,000 $13,568,000,000 $17,320,000,000 $3,752,000,000 27.7%
Main Estimates $7,300,000,000 $13,560,000,000 $13,568,000,000 $17,320,000,000 $3,752,000,000 27.7%
OTHER CONSOLIDATED FUND OUTLAYS
$7,300,000,000 $13,560,000,000 $13,568,000,000 $17,320,000,000 $3,752,000,000 27.7%
4500 Transfers from Consolidated Revenue Account
7,300,000,000 13,560,000,000 13,568,000,000 17,320,000,000 3,752,000,000 27.7

415
SPECIAL TRANSFERS PROGRAMME
PROGRAMME DESCRIPTION
The functions carried out under this programme include the making of appropriations to approved Schemes and expenditures.
Expenditure Estimates by Object Class BLANK Actual Estimated Revised Estimated Code Object Class FY2018 FY2019 FY2019 FY2020 Change Over FY2019
B BLANK Z-C SPECIAL TRANSFERS PROGRAMME $1 $1 $1 $1 $0 0.0%
TOTAL OUTLAYS $1,688,594,299 $1,736,503,600 $1,696,883,500 $4,662,329,700 $2,965,446,200 174.8%
Main Estimates $1,688,594,299 $1,736,503,600 $1,696,883,500 $4,662,329,700 $2,965,446,200 174.8%
OPERATING EXPENDITURE $1,688,594,299 $1,736,503,600 $1,696,883,500 $4,662,329,700 $2,965,446,200 174.8%
TRANSFERS $1,688,594,299 $1,736,503,600 $1,696,883,500 $4,662,329,700 $2,965,446,200 174.8%
3700 Special Transfers 1,688,594,299 1,736,503,600 1,696,883,500 4,662,329,700 2,965,446,200 174.8


