Embed Size (px)
Citation preview
AFRICAN DEVELOPMENT BANK GROUP
REPUBLIC OF KENYA
TOWNS SUSTAINABLE WATER SUPPLY AND SANITATION
PROGRAM
APPRAISAL REPORT
OWAS/EARC DEPARTMENTS
October 2016
Pu
bli
c D
iscl
osu
re A
uth
ori
zed
Pub
lic
Dis
clo
sure
Au
tho
rize
d
TABLE OF CONTENTS
I – STRATEGIC THRUST & RATIONALE..................................................................... 1
1.1 PROGRAM LINKAGES WITH COUNTRY STRATEGY AND OBJECTIVES ...................................... 1
1.2 RATIONALE FOR BANK’S INVOLVEMENT ................................................................................ 2
1.3 DEVELOPMENT PARTNER COORDINATION .............................................................................. 3
II – PROGRAM DESCRIPTION ......................................................................................... 4
2.1 PROGRAM OBJECTIVE .............................................................................................................. 4
2.2 PROGRAM COMPONENTS ......................................................................................................... 5
2.3 TECHNICAL SOLUTION RETAINED AND OTHER ALTERNATIVES ............................................. 5
2.4 PROGRAM TYPE ....................................................................................................................... 6
2.5 PROGRAM COST AND FINANCING ARRANGEMENTS ................................................................ 6
2.6 PROGRAM’S TARGET AREA AND POPULATION ....................................................................... 8
2.7 PARTICIPATORY PROCESS FOR PROGRAM IDENTIFICATION, DESIGN AND IMPLEMENTATION 8
2.8 BANK GROUP EXPERIENCE, LESSONS REFLECTED IN PROGRAM DESIGN ............................... 9
2.9 KEY PERFORMANCE INDICATORS .......................................................................................... 10
III – PROGRAM FEASIBILITY ......................................................................................... 10
3.1 ECONOMIC AND FINANCIAL PERFORMANCE ......................................................................... 10
3.2 ENVIRONMENTAL AND SOCIAL IMPACTS .............................................................................. 11
IV – IMPLEMENTATION ................................................................................................... 14
4.1 IMPLEMENTATION ARRANGEMENTS ..................................................................................... 14
4.2 MONITORING AND EVALUATION (M&E) .............................................................................. 17
4.3 GOVERNANCE ........................................................................................................................ 17
4.4 SUSTAINABILITY .................................................................................................................... 18
4.5 RISK MANAGEMENT .............................................................................................................. 19
4.6 KNOWLEDGE BUILDING ......................................................................................................... 19
V – LEGAL INSTRUMENTS AND AUTHORITY ......................................................... 19
5.1 LEGAL INSTRUMENT .............................................................................................................. 19
5.2 CONDITIONS ASSOCIATED WITH BANK’S INTERVENTION ..................................................... 20
5.3 COMPLIANCE WITH BANK POLICIES ...................................................................................... 20
VI – RECOMMENDATION ................................................................................................ 20
APPENDICES .......................................................................................................................... I
APPENDIX 1: KENYA’S COMPARATIVE SOCIO-ECONOMIC INDICATORS ............................................. I
APPENDIX 2: TABLE OF AFDB’S PORTFOLIO IN THE COUNTRY ........................................................ II
APPENDIX 3: KEY RELATED PROJECTS FINANCED BY THE DPS IN THE COUNTRY .......................... III
APPENDIX 4: MAP OF KENYA AND TARGET TOWNS ......................................................................... IV
APPENDIX 5: JUSTIFICATION FOR FINANCING MORE THAN 50% OF THE PROGRAM COST THROUGH AN
ADB LOAN ........................................................................................................................................ V
APPENDIX 6: CLIMATE SCREENING – FULL RESULTS ...................................................................... VII

i
Currency Equivalents
June 2016
UA 1 = KES 143.3506
UA 1 = USD 1.4029
UA 1 = EUR 1.2600
FISCAL YEAR:
July 1 – June 30
Weights and Measures
1 metric ton = 2204 pounds (lbs)
1 kilogram (kg) = 2.200 pounds (lbs)
1 meter (m) = 3.28 feet (ft)
1 millimeter (mm) = 0.03937 inch (“)
1 kilometer (km) = 0.62 mile
1 hectare (ha) = 2.471 acres

ii
ACRONYMS AND ABBREVIATIONS
ADB African Development Bank MIS Management Information System
AfDB African Development Bank Group MTP-II Medium Term Plan II
ADF African Development Fund MoWI Ministry of Water and Irrigation
AEG Aid Effectiveness Group NCCRS National Climate Change Response Strategy
AES Aid Effectiveness Secretariat NEMA National Environment Management Authority
AFD Agence Ffrançaise de Développement NPV Net Present Value
AREP Adaptation Review and Evaluation Procedures
NRW Non-Revenue Water
AWSB Athi Water Services Board NWSS National Water Services Strategy 2007-2015
CCAP Climate Change Action Plan O&M Operation & Maintenance
CPPR Country Portfolio Performance Review OAG Office of the Auditor General
CSP Country Strategy Paper PAP Project Affected Population
DO Development Objective PCR Project/Program Completion Report
DP Development Partner PIT Program Implementation Team
DPF Development Partnership Forum PPG Public and Publicly Guaranteed
DPG Development Partners Consultative Group RAP Resettlement Action Plan
DSA Debt Sustainability Analysis RBLF Result Based Logical Framework
EARC Bank’s Eastern Africa Regional Resource Center
RMC Regional Member Country
EIA Environmental Impact Assessment RVWSB Rift Valley Water Services Board
EIRR Economic Internal Rate of Return SC Steering Committee
ENPV Economic Net Present Value SDG Sustainable Development Goal
ERP Enterprise Resource Planning SIDA Swedish International Development Cooperation Agency
ESAP Environmental and Social Assessment Procedure
SWG Sector Working Group
ESIA Environmental and Social Impact Assessment TWSB Tana Water Services Board
ESMF Environmental and Social Management Framework
UA Unit of Account
ESMP Environmental and Social Management Plan WRMA Water Resources Management Authority
EU European Union WASREB Water Services Regulatory Board
FIRR Financial Internal Rate of Return WB The World Bank
FM Financial Management WSB Water Services Board
FNPV Financial Net Present Value WSP Water Service Provider
GCG GoK Coordinating Group WSTG Water Sector Technical Group
GDP Gross Domestic Product
GoK Government of Kenya
HDI Human Development Index
IFAD International Fund for Agricultural Development
IFMIS Integrated Financial Management Information System
IP Implementation Progress
IPR Implementation Progress Report
IPSAS International Public Sector Accounting Standards
IWRM Integrated Water Resources Management
JICA Japan International Cooperation Agency
KES Kenyan Shillings
KfW Kreditanstalt fur Wiederaufbau
KOICA Korea International Cooperation Agency
KPI Key Performance Indicator
M&E Monitoring & Evaluation
MIC-TAF Middle Income Country Technical Assistance Fund
iii
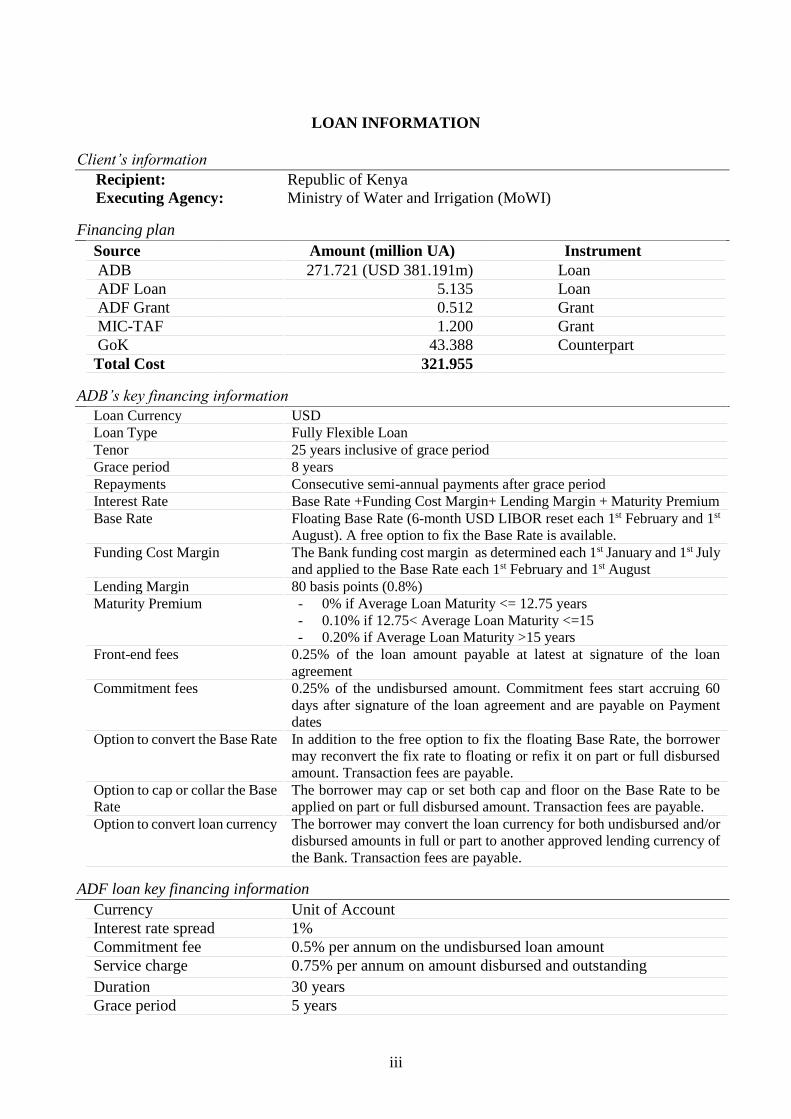
LOAN INFORMATION
Client’s information
Recipient: Republic of Kenya
Executing Agency: Ministry of Water and Irrigation (MoWI)
Financing plan
Source Amount (million UA) Instrument
ADB 271.721 (USD 381.191m) Loan
ADF Loan 5.135 Loan
ADF Grant 0.512 Grant
MIC-TAF 1.200 Grant
GoK 43.388 Counterpart
Total Cost 321.955
ADB’s key financing information
Loan Currency USD
Loan Type Fully Flexible Loan
Tenor 25 years inclusive of grace period
Grace period 8 years
Repayments Consecutive semi-annual payments after grace period
Interest Rate Base Rate +Funding Cost Margin+ Lending Margin + Maturity Premium
Base Rate Floating Base Rate (6-month USD LIBOR reset each 1st February and 1st
August). A free option to fix the Base Rate is available.
Funding Cost Margin The Bank funding cost margin as determined each 1st January and 1st July
and applied to the Base Rate each 1st February and 1st August
Lending Margin 80 basis points (0.8%)
Maturity Premium - 0% if Average Loan Maturity <= 12.75 years
- 0.10% if 12.75< Average Loan Maturity <=15
- 0.20% if Average Loan Maturity >15 years
Front-end fees 0.25% of the loan amount payable at latest at signature of the loan
agreement
Commitment fees 0.25% of the undisbursed amount. Commitment fees start accruing 60
days after signature of the loan agreement and are payable on Payment
dates
Option to convert the Base Rate In addition to the free option to fix the floating Base Rate, the borrower
may reconvert the fix rate to floating or refix it on part or full disbursed
amount. Transaction fees are payable.
Option to cap or collar the Base
Rate
The borrower may cap or set both cap and floor on the Base Rate to be
applied on part or full disbursed amount. Transaction fees are payable.
Option to convert loan currency The borrower may convert the loan currency for both undisbursed and/or
disbursed amounts in full or part to another approved lending currency of
the Bank. Transaction fees are payable.
ADF loan key financing information
Currency Unit of Account
Interest rate spread 1%
Commitment fee 0.5% per annum on the undisbursed loan amount
Service charge 0.75% per annum on amount disbursed and outstanding
Duration 30 years
Grace period 5 years
iv
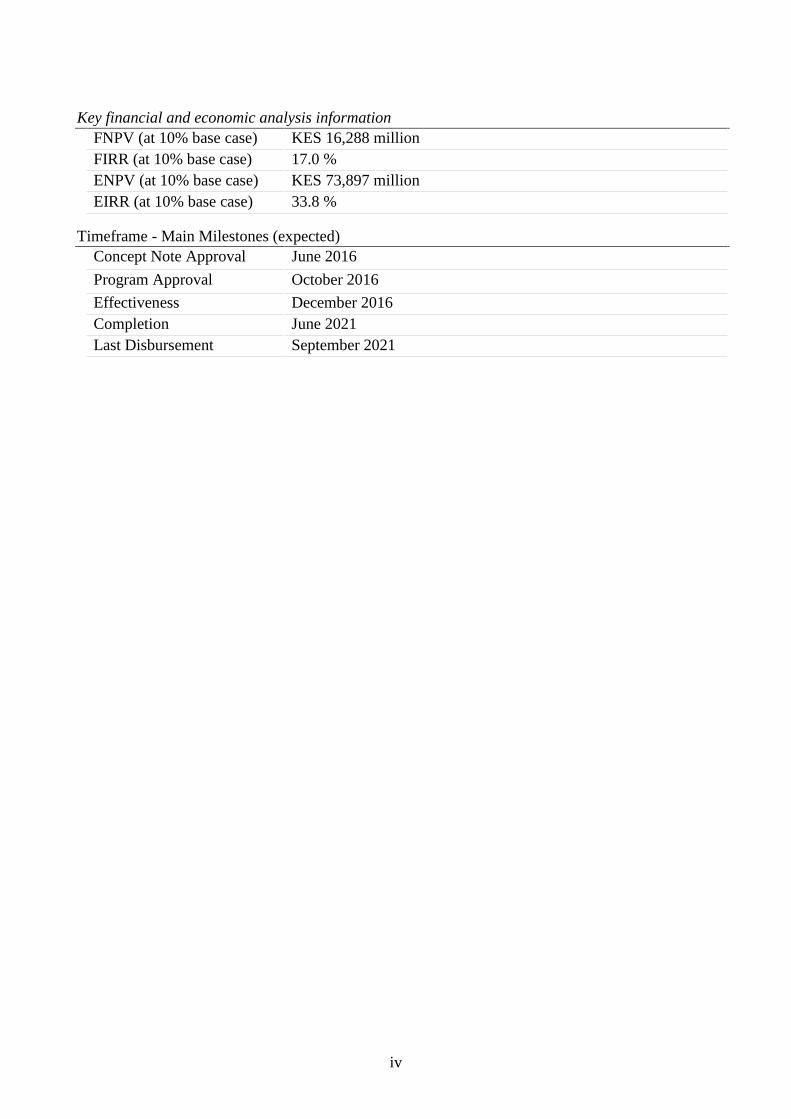
Key financial and economic analysis information
FNPV (at 10% base case) KES 16,288 million
FIRR (at 10% base case) 17.0 %
ENPV (at 10% base case) KES 73,897 million
EIRR (at 10% base case) 33.8 %
Timeframe - Main Milestones (expected)
Concept Note Approval June 2016
Program Approval October 2016
Effectiveness December 2016
Completion June 2021
Last Disbursement September 2021
v
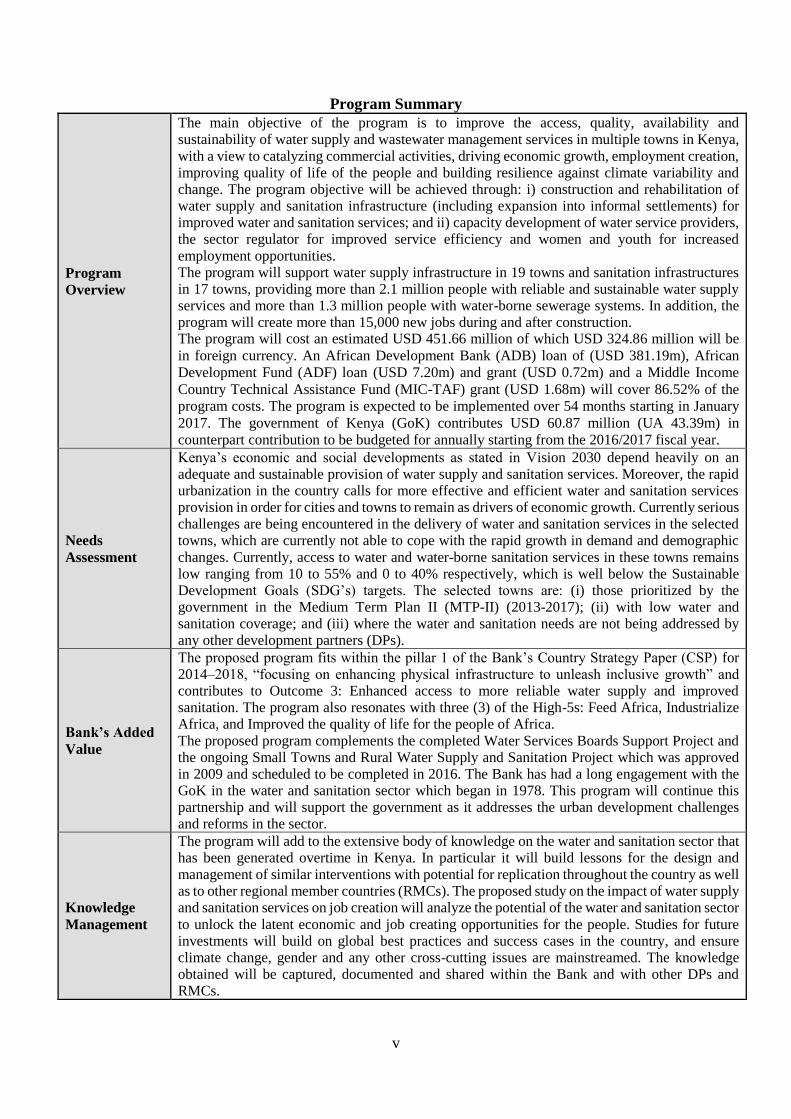
Program Summary
Program
Overview
The main objective of the program is to improve the access, quality, availability and sustainability of water supply and wastewater management services in multiple towns in Kenya,
with a view to catalyzing commercial activities, driving economic growth, employment creation, improving quality of life of the people and building resilience against climate variability and change. The program objective will be achieved through: i) construction and rehabilitation of water supply and sanitation infrastructure (including expansion into informal settlements) for improved water and sanitation services; and ii) capacity development of water service providers, the sector regulator for improved service efficiency and women and youth for increased
employment opportunities. The program will support water supply infrastructure in 19 towns and sanitation infrastructures in 17 towns, providing more than 2.1 million people with reliable and sustainable water supply services and more than 1.3 million people with water-borne sewerage systems. In addition, the program will create more than 15,000 new jobs during and after construction. The program will cost an estimated USD 451.66 million of which USD 324.86 million will be
in foreign currency. An African Development Bank (ADB) loan of (USD 381.19m), African
Development Fund (ADF) loan (USD 7.20m) and grant (USD 0.72m) and a Middle Income
Country Technical Assistance Fund (MIC-TAF) grant (USD 1.68m) will cover 86.52% of the
program costs. The program is expected to be implemented over 54 months starting in January
2017. The government of Kenya (GoK) contributes USD 60.87 million (UA 43.39m) in
counterpart contribution to be budgeted for annually starting from the 2016/2017 fiscal year.
Needs
Assessment
Kenya’s economic and social developments as stated in Vision 2030 depend heavily on an adequate and sustainable provision of water supply and sanitation services. Moreover, the rapid urbanization in the country calls for more effective and efficient water and sanitation services provision in order for cities and towns to remain as drivers of economic growth. Currently serious challenges are being encountered in the delivery of water and sanitation services in the selected towns, which are currently not able to cope with the rapid growth in demand and demographic
changes. Currently, access to water and water-borne sanitation services in these towns remains low ranging from 10 to 55% and 0 to 40% respectively, which is well below the Sustainable Development Goals (SDG’s) targets. The selected towns are: (i) those prioritized by the government in the Medium Term Plan II (MTP-II) (2013-2017); (ii) with low water and sanitation coverage; and (iii) where the water and sanitation needs are not being addressed by any other development partners (DPs).
Bank’s Added
Value
The proposed program fits within the pillar 1 of the Bank’s Country Strategy Paper (CSP) for 2014–2018, “focusing on enhancing physical infrastructure to unleash inclusive growth” and contributes to Outcome 3: Enhanced access to more reliable water supply and improved sanitation. The program also resonates with three (3) of the High-5s: Feed Africa, Industrialize Africa, and Improved the quality of life for the people of Africa.
The proposed program complements the completed Water Services Boards Support Project and the ongoing Small Towns and Rural Water Supply and Sanitation Project which was approved in 2009 and scheduled to be completed in 2016. The Bank has had a long engagement with the GoK in the water and sanitation sector which began in 1978. This program will continue this partnership and will support the government as it addresses the urban development challenges and reforms in the sector.
Knowledge
Management
The program will add to the extensive body of knowledge on the water and sanitation sector that has been generated overtime in Kenya. In particular it will build lessons for the design and management of similar interventions with potential for replication throughout the country as well as to other regional member countries (RMCs). The proposed study on the impact of water supply and sanitation services on job creation will analyze the potential of the water and sanitation sector
to unlock the latent economic and job creating opportunities for the people. Studies for future investments will build on global best practices and success cases in the country, and ensure climate change, gender and any other cross-cutting issues are mainstreamed. The knowledge obtained will be captured, documented and shared within the Bank and with other DPs and RMCs.
vi
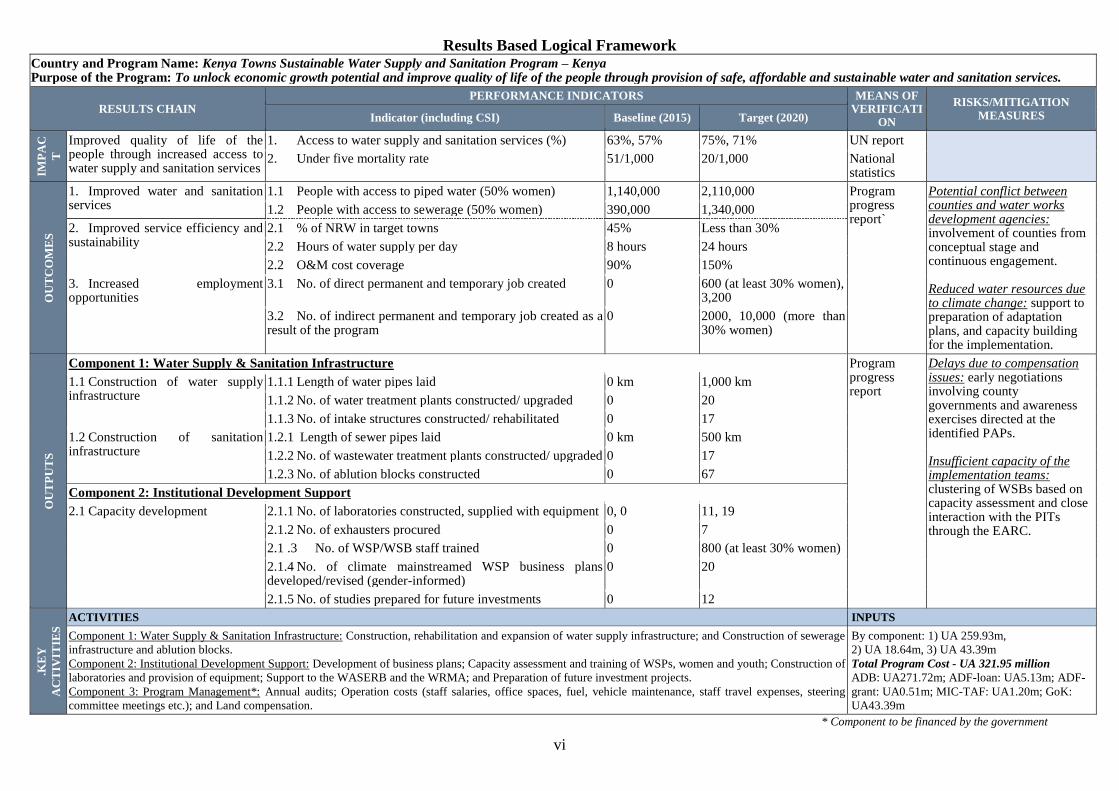
Results Based Logical Framework Country and Program Name: Kenya Towns Sustainable Water Supply and Sanitation Program – Kenya Purpose of the Program: To unlock economic growth potential and improve quality of life of the people through provision of safe, affordable and sustainable water and sanitation services.
RESULTS CHAIN PERFORMANCE INDICATORS MEANS OF
VERIFICATION
RISKS/MITIGATION
MEASURES Indicator (including CSI) Baseline (2015) Target (2020)
IMP
AC
T
Improved quality of life of the people through increased access to water supply and sanitation services
1. Access to water supply and sanitation services (%) 63%, 57% 75%, 71% UN report
2. Under five mortality rate 51/1,000 20/1,000 National statistics
OU
TC
OM
ES
1. Improved water and sanitation services
1.1 People with access to piped water (50% women) 1,140,000 2,110,000 Program progress report`
Potential conflict between counties and water works development agencies: involvement of counties from conceptual stage and continuous engagement. Reduced water resources due to climate change: support to preparation of adaptation plans, and capacity building for the implementation.
1.2 People with access to sewerage (50% women) 390,000 1,340,000
2. Improved service efficiency and sustainability
2.1 % of NRW in target towns 45% Less than 30%
2.2 Hours of water supply per day 8 hours 24 hours
2.2 O&M cost coverage 90% 150%
3. Increased employment opportunities
3.1 No. of direct permanent and temporary job created 0 600 (at least 30% women), 3,200
3.2 No. of indirect permanent and temporary job created as a result of the program
0 2000, 10,000 (more than 30% women)
OU
TP
UT
S
Component 1: Water Supply & Sanitation Infrastructure Program progress report
Delays due to compensation issues: early negotiations involving county governments and awareness exercises directed at the identified PAPs. Insufficient capacity of the implementation teams: clustering of WSBs based on capacity assessment and close interaction with the PITs through the EARC.
1.1 Construction of water supply infrastructure
1.1.1 Length of water pipes laid 0 km 1,000 km
1.1.2 No. of water treatment plants constructed/ upgraded 0 20
1.1.3 No. of intake structures constructed/ rehabilitated 0 17
1.2 Construction of sanitation infrastructure
1.2.1 Length of sewer pipes laid 0 km 500 km
1.2.2 No. of wastewater treatment plants constructed/ upgraded 0 17
1.2.3 No. of ablution blocks constructed 0 67
Component 2: Institutional Development Support
2.1 Capacity development 2.1.1 No. of laboratories constructed, supplied with equipment 0, 0 11, 19
2.1.2 No. of exhausters procured 0 7
2.1 .3 No. of WSP/WSB staff trained 0 800 (at least 30% women)
2.1.4 No. of climate mainstreamed WSP business plans developed/revised (gender-informed)
0 20
2.1.5 No. of studies prepared for future investments 0 12
.KE
Y
AC
TIV
ITIE
S ACTIVITIES INPUTS
Component 1: Water Supply & Sanitation Infrastructure: Construction, rehabilitation and expansion of water supply infrastructure; and Construction of sewerage
infrastructure and ablution blocks.
Component 2: Institutional Development Support: Development of business plans; Capacity assessment and training of WSPs, women and youth; Construction of
laboratories and provision of equipment; Support to the WASERB and the WRMA; and Preparation of future investment projects.
Component 3: Program Management*: Annual audits; Operation costs (staff salaries, office spaces, fuel, vehicle maintenance, staff travel expenses, steering
committee meetings etc.); and Land compensation.
By component: 1) UA 259.93m,
2) UA 18.64m, 3) UA 43.39m
Total Program Cost - UA 321.95 million
ADB: UA271.72m; ADF-loan: UA5.13m; ADF-
grant: UA0.51m; MIC-TAF: UA1.20m; GoK:
UA43.39m
* Component to be financed by the government
vii
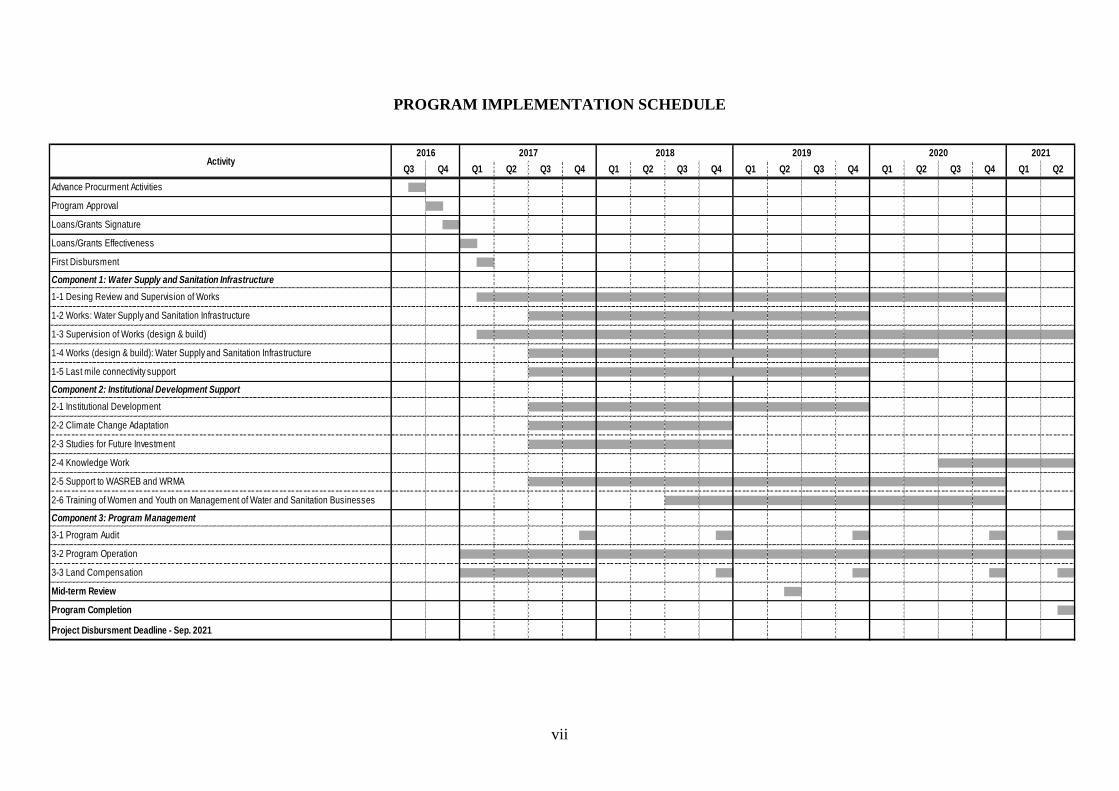
PROGRAM IMPLEMENTATION SCHEDULE
Component 1: Water Supply and Sanitation Infrastructure
Component 2: Institutional Development Support
Component 3: Program Management
Project Disbursment Deadline - Sep. 2021
1-4 Works (design & build): Water Supply and Sanitation Infrastructure
1-3 Supervision of Works (design & build)
1-2 Works: Water Supply and Sanitation Infrastructure
2021
Advance Procurment Activities
Activity
Loans/Grants Signature
Loans/Grants Effectiveness
20192018
Q4 Q1 Q2 Q3
2016 2017 2020
Q1 Q2 Q1 Q2Q4Q2Q1 Q3 Q4
Mid-term Review
Program Completion
1-1 Desing Review and Supervision of Works
Q4 Q3Q4 Q1 Q2 Q3Q3
Program Approval
2-2 Climate Change Adaptation
3-3 Land Compensation
3-2 Program Operation
First Disbursment
1-5 Last mile connectivity support
3-1 Program Audit
2-6 Training of Women and Youth on Management of Water and Sanitation Businesses
2-1 Institutional Development
2-5 Support to WASREB and WRMA
2-4 Knowledge Work
2-3 Studies for Future Investment

1
REPORT AND RECOMMENDATION OF THE MANAGEMENT OF THE AFDB GROUP TO THE BOARD
OF DIRECTORS ON THE PROPOSED ADB AND ADF LOANS AND ADF AND MIC-TAF GRANTS TO
THE GOVERNMENT OF THE REPUBLIC OF KENYA FOR THE KENYA TOWNS SUSTAINABLE
WATER SUPPLY AND SANITATION PROGRAM
Management submits the following report and recommendation on proposed ADB loan of USD
381.191 million, ADF loan not exceeding UA 5.135 million, and ADF grant of UA 0.512 million
and MIC-TAF grant not exceeding UA 1.200 million to finance the Kenya Towns Sustainable
Water Supply and Sanitation Program.
I – STRATEGIC THRUST & RATIONALE
1.1 Program Linkages with Country Strategy and Objectives
1.1.1 The Kenya Vision 2030 aims to transform and elevate the country to an industrialized,
middle income country, providing a high quality of life to all its citizens by 2030. The country has
in the recent past experienced positive economic growth, alongside an increased rate of
urbanization. It is widely acknowledged that urbanization in Kenya has supported the gross
domestic product (GDP) growth, economic transformation, increases in productivity and incomes,
and employment creation1. Overall GDP growth was estimated at 5.5% in 2015 and projected to
rise to 6.0% in 2016 and 6.4% in 2017. Cities and towns have the potential to drive sustainable
economic growth and social development, and it is projected that more than half of the people in
Kenya will be living in cities and towns by 2030, who will need jobs, housing, infrastructure and
other services. Furthermore, following the promulgation of the Constitution of Kenya in 2010, the
47 new county governments are now responsible for devolved services resulting in new
developments in and around county headquarters resulting in an increase in the urban population.
1.1.2 While vibrant cities and towns are critical for the economic development of the country,
rapid urban growth and demographic changes are posing challenges on the water and sanitation
services delivery. Furthermore, inadequate investments in water and sanitation infrastructure is
negatively impacting the main productive sectors of agriculture, tourism, manufacturing, service
industries and energy. Despite increased government investments in the sector (from $82.5 million
per annum in 2005 to $450 million in 2015), the financing gap to meet the Vision 2030 targets for
water and sanitation in the country remains huge at about USD 19.2 Billion (World Bank, 2016),
resulting in access to improved water source and improved/shared sanitation facilities remaining
at 63% and 57% respectively2, well below the Sustainable Development Goal (SDG) targets which
aim at universal access. The low access rate is partly attributed to rapid urbanization, population
growth, weak institutional capacity of the sector and negative impacts of climate change. The
selected towns under the program are: (i) those prioritized by the government in the Medium Term
Plan II (MTP-II) (2013-2017); (ii) with low water and sanitation coverage; and (iii) where the
water and sanitation needs are not being addressed by any other development partners (DPs).
1.1.3 The government of Kenya (GoK) has shown consistent commitment to the sector reforms
since the enactment of the Water Act 2002, and the DPs continue to support the reform process.
Following the promulgation of the new constitution, water and sanitation services are now a
devolved function of the county governments and a new Water Act is in the process of being
enacted to align with the new constitution. The new water bill has passed through the parliament
and its awaiting signature into law by the president.
1 Largest urban centers generate 70% of country’s GDP. 2 Joint Monitoring Programme 2015
2
1.1.4 The water sector reforms have provided a supportive and progressive framework on which
devolution in Kenya can build on in ensuring efficient service delivery. Key challenges the sector
continues to address include: (i) weak capacity of the new institutions to effectively implement
their mandate; (ii) weak governance in the sector institutions; (iii) economically unviable water
service providers; and (iv) the need for more infrastructure investments to cope with the rapid
population increase, urbanization and economic growth. In addition to addressing the challenges
posed by insufficient infrastructure base and weak institutional capacity, the proposed program
will further support the reform initiatives, such as regular performance monitoring and tariff
reviews by Water Services Regulatory Board (WASREB). This support will enhance the
sustainability of the water services providers (WSPs) that are mandated with operating and
maintaining the water infrastructure in the towns. The Bank’s support under the program will
include assistance in coherent investment planning and project preparation in order to deliver
timely and sustainable infrastructure for effective water and sanitation services to the 47 counties.
1.1.5 The GoK’s Vision 2030 and its five (5) years MTP-II form the development blue print for
the country with the three (3) key development areas of: (i) economic growth; (ii) social investment
and poverty reduction; and (iii) institutional strengthening and improvement in governance. The
Vision 2030 pillars are anchored on infrastructure development, public sector reform and
macroeconomic stability. Kenya’s economic and social developments, as stated in the Vision
2030, are heavily dependent on adequate and sustainable provision of water supply and sanitation
services. Furthermore, the rapid urbanization in the country calls for more effective and efficient
water and sanitation services in order for cities and towns to remain as drivers of economic growth.
The MTP-II (under the economic and social pillars) prioritizes water and sanitation infrastructural
investments including expansion of water supply and sanitation in major and medium towns and
water resources development and management.
1.2 Rationale for Bank’s Involvement
1.2.1 Despite the latent economic growth potential in the targeted 28 towns, the development
and growth of these towns is still constrained by prevailing deficiencies in urban infrastructure3
and the low service levels, both in the existing built-up areas (including the informal settlements)
and its peripheries where townships are expanding; deteriorating environmental conditions; and
insufficient finances and weak management capacity. The water supply coverage in the target
towns varies from below 10% to around 55%. Water borne sanitation does not exist in many of
the target towns with average global service coverage of approximately 13%. Currently, only about
half of the WSPs under the program are able to supply water for more than 16 hour per day and
cover operation and maintenance (O&M) cost, while non-revenue water range between 31 and
66%. Delivery of safe, adequate and reliable water and sanitation services to these towns is hence
a high priority.
1.2.2 This program fits within the pillar 1 of the Bank’s Country Strategy Paper (CSP) 2014–
2018, “focusing on enhancing physical infrastructure to unleash inclusive growth” and contributes
to the Outcome 3: Enhanced access to more reliable water supply and improved sanitation. The
proposed program will improve water and sanitation services for commercial and industrial use,
household consumption, and also for minor irrigation and livestock requirements in some towns,
thereby enhancing food security.
1.2.3 The program aligns with the Bank’s Integrated Water Resource Management Policy (2000)
and the Bank’s Strategy for 2013-2022 which recognizes development and management of water
as central to Africa’s sustainable growth. The program is also supported by the Urban
Development Strategy (2011) by providing strategic infrastructures for economic growth. The
3 Poor infrastructure is slowing down economic development, constraining household economic development including businesses,
attractiveness for investment.
3
program’s support to provision of water and sanitation services and capacity building with focus
on women and youth are aligned to Pillars II and III of the Bank’s Gender Strategy (2014-2018)
and Bank Group Strategy for Jobs for Youth in Africa (2016-2025). By enhancing the capacity of
the country to provide basic services especially to conflict-prone areas, the program aligns with
the Bank’s Strategy for Addressing Fragility and Building Resilience in Africa (2014-2019). In
line with Knowledge Management Strategy (2015-2020), lessons from this intervention will help
improve the quality of the Bank’s involvements in urban water and sanitation sub-sector. By
providing sustainable and affordable water and sanitation services, the program will lay
foundations for industrialization and food security, enhance the sources of economic and social
resilience of the people, and contribute to improved quality of life for the people which are in line
with the five (5) priority areas of focus (High-5s) to advance Africa’s transformative agenda to
deliver the outcomes of the Bank’s Strategy for 2013-2022.
1.2.4 The proposed program further complements the completed Water Services Boards Support
Project and the ongoing Small Towns and Rural Water Supply and Sanitation Project approved in
2009 and scheduled to be completed in 2016. The Bank has had a long engagement with the GoK
in the water and sanitation sector since 1978. This program will continue this partnership and
support the government as it moves forward to address the next generation of urban development
challenges and reforms in the sector.
1.3 Development Partner Coordination
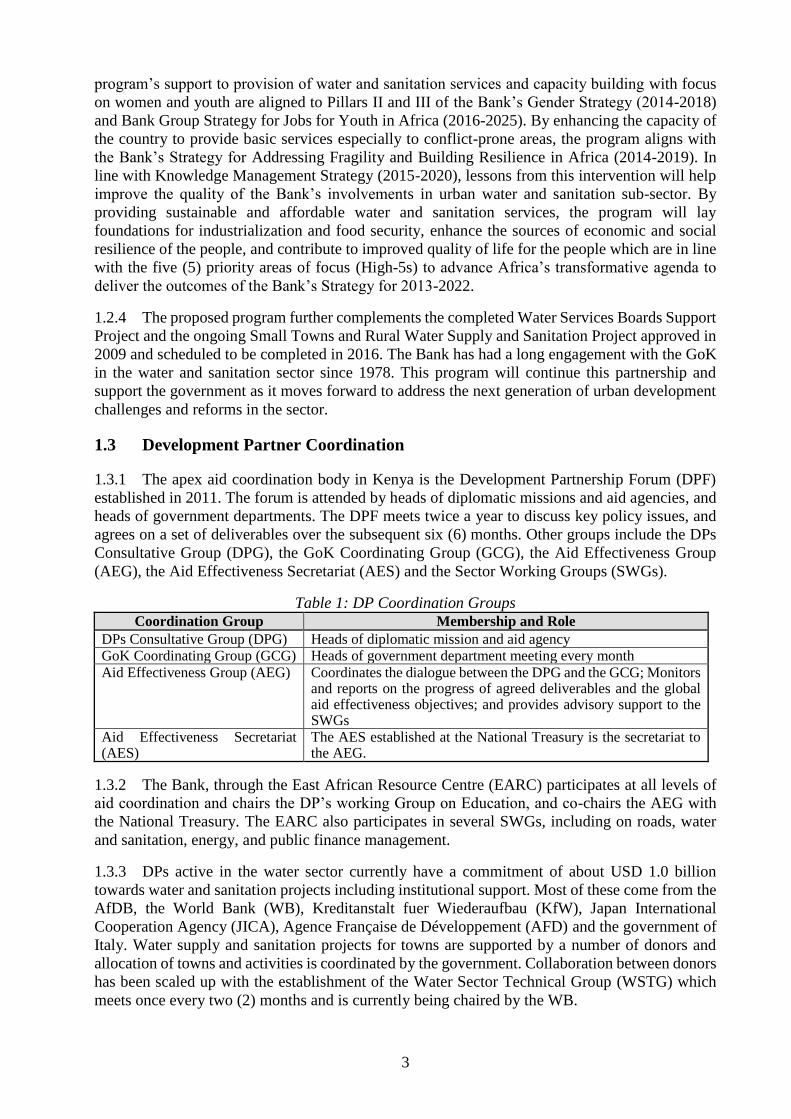
1.3.1 The apex aid coordination body in Kenya is the Development Partnership Forum (DPF)
established in 2011. The forum is attended by heads of diplomatic missions and aid agencies, and
heads of government departments. The DPF meets twice a year to discuss key policy issues, and
agrees on a set of deliverables over the subsequent six (6) months. Other groups include the DPs
Consultative Group (DPG), the GoK Coordinating Group (GCG), the Aid Effectiveness Group
(AEG), the Aid Effectiveness Secretariat (AES) and the Sector Working Groups (SWGs).
Table 1: DP Coordination Groups Coordination Group Membership and Role
DPs Consultative Group (DPG) Heads of diplomatic mission and aid agency GoK Coordinating Group (GCG) Heads of government department meeting every month
Aid Effectiveness Group (AEG) Coordinates the dialogue between the DPG and the GCG; Monitors and reports on the progress of agreed deliverables and the global aid effectiveness objectives; and provides advisory support to the SWGs
Aid Effectiveness Secretariat (AES)
The AES established at the National Treasury is the secretariat to the AEG.
1.3.2 The Bank, through the East African Resource Centre (EARC) participates at all levels of
aid coordination and chairs the DP’s working Group on Education, and co-chairs the AEG with
the National Treasury. The EARC also participates in several SWGs, including on roads, water
and sanitation, energy, and public finance management.
1.3.3 DPs active in the water sector currently have a commitment of about USD 1.0 billion
towards water and sanitation projects including institutional support. Most of these come from the
AfDB, the World Bank (WB), Kreditanstalt fuer Wiederaufbau (KfW), Japan International
Cooperation Agency (JICA), Agence Française de Développement (AFD) and the government of
Italy. Water supply and sanitation projects for towns are supported by a number of donors and
allocation of towns and activities is coordinated by the government. Collaboration between donors
has been scaled up with the establishment of the Water Sector Technical Group (WSTG) which
meets once every two (2) months and is currently being chaired by the WB.
4
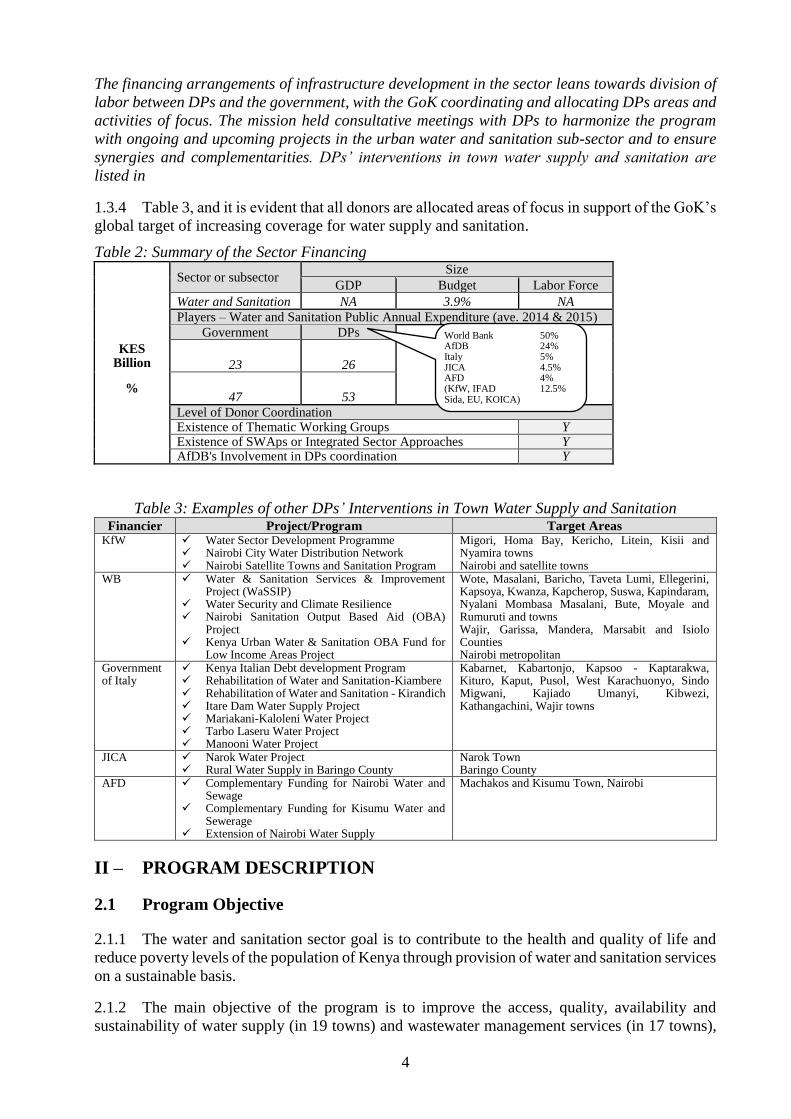
The financing arrangements of infrastructure development in the sector leans towards division of
labor between DPs and the government, with the GoK coordinating and allocating DPs areas and
activities of focus. The mission held consultative meetings with DPs to harmonize the program
with ongoing and upcoming projects in the urban water and sanitation sub-sector and to ensure
synergies and complementarities. DPs’ interventions in town water supply and sanitation are
listed in
1.3.4 Table 3, and it is evident that all donors are allocated areas of focus in support of the GoK’s
global target of increasing coverage for water supply and sanitation.
Table 2: Summary of the Sector Financing
Sector or subsector Size
GDP Budget Labor Force
Water and Sanitation NA 3.9% NA
Players – Water and Sanitation Public Annual Expenditure (ave. 2014 & 2015)
Government DPs
KES Billion 23 26
% 47 53
Level of Donor Coordination Existence of Thematic Working Groups Y Existence of SWAps or Integrated Sector Approaches Y AfDB's Involvement in DPs coordination Y
Table 3: Examples of other DPs’ Interventions in Town Water Supply and Sanitation Financier Project/Program Target Areas
KfW Water Sector Development Programme Nairobi City Water Distribution Network Nairobi Satellite Towns and Sanitation Program
Migori, Homa Bay, Kericho, Litein, Kisii and Nyamira towns Nairobi and satellite towns
WB Water & Sanitation Services & Improvement Project (WaSSIP)
Water Security and Climate Resilience Nairobi Sanitation Output Based Aid (OBA)
Project Kenya Urban Water & Sanitation OBA Fund for
Low Income Areas Project
Wote, Masalani, Baricho, Taveta Lumi, Ellegerini, Kapsoya, Kwanza, Kapcherop, Suswa, Kapindaram, Nyalani Mombasa Masalani, Bute, Moyale and Rumuruti and towns Wajir, Garissa, Mandera, Marsabit and Isiolo Counties Nairobi metropolitan
Government of Italy
Kenya Italian Debt development Program Rehabilitation of Water and Sanitation-Kiambere Rehabilitation of Water and Sanitation - Kirandich Itare Dam Water Supply Project Mariakani-Kaloleni Water Project Tarbo Laseru Water Project Manooni Water Project
Kabarnet, Kabartonjo, Kapsoo - Kaptarakwa, Kituro, Kaput, Pusol, West Karachuonyo, Sindo Migwani, Kajiado Umanyi, Kibwezi, Kathangachini, Wajir towns
JICA Narok Water Project Rural Water Supply in Baringo County
Narok Town Baringo County
AFD Complementary Funding for Nairobi Water and Sewage
Complementary Funding for Kisumu Water and Sewerage
Extension of Nairobi Water Supply
Machakos and Kisumu Town, Nairobi
II – PROGRAM DESCRIPTION
2.1 Program Objective
2.1.1 The water and sanitation sector goal is to contribute to the health and quality of life and
reduce poverty levels of the population of Kenya through provision of water and sanitation services
on a sustainable basis.
2.1.2 The main objective of the program is to improve the access, quality, availability and
sustainability of water supply (in 19 towns) and wastewater management services (in 17 towns),
World Bank 50% AfDB 24% Italy 5% JICA 4.5% AFD 4% (KfW, IFAD 12.5% Sida, EU, KOICA)
5
with a view to catalyzing commercial activities, driving economic growth, improving quality of
life of the people and building resilience against climate variability and change.
2.2 Program Components
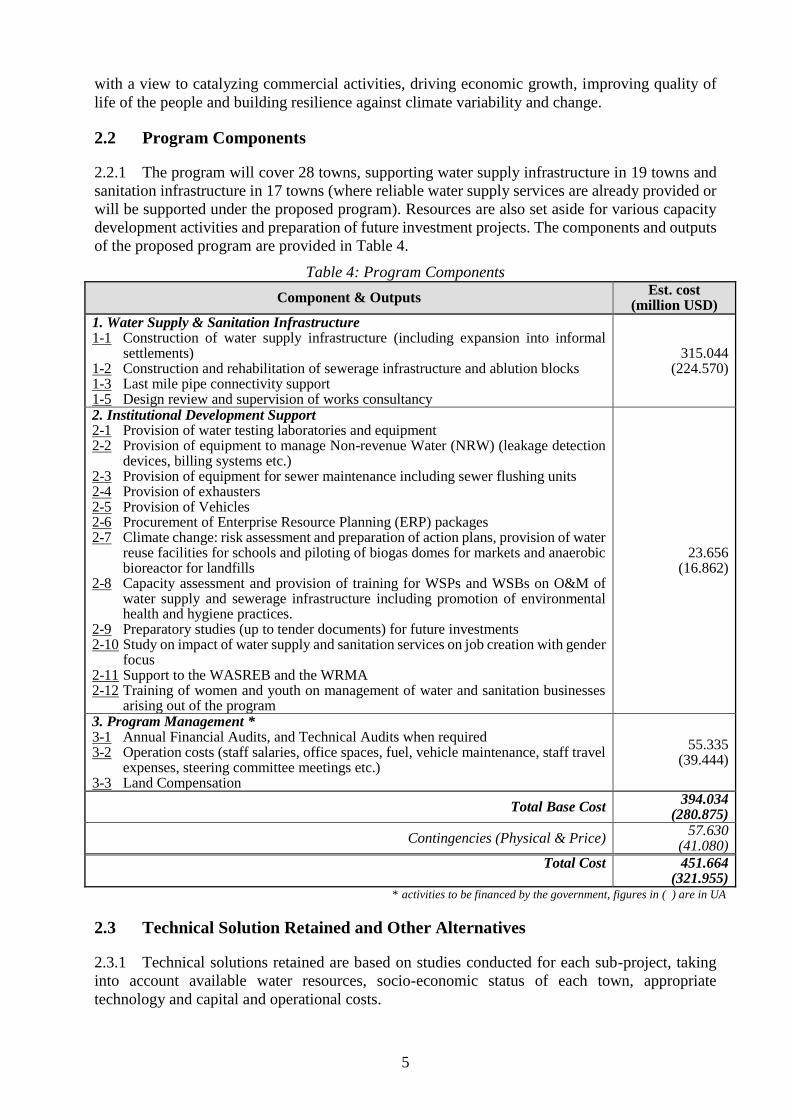
2.2.1 The program will cover 28 towns, supporting water supply infrastructure in 19 towns and
sanitation infrastructure in 17 towns (where reliable water supply services are already provided or
will be supported under the proposed program). Resources are also set aside for various capacity
development activities and preparation of future investment projects. The components and outputs
of the proposed program are provided in Table 4.
Table 4: Program Components
Component & Outputs Est. cost
(million USD)
1. Water Supply & Sanitation Infrastructure 1-1 Construction of water supply infrastructure (including expansion into informal
settlements) 1-2 Construction and rehabilitation of sewerage infrastructure and ablution blocks 1-3 Last mile pipe connectivity support 1-5 Design review and supervision of works consultancy
315.044 (224.570)
2. Institutional Development Support 2-1 Provision of water testing laboratories and equipment 2-2 Provision of equipment to manage Non-revenue Water (NRW) (leakage detection
devices, billing systems etc.) 2-3 Provision of equipment for sewer maintenance including sewer flushing units 2-4 Provision of exhausters 2-5 Provision of Vehicles 2-6 Procurement of Enterprise Resource Planning (ERP) packages 2-7 Climate change: risk assessment and preparation of action plans, provision of water
reuse facilities for schools and piloting of biogas domes for markets and anaerobic bioreactor for landfills
2-8 Capacity assessment and provision of training for WSPs and WSBs on O&M of water supply and sewerage infrastructure including promotion of environmental health and hygiene practices.
2-9 Preparatory studies (up to tender documents) for future investments 2-10 Study on impact of water supply and sanitation services on job creation with gender
focus 2-11 Support to the WASREB and the WRMA 2-12 Training of women and youth on management of water and sanitation businesses
arising out of the program
23.656 (16.862)
3. Program Management * 3-1 Annual Financial Audits, and Technical Audits when required 3-2 Operation costs (staff salaries, office spaces, fuel, vehicle maintenance, staff travel
expenses, steering committee meetings etc.) 3-3 Land Compensation
55.335 (39.444)
Total Base Cost 394.034
(280.875)
Contingencies (Physical & Price) 57.630
(41.080)
Total Cost 451.664 (321.955)
* activities to be financed by the government, figures in ( ) are in UA
2.3 Technical Solution Retained and Other Alternatives
2.3.1 Technical solutions retained are based on studies conducted for each sub-project, taking
into account available water resources, socio-economic status of each town, appropriate
technology and capital and operational costs.

6
2.3.2 Reduction of non-revenue water as well as enhanced capacity of the WSPs are integral part
of the program for efficient delivery of water and sanitation services and sustainability of the
investments.
2.3.3 Various technical solutions were explored (Table 5) for the program taking into account
characteristics of water sources, operation and maintenance costs and capacity in the country.
Table 5: Analysis of the Various Alternatives Considered Alternative Brief Description Selected Option / Reasons for Rejection
Water sources - Use of pumps for raw water main and distribution.
Use of pumping which require constant power supply to reduce distance for water conveyance.
Sources of the water supply services for respective sub-projects are either surface or groundwater selected based on water resources assessment. As much as possible, water intake points were selected to avoid or minimize use of pumping and allow for gravity conveyance for reduced operation cost.
Sanitation options - Sewerage system for low density areas and on-site sanitation for densely populated areas.
Uniformly providing water-borne sanitation infrastructure in all target towns.
Due to high O&M cost of the system, sewerage will be introduced to business center districts and areas with high population density where the option could be economically justified and continuous use of on-site sanitation could pose health and environmental threats. Sites for wastewater treatment plants were selected to minimize pumping. For other areas, septic tanks will continue to be the most viable option, and the program will provide exhausters for the improved management of these facilities. Promotion of environmental health and hygiene is incorporated in the interventions.
Integrated services delivery – Water supply intervention without sanitation services.
Investment for water supply infrastructure only with no provision for sanitation.
Option of only supporting water infrastructure, though financially more viable, was rejected to ensure environmental and social sustainability, and to enable reuse of treated water downstream. Sanitation infrastructure will be supported under the program in towns where water will be provided under the program or where water is already available through completed/ ongoing projects. For towns whose sanitation studies are not ready, readiness of sanitation projects will be supported under the proposed program for future investments.
2.4 Program Type
2.4.1 The proposed program supports infrastructure investments as well as institutional capacity
development funded through a combination of loans, grants and government counterpart
contribution. The program involves multiple projects or interventions to be implemented in
beneficiary towns located across Kenya. The funding instrument for the proposed intervention is
sector investment. The program complements with the projects/programs funded by other donors
and government that focus on urban water and sanitation sub-sector by supporting components or
towns that are not covered by other DPs.
2.5 Program Cost and Financing Arrangements
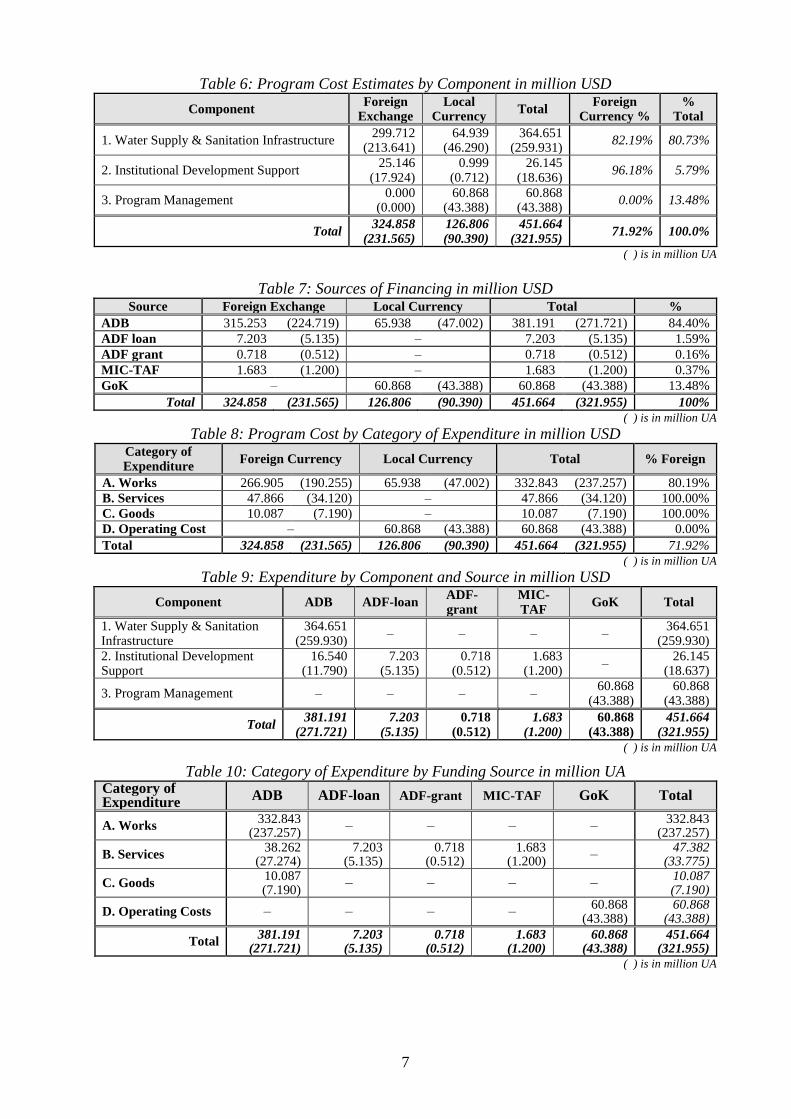
2.5.1 The total cost of the program for the components, defined in 2.2 above, is estimated at USD
451.664 million, net of taxes and duties. Of this, USD 324.858 million or 71.92% is in foreign
currency and USD 126.806 million is in local currency. Tables au-dessous provide the summary
of the program costs.
7
Table 6: Program Cost Estimates by Component in million USD
Component Foreign
Exchange Local
Currency Total
Foreign Currency %
% Total
1. Water Supply & Sanitation Infrastructure 299.712
(213.641) 64.939
(46.290) 364.651
(259.931) 82.19% 80.73%
2. Institutional Development Support 25.146
(17.924) 0.999
(0.712) 26.145
(18.636) 96.18% 5.79%
3. Program Management 0.000
(0.000) 60.868
(43.388) 60.868
(43.388) 0.00% 13.48%
Total 324.858
(231.565) 126.806 (90.390)
451.664 (321.955)
71.92% 100.0%
( ) is in million UA
Table 7: Sources of Financing in million USD Source Foreign Exchange Local Currency Total %
ADB 315.253 (224.719) 65.938 (47.002) 381.191 (271.721) 84.40%
ADF loan 7.203 (5.135) – 7.203 (5.135) 1.59%
ADF grant 0.718 (0.512) – 0.718 (0.512) 0.16%
MIC-TAF 1.683 (1.200) – 1.683 (1.200) 0.37%
GoK – 60.868 (43.388) 60.868 (43.388) 13.48%
Total 324.858 (231.565) 126.806 (90.390) 451.664 (321.955) 100%
( ) is in million UA
Table 8: Program Cost by Category of Expenditure in million USD Category of Expenditure
Foreign Currency Local Currency Total % Foreign
A. Works 266.905 (190.255) 65.938 (47.002) 332.843 (237.257) 80.19%
B. Services 47.866 (34.120) – 47.866 (34.120) 100.00%
C. Goods 10.087 (7.190) – 10.087 (7.190) 100.00%
D. Operating Cost – 60.868 (43.388) 60.868 (43.388) 0.00%
Total 324.858 (231.565) 126.806 (90.390) 451.664 (321.955) 71.92%
( ) is in million UA
Table 9: Expenditure by Component and Source in million USD
Component ADB ADF-loan ADF-grant
MIC-TAF
GoK Total
1. Water Supply & Sanitation Infrastructure
364.651 (259.930)
– – – – 364.651
(259.930)
2. Institutional Development Support
16.540 (11.790)
7.203 (5.135)
0.718 (0.512)
1.683 (1.200)
– 26.145
(18.637)
3. Program Management – – – – 60.868
(43.388) 60.868
(43.388)
Total 381.191
(271.721) 7.203
(5.135) 0.718
(0.512) 1.683
(1.200) 60.868
(43.388) 451.664
(321.955)
( ) is in million UA
Table 10: Category of Expenditure by Funding Source in million UA Category of Expenditure
ADB ADF-loan ADF-grant MIC-TAF GoK Total
A. Works 332.843
(237.257) – – – –
332.843 (237.257)
B. Services 38.262
(27.274) 7.203
(5.135) 0.718
(0.512) 1.683
(1.200) –
47.382 (33.775)
C. Goods 10.087 (7.190)
– – – – 10.087 (7.190)
D. Operating Costs – – – – 60.868
(43.388) 60.868
(43.388)
Total 381.191
(271.721) 7.203
(5.135) 0.718
(0.512) 1.683
(1.200) 60.868
(43.388) 451.664
(321.955)
( ) is in million UA
8
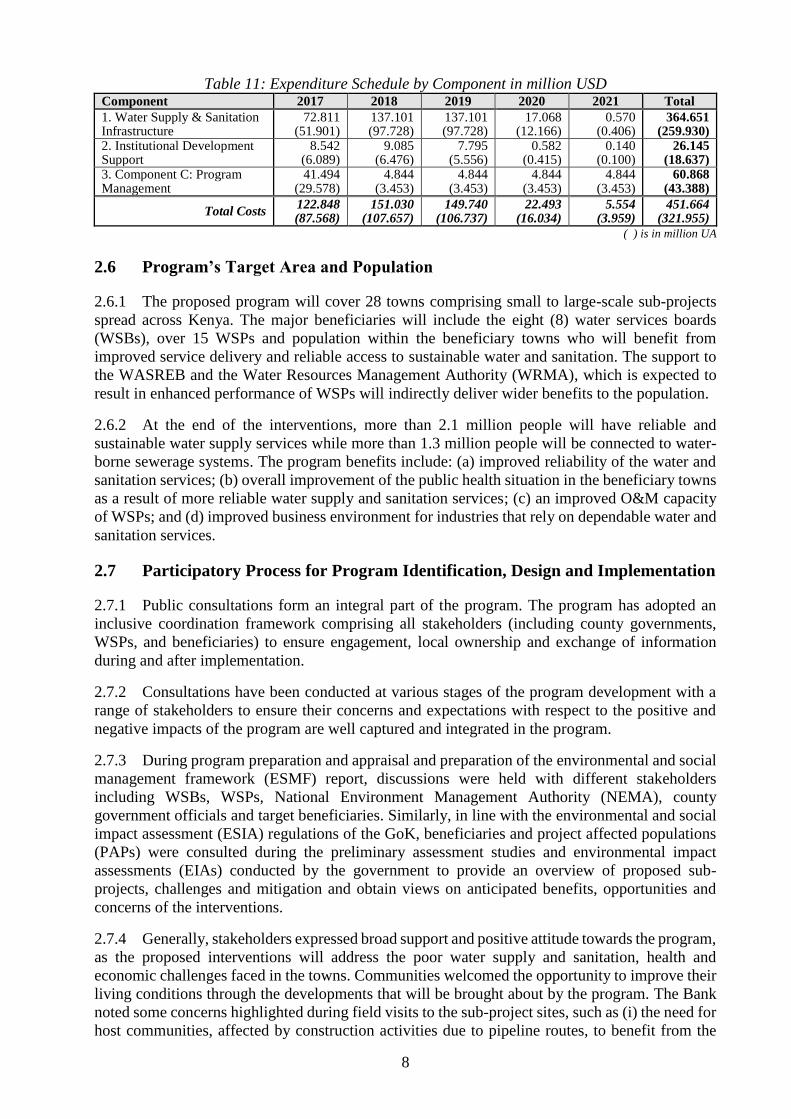
Table 11: Expenditure Schedule by Component in million USD Component 2017 2018 2019 2020 2021 Total
1. Water Supply & Sanitation Infrastructure
72.811 (51.901)
137.101 (97.728)
137.101 (97.728)
17.068 (12.166)
0.570 (0.406)
364.651 (259.930)
2. Institutional Development Support
8.542 (6.089)
9.085 (6.476)
7.795 (5.556)
0.582 (0.415)
0.140 (0.100)
26.145 (18.637)
3. Component C: Program Management
41.494 (29.578)
4.844 (3.453)
4.844 (3.453)
4.844 (3.453)
4.844 (3.453)
60.868 (43.388)
Total Costs 122.848 (87.568)
151.030 (107.657)
149.740 (106.737)
22.493 (16.034)
5.554 (3.959)
451.664 (321.955)
( ) is in million UA
2.6 Program’s Target Area and Population
2.6.1 The proposed program will cover 28 towns comprising small to large-scale sub-projects
spread across Kenya. The major beneficiaries will include the eight (8) water services boards
(WSBs), over 15 WSPs and population within the beneficiary towns who will benefit from
improved service delivery and reliable access to sustainable water and sanitation. The support to
the WASREB and the Water Resources Management Authority (WRMA), which is expected to
result in enhanced performance of WSPs will indirectly deliver wider benefits to the population.
2.6.2 At the end of the interventions, more than 2.1 million people will have reliable and
sustainable water supply services while more than 1.3 million people will be connected to water-
borne sewerage systems. The program benefits include: (a) improved reliability of the water and
sanitation services; (b) overall improvement of the public health situation in the beneficiary towns
as a result of more reliable water supply and sanitation services; (c) an improved O&M capacity
of WSPs; and (d) improved business environment for industries that rely on dependable water and
sanitation services.
2.7 Participatory Process for Program Identification, Design and Implementation
2.7.1 Public consultations form an integral part of the program. The program has adopted an
inclusive coordination framework comprising all stakeholders (including county governments,
WSPs, and beneficiaries) to ensure engagement, local ownership and exchange of information
during and after implementation.
2.7.2 Consultations have been conducted at various stages of the program development with a
range of stakeholders to ensure their concerns and expectations with respect to the positive and
negative impacts of the program are well captured and integrated in the program.
2.7.3 During program preparation and appraisal and preparation of the environmental and social
management framework (ESMF) report, discussions were held with different stakeholders
including WSBs, WSPs, National Environment Management Authority (NEMA), county
government officials and target beneficiaries. Similarly, in line with the environmental and social
impact assessment (ESIA) regulations of the GoK, beneficiaries and project affected populations
(PAPs) were consulted during the preliminary assessment studies and environmental impact
assessments (EIAs) conducted by the government to provide an overview of proposed sub-
projects, challenges and mitigation and obtain views on anticipated benefits, opportunities and
concerns of the interventions.
2.7.4 Generally, stakeholders expressed broad support and positive attitude towards the program,
as the proposed interventions will address the poor water supply and sanitation, health and
economic challenges faced in the towns. Communities welcomed the opportunity to improve their
living conditions through the developments that will be brought about by the program. The Bank
noted some concerns highlighted during field visits to the sub-project sites, such as (i) the need for
host communities, affected by construction activities due to pipeline routes, to benefit from the
9
water supply interventions, (ii) employment opportunities for the youths during the construction
phase, (iii) the need to recognize multiple demands for water resources and to avoid water-induced
conflicts, and (iv) prompt communication with stakeholders during implementation. These issues
were addressed by the Ministry of Water and Irrigation (MoWI) and the WSBs and will be further
addressed in site specific environmental and social management plans (ESMPs) and overall design
of the program. For instance the jobs to be generated by the program will benefit the youth and the
women foremost.
2.7.5 Consultation and public participation is a continuous process, which began at an early stage
during program preparation and continues as needed. As the program implementation progresses,
the MoWI, the WSBs, WSPs and county authorities will continue to consult with key stakeholders
with respect to improved benefits, suitability of the infrastructure, design and timing of
construction.
2.8 Bank Group Experience, Lessons Reflected in Program Design
2.8.1 As of July 2016, the Bank’s portfolio in the country comprises of 31 active operations -24
public sector projects and 7 private sector operations, with a net total commitment of UA 1.82
billion. The Bank’s investment in the water and sanitation sector accounts for about 16% of the
current public sector portfolio. The current (2015) Country Portfolio Performance Review (CPPR)
assessment ratings returned satisfactory with an overall disbursement rate of 48%. The portfolio
recorded a development objective (DO) rating of 3.584, indicating a stronger likelihood that the
most ongoing operations will meet their development objectives and an implementation progress
(IP) rating of 3.23, implying a satisfactory progress on project implementation. In addition, there
is no project-at-risk in the portfolio and there is neither a problematic project nor a potentially
problematic project in the portfolio. There is no outstanding Project Completion Report (PCR) and
conditions precedent to first disbursement for all ongoing operations in the sector have been
fulfilled.
2.8.2 Bank’s assistance in the water and sanitation sector in Kenya has focused on both
infrastructure and institutional support, and from 1978 to date a total of 14 operations have been
financed of which 4 are ongoing. The support has been aimed at achieving national goals for water
and sanitation as articulated in the relevant national policy documents; namely the Constitution of
Kenya (2010), the Vision 2030 document, and the National Water Services Strategy 2007-2015
(NWSS).
2.8.3 Some of the key lessons learnt from on-going and past interventions in the country by the
Bank and other DPs are taken into account in the design of the program. The main lessons taken
into account are:
Streamlined implementation arrangements: In order to streamline implementation
arrangements, the program selected three (3) WSBs based on capacity assessments to lead the
implementation on behalf of the other five (5) WSBs. In addition, given the delays encountered
in justifying expenses paid from special accounts in the past projects, daily operational costs
will be fully covered by counterpart fund, which allows the program not to use revolving fund
(special account) methods.
Improved readiness: To ensure timely implementation of the program and comply with the
Bank’s Presidential Directive (PD) 02/2105, sub-projects were selected based on the readiness
of studies including ESIA among other criteria. For the seven (7) sub-projects that are still at
preliminary design stage, design and build method of implementation will be introduced to
4 The DO rating ranges from 3.00 to 4.00
10
commence works in the shortest possible period. Advance procurement activities for the
recruitment of design review and supervision consultancies commenced in July 2016.
Members of the program implementing teams (PITs) have been appointed and their profiles
were reviewed during appraisal. The steering committee (SC) for the program has also been
established.
Integrated interventions: The program will ensure water supply and sanitation infrastructure
investments and capacity development of WSPs form part of an integrated package for each
sub-projects. Sanitation interventions incorporate promotion of environmental health and
hygiene practices with a focus on sanitation hotspots. Where applicable, the program will
ensure complementarities with other interventions funded by other DPs and the GoK, especially
in towns where water supply investments have not been matched by corresponding sanitation
facilities for the safe disposal of wastewater. The program will enhance capacity of WSPs to
operate, monitor and deliver improved services. Supports to the WASREB and the WRMA are
also expected to contribute to improved performance of WSPs and sustainable service delivery.
Inclusive service delivery: The WSPs will ensure service provision to underprivileged
households through water kiosks, extensions into informal settlements and social tariff structure
guided by WASREB Tariff Guidelines. Resources will also be set aside for the training of
women and youth on management of water and sanitation businesses arising from the program,
such as management of water kiosks and operation and maintenance of water and sanitation
infrastructure.
2.9 Key Performance Indicators
2.9.1 The key performance indicators for monitoring of the program’s achievements are
identified and captured in the result based logical framework (RBLF). In line with the objective of
the program, outcome indicators include those that capture improved quality of life of people in
target towns such as service coverage and employment opportunities, and enhanced capacity of
WSPs. Output indicators were selected to capture progress of major infrastructure investments and
institutional capacity development activities under the program.
2.9.2 The three (3) PITs will prepare quarterly and annual program progress reports in
collaboration with other WSBs presenting the progress of output indicators. Outcome and output
indicators will also be monitored through the PITs. Indicators will be updated in the
implementation progress report (IPR) and necessary adjustments to the program implementation
will be made as appropriate.
III – PROGRAM FEASIBILITY
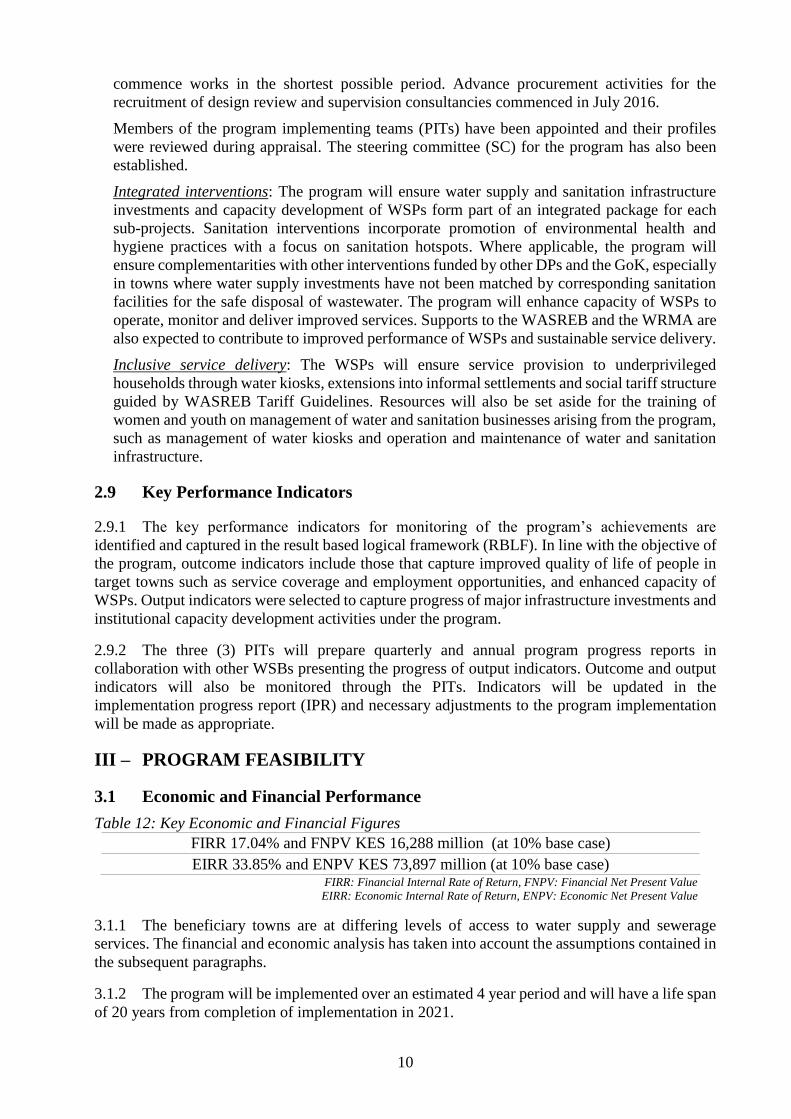
3.1 Economic and Financial Performance
Table 12: Key Economic and Financial Figures
FIRR 17.04% and FNPV KES 16,288 million (at 10% base case)
EIRR 33.85% and ENPV KES 73,897 million (at 10% base case) FIRR: Financial Internal Rate of Return, FNPV: Financial Net Present Value
EIRR: Economic Internal Rate of Return, ENPV: Economic Net Present Value
3.1.1 The beneficiary towns are at differing levels of access to water supply and sewerage
services. The financial and economic analysis has taken into account the assumptions contained in
the subsequent paragraphs.
3.1.2 The program will be implemented over an estimated 4 year period and will have a life span
of 20 years from completion of implementation in 2021.
11
3.1.3 The estimated base population with access to piped water of the towns as at 2015 is
projected to be 1.14 million people. This is expected to grow to 2.11 million by 2021 and thereafter
grow at an average of 2.4% per annum.
3.1.4 For purposes of this analysis, a proxy average tariff was adopted, considering the different
sizes of the target towns. Most of the target towns have tariffs approved by the WASREB, and for
the few that do not have approved tariffs, the WASREB is working towards ensuring that the WSPs
are operating with an approved tariff. The analysis assumes a gradual progression from O&M cost
coverage recovery, subsequently reaching full cost recovery to cover investments.
3.1.5 Operating and maintenance costs, including administration overheads, are estimated to be
55% of the revenue generated, a significant improvement on the current performance of most of
the utilities that are relying on subsidies from the county governments to cover electricity bills and
in some cases, wages. It is anticipated, in this analysis, that as the WSPs improve their non-revenue
water (NRW) situation, and through improvements in billing and collection systems, the utilities
can then graduate to full cost recovery status. Furthermore, the analysis assumes that there will be
need for capital reinvestment, amounting to 10% of the capital expenditure after 10 years of
operation to cater for major refurbishments and efficiency enhancements.
3.1.6 The EIRR considers the incremental benefits arising from reduction in health costs due to
reduction in waterborne infections. It also considers the time saving benefit, as women and
children spend less time fetching water. This will lead to an increase in the focus on other income
generating activities, thus improving the livelihoods of the communities.
3.1.7 Sensitivity analysis was undertaken to assess the impact on the FIRR and EIRR of increases
in the capital costs and tariff reductions, and concluded that the reductions in tariffs, have a more
accelerated impact on the viability program than the measured increases in capital costs. This goes
to buttress the proposed interventions in NRW and improvements in billing and collection
efficiencies of the WSP. The sensitivity analysis’ conclusion is that both increases in capital costs
and reductions in tariffs of up to 20% will not result in the interventions being unviable.
3.2 Environmental and Social Impacts
Environmental Impacts
3.2.1 The program has been classified Category 2 in accordance to the African Development
Bank’s Environmental and Social Assessment Procedures (ESAP), which indicates that the
anticipated environmental and social risks associated with the sub-project investments are
temporal, minimal and can be mitigated based on measures elaborated in site specific ESMPs.
Detailed designs for some of the proposed sub-project investments are under development, hence,
the appropriate environmental and social management instrument proposed and validated by the
Bank’s Compliance and Safeguards Division is an ESMF. An ESMF is prepared for Bank
operations that finance multiple small to large scale sub-projects whose location, scope and designs
are not precisely known at the time the Bank appraises and approves the operation. Consequently,
environmental and social assessment and other safeguard measures can be confirmed during
project implementation phase. The ESMF will ensure compliance with the environmental
regulations of the GoK and safeguard requirements of the Bank, and more importantly foster
environmental and social sustainability of the program interventions.
3.2.2 Main environmental and social benefits: The program will generate positive environmental
and socio-economic impacts because of increased access to water and sanitation services. The
water supply and sanitation service investments under the program will include infrastructure for
bulk water supply, wastewater management, upstream activities to ensure sustainability of
investments (catchment management for selected sites, community outreach, water quality and
12
quantity monitoring, etc.) and enhanced downstream productive water uses to ensure investment
performance. Key benefits include: (i) spurred economic and employment opportunities leading
to socio-economic development of the towns; (ii) increased educational enrolment and attendance
for children; (iii) improved household health status; (iv) time savings to engage in other productive
activities (women); (v) enhanced climate resilience status of the population and environment; and
(vi) reduction in the potential for conflicts in water-stressed areas.
3.2.3 Potential adverse environmental and social impacts: The potential adverse environmental
and social impacts of the program vary with the sub-projects, some of which are indicated in the
technical annexes B7. The major impacts envisaged from the interventions include those typically
associated with construction activities such as soil erosion, air and water pollution of surface and
groundwater from construction machinery effluents, interruption of existing infrastructure when
refurbishing or installing pipelines. Additional impacts associated with the sub-projects include
isolated cases of land acquisition for pipeline transmission routes and siting of new facilities, water
abstraction and changes to water outflows from rivers and associated impacts on downstream
human and ecosystem needs, poor location of sewerage facilities that may result in public
nuisance, as well as risk of HIV/AIDs spread due to influx of construction workers in sub-project
areas, among others.
3.2.4 Mitigation: In line with the already prepared ESMF, site specific ESMPs will be prepared
for each sub-project to identify the significance and magnitude of potential impacts as well as the
mitigation measures to minimize, avoid and compensate for all environmental and social risks.
Some of the measures anticipated in the ESMF include re-vegetating disturbed lands in
construction areas, erosion control, ensure environmental flows, implement appropriate system to
manage solid wastes, ensure discharge effluent as per NEMA Water Quality Regulation, and
implementing sustainable catchment management plans to reverse forest cover loss and land
degradation, siting of sewage treatment facilities at least 10 km from town centres, and educating
communities on personal hygiene and environmental sanitation.
Climate Change
3.2.5 According to the Bank’s Climate Safeguards Screening, the program was classified
Category II, indicating the program interventions may be vulnerable to climate risks and require
the application of the Bank’s Adaptation Review and Evaluation Procedures (AREP) tool to
manage those risks. The program is a strategic response to the impacts of climate change and has
been designed to reflect projected climate change risks.
3.2.6 The GoK has shown proactive commitment to tackling the challenges of climate change
and environmental degradation plaguing the water sector. The National Climate Change Response
Strategy (NCCRS) was prepared to focus on developing robust adaptation and mitigation
interventions to address the impacts of climate change in country while the Climate Change Action
Plan (CCAP) 2013-2017 was developed as the government’s instrument to effectively implement
and operationalize the NCCRS for building climate resilience in all sectors, including water and
sanitation. Consistent with this plan, the program proposes to strengthen the climate resilience of
the water supply and sanitation systems of the towns through ensuring technical designs for the
proposed infrastructures reflect the projected climatic changes of the respective towns. In addition,
the program will also explore some of the CCAP’s priority climate adaptation options for the water
sector customized to the needs of each beneficiary town including: (i) riverbank restoration and
catchment protection activities; (ii) capacity building and campaign programs at the sub-
project/town levels to promote water conservation and water-use efficiency as well as water
capture and storage such as rainwater harvesting; (iii) rehabilitation and equipping of WSPs’
laboratory for effective water quality monitoring; and (iv) strengthen and build capacity of the
WRMA for early warning systems, to execute river flow monitoring and to enhance their capacity
for flood, and drought prediction and monitoring in the catchment. The major investments in
13
addressing NRW will ultimately reduce energy costs associated with pumping, and thus contribute
positively to reduction in carbon emissions.
Gender
3.2.7 Women constitute about 50% of the total Kenya population and the GoK recognizes the
importance of their full participation in the development process to facilitate sustainable
development and equity. The Gender Development Index for Kenya for 2014 is 0.913 and places
it amongst countries with a medium gender equality in Human Development Index 5 (HDI)
achievements. The National Gender Policy (2011) aims to mainstream gender concerns in the
national development process in order to improve the social, legal/civic, and economic and cultural
conditions of women, men, girls and boys in Kenya. NWSS commits to ensuring that all Kenya
people are covered by the formal water supply system and that poor Kenyans pay tariffs that they
can afford. The strategy promotes the participation of women in water governance and decision-
making processes and makes requirements for one gender to occupy at least one third of posts at
all levels.
3.2.8 Within the context of the GoK’s strategic gender goals and the MoWI’s ongoing activities
integrating gender concerns, the water sector mainstreams gender consideration in all its
initiatives. This include establishment of the Gender Desk Office in MoWI to coordinate policy
implementation and create awareness on gender in water utilities as well as incorporating gender-
based indicators in performance contracts with utilities as an avenue to ensure integration of gender
concerns. The proposed program is designed to respond to the diverse livelihood needs of both
men and women. Women will especially benefit from increased access to safe, adequate and
uninterrupted water and sanitation service resulting in improved heath and reduced burden and
time spent on collecting water. This is expected to accrue directly from increased access to water
and sanitation services at household level and also indirectly from improved water and sanitation
in health institutions and schools.
3.2.9 It is recognized that the direct employment of women in the water sector is less than their
male counterparts. Hence, the program will target women specifically as administrators and
management of water supply infrastructures. For instance, the program will ensure that at least
50% of the operators of water kiosks are women and they receive training as mechanics to
regularly repair and maintain the water pumps. Additionally, the multi-stakeholder forums
established at each sub-project intervention area and will promote and track the participation of
women. This will help build on and enhance the participation of women in the town water service
governance structure and process such as water user associations.
Social
3.2.10 Kenya’s economic growth has propelled the country towards middle income status with
expansion in financial and communications being behind the accelerated growth. However, the
country is still placed in the low human development category with a HDI of 0.58 in 2014 and
position of 145 out of 188 countries. Poverty remains high (approx. 40% of the population) with
high inequality especially in the arid and semi-arid regions in the north and north east. There has
been significant decline in infant and child mortality rates (from 115/1,000 in 2003 to 52/1,000 in
2014) with maternal mortality rate being 362/10,000. Awareness of AIDS is now universal in
Kenya, however only 56% of women and 66% men have comprehensive knowledge about HIV
and AIDS prevention. Major challenges facing the prevention and treatment of HIV/AIDS are
changing of behavior of the population and affordability of drugs. Malaria and tuberculosis still
constitute major health threats and causes of death.
5 Human Development Index (HDI): A composite index by UNDP measuring average achievement in three (3) basic dimensions
of human development—a long and healthy life, knowledge and a decent standard of living.

14
3.2.11 The proposed program will bring significant social benefits to urban, peri-urban and rural
towns faced with the enormous challenge of meeting growing water and sanitation service
demands. The program will enhance employment and empowerment opportunities that will target
both women and youths within the intervention areas. It is anticipated that 3 categories of job
opportunities will be created through the program: (i) direct jobs comprise mainly temporary jobs
created during construction - over 10,000 jobs are anticipated, (ii) indirect jobs that will help local
supply industries to develop, including manufacturers of pipes, water pumps, chemical companies,
security services, cement manufacturers, and training providers, and (iii) permanent jobs will be
created to support the operation and maintenance of the water supply and wastewater
infrastructures, including water kiosk operators, plumbers, wastewater treatment operators, septic
tank emptying service providers, sewer pipe cleaners and new staff for the WSPs.
3.2.12 In order to maximize the job opportunities and create equitable access and shared
prosperity, the program interventions will target women and youths for skills development and
training on management, and water and sanitation businesses. The program will ensure that at least
30% of trainees in the skill development interventions are women. In addition, 50 apprenticeships
positions attached to eight (8) WSBs will be created (at least 50% women) under the program to
equip and provide youth with exposure to professional level skills.
3.2.13 The provision of water for multiple uses (domestic, irrigation and livestock) in semi-arid
areas of northern Kenya can address potential water-induced conflicts between communities or
between two (2) conflicting uses. Ultimately, water infrastructure provide opportunities for social
cohesion and resilience, and foster inter-cultural connections.
Involuntary Resettlement
3.2.14 Sub-project activities may require land access and/or land acquisition for pipeline
transmission routes and construction of new infrastructures. For the sub-projects, the RAPs will
be prepared once the exact location, scope, and detailed designs of the interventions have been
completed. Preparation of site specific resettlement action plans (RAPs) have been initiated
already in areas where sites have been confirmed.
IV – IMPLEMENTATION
4.1 Implementation Arrangements
4.1.1 In 2010, Kenya adopted a new constitution that ushered in a devolved system of
government. This resulted in the creation of 47 counties administered locally through county
governments, and headed by a governor. The country is currently undertaking an alignment of its
laws with the constitution, and at the time of appraisal, the Water Bill was going through
parliamentary debate. The bill, once passed into law, thus succeeding the Water Act 2002, will
articulate the roles and responsibilities of the various players in the sector.
4.1.2 The institutional structure of the water sector at national level has the MoWI at the helm.
The ministry provides strategic policy direction and leadership to the sector. There are eight (8)
WSBs currently existing, which were established under section 51 of the Water Act 2002, whose
mandate is to bring about efficiency, economy and sustainability in the provision of water and
sewerage services in the country. These WSBs are currently responsible for developing water
supply and sanitation infrastructure within their areas of coverage.
4.1.3 The program will be implemented across the country covering 28 towns. The GoK will be
the borrower and the grants recipient, and the MoWI will be responsible for the program. Based
on the capacity assessments of the WSBs and the Bank’s experience gained from implementing
water and sanitation projects in the country, the three (3) WSBs of Tana, Athi and Rift Valley are
15
designated as implementing boards that will implement the program within their board areas and
on behalf of the other five (5) beneficiary WSBs. In order to streamline implementation
arrangements, it was agreed that Athi WSB (AWSB) will lead the implementation of sub-projects
within Athi, Tanathi and Coast WSBs areas of responsibility, while Tana WSB (TWSB) will lead
sub-projects under Tana and Northern WSBs. The Rift Valley WSB (RVWSB) will lead
implementation of sub-projects under Rift Valley, Lake Victoria North and South WSBs. The chief
executive officers of the designated boards will assume full responsibility for the successful
implementation of the program components under their jurisdiction. In line with the prevailing
country system of signing performance contracts, this program will form part of the performance
contracts of the executives and the staff involved in its implementation. Capacity development
support to the WASREB and the WRMA will be channelled through the AWSB.
4.1.4 Each of the designated boards will establish a PIT led by a program coordinator assigned
by the implementing board, with staff assigned from the other five (5) beneficiary WSBs. Each
PIT will be composed of the following personnel: Program Coordinator; Water and Sanitation
Engineer/M&E Expert; Procurement Expert; Accountant, Environmentalist and Social Expert.
The CVs of the staff assigned to the PITs were reviewed and approved by the Bank during
appraisal, thus satisfying program implementation readiness requirements in line with the Bank’s
PD 02/2105. In addition to the PITs, the program will ensure the recruitment of qualified design
review and supervision consulting firms to support the implementation of the program and enhance
the capacities of the PITs.
4.1.5 At national level, a SC has been established and is composed of representatives of the
MoWI, the eight (8) WSBs, WRMA, WASREB and the National Treasury to provide program
oversight, and coordinate implementation. The implementation arrangements are detailed in
Technical Annex B3.
Implementation Schedule
4.1.6 The program will be implemented over a period of 54 months following fulfilment of
conditions for first disbursement, expected before January 2017. Procurement processes of various
services has already commenced in July 2016, while most of works are scheduled to commence in
the third quarter of 2017. Program completion is set for 30 June 2021 and the deadline for last
disbursement will be 30 September 2021.
Procurement Arrangements
4.1.7 Procurement of goods (including non-consultancy services), works and the acquisition of
consulting services, financed by the Bank for the program, will be carried out in accordance with
the “Procurement Policy for Bank Group Funded Operations”, dated October 2015 and following
the provisions stated in the Financing Agreement. Specifically, procurement would be carried out
following Bank Procurement Methods and Procedures, using the relevant Bank Standard or Model
Solicitation Documents, for all contracts since the Borrower Procurement System under the Public
Procurement and Asset Disposal Act of 2015 shall not relied upon for any category of procurement
under the program. Third Party Procurement Methods and Procedures shall not be used.
4.1.8 The assessment of procurement risks at the country, sector, and program levels and of
procurement capacity at the executing agency, were undertaken for the program and are detailed
in the technical annexes B.5, the output of which have informed the decisions on the procurement
regimes being used under the program. The appropriate mitigation measures and costs have been
included in the procurement capacity development action plan under the program.
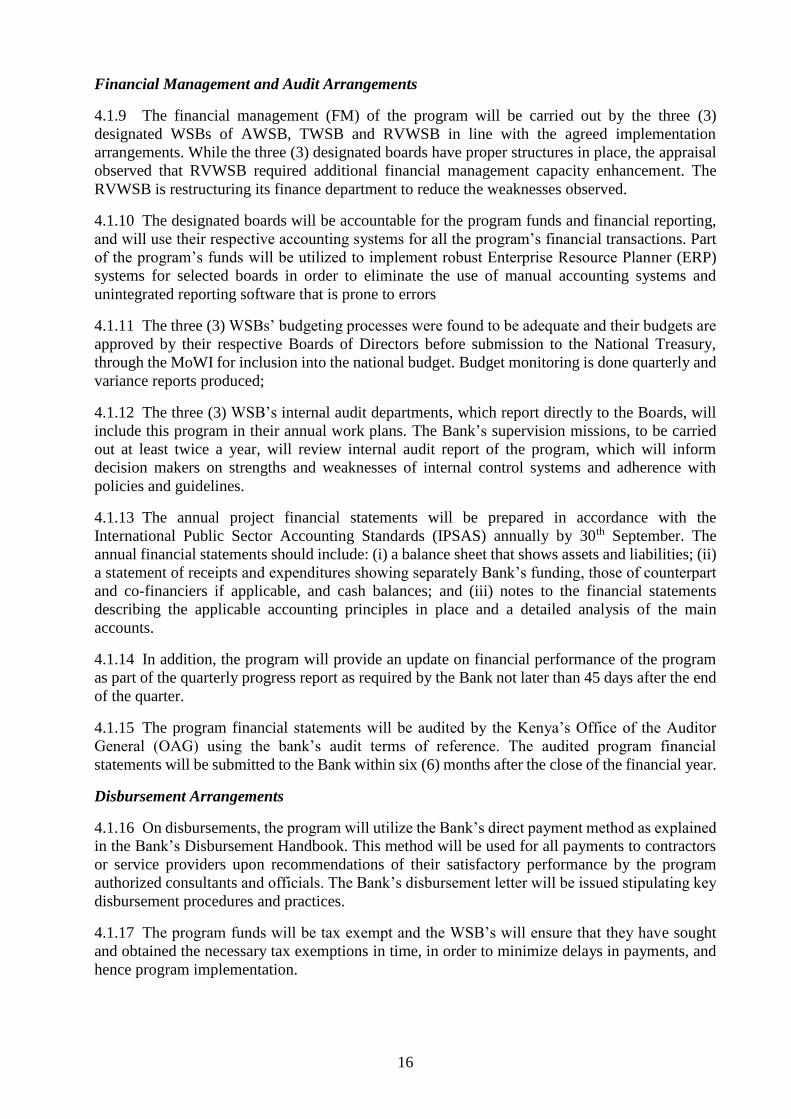
16
Financial Management and Audit Arrangements
4.1.9 The financial management (FM) of the program will be carried out by the three (3)
designated WSBs of AWSB, TWSB and RVWSB in line with the agreed implementation
arrangements. While the three (3) designated boards have proper structures in place, the appraisal
observed that RVWSB required additional financial management capacity enhancement. The
RVWSB is restructuring its finance department to reduce the weaknesses observed.
4.1.10 The designated boards will be accountable for the program funds and financial reporting,
and will use their respective accounting systems for all the program’s financial transactions. Part
of the program’s funds will be utilized to implement robust Enterprise Resource Planner (ERP)
systems for selected boards in order to eliminate the use of manual accounting systems and
unintegrated reporting software that is prone to errors
4.1.11 The three (3) WSBs’ budgeting processes were found to be adequate and their budgets are
approved by their respective Boards of Directors before submission to the National Treasury,
through the MoWI for inclusion into the national budget. Budget monitoring is done quarterly and
variance reports produced;
4.1.12 The three (3) WSB’s internal audit departments, which report directly to the Boards, will
include this program in their annual work plans. The Bank’s supervision missions, to be carried
out at least twice a year, will review internal audit report of the program, which will inform
decision makers on strengths and weaknesses of internal control systems and adherence with
policies and guidelines.
4.1.13 The annual project financial statements will be prepared in accordance with the
International Public Sector Accounting Standards (IPSAS) annually by 30th September. The
annual financial statements should include: (i) a balance sheet that shows assets and liabilities; (ii)
a statement of receipts and expenditures showing separately Bank’s funding, those of counterpart
and co-financiers if applicable, and cash balances; and (iii) notes to the financial statements
describing the applicable accounting principles in place and a detailed analysis of the main
accounts.
4.1.14 In addition, the program will provide an update on financial performance of the program
as part of the quarterly progress report as required by the Bank not later than 45 days after the end
of the quarter.
4.1.15 The program financial statements will be audited by the Kenya’s Office of the Auditor
General (OAG) using the bank’s audit terms of reference. The audited program financial
statements will be submitted to the Bank within six (6) months after the close of the financial year.
Disbursement Arrangements
4.1.16 On disbursements, the program will utilize the Bank’s direct payment method as explained
in the Bank’s Disbursement Handbook. This method will be used for all payments to contractors
or service providers upon recommendations of their satisfactory performance by the program
authorized consultants and officials. The Bank’s disbursement letter will be issued stipulating key
disbursement procedures and practices.
4.1.17 The program funds will be tax exempt and the WSB’s will ensure that they have sought
and obtained the necessary tax exemptions in time, in order to minimize delays in payments, and
hence program implementation.
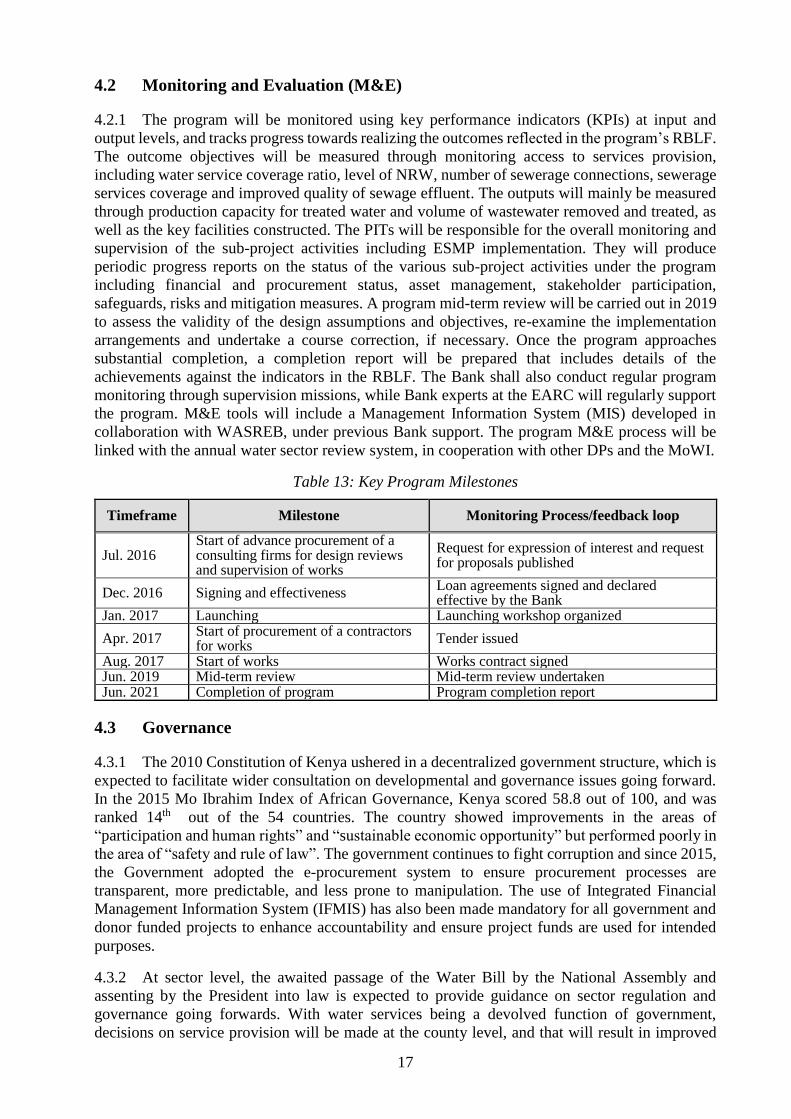
17
4.2 Monitoring and Evaluation (M&E)
4.2.1 The program will be monitored using key performance indicators (KPIs) at input and
output levels, and tracks progress towards realizing the outcomes reflected in the program’s RBLF.
The outcome objectives will be measured through monitoring access to services provision,
including water service coverage ratio, level of NRW, number of sewerage connections, sewerage
services coverage and improved quality of sewage effluent. The outputs will mainly be measured
through production capacity for treated water and volume of wastewater removed and treated, as
well as the key facilities constructed. The PITs will be responsible for the overall monitoring and
supervision of the sub-project activities including ESMP implementation. They will produce
periodic progress reports on the status of the various sub-project activities under the program
including financial and procurement status, asset management, stakeholder participation,
safeguards, risks and mitigation measures. A program mid-term review will be carried out in 2019
to assess the validity of the design assumptions and objectives, re-examine the implementation
arrangements and undertake a course correction, if necessary. Once the program approaches
substantial completion, a completion report will be prepared that includes details of the
achievements against the indicators in the RBLF. The Bank shall also conduct regular program
monitoring through supervision missions, while Bank experts at the EARC will regularly support
the program. M&E tools will include a Management Information System (MIS) developed in
collaboration with WASREB, under previous Bank support. The program M&E process will be
linked with the annual water sector review system, in cooperation with other DPs and the MoWI.
Table 13: Key Program Milestones
Timeframe Milestone Monitoring Process/feedback loop
Jul. 2016 Start of advance procurement of a consulting firms for design reviews and supervision of works
Request for expression of interest and request for proposals published
Dec. 2016 Signing and effectiveness Loan agreements signed and declared effective by the Bank
Jan. 2017 Launching Launching workshop organized
Apr. 2017 Start of procurement of a contractors for works
Tender issued
Aug. 2017 Start of works Works contract signed Jun. 2019 Mid-term review Mid-term review undertaken Jun. 2021 Completion of program Program completion report
4.3 Governance
4.3.1 The 2010 Constitution of Kenya ushered in a decentralized government structure, which is
expected to facilitate wider consultation on developmental and governance issues going forward.
In the 2015 Mo Ibrahim Index of African Governance, Kenya scored 58.8 out of 100, and was
ranked 14th out of the 54 countries. The country showed improvements in the areas of
“participation and human rights” and “sustainable economic opportunity” but performed poorly in
the area of “safety and rule of law”. The government continues to fight corruption and since 2015,
the Government adopted the e-procurement system to ensure procurement processes are
transparent, more predictable, and less prone to manipulation. The use of Integrated Financial
Management Information System (IFMIS) has also been made mandatory for all government and
donor funded projects to enhance accountability and ensure project funds are used for intended
purposes.
4.3.2 At sector level, the awaited passage of the Water Bill by the National Assembly and
assenting by the President into law is expected to provide guidance on sector regulation and
governance going forwards. With water services being a devolved function of government,
decisions on service provision will be made at the county level, and that will result in improved

18
service delivery and increased participation of beneficiaries in decision making. The role of
WASREB in the regulation of the sector, provides check and balances on sector players, brings
uniformity and ensures the protection of consumers through ensuring the levying of fair tariffs for
fair services. Existing pro-poor mechanisms in tariff setting will continue to ensure that the poor
and vulnerable members of society will also enjoy water supply, which is enshrined in the Kenyan
Constitution as a human right.
4.3.3 The program will adopt all current and future governance and anti-corruption policies and
guidelines of the country. The proposed support to WASREB, and the technical and financial
audits embedded in the program will also ensure that funds are used for intended purposes, and
with due regard to economy and efficiency. Other measures shall include the Bank’s prior review
and clearance of most project procurement activities, and continuous program supervisions to
follow up closely on implementation progress on site.
4.4 Sustainability
4.4.1 While the program will be implemented by the WSBs, and in line with the institutional
framework and systems in existence in Kenya, operation and maintenance of the infrastructure is
the responsibility of the WSPs (water companies) that fall under the control and responsibility of
the county governments. For financial and operational sustainability of the WSPs, the program
will support the WSPs to build their capacities through training and provision of equipment to
support credit control, billing and collection systems, reduction in and management of NRW, asset
management and good governance. Reduction in NRW and efficiency improvements in water and
sewerage systems will result in improvements in the financial health of the WSPs, enabling them
to reinvest in improvements, increasing connections and staff retention. Furthermore, the
WASREB has in place tariff setting guidelines, which ensure the setting of fair tariffs that also
provide for pro-poor mechanisms.
4.4.2 Under the environmental safeguards, issues of catchment protection will be entrenched in
the program in line with integrated water resource management (IWRM) principles to ensure
catchment and water towers protection, the protection of water sources and mainstreaming
resilience to climate variability and change. In this respect, this program will support the WRMA
to fulfil its mandate to effectively regulate and manage water resources in collaboration with
stakeholders for sustainable development.
4.4.3 Furthermore, the regulation of the sector is of paramount importance to sustainability, and
support to the WASREB has been included in the program. The WASREB’s mandate is to oversee
the implementation of policies and strategies relating to provision of water and sewerage services.
This includes, but is not limited to: issuance of licenses for the provision of water services;
development of guidelines for fixing of tariffs for provision of water services; monitor compliance
with established standards for the design, construction, operation and maintenance of facilities for
water services, preparation of water safety plans among others. The setting of affordable and cost
recovery tariffs is at the heart of the sustainability of WSPs and the sector. This program will
support the WASREB in some of their activities in order to build and enhance their capacity to
regulate the sector.

19
4.5 Risk Management
4.5.1 Table 14 presents the main risks and mitigation measures.
Table 14: Risks and Mitigation Measures
Risk Probability/
Impact Mitigation measures
The potential conflict between counties and water works development agencies
Low probability/ high impact
Counties including WSPs have been involved from the conceptual stage of each sub-project and are supportive of the implementation arrangement. In addition, currently there is no framework in place for counties to borrow to finance infrastructure of the scale under the program. The Bank and WSBs will ensure that counties and WSPs are involved in the program implementation and appropriate capacity development support will be provided under the program for the smooth hand over of assets. In addition, the passage of the Water Bill 2016 into law will further give clarity to demarcation of responsibilities among sector players.
Delays caused due to the resettlements and compensation not being handled timely or properly
Medium probability/ high impact
The risk is mitigated by the fact that negotiations have already started involving county governments. Moreover, awareness exercises directed at the identified PAPs of the sub-projects and sensitization are ongoing as part of the RAP preparation process.
Reduced water resources due to climate change
Medium probability/ high impact
The program will include climate change adaptation support which entails local level climate change impact assessments and preparation of plans, and capacity building for the implementation of plans. Potential support include development of management procedure for WSPs to cope with drought situation and riverbank and catchment protection.
Delays caused by insufficient capacity of the implementation teams
Low probability/ medium impact
Implementation teams were clustered led by the three (3) best performing WSBs. The PIT members have working experience with DPs, most being conversant in the Bank procedures. The Bank will maintain close interaction with the PIT through the EARC and half yearly field supervision missions to provide timely support whenever necessary.
4.6 Knowledge Building
4.6.1 The program will generate critical knowledge for the performance of the water and
sanitation sector in the country, which will build up lessons for the design and management of
similar interventions, to be adapted for replication throughout the country as well as in other
RMCs. The study on impact of water supply and sanitation services on job creation will analyze
the potential of the water and sanitation sector in unlocking sustainable economic growth and in
creating opportunities for the people. Studies for future investments will build on global best
practices and success cases in the country and ensure climate change, gender and any other cross-
cutting issues are mainstreamed.
4.6.2 The IPR, quarterly progress reports, audit, and completion reports will also provide
information on various aspects of the program for further diagnosis. Given that program covers
wide geographic areas and a large number of towns, there is potential to generate useful lessons.
In line with Knowledge Management Strategy 2015-2020, the knowledge obtained will be
captured, documented and shared within the Bank and with other DPs and RMCs.
V – LEGAL INSTRUMENTS AND AUTHORITY
5.1 Legal Instrument
5.1.1 The program will be financed by and ADB Loan, ADF Loan and Grant and MIC-TAF
Grant.
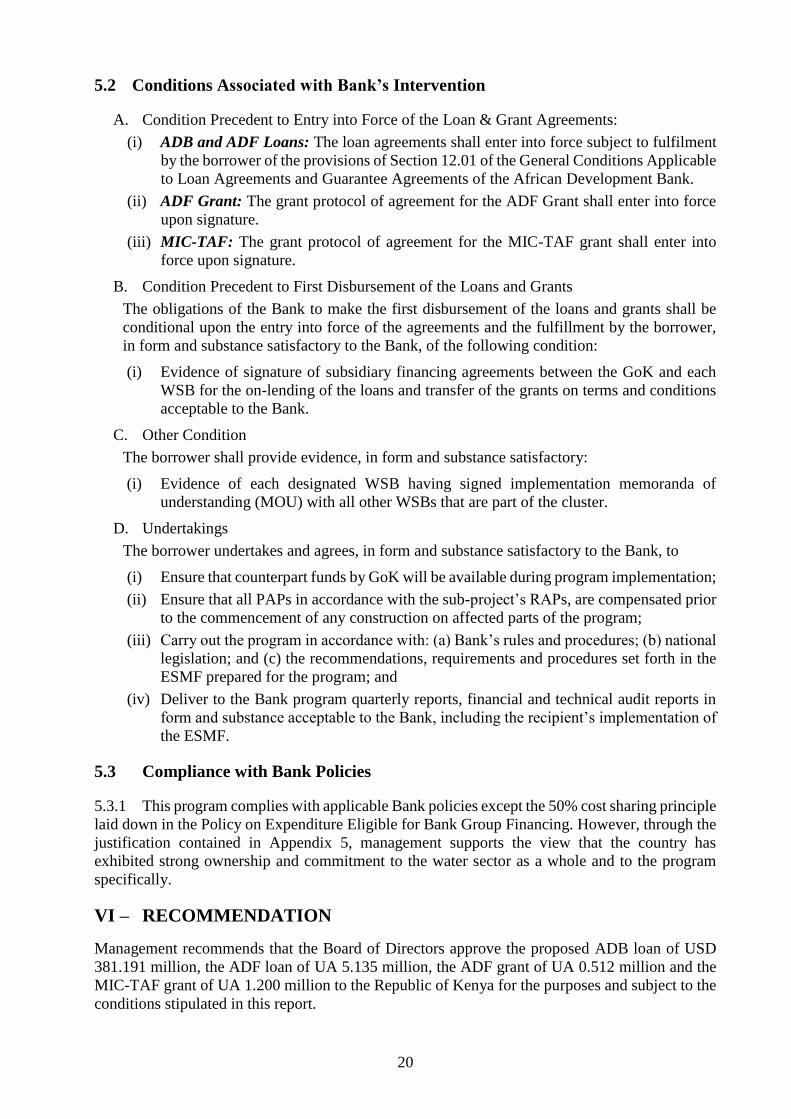
20
5.2 Conditions Associated with Bank’s Intervention
A. Condition Precedent to Entry into Force of the Loan & Grant Agreements:
(i) ADB and ADF Loans: The loan agreements shall enter into force subject to fulfilment
by the borrower of the provisions of Section 12.01 of the General Conditions Applicable
to Loan Agreements and Guarantee Agreements of the African Development Bank.
(ii) ADF Grant: The grant protocol of agreement for the ADF Grant shall enter into force
upon signature.
(iii) MIC-TAF: The grant protocol of agreement for the MIC-TAF grant shall enter into
force upon signature.
B. Condition Precedent to First Disbursement of the Loans and Grants
The obligations of the Bank to make the first disbursement of the loans and grants shall be
conditional upon the entry into force of the agreements and the fulfillment by the borrower,
in form and substance satisfactory to the Bank, of the following condition:
(i) Evidence of signature of subsidiary financing agreements between the GoK and each
WSB for the on-lending of the loans and transfer of the grants on terms and conditions
acceptable to the Bank.
C. Other Condition
The borrower shall provide evidence, in form and substance satisfactory:
(i) Evidence of each designated WSB having signed implementation memoranda of
understanding (MOU) with all other WSBs that are part of the cluster.
D. Undertakings
The borrower undertakes and agrees, in form and substance satisfactory to the Bank, to
(i) Ensure that counterpart funds by GoK will be available during program implementation;
(ii) Ensure that all PAPs in accordance with the sub-project’s RAPs, are compensated prior
to the commencement of any construction on affected parts of the program;
(iii) Carry out the program in accordance with: (a) Bank’s rules and procedures; (b) national
legislation; and (c) the recommendations, requirements and procedures set forth in the
ESMF prepared for the program; and
(iv) Deliver to the Bank program quarterly reports, financial and technical audit reports in
form and substance acceptable to the Bank, including the recipient’s implementation of
the ESMF.
5.3 Compliance with Bank Policies
5.3.1 This program complies with applicable Bank policies except the 50% cost sharing principle
laid down in the Policy on Expenditure Eligible for Bank Group Financing. However, through the
justification contained in Appendix 5, management supports the view that the country has
exhibited strong ownership and commitment to the water sector as a whole and to the program
specifically.
VI – RECOMMENDATION
Management recommends that the Board of Directors approve the proposed ADB loan of USD
381.191 million, the ADF loan of UA 5.135 million, the ADF grant of UA 0.512 million and the
MIC-TAF grant of UA 1.200 million to the Republic of Kenya for the purposes and subject to the
conditions stipulated in this report.

I
APPENDICES
Appendix 1: Kenya’s Comparative Socio-Economic Indicators
Year Kenya Africa
Develo-
ping
Countries
Develo-
ped
Countries
Basic Indicators
Area ( '000 Km²) 2014 580 30,067 80,386 53,939Total Population (millions) 2014 45.5 1,136.9 6.0 1.3Urban Population (% of Total) 2014 25.2 39.9 47.6 78.7Population Density (per Km²) 2014 78.5 37.8 73.3 24.3GNI per Capita (US $) 2013 1 160 2 310 4 168 39 812Labor Force Participation - Total (%) 2014 67.4 66.1 67.7 72.3Labor Force Participation - Female (%) 2014 46.7 42.8 52.9 65.1Gender -Related Dev elopment Index Value 2007-2013 0.908 0.801 0.506 0.792Human Dev elop. Index (Rank among 187 countries) 2013 147 ... ... ...Popul. Liv ing Below $ 1.25 a Day (% of Population)2008-2013 43.4 39.6 17.0 ...
Demographic Indicators
Population Grow th Rate - Total (%) 2014 2.7 2.5 1.3 0.4Population Grow th Rate - Urban (%) 2014 4.3 3.4 2.5 0.7Population < 15 y ears (%) 2014 42.0 40.8 28.2 17.0Population >= 65 y ears (%) 2014 2.7 3.5 6.3 16.3Dependency Ratio (%) 2014 82.1 62.4 54.3 50.4Sex Ratio (per 100 female) 2014 99.5 100.4 107.7 105.4Female Population 15-49 y ears (% of total population) 2014 24.3 24.0 26.0 23.0Life Ex pectancy at Birth - Total (y ears) 2014 62.2 59.6 69.2 79.3Life Ex pectancy at Birth - Female (y ears) 2014 64.2 60.7 71.2 82.3Crude Birth Rate (per 1,000) 2014 34.3 34.4 20.9 11.4Crude Death Rate (per 1,000) 2014 8.0 10.2 7.7 9.2Infant Mortality Rate (per 1,000) 2013 47.5 56.7 36.8 5.1Child Mortality Rate (per 1,000) 2013 70.7 84.0 50.2 6.1Total Fertility Rate (per w oman) 2014 4.3 4.6 2.6 1.7Maternal Mortality Rate (per 100,000) 2013 400.0 411.5 230.0 17.0Women Using Contraception (%) 2014 51.3 34.9 62.0 ...
Health & Nutrition Indicators
Phy sicians (per 100,000 people) 2004-2012 18.1 46.9 118.1 308.0Nurses (per 100,000 people)* 2004-2012 79.2 133.4 202.9 857.4Births attended by Trained Health Personnel (%) 2009-2012 43.8 50.6 67.7 ...Access to Safe Water (% of Population) 2012 61.7 67.2 87.2 99.2Healthy life ex pectancy at birth (y ears) 2012 53.0 51.3 57 69Access to Sanitation (% of Population) 2012 29.6 38.8 56.9 96.2Percent. of Adults (aged 15-49) Liv ing w ith HIV/AIDS 2013 6.0 3.7 1.2 ...Incidence of Tuberculosis (per 100,000) 2013 268.0 246.0 149.0 22.0Child Immunization Against Tuberculosis (%) 2013 79.0 84.3 90.0 ...Child Immunization Against Measles (%) 2013 93.0 76.0 82.7 93.9Underw eight Children (% of children under 5 y ears) 2005-2013 16.4 20.9 17.0 0.9Daily Calorie Supply per Capita 2011 2 189 2 618 2 335 3 503Public Ex penditure on Health (as % of GDP) 2013 1.9 2.7 3.1 7.3
Education Indicators
Gross Enrolment Ratio (%)
Primary School - Total 2011-2014 114.4 106.3 109.4 101.3 Primary School - Female 2011-2014 114.6 102.6 107.6 101.1 Secondary School - Total 2011-2014 67.0 54.3 69.0 100.2 Secondary School - Female 2011-2014 64.5 51.4 67.7 99.9Primary School Female Teaching Staff (% of Total) 2012-2014 48.1 45.1 58.1 81.6Adult literacy Rate - Total (%) 2006-2012 72.2 61.9 80.4 99.2Adult literacy Rate - Male (%) 2006-2012 78.1 70.2 85.9 99.3Adult literacy Rate - Female (%) 2006-2012 66.9 53.5 75.2 99.0Percentage of GDP Spent on Education 2009-2012 6.6 5.3 4.3 5.5
Environmental Indicators
Land Use (Arable Land as % of Total Land Area) 2012 9.8 8.8 11.8 9.2Agricultural Land (as % of land area) 2012 0.5 43.4 43.4 28.9Forest (As % of Land Area) 2012 6.1 22.1 28.3 34.9Per Capita CO2 Emissions (metric tons) 2012 0.3 1.1 3.0 11.6
Sources : AfDB Statistics Department Databases; World Bank: World Development Indicators; last update :
UNAIDS; UNSD; WHO, UNICEF, UNDP; Country Reports.
Note : n.a. : Not Applicable ; … : Data Not Available.
KenyaCOMPARATIVE SOCIO-ECONOMIC INDICATORS
June 2016
0
10
20
30
40
50
60
70
80
90
100
20
00
20
05
20
08
20
09
20
10
20
11
20
12
20
13
Infant Mortality Rate( Per 1000 )
Kenya Africa
0
500
1000
1500
2000
2500
20
00
20
05
20
07
20
08
20
09
20
10
20
11
20
12
20
13
GNI Per Capita US $
Kenya Africa
0.0
0.5
1.0
1.5
2.0
2.5
3.0
20
00
20
05
20
08
20
09
20
10
20
11
20
12
20
13
20
14
Population Growth Rate (%)
Kenya Africa
01020304050607080
20
00
20
05
20
08
20
09
20
10
20
11
20
12
20
13
20
14
Life Expectancy at Birth (years)
Kenya Africa
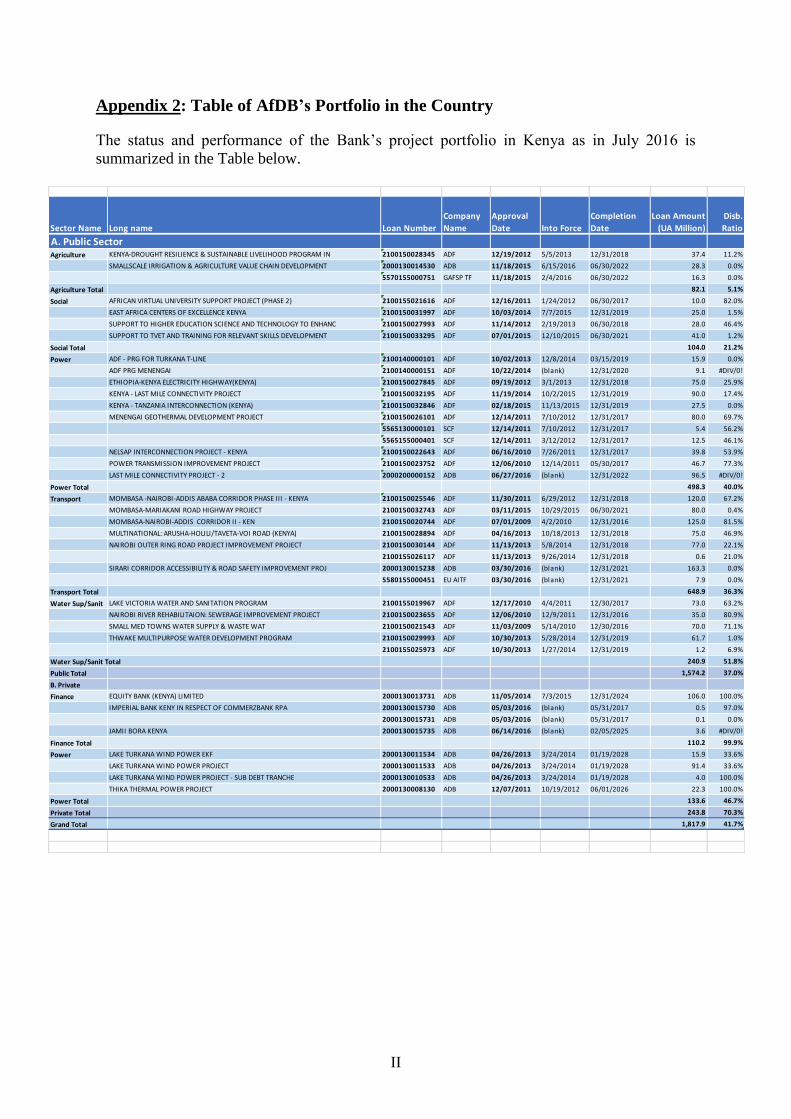
II
Appendix 2: Table of AfDB’s Portfolio in the Country
The status and performance of the Bank’s project portfolio in Kenya as in July 2016 is
summarized in the Table below.
Sector Name Long name Loan Number
Company
Name
Approval
Date Into Force
Completion
Date
Loan Amount
(UA Million)
Disb.
Ratio
A. Public SectorAgriculture KENYA-DROUGHT RESILIENCE & SUSTAINABLE LIVELIHOOD PROGRAM IN 2100150028345 ADF 12/19/2012 5/5/2013 12/31/2018 37.4 11.2%
SMALLSCALE IRRIGATION & AGRICULTURE VALUE CHAIN DEVELOPMENT 2000130014530 ADB 11/18/2015 6/15/2016 06/30/2022 28.3 0.0%
5570155000751 GAFSP TF 11/18/2015 2/4/2016 06/30/2022 16.3 0.0%
Agriculture Total 82.1 5.1%
Social AFRICAN VIRTUAL UNIVERSITY SUPPORT PROJECT (PHASE 2) 2100155021616 ADF 12/16/2011 1/24/2012 06/30/2017 10.0 82.0%
EAST AFRICA CENTERS OF EXCELLENCE KENYA 2100150031997 ADF 10/03/2014 7/7/2015 12/31/2019 25.0 1.5%
SUPPORT TO HIGHER EDUCATION SCIENCE AND TECHNOLOGY TO ENHANC 2100150027993 ADF 11/14/2012 2/19/2013 06/30/2018 28.0 46.4%
SUPPORT TO TVET AND TRAINING FOR RELEVANT SKILLS DEVELOPMENT 2100150033295 ADF 07/01/2015 12/10/2015 06/30/2021 41.0 1.2%
Social Total 104.0 21.2%
Power ADF - PRG FOR TURKANA T-LINE 2100140000101 ADF 10/02/2013 12/8/2014 03/15/2019 15.9 0.0%
ADF PRG MENENGAI 2100140000151 ADF 10/22/2014 (blank) 12/31/2020 9.1 #DIV/0!
ETHIOPIA-KENYA ELECTRICITY HIGHWAY(KENYA) 2100150027845 ADF 09/19/2012 3/1/2013 12/31/2018 75.0 25.9%
KENYA - LAST MILE CONNECTIVITY PROJECT 2100150032195 ADF 11/19/2014 10/2/2015 12/31/2019 90.0 17.4%
KENYA - TANZANIA INTERCONNECTION (KENYA) 2100150032846 ADF 02/18/2015 11/13/2015 12/31/2019 27.5 0.0%
MENENGAI GEOTHERMAL DEVELOPMENT PROJECT 2100150026101 ADF 12/14/2011 7/10/2012 12/31/2017 80.0 69.7%
5565130000101 SCF 12/14/2011 7/10/2012 12/31/2017 5.4 56.2%
5565155000401 SCF 12/14/2011 3/12/2012 12/31/2017 12.5 46.1%
NELSAP INTERCONNECTION PROJECT - KENYA 2100150022643 ADF 06/16/2010 7/26/2011 12/31/2017 39.8 53.9%
POWER TRANSMISSION IMPROVEMENT PROJECT 2100150023752 ADF 12/06/2010 12/14/2011 05/30/2017 46.7 77.3%
LAST MILE CONNECTIVITY PROJECT - 2 2000200000152 ADB 06/27/2016 (blank) 12/31/2022 96.5 #DIV/0!
Power Total 498.3 40.0%
Transport MOMBASA -NAIROBI-ADDIS ABABA CORRIDOR PHASE III - KENYA 2100150025546 ADF 11/30/2011 6/29/2012 12/31/2018 120.0 67.2%
MOMBASA-MARIAKANI ROAD HIGHWAY PROJECT 2100150032743 ADF 03/11/2015 10/29/2015 06/30/2021 80.0 0.4%
MOMBASA-NAIROBI-ADDIS CORRIDOR II - KEN 2100150020744 ADF 07/01/2009 4/2/2010 12/31/2016 125.0 81.5%
MULTINATIONAL: ARUSHA-HOLILI/TAVETA-VOI ROAD (KENYA) 2100150028894 ADF 04/16/2013 10/18/2013 12/31/2018 75.0 46.9%
NAIROBI OUTER RING ROAD PROJECT IMPROVEMENT PROJECT 2100150030144 ADF 11/13/2013 5/8/2014 12/31/2018 77.0 22.1%
2100155026117 ADF 11/13/2013 9/26/2014 12/31/2018 0.6 21.0%
SIRARI CORRIDOR ACCESSIBILITY & ROAD SAFETY IMPROVEMENT PROJ 2000130015238 ADB 03/30/2016 (blank) 12/31/2021 163.3 0.0%
5580155000451 EU AITF 03/30/2016 (blank) 12/31/2021 7.9 0.0%
Transport Total 648.9 36.3%
Water Sup/Sanit LAKE VICTORIA WATER AND SANITATION PROGRAM 2100155019967 ADF 12/17/2010 4/4/2011 12/30/2017 73.0 63.2%
NAIROBI RIVER REHABILITAION: SEWERAGE IMPROVEMENT PROJECT 2100150023655 ADF 12/06/2010 12/9/2011 12/31/2016 35.0 80.9%
SMALL MED TOWNS WATER SUPPLY & WASTE WAT 2100150021543 ADF 11/03/2009 5/14/2010 12/30/2016 70.0 71.1%
THWAKE MULTIPURPOSE WATER DEVELOPMENT PROGRAM 2100150029993 ADF 10/30/2013 5/28/2014 12/31/2019 61.7 1.0%
2100155025973 ADF 10/30/2013 1/27/2014 12/31/2019 1.2 6.9%
Water Sup/Sanit Total 240.9 51.8%
Public Total 1,574.2 37.0%
B. Private
Finance EQUITY BANK (KENYA) LIMITED 2000130013731 ADB 11/05/2014 7/3/2015 12/31/2024 106.0 100.0%
IMPERIAL BANK KENY IN RESPECT OF COMMERZBANK RPA 2000130015730 ADB 05/03/2016 (blank) 05/31/2017 0.5 97.0%
2000130015731 ADB 05/03/2016 (blank) 05/31/2017 0.1 0.0%
JAMII BORA KENYA 2000130015735 ADB 06/14/2016 (blank) 02/05/2025 3.6 #DIV/0!
Finance Total 110.2 99.9%
Power LAKE TURKANA WIND POWER EKF 2000130011534 ADB 04/26/2013 3/24/2014 01/19/2028 15.9 33.6%
LAKE TURKANA WIND POWER PROJECT 2000130011533 ADB 04/26/2013 3/24/2014 01/19/2028 91.4 33.6%
LAKE TURKANA WIND POWER PROJECT - SUB DEBT TRANCHE 2000130010533 ADB 04/26/2013 3/24/2014 01/19/2028 4.0 100.0%
THIKA THERMAL POWER PROJECT 2000130008130 ADB 12/07/2011 10/19/2012 06/01/2026 22.3 100.0%
Power Total 133.6 46.7%
Private Total 243.8 70.3%
Grand Total 1,817.9 41.7%
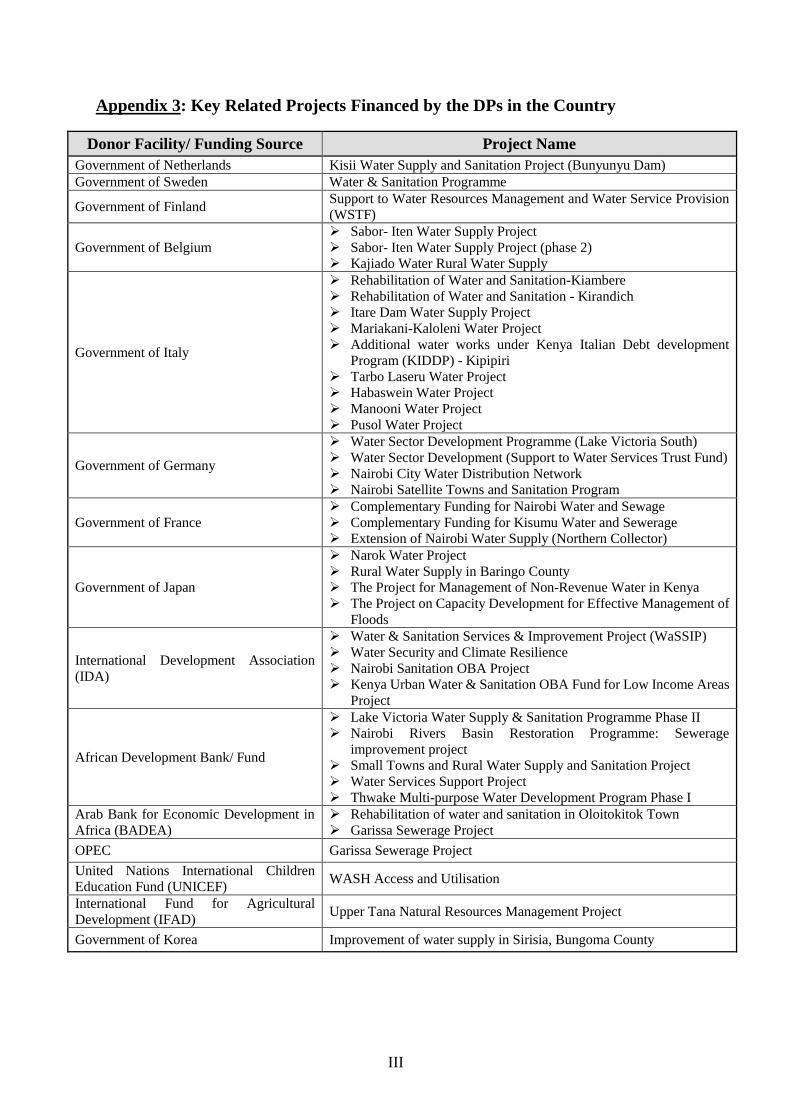
III
Appendix 3: Key Related Projects Financed by the DPs in the Country
Donor Facility/ Funding Source Project Name
Government of Netherlands Kisii Water Supply and Sanitation Project (Bunyunyu Dam)
Government of Sweden Water & Sanitation Programme
Government of Finland Support to Water Resources Management and Water Service Provision
(WSTF)
Government of Belgium
Sabor- Iten Water Supply Project
Sabor- Iten Water Supply Project (phase 2)
Kajiado Water Rural Water Supply
Government of Italy
Rehabilitation of Water and Sanitation-Kiambere
Rehabilitation of Water and Sanitation - Kirandich
Itare Dam Water Supply Project
Mariakani-Kaloleni Water Project
Additional water works under Kenya Italian Debt development
Program (KIDDP) - Kipipiri
Tarbo Laseru Water Project
Habaswein Water Project
Manooni Water Project
Pusol Water Project
Government of Germany
Water Sector Development Programme (Lake Victoria South)
Water Sector Development (Support to Water Services Trust Fund)
Nairobi City Water Distribution Network
Nairobi Satellite Towns and Sanitation Program
Government of France
Complementary Funding for Nairobi Water and Sewage
Complementary Funding for Kisumu Water and Sewerage
Extension of Nairobi Water Supply (Northern Collector)
Government of Japan
Narok Water Project
Rural Water Supply in Baringo County
The Project for Management of Non-Revenue Water in Kenya
The Project on Capacity Development for Effective Management of
Floods
International Development Association
(IDA)
Water & Sanitation Services & Improvement Project (WaSSIP)
Water Security and Climate Resilience
Nairobi Sanitation OBA Project
Kenya Urban Water & Sanitation OBA Fund for Low Income Areas
Project
African Development Bank/ Fund
Lake Victoria Water Supply & Sanitation Programme Phase II
Nairobi Rivers Basin Restoration Programme: Sewerage
improvement project
Small Towns and Rural Water Supply and Sanitation Project
Water Services Support Project
Thwake Multi-purpose Water Development Program Phase I
Arab Bank for Economic Development in
Africa (BADEA)
Rehabilitation of water and sanitation in Oloitokitok Town
Garissa Sewerage Project
OPEC Garissa Sewerage Project
United Nations International Children
Education Fund (UNICEF) WASH Access and Utilisation
International Fund for Agricultural
Development (IFAD) Upper Tana Natural Resources Management Project
Government of Korea Improvement of water supply in Sirisia, Bungoma County

IV
Appendix 4: Map of Kenya and Target Towns
Source of map: http://www.mapsofworld.com/kenya/
: Towns covered by ongoing Small Towns and Rural Water Supply and Sanitation Project
: Propose towns under the proposed program
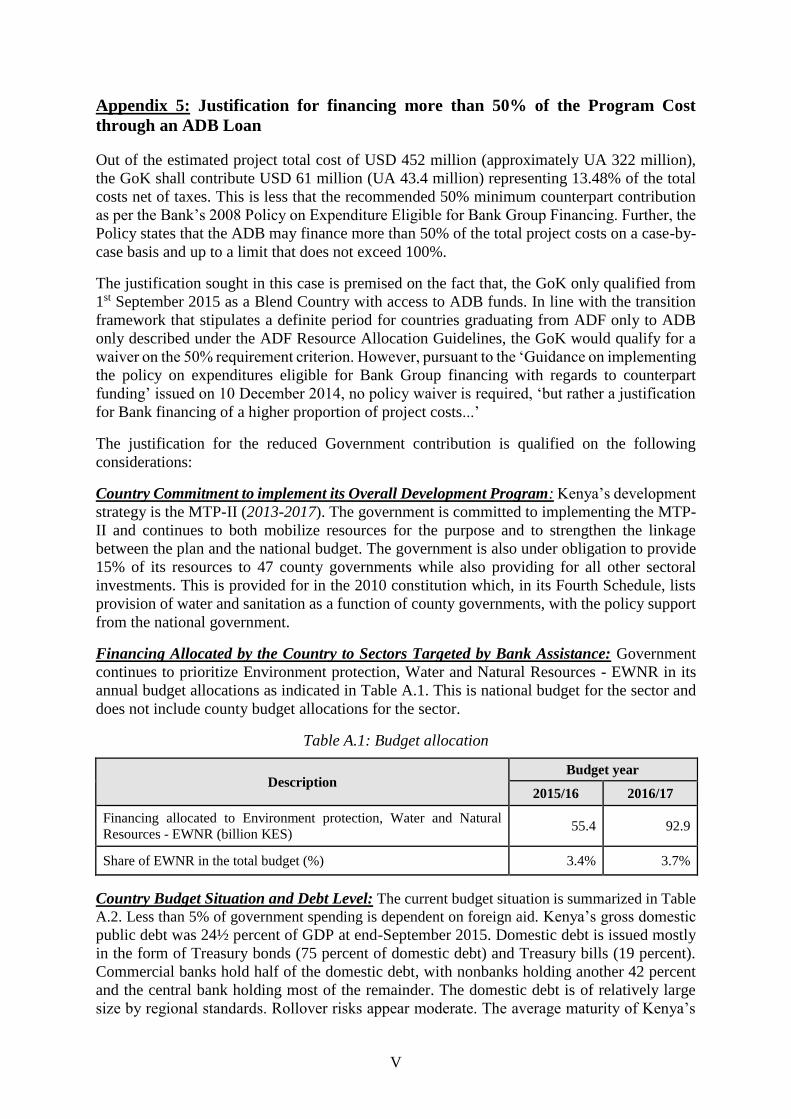
V
Appendix 5: Justification for financing more than 50% of the Program Cost
through an ADB Loan
Out of the estimated project total cost of USD 452 million (approximately UA 322 million),
the GoK shall contribute USD 61 million (UA 43.4 million) representing 13.48% of the total
costs net of taxes. This is less that the recommended 50% minimum counterpart contribution
as per the Bank’s 2008 Policy on Expenditure Eligible for Bank Group Financing. Further, the
Policy states that the ADB may finance more than 50% of the total project costs on a case-by-
case basis and up to a limit that does not exceed 100%.
The justification sought in this case is premised on the fact that, the GoK only qualified from
1st September 2015 as a Blend Country with access to ADB funds. In line with the transition
framework that stipulates a definite period for countries graduating from ADF only to ADB
only described under the ADF Resource Allocation Guidelines, the GoK would qualify for a
waiver on the 50% requirement criterion. However, pursuant to the ‘Guidance on implementing
the policy on expenditures eligible for Bank Group financing with regards to counterpart
funding’ issued on 10 December 2014, no policy waiver is required, ‘but rather a justification
for Bank financing of a higher proportion of project costs...’
The justification for the reduced Government contribution is qualified on the following
considerations:
Country Commitment to implement its Overall Development Program: Kenya’s development
strategy is the MTP-II (2013-2017). The government is committed to implementing the MTP-
II and continues to both mobilize resources for the purpose and to strengthen the linkage
between the plan and the national budget. The government is also under obligation to provide
15% of its resources to 47 county governments while also providing for all other sectoral
investments. This is provided for in the 2010 constitution which, in its Fourth Schedule, lists
provision of water and sanitation as a function of county governments, with the policy support
from the national government.
Financing Allocated by the Country to Sectors Targeted by Bank Assistance: Government
continues to prioritize Environment protection, Water and Natural Resources - EWNR in its
annual budget allocations as indicated in Table A.1. This is national budget for the sector and
does not include county budget allocations for the sector.
Table A.1: Budget allocation
Description Budget year
2015/16 2016/17
Financing allocated to Environment protection, Water and Natural
Resources - EWNR (billion KES) 55.4 92.9
Share of EWNR in the total budget (%) 3.4% 3.7%
Country Budget Situation and Debt Level: The current budget situation is summarized in Table
A.2. Less than 5% of government spending is dependent on foreign aid. Kenya’s gross domestic
public debt was 24½ percent of GDP at end-September 2015. Domestic debt is issued mostly
in the form of Treasury bonds (75 percent of domestic debt) and Treasury bills (19 percent).
Commercial banks hold half of the domestic debt, with nonbanks holding another 42 percent
and the central bank holding most of the remainder. The domestic debt is of relatively large
size by regional standards. Rollover risks appear moderate. The average maturity of Kenya’s
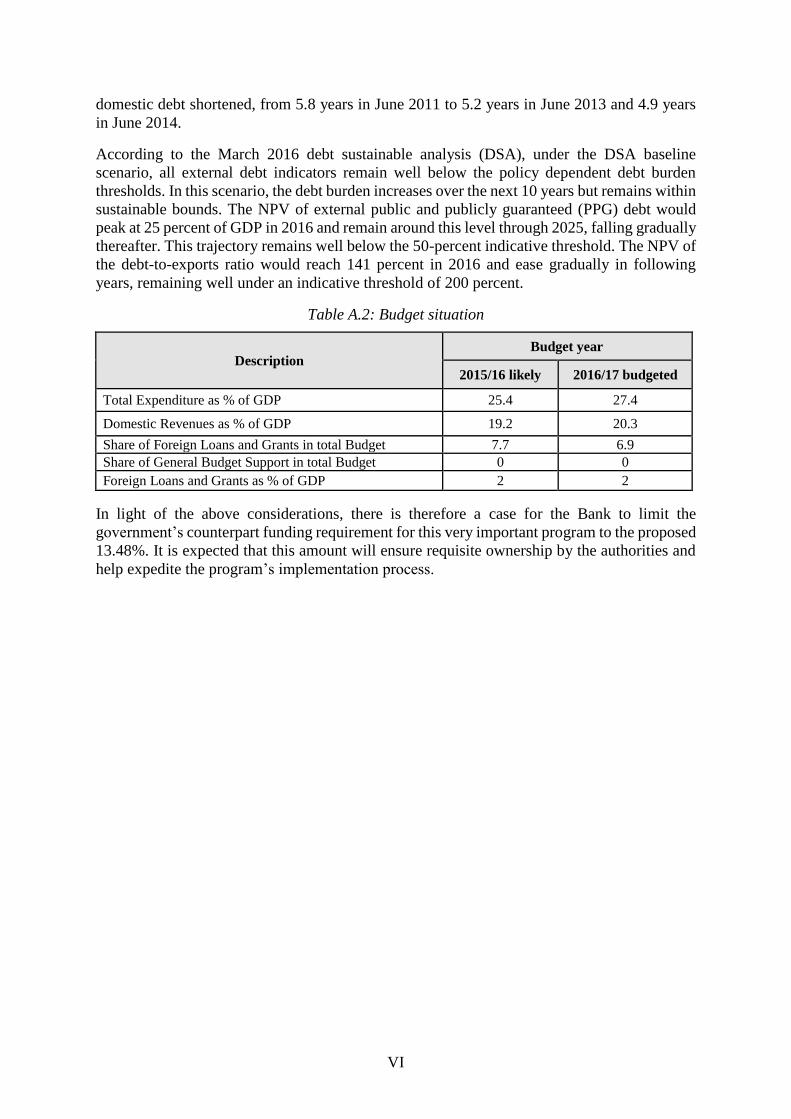
VI
domestic debt shortened, from 5.8 years in June 2011 to 5.2 years in June 2013 and 4.9 years
in June 2014.
According to the March 2016 debt sustainable analysis (DSA), under the DSA baseline
scenario, all external debt indicators remain well below the policy dependent debt burden
thresholds. In this scenario, the debt burden increases over the next 10 years but remains within
sustainable bounds. The NPV of external public and publicly guaranteed (PPG) debt would
peak at 25 percent of GDP in 2016 and remain around this level through 2025, falling gradually
thereafter. This trajectory remains well below the 50-percent indicative threshold. The NPV of
the debt-to-exports ratio would reach 141 percent in 2016 and ease gradually in following
years, remaining well under an indicative threshold of 200 percent.
Table A.2: Budget situation
Description Budget year
2015/16 likely 2016/17 budgeted
Total Expenditure as % of GDP 25.4 27.4
Domestic Revenues as % of GDP 19.2 20.3
Share of Foreign Loans and Grants in total Budget 7.7 6.9
Share of General Budget Support in total Budget 0 0
Foreign Loans and Grants as % of GDP 2 2
In light of the above considerations, there is therefore a case for the Bank to limit the
government’s counterpart funding requirement for this very important program to the proposed
13.48%. It is expected that this amount will ensure requisite ownership by the authorities and
help expedite the program’s implementation process.
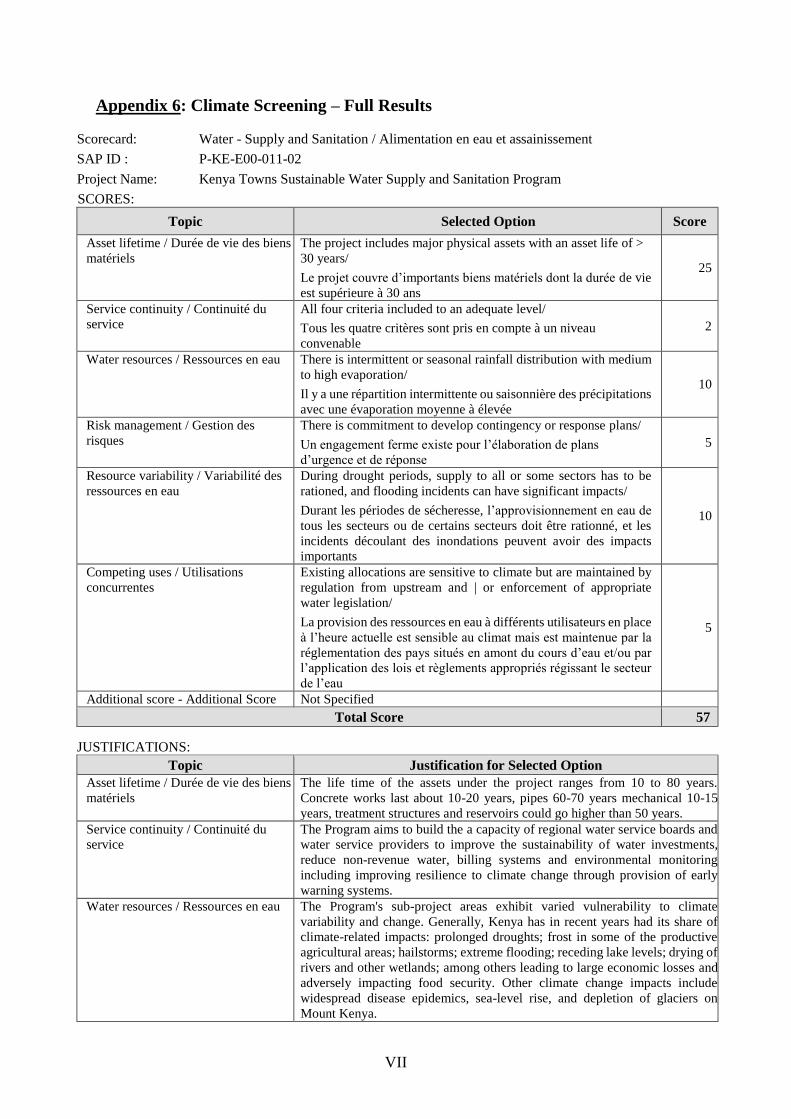
VII
Appendix 6: Climate Screening – Full Results
Scorecard: Water - Supply and Sanitation / Alimentation en eau et assainissement
SAP ID : P-KE-E00-011-02
Project Name: Kenya Towns Sustainable Water Supply and Sanitation Program
SCORES:
Topic Selected Option Score
Asset lifetime / Durée de vie des biens
matériels
The project includes major physical assets with an asset life of >
30 years/
Le projet couvre d’importants biens matériels dont la durée de vie
est supérieure à 30 ans
25
Service continuity / Continuité du
service
All four criteria included to an adequate level/
Tous les quatre critères sont pris en compte à un niveau
convenable
2
Water resources / Ressources en eau There is intermittent or seasonal rainfall distribution with medium
to high evaporation/
Il y a une répartition intermittente ou saisonnière des précipitations
avec une évaporation moyenne à élevée
10
Risk management / Gestion des
risques
There is commitment to develop contingency or response plans/
Un engagement ferme existe pour l’élaboration de plans
d’urgence et de réponse
5
Resource variability / Variabilité des
ressources en eau
During drought periods, supply to all or some sectors has to be
rationed, and flooding incidents can have significant impacts/
Durant les périodes de sécheresse, l’approvisionnement en eau de
tous les secteurs ou de certains secteurs doit être rationné, et les
incidents découlant des inondations peuvent avoir des impacts
importants
10
Competing uses / Utilisations
concurrentes
Existing allocations are sensitive to climate but are maintained by
regulation from upstream and | or enforcement of appropriate
water legislation/
La provision des ressources en eau à différents utilisateurs en place
à l’heure actuelle est sensible au climat mais est maintenue par la
réglementation des pays situés en amont du cours d’eau et/ou par
l’application des lois et règlements appropriés régissant le secteur
de l’eau
5
Additional score - Additional Score Not Specified
Total Score 57 JUSTIFICATIONS:
Topic Justification for Selected Option
Asset lifetime / Durée de vie des biens
matériels
The life time of the assets under the project ranges from 10 to 80 years.
Concrete works last about 10-20 years, pipes 60-70 years mechanical 10-15
years, treatment structures and reservoirs could go higher than 50 years.
Service continuity / Continuité du
service
The Program aims to build the a capacity of regional water service boards and
water service providers to improve the sustainability of water investments,
reduce non-revenue water, billing systems and environmental monitoring
including improving resilience to climate change through provision of early
warning systems.
Water resources / Ressources en eau The Program's sub-project areas exhibit varied vulnerability to climate
variability and change. Generally, Kenya has in recent years had its share of
climate-related impacts: prolonged droughts; frost in some of the productive
agricultural areas; hailstorms; extreme flooding; receding lake levels; drying of
rivers and other wetlands; among others leading to large economic losses and
adversely impacting food security. Other climate change impacts include
widespread disease epidemics, sea-level rise, and depletion of glaciers on
Mount Kenya.
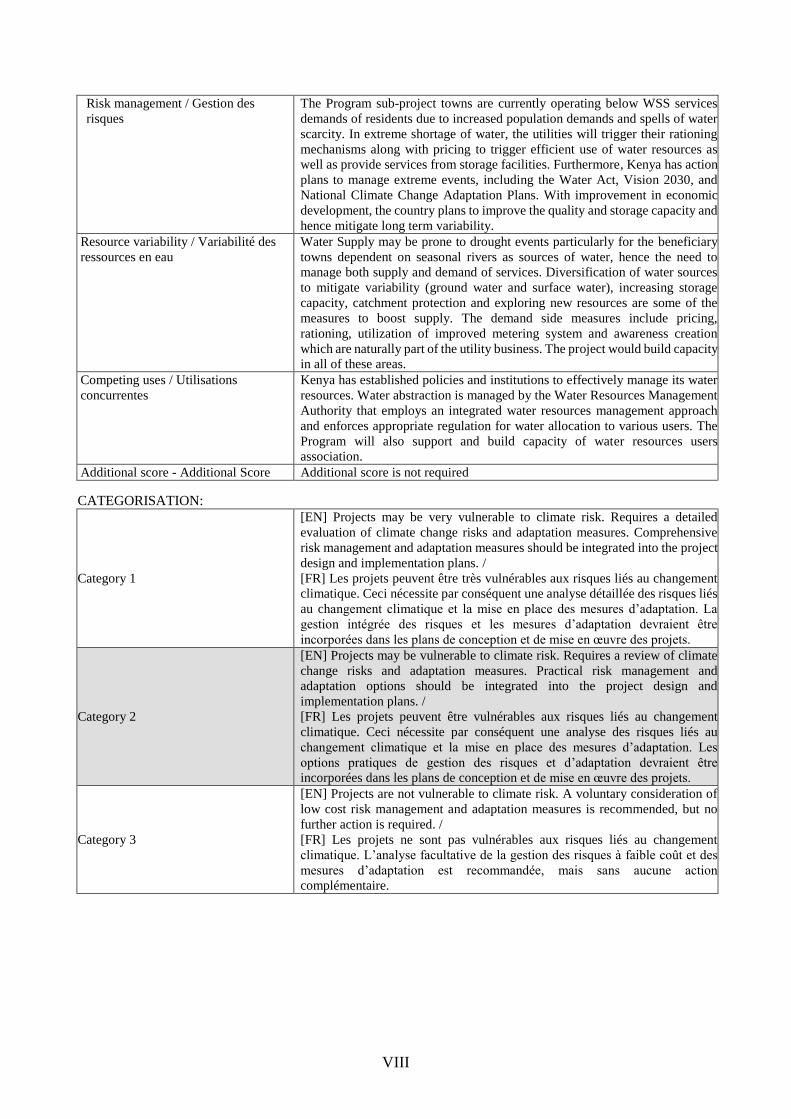
VIII
Risk management / Gestion des
risques
The Program sub-project towns are currently operating below WSS services
demands of residents due to increased population demands and spells of water
scarcity. In extreme shortage of water, the utilities will trigger their rationing
mechanisms along with pricing to trigger efficient use of water resources as
well as provide services from storage facilities. Furthermore, Kenya has action
plans to manage extreme events, including the Water Act, Vision 2030, and
National Climate Change Adaptation Plans. With improvement in economic
development, the country plans to improve the quality and storage capacity and
hence mitigate long term variability.
Resource variability / Variabilité des
ressources en eau
Water Supply may be prone to drought events particularly for the beneficiary
towns dependent on seasonal rivers as sources of water, hence the need to
manage both supply and demand of services. Diversification of water sources
to mitigate variability (ground water and surface water), increasing storage
capacity, catchment protection and exploring new resources are some of the
measures to boost supply. The demand side measures include pricing,
rationing, utilization of improved metering system and awareness creation
which are naturally part of the utility business. The project would build capacity
in all of these areas.
Competing uses / Utilisations
concurrentes
Kenya has established policies and institutions to effectively manage its water
resources. Water abstraction is managed by the Water Resources Management
Authority that employs an integrated water resources management approach
and enforces appropriate regulation for water allocation to various users. The
Program will also support and build capacity of water resources users
association.
Additional score - Additional Score Additional score is not required CATEGORISATION:
Category 1
[EN] Projects may be very vulnerable to climate risk. Requires a detailed
evaluation of climate change risks and adaptation measures. Comprehensive
risk management and adaptation measures should be integrated into the project
design and implementation plans. /
[FR] Les projets peuvent être très vulnérables aux risques liés au changement
climatique. Ceci nécessite par conséquent une analyse détaillée des risques liés
au changement climatique et la mise en place des mesures d’adaptation. La
gestion intégrée des risques et les mesures d’adaptation devraient être
incorporées dans les plans de conception et de mise en œuvre des projets.
Category 2
[EN] Projects may be vulnerable to climate risk. Requires a review of climate
change risks and adaptation measures. Practical risk management and
adaptation options should be integrated into the project design and
implementation plans. /
[FR] Les projets peuvent être vulnérables aux risques liés au changement
climatique. Ceci nécessite par conséquent une analyse des risques liés au
changement climatique et la mise en place des mesures d’adaptation. Les
options pratiques de gestion des risques et d’adaptation devraient être
incorporées dans les plans de conception et de mise en œuvre des projets.
Category 3
[EN] Projects are not vulnerable to climate risk. A voluntary consideration of
low cost risk management and adaptation measures is recommended, but no
further action is required. /
[FR] Les projets ne sont pas vulnérables aux risques liés au changement
climatique. L’analyse facultative de la gestion des risques à faible coût et des
mesures d’adaptation est recommandée, mais sans aucune action
complémentaire.