Embed Size (px)
Citation preview

REPUBLIC OF KENYA
FIFTH NATIONAL REPORT TO THE CONFERENCE OF PARTIES TO THE CONVENTION ON BIOLOGICAL
DIVERSITY
2015

ACRONYMS
ABS Access and Benefit Sharing
ASALs Arid and Semi-arid Lands
AWF African Wildlife Foundation
CBD Convention on Biological Diversity
CBO Community-based Organization
CDF Constituency Development Fund
CGAIR Consultative Group of Agricultural International Research
CIKSAP Centre for Indigenous Knowledge and Products
CIMMYT International Maize and Wheat Research Centre
CIP International Potato Research Centre
CITES Convention on International Trade in Endangered Species of Wild Fauna
COP Conference of Parties
CSO Civil Society Organizations
DVS Department of Veterinary Services
EAWS East African Wildlife Society
EIA Environmental Impact Assessment
EMCA Environmental Management and Co-ordination Act
ERSW & EC Economic Recovery Strategy for Wealth and Employment Creation
ESA Ecologically Sensitive Area
FAN Forest Action Network
FAO Food and Agricultural Organization
FONA Friends of the Nairobi Arboretum
GEF Global Environment Facility
GIS Global Information Systems
GOK Government of Kenya
GTZ German Agency for Technical Co-operation
Ha Hectares
HEP Hydro-electric Power
IBA Important Bird Area
ICIPE International Centre for Insect Physiology and Ecology

ii
KENYA 5TH NATIONAL REPORT
IDPs Internally Displaced Persons
IFAD International Fund for Agricultural Development
ILRI International Livestock Research Institute
IPR Intellectual Property Rights
ITDG Intermediate Technology Development Group-Kenya
IUCN World Conservation Union
KARI Kenya Agricultural Research Institute
KEFRI Kenya Forestry Research Institute
KMFRI Kenya Marine and Fisheries Research Institute
KEPHIS Kenya Plant Health Inspectorate Services
KESREF Kenya Sugar Research Foundation
KNBS Kenya National Bureau of Statistics
KWS Kenya Wildlife Service
LEAP List of East African Plants
LVBC Lake Victoria Basin Commission
LVEMP Lake Victoria Environnent Management Programme
EEZ Exclusive Economic Zone
KFSC Kenya Forestry Seed Centre
ICRAF International Centre for Research in Agro-forestry
ILDP Ilkerin Loita Development Project
IITA International Institute for Tropical Agriculture
ISTA International Seed Testing Association
M & E Monitoring and Evaluation
MOU Memorandum of Understanding
NARS National Agricultural Research Systems
NBSAP National Biodiversity Strategy and Action Plan
NCST National Council for Science & Technology
NEAP National Environnent Action Plan
NEMA National Environnent Management Authority

iii
KENYA 5TH NATIONAL REPORT
NES National Environnent Secretariat
NGO Non-governmental Organization
NMK National Museums of Kenya
NPEP National Poverty Eradication Programme
PCPU Plant Conservation and Propagation Unit
PEV Post-election violence
PGRs Plant Genetic Resources
PRSP Poverty Reduction Strategy Paper
SBSTTA Subsidiary Body for Technical and Technological Advice
SGP Small Grants Programme
SPECK Society for the Protection of the Environment in Kenya
Sp. /Spp. Species
UNCCD United Nations Convention to Combat Desertification
UNCED UN Conference on Environment and Development
UNEP United Nations Environment Programme
UNESCO UN Economic, Social and Cultural Organization
UNFCCC United Nations Framework Convention on Climate Change
UON University of Nairobi
USAID United States Agency for International Development
WRUA Water Resources Users Association

iv
KENYA 5TH NATIONAL REPORT
TABLE OF CONTENTS
ACRONYMS ............................................................................................................................................................... i
TABLE OF CONTENTS ........................................................................................................................................ iv
EXECUTIVE SUMMARY ....................................................................................................................................... 1
1 BIODIVERSITY STATUS AND TRENDS IN KENYA ........................................................................... 3
1.1 Introduction ........................................................................................................................................................... 3
1.2 Biodiversity status in Kenya ............................................................................................................................ 3
1.3 Biodiversity by types .......................................................................................................................................... 4
1.3.1.1 PLANT BIODIVERSITY .............................................................................................................................................. 4
1.3.1.2 FUNGAL DIVERSITY ................................................................................................................................................ 10
1.3.1.3 THREATENED PLANTS .......................................................................................................................................... 11
1.3.1.4 ANIMAL BIODIVERSITY ......................................................................................................................................... 13
1.3.1.5 AVIFAUNA ................................................................................................................................................................... 14
1.4 CASE STUDY: Migratory bird species: ....................................................................................................... 22
1.4.1.1 REPTILES AND AMPHIBIANS .............................................................................................................................. 23
1.4.1.2 BENEFITS OF REPTILES AND AMPHIBIANS ................................................................................................. 25
1.4.1.3 SMALL MAMMALS:................................................................................................................................................... 26
1.4.1.4 The value of small mammals in Kenya ............................................................................................................. 27
1.4.1.5 FISHES........................................................................................................................................................................... 28
1.4.1.6 INVERTERBRATES ................................................................................................................................................... 31
1.4.1.7 Bee diversity in Kenya ............................................................................................................................................. 32
1.4.1.8 Butterflies and Moths (Lepidoptera) in Kenya ............................................................................................. 33
1.4.1.9 Role of Lepidoptera in Sericulture ..................................................................................................................... 35
1.4.1.10 Prawns ..................................................................................................................................................................... 36
2 MAIN PRESSURES ON BIODIVERSITY............................................................................................... 38
2.1 Rapid population growth ................................................................................................................................ 38
2.2 Drivers of biodiversity loss ............................................................................................................................ 39
2.2.1.1 Population growth and trends in Kenya ......................................................................................................... 42
2.3 Expansion of agriculture ................................................................................................................................. 42
2.4 Overexploitation of biological resources .................................................................................................. 46
2.5 Climate change .................................................................................................................................................... 46
2.6 Invasive alien species ....................................................................................................................................... 46
2.6.1.1 Alien/invasive animals ........................................................................................................................................... 47
2.6.1.2 Alien/invasive plants ............................................................................................................................................... 47
3 IMPACTS AND TRENDS IN ECOSYSTEMS AND SPECIES TRENDS IN ECOSYSTEMS ...... 48
3.1 Water towers of national importance: ...................................................................................................... 49
3.2 Montane, dry and coastal forests ................................................................................................................. 51
3.3 Moorland and Afroalpine ................................................................................................................................ 55

v
KENYA 5TH NATIONAL REPORT
3.4 Inland waters, rivers and wetlands ............................................................................................................ 55
3.5 Coastal and Marine Ecosystems ................................................................................................................... 60
3.5.1.1 KENYA: State of the Coast Report 2008 ........................................................................................................... 61
3.5.1.2 Coral reefs .................................................................................................................................................................... 62
3.6 Urban Ecosystems .............................................................................................................................................. 66
3.7 TRENDS IN SPECIES .......................................................................................................................................... 69
4 VALUING BIODIVERSITY ........................................................................................................................ 75
4.1 COMMUNITY CONSERVANCIES ................................................................................................................... 75
4.2 NATURAL CAPITAL AND BIODIVERSITY VALUATION ...................................................................... 75
4.2.1.1 Challenges and opportunities .............................................................................................................................. 77
4.3 CASE STUDY: ........................................................................................................................................................ 79
4.3.1.1 POLICY LEVEL INTERVENTION - Natural Capital Accounting .............................................................. 79
4.3.1.2 The afforestation of Kenya’s water towers ..................................................................................................... 80
4.3.1.3 ECOSYSTEM VALUATION : .................................................................................................................................... 81
4.3.1.4 Payment for ecosystem services .......................................................................................................................... 83
4.3.1.5 Payment for Watershed Services in Lake Naivasha .................................................................................... 84
4.3.1.6 Payment for Wildlife Habitat in the Mara Ecosystem ................................................................................ 88
5 BENEFITS FROM BIODIVERSITY – SUSTAINABLE USE ............................................................. 92
5.1 Agricultural sector ............................................................................................................................................. 92
5.2 Case Study: ............................................................................................................................................................ 94
5.2.1.1 Kipepeo project in Gede, Malindi ........................................................................................................................ 94
5.3 Tourism sector .................................................................................................................................................... 95
5.3.1.1 Tourism threat to biodiversity ............................................................................................................................ 96
5.3.1.2 The “Good Wood” Project ...................................................................................................................................... 96
5.4 Energy sector ....................................................................................................................................................... 97
5.4.1.1 Threats of Energy sector to Biodiversity ......................................................................................................... 97
5.4.1.2 Recommendations .................................................................................................................................................... 98
Case study ......................................................................................................................................................................................... 98
5.4.1.3 Bio-fuel production project in Kenya ................................................................................................................ 99
5.5 Fisheries sector ................................................................................................................................................... 99
5.5.1.1 Threat of fishing to biodiversity ...................................................................................................................... 100
5.5.1.2 Recommendations ................................................................................................................................................. 100
5.6 Forestry sector ................................................................................................................................................. 100
5.6.1.1 Timber forest products ........................................................................................................................................ 101
5.6.1.2 Non-Timber Forest Products............................................................................................................................. 101
5.6.1.3 Gum and Resins ...................................................................................................................................................... 102
5.6.1.4 Essential oils & Lipids .......................................................................................................................................... 103
5.6.1.5 Threats of forestry sector to biodiversity ..................................................................................................... 104
5.6.1.6 Case Study: .............................................................................................................................................................. 104
5.6.1.7 Community forestry, Indigenous Knowledge and forest resource use ............................................. 104
5.6.1.8 Recommendations ................................................................................................................................................. 105
5.7 Health sector ..................................................................................................................................................... 106

vi
KENYA 5TH NATIONAL REPORT
5.7.1.1 Health sector and threats to biodiversity .................................................................................................... 107
5.8 Trade and Industry Sector ........................................................................................................................... 107
5.8.1.1 Threats of trade to Biodiversity ....................................................................................................................... 108
5.9 Biodiversity and cultural/spiritual value .............................................................................................. 109
5.10 Biodiversity and Urbanization .............................................................................................................. 110
5.10.1.1 Sustainable use and Nagoya Protocol challenges ............................................................................... 110
6 THE NATIONAL BIODIVERSITY STRATEGY AND ACTION PLAN, ITS IMPLEMENTATION
AND THE MAINSTREAMING OF BIODIVERSITY................................................................................. 112
6.1 Status of review and updating of NBSAP ............................................................................................... 112
6.2 Legislative instruments ................................................................................................................................ 112
6.2.1.1 ENVIRONMENTAL MANAGEMENT AND COORDINATION ACT (EMCA 1999).............................. 112
6.2.1.2 NATIONAL LAND COMMISSION ACT, 2012 ............................................................................................... 113
6.2.1.3 Land Registration Act, 2012: ............................................................................................................................ 113
6.2.1.4 Seed and Plant Variety Act: ............................................................................................................................... 113
6.2.1.5 Heritage Act 2006: ................................................................................................................................................ 113
6.2.1.6 Agriculture Act.: ..................................................................................................................................................... 114
6.2.1.7 Noxious Weeds Act. ............................................................................................................................................... 114
6.2.1.8 LAND ACT: ................................................................................................................................................................ 114
6.2.1.9 FOREST ACT 2005: ................................................................................................................................................ 114
6.2.1.10 BIOSAFETY ACT 2009: ................................................................................................................................... 115
6.2.1.11 Kenya Agriculture and Livestock Research ACT 2013: ..................................................................... 115
6.2.1.12 THE LAW OF THE SEA: .................................................................................................................................. 115
6.2.1.13 THE NAGOYA PROTOCOL: ............................................................................................................................ 115
6.2.1.14 THE KYOTO PROTOCOL : .............................................................................................................................. 115
7 PROGRESS TOWARDS THE 2020 AICHI BIODIVERSITY TARGETS AND CONTRIBUTION
TO THE RELEVANT 2015 TARGET OF THE MILLENIUM DEVELOPMENT GOALS ................ 116
7.1 Aichi Biodiversity Targets ........................................................................................................................... 116
7.2 Millennium Development Goals and post 2015 sustainable development goals ................. 130
7.2.1.1 Goal 1- Eradicate Extreme Poverty and Hunger ....................................................................................... 130
7.2.1.2 Goal 7 - Ensure Environmental Sustainability ........................................................................................... 130
7.3 Challenges and lessons learnt .................................................................................................................... 131
7.4 CONCLUSION ..................................................................................................................................................... 132
8 ANNEXES .................................................................................................................................................... 133
8.1 ANNEX 1:............................................................................................................................................................. 133
8.2 Annexe 2: ............................................................................................................................................................ 145
LIST OF FIGURES FIGURE 1 PLANT AND FUNGI DIVERSITY IN KENYA ......................................................................................................................................... 5
FIGURE 2 DIVERSITY OF VASCULAR PLANT FAMILIES IN KENYA ................................................................................................................... 6
FIGURE 3 SPECIES DIVERSITY AT GENERIC LEVEL ........................................................................................................................................... 6
FIGURE 4 DRYLAND ECOSYSTEM DOMINATED BY SUCCULENT EUPHORBIA SPECIES ................................................................................. 7
FIGURE 5 PLANT AND FUNGI DIVERSITY IN KENYA ......................................................................................................................................... 9
FIGURE 6 DESCRIBED AND DOCUMENTED FUNGI DIVERSITY IN KENYA .................................................................................................... 11
FIGURE 7 GIGASIPHON MACROSIPHON, A CRITICALLY THREATENED TREE SPECIES ................................................................................ 13
FIGURE 8 MAP OF THE ENDEMIC (EBA) AND SECONDARY (SA) BIRD AREAS FOUND IN KENYA ........................................................ 15
FIGURE 9 MAP SHOWING THE SIX AVIAN BIOMES IN KENYA . ..................................................................................................................... 16
FIGURE 10 MAP OF THE MAJOR WETLANDS IN KENYA AND THEIR ASSOCIATED KEY BIRD SPECIES ..................................................... 17
FIGURE 11 TRENDS OF FLAMINGO NUMBERS AT LAKE BOGORIA ............................................................................................................. 19
FIGURE 12 POPULATION TRENDS OF THE REGIONAL ENDEMIC SOKOKE SCOPS OWL ............................................................................ 20
FIGURE 13 MAP OF THE IMPORTANT BIRD AREAS IN KENYA .................................................................................................................... 22
FIGURE 14 CATCH STATISTICS FOR MARINE FISHES IN KENYA .................................................................................................................. 29
FIGURE 15 ADAPTED FROM GIKUNGU ............................................................................................................................................................ 33
FIGURE 16 PRAWN CATCHES BY TRAWLERS IN KENYA ............................................................................................................................... 36
FIGURE 17 TRENDS IN KENYAN HUMAN POPULATION ................................................................................................................................ 40
FIGURE 18 PERCENTAGE OF LAND UNDER AGRICULTURE FROM 1970-2010 ........................................................................................ 43
FIGURE 19 ANNUAL TRENDS OF THE STATE OF BUSHLAND, SEMI-ARID AND ARID IBAS FROM 2006 TO 2010 .............................. 51
FIGURE 20 DEFFORESTATION TREND OF THE MAU FOREST COMPLEX ................................................................................................... 53
FIGURE 21 FISHING TRENDS IN LAKE VICTORIA .......................................................................................................................................... 57
FIGURE 22 NGOMENI DISAPPEARING MANGROVES ..................................................................................................................................... 66
FIGURE 23 WILDLIFE AND LIVESTOCK TRENDS ............................................................................................................................................ 71
FIGURE 24 INTEGRATED MAP OF SPECIES DENSITIES .................................................................................................................................. 76
LIST OF TABLES TABLE 1 SOME SELECTED FUNGI OF ECONOMIC IMPORTANCE IN KENYA ................................................................................................. 10
TABLE 2 NUMBER OF THREATENED SPECIES IN VARIOUS IUCN CATEGORIES OF THREAT IN KENYA .................................................. 18
TABLE 4 SUMMARY OF KENYA'S PROGRESS TOWARDS ACHIEVEMENT OF A ICHI'S TARGETS................................................ 116

EXECUTIVE SUMMARY
Kenya is a signatory to the Convention on Biological Diversity (CBD) and is committed to its implementation and promotion of all the three objectives. These are the conservation of biological diversity, the sustainable use of its components, and the fair and equitable sharing of the benefits arising from use of genetic resources.
This 5thNational Report to the CBD provides an overview of recent governmental and non-governmental activities on biodiversity in Kenya. It shows that progress and achievements differ between Aichi Biodiversity Targets. There are many success stories and improvements in biodiversity protection and restoration; however, there are also areas of concern Further the report also indicates that, significant progress has been made in the implementation of the convention, strategic plan and the Aichi targets. However speedy implementation is heavily affected by the country’s inadequate capacity with respect to its financial, human, scientific, technical and technological needs Kenya have ratified the Nagoya Protocol on Access to Genetic Resources and the Fair and Equitable Sharing of Benefits Arising from their Utilization. The country continues to review and enact statues and regulations and take up necessary measures to ensure that ecosystems’ capacities are maintained in providing goods and services as well as support livelihoods of local populations.
The reports highlights the progress made in the implementation of the convention, the ten year Biodiversity strategic plan (2011-2020) and Aichi Biodiversity targets which were adopted during COP 10. Kenya has made substantial progress in achievements of Millennium Development Goals and is gearing up for the post 2015 Development Agenda
The process of the revising and updating our NBSAP is on underway and has been very inclusive involving broad participation of stakeholders, including policy makers , local communities, academic institutions ,civil society and NGOs. The role of the stakeholders during the process and even through the implementation phase has been well defined and outlined. Finally, the revised NBSAP containing national targets and indicators is expected to be launched soon.
The Fifth National Report contains the following chapters;

2
KENYA 5TH NATIONAL REPORT
o Biodiversity status and trends in Kenya o Main pressures on biodiversity o Impacts and trends in ecosystems and species o Valuing Biodiversity o Benefits from Biodiversity and its sustainable use o National Biodiversity strategy and Action Plan review and update o Progress towards the 2020 Aichi biodiversity targets and contribution to
Millennium Development Goals, and o Key messages and conclusions
The report points out that current patterns of natural resources utilization and extraction have failed to promote sustainability and integrity of our natural capital. Of major concern is the fact that economic growth and human well being are very much dependant on well managed and sustained natural resources. To this end Kenya has undertake her Natural capital compilation and already an Atlas of our Natural capital has been developed. Additionally, several restoration initiatives especially in our five water towers to mitigate pressure and threats to these vital ecosystems have been undertaken. As a result we have slightly increased our forest cover as well as promoted sustainable land management in most part of the country.
In ensuring sustainability of all the action and initiatives we have undertaken we have integrated environmental conservation and management in our teaching curriculum. To this end we have developed and launched a hand book on Education for sustainable development which is being used in most of our learning institution.

3
KENYA 5TH NATIONAL REPORT
1 BIODIVERSITY STATUS AND TRENDS IN KENYA
1.1 Introduction Kenya covers a land area of approximately 583,000 square kilometers. Kenya straddles the Equator between approximately 4.5 degrees South and 4.5 degrees North latitude. With a coastline of approximately 640 km, the total area of the Kenyan Marine Exclusive Economic Zone (EEZ) extending 200 nautical miles is about 230,000 square kilometers. Thus, by area, about 28% of Kenya’s ecosystems are marine and 72% are terrestrial. About two thirds of Kenya’s land is less than 900 meters above sea level and one third is comprised of highlands. The highlands, mainly in south-western Kenya, surround five major areas of mountains or hill ranges (Mount Kenya, Mount Elgon, the Aberdares Range, the Mau Escarpment, and the Cherangani Hills). The Great Rift Valley, stretching north- south across the country, splits the highlands into a western and eastern part. The Rift Valley contains numerous closed basin saline lakes and some freshwater lakes, including Lake Naivasha and Lake Baringo in the eastern branch of the Rift, and Lake Victoria, which lies between the two Rift branches. Freshwater and saline ecosystems cover about 8% of Kenya, including rivers, lakes and wetlands with Lake Victoria, Lake Turkana, Lake Naivasha, and Lake Baringo being the four largest inland water bodies. The national biological resources are fundamental to national prosperity in the light of Kenya Vision 2030 and Millennium Development Goals. They provide Kenyan population with food, medicines, energy, shelter, employment and foreign exchange. Further, to offering multiple opportunities for human prosperity. Vital national economic engines such as agriculture, energy, tourism, manufacturing, wholesale and retail trade, business process outsourcing (BPO) and financial services sectors, all largely depend on the biodiversity in many aspects.
1.2 Biodiversity status in Kenya Kenya is endowed with diverse ecosystems and habitats that are home to unique and diverse flora and fauna. . Kenya’s rich biodiversity can be attributed to a number of factors, including a long evolutionary history, the country’s varied and diverse habitat types and ecosystems, diversity of landscapes and variable climatic conditions. About 70% national biodiversity resources are found outside the protected, while the 30% are

4
KENYA 5TH NATIONAL REPORT
within protected areas that include national parks, reserves, sanctuaries, gazetted forests, and heritage forests. Kenya government recognize the use of ecosystems approach as the best methods for conserving biodiversity, the country has inadequate environmental and biodiversity related laws, policies and instructional frameworks towards this end. Despite having many sectoral laws and policy that can be used to support the biodiversity conservation there is need to harmonize and mainstream biodiversity conservation in order to realize the objectives of the convention. Kenya is rich in biological diversity. Around 25,000 species of animal and 7000 species of plants have so far been recorded, along with at least 2000 fungi and bacteria. An enormous species of plants and animals inhabit the country’s varied habitats, from its crowded and colorful coral reefs to icy alpine moorlands. What is however, clear is that Kenya’s biodiversity is under threats from a variety of sources include natural and anthropogenic effects, and without concerted efforts for research and focused conservation actions, we are likely to lose unique species some of which are endemic to Kenya.
1.3 Biodiversity by types
1.3.1.1 PLANT BIODIVERSITY
A total of 29,614 vascular plant species (706 ferns, 44 gymnosperms and 28,864 angiosperms i.e. flowering plants) are known from Africa (APD, 2011; Roux, 2009), which is the only continent where a relatively advanced flora revisions have been completed. Except in the subtropical South Africa with a mega diverse flora of 23,400 and Madagascar Island consisting of 12,000 species, the East African region with 12,317 species described and documented has the highest plant diversity in the mainland tropical Africa (Mwachala, et al., 2011; Beentje, 2012). Out of the 12,317 species found in the region, at least 7,004 or 57 per cent are recorded in Kenya (Mwachala, et al., 2011; Appendix I; Figure 1). The current analysis based on comprehensively revised taxa represented in the 263 volumes of Flora of Tropical East Africa (FTEA) confirms the hitherto estimated country diversity of about 6500 (Robertson & Luke, 1993), 6700 (Agnew & Mutangah, 1999), 6817 (Anon, 1992) and 7000 (Muasya, et al., 1994). The total diversity will inevitably increase, though

5
KENYA 5TH NATIONAL REPORT
marginally, when the floras published between 2010 and 2012 (e.g. Solanaceae, Apocynaceae), bryophytes and fungi including lichens are taken into account. There are 766 species of bryophytes recorded from Kenya, represented by 255 Hepaticae (liverworts) and Anthocerotae (Hornworts), and 511 mosses (see Figure 1; Appendix II) (O’shea, 2006; Wigginton, 2009). I
Figure 1 Plant and fungi diversity in Kenya
The Kenyan vascular plants diversity consisting of 7004 species comprises 1720 genera and 240 families. The plant families are dominated by the angiosperms (dicotyledons and monocotyledons) largely dominated by the leguminous and grass species (Figure 2; Appendix I). The Leguminosae (subfamilies Caesalpinioideae, Papilionoideae and Mimosoideae) and Gramineae consistitute 10 % (708) and 8% (576), respectively (Figure 2). Other species rich families include Compositae (7%, 494), Euphorbiaceae (5%, 341), Rubiaceae (5%, 330), Orchidaceae (4%, 249), Acanthaceae (3%, 225), Labiatae (3%, 218) and Cyperaceae (3%, 211) (Figure 2). Most of these taxa are ecosystem indicators such as Acacia grassland savannah or common weeds of disturbed and cultivated ecosystems (Acanthaceae, Compositae, Scrophulariaceae/Orobanchaceae, Cyperaceae, and Labiatae,). The Cyperaceae is also a dominant cover species usually found in permanent or seasonal wetlands. It is worth noting that Cucurbitaceae and Amaranthaceae which are sources of our indigenous vegitables have a moderately high species diversity (Figure 2). The dominant families also contain highly diverse genera. The genera Euphorbia (Euphorbiaceae) with 135 species and Crotalaria (Leguminosae) with 110 species are the

6
KENYA 5TH NATIONAL REPORT
most diverse (see Figure 3). Euphorbia species dominate the Arid and Semi Arid Lands (ASALS) ecosystems due to their semi succulent nature (see Figure 4) which help them withstand extreme dessication. Aloe (56) and Eucalyptus (88) are also highly diverse genera and well represented in dryland ecosystems. Aloes are succulent and sometimes form dense colonies in the ASALS. The Eucalyptus species are natives of Australia and introduced through forestry plantations since 1907. Majority are now naturalised especially in the highlands where they can be invasive.
Figure 2 Diversity of vascular plant families in Kenya
Figure 3 Species diversity at generic level

7
KENYA 5TH NATIONAL REPORT
Figure 4 Dryland ecosystem dominated by succulent Euphorbia species
Although Kenya is categorized as 80% arid and semi arid, it has high species index attributed to the confluence of five major phytogeographical regions, which include Somali-Maasai, afromontane, Swahilian Zanzibar-Inhambane, the Lake Victoria region and the Guinea-Congolian mosaics (White, 1983). The ecotone vegetation zones between the Somali-Masai and afromontane, characterized by wooded grasslands between 700 and 1750 m, has surprisingly the highest concentration of plant diversity of about 4721 species (Mwachala, et al., 2011; Figure 5). This region includes the dry upland forests straddling Nairobi from Ololua Forest through Thika to Nyeri characterized by the rare and threatened Brachylaena huillensis associated with Croton megalocarpus, Eleodedron buchananii and Chaetchme aristata (Bussmann, 2002). The Nairobi ecosystem including the National park contains high species index of 348 (Agnew & Mutangah, 1994), while Nairobi City Park has 558 (Malombe et al., 2010) and Thika indigenous relic forest fragments has 571 species (Malombe & Mutangah, 2004). Others included the biodiversity rich mist evergreen forests in Taita Hills complex consisting of Mbololo, Ngangao, Chawia, Vuria, Sagalla and Kasigau, which represent the northerly arm of eastern Arc Mountains. They are ranked among the 25 biodiversity hotspots on earth due to high concentration of threatened species (Burgess & Clarke, 2000). There are other many evergreen mist forest hilltops scattered throughout the drylands, rising sharply from the 600-700 m a.s.l. to over 2000 m in some cases. Most of these forests are not exhaustively explored and are vulnerable to overexploitation for natural resources (Beentje, 1990). Recorded species richness include 748 in Kitui/Mwingi hills (Mutha 189, Endau 508, Nuu 322, Mutitu 230 and Mumoni 375) characterized by Acacia, Strychnos, Rawsonia, Drypetes and Croton megalocarpus (Malonza, et al., 2006); 433 in Machakos/ Makueni (Makongo 138, Makuli 155, Nthangu 227, Kitondo 119) composed of Acacia, Combretum and Albizia (Malombe et al., 2012). Other representative sites include extensive hills in Central and Upper eastern Province: Nyiru, Ndoto, Kulal, Marsabit, Loroghi, Ndare, Mukogodo, Porror, Mathews range, Kakoe,

8
KENYA 5TH NATIONAL REPORT
Imenti, Ngaia, Nyambene, and Kiangombe) (see Bussman, 2002). Ol Ari Nyiro and Mukutan Gorge in the Laikipia Plateau with 708 also represent mega diversity (Figure 5; Muasya et al., 1994). Most of the lower and central Rift Valley areas dominated by Acacia bushland are ranked within the similar range. Examples in Lake Nakuru ecosystem with 575 species recorded and dominated by Acacia xanthophloea, Euphorbia and Olea species (Mutangah, 1994). The Olea-Croton dominated Kakamega forest with 986 plant species is incidentally located at average altitude of 1600 m. It forms the only easterly arm of the species rich Guinea-Congolian lowland tropical rainforest extension in Kenya (Fischer et al., 2010). It however has some affinity to the moist upland afromontane forests, which range from 1800 to 3000 m a.s.l. characterized by Ocotea and Podocarpus species, interspersed with bamboo vegetation. The afromotane forests hold an approximated diversity of over 2824 species (Mwachala et al., 2011). Specific diversity records include 882 in Mt Kenya (Bussmann, 1994: Musila et al., 2009), 1464 in Mt Elgon (Masinde et al., 2006) and 771 species in Cherangani hills (Musila et al., 2011). The modest diversity of 393 species in Mau complex and 293 in Nandi forests indicates less biodiversity (Musila et al., 2011) but more intensive studies are required to unfold the full biodiversity potential. Above the tree line, between 3000 and 4500 m, most of the higher mountains are represented by the alpine vegetation species poor zone characterized by Hagenia, Hypericum, Erica, Dendrosenecio and Carex. About 472 species have been recorded in this range (Mwachala et al., 2011). The Zanzibar-Inhambane forest at about 30 km strip along the coastline is also known to hold a high diversity of 3040 species (43 per cent of Kenyan flora) in Kenya. The vegetation is characterized by the coastal lowland dry leguminous (Brachystegia, Cynometra, Afzelia, Hymenia, Julbernardia and Scorodophloeus) dominated forest found below 400 m a.s.l. and influenced by the close proximity to the ocean (Burgess & Clarke, 2000; Robertson & Luke, 1993). Except for the few protected areas (Arabuko Sokoke, Boni, and Shimba hills), most of the forests are small and highly fragmented. The species diversity at these fragments is however extremely dissimilar among the sites and estimated to range from 300 to 800 in each of the forests (Burgess & Clarke, 2000). It reaches the peak in Shimba Hills ecosystem with 1396 species recorded (Luke, 2005). These hills have been identified as a globally important centre of plant diversity (Davis, Heywood & Hamilton, 1994) Other recent records include 523 species in Gongoni Forest (Njihia et al., 2012), Kaya Muhaka 492 (Gikungu et al., 2011), and Kaya Jibana and Mrima Hill with 361 and 343 species respectively (Malombe et al., 2010). Other older records for most of the coastal forests are available (see Robertson & Luke 1993). The

9
KENYA 5TH NATIONAL REPORT
coastal forests open to the extensive Somali-Maasai arid Acacia-Commiphora bushland and grassland between 450 to 700 m. About 2678 species have been recorded in Somali-Maasai region with at least 600 and 373 species occurring in Tsavo and Meru National Parks respectively (Mwachala et al., 2011). In addition, 2071 species of fungi and lichens are documented in the country. Therefore a total of 9841 species of plants and fungi are known to occur in Kenya (Figure 1). Bryophytyes are extremely dependent on forest microclimate and any alterations of forest structure usually leads to significant reduction of their diversity or even extinctions (Pócs 1989, Gradstein, 1997; Pócs & Tóthmérész, 1997; Zartman, 2003), and have been used to estimate effects of forest fragmentation and climate change (Monge-Nágera, 1989; Zartman, 2003; Alvarenga & Pôrto, 2007). They have been referred to as ‘canaries in the coal mine’ because of the high sensitivity to increase of carbondioxide and UVB radiation, and almost instantly affected by decline of atmospheric humidity (Slack, 2011; Malombe & Matheka, 2012). Bryophytes are undercollected in the country, but the highest diversity occurs in the humid environment prevailing in the afromontane ecosystems of Mt Kenya (194; Chuah-Petiot, 1995), Aberdares (124; Chuah-Petiot, 1997), Chyulu Hills (79; Pocs & Luke, 2007), and Mt Elgon, Cherangani Hills and Saiwa Swamp (226; Chuah-Petiot, 2003; Masinde et al., 2006).
Figure 5 Plant and fungi diversity in Kenya

10
KENYA 5TH NATIONAL REPORT
1.3.1.2 FUNGAL DIVERSITY
In Kenya, fungi are relatively little known, the same case applies to many other countries globally. The fungi diversity in Kenya is poorly documented given that the country is widely recognized as one of the world's biodiversity “hotspots”. The species distribution is broad associated with the various vegetation types and zones in the country such as forest, woodland, grassland, wetlands, montane, semi desert and agro-ecosystems. It is estimated that over 5000 fungal species occur throughout the country (Figure 6). However, only 2071 species are currently described and documented. The most common groups in the natural, man-made and agro-ecosystem include Glomeromycota (soil fungi connected to roots of some plants), Ascomycota (sac fungi) and Basidiomycota (Club fungi). Fungi are the most important organisms in terms of their ecological and economic roles. They influence major ecosystem processes such as nutrient cycling, soil formation and aggregation, plant nutrition and plant protection from diseases. Other fungi provide numerous drugs (such as penicillin and other antibiotics), foods like mushrooms, truffles and morels, and the bubbles in bread, champagne, and beer. They also cause a number of plant and animal diseases while others such as yeasts are particular important model for studying problems in genetics and molecular biology (Table 1). Table 1 Some selected fungi of economic importance in Kenya
Fungi species Economic importance Agaricus campestris edible Coprinus sterquilinus edible Engleromyces goetzei medicinal Langermannia wahlbergii dye Ganoderma lucidum Medicinal Cantharellus platyphyllus Edible Macrolepiota dolichaula edible Phlebopus sudanicus Hallucinogen Podaxis pistillaris dye
Psilocybe merdaria hallucinogen, poisonous
Termitomyces eurhizus edible Termitomyces striatus edible Armillaria mellea root disease

11
KENYA 5TH NATIONAL REPORT
Glomeromycota species include 51 species out of the 200 morphologically described worldwide (though using molecular tools the number may be higher) which represents about 25% of the total species (Shepherd et al., 1996; Mathimaran et al., 2007; Jefwa et al., 2012; Muchane et al., 2012;). Thirty two species are fully described and documented while the rest are described only to genus level. Ascomycetes species include 760 described and documented species. Out of this an approximately 400 species have been collected from coastal regions, and only scanty information is available on other Kenyan regions (Mibey & Hawksworth, 1997; Mibey & Kokwaro, 1999; Mugambi 2009; Mungai et al., 2002a, b, c, d, e). Basidiomycetes records are mainly from major biodiversity hotspot such as Mt. Kenya, Mt. Elgon, Kakamega forest, Simba Hills, Ngong Hills, Maasai Mara and Arabuko Sokoke forest. A record of 550 described species has been documented in the country (Duke 1969; Pelger & Rayner, 1969; Kost et al., 2002; Tibuhwa et al., 2011). This number may be an under estimate of species given that they appear only during rainy season, and most of sampling could have missed the species. Lichens and lichenicolous fungi include only 710 species recorded in Kenya. However it is estimated that at least 1400 species occur. At least 58 species have recently been documented in Mt. Kenya region (Kirika et al., 2012).
Figure 6 Described and documented Fungi diversity in Kenya
1.3.1.3 THREATENED PLANTS
Threatened Plant Species in Kenya

12
KENYA 5TH NATIONAL REPORT
Out of the 7004 vascular plant species, some 1,100 (16 per cent) species in Kenya are endemic (found exclusively either in Kenya or within the FTEA region in the world) and, whilst there is no published inventory of threatened plant taxa for the country, most botanists recognize a growing number of species in need of special protection. Only 464 species have been assessed and accepted in the global IUCN assessments for Kenya, where 199 taxa meet the threshold categories of threat (EAPRLA, 2012). In addition, 157 species out of 800 national and regional assessments recently undertaken by the EAPRLA occur in Kenya. Therefore a total of 356 vascular species are threatened in Kenya (Appendix VI). (Indicate website) Of the 356 threatened species, 23 are Critically Endangered (CR), Endangered (EN) 83, Vulnerable (VU) 169 and Near Threatened (NT) are 81 (Appendix VI). The CR species includes Aloe classenii (Aloaceae), Cyathula braunii (Amaranthaceae), Sorindeia calantha (Anacardiaceae), Afrothismia baerae (Burmanniaceae), Gigasiphon macrosiphon (Leguminosae, Caesalpiniaceae), Encephalartos tegulaneus ssp. powysii (Cycadaceae), Cyperus flavoculmis, Cyperus microumbellatus, Bulbostylis hispidula (Vahl) R. W. Haines ssp. intermedia (Lye) R. W. Haines and Cyperus kwaleensis Lye (Cyperaceae), Euphorbia taruensis, Aristogeitonia magnistipula, and Euphorbia tanaensis (Euphorbiaceae), Isoetes nigroreticulata Verdc. (Isoetaceae), Taxillus wiensii Polhill (Loranthaceae), Memecylon buxoides Wickens (Melastomataceae), Turraea elephantina Styles & F. White (Meliaceae), Rhynchosia holtzii Harms (Papilionaceae), Plumbago stenophylla (Plumbaginaceae), Ixora scheffleri ssp. keniensis (Rubiaceae), Holmskioldia gigas Faden, Premna discolor var. discolor and Karomia gigas (Faden) Verdc. (Verbenaceae) (see Appendix VI; Table X). Generally, 31 percent (112) of the threatened species are endemic to Kenya. Coastal forests including Eastern Arc (Taita hills) preserves over 86 per cent (307) threatened species, where 69 per cent only occur in this region in Kenya. This exemplifies the importance of imposing strict conservation and protection of coastal forests as refugia of biodiversity wealth for posterity. The majority of the threatened species have either narrow range in distribution, populations are diminishing and few mature individuals and the natural habitats have become increasingly disturbed from agriculture and development encroachments. For example, the Critically endangered leguminous tree Gigasiphon macrosiphon (Figure ) found in 6 localities represented by less than 30 mature individuals in the wild and spread in coastal forests of Kenya and Tanzania which are highly fragmented and poorly protected. Two of the major populations, Gongoni Forest and Mrima hill, in Kwale County are under threat from mining of Tiomin and Niobium, respectively.

13
KENYA 5TH NATIONAL REPORT
Figure 7 Gigasiphon macrosiphon, a critically threatened tree species
1.3.1.4 ANIMAL BIODIVERSITY
Kenya retains a remarkable variety of globally important and locally valuable flagship animal species. These include birds, mammals, reptiles, amphibians, fish and invertebrates. The diversity of Kenya's wildlife has garnered international fame.Animal biodiversity hold medicinal, agricultural, ecological, commercial, aesthetic and recreational value and is protected and saved so that future generations can experience their presence and value. Towards this end, Kenya’s faunal biodiversity wealth is integral to the delivery of the long-term economic development blueprint for Kenya, the “Vision 2030” (GOK, 2007) as it lies at the heart of the tourism sector, which along with agriculture, manufacturing, trade and financial services is expected to deliver the 10 percent annual growth rate envisaged by the country’s long-term development blueprint. Kenya has around 30,000 species of animal species including 25, 000 invertebrates (21, 575 of which are insects), 1,100 birds, 315 mammals (2/3 of these are small mammals), 191 reptiles, 180 freshwater fish, 692 marine and brackish fish, and 88

14
KENYA 5TH NATIONAL REPORT
amphibians.Kenya’s rich biodiversity can be attributed to a number of factors, including a long evolutionary history, the country’s varied and diverse habitat types and ecosystems, diversity of landscapes, variable climatic conditions, and the convergence of at least seven biomes. These unique and biodiversity-rich regions include East African Coast biome including the Indian Ocean Islands of Lamu and Kisite, the coastal forests of Arabuko-Sokoke and the lower Tana River; the Afro-montane forests of Mount Kenya, Aberdare and Mount Elgon; Kakamega’seasternmost outliers of the Guineo-Congolian equatorial forest; and the Somali-Masai biome including the Northern dry lands that form part of the distinct Horn of Africa biodiversity region; the large Afrotropical grassland Highlands biome; the small Lake Victoria Basin biome and the Sudan and Guinea Savannah biome. These ecosystems collectively contain high levels of animal species diversity and genetic variability while some species being endemic or rare, critically endangered, vulnerable or near-threatened.
1.3.1.5 AVIFAUNA
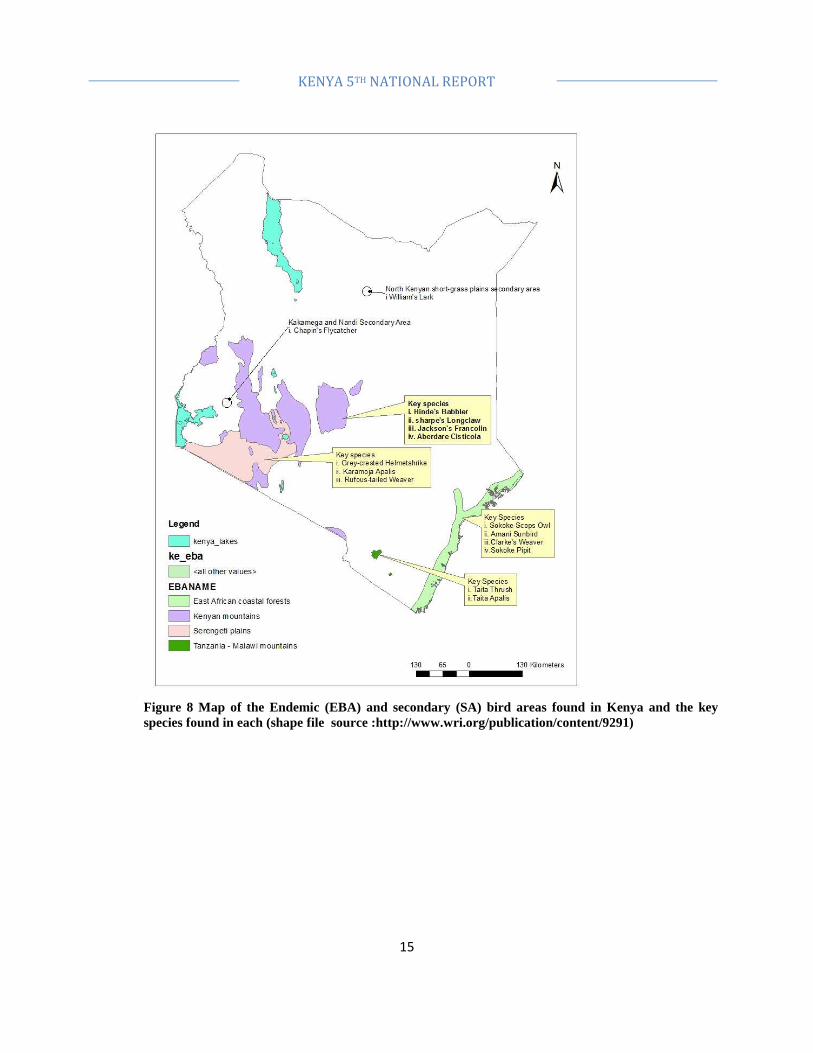
Kenya has one of the richest avifauna diversity in Africa, with around 1100 bird species recorded (Bird committee 2009). At least eight of these are national endemics. There are several reasons for this high number of bird species in Kenya for a relatively small total area of the country.Kenya’s diverse habitats ranging from marine and coastal forests, thorn bushland and woodland, savanna grasslands, highland moist forests, wetlands with fringing papyrus swamps, afro-alpine moorland and relicts of guineo-congolian rainforests in Kakamega .The presence of four ‘endemic bird areas’ and six avian biomes (Fishpool 1996 see map below), Geographical location of the country astride the equator and , Kenya also lies on a major migratory flyway-the Great Rift Valley Bird Migration Flyway used by hundreds of millions of migrating bird species. Endemic Bird areas are defined as places where two or more bird species of restricted range i.e. with world distributions of less than 50,000 km2 occur together. Four globally recognized Endemic Bird Areas are represented in Kenya (Stattersfield et al 1998 .see map below). One other EBA, the Jubba and Shabeelle valleys is only marginally represented in NE Kenya.
15
KENYA 5TH NATIONAL REPORT
Figure 8 Map of the Endemic (EBA) and secondary (SA) bird areas found in Kenya and the key species found in each (shape file source :http://www.wri.org/publication/content/9291)

16
KENYA 5TH NATIONAL REPORT
Figure 9 Map showing the six avian biomes in Kenya and examples of representative species for each (shapefile source:http://www.wri.org/publication/content/9291).
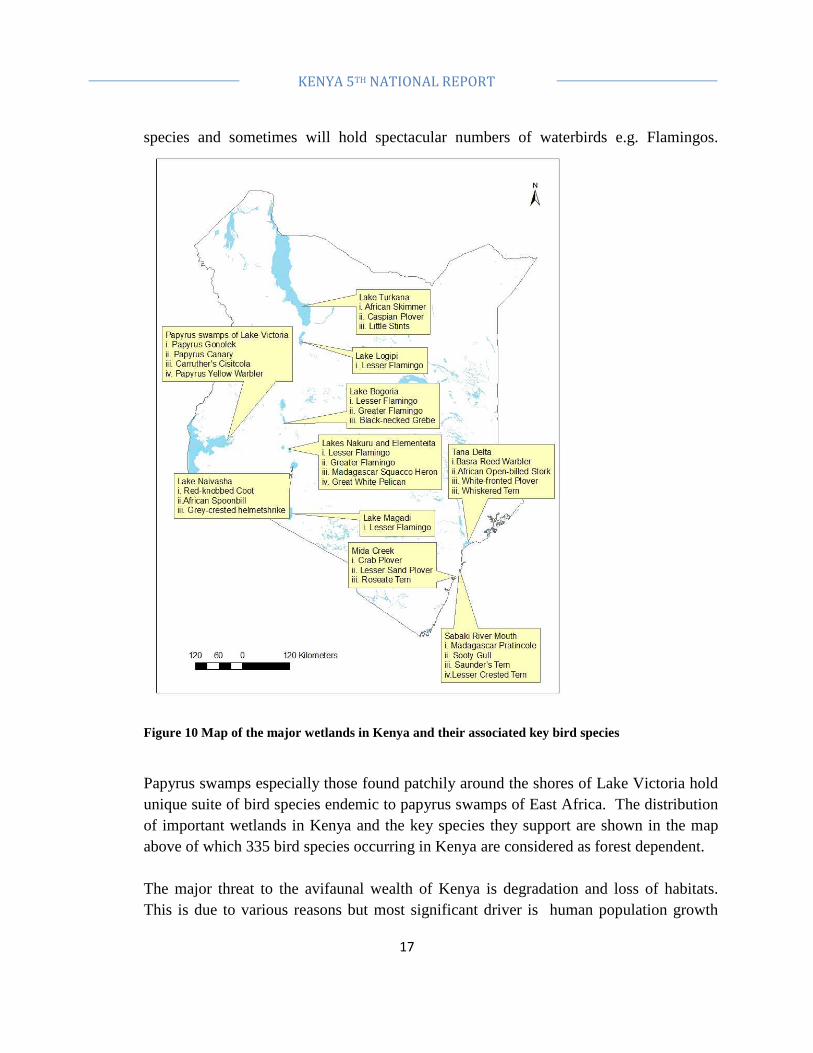
There are about 211 water birds in Kenya while the rest are termed land birds. Wetlands are an important habitat for birds in Kenya covering about 14000 km2 of the country’s land surface (Crafter et al 1992). The strongly alkaline lakes of the Great Rift Valley though lacking any fringing macrophytes are very important for a variety of water bird
17
KENYA 5TH NATIONAL REPORT
species and sometimes will hold spectacular numbers of waterbirds e.g. Flamingos.
Figure 10 Map of the major wetlands in Kenya and their associated key bird species
Papyrus swamps especially those found patchily around the shores of Lake Victoria hold unique suite of bird species endemic to papyrus swamps of East Africa. The distribution of important wetlands in Kenya and the key species they support are shown in the map above of which 335 bird species occurring in Kenya are considered as forest dependent. The major threat to the avifaunal wealth of Kenya is degradation and loss of habitats. This is due to various reasons but most significant driver is human population growth

18
KENYA 5TH NATIONAL REPORT
exerting pressure on habitats rich in bird species. Forests and wetlands are particularly under severe pressure as the need for more agriculturally productive land increases. This has seen many important bird habitats converted to agriculture e.g. Yala swamp and Busia grasslands in Western Kenya, and Kinangop grasslands in central. Other threats include alien species, climate change, pollution and illegal hunting. These threats have seen the number of globally threatened bird species occurring in Kenya increase from 14 in 1988 (Collar et al 1988) to 23 in 1994 ( Collar et al 1994) to 38 at present (IUCN 2012). Though this increase may be attributed to better knowledge about the avifaunal composition of Kenya, a large part of it reflects the rapid changes in bird habitats in Kenya. Table 2 Number of threatened species in various IUCN categories of threat in Kenya
IUCN Threat Category
Number of Species
Critical (CR) 2 Endangered (EN) 16 Vulnerable (VU) 16 Data Deficient (DD) 4 Near Threatened (NT)
28
Least Concern (LC) 1034 Total 1100
Population trends of selected bird species/groups in Kenya Waterbirds in the Rift valley lakes: Since 1991 the National Museums of Kenya and its collaborators have conducted annual waterbird counts at major rift valley lakes in Kenya.These long term data is used for monitoring and setting of threshold limits for normal changes (Owino et al 2001). Flamingo species usually outnumber other waterbirds at most of the lakes counted except the freshwater Lake Naivasha. Analysis of year on year count data shows marked fluctuations for all groups of birds usually in relation to changing local conditions (e.g. see Figure 4 below). However a long term trendline shows declines for all waterbird species over the 20 year period (Mwinami et al 2011).

19
KENYA 5TH NATIONAL REPORT
Figure 11 Trends of Flamingo numbers at Lake Bogoria 1991-2010 (source:Mwinami et al 2012)
Birds of prey: At least 76 diurnal species of raptors (birds of prey) occur in Kenya and because they cover a broad spectrum of ecological requirements and susceptibility, their presence indicates changes and impacts of ecosystems and human activity respectively (Newton 1979). They are however among the most threatened bird group in Kenya. For example of the eight species of vultures that occur in Kenya only three (Palm-nut Vulture Gypohierax angolensis, Lammergeier Gypaetus barbatus and Hooded Vulture Necrosyrtes monachus) are not listed in the IUCN red list of threatened species while the Egyptian Vulture Neophron percnopterus once common in Kenya is now virtually extinct. In a 20 year monitoring study around the Masai Mara region Munir et al (2011) recorded staggering declines in abundance of once common scavenging species. The trend is repeated elsewhere with Sokoke Scops Owl-a regional endemic species only known to occur at three sites in East Africa showing disconcerting declines at Arabuko-sokoke forest, its main stronghold (see Figure 5).

20
KENYA 5TH NATIONAL REPORT
2
4
6
8
10
1993 2005 2005
Year
Mea
n ow
ls/k
m2
Jilore Kararacha
Dida Nyari
Overall
Figure 12 Population trends of the regional endemic Sokoke Scops Owl over a 10 year period at Arabuko Sokoke forest
The major pressure/threat facing the avifaunal wealth of Kenya is the degradation and loss of habitat.Most indigenous forest has been cleared for cultivation or reforestation with non-native timber, and the remaining tiny area is under serious threat from both clearance and degradation. Some species have been affected such as the Taita Thrush Turdus helleri. Elsewhere critical natural habitats for birds continue to be cleared and converted to farmland such as the Dakatcha woodlands where hilltops are being extensively cleared for cultivating pineapples, and where woodland is also being damaged by cutting of Brachylaena trees (in great demand for fuel wood and carving-timber). Apart from being the stronghold for the endemic Clarke’s Weaver Ploceus golandi, Dakatcha holds a recently discovered population of the Sokoke Scops Owl and yet to be assessed populations of other endemic taxa e.g. Golden-rumped Elephant Shrew Rhynchocyon chrysopygus. The unique high altitude grasslands of the Central Kenya highlands and Mau escarpment have experienced range reduction due to the settlement of small-scale farmers and conversion of grassland to farms and woodlots. The unique grassland are now almost

21
KENYA 5TH NATIONAL REPORT
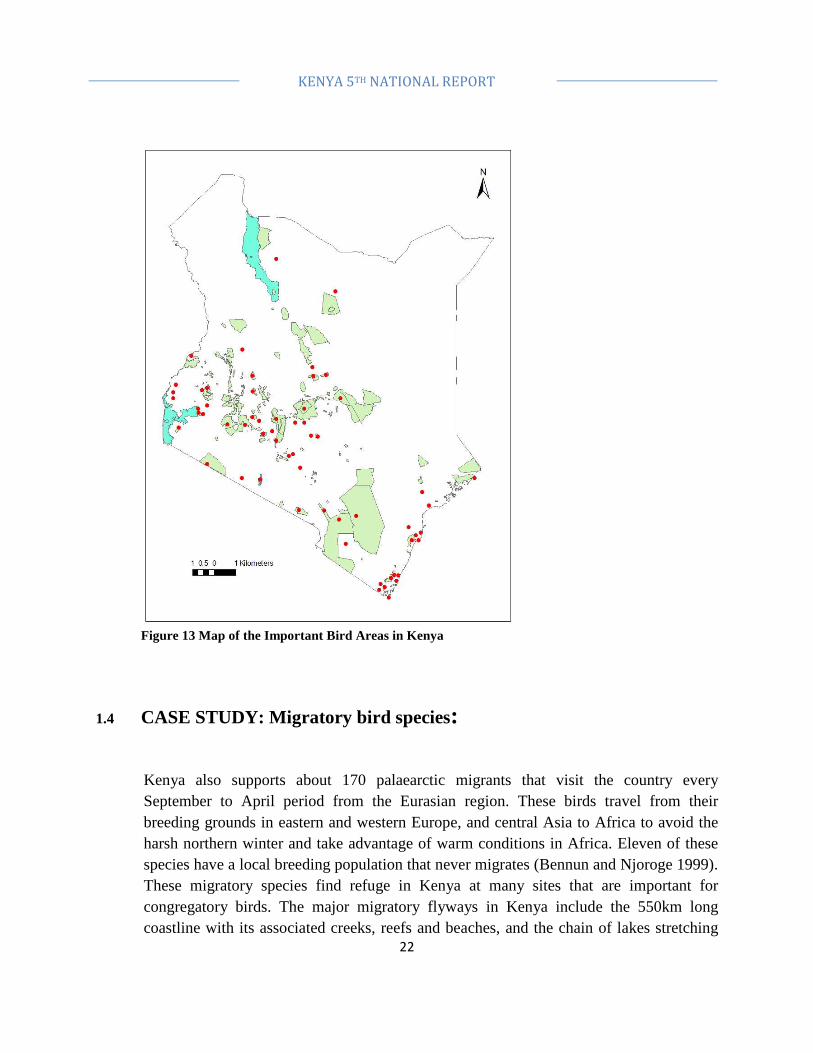
entirely on private land and therefore have no official protection. The endemic Sharpe’s Longclaw, Aberdare Cisticola and Jackson’s Widowbird are under threat in this habitat. The increasing human population density has resulted in the subdivision of farms and increasing stocking rates. Wetlands are vital for not only their environmental services are also critically threatened in Kenya. Main threat for wetland is conversion to agriculture e.g. Yala Swamp in western Kenya. Other threats are less widespread but all the same critical where they occur. These include: (a) Invasive species e.g. Lousiana Red Crayfish Procambarus clarkia, (b) Pollution-usually lethal for benthic feeding species and (c) Illegal hunting and poaching- Despite its obvious public health threat illegal hunting using pesticides such as the carbamate Furadan is common in rice growing areas of Kenya especially Mwea, Ahero and Bunyala irrigation schemes. Thousands of birds are estimated to be killed in this manner every year. Elsewhere large numbers of birds of prey are accidently poisoned when ranchers leave bait usually intended for large predators (Lions, Hyenas etc) which prey on their livestock. Conservation Interventions for Kenya’s Birds: The important Bird Areas programme in Kenya: This programme was started in the 1990s with the function of identifying and protecting a network of sites at a biogeographic scale, critical for the long term viability of naturally occurring bird populations, across the range of those bird species for which a sites-based approach is appropriate . Sixty IBAs (Figure 6 )were identified and documented following an internationally agreed criteria in the late 1990s (Bennun and Njoroge 1999). Since then two more sites – Lake Olborossat and Kwenia cliffs have been added onto the list. Since IBAs are key sites for conservation of birds and other biodiversity in Kenya the programme helped set conservation priorities for Kenya. Birds are an important focus for conservation in Kenya since they: Play major roles in the functioning of many ecosystems, particularly through pollination and seed dispersal. Are important sources of revenue through bird watching tourism and sport hunting- both growing activities in Kenya. Play a significant role as symbols and omens in many Kenyan cultures. Act as environmental and health agents such as vultures (Accipitridae and Cathartidae) which are the only known obligate scavengers. They feed on rotting carcasses and therefore help control the spread of diseases such as anthrax. Despite this useful role they are now the most threatened avian functional group.
22
KENYA 5TH NATIONAL REPORT
Figure 13 Map of the Important Bird Areas in Kenya
1.4 CASE STUDY: Migratory bird species:
Kenya also supports about 170 palaearctic migrants that visit the country every September to April period from the Eurasian region. These birds travel from their breeding grounds in eastern and western Europe, and central Asia to Africa to avoid the harsh northern winter and take advantage of warm conditions in Africa. Eleven of these species have a local breeding population that never migrates (Bennun and Njoroge 1999). These migratory species find refuge in Kenya at many sites that are important for congregatory birds. The major migratory flyways in Kenya include the 550km long coastline with its associated creeks, reefs and beaches, and the chain of lakes stretching

23
KENYA 5TH NATIONAL REPORT
along the rift valley from L Turkana in the north to L Magadi in the south (see Figure 2). Around 60 species that occur in Kenya are afrotropical migrants i.e. they migrate within Africa and the Madagascar island. Migration of Birds: At the onset of migration birds feed as much as possible to deposit fat as fuel. Some species such as Garden Warbler Sylvia borin can double their weight whilst others may only increase by around 10% (e.g. Steppe Buzzard Buteo buteo). The fat is deposited in all organs except the heart, but the bulk of it is subcutaneous. Fat is physiologically advantageous as a storage product because it produces more energy per unit weight than other foods. It also produces a lot of water, and that too is an advantage since with the necessary high rate of metabolism and high rate of breathing there must be much evaporation from the lungs. Fat accumulation is followed by a period of migratory restlessness or ‘zugunruhe’. During migration birds use various cues that include: landmarks, sun, moon, stars and magnetism to orientate and navigate. Different species of birds will migrate during the day or at night. Large Soaring birds will usually migrate by day while small birds will migrate at night. Speed of migratory flight varies with the size of the bird, the weather, and the method of flight (gliding or flapping). Speed ranges for various groups of birds: passerines, 30-50 km/h, white storks 40 -65km/h, ducks & geese 70-90 km/h, birds of prey >100 km/h. Some species will cover incredible distances during migration e.g. The Arctic Tern does a 22,000 km round trip every year!The rest of the bird species (about 800) are residents and are in the country all year around and do not migrate. They inhabit the different habitats that are present in Kenya from the seashores to the afro alpine habitats to the the northern Kenya deserts.
1.4.1.1 REPTILES AND AMPHIBIANS
The rich reptile and amphibian fauna of Kenya occur across all the major Kenyan biomes. Herpes occur in the sea (marine), moist and dry savanna, dry and moist forests, semi-deserts, deserts, wetlands (rivers, streams, swamps, lakes, manmade dams), up to alpine zones of high mountains. However, species diversity and abundance varies across these biomes. In addition while some species are widespread, some are restricted to certain biomes with some further being glued to certain sites (site-specific endemics). Over 200 reptiles (5 marine turtle, 5 tortoise, 100 snake, 100 lizard, 1 crocodile, and 5 terrapin species) and 110 amphibian species (including 5 caecilian species and the rest being frogs and toads) occur throughout the country except at the tip of high mountains such as Mt. Kenya. Due to their physiology (poikilothermic) majority of reptiles and

24
KENYA 5TH NATIONAL REPORT
amphibians occur in the warm and moist forest and savanna areas such the moist coastal strip, western Kenya (the L. Victoria basin) and the south-eastern drylands. The distribution of amphibians and reptiles in Kenya is associated with the broad vegetation types and zones in the country such as forest, woodland, grassland, wetlands, montane habitats, semi desert and desert as well as the marine. . On the extreme case some endemic and site specific species are highly restricted and rare. A good example is the Mt. Elgon torrent frog Athroleptides (Petropedetes) dutoiti which has not been found since early 1960s and the Taita Purple glossy snake Amblypdipsas teitana known only from the type specimen of 1970s. The same applies to several other rare and/or endemic species. However, some of the information paucity may be attributable to lack of sampling at the right time and place to detect the candidate species. Reptiles and amphibians in Kenya have not received much attention in terms of studies compared to other vertebrates. As a result information gaps exist in terms of species counts, and population dynamics. Due to their behaviour many reptiles especially the snakes are very cryptic and hard to study their population dynamics in a broad area. On the other hand many amphibians exhibit high variation in abundance depending on their breeding seasons that are triggered by certain weather conditions calling for proper timing in sampling. In both reptiles and amphibians the situation may even be tough for burrowing species. Therefore population counts and trends are mostly inferred from species habitat condition/state and species habits. In many amphibians the open water breeders (habitat generalists) populations are mostly stable since they are able to utilize a wide array of habitats including the human modified ones. This is the same for majority of reptiles especially lizards. On the extreme end habitat specialists (including site-specific endemics) population trends decrease with modification or loss of their preferred habitat. Exceptions are few endemic chameleons that are able to utilize farmlands edges. In general the population trend of large species of snakes such as Pythons, Mambas, Cobras, puff-adder, Gaboon Viper is decreasing because these species are top on the trophic level (carnivores) and always occurs in very low densities. Many of these historically required large areas for hunting which has now been modified into farmlands and human settlements and the few that venture out of their reserves are highly visible and spotted due to their large size and instantly killed deliberately by humans out of fear. The most important threats to amphibians and reptiles are include habitat destruction mainly driven by human population pressure, agricultural activities, mining, timber

25
KENYA 5TH NATIONAL REPORT
logging, housing, industry, transport etc. Because of their limited dispersal ability, reptiles and amphibians suffer the most due to habitat loss. Illegal collection for international trade is another threat to amphibians and reptiles in Kenya. Species like Chameleons, Pancake tortoise, Mt Kenya bush viper, Africa rock Python and sea turtles are examples of Kenyan reptiles that are targeted for trade. As a result some of the species are currently protected under The Convention on International Trade on Endangered Species of wild Fauna and Flora (CITES). In Kenya several species of reptiles are listed under various CITES appendices for controlled international trade. Some are also protected by the Kenyan Wildlife laws (Wildlife Conservation and management Act) Both amphibians and reptiles suffer from negative publicity. They are feared and/or disliked by many people as a result they are often killed whenever they are encountered. Related to the attitude problem is the fact that many people are not aware of the benefits of amphibians and reptiles and so do not care whether they live or die. There is a common fear of any snake-like-animal in morphology and all are killed even those which are harmless (a snake-is-a snake and deserves death) see Wojnowski, (2008). Climate change will in the long term affect populations due to altered temperature ad rainfall patterns which may adversely affect amphibian breeding patterns.
1.4.1.2 BENEFITS OF REPTILES AND AMPHIBIANS
Ecosystem balance: reptiles and amphibians are the most important second and third level consumers in the food chain and are the primary predators on invertebrates in many ecosystems. Source of food; Most important source of proteins in some societies for example US imports of amphibians from India, and China has led to controlling the harvest because of flare up in insects. Crocodile meat and turtle eggs etc are also know to be delicacies in various communities. Research and education: Amphibians have form part of Biology classes as they are commonly dissected in laboratory for physiological studies. Pest control: Both amphibians and reptiles mainly feed on insects/rodents and hence offer a good biological pest control to farmers. Aquatic amphibians are also known to feed on mosquito larvae and hence help in the control of malaria. Bio-indicators: Amphibians have a semi permeable skin through which substances like agro-chemicals and other pollutants may penetrate. As a result they are among the first

26
KENYA 5TH NATIONAL REPORT
vertebrates to be affected in polluted environments and hence they act as good bio-indicators by giving early warnings to humans. Leather: Leather from the skin of reptiles like crocodiles are used to make shoes, handbags, and belts of high quality. Medicine: Venom from various snake species are being explored for the possibility of their application in medical industry for example, venom from Boomslang (Dispholidus typus) is being explored for treating Hemophilia. Some threatened species listed under the IUCN Red list categories include all the five marine turtles (e.g. Hawksbill Turtle Erytmochelys imbricata : CR –Critically endangered), Shimba Hills Reed Frog Hyperolius rubrovermicualtus: E (Endangered); Forest Spiny Reed Frog Afrixalus sylvaticus: E; Arthroleptides dutoiti: CR; Sagalla caecilian Boulengerula niedeni: CR; Irangi Forest Puddle frog Phrynobatrachusirangi: E, among others.
1.4.1.3 SMALL MAMMALS:
Mammals are an important part of various ecosystems and have economic, cultural and aesthetic values to humans. Small mammals represent over 60% of all mammalian diversity on earth (Schipper et al., 2008). However, these species have been largely neglected by conservation planning and political initiatives (Amori & Gippoliti, 2000). Among the mammals, rodents are the most numerous in terms of species richness, but the least known in terms of conservation issues (Amori and Gippoliti 2000, 2001, 2003). Scant information exists on the faunal diversity, distribution and natural history of small mammals (orders Rodentia, Lagomorpha, Afrosoricida, Macroscelidea, Erinaceomorpha, Soricomorpha and Chiroptera) in East Africa, because they are cryptic, concealed or ‘non majestic’ (Oguge et al., 2004). Kenya, is one of the most important countries in Africa for conservation of rodents and insectivores (order Soricomorpha) because of the large numbers of uniquespeciesfound within her boundaries (Amori, et al., 2012). Habitat degradation is currently the main anthropogenic threat to the survival of small mammals. This has been occasioned by agricultural expansion, urban sprawl, logging, pollution, mining and park management practices. The past few decades have seen pressure mount on wildlife habitats as land use /cover change take toll on wildlife habitats. Kenyas population growth rate currently stand at 2.9% p.a. This has increased the demand for agricultural land and has seen many wildlife habitats converted to

27
KENYA 5TH NATIONAL REPORT
agriculture (Republic of Kenya 2009; Mbau et al., 2013). In addition the impacts are felt largely for the niche specific species whose adaptation mechanism cannot match the rate of habitat degradation. Commercial mining has also seen crucial habitats for endemic, threatened, rare and data deficient species along the coastal dwindle, e.g. Kaya Mrima in south coast ( Mbau et al., 2010).Roads and nature trails many protected areas are not established in consideration of small mammals’ ecology and distribution. These are a threat to some wildlife populations (Forman et al. 2003), because they fragment continuous habitats (Wilcox and Murphy 1985; McGregor, et al., 2008), increase edges which may be avoided by interior species (Ranney et al. 1981) and preferred by others (Andrews, 1990; Johnson et al. 1979). Additionally, the resulting patches become barriers which may prevent animal dispersal (Merriam et al., 1989; Rondinini & Doncaster 2002; Shine et al., 2004; Whittington et al., 2004) or increase animal mortality (Osawa 1989; Jones, 2000; Rosen and Lowe, 1994; Drews, 1995). Roads and nature trails in protected areas in Kenya, might be causing the loss of micro-habitats preferred by small mammal species. Climate change. The inability of small mammal species to physiologically adapt to climate change effects (exceeded temperature tolerances) at the same rate will inevitably threaten their survival.Climate change will increase the variability of weather patterns and extreme events such as droughts, frosts, floods, cold or hot spells, and fire outbreaks leading to change in species distributions and ecological communities, changes in their geographic ranges, changes in species composition within communities in concert with increasing local temperature. For many widely distributed species, higher temperatures may lead to major losses of ecotypes and associated genetic materials. Rainfall pattern will affect ecosystem stability, for example by influencing movements, migrations/ dispersals of animals thus influencing ecosystem structure and functioning. This can lead to biodiversity loss through changes in the structure of primary producers and primary consumers such as small mammals.
1.4.1.4 The value of small mammals in Kenya
Small mammals play crucial ecological roles in the ecosystem, and are of economic importance to human. Ecosystem services such as pollination, disease and pest control: Bats have been known to undertake pollination of over 300 plant species. Among these plants are Boabab trees, Mangoes, guavas and bananas. Bats feeding on fruits also help in forest regeneration through seed dispersal. In addition 70% of bats feed on insects such as mosquitoes and agricultural crop pests thus assisting in containing spread of malaria and

28
KENYA 5TH NATIONAL REPORT
crop pests management respectively. (Taylor & Kankam, 1999; Medellin & Gaona, 1999; Henryi & Jouard, 2007), while insect bats feed on insects, some of which are agricultural pests (Tyalor, 2000; Pierson and Kunz, 1994). Research on diseases : Small mammals have played a key role in enhancing research at the Center for Disease Control (CDC) in Kenya. Likewise bats have been implicated in the study of viruses that have the potential of being transmitted to human beings. Rodents for instance are agricultural pests (Makundi, et al, 1999) and carriers of potentially deadly diseases (Neerinckx et al., 2010) and assist in seeds dispersal (Gautier-Hion et al, 1985). Bats on the other hand are carriers of viruses which can potentially be transmitted to humans (Taylor, 2000). Environmental monitoring Some small mammals such as bats are sensitive to pollution and pesticide levels; they can be useful as a warning sign for potential environmental problems.
1.4.1.5 FISHES
The economically important marine fishes can primarily be categorized as demersal, pelagic, sharks and rays, crustaceans, molluscs and other finfishes. The marine fisheries have been quite stable until early 1990s when there was a drastic decline on all the major groups above. Nzioka (1984); Pitcher et al. (1995); Rabuor and Polovina (1995), also caution on possibilities of overexploitation of these resources. The contribution of marine fisheries to the total national yields is extremely low despite its enormous area of 157,500 km2. Mohamed (1998) attributed this, partly to the preference of inland fishes by early investors and partly to technological inability to exploit the offshore fish stocks. Garcia and Reste (1981); Turner and Brody (1983); Regier et al. (1990) and Turner (1992) noted that shrimp fishery, though low in tonnage, is the most important fishery resource at the coast. It is however, important to note that, inadequate fishing technology encourages overexploitation of inshore coastal waters yet there is a vast area of over 200 nautical miles. Coral reefs form the dominant ecosystem along the majority of the Kenya coast, creating habitats for sea grasses and mangroves in the lagoons and creeks protected by the reef crests. Kenya's marine environment faces a number of threats from the growing coastal human population estimated at just fewer than three million in 2000. Extraction of fish and other resources from the narrow continental shelf, coral reef and mangrove ecosystems increases each year with inadequate monitoring and management structures to protect the resource bases. Coastal development in urban and tourist centres proceeds with little regard for environmental and social impacts. With a faltering economy,

29
KENYA 5TH NATIONAL REPORT
industrial development in Mombasa proceeds with few checks on pollution and other impacts. In 1998 Kenya's coral reefs suffered 50-80% mortality from the El Niño-related coral bleaching event that affected the entire Indian Ocean.
Figure 14 Catch statistics for Marine fishes in Kenya, 1994 – 2006 (Data Source, Fisheries Department annual Reports, 1994 – 2006)
Overfishing/unsustainable fishing/chemical fishing, Pollution and habitat loss, Impact of global climate change on marine ecosystem, Use of more selective gears to reduce bycatch, Oil and human activity, Fish trawling, Mineral and energy mining e.g. recent discovered titanium ores, Clearing of mangroves area to reclaim land for other use e.g. aquaculture, salt manufacture, agriculture. The institutional, human resource and legal infrastructure for managing the coastal environment has in the past been low, however these are rapidly improving with the revitalization of national institutions and the passing in 1999 of an Environment Act. Marine Protected Areas are the key tool currently used in management of marine ecosystems, and focus principally on coral reefs and biodiversity protection. New initiatives are underway to improve application of fisheries regulations, and to use

30
KENYA 5TH NATIONAL REPORT
Integrated Coastal Area Management (ICAM) as a framework for protecting marine and coastal environments. Conservation of fisheries resources in Kenya has been restricted by various anthropogenic activities and threats that include; invasive species, river channelization and water obstruction, pollution from industrial wastes and agro-chemicals, destructive fishing gears, climate change, deforestation leading to siltation, habitat fragmentataion and loss, overfishing and dam construction (Darwall et al,. 2011, Nyingi, et al., 2009). Other threats to fish conservation are water management, urban development, natural habitat change, riverbank farming and aquaculture. The status of the inland fishery resources in freshwater ecosystems in the country is poorly documented. Even though no quantitative population data exists on individual species trends particularly of those that are not commercially exploited, where fisheries data exist, they are mostly generalized catch data which cannot be accurate in predicting population trends because they are affected by catch effort and selectivity for target (commercially viable) species. However, population trends for Bracynus jacksonii, Acolapia grahami, Oreochromisesculentus, O. jipe, O. hunteri and O. variabilis show declining trends. Similar to other African freshwater fishes, most of the species in Kenya have been categorised as ‘Least concern’. According to (Darwall et al,. 2011), such populations are sparsely distributed in habitats that face no major conservation threats. The resulting impacts from increasing destruction of water catchment areas like extensive soil erosion, flooding, increased turbidity and reduced water quality may cause irreversible changes to fish habitats. The seasonality changes of habitats endanger fish species that are not able to physiologically adapt (Lowe-McConnell, 1987). Changes induced by anthropogenic activities like overgrazing, riverbank farming and shifting cultivation endanger fish species by alteration of habitats quality. Excessive nitrates can change an ecosystem in ways that make it impossible for oligotrophic fish species to survive. The dependence of freshwater fishes on aquatic environment renders them extremely vulnerable to changes in land use systems and alteration of riverine vegetations. Kenya has over sixty fish species that are endangered and IUCN red listed. Conservation status of Kenyan fishes (figure 3). Some of the critically endangered species include: Oreochromis esculentus, O.hunteri, O.jipe and O.variabilis while possibly extinct species are Ctenochromis pectoralis, Aplocheilichthys spec. ‘Naivasha’ and Xenoclarias eupogon.
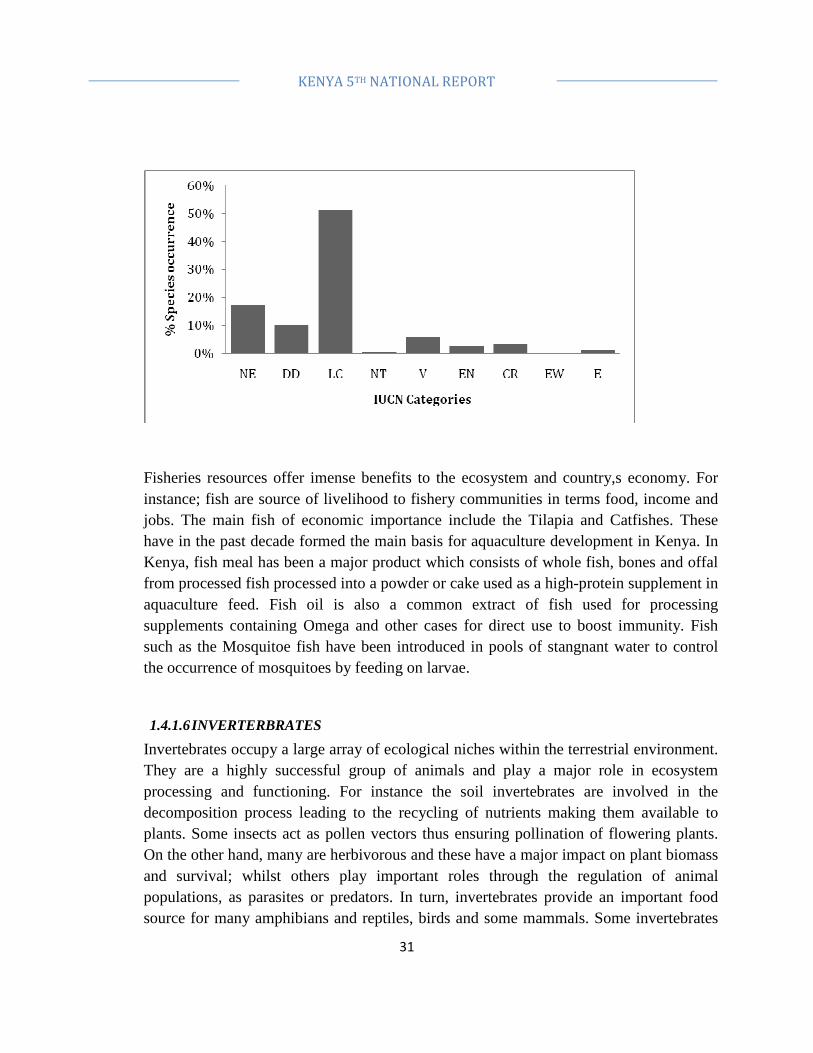
31
KENYA 5TH NATIONAL REPORT
Fisheries resources offer imense benefits to the ecosystem and country,s economy. For instance; fish are source of livelihood to fishery communities in terms food, income and jobs. The main fish of economic importance include the Tilapia and Catfishes. These have in the past decade formed the main basis for aquaculture development in Kenya. In Kenya, fish meal has been a major product which consists of whole fish, bones and offal from processed fish processed into a powder or cake used as a high-protein supplement in aquaculture feed. Fish oil is also a common extract of fish used for processing supplements containing Omega and other cases for direct use to boost immunity. Fish such as the Mosquitoe fish have been introduced in pools of stangnant water to control the occurrence of mosquitoes by feeding on larvae.
1.4.1.6 INVERTERBRATES
Invertebrates occupy a large array of ecological niches within the terrestrial environment. They are a highly successful group of animals and play a major role in ecosystem processing and functioning. For instance the soil invertebrates are involved in the decomposition process leading to the recycling of nutrients making them available to plants. Some insects act as pollen vectors thus ensuring pollination of flowering plants. On the other hand, many are herbivorous and these have a major impact on plant biomass and survival; whilst others play important roles through the regulation of animal populations, as parasites or predators. In turn, invertebrates provide an important food source for many amphibians and reptiles, birds and some mammals. Some invertebrates

32
KENYA 5TH NATIONAL REPORT
(particularly insects) are highly mobile, with small home ranges and key roles in the ecology of that range. Although a lot of ecological studies have been undertaken in Kenya on both terrestrial and aquatic invertebrates of Kenya, the number of species represented in the country remains unknown to the prevailing taxonomic impediment. However, some specific groups are well documented such as moths and butterflies, termites, mollusks although the data available is mainly site specific. According to the available national collection and database at NMK, there are over 35,000 described taxa and thousands of invertebrate material remains undescribed. With the going current habitat degradation trend as well as the perceived climate change effects, there is need for a rapid invertebrate assessment in key habitats where no records exist. Both terrestrial and aquatic invertebrates of Kenya are often directly exposed to pesticides, as they live in a number of habitats which are deliberately sprayed to control insect pests, fungi or weeds or to protect human beings from disease vectors. Others are directly exposed by deposition of insecticide sprays which miss their target, e.g. soil-and water dwelling invertebrates in sprayed farms close to forests or wetlands. In either case, exposure may be through contact or ingestion. Other invertebrates may be indirectly affected through the removal or reduction of food sources, be they vegetable, fungal or animal. Insecticides are designed specifically to kill insects and thus most invertebrates are sensitive to these chemicals. Sensitivity to other pesticides varies, but some herbicides and fungicides are also directly and highly toxic to this group of organisms. Other threats to invertebrates include habitat modification and fragmentation, pollution, alien species, fires and climate change. Whilst a lot of emphasis has been made on the conservation of the ''big 5'' very little is said about the invertebrates as the survival of mankind and the rest of biodiversity is dependent on the ecosystem services delivered or facilitated by the in invertebrates e.g. pollination and nutrient recycling services. Given the wide diversity of both terrestrial and aquatic invertebrates in Kenya, only a few functional group summaries are presented.
1.4.1.7 Bee diversity in Kenya
Studies on bee fauna have been seldom in Kenya until recently when community studies were undertaken in various regions in Kenya (Gikungu, 2002; Gikungu, 2006; Gikungu et al. 2011). However, about 900 species of bees are estimated in Kenya with increased

33
KENYA 5TH NATIONAL REPORT
pollinator survey in poorly studied areas. Majority of bee species remain poorly understood by farmers in Kenya and it is only the Apis mellifera that is commonly known. Bees are found in all warm terrestrial habitats where there are floral resources (nectar and pollen) as well as nesting sites or substrates. The richest bee habitats in Kenya include Kakamega forest where over 240 bees were documented by Gikungu (2006), Coastal forests and savannah ecosystems. Studies in the City of Nairobi have revealed that the urban areas can also serve as important bee refugia. Over 90 species of bees have been documented in Nairobi City Park . The abundance and diversity of bee population reveals spatio-temporal variation following seasonal changes and modification of habitats. Some bee species emerge during certain periods of the year while others are common throughout the year. Social bees such as Honeybees and stingless bees have perennial colonies are abundant throughout the year compared to solitary bees.
Advanced secondary forest
Young secondary forestModerate secondary forest
0
1
2
3
4
5
6
0 1 2 3 4 5
Scale parameter
Ren
yi´s
div
ersi
ty in
dex
Pre-mature forestMature forestFarmland
Guava bushland
Figure 15 Adapted from Gikungu et al. 2011
1.4.1.8 Butterflies and Moths (Lepidoptera) in Kenya
Butterflies in Kenya have been studied to some detail and over 900 butterfly species are found in the habitats across Kenya (Larsen 1996; Namu et al., 2008, Lehman and Kioko, 2005). An estimated 487 butterfly species have been recorded in Kakamega Forest alone (Collins, 2008). The species represents all the five Kenyan buttefly families namely:

34
KENYA 5TH NATIONAL REPORT
Papilionidae, Pieridae, Lycaenidae, Nymphalidae and Hesperiidae. Kakamega. Kakamega Forest butterfly fauna, therefore, comprises of about 54% of all the butterfly species known to Kenya. This emphasizes that the forest is an important biodiversity area in conservation of Kenya’s natural resources The conservation status on butterflies and invertebrates in general is not available or not well explored. This is mainly because the taxa have not been subjected to a rigorous IUCN evaluation and as most are still data deficient. Butterflies are definitely facing challenges of habitat destruction as it is evidenced on current threats to their flora and habitats. Butterfly farming/Eco tourism: Kenya records the presence of some of Africa’s most beautiful butterflies. These among others include Charaxes species which are large colourful butterflies, flying in great speed and present a splendid sight to watch; Junonia species which have beautiful colours; One species of the genus Salamis (the mother of pearls)- an exclusively Afrotropical group consisting of the prettiest of all African butterflies; genus Neptidopsis an exclusively African group; genus Papilio with 17 species represented in Kenya, among them P. dardanus, a large butterfly and one of the most fascinating in Africa and Genus Danaus with a single African representative D. chrisippus which has a lot of interest being a model in mimicry complexes. The diverse butterfly species can be utilized for butterfly farming and for eco-tourism (butterfly walks) to ensure proper mitigation against the threats facing biodiversity conservation. Butterfly farming has been pioneered in Kenya at the Arabuko Sokoke Forest (Gordon & Ayiemba, 2003). Role of Lepidoptera as food sources in Africa, insects have been used as traditional foods among indigenous people and have played an important role in the history of human nutrition. Although insects are generally viewed as crops pests and vectors of diseases, several taxa such as moth larvae and pupae have been used as important food sources. Moth larvae have great potential to provide animal proteins for human consumption, either directly, or indirectly as livestock feed. Oyegoke et al (2006) has demonstrated the potential of edible Lepidoptera larvae of Cirina forda in poultry feed, solving a major constraint facing the poultry industry.Malnutrition in developing countries is as much, or more, a problem of calorie deficiency as of protein deficiency. Insects vary widely in fat (and, thus, energy) content. Lepidoptera (caterpillars) rank among the highest in fat. Along the coast, several species of moth larvae are consumed including Bunaea alcinoe, Cirina spp.

35
KENYA 5TH NATIONAL REPORT
Injurious Lepidoptera: Some moths have larvae that cause damage to crops. These include : species like the armyworms, Spodoptera species (Noctuidae); the diamond backmoth, Plutella xylostella (Yponomeutidae) which are pests of cruciferae; stem borers, Busseola fusca, Sesamia spp. And the invasive Chilo partellus; stored product pests like Sitotroga cerealella (Gelechidae).
1.4.1.9 Role of Lepidoptera in Sericulture
Sericulture is the process of rearing silk-producing insects in captivity or collecting their silk in the field for human use, mainly leading to the production of fabrics. In the world, there are about 400 -500 species of silk-producing moths, out of which 8-9 are known to produce silk of commercial value. Natural silk is broadly classified as mulberry or domesticated silk from Bombyx mori L. (Lepidoptera: Bombycidae), which produces 95-99 % of the silk under commercial use in the world today (Raina et al., 2009, 2011), and non-mulberry silk (Kioko et al., 1999a,b, 2000a,b, 2007; Fening et al., 2008a,b). Wild silkmoths or non-mulberry silkmoths are generally those that are not reared in captivity. Instead of rearing the moths, people collect cocoons from wild populations. In some cases, some semi-captivity rearing is done, often outdoors with little or no protection of the larvae (Kioko et al., 2000a, b; Ngoka et al., 2008). Despite great efforts by various National and International Agencies, raw silk production has failed to keep up with the steady rising demand. Some of the leading mulberry silk producing countries such as India, Japan and China appear to have reached saturation point, attributable to the acute scarcity of labour and the increasing cost of production. This offers developing countries an opportunity, with the enabling environment (surplus labour, land and ideal climate) to raise their silk production for the developed world market. For this reason, the high quality untapped non-mulberry silk has drawn the attention of silk users (Raina et al., 2009, 2011; Kioko et al., 2000a). In addition, the low volume of wild silk production offers an exclusive niche market where scarcity and naturalness is highly valued, leading to a high price for fabrics made from wild silk. In Africa, development of sericulture technology as a rural cottage industry is needed to enhance the income generation potential of the poor-resourced rural communities and to ensure the conservation of the rich biological diversity ( Raina et al., 2009, 2011;Kioko et al., 2007; Fening et al., 2008a). Research on the utilization of silkmoths as a source of income for rural communities and conservation of biodiversity in Kenya has been going on for years at the International Center of Insect Physiology and Ecology (icipe) supported by the International Fund for

36
KENYA 5TH NATIONAL REPORT
Agricultural Development (IFAD) (Kioko et al., 2000a,b; Raina et al, 2011). The potential of the East African indigenous species for wild silk production has been documented in Kenya (Kioko et al., 2000a; Raina et al., 2009, 2011) Gonometa postica Walker (Lasiocampidae), Argema mimosae Boisduval (Saturniidae), Anaphe panda Boisduval (Thaumetopoeidae)and Epiphora species have been reported as potential wild silkmoths species in different regions of Kenya (Kioko et al., 1999, 2000a, b; Ngoka, 2003; Ngoka et al., 2008; Mbahin et al., 2008). Table 1 shows some of the localities where these species have been recorded in Kenya. Wild silkmoths farming face challenges parasitoids and predators. Some for A. mimosae have been recorded in Southern Africa and also East Africa making parasitism one of the major challenges facing wild silk production (Kioko et al., 2007; Fening et al., 2008a).
1.4.1.10 Prawns
Important prawn species which are harvested as food sources for local and export market include five penaeid species; Penaeus monodon, P. indicus, P .japonicus, P. semisulcatus and Metapenaeus monoceros commonly caught within the shallow continental shelf in the fishing grounds of Malindi and Ungwana Bay by commercial prawn trawlers and also in estuaries and deltas by artisanal fishermen. The caridean shrimps Nematopalaemon tenuipes are caught alongside the penaeid prawns by trawlers in shallow areas. The prawn juveniles utilize estuaries and deltas colonized by mangroves trees. According to the Fisheries Department statistics, 2006, commercial prawn catches have been fluctuating over the years with a decrease in 2001-2004 (Figure 1). However no individual prawn species population trends are available in fisheries statistic data.
Figure 16 Prawn catches by trawlers in Kenya (Source; Fisheries Department 2006).

37
KENYA 5TH NATIONAL REPORT
The deep seaprawn Penaeus marginatus are caught by commercial trawlers in deep sea waters of upto 200m deep off Malindi although there are no available catch records of this species to monitor their population trends. IUCN Redlist: Most species have not been assessed for listing in the IUCN Red list (See Fig.2). However there are no endemic species.The main threats are overexploitation/overfishing, pollution, global climate change.More research/surveys on their abundance and distribution to monitor their population trends with view for evaluation for IUCN Red-listing. Conservation issues: No species-specific conservation measures in place but a new Prawn fishery management plan has been prepared by Ministry of Fisheries and now in the process of being implemented.

38
KENYA 5TH NATIONAL REPORT
2 MAIN PRESSURES ON BIODIVERSITY About 8% of Kenya’s land area included in the protected areas and various new special status sites are at different stages of development, with significant community involvement. The key global threats are mirrored at different intensities on the national and local scales. These are outlined below.
2.1 Rapid population growth Kenya’s human population growth rate presents an overarching threat to the country’s biodiversity, one upon which all other threats stem from. The population continues to grow at an estimated 2.9 percent per year – far faster than food production. Kenya’s population stands at about 40 million. This represents a tripling since the late 1960s and represents an effective decline in per-capita food production base (Figure 1). From a population of about 8 million in 1960, the population is projected to reach 51 million by 2025,96.9 million by 2050 and 160 million by 2100.
Figure 1: Kenya’s population growth and Shrinking land base
The overriding problem facing biodiversity in Kenya is habitat degradation, fragmentation and loss. The main drivers are human population growth, exerting pressure on biodiversity habitats and land resources; poverty leading to unsustainable use

39
KENYA 5TH NATIONAL REPORT
of land resources and biodiversity and limited financial resources to support biodiversity conservation. The interaction between human well being, drivers of change and ecosystem services in Kenya Benefits Biodiversity benefits people through more than just its contribution to material welfare and livelihoods. Biodiversity contributes to security, resiliency, social relations, health, and freedom of choices and actions. Changes in biodiversity due to human activities have been rapid since independence. The drivers of change that cause biodiversity loss and lead to changes in ecosystem services are either steady, show no evidence of declining over time, or are increasing in intensity. Many people have benefited over the last century from the conversion of natural ecosystems to human-dominated ecosystems and from the exploitation of biodiversity. At the same time, however, these gains have been achieved at growing costs in the form of losses in biodiversity, degradation of many ecosystem services, and the exacerbation of poverty for other groups of people.
2.2 Drivers of biodiversity loss The most important direct drivers of biodiversity loss and ecosystem service changes are habitat change (such as land use changes, physical modification of rivers or water withdrawal from rivers, loss of coral reefs, and damage to sea floors due to trawling), climate change, invasive alien species, overexploitation, and pollution. Improved valuation techniques and information on ecosystem services demonstrate that although many individuals benefit from biodiversity loss and ecosystem change, the costs borne by society of such changes are often higher. Even in instances where knowledge of benefits and costs is incomplete, the use of the precautionary approach may be warranted when the costs associated with ecosystem changes may be high or the changes irreversible. Kenya’s population of about 41 million people is projected to grow to 96.9 million by 2050 and 160 million by 2100. There are about 71 people per square kilometer of total land area and 348 people per square kilometer of arable land. This reflects a shortage of farming land in the country. Overall population density will increase to 114 people per square kilometer by 2030 and 170 people per square kilometer by 2050. Density for arable land will increase to 831 people per square kilometer by 2050. Other than Nairobi, Western and Nyanza Provinces already have the highest population densities. Density is projected to increase as the regions’ high fertility (5.6 and 5.4 children per woman
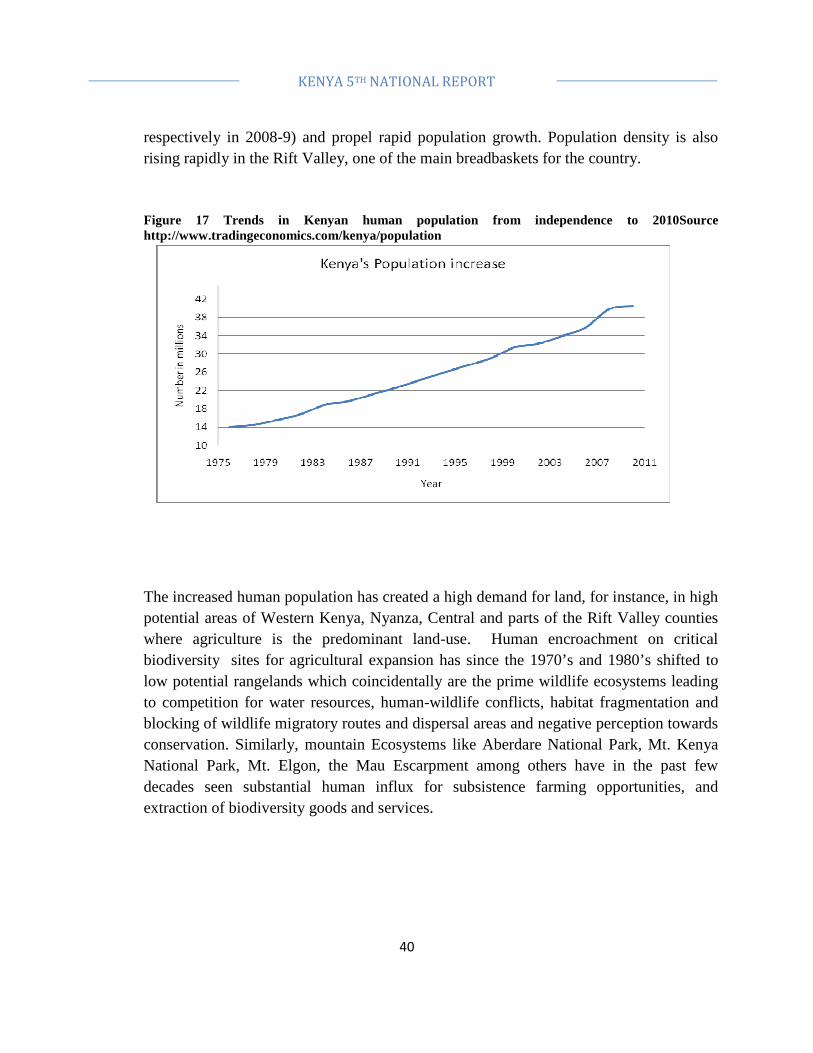
40
KENYA 5TH NATIONAL REPORT
respectively in 2008-9) and propel rapid population growth. Population density is also rising rapidly in the Rift Valley, one of the main breadbaskets for the country. Figure 17 Trends in Kenyan human population from independence to 2010Source http://www.tradingeconomics.com/kenya/population
The increased human population has created a high demand for land, for instance, in high potential areas of Western Kenya, Nyanza, Central and parts of the Rift Valley counties where agriculture is the predominant land-use. Human encroachment on critical biodiversity sites for agricultural expansion has since the 1970’s and 1980’s shifted to low potential rangelands which coincidentally are the prime wildlife ecosystems leading to competition for water resources, human-wildlife conflicts, habitat fragmentation and blocking of wildlife migratory routes and dispersal areas and negative perception towards conservation. Similarly, mountain Ecosystems like Aberdare National Park, Mt. Kenya National Park, Mt. Elgon, the Mau Escarpment among others have in the past few decades seen substantial human influx for subsistence farming opportunities, and extraction of biodiversity goods and services.

41
KENYA 5TH NATIONAL REPORT
Loss of habitats is mainly due to poor land use practices, encroachment on protected areas, unplanned and unregulated human settlement and unsustainable agricultural development. A national spatial framework (NSF) is being developed to address uncoordinated land development. For aquatic and marine environments, declining water quality due to increased pollution and siltation from poorly managed upper catchment and agricultural zones, is a key pressure. In addition, there are insufficient mechanisms to address emerging issues affecting land such as climate change, drought, floods and tsunami and storm surges among others. Inadequate capacity to preserve and conserve natural and cultural heritage within the ecosystems together with inadequate mechanisms for conflict resolution among the various resource users within the ecosystems have led to increased rates of loss of biodiversity. There are now private sector and government efforts to promote strategies to enhance community empowerment and sustainable livelihoods as well effective communication, education and awareness on landscape management reduce land degradation with associated loss of ecosystem values.

42
KENYA 5TH NATIONAL REPORT
2.2.1.1 Population growth and trends in Kenya
High population growth rates in the densely populated regions have led to rural-urban migration. The impacts of population growth on biodiversity are easy to conceptualize. Only 30% of Kenya’s landscape is classified as high potential agricultural land. Unfortunately, 70% of the population is to be found in these 30% productive landscapes. Unfortunately, the distribution of biodiversity and associated protected areas including key water towers (e.g. Mt Elgon, Mt Kenya, Aberdares, Mau Forest Complex) and other water catchments is to be found within the 30% high potential land. This presents a major conflict between biodiversity conservation, food production and settlement as all compete for the limited land and land based resources. Population increase mean that private land is now subdivided to indivisible parcels, population density outstrips the ability of land to meet people needs, biodiversity on private land is near gone and pressure on existing protected areas is at a record high. Also, due to high population growth in the densely populated regions of the country, there has been a noticeable rural-rural migration to the Arid and Semi-Arid Lands (ASAL) areas. Unfortunately, when people migrate they move with their cultures, beliefs and ways of life. That is why the agricultural communities moved with their agricultural practices into arid and semi-arid areas leading to high levels of degradation. The hunters and gatherers and those growing indigenous crops (e.g. Millet and Sorghum) switched to sedentary lifestyles and growing of improved maize crops that are not compatible with their new habitats. To plant enough maize for the population large areas of bushland are converted into cultivated fields. This affects the ecosystems of these regions rendering them more vulnerable to disasters like drought and environmental degradation
2.3 Expansion of agriculture Agriculture and livestock production remain the main sources of livelihood for the majority of Kenyans, thus average land holding per rural household had dropped to less than 1/5 hectare. Agricultural expansion has lead to serious land degradation and massive soil erosion driven by poor farming methods. Crop yields are on the decline, rivers, dams, lakes and, the Indian Ocean are experiencing severe sedimentation. Most of the agrochemicals find their way into water bodies, causing serious pollution and eutrophication. The Lake Naivasha is a case in point due to extensive flower farming around it.

43
KENYA 5TH NATIONAL REPORT
In the dry lands, irrigation is expanding with little investment in optimal water use. Inappropriate crops especially require large-scale land conversion to make up for low harvests. Chemical overload especially in high agricultural potential areas causing unacceptable loss of pollinators (e.g. bees) and other biodiversity including soil enriching microbes. Poor livestock husbandry marred by overstocking and overgrazing are exacerbating the land degradation problem. The spread of farming comes along with expansion of human settlement. Agriculture is the main stay to Kenya's economy and contributes over one-third of the country's Gross Domestic Product (GPD). It also supplies most of Kenya's exports, the most important being coffee, tea, pyrethrum, sisal and horticultural products. Other cash crops include cotton and sugar-cane. Kenya is the largest producer of quality tea in the entire African continent. Of the total agricultural land area of 57.6 million hectares, only 9.4 million hectares is high to medium potential land (DRSRS, 2008; Africover, 2000) accounting for about 17 per cent of the total land area. Of the 9.4 million hectares of high to medium potential land, 2.8 million ha is cropland.
Figure 18 Percentage of land under agriculture from 1970-2010
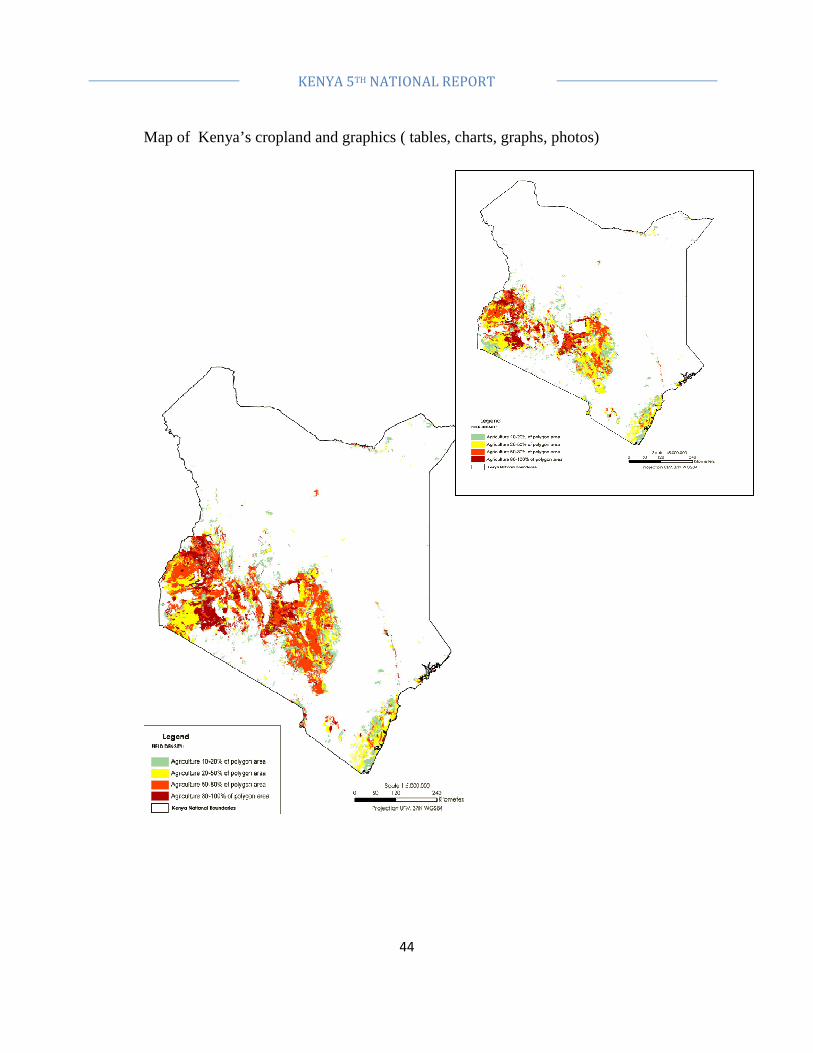
44
KENYA 5TH NATIONAL REPORT
Map of Kenya’s cropland and graphics ( tables, charts, graphs, photos)

45
KENYA 5TH NATIONAL REPORT
Agriculture and biodiversity: Kenya increasing population continues to exert considerable pressure on land. It is estimated that 48% of Kenya’s land area is under a form of agricultural production. The rate of conversion from natural and natural is very high and is in line with the rate of population increase. Direct Drivers of change include: poor farming methods that lead to massive soil erosion leading to loss of crop yields, sedimentation in rivers and ultimately lakes and the Indian ocean; inappropriate crops especially in the dry lands where crops are not grown based on land capability resulting the large areas of natural habitat being converted to crop fields to make up for low harvests; poor livestock husbandry marred by overstocking and overgrazing exacerbating the soil erosion problem; chemical overload especially in high agricultural potential areas causing unacceptable loss of pollinators (e.g. bees) and other biodiversity including soil enriching microbes; bio-energy crops which take up large areas of natural habitat outright replacing wildlife habitats in community lands and causing serious impacts associated with climate change. Where water exists especially in dry lands irrigation is thought of as a follow back option to produce food. These problems can be linked to indirect drivers that include: high population increase that outstrip the ability of the land to provide enough food; lack of agricultural spatial land use plan leading to land uses not based on agricultural capability; poverty resulting to low capital investment in sustainable production technologies; poor policy implementation resulting from weak institutions caused by insufficient political will to prioritise resources allocation to sustainable food production. The impacts arising from this insufficient recognition of sustainable production systems include: Loss of wildlife habitat and associated economic gains; food insecurity causing hunger and famines that overstretch the economy and provision of other services as government has to provide food relief to the masses whose daily income is less than a dollar; soil infertility that leads to low farm yields for food and pasture leading to serious loss of livestock and wildlife at times of drought. Also, soil biodiversity including micro-organisms that should enhance fertility and pollinators that should boos production are lost due to over use of chemicals. Due to soil erosion, most of the chemicals find their way in Lakes and the Indian ocean causing serious eutrophication which serious affect fresh water and marine biodiversity. The Lake Naivasha is a case in point where flower farming and agricultural activities are causing slow ecological death of the lake. There must be a major policy shift, institutional capacity building, agricultural extension

46
KENYA 5TH NATIONAL REPORT
services and sound water use and planning for irrigation if the twin objectives for meeting the needs of people and biodiversity are to be achieved.
2.4 Overexploitation of biological resources Poaching and uncontrolled harvesting are major contributors to the decline of biodiversity. The seriousness of poaching is well known, especially in relation to elephants and rhino. Poaching for meat and trophies has been responsible for the precipitous declines in several other species over the last 30-40 years. According to DRSRS estimates, the biggest declines were registered by the Hunter’s hartebeest or hirola (Beatragus hunteri) with numbers dropping by 77% over the 1970s-1980s. Lesser kudu declined 71% over the same period. The late 1980s and 1990s ushered in an era of heavy declines in Grevy’s zebra (Equus grevyi) at (74%), followed by kongoni at 68% and topi (Damaliscus lunatus), at 65%. Less well documented is the illegal harvesting of plant species such as the African Sandalwood tree (Osyris lanceolata), exploited for its essential oils used in perfumes.
2.5 Climate change Climate change is another major challenge to species and biodiversity in general. The full unravelling of climate change, expected to involve more rainfall over much of eastern Africa, could lead to improved conditions for crop cultivation and enhance pressure from land use change. Most climate projections indicate that, on average, annual temperature is likely rise 1- 4°C by the end of the century with the country is likely to become wetter in both rainy seasons. Rainfall is projected to increase especially in northern and western Kenya. Consequently flood and drought events are likely to increase in both frequency and severity. Species that have long reproductive cycles would have particularly critical adaptation needs. Climate change also makes wildlife populations prone to new diseases.
2.6 Invasive alien species A number of species have recently emerged as particularly serious threats. The tick berry (Lantana camara) has already invaded a number of parks, including Nairobi and Oldonyo national parks. It forms dense, bushy undergrowth that inhibits the growth of the natural vegetation. The Velvet mesquite (Prosopis juliflora), while not yet recorded in any protected areas, is already a serious problem to native plant species in several parts of the country. The same is true of Mauritius thorn (Caesalpinia decapelata) and several other plant species. Aquatic and wetland biodiversity is seriously compromised by alien

47
KENYA 5TH NATIONAL REPORT
invasives. Notable among these is the water hyacinth (Eichhornia crassipes), that has been described as the world's worst aquatic weed. The Red water fern (Azolla filiculoides) has already been described as rampant in the wetlands of Amboseli. A number of naturally occurring pathogens and parasites can become a vexing problem as wildlife and people come into closer contact. This has already been cited in the case of primates. For example, a tuberculosis outbreak was reported in a group of olive baboons (Papio anubis) that frequented a slaughterhouse dump.
2.6.1.1 Alien/invasive animals
Coypu rat (Myocastor coypus); Speckled mousebird (Colius striatus); Ring-necked pheasant (Phasianus colchicus); Mute swan (Cygnus olor); Chaffinch (Fringilla coelebs); House finch (Carpodacus mexicanus); Common indian myna (Acridotheres tristis); Rose-ringed (ring-necked) parakeet (Psittacula krameri); Common (european) starling (Sturnus vulgaris); Rock dove (feral pigeon) (Columba livia); Beautiful fruit dove (Ptilinopus pulchellus); Black-chinned fruit dove (Ptilinopus leclancheri); Coroneted fruit dove (Ptilinopus coronulatus); Mariana fruit dove (Ptilinopus roseicapilla); Pink-spotted fruit dove (Ptilinopus perlatus); Wompoo fruit dove (Ptilinopus magnificus); Speckled mousebird (Colius striatus); House crow (Corvus splendens); Red-billed quelea (Quelea quelea); Red-headed agama lizard (Agama agama); Brother’s island tuatara lizard (Sphenodon guntheri); Orange-throated whiptail lizard (Aspidoscelis hyperythra beldingi); Rainbow kopje skink (Lampropholis delicata,); Brown tree snake (Boiga irregularis); Red diamond rattlesnake (Crotalus exsul); Burmese star tortoise (Geochelone platynota).
2.6.1.2 Alien/invasive plants
Mathenge (velvet mesquite) (Prosopis juliflora); Tickberry (Lantana camara); Nile cabbage (Pistia stratiotes); Yellow oleander (Thevetia peruviana); Crown of thorns (Acanthaster planci); Mauritius thorn (Caesalpinia decapelata); Jimsonweed (Datura stramoniun); Yellow bells (Tecoma stans); Mexican poppy (Argemone mexicana); Long spine cactus (Opuntia exaltata); Sweet prickly pear (Opuntia ficus- indica); Drooping prickly pear (Opuntia vulgaris); Water hyacinth (Eichhornia crassipes).
48
KENYA 5TH NATIONAL REPORT
3 IMPACTS AND TRENDS IN ECOSYSTEMS AND SPECIES TRENDS IN ECOSYSTEMS The extensive network of protected areas gazetted as national parks and reserves offer a greater opportunity for Kenya’s biodiversity conservation. Details are available from the following websites. www.kws.org (conservation, national parks and reserves) http://www.kws.org/research/priority_ecosystems.html (research on priority ecosystems) www.kenyaforestservice.org(ForestConservancies tp://www.kenyaforestservice.org/index.php?option=com_content&view=category&id=98&Itemid=571) Biodiversity Research and Collections http://www.museums.or.ke/content/blogcategory/44/83/) Kenya Atlas of our changing environment (http://www.unep.org/ecosystemmanagement/Publications/Publication/tabid/439/language/en-US/Default.aspx?BookID=4014) Endangered ecosystems: Mara National Reserve, Mara Conservancy, Siana, Koiyaki, Olare Orok Lemek, Ol Pieyei, Loita hills, plains and forest, Suswa, Nguruman, Maji Moto, Ol Choro Orua, Ol Gulului/ Lolorashi Group Ranch, Mbirikani Group Ranch, Kuku A and B Group Ranches, Selengei Group Ranch, Ol Gulului Trust Land, Kimana Group Ranch, Rombo Group Ranch, West Chyulu National Park,Mashuru, Nairobi National park, Athi-Kitengela & Kaputei Plains, Machakos ranches, Lake Nakuru N.P and its catchment, Mau Forest Complex, Soysambu Ranch, Marula Ranch, Lake Elementaita and its catchment and its basin, Soysambu Ranch, Marula ranch, Eburru Forest, Sibiloi National Park, Kerio valley, Lake Turkana, Mt. Kulal, Loima hills, Mt. Nyiro, Central and Southern Islands National Parks, Nairobi Ranch, Kipini, Witu forest, Tana Primate National Primate Reserve, Lango la Simba Ranch, Sheikh Salim Ranch. Areas of environmental significance: Baringo Ecosystem, Boni-Dodori -Kiunga Ecosystem, Malindi- Watamu Ecosystem, Mt. Elgon Ecosystem, Mt. Kenya Ecosystem, Marsabit Ecosystem, Lake Naivasha Ecosystem, Aberdare Ecosystem Ranges, Tsavo Ecosystem, Shimba Hills Ecosystem.

49
KENYA 5TH NATIONAL REPORT
3.1 Water towers of national importance: Mt. Kenya Ecosystem, Aberdares Ecosystem, Mt. Elgon Ecosystem, Mau Forest Complex Ecosystem, Cherangany Forests, Shimba Hills Ecosystem, Chyulu Hills, Taita Hills, Marsabit Forest, Kibwezi Forest, Ngong Forest, Karura Forest, Mathews Range, Mua Hills, Loita Hills, Kakamega Forest National Reserve, Bonjoge Forest, Ol Donyo Sabuk National Park, Ndundori Hills Savanna grasslands, shrub/bushlands and woodlands These dominate the arid and semi arid parts of Kenya and represent the last frontier for agricultural expansion. Land sub-division, inappropriate land uses and, increased rural settlement are the main threats. These are made worse by over harvesting of trees for fuel wood and timber, planting of inappropriate crops, overstocking and overgrazing and, encroachment on wildlife corridors. T A rising land demand for bio-energy production is emerging as another major threat (e.g. proposals for the establishment of Jatropha plantations in the Tana Delta). The critical threats to this biome type /ecosystems are summarised below. Status Key drivers and threats A dynamic ecological mosaic that covers approximately 80% of the country; The last bastions of the big aggregations of charismatic large mammals globally; Major attraction of international tourists and wilderness explorers; Rapidly being lost and degraded through fragmentation and unsustainable grazing; Large-scale wildlife movements quickly diminishing through loss of migratory corridors; Human settlement and infrastructure spreading rapidly, including significant influx of farming communities; Dryland and irrigated cultivation expanding; Modern pastoralism rapidly replacing traditional practices
Subdivision and fencing Urban and peri-urban expansion Unsustainable grazing practices and conversion to rainfed and irrigated agriculture Resource conflicts Human-wildlife conflict Poaching for trophies, bushmeat Loss of keystone species Blockage of dry season wildlife and livestock refuges Poor planning of water points Poor management of catchment areas and upstream water over-abstraction Climate change
50
KENYA 5TH NATIONAL REPORT
The outcome of threats to savanna habitats is clearly illustrated all over Kenya. For example, the Nairobi City has now engulfed Nairobi National Park effectively blocking the southern-bound wildlife migration through the Athi-Kapiti plains. The famed elephant corridor between Mt Kenya and Aberdares has also been completely lost, a scenario that is imminent in Amboseli and Mara ecosystems. Poor production methods lead to unprecedented land degradation and soil erosion which, coupled with the effects of climate change, has exacerbated the problem making it a challenge for local communities to utilise land sustainably. There is little appreciation of nature values beyond tourism mainly due to lack of or insufficient political will. In some places the pressure from unplanned tourism is starting to be felt. The compression of elephants, intensifying human-wildlife conflicts, overexploitation of water resources and increasingly frequent drought exacerbates the impacts of these threats, a trend that is expected worsen with climate change. The status and trends of IBAs provides a clear illustration of the highly dynamic nature of Kenya’s habitats (Figure 2).

51
KENYA 5TH NATIONAL REPORT
Figure 19 Annual trends of the state of bushland, semi-arid and arid IBAs from 2006 to 2010
3.2 Montane, dry and coastal forests It is estimated that Kenya has about 3.5 million ha of forests (indigenous forests, open woodlands, and plantations) and an additional 24.6 million ha of “bush-land”. Most highland moist forest occur between c.1,500m and 3,000m on Mt Kenya, the Aberdares, Mau, Mt Elgon and Cheranganis, with typical tree species belonging to the genera Podocarpus, Olea, Juniperus and Newtonia. Kakamega Forest, comprising only about 0.1% of Kenya’s land area, is a relic of a previously more widespread easternmost extension of the Guineo-Congolean rainforests. The nearby north and south Nandi forests represent a transition to montane forest type. Coastal forests occur in small patches re characteristic of the Zanzibar-Inhambane vegetation mosaic, with characteristic trees being Cynometra, Afzelia, Brachylaena and Brachystegia.

52
KENYA 5TH NATIONAL REPORT
Kenya loses about 54,000 hectares of forest annually through deforestation, degradation and, land use change. Key drivers include: encroachment, overharvesting of commercial timber species (e.g. Camphor in Mt Kenya); illegal logging (e.g. Cedar), overgrazing, human induced forest fires and, climate change. Poverty is an indirect driver, coupled by limited well-being options that has led to increased charcoal burning and unsustainable fuel wood extraction. An under-performing plantation subsector has contributed to increased pressure on the indigenous forest estate. The wetter montane forests represent the greatest percentage of total area lost of any ecosystem in Kenya. The montane forests play a critical water catchment role and host a number of rare and unique animal species such as bongo, and giant forest hog. This myriad of forest conservation problems is linked to poor policy implementation, weak institutional frameworks, poor resource governance and, low capital investment. The combined impacts of these are clearly illustrated by the rapid loss of forest cover in the Mau over the last few decades (Figure 3). Due to intense population growth between the 1960s and 1990s, large areas of indigenous forest have been cleared for tree plantations around Mount Kenya. Extensive illegal logging of valuable species, charcoal production, growing of Cannabis and, unauthorized farming further threatened ecosystem integrity . The status and trends of forest IBAs demonstrates the delicate nature of Kenya’s forests, home to a unique pool of genetic variability that includes endemic, rare, critically endangered, threatened or vulnerable species (Figure 4). Status Key drivers and threats Highly fragmented and degraded; Only about 10% of the original coverage of wet montane remains; Even the remaining small fraction jeopardized by demand for agricultural land; Contain an unusually high proportion of endemic species of plants and other taxa; Source of irreplaceable ecosystem services, in particular as the watershed
Smallholder and large-scale agricultural expansion Spread of commercial and technology-intense farming Demand for water for agriculture and domestic uses Push for exotic timber species and plantations of Illegal logging, charcoal production, firewood collection, bushmeat
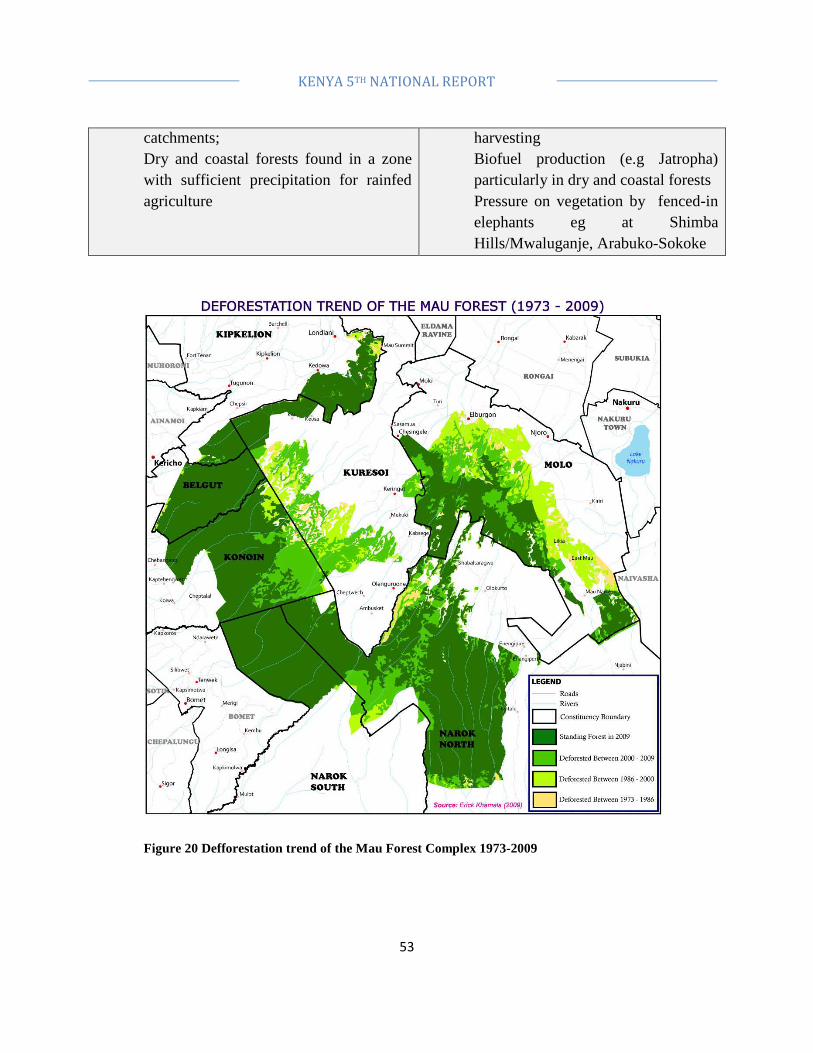
53
KENYA 5TH NATIONAL REPORT
catchments; Dry and coastal forests found in a zone with sufficient precipitation for rainfed agriculture
harvesting Biofuel production (e.g Jatropha) particularly in dry and coastal forests Pressure on vegetation by fenced-in elephants eg at Shimba Hills/Mwaluganje, Arabuko-Sokoke
Figure 20 Defforestation trend of the Mau Forest Complex 1973-2009

54
KENYA 5TH NATIONAL REPORT

55
KENYA 5TH NATIONAL REPORT
3.3 Moorland and Afroalpine The mountain tops have a limited but unique equatorial afro-alpine zone, with the plants that decrease in size and density as conditions get drier and colder with increasing altitude. Open tussock grasslands and sedges characterize the highest elevations of the Aberdares and Mt. Kenya, continuing right up to the snowline in the latter case. They lie above the subalpine zone characterized by Hagenia (Hagenia abyssinica) woodland and bamboo (Arundinaria alpina) and bamboo-forest and mosaics. Mt Kenya also contains rapidly receding remnant glaciers and glacial tarns (small lakes) of varying sizes. Plants that grow in these conditions are specially adapted for survival, the most spectacular of which are the dense leafed rosettes such as Lobelias and Senecios, notably the Giant groundsel - only found on the mountains of East Africa. These are important habitat for specialized plant and animal forms, maintenance of water catchment and climate regulation processes. The moorland contains a variety of unique small mammal subspecies such as the Mount Kenya mouse shrew, rock hyrax hyrax (Procavia johnstoni mackinderi), groove-toothed rat (Otomys orestes orestes)and, common duiker.Several bird species also live in the Afro-alpine zone, including sunbirds, alpine chats, starlings and several raptors. Status Key drivers and threats Covers only about 1.2 % of total land area, generally above 3,000 m asl; Largely intact due to inaccessibility and non-suitability for human habitation; Mount Kenya ice sheet and glaciers on the decline -the largest glacier had decreased by 90% between the 1930s and 2010.
Global warming
3.4 Inland waters, rivers and wetlands Inland waters and wetlands contain unique and highly specialized species, and some provide the last refuge for rare and threatened species. According to various State of the Environment reports, Kenya’s freshwater resources, including rivers, lakes and swamps, are estimated at 20.2 billion cubic meters distributed within six drainage basins namely Lake Victoria, the Tana, Athi, Ewaso Ng’iro north, Ewaso Ngiro south and northern rift valley.Many provide a wide variety of products and environmental services and are

56
KENYA 5TH NATIONAL REPORT
breeding grounds for fish and birds. They constitute vital stepping stones along the route for thousands of migratory birds. The also contribute immensely to livestock production and biodiversity conservation. The rivers provide the basis for generation of hydroelectric power (HEP). These are under pressure from a variety of sources especially by water extraction and transfer, agrochemical runoff, industrial and domestic pollution, and, ultimately, eutrophication invasive aquatic weeds. The pressures emanate from the fact that wetlands collectively rank as one of the earths most productive ecosystems (Kansiime et. al 2007). They provide a range of ecosystem services and goods. Status Key drivers and threats Freshwater and saline ecosystems cover about 8% of the surface area; Rainfall increasingly unpredictable; Surface flow highly erratic and seasonal River discharge and lake levels declining Wetland vegetation and soil moisture rapidly declining; High social, environmental and economic costs of aquatic weeds associated with power generation, tourism, clean drinking water, transportation and biological diversity.
Changes in weather patterns and seasonal flow regimes Reduced inflow into, rivers, lakes and swamps Reduced river recharge Loss of riparian vegetation and frequent/prolonged droughts Conversion of wetlands to agricultural and pasture uses Invasive species
Wetlands occupy 3-4% of Kenya’s land area (Republic of Kenya, 2002-2008). Kenya became a signatory to Ramsar Convention in 1990 and has since designated five wetlands as of international importance, covering an area of 1,018 km2.Categories of Wetlands in Kenya include: Riverine wetlands: this form along the course of a river upstream of its delta. Such wetlands can be found in Tana, Nyando, Mwea-Tabere and Turkwel (Crafter, Njuguna and Howard, 1992). Lacustrine wetlands:these wetlands whose source of water is a lake, whether fresh or saline, permanent or seasonal and whose topographic situation is lake basin. Examples include crater lakes such as Simbi and Chala, the Great Rift Valley lakes and lake Victoria (Crafter, Njuguna and Howard, 1992). Estuarine wetlands: these are usually at the mouths of rivers where the source of the moisture is likely to be partly oceanic and partly fresh water. The Kenyan coast has a number of estuaries that came into existence during recent geological time; examples are

57
KENYA 5TH NATIONAL REPORT
at Mombasa, Shimo la Tewa, Kilifi, Turtle bay and around Islands of Lamu, Manda and Pate (Crafter, Njuguna and Howard, 1992). Marine wetlands: found on open coastlines where the ocean is usually the significant source of water and the topography is that of the shore, either an erosional or depositional shoreline occurs (Crafter, Njuguna and Howard, 1992). Man made wetlands: these owe their existence to human activity that greatly changes the topography to create a permanent seasonal body of water. They include dams such as the Sasumua, Masinga, Kamburu, Gitaru and Turkwell (Crafter, Njuguna and Howard, 1992). Lake Victoria, the second largest fresh water lake in the world in terms of surface area, is the world’s most productive freshwater fishery, worth USD 600 million a year. In the 50s, over 28 genera and around 350 species of fish, of which more than 300 were haplochromine cichlids, had been recorded from the Lake. It has been estimated that 200 species in the Lake have been driven extinct largely as a result of Nile Perch predation. The fisher folks have reduced the number of large-meshed gill-nets and shifted to hooks (especially small ones) that increased by 15.6% in 2012 while gillnets of 5 inches increased by 26% with gillnets less than 5 inches increasing by 17.5% for the same period. Pressure on Lake Victoria fisheries has led to the dominance of the invasive Nile perch. During the Pre-Nile perch period (1960s to early 80s), the lake had annual fish catches below 100,000 tones. During the Nile perch peak (mid 1980s to early 1990s), fishing increased to over 600,000 tones annually. During the Pre-Nile perch boom (post 2000) with Dagaa dominating in landings – total catch approximated 1 million tonnes annually.
Figure 21 Fishing trends in Lake Victoria (Sources: KMFRI and LVFO)

58
KENYA 5TH NATIONAL REPORT
0
200
400
600
800
1000
1200
1965
1968
1971
1974
1977
1980
1983
1986
1989
1992
1995
1998
2001
2004
2007
2011
Years
Cat
ches
(t x
100
0)Tilapias
Others
Nile perch
Haplochromines
Dagaa
Wetland loss is best exemplified by the Yala swamp.Drainage has been ongoing since the mid-1960s, with a significant portion of the swamp’s original 17,500 ha having now been converted to crop land. The pressures, impacts and benefits are summarized below.
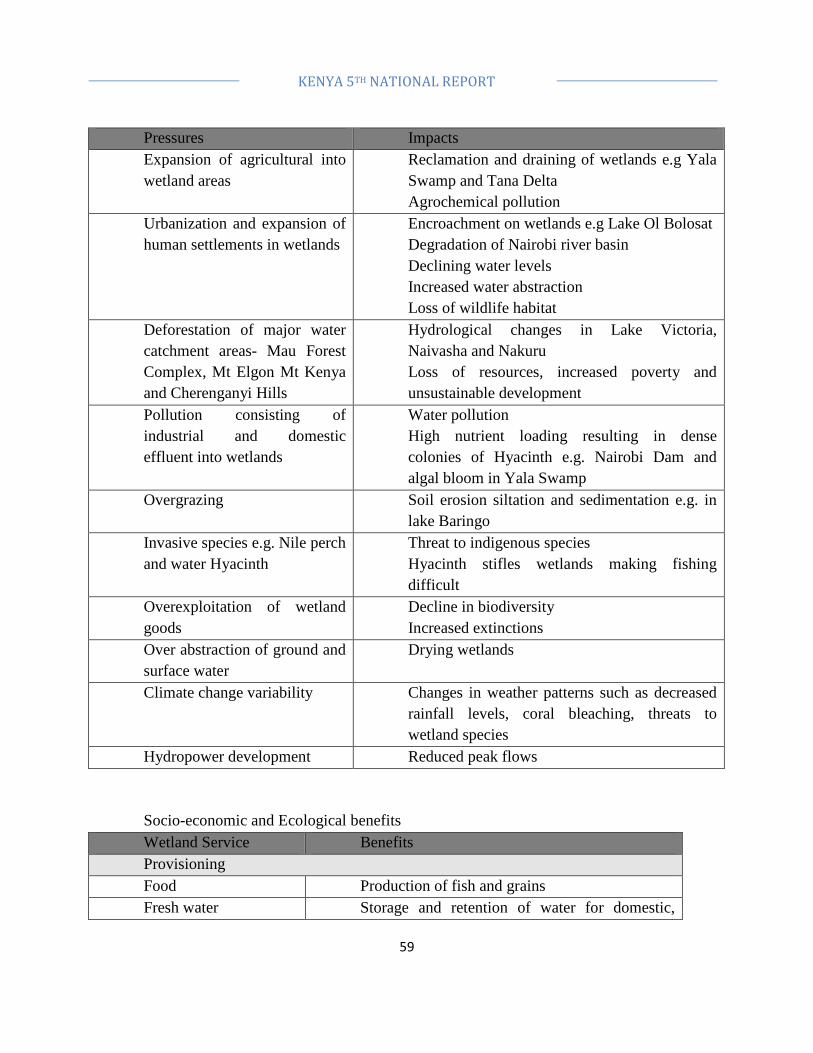
59
KENYA 5TH NATIONAL REPORT
Pressures Impacts Expansion of agricultural into wetland areas
Reclamation and draining of wetlands e.g Yala Swamp and Tana Delta Agrochemical pollution
Urbanization and expansion of human settlements in wetlands
Encroachment on wetlands e.g Lake Ol Bolosat Degradation of Nairobi river basin Declining water levels Increased water abstraction Loss of wildlife habitat
Deforestation of major water catchment areas- Mau Forest Complex, Mt Elgon Mt Kenya and Cherenganyi Hills
Hydrological changes in Lake Victoria, Naivasha and Nakuru Loss of resources, increased poverty and unsustainable development
Pollution consisting of industrial and domestic effluent into wetlands
Water pollution High nutrient loading resulting in dense colonies of Hyacinth e.g. Nairobi Dam and algal bloom in Yala Swamp
Overgrazing Soil erosion siltation and sedimentation e.g. in lake Baringo
Invasive species e.g. Nile perch and water Hyacinth
Threat to indigenous species Hyacinth stifles wetlands making fishing difficult
Overexploitation of wetland goods
Decline in biodiversity Increased extinctions
Over abstraction of ground and surface water
Drying wetlands
Climate change variability Changes in weather patterns such as decreased rainfall levels, coral bleaching, threats to wetland species
Hydropower development Reduced peak flows Socio-economic and Ecological benefits Wetland Service Benefits Provisioning Food Production of fish and grains Fresh water Storage and retention of water for domestic,

60
KENYA 5TH NATIONAL REPORT
industrial and agricultural use Fiber and fuel Source of fuel wood, logs and fodder Biochemical Used to extract medicinal products Genetic Material Used as ornamental species, and genes for
resistance plant pathogens Regulating Climate regulation Source of sink for green house gases, influence
local and regional temperature, precipitation and other climate process
Water regulation Regulates ground water discharge and recharge
Water purification and water treatment
Retention recover and removal of excess nutrients and other pollutants
Erosion regulation Retention of soils and sediments Natural hazard regulation
Flood control and storm protection
Pollination Provides a good habitat for pollinators Supporting Soil Formation Sediment retention and accumulation of organic
matter Nutrient Cycling Storage, recycling, processing and acquisition of
nutrients Cultural Spiritual and inspirational
Source of inspiration. Many religions attach spiritual values to aspects of water ecosystems
Recreational Opportunities for recreational activities Aesthetic Many people find beauty or aesthetic value in
aspects of wetland ecosystems Educational Provide opportunities for formal and informal
training
3.5 Coastal and Marine Ecosystems With a coastline 600 km long, beaches, mangroves, coastal wetlands, sea grass beds, lagoons and, coral reefs account for a large proportion of the species in Kenya. The pelagic marine zone of the open ocean covers almost one-third of Kenya’s territorial area. The coastal belt varies between 4km in the south to 40km in the north, generally under 50 meters altitude. Recent reef limestone overlaid by sands and clays dominate the coastal

61
KENYA 5TH NATIONAL REPORT
plain to the south while deposits of sand, silt and clay form the prominent dunes further north. The geological shifting of the Tana river mouth forms another dominant feature in the north. Kenya’s coastline extends about 600 km along the seafront, from Somalia’s border at Ishakani in the north (Longitude 1° 41’ S), to Tanzanian’s border at Vanga in the south (Longitude 4° 40’ S) Kenya’s coastal ecosystems occupy the western extremity of the tropical Indo-Pacific biogeographic region, and have also recently been classified as part of the Coral Coast of the East African Marine Ecoregion (WWF, 2005). The ecosystems include mangrove swamps, coral reefs, seagrass beds, rocky shores, estuaries, beaches, mudflats, sand dunes and terrestrial habitats, and are closely interlinked (Figure 2.1).The distribution of ecosystems along the coastline is influenced by coastal geology, hydrology, oceanography, and the characteristics of the continental shelf. Sandysoils and a relatively dry climate have produced a mosaic of coastal-forest,and bushland vegetation at the coast. The hills from south of the Shimba Hills to Malindi block the flow of major rivers to the South Coast, enabling the development of a continuous fringing coral reef, rocky cliffs, white sandy beaches and small mangrove creeks and estuaries. The coast north of Malindi is a wide, flat sandy plain carrying Kenya’s two largest rivers to the coast. The sediment plumes from these rivers provide predominantly soft-substrate habitats, open sandy beaches and river deltas.
3.5.1.1 KENYA: State of the Coast Report 2008
The interactions between the north-flowing East African Coastal Current (EACC) and seasonally south-flowing Somali Current (SC) create a temperature gradient of warm to cool from south to north. This affects the productivity of pelagic ecosystems, resulting in lower development of coral reefs in the cooler, nutrient-rich waters of the north, and extensive mangrove, seagrass and suspension-feeding communities towards the south. These richly biodiverse coastal habitats provide critical socio-economic and ecological services, such as protection from storm surges, and food, wood, fuel, and livelihoods for local communities. Economic activities along the coast range from manufacturing (e.g. salt industries), service provision (e.g. tourism), transportation, fishing (both artisanal and commercial), agriculture and a range of cottage industries. All are based on the coastal region’s rich natural resources.

62
KENYA 5TH NATIONAL REPORT
3.5.1.2 Coral reefs
Coral reefs are the ocean's richest ecosystem in terms of biodiversity and productivity. They are incredibly diverse, very productive and at the same time extremely fragile. Coral reefs are critically important for the maintenance of biodiversity and the ecosystem services they provide. They support an incredible diversity of fish from small herbivorous fish to large predatory fish. Algae, soft coral, sponges and invertebrates create the base of this web. Alongside reef fish is an equally diverse array of marine crustaceans, reptiles and mammals. All these depend on the reef for food, habitat and protection and their balanced relationships keep marine ecosystems diverse and abundant with life. Coral reef fish and other marine life have been a primary source of protein for as long as people have lived along the coast. From small scale artisanal fisheries to major commercial fleets, harvesting of marine life is a major economic force in all of the world’s oceans. Local fisheries, such as lobster, stone crab, snapper and grouper, all

63
KENYA 5TH NATIONAL REPORT
directly rely on the reef for spawning and habitat. Other fisheries, such as tuna, dolphin and other pelagic species, rely on the reef indirectly, through the bait fish that they consume. Coral reefs often form the backbone of local economies. Tourists coming to dive need not only dive boats and guides, but also restaurants, hotels and commercial and entertainment facilities. In many cases, tourism asociated with reefs has expanded to transform the entire economy of a region. This of course has both positive and negative consequences for both the marine environment and the communities involved. For example, an unmonitored number of tourists may result in environmental problems such as coral damage, pollution and inadequate waste treatment. Reefs play an important role in protecting the shoreline from storms and surge water. They help stabilize mangroves and seagrass beds, which can easily be uprooted by large waves and currents. Erosion prevention is particularly important in coastal areas where much of the shore is lined with residential homes and commercial buildings. Also, most corals and sponges are filter feeders, which means that they consume particulate matter suspended in the water column. This contributes to enhanced quality and clarity of our near shore waters. Today coral reefs, perhaps more than other marine systems, are suffering from numerous pressures. As a result, many have succumbed as functioning ecosystems. Nutrients and industrial pollution, shoreline alterations, diseases of corals and other important groups of organisms, and over-extraction of fish, invertebrates and even the limestone rock itself, have all contributed to the demise of about one third of the world's reefs. More recently, climate change, notably a rise in sea temperature which has led to coral bleaching and then death of component corals, has added to the stress imposed on this ecosystem. In future, ocean acidification, sea level rise and increased storms will add further stress. Many of these factors interact, making the precise responses of reefs to these changes very complex.

64
KENYA 5TH NATIONAL REPORT
Sea grass Along the Kenyan coastline, twelve seagrass species have been documented (Isaac & Isaac, 1968; Ochieng & Erftemeijer, 2003). These species include Halodule wrightii, Haloduleuninervis, Halodule minor, Halophila ovalis, Halophila stipulacea, Cymodocea rotundata, Cymodocea serrulata, Thalassia hemprichii, Thalassodendron cilatum, Enhalus acoroides, Zostera capensis, and Syringodium isoetifolium. These species are widely distributed along the Kenyan coastline and most of them occur in mixed meadows with Thalassodendron cilatum forming large monospecific meadows in several areas. These species of seagrasses occur in a succession regime with small species such as Halodule spp. and Halophila spp. being pioneer species and the larger seagrasses such as Thalassia sp., Thalassodendron sp. and Enhalus acoroides forming the more dominant climax communities. Although the species diversity is known, the acreage of seagrasses along the Kenyan coastline is yet to be estimated through mapping. Coastal and marine resources provide dominant natural resources supporting the livelihoods of coastal communities. They also provide critical, irreplaceable and undervalued ecosystem services, particularly the protection of the coastline from storms and nutrient cycling. Marine biodiversity faces a number of threats ranging from a rapidly growing coastal human population, overfishing and extraction of other resources (Obura, 2001).

65
KENYA 5TH NATIONAL REPORT
Status Key drivers and threats Approximately 9000km2 within the 12 nautical miles of Kenya’s territorial waters (part of the 200 nautical miles wide Exclusive Economic Zone); Coastal settlements among the fastest increasing; Living resources of the pelagic zone are almost unmanaged Conflict for access and use rights are common and intensifying; Corals periodically bleached and damaged; Declining abundance of keystone coral reef species
Coastal development, land-based and beach erosion Illegal or unmanaged resource extraction –eg mangroves Poor water and waste management and pollution Overfishing and destructive fishing practices Damage to sea floor due to bottom trawling for shrimp/prawns Climate change global climate change (warming and ocean acidification)
Kenya’s mangroves are overexploited for wood products and converted to salt-panning, agriculture, and other land uses. Some estimates suggest that about half of the mangroves have been lost over the past 50 years. Satellite images show rapid loss of mangroves between Ngomeni and Karawa between 2002 and 2008 (yellow arrows, Figure 8).

66
KENYA 5TH NATIONAL REPORT
Figure 22 Ngomeni disappearing Mangroves between years 2002 to 2008 (Source: Kenya Atlas of our Changing Environment
3.6 Urban Ecosystems Nairobi National Park is an island: Human population in Nairobi has increased very rapidly from surpassing one million in the 1980s, two million in the 1990s and now approaching three million residents in 2013. The light purple of the intense urban settlement can be seen steadily growing between 1976 and 2005. The Southern migration corridor is completely blocked due to developments in Kitengela. Wild-beast migration is near halt and Lions, Cheaters and other wildlife can no longer roam into the increasingly densely populated landscape. Human wildlife conflicts have intensified to the detriment of wildlife especially Lions. The plan to expand Nairobi City area to include Ngong, Kajiado and Mavoko will ensure that Nairobi National park is completely engulfed by settlements. Therefore, the future of Nairobi National Park as currently set up is uncertain. There is urgent need to survey and gazette the wildlife migration corridor that will create a permanent link between Nairobi National Park and the Amboseli National Park. The plan to include Mavoko municipality within which a new Konza resort city will be build will exacerbate the Nairobi National Park problem. Even without the implementation of the Nairobi city expansion plan, developments in Kitengela and Mavoko within the Athi-Kapiti Plains are fast expanding and replacing invaluable wildlife habitats with settlements.

67
KENYA 5TH NATIONAL REPORT

68
KENYA 5TH NATIONAL REPORT

69
KENYA 5TH NATIONAL REPORT
3.7 TRENDS IN SPECIES Renowned worldwide, an increasingly large number of Kenya's species are threatened most especially due to poaching for meat and trophies, competition with livestock, and rangeland degradation. The spectacular large mammal populations are in rapid decline, chief among them being the elephant, lion, black rhino, Grevy’s zebra, cheetah, leopard and hirola. The same is true for several marine species such as the dugong, green sea turtle, hawksbill turtle. The Department of Resource Surveys and Remote Sensing (DRSRS) has conducted ecological monitoring of wildlife and livestock populations in the Kenya rangelands using standard counting techniques since the mid-1970s. The regular surveys provide a rich source of information for assessing trends and the status of populations. Most populations have fallen steadily by since the 1970s when monitoring began (Grunblatt et al. 1996; Ottichilo et al. 2000). The losses in the 1970s through 1980s stood at 48%, in the 1990s at 23% and the 2000s at 11%. These are summarized in the figure below. The heaviest declines during the 1970s-1980s were observed in Hunter’s hartebeest (77%), elephant (72%), lesser kudu (71%) and waterbuck (70%) populations. The other species that declined steeply were gerenuk (68%), oryx (67%), warthog (64%), Thompson’s gazelle (59%), impala (59%), Grant’s gazelle (57%), kongoni (54%), Grevy’s zebra (54%), buffalo (52%) and giraffe (50%). There were moderate declines in topi (27%), wildebeest (25%) and Burchell’s zebra 10%) populations. The period 1990s – 2000s registered heavy declines in Grevy’s zebra (74%), kongoni (68%), topi (65%), eland (62%), and oryx (49%), Burchell’s zebra (43%), Hunter’s hartebeest (41%), giraffe (39%) and impala (38%) populations, There were moderate declines in Grant’s gazelle (29%), warthog (28%) waterbuck (16%), lesser kudu (16%) and buffalo (1%). There were increases in elephant (2%), gerenuk (3%), wildebeest (16%) and Thompson’s gazelle (38%). Populations within protected areas have shown a similar loss over the same period (Western et al. 2009), declining by more than 40% in some cases (Figure 10).

70
KENYA 5TH NATIONAL REPORT
Figure 9: Wildlife trends in the Kenya rangelands between 1970s and 2000s
0
20,000
40,000
60,000
80,000
100,000
120,000
140,000
1977
1979
1981
1983
1985
1987
1989
1991
1993
1995
1997
PO
PU
LAT
ION
ES
TIM
AT
E
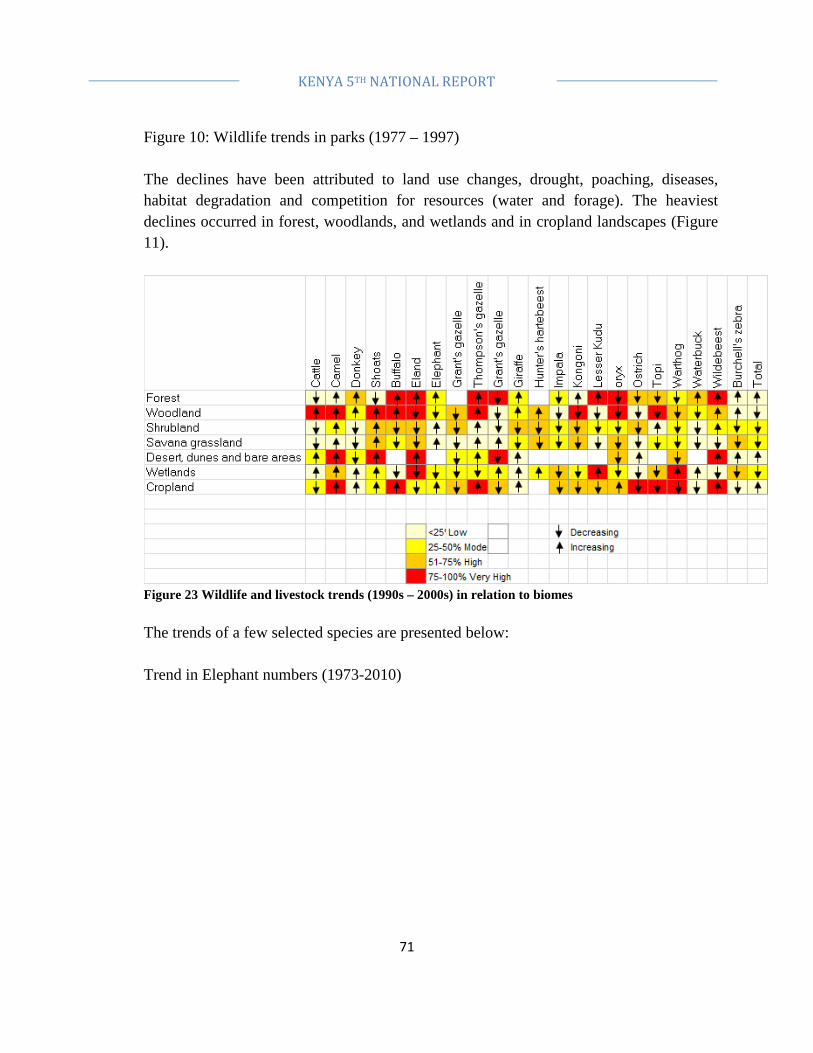
71
KENYA 5TH NATIONAL REPORT
Figure 10: Wildlife trends in parks (1977 – 1997) The declines have been attributed to land use changes, drought, poaching, diseases, habitat degradation and competition for resources (water and forage). The heaviest declines occurred in forest, woodlands, and wetlands and in cropland landscapes (Figure 11).
Figure 23 Wildlife and livestock trends (1990s – 2000s) in relation to biomes The trends of a few selected species are presented below: Trend in Elephant numbers (1973-2010)

72
KENYA 5TH NATIONAL REPORT
Trend in Rhino numbers (1987-2010)

73
KENYA 5TH NATIONAL REPORT
Trend in Roan antelope numbers (1980-2011)
Trend in numbers of bongo at Aberdare (1975-2010)
Trend in lion numbers (2002-2010)

74
KENYA 5TH NATIONAL REPORT

75
KENYA 5TH NATIONAL REPORT
4 VALUING BIODIVERSITY
4.1 COMMUNITY CONSERVANCIES: Habitat-level responses: the evolution of community conservancies Realizing that the current protected areas are incapable of adequately meeting the biodiversity conservation goals and provide support to livelihoods the idea of establishing private sanctuaries and community conservancies has gained momentum over the last few decades. These form the lifeblood of the current PA system and represents the last frontier for conservation in Kenya. The growth of new PA categories also marks the maturation of the ‘parks beyond parks’ concept aggressively promoted in the region since the 1970s and further strengthened during the 50th anniversary of national parks. In line with Vision 2030 - Kenya’s development blueprint, the Constitution and MDG 7, a raft of new interventions have been prompted by the critical need to secure the survival and continuity of many species (Figure 13). Migratory routes/corridors are important for connectivity of habitats for resource accessibility and enhancement of genetic diversity. Restoration of habitats is also important for maintaining ecosystems processes, improving the integrity of their services, reducing human-wildlife conflicts and, enhancing sustainable livelihoods
4.2 NATURAL CAPITAL AND BIODIVERSITY VALUATION Natural capital assessment and valuation are an attempt to change this systematic bias. In Kenya and throughout the world, there are ongoing efforts to value natural capital and factor its value into national and local decision-making processes. This chapter will present some of these efforts and, based on experiments in national capital accounting taking place elsewhere in the world, propose ways Kenya can secure both long-term economic growth and societal well-being. The concept of natural capital was adopted to emphasize the idea that ecosystems are national assets, and that the capacity of ecosystems to provide ecosystem services is limited. As with other forms of capital (e.g., human and manufactured capitals), natural capital needs to be carefully managed. Effective management ensures that the flow of

76
KENYA 5TH NATIONAL REPORT
ecosystem services does not deplete the stock of ecosystem services, and can be maintained or enhanced over time.
Figure 24 Integrated map of species densities and telemetry showing the movements of elephants and wildebeests in southern Kenya rangelands . Figures 14 and 15 below show the migratory routes and habitat connectivity (corridors) required in southern Kenya rangelands based on studies conducted in the five contiguous landscapes - Serengeti-Mara, Magadi-Natron, Amboseli-West Kilimanjaro, Nairobi National Park - Athi-Kapiti and Tsavo-Mkomazi.

77
KENYA 5TH NATIONAL REPORT
Figure 14:
4.2.1.1 Challenges and opportunities
Community based wildlife conservancies are playing an increasingly important role in conserving biodiversity supporting an economically important tourism industry and,

78
KENYA 5TH NATIONAL REPORT
reducing poverty.More than 70% of all large animal life lives permanently or seasonally outside the 38,000 km2 of protected. Reversing the decline of wildlife is an issue of national interest in view of the Vision 2030 ambition to quadruple the contribution of tourism to GDP and increase the number of tourists by 65%. Recognizing the constraints on the possibility of increase capacity inside protected areas, conservation outside will be crucial to allow further growth. The first conservancy was established in 1992 in Narok County. This was followed by a number of conservancies that were established in the 1990s (Figure 16). Since then there has been an exponential growth in conservancies (Figure 17) and in 2012 the area under conservancies equaled 9,975 km2 or 1.9% of Kenya.
#
#
#
#
#
#
#
#
Narok
Lodwar
Isiolo
Nanyuki
NAIROBI
Mombasa
Garissa
Marsabit
100 0 100 Kilometers
N
Wildlife Density (Kg / ha)<11 - 1010 - 100100 - 1000>1000
1990s2000sNo data
Conservancies
Figure 25 Distribution of community conservancies in 2010 and average wildlife density 2000-2010. Source: DRSRS
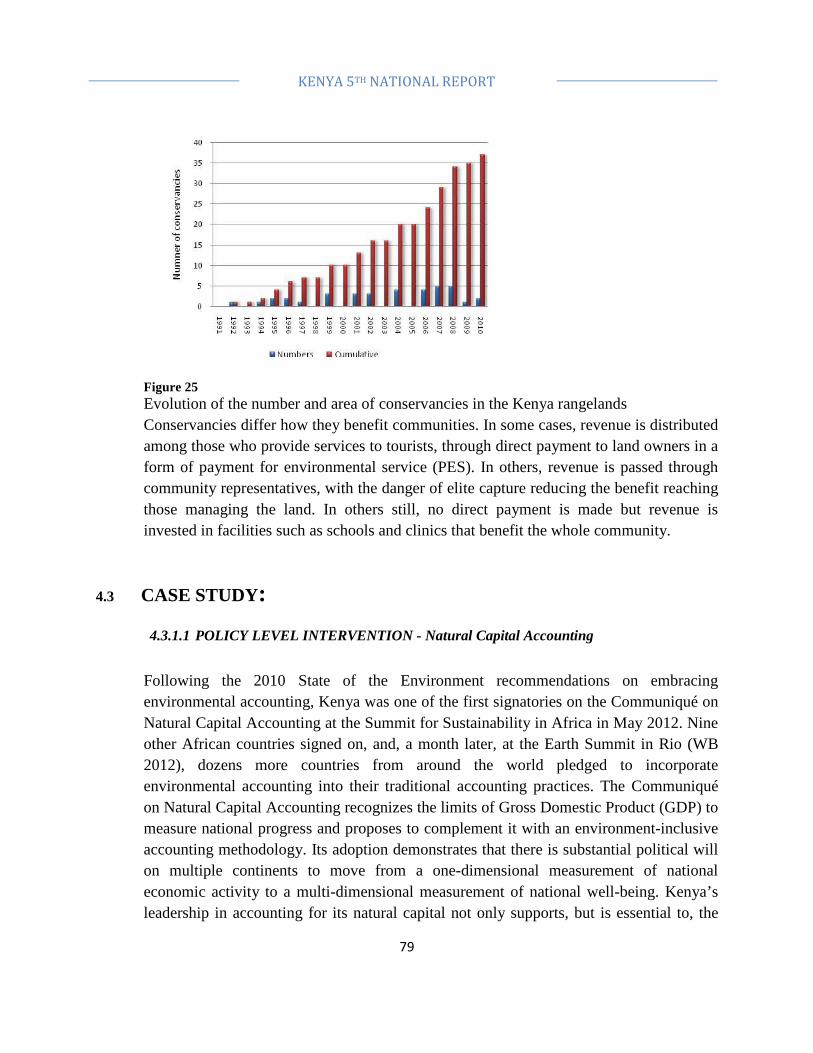
79
KENYA 5TH NATIONAL REPORT
Figure 25 Evolution of the number and area of conservancies in the Kenya rangelands Conservancies differ how they benefit communities. In some cases, revenue is distributed among those who provide services to tourists, through direct payment to land owners in a form of payment for environmental service (PES). In others, revenue is passed through community representatives, with the danger of elite capture reducing the benefit reaching those managing the land. In others still, no direct payment is made but revenue is invested in facilities such as schools and clinics that benefit the whole community.
4.3 CASE STUDY:
4.3.1.1 POLICY LEVEL INTERVENTION - Natural Capital Accounting
Following the 2010 State of the Environment recommendations on embracing environmental accounting, Kenya was one of the first signatories on the Communiqué on Natural Capital Accounting at the Summit for Sustainability in Africa in May 2012. Nine other African countries signed on, and, a month later, at the Earth Summit in Rio (WB 2012), dozens more countries from around the world pledged to incorporate environmental accounting into their traditional accounting practices. The Communiqué on Natural Capital Accounting recognizes the limits of Gross Domestic Product (GDP) to measure national progress and proposes to complement it with an environment-inclusive accounting methodology. Its adoption demonstrates that there is substantial political will on multiple continents to move from a one-dimensional measurement of national economic activity to a multi-dimensional measurement of national well-being. Kenya’s leadership in accounting for its natural capital not only supports, but is essential to, the

80
KENYA 5TH NATIONAL REPORT
delivery of Vision 2030, the goal of which is to create “a globally competitive and prosperous nation with a high quality of life by 2030”. While this development blueprint builds on economic, social and political pillars, it does not articulate how Kenya’s natural capital, i.e. its forest, freshwater, wetland, savanna, coastal ecosystems, supports these pillars. For example, agriculture is expected to contribute an additional KSh.80-90 billion (or US$ 1-1.125 billion) to the GDP by 2030 (GoK 2007). To achieve this objective, Vision 2030 commends investing in agricultural inputs and processing facilities and dramatically increasing the area under agricultural production. These strategies, however, fail to take into consideration the importance of agricultural and non-agricultural ecosystems (e.g., drylands, forests, wetlands and lakes) in supplying water, contributing to soil fertility, providing forage, and supporting pollination. Sufficient evidence exists to suggest that unless Kenya invests in these ecosystems – unless it reverses their degradation (NEMA 2011, Chapter 3 of this Atlas) – it will be unable to meet its agricultural objectives.The fact that biodiversity is on the decline (as shown in Chapter 4) is also of concern in light of the Vision 2030 objective of increasing the contribution of tourism to GDP to more than KShs.200 billion (US$2.5 billion). To achieve this objective, Vision 2030 commends improving tourism infrastructure and touristic activities, and preserving wildlife corridors (GoK 2007). The tourism industry will not be able to grow as planned, however, if the aforementioned expansion of agricultural production deprives wildlife of vital access to water and forage. Choosing between growth in the agricultural and tourist sectors is one of the many complicated tradeoffs that Kenya will have to manage wisely in order to achieve and maintain middle-income status. It is important to note that social, economic and natural capitals are interdependent and only partially interchangeable (President’s council of Advisors on Science and Technology 2011). Without recognizing the true value of natural capital to economic and social capitals, decisions are likely to systematically favor the later forms of capital with the consequence of undermining them in the long-term. While the contribution of fisheries, forest products and wildlife to the national economy is partially recognized, many other contributions of natural capital to people’s livelihoods, health, security, cultural heritage are not yet appreciated.
4.3.1.2 The afforestation of Kenya’s water towers
Kenya’s forests have received some attention in the last few years with concerted efforts to rehabilitate the five water towers, i.e. Mt Kenya, Aberdare Range, Mau Forests

81
KENYA 5TH NATIONAL REPORT
Complex, Cherangani Hills and Mt Elgon and contribute to the 10% of forest cover aimed by 2030. The trigger for aggressive action against forest deforestation and degradation was the vital need for increasing water flows and quality downstream as these forests are the source of a large part of all water in Kenya and their rivers support 60% of electrical power generation (UNEP 2009). The good news is that by investing in its forested natural capital, downstream users will also benefit from reduced soil erosion and sediment loads in river water, regulated local temperature and rainfall, increased groundwater recharge, and reduced events of flooding and landslides (UNEP 2010). Kenya increasing its forest cover also benefits the global community by increasing carbonstock (Map D) and mitigating climate change.The yearly contributions of the Mau Forests Complex to agriculture, tourism, electricity production, urban and industrial use, erosion control, and carbon sequestration among others were estimated at KES 110 billion (US$ 1,4 billion) and the Aberdares’ ecosystem services were evaluated at KES 59 billion yearly (US$ 740 million).
4.3.1.3 ECOSYSTEM VALUATION :
There have been a handful of valuations conducted in Kenya. Several valuation exercises focused on specific ecosystems. For example, a valuation exercise was conducted for the Aberdare Conservation Area in order to calculate the costs and benefits of a nearly 400 km electrified fence (Biotope Consultancy Services 2011). The benefits derived from the Aberdare Conservation Area include the provision of water for human and economic uses, carbon storage, tourism and biodiversity; these benefits were estimated at KSh 59.4 billion a year. The cost of building and maintaining the fence, as well as the opportunity costs associated with foregone logging, charcoal burning and livestock grazing were estimated at a mere Ksh 8.8 billion. The various Benefit-Cost Ratios calculated under different scenarios are all greater than 1, implying the investments in the fence are justified in conserving the Aberdare Conservation Area. In the Upper Tana Basin, implementing soil and water conservation practices in agricultural lands is expected to substantially lower siltation of hydropower dams and increase water availability downstream. These benefits were estimated to be worth $ 6-48 million but only costs 0.5 to 4.3 million, promising a ten-fold return on investment (ISRIC undated. Individual ecosystem services have also been valued. Pollination is a critical ecosystem service provided to small-scale farmers by feral bees and insects. In 2005, small-scale

82
KENYA 5TH NATIONAL REPORT
farmers in Kakamega are estimated to have made a net benefit of US$3.2 million or about 40% of the 2005 annual market value from bee pollination of eight crops (beans, cowpeas, green grams, Bambara nuts, Capsicum, tomatoes, passion fruit and sunflower) (Kasina et al. 2009). In Kenya, only large horticultural and coffee firms have initiated beekeeping projects to mitigate against inadequate pollination. For the large majority of Kenyan farmers, pollination is a non-managed public good that depends on the health of surrounding ecosystems. The economic valuation results of this study demonstrate that it makes economic sense to enhance pollination services as a way to increase agricultural yield and produce quality. The global community values the recreational services provided by the Maasai Mara Ecosystem. Two ways in which this value is expressed are through wildlife rents and what tourists are willing to pay to visit the Mara. The total wildlife rents available to landowners in the Mara area could be as high as US$ 57 million at the highest recorded rent of US$ 50/ha/year (Norton-Griffith et al. 2008). It is estimated that visitor entrance fees to the Maasai Mara National Reserve could generate an estimated US$ 5.5 million annually (Walpole & Leader-Williams, 2001) translating to US$ 35/ha/year while the net global returns to the 1.5 million wildebeests of the Maasai Mara Ecosystem, a key attraction to international tourists, is estimated to range between US$ 125 and 150 per animal (Norton-Griffiths, 1996). Economic valuations enable decision-makers to assess the costs of action versus the costs of inaction. A study on the contribution of Montane Forests to the Kenyan economy (UNEP 2012), for example, demonstrates the importance of accounting for the benefits and costs of deforestation. In 2010, 50,000 hectares of Montane Forests were deforested. The cash value from timber and fuelwood was estimated to be KSh 1.362 billion. In terms of costs, deforestation leads to changes in water quantity and quality, most significantly during the dry season. Low water quantity has direct negative consequences on productive sectors such as irrigation agriculture and electricity production. Poor water quality adversely affects fisheries and increases the costs of treating waste water. Deforestation also increases malaria incidence, which leads to a rise in health care costs and a loss in labor productivity. Eventually, loss of forest foregoes carbon income for the government. The direct cost of deforestation of Montane Forests in 2010 was estimated at KSh 3.652 billion. If considering the interdependencies among sectors of the economy, this cost should be revised upward to KSh. 5.8 billion in 2010. In other words, each KSh from timber and fuelwood costs the economy KSh 2.8-4.2.

83
KENYA 5TH NATIONAL REPORT
While valuing ecosystem services might require additional data collection and analyses, there is already much that can be done with existing ones. “Mapping and valuing ecosystem services in the Ewaso Ng’iro Watershed” (ILRI 2011) used readily available data such as land cover and socio-economic data collected at district level to map the distribution of key ecosystem services; estimate their potential supply; and establish the existing demand for these services and associated market value. The Ewaso Ng’iro Watershed extends from humid and semi-humid agro-climatic zones on the slopes of Mt. Kenya and the Aberdares and on Laikipia Plateau (upper watershed) to the semi-arid and arid plains of Garissa, Isiolo and Marsabit districts (lower watershed). As a result of diverse geology, precipitation and soils, the Ewaso Ng’iro watershed is richly and diversely endowed with natural capital. Its ecosystems include: forest, woodland, bushland and cropland in the upper watershed; and shrubland and grassland in the lower watershed. The Ewaso Ng’iro River and its tributaries, the only permanent rivers, crisscross the upper watershed and are the main sources of surface water. The Merti aquifer and the Lorian Swamp are essential during dry season for water and grazing. In addition to these ecosystems, the watershed is rich in biodiversity with large number of elephants, grevy’s zebra and Jaskson hartebeest; and in livestock with herds of cattle, camels, sheep and goat. The watershed can be classified according to how people derive benefits from the watershed’s natural capital (Map XX). Livestock production system is the dominant land use in the watershed, covering 82% of its area. Other land uses are: mixed crop-livestock production (6%); mixed livestock production and wildlife conservation (4%); wildlife conservation (3%); conservation forestry (3%); production forestry (0.6%); and irrigated crop production (0.1%).
4.3.1.4 Payment for ecosystem services
The government has also taken action and invested in some natural capital (see Box Z). However, many non-material ecosystem services (e.g., regulation of water flows, waste water treatment, pollination, pest regulation) are not depicted at national level. The absence of data for some ecosystem services and the lack of consolidation of existing ecosystem services data prevent from providing a national view of all aspects of natural capital.

84
KENYA 5TH NATIONAL REPORT
This section will present well-documented examples of payment for ecosystem services. In the first case study, water-related ecosystem services were valued to improve downstream water quality; in the second case study, habitat for wildlife is valued to sustain wildlife-tourism in rangelands.
4.3.1.5 Payment for Watershed Services in Lake Naivasha
Payment for ecosystem services in the Lake Naivasha watershed is an excellent example of a local initiative geared toward improving land management practices, decreasing poverty, and promoting sustainable development. The natural capital of the Lake Naivasha watershed contributes hundreds of millions of dollars to the national economy through its flower exports. It also supports small-scale farming for a great number of rural communities, supplies water to urban communities, and contributes to geothermal electricity production. The Lake Naivasha watershed encompasses the lake and the rivers and streams that drain into it (Map CC). While most of the watershed is under small-scale agriculture, there is substantial upland natural forest and shrubland. There are patches of forest plantation and grassland, and papyrus swamps. Intensive agriculture (e.g., horticulture and floriculture farming) are close to the lake shores. The watershed hosts three national parks (Aberdares, Hell’s Gate and Longonot) and is very rich in animal and plant biodiversity. Lake Naivasha’s international importance was recognized when it was designated as a Ramsar site. Map CC: Land use in 2006

85
KENYA 5TH NATIONAL REPORT
Source: LANWRUA 2006 Ecosystems in the watershed contribute to local people’s well-being in many ways (e.g., basic needs; income from crop, fish, flowers, tourism; health from clean water; and aesthetic pleasure), all of which intimately depend on freshwater. The quantity and quantity of the freshwater available in turn depend on ecosystem services supplied by the watershed. Table X presents the water-related ecosystem services provided by the watershed and their beneficiaries. Table XX: Water-related ecosystem services, benefits and beneficiaries

86
KENYA 5TH NATIONAL REPORT
Source: Ellis-Jones 2007 Unfortunately the condition of the lake and its watershed – and their ability to support these services – has been in sharp decline (REF). Evidence suggests that agricultural practices and demographic changes in the region have had negative impacts on the health of the rivers and groundwater sources that feed into Lake Naivasha. To reverse these trends, WWF Kenya and CARE International in Kenya began facilitating an equitable1 payment for environmental services scheme in Lake Nairvasha watershed in 2006. Because of the importance of water quality to most downstream users, the PES aimed at increasing regulation of erosion in small-scale agricultural land to improve water quality in the lake. Since the potential of regulating erosion varies across the watershed according to the plot topography, soil composition, land use and conservation practices, a hydrological assessment was used to identify which sub-catchments contributed the most to downstream water quality (Map YY). To maximize the impact of agricultural practices on water quality, participating farmers were selected in high-sediment-yield sub-catchments (Map YY). Map YY: Mean annual sediment yield (tons/ha)
1 WWF-CARE PES is purposefully equitable in that one of its objectives is explicitly to contribute to the well-being of the ecosystem service providers.
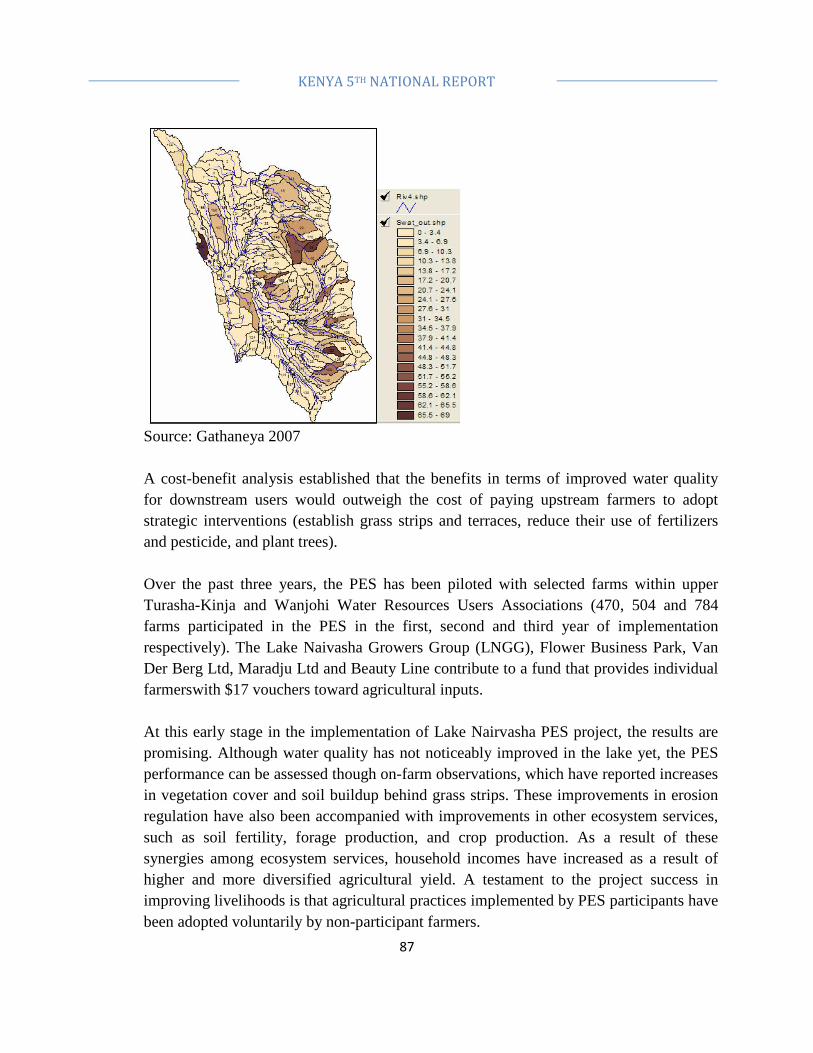
87
KENYA 5TH NATIONAL REPORT
Source: Gathaneya 2007 A cost-benefit analysis established that the benefits in terms of improved water quality for downstream users would outweigh the cost of paying upstream farmers to adopt strategic interventions (establish grass strips and terraces, reduce their use of fertilizers and pesticide, and plant trees). Over the past three years, the PES has been piloted with selected farms within upper Turasha-Kinja and Wanjohi Water Resources Users Associations (470, 504 and 784 farms participated in the PES in the first, second and third year of implementation respectively). The Lake Naivasha Growers Group (LNGG), Flower Business Park, Van Der Berg Ltd, Maradju Ltd and Beauty Line contribute to a fund that provides individual farmerswith $17 vouchers toward agricultural inputs. At this early stage in the implementation of Lake Nairvasha PES project, the results are promising. Although water quality has not noticeably improved in the lake yet, the PES performance can be assessed though on-farm observations, which have reported increases in vegetation cover and soil buildup behind grass strips. These improvements in erosion regulation have also been accompanied with improvements in other ecosystem services, such as soil fertility, forage production, and crop production. As a result of these synergies among ecosystem services, household incomes have increased as a result of higher and more diversified agricultural yield. A testament to the project success in improving livelihoods is that agricultural practices implemented by PES participants have been adopted voluntarily by non-participant farmers.
88
KENYA 5TH NATIONAL REPORT
Similar analyses for financing watershed services are in the making in other watersheds. For example, feasibility studies are being completed for establishing PES in the Sasumua Watershed (PRESA 2012) and more generally for financing green water credits in the Upper Tana Watershed (Green Water Credits 2011). CASE STUDY:
4.3.1.6 Payment for Wildlife Habitat in the Mara Ecosystem
Kenya is endowed with exceptional biodiversity and cultural heritage, as previous chapters have highlighted. This inheritance makes her a major international destination for wildlife and cultural tourism. The Maasai Mara Ecosystem (MME) is among Kenya’s most popular and remunerative tourist destinations. The area is renowned for its abundant and diverse assemblage of wild ungulates, part of which is found in its various protected areas (e.g. Maasai Mara National Reserve, Tsavo National Park, Amboseli National Park). It is also an important Maasai area with large herds of cattle and strong cultural heritage. Wildlife and livestock are sustained by the area’s savanna, bushland and woodland (Map X). At the margin of the ecosystem there is small-scale agriculture whose frontier is advancing within grassland. Map X: Land cover in the Maasai Mara Ecosystem

89
KENYA 5TH NATIONAL REPORT
Livestock is the cornerstone of most local communities’ livelihoods and way of life. People also benefit from cultural and wildlife tourism and in some places from crop production. Natural capital is also an important contributor to Maasais’ cultural identity and personal social standing. While the Maasai Mara Ecosystem also supports livestock and agriculture, it is most famous for the spectacular annual migration of 2 million wildebeest, zebra, and Grant’s gazelle cross the Mara River from the Serengeti Plains and year-round high density of wildlife. The value of MME can be quantified in various ways. It is estimated that the Maasai Mara National Reserve accounts for 13.4% share of all international visitors to Kenya, generating high revenues (US$ X) to both local and national governments (WRI, 2007). It provides in the range of X,000 (direct and indirect) jobs. The value of MME’s cultural and wildlife tourism, and the ecosystem services that support them (i.e. forage production, freshwater and wildlife corridor), is estimated to be as high as US$ 57 million (Norton-Griffith et al. 2008). Visitor entrance fees to the Maasai Mara National Reserve could generate US$ 5.5 million annually (Walpole & Leader-Williams, 2001). Estimates of the tourism value of wildebeests of the MME ranges between US$ 125 and 150 per animal (Norton-Griffiths, 1996). Despite the high value of these cultural services, however, the MME is facing rapid land use changes and land fragmentation that is driving a loss of wildlife. According to Norton-Griffiths and Said (2010), the four main economic driving forces that are

90
KENYA 5TH NATIONAL REPORT
influencing the land use decisions in Kenya’s rangelands are the differential returns to land uses and production systems; the incentives to sub-divide land; the macro and micro economic conditions that are in turn influencing these differential returns; and policy and market distortions with respect to the provision of wildlife goods and ecosystem services. Even though most of these changes are taking place on private land outside protected areas, they encroach upon wildlife habitat and corridors and put at risk the sustainability of the region as a tourist destination. Indeed, a majority of large mammals live permanently or seasonally outside protected areas (see wildlife density in MME in Map Y) and changes in the habitat outside of protected areas affect density levels outside and inside protected areas. Map Y: Wildlife density and wildlife corridors in the Maasai Mara Ecosystem
Until recently, landowners only received a small proportion of wildlife-related income and had no strong incentives to manage the land for wildlife conservation and tourism. Since 2005, though, a number of PES schemes have been set up in conservancies on private land bordering the MMNR. Based on a land lease system, tourists and tourism operators pay the Maasai landowners for access to conservancy land to pursue legally acceptable wildlife use activities such as game viewing and wildlife photography. In exchange for this payment, restrictions are placed on activities such as livestock grazing, cultivation, natural resource collection, human settlement, fencing, and land sales. The stricter the restrictions agreed upon – the greater the benefits to tourists and tourism

91
KENYA 5TH NATIONAL REPORT
operators, in terms of protecting wildlife habitat – the higher the payments to landowners to cover their opportunity costs. A good example of how these tradeoffs in ecosystem services work are the PES schemes for the Olare Orok Conservancy and Kitengela. In the former scheme, land owners receive US$ 43/ha/year in exchange for ending all pastoralist activities on the conservancy; in the later scheme, land owners only receive US$ 10/ha/year because the PES still allows traditional pastoral livelihoods. It is estimated that more than 800 families are benefiting from the PES schemes in MME, and the landowners earn more than US$ 3.6 million annually in payments.The payments to households constitute around 20% (up to 40% during drought periods) of their gross income. Pastoralists use a large share of their PES income to pay for basic needs such as food, clothing, and education. Most of the PES schemes also benefit communities more widely, through conservancy trusts tasked with improving local infrastructure, schools, and health facilities. In such cases PES have concrete benefits for participants and non-participants of the schemes. The eight PES schemes and conservancies in the MME have secured for wildlife an area of approximately 80,000 hectares, which is half the size of the MMNR. A complete analysis of the impacts of the PES schemes on biodiversity is yet to be made due to the relatively recent setup of these schemes. However there are early reports that select wildlife species – including lions and other predators – are increasing inside conservancies.
92
KENYA 5TH NATIONAL REPORT
5 BENEFITS FROM BIODIVERSITY – SUSTAINABLE USE To understand sustainable use of biodiversity, it is prudent to look at how their utilisations contribute to the various sectors of our economy, society and environment as well as how they in return are affected from their utilisation. Sustainability posit that the supply of the resource use outweigh demand.Biodiversity plays a critical role in the provision of ecosystem services that support different types of livelihoods found among various ethnic communities in Kenya as mention in earlier section of this chapter. These ecosystem good and services support several sectors of our country’s economy both directly and indirectly. Some of the major sectors in our economy that directly utilises biodiversity as major input include;
• Agricultural sector
• Tourism sector • Energy sector
• Fisheries sector • Forestry sector
• Health sector • Trade and Industry
5.1 Agricultural sector Kenya land mass is over 80% arid and semi arid (ASAL) while less that 20 % is arable land. Despite this, agriculture is the mainstay of Kenya’s economy. The sector contributes over 24 % of country’s GDP, contributes to 65% of export earnings and provides 18% of total formal employment (GOK 2007). The sector consist of four sub-sectors namely industrial crops, food crops, livestock and fisheries. The ASAL is predominantly livestock producing zone holding over 70% of the country’s livestock with an estimated value of over Kshs 70 Billion. These livestock (cattle, sheep, goats, camels, donkeys, etc) are largely local breeds bred over many generations to suit prevailing environmental conditions where they are found. These livestock do rely on forages (plant biodiversity) to grow and produce goods and services for human well-being. The arable land where rain-fed agriculture is practice produces much of the cash and food crops for foreign exchange and food security. Agricultural sector provides food security

93
KENYA 5TH NATIONAL REPORT
and livelihood for 80% of Kenya’s population. To unlock the country’s economic potentials, an ambitious development blueprint “Vision 2030” was initiated and revitalising agriculture is one of the key focal point. A policy to harness about 50 “orphans and/or emerging crops” for food, medicine, fibres, biodiesel, timber, fodder, aromatic, ornamentals among other uses has been drafted and awaits Cabinet and National Assembly approval to take effect (GOK, 2010) Other than direct benefits of biodiversity in agriculture as highlighted above, there are also indirect ones such as available genetic pool useful in breeding superior crop varieties (e.g. drought, disease or pest resistant varieties, high yielding, fast maturity etc) using wild relatives. Increasing agro biodiversity has been touted as effective means through which to adapt agriculture to impacts of climate change (Cotter and Tirado, 2008). Soil bacteria and other soil microbes are important in crop development (nodulation and nitrogen fixation), soil aerations as well as in nutrients cycling. Furthermore, pollination in agriculture is a crucial ecosystem services worth billions of dollars worldwide. In Kenya, the worth of pollination services to agriculture sector is yet to be evaluated although some of the crops grown in Kenya such as Pawpaw, Sunflower, Avocados, Tomatoes, Pumpkins, Watermelons, Coffee, Mangoes among others requires effective pollinations to be able to produce. Some of the key threats affecting full benefits from agriculture include the fact that: unregulated expansion of agricultural land for farming or pastures contributes to deforestation and loss of biodiversity, water and soil degradation (MA, 2005). In the recent past expansion of agriculture into marginal land is causing concern as some of the impact maybe irreversible such as loss of soils and soil nutrients through erosion. excessive use of inorganic fertiliser and other chemicals (pesticides, herbicides etc) causes soil and water pollution and decline in useful soil microbes thus reducing productivity as well as decline in wetland biodiversity. unregulated development in genetically modified organisms has been noted as having potential threat to biodiversity. Similarly, controlled breeding, development of plants and animals with narrow genetic base threatened resource base (Tyler, 2008).

94
KENYA 5TH NATIONAL REPORT
5.2 Case Study:
5.2.1.1 Kipepeo project in Gede, Malindi
Arabuko Sokoke Forest in Kilifi County is the largest continuous block of indigenous forest in the whole of Coast Province with an area of 370 km². It is a globally important forest for conservation with several endemic species of plants, birds and mammals (see chapter 4). It has been ranked as the second most important forest for threatened bird conservation in mainland Africa (Collar & Stuart, 1988) and one of the 19 important bird area in Kenya (Chapter 4 section..). Over the years the Arabuko Sokoke biodiversity has suffered wanton destruction from farm encroachment, firewood collection and charcoal making, illegal hunting, and accidental fires emanating from neighbouring farms. In addition, there was increasing human-wildlife conflicts emanating from wildlife destroying crops in the area. To reduce threats and further loss of biodiversity as well as change the local community’s attitude towards the forest, an initiative was mooted in the 1990s to establish an income generating project based on the local biodiversity. The initiative proposed butterfly farming and Kipepeo Project was born. The project involves collecting butterflies from the forest and raising them on-farm later sells the pupae to international market. The project is one of the success stories in the county having managed to generate income for farmers as well as promote positive perception of wildlife and biodiversity in general among the locals. Kipepeo project managed jointly by National Museums of Kenya and the local community has about 500 farmers and has employed four people from the local community. Between 1994 and 2001, the project generated cumulatively over US $ 130,000 with positive effects on livelihood and attitudes (Gordon and Ayiemba, 2003). Currently the project sells over 50,000 pupae and ... kilos of honey per year and has been self sustaining since 1999. It also cashes on the vibrant tourism industry where visitors to the coastal beaches pay visits to project’s butterfly centre at Gede Ruins. The following recommendations and conservation intervention in Kenya are being implemented:
• Promote integrated natural resource management that include diversifying farming systems, enhancing natural capital and building on local and traditional knowledge (IAASTD, 2008).
• Development of high valued products from indigenous plants for pharmaceutical, neutraceutical and cosmetic industries places agriculture squarely within the

95
KENYA 5TH NATIONAL REPORT
context of society and ecosystem thus empowering local communities to address depletion of natural resources and loss of biodiversity (IAASTD, 2008).
• Certification of agricultural products e.g. Rainforest Alliance certification certify cash crops that are produce sustainably. Certified products earn premium price in international markets.
• Practice conservation agriculture (e.g minimum tillage or no tillage farming) to reduce excessive use of chemicals as well as reduce soil erosion.
• Increase production per unit area to minimise need for expansion through use of modern technologies (e.g. green house production)
• Promote agro-biodiversity.
• Improve market efficiencies.
5.3 Tourism sector This is a very significant sector in the country’s economy as it is a leading foreign currency earner and has been identified in the country’s development blueprint; Vision 2030 has one of the five key sectors to be promoted. The sector contributes 10 percent of the GDP and 9 percent of total formal employment (GOK, 2007). Tourism industry is maintained by few attractions that include biodiversity (mainly wildlife), coastline beaches, diverse cultural and natural landscapes (e.g Mt. Kenya) and eco-tourism (sport tourism, cultural tourism, scientific tourism, etc). The Seventh Wonders of the World – The Wilderbeest Migration spectacle between Maasai Mara and Serengeti Ecosystem is an attraction of international repute and one of the tourism jewels in the country. The Mara –Serengeti Ecosystem is a unique savanna due to presence of thousands of ungulates and high diversity of large mammals per unit area. Expansion of urban centres, farms and settlement in wildlife corridors e.g. Kitengela-Kapiti Plains in Nairobi that has choked the migration route of wildlife between Nairobi National Park and the large Amboseli - Tsavo ecosystem. Similarly, expansion of wheat farms in Narok is putting pressure on wildlife dispersal area within the Maasai Mara ecosystem.Recently, the subdivision of group ranches in Kajiado into private leasehold have been noted as contributing to decline in wildlife population (Western, Groom, & Worden, 2009). Similarly, expansion of agriculture into the south of Ewaso Ngiro Ecosystem especially Laikipia County is threatening biodiversity

96
KENYA 5TH NATIONAL REPORT
5.3.1.1 Tourism threat to biodiversity
• Unregulated expansion of tourism facilities into protected areas e.g. Kaya forests, Maasai Mara hotels & cottages.
• Unregulated access of visitors’ numbers may interfere with wildlife reproduction especially among the shy animals e.g. Leopards.
• Unregulated access to protected sites may promote land degradation in form of soil erosion, pollution,
• Unregulated sport hunting of some rare wildlife • Unregulated infrastructure within wildlife habitats e.g. Establishment of cottages,
roads within critical wildlife habitats • Manufacture of handicrafts for tourists from rare and endangered plants or
unregulated collection of coral reefs from marine ecosystem.
• Collection of succulents plants from the wild.
Case study:
5.3.1.2 The “Good Wood” Project
The expansion in the tourism sector in the country in the 1980s and part of 1990s saw an increase in the demand for woodcarvings. The woodcarving industry as at 1996 was estimated to support 60,000 to 80,000 carvers with more than 300,000 dependants generating more than US $ 20 Million per year in revenue (Obunga and Sigu, 1996). The industry was estimated to consume about 17,500 m³ of wood 85% of which came from three species; African Blackwood (Dalbergia melanoxylon), African Olive (Olea europea ssp. africana) and Muhuhu (Brachylaena huillensis) (Choge, 2000).To address the problem World Wide Fund for Nature (WWF) funded a project to address the threats to the target species by promoting the use of alternative species “Good Woods” and certification of handcrafts in the country with focus at the Coast. The proposed woods for carving under the project were Neem (Azadirachta indica), Jacaranda (Jacaranda mimosifolia) and Mango (Mangifera indica) trees given their fairly fast growth rate, presence of sufficient wood to satisfy the demand as well as fairly good wood qualities (Obara, Höft, & Höft, 2004).Woodcarvers were trained on wood treatment and storage to avoid cracking and shrinkage. At the same time local farmers with neem trees on their land were trained to manage harvesting, form farmers association and apply for certification of their wood so as to supply the woodcarvers. Under this project, Coast Farm Forestry Association was born after certification preparation, the group applied for certification of their wood by Forest Stewardship Council (FSC). Two woodcarving

97
KENYA 5TH NATIONAL REPORT
societies at the Coast; Akamba Cooperative and Malindi Cooperative too registered their groups to produce certified carvings using the wood from certified farmers. Through these efforts, lots of carvings especially those destine for International markets were made from certified “Good Woods” and less and less use of the indigenous hardwood. The project had it drawback such as farmers/woodcarvers inability to follow strict provisions of the FSC guidelines and to pay for certification every five years, however lots of other objectives were achieved.
5.4 Energy sector Perhaps the biggest contribution of plant biodiversity to rural and urban poor is the provision of bio-energy in form of fuelwood and charcoal. In Kenya, 68% of Kenya population depend on biomass fuel (firewood, charcoal and agricultural residue) as source of energy (Yuko, 2004) and takes up to 11.2% and 9.4% of the rural and urban household budget respectively (KIPPRA, 2010). As at 2005 charcoal sector employed 700,000 people either as producers, vendors or transporters and supported 2 million dependants. Over 84% of the urban poor and 34% of the rural population uses charcoal as source of energy. It was estimated that 1.6 Million tonnes of charcoal are produce annually generating an income of Ksh. 32 Billion (Oimeke, 2012). In 2006, it was estimated that the biomass demand in the country was 38.1 against supply of 15.4 Million tonnes, meaning there was a deficit of about 60% (Ndegwa et al, 2011). Due to the high demand of cheap energy in Kenya, charcoal making has become one of the major sources of deforestation and land degradation especially where harvesting occurs in unprotected areas.The major source of charcoal in Kenya is the semi-arid ecosystems. The Counties bordering major cities in Kenya such as Nairobi, Mombasa, Nakuru and Kisumu bears the greatest brunt of deforestation to satisfy the high demand.
5.4.1.1 Threats of Energy sector to Biodiversity
In the recent past, proponents of climate change mitigations have proposed the use of bio-fuels as opposed to fossil fuels as a means to reduce carbon dioxide emissions. Whereas, these proposals appear stroke of luck, it has generated more controversies than expected benefits in different parts of the world. The proposal to produce bio-diesel or ethanol from Jatropha species and sugarcane respectively has been met with lots of resistance.

98
KENYA 5TH NATIONAL REPORT
Those oppose to the move have liken the proposal as “killing the mother to save the life of unborn infant” as large tract of lands is required to produce viable bio-fuel business. Lots of biodiversity may be loss to achieve economically viable bio-fuel business. Over-exploitation of biomass driven by high energy demand for industrial and domestic use poses a serious threat to biodiversity. The use of inefficient technologies in charcoal making or in the use of biomass fuel (e.g. inefficient jikos) does contribute to losses in energy.
5.4.1.2 Recommendations
• There is need to explore alternatives sources of energy if the country’s effort to reach 10% wood cover is to be attained. Some of the alternatives include Biogas using livestock and household waste, Bargasse from sugarcane and other crop residue, and tapping of solar and wind energy. Other opportunities include improvement in the charcoal production stages, e.g use of Improve charcoal making kilns as 88% of biomass is wasted during production and/or certification of charcoal e.g. Makaazingira Eco-charcoal where charcoal is produced from invasive or weedy plants or other sustainable sources. Efficient use of produce charcoal through use of improve jikos go a long way in reducing demand for bioenergy thus slowing down tree cutting.
• On-farm woodlots of fast growing trees as well as promotions of agro-forestry practice reduce pressure for fuewood from natural forests and these enhance sustainability. Charcoal made from invader species such as Acacia drepanolobium (Okelo et al., 2001), Euclea divinorum (Wahungu et al., 2012), Lantana camara or Prosopis juliflora (Mwangi and Swallow, 2005) could also be encouraged both as a management tool as well as increase the much needed charcoal.
• The government can also tax the industry and the money collected is use in afforestation/ reafforestation or in the supply of subsidised improved efficient jikos.
• Environmental and Social Impact Assessment must be religiously done before bio-fuel projects are approved and prudent follow-up after commencement.
Case study:

99
KENYA 5TH NATIONAL REPORT
5.4.1.3 Bio-fuel production project in Kenya
There have been a number of attempts to grow Jatropha curcas for bio-diesel in Kenya since 2005. The proposed projects one at Tana River and another in Dakatcha woodland Kilifi County attracted cheers and jeers on equal measures. It has also interest the scientific community, NGOs, private sector with intend of knowing the viability of the proposed project as well as negative responses likely to occur (see Mogaka et al, 2010; Tomomatsu and Swallow, 2007; Muok and Källbäck, 2008; Wekesa et al. undated; ). There have been campaign for and against the project and heated debate online and in media abound. What has come out clearly from the discussions and commissioned studies is that no agreement on the viability of the project to support sustainable energy source. The opponents of the project noted that 50,000 hectares of Dakatcha woodland critical habitat for some rare birds and plants would be destroyed to give way to a Jatropha plantation and did request for well done Environmental Impact Assessment be done before the project can proceed. The sugarcane production for bio-fuel at the Tana River Delta also met resistance from conservationists and some members of the local community who rely on the riverine ecosystem for dry season grazing. The arguments were that the Delta is a gazetter Ramsar site of international repute as important bird area (IBA). There are however those who welcome the initiative as god-send and see it as an opportunity to create employment for the youth, generate environmentally friendly biofuel and increase productivity from otherwise idle land.
5.5 Fisheries sector Kenya’s fisheries sector is mainly composed of freshwater (lakes, rivers and dams) and marine (Indian Ocean), with aquaculture still at infancy. The sector is estimated to produce 150,000 metric tonnes (MT) of fish annually thus contributing 5% of the country’s gross domestic product (GDP) and employ directly 50,000 people mainly fishermen, traders, processors and employees (GOK, 2005). Fishing is both a food production as well as a cultural activity (sport) and therefore it potential is enormous. Lake Victoria produces over 70% of the country’s annual fish production though only 6% of the lack surface area is in Kenya with Nile perch, Omena (Rastrineobola argentea) and Tilapia being the main catch. This sector also support tourism sector from collection of materials such as corrie shells, snail shells, dead coral reef and ornamental fishes kept in

100
KENYA 5TH NATIONAL REPORT
Aquariums.
5.5.1.1 Threat of fishing to biodiversity
• Kenya’s aquatic ecosystem and species are faced with both anthropogenic and natural threats. They include the following;
• Over-exploitation of freshwater and marine fisheries attributed to high demand.
• Controlled breeding, development of animals with narrow genetic base threatened resource base
• Introductions of invasive species (e.g. Nile Perch, water Hyacinth in Lake Victoria).
• Use of banned fishing nets and fish poison in fishing (e.g. Tephrosia species sap). • Pollution from farms, industries, accidental spillage of oils and industries
• Climate change causing bleaching of coral reef (kill tourism industry) • Deforestation
• Uncontrolled abstraction of water • Siltation • Unregulated physical developments e.g. Dams, Causeway, bridges etc.
5.5.1.2 Recommendations
• Policy regulating allowable size of nets for fishing and seasons for fishing need to be enforced. This can be done through strengthening existing associations of fishermen/women and supporting establishment of new ones where none exist to regulate their members in best fishing practise.
• Control of pollution through policies such as polluter-pays for cleaning up the mess.
• Increase the capacity of fish farming to release pressure on the few natural habitats
• Streamline market information, value chains and address market inefficiencies. • Control invasive species e.g. Nile Perch in Lake Victoria through targeted
harvesting.
5.6 Forestry sector
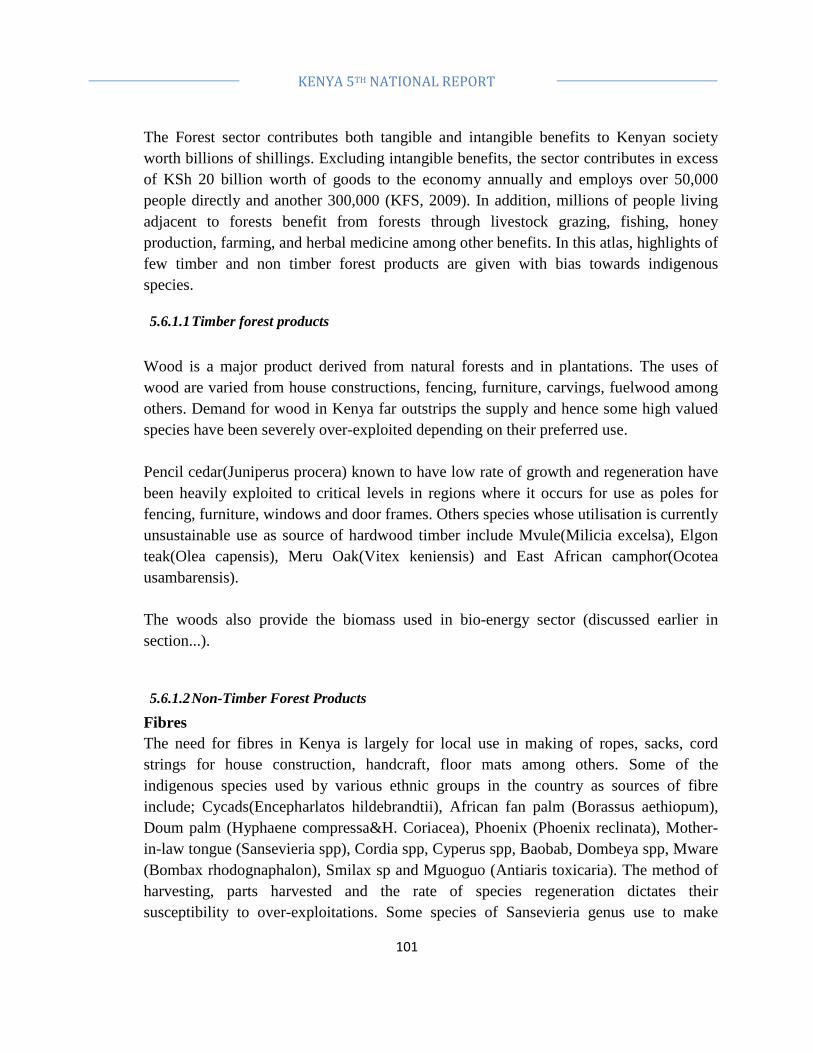
101
KENYA 5TH NATIONAL REPORT
The Forest sector contributes both tangible and intangible benefits to Kenyan society worth billions of shillings. Excluding intangible benefits, the sector contributes in excess of KSh 20 billion worth of goods to the economy annually and employs over 50,000 people directly and another 300,000 (KFS, 2009). In addition, millions of people living adjacent to forests benefit from forests through livestock grazing, fishing, honey production, farming, and herbal medicine among other benefits. In this atlas, highlights of few timber and non timber forest products are given with bias towards indigenous species.
5.6.1.1 Timber forest products
Wood is a major product derived from natural forests and in plantations. The uses of wood are varied from house constructions, fencing, furniture, carvings, fuelwood among others. Demand for wood in Kenya far outstrips the supply and hence some high valued species have been severely over-exploited depending on their preferred use. Pencil cedar(Juniperus procera) known to have low rate of growth and regeneration have been heavily exploited to critical levels in regions where it occurs for use as poles for fencing, furniture, windows and door frames. Others species whose utilisation is currently unsustainable use as source of hardwood timber include Mvule(Milicia excelsa), Elgon teak(Olea capensis), Meru Oak(Vitex keniensis) and East African camphor(Ocotea usambarensis). The woods also provide the biomass used in bio-energy sector (discussed earlier in section...).
5.6.1.2 Non-Timber Forest Products
Fibres The need for fibres in Kenya is largely for local use in making of ropes, sacks, cord strings for house construction, handcraft, floor mats among others. Some of the indigenous species used by various ethnic groups in the country as sources of fibre include; Cycads(Encepharlatos hildebrandtii), African fan palm (Borassus aethiopum), Doum palm (Hyphaene compressa&H. Coriacea), Phoenix (Phoenix reclinata), Mother-in-law tongue (Sansevieria spp), Cordia spp, Cyperus spp, Baobab, Dombeya spp, Mware (Bombax rhodognaphalon), Smilax sp and Mguoguo (Antiaris toxicaria). The method of harvesting, parts harvested and the rate of species regeneration dictates their susceptibility to over-exploitations. Some species of Sansevieria genus use to make
102
KENYA 5TH NATIONAL REPORT
thatch (suti see image) among the Rendille and Ariaal community in northern Kenya have been extirpated in some locations with high human population in Marsabit County e.g. Kargi, Korr and Logologo. A completely weaved suti measuring approximate 1 m2 was sold at Kshs 1500 apiece in 2007 (Kibet et al.
, 2007). Ariaal house thatched using suti made from Sansevieria sp (Oldupai) in Ilaut area of Marsabit County.
5.6.1.3 Gum and Resins
The most renowned species that provide Gum and resins in Kenya include Acacia Senegal, Acacia seyal, Boswellia neglecta, Commiphora holztiana and Commiphora myrrh. Thefirst two species produces the Gum Arabic while the later three produces gum resins. The demand of resins in Kenya is estimated at 620 tonnnes per year while Ethiopia and Somalia need about 1150 and 720 tonnes respectively (GOK, 2010). All the gum and resins produce in Kenya are currently tapped from the wild. Gum and resins have a moderate economic potential in the country but has remains largely untapped due to poverty, market factors, policy neglect and environmental factors (Gachathi and Eriksen, 2011). The marketable gum Arabic comes from Acacia senegal (var) kerensis or Acacia seyalvar.seyal while the Gum resin include Myrrh from Commiphora myrrh, Oppoponax or Hagar from Commiphora holtziana and Frankincense from Boswellia neglecta (Gachathi and Eriksen, 2011). As at 2005, there were five key players in this sector involved in trade in the country with a annual trade volume of over 450 tonnes (Chikamai and Casadei, 2005). In an effort to promote trade and sustainable utilisation of Gum and Resins in Sub-Sahara Africa, a regional network; Network for Natural Gums and Resins in Africa (NGARA) was established in 2000 by 14 countries
103
KENYA 5TH NATIONAL REPORT
producing gum and resins (www.ngara.org). Some of the constrains noted in developing the sector fully include inadequate data on the resources, lack of sound production practices, inadequate market information and lack of credit facilities for traders especially in the rural areas (Chikamai and Casadei, 2005). The immediate threat to Gum and resins producing species comes from alternatives uses such as de-branching for fencing homesteads, firewood and charcoal making. This is particularly critical within proximity to satellite towns in northern Kenya where majority of the species are found. Other threats include improper harvesting methods (excessive tapping) especially Mrryh, spread of invasive species (Prosopis juliflora) overgrazing and conversion of woodlands into arable lands e.g along the Ewaso Nyiro River in Laikipia, Samburu and Isiolo Counties. Another threat to sustainable utilisation of gum and resins is the low prices of the products.
5.6.1.4 Essential oils & Lipids
The Sandalwood (Osyris lanceolata) is one of the indigenous species in Kenya producing essential oils with international market. The demand for the species has caused concern among the conservation organisations in the country and currently has been proposed for inclusion in Convention for International Trade in Endangered Species (CITES) list under appendix II after the expiry of presidential degree invoked in 2007. This means any future trade on the species as a whole or its extracts will be restricted in an effort to promote its conservation. Other popular species producing essential oils in the country include; Adansonia digitata, Calodendrum capense, Ocimum gratissimum, Tarconanthus camphoratus, Calophyllum inophyllum, Moringa oleifera, Boswellia neglecta, Cymbopogon spp andElaeis guineensis most of which are traded locally and internationally. The above species except (Osyris lanceolata) are currently under no threat from over-exploitation; however, limited ecological range for most of them makes them susceptible (Lemmens, 2005, 2008). There is limited or no attempt to cultivate some of the species and any increase in essential oils demand will strain the supplies leading to excessive extraction from the wild populations. There are also exotic species under cultivation in the country for supply of essential oils such as lavender, Avocado, Mints etc.

104
KENYA 5TH NATIONAL REPORT
5.6.1.5 Threats of forestry sector to biodiversity
• The biggest threat to forest biodiversity as a source of timber products is over-exploitation. Wood extractions are not in tandem with level of species regeneration thus causing their population decline. Sustainable extraction of timber is not possible in many forest patches due to limited information such as amount of existing wood volumes, growth rate and regeneration of targeted species, accessibility, competing uses among other needed to plan an effective harvesting schedule.
• The establishment of large scale plantations in previously natural forests, farm encroachment, natural and anthropogenic fires and large scale infrastructures (e.g. mining factories, roads etc.) caused decline in forest diversity.
5.6.1.6 Case Study:
5.6.1.7 Community forestry, Indigenous Knowledge and forest resource use – The Kaya forests
Kaya means homesteads in Mijikenda dialect. The Kaya forests are relic forests of once extensive Zanzibar-Inhambane Mosaic forest that surrounded former settlements of the Mijikenda community. The Mijikenda community comprise of nine sub-ethnic groups namely, Giriama, Chonyi, Kauma, Kambe, Jibana, Ribe and Rabai in Kilifi County and Digo and Duruma in Kwale County. Historical narratives indicates that the community migrated from Singwaya (somewhere south of Kenya Somalia border) due to hostilities from neighbouring Galla people, drought and famine and established fortified villages within forest ridges for security reasons (Spear, 1978). Up to 60 Kaya forests of varying sizes from as little as 2 acres to more than 500 acres are found spread over 200 kilometres at the coastal hinterland. As security improved, the community left the forest villages into adjacent lands and settled but maintained the forests as ancestors’ abodes. The community with the help of council of Kaya elders who are the custodians of the forests, over generations established traditional rules and regulations that governed the use of resources within and outside the Kaya forest boundaries’. A study of one of the Kaya forest (Kaya Mudzimuvya) for the Rabai sub-ethnic group showed that the forest was subdivided into eight zones with varying level of access. The forest was governed through a set of rules/regulations that dictates the use of resources within each of the zones. For example farming, poles cutting, livestock grazing were

105
KENYA 5TH NATIONAL REPORT
prohibited within certain zones of the forest. Fear of divine retribution played a significant role in the enforcement of rules; people believe that the transgression of taboos may result in undesirable events such as illness, death, or the birth of a hand-capped child (Kibet, 2002). Due to these rules and regulation, today Kaya forests remain important sites of cultural and ecological significance with many of them supporting rare and endemic Kenyan flora and fauna. Recently, (in 2008), 11 Kaya forests fragments were inscribed as Whole Heritage Sites under UNESCO giving them international recognition as landscapes of cultural and natural repute. In the last five decades though, Kaya forests have began to experience accelerated degradation due to decline in indigenous knowledge, increase in human population and associated demand for natural resources and decline in respect to cultural value system by younger generations. Similar observations have been noted among the Maasai, Pokot and Luo communities (Kibet and Nyamweru, 2008; Kibet and Oyieke, 2009;).
5.6.1.8 Recommendations
• Previous research and extension policies governing forestry did not address itself to most of the high valued native species, but more towards exotic timber species such as Cypress, Eucalyptus, Pines, Wattle trees and Grevillea. There is need therefore for increase research on these species and promote their cultivation on farms and well as enrichment planting within protected areas.
• Of immediate need, the sector need to undertake a complete inventory of the existing resource base and mapped. This will provide a basis for identifying research needs, existing threats and opportunities for planning sustainable utilisation.
• Purposeful engagement of local communities cannot be gainsaid in pursuit of sustainable use of forest resources. Some practical steps would be to undertake capacity building on better harvesting methods, handling and storage, propagation protocols as well as in situ conservation e.g. enrichment planting within protected sites, botanical gardens etc. The newly established County government have a golden opportunity to tap into local communities’ support in the management of forests resources by building partnership based on mutual trust, through capacity building, sharing of benefits arising from the sector and direct employment.
• Domestication of species of commercial value is mandatory if sustainable utilisation of biological resources is to be achieved. Some species have fast growth rate such as shortlived perennials/biannuals or annuls (e.g. Ocimum spp) and therefore they can easily be cultivated on-farm easily. Some species such as

106
KENYA 5TH NATIONAL REPORT
Leleshwa (Tarconanthus camphoratus) are invaders and therefore their use helps in managing spread.
5.7 Health sector This sector benefits from biodiversity in a number of ways. The nutrition needed for healthy living is largely met by biodiversity from plant-based and animal-based foods. In Kenya traditional foods have gained a lot of recognition in the recent past due to health benefits associated with them and sustained campaign by different stakeholders since 1989. Over a thousand species of plants are used as traditional foods in Kenya either as fruits, vegetables, tubers, food additives (spices) etc. though only a couple of them are domesticated/cultivated. Clean environment provide clean air and water that are essential in sustainable healthy lifestyle. The use of traditional medicine and medicinal plants is as old as the humankind existence on earth. Humankind has learned to use animal and/or plant based medicine to treat various ailments for themselves and their livestock. It is estimated that 50,000 to 70,000 plant species are used in traditional and modern medicinal systems throughout the world out of which 3000 are traded internationally (Lange and Schippmann, 1997). The World Health Organisation -WHO (2002) in recognition to the importance of traditional medicines among the poor in developing countries, it set out to create awareness and promote their use as a compliment to primary healthcare. In response to this campaign, the herbal market has continued to grow. Currently, it is estimated that global market of herbal drugs is about US$ 60 billion per year and growing at a rate of 7%. This increase in demand for herbal products has resulted in unsustainable use of medicinal plants all over the world and particularly in Africa where poverty is widespread and weak regulatory mechanisms and their enforcement is common (Vasisht and Kumar, 2004). In Kenya, 1200 vascular plant species have been reported as having medicinal properties (Vasisht and Kumar, 2004). As a country, we not only grappling with how best to promote sustainable use of traditional medicine but also fight associated stereotype created by the colonial government where administration of herbal medicines was criminalised. Since 2002 a number of projects have been initiated in the country to promote traditional medicines and medicinal plants looking at species inventories, conservation status, markets and

107
KENYA 5TH NATIONAL REPORT
value chain, as well as identification of stakeholders. Some of the initiatives include The Kenya Working Group on Medicinal and Aromatic Plants established in 2002, Community Based Conservation of Medicinal Plants (2004-2008), Network on Traditional Medicines and Medicinal Plants (2005-2008), Capacity Building on Community Based Conservation of Medicinal Plants (2008) among others. All these initiatives aimed at identifying priority research gaps, priority list of species for conservation (domestication and/or cultivation), list of species on currently on trade, capacity building of traditional health practitioners, and review of existing policy with a view to laying a firm foundation that will guarantee sustainable development.
5.7.1.1 Health sector and threats to biodiversity
The volume of trade on medicinal plants in Kenya is not clear, however increasing market for herbal products internationally is likely to threatened some species where harvesting relies on wild population. A stakeholder workshop held in 2005 and again in 2010 to look at the traditional medicine and medicinal plants in Kenya, Conservation Assessment and Management Planning workshop (CAMP I and II) identified 65 medicinal plants species for priority conservation from a list of 780 species that have been reported in publications as having medicinal use in Kenya(see Appendix..). The workshop further identified research needs, market development and potential for cultivation of the selected species (Kibet et al., 2010).
• Biopiracy and illegal trade • Over-exploitation of wild medicinal plants • Quacks practising as traditional health practitioners who have no understanding
on best practices in harvesting and preservation of medicinal plants. • Persistent un-healthy competition between traditional health practitioners and
conventional doctors.
• Examples of plants that have been over-exploited in the recent past in Kenya. • Sandalwood (Osyris lanceolata) for essential oils use in pharmaceuticals and
cosmetic industry
• African Stinkwood (Prunus africana) for medicinal and timber use • Several Aloes species for medicinal and cosmetics purpose
• Muthiga (Warburgia ugandensis) for medicinal purpose
5.8 Trade and Industry Sector

108
KENYA 5TH NATIONAL REPORT
Trade in biological resources cut across other sectors discussed earlier such as agriculture, health, forestry and energy. Trade in biodiversity is a ‘double edge sword’ with potential to promote sustainable use and thus improve livelihood but it can also promote loss in species through illegal transactions. There are a number of small and medium scale firms, Community Based Organisations, NGOS and individuals involved in trade on biodiversity in Kenya. Some of these are involve in trade in fauna e.g. Ostrich farming, reptiles farming (Snakes, tortoise, and chameleons), butterflies (see section 1.1.2.1.) both for local and international market. All business trading in wild flora and fauna requires approval from Kenya wildlife service (KWS), however, illegal trade still occur. Trade in the above biodiversity could either be as whole or parts of the organism e.g. skin, hides or leaves, bark, roots etc.
5.8.1.1 Threats of trade to Biodiversity
Unlike trade in fauna where license requirements is strictly enforced, floral trade has challenges in enforcing regulations such as ease of identification, the fact that some are sold in highly processed form (e.g. lotions, soaps, essential oils etc) and also inadequate information on the stock level of some species. As a country trade in wild species is common, however this sector is not well understood and thus not regulated. Some wild plant whose fruits are sold in local markets (including supermarkets) include Adansonia digitata (Baobab), Landolphia kirkii (Rubber vine), Tamarindus indica (Tamarind), Sclerocarya birrea (Marula tree), Dalium orientale (Mpepeta), Saba comorensis, Ximenia americana, Syzygium spp, Ziziphus mauritiana especially in the semi arid and Garcenia livingstonii, Dovyalis abyssinica, Psidium quajava in the sub-humid part of the country (pers. observation). Most of the above species are not currently under threat of extinction however, increase in volume of trade could endanger them. This is true for almost all medicinal plants sold in local, regional and international markets (Marshall, 1998; Kariuki & Kibet, 2007). Market failures are pose threat to biodiversity. Some of these failures by markets include inability for markets to allocate resources efficiently. Examples include social inefficiency where external costs and benefits are not accounted for in production, Technical inefficiency where goods are not produce at possible minimum amount of resources or Productive inefficiency where goods are not produce at lowest factor cost. What is the selling price for an elephant for example? Recommendations As a country we must enforce national and international regulations that promote fair trade and sustainability principles. Currently 150 species native to Kenya have been listed

109
KENYA 5TH NATIONAL REPORT
under CITES, meaning trade on them is restricted or prohibited. More recently (2013) African Sandalwood (Osyris lanceolata) was added to the list to enhance their conservation. This should not be an end in itself but an opportunity to investigate how best to sustainably use the species. Kenya must lobby international community to ensure international treaties (e.g. International treaty on plant genetic resources on food & Agriculture (ITPGRFA), UN Protocol treaty against Biopiracy, CITES, CBD etc.) are strictly enforced so that illegal trade is curtailed. The country must agree to certify biodiversity in trade with bodies such as Forest Stewardship Council, ISO, FairTrade as a means to culture, promote and adopt best practises. Trade should not be seen only as a threat to biodiversity, but also an opportunity to promote sustainable use. As a matter of priority, organisms in trade or with commercial potential should be domesticated/cultivated and more research carried on them to increase their production to meet quality and market demand. This will not only be benefit in the improvement of society’s livelihood but also promote their sustainable utilisation.
5.9 Biodiversity and cultural/spiritual value Natural and cultural landscapes are critical national heritage and as such they ought to be jealously conserved. Kenya has more than 40 distinct ethnic communities spread from the sea level at the Coast to highlands (over 2000 m a.s.l) each with their own socio-economic, political and cultural value system. All Kenyan communities rely on biodiversity to sustain their livelihood as well as their culture be they agriculturalists, agro-pastoralists, pastoralists, hunter-gatherer or business people. Among some Kenyan communities, a well elaborate biodiversity-culture interface exist where biodiversity maintain culture and vice versa is true based on belief system. Examples include the clan totems, where clan identify themselves with an emblem that could be an insect (e.g. Bee), bird, mammals, reptiles etc. Belief systems (Omieri and the good harvest, timing of cultural events e.g field preparation for farming, planting etc Use of plants and animals in cultural rituals, rites and ceremonies (e.g. marriages, initiations, naming ceremonies, burials etc). Use of animals as bride price

110
KENYA 5TH NATIONAL REPORT
5.10 Biodiversity and Urbanization The expansion of cities is accompanied by need for more land for settlement and infrastructure development. For example Kitengela –Kapiti plains wildlife corridor that once served as lifeline of Nairobi National Park is increasingly being choked by mushrooming farms, settlements, infrastructure (roads, schools, hospitals etc) to the detriment of wildlife. There has been increasing human-wildlife conflicts within this site as a result and things will get worse going into the future unless a complete paradigm shift occur with respect to design of urban planning. ‘Regenerative neighbourhood’ whereby development considers opportunities for ecosystems to regenerate and provide goods and services. Establishment of infrastructure to meet needs of expanding cities e.g. Roads, Electricity lines, Optic fibre etc some of which cut across critical habitats, Southern by-pass (Nairobi) is designed to pass through Nairobi National Park, The Lamu Port-South Sudan-Ethiopia Transport (LAPPSET) project that will ultimately open up sites previously save haven for wildlife, Kenyan –Ethiopia powerline is planned to cut through the Ewaso Nyiro Ecosystem that support 80% of the only remaining 2000 or so Grevy Zebra in the world. Karura forest in Nairobi suffered tremendous degradation thanks to expansion of Nairobi city.
5.10.1.1 Sustainable use and Nagoya Protocol challenges
Traditional knowledge is increasingly declining at faster rate as elderly people passed on and younger generation spend more time in schools and employment in urban centres. Undocumented traditional knowledge in public domain constrains implementation of the protocol (not easy to place ownership) and thus rightful beneficiaries’. Limited institutional capacity within the country to fully implement the protocol e.g. competent focal points and information clearing house to ensure all necessary information is consolidated, collated and shared as necessary. Limited awareness among the general populace on the provision of the protocol and therefore more is needed to educate the public on the same. Suspicions among traditional knowledge experts and research scientists have hindered progress in tapping and improving on local knowledge associated with genetic resource use.
111
KENYA 5TH NATIONAL REPORT
Incidences of biopiracy and illegal trade kills little gains already made in promoting fair and equitable sharing of benefits arising from utilisation of genetic resources e.g the theft of bacteria from Lake Bogoria and subsequent commercialisation without consent of neither the local community nor the government The resource inequity between genetic resources rich and technological advance regions of the world.

112
KENYA 5TH NATIONAL REPORT
6 THE NATIONAL BIODIVERSITY STRATEGY AND ACTION PLAN, ITS IMPLEMENTATION AND THE MAINSTREAMING OF BIODIVERSITY
6.1 Status of review and updating of NBSAP Process initiated Resources mobilized from the GEF and government funding Stakeholder mapped and sensitized Steering committee established Inception workshop held and report generated.
6.2 Legislative instruments To effectively implement conservation, sustainable use and development of biodiversity; Kenya has the following legislative instruments: The National Constitution of Kenya (COK 2010) :Art. 69 of the Kenya Constitution 2010 cover biodiversity issues comprehensively
6.2.1.1 ENVIRONMENTAL MANAGEMENT AND COORDINATION ACT (EMCA 1999)
The Act provides for establishment of an appropriate legal and institutional framework for the management of the environment and related matters. It is a framework environmental legislation that establishes appropriate legal and institutional mechanisms for the management of the environment. This is in view of the fact that the environment constitutes the foundation of national economic, social, cultural and spiritual advancement. The act has been reviewed to conform to the Kenya constitution 2010. Water Act, 2002: Act No 8 of 2002 is an act of Parliament to provide for the management, conservation use and control of water resources and for the acquisition and regulation of rights to use water, to provide for the regulation and management of water supply and sewerage services. The act is being reviewed to conform to Kenya constitution 2010.

113
KENYA 5TH NATIONAL REPORT
6.2.1.2 NATIONAL LAND COMMISSION ACT, 2012
he independent land commission was established as provided by the Kenya constitution 2010 vide article 67. Follow up to this, an act of parliament, the National Land Commission Act, 2012 was enacted to give effect to this article. . The act provides for the establishment of an independent government commission whose among other things seeks to oversee management of public land on behalf of the national and the county governments, initiate investigations into present or historical land injustices and recommend appropriate redress and monitor and have oversight responsibilities over land use planning throughout the country among other provisions Wildlife Act: The Wildlife Conservation and Management Act 2013 became operational on 10th January 2014. The new law has as one of its guiding principles the devolution of conservation and management of wildlife to landowners and managers in areas where wildlife occurs through in particular the recognition of wildlife conservation as a form of land use, better access to benefits from wildlife conservation and adherence to the principles of sustainable utilization. The cat provides harsh penalties for poachers among other provisions.
6.2.1.3 Land Registration Act, 2012:
Land Registration Act is an act of parliament to revise, consolidate and rationalize the registration of land, to give effect to the principles and objects of devolved government in land registration and for connected purposes.
6.2.1.4 Seed and Plant Variety Act:
This is an Act of Parliament to confer power to regulate transactions in seeds, including provision for testing and certification of seeds for the establishment of an index of names of plants varieties, to empower the imposition of restriction on the introduction of new varieties.
6.2.1.5 Heritage Act 2006:
Act of Parliament to consolidate the law relating to National Museums and heritage.To provide for establishment control, management and development of National Museums on transmission of cultural and natural heritage of Kenya.

114
KENYA 5TH NATIONAL REPORT
6.2.1.6 Agriculture Act.:
To provide for the establishment of agriculture, fisheries and food authority, to make provision for the respective roles of the national and county governments in agriculture excluding livestock and related matters in furtherance of the relevant provisions of the fourth schedule to the constitution and for connected purposes.
6.2.1.7 Noxious Weeds Act.
This act provide for the suppression of noxious weeds. It introduces various measures that shall be taken by the Government and individuals for the suppression of a weed that is declared to be a noxious weed by the Minister under this Act. A declaration of noxious weed may apply to a specific area of Kenya. Any person having land in an area for which a noxious weed is declared shall report the existence of such weed and immediately destroy such weed. Inspectors appointed by the Director of Agriculture shall have the power to control land on the existence of noxious weed and order the eradication such weed. If a person fails to observe an order of an inspector, the inspector may proceed to eradicate the weed. A local authority may, with the consent of the Director of Agriculture, make by-laws for securing the eradication of any noxious weed from land within its area and may provide for the appointment of inspectors. Science, Technology And Innovation Act 2013.: To facilitate the promotion, co-ordination and regulation of the progress of science, technology and innovation of the country; to assign priority to the development of science ,technology and innovation; to entrench science, technology and innovation into the national production system and for connected purposes.
6.2.1.8 LAND ACT:
The Land Act focuses on conservation and protection of ecologically sensitive areas such as “Riparian reserve” i.e. Land adjacent to the ocean, lake, sea, dams and water courses and sustainable and productive management of land resources.
6.2.1.9 FOREST ACT 2005:
Provides for the establishment, development and sustainable management including conservation and rational utilisation of forest resources for the socio economic development of the country

115
KENYA 5TH NATIONAL REPORT
6.2.1.10 BIOSAFETY ACT 2009:
Established the national biosafety authority that regulates transfer, handling and use of genetically modified organisms.
6.2.1.11 Kenya Agriculture and Livestock Research ACT 2013:
Established a national agricultural and livestock research organisation comprising semi-autonomous thematic institutes including genetic resource research institute that’s mandated to conserve genetic resources
6.2.1.12 THE LAW OF THE SEA:
The law of the sea governs the resources and the uses of the coastal and ocean areas and also recognizes the interrelationship among the various coastal and marine ecosystems and associated multiple uses.
6.2.1.13 THE NAGOYA PROTOCOL:
The Nagoya protocol which was adopted on 29th October 2010 in Nagoya focuses on fair and equitable sharing of benefits arising from the utilization of genetic resources, thereby contributing to the conservation and sustainable use of biodiversity.
6.2.1.14 THE KYOTO PROTOCOL :
The Kyoto protocol adopted in December 1997 contribute towards stabilizing atmospheric green house gas through enhancing carbon sinks, promoting agricultural activities, promoting energy efficiency and use of renewable energy. This has therefore promoted environmental integrity and enhanced biodiversity conservation.

116
KENYA 5TH NATIONAL REPORT
7 PROGRESS TOWARDS THE 2020 AICHI BIODIVERSITY TARGETS AND CONTRIBUTION TO THE RELEVANT 2015 TARGET OF THE MILLENIUM DEVELOPMENT GOALS
7.1 Aichi Biodiversity Targets Table 3 Summary of Kenya's progress towards achievement of Aichi's targets
AICHI BIODIVERSITY TARGET
ASSESMENT OF PROGRESS TOWARDS AICHI TARGETS
PROPOSED NATIONAL GOALS
Strategic Goal A: Address the underlying causes of biodiversity loss by mainstreaming biodiversity across government and society
Target 1 By 2020, at the latest, people are aware of the values of biodiversity and the steps they can take to conserve and use it sustainably.
Communication Educational and Public awareness (CEPA) on biodiversity conservation and sustainable use targeting terrestrial and aquatic ecosystems carried out in the country. CFAs, WRUAs, PPP, community based conservation initiatives, strengthened collaboration between civil societies and government institutions Strong community wildlife service , education and awareness department at KWS Establishment of community and private conservancies increased by about 100%. Initiated incorporation of environmental (including biodiversity) education programmes within the national educational curriculum (from primary to tertiary level).
By 2020 40 % of the population to have been made aware of biodiversity issues and the steps to be taken to conserve and use them sustainably.

117
KENYA 5TH NATIONAL REPORT
Revision of national food composition table to capture the values of local agro-biodiversity initiated.
Target 2 By 2020, at the latest, biodiversity values have been integrated into national and local development and poverty reduction strategies and planning processes and are being incorporated into national accounting, as appropriate, and reporting systems.
Biodiversity values included in various national and sectoral development and master plans Recognition of biodiversity values in national development blue print (vision 2030). Kenya forestry master plan Ecosystems/site specific plans National biodiversity conservation and restoration plans Climate change strategy/action plan Climate change bill Strategic plans for key biodiversity management institutions Recognition of biodiversity within the Kenya constitution 2010 Wildlife Conservation and management Act 2013 Climate change bill 2015 Draft Climate change policy National Wetlands policy Water Act Kenya Agricultural and Livestock Research (KALR) Act 2013 Bio science bill EMCA review Seed and plant varieties Act 2012 Land Act Land use policy National environment policy Wildlife biodiversity valuation project initiated
By 2015 to have documented the natural capital in Kenya by undertaking ecosystem valuation of identified ecosystems, water catchment areas and other critical habitats. By 2020 to have economic valuation of biodiversity in at least 2 major ecosystems undertaken.
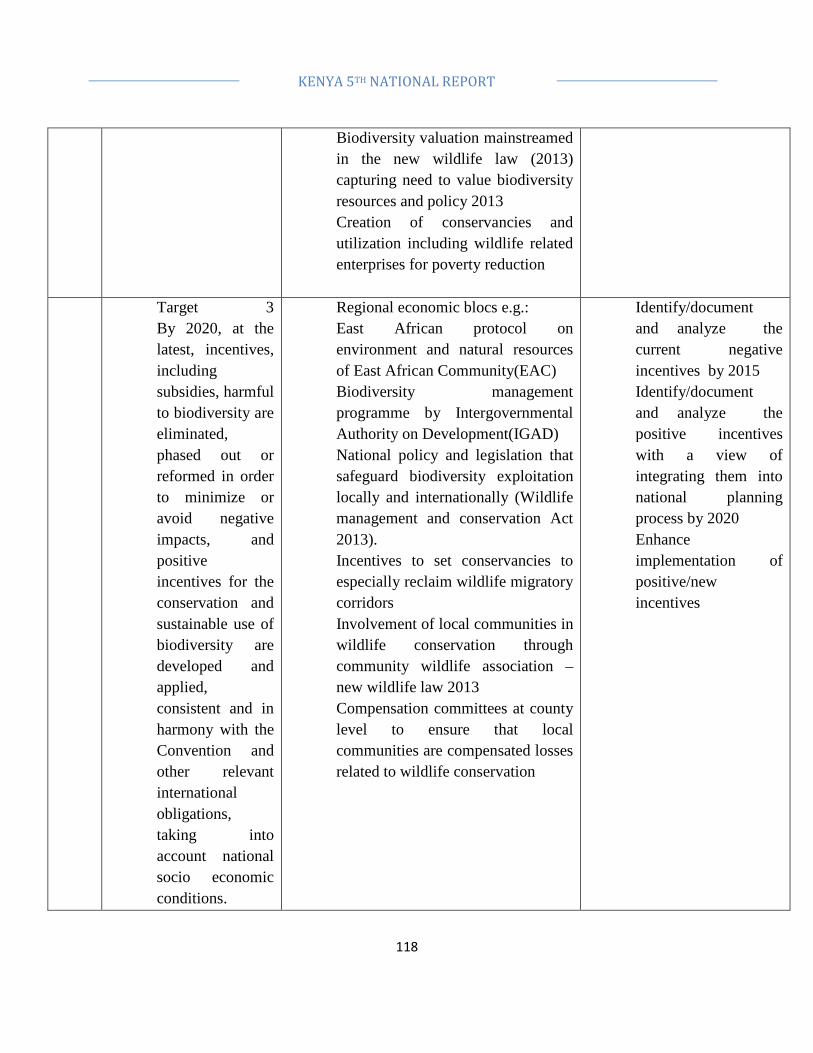
118
KENYA 5TH NATIONAL REPORT
Biodiversity valuation mainstreamed in the new wildlife law (2013) capturing need to value biodiversity resources and policy 2013 Creation of conservancies and utilization including wildlife related enterprises for poverty reduction
Target 3 By 2020, at the latest, incentives, including subsidies, harmful to biodiversity are eliminated, phased out or reformed in order to minimize or avoid negative impacts, and positive incentives for the conservation and sustainable use of biodiversity are developed and applied, consistent and in harmony with the Convention and other relevant international obligations, taking into account national socio economic conditions.
Regional economic blocs e.g.: East African protocol on environment and natural resources of East African Community(EAC) Biodiversity management programme by Intergovernmental Authority on Development(IGAD) National policy and legislation that safeguard biodiversity exploitation locally and internationally (Wildlife management and conservation Act 2013). Incentives to set conservancies to especially reclaim wildlife migratory corridors Involvement of local communities in wildlife conservation through community wildlife association – new wildlife law 2013 Compensation committees at county level to ensure that local communities are compensated losses related to wildlife conservation
Identify/document and analyze the current negative incentives by 2015 Identify/document and analyze the positive incentives with a view of integrating them into national planning process by 2020 Enhance implementation of positive/new incentives

119
KENYA 5TH NATIONAL REPORT
Target 4 By 2020, at the latest, Governments, business and stakeholders at all levels have taken steps to achieve or have implemented plans for sustainable production and consumption and have kept the impacts of use of natural resources well within safe ecological limits.
Controlled exploitation of biodiversity. CITES licensing and national mechanism well established to ensure managed international and local use of wildlife resources Collaboration through formal public-private partnerships SEIA, EIA and EA mandatory for projects within PAs and outside that are likely to impact negatively Enactment of Private Public Partnership Act. The government has put policies and strategies to in place to attain 10% tree cover.
Have a Green economy strategy and action plan by 2015 by 2020 develop SPC plan for priority sectors
Strategic Goal B: Reduce the direct pressures on biodiversity and promote sustainable use
Target 5 By 2020, the rate of loss of all natural habitats, including forests, is at least halved and where feasible brought close to zero, and degradation and fragmentation is significantly reduced.
Land use policy in place Forest Act 2005 in place Rehabilitation initiatives of ecosystems( Mau, Aberdares, Mt. Kenya, Cherengani, Nandi) in progress Protected Areas – with 8 PAs (Chepkitale National Reserve, Mount Kenya National Reserve, Nyambene National Reserve, Lake Simbi National Sanctuary, Naivasha National Sanctuary, Ondago Swamp National Sanctuary, Lake Kanyaboli National Reserve and Lake Elementaita National Sanctuary) declared since year 2000 with a total
Increase the forest cover to 10 % by 2020 by 2020 20% of degraded and fragmented habitats are restored/rehabilitated By 2020 the rate of loss of natural forest is brought close to zero Increase % of protected Area

120
KENYA 5TH NATIONAL REPORT
area of Squire Km 3017 Development and implementation of the National action of UNCCD Project on mapping and recovery of wildlife migratory corridors initiated Establishment of wildlife conservancies by private and community land owners promoted Management of invasive alien species (IAS) initiatives Economic use and management initiatives of IAS One new Ramsar site designated (Tana delta) and nomination of three World Heritage Sites three Rift Valley Lakes – Lakes Elementaita, Nakuru and Bogoria
Target 6 By 2020 all fish and invertebrate stocks and aquatic plants are managed and harvested sustainably, legally and applying ecosystem based approaches, so that overfishing is avoided, recovery plans and measures are in place for all depleted species, fisheries have no significant adverse impacts
Monitoring surveillance, control and patrol of fisheries enhanced Vessel monitoring systems(VMS) to enhanced surveillance established Ecosystem management planning standardized and adopted Critical fish habitats mapped and protected – Beach management regulations developed. New marine vessel acquired for research and training. Economic stimulus policy to promote aquaculture.
By 2020 Illegal, Unreported and Unregulated fishing are eliminated or brought close to zero by 2020 at least five management plans for inland specific water bodies and marine species developed

121
KENYA 5TH NATIONAL REPORT
on threatened species and vulnerable ecosystems and the impacts of fisheries on stocks, species and ecosystems are within safe ecological limits. Target 7 By 2020 areas under agriculture, aquaculture and forestry are managed sustainably, ensuring conservation of biodiversity.
Management and conservation plans to ensure sustainable use of natural resources and biodiversity rich areas e.g. livestock production. Participatory Forest management plans, Aquaculture policy Application of climate smart agriculture including drought resistant/tolerant varieties promoted and Agro forestry practices promoted
Develop and implement a national aquaculture strategy and master plan by 2018 to ensuring conservation of biodiversity Integrating sustainable aquaculture and forestry in county government spatial plan by 2020
Target 8 By 2020, pollution, including from excess nutrients, has been brought to levels that are not detrimental to ecosystem function and biodiversity.
Pollution deterrent legislation including Kenyan constitution 2010 reviewed and enacted.Water quality regulations and solid waste management regulations in place. Management of waste and pollution within protected areas undertaken in collaboration with stakeholders. Establishing of urban rivers programme to minimize pollution. Optimal fertilizer use initiatives promoted. Organic farming practices promoted. linking farmer with research
By 2020 : Provide infrastructure to reduce informal settlements by 50% By 2020 to reduce runoffs from agricultural ecosystems by 40%.

122
KENYA 5TH NATIONAL REPORT
institution for timely information Target 9 By 2020, invasive alien species and pathways are identified and prioritized, priority species are controlled or eradicated, and measures are in place to manage pathways to prevent their introduction and establishment.
Priority invasive and alien species identified and control measures initiated. Legislative and institutional framework to implement Cartagena Protocol on Biosafety among others established. Biotechnology policy 2006 under Review to address other issues including IAS. National invasive alien species management strategy Strategic plan on management of invasive in PAs drafted and activities to implement it initiated. Legislative and institutional framework to prevent introduction of alien invasive species established under plant protection Act [reviewed 2012] and associated regulations. An inventory of IAS on going
Develop and initiate implementation of a national strategy on invasive alien species by 2020 Finalize inventory of IAS by 2020 . Increase capacity to identify IAS to 100 personnel by 2020 to enhance surveillance and monitoring of IAS pathways.
Target 10 By 2015, the multiple anthropogenic pressures on coral reefs, and other vulnerable ecosystems impacted by climate change or ocean acidification are minimized, so as to maintain their integrity and functioning.
Kenya Coastal Development programme (KCDP), for sustainable management of Kenya’s coastal and marine resources established Integrated Coastal Zone Management(ICZM) is in place and is being implemented The level of awareness on coral reef conservation.among . local fishing communities has been enhanced through Beach Management Units . .. Monitoring of coastal biodiversity ongoing e.g Watamu Turtle watch ICZM policy Oceans policy
By 2020 minimise anthropogenic pressures on coastal and marine resources by 50%

123
KENYA 5TH NATIONAL REPORT
Major coral reefs within the Kenya Indian Ocean are protected as part of the Marine PAs. Sensitization regarding pollution and silt into the sea to minimize climate change impacts on the corals Implementation of Nairobi convention protocol on LBS NCCRS and Action plan by 2017 Update information on the sources of pressures Update knowledge base on status trends on coral reefs and other vulnerable ocean ecosystems
Strategic Goal C: To improve the status of biodiversity by safeguarding ecosystems, species and genetic diversity
Target 11 By 2020, at least 17 per cent of terrestrial and inland water, and 10 per cent of coastal and marine areas, especially areas of particular importance for biodiversity and ecosystem services, are conserved through effectively and equitably
Expansion of the protected areas system through increased NPs, community conservancies, forest reserves, private forests. Recovery of wildlife dispersals areas and creation of wildlife corridors ongoing. . Management of protected areas has been mainstreamed into other land use management systems including agriculture. Recognition of the indigenous community conserved areas and conservation practices.
Increasing conservation and protected areas of terrestrial and inland water, and of coastal and marine ecosystems by 17% by 2020.
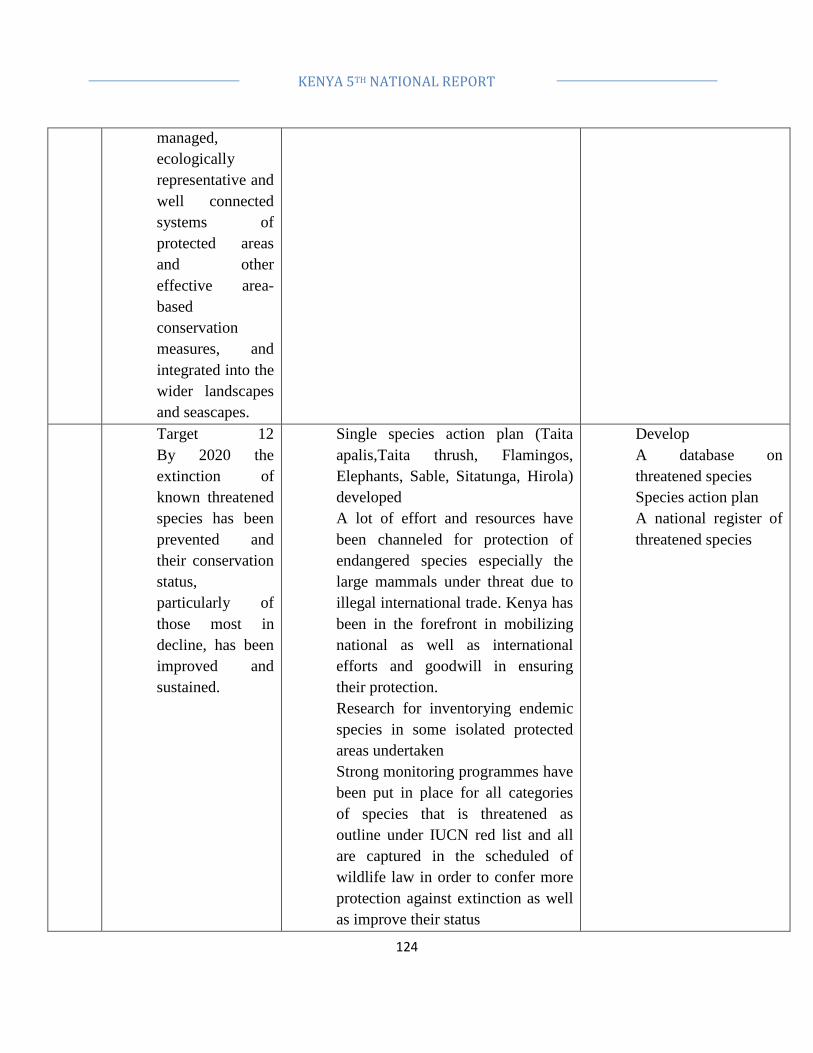
124
KENYA 5TH NATIONAL REPORT
managed, ecologically representative and well connected systems of protected areas and other effective area-based conservation measures, and integrated into the wider landscapes and seascapes. Target 12 By 2020 the extinction of known threatened species has been prevented and their conservation status, particularly of those most in decline, has been improved and sustained.
Single species action plan (Taita apalis,Taita thrush, Flamingos, Elephants, Sable, Sitatunga, Hirola) developed A lot of effort and resources have been channeled for protection of endangered species especially the large mammals under threat due to illegal international trade. Kenya has been in the forefront in mobilizing national as well as international efforts and goodwill in ensuring their protection. Research for inventorying endemic species in some isolated protected areas undertaken Strong monitoring programmes have been put in place for all categories of species that is threatened as outline under IUCN red list and all are captured in the scheduled of wildlife law in order to confer more protection against extinction as well as improve their status
Develop A database on threatened species Species action plan A national register of threatened species

125
KENYA 5TH NATIONAL REPORT
Bioscience Policy and Bill propose to establish KBRC to be ex-situ conservation of microbes and cell lines of threatened species.
Target 13 By 2020, the genetic diversity of cultivated plants and farmed and domesticated animals and of wild relatives, including other socio-economically as well as culturally valuable species, is maintained, and strategies have been developed and implemented for minimizing genetic erosion and safeguarding their genetic diversity.
Legislative and institutional framework for conservation of the diversity of cultivated plants and domesticated animals established. Close to 50000 samples of cultivated and wild relative crops compromising about 2000 species conserved ex-situ. Several botanic gardens and field Gene banks established. Efforts to conserve microbial genetic resources initiated.
By 2020 establish gene banks for animal and microbes. By 2020 community Gene banks are mainstreamed into agricultural systems. .
Strategic Goal D: Enhance the benefits to all from biodiversity and ecosystem services
Target 14 By 2020, ecosystems that provide essential services, including services related to water,
Master plan for protection of water catchment areas developed and adopted. Water catchment areas protection included in climate change response strategy. Establishment of legal and
By 2020 50% of our major ecosystems will be mapped and the extent of degradation established. By 2020 5% of the degraded ecosystem
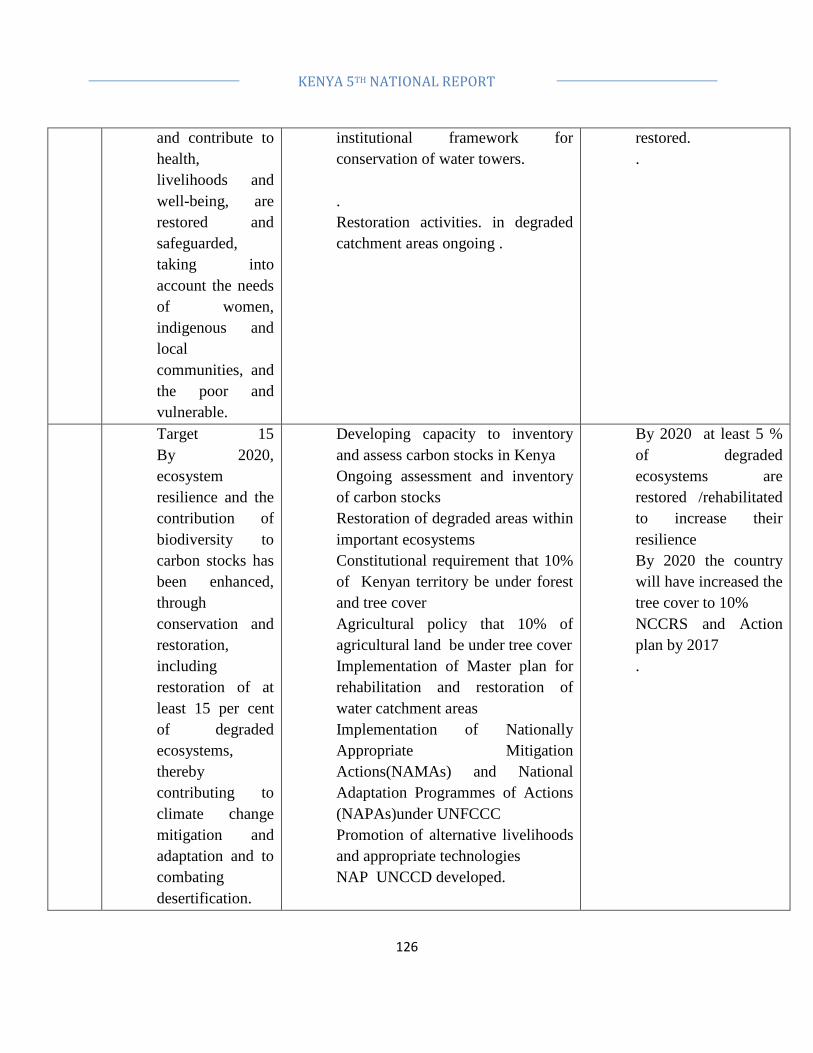
126
KENYA 5TH NATIONAL REPORT
and contribute to health, livelihoods and well-being, are restored and safeguarded, taking into account the needs of women, indigenous and local communities, and the poor and vulnerable.
institutional framework for conservation of water towers. . Restoration activities. in degraded catchment areas ongoing .
restored. .
Target 15 By 2020, ecosystem resilience and the contribution of biodiversity to carbon stocks has been enhanced, through conservation and restoration, including restoration of at least 15 per cent of degraded ecosystems, thereby contributing to climate change mitigation and adaptation and to combating desertification.
Developing capacity to inventory and assess carbon stocks in Kenya Ongoing assessment and inventory of carbon stocks Restoration of degraded areas within important ecosystems Constitutional requirement that 10% of Kenyan territory be under forest and tree cover Agricultural policy that 10% of agricultural land be under tree cover Implementation of Master plan for rehabilitation and restoration of water catchment areas Implementation of Nationally Appropriate Mitigation Actions(NAMAs) and National Adaptation Programmes of Actions (NAPAs)under UNFCCC Promotion of alternative livelihoods and appropriate technologies NAP UNCCD developed.
By 2020 at least 5 % of degraded ecosystems are restored /rehabilitated to increase their resilience By 2020 the country will have increased the tree cover to 10% NCCRS and Action plan by 2017 .
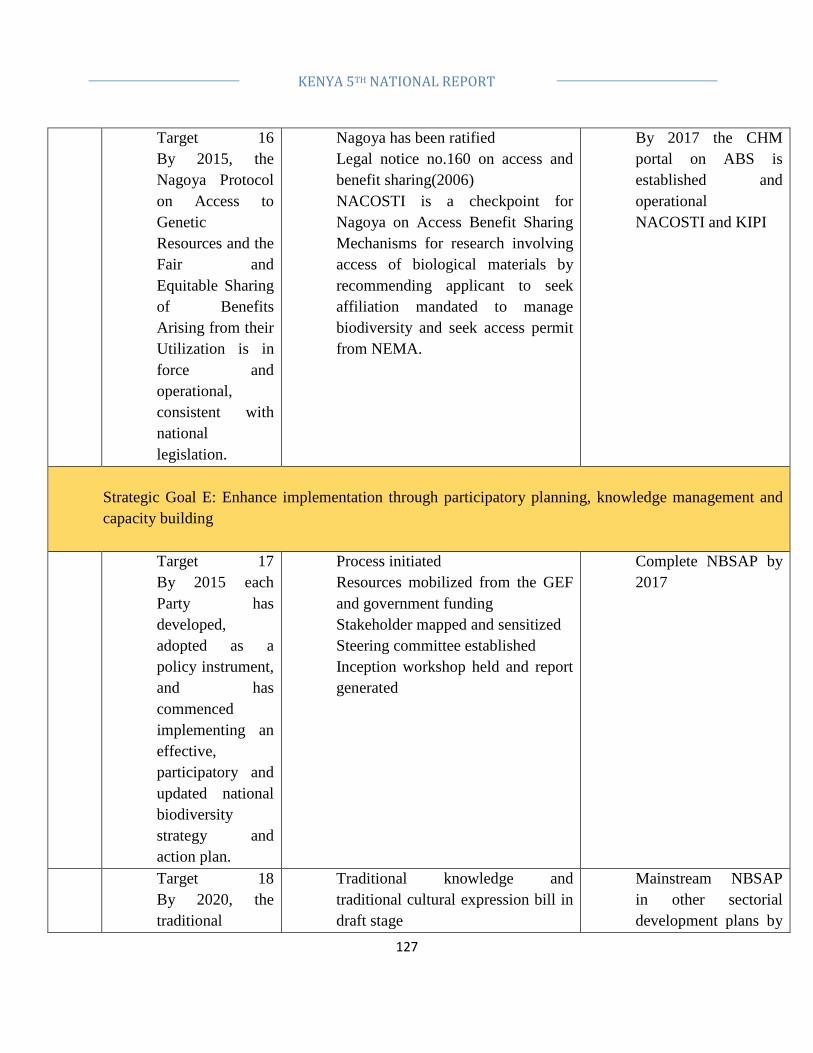
127
KENYA 5TH NATIONAL REPORT
Target 16 By 2015, the Nagoya Protocol on Access to Genetic Resources and the Fair and Equitable Sharing of Benefits Arising from their Utilization is in force and operational, consistent with national legislation.
Nagoya has been ratified Legal notice no.160 on access and benefit sharing(2006) NACOSTI is a checkpoint for Nagoya on Access Benefit Sharing Mechanisms for research involving access of biological materials by recommending applicant to seek affiliation mandated to manage biodiversity and seek access permit from NEMA.
By 2017 the CHM portal on ABS is established and operational NACOSTI and KIPI
Strategic Goal E: Enhance implementation through participatory planning, knowledge management and capacity building
Target 17 By 2015 each Party has developed, adopted as a policy instrument, and has commenced implementing an effective, participatory and updated national biodiversity strategy and action plan.
Process initiated Resources mobilized from the GEF and government funding Stakeholder mapped and sensitized Steering committee established Inception workshop held and report generated
Complete NBSAP by 2017
Target 18 By 2020, the traditional
Traditional knowledge and traditional cultural expression bill in draft stage
Mainstream NBSAP in other sectorial development plans by

128
KENYA 5TH NATIONAL REPORT
knowledge, innovations and practices of indigenous and local communities relevant for the conservation and sustainable use of biodiversity, and their customary use of biological resources, are respected, subject to national legislation and relevant international obligations, and fully integrated and reflected in the implementation of the Convention with the full and effective participation of indigenous and local communities, at all relevant levels.
Legal notice on access and benefit sharing Development of ABS tool kit by NEMA PIC guidelines MTA guidelines MAT guidelines Proposed traditional knowledge digital library, by NMK National policy on traditional knowledge, Genetic Resources and Traditional Knowledge Constitution of Kenya article 40(5) Science, Technology and Innovation Policy Traditional Medicine and Plants Policy(2010) bill Ensure Locals communities are involved by research accessing Biologicals materials and their TK through ABS tools such as MOU, PIC, MAT, MTA and ITA. Establishment of traditional knowledge and genetic resource unit.
2020. IIN KIPI NMK NEMA
Target 19 By 2020, knowledge, the science base and technologies relating to biodiversity, its
Draft bio-science policy and bill, for the establishment of Kenya Biodiversity Information Platform for information sharing Collaborative research with other international institutions Agency websites hosting
Establish/strengthen of a biodiversity repository for data, information and knowledge centre by 2020 By 2020 technology

129
KENYA 5TH NATIONAL REPORT
values, functioning, status and trends, and the consequences of its loss, are improved, widely shared and transferred, and applied.
biodiversity related information and publications Biosciences Policy and Bill proposes establishment of Kenya Biodiversity Informatics Forum with a Platform where Institutions can inventorize data on biodiversity which is accessible to researchers and academia. Establishments of Institutions Higher learning that are enhancing building of capacity in the management of Biodiversity.
need assessment By 2020 appropriate technologies for the conservation and sustainable use for biodiversity use And strengthen capacity.
Target 20 By 2020, at the latest, the mobilization of financial resources for effectively implementing the Strategic Plan for Biodiversity 2011-2020 from all sources, and in accordance with the consolidated and agreed process in the Strategy for Resource Mobilization, should increase substantially from the current levels. This target will be subject to changes
Government agencies prioritizing biodiversity issues on their work plans BIOSCIENCE programs and natural products initiatives(MTP cycle II)
Develop a resources mobilization strategy for biodiversity by 2017 Advocate for biodiversity research fund Designate a biodiversity national resource mobilization focal point by 2015
130
KENYA 5TH NATIONAL REPORT
contingent to resource needs assessments to be developed and reported by Parties.
7.2 Contribution towards the achievement Millennium Development Goals and post 2015 sustainable development goals
7.2.1.1 Goal 1- Eradicate Extreme Poverty and Hunger
Efforts have been untaken by the Kenya Forest Service through the (Plantation Establishment and Livelihood Improvement Scheme) PELIS and Participatory Forest Management (PFM) to enable forest dependent communities access forest resources enabling employment and livelihood generation, e.g. bee-keeping, eco-tourism which has contributed greatly to rural livelihoods. Establishment of community conserved areas, harvesting of non timber forest products, agencies getting involved in the Corporate social responsibility by various agencies like KFS, KWS, WRMA, etc , all leading to minimizing the dependency on natural resources. Promotion of aquaculture across the country by the state department of Fisheries. Promotion of agrobiodiversity (like growing of vegetables in sacks within homesteads.
7.2.1.2 Goal 7 - Ensure Environmental Sustainability
National forest cover currently stands at 6.99% against a 2015 target of 10%. Efforts to gazette more forest reserves will ensure their security and conservation of other depended biodiversity into perpetuity. Efforts are also been made to rehabilitate degraded forest ecosystems and improving their management through participation of the local community living adjacent forests. Enhanced management and protection of fragile ecosystems is being undertaken through fencing, increased surveillance and increased security personnel.
• The land use plan for Tana Delta has been completed. • The site has also been confirmed as a Ramsar site. • The finalization of the Wetlands policy, National Environment policy, Integrated
Coastal Zone Management policy,
131
KENYA 5TH NATIONAL REPORT
• Management plans have been drawn for various ecosystems like the Nandi Forest, Lake Naivasha.
• Development of Community Conserved Areas in various parts of the country like in Kakamega, South Nandi and in Dakatcha woodland
There are restoration programmes of degraded ecosystems being undertaken by various stakeholders. There has been gazettement of more forest and game reserves like (Nairobi Ranch as a provisional forest The number of IBAs has been increased to 65
7.3 Challenges and lessons learnt Challenges that face the implementation of the Aichi targets include:
• Inadequate resources • Transition to devolved governance subject to new Kenyan constitution.
• Slow process of developing and enacting appropriate legislation Increased pressure arising from multiple factors including climate effects
• Changes in national/economic policies
• Changes of government structures • Strengthen institutional capacities towards NBSAP and national biodiversity
reporting Lessons learnt
• Need for priority setting on resource allocation.
• National and Regional integration and coordination are critical to the implementation on the AICHI targets in respect to Trans boundary biodiversity.
• Inadequate mainstreaming of AICHI Targets in sectoral strategic plans slows down progress.
• Involvement and participation of stakeholders is key to successful implementation of AICHI targets.

132
KENYA 5TH NATIONAL REPORT
7.4 CONCLUSION
• Commendable progress towards achieving the AICHI targets. • Necessary legislation to promote biodiversity conservation has been enacted.
Similarly a lot of effort has gone into putting in place institutional structures for biodiversity conservation.
• Human resource capacity development
• Management of water catchment and Protected Areas • Community involvement in conservation initiatives
• Sustainable utilization of genetic resources • Improved awareness on biodiversity conservation concerns. • Mainstreaming biodiversity conservation into sectoral strategies and plans.
• Resource mobilization towards biodiversity conservation. • GAPS
• More initiatives on communication education and public awareness. • Urgent need to improve on clearing house mechanism.
• Urgent need to improve on coordination and sharing of information. • There’s need to identify innovative systems for mobilizing financial resources for
biodiversity conservation.
• Inadequate structures for conserving all forms of biodiversity. • Need to strengthen institutional capacity for enforcement of biodiversity related
laws and regulations
• Integrating biodiversity concerns into strategic and environmental impact assessments.
• Strengthen institutional capacities towards NBSAP and national biodiversity reporting
.

8 ANNEXES
8.1 ANNEX 1: Driving-Pressure-Status-Impact-Response (DPSIR) Analysis on the Ecosystems and Natural Resources Ecosystem/Resource
Benefits Driving pressure/Threats
Status Impact Response
Forest Energy (fuelwood, hydro); wildlife habitat; trap and store rain water; regulate river flows and prevent flooding; help recharge ground-water tables; improve soil fertility; reduce soil erosion and sediment loads in river
Anthropogenic Activities Human population is increasing at about 3% per annum; land use change/land tenure change; human settlements; agricultural expansion; fuelwood/construction; poaching
Degraded/deforested for logging, firewood, timber; loss to encroachment of settlements, and agricultural activities such as crop production, livestock grazing, charcoal production
Habitat degradation and loss, sedimentation, erosion and landslides, alteration of the micro-climate, water shortages, health risks, desertification, reduced river flows, threat to endemic birds, mammal species, butterflies and tree species
Appropriate forest policy 2005, Forest Act 2005, Environment policy, Wildlife policy and Act National land Policy, climate strategy/policy/legislation, UN conventions (UNCCD, CBD, UNFCCC, Ramsar/wetlands, CITES, CCMS, etc)

134
KENYA 5TH NATIONAL REPORT
water; help regulate local climate conditions; act as carbon reservoirs and sinks; are important in cultural ceremonies, as sacred sites, and in tourism
Climate change
Rise in temperature (0.7-2oC, increased rainfall variability
Frequent and prolonged droughts and storms/floods, desertification, increase in disasters, diseases, invasive species, loss of biodiversity and livelihoods, increased human-wildlife conflicts, water scarcity, fires
Grassland/Savanna; Shrubland/Woodland
Energy (fuelwood); wildlife habitat, livestock production; they trap and store rain
Anthropogenic Activities Human population is increase at about 3% per annum;
Degraded for shelter, construction, firewood; loss to encroachment of
Habitat degradation and loss, soil erosion, desertification, threat to birds, mammals and plants
Appropriate forest policy 2005, Forest Act 005,Environment policy, Wildlife policy and Act

135
KENYA 5TH NATIONAL REPORT
water; improve soil fertility; reduce soil erosion; important in tourism
land use change/land tenure change, human settlements, agricultural expansion, fuelwood/construction, poaching Climate change
settlements, and agricultural activities such as crop production, livestock grazing, charcoal production Rise in temperature (0.7–2oC), increased rainfall variability
Frequent and prolonged droughts and storms/floods; desertification, increase in disasters; diseases; invasive species, loss of biodiversity and livelihoods, increased conflicts—human conflicts, human-wildlife conflicts; water scarcity, fires
Livestock policy, National Land Policy, climate Appropriate forest policy 2005, Forest Act 005,Environment policy, Wildlife policy and Act Livestock policy, National Land Policy, climate strategy/policy /legislation,UN conventions (UNCCD, CBD, UNFCCC, Ramsar/wetlands, CITES, CCMS, etc
Marin Energy Anthropoge Degraded Habitat Appropriate
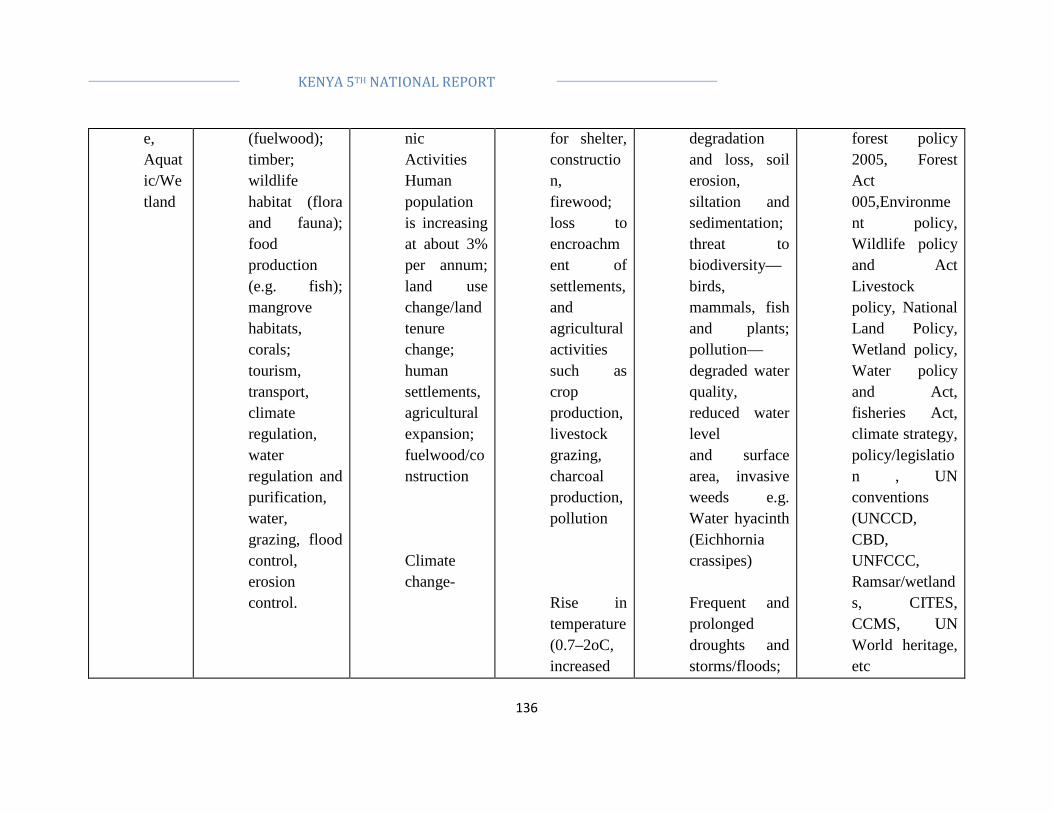
136
KENYA 5TH NATIONAL REPORT
e, Aquatic/Wetland
(fuelwood); timber; wildlife habitat (flora and fauna); food production (e.g. fish); mangrove habitats, corals; tourism, transport, climate regulation, water regulation and purification, water, grazing, flood control, erosion control.
nic Activities Human population is increasing at about 3% per annum; land use change/land tenure change; human settlements, agricultural expansion; fuelwood/construction Climate change-
for shelter, construction, firewood; loss to encroachment of settlements, and agricultural activities such as crop production, livestock grazing, charcoal production, pollution Rise in temperature (0.7–2oC, increased
degradation and loss, soil erosion, siltation and sedimentation; threat to biodiversity—birds, mammals, fish and plants; pollution—degraded water quality, reduced water level and surface area, invasive weeds e.g. Water hyacinth (Eichhornia crassipes) Frequent and prolonged droughts and storms/floods;
forest policy 2005, Forest Act 005,Environment policy, Wildlife policy and Act Livestock policy, National Land Policy, Wetland policy, Water policy and Act, fisheries Act, climate strategy, policy/legislation , UN conventions (UNCCD, CBD, UNFCCC, Ramsar/wetlands, CITES, CCMS, UN World heritage, etc

137
KENYA 5TH NATIONAL REPORT
rainfall variability
desertification; increase in disasters—diseases, invasive species; loss of biodiversity and livelihoods; increased conflicts—human conflicts, human–wildlife conflicts; water scarcity, fires
Arid: Desert and Bare land
Livestock production, wildlife habitat (flora and fauna), tourism
Anthropogenic Activities Human population increases at about 3% per annum leading to
Degraded habitat, soil erosion loss, Rise in
Habitat degradation and loss, soil erosion, desertification, threats to birds, mammal, fish and plants
Environment policy, Wildlife policy and Act Livestock policy, National Land Policy, climate strategy/policy/legislation, UN
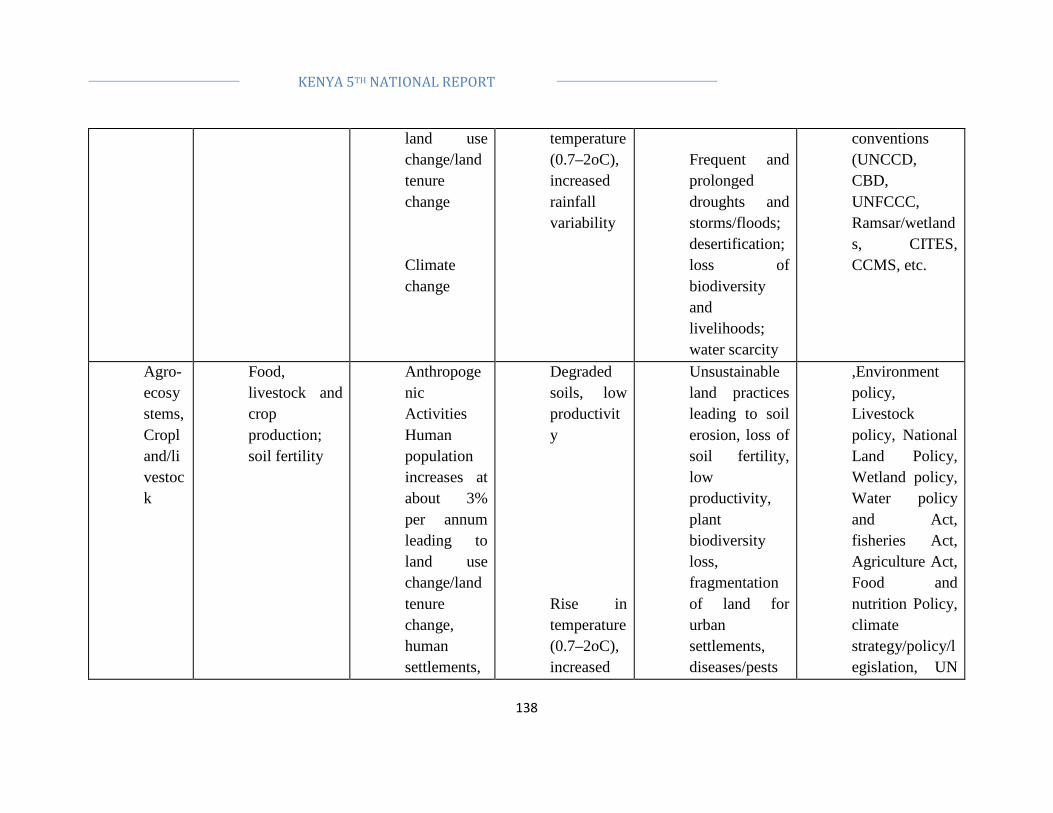
138
KENYA 5TH NATIONAL REPORT
land use change/land tenure change Climate change
temperature (0.7–2oC), increased rainfall variability
Frequent and prolonged droughts and storms/floods; desertification; loss of biodiversity and livelihoods; water scarcity
conventions (UNCCD, CBD, UNFCCC, Ramsar/wetlands, CITES, CCMS, etc.
Agro-ecosystems,Cropland/livestock
Food, livestock and crop production; soil fertility
Anthropogenic Activities Human population increases at about 3% per annum leading to land use change/land tenure change, human settlements,
Degraded soils, low productivity Rise in temperature (0.7–2oC), increased
Unsustainable land practices leading to soil erosion, loss of soil fertility, low productivity, plant biodiversity loss, fragmentation of land for urban settlements, diseases/pests
,Environment policy, Livestock policy, National Land Policy, Wetland policy, Water policy and Act, fisheries Act, Agriculture Act, Food and nutrition Policy, climate strategy/policy/legislation, UN
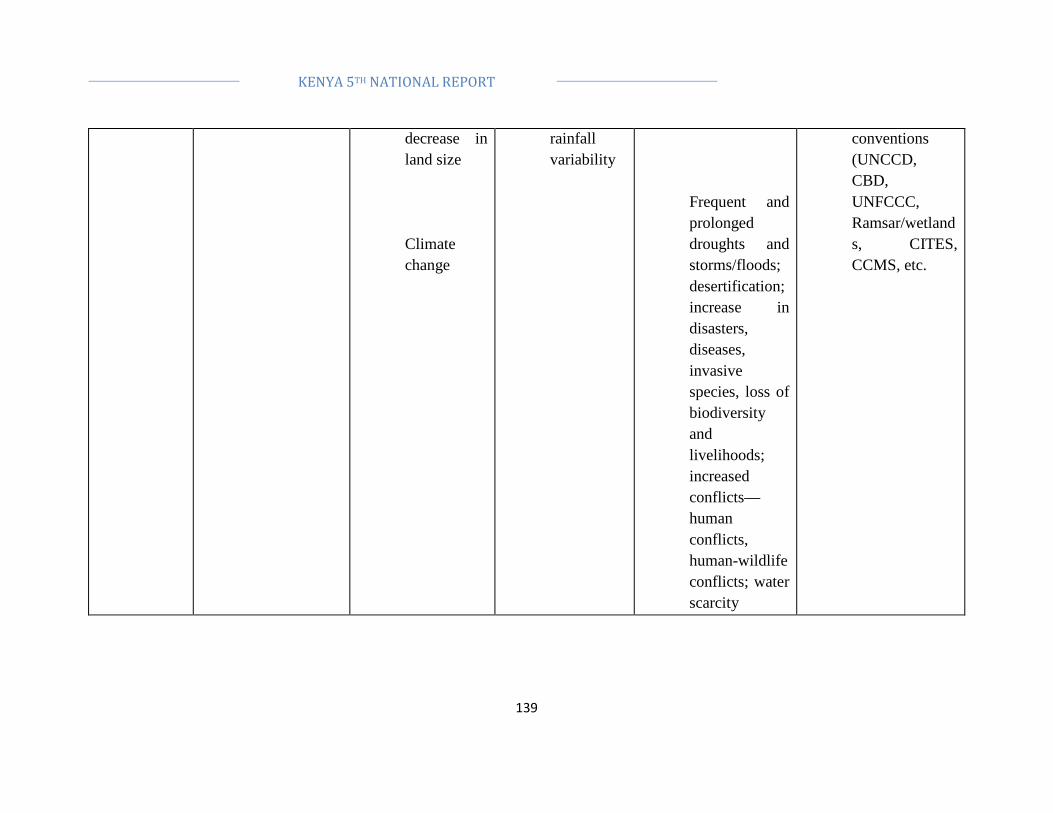
139
KENYA 5TH NATIONAL REPORT
decrease in land size Climate change
rainfall variability
Frequent and prolonged droughts and storms/floods; desertification; increase in disasters, diseases, invasive species, loss of biodiversity and livelihoods; increased conflicts—human conflicts, human-wildlife conflicts; water scarcity
conventions (UNCCD, CBD, UNFCCC, Ramsar/wetlands, CITES, CCMS, etc.
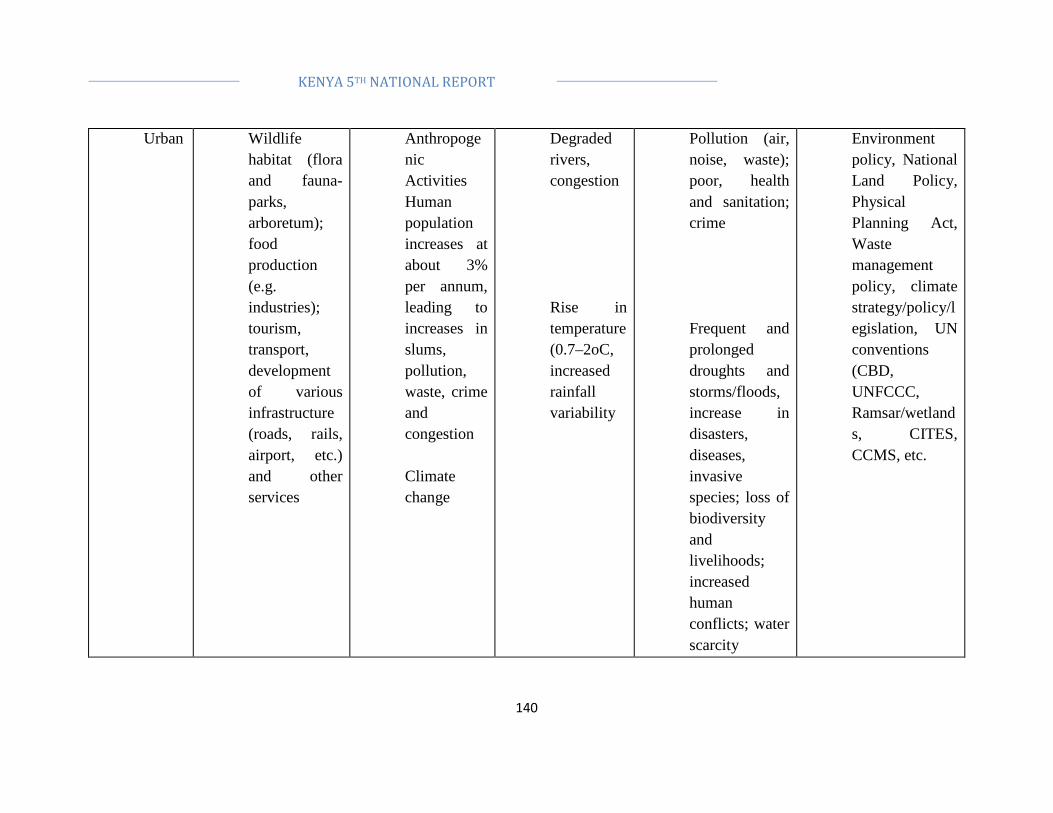
140
KENYA 5TH NATIONAL REPORT
Urban Wildlife habitat (flora and fauna- parks, arboretum); food production (e.g. industries); tourism, transport, development of various infrastructure (roads, rails, airport, etc.) and other services
Anthropogenic Activities Human population increases at about 3% per annum, leading to increases in slums, pollution, waste, crime and congestion Climate change
Degraded rivers, congestion Rise in temperature (0.7–2oC, increased rainfall variability
Pollution (air, noise, waste); poor, health and sanitation; crime Frequent and prolonged droughts and storms/floods, increase in disasters, diseases, invasive species; loss of biodiversity and livelihoods; increased human conflicts; water scarcity
Environment policy, National Land Policy, Physical Planning Act, Waste management policy, climate strategy/policy/legislation, UN conventions (CBD, UNFCCC, Ramsar/wetlands, CITES, CCMS, etc.

141
KENYA 5TH NATIONAL REPORT
Soil Provide nutrients; hold vegetation in place; crop production; allow percolation of rain water; form foundations of buildings; act as carbon reservoirs and sinks; preserve underground biodiversity
Anthropogenic Activities Human population is increasing at about 3% per annum; land use change/land tenure change Climate change
Soil degradation: Soil erosion and loss Rise in temperature (0.7–2oC); increased rainfall variability
Soil degradation and loss due to unsustainable land practices; poor tillage, overgrazing, deforestation, leading to reduced land productivity e.g. food, vegetation, desertification, sedimentation, erosion and landslides; water shortages due to decreased infiltration Frequent and prolonged droughts and storms/floods;
Environment policy, National Land Policy and Acts, Climate strategy/policy, UN conventions (UNCCD, CBD, UNFCCC, etc.)

142
KENYA 5TH NATIONAL REPORT
desertification and soil degradation leading to loss of biodiversity and livelihoods, water scarcity
Mountains/hills
Regulate river flows and prevent flooding; help recharge ground-water tables; improve soil fertility; reduce soil erosion and sediment loads in river water; help regulate local climate conditions; important as
Anthropogenic Activities Human population increase resulting in land use change/land tenure change, human settlements, agricultural expansion Climate
Degradation of the soil, Biodiversity-plants and animals Melting of snow on Mt Kenya, reduction of glaciers
Unsustainable land practices leading to soil erosion, loss of soil fertility, low productivity, biodiversity loss, landslides
Environment policy, National Land Policy, climate strategy/policy/legislation, UN conventions (CBD, UNFCCC, Ramsar/wetlands, CITES, CCMS, etc.)

143
KENYA 5TH NATIONAL REPORT
cultural ceremonies and sacred sites; important in tourism and as wildlife habitats (flora and fauna)
change
Geology
Construction material; soil development; trap and store rain water
Anthropogenic Activities Human population increase results in greater demand for construction material leading to uncontrolled mining, pollution from dust, and reduced
Open quarries, loss of water for use in arid lands
Land degradation, soil erosion, desertification An increase in disasters, water-borne diseases, loss of biodiversity and livelihoods, increased conflicts—human conflicts,
Environment policy, National Land Policy, climate strategy/policy, UN conventions (CBD, UNFCCC, Ramsar/wetlands, CITES, CCMS, etc.)

144
KENYA 5TH NATIONAL REPORT
water storage in sand dams
human-wildlife conflicts; water scarcity

145
KENYA 5TH NATIONAL REPORT
8.2 Annexe 2: Participating Institution Kenya Wildlife Service Fisheries Department Nature Kenya Kenya Agricultural Research Institute National Museums of Kenya National Council for Science and Technology Institute Department of Resource Surveys and Remote Sensing Indigenous Information Network Kenya Marine Fisheries Research Institute Kenya Forest Service Ministry of Devolution, Government of Kenya Ministry of Environment Water and Natural Resources

146
KENYA 5TH NATIONAL REPORT
Appendix 1
Information Concerning Reporting Party
Reporting Party Republic of Kenya
NATIONAL FOCAL POINT
Full name of the institution Ministry of Environment, Natural Resources and Regional Development Authorities
Name and title of contact officer Dr. Richard Lesiyampe, Principal Secretary
Mailing address P.O Box 30126-00100, Nairobi
Telephone +254-20-2730808/9
Fax +254-20-2734722
E-mail [email protected]
CONTACT OFFICER FOR NATIONAL REPORT (IF DIFFERENT F ROM ABOVE)
Full name of the institution Ministry of Environment, Natural Resources and Regional Development Authorities
Name and title of contact officer Parkinson Ndonye, Deputy Director, Multilateral Environmental Agreements
Mailing address P.O Box 30126-00100, Nairobi
Telephone +254-20-2730808
Fax +254-20-2734722
E-mail [email protected];[email protected]
SUBMISSION OF REPORT

147
KENYA 5TH NATIONAL REPORT
Signature of officer responsible for submitting national report
Date of submission 28th OCTOBER 2015


