Embed Size (px)
Citation preview

Reprogramming human peripheral blood
mononuclear cells to inducible pluripotent stem
cells (hiPSC): An examination of the efficacy of
different methods
by
Elham Afshinmanesh
B.Sc., University of Tehran, 2008
Thesis Submitted in Partial Fulfillment of the Requirements for the Degree of
Master of Science
In the
Department of Biomedical Physiology and Kinesiology
Faculty of Science
Elham Afshinmanesh 2016
SIMON FRASER UNIVERSITY
Summer 2016

ii
Approval
Name: Elham Afshinmanesh
Degree: Master of Science
Title: Reprogramming peripheral blood mononuclear cells to inducible Pluripotent Stem Cells (hiPSC): An examination of the efficacy of different methods
Examining Committee: Chair: Dr. Damon Poburko Assistant Professor
Dr. Glen F. Tibbits Senior Supervisor Professor
Dr. Jonathan Choy Supervisor Associate Professor Department of Molecular Biology and Biochemistry
Dr. Tomath Claydon External Examiner Associate Professor
Date Defended/Approved: 28 July 2016

iii
Ethics Statement

iv
Abstract
Modeling a disease “in a dish,” a new research tool to study human heart disease
mechanisms, is becoming as popular as more established techniques such as the use of
transgenic mice. The primary practical challenge of this “disease in a dish” method is
efficiently directing human induced pluripotent stem cell (hiPSC) differentiation into the
desired lineages, with the major concern being the variability within hiPSC clones.
To generate a reliable in vitro model for inherited cardiac diseases and address the
variability problem, characteristics of hiPSCs derived from the blood of four human donors
using both the episomal and Sendai virus reprogramming systems were examined. The
hiPSC-cardiomyocytes (hiPSC-CMs) generated were then characterized according to
their cardiac-specific gene expression properties. No differences were observed on the
effect of the reprogramming system on expression of pluripotent genes in iPSCs but
differences were observed in expression of cardiac specific genes in cardiomyocytes
derived from those iPSCs despite a high variance in the analysis.

v
Dedication
To my parents Safieh and Mohsen for their indefinite love and support.

vi
Acknowledgements
My deep gratitude goes first to my senior supervisor Dr. Glen Tibbits for accepting
me to participate in the iPSC project and his enormous support along the way. To my
supervisory committee member Dr. Jonathan Choy for his critical comments on my project
and his generosity in sharing his laboratory facilities with me to carry out my project.
To Sanam Shafaattalab for teaching me the cell culture techniques required for
running this project. Dr. Anna Von Rossum for teaching me T-cell culture and flow
cytometry. To Timothy Heslip for his help in flow cytometry set-up. To Dr. Cynthia
Gershome for providing me insight in troubleshooting. To Dr. Damon Poburko for teaching
me imaging and image analysis. To my friendly and helpful laboratory members Marvin
Gunawan, Kaveh Rayani, Valentine Sergeev, Dr. Charles Steven, Dr. Christine Genge
and Colin Peters.
My special thanks goes to Deidre de Jong-Wong for being the most helpful and
supportive editor while I was writing my thesis.
I was fortunate to work with all of these wonderful people and I would like to thank
everyone in the Molecular Cardiac Physiology Group (MCPG) in the department of
Biomedical Physiology and Kinesiology at Simon Fraser University.

vii
Table of Contents
Approval .............................................................................................................................ii Ethics Statement ............................................................................................................... iii Abstract .............................................................................................................................iv Dedication ......................................................................................................................... v Acknowledgements ...........................................................................................................vi Table of Contents ............................................................................................................. vii List of Tables ..................................................................................................................... x List of Figures....................................................................................................................xi List of Acronyms and Abbreviations ................................................................................. xii Glossary .......................................................................................................................... xiii
Chapter 1. Introduction ............................................................................................... 1 1.1. Stem cell hierarchy ................................................................................................... 1 1.2. IPSCs as a platform for human disease models ...................................................... 2
1.2.1. Cardiovascular disease models and hiPSC-derived cardiomyocytes ......... 3 1.3. Generating hiPSCs and the role of transcription factors .......................................... 4 1.4. HiPSCs and reprogramming systems ...................................................................... 5
1.4.1. Human somatic cells as a source of iPSCs ................................................ 6 1.4.2. Integrative reprogramming methods ........................................................... 6 1.4.3. Non-integrative reprogramming methods ................................................... 7
1.4.3.1 Sendai virus system .................................................................................. 8 1.4.3.2 Episomal system ....................................................................................... 8
1.5. Molecular mechanism of reprogramming ................................................................. 9 1.5.1. Phases of reprogramming ......................................................................... 10
1.5.1.1 Initiation phase ........................................................................................ 10 1.5.1.2 Intermediate phase ................................................................................. 10 1.5.1.3 Maturation and Stabilization phase ......................................................... 11
1.6. T-cell activation ...................................................................................................... 11 1.7. High level of variability in iPSCs ............................................................................. 12
1.7.1. Cardiogenesis in vivo and in vitro ............................................................. 13 1.7.2. Human cardiac troponin complex and myosin light chain ......................... 13
1.8. Description of this Master’s project ........................................................................ 14
Chapter 2. Materials and Methods ........................................................................... 16 2.1.1. Human cell isolation and culture ............................................................... 16 2.1.2. Trypan blue exclusion assay ..................................................................... 16 2.1.3. Flow cytometry .......................................................................................... 17
2.1.3.1 Analysis of activated T-cells .................................................................... 17 2.1.4. Mitomycin C treatment of mouse embryonic fibroblasts ........................... 18 2.1.5. The reprogramming of T-cells ................................................................... 19
2.1.5.1 Infection with Sendai virus ...................................................................... 19 2.1.5.2 Transfection with episomal plasmids ...................................................... 19
2.1.6. Maintenance of hiPSCs ............................................................................ 21 2.1.6.1 Feeder-dependent step ........................................................................... 21 2.1.6.2 Feeder free step ...................................................................................... 21

viii
2.1.7. Cryopreservation of hiPSCs ...................................................................... 22 2.1.8. Characterization of hiPSCs for pluripotency ............................................. 22
2.1.8.1 Immunocytochemistry of live cells .......................................................... 22 2.1.8.2 Flow cytometry analysis of pluripotent surface markers ......................... 23 2.1.8.3 hiPSC RNA extraction, qRT-PCR ........................................................... 23
2.1.9. In vitro cardiac differentiation of hiPSCs ................................................... 24 2.1.10. CM RNA extraction, qRT-PCR .................................................................. 25
Chapter 3. Results ..................................................................................................... 26 3.1.1. Isolated PBMC count ................................................................................ 26 3.1.2. Trypan blue exclusion assay results ......................................................... 26 3.1.3. Results from flow cytometry analysis of activated T-cells ......................... 27 3.1.4. Activated T-cell morphology results .......................................................... 29 3.1.5. Results of MEF feeder cell density optimization ....................................... 30 3.1.6. Results of optimization of nucleofection in the episomal
reprogramming system ............................................................................. 31 3.1.7. HiPSC morphology results ........................................................................ 31 3.1.8. Immunocytochemistry results from live cell staining ................................. 32
3.1.8.1 Comparison of the efficiency of the SeV and episomal reprogramming systems in Donor 002 hiPSCs ............................................... 33
3.1.9. Flow cytometry analysis of pluripotent surface markers ........................... 38 3.1.10. qRT-PCR analysis of pluripotent gene expression in hiPSCs at P5
and P10. .................................................................................................... 40 3.1.11. qRT-PCR analysis of cardiac specific gene expression in hiPSC-
derived CMs .............................................................................................. 42
Chapter 4. Discussion ............................................................................................... 44 4.1.1. T-cell activation: development of a successful protocol ............................ 44 4.1.2. Identification and optimization of effective reprogramming methods ........ 45 4.1.3. The relative success of the two reprogramming systems in
generating hiPSCs .................................................................................... 46 4.1.3.1 The generation and characterization of SeV- and episomally-
derived hiPSCs ................................................................................................ 46 4.1.3.2 The characterization of SeV- and episomally-derived hiPSC-CMs ........ 47
Chapter 5. Future Directions and Conclusion ........................................................ 49 5.1. Future Directions .................................................................................................... 49 5.2. Conclusion ............................................................................................................. 50
References .................................................................................................................. 51 Appendix A. Consent Form ................................................................................... 62 Appendix B. Protocols ........................................................................................... 64
Human Cell Isolation (SEPMATE PROCEDURE) .................................................. 64 Mitomycin C Treatment of Mouse embryonic Fibroblast cells ................................ 64 Transfection with episomal plasmid ....................................................................... 64 Infection with Sendai virus...................................................................................... 64

ix
Preparing matrigel coated plates............................................................................ 64 Cryopreservation of hiPSCs ................................................................................... 64 Immunocytochemistry of Live cells ......................................................................... 64 Pluripotent Surface marker staining ....................................................................... 64 RNA extraction ....................................................................................................... 65 Reverse transcription ............................................................................................. 65 QuantiTect Reverse Transcription Kit .................................................................... 65 Primer Sequences for pluripotent genes ................................................................ 66
Appendix C...................................................................................................................... 67

x
List of Tables
Table 2.1 Inactivated mouse embryonic fibroblasts (MEF) culture conditions ........ 19
Table 3.1 Pluripotent surface markers in the SeV and Episomal reprogramming systems .......................................................................... 40
Table 3.2 Pluripotent endogenous gene expression in the SeV and episomal reprogramming systems .......................................................................... 41
Table 3.3 Cardiac-specific markers in the SeV-derived and episomal-derived cardiomyocytes ........................................................................................ 42

xi
List of Figures
Figure 1.1 Reprogramming systems: .......................................................................... 7
Figure 3.1 The percentage of viable cells within total cell populations. .................... 27
Figure 3.2 Flow cytometry analysis of activated T-cells with three different activation protocols on blood drawn from one donor in two sets of experiments. ............................................................................................ 29
Figure 3.3 Activation of PBMCs with anti-CD3 antibodies and IL-2 induces T-cell aggregation. ...................................................................................... 30
Figure 3.4 Morphology of hiPSCs generated by both reprogramming systems following two passages on MEFs. ........................................................... 32
Figure 3.5 Epifluorescent imaging of single primary hiPSC colonies generated from the SeV and episomal reprogramming systems. ........... 33
Figure 3.6 Epi-fluorescent imaging of primary hiPSCs generated from SeV reprogramming of PBMCs derived from Donor 002. ............................... 34
Figure 3.7 Epi-fluorescent imaging of primary hiPSCs generated from episomal reprogramming of PBMCs derived from Donor 002. ................ 36
Figure 3.8 Colony size and frequency distributions among hiPSCs generated from SeV and episomal reprogramming systems .................................... 38
Figure 3.9 Flow cytometry analysis of SeV and episomally generated hiPSCs for the presence of TRA-1-60 and SSEA-4 markers at P5 and P10. ............ 39
Figure 3.10 qRT-PCR analyses of pluripotent genes in hiPSCs for passages 5 and 10 ...................................................................................................... 41
Figure 3.11 qRT-PCR analyses of cardiac specific markers in hiPSC-derived cardiomyocytes ........................................................................................ 42

xii
List of Acronyms and Abbreviations
Term Initial components of the term
bFGF Basic fibroblast growth factor
eGFP Enhanced green fluorescent protein
ESC Embryonic stem cell
hiPSCs Human induced pluripotent stem cells
MEF Mouse embryonic fibroblast
MOI Multiplicity of infection
PBMCs Peripheral blood mononuclear cells
SeV Sendai virus
TCR T-cell receptor

xiii
Glossary
Term Definitions
Feeder layer Cells used in co-culture to maintain pluripotent stem cells by releasing nutrients into the culture media and providing a sticky surface to which the stem cells can attach.
MOI The ratio of viruses to infected cells in a specified area.
Nucleofection A rapid and efficient non-viral transfection method that enables the in vitro transfer of nucleic acids into cells by applying a specific voltage in the presence of specific reagents.

1
Chapter 1. Introduction
1.1. Stem cell hierarchy
The term “stem cell” first appeared in scientific literature in 1868, when biologist
Ernst Haeckel used the words to describe the single celled organism that was the ancestor
cell to all life on Earth. Since that first reference, the definition of stem cell has been refined
to refer to cells that possess two remarkable features; the capacity for self-renewal and
the potential for differentiation into disparate specialized cell types1.
Stem cells can be derived from both embryonic and postnatal animal tissues and
exhibit a broad range of developmental potency. This attribute ranges from totipotent,
which has the potential to give rise to all embryonic and extra-embryonic cells and tissues
to unipotent which are limited to differentiating into only one cell type2. The totipotent3
stage of stem cells begins with the zygote (shortly after the fusion of oocyte and sperm)
or its artificial counterpart, the clonote4 (created by removing the somatic nucleus and
inserting it into an enucleated oocyte) and extends to the blastomer (the first division of
the zygote or clonote).
The blastomer5 loses its totipotency once it divides into the 32-cell structure called
the morula. Cells forming the morula and the structures that develop from it, the blastocyst
and the inner cell mass (ICM), are pluripotent and are able to differentiate into any of the
three germ layers; the mesoderm, the ectoderm and the endoderm6. The primary
difference between a totipotent and pluripotent stem cell is the totipotent cells’ ability to
also differentiate into placental tissue, something the pluripotent cells cannot do2,7.
Germ layer cells are multipotent and can give rise to multiple but limited,
specialized cell types such as those present in a specific tissue or organ. Most adult stem
cells are multipotent, able to generate the mature cell types of their tissue of origin8.

2
On the stem cell potency continuum, the final, most limited cells are the unipotent
stem cells, which can only differentiate into a single cell lineage2.
In the fields of regenerative medicine and drug discovery, pluripotent stem cells,
which can differentiate to three germ layers both in vitro and in vivo9, are viewed as the
ideal candidate cells for therapeutic and research purposes. However, the use of
pluripotent human embryonic stem cells (hESCs) extracted from developing embryos is
not only ethically controversial but the in vivo immunogenicity features of these cells often
limit their clinical applications10. The recent technological development of human induced
pluripotent stem cells (hiPSCs), which are generated from already differentiated cells11-13,
do not present the hESC obstacles and are amenable for use in the personalized medicine
approach to developing unique therapies for inherited diseases.
1.2. IPSCs as a platform for human disease models
To date, because mammalian genomes have a high level of evolutionary
conservation14, animal models such as mice, rats and non-human primates have been
used as tools to model human disorders. The animal models facilitate the study of disease
mechanisms at different developmental stages in a variety of cell types. Although the
mouse model in the past decade or so has become the most frequently used animal model
to mimic human diseases due, in large part, to transgenic technologies, it has some
significant structural and functional differences compared to humans. The differing organ
functions of mice and humans inhibits the modeling of some human disease phenotypes
in the mouse15. In the worst-case scenario, the same genotype can be lethal in one
species and viable in the other; for example, mice with monosomy X can survive but this
aneuploidy is embryonically lethal in humans16.
To this end, hiPSCs are viewed as an important new tool for the modeling and
study of human diseases. The primary advantages hiPSCs have over the mouse and other
mammals is that the cells are: 1) human (and carry the genotype of the donor) and 2)
readily amenable to genome editing (e.g. CRISPR). As well, hiPSCs are cell-lines which
have indefinite self-renewal capabilities and can differentiate into any human cell type17,

3
allowing not only genotype-phenotype relationship studies of human disorders but also
the generation of the large numbers of cells necessary for drug screening and cell therapy.
The types of diseases that can be modeled using hiPSCs must meet certain
criteria. The hiPSC model is ideal for the study of monogenic diseases (diseases arising
from a single gene modification), such as Lesch-Nyhan disease18. The disease should
also show high penetrance within the human population, have an early onset during
development and be associated with a clear cellular phenotype17. Meeting these criteria
will likely result in an observable in vitro phenotype using the hiPSC model.
Cell types generated from pluripotent stem cells more closely resemble the fetal
state of those cell types rather than the adult one19-21, meaning hiPSCs are more suitable
for modeling disorders that appear during fetal development or early childhood17. Two
examples of these disorders are Down and Turner Syndromes which affect
embryogenesis and cause high miscarriage levels22,23.
1.2.1. Cardiovascular disease models and hiPSC-derived cardiomyocytes
HiPSCs are of particular interest to researchers in the field of cardiovascular
personalized or precision medicine in which the aim is to uniquely prevent or treat cardiac
diseases based on individual variability24. This field of medicine endeavours to answer
fundamental questions such as why do patients with the same genetic mutation respond
differently to the same clinical treatment and “why are some patients with a particular
genetic mutation at higher risk of complications than others? Studying the process of
diseases at the molecular or cellular level may provide answers.
However, invasive surgical procedures have been required to obtain adult
cardiomyocytes (CMs) and establish primary cells in culture25 and prolonged in vitro
maintenance of these cells is not currently feasible. For these reasons, hiPSCs are an
exciting new tool to generate unlimited amounts of patient-specific CMs which can mimic
their endogenous counterparts and act as integrators25. For example, by exposing hiPSC-
derived CMs to environmental perturbations in vitro, cardiac researchers can integrate the

4
patient’s genomic disease susceptibility with specific environmental influences to simulate
the patient’s condition25.
HiPSCs are used primarily to model cardiovascular diseases such as arrhythmia
syndromes and channelopathies which have clear, and easily assessable phenotypes,
both in vitro and in vivo25. Two of the most commonly modelled cardiac diseases are
Familial Long QT Syndrome (LQTS) which is caused by prolonged ventricular action
potential duration in patients26 and Catecholaminergic Polymorphic Ventricular
Tachycardia (CPVT) which can lead to a life-threatening arrhythmia under emotional
stress and/or physical exertion26.
HiPSC-CMs can be used to model cardiac diseases and enable assessment of
proarrhythmic risks. By expressing important ion channels, hiPSCs-CMs retain the
complexity of the human action potential generation, allowing detection, assessment, and
prediction of proarrhythmic risk. In addition, hiPSC-CMs can be derived from patients with
various types of heart disease, enabling the investigation of the susceptibilities of specific
cardiac diseases to drug-induced arrhythmia. There are several risk factors (genetic
predisposition, being female, and the presence of structural heart disease)27 that can
influence drug-induced arrhythmias and hiPSC-CMs provide a unique platform to
investigate these risk factors at the cellular level. Finally, hiPSC technology can enhance
the development of drugs based on patient-specific differences at the cellular level25.
1.3. Generating hiPSCs and the role of transcription factors
To generate hiPSCs reprogramming factors are essential. Reprogramming or
transcription factors are genes that are normally expressed in the early stages of
embryonic development and are involved in the maintenance of the pluripotency and
self-renewal of stem cells. Before the early 2000s, it was known that already
differentiated somatic cells could be reverted back to pluripotency if its nucleus was
implanted into an enucleated egg28-30. However, it was unclear if an intact differentiated
somatic cell could be reprogrammed back to a pluripotent state. To answer this question,
in 2006, Yamanaka and his colleagues focused on transcriptional factors known to aid
in the maintenance of pluripotency in embryonic stem cells. He and his team screened

5
a pool of 24 pluripotency-associated factors, introducing the genes into skin fibroblasts
and studying the resulting colonies. Some of the colonies generated had embryonic stem
cell characteristics. Next, Yamanaka attempted to determine the minimal number and
which combination of transcriptional factors was required to reprogram adult cells into
pluripotent cells31,32. They determined, first in mice and subsequently in humans, that
four transcription factors: Octamer-binding protein 4 (Oct4; also known as POU5F1);
Sox2; Myc proto-oncogene protein (c-MYC); and Kruppel-like factor 4 (Klf4) 32 were
required. In target somatic cells, such as the fibroblasts that Yamanaka et al. used or the
peripheral mononuclear blood cells (PBMCs)13,33,34 used by Fukuda’s group, the
overexpression of these four genes causes the silencing of expressed somatic genes
and the up-regulation of genes normally expressed only in embryonic stem cells.
These four pluripotency factors function as lineage-specific master transcription
factors that reset the epigenetic and transcriptional state of the differentiated cells to that
of pluripotent cells. The resulting iPS cells exhibit embryonic stem cell features, including
the expression of pluripotent genes such as Nanog35, the ability to develop into different
embryonic tissues, and the formation of teratomas upon injection into
immunocompromised mice32.
Through the overexpression of the four Yamanaka transcription factors, iPSCs
have since been derived not only from different types of human cells but also from different
species including human36, rat37, mice, and rhesus monkey38. This indicates that the
transcriptional network leading to reprogramming is strongly conserved across species39-
43.
1.4. HiPSCs and reprogramming systems
Generating robust human iPSCs and following that, successfully differentiating them into
a specific cell type, is a nascent technology that is just a little over a decade old. As such,
developing efficient and reproducible reprogramming strategies is a burgeoning field.
Although the importance of the four Yamanaka transcription factors--Oct4, Sox2, Klf4, and
c-Myc--have been identified, other elements such as determining appropriate adult human

6
somatic cell sources, vectors and reprogramming cocktails are still in the process of being
optimized and standardized.
1.4.1. Human somatic cells as a source of iPSCs
Choosing which cell type to begin with prior to initiating reprogramming
experiments is critical. Important criteria to consider include the availability of the cell type,
its demonstrated or predicted ease of reprogramming and its yield efficiency. Although
cells from embryonic or juvenile tissues may considered ideal candidates due to their low
accumulation of genetic mutations compared to adult somatic cells, obtaining them is
accompanied with the possible distortion or destruction of the embryo44. This is ethically
controversial and has led to the consideration of other cell types, specifically those from
adult tissues45.
Currently, the two of the most widely used, terminally differentiated, human adult somatic
cells used for reprogramming to iPSCs are dermal fibroblasts and peripheral blood
mononuclear cells (PBMCs). In addition, hiPSCs have been generated from other sources
such as human urine46. However, both dermal fibroblasts and urine cells have limitations.
Urine cells show a marked reprogramming efficiency decrease after five passages47 and
deriving dermal fibroblasts from donors requires relatively invasive procedures and
several weeks to establish a primary cell cultures from the skin biopsy36,48. In contrast,
taking a small volume of blood from donors is non-invasive and sufficient for the isolation
of PBMCs which takes less than an hour to complete13,33. These characteristics make
PBMCs a preferred human cell source.
1.4.2. Integrative reprogramming methods
Integrative reprogramming methods were developed based on activating the
endogenous, silent pluripotent genes in somatic cells. Infecting mouse or human
fibroblasts with the four Yamanaka transcription factors—Oct4, Sox2, Klf4, and c-Myc-
was first achieved in 2006-200732,36, using Moloney murine leukaemia virus derived
retroviruses. In retroviral protocols, transgenes remain in the generated hiPSCs, where
they can randomly integrate into the genome of the host cells, modifying the host genes
and affecting transcription36. Additionally, there is the possibility that the transgenes’

7
transcription can resume in the differentiated cells derived from hiPSCs 49. As a result, in
clinical trials, the use of hiPSCs derived from this method is not recommended, particularly
if the derived cells are to be introduced into patients. The generation of transgene-free
hiPSCs is not only essential for potential therapies and clinical applications, but also for
the development of reliable in vitro models that accurately emulate human diseases50,51.
1.4.3. Non-integrative reprogramming methods
To overcome the major limitation of integrative iPSC generation—the potential for
permanent genetic modification resulting from the integration of retroviral vectors into the
genomes of somatic cells--non-integrative reprogramming methods were developed.
There are currently four main non-integrative reprogramming methods: integration-
defective viral delivery; episomal delivery; RNA delivery; and protein delivery52-56. The two
most efficient non-integrative methods of reprogramming PBMCs are the temperature-
sensitive mutated Sendai virus system50 (an integration-defective viral delivery method)
and the episomal system as shown in Figure 1.1.
Figure 1.1 Reprogramming systems: a) Sendai-virus (SeV) reprogramming system b) Episomal-plasmid reprogramming system
8
1.4.3.1 Sendai virus system
The first effective non-integrative method for reprogramming PBMCs utilizes the
Sendai virus (SeV) 50,57. This virus is derived from the Paramyxovirdae family and is an
enveloped virus with a 15 kb single-stranded, negative-sense, non-segmented RNA
genome58. Most importantly, replication of a recombinant SeV vector is independent of the
host cell’s genome and occurs in the cytoplasm of the infected cell59. SeV vectors have
been shown to be able to efficiently introduce foreign genes into a wide spectrum of host
cell species and tissues 60.
However, while SeV vectors are able to efficiently generate iPSCs from human
fibroblasts 50 and human blood cells,34 they cannot be removed from the host cells unless
an anti-SeV-HN antibody is introduced. “Footprint free” temperature-sensitive (TS) SeV
vectors have since been designed and are now considered to be superior alternatives for
generating vector-free iPSCs54. TS-SeVs have mutations in their RNA polymerase
structures, causing silencing or degradation of the viruses above their permissive
temperatures (for example, above 37oC), leaving the iPSCs transgene free54. The most
efficient TS-SeV vector system available to date, CytoTune-iPS 2.0 (ThermoFisher),
contains the Oct4, Sox2, and Klf4 genes in a single polycistronic vector, c-Myc in a
separate vector and an additional Klf4 vector which serves to enhance the system’s
efficiency. Ts-SeV vectors provide a robust, non-integrative system with high efficiency
and fast viral clearance from generated iPSCs.
1.4.3.2 Episomal system
A second relatively effective, non-integrative method for reprogramming PBMCs
uses episomal vectors. These plasmids have been constructed as either an all-in-one
single plasmid containing all the four Yamanaka transcription factors56 or as separate
plasmids, each containing one of the fours transcription factors53. With the help of a
generated electrical field (electroporation), these plasmids can directly enter the host cell’s
nucleus.
One drawback of the episomal system is that it is not as efficient as the viral
reprogramming methods, possibly due to the large size of the episomal plasmids (5-10
kb), which may mean that fewer host cells are able to receive the appropriate dose of

9
plasmids during reprogramming. The early dilution of the plasmids in actively proliferating
cells and the downregulation of reprogramming factors61 in mammalian cells because of
silencing of prokaryote sequences contained in the backbone of these episomal vectors
are two other factors decreasing the efficiency of episomal system.
To overcome the need for serial transfection due to dilution of episomes through
cell division, oriP/Epstein-Barr nuclear antigen-1-based episomal vectors were designed
53. Although these plasmids can transfect human cells, their transfection efficiency is
extremely low (3 to 6 colonies per million nucleofected cells) due to the large size of the
plasmids (more than 12 kb). As well, their maintenance and stability in transfected cells
requires drug selection. Okita et al62,63 has enhanced the transfection efficiencies of
episomal plasmids by adding the p53 suppressing gene and substituting L-Myc (which is
more potent) instead of c-Myc. The highest transfection efficiency in human PBMCs has
been obtained by co-transfection of four plasmids (Oct4-shp53, L-Myc-LIN28, Sox2-Klf4
and an EBNA-1 vector), in which Shp53 suppresses the activity of the regulatory protein
P53 while EBNA1 is an essential factor for the episomal amplification of vectors62,63.
However, even with these enhancements, the episomal system remains less efficient than
the viral reprogramming methods.
1.5. Molecular mechanism of reprogramming
Although numerous methods have been developed to improve the introduction of
reprogramming factors into somatic cells, the embryonic stem cell-like cells generated are
different in expression levels of pluripotency-associated genes64,65 and only a small
percentage of them develop into fully reprogrammed cells. The reasons for these
discrepancies and low efficiencies are largely unknown.
To date, it also remains unclear exactly how the expression of transcription factors
functions to erase the somatic cells’ program and confers pluripotent capabilities through
the establishment of an ESC-like transcriptional network. What little is known about the
three phases of reprogramming (initiation, the intermediate phase, and maturation and
stabilization) and the modifications that occur in the epigenetic and gene expression

10
networks of the reprogrammed somatic cells in these phases is described in the following
sections.
1.5.1. Phases of reprogramming
The three phases of reprogramming-initiation, the intermediate phase, and
maturation and stabilization--have primarily been studied using fibroblasts as the somatic
cell model.
1.5.1.1 Initiation phase
The first wave of reprogramming is initiated by many events occurring either
sequentially or in parallel. The four introduced transcription factors, also known as the
ectopic OSKM (Oct4, Sox2, Klf4 and Myc), generate a hyper-dynamic chromatin state by
binding to many regions of the host fibroblast’s genome that are not normally OSKM
targets in ESCs. This initiates stochastic gene expression66 causing increased cell
proliferation67,68; introduces histone modifications on somatic genes causing loss of the
somatic cell’s epigenetic programming36,69,70; initiates mesenchymal-to-epithelial transition
71-73 causing the start of morphological changes; inhibits apoptosis and senescence
(aging); and alters the cell metabolism. The initiation phase occurs between day 0 and
day 3 after introduction of the Yamanaka transcription factors74.
1.5.1.2 Intermediate phase
Following the initiation phase, the cells containing the four introduced transcription
factors enter the intermediate phase, transitioning through an unknown rate-limiting step
that leads to a long latency period of 4 to 9 days after introduction of the transcription
factors. In this step, due to the stochastic activation of pluripotency markers66, a temporary
activation of developmental regulators and glycolysis takes place. IPSC predictive
markers, including undifferentiated embryonic cell transcription 1 (Utf1), estrogen-related
receptor beta (Esrrb), developmental pluripotency associated 2 (Dppa2), and Lin28,
activate in a small subset of cells66.

11
1.5.1.3 Maturation and Stabilization phase
Cells that express the iPSC predictive markers in the intermediate phase enter the
last phase of reprogramming through the activation of Sox268. This directly or indirectly
triggers a series of deterministic events-that include activation or silencing of different
combinations of genes that must occur in a particular order to lead to the generation of
iPSCs75,76. In this phase, the cell eventually stabilizes into the pluripotent state which
includes silencing of the transgenes, remodelling of the cytoskeleton to an ESC-like state,
resetting of the epigenetic state and activation of the core pluripotency network (Oct4,
Sox2, Nanog)66,74,77,78. This late phase starts after day 9 with the end of the process
occurring around day 1274.
1.6. T-cell activation
T-cells are the primary reprogramming target of all the cell types making up PBMCs. Their
easy proliferation in culture and their high efficiency induction with pluripotency genes are
two important features necessary for the successful reprogramming of mature cells to
iPSCs. However, in order to achieve efficient levels of T- cell reprogramming, T-cell
activation is key, not only for increasing the number of T-cells but also magnifying the
uptake of pluripotency genes 33,79. In vivo, the events initiating the transition of naïve T-
cells from a quiescent to an activated state are called cell priming 80. In vitro, cell priming
can be recapitulated using anti-CD3 monoclonal antibodies and interleukin-2 (IL-2) 81,82.
In the SeV reprogramming system, T-cells can be selectively activated in PBMC cultures
via interaction of the T-cell receptor complex with anti-CD3 plate bound antibodies. This
stimulates signalling pathways required for T-cell activation 80, enabling the now activated
T-cells to express IL-2 and IL-2 receptors, which are required for cell division 81. However,
activated T-cells are prone to undergo activation-induced cell death shortly after activation
83. To prevent this and to encourage proliferation and longer survival time, high
concentrations of IL-2 (175 U/ml) can be maintained in the medium33,84
In the episomal reprogramming system, T-cells can be selectively activated after
nucleofection of PBMCs with episomal plasmids carrying pluripotency transcription

12
factors. T-cells can be stimulated, immediately following nucleofection, with
immunomagnetic beads coated with anti-CD3 and anti-CD28 monoclonal antibodies and
maintained in low concentrations of IL-2 (30 IU/ml) 63,85. Anti-CD28 monoclonal antibodies
can be included as CD28 has been identified as a co-stimulator that may amplify T-cell
receptor (TCR) signalling to induce proliferation and IL-2 production in T-cells86.
Although much is known about the requirements for T-cell activation both in vivo and in
vitro, protocols are still in the process of being optimized for hiPSC generation.
1.7. High level of variability in iPSCs
Because iPSC technology is so young, not only are there many questions about
T-cell activation and the molecular mechanisms of reprogramming, there are other
aspects of pluripotency which are not clearly understood either. For example, studies on
single pluripotent cells and on populations of pluripotent cells have revealed that the
pluripotent state is a statistical property of stem cell populations and is not well defined at
the single cell level87.
The functionality of pluripotent cells can be experimentally assessed using different
criteria including their ability to differentiate in vitro into cell types of all three germ layers,
their ability to form teratomas in mice in vivo, or their development after introduction into
embryos88. Although these assays distinguish between functional pluripotent cell
populations and non-pluripotent cell populations, they do not assess the pluripotency of
individual stem cells.
Studies, which used high-throughput single-cell gene expression profiling, have
discovered a remarkable degree of cell-to-cell variability in the expression of key
transcription factors such as Nanog, ZFP-42 and Klf4 within functionally homogenous
pluripotent stem cell populations57,89-92. However, despite intracellular expression
fluctuations in which individual cells transit stochastically between states in dynamic
equilibrium, the overall structure of the population remains stable91. Interestingly, although
a population of cells derived from a single stem cell colony may appear to be functionally
homogeneous, it will likely be different from cell populations derived from other colonies

13
due to their unique stochastic expression of pluripotent genes. There is a large degree of
variability not only between cells of a single population but also between different
populations of cells, all depending on the pluripotent genes’ levels of expression. This
variability has serious implications for future research and clinical applications.
1.7.1. Cardiogenesis in vivo and in vitro
Once hiPSCs have been generated, their differentiation into cardiomyocytes
(CMs) is the next critical step for cardiac researchers. However, while the general
roadmap of differentiation to adult cardiomyocyte from embryonic tissue has been well
described in the field of developmental biology, the detailed molecular mechanisms of
these signalling pathways are still unresolved. Once these mechanisms are understood,
directing iPSCs derived from patients with inherited cardiac diseases towards cardiac
lineage differentiation will be more reproducible. This is the goal, to be able to generate a
reproducible cardiac model enabling personalized therapeutic medicine for these patients.
Cardiogenesis in an embryo begins at gastrulation, when the endoderm and
mesoderm are formed. Mesoderm exposed to fibroblast growth factor and bone
morphogenetic protein (BMP), coupled with inhibition of the Wnt pathway, becomes
precardiac, the precursor of the heart tube 93-95. This single layer of the heart tube is
capable of wave-like contraction and encodes the contracting cardiac protein troponin. As
the embryo grows, the heart matures and the conduction system develops, thus
contractility increases and electromechanical coupling transforms from an autonomous
wave-like propagation to a nodal-regulated mature conduction system96-99.
Commensurate with this is the expression of the proteins making up the cardiac contractile
machinery71.
1.7.2. Human cardiac troponin complex and myosin light chain
Among cardiac-specific proteins, the troponin complex with its three subunits,
troponin T, C, and I, plays a crucial role in the generation and regulation of contraction in
cardiac cells. Mutations in the troponin subunits can lead to different types of
cardiomyopathy; in particular, mutations in troponin T and I have been associated with
14
heart failure and sudden cardiac death. As a result, the troponin complex has been the
target for some cardiotonics100 (drugs that improve the contraction of the heart muscle) in
the treatment of heart failure and is the current subject of extensive cardiac research.
In humans, there are three paralogs of troponin I (TnI); the fast and slow skeletal
paralogs and the cardiac paralog 101-103. The slow skeletal TnI (TNNI 1) is expressed in
cardiac muscle during embryonic development104-106 and, within 1-2 years after birth, is
replaced by the cardiac isoform of troponin I (TNNI3) 107-109. Measuring the expression of
these two paralogs provides a reliable indication of whether the hiPSC-derived CMs are
similar to adult or fetal CMs. Another subunit of the troponin complex, troponin T (TnT)
also has three isoforms in humans; the slow and fast skeletal isoforms and the cardiac
isoform110,111. An increased level of mRNA of the slow skeletal isoform of TnT in fetal heart
muscle,112 without any evidence of translation113-115, has been observed. The only isoform
of TnT detected in the adult human heart is the cardiac isoform. By measuring the RNA
for the slow skeletal and cardiac isoforms of TnT in hiPSC-derived CMs, the
developmental status, fetal or adult, of those cells can be determined.
The cardiomyocytes derived from hiPSCs can be chamber specific meaning
cardiomyocytes with either an atrial or ventricular phenotype. One method to determine
the presence of these two phenotypes is to measure the relative expression levels of the
two paralogs of myosin light chain 2 (atrial - MLC-2a and ventricular -MLC-2v).
1.8. Description of this Master’s project
In 2006, Yamanaka and his colleagues identified four transcription factors that
could reprogram an adult somatic cell to become an induced pluripotent stem cell--an
iPSC-- and from that turning point, the technology to reliably and productively generate
hiPSCs has rapidly developed. The ability of hiPSCs to serve as in vitro models for human
diseases, especially the monogenic diseases, is revolutionary, as is their potential use in
drug development, personalized clinical therapies, and regenerative medicine. Of
particular interest is the potential for hiPSCs to elucidate and eventually treat cardiac
diseases such as atrial fibrillation or Long QT syndrome.
15
PBMCs from blood have been identified as an easily available, non-invasive
source of human somatic cells that can be manipulated, through either episomal or SeV
non-integrative reprogramming systems, to become hiPSCs. However, there is much to
learn. Currently, there is little understanding of the molecular mechanism of
reprogramming; the efficiencies of the non-integrative reprogramming systems are both
low (0.01 to 0.1% at maximum) and the level of variability at the cell-to-cell level of hiPSCs
is high. While PBMCs, specifically the T-cells, can be successfully reprogrammed to
become hiPSCs and then differentiated into CMs (either atrial or ventricular) there remain
critical questions about the efficiency of the reprogramming methods and the quality and
reproducibility of the generated CMs.
This Master’s research project addressed two of these questions; which
reprogramming system--the episomal or the SeV--is more effective at generating hiPSCs
from PBMCs and what hiPSC characteristics reliably indicate future successful
differentiation to CMs.
Before the questions could be answered however, a T-cell activation protocol had
to be developed and optimized, followed by optimization of both the SeV and episomal
reprogramming methods. Only then could hiPSCs be generated. Next, these hiPSCs were
characterized for pluripotent surface markers and intracellular pluripotency gene
expression at early (passage 5) and late passage (passage 10). The functionality of the
hiPSCs, that maintained their pluripotency to passage 10, were then assessed for their
successful differentiation to CMs as measured by the levels of expression of cardiac-
specific gene markers.
The aims that were addressed in this research project are integral to the
development of an effective patient-specific hiPSC model.

16
Chapter 2. Materials and Methods
2.1.1. Human cell isolation and culture
Human whole blood was obtained from four healthy donors - two males and two
females between 20-30 years old -whose written informed consent is in accordance with
the Simon Fraser University Ethical Review Board’s guidelines (see Appendix A). The
blood was collected by venipuncture into BD Vacutainer tubes (BD Biosciences,)
containing an anticoagulant citrate dextrose solution. Peripheral blood mononuclear cells
(PBMCs) were aseptically isolated at room temperature immediately following collection
using Sepmate tubes (STEMCELL Technologies) according to the manufacturer’s
instructions.
To begin the selective expansion of T-cells within each PBMC culture, a 24-well
plate (Corning) was first coated with 250 μl /well anti-human CD3 antibodies (eBioscience)
dissolved in 1 ml D-PBS (Life Technologies) for a final concentration of 10 μg/ml and
incubated in 37°C for a minimum of one hour. Wells were next washed twice with 0.5 ml
D-PBS after coating and the D-PBS aspirated. Then, 5 x 10⁵ PBMCs in 500 μl T-cell
medium [RPMI (Lonza) containing 10% FBS (Life Technologies) and 175 U/ml IL-2
(Peprotech)] were added to each well of the coated plate and the plate was incubated at
37°C.
2.1.2. Trypan blue exclusion assay
To determine the number of viable cells present in PBMC cultures before and after
T-cell stimulation, the Trypan blue exclusion assay was used. In triplicate experiments, 5
x 105 live cells were stimulated with plate-bound anti-human CD3 antibodies (10 μg/ml,
eBioscience; see Section 2.1. 1 for plate coating protocol) in 500 μl T-cell medium [RPMI
(Lonza) containing 10% FBS (Life Technologies) and 175 U/ml IL-2 (Peprotech)] and
incubated at 37oC. The number of live cells was counted daily, over a period of one week.
To count, 10 µl cells were pipetted from the PBMC culture and stained with Trypan blue
(Lonza) for 2-3 minutes in a 1:1 ratio (10 μl cells: 10 μl Trypan blue) in a microtube. Then,
17
10 μl of the stained cells was transferred to a counting slide (Bio-Rad) and counted using
an automated cell counter (Bio-Rad TC20).
2.1.3. Flow cytometry
Flow cytometry is a laser-based technology used for characterizing cell
populations in single cell suspensions. Measured parameters include a cell’s relative size
and granularity, as well as quantitation of cell surface and intracellular marker expression
using fluorochrome-conjugated antibodies. In this research project, a FACSJazz flow
cytometer (Becton-Dickinson) was used and the collected data analyzed using FlowJo
software (v10.1r5.OSX, FlowJo).
2.1.3.1 Analysis of activated T-cells
Activation with plate-bound anti-human CD3 antibodies plus IL-2 was compared
with two other methods of activation: 1) activation with both anti-human CD3 and anti-
human CD28 antibodies plus IL-2 and 2) activation with Dynabeads and IL-2 to identify
the technique yielding the highest number of activated T-cells before infection with SeV.
In one set of experiments, 5 x 10⁵ PBMCs obtained from one donor were stimulated in
wells of a 24-well plate (Corning) with plate-bound anti-human CD3 antibodies (10 μg/ml,
eBioscience) in 500 μl T-cell medium [RPMI (Lonza) containing 10% FBS (Life
Technologies) and 175 U/ml IL-2 (Peprotech)], while another 5 x 10⁵ PBMCs from the
same donor were stimulated instead with plate-bound anti-human CD3 antibodies and
anti-human CD28 antibodies (2 μg/ml, eBioscience) in 500 μl T-cell medium [RPMI, 10%
FBS, and 30U/ml IL-2].
In the second set of experiments, 5 x 10⁵ PBMCs obtained from the same donor
as the first set of experiments were stimulated with plate-bound anti-human CD3
antibodies plus 175 U/ml IL-2 in 500ul T-cell medium, while another 5 x 10⁵ PBMCs were
stimulated instead with 5 μl /well Dynabeads human T-Activator (Life Technologies) and
30 U/ml IL-2 (Peprotech) in 500 μl T-cell medium.
On day 5 after activation, the cells were analyzed for their levels of expression of
CD3 (T-cell marker) and CD25 (activation marker) using a FACSJazz flow cytometer (see

18
Section 2.1.3). In preparation for flow cytometry measurements, four samples were
prepared for each technique. For each sample, 5 x 10⁵ cells were transferred to 5 ml
polypropylene tubes (BD Biosciences) and washed twice with 3 ml PBS (Life
Technologies). Three positive samples were prepared: one sample was stained with 5 μl
anti-human CD3 conjugated with Phycoerythin-Cyanine [7(PE-Cy7] (BD-Bioscience) only,
another sample was stained with 5 μl anti-human CD25-conjugated with Phycoerythin
[PE] (BD-Bioscience), and the third sample was stained with 5 μl each of both antibodies.
As a negative control, a tube of cells without antibodies was prepared. The samples were
incubated on ice for 30 minutes in a 4oC refrigerator, washed two times with 3 ml PBS and
then re-suspended in 1 ml PBS for flow cytometry. A blue laser (488 nm) was used for
fluorophore excitation with a bandpass filter (585 29 nm) for CD25-PE and a long pass
filter (750/LP) for CD3-PE-Cy7. To eliminate false signals that can result from spectral
overlap between the two fluorescent dyed antibodies, readings were done first on the
negative control and the two single stained samples. After compensation, data acquisition
was carried out on all samples with the limit of 50,000 live cells recording event.
2.1.4. Mitomycin C treatment of mouse embryonic fibroblasts
To support the growth of hiPSCs, mitotically inactivated mouse embryonic
fibroblasts (MEF) cells were used as feeder cells. To prepare mitotically inactivated MEFS,
106 MEFs (GlobalStem) were plated in a T75 vented-flask (BD Bioscience) in 15 ml MEF
medium [ES-DMEM medium (GlobalStem) with 15% FBS (Life Technologies)] and
passaged to passage 3 (P3). When the cells reached confluence, 0.5 mg/ml Mitomycin C
(Sigma) was added to the MEF medium to yield a final concentration of 10 μg/ml.
Inactivation of the expanded MEFs was then carried out according to the manufacturer’s
(GlobalStem) protocol. Table 2.1 lists the coating conditions and cell densities of the
inactivated MEF cells for the 6-well and 12-well plates (Corning) that were used in this
research project. 6-well plates were coated with 1 ml 0.1% gelatin in dH2O (Sigma) and
incubated for 1 hour at 37°C prior to seeding the inactivated MEFs. Before seeding, the
gelatin was aspirated from the wells. 4 x 10⁵ MEFs in 2 ml MEF medium were then seeded
into the wells of the 6-well plate.1.5 x 105 MEFs in 1 ml MEF medium were seeded into
wells in a 12-well plate which was not gelatin coated.

19
Table 2.1 Inactivated mouse embryonic fibroblasts (MEF) culture conditions
Plate size Coat Cell density Experiment
6‐well plate Gelatin coated 4 x 10⁵ 2.1.5
12‐well plate No coat 1.5 x 10⁵ 2.1.6
2.1.5. The reprogramming of T-cells
2.1.5.1 Infection with Sendai virus
Activated T-cells, at a density of 5 x 10⁵ cells/ml in T-cell medium [RPMI (Lonza)
containing 10% FBS (Life Technologies) and 175 U/ml IL-2], were used for
reprogramming. The T-cell infection was performed on day 4 following their activation
using temperature-sensitive SeV (CytoTune – iPS 2.0 Sendai Reprogramming Kit,
DNAVEC) with a multiplicity of infection (MOI) of 5,5,3 (KOS MOI=5, hc-Myc MOI=5, hKlf4
MOI=3) in T-cell medium. Infection of the activated T-cells with SeV was carried out
according to the manufacturer’s instructions. 24 hours later, the infected cells were spun
down at 800 rpm for 5 min and re-suspended in 2 ml ES medium [Primate ES cell Medium
(Reprocell) supplemented with 5 ng/ml bFGF (Invitrogen)] and 10 μM Rho (STEMCELL
Technologies), plated on a prepared, one-day old, MEF-coated 6-well plate (see Section
2.1.4) and incubated at 37oC. 48 hours after plating, the culture medium was replaced with
1.5 ml fresh ES medium. From this point onwards, Rho was no longer added to the media.
Media (ES medium without Rho) was then changed every two days for a period of 10-20
days after infection until hiPSC colonies formed.
2.1.5.2 Transfection with episomal plasmids
Before transfecting the PBMCs with the four reprogramming transcription factors
63, transfection efficiency was first examined by nucleofecting 3 μg eGFP episomal plasmid
(Addgene) into 3.5 x 10⁶ freshly isolated PBMCs using the Human T-cell Nucleofector Kit
(Lonza) and nucleofector program V-024 on an Amaxa Nucleofector 2b Device (Lonza).
For a negative control, 3.5 x 10⁶ freshly isolated PBMCs were nucleofected under the
same conditions but without the addition of the episomal plasmid. The cells were then
plated in 2 ml X-vivo 10 medium (Lonza) with 5 μl Dynabeads (Life Technologies) on a 24
hour pre-incubated 6-well gelatin-MEF coated plate (see Section 2.1.4). The expression
of eGFP protein was measured 48 hours after nucleofection using a FACSJazz flow

20
cytometer (Becton-Dickinson). Cells from each well were individually transferred to 5 ml
polypropylene tubes (BD Biosciences) and washed twice with 3 ml PBS (Life
Technologies) prior to flow cytometry. The eGFP transfection experiment was repeated
twice, yielding transfection efficiencies between 18%-24%. The same nucleofection
parameters were then used for transfecting PBMCs with the four reprogramming
transcription factors.
24 hours before reprogramming, one 6-well plate was coated with 1 ml 0.1%
gelatin in dH2O (Sigma) per well and incubated for 1 hour at 37°C. After aspiration of the
gelatin, inactivated MEFs at a density of ~4 x 10⁵ per well, were seeded in 2 ml MEF
medium [ES-DMEM medium (GlobalStem) with 15% FBS (Life Technologies)] into the
wells and the plate incubated in 37oC overnight. On the day of reprogramming, 3 μg total
of the reprogramming plasmids [(0.83 μg pCXLE-hOct4-shp53-F, 0.83 μg pCXLE-hSK,
0.83 μg pCXLE-hUL, 0.5 μg pCXWB-EBNA1) (Addgene)] were electroporated into 3.5 x
106 PBMCs with the Amaxa Nucleofector 2b Device using the Human T-cell Nucleofector
kit according to the manufacturer’s instructions. The pre-stored program V-024 for
unstimulated human T-cells was used to perform the nucleofection. The electroporated
cells were then plated on a one-day-old 6-well MEF-coated plate; approximately 300 µl
volume containing a total of 1.1 x 10⁶ cells was added to each well, along with 2 ml X-vivo
10 medium and 5 μl Dynabeads. The plate was returned to a 37oC incubator. On days 2
and 4 following electroporation, 1.5 ml ES Medium [Primate ES cell Medium (Reprocell)
supplemented with 5 ng/ml bFGF (Invitrogen)] and 10 μM Rho (STEMCELL Technologies)
was added to each well without aspiration of the previous medium. On day 6 when the
transfected cells, viewed under a phase contrast microscope, were seen to be 90%
confluent, the culture medium was replaced with fresh 1.5 ml ES medium supplemented
with 10 μM Rho. From day 6, the medium was replaced with fresh ES medium
supplemented with Rho as described, every two days for a period of 20-30 days until
hiPSC colonies formed.

21
2.1.6. Maintenance of hiPSCs
2.1.6.1 Feeder-dependent step
Approximately 20-30 days following transfection for the episomal reprogramming
system and 10-20 days following infection for the SeV reprogramming system, the
resultant individual hiPSC colonies were observed under a phase-contrast microscope
and, in a Class II biosafety cabinet, were transferred aseptically using a 10 μl pipette to
wells in a 96-well plate. The colonies were further broken up into smaller cell clumps by
pipetting gently up and down and then transferred to a prepared MEF-coated 12-well plate,
less than 3 days old, containing 1 ml ES medium [Primate ES cell Medium (Reprocell)
supplemented with 5 ng/ml bFGF (Invitrogen)] and 10 µM Rho (STEMCELL
Technologies). The plated cell clumps were incubated at 37oC. The ES medium without
Rho was changed every day until the colony clumps became confluent, as judged visually
under a phase contrast microscope. After 5-6 days, 1 mg/ml collagenase type IV
(STEMCELL Technologies) was added to each well containing the iPSCs, and incubated
for an hour at 37oC until the iPSCs detached from the MEF feeder cell layer.
After 1hour incubation with collagenase type IV, the detached colonies were spun
down in ES medium for 5 min in 1,000 rpm. Then the cell pellet was broken with 2 ml
mTeSR1 medium (STEMCELL Technologies) supplemented with 10 μM Rho, and
transferred to the 0.5 mg/well Matrigel (Corning) in DMEM/F12 (Life Technologies) coated
wells of a previously prepared 6-well plate and returned to a 37oC incubator.
2.1.6.2 Feeder free step
The mTeSR1 medium was changed daily in the 6-well plates described in Section
2.1.6.1 until the colonies became confluent. After adherence of the iPSCs to the surface
of the Matrigel-coated 6-well plate but before they became confluent, MEF cells, which
were originally transferred with the hiPSCs during the feeder dependent step, were
physically removed using 10 μl pipette tips under a phase contrast microscope. The
hiPSCs were then allowed to continue growing until they became confluent when viewed
under a phase contrast microscope. At that point, the medium was aspirated and 1 ml
0.02% EDTA (Lonza) was added to each well. The colonies and EDTA were incubated for
5-10 minutes at room temperature. The EDTA was then aspirated and 2 ml mTeSR1

22
medium supplemented with 10 μM Rho was added to each well. The medium was pipetted
up and down several times to detach the cells from the surface of the wells. Once detached
and re-suspended in the mTeSR1 medium with 10 μM Rho, each cell line was divided into
two new wells of a Matrigel coated 6-well plate. The mTeSR1 medium was changed every
day until the cells became confluent whereupon the process of detachment (the next
passage) was repeated.
2.1.7. Cryopreservation of hiPSCs
hiPSC colonies at the feeder-free step were cryopreserved for future experiments
using STEM-CELLBANKER cell freezing media (amsbio, Oxford UK) and following the
manufacturer’s instructions. Cell lines from later passages were also frozen in the same
manner and stored first for 24 hours at -80°C and then transferred to a nitrogen tank at -
160oC for longer-term storage.
2.1.8. Characterization of hiPSCs for pluripotency
2.1.8.1 Immunocytochemistry of live cells
One well of newly generated colonies from each donor was used for live staining
for CD44 (differentiation marker) and TRA-1-60 (pluripotency marker). Live staining of the
iPSC colonies was carried out using Stem Cell Antibody Kits for Live Cell Imaging (Life
Technologies) following the manufacturer’s instructions. Stained colonies were imaged
using a Nikon Epi-fluorescence microscope and 400 two-dimensional snapshots, using
20x objectives (1661 μm x 1404 μm in the X and Y planes, respectively), were taken of
the contents of each well. The snapshots were then stitched together and visualized using
ImageJ software (ImageJ).
To complement the live staining results, the iPSC induction efficiency was
calculated based on the number of iPSC colonies per number of seeded cells, which were
estimated from the number of cells used for nucleofection and SeV infection.

23
2.1.8.2 Flow cytometry analysis of pluripotent surface markers
iPSCs generated on passage 5 (1 time passage on MEF and 4 times passage on
Matrigel) were characterized for two pluripotency surface markers, stage-specific
embryonic antigens -4 (SSEA-4) and TRA-1-60, using a FACSJazz flow cytometer
(Becton-Dickinson). The medium for each cell line was aspirated from two confluent wells
of colonies and 1 ml dissociation solution (0.02% EDTA; Lonza) was added to each well.
The colonies and EDTA were incubated for 5-10 minutes at room temperature. The EDTA
was then aspirated and 2.5 ml mTeSR1 medium (STEMCELL Technologies) added to
each well, with pipetting up and down several times to detach the cells from the surface
of the well. Cells from two wells of the 6-well plate (the same cell line) were then divided
equally into five 5 ml polypropylene tubes (BD Biosciences) and washed twice with 3 ml
PBS (Life Technologies). Each cell line experiment had two negative controls and three
positive controls. One positive control was stained for two monoclonal antibodies; 5 µl
Alexa Flour 647 Mouse anti-Human TRA-1-60 Antigen (BD Bioscience) and 20 µl PE
Mouse anti SSEA-4 (BD Bioscience), according to the manufacturer’s instructions while
the other two positive controls were stained with only one of the two antibodies. One
negative control remained unstained (to identify background noise) and the second
negative control was stained with isotypes of the two antibodies (to detect any nonspecific
binding [false positive]). A blue laser (488 nm) with an excitation band pass filter of 585
29 nm was used for SSEA-4 PE while a red laser (640 nm) with an excitation band pass
filter of 670 30 nm was used for TRA-1-60 AlexaFluor647. Cell lines found to have higher
expression levels of these two markers were passaged five more times and on passage
10 (1 time passage on MEF and 9 times passage on Matrigel) were characterized again
for expression of TRA-1-60 and SSEA-4 using the same protocol.
2.1.8.3 hiPSC RNA extraction, qRT-PCR
RNA from hiPSCs collected on passages 5 and 10 was extracted according to the
manufacturer’s instructions using the RNeasy Mini Kit (QIAGEN). The concentrations of
the extracted RNA were measured using a NanoDrop Spectrophotometer ND-1000
(NanoDrop) at wavelength ratio of 260 / 280 nm and the RNA was then stored at -80oC
for later analysis.

24
1 μg from each extracted RNA sample was reverse transcribed into cDNA using the
QuantiTect Reverse Transcription Kit (QIAGEN) according to the manufacturer’s
instructions. The concentration of generated cDNA was measured using a NanoDrop
Spectrophotometer ND-1000 and the concentration of cDNA was then adjusted to 2 ng/μl
through serial dilution with RNAse free water (Qiagen). The master mixes contained 10 µl
SYBR Select Master mix for CFX (Life Technologies) and for each pluripotent gene (Sox-
2, Oct4, c-Myc, Klf4, Nanog and ZFP-42) 2 μl of forward primer and 2 μl of reverse primer
(Integrated DNA Technologies, see Appendix B for primer sequences) with a final
concentration of 2.5 μM each and 1 μl of RNase-free water. 10 ng (5 μl) cDNA was added
to the reaction for a final reaction volume of 20 μl. Two negative controls were used for
each pluripotent gene: one control did not contain cDNA while the other control contained
cDNA from the donor’s activated T-cells. The thermal cycling protocol applied for the qRT-
PCR was as follows: 1) initial activation step of 3 min at 95°C; 2) 3-step cycling including:
a) denaturation for 10 secs at 95°C; b) annealing for 40 secs at 60°C; c) extension for 5
secs at 65°C (these three steps were repeated for 39 cycles); and 3) end of PCR cycling
held at 4°C.
2.1.9. In vitro cardiac differentiation of hiPSCs
After analyzing the generated hiPSCs for the expression of two surface markers,
SSEA-4 and TRA-1-60, on passage 10 (as described in Section 2.1.8.2), the hiPSCs that
expressed both of these markers were chosen for cardiac differentiation. After the medium
was removed, the generated hiPSCs were detached from Matrigel-coated wells in a 6-
well plate by adding 1 ml 0.02% EDTA (Lonza) to each well. The colonies and EDTA were
incubated for 5-10 minutes at room temperature, following which the EDTA was aspirated
and 2 ml mTeSR1 medium supplemented with 10 μM Rho was added to each well. The
medium was pipetted up and down several times to detach the cells from the surface of
the wells. Once detached and re-suspended in the mTeSR1 medium with 10 μM Rho, the
cells were counted using an automated cell counter (Bio-Rad TC20) (see Section 2.1.2
for protocol). 1 x 10⁶ cells from each cell line were then seeded on 6 well Matrigel-coated
plates and 2 ml mTeSR1 medium supplemented with 10 μM Rho was added to each well.
The mTeSR1 medium was changed every day until the cells became confluent. When
cells became almost 100% confluent after viewing under phase-contrast microscope, the

25
differentiation pathway was initiated, following Lian et al’s protocol116. The differentiation
protocol was optimized and performed by Sanam Shafaattalab, a PhD candidate in our
laboratory.
2.1.10. CM RNA extraction, qRT-PCR
The protocol for qRT-PCR to analyze cardiac gene expression is the same as the
protocol described in Section 2.1.8.3 for hiPSCs, except that cardiac markers, adult and
fetal isoforms of TNT2, TNI 3 (cardiac isoform), TNI 1 (skeletal isoform), and myosin light
chain-2 (atrial and ventricular paralogs) were used instead of Sox-2, Oct4, c-Myc, Klf4,
Nanog and ZFP-42. See Appendix B for the CM primer sequences. Two negative controls
were used for each pluripotent gene: one control did not contain cDNA while the other
control contained cDNA from the iPSC cell line from which the CMs were derived.

26
Chapter 3. Results
3.1.1. Isolated PBMC count
The yield and percentage viability of the harvested PBMCs from each individual
donor was determined after isolation, staining with Trypan blue (Lonza) and counting using
an automated cell counter (Bio-Rad TC20) (see Section 2.1.2 for protocol). The total
number of isolated PBMCs from 1 ml of each donor’s whole blood was between 1.5 x 10⁶
cells and 2 x 10⁶ cells; the percentage of viable (actively growing and dividing) cells in the
total counted cells for each donor was 87%-92%.
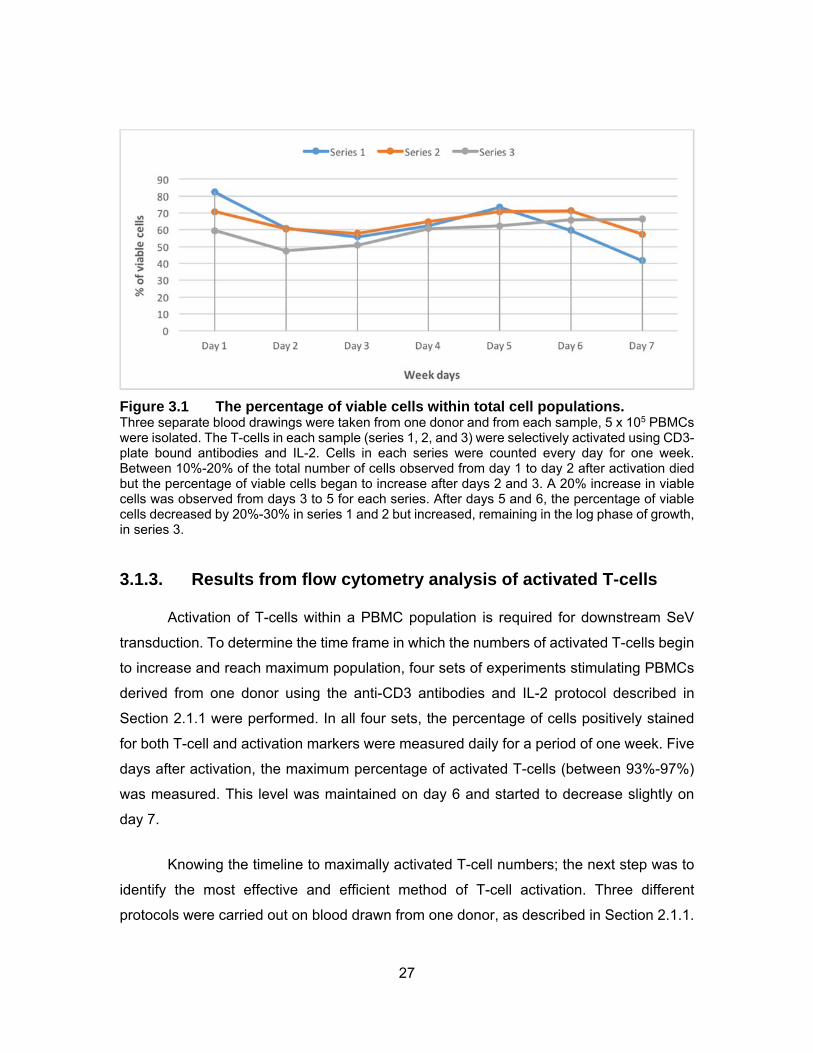
3.1.2. Trypan blue exclusion assay results
Three separate blood samples were taken from one donor, following which the T-
cells in 5 x 10⁵ PBMCs from each sample (series 1, 2, and 3) were selectively activated
using CD3-plate bound antibodies and IL-2. Staining the cells with Trypan blue, the total
number of cells and the number of viable cells were then counted in the Bio-Rad TC20
cell counter, as described in Section 2.1.2, every day over a period of one week. In all
three series, in days 1 and 2 following activation, between 10-20% of the total number of
cells were found to have died but the percentage of viable cells began to increase after
days 2 and 3. Also within all three series, a 20% increase in the number of viable cells
was observed from days 3 to 5. In series 1 and 2, after days 5 and 6, the percentage of
viable cells was found to have decreased by 20-30% but increased in series 3, remaining
in log phase.
The percentage of viable cells in each series was calculated using the following
equation:
%
100
and is shown graphically in Figure 3.1:
27
Figure 3.1 The percentage of viable cells within total cell populations. Three separate blood drawings were taken from one donor and from each sample, 5 x 10⁵ PBMCs were isolated. The T-cells in each sample (series 1, 2, and 3) were selectively activated using CD3-plate bound antibodies and IL-2. Cells in each series were counted every day for one week. Between 10%-20% of the total number of cells observed from day 1 to day 2 after activation died but the percentage of viable cells began to increase after days 2 and 3. A 20% increase in viable cells was observed from days 3 to 5 for each series. After days 5 and 6, the percentage of viable cells decreased by 20%-30% in series 1 and 2 but increased, remaining in the log phase of growth, in series 3.
3.1.3. Results from flow cytometry analysis of activated T-cells
Activation of T-cells within a PBMC population is required for downstream SeV
transduction. To determine the time frame in which the numbers of activated T-cells begin
to increase and reach maximum population, four sets of experiments stimulating PBMCs
derived from one donor using the anti-CD3 antibodies and IL-2 protocol described in
Section 2.1.1 were performed. In all four sets, the percentage of cells positively stained
for both T-cell and activation markers were measured daily for a period of one week. Five
days after activation, the maximum percentage of activated T-cells (between 93%-97%)
was measured. This level was maintained on day 6 and started to decrease slightly on
day 7.
Knowing the timeline to maximally activated T-cell numbers; the next step was to
identify the most effective and efficient method of T-cell activation. Three different
protocols were carried out on blood drawn from one donor, as described in Section 2.1.1.

28
In the first series of experiments, the T-cell activation procedure using anti-CD3 antibodies
and IL-2 (Figure 3.2.a), as was done on the timeline experiments, was compared to the
Dynabeads and IL-2 method (Figure 3.2.b). The percentage of activated T-cells on day 5
following activation was determined using flow cytometry. In the second set of
experiments, T-cell activation with anti-CD3 antibodies and IL-2 (Figure 3.2.c) was
compared to activation with anti-CD3 and anti-CD28 antibodies plus IL-2 (Figure 3.2.d) on
day 6 post activation. Due to facility limitations, flow cytometry was delayed by one day
for the second set of experiments.
In the first set of experiments, 93% of PBMCs stimulated using the anti-CD3
antibodies plus IL-2 method were found to be positive for both activation and T-cell
markers while only 82% were found to be positive in the Dynabeads plus IL-2 protocol, 5
days after activation. In the second set of experiments, 75% of the PBMCs stimulated with
anti-CD3 antibodies plus IL-2 were positive for both activation and T-cell markers while
only 46% were positive in the anti-CD3 and anti-CD28 antibodies plus IL-2 method 6 days
following activation. The highest percentage of activated T-cells was seen in the anti-CD3
antibody and IL-2 protocol 5 days post activation, which correlates with the observation in
Section 2.3.1 that the percentage of viable cells began to decrease 5 days after activation.
In both sets of experiments, the anti-CD3 antibodies plus IL-2 protocol yielded
higher percentages of activated T-cells than either the Dynabeads plus IL-2 protocol or
the anti-CD3 and anti-CD28 antibodies plus IL-2 procedure. As a result, the anti-CD3
antibodies plus IL-2 method was selected as the T-cell activation protocol to be used
before SeV reprogramming.
Although the anti-CD3 antibodies plus IL-2 protocol is best for the SeV
reprogramming system, it is not for the episomal system. Results in Section 3.1.6
demonstrated that electroporation of activated T-cells is not efficient while isolation and
expansion of T-cells after electroporation using Dynabeads was (Section 3.1.6 likely due
to effective interaction of the mobilized Dynabeads with the T-cells, stimulating their
activation63,85.

29
Figure 3.2 Flow cytometry analysis of activated T-cells with three different activation protocols on blood drawn from one donor in two sets of experiments.
Stimulated cells were stained with PE-Cy7-labelled anti-human CD3 antibodies (which bind to the CD3 antigen on the surface of T-cells) and PE-labelled anti-human CD25 antibodies (which bind to the CD25 antigen on the surface of activated T-cells) as described in Section 2.1.3.1. (a) 93% of PBMCs stimulated with anti-CD3 antibodies and IL-2 were positive for both activation and T-cell markers 5 days post activation while, (b) 82% of PBMCs stimulated with Dynabeads and IL-2 were positive for both activation and T-cell markers after 5 days. (c) 75% of PBMCs stimulated with anti-CD3 antibodies and IL-2 were positive for both activation and T-cell markers 6 days post activation and, (d) 46% of PBMCs stimulated with anti-CD3 and anti-CD28 antibodies plus IL-2 were positive for both activation and T-cell markers 6 days following activation.
3.1.4. Activated T-cell morphology results
Phase contrast images were taken of PBMCs 24 hours following activation with
anti-CD3 antibodies and IL-2 and on day 5 post activation. A hallmark of activated T-cells
is aggregation and this was observed by day 5, as shown in Figure 3.3. These visual
results correlate with the flow cytometry results, confirming the presence of activated T-
cells within the expanded population of viable cells counted in the Trypan blue assays.

30
Figure 3.3 Activation of PBMCs with anti-CD3 antibodies and IL-2 induces T-cell aggregation.
These two phase-contrast images are PBMCs activated with 10 µg/ml anti-CD3 antibodies and 175 U/ml IL-2. The day 1 image was taken 24 hrs. after activation and the image of PBMCs on day 5 was taken ~120 hrs. after activation. The images show that the T-cell subpopulation aggregates after activation with anti-CD3 antibodies and IL-2.
3.1.5. Results of MEF feeder cell density optimization
As described in Sections 2.1.4, MEF cells were seeded in different densities (3 x
105 cells/well, 3.5 x 10⁵ cells/well, 4 x 10⁵ cells/well, 5 x 10⁵ cells/well and 7 x 10⁵ cells/well)
on gelatin coated 6-well plates for a period of 9 days under transfection conditions,
excluding transfected cells. Of these densities, MEF cells on gelatin coated plates with a
density of 4 x 10⁵ cells/well maintained the appropriate confluency of 70-80% after 9 days;
not too sparse to be insufficient to support pluripotent stem cells and not too confluent to
detach spontaneously after being cultured for that length of time. For wells with initial cell
densities of 3 x 10⁵ cells/well and 3.5 x 10⁵ cells/well, confluency decreased to 40-50%
after 9 days culturing and for wells with initial cell densities of 5 x 10⁵ cells/well and 7 x 10⁵
cells/well, although confluency was comparable with 4 x 10⁵ cells/well after 9 days, the
number of detached and floating cells increased steeply.
Once the appropriate cell density (4 x 10⁵ cells/well) was determined for MEFs on
gelatin-coated plates, the same density was then plated on non-coated 6-well plates. After
being cultured for 9 days, the cells were only 20-30% confluent; too sparse to support
hiPSC growth. MEF cells with a density of 4 x 10⁵ cells/well on gelatin coated 6 well plates
were demonstrated to be the optimal density and condition for successful growth of
hiPSCs.

31
3.1.6. Results of optimization of nucleofection in the episomal reprogramming system
3 g of eGFP-episomal plasmids were nucleofected into both activated T-cells and
unstimulated PBMCs as described in Section 2.1.5.2. Flow cytometry analysis of eGFP
expression 48 hours post transfection revealed successful transfection of eGFP plasmids
occurred in unstimulated PBMCs but not in activated T-cells. The transfection efficiency
(percentage of cells expressing eGFP) was 24% in PBMCs derived from fresh human
blood and 14% and 17% in PBMCs derived from frozen human blood (donated by Dr.
Jonathan Choy, Molecular Biology and Biochemistry Department, Simon Fraser
University).
3.1.7. HiPSC morphology results
Phase contrast images were taken of hiPSCs generated by either the SeV
reprogramming system or the episomal reprogramming system, following two passaging
on MEFs (see Figure 3.4). As viewed through the 4X objective lens, undifferentiated
colonies of small, round hiPSCs were the result in both reprogramming systems while
through the 20X objective lens, the large nuclei in individual cells could be seen. This is
characteristic of highly mitotically active cells and is a signature of pluripotent stem cells.

32
Figure 3.4 Morphology of hiPSCs generated by both reprogramming systems following two passages on MEFs.
Seen under a phase contrast light microscope, the hiPSCs in images 1 (a) and (b) were generated using the SeV reprogramming system while hiPSCs in images 2 (a) and (b) were generated using the episomal reprogramming system. Images 1 (a) and 2 (a) viewed through a 4x objective lens, show undifferentiated hiPSC colonies of small, round cells, clearly separate from the feeder layer cells. Images 1 (b) and 2 (b), magnified by a 20x objective lens, show hiPSCs with large nuclei.
3.1.8. Immunocytochemistry results from live cell staining
A combination of two antibodies, one against TRA-1-60 (a stem cell surface
marker) conjugated with Alexa Fluor555 and another against CD44 (a differentiated cell
marker) conjugated with Alexa Fluor488, was used to live stain the primary generated
hiPSCs (the first colonies obtained from the reprogramming of activated T-cells), as
described in Section 2.1.8.1. Figure 3.5 shows hiPSCs derived from both the SeV and
episomal reprogramming systems. Pluripotent cells, in each colony, that expressed the
TRA-1-60 surface marker are coloured red while the MEF cells the hiPSCs are growing

33
on are coloured green. This test confirmed that both reprogramming systems generated
hiPSCs.
Figure 3.5 Epifluorescent imaging of single primary hiPSC colonies generated from the SeV and episomal reprogramming systems.
The epifluorescent image (a) is of a single hiPSC colony generated from SeV reprogramming while image (b) is of a single hiPSC colony generated from episomal reprogramming. Both hiPSC colonies were derived from the same donor’s blood samples.
3.1.8.1 Comparison of the efficiency of the SeV and episomal reprogramming systems in Donor 002 hiPSCs
400 two-dimensional snapshots were taken of hiPSCs generated from the blood
sample of Donor 002 using either the SeV or episomal reprogramming systems in wells
of a 6-well plate. The snapshots were then stitched together, as described in Section
2.1.8.1. Cells stained for the presence of the differentiated cell marker, CD44, were
pseudo-coloured green while cells stained for the presence of the stem cell surface
marker, TRA-1-60, were pseudo-coloured red.

34
Figure 3.6 Epi-fluorescent imaging of primary hiPSCs generated from SeV reprogramming of PBMCs derived from Donor 002.
The epi-fluorescent image (a) shows the hiPSCs in grey scale while in image (b) the feeder layer is shown in grey scale and the black holes are the hiPSC colonies. After applying two pseudo-colours, image (c) is the result. hiPSCs are shown in red and feeder layer and differentiated cells are coloured green. In image (d) hiSPC colonies were manually outlined and individually numbered. The area of the smallest selected colony was 25,263 m2 and the area of the largest colony was 187,136 µm2. By comparing image (d) with image (b), the smaller red spots were determined to be background noise. A total of 87 colonies were counted.
Figure 3.6 shows the same image of hiPSCs generated from the SeV
reprogramming system, first in grey scale and then in pseudo-colour, with the hiPSCs
coloured red, indicating the presence of TRA-1-60, and the feeder layer and differentiated
cells coloured green, indicating the presence of CD44. The area of the smallest hiPSC
colony was 25,263 µm2 and the largest colony’s area was 187,136 µm2. Twenty out of the
87 colonies revealed the presence of both pluripotent and differentiation markers,

35
indicating overgrowth of the colonies. Colony overgrowth results in spontaneous
differentiation of the hiPSCs, which can be evidenced by hypertrophic colonies, colonies
without borders and flattened cells117. In future experiments, the colonies need to be
picked 2 to 3 days after formation rather than the 6 days used for these results.
Using the equations below, the efficiency of the SeV reprogramming system in
generating hiPSCs was calculated and found to be 0.044%.
002
100
00287
2 10100 0.044%

36
Figure 3.7 Epi-fluorescent imaging of primary hiPSCs generated from episomal reprogramming of PBMCs derived from Donor 002.
Image (a) shows the hiPSCs in grey scale while image (b) shows the feeder layer in grey scale where the black holes are the hiPSC colonies. Image (c) is the same image after applying the two pseudo-colours. hiPSCs show as red and the feeder layer and differentiated cells show as green. In image (d) colonies are outlined manually and individually numbered. The area of the smallest selected colony was 26,488 m2. The smaller red spots were identified as background noise by comparing image (d) with image (b). The area of the largest colony was 399,796 m2. Four colonies out of 56 expressed both differentiation and pluripotent markers.
Figure 3.7 shows the same image in grey scale and then in pseudo-colour to first
identify the hiPSC colonies generated from the episomal reprogramming system using
Donor 002’s blood sample and then the presence or absence of differentiation and
pluripotent markers in specific colonies. Four out of 56 colonies generated through the
episomal reprogramming system were found to express both differentiation and
pluripotent markers due to overgrowth.

37
Using the equations below, the efficiency of the episomal reprogramming system
in generating transfected hiPSCs was calculated and found to be 0.005%.
002
100
00256
1.1 10100 0.0051%
Comparing the efficiency of the SeV reprogramming system (0.044%) to the
episomal reprogramming system (0.0051%) revealed that the SeV system, using Donor
002’s PBMCs, was nine times more efficient than the episomal system.
Figure 3.8 shows the colony sizes and frequency distributions of hiPSCs generated from
the SeV and episomal reprogramming systems. For hiPSCs derived from SeV
transduction, the colony areas ranged from less than 100,000 µm2 to 500,000 µm2 while,
for the hiPSCs derived from episomal transfection, the colony areas ranged from less than
100,000 µm2 to 300,000 µm2. For hiPSCs from both systems, the majority of the colonies
were in the less than 100,000 µm2 category (51% for the SeV and 59% for the episomal
hiPSCs) and the 100,000 µm2 to 200,000 µm2 category (36% for both systems). In both
systems, the majority of hiPSC colonies had areas less than 100,000 µm2. Colonies
expressing the differentiation marker had areas more than 200,000 µm2, which correlates
with the fact that differentiation increases as colony overgrowth occurs.

38
Figure 3.8 Colony size and frequency distributions among hiPSCs generated from SeV and episomal reprogramming systems
All colonies (undifferentiated and partially differentiated) were counted in this experiment. Figure 3.8 (a) represents the size and frequency distribution of hiPSC colonies generated using the SeV reprogramming system. There was a large range of colony areas. 51% of the colonies had area sizes less than 100,000 m2; 36% of the colonies had areas between100,000 m2 and 200,000 m2; 6% had areas between 200,000 m2 and 300,000 m2; 5% had areas between 300,000 m2 and 400,000m2; and 3% had areas between 400,000 m2 and 500,000 m2. Figure 3.8 (b) represents the size and frequency distribution of hiPSC colonies generated from the episomal reprogramming system. The range of colony areas was less than the areas of hiPSCs derived from the SeV system. 59% of the colonies had areas less than 100,000 m2; 36% had areas between 100,000 m2 and 200,000 m2; and 2% had areas between 200,000 m2 and 300,000 m2. No colonies with an area equal to or greater than 300,000 m2 were measured in the episomal reprogramming system hiPSCs.
3.1.9. Flow cytometry analysis of pluripotent surface markers
HiPSCs generated from both the SeV and episomal reprogramming systems were
quantified for the expression of two specific pluripotent surface markers (SSEA-4 and
TRA-1-60) at two different passages, P5 and P10, as described in Section 2.1.8.2. The
percentage of positively stained cells for each marker was estimated for cell lines derived
from each reprogramming system, with SSEA-4 coloured red and TRA-1-60 assigned
blue. The bar columns, with error bars, in Figure 3.9, represent the mean percentages of
positively stained cells for each surface marker at P5 and P10 for each reprogramming
system (see Appendix C for more details).

39
Figure 3.9 Flow cytometry analysis of SeV and episomally generated hiPSCs for the presence of TRA-1-60 and SSEA-4 markers at P5 and P10.
Cell lines in the SeV system (n=3) two from donor Sevii001 and one from donor Sevii002 and in the episomal system (n=7) two from donor Epii001, one from donor Epii002, three from donor Epii003 and one from donor Epii004 were studied at two different passages (P5 and P10). (Error bars shown as ±1 SEM.) In both the SeV and episomal systems, the cell lines did not show a difference in the expression of SSEA-4 between P5 and P10. More than 80% of the cells were positive for SSEA-4 in both reprogramming systems for P5 and P10. The SEM for SSEA-4 was smaller than that for TRA-1-60 in P5 and P10 for both reprogramming systems.
For both the SeV and episomally generated hiPSCs, there was no significant
difference in the expression of SSEA-4 in either P5 or P10, with more than 80% of all cells
expressing SSEA-4 in both passages. Table 3.1 provides the numerical data. In
comparison with SSEA-4, TRA-1-60 was expressed at a lower level by episomally
generated hiPSCs in P5 and P10 and by SeV generated hiPSCs in P10. The size of the
error bar in the TRA-1-60 result for the SeV generated hiPSCs at P5 was extremely large
but indicates that the marker is expressed at levels similar to or lower than that of SSEA-
4.
a. SeV b. Episomal

40
Table 3.1 Pluripotent surface markers in the SeV and Episomal reprogramming systems
3.1.10. qRT-PCR analysis of pluripotent gene expression in hiPSCs at P5 and P10.
qRT-PCR was used to determine the levels of expression of six pluripotent
markers-Sox2, Klf4, ZFP-42, Nanog, Oct4, and c-Myc--in hiPSCs generated by the SeV
(derived from two donors) and episomal (derived from four donors) reprogramming
systems. Cells at passages 5 and 10 were studied. Figure3.10 shows the results in the
form of bar graphs, with error bars shown as ± 1 SEM. For the SeV generated hiPSCs,
there was no significant difference in OCT-4 expression levels between P5 and P10 which
was also true of c-MyC expression. Only one SeV cell line out of three expressed Nanog
but in the cell line that expressed Nanog, both Nanog and Oct4 expression levels were
higher than c-Myc for passages 5 and 10. Table 3.2 shows the values calculated for the
expression levels of each marker.
For the episomally generated hiPSCs, there were no differences between P5 and
P10 expression levels of Nanog, Oct4, or c-Myc. However, as with the SeV generated
hiPSCs, Nanog and Oct4 were expressed at higher levels than c-Myc at both passages.
Comparing expression levels of these pluripotent markers in hiPSCs generated
from both reprogramming systems, Oct4 expression is higher in the SeV generated
hiPSCs while c-Myc levels are similar across both systems. Nanog expression levels,
while higher than c-Myc levels, are also comparable in both systems.

41
Figure 3.10 qRT-PCR analyses of pluripotent genes in hiPSCs for passages 5 and 10
Cell lines in the SeV system (n=3) two from donor Sevii001 and one from donor Sevii002 and in the episomal system (n=7) two from donor Epii001, one from donor Epii002, three from donor Epii003 and one from donor Epii004 were studied at two different passages (P5 and P10). (Error bars shown as ± 1 SEM.) (a) This bar graph shows the expression levels of three pluripotent genes in hiPSCs generated from the SeV system. Only one cell line out of three expressed Nanog so no standard error was determined for this transcript. (b) The expression levels of the genes in hiPSCs derived from the episomal system are shown in this bar graph.
Table 3.2 Pluripotent endogenous gene expression in the SeV and episomal reprogramming systems
a. SeV b. Episomal

42
3.1.11. qRT-PCR analysis of cardiac specific gene expression in hiPSC-derived CMs
qRT-PCR was run on hiPSC-derived CMs generated using both the SeV and
episomal reprogramming systems to determine the level of expression for cardiac-specific
genes. While the error bars are large, hiPSC-CMs generated by the SeV system show
higher level of MLC-2a, TNNI-1, and TNT-2-adult gene expression than TNNI-3 and TNT-
2-fetal gene expression. It is not clear from the results where the level of gene expression
for MLC-2v falls. For the hiPSC-CMs derived from the episomal system, unfortunately the
error bars are so large that concrete conclusions are difficult to draw both within the system
and between the two reprogramming systems.
Figure 3.11 qRT-PCR analyses of cardiac specific markers in hiPSC-derived cardiomyocytes
CM cell lines were derived from hiPSCs generated using the episomal reprogramming system (n=6) two from donor Epii001, three from donor Epii003 and one from donor Epii004 and hiPSCs generated using the SeV system (n=3) two from donor SeVi001 and one from donor SeVi002. (Error bars shown as ± 1 SEM).
Table 3.3 Cardiac-specific markers in the SeV-derived and episomal-derived cardiomyocytes

43
Although the CMs were examined for expression of cardiac specific markers on
different days following differentiation (between days 39 and 66), no differences were
observed in the expression of cardiac-specific genes in CMs derived from hiPSCs
generated in either the SeV or episomal reprogramming systems.

44
Chapter 4. Discussion
4.1.1. T-cell activation: development of a successful protocol
Successful activation of T-cells prior to infection with Sev or transfection with
episomal plasmids is a critical step in the reprogramming of donor-derived PBMCs.
Results from the Trypan blue exclusion assays determined that, for the anti-CD3 plus IL-
2 T-cell activation method, 10-20% of all cells died in days 1-2 following activation.
However, a 20% increase in viability in days 3-5 occurred, followed by a stable population
or decrease after days 5-6. Flow cytometry results confirmed the Trypan blue exclusion
assay results, identifying the expanded population of viable cells as activated T-cells. 93-
97% of the cells collected on day 5 post activation were positive for T-cell and activation
markers. Phase contrast light microscopy provided a visual confirmation of the flow
cytometry results, showing single cells at day 1 and aggregated cells, a characteristic of
activated T-cells, at day 5 post activation. Together, these different experimental
techniques show that the T-cell population from the donor’s purified PBMCs has been
successfully expanded and activated and that day 5 post activation is the optimal time for
the reprogramming steps to be started. As well, the experiments were done using multiple
samples, highlighting the fact that the activation and expansion protocols are replicable
and can be standardized.
Flow cytometry was also used to determine which T-cell activation protocol, out of
three, was the most effective in generating activated T-cells for use in the SeV
reprogramming system. Compared to the 93% of cells testing positive for activation and
T-cell markers, 5 days post activation, using the anti-CD3 plus IL-2 protocol, only 82%
were positive using the Dynabeads plus IL-2 method in the same time frame. 6 days post
activation, 75% of cells tested positive for activation and T-cell markers using the anti-CD3
plus IL-2 protocol but only 46% were positive using the anti-CD3 and anti-CD28 plus IL-2
procedure. These results showed that the most effective protocol for generating activated
T-cells for SeV reprogramming is the anti-CD3 plus IL-2 method.
45
However, for both reprogramming systems, as indicated by the Trypan blue assay
results, day 5 post activation is the time at which the maximum number of viable activated
T-cells are present.
4.1.2. Identification and optimization of effective reprogramming methods
To assess the efficiency of different reprogramming methods in generating
hiPSCs, one integrative method and two non-integrative methods (the SeV and episomal
reprogramming systems) were tested. The integrative retro viral reprogramming method
was attempted in three separate sets of experiments but was not successful in
reprogramming PBMCs. All further experiments were then focused on the non-integrative
methods.
One important step in successfully generating hiPSCs in the two non-integrative
systems, the SeV and episomal systems, is optimizing the density of mitomycin-c
inactivated MEF cells which act as a feeder layer for transfected PBMCs. After seeding
MEF cells in densities between 3 and 7 x 10⁵ cells/well on gelatin coated and non-coated
6-well plates for 9 days under transfection conditions without transfected cells, MEF cells
on gelatin-coated plates with a density of 4 x 10⁵ cells/well were found to best support the
successful reprogramming and generation of hiPSCs in both reprogramming systems.
In addition to MEF cell density, nucleofection of episomal plasmids into the PBMCs
was optimized as well by nucleofecting eGFP-episomal plasmids into both activated T-
cells and unstimulated PBMCs. Flow cytometry analysis of eGFP expression revealed
successful transfection of eGFP plasmids occurred in unstimulated PBMCs (with a
transfection efficiency of 12 to 24%) but not in activated T-cells. This finding was supported
by the experiment in which eGFP-episomal plasmids, transfected into activated T-cells
using lipofectamine 3000, showed no eFGP expression over the course of one week post-
transfection.

46
4.1.3. The relative success of the two reprogramming systems in generating hiPSCs
Having determined that the anti-CD3 antibodies plus IL-2 protocol is the most
effective T-cell activation protocol for the SeV reprogramming system and that the
maximum number of activated T-cells were present on day 5 post activation, the next step
was to measure the success of transfection and transduction methods. Following the
optimized version of Okita et al’s episomal63 reprogramming protocol (Dynabeads plus IL-
2), and the optimized SeV method, both of which I developed, the efficiency of each
method in generating hiPSCs was calculated. The SeV reprogramming system yielded
0.044% efficiency while the episomal system had 0.005% efficiency.
4.1.3.1 The generation and characterization of SeV- and episomally-derived hiPSCs
Twenty-one SeV derived hiPSC lines were generated from the activated T-cells of
Donors 001 and 002 15-19 days after infection while 41 episomally-derived hiPSC lines
were successfully generated from PBMCs of four donors in 21-24 days following
transfection. The time for both methods, from blood drawing to generation of hiPSCs, was
between 20-24 days.
Although the SeV system was nine times more efficient than the episomal system, phase
contrast images showed that both systems produced hiPSCs with similar morphology,
results confirmed by live cell staining which indicated the presence of the stem cell surface
marker TRA-1-60. In terms of size and frequency, the hiPSC colonies from both systems
were comparable, with the majority in the less than 100,000 µm2 category (51% for the
SeV and 59% for the episomal hiPSCs) and the 100,000 µm2 to 200,000 µm2 category
(36% for both systems). More SeV system hiPSC colonies were larger than the episomal
(3% of the SeV colonies had areas between 400,000 m2 and 500,000 m2 while no
episomal colonies attained that large a size) and live cell staining for the differentiation
marker CD44 revealed that a greater number of SeV hiPSC colonies were positive for this
marker than episomal (20 out of 87 SeV colonies versus 4 out of 56 episomal colonies).
Since differentiation occurs when colonies are overgrown, these findings are not
unexpected.

47
The primary hiPSC colonies for both systems were generated after a similar length of time
following transfection and transduction and were of equally good pluripotency. It was
discovered that as the number of passages increased, the speed at which the hiPSCs
grew to confluency also increased until stabilizing at approximately 3-4 days between
passages. The hiPSCs generated from the two methods were then characterized for
pluripotent surface markers and intracellular pluripotency gene expression at early
passage (passage 5 or P5) and late passage (passage 10 or P10). Characterization for
two pluripotent surface markers, SSEA-4 and TRA-1-60 using flow cytometry, revealed no
differences between the reprogramming systems’ hiPSCs and passage number. The
standard error of the mean for SSEA-4 was close to the mean expression of this gene in
both P5 and P10 while in contrast, TRA-1-60 produced a broader standard error of the
mean in both. This suggests that SSEA-4 expression is a more accurate marker for the
initial identification of hiPSCs.
Characterization for intracellular pluripotency gene expression using qRT-PCR at
P5 and P10 showed that both SeV and episomally-derived hiPSCs expressed higher
levels of Nanog and Oct4 and lower levels of c-Myc in both P5 and P10. No significant
difference was observed between reprogramming systems and passage numbers based
on expression of endogenous pluripotent markers.
In summary, the SeV reprogramming system was nine time more effective at generating
hiPSCs from donor PBMCs than the episomal system. However, the hiPSCs generated
from the SeV and episomal reprogramming systems were of equally good quality, as
measured by visual morphology, speed of generation, size and numbers, presence of
pluripotency surface markers (TRA-1-60 and SSEA-4), and endogenous pluripotent gene
expression (Nanog, Oct4, and c-Myc). The pluripotency levels of the hiPSCs remained
stable from early passage (P5) to late passage (P10).
4.1.3.2 The characterization of SeV- and episomally-derived hiPSC-CMs
With respect to assessing the functionality of P10 hiPSCs by their ability to
differentiate into CMs, the results are inconclusive. While the qRT-PCR experiment to
determine the levels of cardiac-specific gene expression in SeV and episomally-derived
hiPSC-CMs showed higher levels of MLC-2a, TNNI-1, and TNT-2 adult gene expression

48
than TNNI-3 and TNT-2-fetal gene expression within the SeV system CMs, the error bars
for the episomally derived CMs are so large that meaningful comparisons cannot be made,
either within the episomal system or between the two systems.
49
Chapter 5. Future Directions and Conclusion
5.1. Future Directions
As with all research projects, the experimental results of this thesis generated
many more questions to be addressed and experiments that can be done. Although there
were no significant differences in the quality of the hiPSCs derived from the SeV and
episomal reprogramming systems, high levels of variability in pluripotent gene expression
were observed between the cell lines derived from each donor within each reprogramming
system. Part of this problem, in the early passages (such as P5), is that, due to technique
limitations, included among the hiPSCs are MEF cells and differentiated cells. The
molecular footprints of these extraneous cells may be the source of some of the measured
variability. In future to overcome this variability, cells could be sorted in early passages
(such as P5) for the presence or absence of specific pluripotent markers. Based on the
results of this thesis project, the variability of cell lines derived from each donor should be
reduced prior to differentiation. Sorting pools of hiPSCs cell lines derived from each
individual based on the presence or absence of the pluripotent surface marker, SSEA-4,
which remained at the same level between early and late passages and reprogramming
systems. This would provide a more homogenous, hiPSC lines from each donor. Then,
differentiation protocols could be carried out on pools of hiPSCs from individual cell lines
to determine which combinations of gene expression and protocol lead to successful
differentiation118, correlating different levels of pluripotent gene expression to different
levels of cardiac specific marker expression.
The qRT-PCR experiment to measure the expression levels of cardiac-specific
markers in hiPSC-derived CMs should be repeated. The error bars in the initial experiment
prevented any meaningful conclusions from being made about the quality of hiSPC
derived CMs in either the SeV or episomal systems. Future experiments to measure the
expression of cardiac-specific markers on the first day hiPSC-derived CM cells begin
beating, and at time points before and after this critical juncture, would aid in the early
identification and tracking of these differentiated cells. Electrophysiological studies would
complement these physiological functionality experiments.

50
Finally, because of the financial cost of these experiments, and stem cell research
in general, the results of this research project are based on limited numbers (n = 3 to n =
6 with four blood donors in total). In future, replicating these experiments with larger
sample numbers could decrease the variability and the standard error seen in these
preliminary studies and allow more concrete conclusions to be made, particularly with
respect to cardiac specific marker expression levels in hiPSC derived CMs.
5.2. Conclusion
The aims of this research project were to develop and optimize a standardized T-
cell activation protocol for the SeV reprogramming system, optimize both the SeV and
episomal reprogramming procedures for the generation of hiPSCs and determine which
system was more effective, assess the pluripotency characteristics of the hiPSCs at both
early and late passages, and examine their functionality as evidenced by their success at
differentiating into cardiac cells. Although this thesis project did not definitively determine
the functionality of P10 hiPSCs by their ability to differentiate into CMs, all other objectives
were accomplished. A standardized T-cell activation protocol for the SeV reprogramming
system was successfully created and both reprogramming procedures were optimized for
the generation of hiPSCs. It was demonstrated that, although the SeV reprogramming
system was nine times more efficient than the episomal system in generating hiPSCs,
hiPSCs from both systems were similar, with respect to visual morphology, speed of
generation, size and numbers, presence of pluripotency surface markers (TRA-1-60 and
SSEA-4), and endogenous pluripotent gene expression (Nanog, Oct4, and c-Myc). The
pluripotency levels of the hiPSCs from both systems were shown to remain stable from
early passage to late. The findings generated by this thesis project are meaningful
additions to the burgeoning field of hiPSC derived CM research and the development of
human cardiovascular disease models.

51
References
1. Fuchs E, Segre JA. Stem cells: a new lease on life. Cell 2000;100(1):143-55.
2. De Los Angeles A, Ferrari F, Xi R, Fujiwara Y, Benvenisty N, Deng H, Hochedlinger K, Jaenisch R, Lee S, Leitch HG and others. Hallmarks of pluripotency. Nature 2015;525(7570):469-78.
3. Kelly SJ. Studies of the developmental potential of 4- and 8-cell stage mouse blastomeres. J Exp Zool 1977;200(3):365-76.
4. Rideout WM, 3rd, Eggan K, Jaenisch R. Nuclear cloning and epigenetic reprogramming of the genome. Science 2001;293(5532):1093-8.
5. Tarkowski AK. Experiments on the development of isolated blastomers of mouse eggs. Nature 1959;184:1286-7.
6. Bradley A, Evans M, Kaufman MH, Robertson E. Formation of germ-line chimaeras from embryo-derived teratocarcinoma cell lines. Nature 1984;309(5965):255-6.
7. Ratajczak MZ, Zuba-Surma EK, Wysoczynski M, Wan W, Ratajczak J, Wojakowski W, Kucia M. Hunt for pluripotent stem cell -- regenerative medicine search for almighty cell. J Autoimmun 2008;30(3):151-62.
8. Colter DC, Sekiya I, Prockop DJ. Identification of a subpopulation of rapidly self-renewing and multipotential adult stem cells in colonies of human marrow stromal cells. Proc Natl Acad Sci U S A 2001;98(14):7841-5.
9. Choi HW, Kim JS, Hong YJ, Song H, Seo HG, Do JT. In vivo reprogrammed pluripotent stem cells from teratomas share analogous properties with their in vitro counterparts. Sci Rep 2015;5:13559.
10. Zhao T, Zhang ZN, Rong Z, Xu Y. Immunogenicity of induced pluripotent stem cells. Nature 2011;474(7350):212-5.
11. Giorgetti A, Montserrat N, Aasen T, Gonzalez F, Rodriguez-Piza I, Vassena R, Raya A, Boue S, Barrero MJ, Corbella BA and others. Generation of induced pluripotent stem cells from human cord blood using OCT4 and SOX2. Cell Stem Cell 2009;5(4):353-7.
12. Aasen T, Raya A, Barrero MJ, Garreta E, Consiglio A, Gonzalez F, Vassena R, Bilic J, Pekarik V, Tiscornia G and others. Efficient and rapid generation of induced pluripotent stem cells from human keratinocytes. Nat Biotechnol 2008;26(11):1276-84.

52
13. Loh YH, Agarwal S, Park IH, Urbach A, Huo H, Heffner GC, Kim K, Miller JD, Ng K, Daley GQ. Generation of induced pluripotent stem cells from human blood. Blood 2009;113(22):5476-9.
14. Strachan T, Lindsay S, Wilson DI. Molecular genetics of early human development. Oxford ; Herndon, VA: BIOS Scientific Publishers; 1997. xiv, 265 p. p.
15. Hamlin RL, Altschuld RA. Extrapolation from mouse to man. Circ Cardiovasc Imaging 2011;4(1):2-4.
16. Saenger P. Turner's syndrome. N Engl J Med 1996;335(23):1749-54.
17. Avior Y, Sagi I, Benvenisty N. Pluripotent stem cells in disease modelling and drug discovery. Nat Rev Mol Cell Biol 2016;17(3):170-82.
18. Urbach A, Schuldiner M, Benvenisty N. Modeling for Lesch-Nyhan disease by gene targeting in human embryonic stem cells. Stem Cells 2004;22(4):635-41.
19. Wang S, Bates J, Li X, Schanz S, Chandler-Militello D, Levine C, Maherali N, Studer L, Hochedlinger K, Windrem M and others. Human iPSC-derived oligodendrocyte progenitor cells can myelinate and rescue a mouse model of congenital hypomyelination. Cell Stem Cell 2013;12(2):252-64.
20. Mariani J, Simonini MV, Palejev D, Tomasini L, Coppola G, Szekely AM, Horvath TL, Vaccarino FM. Modeling human cortical development in vitro using induced pluripotent stem cells. Proc Natl Acad Sci U S A 2012;109(31):12770-5.
21. Roessler R, Smallwood SA, Veenvliet JV, Pechlivanoglou P, Peng SP, Chakrabarty K, Groot-Koerkamp MJ, Pasterkamp RJ, Wesseling E, Kelsey G and others. Detailed analysis of the genetic and epigenetic signatures of iPSC-derived mesodiencephalic dopaminergic neurons. Stem Cell Reports 2014;2(4):520-33.
22. Chester N, Kuo F, Kozak C, O'Hara CD, Leder P. Stage-specific apoptosis, developmental delay, and embryonic lethality in mice homozygous for a targeted disruption in the murine Bloom's syndrome gene. Genes Dev 1998;12(21):3382-93.
23. Morris JK, Wald NJ, Watt HC. Fetal loss in Down syndrome pregnancies. Prenat Diagn 1999;19(2):142-5.
24. Collins FS, Varmus H. A new initiative on precision medicine. N Engl J Med 2015;372(9):793-5.
25. Chen IY, Matsa E, Wu JC. Induced pluripotent stem cells: at the heart of cardiovascular precision medicine. Nat Rev Cardiol 2016.

53
26. Sallam K, Li Y, Sager PT, Houser SR, Wu JC. Finding the rhythm of sudden cardiac death: new opportunities using induced pluripotent stem cell-derived cardiomyocytes. Circ Res 2015;116(12):1989-2004.
27. Frommeyer G, Eckardt L. Drug-induced proarrhythmia: risk factors and electrophysiological mechanisms. Nat Rev Cardiol 2016;13(1):36-47.
28. King TJ, Briggs R. Changes in the Nuclei of Differentiating Gastrula Cells, as Demonstrated by Nuclear Transplantation. Proc Natl Acad Sci U S A 1955;41(5):321-5.
29. Gurdon JB. The developmental capacity of nuclei taken from intestinal epithelium cells of feeding tadpoles. J Embryol Exp Morphol 1962;10:622-40.
30. Gurdon JB, Laskey RA, Reeves OR. The developmental capacity of nuclei transplanted from keratinized skin cells of adult frogs. J Embryol Exp Morphol 1975;34(1):93-112.
31. Tokuzawa Y, Kaiho E, Maruyama M, Takahashi K, Mitsui K, Maeda M, Niwa H, Yamanaka S. Fbx15 is a novel target of Oct3/4 but is dispensable for embryonic stem cell self-renewal and mouse development. Mol Cell Biol 2003;23(8):2699-708.
32. Takahashi K, Yamanaka S. Induction of pluripotent stem cells from mouse embryonic and adult fibroblast cultures by defined factors. Cell 2006;126(4):663-76.
33. Seki T, Yuasa S, Fukuda K. Generation of induced pluripotent stem cells from a small amount of human peripheral blood using a combination of activated T cells and Sendai virus. Nat Protoc 2012;7(4):718-28.
34. Seki T, Yuasa S, Oda M, Egashira T, Yae K, Kusumoto D, Nakata H, Tohyama S, Hashimoto H, Kodaira M and others. Generation of induced pluripotent stem cells from human terminally differentiated circulating T cells. Cell Stem Cell 2010;7(1):11-4.
35. Pereira L, Yi F, Merrill BJ. Repression of Nanog gene transcription by Tcf3 limits embryonic stem cell self-renewal. Mol Cell Biol 2006;26(20):7479-91.
36. Takahashi K, Tanabe K, Ohnuki M, Narita M, Ichisaka T, Tomoda K, Yamanaka S. Induction of pluripotent stem cells from adult human fibroblasts by defined factors. Cell 2007;131(5):861-72.
37. Li W, Wei W, Zhu S, Zhu J, Shi Y, Lin T, Hao E, Hayek A, Deng H, Ding S. Generation of rat and human induced pluripotent stem cells by combining genetic reprogramming and chemical inhibitors. Cell Stem Cell 2009;4(1):16-9.
54
38. Liu H, Zhu F, Yong J, Zhang P, Hou P, Li H, Jiang W, Cai J, Liu M, Cui K and others. Generation of induced pluripotent stem cells from adult rhesus monkey fibroblasts. Cell Stem Cell 2008;3(6):587-90.
39. Loh YH, Wu Q, Chew JL, Vega VB, Zhang W, Chen X, Bourque G, George J, Leong B, Liu J and others. The Oct4 and Nanog transcription network regulates pluripotency in mouse embryonic stem cells. Nat Genet 2006;38(4):431-40.
40. Boyer LA, Lee TI, Cole MF, Johnstone SE, Levine SS, Zucker JP, Guenther MG, Kumar RM, Murray HL, Jenner RG and others. Core transcriptional regulatory circuitry in human embryonic stem cells. Cell 2005;122(6):947-56.
41. Chambers I, Colby D, Robertson M, Nichols J, Lee S, Tweedie S, Smith A. Functional expression cloning of Nanog, a pluripotency sustaining factor in embryonic stem cells. Cell 2003;113(5):643-55.
42. Nichols J, Zevnik B, Anastassiadis K, Niwa H, Klewe-Nebenius D, Chambers I, Scholer H, Smith A. Formation of pluripotent stem cells in the mammalian embryo depends on the POU transcription factor Oct4. Cell 1998;95(3):379-91.
43. Mitsui K, Tokuzawa Y, Itoh H, Segawa K, Murakami M, Takahashi K, Maruyama M, Maeda M, Yamanaka S. The homeoprotein Nanog is required for maintenance of pluripotency in mouse epiblast and ES cells. Cell 2003;113(5):631-42.
44. Reubinoff BE, Pera MF, Fong CY, Trounson A, Bongso A. Embryonic stem cell lines from human blastocysts: somatic differentiation in vitro. Nat Biotechnol 2000;18(4):399-404.
45. Spar D. The egg trade--making sense of the market for human oocytes. N Engl J Med 2007;356(13):1289-91.
46. Guan X, Mack DL, Moreno CM, Strande JL, Mathieu J, Shi Y, Markert CD, Wang Z, Liu G, Lawlor MW and others. Dystrophin-deficient cardiomyocytes derived from human urine: new biologic reagents for drug discovery. Stem Cell Res 2014;12(2):467-80.
47. Raab S, Klingenstein M, Liebau S, Linta L. A Comparative View on Human Somatic Cell Sources for iPSC Generation. Stem Cells Int 2014;2014:768391.
48. Takahashi K, Okita K, Nakagawa M, Yamanaka S. Induction of pluripotent stem cells from fibroblast cultures. Nat Protoc 2007;2(12):3081-9.
49. Okita K, Ichisaka T, Yamanaka S. Generation of germline-competent induced pluripotent stem cells. Nature 2007;448(7151):313-U1.

55
50. Fusaki N, Ban H, Nishiyama A, Saeki K, Hasegawa M. Efficient induction of transgene-free human pluripotent stem cells using a vector based on Sendai virus, an RNA virus that does not integrate into the host genome. Proc Jpn Acad Ser B Phys Biol Sci 2009;85(8):348-62.
51. Yusa K, Rad R, Takeda J, Bradley A. Generation of transgene-free induced pluripotent mouse stem cells by the piggyBac transposon. Nat Methods 2009;6(5):363-9.
52. Warren L, Manos PD, Ahfeldt T, Loh YH, Li H, Lau F, Ebina W, Mandal PK, Smith ZD, Meissner A and others. Highly efficient reprogramming to pluripotency and directed differentiation of human cells with synthetic modified mRNA. Cell Stem Cell 2010;7(5):618-30.
53. Yu J, Hu K, Smuga-Otto K, Tian S, Stewart R, Slukvin, II, Thomson JA. Human induced pluripotent stem cells free of vector and transgene sequences. Science 2009;324(5928):797-801.
54. Ban H, Nishishita N, Fusaki N, Tabata T, Saeki K, Shikamura M, Takada N, Inoue M, Hasegawa M, Kawamata S and others. Efficient generation of transgene-free human induced pluripotent stem cells (iPSCs) by temperature-sensitive Sendai virus vectors. Proc Natl Acad Sci U S A 2011;108(34):14234-9.
55. Stadtfeld M, Nagaya M, Utikal J, Weir G, Hochedlinger K. Induced pluripotent stem cells generated without viral integration. Science 2008;322(5903):945-9.
56. Gonzalez F, Barragan Monasterio M, Tiscornia G, Montserrat Pulido N, Vassena R, Batlle Morera L, Rodriguez Piza I, Izpisua Belmonte JC. Generation of mouse-induced pluripotent stem cells by transient expression of a single nonviral polycistronic vector. Proc Natl Acad Sci U S A 2009;106(22):8918-22.
57. MacArthur BD, Sevilla A, Lenz M, Muller FJ, Schuldt BM, Schuppert AA, Ridden SJ, Stumpf PS, Fidalgo M, Ma'ayan A and others. Nanog-dependent feedback loops regulate murine embryonic stem cell heterogeneity. Nat Cell Biol 2012;14(11):1139-47.
58. Lamb RA KD. Paramyxoviridae: The viruses and their replication. In: Fields BN, Knipe DM, Howley PM, editors. Fields Virology. 3rd ed. New York: Raven Press; 1996. p 2 v. (xxi, 2950, 97 p.).
59. Li HO, Zhu YF, Asakawa M, Kuma H, Hirata T, Ueda Y, Lee YS, Fukumura M, Iida A, Kato A and others. A cytoplasmic RNA vector derived from nontransmissible Sendai virus with efficient gene transfer and expression. J Virol 2000;74(14):6564-9.

56
60. Nagai Y TA, Irie T, Yonemitsu M, Gotoh B. The journey from mouse pathogen to a state-of-the-art tool in virus research and biotechnology. In: Samal SK, editor. The biology of paramyxoviruses. Norfolk, UK: Caister Academic Press; 2011. p vii, 469 p.
61. Pollack Y, Stein R, Razin A, Cedar H. Methylation of foreign DNA sequences in eukaryotic cells. Proc Natl Acad Sci U S A 1980;77(11):6463-7.
62. Okita K, Matsumura Y, Sato Y, Okada A, Morizane A, Okamoto S, Hong H, Nakagawa M, Tanabe K, Tezuka K and others. A more efficient method to generate integration-free human iPS cells. Nat Methods 2011;8(5):409-12.
63. Okita K, Yamakawa T, Matsumura Y, Sato Y, Amano N, Watanabe A, Goshima N, Yamanaka S. An efficient nonviral method to generate integration-free human-induced pluripotent stem cells from cord blood and peripheral blood cells. Stem Cells 2013;31(3):458-66.
64. Heng JC, Feng B, Han J, Jiang J, Kraus P, Ng JH, Orlov YL, Huss M, Yang L, Lufkin T and others. The nuclear receptor Nr5a2 can replace Oct4 in the reprogramming of murine somatic cells to pluripotent cells. Cell Stem Cell 2010;6(2):167-74.
65. Han J, Yuan P, Yang H, Zhang J, Soh BS, Li P, Lim SL, Cao S, Tay J, Orlov YL and others. Tbx3 improves the germ-line competency of induced pluripotent stem cells. Nature 2010;463(7284):1096-100.
66. Buganim Y, Faddah DA, Cheng AW, Itskovich E, Markoulaki S, Ganz K, Klemm SL, van Oudenaarden A, Jaenisch R. Single-cell expression analyses during cellular reprogramming reveal an early stochastic and a late hierarchic phase. Cell 2012;150(6):1209-22.
67. Schmidt R, Plath K. The roles of the reprogramming factors Oct4, Sox2 and Klf4 in resetting the somatic cell epigenome during induced pluripotent stem cell generation. Genome Biol 2012;13(10):251.
68. Koche RP, Smith ZD, Adli M, Gu H, Ku M, Gnirke A, Bernstein BE, Meissner A. Reprogramming factor expression initiates widespread targeted chromatin remodeling. Cell Stem Cell 2011;8(1):96-105.
69. Maherali N, Sridharan R, Xie W, Utikal J, Eminli S, Arnold K, Stadtfeld M, Yachechko R, Tchieu J, Jaenisch R and others. Directly reprogrammed fibroblasts show global epigenetic remodeling and widespread tissue contribution. Cell Stem Cell 2007;1(1):55-70.
70. Fussner E, Djuric U, Strauss M, Hotta A, Perez-Iratxeta C, Lanner F, Dilworth FJ, Ellis J, Bazett-Jones DP. Constitutive heterochromatin reorganization during somatic cell reprogramming. EMBO J 2011;30(9):1778-89.

57
71. Siedner S, Kruger M, Schroeter M, Metzler D, Roell W, Fleischmann BK, Hescheler J, Pfitzer G, Stehle R. Developmental changes in contractility and sarcomeric proteins from the early embryonic to the adult stage in the mouse heart. J Physiol 2003;548(Pt 2):493-505.
72. Samavarchi-Tehrani P, Golipour A, David L, Sung HK, Beyer TA, Datti A, Woltjen K, Nagy A, Wrana JL. Functional genomics reveals a BMP-driven mesenchymal-to-epithelial transition in the initiation of somatic cell reprogramming. Cell Stem Cell 2010;7(1):64-77.
73. Li R, Liang J, Ni S, Zhou T, Qing X, Li H, He W, Chen J, Li F, Zhuang Q and others. A mesenchymal-to-epithelial transition initiates and is required for the nuclear reprogramming of mouse fibroblasts. Cell Stem Cell 2010;7(1):51-63.
74. Polo JM, Anderssen E, Walsh RM, Schwarz BA, Nefzger CM, Lim SM, Borkent M, Apostolou E, Alaei S, Cloutier J and others. A molecular roadmap of reprogramming somatic cells into iPS cells. Cell 2012;151(7):1617-32.
75. Wakayama S, Jakt ML, Suzuki M, Araki R, Hikichi T, Kishigami S, Ohta H, Van Thuan N, Mizutani E, Sakaide Y and others. Equivalency of nuclear transfer-derived embryonic stem cells to those derived from fertilized mouse blastocysts. Stem Cells 2006;24(9):2023-33.
76. Brambrink T, Hochedlinger K, Bell G, Jaenisch R. ES cells derived from cloned and fertilized blastocysts are transcriptionally and functionally indistinguishable. Proc Natl Acad Sci U S A 2006;103(4):933-8.
77. Golipour A, David L, Liu Y, Jayakumaran G, Hirsch CL, Trcka D, Wrana JL. A late transition in somatic cell reprogramming requires regulators distinct from the pluripotency network. Cell Stem Cell 2012;11(6):769-82.
78. Hansson J, Rafiee MR, Reiland S, Polo JM, Gehring J, Okawa S, Huber W, Hochedlinger K, Krijgsveld J. Highly coordinated proteome dynamics during reprogramming of somatic cells to pluripotency. Cell Rep 2012;2(6):1579-92.
79. Costello E, Munoz M, Buetti E, Meylan PR, Diggelmann H, Thali M. Gene transfer into stimulated and unstimulated T lymphocytes by HIV-1-derived lentiviral vectors. Gene Ther 2000;7(7):596-604.
80. Chen L, Flies DB. Molecular mechanisms of T cell co-stimulation and co-inhibition. Nat Rev Immunol 2013;13(4):227-42.
81. Toribio ML, De la Hera A, Marcos MA, Marquez C, Martinez C. Activation of the interleukin 2 pathway precedes CD3-T cell receptor expression in thymic development. Differential growth requirements of early and mature intrathymic subpopulations. Eur J Immunol 1989;19(1):9-15.

58
82. Tsoukas CD, Landgraf B, Bentin J, Valentine M, Lotz M, Vaughan JH, Carson DA. Activation of resting T lymphocytes by anti-CD3 (T3) antibodies in the absence of monocytes. J Immunol 1985;135(3):1719-23.
83. Iezzi G, Karjalainen K, Lanzavecchia A. The duration of antigenic stimulation determines the fate of naive and effector T cells. Immunity 1998;8(1):89-95.
84. Hedfors IA, Brinchmann JE. Long-term proliferation and survival of in vitro-activated T cells is dependent on Interleukin-2 receptor signalling but not on the high-affinity IL-2R. Scand J Immunol 2003;58(5):522-32.
85. Zappasodi R, Di Nicola M, Carlo-Stella C, Mortarini R, Molla A, Vegetti C, Albani S, Anichini A, Gianni AM. The effect of artificial antigen-presenting cells with preclustered anti-CD28/-CD3/-LFA-1 monoclonal antibodies on the induction of ex vivo expansion of functional human antitumor T cells. Haematologica 2008;93(10):1523-34.
86. June CH, Ledbetter JA, Gillespie MM, Lindsten T, Thompson CB. T-cell proliferation involving the CD28 pathway is associated with cyclosporine-resistant interleukin 2 gene expression. Mol Cell Biol 1987;7(12):4472-81.
87. MacArthur BD, Lemischka IR. Statistical mechanics of pluripotency. Cell 2013;154(3):484-9.
88. Marti M, Mulero L, Pardo C, Morera C, Carrio M, Laricchia-Robbio L, Esteban CR, Izpisua Belmonte JC. Characterization of pluripotent stem cells. Nat Protoc 2013;8(2):223-53.
89. Canham MA, Sharov AA, Ko MS, Brickman JM. Functional heterogeneity of embryonic stem cells revealed through translational amplification of an early endodermal transcript. PLoS Biol 2010;8(5):e1000379.
90. Chambers I, Silva J, Colby D, Nichols J, Nijmeijer B, Robertson M, Vrana J, Jones K, Grotewold L, Smith A. Nanog safeguards pluripotency and mediates germline development. Nature 2007;450(7173):1230-4.
91. Hayashi K, Lopes SM, Tang F, Surani MA. Dynamic equilibrium and heterogeneity of mouse pluripotent stem cells with distinct functional and epigenetic states. Cell Stem Cell 2008;3(4):391-401.
92. Kobayashi T, Mizuno H, Imayoshi I, Furusawa C, Shirahige K, Kageyama R. The cyclic gene Hes1 contributes to diverse differentiation responses of embryonic stem cells. Genes Dev 2009;23(16):1870-5.
93. Marvin MJ, Di Rocco G, Gardiner A, Bush SM, Lassar AB. Inhibition of Wnt activity induces heart formation from posterior mesoderm. Genes Dev 2001;15(3):316-27.

59
94. Olson EN. Development. The path to the heart and the road not taken. Science 2001;291(5512):2327-8.
95. Schneider VA, Mercola M. Wnt antagonism initiates cardiogenesis in Xenopus laevis. Genes Dev 2001;15(3):304-15.
96. Pashmforoush M, Lu JT, Chen H, Amand TS, Kondo R, Pradervand S, Evans SM, Clark B, Feramisco JR, Giles W and others. Nkx2-5 pathways and congenital heart disease; loss of ventricular myocyte lineage specification leads to progressive cardiomyopathy and complete heart block. Cell 2004;117(3):373-86.
97. Ishiwata T, Nakazawa M, Pu WT, Tevosian SG, Izumo S. Developmental changes in ventricular diastolic function correlate with changes in ventricular myoarchitecture in normal mouse embryos. Circ Res 2003;93(9):857-65.
98. Zhou B, Ma Q, Rajagopal S, Wu SM, Domian I, Rivera-Feliciano J, Jiang D, von Gise A, Ikeda S, Chien KR and others. Epicardial progenitors contribute to the cardiomyocyte lineage in the developing heart. Nature 2008;454(7200):109-13.
99. Christoffels VM, Grieskamp T, Norden J, Mommersteeg MT, Rudat C, Kispert A. Tbx18 and the fate of epicardial progenitors. Nature 2009;458(7240):E8-9; discussion E9-10.
100. Li MX, Robertson IM, Sykes BD. Interaction of cardiac troponin with cardiotonic drugs: a structural perspective. Biochem Biophys Res Commun 2008;369(1):88-99.
101. Bhavsar PK, Brand NJ, Yacoub MH, Barton PJ. Isolation and characterization of the human cardiac troponin I gene (TNNI3). Genomics 1996;35(1):11-23.
102. Wade R, Eddy R, Shows TB, Kedes L. cDNA sequence, tissue-specific expression, and chromosomal mapping of the human slow-twitch skeletal muscle isoform of troponin I. Genomics 1990;7(3):346-57.
103. Tiso N, Rampoldi L, Pallavicini A, Zimbello R, Pandolfo D, Valle G, Lanfranchi G, Danieli GA. Fine mapping of five human skeletal muscle genes: alpha-tropomyosin, beta-tropomyosin, troponin-I slow-twitch, troponin-I fast-twitch, and troponin-C fast. Biochem Biophys Res Commun 1997;230(2):347-50.
104. Bhavsar PK, Dhoot GK, Cumming DV, Butler-Browne GS, Yacoub MH, Barton PJ. Developmental expression of troponin I isoforms in fetal human heart. FEBS Lett 1991;292(1-2):5-8.
105. Hunkeler NM, Kullman J, Murphy AM. Troponin I isoform expression in human heart. Circ Res 1991;69(5):1409-14.

60
106. Sasse S, Brand NJ, Kyprianou P, Dhoot GK, Wade R, Arai M, Periasamy M, Yacoub MH, Barton PJ. Troponin I gene expression during human cardiac development and in end-stage heart failure. Circ Res 1993;72(5):932-8.
107. Bhavsar PK, Dellow KA, Yacoub MH, Brand NJ, Barton PJ. Identification of cis-acting DNA elements required for expression of the human cardiac troponin I gene promoter. J Mol Cell Cardiol 2000;32(1):95-108.
108. Dellow KA, Bhavsar PK, Brand NJ, Barton PJ. Identification of novel, cardiac-restricted transcription factors binding to a CACC-box within the human cardiac troponin I promoter. Cardiovasc Res 2001;50(1):24-33.
109. Bodor GS, Porterfield D, Voss EM, Smith S, Apple FS. Cardiac troponin-I is not expressed in fetal and healthy or diseased adult human skeletal muscle tissue. Clin Chem 1995;41(12 Pt 1):1710-5.
110. Mesnard L, Logeart D, Taviaux S, Diriong S, Mercadier JJ, Samson F. Human cardiac troponin T: cloning and expression of new isoforms in the normal and failing heart. Circ Res 1995;76(4):687-92.
111. Townsend PJ, Farza H, MacGeoch C, Spurr NK, Wade R, Gahlmann R, Yacoub MH, Barton PJ. Human cardiac troponin T: identification of fetal isoforms and assignment of the TNNT2 locus to chromosome 1q. Genomics 1994;21(2):311-6.
112. Barton PJ, Felkin LE, Koban MU, Cullen ME, Brand NJ, Dhoot GK. The slow skeletal muscle troponin T gene is expressed in developing and diseased human heart. Mol Cell Biochem 2004;263(1-2):91-7.
113. Anderson PA, Oakeley AE. Immunological identification of five troponin T isoforms reveals an elaborate maturational troponin T profile in rabbit myocardium. Circ Res 1989;65(4):1087-93.
114. Samson F, Mesnard L, Mihovilovic M, Potter TG, Mercadier JJ, Roses AD, Gilbert JR. A new human slow skeletal troponin T (TnTs) mRNA isoform derived from alternative splicing of a single gene. Biochem Biophys Res Commun 1994;199(2):841-7.
115. Jin JP, Chen A, Huang QQ. Three alternatively spliced mouse slow skeletal muscle troponin T isoforms: conserved primary structure and regulated expression during postnatal development. Gene 1998;214(1-2):121-9.
116. Lian X, Zhang J, Azarin SM, Zhu K, Hazeltine LB, Bao X, Hsiao C, Kamp TJ, Palecek SP. Directed cardiomyocyte differentiation from human pluripotent stem cells by modulating Wnt/beta-catenin signaling under fully defined conditions. Nat Protoc 2013;8(1):162-75.

61
117. Human Induced Pluripotent Stem Cell (iPSC) Handling Protocols (MEF Feeder Layer). In: Research CIFM, editor.
118. Rajala K, Pekkanen-Mattila M, Aalto-Setala K. Cardiac differentiation of pluripotent stem cells. Stem Cells Int 2011;2011:383709.

62
Appendix A. Consent Form

63

64
Appendix B. Protocols
Human Cell Isolation (SEPMATE PROCEDURE)
(http://www.stemcell.com/~/media/TechnicalResources/6/D/4/9/D/29251PIS.pdf?la=en)
Mitomycin C Treatment of Mouse embryonic Fibroblast cells
(http://www.amsbio.com/brochures/Mitomycin_C_Treatment_of_Fibroblasts.pdf)
Transfection with episomal plasmid
(http://www.cira.kyoto-u.ac.jp/e/research/img/protocol/Tcell-iPS_Protocol.pdf)
Infection with Sendai virus
http://www.nature.com/nprot/journal/v7/n4/pdf/nprot.2012.015.pdf
Preparing matrigel coated plates
(http://www.wicell.org/media.acux/39c0a534-577e-4850-aede-d91e1322e479)
Cryopreservation of hiPSCs
(http://www.amsbio.com/datasheets/11897.pdf)
Immunocytochemistry of Live cells
(https://tools.thermofisher.com/content/sfs/manuals/stemcell_ab_kits_live_cell_imaging_
man.pdf)
Pluripotent Surface marker staining
PE Mouse anti-SSEA-4

65
https://tools.thermofisher.com/content/sfs/manuals/stemcell_ab_kits_live_cell_imaging_
man.pdf
Alexa Fluor 647 Mouse anti-Human TRA-1-60 Antigen
http://www.bdbiosciences.com/ds/pm/tds/560850.pdf
RNA extraction
Qiagen RNeasy Mini Kit
https://www.qiagen.com/us/resources/resourcedetail?id=0e32fbb1-c307-4603-ac81-
a5e98490ed23&lang=en
Reverse transcription
QuantiTect Reverse Transcription Kit
(https://www.qiagen.com/us/resources/resourcedetail?id=a7889bfb-cb1b-4e23-
a538-9e4f20fdca91&lang=en)

66
Primer Sequences for pluripotent genes
Primers of pluripotent genes Sequence (5’ → 3’)
Sox2 FWD TTA AGG ATC CCA GTG TGG TGG T
Sox2 REV GCT TCA GCT CCG TCT CCA TCA
cMyc FWD TAC TGC GAC GAG GAG GAG AA
cMyc REV CGA AGG GAG AAG GGT GTG AC
Klf4 FWD AGT GTG GTG GTA CGG GAA ATC
Klf4 REV CGT GGA GAA AGA TGG GAG CA
Oct 4 FWD GTG GAG GAA GCT GAC AAC AA
Oct 4 REV ATT CTC CAG GTT GCC TCT CA
Nanog FWD AAG AGG TGG CAG AAA AAC AAC T
Nanog REV CTG GAT GTT CTG GGT CTG GT
ZFP-42 FWD GCAACTGAAGAAACGGGCAA
ZFP-42 REV AACTCACCCCTTATGACGCA
B-Actin FWD ATT GCC GAC AGG ATG CAG AA
B-Actin REV GGG CCG GAC TCG TCA TAC TC

67
Appendix C
Figure C1. Flow cytometry analysis of episomally generated hiPSCs from one donor for the presence of TRA-1-60 and SSEA-4 markers at P5.
representing the unstained cells b) representing negative control (isotype control) of pluripotent markers c) representing cells stained only for SSEA4 pluripotent marker d) representing cells stained only for TRA-1-60 e) representing cells stained for both SSEA4 and TRA-1-60 pluripotent markers.