Embed Size (px)
Citation preview

UN1VERC\l"ry or: HAVVi\1'1 LIBRARY
REPRODUCTION OF ZEBRASOMA FLAVESCENS: OOCYTE MATURATION, SPAWNING PATTERNS, AND AN ESTIMATE OF
REPRODUCTIVE POTENTIAL FOR FEMALE YELLOW TANG IN HAWAI'I
A THESIS SUBMIITED TO THE GRADUATE DIVISION OF THE UNIVERSITY OF HAWAI'J IN PARTIAL FULFILLMENT OF THE REQUIREMENTS FOR THE
DEGREE OF
MASTER OF SCIENCE
IN
ZOOLOGY
DECEMBER 2007
By: Megan Bushnell
Thesis Committee:
James D. Parrish, Chairperson Kathleen S. Cole
Charles W. Laidley

We certify that we have read this thesis and that, in our opinion, it is satisfactory in scope and quality for the degree of Master of Science in Zoology
ii

TABLE OF CONTENTS
ACKNOWLEDGMENTS .................................................................................................. v
LIST OF TABLES ...........................•.....••••.....••••............................•••••••...•........................ vi
LIST OF FIGURES .......................................................................................................... vii
GENERAL INTRODUCTION ........................................................................................... 1
CHAPTER 1. A histological investigation of oocyte development and post-ovulatory follicle (POF) degeneration in Zebrasoma Davescens, the yellow tang .............................. 5
ABSTRACT ............................................................................................................ 5 INTRODUCTION ..................................................•••............................................. 5 MATERIALS AND METHODS ••............................•••............•.............................. 8
Fish collection. ........................................................................................... 8 Fish sex identification ................................................................................ 8 Post-ovulatory follicle (PDF) holding experiments .................................... 9 Fish processing.......... .................................. ............................ .................. 11 Histology. ................................................................................................... 11
RESULTS .....•..•............................................••.•.............................................•....... 12 Staging of oocytes .................................................................................•... 12 Documentation of post-ovulatoryfollicle (PDF) degeneration ............... 21
DISCUSSION ....................................................................................................... 27 Oocyte staging and maturation patterns ..•................................................ 27 Time of spawning ...................................................................................... 27 Frequency of spawning ............................................................................. 28
CHAPTER 2. An investigation of Zebrasomajlavescens (yellow tang) spawning seasonality including lunar periodicity .............................................•.•............................. 30
ABSTRACT .......................................................................................................... 30 INTRODUCTION ........................................................•••••••.....•••........•••••••••••.....• 30 MATERIALS AND METHODS .......................................................................... 34
Sampling ................................................................................................... 34 Fish processing ......................................................................................... 36 Tidal data compilation .............................................................................. 39 Data analysis ............................................................................................ 39
RESULTS .............................................................................................................. 41 Annual season ........................................................................................... 41 Lunar cycle ................................................................................................ 44 Tidal data .................................................................................................. 47
DISCUSSION ....................................................................................................... 48 The annual reproductive season, with implications for management ....... 48 The lunar cycle of spawning ..................................................................... 49
iii

lmplications for future research ................................................................ 52
CHAPTER 3. The relationship of size to fecundity and an estimate of annual reproductive output for female yellow tang (Zebrasomaflavescens) ............................... 55
ABSTRACT .......................................................................................................... 55 IN1RODUCTION ................................................................................................ 55 MATERIALS AND ME1HODS .......................................................................... 58
Sampling ................................................................................................... 58 Fish processing ......................................................................................... 58 Statistical analysis .................................................................................... 58 Annual fecundity estimate ........................................................................ 59
RESULTS .............................................................................................................. 61 Size:fecundtty relationship ........................................................................ 61 Annual fecundity estimate ......................................................................... 63
DISCUSSION ....................................................................................................... 64 Size:fecundtty relationship ........................................................................ 64 Annual fecundity estimate ......................................................................... 65
SUMMARY AND CONCLUSIONS ................................................................................ 70 Histological investigation of ovaries .................................................................... 70 Zebrasoma flavescens spawning................................ ....................... .................... 71 The estimate of annual reproductive output for female Zebrasoma flavescens. ....................... .................................. ...... .......... ............................ ........ 71
LITERATURE CITED ...................................................................................................... 73
iv

ACKNOWLEDGMENTS
The completion of this work would not have been possible had I not been graced
with the guidance, support, and patience of the following people. In order of appearance
in my life, I must thank:
Philip Bushnell, Sharon Bushnell, Grandma Betty, Chris Bushnell, Jim Parrish, Jeremy
Claisse, Brett Schumacher, Sarah McTee, Tun Clark, Everyone at Hawai'i Division of
Aquatic Resources, Andy Taylor, Ross Langston, Kassi Cole, Danielle Jayewardene,
Athula Wikramanayake, Joanna Bince, Charlie Laidley, Chad Callan, Syd Kraul and
many others.
v

LIST OF TABLES
Table I-I. Summary of diameter size ranges for each stage of oocyte maturation in
z. flavescens ................•••••.••..•...•........................................................................... 13
Table 1-2. Differences in cellular components of oocytes in the vitellogenic stage (lID
in female Z. flavescens ....................................................................•..................... 16
Table 1-3. Patterns of oocyte maturation in Z. flavescens sampled over daylight hours .. 19
Table 1-4. The size ranges ofPOFs at 2 time points during degeneration in
Z. flavescens ovaries .............................................................................................. 24
Table 2-1. Sample sizes of adult Z. flavescens Group M and Group S fish ...................... 34
Table 2-2. Ovary composition of 3 Z.flavescens females based on histological data. ..... 37
Table 2-3. Tidal records for Kona, Hawai'i during year sampled ...................•••.•••........... 40
Table 2-4. The fraction of female Z. flavescens spawning for at least 2 consecutive
days over summer 2006 (Group S fish) ....................................••.••.......••.............. 43
Table 3-1. Dates of monthly sampling of Z. flavescens in relation to the full moon ........ 60
Table 3-2. Monthly and annual fecundity estimates of Z. flavescens ............................... 63
vi

LIST OF FIGURES
Figure I-I. A multi-layerfoIlic1e, composed of theca and granulosa cell layers,
surrounding a vitellogenic oocyte (stage IIIb) in a Z.jlavescens ovary .................. 7
Figure 1-2 Diagrams of adult female and adult male genital openings of z.jlavescens
drawn to the same scale .......................................................................................... 9
Figure 1-3. Photographs of genital and anal openings of adult female and adult male
Z. jlavescens .........................................................................................•................ 10
Figure 1-4. Primary oocyres in a Z. jlavescens ovary ...•••••.........................................••••.. 14
Figure 1-5. Cortical alveolar stage oocytes in a z.jlavescens ovary ............................... 14
Figure 1-6. Early, middle and late vitellogenic stage oocytes (stage Ill) in a Z. jlavescens
ovary ..................................................................................................................... 17
Figure 1-7. Maturing oocyte (stage IVa) in a z.jlavescens female sampled at 9 am. ....... 17
Figure 1-8. Hydrated oocyres (stage !Vb) in the ovarian lumen of a Z. jlavescens
female sampled 2 hours prior to sunset ................................................................ 20
Figure 1-9. Zero- and 24-hour POFs in a z.jlavescens ovary .......................................... 21
Figure 1-10. Six-hour POF in aZ.jlavescens ovary ......................................................... 22
Figure 1-11. Twelve-hour POF in aZ.jlavescens ovary ................................................... 23
Figure 1-12. Eighteen-hour POF in a Z.jlavescens ovary ................................................ 23
Figure 1-13. Twenty-four-hour POF in a Z. jlavescens ovary ........................................... 25
Figure 1-14. Thirty-hour POF in a z.jlavescens ovary .................................................... 25
Figure I-IS. Thirty-six-hour POF in a z.jlavescens ovary .............................................. 26
Figure 2-1. Map of Hawai'i Island and inset of part of the Kona Coast .......................... 33
Figure 2-2. Ovary weight of Z. jlavescens sampled in preliminary collections in
2005 ....................................................................................................................... 35
Figure 2-3. Batch fecundity and gonadosomatic index of Group M Z. jlavescens over
vii

the year sampled ................................................................................................... 41
Figure 2-4. The fraction of females spawning and the fraction of females spawning at
least two days in succession in each sample of Group M Z.jfavescens ............... 41
Figure 2-5. Condition factor of female Z. jfavescens over the year sampled ................... 44
Figure 2-6. Mean batch fecundity and GSI of Group S female Z. jfavescens ................... 45
Figure 2-7. The fraction of Group S female Z. jfavescens spawning over the summer
months ................................................................................................................... 45
Figure 2-8. The relationship between female GSI and batch fecundity of Z.
jfavescens .............................................................................................................. 45
Figure 2-9. The fraction of vitellogenic stage oocytes in the late vitellogenic stage
(IDc) in ovaries of Z.jfavescens collected over the summer .....••..•...................... 47
Figure 3-1. Graphical representation of the periodic regression equation (from text)
and batch fecundities of individual Group S female Z. jlavescens ............•.••••••••• 59
Figure 3-2. Relationship of batch fecundity to standard length and ovary-free weight
of Group M female Z. jfavescens .......................................................................... 62
Figure 3-3. Batch fecundity and standard length of Group M female z.jfavescens ......... 62
viii

GENERAL INTRODUCfION
Zebrasoma jlavescens is one of 80 species within the surgeonfish family
Acanthuridae (Nelson, 2006). Acanthurids are gonochoristic and primarily herbivorous,
and are found in coml reef habitats in tropical and sUbtropical seas, although they are
absent in the Meditermnean (Nelson, 2006). Zebrasoma jlavescens (the yellow tang)
and seveml other surgeonfish species are common on most reefs in the Hawai'ian islands,
including an exceptionally large population along the Kona coast of the Big Island of
Hawai'i. In fact, local mythology suggests that the nickname 'Gold Coast' is in reference
to the many golden-colored fishes visible in the shallow waters ofKona, thanks to the
prevalence of yellow tangs.
Yellow tang provide 70.5% of the total catch for the aquarium trade in the
state ofHawai'i, and the majority of these fish are taken from the Kona (west) side of
Hawai'i island (Hawai'i Division of Aquatic Resources, unpublished data, FY 2006).
At the urging of local interests, whose intentions were to protect coml reef fish targeted
for the aquarium tmde, the state legislature established a network of nine separate Fish
Replenishment Areas (FRAs) on the Kona coast of Hawai'i in 2000. Currently, these
protected areas, where aquarium fishing is prohibited, encompass over 30% of the total
western coastline. Since the inception of the FRA network, the Hawai'i Division of
Aquatic Resources (HOAR) has been charged with maintaining populations of popular
reef species, including the yellow tang, at levels that satisfy fishing interests, the
burgeoning snorkel/scuba diving industry, and local conservationists.
Information regarding the basic reproductive biology of a species can contribute
to developing appropriate fishing regulations in terms of both location and season. The
purpose of this research was to elucidate the timing and seasonality of yellow tang
spawning along the Kona coast, and to use this information to estimate the reproductive
potential of adult females within the population. Specific aims of this study were I

achieved in the order presented, and have been divided into three separate chapters within
this thesis.
The first objective of this research was to fonn a more complete understanding
of the reproductive process in yellow tang by analysis of oocyte maturation. Previous
studies on this species in the Hawai'ian Islands have used the gonadosomatic index
(GSI) as an indicator of reproductive output (Lobel, 1989; C.W. Laidley, pers. comm.).
However, discussions in the literature have implied that GSI alone may not accurately
predict spawning output for certain fish species (West, 1990; Stequert et al., 2003;
Kritzer, 2004). Although increased GSI may sometimes serve as a reliable indicator
of spawning, the most comprehensive investigations of fish reproductive patterns
relate GSI to actual ovarian and oocyte state before making this assumption (Jons and
Miranda, 1997; Somarakis et al., 2004). Most commonly, this is achieved by means of a
histological assessment of ovarian and oocyte maturation. To date, only one other species
of acanthurid (Acanthurus nigrofoscus) has been investigated histologically in reference
to reproduction (Fishelson et al., 1987). A histological investigation of Z. flavescens
would make a major contribution to understanding reproductive characteristics of this
abundant and widespread reeffish family.
A thorough study of oocyte maturation patterns in yellow tang, including staging
of oocytes throughout development and over the course the diel cycle, was undertaken as
the first objective in Chapter 1 of this thesis. The information obtained was subsequently
used to investigate monthly and seasonal spawning cycles of the species, reported in later
chapters of the thesis.
The second objective of this research was to detennine the annual peak of
reproductive output for a particular population of yellow tang on the Kona Coast.
2

Knowledge concerning spawning seasonality is an important aspect of food fish
population management, as it can influence regulations such as size limits on catch
and seasonal closures (Williams and Blood, 2003; Kritzer, 2004; Williams and
Shertzer, 2005). It follows that reproductive seasonality data should also be taken into
consideration in management of fish species targeted by the aquarium trade such as Z
flavescens.
In Chapter 2 of this thesis, the spawning seasonality of Z flavescens was
investigated by sampling over the course of one calendar year (May 2006-April
2007). Adult females were chosen as the subject of study because the most obvious
characteristics of reproductive output (i.e., changes in gonad weight and gamete
production) are both more evident and more easily quantifiable in females than in males.
A lunar cycle of spawning was hypothesized due to a perceived increase in both OSI and
batch fecundity of females sampled around the full moon in preliminary studies, as well
as in the observed spawning patterns of captive fish (C.W. Laidley, unpublished data),
and was therefore also investigated.
The last objective of this work, addressed in Chapter 3, was to estimate total
annual reproductive output for female yellow tang in Kona, Hawai'i. This estimate is
intended to assist managers in calculations of the standing stock biomass required to
maintain population size in the face of increasing harvesting rates. Other popUlations
under intense fishing pressure have prompted similar studies that use reproductive
output estimates in large-scale stock assessment models (for review, see Stratoudakis et
al. (2006)). A size-fecundity relationship for females is usually incorporated into such
models, as the number of eggs produced by a given female can vary with weight or
standard length of the individual (reviewed by Birkeland and Dayton (2005)). For this
reason, the relationship between size and fecundity of yellow tang was also addressed
3

in this final chapter. Previously documented methods for calculating annual fecundity of
multiple-spawning fishes were not applicable to this study. (A detailed treatment of this
topic is provided in Chapter 3.) Therefore, a regression model based on data collected
during the year of sampling was used in the estimation.
4

CHAPTERl. A histological investigation of oocyte development and post-ovulatory follicle (pOF) degeneration in Zebrasoma jlavescens, the yellow tang
ABSTRACT
The purpose of this work was to investigate ovarian composition and to describe
oocyte stages of development in Zebrasomaj/avescens, the yellow tang. A histological
investigation of ovaries was carried out on fish sampled from a population off the Kona
coast ofHawai'i during 2005-2007. Oocytes were divided into 8 stages of growth:
primary growth stage (I) [subdivided into chromatin nucleolar (la) and perinucleolar (lb)
stages], cortical alveolar stage (II), vitellogenic stage (Ill) [subdivided into early (lIla),
middle (11Th), and late (lIIc) vitellogenic stages], and mature stage (IV) [subdivided into
maturing (IVa) and hydrated (IVb) stages]. Each stage was pictorially documented and
described according to accepted terminology in the literature. Post-ovulatory follicle
(POF) degradation in captive fish was documented at 6-hour intervals for 48 hours, and
distinctions between new and 24-hour old POFs were established. These histological
findings have established that this species is a multiple-spawning fish with asynchronous
oocyte development and indeterminate fecundity (as defined by Hunter and Macewicz
(1985)). A diel pattern of spawning was recognized, and repeat spawning at least for two
successive days was indicated for female Z. j/avescens.
INTRODUCTION
Staging of oocytes by means of histological methods has been helpful in
determining the time necessary for oocyte maturation and time-ta-spawning in many
fishes (DeMartini and Fountain, 1981; Matsuyama et al., 1988; Scott et al., 1993; Coward
and Bromage, 1998). For many species of interest, studies have also investigated the
relationship of the gonadosomatic index (an expression of gonad weight as a fraction of
5

non-gonadal body weight, or GSI) to histologically determined germ cell stage, in order
to more clearly define the maturational state of the individuals examined (e.g., Somarakis
et al., 2004). For this thesis, histological assessment of oocyte stages, fecundity
measurements and calculation of GSI were used in the investigation offemale yellow
tang reproduction. Prior to incorporation of the latter methods (in Chapters 2 and 3),
however, the basic process of yellow tang oocyte maturation was first assessed using light
microscopy of histologically prepared ovarian tissue, presented here in Chapter 1.
Histological investigations of ovarian development in fishes have provided
researchers with highly detailed information concerning the morphology and functional
processes of egg maturation in the species of interest (Hunter and Macewicz, 1985;
Selman et al., 1993). Other, less time-consuming (and less specific) methods of ovarian
maturity assessment include macroscopic evaluation of ovaries (such as assessment of
ovarian maturity based on size, weight or appearance of tissue), gross measurement of
oocyte sizes, and gonad-weight indices. However, to attain a thorough understanding of
the oocyte maturation process and its relationship to spawning events in the reproductive
assessment of any fish species, histology is the most accurate tool available and can
produce a more complete picture of reproduction, when compared to gonad-weight
indices (such as GSI) or macroscopic ovarian assessment alone (Kritzer, 2004).
The first part of this chapter documents and describes the stages of yellow tang
oocyte development based on morphological criteria observed with light microscopy as
per previous studies on other teleost fishes (Selman et al., 1993; Tyler and Sumpter, 1996;
Rideout et al., 1999; Ravaglia and Maggese, 2002). Classical studies have established
a staging regime and a vocabulary to describe the process of oocyte maturation for
hundreds offish species (e.g., Van den Hurk and Peute, 1979; DeVlaming, 1983;
Wallace and Selman, 1981; Selman et al., 1988; Selman and Wallace, 1989). The basic
mechanisms of oocyte growth are similar among most teleosts, except for variation in
timing and recruitment between stages (Wallace and Selman, 198 I). Current descriptive 6

terminology has been used in this chapter, following the language of Patino and Sullivan
(2002) and Maack and Segner (2003). Once staged, oocyte populations in ovaries of Z.
f1avescens sampled at different times of day were examined, and inference concerning the
rate of egg batch production and time of release was possible.
Tbe second part of tbis cbapter documents and describes specific ovarian
structures, post-ovulatory follicles (POFs), observed within the ovary after egg release.
During development and until ovulation, the oocyte is surrounded by a multi-layer
follicle , consisting of an inner layer of granulosa cells with an associated basal lamina
and an outer layer of theca cells, also associated with meso-epithelial cells and blood
capillaries (Ty ler and Sumpter, 1996 and illustrated in Figure I-I ). Upon ovulation, the
oocyte is released from these surrounding follicle cells into the lumen of the ovary, from
where it will be expelled via smooth muscle contractions of the ovarian wall during
spawning. The follicu lar assemblage collapses away from the opening formed by the
release of the oocyte and folds in onto itse lf, creating a POF, an example of which can
also be seen in Figure I-I. In many studied teleost species, (including, but not limited
to, Sardinella brasiliensis, Pagrus major, Tilapia zilli, and Lutjanlls campechanlls,
Figure I- I. A multi -layer follicle, composed of theca and granulosa cell layers, surrounding a vitellogenic oocyte (stage Illb) in a Z. flavescens ovary. Th = theca cells, G = granulosa cells, ZR = zona radiata, 0 = oocyte cytoplasm, POF = post ovul atory foil ic1 e. Scale bar 20 11m.
7

as investigated by Isaac-Nahum et al. (1988), Matsuyama et al. (1988) Coward and
Bromage (1998), and Jackson et al. (2006)), POFs are broken down by macrophage
activity within a period of less than 2 days. Therefore, the presence ofPOFs is generally
taken to be indicative of spawning within a relatively recent period of time for most
fish species (Hunter and Macewicz, 1985; Selman and Wallace, 1989), with an inverse
correlation between water temperature at spawning and length of time to follicular
degeneration (Hunter and Macewicz, 1985). In the current study, it was hypothesized
that in a tropical species such as Z. jfavescens, an estimation of time-to-breakdown of
POFs would offer some indication as to the frequency of spawning in the population
investigated.
MATERIALS AND METHODS
Fish collection
(For details pertaining to the sites of collection, see Chapter 2.)
Female adult z.jfavescens were sampled from a wild population by SCUBA
divers using three-pronged spears. At least one field collection occurred on the
approximate hour between 0900 and 1700 hrs during the summer of2005. Fish collected
in 2005 were used only for the histological investigation of diel cycling of egg maturation
in this population, as presented in this chapter.
All collections of adult females during 2006 and 2007 were performed between
1500 and 1730 hrs. Fish sampled in 2006 and 2007 were also used in spawning
seasonality investigations further detailed in Chapters 2 and 3.
Fish sex Ukntijication
A consistent difference in the genital openings of male and female Z. jfavescens
was noted early in the study. After standardizing dissection techniques, 23 adult fish
from the May 14, 2006 collection were examined prior to dissection, and identified as 8

having either a female or a male genital opening as illustrated in Figure 1-2. Subsequent
dissection and macroscopic examination of the gonads by eye established a 100%
correlation between the initial identification of sex and the actual sex of the individuals
in this collection, and in all subsequent collections offish in which this protocol was
followed.
a a
g
Figure 1-2. Diagrams of (A) adult female and (B) adult male genital openings of Z Bavescens drawn to the same scale. The (a) anus is anterior to the (g) genital opening in both sexes. The arrow denotes the opening (slit) from which eggs are released. Sperm are released from the center of the male genital opening.
Post-ovulalory jollJcle (POF) holding experiments
Three holding experiments were carried out on June 10, 2006, on July 9, 2006 and
on April 3, 2007. In each instance the following protocol was used.
Three divers on SCUBA herded adult fish into a barrier net in a shallow water location
(approximately 8-10 m in depth) within the sampling site. AIl fish captured in the net
were sexed under water by the divers by noting the shape of the genital opening (Figures
1-2 and 1-3), and all females were maintained in a 35-gallon underwater plastic container
with lid and l-cm diameter holes until the end of the dive. The underwater container
was then attached to a line suspended from the boat above, and was subsequently pulled
9

Figure 1-3. Photogrpahs of genital and anal openings of (A) adult female and (B) ad ult male Z. flavescens. The (a) anus is anterior to the (g) genital opening. Females have a much larger geni tal openi ng than males. This particular female has an enlarged anal opening, probably due to internal pressures on the gut contents from an inflated swim bladder.
up to the surface in smal l vertical increments over a period of 45 - 60 minutes to allow
fish to acclimate to changes in pressure. Once on the surface, females were placed in a
large bucket fi lled with seawater and light ly massaged along the belly. The presence of
ovu lated eggs emitted from the cloacal opening was taken to be evidence of 'readiness
to spawn' for that evening. All females wi th expressed eggs were kept, and all other fish
were released.
In total, 30 ready-to-spawn females were then transported to a land-based holding
facility and maintained in either aerated 25-gallon square plastic containers holding sea
water (fresh sea water was periodically added by hand), or in sea water flow-through
tanks for up to 48 hours. (Tanks were circu lar, 1.5 m in diameter by I m deep, with
surface seawater fi ltered by a 5~m cartridge at 6 Umin continuous flow.) Between four
and six fish were housed per tank or container. All fish were kept outdoors on a natural
photoperiod. Fish were humanely euthanized by decapitation (as per Univers ity of
10

Hawai'i IACUC protocols) at pre-determined time points of6, 12, 18,24,30,36,42 and
48 hours following the assumed time of spawning, Y. hour prior to sunset (Walsh, 1984).
Four fish were euthanized at each time point except at time points 18 and 48 hours; due
to the size of the total collection (30 fish), only three fish each were available for the 18-
hour and 48-hour time points.
Fish processing
For preservation of tissue, fish were placed immediately on ice after spearing or
decapitation, and gonad dissections commenced within 12 hours. Each fish was weighed,
sexed, and measured for total length (TL) and standard length (SL). TL was defined as the
length between the tip of the snout and the posterior rim of the caudal fin; SL was defined
as the length between the tip of the snout and the posterior end of the midlateral portion
of the hypural plate. All gonads were removed in their entirety from the body cavity,
blotted with a paper towel and weighed, and placed in Dietrich's fixative (600 mI distilled
water; 300 ml 95% ethanol; 100 ml 37% formaldehyde; 20 ml glacial acetic acid) for
histological processing.
Histology
Ovaries processed for histology were maintained for at least one month in
Dietrich's fixative, then embedded in either paraffin or JB-4 plastic and sectioned at
6 !IJll, for both embedding media. Paraffin samples were stained with commercially
obtained Harris haematoxylin (Sigma-Aldrich) and eosin Y (Sigma-Aldrich), and plastic
sections were stained with o-toluidine (Sigma-Aldrich) according to standard protocols.
Oocyte measurements
Measurements of cell diameters on histological slides were taken either by using
a calibrated ocular micrometer or by using QCapturePro software (available from Q
Imaging) calibrated to the microscope magnification used. Only oocytes that were sliced 11

through the nucleus were measured. In relation to the ovemll size of an oocyte, the
nuclear region is large, and is therefore likely to be sliced at angles other than through its
center, making the measurement of cross-sectional oocyte diameters of fish analyzed in
such a way subject to a recognized margin of error. Although the probability of slicing
through the center of the nucleus in a given section is directly related to the diameter of
the nucleus itself, this tecbnique was determined to be the most efficient of the tecbniques
previously established in the litemture (see West (1990) for review), even though it
resulted in an inexact measurement of cross-sectional diameter of every stage analyzed.
Oocyte diameters taken by this method are presented in Table 1-1.
Oocyte diameters were measured at a randomly chosen angle. either perpendicular
orpamllel to the field of view (West, 1990). Diameters offresh hydrated oocytes were
measured at lOx magnification using an ocular micrometer, also at an angle either
perpendicular or pamllel to the field of view.
Measurements of POFs
Using QCapturePro software, it was possible to draw a line at the widest part of
each POF (the X-axis). inclusive of all tissue. A second line was drawn perpendicular to
the first, also inclusive of all POF tissue, and was treated as the Y-axis. The two axes were
equated to length and width of an imaginary rectangle. and were therefore multiplied to
determine the approximate area occupied by the POF within the ovary.
RESULTS
Staging of oocytes
Because oocytes in all teleosts undergo the same basic pattern of matumtion
and differentiation - primary oocyte growth. cortical alveolar stage, vitellogenesis,
maturation and ovulation (Tyler and Sumpter. 1996; Patino et a/., 2003) - the division
of Z. flavescens oocyte matumtion into stages was relatively uncomplicated. In this
study. eight stages of oocyte development were distinguished based on morphological 12

Table 1-1. Summary of diameter size ranges (in microns) for each stage of oocyte maturation in Z Davescens. Oocyte diameters were measured with qCapture Pro software at 4x, lOx or 40x magnification using an Olympus cx3I compound microscope. Hydrated oocytes were measured fresh, post-ovulation (see text for explanation).
StIlge Size range (mean dimneter:l:: std. dev.) No.oocytes
measured (N)
I. a) Chromatin nucleolar 10-55 (25.6 :I:: 8.6) 100
I. b) Perinucleolar 23-69 (43.9:1:: 9.3) 99
II. Cortical alveolar 42-136 (83.2 :I:: 23.1) 149
III. a) Early vitellogenic 94-205 (137.1 :I:: 19.8) 93
III. b) Middle vitellogenic 135-242 (178.9:1:: 25.3) 114
III. c) Late vitellogenic 202-318 (271.1 :I:: 26.8) 105
IV. a) Maturing 340-596 (452 :I:: 61.0) 137
IV. b) Hydrated 500-900 (734.5 :I:: 63.2) 156
characteristics, staining affinity, and size (diameter): primary growth stage (I) [subdivided
into chromatin nucleolar (la) and perinucleolar (Ib) stages], cortical alveolar stage
(II), vitellogenic stage (III) [subdivided into early (lIla), middle (IIIb), and late (lIIc)
vitellogenic stages], and mature stage (IV) [subdivided into maturing (IVa) and hydrated
(IVb) stages]. A description and pictorial documentation of each stage follows.
I. Primary oocyte growth stages
During the primary growth stage of Z. jlavescens oocytes, follicular cells surrounding
the developing oocyte were present, though indistinct, and were therefore not described
in detail until they became more obvious in later stages of maturation. Primary oocytes
(stages Ia and Ib) were observed in all ovaries examined.
Ia) Chromatin nucleolar stage
Size range: lO-55pm (mean diameter =25.6 :I:: 8.6 pm)
Oocytes contained a central, lightly stained nucleus (or germinal vesicle (OY) as defined
13

by Ransom, 1867) with a single, large nucleolus (F igure 1-4). The nucleus was basophilic
and large relative to cytoplasm; the cytoplasm was grainy and uniformly dark, with a
more intense ly sta ined nucleop lasm. Oil droplets (which are involved in the formation of
the lipid globu le of fully developed eggs (DeYlaming, 1983» occurred in the cytoplasm,
even at this early stage.
Ib) Perinucleolar stage
Size range: 23-69plll (mean diameter =43.9 ± 9.3 fim)
The perinucleo lar stage oocyte was increased in overall size compared to the chromatin
nucleolar stage oocyte (F igure 1-4). The GY was also increased in size, and took on
an ovoid shape in the later perinucleolar stage. The GV:cytoplasm ratio was still high,
and multiple nucleoli adjo ining the nuclea r envelope appeared . Often, one nucleolus
remained large (close in size to the chromatin nucleolar stage nucleolus), while several
Figure 1-4. Primary oocytes in a Z. flavescens ovary. CN = chromatin nucleolar stage oocyte, Fo = follicle cell s, GV = germinal vesicle, u = nucleolus, P = peri nucleolar stage oocyte, 00 = oil droplet. Scale bar 20 ~m .
14
Figure 1-5. Conical alveolar stage 00-
cytes in a Z. flavescens ovary. CA = cortical aveoli , Calv = cortical alveolar stage oocyte, C = chromatin nucleolar stage oocyte, Fo = follicle cells, GY = germi nal vesicle, LVit = late vitellogenic stage oocyte, P = peri nucleolar stage oocyte, 00 = oil droplet, YG = yolk granule, ZR = zona radiata. Scale bar 50 ~m.

other smaller nucleoli, recent products of division from the original nucleolus, could
be observed nearby within the av. The oocyte cytoplasm was still stained uniformly
dark with haemotoxylin. Follicle cells were evident at 40x magnification as a thin
line surrounding the oocyte, and oil droplets were often present in the cytoplasm of
perinucleolar oocytes (Figure 1-4).
II. Cortical alveolar stage
Size range: 42-136pm (mean diameter =83.2 ± 23.1 pm)
Oocytes more than doubled in size during stage II. This stage began with the first
appearance of cortical alveoli - vesicles that release their contents into the perivitelline
space between the oocyte and the overlying acellular vitelline envelope post-fertilization
(Selman et at., 1988) - and ended with the appearance of yolk granules. Cortical alveoli
and oil droplets appeared within the cytoplasm in a ring formation surrounding the av
(Figure 1-5). (Selman and Wallace (1989) and Ravaglia and Maggese (2002) note that
oil droplets can be difficult to distinguish from cortical alveoli depending on the nature
of histological preparation.) In Z.jlavescens oocytes, the distinction between the two cell
types was made based on size (oil droplets were larger) and position within the oocyte
(cortical alveoli were more likely to be seen toward the periphery of the cytoplasm), since
staining specifically for cortical alveoli was not performed.)
Toward the end of stage II, the zona radiata (ZR) - the acellular vitelline envelope that
develops around the outside of the oocyte at the primary growth stage, and continues to
widen and differentiate throughout oocyte development, finally creating the chorion of
the mature ovum (reviewed by Tyler and Sumpter (1996» - became distinct as a thin line
surrounding the oocyte. Throughout stage II, the oocyte increased in size, oil droplets
increased in size and number, and evidence of follicular cells surrounding the cytoplasm
became apparent by the end of this stage (Figure 1-5). Cortical alveolar stage oocytes
were observed in all ovaries examined. 15

m. Vitellogenic stage
The vitellogenic stage of Z. flavescens has been subdivided into three separate stages,
based on distinct morphological characteristics of oocytes undergoing the vitellogenic
process. Vitellogenic stage oocytes (stages IlIa, lITh, and IIIc) were observed in all
ovaries examined.
IlIa) Early vitellogenesis
Size range: 94-205pm (mean diameter =137.1 ± 19.8 pm)
The onset of vitellogenesis (as reviewed by Tyler and Sumpter (1996» was characterized
by the addition of yolk granules to the cytoplasm, along with the aforementioned cortical
alveoli and oil droplets. Oil droplets of various sizes were more centrally located in a ring
formation around the outside of the GV, with very small yolk granules, which stained
darker with eosin, appearing in the outer cytoplasm (Figure 1-6). Cortical alveoli were
observed at the periphery of the cytoplasm. The ZR was distinct, with a width of about I
11m (Table 1-2). A distinct, multi-layer follicle, composed of a squamous thecal cell layer,
a basal membrane, and a granulosa cell layer, (Tyler and Sumpter, 1996), was evident
in all vitellogenic oocytes (Figures I -I and I -6), although the basal membrane was not
visible using light microscopy.
Table 1-2. Differences in cellular components of oocytes in the vitellogenic stage (III) in Z. flavescens. Ovaries of 7 Group M fish were used in the compilation of these data. 1\vo of the largest oil droplets and two of the largest yolk globules were measured for each of the twenty oocytes analyzed (N). GV:C = germinal vesicle to cytoplasm ratio. ZR = zona radiata. All measurements are in microns in the format of mean ± standard deviation.
Oocyte Oil droplet ZRwidth
Yolk granule GV GV:C N stage diameter diameter diameter
IlIa 9.6±2.0 1.7 ± 0.5 2.2 ± 0.6 62.2 ± 17.2 0.42± 0.08 20
IIIb 13.8 ± 3.4 3.6 ± 1.0 6.6 ± 1.7 73.2 ± 16.0 0.36± 0.07 20
IIIc 19.9 ± 4.6 7.4 ± 2.3 12.7 ± 2.5 89.3 ± 14.7 0.31 ±0.05 20
16

The GV in early vite llogenic oocytes changed from a circular to an ovoid shape,
with a 60-90 ~m lengthwise dimension, and remained about that size until final
maturation (Table 1-2). The GV:cytoplasm ratio in the early stage of vitellogenesis was
approximately 0.4 (Table 1-2) .
Illb) Middle vitellogenesis
Size range: J 35-242pm (mean diameter =178.9 ± 25.3 pm)
As vitellogenesis progressed, yolk granules increased in number and in size and began
to fill the surrounding cytoplasm, even as the oocyte itself increased in size (Figure 1-
6). In the middle vitellogenic stage, the yolk particles were about twice the size of those
found in the early vitellogenic stage, and had begun to form a ring around the oil droplets,
wh ich in turn surrounded the GV (F igure 1-6) . Haemotoxylin-stained cytoplasm was still
visible, especially at the periphery of the oocyte. The ZR stained darkly and widened to
Figure 1-7. Maturing oocyte (stage IVa) in
Figure 1-6. Early, middle and late vitello- a Z. flavescens female sampled at 9 am. genic stage oocytes (stage Ill) in a Z. fla - The germinal vesicle (aV) is in the provescens ovary. CA = cortical aveoli , Calv cess of migrating to the periphery of the = cortical alveolar stage oocyte, EVit = ooplasm. Fo = follicle, 0 = oil droplets early vitellogenic stage oocyte, Fo = fol - coa lescing, Y = yolk granules coalescing. licle cell s, GV = germinal ves icle, LVit Scale bar I 00 ~m. = late vitellogenic stage oocyte, MVit = middle vitellogenic stage oocyte, 00 = oil droplet, YG = yolk granule, ZR = zona ra-diata. Scale bar I 00 ~m .
17

about 3).Lm (Table 1-2). The GV:cytoplasm ratio was approximately 0.36 (Table 1-2).
lIIc) Late vitellogenesis
Size range: 202-318J1m (mean diameter =271.1 ± 26.8 JIm)
Oocyte diameter and the number and size of yolk granules and oil droplets increased
further in the late vitellogenic stage (Figure 1-6). Yolk granules increased in size up to
approximately13 ).Lm in diameter; large oil globules of all sizes were observed, up to 24.5
).Lm in diameter (Table 1-2). The cell cytoplasm was completely filled with both oil and
yolk granules, and no 'empty' cytoplasm was visible, as it was in earlier stages. The ZR
widened to about 9.7).Lm (Table 1-2) and stained intensely with eosin. The GV:cytoplasm
ratio was approximately 0.3 (Table 1-2).
Iv. Mature stage
To ensure neutral buoyancy in sea water and thus proper dispersal upon spawning,
oocytes of Z. jlavescens and other pelagic spawning species undergo the process of final
maturation concomitantly with hydration (Wallace and Selman, 1981; Finn et al., 1999).
[n the present study, maturing stage IVa oocytes were observed in fish sampled at least
3 hours, and up to 12 hours, prior to spawning (Table 1-3). Both fully hydrated and
ovulated oocytes (i.e., oocytes in stage [Vb), having already completed maturation, were
observed in fish sampled within 2 hours of spawning (Table 1-3). In other words, within
2 hours befure spawning, all stage IV oocytes in the ovaries had progressed to stage [Vb.
Mature stage oocytes (stage [Va or IYb) were observed in 134 of 188 total ovaries (71%
of those examined).
[Va) Maturing stage
Size range: 340-596J1m (mean diameter =452 ± 61.0 JIm)
[n this stage, coalescence of yolk granules accompanied the dissolution of the nucleus, 18

Table 1-3. Patterns of oocyte maturation in Z. Davescens sampled over daylight hours. Ail collections of fish were taken in 2005 except the 1730 collection which was taken in 2006. Spawning occurred within 112 hour of sunset, which varied by time of year. The earliest spawning observed (during winter months) was after 1730 hours.
Time Fish No. ovaries with No. ovaries with No. ovaries with
(hrs) (N) oocytes in sttzges oocytes in oocytesin
I-III sttzlle IVa staxeIVb 0900 3 3 2 0 1000 2 2 2 0 1100 I I I 0 1200 3 3 2 0 1300 4 4 4 0 1400 13 13 5 3 1500 3 3 2 I 1600 I I 0 I 1700 2 2 0 2 1730 6 6 0 6
or Germinal Vesicle Break Down (GVBD, as defined by Goetz, 1983), and the migration
of the GV to the periphery of the cytoplasm. Both processes are commonly used as
indicators of oocyte maturation (DeVlaming, 1983) (Figure 1-7). Concurrently, the
maturing stage oocyte began the process of hydration, as noted by its marked increase
in diameter when compared to stage III oocytes (Table I-I). Maturing oocytes were un
ovulated, and still surrounded by the follicle.
!Vb} Hydrated stage
Size range: 500-900pm (mean diameter =734.5 ± 63.2 pm)
Because 'wrinkling' of the oocyte membrane due to the dehydrating histological
preparation of the tissue created a distorted appearance of stage !Vb oocytes (Figure 1-
8), an accurate description of oocyte morphology from histological samples at this stage
proved impossible. However, a distinction between fully hydrated (IVb) and maturing
(IVa) oocytes was possible due to the obvious differences in shape of the two stages
(Figures 1-7 and 1-8). Some fully hydrated oocytes were observed in the ovarian lumen,
having been ovulated prior to sampling of the female examined. 19

Figure 1-8. Hydrated oocytes (stage rVb) in the ovarian lumen of a Z. flavescens individual sampled 2 hours prior to sunset. Fully hydrated oocytes have been ovulated and remai n within ovarian lumen, awaiting spawni ng. Hyd = hydrated oocytes, MYit = middle vitellogenic stage oocyte, OL = ovarian lumen, POF = post ovu latory follicle. Pr = primary oocytes. Scale bar 100 ~m.
In addition to the documentation of oocyte maturation by stage, histological
investigation permitted the observation of ovarian composition of oocyte populations
for all histologically processed ovaries. All healthy ovaries from adult females contained
oocytes in the primary growth stages (la and Ib), cortica l alveolar stage (II), and all three
vitellogenic stages (ilia, IIIb and 111 c). In addition , 134 out of 188 total ovaries examined
also contai ned stage TV oocytes. Ovaries from two females appeared unhealthy and were
omitted from the analys is.
The intentional sampl ing of females at different times of day, starting at 0900
hours and continu ing until 1730 hours, illuminated the daily cycle of egg production
in this species . As early as 0900 hrs, maturing stage (IVa) oocytes were visible within
the ovary, together with oocytes of all previous stages (Table 1-3). Throughout the
day, maturing oocytes became enlarged due to hydration (Figure 1-7), and at about 2
20

hours prior to sunset (i.e. , between 1400 and 1500 hrs, depending on the time of year)
hydrated stage oocytes (IVb) were observed within the ovaries (Table 1-3). Ovaries from
individuals with no stage IV oocytes were also observed at all times of the day (Table 1-
3), indicating that egg release occurs around sunset, but that not all females re lease eggs
every day.
Additionally, some atretic follicles were observed within ind ividual ovaries, both
of unspawned maturing stage and vitellogenic stage oocytes, although they did not occur
frequently enough to warrant any assumptions concerning their role in the regression
of the ovaries after spawning (DeVlaming, 1983; Santiago and Sanz, 1992; Tyler and
Sumpter, 1996). Atretic follicles were easi ly distinguished from POFs by their lack of a
follicular lumen and by the presence of spherical oil droplets.
Docl/mentation o/post-ovl/latory /ollicle (POF) degeneration
Following the methods of Van den Hurk and Peute (1979) and Hunter et
01. (1985), this section documents the degeneration of POFs over a 48-hour period
using captive fish sampled at 6-hour time intervals. POFs were no longer visible in
Figure 1-9. (A) Zero- and 24-hour POFs in a Z. flavescens ovary and (B) the same zero-hour POF at higher magnification. B = blood capillary G = granulosa cells, L = lumen, N = granulosa cell nuclei, Th = theca cell. Scale bars (A) 100 Ilm and (B) 20 Ilm.
2 1

fish euthanized at 42-br and 48-hr time points post egg-release, indicating that in Z.
jlavescens, the resorption of follicular cells and associated structures and molecules was
completed between 36 and 42 hours after ovulation.
Time: O-hr
In ovari an tissue removed from a female directly following egg release, the empty
fo lli cle cell layers, composed of theca and granulosa cells, formed many loose folds,
which together formed the POF (Figure 1-98). Theca cells were tightly associated with
granu losa cells on the outer 'rim' of the POF (Figure 1-9) and were harder to distinguish
toward the interior region. The granu losa cells were cuboidal at this early stage, with cell
wall boundaries defined and clearly evident. Most granulosa cell nuclei were round and
distinct, sta ining uniformly (Figure 1-98).
The most obvious characteristic of this stage was the continuous chain of granulosa cells
which cou ld be followed easily by eye. The follicular lumen between granulosa cell
folds was at its widest relative to older POFs (Figure 1-9A). Theca and granulosa cells
were closely associated with blood capillaries in O-hr POFs and at later stages of POF
.~--
Figure 1-10. Six-hour POF in a Z. flavescensovary. G = granulosa cells, L = lumen, N = granulosa cell nuclei . Scale bar 20 ~m .
22

Figu re 1-11. Twelve-hour POF in a Z. flavescens ovary. B = blood capi llary, G = granulosa cells, Gr = atrophying granulosa cell mass, L = lumen, Th = theca cell. Scale bar 20 Jlm.
Figure 1-12. Eighteen-hour POF in aZ. flavescens ovary. B = blood capillary, G = granulosa cell s, Gr = atrophying granulosa cell mass, L = lumen, Th = theca cell . Scale bar 20 Jlm.
degeneration. All granulosa cells stained approx imately the same intensity with eosin at
thi s O-hr time point.
Time: 6-hr
In comparison to O-hr POFs, the lumen of 6-hr POFs was smaller in area and slightly
less defined by granulosa cell walls that sometimes appeared 'blurred ' (Figure 1-10),
suggesting the beginning of cellular degradation . An observer was able to fo llow the line
of granulosa cell s as on a time O-hr POF, but the continuous fo rmat ion was less distinct
in 6-hr POFs, and included gaps where ce llular structures appeared less organized.
Granulosa ce ll nuclei were still ci rcular, but stained lighter in intensity than in time O-hr
POFs. Most granulosa ce ll s remained cuboidal ; very few were elongated.
Time: 12-hr
The lumen of 12-hr POFs shrank in width and remained only as a narrow space between
an inner region of deteriorating granu losa cells and an outer portion of relatively intact
granu losa and theca ce ll s (Figure 1- 11 ). The walls of granulosa cells in the inner reg ion
of the POF began to disappear, leaving behind an indistinguishable mass of degrading 23

cellular components. Inner granulosa cell remnants stained less intensely than outer
granulosa cells, and appeared to be undergoing disintegration at a faster rate than
granulosa cells on the outer portion of the POF, since outermost granulosa cells still
retained dark nuclei and more often maintained a cuboidal shape. Theca cells did not
exhibit signs of disintegration or atrophy; they appeared to retain both size and shape and
maintained distinct cellular boundaries (Figure I -I I).
Time: IS-hr
The POF lumen was further compressed, and in some cases, was entirely absent from
IS-hr POFs. When present, the lumen was very thin and appeared only between the
inner cell mass and the outer cellular boundary (Figure 1-12). The inner cell mass still
stained with less intensity than outer cells, and was more disorganized in appearance than
in earlier POFs. In the interior of the IS-hr POF, granulosa cells no longer maintained
a cuboid shape; instead, they appeared to have lost internal cellular integrity, and cells
housed only lightly stained and elongated nuclei, if any. Disorganized granular material
of cell fragments filled the entire center region of the POF. Theca cells appeared
unchanged on the outer rim of the POF. A few remaining intact granulosa cells could also
be seen on the outer rim of the POF, associated with the theca cells.
Table I -4. The size ranges of POFs at 2 time points during degeneration in Z. Oavescens ovaries. Time points were chosen so as to be able to assess differences in size (and therefore 'age') ofPOFs observed in ovaries sampled at approximately 1.5-2 hours prior to spawning. All measurements are given in microns. No POFs were observed 48 hours post spawning.
lime post egg release
POF Ohr POF 24hr
Size range (mean :l: sid. dev.)
6.96 x 10'- 51.60 x 10' (lS.24 x 10'±8.36 x 10')
2.51 x 10'- 13.33 x 10' (6.63 x 10'±2.14x 10')
24
No.POFs measured
99 99

Figure 1-13. Twenty-four-hour POF in a Z. flavescens ovary. B = blood capill ary, Gr = atrophying granulosa cell mass, Th = theca cell. Scale bar 20 )lm.
Time: 24-hr
Figure 1- 14. Thirty-hour POF in a Z. flavescens ovary. Gr = atrophying granulosa cell mass, Th = theca cell. Scale bar 20 )lm.
The former lumen of 24-hr POFs was completely absent, although a distinction between
the outer cell layer and the inner ce ll mass could be made due to the more intense
staining of the outer rim of the POF (F igure 1-13). Outer theca ce lls remained intact and
stained similarly to those in O-hr POFs and pre-ovulatory follicles.
The central area of the POF was the most disorganized region: granulosa ce ll wall s were
no longe r dist ingu ishable except in some outer portions of the POF. The size ofa 24-
hr POF tended to be about half that ofa O-hr POF (Table 1-4). A 24-hr POF was easi ly
distingui shed from a O-Ilf POF within the same ovary at lOx magnification (F igure 1-9)
due to obvious differences in size and ce llular compos iti on, as well as presence (i n O-hr
POFs) and absence (in 24-hr POFs) of the follicle lumen.
Time: 30-hr
The overall size of 30-hr POFs was smaller than 24-hr POFs. Inner granulosa ce ll s were
increas ingly disorganized, with on ly a few retaining ce ll walls and visible nuclei (Figure
1-1 4). I nner ce ll remnants stained with very low intensity. Theca cell s on the periphery
25

Figure 1- 15 . Thirty-six-hour POF in a Z fll l vescens ovary. Or = atrophying granulosa cell mass, Th = theca cell. Scale bar 20 11m.
of the POF continued to stain with previous intensity and appeared unchanged during the
degenerati on process .
T ime: 36-hr
Thirty-six-hour o ld POFs tended to be smaller, but otherwise were very simi lar in
appearance to 30-hr POFs (F igure 1-15).
T ime: 42-hr a nd 48-hr
o POFs were visib le in ovaries sampled 42 hours after ovul at ion.
Us ing these documented descriptions from each time point, in addition to
the difference in mean size of POFs at 0 and 24 hours (Table 1-4), it was possible to
distinguish between empty follicles that were remnants of eggs just released (O-hr POFs)
and follicles that were residual fro m the prev ious day's spawn (24-hr POFs) as illustrated
in Figure 1-9. This distinction provided hi stological evidence for or against previous-day
spawning in every female examined.
26

DISCUSSION
The establishment of clearly defined stages of oocyte maturation and POF
degeneration within the ovary of Z. jfavescens can now be used to investigate temporal
changes in oocyte population composition within and among individuals, as will be
demonstrated in Chapter 2 of this thesis. Based on this histological investigation of
oocyte populations within individual ovaries, further conclusions concerning the pattern
of egg maturation in Z. jfavescens were also suggested.
Oocyte stIlging and maturation patterns
Development of oocytes in Z. jfavescens is classified as asynchronous, based on
the simultaneous presence of oocytes in several stages of development within the ovary
(Figures 1-4 through 1-8). In ovaries offish with asynchronous oocyte development,
recruitment of oocytes from an earlier stage to the next stage of development occurs as a
continuous process during the breeding season, with different oocytes at different stages
(and therefore different sizes) together concurrently within an ovary (Scott, 1987; Selman
and Wallace, 1989). By definition, fish with asynchronous oocyte populations in the ovary
are multiple spawners (Scott, 1987; Tyler and Sumpter, 1996), ovulating several batches
of the most mature stage oocyte over the spawning season, while earlier stage oocytes
remain within the ovary to mature and differentiate and are released at later spawning
events. Fecundity of this multiple-spawning fish is therefore indeterminate (as defined
by Hunter and Macewicz (1985», since the number of eggs produced by an individual
over a season cannot be known without an understanding of frequency of spawning or the
number of eggs released per spawn.
Time of spawning
Observations of pre-sunset spawning behavior in Kona by Walsh (1984) and
similar behaviors at dusk by captive fish from the same location (C.W. Laidley, pers. 27

cornm.) both suggest pre-sunset spawning in this species. Spawning of males and females
in this population has been observed within a distinct window of time during the one hour
prior to sunset, with no instance of Z jlavescens spawning reported later than 10 minutes
post-sunset (Walsh, 1984).
In this study, histological evidence from adult female Z jlavescens sampled
at different times of day offers further support for early evening egg release. Full
progression of oocytes through the final stage (stage IV) occurs throughout an - 8-hour
period leading up to pre-sunset spawning (Table 1-3). Maturing (stage IVa) oocytes were
observed within ovaries as early as 0900 hrs, and the maturation and hydration processes
continued throughout the day (Table 1-3 and Figure 1-7). Ovulated eggs were observed
in the lumen of the ovary beginning about 2 hours prior to sunset (Table 1-3 and Figure
1-8). Similarly, the closely related brown surgeonfish, Acanthul7JS nigrojuscus, spawns
daily during its reproductive season, with egg maturation and hydration occurring over
a similar time span (Fishelson et al., 1987). Evening spawning has been noted in several
species of coral reef fishes, including other acanthurids (Randall, 1961 a and b; Lobel,
1989; Craig, 1998). Reasons postulated for evening spawning include the decreased
likelihood of predation on newly released eggs by diurnal planktivores (Lobel, 1978;
May et al., 1979; DeMartini and Fountain, 1981), as well as decreased threat of predation
on the adult spawners (Johannes, 1978).
Frequency of spawning
With the exception of 2 individuals with apparently unhealthy gonads, all adult
females (N= 188) from year-round field collections exhibited similar oocyte composition,
with oocytes in stages I, II, and III present in every ovary examined. In addition, mature
stage (IVa and b) oocytes were also observed in a fraction of all females sampled (Table
1-3). The presence of hydrated stage (IVb) oocytes within an ovary sampled prior to
sunset indicated that an individual would have spawned that evening had it not been 28

caught; conversely, the absence of hydrated stage oocytes indicated that that female
would not have spawned that evening. However, absence of stage IV oocytes did not
signify the female's potential to spawn on ensuing days, or whether she had spawned
previously. Notably, the presence of 24-hour-old POFs (i.e., POFs similar in appearance
to those examined from captive fish, 24 hours post egg release) did indicate day-prior
spawning in certain individuals.
Previous studies have incorporated the presence and 'age' ofPOFs into
estimations of spawning frequency of populations of indeterminate spawning fishes (e.g.,
Hunter and Goldberg, 1980; Hunter et al., 1985; Santiago and Sanz, 1992; Sanz et al.,
1992; Macchi et al., 1999; Stequert et al., 2003; Jackson et al., 2006). While most of
these studies used very large sample sizes to approximate the number of days between
spawning for females within the targeted population, the current study was limited in
its ability to sample suitable numbers of fish to make such an estimate of population
wide spawning frequency. Instead, the determination that POFs remain in the ovary of
this tropical species for up to 42 hours, and the identification of POFs from the previous
day's spawn, contribute to our understanding of the prevalence of consecutive-<lay
spawning for this population of Z. jlavescens. Clearly, a close approximation to the
actual frequency of spawning for individual females cannot be determined by histological
investigation alone. A different approach to estimating spawning frequency in the
sampled popUlation of Z. jlavescens is addressed in Chapter 3.
29

CHAPTER 2. An investigation of Zebrasomajlavescens (yellow tang) spawning
seasonality including lunar periodicity
ABSTRACT
To answer questions concerning annual spawning seasonality and to establish
the presence or absence of a lunar cycle of spawning, reproduction of Zebrasoma
flavescens (yellow tang), a popular aquarium species harvested from the Kona coast of
the Big Island of Hawai'i, was investigated. The results of this study demonstrated that
female Z. flavescens produce mature oocytes year round. However, increases in female
gonadosomatic index (OSI), batch fecundity, and incidence of females spawning for at
least two consecutive days were observed in spring and summer months, indicating a
protracted spawning season with greater reproductive output for the population during
March-July. Female condition (as defined by Froese (2006» did not change significantly
throughout the year. A lunar cycle of spawning, with an observed increase in batch
fecundity and female OSI in the 4 days prior to and the day of the full moon, was
observed in May through July (batch fecundity: periodic regression, F = 32.5, df= 2, 219,
P < 0.001; OS!: periodic regression, F = 38.8, df= 2, 225, p < 0.001). In addition, the
proportion of oocytes in the late vitellogenic stage within yellow tang ovaries sampled in
the summer months also exhibited significant lunar periodicity (periodic regression, F =
9.5, df= 2,52, P < 0.001). These results provide the basis for estimating egg production
for yellow tang populations in Kona, Hawai'i and can support the development of
management measures in this and other locations under aquarium fishing pressures.
INTRODUCTION
Successful reproduction depends upon a specific series of physiological and
behavioral processes, including ooctye (egg-precursor cell) production, spawning,
30

fertilization, and gamete maturation and survival. Because the first step is female
specific, research related to the initial requirements for reproduction in this study focuses
on the female sex. The initial processes in Zebrasoma jlavescens reproduction - oocyte
production and maturation - were investigated and described in detail in Chapter 1. This
chapter will explore temporal trends in spawning for females of this species, including an
investigation into annual seasonality, if any, and the presence or absence of a lunar cycle
of spawning.
It is not unusual for marine tropical reef fish species to exhibit a more protracted
spawning season compared to temperate fish species (Lowe-McConnell, 1979); the
length of the reproductive season has been shown to increase with decreasing latitude
of populatious (Conover, 1992). Instead of sharp delineations between 'reproductive'
and 'non-reproductive' periods, many tropical species exhibit periods of intermediate
spawning production at one or both ends of the season (Colin and Clavijo, 1988;
Figuerola et al., 1998; Kritzer, 2004). Alternatively, as exhibited by some species of
Hawai'ian reef fishes, reproduction within a tropical population may continue year-round,
but with periods of greater reproductive effort concentrated in specific months (Ross,
1982; Walsh, 1987; Lobel, 1989; Privitera, 2002).
The few specific studies of reproductive seasonality within the surgeonfish family
Acanthuridae have shown significant differences in spawning patterns among species.
Acanthurus nigrofuscus, which is found on coral reefs allover the world and in large
numbers on the Kona Coast, exhibits a clear demarcation between on- and off-season
spawning months in the Red Sea (Fishelson et ai., 1987). Ovaries ofA. nigrofuscus
females undergo large-scale atresia of oocytes following the breeding season, and no
mature oocytes are produced in off-season months (Fishelson et al., 1987). Randall
(1961a) found Acanthurus triostegus in Hawai'i to have a distinct spawning season,
based on gonadosomatic index (GSl) of males and females sampled over one year. In
31

contrast, A. triostegus. Acanthurus guttatus, and Acanthurus lineatus were found to
spawn year-round in American Samoa (Craig, 1998), although with periods of more
intense reproductive effort in the austral summer months.
It is likely that Z.jfavescens in Hawai'i also participate in some level of spawning
throughout the year, based on year-round observations of spawning behavior (Lobel,
1989) and the continuous presence of new recruits (though often at low levels) on the
reef in Kona populations (Walsh, 1987; J. T. Claisse and M.E. Bushnell, unpub. data).
Captive fish have also been found to spawn during all months of the year (C. W. Laidley,
unpublished data). The Z. jfavescens spawning season has been previously investigated in
Kona (Lobel, 1989) and the island of Oahu, Hawai'i (C.W. Laidley, pers. comm.). Both
studies indicated a peak in reproductive effort, defined here as increasing OSI values for
males and females, beginning in late March and continuing through August. However,
Lobel (1989) sampled in areas of the reefprobably frequented by juveniles, resulting in
samples of small fish with low OSI values on which his spawning seasonality conclusions
were based. Therefore, a more thorough investigation of yellow tang spawning
seasonality was pursued for the Kona population in the current study.
Lunar periodicity among repetitive spawning species has also been established
for many marine tropical fish species (e.g., Lobel, 1978; May et at., 1979; Robertson et
at., 1990; Mizushima et at., 2000; Soyano et at., 2003; Takemura et at., 2004; Vagelli
and Volpedo, 2004), and has been suggested for some acanthurids (Randall, 1961a and
b; Thresher, 1984; Colin and Clavijo, 1988). Randall (1961a and b) observed a greater
number of ripe females around the full moon among populations located on Oahu (A.
triostegus) and the Society Islands (Zebrasoma scopus), whereas Colin and Clavijo
(1988) observed peak spawning of Acanthurus coerutus between 3 and 8 days after the
full moon in a Puerto Rico population. Preliminary sampling of a Kona population of Z.
jfavescens in 2005 indicated an increase in both the fraction of females producing eggs
32

and the number of eggs released by individuals around the full moon (J.T. Claisse and
M.E. Bushnell, unpublisbed data). In addition, fisb beld in captivity were observed to ,
spawn more eggs and more frequent ly during the full moon quarter than at other times
oftbe month (C.w. Laidley, unpublisbed data). Tberefore, the primary objectives of
this project were: ( I) to establisb tbc pcriod of greatest reproductivc output (i.e., annual
seasonality) for a yellow tang population located on the Kona coast of Hawai' i, by
collecting adult females for one calendar year and analyzing batch fecundity and GSI
for possible atIDual trends, and (2) to verify the presence or absence of a lunar cycle of
spawning for Zflavescens using the same measurements .
• f .. :11
1' 11. 1' i. ! ~I""'"
1 Figure 2-1 . Map of Hawai' i Island and inset of part of the Kona Coast. Arrow indicates sampling area (N19° 42', W156° 03 '), approximately 3 km in length. Image courtesy of Hawai ' i Mapping Research Group, University of Hawai'i .
33

MATERIALS AND METHODS
Sampling
The area sampled was located on the western coast ofHawai'i Island (N19° 42',
W156° 03 ') and is illustrated in Figure 2-1. Intensive sampling (i.e., approximately every
4 days) was performed during the period of the year that had been hypothesized to be the
peak of the spawning season, based on previous studies in Kona (Walsh, 1987; Lobel,
1989), as well as earlier research on Oahu (C.W. Laidley, pers. comm.).
Monthly collections
Sampling was performed once per month for one calendar year, from May 1,2006
Table 2-1. Sample sizes of adult Z Oavescens Group M and Group S fish. N(month) is the number of fish caught in the corresponding monthly collection. N (day) is the number of fish caught on the corresponding day of the summer sampling period. N (histo) is the number of fish examined histologically for presence of POFs and for vitellogenic oocytesize-frequency distributions in Figure 3-7. Cells shaded in gray denote the same sample of fish used in both groups.
Month N(month) Day o/Sampling Period
N(day) N(histo) (summer 2006)
Group Mjish GroupSjish May 2006 12 0 6 Jun2006 16 4 12 7 Jul2006 7 6 17 Aug 2006 - 9 15 6 Sep 2006 17 13 11 6 Oct 2006 9 18 11 6 Nov 2006 14 24 14 Dec 2006 17 28 11 6 Jan 2007 19 31 10 Feb 2007 21 33 16 6 Mar 2007 18 35 16 6 Apr 2007 19 38 14
42 11 6 48 11 6 51 16 58 16 6 61 11 6 63 7 5
34

through April 3, 2007, excepting August 2006. On either the day before, the day after, or
the day of the full moon, between 7 and 21 female fish were sampled using 3-pronged
spears (Table 2-1). Two divers using SCUBA speared fish until either air supplies became
low (after approximately 45-55 min) or until at least 20 female fish were obtained,
whichever came first Fish were collected in 8-10 m of water inshore from the reef crest,
at a location previously determined by J.T. Claisse (unpublished data) to be adult daytime
habitat. All monthly sampling dives were conducted within 2 hours of sunset in order to
minimize effects of egg hydration on ovary weight, since a positive relationship between
time of day and ovary weight had been noted in preliminary collections (Figure 2-2).
No collection was made in August of 2006 due to weather complications. Each
monthly collection of female fish was obtained on one sampling day except the December
2006 collection, which encompassed two days. On December 4 (the full moon), 2006,
only 8 females were obtained, so sampling was also conducted on the following day,
December 5, on which 9 females were collected. There was no statistical difference in
• 0
7 0 0
• 0
0 s, 0 0 0
0 • • 0
t-o • • 0
0 0 0 • 0 • 0
i' 0 0
I 0 0
2 • I R'=18.4%
• 0
0
13:00 14:00 15:00 lG:(ItI 11:00 limo of clay
Figure 2-2. Ovary weight of Z. flavcscensfemales sampled in preliminary collections in 2005 from the Kona Coast A significant relationship between ovary weight and time of day was established (linear regression equation: Ovary weight = - 2.46 + 10.3 Time of day, p<O.OOI) due to the progressive hydration of eggs in the ovary over the course of daylight hours.
35

average fecundity (t-test, p < 0.61) or GSI (t-test, p < 0.84) between females collected on
the two sampling days, so for the month of December, GSI and fecundity values for the
two days were pooled. Fish sampled at the monthly peak were considered to be Group M
fish (M=monthly), and are referred to as such in the remainder of the text.
Summer collections
For a 65-day period lasting from May 8 to July 10, 2006, between 7 and 17
female fish were sampled approximately every 4 days for a total of 18 collections (Table
2-1). Sampling protocols were identical to those used in monthly sampling. Fish collected
during the summer months are considered Group S fish (S=summer) for the remainder of
the text. Data from this 65-day intensive sampling period were applied to the remainder
of the year-round sampling effort in order to maximize sampling of reproductively active
adults.
Fish processing
Fish were placed on ice after spearing, and gonad dissections commenced within
12 hours. Each fish was weighed, sexed, and measured for total length (TL) and standard
length (SL). All gonads were dissected, weighed, and placed either on ice for batch
fecundity counts or into Dietrich's fixative for histological processing.
Histological processing
(See methods section of Chapter I for detailed descriptions of histological
embedding and sectioning protocols.) For frequency distributions of vitellogenic stage
oocytes (stage III), all vitellogenic oocytes from a cross-section of an ovary were
measured using QCapturePro software, and size-frequency distributions based on the
diameter of oocytes in each of the three vitellogenic stages, as defined in Chapter I, were
calculated.
Ovary sampling
Pilot histological data (presented in Table 2-2) suggested no difference in oocyte 36
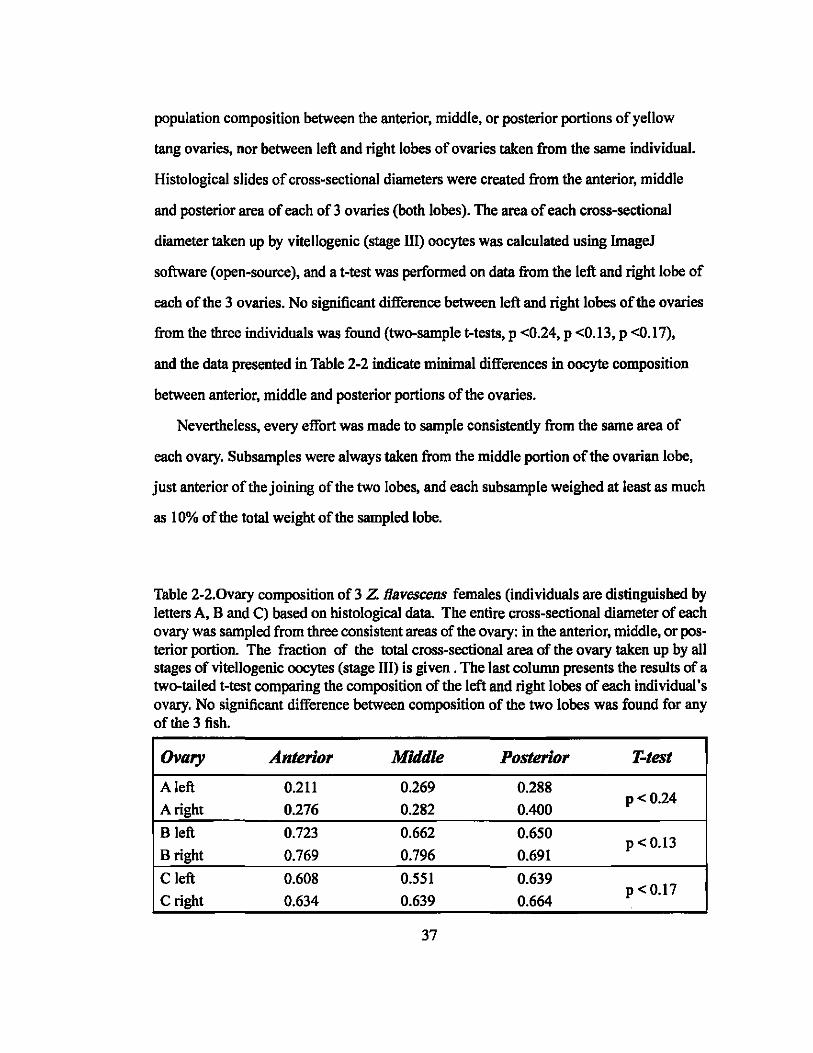
population composition between the anterior, middle, or posterior portions of yellow
tang ovaries, nor between left and right lobes of ovaries taken from the same individual.
Histological slides of cross-sectional diameters were created from the anterior, middle
and posterior area of each of 3 ovaries (both lobes). The area of each cross-sectional
diameter taken up by vitellogenic (stage III) oocytes was calculated using ImageJ
software (open-source), and a t-test was performed on data from the left and right lobe of
each of the 3 ovaries. No significant difference between left and right lobes of the ovaries
from the three individuals was found (two-sample t-tests, p <0.24, p <0.13, p <0.17),
and the data presented in Table 2-2 indicate minimal differences in oocyte composition
between anterior, middle and posterior portions of the ovaries.
Nevertheless, every effort was made to sample consistently from the same area of
each ovary. Subsamples were always taken from the middle portion of the ovarian lobe,
just anterior of the joining of the two lobes, and each subsample weighed at least as much
as 10% of the total weight of the sampled lobe.
Table 2-2.0vary composition of 3 Z Oavescens females (individuals are distinguished by letters A, B and C) based on histological data. The entire cross-sectional diameter of each ovary was sampled from three consistent areas of the ovary: in the anterior, middle, or posterior portion. The fraction of the total cross-sectional area of the ovary taken up by all stages of vitellogenic oocytes (stage III) is given. The last column presents the results of a two-tailed t-test comparing the composition of the left and right lobes of each individual's ovary. No significant difference between composition of the two lobes was found for any of the 3 fish.
Ovary Anterior Middle Posterior T-test
A left 0.211 0.269 0.288 p<0.24
A right 0.276 0.282 0.400
B left 0.723 0.662 0.650 p<O.13
Bright 0.769 0.796 0.691
Cleft 0.608 0.551 0.639 p < 0.17
C right 0.634 0.639 0.664
37

Fecundity measurements
Batch fecundity, defined here as the number of eggs released by a female during
a single spawning event, was considered for the purposes of this study to be equal to
the number of hydrated oocytes and ovulated eggs within an ovary sampled prior to
spawning (See Chapter 1 for definitions and photographs of hydrated oocytes). Any
hydrated oocytes remaining within the follicle at the time of dissection were assumed to
be close to ovulation, as females were intentionally sampled within 1.5-2 hours before
spawning. (For simplicity, the term 'eggs' is used for the rest of this thesis to refer to all
hydrated oocytes and ovulated eggs counted within an ovary.)
For batch fecundity measurements of fish ovaries containing approximately 3000
eggs or less, both the left and right lobes of the ovary were dissected out and weighed.
One lobe was randomly assigned to use for batch fecundity counts and the other was
preserved for histology (See Chapter 1). For batch fecundity counts, all eggs were
counted from a weighed subsample of the chosen lobe. When an ovary lobe weighed less
than 1.0 g, all eggs from the entire left or right lobe of the ovary were counted.
The number of eggs counted from the subsample was then used in the following
equation to estimate batch fecundity of each fish:
SF =Nx Lw + Rw Sw
(EQUATION 2-1)
where BF = batch fecundity, N = number of eggs counted in subsample, L. =
weight of left ovary in grams, R. = weight of right ovary in grams, and S. = weight of
subsample in grams.
The previously described method of subsampling was sufficient if the ovary contained
less than -3000 eggs. Ifmore than -3000 eggs were present, spillage from the genital
opening was likely to occur during dissection, and determination of the lobe from which
the eggs originated became impossible. In these cases, the following method was used.
For the highest fecundity ovaries (those with 4000-28,000 eggs), eggs were extracted
38

from within the fresh ovary by physically massaging both lobes into a Petri dish and
spilling the eggs out of the ovary via the lumen. Eggs and ovarian tissue were then
weighed separately, and a subsample of the eggs was weighed and counted. The number
of eggs counted from the egg subsample was then used in the following equation to
estimate batch fecundity of each fish:
(EQUATION 2-2)
where SF = batch fecundity, N = number of eggs counted in egg subsample, E. =
weight of all eggs within ovary in grams, and Sw = weight of egg subsample in grams.
Condition factor
Condition factor was calculated using the following equation (Froese, 2006):
K = W -Gw x 10' SL3
(EQUATION 2-3)
where K = Fulton's condition factor, W = total weight of the fish in grams, G. = total
weight of the gonad in grams, SL = standard length in millimeters, and C = species
specific constant.
Tidal datil compilation
TIdal data for the sampling location were obtained from the National Oceanic and
Atmospheric Administration website (NOAAtidesandcurrents.com) and are presented
in Table 2-3. Times for high and low tides collected at the tidal station at Kawaihae,
Hawai'i. station ID number 1617433. were adjusted for the Kailua-Kona harbor (N19°
39', W156° 00'), the nearest available location with a time conversion.
Datil analysis
Statistical analyses were performed using Minitab 14 software. Periodic
39

regressions used the following equations (Cryer, 1986; deBruyn and Meeuwig, 2001):
y = q, + q(cos6)+ b,(sin6) (EQUATION 2-4)
where Y is the dependent variable (batch fecundity or OSI), bo is the mean level
of Y, b,and b2 are model coefficients which together define the phase shift and amplitude
of the sine wave, and
6 = 2m., f
(EQUATION 2-5)
where tn is the original time variable (day of sample) and f is the frequency of
the expected pattern. For the lunar cycle, the frequency of recurrence of the pattern was
computed as 28 days.
Table 2-3. Tidal records for Kona, Hawai'i during the year sampled. Tidal amplitude is given in meters relative to mean sea level. HST = Hawaii Standard Time, HHW = higher high water tide, LHW = lower high water tide. "Sampling was not conducted in May 2007, although tidal information is included in the table to better assess annual tidal patterns.
Full High High Low Low Sunset
Month moon dde tide tide dde HST
TIdal description date (m) HST (m) HST
May 06 12 .401 15:44 -.199 22:59 19:01 Outgoing HHW
Juo06 II .506 15:56 -.209 00:23 19:13 Outgoing HHW
Jul06 10 .586 15:44 -.270 23:35 19:17 Outgoing HHW
Aug 06 9 .677 16:08 -.174 22:59 19:06 Outgoing HHW
Sep 06 7 .537 15:32 -.284 22:17 18:42 Outgoing HHW
Oct 06 6 .451 15:02 -.269 21:21 18:14 Outgoing HHW
Nov 06 5 .163 15:08 -.254 20:59 17:53 Outgoing LHW
Dec 06 4 .126 15:14 -.223 20:41 17:49 Outgoing LHW
Jao07 3 .096 16:02 -.240 21:II 18:02 Outgoing LHW
Feb 07 1 .077 15:38 -.266 21:05 18:21 Outgoing LHW
Mar 07 3 .166 15:56 -.253 21:41 18:36 Outgoing LHW
Apr 07 2 .336 16:02 -.198 22:23 18:47 Outgoing HHW
May 07 2 .643 16:08 -.018 23:17 18:57 Outgoing HHW*
40

,..,,;-------------,
0U4 Q6.06 01<06 Ge.Q4 ~ lC-De UoCIS 12-oe ()1.07 C2.01 03.Q7 M007 -
,:Y ,
~DG CfoQ6 07«1 08-05 0f006 1~ 11-0& Uo-D5 01-07 QM1 030\l7 I)H7 -Figure 2-3. (A) Batch fecundity and (B) gonadosomatic index (GSI) of Group M female Z Bavescens over the year sampled (untransfonned data). Bars are one standard error of the mean. Low-season months are designated by the dashed lines. All low-season months were detennined to be significantly different from July 2006 data by the Tukey's test (p<.OOI) except for batch fecundity in October (*). (Tukey's test was performed on transformed batch fecundity data, as noted in text)
Q5..08 06-0S (17..(1$ IllI-QS Q9.06 to.o6 11.(16 12-015 Ol~ 0241 D3-07 0f.07 ..... Figure 24. (A) The fraction of females spawning and (8) the fraction of females spawning at least two days in succession in each sample of Group M female Z Bavescens. Low-season months are designated by the dashed lines.
RESULTS
Annulll season
In the Kona popUlation, a peak in reproductive output in spring and summer
months is suggested by both female GSI and batch fecundity trends throughout the
sampled year (Figure 2-3). Female yellow tang do not completely cease either spawning
behaviors (M.E. Bushnell, pers. obs.) or production of eggs (Figure 24) at any time
during the year. The trends of higher GSI and batch fecundity values in Figure 2-3 in
spring and summer, with lower values in fall and winter, were observed in untransfonned
41

data. Designation of a 'high' season and 'low' season for spawning was attempted
statistically, despite the lack of sampling data for August. Tukey's pairwise comparisons
by month were performed for both OSI and batch fecundity data sets, and a statistical
difference among months sampled was observed for both (p < 0.001, Tukey's 95%
simultaneous confidence level, individual confidence level = 99.87%). Prior to the
analysis, batch fecundity data were transformed to the 4'" root in order to minimize
unequal variances between sampled months.
The peak of reproductive output for which data are available occurred in the
month of July: batch fecundity values were greatest (mean batch fecundity = 13,221
eggs), and mean female OSI was also high (5.24). Months with values not significantly
different from the mean batch fecundity or OSI of July could be considered 'high' season,
and those significantly different could be considered 'low' season (Figure 2-3). It is
important to note, however, that the absence of data for the month of August does not
permit firm, quantitative characterization of the 'season' for this calendar period of2006.
The fraction of females appearing to be close to spawning during each month of
the year was determined by establishing the percentage of females in each sample with
eggs inside the ovary by means of batch fecundity count methods. Pearson Chi-Square
Test (Likelihood Ratio Chi-Square = 39.422, df= 10, P <.001) indicates a significant
difference in the fraction of female fish spawning between months, with the smallest
fraction occurring in January and February 2007 (Figure 2-4A). The month of October
displayed a surprisingly high percentage (100%) of spawning females. This result may
be influenced by the small number of females examined in that month (N=9 females).
Throughout the year, the fraction of females producing eggs never decreased below 0.5,
even in 'low' season months (Figure 2-4A), indicating that some level of reproduction
continued throughout the year.
The fraction of the female population spawning for at least two consecutive days
was determined by histological analysis of gonads from 9-12 females sampled at the 42

Table 2-4. The fraction of female Z flavescens spawning for at least 2 consecutive days over summer 2006 (Group S fish). N = the number of females examined histologically per time point, DaylMoon = the day in relation to the full moon: 0 indicates the day of the full moon, negative numbers indicate days prior to the full moon, positive numbers indicate days after the full moon.
Day of No.fish with eggs and Fraction offemales
DaylMoon sampUng N 24-hr POFs in ovary spawning 2 days in a
period row 0 4 7 7 I
5 9 6 6 I
9 13 6 4 0.667
14 18 6 5 0.833
-6 28 6 6 I
-I 33 6 6 I
I 35 6 5 0.833
8 42 6 5 0.833
14 48 6 6 I
-5 58 6 5 0.833
-2 61 6 5 0.833
0 63 5 5 I
full moon of each month (Group M fish). The presence of 24-hour-old post-ovulatory
follicles (POFs; see Chapter I for definition and description) in addition to hydrated
oocytes within an ovary was taken as indication that the individual had spawned the
day prior to sampling and was prepared to spawn the day of sampling, respectively. A
fraction of females in every month was found to spawn on 2 consecutive days, with fewer
instances of2-day spawning suggested in the 'low' season months (Figure 2-4B). Pearson
Chi-Square Test (Likelihood Ratio Chi-Square = 43.082, df= 10, P < 0.001) indicates
significant differences in the fraction of females spawning 2 days in a row between
months of the sampled year.
During the intensively sampled 65-day period of May - July 2006, histological
analysis of ovaries of Group S fish selected from 12 time points indicated that the fraction
of females spawning at least two days in succession during the summer months remained 43

0.0065
• 0.0060
• O.ooss • •
- • • J. ~
• •• • I 0.00" , • ! & t • ,. .. ~ • J i ~~s , , 4 .. • I ) ( .. • • " I ,
• • • • • • • , 0.0040 • • • • 0.0035 • 0.0030 •
OS<Ol5 05.(16 01.0& 08.0& OlM6 10.(16 u-oe 12..Q5 01.07 1Jl.Q1 03-(11 0+01 _til
Figure 2-5. Condition factor of female Z Oavescens over the year sampled (Group M fish). Solid circles indicate values of individual fish, open circles indicate the mean for each monthly sample. Bars are one standard error of the mean. No significant difference in condition factor of individuals between months was established (one-way ANOVA, p< 0.129)
between 0.833 and 1.0 for all sampled days except one (Table 2-4). In contrast, the
fraction of females spawning at least two days in succession for the collections of January
and February - two 'low' season months - was only 0.5 and 0.1, respectively (Figure
2-4B). Therefore, the data in Table 2-4 further support the conclusion that the summer
months (May-July) include a period of high reproductive effort for yellow tang females.
Female condition did not change significantly over the course of the year sampled
(one-way ANOVA, F = 1.54, P < 0.129) as illustrated in Figure 2-5.
Lu1UI1" cycle
Lunar periodicity in spawning was suggested by the observed patterns of both
batch fecundity and female GS! data during the period of intensive sampling in the
summer of2006 (batch fecundity: periodic regression, F = 32.5, df= 2,219, P < 0.001;
GS!: periodic regression, F = 38.8, df = 2, 225, P < 0.001). Peaks of mean reproductive
output (i.e., batch fecundity) appeared on the full moon or within the 4 days prior to it for
44

"'"' r-"T"-;-------"iZ------'9'---1
figure 2-6. (A) Mean batch fecundity and (B) gonadosomatic index of Oroup S female Z flavescens. Full moons of all months are indicated by lines at days 4, 34, and 63. Bars are one standard error of the mean.
each of the three full moons sampled (Figure 2-6A). Mean female OSI follows a pattern
very similar to that of batch fecundity, with the highest mean OSI values appearing 2-3
days prior to the highest mean batch fecundity values for the months of June and July
(Figure 2-6B). (It is likely that the peak OSI value for May was missed by inadequate
frequency of sampling prior to the first full moon of the sampling period.) A brief time
lag between peak OSI and peak fecundity is to be expected; the increase in OSI prior
to increased spawning output is probably due to ovarian production and hydration of
increasing quantities of eggs, with a resulting decrease in OSI after spawning, both of
which are seen in Figure 2-6B. Providing additional support to the observed lunar cycle
U) .. I" t.,
I: f o. 0>
0>
'.1 10 " 30 " " " " Dayot~pab!
figure 2-7. The fraction of Oroup S female Z flavescens spawning over the summer months. Full moons of all months are indicated by lines at days 4, 34, and 63.
"..
"'" R7:76.6%
""'. f I-r"'"
""'
."" ... ,
• • ."
,
•• • • •
•
figure 2-8. The relationship between GSI and batch fecundity of female Z flavescens. Group M and Group S fish were used in the regression. Linear regression equation: batch fecundity = -4085 + 2997 OSI, p<O.OOl.
45

of spawning, the fraction of females on each day sampled that contained eggs within the
ovaries followed a similar lunar pattern (periodic regression, F = 16.5, df= 2, 15, P <
0.001, Figure 2-7).
Gonadal indices such as the GSI are often used as a proxy for measurements of
fecundity; dissecting ovaries and counting eggs is a much more time-intensive process
than measuring somatic and gonad weights (reviewed by West, 1990). In this species, it
appears that GSI and batch fecundity of yellow tang females are closely related, with an
R2 = 76.6% (linear regression equation: batch fecundity = -4085 + 2997 GS!, P <0.001),
indicating that over 76% of the variation in batch fecundity is explained by female GSI
(Figure 2-8) in all females sampled.
In order to acquire a more complete understanding of the oocyte maturation
process and timing over the lunar cycle, ovaries of 5 randomly selected individual
females from 11 of the 18 sampling days within the summer sampling period (Group S
fish) were analyzed using histological methods. The II days were selected so that every
quarter moon was represented, if possible. If no sampling was done on the exact quarter
moon, the next closest sampling date was chosen.
The fraction of vitellogenic oocytes in each of the three vitellogenic stages (early,
middle and late) was determined using size-frequency distributions of vitellogenic
oocytes from cross-sectional diameters of ovaries from these selected Group S fish. A
periodic cycle in egg maturation was suggested by the increase in late stage (lIIc) oocytes
leading up to the May and June full moons, followed in both instances by a decrease in
the percentage of late vitellogenic stage oocytes observed in ovaries at 8 and 9 days (May
and June, respectively) after the full moon (Figure 2-9).
Oocyte maturation within ovaries of individual females in this population is
extremely temporally variable, probably due to large differences in the number of eggs
produced by individual females on any given day of the cycle. Nevertheless, periodic
46

regression on the fraction of oocytes in the late vitellogenic stage of all 55 females
examined suggests a significant lunar periodicity of the ovarian cycle (F = 9.5, df= 2,52,
P < 0.001).
Taken together, the similarity of cyclic patterns observed in batch fecundity, GSl,
and late stage vitellogenic oocyte frequency strongly suggests that lunar periodicity is an
inherent characteristic of the reproductive processes of this population.
Tidal data
TIdal data indicate that at the time of spawning (approximately one half hour
before sunset (Walsh, 1984», outgoing tides were present on the day of the full moon in
every month of the sampled year (Table 2-3).
M 0.7
• a ! 0.6 • • .s ! 0.5 • r • r·4 • •
0.3 • • • 'I • I 0.2 • • • • .t • 0.1
0 4 8 12 16 20 24 28 32 36 40 44 48 52 58 60 64 Day of sampDog period
Figure 2-9. The fraction of vitellogenic stage oocytes in the late vitellogenic stage (Illc) in ovaries of Z Oavescens collected over the summer months. (See Chapter 1 for descriptions of each stage). Circles indicate individual Group S fish, diamonds indicate the mean value for each day sampled. Bars are one standard error of the mean. Full moons are denoted by lines at days 4. 34 and 63.
47

DISCUSSION
The annual reproductive season, with implicaJions lor mtIIIIlgement
Data presented here clearly suggest year-round reproductive effort in the observed
population of Z. ftavescens, with a significant increase in egg production and spawning
frequency among adult females in the spring and summer months. As this investigation
covered only a consecutive 12-month period, the possibility of inter-annual variation in
spawning could not be investigated. However, data collected in 2004 and 2005 from this
population conform to the patterns shown in this paper (M.E. Bushnell and J. T. Claisse,
unpublished data), and seasonal peaks of reproductive effort reported for populations
of Z. ftavescens on Oahu match the general trends of spring and summer reproductive
intensity established here (C.W. Laidley, pers. comm.). Year-round reproductive effort
may be a simple way to 'hedge bets' that environmental conditions will be advantageous
for new offspring at some point during the year, if not at every spawning event (Johannes,
1978; Goodman, 1984). Additionally, without physiological constraints such as large
temperature shifts in the tropics, there may be little selective pressure for Z. ftavescens to
discontinue spawning at any point in the year.
Despite the fact that egg production and spawning frequency changed
significantly over the course of the sampled year, female condition did not. Condition is
often associated with seasonal shifts in energy resources from somatic to gonadal growth
in other marine species (e.g., Kurita et aI., 2003; Brown and Murphy, 2004; Gomes and
Araujo, 2004; Mello and Rose, 2005). Because yellow tang females are reproductively
active throughout the entire year, without a clear cessation of spawning, at which point
energy may be used for somatic growth in preference to reproductive growth, maternal
condition may not fluctuate as widely in this species as in some others. Continuous
production of eggs throughout the year probably requires fairly constant metabolic
resources, resulting in little annual change in energy expenditure. Somatic growth and
maintenance would also occur at a relatively constant rate, as opposed to somatic growth 48

'spurts' between reproductive periods. The latter pattern has been reported in species with
clearly defined on- and off- seasons of spawning (Conover, 1992).
There is still a great deal to be learned about reproduction in non food-fish
tropical species. In a 2007 literature search, only a handful of papers could be found on
acanthurid reproduction (for examples, see Randall, 1961a and b; Fishelson et al., 1987;
Colin and Clavijo, 1988; Lobel, 1989; Craig, 1998), and most studies include surgeonfish
as only one of several fish families studied. Also, many of these studies were performed
using small sample sizes, and all except one were completed at least twenty years ago.
Importantly, the research detailed here may lead to further questions concerning the
seasonality of spawning in closely related species of acanthurids in the same general
location, some of which are also targeted by the Hawai'i aquarium fishery (e.g., A.
achilles, Ctenochaetus strigosus. and Naso lituratus). It is entirely possible that these
harvested surgeonfish species may also maintain a protracted spawning season, or even a
year-round spawning system similar to that of yellow tang. If so, management of all these
species may depend on other options as well as seasonal closure to protect reproductively
active fish.
The [U1IIl, cycle of spawning
Hypotheses to explain the presence of lunar cycles of spawning are common
in the scientific literature, but the actual adaptive significance of these cycles remains
unclear. Possible advantages of lunar periodicity for pelagic spawning reef fishes include:
synchronization of spawning with gamete release of invertebrates, thus increasing
availability of food sources for new hatchlings (Thresher, 1984), synchronization of
gamete release with outgoing tides to facilitate larval dispersal, or with incoming tides to
minimize larval dispersal (Johannes, 1978; Ross, 1982), and synchronization of female
and male reproductive behaviors, ensuring maximum reproductive effort and possibly
overwhelming predators (Lobel, 1978; Thresher, 1984; Omori, 1995). As stated by Walsh 49

(1987) and others, no single hypothesis is likely to be 'wholly satisfactory,' although
components of more than one hypothesis may contribute to the observed pattern of lunar
periodicity of spawning. The relevance of the above hypotheses in relation to yellow tang
spawning is addressed here.
Zebrasomafo;zvescens females release pelagic eggs in the evening. The eggs then
hatch by morning of the next day, and larvae begin to feed 2-3 days post-hatch, dependent
upon water temperature (S. Kraul, pers. comm.). The location of the larvae 2-3 days after
spawning is largely unknown, although it can be assumed that some eggs and larvae
survive within the plankton until settlement The organisms upon which yellow tang
larvae feed during the 55-day pelagic larval phase (D. Shafer, 2004) also remain largely
unidentified, so knowledge concerning the spawning cycles of these planktonic prey
awaits future research into pre-settlement characteristics and behaviors of this species.
As shown here, spawning activities (frequency of egg release and batch fecundity)
of Z. fo;zvescens increased to a peak during the 5 days surrounding the full moon. Tidal
data indicate that at the time of spawning (approximately one half hour before sunset),
outgoing tides were present on the day of the full moon in every month of the sampled
year (Table 2-3). In months with low levels of yellow tang reproduction, November 2006
through February 2007, the outgoing tide experienced at the site was the lower of the two
semidiumal high tides, marked by smaller amplitudes than outgoing tides in late spring
and summer months of April through October. Overall, it appears that the season during
which reproductive effort of adult females is concentrated - late spring and summer - is
also the period of time during which the outgoing tide is at the highest amplitude.
This spawning pattern may indicate a greater survival rate for larvae when off-reef
dispersal of eggs due to large tidal movements is available to spawning adults. Immediate
off-reef dispersal of spawned eggs has been hypothesized to aid in reduction of predation
by p1anktivorous fishes that are more likely to be closer to the reef as light levels decrease
50

(Johannes, 1978; Lobel, 1978). The month of March 2007 is an anomaly in this pattern,
as the lower high tide is still present at the full moon, yet female GSI and fecundity
values have begun an increase denoting the beginning of the next reproductive season
(Figure 2-2). However, as March is probably the start of the reproductively active portion
of the 2007 year, and the tidal 'switch' between lower high tide and higher high tide in
the afternoon occurs in the following month of April 2007, this may simply indicate that
the general pattern of increased spawning rate during outgoing higher high tides has
evolved with temporal plasticity within the population. Indeed, spawning on the outgoing
higher high tide may not be the single controlling factor involved in resumption of the
peak reproductive season for this species.
Finally, Korringa (1947) found an increased fertilization rate and increased
adult breeding rates when marine invertebrates were entrained in a lunar cycle, and this
might also be true for fish species, especially group and broadcast spawners such as Z.
jlavescens. However, underwater evening observations indicated that movement patterns
of adult yellow tang do not change throughout the month, or even throughout the year
(M.E. Bushnell and J.T. Claisse, unpublished data). Adults migrate from inshore feeding
areas to the reef crest beginning at approximately I hour before sunset, and by the time
of spawning, males have set up temporary territories that they patrol until dark. (For a
full description of crepuscular movements and behaviors of Z. jlavescens, see Walsh
(1984». Female fish will swim by, sometimes engaging in spawning behaviors with a
male, and if a diver is careful not to disturb the fish, he/she will observe a general melee
of lingering fish for the duration of the spawning period. Spawning occurs in pairs as
well as in small groups of 5-10 fish. Observations of the frequency of spawning showed
no clear indication that the number of spawns changed with the moon phase, although
dusk observations were limited in number. Based on these limited data, the existence
of a temporal peak of spawning concurrent with the full moon did not appear to affect
51

the breeding or fertilization rates of individuals in this population by synchronization
of male and female reproductive behaviors. 'Swamping' of potential predators by the
prevalence of multiple spawns at once also does not seem likely. The greatest observed
'rate' of spawning on the most active nights was about 1 spawn per minute. However,
until the specific hypothesis is addressed experimentally, this explanation for lunar cycle
entrainment will remain neither supported nor refuted by the current research.
Implications for future research
The observed pattern of female reproductive attributes (OSI and batch fecundity)
indicates peak spawning periods around full moons of the spring and summer months for
the Kona, Hawai'i Island population. The lunar pattern was observed during the 65-day
intensive sampling period performed in May-July 2006. As far as the author is aware,
there is no evidence to suggest that this cyclic pattern of spawning does not continue
throughout all months of the year, as all other reproductive activities offemales in the
wild (e.g., production of eggs, participation in spawning behaviors, evidence of spawning
at least 2 days in succession) persisted, albeit at lower levels in winter, for all 12 months.
In addition, captive fish have been shown to spawn year-round on a lunar cycle (C.W.
Laidley, unpUblished data). Therefore, the model created in Chapter 3 to estimate the
annual reproductive potential of females in this population assumes maintenance of the
lunar cycle for an entire year. Such an assumption became necessary, as continuation of
the intensive samp ling would have exhausted research resources as well as potentially
harmed the population under investigation by removing an excessive number of
reproductive females.
The lunar cycle of spawning might not have been recognized had the specific
sampling protocol, which involved sampling at the same time of day in relation to sunset,
not been used. Preliminary studies in this population (Figure 2-2) suggested that ovary
weight, and therefore OSI, increased throughout the day due to hydration of eggs, a trend 52

that was also noted in A. nigrofoscus by Fishelson et al. (1987). Had daily sampling
occurred within a larger window of time, OSI values between days would not have been
comparable due to the confounding factor of temporal increase in ovary weight Evidence
of the lunar cycling of spawning was further complicated by the extreme variability in
the number of eggs produced by individuals. On a given day in summer, the range of
batch fecundity values could be as great as 0 to 28,000 eggs. In order to assess the pattern
accurately, daily collections offish had to: (1) contain a large enough sample size to limit
the effects of large variation in egg production; (2) occur frequently enough so as not to
miss any significant periods of the cycle; and (3) continue long enough to infer repetition
of the observed pattem.
It is worth noting that the highest OSI values offemales reported in the earlier
Kona study (Lobel, 1989) ranged from approximately 2 to 3.5. On Oahu, C.W. Laidley
(pers. comm.) measured peak OSI values offemaIes up to 4.5. In contrast, the highest
female OSI of individuals measured in the current study during summer/peak months in
Kona were in the range of 4.0 to 9.1. Lobel (1989) sampled within a window of5 hours
(between 1200 hr and 1700 hr every day), which may have encompassed a significant
difference in ovary weight for fish sampled at either extreme (Figure 2-2). Furthermore,
Lobel's (1989) samples were taken in depths ranging from 8 to 20 In, habitat not
necessarily frequented by adult schools (J.T. Claiss, unpuh. data). Laidley (pers. comm.)
targeted the largest adult fish available, but did not sample consistently at any specific
time of day. Further, neither Lobel (1989) nor Laidley (pers. comm) considered the
effects of a lunar cycle on female OSI when sampling at either location. Taken together,
these differences between sampling protocols may explain the smaller OSI values
reported in past studies when compared to those in the current research. However, higher
OSI offemale tang in Kona, when compared to Oahu, may also be attributable to site
differences.
Throughout the literature, OSI is used in almost every fish reproduction study to 53

distinguish reproductively active from non-reproductive fish, using the values as an index
for maturity andlor fecundity. In Z. jlavescens, a high degree of association was observed
for GS! and batch fecundity in all adult females, as exhibited by the similar patterns of
both over the 65-day intensive sampling period as well as parallel monthly trends over
the year sampled. As the degree of association between ovarian weight, egg size, and
fecundity varies greatly between fish species (West, 1990; Jons and Miranda, 1997),
Z. jlavescens may exemplifY a species for which GSI serves as an acceptable indicator
of batch fecundity. Thus, the time-intensive process of egg counting for fecundity
measurements may not be necessary in future studies of Z. jlavescens.
Most importantly, this research has shown that the results of an investigation
of spawning that does not take into account the possibility of cyclic fluctuations of
ovary weight (and therefore of GSI) over monthly or even weekly time scales may be
misleading if there is reliance entirely upon GSI for reproductive characteristics of the
species in question. It is entirely possible that similar spawning patterns exist in other
species, especially those closely related to Z. jlavescens, and this work should serve as a
caution in the design of future studies on reef fish reproductive seasonality.
54

CHAPTER 3. The relationship of size to fecundity and an estimate of annual
reproductive output for female yellow tang (ZebrasomaJlavescens)
ABSTRACT
Relatively little information concerning the reproductive biology of surgeonfishes
has been documented, and information of value for fisheries management remains
particularly scarce. In this chapter, both a relationship between body size and fecundity
and an estimate of annual reproductive output for female Zebrasomajlavescens (yellow
tang) were sought for populations on the Kona coast of Hawai' i, where this species
is the most economically important fish in the local aquarium fishery. No significant
relationship between size (standard length (SL) or ovary-free weight (OFW» and batch
fecundity of adult females was found in this species (linear regression for SL, p < 0.086,
R2 = 3.0%; for OFW, p < 0.873, R2 = 1.7%). The lackofa significant relationship found
here for Z. flavescens may be due to a strongly laterally compressed body shape and small
total growth as adults - the total range of size variation in adult female yellow tang was
only about 5 cm. Annual reproductive output offemales was estimated from a model
of the cyclic pattern observed in fecundity data from summer 2006 collections. The
relationship detected between batch fecundity and day of the lunar cycle was then used
to estimate monthly and annual fecundity for the sampled year (approximately 1,142,000
±142,OOO eggs per female per year). Limitations of the model and the fecundity estimates
are discussed.
INTRODUCTION
A positive relationship between fecundity and size (length and/or weight) of
females has been established for many marine species, including Seriphus politus
(DeMartini and Fountain, 1981), Engraulis mordax (Hunter et al. 1985), Hemiramphus
55

brasiliensis and H. balao (McBride and Thurman, 2003), Sebastes melanops (Bobko and
Berkeley, 2004), Gadus morhua L and G. morhua callarias L (Bleil and Oeberst, 2005),
and Argyrozona argyrozona (Brouwer and Griffiths, 2005). These and other studies have
concluded that larger, and in some cases older females contribute greater numbers of eggs
during the reproductive season compared to smaller or younger individuals (reviewed by
Birkeland and Dayton, 2005). The aforementioned size-fecundity relationships have been
established mostly for food fishes with body shapes that increase considerably in length
and girth with age (e.g., gadiforms and clupeiforms). No studies have addressed the
relationship in surgeonfishes, which have a strongly laterally compressed body shape and
a sharply asymptotic growth curve (Sadovy, 1996; Choat and Axe, 1996). One objective
of the present research was to investigate the relationship between female size and batch
fecundity for Z. jlavescens - information that can be used to estimate reproductive output
for the population on the Kona coast ofHawai'i Island.
An estimate of reproductive output of adult female fish is useful for managers
of a population under intense fishing pressure, such as yellow tang in Hawai'i. Current
regulations for the Kona coast population allow collection of this species from specific
areas, but do not limit either the quantity or the size of fish taken. Conventional wisdom
assumes that if larger females are responsible for a greater proportion of reproductive
output than smaller females, size limits on take of the species might be beneficial for
population growth and maintenance. Additionally, aquaculture programs concerned with
maximizing reproductive output of Z. jlavescens for commercial sale may find the results
of this study useful.
Estimating annual fecundity for indeterminate, multiple spawning fishes is
necessarily more complicated than making such estimates for determinate-spawning
species with synchronous ovarian development. The ovaries of determinate species
contain a fixed number of oocytes that remains unchanged throughout the breeding
season up until the time of spawning (e.g. Oncorhynchus spp. and Anguilla spp.; 56

DeVlaming, 1983). This standing stock of oocytes matures simultaneously, so annual
fecundity can be assessed at any point in the life cycle of the fish prior to spawning by
simply counting all oocytes witbin the ovary (McEvoy and McEvoy, 1992); hence, the
term 'determinate' spawners. In contrast, in the ovaries of multiple spawning fishes,
maturing oocytes are recruited continually from primary stages, oocyte batches mature at
different rates throughout the season, and the fish releases the batch of most mature stage
oocytes at each spawn (Wallace and Selman, 1981). As a result, a count of the standing
stock of oocytes from the ovary of an individual indeterminate spawning fish gives little
or no information about the seasonal or annual fecundity of that individual. For multiple
spawning species such as Z. jfavescens, the only measurement of fecundity that is useful
for such estimates is batch fecundity, as determined by counting mature, hydrated
oocytes (i.e., those ready to be spawned) from a fish that has been sampled just prior to
the next spawning. (See Chapters I and 2 for spawning data.) Sampling must occur in a
time window when oocytes to be released during the upcoming spawning event can be
unambiguously identified, and yet at a time prior to the expulsion of the eggs (Hunter et
at., 1985). Measurements of batch fecundity alone are insufficient for estimating annual
fecundity, however, unless the number of egg batches released by a female over the
spawning period (i.e., spawning frequency) can also be quantified.
Several studies have attempted to quantify spawning frequency for multiple
spawning fishes (e.g., DeMartini and Fountain, 1981; Hunter and Macewicz, 1985;
Santiago and Sanz, 1992; McBride and Thurman, 2003; Stequert et al., 2003; Roumillat
and Brouwer, 2004). The most common methods involve determining the 'spawning
fraction' - that is, the proportion of females in the popUlation that are spawning - at several
time points witbin a spawning season. Due to small sample sizes, and a sampling protocol
that involved intentional sampling at assumed peak periods of reproduction throughout
the year, these methods were deemed inappropriate to the estimate of reproductive output
in the current study. 57

Instead, a mathematical model of the cyclic fluctuations observed in fecundity
of yellow tang females from the 6S-day intensively sampled period during the peak
reproductive season, May-July 2006, was created. Using this model, the number of
eggs produced per female per day in each month of the year was computed, using batch
fecundity values offish collected monthly in the year of sampling from May 2006 - April
2007 (except August 2006). The model appears to provide an estimate of fecundity that is
more appropriate for yellow tang reproductive patterns than methods previously reported
in the literature.
MATERIALS AND MEmODS
Sampling
(See Chapters 1 and 2 for detailed sampling protocols and exact numbers of fish
collected per sampling date.) Fish sampled during the 6S-day intensive sampling period
of May 8 - July 10, 2006 were collected approximately every four days, for a total of
18 samples. Between 7 and 18 females were taken in each collection. Summer sampled
fish are referred to as Group S fish. Fish sampled near-monthly for the year May 8, 2006
- April 3, 2007 were sampled on the day prior to, the day of, or the day after the full
moon, and each collection consisted of between 9 and 21 females. Monthly sampled fish
are referred to as Group M fish. All fish were collected less than 2 hours before sunset.
Fish processing
Batch fecundity and length and weight measurements were taken using methods
described in Chapter 2.
Statistical analysis
Statistical analyses were performed using Minitab 14 software. See Chapter 2 for
the basic periodic regression model used. 58

® ® 25lI00
20000
f lSllOO
i 10000
5000
o
• • Qo:I'
• •
o
• • • • • • • • • • • • • h tc ., I • ,
! !>Of' 8, • •• bOo foO :, 1<f'
'\ .00 .i • fP 0 0°0
.0 iO ~. ,0 ! 0 • 0 .0. !!.o.,~Jl:· :: ~400 II; i I 8"0 • 10 20 30 40 50 70
Day of sampIJng period
Figure 3-1. Graphical representation of the periodic regression equation from text (open circles) and batch fecundities of individual Group S female Z Ravescens (solid circles). Triangles indicate the mean batch fecundity value each day sampled. Full moons are indicated by lines at days 4, 34, and 63.
Annual fecundity estimaJe
A model of the cyclic variations in batch fecundity values observed during the
65-day summer sampling period was created to estimate daily fecundity per female for
that time period. This model incorporated the equation created by the periodic regression
analysis performed in Chapter 2 (from Cryer, 1986), which fitted the batch fecundity
values ofindividual females to a sine function, as illustrated in Figure 3-1. The mean
batch fecundity value for fish sampled at the full moon (or on the day prior or the day
after - exact sampling dates in relation to the full moon are presented in Table 3-1) of
each month of the year was then assumed to be the apex of the sine wave for that lunar
month. By shifting the amplitude of the sine curve according to the monthly mean batch
fecundity value (MBF), monthly egg production (MEP) was determined for 11 out of
13 months of the lunar year. (No collections were made in August 2006 or May 2007,
59

Table 3-1. Dates of monthly sampling of Z Davescens in relation to the full moon. The full moon is denoted by a 0, the day prior to the full moon by -I, and the day after by + I. The collection for the month of December spanned two days, as previously explained in the methods section of Chapter 2. No samples were taken in August 2006. Months sampled in 2007 are underlined; months sampled in 2006 are not
Month May Jun Jul Aug Sep Oct Nov Dec .I!m fllh Mar A!K DaylMoon 0 -I 0 - -I -I -I 0/+1 0 +1 -I 0
so values for MBF and MEP were interpolated for August based on the midpoint values
between July and September 2006, and for May 2007 based on the midpoint values
between April 2007 and the previous year's May 2006.)
From Chapter 2, periodic regression data for fecundity over the summer sampling
period gave the equation:
Y = 4274 + 3673(cos8) + 2800(sin8) (EQUATION 3-1)
Where the y-intercept, 4274 eggs, is the mean number of eggs produced by one
female per day over the 65-day sampling period. The y-intercept is the midpoint of the
sine wave. and the relationship between the Midpoint (M), Apex (A), and Trough (T) of
the wave must remain constant as the wave is transposed for each of 13 lunar months,
with different values for the apex (and hence the midpoint) determined by mean fecundity
values from samples in each month. Because the trough (the lowest number of eggs
produced per female per day) for each month cannot be negative. it is assumed to be zero
for every month, since it was approximately zero at the peak of the reproductive season.
For example, for the summer months. the equation states:
M=4274 eggs
T=4274-..Jr36-7-c3'=-+-2-800--;;"' =-344 eggs (EQUATIONS 3-2A, B, AND c)
A =4274+..)3673' +2800' =8892 eggs
Where M is the midpoint, T is the trough, and A is the apex/peak of the sine curve
for the model. Having a negative number of eggs (T = -344 eggs) is unrealistic, so the
trough is set to zero for the sake of estimation. The relationship between peak (8892) and
60

midpoint (4274) of the model curve is essentially a 2:1 ratio, which is derived from the
definition of a sine function.
Based on this relationship, the apex value of each month (the average monthly
collection fecundity measurement from Group M fish, or MBF), divided by 2 (as per the
sine wave function representation) and multiplied by 28 days in the lunar month, results
in an estimate for the average number of eggs produced per female for that lunar month,
i.e.:
MEP = MBFn x28 OR n 2 MEP n = MBFn x14 (EQUATIONS 3-3A AND B)
Once the MEP for all months was calculated, annual fecundity (AF) was
computed using the equation:
13
AF =LMEP n (EQUATION 34)
Variance of the estimate, or 0 2, was computed as the sum of the variances of
the monthly estimates (the standard error of each month, or MSE), using the following
equation:
13
OZ = 142 X L(MSE n)2 (EQUATION 3-5)
RESULTS
Size-Jecundity relationship
An extraordinary amount of variation in batch fecundity values of females of all
sizes was observed in this population. Adult female yellow tang exhibited no significant
relationship between either standard length (SL) or ovary-free weight (OFW) and batch
fecundity (SF) (N=169 fish, SL linear regression equation: BF = -14693 + 154 SL, P <
0.086, R2 = 3.0%; OFW linear regression equation: BF = 426 + 45.6 OFW, p < 0.873, R2
= 1.7%). Both relationships are illustrated in Figure 3-2. Only Group M fish were used in
the regressions.
61

The smallest female encountered with eggs inside the ovary (with a total batch
fecundity count of919 eggs) was 103 mm SL, as illustrated in Figure 3-2A. Data from
Figure 3-2A also indicate that female fish over lIS mm SL are capable of producing at
least 5000 eggs per batch.
The difference in SL between the smallest (103 mm) and largest (156 mm) adult
female measured in this study (N=490) was small - 53 MM. The largest adult from Group
M (N=169) was 144 mm SL (Figure 3-2A).
Batch fecundity of Group M females varied across months, as shown in Chapter
2, but standard lengths did not (One-way ANOYA, p < 0.S93) as illustrated in Figure 3-3.
"""A
"""
. .. ". '"
• • R'=3.0% • • • •
• • • . . • •••• · '. .. · .. . .... ..... ,_. ~ .. .... ... . -: ... ,. .
><,
-B .... • • ••• • •
• • • .. •• •• . ". ..... ., ~.: . ,~.~, ~ .~.: . .- . . .... :Vt: ~::.. .. ........ _. "'0 ..
'"
R'=1.7%
•
Figure 3-2. Relationship of batch fecundity to (A) standard length (linear regression equation: BF = -14693 + 154SL. p<O.OS6) and (8) ovary-free weight (linear regression equation: BF = 426 + 45.60FW, p<O.873) in Group M female Z Davescens.
-~ ..,
B I • • """ • ,<0 • t I I • • I t I • • I I I I i
i '" i I • ,: • • • • , I I • • - '" • • • • • ! ." • •
I I • • • • • t i , ... • I • I • •
• I • • •
I • •
I • • • • , .. ",.. I I I • • •
I • • • I • I ..
• I • • • , . • • , • • • '" 0J5.Ce C&Oe 07.0& C8.Q& w.otI tc.os 11.(1$ u.cs Dl~ G2~7 Q3.(J7 0*.Q1 eco ~ OY..QtI OB«I 0'J.4II 1~ 11-CG 12-0& ot-(I7 01.(17 0l.Q7 Q4.tI1 --. -Figure 3-3. (A) batch fecundity and (B) standard length of individual Group M female Z Davescens (solid circles). Batch fecundity varied significantly across months (from Chapter 2, Tukey's pairwise comparison p<O.OOI), but standard lengths did not (one-way ANOYA, p<O.S93). Bars indicate one standard error of the mean.
62

Table 3-2. Monthly and annual fecundity estimates of Z. Oavescens. MBF = monthly mean batch fecundity, MEP = monthly egg production, MSE = Monthly standard error, Model SE = model standard error, AF = annual fecundity, or number of eggs produced per female per year. MBF, MEP, and MSE values were interpolated for the months of August 2006 and May 2007 due to lack of sampling data.
Month N MBF MBF12 MEP MSE ModelSE May-06 12 11,804 5902 165,256 2525
Jun-06 15 6504 3252 91,056 1580
Jul-06 7 12,445 6223 174,230 3669 Aug-06 - 8381 4190 117,327 5604 Sep-06 17 4316 2158 60,424 1358
Oct-06 9 5816 2908 81,424 1561
Nov-06 14 3239 1620 45,346 1345
Dec-06 17 2741 1371 38,374 1125
Jan-07 19 1271 636 17,794 725 Feb-07 21 \113 557 15,582 772
Mar-07 \8 5802 2901 81,228 950 Apr-07 18 8136 4068 113,904 1931 May-07 - 9970 4985 139,580 5992
AF 167 1,141,525 ±141,910
Annual fecundity estimates
In previous studies (e.g., DeMartini and Fountain, 1981; Hunter and Macewicz,
1985; Santiago and Sanz, 1992; McBride and Thurman, 2003; Stequert et at., 2003;
Roumillat and Brouwer, 2004), estimates ofMEP were calculated for each of several
size classes of female fish based on a positive relationship of fecundity and total length
or weight. Since yellow tang females clearly displayed no relationship between fecundity
and length or weight (Figure 3-2) in this study, MEP values were calculated from
each sample of adult females as a whole, with no distinction made between females of
different size classes. Annual fecundity calculated from the model was estimated to be
about 1,142,000 ±142,OOO eggs per yellow tang female per year (Table 3-2).
63

DISCUSSION
Size-/ecundity relationship
A significant relationship between size and batch fecundity was not observed in
Z.jlavescens, in contrast to many other perciform species (e.g., DeMartini and Fountain,
1981; Davis and West, 1993; Roumillat and Brouwer, 2004; Brouwer and Griffiths,
2005). It is possible that positive size-fecundity relationships are not typical for fish with
strongly laterally compressed body shape and non-standard logarithmic growth patterns.
Instead, many surgeonfishes grow to near maximum length within a relatively short
period of time, and then growth essentially stops (Choat and Axe, 1996). Furthermore,
the total range of variation in maximum size of female yellow tang is very small; the
difference in length between the smallest and largest adult female measured in this study
(N=490) was only 5.3 cm. Constraints on body size, in terms oflength, width, and depth,
may restrict ovaries from growing past a maximal size, with the obvious result that the
number of eggs produced is limited by space within the body-cavity. For fully mature
female Z. jlavescens, it appears that batch fecundity varies not with length or weight of
the fish, but with other factors, such as time of month or season, as shown previously in
Chapter 2.
One common goal of fisheries biologists is to estimate the Size of First
Reproduction (SFR) for harvested fish species, which is then typically used to create
management strategies with an aim to protect spawning females. Figure 3-2A suggests
that the smallest female to produce eggs is about 103 mm SL, and that any female fish
over 118 mm SL is capable of spawning at least 5000 eggs per batch (approximately 20%
of the largest observed batch). Given the small sample size of females less than 120 mm
SL in this data set, a precise determination of the point at which 50% of the population
is producing eggs - a common definition of SFR (Sadovy, 1996) - would not be feasible,
since all size ranges of females were not sampled equally. Instead, a description of the
data which notes that 118 mm SL appears to be the length at which females provide a 64

substantial number of gametes to the population seems to be more informative, based on
the data available.
It is important to note that this study addressed only the possible relationship
between batch fecundity and size of females at peak spawning times (around the full
moon). This investigation did not address whether larger females spawn more frequently
or over a more protracted spawning season, or whether they contribute higher quality
eggs - all characteristics that have been shown to relate positively with body size in some
fish of other species (e.g., Bagenal, 1971; DeMartini and Fountain, 1981; Lambert, 1987;
Quinn et 01., 1995; Trippel and Neil, 2004; Abdoli et 01.,2005; Birkeland and Dayton,
2005).
This study also found large variability in the number of eggs produced by females
of all sizes, especially in the spring and summer. However, factors responsible for this
variability remain unknown. Production of different-size batches of eggs may follow a
pattern that was not readily discerned by the sampling method. For example, a female
may spawn for 5 days in succession, with a large batch on day 3, but smaller batches on
days 1,2,4 and 5. Larger females may exhibit patterns in spawning batch sizes that differ
from the patterns of smaller individuals. Observation of spawning habits of individual
fish over time are needed to suggest why some females spawn more eggs than others on a
given day of the lunar cycle or year.
Annualfecundity estimllJes
Previous fecundity estimation methodology and its limitations for this study
Most estimates of reproductive potential in multiple spawning fishes have
been calculated using a variation on one of two methods: the hydrated oocyte method
(DeMartini and Fountain, 1981) and the POF method (Hunter and Macewicz, 1985).
Both methods rely upon estimating spawning frequency of a population using either
the presence/absence of eggs (hydrated oocyte method) or the presence/absence of 65

histological indicators of prior spawning in the ovary (pOF method). The fraction of
females spawning within the population is compiled from fish captured on sampling days
throughout the season. Spawning frequency is then multiplied by the average number of
eggs produced per female per spawn to get an estimate of the number of eggs produced
over the course of the spawning season or year. In studies such as these, sampling is
performed at intermittently spaced time intervals, with the intent to sample as often as
possible but not necessarily at specific times in the spawning cycle.
In the current investigation, sampling was conducted only once per month (minus
August) for one calendar year, and it was performed intentionally at the time of assumed
peak reproductive effort for that month (on or near the full moon). Any calculations of
spawning frequency and of reproductive output based on these samples would therefore
overestimate reproductive output, if applied uniformly for the period of time investigated.
Furthermore, had the hydrated oocyte method been used in the current study, a
calculation of frequency of female spawning in off-season months could be misleading.
(The POF method was also not ideal, as it requires expensive histological processing.)
A female fish would have to be considered as part of the spawning fraction as long as at
least one hydrated oocyte or ovulated egg was present in the ovary at the time of capture.
According to the method, at any point in the year, a fish with 20 eggs in her ovary would
be considered an equal part of the spawning fraction as a female with 20,000 eggs. This
would hold true for calculations of spawning frequency in all months, but occurrence of
females spawning less than 100 eggs was high only in low-season months. (During the
high-season, only 4.3% offemales had between 1 and 100 eggs in the ovary; during low
season months, 11.1 % of females had between 1 and 100 eggs.) The question of whether
these fish that spawn so few eggs at a time do contribute substantially to the reproductive
potential of the population would add further uncertainty to an estimate of egg production
that relied upon spawning frequency calculated in this way. Use of the periodic regression
model, however, does not distinguish between spawning and non-spawning females, as it 66
takes into account only the number of eggs produced on a given day of the cycle by the
average female in the population.
Periodic regression model and its assumptions
These considerations suggest that, given the type of data available, using periodic
regression to model the lunar cycle of spawning produces a more accurate estimate
of annual fecundity than would be obtained by previously described methods. This is
because the periodic regression model incorporates the lunar periodicity observed in
batch fecundity of summer months into daily fecundity estimates for females year-round.
Two major assumptions are employed in this model: (1) that the lunar periodicity
of spawning observed in the summer months continues in all months of the year, and (2)
that the cyclic pattern of spawning is adequately represented by a sine wave. Neither of
these assumptions is trivial. The first assumption seems reasonable and consistent with
all present data, including that of spawning cycles observed in captive fish (C. W. Laidley,
unpublished data), and cannot be tested without extensive additional field sampling, so
it is provisionally accepted for the purposes of this estimate. To address concerns about
the use of the sine curve to approximate the change in fecundity values throughout the
months, some of the major sources of error with the use of the model should be noted.
First, a discrepancy exists between the peak fecundity of the model (which
appears on the day priorto the full moon of each month, Figure 3-1) and the assumed
'peak' of reproduction from each month, which was sampled on either the day prior
to, the day of, or the day after the full moon. In fact, considerable effort was made to
perform monthly collections on the day prior to the fulI moon (Table 3-1), and only when
sampling proved impossible due to weather conditions was sampling performed on other
days of the lunar month. Because the model serves to represent the trend observed in
average batch fecundities of females, this discrepancy is worth noting, but is considered
acceptable for the use of the model. The failure of the sampling dates to overlap exactly 67

with the model peaks may result in slight over- or underestimation of fecundity for a
given month, but given the large standard error reported for the total estimate, it is not
likely to provide much uncertainty to the overall estimate.
It should not be assumed that the day prior to the full moon of every month
represents precisely the peak of reproductive effort for all females in the population,
although this time-point was derived from the periodic regression equation, and sampling
was conducted accordingly. Information concerning the time of peak reproductive output
of this species is not precise, and the best estimate oftiming of the monthly peak of
yellow tang egg production may be that it is 'likely to be' within the 3 days prior to and
the day of the full moon (Chapter 2).
Further assumptions were made so as to make the sine function better represent
the temporal spawning patterns. The trough of the estimate was assumed to be zero
in every month, instead of using the model's sine function value, which computed a
negative number for egg production at the trough. Also, the sine function created a
broader-peaked shape than the trend in the mean batch fecundity values in the summer
(Figure 3-1). For example, in May and July, the data peaked more sharply (and at higher
y-values) than the sine curve, which underestimated peak values for those months.
Finally, the inclusion of interpolated MBF and MEP values for 2 of the 13
months analyzed (August 2006 and May 2007) adds further uncertainty to the accuracy
of the estimate. Confidence in a number created from this model is at least as limited
as the confidence interval presented, which in this case is about ±142,OOO eggs/year,
or about 12% of the estimated total egg production. The estimate of variance of the
model probably underestimates the uncertainty of annual egg production, because the
computation of the model's standard error (Equation 3-5) assumes that the multiplication
by 14, based on the sine curve function (from Equation 3-3), does not harbor intrinsic
error. Figure 3-2, as well as the preceding paragraph, clearly shows that 'intrinsic error'
is present in the sine wave function model. Nevertheless, the model seems to provide 68

a more realistic estimate of annual fecundity than would the hydrated oocyte or POF
methods, given the cyclic fluctuations in spawning activities and the limitations of the
collected data.
The results developed and presented in this chapter are intended to provide
researchers and managers with a starting point - a ''first cut" estimate of the number
of eggs the average adult female Z. ftavescens produces in one year. More accurate
estimation of the annual fecundity of this species would require significantly increased
sample sizes in addition to identification of the currently unknown variables responsible
for the large variation in batch fecundity among individual female tang sampled on the
same day.
69

SUMMARY AND CONCLUSIONS
This thesis represents the most comprehensive investigation of Zebrasomo
jlavescens reproduction to date. Information concerning the production cycle of egg
maturation, timing of spawning, fecundity, and seasonality of spawning presented herein
provides researchers with an understanding of the basic reproductive biology of this
surgeonfish species. This information will further contribute to the scientific pursuit
of knowledge of reproduction in other multiple spawning fishes in the marine tropics.
Specific conclusions resulting from the completion of this work are highlighted below.
Histological investigation of ovaries
Information obtained through histological investigation of this species proved
fundamental to the successful execution of this study. Microscopic analysis of ovaries
revealed that Z. jlavescens is a multiple spawning species with indeterminate fecundity
characterized by asynchronous development of oocytes. The prevalence of females
spawning for at least two consecutive days was documented, and confirmation of a diel
pattern of spawning was achieved. Without specific insights into the timing and frequency
of spawning of female tang, the investigation of spawning seasonality in this species
would have been much less informative.
Based on the findings presented here, histological investigation of ovarian
composition and oocyte maturation is suggested for studies of related acanthurid fishes
prior to investigation of other aspects of their reproduction. Differences in timing of egg
production, spawning behaviors, spawning seasonality and presence/absence of lunar
cycles have been observed in the fewacanthurid species previously studied (Randall,
1961a, 1961b; Fishelson et al., 1987; Colin and Clavijo, 1988; Fouda et al., 1988). This
thesis offers support for the use of histology as the most accurate tool for determining
70

spawning patterns of multiple-spawning females, and the evidence presented indicates
that histology should be at least considered as an essential first step in the investigation of
egg production in most indeterminate spawning fish species.
Zebrasomtl ftavescens spawning
A protracted spawning season was observed for Z. jlavescens in the Kona
population, with peak reproductive effort during the spring and summer months. A lunar
cycle of spawning was also detected, with an increase in the number of eggs produced
and the number of spawning events occurring around the full moon.
The studied population exhibited a high degree of variability in the size of egg
batches, which was not explained by either length or weight offemales. However,
variability in batch size was partially associated with temporal changes in relation
to the moon phase. Diel and lunar spawning patterns had been masked by sampling
methodologies used in earlier studies which did not recognize either daily or monthly
cycles of spawning in other locations (Lobel 1989; C.W. Laidley, pers. comm.). It is
likely that some variables contributing to differences in individual spawning frequency
and fecundity were missed in the current investigation. More work is necessary to fully
understand the major variables responsible for differing levels of reproductive output
between females of this species.
The estinulJe of annual reproductive outputfor female Zebrasomtl jlllvescens
This is the first study to investigate annual fecundity of Z. jlavescens, and in
fact, one of only two studies to investigate fecundity of any member of the family
Acanthuridae. The previous investigation of Ctenochaetus striatus by F ouda et al. (1998)
reported fecundity ranging from 46,963 to 575,448 eggs, with oocyte size frequency
distributions of females suggesting 'continuous egg production. ' Unfortunately, no
definition of 'fecundity' appears in the paper. (The methods section states that the 71

number of 'eggs' per female was extrapolated from weighted subsamples of ovaries of 23
individuals, but the 'eggs' counted were not explicitly defined, e.g., as mature or hydrated
oocytes.) The fecundity measurement reported by F ouda et al. (1998) could very well be
the number of oocytes of all stages found within the ovary upon dissection. As shown in
Chapter 2 and discussed in Chapter 4 of the present thesis, this gives little information as
to the realized seasonal or annual fecundity of a multiple-spawning fish. It seems equally
likely that the fecundity values reported by Fouda et al. (1998) may, in fact, refer to a
count of fully mature eggs. Unfortunately, without an estimate of spawning frequency
for C. striatus, the relationship between Fouda et at. 's (1998) reported fecundity and the
realized annual fecundity of the species is difficult to interpret and probably not usable in
any practical management context. Furthermore, Fouda et al. 's (1998) measurement of
fecundity for C. striatus is not comparable to the annual fecundity values reported here
for the closely related species Z fIovescens. It is clear that the concept of "fecundity"
must be carefully defined in each study, in order that the results be interpreted correctly
by interested scientists.
In the present study, estimation of total annual fecundity of Z. jlavescens, a
multiple-spawning fish, required use of a mathematical model to replicate the cyclic
pattern observed in batch fecundity data of summer sampled fish. The model estimated
fecundity of the individual yellow tang female to be 1,141,525 ± 141,910 eggs per year.
It is the intent of this work that this reproductive estimate of Z. jlavescens be used in a
management context for the location studied, and also that the method of estimation of
annual fecundity be considered for use in the investigation of egg production for other
populations of Z. jlavescens. and for similarly reproducing species.
72

LITERATURE CITED
Abdoli, A., Pont, D. & Sagnes, P. (2005). Influence of female age, body size and environmental conditions on annual egg production of the bullhead. Journal ofFish Biology 67,1327-1341.
Bagenal, T. B. (1971). The interrelation of the size offish eggs, the date of spawning and the production cycle. Journal of Fish Biology 3, 207-219.
Birkeland, C. & Dayton, P. K. (2005). The importance in fishery management ofleaving the big ones. Trends in Ecology and Evolution 20. 356-358.
Bleil, M. & Oeberst, R. (2005). The potential fecundity of cod in the Baltic Sea from 1993 to 1999. Journal of Applied Ichthyology 21, 19-27.
Bobko, S. J. & Berkeley, S. A. (2004). Maturity, ovarian cycle, fecundity, and agespecific parturition of black rockfish (Sebastes melanops). Fishery Bulletin 102, 418-429.
Brouwer, S. L. & Griffiths, M. H. (2005). Reproductive biology of carpenter seabream (Argyrozona argyrozona) (Pisces: Sparidae) in a marine protected area. Fishery Bulletin 103,258-269.
Brown, M. L. & Murphy, B. R. (2004). Seasonal dynamics of direct and indirect condition indices in relation to energy allocation in largemouth bass MlCropterus salmoides (Lacepede). Ecology of Freshwater Fish 13, 23-36.
Choat, J. & Axe, L. (1996). Growth and longevity in acanthurid fishes: an analysis of otolith increments. Marine Ecology Progress Series 134, 15-26.
Colin, P. L. & Clavijo, I. E. (1988). Spawning activity of fishes producing pelagic eggs on a shelf edge coral reef, southwestern Puerto Rico. Bulletin of Marine Science 43, 249-279.
Conover, D. O. (1992). Seasonality and the scheduling of life history at different latitudes. Journal ofFish Biology 41, 161-178.
Coward, K. & Bromage, N. R. (1998). Histological classification ofoocyte growth and the dynamics of ovarian recrudescence in 1i/apia zilli. Journal of Fish Biology 53, 285-302.
Craig, P. C. (1998). Temporal spawning patterns of several surgeonfishes and wrasses in American Samoa. Pacific Science 52,35-39.
73

Cryer, J. (1986). Time series analysis. Boston: Duxbury Press.
Davis, T. L. o. & West, G. 1. (1993). Maturation, reproductive seasonality, fecundity, and spawning frequency in Lutjanus vittus (Quoy and Gaimard) from the North West Shelf of Australia. Fishery Bulletin 91, 224-236.
DeBruyn, A. M. H. & Meeuwig, J. J. (2001). Detecting lunar cycles in marine ecology: periodic regression versus categorical ANOVA. Marine Ecology Progress Series 214, 307-310.
DeMartini, E. E. & Fountain, R. 1(. (1981). Ovarian cycling frequency and batch fecundity in the queenfish, Seriphus politus: Attributes representative of serial spawning fishes. Fishery Bulletin 79, 547-560.
DeViaming, V. (1983). Oocyte development patterns and hormonal involvements among teleosts. In Control Processes in Fish Physiology (Rankin, 1. C., Pitcher, T. J. & Duggan, R. T., eds.), pp. 176-199. London: Croom Helm.
Figuerola, M., Matos-Caraballo, D. & Torres, W. (1998). Maturation and reproductive seasonality of four reef fish species in Puerto Rico. Proceedings of the Gulf and Caribbean Fisheries Institute 50, 938-968.
Finn, R. N., Fyhn, H. J., Norberg, B., Munholland, 1. & Reith, M. (1999). Oocyte hydration as a key feature in the adaptive evolution of teleost fishes to seawater. In Proceedings of the 6th International Syposium on the Reproductive Physiology ofFish, pp. 289-291. University of Bergen: Bergen.
Froese, R. (2006). Cube law, condition factor and weight-length relationships: history, meta-analysis and recommendations. Journal of Applied Ichthyology. 22, 241-253.
Fishelson, L., Montgomery, L. W. & Myrberg, Jr., A.H. (1987). Biology of surgeonfish Acanthurus nigrofoscus with emphasis on changeover in diet and annual gonadal cycles. Marine Ecology Progress Series 39,37-47.
Fouda, M. M., EI-sayed, A. A. & Zaki, Z. T. (1988). Reproductive biology ofa Red Sea surgeonfish Ctenochaetus striatus (Quoy and Gaimard, 1824). In 6th International Coral Reef Symposium. Townsville, Qld (Australia).
Goetz, F.W., Berndtson, A.K. & Ranjan, M. (1991). Ovulation: mediators at the ovarian level. In Vertebrate Endocrinology: Fundamentals and Biomedical Implications (p. 1(. T. Pang & M. P. Schreibman, eds.), pp. 127-203. San Diego: Academic Press, Inc.
Goetz, F.W. (1983). Hormonal control of oocyte final maturation and ovulation in fishes. In Fish Physiology, Volume IXB: Reproduction. (Hoar, w. S., Randall, D. J. & Donaldson,
74

E. M., eds.), pp 117-170. New York: Academic Press, Inc.
Gomes, I. D. & Araujo, F. G. (2004). Influences of the reproductive cycle on condition of marine catfishes (Siluriformes, Ariidae) in a coastal area at southeastern Brazil. Environmental Biology of Fishes 71, 341-351.
Goodman, D. (1984). Risk spreading as an adaptive strategy in iteroparous life histories. Theoretical Population Biology 25, 1-20.
Hunter, 1. R. & Goldberg, S. R. (1980). Spawning incidence and batch fecundity in northern anchovy, Engraulis mordax. Fishery Bulletin 77, 641-652.
Hunter, 1. R., Lo, N. C. H. & Leong, R. 1. H. (1985). Batch Fecundity in Multiple Spawning Fishes. NOAA Technical Report NMFS 36. (Reuben Lasker, ed.), pp. 67-77.
Hunter, 1. R. & Macewicz, B. 1. (1985). Measurement of Spawning Frequency in Multiple Spawning Fishes. NOAA Technical Report NMFS 36. (Reuben Lasker, ed.), pp. 79-94.
Isaac-Nahum, V.I., Cardoso, R. D., Servo, G. & Rossi-Wongtschowski, C. L. B. (1988). Aspects of the spawning biology of the Brazilian sardine, Sardinella brasiliensis (Steindachner, 1879), (Clupeidae). Journal ofFish Biology 32,383-396.
Iackson, M. W., Nieland, D. L. & Cowan, 1. H. (2006). Diel spawning periodicity of red snapper Lutjanus campechanus in the northern Gulf of Mexico. Journal ofFish Biology 68, 695-706.
Iohannes, R. E. (1978). Reproductive strategies of coastal marine fishes in the tropics. Environmental Biology of Fishes 3, 65-84.
Ions, G. D. & Miranda, L. E. (1997). Ovarian weight as an index offecundity, maturity, and spawning periodicity. Journal of Fish Biology 50, 150-156.
Korringa, P. (1947). Relations between the moon and periodicity in the breeding of marine animals. Ecological Monographs 17, 347-381.
Kritzer, 1. P. (2004). Sex-specific growth and mortality, spawning season, and female maturation of the striped bass (Lutjanus caponotatus) on the Great Barrier Reef. Fishery Bulletin 102, 94-107.
Kurita, Y., Meier, S. & Kjesbu, O. S. (2003). Oocyte growth and fecundity regulation by atresia of Atlantic herring (Clupea harengus) in relation to body condition throughout the maturation cycle. Journal of Sea Research 49, 203-219.
75

Lambert, T. C. (1987). Duration and intensity of spawning in herring Clupea harengus as related to the age structure of the mature population. Marine Ecology Progress Series 39, 209-220.
Lobel, P. S. (1978). Diel, lunar, and seasonal periodicity in the reproductive behavior of the pomacanthid Centropyge potteri and some reef fishes in Hawaii. Pacific Science 32, 193-207.
Lobel, P. S. (1989). Ocean current variability and the spawning season of Hawaiian reef fishes. Environmental Biology of Fishes 24, 161-I 7 I .
lowe-McConnell, R. H. (1979). Ecological aspects of seasonality in fishes of tropical waters. Symposium of the Zoological Society of London 44, 219-241.
Maack, G. & Segner, H. (2003). Morphological development of the gonads in zebrafish. Journal of Fish Biology 62, 895-906.
Macchi, G. J., Acha, E. M. & Lasta, C. A. (1999). Spawning frequency and batch fecundity of the whitemouth croaker (Micropogoniasjurnien) of the Rio De La Plata estuary, Argentina-Uruguay. In Proceedings of the 6th International Syposium on the Reproductive Physiology ofFish, p. 103. Institute of Marine Research and University of Bergen: Bergen.
Matsuyama, M., Adachi, S., Nagahama, Y. & Matsuura, S. (1988). Diurnal rhythm of oocyte development and plasma steroid hormone levels in the female red sea bream, Pagrus major, during the spawning season. Aquaculture 73, 357-372.
May, R. C., Akiyama, G. S. & Santerre, M. T. (1979). Lunar spawning of the threadfin, Polydacylus sexfilis, in Hawaii. Fishery Bulletin 76, 900-904.
McBride, R. S. & Thurman, P. E. (2003). Reproductive biology of Hemiramphus brasiliensis and H. balao (Hemiramphidae): maturation, spawning frequency, and fecundity. Biological Bulletin 204, 57-67.
McEvoy, L. A. & McEvoy, J. (1992). Multiple spawning in several commercial fish species and its consequences for fisheries management, cultivation and experimentation. Journal of Fish Biology 41, 125-136.
Mello, L. G. S. & Rose, G. A. (2005). Seasonal cycles in weight and condition in Atlantic cod (Gadus morhua L.) in relation to fisheries. ICES Journal of Marine Science 62, 1006-1015.
Mizushima, N., Nakashima, Y. & Kuwamura, T. (2000). Semilunar spawning cycle of the humbug damseIfish Dascyllus aruanus. Journal of Ethology 18, 105-108.
76

Nelson, J. S. (2006). Fishes of the world Fourth edition. New Jersey: John Wiley & Sons, Inc.
Omori, K. (1995). The adaptive significance of a lunar or semi-lunar reproductive cycle in marine animals. Ecological Modelling 82, 41-49.
Patino, R.. & Sullivan, C. V. (2002). Ovarian follicle growth, maturation and ovulation in teleost fish. Fish Physiology and Biochemistry 26,57-70.
Patino, R.., Thomas, P. & Yoshizaki, G. (2003). Ovarian follicle maturation and ovulation: an integrated perspective. Fish Physiology and Biochemistry 28, 305-308.
Privitera, L. A. (2002). Reproductive biology of the coral-reef goby, Asterropteryx semipunctata, in Kaneohe Bay, Hawaii. Environmental Biology of Fishes 65, 289-310.
Quinn, T. P., Hendry, A. P. & Wetzel, L. A. (1995). The influence of life history trade-ofTs and the size of incubation gravels on egg size variation in sockeye salmon (Oncorhynchus nerka). Gikas 74, 425-438.
Randall, J. E. (1961a). A contribution to the biology of the convict surgeonfish of the Hawaiian Islands, Acanthurus triostegus sandvicensis. Pacific Science 15, 215-272.
Randall, J. E. (1961b). Observations on the spawning ofsurgeonfishes (Acanthuridae) in the Society Islands. Copeia, 237-238.
Ransom, W. H. (1867). Observations on the ovum of osseous fishes. Philosophical Transactions of the Royal Society of London 157,431-501.
Ravaglia, M. A. & Maggese, M. C. (2002). Oogenesis in the swamp eel Synbranchus marmoratus (Bloch, 1795) (Te1eostei: Synbranchidae). Ovarian anatomy, stages of oocyte development and micropyle structure. Biocell26, 325-337.
Rideout, R.. M., Maddock, D. M. & Burton, M. P. M. (1999). Oogenesis and the spawning pattern in Greenland halibut from the North-west Atlantic. Journal of Fish Biology 54, 196-207.
Robertson, D. R.., Petersen, C. W. & Brawn, J. D. (1990). Lunar reproductive cycles of benthic-brooding reef fishes: reflections oflarval biology or adult biology? Ecological Monographs 60, 311-329.
Ross, R.. M. (1982). Annual, semilunar and die1 reproductive rhythms in the Hawaiian labrid Thalassoma duperrey. Marine Biology 72, 311-318.
Roumillat, W. A. & Brouwer, M. C. (2004). Reproductive dynamics offema1e spotted
77

seatrout (Cynoscion nebulosus) in South Carolina. Fishery Bulletin 102, 473-487.
Sadovy, Y. J. (1996). Reproduction in reef fish species. In Reef Fisheries (polunin, N. V. C. & Roberts, C. M., eds.), pp. 15-59. London: Chapman and Hall.
Santiago, J. & Sanz, A. (1992). Daily fecundity of the Bay of Biscay anchovy, Engraulis encrasicolus (L.), population in 1988. Boletin del Instituto Espanol de Oceanogrqfia 8, 215-224.
Sanz, A., Motos, L. & Uriarte, A. (1992). Daily fecundity of the Bay of Biscay anchovy, Engraulis encrasicolus (L.), population in 1987. Boletin del Instituto Espanol de Oceanogrqfia 8, 203-213.
Scott, A. P. (1987). Reproductive endocrinology offish. New York: Plenum Press.
Scott, S. G., Zeldis, J. R. & Pankhurst, N. W. (1993). Evidence of daily spawning in natural populations of the New Zealand Snapper Pagrus auratus (Sparidae). Environmental Biology of Fishes 36, 149-156.
Shafer, D.J. (2004). Early life history strategies and population dynamics of select tropical reef fishes in Hawai'i. Final Progress Report submitted to the Hawaii Coral Reef Initiative Program, Honolulu Hawai'i.
Selman, K. & Wallace, R A. (1989). Review of cellular aspects ofoocyte growth in teleosts. ZoolOgical Science 6, 211-231.
Selman, K., Wallace, R. A. & Barr, V. (1988). Oogenesis in Fundulus heteroclitus V. The relationship of yolk vesicles and cortical alveoli. Journal of Experimental Zoology 246, 42-56.
Selman, K., Wallace, R. A., Sarka, A. & Qi, X. (1993). Stages of oocyte development in the zebrafish, Brachydanio rerio. Journal of Morphology 218, 203-224.
Somarakis, S., Ganias, K., Tserpes, G. & Koutsikopoulos (2004). Ovarian allometry and the use of the gonosomatic index: a case study in the Mediterranean sardine, Sardina pilchardus. Marine Biology 146, 181-189.
Soyano, K., Masumoto, T., Tanaka, H., Takushima, M. & Nakamura, M. (2003). Lunarrelated spawning in honeycomb grouper, Epinephelus merra. Fish Physiology and Biochemistry 28,447-448.
Stequert, B., Menard, F. & Marchal, E. (2003). Reproductive biology of Vinciguerria nimbaria in the equatorial waters of the eastern Atlantic Ocean. Journal of Fish Biology 62, 1116-1136.
78
Stratoudakis, Y., Bernal, M., Ganias, K. & Uriarte, A. (2006). The daily egg production method: recent advances, current applications and future challenges. Fish and Fisheries 7,35-57.
Takemura, A., Rahman, S., Nakamura, S., Park, Y. J. & Takano, K. (2004). Lunar cycles and reproductive activity in reef fishes with particular attention to rabbitfishes. Fish and Fisheries 5, 317-328.
Thresher, R. E. (1984). Reproduction in reeffishes. Hong Kong: T.F.H. Publications, Inc. Ltd.
Trippel, E. A. & Neil, S. R. E. (2004). Maternal and seasonal differences in egg sizes and spawning activity of northwest Atlantic haddock (Melanogrammus aeglejinus) in relation to body size and condition. Canadian Journal of Fisheries and Aquatic Sciences 61, 2097-2110.
lYler, C. R. & Sumpter, J. P. (1996). Oocyte growth and development in teleosts. Reviews in Fish Biology and Fisheries 6, 287-318.
Vagelli, A. A. & Volpedo, A. V. (2004). Reproductive ecology of Pterapogon kaudernl, an endemic apogonid from Indonesia with direct development. Environmental Biology of Fishes 70, 235-245.
Van den Hurk, R. & Peute, J. (1979). Cyclic changes in the ovary of the rainbow trout, Salmo gairtineri, with special reference to sites of steroidogenesis. Cel/Tissue Research 199,289-306.
Wallace, R. A. & Selman, K. (1981). Cellular and dynamic apsects of oocyte growth in teleosts. American Zoology 21, 325-343.
Walsh, W. J. (1984). Aspects of nocturna1 shelter, habitat space and juvenile recruitment in Hawaiian coral reef fishes. PhD dissertation. University of Hawaii.
Walsh, W. J. (1987). Patterns of recruitment and spawning in Hawaiian reeffishes. Environmental Biology of Fishes 18, 257-276.
West, G. (1990). Methods of assessing ovarian development in fishes: a review. Australian Journal of Marine and Freshwater Research 41, 199-222.
Williams, E. H. & Shertzer, K. W. (2005). Effects of fishing on growth traits: a simulation analysis. Fishery Bulletin 103, 392-403.
Williams, G. H. & Blood, C. L. (2003). Active and passive management of the recreational fishery for Pacific halibut off the U.s. west coast North American Journal of Fisheries Management 23, 1359-1368. 79