Embed Size (px)
Citation preview

Repot No. 6138-O0
KoreaManaging the Industrial Transition(In Four Volumes) Volume II: Selected Topics
July 31, 1986
Country Programs DepartmentEast Asia and Pacific Regional Office
FOR OFFICIAL USE ONLY
U
Document of the World Bank
This report has a restricted distribution and may be used by recipientsonly in the performance of their officlal duties. Its contents may not otherwisebe disclosed without World Bank authorization.
Pub
lic D
iscl
osur
e A
utho
rized
Pub
lic D
iscl
osur
e A
utho
rized
Pub
lic D
iscl
osur
e A
utho
rized
Pub
lic D
iscl
osur
e A
utho
rized

GLOSSARY AND ABBREVIATIONS
DMB Deposit-Money BankEPB = Economic Planning BoardJCI = Heavy and Chemical IndustryKDI Korea Development InstituteKIET = Korean Institute for Economics and TechnologyKIRI = Korea Development InstituteKSIC = Korea Standard Industrial ClassificationMOST = Ministry of Science and TechnologyMTI = Ministry of Trade and Industry (Korea)NBFI = Non-bank Financial InstitutionNIC Newly-Industrializing CountryOECD = Organization for Economic Cooperation and DevelopmentOPEC Organization of Petroleum Exporing CountriesRCA = Revealed Comparative AdvantageSMI Small and Medium IndustryTOE = Ton of Oil EquivalentWPI = Wholesale Price Index

FoM OfNcIAL USE ONLY
PREFACE
Volume II contains five chapters of analytic importance in under-standing Korea's recent economic development. Chapter 6 addresses the issuesof industrial transformation, using the latest (1983) input-output table asthe basis of analysis, and also examines the issue of industrial concentra-tion. Chapter 7 reviews the contuct of macroeconomic policy in the recentpast, focusing in particular on structural changes which affect the relation-ship between instruments and targets. In Chapter 8, the issue of liberaliza-tion sequencing is addressed and the risks of the Latin American experienceare reviewed. Chapter 9 includes both a conceptual treatment of the theory ofindustrial interventions and applications for gorea as well as a summary ofrecent Japanese restructuring activities. Chapter 10 examines the linkbetween industrial performance and access to financing.
Thisdoument tm a estit dirbuto and may be ed by nrdpInb ony i th pefofm _of ti ofAcidutiesa Its contnts may oderwie be disckd w_h Wodd BDnk _mthuo
KOREA
MANAGING THE INDUSTRIAL TRANSITION
VOLUME II: SPECIAL TOPICS
Table of Contents
Page No.
Chapter 6: Korea's Industrial StructureI........................... 1A. Introduction .............. I.............................. 1B. Structural Changes in the Economyonm....................... I
Shifts in Production ......... I1Trends in Manufacturing........ 1Increasing Use of Intermediate Inputs.................... 5Changes in Trade Structure..... * e0e040*0 9
C. Import Substitution in the HCI Sector ...................... 12Reducing Import Dependency........................ ....... 12Foreign Markets in HCI Products.o d u c ts.....e............. 14O v e r v i ew.. s0*e.ee~e ec. ........... ............. ........... 16
D. Future Structural I ss u e s 17Future Projections... 17Employment Issues. .............. .. . 21Productivity Issues 21R&D Policy........ .............................. 22
E. The Issue of Industrial Organization... 24I.trod.cti.............. . ........ ............... . ......... 24Changes in. Establishment Size 25Firm Concentration in Manufacturing.....*.*-..*****.. e.-. 28Rising Influence of Conglomerates........................* 29Concentration and Efficiency.............e.............. 33
Appendix 6A: International Comparisons................e............ 35Appendix 6B: Sources of Goo w t h 43
Chapter ?: The Conduct of Macroeconomic Policyl...... 48A.*nrd uto 48S. The Determinants of Investment and Inflation, 1982-85....... 51
Monetary Policy and Investment........................... 51Investment and Foreign Income Growth..................... 52The Role of NBF1s.......... ................ 52The Incidence of Credit Reduction.....................o.. 55Investment and Interest Rates a t........es................ 57Macro Policy and Inf n . .i o . 58Wages and Productivity... .......................... 59Import Price Developments... 62Energy Use Adjustments and Inflationf..... 62Inflationary Expectations.......................e......... 63

- ii -
Page No.
C. Monetary Policy in the Medium Run.......................... 64Monetary Policy and .B FIs 64Monetary Policy and the Corporate Finance Structure...... 65Sterilization and Current Account Surpluses.............. 66
D. Exchange Rate Management 67Impact on the Current Account............................ 68Impact on Inflation ................ ....... 70
D. Lessons for Future Poc in. -msing 72
Chapter 8: Economic Liberalization and the Sequencing of Reforms... 74A. Conceptual Issues ....... 74B. The Capital Account, the Current Account and the Real
Exchange R6................... ......................... ... 76C. Economic Reform, Efficiency and Credibi1it-.....o........ 78D. Review of Sequencing and Implementation.t............ on.... 80
Appendix 8A: Financial Liberalization Risks: Lessons from theSouthern Cone . 82
Chapter 9: The Theory of Industrial Policy in the Korean Context... 85A. Incentive Reiegime... 85B. Functional Invervention..o.....o...e............. . * ..... .. 86
Technology Development........... ..... . .. .......... 86Manpower Development ...... 87Capital Makte t. 37Competition Pollicy. 88
C. Selective Int ervention............. . e. . e. .... o... oo.... 88Sunrise Industries............ .. ...................... .. . 89Sunset Indusriee s 91
Appendix 9A: The Japanese Approach to Industrial Restructuring..... 93
Chapter 10: The Role of Finance and Industrial Performance........* . 99A, Introduction................... ..... . . .... .... . .. . .......... 99S. The Sectoral Experienceeeo*oooo******oo&* 101
Large Firms vs. Sm.ll/Medium Firm i r mso#o................ 102Heavy Chemical Industry vs. Light Industryu....... so**** 102Fxport Industry vs. Domestic Industryo..*&o#..o,o**oo*-*. 103
C. The Experiences of Specific Industries..................... 104D. Overall Assessment 105
Distortive Allocation of Credit.....e d it...............e. 105High Leverage of Firms and Poor Development ofthe Equity Ma r k et..... 106
High Industrial Concentratione...... ... ................o.., 106Slow Development of the Financial Sector................* 106The Implications of Financial LiberalizationSince 1980...................... 107

-iii -
Page go.
E. Future Implications *..................................... 107The Banking Indust tel*--*-*****++**--***.............................. nCapital lobt......... **........ 0Stable Inflation ................. ............... 108Interest Rates and Corporate Profitability ............... 108Policy Coordination ................. . 109
List of References ............ 132
List of Tables
Table 6.1: Structural Change in Production....................... 26.2: Structural Change in Manufacturing.................... 36.3: Significant Changes in the Metals and Machinery
Industry ................ .............................. 46.4: Interindustry Linkages ..............................e 76.5: Top Ten Exports ....................................... 86.6: Changes in Capital-Labor Ratios....................... 96.7: Korea's Revealed Comparative Advantage................. 116.8: Import Dependency in the Heavy-Chemical Industry...... 136.9: Direct and Indirect Import Requirements in
Production......................................e..............146.10: Changes in Export Ratios.............................. 156,11: Captcity Utilization by Industrial Classification ..... 176.12: CDP Projections.................... . 196.13: Comparison of Output Structures in Korea and Japan.... 206.14: Comparative R&D Expenditure-to-Sales Ratios........... 246.15: Manufacturing Firms' R&D.............................. 256.16: Various Manufacturing Production Indicators by
Firm be .................... . 276.17: Establishments by Size in Korea and Japan: 1982...... 286.1a: Average 3 Firm Concentration Ratios................... 286.19: Market Structure of Korean Manufacturing.............* 306.20: Shares of Largest 50 and 100 Firms in Manufacturing... 316.21: Conglomerates Share in Manufacturing.................9 32
Table A6.1: Composition of Value Added in Various Countries....... 38A6.2: Composition of Value Added in Manufacturing ........... 41
Table 86.1: Changes in Structure of Demand........................ 44B6.2: Sources of Output Growth in Manufacturing............. 4486.3: Sources of Output Growth for Various Economiesw....6.. 45B6.4: Supply-Side Sources of Growth......................... 46
Table 7.1: Recent Macroeconomic Performance and Policy Stances... 497.2: Growth in World Income and Trade...................... 537.3: Monetary Development ......... . .......... ..... ......... 557.4: Interest Rate Developments, 1982-85 ..... ....09*000***00 567.5: Structural Developments in Financial System........... 567.6: Composition of Gross Domestic Investment.............. 57

- iv -
Page No.
7.7: Productivity and Wages in Manufacturing............-... 597.8: Average Incremental Capital Output Ratios, 1978-84.... 617.9: Import Price Index Developments............... 627.10: Indicators of Energy Use................ 637.11: Comparative Debt-Equity Ratios (Manufacturing
Sectore ................. ~~667.12: Range of Estimates of Key Trade Elasticities.......... 687.13: Import Generation Coefficients............... 70
Table 9.1: Effects of Targetting According to a "Value Added"Criterion .......... * ~~~~90
Table A9.1: Capacity Reductions Under the 1978 JapaneseRestructuring Law 95
A9.2: Capacity Reduction Plans Under the 1983 JapaneseRestructuring Law 96
Table 1?.1: Sources of NIF......................... . 11010.2: Uses of II 11110.3: Interest Rates on Various Loans*****&****************& 11210.4: Effectije Cost of Foreign Loansa.,.................... 11310.5: Size and Share of Policy Loan by DMB........00.... 11410.6: The Uses of Commercial Banks Net Increase of
Deposit (1981....... 11510.7: Access to Borrowings by Each Sector c t or.....*..... 11610.8: Debt Ratio of Each Sectore ct..........or....,. ee... e.. 11710.9? Average Cost if Borrowing by Each Sectorctor.......... 11810.10: Average Rate of Return on Investment by Each Sector... 11910.11: Profitability of Each Sector... 12010.12: Net Sales Growth Rate of Each Sector c t or............ 12110.13: Access to Borrowing by Each Industryustry#**9**....... 12210.14: Debt Ratio by Each Industry ...... 12310.15: Average Cost of Borrowing by Each Industrystry**o**... 12410.16: Average Rate of Return on Investment by Each Industry 12510.17: Profit Ratio of Each Industry.... 12610.18: Net Sales Growth Rate of Each Industry#*************** 12710.19: Korea ... .................. 12810.20: Japnp.... 12910.21: Bank's Credit Allocation by Industryustry............. 130
List of Figures
Figure 6.1 Intermediate Input Share in Productioni............... 66.2 Shares of R&D Expenditure in GUP 23
Figure A6.1 Structure of Agriculture and Man' acturingturing.e*. 37A6.2 Patterns of Development: Heavy industryustry..... 39A6.3 Patterns of Development: Light Industryuesoooooetry 42
v
Pa.e no.
List of Boxes
Box 6.1 Korea's Industrial Flexibility at the Firm Level........... 12
Box 7.1 The Determinants of Aggregate Private Investment........... 547.2 The Veterminants of Curb Market Interest Rates ........ ...0.. 607.3 The Determinants of the Real Effective Exchange Rate*....... 71
CHAPTER 6: KOREA'S INDUSTRIAL STRUCTURK
A. Introduction
6.01 The purpose of this chapter is to briefly review the major changesin industrial structure that have occurred since 1970. Part I examines indus-trial structure per se, utilizing the latest (1983) input-output relationshipsand analyzes how the economy, esvecially the manufacturing sector, has changedsince 1970. Part II looks specifically at the import substitution phase andattempts to idevtify changes in Korea's industrial structure that emerged fromthis controversial policy, as well as the linkages between HCI, import depend-ency and export development. In Part III the future structure of Koreanindustry is reviewed and several policy issues, namely employment,productivity and R&D are identified. Part IV is devoted to the issue ofindustrial concentration, an issue of rising importance in the Korean context,particularly insofar as conglomerates are concerned. Finally, Appendix 6Aexamines the Korean experience in the context of the international comparisonsof growth framework, while Appendix 68 looks at Korea's historical sources ofgrowth from both the supply and demand perspectives.
B. Structural Changes in the Econom,
Shifts in Production
6.02 The structure of production continued shifting from agriculture tomanufacturing throughout the 1970-83 period, regardless of the indicator(output, value added, or employment) of measurement. According to outputstructure, for example, the share of agriculture declined drastically from 17%in 1970 to 8.3% in 1980, but remained virtually unchanged since then (Table6.1). On the contrary, the share of manufacturing increased sharply from40.32 in 1970 to 50.4Z in 1975, and maintained that level through 1983.Despite the similarity in the direction of change in production structuremeasures, the variation in the size of sectoral shares is quite differentdepending on the indicator chosen. In 1983 agriculture contributed 29.3X ofemployment and 14.1% of value added, while its share of output was only8.22. In contrast, manufacturing captured 50.0X of output in 1983, while itonly accounted for 22.2Z of employment and 29.51 of value added.
Trends in Manufacturing
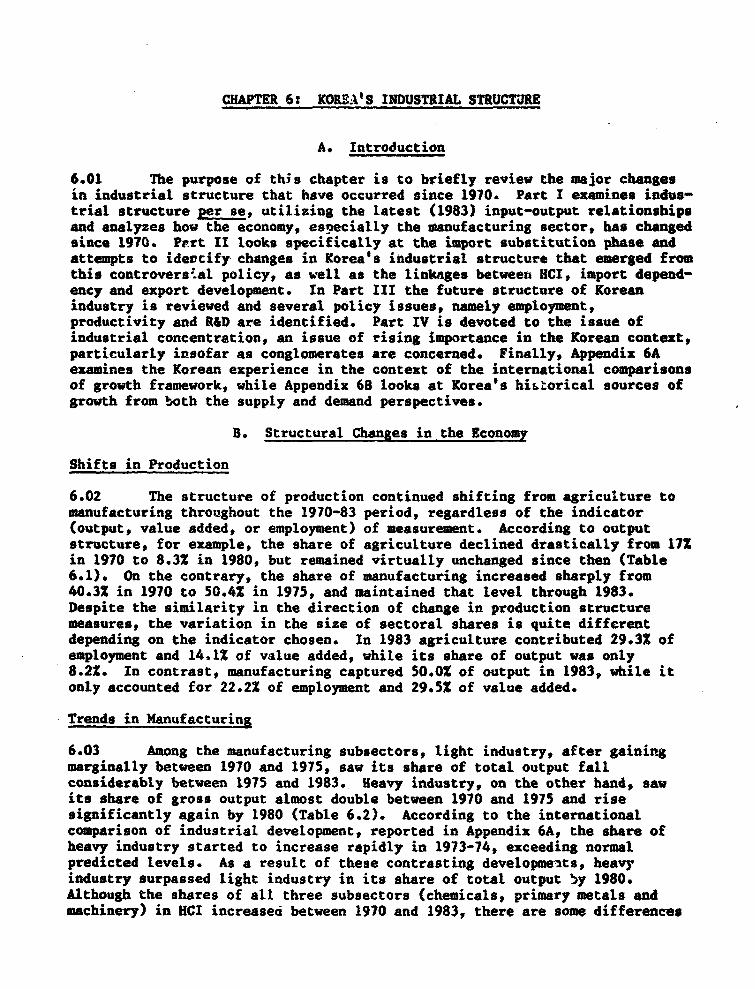
6.03 Among the manufacturing subsectors, light industry, after gainingmarginally between 1970 and 1975, saw its share of total output fallconsiderably between 1975 and 1983. Heavy industry, on the other hand, sawits share of gross output almost double between 1970 and 1975 and risesignificantly again by 1980 (Table 6.2). According to the internationalcomparison of industrial development, reported in Appendix 6A, the share ofheavy industry started to increase rapidly in 1973-74, exceeding normalpredicted levels. As a result of these contrasting developments, heavyindustry surpassed light industry in its share of total output Fy 1980.Although the shares of all three subsectors (chemicals, primary metals andmachinery) in HCI increased between 1970 and 1983, there are some differences

- 2 -
in their developments between pre- and post-1980 periods. After recording asubstantial gain between 1910 and 1980, chemical and chemical prouucts andprimary metal manufacturing lost ground slightly between 1980 and 1983, whilemetal products and machinery -.Atinued expanding their share3 even after 1980.
Table 6.1: STRUCTURAL CHANGE IN PRODUCTION(Percentage shares)
Gross output Value added Employment1970 1975 1980 1983 1970 1975 1980 1983 1970 1975 1980 i983
Agriculture 17.0 12.8 8.3 8.2 25.2 22.7 14.7 14.1 50.2 41.4 32.0 29.3
Mining 1.1 0.9 0.8 0.7 1.7 1.5 1.4 1.1 1.1 1.1 1.1 1.1
Manufacturing 40.3 50.4 51.0 50.0 20.1 26.1 28.2 29.5 12.4 19.2 21.7 22.2
Construction 8.6 6.2 8.0 8.2 6.6 5.2 8.3 8.4 3.7 4.0 5.3 5.6
Social overhead 6.7 6.7 8.1 8.9 8.7 7.5 9.9 11.4 3.8 4.3 4.5 4.9
Services 26.3 23.0 23.8 23.9 37.7 36.9 37.5 35.4 28.7 30.0 35.3 37.0
Source: Bank of Korea, Input-Output Tablea.
6.04 A detailed examination of the developments in the metal products andmachinery subsector during 1980-83 shows that the increase in the compositionshare was particularly substantial in general machinery, electrical machineryand transportaion equipment (see Table 6.3). These industries have alsoprovided a significant number of new jobs since 1980 (data) and are expystedto be among the fastest growing industries for future labor absorption.,
6.05 Unlike the developments in heavy industry subsectors, the directionof the composition shares among the light industry subsectors was less uni-form. Within light industry, food, beverage and tobacco as well as lumber andwood saw their output share decline continuously throughout the period. Tex-tiles and leather did well in the first half of the 1970s but its share hasdeclined considerably since then, to a point in 1983 where its share of grossoutput was essentially on par with its 1970 share. The industry continues to
I/ According to KDI estimates, it is expected that the electric andelectronics industry will have grown from 10.8% of manufacturing to 14.62by 1991 and 18.3% by 1996. Smaller but still significant increases areprojected for machinery and transport machinery, so that these emergingsectors taken together are expected to increase their combined share ofmanufactures from 25.3% (1983) to 36.9% (1996).

Table 6.2: STRUCTURAL CHANGE IN MANUFACTURING(Percentage shard in total output)
Gross output Value added Employment1970 1975 1980 1983 1970 1975 1980 1983 1970 1975 1980 1983
Light industry 28.4 29.5 24.7 22.1 12.8 14.5 13.7 13.6 9.2 13.5 13.8 13.0
Food, beverages and tobacco 15.9 14.4 10.8 9.6 6.2 6.3 6.2 5.9 2.5 2.8 2.9 3.0
Textiles and leather 7.1 9.9 8.4 7.0 3.8 5.5 4.9 3.9 4.0 7.9 7.4 6.5
Lumber and wood products l,b 1.2 1.0 0.9 0.7 0.5 0.4 0.4 0.6 0.6 0.7 0.6
Paper printing and publishing 1.4 1.4 1.6 1.8 0.4 1.3 1.1 1.2 0.6 0.8 0.9 1.0
Nonmetallic metal manufacturing 1.4 1.5 1.9 1.8 1.1 1.3 1.4 1.4 0.6 0.7 0.9 0.9
Miscellaneous manofacturing 1.2 1.1 1.0 1.0 1.0 0.9 0.8 0.8 0.9 0.7 1.1 1.1
Heavy and chemical products 11.9 20.9 26.3 27.9 7.2 11.6 14.5 15.9 3.2 5.7 7.9 9.2
Chemical and chemical products 5.9 10.8 12.6 11.8 4.0 5.9 6.7 6.3 i.2 1.9 2.5 2.7
Primary metal manufacturing 2.0 3.4 5.1 5.0 0.7 1.0 1.7 1.8 0.4 0.5 0.7 0.9
Metal products and machinery 4.0 6.7 8.6 11.2 2.5 4.7 6.1 7.9 1.6 3.3 4.7 5.6
Source: Bank of Korea, Input-Output Tables
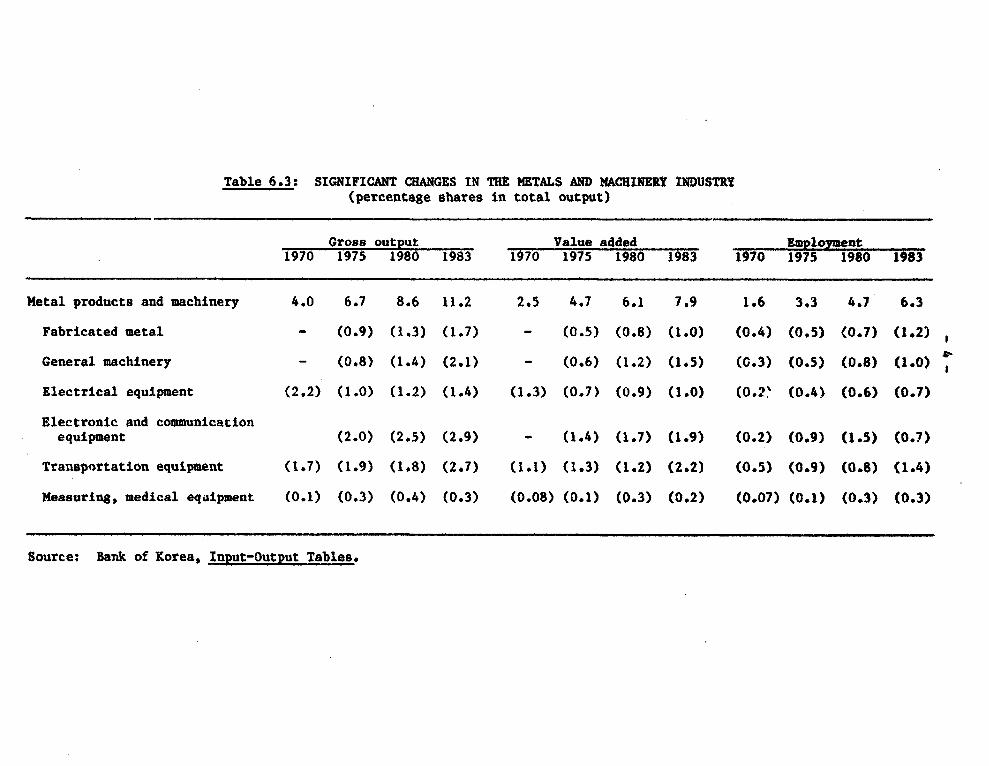
Table 6.3: SIGNIFICANT CHANGES IN THE METALS AND MACHINERY INDUSTRY(percentage shares in total output)
Gross output Value added Emploiment1970 1975 1980 1983 1970 1975 1980 1983 1970 1975 1980 1983
Metal products and machinery 4.0 6.7 8.6 11.2 2.5 4.7 6.1 7.9 1.6 3.3 4.7 6.3
Fabricated metal - (0.9) (1.3) (1.7) - (0.5) (0.8) (1.0) (0.4) (0.5) (0.7) (1.2)
General machinery - (0.8) (1.4) (2.1) - (0.6) (1.2) (1.5) (0.3) (0.5) (0.8) (1.0)
Electrical equipment (2.2) (1.0) (1.2) (1.4) (1.3) (0.7) (0.9) (1.0) (0.2' (0.4) (0.6) (0.7)
Electronic and communicationequipment (2.0) (2.5) (2.9) - (1.4) (1.7) (1.9) (0.2) (0.9) (1.5) (0.7)
Transportation equipment (1.7) (1.9) (1.8) (2.7) (1.1) (1.3) (1.2) (2.2) (0.5) (0.9) (0.8) (1.4)
Measuring, medical equipment (0.1) (0.3) (0.4) (0.3) (0.08) (0.1) (0.3) (0.2) (0.07) (0.1) (0.3) (0.3)
Source: Bank of Korea, Input-Output Tables.

- 5 -
be important as a source of employment, however, providing the largest shareof manufacturing employment, followed by metals aad machinery, which hasexhibited the fastest growth in employment since 1970 among subsectors. Lightindustry's share is expected by Korean planners to continue to decline, inlarge measures because the share of manufacturing stemming from textiles isprojected to decline from 11.02 in 1983 to 8.3X in 1996. This has significantemployment implications, as noted in the employment section.
Increasing Use of Intermediate Inputs
6.06 Industrialization is usually accompanied by an increase in the useof intermediate inputs in production as measured by the intermediate inputsshare. This results from the increasing specialization of economic activity,especially the enlarged share of manufacturing, which uses intermediate goodsintensively. The intermediate inputs share in Korea increased continuouslyfrom 47.9Z in 1960 to 50.42 in 1970, and then to 60.42 in 1980, but itdeclined slightly to 59.52 in 1983. The rate of increase accelerated in 1970-80, and it was especially raid between 1970 and 1975, reflecting rapid heavy-chemical industrialization.- A comparative perspective is given in Figure6.1. Although both Korea and its major competitor experienced a parallelincrease in the intermediate inputs share in the 1965-70 period, reflectingthe fact that both countries were in the process of rapid industrialization,the rate of increase in Korea between 1970 and 1980 was greater, reflectingits capital-intensive strategy. In contrast to these developments, theintermediate inputs share in Japan declined continuously, probably indicatingthat Japan was already in the stage where the service sector had startedexpanding at the cost of manufacturing.
6.07 The increase in the intermediate inputs share indicates deepening ofinterindutry linkages, an important characteristic of the developmentprocess.,' Historical interindustry linkages in Korea have been much higherthan in other developing countries with a similar level of per capita GNP,such as Turkey and Mexico, and much closer to the pqttern observed in moredeveloped countries such as Japan (see Table 6.4).-' A closer look at thecharacteristics of interindustry linkages over the 1963-1973 period reveals animportant difference between those in Korea and its major competitor on theone hand and those in Japan on the other, however. Although overall linkagesin these three countries are comparable, the size of domestic linkages in
2/ The increase in the intermediate inputs share was not affected by oilprice increases. The rate of increase in the share of intermediateinputs share in constant prices (51.52 in 1970 and 601 in 1983) issimilar to that in current prices.
31 See, for example, Chenery, Robinson, and Syrquin, Industrialization andGrowth: Comparative Study, forthcoming.
4/ Interindustry linkages here are computed as the amount of intermedisteinputs (direct and indirect) generated in the process of production inorder to meet 100 units of final demand.

INTERMEDIATE INPUT SHARE IN PRODUCIIONMAJ OR
COMPETITORKOREA ECONOY JAPAN t
62.
60
54
* 56
so
54
46 . . . . ,.,,.,,,--,,..._ _ _1960 t 1 1973 1|# t"5
YEAt

-7-
Table 6.4: INTERINDUSTRY LINKAGES(Units of production generated to meet 100 units of final demand)
Overall linkages Domestic linkages
Korea 1963 89.9 60.91970 89.8 58.71973 92.8 54.6
Korea /a 1970 97.5 64.91975 119.2 72.61980 134.4 79.21983 133.0 80.3
Major Competitor 1956 76.5 42.61961 85.9 55.01966 92.9 55.71971 93.7 55.2
Turkey 1963 52.1 46.41968 56.7 51.51973 59.6 52.8
Mexico 1950 54.3 40.51960 68.9 51.31970 63.9 52.01975 69.5 54.2
Japan 1955 89.9 81.31960 94.5 82.71965 74.6 82.41970 106.3 88.7
/a Bank staff estimates based on Korean input-output data.
Source: Chenery, Robinson and Syrquin (forthcoming).
-8-
Table 6.5: TOP TEN EXPORTS
1970 1975 1981 1985
1. Textiles and Textiles and Textiles and Textiles andGarments Garments Garments Garments
2. Plywood Electronic Electronic ShipsProducts Products
3. Wigs Steel Steel ElectronicProducts Products Products
4. Minerals Plywood Footwear SteelProducts
5. Electronic Footwear Ships FootwearProducts
6. Fruits and Deep-sea Machinery MachineryVegetables Fish
7. Footwear Ships Synth. Resin Fish andProducts Fish products
8. Tobacco Metal Auto Tires Synth. ResinProducts Products
9. Steel Petroleum Metal AutomobilesProducts Products Products
10. Metal Synth. Resin Plywood ElectricProducts Products Products
Sources: Korea Traders Association, The Trend of Foreign Trade; Bank ofKorea, Monthly Statistical Bul .etin.
- 9 -
Korea, for example, which measures interindustry relationships of onlydomestic goods exclusively, is only about 701 of that in Japan. Furthermore,domestic linkages in Korea are not much different from those in Turkey orMexico, although Korea's is the only declining trend. These findings indicatethat Korea achieved a high level of interindustry linkages (implicitly greatertechnology interaction) initially through importation of intermediate goods.Using input-output data, an extension of this approach for Korea shows asignificant increase in domestic industrial linkages between 1970 and 1980,although these interactions are still smaller than the newly generatedinternational linkages over the period.
Chanes in Trade Structure
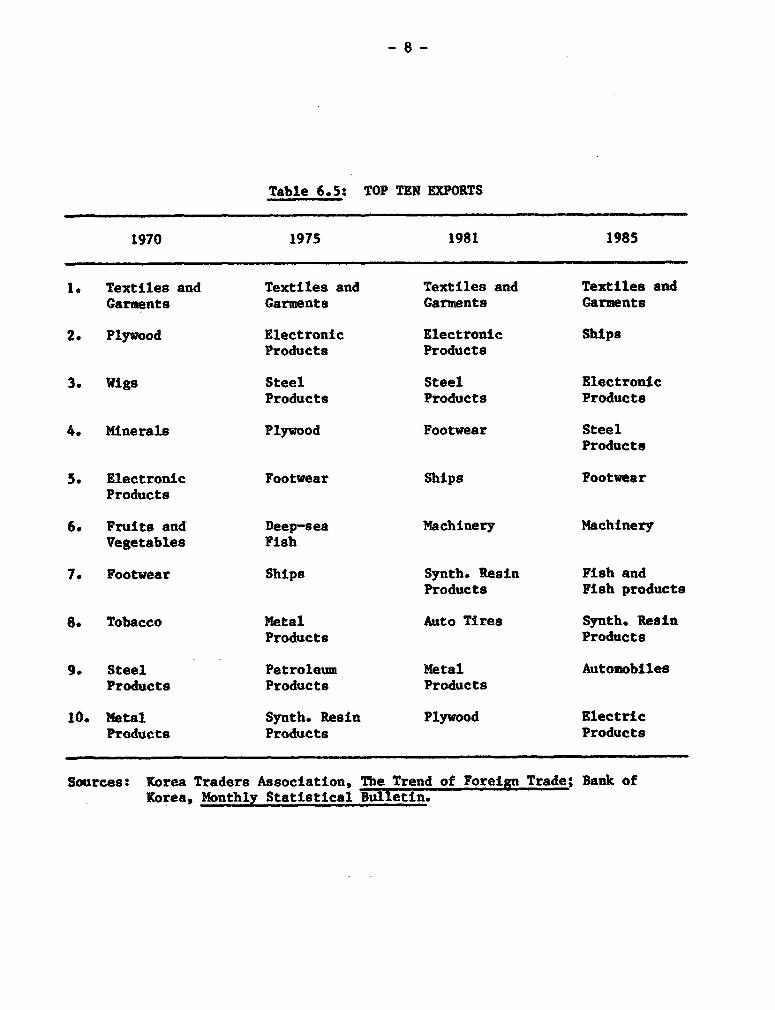
6.08 Changes in Korea's export profile can be seen from a variety ofperspectives. A very crude glimpse can be obtained by comparing Korea's topten export items over time (see Table 6.5). Whereas textiles and garments arestill the largest source of foreign exchange, some of the light industrialmanufactures, like wigs and plywood, are now moribund, compared with 1970,having been replaced by capital-intensive products like ships and sttel.Looking more broadly, the capital-labor ratio for manufactured export-3increased between 1970 and 1983 from 1.6 to 6.3 million won per employee in1977 prices, while the corresponf)ng ratios for import substitutes were 2.1and 7.5 million won (Table 6.6).V Although import substitutes were morecapital intensive than exports even in 1983, the gap between them narrowedbetween 1970 and 1983. A sources decomposition of the changes in capital-labor ratios in exports reveal that about 801 of the increase between 1970 and1983 is due to the increase in overall capital-labor ratios, and the remaining201 is due to the shift in the pattern of exports toward more capitalintensive products. The findings here seem to indicate that the rapidincrease in the capital-labor ratios in the Korean manufacturing exports isattributable not only to rapid capital formation due to active industrializa-tion policies but also to incevtives given to capital intensive exports.
Table 6.6: CHARCES IN CAPITAL-LABOR RATIOSTitn million won in 1977 prices)
1970 1975 1980 1983
Domestic output (D) 2.21 3.09 5.76 7.49Exports (E) 1.61 2.54 5.05 6.32Import substitutes (XS) 2.10 3.38 5.88 7.46E/MS 0.77 0.75 0.86 0.85
Source: World Bank estimates.
5/ Wontack Hong (1985) finds similar results by computing capital-laborratios incorporating both direct and indirect factor requirements. InJapan in 1965, production of exports turned more capital intensivecompared to the production of import substitutes in Japan.
- 10 -
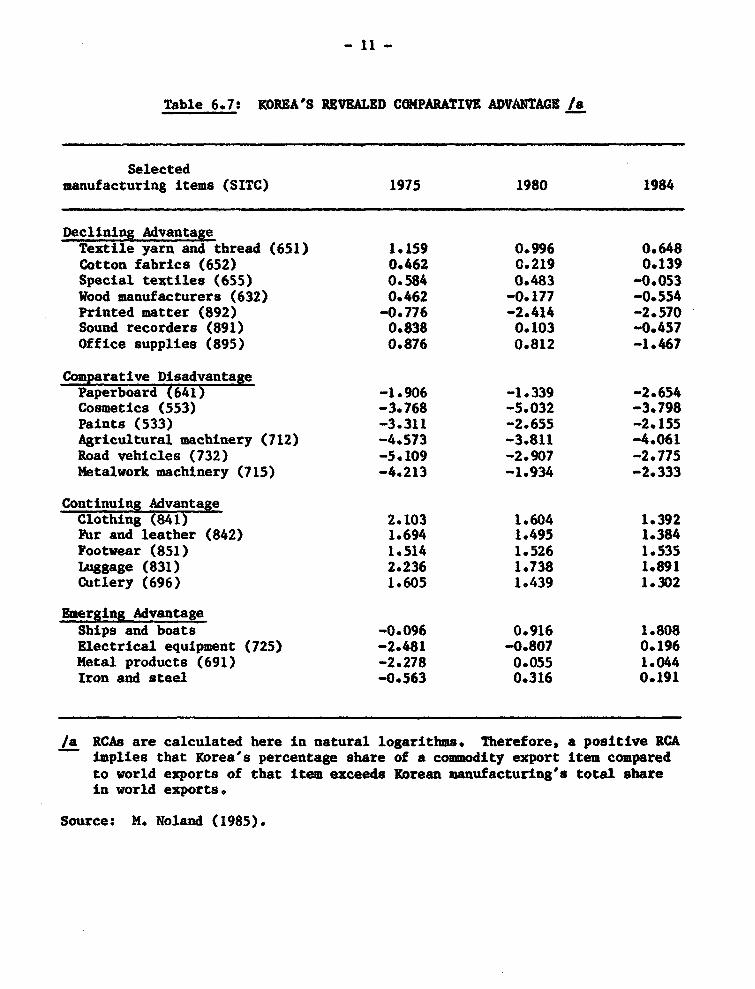
6.09 Comparing the export patterns of Korea and Japan in the 1960s and1970?, Korea can be seen to be exporting commodities which did not require ahigh level of human or physical capital intensity while Jayan exportedrelatively human and physical capital intensive products.' Aspects ofKorea's export structure have been changing rapidly over time, however, asKorean exports have become more physical and human capital intensive veryrapidly. As seen in Table 6.7, for example, which reports changes in"revealed comparative advantage," Korea's exports have been experiencingrelative declines in traditional industries, such as textiles and cottons,wood products and paper, and basic assembly products. That is not to say thatlight manufactured exports are generally uncompetitive, as seen by thecontinued resiliency of clothing, footwear, luggage and cutlery exports. Atthe same time, Korean comparative advantage has clearly emerged over the last10 years in shipbuilding, electrical equipment, metal products, and iron andsteel - all extentions of the UCI sector. Although costly to establish,these capital-intensive industries h- i now reached the level of internationalcompetitiveness, and may legitimately be described as successful infantindustries. On the other hand, in some industries, prominantly in thechemicals subsector and in machinery, Korea has yet to establish itself ininternational markets.
6.10 Korea appears to have made strong progress in shifting its exportstructure from labor-intensive to capital-intensive and moderately skill-intensive products. An interesting example of the underlying industrialflexibility at the firm level is seen in Box 6.1. More broadly, the initialtransition to capital-intensive exports owes its success and speed to theinterventions of the 19709 in establishing industries of sufficient scale tobe internationally competitive. The 5 fastest growing industries between 1977and 1981 in Korea's export profile, tellingly, were steel rods, containers(for shipping transport), household electrical equipment, tubes and pipes, andautos. These are industries in which scale and basic technology areimportant. The next step, to higher-technology intensive and skill-intensiveproducts will be another milestone for Korean exports.
6.11 There is some reason to believe that this second transition willtake longer to achieve. Why might this be the case? First, Government,chastened by the difficulties the economy experienced as a result of the HCIexperience, is perhaps less likely to attempt another aggressive strategy inestablishing skill and technology intensive industries. Second, accumulationof human capital takes longer than physical capital. Third, assuming that therole of the government in investment allocation is diminished in keeping withthe financial liberalization goals discussed in Chapter 5, technology invest-ment may not be expected to increase at the rate similar to that achieved forphysical investment.
6/ Y.S. Lee, (forthcoming).
- 11 -
Table 6.7: KOREA'S REVEALED COMPARATRVE ADVANTAGE /a
Selectedmanufacturing Items (SITC) 1975 1980 1984
Declining AdvantageTextile yarn and thread (651) 1.159 0.996 0.648Cotton fabrics (652) 0.462 0.219 0.139Special textiles (655) 0.584 0.483 -0.053Wood manufacturers (632) 0.462 -0.177 -0.554Printed matter (892) -0.776 -2.414 -2.570Sound recorders (891) 0.838 0.103 -0.457Office supplies (895) 0.876 0.812 -1.467
Comparative DisadvantagePaperboard (641) -1.906 -1.339 -2.654Cosmetics (553) -3.768 -5.032 -3.798Paints (533) -3.311 -2.655 -2.155Agricultural machinery (712) -4.573 -3.811 -4.061Road vehicles (732) -5.109 -2.907 -2.775Metalwork machinery (715) -4.213 -1.934 -2.333
Continuing AdvantageClothing (841) 2.103 1.604 1.392Fur and leather (842) 1.694 1.495 1.384Footwear (851) 1.514 1.526 1.535Luggage (831) 2.236 1.738 1.891Cutlery (696) 1.605 1.439 1.302
Emerging AdvantageShips and boats -0.096 0.916 1.808Electrical equipment (725) -2.481 -0.807 0.196Metal products (691) -2.278 0.055 1.044Iron and steel -0.563 0.316 0.191
/a RCAs are calculated here in natural logarithms. Therefore, a positive RCAimplies that Korea's percentage share of a commodity export item comparedto world exports of that item exceeds Korean manufacturing's total sharein world exports.
Source: .MNoland (1985).

- 12 -
Box 6.1: KOREA'S INDUSTRIAL FLEXIBILITY AT THE FIRM LEVEL
In the 1971 the Handok Company was a wig manufacturer,with this one export item accounting for 951 of total sales. By1976, Handok had diversified extensiveiy, to the point where wigswere only 16S of sales and paper products made up 511 of output#complemented by tuna (221) and the emergence of a new item,watches (9Z). The industrial transformation was completed by1981, when watches accounted for 852 of sales. And by 1985,liquit crystal display manufacturing, including monitors anddashboard items for example, were beginning to emerge as new salesitems (10 of sales) and the bulk of revenue was due to computersand electronics (412) and watches (45S). Handok is an example ofindustrial flexibility in a medium-sized firm employing about3,500 people and generating sales of about 64 million won in 1984.
C. Import Substitution in the HCI Sector
Reducing Import Dependency
6.12 It is widely known that the government pursued heavy-chemicalindustry (HCI) promotion policies through various means. Fiscal and financialpolicies were generously applied in the mid to late 1970s, while import pro-tection policies in the form of quantitative restrictions and tariff protec-tion, were also increased during the period. This section examines how effec-tive the WCI promotion policies were in reducing the import dependency of theheavy and chemical industries. Table 6.8 indicates that import substitutiontook place at a rapid rate throughtout 1970-83 in virtually all the subsectorsin the heavy-chemical industry as shown by a substantial decline in the importdependency of demand, defined as the share of imports in total demand (i.e.,intermediate and final demand). In particular, the rate of import substitu-tion was remarkably high in the primary metal manufacturing, and metalproducts and machinery industries.
6.13 Turning to import dependency in production, defined as the share ofimported intermediate inputs in total inputs including value added, one findsthat the reliance on imported intermediate inputs in the production of heavy-chemical products increased between 1970 and 1975, but has been decliningslowly and continuously since then. The direction and the magnitude of thechanges in the degree of import dependency was not uniform among the subsec-tors, however. In primary metal manufacturing the import dependency declinedsubstantially throughout the period, while in metal products and machinery itincreased slightly between 1970 and 1975 before beginning a steady declinefrom 1975 to 1983. In contrast, the import dependency in chemicals increasedcontinuously throughout 1970-83 probably attributable to the rising price ofoil. The decline in import dependency in primary metal and metal products andmachinery is directly attributable to import substitution in these industriesinasmuch as these industries acquired the capacity to produce more of theirown inputs.

- 13 -
TablU 6.8s IMPRT DEPENDENCY IN TIE HK&VT-CHEMICAL INDUSTRY /a
Demad Production1970 1975 1980 1983 1970 1975 1980 1983
Beavy and chemical industry 37.1 29.5 23.7 22.1 29.1 33.7 31.1 29.1
Chemical and chemical products 23.8 39.6 15.0 16.5 30.5 40.1 42.2 44.
Primary metal manufacturing 35.3 27*6 18.9 17.0 36.0 30.1 20.2 17.6
Metal products and machinery 50.6 41.7 35.8 29.1 23.6 25.3 21.1 18.5
Light industry 8.0 8.1 7.2 7.7 12.3 13.8 13.7 13.4
All industry 11.3 14.6 14.8 13.9 8.6 12.8 14.2 13.5
/a Import dependency in demand is computed as inputs/total demand (final and interme-diate demand), and import dependency in production as imported intermediate inputs/total imports including value added.
Source: Bank of Korea, Input-Output Tables.
6.14 So far the degree of dependency has been examined by consideringonly direct requirements of imported intermediate in thie production. Importdependency can also be measured by considering indirect requirements whichwould arise from interindustry linkages. Table 6.9 shows the amount of directand indirect imports required to produce one unit of output. The importrequirement for heavy and chemical industry declined slightly in 1980-83, butcompared to light industry the production of HCI products requires a signifi-cantly higher amount (about 152 in 1983) of imports. Despite the fact thatthe import dependency in HCI has been declining rapidly, its reliance onimported inputs is ytill significantly higher than that of the heavy-chemicalindustry in Japan.7 One might expect the import dependency to continue todecline in the future as HCI continues to gain in efficiency, but such adevelopment will have to continue in the context of import liberalization andthus be subject to the yardstick of international efficiency. According tothe import liberalization schedule, almost total elimination of restrictionswill occur for metal products and iron and steel products by 1987 and forelectronics, electrical and non-electrical machines by 1988. This means thatcontinued import substitution will have to be efficient by internationalstandards.
7/ The import share in heavy-chemical industry in Japan was 4.3S in 1983.It is not only heavy-chemical industry that has high import dependency inthe Korean economy. According to Chenery, Robinson and Syrquin (1986),Korean import requirements in production are much higher than othercountries.

- 14 -
Table 6.9: DIRECT AND INDIRECT IMPORT BEQIIRMEOMTS IN PRODUCTION (X)(percent)
1975 1980 1983
Heavy and chemical industry 48.7 49.0 45.8
Basic chemicals 47.4 53.6 48.4
Petroleum products 71.3 80.7 81.0
Primary iron and steel products 58.9 49.1 43.5
Fabricated metal products 44.4 40.1 36.7
General industrial machineryand equipment 35.0 35.1 35.3
Electronic and communicationequipment 49.4 44.6 43.1
Transportation equipment 41.8 42.4 34.6
Light industry 26.4 30.0 28.7
Source: Bank of Korea, Quarterly Economic Review, December 1985.
Foreign Markets for Heavy-Chemical Products
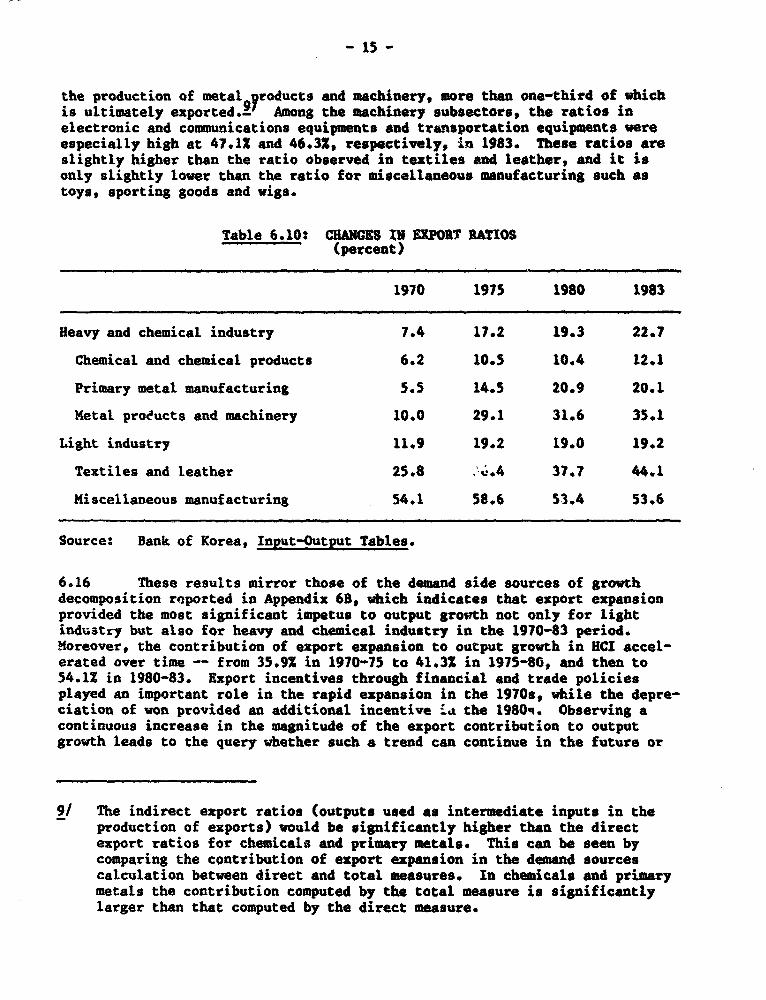
6.15 The share of HCI output sold abroad (the export ratio) increasedsubstantially from 7.4X in 1970 to 22.71 in 1983; a large increase of almost10 percentage points took place between 1970 and 1975 (Table 6.10). All threesubsectors (chemicals, primary metal and machinery) contributed to this rapidincrease, but the magnitude of the contribution gppears to have beenespecially high in metal products and machinery.-' Despite the rapid growthin the early 1970s, the rate of increase in the export ratio slowed down inall three subsectors after 1975. In 1983, the export ratios in chemicals,primary metal and machinery were 12.1X, 20.1Z and 35.12, respectively.Relatively low export ratios in chemicals and primary metal manufacturing seemto be due to the fact that they are intermediate goods used domestically for
8/ Within metal products and machinery, transportation (mainly ships)appears to have contributed most to the rapid increase in the exportratio between 1970 and 1975.
- 15 -
the production of metal 9 yroducts and machinery, more than one-third of whichis ultimately exported.- Among the machinery subsectors, the ratios inelectronic and communications equipments and transportation equipments wereespecially high at 47.1X and 46.32, respectively, in 1983. These ratios areslightly higher than the ratio observed in textiles and leather, and it isonly slightly lower than the ratio for miscellaneous manufacturing such astoys, sporting goods and wigs.
Table 6.10: CHANCES IN EXPORT RATIOS(percent)
1970 1975 1980 1983
Heavy and chemical industry 7.4 17.2 19.3 22.7
Chemical and chemical products 6.2 10.5 10.4 12.1
Primary metal manufacturing 5.5 14.5 20.9 20.1
Metal products and machinery 10.0 29.1 31.6 35.1
Light industry 11.9 19.2 19.0 19.2
Textiles and leather 25.8 .c.4 37.7 44.1
Miscellaneous manufacturing 54.1 58.6 53.4 53.6
Source: Bank of Korea, Input-Output Tables.
6.16 These results mirror those of the demand side sources of growthdecomposition reported in Appendix 68, which indicates that export expansionprovided the most significant impetus to output growth not only for lightindustry but also for heavy and chemical industry in the 1970-83 period.Moreover, the contribution of export expansion to output growth in HCI accel-erated over time -- from 35.92 in 1970-75 to 41.3% in 1975-80, and then to54.1Z in 1980-83. Export incentives through financial and trade policiesplayed an important role in the rapid expansion in the 1970s, while the depre-ciation of won provided an additional incentive ia the 1980q. Observing acontinuous increase in the magnitude of the export contribution to outputgrowth leads to the query whether such a trend can continue in the future or
9/ The indirect export ratios (outputs used as intermediate inputs in theproduction of exports) would be significantly higher than the directexport ratios for chemicals and primary metals. This can be seen bycomparing the contribution of export expansion in the demand sourcescalculation between direct and total measures. In chemicals and primarymetals the contribution computed by the total measure is significantlylarger than that computed by the direct measure.

- 16 -
whether domestic demand must at some point take on larger significance. Theissue needs to be addressed in the context of the year 2000 projections.
Overview
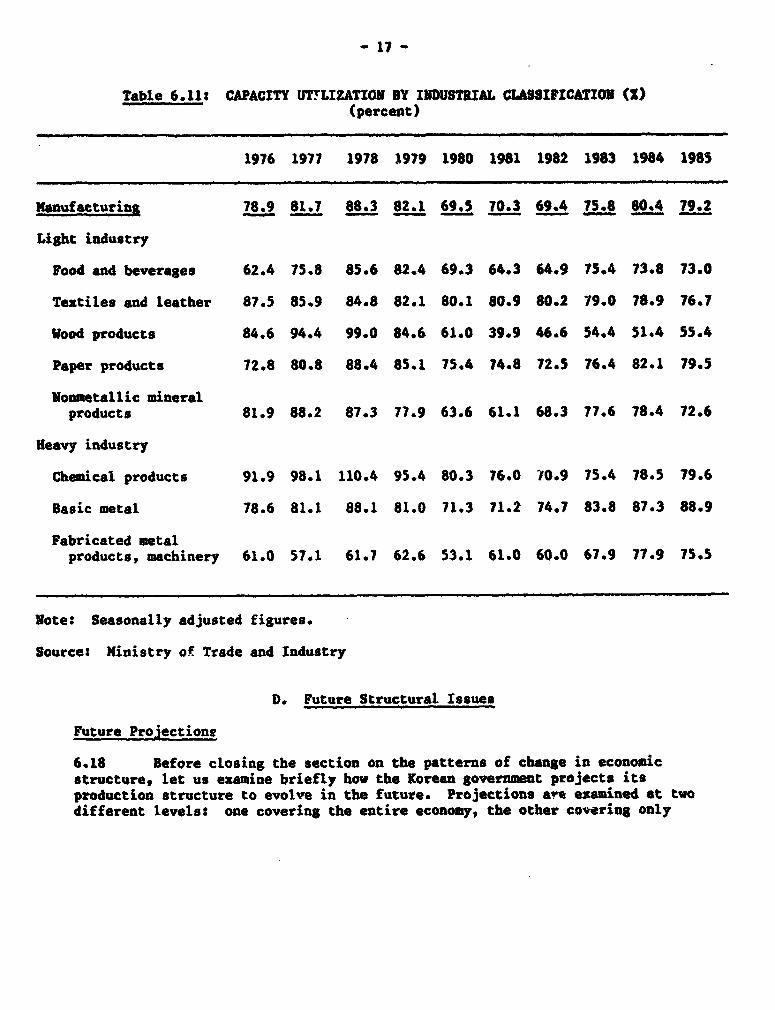
6.17 This section has viewed the HCI episode from the trade perspective,namely, how was import dependency affected and how export-intensive was MCIproduction. The rationale is that Korea as a small, very open economy isunlikely to pursue an industrial strategy without an ultimate export aim.Thus, to merely characterize the HCI period as a classic import substitutionexperiment is incorrect. There is no doubt that the large-scale investmentsin HCI were distortionary of capital market (see Chapter 4) and mqonomicallycostly in the medium-run, as seen by Table 6.11 on utilization.' Yet, thepolicy was unique in o:her respects. First, while its aim was to establishKorean capacity in some tfyic industries, the investment program itself wasfairly import-intensive. Second, the HCI sector did manage to export,indicative either of its ability to compete international,y or reflective ofheavy subsidization on the capital side. Export ratios, seen in Table 6.10,show that all JIee subsectors had already experienced considerable exportgains by 1975.- Although further gains have been uneven, the sector as awhole now exports directly almost 232 of its production, more than thecomparable figure for light industry. Moreover, while the direct importdependency of HCI production has fallen since 1975 (in subsectors other thanchemicals), Korea's overall import requirements are still quite high, andattest to it being highly integrated with the global economy.
10/ The problem of underutilized capacity was especially acute in somesubsectors, like fabricated metals and machinery, which werecharacterized by capacity utilization rates of 55-65X during 1976-79,considerably below the average in manufacturing as a whole.
11/ This helps to explain the finding in Technical Appendix 5B on the sourcesof industrial growth that HCI growth appears to have been fueledprimarily by export expansion and relatively modestly by importsubstitution factors.
12/ This finding is supportive of the evidence presented in TechnicalAppendix 4A, which indicates on the basis of i&.ernational norms thatKorea's big surge in pushing HCI above the pattern expected occurredbetween 1970 and 1974.
- 17 -
Table 6.11: CAPACITY UTTLIZATION BY INDUSTRIAL CLASSIFICATION (2)(percent)
1976 1977 1978 1979 1980 1981 1982 1983 1984 1985
Manufacturing 78.9 81.7 88.3 82.1 69.5 70.3 69.4 15.8 80.4 79.2
Li8ht industry
Food and beverages 62.4 75.8 85.6 82.4 69.3 64.3 64.9 75.4 73.8 73.0
Textiles and leather 87.5 85.9 84.8 82.1 80.1 80.9 80.2 79.0 78.9 76.7
Wood products 84.6 94.4 99.0 84.6 61.0 39.9 46.6 54.4 51.4 55.4
Paper products 72.8 80.8 88.4 85.1 75.4 74.8 72.5 76.4 82.1 79.5
Nonmetallic mineralproducts 81.9 88.2 87.3 77.9 63.6 61.1 68.3 77.6 78.4 72.6
Heavy industry
Chemical products 91.9 98.1 110.4 95.4 80.3 76.0 W0.9 75.4 78.5 79.6
Basic metal 78.6 81.1 88.1 81.0 71.3 71.2 74.7 83.8 87.3 88.9
Fabricated metalproducts, machinery 61.0 57.1 61.7 62.6 53.1 61.0 60.0 67.9 77.9 75.5
Note: Seasonally adjusted figures.
Source: Ministry of Trade and Industry
D. Future Structural Issues
Future Projectione
6.18 Before closing the section on the patterns of change in economicstructure, let us examine briefly how the Korean government projects itsproduction structure to evolve in the future. Projections ave examined at twodifferent levels: one covering the entire economy, the other covering only

- 18 -
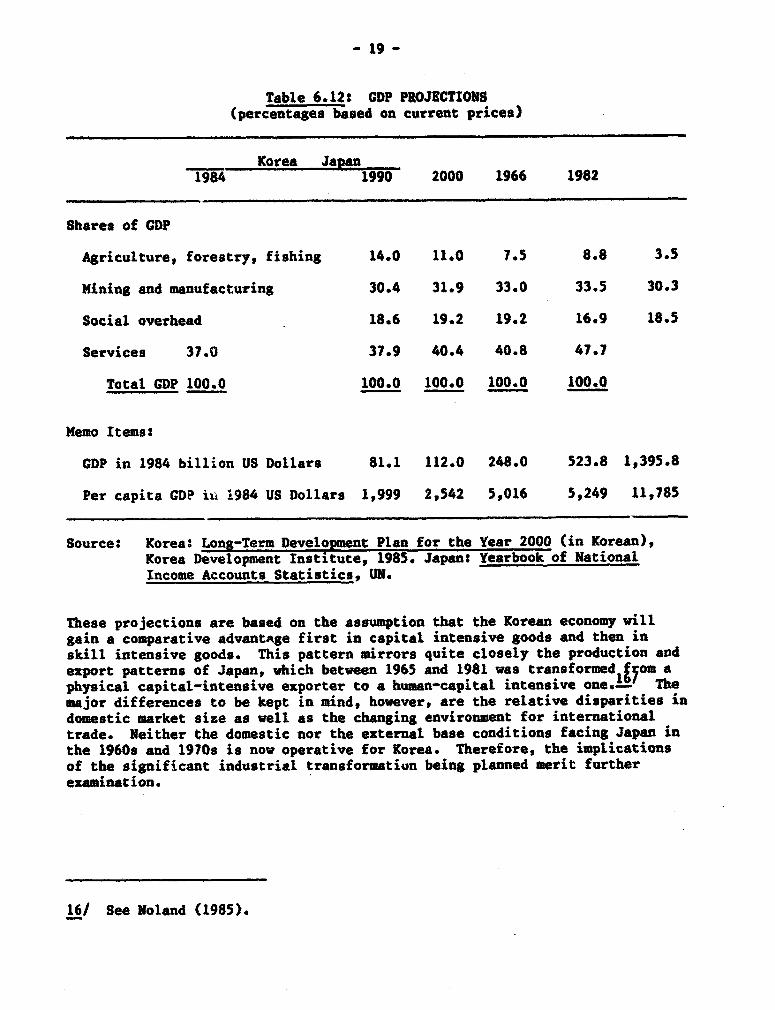
the manufacturing sector.131 Table 6.12 reports RDI projections forproduction structure of GDP in years 1990 and 2?29, as well as thecorresponding Japanese shares in 1966 and 1982.- The projected patternreveals a decline in agriculture's share and offsetting increases in the otherthree sectors. Despite the continuing increase in the manufacturing sharethrough the year 2000, it should be noted that in Japan, the manufacturingshare peaked around 1970, when per capita GNP in 1984 US dollars was 7700, andthe share of the service sector began to expand. The major policy implicationof these projections is the sharp drop in the size of the agricultural sector,which currently accounts for 30% of national employment. A conservativeimplication of these projections, ignoring technical progress, ia that employ-ment in the agricultural sector might fall to half its present share by theyear 2000. This raises a clear issue of labor absorption in thenonagricultural sector.
6.19 Table 6.13 shows the projections of the manufacturing structure foryears 1990 and 2000, along with the corresponding employment projections.According to KIET estimates, output will continue to shift frW, light manufac-turing to heavy manufacturing between 1983 and the year 2000. _1/ The outputcomposition within heavy manufacturing is expected to change drastically,however. The sectors projected to gain shares are machinery, electronics,automobile and industrial chemicals, while the sectors projected to loseshares are shipbuilding, petrochemicals, petroleum refinery, and iron andsteel. Employment shares reflect these anticipated output shifts quitestrongly, with the share of employment provided by electronics almostdoubling, and by autos more than doubling, while textiles falls by 702 overthe period.
13/ This two level approach was necessary because the two sets of projectionshave been provided by two different institutes. The Korea DevelopmentInstitute (RDI) published the projections of overall economic structurein Long-term Development Plan for the Year 2000 in September 1985 byincorporating the projections on the manufacturing sector by the KoreaInstitute for Economics and Technology (KIET). Since then KIET revisedthe earlier projections and published new projections in October 1985(Projections of manufacturing structure and development strategy toward2000).- For this reason, the KDI projections are used for the overal?economy and the revised KIET projections are used for manufacturing.
14/ Per capita CUP for Japan in 1966 in 1984 US dollars was 5249.5, close tothe projected level of 5,016 US dollars in 1984 prices for Korea in 2000.
15/ The KDI projections assume 32 and 62 annual growth rates in the worldeconomy and in world trade (in constant prices), respectively, and 7.42and 6.1Z in annual real GNP and real per capita CUP growth, respectively,between 1985 and 2000. As a result, GNP and per capita CNP in the year2000 are expected to be $252 billion and $5,103, respectively (in 1984prices).
- 19 -
Table 6.12: GDP PROJECTIONS(percentages based on current prices)
Korea Japan1984 K a 1990 2000 1966 1982
Shares of CDP
Agriculture* forestry, fishing 14.0 11.0 7.5 8.8 3.5
Mining and manufacturing 30.4 31.9 33.0 33.5 30.3
Social overhead 18.6 19.2 19.2 16.9 18.5
Services 37.0 37.9 40.4 40.8 47.7
Total GDP 100.0 100.0 100.0 100.0 100.0
Memo Items:
GDP in 1984 billion US Dollars 81.1 112.0 248.0 523.8 1,395.8
Per capita GDP ih 1984 US Dollars 1,999 2,542 5,016 5,249 11,785
Source: Korea: Long-Term Development Plan for the Year 2000 (in Korean),Korea Development Institute, 1985. Japan: Yearbook of NationalIncome Accounts Statistics, UN.
These projections are based on the assumption that the Korean economy willgain a comparative advantAge first in capital intensive goods and then inskill intensive goods. This pattern mirrors quite closely the production andexport patterns of Japan, which between 1965 and 1981 was transformed from aphysical capital-intensive exporter to a human-capital intensive one.,' Themajor differences to be kept in mind, however, are the relative disparities indomestic market size as well as the changing environment for internationaltrade. Neither the domestic nor the external base conditions facing Japan inthe 19609 and 19709 is now operative for Korea. Therefore, the implicationsof the significant industrial transformation being planned merit furtherexamination.
16/ See Noland (1985).

- 20 -
Table 6.13$ COMPARISON OF OUTPUT STRUCTURES IN KOREA AND JAPAN(percent)
EmploymentOutput
1983 2000 1965 1983
Machinery 10.4 12.1 12.2 14.3
Electronics 8.2 15.4 9.5 18.0
Automobile 3.6 8.6 2.7 6.3
Shipbuilding 4.3 3.3 3.3 2.6
Petrochemical 3.2 2.6 } )} }
Industrial chemicals 3.4 4.6 } 4.6 } 3.1
Petroleum refining 9.9 3.8 } }
Iron and steel 7.6 6.2 3.3 2.7
Textiles (excl. garments) 13.9 8.3 17.3 10.2
Food 10.9 7.0 6.7 4.3
Other manufacturing 24.6 28.1 40.4 38.5
Total Manufacturing 100.0 100.0 100.0 100.0
Source: KIET: Projections of Manufacturing Structure and Development Stra-tegy Toward 2000, 1985.
6.20 Three basic issues can be identified as being of critical importanceas Korea attempts this major industrial transformation. The first relates toaiployment and concerns not only the overall rate of job creation but also theskill mix requirements. The second issue relates to productivity, particu-larly total factor productivity, since at some point limitations on furthervery high rates of increase in the savings rate must be anticipated, andcombined with natural limits on labor growth, greater productivity must besqueezed out of Korea's factor inputs. And third, technology will need to beupgraded if Korea is to compete in new industries, and thus a major focus onproductive R&D investments is to be anticipated.

- 21 -
Employment Issues
6.21 Employment is already a serious concern to policymakers, asprospects for higher unemployment rates among white-collar workers rise andlabor displacement occurs in both structurally declining industries (such asoverseas constr tion) and cyclical depressed industries (such asshipbuilding).-' The employment issue is widely expected to become moreprominent as: (i) the employment elasticity with respect to output has fallenfrom an estimated 0.45-0.50 in the 1970s to about 0.25 in the early 1980.,where it is expected to remain; (ii) significant labor displacement inagriculture is expected; and (iii) the skill mix requirements will changesubstantially as employment opportunities shift fir the low-skill to high-skill jobs as a consequence of industrial change*
6.22 With respect to overall job creation, capital for labor substitutioncan only proceed so far; however, the increases in employment will occur inskilled areas and in the service sector. Investments in human capital willtake on greater importance as the overall technology level of the economyincreases. The rural employment problem may prove less tractable, as therural population may be older, less mobile and less trainable. Government hasalready given priority to the location of industry, including agro-industry,in rural areas. And with respect to the labor mix, the three industries pro-jected to grow fastest between now and 1996 (viz, electronics, machinery andautos) will increase their share of the current manufacturing work force andwill in general 8/ requiring higher skill levels than do the light manufactur-ing industries.- This brings the area of retraining to light, in whichpublic sector initiatives would be helpful. It also serves to illustrate thepotential additional benefits of SMI promotion policies, as smaller firms aremore employment-intensive, and the electronics, auto, and machinery componentsindustries are quite suitable for SMIs in terms of subcontracting.
Productivity Issues
6.23 One key for achieving the industrial objectives reflected in theout-year projections is productivity. Total factor productivity (TFP) calcu-lations, as reported in Appendix B of this chapter, show clear drops in TFP
171 See KDI, "Long-Range Prospects for Manpower Supply and Demand and PolicyTasks," December 1985.
18/ A recent KDI study on manpower policy indicates that projected annualoutput growth rates for the 1983-96 period will be highest for theelectronics industry (12.7%), followed by the machinery industry (10.5%),and transport equipment (9.4%).
191 KDI and KIET resources.

- 22 -
during the 1970s in Korea.201 It is the microeconomic level where TFP lapsesmust be attacked. Government's actions to reduce economic rents and increasedomestic competition, through import liberalization for instance, are usefulto increase the incentives to innovate and cut costs at the firm level. Asecond area of importance in reviving TFP is in the area of so-called know-ledge factors. Indeed, it is this factor in particular which according to thesources of growth decomposition in Appendix B has performed poorly in recentyears in Korea. And this is precisely the factor of production which must beboosted if Korea is to apply scientific technology effectively. Whereas pastindustrial transformation have been based on superior labor productivity,organizational skills and the like, the current shift being attempted willrely on application of technology and human skills. In that respect R&D andmanpower training policies will take on far greater significance than in thepast.
R&D Policy
6.24 It can perhaps be said that no area of industrial policy commandsgreater importance in the eyes of Korean policymakers than R&D policy. R&Dinvestment has increased substantially in recent years, increasing almostfivefold between 1980 and 1984 to W 958 billion in 1984, or 1.46% of GNP.This is still low compared to the OECD countries (see Figure 6.2) but is amongthe highest for industrializing counties. The mix of funding has shifted fromalmost entirely public expenditures to rough parity in 1980 and now to a one-quarter/three-quarter sharing with the private sector. This is importantbecause the private sector must ultimately adapt and use technology. WhileKorea still lags far behind in the basic sciences, and in the production ofscieMtsts, it is making great strides in reducing the science and technologygap.- Government recognizes the importance of R&D investments, for example,and is aiming to reach 2% of GNP by this year, which would be a doubling since1983. The challenge, of course, is to successfully apply the new technol-ogies, to adapt foreign technology successfully, and to develop sufficientindigenous capacity to be able to interaci2successfully with the major newtechnology producers in Japan and the US. Data from Table 6.14 reveals theextent to which Korea has begun to rival Japan and the US in R&D expenditures.
20/ According to KDI estimates, Korea's annual growth rate of TFP fell toless than 1% during 1970-77 from 3.1Z in 1960-69 compared to 4.2% forJapan, 5.7% for Germany, and 2.3% for the U.S. Korea Exchange Bank,1985.
21/ See Science and Technology Policy in Korea (Ministry of Science andTechnology, 1985) and W.Y. Lee (1984) for details.
221/ Is is known, for example, in the semi-conductor field, as reported in thecase study on electronics (Volume III of this report), that technology ismore likely to be licensed among technological equals.

- 23 -
Shares of R&D Expenditure in GNP (2)
Fed. Rc:e. Germany
U.S.
Z t25 ^,!.t~~Japan
L0 -s 0 'France_vI.78LO 1.7 LIO*
j. 1-'.75 L1.73 1.73 Ln 1.13
II
1.0~~~~~~~~~~~~~~~~~~~~~~~11.0 ' 7
Korea ,
aGO .2I. do
Qs Q3r < , 042 Q
, s i a, a a , , I , , , '70 '71 '72 'ii V '7S 't70 '77 i 7 '191 'SI '83 i
Science and Tecbno1ogy Yearbook, 1984, MOST
Figure 6.2

- 24 -
Table 6.14s COMPARATIVE R&D EXPENDITURE-TO-SALES RATIOS
Industry Korea Japan Us(1984) (1983) (1984)
Industry average 1.01 2.03 2.88Manufacturing 1.27 2.31 2.84Food 0.65 0.70 0.87Textiles 0.82 0.90 0.81Pulp and paper 0.56 0.55 0.98Chemicals 0.71 1.96 1.94Petrochemicals 0.31 0.49 0.91
Nonferrous metals 0.99 1.82 2.44Machinery 2.25 3.38 4.27General 1.45 2.57 3.53Electrical 3.51 4.70 5.19Transportation 1.21 2.66 3.61Precision 3.07 4.02 5.98
Others 1.38 1.40 2.58
Source: Korea Industrial Research Institute (KIRI).
6.25 On an industry-specific basis, as can be seen in Table 6.15, verysubstantial R&D rates as a percentage of sales are taking place in themachinery, plastics, transportation and other chemicals areas. These areclearly the industries targetted for rapid growth in Korea's long-termdevelopment plan.
E. The Issue of Industrial Organization
Introduction
6.26 During the 1970s and the early 1980s the output structure shiftedfrom primary to non-primary sectors, and from light manufacturing to heavymanufacturing. These changes were accompanied by a deepening of capital-laboras well as intermediate input ratios. The purpose of this section is toexamine the structure of production in the manufacturing sector from the view-point of industrial organization. The first issue examined is how the size ofestablishments changed during the 1970s, an aspect of considerable importancein shedding ipght on the effect of industrialization on the structure of pro-duction, and the second relates to how these changes in organizational struc-ture were associated with the changes in the market power of firms and on

- 25 -
Table 6.15: MANUFACTURING FIRMS$ B4D
R&D Exsenditure-to-sdles ratioIndustries 1977 1980 1983
Food 0.34 0.36 0.70Textile and clothing 0.48 0.53 0.73Wood products 1 0.36 0.34 0.66Pulp and paper } 0.65Industrial chemicals 0.58Other chemicals } 1.62Petroleum refining 0.08 0Rubber products 0.78 0.26 0.98 1(0.56Plastic products and miscellaneous } 1.74
Ceramics 1.45 0.52 0.77Iron and steel 0 } 0.28Nonferrous meatls } 0.52 } 0038 3 0.55 } (0.43)Fabricated metals } 0.54 } (0.33) 0.93Electrical machinery 2.70 1.90 3.01Machinery 3 1.23 } 2.00Transport equipment } 0.99 0.62 3 (0.78) 1.48 } (1.63)Precision machinery } 1.64 } 1.28Other manufacturing 2.68 0.16 1.30
Total 0.95 0.50 0.80
Source: MOST, Science and Technology Annual.
allocative efficiency in the manufacturing sector.o2V A preliminaryassessment of allocative and technical efficiency is possible by extending thecoverage from the firm level to the group or conglomerates level.
Changes in Establishment Size
6.27 Interesting differences are observed in the average size ofestablishment between the 1973-78 and 1978-83 periods. In terms of employment,for example, the average number of employees per establishment increased from49.7 in 1973 to 71.8 in 1978, and then declined to 56.4 in 1983. The largeincrease in the average number of employees per establishment between 1973 and
23/ The distinction between the size measured by establishments and by firmsis important, because the former pertains to the production unit whilethe latter pertains to the marketing unit. Usually there is no one toone correspondence between them because a firm often operates multipleestablishments.
- 26 -
1978 had two primary causes. First, the number of establishments employingmore than 50 employees increased significantly, as is indicated by an increasein its share from 14.1X to 21.82 (Table 6.16). Second, the average size oflarge establishments (those with 300 or more employees) increased rapidly from883.4 employees per establishment in 1973 to 984.2 in 1978. The decline inthe average size in 1978-83 was mainly attributable to a rapid increase in thenumber of small establishments. These patterns mirror official policy towardsindustry fairly closely insofar as the lCI promotions in the 1970s was accom-panied by a shift in the size distribution of establishments to larger firms,and the more recent policy of promoting SMIs in the early 1980s has led to anexpansion of the number of small establishments. Using 1983 data, however,two-thirds of output and almost half of manufacturing employment stems fromlarge firms.
6.28 There are clear disparities among industries. Broadly speaking, thenine KSIC 2-digit manufacturing sectors can be classified into three groupsaccording to the importance of large relative to small and medium establish-ments. The share of large establishments is highest in chemicals, primarymetal and metal manufacturing, the lCI sector which is characterized by scaleeconomies, while the share of large establishments is lowest in lumber andwood products, paper and publishing, nonmetallic mineral products, and miscel-laneous manufacturing. The remaining two sectors, food, beverages andtobacco, and textiles and leather are intermediate in size. This disparity inthe size of establishment is translated into some differences between heavyand light industry with respect to the concentration of output and employment.In HCI, for example, about 22 of the establishments (essentially 400 produc-tion units) account for 712 of output and 512 of employment in the sector.Again using 1983 data, comparable figures for light manufacturing show that2.2Z of establishments (about 550 producers) account for 552 of output and 40Xof employment. (Figure 6.2 shows the degree of concentration.)
6.29 Compared to the Japanese production structure, the share of largeestablishments in terms of production activities appears much greater in Korea(see Table 6.17). Although the proportion of large establishments in Korea isless than in Japan, the importance of large establishments in productionactivities is much greater in Korea. This concentration is important in atleast two senses. First it may increase the economy's vulnerability toshocks, insofar as employment in particular is concerned. Second, it demon-strates the extent to which Government may find its hands tied in trying toredirect credit to SMIs while at the same time pusuring ambitious growthobjectives, which necessitate strong performances from large productionunits. The concentration takes on even greater significance in the Koreansetting when examined at the firm rather than establishment level because ofthe high degree of integrated ownership.
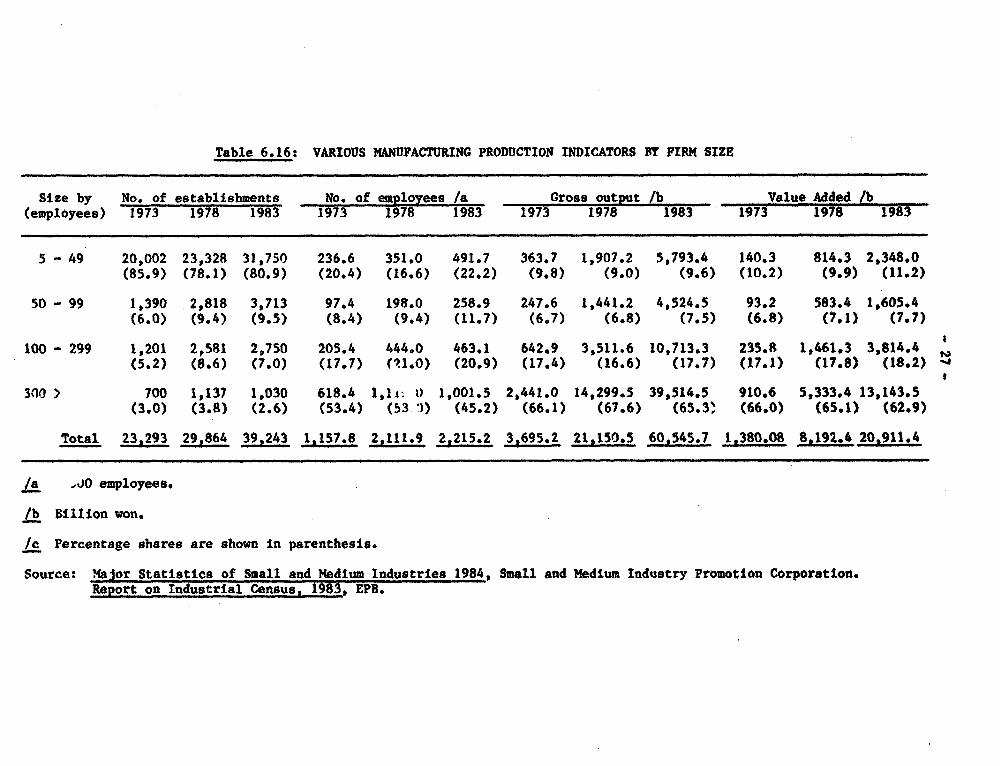
Table 6.16: VARIOUS MANUFACTURING PRODUCTION INDICATORS BY FIRM SIZE
Size by No. of establishments No. of employees /a Gross output /b Value Added /b(empiloyees) 1973 1978 1983' 1973 1978 1983 1973 1978 1983 1973 1978 1983
S - 49 20,002 23,328 31,750 236.6 351.0 491.7 363.7 1,907.2 5,793.4 140.3 814.3 2,348.0(85.9) (78.1) (80.9) (20.4) (16.6) (22.2) (9.8) (9.0) (9.6) (10.2) (9.9) (11.2)
50 - 99 1,390 2,818 3,713 97.4 198.0 258.9 247.6 1,441.2 4,524.5 93.2 583.4 1,605.4(6.0) (9.4) (9.5) (8.4) (9.4) (11.7) (6.7) (6.8) (7.5) (6.8) (7.1) (7,7)
100 - 299 1,201 2,581 2,750 205.4 444.0 463.1 642.9 3,511.6 10,713.3 235.R 1,461.3 3,814.4(5.2) (8.6) (7.0) (17.7) (X1.0) (20.9) (17.4) (16.6) (17.7) (17.1) (17.8) (18.2) s
300 > 700 1,137 1,030 618.4 14i l 1,001.5 2,441.0 14,299.5 39,514.5 910.6 5,333.4 13,143.5(3.0) (3.8) (2.6) (53.4) (53 1) (45.2) (66.1) (67.6) (65.3~ (66.0) (65.1) (62.9)
Total 23,293 291864 39,243 1,157.8 2,111.9 2,215.2 3,695.2 21,150.5 60,545.7 1,380.08 8,192.4 20,911.4
/a ,40 employees.
/b Billion won.
lc Percentage shares are shown in parenthesis.
Source: Major Statistics of Small and Medium Industries 1984, Small and Medium Industry Promotion Corporation.Report on Industrial Census, 1983, EPB.

- 28 -
Table 6.17: KSTABLISHMENTS BY SIZE IN KOREA AND JAPANt 1982(Z)
Z of X of Z ofestablishments employees Value addedKorea Japan Korea Japan Rorea Japan
4 - 99 93.0 96.7 35.6 55.5 19.6 38.6100 - 299 5.1 2.5 20.4 16.4 18.1 17.3300 1.9 4.8 44.0 28.1 62.3 44.1
Source: Small and Medium Industry Promotion Corporation, Major Statistics ofSmall and Medium Industries, 1984.
Economic Planning Board, Report on Industrial Census, 1983, Vols. Iand II.
Firm Concentration in Manufacturing
6.30 Firm concentration can be measured as either market or aggregateconcentration: market concentration is usually measured as the sales share oflargest 3-5 firms in a single market, while aggregate concentration is usuallydefined as the share of largest '0 or 100 firms in manufacturing sales acrossmarkets. The former measure is of interest to Korean policymakers because itmeasures the degree of market power exercised by a few firms and is thus apublic policy concern insofar as protection for consumers is concerned. Onthe basis of Table 6.18 which compares average "3-firm concentration ratios"for Korea, Japan and a major competitor economyt one can conclude that themarket structure in Korea is the most concentrated. In a different vein,since aggregate concentration reflects the extent of total manufacturingactivities controlled by a small number of firms irrespective of the nature ofoperation, it indicates the extent to which the economy is controlled by thejaebol, Korean conglomerates.
Table 6.18: AVERAGE 3 FIRM CONCENTRATION RATIOS
All sectors
Korea (1981) /a 62.0Japan (1980) 7i 56.3Major Competitor Economy (1981) /c 49.2
/a C.H. Yoon and K. Lee (1985).7- A. Senoo (1983).7T T.C. Chou (1985).

- 29 -
6.31 The pattern of market structure measured by industrial concentrationratios in Korean manufacturing changed over the course of the 1970-82 period;namely, between 1970 and 1977 in terms of both the number of comodities andthe sales value, the share of industries characterized as monopoliesincreased, while between 1977 and 1982 the importance of oligopoly industriesincreased markedly, as seen in Table 6.19. The increase in the share ofmonopoLy industries in 1970-77 is probably attributable to the early phase oflCI promotion and a lack of enforcnment of any anti-trust actions. Although adecline in the importance of monopolies in 1977-81 is a favorable development,policymakers have tG be concerned with a simultaneous decline in the import-ance of the con'petitive sales market. The rise of oligopolies in particularpoints to the prevalence of industrial groups tending to establish dominantpositions in a variety of industries, so that conglomerate level concentrationis probably even higher than that reflected in firm level data.
6.32 Table 6.20 shows the aggregate concentration for Korea, Japan and amajor competitor economy. The shares of sales captured by largest firms inKorea are much higher than in Japan or in the other economy; in 1982, forexample, the largest 50 and 100 firms in Korea controlled 37.5 and 46.81 oftotal manufacturing sales, respectively. In contrast, in a major competitor,corresponding shares were as low as 16.4 and 21.9%, respectively in 1980.Moreover, the aggregate concentration ratio in Korea has been increasingslowly but continously, while the ratios in Japan and the other economy havebeen essentially declining. The underlying cause may well have beengovernment policy in the area of industrial finance. Historically, publicpolicy has rewarded fast-growing firms with preferential access to credit andindustrial survivors have been tapped for expansion. This nurturing of largefirms continued during the HCI period and is evident in the bias in industrialfinance towards large firms, noted in Chapter 4. The Korean industrial sceneis now clearly dominated by very large groups, the jaebol.
Rising Influence of Conglomerates
6.33 Market power was analyzed at the firm level in the previoussections. But this may underestimate the extent of market power exercised inthe Korean economy because a substantial number of big firms are controlled bya small number of conglomerates. The importance of conglomerates in theKorean manufacturing sector is seen in Table 6.21. Moreover, conglomeratesgrew substantially faster than the non-conglomerates as shown by a rapidincrease in their sales share, tightening their grip on total manufacturing.The expansion of conglomerates in the 1970s mainly took the form of establish-ment of new companies rather than acquisition of other companies, while in the1980s the number of companies belonging to conglomerates declined throughmergers and sales. 4 Thus the size of Korean conglomerates is very largecompared to firms in other developing countries is attested to, for example,by the fact that 10 Korean conglomerates are listed among 27 developing
24/ The average number of firms in the conglomerates increased rapidly from4.2 in 1970 tc 14.3 in 1979, but then it declined slightly to 13.4 in1982. See K.U. Lee and J.H. Lee (1985).

- 30 -
Table 6.19: MARXET STRUCTURE OF KOREAN MANUFACTURING(2)
1970 1974 1977 1982
mtonopoly /aCommodities 29.6 30.8 31.6 23.6Sales 8.7 12.7 16.3 11.4
Duopoly /bCommodities 18.7 17.9 20.1 11.1Sales 16.3 12.6 11.0 6.6
Oligopoly tcCommodities 33,2 34.2 32.0 47.4Sales 35.1 38.6 33.9 50.6
Total NoncompetitiveCommodities 81.5 82.8 83.7 82.1Sales 61.1 63.9 61.2 68.6
Competitive /dCommodities 18.5 17.2 16.3 17.9Sales 39.9 36.1 38.8 31.4
/a Flrm concentration exceeds 80%.
/b Firms produce more than 80%.
Ic Top three firms produce more than 60%.
Source: Yoon and Lee (1985), and Lee (1985).

- 31 -
Table 6.20: SHARES OF LARGEST 50 AND 100 FIRMS IN MANUFACTURING (X)
Korea Japan Ma&Lr Competitor Economy50 100 50 100 50 - -- 100
1970 30.3 -40.6
1972 32.9 43.6
1973
1974 16.9 (20.3) 23.4 (28.1)
1975 28.4 15.8 (19.3) 21.7 (26.4)
1977 35.0 44.9 15.2 (18.1) 22.4 (26.8)
1980 27.3 16.4 (20.4) 21.9 (27.4)
1982 37.5 46.8
Note: For the Competitor Economy, the figures in parentheses indicate theshares of total private manufacturing.
Sources: C. R. Yoon and K. U. Lee, (1985), A* Senoo (1983), T. C. Chou (1985).

- 32 -
country firms in the "Fortune 500" list of the largest non-US industrial com-panies. However, the size of individual firms in Korean mauufactugg isstill substantially smaller than those in the developed countries._
6.34 Whereas Covernment clearly sees advantages in terms of improvedinternational competitiveness in having large, integrated firms, it also isconcerned about conglomerate control over financial resources, and has as aresult administratively decreed that one-third of banking sector credit bereserved for small and medium firms. This approach may also aim at eventuallydiluting the power of conglomerates, which, while initially needed to promoteKorean exports (i.e., the general trading company concept), have now taken ona life of their oWn despite the existence of a much enlarged entrepreneurialpool. Contrary to Japan, subcontracting relationships have never reallydeveloped in the Korean context, and aggressive forms of vertical integration,as well as horizontal reaching into other product lines has characterizedjaebol behavior.
6.35 The jaebol tend to be thinly capitalized, and engage in cut-throatcompetition, especially when confronted with excess capacity, e.g., the HCIyears. More recently, this problem re-emerged in the case of declining indus-tries, such as overseas construction and shipping. Vigorous competition maybe seen as adding efficiency and dynamism to the economy, but it also addsadditional risk if that competition is conducted under a public umbrella offinancial protection. Contrary once again to the case of Japanese businessgroups (Zaibatsu), which are often reputed to add to the economy's resiliencyby internally shifting employment from declining to expanding sectors, Koreanfirms offer no such implicit employment insurance. An important corollaryissue concerns the efficiency of very large economic units.
Table 6.21: CONGLOMERATES SHARE IN MANUFACTURING (X)
Sales EmploymentConglomerates 1978 1980 1982 1978 1980 1982
Top 5 15.7 16.9 22.6 9.5 9.1 8.410 21.1 23.8 30.2 13.9 12.8 12.220 29.3 31.4 36.6 18.2 17.9 16.030 34.1 36.0 40.7 22.2 22.4 18.6
Source: Y.K. Lee (1985).
25/ See Y.K. Lee (1985).

- 33 -
Concentration and Efficiency
6.36 In examining the production and market structure of Koreanmanufacturing, one may conclude that heavy-chemical industrialization in the19709 was associated with an increase in the size of production units (estab-lishment size), an increase in market 4s well as aggregate concentration, andan increase in the size of conglomerates. Unlike the uniform increases inthese measures in the 19709, their development in the 1980s has been morediverse: the size of establishments and market concentration declined, whileaggregate and conglomerate concentration continued to increase, reflectingoligopolization at the industry level and a general trend away from competi-tive structure at the manufacturing-wide level. These findings are of inter-est because production2gBd market structure have been shown to be related withallocative efficiency.2-7
6.37 Empirical evidence tends to support the view that the efficiency ofsmall I medium firms caught up aith that of large firms by the end of1970s.- These findings tend to siLpport the government's contention that theSMI sector sigyld be expanded and that it can supply new sources of growth tothe economy.' While this is undoubtedly true, and while "affirmativeaction" policies for SMIs are advantageous in light of the HCI distortions, itis not clear that government should take a position of economic structure onthe basis of perceived levels of efficiency. in some industries, in which R&Dand large scale technologies dominate, size may be an important determinant ofefficiency. In others, minimum critical size may be important to competeinternationally. On the other hand, the balance of incentives in the absenceof an active SMI promotion policy would clearly favor further agglomeration,which may be undesirable for a number of reasons (see Chapter 7 onconglomerates).
26/ Several cross-section studies of the market structure and performance inKorean manufacturing have found that highly concentrated sectors tend tohave high profitability. See studies by K.U. Lee (1977), I.B. Choi(1986), and S.S. Lee (1985). There are two radically different interpre-tations as to the casuality of the positive correlation between concen-tration and profitability in recent industrial organization literature.The "structuralist view" asserting that the positive correlation isevidence of rent-seeking behavior by firms in oligopolistic industries.It also maintains that larger firms do not have a substantial efficiencyadvantage over their smaller rivals. On the other hand, the "efficiency-based view"' argues that the positive relationship reflects the superiorperformance of large firms. See, for example, R. Clarke, S. Davies, andWaterson (1984).
27/ KDI estimates show that total factor productivity of SMIs grew con-siderably faster than that for large firms over the 1970-79 period (4%p.a. compared with 1.4X p.a.) su that they were on par by 1979. SeeJ.W. Kim (1985).
28/ See Appendix 6B on sources of growth.
- 34 -
6.38 In terms of domestic public policy, one clear way of controllingunwanted reductions in competition is through trade liberalizations. Whilethe items subject officially to monopoly oversight will be liberalized at anaccelerated pace, there are a wider range of goods praduced in oli polisticmarkets. Therefore, in the absence of strong antitrust measures,- tradeliberalization should be aggressively pursued to raise domestic livingstandards.
29/ There is legislation in the form of Monopoly ReguLation and Fair TradeAct (1980) to protect the consumer from unfair practices.

- 35 - Appendix 6APage 1
INTERNATIONAL COMPARISONS
A6.01 The similarity of the Korean pattern of change in ayiculturaland manufacturing GDP shares with international norm calculations,- isinstructive, yet there are some striking differences, as seen in Figure A6.1.It should be noted, in particular, that the share of manufacturing increasedvery sharply in 1972 and it surpassed the international norm in 1973, whilethe agricultural share remained higher than the international norm throughoutthe period, perhaps reflective of the high protection accorded to agriculture,as noted in Chapter 5. As a result of these developments, the share of bothagriculture and manufacturing was about 2.0 percentage points higher than thecorresponding international norms in 1983 (Table A6.1).
A6.02 An important and unique aspect of Korea's structural transfor-mation was the rapid increase in the share of heavy industry during the 1970s,which has been attributed to deliberate government policies. Several reasonsare given for the promotion of heavy-chemical industries (HCI) in the 1970s.First, the promotion of HCI was seen to facilitate a shift in Korea's compara-tive advantage from labor intensive to capital intensive goods in light ofvarious changes taking place at that time, such as rising domestic wage andrising protectionism against unskilled labor intensive goods in developedcountries. Second, the threatened withdrawal of American forces from Koreaprompted the political leaders to consider rapid establishment of heavy-chemical industries. Finally, the strong aspiration and zeal of the latePresident Park's regime to achieve the so-called "advanced industrial state"in a relatively short period also played an important role. To promote HCI,various incentive policies were adopted, including special tax treatment, 2/import protection, preferential credit allocation and government investment.-
A6.03 To investigate the effect of HCI push on changes in productionstructure, Figure A6.2 compares the actual share of heavy-chemical manufac-turing in GDP to the corresponding international norm. One interestingfinding is the sharp increase in the share of heavy-chemical manufacturingwhich took place in 1973-1974 compared with the predicted structure. Accord-ing to the data on credit allocation by sector in Yechnical Appendix 4, thefinancial preference towards HCI only began to see in 1975, yet the surge inHCI performance compared to international noms had already begun. Moreover,the impetus of the increase in 1973 appears to be different from that in 1974.In 1973, export expansion, due to unprecedented rate of growth in the worldtrade, contributed a great deal to output expansion of manufacturing while in1974 it was investment that provided the major impetus to output growth.Between 1972 and 1973 Korean heavy-chemical exports increased by 112.4%,compared to the average annual increase of 63.42 for 1967-1972 while the
1/ Predicted shares are obtained from regression analysis similar to H.B.Chenery and L. Taylor (1968). For recent extensions of this methodology,see Chenery, Syrquin, and Urata (forthcoming).
2/ For a detailed description, see T. Kwack (1984) and W. Hong (1985).

- 36 - Appendix 68-36- ~~~~~Page 3
36.04 Results of demand sources of growth for various periods showthat in Korea import substitution was very significant before 1963 (see Table36.3). In 1963-70 import substitution turned negative and remained negativeuntil 1970-75, reflecting an opening of the economy. From 1975 to 1983,however, the contribution of import substitution reversed sign again,reflecting a positive contribution from import substitution during theperiod. Export expansion, on the other hand, contributed significantly tooutput growth throughout 1963-1983. The magnitude of the contribution ofexport expansion was particularly high during 1970-73, when the Korean exportsexpanded rapidly thanks to its successful export promotion policies and theexpansion in the world trade.
86.05 An international comparison of the demand sources of growthpresents interesting variations in country patterns depending on populationsize and the trade policies adopted. Large countries (e.g., China, India andJapan) tend to exhibit larger contributions of domestic demand expansionbecause of their large home market. There are noticeable variations in theimportance of foreign trade factors even among the small countries, however.The differences appear to reflect different trade policies pursued indifferent countries. In Mexico, Turkey and Colombia, all of which more orless adopted import substitution policies during the period, trade factorscontributed much less than in other countries of smaller size and endowments.Although export expansion contributed greatly to output increase in Korea, amajor competitor economy, Israel, Norway and Yugoslavia, negative importsubstitution was significant only in Israel, Norway and Yugoslavia, whichadopted open economic policies in both export and import markets, and not inKorea or its competitor, where export promotion and import restrictionpolicies were purused simultaneously.
36.06 Supply Side Sources of Growth. The traditional approach (dueto Denison)-/ to assess the magnitude of various supply factors whichcontribute to the growth decomposes net output growth of the whole economy toseven supply factors: (i) increase in labor inputs, (ii) increase in capitalinputs; and (iii) total factor productivity, which can include, inter alia,economies of scale, advances in knowledge, and miscellaneous determinants.RecenI/results for the 1963-72 and 1972-82 periods are reproduced in TableB6.4,_ showing that labor inputs grew at around 31, and the increase in laborinputs was the largest single contributor to net output growth in both twoperiods, accounting for around 35Z of the total. The rate of growth ofcapital increased substantially from 1.14t in 1963-72 to 2.101 in 1972-82,most likely reflecting increased capitalization in HCI and, as a result, itscontribution to overall growth rose from 13.9 to 26.21 between the twoperiods. Total factor productivity (TFP) declined considerably over theperiod, with the largest decline occurring in the rate of advances in know-ledge. It contributed only 3.71 to growth in the later period. Declining
I/ See Denison (1974).
21 See K.S. Kim and K.K. Park (1985).
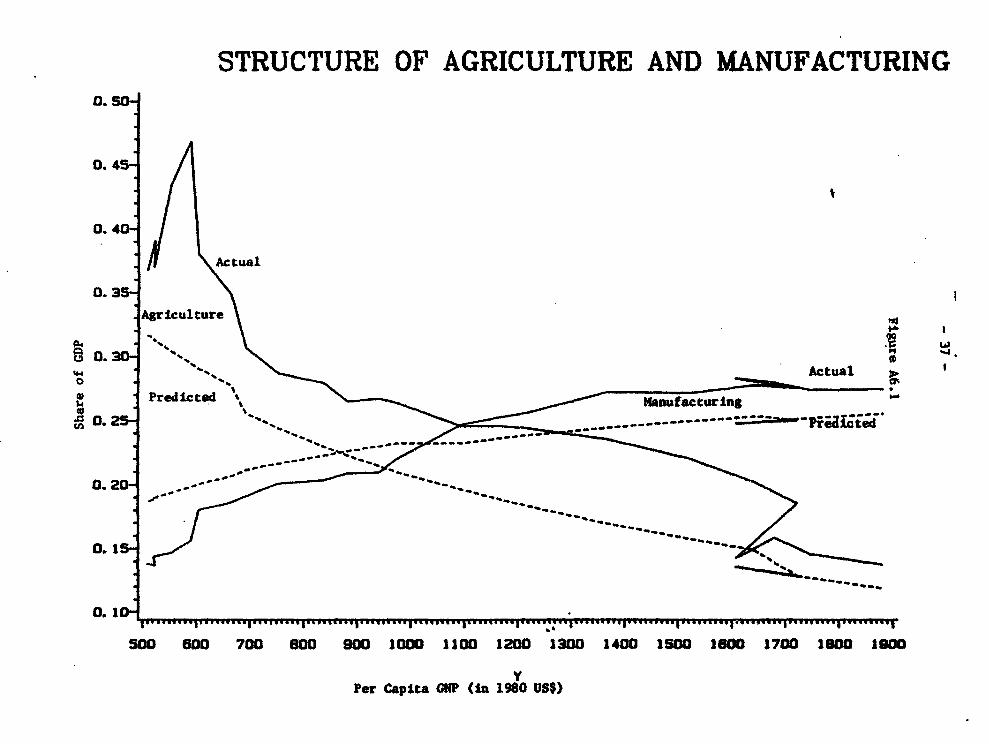
STRUCTURE OF AGRICULTURE AND MANUFACTURING0.50
0. 45
0.40S
Actual
0.35a
:Agriculture
0.30e
0 Predicted '
0>.25 ----------_
0.20
0. 15'
0. 14O.1 ..... ........ I...... I.., .... I f"...... v....l l , llo ;well , . ,... ., , , to.> 1,.,2 ,W, Mlo 9.I I I 11
500 60 700 600 900 1000 1100 1200 1300 1400 1500 1600 1700 10 1900
Per Capita CNP (in 1980 US$)

Table A6.1: COMPOSITION OF VALUE ADDED IN VARIOUS COUNTRIES
Country Korea Korea Argentina Brazil China Hong Kong Japan Malaysia Singapore Turkey uSYear 1983 Predicted 1982 1982 1982 1982 1982 1982 1982 1982 1982Per capita GNPin 1980 US$ 1,880 1,880 1,625 1,864 311 5,824 9,410 1,774 5,613 1,366 11,311
Sector
Agriculture 13.7 11.6 12.5 11.6 36.9 0.7 3.5 22.6 1.0 20.7 2.6 W
Mining 1.4 7.7 2.5 0.8 1.7 0.2 0.5 6.7 0.4 2.0 3.9 t
Manufacturing 27.5 25.2 27.7 27.1 35.9 21.3 29.7 19.4 24.1 22.5 21.5
Construction 8.3 5.5 6.3 5.4 4.0 7.1 8.8 5.1 11.0 4.4 4.2
Utilities 10.7 11.9 8.0 7.6 6.1 9.1 9.7 9.6 14.7 13.0 9.4
Services 38.3 38.0 43.1 47.4 15.4 61.7 47.7 36.6 48.7 37.5 58.4
Source: "Patterns of Development, 1950-83," World Bank research project (RPO 673-85).
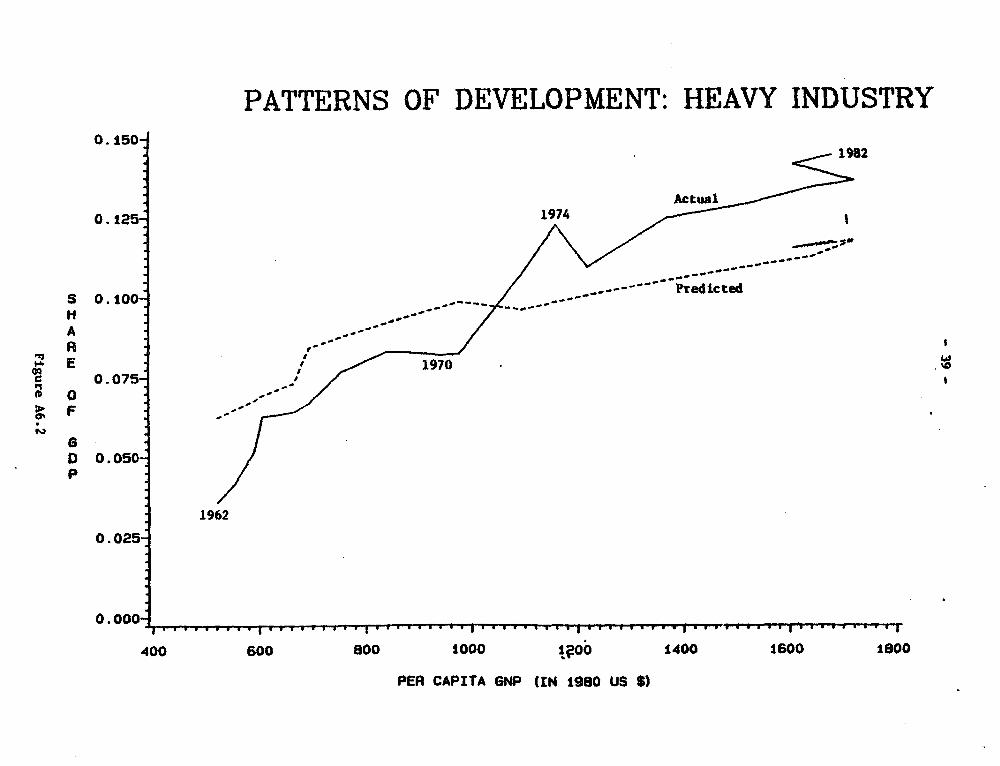
PATTERNS OF DEVELOPMENT: HEAVY INDUSTRY0.150
1982
Actual0. 125 1974
S 0.100
A
mE ,'1970. 0.075
00:>F ,-' -
6D 0.050p
1962
0.025
o 000
400 600 B00 1000 1S?0O 1400 1600 1900
PER CAPITA GNP (IN 1980 US $)
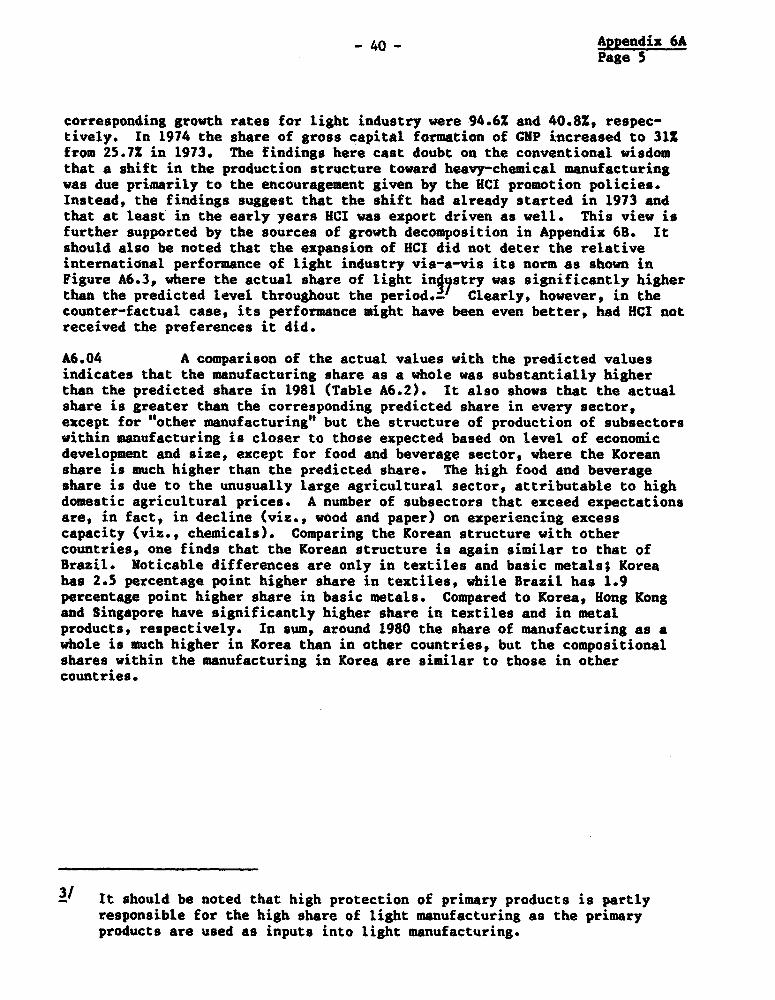
_ 40 - Appendix 6APage 5
corresponding growth rates for light industry were 94.6X and 40.8Z, respec-tively. In 1974 the share of gross capital formation of GNP increased to 31Xfrom 25.7Z in 1973. The findings here cast doubt on the conventional wisdomthat a shift in the production structure toward heavy-chemical manufacturingwas due primarily to the encouragement given by the HCI promotion policies.Instead, the findings suggest that the shift had already started in 1973 andthat at least in the early years HCI was ezport driven as well. This view isfurther supported by the sources of growth decomposition in Appendix 6B. Itshould also be noted that the expansion of HCI did not deter the relativeinternational performance of light industry vis-a-vis its norm as shown inFigure A6.3, where the actual share of light ind3ystry was significantly higherthan the predicted level throughout the period.-' Clearly, however, in thecounter-factual case, its performance might have been even better, had HCI notreceived the preferences it did.
A6.04 A comparison of the actual values with the predicted valuesindicates that the manufacturing share as a whole was substantially higherthan the predicted share in 1981 (Table A6.2). It also shows that the actualshare is greater than the corresponding predicted share in every sector,except for "other manufacturing" but the structure of production of subsectorswithin mAnufacturing is closer to those expected based on level of economicdevelopment and size, except for food and beverage sector, where the Koreanshare is much higher than the predicted share. The high food and beverageshare is due to the unusually large agricultural sector, attributable to highdomestic agricultural prices. A number of subsectors that exceed expectationsare, in fact, in decline (viz., wood and paper) on experiencing excesscapacity (viz., chemicals). Comparing the Korean structure with othercountries, one finds that the Korean structure is again similar to that ofBrazil. Noticable differences are only in textiles and basic metals; Koreahas 2.5 percentage point higher share in textiles, while Brazil has 1.9percentage point higher share in basic metals. Compared to Korea, Hong Kongand Singapore have significantly higher share in textiles and in metalproducts, respectively. In sum, around 1980 the share of manufacturing as awhole is much higher in Korea than in other countries, but the compositionalshares within the manufacturing in Korea are similar to those in othercountries.
31 It should be noted that high protection of primary products is partlyresponsible for the high share of light manufacturing as the primaryproducts are used as inputs into light manufacturing.

- 41 -
Table A6.2: COMPOSITION OF VALUE ADDED IN MANUFACTURING(2)
Country Korea Korea Brazil Hong Kong Japan Singapore Turkey USYear 1981 Predicted 1978 1980 1981 1981 1981 1980Per Capita GNPin 1980 US$) 1,680 1,680 1,852 5,468 9,180 4,926 1,336 11,562
Food, beverages 4.4 1.2 3.8 1.1 2.8 1.4 4.6 2.4
Textiles, apparel 5.5 5.3 3.0 9.3 1.9 1.4 3.6 1.4
Wood, wood products 0.4 0.1 1.2 0.3 1.0 0.8 0.3 0.7
Paper, paper products 1.2 0.6 1.5 1.3 2.4 1.4 0.7 2.2
Chemicals 5.6 4.7 5.3 2.3 4.5 7.4 4.6 3.7
Nonmetallic and 1.4 0.8 1.7 0.2 1.5 0.8 1.9 0.7mineral products
Basic metals 2.4 1.7 4.3 0.2 2.7 0.5 2.0 1.4
Fabricated metal 6.5 5.3 5.8 7.6 13.3 15.2 4.2 10.2products, machines
Other manufacturlng 0.6 1.3 1.0 0.8 0.5 0.4 0.07 0.4
Total Manufacturing 28.0 21.1 27.5 23.1 30.7 29.4 21.8 23.1
Source: 'Patterns of Development, 1950-83," World Bank research project (RPO 673-85).

PATTERNS OF DEVELOPMENT: LIGHT INDUSTRY0.150 Ata
1970/-/l80.125 1974
1962
S 0.100 ____----- --H " N…red…ete
eE
lat o 0.075
F
D 0.050p
0.025
0.000.
400 600 o00 1000 i200 1400 1600 1800
PER CAPITA GNP (IN 1980 US S)
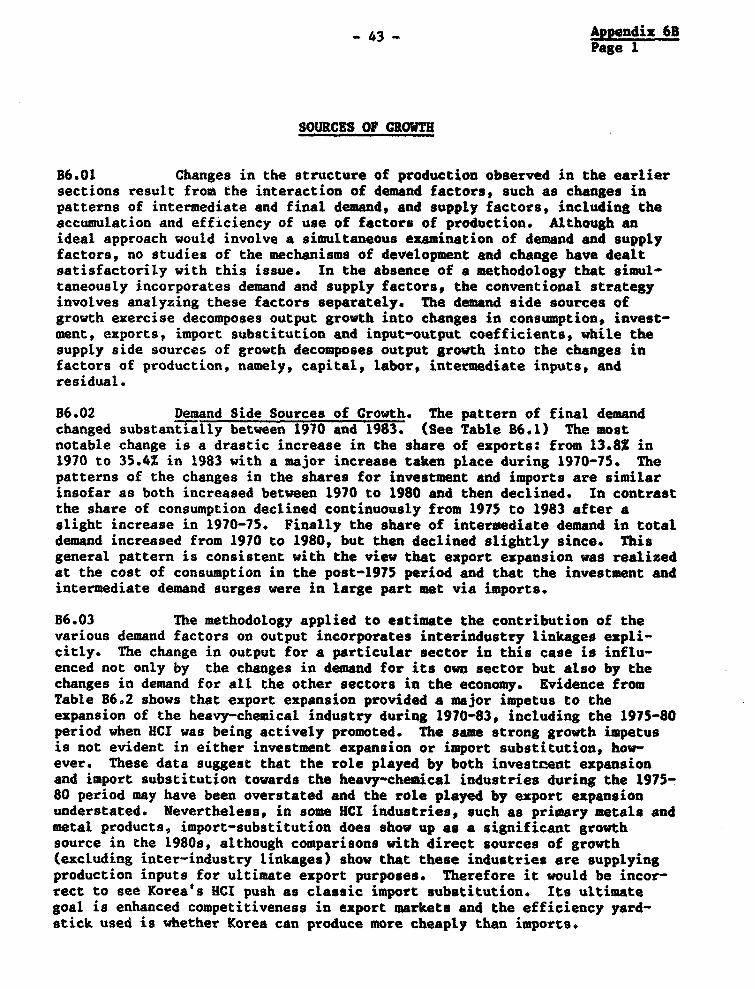
_ 43 - Appendix 6BPage 1
SOURCES OF GROWTH
B6.01 Changes in the structure of production observed in the earliersections result from the interaction of demand factors, such as changes inpatterns of intermediate and final demand, and supply factors, including theaccumulation and efficiency of use of factors of production. Although anideal approach would involve a simultaneous examination of demand and supplyfactors, no studies of the mechanisms of development and change have dealtsatisfactorily with this issue. In the absence of a methodology that simul-taneously incorporates demand and supply factors, the conventional strategyinvolves analyzing these factors separately. The demand side sources ofgrowth exercise decomposes output growth into changes in consumption, invest-ment, exports, import substitution and input-output coefficients, while thesupply side sources of growth decomposes output growth into the changes infactors of production, namely, capital, labor, intermediate inputs, andresidual.
B6.02 Demand Side Sources of Growth. The pattern of final demandchanged substantially between 1970 and 1983. (See Table B6.1) The mostnotable change is a drastic increase in the share of exports: from 13.8% in1970 to 35.4% in 1983 with a major increase taken place during 1970-75. Thepatterns of the changes in the shares for investment and imports are similarinsofar as both increased between 1970 to 1980 and then declined. In contrastthe share of consumption declined continuously from 1975 to 1983 after aslight increase in 1970-75. Finally the share of intermediate demand in totaldemand increased from 1970 to 1980, but then declined slightly since. Thisgeneral pattern is consistent with the view that export expansion was realizedat the cost of consumption in the post-1975 period and that the investment andintermediate demand surges were in large part met via imports.
86.03 The methodology applied to estimate the contribution of thevarious demand factors on output incorporates interindustry linkages expli-citly. The change in output for a particular sector in this case is influ-enced not only by the changes in demand for its own sector but also by thechanges in demand for all the other sectors in the economy. Evidence fromTable B6.2 shows that export expansion provided a major impetus to theexpansion of the heavy-chemical industry during 1970-83, including the 1975-80period when HCI was being actively promoted. The same strong growth impetusis not evident in either investment expansion or import substitution, how-ever. These data suggest that the role played by both investnent expansionand import substitution towards the heavy-chemical industries during the 1975-80 period may have been overstated and the role played by export expansionunderstated. Nevertheless, in some HCI industries, such as primary metals andmetal products, import-substitution does show up as a significant growthsource in the 1980s, although comparisons with direct sources of growth(excluding inter-industry linkages) show that these industries are supplyingproduction inputs for ultimate export purposes. Therefore it would be incor-rect to see Korea's HCI push as classic import substitution. Its ultimategoal is enhanced competitiveness in export markets and the efficiency yard-stick used is whether Korea can produce more cheaply than imports.

- 44 -
Table B6.1: CHANGES IN STRUCTURE OF DEMAND
Compositionof final demand (S) Growth rate of demand
1970 1975 1980 1983 1970-75 1975-80 1980483
Consumption 84.2 84.7 78.7 74.1 29.1 28.9 15.6Investment 27.6 26.6 31.5 30.1 28.1 35.2 16.2Exports 13.8 29.1 33.6 35.4 49.7 34.6 20.1Imports -25.6 -40.5 -43.8 -39.6 41.4 32.8 14.2
Total Final Demand 100.0 100.0 100.0 100.0 29.0 30,8 18.0
Source: Bank of Korea, InMut-Output Tables.
Table B6.2: SOURCES OF OUTPUT GROWTH IN MANUFACTURING
ChangesConsumption Investment Export Import in 1-0expansion expansion expansion substitution coefficient
1970-75Heavy and chemical industry 24.0 23.5 35.9 3.6 13.0Chemical and chemical products 35.7 9.7 30.6 2.4 21.6Primary metal manufacturing 8.6 31.1 45.3 8.5 6.6Metal products and machinery 13.0 41.8 39.8 3.1 2.2
Light industry 57.8 7.9 32.5 -0.8 2.6
Total Industry 54.8 15.5 27.3 -1.3 3.7
19580Heavy and chemlcal Industry 25.6 22.7 41.3 7.1 3.3Chemical and chemical products 44.3 7.9 34.9 5.6 7.3Prlmary metal manufacturing 7.0 29.8 57.2 12.7 -6.7Metal products and machinery 9.9 39.9 40.8 5.8 3.6
Light industry 51.7 13.1 31.7 1.4 2.0
Total Industry 48.1 21.2 27.3 1.7 1.8
1980-83Heavy and chemical industry 30.5 14.6 54.1 7.9 -7.1
Chemical and chemical products 55.6 15.9 52.8 -3.7 -20.5Primary metal manufacturing 18.7 -2.7 74.2 19.6 -9.8Metal products and machinery 17.5 19.2 48.8 12.0 2.6
Light industry 55.6 - 6.7 37.0 -1.2 2.0
Total Industry 45.8 19.8 32.9 3.7 -2.2
Source: World Bank estimates.

- 45 -
Table B6.3: SOURCES OF OUTPUT GROWTH FOR VARIOUS ECONOMIES
Changes inDomestic Export Import input-outputexpansion expansion substitution coefficient
China 1956-65 107.2 1.9 9.2 -18.31965-75 85.7 5.6 -1.3 10.11975-81 80.3 16.4 -7.9 11.2
India 1959-68 81.0 5.1 7.4 6.61968-73 91.6 6.0 9.3 -7.0
Japan 1955-60 87.9 8.0 -4.1 8.31960-65 90.8 15.1 -2.1 -3.81965-70 82.6 14.9 -3.2 5.7
Korea 1955-63 74.5 10.0 21.4 -6.01963-70 81.8 21.9 -1.8 -1.91970-73 51.9 55.7 -3.2 -4.41970-75* 70.3 27.3 -1.3 3.71975-80* 69.3 27.3 1.7 1.81980-83* 65.7 32.9 3.7 -2.2
Major CompetitorEconomy 1956-61 54.3 23.9 15.1 6.7
1961-66 61.3 37.6 -1.1 2.21966-71 52.7 49.5 -0.2 -2.0
Mexico 1950-60 85.5 1.0 5.4 8.11960-70 94.1 3.1 6.0 -3.21970-75 89.8 5.9 -1.3 5.b
Turkey 1953-63 92.3 2.5 1.8 3.31963-68 83.6 4.9 8.3 3.21968-73 86.2 11.8 -1.4 3.5
Colombia 1953-66 76.1 10.0 6.9 7.01966-70 69.5 21.8 6.5 2.1
Israel 1958-65 76.7 25.6 3.1 -5.41965-72 69.1 42.0 -18.9 7.9
Norway 1953-61 60.7 40.4 -10.6 9.51961-69 60.2 49.1 -13.3 4.0
Yugoslavia 1962-66 87.6 23.9 -6.2 -5.31966-72 82.0 30.2 -18.4 6.1
Source: Those without an asterisk are taken from S. Urata, (forthcoming).

- 46 -
Table B6.4: SUPPLY-SIDE SOURCES OF GROWTH(Annual growth rates)
Korea Japan United States1963-82 1963-72 1972-82 1953-71 1963-73 1973-82
Standardized national income 8.13 8.23 8.02 8.81 3.92/a 1.55/a(100.0) (100.0) (100.0) (100.0) (100.0) (100.0)
Labor 2.92 2.74 3.04 1.51 1.32 0.66(35.9) (33.3) (37.9) (17.1) (.3.7) (42.6)
Capital 1.58 1.14 2.10 2.10 0.85 0.69(19.4) (13.9) (26.2) (23.8) (21.7) (44.5)
Total factor productivity 3.63 4.35 2.88 5.20 1.75 0.20(residual) (44.6) (52.9) (35.9) (59.0) (44.6) (12.9)
Of which: Advances inknowledge 1.09 1.89 0.30
/a Excludes educational impact on workers, included in TFP for comparability.
Note: Figures in parentheses are precentage shares of total growth in standardizednational income.
Sources: K.S. Kim and J.K. Park (1985) and Denison (1985).

- 47 - Appendix 6BPage 6
TFPs have been noted in the US for recent years, for ezample, and has prompteda livelier interest in R&D expenditures and other knowledge-augmentingactivities.
86.07 The Korean trend may well be dominated in the 1970. by the HCIexperience. Additional KDI studi covering manufacturing industries showsharp T?;P drops in the mid-1970s.JT Nhmerous explanations are offered,including overestimation of labor hours worked, lack of competition indomest)c product markets, and adjustments to new energy-efficient technolo-gies., A shift in trade strategy from export promotion in the mid to late1960s to import substitution in the mid and late 1970s may well have led to adecline in TIP growth. Opening up of the economy in the 1960. due to exportpromotion policies is believed to have resulted in an improvement in produc-tive efficiency through strong competition from abroad, exploitation of scaleeconomies, and introduction of foreign technology. In contrast import substi-tution policies, which were adopted to promote heavy-chemic#l industries inthe mid to late 1970., nurtured inefficiency in production._ Lack ofdomestic competition might have contributed to slow rate of growth in TFP aswell. During the 1970s market concentration increased significantly in theaftermath of HCI episode which encouraged the expansion of firm size. In theabsence of significant import liberalization efforts, firms in the concentra--ed market might have opted not to improve their productive effciency, result-ing in low TFP growth. Finally, the oil price increase in 1973-74 forcedfirms to adopt new energy-saving technology, which is not additionally produc-tive, at least in the short run. This could also produce a decline in TFPgrowth. Most likely, however, is the overcapaci;y in manufacturing caused bythe ambitious HCI investments of the mid-1970s.1' It would be important toknow whether the recent liberalization program, and the better HCI perfor-mance, have succeeded in turning this around. Clearly, as Korea's productiveinputs become increasingly constrained, it will have to turn to moreefficiency ways of utilizing those inputs to generate growth.
3/ TFP estimates for 1966-71 versus 1971-75 by Kim and Sohn (1979) show adrop from 3.78X during the former period to 1.07X in the latter. Asimilar exercise for mining and manufacturing by Rhee (1982) shows adecline in TFP growth from 6.142 in 1967-71 to 2.392 in 1972-76.
4/ See Park and Kim (1985).
5/ Nishimizu and Robinson (1984) support this argument, as it found that TFPgrowth is positively correlated with export expansion while it isnegatively correlated with import substitution by examing their relationsin Korea, Japan, Turkey and Yugoslavia, among other countries.
6/ See Westphal (forthcoming).

- 48 -
CHAPTER 7s THE CONDUCT OF MACROECONOMIC POLICY, 1982-85
A. Introduction
7.01 During 1980-82, Korea's principal macroeconomic goal was theachievement of stability and recovery from the difficulties engendered by theoverheating of the economy in the late 1970s, the rise in oil prices andinterest rates in 1979-80 and the subsequent international recession. In theprocess, Korea further increased its external debt from about $21 billion in1979 to over $37 billion by the end of 1982, at an annual average rate ofgrowth of 22X. Believing that this rate of growth of debt exposed the countryto unacceptable risks (given the unsettled international financial environ-ment) Korea has sought, since 1982, to achieve an improvement in its externaldebt position while simultaneously maintaining price stability and a reason-able rate of CNP growth. Specifically, the Fifth Plan (1982-86) aimed atbalance of payments equilibrium in the current account together with aninflation rate of under 4X and CGP growth of 7.SZ. Macroeconomic policieshave had to be chosen carefully to accomplish these goals since policydilemias abound when multiple goals are sought.
7.02 Policy Tradeoffs. The notion of a policy tradeoff arises sinceaggregate demand management policies typically achieve desirable goals (suchas the reduction of inflation) at the cost of some undesirable consequences(such as reduced investment and growth and increased unemployment). In Koreathe policy environment of the past several years has been characterisedessentially by tight money, balanced budgets and exchange rate depreciation(see Table 7.1). Money supply has been kept tight so as not to reigniteinflation or put pressure on the balance of payments (BOP). The worry,expressed usually by the business community, is that tight money can havenegative effects on investment, exports and emloyment. Balanced budgets aredeemed necessary for price stability and BOP improvement and Korea has pursuedtight fiscal policy not simply through nearly balanced budgets but also bykeeping the ratio of expenditures to CNP constant. The downside risk to thispolicy is similar to that for tight monetary policy -- possible adverse conse-quences for investment, employment and growth. Finally, the won has beensteadily depreciated so as to promote the balance of payments objective. Thepolicy dilemma that faced Government was a possible adverse effect on infla-tion and domestic output (the so-called contractionary devaluation problem),and the possible ineffectiveness of depreciation, in an import-dependenteconomy, in improving the overall payments position.

- 49 -
Table 7.1: RECENT MACROECONOMIC PERFORMANCE AND POLICY STANCES
1980 1981 1982 1983 1984 1985
Policy StanceMonetaryNDA growth Ia 35 39 34 18 14 24Interest rate:Nominal /b 21 20 12 10 11 12Real /c -2.2 4 5 7 7 8
FiscalDeficit/CNP -3.2 -4.6 -4.4 -1.6 -1.4 1.5Expenditures/CNP 22.8 24.8 24.2 21.3 21.1 21.4
Exchange rateREER change /d -6.8 2.7 -0.3 -7.3 0.2 -11.0
Macroeconomic Performance /eCNP growth -5.2* 6.6 5.4 11.9 8.4 5.1CNP deflator 28.6* 15.4 6.6 3.9 3.8 3.6Current account/CUP -8.8 -7.0 -3.8 -2.2 -1.1 -1.0Investment growth -23.7* 6.3 0.1 17.5 18.6 1.6Investment/CNP 32.1 30.3 28.6 29.9 31.9 31.2Savings/CNP 20.8 20.5 20.9 25.3 27.9 28.4Debt ($ bln) 27.3 32.5 37.1 40.2 42.6 45.6Debt service (Z) 19.7 21.2 22.6 20.9 22.6 23.6Short-term tototal debt (X) 34.3 31.5 33.5 30.1 26.8 25.4
Unemployment rate 5.2 4.5 4.4 4.1 3.8 3.8
/a NDA refers to Net Domestic Assets of banking system.7i Ceiling lending rate on loans of one-year maturity by commercial banks.7- Nominal rate adjusted by GUP deflator measure of inflation.71 Rate of change in the value of the real effective exchange rate (REER).7e All data unless asterisked is based on the new System of National
Accounts and thus is not strictly comparable to pre-1980 data.
Source: Bank of Korea, Economic Statistics Yearbook, and Economic PlanningBoard data.
7.03 The following sections examine the manner in which these policieshave been implemented in recent years, discuss why certain consequencesoccurred and others did not and indicate how policy effectiveness may beaffected by changes taking place in the economy. Four themes emerge. Perhapsthe most important theme is that the achievement of macroeconomic objectivesin Korea is conditioned strongly by external developments. During 1982-84,
- so -
favorable external developments such as the decline in the prices of oil andother commodities and the economic recovery in the OECD countries (and especi-ally in the US) enabled Korea to reduce inflation as well as to maintain ahigh rate of investment and growth despite a conservative domestic macroeco-nomic policy stance. External developments were also important to Korea'seconomic performance in 1985. As the US and other OECD economies entered aperiod of stagnation from mid-1984 on, Korean exports plummetted and bothinvestment and growth faltered.
7.04 The response to this withdrawal of external demand stimulus illus-trates a second theme which is that the conduct of macroeconomic policy hasbeen flexible and selective. As the economy faltered in 1985 monetaryrestraint was moderately relaxed, fiscal expenditures were rearranged withoutbeing increased, and depreciation was accelerated. Domestic stimulus wasprovided selectively for investments in the export sector, a strategy thathelped boost aggregate demand while maintaining the impetus towards externalbalance. Flexibility and selectivity were also present during 1982-84. Forexample, while the overall macroeconomic policy stance was tight, the privatesector was treated more liberally than the public sector.
7.05 A third theme is that the job of demand management was made easierby the simultaneous implementation of supply-side policies. Initiatives takenin the direction of trade and financial liberalization and industrial policyreform began to pay off in the form of higher domestic savings, a pass-throughof low international inflation, a reduction of import dependence, and improve-ments in labor productivity and investment efficiency. While restrainedmacroeconomic policies have helped curtail inflation, part of the inflationreduction has also come about through such supply side developments. Thusfavorable external developments, such as the low rate of inflation in Korea'simport supplying countries, ccmbined with lower trade barriers and an increasein the efficiency of import use to keep downward pressure on domestic infla-tion. Similarly, while depreciation and a tight macroeconomic policy stancehave improved the current account and reduced the rate of growth of externaldebt, part of this outcome is attributable to policies which have raised thedomestic savings rate.
7.06 The fourth theme that emerges is that the effectiveness of macroeco-nomic policy, in particular that of monetary policy, is conditioned by twostructural features of the domestic financial system namely, the growth of anon-bank financial institution (NBFI) segment and the high degree of debt-reliance in Korea's corporate sector. The growth of the NBFI segment relativeto the primary banking sector has increased the uncertainty regarding theultimate effect of monetary policy, exercised through the banking system, oninvestment, output and inflation. This is because monetary developments inthe NBFI sector can offset developments in the primary banking sector. During1983-84, for instance, the authorities sharply reduced the rate of growth of.domestic credit through banks and simultaneously raised nominal interestrates. Both of these moves were partially offset by developments in the NBFIsector where the rate of growth of credit did not decline as sharply (and infact rose during 1984) and real interest rates generally fell. Similarly whena more relaxed stance was adopted in 1985, it was offset to some extent bycontraction in the NBFI sector. Moreover, the high degree of debt-reliance in

- 51 -
Korea's corporate sector has constrained the independence of monetary policyas a policy instrument.
B. The Determinants of Investment and Inflation, 1982-85
7.07 The monetary policy that has been followed since 1981 can be gener-ally characterized as tight. The rate of growth of the net domestic assets ofthe banking system (NDA) was reduced progressively from 34Z during 1982 to 181in 1983 and 14X in 1984. At the same time, nominal bank lending rates werepermitted to rise and real le7ding rates almost doubled between 1981 and theend of 1985 (from 4% to 8%).- During 1985, an emerging recession causedlargely by a sharp fall-off in export growth, prompted some monetary relaxa-tion and net domestic assets were permitted to grow at 24I. However, a targetof 14% growth in NDA has been set for 1986, which indicates that the 1985interlude should be considered a temporary deviation from a monetary trajec-tory that has been, and is intended to remain, essentially restrained.
7.08 The aim of tight monetary policy has been to reduce inflation andthe current account deficit. Inflation had been brought down from the unusualheights (for Korea) of 25.6% in 1980 to 15.9% in 1981, while the currentaccount deficit had been reduced from 8.71 to 6.9% of CNP. These levels werestill considered unacceptably high and he fe monetary policy was set to helpachieve further progress on these fronts._
Monetary Policy and Investment
7.09 An interesting aspect of Korea's recent experience with monetarypolicy is that while the monetary deceleration (as measured by the rate ofgrowth of real and NDA bank lending rates) has been sharp and while inflationand the current account deficit have been reduced partly by this (and partly
1/ It is important to note that the period 1983-85 is being referred to heresince nominal interest rate policy changed in this period. Nominal banklending rate ceilings were reduced sharply during 1982 in the wake of alarge drop in inflation because of the concern that very high realinterest rates might stall the business investment recovery that seemedto be occurring. By late 1983 inflation appeared to be stabilizing at alow level and Government began a program of financial liberalizationunder which the nominal lending rate ceiling was adjusted upwards (seeChapter 4 for details).
2/ A lower rate of monetary growth and higher real interest rates arethought to reduce the rate of growth of economic activity by reducinginvestment. As this happens, the rates of growth of incomes and pricesdecline. In this manner, contractionary monetary policy achieves bothlower inflation and a reduced current account deficit since import growthdeclines as domestic income growth falls and exports rise as domesticprices fall. While the economy is adjusting to the lower rate ofexpansion of money supply and higher interest rates, investment,employment and growth are typically expected to fall relative to trend.

- 52 -
by exchange rate management as discussed later), this has apparently not comeabout at the expense of a slowdown in economic activity. In fact, while themonetary deceleration was underway, investment grew steadily, continuing arecovery from a negative growth rate in 1980 (see Table 7.1). As a proportionof GNP, gross domestic investment rose from 28.6Z in 1982 to almost 32Z in1984. CUP also grew at an average rate of about 8.5Z and unemploymentdeclined from 4.5Z in 1981 to 3.8Z by the end of 1985. Clearly other factorswere at work to offset the potentially adverse consequences of tight monetarypolicy.
7.10 Three factors can be identified as being important. The first wasthe pull exerted by the recovery of the OECD economies beginning in late1982. The second was the fact that the monetary restraint was not as severein actual experience as appears from movements in the rate of growth of thebanking system's NDA and lending rates. Broader measures of liquidity whichinclude the deposit and credit creation activity of nonbank financial interme-diaries indicate a deceleration of smaller proportions. Furthermore, realinterest rates in the unregulated curb market actually fell somewhat during1982-84. A third factor was a shift in the distribution of credit from thepublic to the private sector. These factors are elaborated below.
Investment and Foreign Income Growth
7.11 Beginning in the last quarter of 1982, the OECD countries, andespecially the US, began to pull out of the recession in which they had beenmired. As a result their demand for imports grew and world trade volumerebounded substantially from the trough of 1981-82. In particular, the sharpgrowth of import demand in the US proved a boon for Korean exports. The USmarket normally accounts for over 30% of Korean exports. The elasticitycharacterizing the response of Korean exports to foreign income is very high(between 3.5 and 4.5) and, as the OECD recovery accelerated (see Table 7.2)the prospects for exports brightened enormously and fized investment grewrapidly despite the contractionary stance of monetary policy. It is easy tocast this argument in terms of a standard investment function (see Box 7.1).Among the determinants of private fixed investment are not only the interestrate and credit availability, but also current and expected levels of incomeand profits. Foreign income growth raised current as well as exrected incomeand profits of Korean exporters and thereby led to higher investment.
The Role of IBFIs
7.12 In fact, closer scrutiny of the data indicates that even interestrates and credit availability did not exercise a very strong negative effecton investment. Movements in the banking system's credit supply figures andlending rates do not accurately reflect the overall liquidity situation facedby the private sector to the extent that credit is provided through two othersegments, a relatively unregulated segment consisting of NBFIs and a

- 53 -
Table 7.2 2 GROWTT IN WORLD INCOME AND TRADE
1981 1982 1983 1984 1985
CDP growth rates (Z)Industrial countries 1.6 -0.2 2.6 4.9 2.8USA 2.5 -2.1 3.7 6.8 2.6Others 1.1 0.9 2.0 3.5 3.0Japan 4.0 3.3 3.4 5.8 4.4
Korea /a 7.4 5.7 10.9 8.6 5.2
Trade growth rates (Z)Industrial countries imports (volume) -2.5 -0.8 4.2 11.7 6.1Korean exports (volume) 16.4 4.6 15.5 9.8Korean exports (value) 20.2 1.0 11.0 13.3
/a New System of National Accounts methodology.
Source: IMF, World Economic Outlook, October 1985 and Bank of Korea data.
completely unregulated segment, the curb market.3/ When total credit,including that generated by NBFI, is examined, it is found to have decele-rated much less than the rate of growth of banking system credit (seeTable 7.3). In fact, after declining in 1982 and 1983 this measure of liqui-dity actually rose in 1984. Similarly, when interest rates in the curb marketor the yield of commercial paper sold by NBFIs is examined, the trend over1983-85 is downward (see Table 7.4) in contrast to the trend in bank lendingrates. Thus while the government was reducing credit supplied through thebanking system, other sources of credit supply did not follow suit. Thereason for this is to be found in the particular strategy of financial libera-lization followed since 1982.
3/ The primary banking system denotes a set of seven nationwide commercialbanks, ten regional or local banks, fifty-two foreign banks and a numberof specialized institutions which lend for specific purposes only (e.g.,Korea Housing Bank). This is also referred to as the deposit money bank(DMB) system since only these institutions are allowed to generateregular savings deposits. The NBFIs consist essentially of short-termfinance and investment companies, and insurance and securities companies.These are permitted to raise cash and lend at rates higher than thosepermitted to banks. They are also allowed to issue as well as toguarantee bonds. NBFrs have grown significantly in recent years. SeeChapter 4 for details.
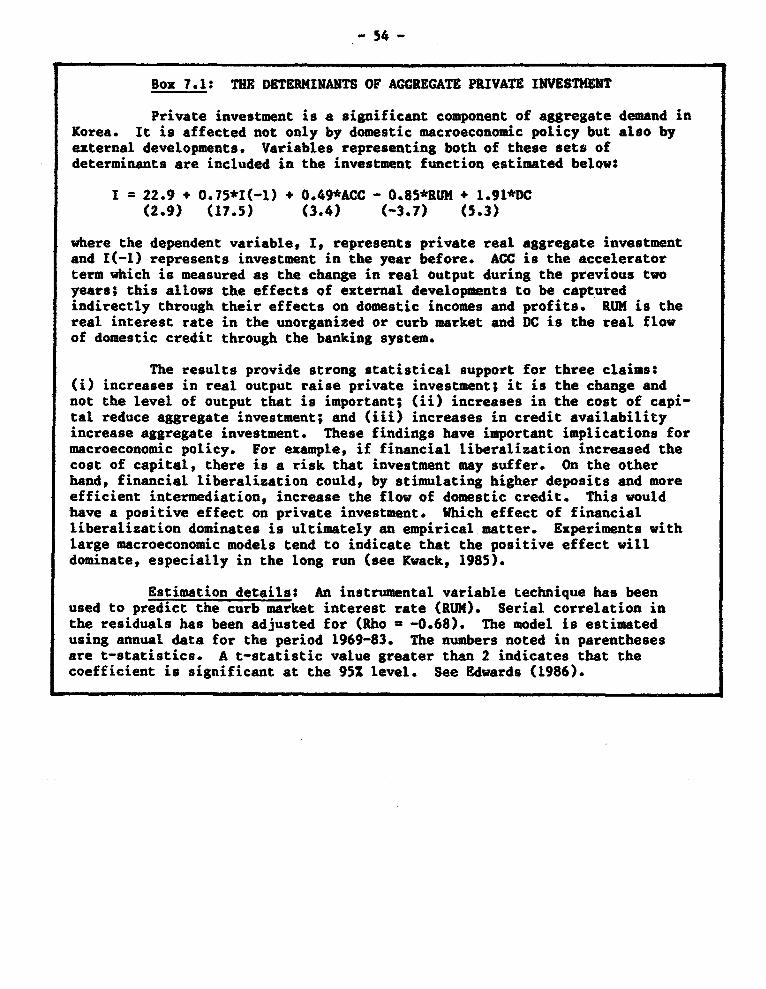
- 54 -
Box 7.1: THI DETERMINANTS OF AGGREGATE PRIVATE INVESTMENT
Private investment is a significant component of aggregate demand inKorea. It is affected not only by domestic macroeconomic policy but also byexternal developments. Variables representing both of these sets ofdeterminants are included in the investment function estimated below:
I = 22.9 + 0.75*I(-1) + 0.49*ACC - 0.85*RUM + l.91*DC(2.9) (17.5) (3.4) (-3.7) (5.3)
where the dependent variable, I, represents private real aggregate investmentand I(-l) represents investment in the year before. ACC is the acceleratorterm which is measured as the change in real output during the previous twoyears; this allows the effects of external developments to be capturedindirectly through their effects on domestic incomes and profits. RUM is thereal interest rate in the unorganized or curb market and DC is the real flowof domestic credit through the banking system.
The results provide strong statistical support for three claims:(i) increases in real output raise private investment; it is the change andnot the level of output that is important; (ii) increases in the cost of capi-tal reduce aggregate investment; and (iii) increases in credit availabilityincrease aggregate investment. These findings have important implications formacroeconomic policy. For example, if financial liberalization increased thecost of capital, there is a risk that investment may suffer. On the otherhand, financial liberalization could, by stimulating higher deposits and moreefficient intermediation, increase the flow of domestic credit. This wouldhave a positive effect on private investment. Which effect of financialliberalization dominates is ultimately an empirical matter. Experiments withlarge macroeconomic models tend to indicate that the positive effect willdominate, especially in the long run (see Kwack, 1985).
Estimation details: An instrumental variable technique has beenused to predict the curb market interest rate (RUM). Serial correlation inthe residuals has been adjusted for (Rho - -0.68). The model is estimatedusing annual data for the period 1969-83. The numbers noted in parenthesesare t-statistics. A t-statistic value greater than 2 indicates that thecoefficient is significant at the 95X level. See Edwards (1986).
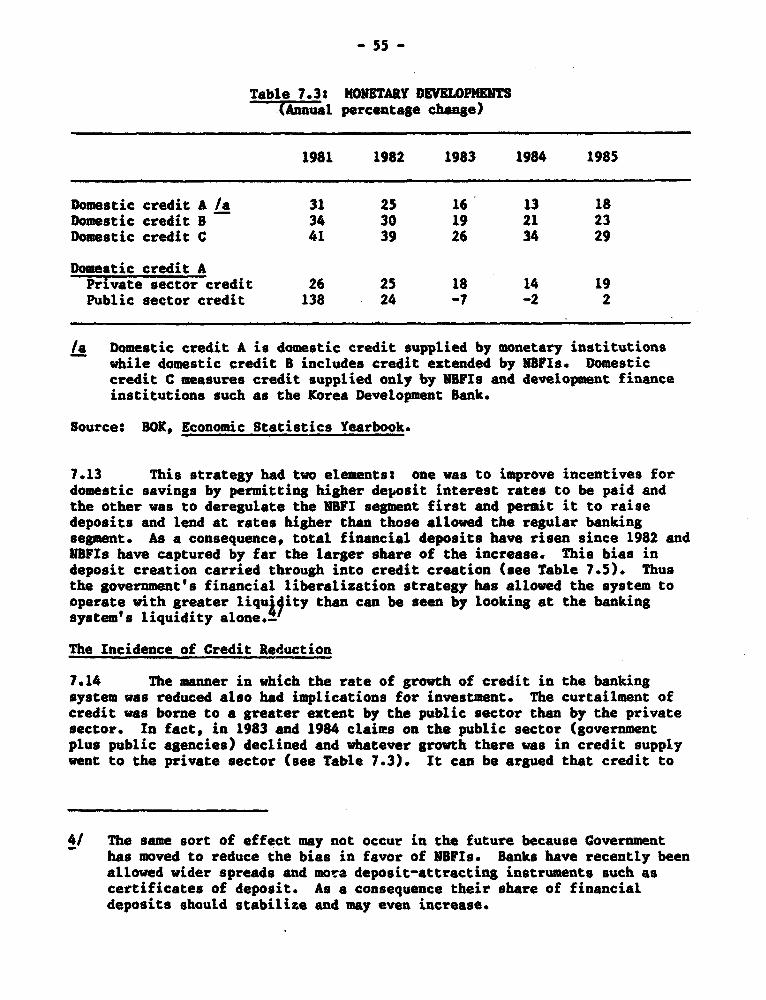
- 55 -
Table 7.3: MONETARY DEVELOPMENTST(Annusi percentage change)
1981 1982 1983 1984 1985
Domestic credit A /a 31 25 16 13 18Domestic credit B 34 30 19 21 23Domestic credit C 41 39 26 34 29
Domestic credit APrivate sector credit 26 25 18 14 19Public sector credit 138 24 -7 -2 2
/a Domestic credit A is domestic credit supplied by monetary institutionswhile domestic credit B includes credit extended by NBFIs. Domesticcredit C measures credit supplied only by EllIs and development financeinstitutions such as the Korea Development Bank.
Source: BOK, Economic Statistics Yearbook.
7.13 This strategy had two elements: one was to improve incentives fordomestic savings by permitting higher deposit interest rates to be paid andthe other was to deregulate the NEPI segment first and permit it to raisedeposits and lend at rates higher than those allowed the regular bankingsegment. As a consequence, total financial deposits have risen since 1982 andNBFIs have captured by far the larger share of the increase. This bias indeposit creation carried through into credit creation (see Table 7.5). Thusthe government's financial liberalization strategy has allowed the system tooperate with greater liqut'jity than can be seen by looking at the bankingsystem's liquidity alone.-
The Incidence of Credit Reduction
7.14 The manner in which the rate of growth of credit in the bankingsystem was reduced also had implications for investment. The curtailment ofcredit was borne to a greater extent by the public sector than by the privatesector. In fact, in 1983 and 1984 claims on the public sector (governmentplus public agencies) declined and whatever growth there was in credit supplywent to the private sector (see Table 7.3). It can be argued that credit to
4/ The same sort of effect may not occur in the future because Governmenthas moved to reduce the bias in favor of NBFIs. Banks have recently beenallowed wider spreads and more deposit-attracting instruments such ascertificates of deposit. As a consequence their share of financialdeposits should stabilize and may even increase.
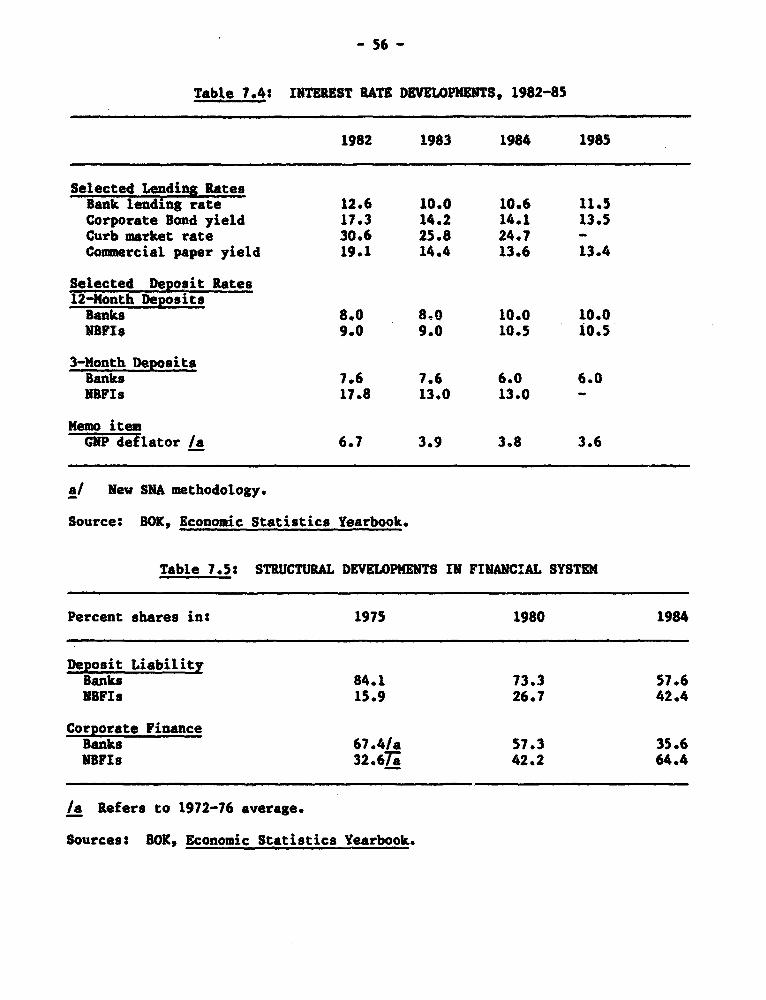
- 56 -
Table 7.4: INTEREST RATE DEVELOPMENTS, 1982-85
1982 1983 1984 1985
Selected Lending RatesBank lending rate 12.6 10.0 10.6 11.5Corporate Bond yield 17.3 14.2 14.1 13.5Curb market rate 30.6 25.8 24.7 -Commercial paper yield 19.1 14.4 13.6 13.4
Selected Deposit Rates12-Month DepositsBanks 8.0 8tQ 10.0 10.0NrFIs 9.0 9.0 10.5 10.5
3-Month DepositsBanks 7.6 7.6 6.0 6.0NBFIs 17.8 13.0 13.0 -
Memo itemCNP deflator /a 6.7 3.9 3.8 3.6
a/ New SNA methodology.
Source: BOK, Economic Statistics Yearbook.
Table 7.5: STRUCTURAL DEVELOPMENTS IN FINAUC'AL SYSTEM
Percent shares in: 1975 1980 1984
Deposit LiabilityBanks 84.1 73.3 57.6NBFIs 15.9 26.7 42.4
Corporate FinanceBanks 67.4/a 57.3 35.6NBFIs 32.67a 42.2 64.4
/a Refers to 1972-76 average.
Sources: BOK, Economic Statistics Yearbook.
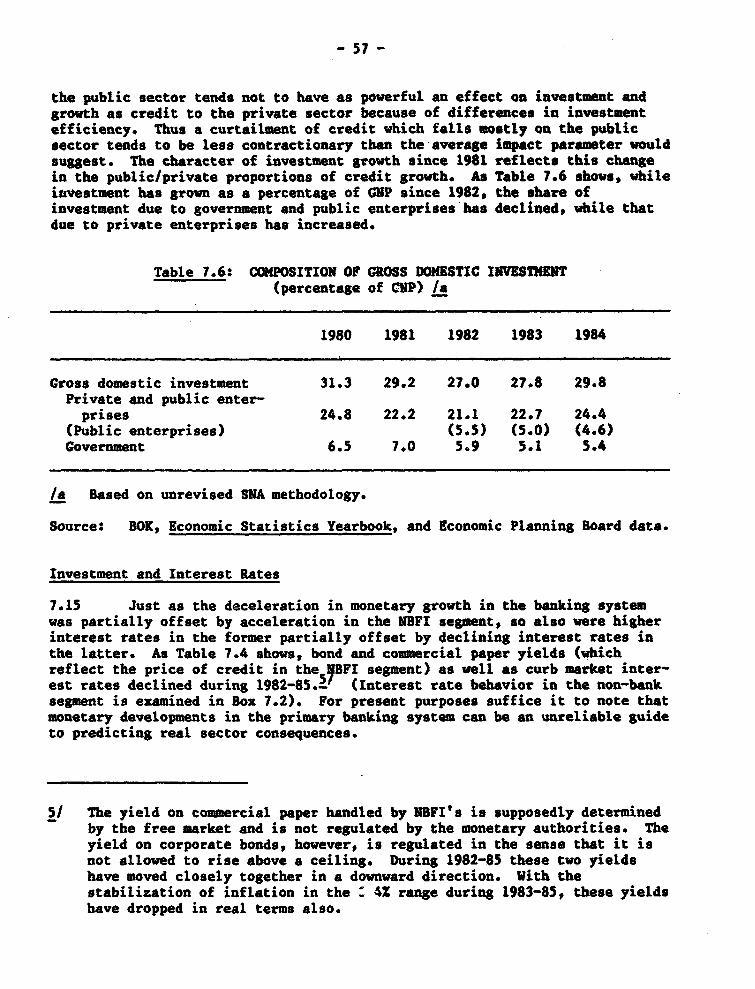
- 57 -
the public sector tends not to have as powerful an effect on investment andgrowth as credit to the private sector because of differences in investmentefficiency. Thus a curtailment of credit which falls mostly on the publicsector tends to be less contractionary than the average impact parameter wouldsuggest. The character of investment growth since 1981 reflects this changein the public/private proportions of credit growth. As Table 7.6 shows, whileinvestment has grown as a percentage of CUP since 1982, the share ofinvestment due to government and public enterprises has declined, while thatdue to private enterprises has increased.
Table 7.6: COMPOSITION OF GROSS DOMESTIC INVESTMENT(percentage of COP) /a
1980 1981 1982 1983 1984
Gross domestic investment 31.3 29.2 27.0 27.8 29.8Private and public enter-prises 24.8 22.2 21.1 22.7 24.4
(Public enterprises) (5.5) (5.0) (4.6)Government 6.5 7.0 5.9 5.1 5.4
/a Based on unrevised SNA methodology.
Source: BOK, Economic Statistics Yearbook, and Economic Planning Board data.
Investment and Interest Rates
7.15 Just as the deceleration in monetary growth in the banking systemwas partially offset by acceleration in the MBFI segment, so also were higherinterest rates in the former partially offset by declining interest rates inthe latter. As Table 7.4 shows, bond and commercial paper yields (whichreflect the price of credit in the yBFI segment) as well as curb market inter-est rates declined during 1982-85.,' (Interest rate behavior in the non-banksegment is examined in Box 7.2). For present purposes suffice it to note thatmonetary developments in the primary banking system can be an unreliable guideto predicting real sector consequences.
51 The yield on commercial paper handled by NBFI's is supposedly determinedby the free market and is not regulated by the monetary authorities. Theyield on corporate bonds, however, is regulated in the sense that it isnot allowed to rise above a ceiling. During 1982-85 these two yieldshave moved closely together in a downward direction. With thestabilization of inflation in the : 4Z range during 1983-85, these yieldshave dropped in real terms also.

- 58 -
7.16 The link between private investment and interest rates is importantfrom the point of view of financial liberalisation. If interest rate decon-trol were to result in a substantial upward movement of the real cost oferedit, and if private investment were highly interest elastic, at least inthe short-run consequences of financial reform would be strongly contrac-tionary. This has not happened in recent years partly because of offsettingdevelopments in the non-bank (and curb market) segments and partly because ofthe effects of foreign income growth. It may also have been due to a lowelasticity of investment with respect to interest rate changes.
7.17 As far as future policymaking is concerned, however, it should benoted that structural changes appear to be occurring in the business environ-ment which suggest that the interest rate elasticity of aggregate investmentmay rise in the future. Among these changes is the fact that the proportionof total investment that is undertaken by the private sector, which tends tobe more cost conscious, has been rising in recent years (see Table 7.6).Second, the guarantee of adequate credit even when profit margins are low orfiancial structure shaky, can no longer be taken for granted; in the pastKorean business could afford to be relatively complacent about interest rateincreases because credit availability was what really mattered. But now thatGovernment has signalled its intention of a following more of a hands-offapproach and of allowing credit availability to be determined to a largerextent by individual firm performance and financial structure, interest ratesshould become a more critical determinant of investment decisions. Third,real curb market rates have fallen in recent years because of the possibleunwinding of inflationary expectations; once such expectations are completelyunwound the relationship between controlled rates and curb market rates willonce again be dominated by domestic liquidity and foreign interest rate(adjusted for devaluation) developments and the conventional transmissionmechanism of monetary policy should assert itself in a stronger fashion.
Macro Policy and Inflation
7.18 Inflation reduction has been a prominent aspect of recentmacroeconomic performance in Korea. Inflation came down sharply from 15.9X in1981 to 42 in 1984. To what extent was this due to contractionary macroecon-omic policy? It can be argued that the dramatic inflation reduction of recentyears was probably due more to favorable developments on the supply siderather than to demand-management policy. Nevertheless, demand managementpolicy may have played an extremely important, but indirect, role by reducingthe level of inflationary expectations.
7.19 The major reduction in inflation occurred during 1980-82 (when theinflation rate was brought down from about 29Z to about 72) when monetary andfiscal policy were in fact rather expansionary (see Table 7.1). When macro-economic policy became relatively tight in 1983 and 1984 inflation was reducedfurther but by a small amount to an average of about 3.52. Furthermore, whenmonetary policy was relaxed in 1985, inflation did not rise. These develop-ments indicate that factors other than domestic macro policy have probablyplayed a more important part in influencing the course of inflation in recentyears. Among these are (i) the decline in the rate of growth of wages andimprovements in the rate of growth of productivity; (ii) the substantial

- S9 -
decline in prices of imports; (iii) adjustments in the use of energy importsand (iv) a reduction in inflationary expectations.
Wages and Productivity
7.20 Nominal wage growth has decelerated sharply in recent years, from arate of about 152 in 1982 to about 8.5Z in 1984-85 (see Table 7.7). Onecannot definitively state whether this deceleration was a cause or an effectof declining inflation. However, attempts were made by Government to bringwages down during this period. These attempts took the form of mandatedreductions in the rate of growth of public sector wages (including a freeze in1984) and of moral suasion in the matter of private sector wage settlements.Since 1982 also, productivity growth, as measured by changes in value-added inthe manufacturing sector, has been rising. This increase in the rate ofproductivity growth has probably reduced the pressure on inflation by reducingunit labor costs.
Table 7.7: PRODUCTIVITY AND WAGES IN MANUFACTURING(Annual percent change)
1982 1983 1984 1985
Nominal wage growth 14.7 12.2 8.1 9.0Real wage growth 7.6 9.2 4.1 5.0Productivity grovth/a -2.0 3.2 12.0 n.a.
/a Refers to index calculated from value-added in anufacturing data (in1980 prices).
Note: The nominal wage refers to gross monthly earnings. The real wagegrowth rate is obtained by adjusting the nominal rate using the CUPdeflator.
Sources: BOK, Economic Statistics Yearbook.
7.21 Mirroring the increase in productivity is an improvement in invest-ment efficiency as indicated by a decline in the average ICOR characterizingthe manufacturing sector. It is clear from Table 7.8 that investment
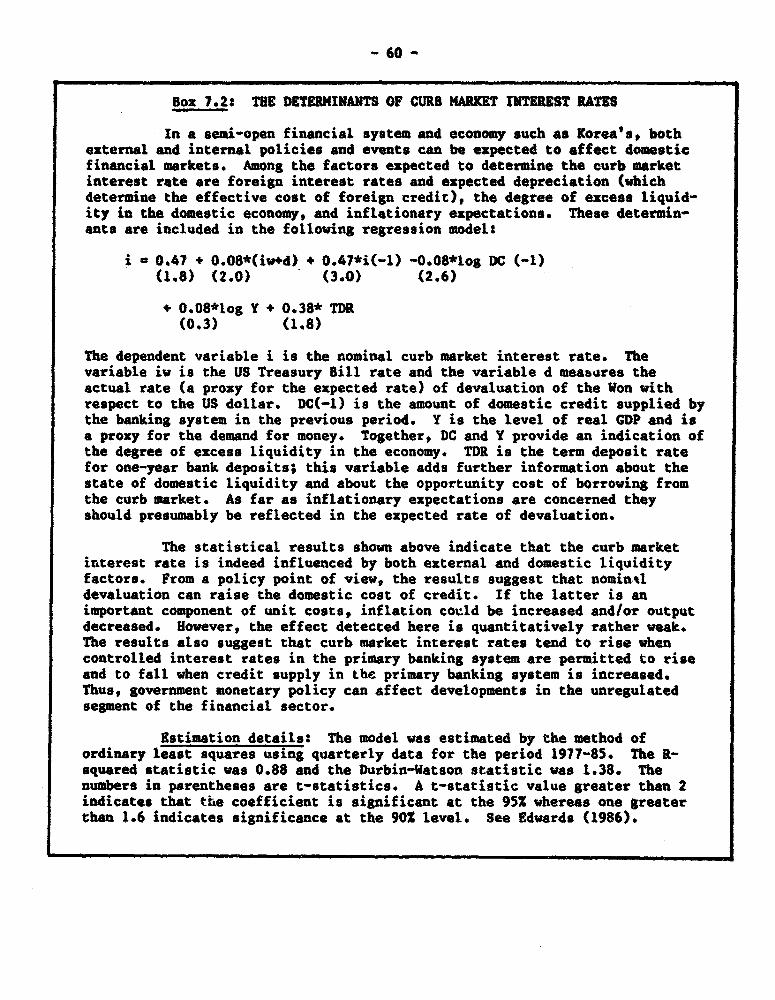
- 60 -
Box 7.2: THE DETERMINANTS OF CURB MARKET INTEREST RATES
In a semi-open financial system and economy such as Korea's, bothexternal and internal policies and events can be expected to effect domesticfinancial markets. Among the factors expected to determine the curb marketinterest rate are foreign interest rates and expected depreciation (whichdetermine the effective cost of foreign credit), the degree of excess liquid-ity in the domestic economy, and inflationary expectations. These determin-ants are included in the following regression model:
i = 0.47 + 0.08*(iw4d) + 0.47*i(-1) -O.08*1og DC (-1)(1.8) (2.0) (3.0) (2.6)
+ 0.08*1og Y + 0.38* TDR(0.3) (1.8)
The dependent variable i is the nominal curb market interest rate. Thevariable iw is the US Treasury Bill rate and the variable d measires theactual rate (a proxy for the expected rate) of devaluation of the Won withrespect to the US dollar. DC(-I) is the amount of domestic credit supplied bythe banking system in the previous period. Y is the level of real GDP and isa proxy for the demand for money. Together, DC and Y provide an indication ofthe degree of excess liquidity in the economy. TDR is the term deposit ratefor one-year bank deposits; this variable adds further information about thestate of domestic liquidity and about the opportunity cost of borrowing fromthe curb market. As far as inflationary expectations are concerned theyshould presumably be reflected in the expected rate of devaluation.
The statistical results shown above indicate that the curb marketinterest rate is indeed influenced by both external and domestic liquidityfactors. From a policy point of view, the results suggest that nominaldevaluation can raise the domestic cost of credit. If the latter is animportant component of unit costs, inflation cot.ld be increased and/or outputdecreased. However, the effect detected here is quantitatively rather weak.The results also suggest that curb market interest rates tend to rise whencontrolled interest rates in the primary banking system are permitted to riseand to fall when credit supply in the primary banking system is increased.Thus, government monetary policy can affect developments in the unregulatedsegment of the financial sector.
Estimation details: The model was estimated by the method ofordinary least squares using quarterly data for the period 1977-85. The R-squared statistic was 0.88 and the Durbin-Watson statistic was 1.38. Thenumbers in parentheses are t-statistics. A t-statistic value greater than 2indicates that t5te coefficient is significant at the 95% whereas one greaterthan 1.6 indicates significance at the 902 level. See Edwards (1986).

- 61 -
efficig7cy has begun to increase after deteriorating sharply in the late1970s.* The improvement can be attributed to the decline in the proportionof investment originating in the public sector or at the behest of Governmentthrough directed credit arrangements. In particular, the improvement in offi-ciency can be attributed to the reduction of the rate of growth of investmentin the HCI sector and an increase in capacity utilization in this sector. Itis also possible that some of the improvements in efficiency and productivityhave come about because of intersectoral shifts of resources from low produc-tivity to high productivity uses, from the growth of skills in the labor forceand from technological improvements arising from indigenous R&D or imports.While it is difficult to quantify the contributions of each of these ft7torspthere is evidence which suggests that they have indeed been important...
Table 7.8: AVERAGE INCREIENTAL CAPITAL OUTPUT RATIOS, 1978-84 /a
1978-81 1982-84
Agriculture, forestry & fishing 6.13 3.6Manufacturing 5.33 1.6Construction 2.69 1.0Wholesale & retail trade, restaurants
& hotel, 7.96 2.6Transport, storage & communications 13.25 1.6Financing, insurance, real estate &business services 1.01 0.7
/a Changes in output are lagged by one year. Both output and fixed invest-ment are in 1980 constant prices.
Source: Economic Planning Board and Bank of Korea.
6/ It should be noted that ICOR's are a crude measure of investmentefficiency. Nevertheless, in the absence of more refined measures,ICOR's can convey useful information. In particular, trends in ICORvalues over time are typically consistent with those of more elaboratemeasures of efficiency.
7/ For example, the supply of skilled manpower is steadily increasing partlybecause of increases in wniver-ity enrolments and partly because of on-the-job training imparted in the new industries that Korea moved into inthe late 1970s. The proportion of government and private resourcesdevoted to R&D activities has risen since 1980 and this may have providedsome technological improvements, but a more important source of suchimprovemen.s has probably been imports. Intra-industry trade is becomingimportant in Korea's trade structure and trade liberalization promiseslarger technology improvement bonuses over time.

- 62 -
Igport Price Developments
7.22 The softness that has characterized the prices of Korea's mainimports (such as oil, intermediate goods) has probably helped significantly inthe control of inflation since imports are a large fraction of Korea's GNP andimport prices typically account for 40X of the wholesale price index (WPI).The import price index has declin6d from a level of 104 in 1981 to 94.4 in1984 as oil and commodity prices have slackened. This -onstitutes a rathersignificant improvement and given the weight of imports in the WPI $t is notsurprising that domestic inflation has eased considerably during 1982-84.(See Table 7.9.) These developments continued into 1985 and show every signof continuing to be important in determining domestic inflation in 1)86.
7.23 The fact that such favorable external price developments have beenallowed to pass-through into the domestic economy by way of a general loweringof trade barriers illustrates a benefit of the trade liberalization processthat Korea has embarked upon. This pass-through would have had even more of arestraining effect on domestic inflation had it not been for the fact thatconsiderations of export competitiveness prompted exchange rate depreciationduring 1983-85, and especially in 1985.
Energy Use Adjustments and Inflation
7.24 The control of inflation since 1980 has also been aided by thesubstantial adjustments achieved by Korea in the level and pattern of energyuse. if investment in the 1980s had been based on the pattern of energy useestablished in the 1970s, a high rate of inflation would undoubtedly haveoccurred as a rising energy coefficient (ratio of energy use to CDP) wouldhave exaggerated the effects of the sharp rise in the price of oil, theeconomy's main energy input, in 1979-80. Even when the relative price of oilbegan to decline after 1982, rising energy use (in volume terms) could haveoffset this effect.
Table 7.9: IMPORT PRICE INDEX DEVELOPMENTS(Weights in parentheses)
1980 1981 1982 1983 1984 1985
All commodities 100 104.0 98.7 94.4 94.4 90.7Mineral products (33.1) 100 112.0 108.6 96.4 92.3 91.7Agriculture and related
(20.6) 100 97.8 81.9 82.2 86.1 75.0Industrial products
(46.3) 100 101.0 99.1 98.4 99.6 96.9
Source: BOK, Economic Statistics Yearbook.

- 63 -
7.25 There are several reasons why the energy coefficient could have beenexpected to rise in the 1980s. Korea's industrial structure changed durinjthe 1970. in the direction of greater energy intensity as such high-energy-consuming sectors as heavy and chemical industries were fostered. Also, themechanization of agriculture was more or less completed in the 1970s andfurther investment in agriculture would have had to contend with higher levelsof energy use. rinally, real incomes had risen substantially in the 1970s andthe consumption of energy intensive durables such as household appliances andcars had begun to rise. Thus, going into the 1980s, Korea could have expectedto see a rise in the ratio of its energy consumption to GDP.
7.26 As a result of strong conservation and substitution measures, how-ever, this did not happen. As Table 7.10 shows the ratio actually declinedfrom 1980 to 1983. The principal measures employed were the continuation of afuel substi-ution program (begun in the 1970s), which featured the building ofnuclear power plants and the passing along of high oil prices to final con-sumers to reduce oil consumption. Devaluation and surcharges made the retailprice of oil even higher than that imposed by OPEC. The elasticity of oilsJnsumption with respect to the GDP fell from 1.2 during 1973-78 to 0.45 dur-ing 1978-84 and the elasticity of total energy consumption with respect tomnufacturing output (in real value added terms) declined from 0.85 in 1973-78to 0.37 in 1978-84.
Table 7.10: INDICATORS OF ENERGY USE
1980 1981 1982 1983
Energy/CDP ratioTOE/$'000 /a 0.77 0.75 0.71 0.70Index (1980 - 100) 100 97.4 92.3 91.5
/a TOE = ton of oil equivalent.
Inflationary Expectations
7.27 Finally, the role of inflationary expectations should also bementioned. The 1970s were a period of relatively high inflation and govern-ment attitude towards investment and growth fed inflationary expections. Theprocess came to a head in 1980 when inflation soared to 25.6Z, while real GNPactually declined (by 5.22) for the first time in Korea's modern economichistory. The reorientation of government attitude since then and the steadi-ness with which the government has pursued a price stability objective hasreduced inflation considerably and must have reduced inflationary expecta-ticns. Korea has never enjoyed inflation rates so low and for so long asduring the past four years. The ensuing decline in inflationary expectationshas been of great importance in reducing inflation and has probably itselfbeen affected strongly by the governments aggregate demand policy stance.
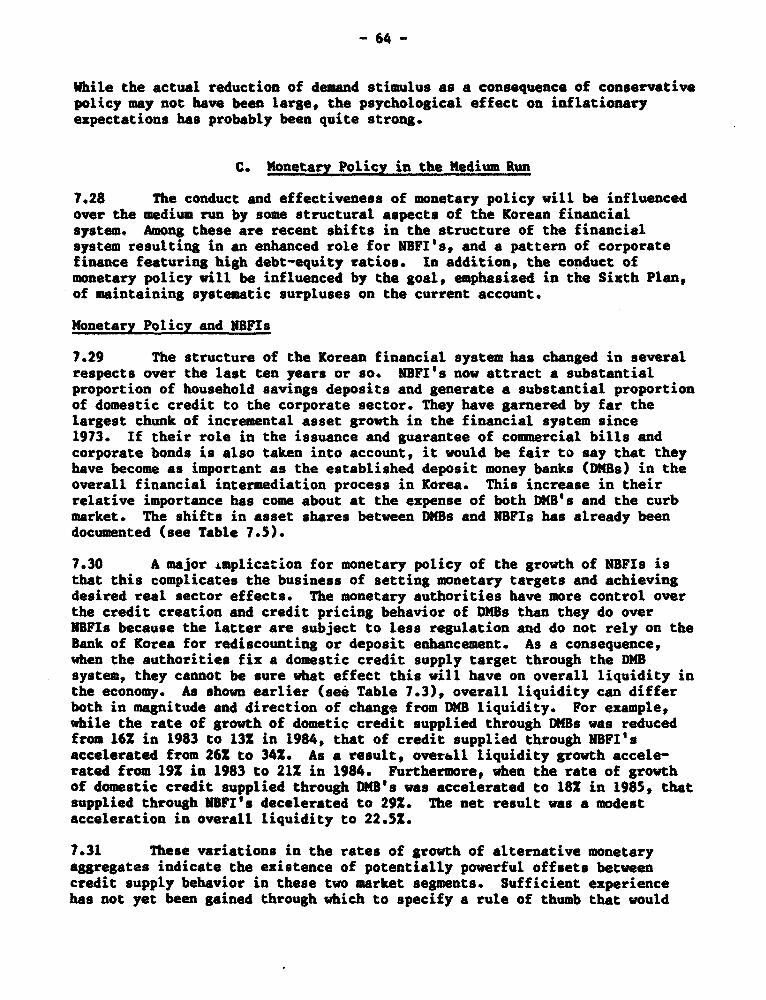
- 64 -
While the actual reduction of demand stimulus as a consequence of conservativepolicy may not have been large, the psychological effect on inflationaryexpectations has probably been quite strong.
C. Monetary Policy in the Medium Run
7.28 The conduct and effectiveness of monetary policy will be influencedover the medium run by some structural aspects of the Korean financialsystem. Among these are recent shifts in the structure of the financialsystem resulting in an enhanced role for NBFI's, and a pattern of corporatefinance featuring high debt-equity ratios. In addition, the conduct ofmonetary policy will be influenced by the goal, emphasized in the Sixth Plan,of maintaining systematic surpluses on the current account.
Monetary Policy and NBFIs
7.29 The structure of the Korean financial system has changed in severalrespects over the last ten years or so. NBFI's now attract a substantialproportion of household savings deposits and generate a substantial proportionof domestic credit to the corporate sector. They have garnered by far thelargest chunk of incremental asset growth in the financial system since1973. If their role in the issuance and guarantee of commercial bills andcorporate bonds is also taken into account, it would be fair to say that theyhave become as important as the established deposit money banks (DMBs) in theoverall financial intermediation process in Korea. This increase in theirrelative importance has come about at the expense of both DMB's and the curbmarket. The shifts in asset shares between DMBs and NBFIs has already beendocumented (see Table 7.5).
7.30 A major Lmplication for monetary policy of the growth of NBFIs isthat this complicates the business of setting monetary targets and achievingdesired real sector effects. The monetary authorities have more control overthe credit creation and credit pricing behavior of DMBs than they do overNBFIs because the latter are subject to less regulation and do not rely on theBank of Korea for rediscounting or deposit enhancement. As a consequence,when the authorities fix a domestic credit supply target through the DMBsystem, they cannot be sure what effect this will have on overall liquidity inthe economy. As shown earlier (see Table 7.3), overall liquidity can differboth in magnitude and direction of change from DMB liquidity. For example,while the rate of growth of dometic credit supplied through DMBs was reducedfrom 16Z in 1983 to 13X in 1984, that of credit supplied through NBFI'saccelerated from 262 to 341. As a result, overll liquidity growth accele-rated from 191 in 1983 to 21S in 1984. Furthermore, when the rate of growthof domestic credit supplied through DM8's was accelerated to 181 in 1985, thatsupplied through pBFI's decelerated to 292. The net result was a modestacceleration in overall liquidity to 22.5x.
7.31 These variations in the rates of growth of alternative monetaryaggregates indicate the existence of potentially powerful offsets betweencredit supply behavior in these two market segments. Sufficient experiencehas not yet been gained through which to specify a rule of thumb that would

- 65 -
allow the authorities to predict the overall liquidity consequences of creditsupply policies framed with respect to the primary banking sector alone. Thisadds further uncertainty to the matter of predicting real sector consequen-ces. Korea's experience is not unique in this respect. As new financialinstruments have proliferated in the OECD economies and as financial deregu-lation has spread, overall liquidity positions have become less subject togovernment control. To the extent that this is so, uncertainty regarding theultimate eIf ect of government policy on investment, output and inflation isincreased.-
7.32 It is also possible that the relative growth of NBFIs will alter theresource allocation effects of monetary policy. The firms, sectors and activ-ities that draw largely upon the DMBs for credit will be more strongly affec-ted by monetary policy changes/initiatives than those who draw credit largelyfrom NBFIs. This effect, of course, will be smaller the greater the extent towhich these segments have overlapping clients. While large firms can switchmore easily between these two segments (indeed, many NBFIs are owned by largefirms), small firms cannot. Since the sectoral pattern of access to thedifferent segments of the financial system is not known, Government may wishto investigate the potential bias in monetary policy on small and mediumindustries versus large firms.
Monetary Policy and the Corporate Finance Structure
7.33 The structure of corporate finance is perhaps the Achilles heel ofthe Korean economy. Debt-equity ratios for Korean manufacturing firms (seeTable 7.11) tend to be high in comparison woh those for firms in mostdeveloped countries as well as in the NICs.- As a consequence, the financialviability of Korean firms is threatened whenever interest rates rise or creditsupply is curtailed by amounts that would be considered quite manageable inother countries. This constrains monetary policy and the process of financialliberalization. Government has had to proceed gingerly with respect tofinancial liberalization in recent years because of the implicit threat offinancial distress among Korea's highly leveraged firms, and especially somelarge conglomerates which are disproportionately important to output,employment and export performance. The structure of corporate finance will
8/ This need not imply that the broadest measure of liquidity is the mostappropriate indicator for macroeconomic performance prediction. Narrowermeasures may still remain appropriate for specific purposes.
9/ Debt-equity ratios have historically been high in Korea essentiallybecause of government-mandated cheap debt and expensive equitypolicies. Real interest rates have typically been very low or negativewhile equity has been discouraged through a variety of disincentives suchas the prohibition of new issues at prices above par. Government hasrecently taken steps to improve corporate debt-equity ratios by raisingthe cost of debt and reducing disincentives to the issue of equities.While some success has been achieved, debt equity ratios remain high andKorean corporations remain hostage to their financial structures.
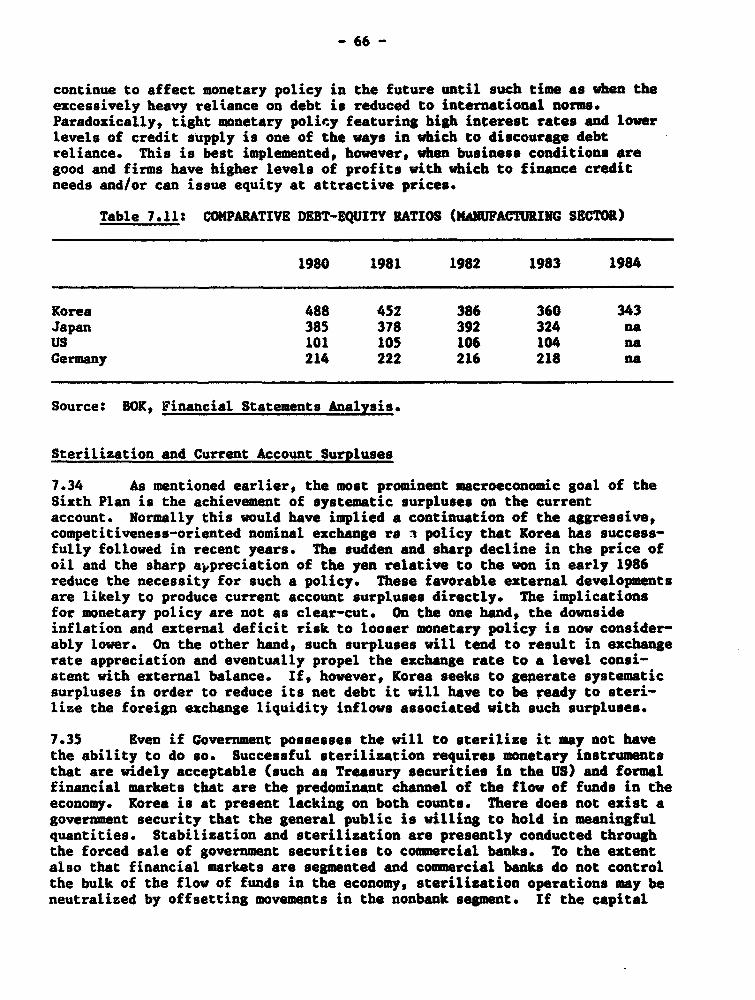
- 66 -
continue to affect monetary policy in the future until such time as when theexcessively heavy reliance on debt is reduced to international norms.Paradoxically, tight monetary policy featuring high interest rates nd lowerlevels of credit supply is one of the ways in which to discourage debtreliance. This is best implemented, however, when business conditions aregood and firms have higher levels of profits with which to finance creditneeds and/or can issue equity at attractive prices.
Table 7.11: COMPARATIVE DEBT-EQUITY RATIOS (MANUFACTURING SECTOR)
1980 1981 1982 1983 1984
Korea 488 452 386 360 343Japan 385 378 392 324 naUS 101 105 106 104 naGermany 214 222 216 218 na
Source: BOK, Financial Statements Analysis.
Sterilization and Current Account Surpluses
7.34 As mentioned earlier, the most prominent macroeconomic goal of theSixth Plan is the achievement of systematic surpluses on the currentaccount. Normally this would have implied a continuation of the aggressive,competitiveness-oriented nominal exchange re u policy that Korea has success-fully followed in recent years. The sudden and sharp decline in the price ofoil and the sharp a1preciation of the yen relative to the won in early 1986reduce the necessity for such a policy. These favorable external developmentsare likely to produce current account surpluses directly. The implicationsfor monetary policy are not as clear-cut. On the one hand, the downsideinflation and external deficit risk to looser monetary policy is now consider-ably lower. On the other hand, such surpluses will tend to result in exchangerate appreciation and eventually propel the exchange rate to a level consi-stent with external balance. If, however, Korea seeks to geperate systematicsurpluses in order to reduce its net debt it will have to be ready to steri-lize the foreign exchange liquidity inflows associated with such surpluses.
7.35 Even if Government possesses the will to sterilize it may not havethe ability to do so. Successful sterilization requires monetary instrumentsthat are widely acceptable (such as Treasury securities in the US) and formalfinancial markets that are the predominant channel of the flow of funds in theeconomy. Korea is at present lacking on both counts. There does not exist agovernment security that the general public is willing to hold in meaningfulquantities. Stabilization and sterilization are presently conducted throughthe forced sale of government securities to commercial banks. To the extentalso that financial markets are segmented and commercial banks do not controlthe bulk of the flow of funds in the economy, sterilization operations may beneutralized by offsetting movements in the nonbank segment. If the capital

- 67 -
account is open there is an addit£onfi/source of offsetting liquidity in theform of international capital flows. _
7.36 The development of a strong sterilization instrument is linked tothe process of financial liberalization. The main reason why government secu-rities are not widely held is that Goverment has found it more convenient to"borrow" from pliant commercial banks at essentially zero interest rates.Government could spread the distribution of its securities among the public byoffering interest rates competitive with those available to the public in thenonbank segment of the financial system. Once all interest rates in thefinancial system are allowed to be market-determined, the system will becomeunified and once government control over the asset management of commercialbanks is reduced Government too will have to borrow at market rates of inter-est. Both of these outcomes will strengthen the sterilization ability of thegovernment.
D. Exchange Rate Management
7.37 In recent years the exchange rate has featured prominently among themacroeconomic instruments employed to stabilize the economy and to adjust tothe economic change wrought by the events, already alluded to, of 1918-81.The stabilization goal has essentially been to avoid large current accountdeficits. The adjustment goal has had two aspects: one to adapt to thechanging structure of international prices (especially for oil) and interestrates and the other to facilitate the liberalization of imports (in order tobenefit from gains from trade and transfer of technology) and to open upKorea's domestic market without serious dislocation. Towards these ends, thenominal exchange rate has been depreciated in small steps (after a devaluationof 17Z in January 1980). The nominal depreciation has been accompanied, forthe most part, by a real depreciation. According to one index, Korea's real
10/ The empirical evidence on the Bank of Korea's ability to sterilize ismixed. The results tend to range from suggesting complete inability tocontrol monetary aggregates to a rather strong ability to do so in theshort run. The difficulty of interpreting the existing empirical studiesis compounded by the fact that the policy environment, which reflects thewill to sterilize, has not remained constant and hence the selection ofdifferent periods for study can yield different results.

- 68 -
effective exchange rate has depreciated by almost 202 since 1982.111 Theresults of this exchange rate management have been successful so far andGovernment is expected to continue to use the exchange rate to attain bothshort-run macroeconomic objectives and long-run structural ones.
Impact on the Current Account
7.38 One measure of this policy's success hbs been the taming of thecurrent account deficit; this has been brought down from 6.9S of GCP in 1982to about 12 in 1985. The success of depreciation in boosting export andrestraining imports has been due in considerable measure to the price elasti-cities that characterize Korean tradeables: -a 10t decrease in export pricesraises exports by almost 17Z, while a similar crease in import prices causesimports to fall by about 52 (see Table 7.12), One should avoid the
Table 7.12: RANGE OF ESTIMATES OF KEY TRADE ELASTICITIES
Earlier period Recent period(1962-78) (1974-84)
Income elasticity of imports 1.4 to 2.3 1.0 to 1.3Import price elasticity of imports 1.4 to 1.7 0.4 to 0.6Foreign income elasticity of exports 5.5 to 6.4 3.5 to 4.3Export price elasticity of exports 1.4 to 3.2 1.4 to 1.7
Sources: Kwack (1985); Kwack-Mered (1980); Y.B. Kim (1984).
11/ While the nominal exchange rate is the policy instrument available to theauthorities it is the real effective exchange rate which actually deter-mines ultimate effects on the balance of payments and resource allocationbetween tradeables and non-tradeables. This rate is affected partly bynominal devaluation, partly by domestic macroeconomic policy, and partlyby external developments (see Box 7.3). In this sense, exchange ratemanagement is not entirely independent of macroeconomic policy.
12/ Korea's success with exchange rate depreciation in recent years shouldnot come as a surprise to students of Korea's macroeconomic history. Twoepisodes are worth recalling. A devaluation of 182 (against the dollar)in late 1974 produced a spectacular recovery of the export growth rate in1975 even though the volume of world trade (in manufactures) fell thatyear by about SX. A similar development occurred in 1980 when adevaluation of 172 (against the dollar) helped produce an export growthsurge in 1980-81. The general policy of depreciation to enhance externalcompetitiveness and control the current account deficit has been more orless consistently followed since the devaluation of 1980. The overalleffects of a nominal depreciation are estimated in a number of largemacroeconomic models for Korea (see Kwack, 1985, and B0K, 1985). It isgenerally confirmed that such a policy can improve the current account.
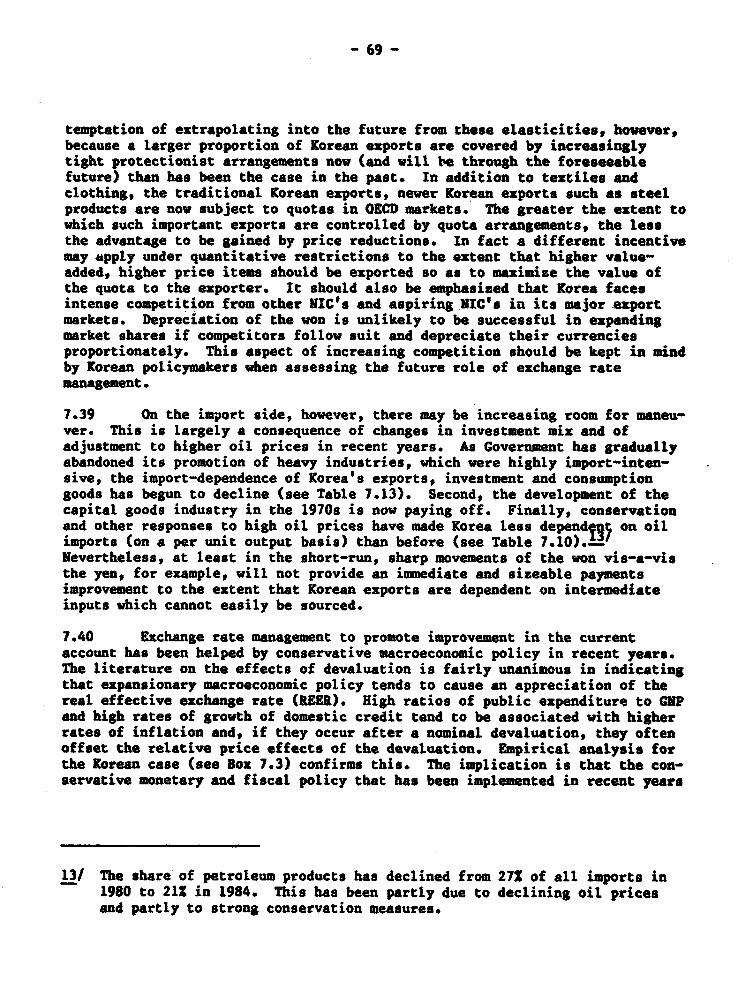
- 69 -
temptation of extrapolating into the future from these elasticities, however,because a larger proportion of Korean exports are covered by increasinglytight protectionist arrangements now (and will be through the foreseeablefuture) than has been the case in the past. In addition to textiles andclothing, the traditional Korean exports, newer Korean exports such as steelproducts are now subject to quotas in OECD markets. The greater the extent towhich such important exports are controlled by quota arrangements, the lessthe advantage to be gained by price reductions. In fact a different incentivemay apply under quantitative restrictions to the extent that higher value-added, higher price items should be exported so as to maximize the value ofthe quota to the exporter. It should also be emphasized that Korea facesintense competition from other NIC's and aspiring NIC's in its major exportmarkets. Depreciation of the won is unlikely to be successful in expandingmarket shares if competitors follow suit and depreciate their currenciesproportionately. This aspect of increasing competition should be kept in mindby Korean policymakers when assessing the future role of exchange ratemanagement.
7.39 On the import side, however, there may be increasing room for maneu-ver. This is largely a consequence of changes in investment mix and ofadjustment to higher oil prices in recent years. As Government has graduallyabandoned its promotion of heavy industries, which were highly import-inten-sive, the import-dependence of Korea's exports, investment and consumptiongoods has begun to decline (see Table 7.13). Second, the development of thecapital goods industry in the 1970s is now paying off. Finally, conservationand other responses to high oil prices have made Korea less depend IgS on oilimports (on a per unit output basis) than before (see Table 7.10). _ Nevertheless, at least in the short-run, sharp movements of the won vis-a-visthe yen, for example, will not provide an i_mediate and sizeable paymentsimprovement to the extent that Korean exports are dependent on intermediateinputs which cannot easily be sourced.
7.40 Exchange rate management to promote improvement in the currentaccount has been helped by conservative macroeconomic policy in recent years.The literature on the effects of devaluation is fairly unanimous in indicatingthat expansionary macroeconomic policy tends to cause an appreciation of thereal effective exchange rate (REER). High ratios of public expenditure to GNPand high rates of growth of domestic credit tend to be associated with higherrates of inflation and, if they occur after a nominal devaluation, they oftenoffset the relative price effects of the devaluation. Empirical analysis forthe Korean case (see Box 7.3) confirms this. The implication is that the con-servative monetary and fiscal policy that has been implemented in recent years
13/ The share of petroleum products has declined from 27Z of all imports in1980 to 21X in 1984. This has been partly due to declining oil pricesand partly to strong conservation measures.
- 70 -
has probably been very important in maintaining export wmpetitiveness throughdownward pressure on the real effective exchange rate.,
Table 1.13: IMPORT GENERATION COEFFICIENTS
1970 1975 1980 1983
Consumption 0.13 0.19 0.23 0.22Investment 0.39 0.48 0.42 0.35Exports 0.26 0.36 0.38 0.36Final Demand 0.20 0.29 0.30 0.28
Notes: The import generation coefficient is the value of imports generatedto satisfy one unit of final demand. It captures both the directand indirect requirements for imported intermediate goods.
Source: World Bank estimates.
Impact on Inflation
7.41 Another measure of the success of depreciation in recent years isthe concurrent achievement of price stability and reasonably high growth. Noserious stagflationary effects have followed the fairly steady depreciationundertaken since 1980. The lack of any visible effect of recent depreciationon inflation is striking because most empirical studies confirm the existenceof a positivelf7lationship between domestic inflation and the rate ofdepreciation.- The principal offsetting factor must have been the declinein the import price index (measured in dollars). The moderation of thedevaluation -- inflation connection may also be due to two developmentsmentioned earlier, viz., the decline in import dependence in general and the
14/ It is possible also that tight fiscal policy reduces import demand inaddition to reducing domestic inflation. If government expenditures havea high import content, restraining government expenditures could improvethe current account directly.
15/ Devaluation is thought to affect domestic inflation through two channels.The first is the direct effect through the won price of imports sinceimports are important intermediate inputs for many of the products thatenter the won price index for Korean manufacturers. The second channeloperates through the curb market interest rate. Devaluation raises thisinterest rate and thereby raises costs of production for Korea's highlyleveraged manufacturing sector. These costs can be passed along it theform of higher prices. Empirical verification of the inflationaryeffects of devaluation in the Korean context is provided in Kwack (1985)and of the transmission channels in Van Wijnbergen (1981).

- 71 -
Box 7.3: THE DETERMINANTS OF THE REAL 8FFECTIVE EXCHANGE RATE
The effective value of a county's exchange rate depends on a set ofreal and monetary variables which reflect the strength of the demand for (andsupply of) the country's currency. Among such variables could be included theterm of trade, the amount of capital inflow, the rate of productivity growth,and measures of domestic macroeconomic policy such as the level of publicexpenditures, the growth of domestic credit and the level of the nominalexchange rate.
The regression analysis reported here takes the logarithm of theREER index to be the dependent variable and suitably modified measures of theabove variables as independent determinants of this index. The terms of tradevariable (T) measures the relative price of imports to exports. This variableis affected both by nominal depreciation and by external price developments.The capital flow variable used (CINF) measures the ratio of capital inflows toGNP. It is expected that the higher this ratio the greater the tendency forthe exchange rate to appreciate. The rate of productivity growth is mostappropriately measured as a differential between Korea and its major tradepartners since it is the differential that determines the net demand forindividual currencies involved. It is expected that the higher the differen-tial in favor of Korea the greater the tendency for its exchange rate toappreciate. In the empirical analysis such differentials are proxied by theaverage output growth differential between Korea and its major trading part-ners (PGD). The effects of domestic macroeconomic policy are captured throughthree variables; the ratio of public expenditures to GNP (PER); the rate ofgrowth of domestic credit (CDC); and dummy variables (D and D(-1)) denotingyears in which nominal devaluations occurred.
Estimation of the above model, by the method of ordinary leastsquares corrected by first-order serial correlation and using annual data from1964 to 1980, yielded the following results (- denotes appreciation):
log REER a 0.55 - 0.58*log T - 0.36*1og (1 + GDC) + O.15*log (1 + CINF)(10.08) (-4.6) (2.5) (0.23)
- 0.72*1og PER - 0.78*1og (1 + PGD) + 0.53*D + 0.98*D (-1)(-5.4) (-1.4) (1.4) (3.4)
These results show that all coefficients with the exception of thecapital inflows have the expected signs and that most of them are significantat conventional levels. Particularly important are the signs and magnitudesof the domestic credit growth and public expenditure ratio coefficients. Theyindicate that in the past expansive monetary and fiscal policies have beenassociated with appreciating real effective exchange rates. This means thatthe authorities need to be particularly careful to avoid expansionary macropolicies in order not to undermine a nominal devaluation. These results alsoindicate through the value of the coefficients of the devaluation dummyvariables that nominal devaluations have, with with other things given, apositive effect in the short run on the real exchange rate. That means thatby managing the nominal exchange rate -- while maintaining an unchangedmonetary and fiscal policy -- it may be possible to manipulate the realexchange rate in the short run. For details see Edwards (1986).

- 72 -
decline in energy or oil dependence in particular since the late 19708. Onceagain it appears that favorable external as well as supply side developmentshave worked to offset the potentially adverse consequences of macroeconomicpolicy.
7.42 Finally, arranging the devaluation in small and gradual steps hasmoderated debt service difficulties for the highly leveraged corporate sector.The increase in exports and profits has apparently kept pace with the increasein the debt service that the corporate sector has had to bear because of thedevaluation. As a consequence, the policy of devaluation has not attractedmuch opposition from business circles.
E. Lessons for Future Policy Making
7.43 Korea has approached its stabilization and adjustment taskscreatively and in-so-doing it has benefitted from not relying exclusively onone approach or one policy instrument. It has also benefitted in that it hasnot applied any one instrument with great force and thereby not risked asharper, more adverse policy tradeoff in the form of a temporary, but disrup-tive, recession. From the demand side it attacked inflation and an unsustain-able BOP deficit by means of restrictive monetary and fiscal policies. Thepossible adverse effects of contractionary demand management were offset bysupply-side policies which sought to raise efficiency and productivity.Incentives to promote savings and investment and policies to reduce distor-tions in the trade and financial regimes have helped maintain output even asthe economy was otherwise being cooled down and a revolution of falling expec-tations being brought about. Accentuation and attenuation of the demand-sideand supply-side effects has been judiciously achieved, as and when necessary,by a flexible exchange rate policy.
7.45 The consequences of macroeconomic policies may differ in the futureto the extent that certain key macroeconomic relationships appear to bechanging. For example, structural changes appear to have been brought aboutby recent changes in what may be called the "rules of the (economic) game:"specifically, the Government's progressive abstention from intervention in theeconomy appears to be changing the investment and savings behavior of theprivate sector. The implicit socialization of business risk that was thehallmark of industrial policy and development in the 1960s and 1970. is nolonger to be counted upon now that Government has announced an industrialpolicy which limits active industry-specific intervention and emphasizesfunctional incentives. When fully effected, this transformation should makeprivate investment more sensitive to monetary policy exercised throughinterest rates and to fiscal policy exercised through variations in tax rates.
7.46 Similarly, the mobilization of private savings has been enhanced byrecent financial policy which has featured rising interest rates (in theprimary banking system), a proliferation of savings instruments, and declininginflation. Should this policy persevere, additional gains could be reaped in
- 73 -
the form of increases in financial and investment efficiency. However, oppo-sition to further financial liberalization could become stronger if the exter-nal environment is not as supportive of growth in the future. A foretaste ofthis came in 1985 when deteriorating exports and profits fed industry opposi-tion to Governments financial policy and succeeded in getting credit controls(on conglomerates) lifted and nominal interest rates rolled back slightly.
7.47 Structural changes have also been wrought by the sustainedexperience of stabilization and adjustment in recent years: specifically,both inflationary expectations and energy and import dependence appear to havebeen reduced. These developments would appear to increase the latitude forexpansionary macroeconomic policy. The risk of sizable increases in inflationor the SOP deficit from expansionary policy is less now than was the case inthe early 1980s. However, this must be set against the possibility thatadministrative wage and price guidance may also have played a considerablerole, for example, in the reduction of inflation. If such repression hasindeed been important in recent years, it is possible that there may begreater resistance to wage and price austerity in the future. This wouldimpart greater rigidity to the aggregate supply responsiveness of theeconomy. Another development that would have a similar effect is a reductionin the growth of productivity. If, as is possible, recent productivityadvances have occurred largely because of increases in capacity utilization,then the rate of such advances in the future will diminish as fuller rates ofutilization are achieved.
7.48 The effects of changes in the external environment have beendescribed at several points in the foregoing. It is clear that growth of GNPand imports in the OECD countries exercises a powerful influence on Korea'smacroeconomic performance and on the effectiveness of Korea's macroeconomicpolicies. Korea remains an open economy and while some structural develop-ments (e.g., successful import substitution and generalized reduction ofimport dependence) may make it less vulnerable to external sAocks in thefuture, Korea is a long way from acquiring the sort of independence that Japanand the US enjoy on account of their large domestic markets. Furthermore, thehigh debt that Korea has acquired in the process of growth is best managed inthe future by maintaining an export orientation. Flexible macroeconomicpolicy, and especially a competitiveness-oriented exchange rate policy, can beof great help in negotiating external shocks of a cyclical nature. Where theshocks are structural in nature, an appropriate industrial policy is calledfor.

- 74 -
CHAPTER 8s ECONOMIC LIBERALIZATION AND THE SEQUENCING OF REFORM
A. Conceptual Issues
8.01 It has long been argued that developing countries should reducetheir restrictions to international trade and become more integrated with therest of the world. The benefits of free trade are well established theoreti-cally, and have become increasingly well documented empirically. Trading atworld prices allows a country to use its resources efficiently and permits itsconsumers to acquire a larger quantity of goods for a given level of income.Cross country empirical studies have documented in a very convincing way thatcountries with more open economies have outperformed, in terms of growth andother indicators, those natjyns that have relied on heavy restrictions tointernational transactions.-
8.02 The general thrust of policy recommendations favoring a moreliberalized economy is not restricted to the elimination of distortions in theexternal sector, however. It is widely accepted that the reduction (elimina-tion) of distortions in all sectors would be desirable and for this reason,traditional policy prescriptions call for eliminating price controls, allowing(real) interest rates to rise, reducing import tariffs and quotas, andincreasing the degS,e of integration of the economy with internationalfinancial markets.-
8.03 Although there is widespread agreement on the desirability ofpursuing these reforms, the problem of recommending a specific sequencing forthese policies is difficult on both theoretical and practical levels. Manytimes, due to political or other constraints, it is not possible to pursue theliberalization of all sectors simultaneously. In those cases, the question ofsequencing becomes very important. Until recently, very little analyticalwork had focussed on issues such as: should domestic interest rates be raisedbefore, after or at the same time as capital controls are lifted? S§guld thetrade account be opened up before the capital account or vice versa?-
1/ See Little, Scitovsky and Scott (1970) Krueger (1978), and Bhagwati andSrinivasan (1979).
2/ From a theoretical perspective there is a question related to thebenefits of partial reforms where only some distortions are eliminated.This, of course, is a typical second best problem. See the discussion inKrueger (1985). Of course in a textbook world with no distortions thequestion of appropriate sequencing is trivial. All markets should beliberalized simultaneously and instantaneously. In the real world,however, complications arise.
3/ See, however, the studies by Edwards (1984), and Krueger (1985).
- 75 -
8.04 Given the present commitment of the Korean Government to liberalizethe economy, by dismantling trade controls and raising interest rates, thequestion of sequencing becomes current and increasingly important. In thissection some of the more important aspects of the sequencing of economicreform will be analyzed. The discussion will basically deal with the order ofliberalization of the current and capital accounts, and will emphasize macro-economic effects of alternative sequences. The analysis will also deal withefficiency and credibility issues. The problem of determining the appropriatesequencing of reform is particularly difficult from an analytical point ofview inasmuch as the analysis depends heavily on the initi'l conditions. InKorea, these conditions are quite different from those encountered in the mostpublicized liberalization attempts in the Southern Cone of Latin America, andthus, the results emerging from that latter experience may not directly applyto the KZyean case. Still, the Latin American experience offers valuablelessons.-
8.05 How might conditions in Korea in 1986 be characterized as itapproaches further liberalization? Very simply put, these conditions are:(i) a negligible inflation; (ii) basically balanced public sector finances;(iii) a very open economy with some export bias; (iv) a repressed andsegmented capital market, where an official market with fixed rates coexistswith a spectrum of less controlled markets, including a freely functioningunorganized (curb) market; (v) the existence of import restrictions which arebeing dismantled; and (vi) selective controls to capital movements, based on a"'negative list," where inflows of capital have to be approved on an individualtransactions basis.
8.06 One aspect of sequencing that is well established is thatimpediments to capital movements (both inflows and outflows) should not befully relaxed before liberalizing the domestic financial sector. Therationale is that if the capital accoant is liberalized at a time whendomestic interest rates are fixed *5 arbitrarily low or negative real levels,an outflow of capital will result It is clear that Korea has begun to takesome of the steps necessary to bolster the domestic financial systems inanticipation of ultimately opening its capital market, but considerable
4/ Much of the discussion on the sequencing of reform has been done usingLatin America as the benchmark. See McKinnon (1982), Edwards (1984,1985), Corbo and de Melo (1985), and Edwards and van Wijnbergen (1986).
5/ Capital flight has indeed been the result of acute imbalances betweendomestic and international real interest rates of a number of developingcountries, i.e., if the domestic interest rate is below the worldinterest rate, appropriately corrected for expected devaluation and otherrisk premia, financial capital will tend to exit. Much of thle capitalflight that Argentina experienced in the early 1980s, for example, was inresponse to the fact that the (anticipated) interept rate was perceivedto be well below that in the rest of the world. In the current Koreancase real interest rates are positive -- although probably below theirequilibrium level -- and it is not likely that a relaxation of exchangecontrols would result in massive capital flight.

- 76 -
further reform will be needed to make this possible. Positive real interestrates now exist, but well functioning capital markets, ready to compete withexternal markets, would also require less segmentation, a wider range ofmaturities, and some financial instruments to hedge exchange rate riskeffectively. Thus, in some sense, it is possible to say that Korea has takenthe initial steps towards financial liberalization.
B. The Capital Account, the Current Account and the Real Exchange Rate
8.07 Perhaps one of the most critical issues related to the dynamics ofeconomic reform is the sequencing of liberalization of the current and capitalaccounts. Different sequences of the liberalization will imply differentpaths for the critical macroeconomic variables, in particular the realexchange rate. In general, the op-;Jmng of the capital account and relaxationof exchange controls in a developing country will generate important movementsin financial capital. In most countries, if the fiscal deficit is undercontrol and the domestic financial market liberalized, the opening of thecapital account will very likely result in significant inflows of foreigncapital, triggered 9 perceived differentials between the domestic and foreignreturns to capital. These add4 tional funds from abroad will allow domesticeconomic agents -- households, firms, and the Government -- to increase theirexpenditure over preliberalization levels. This additional expenditure willgenerally fall both on domestic and international goods. The increasedexpenditure on international goods will generate the current account deficitthat usually mirrors the capital account surplus generated by the increasedcapital inflows. On the domestic side, the increase in expenditure will betranslated in a higher demand for domestic (or nontraded) goods, and in ahigher relative price for these goods. This relative price increase or realexchange rate appreciation is one of the most important consequences of aliberalization of the capital account in a capital importing country.
8.08 Under these conditions, the opening of the capital account willgenerate a real appreciation; however, a successful liberalization of thetrade account (i.e., reduction of import tariffs and elimination of importquotas) will generally require a real depreciation of the domestic currency.This real depreciation will help the exportables sector expand, as the newstructure of relative prices replaces the old protective structure, dnd conse-quently wUll be instrumental for reestablishing external equilibrium afterimport restrictions have been reduced. If, however, the opening of thecapital account precludes this real depreciation, then the transition in theexportable and importable goods sector from a protective to a freer environ-ment will become more difficult. The appreciation generated by the relaxationof capital controls will squeeze profitability in the tradable goods sectorprecisely at the moment when it is going through a costly readjustment. Thiswould be a major risk for Korea in prematurely opening up its capital market.
6/ This assumes that the developing country has relative abundance of labor,and scarcity of capital. In the present world economic conditions withmany LDCs affected by the international debt crisis, an opening of thecapital sccount may not result in massive capital inflows.

- 77 -
8.09 Consequently, it has been suggested that the capital and currentaccounts should not be opened simultaneously and, moreover, that during thetransition periodf fter trade has been liberalized, capital inflows be care-fully controlled.- This view is reinforced by the fact that, in general, theopening of the capital account will result in an overshooting of capitalinflows, which will provoke a steep real appreciation in the short run. Inother words, experience has shown that immediately after the relaxation ofcontrols, capital inflows are likely to be quite large, but that after sometime they decline towards a new long-run equilibrium level. There are anumber of examples where the opening of the capital account has resulted inmassive cgaital inflows and a significant real appreciation of the domesticcurrency.-
8.10 The conflicting movements of the real exchange rate as a result ofopening the capital and current accounts (i.e., real appreciation and depre-ciation respectively) capture the fact that these policies will exercise pres-sures for resources to move in opposite directions. To the extent that thereare adjustment costs associated with resource movements between sectors it isadvisable to implement policies that would avoid unnecessary resourceswitches§ i.e., resource movements that will be reversed after a short periodof time.-
7/ See McKinnon (1973, 1982), Dorn .usch (1983), Frenkel (1982), Edwards(1983, 1984).
8/ Perhaps the best known recent case was Chile during 1979-81 when massivecapital inflows resulted in a reach exchange rate appreciation of 30X.The Korean experience during the 1960s has also been cited in connectionwith capital inflows following a capital account liberalization. In mid-1966, a large inflow of short-term financial capital flooded the Koreaneconomy. As a result, there was an increase in inflation and a substan-tial real appreciation. It should be noted, however, that througheuttheir experiences with major inflows of capital, Korea and Chile followeddifferent strategies. Whereas in Korea the nominal exchange rate wasadjusted periodically, in Chile a fixed nominal rate was in effect duringmost of the period. In both countries, however, a real appreciation tookplace, with the real exchange rate moving against exporters.
9/ Once more Chile provides a good example. Starting in 1976 -- after thepath of trade liberalization had been announced - exporters embarked onextensive investment programs aimed at increasing their export capacity,only to find that in 1979-81 the real exchange rate turned drasticallyagainst them. At this point investors moved away from the export sectorand switched their resources to the nontradable sectors and especiallytowards construction. It has been suggested that one simple way ofavoiding these unnecessary resource switches is by opening the currentaccount first, and, only after the new productive structure has been wellestablished, opening the capital account slowly. See McKinnon (1982),Frenke} (1983).
- 78 -
8.11 The preceeding discussion has assumed that once the capital accountis opened, domestic agents would be able to borrow from abroad and capitalwould flow into the country. This is indeed what would be expected undernormal conditions, where uncontrolled (real) domestic interest rates would besubstantially higher than abroad. This would, in fact, very likely be thesituation in Korea if all exchange controls were suddenly lifted. However,given the current mood in the international financial community regardinglending to the developing countries, there is a risk that these incoming fundsmight be of short-term maturities Qo that the real appreciation which wouldoccur might be of short duration,
C. Economic Reform, Efficiency and Credibility
8.12 Policymakers considering the macroeconomic consequences of alterna-tive sequences of reform may wish to consider two additional issues. Thefirst of these deals with the effects of the reforms on the efficiency of theresource allocation and consumption processes. The specific question is howthe economy's ovflall efficiency will be affected by removing distortions inonly one sector.- Even though the evidence is not conclusive, there is astrong presumption that the relaxation of capital controls in the presence oftariffs will amplify existing distortions, reducing the efficiency of theeconomy. Once capital controls are lifted a proportion of the funds obtainedfrom abroad will be used to increase investment in the import substitutionsector. However, since tariffs have not been lowered yet, this sector isalready producing "too much" and "too inefficiently" relative to what it wouldproduce under a neutral trade regime; the existing distortion may, thus, beamplified. On the other hand, the presumption is that the reduction oftariffs in the presence of capital controls will generally not producenegative amplifications of existing distortions. On the contrary, it is
10/ In the current debt environment countries may face a situation ofinternational credit rationing. Under these circumstances it is likelythat the opening of the capital account will not result in additionalcapital inflows. Moreover, depending on the approach the country ista'ting to solving its debt problems, capital may even tend to flow outwhen capital restrictions are relaxed because in some instances thestabilization program is carried out timidly. These slow adjustmentsintroduce significant uncertainties regarding the future behavior of theexchange rate and domestic interest rates. These considerations againpoint towards delaying the opening of the capital account until thesmooth functioning of domestic capital markets has been demonstrated.
11/ According to the "second-best" theorem of welfare economics, if existingrestrictions are only relaxed sequentially it is not possible to knowa priori whether some of the remaining distortions will be magnified dueto the partial liberalization. If this is the case, partial reforms maygenerate negative results and if the magnification of the remainingdistortion is big enough, partial reforms may have a negative overallshort-run effect on the economy.

- 9 -
likely that a positive indirect effect will result because the r fyction intariffs will likely result in a higher demand for foreign funds.-
8.13 The second important issue is related to the degree of credibilityof economic reforms. Credibility will generally affect the perceived path ofrelative prices and incentives. If a trade reform announcement is credible,firms and investors will expect a particular set of future movements in pricesand relative returns to investment to ensue and they will react accordingly,mobilizing resources, and investing in the "new export industries." On theother hand, if the public believes that the reform is not credible, and thatthere is some probability that the reform will be reversed in the future,"cheap" foreign funds, obtained through the opening of the capital accounttmay be used by the owners of firms in the import substitution industries tomaintain their firms functioning at a (temporary) loss until such time as thereforms are reversed.
8.14 It is important to stress that the degree of credibility - which iscritical for the analysis of the sequencing of liberalization - should not beviewed as completely exogenous. On the contrary, the strategy followed duringthe liberalization process will tend to affect this credibility. A fundamen-tal and critical aspect of establishing credibility is related to the inter &Iconsistency of the policies that have been and are currently being pursued. YThis aspect of reform has been a strong point of the Korean efforts inasmuchas Government has used a long preannouncement period for basic reforms and hasstuck to it. Credibility has thus not been a problem in the Korean context.
8.15 Summarizing, although there is no ironclad rule regarding theappropriate sequencing of liberalization, both analytical considerations andhistorical evidence suggest that a prudent policy consists of liberalizing thecurrent account well before the capital account is fully opened. A corollaryis that the domestic financial sector must be sufficiently strong and thecapital market sufficiently developed to allow the benefits of capital accountliberalization to be reaped. Premature liberalization, before domestic insti-tutions are capable of operating effectively is usually ill-advised. Equallyimportant perhaps to the sequencing of reform is the confidence these policiesinspire. In that sense, a crucial aspect of the liberalization process is todefine a consistent and credible policy package.
12/ See Krueger (1985) and Edwards and van Wijnbergen (1986).
13/ For example, the inconsistency between fiscal and exchange rate policiesin Argentina in the late 1970s, played an important role in the eventualabortion of that country's liberalization program. Also, in Chile, manyagents thought that since tariff reduction was accompanied by asignificant real appreciation of the exchange rate, the trade reform wasactually unsustainable. The extraordinarily large current accountdeficit observed in that country during 1979-81 further fueled thefeeling of the reforms being unsustainable. This aspect of credibilityshould be an important consideration for policymakers undertaking tradepolicy reforms.

- 80 -
D. Review of Sequencing and Implementation
8.16 The Korean Government's commitment to liberalizing the economy isclearly serious and reforms are progressing at a steady pace. The generalapproach followed has been gradual and prudent. Progress, in terms ofliberalization, has been different across sectors, with reform of the tradeaccount proceeding at a relatively more rapid pace tha the reform of theinternal domestic market, and of the capital account.-
8.17 The fact that the liberalization of trade -- movement of items tothe AA list and reduction of tariffs -- has proceeded in a preannounced,gradual fashion is a clearly positive step. This strategy, if well designed,will help those firms affected by the reform to adjust in a smootherfashion. Generally, the problem with this type of policy is to define a timespan for the reform to be carried out that is sufficiently long, so that theadjustment can be indeed smoother, and sufficiently short, so that theannounced liberalization measures are credible. To date it seems that policy-makers have been successful in defining this timing. The reforms arecredible - although interest groups still lobby against it - and those firmsthat expect to be affected by it are taking some measures towards adjust-ment. On the other hand, until now no major disruptions in productionassociated with the reforms have been observed, which can either imply thatinitial trade restrictions were not terribly binding, that they still areoperative in some guise, or that recent real depreciations in the exchangerate have had their desired effect. As noted earlier, changes in the degreeof coverage of the AA list provides biased information, since many items arestill affected by special laws. This procedure reduces the transparency ofthe importation process and it is recommended that the necessity of thesespecial restrictive laws be reviewed. If necessary for their abolition, atemporary hike in their respective tariff levels could be considered, andwould probably be preferable to any binding constraints imposed by thesedevices.
8.18 It is important to realize that the purpose of a trade liberaliza-tion reform is to increase the degree of openness of the economy and toimprove the domestic sector's efficiency, The purpose of these reforms is notto generate a large trade deficit. This means that, in order to increase theamount of imports without increasing the trade deficit, exports shouldincrease pari pasu with imports. This has to be achieved through higherincentives to exports. These incentiveas in turn, come from two sources.Generally by liberalizing imports, imported intermediate inputs are madeavailable at a lower price to the exports industries. Second, in order tomaintain trade equilibrium, liberalization must usually be accompanied of a
14/ Liberalizing the trade account before the capital account and thedomestic capital market account before the external capital account areboth clearly warranted, although there is no clear consensus concerningthe appropriate sequencing between trade and domestic finance. See Park(1985).

- 81 -
real depreciation. In the current Korean experience this real depreciationhas indeed taken place; in 1985 alon2 the real effective rate fell by 12S. Inthat regar! she Korean reform is proceeding in the way most experts wouldrecommend. It should be emphasized that in the next few years the evolu-tion of the real exchange rate will continue to be very critical for thebehavior of the external sector.
8.19 The strategy foLlowed in Korea has also been prudent regarding thesequence of liberalization of the current and capital accounts. As discussed,there are strong presumptions that the liberalization of the capital accountshould be postponed for a substantial period until after trade reforms havebeen finalized. By maintaining some control over capital movements, erraticand counterproductive changes in the real exchange rate can be avoided. Thecurrent policy of monitoring capital movements is therefore quite importantduring the next few years to ensure that there is little impetus forbacksliding on trade reform.
8.20 An important aspect of the Korean reform which has not generatedsufficient attention is related to the liberalization of the service sector.Korea is preparing to open selectively its insurance market to foreign under-writers in 1987, for example. Some care should be taken to avoid confusingthe liberalization of the service sector, which has benefits if the cost ofthose services to Korean industry can be reduced, with a selective opening ofthe capital account. For example, this could be the case, to some extent, ifforeign insurance companies operating in Korea were allowed to freelydiversify their portfolios internationally, with resulting surges in capitaloutflows.
8.21 Overall the liberalization of Korea's external sector is proceedingsmoothly and deliberately. It is noteworthy that liberalization proceededaccording to schedule, despite dim export performance in 1985 and ensuinglower growth. This reflects a genuine commitment to liberalization. At thesame time, restraint is being exercised during the transition. In light ofthe still somewhat immature state of domestic financial markets, and thefragility of certain aspects of corporate finance, this is prudent. The nextpriority in terms of achieving overall liberalization objectives should be thebolstering of the financial sector and, in particular, financial institutions.In order to compete effectively with foreign firms in financial markets,greater attention to profitability and risk will be needed, and some of thekinks endemic in the Korean system of industrial finance will need to beironed out. Premature opening of the capital account is to be avoided untilsuch time as domestic capital markets achieve the requisite level of stabilityand sophistication.
15/ While it is true that some of the real depreciation has been quiteunintentional. and has basically been the result of the Yen'sappreciation, Korean policymakers opted to accept the lower value of thewon.
- 82 - gedix
FINANCIAL LIDSRLIZATION RISKS: LESSONS MIO TUE SOUTHERN CONE
A8.1 The recent Latin American Southern Cone experience withliberalization has beeo traumatic, and has had an important effect onconventional thinking. Interventionists have found in these failed attemptsnew amunition with which to attack the merits of market oriented developmentstrategies; supporters of the liberalization process, on the other hand, havebeen forced to rethink their views on the optimal path to be followed duringthe transition period of a liberalization attempt. The Southern Coneexperiments provide very useful lessons that should be closely scrutinized bypolicymakers who want to avoid the mistakes made, especially during thetransitional period, whilh eventually contributed heavily to the collapse ofthe reform experiments. In this section some of the more relevant aspectsof the Southern Cone experience will be analyzed, and the potential risks forKorea will be highlighted. Most of the analysis will focus on the case ofChile, since it was in this country where the reforms were pushed furthest.
A8.02 It should be stated at the outset that the current economicconditions in Korea are significantly different from the initial conditionsencountered in the Southern Cone in the aid-l970s. First, Korea does not havea serious inflation problem, while rampant inflation was perhaps the mosturgent problem in Argentina, Chile and Uruguay. Second, the fiscal sector inKorea is under control; in the Southern Cone, on the contrary, the fiscaldeficit was initially gigantic, and in Argentina it was never really reducedto manageable levels. Third, Korea's external sector is very open, and hashad a long successful tradition of export growth. Fourth, Korea's financialsector, while controlled and therefore distorted, has been in place for a longtime, and has in the last few years been operating with (significantly)positive real interest rates. In the Southern Cone - and particularly inChile - on the contrary, the financial sector was in shAmbles when thereforms were first started. All these factors make the cases of Korea and theSouthern2 one quite different and comparisons should be handled with
A8.03 Perhaps the two more striking features of the financial reformsin these Latin American countries were the high real interest rates, and,particularly in Chile, the large proportion of nonperforming loans that thebanks accumulated. Immediately following the liberalization of interestrates, these became extremely high in real terms. For example, in Chile theyaveraged more than 40X for long periods of time. At the same time thematurity of bank operations was very short, seldom exceeding 30 days. These
1/ See Bruno (1985), Corbo (1985), Corbo and de Melo (1986), dad Edwards(1985).
2/ There are, however, perhaps surprisingly, some similarities betweenKorea's and Chile's financial reforms. In both cases, big conglomeratesbought major interests in the national banks. Also, in both cases bankshad a large proportion of nonperforming loans, firms were very highlyleveraged and reportedly could actively use borrowed funds as equitycapital.

- 83 - Appendis 8APage 2
high rates persisted throughout the period, in spite of the massive inflow ofcapital that followed the relaZation of exchange controls. Most domesticbanks in Chile, and to soae eztent in Korea as well, were basically owned bylarge jyng1ONerutes, accumulated a large proportion of nonperformingloans., At the end, in Chile - and to a lesser extent in Argentina - thecombination of high real rates, large proportion of bad loans in the bankingsector, and widespread expectations of devaluation conspired to generate amajor collapse of the financial sector. In Chile several conglomerates andbanks failed, and had to be rescued by the Government. In Argentina a numberof banks also had to be bailed out by the Covernment.
A8.04 With hindsight it is possible to say that perhaps the mostserious problem related to the reforms of the domestic capital market, both inChile and Argentina, was the lack of effective supervision of the financialsector. For example, in Chile, as early as 1974 it was well known by everyoneinvolved - including, of course, the "regulators" - that the differentconglomerates were finding ways to circumvent the rules covering excessiveownership concentration in the financial sector. In fact, it was kno w thatthese conglomerates had managed to control most of the largest banks.-Starting in 1974-75, many banks concentrated large fractions of their loanportfolios on related firms owned by the conglomerate that controlled thatparticular bank. The basic scheme used by many of these conglomerates was couse the financial resources obtained through the newly acquired banks to buyfirms that were being privatized; some of these funds were also used to expandthe level of operations of these and other firms. However, many of theseloans to related firms did not represent, from a purely financial point ofview, sound banking practices. In fact, banks were used as pawns in theconglomerates strategy of "growth at almost any cost" in a tightly speculativeenvironment.
A8.05 It has been argued that the existence of an evergrowing "falsedemand" for credit by the conglo rates played a central role in the explana-tion of the high interest rates.- This "false demand" consisted of therolling-over of loans, which in turn, had their origin in the privatization ofa large number of firms during the early years of the military regime. Aspointed out above, many of these firms had to spend significant resources inorder to operate, modernize and expand these companies. Many of them did notturn out to be profitable, and increasingly resorted to additional borrowingin order to stay afloat.
A8.06 The financial problems faced by banks and firms alike werecompounded, both in Chile and Argentina, by a steep real appreciation of thedomestic currency. This tendency towards overvaluation was the result, amongother things, of the exchange rate policies followed in these countries whichconsisted of preannouncing a rate of devaluation significantly lower than theongoing rate of inflation - and of the massive inflows of capital that
3/ See Table 5.16.
4/ Another major difference is the vigiltnt role played by the Ministry ofFinance in Korea, and the close coord"nation among economic ministries.
5/ Harberger (1985).

- 84- AD di- SAP ge 3
followed the opening of the capital account of the balance of payments.b! Oneof the sost important consequences of the real appreciation of the dosticcurrencies was that the tradable goods sector suffered an important lose ofcompetitiveness, ad that a large number of firs ran into serious financialtrouble. In both Chile and Argentina most of these firms faced these problemsby resorting to heavy borrowing from the financial sector, exercising addit-ional pressure on the demand for credit and on interest rates. This circle ofevents came to a sudden end in both countries with major exchange rate andfinancial crises.
A8.07 The main lessons -- in terms of reform of the financial sector- that emerge from the Southern Cone fall into four categories. The firstcategory refers to bank supervision, It is essential that the process offinancial reform is accompanied by strict supervision of the banking andfinancial sectors, in order to avoid fraud, circumvention of sound bankingpractices, or misuse of the financial resources. This supervision should beparticularly strict when conglomerates play such a crucial role in thestructure of industrial organization, as in Chile and Korea. Strongsupervision should reduce the chances of a major bank collapsing with theattendant dangers for foreign borrowing, in which creditworthiness isdominated by a herd mentality among lenders.
A8.08 The second area where lessons emerge refers to the speed andextent to which interest rates should be freed. The Southern Cone casesuggests that a prudent attitude may be warranted when dealing with financialliberalization. More concretely this means that interest rates should beraised slowly, with an effort being made for maturities to be extended. Theslow and prudent raising of interest rates will allow the authorities todetect and tackle early on any market reaction based on destabilizingexpectations or lack of credibility. A precipitious rise in the cost ofborrowing would m -ly serve in a highly leveraged corporate environment todistress financing and greater instability.
A8.09 The third lesson relates to the liberalization of the capitalaccount and the relaxation of exchange controls. A number of authorsanalyzing the Southern Cone experience have concluded that the tim+p) used toopen the capital account was ill-conceived in all three countries.-' Asargued in Section I of this chapter there are compelling reasons to suggestthat the opening of the capital account should be pushed significantly backuntil after the trade account has been opened. The fourth lesson relates toexchange rate policy. It is extremely dangerous to reform the financialsector in an environment of overvalued domestic c-urrency. If this happens, asin Chile and Argentina, large distortions in terms of "excessive" borrowingfrom abroad may take place, in anticipation of real devaluations. In thiscontext, Korea's realistic exchange rate policy serves as a useful lesson ofthe liberalization experience.
6/ See Corbo (1985) and Edwards (1985).
71 See Edtirds (1983, 1984), Dornbusch (1983), McKinnon (1982), and Bruno(1985).
- 85 -
CHAPTER 9: THE THEORY OF INDUsTRrAL POLICY IN THE KOREAN CONTEXT
A. Incentive Regime
9.01 Many arguments are offered to justify industrial interventions. Onthe basis of economic criteria, there are only a few clearly delineated casesfor such public actions. In general, interventi n can be justified by evi-dence of nonexistent or malfunctioning markets. In developing countries,imperfections are most often claimed to occur in markets for capital, tech-nology, and knowledge. But often far more important is the economicenvironment in which these markets operate, namely, the incentive regime.
9.02 The general structure of incentives is often the most importantelement of industrial policy in developing countries. The consensus amongdevelopment theorists favors an outward-oriented incentive regime with rela-tively uniform incentives for different production activities. The case forsuch a regime rests, in the first place, on the proposition that a country canmaximize its income and growth (at world prices) by shifting resources intoareas of comparative advantage and later by adjusting this allocation to trackchanges in comparative advantage. An outward-oriented regime also reducesuncertainty about the government's priorities and policy directions. Theoutward-oriented strategy has received strolf empirical support from evidenceaccumulated in postwar development history._
9.03 The benefits of outward orientation appear to be greater, in fact,than what might bl,reasonably attributed to the achievement of allocativeefficiency alone.- Korea's openness has provided positive externalities in
I/ Even this evidence is theoretically insufficient, to warrant interven-tion, however. Since a compensating policy may cause undersired side-effects, there must be also a strong presumption that the economy will becloser to its "first-best" optimum with intervention than without.
2/ Work by Balassa, Krueger and others has shown that countries with outwardoriented regimes grew faster than those with strong incentives favoringproduction for domestic markets. Improved performance was also commonlyobserved for countries which changed to an outward oriented regime duringthe postwar period. Needless to say, Korean experience figures impor-tantly in this research. See, for example, Frank, Kim and Westphal(1975).
31 Krueger (1985) and others argue that open economies are more flexiblethan import-substituting economies because they have greater "cushions"of unessential imports to squeeze under adverse circumstances. Accordingto Westphal, Kim, Dahlman (1984) and others, openness can also facilitatethe absorption and mastery of foreign technologies. Nishimizu andRobinson (1983) have shown that the rate of technical progress was fasterin countries with outward oriented policies than in those pursuing animport substituting strategy.

- 86 -
the areas of macroeconomic flexibility and the absorption of technical pro-gress. These externalities justify even greater participation in trade thanwould be optimal from the allocational viewpoint alone and validate Korea'spast proexport bias. While recent analyses agree that an outward orientationis conducive to rapid development, the precise implementation of such a policyis somewhat more controversial. According to some, it implies low, uniformlevels of effective protection, with perhaps some escalation to permit infantindustry development in higher stages of assembly end production. Others seea somewhat greater role for selective support for outward oriented infantindustries. Despite these differences, however, there is wide concensus thatprotection ought to be lower and more uniform than is currently the case inKorea as well as in most other developing economies. It is in this light thatthe Korean trade liberalization, described in Chapter 2, is quite important,as a natural successor to the effective export-promotion activities of thepast two decades.
B. Functional Intervention
9.04 Since the case for the open economy assumes well-behaved markets(for factors of production as well as final products), the absence or imper-fection of markets provides a key rationale for nondiscriminatory functionalintervention. This rationale points to policies that correct the marketfailures themselves or compensate for them throughout the economy by offeringfunctional incentives. It does not provide an argument for selective inter-vention in favor of specific sectors or subsectors, however. To be sure, theimplementation of corrective measures may involve a sectoral focus andsectoral coordination, but efforts to correct market failures should notgenerally require comprehensive programs of aid to a specific industry.
Technology Development
9.05 The development of technology generates positive externalities ifthe benefits of innovation "leak out" from the innovating firm to its competi-tors. In the absence of compensating public subsidy, firms will invest lessin research than is justified by social returns. The decision of individualfirms to allocate revenue to R&D expenditures may be influenced also by theircompetitive setting and by the minimum scale required to undertake specificforms of R&D activities. There may, therefore, be an added role forGovernment in subsidizing or coordinating research where competitors cannoteffectively pool their efforts for market reasons. In cases where R&Dinvestments are socially suboptimal, tax incentives can be used to increasethe implicit private rates of return on investment, while in cases whereprivate scale is inadequate, coordinated (public or private) activities arelegitimate alternatives.
9.06 Not all research externalities justify public intervention,however. To merit public support, a research project should generateexternalities for other national firms, but not for firms in othercountries. While the general case for public policy toward research is widelyrecognized, few governments appear to apply the test of "commercialexternality" to guide the specifics of their technology policy. In the Koreanhigh technology sector, for example, individual firms are relatively large,
- 87 -
while the sector as a whole is relatively small (as compared, for example, toits OKCD competitors). Thus implies that external benefits from the researchof a large Korean firm are relatively more likely to accrue to foreign compe-titors and relatively less likely to accrue to other domestic firms.
9.07 Intellectual property rights - protection afforded to inventorsthrough patents and copyrights - represent an important, related area ofpolicy. The problem is familiar; the strict protection of property rightsraises the price of new products above marginal cost and (from a staticeconomic perspective) excludes too many potential users. On the other hand,it provides strong incentives for innovation. The optimal system for a givencountry depends on the net balance of innovations produced and used, and onthe effect of property rights laws on the inflow of foreign teebnology.
Manpower Developsent
9.08 Education and training are hard to finance privately because of theabsence of institutions (families excepted) that lend to individuals againstuncertain and distant future income returns. Thus, market forces generallylead to underinvestment in human capital. In addition, advanced training andforeign training may involve externalities: the benefits of inventions andtechnological transfers made possible by technical and foreign training maynot wholly accrue to any one employer. Zonsequently, wages will fail toreflect the contribution of advanced training. All these possibilities arguefor some public subsidy.
9.09 Retraining can be justified by the same arguments as education ingeneral, but additional motives may be present. Retraining provides targetedassistance to people who are suddenly and adversely affected by changes intrade or production patterns. In this contest, retraining helps to achievedistributional goals as well as increasing the political acceptance of changesin industrial structure. Moreover, retraining increases the flow of laborfrom declining sectors to growing sectors. Thus, retraining constitutes a"second best" policy where factor mobility is hampered.
Capital Markets
9.10 Underdeveloped capital markets represent a frequent rationale forgovernment intervention in the allocation of credit. In many cases, however,the problems attributed to faulty capital markets represent not so much marketimperfections as the high real costs of providing or administering credit.For example, markets may be "missing" for financing new ventures if the numberof such ventures is too small to support adequate risk pooling. Similarly,domestic capital markets may be too small to diversify risks for the estab-lishment of new large-scale industries. But the problem of small risk poolsis a real problem whether credit is publicly or privately allocated; to reducesuch risks it is necessary to enter arrangements that pool risks acrosscountries. rhese arrangements may be either private or public. Similarly,the high cost of capital to small or new businesses often reflects the absenceof organized credit information on businesses and entrepreneurs. This makesthe real costs of administering credit high; it would not be efficient toincrease the flow of credit to such borrowers at subsidized or controlledrates.
- 88 -
9.11 A more compelling rationale for public intervention in creditmarkets must rest on unequal access to credit for reasons other than the highreal costs of credit. In the Korean case, it has been argued that borrowersthat are large compared to relatively isolated domestic credit markets applystrong bargaining (monopsonistic) powers to achieve unusally good terms onloans. Large companies may be getting low cost loans also because they enjoyan implicit government guarantee -- that is, they are more likely to berescued than small firms. These examples provide a rationale for compensatinggovernment intervention. In designing an intervention program, however, itmust be recognized that costs of providing credit to large firms are generallylower than for small firms, due to differences in administrative costs,information availability, and risks of bankruptcy. Thus a differential inborrowing rates in favor of large firms is not, in itself, evidence of marketimperfection.
Competition Policy
9.12 Covernments in the industrialized countries frequently act topreserve or enhance competition in product markets. For swaller countries,such as Korea, the need to exercise control, at least with regard toindustrial subsectors, is closely linked to the extent of protection. In thecase of an open economy world markets provide ample competitive pressure. Inthe case of protected markets and markets for nontraded goods particularlymarkets that are small relative to the minimum efficient scale of production,large firms may exercise market power with adverse implications for consumerwelfare, innovation, and product development. The problem i3 especiallyserious if protection is administered by quantitative restrictions rather thantariffs.
C. Sele..tive Intervention
9.13 Selective intervention, defined as policies that change the alloca-tion of resources among specific industrial sectors or subsectors can bejustifed by a variety of arguments. First, specific externalities and marketfailures may warrant intervention in a particular industry. Second, govern-ment intervention may be also essential (and profitable) in support of firmsthat are competing in internationally oligopolistic markets. Third, nor.-economic objectives may exist with respect to industrial structure, such asgreater economic independence, or greater capacity to produce arms ortransport the nation's essential goods. Fourth, industrial policy objectivesmay also include other, quasi-economic aims, such as the location of industry,employment, and income in certain geographical areas or the desire to reducethe vulnerability of the economy to particular markets. It must be explicitlyrecogni.ed that interventions designed to achieve these structural goals areoften costly and inefficient, and that their burden must be compensated by thebenefits of achieving the government's noneconomic objectives. Alternativeways of achieving industrial policy goals often differ with respect to cost aswell as the distortions they creat relative to market outcomes.
9.14 There is an active ongoing debate on selective industrial policy inindustrialized as well as more advanced developing countries which is relevantfor Korea. In "sunrise" sectors the debate centers as why an activity ought

- 89 -
to operate at a higher level than dictated by market forces. From an economicperspective, the case must rest either on the superior decision-makingcapability of government, or more likely, or interfirm externalities fromlearning on technical progress. In "sunset" industries, the proponents ofinteraction must demonstrate that the pace and/or patterns of decline dictatedby the market are inappropriate, or more specifically, that market forces areleading to socially inefficient outcomes. The attendant issues which requirenormative judgments include (i) the desirable balance between social costs andbenefits, and (ii) the extent to which the existing private institutionalframework is capable of efficiently reallocating productive resources amongindustries.
Sunrise Industries
9.15 Two kinds of questions must be answered with respect to emergingindustries: what makes an industry a potential winner and why does theprivate capital market fail to provide the required support? Beforeaddressing legitimate economic arguments for selective support, it is import-ant to note that common notions about what makes an industry "strategic" areoften poorly founded. Consider, for example, the strategy of aiding "highvalue added" industries. The implied (and flawed) reasoning is that suchindustries generate high levels of national income per unit of output.Depending on how precisely "high value added" is defined, a policy thatencourages such industries may lower national output, employment, and welfare(see the implications of alternative definitions in Table 9.1). At best,under the most favorable definition, the value added criterion produces thesame ranking as would result from applying the conventional economic criteriaof profit maximization and production according to long-run comparative advan-tage. In this case, other market imperfections aside, the ranking does notneed to be implemented through government policy because it will simply corre-spond to the ranking that market agents use to decide on alternative invest-ments.
9.16 The existence of inter.srm externalities provides a more solidrationale for intervention. Such externalities may involve goods, services,and technology created by the firm (in addition to its conventional products)for which the firm is not (fully) compensated. They may include the acquisi-tion of knowhow that is partly passed on to other firms, on-the-job trainingof managers and workers who later move to other businesses, or the developmentof markets for more differentiated and higher quality inputs, which in turnhelp other production activities. These externalities are variously referredto as agglomeration economies, scope economies, and linkage economies. Thiskind of argument forms part of the r;; ionale for highly selective eupport fora few appropriate infant industries._
9.17 Assuming that intervention is justified, the size of the subsidyshould just match the externality identified; it should correct the incentivesystem so that the production of a good is rewarded by the full social
41 This corresponds to Westphal's (1982) recommendation.
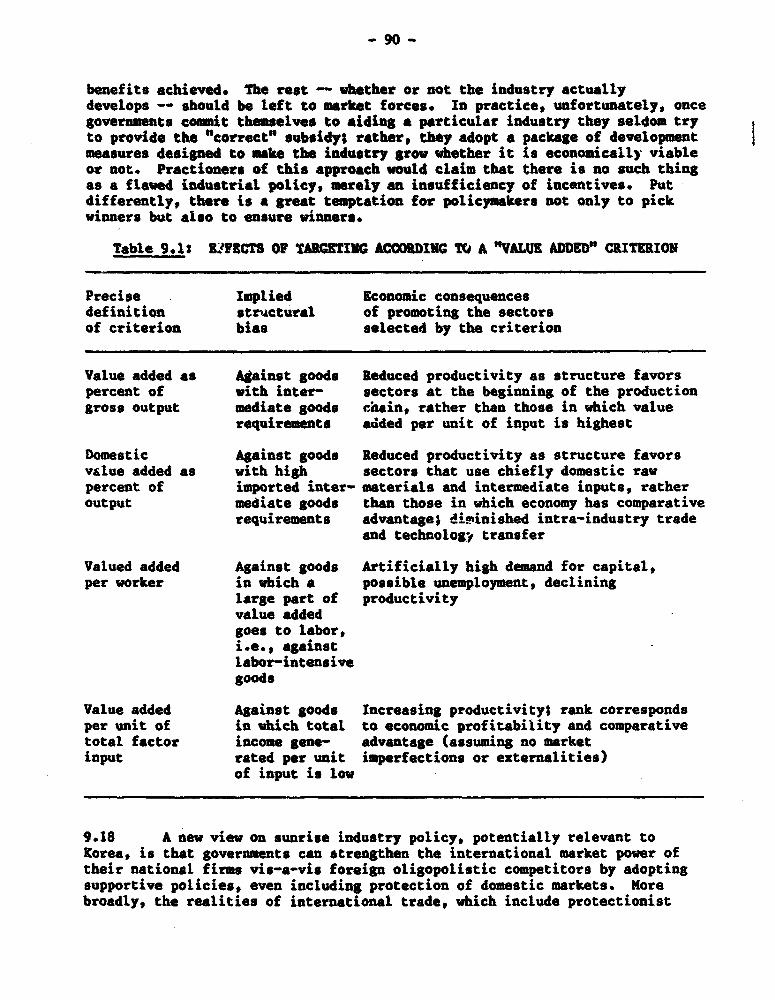
- 90 -
benefits achieved. The rest - whether or not the industry actuallydevelops -- should be left to market forces. In practice, unfortunately, oncegovernments comit themselves to aiding a particular industry they seldom tryto provide the "correct" subsidy; rather, they adopt a package of developmentmeasures designed to make the industry grow whether it is economically viableor not. Practioners of this approach would claim that there is no such thingas a flawed industriat policy, merely an insufficiency of incentives. Putdifferently, there is a great temptation for policymakers not only to pickwinners but also to ensure winners.
Table 9.1: L?FZCTS OF TARGETIMG ACCOBDING TCX A "VALUE ADDED" CRITERION
Precise Implied Economic consequencesdefinition structural of promoting the sectorsof criterion bias selected by the criterion
Value added as Against goods Reduced productivity as structure favorspercent of with inter- sectors at the beginning of the productiongross output mediate goods chain, rather than those in which value
requirements added per unit of input is highest
Domestic Against goods Reduced productivity as structure favorsvalue added as with high sectors that use chiefly domestic rawpercent of imported inter- materials and intermediate inputs, ratheroutput mediate goods than those in which economy has comparative
requirements advantage; diminished intra-industry tradeand technology, transfer
Valued added Against goods Artificially high demand for capital,per worker in which a possible unemployment, declining
large part of productivityvalue addedgoes to labor,i.e., againstlabor-intensivegoods
Value added Against goods Increasing productivity; rank correspondsper unit of in which total to economic profitability and comparativetotal factor income gene- advantage (assuming no marketinput rated per unit imperfections or externalities)
of input is low
9.18 A new view on sunrise industry policy, potentially relevant toKorea, is that governments can strengthen the international market power oftheir national firms vis-a-vis foreign oligopolistic competitors by adoptingsupportive policies, even including protection of domestic markets. Morebroadly, the realities of international trade, which include protectionist
- 91 -
agreements as well as possible collusive behavior, may make it difficult forGovernment to totally distance itself from the activities of its firms. Inparticular, these considerations may affect government policy towards indus-trial organization within Korea, and towards joint ventures between Koreanfirms and foreign partners.
Sunset Industries
9.19 In declining industries, twn quite different issues are at stake.In some cases, government policy may be needed to aid the withdrawal ofresources from a declining industry. In other cases, government participationmay be needed to "restructure" an industry, that is, to add resources and/oralter management in order to reach a stable and profitable operatingstructure. These goals involve different analytical issues. The withdrawalof resources from a declining industry does pgt, under usual marketconditions, require government intervention._' The existence of largeadjustment costs, for example, is in itself not a valid reason for interveningto either slow or accelerate the market rate of adjustment. Similarly, well-functioning markets are also able, in principle, to engineer optimalrestructuring. As in other dimensions of policy, intervention needs to bejustified with specific market failures or imperfections, or by virtue ofnoneconomic objectives.
9.20 Restructuring involves turning a declining activity into a competi-tive one. When restructuring is in fact possible, it requires an infusion ofnew resources -- capital, management, and technology - into an activity whichis presently unprofitable. If the returns on such new investments can beclearly separated from obligations on older debt, then private capital marketscan be relied on to supply restructuring capital, and in general to determinewhether restructuring is feasible or not. However, the separation of "old"debt from "new" debt is not easily effected in practice. Bankruptcy is oneway to do so -- it wipes the slate clean so that new investors can lay claimto future returns. But bankruptcy is complicated and disruptive; it is often.mpractical for large economic units. In Korea, for example, the bankruptcyof a large group may create concern for the creditworthiness of the entirefinancial sector. In some countries, one or a few banks control a suffi-ciently large part of a compan-y's debt to step in with a restructuring plan.
5/ Market imperfections may lead to ineffi'-fently slow or fast adjustment,however; for example, high unemployment compensation in industrializedcountries accelerates the decline of sunset industries (compared withideal market conditions), as workers are reluctant to accept wage cutsthat would permit their companies to compete. At the same time,unemployment compensation reduces incentives to move into new sectors(which may involve significant financial and psychic adjustment costs)and thus decelerates the growth of sunrise industries. Retraining andadjustment assistance policies represent second-best solutions forcompensating for these effects.

-92-
In others, however, private capital markets could faiL to support even veryprofitable projects in declining industries.
9.21 Public support of restructuring can take various forms. Governmentloans provide funds directly. Loan guarantees may assure creditors thereturns that cannot be assigned to them under conventional arrangements.Cartels organized by governments may enable troxyled industries to raiseprices and, in effect, be rescued by consumers.- Mergers among competitorsmay permit a rational scrapping of capacity. In all of these cases, publicintervention has adverse side effects and should be pursued reluctantly; at aminimum, intervention should be contingent on a package of measures thatpromises a return to profitability.
9.22 It has been recently suggested that government intervention may bejustified even in the absence of mayWet imperfections in the case ofoligopolistic declining industries.-' The argument is that oligopolisticfirms sometimes continue to fight for market share even if this involvesselling at below marginal cost, in the hope that they will "win" a large shareof a profitable market as their competitors withdraw. If the firms of theindustry are similar -- equally likely to win -- excessive (that is, belowbelow-marginal cost) competition may persist for a long time, implying aninefficiently high level of output. A government restructuring plan whichreduces capacity (perhaps by compensating the withdrawing firms) would improvenational welfare. Though particularly appealing, this cannot justifyintervention in most declining industries, such as the Korean shipping, forexample, where the distribution of capacities is highly skewed, and differentfirms have obviously different probabilities of financial survival. Indeed,in the typical case the possibility of a government restructuring plan may initself serve to delay adjustment, as potential losers have added incentive towait for a government rescue.
9.23 As the Korean economy becomes more sophisticated and the cases ofovert market failure shrink, the rationale for industrial interventiondeclines. In keeping with this trend, Government has redirected its philoso-phical stance in recent years to favor functional incentiv.i rather industry-specific incentives. It has not yet withdrawn from industrial decision-makingentirely, however, particularly on the side of declining industrieL, wherepublic externalities include effects on employment, the capacity to borrow oninternational capital markets, and perhaps the integrity of the bankingsector. Therefore, the emerging challenge to policymakers is to rein-ingovernment's tentacles, while at the same time improving those markets stillcharacterized by imperfections and bolstering those institutions which areneeded to improve the functioning of those markets.
6/ This is in fact the Japanese solution. See Peck, Levin and Goto (1985)for a detailed description.
71 Okuno and Suzumura (1985).

- 93 - APPENDIX 9APage 1
THE JAPANESE APPROACH TO INDUSTRIAL RESTRUCTURING
A9.01 Introduction. Recent Korean intervention in several majorindustries, including shipping and overseas construction, somewhat resemblesJapanese policies in industrial restructuring. Since the early 19509 Japaneselaw has authorized the formation of so-called "de-ression cartels" indistressed industries, aimed at lowering output and raising prices for alimited period of time, as well as "rationalization cartels," aimed at encour-aging the improvement of industry profitability through cooperation inresearch and product standards.- These laws were originally designed to dealwith cyclical downturns and did not address structural adjustment problems indeclining industries. As a consequence of the economic turmoil of the 1970s,a "Law of Special Measures for the Stabilization of Specific DepressedIndustries" was adopted in 1978, with a five-year horizon, and it was replacedby a "Law of Special Measures for the Structural Improvement of SpecificIndustries" in 1983.
A9.02 Under the 1978 law an industry could be designated as a depressedindustry if (a) it had severe excess capacity; (b) more than half of its firmsfaced "dire" financial conditions for at least three years; and (c) more thantwo thirds of its firms requested designation. Designation also required theapproval of the affected Ministry (typically the MITI, but in the case ofshipbuilding, for example, the Ministry of Transport). Designation exemptedan industry from antimonopoly arws in order to permit the negotiation of ajoint capacity reduction plan.l It also provided limited low interest loansfor financing retirement allowances, and made an industry eligible for loanguarantees. In fact, tht financial provisions of the Law proved unimportant;the loan guarantee fund, for example, was very much undersubscribed.
A9.03 The 1983 law has similar provisions with respect to designation andcapacity reduction; however, it offers somewhat broader financial support,including (i) low-interest loans from the Japan Development Bank for modern-ization and improvement; (ii) grants for R&D spending, especially in the fieldof energy conservation; and (iii) accelerated depreciation for equipment formodernization and additional minor tax benefits. It also permits the forma-tion of "business tie-ups" in which firms can agree to join together to fullycoordinate their production and/or sales activities. These business tie-ups,
1/ For broader discussion of Japanese industrial policy see Magaziner andHlut (1980), Johnson (1982) and Petri (1984).
2/ The Ministry relevant to a designated industry was charged with develop-ing a stabilization and capacity reduction plan, in close consultationwith the industry's trade association and individual firw'- The Govern-ment had no power to implement the capacity reduction xIan, although theestablishment of new plants &nd the expansion of existing pVants was inprinciple prohibited. There is in fact a case of capac ̀y xpansion by a"renegade" firm under a capacity reduction program, in the electric steelfurnace industry.

- 94 - APPENDIX 9APage 2
which must be approved bl the Fair Trade Comission, resemble mergers in thatthe unit formed by the "tied-up" firms typically acts as a single competitoragainst other tie-ups.
A9.04 Operation of the Laws. Of the fourteen industries designated underthe 1978 law, seven were authorized to form legally binding capacity reductionaartels. In each case several rounds of capacity reduction negotiations tookplace among firms. The dimensions of the capacity reduction programs are sumrmarized in Table A9.1. On average, industries agreed to a 241 reduction of1977 c&pacity. The planned reductions roughly equalled underutilized capacityin highly oligopolistic industries, but represented a substantially smallershare of underutilized capacity in more competitive ones. According togovernment reports, 12 of the 14 industries lisposed of at least 90% of thecapacity targeted by the stabilization plan.- Importantly, in fact, undermarket pressure, the more competitive industries generally exceeded theircapacity.reduction targets.
A9.05 The economic effects of the capacity reduction were mixed. Ingeneral, industry finances improved. For examtple, in a sample of the desig-nated industriest the balance of outstanding bank loans declined by 31%between 1977 and 1982. This improvement came at the expense of consumers;between 1975 and 1978 the average price of the desiggqted industries declinedby only 31, and between 1978 and 1981 it rose by 9%.!' Given the apparentlypositive effect of stabilization programs on prices, and presumably profits,and the fact that the industries involved tend to produce homogeneous, exten-sively traded products, one has to assume that these output adjustments tookplace behind some form of protection. Generally in the case of a declining,import-competing industry, a significant price increase cannot occur in theabsence ef some formal or informal trade barrier. In the case of an exportindustry, it implies some cartelization of foreign markets. Capacity reduc-tion was also accompanied by reductions in employment on the order of 15%.Surprisingly, about 70% of these workers were reported to have becomeunemployed for at least some period of time, despite tight labor market condi-tions, and intense efforts by Japanese firms to place workers with otherestablishments or other firms.
3/ Those familiar with the negotiating process suggest that most of thecapacity reduction programs affected capacity proportionally acrossfirms. In some cases the programs allocated half of the reduction targetin proportion to capacity, and another half in proportion to under-utilized capacity as of a date prior to the beginning of the program. Ingeneral, "side payments" were not made, and thus there was no mechaniismfor concentrating cutbacks on firms that owned relatively inefficientfacilities. One exception is shipbuilding where an industry-wideStabilization Association was formed independent of legislation to buyout and eventually close smaller, inefficient shipyards. Another excep-tion is the Joint Scrapping Plan of the textile industry, where interestfree government loans were used to buy out smaller companies.
4/ See Peck, et. al. (1985).
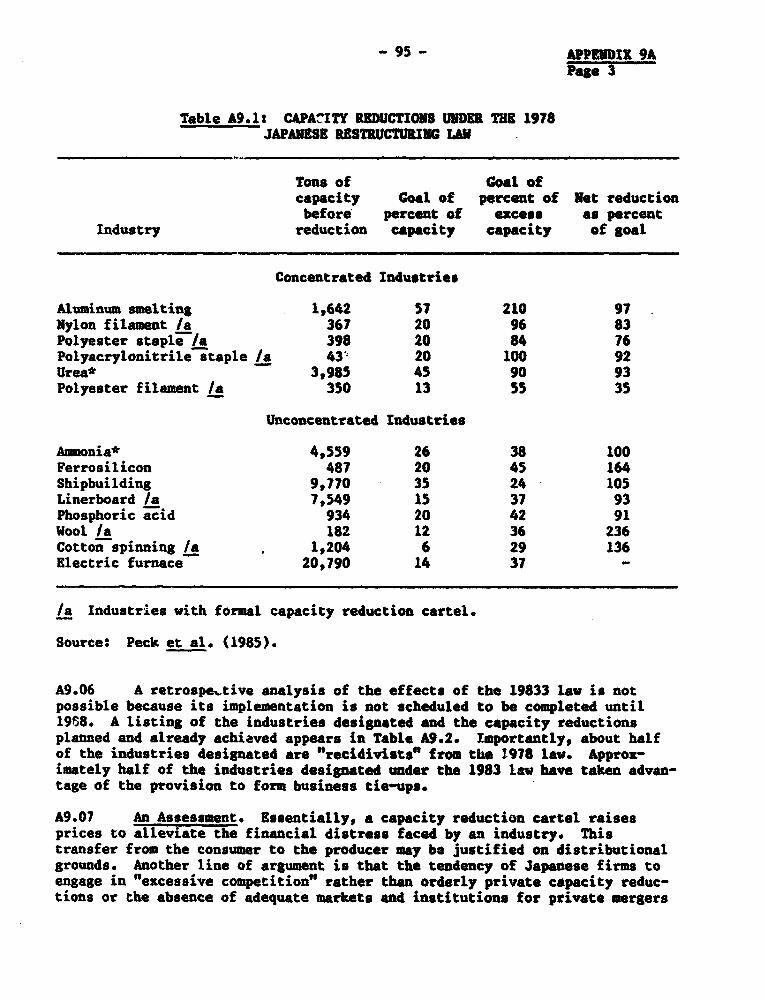
- 95 - APPMNIX 9APage 3
Table A9.1: C&PAPITY REDUCTIONS UNDER THE 1978JAPANESE RESTRUCTU UNG LU
Tons of Goal ofcapacity Goal of percent of Net reductionbefore percent of excess as percent
Industry reduction capacity capacity of goal
Concentrated Industries
Aluminum smelting 1,642 57 210 97Nylon filament /a 367 20 96 83Polyester staple I/a 398 20 84 76Polyacrylonitrile staple /a 43 20 100 92Urea* 3,985 45 90 93Polyester filament /a 350 13 55 35
Unconcentrated Industries
Amuonia* 4,559 26 38 100Ferrosilicon 487 20 45 164Shipbuilding 9,770 35 24 105Linerboard /a 7,549 15 37 93Phosphoric acid 934 20 42 91wool /a 182 12 36 236Cotton spinning /a 1,204 6 29 136Electric furnace 20,790 14 37 -
/a Industries with formal capacity reduction cartel.
Source: Peck et al. (1985).
A9.06 A retrospe,tive analysis of the effects of the 19833 law is notpossible because its implementation is not scheduled to be completed until1968. A listing of the industries designated and the capacity reductionsplanned and already achieved appears in Table A9.2. Importantly, about halfof the industries designated are "recidivists" from the 1978 law. Approw-imately half of the industries designated under the 1983 law have taken advan-tage of the provision to form business tie-ups.
A9.07 An Assessment. Essentially, a capacity reduction cartel raisesprices to alleviate the financial distress faced by an industry. Thistransfer from the consumer to the producer may be justified on distributionalgrounds. Another line of argument is that the tendency of Japanese firms toengage in "excessive competition" rather than orderly private capacity reduc-tions or the absence of adequate markets and institutions for private mergers

- 96 -
Table A9.2: CAPACITY REDUCTION PLANS UNDERTHE 1983 JAPANESE RESTRUCTURING LAW
Disposal Disposalgoal as X of Capacity
as 2 of goal by utilizationcapacity 1985 in 1984
Electric furnace@ 14 0 87Aluminum refining@ 50 0 39Nylon filament@ (Disposal program completed) 87Acrylic staple@ (New investment regulated ) 93Polyester filament@ (until 06/30/86 ) 78Polyester staple@ ( ) 92Viscose staple 15 21 85Ammonia@ 20 83 74Urea@ 36 23 62Wet phosphoric acid@* 17 62 71Solubole phosphoric 32 46 45Chemical fertilizer* 13 44 67Ferrosilicon@ 14 100 53High-carbon ferrochromium 10 0 50Ferronickel 12 0 62Paper* 11 28 86Coirugated board paper@ 20 12 66Ethylene* 36 74 93Polyolefin* 22 74 100Vinyl chloride resin* 24 90 96Ethylene oxide* 27 61 86Styrene 26 0 79Rigid PVC* 18 100 76Sugar 26 60 65Cement 22 85 60Electric wire 14 0 70
Legend: * - Industries participating in a business tie-up.@ - Industries continuing from the 1978 law.
Source: Industrial Development Bank of Japan.

97 - APPENDIX 9APage 5
and acquisitions.51 From a distributional viewpoint, the price increase engi-neered by a capacity reduction cartel typically reverses a steep decline inprices due to world market conditions. These cartels, therefore, tend toprevent, rather than create, windfall transfers between consumers and pro-ducers. While the cartel-induced transfer could in theory be targeted to easethe specific income dislocations caused by the change in world prices, theevidence suggests that Japanese transfers primarily compensated creditors indnot employees. From an efficiency perspective, it is very likely that inter-vention raised prices above marginal production cost and generated ineffi-ciency. While the scope of this inefficiency may be modest in the short run,long-run losses are more significant, especially since cartelised price levelscan be maintained for several successive five year periods. Routine rescueefforts tentd to discourage capacity reduction, particularly by smaller firms,since the cartels generally allocate production targeto irrespective of effi-ciency. Also, the program creates "moral hazard" among lenders, who may bearmuch lar ,r risks than they would in the absence of a government rescueprogram.-
A9.08 Implications for Korean Policy. Japan's industrial adjustmentpolicies have enjoyed wide domestic political support. In sharp contrast tothe adjustroent efforts of many other OECD countries. To be sure, Japan'sadjustment problems were more modest, and occurred in the context of rapidgrowth. Still, the Japanese experience is of great interest to Korea, bothbecause of its supposed success and because of other parallels betweenJapanese and Korean development patterns. The Japanese approach may have somelimited reference in the medium term, that is, until Korean capital marketsdevelop enough to provide wider options for dealing with restructuring. Atthe same time, there are major structural differences between the Japanese andKorean economies that preclude direct application of Japanese methods andwhich may impose intolerably high costs on the economy if this approach isfollowed.
A9.09 Most obviously, Korean domestic markets are much smaller thanJapanese markets because of differences in both population size ad per capitaincome. Thus Korean firms are less likely to 77gage in unprofitable produc-tion simply to maintain long-run market share.- Second, the Korean economyis more open, and Korean industries depend on foreign markets to a fargreater extent than Japanese industries. Third, in Korea, transfers from
5/ Indeed, mergers are very rare in Japan, but this observation alone doesnot prove that capital markets are flawed. In any case, capital marketimperfections are more likely to call for capital market interventionsthan government intervention in industrial structure.
6/ Ultimately, these rescues prove too costly, in particular if marketsignals are ignored. Thus, fc example, Japan recently permitted thebankruptcy of the nation's largest shipping firm.
7/ Relative to Japan, Korean industry is less capital-intensive, and thereis no equivalent of Japanese lifetime employment.

-98- APPUDIX 9APage 6
domestic consumers could at best represent a smll fraction of the financingrequirements f industries in distress. Furthermore, the trade barrierrequired to implement domestic cartels are likely to elicit external pressurefrom Korea's trade partners.
A9.10 Perhaps because of differences in economic size, the financial "mins"of Japanese restructuring programs emphasis., transfers from consumers(through the formation of cartels and deemphasises direct financial supportfrom government. The absence of government financing is desirable, but ithinges on the close relationship between Japanese firms and their banks, whichare often members of the same group, and which in some cases own a substantialshare of the troubled company. To the extent that the Korean private sectorbecomes involved in restructuring, it would directly involve financial supportwhich exacerbates the problem of moral hazard, retards the process of finan-cial liberalization, and perpetuates Government's role in industrial decision-making. Moreover, the inefficiencies inherent in increasing the prices ofintermediate goods can be especially severe in Korea, as they impair theprofitability of up-stream export industries. For all of these reasons, theJapanes adjustment nudel, despite is apparent attractions, has limitedapplicability in the Korean context.

- 99 -
CHAPTER 10: TdE ROLE OF FINANCE AND INDUSTRIAL PERFORMANCE
A. Introduction
10.01 Korea started an ambitious economic development and industrializa-tion plan in the early 1960s. In the process, the Korean Government madeextensive and forceful use of a wide range of incentives designed to assureprivate industry's close compliances with its plans. Among them, probably themost widely used has been differential access to credit from commercial banksas well as specialized banks under government control. In addition, foreignloares which were an attractive source of borrowing required government author-ization and its allocation was largely controlled by the government. Availa-bility of credit was, and continues to be, an extremely effective instrumentbecause of the highly leveraged nature of Korean industry and the implicitsubsidy inherent in preferential credit which had to be rationed. This wasaccomplished essentially by government directive.
10.02 Under these circumstances, access to a stable and low-cost source ofcredit, e.g., bank loans, was considered to be crucial for firm performance.Being disfavored by Government, which owned the banks and controlled theirloans, could easily lead to a firm's demise, particularly since firms areheavily indebted, and, furthermore, because about two thirds of their liabil-ity is in the form of short-term debt. In essence, the Korean Government pro-vided two incentives for the development of strategic industries which had animportant bearing on private firms' investment decisions. First, the Govern-ment changed the expected rate of return of investment by controlling theinterest rate and allocation of bank loans. By favorably allocating cheapbank credit to a strategic sector, the Government could reduce the cost ofinvestment and increase the expected rate of return in that sector. Second,the Government could change the perceived risk of investment by assuring astable flow of bank loans to selected industries regardless of their economicor financial performance. Thus, if a firm followed government policy byinvesting in projects which had government support, its bankruptcy risk wasreduced, perhaps even eliminated. In other words, the Government, by control-ling the financial sector, became a risk partner of firms, encouraging them toundertake projects which might have been declined otherwise. Therefore, inthe case of Korea, it would not be very meaningful to discuss industrialdevelopment without looking at the role of government in financial allocation.
10.03 It is not easy, however, to evaluate the role of finance in theindustrial development and performance. The performance of a firm or anindustry is affected not only by factor market conditions, such as financialcost and labor cost, but also by product market conditions such as the degreeof competition, market structure and external and internal demand condi-tions. Furthermore, it is affected by other government policies with respectto trade, foreign exchange, pricing and taxes, among others. In thesecircumstances, it is difficult to separate out the effect of particularfactors. Most studies on industrial performance and structure assume that
_ 100 -
factor markets are competitive and neutral.A' Clearly, however, this has notbeen the case in Korea, where Government's intervention in factor markets(viz., the finavtial market) was so extensive that it may as well have affec-ted the performa.:e of industry as much as product market conditions di4.
10.04 Therefore, an attempt is made here to investigate the role ofgovernment-directed finance on the development of industry since, in theKorean context, access to concessionary credit has been a primary signal ofstrategic industry policy on the part of Government and also has been animportant factor for firm performance. In the 1970s, foreign and bank loans,the allocation of which was controlled by Government, accounted for about halfthe source of funds of the corporate sector and the costs of these two sourcesof credit were the cheapest among various sources of borrowing due to thestrict interest rate ceilings on the bank credit and continuously fixedexchange rates.2 Therefore, firms which had better access to those sourcesof borrowing, especially to bank policy loans, which were much lower cost thanthe alrelly highly subsidized general bank loant faced a lower average cost ofcapital._
10.05 The approach taken in this chapter is to assess the degree to whichdifferential access to credit by the different sectors of the economy wascreated by Government's control of credit allocation and the difference in theaverage cost of capital paid during the sample period, 1972-84. Inconjunction with this, the question of whether the allocation of government-controlled credit was efficient or not will be examined, to a limited extent,by comparing the access to credit of different sectors with the average rateof return on the investment in the sectors. The approach also looks atwhether Government favoritism in terms of credit allocation has affected theperformance of particular sectors and industries. Furthermore, it addressesthe issue of how financial liberalization in the 1980s improved the allocationof credit between different sectors ot industries compared to that of the19709.
10.06 The measures examined include the ratios of (i) total bank loans andforeigu loans over total assets was chosen as a measure of access toGovernment-controlled credit, (ii) financial expense (interest rate paid plusdiscount) over total borrowing as a measure of average cost of borrowing,(iii) profit before subtracting financial expense over total asset (capitalstock) as a measure of average rate of return on capital investment, and(iv) normal ratio, as well as (v) net sales growth rate adjusted for inflation
11 In other words, in the literature of industrial economics, firms usuallycompete equally in the factor markets and factor markets just take therole of passively meeting the firm's demand for input which again isdependent on the output market conditions.
2/ See Tables 10.3 and 10.4 for the measure of implicit subsidy that accom-panied the bank and foreign loan allocation in the 1970s.
3/ See Table 10.5 for the relative size of policy loans.
- 101 -
as measures of performance of each industry. The data originate from the Bankof Korea's (BOK) Financial Statement Analysis, which reports aggregatedbalance sheets 4nd income statements by industry and sector, and includes 92Xof total corporate sales, although only 45X of total firms.
10.07 The sectors compared here are (i) large firms vs. small firms,(i.) export industry vs. domestic industry, and (iii) heavy and chemicalindustries (MIC) vs. light industries, following the BOX classification.- InKorea, as was mentioned, the sectors which received the highest governmentpriority in the 1970s were export and HC industries. In the process of severecredit rationing under low interest rate ceilings, large firms were favoredover small and medium firms because of the low transaction costs and perceivedrisk to bankers.
B. The Sectoral Experience
10.08 The analysis of the period of 1972-84 yielded the following conclu-sions. In the 1970s, there were substantial gaps in the access to capitalwith favored sectors having greater access to subsidized sources of capital(bank loans and foreign loans) than others (Table 10.7). This seems to havecontributed to their rapid growth and high profitability despite their rela-tively low rates of return. The Government's strong intervention seems tohave created substantial distortions in the allocation of financial resourcesby creating large disparities in the average cost of capital among differentsectors. It is to be expected that substantial gaps in the marginal rates ofreturn on investment across sectors should have resulted. Large firma, theexport industry and HCI had greater access to capital and, as a result, hadlower capital costs than did small/medium firms, domestic industry and lightindustry, respectively, in the 1970s (Table 10.8). Although the former'srates of return on investment were significantly lower, indicative perhaps ofcapital underutilization, they did exhibit higher growth rates (Tables 10.10-10.12).
10.09 In the 1980s, however, the gaps in accessibility to and cost ofcapital have been greatly reduced, or in some cases (small/medium vs. largefirms, for example) completely eliminated as a consequence of the financial
4/ According to the Financial Statements Analysis, large firms are thosewhich employ more than 300 employees in the case of manufacturing firms,more than 200 in the case of the service industry. HCI includes:industrial chemicals (351), petroleum refineries (353), other nonmetal-lic mineral products (369), basic metals (37), fabricated metal products(381), machinery (382), electrical, electronic machinery and appliances(383), transportation equi -ent (384), and precision equipment (385). Afirm is classified into export industry if export constitutes 50% ormore of its total sales. Otherwise, it is classified as domestic indus-try. Therefore, the classification of domestic industry vs. exportindustry is not as clear as other classifications. The figures inparentheses are the code numbers of the Korean Standard IndustryClassification.
- 102 -
liberalization effort in this period. The shrinking share of government-controlled credit (bank loans and foreign loans) in corporate finance and theexplosive expansion of credit from nonbanking sectors (including the securi-ties market), in which the cost of borrowing is much freer of governmentintervention, contributed to more equalized cost of and access to capital inthe 1980s. At the same time, some progress in the liberalization of the bank-ing sector, more importantly the elimination of the interest rate gap betweengeneral loans and various policy loans, has contributed to reducing the dispa-rity in the cost of capital, and, as a result, contributed to reduce distor-tions in the financial allocation. Changes in government credit allocationpolicy to correct past misallocations and favoritism also contributed tobetter allocation. Comparisons of access to capital by different sectors andtheir relative performance are described below, with particular attention paidto the protection cum repression period of the 1970s versus the liberalizedperiod of the 1980s.
Large Firms vs. Small/Medium Firms
10.10 Large firms had relatively much greater access to preferred creditthan did small/medium firms during most of the period (Table 10.7). The gapwas sizable during the 197i-76 period, began to narrow over the 1977-81 periodand was reversed thereafter. Since 1982, small/medium firms have enjoyedbetter access to borrowing from banks and abroad than have large firms. Thisreversal seems due to (i3 a reduced share of foreign borrowing on the part oflarge firms, (ii) government policy to increase the bank lending tosmall/medium firms, and (iii) increased real interest rate which gave rise toless bank rationing in favor of large firms. As a result of greater access tosubsidized credit, large firms faced a lower average cost of capital than didsmall/medium firms in the 1970s (Table 10.9). The disparity in borrowing costwas consistently present over the 1972-78 period, and was sizable on apercentage basis. Abruptly in 1979, this disparity was eliminated and hashovered at close to neutrality since then. Greater access to and lower costof capital seems to have enabled the large firms to grow faster thansmall/medium firms, despite the former's relatively low rate of return oninvestment (Tables 10.10-10.12).
Heavy Chemical Industry vs. Light Industry
10.11 A similar pattern result is observed in the comparison between HCIvs. light industry: HCI had greater access to capital, especially in thelatter half of 1970s durig which Government continued to promote HCIdevelopment (Table 10.7)._4' As a result of substantial access to preferential
5/ HCI's advantage in access to capital seems to be greater than the datain Table 10.7 suggests if we consider that the HCI is leveraged to alesser extent than light industry (Table 10.8) due to the higherproportion of its fixed assets which are financed through equity. Thisis, the proportion of bank and foreign loans in total borrowing (netassets) should be much higher for HCI compared to light industry thanthe figures in Table 10.7 suggest.

- 103 -
borrowing,6/ the cost of capital to the MCI sector was considerably below thatfor ligbt industry in the same period (Table 10.9), by as much as 20S to 35Zas seen in Figure 2.3. This great advantage in terms of access to and cost ofcapital, among other things, seem to have contributed to MCI's ropid growthin the 1970s. It grew faster than light industry despite the fact that it hadmuch lower investment efficiency compared to the latter (Tables 10.10 and10.12) in the 1970s. This lack of efficiency is continued by the data oncapacity utilization as well as sectoral ICORs (see Tables 2.6 and 6.11).
10.12 The gap in the access to and cost of capital between HC and lightindustries started to decrease in the 1960s. The elimination of preferentiallending rates for policy loans in 1982 and expansion of the nonbanking sectorwith a relative diminution in the role of bank and foreign loans seems to havecontributed to reducing the gap. On the other hand, the disparity in therates of return on investmet of the MCI and light industry has been fallingin the 1980. as the excess capacity of MCI has been gradually reduced as theexport -hare of the industry increased (see Chapter 4). As of 1984, there wasno significant difference in the cost of capital and return on investmentmeasures between the two, which provides some evidence that the efficiency ofcapital allocation between the two sectors has much improved compared to the1970s.
_xport Industry vs. Domestic Industry
10.13 There was also a substantial gap in the access to credit betweenexport and domestic industries over the period, with the former exhibitinggreater access, and, as a result, experiencing lower costs than the domesticindustry during most of the period. Interestingly, its advantage vis-a-visdomestic industry in terms of access to and cost of capital was biggest during1980-82. This may be partly explained by the impact of automatic access toexport-related loans under conditions of tight credit control during thisperiod. The rate of return on investment for the export industry was muchlower than that for the domestic industry during 1974-79. This seems to begreatly influenced by the fixed exchange rate policy of the period which ledto overvaluation (see Table 10.4), which appears to have offset the favorableimpact of cheaper credit.
10.14 The growth of exports was, on average, lower than the growth ofdomestic industry in the 1970s, although there were ups and downs, reflectingthe internal and external environment. In a sense, export credit in the 1970swas partially neutralizing the negative effect of high protection and overval-uation on the export industry. Without favored access to borrowing at subsi-dized rates, the performance of the export industry could have been muchpoorer indeed. Or putting it differently, the export industry faced disadvan-tages in the 1970s despite favored treatment in the credit allocation process,
6/ According to the RDI, 931 of policy loans (excluding export loans andsmalllmedium firms' promotion funds) was given to HCI and only 71 wasgiven to light industry in 1978. See The Issues of Industrial Policyand Its Direction (Korean), RDI, December 1982, p. 46.

- 104 -
although, as can be veen from Figure 2.3, that preference was quite variable,and indeed was declining over the 1975-79 period. It took a 3qior reversal in1980 to restore any semblance of an export credit preference._ Continuousdepreciation and import liberalization in the 1980s seem to have contributedto the improved return on investment in the export industry and its profita-bility in the 1980. (see Tables 10.10 and 10.11). As of 1984, the rates ofreturn on investment were almost equalized between the two sectors.
C. The Experiences of Specific Industries
10.15 Similar results are observed when the specific industries cases arestudied. In general, manufacturing, electricity, fishing and transportationindustries had good access to subsidized credit and consequently paid rela-tively less for capital. On the other hand, wholesale and retail trade,mining, and real estate and business service industries had poor access toborrowing and faced relatively high costs of capital (see Table 10.13). Theconstruction industry has increased its access to bank and foreign loans inthe 1980s, due to exceptional circumstances, while all other industries' shareof foreign and bank loans over total assets have been falling. Among manufac-turing industries, the HC industries and the export industries benefitted fromgood access to borrowing while light industries, especially the industrieswhich produce mainly for the domestic market, exhibited poor access. Textileand apparels, and wood and furniture industries, which were the major exportindustries in the 1970s, had favorable access to capital while the food andbeverages, and paper and printing industries, which basically produce fordomestic market, had relatively poor access (Table 10.13). Consequently, thelatter had significantly higher costs of capital than did the former(Table 10.15). Among HC industries, basic metal industryt which includes ironand steel industry, had rapidly increasing access to borrowing from banks andabroad in the latter half of the 1970s, suggesting that it attracted a largepart of new loans during this period. Fabricated metal product and equipmentindustry (which includes shipbuilding and automobile industries) also had goodaccess to borrowing in the latter half of the 1970s. Consequently, theseindustries, especially basic metal industry, paid much less for capital thandid on average manufacturing industries.
10.16 Although it is not possible to establish an exact linkage betweenaccess to capital, the resulting cost, and the relative performance ofdifferent industries, the analysis of data strongly suggests that thegovernment-controlled access to and cost of credit affected the profitabilityand growth of specific industries. The fishing iadustry, for example, wasable to secure access to bank loans in the 1970s, while its profit rate wasnegative for most of the period (Table 10.17). Without cheap bank credit,therefore, this industry may have declined faster. The electricity industry,despite its very low rate of return on investment relative to other indus-tries, enjoyed high profitability, largely due to its access to bank andforeign loans and resulting cheap cost of capital. Service industries
7/ See Rhee Sung Sup (1985) for similar findings on the decline of incen-tives to exports.

- 105 -
(wholesale and retail, and hotel, real estate and business service, andconstruction) had very high rates of return on investment relative to otherindustries in the 19708 (Table 10.16). However, their access to capital wasquite poor in the 19709. If the credit market had not been strongly con-trolled, the growth of these industries may have been faster and its currentshare in Korean industry might have been higher. Similar arguments can bemade for industries in the manufacturing sector. Without intervention incredit allocation, some of the HC industries such as the basic metal industrywould not have obtained such cheap access to funds (see Table 10.16 for itsrelatively low rate of return in the 1970s) and may not have grown as fast.On the contrary, it may be said that paper and printing, and food and beverageindustries may have grown faster had financial allocation been determined inthe free and competitive market.
B. Overall Assessment
10.17 The Korean Government's intervention in the financial sector seemsto have been quite distortive, especially in the latter half of the 1970s whenit strengthened the control over credit allocation to favor the development ofHC industries, although the interventions in the 1960s and 1970s to supportexport activities may have had positive aspects in the sense that they neutra-lized the distortive effects of other government policies such as highprotection and overvaluation. By creating wedges between the average cost ofcapital among various sectors, public policy helped produce disparities in themarginal rates of return to capital. In addition, the Government's strongcontrol over the financial sector affected firm behavior and may have promoteddecision-making patterns, now deeply rooted, which were not conducive to theefficient use of resources in the economy. In general, the strong governmentintervention in the financial sector during the last two decades seems to haveaffected the following developments which have deeply permeated through thepatterns of industrial development in Korea.
Distortive Allocation of Credit
10.18 The government-controlled financial allocation gave rise to a highdistortion in the allocation of capital among various sectors by increasingthe gap in the cost of capital, and consequently the gapslin marginal rate ofreturn of capital between the favored sector and disfavored sector. As aresult, it is suspected that the resulting algeation of capital could notmaximize the growth potential of the country.-1 The data suggest that ahigher proportion of bank credit went to less productive borrowers, or theborrowers who could get much of bank loan with subsidized cost expanded theirbusiness or production lines in a way too much capital-intensive andconsequently low marginal rate of return on capital given the endowment ofcapital and labor of the economy (see large firms vs. small firms, forexample). The significant gaps in the cost of capital and the rate of return
8/ A qualification of this argument is that product market distortions werenot as significant as the distortions in the financial cost amongvarious sectors.

- 106 -
on the capital among different sectors and industry suggest that the overallefficiency of capital allocation could have been increased if the financialallocations had been determdned by the more market-oriented financial system.
HiLh Leverage of Firms and Poor Development of the Equity Market
10.19 The cheap cost of debt due to interest rate ceilings made debtfinance quite attractive to the corporate sector. The real cost of bankloans, a major source of corporate debt, was negative throughout most of the19709. In addition, Government's de facto risk partnership with the corporatesector, exercised through its control over the banking institutioD, increasedcorporate access to debt finance even further. Past government actions toavoid explicit bankruptcies of large firms in favored industries created theperception that debt finance was not very risky compared to equity finance.As a result, the corporate debt ratio became increasingly high in the 1970s,and development of the equity market was slow despite government efforts tothe contrary (see Table 10.18). Paradoxically those who could have raisedcapital through the equity market, the large and well-established firms, hadno incentive to do so because of their preferred borrowing position. Theensuring high debt ratios made the corporate sector as a whole very vulnerableto external shocks and economic fluctuation, thus prompting more governmentinvolvement in the banking system, and its credit allocation, to bail outtroubled firms and industries.
High Industrial Concentration
10.20 The financial repression and the resulting credit rationing tendedto favor large firms because of low transaction costs involved. The bestthing the banks could do to increase their profits in the presence of strictinterest rate ceilings and undifferentiated (for risk) interest rates was toreduce the transaction cost and default risk. This led them to favor largefirms in those sectors favored by government. This resulted in higher loanconcentration and eventually higher industrial concentration (SeeChapter 6).
Slow Development of the Financial Sector
10.21 Heavy government financial intervention interfered with thedevelopment of the financial sector not only with respect to its growth, butalso with respect to quality of its services. Intervention in the bankingindustry (i.e., in its asset management and day-to-day operations) removed anyincentive for the banks to innovate in their operations or to become moreefficient in the intermediation of financial resources. Nor did the bankshave much incentive to select profitable borrowers because they were notrewarded for doing so. Rather, banks passively accommodated the creditdemands of the government-favored borrowers. The repressed interest rateswhich fluctuated around zero or were negative in real terms made bank depositsquite unattractive financial assets and made the holders of bank deposits theultimate bearer of the cost of financial intervention. Consequently, thefinancial sector's growth was more sluggish than it would otherwise havebeen. Purthermore, in the process of channeling government-directed loans,the co_mercial banks accumulated a substantial amount of nonperforming loanswhich reduced profitability and limited its future development.

- 107 -
The Implications of Financial Liberalization Since 1980
10.22 The financial liberalization efforts since 1980 have greatlyimproved various aspects of financial allocation. First, it reduced the gapsin the access to and cost of capital between different sectors as we see inTables 10.7 and 10.9. By reducing these gaps, the financial allocation since1980 became less distortive. The small/medium firms could get better accessto borrowing and this has resulted in more equalized cost of borrowing betweenlarge firms and small firms. Owing to this improved access to capital,small/medium firms since 1980 have been growing faster than large firms whichseems to be desirable in the sense that the latter's rate of return toinvestment is higher. This may well indicate that overall allocativeefficiency has increased. It will also help to reduce the marketconcentration and encourage more competition in the domestic market.
10.23 The gap in the cost of borrowing between the export industry and thedomestic industry also has been reduced since 1982 as the preferential lendingrates were abolished, although the gaps in access still exist. Similarly, thegaps in the cost of and access to capital have been significantly reducedbetween HC industry and light industry. All these suggest that the financialallocation since 1980, especially since 1982, became much less distortive,compared to that of the 1970s. The high real cost of debt along with thereduced degree of (implicit) government commitment to be a risk partner in thecase of bad performance of industrial firms also pushed firms to reduce theirdependence on debt. As a result, the debt ratio has been decreasing rapidlysince 1980 which seems to be desirable not only for the stability of thecorporate sector and lower vulnerability to with jespect to Xternal shock,but also for further liberalization of the finan4i-al system.-
E. Future Implicatiojs
The Banking Industry
10.24 The government's current financial policy is characterized by anemphasis on small/medium firm financing, a reduced commitment to financialsupport for HC industry, and the abolishment of 07arious preferential lendingrates on policy loan (including export loans).- It seems to have
9/ Financial liberalization, grounded on decelerating inflation, alsocontributed to a rapid expansion of the financial sector, especiallyless regulated nonbanking financial institutions, as was seen in Chap-ter II of this report. With more savings channeled through financialinstitutions which became less regulated, it is expected that theoverall capital allocation became more efficient and the intermediationcost of capital in the economy has decreased.
10/ This does not imply, however, that credit rationing does not continue tobe necessary with interest rates in the banking sector still uadergovernment control.

- 108 -
contributed to correcting distortions in the financial allocation caused bypreviously heavy financial repression. One area in which Government has not
pursued liberalization as strongly as its other efforts seems to be vis-a-visits commitment to bailing out troubled firms. Since the 'elief loans of banksand distress borrowing of industrial firms put a significant yoke on the
development of the banking industry and further liberalization of the
financial sectorp it may be desirable to reduce the burden on the bank's asset
management by reducing support for some inefficient firms and helping to
extricate the banks. Although this may give rise to temporary shocks in the
economy, this type of policy will also facilitate the industrial restructuringof the economy and reduce the structural adjustment costs in the long run.
Capital Market
10.25 If the process of further financial liberalization is to involve a
decreasing role of Government as a risk partner of the industrial sector, itwould be advisable to st.. a substitute source of risk capital. Of course,this is particularly tricky in the highly leveraged Korean industrialenvironment. In the case of the United Kingdom and the United States, a well-functioning equity market and merchant banks provide risk capital to the
corporate sector. In Germany and France, universal banks and industrial banksprovide risk capital and become risk partners of the industrial sector. In
Japan, the group banks provide loans to the group firms and become risk
partners. As the Korean economy becomes more industrialized, and its bankingsystem more liberalized, the capital market which could provide the risk
capital to industrial firms needs further developtent.
Stable Inflation
10.26 It also seems desirable for the stable growth of the industrial aswell as the financial sector to maintain the current low rate of inflation.Korean firms' profitability is, as we see in Table A5.19, quite sensitive not
only to the level of nominal but also real interest rates. Of course,inappropriate inflation accounting may have underestimated the profitabilityof firms which are net debtors in the inflationary period. However, it is
true that a substantial part of corporate debt will be held in the form ofliquid financial assets which cannot be fully hedged against inflation (suchas demand deposit or cash) and firms also suffer from inflation as their costs(financial expenses) increase faster than its revenue if the nominal interestrate increases as fast as inflation. High real rates are necessary toencourage financial saving whereas high real rates are a serious problem forthe industrial sector which must roll over a high level of debt. As long asinflationary expectations can be contained, interest rates can be brought downsomewhat without a loss in savings generation but with a considerable gain forfirm profitability and financial stability.
Interest Rates and Corporate Profitability
10.27 If the current low level of inflation continues, and if peoples'
expectations settle down, the Government may be able to reduce slightly thecurrent nominal interest rates at some point in the future to boost theprofitability of industrial firms. Currently, the corporate sector seems to

- 109 -
be confronted with historically high real interest rates, although it is notpossible to judge what would be the optimal level of interest rate in theabsence of controls. If we compare the cost of borrowings and profitabilityof Japanese firms in the 1970s (see Table AS.20), Korean firms are now payinghigher real interest rates and their profitability is lower. However, we haveto note that, if the Government reduces interest rates prematurely, it mayrisk retarding financial sector growth.
Policy Coordination
10.28 Finally, it cannot be overemphasized that the financial liberaliza-tion policy that the Covernment is pursuing now should be well coordinatedwith other government policies. Even if financial distortions are small dueto relaxed regulations on the financial systems, the system may be allocatingresources to economically inefficient projects if -lhe price and profitabilitysignals it receives are incorrect. Therefore, in order to maximize the growthpotential of an economy, it is very important to have a consistentliberalization strategy which fully integrates macroeconomic policy, tradepolicy, pricing policy and financial sector policy.

Table 10.1 SOURCES OF NIF?fllluon won)
Sources 1974 1975 1976 1977 1978 1979 1980 1981 1982 1983 1984 Total
1. NIP bonds issued 71,722 131,688 165,213 276,129 307,471 291,901 372,069 492,152 353,933 443,760 73,326 2,979,362and deposits (98.7) (97.8) (90.0) (89.3) (68.2) (64.1) (71,7) (64.1) (46.0) (53.9) (12.6) (58.8)
National savings 8,776 11,307 12,121 17,027 26,448 38,990 41,814 47,964 39,671 13,086 18,055 275,259association (12.1) (8.4) (6.6) (5.5) (5.9) (8.6) (8.1) (6.2) (5.2) (1.6) (3.1 (S.4)
Public funds 11,512 16,711 25,341 45,368 54,586 64,381 91,459 75,597 37,416 40,046 189,498 277,979(15.8) (12.5) (13.8) (14.7) (12.1) (14.1) (17.6) (9.8) (4,9) (4.9) (32.5) (5.4)
National life Insurance and postal 10,046 15,000 18,500 -2,089 - -24,275 -17,184 - -avingp (13.8) (11.1) (10.1) (0.7) - - - (3.2) (2.2) - - _
Baerking irstitutions 38,746 81,153 97,044 197,769 202,359 172,281 214,768 372,200 286,064 275,129 158,102 2,095,614(53.3) (60.2) (52.8) (64.0) (44.9) (37.8) (41.4) (48.5) (37.1) (33.4) (27.1) (41.3)
Insurance companies 2,642 7,457 12,207 18,054 24,078 16,249 24,029 20,664 7,966 11S,449 86,667 335,511(3.6) (5.5) (6.6) (5.8) (5.3) (3.6) (4.6) (2.7) (1.0) 0i4.0) (14.9) (6.6)
Nonlife Insurance 2,642 7,457 12,207 18,054 24,078 16,249 24,028 20,664 7,966 42,290 1,002 174,633coopanies (3,6) (S.5) (6.6) (5.8) (5.3) (2.6) (4,6) (2.7) (1.0) (5.1) (0.2) (3.4)
Life Insurance - - - - - - 73,209 R7,669 160,878companies - - - (8.9) (15.1) (3.2)
2. Collections of 954 5,712 7,469 27,987 75,166 92,801 131,365 195,242 254,675 338,793 419,280 1,549,444loans (1.3) (4.2) (4.1) (9.7) (16,7) (20.4) (25.3) (25.4) (33.1) (41.2) (72.0) (30.6)
3. Carryover from - 2,731 10,963 5,103 68,482 70,820 15,712 90,730 164,428 40,033 89,995 540,535previous year - (2.0) (6.0) (1.7) (15.2) (;5.5) (3.0) (10.5) (21.o) (4.9) (15.4) (10.7)
Total 72,676 134.669 183,645 309,219 451.119 519,146 768.124 770.036 822.586 582.601 506.934
Note: ( ) - share.

Table 10.2: USES OP NI?(Million won)
Uses 1974 1975 1976 1977 1978 1979 1980 1981 1982 1983 1984 Total
Reavy and chemical 44,120 61,348 100,677 147,218 239,447 28S,299 266,704 332,997 445.003 472,636 318,708 2,714,158Industries (58.5) (49.6) (56.4) (61.2) (62.7) (64.9) (60.8) (54.9) (61.0) (64.5) (65.2) (61.1)
Agriculture 10,547 11,400 19,415 9,998 14,946 19,835 21,711 38,698 45,000 44,954 30,000 266,506(14.0) (9.2) (10.9) (4.2) (13.9) (4.5) (5.0) (6.4) (6.2) (6.1) (6.1) (6.0)
Power Industril 17,000 43,200 40,000 50,000 92,000 100,000 120,000 160,000 140,000 40,000 50,000 852,000(22.S) (34.9) (22.*4) (20.8) (24.2) (22.7) (27.4) (26.4) (19.2) (5.5) (10.2) (19*2)
9eeaoul factories 3,740 4,757 8,450 3,521 4,222 4,676 - - - - - 29,365(5.0) (3.8) (4.7) (1.5) (1.5) (1.1) - - - - - (6.6) E
Import on deferred - 3,000 10,000 30,000 29,684 30,000 30,000 75,000 10,000 175,000 100,000 582,674Payne"2t - (2.4) (5.6) (12.S) (6.2) (6.8) (6.8) (12.4) (1.4) (23.9) (20.5) (13.1)
Total (A) 75 407 123 706 178 542 240 738 380 2"9 438 810 438 415 606 696 730 003 732 590 498 708 4444 913(All) (1.5) (3.1) (t.1) (4.0) (t.4) (3.7) (2.6) (1.8) (1.7) (2.3) (Mb
Total DomesticCredit (C) Ia 3.006 3.973 4.38t 5.979 8.722 11.826 16.778 22.016 27.S29 311.47 36.056
L Billlon won.
Note: Nfubers tn parenthesis are percents.
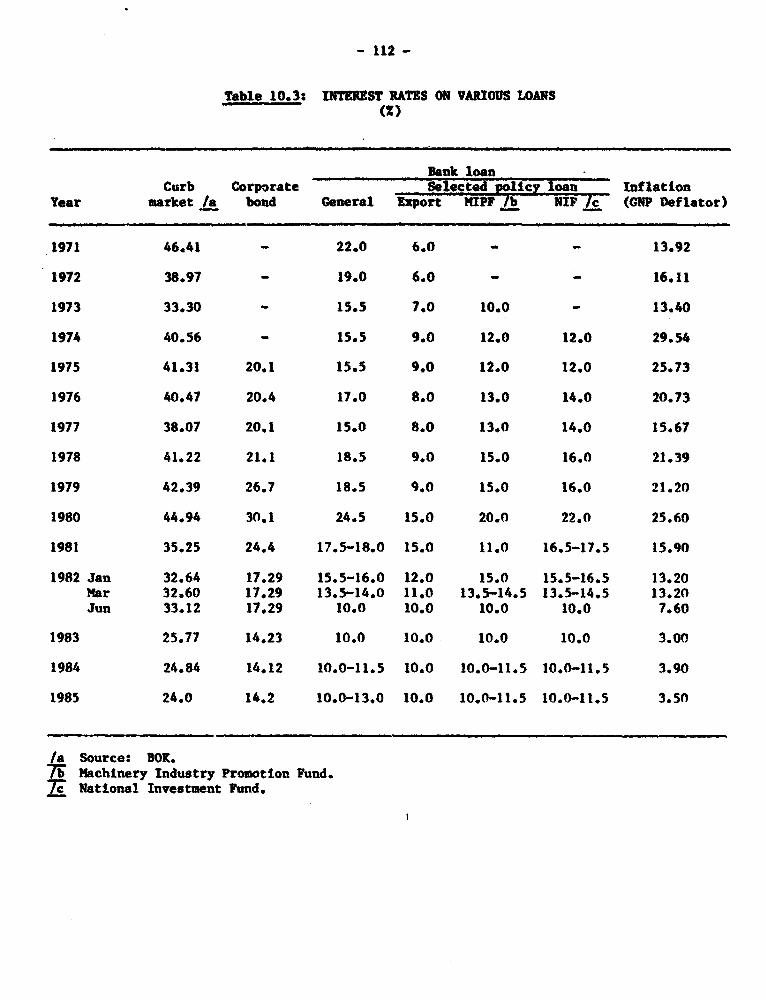
- 112 -
Table 10.3: INTEREST RATES ON VARIOUS LOANS(2)
Bank loanCurb Corporate Selected policy loan Inflation
Year market /a bond General Export MIPF lb NIF Ic (GNP Deflator)
1971 46.41 - 22.0 6.0 - - 13.92
1972 38.97 - 19.0 6.0 - - 16.11
1973 33.30 - 15.5 7.0 10.0 - 13.40
1974 40.56 - 15.5 9.0 12.0 12.0 29.54
1975 41.31 20.1 15.5 9.0 12.0 12.0 25.73
1976 40.47 20.4 17.0 8.0 13.0 14.0 20.73
1977 38.07 20.1 15.0 8.0 13.0 14.0 15.67
1978 41.22 21.1 18.5 9.0 15.0 16.0 21.39
1979 42.39 26.7 18.5 9.0 15.0 16.0 21.20
1980 44.94 30.1 24.5 15.0 20.n 22.0 25.60
1981 35.25 24.4 17.5-18.0 15.0 11.0 16.5-17.5 15.90
1982 Jan 32.64 17.29 15.5-16.0 12.0 15.0 15.5-16.5 13.20Mar 32.60 17.29 13.5-14.0 11.0 13.5-14.5 13.5-14.5 13.20Jun 33.12 17.29 10.0 10.0 10.0 10.0 7.60
1983 25.77 14.23 10.0 10.0 10.0 10.0 3.00
1984 24.84 14.12 10.0-11.5 10.0 10.0-11.5 10.0-11.5 3.90
1985 24.0 14.2 10.0-13.0 10.0 10.0-11.5 10.0-11.5 3.50
/a Source: BOX.73i Machinery Industry Promotion Fund.7 National Investment Fund.

- 113 -
Table 10.4. EFFECTIVE COST OF FOREIGN LOANS
Interestcost of
Exchange Rate of domeMtic Foreign Interest Cost GapYear Rate change Bank loan Nominal/a Effective/b (A
(Dec-Dec) of E.R. (A) (B)
1968 Dec 281.50 8.00 25.2 7.13 15.13 10.071969 Dec 304.45 4.00 24.0 10.06 14.06 10.061970 Dec 316.65 17.85 24.0 6.75 24.60 -6.001971 Dec 373.20 6.88 22.0 5.81 12.69 9.311972 Dec 398.90 -1.00 15.5 6.19 5.19 10.311973 Dec 397.50 21.76 15.5 10.03 31.79 -16.291974 Dec 484.00 0 15.5 10.19 10.19 5.311975 Dec 484.00 0 15.5 6.63 6.63 8.871976 Dec 484.00 0 17.0 5.38 5.38 11.621977 Dec 484.00 0 15.0 7.50 7.50 7.501978 Dec 484.00 0 18.5 12.31 12.31 6.191979 Dec 484.00 36.34 18.5 14.44 50.78 -32.281980 Dec 659.90 6.1 19.5 16.75 22.85 -3.351981 Dec 700.50 6.78 16.5 14.81 21.59 -5.091982 Dec 748.00 6.35 10.0 9.50 15.85 -5.851983 Dec 795.50 3.79 10.0 10.06 13.85 -3.851984 Dec 825.70 7.6 11.0 10.75 18.35 -7.351935 Dec 888.45
/a Libor-based cost of borrowing.7-b Nominal cost adjusted for annual rate of change of exchnage rate.
Source: Bank estimates.

- 114-
Table 10.5: SIZB AND SHAM OF POLICY OAN BY DHB
(Of whichYear Total ' Gneral loans Poller loans export loans)
1970 722.4 510.5 (70.7) 211.9 (29.3) 55.9 (7.7)
1971 919.5 647.2 (70.4) 272.3 (29.6) 80.1 (8.7)
1972 1,198.0 846.4 (70.4) 351.6 (29.3) 108.4 (9.1)
1973 1,587.5 1,052.4 (66.3) 535.1 (33.7) 224.1 (14.1)
1974 2,427.8 1,637.2 (67.4) 790.6 (32.6) 360.2 (14.8)
1975 2,905.5 2,117.9 (72.9) 787.6 (27.1) 339.2 (11.7)
1976 3,724.9 2,497.9 (67.1) 1,227.0 (32.9) 461.8 (12.4)
1977 4,709.0 3,115.4 (66.2) 1,593.6 (33.8) 567.4 (12.0)
1978 6,609.0 4,154.7 (62.9) 2,454.3 (37.1) 883.2 (13.4)
1979 8,977.8 5,827.1 (64.9) 3,150.7 (35.1) 1,227.2 (13.7)
1980 12,204.4 7,904.8 (64.8) 4,299.6 (35.2) 1,720.8 (14.1)
1981 15,955.0 10,585.6 (66.3) 5,369.4 (33.7) 2,197.2 (13.8)
1982 20,225.8 13,801.6 (68.2) 6,424.2 (31.8) 2,278.4 (11.3)
1983 24,150.3 16,190.8 (67.0) 7,959.5 (33.0) 2,620.0 (10.8)
1984 27,978.9 19,101.6 (68.3) 8,877.3 (31.7) 2,765.4 (9.9)
1985 33,810.7 23,382.6 (69.2) 10,428.1 (30.8) 3,129.9 (9.3)
Source: Bank of Korea.
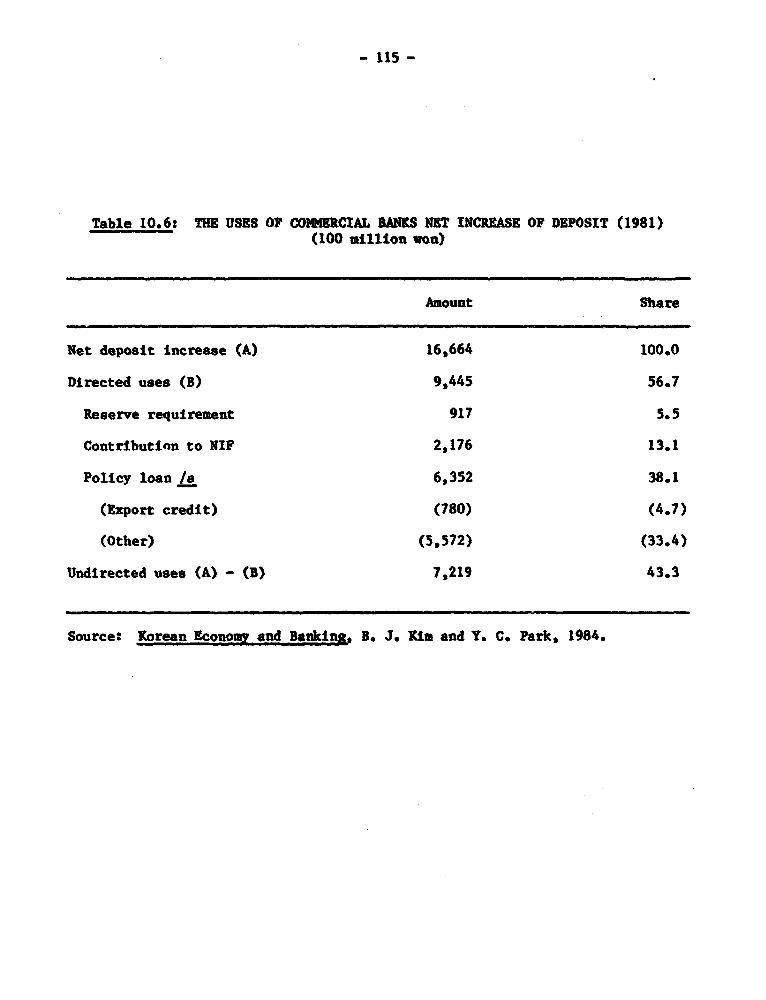
- 115 -
Table 10.6: THE USES OF COMMERCIAL BANKS NET INCREASE OF DEPOSIT (1981)(100 million won)
Amount Share
Net deposit increase (A) 16,664 100.0
Directed uses (B) 9,445 56.7
Reserve requirement 917 5.5
Contribution to NIF 2,176 13.1
Policy loan /a 6,352 38.1
(Export credit) (780) (4.7)
(Other) (5,572) (33.4)
Undirected uses (A) - (B) 7,219 43.3
Source: Korean Economy and Banking. B. J. Kim and Y. C. Park, 1984.
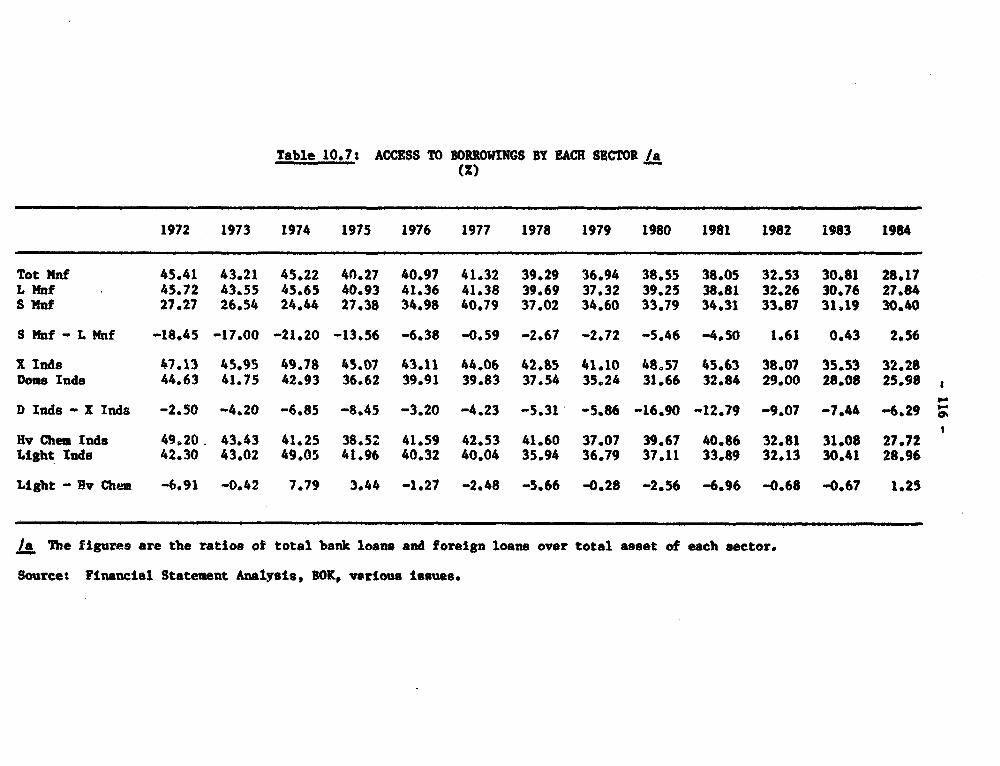
Table 10.7: ACCESS TO BORROWINGS BY EACH SECTOR /a(%)
1972 1973 1974 1975 1976 1977 1978 1979 1980 1981 1982 1983 1984
Tot Mnf 45.41 43.21 45.22 40.27 40.97 41.32 39.29 36.94 38.55 38.05 32.53 30481 28.17L Mhnf 45.72 43.55 45.65 40.93 41.36 41.38 39.69 37.32 39.25 38.81 32.26 30.76 27.84S MUf 27.27 26.54 24.44 27.38 34.98 40.79 37.02 34.60 33.79 34.31 33.87 31A19 30.40
S Mnf - L Mnuf -18.45 -17.00 -21.20 -13.56 -6.38 -0.59 -2.67 -2.72 -5.46 -4.50 1.61 0.43 2.56
X Inds 47.13 45.95 49.78 45.07 43.11 44.06 42.85 41.10 48.57 45.63 38.07 35.53 32.28Dons Inds 44.63 41.75 42.93 36.62 39.91 39.83 37.54 35.24 31.66 32.84 29.00 28.08 25.98
D Inds - X Inds -2.50 -4.20 -6,85 -8.45 -3.20 -4.23 -5.31 -5.86 -16.90 -12.79 -9.07 -7.4 -6.29
Hv Chen Inds 49,20. 43.43 41.25 38.52 41.59 42.53 41.60 37.07 39.67 40.86 32.81 31.08 27.72Light lads 42.30 43.02 49.05 41.96 40.32 40.04 35.94 36.79 37.11 33.89 32.13 30.41 28.96
Llght - lv Chen -6.91 -0.42 7.79 3.44 -1.27 -2.48 -5.66 -0.28 -2.56 -6.96 -0.68 -0.67 1.25
/a The figures are the ratios of total bank loans and foreign loans over total asset of each sector.
Source: Financial Statement Analysis, BOK, various issues.

Table 10.8: DEST RATIO O EACH SECTOR
1969 1970 1971 1972 1973 1974 1975 1976 1977 1978 1979 1980 1981 1982 1983 1984
Tot Naf 270.00 328.40 394.20 313.40 272.70 316.00 339.50 364.60 367.20 366.80 377.10 487.90 451.50 38S.80 360.30 342.70L mRf 272.90 331.80 402.10 319.10 276.50 322.40 351.50 372.20 369.30 363.30 377.50 504.70 451.10 377.fO 360.60 339.50S Mnf 106.80 206.80 161.30 138.80 148.80 140.90 185.90 272.20 347.50 388.10 374.30 394.90 453.20 433.00 357.80 366.00
S Nuf - L Mnf -166.10 -125.00 -240.80 -180.30 -127.70 -181.50 -165.60 -100.00 -21.80 24.80 -3.20 -109.80 2.10 55.40 -2.80 26.50
X Inds NA NA NA 403.90 324.10 402.20 337.00 489.01 479.20 S19.50 406.40 496.10 427.90 333.80 325.30 286.50Dows Inds NA NA NA 282.20 250.10 283.00 314.60 320.30 322.40 316.50 365.00 4U2.40 469.00 425.90 383.20 379.90
Dons - X Inds NA NA NA -121.70 -74.00 -119.20 -22.40 -168.71 -156.80 -203.00 -40.40 -13.70 41.10 92.10 57.90 93.40
Rv Ches Inds NA NA NA 315.40 259.20 275.10 284.70 324.00 316.30 344.50 331.30 460.00 407.00 327.90 305.20 307.30Ligbt lads NA KA NA 311.70 285.30 365.00 408.70 417.00 437.10 403.40 449.10 527.90 533.40 500.10 472.50 421.30
Light - Rv Chen NA NA NA -3.70 26.10 89.90 124.00 93.00 170.80 58.90 117.80 67.90 126.40 172.20 167.30 114.00
Source: Financial Stj!temet Analysis BORK varlous Issues.

Table 10.9s AVERAGE COST OF BORROWING BY EACH SECTOR
1972 1973 1974 1975 1976 1977 1978 1979 1980 1981 1982 1983 1984
Tot Manfact 12.00 8.60 10.50 11.30 11.90 13.10 12.40 14.40 18.70 18.37 15.97 13.63 14.42L Nanfact 11.98 8.48 10.49 11.19 11.80 11.91 11.91 14.42 18.42 18.30 16.08 13.71 14.45S Nanfact 14.16 11.59 11.41 13.92 14.39 13.80 15.55 14.16 20.74 18.77 15.38 12.95 14.k3
S Nnf - L '4af 2.18 3.11 0.92 2.73 2.59 1.89 3.64 -0.26 2.32 0.47 -0.70 -0.76 -0.32
X Inds 11.06 9.78 9.82 9.82 11.34 12.87 12.68 15.70 16.01 15.81 13.55 12.39 12.91Doms Inds 12.46 9.84 10.88 12.60 12.25 13.24 12.25 13.80 21.03 20.36 17.59 14.37 15.20
D Inds - X Inds 1.40 0.06 1.06 2.78 0.91 0.37 -0.43 -1.90 5.02 4.55 4*04 1.98 2.29
Hv Chem Inds 10,53 8.65 10.38 10.24 10.14 11.50 10.09 12.51 17.58 17.49 15.29 12.93 14.39Light Inds 13.31 10.90 10.59 12.16 13.70 14.29 15.85 16.62 20.05 19.64 16.93 14.63 14.46
Light - Hv Chem 2.78 2.25 0.21 1.92 3.56 2.79 5.76 4.11 2.47 2.15 1.64 1.70 0.07
Source: Financial Statement Analysis, BOX, various issues.

Table 10.10: AVERAGE RATE OF RETUTR ON INVESTNEDT BY EACH SECTOR
1972 1973 1974 1975 1976 1977 1978 1979 1960 1981 1982 1983 1984
Tot Manfoct 10.55 12.77 10.91 9.50 10.42 10.27 11.03 10.74 9.14 9.98 8.80 9.59 9.67L Naufact 10.55 12.75 10.86 9.43 10.37 10.06 10.82 1O.S7 8.84 9.70 8.82 9.50 9.59S Manfact 10.42 13.61 12.81 10.87 11.22 12.25 12.23 11.81 11.10 11.44 8.68 10.30 10.21
8 lnf - L lnf -0.13 0.86 1.95 1.44 0.85 2.19 1.41 1.24 2.26 1.74 -0.14 0.80 0.62
x Inds 10.44 15.14 8.21 7.75 9.10 8.75 8.53 8.55 9.22 10.65 7.94 6.91 9 .82DOD8 Irts 9.23 11.62 12.25 10.82 11.08 11.12 12.33 11.68 9.08 9.54 9.33 9.98 9.58 %0
D Inds - X Iads -1.21 -3.52 4.04 3.07 1.98 2.37 3.80 3.13 -0.14 -1.11 1.39 1.07 -0.24
Bv Chbe lads 7.92 10.06 12.4S 9.34 9.41 8.96 9.69 9.32 7.36 9.11 8.56 9.20 9.75Light lads 11.00 15.30 9.45 9.6S 11.5O 11.57 13.80 12.50 11.40 11.28 9.13 10.15 9.52
Light - Iv Chum 3.08 5.24 -3.00 0.31 2.09 2.61 4.11 3.18 4.04 2.17 0.57 0.95 -0.23
Sourcet Financial Statemaent Anlvaysls BOK, various Issues.

Table 10.11: PROFITABILITY OF EACH SECTOR
1969 1970 1971 1972 1973 1974 1975 1976 1977 1978 1979 1980 1981 1982 1983 1984
Tot Manfact 3.69 2.49 1.00 3.80 7.90 5.70 3.90 4.60 4.50 5.00 3.40 -0.20 0.02 1.03 3.29 3.41L Manfact 3.64 2.47 0.83 3.75 7.88 5.59 3.78 4.55 4.24 4.93 3.24 -0.59 -0.51 0.88 3.07 3.22S Manfact 6.60 3,49 4.31 4.93 8.96 9.02 5.96 5.48 5.72 5.30 4,19 1.98 2.68 1.78 4.86 4.65
S Mnf - L Mnf 2.96 1.02 3.48 1.18 1.08 3.43 2.18 0.93 1.48 0.37 0.95 2.57 3.19 0.90 1.79 1.43
69-75 76-79 81-84T Mnf Avg 4.07 4.38 1.94 -L Mnf Avg 3.99 4.24 1.67S Mnf Avg 6.18 5.17 3.49
X Iads NA NA NA 4.55 10.03 2.92 2.45 3.25 2.61 1.78 0.35 0.15 1.30 1.03 3.07 4.33Dons Inds NA NA NA 2.93 6.87 7.03 4.96 5.28 5.72 6.65 4.67 -0,05 -0.84 1.03 3.38 2.91
Dome - X Inds NA NA NA -1.62 -3.16 4.11 2.51 2.03 3.11 4.87 4.32 -0.65 -2.14 0.00 0.31 -1.42
72-75 76-79 81-84X Inds Avg NA NA NA 4.99 2.00 2.43Doms Inds Avg NA NA NA 5.45 5.58 1.62
lv Chem Inds NA NA NA 2.27 5.79 7.63 4.64 4.65 4.55 4.09 3.00 -1.29 -0.26 1.13 3.32 3.71Light Inds NA NA NA 4.40 9.88 3.80 3.17 4.56 4.51 6.26 3.83 1.12 0.43 0.89 3.20 2.88
Light - Hv Chem NA NA NA 2.13 4.09 -3.83 -1.47 -0.09 -0.04 2.17 0.83 2.41 0.69 -0.24 -0.12 -0.83
72-75 76-79 81-84Hv Chem Inds Avg 5.08 4.07 1.98Light Inds Avg 5.31 4.79 1.85
Source: Financial Statement Analysis, BOK, various issues.

Table 10.11s N SALES OROT RATE 0F EH SECTOR /s
1969 1970 1971 1972 1973 1974 1975 1976 1977 1978 1979 1980 1981 1982 1983 1984
WPI (All Prod.) 17.10 18.70 20.30 23.10 24.70 35.10 4.40 49.80 54.30 60.60 72.00 100.00 120.00 126.00 126.30 127.20WI Orth Rate 1.07 1.09 1.09 1.14 1.07 1.42 1.26 1.12 1.09 1.12 1.19 1.39 1.20 1.05 1.00 1.01
Tot Manfact NA NA 15.15 16.88 48.70 10.48 11.47 23.93 21.06 22.76 10.26 *1.36 11.67 6.67 17.72 17.17L Manfact NA NA NA 17.76 49.64 11.19 12.26 23.93 21.06 21.86 10.26 1.52 11.67 7.62 16.72 16.17S Nanfact NA NA NA 8.09 55.25 3.44 5.14 21.25 21.06 22.76 7.73 -14.32 11.67 5.71 21.71 20.14
S Nsf - L Nnf NA NA NA -9.67 5.61 -7.74 -7.11 -2.67 0.00 0.90 -2.53 -15.84 0.00 -1.90 4.99 3.97
72-75 76-79 81-84T MDf Avg 21.88 19.50 13.30L Mnf Avg 22.71 19.28 13.04S Nsf Avg 17.98 18.20 14.81
X rude NA KA NA NA 58.99 -6.41 7.51 33.73 21.06 20.07 0.15 0.08 15.00 6.67 12.73 25.11Dow Iands NA NA NA NA 44.02 21.74 13.84 18.58 21.06 23.65 15.31 -2.08 9.17 7.62 19.71 13.19
Dows - X Inds NA NA NA NA -14.96 28.15 6.32 -15.16 0.00 3.58 15.15 -2.16 -5.83 0.95 6.98 -11.92
73-75 76-79 61-4I Inds Avg NA NA NA 20.03 18.76 14.88Dows lads Avg NA NA NA 26.53 19.65 12.42
eV Chem Inds KA NA NA NA 58,05 35.11 9.89 23.93 22.90 25.45 11.94 -2.08 13.33 8.S7 19.71 18.16Light lads NA NA NA WA 44.96 -5.00 13.05 23.04 19.23 20.07 7.73 -0.64 9.17 5.71 14.73 16.17
Light - iv Chem NA NA NA NA -13.09 -40.11 3.16 -0.89 -3.67 -5.38 -4.21 i.44 -4.17 -2.86 -4.9 -1.99
73-75 76-79 81-84Hv Chem lads Avg 34.35 21.05 14.94Llght Ias Avg 17.67 17.52 11.44
/a The figures are adjusted for Inflation by the formla, I + net sales growth ratell + 117r growth rate.
Source: Plnancl Statement Anal1sis, BO, various issues.

Table 10.13: ACCESS TO BORROWING BY EACH INDUSTRY
1972 1973 1974 1975 1976 1977 1978 1979 1980 1981 1982 1983 1984
Fishlng (1) NA 51,08 46.24 40.14 47.20 54.30 48.49 55.46 42.68 41.47 40.49 31.02 36.75
Mining (2) 39.56 33.05 27.67 26.59 22.88 25.25 21.46 23.78 14.36 12.54 11.08 10.80 7.41
Manufacturing (3) 45.41 43.21 45.22 40.27 40.97 41.32 39.29 36.94 38.55 38.05 32.53 34*73 28.17Food & beverages (31) 42.44 45.63 43.90 37.18 37.67 29.24 23.18 24.04 25.46 20.25 20.51 16.54 19.59(Beverage) 40.93 37.39 38.92 34.55 30.21 21.95 26.56 17.89 17.19 16.77 14.51 9.99 12.63Textile & apparels (32) 47.04 44.59 54.52 44.23 42.24 43.69 42.64 45.14 44.56 39.26 37.50 37.18 34.35Wood & furniture (33) 47.52 47.76 67.10 59.44 54.24 54.20 44.54 44.33 46.51 51.63 48.46 52*81 52.53Paper & printing (34) 40.01 34.21 46.77 38.32 39.23 36.73 37.46 32.45 32.31 35.67 27.46 27.61 28.10Chew, petr. & coal (35) 39.57 39.12 35.15 31.86 31.77 15.11 29.41 28.97 27.01 33.88 28.90 2869S 21.95Nonmetallic uin prod. (36) 67.27 53.57 51.09 44.79 47.35 42.96 40.97 37.61 36.29 35.29 29.80 23.51 22.36Basic metal (37) 46.37 44.64 43.85 47.14 48.61 49.41 50.64 48.28 57.42 52.55 36.53 32.89 28.84(Iron & steel) 46.89 45.17 42.02 47.40 48.85 50.52 51.54 51.43 62.38 50.65 36.27 33.16 25.74Fab wet prod & equip (38) 43.87 41.32 40.28 36.64 40.47 38.96 41.56 34.55 37.07 38.19 33.70 31.66 30.35 '(Transport equipment) 51.48 47.59 50.01 51.79 51.51 46.54 47.71 34.11 36.56 44.20 34.32 33.13 30.25 1Other manufacturing (39) 26.83 29.11 28.41 14.65 31.04 40.48 14.22 32.75 37.03 33.43 29.21 24.43 26.99
Electricity & gas (4) 55.68 49.78 48.77 52.64 27.26 47.58 48.15 53.18 60.70 52.73 50.54 50.48 49.65
Construction (5) 40.90 37.15 44.88 29.26 23.62 20.57 12.67 16.49 29.15 .32*68 32.85 26.95 29.56
W & R trade & hotel (6) 27.62 23.01 28.96 20.56 29.52 30.87 28.09 26.08 26.78 23.65 27.04 17.84 21.36
Transport & storage (7) 51.10 44.16 38*08 36.67 38.42 37.03 34.82 34.90 44.06 42.35 31.68 35*36 31.62
Real est & bus serv (8) 30.59 29.95 20.10 15.03 29.54 17.91 30.74 28.29 30.81 11.17 15.88 I2.50 9.82
Rec, cul & other serv (9) 31*18 33*76 22.68 17.67 17.02 29.28 21.48 17.46 9*91 12.36 9.04 14.08 18.04
Source: Financial Statement Analyslsp BOK, various issues.

Table 10.14s DEBT RATIO BY EACH INDUSTRY
1972 1973 1974 1975 1976 1977 1978 1979 1980 1981 1982 1983 1984
Fishing (1) NA 10,361.10 2,160.60 7,839.60 7,281.20 2,361.40 2,850.40 - 2,590.70 1,929.60 3,590.10 1,072.20 2,078.80
Mining (2) 201.40 159.00 153.30 143.00 167.30 240.90 257.40 369.60 262.00 295.00 225.90 161.90 137.20
Manufacturing (3) 313.40 272.70 316.00 339.50 364.60 367.20 366.80 377.10 487.90 451.50 385.80 360.30 342.70Food & beverages (31) 334.90 375.50 415.60 410.20 453.50 390.50 395.50 409.50 471.90 528.80 422.40 395.60 374.50Textile & apparels (32) 386.90 310.90 440.60 505.70 497.30 528.10 548.60 638.80 820.10 637.70 598.60 579.60 524.80Wood & furniture (33) 548.00 442.30 1,688.60 1,751.10 631.10 558.30 560.40 604.70 2,051.40 4,894.80 10,253.00 -2,676.10 10,253.00Paper & printing (34) 202.10 160.30 243.20 257.50 283.20 310.00 307.50 287.50 382.80 483.80 539.40 393.50 337.20Chean, petr. & coal (35) 212.80 226.40 257.90 259.30 242.50 276.00 228.20 299.80 414.70 439.20 367.70 297.00 273.30Nonmetallic min prod. (36) 597.00 373.00 376.00 282.90 ?23.60 270.30 406.90 422.80 447.90 399.00 290.70 274.40 250.00..Basic metal (37) 552.00 233.80 192.10 282.30 342.20 318.90 301.90 324.90 496.60 463.60 243.80 236.90 219.50:Fab net prod & equip (38) 272.00 245.00 291.90 286.90 381.00 379.00 477.70 335.50 403.00 349.60 374.70 375.70 385.70Other manufacturing (39) 181.60 167.10 139.10 233.40 262.70 457.90 408.00 598.90 310.00 247.20 355.70 252.70 322.60
Electricity 6 gas (4) 289.60 330.80 320.60 200.60 133.50 138.80 167.40 197.20 257.90 262.50 158.30 176.90 176.50
Construction (5) 312.60 193.90 306.50 256.60 368.70 300.90 349.80 383.50 524.90 522.80 491.20 481.10 450.80
W & R trade, hotels (6) 190.50 174.30 202.60 281.60 396.10 367.10 431.00 442.10 566.30 590,10 523.20 403.10 465,70
Transport & storage (7) 463.70 342.10 233.00 602,50 419.00 477.70 488.50 449.00 628.40 544.70 485.30 496.90 537.10
Real eat & bus serv (8) 176.80 332.70 161.00 416.00 446.00 426.50 185.00 189.00 209.20 183.30 182.10 162.10 285.20
Rec, cul & other serv (9) 9.34 13.05 13.41 99.80 106.80 174.10 141.40 311.00 300.40 252.90 275.50 235.70 196.30
Source: Financial Statement Analtsis, 301, various issues.
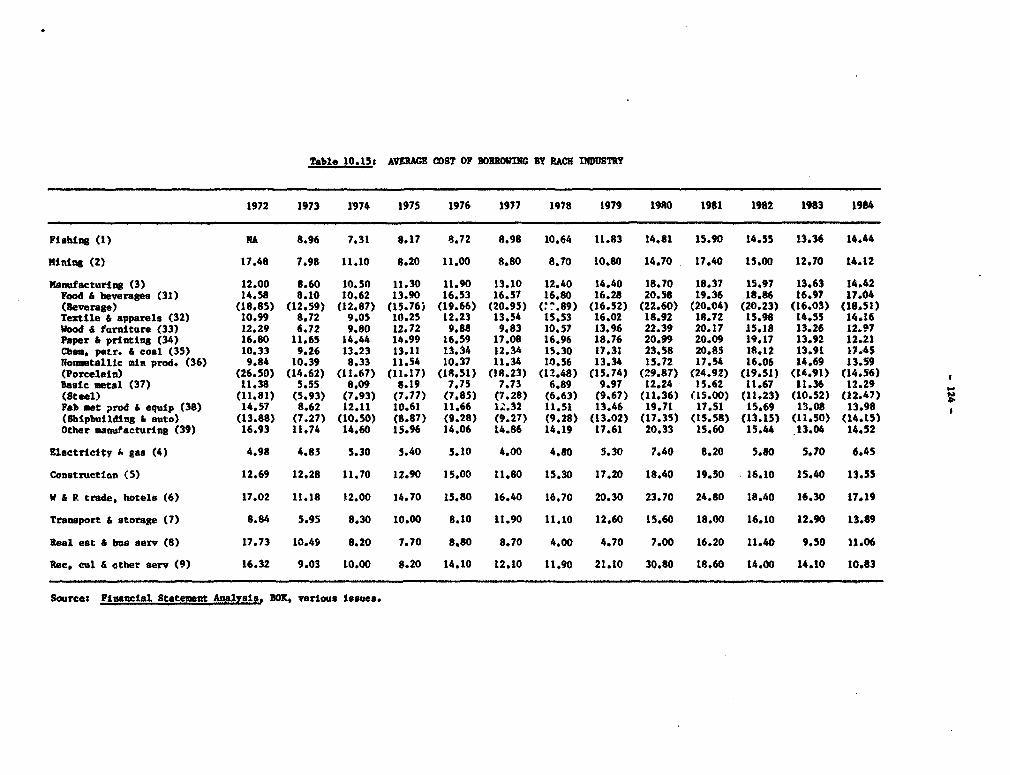
Table 10.15t AVERAGE COST OF BOROlWlG BY RACE INDUSTRY
1972 1973 1974 1975 1976 1977 1978 1979 1980 1981 1982 1983 1984
Fishing (1) NA 8.96 7.31 8.17 8.72 A.98 10.64 11.83 14.81 15.90 14.55 13.36 14.44
Mirnig (2) 17.48 7.98 11.10 8.20 11.00 8.80 8.70 10.80 14.70 17.40 15.00 12.70 14.12
Manufacturiag (3) 12.00 8.60 10.50 11.30 11.90 13.10 12.40 14.40 18.70 18.37 15.97 13.63 14.42Food & beverages (31) 14.58 8.10 10.62 13.90 16.53 16.57 16.80 16.28 20.58 19.36 18.86 16.97 17.04(Beverage) (18.85) (12.59) (12.87) (15.76) (19.66) (20.95) (:2.89) (16.52) (22.60) (20.04) (20.23) (16.03) (18.51)Textile & apparels (32) 10.99 8.72 9.05 10.25 12.23 13.54 15.53 16.02 18.92 18.72 15.98 14.55 14.16Wood & furniture (33) 12.29 6.72 9.80 12.72 9.88 9.83 10.57 13.96 22.39 20.17 15I.18 13.26 12.97Paper & printing (34) 16.80 11.65 14.44 14.99 16.59 17.08 16.96 18.76 20.99 20.09 19.17 13.92 12.21Cbem, petr. & coal (35) 10.33 9.26 13.23 13.11 13.34 12.34 15.30 17.31 23.58 20.85 18.12 13.91 17.45Nonmetallic md prod. (36) 9.84 10.39 8.33 11.54 10.37 11.34 10.56 13.34 15.72 17.54 16.06 14.69 13.59(Porcelain) (26.50) (14.62) (11.67) (11.17) (18.51) (18.23) (12.48) (15.74) (29.87) (24.92) (19.51) (t4.91) (14.56)Basic metal (37) 11.38 5.55 8.09 8.19 7.75 7.73 6.89 9.97 12.24 15.62 11.67 11.36 12.29(Steel) (11.81) (5.93) (7.93) (7.77) (7.85) (7.28) (6.63) (9.67) (11.36) (15.00) (11.23) (10.52) (12.47)rab met prod & equip (38) 14.57 8.62 12.11 10.61 11.66 12.32 11.51 13.46 19.71 17.51 15.69 13.08 13.98(Shipbuilding & auto) (13.88) (7.27) (10.50) (8.87) (9.28) (9.27) (9.28) (13.02) (17.35) (15.58) (13.15) (11.50) (14.15)Other manufacturing (39) 16.93 11.74 14.60 15.96 14.06 14.86 14.19 17.61 20.33 15.60 15.44 .13.04 14.52
Electricity & gas (4) 4.98 4.85 5.30 5.40 5.10 4.00 4.80 5.30 7.40 8.20 5.80 5.70 6.45
Construction (5) 12.69 12.28 11.70 12.90 15.00 11.80 15.30 17.20 18.40 19.50 16.10 15.40 13.55
W & R trade, hotels (6) 17.02 11.18 12.00 14.70 15.80 16.40 16.70 20.30 23.70 24.80 18.40 16.30 17.19
Transport & storage (7) 8.84 5.95 8.30 10.00 8.10 11.90 11.10 12.60 15.60 18.00 16.10 12.90 13.89
Real eat & bus serv (8) 17.73 10.49 8.20 7.70 8.80 8.70 4.00 4.70 7.00 16.20 11.40 9.50 11.06
Rec, cul & other serv (9) 16.32 9.03 10.00 8.20 14.10 12.10 11.90 21.10 30.80 t8.60 14.00 14.10 10.83
Source: Financial Statement Analyss BOK, various Issues.

Table 10.16: AVERAGE RATE OF RETURN ON INVESTMENT BY EACH INDUSTRY
1972 1973 1974 1975 1976 1977 1978 1979 1980 1981 1982 1983 1984
Fishing (1) NA 7.08 1.23 1.43 5.36 5.37 7.13 5.34 2.29 6.17 -1.29 6.30 6.44
Mining (2) 4.36 10.21 16.89 12.03 10.70 6.34 3.81 0.16 3.38 5.36 5.53 3.82 3.88
Manufacturing (3) 10.55 12.77 10... 1 9.50 10.42 10.27 11.03 10,74 9.14 9.98 8.80 9.59 9.67Food & beverages (31) 12.13 11.51 9. c 11.28 13.21 15.36 16,83 13.55 11.97 11.52 10.55 10.97 8.88Textile & apparels (32) 10.02 16.06 7.42 6.71 9.58 8.30 11.02 10.37 9.82 11.54 8.30 8.59 8.23Wood & furniture (33) 14.56 16.72 -1.00 7.77 7.71 10.62 14.72 8.24 -0.16 5.04 3.28 8.89 4.67Paper & printing (34) 13.69 16.04 14.89 11.05 13.75 14.47 14.22 14,53 10.80 7.38 8.71 10.00 9.97Cheap petr. & coal (35) 10.54 12.60 12.45 12.89 13.16 10.53 14.12 13.98 12.18 10.91 10.75 10.98 12.40Nonmetallic min prod. (36) 12.72 18.75 15.77 12.26 10.15 12.81 10.53 11.96 10.50 S.39 9.56 11.66 12.16
ic metal (37) 7.83 8.95 18.18 4.12 7.09 7.55 7.70 8.38 6.24 9.56 6.61 8.35 9.62ab met prod & equip (38) 10.64 10.92 12.26 11.70 10.03 11.25 8.78 8.93 7.04 8.71 8.45 9.04 8.81Other manufacturing (39) 11.12 11.77 12.89 17.32 13.67 11.40 9.15 6.93 12.52 14.34 12.95 13.54 12.07
Electricity & gas (4) 4.98 4.51 4.12 5.09 5.48 7.60 6.61 11.28 10.91 9.00 6.50 6,31 8.36
Construction (5) 11.34 10.86 10.72 12.87 15.49 18.41 17.14 13.36 12.24 11.70 10.49 9.74 7.79
W 4 R trade, hotels (6) 8.53 10.11 11.20 12.42 13.05 11.30 11.85 11.95 11.48 11.19 8.57 9.19 8.29
Trsnsport & storage (7) 7.38 9.77 6.93 7.28 6.58 8.94 8.60 9.39 8.33 9.94 8.27 4.73 5.53
Real est & bus serv (8) 9.42 9.35 9.24 6.98 6.57 7.81 8.32 8.57 7.67 11.58 8.66 9.36 5.58
Rec, cul & other serv (9) 131.20 132.20 90.50 12.91 21.10 15.03 19.30 16.30 16.65 7.62 8.17 10.95 10.36
Source: Financial Statement Analysiu, BOK, various Issues.

Table 10.17: PROFIT RATIO OF EACH INDUSTRY
1972 1973 1974 1975 1976 1977 1978 1979 1980 1981 1982 1983 1984
Fishing (1) NA 0.68 -2.66 -3.61 0.28 -0.65 0.53 -1.61 -6.28 -1.49 -8.73 -0.26 -0.55
Mining (2) -0.29 6.58 12.80 8.90 7.10 8.20 1.10 -3.90 -0.60 0.80 1.63 1.00 0.82
Manufacturing (3) 3.80 7.90 5.70 3.90 4.60 4.50 5.00 3.40 -0.20 0.02 1.03 3.29 3.41Food & beverages (31) 4.06 6.36 4.10 4.09 5.10 8.23 10.46 6.10 2.96 10.67 2.86 4.39 2.20Textile & apparels (32) 3.47 10.61 2.10 0.92 3.20 1.40 2.93 1.15 -0.71 0.53 -0.05 1.29 1.65Wood & furniture (33) 7.58 12.16 -7.00 -0.48 1.32 4.52 9.01 0.95 -13.10 -9.24 -6.08 -1.23 -4.70Paper & printing (34) 5.15 10.51 7,55 3.68 5.05 6.11 6.12 5.47 -0.17 -3.72 0.08 3.55 3.96Chem, petr. & coal (35) 5.59 8.17 7.03 7.70 7.90 5.21 8.42 6.84 3.29 0.81 2.57 5.08 5.59Nonmetallic min prod. (36) 0.40 3.63 3.59 5.79 4.46 6.75 4.84 4.71 2.06 -0.56 1.01 5.03 6.35Basic metal (37) 1.41 5.65 14.35 3.20 3.15 3.42 3.75 2.66 -1.09 -0.05 0.73 3.19 4.66Fab met prod & equip (38) 2.04 6.17 6.86 6.84 4.41 5.58 2.82 1.86 -2.94' -0.30 0.68 2.74 2.43Other manufacturing (39) 5.48 6.69 8.29 10.48 6.70 4.95 2.74 -0.47 3.27 7.47 7,39 9.09 6.21
Electricity & gas (4) 1.54 1.09 0.80 2.00 2.80 5.60 4.10 8.40 6.40 4.40 3.10 3.20 4.74
Construction (5) 4,59 5.54 5.20 7.90 10.50 14.90 13.50 8,90 5.40 3.00 2.70 2,90 1.40
W & R trade & hotel (6) 2.58 6.54 7.00 8.10 7.50 5.40 5.90 3.80 2.40 2.10 1.50 2.70 1.70
Transport & storage (7) 2.17 5.84 3.00 2.00 1.80 3.90 3.40 3.20 0.60 0.80 1.10 -1.20 -0.24
Real est & bus serv (8) 3.61 4.43 7.20 5.00 3.30 6.00 7.00 6.90 5.30 9.00 6.30 7.30 3.73
Rec, cul & other serv (9) 4.43 8.89 10.30 11.10 18.10 12.20 16.10 10.40 10.60 3.80 6.00 8.20 7.39
Source: Financial Statement Analysis, BOX, various issues.
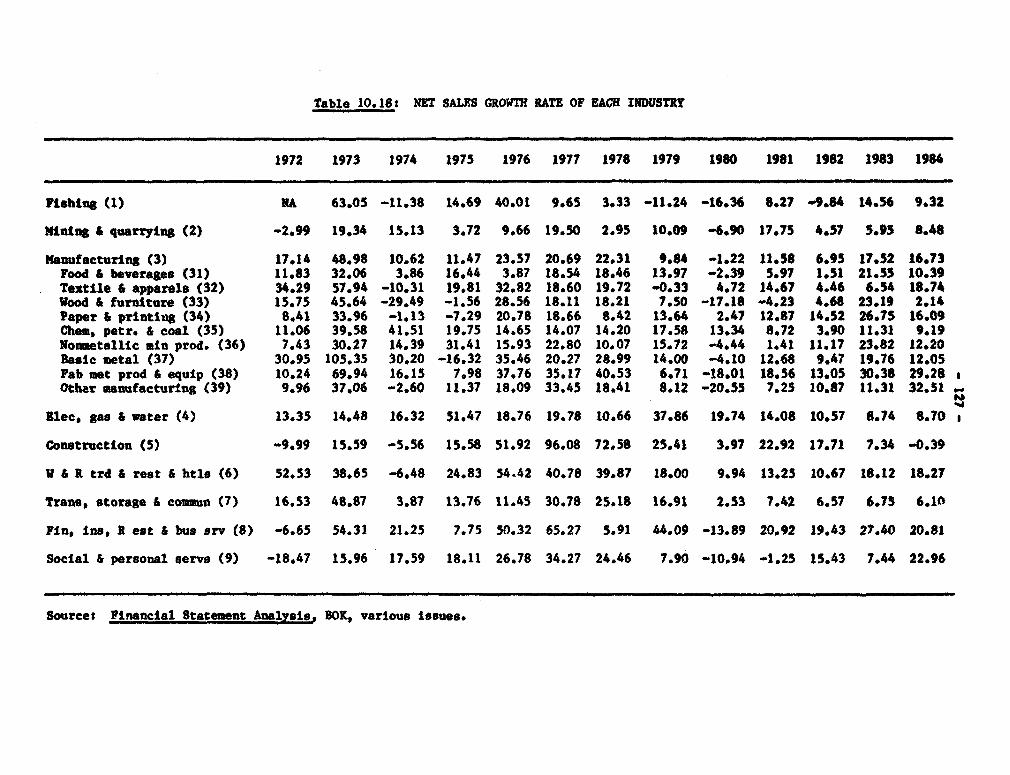
Table 10.18: NET SALES GROWTH RATE OF EACH INDUSTRY
1972 1973 1974 1975 1976 1977 1978 1979 1980 1981 1962 1983 1984
Fishing (1) NA 63.05 -11.38 14.69 40.01 9.65 3.33 -11.24 -16.36 8.27 -9.84 14.56 9.32
Mlning & quarrying (2) -2.99 19.34 15.13 3.72 9.66 19.50 2.95 10.09 -6.9 17.75 4.57 5.95 8.48
Manufacturing (3) 17.14 48.98 10.62 11.47 23.57 20.69 22.31 9.84 -1.22 11.58 6.95 17.52 16.73Food & beverages (31) 11.83 32.06 3.86 16.44 3.87 18.54 18.46 13.97 -2.39 5.97 1.51 21.55 10.39Textile & apparels (32) 34.29 57.94 -10.31 19.81 32.82 18.60 19.72 -0.33 4.72 14.67 4.46 6.54 18.74Wood & furniture (33) 15.75 45.64 -29.49 -1.56 28.56 18.11 18.21 7.50 -17.18 -4.23 4.68 23.19 2.14Paper & printing (34) 8.41 33.96 -1.13 -7.29 20.78 18.66 8.42 13.64 2.47 12.87 14.52 26.75 16.09Chem, petr. & coal (35) 11.06 39.58 41.51 19.75 14.65 14.07 14.20 17.58 13.34 8.72 3.90 11.31 9.19Nonmetallic win prod. (36) 7.43 30.27 14.39 31.41 15.93 22.80 10.07 15.72 -4.44 1.41 11.17 23.82 12.20Basic metal (37) 30.95 105.35 30.20 -16.32 35.46 20.27 28.99 14.00 -4.10 12.68 9.47 19.76 12.05Fab met prod & equip (38) 10.24 69.94 16.15 7.98 37.76 35.17 40.53 6.71 -18.01 18.56 13.05 30.38 29.28Other manufacturing (39) 9.96 37.06 -2.60 11.37 18.09 33.45 18.41 8.12 -20.55 7.25 10.87 11.31 32.51
Elec, gas & water (4) 13.35 14.48 16.32 51.47 18.76 19.78 10.66 37.86 19.74 14.08 10.57 8.74 8.70
Construction (5) -9.99 15.59 -5.56 15.58 51.92 96.08 72.58 25.41 3.97 22.92 17.71 7.34 -0.39
V & R trd & rest & htle (6) 52.53 38.65 -6.48 24.83 54.42 40.78 39.87 18.00 9.94 13.25 10.67 18.12 18.27
Trans, storage & coummn (7) 16.53 48.87 3.87 13.76 11.45 30.78 25.18 16.91 2.53 7.42 6.57 6.75 6.l1
Fin, ins, I est & bus srv (8) -6.65 54.31 21.25 7.75 50.32 65.27 5.91 44.09 -13.89 20.92 19.43 27.40 20.81
Social & personal servo (9) -18.47 15.96 17.59 18.11 26.78 34.27 24.46 7.90 -10.94 -1.25 15.43 7.44 22.96
Source: Financial Statement Analysis, BOK, various issues.
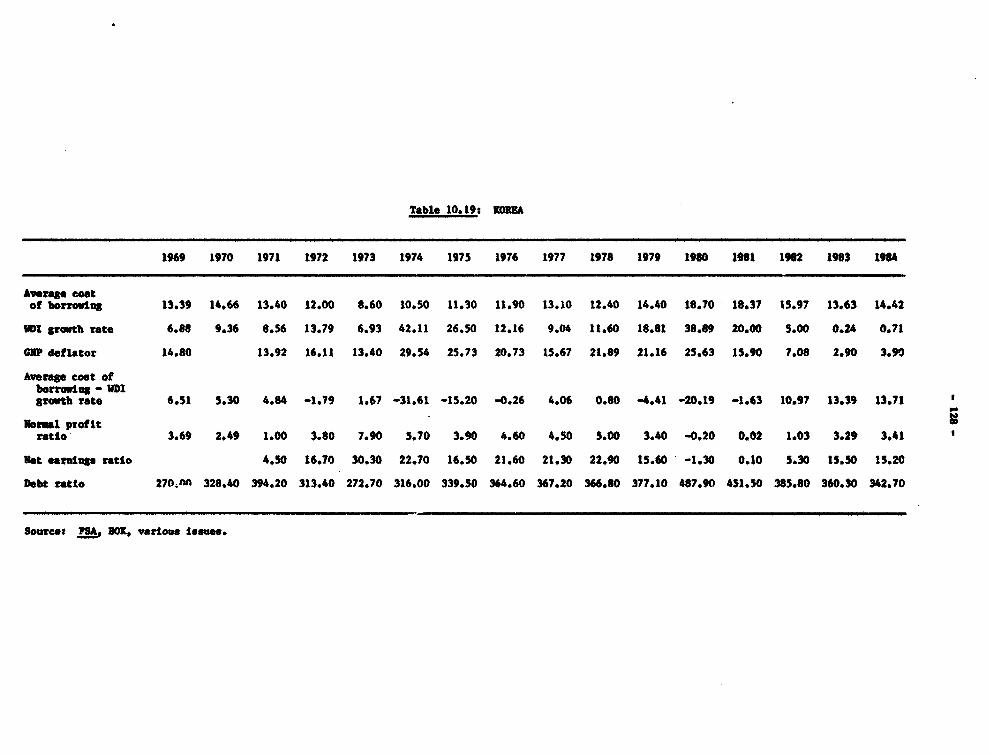
Table 10.19: KOA
1969 1970 1971 1972 1973 1974 1975 1976 1977 1978 1979 1980 1961 1982 1963 1964
Averae costof borrowlng 13.39 14.66 13.40 12.00 8.60 10.50 11.30 11.90 13.10 12.40 14.40 18.70 16.37 15.97 13.63 14.42
lDl growth rate 6.88 9.36 8.56 13.79 6.93 42.11 26.S0 12.16 9.04 11.60 18.81 38.89 20.00 5.00 0.24 0.71
GI defloator 14.80 13.92 16.11 13.40 29.54 25.73 20.73 15.67 21.89 21.16 25.63 15.90 7.08 2.90 3.90
Average cost ofborrowlg - VPIgrotb rate 6.51 5.30 4.84 -1.79 1.67 -31.61 -15.20 -0.26 4.06 0.80 -4.41 -20.19 -1.63 10.97 13.39 13.71
UsamI profitratio 3.69 2.49 1.00 3.80 7.90 5.70 3.90 4.60 4.50 5.00 3.40 -0.20 0.02 1.03 3.29 3.41
met earnigs ratio 4.50 16.70 30.30 22.70 16.50 21.60 21.30 22.90 15.60 -1.30 0.10 5.30 15.50 15.20
Debt ratio 270;A) 328.40 394.20 313.40 272.70 316.00 339.50 364.60 367.20 366.80 377.10 487.90 431.30 385.80 360.30 342.70
Sourcet A BOR, various Issues.

Table 10.20- JAPAN
1969 1970 1971 1972 1973 1974 1975 1976 1977 1978 1979 1980 1981 1982 1983 1984
Average costof borrowing 8.50 8.60 8.60 8.10 8.40 10.30 9.60 9.40 8.50 7.30 7.70 9.60 9.40 8.40 8.00 NA
NDI growth rate 2.20 3.60 -0.80 0.oO 15.70 31.60 3.00 5.00 1.90 -2.60 7.30 17.80 1.40 1.80 -2.20 NA
Average cost ofborrowing - WNDgrowth rate 6.30 5.00 9.40 7.30 -7.30 -21.30 6.60 4.40 6.60 9.90 0.40 -8.20 8.00 6.60 10.20 NA
Normal profitratio 6.90 5.90 3.90 4.70 7.10 4.70 1.40 3.20 3.40 4.00 5.80 5.30 4.30 3.90 4.10 NA
Net earnings ratio 29.20 19.90 24.30 38.30 26.20 8.30 18.90 19.50 22.60 30.10 26.40 20.80 17.60 11.40
Debt ratio NA 403.00 421.00 424.00 449.00 439.00 488.00 488.00 475.00 446.00 418.00 385.00 378.00 342.00 324.00 NA
Sources ISA 10K, various issues.

Table 10.21: sA B'S CVEDIT ALLOCATION BY INDUSTRY(%)
1973 1974 1975 1976 1977 1978 1979 1980 1981 1982 1983 1984 198S
Fishing Cl) 9.43 6.71 7.14 10.05 10.04 6.71 5.63 5.45 7.77 5.04 11429 11.91 0.7
Mining & quarrylag (2) -1.91 1.01 1.10 2.14 -0.06 1.14 1.56 0.34 -0.36 1.43 0.04 -0.42 0.6Nanufacturing (3) 68.22 65.26 52.94 60.S0 59.41 49.96 59.58 59.94 58.75 37.01 36.10 35.83 45.9(19.20) (20.60) (21.60) (23.40) (24.10) (26.60) (27.60) (28.80) (29.10) (28.60) (28.90) (30.90)
glec, gas .water (4) 2.10 3.31 9.71 3.87 5.06 5.64 4.37 3.35 4.27 1.60 2.55 2.67 4.4(1.20) (1.20) (1.40) (1.40) (1.50) (1.60) (1.70) (2.00) (2.00) (2.10) (2.20) (2.20)0Construction (5) 6.68 10.51 2.50 6.92 6.75 10.27 15.06 12.01 2.14 13.47 23.40 27.60 24.1(6.80) (6.50) (6.90) (6.70) (7.50) (8.40) (8.10) (8.40) (7.50) (8.50) (9.50) (8.80)
6 & R trd 6 rest 6 htle (6) 3.98 4,79 7.02 8.56 7.21 12.86 4.22 6.20 8.35 17.01 8.75 9.66 10*4
Trans, storage 5 comun (7) 4.76 3.23 t4.08 6.41 8.90 6.72 7.25 8.03 9.19 11.44 8.12 4.A7 11.2(5.40) (5.30) (5.50) (5.40) (6.00) (6.50) (7.10) (7.70) (7.80) (7.80) (7.70) (7.50)
Fin, ins, R est & bus srv (8) 3.55 1.94 3.42 0.89 0.77 2.77 1.45 1.75 3.64 0.72 6,65 3.00 1.6
Social & personal servs (9) 3.18 3.24 2.08 0.65 1.93 3.93 0.88 2.93 6.25 12.29 3.11 4.89 1.1
Note: The figures are the share of net credit increase of fBNs and KDR.. The figures in parenthesis are share of value added.
- 131 -
REFERENCES
Adams, Gerald, and Lawrence Klein, 1983, eds. Industrial Policies for Growthand Coapetitivenesat An Economic Perspective, Lexington, Kass.
Balassat Bela, et al., 1982. Development Strategies for Semi-IndustrialCountries. Baltimore: Johns Hopkins University Press.
Balassa, Bela, 1985. "Exports, Policy Choices and Economic Growth inDeveloping Countries after the 1973 Oil Shocks," Journal of DevelopmentEconomics.
Bank of Korea, December 1985, "Input-Output Structure of the Korean Economy:1983", Quarterly Economic Review.
Bank of Korea, 1985, Revised Macroeconomic Model for the Korean Economy,Quarterly Economic Review, Bank of Korea, pp. 19-35.
Bhagwati, Jagdish, 1978. "Foreign Trade Regimes and Economic Development:Anatomy and Consequences of Exchange Control Regimes," Cambridge, Mass.
Bhagwatit Jagdish and T.N. Srinivasan, 1979. "Trade Policy and Development,"Dornbusch and Frenkel, eds., International Economic Policy: Theory andEvidence, Johns Hopkins University Press.
Brander, J. and A. Dixit, 1982. "Tariff Protection and ImperfectCompetition," in Kievzkowski, ed., Monopolistic Competition inInternational Trade, Oxford Universlty Press
Brander, J. and B. Spencer, 1983, "International R&D Rivalry and IndustrialStrategy," Review of Economic Studies.
Bruno, Michael, 1985. "Introduction" in World Development.
Caves, Richard, 1985. "Industrial Policy and Trade Policy: A Framework,"Tokyo: JERC, mimeo.
Chenery, Hollis and Syrquin, Moises, 1975. Patterns of Development, London:Oxford University Press.
Chenery, Hollis, Sherman Robinson and Moshe Syrquin. Industrialization andGrowth: Comparative Studs, forthcoming.
Chenery, Hollis and Lance Taylor, November 1968. "Development Patterns AmongCountries and Over Time," Review of Economics and Statistics.
Choi, In bom, 1986. "Effccts of International Trade on Domestic Market,Structure and Performance," Ph.D. dissertation, Georgetown University.

- 132 -
Chou, Tein-chen, 1985. "Industrial Organization in the Process of EconomicDevelopment: Case of Taiwan," mimeo.
Clarke, Davies and Waterson, June 1984. "The Profitability-ConcentrationRelation: Market Power as Efficiency," The Journal of IndustrialEconomics.
Corbo, Vittorio, 1985. "Reform and Macroeconomic Adjustment in Chile During1974-84," World Development.
Corbo, Vittorio and Jaime de Melo eds., 1985. "Scrambling for Survival: HowFirms Adjusted to the Recent Reforms in Argentina, Chile and Uruguay",World Bank Staff Working Paper, No. 764.
Corbo, V., Jaime de Melo and James Tybout, 1986. "What Went Wrong in SouthernCone?" Economic Development and Cultural Chane.
Diebold, William, 1980. Industrial Policy as an International Issue, NewYork: McGraw Hill.
Dornbusch, Rudiger, March 1983. "Remarks on the Southern Cone," IMF StaffPaper.
Edwards, Sebastian, 1983. "The Order of Liberalization of the Current andCapital Accounts of the Balance of Payments," World Bank Working Paper,CPD.
Edwards, Sebastian, 1984. The Order of Liberalization of the External Sectorin Developing Countries, Princeton Essays in International Finance,No. 156.
Edwards, Sebastian, January 1985. "Stabilization with Liberalization: AnEvaluation of Ten Years of Chile's Experiment with Free Market Policies,"Economic Development and Cultural Change.
Edwards, Sebastian and Sweder Van Wijnbergen, February 1986. "The WelfareEffects of Trade and Capital Account Liberalization," InternationalEconomic Review.
Edwards, S., 1986, The Korean Macroeconomy: Recent Developments and FuturePrespectives, Consultant Report, World Bank.
Engardio, Pete, 1984. "Heavy Industries - The Winners and Losers," BusinessKorea, July 1984.
Federation of Korean Banks, The Analysis of the Efficiency of Banking Industryand Suggestions for Higher Efficiency in Korea, 1985.
Frank, Charles, Kwang Suk Kim and Larry Westphal, 1975. Foreign Trade Regimesand Economic Development: South Korea, New York: Columbia UniversityPress.

- 133 -
Freakel, Jacob, 1982. "The Order of Economic Liberalizations Discussion," inBonner and Meltzer, eds., Economic Poliocy in a World of Chanme, NorthHolland.
Frenkel, Jacob, et.al., 1983. "Panel Discussion on Southern Cone," IMF StaffPapers.
Fry, Maxwell, forthcoming. Domestic Resource Mobilization and Allocationthrough the Financial Sector.
Fry, M., 1982, "Models of Financially Repressed Developing Economies", WorldDevelopment, No. 10.
Ceber, Anthony, 1985. "The Korea Automobile Industry," Korea's Economy.
Harberger, Arnold, April 1985. "Reflections on the Chilean Economy," EconomicDevelopment and Cultural Change.
Hasan, Parvez, 1976. Korea: Problems and Issues in a Rapidly GrowingEconomy, Baltimore: Johns Hopkins University Press.
Heller, Walter, August 1976. "Change of Factor Endowment and ComparativeAdvantages: The Case of Japan, 1956-1968," Review of Economics and Sta-tistics.
Hong, Wontack, 1979. Trade, Distortions, and Employmnt Growth in Korea;Seoul: KOI Press.
Hong, Wontack, 1985. "Import Restriction and Import Liberalization in Export-Oriented Developing Economy: in Light of Korean Experience," Seoul:Seoul University, mimeo.
Johnson, Chalmers, 1982. "MITI and the Japanese Miracle: The Growth ofIndustrial Policy, 1927-1975," Stanford University Press.
Jones, Leroy and I1 Sakong, 1980. Government, Business, and Entrepreneurshipin Economic Development: The Korean Case, Studies in the Modernizationof the Republic of Korea, 1945-1975, Cambridge, Mass., Harvard UniversityPress.
KDI, Long-Term Development Plan for the Year 2000, September 1985.
KDI, Long-Range Prospects for Manpowr Supply and Demand and Policy Tasks,December 1985.
KIET, Projections of Manufacturing Structure and Development Strategy Toward2000, October 1985.
Kim, Jae Won, 1985. "The Rate of TFP Change in Small and Medium Industriesand Economic Development: The Case of Korea's Manufacturing," KoreaDevelopment Institute.

- 134 -
Kim, Kwang Suk, 1985. "The Timing and Sequencing of a Trade LiberalizationPolicy -- The Korean Case," Washington: World Bank, mimeo.
Kim, Kwang Suk and Larry Westphal, 1977. "Industrial Policy and Developmentin Korea," World Bank Staff Working Paper, No. 263, Washington, D.C., TheWorld Bank.
Kim, Kwang Suk, and Michael Roemer, 1979. Growth and Structural Transforma-tion, Cambridge: Harvard University Press.
Kim, Kwang Suk and Sung Duck Hong, 1982. "Long-Term Variation of Nominal andEffective Rates of Portection," Korea Development Institute.
Kim, Kwang Suk and Joon Kyung Park, 1985. "Sources of Economic Growth inKorea: 1963-1982," Korea Development Institute.
Kim, Y.B., 1984. Import and Export Functions in Korea, International MonetaryFund, DM/84177.
Korean Traders Association, 1982. Foreign Trade Procedures in Korea, Seoul:KOTRA.
Krueger, Anne, 1977. Growth, Distortions, and Patterns of Trade among ManyCountries, Princeton Studies in International Finance, no. 40.
Krueger, Anne, 1978. Foreign Trade Regimes and Economic Development: Liber-alization Attempts and Consequences, Cambridge, Mass.
Krueger, Anne, 1979. The Development Role of the Foreign Sector and Aid,Cambridge: Harvard University Press.
Krueger, Anne, 1985. "Problems of Liberalization" in Harberger, ed. WorldEconomic Growth.
Krueger, Anne, et al., 1985. Export-oriented DeveLopment Strategies: TheSuccess of Five Newly Industrializing Countries, Westview Press,
Kuznets, Paul, 1977. Economic Growth and Structure in the Republic of Korea,New Haven: Yale University Press.
Kwack, Sung Yung, 1985. "Policy Analysis with a Macroeconomic Model of theKorean Economy," Consultant Report, World Bank.
Kwac-k, Sung Yung and Michael Mered, 1980. "A Model of Economic Policy Effectsand External Influences on the Korean Economy," SRI/Wharton EPA WorldEconomic Program Discussion Paper No. 9.
Kwack, Tae Won, 1984. "Industrial Restructuring Experience and Policies inKorea in the 1970s", KDI Working Paper No. 84-08, Seoul: Korea Develop-ment Institute.

- 135 -
Lee, Byung-Jong, July 1985. "Special Treatment for the Shipbuilding Indus-try?" Business Korea.
Lee, Young Sun, forthcoming. "Changing Export Patterns in Korea, Taiwan andJapan," Weltwzrstschaffliches Archirv.
Lee, Kyu Uck, 1985. "Conglomerates and Business Concentrations The KoreanCase," Korea Development Institute.
Lee, Ryu Uck, 1977. "Market Structure and Monopoly Regulation in ManufacturingIndustry," Korea Development Institute.
Lee, Kyu Uck and Jae Hyung Lee, 1985. "Business Integration and Concentrationof Economic Power," Korea Development Review.
Lee, Sung Sup and Sung Yoon Kang, 1985", Analysis of Export Support System inthe Context of Stabilization Regime", Kore Development Institute Review,Fall.
Lee, Young Ki, 1985. "Conglomeration and Business Concentration - The KoreanCase," Seoul: Korea Development Institute, mimeo.
Lee, Won-young, 1984. "Science and Technology Policy in Korea," Seoul:Korea Development Institute* mimeo.
Little, I., T. Scitovsky and M. Scott, 1970. Industry and Trade in Some Deve-loping Countries, Oxford University Press.
Magaziner, Ira and Thomas Hout, 1980. Japanese Industrial Policy, Berkeley,University of California, Institute of International Studies.
McKinnon, Ronald, 1973. Money and Capital in Economic Development, VashingtonD.C., The Brookings Institute.
McKinnon, Ronald, 1982. "The Order of Economic Liberalization: T.essons fromChile and Argentina," in Brunner and Meltser, eds., Economic Policy in aWorld of Change, North Holland.
MOST, Science and Technology Policy in Korea, 1985.
Nam, Chong Hyun, 1971. "Trade, Industrial Policies, and the Structure of Pro-tection in Korea," in Trade and Growth of the Advanced Developing Coun-tries in the Pacific Basin, KDI Press: Seoul.
Nam, Chong Hyun, 1985. "Trade Policy and Economic Development in Korea,"Discussion Paper No. 9, Korea University, mimeo.
Nishimizu, Mieko and Sherman Robinson, 1983. "Trade Policies and ProductivityChange in Semi-Industrialized Countries," Journal of Development Economics.
boland, Marcus, 1985. "The Changing Pattern of Korean Comparative Advantage,1965-1980," Institute for International Economics, mimeo.
- 136 -
Noland, Marcus, 1985. The Changing Pattern of Japanese ComparativeAdvantage", Johns Hopkins University, mimeo.
Okuno, Masahiro and Kotaro Suzumura, 1985. "Economic Analysis of IndustrialPolicy: A Conceptual Framework through the Japanese Experience," Tokyo,Tokyo University, mimeo.
Pack, Howard and Larry Westphal, 1985. "Industrial Strategy and TechnologicalChange: Theory versus Reality", mimeu.
Park, Yung Chul, 1985. "Economic Stabilization and Liberalization in Korea,1980-1984," Korea University, mimeo.
Park, Yung Chul, 1985. "Korea's Experience with External Debt Management,"Seoul: Korea University, mimeo.
Peck, Merton, Richard Levin and Arika Coto, 1985. "Picking Losers: PublicPolicy Toward Declining Industries in Japan," mimeo.
Petri, Peter, 1983. Synopsis of Japanese Industrial Policy, World Bank,mimeo.
Rhee, Yung Whee, 1984. "Instruments for Export Policy Administration:Lessons from the East Asian Experience," Washington: World Bank, mimeo.
Rhee, Yung Whee, Bruce Ross-Larsen and Gary Pursell, 1984. Korea's Competi-tive Edge: Managing the Entry into World Markets, Baltimore: JohnsHopkins University Press.
Shaw, Edward, 1973. Financial Deepening in Economic Development, Oxford:Oxford University Press.
Senoo A., ed., 1983, Industrial Concentration in Contemporary Japan: 1971-80.
Shujiro Urata, forthcoming. "Sources of Economic Growth and StructuralChanges in China: 1956-81.," Journal of Comparative Economics.
Schultze, Charles 1983. "Industrial Policy: A Dissent," The BrookingsReview, Vol. 2 (Fall).
Syrquin, Moshe and Shujiro Urata, 1985. "Sources of Changes in Factor Inten-sity of Trade," Washington: World Bank, mimeo.
United States International Trade Commission, 1985. Foreign Industrial Tar-geting and its Effects on U.S. Industries: Phase III: Brazil, Canada,The Republic of Korea, Mexico, and Taiwan, USITC Publication 1632,Washington: USITC.
Vaeth, Werner, 1985. "The State and Problems of Declining Industries - TheCase of West German Steel Industry," Berlin: Free University of Berlin,mimeo.

- 137 -
Van Wijnbergen, Sweder, 1983. "Stagflationary Effects of Monetary Stabiliza-tion Policies: A Quantitative Analysis of South Korea," Journal ofDevelopment Economics.
Wade, Robert, forthcoming. "The Role of Government in Overcoming MarketFailure: Taiwan, Korea and Japan," in H. Hughes et al., eds., Explainingthe Success of East Asian Industrialization, Cambridge University Press.
Westphal, Larry, 1978. "The Republic of Korea's Experience with Export-LedIndustrial Development," World Devetopment, Vol. 6, No. 3.
Westphal, Larry, 1982. "Fostering Technological Mastery by Means of SelectiveInfant Industry Protection," in M. Syrquin and S. Teitel (eds.) TradeStability, Technology and Equity in Latin America, New York: Academic.
Westphal, Larry, forthcoming. "Book Review on Sources of Economic Growth inKorea: 1973-1982" by K.S. Kim and J.K. Park, Journal of Economic Litera-ture.
Westphal, Larry and Kwang Suk Kim, 1982. "Korea," in Balassa et al., Develop-ment Strategies in Semi-Industrial Countries.
Westphal, Larry, Linsu Kim and Carl Dahlman, 1984. "Reflections on Korea'sAcquisition of Technological Capability," World Bank Discussion Paper.No. DRD77.
Woronoff, Jon, 1983. Korea's Economy: Man-Made Miracle, Seoul: Si-sa-yong-o-sa Publishers.
Yamazawa, I. and J. Nohara, ed., 1985, Foreign Trade and Industrial Adjustmentin Asia-Pacific Countries, Institute of Development Economics.
Yoon, Chang Ho, and Kung Uck Lee, Industrial Organization, 1985.
Young, Soogit, 1984. "Trade Policy Reform in Korea: Background and Pros-pect," Seoul: Korea Development Institute, mimeo.
Young, Soogil, 1985. "Role of Trade Policy in Korea's Economic Developmentand Problems of Import Liberalization," Korea Development Institute,mimeo.
Young, Soogil and Jung Ho Yoo, 1982. "The Basic Role of Industrial Policy andthe Reform Proposal for the Protection Regime in Korea," Seoul: KoreaDevelopment Institute, mimeo.
Yun, Choon-Sik, 1985. "High Technology Industries in Korea," Korea ExchangeBank Monthly Review.
Yusuf, Shahid and Kyle Peters, 1984. "Saving Behavior and Its Implicationsfor Domestic Resource Mobilization: The Case of Republic of Korea."World Bank Staff Working Paper, No. 628.

- 138 -
Yusuf, Shahid and Rao, D.C., 1979. Korea, Policy Issues for Long-Term Deve-lopment, Baltimore: Johns Hopkins University Press.