Embed Size (px)
Citation preview

Repository of the Max Delbrück Center for Molecular Medicine (MDC) in the Helmholtz Association
http://edoc.mdc-berlin.de/14447
Deregulation of the endogenous C/EBP{beta} LIP isoform predisposes to tumorigenesis Begay, V., Smink, J.J., Loddenkemper, C., Zimmermann, K., Rudolph, C., Scheller, M., Steinemann, D., Leser, U., Schlegelberger, B., Stein, H., Leutz, A. This is the final version of the manuscript. The original article has been published in final edited form in: Publication 2015 JAN ; 93(1): 39-49 The final publication is available at Springer via http://dx.doi.org/10.1007/s00109-014-1215-5 Springer Verlag

1
Deregulation of the endogenous C/EBPβ LIP isoform predisposes to tumorigenesis
Valérie Bégay, Jeske J Smink, Christoph Loddenkemper, Karin Zimmermann, Cornelia
Rudolph, Marina Scheller, Doris Steinemann, Ulf Leser, Brigitte Schlegelberger,
Harald Stein and Achim Leutz
Affiliations:
V. Bégay, JJ. Smink, M. Scheller
Max Delbrueck Center for Molecular Medicine, Berlin, Germany;
C. Loddenkemper, H. Stein
Charité-Universitätmedizin Berlin, Department of Pathology, Campus Benjamin Franklin,
Berlin, Germany;
K. Zimmermann, U. Leser
Institute for Computer Science, Berlin, Humboldt-University of Berlin, Berlin, Germany;
C. Rudolph, D. Steinemann, B. Schlegelberger
Institute of Cell and Molecular Pathology, Hannover Medical School, Hannover, Germany;
A. Leutz
Max Delbrueck Center for Molecular Medicine, Berlin, Germany; Humboldt-University of
Berlin, Institute of Biology, 6Brandenburg Center for Regenerative Therapies, Berlin,
Germany.
Corresponding author: Achim Leutz, Univ.-Prof. Dr. rer. nat., Max Delbrueck Center for
Molecular Medicine, Dept of Tumorigenesis and Cell Differentiation, Robert-Roessle-Str.10,
13125 BERLIN Germany. Phone: + 49 30 9406 3735, Fax: + 49 30 9406 3298, Email:
Keywords: tumorigenesis, lymphomagenesis, translational control, tumor-stroma interaction

2
Abstract
Two long and one truncated isoforms (termed LAP*, LAP, and LIP, respectively) of the
transcription factor C/EBPβ are expressed from a single intronless Cebpb gene by
alternative translation initiation. Isoform expression is sensitive to mTOR mediated activation
of the translation initiation machinery and relayed through an uORF on the C/EBPβ mRNA.
The truncated C/EBPβ LIP, initiated by high mTOR activity, has been implied in neoplasia,
but it was never shown whether endogenous C/EBPβ LIP may function as an oncogene. In
this study we examined spontaneous tumor formation in C/EBPβ knockin mice that
constitutively express only the C/EBPβ LIP isoform from its own locus. Our data show that
deregulated C/EBPβ LIP predisposes to oncogenesis in many tissues. Gene expression
profiling suggests that C/EBPβ LIP supports a pro-tumorigenic microenvironment, resistance
to apoptosis, and alteration of cytokine/chemokine expression. The results imply that
enhanced translation re-initiation of C/EBPβ LIP promotes tumorigenesis. Accordingly,
pharmacological restriction of mTOR function might be a therapeutic option in tumorigenesis
that involves enhanced expression of the truncated C/EBPβ LIP isoform.

3
Introduction
The C/EBPβ transcription factor belongs to the basic leucine zipper (bZip) CCAAT enhancer
binding protein (C/EBP) family and controls cell fate in many tissues. C/EBPβ is involved in
cell growth, proliferation, differentiation, apoptosis, senescence, and tumor tolerance. Cebpb
is a single exon gene, yet three isoform proteins of variable N-terminal length are expressed
from internal AUG start sites. The two long isoforms (C/EBPβ LAP* and LAP) are both
transcriptional activators, but differ by 21 N-terminal amino acid residues that entail
chromatin regulatory capacity. The truncated C/EBPβ LIP isoform lacks the N-terminal 185
amino acid residues, removing the entire transactivation domain and part of the regulatory
domain. C/EBPβ LIP is thought to dominantly counteract tumor suppressive functions of
other C/EBP family members, suggesting C/EBPβ LIP as a potential oncogene [1, 2].
A highly conserved (from fish to man) small upstream open reading frame (uORF) in the 5’
mRNA region regulates alternative translation initiation of Cebpb at consecutive in frame
start sites. Previous data showed that translation of the uORF restrains initiation of C/EBPβ
LAP and causes resumption of ribosomal scanning and reinitiation at the downstream
C/EBPβ LIP start site. The translational control and C/EBPβ isoform switching depends on
mTOR signaling [3-6], stress response pathways [7], and RNA binding-proteins [8]. Briefly,
at high activity of the translation initiation machinery the C/EBPβ LIP isoform is preferentially
produced, whereas at low activity the long C/EBPβ LAP isoform is preferentially produced [9,
10]. Recent evidences suggested that the C/EBPβ LAP:LIP ratio is an important indicator of
C/EBPβ functions. Regulation of C/EBPβ LAP:LIP ratio plays a key role in liver regeneration,
acute phase response, bone homeostasis, and mammary gland development [9, 10].
Enhanced expression of C/EBPβ was observed in human tumors, including mammary
carcinomas [11-13], anaplastic large cell lymphoma (ALCL) [14-16], endometrial
adenocarcinoma [17], ovarian [18], colorectal [19], liver [7] and skin cancer [20]. Among
these, enhanced expression of the truncated C/EBPβ LIP isoform was reported in breast,
ALCL, ovarian and colorectal neoplasia. C/EBPβ LIP also supports metastasis survival in
breast cancer [21] and pharmacological inhibition of C/EBPβ LIP expression reduced ALCL
proliferation, implying a causal relationship between C/EBPβ LIP isoform expression and
tumorigenesis [14].
Here, we used recombinant mouse genetics to explore whether deregulated expression of
C/EBPβ LIP from its own genomic locus supports spontaneous tumor formation. A knockin
mouse strain that expresses the C/EBPβ LIP isoform (LIP ki) developed tumors in multiple

4
tissues of mesenchymal and epithelial origin, providing experimental evidence that
enhanced translation re-initiation of C/EBPβ LIP is involved in tumorigenesis.

5
Materials and Methods
Animals
The generation of C/EBPβ knockout (ko) and LIP ki mice have been previously described [9,
22]. The C/EBPβ ko and LIP ki mice were maintained on a 129 X C57BL/6 genetic
background. Mice were fed with standard mouse diet and water ad libitium on a 12-h light-
dark cycle. Animals were housed in a pathogen free facility at the Max-Delbrück-Center for
Molecular Medicine, Berlin. All procedures and animals experiments were conducted in
compliance with protocols approved by the institutional Animal Care and Use Committee.
Mice were sacrificed by cervical dislocation. All efforts were made to minimize animal
suffering.
Histopathological analyses
Mice were sacrificed upon substantial decline in health (i.e. weight loss, paralysis, ruffling of
fur or inactivity) or obvious tumor burden. Tissues were fixed in buffered 4% formaldehyde at
4°C, dehydrated and paraffin embedded. Sections (4µm) were stained with hematoxylin and
eosin according to standard procedures. To perform immunohistochemical (IHC) staining
slides were immersed in sodium citrate buffer solutions at pH 6.0, heated in a high-pressure
cooker for 5 min, rinsed in cold water and washed in Tris-buffered saline (pH 7.4), and were
then treated with a peroxidase-blocking reagent (Dako) before incubation for 1 h with the
primary antibody for B220 (RA3-6B2, eBioscience) or cleaved-caspase 3 (Asp175, Cell
Signaling). Binding was detected by the Envision peroxidase kit (K4010, Dako) using
diaminobenzidine as chromogenic substrate. Sections were analyzed using an AxioPlan-2
microscope (Zeiss, Germany). Images were acquired using a Zeiss AxioCam Hr camera and
AxioVision software version 4.2. For cleaved-caspase 3 IHC analysis, per animal five
randomly chosen microscope fields were captured at 200 x magnification. The number of
cleaved-caspase 3 positive cells/field were counted and expressed as fold of control.
Cell culture and immunoblotting
Mouse embryonic fibroblasts (MEFs) were isolated from E13.5 embryos and spontaneously
immortalized according to standard protocols. 3T3-L1 murine preadipocytes (ATCC,
American Type Culture Collection) and MEFs were cultured in DMEM (Invitrogen)
supplemented with 10% FBS (Invitrogen). Tissues, lymphoma and cells were lysed with 8 M
urea lysis buffer. Proteins were separated by SDS/PAGE followed by Western blot analysis
using rabbit C/EBPβ antibody (C19, Santa Cruz) and mouse anti-α-tubulin (B-7, Santa Cruz)

6
or mouse anti-β-tubulin (2-28-33, Sigma). Appropriate horseradish peroxidase-conjugated
secondary antibodies were used for chemiluminescence (Amersham Biosciences).
RNA preparation and Microarray gene expression profiling
Total RNA from 5 +/L and 5 WT lymphoma was prepared using the TriPure Isolation
Reagent (Roche) and analyzed on a 4x44K whole genome mouse microarray (Agilent
Technologies). For normalization, quality control, and data analysis, the Bioconductor
system was used (http://www.bioconductor.org) [23]. Raw microarray data from Agilent were
first quantile normalized. For identification of differentially expressed genes, a linear model
was fitted using limma. The fold change cutoff was set to 2 (FC = 2) and the P value cutoff
was selected as 0.05. For functional analysis, GSEA was performed using GSEA v2.0
algorithm (http://www.broadinstitute.org/gsea) [24] and the computed t-statistic from limma
as pre-ranking. The following gene sets from MSigDB database
(http://www.broadinstitute.org/gsea) were used: C2: curated sets, canonical pathways,
Biocarta, KEGG, Reactome and C5: Go gene sets, BP: biological process. Only gene sets
showing nominal P value ≤ 0.05 and false discovery rate (FDR) ≤ 0.25 were taken into
consideration.
Statistical analysis
All data are expressed as mean ± s.e.m. Statistically significant differences between groups
were determined using the unpaired two-tailed Mann-Whitney’s test for the histographs and
the Log-rank test for the Kaplan-Meier curves. Both tests were performed using Prism 5
(GraphPad Software). A P value <0.05 was considered to be statistically significant.
Accession number
The raw microarray data were deposited at Gene Expression Omnibus (GEO accession
number: GSE53770)

7
Results
LIP ki mice are cancer prone
An excess of C/EBPβ LIP has been suggested to promote metastatic breast cancer by
interfering with the TGFβ cytostatic pathway and/or by inhibition of anoikis [21, 25].
Moreover, expression of Cebpb LIP as a transgene under the whey acidic promoter led to
mammary gland hyperplasia and rare neoplasia [26]. Although these experimental
approaches have hinted at an oncogenic potential of C/EBPβ LIP, they did not reflect
organismal constraints in quantitative, spatial and temporal Cebpb regulation from its own
locus.
To examine whether enhanced endogenous C/EBPβ LIP expression is involved in
tumorigenesis, cohorts of 45 wild type (+/+, WT), 52 C/EBPβ LIP homozygous (L/L) and 72
C/EBPβ LIP heterozygous (+/L) mice were monitored over a period of more than 25 months.
Protein analysis confirmed expression of C/EBPβ LIP in the same tissues as C/EBPβ in WT
mice (Fig. 1a). Figure 1b illustrates the survival of +/L and L/L mice as compared to their WT
siblings. Median survival for WT mice was 24 months, versus 20 months for +/L, and 17
months for L/L mice. These results showed that deregulated expression of the C/EBPβ LIP
isoform decreased survival in a dominant and dose-dependent manner.
At 20 months of age, a 3.5-fold increase in tumorigenesis was observed in L/L mice as
compared to WT littermates (Table 1 and Fig. 1c). Histopathological analyses of the solid
tumors of L/L mice revealed B cell non-Hodgkin lymphoma (B-NHL, 25% in L/L vs 9% in
WT), histiocytic sarcoma (HS, 5.8% in L/L vs 0% in WT) and lung adenocarcinoma (1.9%
L/L vs 0% in WT) (Table 1 and Fig. S1).
Mice that express one WT Cebpb allele and Cebpb LIP from the second allele (+/L) reflect
translational deregulated, enhanced endogenous C/EBPβ LIP expression. At 20 months of
age, 37.5% of the +/L mice had developed solid tumors, in comparison to 9% of the WT
mice (Table 1 and Fig. 1c). Compared to L/L mice, the incidence of B-NHL was slightly
increased in +/L (32% in +/L vs 25% in L/L), yet the incidence of histiocytic sarcoma and
lung adenocarcinoma remained similar (histiocytic sarcoma: 7% in +/L vs 5.8% in L/L; lung
adenocarcinoma: 1.4% in +/L vs 1.9% in L/L) (Table 1). A cohort of Cebpb heterozygous
(Cebpb +/-) mice were kept under the same conditions. Median survival was similar in both
Cebpb +/- and WT littermates (cohort: 25 Cebpb +/+ and 27 Cebpb +/- mice, median
survival: 24 months and 25 months, respectively) and no tumor was found at 20 months of

8
age (data not shown). Investigation of spontaneous tumor formation in Cebpb -/- mice was
not possible due to occurrence of infection and severe skin wound phenotype before one
year of age in more than 60% of the mice. Altogether our data suggest that increase in
C/EBPβ LIP is responsible for tumor development (as in +/L mice) but not a decrease in total
C/EBPβ (as in Cebpb +/- mice).
B-NHL was found at high incidence in the LIP ki mice. As shown in Figure 1d, LIP ki mice
developed B-NHL significantly earlier than WT, although the 129 X C57BL/6 strain is known
to be susceptible to B-NHL formation at old age [27]. Interestingly, expression of C/EBPβ,
and in particular of the C/EBPβ LIP isoform, is high in lymphoma that develop in WT mice
(Fig. 1e), in comparison to the spleens of young WT or LIP ki mice (Fig. 1a) and to the
isolated CD19+ B cells (data not shown). Moreover the tumor spectrum in +/L mice was
broader than that in L/L mice and included T-lymphoma, carcinoma of the skin, liver, and
mammary gland (Table 1, Fig. 2, S2, S3 and S4). Note that C/EBPβ protein expression was
detected in all tumor types (Fig. S1, S2 and S5). The generally low carcinoma incidence,
however, may be masked by faster lymphoma development, as previously reported in other
murine cancer models [28]. These data show that deregulated expression of C/EBPβ LIP
from its own locus enhances tumor development in several mesenchymal and epithelial
tissues.
Deregulation of cancer pathways in LIP ki mice
To determine which signaling pathways were altered in LIP ki mice tumors, B-NHL tumors
obtained from LIP ki and WT mice were examined for cytogenetic alterations using SKY
analysis (Table S1). No obvious gross genomic or recurrent rearrangements correlated with
enhanced C/EBPβ LIP expression.
Next, gene expression profiling analysis revealed 123 genes as differentially expressed in
lymphoma of +/L mice in comparison to lymphoma of WT mice (Fig. 3a and Table S2; 66
upregulated and 57 downregulated genes). Gene set enrichment analysis (GSEA) and
examination of leading-edge gene subsets identified enrichment of C2 and C5 functional
sets in +/L mice that belong to mTOR pathways (http://www.broadinstitute.org/gsea/msigdb).
In addition to mTOR signaling, gene sets involved in translation and regulation of translation,
mitochondrial function, metabolism, IGF1, and FOXO pathways, are all significantly enriched
in lymphoma of +/L mice (Fig. 3b, c, d, e and Table S3). These data support the notion that
elevated C/EBPβ LIP participates in metabolic signaling and mTOR regulated gene
expression control during tumorigenesis.

9
In +/L lymphoma, GSEA highlighted 3 significant gene sets implicated in cell death signaling
(Table S3). Moreover, the comparison between lymphoma of WT and +/L mice identified
several gene sets involved in MAPkinase, ALK1, TGFβ, and NF-kB pathways that may affect
apoptosis and that were significantly depleted in +/L lymphoma (Fig. S6 and Table S3). We
also found that the number of apoptotic cells was slightly reduced in the spleen of +/L mice
before tumor onset, whereas apoptosis rate was significantly increased in the spleen of
Cebpb -/- compared to WT mice (Fig. 4a). Furthermore, reduction of caspase 3 cleavage
was detected in CD19+ B cells and lymphoma from +/L, as compared to WT (Fig. 4b and 4c,
respectively). Similar results were obtained with spleen and CD19+ B cells from L/L mice
(data not shown). Altogether these data suggest that increase in C/EBPβ LIP expression
reduced the apoptotic rate in B cells and B-NHL.
Deregulation of immune defense might play a key role in tumorigenesis and several previous
findings suggested C/EBPβ as an important transcription factor controlling cytokine and
chemokine expression in immune cells. Deregulated gene expression comprised known
C/EBPβ target genes, including Saa3, S100a9, Arg1, Fpr1, Cxcl13 (Table S2 and [29, 30]).
Gene expression profiling showed that approximately 14% of the deregulated genes in +/L
lymphoma encoded cytokines/chemokines (Fig. 5a and Table S2). Moreover, the
comparison between lymphoma of WT and +/L mice using GSEA revealed leading-edge
gene subsets involved in cytokine and chemokine biosynthesis, Toll-like receptor pathways,
and innate immune response (Fig. 5b, c, d and Table S3). Expression levels of leukocyte
recruiting Ccl3 and Ccl4 cytokines involved in tumor cell eradication, inflammatory M1 type
classically activated macrophages (Cxcl13, Cxcl14, Cxcl16, Cx3cr1), and dendritic cells
(Cxcl16, Cd11c) markers were all decreased in lymphoma of +/L mice (Fig. 5a). In contrast,
M2 activated macrophage markers were enhanced in lymphoma of +/L mice (Fig. 5a; Cd36,
Arg1, Ccl24, Mrc1, Retnla, Ccl11, Cd163). These data suggest association of a pro-
tumorigenic microenvironment in LIP ki lymphoma.
Collectively, expression profiling and pathway analysis of C/EBPβ LIP lymphoma revealed
an increase in pro-tumorigenic cytokine release, deregulation of chemokine expression and
TLR signaling pathways, in addition to reduced apoptosis, that may all predispose and
contribute to tumor susceptibility. This notion was further supported by recent evidence
suggesting C/EBPβ as a critical regulator of myeloid derived suppressor cells that promote
the pro-tumorigenic immunosuppressive microenvironment [31].

10
To test whether deregulated C/EBPβ LIP expression promotes lympho/myelo-proliferation
we performed bone marrow (BM) transfer of WT cells into lethally irradiated WT or L/L
recipient mice (Fig. S7A). The distribution of hematopoietic cell lineages was different in WT
BM reconstituted L/L and WT mice although engraftment of donor cells and the spleen
weights were similar in both recipient strains (Fig. S7B and C). An increase in myeloid cells
(CD11b positive cells) and a decrease in T cells (CD3 positive cells) were found in the
spleens of WT BM reconstituted L/L mice, in comparison to WT BM reconstituted WT mice
(B220 positive cells were not affected; Fig. S7D). In peripheral blood, white blood cells
(granulocytes, monocytes, lymphocytes) of WT donor origin were higher in L/L than in WT
recipient mice (Fig. S7E and F), but no changes in red blood cell counts were observed (Fig.
S7G). These data suggest that enhanced expression of the C/EBPβ LIP isoform facilitates a
tumor supportive microenvironment, but further experiments are required to determine how
the microenvironment is actually altered in LIP mice.

11
Discussion
Data shown here firmly establish the proto-oncogenic function of endogenous C/EBPβ LIP in
mesenchymal and epithelial tissues. Tumors were found in tissues previously shown to
depend on C/EBPβ functions, including mammary gland, skin, liver, lung, and hematopoietic
cells [15, 16, 30 , 32-34]. Enhanced C/EBPβ LIP expression leads to the development of
follicular lymphoma (B-NHL) and histiocytic sarcoma. Human follicular lymphoma may
eventually trans-differentiate into histiocytic sarcoma and C/EBPβ was found to be strongly
expressed in these tumors [35]. C/EBPβ LIP has also been shown to promote proliferation of
human B cell Hodgkin lymphoma and ALCL [14, 16], suggesting an important function of
C/EBPβ LIP deregulation in lymphomagenesis and hinting at similarities in disease
development in rodents and human.
C/EBPβ LIP is thought to antagonize the long isoforms C/EBPβ LAP*/LAP, other C/EBP
members, and some bZIP factors [36, 37]. Accordingly, four scenarios can be envisioned to
describe the effect of C/EBPβ LIP on gene expression: (i) C/EBPβ LIP acts alone, (ii)
C/EBPβ LIP antagonizes other C/EBP family members or bZIP factors, (iii) C/EBPβ LIP
antagonizes the LAP*/LAP isoforms of C/EBPβ or (iv) ii and iii at the same time. C/EBPβ
LIP heterozygous mice can reflect all four modes of action while L/L mice can affect (i) and
(ii) but not (iii) and (iv). C/EBPβ LIP heterozygous mice develop a broader tumor spectrum
and higher percentage of tumor incidence than L/L mice, suggesting that the oncogenic
action of C/EBPβ LIP is mediated through antagonism of the C/EBPβ LAP*/LAP isoforms.
However, L/L mice die significantly earlier than +/L mice and tumor types that might develop
later in life (e.g. requiring more oncogenic events) will not be found in L/L mice. Similarly,
analysis of spontaneous tumor formation in p53 deficient mice showed a wider tumor
spectrum in p53 +/- mice as compared to p53 -/- mice [28]. These data suggests that
dosage effects of oncogenes or tumor suppressor genes may affect tumor development.
Carcinogen-induced tumorigenesis in LIP ki mice or combination with other murine
oncogenic models will help to resolve the underlying molecular events in future experiments.
Surprisingly and in contrast to the Cebpb -/- mice, L/L and +/L mice both do not show skin
phenotypes, loss of hair or reduced fat content (data not shown), suggesting that C/EBPβ
LIP isoform functions are not reflecting simple loss of function phenotypes and go beyond
inhibition of C/EBPβ LAP*/LAP or other C/EBPs members in the skin or fat. These
observations support the notion that regulatory capacity by C/EBPβ LIP is context
dependent and more complex that the four possibilities of action, as noted above.
Nevertheless, it was important to first analyze spontaneous tumor formation in LIP ki mice

12
and here, our data revealed the oncogenic potential of C/EBPβ LIP from its own locus in
divers tissues.
The long latency of tumor development in LIP ki mice suggests that additional oncogenic
events are required in conjunction with C/EBPβ LIP deregulation. Co-operation of several
proto-oncogenes and loss of tumor suppressor functions is a common explanation of tumor
development. However, tumorigenesis was not accelerated in compound mice heterozygous
for p53 deletion and C/EBPβ LIP deregulation, as compared to p53 heterozygous mice (data
not shown). It therefore remains to be resolved which additional oncogenic events may
accelerate tumor development in +/L or L/L mice.
The GSEA analyses indicated several altered pathways in lymphoma of LIP ki mice that
relate to autonomous and non-cell autonomous effects on B cell lymphomagenesis. The
structural features of Cebpb gene (lack of introns), however, render a conditional genetic
approach rather difficult to experimentally resolve how C/EBPβ LIP supports oncogenesis. In
contrast to Cebpa, no mutational alterations within the Cebpb coding region that affect the
isoform expression have yet been reported. However, deregulation of C/EBPβ LIP
expression may occur on the signaling/proteomic, rather than on the genomic level. In any
case, our results show that tight regulation of the balance between long and truncated
C/EBPβ isoforms is important for preventing tumor formation. Accordingly, the data imply
that translational deregulation may dysbalance C/EBPβ isoform expression to contribute to
tumorigenesis.
Previously, we have shown that the mTOR-TORC1 inhibitor rapamycin restricts upregulation
of C/EBPβ LIP expression and lymphoma xenograft growth [3, 14]. Moreover, a translational
control defective C/EBPβ mutant phenocopied mTOR inhibition and mTOR target genes
were found to be co-regulated by C/EBPβ and thus identified C/EBPβ as an important
mediator of mTOR functions [9, 10]. Activation of mTOR promotes protein biosynthesis,
translation reinitiation, M2 polarization, cell survival, and tumorigenesis, [38, 39].
Deregulated mTOR signaling is evident in lymphomagenesis and leukemogenesis and
development of therapeutic strategies based on mTOR inhibition are currently under
investigation [40, 41]. Lymphoma cells of C/EBPβ LIP heterozygous mice showed
enrichment of rapamycin sensitive genes, including FABP4 and adipokines that are thought
to play an important role in tumorigenesis [42]. In addition, eIF-4E, a key factor of translation
initiation that is regulated by the mTOR sensitive 4EBPs also up-regulates C/EBPβ LIP
expression and promotes neoplasia [3, 43]. Our data therefore imply that pharmacologic

13
interference with uORF mediated C/EBPβ LIP translation initiation control may help to re-
establish the balance between C/EBPβ isoforms and oppose deregulated mTOR signaling.

14
Acknowledgments
We thank E. Sterneck for providing the cebpβ ko mouse strain, HP Rahn for help with flow
cytometry, the radiology department of the Helios Klinikum for help with X-ray radiation and
C. Becker, J. Bergemann, A.V. Giese, P. Heinrich-Gossen, S. Jaksch, R. Leu, S.
Spieckermann and R. Zarmstorff for technical assistance. We are grateful to F. Rosenbauer
and T. Müller for valuable discussions. This work was supported by the Deutsche
Krebsgesellschaft (grant n° LEFF200708 to A.L) and by the German Research Council
(grant n° TRR-54 to A.L. and U.L.).
Disclosure The authors declare no conflict of interest related to this study.

15
References 1. Wethmar K, Smink JJ, Leutz A (2010) Upstream open reading frames: molecular switches in (patho)physiology. BioEssays : news and reviews in molecular, cellular and developmental biology 32: 885-893 2. Zahnow CA (2009) CCAAT/enhancer-binding protein beta: its role in breast cancer and associations with receptor tyrosine kinases. Expert Rev Mol Med 11: e12 3. Calkhoven CF, Muller C, Leutz A (2000) Translational control of C/EBPalpha and C/EBPbeta isoform expression. Genes Dev 14: 1920-1932 4. Nardella C, Carracedo A, Salmena L, Pandolfi PP (2010) Faithfull modeling of PTEN loss driven diseases in the mouse. Curr Top Microbiol Immunol 347: 135-168 5. Ossipow V, Descombes P, Schibler U (1993) CCAAT/enhancer-binding protein mRNA is translated into multiple proteins with different transcription activation potentials. Proc Natl Acad Sci U S A 90: 8219-8223 6. Zoncu R, Efeyan A, Sabatini DM (2011) mTOR: from growth signal integration to cancer, diabetes and ageing. Nat Rev Mol Cell Biol 12: 21-35 7. Li Y, Bevilacqua E, Chiribau CB, Majumder M, Wang C, Croniger CM, Snider MD, Johnson PF, Hatzoglou M (2008) Differential control of the CCAAT/enhancer-binding protein beta (C/EBPbeta) products liver-enriched transcriptional activating protein (LAP) and liver-enriched transcriptional inhibitory protein (LIP) and the regulation of gene expression during the response to endoplasmic reticulum stress. J Biol Chem 283: 22443-22456. DOI 10.1074/jbc.M801046200 8. Timchenko NA, Wang GL, Timchenko LT (2005) RNA CUG-binding protein 1 increases translation of 20-kDa isoform of CCAAT/enhancer-binding protein beta by interacting with the alpha and beta subunits of eukaryotic initiation translation factor 2. J Biol Chem 280: 20549-20557. DOI 10.1074/jbc.M409563200 9. Smink JJ, Begay V, Schoenmaker T, Sterneck E, de Vries TJ, Leutz A (2009) Transcription factor C/EBPbeta isoform ratio regulates osteoclastogenesis through MafB. Embo J 28: 1769-1781 10. Wethmar K, Begay V, Smink JJ, Zaragoza K, Wiesenthal V, Dorken B, Calkhoven CF, Leutz A (2010) C/EBPbetaDeltauORF mice--a genetic model for uORF-mediated translational control in mammals. Genes Dev 24: 15-20 11. Dearth LR, Hutt J, Sattler A, Gigliotti A, DeWille J (2001) Expression and function of CCAAT/enhancer binding proteinbeta (C/EBPbeta) LAP and LIP isoforms in mouse mammary gland, tumors and cultured mammary epithelial cells. J Cell Biochem 82: 357-370 12. Milde-Langosch K, Loning T, Bamberger AM (2003) Expression of the CCAAT/enhancer-binding proteins C/EBPalpha, C/EBPbeta and C/EBPdelta in breast cancer: correlations with clinicopathologic parameters and cell-cycle regulatory proteins. Breast Cancer Res Treat 79: 175-185 13. Zahnow CA, Younes P, Laucirica R, Rosen JM (1997) Overexpression of C/EBPbeta-LIP, a naturally occurring, dominant-negative transcription factor, in human breast cancer. J Natl Cancer Inst 89: 1887-1891 14. Jundt F, Raetzel N, Muller C, Calkhoven CF, Kley K, Mathas S, Lietz A, Leutz A, Dorken B (2005) A rapamycin derivative (everolimus) controls proliferation through down-regulation of truncated CCAAT enhancer binding protein {beta} and NF-{kappa}B activity in Hodgkin and anaplastic large cell lymphomas. Blood 106: 1801-1807 15. Piva R, Pellegrino E, Mattioli M, Agnelli L, Lombardi L, Boccalatte F, Costa G, Ruggeri BA, Cheng M, Chiarle R, Palestro G, Neri A, Inghirami G (2006) Functional validation of the anaplastic lymphoma kinase signature identifies CEBPB and BCL2A1 as critical target genes. J Clin Invest 116: 3171-3182 16. Quintanilla-Martinez L, Pittaluga S, Miething C, Klier M, Rudelius M, Davies-Hill T, Anastasov N, Martinez A, Vivero A, Duyster J, Jaffe ES, Fend F, Raffeld M (2006) NPM-ALK-dependent expression of the transcription factor CCAAT/enhancer binding protein beta

16
in ALK-positive anaplastic large cell lymphoma. Blood 108: 2029-2036. DOI blood-2005-10-014258 [pii] 10.1182/blood-2005-10-014258 17. Arnett B, Soisson P, Ducatman BS, Zhang P (2003) Expression of CAAT enhancer binding protein beta (C/EBP beta) in cervix and endometrium. Mol Cancer 2: 21 18. Sundfeldt K, Ivarsson K, Carlsson M, Enerback S, Janson PO, Brannstrom M, Hedin L (1999) The expression of CCAAT/enhancer binding protein (C/EBP) in the human ovary in vivo: specific increase in C/EBPbeta during epithelial tumour progression. Br J Cancer 79: 1240-1248 19. Rask K, Thorn M, Ponten F, Kraaz W, Sundfeldt K, Hedin L, Enerback S (2000) Increased expression of the transcription factors CCAAT-enhancer binding protein-beta (C/EBBeta) and C/EBzeta (CHOP) correlate with invasiveness of human colorectal cancer. Int J Cancer 86: 337-343 20. Oh HS, Smart RC (1998) Expression of CCAAT/enhancer binding proteins (C/EBP) is associated with squamous differentiation in epidermis and isolated primary keratinocytes and is altered in skin neoplasms. J Invest Dermatol 110: 939-945 21. Gomis RR, Alarcon C, Nadal C, Van Poznak C, Massague J (2006) C/EBPbeta at the core of the TGFbeta cytostatic response and its evasion in metastatic breast cancer cells. Cancer Cell 10: 203-214 22. Sterneck E, Tessarollo L, Johnson PF (1997) An essential role for C/EBPbeta in female reproduction. Genes Dev 11: 2153-2162 23. Gentleman RC, Carey VJ, Bates DM, Bolstad B, Dettling M, Dudoit S, Ellis B, Gautier L, Ge Y, Gentry J, Hornik K, Hothorn T, Huber W, Iacus S, Irizarry R, Leisch F, Li C, Maechler M, Rossini AJ, Sawitzki G, Smith C, Smyth G, Tierney L, Yang JY, Zhang J (2004) Bioconductor: open software development for computational biology and bioinformatics. Genome biology 5: R80. DOI 10.1186/gb-2004-5-10-r80 24. Subramanian A, Tamayo P, Mootha VK, Mukherjee S, Ebert BL, Gillette MA, Paulovich A, Pomeroy SL, Golub TR, Lander ES, Mesirov JP (2005) Gene set enrichment analysis: a knowledge-based approach for interpreting genome-wide expression profiles. Proc Natl Acad Sci U S A 102: 15545-15550. DOI 10.1073/pnas.0506580102 25. Li H, Baldwin BR, Zahnow CA (2011) LIP expression is regulated by IGF-1R signaling and participates in suppression of anoikis. Mol Cancer 10: 100. DOI 10.1186/1476-4598-10-100 26. Zahnow CA, Cardiff RD, Laucirica R, Medina D, Rosen JM (2001) A role for CCAAT/enhancer binding protein beta-liver-enriched inhibitory protein in mammary epithelial cell proliferation. Cancer Res 61: 261-269 27. Ward JM (2006) Lymphomas and leukemias in mice. Exp Toxicol Pathol 57: 377-381. DOI S0940-2993(06)00041-8 [pii] 10.1016/j.etp.2006.01.007 28. Harvey M, McArthur MJ, Montgomery CA, Jr., Butel JS, Bradley A, Donehower LA (1993) Spontaneous and carcinogen-induced tumorigenesis in p53-deficient mice. Nat Genet 5: 225-229 29. Bonzheim I, Irmler M, Klier-Richter M, Steinhilber J, Anastasov N, Schafer S, Adam P, Beckers J, Raffeld M, Fend F, Quintanilla-Martinez L (2013) Identification of C/EBPbeta Target Genes in ALK+ Anaplastic Large Cell Lymphoma (ALCL) by Gene Expression Profiling and Chromatin Immunoprecipitation. PLoS One 8: e64544. DOI 10.1371/journal.pone.0064544 30. Uematsu S, Kaisho T, Tanaka T, Matsumoto M, Yamakami M, Omori H, Yamamoto M, Yoshimori T, Akira S (2007) The C/EBP beta isoform 34-kDa LAP is responsible for NF-IL-6-mediated gene induction in activated macrophages, but is not essential for intracellular bacteria killing. J Immunol 179: 5378-5386 31. Marigo I, Bosio E, Solito S, Mesa C, Fernandez A, Dolcetti L, Ugel S, Sonda N, Bicciato S, Falisi E, Calabrese F, Basso G, Zanovello P, Cozzi E, Mandruzzato S, Bronte V (2010) Tumor-induced tolerance and immune suppression depend on the C/EBPbeta transcription factor. Immunity 32: 790-802. DOI 10.1016/j.immuni.2010.05.010

17
32. Nerlov C (2007) The C/EBP family of transcription factors: a paradigm for interaction between gene expression and proliferation control. Trends in cell biology 17: 318-324. DOI 10.1016/j.tcb.2007.07.004 33. Nerlov C (2010) Transcriptional and translational control of C/EBPs: the case for "deep" genetics to understand physiological function. BioEssays : news and reviews in molecular, cellular and developmental biology 32: 680-686. DOI 10.1002/bies.201000004 34. Ramji DP, Foka P (2002) CCAAT/enhancer-binding proteins: structure, function and regulation. The Biochemical journal 365: 561-575. DOI 10.1042/BJ20020508 35. Feldman AL, Arber DA, Pittaluga S, Martinez A, Burke JS, Raffeld M, Camos M, Warnke R, Jaffe ES (2008) Clonally related follicular lymphomas and histiocytic/dendritic cell sarcomas: evidence for transdifferentiation of the follicular lymphoma clone. Blood 111: 5433-5439 36. Newman JR, Keating AE (2003) Comprehensive identification of human bZIP interactions with coiled-coil arrays. Science 300: 2097-2101. DOI 10.1126/science.1084648 37. Vinson C, Myakishev M, Acharya A, Mir AA, Moll JR, Bonovich M (2002) Classification of human B-ZIP proteins based on dimerization properties. Molecular and cellular biology 22: 6321-6335 38. Chen W, Ma T, Shen XN, Xia XF, Xu GD, Bai XL, Liang TB (2012) Macrophage-induced tumor angiogenesis is regulated by the TSC2-mTOR pathway. Cancer Res 72: 1363-1372. DOI 10.1158/0008-5472.CAN-11-2684 39. Menon S, Yecies JL, Zhang HH, Howell JJ, Nicholatos J, Harputlugil E, Bronson RT, Kwiatkowski DJ, Manning BD (2012) Chronic activation of mTOR complex 1 is sufficient to cause hepatocellular carcinoma in mice. Science signaling 5: ra24. DOI 10.1126/scisignal.2002739 40. Chiarini F, Evangelisti C, Buontempo F, Bressanin D, Fini M, Cocco L, Cappellini A, McCubrey JA, Martelli AM (2012) Dual Inhibition of Phosphatidylinositol 3-Kinase and Mammalian Target of Rapamycin: a Therapeutic Strategy for Acute Leukemias. Current cancer drug targets 41. Xu ZZ, Xia ZG, Wang AH, Wang WF, Liu ZY, Chen LY, Li JM (2013) Activation of the PI3K/AKT/mTOR pathway in diffuse large B cell lymphoma: clinical significance and inhibitory effect of rituximab. Annals of hematology 92: 1351-1358. DOI 10.1007/s00277-013-1770-9 42. Lee D, Wada K, Taniguchi Y, Al-Shareef H, Masuda T, Usami Y, Aikawa T, Okura M, Kamisaki Y, Kogo M (2014) Expression of fatty acid binding protein 4 is involved in the cell growth of oral squamous cell carcinoma. Oncology reports 31: 1116-1120. DOI 10.3892/or.2014.2975 43. Ruggero D, Montanaro L, Ma L, Xu W, Londei P, Cordon-Cardo C, Pandolfi PP (2004) The translation factor eIF-4E promotes tumor formation and cooperates with c-Myc in lymphomagenesis. Nature medicine 10: 484-486. DOI 10.1038/nm1042

18
Figure legends
Fig. 1 LIP ki mice are cancer prone. (a). C/EBPβ isoform expression in tissues of WT and
LIP ki mice. Various tissues isolated from 8-week-old WT and LIP ki mice (+/L, L/L) were
lysed in 8 M urea lysis buffer and analyzed by Western blotting for expression of C/EBPβ
isoforms LAP*, LAP and LIP (as indicated). M.GL.: mammary gland; WAT: white adipose
tissue; BAT: brown adipose tissue; Pan: pancreas; BM: bone marrow. 3T3-L1 cells (L1) and
C/EBPα -/- MEF (α-/-) were used as positive controls whereas C/EBPβ -/- MEF (β-/-) were
used as negative controls. α-tubulin was used as internal control. White asterisk (*):
unspecific immune reactivity. (b) Dosage effect of C/EBPβ LIP on survival rate. Kaplan-
Meier curve of +/+ (black line) and LIP ki mice (+/L, orange line; L/L, green line) housed over
a period of 25 months. Mice were monitored twice weekly for tumor formation. Moribund
mice or mice showing fatal illness or tumor development were sacrificed and tissues were
isolated for further examination. Cohorts of mice: +/+ n= 45; +/L n = 72; L/L n = 52.
Accelerated death of +/L and L/L mice versus +/+ mice, and of +/L mice versus L/L mice
according to the Log-rank test was significant in each case: ***P< 0.0001. (c) Comparison of
survival rate and tumor incidence at 20 months of age between LIP ki mutants and WT mice:
+/+ (4 tumors out 45 +/+ mice); +/L (27 tumors out of 72 mice); L/L (16 tumors out of 52
mice). (d) Comparison of average age for lymphoma development in WT and LIP ki mice.
Cohorts of mice: +/+ n= 45; +/L n = 72; L/L n = 52. Error bars show SEM. Significant
accelerated lymphoma development of +/L and L/L mice versus +/+ mice were analyzed
using the unpaired two-tailed Mann-Whitney’s test: ***P< 0.0001. (e) Lymphoma found in
WT and LIP ki mice were lysed in 8 M urea lysis buffer and analyzed by Western blotting for
expression of C/EBPβ isoforms LAP*, LAP and LIP (as indicated). β-tubulin was used as
internal control.
Fig. 2 LIP ki mice develop mesenchymal and epithelial tumors. Histological analysis (H&E
staining) of mesenchymal (a and c) and epithelial (d-h) tumors found in the +/L mice. (a-b) B
cell non-hodgkin lymphoma (B-NHL, a) with massive infiltration of B cells in the liver (arrows
in a) characterized by B220 immunopositive staining (arrows in b). See Fig. S1 for further
characterization of the B-NHL. (c) A histiocytic sarcoma with nodular infiltrates (arrows)
developed in the spleen. See Fig. S2 for further characterization of the histiocytic sarcoma.
(d) Liver with a hepatocellular carcinoma (HCC) showing a trabecular growth pattern
(arrow). Arrowhead: mitotic figure. (e-f) A ductal (e) and a tubular (f) mammary carcinoma
developed in a +/L female of 16 months of age. (g) Skin carcinoma with squamous
differentiation and keratinization (arrowhead) as well as horn pearl formation (arrow). (h)
Lung adenocarcinoma with papillary growth pattern. a, b: scale bar = 25 µm; c, d, g, h: scale

19
bar = 20 µm; e, f: scale bar = 10 µm. See Fig S3 and S4 for comparison with non-tumor
tissues from age-matched +/+ mice.
Fig. 3 Gene expression profiling analysis of B-NHL of LIP ki mice. (a) Heat map of
differentially regulated genes in B-NHL of +/L mice in comparison to B-NHL of WT mice as
identified by gene array analysis. +/+ n = 5; +/L n = 5, See list of the genes in Table S2. (b-e)
GSEA based on the comparison of B-NHL of +/L and WT mice for enrichment or depletion of
rapamycin sensitive genes (b), translation (c), FOXO pathway (d) and oxidative
phosphorylation and TCA cycle and respiratory electron transport (e) associated genes. The
normalized enrichment scores (NES) and P values are indicated in each plot. Note the
positive NES values observed in all cases indicating an upregulation of these gene sets in B-
NHL of +/L mice compared to B-NHL of WT mice.
Fig. 4 Impaired apoptosis in LIP ki mice before and after tumor onset. (a). Number of
apoptotic cells in the splenic white pulp of C/EBPβ mutants and WT mice before tumor
onset. Apoptotic cells were analyzed using cleaved-caspase 3 immunostaining. Numbers of
positive cleaved-caspase 3 cells/field were counted and expressed as fold of control. n = 5
per genotype. Error bars show SEM. *P<0.05. (b-c). Representative immunoblot analyses
showing decrease in cleaved-caspase 3 (Cl.caspase 3) expression in CD19+ B cells sorted
from spleen of 12 months-old LIP ki mice as compared with those of WT counterparts (b)
and in B-NHL of LIP ki mice as compared with B-NHL of WT mice (c). β-tubulin was used as
loading control. The CD19+ B cells samples were run on the same gel, but were
noncontiguous (same for B-NHL samples).
Fig. 5 Deregulated C/EBPβ LIP expression altered cytokines and chemokines expression
levels in B-NHL of LIP ki mice. (a) Heat map showing deregulated expression of cytokines
and chemokines in B-NHL of +/L mice in comparison to B-NHL of WT mice. +/+ n = 5; +/L n
= 5. (b-d) GSEA based on the comparison of B-NHL of +/L and WT mice for enrichment or
depletion of regulation of cytokine biosynthetic process (b), Toll like receptor signaling
pathway (c), and innate immune system (d) associated-genes. The normalized enrichment
scores (NES) and P values are indicated in each plot. Note the negative NES values
observed in all cases indicating a depletion of these gene sets in B-NHL of +/L mice
compared to B-NHL of WT mice.

20
TABLES
Table 1 Tumor distribution in LIP ki mice at 20 months of age.
Genotype +/+ +/L L/L
Number dead/cohort 11/45 41/72 44/52a
Tumor incidence:
/cohort 4/45 (9%) 27/72 (37.5%)*** 16/52 (30.8%)**
/number dead 4/11 (36%) 27/41 (66%)* 16/44 (36%)
B-NHL 4/45 (9%) 23/72 (32%) 13/52 (25%)
T-lymphoma 0 1/72 0
Histiocytic sarcoma 0 5/72 3/52
Mammary gland carcinoma 0 2/72 0
HCC 0 1/72 0
Skin carcinoma 0 1/72 0
Lung tumor 0 1/72 1/52
Note that some mice developed multiple primary solid tumors. Tumor incidence reflects
number of mice with any kind of tumor(s) even though an animal might develop more than
one tumor. B-NHL: B non-Hodgkin lymphoma, HCC: hepatocellular carcinoma.
Unpaired t test: *P<0.02; **P<0.005; ***P<0.0005. aL/L mice show a high death rate but a lower tumor incidence in comparison to +/L mice. L/L
mice developed more infection and abscess than +/L and +/+ mice.


+/+ +/L
β -/-0.0
0.5
1.0
1.5
3
4 *
apop
totic
cel
ls(fo
ld o
f con
trol)
b
+/+
+/+
+/L
+/La
c
β-tubulin
β-tubulin
cl. caspase 3
cl. caspase 3


1
Journal of Molecular Medicine
SUPPLEMENTARY MATERIAL
Deregulation of the endogenous C/EBPβ LIP isoform predisposes to tumorigenesis
Valérie Bégay, Jeske J. Smink, Christoph Loddenkemper, Karin Zimmermann,
Cornelia Rudolph, Marina Scheller, Doris Steinemann, Ulf Leser, Brigitte
Schlegelberger, Harald Stein and Achim Leutz.
Corresponding author: Achim Leutz, Univ.-Prof. Dr. rer. nat., Max Delbrueck Center
for Molecular Medicine, Dept of Tumorigenesis and Cell Differentiation, Robert-
Roessle-Str.10, 13125 BERLIN Germany. Phone: + 49 30 9406 3735, Fax: + 49 30
9406 3298, Email: [email protected].
SUPPLEMENTARY METHODS
Animals. C57BL/6 Ly5.1 (carrying the CD45.1 marker, also called B6-SJL) congenic
mice were originally obtained from Charles River Laboratoires, crossed to 129-Ola
(carrying the marker CD45.2) mice to generate 129 X C57BL/6 (CD45.1/CD45.2,
called B6-SJL;129-Ola) mice used as donors for bone marrow (BM) cell
transplantation. Four to 5 months-old WT and L/L recipient mice (CD45.2) were kept
on 129 X C57BL/6 genetic background.
Mouse transplantation experiments. Freshly isolated BM cells were injected (2 X
106 cells/mouse) through the tail vein into lethally irradiated (9.5-10 Gy total body
irradiation, Cs-137 source) WT or L/L recipient mice. Six weeks after transplantation,
repopulation/engraftment was determined and then every 4 weeks by collection of
peripheral blood, erythrocyte lysis, and staining of CD45.1 and CD45.2.
Immunohistochemistry (IHC) and analysis. Detection of C/EBPβ (C19, Santa
Cruz), Ki67 (Tec-3; Dako), CD3 (n° 1580; Dako); Pax5 (24, Transduction
Laboratories), or F4/80 (eBioscience) was performed in paraffin embedded tissue as

2
described in the manuscript. Binding of the antibodies was detected by Envision
peroxidase kit (K4010, Dako) using diaminobenzidine as chromogenic substrate or
by the streptavidin alkaline phosphatase kit (K5005, Dako). Note that the rabbit
C/EBPβ antibody (C19, Santa cruz) recognizes the C-terminal part of C/EBPβ
therefore all isoforms.
Cell preparation, FACS analysis and CD19+ B cells sorting. Bone marrow (BM)
cell suspensions were prepared by flushing femurs and tibias with PBS. Single-cell
suspensions were prepared from 2/3 of the spleen dissected from 12 or 13-month-
old mice, and histopathology analysis was performed on the third part of the spleen
as described in the manuscript. Spleen cell suspensions were obtained by gentle
disruption of the organ through a cell strainer (70µm, BD Falcon) in PBS/2% fetal calf
serum. Peripheral blood (PB) samples were obtained from the tail vein and collected
into EDTA coated tubes. The blood cell counts were measured with an automated
veterinary hematological counter Scil Vet abc (SCIL GmbH, Viernheim, Germany),
with software optimized for mouse blood parameters. Red blood cells (RBC) were
lysed on ice with hypotonic erythrocyte lysis buffer (BD Pharmlyse buffer). Non
specific binding was reduced by preincubation with unconjugated antibody to
FcγRII/III (2.4G2, BD PharmingenTM) prior to labeling in FACS buffer (PBS, 0,5%
BSA, 2mM EDTA). Dead cells were excluded by propidium iodide or 7-AAD staining.
Cell staining and sorting were performed using fluorescein isothiocyanate (FITC),
phycoerythrin (PE), allophycocyanin (APC) labeled monoclonal antibodies directed
against CD45.1 (A20), CD45.2 (104), B220 (6B2), CD19 (1D3), CD3 (KT31.1) and
Mac1/CD11b (M1/70) (BD Biosciences, eBioscience and Biolegend). Cells were
sorted on FACS ARIA and data were acquired on a LSRII flow cytometers (Becton
Dickinson), and were further analyzed with FlowJo software (TreeStar).
Spectral karyotyping. Metaphase chromosomes were prepared by treating cells
with colcemid at a final concentration of 0.035 µg/ml overnight, incubated in 0.075 M
KCL for 20 min at 37°C and fixed in a freshly prepared mixture of methanol:acetic
acid (3:1) at room temperature. Cell suspension was dropped onto glass slides in a
climate chamber (Polymer, Kassel, Germany) at 22°C and 48% humidity. Spectral
karyotyping (SKY) was performed as described previously (1) and according to the
manufacturer’s instructions (ASI: Applied Spectra Imaging, Ltd., Migdal HaEmek,
Israel). Spectral images were acquired using an epifluorescence microscope
equipped with an interferometer (SpectraCubeTM ASI), a custom-designed optical
filter and the SkyViewTM software (ASI).

3
SUPPLEMENTARY REFERENCE
1. Rudolph C and Schlegelberger B (2009) Spectral karyotyping and fluorescence in
situ hybridization of murine cells. Methods in molecular biology (Clifton, N.J) 506:
453-466.


Fig S3. Histological analysis (H&E staining) of hematopoietic (B, D) and epithelial (F, H
and J) tumors found in +/L mice in comparison with control tissues from age-matched
WT mice (A, C, E, G and I) at low magnification. (A) Liver with normal parenchyma (p),
vein (asterisk). (B) Liver with massive infiltration of B cells (arrows), vein (asterisk) (C)
Normal splenic architecture with white pulp (WP), red pulp (RP) and trabeculae (arrows).
(D) Histiocytic sarcoma with nodular infiltrates (arrows) developed in the spleen. (E)
Mammary gland fad pad with normal epithelium duct (arrows), lymph node (asterisk) and
vessel (v). (F) Mammary carcinoma developed in mammary fat pad (arrows). (G) Normal
lung parenchyma with bronchiole (arrowheads) and alveoli (asterisks). (H) Lung
adenocarcinoma with papillary growth. (I) Normal skin architecture with epidermis (e),
dermis (d), hair follicle (HF) and muscle (m). (J) Skin carcinoma with squamous
differentiation and keratinization (arrowheads). T: tumor tissue; N: normal tissue.
Magnification x5 for all micrographs.


Fig S4. Histological analysis (H&E staining) of hematopoietic (B, C, E) and epithelial (G,
I, J, L and N) tumors found in +/L mice in comparison with counterpart tissues from
aged-matched WT mice (A, D, F, H, K and M) at higher magnification. (A) Liver with
normal parenchyma (p). (B, C) B-NHL with massive infiltration of B cells in the liver
(arrows in B) characterized by B220 immunopositive staining (arrows in C). (D) Normal
splenic architecture with white pulp (WP), red pulp (RP) and trabeculae (arrow). (E)
Histiocytic sarcoma with nodular infiltrates (arrows) developed in the spleen. (F) Liver
with normal parenchyma (p). (G) Liver with a hepatocellular carcinoma (HCC) showing a
trabecular growth pattern (arrow) (arrowhead: mitotic figure). (H) Mammary gland fad
pad with normal epithelium duct (arrows). (I) A ductal and (J) a tubular mammary
carcinoma developed in mammary fat pad of a +/L female. (K) Normal skin architecture
with hair follicle (HF) and adipocytes (a). (J) Skin carcinoma with squamous
differentiation and keratinization (arrowhead) and horn pearl formation (arrow). (M)
Normal lung parenchyma with bronchiole (arrowheads) and alveoli (asterisk). (N) Lung
adenocarcinoma with papillary growth. p: parenchyma; v: vein. A, B, C: scale bar = 25
µm; D-G, K-N: scale bar = 20 µm; H-J: scale bar = 10 µm.


Granulocytes
+/+ L/L0
2
4
6
8*
x 1
03 /μl
spleen
+/+ L/L0
1
2
3
mg/
g of
bod
y w
eigh
t
CD11b+
+/+ L/L0
10
20
30
40
50*
Freq
uenc
y (%
)
A
C
F
WT donor cells(CD45.1, CD45.2)
lethally irradiatedWT or L/L recipients
(CD45.2)
Transplant 33 weeks PB analysis & FACS analysis of
the spleen
CD3+
+/+ L/L0
10
20
30
40
50
*
Freq
uenc
y (%
)
B220+
+/+ L/L0
10
20
30
40
50
Freq
uenc
y (%
)
WBC
+/+ L/L0
5
10
15
20
25*
Cel
l num
ber (
X103 /μ
l)
Monocytes
+/+ L/L0.0
0.5
1.0
1.5
2.0
2.5***
x 10
3 /μl
spleen
+/+ L/L0
20
40
60
80
CD
45.1
+ C
D45
.2+
(%)
PB
+/+ L/L0
25
50
75
100
CD
45.1
+ C
D45
.2+
(%) B
E
Lymphocytes
+/+ L/L0
5
10
15*
x 10
3 /μl
RBC
+/+ L/L0
5
10
15
x 10
6 /μl
HGB
+/+ L/L0
5
10
15
20
25
g/dl
HCT
+/+ L/L0
20
40
60
80
%
G
D
Bégay et al. Figure S7
Fig S7. C/EBPβ LIP niche alters hematopoietic cell distribution in the peripheral blood and spleen. (A) Schematic representation of the transplantation strategy. Total bone marrow cells (2 X 10⁶) from B6-SJL;129-Ola mice (carrying the CD45.1 and CD45.2 markers) were transplanted into lethally irradiated WT or L/L recipient mice (carrying CD45.2 marker). Recipients were sacrificed 33 weeks after transplantation and the hematopoietic cells of the peripheral blood (PB) and spleen were analyzed by FACS. (B) Engraftment of the donor cells (CD45.1+/CD45.2+ cells) in the spleen and periph-eral blood (PB). (C) Ratio of spleen weight versus body weight. (D) Distribution of myeloid cells (CD11b+ marker), T cells (CD3+ marker) and B cells (B220+ marker) in the spleen. (E) White blood cell (WBC) count measured in the peripheral blood. (F) Distribution of granulocytes, monocytes and lymphocytes measured in the peripheral blood. (G) Red blood cell (RBC) count, hematocrit (HCT) and hemoglobin (HGB) levels measured in the peripheral blood. All graphs represent the +/+ (grey bar) and L/L mice (green bar). n = 5 per genotype. Error bars show SEM. *P<0.05. ***P< 0.001.

Table S1. SKY analysis of B-NHL isolated from LIP ki mice. Genotype Tissuea Karyotypesb
+/+ spleen 40, XX [9]
+/+ spleen 41-43, XX, +14, +15, +17 [cp5]/
40, XX [10]
+/+ spleen 41, XX, +15 [4]/
41, XX, +17 [2]/
42, XX, +15, +17 [1]/
40, XX [8]
+/L LN 40, XX [10]
+/L LN 40, XX [8]
+/L spleen 40, XX [10]
L/L LN 41, XX, +X [3]/
41, XX, +X, ?Del(19) [cp6]/
40, XX [5]
L/L LN 80<4n>, XXXX [3]/
40, XX [11]
L/L spleen 40, XX [6]/
80<4n>, XXXX [8]
L/L spleen 40, XX [9]
No chromosomal alterations were observed in 3 analyzed +/L lymphomas. Tetraploid
chromosomal complements were seen in L/L lymphomas. Note that 2 out of 3
analyzed lymphomas found in WT carried a trisomy 15 and 17 as clonal
chromosomal alterations. B-NHL: B non-Hodgkin’s lymphoma. a LN: lymph node; b
Del: deletion, [n]: number of metaphases showing the alteration, [cp]: composite
karyotype. Clonal chromosomal alterations are marked in bold.

Table S2. List of deregulated genes in B-NHL of +/L mice.
Symbol log2(fc) P value GeneNameCfd 3,47 1,72E-02 complement factor D (adipsin)S100a9 2,89 9,94E-03 S100 calcium binding protein A9 (calgranulin B)Ccl24 2,78 9,40E-03 chemokine (C-C motif) ligand 24Htatip2 2,41 1,50E-04 HIV-1 tat interactive protein 2, homolog (human)Lum 2,32 1,48E-02 lumicanIgfbp5 2,15 8,20E-04 insulin-like growth factor binding protein 5Cidec 2,13 1,81E-02 cell death-inducing DFFA-like effector cPostn 2,09 1,56E-02 periostin, osteoblast specific factorGlycam1 2,09 1,33E-02 glycosylation dependent cell adhesion molecule 1Retnla 1,99 1,93E-02 resistin like alphaMrc1 1,84 8,44E-03 mannose receptor, C type 1Aldh1a2 1,67 9,40E-04 aldehyde dehydrogenase family 1, subfamily A2Fabp4 1,62 9,74E-03 fatty acid binding protein 4, adipocyteRab15 1,62 1,16E-02 RAB15, member RAS oncogene familyAdipoq 1,58 4,06E-02 adiponectin, C1Q and collagen domain containingArg1 1,57 2,35E-02 arginase, liverCpe 1,56 3,84E-03 carboxypeptidase EPlin4 1,52 7,32E-03 perilipin 4Cbr2 1,48 1,76E-02 carbonyl reductase 2Fabp7 1,47 1,34E-02 fatty acid binding protein 7, brainSaa3 1,45 2,11E-02 serum amyloid A 3Fam103a1 1,45 2,00E-05 family with sequence similarity 103, member A1Malat1 1,39 3,95E-03 metastasis associated lung adenocarcinoma transcript 1 (non-coding RNA)Cma1 1,33 5,75E-03 chymase 1, mast cellFus 1,33 2,60E-04 fusion, derived from t(12;16) malignant liposarcoma (human)Clec2d 1,30 1,98E-02 C-type lectin domain family 2, member dCfh 1,30 2,21E-02 complement component factor hCcl11 1,29 8,54E-03 chemokine (C-C motif) ligand 11Cd163 1,27 6,44E-03 CD163 antigenBC018465 1,25 1,59E-03 cDNA sequence BC018465Aldh1a3 1,25 1,30E-02 aldehyde dehydrogenase family 1, subfamily A3Gadd45g 1,25 1,79E-03 growth arrest and DNA-damage-inducible 45 gammaMadcam1 1,25 1,13E-02 mucosal vascular addressin cell adhesion molecule 1Il33 1,24 1,55E-02 interleukin 33Gas6 1,23 3,08E-03 growth arrest specific 6Plin1 1,23 3,71E-02 perilipin 1Dpt 1,22 3,16E-03 dermatopontinFam174b 1,21 1,10E-02 family with sequence similarity 174, member BHdc 1,19 6,75E-03 histidine decarboxylaseMetrn 1,17 3,00E-05 meteorin, glial cell differentiation regulatorFolr2 1,16 3,46E-02 folate receptor 2 (fetal)Surf6 1,15 3,00E-05 surfeit gene 6Dnajc7 1,14 1,96E-03 DnaJ (Hsp40) homolog, subfamily C, member 7Snord123 1,13 3,18E-03 small nucleolar RNA, C/D box 123Hbb-bh1 1,13 3,96E-02 hemoglobin Z, beta-like embryonic chainFigf 1,11 6,84E-03 c-fos induced growth factorEchdc2 1,10 4,59E-02 enoyl Coenzyme A hydratase domain containing 2Agt 1,09 3,01E-02 angiotensinogen (serpin peptidase inhibitor, clade A, member 8)Scgb3a1 1,09 1,71E-02 secretoglobin, family 3A, member 1Mcpt4 1,09 1,35E-02 mast cell protease 4Ppp3ca 1,08 3,00E-05 protein phosphatase 3, catalytic subunit, alpha isoformThemis 1,08 1,96E-02 thymocyte selection associatedHsd11b1 1,06 4,96E-02 hydroxysteroid 11-beta dehydrogenase 1Nkx2-3 1,05 1,06E-02 NK2 transcription factor related, locus 3 (Drosophila)Cyfip1 1,04 8,31E-03 cytoplasmic FMR1 interacting protein 1Prmt1 1,04 1,82E-03 protein arginine N-methyltransferase 1Atp1a2 1,04 5,02E-03 ATPase, Na+/K+ transporting, alpha 2 polypeptideTmed9 1,03 2,30E-04 transmembrane emp24 protein transport domain containing 91500012F01Rik 1,03 2,20E-04 RIKEN cDNA 1500012F01 gene
The Symbol and the annotation of the genes are shown. The fold of change (log2(fc)) and the P value are indicated for each gene.

Symbol log2(fc) P value GeneNameC6 1,03 7,51E-03 complement component 6Ly9 1,01 1,00E-04 lymphocyte antigen 9Cd36 1,01 3,15E-02 CD36 antigenVapb 1,01 7,10E-03 vesicle-associated membrane protein, associated protein B and CCited4 1,01 3,70E-02 Cbp/p300-interacting transactivator, with Glu/Asp-rich carboxy-terminal domain, 4Ces3 1,01 4,37E-03 carboxylesterase 3Cox6c 1,01 0,00E+00 cytochrome c oxidase, subunit VIcTlr2 -1,00 1,03E-03 toll-like receptor 2Rnd3 -1,00 2,06E-02 Rho family GTPase 39830001H06Rik -1,00 9,30E-04 RIKEN cDNA 9830001H06 gene1700112E06Rik -1,00 3,26E-03 RIKEN cDNA 1700112E06 geneD6Mm5e -1,01 2,04E-02 DNA segment, Chr 6, Miriam Meisler 5, expressedLpcat2 -1,02 1,40E-03 lysophosphatidylcholine acyltransferase 2Pigz -1,02 1,37E-03 phosphatidylinositol glycan anchor biosynthesis, class ZTm6sf2 -1,02 4,73E-02 transmembrane 6 superfamily member 2Hist1h2ak -1,03 5,90E-04 histone cluster 1, H2akNr1h3 -1,04 4,06E-02 nuclear receptor subfamily 1, group H, member 3Abhd2 -1,05 1,23E-03 abhydrolase domain containing 2Zmynd15 -1,06 2,79E-03 zinc finger, MYND-type containing 15Hist1h1e -1,06 6,14E-03 histone cluster 1, H1eNiacr1 -1,08 1,43E-03 niacin receptor 1Hist1h2ai -1,08 4,30E-04 histone cluster 1, H2aiCxcl16 -1,10 3,26E-03 chemokine (C-X-C motif) ligand 16Nosip -1,11 1,66E-03 nitric oxide synthase interacting proteinC1qa -1,11 3,91E-02 complement component 1, q subcomponent, alpha polypeptideFcer1g -1,12 2,96E-02 Fc receptor, IgE, high affinity I, gamma polypeptide8430428J23Rik -1,13 4,71E-02 RIKEN cDNA 8430428J23 geneHyi -1,14 7,62E-03 hydroxypyruvate isomerase homolog (E. coli)Ltbp2 -1,15 1,14E-02 latent transforming growth factor beta binding protein 2Kcnj10 -1,15 1,01E-03 potassium inwardly-rectifying channel, subfamily J, member 10Gdf3 -1,17 1,24E-02 growth differentiation factor 3Lsm14b -1,18 8,00E-05 LSM14 homolog B (SCD6, S. cerevisiae)Batf2 -1,19 1,20E-02 basic leucine zipper transcription factor, ATF-like 2Lst1 -1,19 6,64E-03 leukocyte specific transcript 1Smpdl3b -1,19 1,41E-03 sphingomyelin phosphodiesterase, acid-like 3BFam20c -1,20 4,19E-02 family with sequence similarity 20, member CKlra17 -1,20 8,30E-04 killer cell lectin-like receptor, subfamily A, member 17Cap1 -1,21 1,67E-03 CAP, adenylate cyclase-associated protein 1 (yeast)Rdh12 -1,23 4,92E-02 retinol dehydrogenase 12Il28ra -1,23 2,64E-02 interleukin 28 receptor alphaH28 -1,26 1,54E-02 histocompatibility 28Cxcl13 -1,27 4,92E-02 chemokine (C-X-C motif) ligand 13C1qb -1,27 1,47E-02 complement component 1, q subcomponent, beta polypeptide1810033B17Rik -1,28 1,51E-02 RIKEN cDNA 1810033B17 geneClec4a3 -1,29 3,01E-02 C-type lectin domain family 4, member a3Cx3cr1 -1,37 1,80E-03 chemokine (C-X3-C) receptor 1Prim2 -1,37 1,06E-02 DNA primase, p58 subunitFpr2 -1,38 3,73E-02 formyl peptide receptor 2Slc11a1 -1,40 3,65E-03 solute carrier family 11 (proton-coupled divalent metal ion transporters), member 1Fpr1 -1,42 8,82E-03 formyl peptide receptor 1Itgax -1,42 1,53E-02 integrin alpha XCcl4 -1,45 7,46E-03 chemokine (C-C motif) ligand 4Actg2 -1,46 6,00E-05 actin, gamma 2, smooth muscle, entericAsb2 -1,48 5,24E-03 ankyrin repeat and SOCS box-containing 2Ifi202b -1,59 1,38E-02 interferon activated gene 202BKif1a -1,60 5,00E-05 kinesin family member 1ACcl3 -1,61 3,36E-03 chemokine (C-C motif) ligand 3Rmrp -1,65 4,00E-05 RNA component of mitochondrial RNAase PCxcl14 -1,84 7,60E-04 chemokine (C-X-C motif) ligand 14Serpina1d -1,88 1,55E-03 serine (or cysteine) peptidase inhibitor, clade A, member 1DSostdc1 -1,89 4,94E-03 sclerostin domain containing 1Serpina1c -2,00 5,70E-04 serine (or cysteine) peptidase inhibitor, clade A, member 1CSerpina1b -2,19 1,52E-03 serine (or cysteine) preptidase inhibitor, clade A, member 1B1810009J06Rik -2,35 5,10E-04 RIKEN cDNA 1810009J06 gene

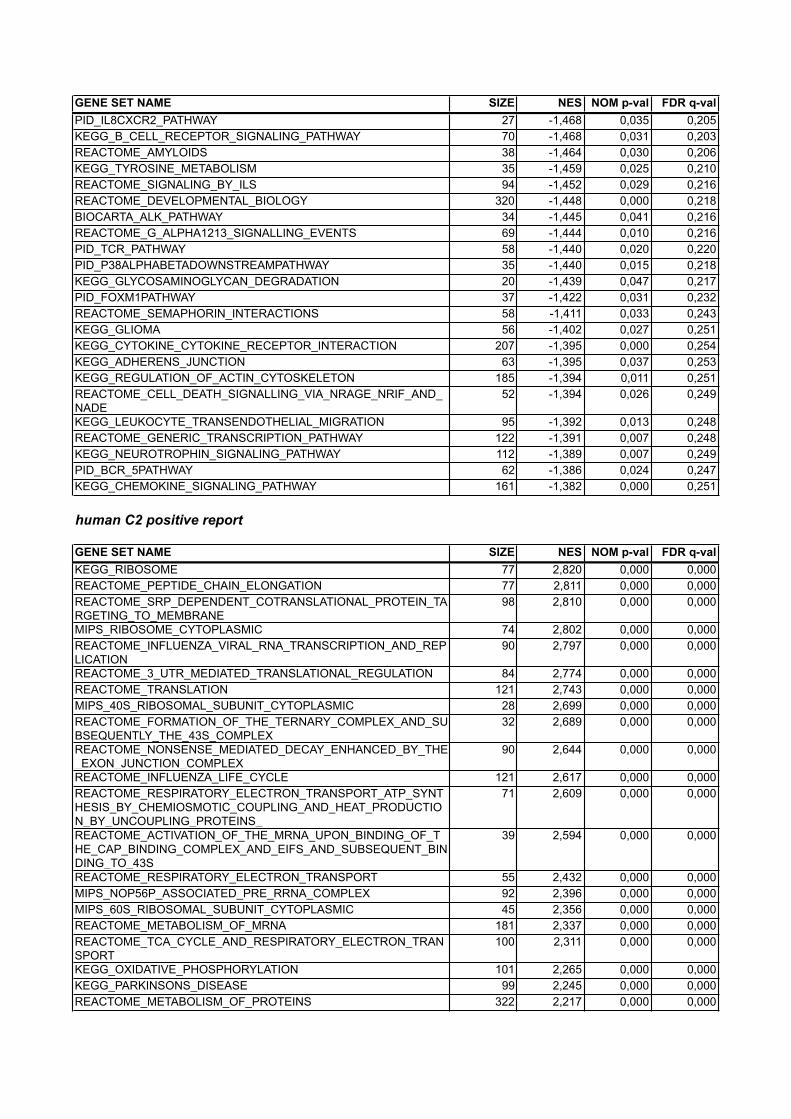
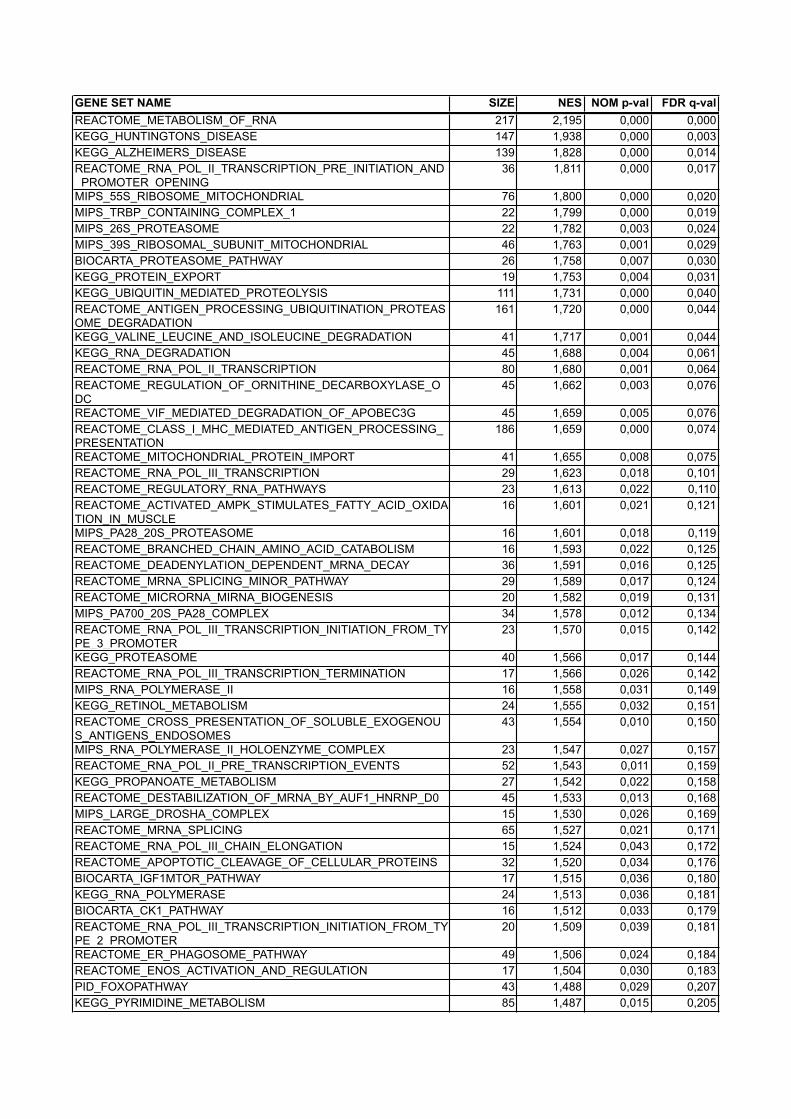
Table S3. GSEA of deregulated genes found in B-NHL of +/L mice.
human C2 negative report
GENE SET NAME SIZE NES NOM p-val FDR q-valKEGG_THYROID_CANCER 25 -2,222 0,000 0,021KEGG_LEISHMANIA_INFECTION 47 -2,165 0,000 0,030PID_IL27PATHWAY 25 -2,154 0,000 0,023KEGG_NATURAL_KILLER_CELL_MEDIATED_CYTOTOXICITY 90 -2,125 0,000 0,022REACTOME_PLATELET_SENSITIZATION_BY_LDL 16 -2,045 0,000 0,043SA_MMP_CYTOKINE_CONNECTION 15 -2,040 0,000 0,038BIOCARTA_IL12_PATHWAY 21 -1,977 0,003 0,064REACTOME_NUCLEAR_EVENTS_KINASE_AND_TRANSCRIPTION_FACTOR_ACTIVATION
23 -1,911 0,000 0,102
BIOCARTA_NTHI_PATHWAY 23 -1,887 0,000 0,110BIOCARTA_NO2IL12_PATHWAY 15 -1,885 0,000 0,100BIOCARTA_IL6_PATHWAY 20 -1,884 0,006 0,093PID_IL23PATHWAY 35 -1,879 0,000 0,088REACTOME_ERK_MAPK_TARGETS 20 -1,878 0,000 0,082PID_ALK1PATHWAY 24 -1,877 0,003 0,077PID_RXR_VDR_PATHWAY 24 -1,875 0,000 0,074KEGG_TOLL_LIKE_RECEPTOR_SIGNALING_PATHWAY 87 -1,857 0,000 0,080REACTOME_GLYCOLYSIS 23 -1,854 0,000 0,077BIOCARTA_NKT_PATHWAY 29 -1,849 0,004 0,075BIOCARTA_TGFB_PATHWAY 18 -1,819 0,000 0,091BIOCARTA_DC_PATHWAY 22 -1,804 0,003 0,099BIOCARTA_FMLP_PATHWAY 33 -1,786 0,000 0,108KEGG_GRAFT_VERSUS_HOST_DISEASE 16 -1,783 0,009 0,106KEGG_NOTCH_SIGNALING_PATHWAY 39 -1,772 0,000 0,111REACTOME_ACTIVATED_TLR4_SIGNALLING 77 -1,769 0,000 0,109BIOCARTA_HCMV_PATHWAY 17 -1,747 0,007 0,124BIOCARTA_P38MAPK_PATHWAY 37 -1,736 0,008 0,129REACTOME_TOLL_RECEPTOR_CASCADES 94 -1,715 0,000 0,144REACTOME_NFKB_AND_MAP_KINASES_ACTIVATION_MEDIATED_BY_TLR4_SIGNALING_REPERTOIRE
60 -1,713 0,000 0,140
SIG_INSULIN_RECEPTOR_PATHWAY_IN_CARDIAC_MYOCYTES 47 -1,710 0,008 0,138REACTOME_MAPK_TARGETS_NUCLEAR_EVENTS_MEDIATED_BY_MAP_KINASES
29 -1,705 0,007 0,138
KEGG_CHRONIC_MYELOID_LEUKEMIA 69 -1,684 0,000 0,157REACTOME_RNA_POL_I_PROMOTER_OPENING 23 -1,681 0,007 0,155PID_FCER1PATHWAY 54 -1,679 0,000 0,153REACTOME_P75_NTR_RECEPTOR_MEDIATED_SIGNALLING 71 -1,675 0,000 0,153BIOCARTA_IL2_PATHWAY 20 -1,666 0,019 0,159ST_T_CELL_SIGNAL_TRANSDUCTION 43 -1,665 0,004 0,156PID_P38_MK2PATHWAY 21 -1,664 0,003 0,152REACTOME_SIGNALLING_TO_RAS 24 -1,659 0,010 0,154REACTOME_MYD88_MAL_CASCADE_INITIATED_ON_PLASMA_MEMBRANE
68 -1,658 0,000 0,151
PID_IL12_STAT4PATHWAY 29 -1,655 0,022 0,150PID_IL12_2PATHWAY 54 -1,653 0,009 0,150BIOCARTA_TOB1_PATHWAY 18 -1,648 0,016 0,152PID_RETINOIC_ACID_PATHWAY 26 -1,646 0,017 0,151
The following gene sets from MSigDB data base (http://www.broadinstitute.org/gsea) were used: for human C2: curated gene sets (canonical pathways, Biocarta, KEGG and Reactome); for mouse: C2. The data are shown as positive and negative scoring gene sets listed in order of decreasing statistical significance (P value). The normalized enrichment score (NES), the normalized P value (NOM-P val) and false discovery rate (FDR) are shown.

GENE SET NAME SIZE NES NOM p-val FDR q-valREACTOME_INNATE_IMMUNE_SYSTEM 166 -1,644 0,000 0,150REACTOME_PACKAGING_OF_TELOMERE_ENDS 22 -1,641 0,007 0,149KEGG_DORSO_VENTRAL_AXIS_FORMATION 21 -1,635 0,017 0,152BIOCARTA_G1_PATHWAY 27 -1,633 0,007 0,151BIOCARTA_IL10_PATHWAY 17 -1,628 0,028 0,153ST_B_CELL_ANTIGEN_RECEPTOR 37 -1,624 0,008 0,154BIOCARTA_TNFR2_PATHWAY 18 -1,613 0,023 0,162REACTOME_COSTIMULATION_BY_THE_CD28_FAMILY 50 -1,608 0,000 0,163BIOCARTA_PYK2_PATHWAY 24 -1,604 0,026 0,164REACTOME_INTERFERON_ALPHA_BETA_SIGNALING 40 -1,604 0,012 0,162PID_NFKAPPABATYPICALPATHWAY 16 -1,602 0,050 0,161SA_G1_AND_S_PHASES 15 -1,601 0,031 0,159KEGG_SYSTEMIC_LUPUS_ERYTHEMATOSUS 59 -1,601 0,000 0,156BIOCARTA_INTEGRIN_PATHWAY 34 -1,593 0,015 0,163PID_ANTHRAXPATHWAY 16 -1,589 0,034 0,165KEGG_RENAL_CELL_CARCINOMA 66 -1,579 0,005 0,173BIOCARTA_NKCELLS_PATHWAY 18 -1,579 0,044 0,171REACTOME_THE_ROLE_OF_NEF_IN_HIV1_REPLICATION_AND_DISEASE_PATHOGENESIS
24 -1,571 0,022 0,177
BIOCARTA_BCR_PATHWAY 30 -1,566 0,015 0,180KEGG_JAK_STAT_SIGNALING_PATHWAY 127 -1,566 0,000 0,178BIOCARTA_EPO_PATHWAY 17 -1,562 0,042 0,178PID_PDGFRBPATHWAY 118 -1,561 0,000 0,178BIOCARTA_CTCF_PATHWAY 22 -1,560 0,038 0,175PID_IL2_1PATHWAY 51 -1,551 0,012 0,184SA_B_CELL_RECEPTOR_COMPLEXES 22 -1,546 0,037 0,187BIOCARTA_INFLAM_PATHWAY 26 -1,546 0,022 0,185BIOCARTA_SPRY_PATHWAY 16 -1,541 0,043 0,188KEGG_CYSTEINE_AND_METHIONINE_METABOLISM 28 -1,535 0,027 0,192BIOCARTA_MAPK_PATHWAY 82 -1,532 0,000 0,193REACTOME_SIGNALING_BY_RHO_GTPASES 85 -1,531 0,006 0,191PID_GMCSF_PATHWAY 33 -1,531 0,024 0,189REACTOME_MUSCLE_CONTRACTION 41 -1,529 0,017 0,189SIG_PIP3_SIGNALING_IN_CARDIAC_MYOCTES 61 -1,528 0,000 0,187KEGG_PRION_DISEASES 29 -1,526 0,030 0,188REACTOME_TRAF6_MEDIATED_INDUCTION_OF_NFKB_AND_MAP_KINASES_UPON_TLR7_8_OR_9_ACTIVATION
63 -1,524 0,010 0,188
BIOCARTA_ERYTH_PATHWAY 15 -1,523 0,029 0,186BIOCARTA_CXCR4_PATHWAY 20 -1,523 0,017 0,184BIOCARTA_IL1R_PATHWAY 31 -1,519 0,032 0,184REACTOME_MAP_KINASE_ACTIVATION_IN_TLR_CASCADE 42 -1,515 0,024 0,186PID_MAPKTRKPATHWAY 30 -1,515 0,021 0,185BIOCARTA_IL22BP_PATHWAY 16 -1,514 0,034 0,184PID_RAC1_REG_PATHWAY 31 -1,511 0,022 0,183BIOCARTA_NFKB_PATHWAY 22 -1,501 0,046 0,192BIOCARTA_KERATINOCYTE_PATHWAY 42 -1,494 0,020 0,199REACTOME_SIGNALLING_TO_ERKS 32 -1,492 0,040 0,198REACTOME_TRIF_MEDIATED_TLR3_SIGNALING 62 -1,492 0,009 0,197BIOCARTA_TOLL_PATHWAY 32 -1,491 0,032 0,196BIOCARTA_NGF_PATHWAY 15 -1,489 0,050 0,196KEGG_VIRAL_MYOCARDITIS 45 -1,489 0,021 0,194BIOCARTA_RELA_PATHWAY 16 -1,489 0,048 0,192REACTOME_IL_2_SIGNALING 37 -1,488 0,012 0,192KEGG_FC_EPSILON_RI_SIGNALING_PATHWAY 74 -1,487 0,014 0,190PID_UPA_UPAR_PATHWAY 39 -1,474 0,030 0,205PID_AR_PATHWAY 42 -1,471 0,032 0,205KEGG_T_CELL_RECEPTOR_SIGNALING_PATHWAY 101 -1,470 0,000 0,203
GENE SET NAME SIZE NES NOM p-val FDR q-valPID_IL8CXCR2_PATHWAY 27 -1,468 0,035 0,205KEGG_B_CELL_RECEPTOR_SIGNALING_PATHWAY 70 -1,468 0,031 0,203REACTOME_AMYLOIDS 38 -1,464 0,030 0,206KEGG_TYROSINE_METABOLISM 35 -1,459 0,025 0,210REACTOME_SIGNALING_BY_ILS 94 -1,452 0,029 0,216REACTOME_DEVELOPMENTAL_BIOLOGY 320 -1,448 0,000 0,218BIOCARTA_ALK_PATHWAY 34 -1,445 0,041 0,216REACTOME_G_ALPHA1213_SIGNALLING_EVENTS 69 -1,444 0,010 0,216PID_TCR_PATHWAY 58 -1,440 0,020 0,220PID_P38ALPHABETADOWNSTREAMPATHWAY 35 -1,440 0,015 0,218KEGG_GLYCOSAMINOGLYCAN_DEGRADATION 20 -1,439 0,047 0,217PID_FOXM1PATHWAY 37 -1,422 0,031 0,232REACTOME_SEMAPHORIN_INTERACTIONS 58 -1,411 0,033 0,243KEGG_GLIOMA 56 -1,402 0,027 0,251KEGG_CYTOKINE_CYTOKINE_RECEPTOR_INTERACTION 207 -1,395 0,000 0,254KEGG_ADHERENS_JUNCTION 63 -1,395 0,037 0,253KEGG_REGULATION_OF_ACTIN_CYTOSKELETON 185 -1,394 0,011 0,251REACTOME_CELL_DEATH_SIGNALLING_VIA_NRAGE_NRIF_AND_NADE
52 -1,394 0,026 0,249
KEGG_LEUKOCYTE_TRANSENDOTHELIAL_MIGRATION 95 -1,392 0,013 0,248REACTOME_GENERIC_TRANSCRIPTION_PATHWAY 122 -1,391 0,007 0,248KEGG_NEUROTROPHIN_SIGNALING_PATHWAY 112 -1,389 0,007 0,249PID_BCR_5PATHWAY 62 -1,386 0,024 0,247KEGG_CHEMOKINE_SIGNALING_PATHWAY 161 -1,382 0,000 0,251
human C2 positive report
GENE SET NAME SIZE NES NOM p-val FDR q-valKEGG_RIBOSOME 77 2,820 0,000 0,000REACTOME_PEPTIDE_CHAIN_ELONGATION 77 2,811 0,000 0,000REACTOME_SRP_DEPENDENT_COTRANSLATIONAL_PROTEIN_TARGETING_TO_MEMBRANE
98 2,810 0,000 0,000
MIPS_RIBOSOME_CYTOPLASMIC 74 2,802 0,000 0,000REACTOME_INFLUENZA_VIRAL_RNA_TRANSCRIPTION_AND_REPLICATION
90 2,797 0,000 0,000
REACTOME_3_UTR_MEDIATED_TRANSLATIONAL_REGULATION 84 2,774 0,000 0,000REACTOME_TRANSLATION 121 2,743 0,000 0,000MIPS_40S_RIBOSOMAL_SUBUNIT_CYTOPLASMIC 28 2,699 0,000 0,000REACTOME_FORMATION_OF_THE_TERNARY_COMPLEX_AND_SUBSEQUENTLY_THE_43S_COMPLEX
32 2,689 0,000 0,000
REACTOME_NONSENSE_MEDIATED_DECAY_ENHANCED_BY_THE_EXON_JUNCTION_COMPLEX
90 2,644 0,000 0,000
REACTOME_INFLUENZA_LIFE_CYCLE 121 2,617 0,000 0,000REACTOME_RESPIRATORY_ELECTRON_TRANSPORT_ATP_SYNTHESIS_BY_CHEMIOSMOTIC_COUPLING_AND_HEAT_PRODUCTION_BY_UNCOUPLING_PROTEINS_
71 2,609 0,000 0,000
REACTOME_ACTIVATION_OF_THE_MRNA_UPON_BINDING_OF_THE_CAP_BINDING_COMPLEX_AND_EIFS_AND_SUBSEQUENT_BINDING_TO_43S
39 2,594 0,000 0,000
REACTOME_RESPIRATORY_ELECTRON_TRANSPORT 55 2,432 0,000 0,000MIPS_NOP56P_ASSOCIATED_PRE_RRNA_COMPLEX 92 2,396 0,000 0,000MIPS_60S_RIBOSOMAL_SUBUNIT_CYTOPLASMIC 45 2,356 0,000 0,000REACTOME_METABOLISM_OF_MRNA 181 2,337 0,000 0,000REACTOME_TCA_CYCLE_AND_RESPIRATORY_ELECTRON_TRANSPORT
100 2,311 0,000 0,000
KEGG_OXIDATIVE_PHOSPHORYLATION 101 2,265 0,000 0,000KEGG_PARKINSONS_DISEASE 99 2,245 0,000 0,000REACTOME_METABOLISM_OF_PROTEINS 322 2,217 0,000 0,000
GENE SET NAME SIZE NES NOM p-val FDR q-valREACTOME_METABOLISM_OF_RNA 217 2,195 0,000 0,000KEGG_HUNTINGTONS_DISEASE 147 1,938 0,000 0,003KEGG_ALZHEIMERS_DISEASE 139 1,828 0,000 0,014REACTOME_RNA_POL_II_TRANSCRIPTION_PRE_INITIATION_AND_PROMOTER_OPENING
36 1,811 0,000 0,017
MIPS_55S_RIBOSOME_MITOCHONDRIAL 76 1,800 0,000 0,020MIPS_TRBP_CONTAINING_COMPLEX_1 22 1,799 0,000 0,019MIPS_26S_PROTEASOME 22 1,782 0,003 0,024MIPS_39S_RIBOSOMAL_SUBUNIT_MITOCHONDRIAL 46 1,763 0,001 0,029BIOCARTA_PROTEASOME_PATHWAY 26 1,758 0,007 0,030KEGG_PROTEIN_EXPORT 19 1,753 0,004 0,031KEGG_UBIQUITIN_MEDIATED_PROTEOLYSIS 111 1,731 0,000 0,040REACTOME_ANTIGEN_PROCESSING_UBIQUITINATION_PROTEASOME_DEGRADATION
161 1,720 0,000 0,044
KEGG_VALINE_LEUCINE_AND_ISOLEUCINE_DEGRADATION 41 1,717 0,001 0,044KEGG_RNA_DEGRADATION 45 1,688 0,004 0,061REACTOME_RNA_POL_II_TRANSCRIPTION 80 1,680 0,001 0,064REACTOME_REGULATION_OF_ORNITHINE_DECARBOXYLASE_ODC
45 1,662 0,003 0,076
REACTOME_VIF_MEDIATED_DEGRADATION_OF_APOBEC3G 45 1,659 0,005 0,076REACTOME_CLASS_I_MHC_MEDIATED_ANTIGEN_PROCESSING_PRESENTATION
186 1,659 0,000 0,074
REACTOME_MITOCHONDRIAL_PROTEIN_IMPORT 41 1,655 0,008 0,075REACTOME_RNA_POL_III_TRANSCRIPTION 29 1,623 0,018 0,101REACTOME_REGULATORY_RNA_PATHWAYS 23 1,613 0,022 0,110REACTOME_ACTIVATED_AMPK_STIMULATES_FATTY_ACID_OXIDATION_IN_MUSCLE
16 1,601 0,021 0,121
MIPS_PA28_20S_PROTEASOME 16 1,601 0,018 0,119REACTOME_BRANCHED_CHAIN_AMINO_ACID_CATABOLISM 16 1,593 0,022 0,125REACTOME_DEADENYLATION_DEPENDENT_MRNA_DECAY 36 1,591 0,016 0,125REACTOME_MRNA_SPLICING_MINOR_PATHWAY 29 1,589 0,017 0,124REACTOME_MICRORNA_MIRNA_BIOGENESIS 20 1,582 0,019 0,131MIPS_PA700_20S_PA28_COMPLEX 34 1,578 0,012 0,134REACTOME_RNA_POL_III_TRANSCRIPTION_INITIATION_FROM_TYPE_3_PROMOTER
23 1,570 0,015 0,142
KEGG_PROTEASOME 40 1,566 0,017 0,144REACTOME_RNA_POL_III_TRANSCRIPTION_TERMINATION 17 1,566 0,026 0,142MIPS_RNA_POLYMERASE_II 16 1,558 0,031 0,149KEGG_RETINOL_METABOLISM 24 1,555 0,032 0,151REACTOME_CROSS_PRESENTATION_OF_SOLUBLE_EXOGENOUS_ANTIGENS_ENDOSOMES
43 1,554 0,010 0,150
MIPS_RNA_POLYMERASE_II_HOLOENZYME_COMPLEX 23 1,547 0,027 0,157REACTOME_RNA_POL_II_PRE_TRANSCRIPTION_EVENTS 52 1,543 0,011 0,159KEGG_PROPANOATE_METABOLISM 27 1,542 0,022 0,158REACTOME_DESTABILIZATION_OF_MRNA_BY_AUF1_HNRNP_D0 45 1,533 0,013 0,168MIPS_LARGE_DROSHA_COMPLEX 15 1,530 0,026 0,169REACTOME_MRNA_SPLICING 65 1,527 0,021 0,171REACTOME_RNA_POL_III_CHAIN_ELONGATION 15 1,524 0,043 0,172REACTOME_APOPTOTIC_CLEAVAGE_OF_CELLULAR_PROTEINS 32 1,520 0,034 0,176BIOCARTA_IGF1MTOR_PATHWAY 17 1,515 0,036 0,180KEGG_RNA_POLYMERASE 24 1,513 0,036 0,181BIOCARTA_CK1_PATHWAY 16 1,512 0,033 0,179REACTOME_RNA_POL_III_TRANSCRIPTION_INITIATION_FROM_TYPE_2_PROMOTER
20 1,509 0,039 0,181
REACTOME_ER_PHAGOSOME_PATHWAY 49 1,506 0,024 0,184REACTOME_ENOS_ACTIVATION_AND_REGULATION 17 1,504 0,030 0,183PID_FOXOPATHWAY 43 1,488 0,029 0,207KEGG_PYRIMIDINE_METABOLISM 85 1,487 0,015 0,205

GENE SET NAME SIZE NES NOM p-val FDR q-valMIPS_17S_U2_SNRNP 27 1,484 0,039 0,208REACTOME_SCF_BETA_TRCP_MEDIATED_DEGRADATION_OF_EMI1
45 1,478 0,031 0,215
REACTOME_ANTIGEN_PROCESSING_CROSS_PRESENTATION 61 1,478 0,029 0,213KEGG_CARDIAC_MUSCLE_CONTRACTION 65 1,477 0,021 0,212REACTOME_TRAFFICKING_OF_AMPA_RECEPTORS 19 1,462 0,047 0,231REACTOME_CDT1_ASSOCIATION_WITH_THE_CDC6_ORC_ORIGIN_COMPLEX
44 1,460 0,026 0,232
REACTOME_MRNA_CAPPING 26 1,460 0,027 0,230REACTOME_AUTODEGRADATION_OF_CDH1_BY_CDH1_APC_C 53 1,458 0,031 0,230REACTOME_APOPTOTIC_EXECUTION_PHASE 45 1,451 0,029 0,237PID_P53REGULATIONPATHWAY 50 1,441 0,038 0,249
mouse C2 negative report
GENE SET NAME SIZE NES NOM p-val FDR q-valGALINDO_IMMUNE_RESPONSE_TO_ENTEROTOXIN 71 -2,362 0,000 0,003QI_PLASMACYTOMA_UP 241 -2,095 0,000 0,012ALTEMEIER_RESPONSE_TO_LPS_WITH_MECHANICAL_VENTILATION
101 -2,011 0,000 0,021
SHIN_B_CELL_LYMPHOMA_CLUSTER_8 35 -1,957 0,000 0,029BROWN_MYELOID_CELL_DEVELOPMENT_UP 121 -1,949 0,000 0,026ICHIBA_GRAFT_VERSUS_HOST_DISEASE_D7_UP 84 -1,909 0,000 0,034ICHIBA_GRAFT_VERSUS_HOST_DISEASE_35D_UP 107 -1,883 0,000 0,038MARKEY_RB1_ACUTE_LOF_UP 168 -1,876 0,000 0,035LI_INDUCED_T_TO_NATURAL_KILLER_UP 213 -1,838 0,000 0,044WUNDER_INFLAMMATORY_RESPONSE_AND_CHOLESTEROL_UP 37 -1,825 0,004 0,044HESS_TARGETS_OF_HOXA9_AND_MEIS1_DN 64 -1,735 0,000 0,082NADLER_OBESITY_UP 54 -1,715 0,004 0,089NEMETH_INFLAMMATORY_RESPONSE_LPS_UP 72 -1,682 0,005 0,104STEARMAN_TUMOR_FIELD_EFFECT_UP 28 -1,665 0,010 0,110VILIMAS_NOTCH1_TARGETS_UP 49 -1,654 0,004 0,112KHETCHOUMIAN_TRIM24_TARGETS_UP 44 -1,638 0,000 0,117STEARMAN_LUNG_CANCER_EARLY_VS_LATE_DN 46 -1,627 0,005 0,119CLASPER_LYMPHATIC_VESSELS_DURING_METASTASIS_UP 19 -1,626 0,021 0,113VILIMAS_NOTCH1_TARGETS_DN 18 -1,612 0,024 0,118FUKUSHIMA_TNFSF11_TARGETS 15 -1,587 0,025 0,132SEKI_INFLAMMATORY_RESPONSE_LPS_UP 65 -1,565 0,000 0,149MORI_IMMATURE_B_LYMPHOCYTE_UP 41 -1,557 0,020 0,150QI_HYPOXIA_TARGETS_OF_HIF1A_AND_FOXA2 28 -1,540 0,043 0,162WORSCHECH_TUMOR_EVASION_AND_TOLEROGENICITY_UP 29 -1,532 0,035 0,164SHIN_B_CELL_LYMPHOMA_CLUSTER_3 26 -1,530 0,037 0,159SHIN_B_CELL_LYMPHOMA_CLUSTER_5 16 -1,523 0,045 0,155MARTORIATI_MDM4_TARGETS_FETAL_LIVER_UP 144 -1,523 0,000 0,150LIAN_LIPA_TARGETS_3M 52 -1,518 0,018 0,151LEE_AGING_CEREBELLUM_UP 74 -1,518 0,006 0,146ZHANG_TLX_TARGETS_36HR_UP 171 -1,496 0,000 0,163JIANG_AGING_HYPOTHALAMUS_DN 38 -1,487 0,020 0,170BILANGES_SERUM_SENSITIVE_GENES 69 -1,439 0,000 0,225LIAN_LIPA_TARGETS_6M 65 -1,437 0,032 0,222HOFFMANN_SMALL_PRE_BII_TO_IMMATURE_B_LYMPHOCYTE_UP
52 -1,423 0,034 0,234
KASLER_HDAC7_TARGETS_1_UP 142 -1,415 0,000 0,241

mouse C2 positive report
GENE SET NAME SIZE NES NOM p-val FDR q-valBILANGES_SERUM_AND_RAPAMYCIN_SENSITIVE_GENES 59 2,515 0,000 0,000MODY_HIPPOCAMPUS_PRENATAL 36 2,182 0,000 0,000MILI_PSEUDOPODIA_HAPTOTAXIS_UP 332 2,146 0,000 0,000SCHAEFFER_PROSTATE_DEVELOPMENT_6HR_UP 125 2,043 0,000 0,002YAO_TEMPORAL_RESPONSE_TO_PROGESTERONE_CLUSTER_13 126 1,960 0,000 0,005
WANG_LSD1_TARGETS_UP 20 1,950 0,000 0,005ZHANG_BREAST_CANCER_PROGENITORS_UP 281 1,892 0,000 0,015LANDIS_ERBB2_BREAST_TUMORS_324_DN 125 1,890 0,000 0,013SCHAEFFER_PROSTATE_DEVELOPMENT_AND_CANCER_BOX4_DN
23 1,876 0,000 0,015
BURTON_ADIPOGENESIS_11 42 1,827 0,000 0,024STEARMAN_LUNG_CANCER_EARLY_VS_LATE_UP 86 1,823 0,000 0,023YAO_TEMPORAL_RESPONSE_TO_PROGESTERONE_CLUSTER_10 43 1,813 0,000 0,024
BURTON_ADIPOGENESIS_5 90 1,770 0,000 0,040WANG_TUMOR_INVASIVENESS_UP 288 1,751 0,000 0,049BURTON_ADIPOGENESIS_12 21 1,749 0,004 0,047LANDIS_ERBB2_BREAST_PRENEOPLASTIC_DN 48 1,732 0,000 0,055LANDIS_BREAST_CANCER_PROGRESSION_DN 62 1,732 0,001 0,052STARK_PREFRONTAL_CORTEX_22Q11_DELETION_DN 338 1,726 0,000 0,053JIANG_AGING_HYPOTHALAMUS_UP 39 1,723 0,000 0,052MILI_PSEUDOPODIA_CHEMOTAXIS_UP 39 1,710 0,001 0,057LANDIS_ERBB2_BREAST_TUMORS_65_DN 30 1,704 0,004 0,059GOLDRATH_HOMEOSTATIC_PROLIFERATION 123 1,704 0,001 0,056PLASARI_TGFB1_TARGETS_10HR_DN 193 1,696 0,000 0,059ZHANG_TLX_TARGETS_36HR_DN 122 1,688 0,001 0,063ELLWOOD_MYC_TARGETS_DN 26 1,686 0,008 0,062BOUDOUKHA_BOUND_BY_IGF2BP2 82 1,685 0,000 0,059PLASARI_NFIC_TARGETS_BASAL_DN 17 1,685 0,010 0,058IKEDA_MIR30_TARGETS_UP 107 1,684 0,000 0,056MCBRYAN_PUBERTAL_BREAST_5_6WK_UP 84 1,681 0,000 0,056CUI_TCF21_TARGETS_UP 32 1,673 0,009 0,059BURTON_ADIPOGENESIS_6 145 1,655 0,000 0,070JIANG_AGING_CEREBRAL_CORTEX_UP 32 1,614 0,007 0,108ZHENG_FOXP3_TARGETS_IN_THYMUS_UP 133 1,607 0,000 0,112CADWELL_ATG16L1_TARGETS_UP 68 1,601 0,004 0,115CHIARADONNA_NEOPLASTIC_TRANSFORMATION_CDC25_UP 98 1,593 0,002 0,122PAL_PRMT5_TARGETS_UP 160 1,591 0,001 0,121SHETH_LIVER_CANCER_VS_TXNIP_LOSS_PAM4 200 1,578 0,000 0,135HOWLIN_PUBERTAL_MAMMARY_GLAND 59 1,578 0,005 0,132PLASARI_TGFB1_SIGNALING_VIA_NFIC_10HR_UP 42 1,571 0,007 0,137BILANGES_RAPAMYCIN_SENSITIVE_VIA_TSC1_AND_TSC2 52 1,559 0,010 0,151WAKABAYASHI_ADIPOGENESIS_PPARG_RXRA_BOUND_WITH_H4K20ME1_MARK
95 1,558 0,002 0,147
MCBRYAN_PUBERTAL_BREAST_4_5WK_UP 209 1,555 0,001 0,148MORI_SMALL_PRE_BII_LYMPHOCYTE_UP 68 1,553 0,011 0,147KARLSSON_TGFB1_TARGETS_DN 156 1,548 0,001 0,150RUAN_RESPONSE_TO_TNF_DN 74 1,545 0,009 0,151TORCHIA_TARGETS_OF_EWSR1_FLI1_FUSION_TOP20_UP 17 1,520 0,043 0,188SWEET_LUNG_CANCER_KRAS_DN 367 1,517 0,000 0,191CUI_TCF21_TARGETS_2_UP 299 1,516 0,000 0,189IGLESIAS_E2F_TARGETS_UP 129 1,505 0,002 0,201HANSON_HRAS_SIGNALING_VIA_NFKB 18 1,504 0,043 0,199YAUCH_HEDGEHOG_SIGNALING_PARACRINE_DN 175 1,504 0,003 0,196

GENE SET NAME SIZE NES NOM p-val FDR q-valPILON_KLF1_TARGETS_UP 365 1,499 0,000 0,202MARTINEZ_TP53_TARGETS_UP 459 1,498 0,000 0,198CHESLER_BRAIN_HIGHEST_EXPRESSION 30 1,493 0,044 0,205NADLER_OBESITY_DN 44 1,493 0,029 0,201BILANGES_SERUM_RESPONSE_TRANSLATION 30 1,491 0,029 0,202MARTORIATI_MDM4_TARGETS_FETAL_LIVER_DN 395 1,488 0,000 0,203LANDIS_ERBB2_BREAST_TUMORS_65_UP 18 1,484 0,049 0,206BERENJENO_TRANSFORMED_BY_RHOA_FOREVER_DN 27 1,483 0,049 0,204YU_MYC_TARGETS_UP 34 1,479 0,031 0,209MARKEY_RB1_ACUTE_LOF_DN 178 1,477 0,001 0,209WANG_TARGETS_OF_MLL_CBP_FUSION_DN 34 1,477 0,043 0,206WANG_CLASSIC_ADIPOGENIC_TARGETS_OF_PPARG 24 1,477 0,039 0,203MARTINEZ_RB1_AND_TP53_TARGETS_UP 465 1,455 0,001 0,230RAMALHO_STEMNESS_UP 157 1,455 0,008 0,227IVANOVA_HEMATOPOIESIS_STEM_CELL_SHORT_TERM 18 1,453 0,048 0,228


![Reporter Gene Plasmids and Minicirclesskeletal mouse muscle[2] lacZ expression in tumor tissue (mouse)[1] [1] Walther and Stein, Max-Delbrück-Center for Molecular Medicine, Berlin](https://img.dokumen.tips/doc/110x75/60298635b6193b543b3438b7/reporter-gene-plasmids-and-minicircles-skeletal-mouse-muscle2-lacz-expression.jpg)


