Embed Size (px)
Citation preview

Chemoinformatic Analysis of Combinatorial Libraries, Drugs,Natural Products and Molecular Libraries Small MoleculeRepository
Narender Singh†, Rajarshi Guha‡, Marc Giulianotti†, Clemencia Pinilla§, RichardHoughten†,§, and Jose L. Medina-Franco*,†,⊥Torrey Pines Institute for Molecular Studies, 11350 SW Village Parkway, Port St. Lucie, Florida34987, USA, School of Informatics, Indiana University, Bloomington, Indiana 47406, USA, TorreyPines Institute for Molecular Studies, 3550 General Atomics Court, San Diego, California 92121,USA, Division of Basic Research, Instituto Nacional de Cancerologia, Av. San Fernando 22, MexicoCity 14080, Mexico
AbstractA multiple criteria approach is presented, that is used to perform a comparative analysis of fourrecently developed combinatorial libraries to drugs, Molecular Libraries Small Molecule Repository(MLSMR) and natural products. The compound databases were assessed in terms of physicochemicalproperties, scaffolds and fingerprints. The approach enables the analysis of property space coverage,degree of overlap between collections, scaffold and structural diversity and overall structural novelty.The degree of overlap between combinatorial libraries and drugs was assessed using the R-NN curvemethodology, which measures the density of chemical space around a query molecule embedded inthe chemical space of a target collection. The combinatorial libraries studied in this work exhibitscaffolds that were not observed in the drug, MLSMR and natural products collections. Thefingerprint-based comparisons indicate that these combinatorial libraries are structurally different tocurrent drugs. The R-NN curve methodology revealed that a proportion of molecules in thecombinatorial libraries are located within the property space of the drugs. However, the R-NNanalysis also showed that there are a significant number of molecules in several combinatoriallibraries that are located in sparse regions of the drug space.
INTRODUCTIONThe advent of combinatorial chemistry and high-throughput screening (HTS) technologiescoupled with the development of computational tools has given rise to large compounddatabases. Such databases can be used for a wide variety of tasks such as the development andexploration of structure-activity relationships1 and identification of polypharmacology.2 Forexample, the National Institutes of Health (NIH) Molecular Library Initiative3 through theMolecular Libraries Screening Center Network (MLSCN) generates large and diversescreening datasets publicly available in PubChem.4 Other publicly available databases like
*Corresponding author phone/fax: +1-772-345-4685; e-mail: E-mail: [email protected].†Torrey Pines Institute for Molecular Studies, Florida.‡School of Informatics, Indiana University.§Torrey Pines Institute for Molecular Studies, California.⊥Instituto Nacional de Cancerologia.Supporting Information Available: Properties distribution and similarity analysis of random sets (Tables S1 and S2, respectively).Histogram of Rmax(S) values for the DrugBank collection with respect to itself using six random and actual physicochemical descriptors(Figures S1 and S2, respectively). This material is available free of charge via the Internet at http://pubs.acs.org.
NIH Public AccessAuthor ManuscriptJ Chem Inf Model. Author manuscript; available in PMC 2010 April 27.
Published in final edited form as:J Chem Inf Model. 2009 April 27; 49(4): 1010–1024. doi:10.1021/ci800426u.
NIH
-PA Author Manuscript
NIH
-PA Author Manuscript
NIH
-PA Author Manuscript
ZINC5 also enable the retrieval of millions of compounds for diverse purposes. These databasesalong with the combinatorial libraries6, 7 and natural products continue to be a key componentin the drug discovery processes.8
It is widely accepted that the comparison of compound collections is important in libraryselection and design.9 When designing new libraries or screening existing libraries inapproaches such as mixture-based screening,6, 10, 11 conventional high-throughput,12structure-based or high-content screening,13 it is relevant to consider the chemical spacecoverage of the new compounds, the structural novelty (i.e., are the compounds accessingunexplored regions of chemical space?) and the pharmaceutical relevance (i.e., are the newregions of chemical space pharmaceutically or biological relevant?).14, 15
Comparing the chemical space of compound collections is not a trivial task since it is verydependent on the method used and the structural representation of the compounds.16, 17Traditionally, compound databases have been compared using physicochemical properties(including drug-like descriptors), scaffolds or fingerprints. However, these comparisonsusually focus on only one or two criteria that do not always necessarily provide acomprehensive assessment of the structural and property diversity. It is also important to notethat each of these methods has its own advantages and disadvantages. For example, the use ofwhole molecule properties (holistic properties) has the advantage of being intuitive andstraightforward to interpret. In fact, the drug-like18 and lead-like criteria,19 and Congreve’s‘rule of 3′ for fragment-based lead-discovery20 have been formulated using only thephysicochemical properties. However, physicochemical properties do not provide informationregarding the structural patterns and molecules with different chemical structures can have thesame or similar physicochemical properties. Similar to physicochemical descriptors,chemotypes or scaffolds are straightforward to interpret and enable easy communication withmedicinal chemists and biologists. For example, scaffold analysis has lead to concepts that arewidely used in medicinal chemistry and drug discovery such as “scaffold hopping”21 and“privileged structures”.22, 23 One of the disadvantages of the scaffold or framework analysisis the lack of information regarding structural similarity due to the side chains and the inherentsimilarity or dissimilarity of the scaffolds themselves. An obvious solution is the analysis notonly of the molecular frameworks but also the side chains, functional groups and other sub-structural analysis strategies.24
Molecular fingerprints are widely used and have been successfully applied to a number ofchemoinformatic and computer-aided drug design applications.25–27 A disadvantage of somefingerprints is that they are more difficult to interpret. Also, it is well known that chemicalspace will depend on the types of fingerprints used.16 Using multiple fingerprints andrepresentations to derive consensus conclusions (e.g., consensus activity cliffs) have beenproposed as a solution.28
In this work, four in-house combinatorial libraries are compared to known drugs, naturalproducts and molecules from the Molecular Libraries Small Molecule Repository (MLSMR).The combinatorial libraries have been developed and published recently by our group and arepart of an on-going effort to develop positional scanning libraries for the rapid identificationand ranking of active library scaffolds.6 A number of compounds obtained from these librarieshave shown activity in a variety of assays such as ones related to the treatment of pain andcentral nervous system (CNS) indications, X-linked inhibitor apoptosis protein (XIAP),methicillin-resistant S. aureus, and vaccinia virus-infected cells to name a few recent examples.6 The analysis and comparison is based on a three-fold criteria namely physicochemicalproperties, cyclic systems (also referred to in the literature as frameworks or scaffolds), andmultiple fingerprints including MACCS keys,29 graph-based three point pharmacophores(GpiDAPH3) and typed graph distance (TGD).30 The use of these multiple criteria allowed
Singh et al. Page 2
J Chem Inf Model. Author manuscript; available in PMC 2010 April 27.
NIH
-PA Author Manuscript
NIH
-PA Author Manuscript
NIH
-PA Author Manuscript

us to obtain a more comprehensive analysis of the density, coverage of chemical space, scaffoldcontent, diversity and structural similarity of combinatorial libraries compared to othercollections, particularly the known drugs. In addition to characterizing the libraries in terms oftheir structural features, we also investigated the overlap of the combinatorial libraries withdrugs. This analysis was performed using the R-NN curve technique published elswhere.31This technique is a general approach for the characterization of the density of space of acompound collection, in a specified chemical space and in this work addressed the followingquestion: Are the compounds in the combinatorial libraries located in very dense regions orvery sparse regions of the drugs?
METHODSDatasets
The core template of the four combinatorial libraries is presented in Figure 1 and the numberof compounds per library is shown in Table 1. Note the wide range of compounds from ~3,500to more than 700,000. The number of diversity position spans from two in library IV to fourin library I. Table 1 also presents the number of molecules in the drugs, natural products andMLSMR collections considered in this work. The collection of drugs was obtained fromDrugBank32 as collected in the ZINC database.5 Natural products were obtained from ZINC.At the time of download, the natural products available at ZINC contained compounds fromseven vendors that advertise their compounds as being natural products or natural productderivatives. Molecules from ZINC were used “as is” without further processing. The MLSMRcollection was obtained from PubChem and processed with Molecular Operating Environment(MOE)30 program by disconnecting group I metals in simple salts and keeping the largestfragment.
Representations and comparison metricsCompound collections were analyzed and compared based on physicochemical properties,scaffolds, fingerprints and the R-NN curve analysis as described herein:
Physicochemical properties—The following properties were computed with MOEprogram: molecular weight (MW), number of rotatable bonds (RB) (the bonds were consideredrotatable if they satisfied the criteria of: bond order of 1; not a ring; and at least two heavyneighbors), hydrogen bond acceptors (HBA), hydrogen bond donors (HBD), topological polarsurface area (TPSA), and the octanol/water partition coefficient (SlogP). To obtain a visualrepresentation of the property space,17 a principal component analysis (PCA) was carried outin Spotfire 9.1.133 considering all six of the above mentioned physicochemical properties. Forthe PCA analysis and property distribution analysis the molecule with Substance ID: 11532938was excluded from the MLSRM because of its high weight (MW = 3,358). Prior to analysis,the descriptor values for the target dataset (i.e. DrugBank collection) were scaled using themedian and interquartile ranges. Each descriptor for the combinatorial libraries were thencentered and scaled using the median and the interquartile range of the correspondingdescriptors for the target collection.
R-NN curve analysis—The R-NN curve method is described in detail elsewhere31 andherein we provide only a brief overview of the algorithm and its implementation for the currentstudy. Given a target collection of molecules, characterized by a set of descriptors representingthe chemical space, we can take a query molecule and identify the number of neighbors lyingwithin a sphere of radius R, centered on the query molecule. Clearly, the number of neighborswithin the sphere will increase with a larger radius. We evaluate the maximum pairwisedistance in the target collection and then perform the above procedure for multiple values ofR, ranging from 1% to 100% of the maximum pairwise radius. The result of this is a set of
Singh et al. Page 3
J Chem Inf Model. Author manuscript; available in PMC 2010 April 27.
NIH
-PA Author Manuscript
NIH
-PA Author Manuscript
NIH
-PA Author Manuscript

nearest neighbor counts versus radii, and is termed the R-NN curve. When plotted, these curvesexhibit a sigmoidal shape. More importantly, if the query molecule is located in a sparse regionof the target collection, the lower tail will be relatively flat and long. On the other hand, if thequery is in a very dense region of the target collection, the lower tail will be very short. Thus,the form of the R-NN curve characterizes the spatial location of the query point with respectto the target collection. In order to generate a summation of the R-NN curves for many querycompounds, we evaluate the Rmax(S) value, which is the value of R, at which the linear, lowertail of the curve transitions to the initial exponentially increasing region of the curve. Smallvalues of Rmax(S) indicate that the molecule is located in a dense region of the target space,whereas large values indicate that it is located in a sparse region. By plotting the Rmax(S) valuesfor an entire query dataset, we can obtain an intuitive summary of the spatial distribution ofthe query molecules with respect to the target collection.
Given that the method requires multiple nearest neighbor calculations for any given querymolecule, it can become computationally intensive, especially for large target collections. Toenhance the performance of this procedure, we employed a relational database coupled with aspatial index. Specifically, we generated the descriptors for the target collection and loadedthem into a Postgres database. We then generated an R-tree index.34 This is a spatial datastructure similar in concept to the B-tree.35 Briefly, an R-tree divides an n-dimensional spaceinto a series of hierarchical hypercubes (termed minimum bounding rectangle or MBR). Thus,the entire space is represented as a top-level MBR, which can be then be divided into two oremore smaller MBR’s enclosing different portions of the space. Each of these MBR’s can befurther divided and so on. The key feature of this index is that points in the original space thatare close to each other will lie in the same bounding rectangle. The use of such an index, allowsone to perform near neighbor searches extremely rapid, since given a query point, one identifiesthe MBR that contains the query point. One can then perform a linear search over the pointsin the MBR (which is usually much smaller than the whole collection) to identify the nearestneighbors. With the target collection loaded, we then queried the database using the descriptorvalues of the query molecules along with the query radii. The advantage of this approach isthat it can scale to target collections of millions of compounds. It should be noted that the useof the R-tree index imposes a constraint on the nature of the nearest neighbor queries. Inparticular, the R-tree index works with (hyper) rectangular regions, rather than spheres. As aresult, the original R-NN query is now performed by asking how many neighbors lie within ahypercube of side 2R, centered on the query point. Clearly, this query will result in a numberof extra neighbors being included, compared to a query based on a hyperspherical region.However, our experiments indicated that the increased number of neighbors did notsignificantly change the results and so we did not perform the extra step of culling extraneighbors.
It is important to note that the results of the R-NN curve analysis are dependent on the chemicalspace that the molecules are embedded in. As a result one will obtain different spatialdistributions of the compounds and hence different values of Rmax(S). Furthermore, thedescriptors for the target collection are autoscaled followed by appropriately scaling the querydescriptors (using the means and standard deviations of the target descriptors). Given theseobservations comparison of the same dataset in two different chemical spaces should only beconsidered on a qualitative level and rigorous, quantitative conclusions will, in general, not bevalid. It is also important to note that the descriptors used to characterize the datasets shouldbe as orthogonal as possible. A closely related point is that high-dimensional chemical spacesmay not be suitable for such an analysis. In such cases, the bulk of the dataset will be relegatedto the “corners” of the chemical space – in effect forcing a clustering of the compounds, whichcan obscure any clustering due to actual molecular structure or property features.
Singh et al. Page 4
J Chem Inf Model. Author manuscript; available in PMC 2010 April 27.
NIH
-PA Author Manuscript
NIH
-PA Author Manuscript
NIH
-PA Author Manuscript

Scaffolds – molecular frameworks—In this work the scaffolds were defined as the cyclicsystems implemented in the chemotype methodology developed by Johnson and Xu and werecomputed with the program Molecular Equivalence Indices.36, 37 In this approach the cyclicsystems are obtained from the entire molecules by iteratively removing all vertices of degreeone (e.g., by removing the side chains) and defining the molecular framework of the molecule.37 In fact the cyclic systems are comparable to the frameworks of Bemis and Murcko (“definedas the union of ring systems and linkers in a molecule”).38 A code of five characters, nameda chemotype identifier or chemotype code, is assigned to each cyclic system using a uniquenaming algorithm.36 This methodology has been widely applied to construct a hierarchicalclassification of compound collections,39 assess scaffold-hopping efficiency of topologicaland pharmacophore pair descriptors,40 identify structural features that distinguish chemicallibraries,37 database shaving,41 and to the construction of an annotated compound librarydirected to nuclear receptors.42 It is important to mention that the chemotypes employed inthis study are not the only ones that can be used. However, classifying and comparing moleculardatabases based on cyclic systems (i.e., molecular frameworks) is a well known approach tocompare the structures of compound databases. An advantageous feature of using cyclicsystems to compare databases is that they represent equivalence classes and moleculesclassified in a given cyclic system do not lie in any other chemotype class.39
For each database the most frequent cyclic systems were identified. The number of cyclicsystems was recorded along with the number of cyclic systems containing only one compound(e.g., singletons). The number of singletons accounts for the number of compounds containingits own scaffold and thus provides information regarding the scaffold diversity in the collection.It is important to point out that in the scaffold analysis the structural similarity of the cyclicsystems is ignored. Therefore, in the present study we also included a comparison of databasesusing other criteria such as fingerprints (vide infra). We also like to stress here that the totalnumber of cyclic systems in the database depends not only on the inherent scaffold diversitybut also on the size of the database.
Fingerprints—Compound collections were analyzed in terms of three different types offingerprints namely MACCS keys,29 GpiDAPH3 and TGD as implemented in MOE.30 Inorder to measure the internal molecular diversity of each collection, pair-wise similarities werecomputed for 5 random samples of 1,000 compounds each. Previous studies have suggestedthat random samples of 1,000 molecules are representative of the molecular diversity.43 Thecombinatorial libraries, natural products and MLSMR were also compared to drugs by meansof the multi-fusion similarity (MFS) maps.44 A MFS map is a method developed recently forthe visual characterization and comparison of compound databases and is based on data-fusionsimilarity measures. The fusion data is plotted in two dimensions, where the ordinate representsthe max-fusion values and the abscissa the mean-fusion values. Each point in the map isassociated with a specific molecule in the test set, and its position is determined by thecorresponding fusion values computed with respect to molecules in the reference set.44 TheMFS maps can be further characterized by the corresponding distributions of the max- andmean-fusion values.17 This approach has recently been used to explore structure-activityrelationships of compounds obtained from mixture-based combinatorial libraries45 and tocompare combinatorial libraries.17
RESULTS AND DISCUSSIONPhysicochemical properties
Figure 2 presents the distribution of the six physicochemical properties described in Methodsas box plots implemented in Spotfire 9.1.1.33 The three important molecular properties of size,flexibility, and molecular polarity are described by MW; RB; and SlogP, TPSA, HBA and
Singh et al. Page 5
J Chem Inf Model. Author manuscript; available in PMC 2010 April 27.
NIH
-PA Author Manuscript
NIH
-PA Author Manuscript
NIH
-PA Author Manuscript

HBD respectively. The six descriptors used here have been used recently to compare theproperty space covered by a virtual collection and reference databases.46 In these plots, theyellow boxes enclose data points with values within the first and third quartile; the black andblue triangles denote the mean and median of distributions, respectively; and the lines aboveand below indicate the upper and lower adjacent values.47 The red squares indicate the datapoints with values beyond the upper and lower adjacent values (i.e., outliers). At the bottomof the box plots, a summary of the maximum, minimum, median, mean and standard deviationsof the distributions are presented. For the analysis in Figure 2, the molecule with SubstanceID:11532938 was excluded from the MLSRM because of the very high weight of this molecule(MW = 3,358).
According to Figure 2, library II has a distribution of HBA similar to drugs as reflected by themedian and mean values although with a narrower distribution as can be deduced from thestandard deviation. Library IV also has a distribution of HBA similar to natural products.Libraries I and III have larger values of HBA than drugs but similar values to MLSMRcompounds (also with narrower distributions). The four combinatorial libraries in Figure 1have, in general, more HBD, RB and larger SlogP values than drugs, natural products andMLSMR compounds with the exception of III, which has a distribution of HBD similar to thatof drugs. Library II has median and mean TPSA values similar to drugs and natural productsbut with less standard deviation. Libraries IV and I tend to have larger TPSA and MW valuesthan drugs, natural products and MLSRM. Library III shows lower values of TPSA than theother collections (Figure 2). The higher hydrophobicity of combinatorial libraries in Figure 1resembles the higher hydrophobicity reported for diversity oriented (DOS) libraries.15
Natural products contained in the ZINC database have similar distribution of HBA, HBD andRB as that of drugs. The distribution of SlogP values shows that natural products are slightlymore hydrophobic than drugs and overall have a slightly larger MW as previously observedfor other collections of natural products.48, 49 Compounds in MLSMR have the same medianand mean distribution of HBD as drugs and natural products (1 and 1.2, respectively) althoughwith outliers (HBD > 10). The MLSMR compounds have more HBA, RB and larger SlogPvalues than natural products and drugs. Regarding MW, the MLSMR compounds are slightlybulkier than drugs, with natural products MW in between these collections. Also, MLSMRhave a large number of outliers with very high MW.
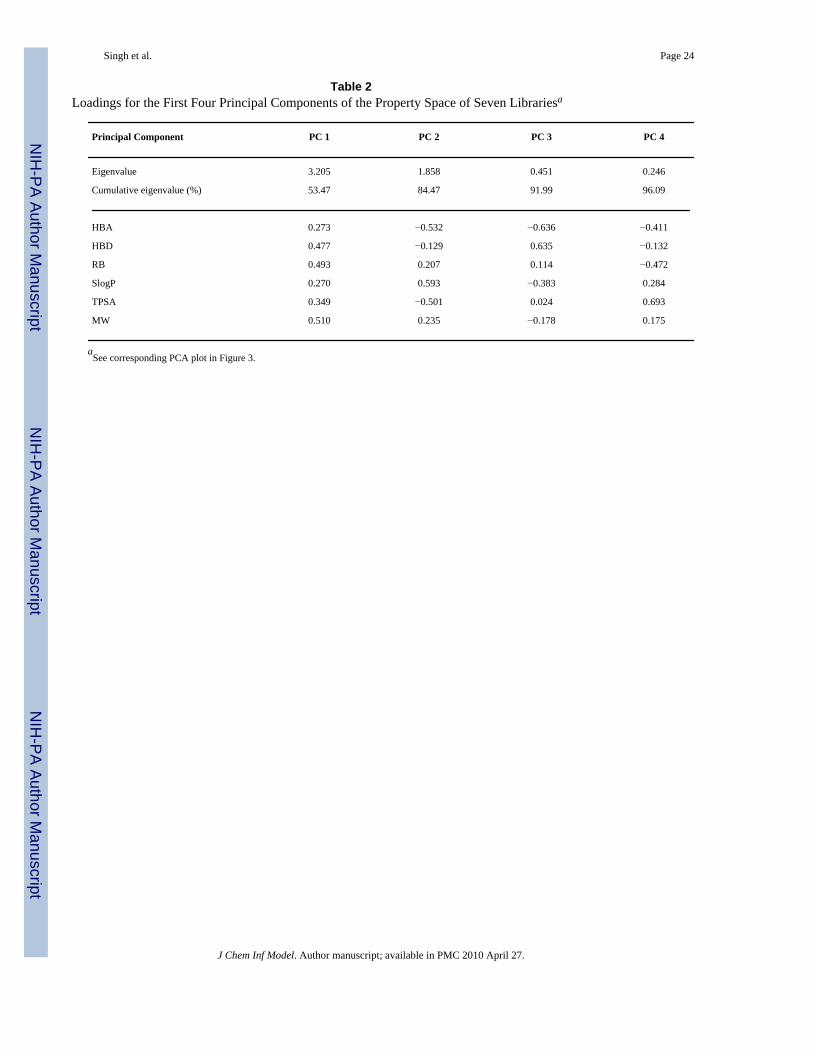
The six physicochemical properties were subject to PCA after Z-scaling. Figure 3 depicts anapproximation of the property space as defined by these properties. The first two principalcomponents (PC) with eigenvalues 3.205 and 1.858, respectively account for 84.47% of thevariance (components with eigenvalues less than 1.0 were not considered). Figure 3A showsall databases in the same space. For the sake of clarity, Figures 3B – 3H shows each compoundcollection separately but within the same coordinates as Figure 3A. Table 2 summarizes thecorresponding loadings and eigenvalues for the first four PC. Note that for the first PC, thelarger loadings correspond to MW followed by RB, whereas, for the second PC the largestloading corresponds to SlogP. Visualization of the property space in Figure 3 reveals that thenatural products cover an area of the property space similar to drugs but also includes additionalareas. Similar observations have been made previously.15, 49, 50 Similar to natural products,the MLSMR covers a broad sample of the property space occupied by drugs but also includingother regions.
Figures 3E–H show different degrees of overlap for the combinatorial libraries with drugs.Library III in Figure 3G shows a significant degree of overlap with the space of drugs.However, a fraction of library III also samples regions sparsely covered by drugs. Figures 3E,3F and 3H show that combinatorial libraries I, II and IV cover regions of the property spacethat are sparsely populated by drugs. The areas in the property space with few drugs represent
Singh et al. Page 6
J Chem Inf Model. Author manuscript; available in PMC 2010 April 27.
NIH
-PA Author Manuscript
NIH
-PA Author Manuscript
NIH
-PA Author Manuscript

areas that are biologically relevant as revealed by the presence of some drugs but may not havebeen sufficiently explored. In addition, libraries I and II sample unexplored regions of the drugspace. Coverage of regions unexplored by drugs has previously been reported for DOSlibraries.15 Molecules in these areas, while potentially unlikely to make drugs by themselves,are valuable in drug discovery as chemical probes in order to better understand the structure-activity relationships associated with unknown targets. Comparing libraries I, II and, to a lesserextent, library IV with MLSMR (Figure 3A) reveals that part of the combinatorial librariescover regions in the property space not covered by MLSMR.
Although Figure 3 provides a useful idea of the molecules distribution in the property space,PCA represents a visual approximation of such space. A more quantitative assessment of thedegree of overlap of compound collections, which avoids dimension reduction (and thereforeloss of information), was evaluated using the R-NN curves. Results of the R-NN methodologyfor the comparison of combinatorial libraries and drugs are described ahead.
Overlap between combinatorial libraries and drugs – R-NN analysisHere we consider the overlap of the combinatorial libraries with the DrugBank dataset in thephysicochemical descriptor space. Given the sizes of the libraries, we summarize the Rmax(S)of the individual compounds in terms of histograms. Figure 4C shows the histogram of theRmax(S) for library III. It is clear that most of library III compounds are located mainly withinthe space of the DrugBank collection. In fact, the Rmax(S) histogram for III peaks atapproximately 18 (Figure 4C). In this space, the library appears to be relatively compactlydistributed, with only 29 (0.8%) compounds exhibiting an Rmax(S) > 35. This is illustratedfurther in Figure 5C by mapping the Rmax(S) values into a visualization of the property spaceobtained from a PCA of the six physicochemical descriptors. It is worth noting that the propertyspace depicted in Figure 5 was obtained by considering compounds from drugs and the fourcombinatorial libraries only. The first two PC (eigenvalues 1.317 and 1.018, respectively)account for 86.87% of the variance. PC with eigenvalues lower than 1.0 were not considered.The Rmax(S) values are represented in a continuous scale from red (small Rmax(S) values) togreen (large Rmax(S) values). In Figure 5C it is clear that most of the library III compounds arered-to-orange in color with few yellow-to-green ones. Noteworthy, the Rmax(S) values arederived from all six dimensions and do not involve any dimensionality reduction as in the PCAplot.
The histogram of the Rmax(S) for library I (Figure 4A) indicates that a large number of moleculesare within the space of the DrugBank collection (626,168 (84.9%), those with Rmax(S) < 35).In contrast to library III, this library contains a number of outlying compounds. Morespecifically, 32 compounds exhibit an Rmax(S) > 50. Figure 5A depicts the Rmax(S) valuesmapped into a visualization of the property space obtained with PCA. While there are moleculescolored red-to-orange (small Rmax(S) values) within the area of drugs, there is also a largenumber of molecules colored yellow-to-green (large Rmax(S) values).
The histogram of the Rmax(S) for library II (Figure 4B) reveals that a significant proportion iswithin the space of the DrugBank collection (41,608 (90.7%) those with Rmax(S) < 35). As withthe other libraries, there are few outliers (324 compounds have an Rmax(S) > 40, though nocompounds exhibit an Rmax(S)>50). Figure 5B shows the Rmax(S) values mapped into avisualization of the property space.
Library IV is nearly wholly located within the DrugBank space (3,523 (99%) those withRmax(S) < 35) (Figure 4D). The largest value of Rmax(S) is 41 and only 1 molecule exhibits anRmax(S) > 40. Figure 5D shows the Rmax(S) values mapped into the PCA. It is clear that a numberof molecules in library IV colored in red-to-orange are within the space of drugs. It is also clearthat there are also a number of molecules in sparse regions of the DrugBank collection.
Singh et al. Page 7
J Chem Inf Model. Author manuscript; available in PMC 2010 April 27.
NIH
-PA Author Manuscript
NIH
-PA Author Manuscript
NIH
-PA Author Manuscript

In summary, it can be concluded from Figure 4 that combinatorial library III is more withinthe property space of DrugBank molecules as defined by the properties used here. Library Ifollowed by II has a larger fraction of molecules located in sparse regions (“holes”) of theDrugBank collection. Library IV represents a borderline case between libraries I, II and III.
R-NN analysis for actual and randomized data setsWhile considering the overlap between the datasets, it is also useful to compare the R-NNanalysis for these datasets with one performed on a randomized dataset, in other words acomputational control experiment. As an example, we consider the DrugBank dataset,characterized by the physicochemical descriptors. We generated six new descriptors usingrandom uniform numbers in the ranges of each original descriptor. If we then perform an R-NN analysis of the random dataset and plot the histogram of the Rmax(S) values we see that itis approximately centered upon Rmax(S) = 50, as one might expect if the points are uniformlydistributed within the space (Figure S1 in Supporting Information). It should be noted that thisanalysis is not completely rigorous, since the random values were not obtained from a truemultivariate distribution. When the original DrugBank dataset is used to generate thehistogram, the distribution of Rmax(S) values is significantly different (Figure S2 in SupportingInformation). Another interesting property that can be evaluated is the maximum observedpairwise observed distance versus the theoretically maximum distance (i.e., the distancebetween two hypothetical points whose coordinates would be the minimum values of thedescriptors and the maximum values of the descriptors, respectively). For the DrugBank datasetcharacterized using physicochemical descriptors these values are 9.20 and 13.61 respectively.For the random version of this dataset, the values are 6.87 and 8.48 respectively. These valuessuggest that the distribution of compounds in the physicochemical space of the DrugBankdataset are unsurprisingly, not distributed uniformly. One could further empirically evaluate ap-value for these measurements. Given the focus of the paper on the analysis of combinatoriallibraries we do not further consider further analysis of the R-NN method itself.
Scaffolds – molecular frameworksTable 3 summarizes the number of cyclic systems in each database and the fraction of cyclicsystems relative to the number of molecules in the data set. The number and fraction ofsingletons (e.g., cyclic systems with only one molecule) are also reported. Drugs collected inDrugBank have the largest proportion of cyclic systems and the largest proportion of singletons(39.7% and 23%, respectively) followed by the MLSMR (29.4% and 14.1%, respectively) andnatural products (17.9% and 7.2%, respectively). This suggests a larger degree of cyclic systemdiversity in drugs as compared to MLSMR and natural products. The surprising lower scaffolddiversity of natural products may be explained by the contents of the natural products collectionavailable in the ZINC database (which also includes natural products derivatives). Notsurprisingly, the four combinatorial libraries have a much lower proportion of cyclic systemsand singletons than the other databases (Table 3) suggesting a lower framework diversity.Interestingly, the 738,192 compounds in library I are distributed in only 2,250 cyclic systemsand just a small proportion of the molecules are singletons with their own cyclic system (Table3). In fact, out of the four combinatorial libraries and all other collections, library I has thelowest proportion of cyclic systems and singletons (0.3% and 0.0018%, respectively), eventhough it is the largest library (Table 1).
Table 3 also presents the fraction of singletons relative to the number of cyclic systems.Notably, roughly half of the cyclic systems in the drugs, MSLMR and library IV are singletons(58.0%, 48.1% and 55.7%, respectively). In contrast, the cyclic systems for library I have alow proportion of singletons (0.6%).
Singh et al. Page 8
J Chem Inf Model. Author manuscript; available in PMC 2010 April 27.
NIH
-PA Author Manuscript
NIH
-PA Author Manuscript
NIH
-PA Author Manuscript

To note, neither the intra-cyclic system structural similarity nor the similarity due to the sidechains is considered here. However, structural similarity using fingerprints described later inthis paper further confirmed the large structural diversity in the drugs collection.
Figure 6 depicts the most frequent cyclic systems in the drugs, natural products and MLSMRcollections along with the corresponding chemotype identifier. All cyclic systems with afrequency of at least 9 molecules for drugs and a frequency of more than 240 molecules fornatural products and MLSMR are shown. Acyclic structures, not indicated in Figure 6, accountfor a relatively large proportion of structures in each collection: 92 (6.2%) in drugs; 639 (0.7%)in natural products and 460 (0.2%) in MLSMR.
For drugs in DrugBank the 17 cyclic systems in Figure 6, in addition to the acyclic structures,account for 31% of the database. The most frequent cyclic system is benzene as previouslyreported for other collection of drugs.38 In fact, benzene is also the most frequent cyclic systemin natural products and MLSMR (Figure 6). For natural products considered here, the 21 cyclicsystems in Figure 6 in addition to the acyclic systems accounts for 13% of the collection. Forthe MLSMR the 15 cyclic systems (Figure 6) along with the acyclic structures accounts for5% of the database.
Other than benzene, several other cyclic systems were found common in at least two of thedatabases. For example, tetrahydropyran (chemotype identifier ZBBFK) is common to drugsand natural products (population of 0.60% and 0.42%, respectively); pyridine (chemotypeidentifier 91DYR) is common to drugs and MLSMR (population of 0.70% and 0.29%,respectively); and indole (chemotype identifier Y1JVZ) is common to natural products andMLSMR compounds (population of 0.41% and 0.21%, respectively) (Figure 6).
Figure 7 presents the most frequent cyclic systems of the combinatorial libraries considered inthis work. The corresponding chemotype identifier is also shown. Together the depicted cyclicsystems retrieve ~20% of each combinatorial library. Overall a very small number of cyclicsystems account for ~1/5 of each database: 5 cyclic systems for libraries I and II, 2 cyclicsystems for library III and 1 for library IV (Figure 7). Interestingly, the 5 cyclic systems shownin Figure 7 accounts for 22% of the library I, and the same amount of cyclic systems accountsfor 20% of the library II, which is a much smaller library compared to I. Note also the differentnature of the scaffolds (e.g., molecular frameworks) of the combinatorial libraries, particularlyI and II as compared to the scaffolds of drugs, natural products and MLSRM (Figure 6).Noteworthy, none of the cyclic systems in Figure 7 are common to drugs, MLSMR and naturalproducts.
FingerprintsLibrary diversity—Table 4 summarizes the mean, standard deviation and median molecularsimilarity of each collection considering three different structural representations namelyMACCS keys, GpiDAPH3 and TGD as described in Methods. In a previous work, to defineconsensus activity cliffs we have shown the significance of using multiple structuralrepresentations to get generalized (i.e., consensus) solutions.28 To compute the intra-molecularsimilarity of each library we considered 5 random samples of 1,000 molecules each. Thedistribution of similarities within each random sample was very similar per library for the threefingerprints (see Supporting Information), indicating that random samples of 1,000 moleculesare good representatives of the molecular diversity as previously suggested.43 Noteworthy,these observations hold true not only for the combinatorial libraries but also for drugs, naturalproducts and MLSMR collections. Similar conclusions were obtained by analyzing thephysiochemical properties distributions of random samples with 1,000 compounds (alsosummarized in Supporting Information).
Singh et al. Page 9
J Chem Inf Model. Author manuscript; available in PMC 2010 April 27.
NIH
-PA Author Manuscript
NIH
-PA Author Manuscript
NIH
-PA Author Manuscript

Overall, similarity values in Table 4 obtained with TGD are higher than similarity valuescomputed with MACCS keys. While values calculated with GpiDAPH3 had the lowestsimilarity of the three fingerprints. This is related to the intrinsic resolution of the fingerprints.
Molecular diversity considering the different fingerprints indicates that drugs from DrugBankare the most diverse, with the lowest mean and median similarities for MACCS keys,GpiDAPH3 and TGD. The second most diverse databases are natural products considered inthis study and MLSMR with similar mean and median similarities for MACCS keys andGpiDAPH3, respectively. Not surprisingly, combinatorial libraries have the largest mean andmedian similarities for the three fingerprints (with the lowest standard deviation in the threecases) indicating less diversity than drugs, natural products and MLSMR (Table 4). Accordingto MACCS keys, the four combinatorial libraries have approximately the same diversity. Incomparison, library I is slightly less diverse than the others (i.e., median similarity of 0.79 vs.0.77 for other combinatorial libraries with a standard deviation of 0.07). According toGpiDAPH3, which seem to have higher resolution than MACCS keys, out of the fourcombinatorial libraries, III is the most diverse (median similarity of 0.56 and standard deviationof 0.11) and I and II the least (median similarity of 0.70 and 0.75, respectively with standarddeviation of 0.08 and 0.07, respectively). Similar conclusions are obtained considering theTGD fingerprints, although with higher similarity values probably due to the lesser resolutionof this type of fingerprints (vide supra). Interestingly, the collection of drugs also showed thelargest cyclic systems diversity (vide supra). Similar conclusions can be drawn for naturalproducts and MLSMR. As opposed to these collections, combinatorial libraries have not onlylow cyclic system diversity but also low structural diversity considering the entire molecules.In other words, combinatorial libraries are packed more densely within the chemical space(vide supra).
MFS maps—The four combinatorial libraries were also compared to drugs by means of theMFS maps using MACCS keys and GpiDAPH3. Natural products and MLSMR were includedin the comparison. TGD was not considered in this analysis because of the lower resolution(vide supra). As summarized in Methods, and detailed elsewhere,44 MFS maps characterizethe relationship of test molecules (e.g., combinatorial libraries) to a set of reference molecules(e.g., drugs). Figure 8 depicts the MFS maps comparing the four combinatorial libraries, naturalproducts and MLSMR to drugs using MACCS keys. A quantitative characterization of theMFS maps is presented in Table 5. The table summarizes the maximum and mean similaritiesdistributions of each database17 for MACCS keys and GpiDAPH3. The low mean similarityfor all compounds in the libraries for MACCS keys (maximum mean similarity < 0.45) andGpiDAPH3 (maximum mean similarity < 0.29) (Table 5) indicates the large diversity of thereference set (i.e., drugs).44
From the MFS maps in Figure 8, it is observed that there are no molecules in the combinatoriallibraries with maximum similarity to drugs equal or greater than 0.90. Only library III has afew molecules (158) with maximum MACCS keys similarity greater than 0.85 to any of thedrugs in DrugBank. This reveals the overall structural novelty represented in the combinatoriallibraries as compared to drugs. Concerning structural novelty, similar conclusions can bederived from the molecular framework analysis (vide supra). In contrast, the natural productsand MLSMR have a significant number of molecules that are very similar to drugs. There are1,617 compounds in the natural products collection with maximum MACCS keys similarityto any of the drug equal or greater than 0.90 and 399 molecules with similarity of 1.0. (Similarityof 1.0 does not necessarily mean that the molecules are identical and could be an effect of theresolution of the MACCS keys). Concerning the MLSMR, there are 1,115 molecules withMACCS keys similarity to drugs equal or greater than 0.90 and 383 compounds with similarityof 1.0.
Singh et al. Page 10
J Chem Inf Model. Author manuscript; available in PMC 2010 April 27.
NIH
-PA Author Manuscript
NIH
-PA Author Manuscript
NIH
-PA Author Manuscript

From Figure 8 and Table 5, it is clearly observed that the widespread distribution of data pointsin the MFS maps for natural products and MLSMR are in agreement with the larger structuraldiversity of these two collections (Table 4). In fact, natural products and MLSMR have thelargest standard deviation and range of maximum and mean MACCS keys and GpiDAPH3similarities (Table 5). In contrast, the more constrained distribution of maximum and meanMACCS keys and GpiDAPH3 similarities of the four combinatorial libraries are in agreementwith the more restricted diversity of the combinatorial libraries (e.g., high density) as discussedin terms of property and scaffold diversity (vide supra). Among the combinatorial libraries,III has slightly higher maximum and mean MACCS key similarities to drugs as deduced fromFigure 8 and Table 5. According to GpiDAPH3, library II shows slightly higher similarity todrugs than other combinatorial libraries.
CONCLUSIONSIn this study we present a comprehensive assessment of a novel series of combinatorial librariesusing diverse criteria including physicochemical properties, scaffolds and three differentfingerprints. Combinatorial libraries were compared to a collection of drugs, compounds fromMLSMR and natural products (as implemented in the ZINC database). Analysis of the propertyspace by means of PCA shows that combinatorial libraries studied here have different degreeof overlap with the property space of drugs. In addition, combinatorial libraries occupy regionsof the property space that are poorly or not populated by the MLSMR and natural products.Comparison of the combinatorial libraries with drugs using the R-NN curve methodologyprovided a quantitative analysis of the degree of overlap between these collections. The R-NNanalysis revealed that a large proportion of molecules of several libraries are located withinthe property space of the collection of drugs. In agreement with the visualization of the propertyspace obtained with PCA, the R-NN analysis also showed that there is a large proportion ofmolecules in sparse regions (“holes”) of the DrugBank collection mainly molecules fromlibrary I (pyrrolidine bis-cyclic guanidine library) followed by compounds in library II (bis-cyclic guanidine library). The scaffold analysis indicated that frequent molecular frameworksin the combinatorial libraries are not common to drugs, natural products and the MLSRMcollection. In addition, the fingerprints-based comparisons using MFS maps indicate thatcombinatorial libraries are structurally different to drugs. The low scaffold and fingerprint-based diversity of combinatorial libraries evaluated in this work represent an advantageousfeature of screening these collections, especially using fast and low cost screening approaches(e.g., positional scanning synthetic combinatorial libraries), since the high density coverage ofthe chemical space would increase the potential of detecting activity cliffs and be beneficial tobetter understand the structure-activity relationships associated with novel targets.
During the course of this work it was found that random samples of combinatorial librariescontaining 1,000 molecules resemble the property and inter-molecular similarity distributionof the complete library. This observation is useful to develop large combinatorial-basedlibraries for virtual screening and other chemoinformatic applications.
Supplementary MaterialRefer to Web version on PubMed Central for supplementary material.
AcknowledgmentsAuthors are grateful to Dr. Karina Martínez-Mayorga, Dr. Mark Johnson and Dr. Andreas Bender for helpfuldiscussions and to the anonymous reviewers for their comments. We also acknowledge Kyle Kryak for technicalassistance. This work was supported by the State of Florida, Executive Office of the Governor’s Office of Tourism,Trade, and Economic Development. Authors are also grateful to the National Institute on Drug Abuse (DA019620)
Singh et al. Page 11
J Chem Inf Model. Author manuscript; available in PMC 2010 April 27.
NIH
-PA Author Manuscript
NIH
-PA Author Manuscript
NIH
-PA Author Manuscript

and to the Multiple Sclerosis National Research Institute for partial funding. We thank Dr. Mark Johnson, PannanuggetConsulting, LLC, for providing the program MEQI.
REFERENCES AND NOTES1. Scior T, Bernard P, Medina-Franco JL, Maggiora GM. Large Compound Databases for Structure-
Activity Relationships Studies in Drug Discovery. Mini-Rev Med Chem 2007;7:851–860. [PubMed:17692047]
2. Hopkins AL. Network Pharmacology: The Next Paradigm in Drug Discovery. Nat Chem Biol2008;4:682–690. [PubMed: 18936753]
3. Austin CP, Brady LS, Insel TR, Collins FS. Molecular Biology: NIH Molecular Libraries Initiative.Science 2004;306:1138–1139. [PubMed: 15542455]
4. PubChem. [accessed Feb 21, 2009]. Available at: http://pubchem.ncbi.nlm.nih.gov5. Irwin JJ, Shoichet BK. ZINC - a Free Database of Commercially Available Compounds for Virtual
Screening. J Chem Inf Model 2005;45:177–182. [PubMed: 15667143]6. Houghten RA, Pinilla C, Giulianotti MA, Appel JR, Dooley CT, Nefzi A, Ostresh JM, Yu YP, Maggiora
GM, Medina-Franco JL, Brunner D, Schneider J. Strategies for the Use of Mixture-Based SyntheticCombinatorial Libraries: Scaffold Ranking, Direct Testing, in Vivo, and Enhanced Deconvolution byComputational Methods. J Comb Chem 2008;10:3–19. [PubMed: 18067268]
7. Kennedy JP, Williams L, Bridges TM, Daniels RN, Weaver D, Lindsley CW. Application ofCombinatorial Chemistry Science on Modern Drug Discovery. J Comb Chem 2008;10:345–354.[PubMed: 18220367]
8. Harvey AL. Natural Products in Drug Discovery. Drug Discovery Today 2008;13:894–901. [PubMed:18691670]
9. Fitzgerald SH, Sabat M, Geysen HM. Diversity Space and Its Application to Library Selection andDesign. J Chem Inf Model 2006;46:1588–1597. [PubMed: 16859290]
10. Pinilla C, Appel JR, Borras E, Houghten RA. Advances in the Use of Synthetic CombinatorialChemistry: Mixture-Based Libraries. Nat Med 2003;9:118–122. [PubMed: 12514724]
11. Houghten RA, Pinilla C, Appel JR, Blondelle SE, Dooley CT, Eichler J, Nefzi A, Ostresh JM. Mixture-Based Synthetic Combinatorial Libraries. J Med Chem 1999;42:3743–3778. [PubMed: 10508425]
12. Macarron R. Critical Review of the Role of HTS in Drug Discovery. Drug Discovery Today2006;11:277–279. [PubMed: 16580969]
13. Carpenter AE. Image-Based Chemical Screening. Nat Chem Biol 2007;3:461–465. [PubMed:17637778]
14. Fitzgerald SH, Sabat M, Geysen HM. Survey of the Diversity Space Coverage of ReportedCombinatorial Libraries. J Comb Chem 2007;9:724–734. [PubMed: 17567080]
15. Shelat AA, Guy RK. The Interdependence between Screening Methods and Screening Libraries. CurrOpin Chem Biol 2007;11:244–251. [PubMed: 17524728]
16. Shanmugasundaram V, Maggiora GM, Lajiness MS. Hit-Directed Nearest-Neighbor Searching. JMed Chem 2005;48:240–248. [PubMed: 15634017]
17. Medina-Franco JL, Martínez-Mayorga K, Giulianotti MA, Houghten RA, Pinilla C. Visualization ofthe Chemical Space in Drug Discovery. Curr Comput -Aided Drug Des 2008;4:322–333.
18. Lipinski CA, Lombardo F, Dominy BW, Feeney PJ. Experimental and Computational Approachesto Estimate Solubility and Permeability in Drug Discovery and Development Settings. Adv DrugDelivery Rev 1997;23:3–25.
19. Teague SJ, Davis AM, Leeson PD, Oprea T. The Design of Leadlike Combinatorial Libraries. AngewChem, Int Ed 1999;38:3743–3748.
20. Congreve M, Carr R, Murray C, Jhoti H. A ‘Rule of Three’ for Fragment-Based Lead Discovery?Drug Discovery Today 2003;8:876–877. [PubMed: 14554012]
21. Schneider G, Neidhart W, Giller T, Schmid G. Scaffold-Hopping by Topological PharmacophoreSearch: A Contribution to Virtual Screening. Angew Chem, Int Ed 1999;38:2894–2896.
22. Evans BE, Rittle KE, Bock MG, DiPardo RM, Freidinger RM, Whitter WL, Lundell GF, Veber DF,Anderson PS, et al. Methods for Drug Discovery: Development of Potent, Selective, Orally EffectiveCholecystokinin Antagonists. J Med Chem 1988;31:2235–2246. [PubMed: 2848124]
Singh et al. Page 12
J Chem Inf Model. Author manuscript; available in PMC 2010 April 27.
NIH
-PA Author Manuscript
NIH
-PA Author Manuscript
NIH
-PA Author Manuscript
23. Mason JS, Morize I, Menard PR, Cheney DL, Hulme C, Labaudiniere RF. New 4-PointPharmacophore Method for Molecular Similarity and Diversity Applications: Overview of theMethod and Applications, Including a Novel Approach to the Design of Combinatorial LibrariesContaining Privileged Substructures. J Med Chem 1999;42:3251–3264. [PubMed: 10464012]
24. Villar HO, Hansen MR, Kho R. Substructural Analysis in Drug Discovery. Curr Comput -Aided DrugDes 2007;3:59–67.
25. Johnson, MA.; Maggiora, GM., editors. Concepts and Applications of Molecular Similarity. JohnWiley & Sons; New York: 1990.
26. Bender A, Glen RC. Molecular Similarity: A Key Technique in Molecular Informatics. Org BiomolChem 2004;2:3204–3218. [PubMed: 15534697]
27. Willett P. Similarity-Based Virtual Screening Using 2D Fingerprints. Drug Discovery Today2006;11:1046–1053. [PubMed: 17129822]
28. Medina-Franco JL, Martínez-Mayorga K, Bender A, Marin R, Giulianotti M, Pinilla C, Houghten R.Characterization of Activity Landscapes Using 2D and 3D Similarity Methods: Consensus ActivityCliffs. J Chem Inf Model. 200910.1021/ci800379q
29. MACCS Structural Keys. MDL Information Systems Inc.; San Leandro, CA:30. Molecular Operating Environment (MOE), version 2007. Chemical Computing Group Inc.; Montreal,
Quebec, Canada: [(accessed Feb 21, 2009)]. Available at: http://www.chemcomp.com31. Guha R, Dutta D, Jurs PC, Chen T. R-NN Curves: An Intuitive Approach to Outlier Detection Using
a Distance Based Method. J Chem Inf Model 2006;46:1713–1722. [PubMed: 16859303]32. Wishart DS, Knox C, Guo AC, Cheng D, Shrivastava S, Tzur D, Gautam B, Hassanali M. Drugbank:
A Knowledgebase for Drugs, Drug Actions and Drug Targets. Nucleic Acids Res 2008;36:D901–D906. [PubMed: 18048412]
33. Spotfire, version 9.1.1. TIBCO Software, Inc.; Somerville, MA: [(accessed Feb 21, 2009)]. Availableat: http://spotfire.tibco.com
34. Guttman, A. SIGMOD Conference. ACM Press; 1984. R-Trees: A Dynamic Index Structure forSpatial Searching; p. 47-57.
35. Cormen, TH.; Leiserson, CE.; Rivest, RL.; Stein, C. Introduction to Algorithms. Vol. 2. MIT Press;2001. Binary Search Trees.
36. Xu Y, Johnson M. Algorithm for Naming Molecular Equivalence Classes Represented by LabeledPseudographs. J Chem Inf Comput Sci 2001;41:181–185. [PubMed: 11206372]
37. Xu YJ, Johnson M. Using Molecular Equivalence Numbers to Visually Explore Structural FeaturesThat Distinguish Chemical Libraries. J Chem Inf Comput Sci 2002;42:912–926. [PubMed:12132893]
38. Bemis GW, Murcko MA. The Properties of Known Drugs. 1. Molecular Frameworks. J Med Chem1996;39:2887–2893. [PubMed: 8709122]
39. Medina-Franco JL, Petit J, Maggiora GM. Hierarchical Strategy for Identifying Active ChemotypeClasses in Compound Databases. Chem Biol Drug Des 2006;67:395–408. [PubMed: 16882314]
40. Renner S, Schneider G. Scaffold-Hopping Potential of Ligand-Based Similarity Concepts.ChemMedChem 2006;1:181–185. [PubMed: 16892349]
41. Schreyer SK, Parker CN, Maggiora GM. Data Shaving: A Focused Screening Approach. J Chem InfComput Sci 2004;44:470–479. [PubMed: 15032526]
42. Cases M, Garcia-Serna R, Hettne K, Weeber M, van der Lei J, Boyer S, Mestres J. Chemical andBiological Profiling of an Annotated Compound Library Directed to the Nuclear Receptor Family.Curr Top Med Chem 2005;5:763–772. [PubMed: 16101416]
43. Agrafiotis DK. A Constant Time Algorithm for Estimating the Diversity of Large Chemical Libraries.J Chem Inf Comput Sci 2001;41:159–167. [PubMed: 11206368]
44. Medina-Franco JL, Maggiora GM, Giulianotti MA, Pinilla C, Houghten RA. A Similarity-BasedData-Fusion Approach to the Visual Characterization and Comparison of Compound Databases.Chem Biol Drug Des 2007;70:393–412. [PubMed: 17927720]
45. Martínez-Mayorga K, Medina-Franco JL, Giulianotti MA, Pinilla C, Dooley CT, Appel JR, HoughtenRA. Conformation-Opioid Activity Relationships of Bicyclic Guanidines from 3d SimilarityAnalysis. Bioorg Med Chem 2008;16:5932–5938. [PubMed: 18468907]
Singh et al. Page 13
J Chem Inf Model. Author manuscript; available in PMC 2010 April 27.
NIH
-PA Author Manuscript
NIH
-PA Author Manuscript
NIH
-PA Author Manuscript

46. Fink T, Reymond JL. Virtual Exploration of the Chemical Universe up to 11 Atoms of C, N, O, F:Assembly of 26.4 Million Structures (110.9 Million Stereoisomers) and Analysis for New RingSystems, Stereochemistry, Physicochemical Properties, Compound Classes, and Drug Discovery. JChem Inf Model 2007;47:342–353. [PubMed: 17260980]
47. The upper adjacent value is defined as the largest observation that is less than or equal to the upperwhisker limit. The upper whisker limit is the third quartile plus 1.5 times the interquartile range (thirdquartile minus first quartile). The lower adjacent value is the smallest observation that is greater thanor equal to the lower whisker limit, which is the first quartile minus 1.5 times the interquartile range.
48. Lee ML, Schneider G. Scaffold Architecture and Pharmacophoric Properties of Natural Products andTrade Drugs: Application in the Design of Natural Product-Based Combinatorial Libraries. J CombChem 2001;3:284–289. [PubMed: 11350252]
49. Feher M, Schmidt JM. Property Distributions: Differences between Drugs, Natural Products, andMolecules from Combinatorial Chemistry. J Chem Inf Comput Sci 2003;43:218–227. [PubMed:12546556]
50. Kong DX, Li XJ, Zhang HY. Where Is the Hope for Drug Discovery? Let History Tell the Future.Drug Discovery Today 2009;14:115–119. [PubMed: 18687410]
51. Nefzi A, Ong NA, Giulianotti MA, Ostresh JM, Houghten RA. Solid Phase Synthesis of 1,4-Benzothiazepin-5-One Derivatives. Tetrahedron Lett 1999;40:4939–4942.
Singh et al. Page 14
J Chem Inf Model. Author manuscript; available in PMC 2010 April 27.
NIH
-PA Author Manuscript
NIH
-PA Author Manuscript
NIH
-PA Author Manuscript

Figure 1.Core templates of combinatorial libraries covered in this study. Library I is made up of 738,192compounds (R1, R2, and R3 = 26 substituents, and R4 = 42 substituents). Library II is madeup of 45,864 compounds (R1 = 42 substituents, R2 = 26 substituents, and R3 = 42 susbtituents).Library III is made up of 31,320 compounds (R1 = 29 susbtituents, R2 = 27 susbtituents, R3= 40 susbtituents). Library IV is made up of 3,552 compounds (R1 = 48 substituents, R2 = 74substituents).
Singh et al. Page 15
J Chem Inf Model. Author manuscript; available in PMC 2010 April 27.
NIH
-PA Author Manuscript
NIH
-PA Author Manuscript
NIH
-PA Author Manuscript

Figure 2.Box plots for the physicochemical properties. The yellow boxes encloses data points withvalues within the first and third quartile; the black and blue triangles denote the mean andmedian of distributions, respectively; the lines above and below indicate the upper and loweradjacent values. The red squares indicate outliers.
Singh et al. Page 16
J Chem Inf Model. Author manuscript; available in PMC 2010 April 27.
NIH
-PA Author Manuscript
NIH
-PA Author Manuscript
NIH
-PA Author Manuscript

Figure 3.Property space of seven libraries obtained by PCA of six (autoscaled) molecular descriptors.The first two PC account for 84.47% of the variance. The loadings are summarized in Table2. (A) All libraries; (B) drugs; (C) natural products; (D) MLSMR; (E) drugs and library I; (F)drugs and library II; (G) drugs and library III; and (H) drugs and library IV.
Singh et al. Page 17
J Chem Inf Model. Author manuscript; available in PMC 2010 April 27.
NIH
-PA Author Manuscript
NIH
-PA Author Manuscript
NIH
-PA Author Manuscript

Figure 4.Histograms of Rmax(S) values for the combinatorial libraries. The target collection wasDrugBank. The plots were generated using the six scaled physicochemical descriptors. (A)Library I; (B) library II; (C) library III and (D) library IV.
Singh et al. Page 18
J Chem Inf Model. Author manuscript; available in PMC 2010 April 27.
NIH
-PA Author Manuscript
NIH
-PA Author Manuscript
NIH
-PA Author Manuscript

Figure 5.Property space of drugs and four combinatorial libraries (820,418 molecules total) obtainedby PCA of six scaled molecular descriptors. The first two PC account for 86.87% of thevariance. Drugs are colored in blue. Combinatorial libraries are color-coded by the Rmax(S)value using a continuous scale from red (low Rmax(S) value) to green (high Rmax(S) value).Each panel depicts a different database: (A) drugs and library I; (B) drugs and library II; (C)drugs and library III; (D) drugs and library IV and (E) drugs.
Singh et al. Page 19
J Chem Inf Model. Author manuscript; available in PMC 2010 April 27.
NIH
-PA Author Manuscript
NIH
-PA Author Manuscript
NIH
-PA Author Manuscript

Figure 6.Most frequent cyclic systems (molecular frameworks) found in (A) drugs, (B) natural productsand (C) MLSMR collections studied in this work. Chemotype identifier, frequency andpercentage are displayed.
Singh et al. Page 20
J Chem Inf Model. Author manuscript; available in PMC 2010 April 27.
NIH
-PA Author Manuscript
NIH
-PA Author Manuscript
NIH
-PA Author Manuscript

Figure 7.Most frequent cyclic systems (molecular frameworks) derived from combinatorial libraries(A) I, (B) II, (C) III and (D) IV. Chemotype identifier, frequency and percentage are shown.Cyclic systems shown recover ~20% of each combinatorial library.
Singh et al. Page 21
J Chem Inf Model. Author manuscript; available in PMC 2010 April 27.
NIH
-PA Author Manuscript
NIH
-PA Author Manuscript
NIH
-PA Author Manuscript

Figure 8.Multi-fusion similarity maps comparing six compound collections (test sets) to drugs(reference set) using MACCS keys. (A) All libraries; (B) natural products; (C) MLSMR; (D)library I; (E) library II; (F) library III; (G) library IV. A quantitative characterization of theplots is presented in Table 5.
Singh et al. Page 22
J Chem Inf Model. Author manuscript; available in PMC 2010 April 27.
NIH
-PA Author Manuscript
NIH
-PA Author Manuscript
NIH
-PA Author Manuscript

NIH
-PA Author Manuscript
NIH
-PA Author Manuscript
NIH
-PA Author Manuscript
Singh et al. Page 23
Table 1Compound Databases Considered in this Study
Library Size Ref.
Drugs (DrugBank from ZINC) 1,490 5, 32
Natural products (from ZINC) 89,425 5
MLSMR 250,000 4
Pyrrolidine bis-cyclic guanidine (I) 738,192 6
Bis-cyclic guanidine (II) 45,864 6
N-Me-1,4,5-trisubstituted-2,3-piperazine (III) 31,320 6
Benzothiazepene (IV) 3,552 51
J Chem Inf Model. Author manuscript; available in PMC 2010 April 27.
NIH
-PA Author Manuscript
NIH
-PA Author Manuscript
NIH
-PA Author Manuscript
Singh et al. Page 24
Table 2Loadings for the First Four Principal Components of the Property Space of Seven Librariesa
Principal Component PC 1 PC 2 PC 3 PC 4
Eigenvalue 3.205 1.858 0.451 0.246
Cumulative eigenvalue (%) 53.47 84.47 91.99 96.09
HBA 0.273 −0.532 −0.636 −0.411
HBD 0.477 −0.129 0.635 −0.132
RB 0.493 0.207 0.114 −0.472
SlogP 0.270 0.593 −0.383 0.284
TPSA 0.349 −0.501 0.024 0.693
MW 0.510 0.235 −0.178 0.175
aSee corresponding PCA plot in Figure 3.
J Chem Inf Model. Author manuscript; available in PMC 2010 April 27.

NIH
-PA Author Manuscript
NIH
-PA Author Manuscript
NIH
-PA Author Manuscript
Singh et al. Page 25
Table 3Scaffold Analysis: Cyclic Systems and Singletons Cyclic Systems
LibraryCyclic systems Singletons
NumberPercentage relative to
library sizePercentage relative to
library sizePercentage relative to
cyclic systems
Drugs 591 39.7 23.0 58.0
Natural products 15,968 17.9 7.2 40.1
MLSMR 73,551 29.4 14.1 48.1
I 2,250 0.3 0.0018 0.6
II 1,620 3.5 0.4 10.4
III 472 1.5 0.05 3.2
IV 336 9.5 5.3 55.7
J Chem Inf Model. Author manuscript; available in PMC 2010 April 27.

NIH
-PA Author Manuscript
NIH
-PA Author Manuscript
NIH
-PA Author Manuscript
Singh et al. Page 26Ta
ble
4M
olec
ular
Div
ersi
ty o
f Com
poun
d C
olle
ctio
ns U
sing
Diff
eren
t Mol
ecul
ar R
epre
sent
atio
ns
Lib
rary
aM
AC
CS
Gpi
DA
PH3
TG
D
Mea
nSt
dev
Med
ian
Mea
nSt
dev
Med
ian
Mea
nSt
dev
Med
ian
Dru
gs0.
311
0.12
60.
300
0.13
40.
154
0.00
00.
521
0.13
30.
528
Nat
ural
pro
duct
s0.
392
0.13
90.
388
0.23
50.
157
0.26
10.
616
0.12
20.
627
MLS
MR
0.40
00.
112
0.39
50.
230
0.14
70.
259
0.69
00.
098
0.69
7
I0.
797
0.07
30.
793
0.70
30.
078
0.70
20.
938
0.03
50.
940
II0.
778
0.07
80.
774
0.74
60.
068
0.74
60.
926
0.06
10.
945
III
0.78
10.
081
0.77
40.
564
0.11
40.
565
0.89
40.
060
0.90
0
IV0.
782
0.07
30.
776
0.65
10.
085
0.64
20.
932
0.03
60.
933
a Ran
dom
sets
with
1,0
00 m
olec
ules
eac
h ex
cept
dru
gs (c
ompl
ete
libra
ry).
J Chem Inf Model. Author manuscript; available in PMC 2010 April 27.

NIH
-PA Author Manuscript
NIH
-PA Author Manuscript
NIH
-PA Author Manuscript
Singh et al. Page 27Ta
ble
5D
istri
butio
n of
Max
imum
and
Mea
n Si
mila
ritie
s of S
ix L
ibra
ries t
o D
rugs
MAC
CS k
eys
Max
imum
sim
ilari
ty
Lib
rary
Max
Q3a
Med
ian
Q1b
Min
Mea
nSt
dev
Nat
ural
pro
duct
s1.
000.
740.
690.
650.
130.
700.
08
MLS
MR
1.00
0.72
0.67
0.62
0.18
0.67
0.07
I0.
800.
690.
670.
650.
590.
670.
03
II0.
830.
690.
660.
650.
600.
670.
03
III
0.89
0.74
0.72
0.69
0.63
0.72
0.04
IV0.
810.
730.
700.
670.
600.
700.
04
Mea
n si
mila
rity
Nat
ural
pro
duct
s0.
440.
380.
350.
300.
040.
330.
06
MLS
MR
0.43
0.35
0.32
0.29
0.03
0.32
0.04
I0.
400.
360.
350.
330.
280.
350.
02
II0.
390.
360.
330.
320.
270.
340.
02
III
0.41
0.38
0.35
0.33
0.29
0.35
0.02
IV0.
410.
380.
370.
360.
320.
370.
02
Gpi
DAP
H3
Max
imum
sim
ilarit
y
Libr
ary
Max
Q3a
Med
ian
Q1
bM
inM
ean
Stde
v
Nat
ural
pro
duct
s1.
000.
580.
530.
490.
000.
540.
09
MLS
MR
1.00
0.55
0.51
0.47
0.00
0.51
0.07
I0.
570.
510.
490.
470.
330.
480.
03
II0.
590.
550.
530.
510.
390.
530.
03
III
0.60
0.51
0.48
0.45
0.28
0.48
0.05
IV0.
580.
520.
490.
480.
420.
500.
03
Mea
n si
mila
rity
J Chem Inf Model. Author manuscript; available in PMC 2010 April 27.

NIH
-PA Author Manuscript
NIH
-PA Author Manuscript
NIH
-PA Author Manuscript
Singh et al. Page 28
MAC
CS k
eys
Max
imum
sim
ilari
ty
Lib
rary
Max
Q3a
Med
ian
Q1b
Min
Mea
nSt
dev
Nat
ural
pro
duct
s0.
280.
210.
170.
130.
000.
170.
06
MLS
MR
0.28
0.17
0.14
0.10
0.00
0.14
0.05
I0.
190.
160.
160.
150.
100.
160.
01
II0.
200.
170.
170.
160.
130.
170.
01
III
0.19
0.14
0.12
0.10
0.00
0.12
0.03
IV0.
210.
170.
140.
120.
070.
140.
03
a Q3:
third
qua
rtile
.;
b Q1:
firs
t qua
rtile
.
J Chem Inf Model. Author manuscript; available in PMC 2010 April 27.