Embed Size (px)
Citation preview

REPORTS AND FINANCIAL STATEMENTS2014


Report and Consolidated financial statements of the Bipiemme Group at 31 December 2014
Approved by the Supervisory Board on 17 March 2015
Co-operative Bank founded in 1865Parent Company of the BPM - Banca Popolare di Milano – Banking GroupShare capital at 31.12.2014: Euro 3,365,439,319.02Milan Companies Register No. 00715120150Enrolled on the National Register of Co-operative Companies No. A109641Registered Office and General Management:Piazza F. Meda, 4 – Milanwww.gruppobpm.it
Member of the Interbank Guarantee Fund
Registered Bank and Parent Company of the BPM – Banca Popolare di Milano -Registered Banking Group
2014This English version is not an official translation and is not a substitute for the original Italian document. It is for informational purposes only and has been prepared solely for the convenience of international readers.

5
Contents
Directors and Officers, General Management and Independent Auditors 9
Notice of Ordinary General Meeting 11
Report and Consolidated financial statements of the Bipiemme Group Year 2014 17
Key figures and ratios of the Bipiemme Group 19
Structure of the Bipiemme Group 20General aspects 21Consolidated reclassified balance sheet 22Consolidated reclassified balance sheet – quarter by quarter 23Consolidated reclassified income statement 24Consolidated reclassified income statement – quarter by quarter 25Key figures 26Key ratios 27Consolidated reclassified income statement, net of non-recurring items 28
Report on operations of the Bipiemme Group 31
The macroeconomic scenario and the banking system 32Significant events for Banca Popolare di Milano and the Bipiemme Group 37Distribution network and human resources 55The Bipiemme Group's scope of consolidation 64Principal balance sheet aggregates 66Income statement 86Statement of cash flows 95Information on the main Group companies 96Related party transactions 104Subsequent events and outlook for operations 107Main risks and uncertainties to which the Bipiemme Group is exposed 108
Consolidated financial statements 109
Consolidated balance sheet 110Consolidated income statement 112Statement of consolidated comprehensive income 113Consolidated Statement of changes in shareholders' equity 114 Consolidated statement of cash flows 116
Consolidated explanatory notes 117Part A – Accounting policies 119 Part B – Information on the consolidated balance sheet 173Part C – Information on the consolidated income statement 247Part D – Consolidated comprehensive income 273Part E – Information on risks and related hedging policies 277Part F – Information on consolidated capital 383Part G – Business combinations 395Part H – Related party transactions 399Part I – Share-based payments 405Part L – Segment reporting 409
Certification of the consolidated financial statements pursuant to art. 81-ter of Consob Regulation no. 11971 dated 14 May 1999 and subsequent additions and amendments 415
Attachments to the consolidated financial statements 417Reconciliation between the consolidated balance sheet and consolidated reclassified balance sheet 419Reconciliation between the consolidated income statement and the consolidated reclassified income statement 421Consolidated reclassified income statement net of non-recurring items -- quarter by quarter 422Disclosure of amounts paid for the audit and other services in accordance with the Issuers' Regulations and Consob art. 149-duodecies 424List of significant shareholdings in unlisted companies pursuant to article 126 of Consob Regulation 11971 of 14 May 1999 425
Report of the Independent Auditors on the consolidated financial statements 429
Report and Financial statements of Banca Popolare di Milano Year 2014 433
Key figures and ratios of Banca Popolare di Milano 435General aspects 437Reclassified balance sheet 438Reclassified balance sheet – quarter by quarter 439Reclassified income statement 440Reclassified income statement – quarter by quarter 441Key figures 442Key ratios 443Reclassified income statement, net of non-recurring items 444
Report on operations 447The macroeconomic scenario and the banking system 449Significant events for Banca Popolare di Milano 449Distribution network and human resources 449Principal balance sheet aggregates 451Income statement 461Statement of cash flows 466BPM shareholders, stock price and ratings 467Report on the criteria followed for running the business for the achievement of its mutual objectives pursuant to art. 2545 of the Civil Code 471Related party transactions 474
C o n t e n t s6

Subsequent events 475Proposed allocation of net income 477
Financial statements 479Balance sheet 480Income statement 482Statement of comprehensive income 483Statement of changes in shareholders' equity 484Statement of cash flows 486
Explanatory notes 487Part A – Accounting policies 489Part B – Information on the balance sheet 537Part C – Information on the income statement 617Part D – Statement of comprehensive income 649Part E – Information on risks and related hedging policies 653Part F – Information on capital 741Part G – Business combinations 753Part H – Related party transactions 757Part I – Share-based payments 765Part L – Segment reporting 769
Certification of the separate financial statements pursuant to art. 81-ter of Consob Regulation no. 11971 dated 14 May 1999 and subsequent additions and amendments 773
Attachments to the financial statements 775Reconciliation between the balance sheet and the reclassified balance sheet 777Reconciliation between the income statement and the reclassified income statement 778Reclassified income statement net of non-recurring items – quarter by quarter 780Disclosure of amounts paid for the audit and other services in accordance with the Issuers' Regulations and Consob art. 149-duodecies 782Restated balance sheet of Banca Popolare di Milano and WeBank at 31 December 2013 783Restated income statement of Banca Popolare di Milano and WeBank for the year ended 31 December 2013 785List of IAS/IFRS endorsed by the European Commission at 31 December 2014 786List of EC Regulations of the European Commission 788Summary of property owned by the Bank with revaluations 790
Report of the Independent Auditors 791
Report of the Supervisory Board to the General Meeting of Members 795
Item 2 on the agenda for the Ordinary General Meeting of Members 805
Item 3 on the agenda for the Ordinary General Meeting of Members 863
Item 4 on the agenda for the Ordinary General Meeting of Members 869
Item 5 on the agenda for the Ordinary General Meeting of Members 873
Resolutions 881
7C o n t e n t s


9
Supervisory Board
ChairmanDino Piero Giarda
Deputy ChairmenMauro PaoloniMarcello Priori
DirectorsAlberto BalestreriAndrea BoitaniAngelo BusaniEmilio Luigi CherubiniMaria Luisa Di BattistaCarlo FrascaroloRoberto FusilliDonata GottardiPiero LonardiFlavia Daunia MinutilloAlberto MontanariGiampietro Giuseppe OmatiLuca Raffaello PerfettiCesare Piovene Porto GodiLucia Vitali
Arbitration CommitteeItalo CianciaGuido MinaAnna Maria Sanchirico
Management Board
ChairmanMario Anolli
Managing Director and General ManagerGiuseppe Castagna
DirectorsDavide Croff Paola De MartiniGiorgio Girelli
Independent Auditors Reconta Ernst & Young S.p.A.
Directors and Officers,General Managementand Independent Auditors
D i r e c t o r s a n d O f f i c e r s


11
The Members of Banca Popolare di Milano Scrl are called to the Ordinary General Meeting, which will be held at first calling on 10 April 2015, at 9.00 a.m., at the head office in Piazza Filippo Meda 4, Milan, to discuss the following
AGENDA
1. Presentation to the Members of the separate and consolidated financial statements at 31/12/2014, pursuant to article 26 of the Articles of Association. Allocation of net income. Related resolutions.
2. Examination of and resolutions relating to the remuneration policies Related resolutions, including the adoption of equity-based compensation plans.
3. Authorisation to purchase and dispose of treasury shares. Related resolutions.
4. Appointment for 2015, 2016 and 2017, of the members of the Arbitration Committee, pursuant to art. 55 of the Articles of Association. Related resolutions.
5. Appointment, on the reasoned proposal of the Supervisory Board, of an auditing firm for the audit of the separate financial statements of the Bank, the consolidated financial statements and the interim report of the Bipiemme Group – under articles 13, paragraph 1, of Legislative Decree 39 of 27 January 2010 and article 26 of the Articles of Association – for the period from 2016 to 2024 and approval of the audit fees. Related resolutions.
********
Please note that because of the co-operative nature of the Company, each Member is entitled to one vote regardless of the number of shares that they hold (the “one-man-one-vote” rule); the Bank's share capital is variable and at 31/12/2014 it amounts to Euro 3,365,439,319.02 fully represented by 4,391,784,467 ordinary shares with no par value. At the date of this notice, the Bank holds 1,395,574 of its own shares.
Members eligible to attend the Meeting and to exercise their voting right are those:
who have been included in the Register of Members for at least ninety days before the day of the General Meeting at first calling, and therefore before 10 January 2015. As of this date, there were 56,185 voting rights (which, considering the “one-man-one-vote” rule, reflects the number of Members);
for whom the Bank has received the related certificate issued by an intermediary belonging to the centralised stock management system (Monte Titoli SpA), pursuant to article 83-sexies of Legislative Decree 58/98 (and subsequent amendments).
Members who wish to attend the General Meeting will therefore have to ask the intermediaries with whom their shares are registered to send the Bank the required communication.
N o t i c e o f O r d i n a r y G e n e r a l M e e t i n g
Notice of Ordinary General Meeting

12
Members whose shares are already lodged with the Bank for safe custody and administration must nonetheless request the required certification in writing from any Bank's branches during working hours. Alternatively, they can go in person to the Members' Secretariat in Piazza Filippo Meda 4, Milan, between 9.00 a.m. and 1.30 p.m., where they can ask for and immediately pick up the document (the so-called “Attestation of Communication”) to be presented at the Meeting to facilitate registration procedures at the entrance.
Without prejudice to article 83-sexies, Legislative Decree 58/98 (and subsequent amendments), note that these Attestations of Communication can be requested from 12 March 2015 to 8 April 2015 (inclusive).
Members holding shares which are still in printed form must deliver the shares to an intermediary in time for them to be input into the centralised electronic administration system in accordance with current regulations.
If there are not enough members to form a quorum at the first Meeting called for 10 April 2015 in accordance with art. 30 of the Articles of Association, the Meeting will be held at
second callingon 11 April 2015, at 9.00 a.m., at
Fiera Milano City Pavilion 1 and 2 Gate 7Viale Scarampo – Milan, with the same agenda.
********
Each Member is entitled to one vote, regardless of the number of shares that they own; postal voting is not allowed.
Every Member entitled to attend meetings can ask by means of a written proxy to be represented by another Member, who can act as proxy for not more 5 (five) other Members; proxies cannot be given to persons who are not allowed to be proxy-holders under the applicable regulations. There is a proxy form at the bottom of each member's “Attestation of Communication”; otherwise, copies can be found at the Bank's Registered office and branches and on the website (www.gruppobpm.it).
Proxies cannot be given with the name of the representative left blank and the signature of the person delegating has to be authenticated by a public official, an employee empowered to authenticate the proxy at the Bank's head office or one of its branches, or by the intermediary who issued the communication for the Member to attend the General Meeting.
In accordance with article 13 of the Articles of Association, it is up to the Chairman of the Meeting to check - in accordance with the Law, the Articles of Association and the Regulations for General Meetings – the validity of the proxies and the right of those present to attend the General Meeting; those Members who wish to do so, may submit their proxies, in advance of the General Meeting, to any of the Bank's branches or to the Members' Secretariat (Piazza Filippo Meda 4 – Milan) prior to 8 April 2015; proxies submitted subsequent to this date, or directly at the General Meeting, must also be completed and authenticated in the same manner as indicated above.
N o t i c e o f O r d i n a r y G e n e r a l M e e t i n g
13N o t i c e o f O r d i n a r y G e n e r a l M e e t i n g
Legal entities, with the exception of Italian and foreign Undertakings for Collective Investment in Transferable Securities (UCITS), as well as foreign collective entities and legal entities, can only attend meetings in the person of their legal representative; alternatively, the legal representative can give a proxy to another member in accordance with the above.
For attendance purposes, only the certifications and proxies handed over by each participant when registering for the first time that they enter the meeting will be considered valid.
********
With reference to item 4 on the agenda, Members are informed that in accordance with art. 21 of the current Regulations for General Meetings, the proposed appointment as Acting or Alternate Arbitrator, signed by those presenting them, must be received at least twenty five days before the date set for the meeting at first calling, accompanied by the personal and professional curriculum of the candidates, the declaration of acceptance of the candidature and an attestation that they satisfy the requirements for the position.
Proposals for the appointment of Arbitrator have to be accompanied by the list - complete with signatures and the information on their identity - of at least three hundred sponsoring Members, registered in the Members' Register at least ninety days before the date set for the meeting at first calling (and therefore by 10 January 2015), and a copy of the certificate issued by an intermediary belonging to the centralised stock management system (Monte Titoli SpA), establishing their right to attend and vote at the Meeting and by a certificate attesting the validity of the right to submit proposed names of candidates for the position of Arbitrator.
Proposals must be submitted – along with the documentation required by the aforementioned Regulations for General Meetings – by 16 March 2015, by one or other of the following methods:
submission to the Bank's head office (Chairman's Secretariat, Piazza Filippo Meda 4 – Milan) on weekdays, from Monday to Friday, between the hours of 9.00 a.m. to 5.00 p.m.,
or
transmission by certified e-mail (PEC) to [email protected] (in this case, it is recommended that you send the original paperwork to the Bank no later than the day prior to the General Meeting at first calling).
With reference to the above appointment of Members of the Arbitration Committee, it should be noted that the related forms and instructions for the submission of candidatures can be found at www.gruppobpm.it.
********
Note that pursuant to article 126-bis of Legislative Decree 58/98 (and subsequent amendments), Members who represent at least one fortieth of the total number of Members can, within 10 (ten) days of this notice being published, ask for other matters to be added to the agenda for discussion, in addition to those listed in the

14
notice of calling, stating in the request the additional matters being proposed or proposing motions on topics that are already on the agenda; adding topics to the agenda is not allowed for matters on which the Meeting is being asked to vote, in accordance with the law, on the proposal of the administrative body or on the basis of a project or a report prepared by it, other than those indicated in article 125-ter, paragraph 1, of Legislative Decree 58/98 (and subsequent amendments). Requests must be made in writing, and in accordance with the provisions of article 126-bis of Legislative Decree 58/98, to the Bank (Chairman's Secretariat, Piazza Filippo Meda 4, Milan) or by certified e-mail (PEC) to [email protected].
Applications must be accompanied by a report stating the reasons for the proposed resolutions on new matters that are being proposed for discussion or the reasons for proposed resolutions presented on the matters already on the agenda.
Detailed information about the terms and conditions to be observed for adding topics to the agenda are available on the Bank's website (www.gruppobpm.it). Any additions to the agenda or submission of proposals of resolutions on the topics already on the agenda will be announced at least 10 (ten) days before the date set for the General Meeting in the same manner as is required for publication of this notice. Concurrently with the publication of such notice, and in the same manner provided for the Meeting documentation, the reports prepared by those proposing amendments to or new items for the agenda will be made available to the public accompanied by any comments made by the Corporate Bodies.
********
Members are reminded that before they can exercise these rights, the Bank must be allowed – within the terms and in the manner provided for in specific legislation – to verify that they are entitled to exercise them (in particular by performing certain formalities vis-à-vis the Bank, as appropriate and where applicable, in accordance with articles 83-quinquies and 83-sexies of Legislative Decree 58/98 and subsequent amendments).
********
Please note that:
the annual report for the year ended 31.12.2014 and the reports of the Independent Auditors, the annual report of the Supervisory Board, as well as the Report on Corporate Governance and Ownership Structure and the Remuneration report shall be made available to the general public, in accordance with current regulations, by 20 March 2015 at the Bank's head office in Piazza Filippo Meda 4, Milan, on its website (www.gruppobpm.it) as well as on the authorised storage device 1Info. In the same manner, the documentation on the topics covered by items 3, 4 and 5 on the agenda has been made public as from 11 March 2015, as well as further documentation relating to item 2;
the candidatures for office of Arbitrator as per item 4 of the agenda for the General Meeting – together with the accompanying documentation – will be announced on 20 March 2015 at the Bank's head office in Piazza Filippo Meda 4, Milan, on its website (www.gruppobpm.it) and on the authorised storage device 1Info;
N o t i c e o f O r d i n a r y G e n e r a l M e e t i n g

15N o t i c e o f O r d i n a r y G e n e r a l M e e t i n g
the documentation referred to in article 77, paragraph 2-bis of Consob Regulations 11971/99 and subsequent amendments, will be made available to the general public at the Bank's head office in Piazza Filippo Meda 4, Milan from 26 March 2015.
********
Members will be able to obtain a copy of the documentation filed at the Bank's head office at their own expense.
This notice, which is also for the purposes of article 84, para. 1, of Consob Regulation 11971/99 (and subsequent amendments), is available pursuant to article 125-bis of Legislative Decree 58/98 (and subsequent amendments), on the Bank's website (www.gruppobpm.it) and is to be published on 11 March 2015 in the daily newspapers "Il Sole 24 Ore" and "MF".
********
Information concerning the procedures for attendance at the Meeting can be requested from the Bank’s Members' Secretariat in Piazza Filippo Meda 4, Milan, by calling the toll free number 800-013090 on weekdays between 9.00 a.m. and 5.00 p.m., or by sending an e-mail to [email protected].
for The Management BoardThe Chairman(Mario Anolli)
Milan, 11 March 2015


17
Report and Consolidated financial statements of the Bipiemme Group
Year 2014


19
Key figures and ratios of Bipiemme Group

20 K e y f i g u r e s a n d r a t i o s o f B i p i e m m e G r o u p
(*) Banca Popolare di Milano is split into various sectors of activity: Retail Banking, Investment Banking, Corporate Centre and Corporate Banking; the other companies are shown in the table according to their main line of business.
Structure of the Bipiemme Group at 31 December 2014
Retail Banking
Banca Popolaredi Mantova
S.p.A.
ProFamilyS.p.A.
Banca AkrosS.p.A.
BPM Capital I Llc.
BPMLuxembourg
S.A.
BPM Covered Bond S.r.l.
Ge.Se.So. S.r.l.
InvestmentBanking
CorporateCenter Other activities
S.c. a r.l. (*)

21K e y f i g u r e s a n d r a t i o s o f B i p i e m m e G r o u p
Consolidated reclassified financial statements: general aspects
To give readers a more immediate understanding of the results for the period, a summary reclassified balance sheet and income statement have been prepared, in which line items have been aggregated and reclassified in keeping with market practice in such a way as to provide a clearer picture of performance. To allow the items in the reclassified statements to be easily reconciled with those in the official statements based on the Bank of Italy’s Circular 262/05, schedules are included in the attachments that provide details of the various reclassifications and aggregations.
The following aggregations have been made in the reclassified balance sheet:1. “Financial assets carried at fair value and hedging derivatives” include the following line items: 20 “Financial assets held for trading”, 30
“Financial assets designated at fair value through profit and loss”, 40 “Financial assets available for sale”, 50 “Investments held to maturity”, 80 “Hedging derivatives” and 90 “Fair value change of financial assets in hedged portfolios”;
2. “Fixed assets” include the following line items: 100 “Investments in associates and companies subject to joint control”, 120 “Property and equipment” and 130 “Intangible assets”;
3. “Other assets” include line items: 140 “Tax assets” and 160 “Other assets”;4. “Financial liabilities and hedging derivatives” include line items: 40 “Financial liabilities held for trading”, 50 “Financial liabilities designated
at fair value through profit and loss”, 60 “Hedging derivatives” and 70 “Fair value change of financial liabilities in hedged portfolios”;5. “Other liabilities” include line items: 80 “Tax liabilities” and 100 “Other liabilities”;6. “Provisions for specific use” comprise line items: 110 “Employee termination indemnities” and 120 “Allowances for risks and charges”;7. “Capital and reserves” include line items: 140 “Valuation reserves”, 150 “Redeemable shares”, 160 “Equity instruments”, 170 “Reserves”,
180 “Share premium reserve”, 190 “Share capital” and 200 “Treasury shares”.
The income statement line items have been reclassified and represented as follows:1. the profits (losses) on investments carried at equity, recorded in line item 240 “Profits (losses) on investments in associates and companies
subject to joint control” have been reported on a separate line forming part of “Operating income” in the reclassified income statement, but only with respect to the component relating to the results of the investees;
2. “Net income from banking activities” includes: the line items 70 “Dividend and similar income”, 80 “Profits (losses) on trading”, 90 “Fair value adjustments in hedge accounting”, 100 “Profits (losses) on disposal or repurchase”, 110 “Profits (losses) on financial assets and liabilities designated at fair value” and 130 b) “Net losses/recoveries on impairment of financial assets available for sale”. Line item 100 a) “Profits (losses) on disposal/repurchase of loans” has been split out of this aggregate;
3. “Other operating expenses/income” (line item 220) booked to “Operating expenses” on the accounting schedule have been reduced by the recovered portion of “indirect taxes and duties” and increased by the “depreciation of leasehold improvements”. This item, reclassified in this way, has been included in “Operating income” in the reclassified income statement;
4. “Other administrative expenses” (line item 180 b) in the reclassified income statement have been reduced by the recovered portion of “indirect taxes and duties” discussed in point 3 above;
5. “Net adjustments to property and equipment and intangible assets” (line items 200 and 210) in the reclassified income statement have been increased by the “depreciation of leasehold improvements” discussed in point 3 above;
6. “Net adjustments for impairment of loans and other activities” reported after “Operating profit” in the reclassified format, include line item 130, net of the sub-item 130 b) “Net losses/recoveries on impairment of financial assets available for sale” (reclassified under “Net income from banking activities”) and line item 100 a) “Profits (losses) on disposal/repurchase of loans” (removed from “Net income from banking activities”);
7. “Profits (losses) from equity and other investments and adjustments to goodwill and intangible assets” in the reclassified format include the line item 260 “Goodwill impairment” and a portion of the line item 240 “Profits (losses) on investments in associates and companies subject to joint control” relating to the writedown of the goodwill component included in the book value of investments carried at equity. It also includes the line item 270 “Profits (losses) on disposal of investments”.

22 K e y f i g u r e s a n d r a t i o s o f B i p i e m m e G r o u p
Bipiemme Group – Consolidated reclassified balance sheet (Euro/000)
Assets 31.12.2014 30.09.2014 31.12.2013 Change A–B Change A–C
A B C amount % amount %
Cash and cash equivalents 322,840 232,295 363,202 90,545 39.0 –40,362 –11.1
Financial assets carried at fair value and hedging derivatives: 11,887,806 11,959,086 11,045,773 –71,280 –0.6 842,033 7.6
– Financial assets held for trading 1,921,518 1,954,084 1,449,237 –32,566 –1.7 472,281 32.6
– Financial assets designated at fair value through profit and loss 97,449 101,861 219,118 –4,412 –4.3 –121,669 –55.5
– Financial assets available for sale 9,670,272 9,662,753 9,189,022 7,519 0.1 481,250 5.2
– Hedging derivatives 178,460 223,056 178,291 –44,596 –20.0 169 0.1
– Fair value change of financial assets in hedged portfolios (+/–) 20,107 17,332 10,105 2,775 16.0 10,002 99.0
Due from banks 984,777 1,562,185 1,813,458 –577,408 –37.0 –828,681 –45.7
Loans to customers 32,078,843 32,095,916 33,345,026 –17,073 –0.1 –1,266,183 –3.8
Fixed assets 1,117,879 1,099,811 1,229,975 18,068 1.6 –112,096 –9.1
Non–current assets held for sale and discontinued operations 0 0 0 0 n.s. 0 n.s.
Other assets 1,879,666 1,519,517 1,555,884 360,149 23.7 323,782 20.8
Total assets 48,271,811 48,468,810 49,353,318 –196,999 –0.4 –1,081,507 –2.2
Liabilities and shareholders’ equity 31.12.2014 30.09.2014 31.12.2013 Change A–B Change A–C
A B C amount % amount %
Due to banks 3,318,564 3,792,622 5,913,928 –474,058 –12.5 –2,595,364 –43.9
Due to customers 27,702,942 26,979,219 26,423,495 723,723 2.7 1,279,447 4.8
Securities issued 8,981,834 9,271,996 10,114,241 –290,162 –3.1 –1,132,407 –11.2
Financial liabilities and hedging derivatives: 1,690,396 1,716,900 1,487,047 –26,504 –1.5 203,349 13.7
– Financial liabilities held for trading 1,463,445 1,491,342 1,163,738 –27,897 –1.9 299,707 25.8
– Financial liabilities designated at fair value through profit and loss 152,116 150,573 276,739 1,543 1.0 –124,623 –45.0
– Hedging derivatives 58,751 57,102 23,348 1,649 2.9 35,403 151.6
– Fair value change of financial liabilities in hedged portfolios (+/–) 16,084 17,883 23,222 –1,799 –10.1 –7,138 –30.7
Other liabilities 1,501,993 1,622,393 1,191,645 –120,400 –7.4 310,348 26.0
Provisions for specific use 519,975 518,136 578,196 1,839 0.4 –58,221 –10.1
Capital and reserves 4,304,390 4,328,863 3,596,116 –24,473 –0.6 708,274 19.7
Minority interests (+/–) 19,424 19,418 19,061 6 0.0 363 1.9
Net income (loss) for the period (+/–) 232,293 219,263 29,589 13,030 5.9 202,704 n.s.
Total liabilities and shareholders' equity 48,271,811 48,468,810 49,353,318 –196,999 –0.4 –1,081,507 –2.2
23K e y f i g u r e s a n d r a t i o s o f B i p i e m m e G r o u p
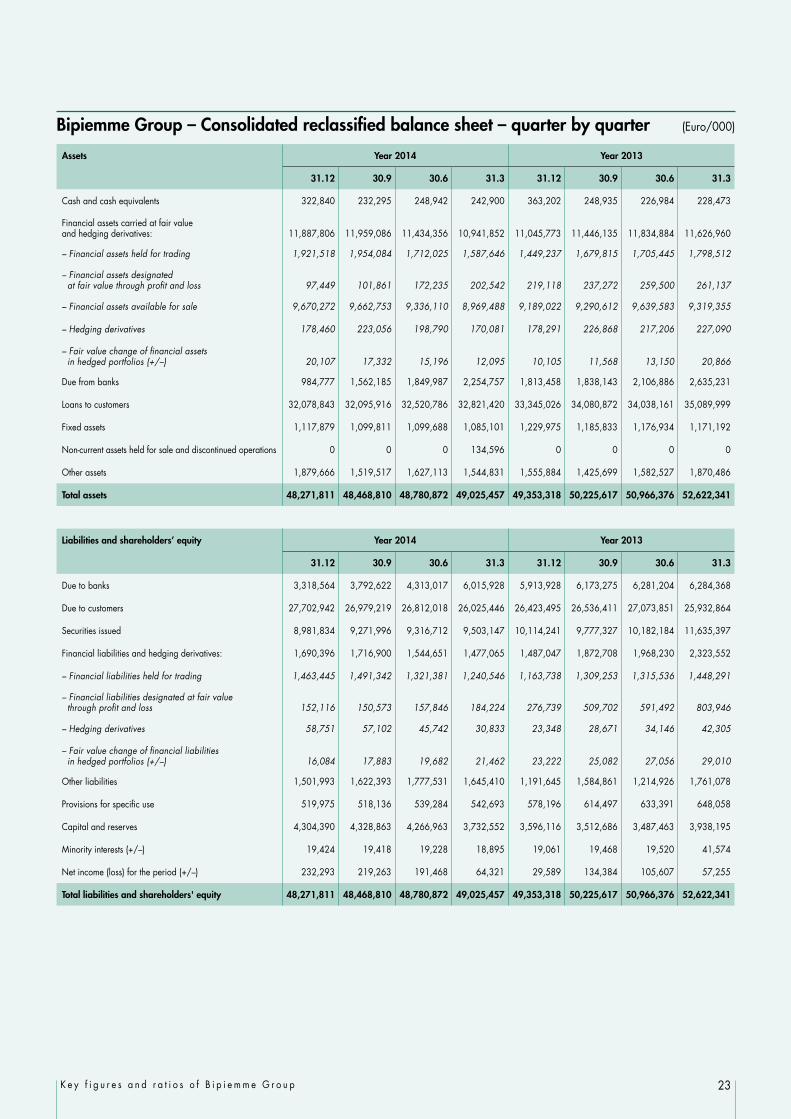
Bipiemme Group – Consolidated reclassified balance sheet – quarter by quarter (Euro/000)
Assets Year 2014 Year 2013
31.12 30.9 30.6 31.3 31.12 30.9 30.6 31.3
Cash and cash equivalents 322,840 232,295 248,942 242,900 363,202 248,935 226,984 228,473
Financial assets carried at fair value and hedging derivatives: 11,887,806 11,959,086 11,434,356 10,941,852 11,045,773 11,446,135 11,834,884 11,626,960
– Financial assets held for trading 1,921,518 1,954,084 1,712,025 1,587,646 1,449,237 1,679,815 1,705,445 1,798,512
– Financial assets designated at fair value through profit and loss 97,449 101,861 172,235 202,542 219,118 237,272 259,500 261,137
– Financial assets available for sale 9,670,272 9,662,753 9,336,110 8,969,488 9,189,022 9,290,612 9,639,583 9,319,355
– Hedging derivatives 178,460 223,056 198,790 170,081 178,291 226,868 217,206 227,090
– Fair value change of financial assets in hedged portfolios (+/–) 20,107 17,332 15,196 12,095 10,105 11,568 13,150 20,866
Due from banks 984,777 1,562,185 1,849,987 2,254,757 1,813,458 1,838,143 2,106,886 2,635,231
Loans to customers 32,078,843 32,095,916 32,520,786 32,821,420 33,345,026 34,080,872 34,038,161 35,089,999
Fixed assets 1,117,879 1,099,811 1,099,688 1,085,101 1,229,975 1,185,833 1,176,934 1,171,192
Non-current assets held for sale and discontinued operations 0 0 0 134,596 0 0 0 0
Other assets 1,879,666 1,519,517 1,627,113 1,544,831 1,555,884 1,425,699 1,582,527 1,870,486
Total assets 48,271,811 48,468,810 48,780,872 49,025,457 49,353,318 50,225,617 50,966,376 52,622,341
Liabilities and shareholders’ equity Year 2014 Year 2013
31.12 30.9 30.6 31.3 31.12 30.9 30.6 31.3
Due to banks 3,318,564 3,792,622 4,313,017 6,015,928 5,913,928 6,173,275 6,281,204 6,284,368
Due to customers 27,702,942 26,979,219 26,812,018 26,025,446 26,423,495 26,536,411 27,073,851 25,932,864
Securities issued 8,981,834 9,271,996 9,316,712 9,503,147 10,114,241 9,777,327 10,182,184 11,635,397
Financial liabilities and hedging derivatives: 1,690,396 1,716,900 1,544,651 1,477,065 1,487,047 1,872,708 1,968,230 2,323,552
– Financial liabilities held for trading 1,463,445 1,491,342 1,321,381 1,240,546 1,163,738 1,309,253 1,315,536 1,448,291
– Financial liabilities designated at fair value through profit and loss 152,116 150,573 157,846 184,224 276,739 509,702 591,492 803,946
– Hedging derivatives 58,751 57,102 45,742 30,833 23,348 28,671 34,146 42,305
– Fair value change of financial liabilities in hedged portfolios (+/–) 16,084 17,883 19,682 21,462 23,222 25,082 27,056 29,010
Other liabilities 1,501,993 1,622,393 1,777,531 1,645,410 1,191,645 1,584,861 1,214,926 1,761,078
Provisions for specific use 519,975 518,136 539,284 542,693 578,196 614,497 633,391 648,058
Capital and reserves 4,304,390 4,328,863 4,266,963 3,732,552 3,596,116 3,512,686 3,487,463 3,938,195
Minority interests (+/–) 19,424 19,418 19,228 18,895 19,061 19,468 19,520 41,574
Net income (loss) for the period (+/–) 232,293 219,263 191,468 64,321 29,589 134,384 105,607 57,255
Total liabilities and shareholders' equity 48,271,811 48,468,810 48,780,872 49,025,457 49,353,318 50,225,617 50,966,376 52,622,341

24 K e y f i g u r e s a n d r a t i o s o f B i p i e m m e G r o u p
Bipiemme Group – Consolidated reclassified income statement (Euro/000)
Line items Year 2014 Year 2013 Changes
Amount %
Interest margin 800,171 837,424 (37,253) –4.4
Non-interest margin: 821,395 845,559 (24,164) –2.9
– Net fee and commission income 556,566 544,817 11,749 2.2
– Other income: 264,829 300,742 (35,913) –11.9
– Profits (losses) on investments carried at equity 22,857 47,353 (24,496) –51.7
– Net income from banking activities 188,572 200,773 (12,201) –6.1
– Other operating charges/income 53,400 52,616 784 1.5
Operating income 1,621,566 1,682,983 (61,417) –3.6
Administrative expenses: (898,831) (913,970) 15,139 1.7
a) personnel expenses (612,420) (608,720) (3,700) –0.6
b) other administrative expenses (286,411) (305,250) 18,839 6.2
Net adjustments to property and equipment and intangible assets (74,884) (72,646) (2,238) –3.1
Operating expenses (973,715) (986,616) 12,901 1.3
Operating profit 647,851 696,367 (48,516) –7.0
Net adjustments for impairment of loans and other activities (423,839) (589,659) 165,820 28.1
Net provisions for risks and charges (3,545) (9,619) 6,074 63.1
Profits (losses) from equity and other investments and adjustments to goodwill and intangible assets 104,474 (258) 104,732 n.s.
Income (loss) before tax from continuing operations 324,941 96,831 228,110 235.6
Taxes on income from continuing operations (92,008) (67,442) (24,566) –36.4
Income (loss) after tax from continuing operations 232,933 29,389 203,544 n.s.
Net income (loss) for the period 232,933 29,389 203,544 n.s.
Net income (loss) for the period pertaining to minority interests (640) 200 (840) n.s.
Parent company’ s net income (loss) for the period 232,293 29,589 202,704 n.s.
Basic EPS from continuing operations – Euro 0.059 0.009
Diluted EPS from continuing operations – Euro 0.059 0.009
Basic EPS – Euro 0.059 0.009
Diluted EPS – Euro 0.059 0.009

25K e y f i g u r e s a n d r a t i o s o f B i p i e m m e G r o u p
Bipiemme Group – Consolidated reclassified income statement – quarter by quarter (Euro/000)
Line items Year 2014 Year 2013
Fourth quarter
Third quarter
Second quarter
First quarter
Fourth quarter
Third quarter
Second quarter
First quarter
Interest margin 197,922 195,003 201,157 206,089 206,386 215,515 224,869 190,654
Non–interest margin: 213,382 150,952 221,011 236,050 196,633 178,562 232,943 237,421
– Net fee and commission income 149,349 130,856 135,990 140,371 142,234 124,335 146,405 131,843
– Other income: 64,033 20,096 85,021 95,679 54,399 54,227 86,538 105,578
– Profits (losses) on investments carried at equity 6,300 4,612 6,910 5,035 28,140 7,423 3,886 7,904
– Net income from banking activities 38,082 5,799 65,253 79,438 18,272 33,928 69,205 79,368
– Other operating charges/income 19,651 9,685 12,858 11,206 7,987 12,876 13,447 18,306
Operating income 411,304 345,955 422,168 442,139 403,019 394,077 457,812 428,075
Administrative expenses: (236,376) (207,166) (236,573) (218,716) (229,220) (220,279) (235,755) (228,716)
a) personnel expenses (147,232) (144,708) (168,601) (151,879) (137,340) (151,410) (158,006) (161,964)
b) other administrative expenses (89,144) (62,458) (67,972) (66,837) (91,880) (68,869) (77,749) (66,752)
Net adjustments to property and equipment and intangible assets (18,612) (18,728) (19,478) (18,066) (19,324) (17,943) (17,977) (17,402)
Operating expenses (254,988) (225,894) (256,051) (236,782) (248,544) (238,222) (253,732) (246,118)
Operating profit 156,316 120,061 166,117 205,357 154,475 155,855 204,080 181,957
Net adjustments for impairment of loans and other activities (136,633) (88,216) (113,653) (85,337) (328,950) (96,893) (99,692) (64,124)
Net provisions for risks and charges (8,004) (286) 7,566 (2,821) 5,081 (6,345) (5,962) (2,393)
Profits (losses) from equity and other investments and adjustments to goodwill and intangible assets 0 0 104,474 0 43 (301) 1 (1)
Income (loss) before tax from continuing operations 11,679 31,559 164,504 117,199 (169,351) 52,316 98,427 115,439
Taxes on income from continuing operations 1,450 (3,532) (36,960) (52,966) 64,058 (23,500) (50,000) (58,000)
Income (loss) after tax from continuing operations 13,129 28,027 127,544 64,233 (105,293) 28,816 48,427 57,439
Income (loss) after tax from discontinued operations 0 0 0 0 0 0 0 0
Net income (loss) for the period 13,129 28,027 127,544 64,233 (105,293) 28,816 48,427 57,439
Net income (loss) for the period pertaining to minority interests (99) (232) (397) 88 498 (39) (75) (184)
Parent company’ s net income (loss) for the period 13,030 27,795 127,147 64,321 (104,795) 28,777 48,352 57,255

26 K e y f i g u r e s a n d r a t i o s o f B i p i e m m e G r o u p
Bipiemme Group – Key figures (Euro/000)
Key balance sheet figures 31.12.2014 30.09.2014 31.12.2013 Change A–B Change A–C
A B C amount % amount %
Loans to customers 32,078,843 32,095,916 33,345,026 –17,073 –0.1 –1,266,183 –3.8
of which: net non–performing loans 1,344,404 1,275,675 1,130,336 68,729 5.4 214,068 18.9
Fixed assets 1,117,879 1,099,811 1,229,975 18,068 1.6 –112,096 –9.1
Direct deposits (*) 36,836,892 36,401,788 36,814,475 435,104 1.2 22,417 0.1
Indirect customer deposits 32,610,223 32,433,072 31,222,136 177,151 0.5 1,388,087 4.4
of which: assets under administration 14,737,869 15,027,485 16,045,590 –289,616 –1.9 –1,307,721 –8.2
of which: assets under management 17,872,354 17,405,587 15,176,546 466,767 2.7 2,695,808 17.8
Total assets 48,271,811 48,468,810 49,353,318 –196,999 –0.4 –1,081,507 –2.2
Shareholders' equity (excluding net income (loss) for the period) 4,304,390 4,328,863 3,596,116 –24,473 –0.6 708,274 19.7
Own funds (**) 5,169,508 5,196,326 4,551,766 –26,818 –0.5 617,742 13.6
of which: Common Equity Tier 1 (**) 3,899,672 3,883,495 3,333,307 16,177 0.4 566,365 17.0
Key income statement figures 31.12.2014 30.09.2014 31.12.2013 Change A–C
A B C amount %
Interest margin 800,171 602,249 837,424 –37,253 –4.4
Operating income 1,621,566 1,210,262 1,682,983 –61,417 –3.6
Operating expenses (973,715) (718,727) (986,616) 12,901 1.3
of which: personnel expenses (612,420) (465,188) (608,720) –3,700 –0.6
Operating profit 647,851 491,535 696,367 –48,516 –7.0
Net adjustments for impairment of loans and other activities (423,839) (287,206) (589,659) 165,820 28.1
Income (loss) before tax from continuing operations 324,941 313,262 96,831 228,110 235.6
Parent Company’s net income (loss) for the period 232,293 219,263 29,589 202,704 n.s.
Operating structure 31.12.2014 30.09.2014 31.12.2013 Change A–B Change A–C
A B C amount % amount %
Headcount (employees and other personnel) 7,759 7,760 7,846 –1 –0.0 –87 –1.1
Number of branches 654 668 716 –14 –2.1 –62 –8.7
(*) This line item includes: Due to customers, securities issued and financial liabilities designated at fair value through profit and loss(**) The figures for 2013 are determined on the basis of the rules then in force (“Basel 2”).
27K e y f i g u r e s a n d r a t i o s o f B i p i e m m e G r o u p
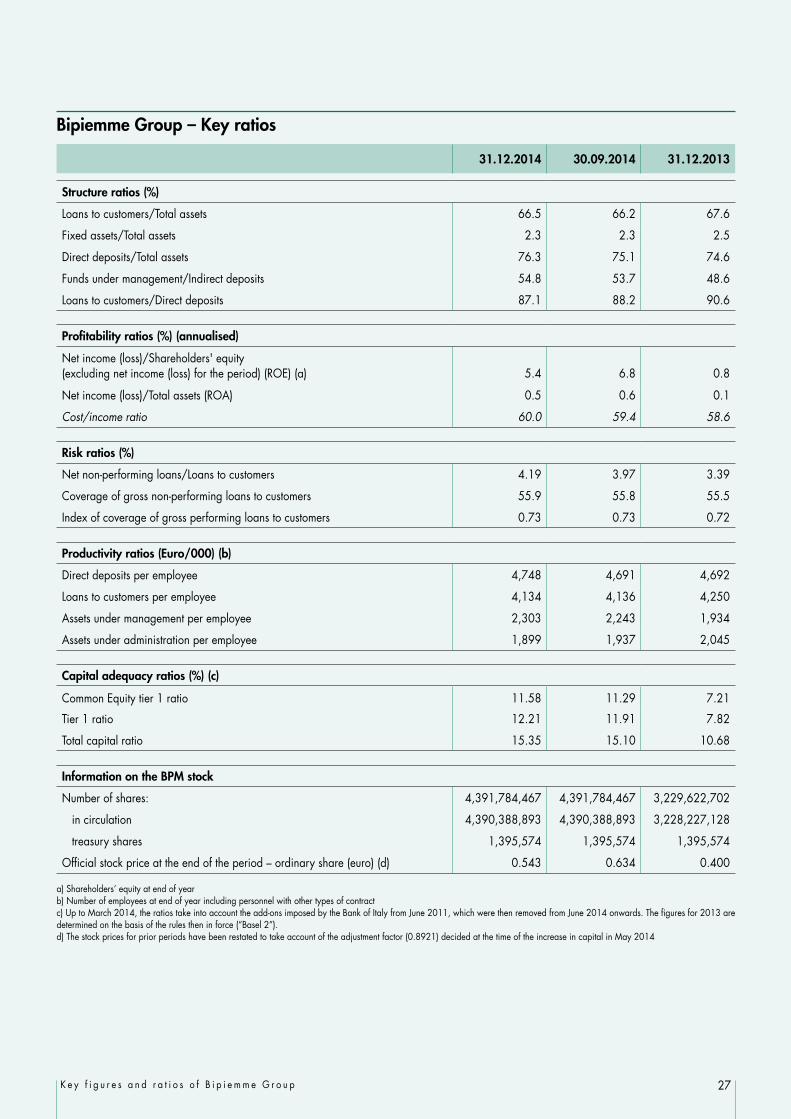
Bipiemme Group – Key ratios
31.12.2014 30.09.2014 31.12.2013
Structure ratios (%)
Loans to customers/Total assets 66.5 66.2 67.6
Fixed assets/Total assets 2.3 2.3 2.5
Direct deposits/Total assets 76.3 75.1 74.6
Funds under management/Indirect deposits 54.8 53.7 48.6
Loans to customers/Direct deposits 87.1 88.2 90.6 Profitability ratios (%) (annualised)
Net income (loss)/Shareholders' equity (excluding net income (loss) for the period) (ROE) (a) 5.4 6.8 0.8
Net income (loss)/Total assets (ROA) 0.5 0.6 0.1
Cost/income ratio 60.0 59.4 58.6 Risk ratios (%)
Net non-performing loans/Loans to customers 4.19 3.97 3.39
Coverage of gross non-performing loans to customers 55.9 55.8 55.5
Index of coverage of gross performing loans to customers 0.73 0.73 0.72 Productivity ratios (Euro/000) (b)
Direct deposits per employee 4,748 4,691 4,692
Loans to customers per employee 4,134 4,136 4,250
Assets under management per employee 2,303 2,243 1,934
Assets under administration per employee 1,899 1,937 2,045 Capital adequacy ratios (%) (c)
Common Equity tier 1 ratio 11.58 11.29 7.21
Tier 1 ratio 12.21 11.91 7.82
Total capital ratio 15.35 15.10 10.68
Information on the BPM stock
Number of shares: 4,391,784,467 4,391,784,467 3,229,622,702
in circulation 4,390,388,893 4,390,388,893 3,228,227,128
treasury shares 1,395,574 1,395,574 1,395,574
Official stock price at the end of the period – ordinary share (euro) (d) 0.543 0.634 0.400
a) Shareholders’ equity at end of yearb) Number of employees at end of year including personnel with other types of contractc) Up to March 2014, the ratios take into account the add-ons imposed by the Bank of Italy from June 2011, which were then removed from June 2014 onwards. The figures for 2013 are determined on the basis of the rules then in force (“Basel 2”).d) The stock prices for prior periods have been restated to take account of the adjustment factor (0.8921) decided at the time of the increase in capital in May 2014

28 K e y f i g u r e s a n d r a t i o s o f B i p i e m m e G r o u p
Bipiemme Group – Consolidated reclassified income statement, net of non–recurring items
As required by CONSOB communication DEM/6064293 of 28 July 2006, the table below reports the effect on net income (loss) of the following non–recurring transactions.
(euro/000)
Year 2014 Year 2013 Changes Changes
A = B + C B C D = E + F E F A – D C – F
Line items Net result Net income (loss) from
non–recurring transactions
Net income (loss) from recurring
transactions
Net result Net income (loss) from
non–recurring transactions
Net income (loss) from recurring
transactions
amount % amount %
Interest margin 800,171 0 800,171 837,424 0 837,424 (37,253) –4.4 (37,253) –4.4
Non-interest margin: 821,395 0 821,395 845,559 (36,186) 881,745 (24,164) –2.9 (60,350) –6.8
– Net fee and commission income 556,566 0 556,566 544,817 0 544,817 11,749 2.2 11,749 2.2
– Other income: 264,829 0 264,829 300,742 (36,186) 336,928 (35,913) –11.9 (72,099) –21.4
– Profits (losses) on investments carried at equity 22,857 0 22,857 47,353 0 47,353 (24,496) –51.7 (24,496) –51.7
– Net income from banking activities 188,572 0 188,572 200,773 (36,186) 236,959 (12,201) –6.1 (48,387) –20.4
– Other operating charges/income 53,400 0 53,400 52,616 0 52,616 784 1.5 784 1.5
Operating income 1,621,566 0 1,621,566 1,682,983 (36,186) 1,719,169 (61,417) –3.6 (97,603) –5.7
Administrative expenses: (898,831) (13,217) (885,614) (913,970) (16,345) (897,625) 15,139 1.7 12,011 1.3
a) personnel expenses (612,420) (13,217) (599,203) (608,720) (16,345) (592,375) (3,700) –0.6 (6,828) –1.2
b) other administrative expenses (286,411) 0 (286,411) (305,250) 0 (305,250) 18,839 6.2 18,839 6.2
Net adjustments to property and equipment and intangible assets (74,884) 0 (74,884) (72,646) 0 (72,646) (2,238) –3.1 (2,238) –3.1
Operating expenses (973,715) (13,217) (960,498) (986,616) (16,345) (970,271) 12,901 1.3 9,773 1.0
Operating profit 647,851 (13,217) 661,068 696,367 (52,531) 748,898 (48,516) –7.0 (87,830) –11.7
Net adjustments for impairment of loans and other activities (423,839) 0 (423,839) (589,659) 0 (589,659) 165,820 28.1 165,820 28.1
Net provisions for risks and charges (3,545) 0 (3,545) (9,619) 3,051 (12,670) 6,074 63.1 9,125 72.0
Profits (losses) from equity and other investments and adjustments to goodwill and intangible assets 104,474 104,474 0 (258) 0 (258) 104,732 n.s. 258 –100.0
Income (loss) before tax from continuing operations 324,941 91,257 233,684 96,831 (49,480) 146,311 228,110 235.6 87,373 59.7
Taxes on income from continuing operations (92,008) (682) (91,326) (67,442) 606 (68,048) (24,566) –36.4 (23,277) –34.2
Net income (loss) for the period 232,933 90,575 142,358 29,389 (48,874) 78,263 203,544 n.s. 64,096 81.9
Net income (loss) for the period pertaining to minority interests (640) 3 (643) 200 (3) 203 (840) n.s. (846) n.s.
Parent Company’ s net income (loss) for the period 232,293 90,578 141,715 29,589 (48,877) 78,466 202,704 n.s. 63,250 80.6

29K e y f i g u r e s a n d r a t i o s o f B i p i e m m e G r o u p
Bipiemme Group – Consolidated reclassified income statement, net of non–recurring items
Year 2014 Year 2013
Non-recurring transactions: 90,578 (48,877)
Other income: – (36,186)
Net income from banking activities:
Gain on shares in the Bank of Italy – 13,100
Writedown of Dexia Crediop – (49,286)
Taxes on income (a) – (2,619)
Operating income, net of taxes – (38,805)
Administrative expenses: a) personnel expenses (13,217) (16,345)
Solidarity Fund (13,217) (16,345)
Taxes on income (b) 3,635 4,495
Personnel expenses, net of taxes (9,582) (11,850)
Net provisions for risks and charges 3,051
Provisions for contractual commitments relating to Anima Holding – 5,606
Provisions for contractual commitments relating to the sale of the custodian bank – (2,555)
Taxes on income (d) – 626
Net provisions for risks and charges, net of taxes – 3,677
Profits (losses) from equity and other investments and adjustments to goodwill and intangible assets 104,474 –
Gain on the sale of Anima Holding 104,474 –
Taxes on income (e) (1,261) –
Profits from equity and other investments, net of taxes on income 103,213 –
Taxes on income from continuing operations: (682) 606
Increase in taxes from 12% to 26% on the gain on shares in the Bank of Italy (3,056) –Tax benefit related to the reimbursement - for previous periods – of the deductibility of IRAP on labour costs from taxable income for IRES purposes – (1,895)
Income taxes (a+b+c+d+e) 2,374 2,501
Net income (loss) for the period pertaining to minority interests 3 (3)
Overall impact of the above operations on minority interests 3 (3)


Report on operations of the Bipiemme Group
31

32 R e p o r t o n o p e r a t i o n s o f t h e B P M G r o u p
The macroeconomic scenario and the banking system
The international economy
After a period of stability in the first half 2014, from the summer months onwards, the world economy has strengthened, driven primarily by the United States, the United Kingdom, Spain and, to a lesser extent, Germany. The emerging nations (particularly China, Brazil and Russia) contributed to a lesser extent, while, in certain euro area economies and in Japan, growth has been close to nil (or negative, such as in France and Italy) up to the third quarter and then there was a slight recovery in the last quarter. Global GDP had been expected to have grown by 3.3% by the end of 2014 (source: IMF), in line with the 2013 figure. World trade had been forecast to increase by 3.1% by the year end, stimulated by robust growth in the United States. In the second half of 2014, there was a sudden fall in Brent oil prices, from around 114 dollars a barrel in June to 55 dollars at the year end, in line with 2009 prices. The precipitous fall in oil prices is due, not only to the increase in world production, with the USA having become the leading producer thanks to new extraction techniques, but also to the fall in demand, attributable to the economic stagnation of the Eurozone and the sharp slowdown in the Chinese economy.
In the United States, economic activity strengthened in the last two quarters of 2014, after extreme volatility at the start of the year. Forecasts for 2014 indicate growth of 2.4%, up on the 2013 figure of +2.2% (source: IMF). Unemployment in December was 5.6%, the lowest rate since June 2008 (source: Department of Labor). At the end of October, a meeting of the FOMC (Federal Open Market Committee, a Federal Reserve body) announced, as expected, the end of the economic stimulus programme known as “Quantitative Easing 3”. In its last meeting of 2014, the FED set its base rates at an all-time low of between 0 and 0.25%, postponing the decision to increase the base rate to 2015.
In Japan, the change in GDP in 2014 is expected to be close to zero (source: IMF). In June, the Prime Minister, Shinzo Abe, announced a package of reforms designed to relaunch the economy and make the country more competitive. He was re-elected in mid-December and stated that he wished to proceed with a policy of economic stimulus and to reactivate a number of the country’s nuclear power plants that had been closed after the Fukushima disaster.
In China, the economy grew by 7.4% in 2014, the lowest rate in almost 25 years (source: IMF). Industrial output as of December had increased by 7.9% on a trend basis (best ever last quarter result) and the consumer price index was up by 1.4% on prior year, to the lowest it had been for five years (source: Chinese statistics office).
In Russia, GDP was expected to grow by 0.6% in 2014 (IMF). In the latter part of 2014, a crisis arose in the country, with interest rates having been increased by the Russian Central Bank to 17% and the rouble at record levels. The causes for the crisis were the vertiginous drop in oil prices and the economic sanctions imposed by the USA and the European Union as a result of the tensions in Ukraine.
In the Eurozone, economic performance varied extensively from country to country: certain countries, such as Italy and Cyprus, ended the year in recession, others, such as Spain and Ireland, showed an unexpected dynamism, while others (Germany and France) substantially attenuated their growth rate. From the summer onwards, the Eurozone’s economy felt the effects of the geopolitical tensions in Eastern Europe, in Syria and Libya that curbed exports. The GDP is expected to increase by 0.8% in 2014 (source: IMF), favoured by the depreciation of the euro, which has helped exports, and the fall in oil prices. Germany and France recorded increases of 1.5% and 0.4%, respectively. The unemployment rate in December was 11.4%, the lowest level since August 2012 (it was 11.8% in December 2013). Among the Member States, the highest rate was in Greece (25.8% in October 2014), while the lowest was in Germany (4.8% – Source: Eurostat). Inflation in December had fallen for the first time since 2009, having fallen year-on-year by 0.2% (source: Eurostat). This was the result of a fall in energy prices (–6.3%), while food prices remained stable, which was also the case for industrial products. The only positive sign was prices of services (+1.2%). Among the main EU member countries, it is worth highlighting the figure for Spain (down 1.1% on an annual basis), which was much lower than expected.

33R e p o r t o n o p e r a t i o n s o f t h e B P M G r o u p
The Italian economy
In Italy, GDP in 2014 decreased by 0.4% (source: Istat). Consumer spending is the only component of domestic demand that has shown signs of recovery, albeit weak, as from the third quarter of 2013 and Confindustria has forecast a rise in household expenditure in 2014 of 0.2%, favoured by a fall in the price of oil. Investment spending has been falling for six years and was expected to drop by 2.4% by the end of 2014. Figures released by Istat on consumer confidence show there had been substantial improvement at the year end. In December the index of consumer confidence reached 99.7 points, representing a sharp rise compared with the December 2013 figure (96.7 points). The improvement on the 2013 figure was across all the components. Business confidence in December was up on the 2013 index (83.9 points) especially in the retail trade sector and, to a lesser extent, in the market services sector, while it had worsened in the manufacturing and construction sectors. The figures released on industrial output for December 2014 show that the seasonally adjusted index had increased by 0.1% compared with December 2013.In December 2014, the national consumer price index, including tobacco, showed no change on an annual basis (Istat). The fact there had been no change reflects the impact of the fall in fuel prices (–7.5% in the year for petrol and –9% for diesel). As regards foreign trade with non-EU countries, figures released by Istat show that, in the fourth quarter of 2014, exports had a positive momentum of 1.8% that encompassed all main product groupings with the exclusion of energy, which fell by 3.6%. As far as imports are concerned, there was a modest decrease (–0.9%) in the same period, mainly attributable to a fall in energy imports (–13.1%), without which there would have been growth of almost 5%. Year-on-year figures – that compare December 2014 data to its value a year earlier – show an increase in exports of 5.3%, while imports fell by 8.7%, primarily due to a sharp contraction in energy purchases (–35.3%). Over the entire year, the trade surplus was 28.1 billion euro against 19.6 billion for 2013. On a trend basis, the United States was the trading partner with which there was the highest rise in exports (+10.2%), followed by the EDA countries (+9.6%) and China (+6.6%), while there was a drop in exports to Russia (–11.6%) and Japan (–10.9%). As far as imports are concerned, the most significant increases were with China (+8.6%), the United States (+8.3%) and Japan (+5.4%), while the largest decreases were with the OPEC countries (down by approximately 30%). In 2014 the public sector borrowing requirements amounted to some 76.8 billion, down on the 2013 figure by 3.5 billion (source: Ministry of Economy and Finance). Compared with last year, the positive result is attributable to moderate expenditure, whereas, as far as payments are concerned, there was a rise in interest expense payable on debt due to a different coupon payment profile and to a reduction in payments for financial activities. The unemployment rate in December was 12.9%, an increase of 0.3% over the last twelve months, but 0.4% lower than forecast. The number of people unemployed (3,322,000) has increased by 2.9% on an annual basis (+95 thousand) and the unemployment rate for 15 to 24 year olds is 42%, an increase of 0.1% on the prior year figure (source: Istat).
Financial and foreign exchange markets
In 2014, a series of “unconventional measures” was adopted by the ECB to facilitate economic recovery in the Eurozone: negative interest rates, TLTRO and the purchase of assets, known as quantitative easing. On 5 June the ECB decided that, on 11 June 2014, a negative interest rate would be introduced (0.10%) on deposits with the central bank to be applied to average excess reserves over the mandatory reserve, as well as to other deposits held by the Eurosystem. On the same date, the European Central Bank decided to introduce, for a period of two years, a series of targeted longer-term refinancing operations (TLTRO), aimed at the provision of bank loans to the non-financial private sector. On 29 July the ECB published details of and the process for the 8 TLTRO transactions, of which the first two were targeted for September and December 2014 and the others were planned to take place at three month intervals commencing in March 2015. At the first auction, which took place on 18 September, the ECB allocated 82.6 billion euro to 255 European banks at a rate of 0.15% for four years, whereas at the second auction on 11 December, the ECB allocated 129.8 billion euro that will mature in 2018. Requests arrived from the 15 major Italian banks for 23.2 billion euro at the first auction and some 26 billion euro at the second.Then, at a meeting held on 22 January 2015, confirmation was given of the start of the programme for the purchase of government securities from the banks (so-called quantitative easing) under which the ECB will purchase, commencing March 2015, assets for a maximum monthly amount of 60 billion euro. The plan will continue until September 2016 and, in any case, until the inflation rate is close to 2%. The purchase of the securities envisages that 80% of the risk will be borne by the central banks of the countries involved, while the remaining 20% will be borne by the ECB.In 2014, equity markets performed positively in the USA and less so in Europe, where they were impacted by geopolitical tensions

34 R e p o r t o n o p e r a t i o n s o f t h e B P M G r o u p
(Ukraine and Greece). In the latter part of the year, the markets were affected by growing concerns over the Russian crisis, the fall in the price of oil and uncertainty relating to the outcome of the elections in Greece. In detail, the U.S. Stock Exchange index (S&P’s 500) rose by 12.77%, which was one of the best performances among the developed countries. Among the EU countries, the French Stock Exchange index (CAC 40) fell by 1.17%, the Frankfurt Stock Exchange index (DAX 30) increased by 2.65% and the London Stock Exchange index (FTSE 100) fell by 2.99%. As regards Italy, the FTSE MIB index hardly changed at all (+0.23%), although it fluctuated over the twelve months.
As regards sector indices, the Dow Jones Euro Stoxx Banks index rose by 0.7% YoY, while the S&P 500 Banks index rose by 14.6% YoY. At the end of 2014 the FTSE Italia All Share Banks index stood at 13,406, up by 7% on the beginning of the year, confirming the good performance of bank shares. As regards monetary interest rates, in 2014, the interest rate on major refinancing operations was reduced twice, firstly in June from 0.25% (in force since November 2013) to 0.15% and, secondly, in September to 0.05%. At the end of December 2014, interest rates on major refinancing operations, on marginal refinancing and on deposits with the central bank stood at 0.05%, 0.30% and -0.20%, respectively. With regard to the return on domestic government securities, the interest rate on 12 month BOTs fell during the year, having fluctuated between a maximum of 0.78% and a minimum of 0.27%, with a weighted average rate for the year of 0.48%. For 10-year BTPs, the benchmark rate fluctuated between 3.98% at the beginning of the year to 1.92% at the end of December. Consequently, the 10-year BTP/Bund spread, which at the beginning of the year stood at 200 basis points, ended 2014 at 134.
The single currency started the year at 1.38 against the dollar and subsequently fluctuated between a high of 1.4 on 8 May and a low of 1.22 at the end of December. In December the average monthly quotation of the euro came to 1.23. The appreciation of the US currency is attributable to the continued stagnation of Europe, the gradual reduction in the Fed’s monetary stimulus and rumours of a possible first rate hike, as well as the fact that the ECB has declared its readiness to adopt new expansionary measures. Moreover, the exchange rate was affected by the fall in the price of oil. As regards the Japanese yen, the average exchange rate in December came to 147.
The banking industry
According to the figures issued by ABI, bank borrowing from resident customers, represented by deposits1 and bonds2, in December 2014 came to 1,701 billion euro, a decline of 1.6% y/y; this is equal to a decrease in stock of about 28 billion euro, reflecting a decline in bonds of 13.8% (-71 billion euro) offset in part by a rise in deposits of 3.6% (+43 billion euro).
The negative trend in lending was reflected by a decrease of 1.75%, the best result since March 2013. Loans to households and non-financial companies amount to 1,418 billion euro, with a variance of +0.1% y/y, the best result since May 2012. Regarding the breakdown by maturity, the long-term component has performed better on a trend basis (+0.1%), whereas the change in the short-term segment has been close to zero. As regards customer categories, as of November (the latest available figure) loans to non-financial companies had fallen by 2.6% (-5.9% as of November 2013) and there had been a slight decrease in household loans (–0.5%). New mortgages granted for home purchases in the first eleven months rose at an annual rate of 31.2%, while consumer credit increased by 10.2%.
(1) The line item includes current accounts, time deposits, deposits repayable with notice and repurchase agreements, net of transactions with central counterparties and transactions involving the sale of receivables(2) Bonds relate to resident and non-resident customers and are recorded at nominal value. Subordinated liabilities are included and liabilities repurchased by banks are excluded

35R e p o r t o n o p e r a t i o n s o f t h e B P M G r o u p
Italian banks: changes in funding Italian banks: changes in lending
-1.8 -1.9 -2.2 -2.0 -1.3 -0.6 -1.3 -1.1 -1.0 -0.8-2.5 -1.6 -1.6
2.0 2.3 1.5 1.3 1.22.4 2.1 2.7 3.0 3.6
2.33.5 3.6
-9.8 -10.5 -9.9 -9.1-6.9 -7.4
-9.2 -9.8 -10.3-11.2
-13.5 -13.5 -13.8
Dec-13 Jan-14 Feb-14 Mar-14 Apr-14 May-14 Jun-14 Jul-14 Aug-14 Sept-14 Oct-14 Nov-14 Dec-14
total deposits deposits bonds
- 4.0
-2.3 -2.6-2.1 -2.1 -2.4
-1.4 -1.3 -1.5-0.8 -0.7 -0.4 0.1
-6.9-6.0
-6.7-4.3 -5.1
-6.4
-2.2
-3.9-3.5
-0.9 -0.8 -0.6 0.1-2.9
-1.0 -1.1 -1.3
-1.0 -1.0
-1.1-0.4 -0.8 -0.8 -0.7
-0.3 0.1
Dec-13 Jan-14 Feb-14 Mar-14 Apr-14 May-14 Jun-14 Jul-14 Aug-14 Sept-14 Oct-14 Nov-14 Dec-14
loans to households and non-fin. cos.
up to 1 year over 1 year
Source: ABI Monthly Outlook – December 2014 Source: ABI Monthly Outlook – December 2014
As of November, gross non-performing loans had risen by 31.5 billion euro compared with the November 2013 figure, to more than 181 billion (+21.1%). Net non-performing loans amounted to 84.8 billion euro, 9.2 billion up on the November 2013 figure (+4.7%). The ratio of gross non-performing loans to total loans was 9.5%. This is the highest level since June 1998. The figure for micro-businesses was 16%, for companies it was 15.9% and for consumer households it was 6.9%. The ratio of net non-performing loans to total loans was 4.67%, compared with the November 2013 figure of 4.05%.
Interest rates compared with 3-month Euribor - monthly averages
1.88 1.86 1.84 1.80 1.75 1.74 1.71 1.67 1.64 1.60 1.58 1.51 1.49
0.28 0.29 0.29 0.31 0.33 0.33 0.25 0.20 0.20 0.10 0.08 0.08 0.08
3.82 3.90 3.89 3.88 3.90 3.87 3.87 3.81 3.78 3.76 3.70 3.65 3.61
Dec-13 Jan-14 Feb-14 Mar-14 Apr-14 May-14 Jun-14 Jul-14 Aug-14 Sept-14 Oct-14 Nov-14 Dec-14
average funding rate (deposits+repos+bonds)
monthly average 3-month Euribor
average rate on loans
Source: ABI Monthly Outlook – December 2014
As regards the 3-month Euribor, the average rate for 2014 was 0.21%, whereas in December it fell to 0.08% (0.21% as of December 2013). Since mid-September, the rate has almost halved, going from 0.10% at the start of the month to a mid-month rate of 0.08% following the announcement of the ECB’s measures.
The average rate on 10-year interest rate swaps stood at 0.9% in December 2014, a marked reduction on the figures of twelve months ago (2.08%).
With regard to bank rates, in December the average rate on deposits applied to households and non-financial companies3 was 1.49% (1.88% in December 2013) and the weighted average interest rate on loans to them amounted to 3.61% (3.82% in December 2013). The spread between the average interest rate on loans and average deposits stood at 212 basis points, with a recovery on December 2013 (194 basis points), but still at much lower levels than those seen before the crisis (at the end of 2007 the spread stood at 327 basis points). The average spread for 2014 was 212 basis points (average of 182 for 2013).
(3) With respect to deposits, repurchase agreements and bonds

36 R e p o r t o n o p e r a t i o n s o f t h e B P M G r o u p
Italian banks: interest rate on funding Italian banks: interest rates on loans
0.97 0.95 0.94 0.94 0.89 0.87 0.86 0.83 0.81 0.79 0.79 0.74 0.71
3.44 3.42 3.39 3.37 3.33 3.34 3.31 3.29 3.28 3.21 3.21 3.17 3.16
1.88 1.86 1.84 1.80 1.75 1.74 1.71 1.67 1.64 1.60 1.58 1.51 1.49
Dec-13 Jan-14 Feb-14 Mar-14 Apr-14 May-14 Jun-14 Jul-14 Aug-14 Sept-14 Oct-14 Nov-14 Dec-14
average rate on deposits from households and companies
average rate on bonds (balance)
average rate of funding
3.82 3.90 3.89 3.88 3.90 3.87 3.87 3.81 3.78 3.76 3.70 3.65 3.61
3.50 3.50 3.43 3.443.34 3.36
3.26 3.213.12
3.002.90 2.91
2.76
Dec-13 Jan-14 Feb-14 Mar-14 Apr-14 May-14 Jun-14 Jul-14 Aug-14 Sept-14 Oct-14 Nov-14 Dec-14
loans to households and non-financial companies (amounts)
home-purchase loans to households (amounts)
Source: ABI Monthly Outlook – December 2014 Source: ABI Monthly Outlook – December 2014
As regards the securities portfolio, ABI notes that this aggregate amounted to 828 billion euro in December 2014, a decrease of 11% since December 2013 (926 billion euro).
Asset management
2014 was a record year for investment funds. According to Assogestioni, total subscriptions were close to 129 billion euro (double the net deposits recorded for 2013), bringing total assets under management by the industry at the end of December to 1,579 billion euro, 248 billion higher than at the end of 2013 (up by around 19%).
Italian and foreign open-ended funds had total assets under management of 681 billion euro at the end of December, representing an increase of 22% since December 2013. The situation was facilitated by net inflows since the beginning of the year of 87 billion euro. Within this aggregate, the assets managed by Italian funds (approximately 30% of the total) at the end of December reported an increase of 23% compared with December 2013 with positive net inflows from the beginning of the year of 32 billion euro. Foreign funds (making up the remaining 70%) also performed extremely well, having increased by 22% since the end of 2013 and having raised a total of 54.6 billion euro since the start of the year.
A breakdown of open-ended mutual funds by type of investment shows a predominance of bond funds (46.5%), followed by flexible funds (22.1%) and by equity funds (20.6%), while balanced funds represent 6.3% and monetary funds 3.8%. Lastly, hedge funds represent 0.8% while 0.2% of the total are unclassified. Net deposits in 2014 mainly consisted of flexible funds (deposits up by 41.6 billion euro) and bond funds (+28.1 billion euro); the predominance of flexible funds is attributable to investors’ propensity for riskier portfolios, while at the same time searching for solutions that keep volatility under control, while bond funds continue to represent an alternative investment to government securities, the returns on which continue to fall.
As regards retail portfolio management schemes, in December 2014 assets under management came to 111 billion euro, almost 15 billion euro higher than in December 2013 (+15%).

37R e p o r t o n o p e r a t i o n s o f t h e B P M G r o u p
Significant events for Banca Popolare di Milano and the Bipiemme Group
The main events that took place in 2014 are reported below.
2014-2016/2018 Business Plan
On 11 March 2014, the Management Board of Banca Popolare di Milano reviewed and approved the Bipiemme Group’s Business Plan for the period 2014-2016 with an extrapolation to 2018. The objectives are designed to increase efficiency and profitability significantly through a new business model that will strengthen BPM’s role as a regional bank that is close to households and SMEs.
Despite the economic decline, the Bipiemme Group has been able to strengthen its fundamentals over the last two years by increasing its coverage of problem loans, optimising cash management and derecognising goodwill. In addition, the management team has been renewed, the Group structure has been simplified and incisive action has been taken to control costs, all of which has resulted in a return to profitability.
With this background, the Bipiemme Group is now ready to seize the opportunities arising from the improved macroeconomic outlook, thanks to its portfolio of high-value customers present in the most productive areas of the country and an optimal combination of regional coverage and product excellence. The Group has all the skills to become a bank of reference within the system, as it consists of a network of branches in constant modernization and streamlining, one of the most innovative digital and multi-channel banking models, thanks to the development of the WeBank brand, specialist skills in consumer credit (ProFamily) and a centre of excellence for high value-added services to private and corporate customers in Banca Akros.
The guidelines for the 2014-2016/2018 Business Plan – previously detailed in the 2013 separate report on operations, to which reference should be made for further details – comprise 10 actions that have either already been completed or which are still in progress, as summarised below:
1. strengthening of the capital base via a capital increase of Euro 500 million that was completed successfully on 30 May, and removal with effect from 30 June 2014 of the capital add-ons previously imposed by the Bank of Italy, following the work performed by BPM to resolve various issues that had been identified;
2. strengthening of liquidity position: in 2014 a senior unsecured bond with a nominal value of Euro 500 million was successfully placed and – thanks to the improved solidity acquired by the Group – all the LTROs (Long Term Refinancing Operations) held by BPM and Banca Akros were repaid and were partially replaced by Euro 1,500 million of TLTROs (Targeted longer term refinancing operations) requested from the ECB at the December auction;
3. constant monitoring of credit quality through initiatives focused on performing and problem loans, for which there is an ongoing review and optimisation of the processes for monitoring and granting credit and for managing problem loans;
4. development of multi-channel banking by means of the absorption – which took place on 23 November 2014 – of WeBank by BPM and the strengthening of the Group’s platform to create a sole “multi-channel bank”. In order to cater for pure digital customers and to develop the customer base outwith the traditional regional coverage, Multi Channel Banking has been introduced within BPM’s Market Function encompassing the core business of WeBank (commercial management and coordination of financial advisors) and the Group’s multichannel services and infrastructure (customer center, virtual branch). For the management of direct channel applications, an IT Channels structure has been set up that reports to the Head of IT and which has been further developed by the Group’s inbound and outbound Contact Center;
5. the creation of a centre of excellence in the ‘core’ retail segments and the expansion of the network of financial advisors, with the objective of strengthening the commercial oversight and development of various customer segments through the creation of new Micromarkets and by making changes to certain criteria for the segmentation and portfoliation of customers;
6. the offer of value-added services for Corporate customers by means of the adoption of a distinctive business model, helped by the synergies with Banca Akros, for corporate finance, advisory, customer support for the issue of mini-bonds and the full implementation of the new corporate model, with the progressive strengthening of the segment in terms of human resources and the quality of its operational processes;
7. creating a centre of excellence in Private Banking for entrepreneurs and professionals through the development of the Akros and BPM Private brands and the external recruitment of highly skilled professionals to achieve a team of 150 professionals over the time horizon of the plan. During the year, a first group of new Private Bankers was added to the team;

38 R e p o r t o n o p e r a t i o n s o f t h e B P M G r o u p
8. enhancement of human resources by recruiting persons with new professional skills and talented young people, developing their commercial skills and strengthening the system of performance-based assessment;
9. a constant focus on cost containment (spending review), thanks to the digitisation of business processes, full implementation of the new sales platform, increased efficiency of back office processes and a specific intervention plan aimed at reducing current expenditure. The Spending Review was completed in the year as preparatory work for the achievement of cost savings in 2015;
10. the development of the property portfolio via the rationalisation of the branch network and the restyling of the Milan head office that is currently ongoing. In this respect, approximately 62 branches were closed in 2014, thus completing, in just one year, the Plan’s three-year objective, while restructuring work has started on a series of branches as envisaged by the Plan.
Partial sale of investment in Anima Holding S.p.A
The global offer of shares in Anima Holding SpA, with a view to obtaining their admission to listing on the MTA, closed on 16 April 2014. In the context of this offer, the Parent Company made available 49,184,616 shares for sale at a unit price of Euro 4.20 and granted the coordinators of the global offer a greenshoe option over a maximum of 12,501,112 shares.On completion of the operation – which involved the sale of 55,299,164 shares – the Bank’s interest in Anima Holding was reduced from 35.29% to 16.85% and a total capital gain – net of tax effect – of Euro 110 million was recognised in the separate financial statements and of Euro 103 million was recognised in the consolidated financial statements.
Increase in share capital
On 30 April 2014, consequent to resolutions adopted at the General Meetings of Members held on 22 June and 21 December 2013, the Management Board established the definitive conditions for the rights issue of up to Euro 500 million and resolved to issue a maximum of 1,162,161,765 ordinary shares at a price of Euro 0.43 per share, to be recognised in full as capital, on the basis of 9 new BPM shares for every 25 already held. The maximum value of the Offer was therefore set at Euro 499,729,558.95. The Prospectus and the related Supplement, containing the terms and conditions of the Offer, were approved by Consob on 29 April and 2 May 2014 respectively. These documents were then published prior to the start of the Offer Period and made available at the registered offices of the Bank and on the Group’s website. The Offer was fully underwritten by a consortium of banks acting as Joint Global Coordinators and Joint Bookrunners.
The option rights were almost entirely (99.48%) taken up during the offer period, from 5 May 2014 to 23 May 2014, with subscriptions totalling more than Euro 497 million. The remaining rights were sold in full on 27 May 2014 (first session of the stock exchange offer) and subsequent subscriptions amounted to Euro 2.6 million. The offer therefore closed on 30 May 2014, with subscriptions for all the new shares without having to call on the underwriting syndicate.
As communicated to the market on 5 June 2014, following subscription in full to the capital increase, Banca Popolare di Milano proceeded to issue 1,162,161,765 new ordinary shares for a total amount of Euro 499,729,558.95. Following the above operations, the share capital of Banca Popolare di Milano now totals Euro 3,365,439,319.02 represented by 4,391,784,467 ordinary shares without par value.

39R e p o r t o n o p e r a t i o n s o f t h e B P M G r o u p
Removal of Add-ons
On 30 June 2014 the Bank of Italy had removed in full the capital add-ons imposed on the Bank following the inspections carried out by the Supervisory Authorities between September 2010 and March 2011. Removal of these capital add-ons follows the action taken by the Bank to resolve the technical and operational problems which led to their imposition in the first place and, more generally, to the path of recovery pursued by the Bank. These add-ons had burdened the Group’s RWAs by about Euro 8.1 billion at 31 March 2014, with a significant impact on its capital adequacy ratios.
Absorption of WeBank S.p.A. by Banca Popolare di Milano S.c.ar.l.
On 17 June 2014, following the expression of a favourable opinion by the Supervisory Board, the Management Board of Banca Popolare di Milano and the Board of Directors of WeBank approved the proposed absorption of WeBank by Banca Popolare di Milano. This merger is envisaged in the Group’s 2014-2016/18 Business Plan and has been intended to strengthen the Group’s presence in the digital market.
On 23 September 2014, after receiving authorisation from the Bank of Italy pursuant to article 57 of Legislative Decree no. 385/1993, the Management Board of Banca Popolare di Milano – pursuant to Article 2505, second paragraph, of the Italian Civil Code – and the Extraordinary Meeting of WeBank approved the merger. The merger project, the resolution of the Bank’s Management Board of 23 September 2014, as well as other documents related to the operation in question, have been published – according to the law – on BPM’s website (www.gruppobpm.it) in Investor Relations/Corporate Transactions/Merger of WeBank with BPM.
On 12 November 2014, Banca Popolare di Milano announced to the press and the market that it had executed the deed for the merger by absorption of WeBank S.p.A. into BPM. The merger became effective on 23 November 2014, whereas it took effect for accounting and tax purposes from 1 January 2014. In accordance with Resolution no. 17221/10 (Consob’s OPC Regulation) and with the related company regulations adopted by the Bank, the merger is a “more important related party transaction”. In the absence of significant interests of other related parties in the subsidiary WeBank, the Bank has taken advantage of the exemption option provided for in Article 14 of Consob OPC Regulation.
Comprehensive Assessment
On 26 October 2014 Banca Popolare di Milano announced that, on the same date, the European Central Bank (“ECB”) had published the results of its Comprehensive Assessment, the conclusion of which, taking account of the further capital strengthening measures implemented by BPM in the first half of 2014, as indicated by the Bank of Italy in its own press release, is that Bipiemme Group has excess capital of Euro 713 million.
The Comprehensive Assessment carried out by the ECB together with the competent national authorities on the larger European banking groups such as BPM – commenced in November 2013 and concluded in October 2014, prior to the introduction of Europe’s Single Supervisory Mechanism (“SSM”) – involved the following two main activities, the results of which were integrated with each other by the ECB for the purpose of communicating the final results of the Comprehensive Assessment: an asset quality review, to improve the transparency of banks’ financial statements, including the adequacy of the valuation of
assets and guarantees, as well as the related provisions; a stress test performed in close cooperation with the European Banking Authority (“EBA”), to check the resilience of bank
balance sheets in the presence of adverse scenarios in the time period 2014-2016; the results of the Stress Test were published by the ECB and the EBA at the same time as those of the Asset Quality Review.
To ensure a correct interpretation of the results of the Comprehensive Assessment we would point out that: the results of the Comprehensive Assessment, which referred to 31 December 2013, showed a shortfall of capital as reported in
Column D - Max deficiency – in the table that follows; in the period from 1 January 2014 to 30 September 2014, the Bipiemme Group has put in place additional capital measures
that obviously have to be taken into account for a fair, complete and updated evaluation of the Bipiemme Group’s capital

40 R e p o r t o n o p e r a t i o n s o f t h e B P M G r o u p
adequacy; of the various capital measures carried out in the period between 1 January 2014 and 30 September 2014, the ECB provides
a separate indication only of the cash increase in capital of Euro 500 million that was completed in May 2014, and of the new different regulatory treatment of the Bank’s investment in the Bank of Italy (including its revaluation), as reported in Column E of the table;
as regards the amount of Euro 879 million, shown in Column H of the table in the Bank of Italy’s press release of 26 October 2014, it is clear that the Bipiemme Group has benefited from (i) complete removal of the add-ons ordered by the Supervisory Authority on 24 June 2014, and (ii) the sale of a portion of BPM’s stake in Anima Holding S.p.A.; capital measures that led to a further significant increase in the Common Equity Tier I ratio of the Bipiemme Group.
Excess/Shortfall
from AQR(*)
Excess/Shortfall from
baseline ST(*)
Excess/Shortfall from
adverse ST(*)
Min. excess/Max. shortfall
(*)
Main capital strengthening
measures
Excess/Shortfall after the
main capital strengthening
measures
Excess/Shortfall with
regards to AQR after the
main capital strengthening
measures
Results including other capital strengthening measures
Other capital strengthening
measures(**)
Final Excess/Shortfall
after all capital strengthening
measures
Method of calculation A B C D = min (A,B,C) E F = D+E G = A+E H I = D+E+H
in millions of Euro –482 –647 –684 –684 +518 –165 +36 +879 +713
(*) at 31 December 2013, before the impact of the Comprehensive Assessment, the CET1 ratio of the Bipiemme Group stood at 7.29%, 71 basis points under the 8% minimum, the equivalent of a capital shortfall of Euro 308 million. Consequently, the shortfalls revealed by the AQR and stress tests have to be assessed net of the capital shortfall of Euro 308 million already in place at the end of 2013. (**) the other capital strengthening measures relate to removal of the add-ons – equal to Euro 646 million of capital – and to the sale of a stake in Anima Holding S.p.A., equal to a capital of Euro 233 million.
Information required by CONSOB pursuant to art. 114, paragraph 5, of Legislative Decree 58/98
As required by Consob, pursuant to article 114, paragraph 5, of Legislative Decree 58/1998, disclosure is provided below of the accounting impact of the results of the AQR conducted by the ECB as part of its Comprehensive Assessment:
a) as regards the Credit File Review or “CFR”, at the end of the Comprehensive Assessment, additional adjustments, compared with the situation taken as a point of reference (31 December 2013), were deemed to be needed of Euro 168.44 million for certain balances in the sample.
With respect to these balances, during the ordinary process of loan classification and assessment, which took account of developments that had occurred in 2014 as well as the adoption of more stringent assessment parameters for the sake of prudence, recognition was made in the 2014 income statement of adjustments totalling Euro 177 million;
b) the statistical Projection of Findings – “PF” of the results of the CFR to the portion of the loan portfolio not included in the sample that was analysed highlighted the need for adjustments of Euro 53.3 million. While bearing in mind that these adjustments arose from the application of statistical methods used for a prudent exercise, which was the case for the AQR, and thus, in light of the requirements of applicable accounting standards, there is no need to automatically recognise them in the financial statements, the following should be noted:
i. the analysis conducted by the ECB did not indicate any critical issues concerning the policies, procedures and parameters adopted by the Bank for the classification and assessment of loans; consequently, no significant amendments needed to be made thereto and, in any case, none that would generate any impact on the 2014 income statement;
ii. purely for information purposes, it is hereby disclosed that, with respect to the balances covered by the statistical projection of findings of the results of the CFR, in 2014 recognition was made in the income statement, in connection with the ordinary process of loan classification and assessment, of adjustments of Euro 99 million;
c) as part of the Comprehensive Assessment, the application of a model laid down by the ECB (so-called Challenger Model) to collectively provide for exposures relating to the selected portfolios, highlighted the need for additional adjustments of some Euro 26 million. This was attributable to the fact that the Challenger Model was based on losses recognised in 2013 alone, a negative year for the Italian economy that had been preceded by a period of economic recession.
Each year, Bipiemme Group updates its risk parameters to take account of the most recent economic conditions. Furthermore,

41R e p o r t o n o p e r a t i o n s o f t h e B P M G r o u p
in 2014 the risk parameters were recalibrated by reducing the calculation period. This decision arose from a review of the risk indicators that commenced some time ago and that, also in line with the findings that arose from the AQR, led Bipiemme Group to adopt parameters that were more consistent with the current economic environment and with the impact thereof on the Bank’s loan portfolio. The new risk parameters were used for the 2014 financial statements, thus implementing the findings of the AQR;
d) the analysis of level 3 financial assets performed as part of the AQR highlighted the need for an adjustment for one balance, consisting of an equity instrument recorded as “Financial assets available for sale”. This adjustment had an impact on the Bank’s own funds of Euro 0.8 million. In 2014, based on the latest information on the results and financial position of an investee company, an adjustment was recognised in the Bank’s income statement of an amount of Euro 1.7 million.
***
As regards the qualitative findings of the AQR and the remedial actions taken or planned by Bipiemme Group and communicated to the ECB, disclosure is provided below:
1) Policy and procedures relating to collateral and appraisals in the property sector In 2014, BPM concluded its internal review and assessment of overdue positions exceeding Euro 1 million pertaining to
its commercial real estate portfolio. The Bank’s Credit Risk Mitigation policy has been updated and was approved by the Management Board on 27 January 2015.
In order to further strengthen the collateral assessment process, the following actions have been planned: (i) the centralisation of data input and review and (ii) the implementation of a collateral management model that provides a more efficient management and control of collateral through the improvement of IT support, the creation of a dedicated organisational unit and new procedures and controls.
2) Application of the Credit Valuation Adjustment (CVA) to the derivatives portfolio Currently, BPM and Banca Akros apply two different models to calculate the CVA/DVA for derivatives. In order to arrive at a sole model for the Group for the calculation of CVA/DVA and the policy therefor, BPM has planned the
following actions: (i) a comparative analysis of the two models based on a sample of positions selected from both BPM’s and Banca Akros’s portfolios. It is planned to complete this analysis by the end of March 2015, (ii) the definition of a Group model, also taking account of the related costs compared with the amount of the exposure to CVA/DVA (principle of proportionality), (iii) the definition and approval of the policy relating to the Group CVA/DVA by the end of July 2015, and (iv) the application of the chosen model to all of the Bipiemme Group by the end of December 2015.
3) Classification of financial assets in line with IAS 39 During the year, BPM adopted a specific policy to provide guidelines for the measurement of financial instruments arising from
debt restructuring to ensure consistency in the measurement of equity instruments and related loans.
4) Fair value During 2014, BPM took steps to update its policy for the fair value measurement and classification of financial instruments.
The update focused on the inclusion of the operational aspects of all the methodologies applied to ensure an appropriate measurement of financial instruments in line with the requirements of the accounting standard IFRS 13.
5) Forborne exposures During the second quarter of 2014, BPM started working on the implementation of the classification criteria introduced by the
EBA to the Bank’s accounting systems. The new processes are aimed at improving the compliance of internal criteria with the regulations, at monitoring changes in exposures and reporting to the Supervisory Authority. The full implementation of the new processes will permit a precise identification of forborne exposures and the subsequent verification, for the new portion of the portfolio, of identification criteria.
BPM had implemented a programme to meet reporting requirements as from the third and fourth quarters of 2014 (for the purpose of the first reports, a number of estimates was used and some limitations were encountered due to the fact that the procedures that will lead to the application of the definition of forborne are still being implemented).
Furthermore, following the publication by the Bank of Italy of the related implementation rules, by the end of September 2015, BPM will identify a solution (i) to overcome the above estimates and limitations, and (ii) to define the procedures to identify and

42 R e p o r t o n o p e r a t i o n s o f t h e B P M G r o u p
to report on forborne exposures.6) Specific adjustments – Non-performing loans During 2014, some refinements were made to the method used for discounting non-performing loans. In particular, for loans with
an original contractual floating rate, a discounting method was adopted that entails the use of interest rates where the floating parameter continues to change periodically, in line with findings observed on the market, whereas the contractual spread applied at the start of the loan remains unchanged.
7) Group of related customers BPM has updated its internal guidelines on “management of related customers” in order to strengthen procedures and controls
for the management of groups of related customers. The new internal regulations introduce a control by the relationship manager during the credit granting process. Subsequently,
prior to the approval of the transaction, the lending department must validate the relationships between related customers. Furthermore, each year the Bank compares the CRIF database to the Bank’s groups master file.
BPM has planned the following actions: (i) verification of the databases, (ii) the introduction of the role of “Chief relationship manager”, (iii) further training for the functions involved in the new procedures and controls, and (iv) integration of the ProFamily groups master file.
Collective assessment of loans
1) Probability of Default (“PD”) and Loss Given Default (“LGD”)
The collective assessment of loans (IBNR + collective specific) is performed by means of the application of internally estimated risk parameters to exposures to the counterparties subject to assessment: Corporate, SME, Small Business and Individuals. In the second half of 2014, on the occasion of the annual update thereto, the following specific refinements were made: (i) the calibration of the PD based on a shorter time period, in order to align the current estimates to recent developments in the economic cycle and by introducing a PIT adjustment where necessary, (ii) the refinement of the LGD by means of the inclusion of historical recovery data relating to the most recent years and (iii) the remeasurement of the LCP for all the portfolios assessed, in order to permit the appropriate detection of the time period between the initial signs of anomalies for a single exposure and the classification of the loan as impaired. These refinements were fully completed and the new risk parameters were used for the 2014 financial statements.
***
As regards capital requirements, note that - as authorised by the ECB on 11 February 2015 – the CET1 ratio to be reported to the Supervisory Authority, inclusive of retained earnings for 2014, is 11.58%.

43R e p o r t o n o p e r a t i o n s o f t h e B P M G r o u p
Directors and Officers and General Meeting of Members
On 17 January 2014, the Supervisory Board – appointed by the General Meeting of Members of 21 December 2013 – elected a new Management Board made up of Mario Anolli (Chairman) and Davide Croff, Paola De Martini, Giorgio Girelli and Giuseppe Castagna (Board Members). On 21 January 2014, the same Management Board appointed Giuseppe Castagna as Managing Director and General Manager of the Bank.
On 12 April 2014, the Ordinary and Extraordinary General Meeting of the Bank was held in the presence of around 2,800 members (in person or by proxy) who having taken note of the financial statements of the Bipiemme Group at 31 December 2013, decided not to distribute any earnings and allocated them entirely to capital reserves. Again with reference to the ordinary part of the AGM, having approved the remuneration policies and the adjustment of the audit fees to the extent of their powers, the Meeting appointed Maria Luisa Di Battista to integrate the Supervisory Board. During the extraordinary part of the Meeting, the proposed amendments to the Articles of Association concerning the reform of the Bank’s governance , received votes in favour from a majority of those who voted, but were not approved as they did not receive the votes in favour of two-thirds of the voting members, as required by art. 31, paragraph 2 of the Articles of Association.
On 22 April 2014, the Supervisory Board acknowledged the resignation with effect from 20 April 2014 of Jean-Jacques Tamburini, a Supervisory board member nominated in accordance with art. 63 of the Articles of Association by Crédit Industriel et Commercial, a bank within the French Crédit Mutuel Group. He had served as a “non-independent” director and member of two Supervisory Board sub-committees, namely the Nominations Committee and the Remuneration Committee. His resignation followed the French group’s sale of its shareholding in BPM and the termination, by BPM, of the Cooperation Agreement between the two banking groups signed in 2004.
On 3 June 2014, the Supervisory Board arranged to replace Jean-Jacques Tamburini, who resigned, on the Nominations Committee and the Remuneration Committee. As of that date, the two Committees comprised: Nominations Committee: Dino Piero Giarda (Chairman), Angelo Busani, Carlo Frascarolo, Alberto Montanari and Luca
Raffaello Perfetti; Remuneration Committee: Dino Piero Giarda (Chairman), Andrea Boitani, Carlo Frascarolo, Roberto Fusilli and Lucia Vitali.
On 6 August 2014 Ezio Maria Simonelli, at the time qualified as “independent director” and member of the Internal Control and Audit Committee, established under the Supervisory Board, has resigned from the office of Supervisory Director, in order to comply with Consob’s regulations concerning limits on the number of posts that members of the supervisory bodies of listed companies can hold simultaneously.
On 11 August 2014, pursuant to the Articles of Association, we proceeded to integrate the Supervisory Board with the addition of Emilio Cherubini as the first unelected candidate on the same list as the outgoing director. Subsequently, on 9 September 2014, having taking into account, among other things, the favourable opinion of the Nominations Committee and having verified compliance with the integrity, professionalism and independence requirements of the regulations and the Articles of Association to take office, the Supervisory Board appointed Mr. Cherubini also as a member of the Internal Control and Audit Committee.
Other significant events
On 23 January 2014, Banca Popolare di Milano informed the market that it had successfully placed a Senior Unsecured Bond with a nominal value of Euro 500 million for five years with a fixed rate coupon of 4.25% reserved for institutional investors. Orders in excess of Euro 1.4 billion were received, almost three times the value of the issue, which was much appreciated by institutional investors.
On 28 February 2014, Banca Popolare di Milano and Fondazione Cassa di Risparmio di Alessandria jointly agreed an amendment to their shareholders’ agreement signed on 9 September 2011. In relation to the first expiry date of the agreement (scheduled for 9 September 2014), this amendment established that the deadline for submitting notice of withdrawal would be 30 June 2014 (instead of 9 March 2014). Subsequently, on 25 June 2014, Banca Popolare di Milano and Fondazione Cassa di Risparmio di Alessandria agreed that a revision of the clauses would be appropriate and established – for the purpose of renewing the agreement

44 R e p o r t o n o p e r a t i o n s o f t h e B P M G r o u p
due to expire on 9 September 2014 – that their shareholders’ agreement would remain in force until 31 December 2015, with the exclusion of those clauses that envisage automatic renewal after that date. An extract of the agreement, as amended, has been published – as required by law – on the Bank’s website (www.gruppobpm.it) in the Governance, Shareholders’ Agreements section.
On 30 June 2014, Banca Popolare di Milano signed an agreement with Adiconsum, Adoc and Federconsumatori that amended and supplemented the Memorandum of Understanding concerning the joint conciliation procedure for the “Convertendo BPM 2009/2013 - 6.75%” bond loan, extending the deadline for the submission of applications for admission by Retail customers and allowing BPM Shareholders to access the procedure under certain conditions. Applications for access to the conciliation procedure can be submitted from 15 September 2014 to 30 September 2015. The full text of the above Amendment Agreement, to which reference should be made for further information, has been published on the websites of the Group’s commercial banks and on those of the Consumer Associations that have signed or accepted the Agreement.In addition, in order to fund the payments expected to be made under this procedure, the Bank recorded a specific provision in the financial statements at 31 December 2011 of Euro 40 million, which was subsequently increased in 2012 to a total of Euro 47.4 million at Group level. As of 31 December 2014, considering any payments already made in favour of those entitled to them, the provision amounts to Euro 26.1 million. At present, this provision is considered adequate to cover the charges to be borne by the Group as a result of the above extension of the conciliation procedure, although they will only be measurable in full once the procedure has been completed.
As part of a broader policy of diversifying the sources of funding and consolidating the Group’s liquidity position, the Bank is working to repay early the LTRO loans obtained from the ECB. In particular, the LTROs of 4,550 million existing at 31/12/2013 were gradually reimbursed and no longer existed at 31 December 2014. It should also be noted that, at the December auction, Banca Popolare di Milano requested Euro 1,500 million of liquidity from the ECB via TLTRO operations at a subsidised rate of 0.15%, aimed, as requested by the ECB, at the provision of new loans to companies.
On 1 August 2014 the Bank completed a securitisation of receivables resulting from commercial mortgage loans secured by first degree mortgages and unsecured loans originated by the Parent Company for a total of Euro 864 million, for which a new vehicle company, called BPM Securitisation 3 S.r.l. was formed and included in the scope of consolidation of the Bipiemme Group from 30 September 2014. All of the securities issued by the vehicle company were subscribed by the Parent Company.Lastly, on 29 September 2014, after having obtained the necessary authorisation, Banca Popolare di Milano repaid ahead of schedule all of its liabilities backed by a government guarantee for a total nominal value of Euro 1 billion at 4.9%, due on 23 March 2015. This liability, which was subscribed by BPM on 23 March 2012 at the time of issue, was never placed on the market.
On 13 November 2014, a group of members set up an association called “Per la Cooperativa BPM”. To the extent that art. 122 of Legislative Decree 58/1998 regarding shareholders’ agreements applies, the members intend to fulfil all of the publicity and disclosure requirements vis-à-vis the public and the Supervisory Authorities in accordance with these regulations. In view of the above, an extract of the association agreement is available on the Group’s website (www.gruppobpm.it) in the Governance – Shareholders’ Agreements and Members’ Associations section.
Events subsequent to 31 December 2014
On 20 January 2015, the Supervisory Board of Banca Popolare di Milano verified, among other things, its members’ independence requirements in accordance with art. 148, paragraph 3, of Legislative Decree 58/98 (“CFA”) and art. 3 of the Code of Conduct for Listed Companies (hereinafter the “Code”) on the basis of appropriate forms filled in by those involved. Based on these checks, all of the members of the Supervisory Board met the independence requirements of article 148, paragraph 3, CFA, while the following Board members met the independence requirements of art. 3 of the Code: Dino Piero Giarda (Chairman), Mauro Paoloni (Deputy Chairman), Marcello Priori (Deputy Chairman), Alberto Balestreri, Andrea Boitani, Angelo Busani, Emilio Luigi Cherubini, Maria Luisa Di Battista, Donata Gottardi, Piero Lonardi, Flavia Daunia Minutillo, Alberto Montanari, Giampietro Giuseppe Omati, Luca Raffaello Perfetti, Cesare Piovene Porto Godi and Lucia Vitali.
On the same date, in accordance with the requirements of the “Instructions accompanying the Regulations for the Markets organised and run by Borsa Italiana S.p.A.”, the Supervisory Board announced that it had decided on the composition of the following sub-committees: Internal Control Committee: Alberto Balestreri (Chairman), Carlo Frascarolo, Dino Piero Giarda, Piero Lonardi and Cesare
Piovene Porto Godi.

45R e p o r t o n o p e r a t i o n s o f t h e B P M G r o u p
Nominations Committee: Dino Piero Giarda (Chairman), Angelo Busani, Carlo Frascarolo, Alberto Montanari and Luca Raffaello Perfetti.
Remuneration Committee: Dino Piero Giarda (Chairman), Andrea Boitani, Carlo Frascarolo, Roberto Fusilli and Lucia Vitali.
Main initiatives in 2014
Work began in 2013 to focus more on the central position of the clientele and improve the ability of the Bank to interact with existing and potential customers. This continued during 2014. Action was taken to strengthen the Hub & Spoke structure, with the introduction of experienced relationship managers who were able to move around to serve both firms and private individuals and with the implementation of a new advisory and sales platform (“NSRv” – New Network System) to simplify administrative activities at branch level and give priority to the various commercial processes. In support of commercial activities, a review was performed in 2014 for the reorganisation of certain structures, such as the Retail function, with the objective of strengthening the oversight and commercial development of various customer segments and the Marketing function, with the objective of applying end-to-end logic for work distribution, of reducing the fragmentation of organisational units and of increasing the integration of various areas of activity.
The following principal initiatives relate to the different customer segments.
Individuals
The innovative service entitled Risparmio Ben Fatto was updated during 2014, in order to enrich and improve the functions available by: allowing objectives to be set: ability to set up to 4 spending objectives (unspecified or defined); allowing unspecified saving: enabling customers to save even without defining specific spending objectives; allowing action on the achievement of objectives: after achieving an objective, the customer can draw on the funds quickly and
easily, by making a bank or account transfer or topping up a prepaid Carta Je@ns; Marketplace Bazak: offers for the on-line purchase of products at attractive prices available to all customers using the multi-
channel banking service; statistics: addition of charts indicating progress over time; elimination and simplification of the PIN so that objectives can be set via Apps and to change access methods.
In the second half of the year, a new function was released called “Obiettivo Condiviso” that enables customers that have signed up for the service to establish and manage a shared objective by inviting their friends and relatives to participate by contributing thereto. The new function has been released as part of the Well Done app and as part of the Bpm banking service.
With the aim of acquiring new customers, work began at the start of 2014 to promote New welcome accounts to individuals and current accounts in euro for non-residents coupled with internet banking services, loans and mortgage loans.
Greater emphasis has been placed on the partnership with AC MILAN (BPM is a top sponsor of the team), via “Rossonero per Sempre” competitions that promote this dedicated current account.
Lastly in this area, the BPM4U groups and conditions have been rationalised in order to streamline the catalogue and action has been taken to add the principal standard current accounts to the NSR platform.
e-moneyWith the merger of We@bank into Bpm, a new international Maestro ATM debit card was introduced that can only be requested online by BPM customers with a current account and which use the multi-channel banking service 2.0., with no requirement for customers to physically visit a branch for the activation thereof. In December a new card named Cartimpronta Debit was introduced that can be used on the MasterCard circuit and which is mainly aimed at allowing customers to make purchases online guaranteed by the Bank’s security system through the introduction of PIN changes and secure codes.

46 R e p o r t o n o p e r a t i o n s o f t h e B P M G r o u p
As regards the prepaid card with IBAN product offering, at the end of July the new Be 1 Card C-Less was released. This card, equipped with contactless technology for proximity payments, meets consumer requirements for basic services and is available with an individually customised image. In October the product range was expanded with the version intended for the BPM4U line, which is dedicated to the employees of our corporate customers. Work also started on the CardLess Mobile, a new product that will be released in the first few months of 2015, designed to provide an innovative service to current account holders that allows them to make cash withdrawals without using an ATM card and which is secure and fast.Again in partnership with AC Milan, the range of products for supporters has been extended by introducing the Cartimpronta Rossonero per Sempre credit cards, with joint AC Milan – BPM branding, which are available in Classic and Gold versions.
As regards prepaid cards, CartaJe@ns has again been used in 2014 to channel disbursements from the new Fondi Cresco (for the proper nutrition of new mothers and their children) and Sostengo (for separated parents) Funds, consistent with the approach taken by the Fondo Nasko (operational since 2010 with over 20 million euro paid out over three years). BPM has been confirmed for 2014 as the Lombardy Region’s sole partner for the provision of these funds, thus increasing our active presence in the territory.In November, the new “Mobile POS” service was launched. This allows payments to be accepted on mobile devices such as smartphones and tablets equipped with contactless and NFC technology.
Insurance products, non-life segmentSales of the Multiprotezione Auto policy offered by Bipiemme Assicurazioni were extended to the branch network of Banca Popolare di Mantova in May. Given the excellent results obtained from the promotion of the Multirischi Mp5 policy in 2013, the Bank decided to repeat the offer in 2014. In October the entire Bipiemme Group network started marketing Bipiemme Assicurazioni’s accident insurance.
Mortgage loans to individualsIn 2014 the focus was on the relaunch of mortgage lending to individuals; a campaign was run in May with more competitive pricing and with an offer aimed at rewarding lower LTV (loan to value) ratios. To support the initiative, an agreement was entered into with LG, whereby mortgage borrowers would receive a coupon for the purchase of household appliances.In October a second proposal was developed to benefit customers, offering the possibility to have an immediate feasibility opinion and a particularly competitive interest rate.
The marketing of personal loans was supported by specific, diversified campaigns to take advantage of seasonal borrowing needs. Particular attention was paid to personal loans collateralised by the assignment of one-fifth of the borrower’s pension, with an initiative that led to personal proposals being made to approximately 30,000 customers.In the second half of 2014, the commercial offering was expanded by the inclusion in the Presta Sport product catalogue of a loan dedicated to meeting the cost of sports activities practiced by families.
Assets under managementAssets under management within the retail network grew strongly during the period, thanks to attentive product offerings linked to Anima SGR funds and Class I and III BPM Vita policies, which met with the approval of customers and generated significant net inflows.
The foregoing was made possible thanks to the issue of maturity funds, the various editions of which have been revised from time to time based on the relevant financial markets. This approach has made it possible to provide customers with new solutions, capable of differentiating the portfolio composition and of distributing a coupon flow.

47R e p o r t o n o p e r a t i o n s o f t h e B P M G r o u p
Small Businesses
In 2014, the Bank continued its efforts to support the development of and access to credit by small firms (sales of less than Euro 15 million), in order to support those in difficulty because of the ongoing economic crisis, via: the “business recovery” initiative, which finances projects and initiatives aimed at helping with the recovery of small and medium-
sized businesses through loans to provide liquidity and capital and to provide working capital financing to meet tax deadlines falling due during the year and to facilitate investments and internationalisation. In particular, as far as working capital financing is concerned, a loan is available for the reduction of payment terms, targeted at all those companies that have the need to make payments to their suppliers, in compliance with the limits imposed by Legislative Decree 192/2012;
specific agreements with local entities and associations for the financing of firms and the creation of conditions for the relaunch and development of their local economies; the availability of rotating funds for the granting of loans at assisted rates to the members of Confindustria Alessandria, Como, Legnano, Bologna and Confartigianato Lombardia; these agreements also envisage the issue, for private retail customers, of territorial bonds at market rates, the proceeds of which are used in the territory in question to finance on favourable terms the internationalisation of firms;
a facility of 300 million euro for female entrepreneurs, that is, for companies run by women that want to invest, set up a new company or obtain help for recovery. The initiative forms part of the Memorandum of Understanding signed by ABI, the Department for Equal Opportunities of the Presidency of the Council of Ministers and by Trade Associations;
a facility and moratoria dedicated to specific territories hit by adverse weather, which was recently the case for the following regions: Puglia, Liguria, Piemonte, Toscana and Emilia Romagna;
the possibility to also suspend, with the consent of the Bank, loans to companies that do not meet the requirements for access to moratoria provided for by law;
other initiatives relating to the activation of awareness campaigns concerning Microcredito FEI, with about 300 transactions already completed, the launch of the Microcredito FEI Under 35 initiative in support of new businesses started in the municipality of Milan, the launch of the Lombardia Concreta initiative and, in the near future, the launch of Plafond Rosa to assist female entrepreneurs, as well as the continued promotion of a facility for the purchase of operating assets under the new “Sabatini” law;
the use of EIB funds for unsecured loans with a duration of up to 10 years and an initiative in conjunction with CDP for the use of an operating assets facility for the provision of interest grants by the Ministry of Economic Development.
With regard to payment systems for small businesses, two further services are available: MyBank and CBILL. In detail: MyBank is a new payment instrument for use in the world of e-commerce, a pan-European project promoted by Eba Clearing,
which our Bank has signed up for in collaboration with ICBPI – Istituto Centrale Banche Popolari Italiane. The service is an internet payment system that provides an alternative to the use of a credit card or PayPal and is particularly appealing to customers who are reluctant to use their credit cards online.
• CBILL is an instrument designed for use on the CBI circuit; it consists of a new e-billing service that allows BPM Banking and Corporate Banking users to consult and pay “bills” (documents that notify an individual or a business of the amount due for a service provided or for an administrative obligation) issued by CBI Billers.
Lastly, with regard to the new current accounts designed for different customer segments, such as for the Individuals and the small businesses segments, work began in early 2014 to promote New welcome accounts with promotional terms designed to attract new customers. As regards the Bpm4u line, a new account is being offered that is dedicated to employees of SMEs that are BPM customers and that has been extended to pensioners and to Bpm early retirees and their family members.
Private banking
Faced with generally positive market conditions, private banking also involved constant attention to customer relations in 2014.
BPM’s private banking organisation comprises 10 private banking branches and 13 offices that are mostly located in the Group’s long established territories of central-northern Italy. Two new bankers have recently joined the network’s 69 active operators, thus achieving the expansion envisaged in the Business Plan.
Product diversification continued throughout the period, thus making new investment solutions available to private customers; in

48 R e p o r t o n o p e r a t i o n s o f t h e B P M G r o u p
particular, Anima has broadened the range of fixed-term bond funds, as well as the Open range. In addition, a multi-brand range has also been developed following the signature of new distribution agreements with leading international asset management companies, while the savings products administered have been diversified via the offer of certificates that guarantee and protect the initial capital.
As regards Banca Akros’s private banking business – focused on a select clientele in the high net-worth segment – in 2014 the Bank continued its development of specialized services in the field of asset management by leveraging recognised customisation features of the service, in a context of “open architecture”, and in the administration, collection and execution of orders on domestic and international markets.
Multi-channel banking
As envisaged by the Business Plan, WeBank was merged into Banca Popolare di Milano on 23 November 2014. One of the main objectives of the merger was to integrate online services, linked to a recognised brand with high market positioning, into Banca Popolare di Milano’s product range. There are numerous ongoing projects being designed to create new synergies between the range of products and services offered by WeBank and by BPM’s physical network. In this regard, all steps have been taken to ensure there will be a successful migration without impacting customers, who will be able to continue using their credit, debit and prepaid cards without having to physically replace them.
The transaction has made it possible to provide customers with a wider range of asset management products, financial advice and online services.
Thanks to the WeBank brand, the online channel will continue to strengthen its positioning among the leading players with a distinctive strategy aimed at attracting digital customers throughout the country. WeBank has become a part of Banca Popolare di Milano and has added more than 150,000 customers to the customer base. The development of the home mortgage loans business for private customers will continue through the direct channel and portals specialised in online brokerage and in offering distinctive products with an all inclusive interest rate, focusing on customer service excellence.
Companies
The new corporate model was completed in 2014, with the progressive strengthening of the segment in terms of human resources and the quality of its operational processes.
The work performed during the first part of 2014 was essential in order to maximise the effectiveness of the organisational and commercial innovations introduced during 2013, particularly with regard to the reorganisation of the network, the modification of the segmentation rules and the strengthening of the central functions responsible for supporting the sales force.
The following actions were taken from the start of 2014 in support of business development: assistance with internationalisation for companies with the potential to grow abroad; identification of high-potential “deserving” customers to be assisted with customised loan pricing or accelerated approval
procedures; lending proposals designed to meet periodic liquidity requirements (campaigns to assist the payment of 13th/14th month salaries
and business taxes); creation of an ad hoc service model for property sector customers, with dedicated relationship managers operating under
central guidance; improved communications between the centre and the network and enhanced commercial supervision via specific reports
and meetings.

49R e p o r t o n o p e r a t i o n s o f t h e B P M G r o u p
As envisaged by the Business Plan, in the second half of 2014 steps were taken to implement measures that will be completed in 2015, the benefits of which will be felt in full: the strengthening of the territorial sales force in areas with a greater number of companies to be developed and acquired; the integration and completion of the product range, focusing on subsidised finance, on medium / long term technical forms and
on advances against receivables due from the tax authorities and the public administration; the strengthening of the approach to budgeting with the identification of customers with high potential on which the growth of the
segment should be focused, with closer ties between commercial and lending policies.
A study has commenced of a series of innovations in terms of service models designed to develop the efficiency and effectiveness of the Corporate business.
This business is strongly influenced by market dynamics, by the wide availability of liquidity and by a stagnant demand for credit. In such a complex market, the Corporate segment has handled customer approach strategy by means of strong centralised direction and management, defining, as part of the commercial initiatives, dedicated pricing and faster approval procedures for certain types of product, giving priority to companies with profiles that comply with lending policy. By leveraging the specialist skills of the central units, the segment has assisted customers with sophisticated financing needs (in particular, the management of structured finance transactions, hedging interest rate and foreign exchange risk and foreign transactions) and customers that were showing the first signs of a low credit rating for which a solution was promptly identified to avert a potential crisis.
Treasury & Investment Banking
The Group’s liquidity position remained strong throughout 2014, while the portfolio of Italian government securities remained stable, ensuring a significant contribution to the interest margin. The marginal increase in the duration of the financial portfolio, consisting mainly of Italian government securities, contributed to the increase in gains on asset disposals in the year as well as the absolute level of positive reserves relating to the AFS portfolio.
Work continued in the field of asset and liability management (ALM) to monitor the interest rate risk of the banking book and to oversee liquidity risk. In particular, further improvement in the perception of the Italian banking sector by institutional investors made it easier for the Parent Company to issue Euro 500 million of 5-year senior debt under an EMTN programme at the beginning of the year; in addition, the increase in share capital by Euro 500 million was completed successfully in May.
The liquidity of the Bank and the Group has made it possible to steadily repay the LTROs to the European Central Bank (ECB), thus reducing the related exposure thereto. The Bank has also made early repayment of a billion euro of the issue, which was guaranteed by the Italian Ministry of Economy and Finance (MEF), used as collateral for refinancing operations with the ECB. In September structuring was completed for a SME securitisation. This transaction involved the sale without recourse to the special purpose entity BPM Securitisation 3 of a loan portfolio totalling Euro 864 million, relating to commercial mortgage loans secured by a first rank mortgage and unsecured loans granted by the Parent Company. The portfolio sold provides for a class of senior securities of Euro 573 million with an A2/AA rating (Moody’s/DBRS) and a class of unrated junior securities of Euro 304 million. Both issues have been fully underwritten by the Bank and used as collateral for refinancing operations with the ECB.Lastly, as part of a measure aimed at supporting Italian companies, in December the Group participated in the targeted LTRO to the sum of 1.5 billion euro.
With regard to Banca Akros, activities during 2014, which focused on the development of services and products for customers as well as on monitoring the chosen market segments and the related market shares, ensured, in a context of constant control over the risks taken on, the achievement of favourable earnings and confirmed the adequacy of capital ratios and liquidity levels.Over-the-counter market making in government securities and corporate bonds continues to be an important activity, with around 41 billion euro of securities traded, in equity derivatives. The proprietary bond book is still mainly represented by Italian government bonds and senior bonds issued by leading domestic banks; the balance at the end of the year was slightly higher than at 31.12.2013 (+15%). Implementation of the project involving joint coverage with the Parent Company of the Corporate & Investment Banking business for Corporate customers continued in accordance with the guidelines of the Group’s Business Plan, giving particular attention to the specific target represented by the Mid Corporate segment operating in the territory where the Group has its roots; the Bank also has significant operations on behalf of companies and institutional

50 R e p o r t o n o p e r a t i o n s o f t h e B P M G r o u p
counterparties in hedging instruments for interest risk (with notional trading volumes of more than 40 billion euro) and exchange risk (88 billion euro) and in commodities.
In its brokerage activity on financial markets – based on Assosim figures – the Bank has consolidated its presence in bond markets: having achieved 3rd place in the DomesticMOT segment and 2nd place in Borsa Italiana’s EuroMOT segment (with a market share of 13.9% and 20.7%, respectively), 2nd place in the EuroTLX market (with a market share of 17.1%) and 1st place in the Hi-MTF market (with a market share of 30.9%), facilitated, in part, by SABE, the proprietary system that automatically seeks dynamic best execution; it achieved 4th place in Borsa Italiana’s Screen-Based Equities Market (MTA), with a market share of 8.1%; it achieved 2nd place in options on the FTSE MIB index and 1st place in Borsa Italiana’s IDEX market for electricity derivatives.
Customers are offered brokerage services on stock markets through ESN – European Securities Network, the European partnership in equities research and trading set up by Banca Akros with eight other European investment banks which are independent and active on their respective national stock markets; note that in a survey published in July, EXTEL-Thomson Reuters said that ESN had the best quality roadshow in southern Europe due, in particular, to the contribution made by Banca Akros in Italy.In the Equity Capital Market Banca Akros assisted the Parent Company, in the role of Joint Global Coordinator, not as an underwriter, in the increase in capital for a total of 500 million euro successfully completed in May and took part, as an underwriter, in the capital increases of Banco Popolare, Banca Monte dei Paschi di Siena, Banca Carige, Credito Valtellinese and Cattolica Assicurazioni, and, as Co-Bookrunner, in that of Banca Popolare di Sondrio. The bank also participated, as underwriter and placement agent, in the initial public offerings for the listing of Cerved S.p.A., FinecoBank S.p.A., Fincantieri S.p.A., Rai Way S.p.A. and Anima Holding S.p.A.; for the latter, the Bank also acted as Co-Lead Manager in its institutional placement. Banca Akros also assisted Notorious Pictures S.p.A. in its listing on Borsa Italiana’s AIM market, acting as Nominated Advisor, Global Coordinator and Specialist.In the Debt Capital Market, the Bank participated as the only Italian bank in the Management Group and with the role of Lead Manager and Bookrunner, for the institutional issue of a fixed-rate five-year senior bond by the Parent Company, which was successfully placed in January for an amount of 500 million euro, as well as for the placement of various issues of leading international institutional issuers, including one by the European Investment Bank (EIB) in which it acted as Joint-Lead Manager and Bookrunner; the Bank also took part as Co-Lead Manager in the placement of a ten-year senior bond issued by SIAS S.p.A. for an amount of Euro 500 million. With a view to supporting deposit taking from SMEs, note that a role was taken as arranger in relation to the issue of mini-bonds.In the advisory business, Banca Akros acted as financial advisor and intermediary responsible for coordinating the collection of acceptances in the takeover bid for Meridiana S.p.A. and as intermediary responsible for coordinating the collection of acceptances in the takeover bids for Aeroporto di Firenze S.p.A., Società Aeroporto Toscano (S.A.T.) Galileo Galilei S.p.A. and Bonifiche Ferraresi S.p.A.

51R e p o r t o n o p e r a t i o n s o f t h e B P M G r o u p
Corporate Centre
Information Technology
IT activities in 2014 were mainly dedicated to developing solutions in support of the Business Plan. More specifically, the principal initiatives covered the following areas:
BusinessProject Hub & Spoke was completed in the first half of 2014. Its objective was to take account of the evolution of the commercial model for 2014, by primarily reflecting changes in current micro markets, the creation of new ones and the addition to a number of micro markets of independent branches known as Spokes. Work was also completed on BPM Next with the finalisation of the online sales project (AOL).
Other ongoing projects at the end of 2014 relate to: Network Infrastructure Development, with activation of the following modules: Other Accounts, CRM updates, Contract
updates with appropriate checks, Credit Cards and Securities Deposit; Offers to Individuals, with the release of the new International Debit Card, the B1 Card C-Less, BPM Masterpass and the
activation of the AC Milan official ticket office; Offers to Companies, with the full network roll out of the “Customer Sheet”; work on the Price Lab project, with conclusion of the assessment phase as start of the development phase; the Wealth Management Offers project, with a view to guaranteeing the evolution of the “4S” platform via the launch of such
important products as Luxe Policies and Securities Lending; the Contact Centre project that was designed to innovate the current Customer Center and to keep customers aware of the
continued development of the multi-channel services offered by Bipiemme Group.
Lastly, as regards “Multi-channel” banking, work has started with the objective of strengthening the Group’s multi-channel platform by activating advanced processes for online sales of products, thus optimising the customer’s web and mobile experience and developing an advanced multi-channel CRM to support the overall service model.
Commercial efficiencyIn 2014 the following were completed: project “Merger and Integration of WeBank” within BPM with a view to maintaining intact all the functions and products
offered by Webank, the same account structure for established Webank clientele, two different websites (Webank and BPM banking) and the technological infrastructure and software used by Webank, thus guaranteeing «zero impact» on the services provided to customers;
project “2014 Branch Closures” that saw the amalgamation of a further 14 BPM branches in December 2014 in addition to 50 that had previously been amalgamated in June 2014.
Technological InfrastructureIn 2014 the following were completed: phase 3 of the ATM project, with the replacement of a further 125 machines; project Private Cloud; a study relating to an “Infrastructure Review” of Bipiemme Group with a view to the consolidation of the WeBank and Akros
environments.Work is still in progress on the Automation and Monitoring and Mailing projects as part of the spending review initiative and on the “Performance Optimisation” project in conjunction with Application development.
Risk governanceIn relation thereto, 2014 saw the completion of: the “Basel 3 – LCR” project to bring the method of calculating liquidity and capital leverage indicators into line with the new Basel
3 regulatory provisions. Reports using the new LCR risk indicator are now ready, together with the individual reports from B3PRO; regarding “Information Security”, work was completed on project “Privacy Protection” to comply with rules on “Tracing of
bank transactions”.
52 R e p o r t o n o p e r a t i o n s o f t h e B P M G r o u p
Work has continued – among others – on projects to support corporate customer credit management and monitoring, on the project concerning the New Electronic Credit Line Dossier that will govern the process of granting credit to corporate customers and on the “Basel 3 – DWH Liquidity” project.
Human ResourcesWork has continued on the “New Personnel Information System” with the release of the latest updates and the definition of the process for implementing the application, as well as on the Internal Communications project, with the launch of the new corporate intranet and community for promoting employee involvement.
Regulatory ComplianceWork has been completed on the AQR – Asset Quality Review initiated by the European Central Bank together with the national Supervisory Bodies, involving a Comprehensive Assessment (CA) prior to the start of the Single Supervisory Mechanism (SSM). Work has continued on the “Anti-Money Laundering” and “Transparency and Usury” project and on the “FATCA (Foreign Account Tax Compliance Act)” project with the objective of rendering Bipiemme Group compliant with the US tax authorities’ FATCA regulations concerning US customers that directly or indirectly hold financial accounts with financial intermediaries.
Organisation
Work performed in 2014 was focused on an organisational review of the Bank with a view to improved efficiency, taking account of the merger by absorption of WeBank into BPM in the latter part of the year; in particular, this involved the following: Reassignment of the Internal Audit Function, which previously reported to the Managing Director, under the responsibility of the
Management Board, as required by the new Supervisory regulations; Activation of a “Human Resources Monitoring and Reporting” OU that reports directly to the Head of Human Resources, with the
task of performing all monitoring and reporting activities of a management control nature regarding the entire Human Resources function at Group level;
Reorganisation of the Marketing function, which reports to the Chief Commercial Officer, with the objective of applying end-to-end logic for work distribution, of reducing the fragmentation of organisational units and of increasing the integration of various areas of activity;
Reorganisation of the Retail function, which reports to the Chief Commercial Officer, with the objective of strengthening the oversight and commercial development of various customer segments, through the creation of new Micromarkets, by making changes to certain criteria for the segmentation and portfoliation of customers and by the introduction to a number of micro markets of independent branches to improve the monitoring of corporate customers.
Risk Management
During the year the Risk Management function was involved in a series of activities aimed, on one hand, at compliance with Supervisory Regulations (i.e. Circ. 263/06 – 15th update) and, on the other hand, at the conduct of the ECB Comprehensive Assessment as part of the Single Supervisory Mechanism (SSM) that was completed in the 4th quarter. In connection with the monitoring and control of risks, a summary is provided below of the main activities performed by the Risk Management function in 2014, split by organisational unit.
Risk Monitoring and ReportingWith the definition of the Risk Appetite Framework, the second phase of the Risk Governance project has been concluded. The objective thereof was to equip the Bank with a Risk Appetite Framework that complies with the new Supervisory Instructions and to render it fully operational throughout the Group via integration with the business model, the strategic plan, the ICAAP (Internal Capital Adequacy Assessment Process), the budget and the overall internal control system.During the year, work was also completed on the consolidation of reporting on the Group’s risk exposures, thus ensuring greater integration and consistency with the Risk Appetite Framework and related regulations, as well as with a view to benchmarking banks subjected to the Single Supervisory Mechanism (SSM). The reports are read and discussed by the Group’s Risk Committee each month and by the Management and Supervisory Boards each quarter.
53R e p o r t o n o p e r a t i o n s o f t h e B P M G r o u p
Operational RiskSupport for network and central teams has continued with regard to the recognition of operational losses, with classroom training on the subject of operational risk and a particular focus on the process of Loss Data Collection and the related tools used.During the year, work started and was completed on Project “Reputational Risk”, which envisaged the definition of a framework at Group level comprising methodological and process aspects as well as the holding of the first cycle of workshops, during which qualitative assessments of risk scenarios were performed by Reputational Risk Owners. The results of the assessments were reported to Bank management.With respect to Project Risk Self Assessment (RSA), work was completed on the implementation of the new RSA framework relating to the methodological and process configuration. The framework will enable the implementation of the Scenario Analysis model planned for 2015. Moreover, the first cycle of RSA was performed in compliance with the new framework, which saw the involvement of Assessors identified at Group level and the results were then presented to Bank management.As part of the strategic management of insurance cover, work was completed on the selection of insurance partners and a new Fine Art policy was taken out, while work is still ongoing on the renewal of various insurance coverages. The new regulatory framework has been prepared and published. This defines the processes and methodologies for operational risk management at Group level and for which it is planned that a second update will be made in 2015 to take account of changes made to the operational risk model and to comply with new regulations.
Credit RiskDuring the year work continued on the AIRB (Advanced Internal Rating Based) project aimed at the revision of the Internal Rating System (IRS), also in view of validation by the ECB. The first phase of the update to the financial statement scorecard, which is used in the currently implemented IRS, has been completed for all internal rating segments, while revisions of the PD modules and LGD models are still ongoing. Particular attention was paid to the identification of specialised lending relationships for which it is envisaged that ad hoc treatment will be accorded at the rating estimation/allocation stage.
As regards the update to the calculation methodology used for collective assessment (IBNR), work was completed on the definition of internal estimates of the Loss Confirmation Period (LCP) and the recalibration of PD and LGD. Furthermore, in line with the strengthening of the supervision of the quality of information on credit risk, the initial design phase has been completed for Credit Risk Mitigation tools and work has also been completed on related updates to internal regulations.
Checks have been implemented to ensure that the monitoring of credit exposures is performed properly and it is planned that, in the first quarter subject to review (June – September 2014), discussions will be held with the Lending Department on the positions subjected to review and the main findings will be reported to the Credit and Loans Committee.
Market & Liquidity RiskIn the context of the new regulations on the prudential supervision of banks (Basel 3) and, in particular, with reference to the new liquidity indicators, a Group-level project has resulted in the calculation and communication of the LCR (Liquidity Coverage Ratio) and the NSFR (Net Stable Funding Ratio) via the system of supervisory reporting. This will help to rationalise the approach taken to the collection and use of information, making it more efficient for operational purposes. In this regard, the project also envisages the creation of a daily datawarehouse for liquidity risk management.
Work has also commenced on the amendment of the Liquidity Policy, in order to reflect organisational changes at Group level, the amendments made to the process of approving the Funding Plan, and the changes resulting from the adoption of the Risk Appetite Framework.
In the second half of the year, work was completed on the preparation of the regulatory framework, which defines the processes and methodologies for financial risk management (liquidity risk, market risk, counterparty risk and banking book related interest rate risk).
ValidationThe internal validation of the risk measurement methodologies used for internal and external reporting purposes has continued. The main results of the checks have been communicated to the corporate bodies in order to allow full assessment of the risks

54 R e p o r t o n o p e r a t i o n s o f t h e B P M G r o u p
accepted. Furthermore, as part of the AIRB project, checks commenced to support the request for the recognition for prudential purposes of the internal models for credit risk.
Audit and Compliance
AuditThe Internal Audit Function supervised the system of controls in 2014, using a methodology based on risk assessment and process evaluation that is aligned with sector best practices. The following activities were completed for the Parent Company and Group companies: 86 compliance audits of processes in accordance with the Audit Plan prepared at the start of the year; 35 extraordinary unplanned audits (on targeted processes or checks); 32 specific checks.
With regard to audit activities within the Commercial Network of BPM and at Banca Popolare di Mantova and ProFamily, 323 inspections were carried out during the period.
ComplianceIn the first few months of 2014, the Compliance function, as required by the latest regulatory updates, commenced a project – named ComplyMetodi – aimed at the adoption of risk based tools and methodologies that enable a structured analysis to be performed of non-compliance risks to which the Bank is exposed. The project made it possible to meet the regulatory requirements by the end of the first half of 2014, with the preparation of a complete mapping of the compliance risks and the development of a work plan for the function.Moreover, work started on the development of a specific IT tool to manage traditional advisory work (issue of opinions, guidance, etc.) and ordinary assurance work (assessments and tests of compliance); in addition to the foregoing, a review was performed of regulatory areas that could be monitored in conjunction with other Organisational Units, that is, “Specialist controls”.For the sake of greater coordination at Group level, in 2014 the Compliance function extended to the equivalent functions in the subsidiaries the same risk based methodology adopted by the Parent Company. The subsidiaries were provided with the support and the guidelines needed for the identification of the regulatory areas that impact their businesses, as well as the tools and the assessment metrics to be used, in close alignment with BPM, for the measurement of overall non-compliance risk. In particular, all the subsidiaries within the scope (WeBank, Akros and ProFamily) have prepared a mapping of the compliance risks relating to relevant regulations that takes account of their own business models.
In particular, a joint compliance review was performed by the Compliance functions of WeBank and BPM, prior to the merger by absorption – that took place on 23 November 2014 – of the subsidiary WeBank into the Parent Company, with the aim of maintaining the compliance of the organisational processes and the IT procedures.
Lastly, in 2014 customer complaints exceeded those received in the previous year, in line, unfortunately, with the environment within the entire banking system, particularly in the areas of accounts and services, credit and savings.

55R e p o r t o n o p e r a t i o n s o f t h e B P M G r o u p
Distribution network and human resources
Distribution network
At 31 December 2014, the Bipiemme Group’s distribution network consisted of 654 retail branches (including the two virtual branches of the online bank), of which 104 are hubs; there are also 15 Corporate Banking Centres and 12 Private Banking Centres (of which 10 relate to Banca Popolare di Milano and 2 to Banca Akros). During 2014, in line with the objectives to strengthen the territorial presence and to optimise and improve the efficiency of the physical network to make it more flexible and sales-oriented, Bipiemme Group closed 62 BPM branches, 3 corporate banking centres and 6 private banking centres, while 1 point of sale was added to the ProFamily network, resulting in an overall decrease of 70 points of sale compared with the end of 2013. Furthermore, in order to improve the quality of customer service delivery and to broaden the base of operations and the workload, 9 branches, of which 1 was a branch of Banca Popolare di Mantova, were transferred to nearby areas.The consumer credit company ProFamily, which in late 2013 completed the reorganisation of its network with the aim of developing synergies with the Parent Company, consists of a distribution network of 25 points of sale made up of direct branches and financial shops.
Distribution network 31.12.2014 31.12.2013 Change
A B A – B
Total branches 654 716 –62Corporate Banking Centres(1) 15 18 –3Private Banking Centres (2) 12 18 –6Financial shops and direct branches (3) 25 24 1Total distribution network 706 776 –70
(1) The Corporate Banking Centres handle the following types of customer: Large Corporate (turnover in excess of 250 million euro), Upper Corporate (turnover between 50 and 250 million euro) and Middle Corporate (turnover between 15 and 50 million euro).(2) The 12 Private Banking Centres, 10 belonging to Banca Popolare di Milano and 2 to Banca Akros.(3) The financial shops and direct branches provide financial advice and loans to households.
Branches of Group banks 31.12.2014 31.12.2013 Change
A % B A – B
Banca Popolare di Milano (1) 636 97.2% 698 –62Banca Popolare di Mantova 17 2.6% 17 0Banca Akros 1 0.2% 1 0Total branches 654 100% 716 –62
(1) The 2013 figures take account of the merger of WeBank with Banca Popolare di Milano that took place on 23 November 2014
Geographical distribution of branches 31.12.2014 31.12.2013 Change
A % B A – B
Lombardia 410 63% 450 –40Piemonte 87 13% 93 –6Lazio 64 10% 71 –7Puglia 36 6% 40 –4Emilia Romagna 28 4% 31 –3Other regions (1) 29 4% 31 –2Total branches 654 100% 716 –62
(1) other regions comprise the following branches: 11 (Liguria), 7 (Veneto), 5 (Toscana), 2 (Campania), 1 (Marche), 1 (Molise), 1 (Abruzzo) and 1 (F.V. Giulia)

56 R e p o r t o n o p e r a t i o n s o f t h e B P M G r o u p
The other distribution channels
The branch network, with its strong local roots, is being integrated more and more by the services offered by remote channels such as internet banking, the call centre and a network of financial advisors.
As regards the network of financial advisors, which is complementary to the traditional network and the main task of which is to place asset management and asset administration products, at 31 December 2014, BPM had 43 sole agents and Banca Akros 15.
The results from internet banking, in terms of distribution and utilisation of services by customers, continue to be highly satisfactory. In particular, at 31 December 2014 the Bipiemme Group has a total of 700,000 internet banking customers, comprising 592,433 individuals and 106,838 companies. This reflects a rise of 6.2% since the end of December 2013, represented by an additional 40 thousand individuals and roughly 1 thousand companies.
Lastly, the telephone banking service of the commercial banks of the Group had over 465 thousand customers at 31 December 2014 compared with 417 thousand at the end of December 2013; there is also a multilingual call centre to respond to the needs of foreign customers.

57R e p o r t o n o p e r a t i o n s o f t h e B P M G r o u p
Personnel
At 31 December 2014 Group personnel, including employees, project workers and staff on other types of contracts, amounted to 7,759, a decrease of 87 compared with the end of 2013. We would remind you that 6 December 2012 saw the signing of a framework agreement that envisages a voluntary retirement plan for those who are already or will become eligible for a pension, and/or who meet the conditions for access to the sector’s Solidarity Fund from the first quarter of 2013. Since the beginning of 2014, the total number of leavers under this incentive plan comes to 161 (including 49 at the end of December), bringing the total number of leavers since the start of the plan to 583.
Those who were employed in commercial network functions account for 68.3% of the total and those employed under a part-time contract account for 14%, while over 50% were female.
Personnel (number at year end) 31.12.2014 31.12.2013 Change A – B
A B amount %
a) managers 150 161 –11 –6.8
b) total officials 2,798 2,820 –22 –0.8
– of which: 3rd and 4th level 1,472 1,471 1 0.1
c) other employees 4,792 4,822 –30 –0.6
Total employees 7,740 7,803 –63 –0.8
Staff with project-related and other types of contract 19 43 –24 –55.8
Total personnel 7,759 7,846 –87 –1.1
Number of employees by company 31.12.2014A
31.12.2013B
Change (+/–) A–B
Banca Popolare di Milano (1) 7,253 7,308 –55
Banca Popolare di Mantova 70 69 1
Banca Akros 261 273 –12
ProFamily 102 98 4
Ge.Se.So 54 55 –1
Total employees 7,740 7,803 –63
Contract staff 19 43 –24
Total personnel 7,759 7,846 –87
of which total head office personnel 2,471 2,457 14
of which total network personnel 5,288 5,389 –101
(1) The 2013 figures take account of the merger of WeBank with Banca Popolare di Milano that took place on 23 November 2014
58 R e p o r t o n o p e r a t i o n s o f t h e B P M G r o u p
Human Resources
Management and training activities during 2014 focused on support for the projects that implement the strategic plan, and on consolidation of the commercial structure. As regards the Network, a new model has been introduced for the allocation of customer portfolios to relationship managers and at the same time work began on repositioning administrative branch personnel into more commercial roles as they were no longer needed due to the modernisation of IT procedures. Furthermore, it was decided where persons previously employed at branches that were closed in June would be reallocated to. These reorganisations and the updating of Network roles have meant that the personnel has had to come to terms with professional mobility; the need to update has been supported by appropriate training courses. The commitment to support the professional development of the personnel was also met by the hiring of young graduates for basic roles; a strong boost, again by means of the recruitment of new personnel, was given to the growth and modernisation of WeBank’s Customer Center, which was then transferred to Banca Popolare di Milano following the merger that took place in the second half of the year.Regarding the Head Office, the management of human resources was focused on supporting the reorganisation of central functions and on steps taken to comply with the observations made by the Bank of Italy, particularly the critical issues that were raised, such as a qualitative-quantitative upgrade of the control functions and the lending organisation. At the same time, action continued in order to partially cover needs generated by leavers accessing the solidarity fund.All these needs to increase the headcount in the head office and network structures and the number of voluntary redundancies combined with the trend in turnover have made it possible to recruit new staff to meet professional needs and to hire young people. Several main HR processes were reviewed, including recruitment, and guidelines were renewed for the personnel management policies to be adopted: together with Organisation, a project was launched to rebalance numerically the head office structures and it is planned that this will be developed further in 2015, ahead of a detailed survey of the actual skills available.
Personnel management
2014 was characterised by the need to apply new business models in the current economic and legislative environment. This ambitious objective was met by means of the professional development of our internal resources and by paying more attention to their skills and potential (supported by training) to enable them to perform the roles assigned thereto.The objective of adding value to the Group was aided by targeted recruitment so as to look to the future with confidence: 182 persons hired by the Group; of which, 162 by Bpm.
The proactive approach was reflected by the hiring of numerous young persons, for whom this was their first job, but also by the hiring of specialists with technical skills and courage, curiosity and expertise, as well as knowledge of the territory. These persons, due to their nature and age, are familiar with innovative processes and work tools.The strategy adopted will enable us to face up to the increasingly determined competition and to manage more skilfully and flexibly numerous technological innovations. In addition to improving internal processes and to rendering them more efficient, the foregoing has met the objective of implementing and strengthening the commercial network with specialists that are more orientated towards the market and the achievement of the Business Plan’s objectives. During the year, in order to improve the internal selection process, Bpm Job Posting was introduced, with this being an innovative process to consider candidates by enabling the Bank to identify those profiles that match the positions requested.

59R e p o r t o n o p e r a t i o n s o f t h e B P M G r o u p
Training and development
In the context of the new Business Plan, an intense programme of initiatives was implemented, aimed at Group personnel, to enable: the strengthening of the new culture based on performance and meritocracy by means of dedicated projects; the development and consolidation of skills, as well as the retraining of personnel in support of the Hub & Spoke model and
Multi-channel 2.0 customer services through the integration of WeBank and the strengthening of its Customer Center to serve BPM customers;
the effective and efficient monitoring of credit quality; the implementation of the new Small Businesses service model; the full implementation of organisational simplification.
TrainingThe 2014 Training Plan was developed in line with the prior year plan that was prepared for a two year period and which took account of the training objectives arising from the projects included in the new “Strong and sustainable growth” Business Plan to support: the recruitment envisaged during the Plan period by means of dedicated training; the operational dynamics associated with the planned departures involving access to the Solidarity Fund, involving the provision
of training to those taking over the vacated positions; the strengthening of the technical-professional and managerial skills required for roles within the branch network; the integration of WeBank through change management dedicated to the players involved; the qualitative strengthening of skills with the Lending and Corporate organisations; the development of training for the new positions of Corporate Premium Portfolio Manager, Company Specialists and District
Loan Analysts as envisaged by the new Small Businesses service model; the monitoring of compliance and, in general, the governance of risk by persons employed within the network and in central
functions.
The course content and the identification of training areas (Regulatory/Controls, Technical, Sales/Relationship and Management) have been agreed with the Market Function functions in terms of subject matter and priorities.
Induction programmes were implemented for those staff moved to the individual and company segments following the departure of personnel accessing the Solidarity Fund, or to meet the needs of the commercial network.
Again in 2014, risk management was a key topic and training thereon has contributed to the dissemination of an approach that is more focused on controls, not merely as a formal requirement but rather as a fundamental element in the prevention of and safeguarding against risk.
It is worth noting the management initiatives that accompanied the commercial network management roles and the central functions at Group level: “Training for Hub and Branch Managers”, with the objective of constructing an identity for and awareness of the role; the completion of training on “Building Managerial Excellence” to accompany during this period of change the Heads of the
Central and Commercial Functions who report directly to first-line management and the extension thereof to all members of head office management in order to build a motivated management team that is able to work in an integrated manner;
the start of a management training course entitled “Authors of the future” for Popolare di Mantova branch managers.
The Lending and Corporate structures took part in a dedicated training course aimed at developing the typical skills needed for the roles therein. Ad hoc training made it possible to build a common vision oriented towards commercial targets and risk monitoring.
The strengthening of lending skills to support the development of the lending business was also done by means of training initiatives for Corporate Premium Portfolio Managers that will also continue in 2015.In line with prior years, the Training Plan was financed by the Bank and Insurance Fund.
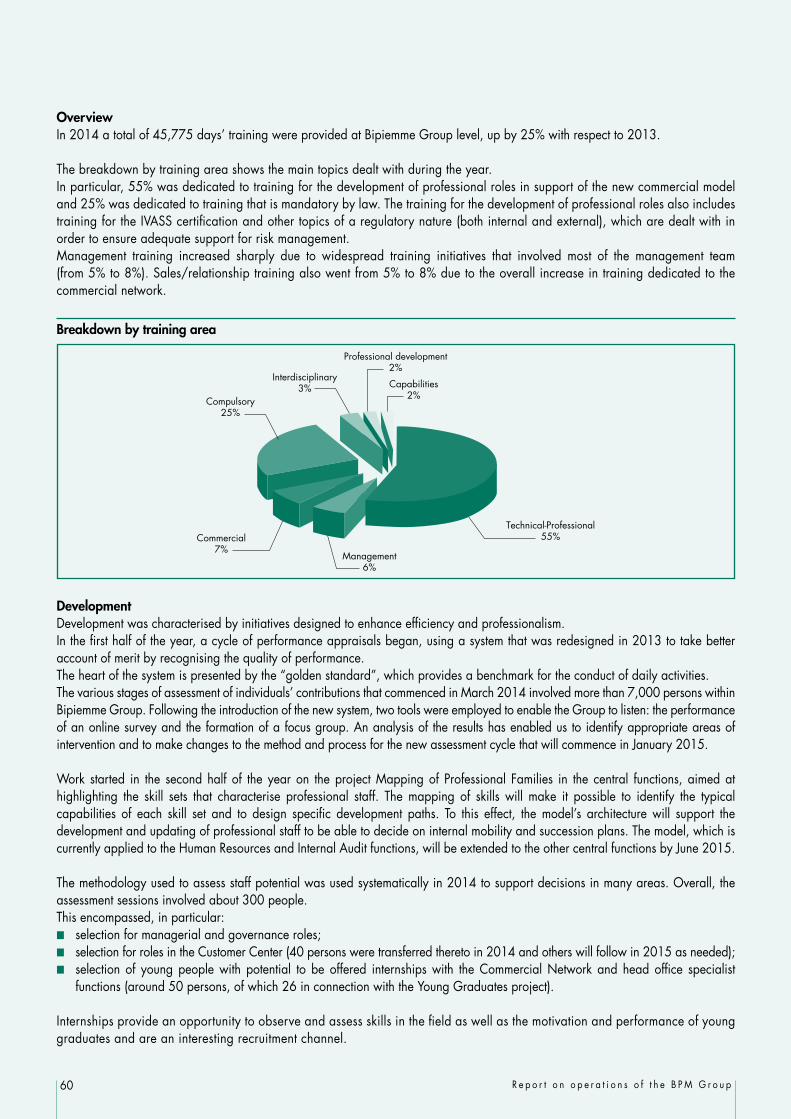
60 R e p o r t o n o p e r a t i o n s o f t h e B P M G r o u p
Overview In 2014 a total of 45,775 days’ training were provided at Bipiemme Group level, up by 25% with respect to 2013.
The breakdown by training area shows the main topics dealt with during the year. In particular, 55% was dedicated to training for the development of professional roles in support of the new commercial model and 25% was dedicated to training that is mandatory by law. The training for the development of professional roles also includes training for the IVASS certification and other topics of a regulatory nature (both internal and external), which are dealt with in order to ensure adequate support for risk management. Management training increased sharply due to widespread training initiatives that involved most of the management team (from 5% to 8%). Sales/relationship training also went from 5% to 8% due to the overall increase in training dedicated to the commercial network.
Breakdown by training area
Technical-Professional55%
Management6%
Commercial7%
Compulsory25%
Professional development2%
Capabilities2%
Interdisciplinary3%
Development Development was characterised by initiatives designed to enhance efficiency and professionalism.In the first half of the year, a cycle of performance appraisals began, using a system that was redesigned in 2013 to take better account of merit by recognising the quality of performance. The heart of the system is presented by the “golden standard”, which provides a benchmark for the conduct of daily activities.The various stages of assessment of individuals’ contributions that commenced in March 2014 involved more than 7,000 persons within Bipiemme Group. Following the introduction of the new system, two tools were employed to enable the Group to listen: the performance of an online survey and the formation of a focus group. An analysis of the results has enabled us to identify appropriate areas of intervention and to make changes to the method and process for the new assessment cycle that will commence in January 2015.
Work started in the second half of the year on the project Mapping of Professional Families in the central functions, aimed at highlighting the skill sets that characterise professional staff. The mapping of skills will make it possible to identify the typical capabilities of each skill set and to design specific development paths. To this effect, the model’s architecture will support the development and updating of professional staff to be able to decide on internal mobility and succession plans. The model, which is currently applied to the Human Resources and Internal Audit functions, will be extended to the other central functions by June 2015.
The methodology used to assess staff potential was used systematically in 2014 to support decisions in many areas. Overall, the assessment sessions involved about 300 people. This encompassed, in particular: selection for managerial and governance roles; selection for roles in the Customer Center (40 persons were transferred thereto in 2014 and others will follow in 2015 as needed); selection of young people with potential to be offered internships with the Commercial Network and head office specialist
functions (around 50 persons, of which 26 in connection with the Young Graduates project).
Internships provide an opportunity to observe and assess skills in the field as well as the motivation and performance of young graduates and are an interesting recruitment channel.

61R e p o r t o n o p e r a t i o n s o f t h e B P M G r o u p
Industrial relations
Within the Group, the first part of 2014 was dedicated to discussions with the trade unions in order to agree an industrial relations model based on the principle of participation and equal dignity, while recognising the respective roles and consequent responsibilities. The process led to the signature of agreements that regulate the rights that may be exercised by the trade unions, inclusive of time off for union duties (in the context of national agreements) and the rules for communications between trade unions and their members.
Moreover, the Bank has introduced, with the objective of the development of co-operative values, new rules for recreational and social activities, given the importance attached to them by regulations governing the sector and those approved by art. 11 of Law 300/70 (Workers’ Statute).
Industrial relations activity also focused on the provision of information and discussions designed to improve the functioning of the territorial network, via actions intended to promote the development of the Hub & Spoke model.Work also started on a contractual comparison for the performance assessment procedure (so-called Contribution Management System) and a new system of staff incentives, with a view, as was already the case last year, to reward the skills, level of responsibility and merit of employees and to bring the content of the remuneration policy into line with numerous legislative changes made as a result of new duties that have been assumed by the European Supervisory Authority (ECB).
Lastly, agreement was reached with regard to the FBA (Training Fund for the Banking and Insurance Industries), involving 4 projects, which, even as far as industrial relations are concerned, are designed to confirm the central nature of training as a tool for the enhancement, requalification and acquisition of skills needed to support the professional development of human resources.
In the second half of the year, discussions held with the trade unions led to the execution of the first agreement for the so-called “Company Social Bonus”. A portion of remuneration, justified by positive results of the business, will be used to support innovative forms of welfare that will be supplementary to traditional types of pensions and health care and which will provide for the supply of goods in kind, services, school fees and education costs, etc. This will be a pilot scheme of an experimental nature, but with the intention of having it confirmed for the future and with an expansion of its potential application.
A positive union agreement led to the transfer to Bpm of personnel that previously worked for WeBank Spa, as a result of the merger by absorption that took place on 23 November 2014: the agreements relating to the Company Social Bonus were extended, with a particular emphasis on health care and supplementary pensions, favouring their integration by the Group. With regard to the management of disciplinary measures, the Group – in terms of the number and type of cases in proportion to its size – is in line, as far as it is possible to obtain relevant data, with the main banking groups in the sector. As regards legal disputes with employees or former employees, note that the number of ongoing disputes, which was already relatively low at December 2013, has decreased further by around 40% as of December 2014, as a demonstration of how positively these delicate situations have been managed.Particular attention was paid in the latter part of 2014 and with the collaboration of various corporate functions, to the innovation of the financial conditions reserved for personnel to be submitted for agreement with the trade unions. These conditions had remained unchanged for some time and they were deemed worthy, despite already being more favourable than those granted to ordinary customers, of an attentive and rational revision and of being brought into line with the innovative channels used for cash management by employees and pensioners.

62 R e p o r t o n o p e r a t i o n s o f t h e B P M G r o u p
Remuneration policies
In 2014 Banca Popolare di Milano’s Human Resources function coordinated the Group’s personnel remuneration policies (Policy) as approved by the Bank’s corporate bodies. The Policy was drawn up in compliance with applicable regulations laid down by the Italian Supervisory Authority and it also took account of changes introduced by the new European regulations (CRD IV). In the implementation of the remuneration policies adopted, particular emphasis was placed on the following initiatives: the incentive scheme, which is designed for the further involvement of and profit-sharing by employees on having achieved or
exceeded company and Group targets, has been drawn up in compliance with the recommendations issued by the Italian and international supervisory authorities, bearing in mind the characteristics and peculiarities of each of the banks/companies that make up the Group as well as overall consistency at Group level in terms of rules and methods for its application;
the reward scheme, which forms part of the overall remuneration package, is designed to establish a consistent relationship between responsibility, professionalism, commitment and level of pay and comprises fixed remuneration (promotions/personalised) and variable remuneration (one-off bonus) components.
Furthermore, a Group plan has been set up with the aim of retaining resources that have key relationships with customers or that perform key roles within the organisation; the initiative was implemented after having reached agreement on an extension of the notice period and/or the period of non-competition. Moreover, having taken account of the achievement of a positive net result for 2013 and having verified that the conditions had been met for the payment of «a productivity bonus» (art. 48 of the national collective labour contract of 19 January 2012), an agreement was reached with the trade unions on the aforementioned «Company Social Bonus», linked, for the payment thereof, to the consolidated cost/income ratio as an indicator of productivity and efficiency of the business.
Welfare
The employees of the former Banca di Legnano joined the BPM welfare system with full effect in the first half of 2014, pursuant to the agreements signed in 2013. In particular, from 1 January 2014, the colleagues from the absorbed bank were able to join both the BPM Pension Fund and the Social Assistance Fund.
The position of the Bank’s internal pension funds was aligned with the requirements of the Supervisory Commission for Pension Funds (Covip), resulting in their addition to the related register.A Head of Funds has been appointed in accordance with the regulations in force.
As regards cultural and recreational activities, in 2014 work started on the implementation of measures defined between the Bank and the unions in an agreement dated 19 June 2014.In particular, efforts were made to update the corporate structure of Ares Bipiemme and on the completion of a service agreement that governs the reciprocal relationships between Ares and the Group; at the same time, agreement was reached on the company’s annual contribution towards social activities, while it was envisaged that two members of the Board of Directors of Ares shall be appointed by the Bank as a sign of the renewed, positive and mutual relationship between the two institutions.
The Welfare function had a fundamental role in the study and implementation of the project that led to an extension of the ways in which the Company Social Bonus could be used. This was done by studying the legislation applicable thereto and by designing an IT platform, which, by means of a dedicated portal, has facilitated a more efficient implementation thereof. The results obtained in the initial months of its implementation have confirmed the considerable success of the new forms of welfare proposed, a sign of the widespread appreciation shown by the personnel for new initiatives that are capable of meeting their needs, while, at the same time, taking advantage of opportunities from a point of view of tax and contributions and maximising the amount of financial resources allocated to the project.
Plans are in place to introduce a new and easier means of managing the consolidated initiative named “Children’s Christmas” by means of vouchers that may be ordered via a dedicated portal, aimed at personnel with children up to 12 years old.

63R e p o r t o n o p e r a t i o n s o f t h e B P M G r o u p
Preliminary work has been completed for company gymnasium facilities in the Viale Bezzi premises. Plans are for the facilities to be opened in the spring of 2015, once work has been completed on the organisation of the space required.
Other worthy initiatives included participation in the “Easy Work Day” promoted by the Municipality of Milan to test various forms of smart working, and participation in Diversità Lavoro, promoted by UNAR (National Office against Racial Discrimination), People, Fondazioni Sodalitas and Adecco to facilitate the employment of the disadvantaged by focusing on their talents and skills. BPM was given the Diversity&Inclusion Award in 2014.
Personnel management
During 2014 the personnel management system for BPM and the Group companies migrated to a new application. The gradual migration to the new personnel management platform transversely involved all of the Human Resource functions with support provided by the Organisation and IT functions.
The importance of the project was emphasised by it being awarded the “ICT innovation” prize at SMAU 2014. This recognition was awarded for the complexity and number of the technological and organisational changes that were needed.The process of change is not yet complete and will continue, presumably, in 2015.
In the second half of the year, an organisational review was conducted with the use of AVA methodology, which should provide a detailed indication of the potential for rationalisation and optimisation of the management function, also in light of the recent legislative changes introduced by the Jobs Act and by the application of the requirements of the so-called “Stability Law” that was approved in December 2014.

64 R e p o r t o n o p e r a t i o n s o f t h e B P M G r o u p
The Bipiemme Group’s scope of consolidation
Reference should be made to the section on accounting policies for the details of changes in the scope of consolidation. The following tables show the contribution made by each Group company to the formation of total assets and consolidated net income.
Contribution made by each Bipiemme Group company to consolidated total assets (Euro/000)Company % held
(*)Total assets Eliminations and
consolidation adjustments
Contribution to consolidated
total assets
% Contribution to consolidated
total assets
Parent Company:
Banca Popolare di Milano 45,219,179 –1,511,119 43,708,060 90.55
Companies consolidated line-by-line: 12,200,724 –7,636,973 4,563,751 9.45
Banca Akros 96.89 3,642,706 –843,395 2,799,311 5.80
ProFamily 100.00 922,107 –8,152 913,955 1.89
Banca Popolare di Mantova 62.62 542,349 –15,329 527,020 1.09
Bpm Securitisation 3 n.a. 888,560 –734,399 154,161 0.32
Bpm Covered Bond 80.00 5,409,801 –5,276,738 133,063 0.28
Bpm Securitisation 2 n.a. 420,974 –391,385 29,589 0.06
Bpm Capital I 100.00 189,532 –183,505 6,027 0.01
Ge.Se.So. 100.00 1,357 –817 540 0.00
Bpm Luxembourg 99.97 183,338 –183,253 85 0.00
Total 57,419,903 –9,148,092 48,271,811 100.00
(*) Based on equity ratios
Contribution made by the individual Group companies to consolidated net income (Euro/000)Company % held
(*)Net income (loss) as per
financial statements
Net income (loss)
pertaining to the Group
Consolidation adjustments
Contribution to consolidated net
income (loss)
% Contribution to consolidated
net income (loss)
Parent Company:
Banca Popolare di Milano 224,544 224,544 –11,230 213,314 91.83%
Companies consolidated line-by-line: 19,553 18,913 66 18,979 8.17%
Banca Akros 96.89 17,802 17,248 17,248 7.43%
ProFamily 100.00 2,770 2,770 66 2,836 1.22%
Banca Popolare di Mantova 62.62 229 143 143 0.06%
Ge.Se.So. 100.00 14 14 14 0.01%
Bpm Luxembourg 99.97 –233 –233 –233 –0.10%
Bpm Capital I 100.00 –1,029 –1,029 –1,029 –0.44%
Total 243,457 –11,164 232,293 100%
(*) Based on equity ratios

65R e p o r t o n o p e r a t i o n s o f t h e B P M G r o u p
Reconciliation of the Parent Company and consolidated net income (Euro/000)
Net income (loss) of Banca Popolare di Milano 224,544
Net income (loss) pertaining to companies consolidated line-by-line 18,913
Net income (loss) pertaining to companies consolidated at equity 22,856
Effect of reversing intraGroup dividends –9,974
Reversal of the writedowns/revaluations of consolidated investments made in BPM’s separate financial statements –18,387
Other adjustments –5,659
Net income (loss) of the Bipiemme Group 232,293
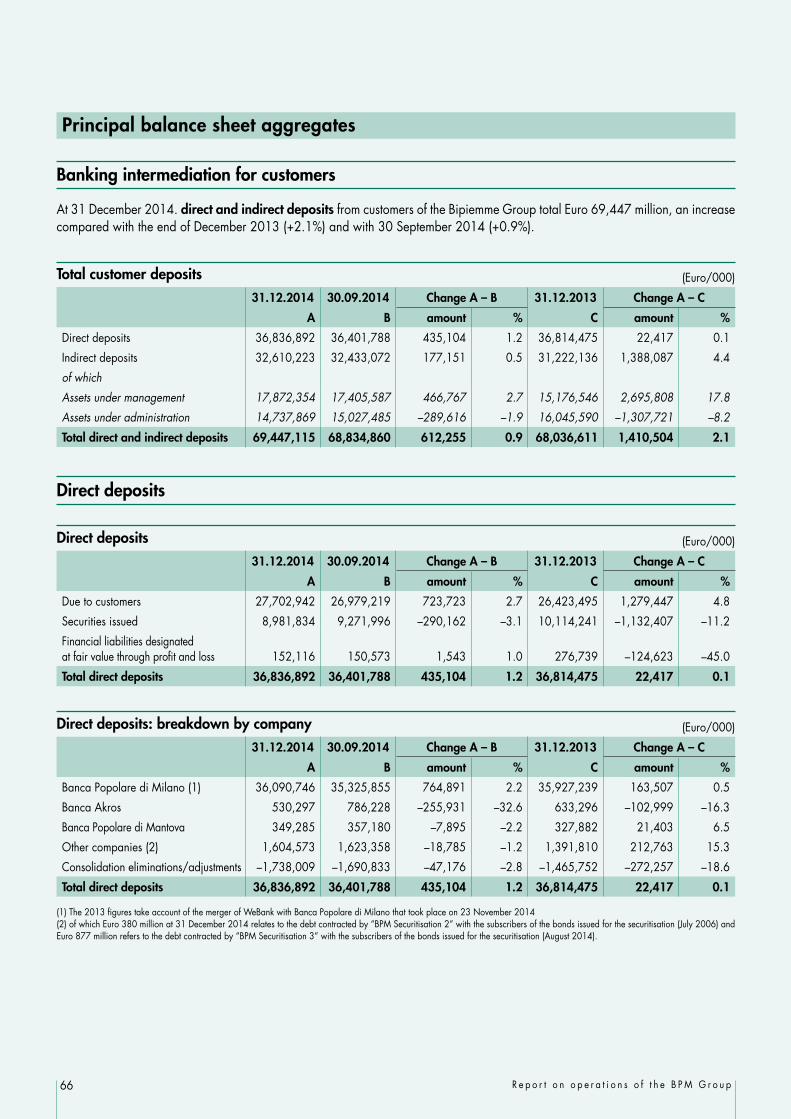
66 R e p o r t o n o p e r a t i o n s o f t h e B P M G r o u p
Principal balance sheet aggregates
Banking intermediation for customers
At 31 December 2014. direct and indirect deposits from customers of the Bipiemme Group total Euro 69,447 million, an increase compared with the end of December 2013 (+2.1%) and with 30 September 2014 (+0.9%).
Total customer deposits (Euro/000)
31.12.2014 30.09.2014 Change A – B 31.12.2013 Change A – C
A B amount % C amount %
Direct deposits 36,836,892 36,401,788 435,104 1.2 36,814,475 22,417 0.1
Indirect deposits 32,610,223 32,433,072 177,151 0.5 31,222,136 1,388,087 4.4
of which
Assets under management 17,872,354 17,405,587 466,767 2.7 15,176,546 2,695,808 17.8
Assets under administration 14,737,869 15,027,485 –289,616 –1.9 16,045,590 –1,307,721 –8.2
Total direct and indirect deposits 69,447,115 68,834,860 612,255 0.9 68,036,611 1,410,504 2.1
Direct deposits
Direct deposits (Euro/000)
31.12.2014 30.09.2014 Change A – B 31.12.2013 Change A – C
A B amount % C amount %
Due to customers 27,702,942 26,979,219 723,723 2.7 26,423,495 1,279,447 4.8
Securities issued 8,981,834 9,271,996 –290,162 –3.1 10,114,241 –1,132,407 –11.2
Financial liabilities designated at fair value through profit and loss 152,116 150,573 1,543 1.0 276,739 –124,623 –45.0
Total direct deposits 36,836,892 36,401,788 435,104 1.2 36,814,475 22,417 0.1
Direct deposits: breakdown by company (Euro/000)
31.12.2014 30.09.2014 Change A – B 31.12.2013 Change A – C
A B amount % C amount %
Banca Popolare di Milano (1) 36,090,746 35,325,855 764,891 2.2 35,927,239 163,507 0.5
Banca Akros 530,297 786,228 –255,931 –32.6 633,296 –102,999 –16.3
Banca Popolare di Mantova 349,285 357,180 –7,895 –2.2 327,882 21,403 6.5
Other companies (2) 1,604,573 1,623,358 –18,785 –1.2 1,391,810 212,763 15.3
Consolidation eliminations/adjustments –1,738,009 –1,690,833 –47,176 –2.8 –1,465,752 –272,257 –18.6
Total direct deposits 36,836,892 36,401,788 435,104 1.2 36,814,475 22,417 0.1
(1) The 2013 figures take account of the merger of WeBank with Banca Popolare di Milano that took place on 23 November 2014(2) of which Euro 380 million at 31 December 2014 relates to the debt contracted by “BPM Securitisation 2” with the subscribers of the bonds issued for the securitisation (July 2006) and Euro 877 million refers to the debt contracted by “BPM Securitisation 3” with the subscribers of the bonds issued for the securitisation (August 2014).

67R e p o r t o n o p e r a t i o n s o f t h e B P M G r o u p
Direct deposits: breakdown (Euro/000)
31.12.2014 30.09.2014 Change A – B 31.12.2013 Change A – C
A B amount % C amount %
Current and savings accounts 22,306,372 22,440,732 –134,360 –0.6 22,012,998 293,374 1.3Repurchase agreements 5,267,799 4,374,964 892,835 20.4 4,276,303 991,496 23.2Other types of deposit 128,771 163,523 –34,752 –21.3 134,194 –5,423 –4.0Due to customers 27,702,942 26,979,219 723,723 2.7 26,423,495 1,279,447 4.8Bonds and structured securities 6,554,710 6,757,700 –202,990 –3.0 7,248,782 –694,072 –9.6Subordinated liabilities 2,095,802 2,078,844 16,958 0.8 2,080,833 14,969 0.7Other types of deposit 331,322 435,452 –104,130 –23.9 784,626 –453,304 –57.8Securities issued 8,981,834 9,271,996 –290,162 –3.1 10,114,241 –1,132,407 –11.2
Financial liabilities designated at fair value through profit and loss 152,116 150,573 1,543 1.0 276,739 –124,623 –45.0
Total direct deposits 36,836,892 36,401,788 435,104 1.2 36,814,475 22,417 0.1
Total “direct deposits” – consisting of amounts due to customers. securities issued and financial liabilities designated at fair value through profit and loss – comes to Euro 36,837 million at 31 December 2014, up slightly on 31 December 2013 (+ Euro 22 million; +0.1%) and up by Euro 435 million (+1.2%) on the 30 September 2014 figure. The change in the year reflects an increase in amounts due to customers (+Euro 1,279 million; +4.8%) offset by a fall in securities issued (– Euro 1,132 million; –11.2%). As regards the change with respect to December 2013, please note the following: amounts due to customers have risen to Euro 27,703 million up by 4.8% (+ Euro 1,279 million). This change is attributable
to an increase in “repurchase agreements” of Euro 991 million (+ 23.2%), which reflects MTS Repo market transactions entered into with Cassa di Compensazione e Garanzia as central counterparty. There has also been an increase in “Current and savings accounts”, which rose by Euro 293.4 million (+1.3%) in the year. This balance includes current accounts and restricted deposits of ordinary customers, households and businesses, which form the core component of deposits;
securities issued amount to Euro 8,982 million, a decrease of 11.2% (– Euro 1,132 million). This reduction is attributable to the performance of both domestic deposits (– Euro 714 million) and institutional deposits (-Euro 419 million). The fall in domestic deposits is due to different choices having been made by subscribers of certificates of deposit and bonds that matured during the year and who reallocated their investments mainly towards asset management products.
The fall in institutional funding is due to the redemption in the first quarter of 2014 of an unsecured senior bond with a nominal value of Euro 900 million (net of repurchases), which was only partially refinanced by the issue of a bond with a nominal value of Euro 500 million;
the financial liabilities designated at fair value through profit and loss, represented by bonds placed with retail customers, total Euro 152 million, a decrease of 45% compared with the end of December 2013. This also reflects the different investment decisions made by holders of the bonds that matured and/or were repaid early.
Set out below is a breakdown of direct deposits by counterparty showing the split, in particular, between retail customer deposits and institutional customer deposits (inclusive of repos entered into with Cassa di Compensazione e Garanzia).
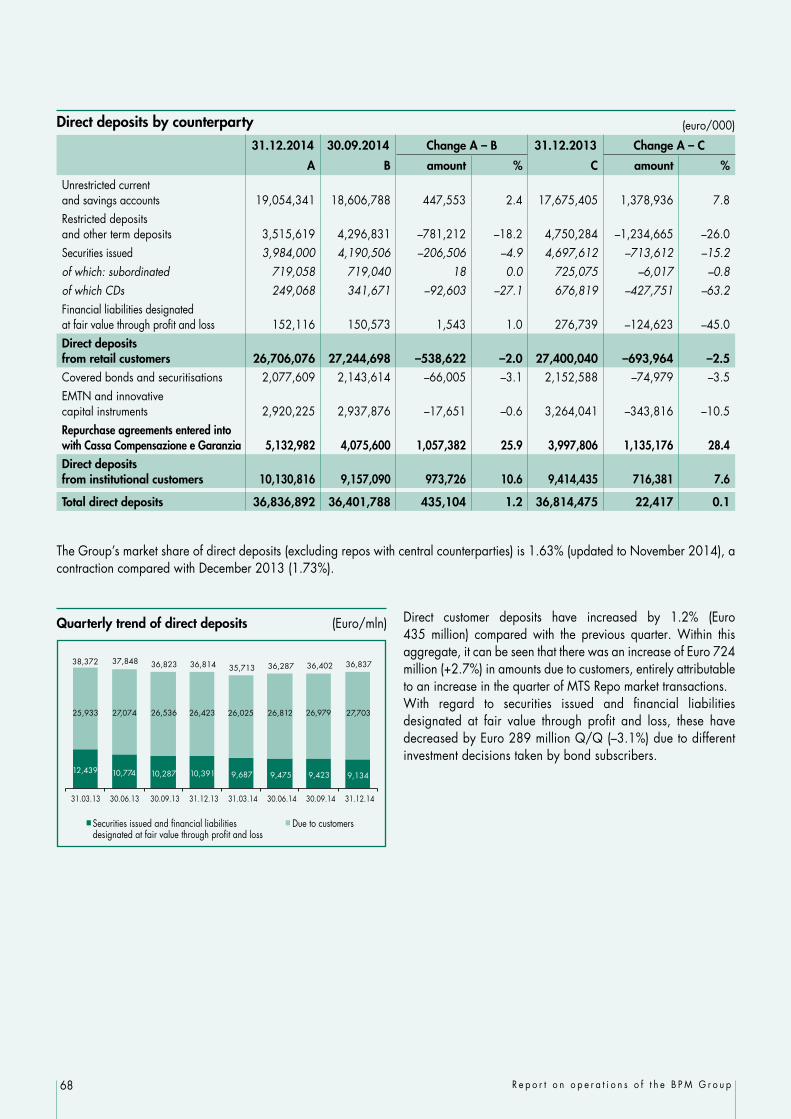
68 R e p o r t o n o p e r a t i o n s o f t h e B P M G r o u p
Direct deposits by counterparty (euro/000)
31.12.2014 30.09.2014 Change A – B 31.12.2013 Change A – C
A B amount % C amount %
Unrestricted current and savings accounts 19,054,341 18,606,788 447,553 2.4 17,675,405 1,378,936 7.8Restricted deposits and other term deposits 3,515,619 4,296,831 –781,212 –18.2 4,750,284 –1,234,665 –26.0Securities issued 3,984,000 4,190,506 –206,506 –4.9 4,697,612 –713,612 –15.2of which: subordinated 719,058 719,040 18 0.0 725,075 –6,017 –0.8of which CDs 249,068 341,671 –92,603 –27.1 676,819 –427,751 –63.2Financial liabilities designated at fair value through profit and loss 152,116 150,573 1,543 1.0 276,739 –124,623 –45.0Direct deposits from retail customers 26,706,076 27,244,698 –538,622 –2.0 27,400,040 –693,964 –2.5Covered bonds and securitisations 2,077,609 2,143,614 –66,005 –3.1 2,152,588 –74,979 –3.5EMTN and innovative capital instruments 2,920,225 2,937,876 –17,651 –0.6 3,264,041 –343,816 –10.5Repurchase agreements entered into with Cassa Compensazione e Garanzia 5,132,982 4,075,600 1,057,382 25.9 3,997,806 1,135,176 28.4Direct deposits from institutional customers 10,130,816 9,157,090 973,726 10.6 9,414,435 716,381 7.6
Total direct deposits 36,836,892 36,401,788 435,104 1.2 36,814,475 22,417 0.1
The Group’s market share of direct deposits (excluding repos with central counterparties) is 1.63% (updated to November 2014), a contraction compared with December 2013 (1.73%).
Quarterly trend of direct deposits (Euro/mln)
12,439 10,774 10,287 10,391 9,687 9,475 9,423 9,134
25,933 27,074 26,536 26,423 26,025 26,812 26,979 27,703
38,372 37,848 36,823 36,814 35,713 36,287 36,402 36,837
31.03.13 30.06.13 30.09.13 31.12.13 31.03.14 30.06.14 30.09.14 31.12.14
Securities issued and financial liabilities designated at fair value through profit and loss
Due to customers
Direct customer deposits have increased by 1.2% (Euro 435 million) compared with the previous quarter. Within this aggregate, it can be seen that there was an increase of Euro 724 million (+2.7%) in amounts due to customers, entirely attributable to an increase in the quarter of MTS Repo market transactions. With regard to securities issued and financial liabilities designated at fair value through profit and loss, these have decreased by Euro 289 million Q/Q (–3.1%) due to different investment decisions taken by bond subscribers.

69R e p o r t o n o p e r a t i o n s o f t h e B P M G r o u p
Indirect deposits and assets under management
At 31 December 2014, the volume of indirect deposits from ordinary customers, measured at market value, totals Euro 32,610 million, up by 4.4% since December 2013 and slightly up compared with the end of September (+0.5%).
Composition of indirect customer deposits at market value (Euro/000)
31.12.2014 30.09.2014 Change A – B 31.12.2013 Change A – C
A B amount % C amount %
Funds 10,279,397 9,755,273 524,124 5.4 8,203,223 2,076,174 25.3
Individual portfolio management (1) 2,344,018 2,400,323 –56,305 –2.3 2,459,349 –115,331 –4.7
Insurance-sector reserves 5,248,939 5,249,991 –1,052 0.0 4,513,974 734,965 16.3
Total assets under management 17,872,354 17,405,587 466,767 2.7 15,176,546 2,695,808 17.8
Assets under administration 14,737,869 15,027,485 –289,616 –1.9 16,045,590 –1,307,721 –8.2
Total indirect customer deposits 32,610,223 32,433,072 177,151 0.5 31,222,136 1,388,087 4.4
(1) includes: securities-based portfolio management schemes, fund-based portfolio management schemes and cash accounts
Assets under management at market value: breakdown by placement agent (Euro/000)
31.12.2014 30.09.2014 Change A – B 31.12.2013 Change A – C
A B amount % C amount %
Banca Popolare di Milano (1) 17,004,930 16,503,825 501,105 3.0 14,290,977 2,713,953 19.0
Banca Popolare di Mantova 57,424 50,762 6,662 13.1 31,569 25,855 81.9
Banca Akros (2) 810,000 851,000 –41,000 –4.8 854,000 –44,000 –5.2
Total assets under management 17,872,354 17,405,587 466,767 2.7 15,176,546 2,695,808 17.8
(1) The 2013 figures take account of the merger of WeBank with Banca Popolare di Milano that took place on 23 November 2014 (2) net of Akros pension fund
2014 has been a positive year for asset management. the balance of which comes to Euro 17,872 million as at 31 December 2014, an increase of Euro 2,696 million (+17.8%) compared with December 2013, thanks to net inflows in the reporting period of Euro 2,202 million (Euro 1,072 million in 2013), 66% of which relates to mutual fund units and 34% to insurance products.The particularly positive performance of the funds segment is also confirmed by the Group’s market share of 1.50% at the end of 2014 compared with 1.45% in December 2013.
Assets under administration at 31 December 2014 amount to Euro 14,738 million. The decrease of 8.2% since December 2013 reflects the different investment decisions made by customers, who tended to prefer assets under management.As regards the breakdown of funds under administration, there has been a decrease in the year of funds invested in bonds (–5.2 %) that has favoured government securities (+3.6%).

70 R e p o r t o n o p e r a t i o n s o f t h e B P M G r o u p
Assets under management at market value: breakdown by placement agent (Euro/000)
31.12.2014 30.09.2014 Change A – B 31.12.2013 Change A – C
A B amount % C amount %
Banca Popolare di Milano (1) 13,569,884 13,835,983 –266,099 –1.9 14,771,330 –1,201,446 –8.1
Banca Popolare di Mantova 97,322 106,144 –8,822 –8.3 135,460 –38,138 –28.2
Banca Akros 1,073,963 1,088,332 –14,369 –1.3 1,141,000 –67,037 –5.9
Eliminations –3,300 –2,974 –326 –11.0 –2,200 –1,100 –50.0
Assets under administration 14,737,869 15,027,485 –289,616 –1.9 16,045,590 –1,307,721 –8.2
(1) The 2013 figures take account of the merger of WeBank with Banca Popolare di Milano that took place on 23 November 2014
Distribution of assets under administration at December 2014 Distribution of assets under administration at December 2013
Government securities43.8%
Bonds and others32.6%
Shares23.6%
Government securities40.2%
Bonds and others37.8%
Shares22.0%
Quarterly trend of indirect deposits (Euro/mln)
16,317 16,087 16,019 16,046 16,316 15,538 15,027 14,738
14,107 14,296 14,703 15,177 15,798 16,633 17,406 17,872
30,424 30,383 30,722 31,222 32,114 32,171 32,433 32,610
31.03.13 30.06.13 30.09.13 31.12.13 31.03.14 30.06.14 30.09.14 31.12.14
Assets under management Assets under administration
In comparison with September 2014, indirect deposits show a slight increase (+0.5%) with a rise in assets under management (+2.7%) and a contraction in assets under administration (–1.9%). In particular, with regard to assets under management, there has been a favourable trend in mutual funds (+5.4%), substantial stability in the insurance sector and a fall of 2.3% in individual portfolio management. Net inflows during the fourth quarter come to Euro 477 million, slightly less than the previous quarter.

71R e p o r t o n o p e r a t i o n s o f t h e B P M G r o u p
Loans to customers
At 31 December 2014, loans to customers amount to Euro 32,079 million, down on December 2013 (– Euro 1,266 million; -3.8%) and stable compared with September 2014. This change compares to the drop of 2.3% reported by the Bank of Italy for the banking system with regard to the private sector.
Again in 2014, this balance sheet component was significantly influenced by the fragile economy, whereby, on one hand, there was a weak recovery in consumer spending, while, on the other hand, there was a contraction in investment spending – which by the end of 2014 is forecast to have dropped by 2.4% – thus confirming a downward trend that has gone on for six years.
As evidence that the entire system is going through a difficult spell, the Group’s market share of loans (excluding repurchase agreements with central counterparties) came to 1.84% (November 2014 figure), more or less the same as in December 2013 (1.86%).
As regards performance in the year by segment, this trend has particularly affected other loans (– Euro 669 million; –8.4%), current accounts (– Euro 417 million; –10.7%) and mortgage loans, which fell in 2014 by Euro 208 million (–1.3%).
New mortgages granted in 2014 totalled Euro 1,740 million, 19.7% less than 2013, whereas new personal loans to individuals and loans to companies came to around Euro 1,841 million, showing an increase of 9.3% on December 2013.
As regards the organisational segmentation by customer portfolio, based on Sisba figures, there was a slight increase in the year in the individuals segment (+0.3%) that represents 32% of total loans and a decrease in the businesses segment (–5.2%).
Loans granted (cumulative amounts) (Euro/mln) Mortgage loans granted (cumulative amounts) (Euro/mln)
129 207350 437
555707
879 9661,101
1,3021,519
1,841
116246
404575
722843
994 1,100 1,2101,338
1,4591,685
Jan Feb Mar Apr May Jun Jul Aug Sept Oct Nov Dec
2014 2013
103 214 357 460601
795 983 1,0671,235
1,3821,532
1,740
180361
593706
9961,177
1,4121,560 1,729
1,894 2,0142,167
Jan Feb Mar Apr May Jun Jul Aug Sept Oct Nov Dec
2014 2013

72 R e p o r t o n o p e r a t i o n s o f t h e B P M G r o u p
Breakdown of loans to customers (Euro/000)
31.12.2014 30.09.2014 Change A – B 31.12.2013 Change A – C
A B amount % C amount %
Mortgage loans 15,773,904 15,572,004 201,900 1.3 15,981,777 –207,873 –1.3
Other types of deposit 16,189,974 16,379,724 –189,750 –1.2 17,234,992 –1,045,018 –6.1
Current accounts 3,468,453 3,652,137 –183,684 –5.0 3,885,296 –416,843 –10.7
Repurchase agreements 64,875 344,255 –279,380 –81.2 74,314 –9,439 –12.7
Credit cards. personal loans and salary assignments 1,566,559 1,595,066 –28,507 –1.8 1,687,572 –121,013 –7.2
Finance leases 218,713 225,299 –6,586 –2.9 269,554 –50,841 –18.9
Other loans 7,273,473 6,972,067 301,406 4.3 7,942,146 –668,673 –8.4
Impaired assets 3,597,901 3,590,900 7,001 0.2 3,376,110 221,791 6.6
Total loans to customers 31,963,878 31,951,728 12,150 0.0 33,216,769 –1,252,891 –3.8
Debt securities 114,965 144,188 –29,223 –20.3 128,257 –13,292 –10.4
Total loans to customers 32,078,843 32,095,916 –17,073 –0.1 33,345,026 –1,266,183 –3.8
Loans to customers: breakdown by company (Euro/000)
31.12.2014 30.09.2014 Change A – B 31.12.2013 Change A – C
A B amount % C amount %
Banca Popolare di Milano (1) 31,554,803 31,665,999 –111,196 –0.4 32,957,647 –1,402,844 –4.3
Banca Popolare di Mantova 475,501 470,053 5,448 1.2 465,091 10,410 2.2
Banca Akros 318,494 659,537 –341,043 –51.7 331,426 –12,932 –3.9
ProFamily 898,425 897,529 896 0.1 914,926 –16,501 –1.8
Other companies (2) 6,644,225 5,535,200 1,109,025 20.0 5,591,174 1,053,051 18.8
Consolidation eliminations/adjustments –7,812,605 –7,132,402 –680,203 –9.5 –6,915,238 –897,367 –13.0
Total 32,078,843 32,095,916 –17,073 –0.1 33,345,026 –1,266,183 –3.8
(1) The 2013 figures take account of the merger of WeBank with Banca Popolare di Milano that took place on 23 November 2014(2) of which at 31 December 2014 Euro 391 million related to the securitisation of commercial mortgage loans by “BPM Securitisation 2” in 2006, Euro 5,337 million relating to “BPM Covered Bonds” and Euro 732 million relating to “BPM Securitisation 3” of 2014.
As regards changes in loans by economic sector, loans granted to businesses (comprising large companies, SMEs and Small Businesses) have fallen in total by 5.2% compared with the end of 2013. There has been a reduction in loans to almost all the component sectors. particularly. loans to financial and insurance activities (–15.7%) and real estate (–7.7%) with the exception of wholesale trade that increased by 3.1%.
Loans to businesses by economic sector December 2014(Euro mn; weighting in%)
Loans to businesses by economic sector December 2013 (Euro mn; weighting in%)
Services 1,7908.4%
Wholesale trade (vehicles excluded) 1,862
8.8%
Real estate 8,11138.2%
Manufacturing 4,619 21.7%
Financial and insurance activities 724
3.4%
Other 3,31515.6%
Agriculture 8273.9%
Services 1,9668.8%
Wholesale trade (vehicles excluded) 1,806
8.1%
Real estate 8,79239.2%
Manufacturing 4,67720.9%
Financial and insurance activities 858
3.8%
Other 3,45315.4%
Agriculture 8503.8%
(1) the businesses segment includes corporates, SMEs and small retail businesses

73R e p o r t o n o p e r a t i o n s o f t h e B P M G r o u p
Quarterly trend in loans to customers (Euro/mln)
34,306 33,910 33,854 33,271 32,628 32,233 31,752 32,014
784 128 22774
194 287 344 65
35,090 34,038 34,081
33,345 32,821 32,521 32,096 32,079
31.03.13 30.06.13 30.09.13 31.12.13 31.03.14 30.06.14 30.09.14 31.12.14
Repurchase agreements
The comparison with 30 September 2014 shows the aggregate has remained substantially stable. This trend reflects growth in mortgage loans (+ Euro 202 million; +1.3%) offset by a fall in other forms of financing of Euro 216 million (–1.3%). Net of repurchase agreements, the aggregate would have shown an increase of Euro 262 million (approximately +0.8%).
As regards the organisational segmentation by customer portfolio, based on Sisba figures, in the last quarter the Individuals segment remained essentially stable, while the businesses segment increased by approximately 1%.
As regards changes in loans by economic sector, changes compared with September 2014 indicate an improvement for almost all sectors, with particularly significant growth in manufacturing and in services, being sectors that represent 22% and 8.4%, respectively, of total loans to businesses.
Asset quality
Recent macroeconomic data confirms that there was a slight improvement in the latter part of 2014, but, overall, the domestic economy is still showing signs of weakness, reflected by the performance of certain segments, particularly the construction industry, which remains extremely critical.
The residential and, above all, the non–residential property markets have been heavily affected by the economic crisis and by household and business confidence. The level of production stands at historically low levels: since the crisis started, the market risk has shrunk by nearly one third. Estimates made by the National Association of Builders (ANCE), which foresee a downturn in capital investment of 2.5% for 2014, appear to have been confirmed by the latest industry data. As of November 2014, the index of production in the construction sector (Source: ISTAT) showed a decrease in production of 7.6% with respect to the comparative prior period. It has been confirmed that there has been a modest recovery in the number of property sales and purchases (but not in prices) and a good response to tax incentives for restructuring work and improved energy use. Expenditure on residential property improvements, which represents 40% of construction expenditure, has grown in real terms by 3% (cumulative growth of 20% from 2008 to 2014). The investment in new homes declines by 8.5% in 2014 compared with 2013; in real terms, production levels are 9.2% below those of 2013 (Source: ANCE). The weakness of the production structure is reflected by the increase in bankruptcies in the construction industry.
Looking at the entire business spectrum, over 11 thousand companies went bankrupt during the year (+11.9% with respect to 2013), while voluntary liquidations of active companies continued to fall (–10.3% with respect to 2013) across all sectors of the economy. There has also been a downward trend in non–payment protests lodged against companies that began in 2013 and which continued between July and September 2014 (last available figure). In particular, this is the fifth consecutive quarter for which there has been a fall in the number of companies hit with at least one non–payment protest and the fourth for which the number of companies protested against went down at a double–digit pace compared with the previous year. Despite this trend, the number of companies protested against still remains high and exceeds the level recorded in 2007 by 10.2%. There has been a reduction in all sectors of the economy, particularly manufacturing, for which the number of companies protested against fell below the 2007 figure (Source: Cerved).
In this context, the weakness of the economic cycle continues to reflect on the quality of lending, albeit to a lesser extent than in previous quarters. ABI figures for November 2014 indicate a rise in gross non–performing loans granted by banks, even if at not at as fast a rate as in the past, of 21.1% on an annual basis. At the same date gross non–performing loans came to over Euro 181 billion (+ Euro 31.5 billion compared with November 2013). The ratio of gross non–performing loans to total loans is 9.5%. which is up on prior year (7.8%).

74 R e p o r t o n o p e r a t i o n s o f t h e B P M G r o u p
As regards net non–performing loans, the ratio to total loans as of November is 4.67% (4.05% as of November 2013) as there has been a rise in net non-performing loans in the year (+Euro 9 billion).
At 31 December 2014. the Group’s gross impaired assets had increased by 10.9%. compared with December 2013, coming to Euro 5,853 million, reflecting a more modest growth compared with the previous year (+25.6%). In particular, the trend reflects an increase in non-performing loans and loans being restructured, as well as difficulties encountered by SMEs and Small Businesses. The sectors of the economy that have had a greater influence on the trend were property, commerce, transport, automotive and the wood and furniture sector.
Compared with the situation at 31 December 2013, the following trends have emerged: non-performing loans increased in the year by Euro 509 million (+20.1% compared with December 2013) to Euro 3,046
million, representing a slower rate of growth compared with the increase recorded in 2013 (+31.3% vs. 2012). The proportion of gross non-performing loans to total Group loans has risen to 8.8% from 7.2% in December 2013;
doubtful loans amounted to Euro 1,647 million, having decreased by Euro 115 million (–6.5% compared with December 2013), with the decrease having been concentrated in the fourth quarter;
restructured loans increase by Euro 216 million (+26.6%). reaching Euro 1,030 million: this is mainly attributable to debt restructuring by Companies and SMEs operating in real estate and commerce.
The proportion of gross impaired loans to total loans was 16.9%. with respect to 14.9% at the end of 2013.
Gross impaired loans (Euro/mln)
2,021 2,211 2,346 2,538 2,704 2,795 2,888 3,046
1,665 1,714 1,735 1,761 1,798 1,789 1,789 1,647628736 721
814889 911 932 1,030
53130 188
166 194 197 142 130
4,3684,791 4,991
5,2795,585 5,693 5,751 5,853
Mar-13 Jun-13 Sept-13 Dec-13 Mar-14 Jun-14 Sept-14 Dec-14
non-performing loans
doubtful loans restructured positions overdue positions
The coverage of the impaired loans portfolio at the end of 2014 was 38.5%. which was up by 2.5 percentage points on December 2013 (36%). In detail: the coverage of non-performing loans was 55.9% with respect to 55.5% as of December 2013. This level increases to 62.7% if
no account is taken of write offs of individual positions made in the past; coverage of doubtful loans has risen from 22.8% at the end of 2013 to 25.4% at 31 December 2014, following an increase in
provisions from Euro 402 million at the end of 2013 to the current balance of Euro 418 million; coverage of restructured loans has risen from 9.9% in December 2013 to 12% now; the coverage of overdue positions has remained largely unchanged, going from 8% at the end of 2013 to 8.4% at 31
December 2014.
As far as performing loans are concerned, coverage was 0.73%, which was substantially in line with the previous year (0.72% as of December 2013), mainly due to a default classification having been assigned to certain high risk positions featuring high levels of coverage. There was a reversal in the trend regarding loans granted to companies, mainly concentrated in the fourth quarter and driven by the positive performance of certain segments, such as services, commerce and machinery.

75R e p o r t o n o p e r a t i o n s o f t h e B P M G r o u p
Overall, total impaired loans at 31 December 2014, net of adjustments, amounted to Euro 3,598 million, up by 6.6% compared with the December 2013 figure, which had changed by 22.2% compared with the prior year figure.As regards the results of the comprehensive assessment – and, in particular, the asset quality review – and the accounting impact thereof, reference should be made to the “Significant events for Banca Popolare di Milano and the Bipiemme Group” section of this report.
Coverage of the impaired loans portfolio (%)
Coverage (%) Mar-13 Jun-13 Sep-13 Dec-13 Mar-14 Jun-14 Sep-14 Dec-14
Total problem loans 33.9 33.3 33.5 36.0 35.6 36.9 37.6 38.5
Non-performing loans 55.0 53.9 53.5 55.5 55.4 56.0 55.8 55.9
Doubtful loans 18.8 19.3 19.8 22.8 21.6 23.5 24.3 25.4
Restructured positions 8.3 8.4 7.9 9.9 9.7 10.4 10.5 12.0
Overdue positions 7.5 8.1 7.5 8.0 8.3 9.5 10.1 8.4
Performing loans 0.63 0.59 0.60 0.72 0.72 0.68 0.73 0.73
Total adjustments to loans 4.6 5.0 5.2 6.0 6.3 6.6 6.9 7.1
Net impaired loans (Euro/mln)
910 1,019 1,091 1,130 1,206 1,230 1,276 1,344
1,351 1,383 1,391 1,359 1,409 1,369 1,354 1,228
576674 665 733
803 817 834 90649119 174 153
178 178 127 1192,8873,195 3,320 3,376 3,596 3,594 3,591 3,598
Mar-13 Jun-13 Sept-13 Dec-13 Mar-14 Jun-14 Sept-14 Dec-14
non-performing loans
doubtful loans restructured positions overdue positions
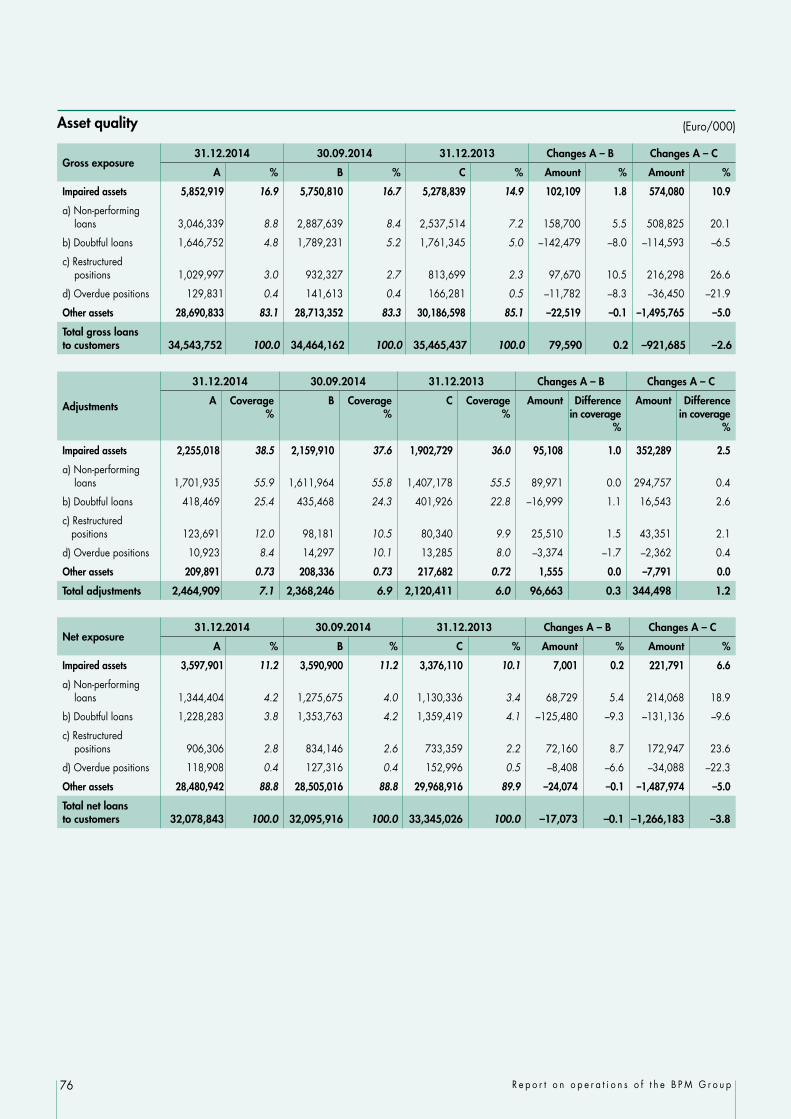
76 R e p o r t o n o p e r a t i o n s o f t h e B P M G r o u p
Asset quality (Euro/000)
Gross exposure31.12.2014 30.09.2014 31.12.2013 Changes A – B Changes A – C
A % B % C % Amount % Amount %
Impaired assets 5,852,919 16.9 5,750,810 16.7 5,278,839 14.9 102,109 1.8 574,080 10.9
a) Non-performing loans 3,046,339 8.8 2,887,639 8.4 2,537,514 7.2 158,700 5.5 508,825 20.1
b) Doubtful loans 1,646,752 4.8 1,789,231 5.2 1,761,345 5.0 –142,479 –8.0 –114,593 –6.5
c) Restructured positions 1,029,997 3.0 932,327 2.7 813,699 2.3 97,670 10.5 216,298 26.6
d) Overdue positions 129,831 0.4 141,613 0.4 166,281 0.5 –11,782 –8.3 –36,450 –21.9
Other assets 28,690,833 83.1 28,713,352 83.3 30,186,598 85.1 –22,519 –0.1 –1,495,765 –5.0
Total gross loans to customers 34,543,752 100.0 34,464,162 100.0 35,465,437 100.0 79,590 0.2 –921,685 –2.6
Adjustments
31.12.2014 30.09.2014 31.12.2013 Changes A – B Changes A – C
A Coverage %
B Coverage %
C Coverage %
Amount Difference in coverage
%
Amount Difference in coverage
%
Impaired assets 2,255,018 38.5 2,159,910 37.6 1,902,729 36.0 95,108 1.0 352,289 2.5
a) Non-performing loans 1,701,935 55.9 1,611,964 55.8 1,407,178 55.5 89,971 0.0 294,757 0.4
b) Doubtful loans 418,469 25.4 435,468 24.3 401,926 22.8 –16,999 1.1 16,543 2.6
c) Restructured positions 123,691 12.0 98,181 10.5 80,340 9.9 25,510 1.5 43,351 2.1
d) Overdue positions 10,923 8.4 14,297 10.1 13,285 8.0 –3,374 –1.7 –2,362 0.4
Other assets 209,891 0.73 208,336 0.73 217,682 0.72 1,555 0.0 –7,791 0.0
Total adjustments 2,464,909 7.1 2,368,246 6.9 2,120,411 6.0 96,663 0.3 344,498 1.2
Net exposure31.12.2014 30.09.2014 31.12.2013 Changes A – B Changes A – C
A % B % C % Amount % Amount %
Impaired assets 3,597,901 11.2 3,590,900 11.2 3,376,110 10.1 7,001 0.2 221,791 6.6
a) Non-performing loans 1,344,404 4.2 1,275,675 4.0 1,130,336 3.4 68,729 5.4 214,068 18.9
b) Doubtful loans 1,228,283 3.8 1,353,763 4.2 1,359,419 4.1 –125,480 –9.3 –131,136 –9.6
c) Restructured positions 906,306 2.8 834,146 2.6 733,359 2.2 72,160 8.7 172,947 23.6
d) Overdue positions 118,908 0.4 127,316 0.4 152,996 0.5 –8,408 –6.6 –34,088 –22.3
Other assets 28,480,942 88.8 28,505,016 88.8 29,968,916 89.9 –24,074 –0.1 –1,487,974 –5.0
Total net loans to customers 32,078,843 100.0 32,095,916 100.0 33,345,026 100.0 –17,073 –0.1 –1,266,183 –3.8

77R e p o r t o n o p e r a t i o n s o f t h e B P M G r o u p
As regards changes in impaired loans, there was a significant decrease in the year in new inflows from performing loans (net of returns to performing category and collections, with a significant reduction compared with the previous year.
Change in the year of net inflows from performing and impaired loans (Euro/mln)
877
349
2013 2014

78 R e p o r t o n o p e r a t i o n s o f t h e B P M G r o u p
Net interbank position
The net interbank position at 31 December 2014 reflects net borrowing of Euro 2,334 million, representing an improvement on the net borrowing of Euro 4,100 million as of December 2013 (+43.1%), but a deterioration (– Euro 2,230 million) when compared with the net borrowing as of September 2014. This trend mainly reflects the decline in borrowing from banks (almost entirely due to the reduction in the amount due to the ECB), which is Euro 474 million lower than in September 2014 and Euro 2,595 million lower than in December 2013.
The unsecured net interbank position at 31 December 2014, being the interbank exposure excluding repurchase agreements and TLTRO transactions with the ECB, is determined by deducting the following components from the overall position: Euro 1.8 billion resulting from open market operations with the European Central Bank; Euro 211 million resulting from net deposits deriving from repurchase agreements; Euro 248 million relating to amounts due from banks shown in the financial statements of BPM Securitisation 2, BPM Securitisation
3 and BPM Covered Bond, as they relate to liquidity that is not immediately available.
Net of these components, the unsecured net interbank position at 31 December 2014 shows a negative balance of Euro 598 million.
Net interbank position (Euro/000)
31.12.2014 30.09.2014 Change A – B 31.12.2013 Change A – C
A B amount % C amount %
Due from banks 984,777 1,562,185 –577,408 –37.0 1,813,458 –828,681 –45.7
Due to banks 3,318,564 3,792,622 –474,058 –12.5 5,913,928 –2,595,364 –43.9
Total –2,333,787 –2,230,437 –103,350 –4.6 –4,100,470 1,766,683 43.1
Difference between amounts due from and due to banks (Euro/mln)
Unsecured net interbank position (Euro/mln)
- 3,649- 4,174 - 4,335 - 4,100
- 3,761
- 2,463 - 2,230 - 2,334
Mar-13 Jun-13 Sept-13 Dec-13 Mar-14 Jun-14 Sept-14 Dec-14
345
- 5 - 68
317 267124
- 845
- 598
Mar-13 Jun-13 Sept-13 Dec-13 Mar-14 Jun-14 Sept-14 Dec-14

79R e p o r t o n o p e r a t i o n s o f t h e B P M G r o u p
Liquidity position
The liquidity position of the Group is solid and the principal indicators easily comply with established limits. Net liquidity – being assets available for use as collateral plus net inflows and outflows over a given time horizon – amounts to Euro 5,455 million at 31 December 2014, with a time horizon of one month, giving a ratio of total assets of 11.3% (11.9% at the end of September 2014).Liquidity at three months at the end of December comes to Euro 4,730 million (9.8% of total assets).The assets eligible as collateral with the European Central Bank amounted to Euro 11.9 billion at the end of December 2014 and are committed for Euro 7.1 billion, while the remaining Euro 4.8 billion is represented by free assets. As regards the LTROs, if we also take into account the repayments made in 2014, since the beginning of the year the Parent Company has made early repayment of Euro 4,550 million of the loans obtained from the ECB.
As regards participation in the TLTRO auctions (Targeted longer term refinancing operations) – a new facility offered to banks by the ECB with a maximum duration of four years at a rate of 0.15% (0.05% as from the 2015 auctions) and aimed at the provision of loans to the real economy – Bipiemme Group participated in the TLTRO auction in December 2014 (TLTRO 2) and borrowed an amount of Euro 1.5 billion (compared with a 3 year LTRO of Euro 4.5 billion borrowed previously and entirely repaid).The liquidity requirement, being the difference between commercial funding and lending to customers, amounts to Euro 3.1 billion at the end of December 2014 (operational data) and is broadly unchanged since the end of the third quarter.
Assets eligible as collateral with the ECB (Euro/mln) Composition of total eligible assets
4.0 2.7 2.2 2.6 3.9 5.3 5.3 4.8
3.4 4.7 4.4 4.53.6
4.0 4.3 5.3
4.6 4.6 4.6 4.6 4.12.9 1.8 1.8
12.1 12.0 11.2 11.7 11.6 12.111.4 11.9
Mar-13 Jun-13 Sept-13 Dec-13 Mar-14 Jun-14 Sept-14 Dec-14
Free Committed – repos and other Committed – ECB
Government securities76.0%
Government guaranteed securities
4.2%
Covered Bonds11.2%
ABS4.8%
Abaco receivables3.3%
Other0.6%

80 R e p o r t o n o p e r a t i o n s o f t h e B P M G r o u p
Financial assets
The financial assets of the Bipiemme Group, net of financial liabilities, amount to Euro 10,350 million, up on December 2013 (+ Euro 514 million; +5.2%) and slightly down on September 2014 (– Euro 43 million; –0.4%). In detail, the net balance of financial assets and financial liabilities held for trading of Euro 458 million at 31 December 2014 is up by Euro 173 million on December 2013 (+60.4%) but is down Euro 5 million on September 2014 (–1%). This aggregate is largely represented by the trading book of Banca Akros, whose operations mainly consist of trading, market making and risk management with dynamic hedging strategies within specific operating limits.
Financial assets designated at fair value through profit and loss – which include structured debt securities and open-ended funds for which regular valuations are available from independent sources – come to Euro 97 million, showing a decrease compared with the figure at the end of 2013 (–55.5%) and compared with September 2014 (–4.3%).Financial assets available for sale come to Euro 9,670 million, up compared with the end of December 2013 (+5.2%), mainly due to an increase in the Parent Company’s portfolio of Italian government securities.
Financial assets/liabilities of the Group: breakdown (Euro/000)
31.12.2014 30.09.2014 Change A – B 31.12.2013 Change A – C
A B amount % C amount %
Financial assets held for trading 1,921,518 1,954,084 –32,566 –1.7 1,449,237 472,281 32.6
Financial assets designated at fair value through profit and loss 97,449 101,861 –4,412 –4.3 219,118 –121,669 –55.5
Financial assets available for sale 9,670,272 9,662,753 7,519 0.1 9,189,022 481,250 5.2
Hedging derivatives receivable 178,460 223,056 –44,596 –20.0 178,291 169 0.1
Fair value change of financial assets in hedged portfolios (+/–) 20,107 17,332 2,775 16.0 10,105 10,002 99.0
Total financial assets 11,887,806 11,959,086 –71,280 –0.6 11,045,773 842,033 7.6
Financial liabilities held for trading 1,463,445 1,491,342 –27,897 –1.9 1,163,738 299,707 25.8
Hedging derivatives payable 58,751 57,102 1,649 2.9 23,348 35,403 151.6
Fair value change of financial liabilities in hedged portfolios (+/–) 16,084 17,883 –1,799 –10.1 23,222 –7,138 –30.7
Total net financial assets 10,349,526 10,392,759 –43,233 –0.4 9,835,465 514,061 5.2
Breakdown of net financial assets portfolio (Euro/mln)
Shares583
Mutual funds148
Derivatives*109
of which Italian sovereign debt
8,920
of which other589
Bonds9,509
(*) Mainly include hedging derivatives and, to a lesser extent, loans
As regards the type of securities in portfolio, at 31 December 2014 financial assets are made up of bonds for over 90% (of which Euro 8,920 million relating to Italian sovereign debt). Equities and mutual fund units in total come to around 7%. The remainder consists mainly of hedging derivatives.

81R e p o r t o n o p e r a t i o n s o f t h e B P M G r o u p
Financial assets/liabilities of the Group: breakdown by company (Euro/000)
31.12.2014 30.09.2014 Change A – B 31.12.2013 Change A – C
A B amount % C amount %
Banca Popolare di Milano (1) 9,424,497 9,429,200 –4,703 0.0 9,031,411 393,086 4.4Banca Akros 957,109 889,408 67,701 7.6 781,738 175,371 22.4Banca Popolare di Mantova 11,554 11,576 –22 –0.2 1,575 9,979 n.s.Other companies 7,637 52,519 –44,882 –85.5 6,115 1,522 24.9Consolidation eliminations/adjustments –51,271 10,056 –61,327 n.s. 14,626 –65,897 n.s.Total net financial assets 10,349,526 10,392,759 –43,233 –0.4 9,835,465 514,061 5.2
(1) The 2013 figures take account of the merger of WeBank with Banca Popolare di Milano that took place on 23 November 2014
Fixed assets
At 31 December 2014, total fixed assets, including investments in associates and companies subject to joint control, property and equipment and intangible assets, amount to Euro 1,118 million, down compared with December 2013 (–9.1%) but up on 30 September 2014 (+1.6%).
In particular, investments in associates and companies subject to joint control of Euro 294 million have decreased since the end of 2013 (–25.7%) due, in the main, to the disposal in May 2014 of 18.44% of Anima Holding S.p.A. upon the listing of that company in April 2014.
Property and equipment of Euro 716 million have decreased with respect to December 2013 (–3%) and are stable compared with September 2014 (0.2%) as a result of the depreciation charge.
Intangible assets (consisting mainly of software) amount to Euro 108 million, higher than in December 2013 (+ Euro 12 million) and than the end of September 2014 (+ Euro 12 million) for investments made during the period.
Fixed assets: breakdown (Euro/000)
31.12.2014 30.09.2014 Change A – B 31.12.2013 Change A – C
A B amount % C amount %
Investments in associates and companies subject to joint control 293,797 288,984 4,813 1.7 395,587 –101,790 –25.7
Property and equipment 715,705 714,341 1,364 0.2 738,200 –22,495 –3.0
Intangible assets 108,377 96,486 11,891 12.3 96,188 12,189 12.7
Total fixed assets 1,117,879 1,099,811 18,068 1.6 1,229,975 –112,096 –9.1
Provisions for specific use
At 31 December 2014 the provisions for specific use amount to Euro 520 million and consist of the provision for risks and charges for Euro 382 million and employee termination indemnities for the other Euro 138 million.
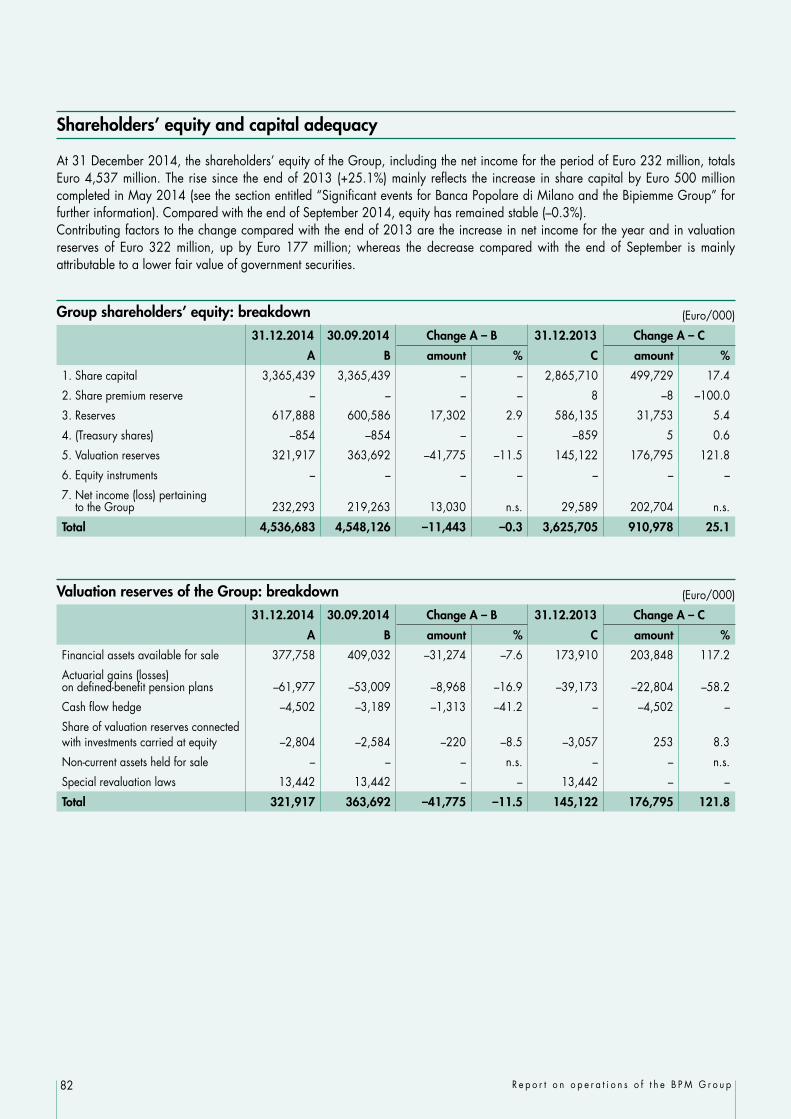
82 R e p o r t o n o p e r a t i o n s o f t h e B P M G r o u p
Shareholders’ equity and capital adequacy
At 31 December 2014, the shareholders’ equity of the Group, including the net income for the period of Euro 232 million, totals Euro 4,537 million. The rise since the end of 2013 (+25.1%) mainly reflects the increase in share capital by Euro 500 million completed in May 2014 (see the section entitled “Significant events for Banca Popolare di Milano and the Bipiemme Group” for further information). Compared with the end of September 2014, equity has remained stable (–0.3%). Contributing factors to the change compared with the end of 2013 are the increase in net income for the year and in valuation reserves of Euro 322 million, up by Euro 177 million; whereas the decrease compared with the end of September is mainly attributable to a lower fair value of government securities.
Group shareholders’ equity: breakdown (Euro/000)
31.12.2014 30.09.2014 Change A – B 31.12.2013 Change A – C
A B amount % C amount %
1. Share capital 3,365,439 3,365,439 – – 2,865,710 499,729 17.4
2. Share premium reserve – – – – 8 –8 –100.0
3. Reserves 617,888 600,586 17,302 2.9 586,135 31,753 5.4
4. (Treasury shares) –854 –854 – – –859 5 0.6
5. Valuation reserves 321,917 363,692 –41,775 –11.5 145,122 176,795 121.8
6. Equity instruments – – – – – – –
7. Net income (loss) pertaining to the Group 232,293 219,263 13,030 n.s. 29,589 202,704 n.s.
Total 4,536,683 4,548,126 –11,443 –0.3 3,625,705 910,978 25.1
Valuation reserves of the Group: breakdown (Euro/000)
31.12.2014 30.09.2014 Change A – B 31.12.2013 Change A – C
A B amount % C amount %
Financial assets available for sale 377,758 409,032 –31,274 –7.6 173,910 203,848 117.2
Actuarial gains (losses) on defined-benefit pension plans –61,977 –53,009 –8,968 –16.9 –39,173 –22,804 –58.2
Cash flow hedge –4,502 –3,189 –1,313 –41.2 – –4,502 –
Share of valuation reserves connected with investments carried at equity –2,804 –2,584 –220 –8.5 –3,057 253 8.3
Non-current assets held for sale – – – n.s. – – n.s.
Special revaluation laws 13,442 13,442 – – 13,442 – –
Total 321,917 363,692 –41,775 –11.5 145,122 176,795 121.8

83R e p o r t o n o p e r a t i o n s o f t h e B P M G r o u p
Minority interests
Minority interests amount to over Euro 19 million at 31 December 2014, being a slight increase on the figure at end of 2013 (+1.9%) and substantially in line with the September 2014 figure.
Minority interests: breakdown (Euro/000)
31.12.2014 30.09.2014 Change A – B 31.12.2013 Change A – C
A B amount % C amount %
1. Share capital 2,359 2,366 –7 –0.3 2,361 –2 –0.12. Share premium reserve 11,982 12,050 –68 –0.6 12,630 –648 –5.13. Reserves 4,353 4,355 –2 –0.0 4,218 135 3.24. Treasury shares – – – – – – –5. Valuation reserves 90 106 –16 –15.1 52 38 73.16. Equity instruments – – – – – – –
7. Net income (loss) pertaining to minority interests 640 541 99 n.s. –200 840 n.s.
Total 19,424 19,418 6 0.0 19,061 363 1.9
Valuation reserves of minority interests: breakdown (Euro/000)
31.12.2014 30.09.2014 Change A – B 31.12.2013 Change A – C
A B amount % C amount %
Valuation reserves: financial assets available for sale 151 154 –3 –1.9 90 61 67.8
Valuation reserves: actuarial gains (losses) on defined-benefit pension plans –61 –48 –13 –27.1 –38 –23 –60.5
Valuation reserves: share of valuation reserves connected with investments carried at equity – – – – – – –
Valuation reserves: special revaluation laws – – – – – – –
Total 90 106 –16 –15.1 52 38 73.1

84 R e p o r t o n o p e r a t i o n s o f t h e B P M G r o u p
Valuation reserves on assets available for sale
At 31 December 2014, Valuation reserves on assets available for sale – inclusive of the portion attributable to minority interests – consist of a positive balance of Euro 378 million, more than doubled compared with 31 December 2013. This is the result of an increase in reserves on debt securities (+ Euro 146 million) and equity securities (+ Euro 53 million).
Valuation reserves on assets available for sale (Euro/000)
31.12.2014 30.09.2014 Change A – B 31.12.2013 Change A – C
A B amount % C amount %
of which: Group 377,758 409,032 –31,274 –7.6 173,910 203,848 117.2
of which: Minority interests 151 154 –3 –1.9 90 61 67.8
Total 377,909 409,186 –31,277 –7.6 174,000 203,909 117.2
Valuation reserves on assets available for sale: breakdown (Euro/000) 31.12.2014 31.12.2013 Changes
Gross book value
Tax effect Net book value
Gross book value
Tax effect Net book value
A – B
a1 a2 A = a1 – a2 b1 b2 B = b1 – b2 amount %
Debt securities, of which: 367,284 –121,463 245,821 149,683 –49,499 100,184 145,637 145.4
Italian sovereign debt 365,117 –120,745 244,372 165,239 –54,644 110,595 133,777 121.0
Sovereign debt of other countries –12 4 –8 – – – –8 8
other 2,179 –722 1,457 –15,556 5,145 –10,411 11,868 114.0
Equities 135,541 –9,374 126,167 78,205 –5,383 72,822 53,345 73.3
Mutual Funds 8,820 –2,899 5,921 1,432 –438 994 4,927 n.s.
Total valuation reserves AFS 511,645 –133,736 377,909 229,320 –55,320 174,000 203,909 117.2

85R e p o r t o n o p e r a t i o n s o f t h e B P M G r o u p
Own funds and capital adequacy ratios
The new harmonized framework for banks and investment firms contained in EU Regulation (“CRR”) and Directive (“CRD IV”) of 26 June 2013 is applicable from 1 January 2014; they transpose the standards defined by the Basel Committee on Banking Supervision (the so-called “Basel 3 Framework”) into the European Union.
At 31 December 2014 the Common equity tier 1 ratio is of 11.58%, Tier 1 Capital Ratio 12.21% and Total capital ratio of 15.35%. The CET 1 capital ratio at the end of 2014 recorded an increase with respect to the ratio of 11.29% as of September 2014 and has improved on the ratio of 7.21% as of December 2013 (calculated using “Basel 2” rules). The increase mainly benefits from the Euro 500 million increase in capital and the Euro 8 billion reduction in RWA following the elimination of the specific add-ons required by the Bank of Italy. Note that, currently, the capital adequacy ratios do not benefit from any impact arising from the adoption of AIRB internal models.
Quarterly trend of capital ratios
8.37%7.45% 7.25% 7.21% 7.32%
11.23% 11.29% 11.58%8.98%8.07% 7.86% 7.82% 7.81%
11.84% 11.91% 12.21%12.12%11.02% 10.73% 10.68% 10.84%
15.67% 15.10% 15.35%
Mar-13 Jun-13 Sept-13 Dec-13 Mar-14 Jun-14 Sept-14 Dec-14
Core Tier 1 Tier 1 Total capital ratio
Basel 2 Basel 3
Common equity tier 1 ratio under phase–in arrangements
Trend of RWA (Euro/mln)
43,251 42,027 43,180 42,612 43,265
35,909 34,952 35,179 34,535 35,194 34,590 34,408 33,688
Mar 13 Jun 13 Sept 13 Dec 13 Mar 14 Jun 14 Sept 14 Dec 14
Total Total net of add-ons

86 R e p o r t o n o p e r a t i o n s o f t h e B P M G r o u p
Income statement Moving on to analyse the income statement, 2014 closed with net income of Euro 232.3 million, a significant increase compared with net income of Euro 29.6 million in 2013. This result benefited from non-recurring income of Euro 103 million (net of tax) arising from the sale of the equity interest in Anima Holding S.p.A. (for further details, reference should be made to the “Significant events for Banca Popolare di Milano and the Bipiemme Group” section in this report). Excluding total non-recurring items (for further details, see the “Reclassified income statement, net of non-recurring items”), net income for 2014 amounts to Euro 141.7 million, marking an increase of Euro 63.3 million on the prior year figure (+80.6%). This increase mainly benefited from the positive effect of a contraction in operating expenses of Euro 9.8 million (–1%) and of a decrease in adjustments to loans of Euro 165.8 million (–28.1%).
Operating income
Operating income at December 2014 amounted to Euro 1,621.6 million compared with Euro 1,683 million in the previous year, down by 3.6%. This result follows the combined effect of the following: a decrease in interest margin from Euro 837.4 million to Euro 800.2 million (–4.4%); a fall in other income (– Euro 35.9 million; –11.9%), which reflects a decrease in net income from banking activities (– Euro 12.2
million) and a decrease in profits (losses) on investments carried at equity (– Euro 24.5 million); the increase in net fee and commission income (+2.2%), which at the end of 2014 comes in at Euro 556.6 million.
Interest margin
The interest margin comes to Euro 800.2 million, being a decrease of Euro 37.3 million (–4.4%) on December 2013. This reflects a fall in the contribution made by the Parent Company’s securities portfolio (– Euro 19 million) and an increase in the cost of institutional funding, which in 2013 had benefited from lower costs due to interest not paid on Trust preferred securities and on Perpetual subordinated notes totalling Euro 20.7 million.
Interest margin (Euro/000)
Year 2014 Year 2013 Changes
amount %
Interest and similar income 1,289,302 1,410,567 (121,265) –8.6Interest and similar expense (489,131) (573,143) 84,012 14.7Total interest margin 800,171 837,424 (37,253) –4.4
Interest margin: breakdown by company (Euro/000) Year 2014 Year 2013 Changes amount %Banca Popolare di Milano (1) 749,307 777,274 (27,967) –3.6ProFamily 31,116 30,255 861 2.8Banca Akros 10,549 12,423 (1,874) –15.1Banca Popolare di Mantova 9,166 8,948 218 2.4Other companies 3,213 19,367 (16,154) –83.4Consolidation eliminations/adjustments (3,180) (10,843) 7,663 70.7Total interest margin 800,171 837,424 (37,253) –4.4
(1) The 2013 figures take account of the merger of WeBank with Banca Popolare di Milano that took place on 23 November 2014

87R e p o r t o n o p e r a t i o n s o f t h e B P M G r o u p
The following is a breakdown of the interest margin by business line, on the basis of the allocation of interest income and expense for management purposes to the various business segments. In particular, the following trends have been seen: commercial margin: this increases by Euro 6.3 million (+0.9%) compared with 2013, from Euro 704.9 million to Euro 711.3
million. This increase is attributable to expansion of the spread between lending and borrowing rates, a rise of about 22 bps, compared with last year, which offset the effect of lower volumes. The average spread in 2014 was in fact 2.15% compared with 1.93% in 2013. This increase benefited from a fall in borrowing rates (-29 bps), which affected term deposits and demand deposits, but which more than offset the fall in lending rates in the year (-7 bps);
margin generated by financial assets has decreased by 1.4%, caused by a lower return on the securities portfolio that was only partly offset by a lower cost of interbank deposits;
the cost of institutional funding has increased compared with the prior year figure, which had benefited from, among other things, the suspension of interest payments on Trust preferred securities and Perpetual subordinated notes (Euro 20.7 million). Excluding this effect, interest expense would have shown an increase of Euro 10.9 million, given the higher rates on new issues.
Trend in interest margin by business line (Euro/mln)
-4.4%
711.3704.9
213.6211.9
- 120.9- 89.3
- 3.7
9.9
800.2837.4
Year 2014Year 2013
Other Institutional fundingTreasury & Investment Banking Commercial margin
Quarterly trend in the interest margin (Euro/mln)
191
225216
206 206 201 195 198
1Q 13 2Q 13 3Q13 4Q13 1Q14 2Q14 3Q14 4Q14
With regard to the quarterly data, the interest margin for the fourth quarter was some Euro 3 million (+1.5%) higher than in the previous quarter.
As regards the trend by business line, in the last quarter of 2014 there was a slight decrease in the commercial margin (– Euro 1.2 million; –0.6%) due to a fall in lending rates (–13 bps) not offset by a lower cost of deposits (–12 bps) and by a contraction in volumes. The investment banking margin has increased (– Euro 2.4 million; +4.5%) thanks mainly to a lower cost of interbank deposits.

88 R e p o r t o n o p e r a t i o n s o f t h e B P M G r o u p
Quarterly trend in Bipiemme Group interest spread
1.42 1.34 1.25 1.20 1.16 1.070.97 0.86
3.24 3.25 3.24 3.19 3.23 3.22 3.16 3.03
1.82 1.91 1.99 1.99 2.07 2.15 2.19 2.17
1Q13 2Q13 3Q13 4Q13 1Q14 2Q14 3Q14 4Q14
Borrowing rates Lending rates Interest spread
The quarterly analysis of the interest spread in 2014 continues to show the positive trend of 2013; only in the fourth quarter of 2014 was there a marginal decrease of 2 bps compared with the previous quarter.
In particular, the lending rates in the fourth quarter were 3.03%, down by 13 bps compared with the previous quarter, while funding rates continued their steady decline that commenced in 2012 and continued during 2013 with an average of 0.86% compared with 0.97% in the third quarter of 2014 (–11 bps).It should also be noted that in the last quarter, the average 3-month Euribor decreased by 8 bps.
Non-interest margin
The non-interest margin of Euro 821.4 million posts a decline (–2.9%) at the end of 2014 compared with last year. While there was an increase in the year in net fee and commission income of Euro 11.7 million, there was a fall in net income from banking activities of Euro 12.2 million (–6.1%) and a decrease in profits (losses) on investments carried at equity of Euro 24.5 million (–51.7%).
Non-interest margin (Euro/000) Year 2014 Year 2013 Changes amount %Net fee and commission income 556,566 544,817 11,749 2.2 Other income: 264,829 300,742 (35,913) –11.9 Profits (losses) on investments carried at equity 22,857 47,353 (24,496) –51.7 Net income (loss) from banking activities 188,572 200,773 (12,201) –6.1 Other operating charges/income 53,400 52,616 784 1.5 Non-interest margin 821,395 845,559 (24,164) –2.9
The quarterly analysis of the non-interest margin highlights an increase of Euro 62.4 million (+41.4%) compared with the previous quarter, due to the good performance of net income from banking activities (+ Euro 32.3 million) and of net fee and commission income (+ Euro 18.5 million). In particular, the good result reflects an increase in profits on disposal or repurchase of financial assets/liabilities (+ Euro 24.5 million) and an increase in profits (losses) on trading of Euro 15.6 million. The increase in net fee and commission income is attributable to higher net fee and commission income on collection and payment services (+ Euro 10.7 million) and on guarantees given and received (+ Euro 4.8 million).Lastly, profits from investments carried at equity and other operating charges/income totalled Euro 26 million in the fourth quarter compared with Euro 14 million in the previous one.
Quarterly trend in non-interest margin (Euro/mln)
132 146 124 142 140 136 131 149
26 1720
36 16 20 1426
79 69
3418 79 65
6
38
237 233
179197
236221
151
213
1Q 13 2Q 13 3Q13 4Q13 1Q14 2Q14 3Q14 4Q14
Net fee and commission income Profits on investments carried at equity + other income Net income from banking activities

89R e p o r t o n o p e r a t i o n s o f t h e B P M G r o u p
Net fee and commission income
Net fee and commission income (Euro/000)
Year 2014 Year 2013 Changes
amount %
Fee and commission income 636,506 632,386 4,120 0.7Fee and commission expense (79,940) (87,569) 7,629 8.7Total net fee and commission income 556,566 544,817 11,749 2.2Breakdown:guarantees given and received 24,860 18,507 6,353 34.3credit derivatives – – – –management, dealing and advisory services 255,302 238,151 17,151 7.2collection and payment services 74,730 79,845 (5,115) –6.4servicing for securitisation transactions – – – –management of current accounts 64,189 66,791 (2,602) –3.9other services 137,485 141,523 (4,038) –2.9Total net fee and commission income 556,566 544,817 11,749 2.2
Net fee and commission income: details by company (Euro/000)
Year 2014 Year 2013 Changes
amount %
Banca Popolare di Milano (1) 530,944 521,368 9,576 1.8Banca Popolare di Mantova 4,778 4,539 239 5.3Banca Akros 24,557 22,815 1,742 7.6ProFamily (1,335) (1,249) (86) –6.9Other companies (1,652) (1,654) 2 0.1Consolidation eliminations/adjustments (726) (1,002) 276 27.5Total net fee and commission income 556,566 544,817 11,749 2.2
(1) The 2013 figures take account of the merger of WeBank with Banca Popolare di Milano that took place on 23 November 2014
The net fee and commission income amounts to Euro 556.6 million in December 2014, up compared with 2013 (+2.2%). This result has benefited mainly from higher net fee and commission income from management, dealing and advisory services (+ Euro 17.2 million; +7.2%) following the successful performance by asset management and guarantees given and received (+ Euro 6.4 million), which more than offset the decline in fees from collection and payment services (– Euro 5.1 million), which continue to be weighed down by the weakness in economic activity and a contraction in the volume of commercial loans and other services (– Euro 2.6 million).
Profits (losses) on investments carried at equity
This line item comes to Euro 22.9 million and is down on 2013 (–51.7%) mainly due to a lower contribution from Anima Holding S.p.A. (Euro 13.1 million compared with Euro 42.3 million in 2013), due to the impact of a partial sale of the equity interest therein, reducing the holding from 35.29% to 16.85%.

90 R e p o r t o n o p e r a t i o n s o f t h e B P M G r o u p
Net income from banking activities
Net income (loss) from banking activities (Euro/000)
Year 2014 Year 2013 Changes
amount %
Dividends 17,699 13,974 3,725 26.7
Profits (losses) on trading 52,870 52,068 802 1.5
Fair value adjustments in hedge accounting 411 (1,711) 2,122 124.0
Profits/losses on disposal or repurchase of financial assets/liabilities 150,667 190,283 (39,616) –20.8
Profits (losses) on financial assets/liabilities designated at fair value 7,667 29,326 (21,659) –73.9
Net losses/recoveries on impairment: financial assets available for sale (40,742) (83,167) 42,425 51.0
Total net income from banking activities 188,572 200,773 (12,201) –6.1
Net income from banking activities: details by company (Euro/000)
Year 2014 Year 2013 Changes
amount %
Banca Popolare di Milano (1) 140,132 155,924 (15,792) –10.1
Banca Popolare di Mantova 57 110 (53) –48.2
Banca Akros 45,781 46,654 (873) –1.9
Other companies – – – –
Consolidation eliminations/adjustments 2,602 (1,915) 4,517 235.9
Total net income from banking activities 188,572 200,773 (12,201) –6.1
(1) The 2013 figures take account of the merger of WeBank with Banca Popolare di Milano that took place on 23 November 2014
Net income from banking activities for 2014 amounted to Euro 188.6 million, down by Euro 12.2 million (–6.1%) with respect to 2013. The following should be noted regarding the components of this aggregate:
dividends amounted to Euro 17.7 million, up by Euro 3.7 million on the figure in December 2013;
profits (losses) on trading amounted to Euro 52.9 million and were up slightly by Euro 0.8 million (+1.5%) with respect to 2013;
the fair value adjustments in hedge accounting amounted to a gain of Euro 0.4 million compared with a loss of Euro 1.7 million in the same period last year. This amount includes the income booked to the income statement on the measurement of hedged assets and liabilities and the related derivative contracts, including any exchange differences;
the profit on the disposal or repurchase of financial assets/liabilities was Euro 150.7 million, down by Euro 39.6 million compared with 2013 due, in the main, to lower profits from the disposal of debt securities traded by the Parent Company;
profits (losses) on financial assets and liabilities designated at fair value are positive for Euro 7.7 million, down with respect to the positive balance of Euro 29.3 million at December 2013, due to the effect of lower writebacks and lower realised gains;
net losses/recoveries on impairment of financial assets available for sale amount to a loss of Euro 40.7 million. This amount relates almost entirely to specific adjustments recorded in relation to shares (– Euro 35.1 million) and mutual funds (– Euro 5.6 million) classified as “assets available for sale”.

91R e p o r t o n o p e r a t i o n s o f t h e B P M G r o u p
Other operating charges/income
Other operating charges/income for 2014 came to Euro 53.4 million, in line with the previous year (+0.8 million).
Operating expenses
In the period ended 31 December 2014, operating expenses – made up of administrative expenses and net adjustments to property and equipment and intangible assets – amounted to Euro 973.7 million, a decrease compared with 2013 (–1.3%). The ratio of operating expenses to operating income (cost/income ratio), 60%, is slightly up on the figure at December 2013 (58.6%).
Operating expenses: breakdown (Euro/000)
Year 2014 Year 2013 Changes
amount %
Administrative expenses: (898,831) (913,970) 15,139 1.7
a) personnel expenses (612,420) (608,720) (3,700) –0.6
b) other administrative expenses (286,411) (305,250) 18,839 6.2
Net adjustments to property and equipment and intangible assets (74,884) (72,646) (2,238) –3.1
Total (973,715) (986,616) 12,901 1.3
Operating expenses: details by company (Euro/000)
Year 2014 Year 2013 Changes
amount %
Banca Popolare di Milano (1) (896,410) (907,697) 11,287 1.2Banca Popolare di Mantova (10,177) (9,847) (330) –3.4Banca Akros (51,120) (52,898) 1,778 3.4ProFamily (19,408) (19,759) 351 1.8Other companies (3,012) (2,916) (96) –3.3Consolidation eliminations/adjustments 6,412 6,501 (89) –1.4
Total operating expenses (973,715) (986,616) 12,901 1.3
(1) The 2013 figures take account of the merger of WeBank with Banca Popolare di Milano that took place on 23 November 2014
In particular, personnel expenses of Euro 612.4 million show a slight increase (+0.6%) on those reported in December 2013.The 2014 figure includes a non-recurring item due to the adjustment of the Solidarity Fund in addition to variable items related to the results for a total of Euro 52.2 million (Euro 36.5 million in 2013). Excluding these items, “ordinary” personnel expenses come to Euro 560 million, a significant decrease (-2.1%; – Euro 12 million) compared with the previous year. This decrease reflects the reduction in the Group workforce for personnel that signed up with the Solidarity Fund (583 since March 2013, the date that the fund was activated, of which 161 in 2014).
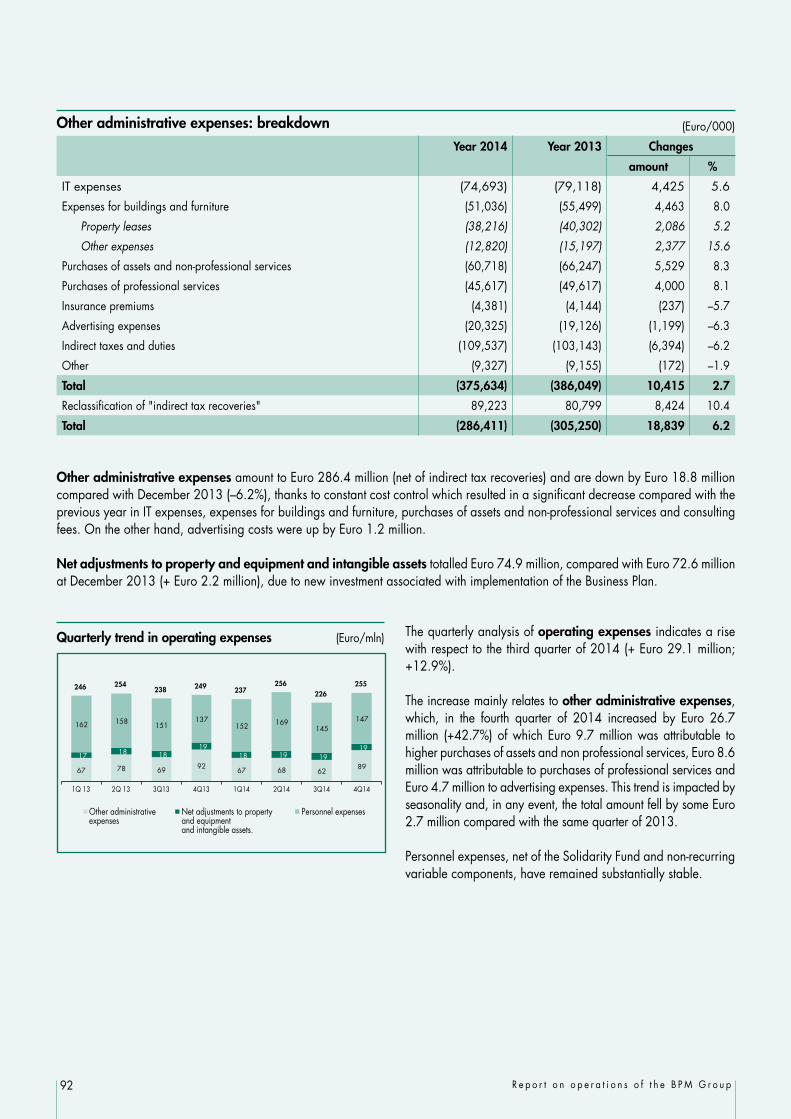
92 R e p o r t o n o p e r a t i o n s o f t h e B P M G r o u p
Other administrative expenses: breakdown (Euro/000)
Year 2014 Year 2013 Changes
amount %
IT expenses (74,693) (79,118) 4,425 5.6
Expenses for buildings and furniture (51,036) (55,499) 4,463 8.0
Property leases (38,216) (40,302) 2,086 5.2
Other expenses (12,820) (15,197) 2,377 15.6
Purchases of assets and non-professional services (60,718) (66,247) 5,529 8.3
Purchases of professional services (45,617) (49,617) 4,000 8.1
Insurance premiums (4,381) (4,144) (237) –5.7
Advertising expenses (20,325) (19,126) (1,199) –6.3
Indirect taxes and duties (109,537) (103,143) (6,394) –6.2
Other (9,327) (9,155) (172) –1.9
Total (375,634) (386,049) 10,415 2.7
Reclassification of "indirect tax recoveries" 89,223 80,799 8,424 10.4
Total (286,411) (305,250) 18,839 6.2
Other administrative expenses amount to Euro 286.4 million (net of indirect tax recoveries) and are down by Euro 18.8 million compared with December 2013 (–6.2%), thanks to constant cost control which resulted in a significant decrease compared with the previous year in IT expenses, expenses for buildings and furniture, purchases of assets and non-professional services and consulting fees. On the other hand, advertising costs were up by Euro 1.2 million.
Net adjustments to property and equipment and intangible assets totalled Euro 74.9 million, compared with Euro 72.6 million at December 2013 (+ Euro 2.2 million), due to new investment associated with implementation of the Business Plan.
Quarterly trend in operating expenses (Euro/mln)
67 78 69 92 67 68 6289
17 18 18 19
18 19 19 19
162 158 151 137
152 169 145
147
246 254238 249 237
256226
255
1Q 13 2Q 13 3Q13 4Q13 1Q14 2Q14 3Q14 4Q14
Other administrative expenses
Net adjustments to property and equipment and intangible assets.
Personnel expenses
The quarterly analysis of operating expenses indicates a rise with respect to the third quarter of 2014 (+ Euro 29.1 million; +12.9%).
The increase mainly relates to other administrative expenses, which, in the fourth quarter of 2014 increased by Euro 26.7 million (+42.7%) of which Euro 9.7 million was attributable to higher purchases of assets and non professional services, Euro 8.6 million was attributable to purchases of professional services and Euro 4.7 million to advertising expenses. This trend is impacted by seasonality and, in any event, the total amount fell by some Euro 2.7 million compared with the same quarter of 2013.
Personnel expenses, net of the Solidarity Fund and non-recurring variable components, have remained substantially stable.

93R e p o r t o n o p e r a t i o n s o f t h e B P M G r o u p
Net adjustments, provisions and other items
Net adjustments for impaired loans and other items amounted to Euro 423.8 million at the end of 2014, down from Euro 589.7 million in 2013 (– Euro 165.8 million; –28.1%).
The following have contributed to the increase in net adjustments for impairment of loans and collateral: specific adjustments of Euro 578.5 million, whereas the amount booked to this item in December 2013 was Euro 700 million; collective portfolio adjustments of about Euro 30 million, compared with Euro 38.6 million in 2013; specific write-backs totalling Euro 147.9 million compared with Euro 122.7 million in the previous year; portfolio write-backs of Euro 36.7 million compared with Euro 26.1 million the previous year.
Given the above interventions, the cost of credit, calculated as the ratio of the annualised amount of net loan adjustments to total loans outstanding, comes to 132 bps (177 bps at December 2013). For further analysis, reference should be made to the section on “Asset quality” in this report on operations.
Provisions for risks and charges amounted to a charge of Euro 3.5 million, compared with a charge of Euro 9.6 million for the comparative period of 2013, mainly in relation to amounts provided for legal disputes.
Net adjustments for impaired loans and other activities: composition (Euro/000)Transactions/Income elements
Adjustments Write-backs Year 2014 Year 2013 Changes
Specific Portfolio Total Specific Portfolio Total amount %
Loans: (559,297) (28,270) (587,567) 142,621 35,542 178,163 (409,404) (569,302) 159,898 28.1
Due from banks – (638) (638) 40 119 159 (479) 294 (773) n.s.
Loans to customers (559,297) (27,632) (586,929) 142,581 35,423 178,004 (408,925) (569,596) 160,671 28.2
Profits/losses on disposal/repurchase of loans (927) – (927) – – – (927) (9,595) 8,668 90.3
Other financial activities (18,240) (1,740) (19,980) 5,287 1,185 6,472 (13,508) (10,762) (2,746) –25.5
Total (578,464) (30,010) (608,474) 147,908 36,727 184,635 (423,839) (589,659) 165,820 28.1
Quarterly trend in net adjustments for impaired loans and other activities (Euro/mln) and the annualised cost of credit (bps)
64100 97
329
85 114 88136
73
117 114
395
104140
110
170
1Q 13 2Q 13 3Q 13 4Q 13 1Q 14 2Q 14 3Q 14 4Q 14
Net adjustments for impaired loans and other activities
Annualised quarterly cost of credit
The quarterly analysis of adjustments for impaired loans and other activities reveals a charge of Euro 137 million in the fourth quarter of 2014. This has significantly increased the coverage of gross impaired assets, as discussed in the section on “asset quality”. As a result of the increase in the coverage, the amount of net impaired loans has remained substantially stable.
The cost of credit, which comes to 170 bps on a quarterly basis, is up by 60 bps compared with the third quarter of 2014.

94 R e p o r t o n o p e r a t i o n s o f t h e B P M G r o u p
Profits (losses) from equity and other investments and adjustments to goodwill and intangible assets
Profits (losses) from equity and other investments and adjustments to goodwill and intangible assets totalled Euro 104.5 million, compared with zero previously, following recognition in the second quarter of 2014 of the capital gain on disposal of part of the interest held in Anima Holding S.p.A.
Net result
At 31 December 2014, the tax rate is affected by the gain arising on the partial disposal of Anima Holding. Accordingly, with income before taxes of Euro 324.9 million and a tax charge of Euro 92 million, net income for the year came to Euro 232.9 million, compared with Euro 29.4 million for 2013.
Net of minority interests (Euro 0.6 million), the net result of the Parent Company amounted to Euro 232.3 million (compared with Euro 29.6 million in 2013).

95R e p o r t o n o p e r a t i o n s o f t h e B P M G r o u p
Statement of cash flows The following statement of cash flows of the Bipiemme Group for the year ended 31 December 2014 shows cash absorption of Euro 40 million, compared with cash generation of Euro 77 million in 2013.
During 2014, operating activities absorbed total cash of Euro 685 million, and we would point out in particular that:1. operations generated cash of Euro 903 million, which is more than in the same period of 2013;2. financial assets net of financial liabilities absorbed liquidity of Euro 1,588 million, compared with liquidity absorption of Euro
128 million at December 2013, largely due to early repayment to the ECB of part of the LTRO.
Investing activities generated net liquidity of Euro 160 million, compared with cash absorption of Euro 74 million in 2013.
Financing activities generated net liquidity of Euro 485 million following the capital increase of about Euro 500 million (net of the expenses linked to the transaction) realised during the second quarter of 2014.
Bipiemme Group – Statement of cash flows (indirect method) (Euro/000)
A. OPERATING ACTIVITIES Year 2014 Year 20131. Cash flow from operations 903,393 779,1962. Cash flow from/used in financial assets 694,245 2,912,0943. Cash flow from/used in financial liabilities –2,282,179 –3,040,473Net cash flow from (used in) operating activities –684,541 650,817
B. INVESTING ACTIVITIES 1. Cash flow from 225,306 4332. Cash flow used in –65,744 –73,948Net cash flow from/used in investing activities 159,562 –73,515C. FINANCING ACTIVITIES Net cash flow from/used in financing activities 484,617 –499,992NET INCREASE (DECREASE) IN CASH AND CASH EQUIVALENTS –40,362 77,310
RECONCILIATION Line items 31.12.2014 31.12.2013Cash and cash equivalents at the beginning of the period 363,202 285,892 Net increase (decrease) in cash and cash equivalents –40,362 77,310 Cash and cash equivalents: foreign exchange effects 0 0 Cash and cash equivalents at the end of the period 322,840 363,202
Key: (+) generated (–) absorbed

96 R e p o r t o n o p e r a t i o n s o f t h e B P M G r o u p
Information on the main Group companiesFor a complete description of the Bipiemme Group, information on the 2014 results of the main companies included in the scope of consolidation are shown below. Key income statement and balance sheet figures are provided, together with a brief commentary.
Companies consolidated line-by-line
Banca Akros S.p.A.
Banca Akros – Reclassified balance sheet (Euro/000)
Assets 31.12.2014 30.09.2014 31.12.2013 Change A–B Change A–C
A B C amount % amount %
Cash and cash equivalents 95 67 119 28 41.8 –24 –20.2
Financial assets designated at fair value and hedging derivatives: 2,556,771 2,451,302 2,038,075 105,469 4.3 518,696 25.5
– Financial assets held for trading 2,124,615 2,060,514 1,571,918 64,101 3.1 552,697 35.2
– Financial assets designated at fair value through profit and loss 0 0 0 0 n.s. 0 n.s.
– Financial assets available for sale 432,156 390,788 466,157 41,368 10.6 –34,001 –7.3
– Hedging derivatives 0 0 0 0 n.s. 0 n.s.
– Fair value change of financial assets in hedged portfolios 0 0 0 0 n.s. 0 n.s.
Due from banks 696,723 741,902 663,371 –45,179 –6.1 33,352 5.0
Loans to customers 318,494 659,537 331,426 –341,043 –51.7 –12,932 –3.9
Fixed assets 39,795 38,985 40,307 810 2.1 –512 –1.3
Other assets 30,828 29,871 24,782 957 3.2 6,046 24.4
Total assets 3,642,706 3,921,664 3,098,080 –278,958 –7.1 544,626 17.6
Liabilities and shareholders’ equity 31.12.2014 30.09.2014 31.12.2013 Change A–B Change A–C
A B C amount % amount %
Due to banks 1,248,482 1,278,162 953,854 –29,680 –2.3 294,628 30.9
Due to customers 530,297 786,228 633,296 –255,931 –32.6 –102,999 –16.3
Securities issued 0 0 0 0 n.s. 0 n.s.
Financial liabilities and hedging derivatives: 1,599,659 1,561,890 1,256,333 37,769 2.4 343,326 27.3
– Financial liabilities held for trading 1,599,659 1,561,890 1,256,333 37,769 2.4 343,326 27.3
– Financial liabilities designated at fair value through profit and loss 0 0 0 0 n.s. 0 n.s.
– Hedging derivatives 0 0 0 0 n.s. 0 n.s.
– Fair value change of financial liabilities in hedged portfolios 0 0 0 0 n.s. 0 n.s.
Other liabilities 41,999 79,821 46,848 –37,822 –47.4 –4,849 –10.4
Provisions for specific use 23,410 21,820 22,078 1,590 7.3 1,332 6.0
Capital and reserves 181,057 181,177 175,844 –120 –0.1 5,213 3.0
Net income (loss) for the period (+/–) 17,802 12,566 9,827 5,236 41.7 7,975 81.2
Total liabilities and shareholders' equity 3,642,706 3,921,664 3,098,080 –278,958 –7.1 544,626 17.6

97R e p o r t o n o p e r a t i o n s o f t h e B P M G r o u p
Other information 31.12.2014 30.09.2014 31.12.2013 Change A–B Change A–C
A B C amount % amount %
Indirect customer deposits at market value 2,020,000 2,063,000 1,995,000 –43,000 –2.1 25,819 1.3
– of which assets under management 810,000 851,000 854,000 –41,000 –4.8 –43,513 –5.1
Headcount at period-end (1) 259 262 275 –3 –1.1 –16 –5.8
Number of branches 1 1 1 0 0.0 0 0.0
(1) employees + net secondees + temps
An analysis of the principal balance sheet aggregates shows: financial assets and liabilities consist of securities and financial derivatives, the fair value of which is mainly represented
by prices drawn from active markets or determined based on observable parameters (levels 1 and 2). The measurement of regulatory VaR (“Value at Risk 99%, 1 day”) of the trading book in 2014 amounted on average to Euro 416 thousand (Euro 556 thousand in 2013); the measurement of internal VaR, which also incorporates the issuer risk on debt securities and credit derivatives, amounts to an average of Euro 551 thousand (Euro 603 thousand in 2013);
the change in the level of amounts due to and from banks and customers is mainly due to the trend in normal operations in repurchase agreements and securities, which were also entered into with Group banks, and the amount of cash collateral exchanged with counterparties for exposures in OTC financial derivatives;
Shareholders’ equity at 31.12.2014 amounts to some Euro 199 million; at 31.12.2014 the Common Equity Tier 1 ratio is equal to 16.7%.
Banca Akros – Reclassified income statement (Euro/000)
Line items Year Year Changes
2014 2013 Amount %Interest margin 10,549 12,423 (1,874) –15.1Non-interest margin 71,784 68,820 2,964 4.3Net fee and commission income 24,557 22,815 1,742 7.6Other income: 47,227 46,005 1,222 2.7Net income (loss) from banking activities 45,780 46,653 (873) –1.9Other operating charges/income 1,447 (648) 2,095 n.s.Operating income 82,333 81,243 1,090 1.3Administrative expenses: (46,645) (48,202) 1,557 3.2 a) personnel expenses (27,568) (28,866) 1,298 4.5 b) other administrative expenses (19,077) (19,336) 259 1.3Net adjustments to property and equipment and intangible assets (4,475) (4,696) 221 4.7Operating expenses (51,120) (52,898) 1,778 3.4Operating profit 31,213 28,345 2,868 10.1Net adjustments for impairment of loans and other activities (1,314) (928) (386) –41.6Net provisions for risks and charges (1,783) (2,717) 934 34.4Profits (losses) from equity and other investments 0 (1) 1 n.s.Income (loss) before tax from continuing operations 28,116 24,699 3,417 13.8Taxes on income from continuing operations (10,314) (14,872) 4,558 30.7Net income (loss) for the period 17,802 9,827 7,975 81.2
An analysis of the principal income statement aggregates shows: interest margin which fell from Euro 12,423 thousand in 2013 to Euro 10,549 thousand in 2014 and which mainly
reflects lower average coupon yields on the proprietary bond portfolio compared with the previous year, not entirely offset by a decrease in the average cost of funding while meeting liquidity requirements;
non-interest margin of some Euro 71,784 thousand, mainly generated by:• net commission flows of Euro 24,557 thousand (Euro 22,815 thousand in 2013), achieved via the core activities of
collecting and trading orders on regulated markets, including other services such as the provision of access to financial

98 R e p o r t o n o p e r a t i o n s o f t h e B P M G r o u p
markets for interconnected professional customers, subscription/placement of equity and bond issues and, in private banking, thanks to individual portfolio management and the fees generated by customers with assets under administration;
• net income from banking activities of Euro 45,780 thousand (Euro 46,653 thousand in 2013); total operating income of Euro 82,333 thousand (Euro 81,243 thousand in 2013); total operating expenses of Euro 51,120 thousand (Euro 52,898 thousand in 2013); income before tax from continuing operations (after deducting net adjustments for impairment of loans and net provisions
for risks and charges) of Euro 28,116 thousand (Euro 24,699 thousand in 2013); net income for the period of Euro 17,802 thousand (Euro 9,827 thousand in 2013), after tax corresponding to an estimated
tax rate of approximately 37%.

99R e p o r t o n o p e r a t i o n s o f t h e B P M G r o u p
Banca Popolare di Mantova S.p.A.
Banca Popolare di Mantova – Reclassified balance sheet (Euro/000)
Assets 31.12.2014 30.09.2014 31.12.2013 Changes A–B Changes A–C
A B C amount % amount %
Cash and cash equivalents 6,557 6,381 6,981 176 2.8 –424 –6.1
Financial assets designated at fair value and hedging derivatives: 11,782 11,818 1,901 –36 –0.3 9,881 n.s.
– Financial assets held for trading 227 242 383 –15 –6.2 –156 –40.7
– Financial assets designated at fair value through profit and loss 0 0 0 0 n.s. 0 n.s.
– Financial assets available for sale 11,555 11,576 1,518 –21 –0.2 10,037 n.s.
– Hedging derivatives 0 0 0 0 n.s. 0 n.s.
Due from banks 25,364 23,980 10,029 1,384 5.8 15,335 152.9
Loans to customers 475,501 470,053 465,091 5,448 1.2 10,410 2.2
Fixed assets 8,139 8,132 8,484 7 0.1 –345 –4.1
Other assets 15,006 12,742 13,157 2,264 17.8 1,849 14.1
Total assets 542,349 533,106 505,643 9,243 1.7 36,706 7.3
Liabilities and shareholders’ equity 31.12.2014 30.09.2014 31.12.2013 Changes A–B Changes A–C
A B C amount % amount %
Due to banks 125,406 117,309 122,737 8,097 6.9 2,669 2.2
Due to customers 326,745 330,059 290,141 –3,314 –1.0 36,604 12.6
Securities issued 22,541 27,121 31,928 –4,580 –16.9 –9,387 –29.4
Financial liabilities and hedging derivatives: 228 242 6,139 –14 –5.8 –5,911 –96.3
– Financial liabilities held for trading 228 242 326 –14 –5.8 –98 –30.1
– Financial liabilities designated at fair value through profit and loss 0 0 5,813 0 n.s. –5,813 n.s.
– Hedging derivatives 0 0 0 0 n.s. 0 n.s.
Other liabilities 30,980 21,632 18,280 9,348 43.2 12,700 69.5
Provisions for specific use 1,095 1,189 1,332 –94 –7.9 –237 –17.8
Capital and reserves 35,125 35,156 36,423 –31 –0.1 –1,298 –3.6
Net income (loss) for the period (+/–) 229 398 –1,337 –169 –42.5 1,566 n.s.
Total liabilities and shareholders’ equity 542,349 533,106 505,643 9,243 1.7 36,706 7.3
Other information 31.12.2014 30.09.2014 31.12.2013 Changes A–B Changes A–C
A B C amount % amount %
Indirect customer deposits at market value 154,746 156,906 167,029 –2,160 –1.4 –12,283 –7.4
– of which assets under management 57,424 50,762 31,569 6,662 13.1 25,855 81.9
Headcount at period-end (*) 77 77 79 0 n.s. –2 –2.5
Number of branches 17 17 17 0 n.s. 0 n.s.
(*) employees + net secondees + temps

100 R e p o r t o n o p e r a t i o n s o f t h e B P M G r o u p
An analysis of the principal balance sheet aggregates shows: Loans to customers at 31 December 2014 of some Euro 476 million, up by Euro 10.4 million (+2.2%) with respect to 31
December 2013. Compared with December 2013, the change was partially attributable to an increase in mortgage loans of Euro 13.9 million (+4.8%), partially offset by a decrease in current accounts of Euro 8.2 million.
“Direct deposits” – consisting of amounts due to customers, securities issued and financial liabilities designated at fair value through profit and loss – amount to Euro 349.3 million, up by Euro 21.4 million with respect to 31 December 2013 (+6.5%). This aggregate includes the following:• amounts due to customers come to Euro 327 million, up by Euro 36.6 million with respect to 31 December 2013
(+12.6%), due to a significant increase in “current and savings accounts” (+12.6%), which benefited from a rise in the number of customers (+7.3% compared with December 2013) and from the increased attractiveness of term deposits;
• securities issued amounting to Euro 22.5 million, down by Euro 9.4 million compared with December 2013 (–29.4%) due to repayments made in the year – of a nominal value of some Euro 8 million – as well as a decrease in certificates of deposit (– Euro 3.3 million), reflecting a preference shown by customers for other forms of deposits;
• financial liabilities designated at fair value through profit and loss show a nil balance, having decreased by Euro 5.8 million, due to all the liabilities having reached maturity in 2014.
The volume of indirect deposits from ordinary customers, measured at market value, comes to some Euro 154.7 million, down with respect to the 31 December 2013 figure of some Euro 12.3 million (–7.4%) and by Euro 2.2 million (–1.4%) compared with September 2014 due to a negative performance by assets under administration.
At 31 December 2014, shareholders’ equity, including income for the year, comes to Euro 35.4 million, up by Euro 268 million compared with the end of 2013.
Banca Popolare di Mantova – Reclassified income statement (Euro/000)
Line items Year Year Changes
2014 2013 Amount %
Interest margin 9,166 8,948 218 2.4
Non-interest margin 5,558 5,451 107 2.0
Net fee and commission income 4,778 4,539 239 5.3
Other income: 780 912 (132) –14.5
Dividend from equity investments 0 0 0 n.s.
Net income (loss) from banking activities 57 111 (54) –48.6
Other operating charges/income 723 801 (78) –9.7
Operating income 14,724 14,399 325 2.3
Administrative expenses: (9,363) (9,055) (308) –3.4
a) personnel expenses (5,151) (4,988) (163) –3.3
b) other administrative expenses (4,212) (4,067) (145) –3.6
Net adjustments to property and equipment and intangible assets (814) (794) (20) –2.5
Operating expenses (10,177) (9,849) (328) 3.3Operating profit 4,547 4,550 (3) –0.1
Net adjustments for impairment of loans and other activities (3,776) (6,228) 2,452 39.4
Net provisions for risks and charges (42) (29) (13) –44.8
Profits (losses) from equity and other investments 0 0 0 n.s.
Income (loss) before tax from continuing operations 729 (1,707) 2,436 n.s.
Taxes on income from continuing operations (500) 370 (870) n.s.
Net income (loss) for the period 229 (1,337) 1,566 n.s.

101R e p o r t o n o p e r a t i o n s o f t h e B P M G r o u p
Operating income for 2014 comes to Euro 14.7 million, up by 2.3% compared with the previous year, thanks to the good performance of both the interest margin (+ Euro 0.2 million; +2.4%) and the non-interest margin (+ Euro 0.1 million; + 2.0%).In details: the interest margin comes to Euro 9.2 million, up by 2.4% with respect to the year to December 2013, due to an increase in
the commercial margin attributable to a widening of the spread between lending and borrowing rates, which comes to 1.82% (average annual figures), a rise of 32 bps. This increase benefited from a reduction in the cost of funding (–47 bps) that exceeded the reduction in lending rates;
the non-interest margin came to Euro 5.6 million in 2014, a rise of 2% with respect to 2013. This result is almost entirely attributable to a substantial increase in net fee and commission income (+ Euro 0.2 million; + 5.3%) that more than offset a fall in other income (– Euro 0.1 million; – 14.5%).
Operating expenses – made up of administrative expenses and net adjustments to property and equipment and intangible assets – come to Euro 10.2 million in 2014, an increase of Euro 0.3 million on the year to December 2013.In detail: personnel expenses come to Euro 5.2 million in 2014, an increase of Euro 0.2 million (+3.3%) compared with the previous year; other administrative expenses amount to Euro 4.2 million net of “tax recoveries” and show a slight increase compared with
31 December 2013 (+3.6%).
Operating profit amounts to Euro 4.5 million, virtually unchanged with respect to 2013. Taking account of loan adjustments that are half the 2013 figure and that amount to Euro 3.8 million, the result before tax from continuing operations is a profit of Euro 729 thousand, up significantly by Euro 2.4 million with respect to 2013.After having booked taxes of Euro 500 thousand, 2014 ended with net income of Euro 0.2 million, compared with a prior year loss of Euro 1.3 million.

102 R e p o r t o n o p e r a t i o n s o f t h e B P M G r o u p
ProFamily S.p.A.
ProFamily – Reclassified balance sheet (Euro/000)
Assets 31.12.2014 30.09.2014 31.12.2013 Changes A–B Changes A–C
A B C amount % amount %
Cash and cash equivalents 0 1 0 –1 –100.0 0 n.s.
Financial assets designated at fair value and hedging derivatives: 0 0 0 0 n.s. 0 n.s.
– Financial assets held for trading 0 0 0 0 n.s. 0 n.s.
– Financial assets designated at fair value through profit and loss 0 0 0 0 n.s. 0 n.s.
– Financial assets available for sale 0 0 0 0 n.s. 0 n.s.
– Hedging derivatives 0 0 0 0 n.s. 0 n.s.
Due from banks 7,525 953 18,169 6,572 n.s. –10,644 –58.6
Loans to customers 898,425 897,529 914,926 896 0.1 –16,501 –1.8
Fixed assets 5,463 5,536 7,142 –73 –1.3 –1,679 –23.5
Other assets 10,694 10,833 9,320 –139 –1.3 1,374 14.7
Total assets 922,107 914,852 949,557 7,255 0.8 –27,450 –2.9
Liabilities and shareholders’ equity 31.12.2014 30.09.2014 31.12.2013 Changes A–B Changes A–C
A B C amount % amount %
Due to banks 853,910 852,336 888,048 1,574 0.2 –34,138 –3.8
Due to customers 2,447 2,838 3,153 –391 –13.8 –706 –22.4
Securities issued 0 0 0 0 n.s. 0 n.s.
Financial liabilities and hedging derivatives: 0 0 0 0 n.s. 0 n.s.
– Financial liabilities held for trading 0 0 0 0 n.s. 0 n.s.
– Financial liabilities designated at fair value through profit and loss 0 0 0 0 n.s. 0 n.s.
– Hedging derivatives 0 0 0 0 n.s. 0 n.s.
Other liabilities 8,829 8,876 9,094 –47 –0.5 –265 –2.9
Provisions for specific use 2,060 1,735 2,171 325 18.7 –111 –5.1
Capital and reserves 52,091 47,091 48,204 5,000 10.6 3,887 8.1
Net income (loss) for the period (+ / –) 2,770 1,976 –1,113 794 40.2 3,883 n.s.
Total liabilities and shareholders' equity 922,107 914,852 949,557 7,255 0.8 –27,450 –2.9
Other information 31.12.2014 30.09.2014 31.12.2013 Changes A–B Changes A–C
A B C amount % amount %
Headcount at year-end (1) 102 100 98 2 2.0 4 4.1
Number of branches 25 23 24 2 8.7 1 4.2
(*) employees + net secondees + temps
An analysis of the principal balance sheet aggregates shows:
Total assets have reached a total of Euro 922.1 million, which is down on the amount of Euro 949.6 million at the end of 2013, with 98% of the total consisting of loans, which include Euro 7.5 million of inventory on the current accounts of the Company and Euro 898.4 million which corresponds to the IAS value of outstanding loans to customers, net of adjustments;
Payables, recorded as liabilities in the financial statements and which amount to Euro 853.9 million, are entirely due to the Parent Company and are attributable to the utilisation of lines of credit related to loans granted;
Shareholders’ equity comes to Euro 54.9 million and consists of share capital of Euro 50.0 million, reserves of Euro 2.1 million and profit for the year of Euro 2.8 million.

103R e p o r t o n o p e r a t i o n s o f t h e B P M G r o u p
ProFamily – Reclassified income statement (Euro/000)
Line items Year Year Changes
2014 2013 Amount %
Interest margin 31,116 30,255 861 2.8
Non-interest margin 1,302 821 481 58.7
Net fee and commission income (1,335) (1,249) (86) –6.9
Other income: 2,637 2,070 567 27.4
Dividends from equity investments 0 0 0 n.s.
Net income (loss) from banking activities 0 0 0 n.s.
Other operating charges/income 2,637 2,070 567 27.4
Operating income 32,418 31,076 1,342 4.3
Administrative expenses: (16,680) (17,259) 579 3.4
a) personnel expenses (7,559) (7,899) 340 4.3
b) other administrative expenses (9,121) (9,360) 239 2.6
Net adjustments to property and equipment and intangible assets (2,729) (2,500) (229) –9.1
Operating expenses (19,409) (19,759) 350 1.8Operating profit 13,010 11,317 1,693 15.0
Net adjustments for impairment of loans and other activities (8,323) (12,796) 4,473 –35.0
Net provisions for risks and charges (344) (3) (341) n.s.
Profits (losses) from equity and other investments 0 0 0 n.s.
Income (loss) before tax from continuing operations 4,343 (1,482) 5,825 n.s.
Taxes on income from continuing operations (1,573) 369 (1,942) n.s.
Net income (loss) for the period 2,770 (1,113) 3,882 n.s.
An analysis of the principal income statement aggregates shows: operating income for the year amounts to Euro 32.4 million, up on Euro 31.1 million in 2013. The interest margin amounts to
Euro 31.1 million. Net fee and commission income is an expense of Euro 1.3 million, whereas other operating income amounts to Euro 2.6 million and mainly consists of recoveries from customers of administrative costs (collection and mailing costs);
loan adjustments amount to Euro 8.3 million. This figure has decreased significantly with respect to the previous year (Euro 12.8 million) mainly due to the impact of a qualitative improvement in the portfolio as a result of a restructuring of the distribution network that was partly based on credit risk ratios;
total administrative expenses incurred by the company in the year amount to Euro 16.7 million, down by Euro 17.3 million compared with 2013. In particular: • personnel expenses come to Euro 7.6 million, down by 4.3% on the previous year;• other administrative expenses amount to Euro 9.1 million. The main component, which accounts for 40% of total
administrative expenses, is professional fees and third-party services that amount to Euro 3.9 million and include for the most part consortium services provided by the Parent Company and outsourcing services for credit recovery, back-office, contact center, help desk and digital storage;
income before tax from continuing operations amounts to Euro 4.3 million, a substantial improvement on the loss of Euro 1.5 million recorded in 2013. Taxes on income amount to a charge of Euro 1.6 million;
net income for the year amounts to Euro 2.8 million, compared with a loss of Euro 1.1 million in 2013. This result is primarily attributable to a qualitative improvement in the portfolio that led to a significant reduction in collective and specific writedowns.

104 R e p o r t o n o p e r a t i o n s o f t h e B P M G r o u p
Related party transactionsAs is generally known, the rules governing related party transactions aim to limit the risk that belonging to or, in any case, the proximity of certain people (so-called “related parties”) to the company’s decision-making bodies might compromise the impartiality of corporate decisions and the exclusive pursuit of the company’s interests, with possible distortions in the process of allocating resources, exposure of the company to risks which are not adequately measured or controlled, and potential damage to the company and its stakeholders.
In this regard, Bipiemme Group has prepared specific internal regulations, approving the “Regulation governing related parties and connected persons” (hereinafter the “Regulation”), drawn up in accordance with the provisions of prudential supervision issued by the Bank of Italy on associated persons (circular no. 263/2006, Title V, Chapter 5) and Consob’s Regulation of Related Party Transactions (Resolution no. 17221 of 12.3.2010, and subsequent amendments), as well as pursuant to article 136 of the Consolidated Banking Act (CBA), and which are available on the Bank’s website www.gruppobpm.it (to which reference should be made for a detailed description).
These Group Regulations, in the version updated during the first half of 2014:i. set out criteria for identifying the Bipiemme Group’s related parties and connected persons (hereinafter known collectively as
“Associated Persons”);ii. define quantitative limits for the assumption by the Banking Group of risk-weighted assets involving Associated Persons,
determining the relevant means for their computation and regulating, at the same time, the system of internal controls over transactions with Associated Persons;
iii. establishes the manner in which transactions with Associated Persons are approved, differentiating between less and more material transactions and defining in this context the role and the duties of the Independent Directors;
iv. sets out cases for exemptions and exceptions for certain types of transactions with Associated Persons;v. lays down the disclosure (and accounting) requirements as a result of entering into related party transactions.
The Bipiemme Group also prepared suitable “implementation instructions” (adopted individually by Group companies) to accompany this “Regulation”. These are designed (i) to define certain aspects regarding the correct management of transactions with related parties, to optimise the monitoring and management of the related positions by operators, and to identify the specific authorisation levels; (ii) collect in a single integrated text (available on www.gruppobpm.it to which reference should be made for details) the internal policies regarding controls over risk assets and conflicts of interest in respect of associated persons adopted by the Bipiemme Group.Therefore, having set out the general legal framework and regulatory system for “related parties” within the Group, it should be pointed out that, with particular reference to the granting of loans (one of the Bank’s main businesses), the IT procedures currently used by the Bank make it possible, among other things, to recognise immediately – and consequently to centralise automatically with the pertinent head office structures – any lines of credit granted to those who are considered to be a related party.Having said this by way of general introduction, as regards 2014 and, in particular, the relationships between BPM and its subsidiaries and associates, as well as with other related parties, we would point out that any such transactions have been carried out as part of the Bank’s normal day-to-day activities. They are regulated at market conditions for transactions of that type and, where these do not exist, based on an adequate remuneration of the costs incurred to produce the services rendered.
In this regard, we would point out in particular that: except as specified below, there were no atypical or unusual transactions during 2014 with related parties or any such that
would significantly affect the balance sheet, income statement or financial position and hence requiring disclosure to the market in accordance with the Consob’s Issuers Regulation in force;
all loans to subsidiaries and associates, as well as to other affiliates were subjected to Board approval regardless of the amount, as foreseen in the internal Credit Line Regulations (without prejudice, where applicable, to the instructions on related party transactions contained in the “Rules”);
also subject to board resolution – i.e. approved by a unanimous vote of Directors and with the unanimous vote in favour of the audit committee – are the transactions carried out directly or indirectly (and, thus, also through “close relatives”) with persons that fall into the field of application of art. 136 of the Banking Code (“Obligations of bank corporate officers”);
at the level of individual transactions:• on 17 June 2014, following favourable opinions from the Supervisory Board issued in accordance with arts. 39 and 51
of the Articles of Association, and the Board of Directors of WeBank SpA, the Management Board of BPM approved, in

105R e p o r t o n o p e r a t i o n s o f t h e B P M G r o u p
accordance with arts. 2501-ter and 2505 of the Italian Civil Code, the proposed absorption of WeBank SpA by BPM. The merger – authorised by the Bank of Italy pursuant to art. 57 of Legislative Decree 385/93 – is a related party transaction as defined by Consob and the rules adopted by the Bank, since BPM wholly owned the bank absorbed. Pursuant to the above Consob regulations, this absorption qualifies as a “more significant” transaction; in this regard, the exemption envisaged in art. 14 of Consob Regulation 17221/2010 (and subsequent amendments), as referred to in the Bank’s rules, is applicable since there are no other related parties with a significant interest in WeBank SpA. The merger deed was executed on 12 November 2014, with effect from 23 November 2014, whereas it took effect for accounting and tax purposes as from 1 January 2014;
• on 4 November 2014, the Management Board of BPM passed a motion to proceed with a sale of loans to Pitagora S.p.A. (a company in which the Bank holds an indirect equity interest). This sale of loans of an indicative amount of Euro 27 million, is a related party transaction, which benefits from exemptions provided for by law, given that it was entered into with an associated company in which no other associated persons have a significant interest;
• on 16 December 2014, the Management Board of BPM passed a motion to proceed with the completion of a settlement agreement for a total amount of Euro 5.8 million with Fondazione Cassa di Risparmio di Alessandria (hereinafter “Fondazione CRAL”), a party that qualifies as a BPM related party, given that it is a strategic partner. Specific safeguards have therefore been activated as required by current regulations, also at corporate level, on the subject of related parties. Under these specific conditions, the foregoing transaction qualifies as a “less relevant” transaction and, accordingly, is subject to approvals as envisaged by law in such cases. The settlement envisages (i) a waiver by Fondazione CRAL of certain claims for compensation for alleged damages inked to Bipiemme Group corporate transactions; (ii) the payment of the above sum to Fondazione CRAL in three annual tranches; (iii) the use of this sum by Fondazione CRAL for socially useful purposes and for the promotion of the development of or of support for voluntary organisations;
• on 30 December 2014, BPM made a capital contribution to ProFamily S.p.A. (fully held subsidiary of BPM) of an amount of Euro 5 million; in this regard, the exemption envisaged in art. 14 of Consob Regulation 17221/2010 (and subsequent amendments), as referred to in the Bank’s rules, is applicable since there are no other related parties with a significant interest in ProFamily SpA.
***

106 R e p o r t o n o p e r a t i o n s o f t h e B P M G r o u p
With reference to the requirements of art. 5, para. 8, of Consob Regulation 17221/2010 (and subsequent amendments) on interim accounting information, note that as part of its normal operations the Bank carried out a number of transactions with related parties in 2014 that would qualify as being of “greater relevance” (under Consob’s regulation and the related internal procedure); in particular, these transactions were carried out with direct or indirect subsidiary companies or associates of the Bank. In this connection, with particular reference to credit line relationships (understood as the overall credit positions granted), the following is a summary table of the credit line relationships maintained by BPM with these companies, approved or revised by BPM during 2014 and falling within the said relevance parameters.
(Amounts in thousands of Euro)Counterparty Nature
of relationship Total credit granted – minimum
Total credit granted – maximum
WeBank SpA(*) Subsidiary company 866,077 1,076,080Anima SGR SpA Associated company 286 300,286Pitagora Finanziamenti contro cessione del quinto SpA Associated company 410,549 417,198Credit Industriel et Commercial (**) Strategic Partner 484,953 494,691Factorit SpA Associated company 240,000 290,000BPM Covered Bond Srl Subsidiary company 7,288,545 10,720,805Anima Holding SpA Associated company 77,000 257,000ProFamily SpA Subsidiary company 1,121,986 1,121,986
(*) Company merged with the Parent Company from 23 November 2014.(**) Strategic Partner of BPM until 15 April 2014.
In addition, the Parent Company also carries out routine transactions with Banca Akros S.p.A. involving the specific activities of that subsidiary. These include, in particular, the provision of rotating funds that are used by Banca Akros S.p.A. for operations in the capital markets, as well as overnight transactions and repurchase agreements.Lastly, again with regard to intercompany transactions, note that in 2014: the subsidiary WeBank SpA (merged into the Parent Company on 23 November 2014) – under the “Multi-originator” Programme
for the issue of covered bonds, structured at the time by the Parent Company – sold to the SPV BPM Covered Bond srl (a subsidiary of BPM) a portfolio of residential mortgage loans of a nominal value of some Euro 433 million;
the Bank – under the “Multi-originator” Programme for the issue of bonds – sold to the SPV BPM Covered Bond Srl (a subsidiary of BPM) a portfolio of residential mortgage loans of nominal value of Euro 1.3 billion, granting the vehicle a loan of Euro 890 million. The total amount of the portfolio was paid for by BPM Covered Bond by using the above loan and in cash, corresponding to an amount of some Euro 404 million; as part of ordinary operations within the Group and with the application of conditions at market level - bonds have been issued for Group companies (“private placements”) for a total nominal value of Euro 350 million.
Lastly, we wish to point out that, during the second half of 2014, the Management Board passed a motion concerning a securitisation operation relating to commercial mortgage loans secured by a first rank mortgage and unsecured loans originating from Bipiemme Group banks and approved the subscription of all of the securities issued by the SPV (BPM Securitization 3, a company consolidated line-by-line) for a maximum total amount of some Euro 864 million.

107R e p o r t o n o p e r a t i o n s o f t h e B P M G r o u p
Subsequent events and outlook for operations Significant events subsequent to the end of 2014 have been reported in the section of this report on “Significant Events for Banca Popolare di Milano and the Bipiemme Group”.
Outlook
Recent macroeconomic data confirms that there has been a slight improvement in the outlook for Italy, which, according to recent forecasts by the major research institutes, could exit from recession in the first quarter of 2015. Growth, which is expected to come from a recovery in consumer spending, as well as from investment spending by companies and exports, is supported by a series of positive factors such as the weak euro, the fall in price of oil, which is almost half the 2013 price and greater availability of credit, thanks to unconventional measures adopted by the ECB such as TLTRO transactions and the purchase of assets (so-called “Quantitati-ve Easing”). The labour market is also expected to start benefiting, even if just slowly, from the effects of the legislative reforms made in the year just ended. Under these circumstances, the Bipiemme Group’s operations will continue in line with the guidelines set out in the Business Plan approved in March of last year. Our commercial operations will remain focused on improving our territorial pre-sence and the level of customer service, while our financial intermediation activities, supported by solid capital and liquidity bases, could benefit from a recovery in volumes, even if faced with an increase in competitive pressure. This could favour a stabilisation of interest margins, even with a reduction in the contribution from the securities portfolio, due to the effect of the constant fall in market yields. Interest spread is not expected to change significantly; the effects of quantitative easing on lending and deposit rates should in fact balance out. Of the components of service income, net fee and commission income is expected to confirm the latest trends, benefiting again from a good performance from asset management and also from lending activities as well as the positive effect of economic recovery on banking services, while net income from banking activities, which is still significant, is expected to fall. Tight control over operating expenses and risks will continue to be an important lever to maintain profitability. New development initiatives will be aimed at achieving greater efficiency, productivity and organisational simplification.

108 R e p o r t o n o p e r a t i o n s o f t h e B P M G r o u p
Main risks and uncertainties to which the Bipiemme Group is exposed
Risks and uncertainties
Over the coming months, the Group’s operations will be exposed to the risk that the economic trend will diverge from that expected, keeping the country in a recessionary environment, exacerbated by possible deflation.
Moreover, the positive outcome of the comprehensive assessment undertaken in 2014 on Bipiemme Group by the EBA and the ECB – details of which are provided in the section in this report on operations on “Significant events for Banca Popolare di Milano and the Bipiemme Group” and which led to a thorough asset quality review and severe stress tests of capital adequacy – confirms the resilience of the Group even under adverse macroeconomic scenarios.
Reference should be made to the explanatory notes for details of risks to which the Group is exposed.
The Group is expected to continue operating in the foreseeable future, so this Report on Operations has been prepared on a going-concern basis.
Opt-out from the obligation to publish a prospectus in the event of significant transactions
Pursuant to art. 3 of Consob Resolution no. 18079 of 20 January 2012, the Management Board of Banca Popolare di Milano has decided to take advantage of the opt-out provided for in arts. 70, paragraph 8, and 71, paragraph 1-bis of Consob Regulation no. 11971/99 (as amended).

109
Consolidated financial statements

110 C o n s o l i d a t e d f i n a n c i a l s t a t e m e n t s
Bipiemme Group – Consolidated balance sheet (Euro/000)
Assets 31.12.2014 31.12.2013
10. Cash and cash equivalents 322,840 363,202
20. Financial assets held for trading 1,921,518 1,449,237
30. Financial assets designated at fair value through profit and loss 97,449 219,118
40. Financial assets available for sale 9,670,272 9,189,022
50. Investments held to maturity 0 0
60. Due from banks 984,777 1,813,458
70. Loans to customers 32,078,843 33,345,026
80. Hedging derivatives 178,460 178,291
90. Fair value change of financial assets in hedged portfolios (+/–) 20,107 10,105
100. Investments in associates and companies subject to joint control 293,797 395,587
110. Technical insurance reserves reassured with third parties 0 0
120. Property and equipment 715,705 738,200
130. Intangible assets 108,377 96,188
of which:
– goodwill 0 0
140. Tax assets 1,091,309 1,018,633
a) current 187,310 171,792
b) deferred 903,999 846,841
of which Law 214/11 710,044 644,598
150. Non-current assets held for sale and discontinued operations 0 0
160. Other assets 788,357 537,251
Total assets 48,271,811 49,353,318

111C o n s o l i d a t e d f i n a n c i a l s t a t e m e n t s
Bipiemme Group – Consolidated balance sheet (Euro/000)
Liabilities and shareholders’ equity 31.12.2014 31.12.2013
10. Due to banks 3,318,564 5,913,928
20. Due to customers 27,702,942 26,423,495
30. Securities issued 8,981,834 10,114,241
40. Financial liabilities held for trading 1,463,445 1,163,738
50. Financial liabilities designated at fair value through profit and loss 152,116 276,739
60. Hedging derivatives 58,751 23,348
70. Fair value change of financial liabilities in hedged portfolios (+/–) 16,084 23,222
80. Tax liabilities 165,201 150,618
a) current 22 44,261
b) deferred 165,179 106,357
90. Liabilities associated with non-current assets held for sale and discontinued operations 0 0
100. Other liabilities 1,336,792 1,041,027
110. Employee termination indemnities 137,730 133,425
120. Allowances for risks and charges: 382,245 444,771
a) post employment benefits 92,568 81,231
b) other allowances 289,677 363,540
130. Technical reserves 0 0
140. Valuation reserves 321,917 145,122
150 Redeemable shares 0 0
160. Equity instruments 0 0
170. Reserves 617,888 586,135
180. Share premium reserve 0 8
190. Share capital 3,365,439 2,865,710
200. Treasury shares (–) –854 –859
210. Minority interests (+/–) 19,424 19,061
220. Net income (loss) for the period (+/–) 232,293 29,589
Total liabilities and shareholders’ equity 48,271,811 49,353,318

112 C o n s o l i d a t e d f i n a n c i a l s t a t e m e n t s
Bipiemme Group – Consolidated income statement (Euro/000)
Income statement line items Year 2014 Year 2013
10. Interest and similar income 1,289,302 1,410,567
20. Interest and similar expense (489,131) (573,143)
30. Interest margin 800,171 837,424
40. Fee and commission income 636,506 632,386
50. Fee and commission expense (79,940) (87,569)
60. Net fee and commission income 556,566 544,817
70. Dividend and similar income 17,699 13,974
80. Profits (losses) on trading 52,870 52,068
90. Fair value adjustments in hedge accounting 411 (1,711)
100. Profits (losses) on disposal or repurchase of: 149,740 180,688
a) loans (927) (9,595)
b) financial assets available for sale 150,764 189,524
c) investments held to maturity 0 0
d) financial liabilities (97) 759
110. Profits (losses) on financial assets and liabilities designated at fair value 7,667 29,326
120. Net interest and other banking income 1,585,124 1,656,586
130. Net losses/recoveries on impairment of: (463,654) (663,231)
a) loans (409,404) (569,302)
b) financial assets available for sale (40,742) (83,167)
c) investments held to maturity 0 0
d) other financial activities (13,508) (10,762)
140. Net income from banking activities 1,121,470 993,355
150. Net insurance premiums 0 0
160. Other net insurance income (expenses) 0 0
170. Net income from banking and insurance activities 1,121,470 993,355
180. Administrative expenses: (988,054) (994,769)
a) personnel expenses (612,420) (608,720)
b) other administrative expenses (375,634) (386,049)
190. Net provisions for risks and charges (3,545) (9,619)
200. Net adjustments to/recoveries on property and equipment (44,450) (43,791)
210. Net adjustments to/recoveries on intangible assets (25,859) (24,346)
220. Other operating expenses/income 138,048 128,906
230. Operating expenses (923,860) (943,619)
240. Profits (losses) on investments in associates and companies subject to joint control 127,331 47,353
250. Net result of valuation differences on property, equipment and intangible assets measured at fair value 0 0
260. Goodwill impairment 0 0
270. Profits (losses) on disposal of investments 0 (258)
280. Income (loss) before tax from continuing operations 324,941 96,831
290. Taxes on income from continuing operations (92,008) (67,442)
300. Income (loss) after tax from continuing operations 232,933 29,389
310. Income (loss) after tax from discontinued operations 0 0
320. Net income (loss) for the period 232,933 29,389
330. Net income (loss) for the period pertaining to minority interests (640) 200
340. Parent Company's net income (loss) for the period 232,293 29,589
Basic EPS from continuing operations – Euro 0.059 0.009
Diluted EPS from continuing operations – Euro 0.059 0.009
Basic EPS – Euro 0.059 0.009
Diluted EPS – Euro 0.059 0.009

113C o n s o l i d a t e d f i n a n c i a l s t a t e m e n t s
Bipiemme Group – Statement of consolidated comprehensive income (Euro/000)
Line items Year 2014 Year 2013
10. Net income (loss) for the period (*) 232,933 29,389
Other comprehensive income, net of tax, without reversal to the income statement (22,902) (3,144)
20. Property and equipment 0 0
30. Intangible assets 0 0
40. Actuarial gains (losses) on defined-benefit plans (22,827) (3,139)
50. Non-current assets held for sale 0 0
60. Share of valuation reserves connected with investments carried at equity (75) (5)
Other comprehensive income, net of tax, with reversal to the income statement 199,706 86,275
70. Hedging of foreign investments 0 0
80. Foreign exchange differences 0 0
90. Cash flow hedges (4,502) 0
100. Financial assets available for sale 203,909 81,873
110. Non-current assets held for sale 0 0
120. Share of valuation reserves connected with investments carried at equity 299 4,402
130. Total other comprehensive income (net of tax) 176,804 83,131
140. Total comprehensive income (Line items 10+130) 409,737 112,520
150. Total consolidated comprehensive income of minority interests (678) 201
160. Total Parent Company's consolidated comprehensive income 409,059 112,721
(*) Parent Company's net income (loss) for the period 232,293 29,589
Net income (loss) for the period pertaining to minority interests 640 (200)
Net income (loss) for the period 232,933 29,389
The statement of comprehensive income is a restatement of the result for the year that includes changes in the value of assets booked directly to the valuation reserves (net of tax).

114 C o n s o l i d a t e d f i n a n c i a l s t a t e m e n t s
Bipiemme Group – Consolidated statement of changes in shareholders’ equity as at 31 December 2014
(Eur
o/00
0)
Amounts as at 31.12.2013
Change in opening balance
Amounts as at 1.1.2014
Allo
catio
n of
net
in
com
e of
the
prev
ious
yea
r
Chan
ges
for
the
perio
d
Shareholders’ equity as at 31.12.2014
Group shareholders’ equity as at 31.12.2014
Minority interests as at 31.12.2014
Changes in reserves (*)
Ope
ratio
ns o
n sh
areh
olde
rs’ e
quity
Comprehensive income – 2014
Reserves
Dividends and other allocations
Issue of new shares (**)
Purchase of treasury shares
Extraordinary dividends
Change in equity instruments
Derivatives on treasury shares
Stock options
Changes in equity interests
Shar
e ca
pita
l:2,
868,
071
02,
868,
071
00
049
9,72
90
00
00
–20
3,36
7,79
83,
365,
439
2,35
9
a) o
rdin
ary
shar
es2,
868,
071
02,
868,
071
00
0 4
99,7
290
00
00
–20
3,36
7,79
83,
365,
439
2,35
9
b) o
ther
shar
es0
00
00
00
00
00
00
00
00
Shar
e pr
emiu
m r
eser
ve12
,638
012
,638
–506
00
–8
00
00
0–1
420
11,9
820
11,9
82
Rese
rves
:59
0,35
30
590,
353
29,7
290
17,2
73–1
5,10
90
00
00
–50
622,
241
617,
888
4,35
3
a) re
tain
ed e
arni
ngs
570,
748
057
0,74
829
,729
0–2
90
00
00
0–5
060
0,44
359
6,09
04,
353
b) o
ther
19,6
050
19,6
050
017
,302
–15,
109
00
00
00
021
,798
21,7
980
Valu
atio
n re
serv
es:
145,
174
014
5,17
40
029
00
00
00
017
6,80
432
2,00
732
1,91
790
a) a
vaila
ble
for s
ale
174,
000
017
4,00
00
00
00
00
00
020
3,90
937
7,90
937
7,75
815
1
b) c
ash
flow
hed
ges
00
00
00
00
00
00
0–4
,502
–4,5
02–4
,502
0
c) A
ctuar
ial g
ains
(los
ses)
on
de
fined
-ben
efit p
ensio
n pl
ans
–39,
211
0–3
9,21
10
00
00
00
00
0–2
2,82
7–6
2,03
8–6
1,97
7–6
1
d) N
on-cu
rrent
ass
ets h
eld
for s
ale
a
nd d
iscon
tinue
d op
erat
ions
00
00
00
00
00
00
00
00
0e)
Sha
re o
f val
uatio
n re
serv
es
c
onne
cted
with
inve
stmen
ts ca
rried
at e
quity
–3,0
570
–3,0
570
029
00
00
00
022
4–2
,804
–2,8
040
f) Sp
ecia
l rev
alua
tion
law
s13
,442
013
,442
00
00
00
00
00
013
,442
13,4
420
Equi
ty in
stru
men
ts0
00
00
00
00
00
00
00
00
Trea
sury
sha
res
–859
0–8
590
00
4,51
8–4
,513
00
00
00
–854
–854
0
Net
inco
me
(loss
) for
the
perio
d29
,389
029
,389
–29,
223
–166
00
00
00
00
232,
933
232,
933
232,
293
640
Shar
ehol
ders
' equ
ity3,
644,
766
03,
644,
766
0–1
6617
,302
489,
130
–4,5
130
00
0–1
4940
9,73
74,
556,
107
4,53
6,68
319
,424
Gro
up s
hare
hold
ers'
equ
ity3,
625,
705
03,
625,
705
00
17,3
0248
9,13
0–4
,513
00
00
040
9,05
94,
536,
683
4,53
6,68
3
Min
ority
inte
rest
s19
,061
019
,061
0–1
660
00
00
00
–149
678
19,4
24
(*) T
he a
mou
nts s
how
n in
this
colu
mn
rela
te to
:
– th
e re
cogn
ition
in th
e in
com
e sta
tem
ent o
f 16,
526,
497.
60 re
latin
g to
pro
fit sh
arin
g by
mea
ns o
f the
allo
catio
n of
shar
es to
em
ploy
ees p
ursu
ant t
o ar
t. 60
of t
he A
rticle
s of A
ssoc
iatio
n an
d to
the
varia
ble
com
pone
nt o
f rem
uner
atio
n ag
ain
pay
able
in sh
ares
acc
ount
ed fo
r in
acco
rdan
ce w
ith IF
RS 2
with
an
oppo
site
entry
to sh
areh
olde
rs’ e
quity
;
–
an a
mou
nt o
f Eur
o 77
5,00
0 re
latin
g to
an
asso
ciat
e co
mpa
ny’s
staff
ince
ntiv
e pl
an;
(**)
The
am
ount
s sho
wn
in th
is co
lum
n re
late
to:
– iss
ue o
f 1,1
62,1
61,7
65 n
ew B
PM o
rdin
ary
shar
es a
t Eur
o 0.
43 e
ach,
for a
tota
l of E
uro
499,
729,
558.
95;
– re
venu
es fr
om th
e sa
le o
f une
xerc
ised
optio
ns fo
r Eur
o 1,
251,
293
book
ed e
ntire
ly to
the
shar
e pr
emiu
m re
serv
e;
–
expe
nses
incu
rred
in c
onne
ction
with
the
incr
ease
in c
apita
l for
Eur
o 22
,544
,682
, net
of t
he re
late
d ta
x ef
fect
of E
uro
6,19
9,78
8, b
ooke
d fo
r Eur
o 1,
235,
681
to th
e sh
are
prem
ium
and
for
Eur
o 15
,109
,214
to o
ther
rese
rves
set u
p at
the
time
the
BPM
200
9/20
13 w
arra
nts w
ere
issue
d;
–
chan
ges i
n tre
asur
y sh
ares
, whi
ch re
duce
d th
e sh
are
prem
ium
rese
rve
by E
uro
23,8
86.

115C o n s o l i d a t e d f i n a n c i a l s t a t e m e n t s
(Eur
o/00
0)
Amounts as at 31.12.2012
Change in opening balance
Amounts as at 1.1.2013
Allo
catio
n of
net
in
com
e of
the
prev
ious
yea
r
Chan
ges
for
the
perio
d
Shareholders’ equityas at 31.12.2013
Group shareholders’ equity as at 31.12.2013
Minority interests as at 31.12.2013
Changes in reserves
Ope
ratio
ns o
n sh
areh
olde
rs’ e
quity
Comprehensive income – 2013
Reserves
Dividends and other allocations
Issue of new shares (*)
Purchase of treasury shares
Extraordinary dividends
Change in equity instruments (**)
Derivatives on treasury shares
Stock options
Changes in equity interests
Shar
e ca
pita
l:2,
880,
167
02,
880,
167
00
01
00
00
0–1
2,09
70
2,86
8,07
12,
865,
710
2,36
1
a) o
rdin
ary
shar
es2,
880,
167
02,
880,
167
00
0 1
00
00
0–1
2,09
70
2,86
8,07
12,
865,
710
2,36
1
b) o
ther
shar
es0
00
00
00
00
00
00
00
00
Shar
e pr
emiu
m r
eser
ve19
3,93
50
193,
935
–172
,102
00
80
00
00
–9,2
030
12,6
388
12,6
30
Rese
rves
:85
6,29
50
856,
295
–262
,895
0–1
4–1
00
00
0–3
,032
059
0,35
358
6,13
54,
218
a) re
tain
ed e
arni
ngs
836,
689
083
6,68
9–2
62,8
950
–14
00
00
00
–3,0
320
570,
748
566,
530
4,21
8
b) o
ther
19,6
060
19,6
060
00
–10
00
00
00
19,6
0519
,605
0
Valu
atio
n re
serv
es:
62,0
290
62,0
290
014
00
00
00
083
,131
145,
174
145,
122
52
a) a
vaila
ble
for s
ale
92,1
270
92,1
270
00
00
00
00
081
,873
174,
000
173,
910
90
b) c
ash
flow
hed
ges
00
00
00
00
00
00
00
00
0
c) A
ctuar
ial g
ains
(los
ses)
on
de
fined
-ben
efit p
ensio
n pl
ans
–36,
072
0–3
6,07
20
00
00
00
00
0–3
,139
–39,
211
–39,
173
–38
d) N
on-cu
rrent
ass
ets h
eld
for s
ale
a
nd d
iscon
tinue
d op
erat
ions
00
00
00
00
00
00
00
00
0e)
Sha
re o
f val
uatio
n re
serv
es
c
onne
cted
with
inve
stmen
ts ca
rried
at e
quity
–7,4
680
–7,4
680
014
00
00
00
04,
397
–3,0
57–3
,057
0
f) Sp
ecia
l rev
alua
tion
law
s13
,442
013
,442
00
00
00
00
00
013
,442
13,4
420
Equi
ty in
stru
men
ts50
0,00
00
500,
000
00
00
00
–500
,000
00
00
00
0
Trea
sury
sha
res
–859
0–8
590
00
1,95
0–1
,950
00
00
00
–859
–859
0
Net
inco
me
(loss
) for
the
perio
d–4
34,8
500
–434
,850
434,
997
–147
00
00
00
00
29,3
8929
,389
29,5
89–2
00
Shar
ehol
ders
' equ
ity4,
056,
717
04,
056,
717
0–1
470
1,95
8–1
,950
0–5
00,0
000
0–2
4,33
211
2,52
03,
644,
766
3,62
5,70
519
,061
Gro
up s
hare
hold
ers'
equ
ity4,
015,
086
04,
015,
086
00
01,
958
–1,9
500
–500
,000
00
–2,1
1011
2,72
13,
625,
705
3,62
5,70
5
Min
ority
inte
rest
s41
,631
041
,631
0–1
470
00
00
00
–22,
222
–201
19,0
61
(*) I
n 20
13, 1
47 B
PM W
arra
nts 2
009/
2013
wer
e ex
erci
sed,
lead
ing
to th
e iss
ue o
f 1,3
23 sh
ares
tota
lling
Euro
9,0
11(*
*) T
he e
limin
atio
n of
the
equi
ty in
strum
ents
is du
e to
full
repa
ymen
t of t
he T
rem
onti
Bond
s on
28 Ju
ne 2
013.
Bipiemme Group – Consolidated statement of changes in shareholders’ equity as at 31 December 2013

116 C o n s o l i d a t e d f i n a n c i a l s t a t e m e n t s
Bipiemme Group – Consolidated statement of cash flows (indirect method) (Euro/000)
A. OPERATING ACTIVITIES Year 2014 Year 20131. Cash flow from operations 903,393 779,196
– net income (loss) for the period (+/–) 232,293 29,589– profits/losses on financial assets held for trading and on financial assets/liabilities designated at fair value through profit and loss (–/+) –7,098 –66,302– profits/losses on hedging activities (–/+) –411 1,711– net losses/recoveries on impairment (+/–) 499,814 695,264– net adjustments to property and equipment and intangible assets (+/–) 70,309 68,137– net provisions for risks and charges and other costs/revenues (+/–) 26,879 41,455– net insurance premiums to be collected (–) 0 0– other insurance revenues/charges to be collected (–/+) 0 0– taxes and duties to be settled (+) 104,463 56,695– net adjustment to/recoveries on discontinued operations net of tax effect (+/–) 0 0– other adjustments (+/–) –22,856 –47,353
2. Cash flow from/used in financial assets 694,245 2,912,094– financial assets held for trading –461,774 419,768– financial assets designated at fair value through profit and loss 121,373 50,469– financial assets available for sale –126,010 512,423– due from banks: repayable on demand –355,406 –803,332– due from banks: other 1,176,457 1,708,539– loans to customers 829,164 851,661– other assets –489,559 172,566
3. Cash flow from/used in financial liabilities –2,282,179 –3,040,473– due to banks: repayable on demand 269,494 126,087– due to banks: other –2,864,858 –504,164– due to customers 1,272,309 118,162– securities issued –1,134,294 –1,053,056– financial liabilities held for trading 299,707 –421,709– financial liabilities designated at fair value through profit and loss –127,736 –724,453– other liabilities 3,199 –581,340
Net cash flow from (used in) operating activities –684,541 650,817B. INVESTING ACTIVITIES1. Cash flow from 225,306 433
– sales of investments in associates and companies subject to joint control 225,304 0– dividends collected on investments in associates and companies subject to joint control 0 0– sales of investments held to maturity 0 0– sales of property and equipment 2 433– sales of intangible assets 0 0– sales of subsidiaries and business branches 0 0
2. Cash flow used in –65,744 –73,948– purchases of investments in associates and companies subject to joint control 0 0– purchases of investments held to maturity 0 0– purchases of property and equipment –22,309 –24,379– purchases of intangible assets –43,435 –49,569– purchases of subsidiaries and business branches 0 0
Net cash flow from/used in investing activities 159,562 –73,515C. FINANCING ACTIVITIES
– issue/purchase of treasury shares 484,617 8– issue/purchase of equity instruments 0 –500,000– dividends distributed and other 0 0
Net cash flow from/used in financing activities 484,617 –499,992NET INCREASE (DECREASE) IN CASH AND CASH EQUIVALENTS –40,362 77,310
RECONCILIATION
Line items 31.12.2014 31.12.2013
Cash and cash equivalents at the beginning of the period 363,202 285,892
Net increase (decrease) in cash and cash equivalents –40,362 77,310
Cash and cash equivalents: foreign exchange effects 0 0
Cash and cash equivalents at the end of the period 322,840 363,202
Key: (+) generated (–) absorbed

117
Consolidated explanatory notes
Part A – Accounting Policies
Part B – Information on the consolidated balance sheet
Part C – Information on the consolidated income statement
Part D – Consolidated comprehensive income
Part E – Information on risks and related hedging policies
Part F – Information on consolidated capital
Part G – Business combinations
Part H – Related party transactions
Part I – Share-based payments
Part L – Segment reporting


119
Part AAccounting policies


121P a r t A – A c c o u n t i n g p o l i c i e s
A.1 – General Part
Section 1Declaration of conformity with IFRS
In application of Legislative Decree 38 of 28 February 2005, the consolidated financial statements of the Bipiemme Group at 31 December 2014 have been prepared in accordance with the IAS/IFRS (International Accounting Standards/International Financial Reporting Standards), issued by the International Accounting Standards Board (IASB), with the related interpretations issued by the International Financial Reporting Interpretations Committee (IFRIC) and by the Standing Interpretations Committee (SIC) as endorsed by the European Commission, pursuant to EC Regulation no. 1606 of 19 July 2002.
In preparing the consolidated financial statements the IAS/IFRS approved and in force as at 31 December 2014 have been applied. For an overview of the principles approved in 2014 and those approved in previous years, the application of which is planned for the year 2014 (or future years), please refer to "Section 2 – General method of preparation" below, where the main impacts for the Group are explained.
Section 2General method of preparation
The consolidated financial statements have been prepared in accordance with instructions issued by the Bank of Italy – in compliance with the powers established by art. 9, paragraph 1, of Legislative Decree 38/2005 – under the Bank of Italy's Circular 262/05 of 22 December 2005 "Bank financial statements: formats and rules for their preparation", and subsequent updates. These instructions establish the format of the financial statements and the related method of compilation, as well as the contents of the explanatory notes, and are binding.
In preparing the consolidated financial statements the IAS/IFRS in force as at 31 December 2014 have been applied (including all SIC and IFRIC interpretations) as listed in the attachments to these financial statements. To help interpret and support the application we have also taken into account other documents prepared by the IASB or IFRIC to supplement the accounting standards that have been issued, even if they have not yet been endorsed, including: Framework for the Preparation and Presentation of Financial Statements, Implementation Guidance, Basis for Conclusion, IASB Update, IFRIC Update. In addition, we also used the interpretative documents on the application of IAS/IFRS in Italy prepared by the Italian Accounting Board (OIC) and the Italian Banking Association (ABI), as well as the documents issued by ESMA (European Securities and Markets Authority) and Consob which make reference to specific IAS/IFRS standards or guidelines.
The consolidated financial statements are made up of the compulsory financial statement schedules (balance sheet, income statement, statement of comprehensive income, statement of changes in shareholders' equity and statement of cash flow prepared according to the indirect method) and the explanatory notes; they are accompanied by the report on operations which covers all of the companies included in the consolidation. The consolidated financial statements are drawn up clearly and give a true and fair view of the assets and liabilities, financial position, results of operations for the year, the change in shareholders' equity and cash flows.In accordance with art. 5, paragraph 2, of Legislative Decree 38 of 28 February 2005, the consolidated financial statements have been prepared with the Euro as the reporting currency. In particular, in line with the instructions issued by the Bank of Italy, the amounts reported in the financial statements and in the explanatory notes, as well as those indicated in the report on operations, are expressed in thousands of euro, unless otherwise specified. Roundings have been made on the basis of the Bank of Italy's recommendations.
The financial statements have been prepared taking into account the following general principles laid down in IAS 1 "Presentation of Financial Statements" and the specific accounting principles endorsed by the European Commission and explained in the next Part A.2 "Part relating to the main line items in the financial statements" and in compliance with the general assumptions from the "Framework for the Preparation and Presentation of Financial Statements" issued by IASB with particular regard to the fundamental principle regarding the prevalence of substance over form, and the concept of relevance and materiality. No exceptions have been made to the application of IAS/IFRS.
The explanatory notes and the report on operations provide the information required by international accounting standards, by laws, by the Bank of Italy and by Consob (the National Commisson for Securities and the Stock Exchange), as well as other information even if not required but nonetheless deemed necessary to give a true and fair view of the Group's situation.

122 P a r t A – A c c o u n t i n g p o l i c i e s
Content of the financial statements
Balance sheet and income statement: the balance sheet and income statement are made up of line items, sub-items and other details. For the sake of completeness, in the schedules laid down by the Bank of Italy we decided to include all of the recommended items even if they had a zero balance in both years. In the income statement (tables and explanatory notes), revenues are shown without a sign, whereas costs are shown in brackets.
Statement of comprehensive income: The statement of comprehensive income presents the net income (loss) for the year (income statement line item 320) together with other items of income and expense, net of taxation, that are recognised in shareholders' equity as an opposite entry to valuation reserves; on the basis of the amendment to IAS 1, these items are grouped into two categories depending on whether or not they are likely to be reversed to the income statement if certain conditions take place. This statement has been prepared showing the part attributable to the Group separately from the part attributable to minority interests. As for the balance sheet and income statement schedules, in the schedules laid down by the Bank of Italy we decided to include all of the recommended items even if they had a zero balance in both years.Negative figures in the statement of comprehensive income are shown in brackets.
Statement of changes in shareholders' equity: this statement shows the composition of and changes in shareholders' equity during the year, split between share capital, capital reserves, retained earnings, valuation reserves and the result of comprehensive income. Treasury shares are deducted from shareholders' equity. The portions of share capital, reserves and the result of comprehensive income pertaining to minority interests are shown separately from those of the Group.
Statement of cash flows: the statement of cash flows during the year and the previous year has been prepared according to the indirect method, whereby cash flows from operations are represented by the result for the year adjusted for costs and revenues of a non-monetary nature. Cash flows are split between cash flow generated by operations, by investing activities and by funding activities. In the statement, cash flows generated are without a sign, whereas cash flows absorbed have a minus sign. As for the balance sheet and income statement schedules, in the schedules laid down by the Bank of Italy we decided to include all of the recommended items even if they had a zero balance in both years.The statement of cash flow, which has been prepared under the indirect method, follows the rules laid down in IAS 7.
Content of the explanatory notes: the explanatory notes include the information required by IAS/IFRS and by Circular 262/2005 of the Bank of Italy and subsequent updates. The explanatory notes are broken down in parts: A – Accounting policies, B – Information on the consolidated balance sheet, C – Information on the consolidated income statement, D – Consolidated comprehensive income, E-Information on risks and related hedging policies, F – Information on consolidated capital, G – Business combinations, H – Related party transactions, I – Share-based payments.Each part of the note is divided into sections, each of which illustrates one aspect of operations.

123P a r t A – A c c o u n t i n g p o l i c i e s
Evolution of international accounting standards
Change in the accounting standards endorsed by the European Commission The following table lists the changes to the standards and interpretations approved by the European Commission in 2014 or in previous years, application of which became compulsory from 2014. The information required by the standards and regulations currently in force are presented in the sections relating to the items affected.
International accounting standards in force from 2014
Approved Regulation
Publication in the Official Journal of the European Union
Title and comments In force from
1254/2012 of 11.12.2012 L. 360 of 29.12.2012 IFRS 10 "Consolidated financial statements"The objective is to provide a sole model for consolidated financial statements based on a new concept of control, applicable to all types of entity and that requires the existence of all the following conditions: power over the investee, exposure, or rights, to variable returns from its involvement with the investee, the ability to use its power over the investee to affect the amount of the investor's returns.The new standard replaces IAS 27 "Consolidated and separate financial statements” as far as consolidated financial statements are concerned and supersedes SIC 12 "Consolidation – Special purpose entities".
1 January 2014
IFRS 11 "Joint arrangements"This outlines the accounting by entities that jointly control an arrangement. These principles are based on rights and obligations of the parties to the arrangements and which the entities need to determine in order to identify the nature thereof: A joint operation (accounted for as assets or liabilities based on the share of assets held jointly or of liabilities incurred jointly) or a joint venture (that has to be solely accounted for under the equity method).The new standard replaces IAS 31 "Interests in joint ventures" and SIC 13 "Jointly controlled entities – Non-monetary contributions by venturers".
1 January 2014
IFRS 12 "Disclosure of interests in other entities"The objective of the standard is to require the disclosure of information that enables users of financial statements to evaluate: the nature of, and risks associated with, its interests in other entities and the effects of those interests on its financial position, financial performance and cash flows. The disclosure requirements apply to entities that have an interest in: subsidiaries, joint arrangements, associates and unconsolidated structured entities.
1 January 2014
Amendments to IAS 27 "Separate financial statements" and to IAS 28 "Investments in associates and joint ventures"These standards have been revised in light of the introduction of IFRS 10, 11 and 12.
1 January 2014
1256/2012 of 13.12.2012 L. 360 of 29.12.2012 Amendments to IAS 32 "Financial instruments: presentation" – Offsetting financial assets and financial liabilitiesThese amendments require the net amount of financial assets and liabilities to be reported when this reflects future cash flow which an entity may expect to obtain from the settlement of two or more distinct financial instruments, where a legal right exists and the entity is willing to offset.
1 January 2014
313/2013 of 04.04.2013 L. 95 of 05.04.2013 Amendments to IFRS 10 "Consolidated financial statements", to IFRS 11 "Joint arrangements" and to IFRS 12 "Disclosure of interests in other entities" – Transitional provisionsThese consist of amendments aimed at simplifying the transition to IFRS 10, 11 and 12 limiting the requirement to provide comparative information to only the preceding comparative period.
1 January 2014
1174/2013 of 20.11.2013 L. 312 of 21.11.2013 Amendments to IFRS 10 "Consolidated Financial Statements", IFRS 12 "Disclosure of Interests in Other Entities", and IAS 27 "Separate Financial Statements" – Investment EntitiesUnder this amendment, investment entities can measure subsidiaries at fair value through profit or loss rather than consolidating them, so such investments will be measured at fair value and not at cost in their separate financial statements as well.
1 January 2014
1374/2013 of 19.12.2013 L. 346 of 20.12.2013 Amendments to IAS 36 "Impairment of Assets" – Recoverable amount disclosures for non-financial assetsThe amendment clarifies that the information to be provided on the recoverable amount of assets, when this is based on the fair value net of disposal costs, only concerns those assets whose value has decreased.
1 January 2014
1375/2013 of 19.12.2013 L. 346 of 20.12.2013 Amendments to IAS 39 "Financial Instruments: Recognition and Measurement" – Novation of derivatives and continuation of hedge accountingThe changes are intended to cover situations in which a derivative designated as a hedging instrument is subject to novation by a counterparty to a central counterparty as a result of legislation or regulations. Hedge accounting can therefore continue regardless of the novation (previously this was not allowed).
1 January 2014
634/2014 of 13.06.2014 L. 175 of 14.06.2014 IFRIC 21 "Levies"The interpretation deals with the recognition of a liability for the payment of a levy in the case where the liability falls within the scope of IAS 37 and the recognition of a liability for the payment of a levy whose timing and amount are uncertain.
1 January 2014
124 P a r t A – A c c o u n t i n g p o l i c i e s
International accounting standards (IAS/IFRS) and related interpretations (SIC/IFRIC) endorsed by the European Commission, application of which is mandatory after 31 December 2014
Pursuant to paragraph 30 and 31 of IAS 8, the following are the Regulations that have made changes to accounting standards already in force, endorsed by the European Commission, of which mandatory application runs from 1 January 2015 or some later date in the case of financial statements that coincide with the calendar year. The Group has not taken the option of early application.
Approved Regulation
Publication in the Official Journal of the European Union
Title and comments In force from
28/2015 of 17.12.2014 L. 5 of 9.1.2015 Annual cycle of improvements to IFRS 2010-2012Amendment to IFRS 2 "Share-based payments", IFRS 3 "Business combinations", IFRS 8 "Operating Segments", IAS 16 "Property and equipment", IAS 24 "Related party disclosures", IAS 38 "Intangible assets".
1 February 2015
29/2015 of 17.12.2014 L. 5 of 9.1.2015 Amendments to IAS 19 "Employee benefits" – Defined benefit plans: employees' contributions. 1 February 2015
International accounting standards (IAS/IFRS), amendments and interpretations issued by the IASB and still to be endorsed by the European Commission
For information purposes, set out below are the accounting standards, amendments and interpretations issued by the IASB, the application of which is subject to endorsement by the European Commission and, consequently, are not yet applicable to these financial statements.
Standard/Interpretation/Amendment Date of IASB approval Indicative effective date
Amendment to IFRS 1 “First-time Adoption of International Financial Reporting Standards”, IFRS 3 “Business Combinations”, IFRS 13 “Fair Value Measurement”, and IAS 40 “Investment Property” – Annual Improvements to IFRSs 2011-2013 Cycle
12.12.2013 Financial years beginning on or after 1 July 2014
IFRS 14 “Regulatory Deferral Accounts” 30.01.2014 Financial years beginning on or after 1 January 2016
Amendment to IFRS 11 “Joint Arrangement” – Acquisition of Interests in Joint Operations
06.05.2014 Financial years beginning on or after 1 January 2016
Amendment to IAS 16 “Property, Plant and Equipment” and IAS 38 “Intangible Assets” – Clarification of acceptable methods of depreciation and amortisation
12.05.2014 Financial years beginning on or after 1 January 2016
IFRS 15 “Revenue from Contracts with Customers” 28.05.2014 Financial years beginning on or after 1 January 2017
IFRS 9 “Financial Instruments” 1st part 24.07.2014 Financial years beginning on or after 1 January 2018 (*)
Amendment to IAS 27 “Separate Financial Statements” – Equity Method in Separate Financial Statements
12.08.2014 Financial years beginning on or after 1 January 2016
Amendment to IFRS 10 “Consolidated Financial Statements” and IAS 28 “Investments in Associates and Joint Ventures” – Sale or Contribution of Assets between an Investor and its Associate or Joint Venture
11.09.2014 Financial years beginning on or after 1 January 2016
Amendment to IFRS 5 “Non-current Assets Held for Sale and Discontinued Operations”, IFRS 7 “Financial Instruments: Disclosures”, IAS 19 “Employee Benefits” and IAS 34 “Interim Financial Reporting” – Annual Improvement to IFRSs 2012-2014 Cycle
25.09.2014 Financial years beginning on or after 1 January 2016
(*) date identified by IASB. Pending confirmation by the competent bodies of the European Union.
The consolidated financial statements of the Bipiemme Group at 31 December 2014 relate to the companies (subsidiaries, associates and joint ventures) included in the scope of consolidation as detailed in the chapter below entitled "Scope of consolidation and consolidation procedures", which also reports the changes that took place during the period.

125P a r t A – A c c o u n t i n g p o l i c i e s
Uncertainties in the use of estimates and assumptions when preparing the consolidated financial statements
The preparation of consolidated financial statements also requires the use of estimates and assumptions that may determine significant changes in the amounts reported in the balance sheet and income statement, and in the information relating to contingent assets and liabilities disclosed therein. The determination of these estimates involves using the available information and making subjective judgements, including on the basis of historical trends, used for deriving reasonable assumptions for reporting the results of operations. These estimates and assumptions have been made on a going concern basis and are strongly influenced by growing uncertainty in the current economic and market climate, characterised by extremely volatile financial indicators and the very high levels of deterioration in credit quality. The parameters and information used to determine estimates and assumptions are heavily influenced by these factors, which by their very nature are hard to predict. As a consequence, the estimates and assumptions used may vary from period to period, meaning that in future years the amounts reported in these financial statements may differ materially as a result of changing one of the subjective bases used.The estimates and assumptions are subject to review to take into account any changes that have taken place during the period. The main areas in which management is required to make subjective judgements are as follows: the quantification of losses that are inherent in risk exposures, typically represented by "impaired" loans and "performing" loans, as well as by
other financial assets; the use of valuation models for measuring the fair value of financial instruments that are not listed on active markets; the determination of the fair value of financial instruments to be used for reporting purposes; the quantification of employee-related provisions and allowances for risks and charges; the estimates and assumptions relating to the recoverability of deferred tax assets.
The use of estimates and assumptions in the above cases is closely linked to the evolution of the national and international economic environment and the performance of financial markets, which generate a significant impact on interest rate trends, price fluctuations, actuarial bases and the creditworthiness of counterparties. For certain of the assets or liabilities associated with the above cases, the most significant estimates made by the Group are for the purpose of the preparation of interim financial reports and they may thus be used in the determination of the carrying amount of these assets and liabilities. Accordingly, it should be noted that the most significant assumptions and estimates adopted consist of the following: for the determination of the fair value of financial instruments not listed in active markets, securities and derivatives, where there is a need to
use parameters not derived from the market, the main estimates relate to the development of future cash flow (coupons, dividends, etc.) that is subject to correction factors derived from probable future events (e.g. default events) as well as the need to use specific input parameters not directly derived from active markets;
as far as the estimation of future cash flow from impaired loans is concerned, the elements taken into consideration essentially relate to: cash flow arising from ordinary operations and/or from extraordinary events that are a feature of the debtor's business, the estimated realisable value of any guarantees, as well as costs expected to be incurred and the expected timing of the recovery of the loan exposure. For the determination of estimated future cash flow arising from loans for which no objective evidence of impairment has been identified, that is, collective evaluation, account is taken of information derived from historical series and other observable elements at the measurement date, which permits estimates to be made of the latent loss ("incurred but not reported") in each homogeneous category into which the Group's portfolio has been stratified for the purpose of monitoring the management of credit risk;
for the quantification of allowances for post employment benefits, an estimate is made of the present value of commitments, taking account of discounted probable outflows inclusive of financial aspects (interest rates), the expected trend in remuneration and employee turnover rates, as well as demographic aspects (mortality);
for the quantification of allowances for risks and charges an estimate is made, where possible, of the amount of outflows needed to meet commitments, taking account of the actual probability of costs being incurred;
for the determination of the components of deferred taxation, an estimate is made of the probability of taxation arising in the future (taxable temporary differences) and of the reasonable degree of certainty, if this exists, of future taxable amounts as and when the tax deductibility will arise (deductible temporary differences).
General principles
The consolidated financial statements have been prepared in accordance with the following general principles laid down in IAS 1 "Presentation of Financial Statements".
Going concern. The accounting principles have been adopted with a view to the Group companies continuing in business as going concerns; they also respond to the accrual principle, the concepts of relevance and materiality of accounting information, and the prevalence of substance over form. The assumptions underlying the preparation of the financial statements on a going-concern basis are explained in the section of the report on operations entitled "Outlook for operations". It is believed that, at present, there is no uncertainty about the Group's ability to continue in business as a going concern, in accordance with the provisions of IAS 1.

126 P a r t A – A c c o u n t i n g p o l i c i e s
Accrual principle. Except for the cash flow statement, the financial statements have been prepared in accordance with the accrual principle of accounting, whereby revenues and expenses are recognised according to their economic maturity, regardless of when they are paid, and according to the matching principle.
Consistency of presentation. The methods of presentation and classification of the items in the financial statements are kept the same from one financial period to the next, except in the case where a change is required by an international accounting standard or by an interpretation or if it is required to raise the meaningfulness of the accounting presentation. In the event of a change and to the extent possible, the new approach is adopted retroactively and the nature, reason and amount of the items affected by the change are disclosed. The presentation and classification of the line items complies with the international accounting standards and with the Bank of Italy's instructions for banks' financial statements.
Relevance and aggregation. the balance sheet and income statement are made up of line items (indicated by numbers), sub-items (indicated by letters) and other details. Line items, sub-items and other details constitute the account headings of the financial statements. The formats comply with those laid down by the Bank of Italy in its Circular 262/2005. New line items can be added provided that their content is not the same as others already envisaged in the format and only if the amounts concerned are significant. Other information is provided in the explanatory notes. The sub-items of the tables can be grouped together if one the following two conditions occur:a) the amount of the sub-items is immaterial;b) combining them makes for greater clarity in the financial statements; in this case the explanatory notes show the sub-items separately.
The tables in the notes are only provided if they contain figures for one of the two years.
No offsetting of balances. Assets and liabilities and costs and revenues cannot be offset against each other except as required or permitted by IAS/IFRS or by an interpretation of them, or by instructions issued by the Bank of Italy for banks' financial statements. Measuring assets net of impairment charges, such as the provision for bad and doubtful accounts, is not considered offsetting.
Comparative information. Comparative figures from previous periods are provided for all information in the financial statements – including that of a qualitative nature if this helps explain the Group's situation – unless IAS/IFRS, or their interpretation, or instructions from the Bank of Italy on the financial statements of banks require or allow otherwise. If the accounts are not comparable, those of the previous period are adjusted to make them so; any lack of comparability and the adjustments made (or the fact that it was not possible to adjust the figures) is disclosed and explained in the notes.

127P a r t A – A c c o u n t i n g p o l i c i e s
Section 3Scope of consolidation and consolidation procedures
The consolidated financial statements of the Bipiemme Group includes the balance sheet and income statement of Banca Popolare di Milano (Parent Company) and its direct and indirect subsidiaries. Starting from the financial statements in force from 1 January 2014 the new IFRS 10, 11 and 12 standards are applicable, respectively, governing the "Consolidated Financial Statements", "joint control agreements" and "disclosure of interests in other entities".
Subsidiaries
IFRS 10 governs the consolidated financial statements and establishes how the scope of consolidation should be identified.According to this standard, "control" appears to be the situation in which a company is exposed to the risk of variability in the results because of its links with another company and is able to influence these results through the power held over it.In particular, subsidiaries are companies that show the coexistence of three conditions: power over the company; exposure to the risk of variability of the company's results; the ability to influence the results through the power held over the company.
"Power over the company" is the ability to direct the key activities of a company in which the investor holds a participatory interest and/or an interest that consists of other legal or contractual rights. This power generally flows from the ownership of rights (not necessarily voting rights) that are legally recognised and of which the entity that holds the interest in the company is the owner or which has links with it; rights that give it the power to direct the company's activities: for example, holding a majority of the voting rights (which can also be acquired through agreements with other shareholders) or, in any case, enough of the voting rights to keep the company under control thanks to fragmentation of the other votes or because it has the right to appoint or remove the company's key management personnel.These rights include the power to direct the company to carry out transactions (or to prohibit changes in them) in its own interest, while they do not include the rights of mere "protection" of the interests of whoever holds them (e.g. a pledge or similar rights). In any case, in determining the extent of the voting rights for the purpose of checking the existence of control situations, one must also consider potential voting rights (both proprietary and third party), i.e. the rights attached to call options (including those embedded in convertible bonds) or similar instruments on the ordinary shares of investee companies, assuming that such rights can effectively be exercised. To assess whether or not the power to govern a company exists, it may also be necessary to consider additional factors that could constitute evidence that this power is in the hands of a particular entity: for example, if the latter's exposure to the risk of variability of the company's results is much higher than its voting rights or other rights over the company.
"Exposure to the risk of variability of the company's results" depends on the presence of returns arising from the investor's relationship with it, which may vary according to the economic performance of the entity making the investment. To this end, we must consider the dividends on shares and interest on securities, as well as changes in the value of the investments held in it.
As regards the "ability to influence the results through the power held over the company", in order to identify the entity that actually controls the company, you also have to ascertain whether the power to affect its results is exercised in its own interest (in which case it is the controlling entity or parent company) or on behalf of another entity (in which case it is merely an agent of the real parent company). Various factors have to be taken into consideration for this purpose, such as: the scope of application of this power (i.e. if there are limits or discretion in the way that it is exercised), the right of any other parties to remove or restrict the decisions taken by the entity exercising the power, the extent and variability of the remuneration foreseen for the services provided (the greater the extent and variability of the remuneration compared with the results expected from the company, the more likely that the recipient is the parent), whether or not other interests are held in the company and the related exposure to the risk of variability in the results. For example, having other interests in the company is usually typical of a parent company, especially if its interest is of a subordinated nature that constitutes forms of credit enhancement of the company's other liabilities.

128 P a r t A – A c c o u n t i n g p o l i c i e s
Joint ventures or companies subject to joint control
The aim of IFRS 11 is to lay down the accounting treatment of entities that are party to agreements involving jointly controlled activities. The standard has to be applied by the entities participating in joint control agreements. This accounting treatment and its presentation in the financial statements is based on rights and obligations laid down in the agreement in which the entities are involved; the entities themselves have to ensure that the agreement contains certain specifics in order to help identify the type of arrangement: a joint operation, in which the parties that have joint control have rights and obligations for the assets and liabilities involved in the agreement,
which are accounted for as assets or liabilities based on the share of assets held jointly or of liabilities incurred jointly, or a joint venture, i.e. a joint control agreement in which the parties have rights to the net assets of the agreement, which can therefore only be
accounted for by the equity method.
The Group considers as joint ventures those companies in which the voting rights and joint control over a business activity are equally shared, directly or indirectly, by Banca Popolare di Milano and by another entity. Also considered a joint venture is an investment in which control over the economic activity and strategic policies of the investee is shared with other entities under contractual agreements, even if the voting rights are not held equally.
The only investment that falls into this category is Calliope S.p.A. which, given the nature of the underlying contractual arrangements, qualifies as a joint venture.
Associates
Associates, i.e. companies subject to significant influence, are defined as all those enterprises over which the Group is able to exercise significant influence but not control. This influence is presumed to exist when the Group has between 20% and 50% of the voting power.Interests held below the threshold of 20% fall within the scope of consolidation and are classified as Investments only in relation to the existence of partnership agreements, under which the Parent Company has the possibility to intervene in the company's management decisions. These cases involve: Bipiemme Vita, for which there is a partnership agreement with the Covéa Group linked to the development of bancassurance activities; Anima Holding, pursuant to the shareholders' agreements in force with the other shareholders.
Further information is provided in Section 10 – Equity investments of Part B of the explanatory notes.
Changes in the scope of consolidation
Changes in the scope of consolidation with respect to 31 December 2013 involve the following companies:
Banca Popolare di MantovaThe Parent Company's holding in Banca Popolare di Mantova has increased to 62.62% (from 62.16% at 31 December 2013) due to further purchases of shares made during 2014.
Bipiemme Vita The resolution to reduce the share capital (registered in the Companies Register on 20 December 2013) took effect on 21 March 2014. The insurance company's share capital has therefore gone from Euro 225,840,000 to Euro 179,125,000. The Parent Company BPM had 1,775,170 of its shares cancelled, for a nominal value of Euro 8,875,850, without any change in its equity interest (19%).
BPM Ireland Plc The company has been cancelled from the Dublin Company Register on 7 January 2014.As a result, the company is excluded from the scope of consolidation.
BPM Securitisation 3 S.r.l.August 2014 saw the completion of the sale of loans by the Parent Company as part of a securitisation operation, for which BPM Securitisation 3 S.r.l. was set up as a special purpose vehicle and which was included in the scope of consolidation of the Bipiemme Group as from 30 September 2014, given that the Parent Company holds rights of a contractual nature (i.e. credit enhancement) which substantially expose it to variability in the results of that company.

129P a r t A – A c c o u n t i n g p o l i c i e s
WeBankOn 23 September 2014, the Management Board of Banca Popolare di Milano and the Extraordinary Shareholders' Meeting of WeBank approved, with authorisation having been granted by the Bank of Italy pursuant to article 57 of Legislative Decree 385/1993, the merger by absorption of WeBank into BPM. The merger is effective from 23 November 2014, with effect for accounting and tax purposes from 1 January 2014. The merger did not result in any exchange of shares or increase in the share capital of BPM.
Anima HoldingThe end of March 2014 saw the start of the public offer for sale of the shares in Anima Holding SpA, which were admitted for trading on the MTA that same day. As part of the offer, on 16 April the Parent Company sold 49,184,616 shares in Anima Holding SpA (reducing its stake from 35.29% to 18.89%); a greenshoe option has been added to the offer, which could be exercised within the next 30 days, offering a further 12,501,112 shares (which if taken up entirely, would reduce BPM's stake to 14.72%). On 16 May 2014, Anima Holding SpA announced that the greenshoe option had been only partially taken up (6,114,548 shares in relation to BPM); consequently BPM's stake in Anima Holding SpA amounted to 16.85% (50,513,608 shares). The after-tax capital gain realised by the Bipiemme Group on the sale of its Anima Holding shares amounted to around Euro 103 million.
ProfamilyOn 30 December 2014 the Parent Company paid in a capital contribution of Euro 5 million to strengthen the capital of the intermediary.
1. Investments in significant subsidiaries
The following table lists the investments in significant subsidiaries. For information on investments in companies subject to joint control (carried at equity) and in companies subject to significant influence please read Part B – Information on the consolidated balance sheet – Section 10 Investments in associates and companies subject to joint control, of these explanatory notes.
Company name Registered office and operational headquarters
Nature of holding
(1)
Nature of investment Voting rights
(2)Holder % held
Parent Company
Banca Popolare di Milano S.c.a r.l. Milan
Significant subsidiaries
1 Banca Akros S.p.A. Milan 1 Banca Popolare di Milano S.c.a r.l. 96.892 Banca Popolare di Mantova S.p.A. Mantua 1 Banca Popolare di Milano S.c.a r.l. 62.623 BPM Capital I Llc. Delaware (USA) 1 Banca Popolare di Milano S.c.a r.l. 100.004 BPM Luxembourg S.A. Luxembourg 1 Banca Popolare di Milano S.c.a r.l. 99.00
Banca Akros S.p.A. 1.005 ProFamily S.p.A. Milan 1 Banca Popolare di Milano S.c.a r.l. 100.006 Ge.Se.So. S.r.l. Milan 1 Banca Popolare di Milano S.c.a r.l. 100.007 BPM Covered Bond S.r.l. Rome 1 Banca Popolare di Milano S.c.a r.l. 80.008 BPM Securitisation 2 S.r.l. (*) Rome 4 Banca Popolare di Milano S.c.a r.l. n.a. n.a.9 BPM Securitisation 3 S.r.l. (*) Conegliano 4 Banca Popolare di Milano S.c.a r.l. n.a. n.a.
(*) These entities are fully consolidated as the Group is exposed and has rights to variable returns from the relationship with the companies (IFRS 10§7 (b)).
Key:(1) Nature of holding:
1. majority of voting rights at general meetings 4. other forms of control 2. dominant influence at ordinary general meeting 5. co-ordinated control under art. 26.1 of Decree 87/923. agreements with other shareholders 6. co-ordinated control under art. 26.2 of Decree 87/92
(2) Voting rights at Ordinary General Meetings. Voting rights are only shown if they differ from the percentage held in the share capital.

130 P a r t A – A c c o u n t i n g p o l i c i e s
2. Significant judgements and assumptions made in determining the scope of consolidation The application of the new accounting standards IFRS 10 and 11 did not lead to any changes in the year to the scope of consolidation of Bipiemme Group, except for events that occurred in the year and which are summarised in the paragraph above on “Changes in the scope of consolidation”.
In particular, the inclusion of wholly-owned subsidiaries in the scope of consolidation of the Group is linked to the concept of a majority of the voting rights at ordinary shareholders' meetings, whereby entities may not be excluded where legal control exists. There are, however, two cases of inclusion in the scope of consolidation of companies in which there is no equity interest, that is, the special purpose vehicles Bpm Securitisation 2 Srl and Bpm Securitisation 3 Srl, for which the Parent Company holds contractual rights (credit enhancement) which expose it to variability in the results of the companies.
Within the Group there is one company subject to joint control, Calliope Finance Srl, which, given the nature of the underlying contractual arrangements, qualifies as a Joint Venture. This company has already previously been consolidated using the equity method.
Associates are those companies over which the Group exercises significant influence, which is assumed to exist where voting rights are held of between 20% and 50%. As a departure from this principle, there are two cases whereby equity interests have been recognised as “investments in associates and companies subject to joint control” due to the existence of partnership arrangements: Bipiemme Vita SpA (19% held) and Anima Holding SpA (16.85% held).Further information is provided in Section 10 – Equity investments of Part B of the explanatory notes.
3. Investments in subsidiaries with significant minority interests Within the Bipiemme Group there are two investments with significant minority interests: Banca Akros and Banca Popolare di Mantova.
3.1 Minority interests, minority voting rights and dividends distributed to holders of minority interests
(Euro/000)
Company name Minority interests % Minority voting rights % Dividends distributed to holders of minority interests
Banca Akros SpA 3.11 3.11 282Banca Popolare di Mantova SpA 37.38 37.38 0
3.2 Investments with significant minority interests: accounting information
(Euro/000)
Name Banca Akros SpA Banca Popolare di Mantova SpA
Total assets 3,642,706 542,349Cash and cash equivalents 95 6,557Financial assets 3,571,989 512,647Property and equipment and intangible assets 39,795 8,139Financial liabilities 3,378,439 474,919Shareholders' equity (including net income for the year) 198,858 35,354Interest margin 10,549 9,166Net interest and other banking income 80,887 14,001Operating expenses (51,457) (9,496)Income (loss) before tax from continuing operations 28,116 729Income (loss) after tax from continuing operations 17,802 229Income (loss) after tax from discontinued operations 0 0Net income (loss) for the year (1) 17,802 229Other comprehensive income (net of tax) (2) 713 39Comprehensive income (3)=(1)+(2) 18,515 268

131P a r t A – A c c o u n t i n g p o l i c i e s
4. Significant restrictions
Within Bipiemme Group there are no significant legal, contractual or regulatory restrictions that could limit the Parent Company's ability to transfer liquid funds or other assets to other Group entities, nor any guarantees that could limit dividend distributions, capital or loans and advances granted or repaid to other Group entities.
5. Other information
Consolidation procedures
Investments in associates and companies subject to joint control are consolidated on a line-by-line basis, while joint controlled companies are reported using the equity method.
Line-by-line consolidation: this method of consolidation involves combining the contents of subsidiary company balance sheets and income statements on a "line by line" basis. For consolidation purposes, we have eliminated the book value of the investment in each subsidiary against the corresponding portion of its net equity.Subsidiaries are consolidated line-by-line from the date of acquisition, i.e. from the date when the Group acquires control, and they are excluded from the scope of consolidation from the date on which control is transferred outside the Group. If the closing date of the subsidiary is different from that of the Parent Company, the subsidiary provides a separate report specifically for consolidation purposes. If this is not feasible, the Parent Company uses the latest available financial statements (prepared not more than three months prior to the reporting date), adjusted to take account of the main transactions that have taken place during the intervening period. The financial statements of subsidiaries used to prepare the consolidated financial statements refer to the same period and are prepared with the same accounting policies of the Parent Company, adjusted where necessary for consistency.All intragroup (or "intercompany") balances and transactions, including any unrealised post-tax profits resulting from intragroup transactions, are eliminated in full upon consolidation. The result of the comprehensive income statement for a subsidiary is attributed to minority interests even if this means that the minority interests have a negative balance.
If the Parent Company loses control of a subsidiary, it: eliminates the assets (including any goodwill) and the liabilities of the subsidiary; eliminates the book values of any minority interests in the former subsidiary; eliminates any accumulated exchange differences booked to shareholders' equity; recognises the fair value of the proceeds received; recognises the fair value of any interest maintained in the former subsidiary; recognises any gain or loss in the income statement; reclassifies the interest pertaining to the parent company in the items previously recognised in the statement of comprehensive income in the
income statement or in retained earnings, as appropriate.
Acquisitions are accounted for according to the "acquisition method" in accordance with IFRS 3 as amended by Regulation 495/2009, under which all business combinations, except for those between companies under common control, are treated like genuine business acquisitions for accounting purposes. Application of the acquisition method requires: identification of the acquirer (i.e. the identity of the entity that takes control of a group or entity); the acquisition date (i.e. the date on which the acquirer obtains control of the acquiree); recognition at the purchase date of the identifiable assets acquired and liabilities assumed (including contingent liabilities) at their respective fair values. In addition, for each business combination, any minority interests in the acquiree may be recognised at fair value or in proportion to the share of the minority interest in the identifiable net assets of the acquiree.Goodwill is initially valued at cost, which arises as the surplus between the sum of the consideration paid plus any minority interests and the fair value of the net assets (identifiable assets acquired less liabilities) taken on by the Group. If the acquisition cost is lower than the fair value of the net assets acquired, the difference is expensed to income for the period.After initial recognition, goodwill is measured at cost less any impairment losses. For impairment testing purposes, goodwill acquired in a business combination is, from the acquisition date, allocated to the cash-generating unit or units of the Group expected to benefit from the synergies of the combination, irrespective of whether other assets or liabilities of the acquiree are assigned to those units.If goodwill has been allocated to a cash-generating unit and the Group disposes of part of the assets of that unit, the goodwill associated with the business being divested is included in the carrying amount when determining the gain or loss on disposal. The goodwill associated with the divested business is determined on the basis of the relative values of the divested business and the cash-generating unit retained.The identification of the fair value of the assets acquired and liabilities assumed has to be completed within a year of the acquisition.In the case of a "step acquisition" (one that takes place in various stages), the acquirer has to recalculate the interest held in the acquiree prior to gaining control at its fair value at the acquisition date and book any gain or loss to the income statement.Consistent with this, sales of minority shares that do not entail a loss of control does not have any impact on the income statement, but translates into changes in group shareholders' equity.

132 P a r t A – A c c o u n t i n g p o l i c i e s
The costs related to the acquisition (except those for issuing debt securities or equities, which follows the rules laid down in IAS 32 and IAS 39) are charged to the income statement in the period when they are incurred.
Consolidation using the equity method: the equity method, which is used to value investments in associates and companies subject to joint control, requires the investment to be initially recorded at cost and adjusted thereafter for the post-acquisition change in the investor's share of net assets of the investee. Goodwill relating to the associate is included in the carrying amount of the investment and is not subjected to amortisation or impairment tests. The income statement reflects the Group's portion of the associate's result for the year. In the event that an associate books adjustments directly to equity, the Group recognises its portion of the adjustments in equity and shows it separately in the statement of comprehensive income. The value of the investment is also reduced by the amount of any dividends received periodically by the Group. The overall value of the investment is subjected to impairment testing in accordance with IAS 28 and IAS 36. If the losses are greater than the carrying value of the investment, the Group books the losses to the extent of that value, i.e. writing it down to zero without recognising any additional loss, unless it has an obligation to make payments on behalf of the associate. Unrealised gains relating to transactions between and with associates are eliminated upon consolidation in proportion to the equity interest held. Any unrealised losses are eliminated upon consolidation, unless there is evidence of impairment of the assets transferred. For the purposes of consolidating investments in associated companies, their financial statements at the reporting date have been used. If no information is available under IAS/IFRS, then the financial statements prepared under local accounting standards are either adjusted accordingly or used directly for consolidation purposes provided the differences between local and international accounting standards are insignificant.
Consolidation of subsidiaries classified as "Non-current assets held for sale and discontinued operations" under IFRS 5: if an investment in a subsidiary is classified as a non-current asset held for sale, it is fully consolidated in accordance with IFRS 5; this means that the assets and liabilities relating to the unit being divested are presented separately from other assets and liabilities in the balance sheet, while a single amount is shown in the income statement to represent the costs and revenues of the operating unit being disposed of.
Section 4Subsequent events
In relation to IAS 10, the main events that took place after the balance sheet date (between 31 December 2014, the date of the consolidated financial statements, and 24 February 2015, when the draft financial statements were approved by the Management Board and forwarded to the Supervisory Board to approve the financial statements at a meeting convened on 17 March 2015) that are not reflected in the figures shown in the consolidated financial statements, are explained in the 2014 report on operations of the Bipiemme Group in the section entitled "Subsequent events", to which reference should be made.

133P a r t A – A c c o u n t i n g p o l i c i e s
Section 5Other aspects
Update of Circular 262/2005 of the Bank of Italy
On 22 December 2014, the Bank of Italy issued the 3rd update of its Circular 262/2005.The main amendments relate to the implementation for 2014 financial statements of the international accounting standards IFRS 10 "Consolidated financial statements", IFRS 11 "Joint arrangements" and IFRS 12 "Disclosure of interests in other entities".For further details, reference should be made to section 3 "Scope of consolidation and consolidation procedures" included in Part A "Accounting policies" and Assets section 10 "Investments in associates and companies subject to joint control" included in Part B "Information on the consolidated balance sheet".
Loans for which concessions have been made – Forborne
The term "forbearance" is used by the EBA to indicate debtors that find or could find themselves in difficulty with respect to their loan repayment terms and for which concessions have been made concerning the renegotiation of the original contractual conditions. Accordingly, a necessary condition for the identification of an exposure as forborne is the existence at the time of the request for renegotiation of a situation whereby a debtor is experiencing financial difficulty.
In January 2015 the Bank of Italy issued an update to circular no. 272, which provides, based on EBA technical standards, definitions for "impaired exposure" and "exposures for which concessions have been made ("forborne"). The latter definition does not represent a new category of impaired loan, but is an additional information tool, since the "forborne" loan category applies to all existing risk classes and both performing and non-performing loans may be included in the renegotiation scope. The allocation of forborne status may be reversed subsequent to a review of the results and financial position of the debtor. This review process takes place after 2 or 3 years, based on whether the loan is performing or impaired.
Bipiemme Group has analysed the EBA and Bank of Italy documents and has identified the loans that fall within the definition of forborne. Further details are provided in part E – Credit risk in accordance with the requirements of the Bank of Italy Circular 262/2005.
Comprehensive Assessment
Note that on 26 October 2014, the European Central Bank published the results of the Comprehensive Assessment carried out by the ECB together with the competent national authorities on the major European banking groups, including BPM. This operation, which consisted of two stages: an asset quality review and a stress test, showed that the Bipiemme Group's balance sheet has excess capital of Euro 713 million.
We wish to point out that the results of the Comprehensive Assessment will not lead to any changes in classifications adopted in the financial statements approved by the Group as no cases were reported of non-compliance of accounting policies adopted with international accounting standards in force.
Italian group tax election
Banca Popolare di Milano and the Italian companies in the Group have elected to file for tax on a group basis since 2004, in accordance with arts 117-129 of the Income Tax Consolidation Act (ITCA), introduced by Decree 344/2003. This optional tax regime makes it possible for each of the subsidiaries to calculate its tax charge for the year and then transfer the equivalent taxable income (or tax loss) to the parent company, adjusting for intercompany interest according to the rules on the deductibility of interest expense. It then calculates a single taxable income or tax loss for the entire group, adding together the profits and subtracting the losses of the individual companies, filing a single tax return and declaring a single amount payable to or receivable from the Tax Authorities.The Parent Company and the subsidiaries taking part in the Italian group tax regime have signed contracts that regulate the compensatory flows related to the transfers of taxable income and tax losses. These flows are determined by applying the IRES rate currently in force to the taxable income of the companies concerned. For companies with tax losses, the compensatory flow, calculated as above, is recognised by the consolidating company to the consolidated company for the losses incurred after joining the Italian group tax regime, to the extent that such losses are covered by the taxable income of the Group. The losses incurred prior to joining the Italian group tax regime have to be offset by the consolidated company against its own taxable income in accordance with current tax rules. The compensatory flows determined in this way are recorded as receivables and payables versus the companies taking part in the Italian group tax regime and classified in "Other assets" and "Other liabilities", with the contra-entry going to "Taxes on income from continuing operations".

134 P a r t A – A c c o u n t i n g p o l i c i e s
Public disclosures (Country by Country reporting)
Bank of Italy Circular no. 285 of 17 December 2013 ("Supervisory Provisions for Banks"), in the 4th update of 17 June 2014, provides for the obligation to publish the information required in subparagraphs a), b) and c) in Appendix A of Part One, Title III, Chapter 2 of this Circular. The information required by the above Circular has been disclosed in an attachment to these consolidated financial statements.
Deadlines for approval and publication of reports
1. Annual reportArt. 154-ter, paragraph 1, of Legislative Decree 59/98 (CFA) lays down that the financial statements have to be approved and the annual report, consisting of the separate and consolidated financial statements, report on operations and the certificate referred to in art. 154-bis, paragraph 5, has to be published within one hundred and twenty days of the year-end. The draft financial statements were approved by the Management Board of the Parent Company on 24 February 2015. The draft has been submitted to the Supervisory Board, which is responsible for the final approval thereof. A meeting of the Supervisory Board will be held on 17 March 2015 to approve the financial statements.The consolidated financial statements (consisting of the balance sheet, income statement, statement of comprehensive income, statement of changes in shareholders' equity, statement of cash flow and explanatory notes) are audited by the Independent Auditors Reconta Ernst & Young S.p.A., according to Legislative Decree 39/2010, in execution of the resolution of the General Meeting of Members of 21 April 2007, which appointed this firm for the period from 2007 to 2015 included.
2. Half – yearly reportThe Bank prepared and approved on 8 August 2014 the half – yearly report at 30 June 2014 of the Bipiemme Group, in accordance with art. 154-ter of Legislative Decree 58/98 introduced by Legislative Decree 195/2007 which adopted the European regulations on the transparency of listed companies (EC/2004/109). The condensed interim financial statements are subjected to a limited audit by Reconta Ernst & Young S.p.A., in compliance with Consob Communication no. 97001574 of 20 February 1997 and with Consob Resolution no. 10867 of 31 July 1997 and in accordance with the decision of the General Meeting of Members' of 21 April 2007.
3. Interim report on operationsThe Bank prepared interim reports of the Bipiemme Group at 31 March 2014 and 30 September 2014 in accordance with art. 154-ter, paragraph 5 of Legislative Decree 58/98, introduced by Legislative Decree 195/2007, and published them on 9 May 2014 and 11 November 2014, respectively. The interim report on operations at 30 September 2014 was not audited, whereas that at 31 March 2014 was prepared in accordance with IAS 34 solely for the purpose of providing adequate disclosures for the Bank's capital increase exercise that took place between 5 May 2014 and 23 May 2014. The figures at 31 March 2014 were therefore subjected to a limited audit by Reconta Ernst & Young S.p.A.

135P a r t A – A c c o u n t i n g p o l i c i e s
A.2 – Part relating to the main line items in the financial statements
The accounting policies followed in preparing the consolidated financial statements at 31.12.2014, as regards the reclassification, recognition, measurement and derecognition of the various asset and liability items, as well as the recognition of revenues and costs. The international accounting standards IFRS 10 "Consolidated financial statements", IFRS 11 "Joint arrangements" and IFRS 12 "Disclosure of interests in other entities" became effective on 1 January 2014. In particular, these standards introduce a sole model for the identification of control over Group entities and introduce new disclosure requirements for investments in associated and companies subject to joint control.
1 – Financial assets held for trading
ClassificationIn this category are classified the debt securities and equities, shares in investment funds and derivatives (except those designated as effective hedging instruments, recorded in assets under "Hedging derivatives") with a positive fair value. They must be held primarily for the purpose of profiting from short-term fluctuations in price or from the operator's profit margin. A financial asset is classified as held for trading if, regardless of why it was acquired, it is part of a portfolio for which there is evidence of a recent actual pattern of short-term profit-taking. Reclassifications to other categories of financial assets are not allowed, except when it is possible to reclassify assets other than derivatives, no longer held for trading purposes, in other categories foreseen by IAS 39 "Financial Instruments: Recognition and Measurement" (Financial assets held to maturity or financial assets available for sale when there are unusual events that are unlikely to recur in the short term, or credits when there is the intention and ability to hold them for the foreseeable future or until maturity), always assuming that the conditions for them being booked are satisfied. The transfer value is represented by the fair value at the time of reclassification. In the event of reclassification, a check is carried out to see if there are any embedded derivatives that have to be separated. The Bipiemme Group has never exercised this option, neither for the current year nor for previous years.The derivative is a financial instrument or other contract with all three of the following characteristics:a) its value changes in response to changes in a specific interest rate, security price, commodity price, foreign exchange rate, index of prices or
rates, a credit rating or credit index, or other variables;b) it requires no initial net investment or little initial net investment relative to other types of contracts that have a similar response to changes in
market conditions;c) it is settled at a future date.
This category consists of financial and credit derivatives. Financial derivatives include forward purchase and sale contracts involving currency and securities, derivative contracts with or without an underlying security that are tied to interest rates, an index or other assets and currency derivatives. Credit derivatives refer to those contracts under which the person purchasing protection transfers the underlying credit risk of a certain asset to the person selling protection. The object of such transactions is represented by the credit risk held by the end recipient of the related funds.
Derivatives include those embedded in other hybrid financial instruments which have been recognised separately from the host instrument to the extent that:K the economic characteristics and risks of the embedded derivative are not closely related to the economic characteristics and risks of the
host contract;K the embedded instrument, even if separated, meets the definition of a derivative;K the hybrid instrument is not measured at fair value with changes in value reported in profit or loss.
RecognitionInitial recognition of financial assets held for trading takes place, for securities, on the settlement date of the underlying purchase transactions – if settled on schedule according to current market practice (known as "regular way") – and, for derivatives, the trade date. In the case of recognition of financial assets at the settlement date, any changes in fair value recognised between the trade date and the settlement date are booked to the income statement.Financial assets held for trading are initially recognised at fair value, which generally corresponds to the price paid, without considering any transaction costs or income, which are charged directly to income.Any derivatives embedded in these complex financial instruments and separated from them from an accounting point of view (see the previous section on "Classification") are also recorded at fair value.

136 P a r t A – A c c o u n t i n g p o l i c i e s
Measurement and recognition of components affecting the income statementFollowing initial recognition, financial assets held for trading are measured at their current fair value, with any changes being booked to the income statement. If the fair value of a financial asset becomes negative, it is accounted for as a financial liability.The fair value of investments listed on active markets is determined with reference to the market bid price reported at the balance sheet date. The fair value of investments for which no price is listed on an active market is determined using estimates and valuation models that take account of all the risk factors related to the instruments along with published price quotations, if available. These techniques may take account of prices reported for recent similar market transactions, discounted cash flows, option pricing models and other well-established methods used in financial markets. For further details, reference should be made to section A.4 "Fair value disclosures". Equities for which it is not possible to determine the fair value reliably in accordance with the above guidelines, and the derivatives related to them, which have to be settled through physical delivery of the equity instruments are maintained at cost and written down in the event of impairment losses. Such losses cannot later be restored.Profits and losses from trading activities and the unrealised gains and losses arising from changes in fair value with respect to the purchase cost, determined on the basis of the weighted average cost on a daily basis, are expensed in the period in which they emerge under the item "Profits (losses) on trading", except for financial derivatives linked to the fair value option, whose result is recorded under "Profits (losses) on financial assets and liabilities designated at fair value".Interest income on debt securities is calculated on the basis of the nominal interest rate. Dividends from equities are recorded when the right to receive them arises. Differentials and margins on derivatives are recognised upon the right to collect them or the obligation to settle them. Interest income and dividends appear in the income statement, respectively, under "Interest and similar income" and "Dividends and similar income". Differentials and margins on derivatives are allocated in the income statement to "Profits (losses) on trading", except for those that are operationally linked to financial assets or liabilities designated at fair value (subject to the fair value option) or linked to financial assets or liabilities classified as held for trading and with settlement of differentials or margins with various maturities ("multiflow" contracts), which are classified in the income statement as "Interest and similar income".
DerecognitionFinancial assets are derecognised when the contractual right to receive cash flows from the financial asset is terminated, or if substantially all of the risks and benefits associated with holding that particular asset are transferred.Conversely, if legal ownership of a financial asset has effectively been transferred, but the bank retains a substantial part of the rewards and benefits of the asset sold, it continues to be reported as an asset in the balance sheet. In such cases, the Group making the transfer recognises a liability to the buyers equal to the price received; the respective costs and revenues are recorded on the assets sold and any related liabilities.
2 – Financial assets available for sale
ClassificationInvestments "held for sale" are financial assets that will be maintained for an indefinite period and that can also be sold for reasons of liquidity, changes in interest rates, exchange rates and market prices. This category excludes derivatives, but includes financial assets not otherwise classified as receivables, assets held for trading, assets held to maturity or assets carried at fair value. In particular, this item includes equity investments not held for trading and which do not qualify as investments in subsidiaries, associates and joint ventures, including private equity investments. Where allowed by IAS 39, reclassifications to the category "Financial assets held to maturity" are permitted. It is also possible to reclassify the debt securities not only in "Financial assets held to maturity", but also in "Receivables", when the company has the intention and ability to hold them for the foreseeable future or until maturity and assuming that the conditions for them to be booked are satisfied. The transfer value is represented by the fair value at the time of reclassification. The Bipiemme Group has never taken advantage of this possibility, neither for the current year nor for previous years.
RecognitionInitial recognition of financial assets available for sale takes place on the settlement date of the underlying purchase transactions in the "regular way". Any changes in fair value recognised between the trade date and the settlement date are booked to shareholders' equity.Financial assets available for sale are initially recognised at fair value, which generally corresponds to the price paid, including any transaction costs or income directly attributable to the instrument concerned.If, as permitted by IAS 39, the entry is made as a result of reclassification of financial assets held to maturity or, in the presence of unusual events, of financial assets held for trading, the carrying amount is represented by the fair value at the time of transfer. Measurement and recognition of components affecting the income statementAfter initial recognition, financial assets available for sale are measured at their current fair value, booking:K to the income statement, the interest calculated under the effective interest rate method (which takes account of the amortisation of both the
transaction costs and the difference between cost and the redemption amount);K to equity (in the revaluation reserve), increasing or decreasing a specific reserve (net of tax) the unrealised gains and losses resulting from the
measurement at fair value until such time that the financial asset is derecognised or an impairment loss is recognised. On derecognition of the financial asset from the balance sheet (e.g. in the case of the asset being sold) or on recognition of an impairment loss, the valuation reserve
137P a r t A – A c c o u n t i n g p o l i c i e s
in question is reversed, in whole or in part, to the income statement. Exchange gains and losses on monetary instruments (e.g. debt securities) are charged directly to income. Changes in fair value indicated by the line item "Valuation reserves" are also reported in the statement of consolidated comprehensive income.
The fair value is determined based on the guidelines already explained for financial assets held for trading. Equities for which it is not possible to determine the fair value reliably are maintained at cost and written down in the event of impairment losses. Such losses cannot later be restored.
Financial assets available for sale are tested for impairment at the end of each financial year or interim period to identify whether there is objective evidence of a deterioration in quality that might compromise the recoverability of the investment. In the case of the Bipiemme Group, objective evidence of impairment, as defined by the IAS 39, was identified on the basis of two circumstances:K if one or more negative events take place after initial recognition of the financial asset;K if this event has a negative impact on future expected cash flows.
In particular, the factors taken into account as indicators of critical circumstances were: the announcement or launch of financial restructuring plans or, in any case, significant financial difficulties, a significant downgrade in the issuer's rating, a material adverse change in book net equity since the last published financial statements, or a market capitalisation significantly lower than the book net equity.
The indicators relating to market values and parameters are verified with reference to specific information available on the company's situation to determine whether the indications given by the market do in fact reflect difficulties on the part of the company.As regards equities, a significant or prolonged decrease in their fair value below the original purchase price is objective evidence of impairment. In this regard, the following quantitative limits were set for identification of the impairment:K a decrease in fair value at the balance sheet date of more than 50% of the original book value;K a decrease in the fair value below the original book value for a continuous period of 18 months.
Exceeding one of these two thresholds means that an impairment loss has to be recognised on the security. However, even if these automatic thresholds are not exceeded, a check should be made for the existence of other symptoms of impairment that would require further analysis of a particular security or investment and that could lead to the need for an adjustment.If there is evidence of an impairment loss, the amount of the write-down, measured as the difference between the asset's original purchase cost and its current fair value, is recorded as an expense in the income statement for the year in "Net impairment adjustments/writebacks of financial assets available for sale" including any equity reserve accumulated up to the balance sheet date. If the reasons for impairment no longer exist because of an event that took place after recognising the loss, a writeback is booked to the income statement, if it refers to debt securities or loans and receivables, or to an equity reserve in case of equities. For debt securities and loans and receivables, the writeback cannot in any case lead to a book value that is higher than the previous writedown.
DerecognitionA financial asset is derecognised when the right to receive cash flows from the asset has expired, or when all the risks and rewards associated with holding this asset are effectively transferred.Conversely, if legal ownership of a financial asset has effectively been transferred, but the bank retains a substantial part of the rewards and benefits of the asset sold, it continues to be reported as an asset in the balance sheet. In such cases, the Group making the transfer recognises a liability to the buyers equal to the price received; the respective costs and revenues are recorded on the assets sold and any related liabilities.

138 P a r t A – A c c o u n t i n g p o l i c i e s
3 – Investments held to maturity
Investments held to maturity comprise non-derivative financial assets with fixed or determinable payments and fixed maturity that the Group has the intention and ability to hold to maturity.The Bipiemme Group has not classified any financial assets in this category.
4 – Loans and receivables
ClassificationLoans and receivables form part of the wider category of non-derivative financial assets that call for fixed or determinable payments and which are not listed on an active market. They originate when the Group provides money, goods or services directly to a debtor without the intent of selling the related receivable. This category therefore does not include loans and receivables originated with the intent of being sold immediately or in the short term.Receivables include loans to customers and banks, whether provided directly or acquired from third parties, securities acquired by subscription or private placement, with identified or identifiable payments, not listed on active markets, debt securities not listed on an active market deriving from debt restructurings and receivables arising from finance leases. They also include the swaps and repurchase agreements with a forward obligation to resell, other than those for trading purposes, and securities lending transactions in which the collateral is represented by cash that remains entirely at the lender's disposal. Such operations are accounted for as lending transactions and do not lead to any changes in the proprietary securities portfolio. In particular, repurchase agreements are recorded as loans for the amount paid spot. This category also includes operating receivables associated with the provision of financial services as defined in the Consolidated Banking Act (CBA) and the Consolidated Finance Act (CFA).Reclassifications are not allowed in the other categories of financial assets under IAS 39.
RecognitionLoans are recognised in the financial statements only when the Group is a party to the loan agreement. This means that the loan must be unconditional and the creditor acquires a right to payment of the contractually agreed sums. Initial recognition of the loans takes place on the date of payment or, in the case of a debt security, on the settlement date of the underlying purchase transactions according to the timing provided by market practice ("regular way"), on the basis of the related fair value, which normally corresponds to the amount granted or the price paid, including costs/revenues directly attributable to the individual instrument and determinable from the outset of the operation, even if settled at a later date. Costs are excluded, even if they have the above characteristics, if they are subject to repayment by the debtor or can be considered normal internal administrative costs. In cases where the date of signing the contract does not coincide with the delivery date, a commitment to grant finance is recorded; this commitment ends on the date that the funds are disbursed.For loans concluded on terms other than market conditions, where the fair value is lower than the amount disbursed or settled as a result of applying a lower interest rate than the market rate or the one normally charged for loans with similar characteristics, initial recognition is done for an amount equal to the future cash flows discounted at a market rate. The difference compared with the amount paid/settled is recognised in the income statement on initial booking, except for loans to employees for whom this difference is amortised over the shorter of the expected period of employment and the duration of the loan.Receivables arising from the sale of goods or services are recognised at the time the sale or service is completed, meaning the moment in which it is possible to recognise the income and hence the right to its receipt.If recognition in the category of loans and receivables takes place when the company has the intention and ability to hold them for the foreseeable future or up to maturity, assuming it meets the conditions for booking, for reclassification from financial assets available for sale or from financial assets held for trading, the fair value of the asset at the date of reclassification is taken as the new amortised cost of the asset.
Measurement and recognition of components affecting the income statementFollowing initial recognition, receivables are measured at amortised cost, equal to the initial value less any repayments of principal, reduced by adjustments and increased by any writebacks of the impairment test and adjusted accumulated amortisation - calculated under the effective interest rate method - of the difference between the amount paid and that repayable on maturity, which is typically attributable to ancillary costs/revenues booked directly to the individual loan.The effective interest rate is the rate that equates the present value of future cash flows of loans, principal and interest, estimated during the expected life of the loan to its initial value, for fixed-rate instruments, or its carrying amount at each repricing date for floating-rate instruments. The estimate of cash flows takes into account all contractual terms which may affect the amounts and maturities, without considering the expected losses on the loan. The calculation includes all the payments between the parties which form an integral part of the interest, even if otherwise specified (fees, expenses, etc), the transaction costs and all other premiums or discounts. This accounting method, using a financial logic, makes it possible to distribute the economic effect of the costs/revenue over the residual life of the loan.The amortised cost method is not used for short-term receivables for which the effect of discounting is immaterial. These receivables are valued at historical cost. The same method is applied to loans without a defined maturity or which can be revoked at any time.
Each time financial statements are prepared, a review of financial assets classified as loans is carried out to identify those which show objective
139P a r t A – A c c o u n t i n g p o l i c i e s
signs of impairment as a result of events that occurred after they were booked. These signs become visible as a consequence of the following events in particular:K significant financial difficulties on the part of the issuer or the debtor;K situations of default on the part of the issuer or the debtor or non-payment of interest or principal;K concession to the debtor or issuer, for economic or legal reasons linked to the financial difficulties of the issuer, of facilities that the Group would
not otherwise have taken into account;K probable bankruptcy of the debtor or issuer or their involvement in other insolvency proceedings;K lack of access to an active market for that particular financial asset because of the financial difficulties of the debtor or issuer;K deterioration in the quality of a homogeneous group of loans due for example: • to payment difficulties on the part of debtors within the group; • to national or local economic conditions that adversely affect the group.
The impairment test of the loans is divided into two phases:K the phase of individual or specific assessments, in which individual impaired loans are selected and the related losses estimated;K the phase of collective or portfolio assessments, in which latent potential losses on performing loans are estimated.
Firstly, we evaluate the assets representing the impaired exposures (non-performing loans), classified into different risk categories according to regulations issued by the Bank of Italy, consistent with IAS/IFRS regulations, integrated with internal arrangements that set criteria and rules for the transfer of the loans to the following risk categories:
K Non-performing loans: amounts owed by borrowers in a state of default or substantially similar situations.
K Doubtful loans: amounts owed by borrowers in temporary difficulties whose recovery is anticipated within a reasonable period of time. So-called "objective doubtful loans" are also included, such as loans that are overdue or overdrawn for more than 270 days and of an amount equal to or greater than 10% of the total exposure.
K Restructured positions: loans for which the bank (or pool of banks) agrees to amend the original terms of the agreement due to adverse changes in the borrower's performance and financial status, where such amendments give rise to a loss.
K Overdue positions: exposures to borrowers that are not classified in the above risk categories which, at the end of the period, have loans that are constantly overdue or overdrawn for more than 90 days according to the relevant regulations of the Bank of Italy.
The bank's front offices classify the loans in the different categories in co-ordination with the functions in charge of monitoring and recovering credit, except for those that are overdue and/or overdrawn for more than 90 days, which are recognised automatically. The assets have been evaluated individually, for which there were no objective signs of impairment, are placed in groups of financial assets with similar characteristics in terms of credit risk, subsequently subjecting them to a collective or portfolio evaluation. The assets evaluated individually, for which a write-down was recorded or for which, despite evidence of impairment, no writedowns was booked because of the value of outstanding guarantees, are not included in the groups used for collective writedowns.If there is objective evidence of impairment, the amount of the writedowns is equal to the difference between the carrying value of the asset at the time of the evaluation (amortised cost) and the present value of the expected future cash flows of principal and interest, calculated by applying the effective interest rate on impairment. The expected cash flows take into account the foreseeable recovery time, the realisable value of any guarantees on the positions, any prepayments received (excluding future loan losses that have not yet arisen), and the costs that will be incurred to recover the loan. The present value of future cash flows of a collateralised financial asset reflects the cash flows that might result from the collateral, net of realisation costs, regardless of the actual probability of realisation. Cash flows related to loans that are expected to be recovered in the short term are not discounted. The original effective interest rate for each loan remains unchanged over time even in the case of a restructuring that has led to a change in the contractual rate and also when the relationship becomes, in practice, non-interest bearing from a contractual point of view. If a loan has a variable interest rate, the discount rate for measuring the loss is the current effective interest rate determined under the contract.In the event of an adjustment, the carrying value of the asset is reduced by setting up an allowance for bad and doubtful accounts that offsets the value of the asset and the amount of the adjustment is booked to the income statement under "Net losses/recoveries on impairment of loans". If the loan is regarded as uncollectable, it is written off against the allowance. If in a subsequent period the amount of the adjustment decreases and the decrease is objectively attributable to an event that occurred after determination of the writedown, as an improvement in the creditworthiness of the borrower, the adjustment recorded previously is eliminated or reduced by booking a writeback to the income statement, though the writeback cannot in any case exceed the amortised cost that the loan would have had if no adjustments had been made previously.Reversals of impairment losses, like reversals associated with the passage of time, for interest earned in the period on the basis of the original effective interest rate (previously used for calculating the impairment loss), are recognised at each balance sheet date under "Net losses/recoveries on impairment of loans" in the income statement.The restructuring of loans that envisages the cancellation thereof in exchange for shares or other participatory instruments via debt/equity swap transactions is tantamount to, from an accounting point of view, a substantial amendment to the original contractual terms leading to the termination of the pre-existing relationship and the consequent fair value measurement of the new relationship, with the recognition in the income statement of

140 P a r t A – A c c o u n t i n g p o l i c i e s
a profit or loss equating to the difference between the book value of the terminated loan and the fair value of the financial instruments received.Loans for which no objective evidence of impairment has been identified ("performing loans") are submitted to collective or portfolio evaluation. The evaluation of performing loans (loans to borrowers who, at the balance sheet date, have not shown any specific risk of default) takes place for homogeneous categories of loans in terms of credit risk and loss rates are estimated taking into account past statistics and other elements that are observable at the valuation date, which make it possible to estimate the latent loss in value of each loan category.For this purpose we use a model developed on the basis of risk management methodologies seeking all possible synergies (as permitted by the various regulations) with the advanced approach for evaluating the creditworthiness of a counterparty, under the current supervisory legislation. From an operational standpoint, the best possible proxy for determining the creditworthiness of a counterparty is the rating calculated by the models that we have developed and validated internally. All of the positions identified using the methods explained above are evaluated on a collective basis by determining the amount of adjustments to be booked to the income statement, as the product of the exposure at the balance sheet date, the probability of default (PD) and the loss in case of default (LGD).The estimation process for the above factors, PD and LGD, takes account of assumptions that permit the closest possible approximation of the notion of "incurred loss", that is, the loss arising from actual events but which have not yet been reflected in the revision of the level of risk of the counterparty ("incurred but not reported"), as envisaged by IAS 39. In particular, a time horizon of one year is used for the identification of a deterioration in creditworthiness that is then corrected by means of a mitigating factor ("Loss Confirmation Period") that represents the time period between the detection of the initial signs of anomalies and the point in time when the default event is recorded by the Bank.
The adjustments are determined collectively and booked to the income statement. At each balance sheet and interim report date, we update the assessment with reference to the entire portfolio of performing loans as of that date and any additional adjustments or writebacks are recalculated differentially with reference to the entire portfolio.Interest on the loans is classified in the income statement under "Interest and similar income" and is recognised on an accrual basis. Any gains and losses on disposal are reported in the income statement under "Profits (losses) on disposal or repurchase of: loans".A similar method is used for determining specific and general write-downs against guarantees given which do not represent derivative contracts. The liabilities resulting from this valuation process are booked to "Other liabilities" in accordance with the Bank of Italy's instructions. Impairment losses on the guarantees issued and any subsequent writebacks are recognised in the income statement under "Net losses/recoveries on impairment of: other financial activities".
DerecognitionLoans and receivables are derecognised when the right to receive cash flows from the financial asset has expired, or when all the risks and rewards associated with holding the asset in question are effectively transferred or when the asset is regarded as definitively irrecoverable upon completion of all the necessary recovery procedures. Conversely, if the legal ownership of loans has been effectively transferred and the Group retains substantially all their rewards and benefits, these loans continue to be reported as assets in the Bank's balance sheet, with the consideration received from the purchaser recognised as a liability.In such cases, the Group making the transfer recognises a liability to the buyers equal to the price received; the respective costs and revenues are recorded on the assets sold and any related liabilities.

141P a r t A – A c c o u n t i n g p o l i c i e s
5 – Financial assets designated at fair value through profit and loss
ClassificationIn general terms the application of the fair value option is extended to all financial assets and liabilities that, if otherwise classified, would give rise to a distortion in the accounting treatment of income and shareholders' equity, as well as to all instruments that are managed and measured at fair value. The following are therefore included in this category:K structured instruments purchased (hybrid debt instruments whose return is linked to equity instruments, foreign exchange, credit instruments or
indices), other than those allocated to trading instruments; K debt securities not included in financial assets held for trading and subject to financial hedging for which the fair value is applied in order to
reduce and/or eliminate valuation and accounting asymmetries;K open-ended funds (including hedge funds), for which regular valuations are available from independent sources and which, not being held for
short-term trading, form part of a suitably documented investment strategy, designed to achieve an overall return based on the change in the fair value of the instrument, with regular detailed reports on their performance provided to management.
Reclassifications to other categories of financial assets are not allowed.
RecognitionThe initial recognition of financial assets at fair value takes place on the settlement date of the underlying purchase transactions according to the timing provided by market practices ("regular way"). Changes in fair value between the trade date and the settlement date are booked to the income statement.Financial assets designated at fair value through profit and loss are initially recognised at fair value, which generally corresponds to their purchase price. Their transaction costs or proceeds are recorded directly in the income statement.
Measurement and recognition of components affecting the income statementAfter initial recognition financial assets are valued at their current fair value.The fair value of investments listed on active markets is determined with reference to the market bid price reported at the balance sheet date. The fair value of investments for which no price is listed on an active market is determined using estimates and valuation models that take account of all the risk factors related to the instruments along with published price quotations, if available. These techniques may take account of prices reported for recent similar market transactions, discounted cash flows, option pricing models and other well-established methods used in financial markets. For further details, reference should be made to section A.4 "Fair value disclosures". Gains and losses realised on sale or redemption and the unrealised gains and losses arising from changes in fair value with respect to the purchase cost, determined on the basis of the weighted average cost on a daily basis, are expensed in the period in which they emerge under the item "Profits (losses) on financial assets and liabilities designated at fair value", to which are also booked the capital gains and losses on derivatives linked to the fair value option.Under the terms of art. 6 of Legislative Decree 38 of 28 February 2005, the share of operating profit, corresponding to gains recognised in the income statement, net of the related tax charge, which stems from the application of fair value to instruments other than those for trading and to foreign exchange operations and hedging instruments, is booked to a restricted reserve that is reduced by the amount of any capital gains that are realised. The amount reported in the restricted reserve refers to the net gains on financial assets and liabilities, not hedged by derivatives, and those on hedged financial instruments.Interest income on debt securities is calculated on the basis of the nominal interest rate. Dividends from equities are recorded when the right to receive them arises. Interest income and dividends appear in the income statement, respectively, under "Interest and similar income" and "Dividends and similar income".
DerecognitionFinancial assets at fair value are derecognised when the right to receive the cash flows from the financial asset has expired, or if substantially all the risks and benefits associated with holding that particular asset are transferred.Conversely, if legal ownership of a financial asset has effectively been transferred, but the bank retains a substantial part of the rewards and benefits of the asset sold, it continues to be reported as an asset in the balance sheet. In such cases, the Group making the transfer recognises a liability to the buyers equal to the price received; the respective costs and revenues are recorded on the assets sold and any related liabilities.

142 P a r t A – A c c o u n t i n g p o l i c i e s
6 – Hedging transactions
ClassificationRisk hedging transactions are designed to neutralise potential losses on a particular item or group of items attributable to a given risk, should a specific risk actually occur. The instruments that may be used for hedging are derivatives (including purchased options) and non-derivative financial instruments, but only to hedge exchange risk. Hedging instruments are classified in the balance sheet under asset line item "80. Hedging derivatives" if positive at the balance sheet date, or under liability line item "60. Hedging derivatives", if negative.
Of those permitted by the standard, the Group uses the following types of hedging:K Fair value hedge in turn split into: • micro-hedging: this aims to hedge the risk of changes in the fair value of individual assets or liabilities in the financial statements, or
portions thereof, attributable to a particular risk, such as interest rate risk or price risk; • macro-hedging: this aims to reduce fluctuations attributable to interest rate risk in the fair value of an indistinct portion (a monetary
amount) of a portfolio of financial assets and/or liabilities. Net amounts corresponding to mismatches of assets and liabilities cannot be macrohedged.
K Cash Flow Hedge: the objective thereof is to hedge the exposure to changes in future cash flow attributable to particular risks associated with financial statement components. This type of hedging is used to stabilise cash flow generated by interest on floating rate loans or to hedge the risk of a price change on future purchases of financial assets.
Financial instruments are designated as hedging instruments only if they involve a counterparty that is external to the Group, which means that transactions between Group companies and their economic results are eliminated from the consolidated financial statements.
RecognitionHedging derivatives are initially recognised at the trade date (the date the contract is signed).Like all derivatives, financial derivative instruments used for hedging are initially recognised at fair value.
Measurement and recognition of components affecting the income statement
Fair value HedgeFinancial derivative instruments used for hedging are measured at their current fair value. The fair value of derivatives is based on prices published by regulated markets or provided by financial markets, option pricing models or discounted future cash flow models. For further details, reference should be made to section A.4 "Fair value disclosures". Hedged positions are also carried at fair value, but only for changes in value produced by the risk being hedged (e.g. interest rate risk), "sterilising" the other risk components that are not subject to such transactions and, for hedged positions subject to the amortised cost method and involved in micro-hedging, with the contra-entry adjusting their amortised cost. In macro-hedging operations, changes in fair value of hedged positions do not involve adjusting their amortised cost, but are recognised in the balance sheet under the asset item "Fair value change of financial assets in hedged portfolios" or under the liability item "Fair value change of financial liabilities in hedged portfolios".The accounting treatment of unrealised gains and losses corresponding to changes in fair value are different depending on the type of coverage. In particular:
K specific fair value hedge: the change in the fair value of the hedged item is connected with the change in the fair value of the hedging instrument. Such compensation is recognised through recognition in income statement item "90. Fair value adjustments in hedge accounting" of the changes in value related to the hedged item (as regards the changes produced by the underlying risk factor), and to the hedging instrument. Any difference, which represents the partial ineffectiveness of the hedge, therefore constitutes the net economic effect. Recognition in the income statement of changes in the fair value of the hedged item, attributable to the risk being hedged, also applies if the hedged item is a financial asset available for sale; if there is no hedge, this change would be booked to equity. In micro-hedging transactions, the difference between the book value of the hedged position (carried at amortised cost) at the time the hedge comes to an end and what would have been its book value if the hedge had never been activated is amortised to income over the residual life of the hedged item based on the effective rate of return. If the hedged item is sold or redeemed, the unamortised portion of fair value is recognised immediately to profit and loss;
K generic fair value hedge: changes in the fair value of assets or liabilities being hedged are recognised in income statement item "90. Fair value adjustments in hedge accounting" and in the balance sheet under asset item "90. Fair value change of financial assets in hedged portfolios" or liability item "70. Fair value change of financial liabilities in hedged portfolios". If the hedging relationship no longer fulfils the conditions for hedge accounting or the hedge relationship is divested, the amount included in asset item 90 or liability item 70 is amortised to the income statement over the estimated life of the hedged items at the time of defining the generic (or "macro") hedge. If the hedge no longer applies as the elements being hedged have been cancelled or reimbursed, the portion of fair value not yet amortised is recognised immediately to profit and loss.
143P a r t A – A c c o u n t i n g p o l i c i e s
Cash Flow HedgeCash flow hedging derivatives are valued at fair value. The change in the fair value of hedging derivatives:K if effective is booked to the line item 140. "Valuation reserves" of the shareholders' equity; K while it is recognised in the income statement line item 90. "Fair value adjustments in hedge accounting" when, in relation to the hedged item,
there is a change in the hedged cash flow or the ineffective portion of the hedge.
If the cash flow hedge is no longer considered effective or the hedging relationship has been terminated, the entire amount of the profits or losses arising from the hedging instrument, already recorded in "Valuation reserves", is recognised in the income statement only when the hedged transaction takes place or when it is deemed that there is no longer any possibility that the transaction will take place; in the latter circumstances the profits or losses are transferred from shareholders' equity to the income statement line item 90. "Fair value adjustments in hedge accounting". Changes in fair value indicated by the line item 140. "Valuation reserves" are also reported in the statement of comprehensive income.
Differentials accrued on derivatives to hedge interest rate risk are recorded in the income statement under "Interest and similar income" or "Interest and similar expense" (the same as the accrued interest on the hedged positions). A transaction qualifies for hedge accounting if there is formal documentation of the relationship between the hedging instrument and risks hedged, of the enterprise's risk management and strategy for undertaking the hedge and how it will assess the hedging instrument's effectiveness. Furthermore, the effectiveness of the hedging relation must be tested when opened and, in the future, over its entire life.The effectiveness of the hedge depends on the extent to which changes in the fair value of the hedged instruments or of the expected cash flows are offset by those of the hedging instrument. Effectiveness is measured by comparing the above changes, taking into account the intent pursued by the company when the hedge was put in place. A hedge is effective (within a range of 80-125%) when the actual and expected changes in the fair value or cash flows of the hedging instrument almost completely neutralise the changes in the hedged item, for the type of risk being hedged. Effectiveness is assessed at each annual or interim balance sheet date using:K prospective tests: which justify the application of hedge accounting, as they demonstrate the expected efficacy;K back tests: which show the degree of hedging effectiveness achieved in the period covered. In other words, they measure how much the results
achieved differ from the perfect hedge.
Hedge accounting is discontinued in the following circumstances:a) the hedging derivative ceases to exist or is no longer highly effective;b) the hedged item is sold or repaid;c) the hedge is terminated prematurely;d) the derivative expires or is sold, terminated or exercised.
In cases a), b) and c) the derivative contract is reclassified to trading instruments (under "20. Financial assets held for trading" or "40. Financial liabilities held for trading"). In cases a), c) and d) the hedged instrument is recognised in its category with a value equal to its fair value at the time when it ceases to be effective and it goes back to being valued according to the class to which it originally belonged.
DerecognitionFinancial assets and liabilities used for hedging are derecognised when there is no longer the contractual right to receive the cash flows relating to financial instruments, assets/liabilities hedged and/or derivative object of the hedging transaction (e.g. expiry of the contract, early termination exercised in accordance with the terms of the contract – so-called "unwinding") or when the financial asset/liability is sold, transferring substantially all of the risks/benefits associated with it.

144 P a r t A – A c c o u n t i n g p o l i c i e s
7 – Investments in associates and companies subject to joint control
ClassificationIFRS 11 detects two types of "joint ventures":K a joint operation, in which the parties that have joint control have rights and obligations for the assets and liabilities involved in the agreement,
which are accounted for as assets or liabilities based on the share of assets held jointly or of liabilities incurred jointly, or;K a joint venture, i.e. a joint control agreement in which the parties have rights to the net assets of the agreement, which can therefore only be
accounted for by the equity method.
The Group considers as joint ventures those companies in which the voting rights and joint control over a business activity are equally shared, directly or indirectly, by Banca Popolare di Milano and by another entity. Also considered a joint venture is an investment in which control over the economic activity and strategic policies of the investee is shared with other entities under contractual agreements, even if the voting rights are not held equally.
Associates, i.e. companies subject to significant influence, are defined as all those enterprises over which the Group is able to exercise significant influence but not control. This influence is presumed to exist when the Group has between 20% and 50% of the voting power.Interests held below the threshold of 20% fall within the scope of consolidation and are classified as Investments only in relation to the existence of partnership agreements, under which the Parent Company has the possibility to intervene in the company's management decisions.
Recognition This item includes the interests in associated companies and joint ventures; on initial recognition these investments are stated at cost.
Measurement and recognition of components affecting the income statementInvestments in associates and companies subject to joint control are carried in the balance sheet at equity, which requires their initial recognition at cost and subsequent adjustment to calculate the share of profits and losses realised after the acquisition. A pro-rata share of the company's operating results is recognised under "Profits (losses) on investments in associates and companies subject to joint control" in the consolidated income statement.The value of investments in associates and companies subject to joint control is reduced by the dividends received periodically by the Group.In the event it is necessary to account for changes in value originating from changes in equity in an investee that the investee has not recognised in the income statement (for example, for changes originating from measurement at fair value of financial assets available for sale), the portion of the changes attributable to the Group is recorded in the line item "Valuation reserves".If there are signs that the value of an investment may be impaired, an estimate of the recoverable amount of the investment is carried out, this being represented by the higher of the fair value net of costs to sell and its value in use. The value in use is the present value of the cash flows that the investment is expected to generate, including its ultimate disposal value. If the recoverable amount is less than the carrying value, the difference is reported in the consolidated income statement under item 240 "Profits (losses) on investments in associates and companies subject to joint control".If the reasons for making a write-down cease to exist due to an event occurring after recognition of an impairment, writebacks are made in the consolidated income statement to the same line item 240 "Profits (losses) on investments in associates and companies subject to joint control".
DerecognitionInvestments in associates and companies subject to joint control are derecognised when the contractual rights to the cash flows from the assets expire or when the investment is sold and substantially all of the risks and benefits associated with it are transferred. Instead, the investment has to be reclassified as a financial instrument in the case of partial disposal that involves the loss of significant influence or joint control.
8 – Property and equipment
ClassificationThe item mainly includes land and buildings for business purposes and those held for investment purposes, together with equipment, vehicles, furniture, furnishings and equipment of any kind.Assets used for business purposes are those held for use in the supply of goods and services or for administrative purposes, which are deemed to be used for more than one period, while investment assets include property held to earn rentals, for capital appreciation or for both reasons. The land and buildings held are mostly used as branches and offices of the parent company and group companies.Property and equipment also include leasehold improvements in the case of additional expenses relating to identifiable and separable assets; in this case, the classification relates to the specific category, taking into account the nature of the asset in question. Leasehold improvements are classified under "Other assets" if they relate to property, plant and equipment that is identifiable but not separable.As regards property, the components relating to land and buildings are treated separately for accounting purposes as they have different useful lives. Land is attributed an unlimited useful life and is therefore not depreciated, whereas buildings are depreciated as they have a limited useful life. An increase in the value of the land on which a building stands does not affect the determination of the building's useful life.

145P a r t A – A c c o u n t i n g p o l i c i e s
If a property includes a portion that is used in the business and a portion that is held for investment purposes, it is classified on the basis of whether these parts can be sold separately or otherwise. If they can be sold separately, they are recorded separately as business property and investment property accordingly. If the portions cannot be sold separately, the entire property is classified as a business property, unless only an insignificant portion of the property is used for business purposes.
RecognitionProperty and equipment are initially recorded at purchase price or production cost, including all directly attributable costs of purchase or of bringing the asset to working condition. Non-routine maintenance expenditure is included in the carrying value of the asset or recorded as a separate asset, as appropriate, only when it is probable that the future economic benefits will flow to the enterprise and the cost can be measured reliably. Expenditure on repairs, maintenance or other work to ensure the functioning of assets is recognised as an expense in the period incurred.
Measurement and recognition of components affecting the income statementSubsequent to initial recognition, items of property and equipment, including investment property, are carried at cost less any accumulated depreciation and any accumulated impairment losses. Property and equipment are depreciated over their estimated useful lives by adopting the straight-line method and the amount is entered under "Net adjustments to/recoveries on property and equipment". Land is not being depreciated, regardless of whether it was separately acquired or forms part of the value of buildings, since it has an unlimited useful life. Works of art are not being depreciated since their useful life cannot be estimated and their value usually increases over time.Depreciation starts when the asset is available and ready for use, or when it is in the required place and conditions to be able to operate. In the first year of amortisation the charge is recognised in proportion to the period the asset is effectively used.Depreciation ceases when the asset is classified as "held for sale" or, if earlier, from the date when the asset is derecognised. Depreciable assets are adjusted for any impairment losses whenever events or changes in circumstance indicate that their carrying amount might not be recoverable. An impairment loss is recognised for the amount by which the carrying amount of an asset exceeds its recoverable amount. The recoverable amount is the higher of fair value, net of any costs to sell, and the related value in use of the asset, understood as the present value of expected future cash flows generated by the asset.Any adjustments are recorded in the income statement, under item "Net adjustments to/recoveries on property and equipment" .If the reasons behind the recognition of an impairment loss no longer exist, the loss may be reversed but by no more than the carrying amount that the asset would have had (net of depreciation) if no impairment losses had been recognised in prior years.
Apart from specific determination of the useful life of individual assets, the Group is depreciating its property and equipment over the following residual lives:K property: from 15 to 30 years;K furniture, machines, vehicles: from 3 to 10 years;K plant and leasehold improvements: from 3 to 12 years.
In the course of 2014 the Parent Company revised the useful life of its property, supported by specific appraisals performed by an independent external expert. Please read section 12 – Property and equipment in the Explanatory notes for details.
DerecognitionProperty and equipment are removed from the balance sheet on disposal or when permanently withdrawn from use and therefore no future benefits are expected from their sale or use. Gains or losses arising from the retirement or disposal of items of property and equipment are determined as the difference between the net disposal proceeds and the carrying amount of the assets and are recognised in the income statement on the date they are eliminated from the books.
9 – Intangible assets
ClassificationIntangible assets are non monetary assets, which are identifiable even if they lack physical substance, are long-term and originate from legal or contractual rights, from which the Bank will derive future economic benefits.

146 P a r t A – A c c o u n t i n g p o l i c i e s
Set out below are the main cases identified by the Group.
Software: software licences, not associable with a tangible asset, are treated as intangible assets. The cost incurred to purchase and implement the specific software is recognised in the balance sheet as "Own software", providing all the rights relating to the software have been acquired; if only the user licence has been purchased this is classified as a "User licence" under Software.
Intangible assets linked to the enhancement of relationships with customers: these are represented by enhancement created at the time of business combinations of asset management relationships, insurance portfolios and core deposits. These assets, all of which have a finite useful life, are originally measured by discounting the flows that represent the profit margins over a period that reflects the residual, contractual or estimated duration of the relationships outstanding at the time of the combination. They are amortised on a straight-line basis over the period when the main economic benefits are expected to arrive, in the case of relationships that do not have a predetermined expiry date, and in declining quotas over the period of duration of the contracts, in the case of relationships that do have a predetermined expiry date.
Goodwill: is represented by the future economic benefits of assets that cannot be individually identified or separately recognised in the accounts.
RecognitionIntangible assets are recorded as assets at cost, adjusted for any ancillary charges, if it is probable that future economic benefits attributable to the asset are realised and if the cost of the asset can be reliably determined and provided it consists of identifiable elements, i.e. protected by legal recognition, or negotiable separately from other assets. In the absence of these conditions, the cost of the intangible asset is expensed to income in the period incurred.Internally produced software in the development phase is capitalised when the related cost can be reliably determined; these costs usually consist of the cost of internal staff working on the development project and any other directly related charges. If the technical feasibility of completing the related projects and their ability to generate future economic benefits fails to be demonstrated or if the cost of production cannot be determined in a reliable fashion, the costs are expensed to income.Goodwill, which in a business combination represents the excess acquisition cost over the fair value of the assets and liabilities acquired, is recorded as an asset at the acquisition date and valued at cost.If this difference is negative (i.e. "badwill") or if the goodwill is not justified by the future income-generating capacity of the investment, the difference is written off directly to the income statement.Goodwill relating to equity investments carried at equity is included in the value of the investments.
Measurement and recognition of components affecting the income statementAfter initial recognition, intangible assets with a "finite" life are carried at cost less accumulated amortisation and any accumulated impairment losses.Goodwill is amortised on a straight-line basis (or, for intangible assets related to the enhancement of customer relationships with defined maturity, on a declining basis), which reflects the long-term use of the assets based on their estimated useful life, and is shown under "Net adjustments to/ recoveries on property and equipment" in the income statement.Amortisation starts when the asset is available for use, or when it is in the place and conditions allowing it to operate in the established manner. In the first year of amortisation the charge is recognised in proportion to the period the asset is effectively used. Amortisation is stopped from the earlier of the date when the intangible asset is classified as "held for sale" or the date on which the asset is derecognised. If there is evidence of impairment, the asset's recoverable amount should be estimated at each balance sheet date. The amount of the impairment loss, expensed to income under item "Net adjustments to/recoveries on intangible assets", is the difference between the carrying amount of an asset and its recoverable value.
Apart from specific determination of the useful life of individual assets, the Group is depreciating its property and equipment over the following residual lives:K licenses: over the term of the license;K software developed internally: 6 years.
Subsequent to initial measurement, goodwill is measured at cost less any cumulative impairment losses. Goodwill purchased as part of a business combination is not amortised, but is tested annually for impairment, or more often if events or changed circumstances indicate evidence of a possible impairment loss. To this end, identification is made of a Cash Generating Unit or CGU to which goodwill can be allocated. The Cash Generating Units (CGU) considered in the assessment are based on customer groups and legal entities that differ from the sectors of activity, for which information is given in Part L of these financial statements. The amount of any impairment is determined based on the difference between the carrying amount of the cash-generating unit to which goodwill has been allocated and its realisable value, whichever is less. The recoverable amount is the higher of the cash-generating unit's fair value, less any costs to sell, and its related value in use. Value in use is represented by the present value of the estimated cash flows for the years of operation of the cash-generating units, including those deriving from its disposal at the end of its useful life. Any resulting adjustments are recognised in the income statement under "Goodwill impairment" and subsequent writebacks are not allowed.For more information on goodwill and business combinations, please refer to section 3 "Scope of consolidation and consolidation procedures" – 5 "Other information" in section A.1 "General part".

147P a r t A – A c c o u n t i n g p o l i c i e s
DerecognitionAn intangible asset is eliminated from the balance sheet on disposal or when no future economic benefits are expected from its use and subsequent disposal. Gains or losses arising from the retirement or disposal of an intangible asset are determined as the difference between the net disposal proceeds and the carrying amount of the asset.
10 – Non-current assets held for sale
ClassificationNon-current assets held for sale and discontinued operations are classified as held for sale if their carrying value will be recovered principally through a sale rather than through their continued use. This condition is considered met only when the sale is highly probable and the asset or disposal group is available for immediate sale in its present condition. Management must be committed to the sale and completion of the sale should be expected within one year of the classification.
In accordance with IFRS 5, "discontinued operations" are also accounted for; these are assets that have either been disposed of or classified as held for sale and:K represent either a separate major line of business or a geographical area of operations;K form part of a single co-ordinated plan to dispose of a separate major line of business or geographical area of operations;K are a subsidiary acquired exclusively with a view to resale.
At 31 December 2014 there are no assets or groups of assets classified as such under IFRS 5.
RecognitionNon-current assets held for sale and discontinued operations classified as held for sale are valued at the lower of their carrying amount and fair value, net of costs to sell.
Measurement and recognition of components affecting the income statementAs a result of being classified in this category these assets are measured at the lower of their carrying amount and the related fair value less costs to sell. In cases where the assets being sold are not fully depreciated, the depreciation process is interrupted from the time they are classified as non-current assets held for sale. Non-current assets held for sale and discontinued operations, as well as "discontinued operations" and related liabilities are shown in specific items under assets ("Non-current assets held for sale and discontinued operations") and liabilities ("Liabilities associated with non-current assets held for sale and discontinued operations").The results of valuations, revenues, charges and profits (losses) on disposal (net of tax), of "discontinued operations" get booked to the relevant item of the income statement: "Income (loss) after tax from discontinued operations".
DerecognitionNon-current assets held for sale are eliminated from the balance sheet from the moment they are disposed of.

148 P a r t A – A c c o u n t i n g p o l i c i e s
11 – Current and deferred taxation
"Current and deferred tax assets and liabilities" respectively include the current and deferred tax assets and current and deferred tax liabilities relating to income taxes. These are calculated in accordance with national tax laws and are recognised in the income statement on an accrual basis, in line with the recognition of the costs and revenues that generated them. An exception to this is the tax on items debited or credited directly to shareholders' equity, for which the recognition of the related tax takes place in shareholders' equity for the sake of consistency.
Current taxation: "Current tax assets and liabilities" show the taxes payable or recoverable on the taxable result for the year. These basically relate to the taxes that will be declared in the tax return. Current taxes show the balance between current tax liabilities for the year, calculated on a conservative basis in accordance with current tax legislation, and current tax assets represented by advance payments, tax credits for withholding taxes incurred and other tax credits from previous years which we asked to offset against future taxation. Current tax assets also include tax credits for which a rebate was requested from the competent Tax Authority.
Deferred taxation: application of the tax rules to the separate financial statements leads to differences between taxable income and statutory income which may be permanent or temporary in nature. Permanent differences are definitive and consist of costs or revenues which under current tax laws may be non-deductible (totally or partially) or exempt.Temporary differences are formed when the carrying value of an asset or liability differs from its tax value, thus giving rise to deferred tax, which is determined on the basis of the so-called "balance sheet liability method". Deferred taxation determined on the basis of this method takes account of the tax effect of the differences, which will lead to taxable or deductible amounts in future periods; it follows that the temporary differences can be divided into "taxable temporary differences" and "deductible temporary differences".
"Taxable temporary differences" arise when the carrying amount of an asset is higher than its value for tax purposes, or when the carrying amount of a liability is less than its value for tax purposes. These differences indicate a future increase in taxable income and consequently generate "deferred tax", as these differences result in taxable amounts in later periods to those in which they are recognised in the Bank's income statement, resulting in a deferral of taxation with respect to the period when it accrues from a statutory point of view. "Deferred tax liabilities" are recognised for all taxable temporary differences except for equity reserves in suspense for tax purposes or those for which there are no plans distribution to the shareholders.Differences between lower taxable profit compared with accounting profit are principally the result of:K positive components of income taxable in periods subsequent to those in which they were recognised for accounting purposes;K negative components of income that are deductible for tax in periods prior to those in which they are recognised for accounting purposes.
"Deductible temporary differences" arise when the carrying amount of an asset is less than its value for tax purposes, or when the carrying amount of a liability is greater than its value for tax purposes. These differences indicate a future reduction in taxable income, which therefore generates "deferred tax assets" (effectively prepaid taxes), as these differences result in taxable amounts in the year they are recognised, leading to an anticipation of the tax with respect to the period when it accrues from a statutory point of view."Deferred tax assets" are recognised in the financial statements for all deductible temporary differences to the extent that they will probably be recovered. This probability is assessed on the ability of the company concerned, or of all the companies taking part in the Group tax regime, to generate positive taxable income against which deductible temporary differences can be offset. Differences between higher taxable profit compared with accounting profit are principally the result of:K positive components of income taxed in years prior to those in which they are recognised for accounting purposes;K negative components of income that are deductible for tax in periods subsequent to those in which they were recognised for accounting purposes.
Deferred tax assets may also be recognised for the carry forward of unused tax losses and unused tax credits.Deferred taxation is calculated by applying the tax rates that, according to the laws in force at the time of preparing the financial statements, will be applied in the period in which the asset will be realised or the liability settled. When different tax rates apply to different levels of taxable income, deferred tax assets and liabilities are measured using the weighted average rate for the period to which the financial statements refer.Deferred tax assets and liabilities are offset if they relate to taxes levied by the same tax authority and when there is a legally enforceable right of set-off.The assets and liabilities booked for deferred tax assets and liabilities are systematically assessed to take into account any changes in the rules or tax rates, or any other circumstances relating to the individual Group companies. The amount of the provision for taxation is also adjusted to meet any charges that could arise from tax assessments already notified or in any case from disputes with the tax authorities.If deferred tax assets and liabilities relate to items affecting the income statement, the contra-entry is booked to "Taxes on income from continuing operations"; if the amount of deferred tax assets exceeds the aggregate cost for current taxes and deferred tax liabilities, a positive amount of "tax revenue" is shown in the above mentioned item of the income statement. In cases where deferred tax assets and liabilities relate to transactions that directly involved shareholders' equity (the "valuation reserves") without passing through the income statement (for example, recognition of actuarial gains or losses, and valuations of financial instruments available for sale and cash flow hedges), these are recorded with a contra-entry to the specific valuation reserves in shareholders' equity and in the statement of comprehensive income. The deferred taxation of companies taking part in the Group tax regime is recognised on an accrual basis by the individual companies in their financial statements, as the Group tax regime can only be used to settle current tax positions.

149P a r t A – A c c o u n t i n g p o l i c i e s
12 – Allowances for risks and charges
Allowances for risks and charges include provisions for risks and charges covered by IAS 37 as well as allowances for employee benefits covered by IAS 19, both post-employment and long-term benefits.
Allowances for risks and chargesAllowances for risks and charges are liabilities whose amount and timing are uncertain and which are recognised in the financial statements when all the following conditions are met:a) a present obligation exists at the balance sheet date as a result of a past event. The obligation must be of a legal nature (i.e. based on a
contract, regulation or other provision of law) or implicit (i.e. arising any time the company generates an expectation in third parties that it would honour its commitments, even if not covered by legal obligations);
b) it is probable that an outflow of financial resources will be required;c) a reliable estimate can be made of the amount of the obligation.
Allowances for employee benefitsThe contents of allowances for risks and charges and the methods of accounting for them, broken down as required by the Bank of Italy between "Post-employment benefits" and "Other allowances", are explained below.
Allowances for post employment benefits"Allowances for post-employment benefits" are made up of provisions for employee benefits to be paid after termination of the employment relationship; depending on the legal and economic substance of the obligation, they can be defined contribution or defined-benefit plans.Under defined contribution plans, an enterprise pays fixed contributions by contract into a separate fund and so has no legal or constructive obligation to pay further contributions if the fund does not hold sufficient assets to pay all employee benefits relating to employee service. The contribution is accounted for on an accrual basis under "Administrative expenses: a) personnel expenses", as the cost of the benefit to the employee.Defined benefit plans are structured quite differently. In fact, in this case, the Group guarantees benefit payments to those entitled by assuming the actuarial risk itself but not that of the investment, insofar as the amounts set aside to satisfy the pensioners' entitlements are not invested in specific assets that are separate from those of the Group in general. These plans are financed by a specific provision booked to "Allowances for risks and charges: a) post employment benefits". In this case the future benefits payable have been valued by an independent actuary using the "projected unit credit method", described in detail in chapter 18 "Other information – Termination indemnities".
Other allowances"Other allowances" include the amounts set aside for bonuses payable to managers in cash and on deferred basis, those to cover estimated losses on lawsuits, including recovery procedures, the estimated costs of customer complaints regarding securities brokerage activities, the estimated costs of other legal obligations existing at the balance sheet date, including amounts set aside for staff severance incentives and related social security contributions.The item also includes allowances for long service bonuses or indemnities due to managers under Group companies' contractual agreements. These benefits are recorded in accordance with the actuarial method described in IAS 19, also used for post-employment benefits with the difference that the full amount of any actuarial gains and losses is recognised immediately in profit and loss in the period they arise, as are any changes in the liability due to revisions in the related plan. These provisions are determined on the basis of appraisals by an independent actuary.The amount recognised as an allowance is the best estimate of the financial benefit needed to implement the obligation that exists at the reporting date of the financial statements and reflects risks and uncertainties that are inherent in the facts and circumstances under review. If deferral of the obligation is significant, with the result that the effect of the time value of money is material, then provisions are discounted to the present value of the expenditure expected to be required to settle the obligation. The discount rate is a pre-tax rate that reflects current market assessments of the time value of money and the risks specific to the liability. It is usually considered significant if 12 months pass between the date of preparation of the financial statements and the disbursement. The provision made to the allowance is recognised in the income statement, where the interest accruing on allowances that are subject to discounting is also recorded. Each provision is used solely to meet the obligations for which it was set up.Provisions are adjusted, if necessary, at each balance sheet date to reflect the current best estimate; if the reasons for past provisions no longer apply, the amount involved is released to the income statement.If liabilities are only potential and not likely, no provision is made, but information is given in the notes, except in cases where the probability of incurring a cost is remote, or the situation is immaterial.

150 P a r t A – A c c o u n t i n g p o l i c i e s
13 – Payables and securities issued
ClassificationPayables and securities issued fall within the broader category of financial instruments and consist of those relationships for which the company is obliged to pay certain amounts to third parties at certain deadlines.The items "due to banks", "due to customers" and "securities issued" include the various technical forms of interbank funding and customer deposits, repurchase agreements (forward agreements with an obligation to repurchase) and the funds raised by issuing certificates of deposit, bankers' drafts and bonds in circulation, i.e. net of any amount repurchased. "Securities issued" also include securities that are past due but not yet reimbursed at the balance sheet date and exclude portions of debt securities issued but not yet placed with third parties. Payables also include those associated with the provision of financial services as defined in the Consolidated Banking Act and in the Consolidated Finance Act. The preference shares (issued by "BPM Capital I", a BPM subsidiary) and the subordinated loans are classified as financial liabilities, as their regulations require periodic coupon payments and/or mandatory redemption of capital for a fixed or determinable amount at a specified future date or give the holder the right to request a refund on or after a set date for a fixed or determinable amount.
RecognitionInitial recognition of these financial liabilities are on receipt of the money raised or the issuance of debt securities and is carried out based on the fair value of the liabilities, normally the amount received or the issue price, adjusted for any costs/income directly attributable to each funding transaction or issue and not reimbursed by the creditor. This does not include internal administrative expenses.The portion of convertible bonds with the characteristics of a liability are recognised as payables less their issue costs. The fair value of the portion of the debt representing a financial liability is determined upon issue using the market price of an equivalent non-convertible bond; this amount, classified as a long-term payable, is adjusted using the amortised cost method until it is extinguished through conversion or redemption. The rest of the amount received is attributed to the conversion option and recognised in shareholders' equity under "Reserves".Repurchase agreements are recorded as funding transactions for the amount paid spot.
Measurement and recognition of components affecting the income statementAfter initial recognition, financial liabilities are carried at amortised cost using the effective interest rate method. Exceptions to this are short-term liabilities, where the time factor is negligible, which are recorded at the amount received and any costs are charged to the income statement on a straight-line basis over the contractual life of the liability. Note that funding instruments subject to an effective hedging relationship are evaluated according to the rules for hedging transactions.Interest expense on debt instruments is classified as "interest and similar expense".Dividends on preference shares are recorded in the income statement as interest on the basis of the effective rate of return.
DerecognitionFinancial liabilities are derecognised when they have expired or have been extinguished. The repurchase of securities issued previously is regarded as an extinguishment of the liability or part of it. The difference between the carrying value of the liability extinguished and the amount paid for its repurchase is booked to the income statement under "Profits (losses) on disposal or repurchase of: d) financial liabilities".Any repurchase of securities issued previously is recorded as a decrease in the liability item to which the issue had been booked. Re-placement of these securities on the market after their repurchase is considered, for reporting purposes, as a new issue that is booked at the new placement price, with no effect on the income statement.

151P a r t A – A c c o u n t i n g p o l i c i e s
14 – Financial liabilities held for trading
ClassificationThe following items are classified in this category:K derivative contracts held for trading (except for those designated as effective hedging instruments, recorded in liabilities under "Hedging
derivatives") with a negative fair value;K derivatives linked to assets/liabilities carried at fair value;K the sub-items "due to banks" and "due to customers" include liabilities arising from short selling as part of securities trading.
RecognitionInitial recognition of financial liabilities held for trading takes place, for the liability in cash, on the settlement date of the underlying operations, if settled on schedule according to market practice ("regular way"); for derivatives, on the trade date. In the case of recognition of financial liabilities on the settlement date, any changes in fair value between the trade date and the settlement date are booked to income.Financial liabilities held for trading are recognised on the subscription date at fair value, which generally corresponds to the amount received, without considering transaction costs or income directly attributable to the instrument concerned, which are charged directly to income.
Measurement and recognition of components affecting the income statementFinancial liabilities held for trading are measured at current fair value, with the result of the valuation being charged to income. If the fair value of a financial liability turns positive, the item is recorded as a financial asset.Profits and losses from trading activities and gains and losses on the valuation of the trading book are recognised in the income statement under "Profits (losses) on trading", except for financial derivatives relating to the fair value option, whose result is recorded under "Profits (losses) on financial assets and liabilities designated at fair value".Differentials and margins on derivatives are allocated in the income statement to "Profits (losses) on trading", except for those that are operationally linked to financial assets or liabilities designated at fair value (subject to the fair value option) or linked to financial assets or liabilities classified as held for trading and with settlement of differentials or margins with various maturities ("multiflow" contracts), which are classified in the income statement as "Interest and similar income".
DerecognitionFinancial liabilities held for trading are derecognised when the contractual rights to the cash flows cease or when the liability is sold and substantially all of the risks and benefits associated with it are transferred.
15 – Financial liabilities designated at fair value through profit and loss
ClassificationFinancial liabilities designated at fair value through profit or loss form part of this item, based on the fair value option granted to companies by IAS 39 and the case studies provided in the standard.This category includes:K structured instruments issued (hybrid debt instruments whose return is linked to equity instruments, foreign exchange, credit instruments or indices); K debt securities issued by the Group not included in financial assets held for trading and subject to financial hedging for which the fair value is
applied in order to reduce and/or eliminate valuation and accounting asymmetries.
RecognitionThese financial liabilities are recognised at the issue date for an amount equal to their fair value, including the value of any embedded derivative, which generally corresponds to the amount received. Any transaction costs (including placement fees paid to third parties) are charged immediately to income.
Measurement and recognition of components affecting the income statementAfter initial recognition financial liabilities are measured at current fair value.The fair value of securities issued listed in active markets is determined with reference to the market bid price reported at the balance sheet date. For unlisted securities issued on an active market, the fair value is determined using valuation models and estimation methods that take into account the risk factors related to the instruments and that are based on observable market data where available. These techniques may take account of prices reported for recent similar market transactions, discounted cash flows, option pricing models and other well-established methods used in financial markets. As regards the credit spread on own issues aimed at ordinary customers, in order to determine the difference between the original and the current spread as at the reporting date, use is made of the implicit spreads of new retail issues made by the Group.Gains and losses realised on redemption and the unrealised gains and losses arising from changes in fair value with respect to the issue cost, are booked to the income statement in the period in which they emerge under the item "Profits (losses) on financial assets and liabilities designated at fair value", to which are also booked the capital gains and losses on derivatives linked to the fair value option.Interest expense on debt instruments is classified as "interest and similar expense".

152 P a r t A – A c c o u n t i n g p o l i c i e s
DerecognitionFinancial liabilities designated at fair value through profit and loss are eliminated from the financial statements once they have expired or been extinguished. The repurchase of securities issued previously is regarded as an extinguishment of the liability or part of it. The difference between the carrying value of the liability extinguished and the amount paid for the repurchase is recorded in the income statement under "Profits (losses) on financial assets and liabilities designated at fair value".Any repurchase of securities issued previously is recorded as a decrease in the liability item to which the issue had been booked. Re-placement of these securities on the market after their repurchase is considered, for reporting purposes, as a new issue that is booked at the new placement price, with no effect on the income statement.
16 – Foreign currency transactions
ClassificationForeign currency assets and liabilities include not only those explicitly denominated in a currency other than the euro, but also those with financial indexation clauses linked to the euro exchange rate against a specific currency or against a specific basket of currencies.For the purposes of the conversion method to be use, foreign currency assets and liabilities are divided into monetary and non-monetary items. Monetary items consist of sums of money and assets and liabilities that express the right to receive or an obligation to pay fixed or determinable amounts of money (receivables, debt securities, financial liabilities). Non-monetary items (such as equities) are assets or liabilities that do not include the right to receive or an obligation to pay fixed or determinable amounts of money.
RecognitionForeign currency assets and liabilities are recorded, at the time of initial recognition, in the reporting currency, by applying the spot exchange rate at the date of the underlying transactions to the foreign currency amounts.
Measurement and recognition of components affecting the income statementAt each balance sheet or interim period, foreign currency balances are valued as follows:K monetary items are translated at the spot exchange rate at the closing date;K non-monetary items carried at historical cost are translated at the spot exchange rate on the date of initial recognition in the financial statements
(historical exchange rate);K non-monetary items carried at fair value are translated using the spot exchange rates at the closing date.
Exchange differences that arise as a result of this process of translation into euro of assets and liabilities denominated in foreign currency, relating to monetary and non-monetary items carried at fair value are reported in the income statement item "Profits (losses) on trading", except for differences attributable to the "valuation reserves" (e.g. those of securities available for sale), which are charged directly to these reserves.
17 – Insurance assets and liabilities
Following the loss of control over the insurance companies Bipiemme Vita S.p.A. and Bipiemme Assicurazioni S.p.A., they are no longer consolidated on a line-by-line basis in the financial statements at 31 December 2011, but at equity. Following the change in consolidation method, the insurance-related items in these consolidated financial statements have zero balances.

153P a r t A – A c c o u n t i n g p o l i c i e s
18 – Other information
a) Other significant items in the financial statements
Cash and cash equivalentsThis item includes legal currencies, including foreign banknotes and coins and demand deposits at the Central Bank of the country in which the Group operates.This item is recorded at face value. The face value of foreign currencies is converted into euro at the spot exchange rate on the balance sheet date.
Other assets This item shows assets that are not classifiable elsewhere on the assets side of the balance sheet. This item also includes:K gold, silver and precious metals; K accrued income, other than what is capitalised to the related financial assets;K leasehold improvements other than those related to "property and equipment", i.e. those that are not related to fixed assets that are
separately identifiable. The restructuring costs of commercial property non owned by the Bank are booked to "Other assets" as required by the Bank of Italy's instructions, considering the fact that for the duration of the lease the company has control over the assets and can draw future economic benefits from them. These costs are depreciated over a period not exceeding the duration of the lease and recognised in the income statement under "Other operating expenses";
K tax debtor balances other than those included in "Tax assets" (e.g. those involved in acting as a tax withholding agent).
Employee termination indemnitiesEmployee termination indemnities are designated as "post-employment benefits".Following the pension reform under Legislative Decree 252 of 5 December 2005, introduced by the 2007 Budget Law, the portions of staff termination indemnities that accrued up to 31.12.2006 remain in the company, whereas the amounts accruing from 1 January 2007 onwards can be transferred, at the employee's discretion, to supplementary pension schemes or to a treasury fund managed by INPS.
The consequence of this is that:K the termination indemnities that accrued up to 1 January 2007 (or at the date when the decision was made to assign them to a supplementary
pension fund) continue to be shown as a "post-employment benefit" classified as a "defined-benefit plan" and, as a consequence, the liability linked to "accrued termination indemnities" is subjected to an actuarial valuation; this valuation, which compared with the methods applied up until 31 December 2006, no longer takes account of the average annual increase in wages and salaries, as the employee benefits are to be considered almost entirely accrued (with the sole exception of the revaluation equal to a fixed amount of 1.5% plus 75% of the increase in ISTAT's consumer price index). The full amount of actuarial gains and losses, defined as the difference between the book value of the liability and the present value of obligations at period end, are recognised directly to shareholders' equity in "Valuation reserves";
K the amounts accruing from 1 January 2007 are considered a "defined-contribution plan" as the company's obligation ceases when it pays the accrued indemnities to the fund chosen by the employee, so the amounts involved, which are accounted for on an accrual basis in personnel costs, are determined on the basis of the contributions payable without applying actuarial methods. Note that the termination indemnities accruing kept in the company and then transferred to INPS, the amounts paid year after year to the treasury fund run by INPS do not include the revaluation applied by law; consequently, the burden of revaluing the amounts paid by the company falls on INPS.
This legislation does not apply to Group companies that had less than 50 employees at the date the reform came into effect (particularly Banca Popolare di Mantova); for these companies, the previous law remains in force, which considers employees' termination indemnities as a defined-benefit plan, the accrued amount of which has to be projected into the future to estimate the amount that will have to be paid at the time the employee leaves the company; it is then discounted using the projected unit credit method to take account of the time that will pass prior to the actual payment. The calculation only concerns the termination indemnities already accrued for periods of service already rendered and will have to take account of future wage rises.More specifically, this method, also known as the "accrued benefit cost method" pro-rated over the years of service or as the "benefit/years of service method", sees each period of service as giving rise to an additional unit of benefit entitlement and measures each unit separately to build up the final obligation.The projection of future payments (including future salary increases for whatever reason: contract renewals, inflation, career promotion, etc.) is carried out on the basis of historical statistics and analyses of the demographic curve; these flows are discounted at a market interest rate. The contributions paid in each period are treated as separate units, recognised and measured individually for the purposes of determining the final obligation.The amount recognised as a liability is therefore the present value of the liability at the balance sheet date, plus the annual interest accruing on the present value of the bank's obligations at the start of the year, calculated using the discount rate for estimating the liability for future outflows adopted at the end of the prior year, and adjusted for the portion of actuarial gains/losses.The rate used to discount the obligations linked to post-employment benefits is determined on the basis of market yields at the reporting date on bonds of leading companies with an average residual duration equal to that of the liabilities being measured.The full amount of actuarial gains and losses, defined as the difference between the book value of the liability and the present value of obligations at period end, are recognised directly to shareholders' equity line item "Valuation reserves".

154 P a r t A – A c c o u n t i n g p o l i c i e s
Obligations to employees are evaluated by an independent actuary every six months.
Other liabilitiesThis item shows liabilities that are not classifiable elsewhere on the liabilities side of the balance sheet. This item also includes:K the commissions received on initial recognition of guarantees given and subsequent writedowns due to impairment of the risks guaranteed; K accrued liabilities other than those capitalised to the related financial liabilities;K payables associated with the payment of supplies of goods and services;K tax creditor balances other than those included in "Tax liabilities" (e.g. those involved in acting as a tax withholding agent).
Accruals and deferralsAccruals and deferrals for income and expenses accrued during the period on financial assets and liabilities are booked as an adjustment to the assets and liabilities to which they relate.
Valuation reservesThis item includes the valuation reserves relating to financial assets available for sale, profits (losses) on defined-benefit pension plans and the portion of the valuation reserves for investments carried at equity. They also include valuation reserves booked in application of special revaluation laws, also if freed up for tax purposes (via a "tax step-up").
Share capital and treasury sharesThis item includes the amount of shares issued net of any capital subscribed but not yet paid at the balance sheet date. The item is shown gross of any treasury shares held by the Parent Company or another Group company. Treasury shares are shown with a minus sign in a specific equity item.If these shares are subsequently resold, any proceeds are classified in treasury shares up to the amount of the book value of the shares themselves. The difference, positive or negative, between the selling price of the treasury shares and the corresponding book value is recorded as an increase or decrease in shareholders' equity under "Share premium reserve". Transaction costs relating to an increase in capital, or other such capital transactions, are accounted for as a reduction in shareholders' equity, net of any related tax benefit.Dividends on ordinary shares are recorded as a reduction in shareholders' equity in the year in which the shareholders approve their distribution. Any interim dividends paid to shareholders are recognised in the balance sheet liability item "Interim dividends" with a minus sign.
Minority interestsThis item represents the portion of the consolidated net equity attributable to shares belonging to minority shareholders, calculated on the basis of equity ratios. The amount is calculated net of any shares repurchased by consolidated companies.
b) Other significant accounting treatments
Finance and operating leases
a) Group lessee companies: the lease agreements made by Group companies are all operating leases. Total payments due on contracts are accounted for in the income statement under "Administrative expenses: b) other administrative expenses" over the life of the contracts. If an operating lease is extinguished before its maturity, all the payments required by the lessor by way of penalty, are recorded as an expense in the period of the lease's extinguishment.
b) Group lessor companies: the lease agreements made by group companies are operating leases. In the case of finance leases reported as assets, the present value of the payments owed by the lessee is recorded as a receivable. The difference between the receivable's gross value (value of the leased asset, net of the advance paid by the customer) and its present value (sum of instalments, principal amount, plus interest, discounted at the contractual rate including any costs and revenues of the transaction) is recorded under "Interest and similar income", in accordance with the terms of the contract, using the effective interest rate method.
Repurchase agreements, securities lending and carry-oversRepurchase agreements or carry-over transactions by which the Group sells securities to third parties with the obligation to repurchase them in the future at a predetermined price are recorded in liabilities to other banks or customers, depending on the counterparty. Similarly, repurchase agreements or carry-over transactions by which the Group buys securities from third parties with the obligation to repurchase them in the future at a predetermined price are recorded in loans or advances to other banks or customers, depending on the counterparty. The difference between the spot price and forward price of these transactions is recognised as interest (income or expense depending on the circumstances) and recorded on an accrual basis over the life of the operation. Securities lending transactions where the collateral is represented by cash that remains entirely at the lender's disposal are recorded in the financial statements in the same way as repurchase agreements (see above). In the case of securities lending with collateral consisting of other securities, or without collateral, the lender and the borrower continue to recognise in their balance sheet, respectively, the security involved in the loan and the one given as a guarantee (if any). If the security being lent is sold by the borrower, the latter has to book a payable to the lender on the liabilities side of its balance sheet. If, on the other hand, it is used in repurchase

155P a r t A – A c c o u n t i n g p o l i c i e s
agreements, the amount due to the repo counterparty is booked as a liability. The revenue from such transactions is booked by the lender as "Fee and commission income", whereas the cost incurred by the borrower is booked as "Fee and commission expense".
Offsetting of financial instrumentsFinancial assets and liabilities can be offset, showing the net balance in the financial statements, when there is a legal right to compensate in this way and when there is the intention to settle the transactions for the net amount or to realise the asset and settle the liability simultaneously.
Share-based payments
Allocations of net profitUnder the new wording of art. 60 of the Parent Company's Articles of Association, as amended by the Extraordinary General Meetings of Members of 25 June and 22 October 2011, each year the Bank allocates to current employees, except those who hold senior positions, or to mutual funds with which they are registered, an amount of 5% of the pre-tax income of the Parent Company ("Income (loss) before tax from continuing operations" in the income statement), calculated before the amount to be determined, unless the General Meeting resolves not to distribute dividends out of net income for the year. The amount is allocated in the form of shares that are subject to a restriction, in that the assignee cannot dispose of them for three years (for the purposes of the tax exemption); the reference value of shares granted is equal to the average stock price posted during the 30 days preceding the award. Based on IFRS 2, the amount to be paid to employees is considered an expense for the year and recognised in the income statement under "Personnel expenses", for an amount equal to the fair value of the labour received, with the contra-entry booked to shareholders' equity. Incentive scheme for "key personnel":Following the issuance by the Bank of Italy of the "Supervisory Provisions concerning remuneration policies and practices and incentives in banks and banking groups" on 30 March 2011, the Parent Company has prepared an update of the "Document on remuneration and incentive policies of Banca Popolare di Milano", approved by the Board of Directors of the Parent Company at its meeting on 7 June 2011, and by the Members at the Ordinary General Meeting of 25 June 2011. With reference to the "key personnel" (also known as "risk takers", i.e. business managers, who can take on considerable risks), the variable component of remuneration is paid 50% in cash and 50% in BPM shares (excluding managers who have responsibility for internal control).
As regards the portion paid in shares, the number of shares is determined by dividing the amount of the variable compensation due by the average price in the thirty days prior to the grant, also making reference for the deferred portion to the value posted in the year of settlement of the upfront allotment. As established in IFRS 2, the transaction explained in this paragraph is considered an expense for the year and recognised in the income statement under "Personnel expenses", for an amount equal to the fair value of the labour received, with the contra-entry booked to shareholders' equity.
SecuritisationsFor operations completed after 1 January 2004, the receivables are derecognised where there is a substantial retention of risks and benefits, even though formally being sold without recourse to a special purpose vehicle (SPV). This occurs, for example, if the Group subscribes to the junior tranche of securities or similar exposures, and therefore bears the risk of first loss and, in the same way, benefits from the performance of the operation. In particular, the Group retains all of the risks and benefits of securitised loans, not proceeding to their derecognition when, according to the specifications of the contracts in place, there is no change in the Group's risk and exposure to them.
The receivables are therefore maintained as assets in the financial statements by recording:K in the separate financial statements, a payable versus the SPV for the loan received, net of the securities issued by the company and underwritten
by the Group that made the transfer,K in the consolidated financial statements, the value of the notes issued by the SPV.
In covered bond transactions, against the maintenance of the receivables on the assets side of the balance sheet, the value of the covered bonds issued directly by the Group is recorded among liabilities in the transferor's financial statements (separate and consolidated). A similar approach is taken in the previous cases in the recognition of income and costs, giving preference to substance over form.
Cost and revenue recognitionRevenues are recognised when they are earned or, in the case of the sale of goods or products, when it is probable that the future benefits will be received and these benefits can be reliably quantified, or, in the case of the provision of services, at the time when they have been rendered. In particular:K interest is recognised on a pro-rata time basis at the contractual interest rate or at the effective rate if amortised cost is applied. Interest income
(or interest expense) also includes differentials or margins, positive (or negative), accrued up to the balance sheet date on the related financial derivatives:
a) to hedge assets and liabilities that generate interest; b) classified in the balance sheet in the trading book, but linked to financial assets/liabilities designated at fair value through profit and loss
(under the fair value option);

156 P a r t A – A c c o u n t i n g p o l i c i e s
c) linked for operational purposes to assets and liabilities classified as held for trading and which provide for the settlement of differentials or margins with several maturities;
K any past due interest provided for in the contract is only recognised in the income statement when actually collected;K dividends are recognised in the income statement in the period when their distribution is decided and shareholders gain the right to
receive payment;K net fee and commission income is recognised in the period when the services are rendered, based on contractual agreements. The fees and
commissions considered in amortised cost for the purpose of determining the effective interest rate are booked as interest. In particular: • fees and commissions relating to syndicated loans are recognised as revenue when the organisation of the syndicated loan is completed,
provided the Group has not financed part of the loan itself or has financed part of the loan at the same effective interest rate as the other syndicate members;
• fees and commissions on the negotiation or participation in negotiation of a transaction for another party, such as fees for preparing the purchase of shares or the purchase/sale of a business, are recognised upon completion of the underlying transaction;
• management fees and other fees relating to advisory services are recognised in accordance with the terms of the related contracts and nonetheless using an appropriate time horizon. Management fees relating to investment funds are accounted for proportionately over the period the service is provided. The same principle applies to fees on wealth management and custody services;
K net income from trading, in addition to the recognition of capital gains/losses and trading profits/losses, include the result of valuing contracts for the purchase and sale of securities not yet settled at the balance sheet date;
K expenses are recognised in the income statement in the periods when the related revenues are recorded; costs that are not show directly associated with revenues are charged immediately to income.
A.3 – Disclosures relating to transfers between portfolios of financial assets
In the current or prior periods, the Group has not carried out any portfolio reclassifications of financial assets from categories measured at fair value into categories carried at amortised cost.

157P a r t A – A c c o u n t i n g p o l i c i e s
A.4 – Fair value disclosures
Qualitative information
Introduction Fair value measurements and disclosures are governed by IFRS 13 "Fair Value Measurement", which in paragraph 9 defines fair value as "the price that would be received to sell an asset or paid to transfer a liability in an orderly transaction between market participants at the measurement date".
As regards the type of financial instruments to be measured at fair value, the requirements of paragraph 9 of IAS 39 remain valid, that is, fair value measurement applies to all financial instruments with the exception of: financial assets classified as "investments held to maturity" and "loans and receivables"; investments in equity instruments for which it is not possible to establish a reliable fair value; non-trading financial liabilities to which the fair value option has not been applied. Moreover, it is worth reiterating that accounting standards and the Bank of Italy require, in any event, to disclose the fair value of assets and liabilities measured at amortised cost (receivables and payables, securities issued).
IFRS 13 is based on the definition of market based fair value, in that the fair value of assets or liabilities should be measured based on the characteristics thereof that a market participant would take into account. Fair value measurement assumes a transaction involving the sale of an asset or the transfer of a liability taking place in the principal market for the asset or liability, or in the absence of a principal market, the most advantageous market for the asset or liability.Compared with the previous definition provided by IAS 39, there is no emphasis on an "arm’s-length transaction between knowledgeable, independent parties", that is, on the neutrality of the transaction, but on a concept of fair value based on an exit price. In fact, the price should reflect the view of the participant that sells the asset or that pays to transfer the liability at the measurement date. There is thus no longer an issue of inconsistency of financial statement presentation between those measuring fair value as a seller and those as a buyer.
Under these circumstances, there is a need for the fair value of financial instruments to reflect the risk an entity will not fulfil an obligation by means of appropriate adjustments to take account of the credit standing of the counterparty.
A.4.1 Fair value Levels 2 and 3: valuation techniques and inputs used
In the absence of listed prices in active markets, financial instruments should be classified in Level 2 or 3. Classification in Level 2 rather than Level 3 depends on the observability of significant market inputs used in determining fair value. Observable inputs are parameters developed using market data, such as publicly available information about actual events or transactions and that reflect the assumptions that market participants would use when pricing the asset or liability; unobservable inputs, on the other hand, are parameters for which no market data is available and which are developed on the basis of the best information available in relation to assumptions that market participants would use to determine a price for a particular financial instrument.A financial instrument has to be classified entirely in a single level; if inputs belonging to different levels of the fair value hierarchy are used to value an instrument, the instrument being valued is categorised in its entirety in the level of the lowest level input that is significant to the entire measurement. Consequently, in cases where observable market inputs (Level 2) and unobservable inputs (Level 3) are used for the valuation of a financial instrument, if the latter are deemed significant, as defined below, the instrument is categorised in Level 3 of the fair value hierarchy.As required by IFRS 13, the Bipiemme Group uses valuation techniques "appropriate in the circumstances and which maximise the use of relevant observable inputs"; furthermore, the techniques are consistent with those commonly used by market participants: market approach, cost approach and income approach.The valuation techniques are used continuously and consistently over time unless alternative valuation techniques exist that provide a more appropriate measurement of fair value (for example, in the case of the development of new markets, information that is no longer available or new information or different market conditions).The fair value used for measuring financial instruments is determined on the basis of the criteria set out below, which assume, as indicated above, the use of observable or unobservable inputs.
158 P a r t A – A c c o u n t i n g p o l i c i e s
Level 2 – Measurement methods based on observable market parametersFor Level 2 instruments, an input is directly or indirectly "observable", when it is continuously available to all market participants with a regular distribution of information through appropriate channels (Stock Exchange, data providers, brokers, market makers, websites, etc.).The measurement of a financial instrument is based on prices which can be derived from market quotations of similar assets (comparable approach) or by valuation techniques for which all relevant factors – including credit spreads and liquidity – are derived from observable market parameters (mark-to-model approach).The comparable approach requires the search for transactions on active markets, relating to instruments that, in terms of risk factors, are comparable with the instrument being valued. The valuation techniques used in the mark-to-model approach are those commonly used and accepted as market "best practice".
Level 2 inputs are defined as:K prices listed for similar assets and liabilities on active markets;K prices listed for the instrument being analysed or for similar instruments on inactive markets (i.e. markets where there are few transactions, the
prices are not current or vary substantially over time and between different market makers or little information is made public);K observable market inputs other than listed prices (e.g. interest rates or yield curves, volatility, credit curves, etc.);K market-corroborated inputs (that is, derived from observable market inputs or corroborated by correlation analysis). In this case, the input is
deduced from listed prices through suitable mathematical techniques.
With respect to the portfolio of financial instruments on hand, those falling within Level 2 are over the counter (OTC) financial and credit derivatives, bonds without official prices expressed by an active market, financial liabilities measured at fair value and hedge funds.
OTC financial derivativesInterest rate, foreign exchange, equity, commodity and inflation derivatives, if not traded on regulated markets, are considered "Over The Counter" (OTC) instruments, i.e. bilaterally traded with market counterparties. Their measurement is carried out through specific pricing models, fed by input parameters such as interest rate curves, volatility matrices and exchange rates, which are generally observable on the market, even if not listed on regulated and/or active markets.
The methodology used in evaluating these contracts is as follows:K for non-option instruments (interest rate swaps, forward rate agreements, overnight interest swaps, domestic currency swaps, etc.) the valuation
techniques use discounted cash flow models whereby certain or expected cash flow is discounted. In the event that linear or quasi-linear OTC derivatives incorporate optional components, the latter are measured using the same methodologies adopted for options;
K financial options: • in the case of plain vanilla options, the most used methodologies fall within a forward risk-neutral framework and are based on analytical
Black-like formulas, whereby the volatility depends on the maturity date and strike price (volatility skew); • for more complex pay-offs (typically, equity basket options or path dependent equity options), while remaining risk-neutral, use is made of
mathematical methodologies based on Monte Carlo simulation, whereby the option pay-off is measured by means of simulations with a sufficiently high level of repetitions (between 20,000 and 100,000) relating to the trend of the risk factors underlying the option. The price of the derivative is thus obtained by calculating the average of the values arising from each scenario;
• for the types of products that are not among those managed by the Parent Company's internal systems, an external assessment is made.
Furthermore, to determine the fair value, account is also taken of the risk that the obligation will not be fulfilled. As required by the relevant standard, fair value takes into account counterparty risk (Credit Valuation Adjustment – CVA) and issuer risk (Debt Valuation Adjustment – DVA). To this end, Bipiemme Group has adopted algorithms for the determination of fair value, the Credit Valuation Adjustment (CVA) and the Debt Valuation Adjustment (DVA), estimated on the basis of market and internal risk parameters (PD, LGD, interest curves).
For the determination of the CVA and DVA, the calculation algorithms take account of: K the probability of default (PD) of the specific counterparty. This figure is determined on the basis of an official external rating of the counterparty
and on related default statistics on market risk, where available; otherwise, the figure is determined on the basis of an internal rating. Based on these figures, a multi-period PD is determined based on the residual contractual duration of the instrument being valued;
K loss given default (LGD): a uniform value is used for all counterparties (60%) determined on the basis of market practice.
OTC credit derivativesCredit derivatives traded by the Group consist of simple single name credit default swap contracts and ITRAXX indices bilaterally traded with market counterparties. Their measurement is based on an estimate of the implicit default probability curve for the issuer or issuers underlying the contract, arrived at using a bootstrapping technique based on market price, whereby the expected cash flow from the contract is weighted.
Bonds without official prices expressed in an active market As regards plain vanilla bonds, that is, without any option or derivative component, a discounted cash flow (DCF) model is used, based on discounted expected future cash flow, which, in the case of floating-rate coupons, is estimated based on forward rates implicit in the curves for the indexing.

159P a r t A – A c c o u n t i n g p o l i c i e s
In the case of bonds with an option component (for example, structured bonds), the component is estimated based on the same methodologies adopted for stand-alone options, thus maintaining consistency between bonds with embedded options and the measurement of derivatives which feature the same type of option. For these types of bonds, the level of the fair value hierarchy assigned to the derivative component contributes, on the basis of an analysis of the significance of the amount of the option in comparison to the overall value of the bond, to the definition of the fair value hierarchy level of the bond, as required by specific internal policy.For bonds assessed on the basis of the model, the issuer's creditworthiness is incorporated in the assessment and is obtained from the credit spread curves of that issuer, if available. In the event that credit spread information is not directly observable, measurement techniques that entail classification in level 3 are generally adopted.
Mutual funds The individual units of such funds (UCITS) are measured on the basis of the latest available NAV (net asset value) reported by the management company or by the data provider and of any corrections due to dividends, coupons or other things.
Fair value optionFor securities issued by the Group, categorised as FVO and measured on the basis of a model, creditworthiness is incorporated in the assessment and the credit spread used is derived implicitly from retail issues carried out by the Group in the last reference quarter. Classification in level 2 rather than level 3 depends essentially on the proportion of observable and unobservable inputs used in measuring the fair value of the instrument, as identified in Section A 4.3, paragraph "Criteria for transfers between levels".
Level 3 – Measurement methods based on unobservable market parameters Level 3 includes all financial instruments that are not listed on an active market, for which the determination of fair value has to be done through valuation models that require the use of parameters that are not directly observable in the market. Unobservable inputs have to be used to the extent that relevant observable inputs are not available and, therefore, unobservable inputs shall reflect the assumptions that market participants would use when pricing the asset or liability, including assumptions about risk. Measurement has to be performed using the best information available in the circumstances, internal data included.The measurement of assets and liabilities pertaining to Level 3 is generally carried out using the same valuation methodologies as those used for Level 2 instruments; the difference lies in the fact that input parameters used in the pricing model are unobservable. The valuation techniques for the latter, as detailed below, make use of various approaches, depending on the parameter. Unobservable inputs may be: derived using mathematical techniques based on prices of options or price quotations by brokers or market-makers (for example, correlations or implicit volatility), or arrived at by extrapolation from observable data (for example, credit spread curves), or obtained from historical figures (for example, volatility of investment funds) or based on a comparable approach.
Set out below are the instruments categorised within Level 3 that largely coincide with those previously described for Level 2, but which differ therefrom due to the presence of discretionary input parameters.
OTC derivatives These are financial derivatives stipulated with institutional counterparties or retail customers, the valuation of which is based on the same pricing models as those used for Level 2 valuations and which differ therefrom due to the extent of the observability of the inputs used for the pricing techniques (reference is mainly made to correlations and implicit volatility). In addition, they are included under financial assets and liabilities categorised in Level 3, among others, are those positions for which the portion of the fair value adjustment that takes account of the risk that the obligation will not be fulfilled is significant compared to the overall value of the financial instrument, as reported in the internal policy.
Debt securitiesThey include structured financial instruments issued directly by leading issuers, including structured credit products such as CDOs (Collateralised Debt Obligations) and credit derivatives on index tranches, ABSs (Asset Backed Securities). Fair value is measured by discounting certain or expected cash flows, duly adjusted to take account of the issuer risk and, for the derivative element, based on models similar to those used for the option contracts assessed in level 2.
Unlisted equitiesThese are essentially minority interests in unlisted financial and non-financial companies. These instruments are measured with reference to significant transactions in the same stock or similar securities observed in a reasonable period of time compared with the valuation date, the method of market multiples of comparable companies and, to a lesser extent, alternative valuation methods based on financial parameters, earnings and net assets. In particular, for certain minority interests, in line with generally accepted valuation techniques, use is made of the Excess Capital variant of the dividend discount model (DDM) income approach. This method assumes that a company's economic value is the sum of the present value of: 1) present value of estimated distributable dividends in the so-called "explicit period" (period covered by the business plan); 2) excess/lack of Common Equity Tier I at the end of the explicit period; 3) terminal value comprising the perpetual return of normalised dividends.Securities for which it is impossible to estimate the fair value on a reasonable basis are maintained at their original purchase cost in accordance with IAS 39, paragraph AG 81.

160 P a r t A – A c c o u n t i n g p o l i c i e s
Mutual funds These are closed-end funds and hedge funds that do not fall into Levels 1 and 2. The fair value is determined by applying the NAV reported by the management company, as this is considered the most reliable estimate of the fair value of the instrument, being an exit value on disposal of the investment and to any adjustments due to dividends and distributions.
Financial instruments carried at amortised costFor other financial instruments carried at amortised cost and classified substantially among the amounts due to and from banks or customers, and among the securities issued, a fair value has been determined only for disclosure purposes in the notes.
In particular:K for amounts due from and to customers and banks related to other technical forms: • for balances that are short term or receivable or payable on demand, that is, which are due within 12 months, the fair value is conventionally
considered to be equal to book value, given the short term repayment date. Conventionally, certificates of deposit with a maximum maturity of 18 months are also measured at cost;
• for amounts receivable and payable beyond 12 months, the fair value is determined in accordance with a valuation methodology based on a mark to model approach, the key elements of which are:
– identification of future cash flow, corresponding to contractual cash flow. As regards loans to customers, cash flow is weighted based on PD (Probability of Default) and LGD (Loss Given Default). For retail and corporate customers, PD is assigned based on a matrix of reliability ratings used to categorise customers on the basis of internal procedures for assessing credit worthiness. As regards balances included in the line item due from banks, use is made of parameters provided by external rating agencies; the cash flows on loans suffering from impairment are quantified on the basis of the repayment plan. As regards the assignment of LGD, solely to customers, this is differentiated based on the customer segment and the technical form of the facility;
– discounting of cash flow quantified as explained above, using a market interest rate curve. For amounts due from customers and banks, the risk free rate is adopted, since the credit risk is quantified based on PD and LGD parameters;
K for debt securities classified as held in the "Due from banks or customers" portfolio, fair value is determined through the use of prices listed in markets or by the use of valuation models, as described above for financial assets and liabilities carried in the balance sheet at fair value.
Given the high proportion of unobservable components, amounts due from and to customers and banks, other than securities, are normally categorised in level 3 of the fair value hierarchy.For bonds carried in the balance sheet at amortised cost, the valuation falls into Level 1 if there is a listed price in an "active market"; otherwise, the valuation is done by discounting the cash flows on the basis of the relevant interest rate curve. As regards valuation techniques, bonds are valued, where available, based on listed prices, which already include an assessment of credit risk. In the absence of market prices, subordinated bonds are measured using internal models, applying a credit spread derived from quotations of subordinated Credit Default Swaps (CDS).
A.4.2 Valuation processes and sensitivity
The Group's valuation processes are subject to verification that extends to the valuation techniques for all financial instrument positions.The valuation, also for accounting purposes, of all financial instruments classified in the HFT, AFS and FVO portfolios is carried out by specific internal functions, depending on the individual Group entity.The Bipiemme Group has procedures in place and manuals that describe the valuation techniques and inputs used.For certain valuations relating to a limited group of financial instruments, the Group is assisted by external companies that, as the case may be, supply the prices of the assets and liabilities or the pricing models used.
For financial instruments, the fair value of which is based on a valuation model, analysis of the sensitivity of such instruments to market data is done by means of standard stress techniques, which, acting on input parameters to the pricing model, determine corresponding changes in the fair value of the instrument. Sensitivity is obtained individually for each curve or risk factor by applying to the latter an increase or decrease (shift) of a pre-defined size, obtaining as an output the corresponding change in fair value. In the case of non scalar risk factors, such as those pertaining to an interest rate curve or volatility surface, a uniform shift is generally applied to the entire structure, thus obtaining an estimate of the sensitivity to parallel movements of the corresponding curve.

161P a r t A – A c c o u n t i n g p o l i c i e s
A.4.3 Fair value hierarchy
The fair value hierarchy, according to IFRS 13, has to be applied to all financial instruments for which their fair value is recognised in the balance sheet. In this regard, for these instruments top priority is given to the official prices available in active markets and a lower priority to the use of unobservable inputs, as they are more discretionary. Fair value is therefore determined through the use of prices obtained from financial markets in the case of instruments listed on active markets, or, for other financial instruments, by using valuation techniques with the aim of estimating the fair value (exit price).Based on the type of input used, the valuation techniques categorise fair value into the following three levels: K Level 1 – listed prices (unadjusted) in active markets for identical assets or liabilities that the entity can access at the measurement date; K Level 2 – inputs other than listed prices included within Level 1 that are observable, either directly or indirectly;K Level 3 – unobservable inputs for the asset or liability.
The procedures for classifying financial instruments in the three levels are as follows:
Level 1 – Quoted prices (unadjusted) in active markets Financial instruments have to be classified as Level 1 if they have been valued using prices listed on active markets for identical instruments to those being evaluated, without making any adjustments. A listed price in an active market provides the most reliable evidence of fair value and shall be used without adjustment. Any adjustment results in the categorisation of a financial instrument within a lower level (for example, no immediate access to information or the lack of availability of a price at the measurement date). A market is considered active for a certain financial instrument on a certain date if in the previous 20 days changes in prices were recorded on at least 50% of the working days considered.Markets in which inputs might be observable for certain financial instruments are: securities markets, direct and assisted exchange markets (for example, over-the-counter markets, the prices of which are public), brokered markets (for example, electronic trading platforms), principal-to-principal and autonomous markets.
Those normally considered to be principal markets are:K MOT and MTS circuits for government bonds and for non-government bonds;K MTA circuits for Italian equities and international regulated stock exchanges for foreign equities;K official ECB exchange rates of the day for spot foreign exchange transactions.
Where a principal market has not been identified for a certain financial instrument, the reference market to be considered is that which is most advantageous. The above considerations also apply to short positions in securities.
For financial instruments listed on active markets, the current bid price is used for financial assets and the ask price for financial liabilities at the end of the reporting period.
Level 2 and 3 In the absence of listed prices in active markets, financial instruments have to be classified in Levels 2 or 3. Classification in Level 2 rather than Level 3 depends on the observability of significant market inputs used in determining the fair value. For further details on the classification in levels 2 and 3, see the previous paragraph A.4.1 "Fair value levels 2 and 3: valuation techniques and inputs used".
CRITERIA FOR TRANSFERS BETWEEN LEVELS
The transfer of a financial instrument from Level 1 to Level 2 of the fair value hierarchy and vice versa is based mainly on the degree of liquidity of the instrument at the time of recognition of its listed price that determines the use of a listed price in an active market rather than a price obtained from a pricing model. In practice, if, for a financial asset or liability, there are objective indications of a significant loss or the lack of availability of a price in an active market (absence of multiple prices from market makers, prices that have not changed much or which are inconsistent), the instrument is categorised in Level 2 of the fair value hierarchy and, in certain cases, recourse is made to a model-based valuation. This valuation technique may no longer be necessary, if, for the same financial instrument, a price in an active market once again becomes available, with a corresponding transfer to Level 1. Such an event mainly arises with debt securities, whereas derivatives listed on regulated markets normally pertain to Level 1, given that, for these, a price is normally provided by the relevant stockmarket. Vice versa, OTC derivatives are normally valued based on pricing models and thus are categorised in Level 2 or 3 of the fair value hierarchy, based on the significance of the input data.
A transfer from Level 2 to Level 3 and vice versa is determined by the weighting or the significance, at various times during the life of the financial instrument, of the unobservable input variables compared to the overall valuation of the instrument. In order to define whether an input is significant

162 P a r t A – A c c o u n t i n g p o l i c i e s
or not for the purpose of the categorisation of the fair value of an instrument, three significance thresholds have been adopted. Of these, the first two relate to the significance of unobservable market parameters, while the third specifically relates to adjustments to the fair value of OTC derivatives to reflect in the mark-to-market the risk that the obligation will not be fulfilled.The two thresholds relating to input data are applied on the basis of whether it is possible (first threshold) or not possible (second threshold) to accurately isolate the components of the financial instrument that, for the valuation thereof, require unobservable inputs. In other words, the first threshold applies if a financial instrument can be exactly broken down into more simple financial instruments, some of which require unobservable inputs, while the second applies in cases where it is not possible to isolate or unbundle from the instrument the component influenced by the unobservable factor.
In detail:1. the first threshold (fair value ratio threshold) is defined based on the ratio of the fair value of the contractual component valued with unobservable
inputs (for example, an implicit option) to the fair value of the entire contract: if this ratio equals or is less than 5%, the impact of the unobservable input is not considered significant for the purpose of the determination of the fair value and the latter is categorised as Level 2; otherwise, the contract is classified as Level 3;
2. the second threshold (sensitivity ratio threshold) is defined based on the sensitivity of the price of the financial instrument to the unobservable parameter: an input is considered not to be significant for the purpose of the determination of fair value if changes in the unobservable input of plus or minus 5% produce a change in the absolute amount of the fair value of the instrument equal to or less than 5% of the fair value, with a consequent classification as Level 2; otherwise, the contract is classified as Level 3. The shock is applied to the unobservable parameter in a symmetric manner, thus acknowledging in the classification any asymmetry of the nonlinearity of the pricing function.
As regards adjustments made to the fair value of OTC derivatives, to establish the degree of significance of these adjustments, a materiality threshold is defined for counterparty risk (CVA ratio threshold). This is identified based on the ratio of the amount of the reduction in fair value, which represents the estimate of counterparty risk, to the overall fair value of the contract, that is, with the inclusion of counterparty risk. If this ratio is equal to or less than 20%, the impact of the adjustment for counterparty risk is not considered significant for the purpose of the determination of fair value and the latter is assigned to the level it would have been classified in, in the absence of the CVA. Otherwise, the entire fair value is classified as Level 3.
A.4.4 Other information
The Group has not applied the option provided by IFRS 13, para. 48, to assess a group of financial assets and liabilities on the basis of its net exposure to market risk or credit risk.

163P a r t A – A c c o u n t i n g p o l i c i e s
Quantitative information
A.4.5 Fair value hierarchy
A.4.5.1 Assets and liabilities carried at fair value on a recurring basis: breakdown of fair value levels
Assets and liabilities carried at fair value 31.12.2014 31.12.2013
L1 L2 L3 L1 L2 L3
1. Financial assets held for trading 497,598 1,341,597 82,323 376,365 977,750 95,122
2. Financial assets designated at fair value through profit and loss 10,710 75,118 11,621 97,703 97,410 24,005
3. Financial assets available for sale 8,892,830 110,706 666,736 8,413,880 60,400 714,742
4. Hedging derivatives – 178,460 – – 171,468 6,823
5. Property and equipment – – – – – –
6. Intangible assets – – – – – –
Total 9,401,138 1,705,881 760,680 8,887,948 1,307,028 840,692
1. Financial liabilities held for trading 156,118 1,243,657 63,670 207,485 879,026 77,227
2. Financial liabilities designated at fair value through profit and loss – 152,116 – – 232,811 43,928
3. Hedging derivatives – 58,751 – – 23,348 –
Total 156,118 1,454,524 63,670 207,485 1,135,185 121,155
Key: L1 = Level 1; L2 = Level 2; L3 = Level 3
Level 3 financial assets as a whole amount to 761 million euro and represent 6.4% of the total of financial assets designated at fair value through profit and loss (7.6% at 31 December 2013); level 3 financial liabilities amounted to 64 million euro, representing 3.8% of total financial liabilities designated at fair value (8.3% at 31 December 2013).
The following table shows the breakdown of financial assets carried at fair value in Level 3:
Financial assets carried at fair value: breakdown by product
Debt securities
and Loans
Equities Mutual funds
Derivatives 31.12.2014 Debt securities
Equities Mutual funds
Derivatives 31.12.2013
Financial assets held for trading 805 8 – 81,510 82,323 5,446 14 – 89,662 95,122
Financial assets designated at fair value through profit and loss 11,621 – – – 11,621 24,005 – – – 24,005
Financial assets available for sale 111,811 438,241 116,684 – 666,736 116,641 380,230 217,871 – 714,742
Hedging derivatives – – – – – – – – 6,823 6,823
Total 124,237 438,249 116,684 81,510 760,680 146,092 380,244 217,871 96,485 840,692

164 P a r t A – A c c o u n t i n g p o l i c i e s
As can be seen from this classification, financial assets carried at fair value are made up of:
a. Debt securities and Loans: 124.2 million euro. These are structured or subordinated debt securities issued directly by leading Italian or international banks.
b. Equities: 438.2 million euro. These are essentially minority interests in unlisted finance and non-finance companies. Note that for some of these financial instruments, for a total of 1.8 million euro, it has not been possible to make reasonable estimates of their fair value. In accordance with IAS 39, para. AG 81, these instruments have therefore been maintained at their original purchase cost, which is in any case close to the book net equity value of the companies concerned.
c. Mutual funds: 116.7 million euro. These are: i. Real estate funds: 71.7 million euro; ii. Mutual investment and similar types of funds: 45.0 million euro. These financial instruments are valued on the basis of the NAV communicated by the management company, as this is considered the most
reliable estimate of the instrument's fair value, given that NAV is the "exit value". This decision is due to the fact that, in accordance with the Group's investment strategies, these instruments are intended for a medium/long term investment and their unwinding only occurs on repayment of all or part of the shares decided by the management company after selling off the fund's investments.
d. Financial derivatives: 81.5 million euro entirely booked under financial assets held for trading. These are financial derivatives valued at fair value stipulated with institutional counterparties and customers. As regards derivatives with customers, financial assets designated at fair value through profit and loss Level 3 include, among others, those positions for which the quota of fair value adjustment that takes account of credit risk (i.e. the so-called "Credit valuation adjustment") is significant compared with the overall value of the financial instrument.

165P a r t A – A c c o u n t i n g p o l i c i e s
Analysis of sensitivity based on unobservable parameters (Level 3)
Valuation techniques and input for the estimation of Level 3 fair value – assets and liabilities (Euro/000)
Type of instrument Parameter Valuation technique Fair value at 31.12.2014
Financial assets/liabilities held for trading Assets LiabilitiesDebt securities correlation between interest rates estimates based on underlying historical performance 90 0 correlations between equities inferred from brokers' quotes 684 0 Cost Cost 31 0Total debt securities 805 0
Equities Cost Cost 8 0Total equities 8 0
Derivatives inflation volatility inferred from brokers' quotes 380 –225 volatility of individual equities estimates based on underlying historical performance 2 –14 volatility of funds based on historical data 0 –67 correlation between interest rates third party valuation 0 –3,294 correlations between equities based on historical data 185 0 correlation between equity indices inferred from info provider quotes 16,923 –2,455 Correlation between indices and currencies estimates based on underlying historical performance 57,615 –57,615 CVA/DVA extrapolation/internal estimates 6,405 0Total Derivatives 81,510 –63,670
Total Financial assets/liabilities held for trading 82,323 –63,670
Financial assets designated at fair value through profit and loss Assets Liabilities
Bonds correlation between interest rates third party valuation 3,248 0 volatility of equities based on historical data 8,373 0Total debt securities 11,621 0
Total Financial assets designated at fair value through profit and loss 11,621 0
Financial assets available for sale Assets Liabilities
Debt securities correlation between interest rates and inflation + inflation volatility
based on historical data110,803 0
Cost Cost 1,008 0Total debt securities 111,811 0
Equities Dividends or Cash flows Valuation techniques based on cash flows used 228,918 0 Earnings, equity and financial data FV estimated based on financial statement figures 192,171 0
Market quotations or recent transaction values Comparable approach 15,377 0
Cost Cost 1,775 0Total equities 438,241 0
Mutual funds NAV Estimate of FV based on the last available NAV 112,880 0 Cost Cost 3,804 0 Total Mutual funds 116,684 0
Total financial assets available for sale 666,736 0
Total 760,680 –63,670

166 P a r t A – A c c o u n t i n g p o l i c i e s
The following table sets out an analysis of the sensitivity of the fair value of Level 3 instruments to a change in unobservable parameters:
Net sensitivity of fair value to changes in unobservable input:
(Euro/000)
Net sensitivity of fair value to a change in unobservable input parameters of +/– 5%:
Portfolio classification/Type of instrument
valuation technique
changes changes
fair value Favourable Unfavourable
Available for saledebt securities volatility inflation rates based on historical data
109,560 0 –578
correlation interest rates and inflation based on historical data 14 –11
Financial assets measured under fair value optiondebt securities volatility of equities based on historical data 5,497 140 –145Available for sale equities Dividends or Cash flows Growth rate "g" 228,918 9,842 –8,378
(Euro/000)
Portfolio classification valuation technique changes changes
fair value Favourable UnfavourableFinancial assets held for tradingDerivatives CVA/DVA Extrapolation/internal
estimates 6,405 426 –819correlation between equity indices
inferred from info provider quotes 16,923 231 –290
Sensitivity analysis was carried out for financial instruments for which the valuation techniques adopted made it possible to do so. The reasons as to why, for certain instruments, it was not possible to perform reliable sensitivity analysis are essentially linked to the fact that, for the measurement of these instruments, valuation techniques were used that were either based on information derived from observed prices of similar marketed securities or on valuations and/or information provided by third parties.

167P a r t A – A c c o u n t i n g p o l i c i e s
A.4.5.2 Annual changes in assets carried at fair value on a recurring basis (Level 3)
Financial assets held for trading
Financial assets designated
at fair value through profit
and loss
Financial assets
available for sale
Hedging derivatives
Property and
equipment
Intangible assets
1. Opening balance 95,122 24,005 714,742 6,823 – –
2. Increases 88,651 15,351 130,880 – – –
2.1. Purchases 57,363 11,571 32,284 – – –
2.2. Profits booked to:
2.2.1. Income statement 9,179 2,959 136 – – –
– of which: gains 2,877 520 6 – – –
2.2.2. Shareholders' equity X X 92,907 – – –
2.3. Transfer from other levels 18,437 – – – – –
2.4. Other increases 3,672 821 5,553 – – –
3. Decreases 101,450 27,735 178,886 6,823 – –
3.1. Sales 58,514 – 94,245 – – –
3.2. Redemptions 25 15,363 – – – –
3.3. Losses booked to:
3.3.1. Income statement 25,554 1,739 22,379 6,823 – –
– of which: unrealised losses 22,367 1,618 19,180 – – –
3.3.2. Shareholders' equity X X 4,067 – – –
3.4. Transfer to other levels 5,457 10,389 45,596 – – –
3.5. Other decreases 11,900 244 12,599 – – –
4. Closing balance 82,323 11,621 666,736 – – –

168 P a r t A – A c c o u n t i n g p o l i c i e s
A.4.5.3 Annual changes in liabilities carried at fair value on a recurring basis (Level 3)
Financial liabilities held
for trading
Financial liabilities
designated at fair value
through profit and loss
Hedging derivatives
1. Opening balance 77,227 43,928 –
2. Increases 12,742 – –
2.1. Issues 4,178 – –
2.2. Losses booked to:
2.2.1. Income statement 8,453 – –
– of which: unrealised losses 2,747 – –
2.2.2. Shareholders' equity X X –
2.3. Transfer from other levels 111 – –
2.4. Other increases – – –
3. Decreases 26,299 43,928 –
3.1. Redemptions 4,177 – –
3.2. Repurchases – – –
3.3. Profits booked to:
3.3.1. Income statement 16,214 – –
– of which gains 13,005 – –
3.3.2. Shareholders' equity X X –
3.4. Transfer to other levels 1,057 43,928 –
3.5. Other decreases 4,851 – –
4. Closing balance 63,670 – –
Disclosures relating to transfers between Level 1 and Level 2 in 2014
During 2014 the following transfers took place:
Financial assets held for trading
K Euro 9.8 million from Level 1 to Level 2;K Euro 2.1 million from Level 2 to Level 1.
These transfers mainly relate to data having become available or no longer being available regarding prices listed in organised markets and that, due to volumes traded and the frequency of the prices reported, permit or do not permit, on the basis of the parameters indicated above, the categorisation of the instruments in Level 1.

169P a r t A – A c c o u n t i n g p o l i c i e s
A.4.5.4 Assets and liabilities not carried at fair value or carried at fair value on a non-recurring basis: breakdown by levels of fair value
Assets and liabilities not carried at fair value or carried at fair value on a non-recurring basis
31.12.2014 31.12.2013
VB L1 L2 L3 VB L1 L2 L3
1. Investments held to maturity – – – – – – – –
2. Due from banks 984,777 – – 987,282 1,813,458 – – 1,829,085
3. Loans to customers 32,078,843 – 97,095 34,812,139 33,345,026 – 103,092 36,255,710
4. Investment properties 23,632 – – 36,343 24,521 – – 36,832
5. Non-current assets held for sale and discontinued operations – – – – – – – –
Total 33,087,252 – 97,095 35,835,764 35,183,005 – 103,092 38,121,627
1. Due to banks 3,318,564 – – 3,314,872 5,913,928 – – 5,997,987
2. Due to customers 27,702,942 – – 27,702,942 26,423,495 – – 26,423,495
3. Securities issued 8,981,834 4,816,758 4,087,265 331,322 10,114,241 4,990,580 4,581,781 784,626
4. Liabilities associated with non-current assets held for sale and discontinued operations – – – – – – – –
Total 40,003,340 4,816,758 4,087,265 31,349,136 42,451,664 4,990,580 4,581,781 33,206,108

170 P a r t A – A c c o u n t i n g p o l i c i e s
Information concerning exposures to sovereign debt
With reference to the request received by ESMA (European Securities Markets Authority) with Communication ESMA/2011/226 of 28 July 2011 and by Consob Communication DEM/11070007 of 5 August 2011, with reference to the figures shown at 31 December 2014 in the above item A.4.5.1 "Accounting portfolios: breakdown by level of fair value", the following is the Bipiemme Group's exposure to sovereign debt, consisting mainly of Italian government securities.
The table shows the following information of the accounting portfolios by individual country:K fair value hierarchy level;K nominal value;K book value at 31 December 2014;K effect of the valuation recognized in the income statement for the period with respect to securities classified as "Financial assets held for trading"
and "Financial assets designated at fair value through profit and loss";K effect of the gross overall valuation recognised at the date of the balance sheet as shareholders' equity under "Valuation reserves", in relation
to securities classified as "Financial assets available for sale".
Financial assets carried at fair value: debt securities (Euro/000)
Accounting portfolios/issuers L1 L2 L3
Nominal value
Book value31.12.2014
Valuation booked to
income statement
Valuation booked to
shareholders' equity
Nominal value
Book value31.12.2014
Valuation booked to
income statement
Valuation booked to
shareholders' equity
Nominal value
Book value31.12.2014
Valuation booked to
income statement
1. Financial assets held for trading 157,582 157,050 –106 X 1,984 1,604 –50 X 42 44 1
Italy 157,440 156,929 –104 X 144 157 5 X – – –
Austria 39 40 1 X 617 622 3 X 40 41 1
Argentina 98 81 2 X 1,182 781 –59 X – – –
Other countries 5 – –5 X 41 44 1 X 2 3 –
2. Financial assets designated at fair value through profit and loss – – – X – – – X – – –
3. Financial assets available for sale 8,307,818 8,771,442 18,384 365,105 – – – – 5 5 –
Italy 8,299,581 8,763,268 18,384 365,117 – – – – 5 5 –
United States 8,237 8,174 0 –12 – – – – – – –
Total 8,465,400 8,928,492 18,278 365,105 1,984 1,604 –50 – 47 49 1
For comparison purposes, the situation at 31 December 2013 is set out below.
Financial assets carried at fair value: debt securities (Euro/000)
Accounting portfolios/issuers L1 L2 L3
Nominal value
Book value31.12.2013
Valuation booked to
income statement
Valuation booked to
shareholders' equity
Nominal value
Book value31.12.2013
Valuation booked to
income statement
Valuationbooked to
shareholders'equity
Nominal value
Book value31.12.2013
Valuation booked to
shareholders' equity
1. Financial assets held for trading 49,719 50,335 202 X 3,068 2,300 38 X 21 26 –
Italy 48,814 49,623 133 X 474 550 48 X 21 26 –
Austria 529 521 –2 X 947 927 17 X – – –
Argentina 375 190 71 X 1,647 823 –27 X – – –
China – – – X – – – X – – –
Germany 1 1 – X – – – X – – –
2. Financial assets designated at fair value through profit and loss – – – X – – – X – – –
3. Financial assets available for sale 8,047,750 8,234,666 1,220 165,239 – – – – 5 5 –
Italy 8,047,750 8,234,666 1,220 165,239 – – – – 5 5 –
Total 8,097,469 8,285,001 1,422 165,239 3,068 2,300 38 – 26 31 –

171P a r t A – A c c o u n t i n g p o l i c i e s
The following table shows these values restated by issuer:
Breakdown by issuer Nominal value Book value31.12.2014
Valuation booked
to income statement
Valuation booked to
shareholders' equity
Italy 8,457,170 8,920,359 18,285 365,117
Financial assets available for sale 8,299,586 8,763,273 18,384 365,117– of which maturing in 2015 574,768 575,880 – 5,297– of which maturing from 2016 to 2017 3,138,268 3,223,912 – 87,560– of which maturing from 2018 to 2021 4,251,550 4,568,677 11,566 238,793– of which maturing beyond 2021 335,000 394,804 6,818 33,467
Financial assets held for trading 157,584 157,086 –99 X
Argentina 1,280 862 –57 –
Financial assets held for trading 1,280 862 –57 X
Austria 696 703 5 –
Financial assets held for trading 696 703 5 X
United States 8,237 8,174 – –12
Financial assets available for sale 8,237 8,174 – –12
Maturing in 2019 8,237 8,174 – –12
Other countries 48 47 –4 –
Financial assets held for trading 48 47 –4 X
Total 8,467,431 8,930,145 18,229 365,105
In addition to these exposures, asset item 70 "Loans to customers" includes exposures to the Italian Government and to Italian local public entities for 309 million euro, not subject to specific value adjustments.At 31 January 2015, the potential gains on the "available-for-sale" government bond portfolio total 380 million euro (versus 365 million euro at 31 December 2014).For comparison purposes, the situation at 31 December 2013 is set out below.
Breakdown by issuer Nominal value Book value31.12.2013
Valuation booked
to income statement
Valuation booked to
shareholders' equity
Italy 8,097,064 8,284,870 1,401 165,239
Financial assets available for sale 8,047,755 8,234,671 1,220 165,239– of which maturing in 2014 996,628 995,194 – 2,513– of which maturing from 2015 to 2016 2,258,244 2,314,782 – 41,344– of which maturing from 2017 to 2020 3,857,883 3,959,174 624 101,984– of which maturing beyond 2020 935,000 965,521 596 19,398
Financial assets held for trading 49,309 50,199 181 X
Austria 1,476 1,448 15 –
Financial assets held for trading 1,476 1,448 15 X
Argentina 2,022 1,013 44 –
Financial assets held for trading 2,022 1,013 44 X
Germany 1 1 – –
Financial assets held for trading 1 1 – X
Total 8,100,563 8,287,332 1,460 165,239
In addition to these exposures, asset item 70 "Loans to customers" at 31 December 2013 includes exposures to the Italian Government and to Italian local public entities for about 283 million euro, not subject to specific value adjustments.

172 P a r t A – A c c o u n t i n g p o l i c i e s
A.5 Information on the so-called "day one profit/loss"
IAS 39 requires a financial instrument to be initially recorded at its fair value, which is normally the amount paid or collected for the transaction; in other words, at the cost or amount paid for financial assets or the amount received for financial liabilities. On initial recognition, the fair value of a financial instrument does not always coincide with the price paid or received; this difference is defined as a "day-one profit/loss".If there is a difference between these values, the fair value of the instrument has to be accounted for rather than the transaction price, but only if the fair value is calculated from other observable market transactions on the same instrument or if it is determined by the use of valuation techniques, whose inputs originate from information derived from observable markets. In such cases the difference between the transaction price and the fair value on initial recognition is immediately charged to income. This criterion applies to the instruments that fall into one of the classes that require the booking of the instrument at fair value through profit and loss: fair value option and trading book.
With regard to these categories we specify as follows:
1. Instruments listed on an active market. In this case, the concept of "day-one profit" is not usually applied since on initial recognition in the financial statements the fair value of a financial instrument which falls within Level 1 of the fair value hierarchy coincides with the transaction price.
2. Instruments not listed on an active market. In this case, classification of the financial instrument in Levels 2 or 3 of the fair value hierarchy leads to a different accounting treatment of the difference between fair value and the transaction price.
In the case of Level 2, initial recognition, in many cases, sees fair value substantially coincide with the transaction price. Any differences between price and fair value go through the income statement on the first remeasurement of the financial instrument.
In the case of Level 3, the presence of model risk and/or input not directly observable in the market significantly influence the outcome of the assessment, to be compared with the transaction price. In this case the difference, if positive, is amortised over the residual life of the financial instrument ("day-one profit") or of the holding period, if this is thought to be lower; if this difference is negative, it is charged directly to income for prudence sake ("day-one loss").
Subsequent to initial recognition of the fair value, mark to model valuations are made using the same methodology and the same input sources as were used when we calculated the fair value on day one.Subsequent changes in fair value after day one will therefore be linked to the trend in the related risk factors to which the instrument is exposed (interest rates, equity prices, exchange rates, etc.) and booked directly to the income statement.
At the date of these consolidated financial statements, there are no significant amounts in the income statement that are in suspense.

173
Part BInformation on the consolidated balance sheet


175P a r t B - I n f o r m a t i o n o n t h e c o n s o l i d a t e d b a l a n c e s h e e t - A s s e t s
Assets
Section 1 – Cash and cash equivalents Line item 10
This item includes legal tender, including foreign bank notes and coins and unrestricted deposits with the Central Bank.
1.1 Cash and cash equivalents: breakdown
31.12.2014 31.12.2013
a) Cash 322,840 363,202
b) Unrestricted deposits with central banks – –
Total 322,840 363,202

176 P a r t B - I n f o r m a t i o n o n t h e c o n s o l i d a t e d b a l a n c e s h e e t - A s s e t s
Section 2 – Financial assets held for trading Line item 20
This line item includes financial assets (debt securities, equities, mutual funds, derivatives), classified in the trading portfolio, including expired and deteriorated derivatives.The underlying technical forms also include assets sold that do not satisfy the requirements of IAS 39 to be eliminated from the financial statements ("sold but not eliminated") and impaired assets.
2.1 Financial assets held for trading: breakdown by product
Line items/Amounts L1 L2 L3 Total31.12.2014
L1 L2 L3 Total 31.12.2013
A. Cash assets
1. Debt securities 236,102 157,047 805 393,954 101,957 154,531 5,446 261,934
1.1 Structured securities 3,605 93,600 697 97,902 3,457 64,382 5,321 73,160
1.2 Other debt securities 232,497 63,447 108 296,052 98,500 90,149 125 188,774
2. Equities 112,691 1 8 112,700 73,297 1 14 73,312
3. Mutual funds – – – – – – – –
4. Loans – – – – – – – –
4.1 Repurchase agreements – – – – – – – –
4.2 Other – – – – – – – –
Total A 348,793 157,048 813 506,654 175,254 154,532 5,460 335,246
B. Derivatives
1. Financial derivatives: 148,805 1,184,549 81,510 1,414,864 201,111 823,108 89,662 1,113,881
1.1 trading 148,805 1,180,209 80,886 1,409,900 201,111 813,599 88,534 1,103,244
1.2 linked to the fair value option – 4,340 624 4,964 – 9,509 1,128 10,637
1.3 other – – – – – – – –
2. Credit derivatives – – – – – 110 – 110
2.1 trading – – – – – 110 – 110
2.2 linked to the fair value option – – – – – – – –
2.3 other – – – – – – – –
Total B 148,805 1,184,549 81,510 1,414,864 201,111 823,218 89,662 1,113,991
Total (A+B) 497,598 1,341,597 82,323 1,921,518 376,365 977,750 95,122 1,449,237
As regards the criteria used for determining the fair value and the classification of financial instruments in the three levels of the fair value hierarchy, they are defined in Part A "Accounting Policies".
Line item "B.1.2 – Derivatives linked to the fair value option", includes the fair value of derivatives related to the instruments for which the fair value option has been adopted. These derivatives are mainly to hedge the risks inherent in the issue of bonds for which the Group has taken advantage of the fair value option according to IAS 39, paragraph 9. Such risks arise from possible fluctuations in interest rates and the presence of options that are implicit in the structured securities issued.

177P a r t B - I n f o r m a t i o n o n t h e c o n s o l i d a t e d b a l a n c e s h e e t - A s s e t s
Breakdown of sub-item A.1.1 "Structured debt securities"
Line items/Amounts Level 1 Level 2 Level 3 31.12.2014 Level 1 Level 2 Level 3 31.12.2013
– Credit linked notes – – – – – – – –
– Reverse convertible – – – – – – – –
– Reverse floaters 13 50,221 – 50,234 17 50,376 – 50,393
– Index linked 785 25,722 – 26,507 – 1,972 2,463 4,435
– Other 2,807 17,657 697 21,161 3,440 12,034 2,858 18,332
Total 3,605 93,600 697 97,902 3,457 64,382 5,321 73,160
Subordinated financial assets
A. Cash assets Level 1 Level 2 Level 3 31.12.2014 Level 1 Level 2 Level 3 31.12.2013
1.2 Debt securities – Other 13,634 1,450 – 15,084 3,605 2,810 – 6,415
– Issued by banks 12,256 1,450 – 13,706 1,078 2,653 – 3,731
– Issued by finance-sector companies 1,366 – – 1,366 2,527 157 – 2,684
– Issued by insurance companies 12 – – 12 – – – –
– Issued by other companies – – – – – – – –
Total 13,634 1,450 – 15,084 3,605 2,810 – 6,415

178 P a r t B - I n f o r m a t i o n o n t h e c o n s o l i d a t e d b a l a n c e s h e e t - A s s e t s
2.2 Financial assets held for trading: breakdown by debtor/issuer
Line items/Amounts 31.12.2014 31.12.2013
A. Cash assets1. Debt securities 393,954 261,934
a) Governments and central banks 158,606 52,322b) Other public entities 93 337c) Banks 152,361 174,159d) Other issuers 82,894 35,116
2. Equities 112,700 73,312a) Banks 14,173 2,199b) Other issuers: 98,527 71,113
– insurance companies 314 5,289 – finance-sector companies 32 15 – non-financial companies 98,181 65,809 – other – –
3. Mutual funds – –4. Loans – –
a) Governments and central banks – –b) Other public entities – –c) Banks – –d) Other parties – –
Total A 506,654 335,246B. Derivatives
a) Banks 918,741 806,472 – Fair value 918,741 806,472b) Customers 496,123 307,519 – Fair value 496,123 307,519
Total B 1,414,864 1,113,991Total (A+B) 1,921,518 1,449,237
The distribution of financial assets by debtor/issuer sector is in accordance with Bank of Italy rules.

179P a r t B - I n f o r m a t i o n o n t h e c o n s o l i d a t e d b a l a n c e s h e e t - A s s e t s
2.3 Cash financial assets held for trading: changes during the year
Debt securities
Equities Mutual funds
Loans Total
A. Opening balance 261,934 73,312 – – 335,246
B. Increases 16,467,165 908,190 2,708 – 17,378,063
B.1 Purchases 16,429,566 895,277 2,705 – 17,327,548
B.2 Fair value increases 3,753 1,417 – – 5,170
B.3 Other increases 33,846 11,496 3 – 45,345
C. Decreases 16,335,145 868,802 2,708 – 17,206,655
C.1 Sales 16,265,077 850,544 2,704 – 17,118,325
C.2 Redemptions 68,282 – – – 68,282
C.3 Fair value decreases 1,314 7,833 – – 9,147
C.4 Transfers to other portfolios – – – – –
C.5 Other decreases 472 10,425 4 – 10,901
D. Closing balance 393,954 112,700 – – 506,654

180 P a r t B - I n f o r m a t i o n o n t h e c o n s o l i d a t e d b a l a n c e s h e e t - A s s e t s
Section 3 – Financial assets designated at fair value through profit and lossLine item 30
This line item includes all cash financial assets (debt securities, equities, mutual funds) designated at fair value, with the results following the valuation booked to the income statement, on the basis of the "fair value option" recognised by IAS 39, 28 and 31.
The following instruments are classified in this category: debt securities with embedded derivatives; debt securities not classified as financial assets held for trading and whose cash flows have been hedged; open-ended funds (including hedge funds), for which regular valuations are available from independent sources and which, not being held for
short-term trading, form part of a duly documented investment strategy, designed to achieve an overall return based on the change in the fair value of the instrument itself, with regular detailed reports on their performance provided to management.
The underlying technical forms also include assets sold that do not satisfy the requirements of IAS 39 to be eliminated from the financial statements ("sold but not eliminated") and impaired assets.
3.1 Financial assets designated at fair value through profit and loss: breakdown by product
Line items/Amounts Total Total
L1 L2 L3 31.12.2014 L1 L2 L3 31.12.2013
1. Debt securities 7,692 75,118 11,621 94,431 63,419 97,410 24,005 184,834
1.1 Structured securities – 41,864 11,621 53,485 56,358 66,178 24,005 146,541
1.2 Other debt securities 7,692 33,254 – 40,946 7,061 31,232 – 38,293
2. Equities – – – – – – – –
3. Mutual funds 3,018 – – 3,018 34,284 – – 34,284
4. Loans – – – – – – – –
4.1 Structured – – – – – – – –
4.2 Other – – – – – – – –
Total 10,710 75,118 11,621 97,449 97,703 97,410 24,005 219,118
Cost 7,320 69,389 12,373 89,082 89,311 93,988 22,579 205,878
As regards the criteria used for determining the fair value and the classification of financial instruments in the three levels of the fair value hierarchy, they are defined in Part A "Accounting Policies".The amounts reported as "cost" correspond to the purchase cost of financial assets held at the balance sheet date.The remainder of the structured securities classified in level 3 includes, among other things, a Credit Link Note for 3.248 million euro (5.335 million euro at 31.12.13) held by the Parent Company.

181P a r t B - I n f o r m a t i o n o n t h e c o n s o l i d a t e d b a l a n c e s h e e t - A s s e t s
Purpose of using the fair value option and the financial assets concerned
Type of transaction/Amounts
Natural hedges
Structured financial
instruments
Portfolios of financial
assets managed
internally on the basis of
the fair value
31.12.2014 Natural hedges
Structured financial
instruments
Portfolios of financial
assets managed
internally on the basis of
the fair value
31.12.2013
1. Debt securities 40,946 53,485 – 94,431 38,293 146,541 – 184,834 1.1 Structured securities – 53,485 – 53,485 – 146,541 – 146,541 1.2 Other debt securities 40,946 – – 40,946 38,293 – – 38,2932. Equities – – – – – – – –3. Mutual funds – – 3,018 3,018 – – 34,284 34,2844. Loans – – – – – – – – 4.1 Structured – – – – – – – – 4.2 Other – – – – – – – –Total 40,946 53,485 3,018 97,449 38,293 146,541 34,284 219,118
The table provides details of table 3.1 above and shows the book value (fair value) of assets for which the fair value option has been adopted, distinguishing the type of use.The amount in the "structured financial instruments" column includes specifically hedged securities of 41.864 million euro (117.746 million euro at 31.12.2013).
Subordinated financial assets
At the balance sheet date, the portfolio of assets designated at fair includes subordinated securities issued by insurance companies of 12,247 million.
3.2 Financial assets designated at fair value through profit and loss: breakdown by debtor/issuer
Line items/Amounts 31.12.2014 31.12.20131. Debt securities 94,431 184,834 a) Governments and central banks – – b) Other public entities – – c) Banks 78,367 155,316 d) Other issuers 16,064 29,5182. Equities – – a) Banks – – b) Other issuers: – – – insurance companies – – – finance-sector companies – – – non-financial companies – – – other – –3. Mutual funds 3,018 34,2844. Loans – – a) Governments and central banks – – b) Other public entities – – c) Banks – – d) Other parties – –Total 97,449 219,118
The distribution of financial assets by debtor/issuer sector is in accordance with Bank of Italy rules.

182 P a r t B - I n f o r m a t i o n o n t h e c o n s o l i d a t e d b a l a n c e s h e e t - A s s e t s
Mutual funds: breakdown by category of open-ended funds
Line items/Amounts 31.12.2014 31.12.2013
Bond/Money-market 1,205 1,155
Equity 621 31,981
Funds of funds – –
Other 1,192 1,148
Total 3,018 34,284
This table provides details of the main types of investments made in mutual funds, the balance of which, at the respective dates, is reported in the preceding table 3.2 under the line item 3 "Mutual funds".
3.3 Financial assets designated at fair value through profit and loss: changes during the year
Debt securities Equities Mutual funds Loans Total
A. Opening balance 184,834 – 34,284 – 219,118
B. Increases 28,501 – 134 – 28,635
B.1 Purchases 11,571 – – – 11,571
B.2 Fair value increases 1,768 – 134 – 1,902
B.3 Other increases 15,162 – – – 15,162
C. Decreases 118,904 – 31,400 – 150,304
C.1 Sales – – 30,518 – 30,518
C.2 Redemptions 112,627 – – – 112,627
C.3 Fair value decreases 2,198 – – – 2,198
C.4 Other decreases 4,079 – 882 – 4,961
D. Closing balance 94,431 – 3,018 – 97,449

183P a r t B - I n f o r m a t i o n o n t h e c o n s o l i d a t e d b a l a n c e s h e e t - A s s e t s
Section 4 – Financial assets available for sale Line item 40
This line item includes all the financial assets (debt securities, equities, etc) classified in the "available for sale" portfolio. Equities essentially include interests in companies which, in accordance with international accounting standards, are no longer defined as equity investments (i.e. investments in associates and companies subject to joint control).The underlying technical forms also include assets sold that do not satisfy the requirements of IAS 39 to be eliminated from the financial statements ("sold but not eliminated") and impaired assets.
4.1 Financial assets available for sale: breakdown by product
Line items/Amounts L1 L2 L3 31.12.2014 L1 L2 L3 31.12.2013
1. Debt securities 8,855,568 83,836 111,811 9,051,215 8,330,026 60,400 115,216 8,505,642
1.1 Structured securities – 56,736 110,803 167,539 – 52,049 95,478 147,527
1.2 Other debt securities 8,855,568 27,100 1,008 8,883,676 8,330,026 8,351 19,738 8,358,115
2. Equities 36,227 – 438,241 474,468 82,829 – 380,230 463,059
2.1 Valued at fair value 36,227 – 436,466 472,693 82,829 – 375,334 458,163
2.2 Valued at cost – – 1,775 1,775 – – 4,896 4,896
3. Mutual funds 1,035 26,870 116,684 144,589 1,025 – 217,871 218,896
4. Loans – – – – – – 1,425 1,425
Total 8,892,830 110,706 666,736 9,670,272 8,413,880 60,400 714,742 9,189,022
As regards the criteria used for determining the fair value and the classification of financial instruments in the three levels of the fair value hierarchy, they are defined in Part A "Accounting Policies".In accordance with the provisions of IAS 39 on the derecognition of financial assets, line item "1.2 Other debt securities" also includes debt securities as part of repurchase agreements made on securities portfolio for 5,392.593 million euro (4,467.271 million euro at 31.12.2013).Line item 2. Equities includes equity interests that do not qualify as subsidiaries, associates or joint ventures.The following table shows the composition of securities carried at fair value, as well as those valued at cost, which have been maintained at their initial book value as it is not possible to determine a reliable fair value, as required by IFRS 7 § 30.
Breakdown of line item 2.1. Equities carried at fair value
Level 1 Level 2 Level 3 31.12.2014 Level 1 Level 2 Level 3 31.12.2013
Banks – – 304,753 304,753 52,090 – 265,716 317,806
Financial institutions and other companies 36,227 – 131,713 167,940 30,739 – 109,618 140,357
Total 36,227 – 436,466 472,693 82,829 – 375,334 458,163
Breakdown of line item 2.2. Equities valued at cost
% held Level 1 Level 2 Level 3 31.12.2014 Level 1 Level 2 Level 3 31.12.2013
Visconti S.r.l. 10.34 – – 1,137 1,137 – – – –
Other equities n.a. – – 638 638 – – 4,896 4,896
Total – – 1,775 1,775 – – 4,896 4,896

184 P a r t B - I n f o r m a t i o n o n t h e c o n s o l i d a t e d b a l a n c e s h e e t - A s s e t s
The following table shows financial assets with a subordination clause:
Subordinated financial assets
Level 1 Level 2 Level 3 31.12.2014 Level 1 Level 2 Level 3 31.12.2013
1. Debt securities 24,520 18,813 – 43,333 23,611 18,727 – 42,338
1.2 Other debt securities 24,520 18,813 – 43,333 23,611 18,727 – 42,338
Issued by banks 24,520 18,813 – 43,333 23,611 18,727 – 42,338
Total 24,520 18,813 – 43,333 23,611 18,727 – 42,338
4.2 Financial assets available for sale: breakdown by debtor/issuer
Line items/Amounts 31.12.2014 31.12.2013
1. Debt securities 9,051,215 8,505,642
a) Governments and central banks 8,771,448 8,234,672
b) Other public entities – –
c) Banks 270,618 269,964
d) Other issuers 9,149 1,006
2. Equities 474,468 463,059
a) Banks 304,797 317,849
b) Other issuers: 169,671 145,210
– insurance companies 70 74
– finance–sector companies 48,920 60,641
– non–financial companies 120,681 84,495
– other – –
3. Mutual funds 144,589 218,896
4. Loans – 1,425
a) Governments and central banks – –
b) Other public entities – –
c) Banks – –
d) Other parties – 1,425
Total 9,670,272 9,189,022
The distribution of financial assets by debtor/issuer sector is in accordance with Bank of Italy rules.

185P a r t B - I n f o r m a t i o n o n t h e c o n s o l i d a t e d b a l a n c e s h e e t - A s s e t s
Mutual funds: breakdown by category of closed-end funds
Line items/Amounts 31.12.2014 31.12.2013
Equity 30,352 49,088
Bond/Money-market 3,804 –
Real estate 71,710 73,700
Other 38,723 96,108
Total 144,589 218,896
This table provides details of the main types of investments made in mutual funds, the balance of which, at the respective dates, is reported in the preceding table 4.2 under the line item 3 "Mutual funds"."Other" also includes investments in Sicars (Société d’Investissement en Capital à Risque) and in foreign private equity firms.
4.3 Financial assets available for sale with specific hedge
Line items/Amounts 31.12.2014 31.12.2013
1. Financial assets with specific fair value hedges 1,197,186 1,018,258
a) interest rate risk 876,705 966,168
b) exchange risk – –
c) credit risk – –
d) price risk 320,481 52,090
e) several risks – –
2. Financial assets with specific cash flow hedges 110,803 –
a) interest rate risk 110,803 –
b) exchange rate risk – –
c) other – –
Total 1,307,989 1,018,258

186 P a r t B - I n f o r m a t i o n o n t h e c o n s o l i d a t e d b a l a n c e s h e e t - A s s e t s
4.4 Financial assets available for sale: changes during the year
Debt securities Equities Mutual funds Loans Total
A. Opening balance 8,505,642 463,059 218,896 1,425 9,189,022
B. Increases 7,698,941 119,077 35,974 – 7,853,992
B.1 Purchases 7,072,373 41,792 26,725 – 7,140,890B.2 Fair value increases 309,644 61,137 6,110 – 376,891B.3 Writebacks 87 7,296 1,093 – 8,476 – booked to income statement – x – – – – booked to shareholders' equity 87 7,296 1,093 – 8,476B.4 Transfer from other portfolios – – – – –B.5 Other increases 316,837 8,852 2,046 – 327,735
C. Decreases 7,153,368 107,668 110,281 1,425 7,372,742
C.1 Sales 4,418,172 56,831 93,483 648 4,569,134C.2 Redemptions 2,522,268 – – – 2,522,268C.3 Fair value decreases 3,570 2,671 1,682 – 7,923C.4 Writedowns for impairment – 43,508 5,725 – 49,233
– booked to income statement – 35,155 5,587 – 40,742 – booked to shareholders' equity – 8,353 138 – 8,491
C.5 Transfers to other portfolios – – – – –C.6 Other decreases 209,358 4,658 9,391 777 224,184
D. Closing balance 9,051,215 474,468 144,589 – 9,670,272
The opening and closing balances of "debt securities" include respectively 4,467.271 million euro and 5,392.593 million euro of own securities used for funding repurchase agreements. As regards "debt securities", the purchases and sales mainly relate to government securities transactions.
The negative fair value changes booked to the income statement are due to the results of the impairment test carried out at the time the financial statements were being prepared. In this regard, the existence of objective evidence of impairment has been checked, in order to proceed, if this is the case, to the recognition of impairment losses, based on the criteria explained in "Part A – Accounting Policies" of these notes. In particular, as regards equities, the Group's accounting policy requires the recognition of impairment on a security in the event of a decrease in the fair value at the balance sheet date of more than 50% of the original book value or a decrease in the fair value below the original book value for a continuous period of 18 months. For the other securities, we have carried out a qualitative analysis of possible negative events, which could lead to the value of the assets not being fully recoverable. Overall, adjustments to equities and mutual funds amount to 40.742 million and have been recorded in the income statement line item 130 b). "Net losses/recoveries on impairment of financial assets available for sale".
Section 5 – Investments held to maturity Line item 50
At the balance sheet date the Group has no investments held to maturity.

187P a r t B - I n f o r m a t i o n o n t h e c o n s o l i d a t e d b a l a n c e s h e e t - A s s e t s
Section 6 – Due from banks Line item 60
This line item reports unlisted financial assets (Level 2 and Level 3) due from banks (overdrafts, security deposits, debt securities, etc) that have been classified in the loan portfolio ("loans and receivables"). They include operating receivables connected with the provision of financial services.The underlying technical forms also include assets sold that do not satisfy the requirements of IAS 39 to be eliminated from the financial statements ("sold but not eliminated") and impaired assets.
6.1 Due from banks: breakdown by product
Type of transaction/Amounts 31.12.2014 31.12.2013
BV FV BV FV
Level 1 Level 2 Level 3 Level 1 Level 2 Level 3
A. Due from central banks 80,688 – – 80,688 382,681 – – 382,681
1. Restricted deposits – X X X – X X X
2. Compulsory reserve 80,682 X X X 382,681 X X X
3. Repurchase agreements – X X X – X X X
4. Other 6 X X X – X X X
B. Due from banks 904,089 – – 906,594 1,430,777 – – 1,446,404
1. Loans 900,427 – – 902,036 1,427,271 – – 1,442,898
1.1 Current accounts and unrestricted deposits 455,453 X X X 810,859 X X X
1.2 Restricted deposits 150,181 X X X 85,756 X X X
1.3 Other loans: 294,793 – – – 530,656 – – –
– Repurchase agreements 388 X X X 306,774 X X X
– Finance leases – X X X – X X X
– Other 294,405 X X X 223,882 X X X
2. Debt securities 3,662 – – 4,558 3,506 – – 3,506
2.1 Structured securities – X X X – X X X
2.2 Other debt securities 3,662 X X X 3,506 X X X
Total 984,777 – – 987,282 1,813,458 – – 1,829,085
See Part A – Accounting Policies for an explanation of the criteria used to determine fair value.

188 P a r t B - I n f o r m a t i o n o n t h e c o n s o l i d a t e d b a l a n c e s h e e t - A s s e t s
Subordinated financial assets
There are no loans to banks with subordination clause at the balance sheet date, as at the end of the previous year.
Impaired assets
Type of transaction/Amounts 31.12.2014 31.12.2013
B.2 Restricted deposits 461 405
B.3.3 Other loans: other – 2
Total 461 407
6.2 Due from banks with specific hedges
At the balance sheet date, as at the end of the previous year, there are no assets with specific hedges.
6.3 Finance leases
At the balance sheet date, as at the end of the previous year, there are no finance leases.

189P a r t B - I n f o r m a t i o n o n t h e c o n s o l i d a t e d b a l a n c e s h e e t - A s s e t s
Section 7 – Loans to customers Line item 70
This line item shows unlisted financial instruments (Level 2 and Level 3) due from customers (loans, lease transactions, factoring transactions, debt securities, etc.) allocated to "loans and receivables".The underlying technical forms also include assets sold that do not satisfy the requirements of IAS 39 to be eliminated from the financial statements ("sold but not eliminated") and impaired assets.
7.1 Loans to customers: breakdown by product
Type of transaction/Amounts
31.12.2014 31.12.2013
Book value Fair Value Book value Fair Value
Performing Impaired L1 L2 L3 Performing Impaired L1 L2 L3
Purchased Other Purchased Other
Loans 28,365,977 – 3,571,668 – – 34,768,415 29,840,659 – 3,376,110 – – 36,221,104
1. Current accounts 3,468,453 – 704,190 X X X 3,885,296 – 764,318 X X X
2. Repurchase agreements 64,875 – – X X X 74,314 – – X X X
3. Mortgage loans 15,773,904 – 1,703,436 X X X 15,981,777 – 1,712,752 X X X
4. Credit cards, personal loans and salary assignments 1,566,559 – 95,494 X X X 1,687,572 – 67,396 X X X
5. Finance leases 218,713 – 69,950 X X X 269,554 – 65,731 X X X
6. Factoring – – – X X X – – – X X X
7. Other loans 7,273,473 – 998,598 X X X 7,942,146 – 765,913 X X X
Debt securities 114,965 – 26,233 – 97,095 43,724 128,257 – – – 103,092 34,606
8. Structured securities 15,513 – – X X X 1,864 – – X X X
9. Other debt securities 99,452 – 26,233 X X X 126,393 – – X X X
Total 28,480,942 – 3,597,901 – 97,095 34,812,139 29,968,916 – 3,376,110 – 103,092 36,255,710
See Part A – Accounting Policies for an explanation of the criteria used to determine fair value.Current account balances due from customers include transactions "in transit" or "in suspense" relating to such accounts; these balances are not affected by non-cash debits and credits relating to bill and document collection services."Other loans" mostly relate to advances on bills, documents and similar instruments subject to collection, other amounts not settled via current accounts, receivables from post offices and the Cassa Depositi e Prestiti, derivative transaction margin changes at clearing houses, bills and documents discounted without recourse and operating loans associated with the provision of financial services (those associated with the payment of supplies of goods and non-financial services are shown under "Other assets").Discounted bills are reported at their face value, less any deferred income; they also include those sent for collection by the Bank's own branches or others.This also includes lease contracts that involve transfer of the risks, with BPM as lessor, relating to assets under construction and those waiting to be leased.The "Impaired" column includes non-performing loans, doubtful loans, restructured loans and overdue positions, net of value adjustments, as defined by the Bank of Italy. Details of these exposures are given in Part E of the notes – asset quality.
190 P a r t B - I n f o r m a t i o n o n t h e c o n s o l i d a t e d b a l a n c e s h e e t - A s s e t s
Subordinated financial assets
Type of transaction/Amounts 31.12.2014 31.12.2013
7. Other transactions: subordinated loans granted to insurance companies 37,999 37,365
8.2 Other debt securities 6,523 8,535
Total 44,522 45,900
Subordinated financial assets versus insurance companies at 31.12.2014 refer to loans granted by the Parent Bank to Bipiemme Vita S.p.A., with the following characteristics:a) original amount of 8 million euro with unspecified maturity – interest rate 12-month Euribor + 250 bps – payment date 27/6/2003;b) original amount of 8 million euro, granted on 31/3/2011 with a 5-year duration – interest rate 5-year MID SWAP + 270 bps,c) original amount of 26.05 million euro, granted on 21/3/2012 with a 10-year duration – interest rate 12-month Euribor.
"Other debt securities" relate for 1.957 million euro to convertible loans issued by Pitagora, an associated company: these loans were partially subscribed at the end of December 2011 and in February 2012 and partially at the end of December 2013; reimbursement of the securities is subject to repayment of the loans received from the issuer; the residual amount of 4.566 million relates to PHARMA Finance securities originating from third party securitisations and which are subordinated by their terms to superior classes.
The line item 3. "Mortgage loans" includes the balances, at the respective dates, of the following portfolio of securitised loans:
Performing Impaired 31.12.2014 Performing Impaired 31.12.2013
• BPM Securitisation 2 S.r.l.:
– carried out in 2006 for 2,011.3 million euro 352,886 37,802 390,688 428,444 36,778 465,222
– securitisation of commercial mortgage backed securities (CMBS) carried out in 2011 for 974 million euro and repurchased in the first quarter of 2014 (*) – – – 495,917 21,014 516,931
• Covered Bond S.r.l.:
– carried out in 2008 for 1,218 million euro, in 2009 for 1,305 million euro, in 2010 for 1,616 million euro, in 2011 for 639 million euro, in 2013 for 993 million euro and in 2014 for 1,294 million euro. 5,243,189 95,246 5,338,435 4,335,516 83,024 4,418,540
• BPM Securitisation 3 S.r.l.:
– securitisation of commercial mortgage backed securities (CMBS) carried out in the third quarter of 2014 for 864 million euro (*) 723,938 2,243 726,181 - - -
Total 6,320,013 135,291 6,455,304 5,259,877 140,816 5,400,693
(*) the Bank has subscribed all of the securities issued by the special purpose vehicle.
For details of the above transactions, see the following sections of Parte E of these Explanatory notes "Information on risks and related hedging policies":1 – Credit risk • "C.1 Securitisation transactions" • "C.3 Covered bond transactions"3 – Liquidity risk • Self-securitisations
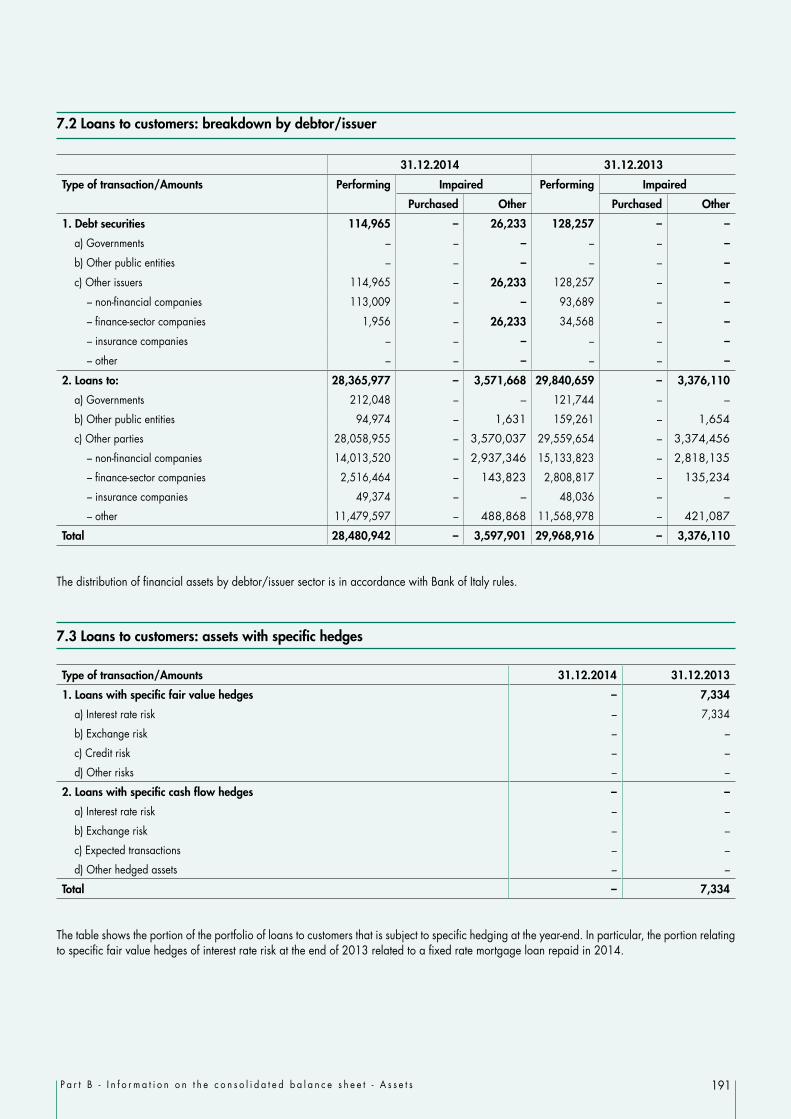
191P a r t B - I n f o r m a t i o n o n t h e c o n s o l i d a t e d b a l a n c e s h e e t - A s s e t s
7.2 Loans to customers: breakdown by debtor/issuer
31.12.2014 31.12.2013
Type of transaction/Amounts Performing Impaired Performing Impaired
Purchased Other Purchased Other
1. Debt securities 114,965 – 26,233 128,257 – –
a) Governments – – – – – –
b) Other public entities – – – – – –
c) Other issuers 114,965 – 26,233 128,257 – –
– non-financial companies 113,009 – – 93,689 – –
– finance-sector companies 1,956 – 26,233 34,568 – –
– insurance companies – – – – – –
– other – – – – – –
2. Loans to: 28,365,977 – 3,571,668 29,840,659 – 3,376,110
a) Governments 212,048 – – 121,744 – –
b) Other public entities 94,974 – 1,631 159,261 – 1,654
c) Other parties 28,058,955 – 3,570,037 29,559,654 – 3,374,456
– non-financial companies 14,013,520 – 2,937,346 15,133,823 – 2,818,135
– finance-sector companies 2,516,464 – 143,823 2,808,817 – 135,234
– insurance companies 49,374 – – 48,036 – –
– other 11,479,597 – 488,868 11,568,978 – 421,087
Total 28,480,942 – 3,597,901 29,968,916 – 3,376,110
The distribution of financial assets by debtor/issuer sector is in accordance with Bank of Italy rules.
7.3 Loans to customers: assets with specific hedges
Type of transaction/Amounts 31.12.2014 31.12.2013
1. Loans with specific fair value hedges – 7,334
a) Interest rate risk – 7,334
b) Exchange risk – –
c) Credit risk – –
d) Other risks – –
2. Loans with specific cash flow hedges – –
a) Interest rate risk – –
b) Exchange risk – –
c) Expected transactions – –
d) Other hedged assets – –
Total – 7,334
The table shows the portion of the portfolio of loans to customers that is subject to specific hedging at the year-end. In particular, the portion relating to specific fair value hedges of interest rate risk at the end of 2013 related to a fixed rate mortgage loan repaid in 2014.

192 P a r t B - I n f o r m a t i o n o n t h e c o n s o l i d a t e d b a l a n c e s h e e t - A s s e t s
7.4 Finance leases
The information required by IAS 17, paragraph 47, is provided below.
Reconciliation between the gross investment in leases and the present value of the minimum payments due at the balance sheet date
31.12.2014 31.12.2013
Gross investment in leases 402,048 455,215
Deferred financial income 86,840 99,455
Net investment 315,208 355,760
Unguaranteed residual value – –
Present value of minimum payments due 315,208 355,760
Adjustments –26,545 –20,475
Book value: line item 5. "finance lease" of table 7.1 above 288,663 335,285
Performing 218,713 269,554
Impaired 69,950 65,731
31.12.2014 31.12.2013
Within 1 year Gross investment 11,476 14,122
Present value of minimum payments due 11,267 13,932 Adjustments –3,264 –2,532 Net exposure 8,003 11,400
– of which impaired 1,992 2,254
Between 1 and 5 years Gross investment 30,833 52,800
Present value of minimum payments due 28,863 49,600 Adjustments –1,783 –1,658 Net exposure 27,080 47,942
– of which impaired 4,101 3,348
Beyond 5 years Gross investment 359,739 388,293
Present value of minimum payments due 275,078 292,228 Adjustments –21,498 –16,285 Net exposure 253,580 275,943
– of which impaired 63,857 60,129
The finance lease portfolio involves 1,402 contracts; the investments related to properties for 94%, functional assets for 5% and motor vehicles for the remainder.

193P a r t B - I n f o r m a t i o n o n t h e c o n s o l i d a t e d b a l a n c e s h e e t - A s s e t s
Section 8 – Hedging derivatives Line item 80
This line item reports financial derivatives used for hedging purposes, which have a positive fair value at the balance sheet date.
8.1 Hedging derivatives: breakdown by type of hedge and level
FV 31.12.2014NV
FV 31.12.2013NVL1 L2 L3 Total L1 L2 L3 Total
A) Financial derivatives – 178,460 – 178,460 2,248,945 – 171,468 6,823 178,291 2,600,278
1) Fair value – 178,460 – 178,460 2,248,945 – 171,468 6,823 178,291 2,600,278
2) Cash flows – – – – – – – – – –
3) Foreign investments – – – – – – – – – –
B) Credit derivatives – – – – – – – – – –
1) Fair value – – – – – – – – – –
2) Cash flows – – – – – – – – – –
Total – 178,460 – 178,460 2,248,945 – 171,468 6,823 178,291 2,600,278
Key:NV = Notional value L1 = Level 1 L2 = Level 2 L3 = Level 3
As regards the criteria used for determining the fair value and the classification of financial instruments in the three levels of the fair value hierarchy, they are defined in Part A "Accounting Policies".The table presents the positive book value (fair value) of hedging derivative contracts, including the amount accruing at the balance sheet date, for hedges made through hedge accounting. This instrument is used to manage accounting hedges of financial instruments recognised in balance sheet items that do not envisage their measurement at fair value through profit or loss.The hedging of financial liabilities represented by securities are normally handled through the fair value option. The fair value option was adopted for structured debt securities and fixed-rate securities issued by Group banks, whose risk of changes in fair value has been hedged with derivatives; derivatives used as part of the "fair value option" are classified in the trading book.With regard to the objectives and strategies underlying hedge transactions, please refer to the information provided in Part E – Information on risks and related hedging policies – Section 2 – Market risks.
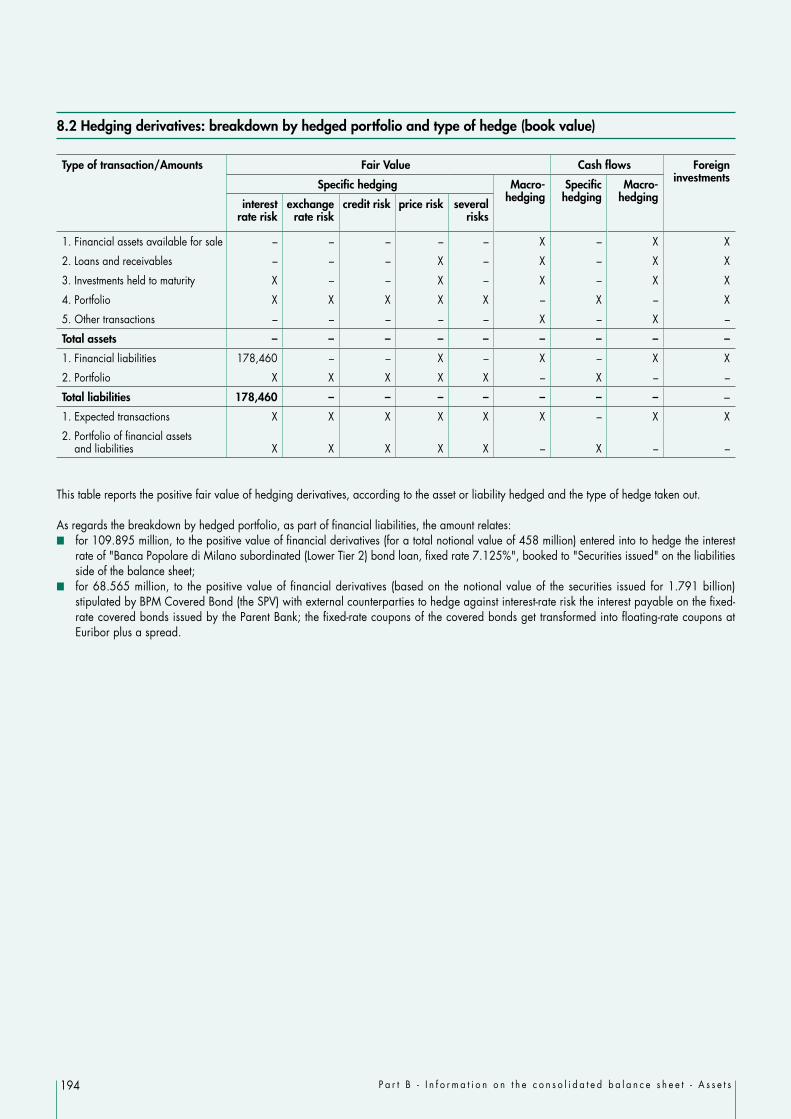
194 P a r t B - I n f o r m a t i o n o n t h e c o n s o l i d a t e d b a l a n c e s h e e t - A s s e t s
8.2 Hedging derivatives: breakdown by hedged portfolio and type of hedge (book value)
Type of transaction/Amounts Fair Value Cash flows Foreign investmentsSpecific hedging Macro-
hedgingSpecific
hedgingMacro-
hedginginterest rate risk
exchange rate risk
credit risk price risk several risks
1. Financial assets available for sale – – – – – X – X X
2. Loans and receivables – – – X – X – X X
3. Investments held to maturity X – – X – X – X X
4. Portfolio X X X X X – X – X
5. Other transactions – – – – – X – X –
Total assets – – – – – – – – –
1. Financial liabilities 178,460 – – X – X – X X
2. Portfolio X X X X X – X – –
Total liabilities 178,460 – – – – – – – –
1. Expected transactions X X X X X X – X X
2. Portfolio of financial assets and liabilities X X X X X – X – –
This table reports the positive fair value of hedging derivatives, according to the asset or liability hedged and the type of hedge taken out.
As regards the breakdown by hedged portfolio, as part of financial liabilities, the amount relates: for 109.895 million, to the positive value of financial derivatives (for a total notional value of 458 million) entered into to hedge the interest
rate of "Banca Popolare di Milano subordinated (Lower Tier 2) bond loan, fixed rate 7.125%", booked to "Securities issued" on the liabilities side of the balance sheet;
for 68.565 million, to the positive value of financial derivatives (based on the notional value of the securities issued for 1.791 billion) stipulated by BPM Covered Bond (the SPV) with external counterparties to hedge against interest-rate risk the interest payable on the fixed-rate covered bonds issued by the Parent Bank; the fixed-rate coupons of the covered bonds get transformed into floating-rate coupons at Euribor plus a spread.

195P a r t B - I n f o r m a t i o n o n t h e c o n s o l i d a t e d b a l a n c e s h e e t - A s s e t s
Section 9 – Fair value change of financial assets in hedged portfoliosLine item 90
This item includes the positive balance of fair value changes in the assets covered by macrohedges against interest rate risk.
9.1 Fair value adjustment of hedged assets: breakdown by hedged portfolio
Fair value adjustment of hedged assets/Amounts 31.12.2014 31.12.2013
1. Positive adjustment 20,107 11,244
1.1 of specific portfolios: 20,107 11,244
a) loans 17,801 6,018
b) financial assets available for sale 2,306 5,226
1.2 overall – –
2. Negative adjustment – (1,139)
2.1 of specific portfolios: – (1,139)
a) loans – (1,139)
b) financial assets available for sale – –
2.2 overall – –
Total 20,107 10,105
The fair value adjustment of hedged assets concerns: a portfolio of fixed rate government securities for a nominal value of 0.250 billion (0.500 billion at 31 December 2013) recorded in "Financial
assets available for sale"; a portfolio of mortgages with a cap option, included in "loans to customers" for a nominal value of 0.159 billion.
The related hedging derivatives, which at 31 December 2014 have a negative valuation, are shown under "Hedging derivatives" on the liabilities side of the balance sheet.Income and expenses relating to the valuation of hedging derivatives and the hedged portfolio are recognised in the income statement under "Fair value adjustments in hedge accounting".
9.2 Assets covered by macrohedges against interest rate risk
Assets hedged 31.12.2014 31.12.2013
1. Loans and receivables 158,970 164,473
2. Financial assets available for sale 250,000 500,000
3. Portfolio – –
Total 408,970 664,473
The amount relating to loans consists of a hedge set up on a portion of mortgage loans of a nominal value of 158.97 million euro.
The amount attributable to the assets available for sale highlights the value of a portfolio of fixed-rate government securities hedged for interest rate risk in table 9.1 above.

196 P a r t B - I n f o r m a t i o n o n t h e c o n s o l i d a t e d b a l a n c e s h e e t - A s s e t s
Section 10 – Investments in associates and companies subject to joint control Line item 100
This item includes investments in joint ventures (or companies subject to joint control as per IAS 31) and associates (or companies subject to significant influence as per IAS 28).
10.1 Investments in associates and companies subject to joint control: disclosures
Company name Share capital in Euro/Original currency
Registered office
Operational headquarters
Nature of holding
(1)
Nature of investment Voting rights
(2)Holder % held
A. Companies subject to joint control
Unlisted financial institutions
1. Calliope Finance S.r.l. 600,000 Conegliano (TV) Conegliano (TV) 1 Banca Popolare di Milano S.c.a r.l. 50.00
B. Companies subject to significant influence
Unlisted financial institutions
1. SelmaBipiemme Leasing S.p.A. 41,305,000 Milan Milan 2 Banca Popolare di Milano S.c.a r.l. 40.00
2. Aedes Bipiemme Real Estate SGR SpA. 5,500,000 Milan Milan 2 Banca Popolare di Milano S.c.a r.l. 39.00
3. Factorit SpA. 85,000,002 Milan Milan 2 Banca Popolare di Milano S.c.a r.l. 30.00
4. Etica SGR S.p.A. 4,500,000 Milan Milan 2 Banca Popolare di Milano S.c.a r.l. 24.44
5. Pitagora 1936 S.p.A. 9,400,000 Turin Turin 2 Banca Popolare di Milano S.c.a r.l. 24.00
6. Wise Venture SGR S.p.A. 1,250,000 Milan Milan 2 Banca Popolare di Milano S.c.a.r.l. 20.00
Quoted financial institutions
7. Anima Holding S.p.A. 5,765,463 Milan Milan 2 Banca Popolare di Milano S.c.a r.l. 16.85
Unlisted insurance companies
8. Bipiemme Vita S.p.A . 179,125,000 Milan Milan 2 Banca Popolare di Milano S.c.a.r.l. 19.00
Key:(1) Nature of holding: 1. joint control 2. significant influence(2) Voting rights at Ordinary General Meetings. Voting rights are only shown if they differ from the percentage held in the share capital.

197P a r t B - I n f o r m a t i o n o n t h e c o n s o l i d a t e d b a l a n c e s h e e t - A s s e t s
10.2 Significant investments: book value, fair value and dividends received
Name Book value Fair value Dividends received
31.12.2014 31.12.2013
A. Companies subject to joint control 1. Calliope Finance S.r.l. 535 528 X –B. Companies subject to significant influence 1. SelmaBipiemme Leasing S.p.A. 23,966 28,026 X – 2. Aedes Bipiemme Real Estate SGR S.p.A. 2,898 2,759 X 341 3. Factorit S.p.A. 67,106 61,783 X 2,295 4. Etica SGR S.p.A. 1,763 1,421 X 110 5. Pitagora 1936 S.p.A. 6,953 6,500 X – 6. Wise Venture SGR S.p.A. 548 502 X 25 7. Anima Holding S.p.A. 124,510 230,879 210,137 – 8. Bipiemme Vita S.p.A. 65,518 63,189 X 2,042Total 293,797 395,587 X 4,813
The fair value of investments in associates is reported only for listed companies.
10.3 Significant investments: accounting information
Name
Cash
and
cas
h eq
uiva
lent
s
Fina
ncia
l ass
ets
Non
-fina
ncia
l ass
ets
Fina
ncia
l lia
bilit
ies
Non
-fina
ncia
l lia
bilit
ies
Tota
l rev
enue
s
Inte
rest
mar
gin
Net
adj
ustm
ents
/writ
ebac
ks
to p
rope
rty
and
equi
pmen
t an
d in
tang
ible
ass
ets
Inco
me
(loss
) bef
ore
tax
from
con
tinui
ng o
pera
tions
Inco
me
(loss
) afte
r ta
x fr
om
cont
inui
ng o
pera
tions
Inco
me
(loss
) afte
r ta
x fr
om
disc
ontin
ued
oper
atio
ns
Net
inco
me
(loss
) fo
r th
e ye
ar (1
)
Oth
er c
ompr
ehen
sive
in
com
e (n
et o
f tax
) (2)
Com
preh
ensi
ve in
com
e (3
)=(1
)+(2
)
A. Companies subject to joint control
1. Calliope Finance S.r.l. – 22,790 131 23,392 756 2,781 1,841 – (2,221) (2,283) – (2,283) – (2,283)
B. Companies subject to significant influence
1. SelmaBipiemme Leasing S.p.A. X 1,685,973 140,574 1,736,659 26,434 54,205 X X (18,424) (12,881) – (12,881) (760) (13,641)
2. Aedes Bipiemme Real Estate SGR S.p.A. X 8,364 572 547 1,316 4,401 X X 1,625 920 – 920 – 920
3. Anima Holding S.p.A. X 314,712 898,671 436,304 160,188 662,350 X X 164,982 119,712 – 119,712 5,092 124,804
4. Factorit S.p.A. X 1,785,003 56,958 1,587,930 63,048 95,959 X X 33,107 19,352 – 19,352 83 19,435
5. Etica SGR S.p.A. X 6,271 3,133 1,258 2,001 7,903 X X 1,184 664 – 664 9 673
6. Pitagora 1936 S.p.A. X 202,752 59,368 162,980 72,211 44,742 X X (555) (1,195) – (1,195) (15) (1,210)
7. Wise Venture SGR S.p.A. X 3,464 604 63 1,492 5,690 X X 730 246 – 246 5 251
8. Bipiemme Vita S.p.A. X 4,928,030 154,113 975,479 3,867,825 958,811 X X 47,591 33,652 – 33,652 630 34,282
The table sets out details of all companies subject to joint control or subject to significant influence.The figures shown are drawn from the financial statements at 31.12.2013, except for those of SelmaBipiemme Leasing S.p.A. which are taken from the financial statements at 30 June 2014. The figures relating to Anima Holding and Pitagora 1936 have been taken from their consolidated financial statements.The "total revenues" column shows the overall amount of income items with plus signs before income taxes.
10.4 Not significant investments: accounting information
Section 10.3 sets out details of all companies subject to joint control or subject to significant influence.

198 P a r t B - I n f o r m a t i o n o n t h e c o n s o l i d a t e d b a l a n c e s h e e t - A s s e t s
10.5 Investments in associates and companies subject to joint control: changes during the year
31.12.2014 31.12.2013
A. Opening balance 395,587 346,039
B. Increases 129,890 59,444
B.1 Purchases – –
B.2 Writebacks – –
B.3 Revaluations 22,857 55,044
B.4 Other increases 107,033 4,400
C. Decreases 231,680 9,896
C.1 Sales 225,304 –
C.2 Adjustments – 243
C.3 Other decreases 6,376 9,653
D. Closing balance 293,797 395,587
E. Total revaluations – –
F. Total adjustments 8,442 92,393
Detail of changes during the year
B. Increases 129,890
B.3 Revaluations 22,857
• Profits on investments carried at equity 22,857
B.4 Other increases 107,033
• Gain on sale of Anima Holding 104,474
• Change in valuation reserves of investments carried at equity 2,559
C. Decreases 231,680
C.1 Sales 225,304
• Sale of equity interest in Anima Holding 225,304
C.3 Other decreases 6,376
• Dividends paid during the year 4,813• Change in valuation reserves of investments carried at equity 1,563
F. Total adjustments 8,442
• SelmaBipiemme Leasing 6,899• Wise Venture SGR 1,543

199P a r t B - I n f o r m a t i o n o n t h e c o n s o l i d a t e d b a l a n c e s h e e t - A s s e t s
10.6 Significant judgements and assumptions made in establishing the existence of joint control or significant influence
"Part A – Accounting Policies", paragraph "A.1 – General Part" and "Section 3 – Scope of consolidation and consolidation procedures" of the notes explain the general criteria for the significant judgements and assumptions made in establishing the presence or otherwise of control over an investee or another entity, as well as the existence of a joint control agreement or the ability to exercise significant influence.
In the case of Bipiemme Vita S.p.A. and Anima Holding S.p.A., despite holding equity interests of less than 20%, the Bank is of the opinion that it is able to exercise significant influence over these companies.
In particular: Bipiemme Vita S.p.A. is classified as a company "subject to significant influence" as the Bank signed a shareholder agreement with Covéa (the
other partner with 81% of the voting rights) that contains the rules of corporate governance, as well as the industrial aspects of the partnership including, among other things, the fact that the insurance company should have access to the distribution networks of the Bipiemme Group for a period of 10 years from the closing date, with the possibility of renewal on expiry.
The interest in Anima Holding S.p.A. fell from 35.29% to 16.85% after completion of the Public Offering. Even though the equity interest in Anima Holding has dropped below 20%, it is still classified as an equity investment, because of the content of
the Programmatic Agreement signed by the shareholders that contains clauses that define the corporate governance of Anima Holding, as well as certain shareholder agreements that entail that BPM still has a significant influence even though the percentage interest has been reduced.
10.7 Commitments relating to investments in companies subject to joint control
At the balance sheet date, there are no commitments relating to investments in companies subject to joint control.
10.8 Commitments relating to investments in companies subject to significant influence
SelmaBipiemme Leasing S.p.A. SelmaBipiemme Leasing (hereafter "Selma") is controlled by Mediobanca.Between BPM, Mediobanca and Compass there is a shareholder agreement lasting until 30 June 2015 which regulates their reciprocal rights and obligations in terms of the company's governance and disposal of the investment (providing for reciprocal sale and purchase options).Call options have been taken out by Mediobanca and put options have been taken out by BPM for BPM's investment in Selma; these can be exercised in the event of cancellation or failure to renew the commercial agreement on the part of BPM, a change of control over BPM, sale of more than 50% of BPM's branch network and if there was no longer exclusive collaboration with Selma, on the one hand, and, on the other, in the event of cancellation of the commercial agreement on expiry by Selma.These options will have to be exercised within 180 days of the event that triggers the exercise. The strike price for Mediobanca will be equal to their pro-rata share of Selma's net equity as shown in its latest financial statements; the price will discount the restructuring charges that Selma will have to pay if it loses BPM's distribution channel. The strike price for BPM will be equal to its pro-rata share of the company's economic value determined on the basis of a method laid down in the agreement.The agreement also includes a call option for BPM to buy Mediobanca's investment in Selma, in the event that Mediobanca loses control over Selma, or if a banking or insurance group acquires control over Mediobanca. The strike price of the option, which will have to be exercised within 180 days of the event, will be equal to its pro-rata share of Selma's economic value determined on the basis of the method laid down in the agreement. In the event of the option being exercised, Mediobanca will have the right to purchase, within 180 days of the transaction, the interests held by Selma as of that date in Palladio Leasing S.p.A. and Teleleasing S.p.A. (currently in liquidation).
Factorit S.p.A. On 29 July 2010, Banca Popolare di Milano and Banca Popolare di Sondrio ("BPS") bought 30% and 60.5% respectively of Factorit S.p.A. from Banca Italease, which has kept the other 9.5%. On the same day, BPM and BPS signed a shareholder agreement to regulate the company's governance; in particular, BPM has the right to appoint two out of the seven directors, the chairman of the Board of Statutory Auditors and an alternate statutory auditor. These agreements also provide for: BPM's willingness to sell a shareholding of not more than 5% of Factorit's share capital to Banca Italease, or to Banco Popolare or to another
company controlled by it, at conditions to be negotiated; a right to sell in favour of BPM in the event that BPS decides to sell 50% of Factorit plus one share.

200 P a r t B - I n f o r m a t i o n o n t h e c o n s o l i d a t e d b a l a n c e s h e e t - A s s e t s
Anima Holding S.p.A.In 2014 the investee was subject to a public offering, as part of which the Parent Company sold a part of its equity holding, reducing its interest from 35.29% to16.85%.BPM and Monte Paschi Siena have entered into a shareholder agreement, which, in addition to establishing rules for the appointment of certain members of Anima Holding's Board of Directors, provides for a lock up commitment whereby the two companies may not reduce their equity interest in Anima below 9.9% prior to April 2017.
Bipiemme VitaOn 8 September 2011 - following the agreements signed on 19 April 2011 by Banca Popolare di Milano and the Covéa Group ("the parties") to set up a strategic partnership in bancassurance selling life and accident insurance - the Covéa Group completed its acquisition of 81% of Bipiemme Vita S.p.A., which also holds 100% of Bipiemme Assicurazioni S.p.A. The sale agreement provides for a mechanism, whereby the price will be increased on the achievement of certain business targets by Bipiemme Vita and Bipiemme Assicurazioni - in the period comprising the year ended 31 December 2011 up to the year ending 31 December 2020, with the potential price increase to be determined by means of an "Earn Out Vita" (up to a maximum of 11.7 million euro) and an "Earn Out Danni" (up to a maximum of 2.5 million euro). The calculation of any price adjustment will take place at the end of this period, subject to renewal of the strategic partnership with the Covéa Group.
The Sale and Purchase Agreement requires BPM to pay indemnification for any losses that Bipiemme Vita should incur as a result of any default involving:(i) securities in the trading portfolio of Italian sovereign debt;(ii) securities of the trading portfolio of bank bonds;(iii) securities of the investment portfolio of Greek sovereign debt (for which default also includes the restructuring of debt assuming a recovery
rate of 79%).
The indemnification obligation also extends to any loss recognised when, in the event of exceptional future liquidity needs on the part of Bipiemme Vita due to extraordinary redemptions of insurance contracts outstanding at 31 August 2011, Bipiemme Vita should have to sell the securities indicated above.During the course of 2012, the indemnification mechanism for Greek government bonds referred to in point iii) was activated, as provided for in the contract (difference between the nominal value and the recovery rate of 79%), which led to an award to Covéa of around 7.3 million (already provided for in the 2011 financial statements). So, as things stand, no further compensation is due on such securities.At 31.12.2014 the maximum indemnification obligation for the securities referred to in points i) and ii) – taking into account repayments and sales that have taken place – amounts to 7.6 million; moreover, on the basis of the market value of the securities at 31.12.2014, the securities in question are showing significant gains overall. As a consequence, it is felt that there is no need to make any provision as the risk of any indemnification is considered remote.The agreements also include reciprocal options which, on the occurrence of certain extraordinary events involving one or both parties – including, by way of example, non-compliance and/or non-renewal of the partnership agreements (termination for breach of the partnership agreement or of the distribution arrangements), any change of control over the parties, liquidation or insolvency/bankruptcy of the parties, a decision-making stalemate regarding a proposal to wind up and liquidate Bipiemme Vita and/or Bipiemme Assicurazioni, to revoke the state of liquidation or the appointment or dismissal of liquidators (a so-called "triggering event") – BPM or the Covéa Group will, according to the party affected by the event in question, to exercise its option to acquire the other party's interest in Bipiemme Vita, or to sell its own interest to the other party. The strike price of the options is determined according to a predetermined reciprocal mechanism based on a valuation of the life and accident businesses. For the first five years of the strategic partnership, there is provision for a penalty in favour of the Covéa Group if the option is exercised linked to certain types of triggering events originated by BPM (termination due to breach of the partnership agreement or of the distribution agreements); the amount of this penalty decreases over time from the date of signing the partnership agreements.
10.9 Significant restrictions
There are no significant restrictions that need to be disclosed in compliance with IFRS 12.
10.10 Other information
The associate SelmaBipiemme Leasing has a 30 June year end and, accordingly, the latest financial statements thereof are for the year ended 30 June 2014. In order to measure the investment therein using the equity method, a pro-forma income statement was prepared consisting of the results for the second half of the financial year ended 30.6.2014 and of the results approved by the Company for the six months ended 31.12.2014.

201P a r t B - I n f o r m a t i o n o n t h e c o n s o l i d a t e d b a l a n c e s h e e t - A s s e t s
Section 11 – Technical insurance reserves reassured with third parties Line item 110
As at the reporting date, there is no such line item as there are no insurance companies in the Group.
Section 12 – Property and equipment Line item 120
12.1 Functional property and equipment: breakdown of assets carried at cost
Assets/Amounts 31.12.2014 31.12.2013
1.1 owned by company 692,073 713,679
a) land 289,067 289,067
b) buildings 319,006 341,447
c) furniture 25,436 25,455
d) electronic equipment 17,180 22,071
e) other 41,384 35,639
1.2 purchased under finance lease – –
a) land – –
b) buildings – –
c) furniture – –
d) electronic equipment – –
e) other – –
Total 692,073 713,679
12.2 Investment properties: breakdown of assets carried at cost
Assets/Amounts 31.12.2014 31.12.2013
Book value Fair value Book value Fair value
L1 L2 L3 L1 L2 L3
1. Owned property and equipment 23,632 – – 36,343 24,521 – – 36,832
a) land 4,660 – – 6,868 4,660 – – 6,745
b) buildings 18,972 – – 29,475 19,861 – – 30,087
2. Purchased under finance lease – – – – – – – –
a) land – – – – – – – –
b) buildings – – – – – – – –
Total 23,632 – – 36,343 24,521 – – 36,832
This line item reports property and equipment (buildings, plant, machinery and other tangible assets, including work of art) used in the business which are governed by IAS 16 and investment properties (land and buildings) which are governed by IAS 40.

202 P a r t B - I n f o r m a t i o n o n t h e c o n s o l i d a t e d b a l a n c e s h e e t - A s s e t s
12.3 Functional property and equipment: breakdown of assets revalued
At the balance sheet date, as at the end of the previous year, there are no items of functional property and equipment that have been measured at fair value.
12.4 Investment properties: breakdown of assets carried at fair value
At the balance sheet date, as at the end of the previous year, there are no items of functional property and equipment that have been measured at fair value.
12.5 Functional property and equipment: changes during the year
Land Buildings Furniture Electronic equipment
Other Total
A. Opening gross amount 289,067 867,227 121,863 187,948 190,642 1,656,747
A.1 Total net reductions in value – 525,780 96,408 165,877 155,003 943,068
A.2 Net opening amount 289,067 341,447 25,455 22,071 35,639 713,679
B. Increases – 3 3,781 2,889 15,282 21,955
B.1 Purchases – – 3,781 2,889 15,282 21,952
B.2 Capitalised improvement expenditure – – – – – –
B.3 Writebacks – – – – – –
B.4 Fair value increases booked to: – – – – – –
– a) shareholders' equity – – – – – –
– b) income statement – – – – – –
B.5 Positive exchange rate adjustments – – – – – –
B.6 Transfer from investment properties – – – – – –
B.7 Other increases – 3 – – – 3
C. Decreases – 22,444 3,800 7,780 9,537 43,561
C.1 Sales – – – – – –
C.2 Depreciation – 20,144 3,800 7,780 9,537 41,261
C.3 Impairment charges booked to: – 2,300 – – – 2,300
– a) shareholders' equity – – – – – –
– b) income statement – 2,300 – – – 2,300
C.4 Fair value decreases booked to: – – – – – –
– a) shareholders' equity – – – – – –
– b) income statement – – – – – –
C.5 Negative exchange rate adjustments – – – – – –
C.6 Transfers to: – – – – – –
– a) investment properties – – – – – –
– b) assets held for sale – – – – – –
C.7 Other decreases – – – – – –
D. Net closing amount 289,067 319,006 25,436 17,180 41,384 692,073
D.1 Total net reductions in value – 547,228 100,071 173,351 164,540 985,190
D.2 Closing gross amount 289,067 866,234 125,507 190,531 205,924 1,677,263
E. Valuation at cost – – – – – –
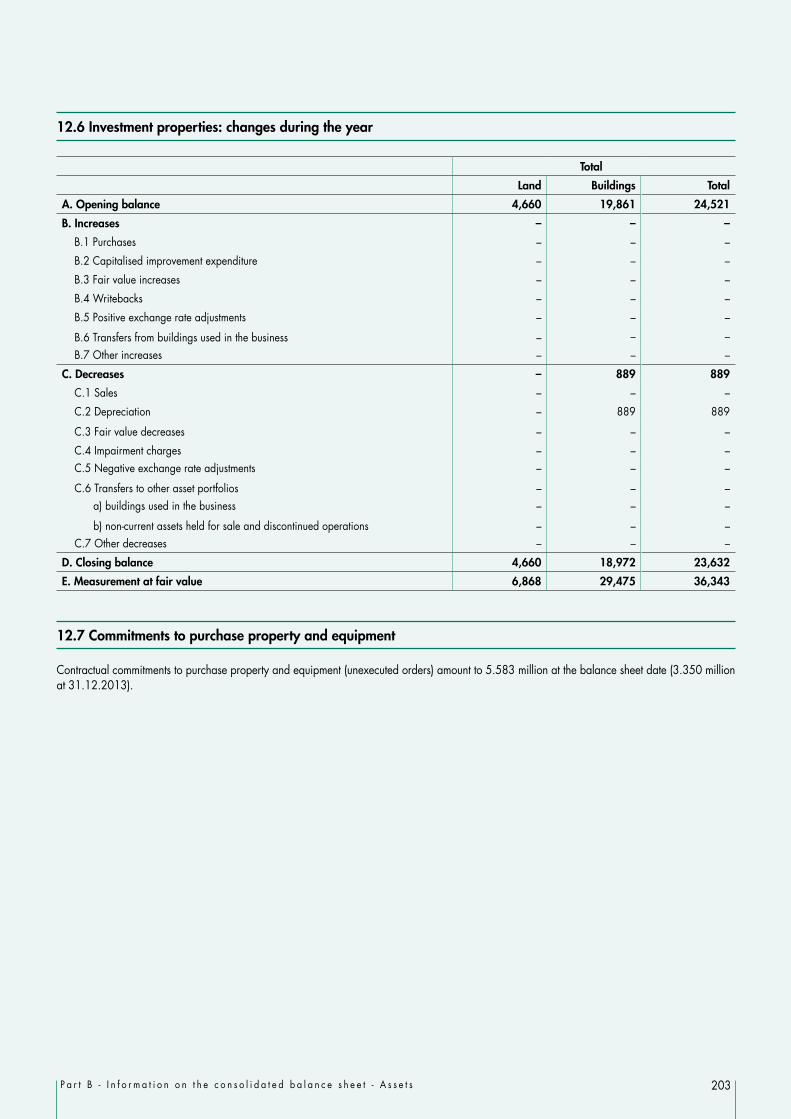
203P a r t B - I n f o r m a t i o n o n t h e c o n s o l i d a t e d b a l a n c e s h e e t - A s s e t s
12.6 Investment properties: changes during the year
Total
Land Buildings Total
A. Opening balance 4,660 19,861 24,521
B. Increases – – –
B.1 Purchases – – –
B.2 Capitalised improvement expenditure – – –
B.3 Fair value increases – – –
B.4 Writebacks – – –
B.5 Positive exchange rate adjustments – – –
B.6 Transfers from buildings used in the business – – –
B.7 Other increases – – –
C. Decreases – 889 889
C.1 Sales – – –
C.2 Depreciation – 889 889
C.3 Fair value decreases – – –
C.4 Impairment charges – – – C.5 Negative exchange rate adjustments – – –
C.6 Transfers to other asset portfolios – – – a) buildings used in the business – – –
b) non-current assets held for sale and discontinued operations – – – C.7 Other decreases – – –
D. Closing balance 4,660 18,972 23,632
E. Measurement at fair value 6,868 29,475 36,343
12.7 Commitments to purchase property and equipment
Contractual commitments to purchase property and equipment (unexecuted orders) amount to 5.583 million at the balance sheet date (3.350 million at 31.12.2013).

204 P a r t B - I n f o r m a t i o n o n t h e c o n s o l i d a t e d b a l a n c e s h e e t - A s s e t s
Section 13 – Intangible assets Line item 130
This line item reports intangible assets in accordance with IAS 38, which are all valued at cost.
13.1 Intangible assets: breakdown by type of assets
Total Total
Assets/Amounts Finite life Indefinite life 31.12.2014 Finite life Indefinite life 31.12.2013
A.1 Goodwill x – – x – –
A.1.1 Of the Group x – – x – –
A.1.2 Of minority interests x – – x – –
A.2 Other intangible assets 108,377 – 108,377 96,188 – 96,188
A.2.1 Assets valued at cost: 108,377 – 108,377 96,188 – 96,188
a) Internally generated intangible assets 619 – 619 1,002 – 1,002
b) Other assets 107,758 – 107,758 95,186 – 95,186
A.2.2 Assets carried at fair value: – – – – – –
a) Other intangible assets: internally generated – – – – – –
b) Other assets – – – – – –
Total 108,377 – 108,377 96,188 – 96,188
A.2 Other intangible assets
As required by paragraph 118 letter a) of IAS 38, software has all been classified under intangible assets with a finite useful life; it is being amortised over a period of between 3 and 7 years.
Line item A.2.1 b) "Other assets" with a finite life is made up as follows:
31.12.2014 31.12.2013
Software 107,758 95,186
107,758 95,186

205P a r t B - I n f o r m a t i o n o n t h e c o n s o l i d a t e d b a l a n c e s h e e t - A s s e t s
13.2 Intangible assets: changes during the year
Goodwill Other intangible assets: internally generated
Other intangible assets: Total
Finite life Indefinite life
Finite life Indefinite life
A. Opening gross amount – 3,083 – 439,461 – 442,544
A.1 Total net reductions in value – 2,081 – 344,275 – 346,356 A.2 Net opening amount – 1,002 – 95,186 – 96,188
B. Increases – – – 38,048 – 38,048
B.1 Purchases – – – 38,048 – 38,048 B.2 Increases in internally generated intangible assets x – – – – – B.3 Writebacks x – – – – – B.4 Fair value increases – – – – – – – to shareholders' equity x – – – – – – to income statement x – – – – – B.5 Positive exchange rate adjustments – – – – – – B.6 Other increases – – – – – –
C. Decreases – 383 – 25,476 – 25,859
C.1 Sales – – – – – – C.2 Adjustments – 383 – 25,476 – 25,859 – amortisation x 383 – 25,476 – 25,859 – Writedowns – – – – – – + shareholders' equity x – – – – – + income statement – – – – – – C.3 Fair value decreases – – – – – – – to shareholders' equity x – – – – – – to income statement x – – – – – C.4 Transfers to non-current assets held for sale and discontinued operations – – – – – – C.5 Negative exchange rate adjustments – – – – – – C.6 Other decreases – – – – – –
D. Net closing amount – 619 – 107,758 – 108,377 D.1 Total net adjustments – 2,464 – 366,698 – 369,162E. Closing gross amount – 3,083 – 474,456 – 477,539
F. Valuation at cost – – – – – –
13.3 Other information
The following declarations are made as required by paragraphs 122 and 124 of IAS 38: there are no intangible assets that have been revalued; as a result, there are no restrictions on distributions to shareholders because of
revaluation surpluses relating to intangible assets (paragraph 124, letter b) of IAS 38); there are no intangible assets that have been acquired under a government concession (paragraph 122, letter c) of IAS 38); there are no intangible assets that have been pledged as security for liabilities (paragraph 122, letter d) of IAS 38); contractual commitments for the purchase of intangible assets (unexecuted orders) amount to 4.543 million at 31.12.2014 (4.887 million at
31.12.2013) (paragraph 122, letter e) of IAS 38); there are no leased intangible assets.

206 P a r t B - I n f o r m a t i o n o n t h e c o n s o l i d a t e d b a l a n c e s h e e t - A s s e t s
Section 14 – Tax assets and liabilities Asset line item 140 and liability line item 80
In accordance with IAS 12, these line items show current and deferred tax assets (asset line item 140) and current and deferred tax liabilities (liability line item 80).With respect to "Deferred tax assets under Law 214/2011" (hereinafter DTA) the Bank of Italy in its letter no. 677311/12 of 7 August 2012 requested, for reasons of transparency, to disclose the characteristics of the DTA and to provide details of changes in the year in table 14.3.1. "Changes in deferred tax assets under Law 214/2011 (with a matching entry in the income statement)".
14.1 Deferred tax assets: breakdown
The types of temporary differences that gave rise to the recognition of deferred tax assets are as follows:
Description 31.12.2014 31.12.2013
Deferred tax assets with contra–entry to the income statement: 868,413 820,745
a) DTA under Law 214/2011 710,044 644,598
+ Writedowns of loans to customers 563,240 495,049
+ Goodwill and other intangible assets 146,804 149,549
+ Tax losses under Law 214/2011 – –
b) Other 158,369 176,147
+ Writedown of amounts due from banks 2,596 2,477
+ Tax losses – –
+ Adjustments to the value of financial assets held for trading and financial liabilities designated at fair value through profit and loss – –
+ Adjustments to securities issued 21,921 30,594
+ Adjustments to financial liabilities held for trading and financial liabilities designated at fair value through profit and loss – 2
+ Impairment adjustments to guarantees given shown under other liabilities 18,308 16,274
+ Allowances for risks and charges 86,533 101,639
+ Costs mainly of an administrative nature 4,601 3,317
+ Writedowns of hedging derivatives – –
+ Differences between tax bases and book values of property and equipment and intangible assets 24,211 21,613
+ Other line items 199 231
Deferred tax assets with contra-entry to shareholders' equity: 35,586 26,096
– Valuation reserves: 5,710 8,272
+ Losses on financial assets available for sale 5,710 8,272
– Other: 29,876 17,824
+ Actuarial gains/losses relating to payroll provisions and other line items 23,247 14,485
+ Costs of share capital increases 6,629 3,339
Total sub-items 140 b) Deferred tax assets 903,999 846,841

207P a r t B - I n f o r m a t i o n o n t h e c o n s o l i d a t e d b a l a n c e s h e e t - A s s e t s
Tax credit arising from the conversion of deferred tax assets recorded in the financial statements (Law 214/2011)
Article 2 of legislative decree no. 225 of 29 December 2010, (so-called "mille proroghe", an annual decree extending the life of various government measures), converted, with amendments, to Law no. 10 of 26 February 2011 and subsequently amended by art. 9 of legislative decree no. 201 of 6 December 2011 (so-called "Monti" decree), converted, with amendments, to Law no. 214/2011, provides for the introduction of rules for the conversion to tax credits of a portion of certain elements that lead to a deferred tax asset being recorded in the financial statements, if a company's separate financial statements show a loss for the financial year.Pursuant to the aforementioned rules, that which can be transformed into tax credits, within certain limits, are deferred tax asset components relating to loan writedowns not yet deducted from taxable income under paragraph 3 of art. 106 of the ITCA, as well as those related to goodwill and other intangible assets that are deductible over more than one tax period for income tax purposes.With respect to the quantification of the amount that can be converted, the law states that the amount of the deferred tax asset that can be converted is that which results from multiplying the loss for the financial year by the ratio of the relevant deferred tax asset to the sum of share capital and reserves.The law also provides for another hypothesis for conversion, concerning a deferred tax asset arising from tax losses, as governed by paragraph 56-bis of the aforementioned art. 2. The tax credit resulting from the conversion of a deferred tax asset is non interest bearing, it may be used for offsetting in accordance with art. 17 of Legislative Decree 241/1997, or may be sold at nominal value in accordance with the procedure set out by art. 43-ter of Presidential Decree 602/1973 and, lastly, a refund may be requested for any balance remaining after offsetting.In the above table, the deferred tax asset under Law 214/2011 is presented separately from other traditional deferred tax asset components, in order to take account of their different nature.More specifically, the amounts shown in the table represent the portion of the deferred tax asset components that is potentially capable of being converted to tax credits at the balance sheet date.Changes in the year, as well as the amounts of deferred tax asset components converted to tax credits during the course of the year, are set out in table 14.3.1 "Change in deferred tax asset under Law 214/2011".The rules relating to the conversion to a tax credit of a deferred tax asset introduces a means of recovery of the asset that are supplementary to the ordinary rules to be applied when there is a loss for the financial year or a tax loss.This method provides certainty of recovery, whatever the circumstances, of a deferred tax asset under Law 214/2011, automatically meeting the requirements of probable recovery of the deferred tax asset as required by IAS 12.
Other deferred tax assetsThe above table also provides details of other deferred tax asset components that differ from those under Law 214/2011. Deferred tax assets are recognised to the extent that there is a likelihood of recovery on the basis of the company's ability to generate positive taxable income on an ongoing basis. The assessment of the probability of recovery of the traditional deferred tax asset components was made on the basis of available information represented by the estimate of future taxable income derived, for the years 2015-2016, from the figures presented in the Bipiemme Group's 2014-2016/2018 business plan approved on 11 March 2014 by the Bank's Management Board.The tax rates used for the computation of deferred tax assets for IRES and IRAP purposes were 27.50% and 5.57%, respectively.

208 P a r t B - I n f o r m a t i o n o n t h e c o n s o l i d a t e d b a l a n c e s h e e t - A s s e t s
14.2 Deferred tax liabilities: breakdown
The types of timing differences that gave rise to the recognition of deferred tax liabilities are as follows:
Description 31.12.2014 31.12.2013
Deferred tax liabilities with contra-entry to the income statement: 27,263 42,173+ Revaluation of financial assets held for trading and financial assets designated at fair value through profit and loss 197 908+ Revaluation of hedging derivatives 20,149 27,687+ Portion of implicit fees contained in bonds carried at fair value, reported under other liabilities – –
+ Portion of the provision for employee termination indemnities already recognised for tax purposes 6,226 7,334+ Adjustments to financial liabilities carried at fair value and securities issued – –+ Depreciation of property and equipment and amortisation of intangible assets already recognised for tax purposes – –+ Other line items 691 6,244
Deferred tax liabilities with contra-entry to shareholders' equity: 137,916 64,184
– Valuation reserves 137,916 64,184
+ Gains on financial assets available for sale 137,916 64,184 + Actuarial gains/losses relating to payroll provisions – –Total sub-items 80 b) Deferred tax liabilities 165,179 106,357
"Other line items" also include the deferred taxation provided for during the year on realised capital gains (the tax can be paid over five years).The tax rates used for the assessment of deferred tax liabilities for IRES and IRAP purposes are 27.5% and 5.57% respectively.
14.3 Change in deferred tax assets (with contra-entry to the income statement)
31.12.2014 31.12.2013
1. Opening balance 820,745 752,529
2. Increases 134,801 187,789
2.1 Deferred tax assets arising in the year 134,656 187,789 a) relating to prior years – – b) due to changes in accounting policies – – c) writebacks – – d) other 134,656 187,789 2.2 New taxes or increases in tax rates – – 2.3 Other increases 145 –
3. Decreases 87,133 119,573
3.1 Deferred tax assets cancelled in the year 86,805 53,754 a) reversals 85,336 53,299 b) written down as now considered unrecoverable – – c) change in accounting policies – – d) other 1,469 455 3.2 Reduction in tax rates 9 – 3.3 Other decreases 319 65,819 a) Conversion to tax credits under Law 214/2011 294 65,761 b) Other 25 584. Carried forward 868,413 820,745
The following table sets out changes in the year of deferred tax asset components under Law 214/2011 and shows the portion of the deferred tax asset components converted to tax credits in the course of the year. The table provides further analysis of the figures shown in table 14.3.

209P a r t B - I n f o r m a t i o n o n t h e c o n s o l i d a t e d b a l a n c e s h e e t - A s s e t s
14.3.1 Changes in deferred tax assets under Law 214/2011 (with a matching entry in the income statement)
31.12.2014 31.12.2013
1. Opening balance 644,598 525,599
2. Increases 110,598 188,808
3. Decreases 45,152 69,809
3.1 Reversals 44,046 4,047
3.2 Conversion to tax credits 319 65,510
a) arising from the loss for the year 319 65,510
b) arising from tax losses – –
3.3 Other decreases 787 252
4. Carried forward 710,044 644,598
14.4 Change in deferred tax liabilities (with matching entry in income statement)
31.12.2014 31.12.2013
1. Opening balance 42,173 61,6762. Increases 21 890 2.1 Deferred tax liabilities arising in the year 21 890 a) relating to prior years – – b) due to changes in accounting policies – – c) other 21 890 2.2 New taxes or increases in tax rates – – 2.3 Other increases – –3. Decreases 14,931 20,393 3.1 Deferred tax liabilities cancelled in the year 14,922 20,393 a) reversals 14,922 20,393 b) due to changes in accounting policies – – c) other – – 3.2 Reduction in tax rates 9 – 3.3 Other decreases – –4. Carried forward 27,263 42,173

210 P a r t B - I n f o r m a t i o n o n t h e c o n s o l i d a t e d b a l a n c e s h e e t - A s s e t s
14.5 Change in deferred tax assets (with matching entry to shareholders' equity)
31.12.2014 31.12.2013
1. Opening balance 26,096 43,608
2. Increases 17,571 4,351
2.1 Deferred tax assets arising in the year 17,571 4,351
a) relating to prior years – –
b) due to changes in accounting policies – –
c) other 17,571 4,351
2.2 New taxes or increases in tax rates – –
2.3 Other increases – –
3. Decreases 8,081 21,863
3.1 Deferred tax assets cancelled in the year 8,081 21,839
a) reversals 8,081 21,839
b) written down as now considered unrecoverable – –
c) due to changes in accounting policies – –
d) other – –
3.2 Reduction in tax rates – –
3.3 Other decreases – 24
4. Carried forward 35,586 26,096
14.6 Change in deferred tax liabilities (with matching entry to shareholders' equity)
31.12.2014 31.12.2013
1. Opening balance 64,184 57,913
2. Increases 93,565 41,591
2.1 Deferred tax liabilities arising in the year 93,565 41,591
a) relating to prior years – –
b) due to changes in accounting policies – –
c) other 93,565 41,591
2.2 New taxes or increases in tax rates – –
2.3 Other increases – –
3. Decreases 19,833 35,320
3.1 Deferred tax liabilities cancelled in the year 19,833 35,319
a) reversals 19,833 35,319
b) due to changes in accounting policies – –
c) other – –
3.2 Reduction in tax rates – –
3.3 Other decreases – 1
4. Carried forward 137,916 64,184

211P a r t B - I n f o r m a t i o n o n t h e c o n s o l i d a t e d b a l a n c e s h e e t - A s s e t s
14.7 Other information
Information on tax disputes is provided below:
Banca Popolare di MilanoSet out below is an update on ongoing legal disputes.
2005 – Former Bipiemme ImmobiliFollowing a tax audit on 2005 at the former Bipiemme Immobili S.p.A., which the Bank absorbed in 2007, assessments were notified on 9 December 2010 claiming higher IRES of 230 thousand euro, IRAP for 29 thousand euro and VAT for 93 thousand euro, plus fines. On 24 May 2012, the Provincial Tax Commission of Milan upheld the appeal relating to VAT and rejected that regarding IRES and IRAP. The Bank appealed against this decision. Given that the Tax Authorities have not challenged the decision of the Provincial Tax Commission, the part relating to VAT has become final. The Milan Regional Tax Commission, with judgement no. 2911/28/14 filed on 29/05/2014, upheld, to a large extent, the appeal relating to IRES and IRAP, confirming the first-level court ruling.The Tax Authorities have appealed against this decision to the Supreme Court.
2008 – Registration taxDuring 2010 three payment requests were received for registration tax on the purchase of branches disposed of by UniCredit S.p.A. in 2008. The notices of liquidation dispute the application of different rates for calculating registration tax. These documents claim taxes for a total of 4,061 thousand euro. Appeals have duly been filed to obtain the cancellation of these claims. On 16 May 2011 the Provincial Tax Commission of Milan rejected the appeal concerning the disputed rates. The Bank appealed against this decision and the appeal was upheld in June 2013, setting aside the judgement of first instance and remitting the case to the Milan Provincial Tax Commission. The Milan Provincial Tax Commission upheld the appeal with a judgement dated 25/9/2014 filed on 16/1/2015.On 20 April 2012 the other two appeals concerning disputed rates were upheld and the Tax Authorities appealed. For both of the disputes, the Regional Tax Commission dismissed the Tax Authorities' appeal with judgements dated 5 February 2014 and 17 April 2014. The Tax Authorities have appealed against one of the judgements to the Supreme Court.
2009-2010 – Substitute tax on loans executed abroadAs the result of a tax inspection by the Milan offices of the Tax Police focusing on direct taxes and other dues for the tax years 2007 to 2011 and of their minutes of findings of 21 March 2013 and 1 August 2013, which disputed the failure to apply substitute tax under arts. 15 and thereafter of Presidential Decree 601/1973 to various medium term loans executed abroad, the Bank has received notification of the following tax assessments and imposition of penalties: on 28/3/2013, notices claiming tax of approximately 0.3 million euro, plus penalties and interest, on loans made in the second half of 2009; on 17/9/2013, notices claiming tax of 1 million euro, plus penalties and interest, on loans granted in the first half of 2010; on 2/12/2013, a notice claiming tax of 0.7 million euro, plus penalties and interest, on loans granted in the second half of 2010.
Similar notices have been received by Banca di Legnano (now merged with BPM) for taxes totalling 0.2 million euro.The Bank duly filed appeals against all these notices to protect its interests. The loan contracts generally provide for a right of recourse against the borrowers.
2010 – registration tax payable on the sale of the "custodian bank" businessOn 25 June 2012 an assessment was received contesting the amount of registration tax payable on the sale of the "custodian bank" business to BNP Paribas on 29 June 2010. The latter, as a principal, was also notified of the same assessment. The assessment assumes a different value of the business sold and claims additional registration tax is payable of 0.4 million euro plus interest. With the intention of closing the dispute, BPM filed a tax settlement proposal. Having done so, no agreement was reached with the Tax Authorities and BPM filed an appeal against the prescriptive claims. The appeal was upheld by the Milan Provincial Tax Commission with judgement no. 1255/47/2015, filed on 11/2/2015.
2010 – Former WeBank S.p.A.In 2013, an inspection by the Tax Authorities, relating to the 2010 tax year, concluded with the notification of a report that disputed taxation (IRES, IRAP and VAT) amounting to some Euro 300,000. On 25 October 2013 WeBank filed a tax settlement proposal to close the dispute.
2012 – Former Banca di Legnano – inspection by Tax AuthoritiesIt should be noted that on 2 February 2015 the Tax Authorities commenced an inspection of the 2012 tax year of the merged entity Banca di Legnano.

212 P a r t B - I n f o r m a t i o n o n t h e c o n s o l i d a t e d b a l a n c e s h e e t - A s s e t s
Section 15 – Non-current assets held for sale and discontinued operations and associated liabilities Asset line item 150 and liability line item 90
At the date of the financial statements, the Bank does not have any non-current assets held for sale or discontinued operations and related liabilities.
Section 16 – Other assets Line item 160
This line item reports assets that are not classified elsewhere in the balance sheet. In particular, accrued income includes income not capitalised as part of the related financial assets; leasehold improvements are those not attributable to "property and equipment". It also includes receivables from the provision of non-financial goods and services.
16.1 Other assets: breakdown
31.12.2014 31.12.2013
Accrued income 4,927 5,371
Leasehold improvements 22,103 22,795
Other assets 761,327 509,085
Items being processed 355,419 141,815
Duty-paid paper and other instruments 1,669 2,616
Cheques drawn on third-party current accounts 41,910 48,358
Advances paid to tax authorities on behalf of others 88,853 72,257
Other tax-related items 110,890 83,176
Non-interest bearing guarantee deposits on own account 3,975 3,941
Prepayments 37,950 54,464
Consolidation difference 2,299 –
Other 118,362 102,458
Total 788,357 537,251
"Leasehold improvements" include the expenses incurred on assets not related to "Property and equipment", and the depreciation charge is recognised in the income statement under "Other income and expenses"."Items being processed" contain mainly cash receipts, ATM withdrawals, bills and payments in process and still to be charged.
"Other tax-related items" include tax credits to be reimbursed, receivables involved in acting as a tax withholding agent and other items not recognised in the balance sheet under "Tax assets".

213P a r t B - I n f o r m a t i o n o n t h e c o n s o l i d a t e d b a l a n c e s h e e t - L i a b i l i t i e s a n d s h a r e h o l d e r s ' e q u i t y
Liabilities and shareholders' equity
Section 1 – Due to banks Line item 10
This line item reports amounts due to banks in all their technical forms (deposits, current accounts, loans). They include operating payables connected with the provision of financial services.
1.1 Due to banks: breakdown by product
Type of transaction/Amounts 31.12.2014 31.12.20131. Due to central banks 1,772,342 4,631,3512. Due to banks 1,546,222 1,282,577
2.1 Current accounts and unrestricted deposits 557,897 288,4032.2 Restricted deposits 574,286 370,7492.3 Loans 402,357 617,389
2.3.1 Repurchase agreements 211,240 464,674 2.3.2 Other 191,117 152,715
2.4 Payables for commitments to repurchase own equity instruments – –2.5 Other payables 11,682 6,036
Total 3,318,564 5,913,928Fair value – level 1 – –Fair value – level 2 – –Fair value – level 3 3,314,872 5,997,987Total fair value 3,314,872 5,997,987
See Part A – Accounting Policies for an explanation of the criteria used to determine the fair value. The balance of "Due to central banks", at the date of the balance sheet, is composed primarily of financing transactions with the Bank of Italy within the Eurosystem and secured by pledged securities.Sub-item 2.3.1 "Repurchase agreements" also includes financial liabilities deriving from repurchase agreements with central banks based on own securities and on securities received as part of reverse repurchase agreements.
1.2 Details of line item 10 "Due to banks": subordinated loans
There are no subordinated loans due to banks at the balance sheet date, as at the end of the previous year.
1.3 Details of line item 10 "Due to banks": structured debts
There are no structured loans due to banks at the balance sheet date, as at the end of the previous year.
1.4 Due to banks with specific hedges
At the balance sheet date, as at the end of the previous year, there are no amounts due to banks with specific hedges.
1.5 Payables for financial leases
At the balance sheet date, as at the end of the previous year, there are no amounts due to banks for financial leases.

214 P a r t B - I n f o r m a t i o n o n t h e c o n s o l i d a t e d b a l a n c e s h e e t - L i a b i l i t i e s a n d s h a r e h o l d e r s ' e q u i t y
Section 2 – Due to customers Line item 20
This line item reports amounts due to customers in all their technical forms (deposits, current accounts, loans), derivative transaction margin changes at clearing houses and operating payables other than those for the supply of goods and services.
2.1 Due to customers: breakdown by product
Type of transaction/Amounts 31.12.2014 31.12.2013
1. Current accounts and unrestricted deposits 19,054,341 17,675,405
2. Restricted deposits 3,252,031 4,337,593
3. Loans 5,359,275 4,373,122
3.1 Repurchase agreements 5,267,799 4,276,303
3.2 Other 91,476 96,819
4. Payables for commitments to repurchase own equity instruments – –
5. Other payables 37,295 37,375
Total 27,702,942 26,423,495
Fair value – level 1 – –
Fair value – level 2 – –
Fair value – level 3 27,702,942 26,423,495
Fair value 27,702,942 26,423,495
See Part A - Accounting Policies for an explanation of the criteria used to determine fair value.Sub-item 3.1 "Repurchase agreements" also includes financial liabilities deriving from repurchase agreements with customers based on own securities and on securities received as part of reverse repurchase agreements.Line item 5. "Other payables" also comprises operating payables related to financial services received.
2.2 Details of line item 20 "Due to customers": subordinated loans
There are no subordinated loans due to customers at the balance sheet date, as at the end of the previous year.
2.3 Details of line item 20 "Due to customers": structured debts
There are no structured loans due to customers at the balance sheet date, as at the end of the previous year.
2.4 Due to customers with specific hedges
At the balance sheet date, as at the end of the previous year, there are no amounts due to customers with specific hedges.
2.5 Payables for financial leases
There are no amounts due to customers for financial leases at the balance sheet date, as at the end of the previous year.

215P a r t B - I n f o r m a t i o n o n t h e c o n s o l i d a t e d b a l a n c e s h e e t - L i a b i l i t i e s a n d s h a r e h o l d e r s ' e q u i t y
Section 3 – Securities issued Line item 30
This item includes securities issued (including certificates of deposit and banker's drafts), valued at amortised cost. The amount reported is stated net of repurchased securities and also includes securities which have matured at the balance sheet date but have not yet been repaid. The amount of these securities comprises their principal, accrued interest at the balance sheet date and, in the case of hedged securities, the effective portion of the associated hedge.
3.1 Securities issued: breakdown by product
31.12.2014 31.12.2013
Book value
Fair Value Book value
Fair Value
Level 1 Level 2 Level 3 Level 1 Level 2 Level 3
A. Securities1. Bonds 8,650,512 4,816,758 4,087,265 – 9,329,615 4,990,580 4,581,781 – 1.1 structured – – – – – – – – 1.2 other 8,650,512 4,816,758 4,087,265 – 9,329,615 4,990,580 4,581,781 –2. Other securities 331,322 – – 331,322 784,626 – – 784,626 2.1 structured – – – – – – – – 2.2 other 331,322 – – 331,322 784,626 – – 784,626Total 8,981,834 4,816,758 4,087,265 331,322 10,114,241 4,990,580 4,581,781 784,626
The fair value column shows the theoretical market value of financial instruments at the date of preparation of the financial statements. Regarding the criteria used for determining fair value and for the classification of financial instruments in the three levels of the fair value hierarchy, please refer to Part A "Accounting Policies".With reference to line item 1.2 "Other bonds", the following table shows the composition of the bonds outstanding at 31/12/2014 of the issue programmes of EMTN and Covered Bonds. With reference to the latter, please read the Part E, point C.3 below on covered bond transactions.

216 P a r t B - I n f o r m a t i o n o n t h e c o n s o l i d a t e d b a l a n c e s h e e t - L i a b i l i t i e s a n d s h a r e h o l d e r s ' e q u i t y
31.12.2014 31.12.2013
Amount issued
Nominal value net
of repurchases
Book value
Fair Value Amount issued
Nominal value net
of repurchases
Book value
Fair Value
Level 1 Level 2 Level 1 Level 2
Euro Medium Term Notes Issue Programme
• Fixed rate 1,975,000 1,936,183 2,098,261 2,143,406 – 1,475,000 1,443,164 1,561,181 1,542,282 –
Of which: subordinated 475,000 447,991 554,780 539,134 – 475,000 448,210 526,298 496,746 –
• Floating rate 600,000 541,425 541,512 541,215 – 1,650,000 1,414,327 1,414,999 1,349,398 50,152
Of which: subordinated 600,000 541,425 541,512 541,215 – 600,000 541,481 541,599 526,128 –
Total EMTN Bonds: 2,575,000 2,477,608 2,639,773 2,684,621 – 3,125,000 2,857,491 2,976,180 2,891,680 50,152
Of which: subordinated 1,075,000 989,416 1,096,292 1,080,349 – 1,075,000 989,691 1,067,897 1,022,874 –
Covered Bond Issues –1. Covered Bonds of Banca Popolare di Milano S.c.a r.l 9.10.2009/17.10.2016 3.5%. 1,000,000 876,965 930,747 979,940 – 1,000,000 876,965 940,833 970,122 –2. Guaranteed Bank Bonds ("OBG") Banca Popolare di Milano S.c.a r.l. 4.11.2010/16.11.2015 3.25% 1,100,000 900,330 911,836 939,324 – 1,100,000 900,330 922,265 952,279 –3. Guaranteed Bank Bonds ("OBG") Banca Popolare di Milano S.c.a r.l. 18.7.2011/18.1.2014 floating rate – maturity extended to 18.1.2019 (*) 1,000,000 – – – – 1,000,000 – – – –4. Guaranteed Bank Bonds ("OBG") Banca Popolare di Milano S.c.a r.l. 28.11.2013/28.0.2016 floating rate (*) 650,000 – – – – 650,000 – – – –Total covered bonds 3,750,000 1,775,295 1,842,583 1,919,264 – 3,750,000 1,777,295 1,863,098 1,922,401 –
(*) The issue was all repurchased by the Company and the securities were used for refinancing operations with the European Central Bank.
EMTN BondsThe EMTN bonds form part of two multi-year programmes for the issue of medium-term euro securities. Of the first programme, which was approved on 11 September 2000, now expired and not renewed, the last bond of 160 million euro, called "Banca Popolare di Milano subordinated (Upper Tier 2) Rate 7.625% – 29.6.01-11" was repaid on 29 June 2011.
The second programme, which was approved on 2 December 2003 for two billion euro, was gradually increased over time to reach the amount of 10 billion euro with a resolution of the Board of Directors of the Parent Company of 22 April 2008. At the date of the financial statements there are four Bond Loans outstanding for a total amount of 2.575 billion euro (3.125 billion euro at 31.12.2013).The nominal value of the EMTN securities is shown net of the securities that have been repurchased by the Parent Company and other Group companies for an amount of 97 million euro (268 million euro at 31.12.2013).
In 2014 the Bank: issued the "Banca Popolare di Milano 2014/2019 fixed rate 4.25% - 30.1.14-30.1.19" bond, with a total nominal value of 0.5 billion euro; repaid the "Banca Popolare di Milano 2007/2014 Floating rate 31.1.14" bond, with an original nominal value on issue of 1 billion; repaid the "Banca Popolare di Milano 2004/2014 Floating rate 14.10.14" bond, with an original nominal value on issue of 50 million.
Covered bonds (guaranteed bank bonds)The nominal value of the Guaranteed Bank Bonds shown at points 1 and 2 of the above table is stated net of securities that have been repurchased of 123.035 million and 199.670 million, respectively, of which: 121.935 million euro of the BPM 9.10.2009/17.10.2016 3.5% bond; 187.120 million euro of the BPM 4.11.2010/16.11.2015 3.25% bond.

217P a r t B - I n f o r m a t i o n o n t h e c o n s o l i d a t e d b a l a n c e s h e e t - L i a b i l i t i e s a n d s h a r e h o l d e r s ' e q u i t y
Composition of line item "2.2 Other securities – other"
This item includes certificates of deposit subscribed by customers and bankers' drafts. In particular:
Type of security/Amounts
31.12.2014 31.12.2013
Book value
Fair Value Book value
Fair Value
Level 1 Level 2 Level 3 Level 1 Level 2 Level 3
Certificates of deposit subscribed by customers 249,068 – – 249,068 676,819 – – 676,819
Bankers' drafts 82,254 – – 82,254 107,807 – – 107,807
Total 331,322 – – 331,322 784,626 – – 784,626
Since most of these instruments are short-term or on demand, their book value is a reasonable approximation of their fair value. These financial instruments have been conventionally classified in Level 3.
3.2 Breakdown of line item 30 "Securities issued": subordinated securities
Unlisted bonds (type B.1.2) comprise the following subordinated securities. The classification indicated is the one required by the prudential regulations in force on the date of their issuance:
Bond 31.12.2014 31.12.2013 Original nominal amount
issued
Bond issue price
Interest rate
Issue date/maturity
Notes
Innovative capital instruments (Tier 1): 279,801 282,599
Preference shares – Bpm Capital Trust I – 8.393% 71,646 73,849 160,000 100 Floating 02.07.2001 Perpetual
1
Perpetual Subordinated Fixed/Floating Rate Notes – 9%
208,155 208,710 300,000 98.955 Floating 25.06.2008 Perpetual
2
Hybrid capital instruments (Upper Tier 2): 651 651
Banca Popolare di Milano subordinated bond loan (Upper Tier 2) – Floating rate – 18 June 2008/2018
651 651 17,850 100 Floating 18.6.2008/18 3
Subordinated liabilities (Lower Tier 2): 1,815,350 1,797,623
Banca Popolare di Milano subordinated bond loan (Lower Tier 2) Floating rate – 29.6.05-15 (issued as part of the EMTN Programme)
541,512 541,599 600,000 99.716 Floating 29.6.2005/15 4
Banca Popolare di Milano Subordinated bond loan (Lower Tier 2) Fixed rate 4.5% 18 April 2008/2018
264,258 270,377 252,750 100 4.50% 18.4.2008/18 5
Banca Popolare di Milano subordinated bond loan (Lower Tier 2) Floating rate 20 October 2008/2018
454,800 454,738 502,050 100 Floating 20.10.2008/18 6
Banca Popolare di Milano subordinated bond loan (Lower Tier 2) Rate 7.125% – 01 March 2011/2021 (issued as part of the EMTN Programme)
554,780 526,298 475,000 99.603 7.125% 01.03.2011/21 7
Banca Popolare di Mantova subordinated bond loan – 03/12/2004-03/12/2014 (Lower Tier 2)
– 4,611 5,000 100 Floating 3.12.2004/14 8
TOTAL 2,095,802 2,080,833

218 P a r t B - I n f o r m a t i o n o n t h e c o n s o l i d a t e d b a l a n c e s h e e t - L i a b i l i t i e s a n d s h a r e h o l d e r s ' e q u i t y
1 Preference shares - Bpm Capital Trust I – 8.393%
Issue price: The Subordinated Bonds were issued at par, at a price of 100% of their nominal value
Interest rate: Fixed rate 8.393% until 2 July 2011; floating rate (Euribor + 4.70%) starting from 2 July 2011
Quotation: Luxembourg Stock Exchange (*)
Early redemption clause: These securities may be redeemed early starting from 2 July 2011, subject to authorisation from the Bank of Italy
Subordination clause: The preference shares have been issued with the clauses required at the time by the Bank of Italy for inclusion in Tier 1 capital; this means that in the event the Bank goes into liquidation, the holders of such shares have priority over ordinary shareholders, but are subordinated to all other creditors.
Other information: The preference shares have been issued by BPM Capital I LLC (through Bpm Capital Trust I), a North American company wholly owned by the Parent Company.
There is a "loss absorption" clause, whereby there is an option not to make a pay-out to employees on the preference shares if Banca Popolare di Milano does not have any distributable net earnings or if it does not pay any dividends on its ordinary shares. There is also provision for a "capital deficiency event", whereby the preference shares may be used to reinstate the Tier 1 capital ratio if it goes below 5%. Any undistributed interest may not be accumulated.
16 December 2009 was the closing date of the Public Purchase Offer (acceptance period 7 December – 16 December 2009) for the Preference Shares issued by the vehicle company BPM Capital Trust I, which obtained 55.54% acceptance for a nominal value of the securities accepting the offer of 88,866,000 euro.
The repurchase price (ex-coupon) was 96%.
2 Perpetual Subordinated Fixed/Floating Rate Notes – 9%
Issue price: The bonds were issued below par, at a price of 98.955% of the nominal value
Interest rate: Fixed rate of 9% until 25 June 2018; Floating rate (3-month Euribor + spread of 6.18%) from 25 June 2018
Quotation: Luxembourg Stock Exchange (*)
Early redemption clause: These securities may be redeemed early starting from 25 June 2018, subject to authorisation from the Bank of Italy.
Early redemption: The notes have been issued with the clauses required at the time by the Bank of Italy for inclusion in Tier 1 capital; this means that in the event the Bank goes into liquidation, the holders of such shares have priority over ordinary shareholders, but are subordinated to all other creditors.
Other information: There is also provision for: optional suspension of interest payments if the Bank does not have distributable
earnings and/or has not paid dividends for the last year ended prior to the payment date of the interest;
obligatory suspension of interest payments in the case of a "capital deficiency event", (which takes place when the total capital ratio falls below the minimum level required by the Supervisory Authority);
a "loss absorption" clause, whereby reimbursement of the notes is suspended if a Capital Deficiency Event takes place.
Any undistributed interest may not be accumulated. 16 December 2009 was the closing date of the Public Purchase Offer (acceptance period
7 December – 16 December 2009), which obtained 34.92% acceptance for a nominal value of the securities accepting the offer of 104,750,000 euro.
The repurchase price (ex-coupon) was 98%. At the date of preparation of the financial statements the nominal value of the securities issued declined to Euro 195,250,000.

219P a r t B - I n f o r m a t i o n o n t h e c o n s o l i d a t e d b a l a n c e s h e e t - L i a b i l i t i e s a n d s h a r e h o l d e r s ' e q u i t y
3 Subordinated bond of Banca Popolare di Milano (Upper Tier 2) – Floating rate – 18 June 2008/2018
Issue price: The Subordinated Bonds were issued at par, at a price of 100% of their nominal value
Interest rate: Floating rate (EONIA rate + 0.75%)
Quotation: Not listed
Early redemption: Early redemption of the Subordinated Bonds is not foreseen
Subordination clause: The subordinated bonds consist of "hybrid capital instruments" as per the supervisory regulations in force at the issue date. The Bond is issued with an Upper Tier II subordination clause, which means that in the event of the Bank being liquidated, bondholders will only be reimbursed after all non-subordinated creditors have been satisfied, except for those with an equal or higher level of subordination compared with the Subordinated Bonds.
Repurchases: The Group has repurchased a total nominal amount of 17,200 thousand euro.
4 Subordinated bond of Banca Popolare di Milano (Lower Tier 2) – Floating rate 29 June 2005/2015
Issue price: The Subordinated Bonds were issued below par, at a price of 99.716% of the nominal value.
Interest rate: Floating rate (3-month Euribor + 0.45% until June 2010, 3-month Euribor + 1.05% beyond that date).
Quotation: Luxembourg Stock Exchange (*)
Early redemption: The Bank may decide to redeem the loan early starting from the fifth year, subject to authorisation from the Bank of Italy.
Subordination clause: The subordinated bonds consist of BPM "tier II subordinated liabilities" as per the supervisory regulations in force at the issue date. This means that if the Bank is liquidated, bondholders will only be reimbursed after all non-subordinated creditors have been satisfied, except for those with an equal or higher level of subordination compared with the Subordinated Bonds.
Other information: The Bond, placed with institutional investors, forms part of the multiannual Euro Medium-Term Note (E.M.T.N.) issue programme approved by the Board of Directors on 2 December 2003.
Repurchases: The Group has repurchased a total nominal amount of 58,575 thousand euro.
5 Subordinated bond of Banca Popolare di Milano (Lower Tier 2) – Fixed rate 4.50% 18 April 2008/2018
Issue price: The Subordinated Bonds were issued at par, at a price of 100% of their nominal value
Interest rate: Fixed interest rate of 4.50% gross per year
Quotation: Not listed
Early redemption: Early redemption of the Subordinated Bonds is not foreseen
Subordination clause: The subordinated bonds consist of BPM "tier II subordinated liabilities" as per the supervisory regulations in force at the issue date. This means that if the Bank is liquidated, bondholders will only be reimbursed after all non-subordinated creditors have been satisfied, except for those with an equal or higher level of subordination compared with the Subordinated Bonds.
Repurchases: The Group has repurchased a total nominal amount of 4,712 thousand euro.

220 P a r t B - I n f o r m a t i o n o n t h e c o n s o l i d a t e d b a l a n c e s h e e t - L i a b i l i t i e s a n d s h a r e h o l d e r s ' e q u i t y
6 Subordinated bond of Banca Popolare di Milano (Lower Tier 2) – Floating rate 20 October 2008/2018
Issue price: The Subordinated Bonds were issued at par, at a price of 100% of their nominal value
Interest rate: Floating rate (3-month Euribor 365 + 0.60% until 20 October 2013, 3-month Euribor + 1.50% after that date).
Quotation: Not listed
Early redemption: As at 20 October 2013, the only date envisaged for early redemption, the Issuer had not exercised its right.
Subordination clause: The subordinated bonds consist of BPM "tier II subordinated liabilities" as per the supervisory regulations in force at the issue date. This means that if the Bank is liquidated, bondholders will only be reimbursed after all non-subordinated creditors have been satisfied, except for those with an equal or higher level of subordination compared with the Subordinated Bonds.
Repurchases: The Group has repurchased a total nominal amount of 48,850 thousand euro.
7 Subordinated bond of Banca Popolare di Milano (Lower Tier 2) – Fixed rate 7.125% 1 March 2011/2021
Issue price: The Subordinated Bonds are issued below par, at a price of 99.603% of the nominal value.
Interest rate: Fixed interest rate of 7.125% gross per year
Quotation: Luxembourg Stock Exchange (*)
Early redemption: Not foreseen
Subordination clause: The Subordinated Bonds consist of “Tier 2 subordinated liabilities” of BPM, classified as such based on supervisory regulations in force at the time of issue. This means that if the Bank is liquidated, bondholders will only be reimbursed after all non-subordinated creditors have been satisfied, except for those with an equal or higher level of subordination compared with the Subordinated Bonds.
Repurchases: The Group has repurchased a total nominal amount of 27,009 thousand euro.
8 Subordinated bond loan of Banca Popolare di Mantova (Lower Tier 2) – 03/12/2004-03/12/2014
Issue price: The Subordinated Bonds were issued at par, at a price of 100% of their nominal value
Interest rate: Fixed rate 2.73% the first coupon payable on 3 June 2005; Floating rate (6-month Euribor + 0.50%) from 3 December 2005 to 3 December 2009; Floating rate (6-month Euribor + 1%) for the period 3 June 2010-3 December 2014
Quotation: Not listed
Early redemption: The Bank may decide to redeem the loan early starting from the fifth year, subject to authorisation from the Bank of Italy.
Subordination clause: The Subordinated Bonds consist of “Tier 2 subordinated liabilities” of BPM, classified as such based on supervisory regulations in force at the time of issue. This means that if the Bank is liquidated, bondholders will only be reimbursed after all non-subordinated creditors have been satisfied, except for those with an equal or higher level of subordination compared with the Subordinated Bonds.
Redemption: The bonds matured on 3 December 2014
(*) Subordinated securities listed on the Luxembourg Stock Exchange have been classified as unlisted for IAS/IFRS purposes since their trading volumes are not such as to satisfy the definition of an active market, as explained in section A.3 of the Accounting Policies on "Fair value disclosures"

221P a r t B - I n f o r m a t i o n o n t h e c o n s o l i d a t e d b a l a n c e s h e e t - L i a b i l i t i e s a n d s h a r e h o l d e r s ' e q u i t y
3.3 Breakdown of line item 30 "Securities issued": securities with specific hedges
31.12.2014 31.12.2013
1. Securities with specific fair value hedges: 2,397,363 2,389,396
a) interest rate risk 2,397,363 2,389,396
b) exchange risk – –
c) various risks – –
2. Securities with specific cash flow hedges: – –
a) interest rate risk – –
b) exchange risk – –
c) other – –
The table shows the bonds issued classified among the outstanding securities that have specific fair value hedges for interest rate risk at the year end.
The securities that have specific fair value hedges are as follows:
Loans with specific hedges: 31.12.2014 31.12.2013
Guaranteed Bank Bonds of Banca Popolare di Milano S.c.a r.l. 1,842,583 1,863,098
Banca Popolare di Milano subordinated bond loan (Lower Tier 2) Rate 7.125% – 01 March 2011/2021 (issued as part of the EMTN Programme) 554,780 526,298
Total 2,397,363 2,389,396
As reported in Section 5.1 of the income statement, the net result from hedging activities and from the outstanding underlying securities was income of 5.4 million euro (loss of 4.4 million euro for the year ended 31.12.2013) and this has been recorded in the income statement line item 90 – "Fair value adjustments in hedge accounting".

222 P a r t B - I n f o r m a t i o n o n t h e c o n s o l i d a t e d b a l a n c e s h e e t - L i a b i l i t i e s a n d s h a r e h o l d e r s ' e q u i t y
Section 4 – Financial liabilities held for trading Line item 40
This item includes debt securities and equities which make up "short positions" for trading and derivative financial instruments other than those formally designated as hedging instruments.
4.1 Financial liabilities held for trading: breakdown by product
31.12.2014 31.12.2013
Type of transaction/Amounts
NV FV FV* NV FV FV*
L1 L2 L3 Total L1 L2 L3 Total
A. Cash liabilities
1. Due to banks 3,740 4,489 175 – 4,664 – 4,473 28,772 162 – 28,934 –
2. Due to customers 145,620 29,176 100 – 29,276 – 6,093 7,196 339 – 7,535 –
3. Debt securities – – – – – – – – – – – –
3.1 Bonds – – – – – – – – – – – –
3.1.1 Structured – – – – – X – – – – – X
3.1.2 Other bonds – – – – – X – – – – – X
3.2 Other securities – – – – – – – – – – – –
3.2.1 Structured – – – – – X – – – – – X
3.2.2 Other – – – – – X – – – – – X
Total A 149,360 33,665 275 – 33,940 – 10,566 35,968 501 – 36,469 –
B. Derivatives
1. Financial derivatives X 122,453 1,243,382 63,670 1,429,505 X X 171,517 878,381 77,227 1,127,125 X
1.1 Trading X 122,453 1,239,458 62,802 1,424,713 X X 171,517 868,678 75,351 1,115,546 X
1.2 Linked to the fair value option X – 3,924 868 4,792 X X – 9,703 1,876 11,579 X
1.3 Other X – – – – X X – – – – X
2. Credit derivatives X – – – – X X – 144 – 144 X
2.1 Trading X – – – – X X – 144 – 144 X
2.2 Linked to the fair value option X – – – – X X – – – – X
2.3 Other X – – – – X X – – – – X
Total B X 122,453 1,243,382 63,670 1,429,505 X X 171,517 878,525 77,227 1,127,269 X
Total A+B X 156,118 1,243,657 63,670 1,463,445 X X 207,485 879,026 77,227 1,163,738 X
Key: NV = Nominal or notional valueFV = Fair valueFV* = Fair value calculated excluding the differences in value due to changes in the issuer's credit rating since the issue date.L1 = Level 1 L2 = Level 2 L3 = Level 3
Regarding the criteria used for determining fair value and for the classification of financial instruments in the three levels of the fair value hierarchy, please refer to Part A "Accounting Policies".Line item "A. Cash liabilities" includes short positions of Banca Akros amounting to 33.94 million, of which 30.114 million related to debt securities and 3.826 million related to equity securities.Line item "B.1.2 - Derivatives linked to the fair value option", includes the fair value of derivatives related to the instruments for which the fair value option has been adopted. These derivatives hedge the risks involved mainly in the issue of bonds for which the Group has used the fair value option in accordance with IAS 39, paragraph 9. Such risks arise from possible fluctuations in interest rates and the presence of options that are implicit in the structured securities issued.

223P a r t B - I n f o r m a t i o n o n t h e c o n s o l i d a t e d b a l a n c e s h e e t - L i a b i l i t i e s a n d s h a r e h o l d e r s ' e q u i t y
4.2 Breakdown of line item 40 "Financial liabilities held for trading": subordinated liabilities
At the reporting date there are subordinated liabilities due to banks of 1,168 thousand euro (1,107 thousand euro at 31.12.2013), while there are no subordinated liabilities due to finance-sector companies (106 thousand euro at 31.12.2013).
4.3 Breakdown of line item 40 "Financial liabilities held for trading": structured debts
There are no structured debts included in liabilities held for trading at the balance sheet date, as at the end of the previous year.
4.4 Trading cash financial liabilities (excluding short positions): changes during the year
Due to banks Due to customers Securities issued Total
A. Opening balance 28,934 7,535 – 36,469
B. Increases 256,128 833,237 – 1,089,365
B1. Issues – – – –
B2. Sales 255,959 831,690 – 1,087,649
B3. Positive change in fair value 77 307 – 384
B4. Other changes 92 1,240 – 1,332
C. Decreases 280,398 811,496 – 1,091,894
C1. Purchases 278,610 810,428 – 1,089,038
C2. Reimbursement 416 – – 416
C3. Negative changes in fair value 8 88 – 96
C4. Other changes 1,364 980 – 2,344
D. Closing balance 4,664 29,276 – 33,940

224 P a r t B - I n f o r m a t i o n o n t h e c o n s o l i d a t e d b a l a n c e s h e e t - L i a b i l i t i e s a n d s h a r e h o l d e r s ' e q u i t y
Section 5 – Financial liabilities designated at fair value through profit and loss Line item 50
This line item reports securities issued designated at fair value with changes in fair value through profit or loss under the option allowed by IAS 39 ("Fair value option").
5.1 Financial liabilities designated at fair value through profit and loss: breakdown by product
31.12.2014 31.12.2013
Type of transaction/Amounts
NV FV FV* NV FV FV*
L1 L2 L3 Total L1 L2 L2 Total
1. Due to banks – – – – – – – – – – – –
1.1 Structured – – – – – X – – – – – X
1.2 Other – – – – – X – – – – – X
2. Due to customers – – – – – – – – – – – –
2.1 Structured – – – – – X – – – – – X
2.2 Other – – – – – X – – – – – X
3. Debt securities 148,914 – 152,116 – 152,116 153,656 273,745 – 232,811 43,928 276,739 283,053
3.1 Structured 148,914 – 152,116 – 152,116 X 153,752 – 109,029 43,928 152,957 X
3.2 Other – – – – – X 119,993 – 123,782 – 123,782 X
Total 148,914 – 152,116 – 152,116 153,656 273,745 – 232,811 43,928 276,739 283,053
Key:NV = Nominal or notional valueFV = Fair valueFV* = Fair value calculated excluding the differences in value due to changes in the issuer's credit rating since the issue date.L1 = Level 1 L2 = Level 2 L3 = Level 3
Regarding the criteria used for determining fair value and for the classification of financial instruments in the three levels of the fair value hierarchy, please refer to Part A "Accounting Policies".Financial liabilities designated at fair value through profit and loss include financial liabilities represented by structured, fixed-rate bonds, which have been classified at fair value and are hedged by derivatives. This hedging concerns both the risk of changes in interest rates and the risk arising from the presence of embedded options. The fair value option is used to eliminate or significantly reduce accounting mismatches, as an alternative to Hedge Accounting. Otherwise, the derivatives would still be carried at fair value, while the bonds would be recognized at amortised cost.Derivatives used as part of the "fair value option" are classified in the trading book.As regards the use of the credit spread on own issues aimed at retail customers, these issues are expected – from both a contractual and a commercial point of view – to be reimbursed at their natural maturity; it follows that when measuring these instruments at fair value, the credit standing has been valued in line with this hypothesis, also taking into account the recommendations contained in IFRS 13.In the income statement, interest income and expense also include positive or negative differentials or margins accrued or paid up to the balance sheet date on the related financial derivatives, whereas valuation gains and losses are recognized under line item 110. "Profits (losses) on financial assets/liabilities designated at fair value", with a presentation that is consistent with that adopted for the funding instruments for which the fair value option was adopted.

225P a r t B - I n f o r m a t i o n o n t h e c o n s o l i d a t e d b a l a n c e s h e e t - L i a b i l i t i e s a n d s h a r e h o l d e r s ' e q u i t y
Purpose of using the fair value option and the financial liabilities concerned
Type of transaction/Amounts
Natural hedges
Structured financial
instruments
Portfolios of financial
liabilities managed on
the basis of the
fair value
31.12.2014 Natural hedges
Structured financial
instruments
Portfolios of financial
liabilities managed on
the basis of the
fair value
31.12.2013
1. Due to banks – – – – – – – –
1.1. Structured – – – – – – – –
1.2 Other – – – – – – – –
2. Due to customers – – – – – –
2.1 Structured – – – – – – – –
2.2 Other – – – – – – – –
3. Debt securities – 152,116 – 152,116 123,782 152,957 – 276,739
3.1 Structured – 152,116 – 152,116 – 152,957 – 152,957
3.2 Other – – – – 123,782 – – 123,782
Total – 152,116 – 152,116 123,782 152,957 – 276,739
The table provides details of table 5.1 above and shows the carrying amount (fair value) of the liabilities for which the fair value option was adopted, distinguishing the method of use.
5.2 Detail of line item 50 "Financial liabilities designated at fair value through profit and loss": subordinated liabilities
At the balance sheet date, as at the end of the previous year, there are no subordinated liabilities designated at fair value through profit and loss.
5.3 Financial liabilities designated at fair value through profit and loss: changes during the year
Due to banks Due to customers Securities issued Total
A. Opening balance – – 276,739 276,739
B. Increases – – 4,043 4,043
B.1 Issues – – – –
B.2 Sales – – – –
B.3 Positive change in fair value – – 3,384 3,384
B.4 Other changes – – 659 659
C. Decreases – – 128,666 128,666
C.1 Purchases – – – –
C.2 Redemptions – – 122,015 122,015
C.3 Fair value decreases – – 272 272
C.4 Other changes – – 6,379 6,379
D. Closing balance – – 152,116 152,116

226 P a r t B - I n f o r m a t i o n o n t h e c o n s o l i d a t e d b a l a n c e s h e e t - L i a b i l i t i e s a n d s h a r e h o l d e r s ' e q u i t y
Section 6 – Hedging derivatives Line item 60
This line item reports financial derivatives used for hedging purposes, which have a negative fair value at the balance sheet date.
6.1 Hedging derivatives: breakdown by type of hedge and level
31.12.2014 31.12.2013
Fair value NV Fair value NV
L1 L2 L3 Total L1 L2 L3 Total
A. Financial derivatives – 58,751 – 58,751 1,578,668 – 23,348 – 23,348 1,296,121
1) Fair value – 51,885 – 51,885 1,478,668 – 23,348 – 23,348 1,296,121
2) Cash flows – 6,866 – 6,866 100,000 – – – – –
3) Foreign investments – – – – – – – – – –
B. Credit derivatives – – – – – – – – – –
1) Fair value – – – – – – – – – –
2) Cash flows – – – – – – – – – –
Total – 58,751 – 58,751 1,578,668 – 23,348 – 23,348 1,296,121
Key: NV = Notional value L1 = Level 1 L2 = Level 2 L3 = Level 3
Regarding the criteria used for determining fair value and for the classification of financial instruments in the three levels of the fair value hierarchy, please refer to Part A "Accounting Policies".
The table shows the negative carrying amount (fair value) of the derivative hedging contracts for the hedges made through hedge accounting. This instrument is used to manage accounting hedges of financial instruments recognised in balance sheet items that do not envisage their measurement at fair value through profit or loss.The hedging of financial liabilities represented by securities are normally handled through the fair value option. The fair value option was adopted for structured debt securities and fixed-rate securities issued by Group banks, whose risk of changes in fair value has been hedged with derivatives; derivatives used as part of the "fair value option" are classified in the trading book. With regard to the objectives and strategies underlying hedge you should refer to the information provided in Part E – Information on risks and related hedging policies – Section 2 – Market Risk.

227P a r t B - I n f o r m a t i o n o n t h e c o n s o l i d a t e d b a l a n c e s h e e t - L i a b i l i t i e s a n d s h a r e h o l d e r s ' e q u i t y
6.2 Hedging derivatives: breakdown by hedged portfolio and type of hedge
Transactions/Type of hedge Fair value Cash flows Foreign investmentsSpecific Generic
Interest rate risk
Exchange rate risk
Credit risk
Price risk
Several risks
Specific Generic
1. Financial assets available for sale 25,669 – – 4,992 – X 6,866 X X
2. Loans and receivables – – – X – X – X X
3. Investments held to maturity X – – X – X – X X
4. Portfolio X X X X X 21,224 X – X
5. Other transactions – – – – – X – X –
Total assets 25,669 – – 4,992 – 21,224 6,866 – –
1. Financial liabilities – – – X – X – X X
2. Portfolio X X X X X – X – X
Total liabilities – – – – – – – – –
1. Expected transactions X X X X X X – X X
2. Portfolio of financial assets and liabilities X X X X X – X – –
The table shows the negative fair values of the hedging derivatives, broken down by asset or liability hedged and by the type of hedge. In particular, as regards assets, generic and specific fair value hedging was used to hedge against the risk of changes in interest rates on mortgages and bonds classified as "available for sale" in order to immunize them from possible adverse changes in interest rates.
Specific fair value hedgeThe amount indicated at item "1. Financial assets available for sale" relates to the negative fair value of financial derivatives: to hedge interest rate risk for a total notional amount of 755 million (667 million at 31.12.2013), taken out to hedge a debt security issued by
an issuing bank of a nominal value of 50 million (50 million at 31.12.2013) and fixed rate government securities of 705 million (617 million at 31.12.2013);
to hedge the price risk of forward sales of government securities of 314.8 million (0 million at 31.12.2013).
Generic fair value hedgeThe amount indicated in item 4. "Portfolio" relates to the negative fair value of derivatives taken out by the Parent Company to cover the interest rate risk of a portfolio of fixed-rate government bonds included in "Financial assets available for sale" of a notional amount of 0.25 billion (0.5 billion at 31.12.2013) and to derivatives taken out by Webank to hedge the interest rate on mortgages of a notional amount of 0.159 billion.
Specific Cash flow hedgeThe amount shown in item "1. Financial assets available for sale" relates to the negative fair value of financial derivatives with a notional amount of 100 million (zero at 31.12.2013), stipulated to hedge cash flows of a debt security issued by a bank for a nominal value of 100 million.
The prospective and retrospective tests performed during 2014 in accordance with the rules laid down in IAS 39 have confirmed the effectiveness of the hedges.For more information on the financial assets and liabilities covered, please refer to the detailed tables presented in this part (Part B) of the Explanatory Notes, in the sections relating to balance sheet items in which there are items being hedged.

228 P a r t B - I n f o r m a t i o n o n t h e c o n s o l i d a t e d b a l a n c e s h e e t - L i a b i l i t i e s a n d s h a r e h o l d e r s ' e q u i t y
Section 7 – Fair value adjustment of financial liabilities in hedged portfolios Line item 70
This item includes the negative balance of fair value changes in the liabilities covered by macrohedges against interest rate risk.
7.1 Fair value adjustment of hedged liabilities
Fair value adjustment of hedged liabilities/Members of the Group 31.12.2014 31.12.2013
1. Positive adjustment of financial liabilities 16,084 23,222
2. Negative adjustment of financial liabilities – –
Total 16,084 23,222
This item relates to the fair value adjustment made to "core deposits" for which a generic fair value hedge was arranged in 2010 using derivatives. During 2011, the hedges were closed and the amount reported at 31 December 2014 and 2013 represents the residual value of the effective portion of the hedge on the date of revocation, which will be released to income on a pro-rata basis up to the original maturity of the hedging transactions (latest envisaged maturity is March 2020).
Section 8 – Tax liabilities Line item 80
This section has been commented on in Section 14 on the assets side of the balance sheet, Part B – Information on the balance sheet in these explanatory notes.
Section 9 – Liabilities associated with non-current assets held for sale and discontinued operations Line item 90
At the date of the financial statements, the Bank does not have any non-current assets held for sale or discontinued operations and related liabilities.

229P a r t B - I n f o r m a t i o n o n t h e c o n s o l i d a t e d b a l a n c e s h e e t - L i a b i l i t i e s a n d s h a r e h o l d e r s ' e q u i t y
Section 10 – Other liabilities Line item 100
This item shows liabilities that are not classifiable elsewhere on the liabilities side of the balance sheet.
10.1 Other liabilities: breakdown
31.12.2014 31.12.2013
Payables for the deterioration in: 66,808 62,142
Guarantees given 66,808 62,142
Share-based payments – –
Accrued liabilities 225 321
Other liabilities 1,269,759 978,563
Guarantee deposits received from third parties 6,859 7,641
Amounts payable to tax authorities on behalf of others 342,336 105,785
Amounts payable to tax authorities on own account 6,071 7,898
Adjustments for illiquid items concerning the portfolio 154,890 121,205
Amounts available to customers 136,297 137,157
Items being processed 368,644 364,562
Due to suppliers 141,464 123,603
Due to social security authorities 37,672 33,183
Personnel expenses 45,476 47,128
Deferred income 1,870 1,506
Consolidation difference – 1,011
Other 28,180 27,885
Total 1,336,792 1,041,027

230 P a r t B - I n f o r m a t i o n o n t h e c o n s o l i d a t e d b a l a n c e s h e e t - L i a b i l i t i e s a n d s h a r e h o l d e r s ' e q u i t y
Section 11 – Employee termination indemnities Line item 110
11.1 Employee termination indemnities: changes during the year
31.12.2014 31.12.2013
A. Opening balance 133,425 147,167
B. Increases 16,181 12,870
Termination indemnities – Provision for the year 3,797 5,760
B.2 Other increases 12,384 7,110
C. Decreases 11,876 26,612
Termination indemnities - Indemnities paid 11,662 26,288
C.2 Other decreases 214 324
D. Closing balance 137,730 133,425
Items B.2 "Other increases" and C.2 "Other decreases" include the actuarial gains and losses booked as a result of the expert appraisal carried out by an independent actuary with the contra-entry going to the "valuation reserve – actuarial gains (losses) on defined-benefit pension plans".

231P a r t B - I n f o r m a t i o n o n t h e c o n s o l i d a t e d b a l a n c e s h e e t - L i a b i l i t i e s a n d s h a r e h o l d e r s ' e q u i t y
11.2 Other information
As described in Part A – Accounting policies, following the reform of supplementary pensions (Decree 252 of 5 December 2005, introduced by the Budget Law 2007), the termination indemnities only refer to the portion accrued up to 31.12.2006, while the amounts accruing from 1 January 2007 have to be transferred to supplementary pension funds, depending on the explicit or tacit choice of the employee, or maintained in the company and then subsequently transferred to a treasury fund set up with INPS.The provision of the year does not therefore include the amounts that are paid to supplementary pension schemes or to the treasury fund at INPS as a result of that reform of the pension system. In this case, the amounts of employee termination indemnities accruing from 1 January 2007 are considered a "defined-contribution plan" and are accounted for under "personnel expenses – termination indemnities" on the basis of the contributions due without applying actuarial methods, with the contra-entry going to "Other liabilities" in the balance sheet or as an outflow of cash.The termination indemnities that accrued up to 1 January 2007 (or to the date when the decision was made to assign them to a supplementary pension fund) continues to be shown as a "post-employment benefit" classified as a "defined-benefit plan"; subsequently the liability linked to the "accrued termination indemnities" is submitted to an actuarial assessment, which compared with the methods applied up until 31 December 2006, no longer takes account of the average annual increase in wages and salaries, as the employee benefits are to be considered almost entirely accrued (with the sole exception of the revaluation). The full amount of actuarial gains and losses, defined as the difference between the book value of the liability and the present value of obligations at period end, are recognised directly in the valuation reserve "actuarial gains and losses on defined-benefit pension plans".For companies with less than 50 employees the previous law remains in force, which considers employees' termination indemnities as a defined benefit plan, the accrued amount of which continues to be valued through the actuarial method known as the "projected unit credit method" explained in Part A "Accounting Policies".This was the case, within the Bipiemme Group, for Banca Popolare di Mantova.
The actuarial valuation of termination indemnities by an independent actuary is carried out according to the "accrued benefit" method using the "Projected Unit Credit" as required by IAS 19, and is based on the following main demographic, economic and financial assumptions:
Demographic assumptions: IPS55 tables were used to estimate death rates and INPS-2000 tables were used to forecast permanent disability; staff turnover was estimated at 3.5%, in line with the previous year.
Financial assumptions: the valuation was based on a discount rate of 1.58%, corresponding to the estimated long-term return (3.17% at 31.12.2013).
Economic assumptions: inflation was estimated at 1.5% (2% at 31 December 2013).
As required by IAS 19, para. 145, the following table shows the sensitivity of the pension funds to changes in the discount rate (in millions of euro):
Sensitivity analysis: 31.12.2014 31.12.2013
Employee termination indemnities with a discount rate of –0.5% 6.3 6.6
Employee termination indemnities with a discount rate of +0.5% (5.9) (6.1)

232 P a r t B - I n f o r m a t i o n o n t h e c o n s o l i d a t e d b a l a n c e s h e e t - L i a b i l i t i e s a n d s h a r e h o l d e r s ' e q u i t y
Section 12 – Allowances for risks and charges Line item 120
12.1 Allowances for risks and charges: breakdown
Line items/Elements 31.12.2014 31.12.2013
1. Post-employment benefit obligations 92,568 81,231
2. Other allowances for risks and charges 289,677 363,540
2.1 Legal disputes 72,141 75,906
2.2 Personnel expenses 184,800 221,270
2.3 Other 32,736 66,364
Total 382,245 444,771
Allowances for risks and charges: breakdown
Line items/Elements 31.12.2014 31.12.2013
1. Post-employment benefit obligations: 92,568 81,231
– Pension funds: 14,203 13,533
- former Banca Popolare di Bologna e Ferrara 14,179 13,510
- former Banca Agricola Milanese 24 23
– Supplementary pension funds 77,110 66,508
- Banca Popolare di Milano 52,588 44,356
- former Cassa di Risparmio di Alessandria 24,522 22,152
– Other pension funds 1,255 1,190
2. Other allowances for risks and charges: 289,677 363,540
2.1 legal disputes: 72,141 75,906
– provisions for estimated losses from legal disputes 72,141 75,906
2.2 personnel expenses: 184,800 221,270
– Solidarity Fund 172,549 209,792
– long-service bonuses – –
– indemnities specifically for managers 3,503 2,811
– estimated losses arising from disputes with employees 3,022 2,572
– other charges 5,726 6,095
2.3 other 32,736 66,364
– recovery procedures 11,405 11,303
– charity and social fund 501 498
– miscellaneous charges 20,830 54,563
Total 382,245 444,771
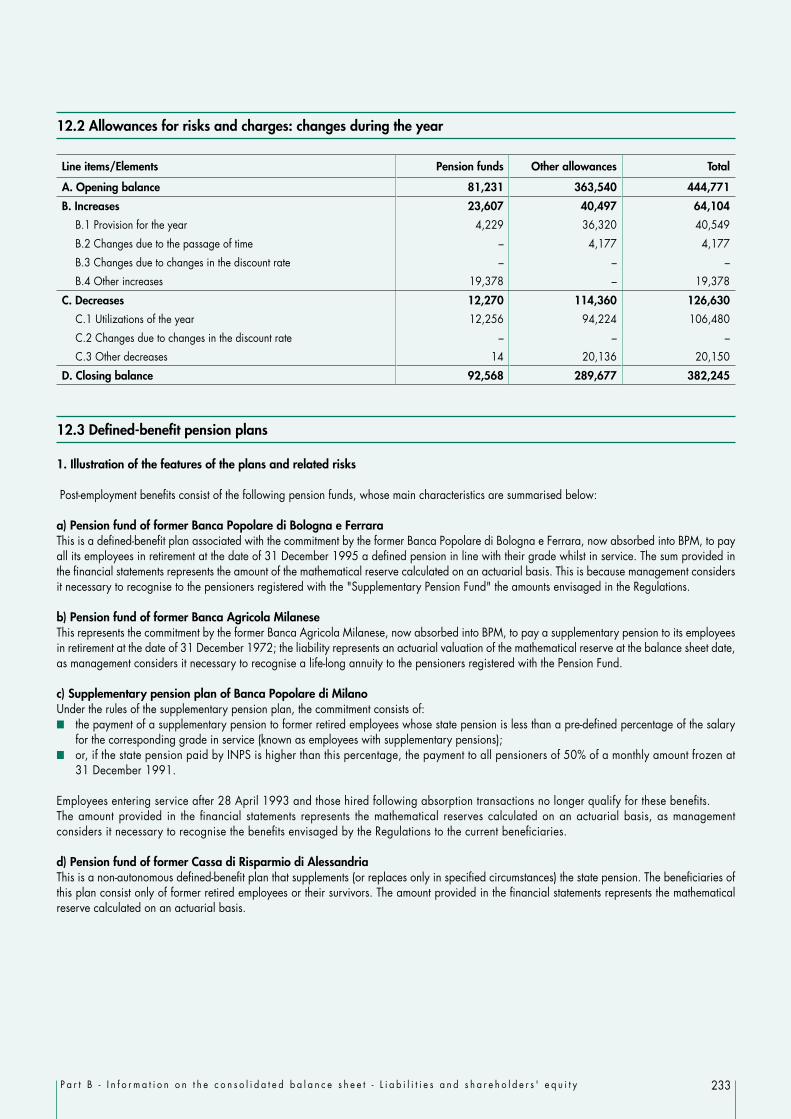
233P a r t B - I n f o r m a t i o n o n t h e c o n s o l i d a t e d b a l a n c e s h e e t - L i a b i l i t i e s a n d s h a r e h o l d e r s ' e q u i t y
12.2 Allowances for risks and charges: changes during the year
Line items/Elements Pension funds Other allowances Total
A. Opening balance 81,231 363,540 444,771
B. Increases 23,607 40,497 64,104
B.1 Provision for the year 4,229 36,320 40,549
B.2 Changes due to the passage of time – 4,177 4,177
B.3 Changes due to changes in the discount rate – – –
B.4 Other increases 19,378 – 19,378
C. Decreases 12,270 114,360 126,630
C.1 Utilizations of the year 12,256 94,224 106,480
C.2 Changes due to changes in the discount rate – – –
C.3 Other decreases 14 20,136 20,150
D. Closing balance 92,568 289,677 382,245
12.3 Defined-benefit pension plans
1. Illustration of the features of the plans and related risks
Post-employment benefits consist of the following pension funds, whose main characteristics are summarised below:
a) Pension fund of former Banca Popolare di Bologna e FerraraThis is a defined-benefit plan associated with the commitment by the former Banca Popolare di Bologna e Ferrara, now absorbed into BPM, to pay all its employees in retirement at the date of 31 December 1995 a defined pension in line with their grade whilst in service. The sum provided in the financial statements represents the amount of the mathematical reserve calculated on an actuarial basis. This is because management considers it necessary to recognise to the pensioners registered with the "Supplementary Pension Fund" the amounts envisaged in the Regulations.
b) Pension fund of former Banca Agricola MilaneseThis represents the commitment by the former Banca Agricola Milanese, now absorbed into BPM, to pay a supplementary pension to its employees in retirement at the date of 31 December 1972; the liability represents an actuarial valuation of the mathematical reserve at the balance sheet date, as management considers it necessary to recognise a life-long annuity to the pensioners registered with the Pension Fund.
c) Supplementary pension plan of Banca Popolare di MilanoUnder the rules of the supplementary pension plan, the commitment consists of: the payment of a supplementary pension to former retired employees whose state pension is less than a pre-defined percentage of the salary
for the corresponding grade in service (known as employees with supplementary pensions); or, if the state pension paid by INPS is higher than this percentage, the payment to all pensioners of 50% of a monthly amount frozen at
31 December 1991.
Employees entering service after 28 April 1993 and those hired following absorption transactions no longer qualify for these benefits.The amount provided in the financial statements represents the mathematical reserves calculated on an actuarial basis, as management considers it necessary to recognise the benefits envisaged by the Regulations to the current beneficiaries.
d) Pension fund of former Cassa di Risparmio di Alessandria This is a non-autonomous defined-benefit plan that supplements (or replaces only in specified circumstances) the state pension. The beneficiaries of this plan consist only of former retired employees or their survivors. The amount provided in the financial statements represents the mathematical reserve calculated on an actuarial basis.

234 P a r t B - I n f o r m a t i o n o n t h e c o n s o l i d a t e d b a l a n c e s h e e t - L i a b i l i t i e s a n d s h a r e h o l d e r s ' e q u i t y
2. Changes in the year in net defined benefit liabilities (assets) and reimbursement rights
Changes in the provisions for post-employment benefits are shown in table 12.2.The items B.4 "Other increases" and C.3 "Other decreases" are mainly attributable to actuarial gains and losses.All the post-employment benefits are funded and have not been valued in currencies other than the euro.
3. Information on fair value of plan assets
None of the defined-benefit plans classified as post-employment benefits has any assets servicing them.
4. Main actuarial assumptions
With reference to defined-benefit supplementary pensions, the determination of the actual values required by the application of IAS 19 "Employee Benefits" is performed by independent actuaries. The following are the actuarial assumptions (demographic, financial and economic) used for each fund.
a) Pension fund of former Banca Popolare di Bologna e FerraraDemographic assumptions: the IPS55 tables were used for estimating death rates.Financial assumptions: the valuations used a compounded interest rate of 1.58%, corresponding to the estimated long-term return (3.17% at 31.12.2013). The recent decrease in market interest rates led to a valuation based on future returns that are lower than the estimate used for prior years.Economic assumptions: pensions were assumed to have zero future growth., in line with the previous year.
b) Pension fund of former Banca Agricola MilaneseDemographic assumptions: the IPS55 tables were used for estimating death rates.Financial assumptions: the valuations used a compounded interest rate of 1.58%, corresponding to the estimated long-term return (3.17% at 31.12.2013). The recent decrease in market interest rates led to a valuation based on future returns that are lower than the estimate used for prior years.Economic assumptions: pensions were assumed to grow at 1% per annum, since the plan rules provide for indexation once every two years for certain pensioners, in line with the previous year.
c) Supplementary pension plan of Banca Popolare di MilanoDemographic assumptions: the IPS55 mortality tables were used in addition to the permanent disability tables prepared by INPS in 2000. Financial assumptions: the valuations used a compounded interest rate of 1.58%, corresponding to the estimated long-term return (3.17% at 31.12.2013). The recent increased variability of market interest rates and a fall thereof has led to a valuation based on future constant and decreased returns of between 3.17% and 1.58%.Economic assumptions: pensions were assumed to grow at 75% of the annual inflation rate. Inflation was assumed to be 2% (the same as the previous year), so the assumed growth rate in pensions is 1.5% (also in line with the previous year). Annual wage inflation was established at 2.5% (unchanged with respect to the previous year). The annual rate of increase in the INPS pension ceiling has been set at 1.5%; the INPS pension ceiling amounts to 46,031 euro (this is the figure announced by INPS, valid from 1.1.2010).
d) Pension fund of former Cassa di Risparmio di AlessandriaDemographic assumptions: the IPS55 mortality tables were used in addition to the permanent disability tables prepared by INPS in 2000.Financial assumptions: the valuations used a compounded interest rate of 1.49%, corresponding to the estimated long-term return (3.17% at 31.12.2013). The recent decrease in market interest rates led to a valuation based on future returns that are lower than the estimate used for prior years.Economic assumptions: inflation was assumed to be 2% (the same as the previous year)

235P a r t B - I n f o r m a t i o n o n t h e c o n s o l i d a t e d b a l a n c e s h e e t - L i a b i l i t i e s a n d s h a r e h o l d e r s ' e q u i t y
5. Information on amount, timing and uncertainty of cash flow
As required by IAS 19, para. 145, the following table shows the sensitivity of the pension funds to changes in the discount rate (in millions of euro):
Sensitivity analysis: 31.12.2014 31.12.2013
Mathematical reserves with a discount rate of –0.5% 3.6 2.9
Mathematical reserves with a discount rate of +0.5% (3.4) (2.8)
6. Multi-employer plans
There are no multi-employer plans.
7. Defined benefit plans sharing risks between entities under common control
There are no defined benefit plans sharing risks between entities under common control.
12.4 Allowances for risks and charges – other allowances
"Other allowances for risks and charges", shown in the table 12.1 above, are detailed as follows:
2.1 legal disputes: the provision covers the estimated obligations arising from outstanding legal disputes involving the Bank (see the explanation given below in Part E – Information on risks and related hedging policies – Section 1.4 Operational risk). The average timing for the payment of such obligations is around 3 years. The amount of this provision reflects the present value of the outlays needed to meet the estimated obligations, calculated at market interest rates. We would also point out that it includes the 26.1 million euro provision made by the Company (30.899 million euro at 31.12.2013) for the "Convertendo 2009-2013 6.75%" bond.
As mentioned in last year's financial statements, on 3 August 2012, the Parent Company BPM, Adiconsum, Adoc and Federconsumatori signed a Memorandum of Understanding (which is available on BPM's website) to commence a joint mediation procedure for the "Convertendo BPM 2009/2013 – 6.75%" bond loan.
On 30 June 2014, the Parent Company signed an agreement with Adiconsum, Adoc and Federconsumatori that amended and supplemented the Memorandum of Understanding concerning the joint conciliation procedure for the "Convertendo 2009/2013 – 6.75%" bond loan, extending the deadline for the submission of applications for admission by Retail customers and allowing BPM Shareholders to access the procedure under certain conditions. Applications for access to the conciliation procedure can be submitted from 15 September 2014 to 30 September 2015. The full text of the above Amendment Agreement, to which reference should be made for further information, has been published on the websites of the Group's commercial banks and on those of the Consumer Associations that have signed or accepted the Agreement.
As of 31 December 2014, considering any payments already made in favour of those entitled to them, the provision amounts to 26 million euro.
2.2. personnel expenses: this covers mainly the charges relating to:
employees entitled to the "Solidarity Fund" joining in 2009 and 2012 , particularly: • the "Solidarity Fund" set up in 2012 relating to the agreement signed by the Parent Bank together with Group companies and the trade
unions on 6 December 2012 for an amount recorded at the balance sheet date of 169.774 million (198,945 million at 31.12.2013). The actuarial assumptions used by an independent actuary to determine the liability at the balance sheet date led to the use of a discount rate of 0.46% (2.10% at 31.12.2013) and a mortality rate taken from the IPS55 tables;
• with regard to the "Solidarity Fund" set up in 2009, the amount recorded at the balance sheet date is 2.775 million (11.023 million at 31.12.2013);
the indemnities specifically reserved for managers of 3.503 million (2.811 million at 31.12.2013);

236 P a r t B - I n f o r m a t i o n o n t h e c o n s o l i d a t e d b a l a n c e s h e e t - L i a b i l i t i e s a n d s h a r e h o l d e r s ' e q u i t y
the indemnities in connection with the non-competition agreement reserved for the former employees of Bipiemme Private Banking SIM, which was absorbed during 2010, for 0.693 million euro (0.524 million euro at 31.12.2013).
As regards the last two obligations, the actuarial assumptions used by an independent actuary for determining the liability at the balance sheet date are as follows:
Demographic assumptions: the IPS55 tables were used in addition to the permanent disability tables prepared by INPS in 2000.Financial assumptions: the valuations were based on a discount rate of 1.58%, corresponding to the estimated long-term return (3.17% at 31.12.2013).Economic assumptions: annual rate of real increase in remuneration of 2.50% (unchanged with respect to the previous year).
2.3 other: This line item includes: an estimate of the obligations arising from recovery procedures against Group companies. The average timing for the payment of such
obligations is around 3 years. The amount of this provision reflects the present value of the outlays needed to meet the estimated obligations, calculated at market interest rates;
provisions made for contractual commitments relating to the sale of the custodian bank activities to the BNP Paribas Group in 2010. This agreement establishes, inter alia, with reference to the ten years after the end of the contract, the price may be subject to adjustment based on the balance sheet of the business being sold, from time to time updated as specified in the agreement and based on the achievement of certain levels of annual revenue. No increases were made in the year to the provision, which amounts to 4.5 million at 31.12.2014 (5.6 million at 31.12.2013); the decrease in the year was due to the payment of 1.1 million pertaining to 2013;
the tax disputes, illustrated in Section 13 "Tax assets and liabilities" for 5.4 million euro (13.43 million euro at 31.12.2013).
Section 13 – Technical reserves Line item 130
As at the reporting date, there is no such line item as there are no insurance companies in the Group.
Section 14 – Redeemable shares Line item 150
No redeemable shares had been issued as at the reporting date.

237P a r t B - I n f o r m a t i o n o n t h e c o n s o l i d a t e d b a l a n c e s h e e t - L i a b i l i t i e s a n d s h a r e h o l d e r s ' e q u i t y
Section 15 – Group shareholders' equity Items 140, 160, 170, 180, 190, 200 and 220
This section explains the liability accounts shown in line items 140, 160, 170, 180, 190, 200, and 220.
15.1 "Share capital" and "Treasury shares": breakdown
31.12.2014 31.12.2013
Share capital Euro 3,365,439,319.02 2,865,709,760.07
No. of ordinary shares 4,391,784,467 3,229,622,702
Of which no. of treasury shares 1,395,574 1,395,574
Share capital: at the date of the financial statements the share capital of the Bank is fully subscribed and paid in and amounts to 3,365,439,319.02 and consists of 4,391,784,467 ordinary shares with implicit par value, given by the ratio between the total amount of the share capital and the number of outstanding shares, of 0.766 euro; the shares have no restrictions or privileges, and each share has the same rights in terms of dividends and repayment of capital.
Treasury shares: at the date of the financial statements there are 1,395,574 shares in portfolio.
15.2 Share capital - Number of shares held by the Parent Company: changes during the year
Line items/Types Ordinary Other
A. Shares in issue at the beginning of the year 3,229,622,702 –– entirely freed up 3,229,622,702 –– not entirely freed up – –
A.1 Treasury shares (-) –1,395,574A.2 Shares in issue: opening balance 3,228,227,128 –B. Increases 1,170,365,226 –B.1 New share issues 1,162,161,765 –
– for payment: 1,162,161,765 –- of business combinations – –- on conversion of bonds – –- on exercise of warrants – –- other – –
– bonus issues: – –- to employees – –- to directors – –- other – –
B.2 Sale of treasury shares 8,203,461 –B.3 Other increases – –C. Decreases 8,203,461 –C.1 Cancellation – –C.2 Purchase of treasury shares 8,203,461 –C.3 Disposal of businesses – –C.4 Other decreases – –D. Shares outstanding: closing balance 4,390,388,893 –D.1 Treasury shares (+) 1,395,574 –D.2 Shares in issue at the end of the period 4,391,784,467 – – entirely freed up 4,391,784,467 – – not entirely freed up – –

238 P a r t B - I n f o r m a t i o n o n t h e c o n s o l i d a t e d b a l a n c e s h e e t - L i a b i l i t i e s a n d s h a r e h o l d e r s ' e q u i t y
Line item A.1 Treasury shares. The number of treasury shares at 1.1.2014 mainly consists of the unassigned portion, as a result of the failure to achieve performance objectives, of the 2,500,000 shares purchased in the fourth quarter of 2011, using the available portion of the "reserve for treasury shares", to be assigned to "key personnel" of BPM and the Group's commercial banks in accordance with the provisions of the "Document on the Remuneration and Incentive Policies of the Bipiemme Group", approved by the Bank's Board of Directors and then by the General Meeting of Members held, respectively, on 7 and 25 June 2011.
Line item B.1 New share issues. The first half of 2014 saw the successful completion of the increase in capital that led to the issuance of 1,162,161,765 new shares, at 0.43 euro per share, for a total amount of Euro 499,729,558.95.
Line item D.1 Treasury shares. The 1,395,574 treasury shares represent the balance at 31.12.2014 remaining after the various purchases and sales of treasury shares.
Line item D.2 Shares in issue at the end of the period. This is the number of Banca Popolare di Milano shares outstanding at 31.12.2014, a total of 4,391,784,467 (including 1,395,574 treasury shares), whose "implicit" value is 0.766 euro per share, taking into account the fact that the share capital amounts to Euro 3,365,439,319.02.
15.3 Share capital: other information
The Parent Company's share capital is variable and is represented by shares without an express nominal value, in accordance with the resolution of the general meeting held on 25 June 2011.The Management Board can buy or reimburse shares of the Parent Company according to current regulations, within the limits of distributable earnings and unrestricted reserves in the latest approved financial statements, allocated for this purpose by the Members in General Meeting. The provision for the purchase of treasury shares amounts to Euro 19,484,887 and is available for Euro 18,626,254, as adjusted for the value of the 1,395,574 treasury shares held in portfolio at the balance sheet date.The shares, as governed by the Articles of Association, constitute a guarantee to the Bank for any commitments of a member towards the Bank.No shareholder's interest may exceed 0.50% of the share capital. As soon as it becomes aware that this limit has been exceeded, the Parent Company serves formal notice of the breach on the shareholder concerned. The excess shares must be sold within a year of such notice; after this deadline, the related rights pertaining to these shares are acquired by the Bank until their disposal. This limit does not apply to mutual investment funds; the relevant limits in such cases are those imposed by the rules of the fund concerned.The shares cannot be split. In the event that the shares are owned jointly, the rights of the joint owners have to be exercised by a common representative.Dividends not claimed within five years from the date they become payable fall are absorbed by the Company.
15.4 Reserves: other information
For the disclosures required by Art 2427, paragraph 7 bis, of the Italian Civil Code, reference should be made to the disclosures provided in the Parent Company's financial statements.
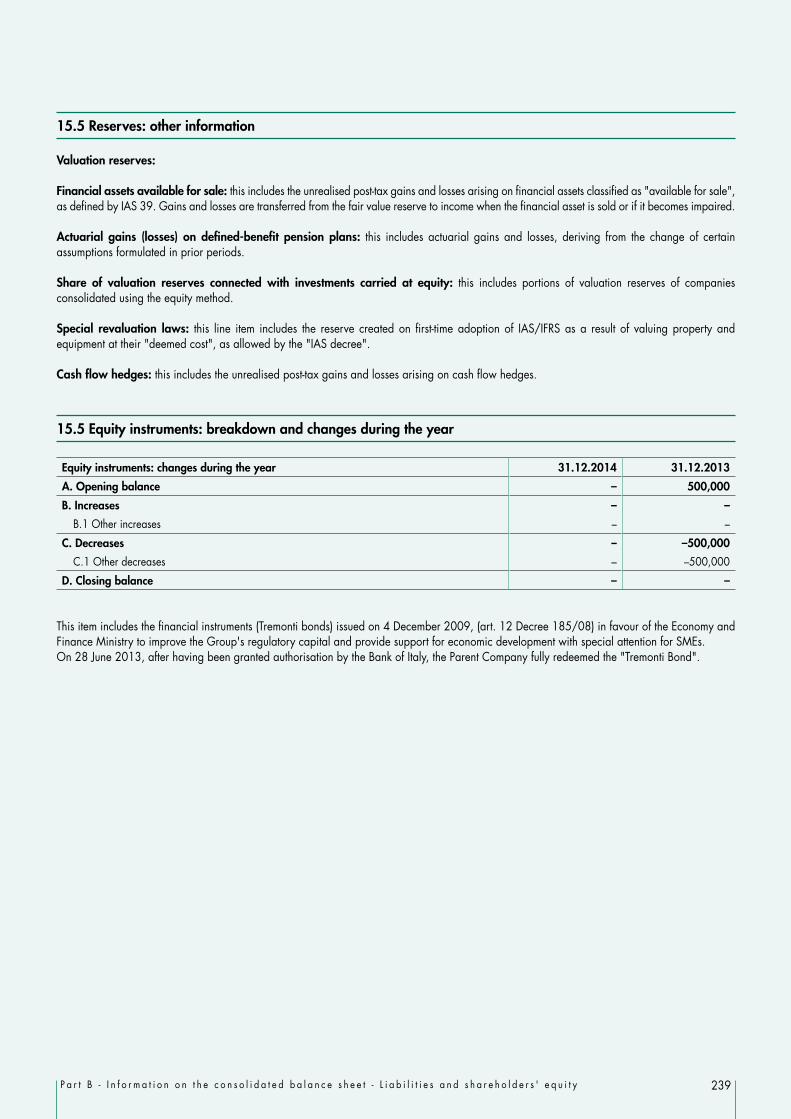
239P a r t B - I n f o r m a t i o n o n t h e c o n s o l i d a t e d b a l a n c e s h e e t - L i a b i l i t i e s a n d s h a r e h o l d e r s ' e q u i t y
15.5 Reserves: other information
Valuation reserves:
Financial assets available for sale: this includes the unrealised post-tax gains and losses arising on financial assets classified as "available for sale", as defined by IAS 39. Gains and losses are transferred from the fair value reserve to income when the financial asset is sold or if it becomes impaired.
Actuarial gains (losses) on defined-benefit pension plans: this includes actuarial gains and losses, deriving from the change of certain assumptions formulated in prior periods.
Share of valuation reserves connected with investments carried at equity: this includes portions of valuation reserves of companies consolidated using the equity method.
Special revaluation laws: this line item includes the reserve created on first-time adoption of IAS/IFRS as a result of valuing property and equipment at their "deemed cost", as allowed by the "IAS decree".
Cash flow hedges: this includes the unrealised post-tax gains and losses arising on cash flow hedges.
15.5 Equity instruments: breakdown and changes during the year
Equity instruments: changes during the year 31.12.2014 31.12.2013
A. Opening balance – 500,000
B. Increases – –
B.1 Other increases – –
C. Decreases – –500,000
C.1 Other decreases – –500,000
D. Closing balance – –
This item includes the financial instruments (Tremonti bonds) issued on 4 December 2009, (art. 12 Decree 185/08) in favour of the Economy and Finance Ministry to improve the Group's regulatory capital and provide support for economic development with special attention for SMEs.On 28 June 2013, after having been granted authorisation by the Bank of Italy, the Parent Company fully redeemed the "Tremonti Bond".

240 P a r t B - I n f o r m a t i o n o n t h e c o n s o l i d a t e d b a l a n c e s h e e t - L i a b i l i t i e s a n d s h a r e h o l d e r s ' e q u i t y
Section 16 – Minority interests Line item 210
16.1 Details of line item 210 “minority interests”
Company name 31.12.2014 31.12.2013
Investments in consolidated companies with significant minority interests
1. Banca Akros SpA 6,185 5,773
2. Banca Popolare di Mantova SpA 13,215 13,276
Other investments 24 12
Total 19,424 19,061
16.2 Equity instruments: breakdown and changes during the year
No equity instruments have been issued by consolidated companies with minority interests.
16.3 Net income (loss) pertaining to minority interests: breakdown
Line items/Amounts 31.12.2014 31.12.2013
1. Share capital 2,359 2,361
2. Share premium reserve 11,982 12,630
3. Reserves 4,353 4,218
4. Treasury shares – –
5. Valuation reserves 90 52
6. Equity instruments – –
7. Net income (loss) pertaining to minority interests 640 –200
Total 19,424 19,061
16.4 Valuation reserves: breakdown
Line items/Elements 31.12.2014 31.12.2013
1. Financial assets available for sale 151 90
2. Property and equipment – –
3. Intangible assets – –
4. Hedging of foreign investments – –
5. Cash flow hedges – –
6. Foreign exchange differences – –
7. Non-current assets held for sale – –
8. Actuarial gains (losses) on defined-benefit pension plans –61 –38
9. Share of valuation reserves connected with investments carried at equity – –
10. Special revaluation laws – –
Total 90 52

241P a r t B - I n f o r m a t i o n o n t h e c o n s o l i d a t e d b a l a n c e s h e e t - O t h e r i n f o r m a t i o n
Other information
1. Guarantees given and commitments
Transactions 31.12.2014 31.12.2013
1) Financial guarantees: 310,158 388,933
a) Banks 60,407 55,842
b) Customers 249,751 333,091
2) Commercial guarantees: 2,968,731 3,143,805
a) Banks 77,818 134,690
b) Customers 2,890,913 3,009,115
3) Irrevocable commitments to grant finance 4,482,370 4,460,902
a) Banks 732,028 660,348
i) certain to be called on 43,278 66,598
ii) not certain to be called on 688,750 593,750
b) Customers 3,750,342 3,800,554
i) certain to be called on 312,648 296,822
ii) not certain to be called on 3,437,694 3,503,732
4) Commitments underlying credit derivatives: sale of protection 3,553 28,861
5) Assets pledged in guarantee for third-party obligations 72,413 61,156
6) Other commitments 106,632 169,276
Total 7,943,857 8,252,933
The amount of "guarantees given" is stated at nominal value net of any drawdowns and any adjustments."Financial guarantees given – banks" also include the commitments undertaken versus the Interbank Deposit Guarantee Fund.The "irrevocable commitments to grant finance" are stated on the basis of the commitment given less the sums already disbursed and any adjustments. They exclude commitments arising from derivative contracts.The "irrevocable commitments to grant finance" which are certain to be called on include forward and spot purchases of securities awaiting settlement and loans and deposits to be made on a specified future date. "Commitments underlying credit derivatives: sales of protection" refer to the notional amount of such commitments, less the sums already disbursed and any adjustments."Assets pledged in guarantee for third-party obligations" include an amount of 72.413 million euro (56.511 million euro at 31.12.2013) relating to contribution quotas to the Default Fund paid into the Cassa di Compensazione e Garanzia for MTS Repo operations.
2. Assets pledged as guarantees for own liabilities and commitments
Portfolio 31.12.2014 31.12.2013
1. Financial assets held for trading 225,066 118,544
2. Financial assets designated at fair value through profit and loss 82,810 56,358
3. Financial assets available for sale 5,926,342 6,538,327
4. Investments held to maturity – –
5. Due from banks 32,627 11,800
6. Loans to customers 6,318,122 5,488,570
7. Property and equipment – –

242 P a r t B - I n f o r m a t i o n o n t h e c o n s o l i d a t e d b a l a n c e s h e e t - O t h e r i n f o r m a t i o n
Guaranteed funding transactions
In accordance with the requirements of the Bank of Italy communicated on 16 February 2011 and 10 February 2012, assets not reported in the financial statements in compliance with IAS 39, which the Group has established as a guarantee of its own liabilities and commitments, are shown below.The following are the own bonds issued and repurchased as part of the refinancing operations with the European Central Bank – two of which covered by a Government guarantee pursuant to art. 8 of the Decree Law 201 of 6 December 2011, converted into Law no. 214 of 22 December 2011 – and provided as collateral for the advances received from central banks (OMO – Open Market Operations): "BPM 23.03.2012/2017 5.90%" bonds guaranteed by the Government, for a nominal value of 0.5 billion (0.5 billion at 31.12.2013); Covered Bonds "BPM CB 18.07.2011-18.01.2014 Floating rate with maturity extended to 18.1.2019" for a nominal value of 1 billion (1
billion at 31.12.2013); Covered Bonds "BPM CB 25.05.2013-28.05.2016 Floating rate" for a nominal value of 0.65 billion (0.65 billion at 31.12.2013). Covered Bonds “BPM 9.10.2009-17.10.2016 3.5%” with a nominal value of 1 million and “BPM 4.11.2010-16.11.2015 3.25%” with a
nominal value of 12.5 million.
In addition, the following have been provided as collateral: "BPM Securitisation 15.01.06/43 Floating rate" bonds, arising from the securitisation carried out by the Parent Company in 2006, for a
residual nominal value of 93.62 million euro (115.276 million euro at 31.12.2013); "BPM Securitisation 3 20.01.14/57 TV% A" bonds with a residual nominal value of 573 million; securities arising from lending repurchase agreements or securities lending of a nominal value of 107 million (299 million at 31.12.2013).
3. Information on operating leases
The assets leased basically consist of: POS equipment; central computer; motor vehicles under long-term rental contracts; machinery – hardware.
The POS equipment is installed on the premises of authorised businesses and allows the holders of "Pagobancomat" cards and other debit and credit cards to pay for goods and services offered by businesses in Italy and abroad.The computer lease forms part of an omnicomprehensive contract entered into with IBM in September 2012 and replaces the previous lease that expired on 31.12.2012. The new contract, which lasts until 31.12.2016, provides for integrated management, inter alia, of: technological evolution/substitution of the storage infrastructure; provision of the services needed to support technological renovation; maintenance of central hardware; software licences and new releases for the operating system and certain subsystems.
Motor vehicles under long-term rental contracts are leased for a contractual term of 36-48 months, with the provision of full service assistance (maintenance, insurance, ownership tax, breakdown service, etc.). There is no option to acquire the vehicles at the end of the lease.During the course of 2014, operating lease payments totalled 8.888 million euro (9.170 million euro in 2013) with long-term vehicle rental costs of 1,425 thousand euro (1,715 thousand euro in 2013).Future operating lease and car rental payments under outstanding contracts fall due as follows.
Leased assets Up to 1 year Between 1 and 5 years
Beyond 5 years
31.12.2014 Up to 1 year Between 1 and 5 years
Beyond 5 years
31.12.2013
POS 3,134 3,187 – 6,321 2,924 3,030 – 5,954
Central computer 5,741 2,600 – 8,341 5,775 11,512 – 17,287
Vehicles 1,523 5,015 – 6,538 1,343 1,550 – 2,893
Machinery – hardware – – – – – – – –
Total 10,398 10,802 – 21,200 10,042 16,092 – 26,134
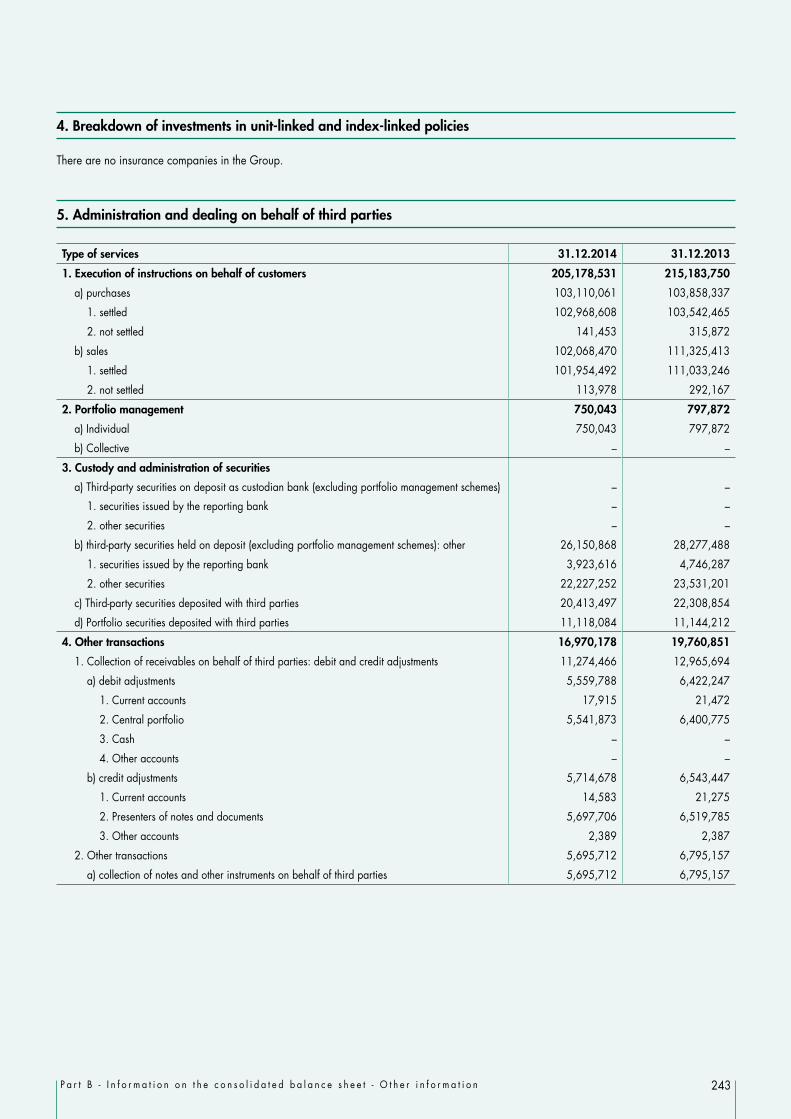
243P a r t B - I n f o r m a t i o n o n t h e c o n s o l i d a t e d b a l a n c e s h e e t - O t h e r i n f o r m a t i o n
4. Breakdown of investments in unit-linked and index-linked policies
There are no insurance companies in the Group.
5. Administration and dealing on behalf of third parties
Type of services 31.12.2014 31.12.2013
1. Execution of instructions on behalf of customers 205,178,531 215,183,750
a) purchases 103,110,061 103,858,337
1. settled 102,968,608 103,542,465
2. not settled 141,453 315,872
b) sales 102,068,470 111,325,413
1. settled 101,954,492 111,033,246
2. not settled 113,978 292,167
2. Portfolio management 750,043 797,872
a) Individual 750,043 797,872
b) Collective – –
3. Custody and administration of securities
a) Third-party securities on deposit as custodian bank (excluding portfolio management schemes) – –
1. securities issued by the reporting bank – –
2. other securities – –
b) third-party securities held on deposit (excluding portfolio management schemes): other 26,150,868 28,277,488
1. securities issued by the reporting bank 3,923,616 4,746,287
2. other securities 22,227,252 23,531,201
c) Third-party securities deposited with third parties 20,413,497 22,308,854
d) Portfolio securities deposited with third parties 11,118,084 11,144,212
4. Other transactions 16,970,178 19,760,851
1. Collection of receivables on behalf of third parties: debit and credit adjustments 11,274,466 12,965,694
a) debit adjustments 5,559,788 6,422,247
1. Current accounts 17,915 21,472
2. Central portfolio 5,541,873 6,400,775
3. Cash – –
4. Other accounts – –
b) credit adjustments 5,714,678 6,543,447
1. Current accounts 14,583 21,275
2. Presenters of notes and documents 5,697,706 6,519,785
3. Other accounts 2,389 2,387
2. Other transactions 5,695,712 6,795,157
a) collection of notes and other instruments on behalf of third parties 5,695,712 6,795,157

244 P a r t B - I n f o r m a t i o n o n t h e c o n s o l i d a t e d b a l a n c e s h e e t - O t h e r i n f o r m a t i o n
As regards the following amounts note that:
Service 1. "Execution of instructions on behalf of customers": it includes purchase and sale transactions, forward contracts traded on Italy's future's market (MIF) and derivatives traded on Italy's derivatives market (IDEM) in which the Group banks executes orders received from its customers (trading for and on behalf of third parties). Amounts of derivatives transactions are as follows:
31.12.2014 31.12.2013
a) Purchases 32,339,338 33,483,8091. settled 32,339,338 33,474,9932. not settled – 8,816
a) Sales 30,186,492 36,573,8721. settled 30,186,492 36,573,8722. not settled – –
Service 3. "Custody and administration of securities": securities received for custody and administration, including those received and held in guarantee, are stated at their nominal value. Line item b) also includes securities received from third parties to guarantee lending transactions, for which the Group banks provides custodian and administration services.
Service 4. Other transactions – 1 "Collection of receivables on behalf of third parties: debit and credit adjustments": the notes and documents received by the Bank subject to collection or after collection and for which the Group handles collection on behalf of third parties, must only be recorded in the balance sheet (as cash, loans to banks and customers, amounts due to banks and customers) at the time these amounts are settled. As a result, the notes portfolio has been reclassified in the financial statements according to settlement date, by making the accounting adjustments specified.
6. Financial assets subject to offsetting in the financial statements, or subject to framework offsetting agreements or similar arrangements
Technical forms Gross amount of financial
assets (a)
Amount of financial
assets offset in the
financial statements
(b)
Net amount of financial
assets reported in
the financial statements (c = a – b)
Related amounts not subject to offsetting in the financial
statements
Net amount 31.12.2014
(f = c – d – e)
Net amount 31.12.2013
Financial instruments
(d)
Cash deposits received
as collateral (e)
1. Derivatives 1,392,010 – 1,392,010 1,124,657 211,501 55,852 41,1612. Repurchase agreements 258,044 214,368 43,676 43,676 – – 273. Securities lending – – – – – – –4. Other – – – – – – –31.12.2014 1,650,054 214,368 1,435,686 1,168,333 211,501 55,852 X31.12.2013 1,229,236 - 1,229,236 1,044,925 143,123 X 41,188

245P a r t B - I n f o r m a t i o n o n t h e c o n s o l i d a t e d b a l a n c e s h e e t - O t h e r i n f o r m a t i o n
7. Financial liabilities subject to offsetting in the financial statements, or subject to framework offsetting agreements or similar arrangements
Technical forms Gross amount of financial
liabilities (a)
Amount of financial liabilities
offset in the financial
statements (b)
Net amount of financial
liabilities reported in
the financial statements (c = a – b)
Related amounts not subject to offsetting in the financial
statements
Net amount 31.12.2014
(f = c – d – e)
Net amount 31.12.2013
Financial instruments
(d)
Cash deposits given as
collateral (e)
1. Derivatives 1,415,920 – 1,415,920 1,088,349 281,939 45,632 51,9712. Repurchase agreements 5,692,424 214,368 5,478,056 5,474,480 – 3,576 4,6653. Securities lending – – – – – – –4. Other transactions – – – – – – –31.12.2014 7,108,344 214,368 6,893,976 6,562,829 281,939 49,208 X31.12.2013 5,597,952 – 5,597,952 5,375,539 165,777 X 56,636
The Group has entered into offsetting contracts on financial instruments and foreign exchange operations. The amount relating to repurchase agreements is mainly to do with operations carried out with the Cassa di Compensazione e Garanzia.
8. Securities lending transactions
Securities lending transactions are not significant at consolidated level and, accordingly, the related disclosures have been omitted.
9. Disclosures concerning joint arrangements
The Group is not party to any joint arrangements.


247
Part CInformation on the consolidated income statement


249P a r t C – I n f o r m a t i o n o n t h e c o n s o l i d a t e d i n c o m e s t a t e m e n t
Section 1 – Interest Line items 10 and 20
1.1 Interest and similar income: breakdown
Description/Technical forms Debt securities
Loans Other transactions
Year 2014
Year 2013
1. Financial assets held for trading 8,655 – 49 8,704 8,946
2. Financial assets designated at fair value through profit and loss 7,076 – – 7,076 8,108
3. Financial assets available for sale 204,466 – – 204,466 241,115
4. Investments held to maturity – – – – –
5. Due from banks 180 11,524 – 11,704 10,150
6. Loans to customers 7,584 1,000,914 – 1,008,498 1,101,282
7. Hedging derivatives – – 43,406 43,406 38,062
8. Other assets – – 5,448 5,448 2,904
Total 227,961 1,012,438 48,903 1,289,302 1,410,567
Line item 1. "Financial assets held for trading: other transactions" includes positive margins related to derivative contracts linked for operational purposes with financial assets and liabilities at fair value (under the fair value option) for 0.049 million (1.703 million in 2013). Line items 5 and 6 "Due from banks" and "Loans to customers" show, in the "Debt securities" column, interest income on own securities not listed on active markets, classified in these portfolios. The "Loans" column also includes interest income accrued on repurchase agreements used for lending purposes.Interest, other than that reported in line item 130. "Writebacks", accrued during the year on "impaired" positions, totals 39.924 million (44.192 million at 31.12.2013). This interest, calculated on financial assets valued at amortised cost according to the effective interest rate method, is reported in the various columns according to the technical form that gave rise to the interest. Any past due interest provided for in the contract is only recognised in the income statement when actually collected.
1.2 Interest and similar income: differentials on hedging transactions
Line items Year 2014 Year 2013
A. Positive differentials on hedging transactions 90,330 91,368
B. Negative differentials on hedging transactions (46,924) (53,306)
C. Balance (A-B) 43,406 38,062
The following table shows the breakdown of the differential balance, positive and negative, accrued on "hedging derivatives", reported in sub-item 7. "Hedging derivatives".

250 P a r t C – I n f o r m a t i o n o n t h e c o n s o l i d a t e d i n c o m e s t a t e m e n t
1.3 Interest and similar income: other information
1.3.1 Interest income on financial assets in foreign currency
Line items Year 2014 Year 2013
Interest income on financial assets in foreign currency 14,155 15,565
"Interest and similar income" on financial assets in foreign currency relates to income received and accrued on assets in currencies outside the euro-zone.
1.3.2 Interest income from finance leases
Interest income from finance leases amounts to 6.516 million (7.185 million at 31.12.2013).
1.4 Interest and similar expense: breakdown
Line items/Technical forms Payables Securities Other transactions
Year 2014
Year 2013
1. Due to central banks (5,868) X – (5,868) (25,666)
2. Due to banks (24,412) X – (24,412) (27,557)
3. Due to customers (154,259) X – (154,259) (210,112)
4. Securities issued X (300,180) – (300,180) (289,858)
5. Financial liabilities held for trading (776) – (1,609) (2,385) (2,071)
6. Financial liabilities designated at fair value through profit and loss – (1,984) – (1,984) (17,872)
7. Other liabilities and provisions X X (43) (43) (7)
8. Hedging derivatives X X – – –
Total (185,315) (302,164) (1,652) (489,131) (573,143)
Line items 2. and 3. "Due to banks/customers" in the "Payables" column include the interest related to amounts due for repurchase agreements on own securities and charges relating to amounts due for repurchase agreements on securities whose availability was obtained through reverse repurchase agreements.Line item 4. "Securities issued" shows the interest expense accrued on bonds and certificates of deposit valued at amortised cost during the year.
Line item 5. "Financial liabilities held for trading", in the "Other transactions" column, shows a net negative balance of 1.609 million (0.709 million in 2013) which relates to differentials and positive/negative margins on derivatives operationally linked to financial assets and liabilities classified in the trading book and which accrue interest. These are multiflow derivatives (interest rate swaps) connected to fixed rate debt securities classified as held for trading.
Line item 6. "Financial liabilities designated at fair value through profit and loss" includes interest expense accrued on structured and fixed-rate bonds issued, hedged by derivative contracts.In line item 8. "Hedging derivatives", the "Other transactions" column shows a zero balance, as the difference between the positive and negative differentials related to derivatives classified as hedges according to the hedge accounting rules is positive. Consequently, this balance is shown in the table 1.1 "Interest and similar income: breakdown".

251P a r t C – I n f o r m a t i o n o n t h e c o n s o l i d a t e d i n c o m e s t a t e m e n t
1.5 Interest and similar expense: differentials on hedging transactions
The balance of interest on differentials in hedging transactions at 31 December 2014 is positive. Details are provided in table "1.2 Interest and similar income: differentials on hedging transactions".
1.6 Interest and similar expense: other information
1.6.1 Interest expense on foreign currency liabilities
Line items Year 2014 Year 2013
Interest expense on foreign currency financial liabilities (2,528) (2,913)
Interest expense on foreign currency liabilities relates to that paid and accrued on liabilities in currencies outside the euro-zone.
1.6.2 Interest expense on finance leases
There is no interest expense on finance leases.

252 P a r t C – I n f o r m a t i o n o n t h e c o n s o l i d a t e d i n c o m e s t a t e m e n t
Section 2 – Commission Line items 40 and 50
2.1 Fee and commission income: breakdown
Type of service/Amounts Year 2014 Year 2013
a) guarantees given 34,838 31,860
b) credit derivatives – –
c) management, dealing and advisory services: 273,487 266,145
1. trading of financial instruments 20,545 19,769
2. currency trading 4,522 4,652
3. portfolio management 6,650 6,377
3.1 individual 6,650 6,377
3.2 collective – –
4. custody and administration of securities 11,789 12,205
5. custodian bank 18 20
6. placement of securities 153,239 150,115
7. receipt and transmission of instructions 26,409 25,072
8. advisory services 1,536 2,488
8.1 on investments 211 122
8.2 on financial structure 1,325 2,366
9. distribution of third-party services 48,779 45,447
9.1 portfolio management 4,196 4,361
9.1.1 individual 4,196 4,361
9.1.2 collective – –
9.2 insurance products 42,493 38,284
9.3 other products 2,090 2,802
d) collection and payment services 108,184 111,592
e) servicing for securitisation transactions – –
f) factoring services – –
g) tax collection services – –
h) management of multilateral trading systems – –
i) management of current accounts 64,189 66,791
j) other services 155,808 155,998
Total 636,506 632,386
Line item j) "Other services" includes: net fee and commission income on loans granted of 121.544 million (122.974 million at 31.12.2013), on the use of safe deposit boxes of 2.284 million (2.076 million at 31.12.2013), fee and commission income on securities lending of 1.906 million (2.194 at 31.12.2013) and the recharge of expenses for other banking services of 30.801 million (28.754 million at 31.12.2013).
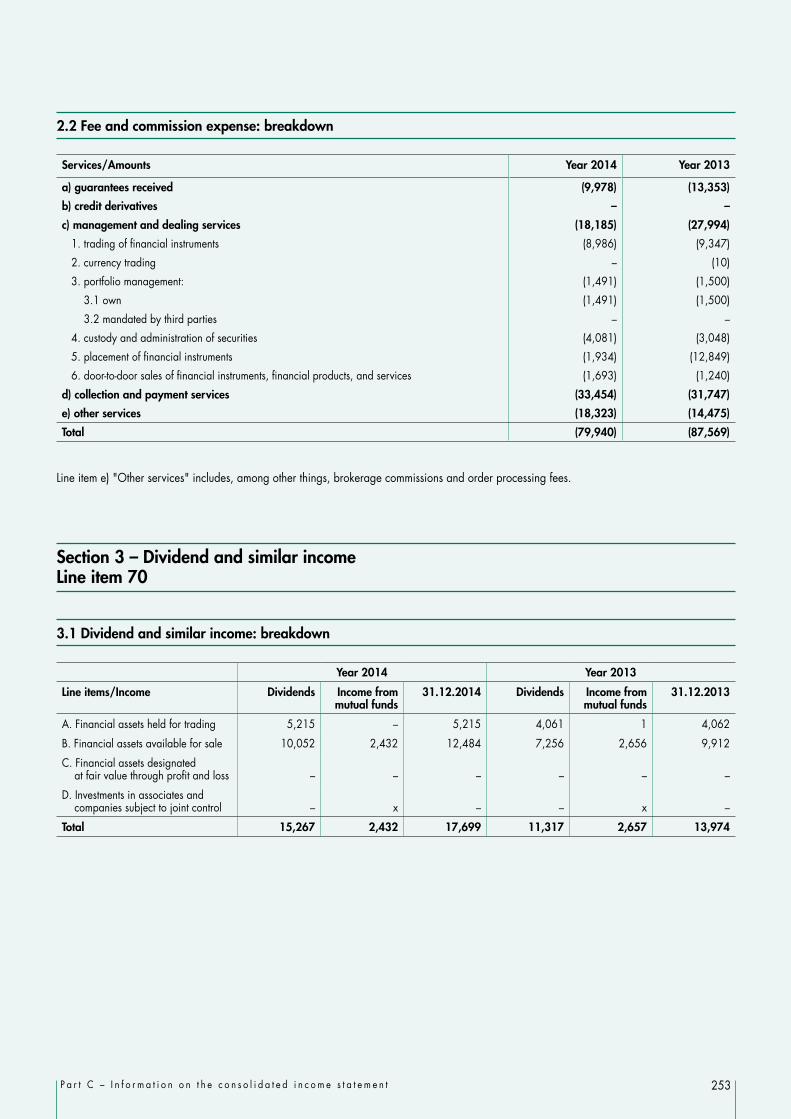
253P a r t C – I n f o r m a t i o n o n t h e c o n s o l i d a t e d i n c o m e s t a t e m e n t
2.2 Fee and commission expense: breakdown
Services/Amounts Year 2014 Year 2013
a) guarantees received (9,978) (13,353)
b) credit derivatives – –
c) management and dealing services (18,185) (27,994)
1. trading of financial instruments (8,986) (9,347)
2. currency trading – (10)
3. portfolio management: (1,491) (1,500)
3.1 own (1,491) (1,500)
3.2 mandated by third parties – –
4. custody and administration of securities (4,081) (3,048)
5. placement of financial instruments (1,934) (12,849)
6. door-to-door sales of financial instruments, financial products, and services (1,693) (1,240)
d) collection and payment services (33,454) (31,747)
e) other services (18,323) (14,475)
Total (79,940) (87,569)
Line item e) "Other services" includes, among other things, brokerage commissions and order processing fees.
Section 3 – Dividend and similar income Line item 70
3.1 Dividend and similar income: breakdown
Year 2014 Year 2013
Line items/Income Dividends Income from mutual funds
31.12.2014 Dividends Income from mutual funds
31.12.2013
A. Financial assets held for trading 5,215 – 5,215 4,061 1 4,062
B. Financial assets available for sale 10,052 2,432 12,484 7,256 2,656 9,912
C. Financial assets designated at fair value through profit and loss – – – – – –
D. Investments in associates and companies subject to joint control – x – – x –
Total 15,267 2,432 17,699 11,317 2,657 13,974

254 P a r t C – I n f o r m a t i o n o n t h e c o n s o l i d a t e d i n c o m e s t a t e m e n t
Section 4 – Profits (losses) on trading Line item 80
4.1 Profits (losses) on trading: breakdown
Transactions/Element of income Unrealised profits
Trading profits
Losses Trading losses
Net result [(A+B) – (C+D)]
(A) (B) (C) (D) Year 2014
1. Financial assets held for trading 11,212 36,462 (13,064) (12,610) 22,000
1.1 Debt securities 3,753 23,851 (1,314) (2,162) 24,128
1.2 Equities 1,418 12,394 (7,833) (10,433) (4,454)
1.3 Mutual funds – 3 – (4) (1)
1.4 Loans – – – – –
1.5 Other 6,041 214 (3,917) (11) 2,327
2. Financial liabilities held for trading 96 1,855 (383) (1,177) 391
2.1 Debt securities – – – – –
2.2 Payables 96 1,855 (383) (1,177) 391
2.3 Other – – – – –
3. Other financial assets and liabilities: foreign exchange differences X X X X (13)
4. Derivatives 930,552 1,005,454 (917,344) (1,001,494) 30,492
4.1 Financial derivatives: 930,552 1,005,404 (917,344) (1,001,391) 30,545
– On debt securities and interest rates 839,164 440,656 (869,289) (399,241) 11,290
– On equities and stock indices 85,808 546,978 (42,473) (584,744) 5,569
– On currency and gold X X X X 13,324
– Other 5,580 17,770 (5,582) (17,406) 362
4.2 Credit derivatives – 50 – (103) (53)
Total 941,860 1,043,771 (930,791) (1,015,281) 52,870
The table shows the profits or losses attributable to the portfolio of financial assets and liabilities held for trading, with the exception of derivatives hedging financial instruments for which the fair value option was adopted, with the valuation results being shown in Section 7 – "Profits (losses) on financial assets and liabilities designated at fair value – Line item 110".
1. Financial assets held for trading: line item "1.5 Other" includes the profits and losses from trading in currency, gold and other precious metals.3. Other financial assets and liabilities: foreign exchange differences: this sub-item includes the positive or negative balance of changes
in the value of financial assets and liabilities in foreign currency, other than those designated at fair value , those subject to fair value hedging (exchange risk or fair value) or cash flow hedging (exchange risk), as well as changes in the value of hedging derivatives.
4. Derivatives: positive and negative differentials and margins are reported in the "trading profits" and "trading losses" columns respectively.

255P a r t C – I n f o r m a t i o n o n t h e c o n s o l i d a t e d i n c o m e s t a t e m e n t
Section 5 – Fair value adjustments in hedge accounting Line item 90
5.1 Fair value adjustments in hedge accounting: breakdown
Element of income/Amounts Year 2014 Year 2013
A. Income relating to:
A.1 Derivatives with fair value hedges 32,094 28,110
A.2 Financial assets with fair value hedges 43,014 18,121
A.3 Financial liabilities with fair value hedges 26,529 62,019
A.4 Cash flow hedges – –
A.5 Foreign currency assets and liabilities – –
Total income from hedging activities (A) 101,637 108,250
B. Charges relating to:
B.1 Derivatives with fair value hedges (70,689) (84,625)
B.2 Financial assets with fair value hedges (2,121) (19,369)
B.3 Financial liabilities with fair value hedges (28,416) (5,967)
B.4 Cash flow hedges – –
B.5 Foreign currency assets and liabilities – –
Total charges from hedging activities (B) (101,226) (109,961)
C. Fair value adjustments in hedge accounting (A–B) 411 (1,711)
The table shows the net result of the fair value adjustments in hedge accounting. It therefore shows the realised income items booked to the income statement and arising from valuation of hedged assets and liabilities and the related derivative contracts, including any exchange differences. For information on the hedging derivatives, whose income and expenses must be entered on lines A.1 and B.1 of this table, please refer to Section 8 "Hedging derivatives – Line item 80" in assets and Section 6 "Hedging derivatives – Line item 60" of liabilities in Part B of these explanatory notes. For more information on hedged financial assets and liabilities, please refer to the detailed tables set out in Part B of these explanatory notes, in the sections relating to balance sheet items in which there are items being hedged.

256 P a r t C – I n f o r m a t i o n o n t h e c o n s o l i d a t e d i n c o m e s t a t e m e n t
The table below shows the details of net income items.
Fair value adjustments in hedge accounting: details of income items
Line items/Amounts Income Expenses Year 2014 Net result
Income Expenses Year 2013 Net result
1 Derivatives for fair value hedges:
Interest rate risk 32,094 (58,873) (26,779) 28,110 (70,183) (42,073)
Exchange rate risk – – – – – –
Credit risk – – – – – –
Price risk – (11,816) (11,816) – (14,442) (14,442)
Several risks – – – – – –
2 Financial assets with fair value hedges:
Specific hedges 30,092 (300) 29,792 18,121 (4,768) 13,353
Generic hedges 12,922 (1,821) 11,101 – (14,601) (14,601)
3 Financial liabilities with fair value hedges:
Specific hedges 26,529 (28,416) (1,887) 62,019 (5,967) 56,052
Generic hedges – – – – – –
4 Financial derivatives for cash flow hedges:
Expected transactions – – – – – –
Foreign investments – – – – – –
Exchange rate risk – – – – – –
5 Foreign currency assets and liabilities:
Assets in foreign currency – – – – – –
Liabilities in foreign currency – – – – – –
Total 101,637 (101,226) 411 108,250 (109,961) (1,711)
The breakdown of the net result of fair value adjustments in hedge accounting with regard to their underlying positions is shown below.
Description 2014 Net result
2013 Net result
Assets:
Debt securities available for sale (1,819) 1,899
Equities available for sale (2,581) 697
Due from banks – –
Loans to customers (560) 95
Liabilities
Bonds in circulation 5,371 (4,402)
Net result of fair value adjustments in hedge accounting 411 (1,711)
The amount shown under "Loans to customers" relates to the generic hedging of loans pertaining to the merged company Webank.

257P a r t C – I n f o r m a t i o n o n t h e c o n s o l i d a t e d i n c o m e s t a t e m e n t
Section 6 – Profits (losses) on disposal/repurchase Line item 100
6.1 Profits (losses) on disposal/repurchase: breakdown
Line items/Element of income Year 2014 Year 2013
Profits Losses Net result Profits Losses Net result
Financial assets
1. Due from banks – – – – – –
2. Loans to customers – (927) (927) 450 (10,045) (9,595)
3. Financial assets available for sale 154,171 (3,407) 150,764 189,852 (328) 189,524
3.1 Debt securities 154,040 (125) 153,915 172,112 (90) 172,022
3.2 Equities 105 (83) 22 17,387 (150) 17,237
3.3 Mutual funds 26 (2,422) (2,396) 353 (88) 265
3.4 Loans – (777) (777) – – –
4. Investments held to maturity – – – – – –
Total assets 154,171 (4,334) 149,837 190,302 (10,373) 179,929
Financial liabilities
1. Due to banks – – – – – –
2. Due to customers – – – 758 – 758
3. Securities issued – (97) (97) 208 (207) 1
Total liabilities – (97) (97) 966 (207) 759
Total 154,171 (4,431) 149,740 191,268 (10,580) 180,688
The table shows the result of selling financial assets other than those held for trading and those designated at fair value, and the result of repurchasing own financial liabilities.
Breakdown of "Financial assets: Due from banks and Loans to customers"
Line items/Amounts Year 2014 Year 2013
Profits Losses Net result Profits Losses Net result
1. Due from banks:
Loans – – – – – –
Debt securities – – – – – –
2. Loans to customers:
Loans – (927) (927) 450 – 450
Debt securities – – – – (10,045) (10,045)
Total – (927) (927) 450 (10,045) (9,595)
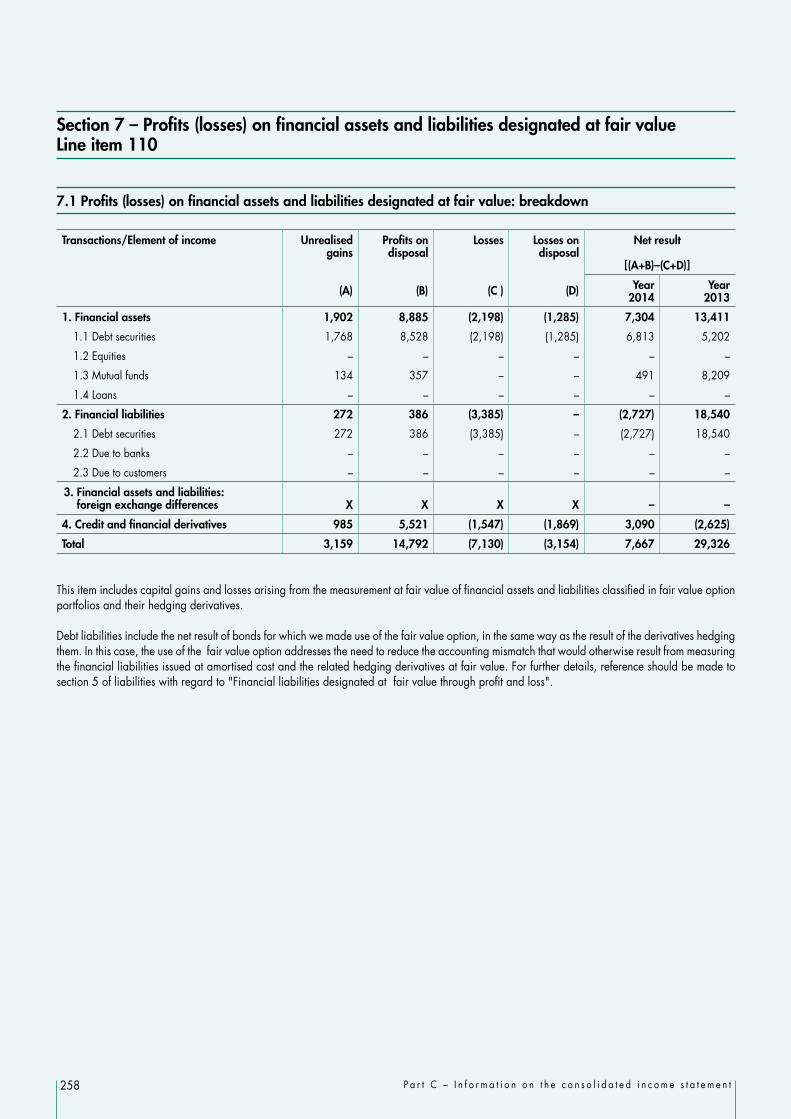
258 P a r t C – I n f o r m a t i o n o n t h e c o n s o l i d a t e d i n c o m e s t a t e m e n t
Section 7 – Profits (losses) on financial assets and liabilities designated at fair value Line item 110
7.1 Profits (losses) on financial assets and liabilities designated at fair value: breakdown
Transactions/Element of income Unrealised gains
(A)
Profits on disposal
(B)
Losses
(C )
Losses on disposal
(D)
Net result
[(A+B)–(C+D)]
Year 2014
Year 2013
1. Financial assets 1,902 8,885 (2,198) (1,285) 7,304 13,411
1.1 Debt securities 1,768 8,528 (2,198) (1,285) 6,813 5,202
1.2 Equities – – – – – –
1.3 Mutual funds 134 357 – – 491 8,209
1.4 Loans – – – – – –
2. Financial liabilities 272 386 (3,385) – (2,727) 18,540
2.1 Debt securities 272 386 (3,385) – (2,727) 18,540
2.2 Due to banks – – – – – –
2.3 Due to customers – – – – – –
3. Financial assets and liabilities: foreign exchange differences X X X X – –
4. Credit and financial derivatives 985 5,521 (1,547) (1,869) 3,090 (2,625)
Total 3,159 14,792 (7,130) (3,154) 7,667 29,326
This item includes capital gains and losses arising from the measurement at fair value of financial assets and liabilities classified in fair value option portfolios and their hedging derivatives.
Debt liabilities include the net result of bonds for which we made use of the fair value option, in the same way as the result of the derivatives hedging them. In this case, the use of the fair value option addresses the need to reduce the accounting mismatch that would otherwise result from measuring the financial liabilities issued at amortised cost and the related hedging derivatives at fair value. For further details, reference should be made to section 5 of liabilities with regard to "Financial liabilities designated at fair value through profit and loss".

259P a r t C – I n f o r m a t i o n o n t h e c o n s o l i d a t e d i n c o m e s t a t e m e n t
Section 8 – Net losses/recoveries on impairment Line item 130
8.1 Net losses/recoveries on impairment of loans: breakdown
Transactions/Element of income
Adjustments (1)
Write-backs (2)
Total
Year 2014
Year 2013Specific Portfolio Specific Portfolio
Write-offs Other A B A B
A. Due from banks
– Loans – – (638) – 40 – 119 (479) 294
– Debt securities – – – – – – – – –
B. Loans to customers
Impaired loans purchased
– Loans – – x – – x x – –
– Debt securities – – x – – x x – –
Other receivables
– Loans (11,285) (545,825) (27,632) 45,815 96,766 – 35,423 (406,738) (569,596)
– Debt securities – (2,187) – – – – – (2,187) –
C. Total (11,285) (548,012) (28,270) 45,815 96,806 – 35,542 (409,404) (569,302)
Key: A = for interest B = Other writebacks
This item includes adjustments and writebacks to cover impairment of the financial instruments allocated to the "loans to customers" and "due from banks" portfolios. In particular, the "Write-offs" column shows the losses booked on final cancellation of the loans, while the "Other" column includes specific write-downs on impaired loans subject to analytical assessment. The portfolio adjustments are quantified on the performing financial instruments. As part of the specific writebacks, column A mainly shows the writebacks represented by the release of interest on impaired loans measured at amortised cost.
8.2 Net losses/recoveries on impairment of financial assets available for sale: breakdown
Transactions/Element of income Adjustments (1) Write-backs (2) Year 2014 Year 2013
Specific Specific
Write-offs Other A BA. Debt securities – – – – – –B. Equities – (35,155) x x (35,155) (65,788)C. Mutual funds – (5,587) x – (5,587) (17,379)D. Loans to banks – – – – – –E. Loans to customers – – – – – –F. Total – (40,742) – – (40,742) (83,167)
Key: A = for interest B = Other writebacks

260 P a r t C – I n f o r m a t i o n o n t h e c o n s o l i d a t e d i n c o m e s t a t e m e n t
Specific adjustments to equities relate to the write-offs and writedowns made to the investments held in the following companies and investment funds.
Specific adjustments Year 2014 Year 2013
Equities (35,155) (65,788)• Aedes S.p.A (26) (18)• Alba Leasing S.p.A. (101) (1,380)• Banca Popolare dell’Etruria – (153)• Comital S.p.A. (330) (900)• Dexia Crediop S.p.A. – (49,286)• Equinox (1,655) (2,718)• Fenice Holding S.p.A. – (6,783)• Gabetti S.p.A. – azioni ordinarie (1,912) (97)• Industria e Università S.c.r.l. (269) –• Idroenergia S.c.r.l. – (2)• Istituto Europeo di Oncologia S.r.l. – (277)• Italtel S.p.A. – Strumenti Partecipativi – (1,585)• Milanosesto S.p.A. – Strumenti partecipativi (325) –• Premuda (691) (73)• Release S.p.A. (10,070) –• Risanamento S.p.A. (9,304) –• Targetti S.p.A.– Strumenti Partecipativi (488) (2,032)• Prelios S.p.A. (9,639) (262)• Expo Piemonte S.p.A. (84) (197)• Terme di Acqui S.p.A. (7) (25)• Zucchi S.p.A. (254) –
Mutual funds (5,587) (17,379)• Cambria Co–Invest Fund – (100)• Fondo Amber Energia (1,192) –• Fondo Idea I A FOF – (1,169)• Fondo immobiliare italiano Goethe (2,976) (5,383)• Fondo immobiliare italiano Sammartini – (7,251)• Fondo immobiliare italiano Tikal (41) (1,918)• Fondo Wisequity II (1,378) (1,558)
Total (40,742) (83,167)
8.3 Net losses/recoveries on impairment of investments held to maturity: breakdown
At the date of the financial statements there are no financial assets held to maturity.

261P a r t C – I n f o r m a t i o n o n t h e c o n s o l i d a t e d i n c o m e s t a t e m e n t
8.4 Net losses/recoveries on impairment of other financial activities: breakdown
Transactions/Element of income
Adjustments (1) Write-backs (2) Year 2014
Year 2013Specific Portfolio Specific Portfolio
Write-offs Other A B A B
Other (3,393) (14,847) (1,740) – 5,287 – 1,185 (13,508) (10,762)
B. Credit derivatives – – – – – – – – –
C. Commitments to disburse funds – – – – – – – – –
D. Other transactions – – – – – – – – –
E. Total (3,393) (14,847) (1,740) – 5,287 – 1,185 (13,508) (10,762)
Key: A = for interest B = Other writebacks
This line item shows the adjustments/writebacks made on guarantees given in conjunction with the expected loss in the event of their enforcement.The adjustments, in the "Other" column, relate to provisions made on specific positions of guarantees given, while the portfolio adjustments are calculated by the same method adopted for collective writedowns. This item includes the provision on the portion attributable to the commitment taken by the Interbank Guarantee Fund for the rescue interventions that have been approved.
Section 9 – Net insurance premiums Line item 150
As at the reporting date, there is no such line item as there are no insurance companies in the Group.
Section 10 – Other net insurance income (expense) Line item 160
As at the reporting date, there is no such line item as there are no insurance companies in the Group.

262 P a r t C – I n f o r m a t i o n o n t h e c o n s o l i d a t e d i n c o m e s t a t e m e n t
Section 11 – Administrative expenses Line item 180
11.1 Personnel expenses: breakdown
In addition to personnel expenses, these costs include: the cost of employees seconded to other companies and the related recharges; costs for non-standard employment contracts (e.g. temporary and contract workers); reimbursement of cost of employees of other companies seconded to group companies; remuneration payable to the members of the Management Board and the Supervisory Board of the Parent Company and to the directors and
the statutory auditors of the other Group companies (including the costs incurred for civil liability insurance policies); costs associated with share-based payments; provisions made, with contra-entry to "other liabilities", for productivity bonuses relating to the year, but paid the following year.
Type of expense/Amounts Year 2014 Year 2013
1) Employees (607,985) (600,999)
a) wages and salaries (403,761) (401,750)
b) social security charges (119,901) (118,047)
c) termination indemnities (20,827) (21,981)
d) pension costs – –
e) charge to employee termination indemnities (3,797) (5,760)
f) charge to provision for post employment benefits: (6,375) (9,867)
– defined contribution – –
– defined benefit (6,375) (9,867)
g) payments to external supplementary pension funds: (9,415) (10,275)
– defined contribution (9,415) (10,275)
– defined benefit – –
h) costs associated with share–based payments (16,526) –
i) other staff benefits (27,383) (33,319)
2) Other personnel (126) (1,861)
3) Directors and Statutory Auditors (4,309) (5,860)
4) Retired personnel – –
Total (612,420) (608,720)
With reference to these types of expenses, we would point out the following:
Line item c) "employee termination indemnities" comprises, in addition to the persons who left during the year, also the termination indemnities paid directly to INPS and to pension funds.
Sub-item g) "payments to external supplementary pension funds – defined contribution" comprises the contribution paid to external retirement benefit plans.
Sub-item "h) costs associated with share-based payments" refers to the portion reserved to employees of the Parent Company, except for those who hold top management positions, in compliance with art. 60 based on the Articles of Association approved by the Extraordinary General Meeting of Members held on 22 October 2011. This portion is equal to 5% of the pre-tax profit of the Parent Company (i.e. "income before tax from continuing operations") calculated prior to the amount to be determined, unless the general meeting decides not to distribute dividends on the net income for the year. This amount is paid in the form of shares, which will be subject to a three-year retention period before the assignee can dispose of them. The reference value of the shares is equal to the average market price recorded during the 30 days preceding the assignment.That said, note that – based on the results of the Parent Company for 2014 – "income from continuing operations before taxes" (that is, income prior to the impact of the above), prior to the computation of amounts to be allocated to employees, came to Euro 319,519,671.98. Accordingly, given what is laid down in the articles of association, the amount payable to employees was Euro 15,975,983.60.After deducting this amount, income from continuing operations before taxes comes to Euro 303,543,688.38, as shown by income statement line item 250.

263P a r t C – I n f o r m a t i o n o n t h e c o n s o l i d a t e d i n c o m e s t a t e m e n t
In 2013, in view of the fact that no dividends were proposed and, given what is laid down in the articles of association, the amount payable to employees for 2013 was deemed to be zero.
Sub-item i) "other staff benefits" is illustrated in paragraph 11.4 of this Section.
The line item "3) Directors and Statutory Auditors" includes the following remuneration:
1.183 million to members of the Management Board of the Parent Company; 2.180 million to members of the Supervisory Board of the Parent Company; 0.708 million to members of the Boards of Directors of subsidiaries; 0.238 million to members of the Boards of Statutory Auditors of subsidiaries.
11.2 Average number of employees by level
Line items Year 2014 Year 2013
Employees 7,260 7,420
a) managers 153 169
b) officials 2,751 2,840
– of which: 3rd and 4th level 1,466 1,530
c) other employees 4,356 4,411
Other personnel 23 55
Consultants and temps 23 55
Total 7,283 7,475
The average number is calculated as the weighted average number of employees where the weighting is given by the number of months worked during the year. Part-time employees are conventionally considered at 50%.
Number of employees by category
Line items 31.12.2014 31.12.2013
Employees 7,740 7,803
a) managers 150 161
b) officials 2,798 2,820
– of which: 3rd and 4th level 1,472 1,471
c) other employees 4,792 4,822
Other personnel 19 43
Consultants and temps 19 43
Total 7,759 7,846
The number of employees includes 1,095 part-timers (1,060 at 31.12.2013), with an incidence of 14.1% of total personnel in service at the balance sheet date. Changes in the number of employees are shown in the "Human resources" chapter of the report on operations, to which you are referred.

264 P a r t C – I n f o r m a t i o n o n t h e c o n s o l i d a t e d i n c o m e s t a t e m e n t
11.3 Defined-benefit pension plans: costs and revenues
Year 2014 Year 2013
– pension cost: (1,703) (6,562)
– BPM supplementary pension plan (1,703) (6,562)
– plan of the former Banca popolare Bologna e Ferrara – –
– plan of the former Banca Agricola Milanese – –
– plan of the former CR Alessandria – –
– interest expense: (2,331) (3,305)
– BPM supplementary pension plan (1,415) (1,965)
– plan of the former Banca popolare Bologna e Ferrara (213) (449)
– plan of the former Banca Agricola Milanese (1) (1)
– plan of the former CR Alessandria (702) (890)
Total (4,034) (9,867)
In addition to the above costs, for 2014 there is also a solidarity contribution of 10% under Law 166/91 of 2.341 million recognised in the income statement in the sub-item "charge to provision for post employment benefits".
Breakdown of "actuarial gains (losses) posted to shareholders' equity"
Line items 31.12.2013 Change 31.12.2014
BPM supplementary pension plan (19,041) (13,410) (32,451)
Plan of the former Banca popolare Bologna e Ferrara (8,140) (1,974) (10,114)
Plan of the former Banca Agricola Milanese (4) (3) (7)
Plan of the former CR Alessandria (6,986) (3,991) (10,977)
Total actuarial gains (losses) (34,171) (19,378) (53,549)
11.4 Other staff benefits
"Other staff benefits" include an expense of 13.181 relating to the Solidarity Fund agreement signed by the Group's banks and the trade unions in December 2012 (16.345 million in 2013).Lastly, this item includes contributions towards the running of staff canteens, the cost of subsidised-rate loans given to employees and the cost of staff severance incentives.

265P a r t C – I n f o r m a t i o n o n t h e c o n s o l i d a t e d i n c o m e s t a t e m e n t
11.5 Other administrative expense: breakdown
Type of service/Amounts Year 2014 Year 2013
IT expenses (74,693) (79,118)
Maintenance and rent of hardware and software and data transmission (60,514) (64,853)
Services rendered by Group companies – –
ATM running costs (1,270) (1,559)
Outsourced IT services (12,909) (12,706)
Expenses for buildings and furniture (51,036) (55,499)
Property leases (38,216) (40,302)
Property leases (37,560) (39,563)
Office machine lease charges (656) (739)
Other expenses (12,820) (15,197)
Maintenance (8,107) (9,299)
Cleaning (4,713) (5,898)
Purchases of assets and non-professional services (60,718) (66,247)
Telephone and postage (11,360) (13,478)
Sub-contract work (14,910) (14,937)
Security and cash counting services (8,479) (9,755)
Electricity, heating and water (13,032) (15,023)
Transport (6,916) (6,888)
Stationery and printing (4,156) (4,416)
Removals and porterage (1,385) (1,177)
Subscriptions to newspapers and magazines (480) (573)
Purchases of professional services (45,617) (49,617)
Professional fees (29,798) (33,559)
Legal expenses and company information (15,576) (15,620)
Directors' and statutory auditors' fees (243) (438)
Insurance premiums (4,381) (4,144)
Advertising expenses (20,325) (19,126)
Indirect taxes and duties (109,537) (103,143)
Other (9,327) (9,155)
Charity (1,037) (789)
Membership fees and fees mandatory by law (3,969) (3,868)
Other (4,321) (4,498)
Total (375,634) (386,049)
"Indirect taxes and duties" include indirect taxes (stamp duty and flat-rate tax) recharged to customers of 89.223 million. In the reclassified income statement, as indicated in the notes thereto, this amount has been reversed from both "other administrative expenses" and "other operating charges/income".

266 P a r t C – I n f o r m a t i o n o n t h e c o n s o l i d a t e d i n c o m e s t a t e m e n t
Section 12 – Net provisions for risks and charges Line item 190
12.1 Net provisions for risks and charges: breakdown
Year 2014 Year 2013
Provisions (20,496) (24,208)
Legal disputes (15,257) (16,968)
Other risks and charges (5,239) (7,240)
– Provision for recovery procedures (2,227) (668)
– Provision for tax disputes – –
– Provision for other future charges (3,012) (6,572)
Reallocations 16,951 14,589
Legal disputes 13,587 7,209
Other risks and charges 3,364 7,380
– Provision for recovery procedures 75 786
– Provision for tax disputes 3,000 –
– Provision for other future charges 289 6,594
Total (3,545) (9,619)
Net provisions for risks and charges concern the risk related to ongoing legal disputes, and others, to cover any loss that might arise in connection with contractual disputes of a commercial nature; they also include changes in provisions during the year as the timing of expected liabilities comes nearer, to reflect the financial component related to the time value of money.

267P a r t C – I n f o r m a t i o n o n t h e c o n s o l i d a t e d i n c o m e s t a t e m e n t
Section 13 – Net adjustments to/recoveries on property and equipment Line item 200
This line item includes the depreciation charge on property and other fixed assets.
13.1 Net adjustments to/recoveries on property and equipment: breakdown
Asset/Element of income Depreciation
(A)
Impairment adjustments
(B)
Write-backs
(C)
Net result
(A + B + C)
Year 2014 Year 2013
A. Property and equipment
A.1 Owned by company (42,150) (2,300) – (44,450) (43,791)
– used in the business (41,261) (2,300) – (43,561) (42,847)
– for investment (889) – – (889) (944)
A.2 Purchased under finance lease – – – – –
– used in the business – – – – –
– for investment – – – – –
Total (42,150) (2,300) – (44,450) (43,791)
In the course of the year the Parent Company revised the useful life of its property.This revision took place with the support of a valuation performed by an independent expert, who provided an estimate of the fair value of each property, leading, as a consequence, to an updated residual useful life. As a result of this exercise, the useful life of the properties owned by the Parent Company has been determined to be between 15 and 30 years.The new residual useful life has been applied as from 1 October 2014 and has led, in comparison to the parameters used last year, to a lower depreciation charge of some 2.2 million euro.Furthermore, the valuation exercise performed by the independent expert has identified, for a limited number of properties, differences between the carrying amount and fair value that are indicative of impairment.The impairment adjustment recognised in the income statement of an amount of 2.3 million euro has reduced the total carrying amount of property (land and buildings) due to impairment from 7.2 million euro at 31 December 2013 to 4.7 million euro at 31 December 2014, being an amount which also includes the depreciation charge for the year ended 31 December 2014 (some 0.2 million euro).

268 P a r t C – I n f o r m a t i o n o n t h e c o n s o l i d a t e d i n c o m e s t a t e m e n t
Section 14 – Net adjustments to/recoveries on intangible assets Line item 210
14.1 Net adjustments to/recoveries on intangible assets: breakdown
Asset/Element of income Amortisation
(A)
Impairment adjustments
(B)
Write-backs
(C)
Net result
(A + B + C)
Year 2014 Year 2013
A. Intangible assets
A.1 Owned by company (25,859) – – (25,859) (24,346)
– Internally generated (383) – – (383) (415)
– Other (25,476) – – (25,476) (23,931)
A.2 Purchased under finance lease – – – – –
Total (25,859) – – (25,859) (24,346)
Section 15 – Other operating expenses/income Line item 220
15.1 Other operating expenses: breakdown
Element of income/Amount Year 2014 Year 2013
Leasehold improvements booked to "Other assets" (4,575) (4,509)
Other operating expenses (16,793) (11,284)
Total (21,368) (15,793)
15.2 Other operating income: breakdown
Element of income/Amount Year 2014 Year 2013
Tax recoveries 89,223 80,799
Rental and leasing income 7,955 7,382
Income and IT services rendered to: 35 39
Group companies – –
Third parties 35 39
Recharge of costs 41,688 47,010
On deposits and overdrafts 27,372 33,444
Other 14,316 13,566
Other income 20,515 9,469
Total 159,416 144,699
Year 2014 Year 2013
Total other operating expenses/income (line item 220) 138,048 128,906
"Tax recoveries" are mainly the stamp duty on current accounts and securities deposits and the flat-rate tax on medium-term loans.

269P a r t C – I n f o r m a t i o n o n t h e c o n s o l i d a t e d i n c o m e s t a t e m e n t
Section 16 – Profits (losses) on investments in associates and companies subject to joint controlLine item 240
16.1 Profits (losses) on investments in associates and companies subject to joint control: breakdown
Element of income/Sectors Year 2014 Year 2013
1) Jointly controlled entities
A. Income 8 16
1. Revaluations 8 16
2. Profits on disposal – –
3. Writebacks – –
4. Other income – –
B. Charges – (243)
1. Writedowns – –
2. Impairment charges – (243)
3. Losses on disposal – –
4. Other charges – –
Net result 8 (227)
2) Companies subject to significant influence
A. Income 129,879 55,028
1. Revaluations 25,405 55,028
2. Profits on disposal 104,474 –
3. Writebacks – –
4. Other income – –
B. Charges (2,556) (7,448)
1. Writedowns (2,556) (7,448)
2. Impairment charges – –
3. Losses on disposal – –
4. Other charges – –
Net result 127,323 47,580
Total 127,331 47,353
The "revaluations" and "writedowns" lines show adjustments to investments in jointly controlled entities and companies subject to significant influence, to align them with the corresponding portion of the investees’ net equity at the balance sheet date, inclusive of the result for the year attributable to the Group. Total net income pertaining to the Group from investments carried at equity value amounted to 22.857 million. This amount, which is presented in the reclassified income statement as "Profit (loss) on investments carried at equity", is mainly attributable to Anima Holding and Factorit.The profits on disposal derive from the sale of BPM's 18.44% interest in Anima Holding.
Section 17 – Net result of valuation differences on property, equipment and intangible assets measured at fair valueLine item 250
The Group does not hold any property, equipment or intangible assets measured at fair value or revalued.

270 P a r t C – I n f o r m a t i o n o n t h e c o n s o l i d a t e d i n c o m e s t a t e m e n t
Section 18 – Goodwill impairment Line item 260
The total value of goodwill was written down to zero in the first half of 2012.
Section 19 – Profits (losses) on disposal of investments Line item 270
19.1 Profits (losses) on disposal of investments: breakdown
Element of income/Amount Year 2014 Year 2013
A. Buildings – (261)
– Profits on disposal – 109
– Losses on disposal – (370)
B. Other assets – 3
– Profits on disposal – 6
– Losses on disposal – (3)
Net result – (258)
Section 20 – Taxes on income from continuing operations Line item 290
20.1 Taxes on income from continuing operations: breakdown
Element of income/Sectors Year 2014 Year 2013
1. Current taxes (–) (167,942) (210,033)
2. Change in prior period income taxes (+/–) 13,210 (10,944)
3. Reduction in current taxes (+) – –
3. bis Reduction in current taxes due to tax credits under Law 214/2011 (+) 187 65,509
4. Change in deferred tax assets (+/–) 47,628 68,528
5. Change in deferred tax liabilities (+/–) 14,909 19,498
6. Income taxes for the year (–) ( –1+/–2+3+3bis+/–4+/–5) (92,008) (67,442)
The balance on line item 290 "Taxes on income from continuing operations" is negative for 92 million (negative for 67.442 million in 2013).The change in deferred tax assets of 47.628 million is explained in the notes in asset section 14 – tables 14.3 and 14.5. The change in deferred tax liabilities of 14.909 million is explained in the notes in asset section 14 – tables 14.4 and 14.6.

271P a r t C – I n f o r m a t i o n o n t h e c o n s o l i d a t e d i n c o m e s t a t e m e n t
Section 21 – Income (loss) after tax from discontinued operations Line item 310
During the year, the Bank did not book any profits or losses relating to discontinued operations.
Section 22 – Net income (loss) for the period pertaining to minority interests Line item 330
22.1 Breakdown of line item 330 "Net income (loss) for the period pertaining to minority interests"
Net income (loss) attributable to minority interests relates to the following consolidated companies:
Company Year 2014 Year 2013
Net income (loss) from continuing operations attributable to minority interests
• Banca Popolare Mantova 86 (506)
• Banca Akros 554 306
Total 640 (200)
Section 23 – Other information
Further information on the 2014 results is provided in the section of the report on operations on the various business segments.

272 P a r t C – I n f o r m a t i o n o n t h e c o n s o l i d a t e d i n c o m e s t a t e m e n t
Section 24 – Earnings per share
The new international accounting standards (IAS 33) stress the importance of the "profit per share" ratio – commonly known as "EPS – earnings per share", making its disclosure compulsory: "Basic EPS", calculated by dividing the net income attributable to the holders of the ordinary shares of the Parent Company by the weighted
average number of ordinary shares outstanding during the period, "Diluted EPS", calculated by dividing the net income by the weighted average number of ordinary shares outstanding during the period as
adjusted for the dilutive effect of all potential shares, i.e. those financial instruments and/or contracts which give their owners the right to obtain ordinary shares.
The profit (or loss) from continuing operations during the year and the profit (or loss) from discontinued operations are shown separately.
24.1 Average number of diluted ordinary shares
The average number of ordinary shares used as the denominator in the calculation of basic EPS (3,931,050,125) was determined taking into account the number of ordinary shares outstanding during the period, adjusted by the number of treasury shares held. In particular, the number of shares issued at the time of subscription of the capital increase (1,162,161,765) has been weighted based on the number of days between the date of completion of the offering period (for the rights exercised during the offering period) or the exercise date (for the rights not exercised during the offering period) and 31 December 2014.At 31 December 2014, there are no outstanding instruments that could have a dilutive effect on earnings per share; consequently, the basic and diluted EPS shown below are the same.
Basic and diluted EPS are therefore as follows:
Net income per share pertaining to the Group (in Euro)
31.12.2014 31.12.2013
Basic EPS from continuing operations 0.059 0.009
Basic EPS from discontinued operations – –
Basic EPS 0.059 0.009
Diluted EPS from continuing operations 0.059 0.009
Diluted EPS from discontinued operations – –
Diluted EPS 0.059 0.009

273
Part DConsolidated comprehensive income

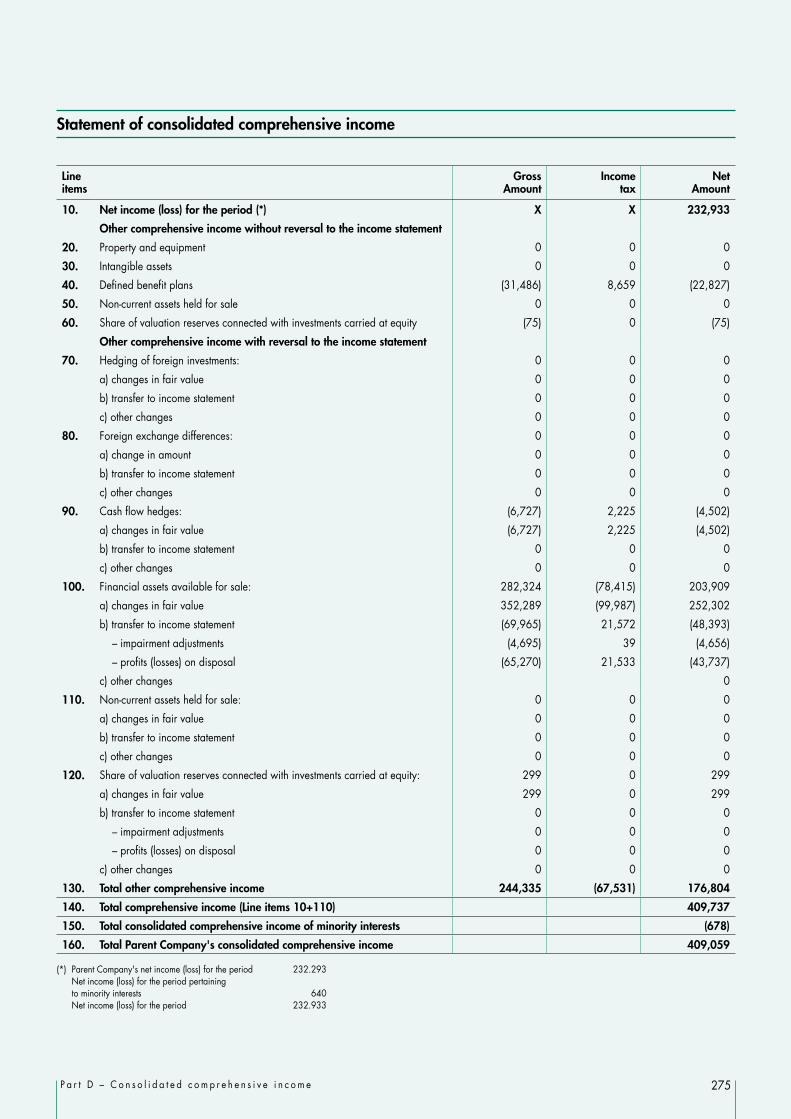
275P a r t D – C o n s o l i d a t e d c o m p r e h e n s i v e i n c o m e
Statement of consolidated comprehensive income
Line items
Gross Amount
Income tax
Net Amount
10. Net income (loss) for the period (*) X X 232,933
Other comprehensive income without reversal to the income statement
20. Property and equipment 0 0 0
30. Intangible assets 0 0 0
40. Defined benefit plans (31,486) 8,659 (22,827)
50. Non-current assets held for sale 0 0 0
60. Share of valuation reserves connected with investments carried at equity (75) 0 (75)
Other comprehensive income with reversal to the income statement
70. Hedging of foreign investments: 0 0 0
a) changes in fair value 0 0 0
b) transfer to income statement 0 0 0
c) other changes 0 0 0
80. Foreign exchange differences: 0 0 0
a) change in amount 0 0 0
b) transfer to income statement 0 0 0
c) other changes 0 0 0
90. Cash flow hedges: (6,727) 2,225 (4,502)
a) changes in fair value (6,727) 2,225 (4,502)
b) transfer to income statement 0 0 0
c) other changes 0 0 0
100. Financial assets available for sale: 282,324 (78,415) 203,909
a) changes in fair value 352,289 (99,987) 252,302
b) transfer to income statement (69,965) 21,572 (48,393)
– impairment adjustments (4,695) 39 (4,656)
– profits (losses) on disposal (65,270) 21,533 (43,737)
c) other changes 0
110. Non-current assets held for sale: 0 0 0
a) changes in fair value 0 0 0
b) transfer to income statement 0 0 0
c) other changes 0 0 0
120. Share of valuation reserves connected with investments carried at equity: 299 0 299
a) changes in fair value 299 0 299
b) transfer to income statement 0 0 0
– impairment adjustments 0 0 0
– profits (losses) on disposal 0 0 0
c) other changes 0 0 0
130. Total other comprehensive income 244,335 (67,531) 176,804
140. Total comprehensive income (Line items 10+110) 409,737
150. Total consolidated comprehensive income of minority interests (678)
160. Total Parent Company's consolidated comprehensive income 409,059
(*) Parent Company's net income (loss) for the period 232.293 Net income (loss) for the period pertaining to minority interests 640 Net income (loss) for the period 232.933


277
Part EInformation on risks and related hedging policies


279P a r t E - I n f o r m a t i o n o n r i s k s a n d r e l a t e d h e d g i n g p o l i c i e s
Section 1 – Risks of the Banking Group
Unless indicated otherwise, the information contained in Section 1 "Risks of the Banking Group" only refers to the Banking Group.The figures are shown prior to elimination of intercompany transactions with other consolidated companies not included in the Banking Group and conventionally also include assets and liabilities of banking, financial and near-banking joint ventures in proportion to the interest held.
Within Bipiemme Group there are: two companies (Bpm Securitisation 2 Srl and Bpm Securitisation 3 Srl) that are consolidated line-by-line but which are not part of the Banking Group, given that they are special purpose vehicles for securitisations and in which no equity interests are held; one jointly controlled company (Calliope Finance Srl), which, in the consolidated financial statements, is measured using the equity method.
Please note that the figures contained in the other sections of these notes (in part B and C) include the figures of companies which are not part of the Banking Group and exclude the figures relating to the joint ventures.
Introduction
The risk monitoring and control process
In accordance with the role assigned to it by the Supervisory Regulations, the Management Board of the Parent Company is responsible for making strategic decisions concerning risk management and control at Group level, with a view to achieving an integrated and coherent risk management policy that, at the same time, takes into account the type of operations and associated risk profile of each Bipiemme Group company, with the aim of preserving the Group's sound and prudent management.
In November 2014 BPM's Management Board set up a Risk Committee, which was set up as a sub-committee of the former, in compliance with the Bank of Italy Circular no. 285, with functions of strategic supervision of risk and of the internal control system; the Board Committee works alongside the Group Risks Committee, set up by the Bipiemme Group in 2013 to support the corporate bodies in achieving integrated management of risks. The latter meets at least once a month and has the task of supervising the integrated management of all business risks to which the individual members of the Group and the Group as a whole are exposed to.
The tasks assigned thereto, among other, are: to discuss and share the Risk Appetite Framework, proposing to the Management Board – through the Managing Director – for its approval,
the quantitative measures on which the RAF is based, as well as the various thresholds such as Risk Capacity (internal or regulatory constraint), Tolerance (maximum deviation allowed), Trigger (budget target), Target (objective of the Business Plan) and Profile (risk actually taken at a given point in time). It is informed by Risk Management on the opinions provided for more significant transactions;
to approve the risk limit in accordance with the risk appetite defined by the Strategic Supervisory Body and propose to the Managing Director, in the event that the tolerance limit is exceeded, the management/operational actions required to bring the risk back down to the target level (so-called contingency and recovery actions);
to ensure that the risk management process is consistent with the risk appetite and risk governance policies, taking into account any changes in the internal and external conditions in which the Group operates;
to define the criteria to be followed and activities to be carried out to maintain control over risk management and its adequacy on an ongoing basis;
to define and/or request, as appropriate, measures to be taken to eliminate any weaknesses observed in the risk management processes; to monitor on a continuing basis the evolution of business risks and compliance with the limits on the various types of risk that can be taken; to facilitate the development and implementation of specific indicators able to detect anomalies and inefficiencies in the risk measurement and
control models; to facilitate the development and dissemination at all levels of an integrated risk culture in relation to the various types of risk, extended to the
whole of the Bipiemme Group.
The monitoring and control of risk is delegated to the Risk Management function of the Parent Company, which has the task of monitoring risk at Group level, ensuring the development and continuous improvement of methodologies and models used in their measurement. The Risk Management function also coordinates the formulation and implementation of the Risk Appetite Framework (RAF) and related risk governance policies through an adequate risk management process, defined as the identification, measurement or assessment, monitoring, prevention, mitigation and communication of the risks to which the Group is or could be exposed.

280 P a r t E - I n f o r m a t i o n o n r i s k s a n d r e l a t e d h e d g i n g p o l i c i e s
In the case of market risks, the Parent Company's Risk Management function also makes use of the work performed by the equivalent function at Banca Akros. For these purposes, the Parent Company: ensures that the same methods, measurement criteria and control tools are used throughout the Group and that they are suitable for the type
and size of the risks being assumed; makes sure that the corporate bodies of the subsidiary companies are involved in the decisions made concerning risk management procedures
and policies; performs the periodic assessment of the Group Risk Profile as part of the Risk Management reporting (actual risk assumed by the Group,
measured at a given point in time) and compares it with the threshold values laid down in the RAF.
The Bank's system of internal control (ICS) reflects an articulated, systemic vision, which sets out the general principles that are designed to ensure the correct and effective management of the systems to be checked for risks, defining, in particular, how they function and the guidelines for the monitoring and coordination of the Group companies' control activities.More specifically, the 15th update of the Bank of Italy's Circular no. 263 defines the internal control system as a set of rules, functions, structures, resources, processes and procedures designed to ensure the achievement of the following goals in accordance with sound and prudent management: checks on the implementation of corporate strategies and policies; mitigation of risk within the limits laid down in the RAF; protection of the value of assets and protection against losses; effectiveness and efficiency of business processes; reliability and security of corporate information and IT procedures; prevention of the risk that the Group may be involved, even unwittingly, in unlawful activities (with particular reference to those related to money
laundering, usury and the financing of terrorism); compliance of operations with the law and regulatory provisions, as well as with internal policies, regulations and procedures.
As part of a more general process of value creation for the Group, the correct functioning, formalisation and updating of the Organisational Model for the ICS are also essential conditions for the maintenance of this process, given that the methods for carrying out business processes always have to be suitably aligned with the processes of governance and control.This Model constitutes a point of reference for a common, standard approach on the part of the entire Group, which presumes widespread knowledge of its contents, complete awareness of the underlying assumptions and common acceptance of the values on which it is based.The Parent Company also favours the development of a suitable risk corporate culture also based on customer assistance, providing them with adequate information also regarding complaints and matters that need reporting. This represents, above all, a means of protection for customers, while also supplementing the Group's own ICS.
Based on the relevant generally accepted principles, on the Supervisory Regulations of the Bank of Italy and on the Code of Conduct of Borsa Italiana SpA, it is possible to affirm that the ICS consists of a set of rules, procedures and organisational structures that, through a suitable process of identification, permits: the measurement, management and monitoring of risks to which the Group is or might be exposed; the company to be run in a healthy, correct and consistent way in line with objectives set by the governing bodies; the safeguarding of the company's assets, the efficiency and effectiveness of its operations, the reliability of the financial reporting process and
compliance with all laws and regulations.
The adequacy, efficacy and effective functioning of the System of Internal Control are assessed, according to their respective areas of competence, by: the Management Board of the Parent Company, which is responsible for risk management and internal controls in accordance with art. 39,
paragraph 2.d of the Articles of Association, without prejudice to the powers and duties of the Supervisory Board; the Managing Director of the Parent Company, who has been assigned the power to promote integrated risk management (art. 45, paragraph
2.m, of the Articles of Association); the Supervisory Board of the Parent Company, which is responsible for the assessment of the level of efficiency and adequacy of the internal
control system, with particular regard to risk control, the internal audit function and the accounting and reporting system; it also checks that the Parent Company properly performs its strategic and management control activities over the other Group companies (art. 51.e of the Articles of Association);
the Parent Company's Internal Control and Audit Committee is the means by which the Supervisory Board carries out its control functions and the Committee has to respond to it with up-to-date and timely information;
the Parent Company's Internal Auditing Department, which carries out audit work, the Compliance Department, which checks compliance with the Bank's policies, and the Risk Management Department, which is responsible at Group level for the monitoring of risk and the implementation of processes to ensure risk management.
Following the update of Circular 263 of 2 July 2013 and the related gap analysis, the Bipiemme Group has set up specific projects designed to address all of the areas of development that have been identified. In this context, the Risk Management function had already activated Phase 1 of the Risk Governance project, with the objective of defining an overall Risk Appetite Framework. The project was fully completed in 2014.

281P a r t E - I n f o r m a t i o n o n r i s k s a n d r e l a t e d h e d g i n g p o l i c i e s
The Risk Appetite approved by the Corporate Bodies is therefore considered to be the framework through which the Group defines its mission in terms of risk, through an organic and structured approach that has implications for Governance and the processes of integrated risk management, as well as widespread impacts on almost all business functions. In this context, the long-term vision of the desired risk profile was made explicit and the area of risk within which the Group intends to operate was defined. The RAF can be set up both in terms of metrics and limits and in terms of quality guidelines. In 2014 the Bank completed the Risk Governance project with the objective of rendering the Risk Appetite Framework fully effective via: operational application of the overall framework by defining KPI/metrics in greater detail; the definition and formalisation of key processes; identification of the approaches to oversight and compliance with the limits, as well as the actions of escalation in the event that the risk profile
established by the Corporate Bodies is exceeded.
The RAF has to be integrated with key business processes in line with the New Minimum Capital Requirements for Banks: "Banks ensure consistency and timely compliance between the business model, strategic plan, risk appetite framework, ICAAP, budget, corporate organisation and the internal control system".
As regards the principal risks to which the Group is exposed, for credit, and concentration risk, the Parent Company ensures that a Group lending and credit management policy is defined and adopted, that "significant exposures" are monitored centrally and that the overall quality of the loan and commitment portfolio is kept under control. The Parent Company is also responsible for setting up and maintaining the internal rating system, which is currently used in various processes: granting/renewing credit, monitoring and measurement of credit risk, calculating portfolio adjustments, measuring risk-adjusted performance, defining risk-adjusted pricing for new lending operations.
In matters of financial risks (market risk, counterparty risk, liquidity risk, interest rate risk on the banking book), the Parent Company's Management Board identifies and authorises the Group companies that can assume and manage its own financial risks in compliance with the limits established by the Parent Company.
With reference to market risk, the limit system for the various types of portfolio is organised as follows: company macro-limits, i.e. the maximum exposure that can be assumed by the companies authorised to take on financial risks; directional limits, meaning the allocation of company limits to individual portfolios, to be defined in specific Regulations for Financial Operations
for each group company.
The Group's Finance Committee ensures the coordination of the Group's policies for investing in financial assets, as well as the implementation of the liquidity policy and the monitoring and management of exposure to interest rate risk on the banking book.In particular, the Committee monitors and directs interventions regarding the Group's short- and medium-term liquidity position and the risk/return profile of the Group's portfolio of financial assets.In particular, the Committee performs the following tasks: monitoring the Group's operational and structural liquidity – by checking exposure to short-term liquidity gaps, the exposure on the interbank
market, cash flow and the pricing of intragroup liquidity – and the definition of guidelines for managing liquidity; monitoring earnings performance; approving new banking book investments, within the limits established by the Management Board of the Parent Company on proposal of the
Risk Committee; monitoring the activity of the Asset & Liability Management (ALM) function and defining corrective policies to balance the exposure of the
banking book to interest rate risk for the Group as a whole and for the individual companies.
As regards operational risk, the Parent Company has responsibility for setting up the system of operational risk management and control, this being understood as a structured series of processes, functions and resources for the identification, measurement, valuation and control of operational risk.The Parent Company's Risk Management Department supervises activities in the field of Operational Risk and coordinates the Operational Risk Managers of the various Group banks.
Through the Risk Management function, the Parent Company ensures the measurement, monitoring and management of the capital requirements for each type of risk, while through the Planning function it ensures the monitoring and quantification of the Group's capital resources to comply with the regulatory obligations of the First and Second Pillar of Basel 2.In particular, centralised control over the Group's capital adequacy, which involves comparing the amount of available capital with the capital requirements deriving from the risks to which the Group is exposed, on an actual and prospective basis, in conditions of normality and of stress, is carried out through the Internal Capital Adequacy Assessment Process, as required by the "Minimum Capital Requirements for Banks" (Circular 285/2013).The Parent Company also performs continuous measurement, monitoring and management of the consolidated capital ratios, defining their target levels in the medium term in line with the evolution of regulatory requirements and with the credit rating assigned to it by the agencies.

282 P a r t E - I n f o r m a t i o n o n r i s k s a n d r e l a t e d h e d g i n g p o l i c i e s
As regards the Second Pillar, in April 2014, all the information on the management and quantification of risks and capital absorption, based on the actual position at 31 December 2013 and on the prospective position at 31 December 2014, was collected and summarised by the Planning Function and embodied in a document entitled "ICAAP report". This also contains information on unquantifiable risks (for example, reputational risk, liquidity risk and business risk etc.) and on details of organisational controls put in place by the Group to monitor and mitigate them. The 2013-2014 ICAAP report, which was reviewed by the Parent Company's strategic and control functions, was submitted to the Bank of Italy in compliance with supervisory regulations.Lastly, as regards the requirements of the Third Pillar, the Group will publish its report disclosing details of risk monitoring and management on the website www.gruppobpm.it. A Third Pillar report will be published at least once a year.

283P a r t E - I n f o r m a t i o n o n r i s k s a n d r e l a t e d h e d g i n g p o l i c i e s
1.1 – Credit risk
Qualitative information
1. General aspects
The policies for managing and controlling the quality of the loan book and the associated risks are based on rules of sound and prudent management.They are implemented through the processes of disbursing, managing and monitoring credit for which specific activities are required and special instruments made available for controlling the risk that varies according to the circumstances of the market and business sector and type of individual borrower.The Parent Company BPM grants credit to households and businesses in its territory in order to meet their needs and to help them achieve sustainable growth, with the goal of increasing profitable long-term relationships, encouraging development and the arrival of new customers, in compliance with objectives of proper management of the risk/return profile. As a local bank, the Parent Company gives preference to development activities geared to small and medium-sized Italian companies.The loan portfolio is closely monitored on an ongoing basis in order to rapidly identify any symptoms of imbalance and to take corrective action to prevent any deterioration.
2. Credit risk management policies
2.1 Organisational aspects
At each company in the Group, the lending activity is supervised by a specific function dedicated to credit disbursement and control by means of well identified and suitably empowered structures. All of the structures involved are called upon to grant and manage credit, as well as to control credit risk, making use of appropriate procedures, of which the internal rating system is an integral part, to set up the dossier, determine credit-worthiness and, more generally, to follow the relationship over time.The credit "chain" for the commercial banks offers the possibility that in the presence of low risk (in rating terms) and for amounts that form part of the duties foreseen in the current Credit Line Regulations, proposals can be decided locally by the Commercial Network. If the risk is classed as "medium" or "high" - and, in any case, as may be required by parameters laid down by the aforementioned regulations - the "Credit and Loans Function", which is a structure dedicated to the detailed analysis of a counterparty's credit-worthiness, takes over. This function comprises specialists who, by virtue of their greater experience, carry out the necessary reviews for analysing the proposed loan and deciding accordingly or who prepare a report for presentation to the Bank's management boards and committees, in accordance with the power established by the Credit Line Regulations.Ratings can only be changed by "raters" specifically appointed for this purpose, who do not have any power of approval for loans. Any change that upgrades or downgrades the rating developed by the model is limited to within a certain range, it has to be motivated and usually has to be attributable to particular circumstances that have not be adequately reflected by the statistical models or in the presence of events involving particularly high risk.
2.2 Management, measurement and control systems
For the assessment of the credit standing of performing counterparties, the Bipiemme Group uses an internal rating system (IRS) which has been developed internally. From a quantitative point of view, the Bank has implemented statistical models for calculating the ratings to be given to counterparties split into four customer macrosegments based on turnover (or equivalent) and/or size of credit line: Individuals, Small Businesses, SMEs (small and medium-sized enterprises) and Companies.
The internal rating system is used in the following processes: the assessment of credit-worthiness carried out when granting and renewing a line of credit; monitoring of existing risk; the definition of lending policies; reporting to management; collective writedown of loans in the balance sheet; risk-adjusted pricing; analytical management reporting; control over capital adequacy (ICAAP process); measurement of value.

284 P a r t E - I n f o r m a t i o n o n r i s k s a n d r e l a t e d h e d g i n g p o l i c i e s
All of the credit processes use the counterparty rating as a decision-making "driver" and are considered in function of the specific nature of the various customer segments in order to optimise use of the resources involved in managing and monitoring credit, as well as to achieve a reasonable balance between commercial aggressiveness and effective credit management.During the credit granting stage, whether as a first-time credit facility or for the renewal/review of a revocable line of credit, the rating is one of the key elements in defining which body has decision-making power: with the completion of the proposal according to the outcome of the customer assessment and the amount/category of risk of the loan being proposed, the system automatically assigns the decision-making level required for approval. It also has an influence on how the automatic renewal mechanism is applied to revocable positions.
Usually, subject to changes in the lending rules, the assignment to a particular decision-making body takes place as follows: with a rating in the "low risk" area, the decision can be taken at a local level, providing the amounts are below the assigned limits; otherwise,
the decision is passed to a higher level in accordance with the current Credit Line Regulations; with a rating classified as "medium or high risk", even for amounts that fall within approved local limits, the decision is taken by the Credit and
Loans Function/Credit and Loans Committee for amounts that fall within their approved limits and at the conditions laid down in the regulations; in the case of an override request, after the assignment of a definitive rating by the responsible function, which has no decision-making powers,
the system updates the results of the applicant's assessment and then determines which function should be responsible for the approval thereof.
The credit granting process: corporate, SME and Small Business segmentsIn the process of granting of credit to counterparties within the "Businesses" segments (Corporates, SMEs and Small Businesses) as defined on the basis of size thresholds in the annual process of segmentation, a central role was given to the use of ratings, with the aim of providing users with all relevant information on the relationship: details of all of the elements that led to the definitive rating; the visibility of the historical rating for the last 12 months; details of the reasons for exclusion from the rating calculation (financial statements too remote in time, qualitative questionnaire expired, etc.).
In addition to applying common rules over the granting of credit (e.g. external negative deeds control, internal risk situations, etc.), the rating also constitutes an essential element in assessing a customer, so it is not allowed to go ahead with a preliminary investigation if any of the elements needed to calculate the rating is missing, both for the applicant and for any guarantors.Moreover, during the course of the preliminary investigation, it is possible for the relationship manager to ask for a change in or "override" of the applicant's rating or that of any guarantors, providing the request is substantiated and supported by adequate documentation.Such requests are evaluated by specialist raters in the Credit and Loans Function, who do not have decision-making power in the lending process; the evaluation and assignment of the definitive rating is entirely up to the raters, who can refuse or accept the change.The decision to provide an override function exclusively for these segments depends on the desire to take into account information contributed by sector experts to integrate the automatic rating with non-standard data of a qualitative nature.For Small Business customers alone, there is automatic renewal of consecutive lines of credit in order to lessen the burden of administrative duties on the sales network.For consecutive lines of credit of a customer in the Small Business segment to be automatically renewed, however, certain requirements relating to the portfoliation and limited risk of the positions on an ongoing basis have to be satisfied. In any case, Small Business positions already under automatic renewal in the previous period are excluded from automatic renewal.
The credit granting process: Individuals segmentAs regards the Individuals Segment, the process of granting credit differs during the investigatory phases depending on the product that the customer has requested (overdraft, mortgage, personal loan, special purpose loan).The dossier includes not only the acceptance rating, but also the so-called "performance rating", if one has been carried out, the analysis of the rating on the financial system assigned by the credit reference bureau, as well as the application of common rules over the granting of credit, differentiating according to the specific needs of each type of credit facility (e.g. external negative deeds control, internal risk situations, limits on the ratio between repayments and income, the presence of residual debt on the building, limits on the "loan to value", the maximum age of the applicant, etc.).The process also provides access to "black list" databases according to the requirements of the applicable anti-money laundering regulations.The process of renewal/review of the credit line granted to individuals provides for the use of the performance rating system as a support in determining: automatic renewal (without any change in existing credit lines); risk analysis during the preliminary investigation.

285P a r t E - I n f o r m a t i o n o n r i s k s a n d r e l a t e d h e d g i n g p o l i c i e s
Credit monitoring processControl over the credit risk in individual performing exposures is guaranteed by a monitoring process that systematically examines internal and external events and information to identify any signs of a deterioration in the relationship, proposing suitable changes to the rating.Performance control is therefore reflected in the rating level, providing a single approach to measuring credit risk.The entire process is characterised by: a high level of operating automation; centralised management of control policies; the transparency and traceability of the decisions taken by the operators assigned to control functions; the interaction between these control functions and the commercial network on internal rating matters, making sure that integrity is maintained.
As part of this process, it is also possible to change a rating, a faculty that is assigned to a specific function that monitors the loan portfolio, but without the power to authorise loans. Rating changes can take place on the initiative of this structure when risk situations clearly arise without having been flagged by the performance control systems, or to update a rating when information has not been processed in the right way by the automatic rating systems; in such situations, these are called "monitoring interventions". Rating changes can also be requested by the managers of the relationship as part of the processes of confirmation or revision of credit lines, which are then assessed by the monitoring structure. It can only intervene for companies and has to stay within a specific variation range. Such changes are called "override" in the strictest sense.Closely related to credit risk is concentration risk, which results from particularly high exposures to counterparties or groups of connected counterparties, or that belong to the same economic sector, engaged in the same activity, or that reside or do business in the same geographical area.The Group uses therefore a system of limits on loan exposures for specific purposes, essentially to avoid excessive concentration of risk with a single customer or group of related customers in relation to the free capital. This limit system is defined and updated periodically.Stress tests are carried out on the loan portfolio to assess the resilience of credit exposures in periods of potential economic weakness and the impact on the Group's overall capital adequacy. In this context, BPM gives preference to scenario analyses instead of sensitivity analyses as they are closer to reality. We have therefore chosen a set of economic and financial variables whose movements have a significant impact on all of the risks to which the Group is exposed.
2.3 Credit risk mitigation techniques
The Bipiemme Group requests guarantees against credit risk on a selective basis according to the customer's credit rating. In this case, granting the loan depends on obtaining the guarantee. Guarantees are either secured, particularly by mortgages and securities, or unsecured.
In the case of mortgages, the value of the registration is equal to: one and a half times the amount of funding granted for any length of time to individuals (twice in case of taking on a mortgage on the
subdivision of a building loan); twice the amount of funding granted for any length of time to companies.
In order to ensure effective acquisition and management of guarantees, the Group has defined the general requisites to be submitted to control with regard to property guarantees, financial pledges (cash and cash equivalents) and personal guarantees.
For property mortgages, there is a specific monitoring process characterised by: setting up a master file of property granted as collateral for mortgage loans; the continuous update of databases, by means of internal control processes or by the automatic acquisition of information from specialised
suppliers (e.g. the value indicated by an expert appraisal); the automatic revaluation of the value of the property based on price trends shown periodically by the real estate market observatory (Land
Registry Office).
In the case of collateral, the valuation process follows the procedures and frequency applicable to the specific form of guarantee received.Unsecured guarantees are obtained after assessing the adequacy of the guarantor's assets and personal credit rating, where available.Special dedicated structures within the Credit, Risk Management and Operations Functions (Smart Center) supervise the collection, processing, administration and monitoring of guarantees.Actions already taken by the Group in recent years, as a result of the issues reported by the Bank of Italy following their inspection in 2011, whereby capital add-ons were imposed on BPM, have led to the complete removal thereof as per the communication of the Supervisory Authority of 25 June 2014.

286 P a r t E - I n f o r m a t i o n o n r i s k s a n d r e l a t e d h e d g i n g p o l i c i e s
2.4 Impaired financial assets
Specialist units within the Credit and Loans Function have the task of managing impaired credit positions, made up of overdue and non-performing loans, and of following the recovery process.Once an "impairment" status has been ascertained, these units take steps, together with the commercial network, to restore the position to a performing one. If this is not possible, a disengagement plan is agreed; if this fails, the positions in default are referred to a specific department for the purposes of initiating specific procedures to protect the Group's credit. It is hereby disclosed that the Group has not been party to any purchases of impaired loans from third parties.Lastly, due to new reporting requirements having been introduced for forborne loans, in 2014 the Group took steps to implement appropriate methodologies for the correct identification thereof. These methodologies, which take account of risk factors (rating class) and evidence of continuous monitoring, such as, for example, the number of days past due, are in line with the indications provided by the EBA. Steps will be taken by the Group to update its policy and internal procedures for credit monitoring and assessment in order to manage these exposures in a conscientious and comprehensive manner.
Quantitative information
A. Asset quality
A.1 Impaired and performing positions: balance, impairment adjustments, change, distribution by business segment and geographical location
Tables A.1.1 and A.1.2 comprise both the figures related to companies belonging to the banking group and to other consolidated companies. At 31 December 2014, consolidated companies that do not form part of the Banking group are Bpm Securitisation 2 Srl and Bpm Securitisation 3 Srl.These tables only include the figures related to companies belonging to the Banking Group. These include, conventionally, a proportion of the assets and liabilities of the Group's banking, financial and instrumental joint ventures. At 31 December 2014, the only joint venture is Calliope Finance Srl.
A.1.1 Distribution of credit exposures by originating portfolio and credit quality (book value)
Portfolio/quality Banking group Other companies Total
Non-performing
loans
Doubtful loans
Restructured positions
Impaired overdue
positions
Non-impaired overdue
positions
Other assets
Impaired Other assets
1. Financial assets held for trading 10 3,241 636 – – 1,804,931 – – 1,808,818
2. Financial assets available for sale – – – – – 9,051,215 – – 9,051,215
3. Investments held to maturity – – – – – – – – –
4. Due from banks 461 – – – – 800,591 – 183,725 984,777
5. Loans to customers 1,344,404 1,228,283 906,306 118,908 1,248,324 27,232,618 – – 32,078,843
6. Financial assets designated at fair value through profit and loss – – 973 – – 93,458 – – 94,431
7. Financial assets due for disposal – – – – – – – – –
8. Hedging derivatives – – – – – 178,460 – – 178,460
31.12.2014 1,344,875 1,231,524 907,915 118,908 1,248,324 39,161,273 – 183,725 44,196,544
31.12.2013 1,130,802 1,364,612 758,520 153,466 1,672,344 40,179,992 – 144,865 45,404,601

287P a r t E - I n f o r m a t i o n o n r i s k s a n d r e l a t e d h e d g i n g p o l i c i e s
A.1.2 Distribution of credit exposures by originating portfolio and credit quality (gross and net amounts)
Impaired assets Performing Total
Portfolio/quality Gross exposure
Specific adjustments
Net exposure
Gross exposure
Specific adjustments
Net exposure
Net exposure
A. Banking group
1. Financial assets held for trading 11,379 7,492 3,887 X X 1,804,931 1,808,818
2. Financial assets available for sale 5,392 5,392 – 9,051,215 – 9,051,215 9,051,215
3. Investments held to maturity – – – – – – –
4. Due from banks 10,288 9,827 461 801,989 1,398 800,591 801,052
5. Loans to customers 5,852,918 2,255,017 3,597,901 28,690,833 209,891 28,480,942 32,078,843
6. Financial assets designated at fair value through profit and loss 1,811 838 973 X X 93,458 94,431
7. Financial assets due for disposal – – – – – – –
8. Hedging derivatives – – – X X 178,460 178,460
Total A 5,881,788 2,278,566 3,603,222 X 211,289 40,409,597 44,012,819
B. Other companies included in the scope of consolidation
1. Financial assets held for trading – – – X X – –
2. Financial assets available for sale – – – – – – –
3. Investments held to maturity – – – – – – –
4. Due from banks – – – 183,725 – 183,725 183,725
5. Loans to customers – – – – – – –
6. Financial assets designated at fair value through profit and loss – – – X X – –
7. Financial assets due for disposal – – – – – – –
8. Hedging derivatives – – – X X – –
Total B – – – X – 183,725 183,725
31.12.2014 5,881,788 2,278,566 3,603,222 X 211,289 40,593,322 44,196,544
31.12.2013 5,332,801 1,925,401 3,407,400 X 218,561 41,997,201 45,404,601
The following table shows the aggregate of "Loans to customers" (item 5 of the previous table, in the "net performing exposures" column), the values of loans subject to renegotiation in collective agreements and other exposures. Overdue positions for both groups are broken down by maturity.
Portfolios/ageing of past due up to 3 months (*)
from 3 to 6 months
from 6 months to 1 year
past due for more
than 1 year
Non past due
Total31.12.2014
Exposures subject to renegotiation under collective agreements (relating to renegotiations with customers in difficulties) 15,819 27,275 7,228 4,490 286,570 341,382
Exposure subject to renegotiation under collective agreements (other) 16,729 1,298 133 – 257,495 275,655
Exposure subject to renegotiation under collective agreements 32,548 28,573 7,361 4,490 544,065 617,037
Other Exposures (relating to negotiations with customers in difficulties) 33,827 31,738 15,531 16,816 301,468 399,380
Other Exposures (other) 846,569 152,840 62,270 15,761 26,387,085 27,464,525
Total other exposures 880,396 184,578 77,801 32,577 26,688,553 27,863,905
Total performing positions 912,944 213,151 85,162 37,067 27,232,618 28,480,942
(*) The balance of "Exposures up to 3 months" does not include loans with one instalment overdue by 1 day for 1,415 million euro (1,552 million euro at 31.12.2013).

288 P a r t E - I n f o r m a t i o n o n r i s k s a n d r e l a t e d h e d g i n g p o l i c i e s
A.1.3 Banking Group – Cash loans and off-balance sheet exposures to banks: gross and net amounts
Types of exposure/amounts Gross exposure Specific adjustments General adjustments Net exposure
A. CASH EXPOSURES
a) Non-performing loans 10,289 9,827 – 462
b) Doubtful loans – – – –
c) Restructured positions – – – –
d) Impaired overdue positions – – – –
e) Other assets 1,303,333 – 1,398 1,301,935
TOTAL A 1,313,622 9,827 1,398 1,302,397
B. OFF-BALANCE SHEET EXPOSURES
a) Impaired 960 960 – –
b) Other 1,195,996 – 49 1,195,947
TOTAL B 1,196,956 960 49 1,195,947
TOTAL A+B 2,510,578 10,787 1,447 2,498,344
A.1.4 Banking Group – Cash loans to banks: changes in gross impaired exposures
Description/Categories Non-performing loans
Doubtful loans Restructured positions
Overdue positions
A. Gross exposure at the beginning of period 9,280 – – 2
– of which: exposures sold but not eliminated – – – –
B. Increases 1,049 – – –
B.1 transfers from performing positions – – – –
B.2 transfers from other categories of impaired exposures – – – –
B.3 other increases 1,049 – – –
C. Decreases 40 – – 2
C.1 transfers to performing positions – – – –
C.2 write-offs – – – –
C.3 collections 40 – – 2
C.4 recovery through disposals – – – –
C.4 bis losses on disposal – – – –
C.5 transfers to other categories of impaired exposure – – – –
C.6 Other decreases – – – –
D. Closing gross exposure at the end of the period 10,289 – – –
– of which: exposures sold but not eliminated – – – –

289P a r t E - I n f o r m a t i o n o n r i s k s a n d r e l a t e d h e d g i n g p o l i c i e s
A.1.5 Banking Group – Cash loans to banks: changes in total adjustments
Description/Categories Non-performing loans
Doubtful loans Restructured positions
Impaired overdue
positions
A. Total writedowns at the beginning of the period 8,874 – – –
– of which: exposures sold but not eliminated – – – –
B. Increases 993 – – –
B.1 adjustments – – – –
B.1 bis losses on disposal – – – –
B.2 transfers from other categories of impaired exposures – – – –
B.3 other increases 993 – – –
C. Decreases 40 – – –
C.1 writebacks – – – –
C.2 writebacks on collection 40 – – –
C.2 bis profits on disposal – – – –
C.3 write-offs – – – –
C.4 transfers to other categories of impaired exposures – – – –
C.5 Other decreases – – – –
D. Total writedowns at the end of the period 9,827 – – –
– of which: exposures sold but not eliminated – – – –
A.1.6 Banking Group – Cash loans and off-balance sheet exposures to customers: gross and net amounts
Types of exposure/amounts Gross exposure Specific adjustments
General adjustments
Net exposure
A. CASH EXPOSURES
a) Non-performing loans 3,051,730 1,707,326 – 1,344,404
b) Doubtful loans 1,657,014 427,810 – 1,229,204
c) Restructured positions 1,031,808 124,529 – 907,279
d) Impaired overdue positions 129,831 10,923 – 118,908
e) Other assets 37,882,242 X 209,891 37,672,351
TOTAL A 43,752,625 2,270,588 209,891 41,272,146
B. OFF-BALANCE SHEET EXPOSURES
a) Impaired 620,235 51,320 – 568,915
b) Other 6,632,948 – 11,565 6,621,383
TOTAL B 7,253,183 51,320 11,565 7,190,298
TOTAL A+B 51,005,808 2,321,908 221,456 48,462,444

290 P a r t E - I n f o r m a t i o n o n r i s k s a n d r e l a t e d h e d g i n g p o l i c i e s
A.1.7 Banking Group – Cash loans to customers: change in gross impaired exposures
Description/Categories Non-performing loans
Doubtful loans Restructured positions
Overdue positions
A. Gross exposure at the beginning of period 2,542,905 1,769,396 840,275 166,280
– of which: exposures sold but not eliminated 127,232 38,083 – 13,454
B. Increases 659,479 1,274,586 462,459 819,764
B.1 transfers from performing positions 8,315 757,859 223,985 719,713
B.2 transfers from other categories of impaired exposures 621,637 422,915 89,869 90,150
B.3 other increases 29,527 93,812 148,605 9,901
C. Decreases 150,654 1,386,968 270,926 856,213
C.1 transfers to performing positions (including non-impaired overdue positions) 35 379,750 26,025 428,834
C.2 write-offs 38,722 25,558 2,482 –
C.3 collections 93,264 186,079 216,967 28,658
C.4 recovery through disposals 2,928 1,234 648 –
C.4 bis losses on disposal 878 49 777 –
C.5 transfers to other categories of impaired exposures 7,606 794,258 24,027 398,680
C.6 Other decreases 7,221 40 – 41
D. Closing gross exposure at the end of the period 3,051,730 1,657,014 1,031,808 129,831
– of which: exposures sold but not eliminated 124,738 34,641 – 9,653
"Other decreases" (line C.6) relate for 7,132 thousand euro to the recovery of assets under finance leases for which the purchase option was not exercised.
A.1.8 Banking Group – Cash loans to customers: change in total adjustments
Description/Categories Non-performing loans
Doubtful loans Restructured positions
Impaired overdue
positions
A. Total writedowns at the beginning of the period 1,412,569 410,117 83,033 13,284
– of which: exposures sold but not eliminated 33,892 3,264 – 797
B. Increases 421,570 198,088 55,385 1,638
B1. adjustments 316,256 195,033 46,370 1,638
B.1 bis losses on disposal 878 49 777 –
B.2 transfers from other categories of impaired exposures 100,909 3,006 8,238 –
B.3 other increases 3,527 – – –
C. Decreases 126,813 180,395 13,889 3,999
C.1 writebacks 74,430 22,104 4,929 3,972
C.2 writebacks on collection 12,783 23,496 840 27
C.2 bis profits on disposal – – – –
C.3 write-offs 38,722 25,558 2,482 –
C.4 transfers to other categories of impaired exposures – 109,147 3,006 –
C.5 Other decreases 878 90 2,632 –
D. Total writedowns at the end of the period 1,707,326 427,810 124,529 10,923
– of which: exposures sold but not eliminated 30,559 2,575 – 607
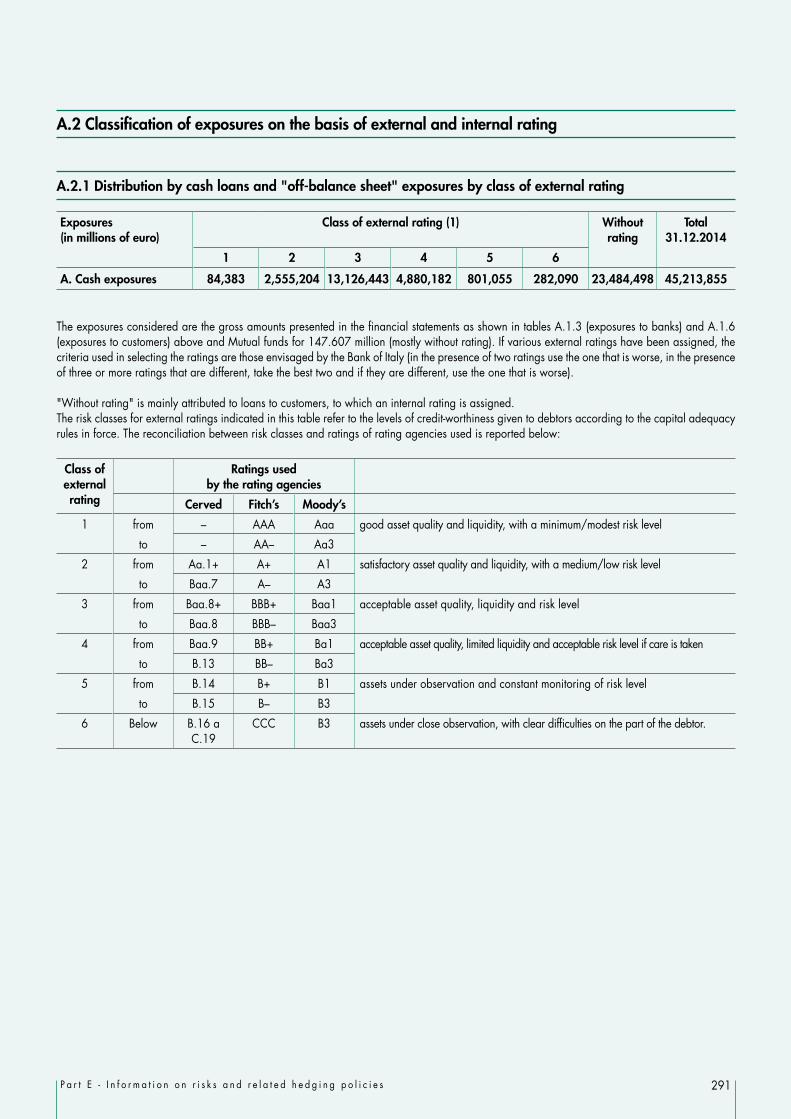
291P a r t E - I n f o r m a t i o n o n r i s k s a n d r e l a t e d h e d g i n g p o l i c i e s
A.2 Classification of exposures on the basis of external and internal rating
A.2.1 Distribution by cash loans and "off-balance sheet" exposures by class of external rating
Exposures (in millions of euro)
Class of external rating (1) Without rating
Total 31.12.2014
1 2 3 4 5 6
A. Cash exposures 84,383 2,555,204 13,126,443 4,880,182 801,055 282,090 23,484,498 45,213,855
The exposures considered are the gross amounts presented in the financial statements as shown in tables A.1.3 (exposures to banks) and A.1.6 (exposures to customers) above and Mutual funds for 147.607 million (mostly without rating). If various external ratings have been assigned, the criteria used in selecting the ratings are those envisaged by the Bank of Italy (in the presence of two ratings use the one that is worse, in the presence of three or more ratings that are different, take the best two and if they are different, use the one that is worse).
"Without rating" is mainly attributed to loans to customers, to which an internal rating is assigned.The risk classes for external ratings indicated in this table refer to the levels of credit-worthiness given to debtors according to the capital adequacy rules in force. The reconciliation between risk classes and ratings of rating agencies used is reported below:
Class of external rating
Ratings used by the rating agencies
Cerved Fitch’s Moody’s
1 from – AAA Aaa good asset quality and liquidity, with a minimum/modest risk level
to – AA– Aa3
2 from Aa.1+ A+ A1 satisfactory asset quality and liquidity, with a medium/low risk level
to Baa.7 A– A3
3 from Baa.8+ BBB+ Baa1 acceptable asset quality, liquidity and risk level
to Baa.8 BBB– Baa3
4 from Baa.9 BB+ Ba1 acceptable asset quality, limited liquidity and acceptable risk level if care is taken
to B.13 BB– Ba3
5 from B.14 B+ B1 assets under observation and constant monitoring of risk level
to B.15 B– B3
6 Below B.16 a C.19
CCC B3 assets under close observation, with clear difficulties on the part of the debtor.

292 P a r t E - I n f o r m a t i o n o n r i s k s a n d r e l a t e d h e d g i n g p o l i c i e s
A.2.2 Distribution by cash loans and "off-balance sheet" exposures by class of internal rating
Exposures Class of internal rating Total
Class 1 Class 2 Class 3 Class 4 Class 5 Class 6 Class 7 Class 8 Class 9 31.12.2014
A. Cash loans 2,606,914 4,283,737 5,729,914 4,588,116 3,088,959 1,480,444 1,204,168 334,415 480,812 23,797,479
Companies 192,617 891,557 1,802,158 1,479,933 914,706 263,011 279,012 – – 5,822,995
SMES 559,828 662,356 1,012,636 950,442 780,646 460,019 354,592 88,621 224,342 5,093,484
Small Businesses 272,865 514,406 914,150 748,841 669,508 521,383 360,823 146,422 189,948 4,338,345
Not-for-profit entities 5,958 5,883 9,456 7,924 27,768 1,673 1,837 355 299 61,152
Individuals 1,575,647 2,209,534 1,991,514 1,400,975 696,331 234,358 207,903 99,017 66,224 8,481,503
C. Guarantees given 379,285 620,548 614,152 471,966 347,950 90,975 36,947 5,951 13,217 2,580,989
The internal rating table has been prepared using the internal rating systems illustrated at point "D. Credit risk measurement models". These models are those used in the credit risk management and control systems.The first rating classes contain the exposures to borrowers with a higher credit quality, whereas the latter classes show the exposures of a lower quality.
Line item "A. Cash exposures" refers only to "Loans to customers", excluding "Impaired assets", "repurchase agreements" and loans to governments and public entities. The figures refer to commercial banks of the Group. The amounts reported include portfolio adjustments.
Line item "C. Guarantees given" exclude "Guarantees given to impaired customers". The figures refer to commercial banks of the Group. The amounts reported include portfolio adjustments.

293P a r t E - I n f o r m a t i o n o n r i s k s a n d r e l a t e d h e d g i n g p o l i c i e s
A.3 Distribution of exposures guaranteed by type of guarantee
A.3.1 Banking Group – Guaranteed exposures to banks
Net exposures
Secured guarantees (1) Unsecured guarantees (2) Total (1)+(2)
Credit derivatives Guarantees given
CLN Other derivatives Government and Central
Banks
Other public entities
Banks Other parties
Property, mortgages
Property, finance leases
Securities Other secured
guarantees
Government and Central
Banks
Other public entities
Banks Other parties
1. Guaranteed cash exposures 128,475 – – 128,462 – – – – – – – – – – 128,462
1.1 Totally guaranteed 128,475 – – 128,462 – – – – – – – – – – 128,462
– of which impaired – – – – – – – – – – – – – – –
1.2 Partly guaranteed – – – – – – – – – – – – – – –– of which impaired – – – – – – – – – – – – – – –
2. Guaranteed off-balance sheet exposures 197,208 – – – 186,008 – – – – – – – 238 – 186,246
2.1 Totally guaranteed 70,137 – – – 70,137 – – – – – – – – – 70,137
– of which impaired – – – – – – – – – – – – – – –
2.2 Partly guaranteed 127,071 – – – 115,871 – – – – – – – 238 – 116,109– of which impaired – – – – – – – – – – – – – – –
A.3.2 Banking Group – Guaranteed exposures to customers
Net exposures
Secured guarantees (1) Unsecured guarantees (2) Total (1)+(2)
Credit derivatives Guarantees given
CLN Other derivatives Government and Central
Banks
Other public entities
Banks Other parties
Property, mortgages
Property, finance leases
Securities Other secured
guarantees
Government and Central
Banks
Other public entities
Banks Other parties
1. Guaranteed cash exposures: 21,681,517 48,390,282 408,102 428,162 776,258 – – 186 13,077 52,277 24 253,604 11,342 2,793,614 53,126,928
1.1. totally guaranteed 20,391,366 47,903,264 408,102 367,876 708,303 – – 186 7,872 48,508 24 174,954 11,241 2,513,795 52,144,125
– of which impaired 2,407,500 6,625,086 100,717 4,638 47,872 – – – 234 7,281 24 13,396 – 276,254 7,075,502
1.2. partly guaranteed 1,290,151 487,018 – 60,286 67,955 – – – 5,205 3,769 – 78,650 101 279,819 982,803– of which impaired 346,329 253,008 – 12,685 19,336 – – – 70 376 – 6,920 96 70,981 363,472
2. Guaranteed off-balance sheet exposures: 1,352,951 1,864,333 19,001 89,751 156,170 – – – – 1,953 – 51 20,877 595,848 2,747,984
2.1. totally guaranteed 1,033,495 1,825,375 19,001 80,366 102,657 – – – – 1,864 – 30 19,595 564,254 2,613,142
– of which impaired 65,851 338,923 1 402 14,001 – – – – 509 – – – 11,246 365,082
2.2. partly guaranteed 319,456 38,958 – 9,385 53,513 – – – – 89 – 21 1,282 31,594 134,842– of which impaired 14,993 8,089 – 77 1,473 – – – – – – – – 2,030 11,669

294 P a r t E - I n f o r m a t i o n o n r i s k s a n d r e l a t e d h e d g i n g p o l i c i e s
B. Distribution and concentration of credit exposures
B.1 Banking group – Segment distribution of cash and "off-balance sheet" exposures to customers (book value)
Governments Other public entities Finance-sector companies
Exposures/Counterparties Net exposure
Specific value
adjustments
General adjustments
Net exposure
Specific value
adjustments
General adjustments
Net exposure
Specific value
adjustments
General adjustments
A. Cash exposures
A.1 Non-performing loans – – X 157 873 X 11,858 30,737 X
A.2 Doubtful loans – – X 318 46 X 132,229 66,417 X
A.3 Restructured positions – – X 1,157 67 X 22,205 500 X
A.4 Overdue positions – – X 1 – X 348 21 X
A.5 Other exposures 9,142,102 X – 95,067 X 56 2,716,874 X 11,026
TOTAL A 9,142,102 – – 96,700 986 56 2,883,514 97,675 11,026
B. "Off-balance sheet" exposures
B.1 Non-performing loans – – X – – X 196 417 X
B.2 Doubtful loans – – X – – X 95,362 160 X
B.3 Other impaired assets – – X – – X 466 7,054 X
B.4 Other exposures – X – 243,192 X 2 622,302 X 328
TOTAL B – – – 243,192 – 2 718,326 7,631 328
TOTAL (A+B) 31.12.2014 9,142,102 – – 339,892 986 58 3,601,840 105,306 11,354
TOTAL (A+B) 31.12.2013 8,408,737 – – 170,111 181 74 3,520,177 84,822 12,307
B.1 Banking group – Segment distribution of cash and "off-balance sheet" exposures to customers (book value)
Insurance companies Non-financial companies Other parties
Exposures/Counterparties Net exposure
Specific value
adjustments
General adjustments
Net exposure
Specific value
adjustments
General adjustments
Net exposure
Specific value
adjustments
General adjustments
A. Cash exposures
A.1 Non-performing loans – – X 1,025,859 1,385,162 X 306,530 290,554 X
A.2 Doubtful loans – – X 968,817 339,397 X 127,840 21,950 X
A.3 Restructured positions – – X 858,164 122,962 X 25,753 1,000 X
A.4 Overdue positions – – X 89,814 7,749 X 28,745 3,153 X
A.5 Other exposures 61,759 X – 14,176,953 X 162,240 11,479,596 X 36,569
TOTAL A 61,759 – – 17,119,607 1,855,270 162,240 11,968,464 316,657 36,569
B. "Off-balance sheet" exposures
B.1 Non-performing loans – – X 59,713 19,676 X 297 576 X
B.2 Doubtful loans – – X 229,557 7,245 X 1,344 697 X
B.3 Other impaired assets – – X 179,785 15,485 X 2,195 10 X
B.4 Other exposures 69,061 X 31 5,271,820 X 10,630 415,008 X 574
TOTAL B 69,061 – 31 5,740,875 42,406 10,630 418,844 1,283 574
TOTAL (A+B) 31.12.2014 130,820 – 31 22,860,482 1,897,676 172,870 12,387,308 317,940 37,143
TOTAL (A+B) 31.12.2013 231,644 – 27 21,154,106 1,576,927 175,722 15,734,425 298,000 40,572

295P a r t E - I n f o r m a t i o n o n r i s k s a n d r e l a t e d h e d g i n g p o l i c i e s
B.2 Banking group – Geographical distribution of cash and "off-balance sheet" exposures to customers (book value)
Exposures/Geographical areas
ITALY OTHER EUROPEAN COUNTRIES
AMERICA ASIA REST OF THE WORLD
Net exposure
Total writedowns
Net exposure
Total writedowns
Net exposure
Total writedowns
Net exposure
Total writedowns
Net exposure
Total writedowns
A. Cash exposures
A.1 Non-performing loans 1,343,358 1,695,192 786 4,553 5 4,469 255 3,112 – –
A.2 Doubtful loans 1,218,367 408,537 4,285 19,272 2 1 – – – –
A.3 Restructured positions 907,279 123,691 – 838 – – – – – –
A.4 Overdue positions 115,980 10,909 2,923 14 5 – – – – –
A.5 Other exposures 37,300,677 207,542 307,289 2,196 45,395 140 1,663 1 17,327 12
TOTAL A 40,885,661 2,445,871 315,283 26,873 45,407 4,610 1,918 3,113 17,327 12
B. "Off-balance sheet" exposures"
B.1 Non-performing loans 60,206 20,669 – – – – – – – –
B.2 Doubtful loans 305,592 8,102 20,671 – – – – – – –
B.3 Other impaired assets 182,446 22,549 – – – – – – – –
B.4 Other exposures 6,408,568 11,317 212,815 248 – – – – – –
TOTAL B 6,956,812 62,637 233,486 248 – – – – – –
TOTAL A+B 31.12.2014 47,842,473 2,508,508 548,769 27,121 45,407 4,610 1,918 3,113 17,327 12
TOTAL A+B 31.12.2013 48,704,761 2,172,514 444,230 8,302 69,650 5,089 247 2,727 312 –
B.3 Banking group – Geographical distribution of cash and "off-balance sheet" exposures to banks (book value)
Exposures/Geographical areas
ITALY OTHER EUROPEAN COUNTRIES
AMERICA ASIA REST OF THE WORLD
Net exposure
Total writedowns
Net exposure
Total writedowns
Net exposure
Total writedowns
Net exposure
Total writedowns
Net exposure
Total writedowns
A. Cash exposures
A.1 Non-performing loans – – 462 8,339 – 1,488 – – – –
A.2 Doubtful loans – – – – – – – – – –
A.3 Restructured positions – – – – – – – – – –
A.4 Overdue positions – – – – – – – – – –
A.5 Other exposures 895,494 372 347,880 872 53,366 115 2,056 25 3,139 14
TOTAL A 895,494 372 348,342 9,211 53,366 1,603 2,056 25 3,139 14
B. Off-balance sheet exposures
B.1 Non-performing loans – – – – – – – – – –
B.2 Doubtful loans – – – – – – – – – –
B.3 Other impaired assets – 960 – – – – – – – –
B.4 Other exposures 407,371 4 747,367 17 19,803 1 10,179 27 11,227 –
TOTAL B 407,371 964 747,367 17 19,803 1 10,179 27 11,227 –
TOTAL A+B 31.12.2014 1,302,865 1,336 1,095,709 9,228 73,169 1,604 12,235 52 14,366 14
TOTAL A+B 31.12.2013 1,899,372 4,525 1,557,294 7,857 81,391 1,586 17,714 12 4,998 13

296 P a r t E - I n f o r m a t i o n o n r i s k s a n d r e l a t e d h e d g i n g p o l i c i e s
B.4 Large Exposures
31.12.2014 31.12.2013
a) Nominal amount 18,143,090 9,569,436
b) Weighted amount 981,684 501,673
c) Number 6 3
Under the new rules on risk concentration, it is considered "large exposure" if the sum of the risk assets for cash and off-balance sheet transactions versus a single customer or group of related customers is equal to or greater than 10% of the Group's regulatory capital.
As a result, the following are reported as large exposures: Exposures to the Italian government for securities in portfolio with a nominal value of 9.7 billion euro and a weighted value of 0 million; Exposure to three foreign banking groups with a nominal value of 2 billion euro, and a weighted value of 551.7 million euro. Exposure to a leading Italian banking group with a nominal value of 0.6 billion euro, and a weighted value of 430 million euro. Exposure to Cassa di Compensazione e Garanzia with a nominal value of 5.8 billion euro mainly relates to repurchase agreements with a
weighted value of zero euro.

297P a r t E - I n f o r m a t i o n o n r i s k s a n d r e l a t e d h e d g i n g p o l i c i e s
C. Securitisation transactions
Qualitative information
Securitisation transactions of the Parent Company
In 2006 the Parent Company finalised the securitisation operation which involved transferring without recourse, as permitted by Law 130 of 30 April 1999, a portfolio of around 2,011.3 million euro in performing loans to BPM Securitisation 2 S.r.l. These loans refer to property and other secured loans given by the Company itself and backed by first-degree mortgages.The BPM Securitisation 2 operation was given a rating by the three main agencies: Standard & Poor’s, Moody’s and Fitch. The same agencies will look after the annual monitoring for the entire duration of the operation.The operation involved BPM Securitisation 2 S.r.l. issuing in July 2006 the following series of senior securities with limited recourse for a total of 2,015.3 million euro, with ratings of AAA, AA and BBB, listed on the Luxembourg Stock Exchange and destined for the domestic and international market, and a subordinated line of credit made available by the Parent Company:
Security Original amount (in millions of euro)
Amount at 31 December 2014 (in millions of Euro)
Characteristics
Class A1 – AAA/Aaa/AAA 350 0 expected average weighted life of 1.57 years and credit enhancement of 5.82%, bearing interest of 3-month Euribor +6 basis points.
Class A2 – AAA/Aaa/AAA 1,574.6 314.4 expected average weighted life of 6.72 years and credit enhancement of 5.82%, bearing interest of 3-month Euribor +14 basis points.
Class B – AA/Aa2/AA 40.3 14.6 expected average weighted life of 9.45 years and credit enhancement of 3.82%, bearing interest of 3-month Euribor +20 basis points.
Class C – BBB/Baa2/BBB 50.4 50.4 expected average weighted life of 14.25 years and credit enhancement of 1.32%, bearing interest of 3-month Euribor +70 basis points.
Total 2,015.3 379.4
The senior securities feature a sequential type of amortisation profile, with pro-rata amortisation being adopted upon the occurrence of certain events agreed with the rating agencies. There is also a clean-up option in the Company's favour if the residual nominal value of the securitised portfolio (expected maturity 15 July 2020) is equal to 10% or less of the portfolio's initial nominal value.At 31 December 2014, the whole of "Class A1", 1,260.2 million euro of "Class A2" and 25.7 million euro of "Class B" were reimbursed. Moreover, the Bank bought back various tranches of Class A2 securities from 2008 to 2014 worth a total of 93.5 million euro at the balance sheet date.Banca Popolare di Milano, acting as the servicer, continues to manage collections of the portfolio that was assigned and to maintain relationships with customers directly, transferring on a day-to-day basis the collections of principal and interest of the portfolio to the Collection Account at the custodian bank, net of the sums received by way of insurance premiums; these are deducted to pay the premiums to the respective insurance companies and mortgage instalment collection fees paid by customers for the service.
Servicing is performed by an in-house function of the Bank which, in accordance with the Servicing Agreement, looks after: each day, the activities involved in handling collections and checking cash flows; each month, balancing the month's transactions according to the internal monthly report with the daily schedules; each quarter, preparing the report (containing the information on the performance of the securitised portfolio) to be sent to the functions that
monitor the portfolio (the arranger, the special purpose vehicle, the cash manager, the paying agent and the rating agencies), calculating the weighted average rate and the notional capital for the swap (split between fixed- and floating-rate mortgages), handling the collection of fees and commissions, expense reimbursements and interest on the servicing activity and on the line of credit granted to the entity. A statement of the collection account is also sent at the same time as the quarterly report;
to proceed on a quarterly basis with the verification, completion and transmission of the loan by loan templates requested by the Agencies.
The securitisation, which was carried out in accordance with Law no. 130 of 30/4/1999 ("Regulations for securitisation of performing loans"), involved performing residential mortgage loans and, accordingly, did not lead to additional credit risk.
The operation involved the execution of back-to-back swap contracts between BPM and the arranger and between the arranger and the SPV. The notional value of the swaps, one for the fixed-rate mortgages, the other for the floating-rate mortgages, is represented by the amount of the securitised loans at the start of the operation, subsequently declining as the portfolio is repaid.

298 P a r t E - I n f o r m a t i o n o n r i s k s a n d r e l a t e d h e d g i n g p o l i c i e s
Based on these contracts, at each quarterly payment date, BPM pays the flat quarterly Euribor including a spread of 0.0115% to the arranger and receives: on the floating-rate mortgages, the difference between the weighted average rate of the loans (including margin) and the weighted average
spread on them, calculated at the beginning of the quarter; on the fixed-rate mortgages, the lower between 3% and the lower rate applied to this category of loans.
The contracts between the arranger and the SPV, net of the above mentioned spread, are mirrored.
The characteristics of the operation and the consequent accounting treatment lead to the non-recognition in the balance sheet of the swaps as derivatives, as the flow of interest income associated with the securitised mortgage loans is already reflected in the income statement for the period under interest income and expense.
The accounting treatment of the securitisation in the separate financial statements of Banca Popolare di Milano is as follows:1) securitised mortgage loans have remained on the books as part of loans to customers, under item "mortgage loans";2) the debt for the financing granted to the special purpose vehicle has been booked to due to customers in the sub-item "other payables";3) the interest income on these mortgage loans has remained in the same item of the financial statements, namely "interest income on loans to
customers";4) interest expense, represented by the payable side of the swap, is booked to "Interest expense on amounts due to customers";5) the expenses linked to the operation have been split in the income statement on an accrual basis according to their expected maturity.
The securitised mortgage loans have not been eliminated from the financial statements as the Bank has maintained all of the risks and benefits, given that there has not been any substantial change in the exposure to the variability and timing of the net financial flows of the assets transferred. In particular, given the technical characteristics of the operation, the lack of recognition is principally linked to the concession of the subordinated line of credit, the excess spread mechanism and the stipulation of swap contracts with the arranger.With the excess spread mechanism, the special purpose vehicle sets up a reserve in favour of BPM which is paid quarterly, it being essentially the fruit of the positive difference between the interest income on the loans, the interest expense on the notes issued and the swap differential.Based on the cash flows of these contracts explained above: BPM effectively ensures itself the interest income on the mortgage loans, remunerating the financing received at Euribor plus a spread, which
is shown under "Interest expense on amounts due to customers"; the special purpose vehicle ensures itself the payable rate to remunerate the subscribers of the notes.
The accounting treatment of the securitisation in the financial statements of the Bipiemme Group is as follows:1) securitised mortgage loans have remained on the books as part of loans to customers, under item "mortgage loans";2) the notes issued by the SPV Bpm Securitisation 2, net of securities repurchased by the Parent Company, have been recorded as “Securities issued”;3) the cash and cash equivalents of the SPV have been recorded as “Due from banks”;4) the interest income on these mortgage loans has remained in the same item of the financial statements, namely "interest income on loans to
customers";5) interest payable on the notes has been recorded as “interest expense on securities issued”;6) the expenses linked to the operation have been split in the income statement on an accrual basis according to their expected maturity.
The amount of the securitised mortgage loans has not been derecognised, given that the Parent Company holds rights of a contractual nature (i.e. credit enhancement) which substantially expose it to variability in the results of that company.
At the date of the financial statements the securitisation transaction is represented as follows:
Euro/000
31.12.2014 31.12.2013
Principal balance sheet aggregates
Loans to customers 390,688 465,222
Due from banks (cash and cash equivalents of the special purpose vehicle) 29,583 32,895
Securities issued 235,029 289,490
Economic result of the operation 5,163 7,477
Other securitisation transactions
The Group holds certain securities in its loan book that are linked to the securitisations of third-party issuers. These investments are of relatively modest amounts and constitute a residual alternative form of loan diversification.

299P a r t E - I n f o r m a t i o n o n r i s k s a n d r e l a t e d h e d g i n g p o l i c i e s
Quantitative information
C.1 Banking group – Exposures arising from securitisation transactions broken down by quality of the underlying assets
Quality of underlying assets/Exposures Cash exposures
Senior Mezzanine Junior
Gro
ss
expo
sure
Net
ex
posu
re
Gro
ss
expo
sure
Net
ex
posu
re
Gro
ss
expo
sure
Net
ex
posu
re
A. With own underlying assets: 93,492 93,537 50,401 50,485 10,127 10,117
a) Impaired – – – – – –
b) Other 93,492 93,537 50,401 50,485 10,127 10,117
B. With underlying assets of third parties: 21,667 21,667 6,753 4,566 – –
a) Impaired 21,667 21,667 6,753 4,566 – –
b) Other – – – – – –
Gross and net exposures shown in this table – with reference to own securitisations where the assets sold have remained in the balance sheet of the Parent Company – relate to the "retained risk" measured as the difference between the assets sold and the corresponding liabilities at the sale date (July 2006) and at the reference date of the financial statements.As regards item A. "Own underlying assets", the amounts shown relate to the "BPM Securitisation 2" operation and are represented as follows: the senior exposures include the Class A2 notes issued by the special purpose vehicle and repurchased by the Parent Company from 2008 to
the balance sheet date; mezzanine exposures include Class C notes issued by the special purpose vehicle and purchased by BPM Ireland on the date of completion of
the securitisation and which were then sold by the latter to the Parent Company in March 2007; junior exposures are represented by the share held by BPM Securitisation 2 and destined to absorb the first losses.
The amount of the retained risk at the start of the transaction (July 2006) was some 26.6 million euro, that is, the amount of the securitised loans and the subordinated loan granted to the SPV, net of the debt owing to the SPV.Consequently, the gross exposure columns for the Senior and Mezzanine tranches show the historical amount, increased by the impact of further repurchases and decreased by pool factor redemptions. The gross exposure column for the Junior tranche shows the amount of the subordinated loan granted to the SPV, reduced by the impact of periodic repayments.The net exposure columns show gross amounts adjusted for accrued interest at the balance sheet date.The exposures to third-party securitisations (line B. "with underlying assets of third parties") are cash related and are represented by securities issued by third-party SPVs, as detailed in table C.3.
The part of the table regarding Guarantees given and Lines of credit is not provided as they both have zero balances.

300 P a r t E - I n f o r m a t i o n o n r i s k s a n d r e l a t e d h e d g i n g p o l i c i e s
C.2 Banking group – Exposures deriving from the main "own" securitisations broken down by type of asset securitised and by type of exposures
Type of securitised assets/Exposures Cash exposures
Senior Mezzanine Junior
Book
val
ue
Adj
ustm
ents
/w
rite
back
s
Book
val
ue
Adj
ustm
ents
/w
rite
back
s
Book
val
ue
Adj
ustm
ents
/w
rite
back
s
A. Completely eliminated from the financial statements – – – – – –
B. Partially eliminated from the financial statements – – – – – –
C. Not eliminated from the financial statements 93,537 – 50,485 – 10,117 –
C.1 BPM Securitisation 2 S.r.l. 93,537 – 50,485 – 10,117 –
– Residential mortgage 93,537 – 50,485 – 10,117 –
The table shows the exposures incurred by the Group in respect of each own securitisation, also indicating the contractual forms applicable to the assets sold. The "Adjustments/writebacks" column shows any adjustments and writebacks for the year, as well as writedowns and revaluations recognised in the income statement or directly to an equity reserve.
The part of the table regarding Guarantees given and Lines of credit is not provided as they both have zero balances.
C.3 Banking group – Exposures arising from the main securitisation transactions of "third parties" broken down by type of securitised asset and by type of exposures
Type of assetsSecuritised/Exposures
Cash exposures
Senior Mezzanine Junior
Book
val
ue
Adj
ustm
ents
/w
rite
back
s
Book
val
ue
Adj
ustm
ents
/w
rite
back
s
Book
val
ue
Adj
ustm
ents
/w
rite
back
s
A.1 Pharmafin 3 cl. A 21,667 – – – – –
– Receivables – – – – – –
A.2 Pharmafin 3 cl. B – – 336 –2,187 – –
– Receivables – – – – – –
A.3 Pharmafin 3 cl. C – – 4,230 – – –
– Receivables – – – – – –
The amounts in the "book value" column include accrued interest.
The part of the table regarding Guarantees given and Lines of credit is not provided as they both have zero balances.

301P a r t E - I n f o r m a t i o n o n r i s k s a n d r e l a t e d h e d g i n g p o l i c i e s
C.4 Banking group – Exposures arising from securitisation transactions by type of portfolio
Exposures/portfolio Financial assets held for trading
Financial assets
designated at fair value
through profit and
loss
Financial assets
available for sale
Investments held to
maturity
Receivables 31.12.2014 31.12.2013
1. Cash exposures – – – – 26,233 26,233 32,704– Senior – – – – 21,667 21,667 26,033– Mezzanine – – – – 4,566 4,566 6,671– Junior – – – – – –
2. Off-balance sheet exposures – – – – – – –– Senior – – – – – – –– Mezzanine – – – – – – –– Junior – – – – – – –
The table shows the exposures taken on by the Group in respect of each third-party securitisation and the portfolios in the financial statements to which these assets have been allocated.
C.5 Banking Group – Total amount of securitised assets underlying junior securities or other forms of credit support
Assets/Amounts Traditional securitisations
Synthetic securitisations
A. Own underlying assets: 390,688 –A.1 Completely eliminated – X 1. Non-performing loans – X 2. Doubtful loans – X 3. Restructured positions – X 4. Overdue positions – X 5. Other assets – XA.2 Partially eliminated – X 1. Non-performing loans – X 2. Doubtful loans – X 3. Restructured positions – X 4. Overdue positions – X 5. Other assets – XA.3 Not eliminated 390,688 – 1. Non-performing loans 30,986 – 2. Doubtful loans 6,111 – 3. Restructured positions – – 4. Overdue positions 705 – 5. Other assets 352,886 –B. Underlying assets of third parties: – –B.1 Non-performing loans – –B.2 Doubtful loans – –B.3 Restructured positions – –B.4 Overdue positions – –B.5 Other assets – –
Line item A.3 "Not eliminated" includes underlying assets recorded in the balance sheet, broken down by quality of credit, relating to the securitisation of performing residential mortgages using BPM Securitisation 2.

302 P a r t E - I n f o r m a t i o n o n r i s k s a n d r e l a t e d h e d g i n g p o l i c i e s
C.6 Banking group – Interests in special purpose vehicle
As at the reporting date, Bipiemme Group does not hold any interests in special purpose vehicles created for securitisations.
C.7 Banking group – Unconsolidated special purpose vehicles created for securitisations
As at the reporting date, there are no unconsolidated special purpose vehicles within Bipiemme Group.
C.8 Banking group – Servicing activities – Collections of securitised receivables and reimbursement of securities issued by the special purpose vehicle
Servicer Special purpose vehicle
Securitised assets(at the end of period)
Collections of receivables during the year
Percentage of securities reimbursed(at the end of period)
Senior Mezzanine Junior
Impaired Performing Impaired Performing Impaired assets
Performing assets
Impaired assets
Performing assets
Impaired assets
Performing assets
Banca Popolare di Milano
BPM Securitisation 2 S.r.l. 37,802 352,886 1,383 79,838 83.25% 0% 0%
C.9 Banking group – Consolidated special purpose vehicles created for securitisations
Name of securitisation/Name of special purpose vehicle
Registered office
Consolidation Assets Liabilities
Receivables Debt securities
Other Senior Mezzanine Junior
Bpm Securisation 2 Srl Rome Line-by-line 391,243 – 29,681 329,040 50,400 –
There is no holding in the special purpose vehicle mentioned above. In any case, the company has been consolidated on the basis of "continuing involvement".
D. Information on structured entities (other than special purpose vehicles created for securitisations)
As at the reporting date, there are no structured entities (other than special purpose vehicles created for securitisations) in the Bipiemme Group.

303P a r t E - I n f o r m a t i o n o n r i s k s a n d r e l a t e d h e d g i n g p o l i c i e s
E. Disposal transactions
A. Financial assets sold but not eliminated
Qualitative information
The Group's "financial assets sold but not eliminated" are of two types: the securitisation of loans carried out through the SPV "Bpm Securitisation 2", as described in detail in paragraph "C. Securitisation transactions"; typical transactions concerning repurchase agreements, with which the Group's Banks obtain funding from the sale of securities owned by them.
Quantitative information
E.1 Banking group – Financial assets sold but not eliminated: book value and full value
Technical forms/Portfolio
Financial assets held for trading
Financial assets designated at fair value
through profit and loss
Financial assets available for sale
Investments held to maturity
Due from banks
Loans to customers Total
A B C A B C A B C A B C A B C A B C 31.12.2014 31.12.2013
A. Cash assets 72,051 – – – – – 5,209,590 – – – – – – – – 390,688 – – 5,672,329 4,948,073
1. Debt securities 46,412 – – – – – 5,209,590 – – – – – – – – – – – 5,256,002 4,479,961
2. Equities 25,639 – – – – – – – – X X X X X X X X X 25,639 2,890
3. Mutual funds – – – – – – – – – X X X X X X X X X – –
4. Loans – – – – – – – – – – – – – – – 390,688 – – 390,688 465,222
B. Derivatives – – – X X X X X X X X X X X X X X X – –
Total 31.12.2014 72,051 – – – – – 5,209,590 – – – – – – – – 390,688 – – 5,672,329 X
of which impaired – – – – – – – – – – – – – – – 37,802 – – 37,802 X
Total 31.12.2013 15,580 – – – – – 4,467,271 – – – – – – – – 465,222 – – X 4,948,073
of which impaired – – – – – – – – – – – – – – – 36,778 – – X 36,778
Key:A = Financial assets sold and fully recognised (book value);B = Financial assets sold and partially recognised (book value);C = Financial assets sold and partially recognised (full value).
The table shows the book value of financial assets sold but not eliminated and fully recognised as assets in the balance sheet.Line 1. "Debt Securities" in the "Financial assets held for trading" and "Financial assets available for sale" columns only includes securities sold as part of repurchase agreements.With respect to MTS Repo market, the margin deposited and default fund of 244 million euro to guarantee collateralization are shown in the financial statements under "Loans to customers".Line "2. Equities" under "Financial assets held for trading" includes securities used for securities lending transactions.The amount shown in line 4. "Loans" refers to the loans involved in the "BPM Securitisation 2" securitisation without derecognition carried out by the Parent Company in 2006.We would also point out that securities with a book value of Euro 317.6 million have been provided as collateral for repo transactions and these securities have not been included in the table, since the related amounts receivable and payable have been offset.

304 P a r t E - I n f o r m a t i o n o n r i s k s a n d r e l a t e d h e d g i n g p o l i c i e s
E.2 Banking group – Financial liabilities for financial assets sold but not eliminated: book value
Liabilities/Asset portfolio Financial assets held for trading
Financial assets
designated at fair value
through profit and loss
Financial assets
available for sale
Investments held to
maturity
Due from banks
Loans to customers
Total
1. Due to customers 4,940 – 5,101,760 – – – 5,106,700
a) for assets fully recognised 4,940 – 5,101,760 – – – 5,106,700
b) for assets partially recognised – – – – – – –
2. Due to banks 44,790 – 5,690 – – – 50,480
a) for assets fully recognised 44,790 – 5,690 – – – 50,480
b) for assets partially recognised – – – – – – –
3. Securities issued – – – – – 251,634 251,634
a) for assets fully recognised – – – – – 251,634 251,634
b) for assets partially recognised – – – – – – –
Total 31.12.2014 49,730 – 5,107,450 – – 251,634 5,408,814
Total 31.12.2013 14,917 – 4,407,111 – – 289,490 4,711,518
The table shows the book value of financial liabilities recorded as an opposite entry to financial assets sold and not fully eliminated from the balance sheet."Securities issued" include the liabilities issued by the special purpose vehicle "BPM Securitisation 2" as part of the securitisation.

305P a r t E - I n f o r m a t i o n o n r i s k s a n d r e l a t e d h e d g i n g p o l i c i e s
E.3 Banking group – Disposal of assets with liabilities that only have recourse to transferred assets: fair value
Technical forms/Portfolio Financial assets held for trading
Financial assets
designated at fair value
through profit and
loss
Financial assets available
for sale
Investments held to
maturity(fair value)
Due from banks
(fair value)
Loans to customers
(fair value)
Total
A B A B A B A B A B A B 31.12.2014 31.12.2013
A. Cash assets 72,051 – – – 5,209,590 – – – – – 415,660 – 5,697,301 4,979,494
1. Debt securities 46,412 – – – 5,209,590 – – – – – – – 5,256,002 4,479,961
2. Equities 25,639 – – – – – X X X X X X 25,639 2,890
3. Mutual funds – – – – – – X X X X X X – –
4. Loans – – – – – – – – – – 415,660 – 415,660 496,643
B. Derivatives – – X X X X X X X X X X – –
Total assets 72,051 – – – 5,209,590 – – – – – 415,660 – 5,697,301 4,979,494
C. Associated liabilities 49,730 – – – 5,107,450 – – – – – 230,138 – X X
1. Due to customers 4,940 – – – 5,101,760 – – – – – – – X X
2. Due to banks 44,790 – – – 5,690 – – – – – – – X X
3. Securities issued – – – – – – – – – – 230,138 – X X
Total liabilities 49,730 – – – 5,107,450 – – – – – 230,138 – 5,387,318 4,696,671
Net book value 31.12.2014 22,321 – – – 102,140 – – – – – 185,522 – 309,983 X
Net book value 31.12.2013 663 – – – 60,160 – – – – – 222,000 – X 282,823
Key:A = Financial assets sold and fully recognised B = Financial assets sold and partially recognised
The table shows the fair value of financial assets sold but not eliminated, fully recognised as assets in the balance sheet, as well as the related liabilities. With regard to assets, line "1. Debt securities" includes the fair value of securities sold under repurchase agreements, line "2. Equities" shows the fair value of securities loaned as part of securities lending transactions, while the associated liabilities relate respectively to the fair value of the repurchase agreements and securities lending entered into with the aforementioned owned securities.The amount shown in line 4. "Loans" refers to the fair value of loans involved in the "BPM Securitisation 2 srl" securitisation without derecognition carried out by the Parent Company in 2006; the associated liabilities show the fair value of the notes issued by the SPV.
B. Financial assets sold and fully eliminated with recognition of continuing involvement
Qualitative information
The Group does not have any financial assets sold and fully eliminated for which it needs to recognise continuing involvement.
Quantitative information
The Group does not have any financial assets sold and fully eliminated for which it needs to recognise continuing involvement.

306 P a r t E - I n f o r m a t i o n o n r i s k s a n d r e l a t e d h e d g i n g p o l i c i e s
E.4 Banking group – covered bond transactions
Guaranteed Bank Bonds ("covered bond") issue programme
On 13 November 2007 the Board of Directors of BPM authorised a 10-year Programme, with annual issues of Guaranteed Bank Bonds ("covered bonds") for a maximum of Euro 2 billion per year and a maximum total amount of Euro 10 billion, based on the sale of mortgage loans originated by BPM to a special purpose vehicle. The programme was extended during 2010 to the mortgage loans originated by the former subsidiary Banca di Legnano (absorbed by the Parent Company BPM in September 2013) and during 2014 to those of WeBank (absorbed by the Parent Company BPM in November 2014).
The Programme forms part of a wider strategy that is designed: to reduce funding costs thanks to the high standing of the covered bonds, as instruments issued directly by a bank with redemption guaranteed
by a separate capital fund. In the event of the issuing bank going bankrupt, the bearers of covered bonds can in fact claim off high quality assets specifically segregated for this purpose, which means that they are willing to accept a lower yield compared with the holders of similar but unguaranteed bonds;
to diversify its sources of funding, including the international market; to extend the average maturity of its debt profile by having access to the covered bond market; to meet the needs of investors with a strong aversion to risk.
The rules governing the issuance of covered bonds are contained in the following legislative sources:a) Law 80 of 14 May 2005, which introduced art. 7-bis of Law 130 of 30 April 1999, which essentially defines the field of application of the rules;b) the Regulations introduced by the Economy and Finance Ministry decree no. 310 of 14 December 2006, which govern: i) the maximum
ratio between the bonds covered by guarantee and the assigned assets; ii) the types of assets that can be assigned, both originally and on subsequent integration; iii) the characteristics of the guarantee that the special purpose vehicle has to give;
c) the Supervisory Authority's Instructions of 17 May 2007, which not only have the general task of activating the rules contained in art. 7-bis, but also regulate: i) the requirements of the banks issuing such bonds; ii) the criteria that the assigning banks have to adopt for the valuation of the assets being assigned; iii) the methods for integrating the assets originally assigned; iv) the checks that banks have to perform, or have the auditors perform, to ensure compliance with the legal obligations.
In March 2010 the rules were changed to reinforce the regulatory framework of Italian covered bonds in order to encourage their use. The main changes are designed to clarify certain concepts, such as: the capital requirements have to be satisfied at the time of the transfer; the transfer limits have to be considered also in light of any covered bonds issued by other members of the banking group, which will therefore
have assigned part of their assets to guarantee the operation; the substitution of suitable assets included in the separate capital fund of the transferee with other assets of the same type originated by the
transferor bank is allowed, providing this faculty is expressly foreseen in the programme and in the issue prospectus; in order to avoid overlapping checks, the asset monitor can organise its activity as verification of the checks carried out by the issuing bank as
part of the so-called "agreed-upon procedures".
In June 2014 further updates to the rules were issued (Circular no. 285 of 17 December 2013) with respect to the following topics: requirements for the issuing and/or assigning banks; limits to assignment; integration methods for assets and related prudential treatment; responsibility and controls.

307P a r t E - I n f o r m a t i o n o n r i s k s a n d r e l a t e d h e d g i n g p o l i c i e s
Based on what we have said, the system for issuing covered bonds provides for: the existence of a special purpose vehicle or SPV, whose sole purpose is to purchase the assets assigned by originator banks and to provide
a guarantee for the subscribers of the covered bonds. In this regard, BPM acquired 80% of the quotas of an SPV specifically set up for the purpose under Law 130, called "BPM Covered Bond S.r.l." (formerly Duse Finance S.r.l.). The other 20% is held by Stichting Horizonburg, a Dutch foundation;
the disbursement of a subordinated loan by the financing banks to the SPV at the same time as BPM (the sole issuing bank) issues the securities so that it can buy the assets;
assignment by the originator banks to the SPV of high credit quality receivables that form a separate capital fund pursuant to Law 130/99 to satisfy the bearers of the covered bonds. The assets that form a separate capital fund are residential mortgage loans to individuals who meet the requirements of the aforementioned Economy and Finance Ministry decree no. 310 of 14/12/2006;
the provision of a guarantee by the SPV in favour of the bondholders, up to the limits of the separate capital fund.
As regards the guarantee, the rules laid down by the Economy and Finance Ministry require that the guarantee given by the SPV to the bearers of the covered bonds be irrevocable, "at first request", unconditional and autonomous with respect to the obligations taken on by the issuing bank.The ongoing integrity and adequacy of the guarantee for the investor take the form of "over-collateralisation" which derives from the obligation taken on by the originator bank to ensure that the value of the assigned assets forming part of the "cover pool" at any moment in time (both on issue and during the life of the loan) is higher than the covered bonds that were issued; in particular, the minimum variance between the two amounts is defined by the rating agencies based on the characteristics of the issuer.Again with a view to ensuring that the SPV is able to fulfil the obligations deriving from the guarantee that it has given, the issuing bank, using suitable asset and liability management techniques, has to ensure a reasonable balance between the maturities of the cash flows generated by the assigned assets included in the SPV's separate capital fund, and the maturities of the payments due by the issuing bank in connection with the covered bonds issued and the costs of the operation. Unlike a traditional securitisation, the bond payments are independent of the cash flows and of the performance of the portfolio underlying the guarantee, as the programme's final guarantor is BPM, which remains totally exposed to the risks and benefits associated with the assigned assets.An asset coverage test is carried out once a month to check compliance with the guarantee level required by the rating agencies; in the event that overcollateralisation is lower than the amount indicated by the rating agencies (which means that the cover pool is insufficient for the bonds issued), the portfolio has to be topped up by the originator banks with new assets entirely originated by the same banks; assets that are suitable to replace those that are extinct and/or impaired, or with supplementary assets.BPM's Covered Bond Issue Programme have been awarded ratings by Moody's (Baa2) and by Fitch (BBB+); the same agencies will look after ongoing monitoring for the entire period of the Programme to ensure that the rating adequately reflects the credit risk of the securities issued and that the quality of the cover pools transferred is in line with the rating assigned to the covered bonds.
The evolution of the Covered Bond Programme
At the date of these financial statements the Bank approved the issue of five series of guaranteed bank bonds, for a total of 4.75 billion euro, following the assignment without recourse to the special purpose vehicle "BPM Covered Bond S.r.l." of five portfolios for a total of 7.5 billion of performing loans (the so-called "cover pool") originated by BPM”; of these, 0.5 billion euro were sold by Banca di Legnano and 0.4 billion euro were sold by WeBank. In 2011, under the programme, the "Banca Popolare di Milano S.c.a.r.l. 15.7.2008/2011 5.5%" loan was repaid for a nominal amount of 1 billion euro and subsequently cancellations for 0.3 billion euro were made, for which at the date of these financial statements, there are four series of covered bonds outstanding, for a total of 3.44 billion euro; note that the last two issues, one for one billion euro (BPM 18.7.2011/18.1.2014 FR%, extended to 18/01/2019) and one of 0.65 billion euro (BPM 28.11.13/28.05.2016 FR%) have all been repurchased by the Parent Company and the related securities have been used for refinancing operations with the European Central Bank.To date, it has not been necessary to top up the portfolio of receivables initially transferred from time to time.During 2014, repurchases of the cover pool were made for 38 million euro, in accordance with the contractual clauses originally foreseen in the "Master Receivables Purchase Agreement”. These repurchases are to be understood as ordinary administration of the contracts included in the pool of mortgages in order to ensure adequate coverage of the level of "collateralisation" of the covered bonds issued.

308 P a r t E - I n f o r m a t i o n o n r i s k s a n d r e l a t e d h e d g i n g p o l i c i e s
The following are the main characteristics of the cover pools involved in the assignment and of the guaranteed bank bonds that were issued from 2008:
Type of securitised assets: residential mortgage loansQuality of securitised assets: performing positionsDistribution by sector of the assigned debtors: 100% Individuals
Date of assignment of the Cover Pool June 2008
June 2009
October 2010
June 2011 (*)
March/November 2013 (***)
November 2014
Total
Amount of the assets sold (in millions of Euro): 1,218 1,305 1,616 639 1,426 1,294 7,498
Banca Popolare di Milano 1,218 1,305 1,137 639 993 1,294 6,586
Banca di Legnano – – 479 – – – 479
WeBank – – – – 433 – 433
Number of mortgage loans sold: 12,229 11,681 15,504 5,031 11,633 13,503 69,581
Banca Popolare di Milano 12,229 11,681 10,110 5,031 8,319 13,503 60,873
Banca di Legnano – – 5,394 – – – 5,394
WeBank – – – – 3,314 – 3,314
Distribution by sector of the assigned debtors:
100% Individuals
Type of securities issued (Covered bonds)
Guaranteed Bank Bonds ("GBB") of Banca Popolare di Milano
Amount issued (in millions of Euro): 1,000 1,000 1,100 1,000 650 4,750
Bond issue price (Reoffer Price) 99.784 99.558 99.451 100.00 100.00
Issue date 15.7.2008 9.10.2009 4.11.2010 18.7.2011 28.11.2013
Date of maturity 15.7.2011 17.10.2016 16.11.2015 18.1.2019 (**) 28.5.2016
Interest Fixed rate 5.5%
for 3 years
Fixed rate 3.5%
for 7 years
Fixed rate 3.25%for 5 years
Floating rate3-mth Euribor
+100 bps
Floating rate3-mth Euribor
+135 bps
Expected Issue Ratings in the issue period
Moody’s: Aaa
Moody’s: Aaa
Moody’s: Aaa
Moody’s: A1
Moody’s:Baa2
Fitch: AAA
Fitch: AAA
Fitch: AAA
Fitch: AA+
Fitch: BBB+
Current Expected Issue Ratings
Moody’s: Baa1
Fitch: BBB+
(*) the June 2011 sale was in preparation for the issue made in July 2011.(**) the issue, which had an original maturity of 18.1.2014, has been extended in December 2013(***) two sales of receivables have been made against the November 2013 issue: WeBank's was carried out in March 2013, whereas BPM's took place in November 2013.
Overall distribution of securitised assets by geographical area at the date of the financial statements
North West North East Centre South and Islands
Banca Popolare di Milano 70.96% 5.55% 17.97% 5.52%
The 2010 and 2013 issues had a covered bond multi-originator issue programme structure, given that the roles of originator bank and financing bank were played by two entities (Banca Popolare di Milano and Banca di Legnano in the first case and Banca Popolare di Milano and WeBank in the second case), while BPM acted as exclusive issuing bank. The other two issues are classed as simple because BPM is the originating, financing and issuing bank.
309P a r t E - I n f o r m a t i o n o n r i s k s a n d r e l a t e d h e d g i n g p o l i c i e s
The main reasons for using loans originated by subsidiary companies were: a credit quality in line with BPM's lending policies so as to maintain the low risk profile of the over pool; higher collateral available for the disbursements and/or to top up the existing collateral in the event of changes in the required level of overcollateralisation.
Contractually, the transfer was carried out directly by the subsidiary, which granted the loan to the SPE to buy the cover pool. As for BPM, the loan was subordinated to repayment of the covered bonds by the issuer or by the guarantor, BPM Covered Bond.Until November 2014, BPM acted as counterparty of the cover pool swap, also for the subsidiary's part of the portfolio, which periodically received its portion of the excess spread through BPM; this amount acted as remuneration for the subordinated loan granted to the Vehicle. The mechanism for sharing the excess spread between BPM and the subsidiary was regulated by an agreement between the two banks based on criteria of economic neutrality. The allocation of the excess spread reflected the Bank's share of the assets transferred under the Programme.
As regards the method of determining the transfer price, in accordance with the Bank of Italy's instructions, we would point out the following: for the first two issues, the book values of the loans transferred, as shown in the latest approved and audited financial statements, were used
as the starting point; the loans originated up to 30/06/2010 (2010 issue), 31/03/2011 (2011 issue), 30/09/2012 (2013 issue, WeBank portfolio), 30/06/2013
(2013 issue) and 30/09/2014 (2014 issue) were used respectively for the 2010, 2011, 2013 and 2014 tranches; therefore, certification was issued by the auditors, based on provisions of art. 5 section II of the rules on covered bonds, which certified compliance with the criteria used by the Bank for determining the transfer price of the loans sold to those used in preparing the financial statements.
These operations did not generate any assignment gains or losses and the securitised assets have not suffered any further writedowns other than those due to the collective evaluation applied at the time of the sale.
For the originator banks, the Covered Bond programme has given rise to a series of contractual commitments, the most important ones at the time of the last issue being the concession of: a subordinated line of credit for 5,386.3 million euro against the payment of subordinated loans in favour of BPM Covered Bond Srl, to finance
the purchase of the cover pool. This line of credit was quantified by taking as a point of reference the transfer prices of the cover pool tranches, net of the liquidity held by the SPV. The Programme envisages a commitment on the part of the Bank to grant further loans, also to purchase the cover pools underlying future issues, as part of the same Programme;
a capital market line of credit granted by BPM of Euro 5,182 million, with a maturity date of 30 September 2029, but which was revoked on 18.12.2014, for the execution of a Cover Pool Swap Transaction contract with BPM Covered Bond S.r.l., in order to swap on a monthly basis the cover pool interest (a cash inflow for BPM) against a floating rate linked to Euribor plus a spread (a cash outflow for BPM). The notional of the swap followed to a certain extent the performance of the assigned portfolio and in part considered the investment outstanding and the liquidity of the SPV.
The capital market line of credit was revoked due to the unwinding of the Cover Pool Swap in place between Banca Popolare di Milano and the SPV “BPM Covered Bond S.r.l.” on 14.11.2014. The unwinding of the Cover Pool Swap led to the restitution of the collateral provided, with a considerable benefit in terms of Group liquidity, while still ensuring a natural hedge of the covered bonds issued based on the cash flow arising from the mortgage loans forming part of the cover pool.
The role of the originatorBanca Popolare di Milano continues to manage collections of the assigned receivables and to maintain relationships with customers directly, transferring each day onto the collection account the mortgage loan instalments (principal and interest) that it collects, net of collection fees and insurance premiums (to be transferred to the respective insurance companies).
In addition, the Parent Company looks after the SPV's cash management, transferring on a daily basis the inflows into the collection account to the transaction account, from which they flow either into the reserve account (for the portion that remains at the disposal of the SPV by way of liquidity) or into the investment account (for the surplus liquidity to be invested).

310 P a r t E - I n f o r m a t i o n o n r i s k s a n d r e l a t e d h e d g i n g p o l i c i e s
Internal risk measurement and control systems
The rules governing covered bonds mean that the cover pool is extremely dynamic in nature, so the issuing and assigning bank is required to be continuously involved, which leads to a need to create a rigorous monitoring system.
A control model has been approved, which provides for three levels of monitoring: First level internal control (performed by the Special Unit that manages the covered bonds and the securitisation), which as the main
organisational structure involved, handles servicing at a Group level and the related controls (see paragraph C. "Securitisation transactions") as well as the checks to ensure that the issue operations are carried out properly;
Asset Monitor, is a role performed by an independent third party (PricewaterhouseCoopers Spa), which periodically verifies (generally at the time of the interim and annual reports) the regularity of the operations and the integrity of the guarantee in favour of the investors, issuing a specific report. In particular, the Asset Monitor checks:
• the quality and integrity of the assets assigned in guarantee. Periodically, the Asset Monitor is required to check compliance with the limits and parameters for the assignment of the assets and in the case of subsequent integrations, ensures that they satisfy the criteria of eligibility laid down by the Bank of Italy;
• compliance with the ratios between the covered bonds issued and the assets assigned in guarantee established by the Regulations; • observation of the limits to assignment set by the Regulations based on Capital adequacy ratios and on the Tier 1 ratio; • the effectiveness and adequacy of the risk hedges provided by the derivatives taken out in connection with the operation.
It has been agreed that the checks carried out by the Asset Monitor and the assessments regarding the results of the operations would be the subject of an interim report addressed to the Parent Company's Internal Control and Audit Committee. The Internal Auditing Department, as part of the audit plan, checks at least once a year the functionality, adequacy, consistency and
effectiveness of the controls implemented by the Special Unit. The results of these checks, together with those carried out by the Asset Monitor, are brought to the attention of top management.
Accounting treatment of the operation
As regards the accounting treatment of this operation in the separate financial statements of the Parent Company: the SPV "BPM Covered Bond S.r.l." is held 80% by BPM and shown in line item 100 "Equity investments", which means that it is consolidated
in the Group's financial statements on a line-by-line basis; the subordinated loans made to the SPV are not shown separately in the financial statements because, even though they are booked to "Other
assets" at the time they are disbursed, for presentation purposes in the financial statements, they get offset, up to the same amount, against the amounts due to the SPV ("Due to customers") which show the assignments at their initial transfer prices; these loans are not subject to remeasurement as the credit risk is entirely reflected in the valuation of the loans being covered;
the mortgage loans assigned continue to be shown on the assets side of the originator bank's balance sheet in line item 70 "Loans to customers – mortgage loans", given that the bank holds rights of a contractual nature (i.e. credit enhancement) which substantially expose it to variability in the results of the company. Mortgage loans also change on the basis of the events affecting them (in terms of volumes and valuations). The collection of principal and interest on the loans is paid each day into the collection account, at the same time booking a reduction in the debt owing to the SPV. The interest income is booked to line item 10 "Interest income: loans to customers";
the debt owing to the SPV, which initially records the collection of the assignment price of the mortgage loans that are not eliminated from the balance sheet, is booked to item 20 of liabilities "Due to customers" under "Other payables". Subsequently, it incurs the movement relating to the payment of the instalment payments in the collection account. The debt is then offset, up to the same amount, by the subordinated loan granted to the SPV;
the covered bonds issued by BPM are booked to liabilities in line item 30 "Securities issued" and the related interest expense is recorded as “interest expense: securities issued”.
As regards the accounting treatment of this operation in the consolidated financial statements: mortgage loans sold to the special purpose vehicle remain in the sub-item "Mortgage loans" as they have been sold to a company included in
the scope of consolidation; the covered bonds are reported under securities issued and the book value of those that are fixed rate includes the impact of hedge accounting
(fair value hedge) for the hedging derivative contracts between the SPV and the external counterparties under which the former swaps a floating rate (Euribor plus a spread) for the annual coupons of the covered bonds issued; these coupons will be passed on to BPM with the excess spread by way of remuneration for the subordinated loans. The hedging derivatives in practice transform the fixed-rate coupons of the covered bonds into floating-rate coupons at Euribor plus a spread;
the Covered Bond Swap contracts between the Special Purpose Vehicle (SPV) and the market counterparties outside the Group are shown in item 80 "Hedging derivatives" under assets and item 60 "Hedging derivatives" under liabilities.

311P a r t E - I n f o r m a t i o n o n r i s k s a n d r e l a t e d h e d g i n g p o l i c i e s
The consolidated income statement consists of the following elements: line item "Interest income" reports interest on mortgage loans sold (Cover Pool); "Interest expense" shows the interest on the Covered Bonds issued at a fixed and floating rate; "interest" includes differentials on the hedging derivative (which transforms the interest rate of the covered bonds from fixed to floating); line 90 "net income from hedging" shows the fair value change of the hedging contract and of the items being hedged.
At the balance sheet date, the securitisation is represented in the financial statements of the Bipiemme Group as follows: Euro/000
Line items 31.12.2014 31.12.2013
Principal balance sheet aggregates Loans to customers: Cover Pool 5,338,435 4,418,540Due from banks: cash and cash equivalents of the special purpose vehicle 64,106 227,202Hedging derivatives receivable: Covered Bond Swap between BPM Covered Bond and market counterparties 68,565 89,810Securities issued: Covered Bonds issued 1,842,580 1,863,098Economic result of the operation 72,757 68,123
Quantitative information
Total amount of securitised assets underlying junior securities or other forms of credit support
Assets/Amounts Traditional securitisations
Synthetic securitisations
A. Own underlying assets: 5,338,435 –
A.1 Completely eliminated – X
1. Non-performing loans – X
2. Doubtful loans – X
3. Restructured positions – X
4. Overdue positions – X
5. Other assets – X
A.2 Partially eliminated – X
1. Non-performing loans – X
2. Doubtful loans – X
3. Restructured positions – X
4. Overdue positions – X
5. Other assets – X
A.3 Not eliminated 5,338,435 –
1. Non-performing loans 63,101 –
2. Doubtful loans 25,197 –
3. Restructured positions – –
4. Overdue positions 6,948 –
5. Other assets 5,243,189 –
B. Underlying assets of third parties: – –
B.1 Non-performing loans – –
B.2 Doubtful loans – –
B.3 Restructured positions – –
B.4 Overdue positions – –
B.5 Other assets – –

312 P a r t E - I n f o r m a t i o n o n r i s k s a n d r e l a t e d h e d g i n g p o l i c i e s
Servicing activities - Collections of securitised receivables and reimbursement of securities issued by the special purpose vehicle
Servicer Special purpose vehicle
Securitised assets(at the end of period)
Collections of receivables during the year
Percentage of securities reimbursed(at the end of period)
Senior
Impaired Performing Impaired Performing Impaired assets
Performing assets
Banca Popolare di Milano BPM Covered Bond S.r.l. 95,245 5,243,190 3,832 437,533 0%

313P a r t E - I n f o r m a t i o n o n r i s k s a n d r e l a t e d h e d g i n g p o l i c i e s
F. Banking Group – Credit risk measurement models
Running the internal rating models is the responsibility of the Parent Company's Risk Management Department, which performs the following activities: developing and maintaining the internal rating models and estimating the probability of default (PD) and the loss given default (LGD), which
are done by the Credit Risk function; internal validation and analysis of the performance of rating and LGD models, which also involve analyses of backtesting and benchmarking
on individual rating elements by the Validation Unit, which is separate from the Credit Risk Unit; producing reports for the Group's Governing Bodies.
The annual calibration and update of the internal models guarantee a continuous process of risk metrics improvement, also based on the findings of the audit work performed by the internal control functions (Validation and Internal Audit). On performing the recalibration for 2014 and partly based on indications that arose from the exercises conducted in 2014 (for example, Comprehensive Assessment), the Group has decided to revise the internal estimates by placing more emphasis on economic cycle components. In particular, with a view to amending the procedures for the computation of portfolio adjustments (so-called “Collective”), the following updates were made: use of PD calibrated with reference to recent years in order to make use of a point in time PD; introduction of a prudential buffer to the LGD component to take account of recent evidence on historical recoveries; reduction, for certain segments, of the Loss Confirmation Period (LCP) parameter based on internal estimates.
With particular reference to the credit risk parameters (PD and LGD), the Group has set up specific projects designed to strengthen and adapt its models to comply with new regulations, with a view to evolving towards an advanced use of its Internal Rating System (IRS) for reporting purposes.
Rating models and estimating the probability of default (PD)
The internal rating models refer to four ordinary customer segments, classified according to the following parameters: Individuals: (consumer households); Small Businesses: this portfolio includes all companies, partnerships, one-man firms, micro-businesses and individuals with a VAT number with
a structure (turnover or total assets) of less than 5 million euro, or, in the absence of financial statement figures, those with an overall exposure (granted facilities) of less than 5 million euro;
SMEs: these include companies with a structure (turnover or total assets) of between 5 and 50 million euro, or, in the absence of financial statement figures, those with an overall exposure (granted facilities) of between 5 million and 50 million euro;
Companies: this category includes large corporate firms with a structure (turnover or total assets) of more than 50 million euro (or, if outside this range, with an overall exposure (granted facilities) of more than 50 million euro).
All of the models have been developed internally on representative samples of the Bipiemme Group's customer portfolio. The models' performances are assessed quarterly on an independent basis by the Validation function by applying a series of defined statistical tests. The rating is assigned to the counterparty, quite apart from the type of credit that has been requested (so-called "counterparty rating"). The IRS is extended to all commercial banks in the Bipiemme Group.
More specifically, the aforementioned internal models are based on advanced statistical techniques and on a common modular framework designed to comprise and integrate all the information needed for a correct assessment of the creditworthiness of borrowing counterparties.

314 P a r t E - I n f o r m a t i o n o n r i s k s a n d r e l a t e d h e d g i n g p o l i c i e s
A summary of the structure is provided by the following chart.
The rating model for the Individuals segment is a system in which the following elements converge at the time that credit is granted for the first time (the counterparty acceptance phase): background information about the counterparty and the product; a summary opinion about the counterparty's credit-worthiness from an external information bureau.
During the monitoring and renewal phase for a facility or in the event of new credit being granted, further information of a quantitative and analytical nature is added (behavioural information).Monitoring the statistical rating involves monitoring events, split into negative acts, CR risk indicators relating to the borrower (kept on the Central Risk File) and early warning signals; when they take place, the system automatically proposes a downgrade of the rating, based on a series of rules that assess the extent of the anomaly in relation to the value of the counterparty's rating. The monitoring system's proposed downgrading is subject to approval by a dedicated structure, which has no decision-making powers.Ratings are expressed on a scale of nine classes, numbered from 1 (best rating) to 9 (worst rating) and each of these is assigned a probability of default (PD).
As regards the Small Business segment, the internal rating system consists of the following modules: the financial module, based on information acquired from financial statements and tax returns, broken down by companies, other entities with
full accounting records and those with simplified accounting records; the internal performance module, designed to observe the credit behaviour of the counterparty versus the Group by means of aggregate
information by risk category; the external performance module, designed to observe the behaviour of the counterparty versus the banking system, developed on the basis
of information deriving from the census of exposures kept at the Central Risk File (CR).
The three modules in question form an integrated statistical rating. The following elements are added to this component: the qualitative module, based on company information gathered by means of questionnaires submitted to the commercial manager at the time
that the Electronic Credit Line Dossier (ECLD) was compiled. These go to form a final rating through a process of notching (adjusted up or down according to the rating class given);
monitoring interventions, split into negative acts, CR risk indicators relating to the borrower and early warning signals; when they take place, the system automatically proposes a downgrade of the rating resulting from the integration of the statistical rating and the qualitative questionnaire, based on a series of rules that assess the extent of the anomaly in relation to the value of the counterparty's rating. The proposal to downgrade by the monitoring system is subject to approval by the dedicated structure;
override, a change in the rating produced by the process described up to this point, based on discretional assessments made by the relationship managers and suitably approved by a structure with no decision-making powers, which is also involved in monitoring of the loan portfolio. An override can also take place on the initiative of this monitoring structure.
Final ratings are expressed on a scale of nine classes, numbered from 1 (best rating) to 9 (worst rating) and each of these is assigned a probability of default (PD).
COMPANIES INDIVIDUALS
COMPANIES SMEs SMALL BUSINESSES
Final rating Final rating Final rating
Financial statements
External trends
Integrated statistical rating
Qualitative
Mo.Ri.
Override
Financial statements Qualitative Internal
trendsExternal trends
Integrated statistical rating
Mo.Ri.
Override
Financial Internal trends
External trends
Integrated statistical rating
Qualitative
Mo.Ri.
Override
Final rating
Background information
External trends
Acceptance rating
Internal trends
Integrated statistical rating
Earlywarning

315P a r t E - I n f o r m a t i o n o n r i s k s a n d r e l a t e d h e d g i n g p o l i c i e s
For an estimate of the probability of default of counterparties in the SME segment, the Bipiemme Group uses a model structured with modules, suitably integrated statistically so as to produce a first-time rating or a performance rating, according to the type of information available.
The elementary modules making up the model are as follows: the financial statement module, for an assessment of the figures in the financial statements, developed by an external provider (Centrale dei
Bilanci – the Central Financial Statements File) with statistical methods using system data; the internal performance module, designed to observe the credit behaviour of the counterparty versus the Group by means of aggregate
information by risk category; the external performance module, designed to observe the behaviour of the counterparty versus the banking system, developed on the basis
of information deriving from the census of exposures kept at the Central Risk File (CR); the qualitative module, to assess information on the counterparty's corporate structure and the context in which it operates.
The results of these various modules are then combined by statistical techniques to produce an integrated statistical rating, to which the following elements are added: monitoring interventions, split into negative acts, CR risk indicators relating to the borrower and early warning signals; should these
situations arise, the system proposes a downgrade of the statistical rating, based on a series of rules that assess the extent of the anomaly in relation to the value of the counterparty's rating. The proposal to downgrade by the monitoring system is subject to approval by the dedicated structure;
override, a change in the rating produced by the process described up to this point, based on discretional assessments made by the relationship managers and suitably approved by a structure with no decision-making powers, which is also involved in monitoring of the loan portfolio. An override can also take place on the initiative of this monitoring structure.
Final ratings are expressed on a scale of nine classes, numbered from 1 (best rating) to 9 (worst rating) and each of these is assigned a probability of default (PD).
The internal rating model for the Companies segment is made up of the following modules: the financial statement module, developed by an external provider (Central Financial Statements File) with statistical methods using system data; the external performance module, designed to observe the behaviour of the counterparty versus the banking system, developed on the basis
of information deriving from the census of exposures kept at the Central Risk File.
The results of these various modules are then combined by statistical techniques to produce an integrated statistical score.The model also puts particular emphasis on the qualitative element based on the opinion of the relationship manager and not included in the statistical engine, all consistent with the size of the segment and the type of business.
Various other elements can then be added on to these ratings, such as: qualitative module: a qualitative analysis of the sector strategic risk, the economic and financial risk and the internal performance risk; monitoring interventions, split into negative acts, CR risk indicators relating to the borrower and early warning signals; should these
situations arise, the system proposes a downgrade of the statistical rating, based on a series of rules that assess the extent of the anomaly in relation to the value of the counterparty's rating. The proposal to downgrade by the monitoring system is subject to approval by the dedicated structure;
override, a change in the rating produced by the process described up to this point, based on discretional assessments made by the relationship managers and suitably approved by a structure with no decision-making powers, which is also involved in monitoring of the loan portfolio. An override can also take place on the initiative of this monitoring structure.
Final ratings are expressed on a scale of seven classes, numbered from 1 (best rating) to 7 (worst rating) and each of these is assigned a probability of default (PD).

316 P a r t E - I n f o r m a t i o n o n r i s k s a n d r e l a t e d h e d g i n g p o l i c i e s
LGD model
For the determination of Loss Given Default (LGD), the Bipiemme Group uses a "work-out" model, founded on the observation of the events of interest (exposure to default, expenses incurred for the recovery, recoveries, guarantees, etc.) of default positions closed in the past.The main determinants in the quantification of Loss Given Default are: the technical form of the loan, the exposure, the existence and type of collateral provided and anagraphical-type variables.The Loss Given Default model is constructed in such a way as to be applied to all customers at a single facility level. The personal and dimensional characteristics of the counterparties are considered genuine variables by the model.
The LGD estimate runs through the following steps: determination of a nominal recovery rate, including direct and indirect costs, recognised in the case of previous non-performing counterparties.
The recovery rate on non-performing positions springs from the relationship between recoveries collected by the bank, net of legal and administrative costs that may be incurred to regain possession of the sums involved, and the exposure of the customer at the time that it was considered in dispute;
determination of the duration of recovery in order to discount the nominal recovery; estimate of a parameter of recalibration (the so-called "danger-rate") for the calculation of the overall LGD, in order to consider the different
states of deterioration included in the default. Three aggregates are used to determine this amount: • the probability of transfer from performing to past-due/doubtful/non-performing; • the probability that a counterparty is transferred from doubtful/past-due to non-performing; • reduction, or increase, of the exposure at the time of transfer to doubtful/past-due to that of the subsequent transfer to non-performing.
The danger rate is determined by the product of these three factors. In this way, the LGD rate for positions not in non-performing is determined by weighting the LGD on non-performing positions by the danger-rate.
Composition of the one-year default rate by default status
Probability of migration between credit statuses (default or performing)
Non-performing loans
Non-performing loans
Non-performing loans
Non-performing loans
Performing
Performing
Performing
Performing
Past due
Doubtful
Doubtful
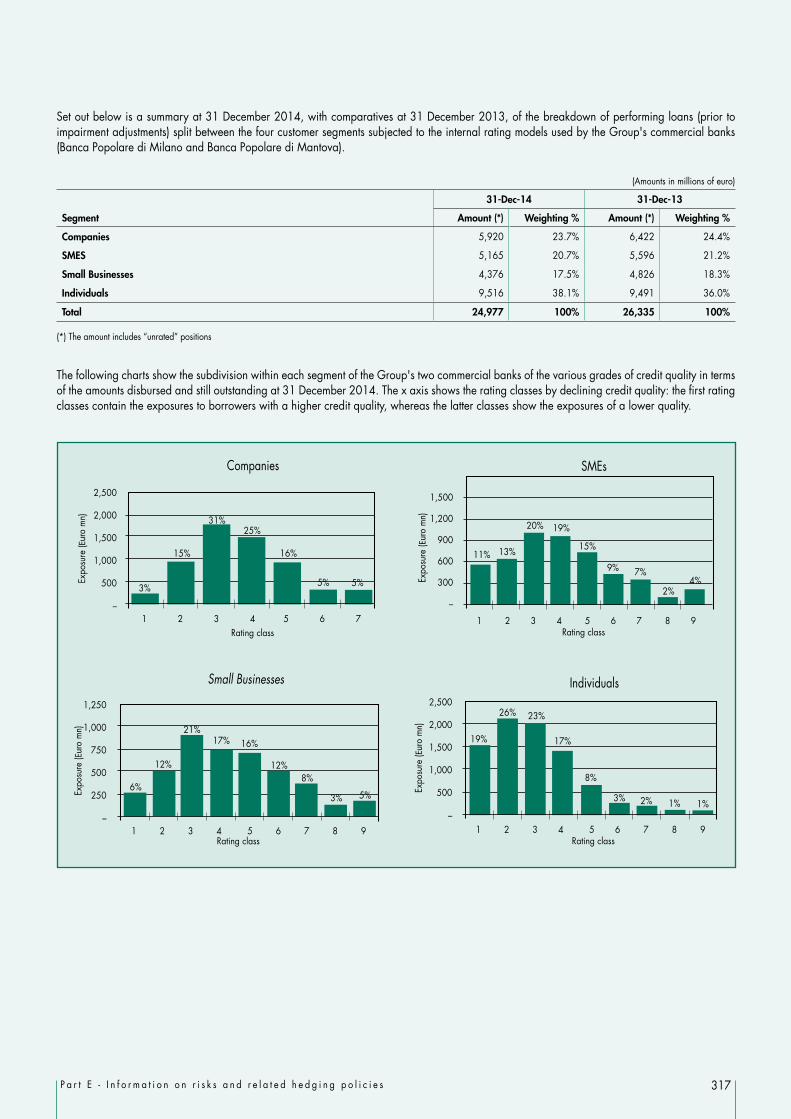
317P a r t E - I n f o r m a t i o n o n r i s k s a n d r e l a t e d h e d g i n g p o l i c i e s
Set out below is a summary at 31 December 2014, with comparatives at 31 December 2013, of the breakdown of performing loans (prior to impairment adjustments) split between the four customer segments subjected to the internal rating models used by the Group's commercial banks (Banca Popolare di Milano and Banca Popolare di Mantova).
(Amounts in millions of euro)
31-Dec-14 31-Dec-13
Segment Amount (*) Weighting % Amount (*) Weighting %
Companies 5,920 23.7% 6,422 24.4%
SMES 5,165 20.7% 5,596 21.2%
Small Businesses 4,376 17.5% 4,826 18.3%
Individuals 9,516 38.1% 9,491 36.0%
Total 24,977 100% 26,335 100%
(*) The amount includes “unrated” positions
The following charts show the subdivision within each segment of the Group's two commercial banks of the various grades of credit quality in terms of the amounts disbursed and still outstanding at 31 December 2014. The x axis shows the rating classes by declining credit quality: the first rating classes contain the exposures to borrowers with a higher credit quality, whereas the latter classes show the exposures of a lower quality.
Companies
2,500
2,000
1,500
1,000
500
–
3%
1 2 3 4 5 6 7
15%
31%25%
16%
5% 5%
Rating class
Expo
sure
(Euro
mn)
Small Businesses
1,250
1,000
750
500
250
–
6%
1 2 3 4 5 6 7 8 9
12%
17%
12%8%
3% 5%
16%
Rating class
Expo
sure
(Euro
mn) 21%
SMEs
1,500
1,200
900
600
300
–
11%
1 2 3 4 5 6 7 8 9
13%
19%
15%
9% 7%
2%4%
Rating class
Expo
sure
(Euro
mn)
20%
Individuals2,500
2,000
1,500
1,000
500
–
19%
1 2 3 4 5 6 7 8 9
26%
17%
8%
3% 2% 1%1%
Rating class
Expo
sure
(Euro
mn)
23%
318 P a r t E - I n f o r m a t i o n o n r i s k s a n d r e l a t e d h e d g i n g p o l i c i e s
1.2. Banking Group – Market risk
General common aspects of the market risk management processes adopted by the Bipiemme Group
1. Organisational aspects
The role of strategic supervision is attributed for the whole of the Bipiemme Group to the Parent Company's Board of Directors. It establishes the guidelines for risk management and control for each of the companies in the Group, so as to create an integrated management policy, while at the same time taking account of the each bank's specific risk profiles and the extent to which they are interconnected. In the field of financial risk, BPM's Board of Directors establishes the Group's propensity for risk and the related macro-limits (corporate limits), delegating to the individual Group companies to define their own policies and limits (management limits) in compliance with the general guidelines.
In the Bipiemme Group, financial assets are split between the trading portfolio and the banking book, these two portfolios being broken down as follows:
1. the trading book includes financial instruments held with a view to benefiting in the short term from positive changes between buy and sell prices through directional and absolute yield strategies and managing position books as market maker;
2. the banking book consists of: positions traded for cash management purposes, by investing in government securities and/or securities of primary banking issuers, in
order to have "easily negotiable assets" or those that are considered "eligible assets" for refinancing transactions with the Central Bank; traded securities to be used for guarantee and/or repo transactions with customers; positions that are invested long-term with a view to obtaining stable returns over time with a low level of volatility; derivatives traded on behalf of customers (so-called "balanced trades") without keeping position books open; treasury and forex portfolio and financial instruments traded with a view to covering the interest rate mismatch caused by the commercial
banks' funding and lending activities (Asset & Liability Management – ALM).
The new Group Regulation established that Banca Akros, the Group's investment bank, is the only company of the Bipiemme Group authorised to manage the trading book.
The banking book, on the other hand, has been mainly assigned to the Parent Company and, for the rest, to Banca Popolare di Mantova.
Different types of operating limits are envisaged in line with the type of portfolio assigned. The following types of limits have been assigned to BPM and Banca Popolare di Mantova, among others: portfolio fair value sensitivity to the trend in interest rates and credit spreads: a limit is set on the potential change in value of the portfolio
as a result of a movement of +/–100 bps in interest rates and +/–25 bps in credit spreads; sensitivity of interest margin: this limit is quantified on the basis of the potential change in interest margin in the subsequent twelve months
caused by a parallel shift in the rate curve of +/–100 bps; stop loss limits; quantitative limits for total portfolio exposures and concentration limits for individual issuers; qualitative limits on the composition of the portfolio, with issuer risk limits by type of counterparty, by type of rating and by country risk.
Banca Akros has applied the limits to specific sub-areas and individual risk factors in accordance with overall limits established by the Parent Company.
319P a r t E - I n f o r m a t i o n o n r i s k s a n d r e l a t e d h e d g i n g p o l i c i e s
2. Risk measurement methods
2.1 Commercial banks
The portfolio managed by the commercial banks is subject to monitoring and reporting by the Parent Company's Risk Management Function.
The banks where the banking book has been allocated use systems of measuring risk that are based on interest rate sensitivity and credit spread sensitivity.The Parent Company's Risk Management Function has developed the following risk monitoring tools using the Kondor+ application: interest rate sensitivity: on changes in interest rates, the system calculates the change in the net present value of the portfolio based on set rate
scenarios, usually +/– 100 bps, applied to the various Euribor/swap curves for each currency; credit spread sensitivity: as regards bonds, in addition to the sensitivity mentioned above, the change in net present value is also measured by
applying a shift of +/– 25bps to the Euribor/swap discount curve. As regards floating rate securities the curve with which the forward rates are estimated remains unchanged.
The Parent Company has not developed any models for analysing sensitivity to price risk; monitoring the portfolio subject to price risk does in fact take place when we analyse the performance of individual positions.
2.2 Banca Akros
Over the years the Bank has developed its own quantitative and organisational model (i.e. an internal model) for measuring market risk. The main indicator used to quantify market risk is Value-at-Risk (VaR), calculated according to the Montecarlo method. This method involves estimating the distribution of potential profits and losses by recalculating the value of the portfolio according to the various simulated risk factor scenarios generated according to the dynamics of volatility and correlation implicit in the historical trend of the factors. The estimate of the maximum potential loss is identified on the basis of a suitable percentile of the distribution. The contribution made by historical correlations gives rise to the so-called "diversification effect", according to which the economic effects of changes in individual market variables on the portfolio can, to a certain extent, offset each other, compared with the situation in which these variables are considered separately.
The main types of risks that this method identifies are: delta risk (price sensitivity of a financial instrument to risk factors), that is: • price risk, in the case of the equity market; • interest rate risk, in the case of fixed or floating rate positions; • exchange risk, in the case of the forex market; gamma risk (sensitivity to the delta factor of a financial instrument to the underlying risk factors); vega risk (price sensitivity of a financial instrument to the volatility of risk factors); rho risk (price sensitivity of a financial instrument to interest rate risk); theta risk (price sensitivity of a financial instrument to the passage of time).
It is not permitted to assume market risk in relation to factors that risk having a significant impact, for which the Bank does not have systems or models that have been checked and convalidated by the Pricing and Market Risk Control Model Validation Office.
The individual financial contracts are represented in the VaR model on a "full evaluation" basis, i.e. by a series of theoretical evaluation models implemented in the risk calculation model. The non-linear "partial revaluation" method is used in a limited number of cases(1). The pricing models are subjected to checks to ensure that they have been formulated correctly in theory, that correct input data is used and that the numerical results obtained are reasonable. The checks carried out are documented in specific manuals.
The parameters of the VaR model are: historical period used for estimating volatility and empirical correlations: 12 months (252 observations); confidence interval: 99%, unilateral; holding period: 1 day; weighting factor: 0.992.
The historical series of risk factors are updated on a daily basis. The 10-day VaR calculation is estimated by applying the scaling of the square root law, but is also done for the purpose of verifying the prudence of this approach on the capital requirement, a direct calculation of the extent of risk-taking by adopting the log yields obtained over a 10-day time frame.
(1) These include a small number of options, for which the non-linear partial revaluation model makes it possible to represent the payoffs of the options in a way that is reasonably complete (up to the second order, including cross gamma risks). Certain plain vanilla options with baskets of equities as their underlying are also handled using the same method of partial revaluation.

320 P a r t E - I n f o r m a t i o n o n r i s k s a n d r e l a t e d h e d g i n g p o l i c i e s
Starting with the supervisory report of June 2007, following recognition by the Bank of Italy, Banca Akros now uses its own internal model based on VaR metrics also to determine the capital requirement for the following market risks that derive from trading: generic and specific risk on equities; generic risk on debt securities; position risk on investments in mutual fund units (excluding investments in hedge funds); exchange risk on all assets/liabilities in the financial statements.
The calculation of the capital requirements for market risk, and for the risk factors mentioned above, is therefore carried out on the basis of the internal model ("regulatory VaR") and the results it produces for three portfolios: fixed income, equity and FX.The prudential capital requirements for the specific risk component on debt securities and credit default swap contracts (single name and index), which was not mentioned in the risks discussed previously, is calculated on the basis of the Standardised Approach. For the same reason, the credit derivative book is excluded from the internal model used for calculating minimum capital requirements.
In addition to regulatory VaR calculated under current conditions, Banca Akros has implemented a model for calculating regulatory VaR under conditions of stress (so-called stressed VaR) that was developed in 2010 and which adopts, as a scenario of greatest severity, the time period comprised between 10 March 2008 – 10 March 2009 (“Lehman” scenario). This model was subjected to testing, with a positive outcome, by the Supervisory Body and, as required by rules on capital adequacy, it has been used to compute the capital requirement for market risk as from the last quarter of 2011, as well as for management purposes.
For internal purposes, the Pricing Models Validation and Market Risk Control Office had already developed in 2010 an extension to the regulatory model to include the specific risk component of debt securities in the measurement of market risk (so-called "credit spread VaR"). This extended version of the VaR model makes it possible to quantify the contribution made by issuer risk to the expected daily stop-loss limit. The specific risk is mapped against the series of curves of the bond credit spread of the debt issuers present in the portfolio, taken from the prices of the more liquid bonds listed on active markets. A series of generic credit spread curves has also been defined, split by rating and business sector, as a proxy for those issuers to which a specific credit spread cannot be attributed. The historical series of issuer curves are updated on a daily basis. Quantification of the credit spread VaR is carried out using the same approach as for other risk factors (Montecarlo simulation of the expected scenarios), including the effects of diversification on the portfolio implicit in the historical trends in credit spreads.
In order to keep the risk perimeters of the two measurements separate (regulatory VaR, calculated on the recognised risk factors, and internal VaR, calculated on the extended perimeter which includes credit spreads), an organisational and IT procedure, which is similar and supplementary to that used for regulatory VaR, has been created. This procedure also involves mapping the positions of the risk factors represented by the risk curves of the individual issuers and preparing reports on the portfolio VaR including the credit spread factor. The report output generated by the model on this specific development reflects similar processing performed for regulatory VaR and is filed to create a historical record in the market risk repository.
Again, with respect to the measurement of issuer risk for internal purposes, the MRC Office has implemented the calculation of the Incremental Default Risk Charge (IRC), which identifies the impact on the trading portfolio of default risks (or potential losses due to the insolvency of an issuer) and of migration of rating class (that is, potential direct or indirect losses incurred by changes to the credit rating of one or more issuers). The estimation model behind the adopted IRC (Merton equity factor model in CreditManager™ methodology) is based on the use of historical rating transition matrices with reference to the rating of each issuer (obligor), while correlations between issuers are estimated by means of an ample set of indices used to map each obligor.Currently, the model is used for bonds included in the trading portfolio and it provides a daily estimate of the IRC over a liquidity time horizon of a year with a confidence interval of 99.9%. These estimates are used, for the time being, for information purposes in order to monitor the model.
During 2014, Banca Akros took part in the activities of the task force set up by BPM for the ECB-EBA stress testing, as part of the Comprehensive Assessment promoted by the European Central Bank in view of the transition to the Single Supervisory Mechanism (SSM). Banca Akros's Risk Management's involvement specifically covered the impact assessments of the stress scenarios assigned by the EBA in relation to market risk. These activities, which were carried out in coordination with the other projects, saw a significant commitment of resources by Banca Akros, leading to the implementation of the scenarios provided in the systems for calculating the Bank's risk, according to the methodological indications provided by the Authorities for institutions using internal models approved for regulatory purposes. These scenarios were then applied to the trading book, with 31 December 2013 as the reference date; the results were then verified and transmitted to the organisational structure of the Parent Company in charge of consolidating them. More generally, in addition to the economic effects deriving from the application of stress scenarios to the various types of risk (interest rate, equity, FX and related volatility), the figures for which an estimate is required also concern assessments of counterparty risk (credit valuation adjustment and Jump-to-default) and market liquidity risk (resulting from a pre-established widening of the bid/ask spread). The calculations relating to Banca Akros's counterparty risk were carried out by the Credit Office. They were accompanied by a brief "Explanatory Note" which explained the implementation aspects and the methodological decisions involved in each project.

321P a r t E - I n f o r m a t i o n o n r i s k s a n d r e l a t e d h e d g i n g p o l i c i e s
1.2.1 Interest rate risk and price risk - regulatory trading book
Qualitative information
A. General aspects
A.1 Sources of interest rate risk
The Bank's main activities giving rise to interest rate risk are: management of the bond and government security portfolio; transactions in interest rate derivatives, both on regulated markets (e.g. Euribor futures) and over the counter, mainly interest rate swaps,
overnight interest swaps, forward rate agreements.
A.2 Sources of price risk and objectives and strategies underlying trading assets
A.2.1 Banca Popolare di Milano
No trading transactions have been entered into that have led to any positions exposed to price risk.
A.2.2 Banca Akros
Price risk is generated by the equities trading portfolio. The main types of financial instruments traded are: equities, options on individual shares or equity indices, both regulated and OTC, futures with underlying securities or equity indices and, on a residual basis, OTC financial instruments on mutual funds.This activity, which mainly relates to the domestic equity market, can be split essentially into three parts: market making on regulated and OTC equity derivatives (single stock and index), through which the pertinent desk offers its quotations in
electronic form on regulated markets (Italian Stock Exchange and Eurex) or off-market. The execution of instructions from customers and counterparties, through which it is possible take advantage of market opportunities of relative value and event as part of the dynamic management of the risks that are typical of the portfolio (delta risk, covered principally by buying and selling underlying equities, vega risk, gamma risk, rho and theta risk). The price risk taken on lies within the operating limits established by the Board of Directors;
arbitrage or "spread" strategies between regulated and OTC derivatives on equity indices or between equity indices and stocks. This activity is carried on through directional and optional trading strategies on the underlying financial instruments, within established operating limits;
management of OTC derivatives index-linked to baskets of equities, listed international stockmarket indices (individual or in baskets) and mutual funds.
A.3 Objectives and strategies underlying trading activity
A.3.1 Banca Akros
Trading in interest rate derivatives is designed to optimise the flows generated by the need on the part of institutional customers (banks, funds, insurance companies, leasing and consumer credit companies) and corporate customers to hedge their interest rate risk in directional terms and/or in terms of volatility, taking on the risk in a proprietary sense, handling it with dynamic hedging strategies. The Bank operates prevalently as a market maker on first and second generation OTC derivatives, principally on the Euro and, to a lesser extent, the US dollar curves. The overall management of risks deriving from positions in interest rate derivatives also envisages recourse to trading in government or supranational securities listed on the MTS or traded on multilateral trading systems, of regulated futures on short- and medium/long-term interest rates and regulated and OTC options on the same interest rate futures. The pricing models used for valuing OTC derivatives are subject to validation ("model testing") by the Pricing and Market Risk Control Model Validation Office, which also attests to the reliability of the market parameters used as input to the models for calculating the daily mark-to-market adjustments to transactions.

322 P a r t E - I n f o r m a t i o n o n r i s k s a n d r e l a t e d h e d g i n g p o l i c i e s
B. Management processes and methods of measuring interest rate risk and price risk
B.1 Internal processes for managing and controlling interest rate risk
Reference should be made to the section entitled "General common aspects of the market risk management processes adopted by the Bipiemme Group".
B.2 Internal management processes and methods of measuring price risk
Reference should be made to the section entitled "General common aspects of the market risk management processes adopted by the Bipiemme Group".
B.3 Methods used to analyse sensitivity to interest rate risk
B.3.1 Banca Popolare di Milano
For BPM, the main indicators used to measure exposures to interest rate risk are interest rate sensitivity and Credit spread sensitivity , which measure the change in the Fair value of the portfolio in predetermined scenarios of variances in interest rates and widening/narrowing of credit spreads.
B.3.2 Banca Akros
For the measurement of exposures to interest rate risk, the main indicator is portfolio VaR, calculated both with regulatory parameters, to determine the maximum potential loss relating to generic risk and volatility, and in the version extended to include issuer specific credit spread VaR risk, so as to take account of credit spreads as well. Alongside this, we also use analyses of sensitivity to risk factors of rate, volatility and credit spread curves when debt securities and credit derivatives are involved, as well as stress tests on this portfolio.
B.4 Methods used for the analysis of price risk
B.4.1 Banca Popolare di Milano
No trading transactions have been entered into that have led to any positions exposed to price risk.
B.4.2 Banca Akros
Banca Akros measures the price risk (or equity risk) of the trading portfolio through an estimate of the daily value at risk, using the methods already discussed (see "General common aspects of the market risk management processes and measurement methods adopted by the Bipiemme Group"). In particular, the VaR model used identifies both the generic component of price risk and the specific one due to the individual risk factors (equities), taking account of the non-linear dynamics caused by the portfolio of equity options (gamma factor); it also measures the element of risk due to the volatility of individual share prices, as well as the other risks involved in derivative transactions.

323P a r t E - I n f o r m a t i o n o n r i s k s a n d r e l a t e d h e d g i n g p o l i c i e s
Quantitative information
1. Regulatory trading book: distribution by residual duration (repricing date) of the financial assets and liabilities in cash and financial derivatives
Summary table
Type/residual duration On demand Up to 3 months
From 3 to 6 months
From 6 months to
1 year
From 1 year to 5 years
From 5 years to 10 years
Over 10 years
Unspecified duration
1. Cash assets 1,186 72,517 65,701 94,726 135,372 19,229 3,825 –
1.1 Debt securities 1,186 72,517 64,795 94,726 135,372 19,229 3,825 –
– with early redemption option – – – – – – – –
– other 1,186 72,517 64,795 94,726 135,372 19,229 3,825 –
1.2 Other assets – – 906 – – – – –
2. Cash liabilities 29,614 – – – – – – –
2.1 Repurchase agreements – – – – – – – –
2.2 Other liabilities 29,614 – – – – – – –
3. Financial derivatives 12,012,779 50,127,812 24,190,488 16,867,993 26,500,357 9,876,009 3,517,226 –
3.1 With underlying security 1,160 305,903 141,366 98,191 21,537 11,498 1,336 –
– Options – 86,525 17,295 13,969 – – – –
+ Long positions – 74,925 7,625 10,830 – – – –
+ Short positions – 11,600 9,670 3,139 – – – –
– Other 1,160 219,378 124,071 84,222 21,537 11,498 1,336 –
+ Long positions 585 80,382 43,654 197 5,969 3,718 655 –
+ Short positions 575 138,996 80,417 84,025 15,568 7,780 681 –
3.2 Without underlying security 12,011,619 49,821,909 24,049,122 16,769,802 26,478,820 9,864,511 3,515,890 –
– Options 3,754,051 638,152 979,033 1,290,349 2,867,812 603,403 961,125 –
+ Long positions 1,470,361 289,148 510,522 959,966 1,430,682 326,956 562,974 –
+ Short positions 2,283,690 349,004 468,511 330,383 1,437,130 276,447 398,151 –
– Other 8,257,568 49,183,757 23,070,089 15,479,453 23,611,008 9,261,108 2,554,765 –
+ Long positions 3,627,105 25,680,631 11,800,508 6,699,605 12,012,375 4,615,442 1,370,854 –
+ Short positions 4,630,463 23,503,126 11,269,581 8,779,848 11,598,633 4,645,666 1,183,911 –

324 P a r t E - I n f o r m a t i o n o n r i s k s a n d r e l a t e d h e d g i n g p o l i c i e s
1. Regulatory trading book: distribution by residual duration (repricing date) of the financial assets and liabilities in cash and financial derivatives
Currency: Euro
Type/residual duration On demand Up to 3 months
From 3 to 6 months
From 6 months to
1 year
From 1 year to 5 years
From 5 years to 10 years
Over 10 years
Unspecified duration
1. Cash assets 1,186 72,517 64,698 94,726 135,371 12,183 3,824 –
1.1 Debt securities 1,186 72,517 63,792 94,726 135,371 12,183 3,824 –
– with early redemption option – – – – – – – –
– other 1,186 72,517 63,792 94,726 135,371 12,183 3,824 –
1.2 Other assets – – 906 – – – – –
2. Cash liabilities 29,614 – – – – – – –
2.1 Repurchase agreements – – – – – – – –
2.2 Other liabilities 29,614 – – – – – – –
3. Financial derivatives 11,972,617 44,072,202 22,290,666 16,002,971 25,953,649 9,854,260 3,479,314 –
3.1 With underlying security 1,160 218,913 104,176 29,694 12,443 10,724 1,312 –
– Options – 82,959 16,789 13,474 – – – –
+ Long positions – 71,359 7,119 10,335 – – – –
+ Short positions – 11,600 9,670 3,139 – – – –
– Other 1,160 135,954 87,387 16,220 12,443 10,724 1,312 –
+ Long positions 585 79,948 43,654 197 5,969 3,331 643 –
+ Short positions 575 56,006 43,733 16,023 6,474 7,393 669 –
3.2 Without underlying security 11,971,457 43,853,289 22,186,490 15,973,277 25,941,206 9,843,536 3,478,002 –
– Options 3,729,341 418,831 843,412 1,182,555 2,816,435 603,403 961,125 –
+ Long positions 1,453,888 174,922 442,519 901,702 1,408,441 326,956 562,974 –
+ Short positions 2,275,453 243,909 400,893 280,853 1,407,994 276,447 398,151 –
– Other 8,242,116 43,434,458 21,343,078 14,790,722 23,124,771 9,240,133 2,516,877 –
+ Long positions 3,619,423 22,616,061 11,068,445 6,364,128 11,733,704 4,605,214 1,351,910 –
+ Short positions 4,622,693 20,818,397 10,274,633 8,426,594 11,391,067 4,634,919 1,164,967 –

325P a r t E - I n f o r m a t i o n o n r i s k s a n d r e l a t e d h e d g i n g p o l i c i e s
1. Regulatory trading book: distribution by residual duration (repricing date) of the financial assets and liabilities in cash and financial derivatives
Currency: US Dollar
Type/residual duration On demand Up to 3 months
From 3 to 6 months
From 6 months to
1 year
From 1 year to 5 years
From 5 years to 10 years
Over 10 years
Unspecified duration
1. Cash assets – – 1,003 – 2 46 1 –
1.1 Debt securities – – 1,003 – 2 46 1 –
– with early redemption option – – – – – – – –
– other – – 1,003 – 2 46 1 –
1.2 Other assets – – – – – – – –
2. Cash liabilities – – – – – – – –
2.1 Repurchase agreements – – – – – – – –
2.2 Other liabilities – – – – – – – –
3. Financial derivatives 40,162 4,131,017 1,041,043 538,032 410,250 13,693 37,888 –
3.1 With underlying security – 9,879 – 68,002 9,094 762 – –
– Options – – – – – – – –
+ Long positions – – – – – – – –
+ Short positions – – – – – – – –
– Other – 9,879 – 68,002 9,094 762 – –
+ Long positions – 416 – – – 381 – –
+ Short positions – 9,463 – 68,002 9,094 381 – –
3.2 Without underlying security 40,162 4,121,138 1,041,043 470,030 401,156 12,931 37,888 –
– Options 24,710 212,893 126,493 95,632 48,627 – – –
+ Long positions 16,473 109,514 62,329 49,143 19,491 – – –
+ Short positions 8,237 103,379 64,164 46,489 29,136 – – –
– Other 15,452 3,908,245 914,550 374,398 352,529 12,931 37,888 –
+ Long positions 7,682 2,075,612 451,870 157,171 207,639 6,342 18,944 –
+ Short positions 7,770 1,832,633 462,680 217,227 144,890 6,589 18,944 –

326 P a r t E - I n f o r m a t i o n o n r i s k s a n d r e l a t e d h e d g i n g p o l i c i e s
1. Regulatory trading book: distribution by residual duration (repricing date) of the financial assets and liabilities in cash and financial derivatives
Currency: Pound Sterling
Type/residual duration On demand Up to 3 months
From 3 to 6 months
From 6 months to
1 year
From 1 year to 5 years
From 5 years to 10 years
Over 10 years
Unspecified duration
1. Cash assets – – – – – – – –
1.1 Debt securities – – – – – – – –
– with early redemption option – – – – – – – –
– other – – – – – – – –
1.2 Other assets – – – – – – – –
2. Cash liabilities – – – – – – – –
2.1 Repurchase agreements – – – – – – – –
2.2 Other liabilities – – – – – – – –
3. Financial derivatives – 856,808 420,418 124,526 35,066 – – –
3.1 With underlying security – 15,467 24,715 495 – – – –
– Options – 3,566 506 495 – – – –
+ Long positions – 3,566 506 495 – – – –
+ Short positions – – – – – – – –
– Other – 11,901 24,209 – – – – –
+ Long positions – – – – – – – –
+ Short positions – 11,901 24,209 – – – – –
3.2 Without underlying security – 841,341 395,703 124,031 35,066 – – –
– Options – 6,138 9,128 12,162 – – – –
+ Long positions – 4,566 5,674 9,121 – – – –
+ Short positions – 1,572 3,454 3,041 – – – –
– Other – 835,203 386,575 111,869 35,066 – – –
+ Long positions – 374,485 206,629 25,518 27,459 – – –
+ Short positions – 460,718 179,946 86,351 7,607 – – –

327P a r t E - I n f o r m a t i o n o n r i s k s a n d r e l a t e d h e d g i n g p o l i c i e s
1. Regulatory trading book: distribution by residual duration (repricing date) of the financial assets and liabilities in cash and financial derivatives
Currency: Swiss Franc
Type/residual duration On demand Up to 3 months
From 3 to 6 months
From 6 months to
1 year
From 1 year to 5 years
From 5 years to 10 years
Over 10 years
Unspecified duration
1. Cash assets – – – – – – – –
1.1 Debt securities – – – – – – – –
– with early redemption option – – – – – – – –
– other – – – – – – – –
1.2 Other assets – – – – – – – –
2. Cash liabilities – – – – – – – –
2.1 Repurchase agreements – – – – – – – –
2.2 Other liabilities – – – – – – – –
3. Financial derivatives – 85,055 15,617 5,613 28,941 8,044 – –
3.1 With underlying security – – – – – – – –
– Options – – – – – – – –
+ Long positions – – – – – – – –
+ Short positions – – – – – – – –
– Other – – – – – – – –
+ Long positions – – – – – – – –
+ Short positions – – – – – – – –
3.2 Without underlying security – 85,055 15,617 5,613 28,941 8,044 – –
– Options – 290 – – – – – –
+ Long positions – 146 – – – – – –
+ Short positions – 144 – – – – – –
– Other – 84,765 15,617 5,613 28,941 8,044 – –
+ Long positions – 35,244 2,331 5,613 18,296 3,886 – –
+ Short positions – 49,521 13,286 – 10,645 4,158 – –

328 P a r t E - I n f o r m a t i o n o n r i s k s a n d r e l a t e d h e d g i n g p o l i c i e s
1. Regulatory trading book: distribution by residual duration (repricing date) of the financial assets and liabilities in cash and financial derivatives
Currency: Yen
Type/residual duration On demand Up to 3 months
From 3 to 6 months
From 6 months to
1 year
From 1 year to 5 years
From 5 years to 10 years
Over 10 years
Unspecified duration
1. Cash assets – – – – – – – –
1.1 Debt securities – – – – – – – –
– with early redemption option – – – – – – – –
– other – – – – – – – –
1.2 Other assets – – – – – – – –
2. Cash liabilities – – – – – – – –
2.1 Repurchase agreements – – – – – – – –
2.2 Other liabilities – – – – – – – –
3. Financial derivatives – 635,987 322,062 20,105 53,879 – – –
3.1 With underlying security – – – – – – – –
– Options – – – – – – – –
+ Long positions – – – – – – – –
+ Short positions – – – – – – – –
– Other – – – – – – – –
+ Long positions – – – – – – – –
+ Short positions – – – – – – – –
3.2 Without underlying security – 635,987 322,062 20,105 53,879 – – –
– Options – – – – 2,750 – – –
+ Long positions – – – – 2,750 – – –
+ Short positions – – – – – – – –
– Other – 635,987 322,062 20,105 51,129 – – –
+ Long positions – 466,267 18,063 6,809 6,900 – – –
+ Short positions – 169,720 303,999 13,296 44,229 – – –

329P a r t E - I n f o r m a t i o n o n r i s k s a n d r e l a t e d h e d g i n g p o l i c i e s
1. Regulatory trading book: distribution by residual duration (repricing date) of the financial assets and liabilities in cash and financial derivatives
Currency: Canadian Dollars
Type/residual duration On demand Up to 3 months
From 3 to 6 months
From 6 months to
1 year
From 1 year to 5 years
From 5 years to 10 years
Over 10 years
Unspecified duration
1. Cash assets – – – – – – – –
1.1 Debt securities – – – – – – – –
– with early redemption option – – – – – – – –
– other – – – – – – – –
1.2 Other assets – – – – – – – –
2. Cash liabilities – – – – – – – –
2.1 Repurchase agreements – – – – – – – –
2.2 Other liabilities – – – – – – – –
3. Financial derivatives – 29,173 2,977 – – – – –
3.1 With underlying security – – – – – – – –
– Options – – – – – – – –
+ Long positions – – – – – – – –
+ Short positions – – – – – – – –
– Other – – – – – – – –
+ Long positions – – – – – – – –
+ Short positions – – – – – – – –
3.2 Without underlying security – 29,173 2,977 – – – – –
– Options – – – – – – – –
+ Long positions – – – – – – – –
+ Short positions – – – – – – – –
– Other – 29,173 2,977 – – – – –
+ Long positions – 13,232 2,977 – – – – –
+ Short positions – 15,941 – – – – – –

330 P a r t E - I n f o r m a t i o n o n r i s k s a n d r e l a t e d h e d g i n g p o l i c i e s
1. Regulatory trading book: distribution by residual duration (repricing date) of the financial assets and liabilities in cash and financial derivatives
Currency: Other currencies
Type/residual duration On demand Up to 3 months
From 3 to 6 months
From 6 months to
1 year
From 1 year to 5 years
From 5 years to 10 years
Over 10 years
Unspecified duration
1. Cash assets – – – – – – – –
1.1 Debt securities – – – – – – – –
– with early redemption option – – – – – – – –
– other – – – – – – – –
1.2 Other assets – – – – – – – –
2. Cash liabilities – – – – – – – –
2.1 Repurchase agreements – – – – – – – –
2.2 Other liabilities – – – – – – – –
3. Financial derivatives – 317,570 97,705 176,746 18,572 12 24 –
3.1 With underlying security – 61,644 12,475 – – 12 24 –
– Options – – – – – – – –
+ Long positions – – – – – – – –
+ Short positions – – – – – – – –
– Other – 61,644 12,475 – – 12 24 –
+ Long positions – 18 – – – 6 12 –
+ Short positions – 61,626 12,475 – – 6 12 –
3.2 Without underlying security – 255,926 85,230 176,746 18,572 – – –
– Options – – – – – – – –
+ Long positions – – – – – – – –
+ Short positions – – – – – – – –
– Other – 255,926 85,230 176,746 18,572 – – –
+ Long positions – 99,730 50,193 140,366 18,377 – – –
+ Short positions – 156,196 35,037 36,380 195 – – –

331P a r t E - I n f o r m a t i o n o n r i s k s a n d r e l a t e d h e d g i n g p o l i c i e s
2. Regulatory trading book: distribution of exposures in equities and equity indices for the main countries of the listing market
Type of transactions/Quotation index
Listed Unlisted
ITALY UNITED KINGDOM
GERMANY U.S.A. AUSTRALIA Other countries
A. Equities
– long positions 75,997 33,940 2,162 15 577 – 9
– short positions 3,823 – – 3 – – –
B. Purchases/sales of equities not yet settled
– long positions 781 – – – – – –
– short positions 170 – 6 – – – –
C. Other derivatives on equities
– long positions 14,344 – 375 – – – 16,586
– short positions 44,294 3,116 1,894 – – – 892,577
D. Derivatives on equity indices
– long positions 63,755 1,437 560,133 – – – 912,638
– short positions 9,966 1,869 511,845 – – – 280,825
3. Regulatory trading book: internal models and other methodologies used for sensitivity analysis
3.1 Interest rate risk
3.1.1 Banca Popolare di Milano
The Parent Company's exposure to interest rate risk also includes the bond portfolio classified under securities at line items 30. "Financial assets designated at fair value through profit and loss" and 40. "Financial assets available for sale" in the balance sheet; which, even though they form part of the banking book for supervisory reporting purposes, is treated as part of the risks of the trading book as they share risk measurement systems and operational responsibility.
The bulk of the bond portfolio is composed of securities belonging to line item 40. "Financial assets available for sale", whose duration (defined as the weighted average maturity compared with the timing of the cash flow profile) at the end of December 2014 amounted to 2.56 years (2.68 years at the end of 2013).
As regards the sensitivity analysis of BPM's securities portfolio (including the related hedging swaps), understood as the change in value of the portfolio when faced by a parallel and uniform shift of the interest rate curve by one percentage point (100 bps), in December 2014 a figure of –242.7 million euro was recorded in the event of a rise in interest rates, in line with the figure recorded at the end of 2013, namely –240.2 million.
The following table shows the sensitivity trend during the course of 2014.
BPM – Sensitivity of the fair value of the securities portfolio and related hedging swaps to a change in interest rates (in millions of Euro)
Total securities + hedging swaps
Change in rates 31 December 2014 Average Min Max 31 December 2013
+100 bps –242.7 –233.6 –251.6 –219.2 –240.2
–100 bps 250.6 241.7 227.8 260.3 248.4

332 P a r t E - I n f o r m a t i o n o n r i s k s a n d r e l a t e d h e d g i n g p o l i c i e s
The sensitivity of the portfolio of interest rate derivatives (to mitigate the variability of the interest margin of the banking book) at the end of 2014, based on a parallel shift in the rate curve of +/– 100 basis points, shows a sensitivity of 20.8 million euro in the case of a rate increase and of –11.5 million euro in the case of a decrease of 100 basis points in the rate curve.
BPM – Sensitivity of the fair value of the derivatives portfolio to changes in interest rates (in millions of Euro)
Altri derivati
Change in rates 31 December 2014 Average Min Max 31 December 2013
+100 bps 20.8 13.1 7.0 22.0 11.7
–100 bps –11.5 –11.7 –16.7 –6.3 –11.1
The following table shows the trend in the overall sensitivity of the securities portfolio and related hedging swap and derivatives during 2014.
BPM – Total sensitivity of the fair value of the securities derivatives portfolio to changes in interest rates (in millions of Euro)
Change in rates 31 December 2014 Average Min Max 31 December 2013
+100 bps –221.8 –220.6 –236.7 –202.6 –228.5
–100 bps 239.0 230.1 212.3 246.2 237.3
The effects on the principal income statement and balance sheet aggregates of a change of +/–100 b.p. The effects on shareholders' equity are generated by debt securities classified under financial assets available for sale, shown in the balance sheet at 8.611 billion euro.
BPM – Effect of a +/–100 change in the rate curve on: (in millions of Euro)
Rate change Net interest and other banking income
Shareholders' equity Result for the year
+100 bps 17.0 –238.8Same effect as on the interest margin, net of tax
–100 bps –7.6 246.6
As regards credit spread sensitivity, given a 25 bps increase in credit spreads, the potential change in the value of the portfolio is around –80 million euro.The following table shows the trend during 2014 in credit spread sensitivity given changes in credit default spreads of +/– 25 b.p.
BPM – Sensitivity of the portfolio with changes in credit spread (in millions of Euro)
Widening of credit spreads
Credit spread sensitivity
31 December 2014 Average Min Max 31 December 2013
+25 bps –80.0 –77.3 –84.6 –71.6 –77.7
–25 bps 80.7 77.9 72.2 85.4 78.3
BPM – Effects of a +/–25 bps change in credit spreads on: (in millions of Euro)
Widening of credit spreads Net interest and other banking income
Shareholders' equity Result for the year
+25 bps –1.3 –78.8Same effect as on the interest margin, net of tax
–25 bps 1.3 79.4
The trend in credit spreads showed significant fluctuations during 2014. The iTraxx Europe index, which shows changes in credit default spread (i.e. the premium/cost to take on/hedge credit risk) of a basket of 125 "entities" or European issues among the more liquid at the time and with an investment grade rating (at least BBB–/Baa3 and with at least a stable outlook), posted a closing level at the end of 2014 of 63 bps, in line with the figure of 70 bps at the end of 2013.The iTraxx Europe Crossover index, which is made up of non–investment grade borrowers, with ratings below BBB–/Baa3 and a negative outlook, increased by around 60 bps compared with the end of 2013 (346 bps at 31.12.2014 compared with 286.25 bps at 31.12.2013).

333P a r t E - I n f o r m a t i o n o n r i s k s a n d r e l a t e d h e d g i n g p o l i c i e s
3.1.2 Banca Akros
3.1.2.1 Trend in market risk
The average daily amount of the regulatory Value at Risk of the trading book, related solely to the market risks included in the perimeter of the internal model recognised for supervisory purposes, and measured over a holding period of 1 day and with a confidence interval of 99 per cent, came to around 416 thousand euro in 2014, down with respect to the prior year, for which the average daily regulatory VaR was 556 thousand euro, being an average decrease of 25%.
The variation in the measurement of risk in 2014 ranged between 174 thousand euro and 833 thousand euro, whereas the prior year VaR had ranged between 281 thousand euro and 869 thousand euro. The Bank's risk capacity in terms of market risk-taking, measured in terms of regulatory VaR, currently stands at 1,750 thousand euro.
The risk metric showed a trend initially characterised by a moderate increase which, starting from a value of 380 thousand euro in January, gradually increased to reach a maximum of about 770 thousand euro in mid-April. This initial phase was followed by a period of progressive contraction of risk, which in early June returned to the same levels as at the beginning of the year. Subsequently, there was a recovery in risk taking that pushed the metric at 30 June 2014 up to a figure of approximately 580 thousand euro. In the second half of the year, the portfolio VaR remained at the same amount as at the beginning of the year, that is, 400 thousand euro, and it then followed a trend of slight but constant reduction, until it arrived at around 200 thousand euro at the end of the year.
In 2014 the risk profile of the trading book was characterised by a prudent approach, with a level of market risk actually assumed averaging around one quarter of the overall risk capacity. The relatively low use is partly based on the definition of risk capacity itself, being the highest level of risk technically acceptable by the Bank without violating regulatory requirements. Accordingly, it represents an absolute and unattainable level of risk, rather than an operating parameter. In this sense, a more appropriate comparison is provided by the maximum deviance compared with the risk appetite expressed by the portfolio, i.e. the maximum level of VaR taken on during the year. This level of around 833 thousand euro represents 48% of the Bank's overall risk capacity. Secondly, the assumption of risk is also determined by the awareness that the risk measurement used is influenced by the benefit of diversification between risks, whose contribution could be substantially reduced in certain circumstances (typically in situations of market stress), even in a situation where there is very little change in the individual exposures.
The main levels of regulatory VaR (average, maximum, minimum and period-end) for 2014, both for the entire trading portfolio and for the areas of risk into which it is split, are shown in the following table. The diversification effect is quantified for average and year-end VaR, given that these figures are comparable. The same table shows the number of exceptions found in relation to regulatory VaR (i.e. events in which the loss actually recorded exceeded the loss estimate calculated the previous day) both for tests carried out considering the hypothetical change in portfolio value ("hyp."), and considering the actual change ("act.").
99% – 1 Day2014
Fixed Income Area
Equity area
FX area Undiversified Trading Book
Diversification effect
Trading Book
Ave. VaR EUR (000) 286 339 95 719 –304 416
Max VaR EUR (000) 787 787 205 (*) (*) 833
Min VaR EUR (000) 115 106 13 (*) (*) 174
Last VaR EUR (000) 204 126 55 386 –142 243
No. of hyp./act. exceptions 11/8 0/1 1/0 n.s. n.s. 1/1
(*) The undiversified VaR and the diversification effect are quantified only for the measurement of average and last VaR and not for those of maximum and minimum VaR, as these figures refer to different days.

334 P a r t E - I n f o r m a t i o n o n r i s k s a n d r e l a t e d h e d g i n g p o l i c i e s
Figures of regulatory VaR related to 2013 have been reported for comparison purposes:
99% – 1 Day2013
Fixed Income Area
Equity area
FX area Undiversified Trading Book
Diversification effect
Trading Book
Ave. VaR EUR (000) 330 423 78 831 –275 556
Max VaR EUR (000) 793 720 146 (*) (*) 869
Min VaR EUR (000) 129 213 9 (*) (*) 281
Last VaR EUR (000) 254 313 121 688 –330 358
Nr. Eccezioni ip./eff. 2/2 0/0 1/6 n.s. n.s. 0/0
(*) The undiversified VaR and the diversification effect are quantified only for the measurement of average and last VaR and not for those of maximum and minimum VaR, as these figures refer to different days.
Moving on to look at the three macro aggregates ("Areas of risk") that the VaR of the entire trading book can be broken down into – Fixed income, FX and FX derivatives and Equity, it can be seen that, in 2014, the most significant contribution was, on average, generated by equity (average daily VaR of 339 thousand euro), followed by the fixed income area of risk (286 thousand euro) and by foreign exchange (FX and FX derivatives area of risk, 95 thousand euro). Although slightly lower than the previous year (–20%), the market risks in the equity sector continue to be the main component of risk, given the persistence of interest in equity markets, particularly in the domestic equity segment, and the related levels of volatility, which remain attractive, partly because of price shocks that affected individual securities and indices in the year. Also down with respect to 2013 was the exposure to interest rates of the trading portfolio (286 thousand euro versus 330 thousand euro in 2013, –13%), generated not only by proprietary trading, but also by market making, OTC derivatives and Eurobonds. Compared with the previous year, there was an upward trend in the daily VaR of FX and FX derivatives, for which the measurement of maximum expected daily loss rose, on average, from 78 thousand euro in 2013 to 95 thousand euro in 2014 (+22%), an increase that was due to having taken on risk positions in order to benefit from the volatility in certain cross currency rates.
The average impact of the diversification effect, measured as the relative difference between total regulatory VaR and undiversified VaR for the three areas of risk, comes to –42% on average in 2014, which compares with –33% in 2013. The most significant role assumed by the diversification benefit is attributable to a more balanced distribution of risks between the three sectors compared with the previous year, in turn generated by lower risk in the equity segment in favour of the foreign exchange sector.
The next graph shows the frequency distribution of the daily regulatory VaR values for the entire trading book posted during 2014. Daily measurements of risk were concentrated within a range of between 300 and 600 thousand euro, into which 90% of the sample observations fell.
TOT VaR
0.0%
5.0%
10.0%
15.0%
20.0%
25.0%
30.0%
35.0%
40.0%
0 500 1,000Eur (000)
frequ
ency
TOT VaR

335P a r t E - I n f o r m a t i o n o n r i s k s a n d r e l a t e d h e d g i n g p o l i c i e s
Unlike the measurement of regulatory VaR, which is calculated with regard to current market conditions, the corresponding metric related to a stress scenario ("stressed VaR") differentiates itself in that this is calculated on the same portfolio positions, but taking as reference points a time period characterised by particularly severe market conditions in terms of intrinsic risk, with very high values for the volatility of the risk factors and related correlations. Direct comparison between the two figures therefore makes it possible to readily identify the contribution to risk that could result from a significant deterioration in market conditions, all other positions being equal. This makes it possible to overcome the intrinsic limit in the measurement of VaR which is to base future estimates of correlations and volatility on a relatively recent time window, leading potentially to an underestimation of the prospective risk (the so-called "procyclicality effect").
The average value of stressed regulatory VaR for 2014 was 1,598 thousand euro, representing a slight increase with respect to the corresponding figure for 2013 of 1,493 thousand euro, while the range of variation fell between 694 thousand euro and 3,863 thousand euro (between 925 thousand euro and 2,137 thousand euro in 2013). Accordingly, in 2014, daily average VaR under conditions of stress was around 3.8 times that computed under ordinary conditions, which confirms the degree of severity of the chosen stress scenario ("Lehman" scenario). The ratio between VaR and stressed VaR is, on average, higher than that for the previous year, partly due to the impact, in the middle of the year, of the contribution made by the FX sector. The trend in 2014 in the ratio between the stressed measure and that under current conditions showed that VaR under conditions of stress was always higher than that under current conditions, which is consistent with the assumption that, for all the risk factors being considered, the historical period used to calculate stressed VaR represents the scenario of greatest severity even when compared to current market conditions. A comparison between VaR and stressed VaR is the basis for a number of control mechanisms for the persistence of the stress scenario severity characteristics adopted with reference to the risk factors considered. The following chart shows the trend in the sVaR/VaR ratio during the course of 2014 and the outcome of the two control processes based on the number of times the alarm thresholds for this indicator were exceeded. The early warning thresholds, which indicate that the choice of stress scenario may need to be reviewed, were never reached, confirming the choice of stress scenario adopted.
0
1
2
3
4
5
6
7
8
9
10
Jan-14 Feb-14 Mar-14 Apr-14 May-14 Jun-14 Jul-14 Aug-14 Sept-14 Oct-14 Nov-14 Dec-14
R
01234567891011121314151617181920
R No. observations process window 1 (20) No. observations process window 2 (10)
Threshold 2
Threshold 1
REVIEW OF THE STRESS SCENARIO
The average VaR credit spread in 2014 amounted to 551 thousand euro (slightly down on the 2013 figure of 603 thousand euro) and it fluctuated during the period between a low of 384 thousand euro and a high of 901 thousand euro (between 325 thousand euro and 896 thousand euro in 2013). The assumption of risk associated with fluctuations in credit spreads is generated mainly by the cash component of the portfolio of government and corporate debt securities (banks in particular). The trend in internal VaR over time reflects that of the regulatory measurement, showing a moderate upward trend during the first three months, up to a figure of approximately 800 thousand euro in April, followed by a period of contraction, which took the internal VaR to around 450 thousand euro in late May, subsequently increasing again to reach a level of about 680 thousand euro at the end of the half-year. Subsequently, the internal measurement of risk ranged between 500 and 600 thousand euro, to then, as was the case for regulatory VaR, fall significantly in November (reaching a minimum of some 400 thousand euro). At the end of 2014 internal VaR came to some 500 thousand euro. Also for the internal measurement of risk, use of the corresponding limit was, on average, around a quarter.
The maximum potential loss under stress conditions calculated on the basis of the internal measurement (stressed credit spread VaR), with reference to the same scenario adopted for regulatory VaR, amounted on average to 1,642 thousand euro (maximum amount 3,941 thousand euro, minimum amount 814 thousand euro), corresponding to 3 times the current average credit spread VaR (1,484 thousand euro in 2013).

336 P a r t E - I n f o r m a t i o n o n r i s k s a n d r e l a t e d h e d g i n g p o l i c i e s
We remind you that credit spread VaR is used for the internal measurement of risk. For the calculation of the prudential requirement (regulatory measurement), the capital absorbed just by issuer risk is determined according to a standardised approach (so-called mixed model).
Comparing the trends in metrics of regulatory VaR and credit spread VaR in the 2014, it can be seen that the maximum expected daily loss estimated based on the measure extended to issuer risk is, on average, higher than the regulatory measure by some 136 thousand euro (+33%), already considering the effects of diversification between risks. Only the component of credit spread VaR associated with fluctuations in credit spread (issuer risk), a factor that is not present in regulatory VaR, was, on average, 476 thousand euro (with a high of 746 thousand euro and a low of 307 thousand euro). Comparing the average marginal contribution made by issuer risk (476 thousand euro) with the net contribution (136 thousand euro), it follows that the difference (–71%) is attributable to the diversification gain between general risks and specific risks.
On 16 October, backtesting with respect to regulatory VaR for the entire trading portfolio during 2014, revealed an event that exceeded the maximum daily loss, both in the tests carried out in hypothetical mode, as well as those in actual mode (that which identifies the actual change in value as that obtained by excluding the operating results of the day, fees and accrued coupons). The measurement of maximum expected risk was exceeded by 4% in actual mode and by 35% in hypothetical mode. No exception was observed in 2013.
The analysis performed to ascertain the cause of the event that exceeded the maximum expected loss led to the conclusion that the event, both for hypothetical and actual backtesting, is attributable to two elements: in the first instance, to the impact of the significant widening of credit spreads over the course of the day, a factor that does not fall within the risk perimeter revealed by the measurement of regulatory VaR; as a contributory cause, it was found that a significant shock had been suffered during the day by the risk-free interest rates yield curve, which, because of the market turbulence that occurred, led to negative changes in the trading book that exceeded the VaR estimates.
The results of intraday trading, which are included in the actual change in the value of the portfolio, but not in the hypothetical change, justify the difference in the amounts by which the maximum expected loss was exceeded under the two configurations.
The following chart gives a comparison between regulatory VaR at the end of the day and the daily changes in portfolio value of the next business day for hypothetical and actual backtesting purposes.
–1,200,000
–800,000
–400,000
0
400,000
800,000
1,200,000
Jan-14 Feb-14 Mar-14 Apr-14 May-14 Jun-14 Jul-14 Aug-14 Sept-14 Oct-14 Nov-14 Dec-14
Hypothetical change in the value of the portfolio
Regulatory VaR
Hypothetical backtesting of the trading book with respect to regulatory VaR – year 2014

337P a r t E - I n f o r m a t i o n o n r i s k s a n d r e l a t e d h e d g i n g p o l i c i e s
–1,200,000
–800,000
–400,000
0
400,000
800,000
1,200,000
Jan-14 Feb-14 Mar-14 Apr-14 May-14 Jun-14 Jul-14 Aug-14 Sept-14 Oct-14 Nov-14 Dec-14
Effective change in the value of the portfolio
Regulatory VaR
Actual backtesting of the trading book with respect to regulatory VaR – year 2014
Moving on to backtesting against the extended measure of credit spread VaR (i.e. including issuer risk), in this case, there was no evidence of the risk measure having been exceeded, neither in hypothetical mode nor in actual mode, as reported in the following charts. The higher capacity of the internal measurement of risk, for which a uniform risk perimeter is applied to a change in the value of the portfolio, unlike the regulatory measurement, does not give rise to the loss being exceeded ex-ante.
–1,200,000
–800,000
–400,000
0
400,000
800,000
1,200,000
Jan-14 Feb-14 Mar-14 Apr-14 May-14 Jun-14 Jul-14 Aug-14 Sept-14 Oct-14 Nov-14 Dec-14
Hypothetical change in the value of the portfolio
internal VaR
Hypothetical backtesting of the trading book with respect to internal VaR (credit spread VaR) – year 2014

338 P a r t E - I n f o r m a t i o n o n r i s k s a n d r e l a t e d h e d g i n g p o l i c i e s
–1,200,000
–800,000
–400,000
0
400,000
800,000
1,200,000
Jan-14 Feb-14 Mar-14 Apr-14 May-14 Jun-14 Jul-14 Aug-14 Sept-14 Oct-14 Nov-14 Dec-14
Effective change in the value of the portfolio
internal VaR
Actual backtesting of the trading book with respect to internal VaR (credit spread VaR) – year 2014
Banca Akros regularly carries out stress testing on its trading portfolio in order to determine any weaknesses in the portfolio that fall outside the possibilities of regulatory risk measurement and to ascertain the ability of the Bank's regulatory capital to absorb any potential losses. The types of stress scenarios (hypothetical and specific) involve the major risk factors of the portfolio and get disrupted both jointly (historical and hypothetical scenarios) and individually (specific scenarios). In particular, sensitivity tests to credit spread VaR are performed for each issuer curve and for rating/segment curves, aggregating them by rating class, sector of activity or portfolio. The scenarios adopted foresee a deterioration in creditworthiness as a result of a widening in credit spreads of +25 and +50 basis points. To take account of possible negative impacts resulting from indebtedness, symmetrical improvement scenarios of credit spread (–25 and –50 basis points) have also been implemented. In addition to these tests, we also estimate the impacts for non-parallel changes in credit curves (deepening and flattening of the yield curve).
During 2014, the most unfavourable stress scenarios were those which assumed significant widening of credit spreads. In addition to these scenarios, to assess their potential impact, other scenarios were adopted that envisaged specific, large movements in the interest rate curve (parallel movements of the Euro curve, tilting around a pivotal point), as well as some scenarios that envisaged substantial idiosyncratic shocks on specific equities. Generally speaking, the results of historical and hypothetical scenarios are less drastic.
The potential impacts on the income statement of certain interest rate and credit spread shock scenarios for the entire trading portfolio at the end of 2014 are summarised in the following table. In particular, due to the effect of an assumed parallel widening of the credit spread curve of +25 and +50 basis points, the negative change in the portfolio would be –1,753 thousand euro and – 3,487 thousand euro, respectively. Of the interest rate scenarios, a parallel upwards movement of the entire Euro interest rate curve of +50 basis points would lead to a fall in the value of the entire Trading Book of some –2,855 thousand euro, while an upward movement of the short and medium term element of the Euro interest rate curve, along with a fall in medium to long term interest rates (so-called "tilting Up-Down"), would produce a reduction in the value of the portfolio of –1,412 thousand euro.
(thousands of Euro)
Interest Rates Credit Spread
–50 bps +50 bps Tilting Down-Up
Tilting Up-Down
–50 bps –25 bps +25 bps +50 bps
1,453 –2,855 1,083 –1,412 3,544 1,765 –1,753 –3,487

339P a r t E - I n f o r m a t i o n o n r i s k s a n d r e l a t e d h e d g i n g p o l i c i e s
1.2.2 Interest rate risk and price risk – Banking book
Qualitative information
A. General aspects, management processes and methods of measuring interest rate risk and price risk
Interest rate risk is substantiated in the potential impact that unexpected changes in market interest rates have on current earnings (cash flow risk) and the Group's shareholders' equity (fair value risk). This risk occurs typically on positions in the banking book, namely: customers' loans and deposits; own bonds; own issues for institutional investors; interbank operations; operations with the European Central Bank (OMO); hedging derivatives.
Interest rate risk is therefore measured from the point of view of both income statement and the balance sheet.
From the point of view of the income statement, interest rate risk arises from the possibility that an unexpected change in interest rates generates a reduction in net interest income, and hence in Group profits. This risk therefore depends on: a shift in the time structure of loans and deposits in the case of fixed-rate items; a misalignment of the review periods of rate conditions in the case of floating-rate items.
From the point of view of the balance sheet, interest rate risk arises from the possibility that an unexpected change in interest rates generates a decrease in the values of all balance sheet items, destabilising the Group's capital.
The main sources of interest rate risk can be schematised as follows: repricing risk: risk arising from timing mismatches in maturities and repricing of assets and liabilities; The main features of this type of risk are: • yield curve risk: risk resulting from exposure of balance sheet items to changes in slope and shape of the yield curve; • basis risk: risk from imperfect correlation in the variations of the rates earned and paid on different instruments, even with similar
repricing structures; optionality risk: risk resulting from embedded options in the Banking Book items.
The Bipiemme Group monitors – both at consolidated level and at the level of individual legal entity – the banking book's exposure to adverse changes in interest rates, in terms of both the income statement and the balance sheet.Measuring the interest rate risk on the banking book is done using integrated methods of Asset and Liability Management (ALM). In particular, the risk measurements used are: the change in interest margin expected as a result of a parallel shock on the spot rate curve of +/–100 basis points (earnings perspective); the change in economic value as a result of a parallel shock on the spot rate curve of +/–200 basis points (capital perspective), as defined
in the Second Pillar of Basel II.
The impact on the interest margin is due to the reinvestment/refinancing at new market conditions of the principal amount due (reinvestment/refinancing risk) and to the change in the coupon element (repricing risk, only for floating rate operations). The impact on the interest margin is obtained by mapping the items at the actual dates at risk, or the date of payment of principal amounts for fixed rate transactions and the next repricing date after the cut-off for floating rate transactions. This approach, known as the repricing gap, implies the adoption of a time horizon (known as the "gapping period"), of one year according to market best practices.
The impact on the economic value is measured according to a full evaluation approach, or as the change in fair value of the items mapped in each time band following a parallel shock in the curve of spot rates.The methodologies used for analysing sensitivity to interest rate risk also include behavioural modelling of demand deposits and prepayments of the mortgage portfolio.

340 P a r t E - I n f o r m a t i o n o n r i s k s a n d r e l a t e d h e d g i n g p o l i c i e s
As for the modelling of demand deposits, the Bipiemme Group adopts statistical models able to grasp both the persistence of volumes over time and the responsiveness of rates to market conditions; in particular: the volume analysis model makes it possible to represent the element of aggregate demand items considered stable as a portfolio of amortizing
to maturity items; the rate analysis model makes it possible to identify the proportion of demand items that react to movements in a market parameter considered
significant and to measure the time needed to make the adjustment (viscosity effect).
These models have been run on historical data from 2002 to 2012.
Lastly, the risk of prepayment on the mortgage portfolio is measured through a CPR-type model (Constant Prepayment Rate), which estimates a prepayment rate for each time band, based on historical data updated to 2012.
B. Fair value hedging
A hedge accounting policy drawn up by the Parent Company has been in force since 2009. It defines the methodology and the organisational process for managing hedges of interest rate risk, with particular reference to the players involved, the definition of roles and responsibilities and the description of planned activities and mapping processes.This policy also gives the Parent Company the responsibility for managing the interest rate risk of the Bipiemme Group's banking book, both as regards monitoring the exposure and compliance with the operational limits and for its management and hedging activities.
The responsibility for managing interest rate risk and hedging activities is centralized in the Parent Company's Finance Committee, for any legal entity included in the scope of the policy (which excludes Banca Akros).The Finance Committee establishes guidelines for management of the assets and liabilities side of the financial statements and sets up all interest rate risk hedging transactions. Such hedging transactions, as approved by the Finance Committee, are carried out by the Finance Function of Banca Popolare di Milano. This function has also been delegated the power to implement operating hedging strategies, taking positions on the interest rate curve with a view to reducing the exposure to the interest rate risk generated by the Bank's commercial activities in deposits and loans.
Hedging of interest rate risk has the objective of protecting the banking book from changes in the fair value of deposits and loans due to movements in the interest rate curve or to reduce the variability of cash flows related to a particular asset or liability.
The main types of hedge derivatives used are represented by Interest Rate Swap (IRS), Overnight Indexed Swap (OIS), Cross Currency Swap (CCS) and options on interest rate (cap, floor, collar).
The hedging activity carried on by the Bipiemme Group is reflected in the books (hedge accounting) in two ways: micro fair value hedge: hedging of the fair value of assets or liabilities specifically identified and represented mainly by bonds issued or purchased; macro fair value hedge: hedging of homogeneous pools of assets or liabilities not individually identifiable and represented mainly by loans to
ordinary customers.
C. Cash flow hedging
The Bipiemme Group has taken out cash flow hedges to stabilise, by means of a swap, the coupon yield of a security recorded under financial assets available for sale.
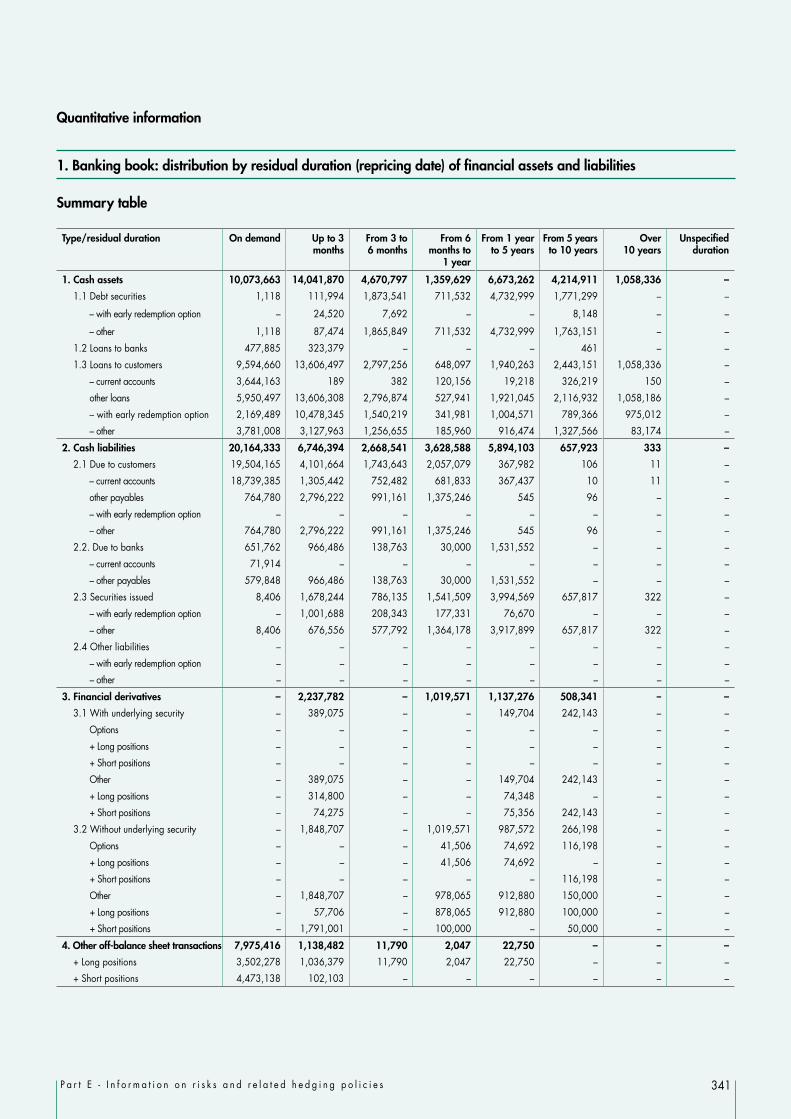
341P a r t E - I n f o r m a t i o n o n r i s k s a n d r e l a t e d h e d g i n g p o l i c i e s
Quantitative information
1. Banking book: distribution by residual duration (repricing date) of financial assets and liabilities
Summary table
Type/residual duration On demand Up to 3 months
From 3 to 6 months
From 6 months to
1 year
From 1 year to 5 years
From 5 years to 10 years
Over 10 years
Unspecified duration
1. Cash assets 10,073,663 14,041,870 4,670,797 1,359,629 6,673,262 4,214,911 1,058,336 –
1.1 Debt securities 1,118 111,994 1,873,541 711,532 4,732,999 1,771,299 – –
– with early redemption option – 24,520 7,692 – – 8,148 – –
– other 1,118 87,474 1,865,849 711,532 4,732,999 1,763,151 – –
1.2 Loans to banks 477,885 323,379 – – – 461 – –
1.3 Loans to customers 9,594,660 13,606,497 2,797,256 648,097 1,940,263 2,443,151 1,058,336 –
– current accounts 3,644,163 189 382 120,156 19,218 326,219 150 –
other loans 5,950,497 13,606,308 2,796,874 527,941 1,921,045 2,116,932 1,058,186 –
– with early redemption option 2,169,489 10,478,345 1,540,219 341,981 1,004,571 789,366 975,012 –
– other 3,781,008 3,127,963 1,256,655 185,960 916,474 1,327,566 83,174 –
2. Cash liabilities 20,164,333 6,746,394 2,668,541 3,628,588 5,894,103 657,923 333 –
2.1 Due to customers 19,504,165 4,101,664 1,743,643 2,057,079 367,982 106 11 –
– current accounts 18,739,385 1,305,442 752,482 681,833 367,437 10 11 –
other payables 764,780 2,796,222 991,161 1,375,246 545 96 – –
– with early redemption option – – – – – – – –
– other 764,780 2,796,222 991,161 1,375,246 545 96 – –
2.2. Due to banks 651,762 966,486 138,763 30,000 1,531,552 – – –
– current accounts 71,914 – – – – – – –
– other payables 579,848 966,486 138,763 30,000 1,531,552 – – –
2.3 Securities issued 8,406 1,678,244 786,135 1,541,509 3,994,569 657,817 322 –
– with early redemption option – 1,001,688 208,343 177,331 76,670 – – –
– other 8,406 676,556 577,792 1,364,178 3,917,899 657,817 322 –
2.4 Other liabilities – – – – – – – –
– with early redemption option – – – – – – – –
– other – – – – – – – –
3. Financial derivatives – 2,237,782 – 1,019,571 1,137,276 508,341 – –
3.1 With underlying security – 389,075 – – 149,704 242,143 – –
Options – – – – – – – –
+ Long positions – – – – – – – –
+ Short positions – – – – – – – –
Other – 389,075 – – 149,704 242,143 – –
+ Long positions – 314,800 – – 74,348 – – –
+ Short positions – 74,275 – – 75,356 242,143 – –
3.2 Without underlying security – 1,848,707 – 1,019,571 987,572 266,198 – –
Options – – – 41,506 74,692 116,198 – –
+ Long positions – – – 41,506 74,692 – – –
+ Short positions – – – – – 116,198 – –
Other – 1,848,707 – 978,065 912,880 150,000 – –
+ Long positions – 57,706 – 878,065 912,880 100,000 – –
+ Short positions – 1,791,001 – 100,000 – 50,000 – –
4. Other off-balance sheet transactions 7,975,416 1,138,482 11,790 2,047 22,750 – – –
+ Long positions 3,502,278 1,036,379 11,790 2,047 22,750 – – –
+ Short positions 4,473,138 102,103 – – – – – –

342 P a r t E - I n f o r m a t i o n o n r i s k s a n d r e l a t e d h e d g i n g p o l i c i e s
1. Banking book: distribution by residual duration (repricing date) of financial assets and liabilities
Currency: Euro
Type/residual duration On demand Up to 3 months
From 3 to 6 months
From 6 months to
1 year
From 1 year to 5 years
From 5 years to 10 years
Over 10 years
Unspecified duration
1. Cash assets 10,005,114 13,784,673 4,664,629 1,359,629 6,665,088 4,214,196 1,058,336 –
1.1 Debt securities 1,118 111,994 1,873,541 711,532 4,724,825 1,771,299 – –
– with early redemption option – 24,520 7,692 – – 8,148 – –
– other 1,118 87,474 1,865,849 711,532 4,724,825 1,763,151 – –
1.2 Loans to banks 452,617 261,110 – – – – – –
1.3 Loans to customers 9,551,379 13,411,569 2,791,088 648,097 1,940,263 2,442,897 1,058,336 –
– current accounts 3,618,124 189 382 120,156 19,218 326,219 150 –
other loans 5,933,255 13,411,380 2,790,706 527,941 1,921,045 2,116,678 1,058,186 –
– with early redemption option 2,169,489 10,478,345 1,540,219 341,981 1,004,571 789,366 975,012 –
– other 3,763,766 2,933,035 1,250,487 185,960 916,474 1,327,312 83,174 –
2. Cash liabilities 19,984,580 6,470,708 2,668,495 3,628,448 5,894,103 657,923 333 –
2.1 Due to customers 19,331,180 4,101,664 1,743,643 2,057,079 367,982 106 11 –
– current accounts 18,566,401 1,305,442 752,482 681,833 367,437 10 11 –
other payables 764,779 2,796,222 991,161 1,375,246 545 96 – –
– with early redemption option – – – – – – – –
– other 764,779 2,796,222 991,161 1,375,246 545 96 – –
2.2. Due to banks 644,994 691,156 138,763 30,000 1,531,552 – – –
– current accounts 66,588 – – – – – – –
– other payables 578,406 691,156 138,763 30,000 1,531,552 – – –
2.3 Securities issued 8,406 1,677,888 786,089 1,541,369 3,994,569 657,817 322 –
– with early redemption option – 1,001,688 208,343 177,331 76,670 – – –
– other 8,406 676,200 577,746 1,364,038 3,917,899 657,817 322 –
2.4 Other liabilities – – – – – – – –
– with early redemption option – – – – – – – –
– other – – – – – – – –
3. Financial derivatives – 2,230,074 – 1,019,571 1,137,276 508,341 – –
3.1 With underlying security – 389,075 – – 149,704 242,143 – –
Options – – – – – – – –
+ Long positions – – – – – – – –
+ Short positions – – – – – – – –
Other – 389,075 – – 149,704 242,143 – –
+ Long positions – 314,800 – – 74,348 – – –
+ Short positions – 74,275 – – 75,356 242,143 – –
3.2 Without underlying security – 1,840,999 – 1,019,571 987,572 266,198 – –
Options – – – 41,506 74,692 116,198 – –
+ Long positions – – – 41,506 74,692 – – –
+ Short positions – – – – – 116,198 – –
Other – 1,840,999 – 978,065 912,880 150,000 – –
+ Long positions – 50,054 – 878,065 912,880 100,000 – –
+ Short positions – 1,790,945 – 100,000 – 50,000 – –
4. Other off-balance sheet transactions 7,875,536 1,138,462 11,784 2,047 22,750 – – –
+ Long positions 3,452,351 1,036,359 11,784 2,047 22,750 – – –
+ Short positions 4,423,185 102,103 – – – – – –

343P a r t E - I n f o r m a t i o n o n r i s k s a n d r e l a t e d h e d g i n g p o l i c i e s
1. Banking book: distribution by residual duration (repricing date) of financial assets and liabilities
Currency: US Dollar
Type/residual duration On demand Up to 3 months
From 3 to 6 months
From 6 months to
1 year
From 1 year to 5 years
From 5 years to 10 years
Over 10 years
Unspecified duration
1. Cash assets 53,310 239,738 6,150 – 8,174 715 – –
1.1 Debt securities – – – – 8,174 – – –
– with early redemption option – – – – – – – –
– other – – – – 8,174 – – –
1.2 Loans to banks 10,481 50,867 – – – 461 – –
1.3 Loans to customers 42,829 188,871 6,150 – – 254 – –
– current accounts 25,926 – – – – – – –
other loans 16,903 188,871 6,150 – – 254 – –
– with early redemption option – – – – – – – –
– other 16,903 188,871 6,150 – – 254 – –
2. Cash liabilities 163,814 275,422 46 140 – – – –
2.1 Due to customers 157,051 – – – – – – –
– current accounts 157,050 – – – – – – –
other payables 1 – – – – – – –
– with early redemption option – – – – – – – –
– other 1 – – – – – – –
2.2. Due to banks 6,763 275,066 – – – – – –
– current accounts 5,321 – – – – – – –
– other payables 1,442 275,066 – – – – – –
2.3 Securities issued – 356 46 140 – – – –
– with early redemption option – – – – – – – –
– other – 356 46 140 – – – –
2.4 Other liabilities – – – – – – – –
– with early redemption option – – – – – – – –
– other – – – – – – – –
3. Financial derivatives – 7,708 – – – – – –
3.1 With underlying security – – – – – – – –
Options – – – – – – – –
+ Long positions – – – – – – – –
+ Short positions – – – – – – – –
Other – – – – – – – –
+ Long positions – – – – – – – –
+ Short positions – – – – – – – –
3.2 Without underlying security – 7,708 – – – – – –
Options – – – – – – – –
+ Long positions – – – – – – – –
+ Short positions – – – – – – – –
Other – 7,708 – – – – – –
+ Long positions – 7,652 – – – – – –
+ Short positions – 56 – – – – – –
4. Other off-balance sheet transactions 84,896 20 6 – – – – –
+ Long positions 42,435 20 6 – – – – –
+ Short positions 42,461 – – – – – – –

344 P a r t E - I n f o r m a t i o n o n r i s k s a n d r e l a t e d h e d g i n g p o l i c i e s
1. Banking book: distribution by residual duration (repricing date) of financial assets and liabilities
Currency: Pound Sterling
Type/residual duration On demand Up to 3 months
From 3 to 6 months
From 6 months to
1 year
From 1 year to 5 years
From 5 years to 10 years
Over 10 years
Unspecified duration
1. Cash assets 2,584 1,841 10 – – – – –
1.1 Debt securities – – – – – – – –
– with early redemption option – – – – – – – –
– other – – – – – – – –
1.2 Loans to banks 2,549 – – – – – – –
1.3 Loans to customers 35 1,841 10 – – – – –
– current accounts 13 – – – – – – –
other loans 22 1,841 10 – – – – –
– with early redemption option – – – – – – – –
– other 22 1,841 10 – – – – –
2. Cash liabilities 5,977 – – – – – – –
2.1 Due to customers 5,977 – – – – – – –
– current accounts 5,977 – – – – – – –
other payables – – – – – – – –
– with early redemption option – – – – – – – –
– other – – – – – – – –
2.2. Due to banks – – – – – – – –
– current accounts – – – – – – – –
– other payables – – – – – – – –
2.3 Securities issued – – – – – – – –
– with early redemption option – – – – – – – –
– other – – – – – – – –
2.4 Other liabilities – – – – – – – –
– with early redemption option – – – – – – – –
– other – – – – – – – –
3. Financial derivatives – – – – – – – –
3.1 With underlying security – – – – – – – –
Options – – – – – – – –
+ Long positions – – – – – – – –
+ Short positions – – – – – – – –
Other – – – – – – – –
+ Long positions – – – – – – – –
+ Short positions – – – – – – – –
3.2 Without underlying security – – – – – – – –
Options – – – – – – – –
+ Long positions – – – – – – – –
+ Short positions – – – – – – – –
Other – – – – – – – –
+ Long positions – – – – – – – –
+ Short positions – – – – – – – –
4. Other off-balance sheet transactions – – – – – – – –
+ Long positions – – – – – – – –
+ Short positions – – – – – – – –

345P a r t E - I n f o r m a t i o n o n r i s k s a n d r e l a t e d h e d g i n g p o l i c i e s
1. Banking book: distribution by residual duration (repricing date) of financial assets and liabilities
Currency: Swiss Franc
Type/residual duration On demand Up to 3 months
From 3 to 6 months
From 6 months to
1 year
From 1 year to 5 years
From 5 years to 10 years
Over 10 years
Unspecified duration
1. Cash assets 4,148 7,405 8 – – – – –
1.1 Debt securities – – – – – – – –
– with early redemption option – – – – – – – –
– other – – – – – – – –
1.2 Loans to banks 3,953 4,156 – – – – – –
1.3 Loans to customers 195 3,249 8 – – – – –
– current accounts 13 – – – – – – –
other loans 182 3,249 8 – – – – –
– with early redemption option – – – – – – – –
– other 182 3,249 8 – – – – –
2. Cash liabilities 3,730 – – – – – – –
2.1 Due to customers 3,730 – – – – – – –
– current accounts 3,730 – – – – – – –
other payables – – – – – – – –
– with early redemption option – – – – – – – –
– other – – – – – – – –
2.2. Due to banks – – – – – – – –
– current accounts – – – – – – – –
– other payables – – – – – – – –
2.3 Securities issued – – – – – – – –
– with early redemption option – – – – – – – –
– other – – – – – – – –
2.4 Other liabilities – – – – – – – –
– with early redemption option – – – – – – – –
– other – – – – – – – –
3. Financial derivatives – – – – – – – –
3.1 With underlying security – – – – – – – –
Options – – – – – – – –
+ Long positions – – – – – – – –
+ Short positions – – – – – – – –
Other – – – – – – – –
+ Long positions – – – – – – – –
+ Short positions – – – – – – – –
3.2 Without underlying security – – – – – – – –
Options – – – – – – – –
+ Long positions – – – – – – – –
+ Short positions – – – – – – – –
Other – – – – – – – –
+ Long positions – – – – – – – –
+ Short positions – – – – – – – –
4. Other off-balance sheet transactions 14,984 – – – – – – –
+ Long positions 7,492 – – – – – – –
+ Short positions 7,492 – – – – – – –

346 P a r t E - I n f o r m a t i o n o n r i s k s a n d r e l a t e d h e d g i n g p o l i c i e s
1. Banking book: distribution by residual duration (repricing date) of financial assets and liabilities
Currency: Yen
Type/residual duration On demand Up to 3 months
From 3 to 6 months
From 6 months to
1 year
From 1 year to 5 years
From 5 years to 10 years
Over 10 years
Unspecified duration
1. Cash assets 1,285 7,359 – – – – – –
1.1 Debt securities – – – – – – – –
– with early redemption option – – – – – – – –
– other – – – – – – – –
1.2 Loans to banks 1,114 6,881 – – – – – –
1.3 Loans to customers 171 478 – – – – – –
– current accounts 36 – – – – – – –
other loans 135 478 – – – – – –
– with early redemption option – – – – – – – –
– other 135 478 – – – – – –
2. Cash liabilities 982 – – – – – – –
2.1 Due to customers 982 – – – – – – –
– current accounts 982 – – – – – – –
other payables – – – – – – – –
– with early redemption option – – – – – – – –
– other – – – – – – – –
2.2. Due to banks – – – – – – – –
– current accounts – – – – – – – –
– other payables – – – – – – – –
2.3 Securities issued – – – – – – – –
– with early redemption option – – – – – – – –
– other – – – – – – – –
2.4 Other liabilities – – – – – – – –
– with early redemption option – – – – – – – –
– other – – – – – – – –
3. Financial derivatives – – – – – – – –
3.1 With underlying security – – – – – – – –
Options – – – – – – – –
+ Long positions – – – – – – – –
+ Short positions – – – – – – – –
Other – – – – – – – –
+ Long positions – – – – – – – –
+ Short positions – – – – – – – –
3.2 Without underlying security – – – – – – – –
Options – – – – – – – –
+ Long positions – – – – – – – –
+ Short positions – – – – – – – –
Other – – – – – – – –
+ Long positions – – – – – – – –
+ Short positions – – – – – – – –
4. Other off-balance sheet transactions – – – – – – – –
+ Long positions – – – – – – – –
+ Short positions – – – – – – – –

347P a r t E - I n f o r m a t i o n o n r i s k s a n d r e l a t e d h e d g i n g p o l i c i e s
1. Banking book: distribution by residual duration (repricing date) of financial assets and liabilities
Currency: Canadian Dollars
Type/residual duration On demand Up to 3 months
From 3 to 6 months
From 6 months to
1 year
From 1 year to 5 years
From 5 years to 10 years
Over 10 years
Unspecified duration
1. Cash assets 406 489 – – – – – –
1.1 Debt securities – – – – – – – –
– with early redemption option – – – – – – – –
– other – – – – – – – –
1.2 Loans to banks 381 – – – – – – –
1.3 Loans to customers 25 489 – – – – – –
– current accounts 25 – – – – – – –
other loans – 489 – – – – – –
– with early redemption option – – – – – – – –
– other – 489 – – – – – –
2. Cash liabilities 2,153 264 – – – – – –
2.1 Due to customers 2,153 – – – – – – –
– current accounts 2,153 – – – – – – –
other payables – – – – – – – –
– with early redemption option – – – – – – – –
– other – – – – – – – –
2.2. Due to banks – 264 – – – – – –
– current accounts – – – – – – – –
– other payables – 264 – – – – – –
2.3 Securities issued – – – – – – – –
– with early redemption option – – – – – – – –
– other – – – – – – – –
2.4 Other liabilities – – – – – – – –
– with early redemption option – – – – – – – –
– other – – – – – – – –
3. Financial derivatives – – – – – – – –
3.1 With underlying security – – – – – – – –
Options – – – – – – – –
+ Long positions – – – – – – – –
+ Short positions – – – – – – – –
Other – – – – – – – –
+ Long positions – – – – – – – –
+ Short positions – – – – – – – –
3.2 Without underlying security – – – – – – – –
Options – – – – – – – –
+ Long positions – – – – – – – –
+ Short positions – – – – – – – –
Other – – – – – – – –
+ Long positions – – – – – – – –
+ Short positions – – – – – – – –
4. Other off-balance sheet transactions – – – – – – – –
+ Long positions – – – – – – – –
+ Short positions – – – – – – – –

348 P a r t E - I n f o r m a t i o n o n r i s k s a n d r e l a t e d h e d g i n g p o l i c i e s
1. Banking book: distribution by residual duration (repricing date) of financial assets and liabilities
Currency: Other currencies
Type/residual duration On demand Up to 3 months
From 3 to 6 months
From 6 months to
1 year
From 1 year to 5 years
From 5 years to 10 years
Over 10 years
Unspecified duration
1. Cash assets 6,816 365 – – – – – –
1.1 Debt securities – – – – – – – –
– with early redemption option – – – – – – – –
– other – – – – – – – –
1.2 Loans to banks 6,790 365 – – – – – –
1.3 Loans to customers 26 – – – – – – –
– current accounts 26 – – – – – – –
other loans – – – – – – – –
– with early redemption option – – – – – – – –
– other – – – – – – – –
2. Cash liabilities 3,097 – – – – – – –
2.1 Due to customers 3,092 – – – – – – –
– current accounts 3,092 – – – – – – –
other payables – – – – – – – –
– with early redemption option – – – – – – – –
– other – – – – – – – –
2.2. Due to banks 5 – – – – – – –
– current accounts 5 – – – – – – –
– other payables – – – – – – – –
2.3 Securities issued – – – – – – – –
– with early redemption option – – – – – – – –
– other – – – – – – – –
2.4 Other liabilities – – – – – – – –
– with early redemption option – – – – – – – –
– other – – – – – – – –
3. Financial derivatives – – – – – – – –
3.1 With underlying security – – – – – – – –
Options – – – – – – – –
+ Long positions – – – – – – – –
+ Short positions – – – – – – – –
Other – – – – – – – –
+ Long positions – – – – – – – –
+ Short positions – – – – – – – –
3.2 Without underlying security – – – – – – – –
Options – – – – – – – –
+ Long positions – – – – – – – –
+ Short positions – – – – – – – –
Other – – – – – – – –
+ Long positions – – – – – – – –
+ Short positions – – – – – – – –
4. Other off-balance sheet transactions – – – – – – – –
+ Long positions – – – – – – – –
+ Short positions – – – – – – – –

349P a r t E - I n f o r m a t i o n o n r i s k s a n d r e l a t e d h e d g i n g p o l i c i e s
2. Banking book: internal models and other methodologies used for sensitivity analysis
As described in the methodological section, the exposure to interest rate risk in terms of profitability is measured by the change in the interest margin expected over a period of one year following a parallel shock on the spot rate curve of +/– 100 basis points.
The following table shows the average and actual results of the estimate of this change at 31 December 2014. For consistency with respect to the measurement of interest rate risk from a capital point of view, the result of the estimates obtained by applying a shock of +/– 200 basis points is also shown.
(In millions of euro)
Floating Figure at 31 December 2014
Average figure for 2014
Sensitivity of interest margin +100bps 22.1 23.7
Sensitivity of interest margin –100 bps –0.4 –3.9
Sensitivity of interest margin +200bps 43.7 45.7
Sensitivity of interest margin –200 bps –0.4 –4.0
The exposure to interest rate risk from a capital point of view is measured by the maximum absolute change in economic value (fair value) following a parallel shock on the spot rate curve of +/– 200 basis points.
The following table shows the average and actual results of the estimate of this change at 31 December 2014. For consistency with respect to the measurement of interest rate risk from an economic point of view, the result of the estimates obtained by applying a shock of +/– 100 basis points is also shown.
(In millions of euro)
Floating Figure at 31 December 2014
Average figure for 2014
Sensitivity of the economic value +100bps –173.8 –218.7
Sensitivity of the economic value -100bps 55.8 175.2
Sensitivity of the economic value +200bps –365.0 –439.9
Sensitivity of the economic value -200bps 53.9 205.4
As shown in the following table, the maximum absolute change in fair value is then compared with the regulatory capital.
Floating Figure at 31 December 2014
Average figure for 2014
Maximum absolute change in fair value (+/–100bps) in relation to Regulatory Capital 3.3% 4.5%
Maximum absolute change in fair value (+/–200bps) in relation to Regulatory Capital 7.0% 9.1%
As indicated in the reference standard, in the case of downward scenarios the application of an implicit floor equal to zero ensures that interest rates can not turn negative.

350 P a r t E - I n f o r m a t i o n o n r i s k s a n d r e l a t e d h e d g i n g p o l i c i e s
1.2.3 – Exchange risk
Qualitative information
A. General aspects, management processes and methods of measuring exchange risk
Banca Popolare di Milano
The Parent Company's forex operations are substantially limited to servicing the needs of the commercial functions.Foreign exchange activities are limited to transactions involving currency gains (interest margin or commissions and fees collected in foreign currency) and foreign banknotes for the purchase and sale of currency by the branch network.There is also a forex brokerage service for customers, but without keeping significant position books open.
Banca Akros
Exchange rate risk is managed internally by a specific desk, where forex and forex derivative transactions are also focused with a view to hedging the currency exposure of any of the Bank's assets.
A.1 Sources of exchange rate risk
The main sources of exchange rate risk are: loans and deposits in foreign currency with corporate and/or retail customers; purchases of securities and/or equity investments and other financial instruments in foreign currency; trading in foreign notes; receipt and/or payment of interest, dividends, administrative expenses, etc.; at Banca Akros, the forex desk and the currency operations of the other desks.
A.2 Internal processes for managing and controlling exchange rate risk
Banca Popolare di Milano
The system of operating limits allows the Head of the Finance Function to hold an overnight currency position of up to 5 million euro. Moreover, the sum of the absolute values of the open positions in all foreign currencies must not exceed the limits set, and periodically reviewed, by the Regulation for Financial Operations. There is also a stop loss of 1 million euro.This position is monitored through the front-office application (Kondor+).
Banca Akros
Banca Akros assumes exchange risk within the established operating limits.The principal indicator of exposure to exchange rate risk is the VaR of the FX Area, which includes analysing the sensitivity to exchange rate and interest rate risk, the risk of volatility and the effect of non-linear trends by the options portfolio (gamma and vega risk), using the methods explained above (see "General common aspects related to the management processes and methods adopted by the Bank").

351P a r t E - I n f o r m a t i o n o n r i s k s a n d r e l a t e d h e d g i n g p o l i c i e s
B. Exchange rate risk hedging
The exchange rate risk generated by loans and deposits on the banking books of the commercial banks and by investing in securities and/or equity investments is systematically hedged by carrying out funding (and/or lending) transactions in the same currency.The forex position created by income flows in foreign currency (interest income/expense, fees and commissions) and foreign banknote transactions with customers tend to be hedged by carrying out forex transactions in the reverse direction.
Quantitative information
1. Distribution by currency of assets, liabilities and derivatives
Line items USD GBP JPY CAD CHF OTHER CURRENCIES
A. Financial assets 309,212 38,376 8,644 895 11,561 7,759
A.1 Debt securities 9,225 – – – – –
A.2 Equities 74 33,941 – – – 578
A.3 Loans to banks 61,809 2,549 7,995 381 8,109 7,155
A.4 Loans to customers 238,104 1,886 649 514 3,452 26
A.5 Other financial assets – – – – – –
B. Other assets 6,124 5,050 1,503 1,064 4,369 1,532
C. Financial liabilities 439,422 5,977 982 2,417 3,730 3,097
C.1 Due to banks 281,829 – – 264 – 5
C.2 Due to customers 157,051 5,977 982 2,153 3,730 3,092
C.3 Debt securities 542 – – – – –
C.4 Other financial liabilities – – – – – –
D. Other liabilities – – – – – –
E. Financial derivatives 4,407,793 802,697 638,985 20,968 60,798 340,625
– Options 495,794 27,427 2,750 – 290 –
+ Long positions 250,559 19,361 2,750 – 146 –
+ Short positions 245,235 8,066 – – 144 –
– Other 3,911,999 775,270 636,235 20,968 60,508 340,625
+ Long positions 2,041,511 361,976 314,001 11,922 27,619 174,697
+ Short positions 1,870,488 413,294 322,234 9,046 32,889 165,928
Total assets 2,607,406 424,763 326,898 13,881 43,695 183,988
Total liabilities 2,555,145 427,337 323,216 11,463 36,763 169,025
Difference (+/–) 52,261 –2,574 3,682 2,418 6,932 14,963
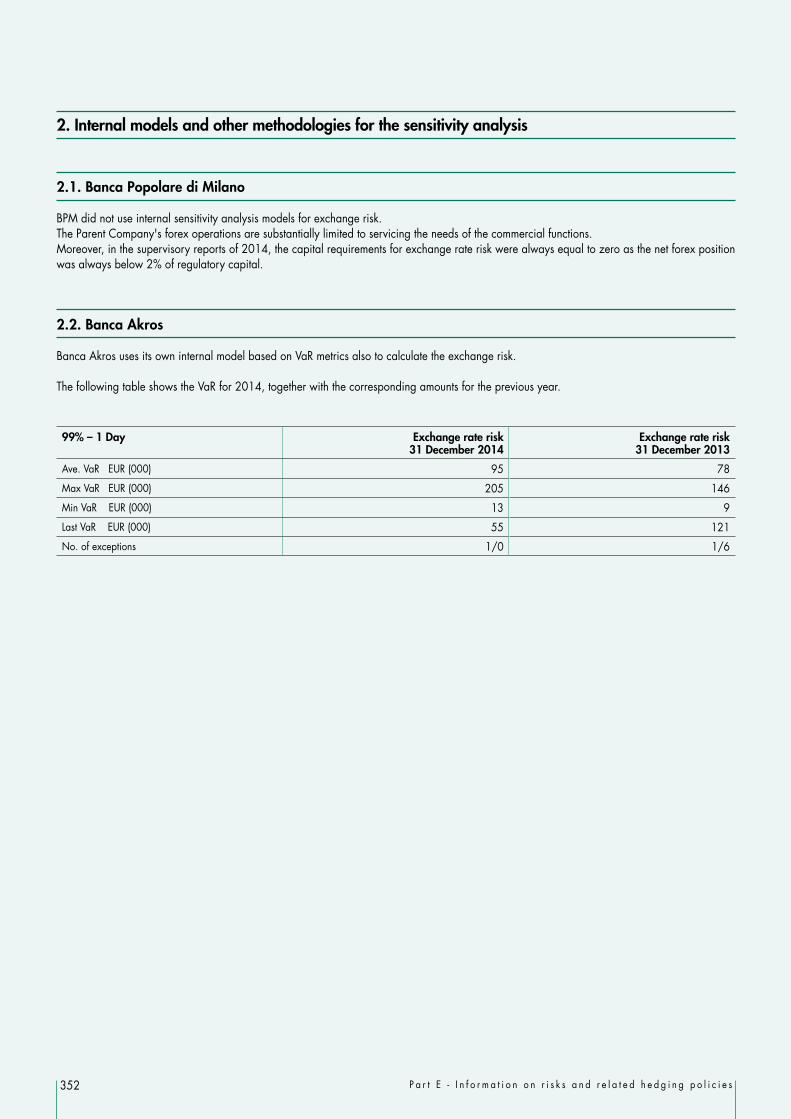
352 P a r t E - I n f o r m a t i o n o n r i s k s a n d r e l a t e d h e d g i n g p o l i c i e s
2. Internal models and other methodologies for the sensitivity analysis
2.1. Banca Popolare di Milano
BPM did not use internal sensitivity analysis models for exchange risk. The Parent Company's forex operations are substantially limited to servicing the needs of the commercial functions.Moreover, in the supervisory reports of 2014, the capital requirements for exchange rate risk were always equal to zero as the net forex position was always below 2% of regulatory capital.
2.2. Banca Akros
Banca Akros uses its own internal model based on VaR metrics also to calculate the exchange risk.
The following table shows the VaR for 2014, together with the corresponding amounts for the previous year.
99% – 1 Day Exchange rate risk31 December 2014
Exchange rate risk31 December 2013
Ave. VaR EUR (000) 95 78
Max VaR EUR (000) 205 146
Min VaR EUR (000) 13 9
Last VaR EUR (000) 55 121
No. of exceptions 1/0 1/6

353P a r t E - I n f o r m a t i o n o n r i s k s a n d r e l a t e d h e d g i n g p o l i c i e s
1.2.4 – Derivatives
A. Financial derivatives
As regards OTC derivatives, leaving aside which portfolio they were held in, average notionals in 2014 came to 59,777 million euro relating to interest rate swaps, 6,163 million euro of cap/floor options and options on debt securities, 2,679 million euro of options on equities and indices and 721 million euro of exchange rate options and 114 million euro of derivatives on commodities.
A.1 Regulatory trading book: notional values at the end of period and average notional values
Underlying assets/Type of derivatives 31.12.2014 31.12.2013
Over the counter Central counterparties
Over the counter Central counterparties
1. Debt securities and interest rates 56,534,652 20,000 67,269,921 151,500
a) Options 5,068,057 – 6,928,357 –
b) Swap 51,466,595 – 60,341,564 –
c) Forward – – – –
d) Futures – 20,000 – 151,500
e) Other – – – –
2. Equities and stock indices 2,338,252 2,329,028 2,964,048 2,824,564
a) Options 2,338,252 2,253,253 2,964,048 2,709,412
b) Swap – – – –
c) Forward – – – –
d) Futures – 75,775 – 115,152
e) Other – – – –
3. Currency and gold 5,661,945 – 7,058,883 –
a) Options 859,518 – 582,632 –
b) Swap 4,309,225 – 5,976,085 –
c) Forward 493,202 – 500,166 –
d) Futures – – – –
e) Other – – – –
4. Commodities 62,673 – 165,619 –
5. Other underlyings – – – –
Total 64,597,522 2,349,028 77,458,471 2,976,064

354 P a r t E - I n f o r m a t i o n o n r i s k s a n d r e l a t e d h e d g i n g p o l i c i e s
A.2 Banking book: notional values at the end of period and average notional values
A.2.1 Hedging
Underlying assets/Type of derivatives 31.12.2014 31.12.2013
Over the counter Central counterparties
Over the counter Central counterparties
1. Debt securities and interest rates 3,927,613 – 3,840,066 –
a) Options 196,221 – 100,888 –
b) Swap 3,416,592 – 3,739,178 –
c) Forward 314,800 – – –
d) Futures – – – –
e) Other – – – –
2. Equities and stock indices – – 56,333 –
a) Options – – 56,333 –
b) Swap – – – –
c) Forward – – – –
d) Futures – – – –
e) Other – – – –
3. Currency and gold – – – –
a) Options – – – –
b) Swap – – – –
c) Forward – – – –
d) Futures – – – –
e) Other – – – –
4. Commodities – – – –
5. Other underlyings – – – –
Total 3,927,613 – 3,896,399 –

355P a r t E - I n f o r m a t i o n o n r i s k s a n d r e l a t e d h e d g i n g p o l i c i e s
A.2.2 Other derivatives
Underlying assets/Type of derivatives 31.12.2014 31.12.2013
Over the counter Central counterparties
Over the counter Central counterparties
1. Debt securities and interest rates 234,383 – 390,019 –
a) Options – – 33,392 –
b) Swap 234,383 – 356,627 –
c) Forward – – – –
d) Futures – – – –
e) Other – – – –
2. Equities and stock indices – – – –
a) Options – – – –
b) Swap – – – –
c) Forward – – – –
d) Futures – – – –
e) Other – – – –
3. Currency and gold – – – –
a) Options – – – –
b) Swap – – – –
c) Forward – – – –
d) Futures – – – –
e) Other – – – –
4. Commodities – – – –
5. Other underlyings – – – –
Total 234,383 – 390,019 –
The figures in the table relate to financial derivatives linked to the fair value option.

356 P a r t E - I n f o r m a t i o n o n r i s k s a n d r e l a t e d h e d g i n g p o l i c i e s
A.3 Financial derivatives: positive gross fair value – breakdown by products
Portfolio/Type of derivatives Positive fair value
31.12.2014 31.12.2013
Over the counter Central counterparties
Over the counter Central counterparties
A. Regulatory trading book 1,268,009 141,025 903,766 199,411
a) Options 184,546 141,025 197,604 199,411
b) Interest Rate Swap 997,147 – 644,886 –
c) Cross Currency Swap 69,004 – 56,660 –
d) Equity Swap – – – –
e) Forward 16,264 – 4,398 –
f) Futures – – – –
g) Other 1,048 – 218 –
B. Banking book - hedging 178,460 – 178,291 –
a) Options – – 6,823 –
b) Interest Rate Swap 178,460 – 171,468 –
c) Cross Currency Swap – – – –
d) Equity Swap – – – –
e) Forward – – – –
f) Futures – – – –
g) Other – – – –
C. Banking book – other derivatives 4,964 – 10,637 –
a) Options – – 1,843 –
b) Interest Rate Swap 4,964 – 8,794 –
c) Cross Currency Swap – – – –
d) Equity Swap – – – –
e) Forward – – – –
f) Futures – – – –
g) Other – – – –
Total 1,451,433 141,025 1,092,694 199,411

357P a r t E - I n f o r m a t i o n o n r i s k s a n d r e l a t e d h e d g i n g p o l i c i e s
A.4 Financial derivatives: negative gross fair value – breakdown by products
Portfolio/Type of derivatives Negative fair value
31.12.2014 31.12.2013
Over the counter Central counterparties
Over the counter Central counterparties
A. Regulatory trading book 1,305,549 119,173 948,145 167,400
a) Options 147,259 119,173 162,905 167,400
b) Interest Rate Swap 1,078,877 – 729,055 –
c) Cross Currency Swap 63,906 – 46,144 –
d) Equity Swap – – – –
e) Forward 13,796 – 9,883 –
f) Futures – – – –
g) Other 1,711 – 158 –
B. Banking book - hedging 58,751 – 23,348 –
a) Options 6,068 – 2,987 –
b) Interest Rate Swap 47,691 – 20,361 –
c) Cross Currency Swap – – – –
d) Equity Swap – – – –
e) Forward 4,992 – – –
f) Futures – – – –
g) Other – – – –
C. Banking book – other derivatives 4,792 – 11,579 –
a) Options – – – –
b) Interest Rate Swap 4,792 – 11,579 –
c) Cross Currency Swap – – – –
d) Equity Swap – – – –
e) Forward – – – –
f) Futures – – – –
g) Other – – – –
Total 1,369,092 119,173 983,072 167,400

358 P a r t E - I n f o r m a t i o n o n r i s k s a n d r e l a t e d h e d g i n g p o l i c i e s
A.5 OTC financial derivatives – Regulatory trading book: notional values, positive and negative gross fair values by counterparty – contracts that do not form part of compensation arrangements
Contracts that do not form part of compensation arrangements
Government and Central
Banks
Other public
entities
Banks Finance-sector
companies
Insurance companies
Non-financial
companies
Other parties
1. Debt securities and interest rates
– notional value – 277,442 475,975 284,596 41,100 1,368,454 96,738
– positive fair value – 858 5,055 9,788 – 75,842 7,020
– negative fair value – –10,246 –11,281 –66 –3,294 –1,666 –3,150
– future exposure – 1,449 4,029 552 – 7,213 438
2. Equities and stock indices
– notional value – – – 32,752 – 18,862 45,336
– positive fair value – – – 150 – 498 7,408
– negative fair value – – – – – – –5,560
– future exposure – – – 1,965 – 2,017 2,524
3. Currency and gold
– notional value 12,491 – 2,072,617 35,493 3,607 274,992 37,512
– positive fair value 339 – 32,205 15 31 6,390 264
– negative fair value – – –26,026 –1,834 –1 –5,560 –965
– future exposure 125 – 23,379 281 36 2,752 375
4. Other instruments
– notional value – – – – – 6,350 1,800
– positive fair value – – – – – – –
– negative fair value – – – – – – –
– future exposure – – – – – 526 180

359P a r t E - I n f o r m a t i o n o n r i s k s a n d r e l a t e d h e d g i n g p o l i c i e s
A.6 OTC financial derivatives – Regulatory trading book: notional values, positive and negative gross fair values by counterparty – contracts that form part of compensation arrangements
Contracts that form part of compensation arrangements
Government and Central
Banks
Other public
entities
Banks Finance-sector
companies
Insurance companies
Non-financial
companies
Other parties
1. Debt securities and interest rates
– notional value – – 41,750,611 12,089,707 – 149,548 481
– positive fair value (before offsetting) – – 639,732 284,258 – 2,101 –
– negative fair value (before offsetting) – – –805,250 –273,194 – –1,099 –556
2. Equities and stock indices
– notional value – – 1,321,320 783,818 – – 136,164
– positive fair value (before offsetting) – – 65,149 65,855 – – 7,876
– negative fair value (before offsetting) – – – –64,646 – – –33,873
3. Currency and gold
– notional value – – 1,595,365 878,332 – 726,337 25,199
– positive fair value (before offsetting) – – 32,501 11,019 – 13,017 608
– negative fair value (before offsetting) – – –26,161 –12,909 – –18,172 –6
4. Other instruments
– notional value – – 24,334 7,018 – 23,171 –
– positive fair value (before offsetting) – – 23 – – 9 –
– negative fair value (before offsetting) – – –9 – – –24 –

360 P a r t E - I n f o r m a t i o n o n r i s k s a n d r e l a t e d h e d g i n g p o l i c i e s
A.7 OTC financial derivatives – Banking book: notional values, positive and negative gross fair values by counterparty – contracts that do not form part of compensation arrangements
Contracts that do not form part of compensation arrangements
Government and Central
Banks
Other public
entities
Banks Finance-sector
companies
Insurance companies
Non-financial
companies
Other parties
1. Debt securities and interest rates
– notional value – – 4,161,996 – – – –
– positive fair value – – 183,424 – – – –
– negative fair value – – –63,543 – – – –
– future exposure – – 21,563 – – – –
2. Equities and stock indices
– notional value – – – – – – –
– positive fair value – – – – – – –
– negative fair value – – – – – – –
– future exposure – – – – – – –
3. Currency and gold
– notional value – – – – – – –
– positive fair value – – – – – – –
– negative fair value – – – – – – –
– future exposure – – – – – – –
4. Other instruments
– notional value – – – – – – –
– positive fair value – – – – – – –
– negative fair value – – – – – – –
– future exposure – – – – – – –

361P a r t E - I n f o r m a t i o n o n r i s k s a n d r e l a t e d h e d g i n g p o l i c i e s
A.8 OTC financial derivatives – Banking book: notional values, positive and negative gross fair values by counterparty – contracts that form part of compensation arrangements
Contracts that form part of compensation arrangements
Government and Central
Banks
Other public
entities
Banks Finance-sector
companies
Insurance companies
Non-financial
companies
Other parties
1. Debt securities and interest rates
– notional value – – – – – – –
– positive fair value – – – – – – –
– negative fair value – – – – – – –
2. Equities and stock indices
– notional value – – – – – – –
– positive fair value – – – – – – –
– negative fair value – – – – – – –
3. Currency and gold
– notional value – – – – – – –
– positive fair value – – – – – – –
– negative fair value – – – – – – –
4. Other instruments
– notional value – – – – – – –
– positive fair value – – – – – – –
– negative fair value – – – – – – –
A.9 Residual life of OTC financial derivatives: notional values
Underlying/Residual life Up to 1 year Between 1 and 5 years
Beyond 5 years Total
A. Regulatory trading book 28,082,314 24,993,029 11,522,179 64,597,522
A.1 Financial derivatives on debt securities and interest rates 22,055,030 23,125,583 11,354,039 56,534,652
A.2 Financial derivatives on equities and stock indices 516,862 1,653,250 168,140 2,338,252
A.3 Financial derivatives on exchange rates and gold 5,447,749 214,196 – 5,661,945
A.4 Financial derivatives on other instruments 62,673 – – 62,673
B. Banking book 1,638,853 1,610,966 912,177 4,161,996
B.1 Financial derivatives on debt securities and interest rates 1,638,853 1,610,966 912,177 4,161,996
B.2 Financial derivatives on equities and stock indices – – – –
B.3 Financial derivatives on exchange rates and gold – – – –
B.4 Financial derivatives on other instruments – – – –
31.12.2014 29,721,167 26,603,995 12,434,356 68,759,518
31.12.2013 33,430,846 33,346,663 14,967,380 81,744,889
A.10 OTC financial derivatives: Counterparty risk/Financial risk – Internal models
The Group's commercial banks do not use EPE-type internal models.Banca Akros, as explained in section 1.2.1., has been authorised by the Bank of Italy to use an internal model for market risks for supervisory purposes. Information on the internal model is provided in section 1.2.1. "Interest rate risk and price risk – Regulatory trading book" and 1.2.3. "Exchange rate risk".

362 P a r t E - I n f o r m a t i o n o n r i s k s a n d r e l a t e d h e d g i n g p o l i c i e s
B. Credit derivatives
B.1 Credit derivatives: notional values at the end of period and average notional values
Type of transaction Regulatory trading book Banking book – other contracts
on a single subject
on several subjects (basket)
on a single subject
on several subjects (basket)
1. Purchases of protection
a) Credit default products – – – –
b) Credit spread products – – – –
c) Total rate of return swap – – – –
d) Other – – – –
31.12.2014 – – – –
AVERAGE AMOUNTS 12,000 1,000 – –
31.12.2013 24,000 2,000 – –
2. Sales of protection
a) Credit default products – – – –
b) Credit spread products – – – –
c) Total rate of return swap – – – –
d) Other – – – 3,553
31.12.2014 – – – 3,553
AVERAGE AMOUNTS 11,500 – – 4,707
31.12.2013 23,000 – – 5,861
B.2 OTC credit derivatives: positive gross fair value – breakdown by products
Portfolio/Type of derivatives Positive fair value
31.12.2014 31.12.2013
A. Regulatory trading book – 110
a) Credit default products – 110
b) Credit spread products – –
c) Total rate of return swap – –
d) Other – –
B. Banking book 3,248 5,335
a) Credit default products – –
b) Credit spread products – –
c) Total rate of return swap – –
d) Other 3,248 5,335
Total 3,248 5,445

363P a r t E - I n f o r m a t i o n o n r i s k s a n d r e l a t e d h e d g i n g p o l i c i e s
B.3 OTC credit derivatives: negative gross fair value – breakdown by products
Portfolio/Type of derivatives Negative fair value
31.12.2014 31.12.2013
A. Regulatory trading book – 144
a) Credit default products – 144
b) Credit spread products – –
c) Total rate of return swap – –
d) Other – –
B. Banking book – –
a) Credit default products – –
b) Credit spread products – –
c) Total rate of return swap – –
d) Other – –
Total – 144
B.4 OTC credit derivatives: positive and negative gross fair values by counterparty – contracts that do not form part of compensation arrangements
Contracts that do not form part of compensation arrangements
Government and Central
Banks
Other public
entities
Banks Finance-sector
companies
Insurance companies
Non-financial
companies
Other parties
Regulatory trading
1. Purchase of protection
– notional value – – – – – – –
– positive fair value – – – – – – –
– negative fair value – – – – – – –
– future exposure – – – – – – –
2. Sale of protection
– notional value – – – – – – –
– positive fair value – – – – – – –
– negative fair value – – – – – – –
– future exposure – – – – – – –
Banking book
1. Purchase of protection
– notional value – – – – – – –
– positive fair value – – – – – – –
– negative fair value – – – – – – –
2. Sale of protection
– notional value – – 3,553 – – – –
– positive fair value – – 3,248 – – – –
– negative fair value – – – – – – –

364 P a r t E - I n f o r m a t i o n o n r i s k s a n d r e l a t e d h e d g i n g p o l i c i e s
B.5 OTC credit derivatives: positive and negative gross fair values by counterparty – contracts that form part of compensation arrangements
Contracts that form part of compensation arrangements
Government and Central
Banks
Other public
entities
Banks Finance-sector
companies
Insurance companies
Non-financial
companies
Other parties
Regulatory trading
1. Purchase of protection
– notional value – – – – – – –
– positive fair value – – – – – – –
– negative fair value – – – – – – –
2. Sale of protection
– notional value – – – – – – –
– positive fair value – – – – – – –
– negative fair value – – – – – – –
Banking book
1. Purchase of protection
– notional value – – – – – – –
– positive fair value – – – – – – –
– negative fair value – – – – – – –
2. Sale of protection
– notional value – – – – – – –
– positive fair value – – – – – – –
– negative fair value – – – – – – –
B.6 Residual life of credit derivatives: notional values
Underlying/Residual life Up to 1 year Between 1 and 5 years
Beyond 5 years Total
A. Regulatory trading book – – – –
A.1 Credit derivatives with qualified reference obligation – – – –
A.2 Credit derivatives with unqualified reference obligation – – – –
B. Banking book – 3,553 – 3,553
B.1 Credit derivatives with qualified reference obligation – 3,553 – 3,553
B.2 Credit derivatives with unqualified reference obligation – – – –
31.12.2014 – 3,553 – 3,553
31.12.2013 50,408 4,453 – 54,861
B.7 Credit derivatives: counterparty and financial risk – Internal models
The Group does not use internal models for the analysis of underlying risk pertaining to credit derivatives.

365P a r t E - I n f o r m a t i o n o n r i s k s a n d r e l a t e d h e d g i n g p o l i c i e s
C. Financial and credit derivatives
C.1 OTC Financial and credit derivatives: net fair values and future exposure by counterparty
Government and Central
Banks
Other public
entities
Banks Finance-sector
companies
Insurance companies
Non-financial
companies
Other parties
1) Bilateral financial derivative agreements – – 693,906 260,548 – 37,448 36,767
– positive fair value – – –198,092 –70,280 – –7,821 –1,899
– negative fair value – – –220,440 –59,896 – –11,990 –27,849
– future exposure – – 131,645 59,616 – 4,908 2,560
– net counterparty risk – – 143,729 70,756 – 12,729 4,459
2) Bilateral credit derivative agreements – – – – – – –
– positive fair value – – – – – – –
– negative fair value – – – – – – –
– future exposure – – – – – – –
– net counterparty risk – – – – – – –
3) Cross product agreements – – – – – – –
– positive fair value – – – – – – –
– negative fair value – – – – – – –
– future exposure – – – – – – –
– net counterparty risk – – – – – – –
The sub-item "net counterparty risk" shows the balance between the positive fair value, increased by the future credit exposure and decreased by the current value of any cash collaterals received.

366 P a r t E - I n f o r m a t i o n o n r i s k s a n d r e l a t e d h e d g i n g p o l i c i e s
1.3 – Banking group – Liquidity risk
Qualitative information
A. General aspects, management processes and methods of measuring liquidity risk
A.1 Sources of liquidity risk
Liquidity risk is the risk that the Group may not be able to meet its definite and foreseeable payment commitments with reasonable certainty. Normally, two types of liquidity risk are identified: Funding Liquidity Risk, i.e. the risk that the Group may not be able to meet its payment commitments and obligations efficiently because of an inability to raise funds without jeopardising its normal business activity and/or its financial situation; Market Liquidity Risk, i.e. the risk that the Group may not be able to liquidate an asset without incurring a capital loss because of the limited depth of the market and/or as a result of the timing with which it is necessary to carry out the transaction. In this second definition, liquidity risk comes very close to traditional market risk. The main difference between the two types of risk lies in the fact that while market risk measures the sensitivity of position's value to possible future scenarios, liquidity risk concentrates on the ability to finance present and future payment commitments in normal and in stress situations.
A.2 Internal procedures for managing and controlling liquidity risk
In the Bipiemme Group, the governance of liquidity risk is regulated by the Group's liquidity policy, which sets out: the liquidity risk governance model; responsibilities of the corporate bodies and business functions; the threshold of tolerance to liquidity risk; the tools for managing and monitoring liquidity risk; the tools for mitigating liquidity risk; the contingency funding plan; guidelines for defining and monitoring the funding plan.
Liquidity risk governance modelLiquidity governance is centralised at the Parent Company. Operative management of liquidity is coordinated by the Parent Company on a centralised basis, subject to appropriate exemptions, with part of liquidity management being done on a decentralised basis at the individual Group companies.
Responsibilities of corporate and business functionsThe policy identifies the role and responsibilities of the corporate bodies involved in liquidity governance and management. In particular: the Management Board of the Parent Company sets the threshold of tolerance to liquidity risk and is responsible for maintaining a level of
liquidity consistent with this threshold. It is responsible for setting governance policies and management processes related to liquidity risk; more in general, it also approves the methods of managing and monitoring liquidity risk;
the Group Finance Committee is responsible for managing operational and structural liquidity and the related risk in the states of "normality", "observation", "stress" and "crisis" as defined in the Contingency Funding Plan, with the adoption of appropriate measures;
the Supervisory Board of the Parent Company is responsible for ensuring the adequacy and compliance of the process of managing, monitoring and controlling liquidity risk with respect to the legislative requirements and in accordance with the tasks assigned to it by the Company's Articles of Association.
The Group has also defined the roles and responsibilities of the corporate functions involved in the process of managing and monitoring liquidity risk, such as the operational functions (finance, treasury, commercial network), the control functions (risk management, internal audit) and the function in charge of processing the pricing system for the internal transfer of funds.

367P a r t E - I n f o r m a t i o n o n r i s k s a n d r e l a t e d h e d g i n g p o l i c i e s
Threshold of tolerance to liquidity riskThe threshold of tolerance to liquidity risk is understood as the maximum risk exposure considered to be sustainable in the context of the "normal course of business" (going concern), integrated with stress scenarios. It is defined in terms of limits on a set of indicators that must be respected in both short- and long-term liquidity management. These indicators are approved at Group level as part of the Risk Appetite Framework (RAF).
Tools for managing and monitoring liquidity risk The liquidity risk is monitored through the following instruments: Operative maturity ladder: the report provides the liquidity requirement for a time horizon of up to twelve months, aggregating imbalances
between cash inflows and outflows that occur in different time zones and adding to this the balance of available liquidity reserves; Structural maturity ladder: this report aims to monitor the maintenance of an adequate ratio between long-term assets and liabilities, i.e. to
limit the exposure to refinancing for maturities over twelve months. The relationship between sources and uses of liquidity and the degree of maturity transformation are also monitored;
Early Warning Indicators (EWI) for any liquidity tensions. We have identified a set of indicators for early detection of potential tensions in the Group's liquidity position. They provide market indicators and internal indicators, i.e. based on specific indicators of the Group's liquidity situation. Monitoring these indicators, in addition to allowing for timely identification of the deterioration of certain key variables, helps to determine the status of the liquidity situation between "normality", "observation", "stress" and "crisis";
stress tests of the Group's ability to withstand adverse scenarios. Among the risk factors considered in the conduct of stress tests are potential cash outflows such as the impact of a downgrade of the bank in question, the granting of further collateral for derivative transactions and the unexpected use by customers of committed lines of credit granted.
Tools for mitigating liquidity riskAs tools for mitigating liquidity risk, the liquidity policy requires the Group to keep an adequate amount of cash reserves to maintain an liquidity profile that is consistent with the threshold of tolerance to this kind of risk, compliance with specific limits placed on certain variables, both operational and structural, and an appropriate diversification of funding sources.
Contingency Funding PlanThe Contingency Funding Plan is an integral part of the policy and sets out to protect the Group and the individual Group companies from situations of crisis of different magnitudes. The Contingency Funding Plan describes a series of non-binding actions that can be taken to overcome the crisis. In particular, it describes: the mechanism for activating the states of "observation", "stress" and "crisis"; identification of the functions involved and their responsibilities; possible action plans with an indication of the estimated cash recoverable by each of them; communication management in cases of stress and crisis.
Quantitative information
a. Net interbank positionThe net interbank position at 31 December 2014 reflects net borrowing of Euro 2,334 million, representing an improvement on the net borrowing of Euro 4,100 million as of December 2013 (+43.1%), but a deterioration (– Euro 2,230 million) when compared with the net borrowing as of September 2014. This trend mainly reflects the decline in borrowing from banks (almost entirely due to the reduction in the amount due to the ECB), which is Euro 474 million lower than in September 2014 and Euro 2,595 million lower than in December 2013.
The unsecured net interbank position at 31 December 2014, being the interbank exposure excluding repurchase agreements and TLTRO transactions with the ECB, is determined by deducting the following components from the overall position: Euro 1.8 billion resulting from open market operations with the European Central Bank; Euro 211 million resulting from net deposits deriving from repurchase agreements; Euro 248 million relating to amounts due from banks shown in the financial statements of BPM Securitisation 2, BPM Securitisation 3 and BPM
Covered Bond, as they relate to liquidity that is not immediately available.
Net of these components, the unsecured net interbank position at 31 December 2014 shows a negative balance of Euro 598 million.

368 P a r t E - I n f o r m a t i o n o n r i s k s a n d r e l a t e d h e d g i n g p o l i c i e s
Net interbank position
(Euro/000)
31.12.2014 30.09.2014 Change A – B 31.12.2013 Change A – C
A B amount % C amount %
Due from banks 984,777 1,562,185 –577,408 –37.0 1,813,458 –828,681 –45.7
Due to banks 3,318,564 3,792,622 –474,058 –12.5 5,913,928 –2,595,364 –43.9
Total –2,333,787 –2,230,437 –103,350 –4.6 –4,100,470 1,766,683 43.1
b. Liquidity positionThe liquidity position of the Group is solid and the principal indicators easily comply with established limits. Net liquidity – being assets available for use as collateral plus net inflows and outflows over a given time horizon – amounts to Euro 5,455 million at 31 December 2014, with a time horizon of one month, giving a ratio of total assets of 11.3% (11.9% at the end of September 2014).
Liquidity at three months at the end of December comes to Euro 4,730 million (9.8% of total assets).The assets eligible as collateral with the European Central Bank amounted to Euro 11.9 billion at the end of December 2014 and are committed for Euro 7.1 billion, while the remaining Euro 4.8 billion is represented by free assets.
As regards the LTROs, if we also take into account the repayments made in 2014, since the beginning of the year the Parent Company has made early repayment of Euro 2,800 million of the loans obtained from the ECB.
As regards participation in the TLTRO auctions (Targeted longer term refinancing operations) – a new facility offered to banks by the ECB with a maximum duration of four years at a rate of 0.15% (0.05% as from the 2015 auctions) and aimed at the provision of loans to the real economy – Bipiemme Group participated in the TLTRO auction in December 2014 (TLTRO 2) and borrowed an amount of Euro 1.5 billion (compared with a 3 year LTRO of Euro 4.5 billion borrowed previously and entirely repaid).The liquidity requirement, being the difference between commercial funding and lending to customers, amounts to Euro 3.1 billion at the end of December 2014 (operational data) and is broadly unchanged since the end of the third quarter.
The following is an analysis of the main financial obligations maturing over the next twelve months.
Main financial liabilities in maturity – management figures(in millions of Euro)
01.15 02.15 03.15 04.15 05.15 06.15 07.15 08.15 09.15 10.15 11.15 12.15 Totale
Securities issued (senior, subordinated, covered bonds) – – 541 71 – – – – – – 900 – 1,512
Securities issued (retail issues) 2 145 135 2 47 182 119 42 1 141 25 87 928
Certificates of deposit (retail) 42 34 22 22 20 14 13 10 4 2 6 4 193
Total 44 179 698 95 67 196 132 52 5 143 931 91 2,633
Conventionally, based on IFRS 7, callable instruments have been considered as falling due at the first call date foreseen in the issue regulations.
Looking at the maturities of financial liabilities for the next 12 months (so at the same level of customer loans and deposits), the funding requirement of 2.6 billion euro is amply covered by the portfolio of financial assets eligible for refinancing with the ECB, on the one hand, and by the expected renewal on maturity of the liabilities represented by the retail issues placed by the commercial network, on the other.

369P a r t E - I n f o r m a t i o n o n r i s k s a n d r e l a t e d h e d g i n g p o l i c i e s
1. Distribution of financial assets and liabilities by residual contractual duration
Summary table
Items/Time bands On demand From 1 to 7 days
From 7 to 15 days
From 15 days to 1
month
From 1 to 3 months
from 3 to 6 months
from 6 months to
1 year
from 1 year to 5 years
Beyond 5 years
Unspecified duration
Cash assets 7,706,182 254,737 191,422 629,107 1,451,370 1,448,228 2,717,000 15,330,771 13,224,715 84,434
A.1 Government securities 1,153 – – – – 205,576 467,415 6,042,638 1,748,308 –
A.2 Other debt securities 5,146 8,846 20 182 2,678 22,445 160,203 244,624 262,596 2,846
A.3 Mutual funds 147,607 – – – – – – – – –
A.4 Loans 7,553,482 245,891 191,402 628,925 1,448,692 1,220,207 2,089,382 9,043,509 11,213,811 81,588
– Banks 598,767 33,192 2,587 1,580 170 31,285 309 49,569 461 80,682
– Customers 6,954,715 212,699 188,815 627,345 1,448,522 1,188,922 2,089,073 8,993,940 11,213,350 906
Cash liabilities 20,299,362 1,826,980 556,333 830,817 2,126,235 2,801,060 3,725,866 7,232,020 723,812 –
B.1 Current accounts and deposits 19,425,373 326,913 199,981 311,834 1,104,120 918,271 829,863 367,983 21 –
– Banks 394,433 243,363 42,759 19,629 279,308 138,763 30,000 – – –
– Customers 19,030,940 83,550 157,222 292,205 824,812 779,508 799,863 367,983 21 –
B.2 Debt securities 89,091 9,952 16,323 92,375 112,519 898,172 1,521,779 5,332,485 723,791 –
B.3 Other liabilities 784,898 1,490,115 340,029 426,608 909,596 984,617 1,374,224 1,531,552 – –
Off-balance sheet transactions 7,995,485 2,917,772 670,779 1,521,403 4,699,929 2,566,058 1,165,456 2,030,837 1,504,544 –C.1 Financial derivatives with exchange of capital – 1,894,102 670,778 1,449,346 4,584,966 2,459,050 916,325 540,141 223,120 –
– Long positions – 909,908 397,730 785,345 2,374,233 1,230,376 463,282 265,967 7,009 –
– Short positions – 984,194 273,048 664,001 2,210,733 1,228,674 453,043 274,174 216,111 –
C.2 Financial derivatives without exchange of capital 3,132,577 – – – 100 97 2,334 – – –
– Long positions 1,644,799 – – – 100 97 – – – –
– Short positions 1,487,778 – – – – – 2,334 – – –
C.3 Deposits and loans to be received 1,009,400 1,009,400 – – – – – – – –
– Long positions – 1,009,400 – – – – – – – –
– Short positions 1,009,400 – – – – – – – – –
C.4 Irrevocable commitments to grant finance 3,787,309 14,269 – 72,054 114,853 106,905 246,781 1,490,641 1,281,373 –
– Long positions 332,319 – – 54,220 44,853 106,905 246,781 1,490,641 1,281,373 –
– Short positions 3,454,990 14,269 – 17,834 70,000 – – – – –
C.5 Financial guarantees given 66,199 1 1 3 10 6 16 54 51 –C.6 Financial guarantees received – – – – – – – – – –C.7 Credit derivatives with exchange of capital – – – – – – – – – –
– Long positions – – – – – – – – – –
– Short positions – – – – – – – – – –C.8 Credit derivatives without exchange of capital – – – – – – – – – –
– Long positions – – – – – – – – – –
– Short positions – – – – – – – – – –

370 P a r t E - I n f o r m a t i o n o n r i s k s a n d r e l a t e d h e d g i n g p o l i c i e s
1. Distribution of financial assets and liabilities by residual contractual duration
Currency: Euro
Items/Time bands On demand From 1 to 7 days
From 7 to 15 days
From 15 days to 1
month
From 1 to 3 months
from 3 to 6 months
from 6 months to
1 year
from 1 year to 5 years
Beyond 5 years
Unspecified duration
Cash assets 7,611,811 201,039 163,650 589,282 1,372,071 1,442,233 2,716,492 15,314,202 13,195,423 84,434
A.1 Government securities 1,153 – – – – 205,576 467,415 6,034,401 1,748,265 –
A.2 Other debt securities 5,140 8,846 20 182 2,678 22,445 160,203 244,622 261,385 2,846
A.3 Mutual funds 147,607 – – – – – – – – –
A.4 Loans 7,457,911 192,193 163,630 589,100 1,369,393 1,214,212 2,088,874 9,035,179 11,185,773 81,588
– Banks 547,595 87 9 – 166 31,285 309 49,569 – 80,682
– Customers 6,910,316 192,106 163,621 589,100 1,369,227 1,182,927 2,088,565 8,985,610 11,185,773 906
Cash liabilities 20,086,659 1,743,618 518,574 824,688 2,010,534 2,801,014 3,725,725 7,232,020 723,812 –
B.1 Current accounts and deposits 19,214,116 243,551 162,222 305,705 988,777 918,271 829,863 367,983 21 –
– Banks 356,160 160,001 5,000 13,500 163,965 138,763 30,000 – – –
– Customers 18,857,956 83,550 157,222 292,205 824,812 779,508 799,863 367,983 21 –
B.2 Debt securities 89,091 9,952 16,323 92,375 112,161 898,126 1,521,638 5,332,485 723,791 –
B.3 Other liabilities 783,452 1,490,115 340,029 426,608 909,596 984,617 1,374,224 1,531,552 – –
Off-balance sheet transactions 7,918,784 1,966,533 392,350 801,716 2,452,856 1,339,286 643,940 1,831,800 1,468,788 –C.1 Financial derivatives with exchange of capital – 942,863 392,349 729,659 2,337,893 1,232,278 394,875 347,352 222,254 –
– Long positions – 383,185 259,551 401,657 1,198,952 685,048 223,025 151,437 6,576 –
– Short positions – 559,678 132,798 328,002 1,138,941 547,230 171,850 195,915 215,678 –
C.2 Financial derivatives without exchange of capital 3,097,080 – – – 100 97 2,334 – – –
– Long positions 1,627,336 – – – 100 97 – – – –
– Short positions 1,469,744 – – – – – 2,334 – – –
C.3 Deposits and loans to be received 1,009,400 1,009,400 – – – – – – – –
– Long positions – 1,009,400 – – – – – – – –
– Short positions 1,009,400 – – – – – – – – –
C.4 Irrevocable commitments to grant finance 3,746,105 14,269 – 72,054 114,853 106,905 246,715 1,484,394 1,246,483 –
– Long positions 332,319 – – 54,220 44,853 106,905 246,715 1,484,394 1,246,483 –
– Short positions 3,413,786 14,269 – 17,834 70,000 – – – – –
C.5 Financial guarantees given 66,199 1 1 3 10 6 16 54 51 –C.6 Financial guarantees received – – – – – – – – – –C.7 Credit derivatives with exchange of capital – – – – – – – – – –
– Long positions – – – – – – – – – –
– Short positions – – – – – – – – – –C.8 Credit derivatives without exchange of capital – – – – – – – – – –
– Long positions – – – – – – – – – –
– Short positions – – – – – – – – – –

371P a r t E - I n f o r m a t i o n o n r i s k s a n d r e l a t e d h e d g i n g p o l i c i e s
1. Distribution of financial assets and liabilities by residual contractual duration
Currency: US Dollar
Items/Time bands On demand From 1 to 7 days
From 7 to 15 days
From 15 days to 1
month
From 1 to 3 months
from 3 to 6 months
from 6 months to
1 year
from 1 year to 5 years
Beyond 5 years
Unspecified duration
Cash assets 79,292 46,693 25,150 37,618 74,759 5,972 500 15,769 29,292 –
A.1 Government securities – – – – – – – 8,237 43 –
A.2 Other debt securities 6 – – – – – – 2 1,211 –
A.3 Mutual funds – – – – – – – – – –
A.4 Loans 79,286 46,693 25,150 37,618 74,759 5,972 500 7,530 28,038 –
– Banks 35,341 26,192 – – 1 – – – 461 –
– Customers 43,945 20,501 25,150 37,618 74,758 5,972 500 7,530 27,577 –
Cash liabilities 196,764 83,362 37,759 5,864 115,701 46 141 – – –
B.1 Current accounts and deposits 195,318 83,362 37,759 5,864 115,343 – – – – –
– Banks 38,268 83,362 37,759 5,864 115,343 – – – – –
– Customers 157,050 – – – – – – – – –
B.2 Debt securities – – – – 358 46 141 – – –
B.3 Other liabilities 1,446 – – – – – – – – –
Off-balance sheet transactions 66,671 297,374 223,994 637,554 1,868,809 793,018 345,337 147,245 35,724 –C.1 Financial derivatives with exchange of capital – 297,374 223,994 637,554 1,868,809 793,018 345,271 147,228 834 –
– Long positions – 179,231 120,371 338,204 991,398 391,617 135,916 80,886 417 –
– Short positions – 118,143 103,623 299,350 877,411 401,401 209,355 66,342 417 –
C.2 Financial derivatives without exchange of capital 31,698 – – – – – – – – –
– Long positions 15,198 – – – – – – – – –
– Short positions 16,500 – – – – – – – – –
C.3 Deposits and loans to be received – – – – – – – – – –
– Long positions – – – – – – – – – –
– Short positions – – – – – – – – – –
C.4 Irrevocable commitments to grant finance 34,973 – – – – – 66 17 34,890 –
– Long positions – – – – – – 66 17 34,890 –
– Short positions 34,973 – – – – – – – – –
C.5 Financial guarantees given – – – – – – – – – –C.6 Financial guarantees received – – – – – – – – – –C.7 Credit derivatives with exchange of capital – – – – – – – – – –
– Long positions – – – – – – – – – –
– Short positions – – – – – – – – – –C.8 Credit derivatives without exchange of capital – – – – – – – – – –
– Long positions – – – – – – – – – –
– Short positions – – – – – – – – – –

372 P a r t E - I n f o r m a t i o n o n r i s k s a n d r e l a t e d h e d g i n g p o l i c i e s
1. Distribution of financial assets and liabilities by residual contractual duration
Currency: Pound Sterling
Items/Time bands On demand From 1 to 7 days
From 7 to 15 days
From 15 days to 1
month
From 1 to 3 months
from 3 to 6 months
from 6 months to
1 year
from 1 year to 5 years
Beyond 5 years
Unspecified duration
Cash assets 2,739 – – 25 1,825 11 – – – –
A.1 Government securities – – – – – – – – – –
A.2 Other debt securities – – – – – – – – – –
A.3 Mutual funds – – – – – – – – – –
A.4 Loans 2,739 – – 25 1,825 11 – – – –
– Banks 2,704 – – – – – – – – –
– Customers 35 – – 25 1,825 11 – – – –
Cash liabilities 5,977 – – – – – – – – –
B.1 Current accounts and deposits 5,977 – – – – – – – – –
– Banks – – – – – – – – – –
– Customers 5,977 – – – – – – – – –
B.2 Debt securities – – – – – – – – – –
B.3 Other liabilities – – – – – – – – – –
Off-balance sheet transactions 980 116,635 18,070 24,063 311,517 218,749 71,462 17,460 – –C.1 Financial derivatives with exchange of capital – 116,635 18,070 24,063 311,517 218,749 71,462 17,460 – –
– Long positions – 41,979 330 14,647 151,451 113,171 25,102 13,729 – –
– Short positions – 74,656 17,740 9,416 160,066 105,578 46,360 3,731 – –
C.2 Financial derivatives without exchange of capital 980 – – – – – – – – –
– Long positions 609 – – – – – – – – –
– Short positions 371 – – – – – – – – –
C.3 Deposits and loans to be received – – – – – – – – – –
– Long positions – – – – – – – – – –
– Short positions – – – – – – – – – –
C.4 Irrevocable commitments to grant finance – – – – – – – – – –
– Long positions – – – – – – – – – –
– Short positions – – – – – – – – – –
C.5 Financial guarantees given – – – – – – – – – –C.6 Financial guarantees received – – – – – – – – – –C.7 Credit derivatives with exchange of capital – – – – – – – – – –
– Long positions – – – – – – – – – –
– Short positions – – – – – – – – – –C.8 Credit derivatives without exchange of capital – – – – – – – – – –
– Long positions – – – – – – – – – –
– Short positions – – – – – – – – – –

373P a r t E - I n f o r m a t i o n o n r i s k s a n d r e l a t e d h e d g i n g p o l i c i e s
1. Distribution of financial assets and liabilities by residual contractual duration
Currency: Swiss Franc
Items/Time bands On demand From 1 to 7 days
From 7 to 15 days
From 15 days to 1
month
From 1 to 3 months
from 3 to 6 months
from 6 months to
1 year
from 1 year to 5 years
Beyond 5 years
Unspecified duration
Cash assets 4,237 31 2,579 1,874 2,132 12 8 800 – –
A.1 Government securities – – – – – – – – – –
A.2 Other debt securities – – – – – – – – – –
A.3 Mutual funds – – – – – – – – – –
A.4 Loans 4,237 31 2,579 1,874 2,132 12 8 800 – –
– Banks 4,041 – 2,578 1,580 – – – – – –
– Customers 196 31 1 294 2,132 12 8 800 – –
Cash liabilities 3,730 – – – – – – – – –
B.1 Current accounts and deposits 3,730 – – – – – – – – –
– Banks – – – – – – – – – –
– Customers 3,730 – – – – – – – – –
B.2 Debt securities – – – – – – – – – –
B.3 Other liabilities – – – – – – – – – –
Off-balance sheet transactions 8,538 3,457 13,311 5,266 23,654 2,331 873 16,231 – –C.1 Financial derivatives with exchange of capital – 3,457 13,311 5,266 23,654 2,331 873 10,000 – –
– Long positions – 1,833 6,655 2,751 7,952 1,748 873 5,000 – –
– Short positions – 1,624 6,656 2,515 15,702 583 – 5,000 – –
C.2 Financial derivatives without exchange of capital 2,307 – – – – – – – – –
– Long positions 1,551 – – – – – – – – –
– Short positions 756 – – – – – – – – –
C.3 Deposits and loans to be received – – – – – – – – – –
– Long positions – – – – – – – – – –
– Short positions – – – – – – – – – –
C.4 Irrevocable commitments to grant finance 6,231 – – – – – – 6,231 – –
– Long positions – – – – – – – 6,231 – –
– Short positions 6,231 – – – – – – – – –
C.5 Financial guarantees given – – – – – – – – – –C.6 Financial guarantees received – – – – – – – – – –C.7 Credit derivatives with exchange of capital – – – – – – – – – –
– Long positions – – – – – – – – – –
– Short positions – – – – – – – – – –C.8 Credit derivatives without exchange of capital – – – – – – – – – –
– Long positions – – – – – – – – – –
– Short positions – – – – – – – – – –

374 P a r t E - I n f o r m a t i o n o n r i s k s a n d r e l a t e d h e d g i n g p o l i c i e s
1. Distribution of financial assets and liabilities by residual contractual duration
Currency: Yen
Items/Time bands On demand From 1 to 7 days
From 7 to 15 days
From 15 days to 1
month
From 1 to 3 months
from 3 to 6 months
from 6 months to
1 year
from 1 year to 5 years
Beyond 5 years
Unspecified duration
Cash assets 1,311 6,947 42 280 100 – – – – –
A.1 Government securities – – – – – – – – – –
A.2 Other debt securities – – – – – – – – – –
A.3 Mutual funds – – – – – – – – – –
A.4 Loans 1,311 6,947 42 280 100 – – – – –
– Banks 1,139 6,886 – – – – – – – –
– Customers 172 61 42 280 100 – – – – –
Cash liabilities 982 – – – – – – – – –
B.1 Current accounts and deposits 982 – – – – – – – – –
– Banks – – – – – – – – – –
– Customers 982 – – – – – – – – –
B.2 Debt securities – – – – – – – – – –
B.3 Other liabilities – – – – – – – – – –
Off-balance sheet transactions 270 447,521 5,087 1,563 11,776 150,923 13,401 8,717 – –C.1 Financial derivatives with exchange of capital – 447,521 5,087 1,563 11,776 150,923 13,401 8,717 – –
– Long positions – 294,421 1,495 1,251 6,312 849 6,698 5,726 – –
– Short positions – 153,100 3,592 312 5,464 150,074 6,703 2,991 – –
C.2 Financial derivatives without exchange of capital 270 – – – – – – – – –
– Long positions 28 – – – – – – – – –
– Short positions 242 – – – – – – – – –
C.3 Deposits and loans to be received – – – – – – – – – –
– Long positions – – – – – – – – – –
– Short positions – – – – – – – – – –
C.4 Irrevocable commitments to grant finance – – – – – – – – – –
– Long positions – – – – – – – – – –
– Short positions – – – – – – – – – –
C.5 Financial guarantees given – – – – – – – – – –C.6 Financial guarantees received – – – – – – – – – –C.7 Credit derivatives with exchange of capital – – – – – – – – – –
– Long positions – – – – – – – – – –
– Short positions – – – – – – – – – –C.8 Credit derivatives without exchange of capital – – – – – – – – – –
– Long positions – – – – – – – – – –
– Short positions – – – – – – – – – –

375P a r t E - I n f o r m a t i o n o n r i s k s a n d r e l a t e d h e d g i n g p o l i c i e s
1. Distribution of financial assets and liabilities by residual contractual duration
Currency: Canadian Dollars
Items/Time bands On demand From 1 to 7 days
From 7 to 15 days
From 15 days to 1
month
From 1 to 3 months
from 3 to 6 months
from 6 months to
1 year
from 1 year to 5 years
Beyond 5 years
Unspecified duration
Cash assets 421 – 1 28 480 – – – – –
A.1 Government securities – – – – – – – – – –
A.2 Other debt securities – – – – – – – – – –
A.3 Mutual funds – – – – – – – – – –
A.4 Loans 421 – 1 28 480 – – – – –
– Banks 396 – – – – – – – – –
– Customers 25 – 1 28 480 – – – – –
Cash liabilities 2,153 – – 265 – – – – – –
B.1 Current accounts and deposits 2,153 – – 265 – – – – – –
– Banks – – – 265 – – – – – –
– Customers 2,153 – – – – – – – – –
B.2 Debt securities – – – – – – – – – –
B.3 Other liabilities – – – – – – – – – –
Off-balance sheet transactions 8 609 7,174 5,302 2,868 2,879 – – – –C.1 Financial derivatives with exchange of capital – 609 7,174 5,302 2,868 2,879 – – – –
– Long positions – 591 777 5,121 2,552 2,879 – – – –
– Short positions – 18 6,397 181 316 – – – – –
C.2 Financial derivatives without exchange of capital 8 – – – – – – – – –
– Long positions – – – – – – – – – –
– Short positions 8 – – – – – – – – –
C.3 Deposits and loans to be received – – – – – – – – – –
– Long positions – – – – – – – – – –
– Short positions – – – – – – – – – –
C.4 Irrevocable commitments to grant finance – – – – – – – – – –
– Long positions – – – – – – – – – –
– Short positions – – – – – – – – – –
C.5 Financial guarantees given – – – – – – – – – –C.6 Financial guarantees received – – – – – – – – – –C.7 Credit derivatives with exchange of capital – – – – – – – – – –
– Long positions – – – – – – – – – –
– Short positions – – – – – – – – – –C.8 Credit derivatives without exchange of capital – – – – – – – – – –
– Long positions – – – – – – – – – –
– Short positions – – – – – – – – – –
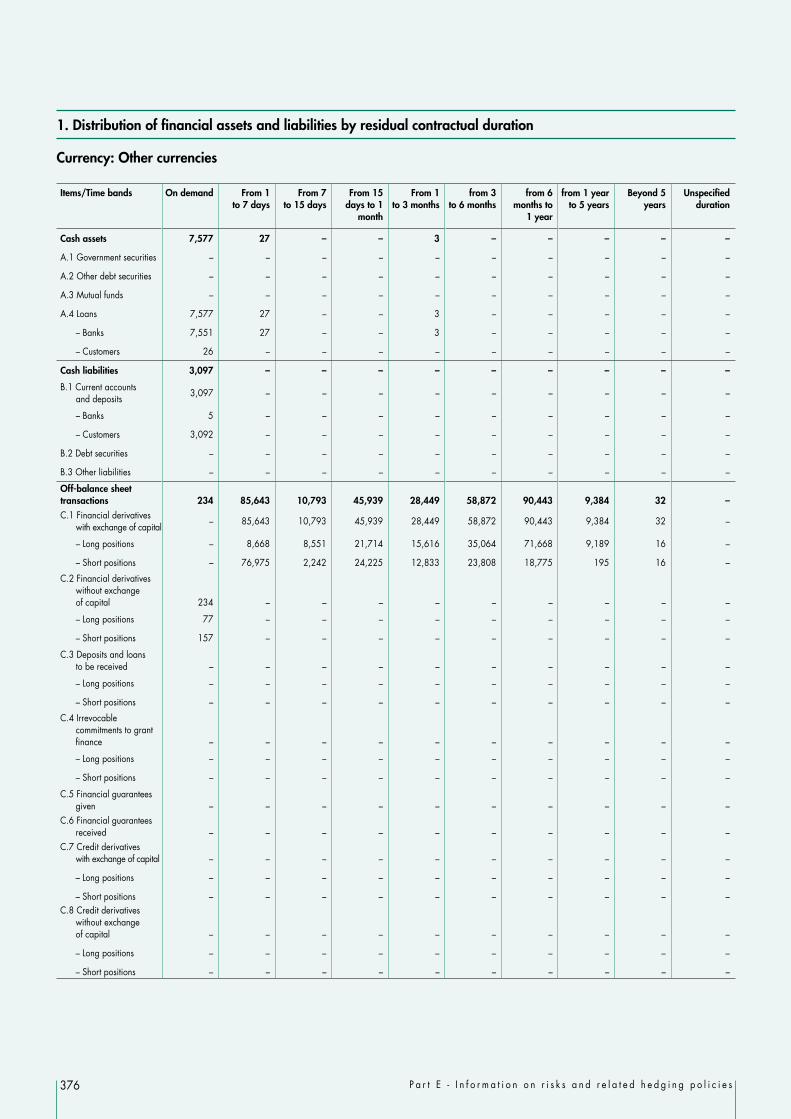
376 P a r t E - I n f o r m a t i o n o n r i s k s a n d r e l a t e d h e d g i n g p o l i c i e s
1. Distribution of financial assets and liabilities by residual contractual duration
Currency: Other currencies
Items/Time bands On demand From 1 to 7 days
From 7 to 15 days
From 15 days to 1
month
From 1 to 3 months
from 3 to 6 months
from 6 months to
1 year
from 1 year to 5 years
Beyond 5 years
Unspecified duration
Cash assets 7,577 27 – – 3 – – – – –
A.1 Government securities – – – – – – – – – –
A.2 Other debt securities – – – – – – – – – –
A.3 Mutual funds – – – – – – – – – –
A.4 Loans 7,577 27 – – 3 – – – – –
– Banks 7,551 27 – – 3 – – – – –
– Customers 26 – – – – – – – – –
Cash liabilities 3,097 – – – – – – – – –
B.1 Current accounts and deposits 3,097 – – – – – – – – –
– Banks 5 – – – – – – – – –
– Customers 3,092 – – – – – – – – –
B.2 Debt securities – – – – – – – – – –
B.3 Other liabilities – – – – – – – – – –
Off-balance sheet transactions 234 85,643 10,793 45,939 28,449 58,872 90,443 9,384 32 –C.1 Financial derivatives with exchange of capital – 85,643 10,793 45,939 28,449 58,872 90,443 9,384 32 –
– Long positions – 8,668 8,551 21,714 15,616 35,064 71,668 9,189 16 –
– Short positions – 76,975 2,242 24,225 12,833 23,808 18,775 195 16 –
C.2 Financial derivatives without exchange of capital 234 – – – – – – – – –
– Long positions 77 – – – – – – – – –
– Short positions 157 – – – – – – – – –
C.3 Deposits and loans to be received – – – – – – – – – –
– Long positions – – – – – – – – – –
– Short positions – – – – – – – – – –
C.4 Irrevocable commitments to grant finance – – – – – – – – – –
– Long positions – – – – – – – – – –
– Short positions – – – – – – – – – –
C.5 Financial guarantees given – – – – – – – – – –C.6 Financial guarantees received – – – – – – – – – –C.7 Credit derivatives with exchange of capital – – – – – – – – – –
– Long positions – – – – – – – – – –
– Short positions – – – – – – – – – –C.8 Credit derivatives without exchange of capital – – – – – – – – – –
– Long positions – – – – – – – – – –
– Short positions – – – – – – – – – –

377P a r t E - I n f o r m a t i o n o n r i s k s a n d r e l a t e d h e d g i n g p o l i c i e s
2. Information on committed assets recorded in the financial statements
Technical forms Committed Uncommitted 31.12.2014 31.12.2013
BV FV BV FV
1. Cash and cash equivalents – X 322,840 X 322,840 363,202
2. Debt securities 6,151,748 6,151,541 3,532,711 3,533,436 9,684,459 9,084,173
3. Equities 25,638 25,638 561,530 561,534 587,168 931,430
4. Loans 7,835,107 X 25,054,977 X 32,890,084 34,883,141
5. Other financial assets – X 2,054,301 X 2,054,301 1,555,567
6. Non-financial assets – X 2,705,455 X 2,705,455 2,332,262
31.12.2014 14,012,493 6,177,179 34,231,814 4,094,970 48,244,307 X
31.12.2013 14,016,515 7,115,447 35,133,260 2,930,384 X 49,149,775
3. Information on own committed assets not recorded in the financial statements
Technical forms Committed Uncommitted 31.12.2014 31.12.2013
1. Financial assets 3,776,088 1,586,525 5,362,613 5,192,500
– Securities 3,776,088 1,586,525 5,362,613 5,192,500
– Other – – – –
2. Non-financial assets – – – –
31.12.2014 3,776,088 1,586,525 5,362,613 x
31.12.2013 3,732,291 1,460,209 x 5,192,500
Self-securitisations
Securitisations in which the Parent Company has subscribed all of the securities issued by the special purpose vehicle (self-securitisations) are not shown in the tables in Part E, Section C of the Notes "Securitisation transactions", in accordance with Bank of Italy Circular 262. The self-securitisations of performing loans were structured in such a way as to improve liquidity risk management, focusing on efficient management of the loan portfolio and diversification of funding sources, reducing their cost and covering the natural maturities of assets with those of liabilities.Direct and full subscription by the Bank of the notes issued by BPM Securitisation 3 S.r.l., despite not permitting direct access to liquidity from the market, did make it possible to have securities eligible for refinancing with the European Central Bank. Given that the Parent Company has retained substantially all of the risks and benefits of the assets that were sold, the entire amount of these receivables has been kept on its balance sheet (applying the accounting treatment envisaged in IAS 39 for the category of financial instruments to which these belong), whereas the notes issued by the vehicle and subscribed by the Bank are not shown. At least until part of the junior securities are placed on the market, these assignment and purchase transactions, which are to be considered jointly according to the principle of substance over form, are in effect a straightforward transformation of receivables into financial instruments (securities), without there being any real economic effect.
Securitisation of mortgages and issue of Asset Backed Securities (ABS)As at the reporting date, there is an ongoing self-securitisation that was finalised by the Bank in September 2014 and approved by the Management Board on 25 February 2014. In detail, this is a securitisation of mortgage loans with a view to issuing Asset Backed Securities (ABS), that is, financial instruments issued under Law 130 of 30 April 1999 (and subsequent amendments and updates). Loans (and other assets) intended exclusively for this purpose will be used to guarantee the rights enclosed in these securities and to cover the cost of the securitisation.This operation was carried out through a sale without recourse to the vehicle company BPM Securitisation 3 S.r.l. (a company created ad hoc) of a portfolio of performing loans totalling some Euro 864 million, deriving from commercial loans secured by first rank mortgages and unsecured loans granted by the Bank.The portfolio sold provides for a class of ABS senior securities (Class A) with an "A2/AA" rating assigned by Moody's and DBRS, respectively, and an unrated class of ABS junior securities (Class Z).

378 P a r t E - I n f o r m a t i o n o n r i s k s a n d r e l a t e d h e d g i n g p o l i c i e s
Securities Amount in Euro Characteristics
Class A – rating AA/A2 573,000,000 Legal maturity: 20 January 2057; coupon: 3-mth Euribor + 60 b.p.s., to be paid quarterly from 20 January 2015; quotation: Luxembourg Stock Exchange ("Senior Securities")
Class Z – junior notes 304,000,000Legal maturity: 20 January 2057; coupon: not foreseen; unrated; quotation: unlisted ("Junior Securities")
877,000,000
The transaction structure provides for a call option under which Banca Popolare di Milano will have the right to repurchase all of the loans sold to the SPV, the issuer of the ABS, and not yet collected at each payment date. BPM Securitisation 3 S.r.l. and Banca Popolare di Milano have signed a servicing contract, under which the SPV has delegated to BPM the task of managing and administrating the receivables, including their collection and recovery.
The ABS issued by BPM Securitisation 3 S.r.l. have been fully subscribed by the Bank, which will use the senior securities to carry out refinancing transactions with the European Central Bank.
At the date of the financial statements the self-securitisation transaction is represented as follows:
(Euro/000)
Line items 31.12.2014
Principal balance sheet aggregates
Loans to customers 726,181
Due from banks 154,142
Economic result of the operation 5,432
Note that the previous self-securitisation of mortgage loans, which was finalised by the Parent Company in December 2011, was closed in advance in March 2014, with the consequent repurchase of the mortgages and loans that had previously been sold. Income statement items arising from this operation were closed out with a positive balance of 17,169 thousand euro.

379P a r t E - I n f o r m a t i o n o n r i s k s a n d r e l a t e d h e d g i n g p o l i c i e s
1.4 – Banking group – Operational risk
Qualitative information
A. General aspects, management processes and methods of measuring operational risk
Main sources of operational riskIn line with EC Regulation 575/2013 of the European Parliament and Council, operational risk is defined as the risk of loss resulting from inadequate or failed internal processes, people or systems, or from external events. This type includes losses due to frauds, human resources, breakdown of operations, non-availability of systems, breach of contract, natural disasters and legal risks, whereas strategic risk and reputational risk are excluded.The supervisory regulations also say that banks have to equip themselves with operational risk management systems that are suitable for their size and risk profile and able to guarantee the identification, measurement, monitoring and control of such risk over time.Unlike credit and market risk, operational risk is not taken on by the Group on the basis of strategic decisions, as it is inherent in its ordinary operations.
Organisational aspectsThe Group has adopted The Standardised Approach (TSA) to calculate the amount of capital absorbed by operational risk for Banca Popolare di Milano and Banca Akros and applies the Basic Indicator Approach (BIA) for the other Group companies1.
This method is adequate for the size and risk profile of the Group and helps to improve the efficiency and effectiveness of processes as well as to reduce the impact and probability of onerous losses arising; furthermore, this is a preparatory step in a gradual evolution towards more advanced models of risk evaluation.
From this point of view, Banca Popolare di Milano at Group level has taken steps: to define and formalise a model for governing operational risk and guidelines for the entire system of operational risk management; to regulate in accordance with company rules the duties and responsibilities assigned the various functions involved, giving a detailed
description of their activities; to prepare suitable periodic reports for top management of the individual banks and for the Parent Company's corporate bodies on operational
risk and operating losses; to evaluate the adequacy and effectiveness of the system implemented by defining operating criteria and methods.
Model of GovernanceFor the management of the Group's operational risk, it was decided to adopt a centralised model of governance at the Parent Company which provides for the definition of principles and methodologies that are common to all of the banks.The model assigns to Banca Popolare di Milano, as the Parent Company, the task of coordinating and supervising all of the operating activities carried on by the individual banks in the Group through: a strategic level involving the Management Board, the Supervisory Board, the Internal Control and Audit Committee with the support of the Risk
Management Department; a more operational level involving the Operational Risk of the Parent Company and the Operational Risk Owners identified within each of
the banks.
The system of managing operational riskBanca Popolare di Milano has implemented a system for managing operational risk at Group level by means of: an organisational process of collecting data on operating losses and insurance recoveries that involves and responsibilises the various bank
functions, guaranteeing the completeness, reliability and updating of the data; activation of the Risk Self Assessment tool, an annual process of identifying, assessing and measuring (where possible) the Group's exposure to
operational risk in its main business processes and support carried out by means of questionnaires sent to the Process Owner by Operational Risk Management;
the definition of criteria and methods for linking the Group's activities to the regulatory lines of business for the calculation of the individual and consolidated capital ratio;
the implementation of a system of periodic reporting to top management and the operating functions on the main loss events and operational risks identified;
1 WeBank was merged by absorption into Banca Popolare di Milano on 23 November 2014, with effect for accounting and tax purposes as from 1 January 2014.

380 P a r t E - I n f o r m a t i o n o n r i s k s a n d r e l a t e d h e d g i n g p o l i c i e s
the preparation of training tools for top management and the operating functions to encourage their involvement and to provide guidelines to the staff concerned for identifying and reporting such risk;
an annual review of the entire system of operational risk management by means of a process of internal self-assessment, which allows the Group to evaluate the effectiveness of its strategies and the adequacy of the system implemented according to the Group's risk profile.
Loss data collectionOne of the key aspects of the operational risk management system is loss data collection (LDC). Its purpose is to provide a picture over time of the trend in the more significant loan losses; it also represents a statistical basis necessary for a better risk analysis and for the adoption of advanced VaR models and for calculating the amount of capital absorbed by operational risk.Detailed internal rules guarantee consistency in the classification of events within each Group bank, while at an operational level Group banks have been equipped with suitable procedures for collecting loss data and efficient management of all steps of the process.
By means of the reporting system, on a quarterly basis, operational loss data is brought to the attention of the corporate bodies of the Parent Company and of the other banks within the scope of application of the TSA model. Similar reports are also produced for the corporate bodies of Banca Popolare di Mantova, for which the BIA method is applied.In 2014, the main sources of operating losses, in terms of impact and frequency, were the categories entitled "Execution, delivery and management of processes" and "External fraud".
0%
10%
20%
30%
40%
50%
60%
70%
80%
Internal fraud External fraud Employment relationships and safety
in the workplace
Customer, products
and operating practices
Damages to fixed assets
Breakdown of operations
and non-availability of systems
Execution, delivery and management of processes
% Frequency % Impact
Percentage distribution of losses of the BPM Group in 2014
Identifying operational riskDuring 2014, the Risk Self Assessment (RSA) process was implemented as usual for the identification and analysis of operational risk. Assessments of operational risk represent the outcome of an assessment cycle performed in accordance with a methodological configuration and a common process agreed at Group level that enables the identification and measurement of the main operational risks to which the Group is exposed, as well as the adoption of suitable mitigating measures, where needed or appropriate.The methodological approach to the Risk Self Assessment model was revised, making it easier to use the questionnaire, which is in an electronic format with prompts for the compilation of the various fields.As was the case for previous assessments, particular attention was paid to the assessment of the design of the internal control system, for which process owners were asked to provide their opinion on the functioning thereof.
Preliminary interviews were held with process owners to identify risks that are typical of each structure's operations, in order to make it easier to compile the questionnaire by limiting the risks to those that are already known.

381P a r t E - I n f o r m a t i o n o n r i s k s a n d r e l a t e d h e d g i n g p o l i c i e s
To facilitate the foregoing, the assessors were provided with details of loss data collection relating to the previous five years (if existing and consistent).The estimates provided were subject to checks for qualitative-quantitative consistency by Operational Risk, to ensure the utmost uniformity and quality of the information gathered. In certain cases, requests were made by the assessors to add to assessments initially provided, to facilitate the statistical classification of the data collected.The assessment cycle also allowed for "testing" of the methods adopted for the selection of the elements to be used to fine tune the methodology and the process with a view to the performance of RSA in subsequent years.The findings from the assessment were shared with the appropriate corporate functions and bodies and represent the basis for the eventual definition and updating of measures for the mitigation and prevention of risk, as part of a wider process for the mitigation of operational risks. The results will be summarised and reported to the corporate bodies and senior management.
Business Continuity PlanThe Business Continuity Plan allows the Parent Company to verify its ability to restore vital and critical processes in the event of a disaster.Through a structure set up specifically to manage the Plan: formalises the effective maintenance procedure; the crisis simulation plan gets tested; the continuity of vital and critical processes is guaranteed; mitigation steps are evaluated, widening the scope of the business continuity plan to new scenarios, such as that of a pandemic, and to new processes.
Quantitative information
Lawsuits pending
Legal risk can derive from a failure to comply with laws, regulations or directives from the Supervisory Authorities or from unfavourable changes in the legislative framework. The impact of this risk may take the form of fines or other sanctions or it may involve the Group in legal proceedings. So in principle, it concerns all corporate functions that are affected by legislative, regulatory and other legal provisions.
Banca Popolare di MilanoThe lawsuits outstanding at 31 December 2014 mostly fall into the following categories: erroneous application of interest rates: there are 532 lawsuits outstanding for which 12.1 million euro has been provided for possible losses; operational errors in the provision of services to customers: there are 355 lawsuits outstanding for which 18.7 million euro has been
provided for possible losses; financial lawsuits: these are disputes associated with financial advisory activities (documentary errors, incorrect information on financial risks,
etc); as far as lawsuits are concerned, there are specific provisions of 10.9 million euro for the 157 lawsuits that are outstanding.
Furthermore, it should be noted that a provision of Euro 26 million has been made as an estimate of the risk relating to issues connected with the placement of the BPM "Convertendo 2009-2013 6.75%" bond. Of this provision, which initially amounted to 40 million in 2011 and which was increased by another 7 million in 2012, 21 million was used for payments made under the Settlement Protocol and other arrangements reached.
Banca AkrosIt should be noted that appropriate provision has been made for liabilities that could arise from lawsuits, claims, action taken in court and out of court and the costs of external advisers. Specific provisions made over the years for potential losses that could arise from disputes and lawsuits, including claims for damages, action taken in court and out of court, claims from customers and related legal expenses amount to 6.9 million euro at 31 December 2014.
Banca Popolare di MantovaThe lawsuits outstanding at 31 December 2014 mostly fall into the following categories: erroneous application of interest rates: there are 2 lawsuits outstanding for which 2 thousand euro has been provided in previous years for
possible losses; operational errors in the provision of services to customers: there are 3 lawsuits outstanding for which 20 thousand euro has been
provided in previous years for possible losses; financial lawsuits: there are 2 lawsuits outstanding for which 20 thousand euro has been provided for possible losses.
Following the signature of the Settlement Protocol in August 2012, in relation to the estimate of risk on issues concerning the placement of the "Convertendo BPM 2009-2013 – 6.75%" bond loan, at 31 December 2014 the Bank has provided 66 thousand euro for the expected cost of settlements being reached with its customers. Of this provision, which initially amounted to 350 thousand euro in 2012, 284 thousand euro has been used due to payments made in 2014.


383
Part FInformation on consolidated capital


385P a r t F - I n f o r m a t i o n o n c o n s o l i d a t e d c a p i t a l
Section 1 – Consolidated capital
A. Qualitative information
Capital management involves a range of policies and decisions needed to define its size, as well as the best combination of the various alternative capitalisation instruments to ensure that the capital and consolidated ratios of the Bipiemme Group are consistent with the risk profile taken on in full compliance with the requirements of the Supervisory Authority.
As regards the policies adopted regarding compliance with the capital adequacy requirements, as well as the policies and processes adopted in the field of capital management, reference should be made to Section 2 below, entitled "Own funds and capital adequacy ratios".
B. Quantitative information
B1. Consolidated capital: breakdown by type of company
Equity line items Banking group
Insurance companies
Other companies
Eliminations and
consolidation adjustments
Total of which Group
of which minority interests
Share capital 3,367,776 – 22 – 3,367,798 3,365,439 2,359
Share premium reserve 11,982 – – – 11,982 – 11,982
Reserves 622,241 – – – 622,241 617,888 4,353
Equity instruments – – – – – –
(Treasury shares) –854 – – – –854 –854 –
Valuation reserves: 322,007 – – – 322,007 321,917 90
– Financial assets available for sale 377,909 – – – 377,909 377,758 151
– Property and equipment – – – – – – –
– Intangible assets – – – – – – –
– Hedging of foreign investments – – – – – – –
– Cash flow hedges –4,502 – – – –4,502 –4,502 –
– Foreign exchange differences – – – – – – –
– Non-current assets held for sale and discontinued operations – – – – – – –
– Actuarial gains (losses) on defined-benefit pension plans –62,038 – – – –62,038 –61,977 –61
– Share of valuation reserves connected with investments carried at equity –2,804 – – – –2,804 –2,804
–
– Special revaluation laws 13,442 – – – 13,442 13,442 –
Net income (loss) (+/–) for the period of the Group and minority interests 232,933 – – – 232,933 232,293 640
Shareholders' equity 4,556,085 – 22 – 4,556,107 4,536,683 19,424
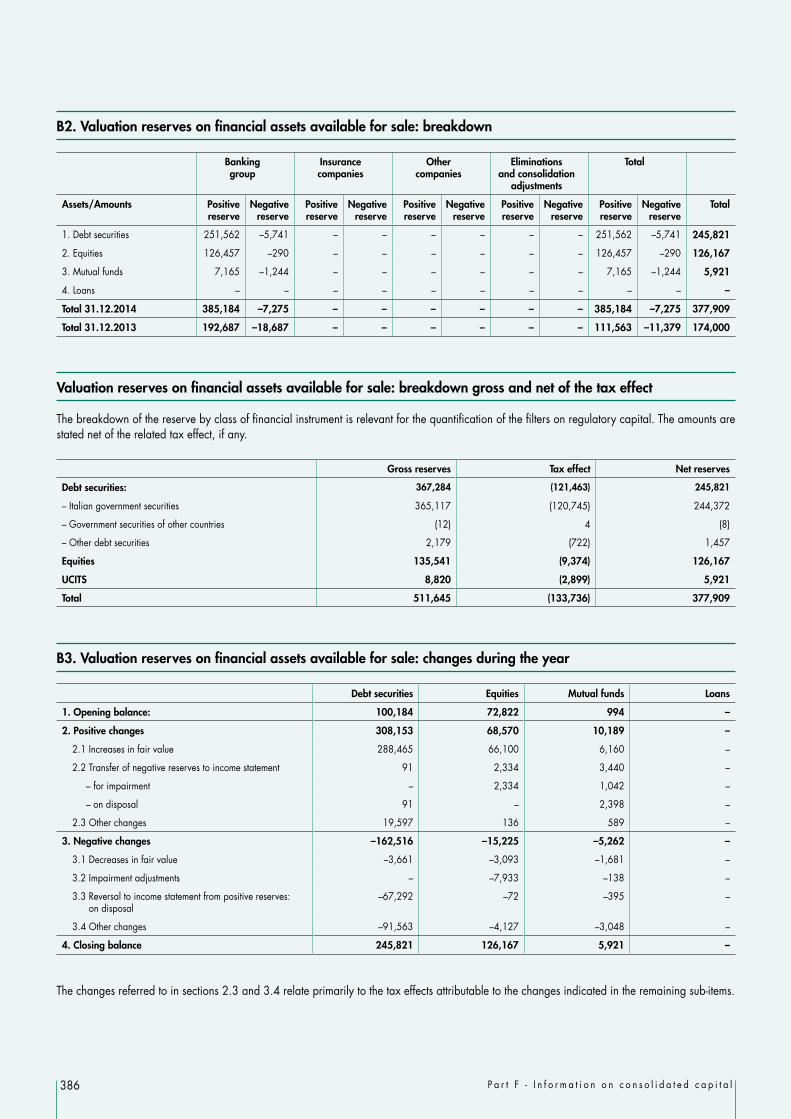
386 P a r t F - I n f o r m a t i o n o n c o n s o l i d a t e d c a p i t a l
B2. Valuation reserves on financial assets available for sale: breakdown
Banking group
Insurance companies
Other companies
Eliminations and consolidation
adjustments
Total
Assets/Amounts Positive reserve
Negative reserve
Positive reserve
Negative reserve
Positive reserve
Negative reserve
Positive reserve
Negative reserve
Positive reserve
Negative reserve
Total
1. Debt securities 251,562 –5,741 – – – – – – 251,562 –5,741 245,821
2. Equities 126,457 –290 – – – – – – 126,457 –290 126,167
3. Mutual funds 7,165 –1,244 – – – – – – 7,165 –1,244 5,921
4. Loans – – – – – – – – – – –
Total 31.12.2014 385,184 –7,275 – – – – – – 385,184 –7,275 377,909
Total 31.12.2013 192,687 –18,687 – – – – – – 111,563 –11,379 174,000
Valuation reserves on financial assets available for sale: breakdown gross and net of the tax effect
The breakdown of the reserve by class of financial instrument is relevant for the quantification of the filters on regulatory capital. The amounts are stated net of the related tax effect, if any.
Gross reserves Tax effect Net reserves
Debt securities: 367,284 (121,463) 245,821
– Italian government securities 365,117 (120,745) 244,372
– Government securities of other countries (12) 4 (8)
– Other debt securities 2,179 (722) 1,457
Equities 135,541 (9,374) 126,167
UCITS 8,820 (2,899) 5,921
Total 511,645 (133,736) 377,909
B3. Valuation reserves on financial assets available for sale: changes during the year
Debt securities Equities Mutual funds Loans
1. Opening balance: 100,184 72,822 994 –
2. Positive changes 308,153 68,570 10,189 –
2.1 Increases in fair value 288,465 66,100 6,160 –
2.2 Transfer of negative reserves to income statement 91 2,334 3,440 –
– for impairment – 2,334 1,042 –
– on disposal 91 – 2,398 –
2.3 Other changes 19,597 136 589 –
3. Negative changes –162,516 –15,225 –5,262 –
3.1 Decreases in fair value –3,661 –3,093 –1,681 –
3.2 Impairment adjustments – –7,933 –138 –
3.3 Reversal to income statement from positive reserves: on disposal
–67,292 –72 –395 –
3.4 Other changes –91,563 –4,127 –3,048 –
4. Closing balance 245,821 126,167 5,921 –
The changes referred to in sections 2.3 and 3.4 relate primarily to the tax effects attributable to the changes indicated in the remaining sub-items.

387P a r t F - I n f o r m a t i o n o n c o n s o l i d a t e d c a p i t a l
B4. Valuation reserves relating to defined-benefit plans: changes during the year
Pension funds
Termination indemnities
TOTAL
Net valuation reserve at 31.12.2013 –24,775 –14,436 –39,211
Increases 5,329 3,330 8,659
Actuarial gains – – –
Other positive changes 5,329 3,330 8,659
– other positive changes – tax effect 5,329 3,330 8,659
Decreases –19,378 –12,108 –31,486
Actuarial losses –19,378 –12,108 –31,486
Other negative changes – – –
– other positive changes – tax effect – – –
Net valuation reserve at 31.12.2014 –38,824 –23,214 –62,038

388 P a r t F - I n f o r m a t i o n o n c o n s o l i d a t e d c a p i t a l
Section 2 – Own funds and capital adequacy ratios
2.1 Scope of application of the regulation
Changes in prudential bank regulations
The new harmonized framework for banks and investment firms contained in EU Regulation ("CRR") and Directive ("CRD IV") of 26 June 2013 is applicable from 1 January 2014; they transpose the standards defined by the Basel Committee on Banking Supervision (the so-called "Basel 3 Framework") into the European Union. The Regulation (CRR) is directly applicable in the national legal systems, without the need for transposition, and constitutes the so-called "Single Rulebook"; the rules contained in the Directive (CRD IV), on the other hand, have to be transposed into the sources of national law. In order to implement and facilitate the implementation of the new guidelines, as well as to achieve an overall revision and simplification of the rules for banks, on 17 December 2013 the Bank of Italy issued Circular 285 "Supervisory Provisions for Banks" which:i) incorporates the provisions of CRD IV, implementation of which is the responsibility of the Bank of Italy under the Consolidated Banking Act;ii) indicates the manner in which the discretional decisions granted by the EU framework to the national authorities were exercised;iii) outlines a comprehensive regulatory framework that is organic, rational and integrated with the directly applicable EU provisions, in order to
facilitate its use by the operators.In particular, with reference to the transitional arrangements for own funds, banks have the faculty – which they have to exercise by 31 January 2014 – not to include unrealized capital gains and losses related to exposures to central governments classified as "financial assets available for sale" in any element of own funds. The Management Board of BPM has resolved to take advantage of this faculty in the calculation of the individual own funds of all Group banks and of consolidated own funds. This faculty is a continuation of a similar option granted by the Bank of Italy in 2010 and adopted by BPM for the calculation of regulatory capital in accordance with the regulations contained in Circular 263.
2.2 Bank's own funds
A. Qualitative information
Own funds (which under the previous rules constituted regulatory capital) are the first line of defence against the risks involved in the banking business as a whole and are the first parameter of reference for any assessment of a bank's solidity.Own funds are the sum of:"Common Equity Tier 1" or "CET1""Additional Tier 1" or "AT1""Tier 2" or "T2" In particular, with reference to the transitional arrangements for own funds, the Bipiemme Group has chosen not to include unrealized capital gains and losses related to exposures to central governments classified as "financial assets available for sale” in any element of own funds. At 31 December 2014, capital gains, net of tax, on AFS securities issued by central governments amounted to 240 million euro. This amount is entirely related to bonds issued by the Italian government.

389P a r t F - I n f o r m a t i o n o n c o n s o l i d a t e d c a p i t a l
B. Quantitative information
Set out below is a quantification of consolidated own funds at 31 December 2014:
31.12.2014A. Common Equity Tier 1 – CET1 before the application of prudential filters 4,352,272 of which CET1 instruments subject to transitional instructions –B. Prudential filters of CET1 capital (+/–) –5,977C. CET1 before items to be deducted and the effects of transitional instructions (A +/– B) 4,346,295D. Items to be deducted from CET1 –150,276E. Transitional regime – Impact on CET1 (+/–), including minority interests subject to transitional instructions
F. Total Common Equity Tier 1 – CET1 (C – D +/– E) 3,899,672
G. Additional Tier 1 – AT1 before items to be deducted and the effects of transitional instructions 213,499 of which AT1 instruments subject to transitional instructions 210,940H. Items to be deducted from AT1 –
I. Transitional regime – impact on AT1 (+/–), including instruments issued by subsidiaries and included in AT1 as per transitional instructions –
L. Total Additional Tier 1 – AT1 (G – H +/– I) 213,499
M. Tier 2 capital (T2) before items to be deducted and the effects of the transitional regime 1,073,546 of which T2 instruments subject to transitional instructions 460,786N. Items to be deducted from T2 37,999
O. Transitional regime – Impact on T2 (+/–), including instruments issued by subsidiaries and included in T2 as per transitional instructions
20,790
P. Total Tier 2 capital (T2) (M – N +/– O) 1,056,337Q. Total own funds (F + L + P) 5,169,508
Quantitative information on consolidated regulatory capital at 31 December 2013 calculated according to the previous discipline (Circular 263 of 27 December 2006 and subsequent updates).
31.12.2013A. Tier 1 capital before the application of prudential filters 3,554,595B. Prudential filters of Tier 1 capital: –22,029 B.1 Positive IFRS prudential filters (+) – B.2 Negative IFRS prudential filters (-) –22,029C. Tier 1 capital inclusive of items to be deducted (A + B) 3,532,566D. Items to be deducted from Tier 1 capital –199,259E. Total Tier 1 capital (C – D) 3,333,307 F. Tier 2 capital before the application of prudential filters 1,430,906G. Prudential filters of Tier 2 capital: –13,188 G.1 Positive IFRS prudential filters (+) – G.2 Negative IFRS prudential filters (-) –13,188H. Tier 2 capital inclusive of items to be deducted (F + G) 1,417,718J. Items to be deducted from Tier 2 capital –199,259L. Total Tier 2 capital (H – J) 1,218,459 M. Items to be deducted from total Tier 1 and 2 capital –N. Regulatory capital (E + L – M) 4,551,766O. Tier 3 capital –P. Regulatory capital including Tier 3 capital (N + O) 4,551,766

390 P a r t F - I n f o r m a t i o n o n c o n s o l i d a t e d c a p i t a l
Composition of own funds at 31 December 2014:
Capital components 31.12.2014
CET1 instruments
Paid-in share capital 3,365,439
Treasury shares –854
Reserves
Reserves 601,361
Net income for the period attributed to own funds 136,032
Accumulated other comprehensive income (OCI) 224,912
Other reserves 13,442
Minority interests 11,940
Tier 1 capital prudential filters –5,977
Deductions:
Intangible assets – Goodwill –41,899
Intangible assets – Other intangible assets: –108,377
Adjustments arising from transitional provisions –296,347
Common Equity Tier 1 – CET1 3,899,672
Additional Tier 1 capital equity instruments subject to transitional provisions (grandfathering) 210,940
Minority interests 2,559
Additional Tier 1 – AT1 213,499
Tier 1 capital 4,113,171
Instruments and subordinated debt included in calculation of Tier 2 capital 610,903
Tier 2 capital equity instruments subject to transitional provisions (grandfathering) 460,786
Minority interests 1,857
Deductions pertaining to Tier 2 capital equity instruments in which the entity holds a significant investment –37,999
Adjustments arising from transitional provisions 20,790
Tier 2 capital 1,056,337
Total own funds 5,169,508

391P a r t F - I n f o r m a t i o n o n c o n s o l i d a t e d c a p i t a l
The following table provides a reconciliation between Common Equity Tier 1 and the book value of the Group's shareholders' equity.
Line items 31.12.2014
Group shareholders' equity 4,536,683
Minority interests 19,424
Total shareholders' equity 4,556,107
Dividend –96,901
Shareholders' equity after distribution to shareholders 4,459,206
Adjustments for instruments included in calculation of AT1 or T2
Minority interests included in calculation of AT1 –2,559
Minority interests included in calculation of T2 –1,857
Minority interests not eligible for inclusion –2,277
Other components not eligible for inclusion relating to valuation reserves for securities available for sale –83,714
Other components: allocation of earnings to employees –16,527
Common Equity Tier 1 prior to regulatory adjustments 4,352,272
Regulatory adjustments: prudential filters and deductions –452,600
Common Equity Tier 1 net of regulatory adjustments 3,899,672

392 P a r t F - I n f o r m a t i o n o n c o n s o l i d a t e d c a p i t a l
Instruments included in the calculation of Additional Tier 1 capital and of Tier 2 capital at 31 December 2014 are listed below; For the characteristics of individual bond loans, please refer to Section 3 – "Debt securities in issue" of these Explanatory Notes.
Bond 31.12.2014 Original nominal amount issued
Bond issue price
Interest rate
Issue date/maturity
Early redemption
from:Book value
Contribution to own funds
Additional Tier 1 – AT1 279,801 210,940
Preference shares – Bpm Capital Trust I – 8.393% 71,646 56,881 160,000 Euro 100 Floating 02.07.2001 02.07.2011
Perpetual
Perpetual Subordinated Fixed/Floating Rate Notes – 9% 208,155 154,059 300,000 Euro 98.955 Floating 25.06.2008 25.06.2018
Perpetual
Tier 2 capital 1,816,001 1,071,689
Subordinated bond of Banca Popolare di Milano 541,512 59,146 600,000 Euro 99.716 Floating 29.06.2005/15 29.6.2010
(Lower Tier 2) Floating rate – 29.6.05-15 (*) 264,258 165,459 252,750 Euro 100 4.50 18.04.2008/18 n.p.
Banca Popolare di Milano Subordinated bond loan (Lower Tier 2) Fixed rate 4.5% 18 April 2008/2018 454,800 401,640 502,050 Euro 100 Floating 20.10.2008/18 20.10.2013
Banca Popolare di Milano subordinated bond loan (Lower Tier 2) Floating rate 20 October 2008/2018 (*) 554,780 445,444 475,000 Euro 99.603 7.125 01.03.2011/21 n.p.
Banca Popolare di Milano subordinated bond loan (Lower Tier 2) Fixed rate 7.125% (issued as part of the EMTN Programme) 651 – 17,850 Euro 100 Floating 18.06.2008/18 n.p.
Banca Popolare di Milano subordinated bond – Floating rate – 18.06.08/18
(*) T2 instruments subject to transitional provisions (grandfathering) for which it is envisaged they will gradually become ineligible for inclusion in own funds up to 2017, when they will no longer be fully eligible for inclusion in own funds.
2.3 Capital adequacy
A. Qualitative information
Capital ratios at 31 December 2014 have been calculated in accordance with the methodology set out in the Basel III Capital Accord; the new Basel 3 regulations have been applied as from the report as of March 2014.Total capital requirements are calculated as the sum of:
Credit and counterparty risk
Market risksThe Standardised Approach is used by the Bipiemme Group, except for Banca Akros which since 2007 has been authorised by the Bank of Italy to use internal models.
Operational riskThe capital requirement for operational risk is calculated by using a combination of the Standardised Approach and the Basic Approach. According to the Standardised Approach, the capital requirement is determined by applying distinct regulatory coefficients to the three-year average of the relevant indicator for each line of business foreseen in the regulations. In BPM's case, this method is applied to the relevant consolidated indicator for the Group's banks (excluding Banca Popolare di Mantova). The Basic Approach, which provides for a capital requirement of 15% of the three-year average of the relevant indicator, is applied to the relevant consolidated indicator for the non-banking companies and to Banca Popolare di Mantova.
The following coefficients take on particular importance for the assessment of capital solidity: Common Equity tier 1 ratio , represented by the ratio between Common Equity Tier 1 and risk-weighted assets; Tier 1 share capital ratio, represented by the ratio between Tier 1 capital and risk-weighted assets; The Total capital ratio, represented by the ratio between total capital and risk-weighted assets.

393P a r t F - I n f o r m a t i o n o n c o n s o l i d a t e d c a p i t a l
Removal of specific add-ons imposed by the Bank of ItalyFollowing its inspection of the Parent Company between 2010 and 2011, the Bank of Italy imposed a series of add-ons in the calculation of risk-weighted assets, from 30 June 2011, on the Parent Company Banca Popolare di Milano, in relation to:1. the ineligibility of mortgages on residential and non-residential buildings;2. a one-third increase in the weighting normally used for loans to construction companies, property companies and real estate funds;3. a 100% increase in the capital requirement for operational risk.
On 25 June 2014, the Bank of Italy ordered the complete removal of the add-ons, with effect from 30 June 2014. This measure follows the resolution of the critical issues of a technical and operational nature that at the time resulted in the add-ons mentioned above and, more generally, to the path of recovery pursued by BPM that led to the complete success of the capital increase of Euro 500 million completed in May 2014.The removal of the add-ons, together with the capital increase and the sale of part of the interest in Anima Holding, made it possible to achieve a Common Equity Tier I ratio of 11.58%, compared with 7.21% at 31 December 2013.
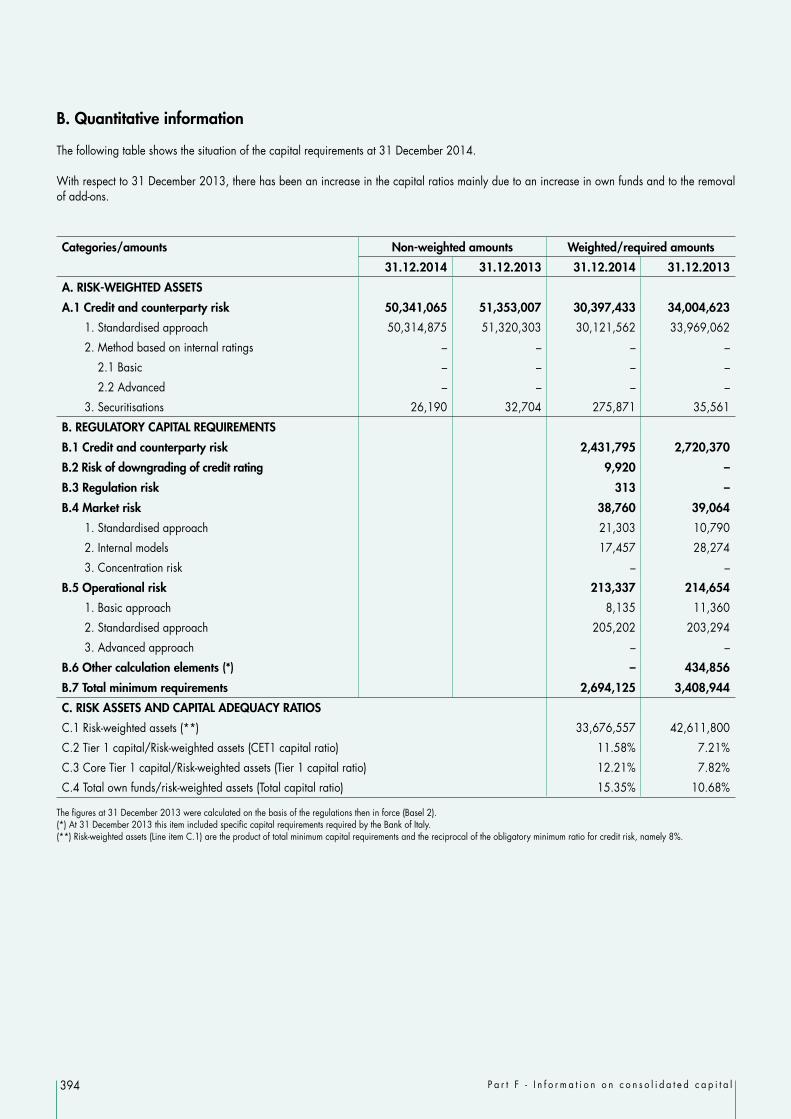
394 P a r t F - I n f o r m a t i o n o n c o n s o l i d a t e d c a p i t a l
B. Quantitative information
The following table shows the situation of the capital requirements at 31 December 2014.
With respect to 31 December 2013, there has been an increase in the capital ratios mainly due to an increase in own funds and to the removal of add-ons.
Categories/amounts Non-weighted amounts Weighted/required amounts
31.12.2014 31.12.2013 31.12.2014 31.12.2013
A. RISK-WEIGHTED ASSETS
A.1 Credit and counterparty risk 50,341,065 51,353,007 30,397,433 34,004,623
1. Standardised approach 50,314,875 51,320,303 30,121,562 33,969,062
2. Method based on internal ratings – – – –
2.1 Basic – – – –
2.2 Advanced – – – –
3. Securitisations 26,190 32,704 275,871 35,561
B. REGULATORY CAPITAL REQUIREMENTS
B.1 Credit and counterparty risk 2,431,795 2,720,370
B.2 Risk of downgrading of credit rating 9,920 –
B.3 Regulation risk 313 –
B.4 Market risk 38,760 39,064
1. Standardised approach 21,303 10,790
2. Internal models 17,457 28,274
3. Concentration risk – –
B.5 Operational risk 213,337 214,654
1. Basic approach 8,135 11,360
2. Standardised approach 205,202 203,294
3. Advanced approach – –
B.6 Other calculation elements (*) – 434,856
B.7 Total minimum requirements 2,694,125 3,408,944
C. RISK ASSETS AND CAPITAL ADEQUACY RATIOS
C.1 Risk-weighted assets (**) 33,676,557 42,611,800
C.2 Tier 1 capital/Risk-weighted assets (CET1 capital ratio) 11.58% 7.21%
C.3 Core Tier 1 capital/Risk-weighted assets (Tier 1 capital ratio) 12.21% 7.82%
C.4 Total own funds/risk-weighted assets (Total capital ratio) 15.35% 10.68%
The figures at 31 December 2013 were calculated on the basis of the regulations then in force (Basel 2).(*) At 31 December 2013 this item included specific capital requirements required by the Bank of Italy.(**) Risk-weighted assets (Line item C.1) are the product of total minimum capital requirements and the reciprocal of the obligatory minimum ratio for credit risk, namely 8%.

395
Part GBusiness combinations


397P a r t G - B u s i n e s s c o m b i n a t i o n s
Section 1 – Transactions carried out during the year
1.1 Business combinations
During the year no business combinations within the scope of IFRS 3 were completed.
Business combination between entities under common controlAs for "business combinations between entities under common control", which do not fall within the scope of IFRS 3, by convention information is given in this section. So we can mention here the merger of WeBank S.p.A. with Banca Popolare di Milano.
Merger of WeBank S.p.A with Banca Popolare di Milano S.c.ar.l.
On 17 June 2014, following the expression of a favourable opinion by the Supervisory Board, the Management Board of Banca Popolare di Milano and the Board of Directors of WeBank approved the proposed absorption of WeBank by Banca Popolare di Milano. This merger is envisaged in the Group's 2014-2016/18 Business Plan and is intended to create a multi-channel bank that will strengthen the Group's presence in the digital market.
On 23 September 2014, after receiving authorisation from the Bank of Italy pursuant to article 57 of Legislative Decree no. 385/1993, the Management Board of Banca Popolare di Milano – pursuant to Article 2505, second paragraph, of the Italian Civil Code – and the Extraordinary Meeting of WeBank approved the merger. The merger project, the resolution of the Bank's Management Board of 23 September 2014, as well as other documents related to the operation in question, have been published – according to the law – on BPM's website (www.gruppobpm.it) in Investor Relations/Corporate Transactions/Merger of WeBank with BPM.
The merger deed was executed on 12 November 2014; the merger took effect for legal purposes as from 23 November 2014 as established in the merger deed, whereas for tax and accounting purposes it took effect from 1 January 2014.
We would also point out that, in accordance with Resolution no. 17221/10 (Consob's OPC Regulation) and with the related company regulations adopted by the Bank, the merger is a "more important related party transaction" and, in the absence of significant interests of other related parties in the subsidiary WeBank, the Bank has taken advantage of the exemption option provided for in Article 14 of Consob OPC Regulation, as referred to in these regulations.
Therefore, the merger did not result in any exchange of shares or increase in the share capital of BPM.

398 P a r t G - B u s i n e s s c o m b i n a t i o n s
Section 2 – Transactions carried out after the end of the period
2.1 Business combinations
No combinations involving companies or businesses within the scope of IFRS 3 have been carried since the end of the period.
Section 3 – Retrospective adjustments
No retrospective adjustments were made during the year.

399
Part HRelated party transactions


401P a r t H - R e l a t e d p a r t y t r a n s a c t i o n s
1. Information relating to the remuneration of key management personnel
As a result of the Extraordinary General Meeting of Members on 22 October 2011, the Parent Company changed its system of corporate governance, adopting the "two-tier" model which envisages: a Supervisory Board elected by the General Meeting of Members and vested with the control functions foreseen by law and the Articles of
Association; the Management Board, elected by the Supervisory Board, which is responsible for running the business.
Other Group companies have maintained the traditional system of governance, typically with a Board of Directors and, where applicable, a Board of Statutory Auditors. The fees accruing to the administrative and control bodies in 2014 – booked to the income statement in line item 180 a) "Personnel expenses" - amount to 4.309 million, as follows: Management Board of the Parent Company: 1.183 million; Supervisory Board of the Parent Company: 2.180 million; Boards of Directors of subsidiaries: 0.708 million; Boards of Statutory Auditors of subsidiaries: 0.238 million.
Information relating to the remuneration of key management personnel
The information required by paragraph 16 of IAS 24 is provided below in relation to managers belonging to the senior management teams of group companies and of the Parent Company.
31.12.2014 31.12.2013
Salaries and other short-term benefits 5,168 4,948
Bonuses and other incentives in cash 24 –
Post-employment benefits (1) 446 411
Termination benefits – 3,017
(1) Represents the annual charge to the employee termination indemnities and pension fund.

402 P a r t H - R e l a t e d p a r t y t r a n s a c t i o n s
2. Related party disclosures
For further details on the procedures governing related party transactions, please refer to the specific section in the report on operations.
A. Joint ventures and companies subject to significant influence
Line items 31.12.2014 31.12.2013
Joint ventures
Companies subject to
significant influence
Total Joint ventures
Companies subject to
significant influence
Total
Balance sheet: assets 3,416 683,453 686,869 7,480 608,174 615,654
Financial assets held for trading – 9,318 9,318 – 9,859 9,859
Due from banks – – – – – –
Loans to customers 3,416 674,135 677,551 7,480 598,315 605,795
Balance sheet: liabilities 2,095 221,627 223,722 3,956 216,463 220,419
Due to customers 2,095 186,645 188,740 3,956 177,268 181,224
Securities issued – 31,689 31,689 – 31,964 31,964
Financial liabilities held for trading – 3,293 3,293 – 7,231 7,231
Financial liabilities designated at fair value through profit and loss – – – – – –
Balance sheet: guarantees and commitments – 52,891 52,891 – 151,477 151,477
Guarantees given – 3,901 3,901 – 4,929 4,929
Commitments – 48,990 48,990 – 146,548 146,548
Income statement 396 182,108 182,504 510 148,154 148,664
Interest income 409 16,941 17,350 516 15,071 15,587
Interest expense (13) (5,547) (5,560) (6) (12,714) (12,720)
Fee and commission income – 174,437 174,437 – 144,237 144,237
Fee and commission expense – – – – – –
Recharge of personnel expenses for staff seconded to third parties – 1,087 1,087 – 544 544
Other operating expenses/income – –4,810 –4,810 – 1,016 1,016
The column entitled "Companies subject to significant influence" conventionally includes the figures relating to the subsidiaries of associates, Fondazione Cassa di Risparmio di Alessandria and its subsidiaries and the BPM Pension Fund.

403P a r t H - R e l a t e d p a r t y t r a n s a c t i o n s
B. Other related parties
The following table reports transactions and balances between group companies and members of the Management Boards and of the Supervisory Board and of the Boards of Directors and of Statutory Auditors, as well as key management personnel of group companies, and other parties related to them.
Management Board of the Parent Company Members of the Board
Companies controlled by
members of the Board
Relatives of members of the Board
Companies controlled by
relatives of members of the Board
Loans Granted 11 – 1 1Drawdowns – – – –
Deposits 526 – 260 4Indirect deposits (at market value) 11 – 40 –Assets under management (at market value) 296 – – –Guarantees given – – – –Interest income – – – –Interest expense (5) – – –Commission and other income – – – –
Amounts recognised for professional and consultancy services – – – (754)
Boards of Directors of other Group companies Members of the Board
Companies controlled by
members of the Board
Relatives of members of the Board
Companies controlled by
relatives of members of the Board
Loans Granted 2,151 9,723 726 51,357Drawdowns 1,582 2,975 672 17,559
Deposits 2,708 1,301 15,545 8,406Indirect deposits (at market value) 7,390 629 22,876 55,893Assets under management (at market value) 5,976 56 1,377 –Guarantees given – 29 – 7Interest income 24 52 15 597Interest expense (22) (3) (258) (145)Commission and other income 56 14 17 31
Amounts recognised for professional and consultancy services – – – –
Supervisory Board of the Parent Company Members of the Board
Companies controlled by
members of the Board
Relatives of members of the Board
Companies controlled by
relatives of members of the Board
Loans Granted 112 158 60 456Drawdowns 25 – – 287
Deposits 629 107 451 1Indirect deposits (at market value) 747 – 263 –Assets under management (at market value) 458 – 390 –Guarantees given – – 7 –Interest income 1 – – 8Interest expense (3) – (3)Commission and other income 5 2 4 4
Amounts recognised for professional and consultancy services – – – –

404 P a r t H - R e l a t e d p a r t y t r a n s a c t i o n s
Boards of Statutory Auditors of other Group companies
Members of the Boardof Statutory
Auditors
Companies controlled by
members of the Board of
Statutory Auditors
Relatives of members of the Board
Companies controlled by
relatives of members of the Board
Loans Granted 25 248 166 145Drawdowns 8 140 10 44
Deposits 341 – 87 119Indirect deposits (at market value) – – 54 –Assets under management (at market value) – – – –Guarantees given – – – –Interest income 2 5 1 2Interest expense (7) – – (2)Commission and other income 1 2 3 1Amounts recognised for professional and consultancy services – – – –
General Management Members of General
Management
Companies controlled by
members of General
Management
Relatives of members of General
Management
Companies controlled by
relatives of members of General
Management
Loans Granted 1,599 – 8 –Drawdowns 1,102 – – –
Deposits 1,085 – 598 129Indirect deposits (at market value) 912 – 1,840 –Assets under management (at market value) 383 – 759 –Guarantees given – – – 9Interest income 15 – – –Interest expense (6) – (4) –Commission and income 3 – 7 –Amounts recognised for professional and consultancy services – – – –
Proportion of related party transactionsOn the basis of Consob Communication DEM/6064293 of 28.7.2006 and in addition to the requirements of the international accounting standard on "Related party disclosures" (IAS 24), we also provide information on related party transactions or balances as classified by IAS 24, and their impact on the balance sheet and income statement of the Group.
Impact of related party transactions or balances on:
31.12.2014 31.12.2013
Book value Related parties Book value Related parties
Absolute amount
% Absolute amount
%
Asset line items:20. Financial assets held for trading 1,921,518 9,318 0.5% 1,449,237 9,859 0.7%70. Loans to customers 32,078,843 701,955 2.2% 33,345,026 634,006 1.9%
Liabilities:20. Due to customers 27,702,942 221,037 0.8% 26,423,495 215,114 0.8%30. Securities issued 8,981,834 31,689 0.4% 10,114,241 31,964 0.3%40. Financial liabilities held for trading 1,463,445 3,293 0.2% 1,163,738 7,231 0.6%50. Financial liabilities designated at fair value through profit and loss 152,116 – n.s. 276,739 – n.s.
Income statement line items:10. Interest and similar income 1,289,302 18,072 1.4% 1,410,567 16,423 1.2%20. Interest and similar expense (489,131) (6,018) 1.2% (573,143) (13,389) 2.3%40. Fee and commission income 636,506 174,587 27.4% 632,386 144,402 22.8%50. Fee and commission expense (79,940) – n.s. (87,569) – n.s.180. Administrative expenses (*) (988,054) 333 n.s. (994,769) 544 n.s.220. Other operating expenses/income 138,048 (4,810) n.s. 128,906 1,016 0.8%
(*) The amount of 333 consists of income of 1,087 (recharge of expenses relating to Group personnel seconded to associated companies) and costs of 754 (professional and consultancy services provided by related parties).

405
Part IShare-based payments


407P a r t I – S h a r e - b a s e d p a y m e n t s
A. Qualitative information
1. Description of share-based payments
Allocations of net profitUnder art. 60 of the Parent Company's Articles of Association, an annual allocation is made to current employees – except those who hold senior management positions – or to collective funds where they are registered, of 5% of the Parent Company's pre-tax profit ("Income (loss) before tax from continuing operations"), calculated before determining this amount, unless the Meeting decides not to distribute a dividend out of earnings for the year. This amount is paid in the form of shares, which will be subject to a three-year retention period before the assignee can dispose of them; the reference value of shares granted is equal to the average stock price posted during the 30 days preceding the award.Based on IFRS 2, the amount to be paid to employees is considered an expense for the year and recognised in the income statement under "Personnel expenses", for an amount equal to the fair value of the labour received, with the contra-entry booked to shareholders' equity.
Variable component of remuneration linked to performance targets Banca Popolare di Milano, as Parent Company, prepares an annual update of the Remuneration Report in accordance with the current provisions on remuneration policies and practices of the Bank of Italy dated 30 March 2011, art. 123-ter of Legislative Decree 58/1998 (Consolidated Finance Act or CFA) and art. 84-quater of the Issuers' Regulations (Consob Resolution 11971/1999 and subsequent amendments).This document is available on the website www.gruppobpm.it.These remuneration policies define – in the interests of all stakeholders – the guidelines of the remuneration and incentive system for personnel of the Group. The aim, on the one hand, is to encourage the pursuit of strategies, objectives and results over the long term in line with the levels of liquidity and capitalisation and in accordance with sound and prudent risk management; and, on the other hand, to attract and retain within the Group people with the right professional skills and abilities for the needs of the business, to the benefit of competitiveness and good governance.For so-called "key personnel" (i.e. those identified at Group level whose professional duties have or may have a significant impact on the risk profile of the Group) is envisaged a variable component of remuneration linked to performance targets ("annual bonus").Recognition of the individual "annual bonus": depends on the implementation of an incentive system by the Group Company or Bank for which the person works, which provides for the
assignment of quantitative and qualitative objectives; is subject to full compliance with the predetermined access conditions (the so-called "access gates"); is paid in line with the guidelines issued from time to time by the Supervisory Authorities.
The "annual bonus" of "key personnel" is divided into: an up-front portion of 60% of the annual bonus, payable by the end of July of the year after the one that the bonus relates to; three annual instalments, amounting in total to 40% of the annual bonus, each of an equal amount, deferred over the three-year period
subsequent to the year in which the up-front portion is paid, with each instalment payable by the end of July of each year.Where the variable component of remuneration exceeds 50% of gross annual remuneration, the deferred portion is 60% of the annual bonus, paid in the same way as explained above.For "key personnel", both the 50% up-front portion and the 50% deferred portion of the annual bonus are paid in Banca Popolare di Milano shares.The total number of shares to be allocated to each beneficiary – for both the up-front portion and the deferred portion – is calculated on the basis of their "normal value" (corresponding to the average price of the shares over the thirty days prior to allocation of the up-front portion), as recorded in the year that the up-front allocation is made. The carrying price of the shares for the deferred portion of the annual bonus is calculated for each year on the average of the 30 calendar days prior to the date of assignment.For the financial instruments granted there is a retention period (i.e. a restriction on sale) of two years for the up-front portion and one year for the deferred portion. For the deferred instruments, the retention period starts from the end of the entire period of deferral. The Management Board approves the compensation plans based on financial instruments and decides about their purchase to support the annual bonus.Any dividends due (both the up-front portion and the deferred portions) will be distributed at the end of the entire period of deferral.The Parent Company has established after-the-event (so-called "malus") correction systems, which link the allocation of each of the deferred portions to full compliance with the "access gates" and the related thresholds set for the year preceding that of their allocation. The Parent Company has also identified certain situations of a qualitative nature (i.e. regulatory violations, fraudulent behaviour, etc.) that would block allocation of the annual bonus (both the up-front and deferred portions).The Parent Company also has the right to consider restitution (or "claw-back") of the annual bonus or any portions of it that have already been paid.As established in IFRS 2, the transaction explained in this paragraph is considered an expense for the year and recognised in the income statement under "Personnel expenses", for an amount equal to the Fair value of the labour received, with the contra-entry booked to shareholders' equity.
408 P a r t I – S h a r e - b a s e d p a y m e n t s
B. Quantitative information
2. Other information
As regards the allocation of profits to employees pursuant to art. 60 of the Articles of Association, having taken account of the proposed distribution of dividends to shareholders, the cost of Euro 16 million for the year ended 31 December 2014 (zero for 2013) has been accounted for under personnel expenses in sub-item "h) costs associated with share-based payments" to be allocated entirely in Banca Popolare di Milano ordinary shares.As regards the incentive scheme for key personnel, in relation to 2014 performance, the first parameter (the so-called "access gate") exceeded the threshold, requiring the recognition of the upfront portion of the bonus.
Accordingly, an amount of some Euro 799 thousand has been recognised under personnel expenses.
The after-the-event correction mechanism, which makes payment of the deferred elements of the incentives subject to the ability to maintain over time some of the parameters set at a higher level than the "gate" parameter in the year that the incentive originally accrues, means that the last of three instalments of deferred variable remuneration for the 2010 will not be paid.

409
Part LSegment reporting


411P a r t L – S e g m e n t r e p o r t i n g
Consolidated results by business segment
This section presents the consolidated results broken down by business segment on the basis of IFRS 8 "Operating Segments".
Primary reporting by business segment
The definition of the activities carried out by each Bipiemme Group company represents the basis for their allocation to the relevant business segment. Broad customer groupings have been identified with regard to the numerous types of customer served by the Group, particularly by its retail banks which use a model that splits customers into different groups. These groupings have similar characteristics in terms of: type of products provided; distribution channels; risk-return profiles.
The method used for segmenting customers is based on qualitative and quantitative criteria; in particular, as regards corporate customers, the reference parameter is represented by the following turnover thresholds: retail customers, up to Euro 15 million; middle corporate, over Euro 15 million and up to Euro 50 million; upper corporate, over Euro 50 million and up to Euro 250 million; large corporate, over Euro 250 million.
The customer segmentation model is also consistent with the principle used for allocating them to portfolios, adopted for setting commercial policies and representing the basis for management reporting.The following segments have therefore been identified and reported: "Retail Banking": this contains the results of individual customers and SMEs of the Group's "retail" banks together with those of Banca Akros.
In addition, this segment contains the results of the private banking business, the amounts related to WeBank customers (post-merger) and the results and financial position of ProFamily;
"Corporate Banking": this contains amounts relating to middle, upper and large corporate customers mainly related to the Parent Company; "Treasury & Investment banking": this contains the results of managing the bank's own securities portfolio, trading on its own account in
securities and foreign exchange and treasury activities. This segment not only reports the financial activities typifying the Group's commercial banks but also the results of Banca Akros, the Group's investment bank;
"Corporate Centre": this covers services relating to the Group operations, its role as the receptacle for the investments portfolio, the subordinated liabilities and all the other assets and liabilities not allocated to the other business segments and as the counterparty to all the figurative/standard effects. The following companies are classified in this segment: BPM Capital I, BPM Luxembourg, the three special purpose vehicles BPM Securitisation 2, BPM Securitisation 3 and BPM Covered Bond (set up respectively for the securitisation of mortgages and for the Covered Bond issue programme) and the results of Ge.Se.So. (canteen services company).
For the purpose of reconciling the segment results and the consolidated results, please note that: the methods used for measuring the quantitative information shown below are the same as those used for management reporting purposes,
which are also in line with the accounting policies applied in drawing up the consolidated financial statements; the format of the schedule provides for the disclosure of the amounts of eliminations between the above segments, as well as the consolidation
adjustments, in a column entitled "Corporate Centre", which also includes the results of the companies measured under the equity method; it was not necessary to prepare the reconciliation schedule as there were no other reconciling items between the sum of the pre-tax results of
the segments and the consolidated book result.

412 P a r t L – S e g m e n t r e p o r t i n g
Definition of content
With reference to the information reported in the formats below, it is to be noted as follows: "interest margin" is determined according to the model of internal transfer rates used to measure the performances of all the centres of
responsibility of the individual legal entities belonging to the Group; "indirect costs" contain an allocation of overheads based an internal cost-allocation model, which makes it possible to identify the business
and service units and the relationships between them, so as to recognise their exchanges of value and put a price on them. The revenues and costs to be allocated, calculated in this way, are included in internal revenues and costs;
the "segment income (loss) before tax from continuing operations" is obtained by deducting segment costs from segment revenues, including the effect of figurative income and expenses. The sum of all of the segment results is the same as the corresponding line item in the consolidated income statement;
assets are those reported internally at the end of the period; liabilities are shown net of capital, reserves and the result for the period.
A. Segment quantitative information
In order to make a comparison, the figures for 2013 have been restated, where necessary, to take account of the update of the customer "portfoliation", which in some cases led to a different allocation of customers between the various segments.Moreover, the review of the "internal transfer rates" system led to a different allocation of the interest margin to the various business units.
A.1 Segment results
The results by business segment are reported below:
"Retail banking" reported a pre-tax loss of Euro 15.5 million. In details: • operating income of Euro 969.1 million, with a rise of Euro 43.1 million on the previous year. This result is mainly attributable to a positive
performance by interest margin and service income. The interest margin has benefited from a contraction in the cost of funding due to lower borrowing rates and a different mix of technical forms, with term deposits having had a lower weighting than demand deposits.
The positive trend in service income is due to higher net fee and commission income from management, dealing and advisory services following the successful performance by asset management;
• operating expenses amount to Euro 801.9 million, down by Euro 15 million on the previous year mainly thanks to a decrease in other administrative expenses due to constant cost control that resulted in a significant fall in the year of IT expenses, expenses for buildings and furniture, purchases of assets and non professional services and consulting fees;
• net impairment adjustments to loans, financial assets and other items amount to Euro 182.8 million, up by Euro 9 million on the previous year;
"Corporate Banking": contributes with an operating profit of Euro 286.5 million that is slightly lower than that recorded in the previous year (– Euro 0.6 million). Operating income amounts to Euro 384.3 million, down on the previous year (– Euro 7.8 million) as a result of the contraction in the average volume of loans (–6.9%) combined with a downward trend in lending rates (–3bps). Operating expenses amount to Euro 97.8 million, an improvement on the previous year (– Euro 7.1 million) that is mainly attributable to the reasons given above for retail banking. Net impairment adjustments to loans are down on the previous year, amounting to Euro 240.9 million for 2014 versus 412.2 million for 2013. Income before taxes comes to Euro 45.6 million, a significant improvement on the previous year (+ Euro 170.7 million);
"Treasury & Investment banking": contributes a pre-tax profit of Euro 412.5 million, a decrease of Euro 7.3 million on the previous year that was due, among other things, to lower realised gains on securities classified as assets available for sale;
"Corporate Centre": this reports a loss of Euro 117.7 million, versus Euro 133.3 million loss for the previous year.
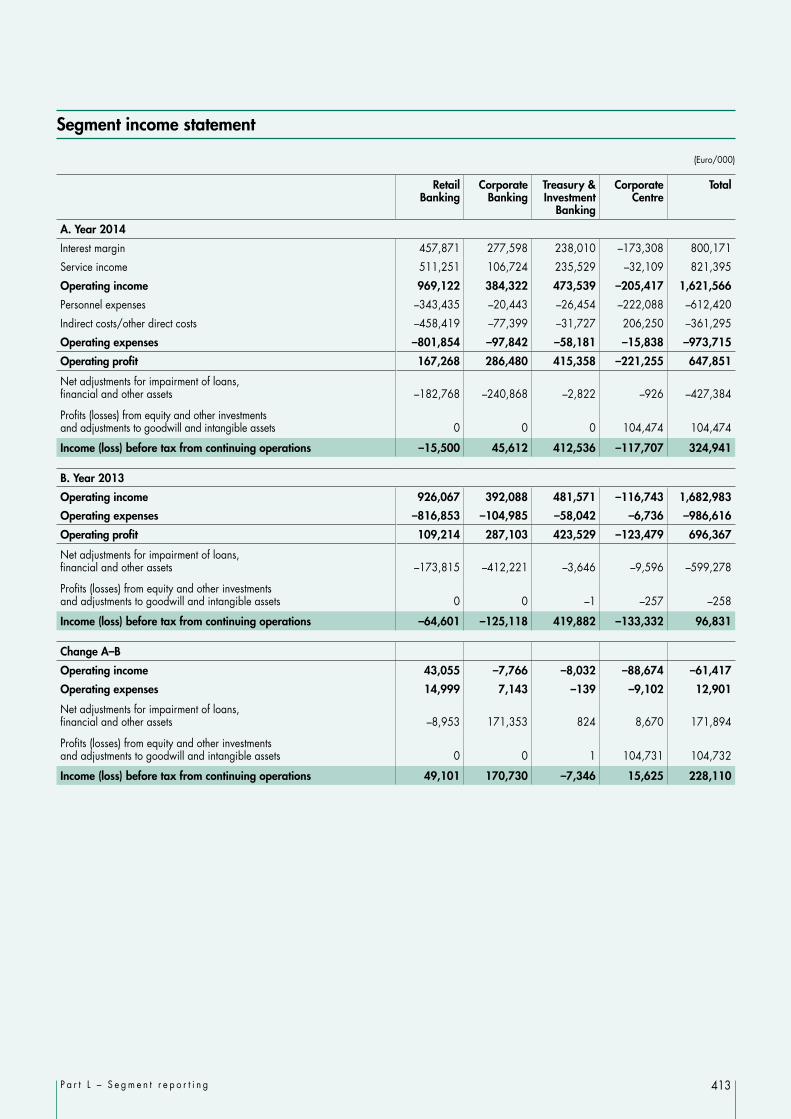
413P a r t L – S e g m e n t r e p o r t i n g
Segment income statement
(Euro/000)
Retail Banking
Corporate Banking
Treasury & Investment
Banking
Corporate Centre
Total
A. Year 2014
Interest margin 457,871 277,598 238,010 –173,308 800,171
Service income 511,251 106,724 235,529 –32,109 821,395
Operating income 969,122 384,322 473,539 –205,417 1,621,566
Personnel expenses –343,435 –20,443 –26,454 –222,088 –612,420
Indirect costs/other direct costs –458,419 –77,399 –31,727 206,250 –361,295
Operating expenses –801,854 –97,842 –58,181 –15,838 –973,715
Operating profit 167,268 286,480 415,358 –221,255 647,851
Net adjustments for impairment of loans, financial and other assets –182,768 –240,868 –2,822 –926 –427,384
Profits (losses) from equity and other investments and adjustments to goodwill and intangible assets 0 0 0 104,474 104,474
Income (loss) before tax from continuing operations –15,500 45,612 412,536 –117,707 324,941
B. Year 2013
Operating income 926,067 392,088 481,571 –116,743 1,682,983
Operating expenses –816,853 –104,985 –58,042 –6,736 –986,616
Operating profit 109,214 287,103 423,529 –123,479 696,367
Net adjustments for impairment of loans, financial and other assets –173,815 –412,221 –3,646 –9,596 –599,278
Profits (losses) from equity and other investments and adjustments to goodwill and intangible assets 0 0 –1 –257 –258
Income (loss) before tax from continuing operations –64,601 –125,118 419,882 –133,332 96,831
Change A–B
Operating income 43,055 –7,766 –8,032 –88,674 –61,417
Operating expenses 14,999 7,143 –139 –9,102 12,901
Net adjustments for impairment of loans, financial and other assets –8,953 171,353 824 8,670 171,894
Profits (losses) from equity and other investments and adjustments to goodwill and intangible assets 0 0 1 104,731 104,732
Income (loss) before tax from continuing operations 49,101 170,730 –7,346 15,625 228,110

414 P a r t L – S e g m e n t r e p o r t i n g
Segment balance sheet (Euro/000)
Retail Banking
Corporate Banking
Treasury & Investment
Banking
Corporate Center
Total companies
A. 31 December 2014
Total assets 17,794,832 12,646,954 13,060,344 4,769,681 48,271,811
of which investments carried at equity – – – 293,797 293,797
Total liabilities (*) –25,340,800 –2,295,659 –10,553,622 –5,525,623 –43,715,704
B. 31 December 2013
Total assets 18,171,517 13,611,858 13,842,285 3,727,658 49,353,318
of which investments carried at equity – – – 395,587 395,587
Total liabilities (*) –25,944,840 –1,808,855 –11,877,717 –6,077,140 –45,708,552
Change A – B
Total assets –376,685 –964,904 –781,941 1,042,023 –10,781,507
of which investments carried at equity – – – –101,790 –101,790
Total liabilities (*) 604,040 –486,804 1,324,095 551,517 1,992,848
(*) not including shareholders' equity

415
Certification of the consolidated financial statements pursuant to art. 81-ter of Consob Regulation no. 11971 dated 14 May 1999 and subsequent additions and amendments1. Giuseppe Castagna, as Managing Director, and Angelo Zanzi, as the Financial Reporting Manager of Banca Popolare di Milano S.c.a.r.l., certify, taking into account art. 154-bis, para. 3 and 4, of Decree 58 of 24 February 1998:
K the adequacy in relation to the characteristics of the company andK effective application
of the administrative and accounting procedures for the preparation of the consolidated financial statements during the course of 2014.
2. The assessment of adequacy of the administrative and accounting procedures as a basis for the formation of the consolidated financial statements at 31 December 2014 is based on a model developed by Banca Popolare di Milano in line with that of the Internal Control – Integrated Framework issued by the Committee of Sponsoring Organizations of the Treadway Commission (CoSO), which represents a framework of reference that is generally accepted at international level.
IT procedures have been evaluated using the "Control Objective for Information and Related Technologies" (COBIT), developed by Information System Audit and Control Association (ISACA).
3. In addition, we certify that:
3.1 the consolidated financial statements: a) have been prepared in accordance with the international accounting
standards (IAS/IFRS) applicable and recognised by the European Community as per (EC) Regulation 1606/2002 of the European Parliament and Council dated 19 July 2002;
b) agree with the balances on the books of account and accounting entries;
c) give a true and fair view of the assets and liabilities, results and financial situation of the issuer and of the companies included in the consolidation.
3.2 The report on operations includes a reliable analysis of the business trends and results, as well as of the general situation of the issuer and of the other companies included in the consolidation, together with a description of the main risks and uncertainties to which they are exposed.
Milan, 24 February 2015
Managing Director Financial Reporting Manager
Giuseppe Castagna Angelo Zanzi


Attachments to the consolidated financial statements
417

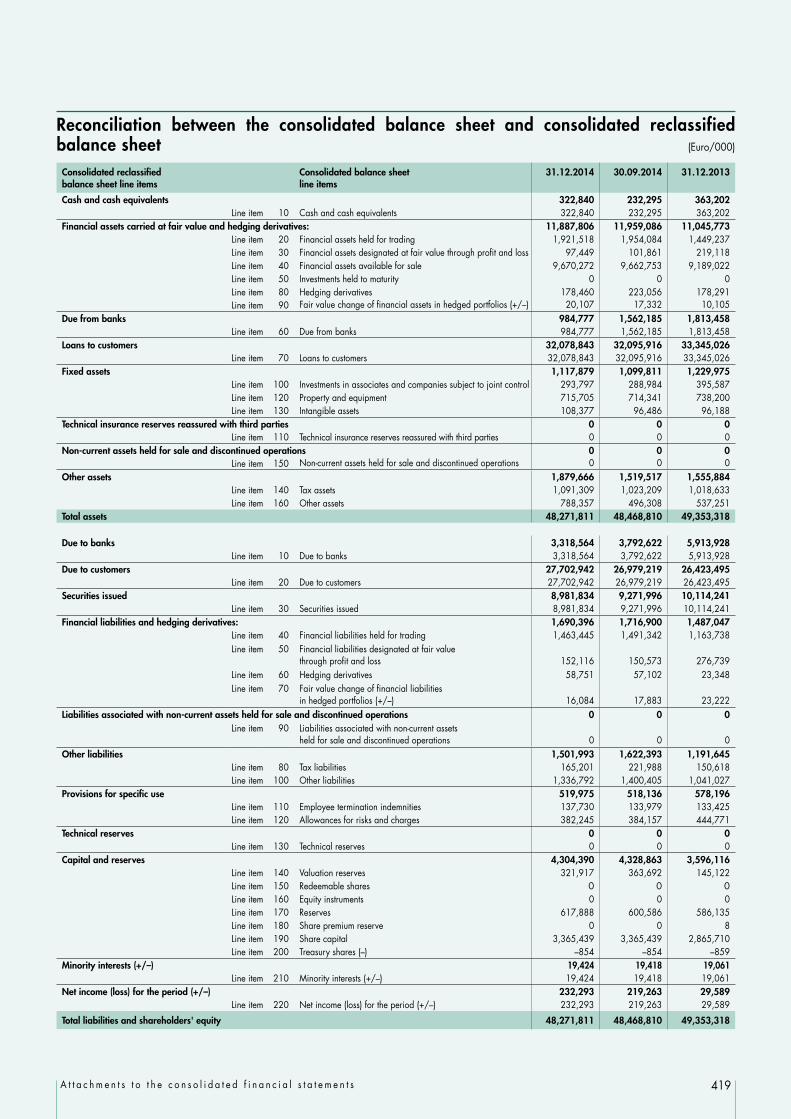
419A t t a c h m e n t s t o t h e c o n s o l i d a t e d f i n a n c i a l s t a t e m e n t s
Reconciliation between the consolidated balance sheet and consolidated reclassified balance sheet (Euro/000)
Consolidated reclassified balance sheet line items
Consolidated balance sheetline items
31.12.2014 30.09.2014 31.12.2013
Cash and cash equivalents 322,840 232,295 363,202Line item 10 Cash and cash equivalents 322,840 232,295 363,202
Financial assets carried at fair value and hedging derivatives: 11,887,806 11,959,086 11,045,773Line item 20 Financial assets held for trading 1,921,518 1,954,084 1,449,237Line item 30 Financial assets designated at fair value through profit and loss 97,449 101,861 219,118Line item 40 Financial assets available for sale 9,670,272 9,662,753 9,189,022Line item 50 Investments held to maturity 0 0 0Line item 80 Hedging derivatives 178,460 223,056 178,291Line item 90 Fair value change of financial assets in hedged portfolios (+/–) 20,107 17,332 10,105
Due from banks 984,777 1,562,185 1,813,458Line item 60 Due from banks 984,777 1,562,185 1,813,458
Loans to customers 32,078,843 32,095,916 33,345,026Line item 70 Loans to customers 32,078,843 32,095,916 33,345,026
Fixed assets 1,117,879 1,099,811 1,229,975Line item 100 Investments in associates and companies subject to joint control 293,797 288,984 395,587Line item 120 Property and equipment 715,705 714,341 738,200Line item 130 Intangible assets 108,377 96,486 96,188
Technical insurance reserves reassured with third parties 0 0 0Line item 110 Technical insurance reserves reassured with third parties 0 0 0
Non-current assets held for sale and discontinued operations 0 0 0Line item 150 Non-current assets held for sale and discontinued operations 0 0 0
Other assets 1,879,666 1,519,517 1,555,884Line item 140 Tax assets 1,091,309 1,023,209 1,018,633Line item 160 Other assets 788,357 496,308 537,251
Total assets 48,271,811 48,468,810 49,353,318
Due to banks 3,318,564 3,792,622 5,913,928Line item 10 Due to banks 3,318,564 3,792,622 5,913,928
Due to customers 27,702,942 26,979,219 26,423,495Line item 20 Due to customers 27,702,942 26,979,219 26,423,495
Securities issued 8,981,834 9,271,996 10,114,241Line item 30 Securities issued 8,981,834 9,271,996 10,114,241
Financial liabilities and hedging derivatives: 1,690,396 1,716,900 1,487,047Line item 40 Financial liabilities held for trading 1,463,445 1,491,342 1,163,738Line item 50 Financial liabilities designated at fair value
through profit and loss 152,116 150,573 276,739Line item 60 Hedging derivatives 58,751 57,102 23,348Line item 70 Fair value change of financial liabilities
in hedged portfolios (+/–) 16,084 17,883 23,222Liabilities associated with non-current assets held for sale and discontinued operations 0 0 0
Line item 90 Liabilities associated with non-current assets held for sale and discontinued operations 0 0 0
Other liabilities 1,501,993 1,622,393 1,191,645Line item 80 Tax liabilities 165,201 221,988 150,618Line item 100 Other liabilities 1,336,792 1,400,405 1,041,027
Provisions for specific use 519,975 518,136 578,196Line item 110 Employee termination indemnities 137,730 133,979 133,425Line item 120 Allowances for risks and charges 382,245 384,157 444,771
Technical reserves 0 0 0Line item 130 Technical reserves 0 0 0
Capital and reserves 4,304,390 4,328,863 3,596,116Line item 140 Valuation reserves 321,917 363,692 145,122Line item 150 Redeemable shares 0 0 0Line item 160 Equity instruments 0 0 0Line item 170 Reserves 617,888 600,586 586,135Line item 180 Share premium reserve 0 0 8Line item 190 Share capital 3,365,439 3,365,439 2,865,710Line item 200 Treasury shares (–) –854 –854 –859
Minority interests (+/–) 19,424 19,418 19,061Line item 210 Minority interests (+/–) 19,424 19,418 19,061
Net income (loss) for the period (+/–) 232,293 219,263 29,589Line item 220 Net income (loss) for the period (+/–) 232,293 219,263 29,589
Total liabilities and shareholders' equity 48,271,811 48,468,810 49,353,318

420 A t t a c h m e n t s t o t h e c o n s o l i d a t e d f i n a n c i a l s t a t e m e n t s
Reconciliation between the consolidated income statement and the consolidated reclassified income statement (Euro/000)
Consolidated reclassified income statement line items
Consolidated income statement line items Year 2014 Year 2013
Interest margin 800,171 837,424
Line item 10 Interest and similar income 1,289,302 1,410,567
Interest and similar income 1,289,302 1,410,567
Line item 20 Interest and similar expense (489,131) (573,143)
Interest and similar expense (489,131) (573,143)
Non-interest margin 821,395 845,559
Net fee and commission income 556,566 544,817
Line item 40 Fee and commission income 636,506 632,386
Fee and commission income 636,506 632,386
Line item 50 Fee and commission expense (79,940) (87,569)
Fee and commission expense (79,940) (87,569)
Other income 264,829 300,742
Profits (losses) on investments carried at equity 22,857 47,353
(+) Line item 240 (partial) – Profits (losses) on investments in associates and companies subject to joint control (carried at equity) 22,857 47,353
Net income from banking activities 188,572 200,773
Line item 70 Dividend and similar income 17,699 13,974
Dividend and similar income 17,699 13,974
Line item 80 Profits (losses) on trading 52,870 52,068
Profits (losses) on trading 52,870 52,068
Line item 90 Fair value adjustments in hedge accounting 411 (1,711)
Fair value adjustments in hedge accounting 411 (1,711)
Line item 100 Profits (losses) on disposal or repurchase of: 149,740 180,688 a) loans (927) (9,595) b) financial assets available for sale 150,764 189,524 c) investments held to maturity 0 0 d) financial liabilities (97) 759
(–) Line item 100 a) Profits (losses) on disposal or repurchase of loans 927 9,595
Profits/losses on disposal or repurchase of financial assets/liabilities 150,667 190,283
Line item 110 Profits (losses) on financial assets and liabilities designated at fair value 7,667 29,326
Profits (losses) on financial assets/liabilities designated at fair value 7,667 29,326
(+) Line item 130 b) Net losses/recoveries on impairment: financial assets available for sale (40,742) (83,167)
Net losses/recoveries on impairment: financial assets available for sale (40,742) (83,167)
Other operating charges/income 53,400 52,616
Line item 220 Other operating expenses/income 138,048 128,906(–) Line item 220 (partial) – Recoverable portion of indirect taxes (89,223) (80,799)(+) Line item 220 (partial) – Depreciation of leasehold improvements 4,575 4,509
Operating income 1,621,566 1,682,983
Administrative expenses: (898,831) (913,970)
a) personnel expenses (612,420) (608,720) Line item 180 a) Personnel expenses (612,420) (608,720) b) other administrative expenses (286,411) (305,250)
Line item 180 b) Other administrative expenses (375,634) (386,049)(+) Line item 220 (partial) – Other operating expenses/income
(recoverable portion of indirect taxes) 89,223 80,799Net adjustments to property and equipment and intangible assets (74,884) (72,646)
Line item 200 Net adjustments to/recoveries on property and equipment (44,450) (43,791)Line item 210 Net adjustments to/recoveries on intangible assets (25,859) (24,346)
(+) Line item 220 (partial) – Other operating expenses/income (depreciation of leasehold improvements) (4,575) (4,509)
Operating expenses (973,715) (986,616)
Operating profit 647,851 696,367
(cont.)

421A t t a c h m e n t s t o t h e c o n s o l i d a t e d f i n a n c i a l s t a t e m e n t s
Reconciliation between the consolidated income statement and the consolidated reclassified income statement (Euro/000)
Net adjustments for impairment of loans and other activities (423,839) (589,659)
Line item 130 Net losses/recoveries on impairment of: (463,654) (663,231) a) loans (409,404) (569,302) b) financial assets available for sale (40,742) (83,167) c) investments held to maturity 0 0 d) other financial activities (13,508) (10,762)
(+) Line item 100 a) Profits (losses) on disposal or repurchase of loans (927) (9,595)(–) Line item 130 b) Net losses/recoveries on impairment: financial assets available for sale 40,742 83,167
Net provisions for risks and charges (3,545) (9,619)
Line item 190 Net provisions for risks and charges (3,545) (9,619)
Profits (losses) from equity and other investments and adjustments to goodwill and intangible assets 104,474 (258)Line item 240 Profits (losses) on investments in associates
and companies subject to joint control 127,331 47,353Line item 250 Net result of valuation differences on property, equipment
and intangible assets measured at fair value 0 0Line item 260 Goodwill impairment 0 0Line item 270 Profits (losses) on disposal of investments 0 (258)
(–) Line item 240 (partial) – Profits (losses) on investments in associates and companies subject to joint control (carried at equity) (22,857) (47,353)
Income (loss) before tax from continuing operations 324,941 96,831
Taxes on income from continuing operations (92,008) (67,442)
Line item 290 Taxes on income from continuing operations (92,008) (67,442)
Income (loss) after tax from continuing operations 232,933 29,389
Net income (loss) for the period 232,933 29,389
Net income (loss) for the period pertaining to minority interests (640) 200
Line item 330 Net income (loss) for the period pertaining to minority interests (640) 200
Parent company' s net income (loss) for the period 232,293 29,589

422 A t t a c h m e n t s t o t h e c o n s o l i d a t e d f i n a n c i a l s t a t e m e n t s
Consolidated reclassified income statement net of non-recurring items – quarter by quarter
Year
201
4
4th
Qua
rter
3rd
Qua
rter
2nd
Qua
rter
1st Q
uart
er
Line
item
sN
et
resu
ltN
et in
com
e (lo
ss) f
rom
no
n-re
curr
ing
tran
sact
ions
Net
inco
me
(loss
) fro
m
recu
rrin
g tr
ansa
ctio
ns
Net
re
sult
Net
inco
me
(loss
) fro
m
non-
recu
rrin
g tr
ansa
ctio
ns
Net
inco
me
(loss
) fro
m
recu
rrin
g tr
ansa
ctio
ns
Net
re
sult
Net
inco
me
(loss
) fro
m
non-
recu
rrin
g tr
ansa
ctio
ns
Net
inco
me
(loss
) fro
m
recu
rrin
g tr
ansa
ctio
ns
Net
re
sult
Net
inco
me
(loss
) fro
m
non-
recu
rrin
g tr
ansa
ctio
ns
Net
inco
me
(loss
) fro
m
recu
rrin
g tr
ansa
ctio
ns
Inte
rest
mar
gin
197,
922
197,
922
195,
003
195,
003
201,
157
201,
157
206,
089
206,
089
Non
-inte
rest
mar
gin:
213,
382
213,
382
150,
952
150,
952
221,
011
221,
011
236,
050
236,
050
– N
et fe
e an
d co
mm
issio
n in
com
e14
9,34
914
9,34
913
0,85
613
0,85
613
5,99
013
5,99
014
0,37
114
0,37
1
– O
ther
inco
me:
64,0
3364
,033
20,0
9620
,096
85,0
2185
,021
95,6
7995
,679
– Pr
ofits
(loss
es) o
n in
vestm
ents
ca
rried
at e
quity
6,30
06,
300
4,61
24,
612
6,91
06,
910
5,03
55,
035
– N
et in
com
e fro
m b
anki
ng a
ctivi
ties
38,0
8238
,082
5,79
95,
799
65,2
5365
,253
79,4
3879
,438
– O
ther
ope
ratin
g ch
arge
s/in
com
e19
,651
19,6
51
9,6
85
9,68
5
1
2,85
8 12
,858
11,
206
11,2
06
Ope
ratin
g in
com
e41
1,30
441
1,30
434
5,95
534
5,95
542
2,16
842
2,16
844
2,13
944
2,13
9
Adm
inist
rativ
e ex
pens
es:
(236
,376
)(3
,740
)(2
32,6
36)
(207
,166
)(9
86)
(206
,180
)(2
36,5
73)
(7,1
79)
(229
,394
)(2
18,7
16)
(1,3
12)
(217
,404
)
a) p
erso
nnel
exp
ense
s (1
47,2
32)
(3,7
40)
(143
,492
)(1
44,7
08)
(986
)(1
43,7
22)
(168
,601
)(7
,179
)(1
61,4
22)
(151
,879
)(1
,312
)(1
50,5
67)
b) o
ther
adm
inist
rativ
e ex
pens
es(8
9,14
4)
(89,
144)
(62,
458)
(6
2,45
8)(6
7,97
2)
(67,
972)
(66,
837)
(6
6,83
7)
Net
adj
ustm
ents
to p
rope
rty a
nd
equi
pmen
t and
inta
ngib
le a
sset
s(1
8,61
2)
(18,
612)
(18,
728)
(1
8,72
8)(1
9,47
8)
(19,
478)
(18,
066)
(1
8,06
6)
Ope
ratin
g ex
pens
es(2
54,9
88)
(3,7
40)
(251
,248
)(2
25,8
94)
(986
)(2
24,9
08)
(256
,051
)(7
,179
)(2
48,8
72)
(236
,782
)(1
,312
)(2
35,4
70)
Ope
ratin
g pr
ofit
156,
316
(3,7
40)
160,
056
120,
061
(986
)12
1,04
716
6,11
7(7
,179
)17
3,29
620
5,35
7(1
,312
)20
6,66
9
Net
adj
ustm
ents
for i
mpa
irmen
t of l
oans
an
d ot
her a
ctivit
ies
(136
,633
)(1
36,6
33)
(88,
216)
(88,
216)
(113
,653
)(1
13,6
53)
(85,
337)
(85,
337)
Net
pro
visio
ns fo
r risk
s and
cha
rges
(8,0
04)
(8,0
04)
(286
)(2
86)
7,56
67,
566
(2,8
21)
(2,8
21)
Profi
ts (lo
sses
) fro
m e
quity
and
oth
er
inve
stmen
ts an
d ad
justm
ents
to g
oodw
ill an
d in
tang
ible
ass
ets
104,
474
104,
474
Inco
me
(loss
) bef
ore
tax
from
co
ntin
uing
ope
ratio
ns
11,6
79(3
,740
)15
,419
31,5
59(9
86)
32,5
4516
4,50
497
,295
67,2
0911
7,19
9(1
,312
)11
8,51
1
Taxe
s on
inco
me
from
con
tinui
ng o
pera
tions
1,45
01,
029
421
(3,5
32)
271
(3,8
03)
(36,
960)
(2,3
43)
(34,
617)
(52,
966)
361
(53,
327)
Inco
me
(loss
) afte
r ta
x fr
om c
ontin
uing
ope
ratio
ns13
,129
(2,7
11)
15,8
4028
,027
(715
)28
,742
127,
544
94,9
5232
,592
64,2
33(9
51)
65,1
84
Inco
me
(loss
) afte
r tax
fro
m d
iscon
tinue
d op
erat
ions
Net
inco
me
(loss
) for
the
perio
d13
,129
(2,7
11)
15,8
4028
,027
(715
)28
,742
127,
544
94,9
5232
,592
64,2
33(9
51)
65,1
84
Net
inco
me
(loss
) for
the
perio
d pe
rtain
ing
to m
inor
ity in
tere
sts
(99)
(1)
(98)
(232
)(2
32)
(397
)4
(40
1)88
88
Pare
nt c
ompa
ny' s
net
inco
me
(loss
) fo
r th
e pe
riod
13,0
30(2
,712
)15
,742
27,7
95(7
15)
28,5
1012
7,14
794
,956
32,1
9164
,321
(951
)65
,272

423A t t a c h m e n t s t o t h e c o n s o l i d a t e d f i n a n c i a l s t a t e m e n t s
Year
201
3
4th
Qua
rter
3rd
Qua
rter
2nd
Qua
rter
1st Q
uart
er
Line
item
sN
et
resu
ltN
et in
com
e (lo
ss) f
rom
no
n-re
curr
ing
tran
sact
ions
Net
inco
me
(loss
) fro
m
recu
rrin
g tr
ansa
ctio
ns
Net
re
sult
Net
inco
me
(loss
) fro
m
non-
recu
rrin
g tr
ansa
ctio
ns
Net
inco
me
(loss
) fro
m
recu
rrin
g tr
ansa
ctio
ns
Net
re
sult
Net
inco
me
(loss
) fro
m
non-
recu
rrin
g tr
ansa
ctio
ns
Net
inco
me
(loss
) fro
m
recu
rrin
g tr
ansa
ctio
ns
Net
re
sult
Net
inco
me
(loss
) fro
m
non-
recu
rrin
g tr
ansa
ctio
ns
Net
inco
me
(loss
) fro
m
recu
rrin
g tr
ansa
ctio
ns
Inte
rest
mar
gin
206,
386
206,
386
215,
515
215,
515
224,
869
224,
869
190,
654
190,
654
Non
–int
eres
t mar
gin:
196,
633
(36,
186)
232,
819
178,
562
178,
562
232,
943
232,
943
237,
421
237,
421
– N
et fe
e an
d co
mm
issio
n in
com
e14
2,23
414
2,23
412
4,33
512
4,33
514
6,40
514
6,40
513
1,84
313
1,84
3
– O
ther
inco
me:
54,3
99(3
6,18
6)90
,585
54,2
2754
,227
86,5
3886
,538
105,
578
105,
578
– Pr
ofits
(loss
es) o
n in
vestm
ents
car
ried
at e
quity
28,1
4028
,140
7,42
37,
423
3,88
63,
886
7,90
47,
904
– N
et in
com
e fro
m b
anki
ng a
ctivi
ties
18,2
72(3
6,18
6)54
,458
33,9
2833
,928
69,2
0569
,205
79,3
6879
,368
– O
ther
ope
ratin
g ch
arge
s/in
com
e7,
987
7,98
712
,876
12
,876
13,4
47
13,4
4718
,306
18
,306
Ope
ratin
g in
com
e40
3,01
9(3
6,18
6)43
9,20
539
4,07
739
4,07
745
7,81
245
7,81
242
8,07
542
8,07
5
Adm
inist
rativ
e ex
pens
es:
(229
,220
)(1
2,86
0)(2
16,3
60)
(220
,279
)(1
,300
)(2
18,9
79)
(235
,755
)(1
,162
)(2
34,5
93)
(228
,716
)(1
,023
)(2
27,6
93)
a) p
erso
nnel
exp
ense
s (1
37,3
40)
(12,
860)
(124
,480
)(1
51,4
10)
(1,3
00)
(150
,110
)(1
58,0
06)
(1,1
62)
(156
,844
)(1
61,9
64)
(1,0
23)
(160
,941
)
b) o
ther
adm
inist
rativ
e ex
pens
es(9
1,88
0)(9
1,88
0)(6
8,86
9)(6
8,86
9)(7
7,74
9)(7
7,74
9)(6
6,75
2)(6
6,75
2)
Net
adj
ustm
ents
to p
rope
rty a
nd
equi
pmen
t and
inta
ngib
le a
sset
s(1
9,32
4)(1
9,32
4)(1
7,94
3)(1
7,94
3)(1
7,97
7)(1
7,97
7)(1
7,40
2)(1
7,40
2)
Ope
ratin
g ex
pens
es(2
48,5
44)
(12,
860)
(235
,684
)(2
38,2
22)
(1,3
00)
(236
,922
)(2
53,7
32)
(1,1
62)
(252
,570
)(2
46,1
18)
(1,0
23)
(245
,095
)
Ope
ratin
g pr
ofit
154,
475
(49,
046)
203,
521
155,
855
(1,3
00)
157,
155
204,
080
(1,1
62)
205,
242
181,
957
(1,0
23)
182,
980
Net
adj
ustm
ents
for i
mpa
irmen
t of
loan
s and
oth
er a
ctivit
ies
(328
,950
)(3
28,9
50)
(96,
893)
(96,
893)
(99,
692)
(99,
692)
(64,
124)
(64,
124)
Net
pro
visio
ns fo
r risk
s and
cha
rges
5,08
13,
051
2,03
0(6
,345
)(6
,345
)(5
,962
)(5
,962
)(2
,393
)(2
,393
)
Profi
ts (lo
sses
) fro
m e
quity
and
oth
er
inve
stmen
ts an
d ad
justm
ents
to g
oodw
ill an
d in
tang
ible
ass
ets
4343
(301
)(3
01)
11
(1)
(1)
Inco
me
(loss
) bef
ore
tax
from
co
ntin
uing
ope
ratio
ns
(169
,351
)(4
5,99
5)(1
23,3
56)
52,3
16(1
,300
)53
,616
98,4
27(1
,162
)99
,589
115,
439
(1,0
23)
116,
462
Taxe
s on
inco
me
from
con
tinui
ng o
pera
tions
64,0
581,
543
62,5
15(2
3,50
0)(4
8)(2
3,45
2)(5
0,00
0)(1
,170
)(4
8,83
0)(5
8,00
0)28
1(5
8,28
1)
Inco
me
(loss
) afte
r ta
x fr
om
cont
inui
ng o
pera
tions
(105
,293
)(4
4,45
2)(6
0,84
1)28
,816
(1,3
48)
30,1
6448
,427
(2,3
32)
50,7
5957
,439
(742
)58
,181
Inco
me
(loss
) afte
r tax
fro
m d
iscon
tinue
d op
erat
ions
Net
inco
me
(loss
) for
the
perio
d(1
05,2
93)
(44,
452)
(60,
841)
28,8
16(1
,348
)30
,164
48,4
27(2
,332
)50
,759
57,4
39(7
42)
58,1
81
Net
inco
me
(loss
) for
the
perio
d pe
rtain
ing
to m
inor
ity in
tere
sts
498
(3)
501
(39)
(39)
(75)
(2)
(73)
(184
)2
(186
)
Pare
nt c
ompa
ny' s
net
inco
me
(loss
) fo
r th
e pe
riod
(104
,795
)(4
4,45
5)(6
0,34
0)28
,777
(1,3
48)
30,1
2548
,352
(2,3
34)
50,6
8657
,255
(740
)57
,995
Consolidated reclassified income statement net of non-recurring items – quarter by quarter

424 A t t a c h m e n t s t o t h e c o n s o l i d a t e d f i n a n c i a l s t a t e m e n t s
Disclosure of amounts paid for the audit and other services in accordance with the Issuers' Regulations and Consob art. 149-duodecies
The following table shows the information required by art. 149-duodecies of Consob's Issuers' Regulations on audit and other fees paid to Reconta Ernst & Young S.p.A. and companies belonging to the same network for the following services:
1. Audit services which include: audit of the annual accounts with a view to expressing an opinion on them; audit of the interim accounts.
2. Certification services, which include engagements with which the auditor evaluates a specific element: the valuation is carried out by another person who is responsible for it, whereas the auditor applies suitable criteria in order to come to a conclusion that provides the recipient with a degree of reliability with regard to the specific element in question.
3. Other services, which include engagements of a residual nature, for which an adequate level of detail has to be provided. For example, without being an exhaustive list, this category could include services such as: due diligence reviews of accounting, tax and administrative matters, agreed upon procedures on lending operations and on the internal control system, provision of assistance (risk assessment, gap analysis, project management and risk management) and methodological support.
The fees shown in the table for 2014 are those established by contract, including forfeit expenses, index-linking and the supervisory contribution, if due. In accordance with the instructions, they do not include any fees paid to secondary auditors or to members of their respective networks.
Type of service Service provided by Remuneration (Euro/000)
Audit Reconta Ernst & Young S.p.A. 1,279
Certification services (*) Reconta Ernst & Young S.p.A. 860
Other services (**) Reconta Ernst & Young S.p.A. and Ernst & Young Financial Business Advisors 371
Total 2,510
(*) The certification services consisted of the comfort letter and the work performed with respect to the capital increase, the EMTN programme and the Covered Bond Issuance Programme and the limited review of the 31 March 2014 figures.(**) The amount includes fees for methodological support for the adjustments required by regulatory updates.
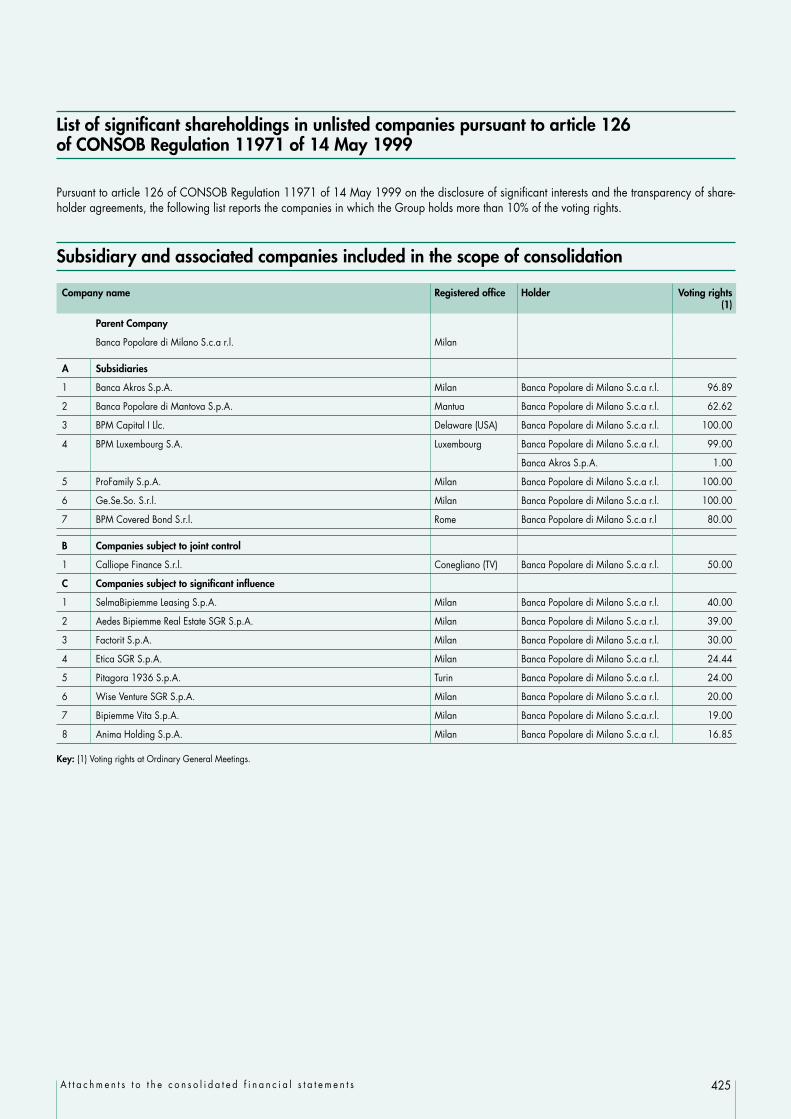
425A t t a c h m e n t s t o t h e c o n s o l i d a t e d f i n a n c i a l s t a t e m e n t s
List of significant shareholdings in unlisted companies pursuant to article 126 of CONSOB Regulation 11971 of 14 May 1999
Pursuant to article 126 of CONSOB Regulation 11971 of 14 May 1999 on the disclosure of significant interests and the transparency of share-holder agreements, the following list reports the companies in which the Group holds more than 10% of the voting rights.
Subsidiary and associated companies included in the scope of consolidation
Company name Registered office Holder Voting rights(1)
Parent Company
Banca Popolare di Milano S.c.a r.l. Milan
A Subsidiaries
1 Banca Akros S.p.A. Milan Banca Popolare di Milano S.c.a r.l. 96.89
2 Banca Popolare di Mantova S.p.A. Mantua Banca Popolare di Milano S.c.a r.l. 62.62
3 BPM Capital I Llc. Delaware (USA) Banca Popolare di Milano S.c.a r.l. 100.00
4 BPM Luxembourg S.A. Luxembourg Banca Popolare di Milano S.c.a r.l. 99.00
Banca Akros S.p.A. 1.00
5 ProFamily S.p.A. Milan Banca Popolare di Milano S.c.a r.l. 100.00
6 Ge.Se.So. S.r.l. Milan Banca Popolare di Milano S.c.a r.l. 100.00
7 BPM Covered Bond S.r.l. Rome Banca Popolare di Milano S.c.a r.l 80.00
B Companies subject to joint control
1 Calliope Finance S.r.l. Conegliano (TV) Banca Popolare di Milano S.c.a r.l. 50.00
C Companies subject to significant influence
1 SelmaBipiemme Leasing S.p.A. Milan Banca Popolare di Milano S.c.a r.l. 40.00
2 Aedes Bipiemme Real Estate SGR S.p.A. Milan Banca Popolare di Milano S.c.a r.l. 39.00
3 Factorit S.p.A. Milan Banca Popolare di Milano S.c.a r.l. 30.00
4 Etica SGR S.p.A. Milan Banca Popolare di Milano S.c.a r.l. 24.44
5 Pitagora 1936 S.p.A. Turin Banca Popolare di Milano S.c.a r.l. 24.00
6 Wise Venture SGR S.p.A. Milan Banca Popolare di Milano S.c.a r.l. 20.00
7 Bipiemme Vita S.p.A. Milan Banca Popolare di Milano S.c.a.r.l. 19.00
8 Anima Holding S.p.A. Milan Banca Popolare di Milano S.c.a r.l. 16.85
Key: (1) Voting rights at Ordinary General Meetings.

426 A t t a c h m e n t s t o t h e c o n s o l i d a t e d f i n a n c i a l s t a t e m e n t s
Name Registered office % voting rights
Holder
Stellina 10 S.r.l. Milan 19.00 Banca Popolare di Milano S.c.a r.l.
Cassa di Risparmio di Asti S.p.A. Asti 18.20 Banca Popolare di Milano S.c.a r.l.
8 marzo 91 S.r.l. Rome 16.67 Banca Popolare di Milano S.c.a r.l.
Otto Valli S.c.a r.l. Ponzone (AL) 15.00 Banca Popolare di Milano S.c.a r.l.
G.R.O.U.P. S.r.l. Milan 12.50 Banca Akros S.p.A.
GSN North America Inc. (formerly ESN North America Inc.) Delaware (USA) 11.88 Banca Akros S.p.A.
Visconti S.r.l. Milan 10.34 Banca Popolare di Milano S.c.a r.l.
Minority investments in which the Group holds voting rights of 10% of share capital or more
Name Registered office % voting rights
Reason for holding voting rights
Oltrecaffè S.r.l. Milan 100.00 Collateral
Newcam 96 S.r.l. Genoa 100.00 Collateral
Abitare Cernusco S.r.l. Milan 11.35 Collateral
Investments of more than 10% in the following companies, currently in liquidation and valued at zero, are included in "Financial assets available for sale – Equities":
Companies in liquidation Registered office % voting rights
Ricostruzioni Ansa S.r.l. – in liquidation Milan 100.00
Immobiliare Zenith Terza S.r.l. – in liquidation Milan 100.00
Gal Borba Due Leader S.r.l. in liquidation Ponzone (AL) 15.00
Emprimer S.p.A. – in liquidation Milan 12.26
Other equity investments in which the interest exceeds 10%

427A t t a c h m e n t s t o t h e c o n s o l i d a t e d f i n a n c i a l s t a t e m e n t s
Public disclosures (Country by Country reporting)
Bank of Italy Circular no. 285 of 17 December 2013 ("Supervisory Provisions for Banks"), in the 4th update of 17 June 2014, provides for the obligation to publish the information required in subparagraphs a), b) and c) in Appendix A of Part One, Title III, Chapter 2 of this Circular.
The following table provided the information required – on a consolidated basis – with reference to 31 December 2014:
Country where business is established
Nature of business (*)
Revenue (**)(Euro/000
Number of employees on full-time equivalent basis (***)
Income or loss before taxes
Tax on income or loss
Government grants received
Italy Banking 1,565,060 7,128 332,389 89,814 –
Finance 32,346 97 4,343 1,573 –
Non-financial 9 42 61 47 –
Luxembourg Finance (125) – (186) 47 –
United States Finance (888) – (1,029) – –
Total companies of the Bipiemme Group 1,596,402 7,267 335,578 91,481 –
Consolidation adjustments (11,278) – (10,637) 527 –
Total Bipiemme Group (Consolidated) 1,585,124 7,267 324,941 92,008 –
Country where business is established
Company name Nature of business (*)
Italy BANCA POPOLARE DI MILANO S.C. a R. L. - Banking
BANCA AKROS S.p.A. Banking
BANCA POPOLARE DI MANTOVA S.p.a. Banking
PROFAMILY S.p.a. Finance
BPM COVERED BOND S.R.L. Finance
BPM SECURITISATION 2 S.R.L. Finance
BPM SECURITISATION 3 S.R.L. Finance
GE.SE.SO. S.R.L. Non-financial
Luxembourg BPM LUXEMBOURG S.A. Finance
United States BPM CAPITAL I LLC. Finance
(*) The list of activities carried on, directly by the Parent Company or through subsidiaries, is based on the lines of business listed in Table 2 of art. 317, para. 4 of the CRR. More specifically:– BANKING: financial services for companies, trading and sales, retail brokerage services, commercial banking, retail banking, payments and settlements, fiduciary management and
portfolio management, as defined by the CRR. – FINANCIAL: Financial services for companies, trading and sales, retail brokerage services, commercial banking, retail banking, payments and settlements, fiduciary management and
portfolio management, as defined by the CRR, but with the exclusion of the acceptance of deposits from the public and/or the granting of loans to customers. – NON-FINANCIAL: if no services have been provided as included in Table 2 of art. 317, paragraph 4 of the CRR.
(**) The figure corresponds to item 120 in the Consolidated Income Statement "Net interest and other banking income".


Report of the Independent Auditors on the Consolidated Financial Statements
429


431R e p o r t o f t h e I n d e p e n d e n t A u d i t o r s o n t h e C o n s o l i d a t e d F i n a n c i a l S t a t e m e n t s

432 D a t i d i s i n t e s i e i n d i c a t o r i