Embed Size (px)
Citation preview
1
REPORTING THE RESULTS OF CULTURAL ASSESSMENTS – FROM SITE ASSESSMENTS TO CATCHMENT WIDE REPORTING
Gail Tipa, Mandy Home, Kyle Nelson, together with Members of Te Runanga o Arowhenua, Te Runanga o Waihao and Te Runanga o Moeraki
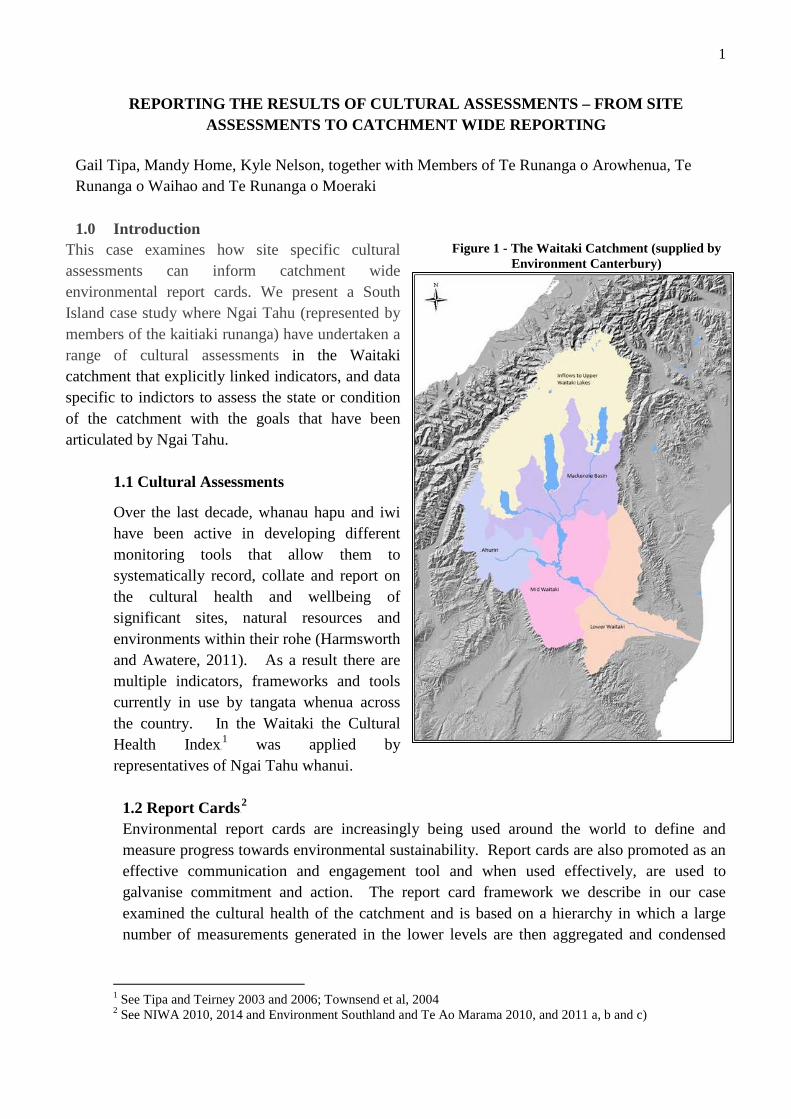
1.0 Introduction This case examines how site specific cultural assessments can inform catchment wide environmental report cards. We present a South Island case study where Ngai Tahu (represented by members of the kaitiaki runanga) have undertaken a range of cultural assessments in the Waitaki catchment that explicitly linked indicators, and data specific to indictors to assess the state or condition of the catchment with the goals that have been articulated by Ngai Tahu.
1.1 Cultural Assessments
Over the last decade, whanau hapu and iwi have been active in developing different monitoring tools that allow them to systematically record, collate and report on the cultural health and wellbeing of significant sites, natural resources and environments within their rohe (Harmsworth and Awatere, 2011). As a result there are multiple indicators, frameworks and tools currently in use by tangata whenua across the country. In the Waitaki the Cultural Health Index0F
1 was applied by representatives of Ngai Tahu whanui.
Figure 1 - The Waitaki Catchment (supplied by Environment Canterbury)
1.2 Report Cards1F
2 Environmental report cards are increasingly being used around the world to define and measure progress towards environmental sustainability. Report cards are also promoted as an effective communication and engagement tool and when used effectively, are used to galvanise commitment and action. The report card framework we describe in our case examined the cultural health of the catchment and is based on a hierarchy in which a large number of measurements generated in the lower levels are then aggregated and condensed
1 See Tipa and Teirney 2003 and 2006; Townsend et al, 2004 2 See NIWA 2010, 2014 and Environment Southland and Te Ao Marama 2010, and 2011 a, b and c)

2
into a progressively smaller number of objectives and goals during the transition to higher levels.
2.0 Reporting the Cultural Health of the Waitaki at Multiple Scales The Waitaki River is a large braided river in the South Island, some 110 km long. It is fed by three large glacial lakes in the upper catchment – Lakes Pukaki, Tekapo, and Ohau. Flows throughout the summer are rainfall dependent, before declining in the autumn as the colder weather begins to freeze the smaller streams which feed the catchment. The river’s flow historically was low in winter, with flows increasing in spring when the snow covering the Southern Alps begins to melt. This pattern changed with the construction of the Waitaki Power Scheme. Today, winter water flows are higher to enable electricity generation at eight power stations in the valley. The river now flows through Lake Ruataniwha, Lake Benmore, Aviemore and Waitaki, which are the four artificial lakes created as part of the Waitaki Power Scheme.
For our reporting we divided the catchment into five sub-units, also shown in Figure 1: 1. Aoraki, and the rivers upstream of Lakes Tekapo, Pukaki, and Ohau; 2. The Upper Waitaki lakes (Tekapo, Pukaki, Ohau), and the Mackenzie Basin which
includes the streams flowing from the lakes, and the streams of the Mackenzie Basin; 3. The Ahuriri catchment; 4. The lakes of the Mid Waitaki and the streams feeding them; and 5. The lower Waitaki catchment, including the Maerewhenua and Hakataramea catchments.
The Waitaki Report Card starts with the goals that were set by Ngai Tahu in 20032F
3. Each goal was then broken down into a number of objectives which enabled the specification of indicators. Table 1 shows how the concept of mahinga kai was translated into a series of objectives and indicators.
Table 1: An example of some of the goals, objectives and indicators in the Waitaki Catchment Report Card3F
4 (Tipa et al, 2015)
Goal Objective Indicators To ensure abundant mahinga kai resources and cultural materials are available for gathering, particularly in the wetlands, side braids, backwaters, tributaries and the Waitaki River mainstem
Protect and enhance the abundance of taonga species (birds, plants and fish), many of which are valued mahinga kai and cultural materials
1. Fish diversity (narrative only) 2. Bird diversity (narrative only) 3. Mahinga kai species traditionally gathered are still found across historic
range 4. Number of taonga species traditionally gathered now in gradual decline,
threatened or endangered – bird, fish, plant 5. Yes / No and trend in the number of species restoration programmes
underway to enhance the populations of taonga species 6. MCI (as an indicator of food for taonga species)
Ensure that mahinga kai and cultural materials are fit for cultural use
7. Cultural Health Index (% of monitoring sites assessed still sustaining use) 8. Gathering
a) No. of waterborne diseases affecting waterway, public health advisories etc
b) Recreational / food gathering water quality standards met c) Resources gathered are free of heavy metal contamination
9. Whanau satisfaction with condition of mahinga kai and they continue to gather from the Waitaki
3 Ngai Tahu engaged in a participatory process that was assessing the impacts of a hydro development (called Project Aqua). Whanau identified outcomes that they wanted to realise. These have been reworded as goals. 4 This is only a subset of the goals, objectives and indicators in the Report Card.
3
A total of 45 indicators are included in the Waitaki report card framework. Although a number of bio-physical indicators are reported on, such as water quality, we also included indicators that required conditions be assessed through a cultural lens, for example we applied the Cultural Health Index at more than 40 sites across the catchment.
2.1 Presenting the Waitaki Report Card – at catchment level
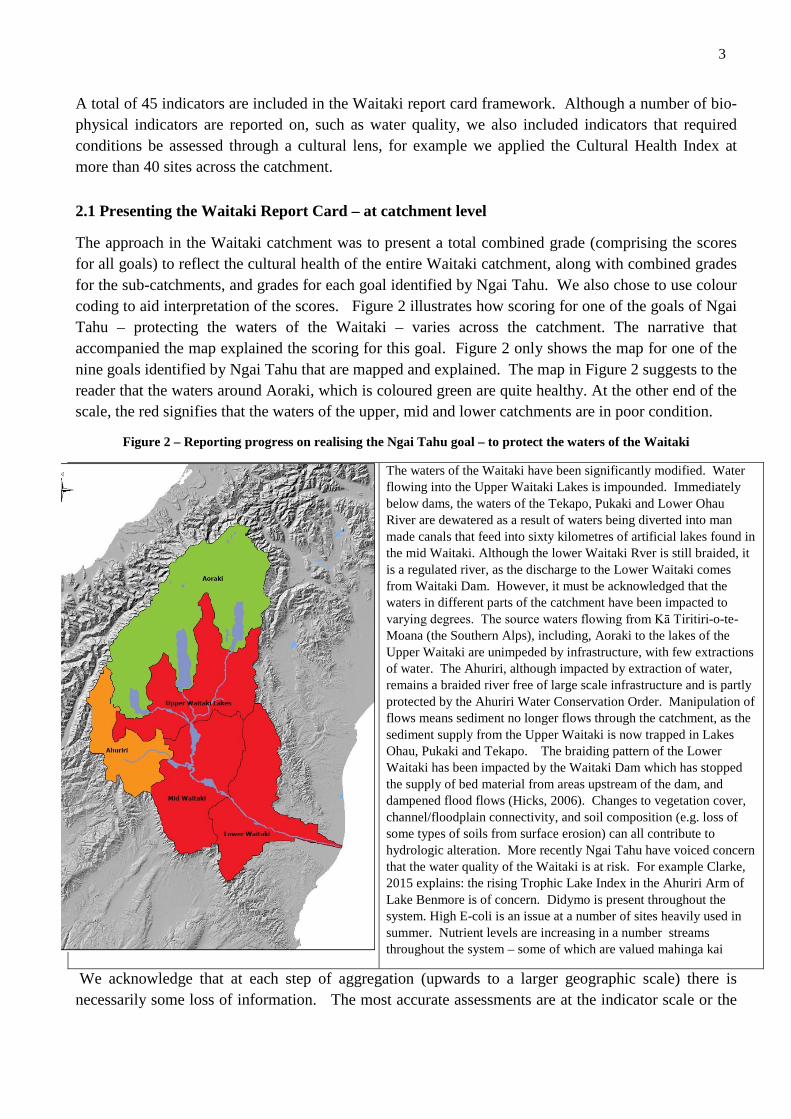
The approach in the Waitaki catchment was to present a total combined grade (comprising the scores for all goals) to reflect the cultural health of the entire Waitaki catchment, along with combined grades for the sub-catchments, and grades for each goal identified by Ngai Tahu. We also chose to use colour coding to aid interpretation of the scores. Figure 2 illustrates how scoring for one of the goals of Ngai Tahu – protecting the waters of the Waitaki – varies across the catchment. The narrative that accompanied the map explained the scoring for this goal. Figure 2 only shows the map for one of the nine goals identified by Ngai Tahu that are mapped and explained. The map in Figure 2 suggests to the reader that the waters around Aoraki, which is coloured green are quite healthy. At the other end of the scale, the red signifies that the waters of the upper, mid and lower catchments are in poor condition.
Figure 2 – Reporting progress on realising the Ngai Tahu goal – to protect the waters of the Waitaki
The waters of the Waitaki have been significantly modified. Water flowing into the Upper Waitaki Lakes is impounded. Immediately below dams, the waters of the Tekapo, Pukaki and Lower Ohau River are dewatered as a result of waters being diverted into man made canals that feed into sixty kilometres of artificial lakes found in the mid Waitaki. Although the lower Waitaki Rver is still braided, it is a regulated river, as the discharge to the Lower Waitaki comes from Waitaki Dam. However, it must be acknowledged that the waters in different parts of the catchment have been impacted to varying degrees. The source waters flowing from Kā Tiritiri-o-te-Moana (the Southern Alps), including, Aoraki to the lakes of the Upper Waitaki are unimpeded by infrastructure, with few extractions of water. The Ahuriri, although impacted by extraction of water, remains a braided river free of large scale infrastructure and is partly protected by the Ahuriri Water Conservation Order. Manipulation of flows means sediment no longer flows through the catchment, as the sediment supply from the Upper Waitaki is now trapped in Lakes Ohau, Pukaki and Tekapo. The braiding pattern of the Lower Waitaki has been impacted by the Waitaki Dam which has stopped the supply of bed material from areas upstream of the dam, and dampened flood flows (Hicks, 2006). Changes to vegetation cover, channel/floodplain connectivity, and soil composition (e.g. loss of some types of soils from surface erosion) can all contribute to hydrologic alteration. More recently Ngai Tahu have voiced concern that the water quality of the Waitaki is at risk. For example Clarke, 2015 explains: the rising Trophic Lake Index in the Ahuriri Arm of Lake Benmore is of concern. Didymo is present throughout the system. High E-coli is an issue at a number of sites heavily used in summer. Nutrient levels are increasing in a number streams throughout the system – some of which are valued mahinga kai
We acknowledge that at each step of aggregation (upwards to a larger geographic scale) there is necessarily some loss of information. The most accurate assessments are at the indicator scale or the
4
site scale, but they are less informative about overall catchment condition. In contrast, the score at the objective or goal level is less accurate and has higher variability, but tells us more about overall condition. It is necessary to understand how the data that is to be reported is to be used.
2.2 Reporting at a sub-catchment level
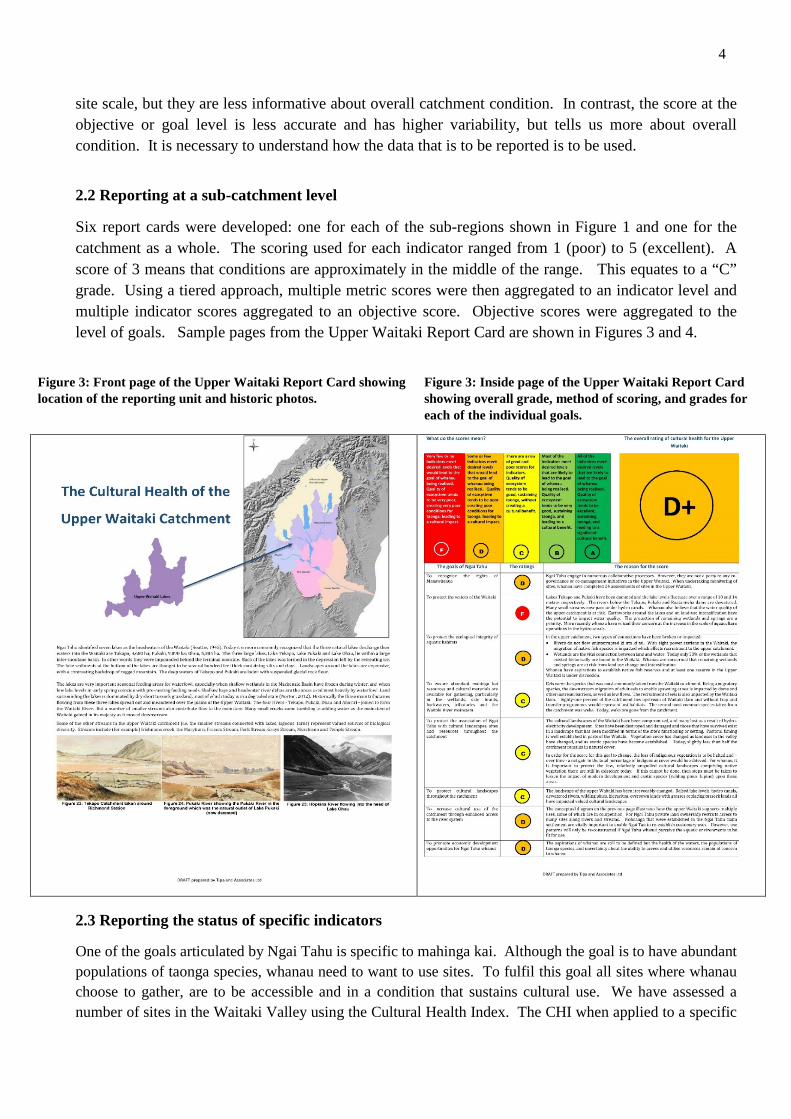
Six report cards were developed: one for each of the sub-regions shown in Figure 1 and one for the catchment as a whole. The scoring used for each indicator ranged from 1 (poor) to 5 (excellent). A score of 3 means that conditions are approximately in the middle of the range. This equates to a “C” grade. Using a tiered approach, multiple metric scores were then aggregated to an indicator level and multiple indicator scores aggregated to an objective score. Objective scores were aggregated to the level of goals. Sample pages from the Upper Waitaki Report Card are shown in Figures 3 and 4.
Figure 3: Front page of the Upper Waitaki Report Card showing location of the reporting unit and historic photos.
Figure 3: Inside page of the Upper Waitaki Report Card showing overall grade, method of scoring, and grades for each of the individual goals.
2.3 Reporting the status of specific indicators
One of the goals articulated by Ngai Tahu is specific to mahinga kai. Although the goal is to have abundant populations of taonga species, whanau need to want to use sites. To fulfil this goal all sites where whanau choose to gather, are to be accessible and in a condition that sustains cultural use. We have assessed a number of sites in the Waitaki Valley using the Cultural Health Index. The CHI when applied to a specific
5
site will result in a score such as A-1/2.9/4.1. Each component of this score related to specific cultural conceptualisations.
Site Status Mahinga kai measure Stream health measure A – 1 2.9 4.1
For example a score of A-1/2.9/4.1 describes a site of traditional and historical significance that Maori will return to, the mahinga kai values are only average, but the overall health of the stream is very good.
The first component – site status - assesses the significance of the site to Maori and asks them to distinguish between the traditional significance of sites and sites of lesser and more contemporary significance and use.
The second component– cultural use - requires an assessment of the ability of the sites to sustain the uses for which it was significant. There are four factors to be assessed and scored on a 1 (poor) to 5 (healthy) scale. The four factors are averaged to give a final from 1-5.
The third and final component of the Cultural Health Index is the stream health measure. Eight indicators that can be defined objectively and most appropriately reflect whanau evaluations of overall stream health are included in the Stream Health Measure4F
5. The stream health measure is derived by averaging the 1-5 scores awarded to the eight factors to give a final stream health measure from 1-5.
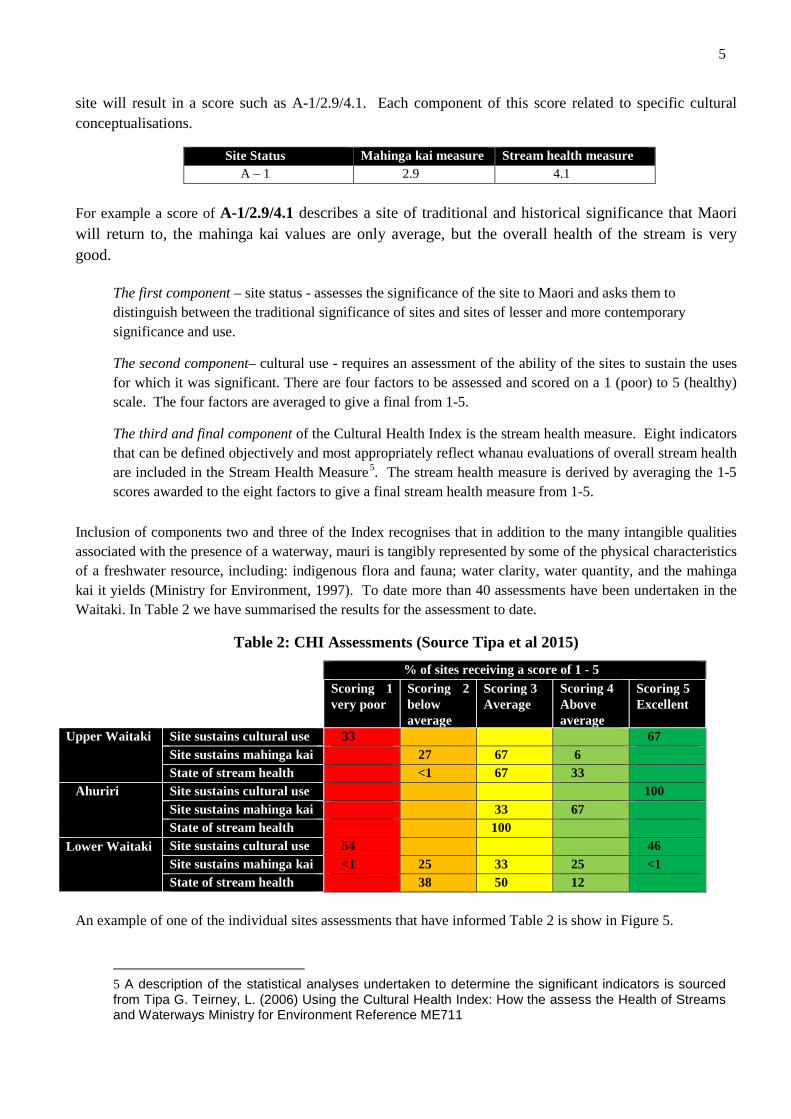
Inclusion of components two and three of the Index recognises that in addition to the many intangible qualities associated with the presence of a waterway, mauri is tangibly represented by some of the physical characteristics of a freshwater resource, including: indigenous flora and fauna; water clarity, water quantity, and the mahinga kai it yields (Ministry for Environment, 1997). To date more than 40 assessments have been undertaken in the Waitaki. In Table 2 we have summarised the results for the assessment to date.
Table 2: CHI Assessments (Source Tipa et al 2015)
% of sites receiving a score of 1 - 5 Scoring 1
very poor Scoring 2 below average
Scoring 3 Average
Scoring 4 Above average
Scoring 5 Excellent
Upper Waitaki Site sustains cultural use 33 67 Site sustains mahinga kai 27 67 6 State of stream health <1 67 33
Ahuriri Site sustains cultural use 100 Site sustains mahinga kai 33 67 State of stream health 100
Lower Waitaki Site sustains cultural use 54 46 Site sustains mahinga kai <1 25 33 25 <1 State of stream health 38 50 12
An example of one of the individual sites assessments that have informed Table 2 is show in Figure 5.
5 A description of the statistical analyses undertaken to determine the significant indicators is sourced from Tipa G. Teirney, L. (2006) Using the Cultural Health Index: How the assess the Health of Streams and Waterways Ministry for Environment Reference ME711

6
2.4 Reporting the results of site specific assessments
As noted earlier, more than 40 sites have been assessed in the Waitaki. An example of one assessment is shown in Figure 5.
Figure 5: the Assessment using the Cultural Health Index at Takiroa (Tipa et al, 2015)
Many taonga present including
• Spring-fed channels and swamp. Modified, but good ecological values; large stands of harakeke (uncommon in valley) and purei common. Water cress and other macrophytes abundant in channels. Recent restoration planting at downstream end on southern side.
• Birds of note: mallard, paradise shelduck, pukeko, welcome swallow • Fish (NIWA): shortfin eel, longfin eel • Cultural landscape includes rock art, rock shelter, nohoanga, pa • A highly significant site.
Looking upstream from the bridge below Takiroa
Looking downstream from the bridge at Takiroa
Values & Opportunities sought (as articulated by whanau)
• This area is to be abundant with watercress • Eels are present. There is to be no harvesting. • Raupo and flax is to be present and good quality. It is
valued as a pa harakeke. Restore access for cultural use • Deep water channel is to be maintained. • The sound of birds - unseen but heard. Populations are to
be protected. • Springs at the base of the terrace that feed the stream are
to be protected • Manage the stream and wetlands as a native fish reserve
• Good water quality is to be maintained • Mix of wetland, stream, springs are to be protected. • The appeal of the wetland is its proximity to Takiroa. The
cultural landscape is to be protected. • Better fencing is to be erected. Stock are to be excluded. • The land between the wetlands and road should be retired • Flows need to:
o Protect connectivity – 1) springs, wetlands and streams. 2) Stream to the mainstem Waitaki.
o Allow restoration of the wetland / riparian vegetation / along the drainage channels.
Perceived threats
• It is a working farm. • Permission is required to access.
• Since 2000 this place has been destroyed. “I am sad cos I saw it pre cows”.
• Contamination from farming • Risk of grazing in fenced area
Site status Cultural use measure Health measure
A-1 4.5 3.50
Based on this cultural assessment of Takiroa whanau are implementing a restoration plan and have negotiated a number of initiatives in this valued cultural landscape including:

7
• Restoring access for cultural use; • Securing fencing of the wetland; • Retiring some paddocks from grazing; • Replanting indigenous vegetation
• Preparing an inventory of native fish species • Assessing the whitau in the harakeke • Gaining recognition of a significant cultural
landscape.
3.0 Conclusion
Reporting the results of cultural assessments need to take account of the intended purpose of the assessment and reporting. Site specific assessments have been valuable in developing responsive restoration programme. However, regional plans are not formulated at a site specific level. Having undertaken more than 40 assessments, there needed to be a mechanism to aggregate the data from the cultural assessments to enable analyses to inform regional planning which occurs at catchment and sub-catchment levels. In the Waitaki the formulation of report cards that report cultural health at a broader geographic scale. Individual assessments informed a report card. In turn the report card scores were utilised in a spreadsheet that enabled us to assess the potential cultural impact of the scenarios that the regional council was proposing. Data that was collected and analysed needed to be fit for purpose and needed to be able to be aggregated and reported across multiple scales.
References
Clarke, G. (2015) The current water quality state of lakes in the Waitaki catchment Report for Environment Canterbury can be accessed from www.ecan.govt.nz
Environment Southland, & Te Ao Marama Inc. (2010). Our Health: Is our water safe to play in, drink and gather kai from? Part 1 of Southland Water 2010: Report on the State of Southland’s Freshwater Environment. Water. Invercargill: Environment Southland. Publication number 2010/06. Environment Southland, & Te Ao Marama Incorporated. (2011a). Our Ecosystems: How healthy is the life in our water and our freshwater ecosystems. Part 2 of Southland Water 2010: Report on the State of Southland’s Freshwater Environment. Invercargill. Environment Southland, & Te Ao Marama Incorporated. (2011b). Our Threats: How safe are we from floods, droughts and other extreme climate events? Part 4 of Southland Water 2010: Report on the State of Southland’s Freshwater Environment. Invercargill. Environment Southland, & Te Ao Marama Incorporated. (2011c). Our Uses: How do we use our water and is there enough for our different needs? Part 3 of Southland Water 2010: Report on the State of Southland’s Freshwater Environment. Invercargill.
Harmsworth, G., Awatere, S. (2011) Review and evaluation of cultural monitoring approaches in New Zealand. Paper produced as part of the Integrated Valuation and Monitoring Framework for Improved Freshwater Outcomes (C09X1003) programme. 8 p. http://www.landcareresearch.co.nz/__data/assets/pdf_file/0010/77680/Review_Cultural_Monitoring.pdf
Hicks, D.M. 2006. North Bank Tunnel Concept – Water Consents: River geomorphology, sediment transport, coastal processes and flood hazard management. NIWA Client Report CHC2006-090, September 2006.
8
NIWA (2010) Waikato River Independent Scoping Study NIWA Client Report HAM2010-032, NIWA Project MFE10201 NIWA (2014) Maniapoto Priorities for the Restoration of the Waipa River Catchment NIWA Client Report WEL2015-3, NIWA Project MMT14303
Tipa G. Nelson, K, Williams E. (2015) A report Card for the Health of the Waitaki Catchment. A report prepared for use by Environment Canterbury and the three kaitiaki runanga
Tipa, G., Teirney, L. (2003). A Cultural Health Index for streams and waterways: indicators for recognising and expressing Māori values. Wellington: Ministry for the Environment. 72 p.
www.mfe.govt.nz/publications/water/cultural-health-index-jun03/
Tipa, G., Teirney, L. (2006b). A Cultural Health Index for streams and waterways: a tool for nationwide use. Final technical report. Wellington: Ministry for Environment. www.mfe.govt.nz/publications/water
Townsend, C. R., Tipa, G, Teirney, L.D., Niyogi, D. K. (2004). Development of a tool to facilitate participation of Māori in the management of stream and river health. Ecohealth 1: 184-195.

9