Embed Size (px)
Citation preview
Responses during 1998 flood in Bangladesh:
Is different targeting needed during emergency and recovery to tackle
malnutrition ?
Moazzem Hossain
Save the Children UK, Bangladesh
and
Patrick Kolsteren
Institute of tropical Medicine, Antwerpen
Correspondence:
Moazzem Hossain
Save the Children Fund (UK), Bangladesh
House 28, Road 16 (New)
Dhanmondi R/A, Dhaka- 1205
Bangladesh
Ph: 00-880-2-8117561-3
Email: [email protected]

Biography
Dr. Moazzem Hossain graduated in medicine from Dhaka Medical College in 1990. Since
then he worked both in clinical and public health medicine with national and international
organisations. He combined programme and research experience during his association with
Pathfinder International, Centre for Health and Population Research (ICDDR,B) and Save the
Children Fund UK. He did his Masters in Public Health degree from Institute of Tropical
Medicine, Antwerpen, Belgium and later worked in the Nutrition Faculty as a Research
Fellow at the time of writing this report. He is currently attached to Save the Children Fund
as a consultant for designing health and nutrition initiatives where he worked as a Programme
Manager in Health and Nutrition at the time of the study. Correspondence for reprint and
other requests: Dr. Moazzem Hossain, Save the Children Fund, House 28, Road 16 (New),
Dhanmondi R/A, Dhaka- 1205, Bangladesh. Email: [email protected]
Patrick Kolsteren is currently head of the nutrition and child health unit of the Institute of
Tropical Medicine. His basic degree is in medicine with post-graduation in Tropical
Medicine, child health and a PhD in nutrition. He worked from 1981-89 in Thailand, Nepal
and Tibet for NGOs including Save the Children Fund. His present activities include teaching
in nutrition at the Institute of Tropical Medicine, Antwerpen and Ghent University and
research in child health and nutrition. Correspondence: Patrick Kolsteren, ITM,
Nationalestraat 155, Antwerpen 2000, Belgium. Email: [email protected]
Page 2
Summary
Bangladesh suffered the worst flood of the century during July-October 1998. The
government of Bangladesh appealed for international assistance. To provide valid
information for designing an appropriate intervention to tackle malnutrition problems, a rapid
nutrition assessment survey was conducted to look at the nutrition situation, problems
encountered by the community, their coping mechanisms and rehabilitation priorities in six
rural (charland) areas of Bangladesh. The survey was repeated after 4 months to see the
outcome of activities during flood and the necessity for future assistance. Of the 3048
children measured in two rounds (1597 & 1451), 180 cases were found to be common in both
rounds and a secondary analysis was done to see their progress in nutritional status and to
formulate a strategy for future intervention.
The analysis found that while moving from crisis (flood period) to rehabilitation (post-flood)
phase there was a clear evidence of a cross over phenomenon in the recovery pattern of
nutrition status. There were 13 percent of children (68% of all malnourished) who were
malnourished (whz <-2SD) during the crisis period and could recover enough to cross the
cut-off point and became normal after 4 months. Another 8 percent of children (9% of all
normal) who were normal during the crisis period but deteriorated to the level that they
crossed the cut-off point to become malnourished after 4 months. As a result, despite being a
shift in the overall distribution of nutrition status, there has been an internal shift that reduced
the net effect. Subsequent episode of diarrhoea, access to food and loan burden had also
influenced the recovery pattern of the children’s nutritional status as evident from the
statistically significant association. The finding of the analysis raise the question of relevance
of targeting malnutrition during emergency and appropriateness of criteria used for targeting
to assist which presumably is the same during crisis and rehabilitation phase.
Page 3

Introduction
Bangladesh experienced one of the worst floods in its recorded history from late July until
early October 1998. Some 30 million persons in 6 million families were affected by the crisis.
The people of Bangladesh have extraordinary coping mechanisms for dealing with floods,
which occur on a regular basis. But the scale and duration of the 1998 flood placed all these
mechanisms under considerable strain, and there were serious concerns about the possibility
of a large-scale famine similar to that which followed the floods of 1974. Many people
exhausted all their assets and were forced into debt in order to survive the flood period.
Many of the poorest families ran out of food supplies, and were forced to eat their seed
supplies, sell their animals, and take high interest loans to pay for food and medical care.
(Disaster Forum 1998, News Paper 1998)
Throughout Bangladesh, there was a wide spread mobilization of volunteer assistance during
the flood to support both the community and external agencies. Immediate assistance came
in the form of search and rescue when human lives were affected. Flood shelters were built
by many agencies and others used the existing structures like community meeting places or
schools. Food assistance was the most common form of assistance that came from outside.
Global distribution of food was targeted to those at urgent need and the poorest section of the
community. The government and many NGOs assisted by providing curative medical care in
remote treatment centers or through mobile teams. Most teams traveled into remote areas to
provide treatment for diarrhoea, acute respiratory infection and skin diseases. Nutrition
interventions included supplementary feeding for those households who had a malnourished
child and vitamin A capsule whenever a child with symptoms of night blindness was
detected. Nutrition surveys were conducted on a small or large scale by many agencies to
decide whether specific nutrition interventions were needed and this study was part of that
Page 4
process.
After the emergency phase rehabilitation activities were initiated. They included repair of
damaged houses and supply of agriculture products like seeds, fertilizer etc. Many NGOs
organized cash for work programmes, as a means of providing beneficiaries with income for
household consumption needs, as well as to regain productive assets. Cash grants and interest
free loans were also provided by many agencies. Targeting was directed towards those most
in need predominantly using the presence of malnourished children in the family as a proxy.
However, whatever the intervention, many experts and evaluators have questioned the
efficiency of targeting the true beneficiary and how far assistance can reach beneficiaries
outside regular credit-savings schemes of NGOs. Some even questions, even when the
recommended targeting is done well, whether targeting works at all. (Young 2000) .
The present paper presents findings from the follow up of a cohort of children and underlines
the need to consider different indicators for targeting during the emergency phase of a
disaster and during the rehabilitation phase.
Page 5

Materials and Methods
Study areas
Two cross sectional surveys were done in flood-affected areas of Bangladesh situated on the
bank of the Jamuna river, the main responsible for the monsoon floods. The river originates
in the mountains of neighbouring India, enters Bangladesh through it's northern border and
ends at the south in the bay of Bengal. All the study sites consisted mainly of charlands
(small islands in the chest of the river or near shores). They are stretched over 7 thanas (the
lowest functional administrative unit holding a population of about 200,000) that falls under
the geographical boundary of 5 districts. They are Roumari and Ulipur under Kurigram
district, Fulchari and Shaghata under Gaibandah district, Dewanganj under Jamalpur district,
Chouhali under Sirajganj district and Naria under Shariatpur district. The sites are located in
the upper, middle and lower part of the course of the river and approximately 40-50 km apart.
Despite the disperse location of sites, the background characterisitcs and livelihoods of the
people remain very similar in all places.
Livelihoods of char-dwelling families
Most of the char-dwellers are effectively land-less. They either don’t have land or have lost
land in the river erosion. The quality of the land is usually very poor. They rarely find other
income generating opportunities than low yielding farming, cattle/goat rearing, or 'migratory
labour', activities very prone to the effects of floods and droughts. Periods of accretion
provide opportunities to accumulate resources but these may be washed away again in the
next flood or in the process of river erosion. The charland people have also very limited
access to basic services like education and health care. To gain access to land, employment
and, particularly, to cope with emergency and stress, many char-dwellers have to depend on
loans, mostly from private money lenders or 'mohajons' who charge interest rates up to 200
Page 6

percent a year. Despite the fact that these loans bindpeople to a process of long-term
exploitation, they provide some protection against uncertain stress. Very few char-dwelling
families succeed to migrate to a more secured less flood prone environment
Study period
Two separate surveys were done in two different periods; in August at the peak of the flood
and in December, the post-flood harvesting period. During flood (August), unemployment is
high and food supply low. Many people depend on relatives or relief for food. The water and
sanitation situation deteriorates severely, morbidity increases and there are more
malnourished children. All these variables show a significant improvement during the second
survey round in December.
Study Sample
Sample size was estimated on the assumption that p (probable proportion of malnutrition in
population) was 20 percent, z as a constant (1.96) at 95% confidence interval and 5%
acceptable error. 200-250 children were needed in each of the six areas. ta Multiple stage
cluster sampling was done for each survey round following WHO guidelines (WHO 1995,
Hossain and Shuaib 1998). The sampling frame was constructed to include all unions in the
study areas affected by flood. Information on the level of flood was collected from the Flood
Control and Warning Centre at Dhaka (the capital of Bangladesh). A list of villages was
made based on the Population Census Report (BBS 1991) and constituted the sampling
frame. Villages were randomly selected as Primary Sampling Units (PSU) by probability
proportional to size. Selected villages were then divided into segments or clusters of 30-40
households and one of the segments were chosen randomly. A total of 60 clusters in 6 areas
were visited and surveyed during 1st round. All the households in a cluster were visited but
Page 7

only those with at least one child of 6-59 months were interviewed. During the 2nd round, all
those clusters were visited again but the survey could be done in 56 clusters because 4
clusters refused to have their children measured. There is something fishy here. If the same
clusters are taken then why are there so few children in both surveys. I thought that the
sampling was done again the second time.
A total of 1597 children aged 6-59 months were measured for nutrition assessment during
August 1998 and 1451 children during December. Of those children, 180 children were found
to be common in both rounds and distributed almost uniformly over the six areas. These cases
were considered for secondary analysis and form the cohort to look at the recovery pattern or
progress of their nutrition status.
Data collection method
A total of 12 teams (3 members in each team) conducted the survey in less than 2 weeks and
all of them were trained at the beginning of the survey. The household head or next
responsible person was interviewed and the children measured for weight and height.
Children were weighed with Salter scales (GLASS SALTER, 25 kg x 100g, made in
England, approved by UNICEF) calibrated daily. Length (for children upto 2 years) was
measured with child supine and height (children more than 2 years) was measured with child
in erect posture using a length measuring board prepared according to standard guidelines
(United Nations 1990a, 1990b). Weight for age, weight for height and height for age were
calculated using anthropometric software obtained from EPINUT. The nutritional indices
were expressed as standard deviation scores (z scores) of the reference medians.
Definition of variables
Page 8

A household was defined as a group of people who cook together (BBS 1998). Household
information included age, sex and education of the household head. Head of the household is
someone whom others consider to be so, usually the eldest person. Amount of land here
includes both homestead and agriculture land. Absolute landless meant having no land
whereas function landless meant having land less than 50 m2. Asset value was calculated by
estimating the price of individual items in the household if sold at a normal functioning
market at the time of survey. Asset loss was calculated in taka (1 US$ = 50 taka approx.) by
deducting the sells price from the estimated value (perception of the respondent crossed by
the interviewer) in the normal functioning market. The possibility to over-estimate was
balanced by seeking a second opinion from neighbours in case of doubtful estimation by the
respondent. In case the asset was damaged by water or stolen, the total estimated selling cost
was considered as loss. Proportion of asset loss was calculated by dividing the total asset loss
by the total value of the assets. Loan burden was assessed by asking about the total amount
loaned and then checked with each source like relatives, mohajon, NGO, etc. Amount of loan
was dichotomised at 3000 taka as several NGOs gave a crisis credit of 3000taka. Source of
food for last week was categorised as own stock, loan or relatives and donation. Assistance
was defined as receiving money, rice, other food or major items either from local or external
agencies.
Morbidity was reported by seeking information on any episode of diarrhoea (three times
watery stools in 24 hours) in the week preceding the survey. Although nutritional status is
classified as Stunting, Wasting and Underweight, wasting is mainly used in this study
because it is considered as the most appropriate indicator to measure acute malnutrition (UN
1990a & 1990b). Moreover, the other two indicators were difficult to rely on because of
difficulty to assess accurately the age of the child (WHO 1995). Changes in nutrition status
Page 9

between the survey rounds were computed by deducing the weight-for-height z scores of first
round from those of the second round
Data analysis
Data was entered into the computer using data base software (FoxPro 2.6) and analysed in
statistical package programmes (SPSSPC 9.0 & EPI Info 6.0). Anthropometric measurements
were compared with NCHS median and z scores calculated using EPINUT.
Page 10

Results
A total of 180 children were measured during August and December 1999. Of those, 56
percent were boys and 44 percent girls. There were 17 percent children malnourished (WHZ
score <-2 SD) in August and 12 percent in December (p 0.011). Although there was net
improvement of 5 percent in the malnutrition prevalence, the recovery pattern was not that
straight forward.
Figure 1
Figure one gives the natural history of the nutritional status of the children from August to
December. 90 percent of the malnourished children improved with 82 percent returning to a
cut-off above -2 SD, her defined as 'normal'. In contrast, half of the children who were well
(W/H ≥ -2 SD) saw their nutritional status worsen so that in December 9 percent them
became malnourished. Of the whole cohort, 57 percent improved and 43 percent declined in
nutritional status although the overall prevalence declined from 17 percent to 12 percent. 14
out of 23 malnourished (64%) were ”new” cases or previously normal children. We can thus
observe an important cross-over phenomenon.
Table one compares a number of variables between the two classes, children who improved
in W/H versus children who declined and children became malnourished (W/H < -2SD)
versus children who normalised in W/H, children who crossed over. The loan burden seemed
to have a strong association with the recovery pattern when any improvement or decline was
considered as the outcome. When crossing over is considered as an outcome, proportion of
asset lost, either single or repeated episode of diarrhoea and source of food during the week
Page 11

preceding the survey of December were found to have a significant relationship. The rest of
the variables showed some trend but there was no statistical significant association.
Table 1
Although not significant, the proportion of male children was almost similar in both the
groups who improved or declined (52% versus 61%) but more boys became malnourished
from normal as opposed to those who became normal (86% versus 55%). The percentage of
non-school goers was slightly higher among those who improved, the mean level of
education was always higher among the same groups. This paragraph is funny. What about
the age? The education is of whom?
The proportion of absolute landless families did not vary significantly among the groups. The
total asset value was higher in the group who went from malnutrition to normal but they were
also the groups where significantly less people lost more than 95 percent of their assets. In
the group who had children who became malnourished, 50 percent had virtually lost
everything.
Almost all people had to take some loan during or after the flood but there is a variation in
the sources. Although the proportion of loans from a mohajon was very similar among those
who either improved (62%) or declined (65%), the mean amount was much higher in the
groups who declined (3854 taka) than for those who improved (2423 taka). Even so, the
proportion of families who took a loan of more than 3000 taka was higher among those
declined (25% versus 12%). The difference in the loan amount among the groups was
significant (p 0.022). Other lending sources were protective , like neighbours or banks. The
Page 12

proportion of families who hasd access to loans from neighbours, family or banks was
higher among those who improved than those who decline (13% versus 8%). None of those
who declined from normal to malnutrition had any access to such type of loan. The mean
loan from other sources was also higher among those who improved (3473 taka) than
declined (2583 taka).
Episodes of diarrhoea had some relationship with crossing over of cut-off points but not with
simple improvement or decline in nutritional status. 64 percent of the children who were
malnourished in December had an episode of diarrhoea in the week prior to the study of
August. This was 27 percent for the children who normalised their malnutrition by
December. This relationship was significant (p 0.028). The association between worsening
of nutritional status and repeated episodes of diarrhoea was even more pronounced. In
August, 43 percent of the normal children who became malnourished had repeated diarrhoeal
episodes compared to 5 percent in the group who were malnourished but became normal. (p
0.005; OR 15.8; CI 1-41)
The children of families who had access to various sources of food had more chance of
improving than declining. Although the proportion of those who did not have any access or
did not want any loan or donation for food was very similar among various groups during the
flood period (August), it varied during December. The difference in proportion did not matter
much for mere improvement or decline but made a significant difference in turning normal to
malnutrition or the reverse. 79 percent of those who deteriorated to be malnourished were
depending only on their own stock for food which was only 36 percent in the other group (p
0.013; OR 6.4; CI 1.4 - 30). This meant that they had less access to food either through a loan
from relatives or donation form local or external agencies.
Page 13

Table 2
When looking at the background or criteria for assistance, it was found that those who were
NGO members, were land less, had higher loan burden, more compromised food habits and
had malnutrition during flood got more assistance than the others (see table 2). Although not
significant, proportion of malnutrition during August was slight higher (18%) among those
who got assistance than who did not (16%), it was reverse during December (11% versus
15%). The proportion of NGO members were significantly higher among those who got
assistance than who did not (44% versus 23%, p 0.005). The absolute and functional land
less families received also more assistance than those who did not get (43% versus 29%; p =
.053 and 79% versus 63%; p 0.015). It was interesting to see that the proportion of families
who lost more than 95 percent of their assets were also less among those who got assistance
than those who did not get (30% versus 49%; p 0.014). Although the proportion of loans from
mohajon or other sources were similar in different groups, the mean amount of loan from
mohajon was much higher among the assisted group than the other group (4363 taka versus
2818 taka; p 0.017). This was reverse in case of loan amount from other sources (3441 taka
versus 2381 taka; p 0.045). There is also something wrong here 4363 it the total 3441
comes from the mahajon (see table). I am also confused here. What does this
demonstrates???
Nutrition status improved from August to December when land tenure in August was higher
(r= 0.19; p= 0.022), proportion of asset loss smaller (r= -0.262; p= 0.001), the loan from
mohajon smaller (r= -0.171; p= 0.011) and loan from other sources higher (r= 0.171; p=
0.001).
Page 14

Conclusion
In the study area, almost every one was affected by flood and hence it is difficult to isolate
specific factors that could have influenced the vulnerability of a child to become
malnourished during flood or its recovery afterwards. During flood, all the socio-economic
factors declined which was evident from the extremely high unemployment rate. Food stocks
were exhausted leading to more households depending on loans or donations for their daily
food. . Similar findings were reported by other agencies as well (HKI-NSP 1999, Hossain
and Shuaib 1998).
Negative impacts of a natural disaster on child malnutrition have been reported by several
studies in Bangladesh (HKI-NSP 1999, Chowdhury and Bhuiya 1993). The studies
demonstrated an association between malnutrition and education level of the care-givers, land
ownership and reported illness (Bhuiya et al 1986a). A high rate of diarrhoea during flood
was reported in some studies (Briend et al 1987, Stewart et al 1990, HKI-NSP 1999, Hossain
and Shuaib 1998). Nutrition status was also associated with the health seeking behaviour
before and after each episode of illness, gender preferences and age of children (Bhuiya et al.
1986b, Briend et al 1989). Most of these findings have been confirmed by the surveys done
in our study area which were reported previously (Hossain 2000)
This study observed an increase in the malnutrition rate that was higher than the national
average (BBS 1997) but how the associations between the nutrition status and other factors
affect on the recovery pattern of the children with malnutrition is however not clear. One of
the striking finding in the present study was the cross-over phenomenon i.e., some children
improved from malnutrition to normal while others deteriorated from normal to malnutrition
when they move from crisis to rehabilitation period. Ultimately the impact on the prevalence
Page 15

of malnutrition is a mixed effect and the net improvement is reduced by the cross-over
phenomenon, 61% of all the malnourished children of the recovery period are new cases..
Although the study is obersvational with all its lilmits, some interesting observations can be
made There was a significant higher proportion of asset loss, loan burden and in particular
the type of loan in families where children became malnourished.
Mohajons are the money-lenders who lend money at very high rates (some times 200 percent
a year) at the moment of crisis and poor people with minimal reserves or collateral are forced
to take loans from these mohajons. Inability to pay back the money usually ends in loosing
the remaining assets or provide free labour for any amount of days decided by the money-
lenders.. Unfortunately, the loan from mohajon is negatively correlated with the progress in
nutrition status. On the other hand, having an access or ability to take loan from other sources
(banks, neighbours etc.) with long-term repayment schedules at a very low or no interest was
positively correlated with the improvement of nutrition status. This suggests that flood-
affected families need to be assisted prior to the moment when they exhaust their resources
and are forced to take loans from mohajon or that their accessibility to other loans should be
widened.
The other factor that seemed to have some influences on the recovery pattern was the
repeated attacks of diarrhoea. Although there was association between an attack during flood
(August) and deteriorating from normal to malnutrition, it was absent when checked with an
episode of diarrhoea during December. The association became even stronger when it was
checked with those who had repeated episodes of diarrhoea i.e., during flood (August) and
post-flood period (December). It has been documented earlier that reported illness due to
diarrhoea remains high during and immediately after flood. Despite this fact, deterioration
Page 16
from normal to malnutrition could be stopped if the repeated episode of diarrhoea could be
prevented by taking adequate care of those who once become ill during flood any way.
Diarrhoea control seems a top priority in flood affected areas, next to efforts to rehabilitate.
The third and probably most interesting finding of this study is criteria for assistance was not
very suitable for all periods of the emergency. It seems that eligibility criteria for assistance
need to be different for the immediate crisis and the rehabilitation Results show that those
who were poor and in need during flood were helped. It appears that those who had a
malnourished child during flood (crisis) had more possibility of getting assistance, which fits
with the anhtropometric criteria used by agencies involved in the flood response. However,
crisis is not the same as recovery. In a crisis situation the aim is to save as many lives as
possible. It is therefore legitimate to target assistance based on clinical criteria such as
malnutrition. But in a rehabilitation or recovery phase the situation becomes completely
different, in particular if the flood affects all people indiscriminate of their socio-economic
condition. Some one who coped and survived well during the flood might have exhausted all
his assets during flood. He would be more vulnerable in the rehabilitation phase in
comparison to some one who was poor and vulnerable during flood and was assisted by
alocal or external agency. Moreover, assistance was targeted at the land ownership and
missed the fact that those who lost almost everything (more than 95 percent of their assets)
were more vulnerable than those who lost less. Their coping capacity is stretched to the limit
and the possibility of recovery is small. Since they are not eligible for a “normal” or “soft”
loan, they are forced to find money at very high interest rates. Asset loss was significantly
associated with deterioration from normal to malnutrition.
Page 17
A last is that more beneficiaries of assistance were members of an NGO. NGOs claimed
that they consulted the local community to identify appropriate beneficiaries. The current
findings may allow critics to raise the question whether aid agencies help the affected
people in general or aim first to promote their own development programme and help their
own beneficiaries. (Young 2000) However, it could also be that most of the NGO members
were among those vulnerable group who required assistance more than others.
The results of the present study have to be interpreted with care. An observation of a cross-
over phenomenon was made, some associated factors were identified and an explanation is
available. However, this was not a longitudinal design, the numbers are small and
information on asset losses could be biased due to a hidden expectation for relief. We do feel
however that the findings merit further consideration and particular attention, certainly in
future disaster episodes. We strongly feel that during a disaster of large scale that spares
almost none, all should be helped. If targeting needs to be done due to lack of resources,
there should be two separate criteria for assistance, one for the crisis period and the other for
the rehabilitation. It was also strongly felt during the analysis that there should be more well-
designed longitudinal studies set up in periods of flood to look at those issues more carefully
and come-up with appropriate recommendations. Sensitive indicators should be tested that
will be easily applicable by community people but appropriate to respond to the problems of
that period and of that place.
Page 18
Acknowledgement
We would like to acknowledge the contribution of Save the Children Fund UK who funded
the initial surveys through the money that came from ‘DEC appeal 1998’. We are grateful to
Lola Gostelow, Emergency Advisor and Anna Taylor, Nutrition Advisor, SCF-UK for their
encouragement, questions and comments during the whole period of this study. We are
indebted to Martine Billanou, Programme Director of SCF-UK Bangladesh Programme who
managed to sponsor a visit to Bangladesh during the current study for data re-organisation.
Thanks to Muhammad Shuaib and Abdullah-Al-Harun of SURCH for their support during
the initial surveys and the secondary analysis. We are also indebted to the children and their
parents who were affected during the flood but always co-operated during the data collection.
The views expressed in this paper are exclusively those of the authors and not related to the
work of Save the Children Fund UK any way.
Page 19
References
BBS 1991 The Population Census Report. Ministry of Planning, Government of People's
Republic of Bangladesh, Dhaka.
BBS 1997 Child Nutrition Survey of Bangladesh – 1995-96. Ministry of Planning,
Government of People's Republic of Bangladesh, Dhaka.
BBS 1998 Statistical terms/concepts/definitions need in censuses/surveys of BBS and other
National/ International Agencies. Ministry of Planning, Government of People's
Republic of Bangladesh, Dhaka.
Bhuiya A, Zimicki S, D’Souza S 1986a Socio-economic differentials in child nutrition and
morbidity in rural area of Bangladesh. J. trop. Paediat. 32(1), 17-23.
Bhuiya A, Wojtyniak B, D’Souza S, Zimicki S 1986b Socio-economic determinants of child
nutritional status: boys vs. girls. Food and Nutrition Bulletin, 8 (3): 3-7.
Briend A, Wojtyniak B, Rowland MG 1987 Arm circumference and other factors in
children at high risk of death in rural Bangladesh. The Lancet, 2 (8561): 725-8.
Briend A, Hasan KZ, Aziz KM, Hoque BA, Henry FJ 1989 Measuring change in
nutritional status: a comparison of different anthropometric indices and the sample
sizes required. Eur. J. Clin. Nutr 43 (11): 769-78.
Page 20

Chowdhury AY and Bhuiya A 1993 Effects of Bio-social variable on changes in nutritional
status of rural Bangladeshi children, pre and post monsoon flooding. J Biosoc. Sci, 25
(3): 351-357.
Disaster Forum 1998 Bangladesh Disaster Report 1998. Disaster Forum, Dhaka, Bangladesh.
Goyet CV, Seaman J, Geijer U 1978 The Management of Nutritional Emergencies in Large
Populations. Word Health Organisations, Geneva, Switzerland.
HKI-NSP 1999 Impact of the 1998 Floods on Rural Households in Bangladesh. A special
report from the Nutrition Surveillance Project. Helen Keller International, Dhaka,
Bangladesh.
Hossain SMM 2000 Tackling Child Malnutrition during Floods: experience from Charlands
of Bangladesh. MPH thesis submitted at the Institute of Tropical Medicine,
Antwerpen, Belgium.
Hossain SMM and Shuaib M 1998 Rapid Nutrition Assessment During Flood 1998: Coping
Mechanisms and Community Perception of Suitable Rehabilitation, Volume-1 & 2.
The Save the Children Fund (UK), Dhaka, Bangladesh.
Newspaper Clippings (1998) Assorted Flood-Related Articles, by several authors, from
various newspapers including Dhaka Courier, ENN, Holiday, The Daily Star, The
Financial Express and The Independent. Flood News File, July to October, SCF-UK,
Dhaka, Bangladesh.
Page 21
Stewart MK, Fauveau V, Chakraborty J, Briend A, Yunus M, Sarder AM 1990 Post-flood
nutritional anthropometry of children in Matlab, Bangladesh. Ecology of Food and
Nutrition, 24: 121-131
UN1990a Assessing the Nutritional Status of Young Children. National Household Survey
Capability Programme, Statistical Division, United Nations, New York, USA.
UN 1990b How to weight and measure children . National Households Survey Capability
Programme, Statistical Division, United Nations, New York, USA.
WHO 1995 Field Guide on Rapid Nutritional Assessment in Emergencies. World Health
Organisation, Regional office for the Eastern Mediterranean, Alexandria, Egypt.
WHO 1986 Use and interpretation of anthropometric indicators of nutritional status. Bull
World Health Organ, 64 (6): 929-41.
Young R and Associates 2000 DEC Bangladesh: 1998 Flood Appeal- an independent
evaluation report. Disaster Emergency Committee, London
Page 22

Fig 1: Recovery outcome of the children from 1st round to 2nd round in terms of
malnutrition status
All children n=180
Normal 1 149 (83%)
Improve 75(50%)
Decline 74(50%)
Decline 3 (10%)
Improve 28 (90%)
Malnutrition 2 14 (19%)
Normal 2 75
Malnutrition 2 3
Normal 2 60 (81%)
Normal 2 23 (82%)
Malnutrition 2 5 (18%)
Normal to Malnutrition (8% of total)
Malnutrition to Normal
(13% of total)
Transition 2nd round End result
Normal to Normal
( 75% of total)
Malnutrition to Malnutrition (4% of total)
Malnutrition 1 31 (17%)
1st round
Page 23
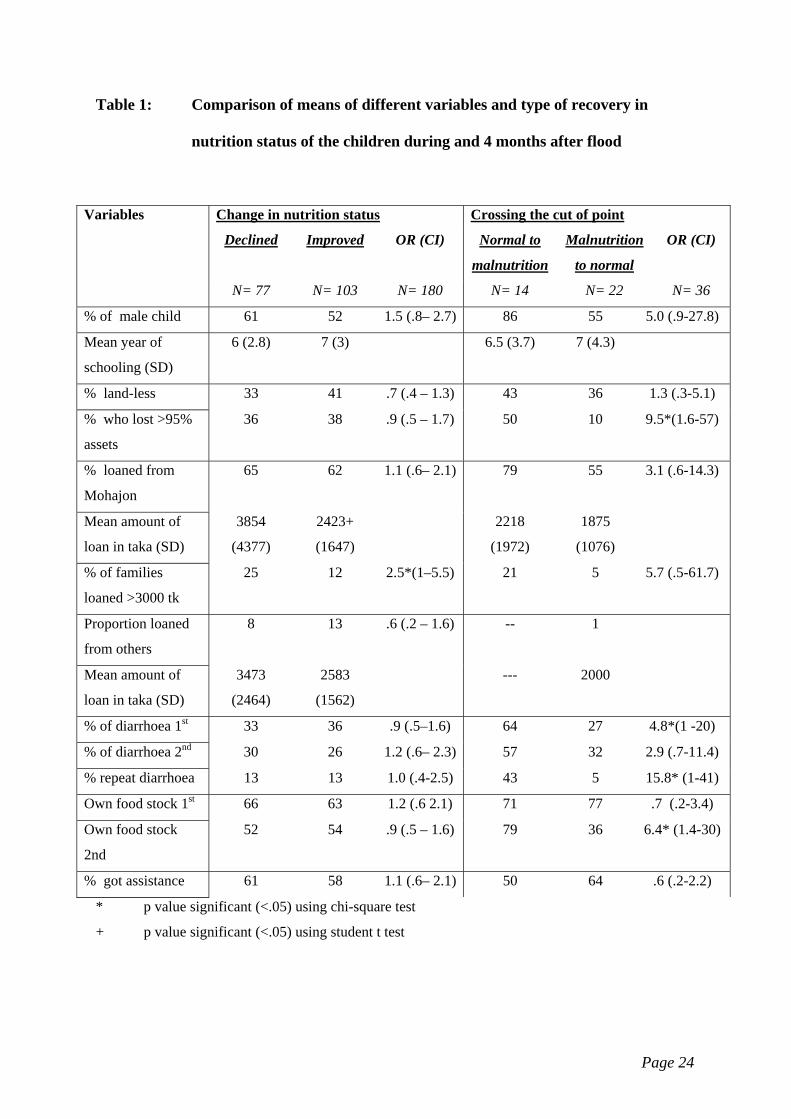
Table 1: Comparison of means of different variables and type of recovery in
nutrition status of the children during and 4 months after flood
Variables Change in nutrition status Crossing the cut of point
Declined Improved OR (CI) Normal to
malnutrition
Malnutrition
to normal
OR (CI)
N= 77 N= 103 N= 180 N= 14 N= 22 N= 36
% of male child 61 52 1.5 (.8– 2.7) 86 55 5.0 (.9-27.8)
Mean year of
schooling (SD)
6 (2.8) 7 (3) 6.5 (3.7) 7 (4.3)
% land-less 33 41 .7 (.4 – 1.3) 43 36 1.3 (.3-5.1)
% who lost >95%
assets
36 38 .9 (.5 – 1.7) 50 10 9.5*(1.6-57)
% loaned from
Mohajon
65 62 1.1 (.6– 2.1) 79 55 3.1 (.6-14.3)
Mean amount of
loan in taka (SD)
3854
(4377)
2423+
(1647)
2218
(1972)
1875
(1076)
% of families
loaned >3000 tk
25 12 2.5*(1–5.5) 21 5 5.7 (.5-61.7)
Proportion loaned
from others
8 13 .6 (.2 – 1.6) -- 1
Mean amount of
loan in taka (SD)
3473
(2464)
2583
(1562)
--- 2000
% of diarrhoea 1st 33 36 .9 (.5–1.6) 64 27 4.8*(1 -20)
% of diarrhoea 2nd 30 26 1.2 (.6– 2.3) 57 32 2.9 (.7-11.4)
% repeat diarrhoea 13 13 1.0 (.4-2.5) 43 5 15.8* (1-41)
Own food stock 1st 66 63 1.2 (.6 2.1) 71 77 .7 (.2-3.4)
Own food stock
2nd
52 54 .9 (.5 – 1.6) 79 36 6.4* (1.4-30)
% got assistance 61 58 1.1 (.6– 2.1) 50 64 .6 (.2-2.2)
* p value significant (<.05) using chi-square test
+ p value significant (<.05) using student t test
Page 24

Page 25
Table 2: Background characteristics of those who got any assistance or not
Variables Status of getting any assistance
Yes No OR (CI)
N= 107 N= 73 N=180
% of malnutrition during Aug 1998 18 16 1.1 (.5-2.6)
% of malnutrition during December 1998 11 15 .7 (.27 - 1.9)
% of NGO members 44 23 2.6 (1.3 - 5.3)
% of absolute land less families 43 29 1.9* (1.0 -3.5)
% of functional land less families 79 63 2.3* (1.2 - 4.4)
Proportion who lost >95% assets 30 49 .45 *(.2-.8)
Mean amount of total loan taken (SD) 4363 (4852) 2818+ (2200)
Proportion of loanee from Mohajon 67 58 1.5(.8-2.8)
Mean loan from Mohajon (SD) 3441 (3710) 2381 (1978)
Mohajon loan >3000 taka 31 21 1.6 (.6 - 4.3)
Proportion loanee from others 10 11 1.8(.8-4.2)
Mean loan from other sources 4045 (2433) 2018+ (1192)
* p value significant (<.05) using chi-square test
+ p value significant (<.05) using student t test