Embed Size (px)
Citation preview

VTB BANK
CONSOLIDATED FINANCIAL STATEMENTS AND INDEPENDENT AUDITOR’S REPORT
FOR THE YEAR ENDED 31 DECEMBER 2020

VTB BANK CONSOLIDATED FINANCIAL STATEMENTS AND INDEPENDENT AUDITOR’S REPORT
2
CONTENTS
INDEPENDENT AUDITOR’S REPORT ............................................................................................................... 3
CONSOLIDATED INCOME STATEMENT ................................................................................................................ 12CONSOLIDATED STATEMENT OF COMPREHENSIVE INCOME ......................................................................... 13CONSOLIDATED STATEMENT OF FINANCIAL POSITION ................................................................................... 14CONSOLIDATED STATEMENT OF CASH FLOWS ................................................................................................ 15CONSOLIDATED STATEMENT OF CHANGES IN SHAREHOLDERS’ EQUITY .................................................... 17
NOTES TO THE CONSOLIDATED FINANCIAL STATEMENTS
1. Principal Activities ................................................................................................................................................................ 18 2. Basis of Preparation ............................................................................................................................................................ 18
DELVING INTO NUMBERS
3. Analysis by Segment .................................................. 204-17. Notes to Income Statements ...................................... 2818-38. Notes to Statements of Financial Position .................. 35
RISK
39. Significant Accounting Estimates and Judgments ...... 6540. Operating Environment of the Group .......................... 6741. Financial Risk Management ....................................... 6842. Fair Value Measurement ............................................ 8743. Capital Management and Capital Adequacy ............ 102
GROUP STRUCTURE
44. Composition of the Group ......................................... 10445. Changes in Group structure ....................................... 10546. Investments in Associates and Joint Ventures .......... 10647. Non-controlling Interest............................................. 10948. Interests in Structured Entities .................................. 110
OFF BALANCE-SHEET ITEMS
49. Contingencies and Commitments............................. 11250. Subsequent Events .................................................. 115
OTHER INFORMATION
51. Related Party Transactions ................................................................................................................................................ 11752. Offsetting of Financial Instruments ..................................................................................................................................... 11953. Share-Based Payments ..................................................................................................................................................... 12054. Basic and Diluted Earnings per Share ............................................................................................................................... 12155. Transfers of Financial Assets and Assets Held or Pledged as Collateral ............................................................................ 12156. Summary of Principal Accounting Policies ......................................................................................................................... 12357. New and Revised Standards ............................................................................................................................................. 13858. New Accounting Pronouncements ..................................................................................................................................... 13959. Changes in Presentation and Correction ........................................................................................................................... 139

3 A member firm of Ernst & Young Global Limited
ErnstС&СYoungСLLC SadovnicheskayaСNab.тС77тСbld.С1 MoscowтС115035тСRussia Tel: с7Со495)С705С9700 с7Со495)С755С9700 Fax: с7Со495)С755С9701 www.ey.com/ru
С«Э Сэ С » иятС115035тС С
ич яС .тС77тС .С1 .: +7 (495) 705 9700
+7 (495) 755 9700 Ф : +7 (495) 755 9701
К : 59002827 Г : 1027739707203
И : 7709383532
Independent auditor’s report To the Shareholders and Supervisory Council of VTB Bank (public joint-stock company) Report on the audit of the consolidated financial statements
Opinion
We have audited the consolidated financial statements of VTB Bank (public joint-stock company) оhereinafterтСtheС“Bank”)СandСitsСsubsidiariesСоhereinafterтСtheС“Group”)тСwhichСcompriseСtheСconsolidated income statement and consolidated statement of comprehensive income for the year ended 31 December 2020, the consolidated statement of financial position as of 31 December 2020тСtheСconsolidatedСstatementsСofСcashСflowsСandСchangesСinСshareholders’Сequity for the year ended 31 December 2020, and notes to the consolidated financial statements, including a summary of significant accounting policies. In our opinion, the accompanying consolidated financial statements present fairly, in all material respects, the consolidated financial position of the Group as of 31 December 2020 and its consolidated financial performance and consolidated cash flows for the year then ended in accordance with International Financial Reporting Standards (IFRSs). Basis for opinion
We conducted our audit in accordance with International Standards on Auditing (ISAs). Our responsibilities under those standards are further described in the Auditor’s responsibilities for the audit of the consolidated financial statements section of our report. We are independent ofСtheСGroupСinСaccordanceСwithСtheСInternationalСEthicsСStandardsСBoardСforСAccountants’ (IESBA) International Code of Ethics for Professional Accountants (including International Independence Standards) (IESBA Code) together with the ethical requirements that are relevant to our audit of the consolidated financial statements in the Russian Federation, and we have fulfilled our other ethical responsibilities in accordance with these requirements and the IESBA Code. We believe that the audit evidence we have obtained is sufficient and appropriate to provide a basis for our opinion. Key audit matters
Key audit matters are those matters that, in our professional judgment, were of most significance in our audit of the consolidated financial statements of the current period. These matters were addressed in the context of our audit of the consolidated financial statements as a whole, and in forming our opinion thereon, and we do not provide a separate opinion on these matters. For each matter below, our description of how our audit addressed the matter is provided in that context.

4 A member firm of Ernst & Young Global Limited
We have fulfilled the responsibilities described in the Auditor’s responsibilities for the audit of the consolidated financial statements section of our report, including in relation to these matters. Accordingly, our audit included the performance of procedures designed to respond to our assessment of the risks of material misstatement of the consolidated financial statements. The results of our audit procedures, including the procedures performed to address the matters below, provide the basis for our audit opinion on the accompanying consolidated financial statements. Key audit matter How our audit addressed the key audit matter
Expected credit losses for loans and advances to customers and provision for credit related
commitments
Given the significance of the expected credit losses for loans and advances to customers and provision for creditСrelatedСcommitmentsСtoСtheСGroup’sСfinancial position, the complexity and judgements related to the estimation of expected credit losses under IFRS 9 Financial Instruments о“IFRSС9”)тСweСconsidered this area as a key audit matter.
Assessment on an individual and a portfolio basis of whether a significant increase in credit risk has occurred since initial recognition, as well as calculationСofСexpectedСcreditСlossesСо“ECL”)тСrequire judgement. Determination of whether an increase in credit risk has occurred is based on relative change in credit ratings, days past due and other objective and subjective factors. Selection of thresholds used to conclude that the increase in credit risk is significant, such as the extent of the downgrade in a credit rating, is also judgemental.
The calculation of ECL involves estimation techniques that use significant unobservable inputs and factors, such as internal credit ratings, complex statistical modelling and expert judgement. These techniques are used to determine probability of default, projected exposure at default and loss arising at default, based on available historical data and external information, which is adjusted for forward looking information, including forecast of macroeconomic variables.
The calculation of expected credit losses for significant credit-impaired financial assets on an individual basis requires analysis of financial and non-financial information and extensive use of assumptions. Assessment of estimated future cash flows is based on significant unobservable inputs, such as current and projected financial performance of the borrower, collateral value, and estimation of probabilities of possible outcomes. The use of different modelling techniques, assumptions and forecasts could produce significantly different estimates of the allowance for expected credit losses.
We focused our audit on the following:
• evaluating credit risk models and assumptions used to estimate key provisioning parameters, and determine expected credit losses on a portfolio basis;
• assessingСmanagement’sСjudgementСinСrelation to the identification of significant increases in credit risk on an individual and portfolio basis based on quantitative and qualitative criteria;
• testing estimated future cash flows, including collateral-sourced cash flows, in relation to significant credit-impaired loans and advances to customers and credit related commitments;
• assessing management’sСjudgementСinСrelationСto the evaluation of the effect of current economic situation related to COVID-19 pandemic on ECL calculation.
Our audit procedures included evaluation of expected credit loss methodology developed by the Group in accordance with the requirements of IFRS 9 to calculate the expected credit losses for loans and advances to customers and provision for credit related commitments.
We assessed the reasonableness of the credit risk factors and thresholds selected by the management to determine whether significant increase in credit risk has occurred on individual and portfolio basis. We evaluated consistency of application of the criteria selected by the management as of the reporting date. We analysed the information about the transfer of certain borrowers, most influenced by the COVID-19СpandemicтСfromС“12-monthСECL”СtoС“LifetimeСECLСnotСcredit-impaired”.

5 A member firm of Ernst & Young Global Limited
Key audit matter How our audit addressed the key audit matter
During 2020 in the current economic conditions, connected with COVID-19 pandemic and its influence on global and Russian economy, the Group reassessed the macroeconomic variables incused for ECL calculation; increased weighted estimates of credit losses for certain industries for the purpose of assessment on portfolio basis; transferredСcertainСborrowersСfromС“12-monthСECL” toС“LifetimeСECLСnotСcredit-impaired”;СdowngradedСcredit ratings for certain major borrowers assessed on an individual basis.
Information on the allowance for expected credit losses on loans and advances to customers and provision for credit related commitments is included in Note 22, Loans and advances to customers, Note 41, Financial risk management, and Note 49, Contingencies and commitments, to the consolidated financial statements.
To test allowance calculated on a portfolio basis, we evaluated underlying statistical models, key inputs and assumptions used and assessed incorporation of forward-looking information in the calculation of expected credit losses. For significant credit exposures, we evaluated, on a sample basis, internal credit ratings, credit risk factors and staging. We focused on the analysis ofСtheСGroup’sСapproach to assessment of the macroeconomic variables, including the effect of COVID-19 pandemic, on the forecasted economic information. We have also considered the results of retrospective testing of the IFRS 9 models performed by the Group.
For a sample of significant credit-impaired corporate exposures, we, together with our valuation specialists, challenged assumptions on estimated future cash flows, including value of collateral and probabilities of expected outcomes. We focused on the calculation of ECL for those borrowers that were most affected by current economic deterioration caused by COVID-19 pandemic.
We also assessed the disclosures in the consolidatedСfinancialСstatementsСaboutСtheСGroup’sСallowance for expected credit losses on loans and advances to customers and provision for credit related commitments.
Valuation of land, premises, investment property and property intended for sale in the ordinary course
of business
TheСGroup’sСaggregateСcarryingСvalueСofСlandтСpremises, investment property and property intended for sale in the ordinary course of business was RUR 261.5 billion at 31 December 2020. The Group determines the value of these assets with the assistance of independent or internal valuation specialists. The valuation models prepared by these specialists contain unobservable inputs and assumptions. Changes in these inputs and assumptions may have a significant impact on the valuation. The significance and subjectivity of these valuations make them a key audit matter.
In 2020 due to the deterioration of current economic situation, caused by COVID-19 pandemic, and the subsequent decline in business activity and purchasingСpowerСofСtheСGroup’sСcounterpartiesтСthe Group impaired certain items of land, premises, investment property and property intended for sale in the ordinary course of business. The amount of impairment recognised in 2020 comprised RUR 113.6 billion.
Our audit procedures included an assessment, on a sample basis, of the valuation methods and models as well as the sources of significant assumptions. We also tested the determination of the net realizable value of a sample of individually significant properties intended for sale in the ordinary course of business. We focused on the management’sСjudgementsСrelated to the effect of deterioration of current economic situation on the valuation of these assets.
Where management involved a valuation specialist, we assessed their qualification and objectivity. For a sample of individually significant properties, we involved our valuation specialists to assist us in assessing the reasonableness of the methodology andСassumptions.СWeСalsoСassessedСtheСGroup’sСdisclosures in relation to the valuation of land, premises and investment property.

6 A member firm of Ernst & Young Global Limited
Key audit matter How our audit addressed the key audit matter
Information on the valuation of land, premises, investment property and property intended for sale in the ordinary course of business is included in Note 24, Land, premises and equipment, Note 25, Investment property, Note 27, Other assets, and Note 42, Fair value measurement, to the consolidated financial statements.
Valuation of financial instruments not quoted in active market
Financial instruments not quoted in an active market (instruments in Level 2 and Level 3 of the fair value hierarchy) represent a significant part of theСGroup’sСinvestmentsСinСsecuritiesСandСderivatives, due from other banks and loans and advances to customers at fair value through profit or loss.
The fair value of these instruments is determined by internally developed valuation models that may use complex assumptions and unobservable inputs. The significance and subjectivity of these valuations make them a key audit matter.
Information on the valuation of financial instruments not quoted in an active market is included in Note 42, Fair value measurement, to the consolidated financial statements.
Our audit procedures included an assessment, on a sample basis, of internally developed models and the sources of significant assumptions used in determining fair value. For a sample of individually significant instruments, we inspected, with assistance of our valuation specialists, the models and assumptions used, and/or performed an independent valuation assessment using alternative valuation methods and assumptions. We also assessedСtheСGroup’sСdisclosuresСinСrelationСtoСtheСvaluation of such financial instruments, including disclosures regarding significant Level 3 inputs used and sensitivity of the value to changes in these inputs.
Goodwill impairment
Impairment of goodwill is a key audit matter due to both the significance of its carrying value and the judgement inherent in the impairment testing. Management has to use significant unobservable inputs and make assumptions in their goodwill impairment analysis to develop cash flow forecasts, and to determine appropriate growth rates and discount rates.
The use of different modelling techniques and assumptions could have significant impact on the outcome of the impairment testing.
Current economic deterioration, connected with COVID-19 pandemic, influenced the factors and assumptions used for cash flow forecasts.
Information on goodwill is included in Note 26, Goodwill and other intangible assets, to the consolidated financial statements.
We assessed, with the assistance of our business valuation specialists, management’sСgoodwillСimpairment analysis, including calculations of carrying values and recoverable amounts of cash-generating units. We evaluated forecasted cash flows, discount rates and long-term growth rates, by comparing them with the historical operating performance, business plans, market indicators and other available evidence. We focused on the analysis of assumptions updated for the current economic situations, which were used as a basis for cash flow forecasts. We assessed the disclosure prepared by the Group in relation to the results of testing.
7 A member firm of Ernst & Young Global Limited
Other information included in VTB Annual Report 2020
Other information consists of the information included in the VTB Annual Report 2020 оhereinafterтСtheС“AnnualСReport”)СotherСthanСtheСconsolidatedСfinancialСstatementsСandСourСauditor’sСreportСthereon.СManagementСisСresponsibleСforСtheСotherСinformation.СThe Annual Report is expected to be made available to us after the date of this auditor’sСreport.С Our opinion on the consolidated financial statements does not cover the other information and we will not express any form of assurance conclusion thereon. In connection with our audit of the consolidated financial statements, our responsibility is to read the other information identified above when it becomes available and, in doing so, consider whether the other information is materially inconsistent with the consolidated financial statements or our knowledge obtained in the audit or otherwise appears to be materially misstated. Responsibilities of management and the Audit Committee for the consolidated financial
statements
Management is responsible for the preparation and fair presentation of the consolidated financial statements in accordance with IFRSs, and for such internal control as management determines is necessary to enable the preparation of consolidated financial statements that are free from material misstatement, whether due to fraud or error. In preparing the consolidated financial statements, management is responsible for assessing the Group’sСabilityСtoСcontinueСasСaСgoingСconcernтСdisclosingтСasСapplicableтСmattersСrelatedСtoСgoingСconcern and using the going concern basis of accounting unless management either intends to liquidate the Group or to cease operations, or has no realistic alternative but to do so. TheСAuditСCommitteeСisСresponsibleСforСoverseeingСtheСGroup’sСfinancialСreportingСprocess.
Auditor’s responsibilities for the audit of the consolidated financial statements
Our objectives are to obtain reasonable assurance about whether the consolidated financial statements as a whole are free from material misstatement, whether due to fraud or error, and toСissueСanСauditor’sСreportСthatСincludes our opinion. Reasonable assurance is a high level of assurance but is not a guarantee that an audit conducted in accordance with ISAs will always detect a material misstatement when it exists. Misstatements can arise from fraud or error and are considered material if, individually or in the aggregate, they could reasonably be expected to influence the economic decisions of users taken on the basis of these consolidated financial statements.
8 A member firm of Ernst & Young Global Limited
As part of an audit in accordance with ISAs, we exercise professional judgment and maintain professional skepticism throughout the audit. We also:
► Identify and assess the risks of material misstatement of the consolidated financial statements, whether due to fraud or error, design and perform audit procedures responsive to those risks, and obtain audit evidence that is sufficient and appropriate to provide a basis for our opinion. The risk of not detecting a material misstatement resulting from fraud is higher than for one resulting from error, as fraud may involve collusion, forgery, intentional omissions, misrepresentations, or the override of internal control.
► Obtain an understanding of internal control relevant to the audit in order to design audit procedures that are appropriate in the circumstances, but not for the purpose of expressingСanСopinionСonСtheСeffectivenessСofСtheСGroup’sСinternalСcontrol.
► Evaluate the appropriateness of accounting policies used and the reasonableness of accounting estimates and related disclosures made by management.
► ConcludeСonСtheСappropriatenessСofСmanagement’sСuseСofСtheСgoingСconcernСbasisСofСaccounting and, based on the audit evidence obtained, whether a material uncertainty exists related to events or conditionsСthatСmayСcastСsignificantСdoubtСonСtheСGroup’sСabilityСto continue as a going concern. If we conclude that a material uncertainty exists, we are requiredСtoСdrawСattentionСinСourСauditor’sСreportСtoСtheСrelatedСdisclosuresСinСtheСconsolidated financial statements or, if such disclosures are inadequate, to modify our opinion. Our conclusions are based on the audit evidence obtained up to the date of our auditor’sСreport.СHoweverтСfutureСeventsСorСconditionsСmayСcauseСtheСGroupСtoСceaseСtoСcontinue as a going concern.
► Evaluate the overall presentation, structure and content of the consolidated financial statements, including the disclosures, and whether the consolidated financial statements represent the underlying transactions and events in a manner that achieves fair presentation.
► Obtain sufficient appropriate audit evidence regarding the financial information of the entities or business activities within the Group to express an opinion on the consolidated financial statements. We are responsible for the direction, supervision and performance of the group audit. We remain solely responsible for our audit opinion.
We communicate with the Audit Committee regarding, among other matters, the planned scope and timing of the audit and significant audit findings, including any significant deficiencies in internal control that we identify during our audit. We also provide the Audit Committee with a statement that we have complied with relevant ethical requirements regarding independence and communicate with them all relationships and other matters that may reasonably be thought to bear on our independence, and where applicable, actions taken to eliminate threats or safeguards applied.
9 A member firm of Ernst & Young Global Limited
From the matters communicated with the Audit Committee, we determine those matters that were of most significance in the audit of the consolidated financial statements of the current period and are thereforeСtheСkeyСauditСmatters.СWeСdescribeСtheseСmattersСinСourСauditor’sСreportСunless law or regulation precludes public disclosure about the matter or when, in extremely rare circumstances, we determine that a matter should not be communicated in our report because the adverse consequences of doing so would reasonably be expected to outweigh the public interest benefits of such communication. Report in accordance with the requirements of Article 42 of the Federal Law of the Russian
Federation No. 395-1 Concerning Banks and Banking Activities of 2 December 1990
Management of the Bank is responsible for the compliance of the Banking group, where the Bank isСtheСparentСcreditСinstitutionСоhereinafterтСtheС“BankingСgroup”)СwithСtheСmandatoryСprudentialСratiosСestablishedСbyСtheСCentralСBankСofСtheСRussianСFederationСоhereinafterтСtheС“BankСofСRussia”) and for the conformity of internal control and organization of the risk management systems of the Banking group with the requirements set forth by the Bank of Russia in respect of such systems. In accordance with the requirements of Article 42 of the Federal Law of the Russian Federation No. 395-1 Concerning Banks and Banking Activities of 2 December 1990 (hereinafter, the “FederalСLaw”)тСduringСtheСauditСofСtheСGroup’sСconsolidatedСfinancialСstatementsСforСtheСyearСended 31 December 2020, we determined:
1) Whether the Banking group complied as of 1 January 2021 with the obligatory ratios established by the Bank of Russia;
2) Whether internal control and organization of the risk management systems of the Banking group conformed to the requirements set forth by the Bank of Russia for such systems in respect of the following:
• subordination of the risk management departments;
• theСexistenceСofСmethodologiesтСapprovedСbyСtheСBank’sСrespectiveСauthorizedСbodiesтСfor detecting and managing risks that are significant to the Bank and for performing stress-testing; the existence of a reporting system at the Bank pertaining to its significant risks and capital;
• consistency in applying and assessing the effectiveness of methodologies for managing risks that are significant to the Bank;
• oversight performed by the Supervisory Council and executive management of the BankСinСrespectСofСtheСBank’sСcomplianceСwithСriskСlimitsСandСcapitalСadequacyСrequirementsСsetСforthСinСtheСBank’sСinternalСdocumentsтСandСeffectivenessСandСconsistencyСofСtheСapplicationСofСtheСBank’sСriskСmanagementСprocedures.
This work included procedures selected based on our judgment, such as inquiries, analysis, reading of documents, comparison of the requirements, procedures and methodologies approved by the Bank with the requirements set forth by the Bank of Russia, and the recalculation, comparison and reconciliation of numerical values and other information. The findings from our work are provided below.

10 A member firm of Ernst & Young Global Limited
Compliance by the Banking group with the obligatory ratios established by the Bank of
Russia
We found that the values of the obligatory ratios of the Banking group as of 1 January 2021 were within the limits established by the Bank of Russia. We have not performed any procedures in respect of accounting data of the Banking group, except for those procedures we considered necessary to express our opinion on the fair presentation of the Group’sСconsolidatedСfinancialСstatements.С Conformity of internal control and organization of the risk management systems of the
Banking group with the requirements set forth by the Bank of Russia in respect of such
systems
• We found that, in accordance with the legal acts and recommendations issued by the Bank
of Russia, as of 31 December 2020 the Bank’s internal audit division was subordinated and accountableСtoСtheСSupervisoryСCouncilтСandСtheСBank’sСriskСmanagement departments were not subordinated or accountable to the departments that take the relevant risks.
• WeСfoundСthatСtheСBank’sСinternalСdocumentsСeffectiveСasСof 31 December 2020 that establish the methodologies for detecting and managing credit, market, operational, and liquidity risks that are significant to the Banking group and stress-testing have been approvedСbyСtheСBank’sСauthorizedСbodiesСinСaccordanceСwithСtheСlegalСactsСandСrecommendations issued by the Bank of Russia. We also found that, as of 31 December 2020, the Bank had a reporting system pertaining to credit, market, operational and liquidity risks that were significant to the Banking group and pertaining to its capital.
• We found that the frequency and consistency of reports prepared byСtheСBank’sСriskСmanagement departments and internal audit division during the year ended 31 December 2020 with regard to the management of credit, market, operational and liquidity risks of theСBankingСgroupСcompliedСwithСtheСBank’sСinternalСdocumentsтСand that those reports includedСobservationsСmadeСbyСtheСBank’sСriskСmanagementСdepartmentsСandСinternalСauditСdivision in respect of the effectiveness of relevant risk management methodologies.
• We found that, as of 31 December 2020, the authority of the Supervisory Council and executive management bodies of the Bank included control over compliance of the Banking group with internally established risk limits and capital adequacy requirements. For the purpose of control over the effectiveness and consistency of the risk management procedures applied by the Banking group during the year ended 31 December 2020, the Supervisory Council and executive management bodies of the Bank regularly reviewed the reportsСpreparedСbyСtheСBank’sСriskСmanagementСdepartments and internal audit division.


VTB BANK CONSOLIDATED INCOME STATEMENT FOR THE YEAR ENDED 31 DECEMBER (IN BILLIONS OF RUSSIAN ROUBLES)
The notes № 1-59 form an integral part of these consolidated financial statements. 12
Note 2020 2019 Change
Interest income calculated using the effective interest method 4 974.3 1,039.8 -6.3% Other interest income 4 81.5 67.2 21.3% Interest expense 4 (501.6) (636.5) -21.2% Payments to deposit insurance system 4 (22.5) (29.9) -24.7% Net interest income 4 531.7 440.6 20.7%
Provision charge for credit losses on debt financial assets 21, 22, 23 (227.0) (92.2) 146.2% Net interest income after provision for credit losses 304.7 348.4 -12.5%
Net fee and commission income 5, 59 136.8 121.6 12.5%
(Losses net of gains) / gains net of losses arising from sale and
revaluation of loans at fair value through profit or loss (3.1) 3.3 -193.9% Gains net of losses arising from other financial instruments at fair value
through profit or loss 6 32.8 63.1 -48.0% Gains net of losses arising from sale of financial assets at fair value
through other comprehensive income 7 0.8 1.0 -20.0% Gains net of losses / (losses net of gains) arising from foreign currencies
and precious metals 8, 59 18.9 (35.5) 153.2% Gains net of losses arising from disposal of financial assets at amortised
cost 1.4 9.1 -84.6% Other gains net of losses on financial instruments at amortised cost 0.7 0.2 250.0% Share in profit of associates and joint ventures 17.3 11.1 55.9% Impairment of investments in associates 46 (12.8) – n/a Gains from disposal of subsidiaries and associates 28, 45, 46 6.1 7.5 -18.7% Losses net of gains arising from extinguishment of liabilities (0.2) – n/a Provision charge for credit losses on credit related commitments and
other financial assets 27, 49 (19.9) (7.8) 155.1% Provision charge for legal claims and other commitments 49 (2.9) (3.3) -12.1% Excess of fair value of acquired net assets over cost – 5.6 -100.0% Other operating income 9 9.2 7.5 22.7% Non-interest gains 48.3 61.8 -21.8%
Revenue and other gains from operating lease of equipment 10 30.3 30.5 -0.7% Expenses related to equipment leased out 10 (17.3) (15.1) 14.6% Revenues less expenses from operating leasing 10 13.0 15.4 -15.6%
Net insurance premiums earned from non-state pension fund activity 13 14.1 40.8 -65.4% Net insurance claims incurred, movement in liabilities to policyholders
and acquisition costs on non-state pension fund activity 14 (30.0) (60.5) -50.4% Revenues less expenses from non-state pension fund activity (15.9) (19.7) -19.3%
Revenue and other gains from other non-banking activities 11 102.6 96.9 5.9% Cost of sales and other expenses from other non-banking activities 12, 59 (92.7) (87.0) 6.6% Expenses from write-down of property held for sale in the ordinary
course of business 59 (9.6) (6.2) 54.8% Impairment of land, premises and intangible assets other than goodwill
used in non-banking activities 24, 26 (17.0) (1.1) 1,445.5% Net loss from change in fair value of investment property recognised on
revaluation or disposal 25, 42 (87.0) (0.9) 9,566.7% Revenues less expenses from other non-banking activities (103.7) 1.7 -6,200.0%
(Impairment)/reversal of impairment of land, premises and intangible
assets other than goodwill 24, 26 (0.2) 0.1 -300.0% Other operating expense 15, 59 (23.4) (22.2) 5.4% Staff costs and administrative expenses 16 (269.9) (254.2) 6.2% Non-interest expenses (293.5) (276.3) 6.2%
Profit before tax 89.7 252.9 -64.5% Income tax expense 17 (14.4) (51.7) -72.1% Net profit 75.3 201.2 -62.6%
Net profit/(loss) attributable to: Shareholders of the parent 80.6 202.0 -60.1% Non-controlling interests (5.3) (0.8) 562.5%
Basic and diluted earnings per share (expressed in Russian roubles per share) 54 0.00503 0.01453 -65.4%

VTB BANK CONSOLIDATED STATEMENT OF COMPREHENSIVE INCOME FOR THE YEAR ENDED 31 DECEMBER (IN BILLIONS OF RUSSIAN ROUBLES)
The notes № 1-59 form an integral part of these consolidated financial statements. 13
2020 2019
Net profit 75.3 201.2
Other comprehensive income/(loss): Other comprehensive income/(loss) to be reclassified to profit or loss in
subsequent periods: Net change in fair value of debt financial assets at fair value through other comprehensive
income, net of tax 8.6 7.4 Reclassification of gains to income statement on sale of debt financial assets at fair value
through other comprehensive income, net of tax (0.7) (0.7) Cash flow hedges, net of tax – 0.1 Share of other comprehensive income/(loss) of associates and joint ventures 4.3 (2.0) Effect of translation, net of tax 27.9 (21.2) Total other comprehensive income/(loss) to be reclassified to profit or loss in
subsequent periods 40.1 (16.3)
Other comprehensive income/(loss) not to be reclassified to profit or loss in
subsequent periods: Net change in fair value of equity financial assets at fair value through other
comprehensive income, net of tax 0.6 2.0 Actuarial losses net of gains arising from difference between pension plan assets and
obligations – (0.1) Land and premises revaluation, net of tax 0.1 (0.3) Total other comprehensive income not to be reclassified to profit or loss in
subsequent periods 0.7 1.6
Other comprehensive income/(loss), net of tax 40.8 (14.7)
Total comprehensive income 116.1 186.5 Total comprehensive income/(loss) attributable to: Shareholders of the parent 120.8 186.2 Non-controlling interests (4.7) 0.3


VTB BANK CONSOLIDATED STATEMENT OF CASH FLOWS FOR THE YEAR ENDED 31 DECEMBER (IN BILLIONS OF RUSSIAN ROUBLES)
The notes № 1-59 form an integral part of these consolidated financial statements. 15
Note 2020 2019
Cash flows from/(used in) operating activities Interest received 1,001.4 1,081.2 Interest paid (516.1) (649.7) Payments to deposit insurance system (24.6) (28.2) Gains on operations with trading financial assets 20.2 65.1 Gains/(losses)/gains incurred on dealing in foreign currency 59 6.7 (106.4) Fees and commissions received 59 191.4 169.9 Fees and commissions paid 59 (58.3) (55.2) Other operating income received 11.1 6.6 Other operating expenses paid 59 (22.1) (12.1) Revenue received from operating lease of equipment 19.0 28.4 Expenses paid related to equipment leased out (2.1) (4.8) Net insurance premiums received from non-state pension fund activity 14.0 40.7 Net insurance claims paid on non-state pension fund activity (2.9) (3.4) Revenue received from non-banking activities 78.7 101.1 Expenses paid related to non-banking activities (57.0) (87.7) Staff costs, administrative expenses paid (229.1) (227.3) Income tax paid (46.8) (53.4) Cash flows from operating activities before changes in operating assets and
liabilities 383.5 264.8
Net decrease/(increase) in operating assets Net increase in mandatory cash balances with central banks (9.8) (15.7) Net decrease/(increase) in correspondent accounts in precious metals 13.1 (2.9) Net increase in trading financial assets (126.0) (147.9) Net (increase)/decrease in due from other banks (204.6) 53.2 Net increase in loans and advances to customers (1,102.5) (319.5) Net increase in other assets (61.2) (129.4) Net (decrease)/increase in operating liabilities Net decrease in due to other banks (184.5) (200.2) Net increase in customer deposits 1,145.1 845.5 Net (decrease)/increase in debt securities issued other than bonds issued (20.3) 3.8 Net increase in other liabilities 8.4 17.8 Net cash (used in)/from operating activities (158.8) 369.5
Cash flows from/(used in) investing activities Dividends and other distributions received 10.8 10.7 Proceeds from redemption and sale of investment financial assets 214.3 341.4 Purchase of investment financial assets (827.1) (257.5) Purchase of subsidiaries, net of cash 0.3 (32.1) Disposal of subsidiaries, net of cash disposed 45 0.4 3.7 Acquisition and other contributions of shares in associates and joint ventures 46 (73.1) (39.1) Proceeds from sale of shares in associates and other distributions 80.1 0.3 Purchase of land, premises and equipment (64.3) (17.4) Proceeds from sale of land, premises and equipment 2.3 1.1 Purchase or construction of investment property (2.8) (6.6) Proceeds from sale of investment property 19.2 12.2 Purchase of intangible assets (47.6) (14.7) Proceeds from sale of intangible assets 0.2 0.1 Net cash (used in)/from investing activities (687.3) 2.1

VTB BANK CONSOLIDATED STATEMENT OF CASH FLOWS (CONTINUED) FOR THE YEAR ENDED 31 DECEMBER (IN BILLIONS OF RUSSIAN ROUBLES)
The notes № 1-59 form an integral part of these consolidated financial statements. 16
Note 2020 2019
Cash flows from/(used in) financing activities Dividends paid 38 (26.7) (31.1) Proceeds, net of repayment, from short-term local bonds issued – (13.6) Proceeds from local bonds issued 108.3 125.9 Repayment of local bonds (158.5) (16.3) Buy-back of local bonds (2.5) (12.0) Proceeds from sale of previously bought-back local bonds 0.1 0.6 Repayment of Eurobonds (66.2) – Buy-back of Eurobonds (5.6) (6.7) Proceeds from sale of previously bought-back Eurobonds 5.8 6.0 Repayment of syndicated loans (1.4) (1.6) Proceeds from other borrowings and funds from local central banks 1,773.2 402.6 Repayment of other borrowings and funds from local central banks (1,122.8) (394.0) Repayments of lease liabilities (6.3) (10.6) Proceeds from subordinated debt 74.6 20.0 Repayment of subordinated debt (3.0) (0.5) Purchase of shares in subsidiaries from non-controlling interests (0.7) (6.6) Cash received from sale of treasury shares 0.7 2.9 Cash paid for treasury shares (0.5) (2.4) Buy-back of perpetual loan participation notes (0.5) (10.6) Proceeds from sale of previously bought-back perpetual loan participation notes – 10.7 Amounts paid on perpetual loan participation notes 38 (15.4) (13.8) Net cash from financing activities 552.6 48.9
Effect of exchange rate changes on cash and cash equivalents 196.5 (24.0) Effect of change in impairment loss allowance 0.2 (0.2) Net (decrease)/increase in cash and cash equivalents (96.8) 396.3
At the beginning of year 18 1,325.6 929.3 At the end of year 18 1,228.8 1,325.6
Non-cash changes in liabilities arising from financial activities 2020 2019
Foreign currency translation Eurobonds 21.6 (6.4) Syndicated loans 1.6 3.0 Subordinated debt 22.2 14.6
Other non-cash changes Local bonds (3.0) 11.4 Eurobonds 5.1 12.9 Syndicated loans – (2.1) Funds from local central banks 1.8 9.2 Subordinated debt (0.1) (3.7)

VTB BANK CONSOLIDATED STATEMENT OF CHANGES IN SHAREHOLDERS’ EQUITY FOR THE YEAR ENDED 31 DECEMBER (IN BILLIONS OF RUSSIAN ROUBLES)
The notes № 1-59 form an integral part of these consolidated financial statements. 17
Attributable to shareholders of the parent
Share capital
Share premium
Perpetual loan
participation notes
(Note 36)
Treasury shares and
bought back perpetual
loan participation
loan notes
Other reserves
(Note 37) Retained earnings Total
Non-controlling
interests (Note 47)
Total equity
Balance at 1 January 2019 659.5 433.8 156.3 (1.0) 82.4 190.3 1,521.3 (5.0) 1,516.3
Net result from treasury shares
transactions – – – 0.5 – (0.1) 0.4 – 0.4 Net result from bought back
perpetual loan participation notes transactions – – – 0.1 – – 0.1 – 0.1
Profit/(loss) for the period – – – – – 202.0 202.0 (0.8) 201.2 Other comprehensive (loss)/income – – – – (15.7) (0.1) (15.8) 1.1 (14.7) Total comprehensive
income/(loss) for the period – – – – (15.7) 201.9 186.2 0.3 186.5
Transfer of premises revaluation
reserve upon disposal or depreciation – – – – (0.3) 0.3 – – –
Reclassification of net change in fair value of equity instruments upon derecognition – – – – (0.3) 0.3 – – –
Share-based payments – – – – – (0.5) (0.5) – (0.5) Acquisition of subsidiaries – – – – – 0.6 0.6 5.1 5.7 Acquisition of non-controlling
interests – – – – – 3.0 3.0 (5.4) (2.4) Amounts paid on perpetual loan
participation notes – – – – – (13.8) (13.8) – (13.8) Foreign exchange translation of
perpetual loan participation notes – – (17.0) – – 17.0 – – – Tax effect recognised on perpetual
loan participation notes – – – – – (3.4) (3.4) – (3.4)
Dividends declared and other distributions to shareholders – – – – – (33.5) (33.5) (2.1) (35.6)
Balance at 31 December 2019 659.5 433.8 139.3 (0.4) 66.1 362.1 1,660.4 (7.1) 1,653.3
Net result from treasury shares
transactions – – – 0.2 – – 0.2 – 0.2 Net result from bought back
perpetual loan participation notes transactions – – – (0.5) – – (0.5) – (0.5)
Profit/(loss) for the period – – – – – 80.6 80.6 (5.3) 75.3 Other comprehensive income – – – – 39.9 0.3 40.2 0.6 40.8 Total comprehensive
income/(loss) for the period – – – – 39.9 80.9 120.8 (4.7) 116.1
Transfer of premises revaluation
reserve upon disposal or depreciation – – – – 5.3 (5.3) – – –
Reclassification of net change in fair value of equity instruments upon derecognition – – – – 0.8 (0.8) – – –
Share-based payments (Note 53) – – – – – (0.1) (0.1) – (0.1) Acquisition of non-controlling
interests – – – – – (14.7) (14.7) 14.0 (0.7) Amounts paid on perpetual loan
participation notes (Notes 38) – – – – – (15.4) (15.4) – (15.4) Foreign exchange translation of
perpetual loan participation notes – – 27.3 – – (27.3) – – – Tax effect recognised on perpetual
loan participation notes – – – – – 5.5 5.5 – 5.5 Dividends declared and other
distributions to shareholders (Notes 38) – – – – – (24.5) (24.5) (2.2) (26.7)
Other changes – – – – – (9.1) (9.1) – (9.1)
Balance at 31 December 2020 659.5 433.8 166.6 (0.7) 112.1 351.3 1,722.6 – 1,722.6
VTB BANK NOTES TO THE CONSOLIDATED FINANCIAL STATEMENTS 31 DECEMBER 2020
18
1. PRINCIPAL ACTIVITIES VTB Bank and its subsidiaries (the “Group”) comprise Russian and foreign commercial banks, insurance, leasing and other entities controlled by the Group. VTB Bank, formerly known as Vneshtorgbank (the “Bank”, or “VTB”), was formed as Russia’s foreign trade bank under the laws of the Russian Federation on 17 October 1990. In 1998, following several reorganisations, VTB was reorganised into an open joint stock company. In October 2006 the Group started re-branding to change its name from Vneshtorgbank to VTB. In March 2007, the Bank for Foreign Trade was renamed into “VTB Bank” (Open Joint-Stock Company). In June 2015 “VTB Bank” (open joint-stock company) was renamed into VTB Bank (Public Joint-Stock Company) in accordance with the legislative requirements. On 2 January 1991, VTB received a general banking license (number 1000) from the Central Bank of the Russian Federation (CBR). In addition, VTB holds licenses required for trading and holding securities and engaging in other securities-related activities, including acting as a broker, a dealer and a custodian, and providing asset management and special depositary services. VTB and other Russian banks within the Group are regulated and supervised by the CBR. Foreign banks within the Group operate under the bank regulatory regimes of their respective countries. On 29 December 2004, the Bank became a member of the obligatory deposit insurance system provided by the State Corporation “Deposit Insurance Agency” (DIA). The Group subsidiary banks in Russia: “BM-Bank”, JSC, “Vozrozhdenie Bank”, PJSC, “Sarovbusinessbank”, PJSC and “Zapsibcombank”, PJSC are also members of the obligatory deposit insurance system provided by DIA. The State deposit insurance scheme implies that DIA guarantees repayment of individual deposits up to the
maximum total guaranteed amount of RUR 1.4 million with a 100% compensation of deposited amount from 29 December 2014. Starting 2019, the same guaranties are implied to deposits of legal entities referred to ‘small entities’ as it stated in legislation of the RF. In 2020, VTB re-registered its legal address to 11a Degtyarnyy Pereulok, Saint-Petersburg 191144, Russian Federation. VTB’s Head Office is located in Moscow. The Group operates in the corporate and investment banking, retail banking, real estate and other sectors. Corporate and investment banking include deposit taking and commercial lending, support of clients’ export/import transactions, foreign exchange, securities trading and trading in derivative financial instruments. The Group’s operations are conducted in both Russian and international markets. The Group conducts its banking business in Russia through VTB as a parent and several subsidiary banks. The Group operates outside Russia through subsidiary banks, located in Germany, the UK, Armenia, Belarus, Kazakhstan, Azerbaijan, Georgia and Angola; through representative offices located in Italy and China; through VTB branches in China and India, a branch of “VTB Bank (Europe)” in Austria and a branch of “VTB Capital”, Plc in Singapore. The Group investment banking division also engages in securities dealing and financial advisory in Hong Kong and investment banking operations in Bulgaria. VTB’s majority shareholder is the Russian Federation, acting through the Federal Property Agency, which holds 60.9% of VTB’s issued and outstanding ordinary shares as at 31 December 2020 (31 December 2019: 60.9%). Unless otherwise noted herein, all amounts are expressed in billions of Russian roubles rounded off to one decimal.
2. BASIS OF PREPARATION These consolidated financial statements (“financial statements”) have been prepared in accordance with International Financial Reporting Standards (“IFRS”). The Bank and its subsidiaries and associates maintain their accounting records in accordance with regulations applicable in their country of registration. These financial statements are based on those accounting books and records, as adjusted and reclassified to comply with IFRS.
These financial statements have been prepared under the historical cost convention, as modified by the initial recognition of trading financial instruments based on fair value, by the revaluation of land, premises and investment properties, investment securities at fair value through profit and loss and through other comprehensive income.
The summary of principal accounting policies applied in the preparation of these financial statements is set out below in Note 56. These policies have been consistently applied to all the periods presented, unless otherwise stated. These financial statements are presented in Russian roubles (RUR), the national currency of the Russian Federation, where the Bank is domiciled. Unless otherwise noted herein, all amounts are expressed in billions of Russian roubles rounded off to one decimal. Due to rounding, numbers presented throughout this document may not sum precisely to the totals provided and percentages may not precisely reflect the absolute figures.

VTB BANK NOTES TO THE CONSOLIDATED FINANCIAL STATEMENTS 31 DECEMBER 2020 (CONTINUED)
19
DELVING INTO NUMBERS
3. ANALYSIS BY SEGMENT ............................. 20
4. INTEREST INCOME AND EXPENSE ............. 28
5. NET FEE AND COMMISSION INCOME ........ 28
6. GAINS NET OF LOSSES ARISING FROM OTHER FINANCIAL INSTRUMENTS AT FAIR VALUE THROUGH PROFIT OR LOSS ............29
7. GAINS NET OF LOSSES ARISING FROM SALE OF FINANCIAL ASSETS AT FAIR VALUE THROUGH OTHER COMPREHENSIVE INCOME ......................... 29
8. GAINS NET OF LOSSES / (LOSSES NET OF GAINS) ARISING FROM FOREIGN CURRENCIES AND PRECIOUS METALS .... 29
9. OTHER OPERATING INCOME...................... 29
10. REVENUES LESS EXPENSES FROM OPERATING LEASING .................................. 30
11. REVENUES AND OTHER GAINS FROM OTHER NON-BANKING ACTIVITIES ............ 30
12. COST OF SALES AND OTHER EXPENSES FROM OTHER NON-BANKING ACTIVITIES ...30
13. NET INSURANCE PREMIUMS EARNED FROM NON-STATE PENSION FUND ACTIVITY ....................................................... 30
14. NET INSURANCE CLAIMS INCURRED, MOVEMENT IN LIABILITIES TO POLICYHOLDERS AND ACQUISITION COSTS ON NON-STATE PENSION FUND ACTIVITY ....................................................... 31
15. OTHER OPERATING EXPENSE .................. 31
16. STAFF COSTS AND ADMINISTRATIVE EXPENSES .................................................... 31
17. INCOME TAX ................................................. 32
18. CASH AND SHORT-TERM FUNDS ............... 35
19. TRADING FINANCIAL ASSETS ..................... 35
20. DERIVATIVE FINANCIAL INSTRUMENTS .... 36
21. DUE FROM OTHER BANKS .......................... 36
22. LOANS AND ADVANCES TO CUSTOMERS .. 38
23. INVESTMENT FINANCIAL ASSETS .............. 47
24. LAND, PREMISES AND EQUIPMENT ........... 48
25. INVESTMENT PROPERTY ............................ 50
26. GOODWILL AND OTHER INTANGIBLE ASSETS ......................................................... 51
27. OTHER ASSETS ............................................ 56
28. DISPOSAL GROUPS AND NON-CURRENT ASSETS HELD FOR SALE ............................ 57
29. DUE TO OTHER BANKS ............................... 58
30. CUSTOMER DEPOSITS ................................ 58
31. OTHER BORROWED FUNDS ...................... 59
32. DEBT SECURITIES ISSUED ......................... 60
33. SUBORDINATED DEBT ............................... 60
34. OTHER LIABILITIES ...................................... 61
35. SHARE CAPITAL ........................................... 61
36. PERPETUAL LOAN PARTICIPATION NOTES ........................................................... 62
37. OTHER RESERVES ...................................... 62
38. DIVIDENDS AND AMOUNTS PAID UNDER PERPETUAL LOAN PARTICIPATION NOTES ........................................................... 62

VTB BANK NOTES TO THE CONSOLIDATED FINANCIAL STATEMENTS 31 DECEMBER 2020 (CONTINUED)
20
3. ANALYSIS BY SEGMENT In accordance with IFRS 8, Operating Segments, the Group has defined five reportable segments.
Corporate-Investment banking (CIB)
Medium and Small banking (MSB)
Retail business (RB)
Treasury
Other business The Group has also separately disclosed Corporate Centre. The Group also disclosed a new acquisition – non distributed item as a separate reportable segment that presents data of subsidiary banks for the quarter when these subsidiary banks were acquired. Following the further integration of activities of the subsidiary into the Group’s global business lines the data for the subsidiary are presented within reportable segments listed above. In 2019 included in the new acquisitions-non distributed reportable segment are the financial results of “Sarovbusinessbank”, PJSC and “Zapsibcombank”, PJSC for the 1st quarter of 2019. Their financial results for the 2nd, 3rd and 4th quarters of 2019 have been reallocated to respective reportable segments following completion of internal procedures. The composition of reportable segments is approved by resolutions of VTB Group’s Management Committee (Chief Decision Makers), the body that on a regular basis assesses performance of reportable segments and allocates resources to them. (a) Factors that management used in order to
identify the reportable segments
The Group’s segments are strategic business lines that are managed separately, focus on different clients and have product specialisation. The majority of the Group’s activities and resources are allocated and managed, and their performance is assessed via the respective segment information. (b) Segments’ business activities
The CIB, MSB and RB segments are global business lines that focus on servicing different customer segments. The Treasury and Other Business segments, as well as Corporate Centre do not constitute separate global business lines. The criteria used to identify client segments for each global business line are set by the Group Management Committee. They include principles for allocating customers between large, medium and small business customer segments.
CIB and MSB
CIB global business line encompasses operations with corporate customers that are 'large business' customers and banking financial institutions, as well as operations on the securities market, excluding operations with securities for liquidity management purposes. In addition, CIB global business line makes direct equity investments, becoming a partner in socially significant infrastructure projects and companies in various industries. CIB’s global business line offers partnership experience, infrastructure and financial resources of VTB Group, which allows them to increase their operational efficiency and investment appeal as part of a long-term strategy. Starting from reporting date 2020, a separate disclosure has been prepared highlighting the result of
these operations. MSB global business line encompasses operations with corporate customers of “medium business” and “small business” categories. Reportable segment comprises:
operations with prevailing market risk including loans with exposure to market risks;
corporate finance operations;
asset management, brokerage services and financial consulting;
operations with precious metals;
profit-taking operations on the financial and currency markets, including interbank market;
other products and services with prevailing market risk;
operations with prevailing credit risk and interest rate risk, such as lending to corporate customers (large and medium businesses segments), including overdrafts on customers’ current accounts;
trade and export financing;
operations with corporate customers: current and settlement accounts and term deposits;
documentary operations, including letters of credit and guarantees;
depositary operations;
fee-based services of all kinds not related to operations on the financial markets and currency valuables: settlement and cash services, collection, storage box, remote banking services, payment processing centre service.
Also includes term funding from certain clients (including promissory notes issued), based on the decision of VTB Group’s Management Committee.

VTB BANK NOTES TO THE CONSOLIDATED FINANCIAL STATEMENTS 31 DECEMBER 2020 (CONTINUED)
21
3. ANALYSIS BY SEGMENT (CONTINUED) (b) Segments’ business activities (continued) Retail business
RB global business line encompasses operations with individuals and specific operations with corporate customers.
The retail business comprises operations with individuals and also internet and mobile POS-acquiring operations with major retail chains, operations of individuals with plastic cards, payroll related services, payment processing centre service, all types of insurance products and services, non-government pension funds.
Treasury
The Treasury comprises:
operations to manage liquidity (including those with securities portfolios maintained for liquidity management purposes);
operations on financial and interbank markets as a part of management of payment and currency positions, as well as interest rate risk management;
cash flow management within the Head office or subsidiary and between VTB Group members;
debt financing operations;
reallocation of resources between segments both within the Head office or subsidiary and between VTB Group members.
The net financial results of the Treasury reportable segment are allocated to other reportable segments in accordance with established methodology. Corporate Centre
The Corporate Centre represents unallocated staff and administrative expenses related to VTB Group’s management, as well as expenses on strategic programmes connected with VTB Group’s brand development and positioning on the local and international markets, etc. It may also include other items resulting from intersegment reallocations as determined by VTB Group’s Management Committee. Corporate Center also includes investments in associates not allocated to reportable segments and operations of companies in non-banking digital business. Starting from reporting date 2020, a separate disclosure has been prepared to disclose investments in operations of companies in non-banking digital business.
Other business
The other business includes two lines of business: Construction and development and Other. The Construction and development business line is non-banking operations undertaken by Group members operating in the construction and development industry. The Other activities represent non-banking business, including assets, which were transferred to the Group as a result of debt settlement. Starting from reporting date 2020, a separate disclosure has been prepared highlighting the result of these operations (c) Managing operating segments’ profit or loss,
assets or liabilities
The performance of a segment and its profit or loss are measured in accordance with IFRS, as adjusted by intersegment reallocations and decisions of VTB Group’s Management Committee regarding the allocation of operations between segments. The Head office and the Group members prepare segment reporting using unified rules. Intersegment transactions within a single entity of the Group are settled using the internal transfer prices, which are designed to reflect the cost of resources. Transfer prices are set and reviewed on a regular basis in each of the Group’s entities. VTB Group’s Management Committee evaluates segments’ performance based on their net profit after tax, as well as other qualitative and quantitative information. Intersegment transactions are predominantly conducted in the normal course of business. As at 31 December 2020, the Group’s reportable segments and their compositions remained as disclosed in the consolidated financial statements as at 31 December 2019.

VTB BANK NOTES TO THE CONSOLIDATED FINANCIAL STATEMENTS 31 DECEMBER 2020 (CONTINUED)
22
3. ANALYSIS BY SEGMENT (CONTINUED)
CIB MSB RB Treasury Corporate
centre Other
business New acquisitions –
non distributed Inter-segment eliminations Total
2020 2019 2020 2019 2020 2019 2020 2019 2020 2019 2020 2019 2020 2019 2020 2019 2020 2019
Revenues from: External customers 681.9 726.3 148.3 156.7 551.3 572.9 53.5 60.0 1.3 0.5 64.1 53.8 – 4.5 – – 1,500.4 1,574.7 Other segments 179.1 243.6 90.6 102.6 257.7 281.1 724.2 821.7 0.5 – 9.5 6.7 – 0.3 (1,261.6) (1,456.0) – – Total revenues 861.0 969.9 238.9 259.3 809.0 854.0 777.7 881.7 1.8 0.5 73.6 60.5 – 4.8 (1,261.6) (1,456.0) 1,500.4 1,574.7 Segment income and expense: Interest income 665.2 754.4 200.7 223.1 657.3 681.2 767.0 878.0 0.4 0.1 4.4 4.5 – 3.9 (1,239.2) (1,438.2) 1,055.8 1,107.0 Interest expense (502.3) (630.4) (135.9) (162.0) (436.6) (478.5) (640.6) (775.9) (0.1) (0.2) (25.2) (25.8) – (1.9) 1,239.1 1,438.2 (501.6) (636.5) Payments to deposit insurance
system (0.5) (0.3) (2.6) (3.2) (19.1) (26.1) (0.3) (0.1) – – – – – (0.2) – – (22.5) (29.9) Treasury result allocation 22.0 9.2 14.9 7.4 34.2 18.0 (115.6) (41.8) 35.8 (1.5) 8.7 8.7 – – – – – – Net interest income/(expense) 184.4 132.9 77.1 65.3 235.8 194.6 10.5 60.2 36.1 (1.6) (12.1) (12.6) – 1.8 (0.1) – 531.7 440.6 (Provision charge) / reversal of
provision for credit losses on debt financial assets (69.6) (33.1) (26.2) (14.6) (83.6) (48.8) (0.2) 0.8 (47.4) 4.3 – 0.2 – (1.0) – – (227.0) (92.2)
Net interest income/(expense) after provision charge for credit losses 114.8 99.8 50.9 50.7 152.2 145.8 10.3 61.0 (11.3) 2.7 (12.1) (12.4) – 0.8 (0.1) – 304.7 348.4
Net fee and commission income 33.7 32.8 31.2 30.3 66.0 55.4 5.0 1.9 – – 0.8 0.7 – 0.7 0.1 (0.2) 136.8 121.6 Other gains net of losses/(losses net
of gains) arising from financial instruments and foreign currencies 60.4 80.9 1.0 0.8 3.7 17.4 (16.3) (61.7) (0.6) – 3.0 3.8 – – 0.1 – 51.3 41.2
Share in profit/(loss) of associates and joint ventures 9.1 3.6 0.2 0.3 8.0 6.3 0.2 0.6 0.1 0.2 (0.3) 0.1 – – – – 17.3 11.1
Profit/(losses) from disposal of subsidiaries and associates 5.9 1.1 – – – – – 0.1 – – 0.2 6.3 – – – – 6.1 7.5
(Provision charge) / reversal of provision for credit losses on credit related commitments and other financial assets (16.1) (4.6) (5.9) (1.5) 0.1 (0.2) – – (0.8) (4.3) (0.1) (0.5) – – – – (22.8) (11.1)
Other operating (expense)/income 23.4 31.4 2.2 1.5 (34.7) (41.7) 0.8 (1.9) (0.8) (0.8) (118.4) (2.4) – 5.5 (6.3) (3.2) (133.8) (11.6) Net operating income/(expense) 231.2 245.0 79.6 82.1 195.3 183.0 – – (13.4) (2.2) (126.9) (4.4) – 7.0 (6.2) (3.4) 359.6 507.1 Staff costs and administrative
expenses (76.9) (71.7) (44.4) (38.9) (109.4) (103.2) – – (32.4) (32.3) (13.0) (10.2) – (1.3) 6.2 3.4 (269.9) (254.2) Profit/(loss) before tax 154.3 173.3 35.2 43.2 85.9 79.8 – – (45.8) (34.5) (139.9) (14.6) – 5.7 – – 89.7 252.9 Income tax (expense)/benefit (33.3) (37.9) (6.8) (8.7) (15.9) (14.8) – – 9.8 7.2 31.8 2.6 – (0.1) – – (14.4) (51.7) Net profit/(loss) 121.0 135.4 28.4 34.5 70.0 65.0 – – (36.0) (27.3) (108.1) (12.0) – 5.6 – – 75.3 201.2
Capital expenditure 9.8 3.7 14.8 3.7 57.5 19.1 – – 6.5 1.0 20.1 7.1 – – – – 108.7 34.6 Depreciation 18.9 17.2 3.9 2.9 13.5 13.3 – – 1.1 0.5 5.9 3.6 – 0.1 (0.1) (0.3) 43.2 37.3

VTB BANK NOTES TO THE CONSOLIDATED FINANCIAL STATEMENTS 31 DECEMBER 2020 (CONTINUED)
23
3. ANALYSIS BY SEGMENT (CONTINUED)
CIB MSB RB Treasury Corporate
centre Other
business New acquisitions –
non distributed Inter-segment eliminations Total
2020 2019 2020 2019 2020 2019 2020 2019 2020 2019 2020 2019 2020 2019 2020 2019 2020 2019
Net profit/(loss) 121.0 135.4 28.4 34.5 70.0 65.0 – – (36.0) (27.3) (108.1) (12.0) – 5.6 – – 75.3 201.2
Net result on financial assets
at fair value through other comprehensive income, net of tax 1.8 2.1 – – 4.1 0.9 2.4 5.8 – – 0.2 – – 0.1 – (0.2) 8.5 8.7
Cash flow hedges, net of tax 0.4 0.1 – – – – – – – – (0.4) – – – – – – 0.1 Share of other comprehensive loss
of associates and joint ventures – 0.1 – – 0.1 0.1 4.2 (2.2) – – – – – – – – 4.3 (2.0) Effect of translation, net of tax – – – – – – 27.3 (21.1) 0.6 – – – – – – – 27.9 (21.1) Actuarial (losses net of gains) /
gains net of losses / arising from difference between pension plan assets and obligations – (0.1) – – – – – – – – – – – – – – – (0.1)
Land and premises revaluation, net of tax 0.3 – – – – – – – – – (0.2) (0.3) – – – – 0.1 (0.3)
Total other comprehensive (loss)/income before treasury result allocation 2.5 2.2 – – 4.2 1.0 33.9 (17.5) 0.6 – (0.4) (0.3) – 0.1 – (0.2) 40.8 (14.7)
Treasury result allocation 1.5 0.8 1.4 0.6 2.7 1.5 (33.9) 17.5 28.3 (20.4) – – – – – – – – Total other comprehensive
(loss)/income 4.0 3.0 1.4 0.6 6.9 2.5 – – 28.9 (20.4) (0.4) (0.3) – 0.1 – (0.2) 40.8 (14.7)
Total comprehensive income/(loss) 125.0 138.4 29.8 35.1 76.9 67.5 – – (7.1) (47.7) (108.5) (12.3) – 5.7 – (0.2) 116.1 186.5
As at 31 December 2020 and for the year then ended provision for credit losses on debt financial assets and provision charge for credit losses on debt financial assets amounted to RUR 898.7 billion and RUR 227.0 billion, respectively (31 December 2019: RUR 688.1 billion and RUR 92.2 billion, respectively); provision and provision charge for credit losses on off-balance sheet commitments and other financial assets amounted to RUR 44.3 billion and RUR 22.8 billion, respectively (31 December 2019: RUR 36.0 billion and RUR 11.1 billion, respectively).
Included in these balance sheet amounts is the amount of RUR 112.2 billion (31 December 2019: RUR 93.1 billion), which represents the provision for credit losses on debt financial instruments and off-balance sheet items related to the Group’s exposure to certain groups of borrowers that in the Group’s management view are subject to industry and other portfolio specific risks. Group’s exposures to these groups of borrowers are predominantly residing in the Corporate and Investment Banking segment.

VTB BANK NOTES TO THE CONSOLIDATED FINANCIAL STATEMENTS 31 DECEMBER 2020 (CONTINUED)
24
3. ANALYSIS BY SEGMENT (CONTINUED)
CIB MSB RB Treasury Corporate
centre Other
business Inter-segment eliminations Total
2020 2019 2020 2019 2020 2019 2020 2019 2020 2019 2020 2019 2020 2019 2020 2019
Cash and short-term funds 76.1 28.5 12.4 – 198.3 113.4 942.7 1,193.0 – – – 0.1 – – 1,229.5 1,335.0 Mandatory cash balances with central banks – – – – – – 137.2 127.2 – – – – – – 137.2 127.2 Due from other banks 441.6 275.0 0.1 – 3.9 16.7 392.3 318.3 – 0.1 – – – – 837.9 610.1 Loans and advances to customers 7,014.2 5,951.2 1,428.3 1,340.3 3,586.2 3,157.8 295.4 329.6 (65.4) (17.9) 5.7 13.1 – – 12,264.4 10,774.1 Other financial instruments 792.1 452.8 0.8 0.4 281.4 223.9 749.9 265.1 0.4 0.3 8.9 18.2 – – 1,833.5 960.7 Investments in associates and joint ventures 198.0 141.9 0.9 0.8 97.5 86.1 5.1 4.2 20.1 17.5 5.3 14.4 – – 326.9 264.9 Other assets items 780.5 676.1 118.4 94.1 265.7 241.9 7.1 9.7 37.0 22.7 304.1 399.6 – – 1,512.8 1,444.1
Net amount of intersegment settlements – – 441.1 383.0 1,613.8 1,952.1 884.5 559.7 85.2 15.7 – – (3,024.6) (2,910.5) – – Segment assets 9,302.5 7,525.5 2,002.0 1,818.6 6,046.8 5,791.9 3,414.2 2,806.8 77.3 38.4 324.0 445.4 (3,024.6) (2,910.5) 18,142.2 15,516.1
Due to other banks 458.9 149.6 0.1 0.3 0.9 0.5 633.1 1,026.8 – – – – – – 1,093.0 1,177.2 Customer deposits 4,857.8 3,740.9 1,804.0 1,624.5 5,161.7 4,921.8 1,006.1 685.7 – – 1.4 1.3 – – 12,831.0 10,974.2 Other borrowed funds 181.1 142.3 2.3 0.8 3.3 2.3 866.5 203.5 – – – – – – 1,053.2 348.9 Debt securities issued 24.7 34.4 18.4 22.5 139.7 194.6 32.9 91.9 – – – – – – 215.7 343.4 Subordinated debt – – – – – – 316.7 223.1 – – – – – – 316.7 223.1 Other liabilities items 389.8 327.1 33.4 23.8 354.2 330.3 32.3 31.8 59.8 22.4 40.5 60.6 – – 910.0 796.0 Net amount of intersegment settlements 2,686.4 2,507.9 – – – – – – – – 338.2 402.6 (3,024.6) (2,910.5) – – Segment liabilities 8,598.7 6,902.2 1,858.2 1,671.9 5,659.8 5,449.5 2,887.6 2,262.8 59.8 22.4 380.1 464.5 (3,024.6) (2,910.5) 16,419.6 13,862.8
Net (loss)/profit after tax by segment Segment assets Segment liabilities
1 1 1 1 1 1 1 1 1 1 1
2 2 2 2 2 2 2 2 2 2 2
3 3 3 3 3 3 3 3 3 3 3
4 4 4 4 4 4 4 4 4 4 4
5 5 5 5 5 5 5 5 5 5 5
6 6 6 6 6 6 6 6 6 6 6
7 7 7 7 7 7 7 7 7 7 7
8 8 8 8 8 8 8 8 8 8 8
9 9 9 9 9 9 9 9 9 9 9
10 10 10 10 10 10 10 10 10 10 10
11 11 11 11 11 11 11 11 11 11 11
12 12 12 12 12 12 12 12 12 12 12
13 13 13 13 13 13 13 13 13 13 13
14 14 14 14 14 14 14 14 14 14 14
15 15 15 15 15 15 15 15 15 15 15
16 16 16 16 16 16 16 16 16 16 16
17 17 17 17 17 17 17 17 17 17 17
18 18 18 18 18 18 18 18 18 18 18
19 19 19 19 19 19 19 19 19 19 19
20 20 20 20 20 20 20 20 20 20 20
21 21 21 21 21 21 21 21 21 21 21
22 22 22 22 22 22 22 22 22 22 22
23 23 23 23 23 23 23 23 23 23 23
24 24 24 24 24 24 24 24 24 24 24
25 25 25 25 25 25 25 25 25 25 25
26 26 26 26 26 26 26 26 26 26 26
27 27 27 27 27 27 27 27 27 27 27
28 28 28 28 28 28 28 28 28 28 28
29 29 29 29 29 29 29 29 29 29 29
30 30 30 30 30 30 30 30 30 30 30
31 31 31 31 31 31 31 31 31 31 31
32 32 32 32 32 32 32 32 32 32 32
33 33 33 33 33 33 33 33 33 33 33
33 33 33 33 33 33 33 33 33 33 33
135.434.5
65.0 -27.3-12.0 5.6
-
201.2
2019
RBSMBCIB Corporate
centerNew
acquisitionsInter-segment
eliminations
TotalOther
business
121.028.4
70.0 -36.0
-108.1
- - 75.3
2020
1 1 1 1 1 1 1
1 1 1 1 1 1 1
1 1 1 1 1 1 1
1 1 1 1 1 1 1
1 1 1 1 1 1 1
1 1 1 1 1 1 1
1 1 1 1 1 1 1
1 1 1 1 1 1 1
1 1 1 1 1 1 1
1 1 1 1 1 1 1
1 1 1 1 1 1 1
1 1 1 1 1 1 1
1 1 1 1 1 1 1
1 1 1 1 1 1 1
1 1 1 1 1 1 1
1 1 1 1 1 1 1
1 1 1 1 1 1 1
51%
9%
24%
14%2%
31 Dec 2020
CIB
SMB
RB
Treasury
Other
1 1 1 1 1 1 1
1 1 1 1 1 1 1
1 1 1 1 1 1 1
1 1 1 1 1 1 1
1 1 1 1 1 1 1
1 1 1 1 1 1 1
1 1 1 1 1 1 1
1 1 1 1 1 1 1
1 1 1 1 1 1 1
1 1 1 1 1 1 1
1 1 1 1 1 1 1
1 1 1 1 1 1 1
1 1 1 1 1 1 1
1 1 1 1 1 1 1
1 1 1 1 1 1 1
1 1 1 1 1 1 1
1 1 1 1 1 1 1
36%
11%
34%
18%
1%
31 Dec 2020
CIB
SMB
RB
Treasury
Other

VTB BANK NOTES TO THE CONSOLIDATED FINANCIAL STATEMENTS 31 DECEMBER 2020 (CONTINUED)
25
3. ANALYSIS BY SEGMENT (CONTINUED)
Operations of reportable segments related to long term investments of CIB, non-bank digital assets and other business transferred to the Group under debt settlement are presented below:
CIB without long term Investments
Long term Investments Total CIB
Corporate centre without non-bank
digital assets Non-bank digital
assets Total Corporate
centre
Other business without assets credit
workout Assets credit workout Total
Other business
2020 2019 2020 2019 2020 2019 2020 2019 2020 2019 2020 2019 2020 2019 2020 2019 2020 2019
Revenues from: External customers 618.0 653.7 63.9 72.6 681.9 726.3 0.4 0.2 0.9 0.3 1.3 0.5 – – 64.1 53.8 64.1 53.8 Other segments 178.9 243.0 0.2 0.6 179.1 243.6 0.1 – 0.4 – 0.5 – – – 9.5 6.7 9.5 6.7 Total revenues 796.9 896.7 64.1 73.2 861.0 969.9 0.5 0.2 1.3 0.3 1.8 0.5 – – 73.6 60.5 73.6 60.5 Segment income and expense: Interest income 656.2 748.3 9.0 6.1 665.2 754.4 – 0.1 0.4 – 0.4 0.1 – – 4.4 4.5 4.4 4.5 Interest expense (482.8) (610.6) (19.5) (19.8) (502.3) (630.4) (0.1) (0.2) – – (0.1) (0.2) – – (25.2) (25.8) (25.2) (25.8) Payments to deposit insurance
system (0.5) (0.3)
– – (0.5) (0.3) – – – – – – – – – – – – Treasury result allocation 19.3 8.9 2.7 0.3 22.0 9.2 35.8 (1.5) – – 35.8 (1.5) – – 8.7 8.7 8.7 8.7
Net interest income/(expense) 192.2 146.3 (7.8) (13.4) 184.4 132.9 35.7 (1.6) 0.4 – 36.1 (1.6) – – (12.1) (12.6) (12.1) (12.6) (Provision charge) / reversal of
provision for credit losses on debt financial assets (69.5) (33.1) (0.1) – (69.6) (33.1) (47.4) 4.3 – – (47.4) 4.3 – – – 0.2 – 0.2
Net interest income/(expense) after provision charge for credit losses 122.7 113.2 (7.9) (13.4) 114.8 99.8 (11.7) 2.7 0.4 – (11.3) 2.7 – – (12.1) (12.4) (12.1) (12.4)
Net fee and commission income 33.7 32.6 – 0.2 33.7 32.8 – – – – – – – – 0.8 0.7 0.8 0.7 Other gains net of losses/(losses net
of gains) arising from financial instruments and foreign currencies 55.2 64.3 5.2 16.6 60.4 80.9 (0.6) – – – (0.6) – – – 3.0 3.8 3.0 3.8
Share in profit/(loss) of associates and joint ventures 0.1 0.3 9.0 3.3 9.1 3.6 0.2 0.2 (0.1) – 0.1 0.2 – – (0.3) 0.1 (0.3) 0.1
Profit/(losses) from disposal of subsidiaries and associates 1.9 – 4.0 1.1
5.9 1.1 – – – – – – – – 0.2 6.3 0.2 6.3
(Provision charge) / reversal of provision for credit losses on credit related commitments and other financial assets (16.1) (4.6) – – (16.1) (4.6) (0.8) (4.3) – – (0.8) (4.3) – – (0.1) (0.5) (0.1) (0.5)
Other operating (expense)/income 12.9 22.8 10.5 8.6 23.4 31.4 0.3 (0.3) (1.1) (0.5) (0.8) (0.8) – – (118.4) (2.4) (118.4) (2.4) Net operating income/(expense) 210.4 228.6 20.8 16.4 231.2 245.0 (12.6) (1.7) (0.8) (0.5) (13.4) (2.2) – – (126.9) (4.4) (126.9) (4.4) Staff costs and administrative
expenses (76.6) (71.5) (0.3) (0.2) (76.9) (71.7) (32.4) (32.3) – – (32.4) (32.3) (10.4) (8.1) (2.6) (2.1) (13.0) (10.2) Profit/(loss) before tax 133.8 157.1 20.5 16.2 154.3 173.3 (45.0) (34.0) (0.8) (0.5) (45.8) (34.5) (10.4) (8.1) (129.5) (6.5) (139.9) (14.6) Income tax (expense)/benefit (31.2) (36.8) (2.1) (1.1) (33.3) (37.9) 9.7 7.1 0.1 0.1 9.8 7.2 2.1 1.6 29.7 1.0 31.8 2.6 Net profit/(loss) 102.6 120.3 18.4 15.1 121.0 135.4 (35.3) (26.9) (0.7) (0.4) (36.0) (27.3) (8.3) (6.5) (99.8) (5.5) (108.1) (12.0)

VTB BANK NOTES TO THE CONSOLIDATED FINANCIAL STATEMENTS 31 DECEMBER 2020 (CONTINUED)
26
3. ANALYSIS BY SEGMENT (CONTINUED)
CIB without long term Investments
Long term Investments Total CIB
Corporate centre without non-bank
digital assets Non-bank digital
assets Total Corporate
centre
Other business without assets credit
workout Assets credit workout Total
Other business
2020 2019 2020 2019 2020 2019 2020 2019 2020 2019 2020 2019 2020 2019 2020 2019 2020 2019
Net profit/(loss) 102.6 120.3 18.4 15.1 121.0 135.4 (35.3) (26.9) (0.7) (0.4) (36.0) (27.3) (8.3) (6.5) (99.8) (5.5) (108.1) (12.0)
Net result on financial assets at fair
value through other comprehensive income, net of tax 1.8 2.6 – (0.5) 1.8 2.1 – – – – – – – – 0.2 – 0.2 –
Cash flow hedges, net of tax 0.4 0.1 – – 0.4 0.1 – – – – – – – – (0.4) – (0.4) – Share of other comprehensive loss
of associates and joint ventures – 0.1 – – – 0.1 – – – – – – – – – – – – Effect of translation, net of tax – – – – – – 0.6 – – – 0.6 – – – – – – – Actuarial (losses net of gains) /
gains net of losses / arising from difference between pension plan assets and obligations – (0.1) – – – (0.1) – – – – – – – – – – – –
Land and premises revaluation, net of tax 0.3 – – – 0.3 – – – – – – – – – (0.2) (0.3) (0.2) (0.3)
Total other comprehensive (loss)/income before treasury result allocation 2.5 2.7 – (0.5) 2.5 2.2 0.6 – – – 0.6 – – – (0.4) (0.3) (0.4) (0.3)
Treasury result allocation 1.5 0.8 – – 1.5 0.8 28.3 (20.4) – – 28.3 (20.4) – – – – – – Total other comprehensive
(loss)/income 4.0 3.5 – (0.5) 4.0 3.0 28.9 (20.4) – – 28.9 (20.4) – – (0.4) (0.3) (0.4) (0.3)
Total comprehensive income/(loss) 106.6 123.8 18.4 14.6 125.0 138.4 (6.4) (47.3) (0.7) (0.4) (7.1) (47.7) (8.3) (6.5) (100.2) (5.8) (108.5) (12.3)

VTB BANK NOTES TO THE CONSOLIDATED FINANCIAL STATEMENTS 31 DECEMBER 2020 (CONTINUED)
27
3. ANALYSIS BY SEGMENT (CONTINUED)
CIB without long term
Investments Long term
Investments Total CIB
Corporate centre without non-bank
digital assets Non-bank digital
assets Total Corporate
centre
Other business without assets credit
workout Assets credit workout
Total Other business
2020 2019 2020 2019 2020 2019 2020 2019 2020 2019 2020 2019 2020 2019 2020 2019 2020 2019
Cash and short-term funds 76.0 28.3 0.1 0.2 76.1 28.5 – – – – – – – – – 0.1 – 0.1 Mandatory cash balances with
central banks – – – – – – – – – – – – – – – – – – Due from other banks 441.6 275.0 – – 441.6 275.0 – – – 0.1 – 0.1 – – – – – – Loans and advances to customers 6,962.4 5,915.4 51.8 35.8 7,014.2 5,951.2 (65.4) (17.9) – – (65.4) (17.9) – – 5.7 13.1 5.7 13.1 Other financial instruments 752.0 442.0 40.1 10.8 792.1 452.8 0.4 0.3 – – 0.4 0.3 – – 8.9 18.2 8.9 18.2 Investments in associates and joint
ventures – – 198.0 141.9 198.0 141.9 19.4 16.9 0.7 0.6 20.1 17.5 – – 5.3 14.4 5.3 14.4 Other assets items 768.3 535.9 12.2 140.2 780.5 676.1 34.4 21.4 2.6 1.3 37.0 22.7 82.7 59.1 221.4 340.5 304.1 399.6 Net amount of intersegment
settlements – – – – – – 49.8 14.4 35.4 1.3 85.2 15.7 – – – – – – Segment assets 9,000.3 7,196.6 302.2 328.9 9,302.5 7,525.5 38.6 35.1 38.7 3.3 77.3 38.4 82.7 59.1 241.3 386.3 324.0 445.4
Due to other banks 458.9 149.6 – – 458.9 149.6 – – – – – – – – – – – – Customer deposits 4,827.4 3,740.9 30.4 – 4,857.8 3,740.9 – – – – – – – – 1.4 1.3 1.4 1.3 Other borrowed funds 181.1 142.3 – – 181.1 142.3 – – – – – – – – – – – – Debt securities issued 24.7 34.4 – – 24.7 34.4 – – – – – – – – – – – – Subordinated debt – – – – – – – – – – – – – – – – – – Other liabilities items 373.2 311.2 16.6 15.9 389.8 327.1 24.6 22.1 35.2 0.3 59.8 22.4 – – 40.5 60.6 40.5 60.6 Net amount of intersegment
settlements 2,417.4 2,193.0 269.0 314.9 2,686.4 2,507.9 – – – – – – 78.0 55.2 260.2 347.4 338.2 402.6 Segment liabilities 8,282.7 6,571.4 316.0 330.8 8,598.7 6,902.2 24.6 22.1 35.2 0.3 59.8 22.4 78.0 55.2 302.1 409.3 380.1 464.5

VTB BANK NOTES TO THE CONSOLIDATED FINANCIAL STATEMENTS 31 DECEMBER 2020 (CONTINUED)
28
3. ANALYSIS BY SEGMENT (CONTINUED) Geographical segment information based on geographical location of entities within the Group: 2020 2019
Russia Other Total Russia Other Total
Revenues from external customers for the year 1,369.2 108.8 1,478.0 1,441.4 105.1 1,546.5 Non-current assets as at end of period 899.7 199.2 1,098.9 926.4 166.3 1,092.7
4. INTEREST INCOME AND EXPENSE 2020 2019
Interest income calculated using the effective interest method Financial assets measured at amortised cost
Loans and advances to customers 905.4 974.6
Due from other banks 24.9 39.3
Investment financial assets 1.8 1.2 Debt financial assets measured at fair value through other comprehensive income 42.2 24.7 Total interest income calculated using the effective interest method 974.3 1,039.8 Other interest income Financial assets at fair value through profit or loss 52.3 38.8 Net investments in finance lease 29.2 28.4 Total other interest income 81.5 67.2 Total interest income 1,055.8 1,107.0
Interest expense Customer deposits (389.7) (501.1) Due to other banks and other borrowed funds (74.5) (99.7) Debt securities issued (17.6) (19.9) Subordinated debt (14.6) (12.8) Total interest expense calculated using the effective interest rate (496.4) (633.5) Interest expense on lease liabilities (3.3) (2.3) Advances received under construction agreements (1.9) (0.7) Total interest expense (501.6) (636.5)
Payments to deposit insurance system (22.5) (29.9)
Net interest income 531.7 440.6
In May 2020 the State Corporation “Deposit Insurance Agency” decreased retrospectively the rate of payment to the obligatory deposit insurance system starting 1 January 2020.
5. NET FEE AND COMMISSION INCOME 2020 2019
Commission on settlement transactions and trade finance 86.2 85.0 Fee received for insurance products distribution and agents' services 44.9 35.3 Commission on operations with securities and capital markets 23.9 17.4 Commission on guarantees and other credit related commitments issued 13.2 10.9 Commission for client operations with foreign currency and precious metals 10.8 9.9 Commission on cash transactions 9.3 9.0 Other 7.8 8.7 Total fee and commission income 196.1 176.2
Commission on settlement transactions and trade finance (50.7) (46.8) Commission on cash transactions (2.9) (2.8) Commission on operations with securities and capital markets (2.9) (1.9) Commission on guarantees and other credit related facilities received (0.8) (0.9) Other (2.0) (2.2) Total fee and commission expense (59.3) (54.6)
Net fee and commission income 136.8 121.6

VTB BANK NOTES TO THE CONSOLIDATED FINANCIAL STATEMENTS 31 DECEMBER 2020 (CONTINUED)
29
6. GAINS NET OF LOSSES ARISING FROM OTHER FINANCIAL INSTRUMENTS AT FAIR VALUE THROUGH PROFIT OR LOSS
2020 2019
Gains net of losses arising from non-derivative trading financial assets 27.3 46.6 Gains net of losses arising from investment financial assets mandatorily measured
at fair value through profit or loss 8.1 4.0 Gains net of losses from associates and joint ventures designated as at fair value
through profit or loss 4.5 14.9 (Losses net of gains)/gains net of losses arising from investment financial assets
designated as at fair value through profit or loss (0.2) 0.1 (Losses net of gains)/gains net of losses arising from other financial instruments
designated as at fair value through profit or loss (2.5) 3.1 Losses net of gains arising from derivative financial assets and liabilities (4.4) (5.6) Total gains net of losses arising from financial instruments at fair value
through profit or loss 32.8 63.1
7. GAINS NET OF LOSSES ARISING FROM SALE OF FINANCIAL ASSETS AT FAIR VALUE THROUGH OTHER COMPREHENSIVE INCOME
2020 2019
Gains net of losses arising from sale of loans at fair value through other
comprehensive income 0.9 – (Losses net of gains)/gains net of losses arising from sale of debt investment assets
at fair value through other comprehensive income (0.1) 1.0 Total gains net of losses arising from sale of financial instruments at fair
value through other comprehensive income 0.8 1.0
8. GAINS NET OF LOSSES / (LOSSES NET OF GAINS) ARISING FROM FOREIGN CURRENCIES AND PRECIOUS METALS
2020 2019
Gains net of losses/(losses net of gains) arising from dealing in foreign currencies
and precious metals 33.4 (140.9)
derivative financial instruments 41.1 (132.6)
non-derivative financial assets (7.7) (8.3) Foreign exchange translation (losses net of gains) / gains net of losses (14.5) 105.4 Total gains net of losses / (losses net of gains) arising from foreign
currencies and precious metals 18.9 (35.5)
Gains net of losses / (losses net of gains) arising from dealing in foreign currencies represent foreign currency trading results and changes in value of foreign currency derivative positions, including those economically hedging net foreign currency positions.
Foreign exchange translation gains net of losses / (losses net of gains) include foreign exchange translation related to equity investment securities amounted to RUR 3.6 billion for the year ended 31 December 2020 (for the year ended 31 December 2019: RUR 0.9 billion).
9. OTHER OPERATING INCOME 2020 2019
Reimbursements received and reversal of impairment of other non-financial assets 4.9 0.7 Dividends received on equity investment financial assets 0.5 0.4 Gains arising from disposal of property 0.5 2.2 Fines and penalties received 0.5 0.6 Write-off of liabilities upon expiration 0.1 0.1 Other 2.7 3.5 Total other operating income 9.2 7.5

VTB BANK NOTES TO THE CONSOLIDATED FINANCIAL STATEMENTS 31 DECEMBER 2020 (CONTINUED)
30
10. REVENUES LESS EXPENSES FROM OPERATING LEASING 2020 2019
Revenue and other gains from operating lease of equipment 30.3 30.5 Expenses related to equipment leased out
Depreciation and amortisation (14.4) (13.0) Insurance (0.7) (0.6) Loss arising from disposal (0.5) (0.4) Taxes other than on income (0.1) (0.1) Other expenses (1.6) (1.0)
Total expenses related to equipment leased out (17.3) (15.1)
Total revenues less expenses from operating leasing 13.0 15.4
11. REVENUES AND OTHER GAINS FROM OTHER NON-BANKING ACTIVITIES 2020 2019
Construction, development and other real estate operations Revenue from sale of property intended for sale in the ordinary course of business 60.3 45.9 Rental income from investment property 4.4 4.9 Other income from real estate operations 4.6 6.3 Revenues and other gains from construction, development and other real
estate operations 69.3 57.1
Other non-banking activities Food and agriculture 23,1 30.4 Telecommunications and media 2.1 3.5 Sport and entertainment 2.1 1.8 Information technologies 1.9 1.5 Other 4.1 2.6 Revenues from other non-banking activities 33.3 39.8
Total revenues and other gains from other non-banking activities 102.6 96.9
12. COST OF SALES AND OTHER EXPENSES FROM OTHER NON-BANKING ACTIVITIES
2020 2019
Construction, development and other real estate operations Cost of sales – property intended for sale in the ordinary course of business 45.7 34.7 Administrative expenses 9.0 10.0 Staff cost 3.3 3.1 Depreciation and amortisation 0.9 0.7 Impairment of other assets related to non-banking activities 0.1 0.4 Cost of sales and other expenses from construction, development and other
real estate operations 59.0 48.9
Other non-banking activities Cost of sales 19.8 27.2 Administrative expenses 8.6 6.7 Staff cost 2.8 2.4 Depreciation and amortisation 2.5 1.8 Cost of sales and other expenses from other non-banking activities 33.7 38.1
Total cost of sales and other expenses from other non-banking activities 92.7 87.0
13. NET INSURANCE PREMIUMS EARNED FROM NON-STATE PENSION FUND ACTIVITY 2020 2019
Pension contributions accounted for under IFRS 4 Insurance Contracts 13.9 40.6 Gross premiums written 0.2 0.2 Net insurance premiums earned from non-state pension fund activity 14.1 40.8
As of 31 December 2020 and 31 December 2019 provision for unearned premiums amounted to RUR 0.1 billion.

VTB BANK NOTES TO THE CONSOLIDATED FINANCIAL STATEMENTS 31 DECEMBER 2020 (CONTINUED)
31
14. NET INSURANCE CLAIMS INCURRED, MOVEMENT IN LIABILITIES TO POLICYHOLDERS AND ACQUISITION COSTS ON NON-STATE PENSION FUND ACTIVITY
2020 2019
Change in pension liabilities accounted for under IFRS 4 Insurance Contracts (26.9) (57.0) Pension benefits accounted for under IFRS 4 Insurance Contracts (2.8) (3.2) Acquisition costs paid net of related commission income from reinsurance ceded (0.3) (0.4) Claims ceded to reinsurers – 0.1 Net insurance claims incurred, movement in liabilities to policyholders and
acquisition costs on non-state pension fund activity (30.0) (60.5)
The movements in pension liabilities accounted for under IFRS 4 Insurance Contracts were as follows:
Pension liabilities accounted under
IFRS 4 Insurance Contracts
2018 190.9 Acquisitions of subsidiary 11.9 Change in pension liabilities accounted for under IFRS 4 Insurance contracts 57.0 2019 259.8 Change in pension liabilities accounted for under IFRS 4 Insurance contracts 26.9 2020 286.7
15. OTHER OPERATING EXPENSE
2020 2019
Expenses related to SMS-information service 5.4 4.5 Expenses related to plastic cards' issue and servicing 5.1 4.9 Debt collection 2.1 1.6 Expenses under additional customer service programmes 1.5 2.3 Losses under claims and frauds 1.0 0.9 Losses arising from disposal of property 0.5 0.8 Taxes other than on income, related to other operating activity 0.2 0.2 Other 7.6 7.0 Total other operating expense 23.4 22.2
16. STAFF COSTS AND ADMINISTRATIVE EXPENSES 2020 2019
Staff costs 147.5 141.3 Defined contribution pension expense 17.6 16.5
Depreciation and other expenses related to premises and equipment 35.2 29.1 Amortisation and other expenses related to intangibles 17.8 14.3 Advertising expenses 15.5 16.5 Professional services 11.3 10.0 Charity 8.1 9.6 Post and telecommunication expenses 4.4 4.2 Taxes other than on income 4.1 3.3 Security expenses 2.3 2.3 Transport expenses 2.0 2.0 Leasing and rent expenses 1.2 2.2 Insurance 0.7 0.8 Other 2.2 2.1 Total staff costs and administrative expenses 269.9 254.2

VTB BANK NOTES TO THE CONSOLIDATED FINANCIAL STATEMENTS 31 DECEMBER 2020 (CONTINUED)
32
17. INCOME TAX Income tax expense comprises the following: 2020 2019
Current tax expense 43.4 63.8 Deferred income tax benefit due to the origination and reversal of temporary
differences (29.0) (12.1) Income tax expense 14.4 51.7
The income tax rate applicable to the majority of the Group’s income in 2020 is 20% (2019: 20%). The income tax rate applicable to subsidiaries’ income ranges from 0% to 35% in 2019 (2019: 0% to 35%). 2020 2019
IFRS profit before tax 89.7 252.9
Theoretical tax expense at the applicable statutory rate of each Group entity 19.5 55.2 Tax effect of items, which are not deductible or assessable for tax purposes:
Change in unrecognised deferred taxes 1.4 3.3 Non-deductible expenses 15.8 10.0 Income, which is exempt from taxation (10.5) (8.6) Income taxed at different rates (5.1) (3.9) Other (6.7) (4.3)
Income tax expense 14.4 51.7
The difference between the theoretical and actual income tax expense for the year ended 31 December 2020 and 31 December 2019 was mainly due to differences associated with non-deductible expenses.
Differences between IFRS and taxation regulations give rise to certain temporary differences between the carrying amount of certain assets and liabilities for financial reporting purposes and for profits tax purposes.
The tax effect of the movement on these temporary differences is recorded at tax rates applicable to respective members of the Group’. The Bank and its subsidiaries have no right to set off current tax assets and tax liabilities between legal entities, so deferred income tax assets and deferred income tax liabilities are separately assessed for each entity.

VTB BANK NOTES TO THE CONSOLIDATED FINANCIAL STATEMENTS 31 DECEMBER 2020 (CONTINUED)
33
17. INCOME TAX (CONTINUED)
Origination and reversal of
temporary differences Origination and reversal of
temporary differences
Origination and reversal of temporary differences 2018
Credited/ (charged) to profit or loss
Credited/ (charged)
to other comprehensive
income
Currency translation difference
Business Combination and
Disposal of subsidiaries 2019
Credited/ (charged) to profit or loss
Credited/ (charged)
to other comprehensive
income
Currency translation difference
Business Combination and
Disposal of subsidiaries 2020
Tax effect of deductible temporary differences: Fair value of loans acquired through business
combinations 19.2 – – – – 19.2 (18,3) – – – 0.9 Allowances for impairment and provisions for other
losses 27.1 (4.5) – (0.1) – 22.5 – – 0.5 – 23.0
Tax losses carried forward 64.3 (2.3) – (0.8) 0.4 61.6 18.5 – 1.1 – 81.2 Fair value of derivatives 3.8 7.4 – – – 11.2 (4.3) – – – 6.9 Accruals 30.4 1.1 0.1 (0.1) 0.1 31.6 7.8 – (0.3) (0.8) 38.3 Fair value of debt financial assets 0.7 0.3 – – – 1.0 (0.4) – 0.1 – 0.7
Fair value of equity financial assets 3.2 (0.9) – – – 2.3 3.9 (0.2) – – 6.0 Fair value of investment property 3.5 0.2 – – – 3.7 13.3 – (0.1) – 16.9 Loans and advances to customers 16.0 (7.7) (0.3) – – 8.0 0.1 (0.4) – – 7.7
Property and equipment 7.4 0.3 – – – 7.7 2.1 – – – 9.8 Investments in subsidiaries and associates 25.2 – – – – 25.2 0.6 – – – 25.8 Other 18.3 (1.4) (0.8) 0.8 0.1 17.0 (0.5) 0.1 1.7 – 18.3
Gross deferred income tax assets 219.1 (7.5) (1.0) (0.2) 0.6 211.0 22.8 (0.5) 3.0 (0.8) 235.5 Unrecognised deferred income tax assets (19.6) (3.3) – 0.8 – (22.1) (1.4) – (2.1) – (25.6) Deferred income tax asset 199.5 (10.8) (1.0) 0.6 0.6 188.9 21.4 (0.5) 0.9 (0.8) 209.9
Tax effect of taxable temporary differences: Fair value of debt financial assets (8.1) 4.4 (1.2) – – (4.9) 1.8 (1.5) – – (4.6)
Fair value of equity financial assets (1.8) (4.1) – – – (5.9) 3.3 – – – (2.6) Property and equipment (11.8) 1.7 – (0.1) (0.6) (10.8) (1.5) – 0.1 – (12.2) Intangible assets (0.6) (0.2) – – (3.1) (3.9) 0.4 – 0.3 2.8 (0.4) Net investment in lease (3.2) (0.1) – – – (3.3) (2.4) – – – (5.7)
Fair value of investment property (11.1) (0.1) – (0.1) – (11.3) 6.4 – 0.1 – (4.8) Allowances for impairment and provisions for other
losses (11.7) 7.2 – – (0.7) (5.2) 3.6 – (0.2) – (1.8)
Fair value of derivatives (14.3) 11.5 – – – (2.8) (1.2) – (0.1) – (4.1) Other borrowed funds (30.2) 2.6 – – – (27.6) 3.2 – – – (24.4) Effect of currency translation (1.7) – – 0.3 0.2 (1.2) (0.1) – – – (1.3) Other 2,2 – – – – 2.2 (5.9) – (0.5) – (4.2)
Deferred income tax liability (92.3) 22.9 (1.2) 0.1 (4.2) (74.7) 7.6 (1.5) (0.3) 2.8 (66.1)
Deferred income tax asset, net 119.6 10.0 (1.5) 1.2 0.6 129.9 26.1 (2.0) 1.5 (0.8) 154.7
Deferred income tax liability, net (12.4) 2.1 (0.7) (0.5) (4.2) (15.7) 2.9 – (0.9) 2.8 (10.9)

VTB BANK NOTES TO THE CONSOLIDATED FINANCIAL STATEMENTS 31 DECEMBER 2020 (CONTINUED)
34
17. INCOME TAX (CONTINUED) As at 31 December 2020, recognised deferred income tax assets included RUR 55.6 billion resulting from tax losses carried forward (31 December 2019: RUR 39.5 billion) primarily related to the Group members located in the Russian Federation. The existing tax losses eligible for carry forward are expected to be fully utilised by 2027. Effective 1 January 2017, new tax regulations in Russia cancelled the previously existing 10-year limit for tax loss carry forward for tax losses incurred in
2007 and subsequent periods. Further, these regulations stipulate that the taxable income in each of the years 2017-2021 cannot be reduced by prior period tax loss carry forward by more than 50%. Group determined that deferred income tax asset could be utilised, taking into account the level of predicted profitability and assumptions that in the years after 2020, the predicted profitability would not be lower than that in 2019-2020.
As at 31 December 2020 the Group had unrecognised deferred income tax asset of RUR 25.6 billion (31 December 2019: RUR 22.1 billion) in respect of unused tax loss expiring as presented below: 2020 2019
Unused tax loss carried forward expiring by the end of: 31 December 2021 0.1 – After 31 December 2021 47.4 29.0 With no expiry date 66.0 51.4 Total tax loss carry forwards 113.5 80.4
As at 31 December 2020, the aggregate amount of temporary differences associated with investments in subsidiaries, associates and joint ventures for which
deferred income tax liability has not been recognised amounted to RUR 209.1 billion (31 December 2019: RUR 180.1 billion). See also Note 46.
The following table provides disclosure of income tax effects relating to each component of other comprehensive income: 2020 2019
Before
tax Tax expense/
(recovery) Net of tax Before
tax Tax expense/
(recovery) Net of tax
Net change in fair value of debt
financial assets at fair value through other comprehensive income 10.4 (1.8) 8.6 9.3 (1.9) 7.4
Net change in fair value of equity financial assets at fair value through other comprehensive income 0.8 (0.2) 0.6 2.5 (0.5) 2.0
Actuarial losses net of gains arising from difference between pension plan assets and obligations – – – (0.1) – (0.1)
Cash flow hedges – – – 0.1 – 0.1 Share of other comprehensive
income of associates and joint ventures 4.3 – 4.3 (2.0) – (2.0)
Effect of changes in tax rates recognized in land and premises revaluation reserve 0.1 – 0.1 (0.3) – (0.3)
Effect of translation 27.9 – 27.9 (21.1) – (21.1) Reclassification of gains to income
statement on sale of debt financial assets at fair value through other comprehensive income (0.7) – (0.7) (0.9) 0.2 (0.7)
Other comprehensive income/(loss) 42.8 (2.0) 40.8 (12.5) (2.2) (14.7)

VTB BANK NOTES TO THE CONSOLIDATED FINANCIAL STATEMENTS 31 DECEMBER 2020 (CONTINUED)
35
18. CASH AND SHORT-TERM FUNDS
2020 2019
Cash on hand 309,4 276.3 Cash balances (other than mandatory) with central banks 691,0 911.0 Correspondent accounts with other banks
Russia 162,4 83.0
OECD 52,2 56.1
Other countries 14,6 8.9
Total Correspondent accounts with other banks 229,2 148.0 Less: Expected credit loss (0,1) (0.3) Total cash and short-term funds 1,229,5 1,335.0
Less: correspondent accounts in precious metals (0,6) (9.3) Less: restricted cash (0,1) (0.1) Total cash and cash equivalents 1,228,8 1,325.6
The following table shows reconciliation from the opening to the closing balance of the expected credit loss (ECL) of correspondent accounts with other banks at amortised cost by class.
2020
12-month
ECL
Lifetime ECL not credit-
impaired
Lifetime ECL credit-
impaired
Purchased credit-
impaired Total Russia Balance at 1 January 0.2 – – – 0.2 Foreign exchange (0,1) – – – (0,1) Balance at 31 December 0,1 – – – 0,1 Other countries Balance at 1 January 0.1 – – – 0.1 Net remeasurement of ECL (0,1) – – – (0,1) Balance at 31 December – – – – –
2019
12-month
ECL
Lifetime ECL not credit-
impaired
Lifetime ECL credit-
impaired
Purchased credit-
impaired Total Russia Balance at 1 January – – – – – Net remeasurement of ECL 0.2 – – – 0.2 Balance at 31 December 0.2 – – – 0.2 Other countries Balance at 1 January 0.1 – – – 0.1 Balance at 31 December 0.1 – – – 0.1
19. TRADING FINANCIAL ASSETS
2020 2019
Trading financial assets Debt securities
Bonds and eurobonds of Russian companies and banks 330.6 299.8
Bonds and eurobonds of the Russian Federation 165.8 60.4
Bonds and eurobonds of foreign companies and banks 24.9 13.6
Russian municipal bonds 22.3 18.1
Bonds and eurobonds of foreign governments 6.4 4.1
Bonds of the Central Bank of the Russian Federation – 20.1 Total debt securities 550.0 416.1 Equity securities 34.7 65.8 Total trading financial assets 584.7 481.9 Trading financial assets, pledged under repurchase agreements Debt securities
Bonds and eurobonds of the Russian Federation 48.8 0.2
Bonds and eurobonds of Russian companies and banks 10.4 18.6
Russian municipal bonds 2.5 –
Bonds and eurobonds of foreign companies and banks 0.1 – Total debt securities 61.8 18.8 Equity securities 0.5 0.6 Total trading financial assets, pledged under repurchase agreements 62.3 19.4 Total trading financial assets 647.0 501.3

VTB BANK NOTES TO THE CONSOLIDATED FINANCIAL STATEMENTS 31 DECEMBER 2020 (CONTINUED)
36
19. TRADING FINANCIAL ASSETS (CONTINUED) At 31 December 2020, bonds and eurobonds are mostly those issued by banks and companies from public administration on the Central (federal) level of RF; equity securities are mostly represented by companies from extraction of precious metals and jewelry industry and water transport.
At 31 December 2019, bonds and eurobonds of Russian companies and banks are mostly those issued by banks and companies from financial market services; equity securities are mostly represented by railway transport and non-ferrous industry.
20. DERIVATIVE FINANCIAL INSTRUMENTS Foreign exchange and other financial instruments are generally traded in an over-the-counter market with professional market counterparties on standardised contractual terms and conditions. 2020 2019
Positive fair
value Negative fair
value Positive fair
value Negative fair
value
Derivative financial assets and liabilities held
for trading Interest rate contracts 157.1 (119.7) 75.1 (70.9) Foreign exchange and precious metals contracts 63.1 (107.7) 43.5 (70.7) Contracts with commodities 11.2 (11.8) 12.0 (12.8) Contracts with securities 1.4 (5.7) 11.1 (18.7) Contracts with other underlyings 0.7 (5.6) 1.0 (3.2) Total derivative financial assets and liabilities
held for trading 233.5 (250.5) 142.7 (176.3) Derivative financial assets and liabilities
designated as hedging instruments Derivatives held as fair value hedges 0.2 (0.2) – – Derivatives held as cash flow hedges 0.1 – 0.1 (0.2) Total derivative financial assets and liabilities
designated as hedging instruments 0.3 (0.2) 0.1 (0.2) Total derivative financial assets and liabilities 233.8 (250.7) 142.8 (176.5)
21. DUE FROM OTHER BANKS 2020 2019
Due from other banks at amortised cost Due from other banks
Russia 439.0 323.8
OECD 25.7 57.0
Other countries 355.7 214.7 Total gross due from other banks at amortised cost 820.4 595.5
Less: Expected credit loss (0.2) (0.4) Total net due from other banks at amortised cost 820.2 595.1
Due from other banks at fair value through profit or loss Due from other banks
Russia 15.7 13.5
Other countries 2.0 1.5 Total gross due from other banks at fair value through profit or loss 17.7 15.0
Total due from other banks 837.9 610.1
As at 31 December 2020, reverse sale and repurchase agreements with other banks at amortised cost amounted to RUR 289.8 billion (31 December 2019: RUR 108.8 billion). These reverse sale and repurchase agreements with other banks at amortised cost were collateralised by securities with fair value of RUR 308.8 billion (31 December 2019: RUR 127.4 billion). As at 31 December 2020, amount included in due from other banks of RUR 0.0 billion is pledged against issued local mortgage-backed bonds (31 December 2019: RUR 0.4 billion).
As at 31 December 2020 Due from other banks includes subordinated loans to other banks at fair value through profit or loss in the amount of RUR 17.7 billion (31 December 2019: subordinated loans at fair value through profit or loss in the amount of RUR 15.0 billion). These subordinated loans have lower priority in relation to other creditors of these banks and may contain contractual provisions, which require full or partial write-off in case of certain triggers specified in the underlying loan agreements, typically minimal capital levels.

VTB BANK NOTES TO THE CONSOLIDATED FINANCIAL STATEMENTS 31 DECEMBER 2020 (CONTINUED)
37
21. DUE FROM OTHER BANKS (CONTINUED) The following table shows analysis of the amounts due from other banks (gross) by classes, credit quality risk grades and ECL stages:
2020
12-month ECL
Lifetime ECL not credit-
impaired
Lifetime ECL credit-
impaired
Purchased credit –
impaired Total
Due from other banks at amortised cost Russia
pass 438.6 – – – 438.6
sub-standard – 0.4 – – 0.4 OECD
pass 25.7 – – – 25.7 Other countries
pass 355.7 – – – 355.7
2019
12-month ECL
Lifetime ECL not credit-
impaired
Lifetime ECL credit-
impaired
Purchased credit –
impaired Total
Due from other banks at amortised cost Russia
pass 323.2 – – – 323.2
watch – 0.6 – – 0.6 OECD
pass 57.0 – – – 57.0 Other countries
pass 214.6 – – – 214.6
NPL – – 0.1 – 0.1
The following table shows reconciliation from the opening to the closing balance of the expected credit loss (ECL) of due from banks at amortised cost, including pledged under repurchase agreements by class.
2020
12-month
ECL
Lifetime ECL not credit-
impaired
Lifetime ECL credit-
impaired
Purchased credit-
impaired Total
Russia Balance at 1 January 0.1 – – – 0.1 Net remeasurement of ECL (0.1) – – – (0.1) Foreign exchange 0.1 – – – 0.1 Balance at 31 December 0.1 – – – 0.1 OECD Balance at 1 January 0.1 – – – 0.1 Net remeasurement of ECL (0.2) – – – (0.2) Foreign exchange 0.1 – – – 0.1 Balance at 31 December – – – – – Other countries Balance at 1 January 0.1 – 0.1 – 0.2 Write-offs – – (0.1) – (0.1) Balance at 31 December 0.1 – 0.0 – 0.1
2019
12-month
ECL
Lifetime ECL not credit-
impaired
Lifetime ECL credit-
impaired
Purchased credit-
impaired Total
Russia Balance at 1 January 0.2 – 0.1 – 0.3 Net remeasurement of ECL (0.1) – – – (0.1) Write-offs – – (0.1) – (0.1) Balance at 31 December 0.1 – – – 0.1 OECD Balance at 1 January – – – – – Net remeasurement of ECL 0.2 – – – 0.2 Foreign exchange (0.1) – – – (0.1) Balance at 31 December 0.1 – – – 0.1 Other countries Balance at 1 January 0.2 – 0.1 – 0.3 Net remeasurement of ECL (0.1) – – – (0.1) Balance at 31 December 0.1 – 0.1 – 0.2

VTB BANK NOTES TO THE CONSOLIDATED FINANCIAL STATEMENTS 31 DECEMBER 2020 (CONTINUED)
38
22. LOANS AND ADVANCES TO CUSTOMERS 2020 2019
Loans and advances to customers at amortised cost Loans at amortised cost to legal entities
Current activity financing 6,719.7 5,704.4
Project finance and other 1,366.4 1,341.6
Reverse sale and repurchase agreements 543.2 413.9
Finance leases 455.2 412.1 Total gross loans at amortised cost to legal entities 9,084.5 7,872.0 Less: Expected credit loss (647.7) (485.6) Loans and advances to legal entities at amortised cost loaned and pledged under
repurchase agreements
Reverse sale and repurchase agreements 6.6 – Total loans and advances to legal entities at amortised cost loaned and pledged
under repurchase agreements 6.6 – Less: Expected credit loss (0.1) – Net loans at amortised cost to legal entities 8,443.3 7,386.4
Loans at amortised cost to individuals
Mortgages 1,776.0 1,456.8
Consumer loans and other 1,568.0 1,463.1
Credit cards 131.7 143.8
Car loans 122.7 129.6
Reverse sale and repurchase agreements 28.0 14.8 Total gross loans at amortised cost to individuals 3,626.4 3,208.1 Less: Expected credit loss (250.4) (201.8) Net loans at amortised cost to individuals 3,376.0 3,006.3
Loans and advances to customers at fair value through profit or loss Loans at fair value through profit or loss to legal entities 156.2 149.4 Total loans and advances to customers at fair value through profit or loss 156.2 149.4
Loans and advances to customers at fair value through other comprehensive
income Loans at fair value through other comprehensive income to individuals 230.8 157.2 Loans at fair value through other comprehensive income to legal entities 1.3 53.8 Loans at fair value through other comprehensive income to legal entities pledged
under repurchase agreements 56.8 21.0 Total loans and advances to customers at fair value through other
comprehensive income 288.9 232.0
Total loans and advances to customers 12,264.4 10,774.1
As at 31 December 2020, the total amount of outstanding loans issued by the Group to 10 largest groups of interrelated borrowers comprises RUR 2,170.6 billion or 16.5% of the gross loan portfolio (31 December 2019: RUR 1,914.6 billion or 16.7%).
As at 31 December 2020, the gross amount of non-performing loans (refer to Note 41 for a definition of non-performing loans) was RUR 744.8 billion or 5.7% of the aggregate of the gross loan portfolio, including loans pledged under repurchase agreements (31 December 2019: RUR 534.3 billion or 4.7%). As at 31 December 2020, the Group received securities with a fair value of RUR 736.7 billion (31 December 2019: RUR 502.5 billion) as collateral under reverse sale and repurchase agreements with customers. As at 31 December 2020, the total amount of pledged loans to customers is RUR 108.1 billion (31 December 2019: RUR 88.7 billion). The loans are pledged against the funds accounted for other borrowed funds (Note 31), due to other banks (Note 29) and debt securities issued (Note 32).
The table below represents carrying value of mortgage loans pledged against debt securities issued under securitization programmes (Note 55): 2020 2019
DOM.RF 226.3 48.2 Vozrozhdenie Bank 4.5 9.2 VEB – 8.5
As at 31 December 2020, loans and advances to customers with the carrying amount of RUR 159.6 billion (31 December 2019: RUR 186.2 billion) represented by federal loan bonds with debt amortisation (OFZ-AD) purchased in September 2011 by former “Bank of Moscow”, OJSC are included in loans to government bodies for the purpose of economic sector risk concentrations disclosure. Refer to Note 44 on restrictions related to certain loans represented by OFZ-AD.

VTB BANK NOTES TO THE CONSOLIDATED FINANCIAL STATEMENTS 31 DECEMBER 2020 (CONTINUED)
39
22. LOANS AND ADVANCES TO CUSTOMERS (CONTINUED) Economic sector risk concentrations within the customer loan portfolio are as follows:
2020 2019
Amount % Amount %
Individuals 3,857.2 29.3 3,365.3 29.4 Building construction 1,571.2 11.9 1,244.3 10.9 Oil and gas 1,413.0 10.7 1,052.1 9.2 Metals 1,115.6 8.5 895.8 7.8 Transport 884.4 6.7 673.6 5.9 Trade and commerce 657.4 5.0 716.6 6.3 Engineering and other manufacturing 577.9 4.4 694.2 6.1 Telecommunications and media 513.3 3.9 493.9 4.3 Food and agriculture 491.9 3.7 427.7 3.7 Government bodies 479.2 3.6 608.8 5.3 Finance 456.9 3.5 374.4 3.3 Energy 374.6 2.8 456.6 4.0 Chemical 318.4 2.4 176.0 1.5 Coal mining 225.7 1.7 115.3 1.0 Other 225.9 1.9 166.9 1.3 Total gross loans and advances to customers 13,162.6 100.0 11,461.5 100.0
Finance industry includes loans issued to holding companies of industrial groups, mergers and acquisitions financing, and loans to leasing, insurance and other non-bank financial companies. Finance lease 2020 2019
Gross investment in leases 340.3 324.9 Less: unearned finance lease income (80.1) (83.7) Net investment in leases before allowance 260.2 241.2 Less: Expected credit loss (23.6) (18.5) Net investment in leases 236.6 222.7
Future minimum lease payments Net investments in leases
2020 2019 2020 2019
Within 1 year 79.1 79.2 68.3 75.2 From 1 to 2 years 61.7 58.3 50.5 48.4 From 2 to 3 years 47.8 44.5 36.9 33.2 From 3 to 4 years 36.3 35.3 26.1 23.9 From 4 to 5 years 27.2 27.2 18.8 16.5 More than 5 years 88.2 80.4 59.6 44.0 Total 340.3 324.9 260.2 241.2

VTB BANK NOTES TO THE CONSOLIDATED FINANCIAL STATEMENTS 31 DECEMBER 2020 (CONTINUED)
40
22. LOANS AND ADVANCES TO CUSTOMERS (CONTINUED) Credit quality by class of loans and advances to customers
The tables below present loans and advances to customers at amortised cost (gross) by classes, credit quality risk grades and ECL stages:
2020
12-month
ECL
Lifetime ECL not credit-
impaired
Lifetime ECL credit-
impaired
Purchased credit-
impaired Total
Loans and advances to legal entities
Current activity financing
Pass 4,688.5 117.7 – – 4,806.2
Watch 162.8 22.2 – – 185.0
Sub-Standard 93.7 1,126.0 58.5 5.8 1,284.0
Doubtful – – 24.3 0.8 25.1
NPL n/a n/a 409.3 10.1 419.4 Project finance and other
Pass 578.8 12.4 – – 591.2
Watch 9.2 0.4 – – 9.6
Sub-Standard 2.5 521.2 137.6 4.1 665.4
Doubtful – – 1.1 – 1.1
NPL n/a n/a 79.0 20.1 99.1 Reverse sale and repurchase agreements
Pass 427.0 0.6 – – 427.6
Watch 35.1 – – – 35.1
Sub-Standard – 87.1 – – 87.1 Finance leases
Pass 292.9 6.0 – – 298.9
Watch 0.4 8.6 – – 9.0
Sub-Standard 1.6 69.5 29.6 24.6 125.3
Doubtful – – 6.1 – 6.1
NPL n/a n/a 15.9 – 15.9 Total loans and advances to legal entities 6,292.5 1,971.7 761.4 65.5 9,091.1
2020
12-month
ECL
Lifetime ECL not credit-
impaired
Lifetime ECL credit-
impaired
Purchased credit-
impaired Total
Loans and advances to individuals
Mortgages
Pass 1,650.0 – – – 1,650.0
Watch 24.4 – – – 24.4
Sub-Standard 1.5 61.0 – – 62.5
Doubtful – – 13.8 0.3 14.1
NPL n/a n/a 24.5 0.5 25.0 Consumer loans and other
Pass 980.7 – – – 980.7
Watch 267.7 – – – 267.7
Sub-Standard 40.6 127.7 – – 168.3
Doubtful – – 17.2 – 17.2
NPL n/a n/a 133.5 0.6 134.1 Credit cards
Pass 97.9 – – – 97.9
Watch 3.2 – – – 3.2
Sub-Standard 2.9 2.1 – – 5.0
Doubtful – – 1.3 – 1.3
NPL n/a n/a 24.2 0.1 24.3 Car loans
Pass 95.2 – – – 95.2
Watch 9.2 – – – 9.2
Sub-Standard 1.3 3.2 0.1 – 4.6
Doubtful – – 1.8 – 1.8
NPL n/a n/a 11.9 – 11.9 Reverse sale and repurchase agreements
Pass 27.9 – – – 27.9
Watch 0.1 – – – 0.1 Total loans and advances to individuals 3,202.6 194.0 228.3 1.5 3,626.4
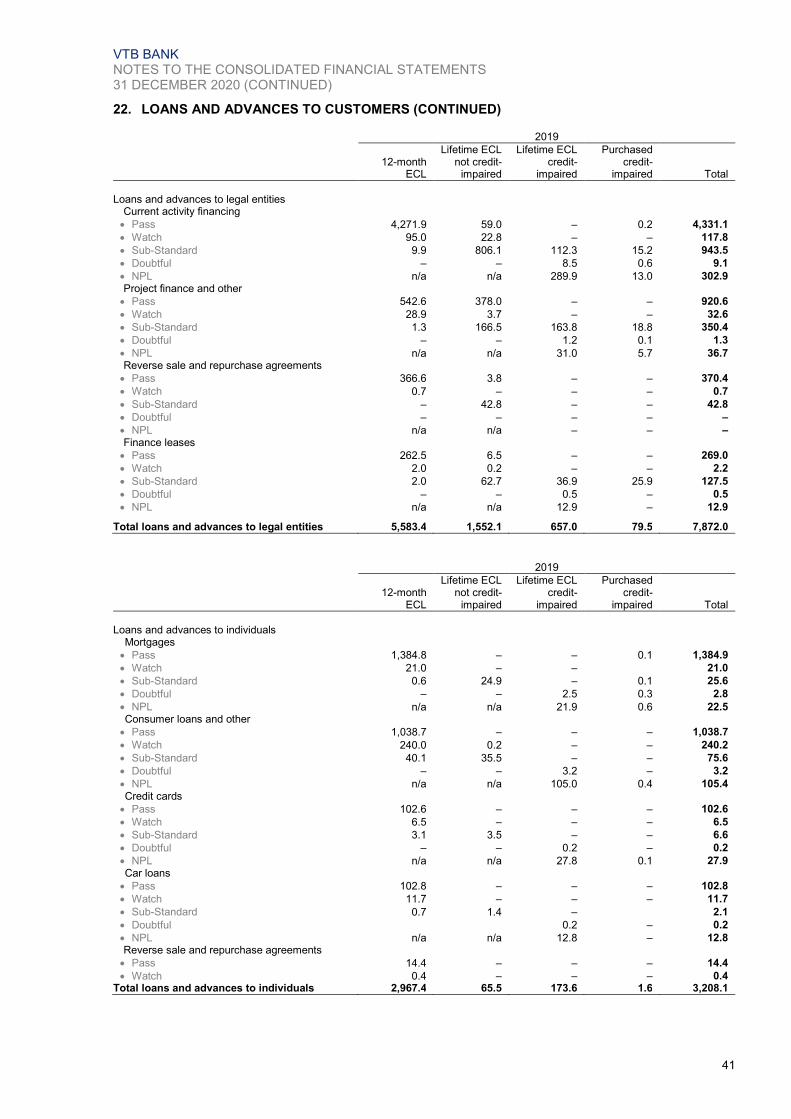
VTB BANK NOTES TO THE CONSOLIDATED FINANCIAL STATEMENTS 31 DECEMBER 2020 (CONTINUED)
41
22. LOANS AND ADVANCES TO CUSTOMERS (CONTINUED)
2019
12-month
ECL
Lifetime ECL not credit-
impaired
Lifetime ECL credit-
impaired
Purchased credit-
impaired Total
Loans and advances to legal entities
Current activity financing
Pass 4,271.9 59.0 – 0.2 4,331.1
Watch 95.0 22.8 – – 117.8
Sub-Standard 9.9 806.1 112.3 15.2 943.5
Doubtful – – 8.5 0.6 9.1
NPL n/a n/a 289.9 13.0 302.9 Project finance and other
Pass 542.6 378.0 – – 920.6
Watch 28.9 3.7 – – 32.6
Sub-Standard 1.3 166.5 163.8 18.8 350.4
Doubtful – – 1.2 0.1 1.3
NPL n/a n/a 31.0 5.7 36.7 Reverse sale and repurchase agreements
Pass 366.6 3.8 – – 370.4
Watch 0.7 – – – 0.7
Sub-Standard – 42.8 – – 42.8
Doubtful – – – – –
NPL n/a n/a – – – Finance leases
Pass 262.5 6.5 – – 269.0
Watch 2.0 0.2 – – 2.2
Sub-Standard 2.0 62.7 36.9 25.9 127.5
Doubtful – – 0.5 – 0.5
NPL n/a n/a 12.9 – 12.9 Total loans and advances to legal entities 5,583.4 1,552.1 657.0 79.5 7,872.0
2019
12-month
ECL
Lifetime ECL not credit-
impaired
Lifetime ECL credit-
impaired
Purchased credit-
impaired Total
Loans and advances to individuals
Mortgages
Pass 1,384.8 – – 0.1 1,384.9
Watch 21.0 – – 21.0
Sub-Standard 0.6 24.9 – 0.1 25.6
Doubtful – – 2.5 0.3 2.8
NPL n/a n/a 21.9 0.6 22.5 Consumer loans and other
Pass 1,038.7 – – – 1,038.7
Watch 240.0 0.2 – – 240.2
Sub-Standard 40.1 35.5 – – 75.6
Doubtful – – 3.2 – 3.2
NPL n/a n/a 105.0 0.4 105.4 Credit cards
Pass 102.6 – – – 102.6
Watch 6.5 – – – 6.5
Sub-Standard 3.1 3.5 – – 6.6
Doubtful – – 0.2 – 0.2
NPL n/a n/a 27.8 0.1 27.9 Car loans
Pass 102.8 – – – 102.8
Watch 11.7 – – – 11.7
Sub-Standard 0.7 1.4 – 2.1
Doubtful 0.2 – 0.2
NPL n/a n/a 12.8 – 12.8 Reverse sale and repurchase agreements
Pass 14.4 – – – 14.4
Watch 0.4 – – – 0.4 Total loans and advances to individuals 2,967.4 65.5 173.6 1.6 3,208.1

VTB BANK NOTES TO THE CONSOLIDATED FINANCIAL STATEMENTS 31 DECEMBER 2020 (CONTINUED)
42
22. LOANS AND ADVANCES TO CUSTOMERS (CONTINUED) In 2020 the Group updated forward looking information in the expected credit loss models, including forecasts of macroeconomic indicators, to reflect appropriately the uncertainty associated with fall in market prices and spread of COVID-19 pandemic (Note 40) taking into account:
the GDP reduction and decrease in income of individuals and business caused by a limited economic activity;
updated forecasts for prices of major commodities and exchange rates;
measures of state support;
impact of changes on different sectors. Subsequently, as at 31 December 2020 the Group:
used the macro-adjustment updated in the first half of 2020;
increased weighted estimates of credit losses for certain industries for the purpose of assessment on portfolio basis;
reassessed 12-month PDs;
transferred certain borrowers from “12-month ECL” to “Lifetime ECL not credit-impaired” stage; and
downgraded credit ratings for certain borrowers assessed on individual basis.
In 2020, the Group has modified the terms and conditions of loans to legal entities and loans to individuals, including introduction of payment holidays, as part of the measures introduced by the Government related to consequences of COVID-19 pandemic. The Group considered these modifications to be non-substantial and reported a modification loss within Other gains net of losses on financial instruments at amortised cost.
The following table shows reconciliation from the opening to the closing balance of the expected credit loss (ECL) of loans and advances to legal entities, including pledged under repurchase agreements, at amortised cost by class and ECL stage. 2020
12-month ECL
Lifetime ECL not credit-
impaired Lifetime ECL
credit-impaired Purchased
credit-impaired Total
Current activity financing Balance at 1 January 24.6 95.8 252.1 1.7 374.2 Transfer to 12-month ECL 5.8 (4.5) (1.3) – – Transfer to lifetime ECL not credit-impaired (6.8) 10.5 (3.7) – – Transfer to lifetime ECL credit-impaired (0.5) (11.8) 12.3 – – Net remeasurement of ECL 15.9 49.3 29.3 3.0 97.5 Unwinding of discount – – 10.3 0.3 10.6 Write-offs – – (13.1) (0.5) (13.6) Recoveries of amounts previously written off – 0.3 1.5 0.5 2.3 Financial assets that have been derecognised during the
period (0.3) (0.3) (8.9) 1.5 (8.0) Foreign exchange 0.9 4.6 17.1 0.3 22.9 Balance at 31 December 39.6 143.9 295.6 6.8 485.9
Project finance and other Balance at 1 January 7.9 27.0 33.7 4.4 73.0 Transfer to 12-month ECL 1.3 (0.9) (0.4) – – Transfer to lifetime ECL not credit-impaired (9.0) 9.3 (0.3) – – Transfer to lifetime ECL credit-impaired – (3.7) 3.7 – – Net remeasurement of ECL 9.8 17.5 3.3 2.2 32.8 Unwinding of discount – – 1.0 0.6 1.6 Write-offs – – (7.7) (0.1) (7.8) Recoveries of amounts previously written off 0.1 – 0.3 – 0.4 Financial assets that have been derecognised during the
period (0.3) – – – (0.3) Foreign exchange 0.7 3.0 3.7 0.5 7.9 Balance at 31 December 10.5 52.2 37.3 7.6 107.6
Reverse sale and repurchase agreements Balance at 1 January 0.8 9.2 – – 10.0 Transfer to 12-month ECL 1.7 (1.7) – – – Transfer to lifetime ECL not credit-impaired (0.6) 0.6 – – – Net remeasurement of ECL 0.8 7.3 0.1 – 8.2 Foreign exchange 0.2 0.4 – – 0.6 Balance at 31 December 2.9 15.8 0.1 – 18.8
Finance leases Balance at 1 January 1.2 5.2 21.9 0.1 28.4 Transfer to 12-month ECL 0.3 (0.1) (0.2) – – Transfer to lifetime ECL not credit-impaired (0.2) 0.2 – – – Transfer to lifetime ECL credit-impaired – (0.1) 0.1 – – Net remeasurement of ECL 0.8 1.8 2.0 0.1 4.7 Unwinding of discount – – 0.3 – 0.3 Write-offs – – (0.3) (0.1) (0.4) Financial assets that have been derecognised during the
period – – (0.2) – (0.2) Foreign exchange – (0.1) 2.7 – 2.6 Balance at 31 December 2.1 6.9 26.3 0.1 35.4

VTB BANK NOTES TO THE CONSOLIDATED FINANCIAL STATEMENTS 31 DECEMBER 2020 (CONTINUED)
43
22. LOANS AND ADVANCES TO CUSTOMERS (CONTINUED)
Expected credit loss for finance leases represents expected credit loss for loans to leasing companies and net investment in leases. The following table shows reconciliation from the opening to the closing balance of ECL of finance lease receivables, which are the part of finance lease corporate loans. 2020
12-month ECL
Lifetime ECL not credit-
impaired Lifetime ECL
credit-impaired Total
Financial lease receivable Balance at 1 January 0.3 4.4 17.9 22.6 Transfer to 12-month ECL 0.1 – (0.1) – Transfer to lifetime ECL not credit-impaired (0.2) 0.2 – – Transfer to lifetime ECL credit-impaired – (0.1) 0.1 – Net remeasurement of ECL 0.4 0.7 1.4 2.5 Write-offs – – (0.3) (0.3) Financial assets that have been derecognised during the period – – (0.2) (0.2) Foreign exchange (0.1) – 2.6 2.5 Balance at 31 December 0.5 5.2 21.4 27.1
2019
12-month ECL
Lifetime ECL not credit-
impaired Lifetime ECL
credit-impaired Purchased
credit-impaired Total
Current activity financing Balance at 1 January 29.8 76.3 273.7 6.4 386.2 Transfer to 12-month ECL 8.7 (8.0) (0.7) – – Transfer to lifetime ECL not credit-impaired (6.6) 9.1 (2.5) – – Transfer to lifetime ECL credit-impaired (3.2) (8.4) 11.6 – – Net remeasurement of ECL (3.2) 28.4 15.2 (11.8) 28.6 Unwinding of discount – – 13.8 1.5 15.3 Write-offs – – (57.6) (1.8) (59.4) Recoveries of amounts previously written off – 0.1 3.9 1.9 5.9 Financial assets that have been derecognised during the
period and correction of loss on initial recognition of Purchased credit-impaired loans (0.2) – – 5.4 5.2
Foreign exchange (0.7) (1.7) (5.3) 0.1 (7.6) Balance at 31 December 24.6 95.8 252.1 1.7 374.2
Project finance and other Balance at 1 January 8.0 18.9 50.1 4.1 81.1 Transfer to 12-month ECL 0.9 (0.9) – – – Transfer to lifetime ECL not credit-impaired (6.3) 6.6 (0.3) – – Transfer to lifetime ECL credit-impaired – (1.2) 1.2 – – Net remeasurement of ECL 5.0 4.6 (2.3) 0.6 7.9 Unwinding of discount – – 1.8 0.2 2.0 Write-offs – – (12.9) (0.1) (13.0) Recoveries of amounts previously written off – 0.1 0.5 – 0.6 Financial assets that have been derecognised during the
period and correction of loss on initial recognition of Purchased credit-impaired loans – – (2.1) – (2.1)
Foreign exchange 0.3 (1.1) (2.3) (0.4) (3.5) Balance at 31 December 7.9 27.0 33.7 4.4 73.0
Reverse sale and repurchase agreements Balance at 1 January 0.4 6.5 0.1 – 7.0 Transfer to lifetime ECL not credit-impaired (0.2) 0.2 – – – Net remeasurement of ECL 0.7 2.4 – – 3.1 Foreign exchange (0.1) 0.1 (0.1) – (0.1) Balance at 31 December 0.8 9.2 – – 10.0
Finance leases Balance at 1 January 0.8 3.4 22.7 0.1 27.0 Transfer to 12-month ECL 0.1 – (0.1) – – Transfer to lifetime ECL not credit-impaired (0.1) 0.1 – – – Net remeasurement of ECL 0.5 1.7 0.9 – 3.1 Unwinding of discount – – 0.2 – 0.2 Write-offs – – (0.5) – (0.5) Foreign exchange (0.1) – (1.3) – (1.4) Balance at 31 December 1.2 5.2 21.9 0.1 28.4

VTB BANK NOTES TO THE CONSOLIDATED FINANCIAL STATEMENTS 31 DECEMBER 2020 (CONTINUED)
44
22. LOANS AND ADVANCES TO CUSTOMERS (CONTINUED) 2019
12-month ECL
Lifetime ECL not credit-
impaired Lifetime ECL
credit-impaired Total
Financial lease receivable Balance at 1 January 0.2 3.4 20.1 23.7 Transfer to 12-month ECL 0.1 – (0.1) – Transfer to lifetime ECL not credit-impaired (0.1) 0.1 – – Net remeasurement of ECL 0.1 1.0 (0.1) 1.0 Write-offs – – (0.5) (0.5) Foreign exchange – (0.1) (1.5) (1.6) Balance at 31 December 0.3 4.4 17.9 22.6
Significant changes in the gross carrying amount of loan portfolio that contributed to changes in the ECL were:
Write-off of fully impaired loans of RUR 72.2 billion against the allowance reduced the loss allowance for financial assets measured on a Lifetime ECL credit-impaired basis ( 2019: RUR 165.4 billion).
Reclassification of RUR 282.7 billion and RUR 10.2 billion of corporate loans measured on a 12-month basis to Lifetime ECL not credit-impaired and Lifetime credit-impaired ECL basis respectively, following increase in credit risk on a portfolio basis, which contributed to an increase of loan ECL in both ECL stages (2019: reclassification of RUR 476.8 billion and RUR 47.0 billion of corporate loans measured on a 12-month basis to Lifetime ECL not credit-impaired and Lifetime credit-impaired ECL basis respectively, following increase in credit risk on a portfolio basis, which contributed to an increase of loan ECL in both ECL stages).
Sale of RUR 13.2 billion corporate loans reduced the gross carrying amount of loan portfolio classified to category Lifetime credit-impaired ECL. Sale of RUR 33.8 billion corporate loans reduced the gross carrying amount of loan portfolio classified to category 12-month ECL (2019: sale of RUR 30.1 billion corporate loans reduced the gross carrying amount of loan portfolio classified to category Purchased credit-impaired. Sale of RUR 17.6 billion corporate loans reduced the gross carrying amount of loan portfolio classified to category 12-month ECL).
Sale of RUR 0.4 billion loans to individuals reduced the gross carrying amount of loan portfolio classified to category 12-month ECL. Sale of RUR 41.6 billion loans to individuals reduced the gross carrying amount of loan portfolio classified to category Lifetime ECL credit-impaired (2019: sale of RUR 197.0 billion loans to individuals reduced
the gross carrying amount of loan portfolio classified to category 12-month ECL. Sale of RUR 81.5 billion loans to individuals reduced the gross carrying amount of loan portfolio classified to category Lifetime ECL credit-impaired).
Other changes in gross carrying amount of loan portfolio are additions, redemptions and foreign currencies revaluation in the normal course of business of the Group. The Group management identified a number of industry and other portfolio specific risks, which resulted in the significant increase in the credit risk for certain segments of the loan portfolio. At present, it is not possible to identify the individual borrowers with significantly increased credit risk. Therefore, the Group management determined that a portion of the carrying value of these portfolios should be transferred into Lifetime ECL – not credit impaired category, with recognition the allowance to cover credit risks for these segments of loan portfolio in accordance with IFRS 9. Based on the analysis performed by the Group management, the amount of the corporate loan portfolio exposed to the industry and other portfolio specific risks amounted to RUR 3,970.7 billion and RUB 2,401.0 billion of the off-balance sheet liabilities at 31 December 2020 (31 December 2019: RUR 2,950.8 billion and RUB 2,144.5 billion, respectively). In accordance with the model developed by the Group, loan loss allowance for the above-mentioned portion of portfolio (including off-balance sheet liabilities), as of 31 December 2020 amounted to RUR 112.2 billion, including the ECL for the loan portfolio of RUR 98.3 billion and ECL for the off-balance sheet exposures of RUR 13.9 billion (31 December 2019: RUR 93.1 billion, including the ECL for the loan portfolio of RUR 78.4 billion, and ECL for the off-balance sheet exposures of RUR 14.7 billion).

VTB BANK NOTES TO THE CONSOLIDATED FINANCIAL STATEMENTS 31 DECEMBER 2020 (CONTINUED)
45
22. LOANS AND ADVANCES TO CUSTOMERS (CONTINUED)
The following table shows reconciliation from the opening to the closing balance of the expected credit loss (ECL) of loans and advances to individuals at amortised cost by class and ECL stage. 2020
12-month ECL
Lifetime ECL not credit-
impaired
Lifetime ECL credit-
impaired
Purchased credit-
impaired Total
Consumer loans and other Balance at 1 January 35.0 9.8 97.2 0.4 142.4 Transfer to 12-month ECL 23.5 (23.1) (0.4) – – Transfer to lifetime ECL not credit-impaired (20.0) 23.4 (3.4) – – Transfer to lifetime ECL credit-impaired (7.0) (27.1) 34.1 – – Net remeasurement of ECL 6.0 38.0 29.4 (0.5) 72.9 Financial assets that have been derecognised
during the period – – 0.1 0.4 0.5 Unwinding of discount – – 6.8 0.2 7.0 Write-offs – – (33.2) – (33.2) Recoveries of amounts previously written off – – 0.8 0.1 0.9 Foreign exchange (0.4) (0.3) 1.4 (0.1) 0.6 Balance at 31 December 37.1 20.7 132.8 0.5 191.1
Mortgages Balance at 1 January 1.9 1.8 12.2 0.4 16.3 Transfer to 12-month ECL 3.2 (2.8) (0.4) – – Transfer to lifetime ECL not credit-impaired (0.8) 2.5 (1.7) – – Transfer to lifetime ECL credit-impaired (0.3) (3.1) 3.4 – – Net remeasurement of ECL (0.8) 3.4 3.2 (2.1) 3.7 Financial assets that have been derecognised
during the period – – – 0.2 0.2 Unwinding of discount – – 0.8 – 0.8 Write-offs – – (1.9) – (1.9) Recoveries of amounts previously written off – – 0.9 – 0.9 Foreign exchange – – 0.9 (0.2) 0.7 Balance at 31 December 3.2 1.8 17.4 (1.7) 20.7
Credit cards Balance at 1 January 2.7 1.1 26.2 – 30.0 Transfer to 12-month ECL 2.0 (1.8) (0.2) – – Transfer to lifetime ECL not credit-impaired (1.8) 2.7 (0.9) – – Transfer to lifetime ECL credit-impaired (1.3) (4.7) 6.0 – – Net remeasurement of ECL 0.2 3.4 1.8 (0.1) 5.3 Financial assets that have been derecognised during
the period – – – 0.1 0.1 Unwinding of discount – – 2.8 – 2.8 Write-offs – – (12.6) – (12.6) Recoveries of amounts previously written off – – 0.1 – 0.1 Foreign exchange – – – 0.1 0.1 Balance at 31 December 1.8 0.7 23.2 0.1 25.8
Car loans Balance at 1 January 1.1 0.2 11.8 – 13.1 Transfer to 12-month ECL 0.7 (0.7) – – – Transfer to lifetime ECL not credit-impaired (0.5) 0.7 (0.2) – – Transfer to lifetime ECL credit-impaired (0.3) (0.6) 0.9 – – Net remeasurement of ECL – 0.6 0.8 – 1.4 Unwinding of discount – – 0.3 – 0.3 Write-offs – – (2.7) – (2.7) Recoveries of amounts previously written off – – 0.3 – 0.3 Foreign exchange – – 0.4 – 0.4 Balance at 31 December 1.0 0.2 11.6 – 12.8
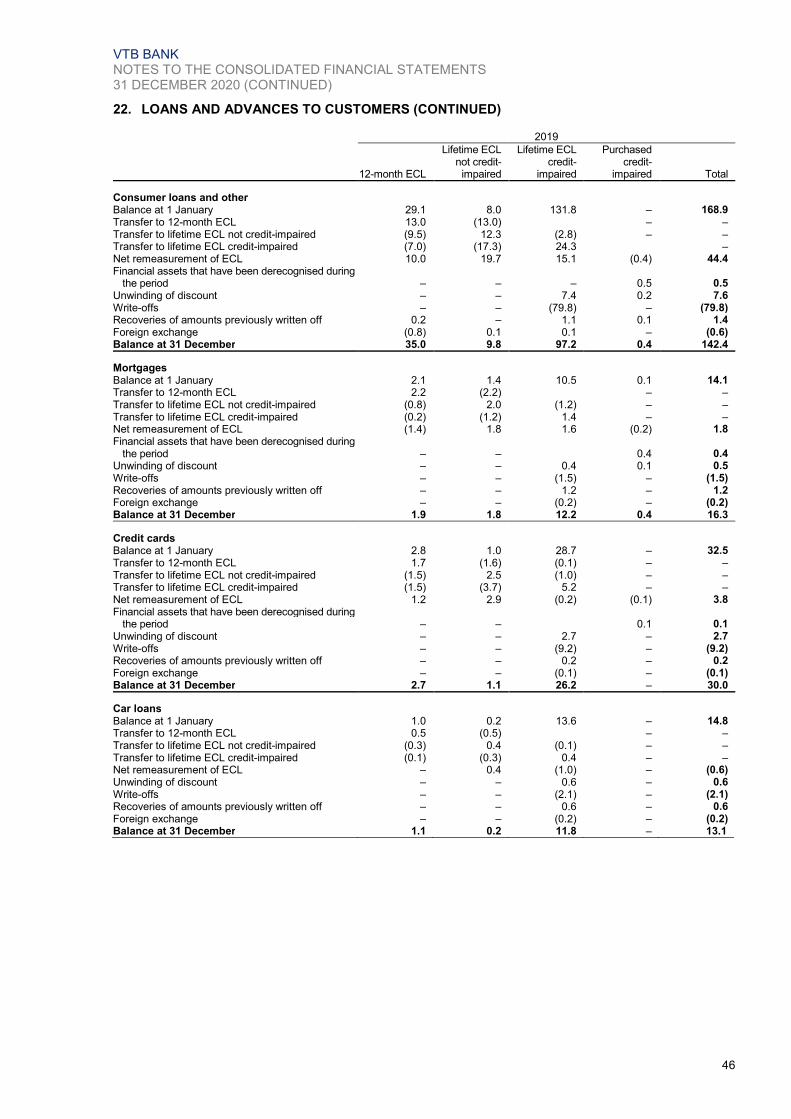
VTB BANK NOTES TO THE CONSOLIDATED FINANCIAL STATEMENTS 31 DECEMBER 2020 (CONTINUED)
46
22. LOANS AND ADVANCES TO CUSTOMERS (CONTINUED) 2019
12-month ECL
Lifetime ECL not credit-
impaired
Lifetime ECL credit-
impaired
Purchased credit-
impaired Total
Consumer loans and other Balance at 1 January 29.1 8.0 131.8 – 168.9 Transfer to 12-month ECL 13.0 (13.0) – – Transfer to lifetime ECL not credit-impaired (9.5) 12.3 (2.8) – – Transfer to lifetime ECL credit-impaired (7.0) (17.3) 24.3 – Net remeasurement of ECL 10.0 19.7 15.1 (0.4) 44.4 Financial assets that have been derecognised during
the period – – – 0.5 0.5 Unwinding of discount – – 7.4 0.2 7.6 Write-offs – – (79.8) – (79.8) Recoveries of amounts previously written off 0.2 – 1.1 0.1 1.4 Foreign exchange (0.8) 0.1 0.1 – (0.6) Balance at 31 December 35.0 9.8 97.2 0.4 142.4
Mortgages Balance at 1 January 2.1 1.4 10.5 0.1 14.1 Transfer to 12-month ECL 2.2 (2.2) – – Transfer to lifetime ECL not credit-impaired (0.8) 2.0 (1.2) – – Transfer to lifetime ECL credit-impaired (0.2) (1.2) 1.4 – – Net remeasurement of ECL (1.4) 1.8 1.6 (0.2) 1.8 Financial assets that have been derecognised during
the period – – 0.4 0.4 Unwinding of discount – – 0.4 0.1 0.5 Write-offs – – (1.5) – (1.5) Recoveries of amounts previously written off – – 1.2 – 1.2 Foreign exchange – – (0.2) – (0.2) Balance at 31 December 1.9 1.8 12.2 0.4 16.3
Credit cards Balance at 1 January 2.8 1.0 28.7 – 32.5 Transfer to 12-month ECL 1.7 (1.6) (0.1) – – Transfer to lifetime ECL not credit-impaired (1.5) 2.5 (1.0) – – Transfer to lifetime ECL credit-impaired (1.5) (3.7) 5.2 – – Net remeasurement of ECL 1.2 2.9 (0.2) (0.1) 3.8 Financial assets that have been derecognised during
the period – – 0.1 0.1 Unwinding of discount – – 2.7 – 2.7 Write-offs – – (9.2) – (9.2) Recoveries of amounts previously written off – – 0.2 – 0.2 Foreign exchange – – (0.1) – (0.1) Balance at 31 December 2.7 1.1 26.2 – 30.0
Car loans Balance at 1 January 1.0 0.2 13.6 – 14.8 Transfer to 12-month ECL 0.5 (0.5) – – Transfer to lifetime ECL not credit-impaired (0.3) 0.4 (0.1) – – Transfer to lifetime ECL credit-impaired (0.1) (0.3) 0.4 – – Net remeasurement of ECL – 0.4 (1.0) – (0.6) Unwinding of discount – – 0.6 – 0.6 Write-offs – – (2.1) – (2.1) Recoveries of amounts previously written off – – 0.6 – 0.6 Foreign exchange – – (0.2) – (0.2) Balance at 31 December 1.1 0.2 11.8 – 13.1

VTB BANK NOTES TO THE CONSOLIDATED FINANCIAL STATEMENTS 31 DECEMBER 2020 (CONTINUED)
47
23. INVESTMENT FINANCIAL ASSETS 2020 2019
Investment financial assets measured at fair value through other comprehensive
income 852.8 247.2 Investment financial assets mandatorily measured at fair value through profit or loss 60.3 34.6 Investment financial assets measured at amortised cost 32.3 28.5 Investment financial assets designated as at fair value through profit or loss 7.3 6.3 Total investment financial assets 952.7 316.6
Investment financial assets measured at fair value through other comprehensive income
2020 2019
Investment financial assets measured at fair value through other comprehensive income
Debt securities
Bonds and eurobonds of the Russian Federation 241.3 49.0
Bonds and eurobonds of foreign governments 23.4 19.2
Bonds and eurobonds of foreign companies and banks 15.5 6.0
Bonds and eurobonds of Russian companies and banks 6.0 2.7
Russian municipal bonds 0.2 0.3
Bonds of the Central Bank of the Russian Federation – 7.1 Total debt securities 286.4 84.3 Equity securities 3.9 9.8 Total investment financial assets measured at fair value through other
comprehensive income 290.3 94.1 Investment financial assets measured at fair value through other comprehensive
income, pledged under repurchase agreements Debt securities
Bonds and eurobonds of the Russian Federation 561.6 152.1
Bonds and eurobonds of foreign governments 0.9 1.0 Total debt securities 562.5 153.1 Total investment financial assets measured at fair value through other
comprehensive income, pledged under repurchase agreements 562.5 153.1
Total investment financial assets measured at fair value through other comprehensive income 852.8 247.2
Investment financial assets mandatorily measured at fair value through profit or loss
2020 2019
Investment financial assets mandatorily measured at fair value through profit or loss Equity securities 40.9 18.8 Debt securities
Bonds and eurobonds of Russian companies and banks 11.7 9.4
Bonds and eurobonds of foreign companies and banks 7.5 6.4
Bonds and eurobonds of foreign governments 0.2 – Total debt securities 19.4 15.8 Total investment financial assets mandatorily measured at fair value through
profit or loss 60.3 34.6
Investment financial assets measured at amortised cost 2020 2019
Investment financial assets measured at amortised cost
Bonds and eurobonds of foreign companies and banks 15.8 0.3
Bonds and eurobonds of the Russian Federation 5.5 5.1
Bonds and eurobonds of foreign governments 4.6 2.9
Bonds and eurobonds of Russian companies and banks 4.2 6.6
Russian municipal bonds 2.3 1.4
Bonds of the Central Bank of the Russian Federation – 12.2 Less: Expected credit loss (0.1) – Total investment financial assets measured at amortised cost 32.3 28.5

VTB BANK NOTES TO THE CONSOLIDATED FINANCIAL STATEMENTS 31 DECEMBER 2020 (CONTINUED)
48
23. INVESTMENT FINANCIAL ASSETS (CONTINUED) Investment financial assets designated as at fair value through profit or loss 2020 2019
Reverse sale and repurchase agreements to maturity 7.3 6.3 Total investment financial assets designated as at fair value through profit or
loss 7.3 6.3
As at 31 December 2020 and 31 December 2019, debt investment financial assets, including pledged under repurchase agreements, are attributable to 12-month ECL stage (credit grade “pass”).
As at 31 December 2020 and 31 December 2019, the expected credit loss (ECL) for debt investment financial assets at fair value through other comprehensive
income, including pledged under repurchase agreements amounted to RUR 0.1 billion. The above ECL is not recognised in the consolidated statement of financial position because the carrying amount of debt investment financial assets at fair value through other comprehensive income, including pledged under repurchase agreements is their fair value.
24. LAND, PREMISES AND EQUIPMENT
Land and premises Equipment
Construction in progress
Equipment in operating
lease Right-of-use
assets Total
Net book amount at
31 December 2019 137.6 35.1 50.3 154.5 45.0 422.5 Cost or revalued amount Opening balance at 1 January
2020 140.4 82.8 50.3 195.3 53.5 522.3 Acquisitions of subsidiaries – 0.9 – – 0.1 1.0 Disposal of subsidiaries (0.9) (0.4) – – (0.8) (2.1) Additions 0.7 1.9 59.7 0.3 1.7 64.3 Transfers and reclassifications 3.3 26.6 (32.6) (0.1) – (2.8) Disposals (0.4) (1.7) – (0.5) – (2.6) Write-offs of fully amortised items (0.1) (0.3) – – (0.8) (1.2) Impairment (16.0) (0.3) – (0.8) (0.1) (17.2) Revaluation (0.3) – – – – (0.3) Reassessment and modification of
right-of-use assets – – – – (1.8) (1.8) Effect of translation (0.1) 0.6 – 32.9 0.6 34.0 Other changes 1.5 1.0 – – – 2.5 Closing balance at 31 December
2020 128.1 111.1 77.4 227.1 52.4 596.1
Accumulated depreciation Opening balance at 1 January
2020 2.8 47.7 – 40.8 8.5 99.8 Depreciation charge 2.8 9.4 – 12.5 8.6 33.3 Disposal of subsidiaries – (0.1) – – – (0.1) Disposals – (1.6) – (0.3) – (1.9) Write-offs of fully amortised items (0.1) (0.3) – – (0.6) (1.0) Transfers and reclassifications 1.0 (1.2) – (0.3) (0.1) (0.6) Effect of translation (0.3) 0.8 – 6.1 (0.4) 6.2 Other changes – 3.9 – – – 3.9 Closing balance at 31 December
2020 6.2 58.6 – 58.8 16.0 139.6 Net book amount at
31 December 2020 121.9 52.5 77.4 168.3 36.4 456.5
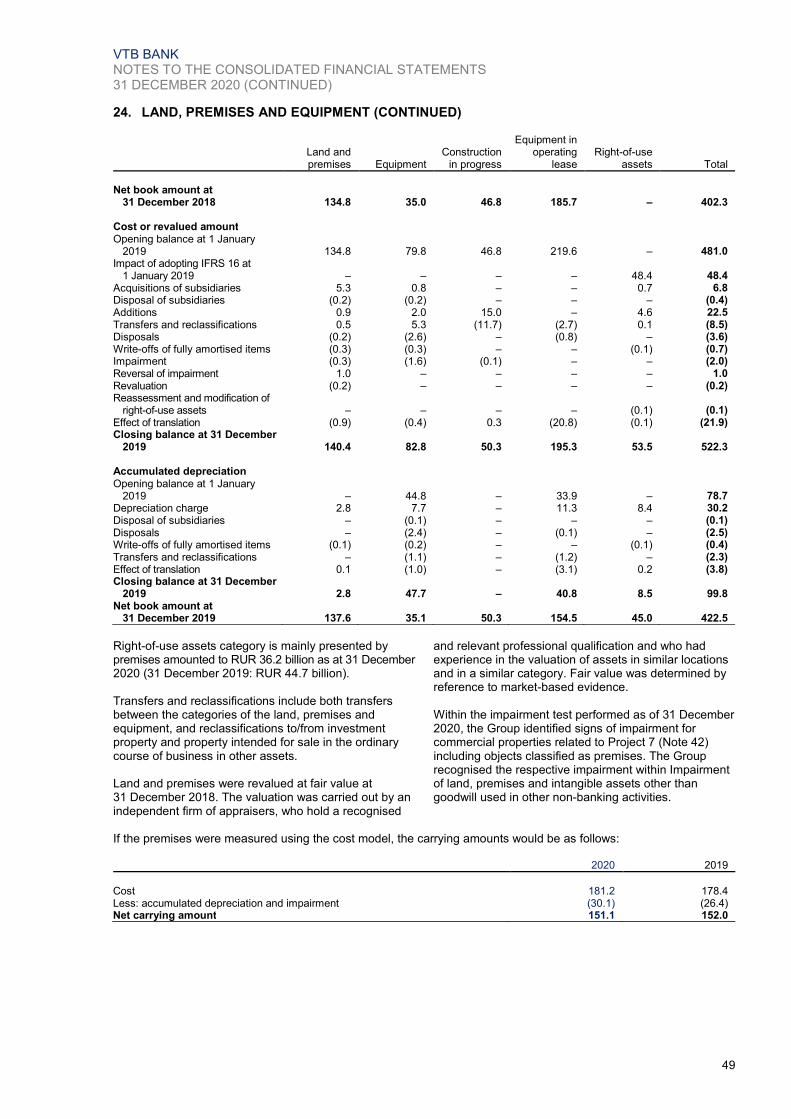
VTB BANK NOTES TO THE CONSOLIDATED FINANCIAL STATEMENTS 31 DECEMBER 2020 (CONTINUED)
49
24. LAND, PREMISES AND EQUIPMENT (CONTINUED)
Land and premises Equipment
Construction in progress
Equipment in operating
lease Right-of-use
assets Total
Net book amount at
31 December 2018 134.8 35.0 46.8 185.7 – 402.3 Cost or revalued amount Opening balance at 1 January
2019 134.8 79.8 46.8 219.6 – 481.0 Impact of adopting IFRS 16 at
1 January 2019 – – – – 48.4 48.4 Acquisitions of subsidiaries 5.3 0.8 – – 0.7 6.8 Disposal of subsidiaries (0.2) (0.2) – – – (0.4) Additions 0.9 2.0 15.0 – 4.6 22.5 Transfers and reclassifications 0.5 5.3 (11.7) (2.7) 0.1 (8.5) Disposals (0.2) (2.6) – (0.8) – (3.6) Write-offs of fully amortised items (0.3) (0.3) – – (0.1) (0.7) Impairment (0.3) (1.6) (0.1) – – (2.0) Reversal of impairment 1.0 – – – – 1.0 Revaluation (0.2) – – – – (0.2) Reassessment and modification of
right-of-use assets – – – – (0.1) (0.1) Effect of translation (0.9) (0.4) 0.3 (20.8) (0.1) (21.9) Closing balance at 31 December
2019 140.4 82.8 50.3 195.3 53.5 522.3
Accumulated depreciation Opening balance at 1 January
2019 – 44.8 – 33.9 – 78.7 Depreciation charge 2.8 7.7 – 11.3 8.4 30.2 Disposal of subsidiaries – (0.1) – – – (0.1) Disposals – (2.4) – (0.1) – (2.5) Write-offs of fully amortised items (0.1) (0.2) – – (0.1) (0.4) Transfers and reclassifications – (1.1) – (1.2) – (2.3) Effect of translation 0.1 (1.0) – (3.1) 0.2 (3.8) Closing balance at 31 December
2019 2.8 47.7 – 40.8 8.5 99.8 Net book amount at
31 December 2019 137.6 35.1 50.3 154.5 45.0 422.5
Right-of-use assets category is mainly presented by premises amounted to RUR 36.2 billion as at 31 December 2020 (31 December 2019: RUR 44.7 billion). Transfers and reclassifications include both transfers between the categories of the land, premises and equipment, and reclassifications to/from investment property and property intended for sale in the ordinary course of business in other assets. Land and premises were revalued at fair value at 31 December 2018. The valuation was carried out by an independent firm of appraisers, who hold a recognised
and relevant professional qualification and who had experience in the valuation of assets in similar locations and in a similar category. Fair value was determined by reference to market-based evidence. Within the impairment test performed as of 31 December 2020, the Group identified signs of impairment for commercial properties related to Project 7 (Note 42) including objects classified as premises. The Group recognised the respective impairment within Impairment of land, premises and intangible assets other than goodwill used in other non-banking activities.
If the premises were measured using the cost model, the carrying amounts would be as follows: 2020 2019
Cost 181.2 178.4 Less: accumulated depreciation and impairment (30.1) (26.4) Net carrying amount 151.1 152.0

VTB BANK NOTES TO THE CONSOLIDATED FINANCIAL STATEMENTS 31 DECEMBER 2020 (CONTINUED)
50
25. INVESTMENT PROPERTY
2020 2019
Investment property at 1 January 196.1 197.2 Impact of adopting IFRS 16 at 1 January 2019 – 0.2 Acquisition of subsidiaries 3.6 – Disposal of subsidiaries (0.4) (2.1) Additions 2.1 4.9 Disposals (16.9) (10.3) Reclassified (to)/from premises 0.7 1.8 Reclassified (to)/from property intended for sale in the ordinary course of business – 1.3 Net losses from changes in fair value (87.0) (0.9) Capitalisation of expenses 3.0 5.4 Reassessment and modification of right-of-use assets (0.3) – Effect of translation – (0.3) Reclassified (to)/from assets of disposal groups held for sale – (1.1) Reclassified (to)/from other assets (0.4) – Investment property at 31 December 100.5 196.1
Where the Group is the lessor, the future minimum lease payments receivable under non-cancellable operating leases are as follows: 2020 2019
Not later than 1 year 2.4 4.6 Later than 1 year and not later than 5 years 5.1 3.7 Later than 5 years 2.5 – Total operating lease payments receivable 10.0 8.3
For the year ended 31 December 2020 the Group recognised rental income as part of income arising from non-banking activities of RUR 4.4 billion (Note 11) and direct operating expenses of RUR 1.1 billion in relation to investment property that generated rental income (for the year ended 31 December 2019: RUR 4.9 billion and RUR 0.9 billion, respectively).
For the year ended 31 December 2020 the Group obtained the property of RUR 0.8 billion (for the year ended 31 December 2019: RUR 4.3 billion) through foreclosure of collateral under mortgage loans. For the year ended 31 December 2020 the Group received the property of RUR 3.6 billion through control obtained over subsidiary under debt settlement. The acquired
investment properties were valued by an independent, professionally qualified appraiser at fair value at the acquisition date.
As at 31 December 2020 investment property in the amount of RUR 4.1 billion was under construction in progress or development (31 December 2019: RUR 21.2 billion).
The fair values of the investment properties were estimated using comparatives and the income approach under the highest and best use assumption. Actually used key valuation assumptions and fair value sensitivity to their changes are disclosed in Note 42.
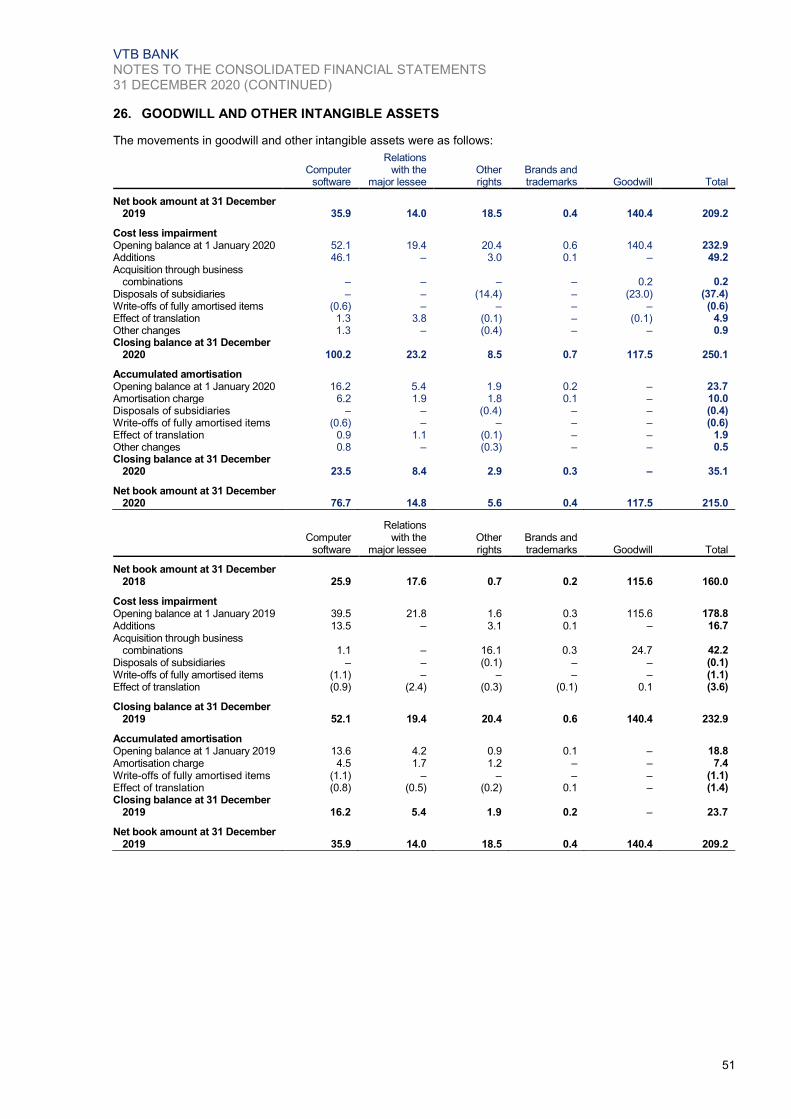
VTB BANK NOTES TO THE CONSOLIDATED FINANCIAL STATEMENTS 31 DECEMBER 2020 (CONTINUED)
51
26. GOODWILL AND OTHER INTANGIBLE ASSETS
The movements in goodwill and other intangible assets were as follows:
Computer
software
Relations with the
major lessee Other rights
Brands and trademarks Goodwill Total
Net book amount at 31 December
2019 35.9 14.0 18.5 0.4 140.4 209.2 Cost less impairment Opening balance at 1 January 2020 52.1 19.4 20.4 0.6 140.4 232.9 Additions 46.1 – 3.0 0.1 – 49.2 Acquisition through business
combinations – – – – 0.2 0.2 Disposals of subsidiaries – – (14.4) – (23.0) (37.4) Write-offs of fully amortised items (0.6) – – – – (0.6) Effect of translation 1.3 3.8 (0.1) – (0.1) 4.9 Other changes 1.3 – (0.4) – – 0.9 Closing balance at 31 December
2020 100.2 23.2 8.5 0.7 117.5 250.1 Accumulated amortisation Opening balance at 1 January 2020 16.2 5.4 1.9 0.2 – 23.7 Amortisation charge 6.2 1.9 1.8 0.1 – 10.0 Disposals of subsidiaries – – (0.4) – – (0.4) Write-offs of fully amortised items (0.6) – – – – (0.6) Effect of translation 0.9 1.1 (0.1) – – 1.9 Other changes 0.8 – (0.3) – – 0.5 Closing balance at 31 December
2020 23.5 8.4 2.9 0.3 – 35.1 Net book amount at 31 December
2020 76.7 14.8 5.6 0.4 117.5 215.0
Computer
software
Relations with the
major lessee Other rights
Brands and trademarks Goodwill Total
Net book amount at 31 December
2018 25.9 17.6 0.7 0.2 115.6 160.0 Cost less impairment Opening balance at 1 January 2019 39.5 21.8 1.6 0.3 115.6 178.8 Additions 13.5 – 3.1 0.1 – 16.7 Acquisition through business
combinations 1.1 – 16.1 0.3 24.7 42.2 Disposals of subsidiaries – – (0.1) – – (0.1) Write-offs of fully amortised items (1.1) – – – – (1.1) Effect of translation (0.9) (2.4) (0.3) (0.1) 0.1 (3.6) Closing balance at 31 December
2019 52.1 19.4 20.4 0.6 140.4 232.9 Accumulated amortisation Opening balance at 1 January 2019 13.6 4.2 0.9 0.1 – 18.8 Amortisation charge 4.5 1.7 1.2 – – 7.4 Write-offs of fully amortised items (1.1) – – – – (1.1) Effect of translation (0.8) (0.5) (0.2) 0.1 – (1.4) Closing balance at 31 December
2019 16.2 5.4 1.9 0.2 – 23.7 Net book amount at 31 December
2019 35.9 14.0 18.5 0.4 140.4 209.2

VTB BANK NOTES TO THE CONSOLIDATED FINANCIAL STATEMENTS 31 DECEMBER 2020 (CONTINUED)
52
26. GOODWILL AND OTHER INTANGIBLE ASSETS (CONTINUED) The table below presents the carrying amount of goodwill and relations with the major lessee intangible allocated to relevant cash-generating units (CGU) of the following entities:
CGU
Carrying amount of
goodwill
Relations with the
major lessee
intangible Total
CGU
Carrying amount of
goodwill
Relations with the
major lessee
intangible Total
“VTB Bank”, PJSC “VTB Bank”, PJSC
CIB 76.1 – 76.1 CIB 76.1 – 76.1
MSB 26.8 – 26.8 MSB 26.8 – 26.8
RB 11.1 – 11.1 RB 11.1 – 11.1 Sarovbusinessbank 1.1 – 1.1 Sarovbusinessbank 1.1 – 1.1 “Avia Capital
Management” Ltd. – 14.8 14.8 “Avia Capital
Management” Ltd. – 14.0 14.0 Novorossiysk Grain
Terminal, LLC – – – Novorossiysk Grain
Terminal, LLC 21.9 – 21.9 Other subsidiaries 2.4 – 2.4 Other subsidiaries 3.4 – 3.4 Net book amount 117.5 14.8 132.3 Net book amount 140.4 14.0 154.4
Avia Capital Management Ltd.
Group recognised an intangible asset (relations with the major lessee) that arose following the acquisition of a subsidiary in 2013. It was allocated to the Avia Capital Management Ltd cash flow generating unit (further “CGU”) and tested for impairment as a part of this CGU in accordance with IAS 36 Impairment of Assets. As at 31 December 2020, the recoverable amount was estimated as value in use of the CGU. The key assumptions in determining the value in use were:
the discount rate in USD which represents the pre-tax cost of equity and was calculated under CAPM (the Capital Asset Pricing Model) at 9.95% (2019: 10.4%) to reflect the specific risks related to the given CGU;
the projection of cash outflows from financing activity applying synthetic USD rate. The rate was estimated based on the assumption of continuing hedging of the existing rouble funding with derivative financial instruments.
As at 31 December 2020 and 2019 no reasonable possible changes in assumptions could have led to carrying amount to exceed the recoverable amount of the asset. Novorossiysk Grain Terminal, LLC.
In 2019 the Group recognized goodwill from acquisition of Novorossiysk Grain Terminal in the amount of RUR 21.9 billion. The goodwill was allocated to the cash generating unit representing grain transshipment business of Novorossiysk Grain Terminal (further NGT CGU) and tested for impairment as a part of NGT CGU in accordance with IAS 36 Impairment of assets.
In 2020 the Group derecognized goodwill related to Novorossiysk Grain Terminal following the loss of control over Demetra Holding LLC (Note 45).

VTB BANK NOTES TO THE CONSOLIDATED FINANCIAL STATEMENTS 31 DECEMBER 2020 (CONTINUED)
53
26. GOODWILL AND OTHER INTANGIBLE ASSETS (CONTINUED)
As of 31 December 2019, the recoverable amount of NGT CGU has been determined based on value in use calculation using the discounted cash flow valuation model. The forecast period of the model covers 10 years. The key assumptions in determining the value in use were discount rate, terminal growth rate, cargo handling volume, tariff and margin. CAPM based discount rate was calculated at 13.5% on the basis of RUB risk-free interest rates, a market risk premium and beta as a measure of systematic market risk. Cash flows beyond 2029 were extrapolated using estimated total growth rate of 4% p.a. Cargo handling volumes were estimated based on available management and market forecasts. Tariff for grain transhipment services were determined based on US Dollar denominated historic rates multiplied by forward RUR/US Dollar exchange rates. Margin was calculated based on historic data for the preceding three years. For the purpose of impairment testing the carrying amount of the NGT CGU together with the allocated goodwill was compared to the recoverable amount of the respective CGU. As at 31 December 2019, the recoverable amount of the NGT CGU exceeded its carrying value by RUB 4.0 billion. “VTB Bank”, PJSC
The Group management defined in the operational structure of “VTB Bank”, PJSC the following key cash flow generating units (“CGUs”):
Corporate-Investment banking (“CIB”);
Medium and Small banking (“MSB”);
Retail banking (“RB”). Each of the abovementioned segments has its internal unified systems:
Management system under the leadership of a separate member of the Management Board of VTB Bank;
Decision-making process and process of allocating resources;
Bonus system. Management reports for each CGU are prepared on a monthly basis and are reviewed by management bodies of VTB Bank, including the Management board as part of operational decision-making. For the purposes of goodwill impairment test, the recoverable amount of the above individual CGUs was determined based on the net present value of expected cash flows. Carrying amount of CGU At 31 December 2020, the carrying amount of the relevant CGUs was determined through allocation of the adjusted VTB shareholders’ equity. VTB shareholders’ equity was adjusted for investment in subsidiaries and other deductions related to regulatory Group Treasury functions. Subsequently the adjusted VTB shareholders’ equity was allocated to CGUs proportionately based on their share in assets and open risk position for credit related commitments on an aggregate basis for the Bank.
Goodwill in the total amount of RUB 114.0 billion, recognised on the acquisition of other banks that were subsequently reorganised with their assets transferred on VTB’s balance, was allocated to CGUs based on the amount of acquired assets, generating cash flows as following (as of 31 December 2020 and 2019): Purchased bank CIB MSB RB Total
Guta-bank, JSC – – 2.1 2.1 “Bank VTB North-
West”, OJSС 5.2 – – 5.2 “TransCreditBank”,
JSC 4.8 0.4 1.3 6.5 “Bank of Moscow”,
OJSC 66.1 26.4 7.7 100.2 Total 76.1 26.8 11.1 114.0
In accordance with integration plan of businesses of “Vozrozhdenie Bank”, PJSC, “Sarovbusinessbank”, PJSC and “Zapsibcombank”, PJSC, the financial information related to above mentioned banks was included in carrying and recoverable amounts of CGUs for the purpose of goodwill impairment testing. This information includes the goodwill of “Sarovbusinessbank”, PJSC recognised in CGUs as following (as of 31 December 2020 and 2019): Purchased bank CIB MSB RB Total
“Sarovbusinessbank”, PJSC – 0.2 0.9 1.1
Result of total goodwill amount for each CGU for integrated VTB’s business is showed in the table below: CGU 2020 2019
CIB 76.1 76.1 MSB 27.0 27.0 RB 12.0 12.0 Total 115.1 115.1
For the purpose of impairment testing the carrying amount of the relevant CGUs together with the allocated goodwill were compared to the recoverable amount of the respective CGUs.
DCF Model The Group determines the recoverable amounts of each CGU on the basis of value in use for a 3-year forecast period up to 2023 and post-forecast period of 2024, calculated using the VTB Bank business model. Future cash flows were discounted to their present value at a rate that reflected investors expected returns in the forecasted periods. Cash flows beyond 2024 period were extrapolated using estimated total growth rate of 4.5% p.a. Moderately optimistic forecast of the development of the RF economy and the banking sector underlies the estimates, assuming an economic growth rate in medium term of 1.4-2.0% with growth rate of -3.7% in 2020 and +4% in 2021 due to instability of the world economy, situation in the regions of oil extraction and uncertainty situation with COVID-19 pandemic. It is supposed to achieve target inflation rate of 4.0%.

VTB BANK NOTES TO THE CONSOLIDATED FINANCIAL STATEMENTS 31 DECEMBER 2020 (CONTINUED)
54
26. GOODWILL AND OTHER INTANGIBLE ASSETS (CONTINUED) Estimates of future cash flows were based on the most recent financial statements, as well as figures, forecasts and budgets for the relevant CGUs, in addition to the economic and market forecasts that chief decision makers approve for internal management purposes. The following assumptions were used in the DCF model in respect of expected cash flows and the discount rate. COR: The Cost of Risk, representing the provision
charge for loan credit losses divided by average gross loans and advances to customers for each CGU, was projected on the basis of each CGU’s key strategic targets and historical data. NIM: The Net Interest Margin was projected on the basis
of a CGU’s key strategic targets, expected business profitability and the historical level for each CGU. CIR: The Cost to Income ratio was projected on the
basis of a CGU’s key strategic targets, expected cost reduction, efficiencies following the large-scale digitalization and the historical levels for each CGU. Discount rate: The CAPM-based discount rates was
determined on the basis of RUB and foreign currency risk-free interest rates, a market risk premium and beta as a measure of systematic market risk. The market risk premium and beta were derived from public sources of information, while the risk-free interest rates for the terminal period were derived both from public and internal sources of information.
The Group applied different discount rate for different future periods based on its expectation of decrease of the risk free rate. Variations in all of these components might impact the calculation of expected cash flows and might have a material effect on the recoverable amounts of respective CGUs. As at 31 December 2020, the range of key assumptions for the relevant CGUs for the projection period (2021-2023) was as follows:
CGU COR, b.p. NIM, % p.a. CIR, % p.a. Discount
rate, % p.a.
CIB 91-97 2.1 27.0
11.9-12.0 MSB 150 4.0-4.2 42.3-42.8
RB 152-160 4.3-4.7 47.8-49.7
As at 31 December 2019, the range of key assumptions for the relevant CGUs for the projection period (2020-2022) was as follows:
CGU COR, b.p. NIM, % p.a. CIR, % p.a. Discount
rate, % p.a.
CIB 53-97 1.6-1.9 28.0
11.8-12.3 MSB 152 3.6-3.8 36.5-44.1 RB 155-160 3.9-4.4 49.1-53.1
Sensitivity of recoverable amount to possible changes in key assumptions The tables show the impact that possible changes in our key assumptions might have on the recoverable amount of the relevant CGUs in terms of the goodwill impairment recognition.
As at 31 December 2020:
CGU Key assumption Reasonably possible
change Goodwill impairment,
RUR billion
Recoverable amount exceeds carrying
amount, RUR billion
Change in key assumptions
resulting in recoverable amount
to equal carrying amount
CIВ NIM -0.30% (76.1) 53.9 -0.06% CIВ CIR +0.60% (29.8) 53.9 +0.23% CIВ COR +20 b.p. (61.5) 53.9 +9 b.p RB NIM -0.60% (12.0) 180.3 -0.43% As at 31 December 2019:
CGU Key assumption Reasonably possible
change Goodwill impairment,
RUR billion
Recoverable amount exceeds carrying
amount, RUR billion
Change in key assumptions
resulting in recoverable amount
to equal carrying amount
CIВ NIM -0.30% (76.1) 84.3 -0.13% CIВ COR 20 b.p. (27.6) 84.3 8 b.p. RB NIM -0.30% (12.0) 81.2 -0.21%

VTB BANK NOTES TO THE CONSOLIDATED FINANCIAL STATEMENTS 31 DECEMBER 2020 (CONTINUED)
55
26. GOODWILL AND OTHER INTANGIBLE ASSETS (CONTINUED) The following table summarises uncertainties of key assumptions used in the DCF model: Input Assumptions Uncertainties of Assumptions
CIB CIR Continued focus on operating efficiency Cost savings are not realised as anticipated
NIM Recovery of Russian markets over the forecast period
Expected level of the market interest rates and likely decrease in the CB key rate in middle-term horizon
Decreasing cost of liabilities in VTB, resulting from implementation of the Group’s plans to optimise the funding structure
Unfavourable margin development and adverse competition levels in key products beyond expected levels Significant share of large corporates in VTB’s loan book limits the Group’s pricing power to re-price loans if the key rate is increased
COR COR is based on anticipated dynamics of the loans Unexpected market conditions and possible additional sanctions against RF-entities that will increase loan loss risks
Discount rate Discount rate used is a reasonable estimate of a suitable market rate for the profile of the business
Major industry threats, i.e. market volatility, sovereign debt burden, increasing costs from possible regulatory changes
MSB CIR Strict discipline applied to operating expenses Cost savings are not realised as anticipated
NIM Recovery of Russian markets over the forecast period
Expected level of the market interest rates and likely decrease in the CB key rate in middle-term horizon
Unfavourable margin development and adverse competition levels in key products beyond expected levels
COR Strict discipline applied to cost of risk Significant economic decline to increase credit loss provisions
Discount rate Discount rate used is a reasonable estimate of a suitable market rate for the profile of the business.
Major industry threats, i.e. market volatility, sovereign debt burden, increasing costs from possible regulatory changes
RB CIR Development of mobile applications for interaction with customers,
back office reallocation to regions with lower labour costs Initial stage may be long and high cost
NIM General economic conditions improve, which would result in the Group reassessing its risk appetite and help to increase the share of high margin banking products
Unfavourable margin development and adverse competition levels in key products beyond expected levels
COR Solid management of cost of risk despite growth in share of higher margin but more risky products
Significant economic decline potentially resulting in higher unemployment rates, increasing credit loss provisions
Discount rate Discount rate used is a reasonable estimate of a suitable market rate for the profile of the business
Major industry threats, i.e. market volatility, sovereign debt burden, increasing costs from possible regulatory changes
Current economic and industry risks such as volatility of the key interest rate determined by the CBR (“key rate”), oil prices and foreign exchange rates might negatively impact actual cash flows as compared to forecasted cash flows and result in impairment of goodwill allocated to CGUs.
Management’s forecast of NIM, WACC and loan portfolio growth takes into consideration existing expectations regarding the future changes in the key rate. Should the actual reductions in the key rate be slower that it was expected by the management, it might have negative influence on the actual future cash flows and rates.

VTB BANK NOTES TO THE CONSOLIDATED FINANCIAL STATEMENTS 31 DECEMBER 2020 (CONTINUED)
56
27. OTHER ASSETS 2020 2019
Other financial assets at amortised cost:
Initial margin and other performance collateral 122.0 9.1 Amounts in course of settlement 83.4 40.1 Accrued commission income 25.6 16.4 Accrued income on operating leases 13.0 2.0 Trade receivables and prepayments 9.3 4.9 Advances issued to leasing equipment suppliers 7.6 4.9 Other 11.0 11.1
Total other financial assets at amortised cost before allowance for impairment 271.9 88.5 Less: loss allowance (3.3) (3.4) Total other financial assets at amortised cost 268.6 85.1
Other financial assets at fair value through profit or loss:
Amounts in course of settlement related to regular way transactions with financial instruments 0.4 0.1
Other 0.6 4.1 Total other financial assets at fair value through profit or loss 1.0 4.2 Total other financial assets 269.6 89.3 Insurance assets:
Deferred acquisition costs 1.9 2.0 Total insurance assets 1.9 2.0 Other non-financial assets accounted at cost less impairment:
Property intended for sale in the ordinary course of business 39.1 88.8 Prepayments 17.0 8.9 Other assets related to non-banking activities 11.1 19.8 Tax prepayments 9.4 8.4 Deferred expenses 7.6 7.4 Inventories 7.1 3.5 Equipment purchased for subsequent leasing 0.3 0.3 Other 10.0 7.0
Total other non-financial assets accounted at cost less impairment 101.6 144.1 Other non-financial assets at fair value:
Precious metals 153.2 163.7 Exchange-tradable commodities 57.3 11.5
Total other non-financial assets at fair value 210.5 175.2 Total other non-financial assets 312.1 319.3
Total other assets 583.6 410.6
As at December 2020, other non-financial assets include the amount of RUR 4.9 billion (31 December 2019: RUR 4.0 billion) representing foreclosed collateral (goods, equipment, etc.) under default loans before further decision (Note 41). As at 31 December 2020 and 2019, other assets related to non-banking activities were predominantly related to real estate and construction.
As at 31 December 2020, property intended for sale in the ordinary course of business under construction in progress or development amounted to RUR 7.1 billion (31 December 2019: RUR 39.4 billion) and property intended for sale in the ordinary course of business ready for use by buyer amounted to RUR 32.0 billion (31 December 2019: RUR 49.4 billion).
2020 2019
Property intended for sale in the ordinary course of business at 1 January 88.8 109.5 Additions 0.1 – Disposals (45.8) (34.7) Impairment (9.6) (6.2) Capitalisation of expenses 5.6 21.4 Disposal of subsidiaries – (0.4) Reclassified to investment property – (1.3) Reclassified to other accounts – (0.2) Reversal of impairment – 0.7 Property intended for sale in the ordinary course of business at 31 December 39.1 88.8
Within the impairment test performed as of 31 December 2020, the Group identified signs of impairment for commercial properties related to Project 7 (Note 42) including objects classified as property held for sale. The Group recognised the respective impairment within Expenses from write-down of property held for sale in the ordinary course of business.

VTB BANK NOTES TO THE CONSOLIDATED FINANCIAL STATEMENTS 31 DECEMBER 2020 (CONTINUED)
57
27. OTHER ASSETS (CONTINUED) The movements in expected credit loss (ECL) of other financial assets at amortised cost were as follows: 2020
12-month
ECL
Lifetime ECL not credit-
impaired
Lifetime ECL credit-
impaired Total
Balance at 1 January 0.6 1.1 1.7 3.4 Transfer to 12-month ECL 0.2 (0.1) (0.1) – Transfer to lifetime ECL not credit-impaired (0.1) 0.2 (0.1) – Transfer to lifetime ECL credit-impaired – (0.1) 0.1 – Net remeasurement of ECL 0.1 0.2 0.4 0.7 Write-offs – (0.2) (0.5) (0.7) Reclassification from/to ECL due to reclassification of items from/to this
category – – 0.1 0.1 Foreign exchange (0.2) (0.1) 0.1 (0.2) Balance at 31 December 0.6 1.0 1.7 3.3
2019
12-month
ECL
Lifetime ECL not credit-
impaired
Lifetime ECL credit-
impaired Total
Balance at 1 January 0.6 1.0 1.2 2.8 Transfer to lifetime ECL credit-impaired (0.2) – 0.2 – Net remeasurement of ECL 0.3 0.5 0.5 1.3 Write-offs – (0.5) (0.3) (0.8) Reclassification from/to ECL due to reclassification of items from/to this
category – – 0.1 0.1 Foreign exchange (0.1) 0.1 – – Balance at 31 December 0.6 1.1 1.7 3.4
28. DISPOSAL GROUPS AND NON-CURRENT ASSETS HELD FOR SALE The Group has non-current assets and investments in the disposal groups held for sale, including subsidiaries acquired exclusively with a view to resale, accounted for in accordance with IFRS 5. The Management of the Group is committed to dispose of these non-current assets and investments in the near future, within one year from the initial classification as a disposal group.
2020 2019
Assets of disposal groups held for sale: GOK Pekin 100% owned subsidiary 2.5 2.5 T2 (Netherlands) B.V. 50% owned joint venture – 66.0 Viva Telecom Bulgaria OOD 19.99% owned associate – 7.3 Total assets of disposal groups and
non-current assets held for sale 2.5 75.8
Liabilities of disposal groups held for sale: GOK Pekin 100% owned subsidiary 0.3 0.3 Total liabilities of disposal groups held for sale 0.3 0.3
The Group undertakes necessary actions to respond to the changes in the current operating environment and circumstances and remains committed to the plans to sell GOK Pekin. As at 31 December 2020 the Group considers that sale is highly probable and classifies investments in GOK Pekin as a disposal group held for sale under IFRS 5 presented in segment “Construction and development”. In March 2020, the Group has closed the deal to sell 55% share in T2 RTK Holding LLC owned by T2 (Netherlands) B.V. (joint venture of the Group and the consortium of investors) to PJSC Rostelecom (Note 46). The transaction does not have any impact on the income statement for the year ended 31 December 2020, as the investments were measured at fair value as of
31 December 2019 with the value approximating to the consideration received by the Group in March 2020. In July 2020, InterV Investments S.a r.L, where the Group indirectly holds 19.99% shares, completed the sale of 100% shares in Viva Telecom Bulgaria OOD (holding company of Vivacom Group) to United Group Bulgaria EOOD. The proceeds from the sale were used to repay the consortium facility provided by VTB Group in its entirety and to upstream the rest of the funds to shareholders pro rata to their shareholding in the form of repayment of outstanding convertible subordinated shareholders’ loans and interim liquidation payments. The gain from disposal which amounted to RUR 1.9 billion is attributable to CIB reporting segment and presented in the consolidated income statement within Gains from disposal of subsidiaries and associates.

VTB BANK NOTES TO THE CONSOLIDATED FINANCIAL STATEMENTS 31 DECEMBER 2020 (CONTINUED)
58
28. DISPOSAL GROUPS AND NON-CURRENT ASSETS HELD FOR SALE (CONTINUED)
Major classes of non-current assets and assets of disposal groups held for sale are as follows: 2020 2019
Assets of a disposal group held for sale:
Investments in associates and joint ventures – 73.3 Premises and equipment 1.3 1.3 Investment property 1.1 1.1 Other assets 0.1 0.1
Total assets of disposal groups and non-current assets held for sale 2.5 75.8
Major classes of liabilities of disposal groups held for sale are as follows: 2020 2019
Other liabilities 0.3 0.3 Total liabilities of disposal groups held for sale 0.3 0.3
29. DUE TO OTHER BANKS
2020 2019
Term loans and deposits 559.2 736.7 Correspondent accounts and overnight deposits of other banks 73.8 209.3 Sale and repurchase agreements 460.0 231.2 Total due to other banks 1,093.0 1,177.2
The table below shows the amounts of pledged assets and carrying amount of associated liabilities as at 31 December 2020 and 31 December 2019:
2020 2019
Amount of the assets
pledged
Carrying amount of
the associated
liabilities Net position
Amount of the assets
pledged
Carrying amount of
the associated
liabilities Net position
Sale and repurchase agreements
trading financial assets (Note 19) 59.8 54.8 5.0 14.9 12.6 2.3
investment financial assets (Note 23) 13.5 12.7 0.8 124.9 117.0 7.9
loans and advances to customers (Note 22) 6.4 6.8 (0.4) 0.2 0.2 –
financial assets received under reverse sale and repurchase agreements and general collateral certificates 385.7 385.7 – 112.5 101.4 11.1
Total 465.4 460.0 5.4 252.5 231.2 21.3
30. CUSTOMER DEPOSITS
2020 2019
Government bodies
Current/settlement deposits 303.3 208.1
Term deposits 869.5 1,084.0 Other legal entities
Current/settlement deposits 2,068.5 1,128.1
Term deposits 3,848.3 3,452.5 Individuals
Current/settlement deposits 2,767.5 1,426.4
Term deposits 2,961.4 3,611.6 Sale and repurchase agreements 12.5 63.5 Total customer deposits 12,831.0 10,974.2
As at 31 December 2020, the Group’s 10 largest groups of interrelated customers had aggregated balances amounting to RUR 3,108.8 billion or 24.2% of total customer deposits (Note 51) (31 December 2019: RUR 2,570.2 billion or 23.4%). As at 31 December 2020, deposits of RUR 28.4 billion (31 December 2019: RUR 22.8 billion) were held as collateral against irrevocable commitments under import letters of credit and guarantees (Note 49).
As at 31 December 2020 financial assets pledged against sale and repurchase agreements represent trading financial assets with fair value of RUR nil billion (31 December 2019: RUR 4.5 billion) (Note 19), loans and advances to customers with fair value of RUR nil billion (31 December 2019: RUR 20.8 billion) (Note 22), investment assets with fair value of RUR nil billion (31 December 2019: RUR 28.2 billion) and securities received under reverse sale and repurchase agreements with fair value of RUR 12.0 billion (31 December 2019: RUR 11.8 billion).

VTB BANK NOTES TO THE CONSOLIDATED FINANCIAL STATEMENTS 31 DECEMBER 2020 (CONTINUED)
59
30. CUSTOMER DEPOSITS (CONTINUED) Economic sector risk concentrations within customer deposits are as follows:
2020 2019
Amount % Amount %
Individuals 5,735.9 44.7 5,041.5 45.9 Oil and Gas 1,675.7 13.1 962.7 8.8 Government bodies 1,172.8 9.1 1,336.3 12.2 Building construction 693.4 5.4 574.0 5.2 Finance 658.3 5.1 704.9 6.4 Trade and commerce 418.4 3.3 364.0 3.3 Engineering and Other Manufacturing 358.7 2.8 319.7 2.9 Metals 357.6 2.8 241.4 2.2 Transport 333.2 2.6 276.9 2.5 Energy 304.8 2.4 245.9 2.2 Telecommunications and media 242.3 1.9 211.0 1.9 Food and agriculture 141.7 1.1 98.2 0.9 Chemical 109.0 0.8 55.8 0.5 Coal mining 13.3 0.1 10.8 0.1 Other 615.9 4.8 531.1 5.0 Total customer deposits 12,831.0 100.0 10,974.2 100.0
31. OTHER BORROWED FUNDS
2020 2019
Funds from local central banks: 709.4 55.4
Sale and Repurchase Agreements 611.8 –
Term deposits from 97.6 55.4 Syndicated loans 6.9 6.6 Other borrowings 336.9 286.9 Total other borrowed funds 1,053.2 348.9
In September 2011, “Bank of Moscow”, OJSC received a RUR 294.8 billion deposit from the related party DIA at 0.51% p.a. maturing in 10 years under the plan of support (the “Plan”) of “Bank of Moscow”, OJSC approved by the CBR and the DIA. During the fourth quarter 2014, the DIA agreed to the deposit extension due to adverse effects of the current political and macro-economic environment on “Bank of Moscow”, OJSC and its clients, which in turn influenced the execution of the Plan. In December 2014, the CBR and the DIA approved the extension of the deposit until September 2026 at 0.51% p.a.
As at 31 December 2020, the carrying amount of the deposit amounted to RUR 130.0 billion (31 December 2019: RUR 115.4 billion) and was included in Other borrowings. The contractual amount of the deposit was RUR 265.4 billion at 31 December 2020 (31 December 2019: RUR 265.8 billion). As at 31 December 2020 the deposit was collateralised by loans and advances to customers with the carrying amount of RUR 325.5 billion (31 December 2019: RUR 306.5 billion) (Note 22).
The table below shows the amounts of pledged assets and carrying amount of associated liabilities as at 31 December 2020 and 31 December 2019: 2020 2019
Amount of the assets
pledged
Carrying amount of the
associated liabilities Net position
Amount of the assets
pledged
Carrying amount of the
associated liabilities Net position
Funds from local central banks: Term deposits
loans and advances to customers (Note 22) 40.3 36.1 4.2 50.6 41.9 8.7
investment financial assets (Note 23) 1.6 1.5 0.1 0.6 0.6 –
Sale and repurchase agreements
trading financial assets (Note 19) 2.5 2.5 – – – –
investment financial assets (Note 23) 549.0 551.9 (2.9) – – –
loans and advances to customers (Note 22) 56.9 57.4 (0.5) – – –
Other borrowings
loans and advances to customers (Note 22) 325.5 130.0 195.5 306.5 115.4 191.1
Total 975.8 779.4 196.4 357.7 157.9 199.8
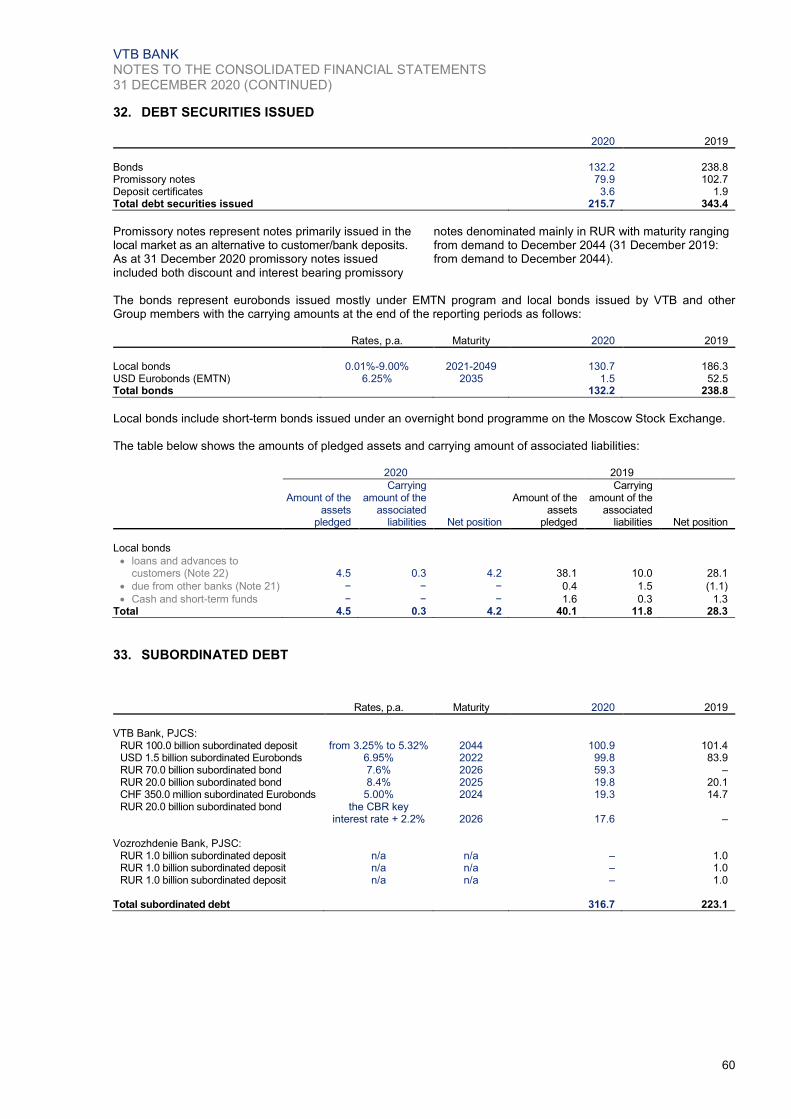
VTB BANK NOTES TO THE CONSOLIDATED FINANCIAL STATEMENTS 31 DECEMBER 2020 (CONTINUED)
60
32. DEBT SECURITIES ISSUED
2020 2019
Bonds 132.2 238.8 Promissory notes 79.9 102.7 Deposit certificates 3.6 1.9 Total debt securities issued 215.7 343.4
Promissory notes represent notes primarily issued in the local market as an alternative to customer/bank deposits. As at 31 December 2020 promissory notes issued included both discount and interest bearing promissory
notes denominated mainly in RUR with maturity ranging from demand to December 2044 (31 December 2019: from demand to December 2044).
The bonds represent eurobonds issued mostly under EMTN program and local bonds issued by VTB and other Group members with the carrying amounts at the end of the reporting periods as follows: Rates, p.a. Maturity 2020 2019
Local bonds 0.01%-9.00% 2021-2049 130.7 186.3 USD Eurobonds (EMTN) 6.25% 2035 1.5 52.5 Total bonds 132.2 238.8
Local bonds include short-term bonds issued under an overnight bond programme on the Moscow Stock Exchange. The table below shows the amounts of pledged assets and carrying amount of associated liabilities: 2020 2019
Amount of the assets
pledged
Carrying amount of the
associated liabilities Net position
Amount of the assets
pledged
Carrying amount of the
associated liabilities Net position
Local bonds
loans and advances to customers (Note 22) 4.5 0.3 4.2 38.1 10.0 28.1
due from other banks (Note 21) − − − 0.4 1.5 (1.1)
Cash and short-term funds − − − 1.6 0.3 1.3 Total 4.5 0.3 4.2 40.1 11.8 28.3
33. SUBORDINATED DEBT
Rates, p.a. Maturity 2020 2019
VTB Bank, PJCS:
RUR 100.0 billion subordinated deposit from 3.25% to 5.32% 2044 100.9 101.4 USD 1.5 billion subordinated Eurobonds 6.95% 2022 99.8 83.9 RUR 70.0 billion subordinated bond 7.6% 2026 59.3 – RUR 20.0 billion subordinated bond 8.4% 2025 19.8 20.1 CHF 350.0 million subordinated Eurobonds 5.00% 2024 19.3 14.7 RUR 20.0 billion subordinated bond the CBR key
interest rate + 2.2% 2026 17.6 –
Vozrozhdenie Bank, PJSC: RUR 1.0 billion subordinated deposit n/a n/a – 1.0 RUR 1.0 billion subordinated deposit n/a n/a – 1.0 RUR 1.0 billion subordinated deposit n/a n/a – 1.0
Total subordinated debt 316.7 223.1
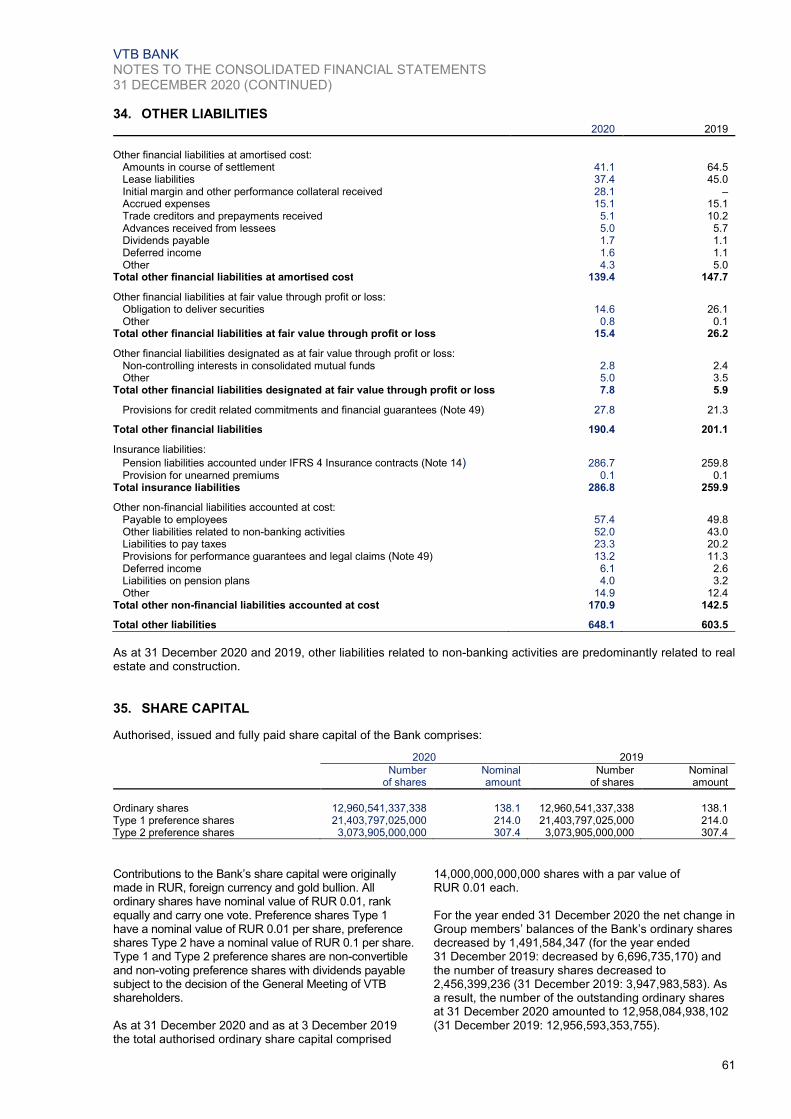
VTB BANK NOTES TO THE CONSOLIDATED FINANCIAL STATEMENTS 31 DECEMBER 2020 (CONTINUED)
61
34. OTHER LIABILITIES
2020 2019
Other financial liabilities at amortised cost:
Amounts in course of settlement 41.1 64.5 Lease liabilities 37.4 45.0 Initial margin and other performance collateral received 28.1 – Accrued expenses 15.1 15.1 Trade creditors and prepayments received 5.1 10.2 Advances received from lessees 5.0 5.7 Dividends payable 1.7 1.1 Deferred income 1.6 1.1 Other 4.3 5.0
Total other financial liabilities at amortised cost 139.4 147.7 Other financial liabilities at fair value through profit or loss:
Obligation to deliver securities 14.6 26.1 Other 0.8 0.1
Total other financial liabilities at fair value through profit or loss 15.4 26.2 Other financial liabilities designated as at fair value through profit or loss:
Non-controlling interests in consolidated mutual funds 2.8 2.4 Other 5.0 3.5
Total other financial liabilities designated at fair value through profit or loss 7.8 5.9
Provisions for credit related commitments and financial guarantees (Note 49) 27.8 21.3 Total other financial liabilities 190.4 201.1 Insurance liabilities:
Pension liabilities accounted under IFRS 4 Insurance contracts (Note 14) 286.7 259.8 Provision for unearned premiums 0.1 0.1
Total insurance liabilities 286.8 259.9 Other non-financial liabilities accounted at cost:
Payable to employees 57.4 49.8 Other liabilities related to non-banking activities 52.0 43.0 Liabilities to pay taxes 23.3 20.2 Provisions for performance guarantees and legal claims (Note 49) 13.2 11.3 Deferred income 6.1 2.6 Liabilities on pension plans 4.0 3.2 Other 14.9 12.4
Total other non-financial liabilities accounted at cost 170.9 142.5 Total other liabilities 648.1 603.5
As at 31 December 2020 and 2019, other liabilities related to non-banking activities are predominantly related to real estate and construction.
35. SHARE CAPITAL
Authorised, issued and fully paid share capital of the Bank comprises:
2020 2019
Number
of shares Nominal amount
Number of shares
Nominal amount
Ordinary shares 12,960,541,337,338 138.1 12,960,541,337,338 138.1 Type 1 preference shares 21,403,797,025,000 214.0 21,403,797,025,000 214.0 Type 2 preference shares 3,073,905,000,000 307.4 3,073,905,000,000 307.4
Contributions to the Bank’s share capital were originally made in RUR, foreign currency and gold bullion. All ordinary shares have nominal value of RUR 0.01, rank equally and carry one vote. Preference shares Type 1 have a nominal value of RUR 0.01 per share, preference shares Type 2 have a nominal value of RUR 0.1 per share. Type 1 and Type 2 preference shares are non-convertible and non-voting preference shares with dividends payable subject to the decision of the General Meeting of VTB shareholders. As at 31 December 2020 and as at 3 December 2019 the total authorised ordinary share capital comprised
14,000,000,000,000 shares with a par value of RUR 0.01 each. For the year ended 31 December 2020 the net change in Group members’ balances of the Bank’s ordinary shares decreased by 1,491,584,347 (for the year ended 31 December 2019: decreased by 6,696,735,170) and the number of treasury shares decreased to 2,456,399,236 (31 December 2019: 3,947,983,583). As a result, the number of the outstanding ordinary shares at 31 December 2020 amounted to 12,958,084,938,102 (31 December 2019: 12,956,593,353,755).

VTB BANK NOTES TO THE CONSOLIDATED FINANCIAL STATEMENTS 31 DECEMBER 2020 (CONTINUED)
62
36. PERPETUAL LOAN PARTICIPATION NOTES In August 2012 and November 2012, VTB issued Perpetual Loan Participation Notes for the amount of USD 1.0 billion (RUR 32.5 billion) and USD 1,250 million (RUR 39.2 billion) respectively. The transaction included the issuance of Perpetual Loan Participation Notes by VTB Eurasia Limited (Ireland), a consolidated structured entity, which used the proceeds to provide a subordinated loan to VTB. The Perpetual loan participation notes have an unlimited term and are redeemable at VTB’s option starting from December 2022 at their principal amount. Coupon rate is fixed at 9.5% p.a. and will be reset in 10.5 years and then every 10 years as 10 year US Treasury yield increased by 806.7 b.p. Coupon payments are paid semi-annually from December 2012 and may be cancelled or deferred in accordance with the terms of the notes. Such cancellation or deferral is at the discretion of VTB. Due to the undefined maturity and optional non-cumulative cancellation of coupon payments, the Group accounts for the Perpetual loan participation notes as an equity instrument and as a Tier I eligible instrument for the purpose of Basel Capital Adequacy Ratio calculation. Further, the CBR approved the inclusion of the subordinated loan in the statutory capital ratio calculation of VTB Bank.
The Group accounts for the USD-denominated Perpetual loan participation notes in the amount of RUR equivalent amount using the foreign exchange rate at the reporting date with foreign exchange translation effects recorded in retained earnings. Issuance costs were also recorded in retained earnings. Under the current terms of the Perpetual Loan Participation Notes, the payment of coupon is not mandatory. Coupon amounts due under Perpetual Loan Participation Notes are recorded on their payment dates in June and December of each year, subject to VTB’s decision to make such payments (Note 38). In their capacity as market-makers, VTB Group subsidiaries buy and sell Perpetual loan participation notes in the market, usually with a short holding period. During the holding period, Perpetual loan participation notes are included in Treasury shares and bought back perpetual loan participation notes in equity.
37. OTHER RESERVES Movements in other reserves were as follows:
Fair value reserve for debt and
equity investment financial assets
and cash-flow hedges
Land and premises
revaluation reserve
Currency translation difference Total
2018 (0.9) 24.6 58.7 82.4 Total comprehensive income/(loss) for the period 9.2 (0.2) (24.7) (15.7) Transfer of premises revaluation reserve upon
disposal or depreciation – (0.3) – (0.3) Transfer of fair value reserve of equity investment
financial assets upon disposal or derecognition (0.3) – – (0.3) 2019 8.0 24.1 34.0 66.1 Total comprehensive income/(loss) for the period 8.6 (0.3) 31.6 39.9 Transfer of premises revaluation reserve upon
disposal or depreciation – 5.3 – 5.3 Transfer of fair value reserve of equity investment
financial assets upon disposal or derecognition 0.8 – –
0.8 2020 17.4 29.1 65.6 112.1
38. DIVIDENDS AND AMOUNTS PAID UNDER PERPETUAL LOAN PARTICIPATION NOTES In accordance with the VTB dividend policy as approved by the Supervisory Council on 29 January 2016 dividends are distributed based on an annual IFRS net profit. The Supervisory Council proposes the amount of dividends for the approval by the Annual General Meeting of VTB. The approved dividend amounts are paid out to eligible shareholders within 25 working days.
Following the decision approved by the Extraordinary General Meeting of VTB shareholders on 8 December 2016 the amount of dividends on Type 1 preference shares and Type 2 preference shares may be determined upon results of the first three months, six months and nine months of the reporting year, and/or upon results of the reporting year by the General Shareholders Meeting on the recommendation of the Supervisory Council.

VTB BANK NOTES TO THE CONSOLIDATED FINANCIAL STATEMENTS 31 DECEMBER 2020 (CONTINUED)
63
38. DIVIDENDS AND AMOUNTS PAID UNDER PERPETUAL LOAN PARTICIPATION NOTES (CONTINUED)
In September 2020, Annual General Meeting of VTB shareholders held in form of absentee voting declared dividends for 2019:
for ordinary shares in the total amount of RUR 10.0 billion (RUR 0.00077345337561138 per ordinary share);
for Type 1 preference shares in the total amount of RUR 4.1 billion (RUR 0.000193614774199896 per Type 1 preference share);
for Type 2 preference shares in the total amount of RUR 6.0 billion (RUR 0.00193614774199896 per Type 2 preference share).
Besides, the Annual General Meeting of VTB shareholders declared dividends for Type 1 preference shares in the total amount of RUR 4.4 billion (RUR 0.000204477847951373 per Type 1 preference share) to be charged from retained earnings of previous years. The dividends were paid in full in October 2020. In February 2020 the Annual General Meeting of VTB Capital AD shareholders approved dividends for 2019 in the amount of RUR 1,062,789.0 (EUR 14,452.0) for each Class B share. The total amount of dividends to non-controlling shareholders was RUR 0.3 billion. In May-November 2020 the General Meetings of JSC Asgard shareholders approved dividends for 2019 in the amount of RUR 33.3 and for the first , second and third quarters of 2020 in the amount of RUR 30.0, RUR 57.0 and RUR 127.0 for each ordinary share, respectively. The total amount of dividends to non-controlling shareholders was RUR 0.7 billion. In April-November 2020 the General Meetings of JSC Crystal Tower shareholders approved dividends for 2019 in the total amount of RUR 1.3 billion and for the first, second and third quarters of 2020 in the total amount of RUR 0.9 billion, RUR 1.0 billion and RUR 0.6 billion, respectively. The total amount of dividends to non-controlling shareholders was RUR 0.4 billion. In April 2020, the General Meeting of Citer Invest B.V. shareholders approved dividends for 2019 in the amount of RUR 0.5 billion pro rata to each respective share. The total amount of dividends to non-controlling shareholders was RUR 0.3 billion. In June 2020, the Annual General Meeting of VTB Africa S.A. shareholders approved dividends for 2019 in amount of RUR 49.7 (AOA 416.592) per ordinary share including dividends payable to non-controlling shareholders in amount of RUR 0.5 billion. In June 2019, the Annual General Meeting of VTB shareholders declared dividends for 2018 for ordinary shares in the total amount of RUR 14.2 billion
(RUR 0.00109867761463259 per ordinary share); for Type 1 preference shares in the total amount of RUR 5.2 billion (RUR 0.00024127074137541 per Type 1 preference share); for Type 2 preference shares in the total amount of RUR 7.4 billion (RUR 0.0024127074137541 per Type 2 preference share). In November 2019, the Extraordinary General Meeting of VTB shareholders declared dividends for Type 1 preference shares in the total amount of RUR 3.8 billion (RUR 0.000176672679543876 per Type 1 preference share). In February 2019, the Annual General Meeting of VTB Capital AD shareholders approved dividends for 2018 in the amount of RUR 1,305,800.0 (EUR 17,452.0) for each Class B share. The total amount of dividends to non-controlling shareholders was RUR 0.3 billion. In July 2019, the Annual General Meeting of “VTB Bank (Europe)” SE shareholders approved dividends for 2018 in amount of RUR 7.1 billion including dividends payable to non-controlling shareholders in amount of RUR 0.1 billion. In August and in September 2019, the General Meetings of JSC “Crystal Tower” and JSC “Vedomstvo-Kapital” shareholders approved dividends for the six-month period ended 30 June 2019 in the amount of RUR 2.8 billion and RUR 0.4 billion, respectively. The dividends were paid in full in August-September 2019. The total amount of dividends paid to non-controlling shareholders was RUR 0.3 billion. In August 2019, the Annual General Meeting of VTB Africa S.A. shareholders approved dividends for 2018 in amount of RUR 79.53 (AOA 346.047) per ordinary share including dividends payable to non-controlling shareholders in amount of RUR 0.7 billion. In November 2019, the Annual General Meeting of JSC “Crystal Tower” shareholders approved dividends for the nine-month period ended 30 September 2019 in the amount of RUR 1.8 billion. The dividends were paid in full in November 2019. The total amount of dividends paid to non-controlling shareholders was RUR 0.2 billion. In November 2019, the Extraordinary General Meeting of Citer Invest B.V. shareholders approved dividends for 2018 in the amount of RUR 1.0 billion pro rata to each respective share. The total amount of dividends to non-controlling shareholders was RUR 0.5 billion. In June and December 2020 VTB paid the amounts under Perpetual Loan Participation Notes in the total amount of USD 213.7 million (RUR 15.4 billion). In June and December 2019 VTB paid the amounts under Perpetual Loan Participation Notes in the total amount of USD 213.7 million (RUR 13.8 billion).

VTB BANK NOTES TO THE CONSOLIDATED FINANCIAL STATEMENTS 31 DECEMBER 2020 (CONTINUED)
64
RISK
39. SIGNIFICANT ACCOUNTING ESTIMATES AND JUDGEMENTS .............................................................. 65
40. OPERATING ENVIRONMENT OF THE GROUP ......................................................................................... 67
41. FINANCIAL RISK MANAGEMENT ............................................................................................................... 68
- CREDIT RISK 71
- MARKET RISK 77
- INTEREST RATE RISK EXPOSURE AND SENSITIVITY ANALYSIS 77
- CURRENCY RISK AND VAR ANALYSIS 79
- PRICE RISK 81
- LIQUIDITY RISK AND CONTRACTUAL MATURITY ANALYSIS 81
- CURRENT AND NON-CURRENT ASSETS AND LIABILITIES 86
- GEOGRAPHICAL CONCENTRATION 86
42. FAIR VALUE MEASUREMENT .................................................................................................................... 87
43. CAPITAL MANAGEMENT AND CAPITAL ADEQUACY .............................................................................. 102

VTB BANK NOTES TO THE CONSOLIDATED FINANCIAL STATEMENTS 31 DECEMBER 2020 (CONTINUED)
65
39. SIGNIFICANT ACCOUNTING ESTIMATES AND JUDGEMENTS The Group makes estimates and assumptions that affect the amounts recognised in the consolidated financial statements, and the carrying amounts of assets and liabilities within the next financial year. Estimates and judgments are continually evaluated and are based on management’s experience and other factors, including expectations of future events that are believed to be reasonable under the circumstances. Management also makes certain judgments, apart from those involving estimations, in the process of applying the accounting policies. These estimates are based on information available as of the date of the financial statements. Actual results can differ significantly from such estimates. Judgments that have the most significant effect on the amounts recognised in the consolidated financial statements and estimates that can cause a significant adjustment to the carrying amount of assets and liabilities within the next financial year include: Classification of financial assets
The Group determines the business model within which the assets are held and assesses of whether the contractual terms of the financial asset are solely payments of principal and interest on the principal amount outstanding. Business model assessment includes assessing the risks that affect the performance of the business model and performance of the portfolio. Assessment whether contractual cash flows are solely payments of principal and interest includes assessing whether the financial asset contains a contractual term that could change the timing or amount of contractual cash flows such that it would not meet this condition. Impairment of financial assets
The Group assesses whether credit risk on the financial asset has increased significantly since initial recognition and incorporates of forward-looking information in the measurement of ECL (Note 41).
Impairment of goodwill
The Group determines whether goodwill is impaired at least on an annual basis. This requires an estimation of the value in use or fair value less cost to sell of the cash-generating units, to which goodwill is allocated. Estimating the value in use requires the Group to make an estimate of the expected future cash flows from the cash-generating unit and also to choose a suitable discount rate in order to calculate the present value of those cash flows (Note 26). Impairment of intangible assets with finite useful lives
The Group assesses whether intangible assets with finite lives are impaired whenever there is an indication that the intangible asset may be impaired. This requires an estimation of the value in use or fair value less cost to sell of the corresponding intangible asset. Estimating the value in use requires the Group to make an estimate of
the expected future cash flows from the intangible asset and also to choose a suitable discount rate in order to calculate the present value of those cash flows (Note 26). Land and premises
The fair value of land and premises is determined by using valuation techniques. Further details of the judgements and assumptions made are presented in Note 42. Lease term and amount of a lease liability
Extension and termination options are included in a number of leases across the Group. These terms are used to maximise operational flexibility in terms of managing contracts. Management concludes on existence of extension option based on the lease contract terms and applicable legislation. The majority of termination options held are exercisable only by the Group and not by the respective lessor. In determining the lease term, the Group’s management considers all facts and circumstances that create economic incentives to exercise an extension option, or not to exercise a termination option. Periods covered by options to extend and terminate the lease are only included in the lease term if it is reasonably certain that the lease will be extended or not terminated. Lease payments may include (or be comprised of) variable lease payments depending on an index or a rate, which is usually consumer price index, or inflation index or a certain percentage of indexation agreed by the parties. There is some uncertainty regarding future indices, which influence the amount of the lease liability. The Group assesses on an annual basis the future lease payments based on indices available at that date and remeasures the lease liability accordingly, when the change in the index or rate affects lease payments. Property intended for sale in the ordinary course of non-banking activities
Property intended for sale in the ordinary course of non-banking activities is stated at the lower of cost and net realisable value. Net realisable value is the estimated selling price in the ordinary course of business less the estimated costs of completion and the estimated costs necessary to make the sale. Net realisable value for completed property is assessed with reference to market conditions and prices existing at the reporting date and is determined by the Group having taken suitable external advice and in the light of recent market transactions. Net realisable value for property under construction is assessed with reference to the selling market prices at the reporting date for similar completed property, less estimated cost to complete the construction provided in the current construction budget, adjusted for the time value of money if material.

VTB BANK NOTES TO THE CONSOLIDATED FINANCIAL STATEMENTS 31 DECEMBER 2020 (CONTINUED)
66
39. SIGNIFICANT ACCOUNTING ESTIMATES AND JUDGEMENTS (CONTINUED) Lack of control over entities in which the Group holds more than half of voting right
The Group considers that it does not have control over certain investees although it owns more than 50% of their voting rights. Factors considered by the Group include placement of the company under external administration and other factors leading to inability to exercise effective control over the investee’s operations (Notes 28, 46). Control over entities in which the Group holds less than half of voting right
The Group has control over certain investees in accordance with IFRS 10 although it owns less than 50% of their voting rights. Factors considered by the Group include existence of potential voting rights, contractual arrangement between the Bank and other vote holders and other factors leading to ability to exercise control over the investee’s operations (Note 44). Existence of significant influence in other entities
The Group may have voting rights in other entities approaching to, but lower than 20%. In assessing whether the Group has significant influence over such entities, judgment is exercised to determine whether the Group has the power to participate in the financial and operating policy decisions of the investee including the ability to block certain changes which are unfavourable to the Group but without control or joint control in those entities. The Group’s investments in those entities where the Group has significant influence are detailed in Note 46. Deferred income tax asset recognition
Income tax expense in respect of the current tax assets and liabilities is recognised based on the income tax rates enacted by the end of the reporting period in relevant tax jurisdictions where the Group is presented. Income tax expense in respect of the deferred income tax assets and liabilities is measured at the income tax rates that are expected to be applied to the period when deferred assets are realised or liability are settled based on the income tax rates officially enacted by the end of the reporting period. The recognised deferred income tax asset represents income taxes recoverable through future deductions from taxable profits, and is recorded in the statement of financial position. Deferred income tax assets are recorded to the extent that realisation of the related tax benefit is probable. The future taxable profits and the amount of tax benefits that are forecasted probable in the future are based on a medium term business plan prepared by management. The Group considers consolidating tax profitable entities with tax loss making entities for tax purposes. Refer to Note 17. Structured entities
Structured entities are designed so that voting or similar rights are not the dominant factor in deciding who controls the entity. Judgment is also required to
determine whether the substance of the relationship between the Group and a structured entity indicates that the structured entity is controlled by the Group. The Group does not consolidate structured entities that it does not control. As it can sometimes be difficult to determine whether the Group does control a structured entity, management makes judgments about its exposure to the risks and rewards, as well as about its ability to make operational decisions for the structured entity is in question. In many instances, elements that are presented, considered in isolation, indicate control or lack of control over a structured entity, but when considered together make it difficult to reach a clear conclusion. In cases where more arguments are in place towards existence of control, the structured entity is consolidated. Refer to Note 48 for further information about the Group’s exposure to structured entities. Fair value estimation of financial instruments where significant unobservable inputs have been used Details of fair value estimation of unquoted shares classified as financial assets at fair value through profit or loss, investment financial assets available-for-sale and Investments in associates and joint ventures designated as at fair value through profit or loss are provided in Note 42. Assessment of significance of particular fair value measurement input requires management judgment and is disclosed in Note 42. Investment property The fair value of investment properties is determined by using valuation techniques. For further details of the judgements and assumptions made, refer to Note 42. Net investment in a foreign operation
The Group classified certain intercompany amounts due from and loans to several foreign subsidiaries as part of the Group’s net investment in these foreign operations. The settlement for these intercompany transactions is neither planned nor likely to occur in the foreseeable future. As at 31 December 2020, net accumulated gains arising from the foreign exchange differences on these transactions in the amount of RUR 1.5 billion were included as part of the currency translation difference (Note 37) in the Group’s equity (31 December 2019: net accumulated gains in the amount of RUR 0.9 billion). In 2020 and 2019, the net foreign exchange differences on these transactions amounted to RUR 0.6 billion and RUR 0.0 billion (net profit), respectively. Litigations The Group is involved in a number of litigations. The Group uses its judgement to evaluate their expected outcome, and to estimate the necessary provision. Note 49 discloses information on claims where outflow of economic benefits was deemed to be possible, and provides information on the provision created on those claims where the outflow of economic benefits was deemed to be probable.
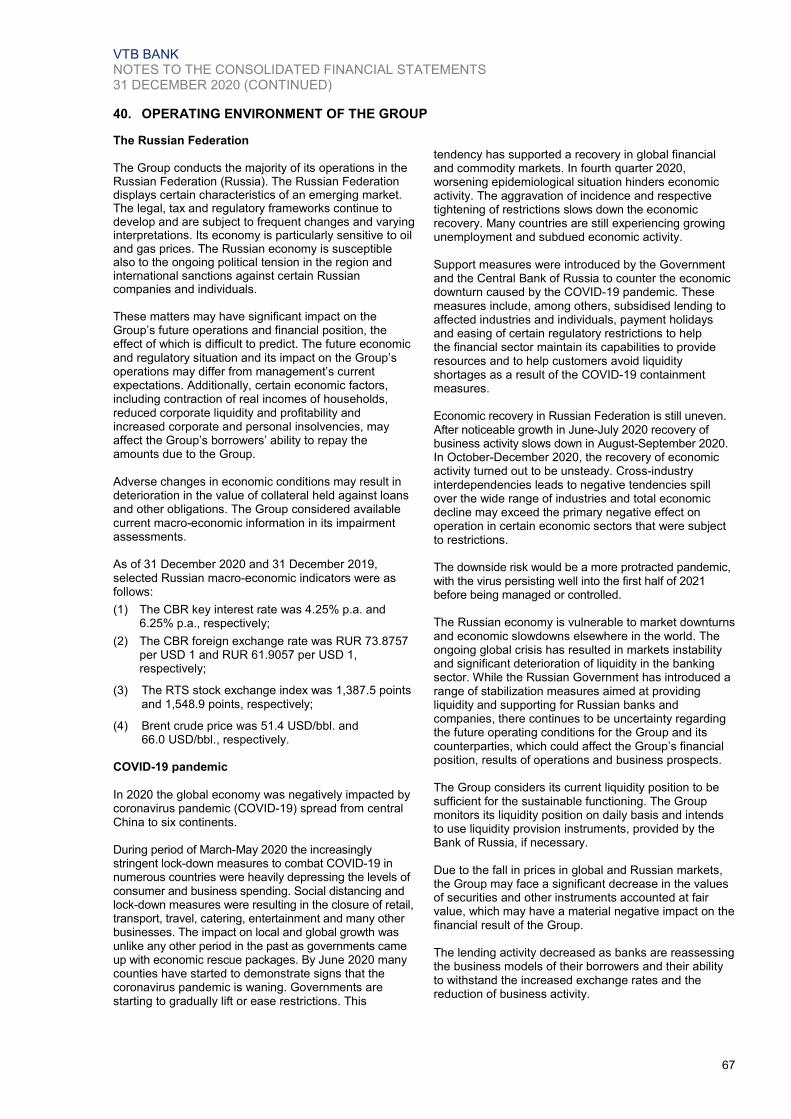
VTB BANK NOTES TO THE CONSOLIDATED FINANCIAL STATEMENTS 31 DECEMBER 2020 (CONTINUED)
67
40. OPERATING ENVIRONMENT OF THE GROUP
The Russian Federation
The Group conducts the majority of its operations in the Russian Federation (Russia). The Russian Federation displays certain characteristics of an emerging market. The legal, tax and regulatory frameworks continue to develop and are subject to frequent changes and varying interpretations. Its economy is particularly sensitive to oil and gas prices. The Russian economy is susceptible also to the ongoing political tension in the region and international sanctions against certain Russian companies and individuals. These matters may have significant impact on the Group’s future operations and financial position, the effect of which is difficult to predict. The future economic and regulatory situation and its impact on the Group’s operations may differ from management’s current expectations. Additionally, certain economic factors, including contraction of real incomes of households, reduced corporate liquidity and profitability and increased corporate and personal insolvencies, may affect the Group’s borrowers’ ability to repay the amounts due to the Group. Adverse changes in economic conditions may result in deterioration in the value of collateral held against loans and other obligations. The Group considered available current macro-economic information in its impairment assessments. As of 31 December 2020 and 31 December 2019, selected Russian macro-economic indicators were as follows:
(1) The CBR key interest rate was 4.25% p.a. and 6.25% p.a., respectively;
(2) The CBR foreign exchange rate was RUR 73.8757 per USD 1 and RUR 61.9057 per USD 1, respectively;
(3) The RTS stock exchange index was 1,387.5 points and 1,548.9 points, respectively;
(4) Brent crude price was 51.4 USD/bbl. and 66.0 USD/bbl., respectively.
COVID-19 pandemic
In 2020 the global economy was negatively impacted by coronavirus pandemic (COVID-19) spread from central China to six continents. During period of March-May 2020 the increasingly stringent lock-down measures to combat COVID-19 in numerous countries were heavily depressing the levels of consumer and business spending. Social distancing and lock-down measures were resulting in the closure of retail, transport, travel, catering, entertainment and many other businesses. The impact on local and global growth was unlike any other period in the past as governments came up with economic rescue packages. By June 2020 many counties have started to demonstrate signs that the coronavirus pandemic is waning. Governments are starting to gradually lift or ease restrictions. This
tendency has supported a recovery in global financial and commodity markets. In fourth quarter 2020, worsening epidemiological situation hinders economic activity. The aggravation of incidence and respective tightening of restrictions slows down the economic recovery. Many countries are still experiencing growing unemployment and subdued economic activity. Support measures were introduced by the Government and the Central Bank of Russia to counter the economic downturn caused by the COVID-19 pandemic. These measures include, among others, subsidised lending to affected industries and individuals, payment holidays and easing of certain regulatory restrictions to help the financial sector maintain its capabilities to provide resources and to help customers avoid liquidity shortages as a result of the COVID-19 containment measures. Economic recovery in Russian Federation is still uneven. After noticeable growth in June-July 2020 recovery of business activity slows down in August-September 2020. In October-December 2020, the recovery of economic activity turned out to be unsteady. Cross-industry interdependencies leads to negative tendencies spill over the wide range of industries and total economic decline may exceed the primary negative effect on operation in certain economic sectors that were subject to restrictions. The downside risk would be a more protracted pandemic, with the virus persisting well into the first half of 2021 before being managed or controlled. The Russian economy is vulnerable to market downturns and economic slowdowns elsewhere in the world. The ongoing global crisis has resulted in markets instability and significant deterioration of liquidity in the banking sector. While the Russian Government has introduced a range of stabilization measures aimed at providing liquidity and supporting for Russian banks and companies, there continues to be uncertainty regarding the future operating conditions for the Group and its counterparties, which could affect the Group’s financial position, results of operations and business prospects. The Group considers its current liquidity position to be sufficient for the sustainable functioning. The Group monitors its liquidity position on daily basis and intends to use liquidity provision instruments, provided by the Bank of Russia, if necessary. Due to the fall in prices in global and Russian markets, the Group may face a significant decrease in the values of securities and other instruments accounted at fair value, which may have a material negative impact on the financial result of the Group. The lending activity decreased as banks are reassessing the business models of their borrowers and their ability to withstand the increased exchange rates and the reduction of business activity.

VTB BANK NOTES TO THE CONSOLIDATED FINANCIAL STATEMENTS 31 DECEMBER 2020 (CONTINUED)
68
40. OPERATING ENVIRONMENT OF THE GROUP (CONTINUED) COVID-19 pandemic (continued)
Also, factors, including increased unemployment, reduced corporate liquidity and profitability and increased corporate and personal insolvencies may affect the Group’s borrowers’ ability to repay the amounts due to the Group. In addition, adverse changes in economic conditions may result in deterioration in the value of collateral held against loans and other obligations. To the extent that information is available, the Group has reflected revised estimates of expected future cash flows in its ECL assessment. During the year ended 31 December 2020, the Group recognized significant impairment of real estate, including land and premises, investment property and property held for sale. The fair value of real estate properties was determined by using valuation techniques. For further details of the judgements and assumptions made, refer to Note 42. The decline of purchasing power and reduction of business activity of prospective buyers and lessees may result in further impairment of real estate owned by the Group. All events mentioned above may have a further significant impact on the Group’s future operations and financial position, the effect of which is difficult to predict. The future economic and regulatory situation and its impact on the Group’s operations may differ from management’s current expectations. Due to the high level of uncertainty and limited actual and consistent information on the financial position of the Group’s counterparties and borrowers, it is practically impossible to present a reliable assessment of the impact of the changes in the economic environment on the Group’s future results. Other jurisdictions
In addition to Russia, the Group conducts operations in Belarus, Kazakhstan, Azerbaijan, Armenia and Georgia, certain European countries (Austria, Germany, United Kingdom (UK)) and several other countries.
Difficult economic and financial market situation in certain of these jurisdictions led to a decrease or negative growth of GDP, currency devaluation, reduced consumption, as well as a decline in investment activities. The Group operates in the UK via a subsidiary bank. 31 January 2020 the UK left the European Union (‘EU’). During the transitional period due to run to 31 December 2020 the UK was no longer a member of the EU but was still subject to EU rules and remained a member of the Customs Union. In December 2020, the UK and EU negotiated the project of EU-UK Trade and Cooperation Agreement (“TCA”) to be applied to future trading and other relationships. The project of TCA is subject to ratification for both parties until that it will be applied on temporary basis from 1 January2021 to 28 February 2021. Due to the uncertainty surrounding the subsequent UK relationship with the EU, the net effect on business and markets cannot be accurately gauged. The Group has been analysing different scenarios and their impact on the Group’s client offering and trading business, and is taking measures to minimize the potential impact. Sanctions
Since the second half of 2014 the Group operates under limited sectorial sanctions imposed by several countries on the Group. The Group considers these sanctions in its activities, continuously monitors them and analyses the effect of the sanctions on the Group’s financial position and its financial performance. While management believes it is taking appropriate measures to support the sustainability of the Group’s business in the current circumstances, unexpected further deterioration in the areas described above could negatively affect the Group’s results and financial position in a manner not currently determinable.
41. FINANCIAL RISK MANAGEMENT
The Group is exposed to financial risks, including credit, liquidity and market risks. One of the key approaches to VTB Group’ financial risks management is ensuring VTB Group activities with respect to the risk-appetite. VTB Group risk-appetite is a system of quantitative and quality measures, which defines a target aggregated level / risk profile that VTB Group is capable and/or willing to accept taking into account requirements of interested parties (shareholders, regulators, the management, rating agencies, and investors) in order to achieve the established strategic goals.
According with “VTB Group Consolidated Risk Management Concept” and the Group’s business model risk management system of VTB Group has a matrix structure which:
includes local (at the Company Group level) and consolidated (at the Group level in general) levels of risk management with a high degree of centralization of a group function of a risk management;
is structured in the context of global business lines of the Group (corporate and investment business, medium and small business, retail business) and its risk specifics and also broken down by types of risk.

VTB BANK NOTES TO THE CONSOLIDATED FINANCIAL STATEMENTS 31 DECEMBER 2020 (CONTINUED)
69
41. FINANCIAL RISK MANAGEMENT (CONTINUED)
Risk management organization structure in VTB Group includes:
collegial bodies (committees) of the Group;
committees of VTB Bank as a holding company of the a banking group;
central office (chief risk manager of the Group and risk competence centres of the Group);
local governing bodies, working collegial bodies (committees), structural divisions / authorized officers of the Group’s participants.
In each bank of VTB Group risks are managed by the appropriate authorities, primary by Supervisory Council (Board of Directors) and Management Board. The standard organizational structure of VTB Group’s banks includes a Chief Risk Officer and one or several Risk divisions responsible for risk management. In the subsidiary financial companies whose activity implies exposure to financial risks (such as “VTB Leasing”, “VTB Factoring” and “VTB Capital”) the general principles of risk management organization are the same as in banks of Group. The consolidated risk management function of VTB Group is centralised and is carried out by VTB Bank as a holding company of the banking group. The main divisions responsible for risk management at the level of Group in VTB Bank organizational structure are Department of Integrated Risk Management, Corporate Credit Risk Department, Retail Credit Risks Department, Underwriting Department, Model Risk and Validation Department and Department of Expertise and Fraud Monitoring. VTB Bank’ Supervisory Council according to requirements of the Bank of Russia carries out risk management functions of Group (in particular, approves and regularly reconsiders the risk and capital management strategy of the Group, including key risk appetite parameters, considers regular significant risks and capital adequacy of the Group and its participant’s reports). The Management Board of VTB bank has overall responsibility for risk management at VTB Group. Additionally on the Group level a number of collegial bodies performs day-to-day coordination of consolidated risk management activities. General supervision of risk management in the Group’s participants is executed by the Group Management Committee (“GMС”). Being a high-level Group’s management coordination body, GMC takes decisions in the area of the Group’s risk management policies and procedures based on delegated powers. Decisions and recommendations of the GMC are basis for the respective management decisions of VTB Group’s participants.
Risk management methodological and operational issues are considered by special committees and authorized divisions / risk competence centres of the Group. The Group Risk Committee (“GRC”) functioned under the GMC. The principal tasks of the GRC included:
setting of priorities, the development, approval and implementation of the group-wide documents (methodologies, regulations) defining risk management methods (approaches, standards) in VTB Group;
development of the system of aggregated limitations (limits, internal ratios, target goals), including the existing risk appetite control system in the VTB Group;
regular review (monitoring, analysis) of the current profile and the level of risks assumed by the Group (within the competence of the Committee);
elaboration and coordination of the necessary measures to be taken in the context of the current and perspective risk management in VTB Group. (including the issues concerning the development of unified risk management approaches / standards in the Group and monitoring / coordination of their implementation).
In particular, GRC is involved in the elaboration and monitoring of implementation of risk management strategic initiatives in VTB Group. The Commission on the Implementation of Risk Management Methods and Business Continuity Management in VTB Group functions under the GRC. Its responsibilities include:
coordination of work and consideration of the proposals of the Group companies concerning implementation of effective risk management methods and procedures in the VTB Group;
creation of conditions to optimize the interaction of VTB Bank and its subsidiaries in respect of the risk function in the VTB Group;
establishment of a general information and methodological platform for risk management operating processes within the Group, including the issues of coordination of project activities of VTB Bank and subsidiary companies and issues of business continuity in VTB Group companies;
assessment of responses to non-standard and emergency situations in VTB Group companies;
coordination and control of the recovery of critical activities of VTB Group, as a result of non-standard and emergency situations.
VTB BANK NOTES TO THE CONSOLIDATED FINANCIAL STATEMENTS 31 DECEMBER 2020 (CONTINUED)
70
41. FINANCIAL RISK MANAGEMENT (CONTINUED) The following committees are formed at VTB Bank level as a holding company of the Group: Credit and Market Risk Management (CMRMC), Retail Risk Committee (RRC) and the Finance Committee (FC). The main objectives of FC in terms of risk management of the Group are:
improving the risk and capital management system;
capital management;
management of the currency risk of a structural open currency position (hereinafter referred to as the “OCP”) by the interest rate risk of the Bank Book, the market risk of the Treasury securities portfolio, and the liquidity risk;
the definition of policies in the field of internal and external pricing and the formation of the principles of a funding system for operations.
The main objectives of CMRMC regarding the Group’s risk management are:
improving the management system for core types of risks;
market risk management of the Trade Book;
management of model risk in terms of credit risks and market risks of the Trade Book;
concentration risk management (except for the risk of concentration of liquidity sources).
The main objectives of RRC regarding the Group’s risk management are:
identification of priority areas, approaches and standards;
recommendations in retail risk management. Information on other committees of financial risks management of VTB Group is disclosed below in sections by types of risks. CREDIT RISK
Credit risk means the risk of Group’ losses as a result of non-performance (improper performance) by the counterparty of its obligations to the Group Companies. VTB Group’s exposures to credit risk arise principally from banking activities such as granting loans to corporate and retail customers, interbank lending, issuance of unpaid letters of credit and guarantees, securities and derivative financial instruments business and leasing business. Credit risk management within the VTB Group is based on a combination of the following approaches:
local credit risk management at the level of individual Group members;
consolidated credit risk management at the Group level.
As part of the local credit risk management system, the Group members assume and manage credit risks independently (including insurance, hedging, etc.) in the scope of the established powers and limits with regard to
risk indicators, in accordance with the national regulations and the standards of the Group. The Group members are responsible for the results of their lending activity, for the quality of their loan portfolios and for monitoring and control of credit risk level in their portfolios. As per the “VTB Group Consolidated Risk Management Concept”, adopted by the GMC, the consolidated credit risk management comprises the following functions:
consideration and approval of the Group-wide strategy, policies, unified basic principles and approaches related to the lending / investment activities and credit risk management;
control of the current credit risk level (concentration) on a consolidated basis and elaboration of the necessary measures to mitigate risks (potential losses).
Consolidated credit risk management covers the main types of assets and off-balance sheet (contingent) exposures of the Group members, which bear credit risk and require control of their concentration at the Group level. In the context of consolidated control and reporting the scope and parameters of such operations are defined by the co-coordinating bodies of the Group. The key elements of consolidated credit risk management in the VTB Group are as follows:
periodic review of the credit risk policies of the VTB Group, harmonising and streamlining of credit policies of the subsidiaries with the Group’s credit policy;
setting of consolidated limits, portfolio limits (including limits on common counterparties / groups of related counterparties, countries, industry sectors), internal indicative limitations of large credit exposure;
unifying credit procedures and methods of credit risk assessment (credit rating systems – for corporate customers and financial institutions, and also rating (scoring) systems – for retail customers);
optimization of business procedures for problem (low-quality) assets, incl. with the involvement of the third parties on the terms and conditions of the contract in compliance with current legislation;
improving the credit decision system quality;
unification and standardisation of the technological processes of credit products production and realization with “mass” credit conditions;
assessment of economic capital (Capital-at-Risk) sufficient to cover Group credit risks;
consolidated analytical reporting on credit risks;
stress-testing;
making/monitoring provisions for expected credit losses according to IFRS.
The Group-wide policies and other documents, which are adopted by the GMC and its relevant sub-committees, outline the main approaches and standards of risk management and organisation of credit operations in the Group. These principles should be complied with by each subsidiary bank and separate financial companies of the Group.

VTB BANK NOTES TO THE CONSOLIDATED FINANCIAL STATEMENTS 31 DECEMBER 2020 (CONTINUED)
71
41. FINANCIAL RISK MANAGEMENT (CONTINUED) CREDIT RISK (CONTINUED) Subsidiary banks should implement credit risk management system as well as credit procedures in compliance with the Group’s standards. Credit risk policies are adopted by each subsidiary bank and are subject to a regular review, usually once in one or two years. The general (typical) procedure for adopting credit policies is as follows:
the draft credit policies or significant amendments are subject to the preliminary consideration and agreement by VTB bank;
the credit policies and amendments should be approved by the Supervisory Council (Board of Directors) of the subsidiary bank;
VTB bank may propose amendments to the credit policies of a subsidiary bank as part of centralised regulation and credit risk control for the Group, provided that such amendments are in line with local regulations.
The control of management and executive bodies of the Group members in relation to decision making and lending transactions are determined by their constituent documents and applicable statutory legislation. On a Group-wide basis credit risk management is overseen and co-ordinated by the following collegiate bodies:
the GMС;
the CMRMC;
VTB Group Corporate Investment Business Credit Committee (“GCIBCC”);
VTB Group Medium Business Credit Committee (“GMBCC”);
the RRC. GCIBCC and GMBCC are permanent collective decision-making (relevant to Corporate Investment Business Global line and Medium Business Global line customers respectively) committees under the GMС. GCIBCC chaired by the VTB Bank Management Board Member responsible for the group-wide risk management and GMBCC chaired by Corporate Credit Risk Department representative and includes representatives of divisions (Risk, Legal, Corporate Business Support, Investment Banking, Treasury etc.). The key tasks of this committee are as follows:
taking decisions on VTB Group risk concentration policy (relevant to Corporate Investment Business Global line and Medium Business Global line customers respectively);
setting consolidated limits for the credit risk;
consideration of some individual operations and large-scale transactions of Group members.
VTB Group is set to reduce the risk factors related to loan concentration per separate large corporate customers / group of related customers and to ensure credit risk diversification. For this purpose the benchmark for the share of VTB Group largest borrowers in Group’s corporate loan portfolio is set. VTB Group Companies are recommended to determine reasonable local levels of similar benchmarks within their local credit policies/ risk strategies, based on the Group's acceptable credit risk concentration target. In VTB Bank the Corporate Credit Risk Department (CCRD) is responsible for corporate credit risk management on a Group-wide basis including development of credit risk management system, relevant Group data consolidation and consolidated limits monitoring. Retail Credit Risk Department (RCRD), Underwriting Department and Department of Expertise and Fraud monitoring coordinates retail credit risk management across the Group and is responsible for:
developing standards of retail risk management in VTB Group;
developing systems of retail credit risk limits;
developing standards of decision making procedure in VTB Group;
developing standards of monitoring and reporting of retail credit risks (methodology and formats);
consolidating reports on retail lending of the Group;
monitoring performance and management of retail loan portfolios across the Group.
In retail risk management the VTB Group subsidiary banks apply to “Basic statements of retail credit risk management in the VTB Group”, approved on the RRC by RCRD and other group-wide documents (in the field of retail risk management) applicable to VTB Group retail lending. Credit risk monitoring at the Group level is supported by regular reporting from subsidiaries to the CCRD and RCRD for assessing of credit risk exposures on a consolidated basis.
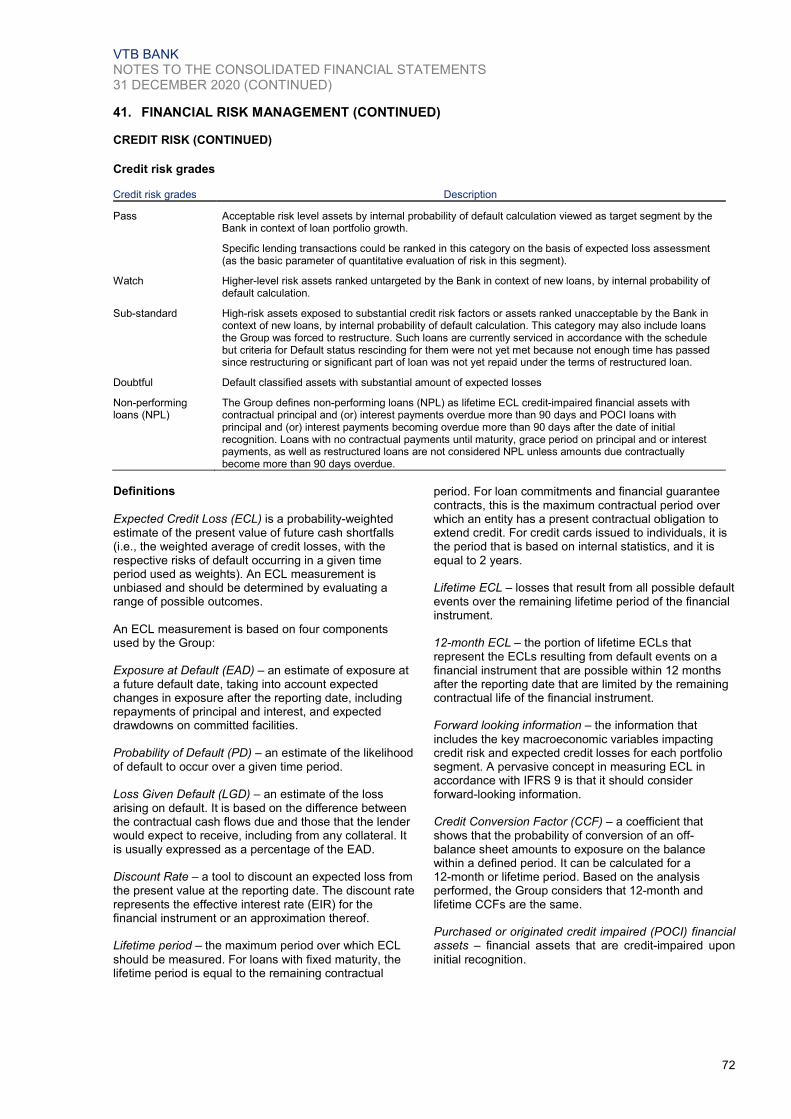
VTB BANK NOTES TO THE CONSOLIDATED FINANCIAL STATEMENTS 31 DECEMBER 2020 (CONTINUED)
72
41. FINANCIAL RISK MANAGEMENT (CONTINUED) CREDIT RISK (CONTINUED)
Credit risk grades
Сredit risk grades Description
Pass Acceptable risk level assets by internal probability of default calculation viewed as target segment by the Bank in context of loan portfolio growth.
Specific lending transactions could be ranked in this category on the basis of expected loss assessment (as the basic parameter of quantitative evaluation of risk in this segment).
Watch Higher-level risk assets ranked untargeted by the Bank in context of new loans, by internal probability of default calculation.
Sub-standard High-risk assets exposed to substantial credit risk factors or assets ranked unacceptable by the Bank in context of new loans, by internal probability of default calculation. This category may also include loans the Group was forced to restructure. Such loans are currently serviced in accordance with the schedule but criteria for Default status rescinding for them were not yet met because not enough time has passed since restructuring or significant part of loan was not yet repaid under the terms of restructured loan.
Doubtful Default classified assets with substantial amount of expected losses
Non-performing loans (NPL)
The Group defines non-performing loans (NPL) as lifetime ECL credit-impaired financial assets with contractual principal and (or) interest payments overdue more than 90 days and POCI loans with principal and (or) interest payments becoming overdue more than 90 days after the date of initial recognition. Loans with no contractual payments until maturity, grace period on principal and or interest payments, as well as restructured loans are not considered NPL unless amounts due contractually become more than 90 days overdue.
Definitions
Expected Credit Loss (ECL) is a probability-weighted estimate of the present value of future cash shortfalls (i.e., the weighted average of credit losses, with the respective risks of default occurring in a given time period used as weights). An ECL measurement is unbiased and should be determined by evaluating a range of possible outcomes. An ECL measurement is based on four components used by the Group: Exposure at Default (EAD) – an estimate of exposure at a future default date, taking into account expected changes in exposure after the reporting date, including repayments of principal and interest, and expected drawdowns on committed facilities. Probability of Default (PD) – an estimate of the likelihood of default to occur over a given time period. Loss Given Default (LGD) – an estimate of the loss arising on default. It is based on the difference between the contractual cash flows due and those that the lender would expect to receive, including from any collateral. It is usually expressed as a percentage of the EAD. Discount Rate – a tool to discount an expected loss from the present value at the reporting date. The discount rate represents the effective interest rate (EIR) for the financial instrument or an approximation thereof. Lifetime period – the maximum period over which ECL
should be measured. For loans with fixed maturity, the lifetime period is equal to the remaining contractual
period. For loan commitments and financial guarantee contracts, this is the maximum contractual period over which an entity has a present contractual obligation to extend credit. For credit cards issued to individuals, it is the period that is based on internal statistics, and it is equal to 2 years. Lifetime ECL – losses that result from all possible default events over the remaining lifetime period of the financial instrument. 12-month ECL – the portion of lifetime ECLs that represent the ECLs resulting from default events on a financial instrument that are possible within 12 months after the reporting date that are limited by the remaining contractual life of the financial instrument. Forward looking information – the information that
includes the key macroeconomic variables impacting credit risk and expected credit losses for each portfolio segment. A pervasive concept in measuring ECL in accordance with IFRS 9 is that it should consider forward-looking information. Credit Conversion Factor (CCF) – a coefficient that shows that the probability of conversion of an off-balance sheet amounts to exposure on the balance within a defined period. It can be calculated for a 12-month or lifetime period. Based on the analysis performed, the Group considers that 12-month and lifetime CCFs are the same. Purchased or originated credit impaired (POCI) financial assets – financial assets that are credit-impaired upon
initial recognition.
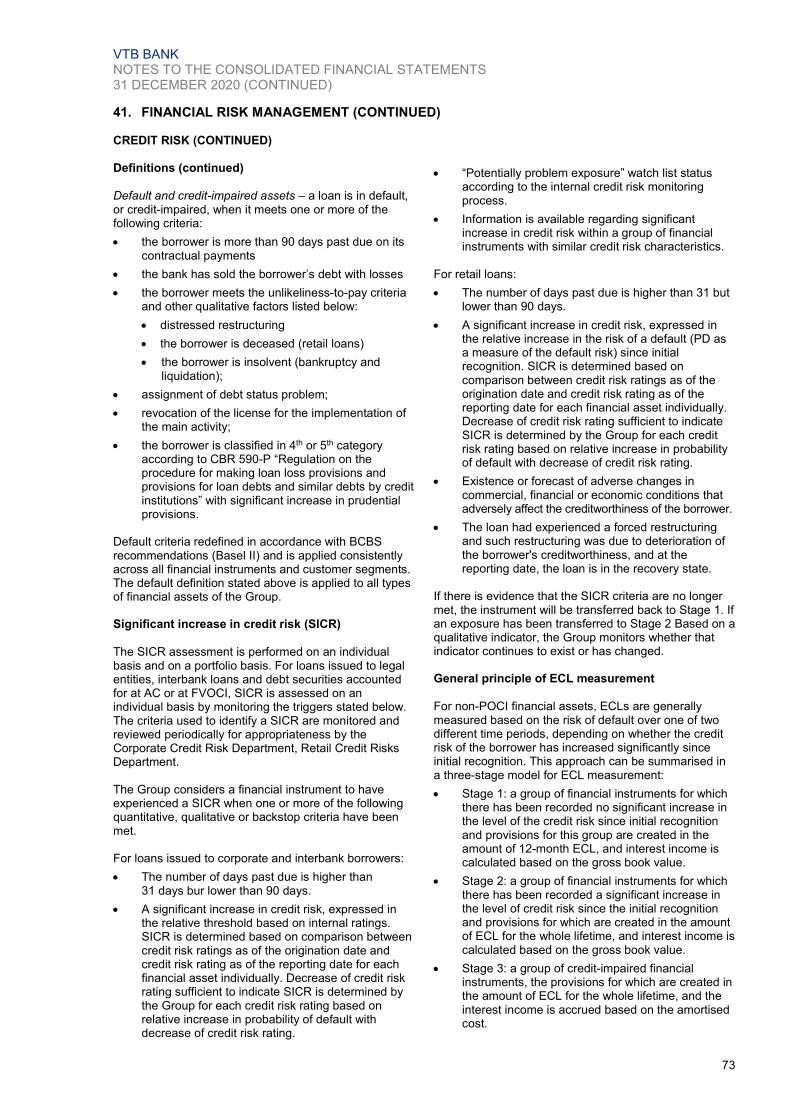
VTB BANK NOTES TO THE CONSOLIDATED FINANCIAL STATEMENTS 31 DECEMBER 2020 (CONTINUED)
73
41. FINANCIAL RISK MANAGEMENT (CONTINUED) CREDIT RISK (CONTINUED)
Definitions (continued)
Default and credit-impaired assets – a loan is in default, or credit-impaired, when it meets one or more of the following criteria:
the borrower is more than 90 days past due on its contractual payments
the bank has sold the borrower’s debt with losses
the borrower meets the unlikeliness-to-pay criteria and other qualitative factors listed below:
distressed restructuring
the borrower is deceased (retail loans)
the borrower is insolvent (bankruptcy and liquidation);
assignment of debt status problem;
revocation of the license for the implementation of the main activity;
the borrower is classified in 4th or 5th category according to CBR 590-P “Regulation on the procedure for making loan loss provisions and provisions for loan debts and similar debts by credit institutions” with significant increase in prudential provisions.
Default criteria redefined in accordance with BCBS recommendations (Basel II) and is applied consistently across all financial instruments and customer segments. The default definition stated above is applied to all types of financial assets of the Group. Significant increase in credit risk (SICR) The SICR assessment is performed on an individual basis and on a portfolio basis. For loans issued to legal entities, interbank loans and debt securities accounted for at AC or at FVOCI, SICR is assessed on an individual basis by monitoring the triggers stated below. The criteria used to identify a SICR are monitored and reviewed periodically for appropriateness by the Corporate Credit Risk Department, Retail Credit Risks Department. The Group considers a financial instrument to have experienced a SICR when one or more of the following quantitative, qualitative or backstop criteria have been met. For loans issued to corporate and interbank borrowers:
The number of days past due is higher than 31 days bur lower than 90 days.
A significant increase in credit risk, expressed in the relative threshold based on internal ratings. SICR is determined based on comparison between credit risk ratings as of the origination date and credit risk rating as of the reporting date for each financial asset individually. Decrease of credit risk rating sufficient to indicate SICR is determined by the Group for each credit risk rating based on relative increase in probability of default with decrease of credit risk rating.
“Potentially problem exposure” watch list status according to the internal credit risk monitoring process.
Information is available regarding significant increase in credit risk within a group of financial instruments with similar credit risk characteristics.
For retail loans:
The number of days past due is higher than 31 but lower than 90 days.
A significant increase in credit risk, expressed in the relative increase in the risk of a default (PD as a measure of the default risk) since initial recognition. SICR is determined based on comparison between credit risk ratings as of the origination date and credit risk rating as of the reporting date for each financial asset individually. Decrease of credit risk rating sufficient to indicate SICR is determined by the Group for each credit risk rating based on relative increase in probability of default with decrease of credit risk rating.
Existence or forecast of adverse changes in commercial, financial or economic conditions that adversely affect the creditworthiness of the borrower.
The loan had experienced a forced restructuring and such restructuring was due to deterioration of the borrower's creditworthiness, and at the reporting date, the loan is in the recovery state.
If there is evidence that the SICR criteria are no longer met, the instrument will be transferred back to Stage 1. If an exposure has been transferred to Stage 2 Based on a qualitative indicator, the Group monitors whether that indicator continues to exist or has changed. General principle of ECL measurement
For non-POCI financial assets, ECLs are generally measured based on the risk of default over one of two different time periods, depending on whether the credit risk of the borrower has increased significantly since initial recognition. This approach can be summarised in a three-stage model for ECL measurement:
Stage 1: a group of financial instruments for which there has been recorded no significant increase in the level of the credit risk since initial recognition and provisions for this group are created in the amount of 12-month ECL, and interest income is calculated based on the gross book value.
Stage 2: a group of financial instruments for which there has been recorded a significant increase in the level of credit risk since the initial recognition and provisions for which are created in the amount of ECL for the whole lifetime, and interest income is calculated based on the gross book value.
Stage 3: a group of credit-impaired financial instruments, the provisions for which are created in the amount of ECL for the whole lifetime, and the interest income is accrued based on the amortised cost.

VTB BANK NOTES TO THE CONSOLIDATED FINANCIAL STATEMENTS 31 DECEMBER 2020 (CONTINUED)
74
41. FINANCIAL RISK MANAGEMENT (CONTINUED)
CREDIT RISK (CONTINUED)
General principle of ECL measurement (continued)
ECL for POCI financial assets is always measured on a lifetime basis (Stage 3), and at the reporting date, the Group only recognises the cumulative changes in lifetime expected credit losses since initial recognition. The Group performs an assessment on an individual basis for credit-impaired financial assets taking into account the principles, listed below. The Group performs an assessment on a portfolio basis for the following types of loans: retail loans, loans issued to SMEs and particular categories of corporate borrowers. This approach incorporates aggregating the portfolio into homogeneous segments based on borrower-specific information, such as delinquency, the historical data on losses and forward-looking macroeconomic information. Principles of assessment on individual basis – ECL
assessments on an individual basis are done by weighting the estimates of credit losses for different possible outcomes against the probabilities of each outcome. The Group defines at least two possible outcomes for each loan, one of which leads to credit loss in spite of the probability of such a scenario. Individual assessment is mainly based on the expert judgement. Expert judgements are regularly tested in order to decrease the difference between estimates and actual losses. Retail loans with residual above RUR 400 million are assessed individually.
Principles of assessment on portfolio basis – to assess the staging of exposure and to measure a loss allowance on a collective basis, the Group combines its exposures into segments on the basis of shared credit risk characteristics, such as that exposures to risk within a group are homogeneous. If the Group is not able to combine financial instruments on the basis of shared credit risk characteristics, and credit risk for these financial instruments considered to increase significantly from initial recognition, the Group recognizes lifetime ECL for financial assets with significantly increased credit risk. Backtesting – the Group regularly reviews its
methodology and assumptions to reduce any difference between the estimates and the actual loss of credit. Such backtesting is performed at least once a year. The results of backtesting the ECL measurement methodology are communicated to Group Management and further steps for tuning models and assumptions are defined after discussions between authorised persons. ECL measurement – description of estimation techniques
Distribution of legal entities loans, debt securities and credit-related contingencies is determined by principles specified in Bank’s methodologies for borrower’s ranking and defines homogenous segments.
The ECL is determined by predicting credit risk parameters (EAD, PD and LGD) for each future period during the lifetime period for each individual exposure or collective segment. These three components are multiplied together and in some cases adjusted for the likelihood of survival (i.e. the exposure has been repaid or defaulted in an earlier month). This effectively calculates an ECL for each future period, which is then discounted back to the reporting date and summed up. The discount rate used in the ECL calculation is the original effective interest rate or an approximation thereof, for POCI financial assets – credit risk adjusted EIR. The EADs are determined based on the expected payment profile, which varies by product type:
for amortising products and bullet repayment loans, EAD is based on the contractual repayments.
for revolving products, the EAD is predicted by taking the current drawn balance and adding a “credit conversion factor (CCF)” that accounts for the expected drawdown of the remaining limit by the time of default. These assumptions vary by product type, current limit utilisation and other borrower-specific behavioural characteristics. As assessment of the CCF for credit lines is based on the latest available historic data about residuals on balance and off-balance accounts of defaulted credit lines. For other off balance sheet exposures CCF is determined based on available historical data or regulatory values and expert judgment.
Two types of PDs are used for calculating ECLs: 12-month and Lifetime PD:
12-month PDs – the estimated probability of a default occurring within the next 12 months (or over the remaining life of the financial instrument if less than 12 months). This parameter is used to calculate 12-month ECLs;
Lifetime PDs – the estimated probability of a default occurring over the remaining life of the financial instrument. This parameter is used to calculate lifetime ECLs. An assessment of a Lifetime PD is based on the latest available historic default data and adjusted for forward looking information.
An assessment of a 12-month PD is based on:
statistical analysis of the internal historic default and internal/external ratings. Calibrated PD checked on the latest available information.
expert rating models are used in case no historical or external information is available, however expert rating models are applied to limited number of segments.
Approach for PD calibration should lead to concordance of weighted average model PD to central tendency (average default rate for the economic cycle) and also to proportionality of PD change with change of rating grade to predictive power of a ranking model. Then obtained 12-month PDs were adjusted for forward-looking information.

VTB BANK NOTES TO THE CONSOLIDATED FINANCIAL STATEMENTS 31 DECEMBER 2020 (CONTINUED)
75
41. FINANCIAL RISK MANAGEMENT (CONTINUED) CREDIT RISK (CONTINUED) Forward-looking information has been incorporated into the determination of 12-month PDs by considering the dynamics of the macro-factors, including annual real GDP, average annual RUB/USD exchange rate, and average annual price for a barrel of URALS oil. Forecasts of economic variables (the “base economic scenario”) are reviewed at least once every year and submitted to the FС. The impact of the economic variables on the PD has been determined by performing statistical regression analysis (using an ensemble of single factor models) to understand the impact changes in these variables historically had on default rates. In addition to the base economic scenario, the Group considers other possible scenarios along with scenario weighting. The scenarios are determined by a statistical analysis, taking into account the percentiles of distributions of annual growth rates of each chosen macro-factor.
To calculate Lifetime PD, the Group uses different statistical approaches depending on the segment and product type, such as the extrapolation of 12-month PDs based on migration matrixes, developing lifetime PD curves based on the historical default data, hazard rate approach, approach based on an assumption of convergence of marginal PDs to the central tendency on the horizon of the economic cycle length or other. In
certain cases, in order to determine lifetime PD the Group may use expert judgement, which is based on comprehensive analysis of credit risk of particular borrower and/or group of borrowers, including macroeconomic projections. The duration of the economic cycle is defined as the length of the period of fluctuations in the economic situation, covering at least one stage of recession and recovery in accordance with indicators characterizing the dynamics of economic development of the Russian Federation. LGD represents the Group's expectation of the extent of loss on a defaulted exposure and assessed on the latest available recovery statistics. LGD is applied to non-defaulted exposures. For loans secured by real estate and securities, the Group calculates LGD based on specific characteristics of the collateral, such as market and projected collateral values. For conventional borrowers the Group calculates LGD based on recovery of previously defaulted loans. The Group considers actual amounts recovered and projected recoveries on multi-scenario, probability weighted basis. All cash flows received in respect of defaulted loans are discounted to the date of default using original effective interest rate.
Maximum credit risk exposure
The following table discloses the Group’s maximum credit risk exposure: 2020 2019
Balance sheet exposure: Cash and short-term funds (excluding cash on hand) 920.2 1,059.0 Debt securities 1,519.7 722.9
Investment financial assets measured at fair value through other comprehensive income, pledged under repurchase agreements 562.5 153.1
Trading financial assets 550.0 416.1 Investment financial assets measured at fair value through other comprehensive
income 286.4 84.3 Investment financial assets at amortised cost 32.3 28.5 Trading financial assets, pledged under repurchase agreements 61.8 18.8 Investment financial assets at fair value through profit or loss 19.4 15.8 Investment financial assets designated as at fair value through profit or loss 7.3 6.3
Due from other banks 837.9 610.1 Due from other banks at amortised cost 820.2 595.1 Due from other banks measured at fair value through profit or loss 17.7 15.0
Loans and advances to customers 12,264.4 10,774.1 Loans to legal entities at amortised cost 8,436.8 7,386.4 Loans to individuals at amortised coat 3,376.0 3,006.3 Loans to individuals measured at fair value through other comprehensive income 230.8 157.2 Loans to legal entities measured at fair value through profit or loss 156.2 149.4 Loans and advances to customers at amortised cost pledged under repurchase
agreements 63.3 21.0 Loans to legal entities measured at fair value through other comprehensive income 1.3 53.8
Exposure arising from credit default swaps 0.2 0.2 Other financial assets 268.6 85.1
Total balance sheet exposure 15,811.0 13,251.4 Off-balance sheet exposure: 196.2 213.4 Total maximum exposure to credit risk 16,007.2 13,464.8
Where financial instruments are recorded at fair value the amounts shown above represent the current credit risk exposure but not the maximum risk exposure that could arise in the future as a result of changes in values.
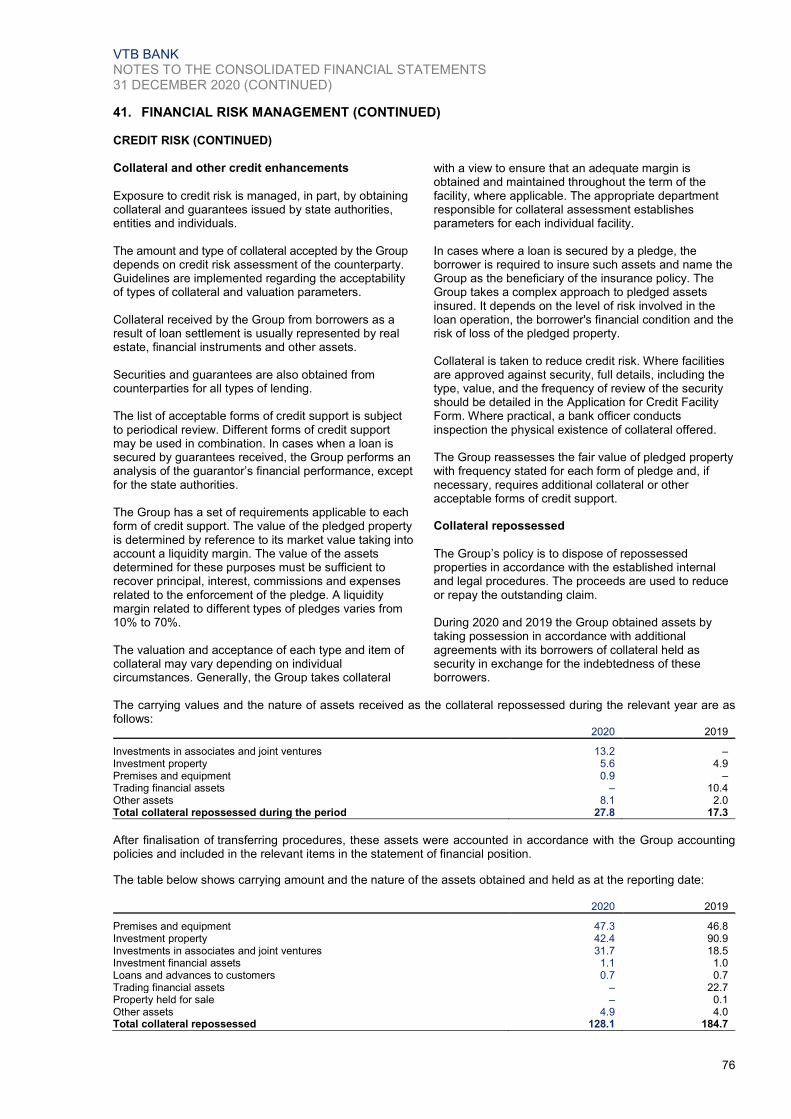
VTB BANK NOTES TO THE CONSOLIDATED FINANCIAL STATEMENTS 31 DECEMBER 2020 (CONTINUED)
76
41. FINANCIAL RISK MANAGEMENT (CONTINUED) CREDIT RISK (CONTINUED) Collateral and other credit enhancements
Exposure to credit risk is managed, in part, by obtaining collateral and guarantees issued by state authorities, entities and individuals. The amount and type of collateral accepted by the Group depends on credit risk assessment of the counterparty. Guidelines are implemented regarding the acceptability of types of collateral and valuation parameters. Collateral received by the Group from borrowers as a result of loan settlement is usually represented by real estate, financial instruments and other assets. Securities and guarantees are also obtained from counterparties for all types of lending. The list of acceptable forms of credit support is subject to periodical review. Different forms of credit support may be used in combination. In cases when a loan is secured by guarantees received, the Group performs an analysis of the guarantor’s financial performance, except for the state authorities. The Group has a set of requirements applicable to each form of credit support. The value of the pledged property is determined by reference to its market value taking into account a liquidity margin. The value of the assets determined for these purposes must be sufficient to recover principal, interest, commissions and expenses related to the enforcement of the pledge. A liquidity margin related to different types of pledges varies from 10% to 70%. The valuation and acceptance of each type and item of collateral may vary depending on individual circumstances. Generally, the Group takes collateral
with a view to ensure that an adequate margin is obtained and maintained throughout the term of the facility, where applicable. The appropriate department responsible for collateral assessment establishes parameters for each individual facility. In cases where a loan is secured by a pledge, the borrower is required to insure such assets and name the Group as the beneficiary of the insurance policy. The Group takes a complex approach to pledged assets insured. It depends on the level of risk involved in the loan operation, the borrower's financial condition and the risk of loss of the pledged property. Collateral is taken to reduce credit risk. Where facilities are approved against security, full details, including the type, value, and the frequency of review of the security should be detailed in the Application for Credit Facility Form. Where practical, a bank officer conducts inspection the physical existence of collateral offered. The Group reassesses the fair value of pledged property with frequency stated for each form of pledge and, if necessary, requires additional collateral or other acceptable forms of credit support. Collateral repossessed
The Group’s policy is to dispose of repossessed properties in accordance with the established internal and legal procedures. The proceeds are used to reduce or repay the outstanding claim. During 2020 and 2019 the Group obtained assets by taking possession in accordance with additional agreements with its borrowers of collateral held as security in exchange for the indebtedness of these borrowers.
The carrying values and the nature of assets received as the collateral repossessed during the relevant year are as follows: 2020 2019
Investments in associates and joint ventures 13.2 – Investment property 5.6 4.9 Premises and equipment 0.9 – Trading financial assets – 10.4 Other assets 8.1 2.0 Total collateral repossessed during the period 27.8 17.3
After finalisation of transferring procedures, these assets were accounted in accordance with the Group accounting policies and included in the relevant items in the statement of financial position.
The table below shows carrying amount and the nature of the assets obtained and held as at the reporting date: 2020 2019
Premises and equipment 47.3 46.8 Investment property 42.4 90.9 Investments in associates and joint ventures 31.7 18.5 Investment financial assets 1.1 1.0 Loans and advances to customers 0.7 0.7 Trading financial assets – 22.7 Property held for sale – 0.1 Other assets 4.9 4.0 Total collateral repossessed 128.1 184.7

VTB BANK NOTES TO THE CONSOLIDATED FINANCIAL STATEMENTS 31 DECEMBER 2020 (CONTINUED)
77
41. FINANCIAL RISK MANAGEMENT (CONTINUED) MARKET RISK
Market Risk, for the purpose hereof, shall mean a risk of worsening of either the Group financial result or its capital base under the IFRS due to unfavourable changes in the value of the Group assets/liabilities affected by market indicators – risk factors. FC participates in management of market risk setting the operational and framework limits and allocating the risk appetite for Trading book across group members and business lines. VTB Group market risk Policy (the Policy) sets out procedures for identification and monitoring of market risks, market risk limit structure and hierarchy from VTB Group level to the level of the group members and separate divisions; sets out procedures for control over compliance with the limits and restrictions and also for response to them when being exceeded; it also sets out the Group market risk reporting procedure. According to the Policy market risk assessment and management is carried out in the context of the following types of Books:
Trading Book, consists of positions held for trading or to hedge elements of the Trading book;
Treasury bond portfolio, consists of operations executed by Treasury with bonds which are carried at fair value;
Banking Book, consists of interest bearing instruments which are carried at amortized cost or instruments that are used to hedge the elements of Banking book. It also includes risk from SPPI-failed corporate loans.
Based on the analytical division of the whole VTB Group portfolio (provided above) the following directions of Market risk are identified:
Interest rate risk of Banking book;
Foreign exchange (FX) risk of Banking book and Treasury bond portfolio All Group FX exposure is divided by the nature of operations that generate the risk and thus it’s divided for Trading book FX risk and Banking book FX risk.
Market risk of Trading book and Treasury bond portfolio.
INTEREST RATE RISK EXPOSURE OF BANKING BOOK AND SENSITIVITY ANALYSIS
The Group is exposed to interest rate risk of the Banking Book (IRRBB). Interest rate risk – risk of financial loss (damage) due to unfavourable change in the Basic yield curve corresponding to assets and liabilities sensitive to interest rate change. Banking Book shall include interest bearing instruments/ operations, which are not subject to marking-to-market under the IFRS and which do not belong either to Trading Operations or Treasury Debt Securities Portfolio. The Department of Integrated Risk Management submits a report to the FC on a monthly basis on interest rate risk profile of the Group and of individual banks of the Group, including:
Economic capital (ECap IRRBB);
Net present value (NPV) of assets and liabilities exposed to interest rate risk;
Sensitivity of NPV to100 basis points change (ΔNPV+100 b.p);
sensitivity of Net Interest Income (ΔNII+100 b.p. and ΔNII Stress).
Valuations are made by using Kamakura Risk Manager software. To mitigate IRRBB the FC sets up limits and triggers on Economic Capital and on sensitivity of Net Interest Income to cover interest rate risk of the Group and/or of individual banks of the Group. The Treasury manages and hedges Group’s exposures by entering into interest rate derivative transactions within the limits and parameters set by the FC.

VTB BANK NOTES TO THE CONSOLIDATED FINANCIAL STATEMENTS 31 DECEMBER 2020 (CONTINUED)
78
41. FINANCIAL RISK MANAGEMENT (CONTINUED) INTEREST RATE RISK EXPOSURE OF BANKING BOOK AND SENSITIVITY ANALYSIS (CONTINUED)
As at 31 December 2020, the Group has the following interest rate exposures based on information provided internally to key management personnel. Included in the table are Group’s monetary assets and liabilities, categorised by the contractual repricing date. IRRBB exposures include SPPI-failed corporate loans and exclude transactions of internal funding of the trading portfolio.
On demand and up to
1 month
From 1 month to
3 months
From 3 months to
6 months
From 6 months to 1 year
From 1 year to
3 years
From 3 years to
5 years More than
5 years Total
Assets Interest bearing assets RUR 3,746.4 846.6 958.1 1,034.2 1,797.5 939.4 680.2 10,002.4 USD 2,357.4 1,108.5 55.8 40.4 99.6 82.3 226.9 3 970.9 EUR 576.3 864.9 830.9 76.1 327.9 114.7 27.0 2 817.8 Other currencies 59.7 38.6 15.8 164.9 85.0 38.4 10.5 412.9 Total assets 6,739.8 2,858.6 1,860.6 1,315.6 2,310.0 1,174.8 944.6 17,204.0 Liabilities Interest bearing liabilities RUR 4,993.0 1,406.9 2,023.0 784.3 431.5 199.4 413.1 10,251.2 USD 510.3 277.2 465.3 458.6 940.5 181.1 189.5 3,022.5 EUR 897.8 534.5 153.7 216.9 94.7 35.9 10.6 1,944.1 Other currencies 44.4 18.6 12.5 189.7 58.9 38.0 4.8 366.9 Total liabilities 6,445.5 2,237.2 2,654.5 1,649.5 1,525.6 454.4 618.0 15,584.7 Net repricing gap 294.3 621.4 (793.9) (333.9) 784.4 720.4 326.6 1,619.3
As at 31 December 2019, the Group has the following interest rate exposures based on information provided internally to key management personnel.
On demand and up to
1 month
From 1 month to
3 months
From 3 months to
6 months
From 6 months to 1 year
From 1 year to
3 years
From 3 years to
5 years More than
5 years Total
Assets Interest bearing assets RUR 2,938.3 537.0 666.7 916.5 2,074.9 847.2 809.8 8,790.4 USD 1,871.5 548.5 116.6 10.3 53.7 239.9 66.8 2,907.3 EUR 606.4 722.1 436.6 182.1 126.1 50.1 66.0 2,189.4 Other currencies 63.9 29.0 10.0 11.7 157.9 54.6 6.6 333.7 Total assets 5,480.1 1,836.6 1,229.9 1,120.6 2,412.6 1,191.8 949.2 14,220.8 Liabilities Interest bearing liabilities RUR 3,320.5 1,796.6 1,882.2 751.5 394.3 150.7 303.1 8,598.9 USD 407.0 371.3 396.5 430.6 981.4 254.7 3.6 2,845.1 EUR 995.3 179.9 131.5 67.8 244.9 47.6 10.3 1,677.3 Other currencies 20.4 15.8 11.1 24.2 142.8 62.6 3.2 280.1 Total liabilities 4,743.2 2,363.6 2,421.3 1,274.1 1,763.4 515.6 320.2 13,401.4 Net repricing gap 736.9 (527.0) (1,191.4) (153.5) 649.2 676.2 629.0 819.4
The interest rate sensitivities set out in the tables below represent an effect on the historical net interest income for one-year period in case of a parallel shift in all yield curves. The calculations are based on the Group’s actual interest rate risk exposures of the Banking Book at the relevant reporting dates. The Group includes in the interest position calculation and sensitivity analysis instruments at both floating and fixed rates. Interest rate sensitivity analysis as at 31 December 2020 as an effect on net interest income is as follows. Interest rate Effect on net Interest rate Effect on net Currency increase, b.p. interest income decrease, b.p. interest income
RUR 125 (28.8) (75) 17.3 USD 100 21.6 (25) (5.4) EUR 20 0.7 (20) (0.7) Total (6.5) 11.2
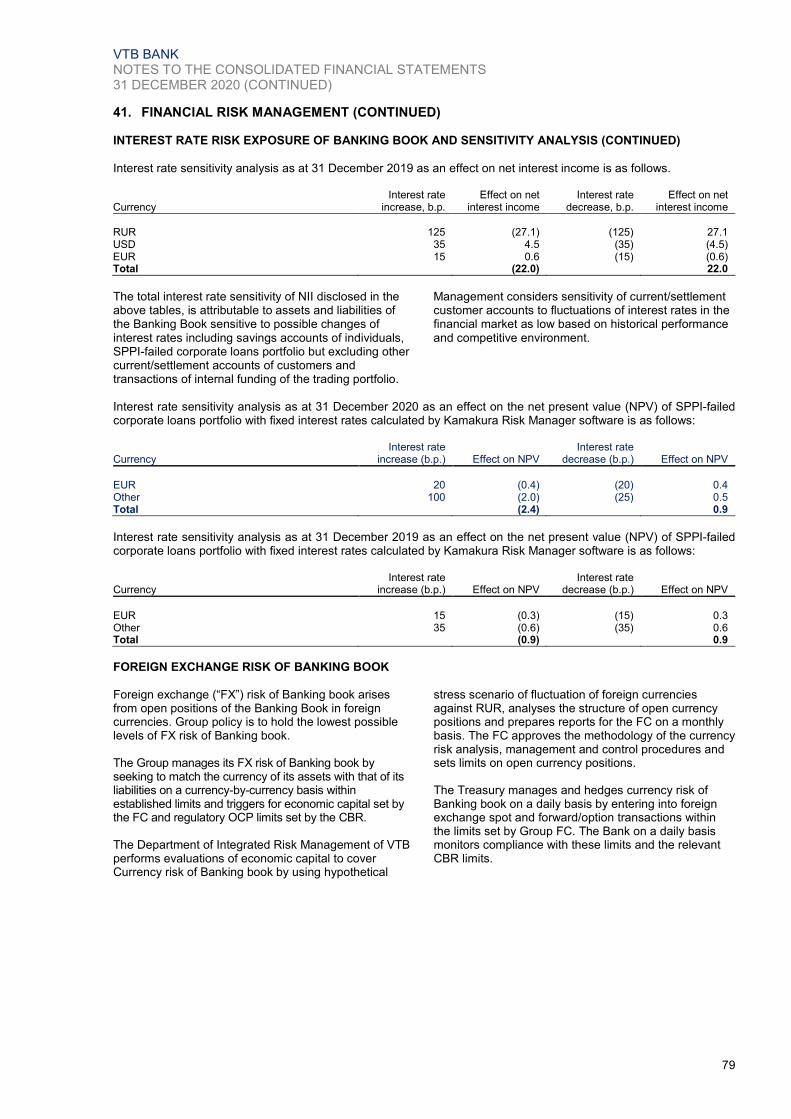
VTB BANK NOTES TO THE CONSOLIDATED FINANCIAL STATEMENTS 31 DECEMBER 2020 (CONTINUED)
79
41. FINANCIAL RISK MANAGEMENT (CONTINUED) INTEREST RATE RISK EXPOSURE OF BANKING BOOK AND SENSITIVITY ANALYSIS (CONTINUED)
Interest rate sensitivity analysis as at 31 December 2019 as an effect on net interest income is as follows. Interest rate Effect on net Interest rate Effect on net Currency increase, b.p. interest income decrease, b.p. interest income
RUR 125 (27.1) (125) 27.1 USD 35 4.5 (35) (4.5) EUR 15 0.6 (15) (0.6) Total (22.0) 22.0
The total interest rate sensitivity of NII disclosed in the above tables, is attributable to assets and liabilities of the Banking Book sensitive to possible changes of interest rates including savings accounts of individuals, SPPI-failed corporate loans portfolio but excluding other current/settlement accounts of customers and transactions of internal funding of the trading portfolio.
Management considers sensitivity of current/settlement customer accounts to fluctuations of interest rates in the financial market as low based on historical performance and competitive environment.
Interest rate sensitivity analysis as at 31 December 2020 as an effect on the net present value (NPV) of SPPI-failed corporate loans portfolio with fixed interest rates calculated by Kamakura Risk Manager software is as follows:
Currency Interest rate
increase (b.p.) Effect on NPV Interest rate
decrease (b.p.) Effect on NPV
EUR 20 (0.4) (20) 0.4 Other 100 (2.0) (25) 0.5 Total (2.4) 0.9
Interest rate sensitivity analysis as at 31 December 2019 as an effect on the net present value (NPV) of SPPI-failed corporate loans portfolio with fixed interest rates calculated by Kamakura Risk Manager software is as follows:
Currency Interest rate
increase (b.p.) Effect on NPV Interest rate
decrease (b.p.) Effect on NPV
EUR 15 (0.3) (15) 0.3 Other 35 (0.6) (35) 0.6 Total (0.9) 0.9
FOREIGN EXCHANGE RISK OF BANKING BOOK
Foreign exchange (“FX”) risk of Banking book arises from open positions of the Banking Book in foreign currencies. Group policy is to hold the lowest possible levels of FX risk of Banking book. The Group manages its FX risk of Banking book by seeking to match the currency of its assets with that of its liabilities on a currency-by-currency basis within established limits and triggers for economic capital set by the FC and regulatory OCP limits set by the CBR. The Department of Integrated Risk Management of VTB performs evaluations of economic capital to cover Currency risk of Banking book by using hypothetical
stress scenario of fluctuation of foreign currencies against RUR, analyses the structure of open currency positions and prepares reports for the FC on a monthly basis. The FC approves the methodology of the currency risk analysis, management and control procedures and sets limits on open currency positions. The Treasury manages and hedges currency risk of Banking book on a daily basis by entering into foreign exchange spot and forward/option transactions within the limits set by Group FC. The Bank on a daily basis monitors compliance with these limits and the relevant CBR limits.

VTB BANK NOTES TO THE CONSOLIDATED FINANCIAL STATEMENTS 31 DECEMBER 2020 (CONTINUED)
80
41. FINANCIAL RISK MANAGEMENT (CONTINUED) FOREIGN EXCHANGE RISK OF BANKING BOOK (CONTINUED) As at 31 December 2020 and 2019, the Group had the following exposures to FX risk of Banking book, which include balance sheet positions and off-balance sheet foreign currency derivatives positions of the Banking Book against RUR (open structural currency positions).
Currency
Open positions
2020 2019
USD 115.1 187.6 EUR 100.6 70.8 BYN 11.4 10.6 CNY 5.4 0.3 CHF 4.4 0.6 AMD 4.3 6.8 AOA 3.4 2.7 GEL 1.4 5.1 A98 0.3 0.2 AZN 0.3 0.4 JPY (0.1) 2.6 HKD (0.5) (0.5) KZT (0.9) (0.7) GBP (1.7) (2.3) UAH (1.9) (1.5) Other 0.4 (0.5)
FX sensitivity analysis as at 31 December 2020 as an effect on profit/loss is as follows:
Currency Currency up (%) Sensitivity Currency down
(%) Sensitivity
USD 16.0 10.6 (16.0) (10.6) EUR 16.0 (1.8) (16.0) 1.8 Other (2.6) 2.5 Total 6.2 (6.3)
FX sensitivity analysis as at 31 December 2019 as an effect on profit/loss is as follows:
Currency Currency up (%) Sensitivity Currency down
(%) Sensitivity
USD 13.0 16.4 (11.0) (13.9) EUR 13.0 (1.8) (11.0) 1.5 Other (1.7) 1.7 Total 12.9 (10.7)
FX sensitivity analysis as at 31 December 2020 as an effect on equity is as follows:
Currency Currency up (%) Sensitivity Currency down
(%) Sensitivity
USD 16.0 7.8 (16.0) (7.8) EUR 16.0 17.9 (16.0) (17.9) Other 6.7 (6.7) Total 32.4 (32.4)
FX sensitivity analysis as at 31 December 2019 as an effect on equity is as follows:
Currency Currency up (%) Sensitivity Currency down
(%) Sensitivity
USD 13.0 8.0 (11.0) (6.7) EUR 13.0 11.0 (11.0) (9.3) Other 4.5 (4.6) Total 23.5 (20.6)
The FX sensitivity, disclosed in the above tables, is attributable to the Banking Book sensitive to possible changes of foreign exchange rates against RUR. Inclusion of USD 2.25 billion of perpetual loan participation notes in open structural currency position calculation will result in the following sensitivity of the Banking book in USD: as of 31 December 2020 RUR: (26.6) billion and RUR 26.6 billion respectively; as of 31 December 2019 – RUR (18.1) billion and RUR 15.3 billion, respectively.

VTB BANK NOTES TO THE CONSOLIDATED FINANCIAL STATEMENTS 31 DECEMBER 2020 (CONTINUED)
81
41. FINANCIAL RISK MANAGEMENT (CONTINUED)
PRICE RISK
The Group is exposed to the market risk in Trading book and Treasury bond portfolio which is related to a negative revaluation of instruments due to the change of values of various risk factors including quotes of bonds, equities, commodity instruments, FX rates, interest rates, credit spreads, volatilities of risk factors and correlations between risk factors. Although Treasury bond portfolio is separated from the Trading book due to the different goals of positions held within these portfolios, market risk of Treasury bond portfolio is managed the same way as market risk of Trading book. In order to bound Group market risk the set of limits is used. All the limits can be divided into the two following groups: framework limits (VaR-limit, Stop-Loss limit, Stress-Loss limit) and operational limits which restrict the concentration in particular indicators or types of assets in portfolio (limit for DV01, FX Delta and etc.). The Department of Integrated Risk Management is responsible for calculation and reporting Group Market risk profile, review of limits structure and preparation of suggestions on the mitigation and managing of Market risk in Trading book and Treasury bond portfolio. On a weekly basis Department of Integrated Risk Management controls Group market risk limits utilisation. Local risk management teams control local market risk limits on a daily basis. On a weekly basis Department of Integrated Risk Management reports limits usage to the Business Departments, on a monthly basis Department of Integrated Risk Management provides detailed information on Group market risk profile of Trading book and Treasury bond portfolio to CMRMC.
Stress-test result and VaR are used for the assessment of Market risk of Trading book and Treasury bond portfolio. Methodology used for estimation of these risk measures is approved by CMRMC and shared between all Group members. Stress testing
The revaluation result of Group Trading book and Treasury bond portfolio is modelled based on historical changes in risk-factors (observed in conditions of severe changes of macroeconomic indicators) and on hypothetical risk-factors changes. The scenario analysis showed that in 2020 the largest market risk severe impacts would be due to a severe rise in RUB risk free rates and widening of credit spreads. VaR
Parameters used for VaR estimation are the following:
historical period – 2 years;
holding period – 1 trading day;
confidence level – 95%;
method – historical simulation. Total Group’s VaR 1d 95% measure for Trading book and Treasury bond portfolio for 2020 amounts to RUR 1.5 billion (2019: RUR 1.1 billion). The year to year rise in VaR is primarily driven by increase of position amount.
LIQUIDITY RISK AND CONTRACTUAL MATURITY ANALYSIS
Liquidity risk is a risk resulting from inability of the Group to meet in full its obligations when they fall due and without borrowing funds at rates higher than market rates. The Group’s exposure to liquidity risk arises due to a mismatch of maturities of assets and liabilities. Liquidity risk management within the Group is carried out at two main levels:
Bank/company level: Each bank / company of the Group manages its liquidity on an individual basis to meet its obligations and to comply with the requirements of its national regulator and standards of the Group.
Group level: Liquidity of the Group is managed on the basis of centralised control and management of key activities of the Group including:
universal policy and approaches to liquidity management;
integrated methodology of liquidity risk;
centralised system of on-going reporting and data warehousing.
The tools used by VTB for measurement, management and mitigation of liquidity risk include:
Contractual maturity analysis (gap analysis) and cash flow forecasts including planned transactions; forecasted roll-over of clients’ term funds (deposits and promissory notes); possible outflow of unstable “on-demand” funds (clients’ current accounts and Nostro accounts).
Analysis of deposit base concentration;
Stress-test analysis;
Setting of internal limits and triggers on the following liquidity metrics: economic capital; minimum stress scenario gaps; sourсes of funding (concentration limits) and highly liquid assets
Allocation and utilisation of securities from Treasury portfolio, which provide financing from the CBR through reverse repo operations and help manage short-term liquidity; and
Development of emergency plans (funding contingency plans).
).

VTB BANK NOTES TO THE CONSOLIDATED FINANCIAL STATEMENTS 31 DECEMBER 2020 (CONTINUED)
82
41. FINANCIAL RISK MANAGEMENT (CONTINUED) LIQUIDITY RISK AND CONTRACTUAL MATURITY ANALYSIS (CONTINUED)
VTB and other banks of the Group are also subject to liquidity requirements set by regulatory authorities, including those set by the CBR in the form of prudential ratios. The Department of Integrated Risk Management analyses cash flow of the Group and prepares liquidity report for FC on a monthly basis. VTB’s Treasury manages short-term liquidity on an ongoing basis through its cash position and portfolio of highly liquid securities and prepares information on short-term liquidity of the Bank and reports to the FC on a weekly basis. The Inflow column in the tables below includes gross amounts to be received by the Group within a certain time band upon contractual maturities/redemptions of financial instruments (assets/claims). Outflow column includes gross amounts to be repaid by the Group in a certain time band upon contractual maturities/redemptions of financial instruments (liabilities/obligations except current and settlement accounts). Gap represents the difference between Inflow and Outflow columns. Gap Cumulative column represents the cumulative gap. FX Swap Cumulative column represents the cumulative gaps of notional amounts of foreign exchange transactions (FX Swaps, FX Spot and Forwards, NDFs). Dynamic Gap (total) Cumulative column represents the cumulative gap
including FX Swap Cumulative. Opening balance represents highly liquid assets, which mostly consist of cash and correspondent accounts with other banks. The performed analysis confirms that in spite of a substantial portion of customer accounts being on demand or short-term, diversification of these deposits by number and type of depositors, and the past experience of the Group would indicate that these customer accounts and time deposits provide, in a substantial part, a long-term and stable source of funding for the Group. Also portfolios of Treasury Securities held for trading could be used for short-term liquidity management through reverse sale and repurchase operations. VTB Group medium-term liquidity needs are managed through interbank and customer deposits (new borrowings and renewal of existing deposits), repurchase agreements and in the form of collateralised loans (against corporate loans or securities) which allow the Group to reduce the negative medium-term liquidity gaps. VTB Group has a substantial volume of additional funding facilities made available by Bank of Russia to bridge negative medium term liquidity gaps. Currency mismatches in the structure of liquidity gaps are managed with the use of foreign exchange transactions (FX Swaps).
As at 31 December 2020, VTB Group had the following cash flow by remaining contractual maturities.
Time Band Inflow Outflow Gap Gap
Cumulative FX Swap
Cumulative
Dynamic Gap (total)
Cumulative
RUR positions Opening balance – – 619.6 619.6 – 619.6 Up to 1 month 529.1 (3,539.5) (3,010.4) (2,390.8) (572.4) (2,963.2) From 1 to 3 months 695.8 (1,157.9) (462.1) (2,852.9) (937.4) (3,790.3) From 3 months to 1 year 2,385.9 (1,837.7) 548.2 (2,304.7) (895.2) (3,199.9) From 1 to 3 years 4,504.8 (789.4) 3,715.4 1,410.7 (918.9) 491.8 More than 3 years 7,896.8 (1,016.6) 6,880.2 8,290.9 (902.7) 7,388.2 Other currency positions Opening balance – – 541.4 541.4 – 541.4 Up to 1 month 448.7 (406.9) 41.8 583.2 584.5 1,167.7 From 1 to 3 months 213.6 (280.3) (66.7) 516.5 952.3 1,468.8 From 3 months to 1 year 824.4 (1,513.6) (689.2) (172.7) 918.4 745.7 From 1 to 3 years 1,549.5 (1,362.7) 186.8 14.1 932.2 946.3 More than 3 years 2,001.7 (661.0) 1,340.7 1,354.8 918.9 2,273.7 Total Opening balance – – 1,161.0 1,161.0 – 1,161.0 Up to 1 month 977.8 (3,946.4) (2,968.6) (1,807.6) 12.1 (1,795.5) From 1 to 3 months 909.4 (1,438.2) (528.8) (2,336.4) 14.9 (2,321.5) From 3 months to 1 year 3,210.3 (3,351.3) (141.0) (2,477.4) 23.2 (2,454.2) From 1 to 3 years 6,054.3 (2,152.1) 3,902.2 1,424.8 13.3 1,438.1 More than 3 years 9,898.5 (1,677.6) 8,220.9 9,645.7 16.2 9,661.9

VTB BANK NOTES TO THE CONSOLIDATED FINANCIAL STATEMENTS 31 DECEMBER 2020 (CONTINUED)
83
41. FINANCIAL RISK MANAGEMENT (CONTINUED) LIQUIDITY RISK AND CONTRACTUAL MATURITY ANALYSIS (CONTINUED)
As at 31 December 2019, VTB Group had the following cash flow by remaining contractual maturities.
Time Band Inflow Outflow Gap Gap
Cumulative FX Swap
Cumulative
Dynamic Gap (total)
Cumulative
RUR positions Opening balance – – 585.9 585.9 – 585.9 Up to 1 month 775.3 (2,249.0) (1,473.7) (887.8) (314.9) (1,202.7) From 1 to 3 months 507.3 (1,727.3) (1,220.0) (2,107.8) (693.7) (2,801.5) From 3 months to 1 year 2,268.3 (2,407.5) (139.2) (2,247.0) (612.1) (2,859.1) From 1 to 3 years 3,964.8 (622.7) 3,342.1 1,095.1 (600.2) 494.9 More than 3 years 5,888.4 (907.6) 4,980.8 6,075.9 (633.4) 5,442.5 Other currency positions Opening balance – – 599.6 599.6 – 599.6 Up to 1 month 345.1 (385.3) (40.2) 559.4 343.2 902.6 From 1 to 3 months 111.7 (501.9) (390.2) 169.2 724.8 894.0 From 3 months to 1 year 596.2 (1,352.1) (755.9) (586.7) 657.2 70.5 From 1 to 3 years 1,614.4 (1,639.1) (24.7) (611.4) 657.3 45.9 More than 3 years 1,565.1 (465.1) 1,100.0 488.6 684.3 1,172.9 Total Opening balance – – 1,185.5 1,185.5 – 1,185.5 Up to 1 month 1,120.4 (2,634.3) (1,513.9) (328.4) 28.3 (300.1) From 1 to 3 months 619.0 (2,229.2) (1,610.2) (1,938.6) 31.1 (1,907.5) From 3 months to 1 year 2,864.5 (3,759.6) (895.1) (2,833.7) 45.1 (2,788.6) From 1 to 3 years 5,579.2 (2,261.8) 3,317.4 483.7 57.1 540.8 More than 3 years 7,453.5 (1,372.7) 6,080.8 6,564.5 50.9 6,615.4
The table below shows undiscounted cash flows payable under financial liabilities and credit-related commitments at 31 December 2020 by their remaining contractual maturity.
On demand and up to 1 month
From 1 month to 3 months
From 3 month to
6 months
From 6 months to 1 year
More than 1 year Total
Non-derivative liabilities: Due to other banks 593.5 76.1 32.3 27.5 379.4 1,108.8 Customer deposits 7,829.5 1,198.8 1,079.4 1,262.7 1,670.8 13,041.2 Other borrowed funds 605.5 1.9 43.9 184.8 377.2 1,213.3 Debt securities issued 59.6 21.3 38.0 50.2 49.5 218.6 Other liabilities 84.4 15.3 4.8 14.5 46.4 165.4 Subordinated debt – 3.6 7.0 11.4 547.3 569.3 Total cash flows payable under
non-derivative liabilities 9,172.5 1,317.0 1,205.4 1,551.1 3,070.6 16,316.6 Derivative financial instruments –
gross settled: Positive fair value of derivatives (Inflow) (217.4) (186.3) (33.2) (307.2) (718.6) (1,462.7) Outflow 215.9 184.4 35.5 303.7 660.5 1,400.0 Negative fair value of derivatives: (Inflow) (64.5) (135.2) (87.3) (199.0) (668.0) (1,154.0) Outflow 66.8 135.9 90.1 194.9 731.1 1,218.8 Derivative financial instruments –
net settled: (Inflow) (47.7) (46.9) (38.9) (88.9) (78.4) (300.8) Outflow 91.6 74.1 75.3 67.2 68.6 376.8 Credit related commitments 199.5 – – – – 199.5
Included in amounts due to customers are term deposits of individuals. In accordance with the Russian legislation, the Group is obliged to repay such deposits upon demand of a depositor. Included in amounts of other liabilities are lease liabilities. The table below shows undiscounted cash flow payables of lease liabilities at 31 December 2020 by their remaining contractual maturity.
On demand and up to 1 month
From 1 month to 3 months
From 3 month to
6 months
From 6 months to 1 year
More than 1 year Total
Lease liabilities 0.9 1.1 1.7 3.3 32.2 39.2

VTB BANK NOTES TO THE CONSOLIDATED FINANCIAL STATEMENTS 31 DECEMBER 2020 (CONTINUED)
84
41. FINANCIAL RISK MANAGEMENT (CONTINUED)
LIQUIDITY RISK AND CONTRACTUAL MATURITY ANALYSIS (CONTINUED)
The table below shows undiscounted cash flows payable under financial liabilities and credit-related commitments at 31 December 2019 by their remaining contractual maturity.
On demand and up to 1 month
From 1 month to 3 months
From 3 month to
6 months
From 6 months to 1 year
More than 1 year Total
Non-derivative liabilities: Due to other banks 784.3 161.1 6.3 17.5 236.0 1,205.2 Customer deposits 4,728.5 1,941.9 1,837.0 1,126.1 1,536.4 11,169.9 Other borrowed funds 3.1 0.6 2.9 20.3 482.6 509.5 Debt securities issued 41.6 33.0 89.4 120.8 59.6 344.4 Other liabilities 110.4 17.4 4.4 7.5 44.4 184.1 Subordinated debt 0.1 3.6 3.8 10.9 412.7 431.1 Total cash flows payable under
non-derivative liabilities 5,668.0 2,157.6 1,943.8 1,303.1 2,771.7 13,844.2 Derivative financial instruments –
gross settled: Positive fair value of derivatives (Inflow) (57.2) (53.2) (59.9) (46.6) (107.2) (324.1) Outflow 53.2 64.3 69.6 50.7 98.8 336.6 Negative fair value of derivatives: (Inflow) (39.4) (506.4) (183.5) (291.0) (494.8) (1,515.1) Outflow 40.4 507.0 183.6 303.5 502.6 1,537.1 Derivative financial instruments –
net settled: (Inflow) (26.3) (32.8) (36.7) (72.0) (53.7) (221.5) Outflow 55.6 62.3 38.2 77.1 39.5 272.7 Credit related commitments 216.3 – – – – 216.3
On demand and up to 1 month
From 1 month to 3 months
From 3 month to
6 months
From 6 months to 1 year
More than 1 year Total
Lease liabilities 1.2 1.4 2.0 4.4 39.0 48.0
CURRENT AND NON-CURRENT ASSETS AND LIABILITIES
The table below shows assets and liabilities at 31 December 2020 by their remaining contractual maturity (expected maturity match the remaining contractual maturity) by which the Group has right to realise the assets and settle the liabilities. The Group considers assets and liabilities with remaining contractual maturity of “Less than 1 year” as current and assets and liabilities with remaining contractual maturity of “More than 1 year” and “Maturity undefined” as non-current.
Less than
1 year More than
1 year Maturity
undefined Total
Assets Cash and short-term funds 1,229.5 – – 1,229.5 Mandatory cash balances with central banks 136.5 0.7 – 137.2 Trading financial assets 647.0 – – 647.0 Derivative financial assets 81.1 152.7 – 233.8 Due from other banks 682.2 155.7 – 837.9 Loans and advances to customers 2,296.0 9,968.4 – 12,264.4 Investment financial assets 39.0 867.8 45.9 952.7 Investments in associates and joint ventures – – 326.9 326.9 Assets of disposal group and non-current assets
held for sale 2.5 – – 2.5 Land, premises and equipment – – 456.5 456.5 Investment property – – 100.5 100.5 Goodwill and other intangible assets – – 215.0 215.0 Deferred income tax asset – – 154.7 154.7 Other assets 475.4 67.5 40.7 583.6 Total assets 5,589.2 11,212.8 1,340.2 18,142.2
Liabilities Due to other banks 720.6 372.4 – 1,093.0 Customer deposits 11,231.4 1,599.6 – 12,831.0 Derivative financial liabilities 138.1 112.6 – 250.7 Other borrowed funds 827.1 226.1 – 1,053.2 Debt securities issued 169.0 46.7 – 215.7 Liabilities of disposal group held for sale 0.3 – – 0.3 Deferred income tax liability – – 10.9 10.9 Other liabilities 252.2 338.6 57.3 648.1 Subordinated debt 2.8 313.9 – 316.7 Total liabilities 13,341.5 3,009.9 68.2 16,419.6
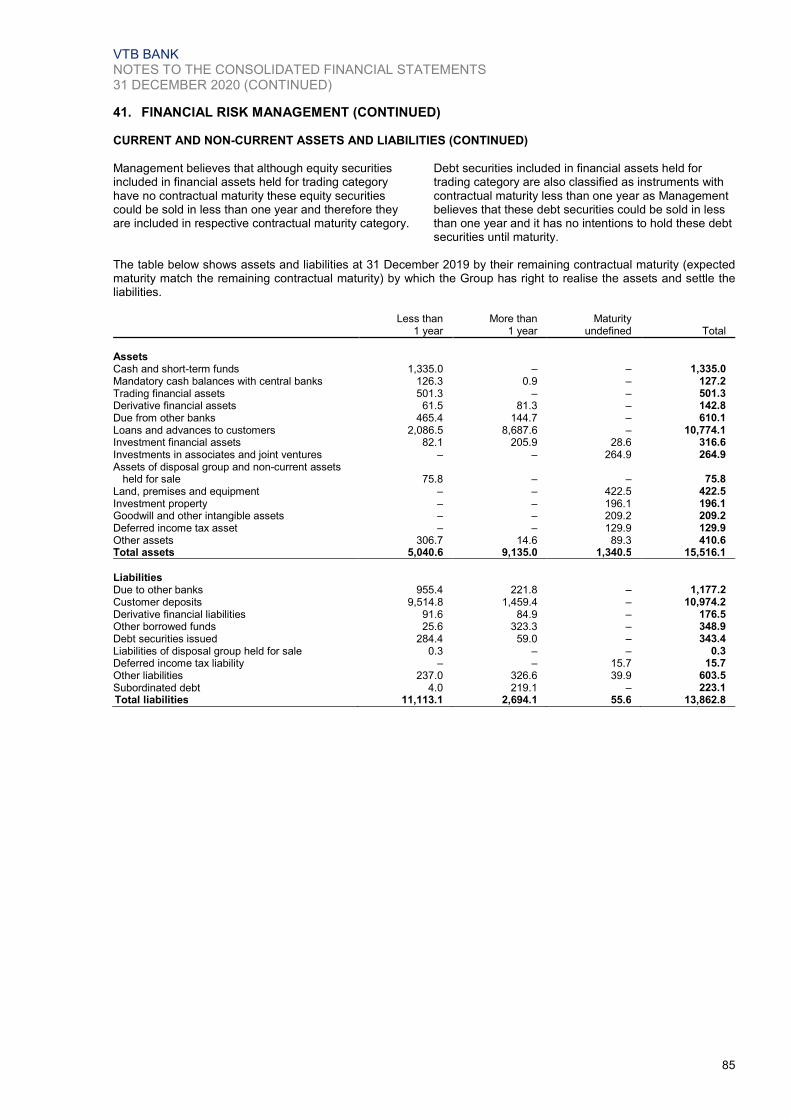
VTB BANK NOTES TO THE CONSOLIDATED FINANCIAL STATEMENTS 31 DECEMBER 2020 (CONTINUED)
85
41. FINANCIAL RISK MANAGEMENT (CONTINUED) CURRENT AND NON-CURRENT ASSETS AND LIABILITIES (CONTINUED)
Management believes that although equity securities included in financial assets held for trading category have no contractual maturity these equity securities could be sold in less than one year and therefore they are included in respective contractual maturity category.
Debt securities included in financial assets held for trading category are also classified as instruments with contractual maturity less than one year as Management believes that these debt securities could be sold in less than one year and it has no intentions to hold these debt securities until maturity.
The table below shows assets and liabilities at 31 December 2019 by their remaining contractual maturity (expected maturity match the remaining contractual maturity) by which the Group has right to realise the assets and settle the liabilities.
Less than
1 year More than
1 year Maturity
undefined Total
Assets Cash and short-term funds 1,335.0 – – 1,335.0 Mandatory cash balances with central banks 126.3 0.9 – 127.2 Trading financial assets 501.3 – – 501.3 Derivative financial assets 61.5 81.3 – 142.8 Due from other banks 465.4 144.7 – 610.1 Loans and advances to customers 2,086.5 8,687.6 – 10,774.1 Investment financial assets 82.1 205.9 28.6 316.6 Investments in associates and joint ventures – – 264.9 264.9 Assets of disposal group and non-current assets
held for sale 75.8 – – 75.8 Land, premises and equipment – – 422.5 422.5 Investment property – – 196.1 196.1 Goodwill and other intangible assets – – 209.2 209.2 Deferred income tax asset – – 129.9 129.9 Other assets 306.7 14.6 89.3 410.6 Total assets 5,040.6 9,135.0 1,340.5 15,516.1
Liabilities Due to other banks 955.4 221.8 – 1,177.2 Customer deposits 9,514.8 1,459.4 – 10,974.2 Derivative financial liabilities 91.6 84.9 – 176.5 Other borrowed funds 25.6 323.3 – 348.9 Debt securities issued 284.4 59.0 – 343.4 Liabilities of disposal group held for sale 0.3 – – 0.3 Deferred income tax liability – – 15.7 15.7 Other liabilities 237.0 326.6 39.9 603.5 Subordinated debt 4.0 219.1 – 223.1 Total liabilities 11,113.1 2,694.1 55.6 13,862.8

VTB BANK NOTES TO THE CONSOLIDATED FINANCIAL STATEMENTS 31 DECEMBER 2020 (CONTINUED)
86
41. FINANCIAL RISK MANAGEMENT (CONTINUED) GEOGRAPHICAL CONCENTRATION
Geographical concentration information is based on registration of the Group’s counterparts. As at 31 December 2020, the geographical concentration of the Group’s assets and liabilities is set out below: Russia OECD Other countries Total
Assets Cash and short-term funds 940.3 238.2 51.0 1,229.5 Mandatory cash balances with central banks 125.9 – 11.3 137.2 Trading financial assets 608.7 29.9 8.4 647.0 Derivative financial assets 95.2 114.2 24.4 233.8 Due from other banks 454.6 25.7 357.6 837.9 Loans and advances to customers 9,948.5 474.9 1,841.0 12,264.4 Investment financial assets 867.7 56.0 29.0 952.7 Investments in associates and joint ventures 248.6 13.2 65.1 326.9 Assets of disposal group and non-current assets
held for sale 2.5 – – 2.5 Land, premises and equipment 292.4 13.7 150.4 456.5 Investment property 98.9 – 1.6 100.5 Goodwill and other intangible assets 117.2 3.7 94.1 215.0 Deferred income tax asset 146.0 4.7 4.0 154.7 Other assets 351.1 178.2 54.3 583.6 Total assets 14,297.6 1,152.4 2,692.2 18,142.2
Liabilities Due to other banks 655.5 61.4 376.1 1,093.0 Customer deposits 12,108.4 394.2 328.4 12,831.0 Derivative financial liabilities 59.1 183.3 8.3 250.7 Other borrowed funds 863.7 7.5 182.0 1,053.2 Debt securities issued 208.1 4.7 2.9 215.7 Liabilities of disposal group held for sale 0.3 – – 0.3 Deferred income tax liability 9.5 0.4 1.0 10.9 Other liabilities 565.0 58.6 24.5 648.1 Subordinated debt 197.5 119.2 – 316.7 Total liabilities 14,667.1 829.3 923.2 16,419.6
Net balance sheet position (369.5) 323.1 1,769.0 1,722.6
Gross off-balance sheet position Credit Related Commitments 140.6 14.6 44.3 199.5 Performance guarantees 621.9 0.5 10.8 633.2

VTB BANK NOTES TO THE CONSOLIDATED FINANCIAL STATEMENTS 31 DECEMBER 2020 (CONTINUED)
87
41. FINANCIAL RISK MANAGEMENT (CONTINUED) GEOGRAPHICAL CONCENTRATION (CONTINUED)
Geographical concentration information is based on registration of the Group’s counterparts. As at 31 December 2019, the geographical concentration of the Group’s assets and liabilities is set out below: Russia OECD Other countries Total
Assets Cash and short-term funds 886.2 416.0 32.8 1,335.0 Mandatory cash balances with central banks 113.3 – 13.9 127.2 Trading financial assets 482.1 15.2 4.0 501.3 Derivative financial assets 51.8 73.3 17.7 142.8 Due from other banks 337.2 56.9 216.0 610.1 Loans and advances to customers 8,915.9 371.5 1,486.7 10,774.1 Investment financial assets 264.2 28.1 24.3 316.6 Investments in associates and joint ventures 201.9 – 63.0 264.9 Assets of disposal group and non-current assets
held for sale 2.5 66.0 7.3 75.8 Land, premises and equipment 274.9 13.2 134.4 422.5 Investment property 195.2 – 0.9 196.1 Goodwill and other intangible assets 189.2 2.3 17.7 209.2 Deferred income tax asset 123.1 3.7 3.1 129.9 Other assets 350.1 49.0 11.5 410.6 Total assets 12,387.6 1,095.2 2,033.3 15,516.1
Liabilities Due to other banks 889.6 63.7 223.9 1,177.2 Customer deposits 10,343.0 402.6 228.6 10,974.2 Derivative financial liabilities 54.7 110.4 11.4 176.5 Other borrowed funds 201.6 9.6 137.7 348.9 Debt securities issued 233.5 99.7 10.2 343.4 Liabilities of disposal group held for sale 0.3 – – 0.3 Deferred income tax liability 14.6 0.1 1.0 15.7 Other liabilities 516.4 65.2 21.9 603.5 Subordinated debt 124.5 98.6 – 223.1 Total liabilities 12,378.2 849.9 634.7 13,862.8
Net balance sheet position 9.4 245.3 1,398.6 1,653.3
Gross off-balance sheet position Credit Related Commitments 126.9 13.8 75.6 216.3 Performance guarantees 652.1 0.5 19.6 672.2
42. FAIR VALUE MEASUREMENT Fair value of financial instruments measured at fair value
Fair value is the price that would be received to sell an asset or paid to transfer a liability in an orderly transaction between market participants at the measurement date. The fair value measurement is based on the presumption that the transaction to sell the asset or transfer the liability takes place either:
in the principal market for the asset or liability; or
in the absence of a principal market, in the most advantageous market for the asset or liability.
The principal or the most advantageous market must be accessible by the Group. The fair value of an asset or a liability is measured using the assumptions that market participants would use when pricing the asset or liability, assuming that market participants act in their economic best interest. A fair value measurement of a non-financial asset takes into account a market participant's ability to generate economic benefits by using the asset
in its highest and best use or by selling it to another market participant that would use the asset in its highest and best use. Fair value measurements are analysed by level in the fair value hierarchy as follows: (i) Level 1 are measurements at quoted prices (unadjusted) in active markets for identical assets or liabilities, (ii) Level 2 measurements are valuations techniques with all material inputs observable for the asset or liability, either directly (that is, as prices) or indirectly (that is, derived from prices), and (iii) Level 3 measurements are valuations not based on observable market data (that is, unobservable inputs). Management applies judgment in categorising financial instruments using the fair value hierarchy. If a fair value measurement uses observable inputs that require significant adjustment based on unobservable inputs, that measurement is a Level 3 measurement. The significance of a valuation input is assessed against the fair value measurement of a financial instrument in its entirety.

VTB BANK NOTES TO THE CONSOLIDATED FINANCIAL STATEMENTS 31 DECEMBER 2020 (CONTINUED)
88
42. FAIR VALUE MEASUREMENT (CONTINUED)
Assets and liabilities measured at fair value
The following table shows an analysis of assets and liabilities recorded at fair value by level of the fair value hierarchy as at 31 December 2020:
Quoted prices in active markets
Significant observable
inputs
Significant unobservable
inputs Level 1 Level 2 Level 3 Total
Financial assets measured at fair value Trading financial assets Trading financial assets
Debt securities 423.1 112.0 14.9 550.0
Equity securities 34.6 – 0.1 34.7
Trading financial assets, pledged under repurchase agreements
Debt securities 60.2 1.6 – 61.8
Equity securities 0.5 – – 0.5
Derivative financial assets Derivative financial assets held for trading
Interest rate contracts – 151.0 6.1 157.1
Foreign exchange and precious metals contracts – 63.1 – 63.1
Contracts with commodities 0.6 10.6 – 11.2
Contracts with securities – 1.0 0.4 1.4
Other basic assets contracts – 0.7 – 0.7 Derivative financial assets designated as hedging instruments
Derivatives held as fair value hedges – 0.2 – 0.2
Derivatives held as cash flow hedges – 0.1 – 0.1 Due from other banks at fair value through profit or loss – – 17.7 17.7 Loans and advances to customers at fair value through profit or loss Loans and advances to legal entities – – 156.2 156.2 Loans and advances to customers at fair value through other
comprehensive income Loans and advances to individuals – – 230.8 230.8 Loans and advances to legal entities, pledged under repurchase agreements 56.8 – – 56.8 Loans and advances to legal entities 1.3 – – 1.3 Investment financial assets Investment financial assets mandatory measured at fair value through profit
or loss
Equity securities 26.3 1.9 12.7 40.9
Debt securities 0.1 0.2 19.1 19.4 Investment financial assets designated as at fair value through other
comprehensive income
Debt securities 275.6 10.6 0.2 286.4
Equity securities 0.3 – 3.6 3.9 Investment financial assets designated as at fair value through other
comprehensive income pledged under repurchase agreements
Debt securities 561.6 0.9 – 562.5 Investment financial assets designated as at fair value through profit or loss
pledged under repurchase agreements
Reverse sale and repurchase agreements to maturity – 7.3 – 7.3
Investments in associates and joint ventures designated as at fair value through profit or loss 4.8 – 50.7 55.5
Other financial assets 0.2 0.4 0.4 1.0 Other non-financial assets measured at fair value Investment property (including right of use assets) – – 100.5 100.5 Land and premises – – 121.9 121.9 Precious metals within Other Assets – 153.2 – 153.2 Exchange-tradable commodities within Other Assets – 57.3 – 57.3 Financial liabilities measured at fair value Derivative financial liabilities Derivative financial liabilities held for trading
Interest rate contracts – 119.7 – 119.7
Foreign exchange and precious metals contracts – 107.7 – 107.7
Contracts with commodities 6.0 5.8 – 11.8
Contracts with securities – 0.1 5.6 5.7
Other basic assets contracts – 5.6 – 5.6 Derivative financial liabilities designated as hedging instruments
Derivatives held as fair value hedges – 0.2 – 0.2
Other financial liabilities Obligation to deliver securities 14.3 0.3 – 14.6 Non-controlling interests in consolidated mutual funds – – 2.8 2.8
Other financial liabilities – 0.8 5.0 5.8

VTB BANK NOTES TO THE CONSOLIDATED FINANCIAL STATEMENTS 31 DECEMBER 2020 (CONTINUED)
89
42. FAIR VALUE MEASUREMENT (CONTINUED)
Assets and liabilities measured at fair value (continued)
The following table shows an analysis of assets and liabilities recorded at fair value by level of the fair value hierarchy as at 31 December 2019:
Quoted prices in active markets
Significant observable
inputs
Significant unobservable
inputs Level 1 Level 2 Level 3 Total
Financial assets measured at fair value Trading financial assets Trading financial assets
Debt securities 319.9 88.2 8.0 416.1
Equity securities 43.1 22.7 – 65.8
Trading financial assets, pledged under repurchase agreements
Debt securities 18.8 – – 18.8
Equity securities 0.6 – – 0.6
Derivative financial assets Derivative financial assets held for trading
Interest rate contracts – 75.1 – 75.1
Foreign exchange and precious metals contracts – 43.5 – 43.5
Contracts with commodities – 12.0 – 12.0
Contracts with securities – 8.4 2.7 11.1
Other basic assets contracts – 1.0 – 1.0 Derivative financial assets designated as hedging instruments Derivatives held as fair value hedges – 0.1 – 0.1 Due from other banks at fair value through profit or loss – – 15.0 15.0 Loans and advances to customers at fair value through profit or loss Loans and advances to legal entities – – 149.4 149.4 Loans and advances to customers at fair value through other
comprehensive income Loans and advances to individuals – – 157.2 157.2 Loans and advances to legal entities 53.8 – – 53.8 Loans and advances to legal entities, pledged under repurchase agreements 21.0 – – 21.0
Investment financial assets Investment financial assets mandatory measured at fair value through profit
or loss
Equity securities 5.4 7.7 5.7 18.8
Debt securities – – 15.8 15.8 Investment financial assets measured at fair value through other
comprehensive income
Debt securities 73.6 10.1 0.6 84.3
Equity securities 0.2 5.9 3.7 9.8 Investment financial assets measured at fair value through other
comprehensive income pledged under repurchase agreements
Debt securities 124.9 27.2 1.0 153.1 Investment financial assets designated as at fair value through profit or loss
pledged under repurchase agreements
Reverse sale and repurchase agreements to maturity – 6.3 – 6.3
Investments in associates and joint ventures designated as at fair value through profit or loss – – 42.4 42.4
Other financial assets – 0.1 4.1 4.2 Other non-financial assets measured at fair value Investment property (including right of use assets) – – 196.1 196.1 Land and premises – – 137.6 137.6 Precious metals within Other Assets – 163.7 – 163.7 Exchange-tradable commodities within Other Assets – 11.5 – 11.5 Financial liabilities measured at fair value Derivative financial liabilities Derivative financial liabilities held for trading
Interest rate contracts – 70.9 – 70.9
Foreign exchange and precious metals contracts – 70.7 0,0 70.7
Contracts with securities – 16.1 2.6 18.7
Contracts with commodities 0.4 12.4 – 12.8
Other basic assets contracts – 3.2 – 3.2 Derivative financial liabilities designated as hedging instruments
Derivatives held as cash flow hedges – 0.2 – 0.2
Other financial liabilities Obligation to deliver securities 23.9 2.2 – 26.1 Non-controlling interests in consolidated mutual funds – – 2.4 2.4 Other financial liabilities – 0.1 3.5 3.6

VTB BANK NOTES TO THE CONSOLIDATED FINANCIAL STATEMENTS 31 DECEMBER 2020 (CONTINUED)
90
42. FAIR VALUE MEASUREMENT (CONTINUED) Assets and liabilities measured at fair value (continued)
For financial instruments that are recognised at fair value on a recurring basis, the Group determines whether transfers have occurred between Levels in the hierarchy by re-assessing categorisation (based on the lowest level input that is significant to the fair value measurement as a whole) at the end of each reporting period.
A significant portion of the equity securities in Level 3 is invested in shares of non-listed companies, which are valued based on non-market observable information. Changes in assumptions can lead to adjustments in the fair value of these investments.
Movement in Level 3 financial instruments measured at fair value A reconciliation of movements in Level 3 of the fair value hierarchy by class of financial instruments for the year ended 31 December 2020 is as follows:
Investment financial assets Other financial liabilities
Trading financial
assets
Investment financial
assets mandatorily
measured at fair value
through profit or loss,
Investment financial
assets measured at
fair value through other
comprehen-sive income,
Investments in associates
and joint ventures at
fair value through profit
or loss
Derivative financial
assets and liabilities held
for trading (net)
Due from other banks at
fair value through profit
or loss
Loans and advances to
customers at fair value
through profit or loss
Loans and advances to
customers at fair value
through other comprehen-sive income
Other financial assets
Non-controlling interests in
consolidated mutual funds
Other financial liabilities
measured at fair value
Fair value at 1 January
2020 8.0 21.5 5.3 42.4 0.1 15.0 149.4 157.2 4.1 (2.4) (3.5)
Interest income and gains or (losses) recognised in income statement (0.3) 0.2 0.1 3.0 (0.7) 2.0 39.1 21.3 0.4 (0.4) (2.3)
of which unrealised gains or (losses) (0.4) 0.2 0.1 3.0 (0.5) 0.6 27.5 (0.5) 0.4 (0.4) (2.3)
Gains recognised in other comprehensive income – – – – – – – 6.1 – – –
Purchase 50.0 1.8 0.2 0.3 0.8 – 8.1 – – – – Sale (34.7) – (1.8) (0.1) – – – – – 0.8 Issue – 1.6 – – – 2.7 2.5 140.8 – – – Settlement (0.5) – – – (2.9) (2.0) (42.9) (94.6) (4.1) – – Transfers into Level 3 9.3 6.7 – 5.1 3.6 – – – – – – Transfers out of Level 3 (16.8) – – – – – – – – – – Fair value at
31 December 2020 15.0 31.8 3.8 50.7 0.9 17.7 156.2 230.8 0.4 (2.8) (5.0)
A reconciliation of movements in Level 3 of the fair value hierarchy by class of financial instruments for the year ended 31 December 2019 is as follows:
Investment financial assets Other financial liabilities
Trading financial
assets
Investment financial
assets mandatorily
measured at fair value
through profit or loss,
Investment financial
assets measured at
fair value through other
comprehen-sive income,
Investments in associates
and joint ventures at
fair value through profit
or loss
Derivative financial
assets and liabilities held
for trading (net)
Due from other banks at
fair value through profit
or loss
Loans and advances to
customers at fair value
through profit or loss
Loans and advances to
customers at fair value
through other comprehen-sive income
Other financial assets
Non-controlling interests in
consolidated mutual funds
Other financial liabilities
measured at fair value
Fair value at 1 January
2019 12.6 11.2 5.5 70.7 (1.2) 7.6 107.4 – – (2.7) (2.4) Interest income and
gains or (losses) recognised in income statement 0.4 (0.3) 1.4 13.8 2,2 7.3 7.6 1.6 4.1 0.3 (0.7)
of which unrealised gains or (losses) 0.4 (0.3) 0.3 13.8 1.1 2.0 (1.8) (0.1) 4.1 0.3 (0.7)
Gains recognised in other comprehensive income – – (1.1) – – – – 1.1 – – –
Purchase 13.5 6.3 1.8 31.0 – – – – – – – Sale (3.0) (5.1) (2.0) – – – (2.0) – – – – Issue – 9.4 – – – 12.8 78.4 155.9 – – (0.9) Settlement (1.0) – – (0.3) (1.1) (12.7) (42.0) (1.4) – – 0.5 Acquisition of
subsidiaries 0.7 – – – – – – – – – Transfers into Level 3 16.7 – 0.3 0.5 – – – – – – – Transfers out of Level 3 (31.9) – (0.6) – 0.2 – – – – – – Transfer into disposal
group – – – (73.3) – – – – – – – Fair value at
31 December 2019 8.0 21.5 5.3 42.4 0.1 15.0 149.4 157.2 4.1 (2.4) (3.5)

VTB BANK NOTES TO THE CONSOLIDATED FINANCIAL STATEMENTS 31 DECEMBER 2020 (CONTINUED)
91
42. FAIR VALUE MEASUREMENT (CONTINUED) Transfers between levels
For the year ended 31 December 2020
Reason for transfer (valuation at the reporting
date) Trading
financial assets
Investment financial assets
measured at fair value through
profit or loss
Investment financial assets
measured at fair value through
other comprehensive
income
Investments in associates and
joint ventures at fair value through
profit or loss
Derivative financial assets
and liabilities held for trading (net) Total
From Level 1:
to Level 2 valuation models with market observable inputs 103.8 – 6.8 – – 110.6
to Level 3 valuation models with non-market-observable inputs 2.2 – – – – 2.2
From Level 2:
to Level 1 active market quotes 96.9 – 29.2 – – 126.1
to Level 3 valuation models with non-market-observable inputs 7.1 6.7 – 5.1 3.6 22.5
From Level 3:
to Level 1 active market quotes 2.7 – – – – 2.7
to Level 2 valuation models with market observable inputs 14.1 – – – – 14.1
Total 226.8 6.7 36.0 5.1 3.6 278.2
For the year ended 31 December 2019
Reason for transfer (valuation at the reporting
date) Trading financial
assets
Investment financial assets measured at
fair value through other comprehensive
income
Investments in associates and joint
ventures at fair value through profit or loss
Derivative financial assets and liabilities held for trading (net) Total
From Level 1:
to Level 2 valuation models with market observable inputs 98.1 1.3 – – 99.4
to Level 3 valuation models with non-market-observable inputs 1.7 – – – 1.7
From Level 2:
to Level 1 active market quotes 108.3 1.3 – – 109.6
to Level 3 valuation models with non-market-observable inputs 15.0 0.3 0.5 – 15.8
From Level 3:
to Level 1 active market quotes 5.7 0.5 – – 6.2
to Level 2 valuation models with market observable inputs 26.2 0.1 – 0.2 26.5
Total 255.0 3.5 0.5 0.2 259.2
Movement in Level 3 non-financial assets measured at fair value
A reconciliation of movements in Level 3 of the fair value hierarchy by class of non-financial assets measured at fair value for the year ended 31 December 2020 is as follows:
Land and premises Investment property,
right-of-use assets
Fair value at 1 January 2020 137.6 196.1 Losses net of gains recognised in profit or loss (18.7) (87.3) Losses net of gains in other comprehensive income (0.1) – Purchase 0.7 2.1 Capitalisation of expenses – 3.0 Sale (0.4) (16.9) Acquisition of subsidiaries – 3.6 Disposal of subsidiaries (0.9) (0.4) Transfers within Level 3 (0.7) 0.7 Net transfers from/(to) another categories 2.9 (0.4) Other changes 1.5 – Fair value at 31 December 2020 121.9 100.5
A reconciliation of movements in Level 3 of the fair value hierarchy by class of non-financial assets measured at fair value for the year ended 31 December 2019 is as follows:
Land and premises Investment property,
right-of-use assets
Fair value at 1 January 2019 134.8 197.2 Impact of adopting IFRS 16 at 1 January 2019 – 0.2 Losses net of gains recognised in profit or loss (1.9) (0.9) Losses net of gains in other comprehensive income (1.2) (0.3) Purchase 0.9 4.9 Capitalisation of expenses – 5.4 Sale (0.4) (10.3) Acquisition of subsidiaries 5.3 – Disposal of subsidiaries (0.2) (2.1) Transfers within Level 3 (1.8) 1.8 Net transfers into another categories 2.1 0.2 Fair value at 31 December 2019 137.6 196.1

VTB BANK NOTES TO THE CONSOLIDATED FINANCIAL STATEMENTS 31 DECEMBER 2020 (CONTINUED)
92
42. FAIR VALUE MEASUREMENT (CONTINUED) Movement in Level 3 non-financial assets measured at fair value (continued)
Net transfers into categories not measured at fair value in the above table include amounts reclassified to property intended for sale in the ordinary course of business and to assets of disposal groups held for sale and reclassifications from other accounts.
There were no transfers out of Level 3 of the fair value hierarchy of non-financial assets.
Impact on fair value of Level 3 financial instruments of changes to key assumptions The following table shows the quantitative information as at 31 December 2020 about significant unobservable inputs used in the fair value measurement categorised within Level 3 of the fair value hierarchy:
Fair
value Valuation
techniques Unobservable input
description Reasonable range
(values used)
Trading financial assets Debt securities Development real estate 3.5 Traders price Traders price 105.0%-135.0% (120.0%) Banking 1.1 Traders price Traders price 102.6%-112.6% (107.6%) Railways 2.7 Traders price Traders price 94.7%-104.7% (99.7%) Other economic sectors 7.6 Other n/a n/a Equity securities Other economic sectors 0.1 Other n/a n/a Derivative financial assets and
liabilities held for trading (net) Interest rate contracts 6.1 Discounted Cash flow CVA 1.418-2.633 (2.026) Contracts with securities (5.2) Other n/a n/a Investment financial assets mandatorily measured at fair value through profit or loss, including pledged under repurchase agreements Debt securities
Food Industry 7.4 Discounted Cash flow;
EV/EBITDA multiple WACC 5.1%-9.1% (7.1%) Terminal Growth 0.0%-2.0% (1.0%)
Weight of multiples-based
valuation 0%-100% (50% & 50%) Coal and mining 5.7 Discounted Cash flow WACC 7.0%-15.0% (11.0%)
Average gold price forecast
(from 2023) in USD 1500-2000 (1750) Other economic sectors 6.0 Other n/a n/a Equity securities Banking 12.7 Discounted Cash flow Discount rate (1.0)%-1.0% (various) Investment financial assets measured at fair value through other comprehensive income, including pledged under repurchase agreements Debt securities Other economic sectors 0.2 Other n/a n/a Equity securities
Finance companies, Banks, Leasing 2.7 Gordon and Exit multiple
Discount rate that can be changed based changes in macroeconomic backdrop 6.7%-10.7% (8.7%)
exit multiple 0.4-0.8 (0.6) Other economic sectors 0.9 Other n/a n/a
Loans and advances to customers at fair value through profit or loss Other 156.2 Discounted Cash flow Discount rate (1.0)%-1.0% (various) Loans and advances to customers at fair value through other comprehensive income
Iindividuals – mortgages 230.8 Discounted Cash flow Interest rates currently
available for mortgages (0.1)%-0.1% (various)
Percentage of early
repayment 1.8%-2.2% (2.0%) Due from other banks at fair value through profit or loss Finance companies and banks 17.7 Fair value model Discount rate (1.0)%-1.0% (various)

VTB BANK NOTES TO THE CONSOLIDATED FINANCIAL STATEMENTS 31 DECEMBER 2020 (CONTINUED)
93
42. FAIR VALUE MEASUREMENT (CONTINUED) Impact on fair value of Level 3 financial instruments of changes to key assumptions (continued)
Fair
value Valuation
techniques Unobservable input
description Reasonable range
(values used)
Investments in associates and joint ventures designated as at fair value through profit or loss Services: Air transportation 1.9 Discounted Dividend flow Base equity risk premium 7.0%-8.0% (7.5%) RUR inflation (CPI)
from 2022 3.3%-4.3% (3.8%)
Growth rate of duty free revenue (in euro) per
international passenger from 2022 year
0.0%-3.0% (1.4%)
Growth of tariffs in 2027 2029
20.0%-40.0% (30.0%)
The date of traffic recovery to 2019 year
3Q 2021 – 3Q 2023 (1Q 2022)
Railways 30.9 Discounted Cash flow WACC 12.5%-14.5% (13.5%) Terminal Growth 2.0%-6.0% (4.0%)
Fleet growth (only
Hoppers Grains new gen.) 2021-2029
8.0%-12.0% (10.0%)
Fast Food 7.8 Discounted Cash flow;
EV/EBITDA multiple Liquidity discount 20.0%-30.0% (25.0%)
Weight of multiples-based valuation
0.0%-100.0% (50.0% & 50.0%)
LFL sales CAGR 2020-2026
4.0%-6.0% (5.0%)
WACC 10.2%-14.2% (12.2%) Terminal Growth 2.0%-6.0% (4.0%) Infrastructure Construction 3.5 Discounted Dividend flow Base equity risk premium 7.0%-8.0% (7.5%) RUR inflation (CPI) from
2022 3.3%-4.3% (3.8%)
Project specific risk premium
0.0%-(2.3%) (1.1%)
CBR Key rate from 2024 4.0%-5.0% (4.5%) Agriculture 5.5 Discounted Dividend flow Terminal Growth 3.0%-5.0% (4.0%) MGR gross margin 9.3%-11.3% (10.3%) WACC of terminals 12.4%-14.4% (13.4%) Other 1.1 Other n/a n/a
Other financial assets accounted at fair value
Other financial assets 0.4 Other n/a n/a Other financial liabilities accounted at fair value Non-controlling interests in
consolidated mutual funds (2.8) Net asset value n/a n/a Other financial liabilities (5.0) Discounted Cash flow Discount rate 22.5%-24.0% (23.2%)

VTB BANK NOTES TO THE CONSOLIDATED FINANCIAL STATEMENTS 31 DECEMBER 2020 (CONTINUED)
94
42. FAIR VALUE MEASUREMENT (CONTINUED) Impact on fair value of Level 3 financial instruments of changes to key assumptions (continued)
The following table shows the quantitative information as at 31 December 2019 about significant unobservable inputs used in the fair value measurement categorised within Level 3 of the fair value hierarchy:
Fair
value Valuation
techniques Unobservable input
description Reasonable range
(values used)
Trading financial assets Debt securities Development real estate 5.3 Traders price Traders price 117.0%-127.0% (122.0%) Other economic sectors 2.7 Other n/a n/a Derivative financial assets and
liabilities held for trading (net) Equity derivatives 0.1 Other n/a n/a Investment financial assets mandatorily measured at fair value through profit or loss, including pledged under repurchase agreements Debt securities Banking 9.4 Discounted Cash flow Discount rate (1.0)%-1.0% (various)
Food Industry 6.4 Discounted Cash flow;
EV/EBITDA multiple WACC 6.5%-10.5% (8.5%) Terminal Growth 1.0%-3.0% (2.0%) EV/EBITDA 6,5X – 10,5X (8,5X) Equity securities Other economic sectors 5.7 Other n/a n/a Investment financial assets measured at fair value through other comprehensive income, including pledged under repurchase agreements Debt securities Finance companies, Banks 1.4 Other n/a n/a Other economic sectors 0.2 Other n/a n/a Equity securities
Finance companies, Banks, Leasing 2.7 Gordon and Exit multiple
Discount rate that can be changed based changes in macroeconomic backdrop 6.7%-10.7% (8.7%)
exit multiple 0.4-0.8 (0.6) Other economic sectors 1.0 Other n/a n/a Loans and advances to customers at fair value through profit or loss Communication 13.2 Fair value model Fair value of collateral 43.0-53.5 (53.5) Other 136.2 Discounted Cash flow Discount rate (1.0)%-1.0% (various) Loans and advances to customers at fair value through other comprehensive income
Iindividuals - mortgages 157.2 Discounted Cash flow Interest rates currently
available for mortgages (0.1)%-0.1% (various)
Percentage of early
repayment 1.8%-2.2% (2.0%) Due from other banks at fair value through profit or loss Finance companies and banks 15.0 Fair value model Discount rate (1.0)%-1.0% (various)

VTB BANK NOTES TO THE CONSOLIDATED FINANCIAL STATEMENTS 31 DECEMBER 2020 (CONTINUED)
95
42. FAIR VALUE MEASUREMENT (CONTINUED) Impact on fair value of Level 3 financial instruments of changes to key assumptions (continued)
Fair
value Valuation
techniques Unobservable input
description Reasonable range
(values used)
Investments in associates and joint ventures designated as at fair value through profit or loss Services: Air transportation 5.4 Discounted Dividend flow Base equity risk premium 7.0%-8.0% (7.5%) RUR inflation (CPI) from
2020 3.5%-4.5% (4.0%)
Growth rate of duty free revenue (in euro) per
international passenger
0.0%-4.0% (1.6%)
Railways 28.6 Discounted Cash flow;
EV/EBITDA multiple WACC 13.4%-15.4% (14.4%)
Terminal Growth 2.0%-6.0% (4.0%) Fleet growth 2020-2024 2.0%-6.0% (4.0%) Fast Food 7.8 Discounted Cash flow;
EV/EBITDA multiple Liquidity discount 20.0%-30.0% (25.0%)
Weight of multiples-based valuation
0.0%-100.0% (50.0% & 50.0%)
LFL sales CAGR 2020-2024 4.8%-6.8% (5.8%) WACC 11.0%-15.0% (13.0%) Terminal Growth 2.0%-6.0% (4.0%) Other 0.6 Other n/a n/a
Other financial assets accounted at fair value
Other financial assets 4.1 Other n/a n/a Other financial liabilities accounted at fair value Non-controlling interests in
consolidated mutual funds (2.4) Net asset value n/a n/a Other financial liabilities (2.7) Discounted Cash flow Discount rate 22.5%-24.0% (23.2%)
(0.8) Grain transhipment volume
2020-2022 3.0-13.0 (8.0)
For financial instruments, which fair value is estimated using significant unobservable inputs, parameters and assumptions, the exact value of such inputs at the reporting date might be drawn from a range of reasonably possible alternatives. For each unobservable input to which the fair value is most sensitive, the Group calculates its impact on valuation by taking each individual input to the extreme point of its reasonably possible range, while keeping other inputs unchanged. The table below presents the range of fair value of the respective class of financial instruments calculated using the approach discussed above. Should all the
parameters be changed simultaneously to the extreme points of their reasonable ranges, the impact on the fair value would be more significant than disclosed in the table, however, the Group considers that it is unlikely that all parameters and assumptions will be simultaneously at their extreme points. This disclosure is intended to illustrate the magnitude of the relative uncertainty in the fair value of financial instruments for which valuation is dependent on unobservable parameters, however, the disclosure is not indicative of future movements in fair value.
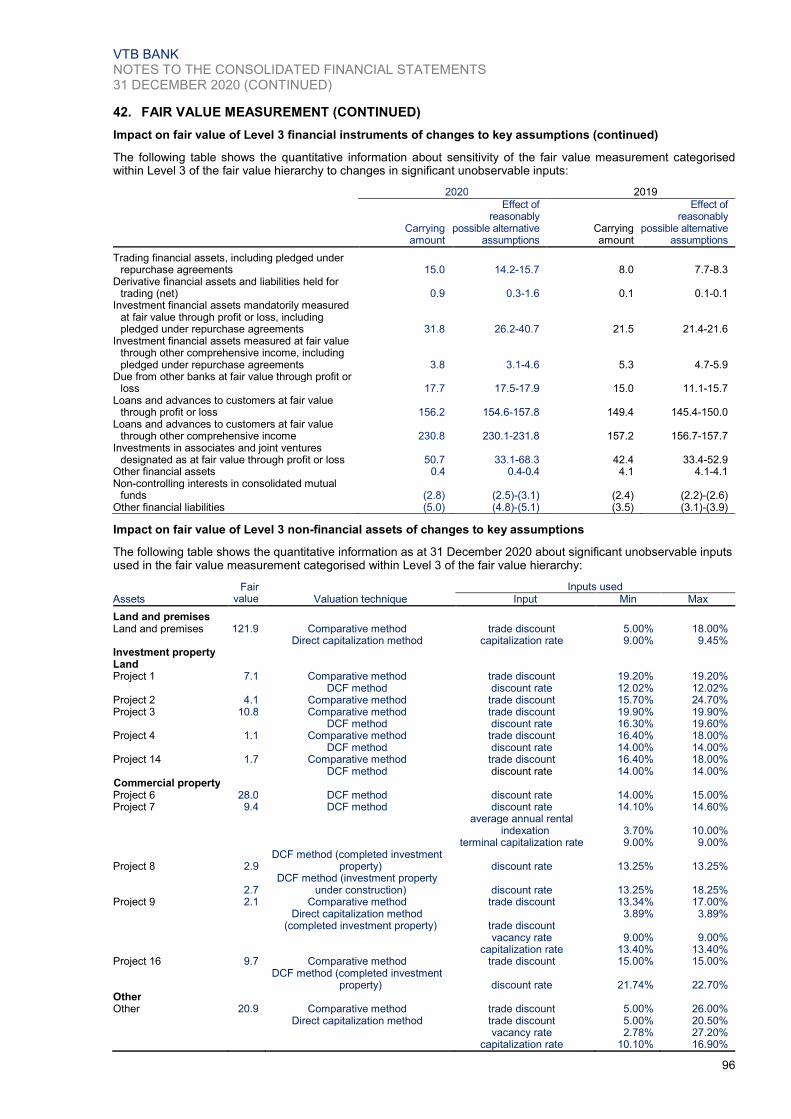
VTB BANK NOTES TO THE CONSOLIDATED FINANCIAL STATEMENTS 31 DECEMBER 2020 (CONTINUED)
96
42. FAIR VALUE MEASUREMENT (CONTINUED)
Impact on fair value of Level 3 financial instruments of changes to key assumptions (continued)
The following table shows the quantitative information about sensitivity of the fair value measurement categorised within Level 3 of the fair value hierarchy to changes in significant unobservable inputs:
2020 2019
Carrying amount
Effect of reasonably
possible alternative assumptions
Carrying amount
Effect of reasonably
possible alternative assumptions
Trading financial assets, including pledged under repurchase agreements 15.0 14.2-15.7 8.0 7.7-8.3
Derivative financial assets and liabilities held for trading (net) 0.9 0.3-1.6 0.1 0.1-0.1
Investment financial assets mandatorily measured at fair value through profit or loss, including pledged under repurchase agreements 31.8 26.2-40.7 21.5 21.4-21.6
Investment financial assets measured at fair value through other comprehensive income, including pledged under repurchase agreements 3.8 3.1-4.6 5.3 4.7-5.9
Due from other banks at fair value through profit or loss 17.7 17.5-17.9 15.0 11.1-15.7
Loans and advances to customers at fair value through profit or loss 156.2 154.6-157.8 149.4 145.4-150.0
Loans and advances to customers at fair value through other comprehensive income 230.8 230.1-231.8 157.2 156.7-157.7
Investments in associates and joint ventures designated as at fair value through profit or loss 50.7 33.1-68.3 42.4 33.4-52.9
Other financial assets 0.4 0.4-0.4 4.1 4.1-4.1 Non-controlling interests in consolidated mutual
funds (2.8) (2.5)-(3.1) (2.4) (2.2)-(2.6) Other financial liabilities (5.0) (4.8)-(5.1) (3.5) (3.1)-(3.9)
Impact on fair value of Level 3 non-financial assets of changes to key assumptions
The following table shows the quantitative information as at 31 December 2020 about significant unobservable inputs used in the fair value measurement categorised within Level 3 of the fair value hierarchy:
Fair
value
Inputs used Assets Valuation technique Input Min Max
Land and premises Land and premises 121.9 Comparative method trade discount 5.00% 18.00%
Direct capitalization method capitalization rate 9.00% 9.45%
Investment property
Land
Project 1 7.1 Comparative method trade discount 19.20% 19.20% DCF method discount rate 12.02% 12.02% Project 2 4.1 Comparative method trade discount 15.70% 24.70% Project 3 10.8 Comparative method trade discount 19.90% 19.90% DCF method discount rate 16.30% 19.60% Project 4 1.1 Comparative method trade discount 16.40% 18.00% DCF method discount rate 14.00% 14.00% Project 14 1.7 Comparative method trade discount 16.40% 18.00% DCF method discount rate 14.00% 14.00% Commercial property
Project 6 28.0 DCF method discount rate 14.00% 15.00% Project 7 9.4 DCF method discount rate 14.10% 14.60%
average annual rental indexation 3.70% 10.00%
terminal capitalization rate 9.00% 9.00%
Project 8 2.9 DCF method (completed investment
property) discount rate 13.25% 13.25%
2.7
DCF method (investment property under construction) discount rate 13.25% 18.25%
Project 9 2.1 Comparative method trade discount 13.34% 17.00%
Direct capitalization method
(completed investment property) trade discount 3.89% 3.89%
vacancy rate 9.00% 9.00%
capitalization rate 13.40% 13.40%
Project 16 9.7 Comparative method trade discount 15.00% 15.00%
DCF method (completed investment
property) discount rate 21.74% 22.70% Other
Other 20.9 Comparative method trade discount 5.00% 26.00% Direct capitalization method trade discount 5.00% 20.50%
vacancy rate 2.78% 27.20%
capitalization rate 10.10% 16.90%

VTB BANK NOTES TO THE CONSOLIDATED FINANCIAL STATEMENTS 31 DECEMBER 2020 (CONTINUED)
97
42. FAIR VALUE MEASUREMENT (CONTINUED) Impact on fair value of Level 3 non-financial assets of changes to key assumptions (continued)
The following table shows the quantitative information as at 31 December 2019 about significant unobservable inputs used in the fair value measurement categorised within Level 3 of the fair value hierarchy:
Fair
value
Inputs used
Assets Valuation technique Input Min Max
Land and premises Land and premises 137.6 Comparative method trade discount 5.00% 18.00%
Direct capitalization method capitalization rate 9.00% 9.45% Investment property
Land
Project 1 43.3 Comparative method trade discount 16.40% 16.40% Project 2 17.1 Comparative method trade discount 14.70% 24.70% Project 3 14.7 Comparative method trade discount 16.40% 18.00% Project 4 7.2 Comparative method trade discount 16.40% 18.00% Project 14 15.0 Comparative method trade discount 16.40% 18.00% DCF method discount rate 12.10% 18.52% Commercial property
Project 6 26.1
DCF method (completed investment property) discount rate 13.50% 14.50%
13.6 DCF method (investment property
under construction) discount rate 14.00% 14.00%
Project 7 11.8 DCF method (completed investment
property) discount rate 13.34% 13.34% average annual rental
indexation 3.89% 3.89% terminal capitalization rate 9.45% 9.45%
4.9 DCF method (investment property
under construction) discount rate 13.34% 17.00%
average annual rental
indexation 3.89% 3.89% terminal capitalization rate 9.00% 9.00%
Project 8 3.2 DCF method (completed investment
property) discount rate 13.40% 13.40%
1.7 DCF method (investment property
under construction) discount rate 13.40% 18.40% Project 9 2.1 Comparative method trade discount 12.00% 12.00%
Direct capitalization method
(completed investment property) trade discount 7.00% 7.00% vacancy rate 0.00% 7.70% capitalization rate 9.80% 9.80% Project 16 10.2 Comparative method trade discount 15.00% 15.00%
DCF method (completed investment
property) discount rate 21.74% 22.70%
Other
Other 25.3 Comparative method trade discount 5.00% 18.00% Direct capitalization method trade discount 5.00% 14.30% vacancy rate 7.70% 19.80% capitalization rate 11.00% 12.70%

VTB BANK NOTES TO THE CONSOLIDATED FINANCIAL STATEMENTS 31 DECEMBER 2020 (CONTINUED)
98
42. FAIR VALUE MEASUREMENT (CONTINUED) Impact on fair value of Level 3 non-financial assets of changes to key assumptions (continued) The following table summarises the sensitivity of the fair value measurement categorised within Level 3 of the fair value hierarchy to changes in unobservable inputs as at 31 December 2020: Input Description of input Description of sensitivity
Trade discount (difference between supply and demand)
The leading realtors were interviewed, and the resulted adjustment for offer was found to be between 3.89% and 26.0%.
Depending on change in the demand on the investment objects, the corrective adjustment for offer may vary from 3.0% up to 30.0%.The change of this input might lead to a substantial change in the fair value of the investment property of the Group.
Discount rate Discounting rate-interest rate used to discounting future cash payments received or payed. The discounting rate reflects the relationship between risk and rate of return and various types of risks associated with the investment property. The discounting rate is between 12.02% and 22.7%, depending on the individual characteristics of an object.
Depending on the market situation on the investment property market, the discounting rate may vary from 9% up to 25%.The change of this input might lead to a substantial change in the fair value of the investment property of the Group.
Capitalization rate The capitalization rate – ratio of the net year income, received on investment, to its market value. The capitalization rate accounts for 10.1% to 16.9%, depending on the individual characteristics of an object.
Depending on the market situation on the investment property market, capitalization rate may vary from 8.75% up to 17.0%. The change of this input might lead to a substantial change in the fair value of the investment property of the Group.
Terminal capitalization rate
The terminal capitalization rate is the rate used to estimate the resale value of a property at the end of the holding period. The terminal capitalization rate was found to be 9.0%.
Depending on the market situation on the investment property market, terminal capitalization rate may vary from 5.0% up to 15.0%. The change of this input might lead to a substantial change in the fair value of the investment property of the Group.
Average annual rental indexation
Indexation of the current annual rental rate was found to be between 3.7% and 10%, depending on the individual characteristics of an object.
Depending on the market situation on the investment property market, rental rate indexation may vary from 0.0% up to 10.0%. The change of this input might lead to a substantial change in the fair value of the investment property of the Group.
Vacancy rate The vacancy rate is the percentage of all available units in a rental property that are vacant or unoccupied at a particular time. According to the market analysis the vacancy rate was found to be between 2.78% and 27.2%.
Depending on the market situation on the investment property market, vacancy rate may vary from 0.0% up to 30.0%. The change of this input might lead to a substantial change in the fair value of the investment property of the Group.

VTB BANK NOTES TO THE CONSOLIDATED FINANCIAL STATEMENTS 31 DECEMBER 2020 (CONTINUED)
99
42. FAIR VALUE MEASUREMENT (CONTINUED) Impact on fair value of Level 3 non-financial assets of changes to key assumptions (continued)
The following table summarises the sensitivity of the fair value measurement categorised within Level 3 of the fair value hierarchy to changes in unobservable inputs as at 31 December 2019:
Input Description of input Description of sensitivity
Trade discount (difference between supply and demand)
The leading realtors were interviewed, and the resulted adjustment for offer was found to be between 5.0% and 29.0%.
Depending on change in the demand on the investment objects, the corrective adjustment for offer may vary from 3.0% up to 30.0%.The change of this input might lead to a substantial change in the fair value of the investment property of the Group.
Discount rate Discounting rate-interest rate used to discounting future cash payments received or payed. The discounting rate reflects the relationship between risk and rate of return and various types of risks associated with the investment property. The discounting rate is between 12.1% and 22.7%, depending on the individual characteristics of an object.
Depending on the market situation on the investment property market, the discounting rate may vary from 9.0% up to 25.0%.The change of this input might lead to a substantial change in the fair value of the investment property of the Group.
Capitalization rate The capitalization rate – ratio of the net year income, received on investment, to its market value. The capitalization rate accounts for 9.8% to 12.7%, depending on the individual characteristics of an object.
Depending on the market situation on the investment property market, capitalization rate may vary from 8.75% up to 13.0%. The change of this input might lead to a substantial change in the fair value of the investment property of the Group.
Terminal capitalization rate
The terminal capitalization rate is the rate used to estimate the resale value of a property at the end of the holding period. The terminal capitalization rate accounts for 9.0% to 10.5%, depending on the individual characteristics of an object.
Depending on the market situation on the investment property market, terminal capitalization rate may vary from 5.0% up to 15.0%. The change of this input might lead to a substantial change in the fair value of the investment property of the Group.
Average annual rental indexation
Indexation of the current annual rental rate was found to be 3.89%.
Depending on the market situation on the investment property market, rental rate indexation may vary from 0.0% up to 10.0%. The change of this input might lead to a substantial change in the fair value of the investment property of the Group.
Vacancy rate The vacancy rate is the percentage of all available units in a rental property that are vacant or unoccupied at a particular time. According to the market analysis the vacancy rate was found to be between 0.0% and 19.8%.
Depending on the market situation on the investment property market, vacancy rate may vary from 0.0% up to 20.0%. The change of this input might lead to a substantial change in the fair value of the investment property of the Group.
Fair value of projects was determined on the base of the highest and best use that differs from its current use. Fair value measurement for a projects intended to use for sale was determined using the certain exposure periods needed for market absorption:
Within the revaluation performed as of 31 October 2020 for fair value measurement of the Project 1 the Group assumed the required project implementation period within 10 years, during which it is planned to complete the sale of land plots on the open market.
Within the revaluation performed as of 31 October 2020 for fair value measurement of the Project 2 the Group revised duration of period needed to complete market sales of land plots related to the project.
The Group had agricultural land plots under Project 3 that it currently intends to use as land plots for sale and agricultural production under a special economic zone project. Within the revaluation performed as of 1 December 2020 for fair value measurement of the Project 3 the Group revised duration of period needed to complete market sales of land plots related to the project.
Also the Group revised the best use of certain land plots within Project 3 as agricultural (31 December 2019: industrial use and individual residential property).
The Group had land plots under Project 4 that it currently intends to use as land plots for sale. Within the revaluation performed as of 31 December 2020 for fair value measurement of the Project 4 the Group assumed the required project implementation period within 36 years for agricultural land plots and 24 years for individual residential property land plots, during which it is planned to complete the sale of land plots on the open market.
The Group had land plots under Project 14 that it currently intends to use as land plots for sale. Within the revaluation performed as of 31 December 2020 for fair value measurement of the Project 14 the Group assumed the required project implementation period within 36 years for agricultural land plots and 24 years for individual residential property land plots, during which it is planned to complete the sale of land plots on the open market.

VTB BANK NOTES TO THE CONSOLIDATED FINANCIAL STATEMENTS 31 DECEMBER 2020 (CONTINUED)
100
42. FAIR VALUE MEASUREMENT (CONTINUED) Methods and assumptions for Level 2 financial instruments The fair value of trading financial assets, investment financial assets measured at fair value or designated at fair value through profit or loss and derivative financial instruments valued according to Level 2 models was estimated based on DCF (projected cash flows) method using the assumption of future coupon payment, recent transactions prices and the quotes of non-active markets if based on the Group’s analysis such quotes represent the best estimate of the fair value of the financial instrument as at the reporting date. Probability models were calibrated using market indicators (currency forward, ITRAX Index). Valuation methods for level 3 fair value measurements
In order to value Level 3 equity investments, the Group utilizes comparable trading multiples. Management (if deemed necessary based on external valuators’ reports) determines comparable public companies (peers) based on industry, size, developmental stage and strategy. Management then calculates a trading multiple for each comparable company identified. The multiple is calculated by dividing the enterprise value of the comparable company by its earnings before interest, taxes, depreciation and amortization (EBITDA). The trading multiple is then discounted for considerations such as illiquidity and differences between the comparable companies based on company-specific facts and circumstances. Internal valuation of the fair value of joint ventures and associates designated as at fair value is performed at the time of commencing the project. Internal valuations of the fair value are performed on the quarterly basis, which are reviewed by business owners of the portfolio on at least a quarterly basis to make decisions on the best timing to exit the investment according to the investment strategy. The Level 3 debt instruments are valued at the net present value of estimated future cash flows. The Group also considers liquidity, credit and market risk factors, and adjusts the valuation model as deemed necessary. Non-financial assets and liabilities measured at fair value Investment property. Investment property is measured at fair value reflecting market conditions at the end of the reporting period (valuation date). The valuation was carried out by independent appraisers or management. Sales comparison, discounted cash flow methods or their combination was used for the revaluation. The following non-observable assumptions (Level 3) were applied in determining of the fair value of the investments properties: discount rates, terminal capitalization rates, price dynamics, vacancy allowance rate, discounts for asking prices, adjustments reflecting comparables and subjects differences in location, area (volume), class and other conditions.
Land and premises. Land and premises of the Group are subject to revaluation on a regular basis. The frequency of revaluation depends upon the change in the fair values. When the fair value of a revalued asset differs materially from its carrying amount further revaluation is performed. The basis used for valuation was market approach (sales comparison method). The following non-observable assumptions (Level 3) were applied in determining the fair value of land and premises: adjustments reflecting comparables and subjects differences in location, area (volume), class and other conditions. Assets and liabilities of disposal group held for sale. Held for sale disposal groups as a whole are measured at the lower of their carrying amount and fair value less costs to sell. Reclassified financial instruments, deferred taxes and investment properties held at fair value shall be remeasured in accordance with applicable IFRSs before the fair value less cost to sell of the disposal group is remeasured. Precious metals. Precious metals are measured at fair value using reference prices for refined precious metals. Reference prices are calculated based on London fixing prices translated into RUR using the closing rate of exchange USD to Russian roubles at the reporting date. Exchange-tradable commodities. Commodities are
measured at fair value using international market prices. Reference prices are calculated based on commodity prices translated into RUR using the closing rate of exchange USD to Russian roubles at the reporting date. Fair value of financial assets and liabilities not carried at fair value
Set out below is a comparison by class of the carrying amounts and fair values of the Group’s financial instruments that are not carried at fair value in the consolidated statement of financial position. The table does not include the fair values of non-financial assets and non-financial liabilities. The following describes the methodologies and assumptions used to determine fair values for those financial instruments which are not already recorded at fair value in the financial statements.
Assets for which fair value approximates carrying value. For financial assets and financial liabilities that are liquid or having a short term maturity it is assumed that the carrying amounts approximate to their fair value. This assumption is also applied to customer current/settlement deposits without a specific maturity.
Fixed and variable rate financial instruments. For quoted debt instruments the fair values are determined based on quoted market prices. The fair values of unquoted debt instruments are estimated by discounting future cash flows using rates currently available for debt on similar terms, credit risk and remaining maturities.
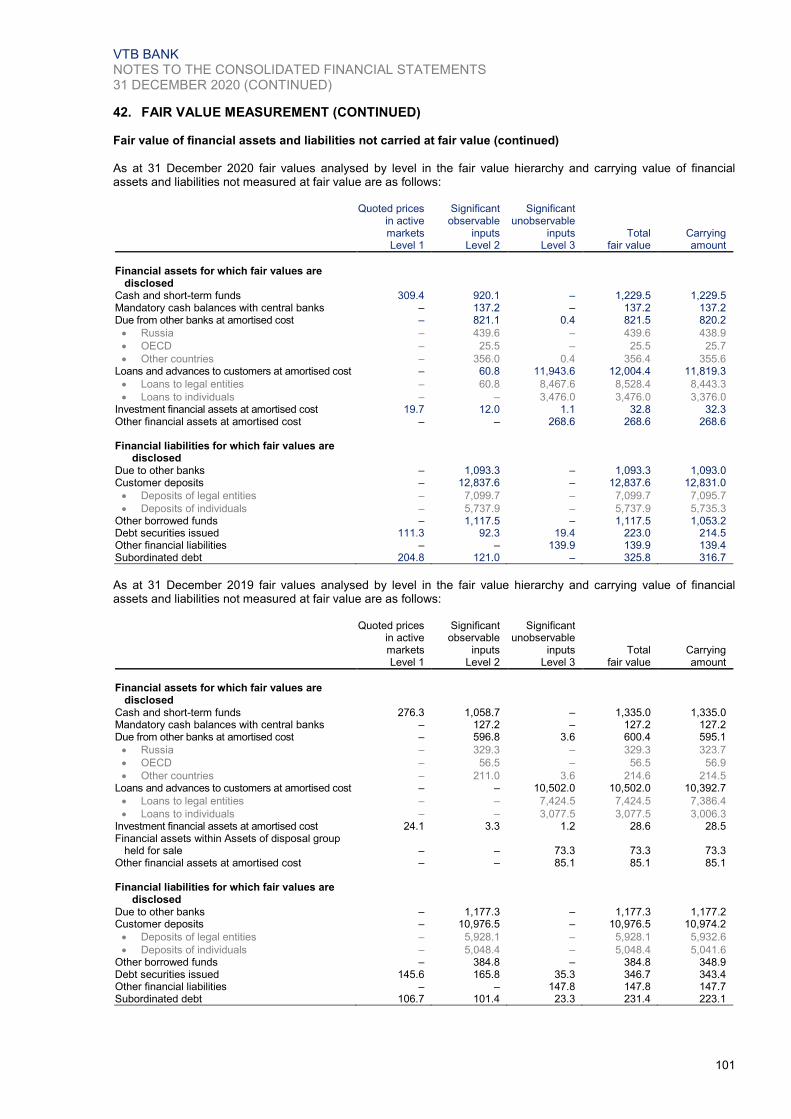
VTB BANK NOTES TO THE CONSOLIDATED FINANCIAL STATEMENTS 31 DECEMBER 2020 (CONTINUED)
101
42. FAIR VALUE MEASUREMENT (CONTINUED) Fair value of financial assets and liabilities not carried at fair value (continued)
As at 31 December 2020 fair values analysed by level in the fair value hierarchy and carrying value of financial assets and liabilities not measured at fair value are as follows:
Quoted prices in active markets
Significant observable
inputs
Significant unobservable
inputs Total fair value
Carrying amount Level 1 Level 2 Level 3
Financial assets for which fair values are
disclosed Cash and short-term funds 309.4 920.1 – 1,229.5 1,229.5 Mandatory cash balances with central banks – 137.2 – 137.2 137.2 Due from other banks at amortised cost – 821.1 0.4 821.5 820.2
Russia – 439.6 – 439.6 438.9
OECD – 25.5 – 25.5 25.7
Other countries – 356.0 0.4 356.4 355.6 Loans and advances to customers at amortised cost – 60.8 11,943.6 12,004.4 11,819.3
Loans to legal entities – 60.8 8,467.6 8,528.4 8,443.3
Loans to individuals – – 3,476.0 3,476.0 3,376.0 Investment financial assets at amortised cost 19.7 12.0 1.1 32.8 32.3 Other financial assets at amortised cost – – 268.6 268.6 268.6 Financial liabilities for which fair values are
disclosed Due to other banks – 1,093.3 – 1,093.3 1,093.0 Customer deposits – 12,837.6 – 12,837.6 12,831.0
Deposits of legal entities – 7,099.7 – 7,099.7 7,095.7
Deposits of individuals – 5,737.9 – 5,737.9 5,735.3 Other borrowed funds – 1,117.5 – 1,117.5 1,053.2 Debt securities issued 111.3 92.3 19.4 223.0 214.5 Other financial liabilities – – 139.9 139.9 139.4 Subordinated debt 204.8 121.0 – 325.8 316.7
As at 31 December 2019 fair values analysed by level in the fair value hierarchy and carrying value of financial assets and liabilities not measured at fair value are as follows:
Quoted prices in active markets
Significant observable
inputs
Significant unobservable
inputs Total fair value
Carrying amount Level 1 Level 2 Level 3
Financial assets for which fair values are
disclosed Cash and short-term funds 276.3 1,058.7 – 1,335.0 1,335.0 Mandatory cash balances with central banks – 127.2 – 127.2 127.2 Due from other banks at amortised cost – 596.8 3.6 600.4 595.1
Russia – 329.3 – 329.3 323.7
OECD – 56.5 – 56.5 56.9
Other countries – 211.0 3.6 214.6 214.5 Loans and advances to customers at amortised cost – – 10,502.0 10,502.0 10,392.7
Loans to legal entities – – 7,424.5 7,424.5 7,386.4
Loans to individuals – – 3,077.5 3,077.5 3,006.3 Investment financial assets at amortised cost 24.1 3.3 1.2 28.6 28.5 Financial assets within Assets of disposal group
held for sale – – 73.3 73.3 73.3 Other financial assets at amortised cost – – 85.1 85.1 85.1 Financial liabilities for which fair values are
disclosed Due to other banks – 1,177.3 – 1,177.3 1,177.2 Customer deposits – 10,976.5 – 10,976.5 10,974.2
Deposits of legal entities – 5,928.1 – 5,928.1 5,932.6
Deposits of individuals – 5,048.4 – 5,048.4 5,041.6 Other borrowed funds – 384.8 – 384.8 348.9 Debt securities issued 145.6 165.8 35.3 346.7 343.4 Other financial liabilities – – 147.8 147.8 147.7 Subordinated debt 106.7 101.4 23.3 231.4 223.1

VTB BANK NOTES TO THE CONSOLIDATED FINANCIAL STATEMENTS 31 DECEMBER 2020 (CONTINUED)
102
43. CAPITAL MANAGEMENT AND CAPITAL ADEQUACY Capital adequacy is of a critical importance to the Group. The Group’s intention is to have a strong capital base in order to maintain investor, creditor and market confidence and to sustain future development of its business. The Group applies CBR requirements to manage its capital base. The Group is subject to consolidated regulatory capital requirements which are calculated in accordance with the regulations of the CBR. CBR has designated the Bank as a systemically important bank (SIB). Accordingly, the capital requirements calculated in accordance with the CBR rules include the risk-based capital buffers and SIB surcharge.
The risk-based capital buffers, applicable to the Group, include capital conservation buffer of 2.5% and the countercyclical capital buffer, which the CBR has set to 0%. In addition, the SIB surcharge applicable to the Group as of 31 December 2020 is 1.0%. The risk-based capital buffers and SIB surcharge in the future may differ due to additional guidance from the CBR. The Group controls its capital adequacy ratios, determined in accordance with the CBR requirements by following categories of capital: common equity adequacy ratio of the Group (N 20.1); core capital adequacy ratio of the Group (N 20.2) and total capital adequacy ratio of the Group (N 20.0).
2020 2019
Common capital 1,585.3 1,552.9
Additional capital 310.6 276.1
Total capital 1,895.9 1,829.0
Risk-weighted assets after consolidation adjustments for N 20.1 16,041.5 16,278.1 Risk-weighted assets after consolidation adjustments for N 20.2 16,028.6 16,268.4 Risk-weighted assets after consolidation adjustments for N 20.0 16,007.3 16,259.3
Common equity adequacy ratio of the Group (N 20.1) 8.9% 8.7%
Core capital adequacy ratio of the Group (N 20.2) 9.9% 9.5% Total capital adequacy ratio of the Group (N 20.0) 11.8% 11.2%
As at 31 December 2020 the Bank was in compliance with the CBR requirements to maintain minimum capital adequacy ratios of the Bank as a percentage of risk-weighted assets, determined in accordance with CBR’s requirements by the following categories of capital: common equity adequacy ratio (N 1.1); core capital adequacy ratio (N 1.2) and total capital adequacy ratio (N 1.0). 2020 2019
Core equity adequacy ratio (N 1.1) 8.8% 8.9% Common capital adequacy ratio (N 1.2) 9.9% 9.7% Total capital adequacy ratio (N 1.0) 11.5% 11.2%
In 2020, in the context of the COVID-19 pandemic and a sharp drop in oil prices, the Bank of Russia has decided to implement a package of measures to help the financial sector maintain its capability to provide resources to the economy of RF, in particular:
1) credit institutions, which apply Bank of Russia regulations to their accounting procedures, are entitled to recognise equity and debt securities, acquired before 1 March 2020, at fair value in the accounting records; and to recognise debt securities, acquired from 1 March 2020 through 30 September 2020, at fair value as of the acquisition date. These measures will be effective until 1 January 2021;
2) credit institutions can use the opportunity to sustain the quality of debt servicing and to make a decision confirming a non-deteriorated assessment of a financial position of certain borrowers;
3) the Lombard List of Bank of Russia has expanded to include a number of mortgage bonds which are of appropriate credit quality and meet other statutory requirements;
4) easier conditions are offered for providing irrevocable credit lines in accordance with the liquidity coverage ratio N 26 (N 27) until 1 April 2021. The limit for irrevocable credit line will be calculated in line with the new procedure, offering more opportunities for systemically important credit institutions to manage their liquidity amid elevated volatility;
5) the Bank of Russia allows credit institutions to include operations in six foreign currencies (US dollar, euro, Pound sterling, Swiss franc, Japanese yen, and Chinese yuan) into their required ratios calculations (excluding calculations of the values (limits) of open currency positions) at the official exchange rate of the respective currency, set by the Bank of Russia as of 1 March 2020 for the period from 1 March 2020 through 30 September 2020 inclusive;
6) the national countercyclical capital buffer is retained at 0%.
As at 31 December 2020 the Bank did not use opportunities provided by the CBR except of point 2. Other members of the Group, including those located in other countries, comply with the applicable regulatory capital requirements of the CBR, local central banks or other supervisory authorities.

VTB BANK NOTES TO THE CONSOLIDATED FINANCIAL STATEMENTS 31 DECEMBER 2020 (CONTINUED)
103
GROUP STRUCTURE
44. COMPOSITION OF THE GROUP ............................................................................................................... 104
45. CHANGES IN GROUP STRUCTURE ......................................................................................................... 105
46. INVESTMENTS IN ASSOCIATES AND JOINT VENTURES ...................................................................... 106
47. NON-CONTROLLING INTERESTS ........................................................................................................... 109
48. INTERESTS IN STRUCTURED ENTITIES ................................................................................................. 110

VTB BANK NOTES TO THE CONSOLIDATED FINANCIAL STATEMENTS 31 DECEMBER 2020 (CONTINUED)
104
44. COMPOSITION OF THE GROUP VTB bank is the direct or indirect holding company for the Group’s subsidiaries. The principal subsidiaries included in these consolidated financial statements are presented in the table below:
Name Activity Country of registration
Percentage of ownership
2020 2019
Subsidiaries: “BM-Bank”, JSC Banking Russia 100.00% 100.00% “Vozrozhdenie Bank“, PJSC Banking Russia 100.00% 100.00% “Sarovbusinessbank”, PJSC Banking Russia 84.36% 84.36% “Zapsibcombank”, PJSC Banking Russia 100.00% 100.00% “VTB Bank (Europe)” SE Banking Germany 99.39% 99.39% “VTB Bank (Armenia)”, CJSC Banking Armenia 100.00% 100.00% “VTB Bank (Belarus)”, CJSC Banking Belarus 100.00% 100.00% “Bank VTB (Kazakhstan)”, JSC Banking Kazakhstan 100.00% 100.00% “VTB Bank (Georgia)”, JSC Banking Georgia 97.38% 97.38% “VTB Capital”, Plc Banking UK 96.39% 96.39% “VTB Bank (Azerbaijan)”, OJSC Banking Azerbaijan 100.00% 100.00% “VTB-Capital”, JSC Finance Russia 100.00% 100.00% “Holding VTB Capital”, CJSC Finance Russia 100.00% 100.00% Non-state pension fund “VTB Pension Fund”, JSC Finance Russia 100.00% 100.00% “VTB Factoring”, Ltd Factoring Russia 100.00% 100.00% “VTB-Leasing”, JSC Leasing Russia 100.00% 100.00% “Hals-Development”, OJSC Real Estate Russia 99.76% 99.76% “Upravlyayuschaya kompaniya Dynamo”, CJSC
(Note 47) Real Estate Russia 92.30% 75.00%
Further information about disposal of subsidiaries for the year ended 31 December 2020 is presented in Note 45. Restrictions to access or use the Group’s assets Statutory, contractual or regulatory requirements, corporate laws, as well as protective rights of non-controlling interests might restrict the ability of the Group to access and transfer assets freely to or from entities within the Group and to settle liabilities of the Group. At 31 December 2020 and 31 December 2019, the Group had no material non-controlling interests whose protective rights significantly restricted the Group’s ability to access or use the assets and settle the liabilities of the Group (Note 47). Other types of restrictions included the following:
The Group has pledged assets to collateralize its obligations under repurchase agreements, securities financing transactions, collateralized loan obligations and for margining purposes for over-the-counter derivative liabilities (Notes 20, 21, 22, 23, 42, 55);
The Group has financial assets, including loans and advances to customers and investment financial assets in the aggregate amount of RUR 242.6 billion (31 December 2019: RUR 288.4 billion), that cannot be disposed of without prior approval of the government authority. The amount includes
RUR 184.4 billion worth of OFZ AD purchased in September 2011 by former “Bank of Moscow”, OJSC (Note 22, 31) that cannot be sold more than RUR 2.0 billion a day without approval of the Ministry of Finance of the Russian Federation and the amount includes RUR 58.2 billion worth of OFZ that cannot be sold more than RUR 1.0 billion a day without approval of the Ministry of Finance of the Russian Federation (31 December 2019: RUR 213.6 billion of OFZ-AD and RUR 74.8 billion of OFZ).
The assets of consolidated structured entities, such as securitizations, are held for the benefit of the parties that have bought the notes issued by these entities (Note 48).
Assets held by pension funds subsidiaries are primarily held to satisfy the obligations to the subsidiaries’ policy holders (Note 34).
Banking regulations and regulations applicable to non-state pension funds, including solvency and liquidity requirements, may restrict the Group’s ability to transfer assets to or from its regulated subsidiaries in certain jurisdictions, as well as the ability of such subsidiaries to transfer funds to the Group in the form of cash dividends or to repay intergroup loans and advances.

VTB BANK NOTES TO THE CONSOLIDATED FINANCIAL STATEMENTS 31 DECEMBER 2020 (CONTINUED)
105
45. CHANGES IN GROUP STRUCTURE Disposal of subsidiaries
In April 2020, the Group entered into an agreement to attract strategic investors in Demetra Holding LLC which was a Group subsidiary controlling Novorossiysk Grain Terminal LLC, MiroGroup Resources LLC, as well as holding stakes in the following associates and joint ventures of the Group: Novorossiysk Grain Plant PJSC, United Grain Company JSC, Rustranscom plc and Taman Grain Terminal Holdings Limited, as of 31 March 2020. Following the introduction of new investors, the Group’s share in Demetra Holding LLC decreased to 50.001%. The Group and the new investors exercise joint control over Demetra Holding LLC in accordance with the new shareholder agreement which requires unanimous approval of all shareholders for all key decisions in relation to significant activities.
The Group lost control over Demetra Holding LLC and its subsidiaries, except for QSR Holdings LLC, which is a shareholder of Rustranscom plc. The Group continues to control QSR Holdings LLC due to the Group’s ability to appoint and direct the decisions of the management of QSR Holdings LLC, based on the corporate governance structure agreed between the Group and the new investors. The Group derecognized net assets of Demetra Holding LLC and its subsidiaries (except for QSR Holdings LLC) and recognized gain on disposal of RUR 2.9 billion. The Group accounts for the remaining 50.001% stake in Demetra Holding LLC as an investment in joint venture designated at fair value through profit and loss, which fair value was equal to RUR 5.1 billion as at transaction date.
The assets and liabilities disposed as of the date of disposal were as follows:
Assets Cash and short-term funds 0.4 Due from other banks 5.0 Loans and advances to customers 32.9 Investments in associate and joint ventures 22.4 Land, premises and equipment 1.8 Goodwill and other intangible assets 37.0 Deferred tax asset 0.8 Other assets 9.4 Total assets 109.7 Liabilities Due to other banks 89.7 Customer deposits 12.4 Deferred tax liability 2.8 Other liabilities 3.2 Total liabilities 108.1
Non-controlling interest 0.6 Fair value of investment in joint venture 5.1 Gains arising from disposal 2.9
Business combinations
In October 2020, the Group obtained control over MPZhB-18, LLC as a result of debt settlement. The fair value of assets and liabilities obtained were as follows:
Assets Cash and short-term funds 0.3 Land, premises and equipment 0.9 Investment property 3.6 Other assets 0.3 Total assets 5.1 Liabilities Other liabilities 0.2 Total liabilities 0.2 Pre-existing relationship (5.1) Goodwill arising from the acquisition 0.2

VTB BANK NOTES TO THE CONSOLIDATED FINANCIAL STATEMENTS 31 DECEMBER 2020 (CONTINUED)
106
46. INVESTMENTS IN ASSOCIATES AND JOINT VENTURES 2020 2019
Investments accounted for under equity method
Investments in associates 182.8 188.8
Investments in joint ventures 88.6 33.7
Investments designated as at fair value through profit or loss
Investments in joint ventures 36.4 28.6
Investments in associates 19.1 13.8 Total investments in associates and joint ventures 326.9 264.9
The Group’s interests in its principal associates and joint ventures accounted for under equity method were as follows: Principal place of
business / Country of registration
2020 2019
Activity Carrying amount
Ownership percentage
Carrying amount
Ownership percentage
Investments in associates Magnit, PJSC Russia Retail trade 69.8 17.28% 78.4 17.28% Sogaz, JSC Russia Insurance 66.7 10.00% 62.7 10.00% Rostelecom, PJSC Russia Telecommunication 25.5 7.93% ‒ ‒ RCB Bank Ltd. Cyprus Banking 19.4 46.29% 16.9 46.29% “United Electronic Market
Place”, OJSC Russia Information
technologies 0.9 48.18% 0.8 48.18% "Gelendzhik seaport", LLC Russia Construction 0.4 20.00% 0.4 20.00% Highway Operator North-West,
LLC Russia Construction 0.1 49.90% – 49.90% “Group Technoserv”, LLC Russia Information
technologies – 40.00% ‒ 40.00% “T1”, LLC Russia Information
technologies – 30.50% ‒ ‒ “Moscovsky Metrostroy”, JSC Russia Construction – 49.00% 13.3 49.00% “United Grain Company”, JSC Russia Operations on grain
market – – 10.6 50.00% less
1 share “Novorossiysk Grain Plant”,
PJSC Russia Transhipment and
resale of grain – – 5.7 35.36% Total investments in associates accounted for under equity method 182.8 188.8 Investments in joint ventures “Post Bank”, PJSC Russia Banking 30.8 50.00% less
1 share 23.4 50.00% less
1 share “Telecom Investment”, JSC Russia Telecommunication 28.0 43.91% ‒ ‒ Invintel B.V. Netherlands Telecommunication 13.2 25.00% ‒ ‒ “National Logistics
Technologies”, JSC Russia Other services 5.9 49.99% 4.7 49.99% “Vietnam-Russia Joint Venture
Bank” Vietnam Banking 5.1 50.00% 4.2 50.00% “Igora Drive” LLC Russia Other services 2.8 15.00% ‒ ‒ “Gelendzhik Airport”, LLC Russia Transport 2.1 49.50% 0.7 49.50% UNICOM24 Russia Information
technology 0.5 27.04% 0.4 27.04% “Domyland”, LLC Russia Property
management services 0.2 72.28% 0.2 72.28%
“VTB Capital I2BF JVC (Cayman)”, Ltd
Russia and Kazakhstan /
Cayman Islands Finance – – 0.1 50.00% Total investments in joint ventures accounted for under equity
method 88.6 33.7
Although the Group’s shares in “Magnit”, PJSC and in SK Sogaz are below 20%, the Group exercises significant influence over “Magnit”, PJSC and SK Sogaz due to its ability to appoint a member of the board of directors and participate in board decision making process.
In March 2020, the Group has closed the deal to sell 55% share in T2 RTK Holding LLC owned by T2 (Netherlands) B.V. to PJSC Rostelecom.
T2 (Netherlands) B.V. is a joint venture of the Group and the consortium of investors. On the transaction date the Group owned 50% in T2 (Netherlands) B.V. Also the Group held 25% share in Invintel B.V. which was obtained in February 2020. Invintel B.V. owned 40% in T2 (Netherlands) B.V.
The consideration for the transaction received by the subsidiary of T2 (Netherlands) B.V. consisted of 7.84% of PSJC Rostelecom ordinary shares and RUR 108.0 billion. Simultaneously the Bank acquired 21.57% of PJSC Rostelecom ordinary shares issued through additional offering for consideration of RUR 66.0 billion.
Subsequently the ordinary shares of PJSC Rostelecom received by the subsidiary of T2 (Netherlands) B.V. and the portion of the ordinary shares acquired by the Bank through additional offering was transferred by means of sale to JSC Telecom Investment which is a joint venture of the Group and the consortium of investors.

VTB BANK NOTES TO THE CONSOLIDATED FINANCIAL STATEMENTS 31 DECEMBER 2020 (CONTINUED)
107
46. INVESTMENTS IN ASSOCIATES AND JOINT VENTURES (CONTINUED)
As a result of the abovementioned deals the Group obtained:
8.44% of PJSC Rostelecom ordinary shares (certain Group rights for handling and disposal of these shares are restricted during the 4-year period from the transaction date in accordance with the terms of shareholder agreement between the Group and Russian Federation);
43.91% of JSC Telecom Investment possessing 20.98% of PJSC Rostelecom ordinary shares.
As of 31 December 2020, the Group’s share in PJSC Rostelecom ordinary and preference shares amounted to 9.51% which also includes the preference and ordinary shares held in portfolio of Group’s trading desk which are accounted at fair value though profit or loss.
PJSC Rostelecom is Russia’s largest provider of digital services and solutions with presence in all market segments, and passing through millions of Russian households, governmental and private organizations.
The Group exercises significant influence over PSJC Rostelecom due participation of Groups’ representatives on the Board of directors of PSJC Rostelecom and due to other factors indicating Group’s influence on decision making process in relation to financial and operating policies of the investee.
The Group accounts for its investments in JSC Telecom Investment and PJSC Rostelecom as investment in joint venture and investment in associate under equity method. In December 2020, the Group completed its identification and measurement of various components of these investments.
In March 2020 the Group acquired 50.0% of the ordinary shares of Taman Grain Terminal Holdings Limited for consideration of EUR 61.0 million or RUR 5.3 billion.
Prior to disposal (Note 45) the Group exercised joint control over the investee and accounted for it as an investment in joint ventures under equity method.
In April 2020, the Group entered into an agreement to attract strategic investors in Demetra Holding LLC which was a Group subsidiary controlling “Novorossiysk Grain Terminal” LLC, “MiroGroup Resources” LLC, as well as holding investments in the following associates and joint ventures of the Group: “Novorossiysk Grain Plant” PJSC, “United Grain Company” JSC, Rustranscom plc and Taman Grain Terminal Holdings Limited, as of 31 March 2020. The deal turned Demetra Holding LLC into a joint venture of the Group and the investors with a Group share of 50.001%.
In July 2020 the Group acquired 15.0% shareholding in “Igora Drive” LLC for consideration of RUR 2.8 billion. The Group exercises joint control over the investee and accounted it as an investment in joint ventures under equity method.
In September 2020 the Group acquired part of additional issue of “Post Bank”, PJSC shares on pro rata basis for the amount of RUR 5.0 billion. Ownership percentage of the Group remains equal to 50.00% less 1 share.
As at 31 December 2020 the Group identified signs of impairment for the investment in “Moscovsky Metrostroy”, JSC. The Group recognised impairment loss in the amount of RUR 12.8 billion in the accompanying consolidated income statement. The recoverable value of the investment was determined based on DCF model provided by independent appraisal company.
As at 31 December 2020, an investment in an associate in the amount of RUR 1.9 billion was pledged against the funds obtained by the subsidiary of that associate (31 December 2019: RUR 5.5 billion).
For the years ended 31 December 2020 and 31 December 2019 the Group has unrecognized share of losses of associates in the amount of RUR 0.5 billion and nil, respectively.
As at 31 December 2020, accumulated unrecognized share of losses of associates amounted to of RUR 0.5 billion (31 December 2019: nil).
The Group’s interests in its principal associates and joint ventures designated as at fair value through profit or loss were as follows: Principal place of
business / Country of registration
2020 2019
Activity Carrying amount
Ownership percentage
Carrying amount
Ownership percentage
Investments in joint ventures “Rustranscom”, PLC Russia Transport 30.9 50.00% plus
1 share 28.6 50.00% plus
1 share Demetra Holding,LLC Russia Holding
company 5.5 50.001% – – Total investments in joint ventures designated as at fair value
through profit or loss 36.4 28.6 Investments in associates “Burger King Russia (Cyprus)”, Ltd Russia/Cyprus Fast food 7.8 19.98% 7.8 19.98% Rostelecom, PJSC Russia Telecommuni
cation 4.8 1.58% – –
Northern Capital Highway LLC Russia Construction 3.5 49.00% 0.3 50.00% “Thalita Trading”, Ltd Russia/Cyprus Transport 1.9 25.01% 5.4 25.01% “Regional infrastructure
company”, LLC Russia/Russia Construction 0.8 26.00% 0.3 26.00% Bashkirian concession company,
LLC Russia/Russia Construction 0.3 49.90% – 49.90% Total investments in associates designated as at fair value
through profit or loss 19.1 13.8

VTB BANK NOTES TO THE CONSOLIDATED FINANCIAL STATEMENTS 31 DECEMBER 2020 (CONTINUED)
108
46. INVESTMENTS IN ASOCIATES AND JOINT VENTURES (CONTINUED) Summarized financial information of individually material investments in associates and joint ventures accounted for under equity method and designated as at fair value through profit or loss based on its consolidated IFRS complied management data is as follows:
As at 31 December 2020 and for the year ended 31 December 2020 Total assets
Liabilities, including minority Net assets Revenue Net profit
Other comprehensive
income
Total comprehensive
income Dividends
Investments in associates
Magnit, PJSC 1,091.3 791.7 299.6 1,553.8 31.6 – 31.6 56.0
Sogaz, JSC 1,076.1 784.1 292.0 373.6 43.0 1.3 44.4 8.5
Rostelecom, PJSC * 1,128.7 852.0 276.7 491.7 15.2 0.1 15.3 16.8
RCB Bank Ltd. 444.2 402.3 41.9 15.7 0.9 7.4 8.2 2.7
Other associates 249.9 320.9 (71.0) 97.2 (15.4) – (15.4) 0.4
Investments in joint ventures
“Post Bank”, PJSC 475.0 410.8 64.2 101.1 5.5 – 5.5 –
“Telecom Investment”, JSC 64.3 – 64.3 – 2.5 – 2.5 3.0
“Rustranscom”, PLC 137.9 93.4 44.5 61.8 8.1 – 8.1 –
Other joint ventures 345.4 259.3 86.1 79.3 (2.0) – (2.0) 0.1
As at 31 December 2019 and for the year ended 31 December 2019 Total assets
Liabilities, including minority Net assets Revenue Net profit
Other comprehensive
income
Total comprehensive
income Dividends
Investments in associates
Magnit, PJSC 1,080.2 799.6 280.6 1,368.7 8.2 – 8.2 30.0
Sogaz, JSC 879.4 628.0 251.4 282.3 34.5 1.1 35.6 8.5
RCB Bank Ltd. 327.2 290.8 36.4 17.9 1.1 (4.7) (3.6) 3.9
Other associates 293.0 333.2 (40.2) 145.6 7.8 – 7.8 2.5
Investments in joint ventures
“Post Bank”, PJSC 473.6 423.8 49.8 99.5 5.7 – 5.7 2.7
“Rustranscom”, PLC 113.9 77.7 36.2 59.4 9.5 – 9.5 –
Other joint ventures 63.6 44.7 18.9 4.0 0.4 (0.1) 0.3 –
* Summarized financial information for the company “Rostelecom”, PJSC is based on its operations for the 10 month period ended December 31, 2020 and includes the fair value adjustments made at the date of acquisition.
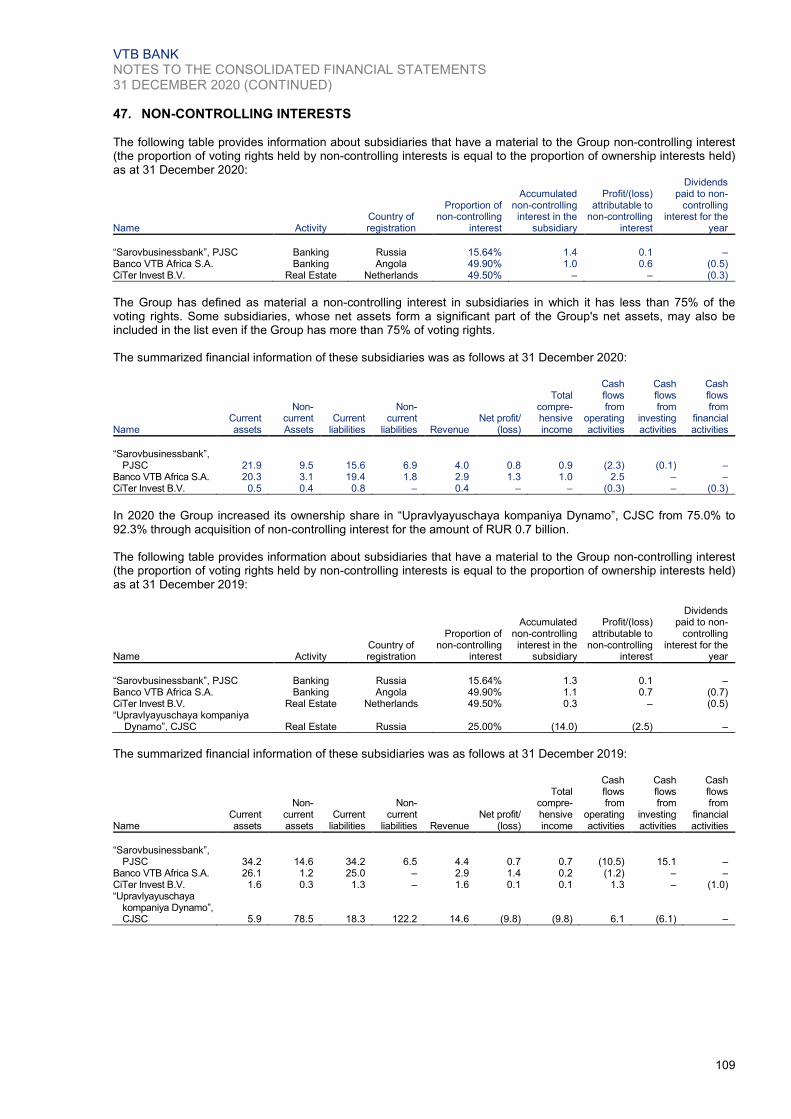
VTB BANK NOTES TO THE CONSOLIDATED FINANCIAL STATEMENTS 31 DECEMBER 2020 (CONTINUED)
109
47. NON-CONTROLLING INTERESTS The following table provides information about subsidiaries that have a material to the Group non-controlling interest (the proportion of voting rights held by non-controlling interests is equal to the proportion of ownership interests held) as at 31 December 2020:
Name Activity Country of registration
Proportion of non-controlling
interest
Accumulated non-controlling interest in the
subsidiary
Profit/(loss) attributable to
non-controlling interest
Dividends paid to non-
controlling interest for the
year
“Sarovbusinessbank”, PJSC Banking Russia 15.64% 1.4 0.1 – Banco VTB Africa S.A. Banking Angola 49.90% 1.0 0.6 (0.5) CiTer Invest B.V. Real Estate Netherlands 49.50% – – (0.3)
The Group has defined as material a non-controlling interest in subsidiaries in which it has less than 75% of the voting rights. Some subsidiaries, whose net assets form a significant part of the Group's net assets, may also be included in the list even if the Group has more than 75% of voting rights. The summarized financial information of these subsidiaries was as follows at 31 December 2020:
Name Current assets
Non-current Assets
Current liabilities
Non-current
liabilities Revenue Net profit/
(loss)
Total compre-hensive income
Cash flows from
operating activities
Cash flows from
investing activities
Cash flows from
financial activities
“Sarovbusinessbank”,
PJSC 21.9 9.5 15.6 6.9 4.0 0.8 0.9 (2.3) (0.1) – Banco VTB Africa S.A. 20.3 3.1 19.4 1.8 2.9 1.3 1.0 2.5 – – CiTer Invest B.V. 0.5 0.4 0.8 – 0.4 – – (0.3) – (0.3)
In 2020 the Group increased its ownership share in “Upravlyayuschaya kompaniya Dynamo”, CJSC from 75.0% to 92.3% through acquisition of non-controlling interest for the amount of RUR 0.7 billion. The following table provides information about subsidiaries that have a material to the Group non-controlling interest (the proportion of voting rights held by non-controlling interests is equal to the proportion of ownership interests held) as at 31 December 2019:
Name Activity Country of registration
Proportion of non-controlling
interest
Accumulated non-controlling interest in the
subsidiary
Profit/(loss) attributable to
non-controlling interest
Dividends paid to non-
controlling interest for the
year
“Sarovbusinessbank”, PJSC Banking Russia 15.64% 1.3 0.1 – Banco VTB Africa S.A. Banking Angola 49.90% 1.1 0.7 (0.7) CiTer Invest B.V. Real Estate Netherlands 49.50% 0.3 – (0.5) “Upravlyayuschaya kompaniya
Dynamo”, CJSC Real Estate Russia 25.00% (14.0) (2.5) –
The summarized financial information of these subsidiaries was as follows at 31 December 2019:
Name Current assets
Non-current assets
Current liabilities
Non-current
liabilities Revenue Net profit/
(loss)
Total compre-hensive income
Cash flows from
operating activities
Cash flows from
investing activities
Cash flows from
financial activities
“Sarovbusinessbank”,
PJSC 34.2 14.6 34.2 6.5 4.4 0.7 0.7 (10.5) 15.1 – Banco VTB Africa S.A. 26.1 1.2 25.0 – 2.9 1.4 0.2 (1.2) – – CiTer Invest B.V. 1.6 0.3 1.3 – 1.6 0.1 0.1 1.3 – (1.0) “Upravlyayuschaya
kompaniya Dynamo”, CJSC 5.9 78.5 18.3 122.2 14.6 (9.8) (9.8) 6.1 (6.1) –

VTB BANK NOTES TO THE CONSOLIDATED FINANCIAL STATEMENTS 31 DECEMBER 2020 (CONTINUED)
110
48. INTERESTS IN STRUCTURED ENTITIES The Group issues eurobonds and subordinated eurobonds through a number of consolidated structured entities incorporated in OECD countries. As at 31 December 2020 and 31 December 2019 interests in structured entities include: Name Country of registration
VTB Capital S.A Luxembourg
As at 31 December 2020 the Group guarantees all external obligations of these entities represented by the eurobonds issued in the amount of RUR 1.5 billion and by the subordinated eurobonds issued in the amount of RUR 119.1 billion (31 December 2019: eurobonds issued in the amount of RUR 52.5 billion and subordinated Eurobonds issued in the amount of RUR 98.6 billion). The Group also guarantees payments of the amounts under Perpetual Loan Participation Notes when due. (Note 36).
The Group issues mortgage-backed securities and purchases right of claims under mortgage through a consolidated structured entity performing its activity as mortgage agent. During 2020 and 2019 the Group did not provide any other financial support to the consolidated structured entities. The Group has no current obligation or intention to provide financial or other support to consolidated structured entities, or to assist the structured entities in obtaining financial support.

VTB BANK NOTES TO THE CONSOLIDATED FINANCIAL STATEMENTS 31 DECEMBER 2020 (CONTINUED)
111
OFF BALANCE-SHEET ITEMS
49. CONTINGENCIES AND COMMITMENTS .................................................................................................. 112
50. SUBSEQUENT EVENTS ............................................................................................................................ 115

VTB BANK NOTES TO THE CONSOLIDATED FINANCIAL STATEMENTS 31 DECEMBER 2020 (CONTINUED)
112
49. CONTINGENCIES AND COMMITMENTS LEGAL PROCEEDINGS
From time to time and in the normal course of business, claims against the Group are received. As at the reporting date the Group had several unresolved legal claims. Management assessed a probable outflow of resources and the respective provision has been made as at 31 December 2020 and 31 December 2019. The movements in provisions for legal claims recorded in liabilities were as follows:
2018 1.1 Provision during the period 0.7 Write-offs (0.3) 2019 1.5 Reversal of provision during the
period (0.2) Write-offs (0.8) 2020 0.5
As at 31 December 2020, the Group was involved in several legal cases related to its borrowers which are currently undergoing bankruptcy procedures. In these cases, the bankruptcy trustees’ claims against the Group aggregate RUR 1.1 billion (31 December 2019: RUR 2.2 billion). The Group intends to defend itself vigorously. Management views the risk of loss from these legal cases as possible but not probable, therefore, no provision for these legal claims is made in these consolidated financial statements TAX CONTINGENCIES
Major part of the Group’s business activity is carried out in the Russian Federation. Russian tax, currency and customs legislation as currently in effect is vaguely drafted and is subject to varying interpretations, selective and inconsistent application and changes, which can occur frequently, at short notice and may apply retrospectively. Management’s interpretation of such legislation as applied to the transactions and activities of the Group may be challenged by the relevant state authorities. The Russian transfer pricing legislation as currently in effect allows the Russian tax authorities to apply transfer pricing adjustments and impose additional profits tax and VAT liabilities in respect of all “controlled” transactions if the transaction price differs from the market level of prices unless the Group is able to demonstrate the use of market prices with respect to the “controlled” transactions supported by the appropriate transfer pricing documentation and proper reporting to the Russian tax authorities. For the years ended 31 December 2020 and 31 December 2019 the Group determined its tax liabilities arising from controlled transactions using actual transaction prices.
Apart from the Russian Federation, the Group also operates in a number of foreign jurisdictions. The Group includes companies incorporated outside of Russia that are taxed pursuant to the provisions of the tax legislation of the jurisdictions of their tax residence. Tax liabilities of
the foreign companies of the Group are determined on the basis that non-Russian companies of the Group do not qualify as Russian tax residents, do not have a permanent establishment in Russia and hence are not subject to Russian profits tax except for Russian tax withheld at source (i.e. dividend, interest, certain capital gains, etc.). Effective 1 January 2015 the concepts of “tax residency” for foreign legal entities, “beneficial owner of income” and rules for taxation of undistributed profit of controlled foreign companies in Russia were introduced into the Russian tax legislation. The practice for application of these concepts is currently being developed, and the respective provisions of the Russian Tax Code undergo frequent revisions and are subject to varying interpretations by the tax authorities. Russian tax laws related to the rules for taxation of foreign companies are quite unclear. It is possible that with the evolution of these rules and changes in the approach of the Russian tax authorities and courts as to their interpretation and application, the non-taxable status of some or all of the foreign companies of the Group in Russia may be challenged, in which case the foreign companies may be taxed according to the rules similar to the rules applicable to the Russian entities. So far, since 2015, there has been a number of relevant changes and additions to the Russian Tax Code, including those that have been applied retrospectively. The introduction and frequent revision of these concepts generally leads to an increase in the administrative (including tax) burden for the Russian entities that have subsidiary and affiliated structures incorporated outside of Russia. The recent trends in law enforcement practice in taxation indicate that the tax authorities and courts are taking assertive positions in their interpretation of the tax legislation and, as a result, it is possible that transactions and activities that have not been challenged in the past may be challenged in the future. As such, taxpayers may be subject to significant additional taxes, fines and late payment interest. Generally, fiscal periods remain open and subject to review by the Russian tax authorities for a period of three calendar years immediately preceding the year in which the decision to conduct a tax review is taken (exception to the general statute of limitation for the tax audits is provided by the cooperative tax compliance regime, which some of the entities of the Group have entered into). Under certain circumstances tax reviews may cover longer periods. As at 31 December 2020 and 31 December 2019, management believes that its interpretation of the relevant legislation is appropriate and that the Group’s tax, currency and customs positions should be sustained vis-à-vis tax authorities and courts.
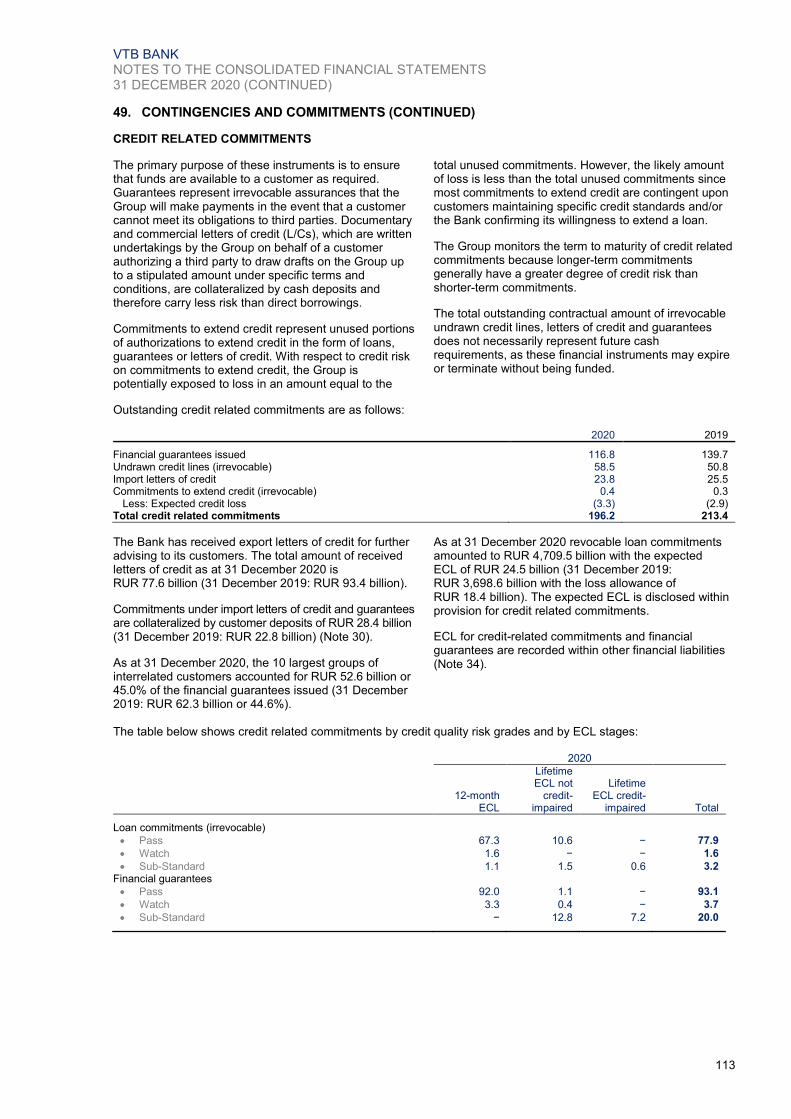
VTB BANK NOTES TO THE CONSOLIDATED FINANCIAL STATEMENTS 31 DECEMBER 2020 (CONTINUED)
113
49. CONTINGENCIES AND COMMITMENTS (CONTINUED)
CREDIT RELATED COMMITMENTS
The primary purpose of these instruments is to ensure that funds are available to a customer as required. Guarantees represent irrevocable assurances that the Group will make payments in the event that a customer cannot meet its obligations to third parties. Documentary and commercial letters of credit (L/Cs), which are written undertakings by the Group on behalf of a customer authorizing a third party to draw drafts on the Group up to a stipulated amount under specific terms and conditions, are collateralized by cash deposits and therefore carry less risk than direct borrowings.
Commitments to extend credit represent unused portions of authorizations to extend credit in the form of loans, guarantees or letters of credit. With respect to credit risk on commitments to extend credit, the Group is potentially exposed to loss in an amount equal to the
total unused commitments. However, the likely amount of loss is less than the total unused commitments since most commitments to extend credit are contingent upon customers maintaining specific credit standards and/or the Bank confirming its willingness to extend a loan.
The Group monitors the term to maturity of credit related commitments because longer-term commitments generally have a greater degree of credit risk than shorter-term commitments.
The total outstanding contractual amount of irrevocable undrawn credit lines, letters of credit and guarantees does not necessarily represent future cash requirements, as these financial instruments may expire or terminate without being funded.
Outstanding credit related commitments are as follows: 2020 2019
Financial guarantees issued 116.8 139.7 Undrawn credit lines (irrevocable) 58.5 50.8 Import letters of credit 23.8 25.5 Commitments to extend credit (irrevocable) 0.4 0.3
Less: Expected credit loss (3.3) (2.9) Total credit related commitments 196.2 213.4
The Bank has received export letters of credit for further advising to its customers. The total amount of received letters of credit as at 31 December 2020 is RUR 77.6 billion (31 December 2019: RUR 93.4 billion).
Commitments under import letters of credit and guarantees are collateralized by customer deposits of RUR 28.4 billion (31 December 2019: RUR 22.8 billion) (Note 30).
As at 31 December 2020, the 10 largest groups of interrelated customers accounted for RUR 52.6 billion or 45.0% of the financial guarantees issued (31 December 2019: RUR 62.3 billion or 44.6%).
As at 31 December 2020 revocable loan commitments amounted to RUR 4,709.5 billion with the expected ECL of RUR 24.5 billion (31 December 2019: RUR 3,698.6 billion with the loss allowance of RUR 18.4 billion). The expected ECL is disclosed within provision for credit related commitments.
ECL for credit-related commitments and financial guarantees are recorded within other financial liabilities (Note 34).
The table below shows credit related commitments by credit quality risk grades and by ECL stages:
2020
12-month
ECL
Lifetime ECL not
credit-impaired
Lifetime ECL credit-
impaired Total
Loan commitments (irrevocable)
Pass 67.3 10.6 − 77.9
Watch 1.6 − − 1.6
Sub-Standard 1.1 1.5 0.6 3.2 Financial guarantees
Pass 92.0 1.1 − 93.1
Watch 3.3 0.4 − 3.7
Sub-Standard − 12.8 7.2 20.0

VTB BANK NOTES TO THE CONSOLIDATED FINANCIAL STATEMENTS 31 DECEMBER 2020 (CONTINUED)
114
49. CONTINGENCIES AND COMMITMENTS (CONTINUED) CREDIT RELATED COMMITMENTS (CONTINUED)
2019
12-month
ECL
Lifetime ECL not
credit-impaired
Lifetime ECL credit-
impaired Total
Loan commitments (irrevocable)
Pass 64.1 10.8 − 74.9
Watch 0.6 − − 0.6
Sub-Standard 0.8 0.2 − 1.0
Doubtful − − 0.1 0.1 Financial guarantees
Pass 121.1 3.1 0.1 124.3
Watch 8.1 − − 8.1
Sub-Standard 0.6 5.9 0.8 7.3
The movements in expected credit loss for loan commitments, financial guarantees and letters of credit were as follows:
2020
12-month
ECL
Lifetime ECL not credit-
impaired
Lifetime ECL credit-
impaired
Purchased credit-
impaired Total
Financial guarantees Balance at 1 January 0.5 1.3 0.7 – 2.5 Transfer to lifetime ECL not credit-impaired (0.1) 0.1 – – – Transfer to lifetime ECL credit-impaired – (0.2) 0.2 – – Net remeasurement of expected ECL 0.1 0.3 0.1 – 0.5 Write-offs – – (0.1) – (0.1) Foreign exchange 0.1 (0.1) 0.1 – 0.1 Balance at 31 December 0.6 1.4 1.0 – 3.0
Loan commitments and letters of credit Balance at 1 January 2.9 14.8 0.7 0.4 18.8 Transfer to 12-month ECL 0.4 (0.4) – – – Transfer to lifetime ECL not credit-impaired (1.4) 1.5 (0.1) – – Transfer to lifetime ECL credit-impaired (0.3) – 0.3 – – Net remeasurement of expected ECL 7.0 (0.4) 12.3 (0.3) 18.6 Write-offs – – (12.9) – (12.9) Foreign exchange 0.3 0.1 – (0.1) 0.3 Balance at 31 December 8.9 15.6 0.3 – 24.8
2019
12-month
ECL
Lifetime ECL not credit-
impaired
Lifetime ECL credit-
impaired
Purchased credit-
impaired Total
Financial guarantees Balance at 1 January 0.3 0.2 0.8 – 1.3 Net remeasurement of expected ECL 0.3 1.1 (0.1) – 1.3 Foreign exchange (0.1) – – – (0.1) Balance at 31 December 0.5 1.3 0.7 – 2.5
Loan commitments and letters of credit Balance at 1 January 4.1 9.3 0.3 – 13.7 Transfer to 12-month ECL 0.3 (0.3) – – – Transfer to lifetime ECL not credit-impaired (1.3) 1.3 – – – Net remeasurement of expected ECL (0.2) 4.6 0.3 0.4 5.1 Foreign exchange – (0.1) 0.1 – – Balance at 31 December 2.9 14.8 0.7 0.4 18.8

VTB BANK NOTES TO THE CONSOLIDATED FINANCIAL STATEMENTS 31 DECEMBER 2020 (CONTINUED)
115
49. CONTINGENCIES AND COMMITMENTS (CONTINUED) PERFORMANCE GUARANTEES
Performance guarantees are contracts that provide compensation if another party fails to perform a contractual obligation. Performance guarantees are initially recognised at their fair value, which is normally evidenced by the amount of fees received. This amount is amortised on a straight line basis over the life of the contract. Performance guarantees do not transfer credit risk. The risk under performance guarantee contracts is the possibility that the failure to perform the contractual obligation by another party occurs. As at 31 December 2020, the Group has provided performance guarantees in the gross amount of RUR 633.2 billion (31 December 2019: RUR 672.2 billion). As at 31 December 2020, the 10 largest groups of interrelated customers accounted for RUR 192.1 billion or 30.3% of the performance guarantees issued (31 December 2019: RUR 207.0 billion or 30.8%). Provisions for performance guarantees are recorded within other non-financial liabilities (Note 34). The movements in provision for performance guarantees were as follows: 2020 2019
Balance at 1 January 9.8 10.3 Net remeasurement of loss
allowance 3.1 2.6 Write-offs (0.3) (3.0) Foreign exchange 0.2 (0.1) Balance at 31 December 12.8 9.8
As at 31 December 2020, the Group was involved in a number of legal cases with claims in the total amount of RUR 0.7 billion (31 December 2019: RUR 0.7 billion) related to issued performance guarantees. The Group contests the validity or amount of the claims made by the beneficiaries and has created the provision in the amount of RUR 0.7 billion (31 December 2019: RUR 0.7 billion), which is the Group’s best estimate of the loss under these guarantees. In addition to the legal claims mentioned above, as at 31 December 2020, the Group was involved in legal cases related debt collection under provided bank guarantees. Aggregated amount of claims against the Group is RUR 4.2 billion (31 December 2019: RUR 4.2 billion). Management views the risk of loss from
these legal cases as possible but not probable, therefore, no provision for these legal claims is made in these consolidated financial statements. PURCHASE COMMITMENTS
As at 31 December 2020 the Group had RUR 159.3 billion of outstanding commitments for the purchase of precious metals (31 December 2019: RUR 96.7 billion). As the price of these contracts is linked to the fair value of precious metals at the date of delivery, no gain or loss is recognised on these contracts. COMMITMENTS UNDER CONSTRUCTION CONTRACTS
The Group has entered into agreements with third parties for construction of investment property objects or properties intended for sale, which will require future capital outlays. The Group’s future minimum capital expenditures and respective expected periods of expenditures related to investment property or property intended for sale in the ordinary course of business under construction in progress or development: 2020
Expected period of expenditure Investment
property
Property intended for
sale in the ordinary
course of business
Within 1 year 0.1 0.2 From 1 to 5 years – 0.3 Total future minimum capital
expenditures 0.1 0.5
2019
Expected period of expenditure Investment
property
Property intended for
sale in the ordinary
course of business
Within 1 year 1.2 5.8 From 1 to 5 years – 6.3 Total future minimum capital
expenditures 1.2 12.1
50. SUBSEQUENT EVENTS In December 2020, the Group entered into investment agreement for participation in Safedata, LLC which is a subsidiary of Rostelecom, PJSC. The transaction was completed in January 2021. The Group made contribution of RUB 35.0 billion into the share capital of Safedata, LLC and obtained 44.77% stake. Starting from the transaction completion date the Group exercises significant influence over the Safedata, LLC and accounts it as an investment in associate designated at fair value through profit or loss.
In January and February 2021 VTB repaid upon maturity local bonds in the amount of RUR 29.8 billion. In February 2021 VTB issued perpetual subordinated bonds in the amount of USD 286.7 million (RUR 21.2 billion) and EUR 130.5 million (RUR 11.7 billion), respectively.

VTB BANK NOTES TO THE CONSOLIDATED FINANCIAL STATEMENTS 31 DECEMBER 2020 (CONTINUED)
116
OTHER INFORMATION
51. RELATED PARTY TRANSACTIONS .......................................................................................................... 117
52. OFFSETTING OF FINANCIAL INSTRUMENTS ......................................................................................... 119
53. SHARE-BASED PAYMENTS ...................................................................................................................... 120
54. BASIC AND DILUTED EARNINGS PER SHARE ........................................................................................ 121
55. TRANSFERS OF FINANCIAL ASSETS AND ASSETS HELD OR PLEDGED AS COLLATERAL.............. 121
56. SUMMARY OF PRINCIPAL ACCOUNTING POLICIES .............................................................................. 123
57. ADOPTION OF NEW OR REVISED STANDARDS AND INTERPRETATIONS ......................................... 138
58. NEW ACCOUNTING PRONOUNCEMENTS .............................................................................................. 139
59. CHANGES IN PRESENTATION AND CORRECTION ................................................................................ 139

VTB BANK NOTES TO THE CONSOLIDATED FINANCIAL STATEMENTS 31 DECEMBER 2020 (CONTINUED)
117
51. RELATED PARTY TRANSACTIONS Parties are considered to be related if one party has the ability to control the other party or exercise significant influence over the other party in making financial or operational decisions as defined by IAS 24, Related Party Disclosures. In considering each possible related
party relationship, attention is directed to the substance of the relationship, not merely the legal form. A government-related entity is an entity that is controlled, jointly controlled or significantly influenced by a government.
Transactions and balances with related parties comprise transactions and balances with Russian government-related entities and associates and joint ventures and are stated in the tables below (summarized financial information of material investments in associates and joint ventures is provided in Note 46):
Statement of financial position 2020 2019
Government-related entities Associates
Joint ventures
Government-related entities Associates
Joint ventures
Assets Cash and short-term funds 594.8 0.4 − 577.2 0.1 0.1 Mandatory cash balances with
central banks 125.9 − − 113.3 − − Trading financial assets 448.1 16.4 − 303.0 3.3 − Derivative financial assets 52.1 0.7 0.5 40.0 0.1 0.2 Due from other banks 392.0 134.0 15.7 274.1 105.6 13.5
Less: expected credit loss − − − (0.1) − − Loans and advances to customers 2,087.0 220.8 175.8 1,975.8 214.7 141.0
Less: expected credit loss (25.9) (16.3) (3.4) (27.0) (17.0) (1.1) Investment financial assets 831.3 − 11.7 240.8 − 9.4 Other assets 15.4 5.2 0.5 0.7 − 0.6 Liabilities Due to other banks 539.4 135.0 9.0 645.9 105.9 5.5 Customer deposits 3,075.4 95.2 94.1 2,557.0 95.1 24.2 Derivatives financial liabilities 36.4 − 1.2 24.8 − − Other borrowed funds 863.7 − − 201.6 − − Subordinated debt 100.9 − − 101.4 − − Other liabilities 18.3 1.8 0.1 8.8 0.9 − Credit related commitments Financial guarantees issued 9.9 0.5 − 14.0 2.8 − Undrawn credit lines (irrevocable) 23.1 − − 2.7 − − Import letters of credit 1.3 − − 3.4 − − Performance guarantees issued 236.0 27.6 0.1 281.3 12.0 0.1

VTB BANK NOTES TO THE CONSOLIDATED FINANCIAL STATEMENTS 31 DECEMBER 2020 (CONTINUED)
118
51. RELATED PARTY TRANSACTIONS (CONTINUED) Income statement 2020 2019
Government-related entities Associates
Joint ventures
Government-related entities Associates
Joint ventures
Interest income calculated using
the effective interest method Financial assets measured at
amortised cost Loans and advances to customers 128.4 18.2 7.2 123.1 17.2 7.2 Due from other banks 15.2 0.6 − 30.5 3.8 − Investment financial assets 0.7 − − 0.6 − − Debt financial assets measured at
fair value through other comprehensive income 15.0 − − 16.1 − −
Other interest income Financial assets at fair value
through profit or loss 20.9 5.3 2.3 16.0 3.2 2.0 Net investments in finance lease 5.0 0.1 3.3 5.0 − 3.9 Interest expense Customer deposits (117.7) (3.8) (1.7) (179.4) (3.7) (0.1) Due to other banks and other
borrowed funds (39.5) (15.4) (0.3) (67.1) (8.2) (2.8) Subordinated debt (4.3) − − (5.5) − − Provision for credit losses (Provision charge)/reversal of
provision for credit losses on debt financial assets (3.6) 0.7 (2.3) (5.2) (8.3) 0.1
(Provision charge)/reversal of provision for credit losses on credit related commitments (0.5) (0.1) − 0.1 − −
For the year ended 31 December 2020 and 31 December 2019 the key management personnel includes members of the Management Board of VTB Bank and members of the Supervisory Council of VTB Bank. The aggregate remuneration of the key management personnel for the year ended 31 December 2020 amounted to RUR 3.4 billion (31 December 2019: RUR 4.4 billion). Compensation of key management personnel consists primarily of short-term employee benefits, including pension contributions. Under the Group’s updated policy of key management personnel remuneration, starting from 2017 the
Management Board of VTB Bank receives 60% of the annual bonus in cash, and 40% is deferred for the period of 3 years. The deferred amount is paid in three equal instalments in one, two and three years after the grant date, subject to the certain non-vesting conditions. Half of the deferred amount is paid in cash and another half is paid under a cash-settled share based payment plan (Note 53). The share-based payment expense for 2020 was RUR 0.2 billion (2019: RUR 0.9 billion). As at 31 December 2020 the liability arising from cash-settled share-based payment transaction totalled RUR 0.5 billion (31 December 2019: RUR 1.2 billion) and was recognized in Other liabilities (Note 34).

VTB BANK NOTES TO THE CONSOLIDATED FINANCIAL STATEMENTS 31 DECEMBER 2020 (CONTINUED)
119
52. OFFSETTING OF FINANCIAL INSTRUMENTS
The tables below show financial assets offset against financial liabilities and financial liabilities offset against financial assets in the statement of financial position, as well as the effect of enforceable master netting agreements and similar arrangements that does not result in an offset in the statement of financial position as at 31 December 2020:
Assets (gross before allowance for impairment)
Gross amount of recognised
financial assets
Gross amount of recognised
financial liabilities set
off in the statement of
financial position
Net amount of financial
assets presented in
the statement of financial
position
Related amounts not set off in the statement of financial position
Net amount
Financial instruments
Cash collateral received
Reverse sale and repurchase
agreements to maturity (Investment financial assets) 7.3 – 7.3 (7.3) – –
Investment financial assets, pledged under repurchase agreements 562.5 – 562.5 (560.9) – 1.6
Reverse sale and repurchase agreements with other banks 289.8 – 289.8 (288.1) – 1.7
Reverse sale and repurchase agreements with legal entities and individuals 571.2 – 571.2 (545.4) (0.3) 25.5
Loans and advances to legal entities pledged under repurchase agreements 63.4 – 63.4 (63.2) – 0.2
Trading financial assets, pledged under repurchase agreements 62.3 – 62.3 (57.1) – 5.2
Total 1,556.5 – 1,556.5 (1,522.0) (0.3) 34.2
Liabilities
Gross amount of recognised
financial liabilities
Gross amount of recognised
financial assets
set off in the statement of
financial position
Net amount of financial
liabilities presented in
the statement of financial
position
Related amounts not set off in the statement of financial position
Net amount
Financial instruments
Cash collateral pledged
Sale and repurchase agreements
with central banks 611.8 – 611.8 (608.2) – 3.6 Sale and repurchase agreements
with other banks 460.0 – 460.0 (394.8) – 65.2 Sale and repurchase agreements
with customers 12.5 – 12.5 – – 12.5 Obligation to deliver securities 14.6 – 14.6 (13.8) – 0.8 Total 1,098.9 – 1,098.9 (1,016.8) – 82.1
The tables below show financial assets offset against financial liabilities and financial liabilities offset against financial assets in the statement of financial position, as well as the effect of enforceable master netting agreements and similar arrangements that does not result in an offset in the statement of financial position as at 31 December 2019:
Assets (gross before allowance for impairment)
Gross amount of recognised
financial assets
Gross amount of recognised
financial liabilities set
off in the statement of
financial position
Net amount of financial
assets presented in
the statement of financial
position
Related amounts not set off in the statement of financial position
Net amount
Financial instruments
Cash collateral received
Reverse sale and repurchase
agreements to maturity (Investment financial assets) 6.3 – 6.3 (6.3) – –
Investment financial assets, pledged under repurchase agreements 153.1 – 153.1 (134.8) – 18.3
Reverse sale and repurchase agreements with other banks 108.8 – 108.8 (92.8) (8.4) 7.6
Reverse sale and repurchase agreements with legal entities and individuals 428.7 – 428.7 (397.3) (22.3) 9.1
Loans and advances to legal entities pledged under repurchase agreements 21.0 – 21.0 (17.4) – 3.6
Trading financial assets, pledged under repurchase agreements 19.4 – 19.4 (17.1) – 2.3
Total 737.3 – 737.3 (665.7) (30.7) 40.9

VTB BANK NOTES TO THE CONSOLIDATED FINANCIAL STATEMENTS 31 DECEMBER 2020 (CONTINUED)
120
52. OFFSETTING OF FINANCIAL INSTRUMENTS (CONTINUED)
Liabilities
Gross amount of recognised
financial liabilities
Gross amount of recognised
financial assets
set off in the statement of
financial position
Net amount of financial
liabilities presented in
the statement of financial
position
Related amounts not set off in the statement of financial position
Net amount
Financial instruments
Cash collateral pledged
Sale and repurchase agreements
with other banks 231.2 – 231.2 (129.8) – 101.4 Sale and repurchase agreements
with customers 63.5 – 63.5 (39.5) – 24.0 Obligation to deliver securities 26.1 – 26.1 (12.9) – 13.2 Total 320.8 – 320.8 (182.2) – 138.6
The Group has master netting arrangements with counterparty banks, which are enforceable in case of default. In addition, applicable legislation allows an entity to unilaterally set off trade receivables and payables that
are due for payment, denominated in the same currency and outstanding with the same counterparty. These fall in the scope of the disclosure as they were set off in the statement of financial position.
53. SHARE-BASED PAYMENTS In February 2012, several VTB Group members introduced for their selected employees a share-based remuneration plan. This plan has established a right of those employees to receive common shares (“Shares Plan”) or GDR (“GDRs Plan”) of VTB (depending on the employing entity’s country of incorporation) contingent on their service over a specified period of time. In February 2013-2017 several VTB Group members made additional awards to their selected employees
under the same plan rules and vesting conditions. Shares Plan. The vesting conditions envisage that an
employee remains in service for a certain vesting period to receive the shares award. The awarded shares vest gradually in three equal instalments over the vesting periods of one, two and three years, subject to employee’s continuous employment with the Group during the relevant vesting period. An award, or portion of it, may be forfeited or paid if the employee terminates employment before the end of the relevant vesting period voluntarily or subject to certain other conditions as described in the Plan rules. In February 2016 and 2017 several VTB Group members communicated to their selected employees that part of reward can be granted in the perpetual loan participation notes issued (“PLPNs”). Vesting conditions are the same as for the Share Plan above. GDRs Plan. Under GDRs Plan, the selected employees are granted zero strike price options to purchase GDRs exercisable over ten years from each respective vesting date. The vesting conditions envisage that an employee remains in service for a certain vesting period to receive the GDRs award. The awarded GDRs vest gradually in three equal instalments over the vesting periods of one, two and three years, subject to employee’s continuous employment with the Group during the relevant vesting period. An award, or portion of it, may be forfeited or exercised if the employee terminates employment before the end of the relevant vesting period voluntarily or
subject to certain other conditions as described in the Plan rules. Cash-settled Plan. In December 2017, VTB introduced a new remuneration plan for key management (Note 51). Under the plan, participants are granted cash-settled awards linked to VTB shares, which are settled in three equal instalments in one, two and three years after the grant date, subject to the certain non-vesting conditions. As at 31 December 2020 the total value of the award granted under the Shares Plan was RUR 0.0 billion (31 December 2019: RUR 0.1 billion) represented by 0.0 billion of common shares of VTB (31 December 2019: 1.6 billion). As at 31 December 2020 the total value of the award granted under the GDRs Plan was RUR 0.3 billion (31 December 2019: RUR 0.2 billion) represented by 1.3 million of GDRs of VTB (31 December 2019: 1.4 million). Each GDR contains 2,000 VTB shares. As at 31 December 2020 the total value of the award granted under the Cash-Settled Plan was RUR 0.5 billion (31 December 2019: RUR 1.2 billion) represented by 12.0 billion of common shares of VTB (31 December 2019: 25.1 billion of common shares of VTB). As of 31 December 2020 the total value of award granted in perpetual loan participation notes is RUR 0.0 billion (31 December 2019: RUR 0.0 billion) represented by 0.1 thousand of loan participation notes (31 December 2019: 0.6 thousand). For the year ended 31 December 2020 the Group recognised in Staff costs the amount of RUR 0.0 billion (31 December 2019: RUR 0.1 billion) as expenses related to the above equity-settled share-based payment transactions. For the year ended 31 December 2020 the Group recognised in Staff costs the amount of RUR 0.2 billion (31 December 2019: RUR 0.6 billion) as expenses related to the above cash-settled share-based payment transactions.
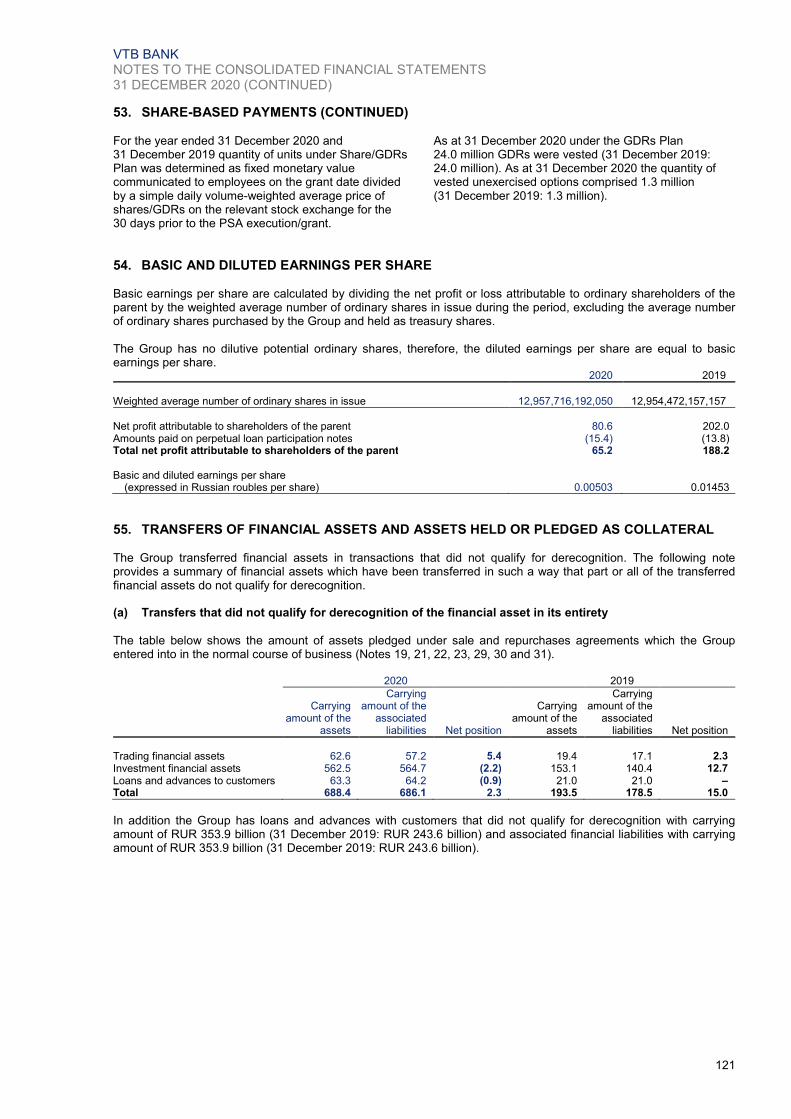
VTB BANK NOTES TO THE CONSOLIDATED FINANCIAL STATEMENTS 31 DECEMBER 2020 (CONTINUED)
121
53. SHARE-BASED PAYMENTS (CONTINUED) For the year ended 31 December 2020 and 31 December 2019 quantity of units under Share/GDRs Plan was determined as fixed monetary value communicated to employees on the grant date divided by a simple daily volume-weighted average price of shares/GDRs on the relevant stock exchange for the 30 days prior to the PSA execution/grant.
As at 31 December 2020 under the GDRs Plan 24.0 million GDRs were vested (31 December 2019: 24.0 million). As at 31 December 2020 the quantity of vested unexercised options comprised 1.3 million (31 December 2019: 1.3 million).
54. BASIC AND DILUTED EARNINGS PER SHARE Basic earnings per share are calculated by dividing the net profit or loss attributable to ordinary shareholders of the parent by the weighted average number of ordinary shares in issue during the period, excluding the average number of ordinary shares purchased by the Group and held as treasury shares. The Group has no dilutive potential ordinary shares, therefore, the diluted earnings per share are equal to basic earnings per share. 2020 2019
Weighted average number of ordinary shares in issue 12,957,716,192,050 12,954,472,157,157
Net profit attributable to shareholders of the parent 80.6 202.0 Amounts paid on perpetual loan participation notes (15.4) (13.8) Total net profit attributable to shareholders of the parent 65.2 188.2 Basic and diluted earnings per share
(expressed in Russian roubles per share) 0.00503 0.01453
55. TRANSFERS OF FINANCIAL ASSETS AND ASSETS HELD OR PLEDGED AS COLLATERAL The Group transferred financial assets in transactions that did not qualify for derecognition. The following note provides a summary of financial assets which have been transferred in such a way that part or all of the transferred financial assets do not qualify for derecognition. (a) Transfers that did not qualify for derecognition of the financial asset in its entirety
The table below shows the amount of assets pledged under sale and repurchases agreements which the Group entered into in the normal course of business (Notes 19, 21, 22, 23, 29, 30 and 31). 2020 2019
Carrying amount of the
assets
Carrying amount of the
associated liabilities Net position
Carrying amount of the
assets
Carrying amount of the
associated liabilities Net position
Trading financial assets 62.6 57.2 5.4 19.4 17.1 2.3 Investment financial assets 562.5 564.7 (2.2) 153.1 140.4 12.7 Loans and advances to customers 63.3 64.2 (0.9) 21.0 21.0 – Total 688.4 686.1 2.3 193.5 178.5 15.0
In addition the Group has loans and advances with customers that did not qualify for derecognition with carrying amount of RUR 353.9 billion (31 December 2019: RUR 243.6 billion) and associated financial liabilities with carrying amount of RUR 353.9 billion (31 December 2019: RUR 243.6 billion).

VTB BANK NOTES TO THE CONSOLIDATED FINANCIAL STATEMENTS 31 DECEMBER 2020 (CONTINUED)
122
55. TRANSFER OF FINANCIAL ASSETS AND ASSETS HELD OR PLEDGED AS COLLATERAL (CONTINUED)
(a) Transfers that did not qualify for derecognition of the financial asset in its entirety (continued) The table below shows the amount of securitization operations which the Group enters into in the normal course of business.
2020 2019
Note
Carrying amount of the
assets
Carrying amount of the
associated liabilities Net position
Carrying amount of the
assets
Carrying amount of the
associated liabilities Net position
Due from Central Bank (A) 21 – – – 0.4 1.5 (1.1) Mortgage loans (A) 22 – – – 8.5 5.3 3.2 Mortgage loans (B) 22 4.5 0.3 4.2 9.2 1.2 8.0 Mortgage loans (C) 22 226.3 – 226.3 48.2 – 48.2 Total 230.8 0.3 230.5 66.3 8.0 58.3
(A) Starting from 2010, VTB (former “Bank VTB 24”, PJSC) participated in VEB Programme to support affordable housing projects using the mortgage. Under this programme VTB issued mortgage-backed securities which are all bought by VEB. As at 31 December 2020 these bonds are repaid in full. (B) “Vozrozhdenie Bank”, PJSC exercises securitization operations through mortgage-backed securities issued by mortgage agents and bought by unlimited range of counterparties. As at 31 December 2020 the carrying amount of pledged assets under the securitization programme of “Vozrozhdenie Bank”, PJSC was RUR 4.5 billion, amortized cost of issued mortgage-backed securities was RUR 0.3 billion. (C) In November, 2020 the Group transferred a portfolio of mortgage loans in the amount of RUR 194.7 billion to LLC “Mortgage agent “DOM.RF” (“Factory MBS”), subsidiary of JSC “DOM.RF”, in exchange for the bonds with the same nominal value. As a part of securitization transaction, the Group entered into an interest rate swap with JSC “DOM.RF” and committed to repurchase defaulted loans until the cumulative losses on the portfolio reach 15% of its nominal value. The Group continues to recognize the loans until these bonds are sold to third parties. As at 31 December 2020, the remaining loans with a carrying value of RUR 193.3 billion were included in loans to individuals. In December, 2019 the Group transferred a portfolio of mortgage loans in the amount of RUR 96.6 billion to LLC “Mortgage agent “DOM.RF” (“Factory MBS”), subsidiary of JSC “DOM.RF”, in exchange for the bonds with the same nominal value. The Group continues to recognize the loans until these bonds are sold to third parties. In December 2019, the Group sold bonds with a nominal value of RUR 50.0 billion, derecognized the corresponding loans and recognized a gain on sale of RUR 2.7 billion in Gains less losses arising from sale of debt securities from loans portfolios. In July 2020, the Group sold bonds with a nominal value of RUR 0.4 billion, derecognized the corresponding loans and recognized a gain on sale of RUR 19.0 million in Gains less losses arising from sale of debt securities from loans portfolios.
As at 31 December 2020, the remaining loans with a carrying value of RUR 32.0 billion were included in loans to individuals (31 December 2019: RUR 46.6 billion). In November, 2019 the Group transferred a portfolio of mortgage loans in the amount of RUR 92.5 billion to LLC “Mortgage agent “DOM.RF” (“Factory MBS”), subsidiary of JSC “DOM.RF”, in exchange for the bonds with the same nominal value. These bonds are fully sold to third parties in 2019.The gain on sale of RUR 4.5 billion was reported within Gains less losses arising from sale of debt securities from loans portfolios. In October, 2018 the Group transferred a portfolio of mortgage loans in the amount of RUR 74.3 billion to LLC “Mortgage agent “DOM.RF” (“Factory MBS”), subsidiary of JSC “DOM.RF”, in exchange for the bonds with the same nominal value. As a part of securitization transaction, the Group entered into an interest rate swap with JSC “DOM.RF” and committed to repurchase defaulted loans until the cumulative losses on the portfolio reach 15% of its nominal value. These bonds are fully sold to third parties in 2018 and 2019. The gain on sale recognized in 2019 amounted to RUR 1.6 billion and was reported within Gains less losses arising from sale of debt securities from loans portfolios. In October, 2017 the Group transferred a portfolio of mortgage loans in the amount of RUR 48.8 billion to LLC “Mortgage agent “Factory MBS” (“Factory MBS”), subsidiary of JSC “DOM.RF” (former “The Agency for Housing Mortgage Lending” (“AHML”)), in exchange for the bonds with the same nominal value. As a part of securitization transaction, the Group entered into an interest rate swap with JSC “DOM.RF” and committed to repurchase defaulted loans until the cumulative losses on the portfolio reach 15% of its nominal value. The Group continues to recognize the loans until these bonds are sold to third parties. In 2017, the Group sold bonds with a nominal value of RUR 44.1 billion, derecognized the corresponding loans. As at 31 December 2020, the remaining loans with a carrying value of RUR 1.0 billion (as at 31 December 2019: RUR 1.6 billion) were included in loans to individuals.

VTB BANK NOTES TO THE CONSOLIDATED FINANCIAL STATEMENTS 31 DECEMBER 2020 (CONTINUED)
123
55. TRANSFER OF FINANCIAL ASSETS AND ASSETS HELD OR PLEDGED AS COLLATERAL (CONTINUED)
(b) Transfers that qualified for derecognition of the financial asset in its entirety The Group has certain transferred financial assets which have been derecognized in their entirety, but for which there is continuing involvement at the reporting date due to the representation on the board of directors and/or due to effectively holding collateral under transferred assets to secure remaining payments from third parties related to the transfer. The collateral fair value under transferred assets comprised 3.1 RUR billion as at 31 December 2020 (31 December 2019: RUR 3.1 billion). In 2014 early settlement procedures were initiated for a derivative financial instrument pertaining to a certain transferred financial asset. Such transferred financial asset has not been recognized on the balance sheet as management expects to unwind the derivative financial instrument with no impact on the Group’s income statement or statement of financial position. Assets pledged as collateral The Group pledges assets that are on its statement of financial position in various day-to-day transactions that are conducted under the usual terms and conditions applying to such agreements. As at 31 December 2020 the Group pledged securities as collateral in repurchase agreements for RUR 1,251.5 billion (31 December 2019: RUR 172.5 billion). Refer to the section “(a) Transfers
that did not qualify for derecognition of the financial asset in its entirety” above. Assets held as collateral The Group holds certain assets as collateral, which it is permitted to sell or repledge in the absence of default by the owner of the collateral, under the usual terms and conditions applying to such agreements. The Group received securities as collateral in reverse repurchase agreements with banks and customers (Notes 21, 22) and reverse sale and repurchase agreements to maturity accounted at fair value with a fair value of RUR 1,045.5 billion and RUR 7.3 billion (31 December 2019: RUR 629.9 billion and RUR 8.3 billion respectively). Of these, the Group sold securities with a fair value of RUR 14.6 billion (31 December 2019: RUR 26.1 billion) in short sale transactions and securities with a fair value of RUR 398.3 billion (31 December 2019: RUR 124.3 billion) under repurchase agreements. In addition, the Group held RUR 28.4 billion of Customer deposits (31 December 2019: RUR 22.8 billion) as collateral for irrevocable commitments under import letters of credit (Note 30). The Group is obliged to return the collateral at maturity of the import letters of credit.
56. SUMMARY OF PRINCIPAL ACCOUNTING POLICIES Subsidiaries
Subsidiaries are those investees, including structured entities, that the Group controls because the Group (i) has power to direct relevant activities of the investees that significantly affect their returns (ii) has exposure, or rights, to variable returns from its involvement with the investees, and (iii) has the ability to use its power over the investees to affect the amount of investor’s returns. The existence and effect of substantive rights, including substantive potential voting rights, are considered when assessing whether the Group has power over another entity. Subsidiaries are consolidated from the date, on which control is transferred to the Group (acquisition date) and are no longer consolidated from the date when control ceases. All intragroup balances and transactions, including income, expenses, dividends and unrealised gains on transactions between the Group members are eliminated in full unrealised losses are also eliminated unless the transaction provides evidence of an impairment of the asset transferred. Where necessary, accounting policies for subsidiaries have been changed to ensure consistency with the accounting policies adopted by the Group. Acquisition of subsidiaries
The acquisition method of accounting is used to account for the acquisition of subsidiaries by the Group. Identifiable assets acquired and liabilities assumed, including contingent liabilities, which are a present obligation and can be measured reliably, are measured
initially at their fair values at the acquisition date, irrespective of the extent of any non-controlling interest. The excess of the aggregate of: i) purchase consideration paid ii) the amount of any non-controlling interest in the acquiree and iii) acquisition-date fair value of the acquirer’s previously held equity interest in the acquiree (in case of the business combination achieved in stages), over the fair value of the acquiree’s identifiable net assets is recorded as goodwill. If the result of the above calculation is negative, the difference is recognised directly in the income statement. Non-controlling interest is the interest in subsidiaries not attributable, directly or indirectly to the Group. The Group measures non-controlling interest that represents present ownership interest and entitles the holder to a proportionate share of net assets in the event of liquidation on a transaction by transaction basis, either at: (a) fair value, or (b) the non-controlling interest's proportionate share of net assets of the acquiree. This choice is made by the acquirer for each business combination. Non-controlling interests that are not present ownership interests are measured at fair value. Non-controlling interest at the subsequent reporting date represents the initially recognised amount of non-controlling interest at the acquisition date and the non-controlling interest's portion of movements in comprehensive income and equity since the date of the combination. Non-controlling interest is presented as a separate component within the Group's equity except for the non-controlling interests in mutual funds under the Group’s control, which are accounted for within Group’s liabilities.

VTB BANK NOTES TO THE CONSOLIDATED FINANCIAL STATEMENTS 31 DECEMBER 2020 (CONTINUED)
124
56. SUMMARY OF PRINCIPAL ACCOUNTING POLICIES (CONTINUED)
Subsidiaries (continued)
Acquisition of subsidiaries (continued)
In a business combination achieved in stages, the acquirer shall remeasure its previously held equity interest in the acquiree at its acquisition date fair value and recognise the resulting gain or loss, if any, in profit or loss. Acquisition-related costs should be accounted for separately from the business combination and therefore recognised as expenses rather than included in goodwill. An acquirer should recognise at the acquisition date a liability for any contingent purchase consideration.
Increases in ownership interests in subsidiaries
The differences between the carrying values of net assets attributable to interests in subsidiaries acquired and the consideration given for such increases are charged or credited directly to retained earnings as a capital transaction.
Investments in associates and joint arrangements
Associates are entities over which the Group has significant influence (directly or indirectly), but not control, generally accompanying a shareholding of between 20 and 50 percent of the voting rights. Investments in associates are accounted for using the equity method of accounting, and are initially recognised at cost. The carrying amount of associates includes goodwill identified on acquisition less accumulated impairment losses, if any. Dividends received from associates reduce the carrying value of the investment in associates. Other post-acquisition changes in Group’s share of net assets of an associate are recognised as follows: (i) the Group’s share of profits or losses of associates is recorded in the consolidated profit or loss for the year as share of result of associates, (ii) the Group’s share of other comprehensive income is recognised in other comprehensive income and presented separately, (iii) all other changes in the Group’s share of the carrying value of net assets of associates are recognised in profit or loss within the share of result of associates. However, when the Group’s share of losses in an associate equals or exceeds its interest in the associate, including any other unsecured receivables, the Group does not recognise further losses, unless it has incurred obligations or made payments on behalf of the associate.
Unrealised gains on transactions between the Group and its associates are eliminated to the extent of the Group’s interest in the associates; unrealised losses are also eliminated unless the transaction provides evidence of an impairment of the asset transferred.
A joint venture exists where the Group has a joint arrangement with one or more parties to have rights to the net assets of the arrangement. The Group recognises interests in a joint venture using the equity method and applies the same accounting policies as those for investments in associates.
Venture Capital Investments
Investments in companies that are managed by a dedicated team within VTB Group, primarily involved in venture capital activities, as part of the Group’s investment portfolio of securities at fair value through profit and loss
and over which the Group may have significant influence are carried at fair value as permitted by IAS 28 which allows investments in associates and joint ventures that are held by venture capital organizations to be excluded from the scope of IAS 28 if these investments are upon initial recognition designated as at fair value through profit or loss or are classified as held for trading and accounted in accordance with IFRS 9. These venture capital investments of the Group are classified as investments in associates and joint ventures designated as at fair value through profit or loss and the changes in the fair value of such investments are accounted for similar to the changes in the fair value of financial assets designated as at fair value through profit or loss as described below, and is included in the gains less losses arising from financial instruments at fair value through profit or loss.
Structured entities
Structured entities are designed so that voting or similar rights are not the dominant factor in deciding who controls the entity. Judgement is also required to determine whether the substance of the relationship between the Group and a structured entity indicates that the structured entity is controlled by the Group.
The Group does not consolidate structured entities that it does not control. As it can sometimes be difficult to determine whether the Group does control a structured entity, management makes judgements about its exposure to the risks and rewards, as well as about its ability to make operational decisions for the structured entity in question. In many instances, elements are present that, considered in isolation, indicate control or lack of control over a structured entity, but when considered together make it difficult to reach a clear conclusion. Refer to Note 48 for further information about the Group’s exposure to structured entities.
Disposals of subsidiaries, associates or joint ventures
When the Group ceases to have control or significant influence, any retained interest in the entity is remeasured to its fair value, with the change in carrying amount recognised in profit or loss. The fair value is the initial carrying amount for the purposes of subsequently accounting for the retained interest as an associate, joint venture or financial asset. In addition, any amounts previously recognised in other comprehensive income in respect of that entity, are accounted for as if the Group had directly disposed of the related assets or liabilities. Therefore, if a gain or loss previously recognised in other comprehensive income would be reclassified to profit or loss on the disposal of the related assets or liabilities, the Group shall reclassify the gain or loss from equity to profit or loss (as a reclassification adjustment) when it loses control of the subsidiary. If a revaluation surplus previously recognised in other comprehensive income would be transferred directly to retained earnings on the disposal of the asset, the Group shall transfer the revaluation surplus directly to retained earnings when it loses control of the subsidiary.
If the ownership interest in an associate is reduced but significant influence is retained, only a proportionate share of the amounts previously recognised in other comprehensive income are reclassified to profit or loss, where appropriate.

VTB BANK NOTES TO THE CONSOLIDATED FINANCIAL STATEMENTS 31 DECEMBER 2020 (CONTINUED)
125
56. SUMMARY OF PRINCIPAL ACCOUNTING POLICIES (CONTINUED) Financial assets
Valuation of financial instruments All financial instruments are recognised initially at fair value plus, in the case of a financial asset not at fair value through profit or loss, transaction costs are directly attributable to the acquisition or issue of the financial asset. In the normal course of business, the fair value of a financial instrument on initial recognition is the transaction price (that is, the fair value of the consideration given or received). Subsequent to initial recognition, the fair values of financial instruments measured at fair value are measured in accordance with the Group’s valuation methodologies, which are described in Notes 39, 42. ‘Day 1’ profit Where the transaction price in a non-active market is different to the fair value from other observable current market transactions in the same instrument or based on a valuation technique with all material inputs observable, the Group immediately recognises the difference between the transaction price and fair value (a ‘Day 1’ profit) in the consolidated income statement. Any other differences are not recognised as “day 1” gain or loss but rather are amortized on a straight line basis over the term of the relevant financial asset or recognised in the consolidated income statement when the inputs become observable, or when the instrument is derecognised. Classification of financial assets
On initial recognition, a financial asset is classified as measured at: amortised cost, fair value through other comprehensive income or fair value through profit or loss. A financial asset is measured at amortised cost if it meets both of the following conditions and is not designated as at fair value through profit or loss:
the asset is held within a business model whose objective is to hold assets to collect contractual cash flows; and
the contractual terms of the financial asset give rise on specified dates to cash flows that are solely payments of principal and interest on the principal amount outstanding.
A debt instrument is measured at fair value through other comprehensive income only if it meets both of the following conditions and is not designated as at fair value through profit or loss:
the asset is held within a business model whose objective is achieved by both collecting contractual cash flows and selling financial assets; and
the contractual terms of the financial asset give rise on specified dates to cash flows that are solely payments of principal and interest on the principal amount outstanding.
On initial recognition of an equity investment that is not held for trading, the Group may irrevocably elect to present subsequent changes in fair value in other comprehensive income. This election is made on an investment-by-investment basis. All other financial assets are classified as measured at fair value through profit or loss. In addition, on initial recognition, the Group may irrevocably designate a financial asset that otherwise meets the requirements to be measured at amortised cost or at fair value through other comprehensive income as at fair value through profit or loss if doing so eliminates or significantly reduces an accounting mismatch that would otherwise arise. Business model assessment
The Group makes an assessment of the objective of a business model in which an asset is held at a portfolio level because this best reflects the way the business is managed and information is provided to management. The information considered includes:
the stated policies and objectives for the portfolio and the operation of those policies in practice. In particular, whether management’s strategy focuses on earning contractual interest revenue, maintaining a particular interest rate profile, matching the duration of the financial assets to the duration of the liabilities that are funding those assets or realising cash flows through the sale of the assets;
how the performance of the portfolio is evaluated and reported to the Group’s management;
the risks that affect the performance of the business model (and the financial assets held within that business model) and how those risks are managed;
how managers of the business are compensated – e.g. whether compensation is based on the fair value of the assets managed or the contractual cash flows collected; and
the frequency, volume and timing of sales in prior periods, the reasons for such sales and its expectations about future sales activity. However, information about sales activity is not considered in isolation, but as part of an overall assessment of how the Group’s stated objective for managing the financial assets is achieved and how cash flows are realised.
Financial assets that are held for trading or managed and whose performance is evaluated on a fair value basis are measured at fair value through profit or loss because they are neither held to collect contractual cash flows nor held both to collect contractual cash flows and to sell financial assets.
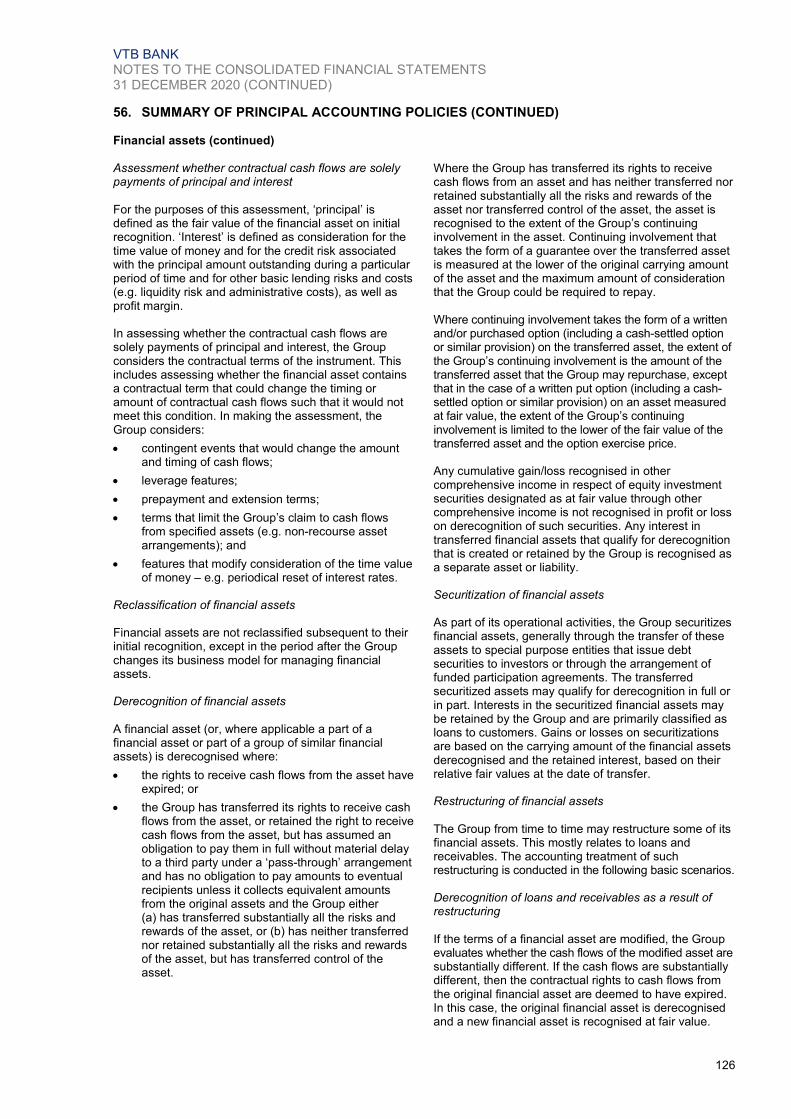
VTB BANK NOTES TO THE CONSOLIDATED FINANCIAL STATEMENTS 31 DECEMBER 2020 (CONTINUED)
126
56. SUMMARY OF PRINCIPAL ACCOUNTING POLICIES (CONTINUED) Financial assets (continued) Assessment whether contractual cash flows are solely payments of principal and interest
For the purposes of this assessment, ‘principal’ is defined as the fair value of the financial asset on initial recognition. ‘Interest’ is defined as consideration for the time value of money and for the credit risk associated with the principal amount outstanding during a particular period of time and for other basic lending risks and costs (e.g. liquidity risk and administrative costs), as well as profit margin. In assessing whether the contractual cash flows are solely payments of principal and interest, the Group considers the contractual terms of the instrument. This includes assessing whether the financial asset contains a contractual term that could change the timing or amount of contractual cash flows such that it would not meet this condition. In making the assessment, the Group considers:
contingent events that would change the amount and timing of cash flows;
leverage features;
prepayment and extension terms;
terms that limit the Group’s claim to cash flows from specified assets (e.g. non-recourse asset arrangements); and
features that modify consideration of the time value of money – e.g. periodical reset of interest rates.
Reclassification of financial assets Financial assets are not reclassified subsequent to their initial recognition, except in the period after the Group changes its business model for managing financial assets. Derecognition of financial assets
A financial asset (or, where applicable a part of a financial asset or part of a group of similar financial assets) is derecognised where:
the rights to receive cash flows from the asset have expired; or
the Group has transferred its rights to receive cash flows from the asset, or retained the right to receive cash flows from the asset, but has assumed an obligation to pay them in full without material delay to a third party under a ‘pass-through’ arrangement and has no obligation to pay amounts to eventual recipients unless it collects equivalent amounts from the original assets and the Group either (a) has transferred substantially all the risks and rewards of the asset, or (b) has neither transferred nor retained substantially all the risks and rewards of the asset, but has transferred control of the asset.
Where the Group has transferred its rights to receive cash flows from an asset and has neither transferred nor retained substantially all the risks and rewards of the asset nor transferred control of the asset, the asset is recognised to the extent of the Group’s continuing involvement in the asset. Continuing involvement that takes the form of a guarantee over the transferred asset is measured at the lower of the original carrying amount of the asset and the maximum amount of consideration that the Group could be required to repay. Where continuing involvement takes the form of a written and/or purchased option (including a cash-settled option or similar provision) on the transferred asset, the extent of the Group’s continuing involvement is the amount of the transferred asset that the Group may repurchase, except that in the case of a written put option (including a cash-settled option or similar provision) on an asset measured at fair value, the extent of the Group’s continuing involvement is limited to the lower of the fair value of the transferred asset and the option exercise price. Any cumulative gain/loss recognised in other comprehensive income in respect of equity investment securities designated as at fair value through other comprehensive income is not recognised in profit or loss on derecognition of such securities. Any interest in transferred financial assets that qualify for derecognition that is created or retained by the Group is recognised as a separate asset or liability. Securitization of financial assets As part of its operational activities, the Group securitizes financial assets, generally through the transfer of these assets to special purpose entities that issue debt securities to investors or through the arrangement of funded participation agreements. The transferred securitized assets may qualify for derecognition in full or in part. Interests in the securitized financial assets may be retained by the Group and are primarily classified as loans to customers. Gains or losses on securitizations are based on the carrying amount of the financial assets derecognised and the retained interest, based on their relative fair values at the date of transfer. Restructuring of financial assets
The Group from time to time may restructure some of its financial assets. This mostly relates to loans and receivables. The accounting treatment of such restructuring is conducted in the following basic scenarios. Derecognition of loans and receivables as a result of restructuring If the terms of a financial asset are modified, the Group evaluates whether the cash flows of the modified asset are substantially different. If the cash flows are substantially different, then the contractual rights to cash flows from the original financial asset are deemed to have expired. In this case, the original financial asset is derecognised and a new financial asset is recognised at fair value.

VTB BANK NOTES TO THE CONSOLIDATED FINANCIAL STATEMENTS 31 DECEMBER 2020 (CONTINUED)
127
56. SUMMARY OF PRINCIPAL ACCOUNTING POLICIES (CONTINUED) Financial assets (continued)
Derecognition of loans and receivables as a result of restructuring (continued) In determining the financial assets that are subject to derecognition the Group analogizes its approach to the guidance on the derecognition of financial liabilities. Qualitative Assessment
A qualitative assessment is performed to determine whether the terms of the instrument are substantially different. Indicators that qualitative modifications may be considered significant irrespective of any signs of quantitative modification may include:
change of the borrower, while changing a borrower within one group of interrelated legal entities, provided that credit risk level remained unchanged, does not lead to derecognition of the original financial asset and the recognition of a new one;
change of currency;
change of floating interest rate to fixed interest rate and vice versa;
change of contractual terms which leads to the reassessment of SPPI criterion, including cancellation (or introduction) of contractual right to convert debt instrument into a number of ordinary shares.
Quantitative Assessment Quantitative assessment of modification is usually applied when modification of contractual terms is not connected with the deterioration of the borrower`s creditworthiness (for Stage 1 and Stage 2 financial assets). Terms are considered to have been substantially modified when the net present value of the cash flows under the new terms, including any fees paid net of any fees received and discounted using the original effective interest rate – substantially differs (similar to quantitative assessment of modification for financial liabilities) from the present value of the remaining cash flows under the original terms. The following thresholds are used for quantitative assessment of modification:
less than 10% – modification is not substantial;
10-20% – combined test: quantitative modification within the specified thresholds is considered substantial provided there are other changes that are secondary in terms of a separate qualitative assessment, such as, for example, amendments in restrictive terms (covenants), change of loan purpose, etc.;
more than 20% – modification is substantial
Restructuring of loans and receivables without derecognition
If the cash flows of the modified asset carried at amortised cost are not substantially different, then the modification does not result in derecognition of the financial asset. In this case, the Group recalculates the gross carrying amount of the financial asset and recognises the amount arising from adjusting the gross carrying amount as a modification gain or loss in profit or loss. Derecognition of financial assets and liabilities carried at amortized cost
If financial assets and liabilities carried at amortized cost are derecognised before maturity (for example, as a result of restructuring), unamortized part of commission and transaction costs is recognised in the same line of the current year income statement, that was used for financial asset/liability amortization prior derecognition. Financial liabilities
Financial liabilities in the scope of IAS 32 and IFRS 9 are classified as either financial liabilities at fair value through profit or loss, or other financial liabilities, as appropriate. The Group determines the classification of its financial liabilities at initial recognition. When financial liabilities are recognised initially, they are measured at fair value, minus, in the case of financial liabilities not at fair value through profit or loss, directly attributable transaction costs. Other financial liabilities are carried at amortized cost using the effective interest rate method. Financial liabilities of acquired subsidiaries are initially recorded in the statement of financial position at their estimated fair value at the date of acquisition. Financial liabilities are classified as financial liabilities at fair value through profit or loss if they are issued for the purpose of repurchasing them in the near term. They normally contain trade financial liabilities or "short" positions in securities. Derivatives with negative fair value are also classified as financial liabilities at fair value through profit or loss. Gains or losses on financial liabilities at fair value through profit or loss are recognised in the income statement. Derecognition of financial liabilities A financial liability is derecognised when the obligation under the liability is discharged or cancelled or expires. Where an existing financial liability is replaced by another from the same creditor on substantially different terms, or the terms of an existing liability are substantially modified, such an exchange or modification is treated as a derecognition of the original liability and the recognition of a new liability, and the difference in the respective carrying amounts is recognised in the income statement. When a financial liability is repurchased (bought-back) by a certain Group member, it is derecognised. The difference between the carrying value (amortized cost) of a financial liability as of the date of buy-back and the consideration paid is recognised in the income statement as the gain or loss arising from extinguishment of liability.

VTB BANK NOTES TO THE CONSOLIDATED FINANCIAL STATEMENTS 31 DECEMBER 2020 (CONTINUED)
128
56. SUMMARY OF PRINCIPAL ACCOUNTING POLICIES (CONTINUED) Offsetting
Financial assets and liabilities are offset and the net amount is reported in the statement of financial position when there is a legally enforceable right to set off the recognised amounts and there is an intention to settle on a net basis, or to realize the asset and settle the liability simultaneously. Such a right of set off (a) must not be contingent on a future event and (b) must be legally enforceable in all of the following circumstances: (i) in the normal course of business, (ii) the event of default and (iii) the event of insolvency or bankruptcy. This is not generally the case with master netting agreements, and the related assets and liabilities are presented gross in the consolidated statement of financial position. Cash and cash equivalents
Cash and cash equivalents are items, which can be converted into cash within a day. All short-term interbank placements, including overnight placements, are included in due from other banks. Amounts which relate to funds that are of a restricted nature, and correspondent accounts in precious metals are excluded from cash and cash equivalents. Cash and cash equivalents are carried at amortized cost, which approximates fair value. Mandatory cash balances with central banks
Mandatory reserve deposits with the CBR and other central banks are carried at amortized cost and represent non-interest bearing deposits, which are not available to finance the Group’s day-to-day operations and hence are not considered as part of cash and cash equivalents for the purposes of the statement of cash flows. Due from other banks
Amounts due from other banks are recorded when the Group advances money to counterparty banks with no intention of trading the resulting receivable, which is due on fixed or determinable dates. Amounts due from other banks are carried at amortized cost less allowance for impairment. Repurchase and reverse repurchase agreements and lending of financial instruments
Sale and repurchase agreements (“repo agreements”) are treated as secured financing transactions. Securities or other financial assets sold under sale and repurchase agreements are not derecognised. The financial assets are not reclassified in the statement of financial position unless the transferee has the right by contract or custom to sell or repledge the financial assets, in which case they are reclassified as financial assets pledged under sale and repurchase agreements (repurchase receivables). The corresponding liability is presented within customer deposits, amounts due to other banks or other borrowed funds. Financial assets purchased under agreements to resell (“reverse repo agreements”) are recorded as due from other banks or loans and advances to customers, as appropriate.
The difference between the sale and repurchase price is treated as interest income/expense and accrued over the life of repo agreements using the effective interest method. Financial assets lent to counterparties are retained in the financial statements in their original statement of financial position category unless the counterparty has the right by contract or custom to sell or repledge the financial assets, in which case they are reclassified and presented separately as loaned financial assets. Financial assets borrowed are not recorded in the financial statements, unless these are sold to the third parties, in which case an obligation to return the financial assets (“short position”) is recorded in Other liabilities at fair value through profit or loss in the statement of financial position. The revaluation of this obligation is recorded in the income statement within gains less losses arising from financial instruments at fair value through profit or loss.
Derivative financial instruments
Derivatives are recognised initially, and are subsequently remeasured, at fair value. Fair values of exchange traded derivatives are obtained from quoted market prices. Fair values of over-the-counter derivatives are obtained using valuation techniques, including discounted cash flow models and option pricing models. Derivatives may be embedded in other financial instruments. Embedded derivatives are treated as separate derivatives when their economic characteristics and risks are not clearly and closely related to those of the host contract; the terms of the embedded derivative would meet the definition of a stand-alone derivative if they were contained in a separate contract; and the combined contract is not held for trading or designated at fair value. These embedded derivatives are measured at fair value with changes therein recognised in the income statement. Derivatives are classified as assets when their fair value is positive or as liabilities when their fair value is negative. Derivative assets and liabilities arising from different transactions are only offset if the transactions are with the same counterparty, a legal right of offset exists, and the parties intend to settle the cash flows on a net basis. The method of recognizing fair value gains and losses depends on whether derivatives are held for trading or are designated as hedging instruments, and if the latter, the nature of the risks being hedged. All gains and losses from changes in the fair value of derivatives held for trading are recognised in the income statement.
Hedge accounting The Group uses derivative instruments to manage exposures to fluctuations both of cash flows from interest received and paid, and of fair values for specifically determined items. As a result, the Group applies hedge accounting for transactions, which meet the specified criteria.
VTB BANK NOTES TO THE CONSOLIDATED FINANCIAL STATEMENTS 31 DECEMBER 2020 (CONTINUED)
129
56. SUMMARY OF PRINCIPAL ACCOUNTING POLICIES (CONTINUED) Derivative financial instruments (continued) Hedge accounting (continued)
At inception of the hedge relationship, the Group formally documents the relationship between the hedged item and the hedging instrument, including the nature of the risk, the objective and strategy for undertaking the hedge and the method that will be used to assess the effectiveness of the hedging relationship. Also at the inception of the hedge relationship, a formal assessment is undertaken to ensure the hedging instrument is expected to be highly effective in offsetting the designated risk in the hedged item. Hedges are formally assessed each quarter. A hedge is regarded as highly effective if the changes in fair value or cash flows attributable to the hedged risk during the period, for which the hedge is designated, are expected to offset in a range of 80% to 125%. For situations where that hedged item is a forecast transaction, the Group assesses whether the transaction is highly probable and presents an exposure to variations in cash flows that could ultimately affect the income statement. Fair value hedges
For designated and qualifying fair value hedges, the change in the fair value of a hedging derivative is recognised in the income statement within “Gains less losses arising from financial instruments at fair value through profit or loss” caption. Meanwhile, the change in the fair value of the hedged item attributable to the risk being hedged is recorded as part of the carrying value of the hedged item and is also recognised in the income statement in ‘Gains less losses arising from financial instruments at fair value through profit or loss’ caption.
If the hedging instrument expires or is sold, terminated or exercised, or where the hedge no longer meets the criteria for hedge accounting, the hedge relationship is terminated. For hedged items recorded at amortized cost, using the effective interest rate method, the difference between the carrying value of the hedged item on termination and the face value is amortized over the remaining term of the original hedge. If the hedged item is derecognised, the unamortized fair value adjustment is recognised immediately in the income statement. Cash flow hedges For designated and qualifying cash flow hedges, the effective portion of the gain or loss on the hedging instrument is initially recognised through other comprehensive income directly in equity in the cash flow hedge reserve within ‘Unrealised gain on financial assets available-for-sale and cash flow hedge’ caption. The ineffective portion of the gain or loss on the hedging instrument is recognised immediately in the income statement in ‘Gains less losses arising from financial instruments at fair value through profit or loss’.
When the hedged cash flow affects the income statement, the gain or loss on the hedging instrument is “recycled” in the corresponding income or expense line of the income statement. When a hedging instrument expires, or is sold, terminated, exercised, or when a hedge no longer meets the criteria for hedge accounting, any cumulative gain or loss existing in equity at that time remains separately in equity until the forecast transaction occurs. When a forecast transaction is no longer expected to occur, the cumulative gain or loss that was reported in equity is immediately transferred to the income statement in “Gains less losses arising from financial instruments at fair value through profit or loss”. Regular way transactions
Regular way transactions are purchases or sales of financial assets that require delivery of assets within the period generally established by regulation or convention in the marketplace. All regular way purchases and sales of financial assets are recognised or derecognised on the contractual settlement date which is the date when the asset is to be delivered to or by the Group. Regular way transactions are not recognised as derivatives because of the short duration of the commitment to deliver financial assets between the trade and settlement date. Any change in the fair value of the financial assets at fair value through profit or loss to be received during the period between the trade date and the settlement date is recognised in the income statement and for financial assets available for sale is recognised in other comprehensive income for financial assets purchased. For financial assets sold on a regular way basis no changes in fair value are recognised in the income statement or in other comprehensive income between the trade and settlement date. Assets carried at cost or amortized cost are not affected by the change in fair value during the period between the trade and settlement date. Promissory notes purchased
Promissory notes purchased are included in financial assets at fair value through profit or loss or in due from other banks or in loans and advances to customers or in investment securities held-to-maturity, depending on their substance and are recorded, subsequently remeasured and accounted for in accordance with the accounting policies for these categories of assets.

VTB BANK NOTES TO THE CONSOLIDATED FINANCIAL STATEMENTS 31 DECEMBER 2020 (CONTINUED)
130
56. SUMMARY OF PRINCIPAL ACCOUNTING POLICIES (CONTINUED) Leases
When the Group is a lessor under finance leases the amounts due under the leases, after deduction of unearned charges, are included in ‘Loans and advances to customers’. The finance income receivable is recognised in ‘Interest income’ over the periods of the leases so as to give a constant rate of return on the net investment in the leases. When acting as a lessor under operating leases, the Group includes the assets subject to operating leases in ‘Land, property and equipment’ and accounts for them accordingly. Impairment losses are recognised to the extent that residual values are not fully recoverable and the carrying value of the assets is thereby impaired. When acting as a lessee, the Group recognises a right-of-use asset representing its right to use the underlying leased asset and a lease liability representing its obligation to make lease payments. The Group measures right-of-use assets similarly to land, premises and equipment or investment property and lease liabilities similarly to other financial liabilities. The Group applies the fair value model to right-of-use assets that meet the definition of investment property in accordance with IAS 40. The Group applies the revaluation model to right-of-use assets that relate to land and premises. The Group applies the cost model and recognise depreciation on a straight-line basis in respect of equipment. Assets and liabilities arising from a lease are initially measured on a present value basis. The measurement includes non-cancellable lease payments (including inflation-linked payments) and payments to be made in optional periods if the lessee is reasonably certain to exercise an option to extend the lease, or not to exercise an option to terminate the lease. In most cases, the initial lease asset equals the lease liability. The lease asset is the right to use the underlying asset presented in the statement of financial position as part of Investment property or Land, premises and equipment. Lease liability to the lessor is included in Other liabilities. Interest expenses on the lease liability are recognised in the Consolidated Income Statement as ‘Interest expense’ over the period of the lease based on the interest rate implicit in the lease so as to give a constant rate of interest on the remaining balance of the liability. Impairment of financial assets
The Group recognises loss allowances for ECL on the following financial instruments that are not measured at fair value through profit or loss:
financial assets that are debt instruments;
lease receivables;
financial guarantee contracts issued; and
loan commitments issued. No impairment loss is recognised on equity investments. The Group measures loss allowances at an amount equal to lifetime ECL, except for the following, for which they are measured as 12-month ECL:
debt investment securities that are determined to have low credit risk at the reporting date; and
other financial instruments (other than lease receivables) on which credit risk has not increased significantly since their initial recognition).
Loss allowances for lease receivables are always measured at an amount equal to lifetime ECL. The Group considers a debt security to have low credit risk when their credit risk rating is equivalent to the globally understood definition of ‘investment grade’. 12-month ECL are the portion of ECL that result from default events on a financial instrument that are possible within the 12 months after the reporting date. Presentation of allowance for ECL in the statement of financial position Loss allowances for ECL are presented in the statement of financial position as follows:
financial assets measured at amortised cost: as a deduction from the gross carrying amount of the assets;
loan commitments and financial guarantee contracts: generally, as a provision;
where a financial instrument includes both a drawn and an undrawn component, and the Group cannot identify the ECL on the loan commitment component separately from those on the drawn component: the Group presents a combined loss allowance for both components. The combined amount is presented as a deduction from the gross carrying amount of the drawn component. Any excess of the loss allowance over the gross amount of the drawn component is presented as a provision; and
debt instruments measured at fair value through other comprehensive income: no loss allowance is recognised in the statement of financial position because the carrying amount of these assets is their fair value. However, the loss allowance is disclosed and is recognised in the fair value reserve.

VTB BANK NOTES TO THE CONSOLIDATED FINANCIAL STATEMENTS 31 DECEMBER 2020 (CONTINUED)
131
56. SUMMARY OF PRINCIPAL ACCOUNTING POLICIES (CONTINUED) Pension liabilities
Pension liabilities are accounted under IFRS 4 Insurance Contracts. IFRS 4 Insurance Contracts permits an
insurer to apply existing national GAAP for insurance contracts and financial instruments with discretionary participation feature (‘DPF’). Thus, pension liabilities under insurance contracts and financial instruments with DPF are determined by the Group in accordance with Russian legislation and pension and insurance rules also. Pension liabilities are recognised at the earlier of the following dates:
(a) the beginning of insurance coverage;
(b) the date when the Group shall receive the first payment according to non-state pension contract or obligatory pension insurance contract with third parties.
The Group uses retrospective method to evaluate non-state pension liabilities if benefits under these contracts has not been granted yet, and prospective method if benefits has been already granted. The estimation is made on the basis of mortality rates and investment return. Assumptions also include adjustments for unfavourable events in order to provide the best estimate of possible future claims. Investment return assumptions are determined and fixed when non-state pension contract is signed, and may differ depending on the year of contract commencement. Obligatory pension insurance liabilities are determined as cumulative contributions reduced by benefits and adjusted by investment return. At each reporting date, liability adequacy test is performed to ensure the adequacy of the contract liabilities. The carrying amount of pension liabilities may be increased if the test shows that the carrying amount of pension liabilities is inadequate in the light of the estimated future cash flows. The adequacy test considers current estimates of all contractual cash flows (including future cash flows such as contributions, benefits paid, lump sum payments and payments to successors), and of related cash flows such as contracts handling costs, cash flows resulting from embedded options and guarantees, as well as investment return on related assets. The Group uses current best estimates of future cash flows, taking into account expected improvements in life interval of participants in the future. Certain estimation techniques are applied by the Group, including discounting of cash flows and stochastic simulation. For financial instruments with DPF the Group applies the same accounting policy as for insurance contracts liabilities. Pension liabilities are derecognised when the term of the contract expires, the contract is repaid or cancelled.
Movement in pension liabilities is recognised within ‘Net insurance claims incurred, movement in liabilities to policyholders and acquisition costs’ in the consolidated income statement of the Group. Pension contributions and benefits paid Contributions are recognised in full amount as income when paid by a sponsor. In the consolidated income statement of the Group pension contributions are included in ‘Net insurance premiums earned’. Benefits paid are charged to the consolidated income statement as incurred. Pension benefits paid are recognised within ‘Net insurance claims incurred, movement in liabilities to policyholders and acquisition costs’ in the consolidated income statement of the Group. Non-current assets and disposal group held for sale
Non-current assets (or disposal groups, which may include both non-current and current assets and liabilities), are classified in the statement of financial position as ‘non-current assets held for sale’ (or as ‘assets of disposal group held for sale’ and ‘liabilities of disposal group held for sale’) if their carrying amount will be recovered principally through a sale transaction, including deconsolidation of a subsidiary holding the assets, within twelve months after the end of the reporting period. Assets (or disposal groups) are eligible to be classified or reclassified when all of the following conditions are met:
(a) the assets are available for immediate sale in their present condition;
(b) the Group’s management approved and initiated an active programme to locate a buyer;
(c) the assets are actively marketed for a sale at a reasonable price;
(d) the sale is expected to occur within one year from the date of classification and
(e) it is unlikely that significant change to the plan to sell will be made or that the plan will be withdrawn.
Non-current assets or disposal groups classified as held for sale in the current period’s statement of financial position are not reclassified or re-presented in the comparative statement of financial position to reflect the classification at the end of the current period. A disposal group represents assets current and/or non-current assets to be disposed of, by sale or otherwise, together as a group in a single transaction, and liabilities directly associated with those assets that will also be transferred in the transaction. Goodwill is also included if the disposal group includes an operation within a cash-generating unit to which goodwill has been allocated on acquisition. Non-current assets are assets that include amounts expected to be recovered or collected more than twelve months after the end of the reporting period. If reclassification is required, both the current and non-current portions of an asset are reclassified.

VTB BANK NOTES TO THE CONSOLIDATED FINANCIAL STATEMENTS 31 DECEMBER 2020 (CONTINUED)
132
56. SUMMARY OF PRINCIPAL ACCOUNTING POLICIES (CONTINUED) Non-current assets and disposal group held for sale (continued)
Held for sale disposal groups as a whole are measured at the lower of their carrying amount and fair value less costs to sell. Held for sale premises and equipment and intangible assets are not depreciated or amortized. Reclassified financial instruments, deferred taxes and investment properties held at fair value are not subject to the write down to the lower of their carrying amount and fair value less costs to sell. Reclassified financial instruments, deferred taxes and investment properties held at fair value shall be remeasured in accordance with applicable IFRSs before the fair value less cost to sell of the disposal group is remeasured. Liabilities directly associated with disposal groups that will be transferred in the disposal transaction are reclassified and presented separately in the statement of financial position. Gains or losses of the subsidiary classified as disposal group held for sale are included in the relevant caption of the consolidated income statement and other comprehensive income. Investment property Investment property is land or building or a part of building held to earn rental income or for capital appreciation and which is not used by the Group or held for the sale in the ordinary course of business. Property that is being constructed or developed or redeveloped for future use as investment property is also classified as investment property. Investment property is initially recognised at cost, including transaction costs, and subsequently remeasured at fair value reflecting market conditions at the end of the reporting period. Fair value of the Group’s investment property is determined on the base of various sources including reports of independent appraisers, who hold a recognised and relevant professional qualification and who have recent experience in valuation of property of similar location and category. Investment property that is being redeveloped for continuing use as investment property or for which the market has become less active continues to be measured at fair value. Earned rental income is recorded in the income statement within income arising from non-banking activities. Gains and losses resulting from changes in the fair value of investment property are recorded in the income statement and presented within income or expense arising from non-banking activities.
Subsequent expenditure is capitalized only when it is probable that future economic benefits associated with it will flow to the Group and the cost can be measured reliably. All other repairs and maintenance costs are expensed when incurred. If an investment property becomes owner-occupied, it is reclassified to premises and equipment, and its carrying amount at the date of
reclassification becomes its deemed cost to be subsequently depreciated. Land, premises and equipment
Premises and equipment are stated at revalued amounts and cost, respectively, less accumulated depreciation and allowance for impairment where required. Land is stated at revalued amounts. Land has indefinite term of usage and, therefore, is not depreciable. Where the carrying amount of an asset is greater than its estimated recoverable amount, it is written down to its recoverable amount and the difference is recognised in the income statement. The estimated recoverable amount is the higher of an asset’s fair value less costs to sell and its value in use.
Land, premises and equipment of acquired subsidiaries are initially recorded in the statement of financial position at their estimated fair value at the date of acquisition. No accumulated depreciation on the premises and equipment acquired in the business combinations is presented in the financial statements on the date of acquisition. Land and premises of the Group are subject to revaluation on a regular basis, approximately every three to five years. The frequency of revaluation depends upon the change in the fair values. When the fair value of a revalued asset differs materially from its carrying amount further revaluation is performed. The revaluation is applied simultaneously to the whole class of property to avoid selective revaluation. Any revaluation surplus is credited to the other comprehensive income and increases land and premises revaluation reserve which is a separate equity section of the statement of financial position, except to the extent that it reverses an impairment of the same asset previously recognised in the income statement, in which case the increase is recognised in the income statement. A revaluation deficit is recognised in the income statement except for the deficit directly offsetting a previous surplus on the same asset is directly offset against the surplus in the asset revaluation reserve for land and premises. The land and premises revaluation reserve included in equity is transferred directly to retained earnings when the surplus is realised, i.e. on the retirement or disposal of the asset or as the asset is used by the Group; in the latter case, the amount of the surplus realised is the difference between depreciation based on the revalued carrying amount of the asset and depreciation based on the asset’s original cost. Construction in progress is carried at cost less allowance for impairment, if any. Upon completion, assets are transferred to premises and equipment at their carrying value. Construction in progress is not depreciated until the asset is available for use.
If impaired, land, premises and equipment are written down to the higher of their value in use and fair value less costs to sell.

VTB BANK NOTES TO THE CONSOLIDATED FINANCIAL STATEMENTS 31 DECEMBER 2020 (CONTINUED)
133
56. SUMMARY OF PRINCIPAL ACCOUNTING POLICIES (CONTINUED) Land, premises and equipment (continued)
The decrease in carrying amount is charged to income statement to the extent it exceeds the previous revaluation surplus in equity. An impairment loss recognised for an asset in prior years is reversed if there has been a change in the estimates used to determine the asset’s value in use or fair value less costs to sell. Gains and losses on disposal of land, premises and equipment are determined by reference to their carrying amount and are taken into account in determining profit or loss. Repairs and maintenance are charged to the income statement when the expense is incurred.
Depreciation
Depreciation is recognised on a straight-line basis over the estimated useful lives of the assets using the following basic annual rates: Useful life Depreciation rates
Premises Maximum 150 years
Minimum 0.7% per annum
Equipment 4-20 years 5%-25% per annum
Estimated useful lives and residual values are reassessed annually. Goodwill
Goodwill recognised in a business combination represents the future economic benefits arising from other assets acquired in a business combination that are not individually identified and separately recognised and is calculated as the excess of (a) over (b) below:
(a) the aggregate of:
the consideration transferred, which generally requires acquisition-date fair value;
the amount of any non-controlling interest in the acquiree; and
in a business combination achieved in stages, the acquisition-date fair value of the acquirer’s previously held equity interest in the acquiree.
(b) the net of the acquisition-date amounts of the identifiable assets acquired and the liabilities assumed.
If the above resulting amount is negative, the acquirer has made a gain from a bargain purchase, that gain is recognised in profit or loss.
The revised IFRS 3 allows the acquirer to measure any non-controlling interests, which are present ownership interests in the acquiree either at fair value or at the non-controlling interest’s proportionate share of the acquiree’s identifiable net assets for each business combination. This results in different amount of goodwill or gain from bargain purchase to be recognised in financial statements depending on the choice of the acquirer. Goodwill on an acquisition of a subsidiary is disclosed in the caption ‘Goodwill and other intangible assets’ of the statement of financial position. Goodwill on an
acquisition of an associate or joint venture is included in the carrying amount of investments in associates and joint ventures. Following initial recognition, goodwill is measured at cost less any accumulated impairment losses, if any. Goodwill is reviewed for impairment, annually or more frequently if events or changes in circumstances indicate that the carrying amount may be impaired. For the purpose of impairment testing, goodwill acquired in a business combination is, from the acquisition date, allocated to each of the Group’s cash-generating units, or groups of cash-generating units, that are expected to benefit from the synergies of the combination, irrespective of whether other assets or liabilities of the Group are assigned to those units or groups of units. Each unit or group of units, to which the goodwill is so allocated:
represents the lowest level within the Group, at which the goodwill is monitored for internal management purposes; and
is not larger than an operating segment in accordance with IFRS 8, Operating Segments, before aggregation.
Impairment of goodwill is determined by assessing the recoverable amount of the cash-generating unit (group of cash-generating units), to which the goodwill relates. Where the recoverable amount of the cash-generating unit (group of cash-generating units) is less than the carrying amount, an impairment loss is recognised. Where goodwill forms a part of a cash-generating unit (group of cash-generating units) and a part of the operation within that unit is disposed of, the goodwill associated with the operation disposed of is included in the carrying amount of the operation when determining the gain or loss on disposal of the operation.
Goodwill disposed of in this circumstance is measured based on the relative values of the operation disposed of and the portion of the cash-generating unit retained. Intangible assets other than goodwill
Intangible assets other than goodwill include licenses, computer software, and other identifiable intangible assets, including those acquired in business combinations. Intangible assets acquired or recognised separately are measured on initial recognition at cost. The cost of intangible assets acquired in a business combination is fair value as at the date of acquisition. Following initial recognition, intangible assets are carried at cost less any accumulated amortization and any accumulated impairment losses. The useful lives of intangible assets are assessed to be either finite or indefinite. Intangible assets with finite lives are amortized using straight-line method over the useful economic lives, which normally do not exceed 5 years, and assessed for impairment whenever there is an indication that the intangible asset may be impaired. Amortization periods and amortization methods for intangible assets with finite useful lives are reviewed at least at each financial year-end.
VTB BANK NOTES TO THE CONSOLIDATED FINANCIAL STATEMENTS 31 DECEMBER 2020 (CONTINUED)
134
56. SUMMARY OF PRINCIPAL ACCOUNTING POLICIES (CONTINUED)
Intangible assets other than goodwill (continued)
Intangible assets with indefinite useful lives are not amortized, but are tested for impairment annually or more frequently if events or changes in circumstances indicate that the carrying amount may be impaired either individually or at the cash-generating unit level. The useful life of an intangible asset with an indefinite life is reviewed annually to determine whether indefinite life assessment continues to be supportable.
Operations with precious metals
The Group enters into different types of transactions with precious metals including sale and purchase agreements, metal-currency swap transactions, lending and borrowing in precious metals. Correspondent accounts in precious metals (assets) are recorded within Cash and short-term funds; however, they are excluded from Cash and cash equivalents as the precious metals are considered to be a commodity rather than a financial instrument. Precious metals inventory in vault is included in Other assets.
Core deposit, loan to customer and relation with the major lessee intangibles
Core deposit, loan to customer and relations with the major lessee intangibles relate to the acquisition of the Group’s subsidiaries and are attributable to the customer demand deposits, loans to customers, leasing contracts, stable client base identified as intangible assets. The identification is based on examination of the subsidiaries’ customer base.
The core deposit intangible is recognised if it was concluded that the acquired subsidiaries has a well-established and long-dated relationship with its major customers and that demand deposits actual maturity was significantly longer than contract maturity. The loan to customer intangible is determined by applying income approach and calculated as discounted cash-flow from new loans to existing borrowers. The relations with the major lessee intangible is determined by applying income approach and calculated as discounted cash-flow from new contracts to existing lessee.
The useful life of the core deposit, loan to customer and relation with the major lessee intangibles was estimated from five to eight years and is amortized over its useful life using the straight-line method.
Due to other banks
Amounts due to other banks are recorded when money or other financial assets are advanced to the Group by counterparty banks. The liability is carried at amortized cost using the effective interest method.
Customer deposits
Customer deposits are liabilities to individuals, state or corporate customers and are carried at amortized cost using the effective interest method. Customer deposits include both demand and term deposits. Interest expense is recognised in the income statement over the period of deposits using effective interest method.
Debt securities issued
Debt securities issued include promissory notes, certificates of deposit, eurobonds and debentures issued by the Group. Debt securities are stated at amortized cost using the effective interest method. If the Group purchases its own debt securities in issue, they are removed from the statement of financial position and the difference between the carrying amount of the liability the consideration paid is included in gains less losses arising from extinguishment of liability in the income statement.
Other borrowed funds
Other borrowed funds include some specific borrowings, which differ from the above items of liabilities and include funds from local central banks, syndicated loans, revolving, other credit lines and other specific items. Other borrowed funds are carried at amortized cost using the effective interest method. Interest expense is recognised in the income statement over the period of other borrowed funds using effective interest method.
When the Group borrows precious metals or accepts deposits in precious metals with a subsequent metal-currency swap or economically similar transaction, the Group accounts for such transactions as borrowings within the appropriate liability caption in the statement of financial position and recognises interest expense at the effective interest rate over the term of the borrowing. Related derivatives, including bifurcated precious metals derivatives, are accounted for in the statement of financial position as assets or liabilities at fair value through profit or loss with any changes in fair value recorded in the income statement.
Income tax
Income tax comprises current tax and deferred tax. Income tax is recognised in the income statement except to the extent that it relates to items recognised in other comprehensive income or directly in equity, in which case it is recognised in the same statement in which the related item appears.
Current tax is the tax expected to be payable on the taxable profit for the year, calculated using tax rates enacted or substantively enacted by the balance sheet date, and any adjustment to tax payable in respect of previous years. Current tax assets and liabilities are offset when the Group intends to settle on a net basis and the legal right to offset exists. Current tax is the amount expected to be paid to or recovered from the taxation authorities in respect of taxable profits or losses for the current and prior periods. Taxable profits or losses are based on estimates if financial statements are authorized prior to filing relevant tax returns. Taxes, other than on income, are recorded within administrative expenses.
Deferred income tax is recognised on temporary differences between the carrying amounts of assets and liabilities in the balance sheet and the amounts attributed to such assets and liabilities for tax purposes. Deferred income tax liabilities are generally recognised for all taxable temporary differences and deferred income tax assets are recognised to the extent that it is probable that future taxable profits will be available against which deductible temporary differences can be utilized.

VTB BANK NOTES TO THE CONSOLIDATED FINANCIAL STATEMENTS 31 DECEMBER 2020 (CONTINUED)
135
56. SUMMARY OF PRINCIPAL ACCOUNTING POLICIES (CONTINUED) Income tax (continued)
Deferred income tax is calculated using the tax rates expected to apply in the periods in which the assets will be realised or the liabilities settled, based on tax rates and laws enacted, or substantively enacted, by the balance sheet date. Deferred income tax assets and liabilities are offset when they arise in the same tax reporting group and relate to income taxes levied by the same taxation authority, and when the Group has a legal right to offset. Deferred income tax relating to actuarial gains and losses on post-employment benefits is recognised in other comprehensive income. Deferred income tax relating to share-based payment transactions is recognised directly in equity to the extent that the amount of the estimated future tax deduction exceeds the amount of the related cumulative remuneration expense. Deferred income tax relating to fair value re-measurements of available-for-sale investments and cash flow hedging instruments which are charged or credited directly to other comprehensive income, is also charged or credited to other comprehensive income and is subsequently recognised in the income statement when the deferred fair value gain or loss is recognised in the income statement. Provisions for liabilities and charges
Provisions for liabilities and charges are non-financial liabilities of uncertain timing or amount. They are recorded when the Group has a present legal or constructive obligation as a result of past events, it is probable that an outflow of resources embodying economic benefits will be required to settle the obligation, and a reliable estimate of the amount of the obligation can be made. Credit related commitments
Financial guarantees issued or commitments to provide a loan at a below-market interest rate are initially measured at fair value and the initial fair value is amortised over the life of the guarantee or the commitment. Subsequently, they are measured at the higher of this amortised amount and the amount of ECL. The Group has issued no loan commitment that are measured at FVTPL. For other loan commitment the Group recognises loss allowance. Liabilities arising from financial guarantees and loan commitments are included within provisions. Performance guarantees
Performance guarantees are contracts that provide compensation if another party fails to perform a contractual obligation. Performance guarantees are initially recognised at their fair value, which is normally evidenced by the amount of fees received. This amount is amortized on a straight line basis over the life of the
contract. At the end of each reporting period, the performance guarantee contracts are measured at the higher of the unamortized balance of the amount at initial recognition and the best estimate of expenditure required to settle the contract at the end of each reporting period, discounted to present value. Where the Group has the contractual right to revert to its customer for recovering amounts paid to settle the performance guarantee contracts, such amounts will be recognised as loans and receivables upon transfer of the loss compensation to the guarantee’s beneficiary. Perpetual Loan Participation Notes
Due to the undefined maturity and an option for non-cumulative cancellation of coupon payments, the Group accounts for the Perpetual Loan Participation Notes as an equity instrument and as a Tier I eligible instrument for the purpose of Capital Adequacy Ratio calculation. The CBR approved the inclusion of the subordinated loan in the statutory capital ratio calculation of the Bank. The Group accounts for the Perpetual Loan Participation Notes (PLPN) denominated in the foreign currency in the amount of RUR equivalent amount using the foreign exchange rate at the reporting date with foreign exchange translation effects recorded in Retained earnings. Issuance costs were also recorded in Retained earnings. While coupon payments are optional at the discretion of VTB, certain terms in the PLPN may cause such payments to become mandatory. At the moment the coupon under PLPN becomes mandatory, it is recorded as a dividend declaration described below. Treasury perpetual loan participation notes are included in Treasury shares and PLPN in the consolidated statement of changes in shareholder’s equity. Share premium
Share premium represents the excess of contributions over the nominal value of the shares issued. Dividends
Dividends are recorded as a separate debit caption in equity in the period in which they are declared. Dividends declared after the reporting date and before the financial statements are authorized for issue are disclosed in the subsequent events note. The statutory accounting reports of the Bank are the basis for profit distribution and other appropriations. Russian legislation identifies the basis of distribution as the current year net profit. Recognition of income and expenses
Revenue is recognised to the extent that it is probable that the economic benefits will flow to the Group and the revenue can be reliably measured.

VTB BANK NOTES TO THE CONSOLIDATED FINANCIAL STATEMENTS 31 DECEMBER 2020 (CONTINUED)
136
56. SUMMARY OF PRINCIPAL ACCOUNTING POLICIES (CONTINUED) Interest and similar revenue and expense
Effective interest rate
Interest income and expense are recognised in profit or loss using the effective interest method. The ‘effective interest rate’ is the rate that exactly discounts estimated future cash payments or receipts through the expected life of the financial instrument to:
the gross carrying amount of the financial asset; or
the amortised cost of the financial liability. When calculating the effective interest rate for financial instruments other than credit-impaired assets, the Group estimates future cash flows considering all contractual terms of the financial instrument, but not expected credit losses. For credit-impaired financial assets, a credit-adjusted effective interest rate is calculated using estimated future cash flows including expected credit losses. The calculation of the effective interest rate includes transaction costs and fees and points paid or received that are an integral part of the effective interest rate. Transaction costs include incremental costs that are directly attributable to the acquisition or issue of a financial asset or financial liability. Amortised cost and gross carrying amount The ‘amortised cost’ of a financial asset or financial liability is the amount at which the financial asset or financial liability is measured on initial recognition minus the principal repayments, plus or minus the cumulative amortisation using the effective interest method of any difference between that initial amount and the maturity amount and, for financial assets, adjusted for any expected credit loss allowance. The ‘gross carrying amount of a financial asset’ is the amortised cost of a financial asset before adjusting for any expected credit loss allowance. Calculation of interest income and expense In calculating interest income and expense, the effective interest rate is applied to the gross carrying amount of the asset (when the asset is not credit-impaired) or to the amortised cost of the liability. However, for financial assets that have become credit-impaired subsequent to initial recognition, interest income is calculated by applying the effective interest rate to the amortised cost of the financial asset. If the asset is no longer credit-impaired, then the calculation of interest income reverts to the gross basis. For financial assets that were credit-impaired on initial recognition, interest income is calculated by applying the credit-adjusted effective interest rate to the amortised cost of the asset. The calculation of interest income does not revert to a gross basis, even if the credit risk of the asset improves.
Presentation Interest income and expense presented in the statement of profit or loss and other comprehensive income include:
interest on financial assets and financial liabilities measured at amortised cost calculated on an effective interest basis;
interest on debt instruments measured at fair value through other comprehensive income calculated on an effective interest basis.
Fee and commission income
Fee income is earned from a diverse range of services provided by the Group to its customers. Fee income is accounted for as follows:
income earned on the execution of a significant act is recognised as revenue when the act is completed (for example, fees arising from negotiating, or participating in the negotiation of, a transaction for a third party such as an arrangement for the acquisition of shares or other securities);
income earned from the provision of services is recognised as revenue as the services are provided (for example, asset management, portfolio and other management advisory and service fees); and
income which forms an integral part of the effective interest rate of a financial instrument is recognised as an adjustment to the effective interest rate (for example, certain loan commitment fees) and recorded in ‘Interest income’.
Gains on initial recognition of financial instruments
When resources are attracted at off-market interest rates the difference between the nominal amount received and present value of cash flows discounted at the market interest rate is recognized as gains or losses on initial recognition of due from other banks or customer deposits in the income statement. The Group shall recognize a gain on initial recognition of resources attracted at interest rates below market only when the contract makes no provision for early termination upon a depositor’s demand. Dividend income
Dividend income is recognised when the right to receive payment is established. This is the ex-dividend date for listed equity securities, and usually the date when shareholders have approved the dividend for unlisted equity securities. Dividends from equity securities are presented within ‘Gains net of losses arising from other financial instruments at fair value through profit or loss’, ‘Other operating income’ lines of the income statement.

VTB BANK NOTES TO THE CONSOLIDATED FINANCIAL STATEMENTS 31 DECEMBER 2020 (CONTINUED)
137
56. SUMMARY OF PRINCIPAL ACCOUNTING POLICIES (CONTINUED) Revenues and expenses from other non-banking activities
Income and expenses of the Group members which principal activities are other than banking and insurance operations are recognized generally on the aggregated basis in the consolidated income statement as non-banking income and non-banking expenses except for revenues and expenses recognized in other lines of the income statement (for example, interest income or expense or gains less losses arising from financial instruments at fair value through profit or loss). Non-banking income and expenses also include income/ expenses from construction, development and other real estate operations. Revenue is recognised when the goods or services are transferred to the customer, at the transaction price. Any bundled goods or services that are distinct are separately recognised, and any discounts or rebates on the contract price are generally allocated to the separate elements. When the consideration varies for any reason, minimum amounts are recognised if they are not at significant risk of reversal. Costs incurred to secure contracts with customers have to be capitalized and amortized over the period when the benefits of the contract are consumed. Staff costs and related contributions
The Group’s contributions to the State and Group’s social insurance and obligatory medical insurance funds in respect of its employees are expensed as incurred and included in staff costs within staff costs and administrative expenses. The Group’s contributions to the State and Group pension schemes are included in defined contribution pension expense within staff costs and administrative expenses. Unused vacations accrued amounts are also included in staff costs within staff costs and administrative expenses. The Group recognises all actuarial gains and losses related to the defined benefit plan directly in other comprehensive income. Share-based payment
Equity-settled share-based payment transactions are transactions, in which the entity receives goods or services as consideration for equity instruments of the entity. For equity-settled share-based payment transactions, the goods or services received, and the corresponding increase in equity, are measured directly, at the fair value of the goods or services received, unless that fair value cannot be estimated reliably. If the entity cannot estimate reliably the fair value of the goods or services received, the entity shall measure their value, and the corresponding increase in equity, indirectly, by reference to the fair value of the equity instruments granted.
For share-based payment transactions among Group’s entities, in its separate or individual financial statements, the entity receiving the goods or services shall measure the goods or services received as either an equity-settled or a cash-settled share-based payment transaction by assessing:
(a) the nature of the awards granted, and
(b) its own rights and obligations. The entity receiving the goods or services shall measure the goods or services received as an equity-settled share-based payment transaction when:
(a) the awards granted are its own equity instruments, or
(b) the entity has no obligation to settle the share-based payment transaction.
In all other circumstances, the entity receiving the goods or services shall measure the goods or services received as a cash-settled share-based payment transaction.
The entity settling a share-based payment transaction when another entity in the Group receives the goods or services shall recognise the transaction as an equity-settled share-based payment transaction only if it is settled in the entity’s own equity instruments. Otherwise, the transaction shall be recognised as a cash-settled share-based payment transaction. Inflation accounting
If an economy in which a Group’s subsidiary operates is considered to be hyperinflationary as defined by IAS 29, Financial Reporting in Hyperinflationary Economies, than this subsidiary applies IAS 29. The standard requires that the financial statements prepared in the currency of a hyperinflationary economy shall be stated in terms of the measuring unit current at the reporting date. Foreign currency translation
Each Group member determines its own functional currency and items included in the financial statements of each entity are measured using that functional currency. Transactions in foreign currencies are initially recorded in the functional currency equivalent, translated at the rate of exchange at the date of the transaction. Monetary assets and liabilities denominated in foreign currencies are retranslated at the functional currency rate of exchange ruling at the reporting date. Gains and losses resulting from the translation of foreign currency transactions are recognised in the income statement as foreign exchange translation gains less losses. Non-monetary items that are measured in terms of historical cost in a foreign currency are translated using the exchange rates at the dates of the initial transactions. Non-monetary items measured at fair value in a foreign currency are translated using the exchange rates at the date when the fair value was determined.
These financial statements are presented in Russian roubles (RUR), the national currency of the Russian Federation, where the Bank is domiciled. As at the reporting date, the assets and liabilities of the entities whose functional currency is different from the presentation currency of the Group and is not a currency of hyperinflationary economy, are translated into RUR at the closing rate of exchange at the reporting date and their income statements are translated into RUR at the average exchange rates for the reporting period.

VTB BANK NOTES TO THE CONSOLIDATED FINANCIAL STATEMENTS 31 DECEMBER 2020 (CONTINUED)
138
56. SUMMARY OF PRINCIPAL ACCOUNTING POLICIES (CONTINUED) Foreign currency translation (continued)
The exchange differences arising on the translation are recognised in other comprehensive income in a separate component of equity (‘Currency translation difference’). Exchange differences arising on monetary items due from the foreign subsidiaries that form part of the Bank’s net investment in a foreign operation are recognised initially in other comprehensive income and reclassified from equity to profit or loss on disposal of the net investment. If the entity’s functional currency is a currency of hyperinflationary economy, all amounts (assets, liabilities, equity items, income and expenses) of these entities are translated into RUR at the closing rate of exchange at the reporting date; and, before applying this translation method, the entity restates its financial statements in accordance with IAS 29 (see above ‘Inflation accounting’), except for comparative amounts that are translated into RUR. Differences which arise each period between the closing equity items of the previous year and the opening equity items of the current year presented in RUR are recognised as an ‘Effect of translation, net of tax’ in other comprehensive income, as to the related equity items. The remaining exchange differences arising on the consolidation are recognised in other comprehensive income as a separate component of equity (‘Currency translation difference’). On disposal of a subsidiary, an associate or a joint venture, whose functional currency is different from the presentation currency of the Group, the deferred cumulative amount recognised in equity relating to that particular entity is reclassified to the income statement. Fiduciary assets
Assets held by the Group in its own name, but for the account of third parties, are not reported in the consolidated statement of financial position.
Commissions received from such operations are shown within fee and commission income in the consolidated income statement. Segment reporting
An operating segment is a distinguishable component of the Group that is engaged in business activities from which it may earn revenues and incur expenses (including revenues and expenses relating to transactions with other components of the same entity), whose operating results are regularly reviewed by the Group’s chief operating decision maker to make decisions about resources to be allocated to the segment and assess its performance, and for which discrete financial information is available. Segments with a majority of revenue earned from sales to external customers and whose revenue, net profit (loss) or combined assets are ten percent or more of all the segments are reported separately (reportable segments). The segments, that are below the above materiality thresholds, but can be aggregated on the basis of their activities, production processes, products or services, should be tested for the meeting the criteria of reportable segments on these aggregated amounts. In accordance with IFRS 8, Operating Segments, the
Group defined as the operating segments its global business lines. Segment disclosure is presented on the basis of IFRS compliant data of the global business lines and entities adjusted, where necessary, for intersegment reallocation. Presentation of statement of financial position in order of liquidity
The Group does not have a clearly identifiable operating cycle and therefore does not present current and non-current assets and liabilities separately in the statement of financial position. Instead, assets and liabilities are presented in order of their liquidity in accordance with common banking practice.
57. ADOPTION OF NEW AND REVISED STANDARDS The following amended standards and interpretations became effective from 1 January 2020, but did not have any material impact on the Group:
Amendments to the Conceptual Framework for Financial Reporting (issued on 29 March 2018 and effective for annual periods beginning on or after 1 January 2020);
Definition of a business – Amendments to IFRS 3 (issued on 22 October 2018 and effective for acquisitions from the beginning of annual reporting period that starts on or after 1 January 2020);
Definition of material – Amendments to IAS 1 and IAS 8 (issued on 31 October 2018 and effective for annual periods beginning on or after 1 January 2020);
“Interest rate benchmark reform” – Amendments to IFRS 9, IAS 39 and IFRS 7 (issued on 26 September 2019 and effective for annual periods beginning on or after 1 January 2020).
VTB BANK NOTES TO THE CONSOLIDATED FINANCIAL STATEMENTS 31 DECEMBER 2020 (CONTINUED)
139
58. NEW ACCOUNTING PRONOUNCEMENTS Certain new standards and interpretations have been issued that are mandatory for the Group’s annual accounting periods beginning on or after 1 January 2021 or later and which the Group has not early adopted: IFRS 17 Insurance Contracts issued in May 2017 is mandatorily effective for annual reporting periods beginning on or after 1 January 2021. IFRS 17 will replace IFRS 4 Insurance Contracts. IFRS 17 covers recognition and measurement, presentation and disclosure of insurance contracts and applies to all types of insurance contracts, regardless of the type of entities that issue them, as well as to certain guarantees and financial instruments with discretionary participation features. IFRS 17 provides a comprehensive model for insurance contracts, covering all relevant accounting aspects. The general model is supplemented by:
A specific adaptation for contracts with direct participation features (the variable fee approach);
A simplified approach (the premium allocation approach) mainly for short-duration contracts.
The standard includes specific guidance on measurement and presentation for insurance contracts with participation features. The Group is currently assessing the impact of IFRS 17 on its consolidated financial statements in part of activity of subsidiary non-state pension funds. Amendment to IFRS 9 Financial Instruments – Fees in the ’10 per cent’ test for derecognition of financial liabilities clarifies the fees that an entity includes when
assessing whether the terms of a new or modified financial liability are substantially different from the terms of the original financial liability. These fees include only
those paid or received between the borrower and the lender, including fees paid or received by either the borrower or lender on the other’s behalf. An entity applies the amendment to financial liabilities that are modified or exchanged on or after the beginning of the annual reporting period in which the entity first applies the amendment. The amendment is effective for annual reporting periods beginning on or after 1 January 2022. The Group will apply the amendments to financial liabilities that are modified or exchanged on or after the beginning of the annual period in which it will first apply the amendment and does not expect this will result in a material impact on its consolidated financial statements. Amendments to IFRS 9, IAS 39 IFRS 7, IFRS 4 and IFRS 16 – Interest Rate Benchmark Reform – Phase 2 (“IBOR reform Phase 2”) issued in August 2020 to address the accounting issues which arise upon the replacement of an IBOR with a risk-free-rate (“RFR”). IBOR reform Phase 2 includes a number of reliefs and additional disclosures. The reliefs apply upon the transition of a financial instrument from an IBOR to RFR. Changes to the basis for determining contractual cash flows as a result of IBOR reform are required as a practical expedient to be treated as changes to a floating interest rate, provided that, for the financial instrument, the transition from the IBOR benchmark rate to RFR takes place on an economically equivalent basis. The amendments are effective for annual reporting periods beginning on or after 1 January 2022. Unless otherwise described above, the new standards and interpretations are not expected to affect significantly the Group’s consolidated financial statement.
59. CHANGES IN PRESENTATION AND CORRECTION Starting 2020, the Group presents Expenses from write-down of property held for sale in the ordinary course of business as a separate line in the accompanying consolidated income statement. The effects of the changes for the year ended 31 December 2019 were as follows:
As previously reported Reclassification
As reclassified
Consolidated income statement Cost of sales and other expenses from other non-banking activities (93.2) 6.2 (87.0) (Expenses from) / reversal of write-down of property held for sale in the
ordinary course of business – (6.2) (6.2) Note 12 Cost of sales and other expenses from other non-banking
activities Impairment / (reversal of impairments) of other assets related to non-
banking activities 6.6 (6.2) 0.4 Expenses from write-down of property held for sale and impairment /
(reversal of impairment) for other assets related to non-banking activities – 6.2 6.2

VTB BANK NOTES TO THE CONSOLIDATED FINANCIAL STATEMENTS 31 DECEMBER 2020 (CONTINUED)
140
59. CHANGES IN PRESENTATION AND CORRECTION (CONTINUED) In the fourth quarter 2020 the Group separated commission and non-commission components in certain operating income and expenses. Accordingly the presentation of the comparative figures for the year ended 31 December 2019 has been adjusted to be consistent with the new presentation. The effects of the changes for the year ended 31 December 2019 were as follows:
As previously reported Reclassification
As reclassified
Consolidated income statement Net fee and commission income 108.5 13.1 121.6 Gains net of losses / (losses net of gains) arising from foreign
currencies and precious metals (25.6) (9.9) (35.5) Other operating expense (19.0) (3.2) (22.2) Consolidated statement of cash flows (Losses)/gains incurred on dealing in foreign currency (96.5) (9.9) (106.4) Fees and commissions received 160.0 9.9 169.9 Fees and commissions paid (58.4) 3.2 (55.2) Other operating expenses paid (8.9) (3.2) (12.1) Note 12 Net fee and commission income Total fee and commission income 166.3 9.9 176.2 Commission for client operations with foreign currency and precious metals – 9.9 9.9 Total fee and commission expense (57.8) 3.2 (54.6) Commission on settlement transactions and trade finance (50.0) 3.2 (46.8) Note 8 Gains net of losses / (losses net of gains) arising from
foreign currencies and precious metals (Losses net of gains)/gains net of losses arising from dealing in foreign
currencies and precious metals (131.0) (9.9) (140.9) non-derivative financial assets 1.6 (9.9) (8.3)
Note 15 Other operating expense Expenses related to plastic cards' issue and servicing 1.7 3.2 4.9