Embed Size (px)
Citation preview

1
=
Report to the Meeting of the Oxfordshire and
Buckinghamshire Mental Health NHS Foundation Trust Board of Directors
For Assurance
28 September 2011
Access and Diversity Assurance Report
Executive Summary This report provides an end of year summary of the evidence used to provide assurance of the Trust’s position against the Care Quality Commission’s (CQC) Essential Standards and the duty to publish data under equality legislation. Recommendation The Board is asked to confirm that it is assured of the Trust’s level of compliance with the CQC’s Essential Standards. The Board is asked to approve the Annual Report for Publication. Author and Title: Sarah Coleman (Equality and Diversity Officer) Lead Executive Director: Ros Alstead (Director of Nursing and Clinical Governance)
1. A risk assessment has been undertaken around the legal issues that this paper presents and there are no issues that need to be referred to the Trust Solicitors.
This paper provides evidence of compliance with CQC outcomes 1, 4,5,12, 13
PAPER BOD 132/2011
(Agenda item: 12)

2
Equality and Diversity Annual Report Introduction: This paper describes the activities undertaken during 2010/11, the last complete year on which we can report, comply the Care Quality Commissions Essential Standards. This report provides reasonable assurance to the Board of Directors that the compliance with those standards is met for the full year. . The Essential Standards Outcome 1 respecting and involving people who use services The registered person must take care to ensure that care and treatment is provided to service users with due regard to their age, sex, religious persuasion, sexual orientation, racial origin, cultural and linguistic background and any disability they may have. Outcome 4 Care and Welfare of people who use services The registered person must take proper steps to ensure that each service user is protected against the risks of receiving care or treatment that is inappropriate by avoiding any unlawful discrimination including, where applicable, by providing for the making of reasonable adjustments in service provisions to meet the service user’s individual needs. Outcome 5 Meeting Nutritional Needs Where food and hydration are provided to service users as a component of the carrying on of the regulated activity, the registered person must ensure that service users are protected from the risks of inadequate nutrition and dehydration, by means of provision of food and hydration that meet any reasonable requirements arising from a service user’s religious or cultural background. The Trust must also comply with the Equality Act 2010. This new duty provides protection for the following characteristics:
• Age • Disability • Gender reassignment • Pregnancy and maternity • Race – including ethnic or national origins, colour or nationality • Religion or belief – including lack of belief • Gender • Sexual orientation.
The Equality Act requires public bodies to have due regard to: the need to eliminate unlawful discrimination, harassment and victimisation, advance equality of opportunity between people who share a protected characteristic and people who do not share it, and foster good relations. The Equality Act 2010 came into effect on 1 October 2010. This Act provides a new cross-cutting legislative framework to protect the rights of individuals and advance equality of opportunity for all; to update, simplify and strengthen the previous legislation; and to deliver a simple, modern and accessible framework of discrimination law which protects individuals from unfair treatment and promotes a fair and more equal society.

3
Access from Service Users: Table 1 below shows the breakdown of the Trust’s patients during the Financial Year 2010 to 2011. The breakdown includes race, age and gender. There were consistently more female patients in both age and racial groups with the exception of the 0-18 age range where there were more male patients across a number of racial categories. Over all 53% of patients were female. It is well documented that women in the UK access mental health services in higher numbers in both primary and secondary care. It is pleasing that the numbers of men and women accessing the Trust’s services are not vastly different. This demonstrates that our service is accessible to both genders. Currently there are more patients from the 0-18 age range. However, this is largely due to the Trust providing Child and Adolescent Mental Health Services in Wiltshire and Bath and North East Somerset where other organisations provide mental health care for adults. All of the racial groups with the exception of White British access services in slightly higher numbers than would be expected from the 2001 census of the populations of Oxfordshire and Buckinghamshire. However, this is between approximately 0.5 to 1% and therefore the figures are not worrying for any one group. This difference may also be due to the out of date census data, which will be replaced next year with information from the 2011 census. Table 1 CLIENTS
0-18 19-35 36-65 65+ Grand Total ETHNIC_GROUP ETHNIC_CATEGORY F M F M F M F M
Asian or Asian British Any other Asian
background 18 27 20 21 15 17 10 3 131 Bangladeshi 2 5 7 2 16
Indian 10 7 23 20 31 20 8 4 123 Pakistani 26 21 73 88 68 56 11 10 353
Asian or Asian British Total 54 57 121 136 116 93 29 17 623 Black or Black British African 6 12 15 29 25 16 1 1 105
Any other Black background 5 8 12 17 8 31 2 1 84 Caribbean 5 15 19 33 34 50 19 15 190
Black or Black British Total 16 35 46 79 67 97 22 17 379
Mixed Any other mixed
background 43 48 16 25 20 13 7 2 174 White and Asian 15 22 11 17 6 4 1 1 77 White and Black
African 10 17 7 8 10 9 2 63 White and Black
Caribbean 39 59 21 30 19 14 4 6 192 Mixed Total 107 146 55 80 55 40 14 9 506 Not stated Not stated 760 837 750 531 770 696 403 225 4972
Not stated Total 760 837 750 531 770 696 403 225 4972
Other Ethnic Groups Any other ethnic
group 7 11 10 8 7 3 2 4 52 Chinese 10 2 11 4 8 5 4 44
Other Ethnic Groups Total 17 13 21 12 15 8 6 4 96
White Any other White
background 92 158 166 146 216 182 197 94 1251 British 3005 3644 2208 1946 2956 2664 3572 2106 22101 Irish 12 18 20 20 31 27 53 15 196
White Total 3109 3820 2394 2112 3203 2873 3822 2215 23548 Grand Total 4063 4908 3387 2950 4226 3807 4296 2487 30124

4
Interpreting Services Interpreting services are available 365 days a year for service users who do not speak English fluently or who are deaf or hard of hearing. The table below shows the uptake of services in Oxfordshire and Buckinghamshire from April 2010 to March 2011. Table 2 shows that 141 patients accessed face to face interpreters in the last financial year. This equates to approximately 0.5% of our patients. Guidance to using interpreters is available on the intranet for staff. In emergency situations or where a patient refuses to see a face to face interpreter there is a telephone service available. Table 2 Language Number of
Patients in Buckinghamshire
Number of Patients in Oxfordshire
Total
Punjabi 24 6 30 Urdu 20 6 26 Polish 7 6 13 Bengali 4 5 9 Albanian 2 2 Portuguese 2 5 7 Pashto 6 1 7 Cantonese 4 2 6 Arabic 5 5 Spanish 1 4 5 Russian 2 2 4 Mandarin 1 2 3 Vietnamese 3 3 Italian 3 3 French 1 1 2 Kurdish 2 2 German 2 2 Sylheti 1 1 Hindi 1 1 Lithuanian 1 1 Slovak 1 1 Serbian 1 1 Thai 1 1 Romanian 1 1 Moroccan Arabic
1 1
Hakka 1 1 Japanese 1 1 Farsi 1 1 Hindi 1 1 Total 84 57 141

5
Improvements to Equality and Diversity Interpreting Providers now secured across the whole Trust to provide face to face bilingual and deaf interpreting, as well as a phone line for bilingual interpreting. The Trust now also has access to British Sign Language Interpreting via webcam for emergency situations. Mandatory Training Mandatory training for Equality and Diversity is delivered at Trust induction to all staff. The course covers Equality legislation, protected characteristics, discrimination, harassment and bullying. The session is interactive and staff members are required to feedback and participate during the training. The session lasts for one hour. By the end of the financial year over eighty per cent of staff had received their mandatory training. Plans for 2011-12 include:
• Developing an online multiple choice test to ensure that staff have understood the training material and that they are up to date with the latest equality legislation.
• Providing extra training sessions to staff members who have joined the Trust following the integration of Community Health Oxfordshire.
Equality Impact Assessments (&training) The Trust is required to complete Equality Impact Assessments (EIAs) on all new policies and existing services. A new tool for completing the assessments was developed in May 2010. Three official training sessions for managers have taken place throughout the year as well as some individual sessions for those who have requested extra support. The EIA is attached to the policy prior to being ratified by committees. This ensures that they have been completed. In 2011 to 2012 training will be offered to committee members to ensure that they are able to quality assess the EIAs. Spiritual and pastoral care The Department of Spiritual and Pastoral Care has been piloting work with CMHTs across the Trust to improve access to spiritual and pastoral care for community patients. Members of the team have been attending CMHT business and clinical meetings to raise the profile of the importance of attending to the spiritual needs of patients. To simplify the referral process the department has introduced an e- referral system utilising the dedicated email address [email protected] . On October 10th a week long photographic exhibition will be held in the Warneford chapel which is a collaborative piece of work with Occupational Therapy at Fulbrook. The Warneford chapel continues to host yoga classes for patients and staff, art therapy, an older adult singing group, regular worship and a dedicated space for Muslim prayer. Cultural Competency Toolkit The Trust has a cultural competency toolkit which staff are advised to use when care planning with patients. This is a quick checklist which helps staff and patients assess whether there are any cultural or spiritual needs that will need consideration during the patient’s treatment. This has been well used in some wards. Work will be done to raise awareness of the toolkit across the organisation. BME Staff conference The NHS Trusts which operate in Oxfordshire worked together to put on a conference for Black and Minority Ethnic Staff which was held on 1 March 2011. The Conference was attended by over 70 members of NHS staff. The event followed the national initiative Breaking Through which addresses the national picture of less BME manager in the NHS. Following the day participants were invited to join a county wide BME network.
6
Personalisation Service users are involved in the development of and agreement to their care plan, which helps identify choices for treatment. CPA review meetings enable patients to review their care package and make choices about the next steps. CPA documentation has been reviewed to meet the needs of the new CPA guidelines. The table below shows the monthly audits of Oxfordshire and Buckinghamshire Adult and Older Adult Community Teams and Wards. The Trust has implemented the national Self Directed Support scheme in both Oxfordshire and Buckinghamshire. Self Directed Support gives service users a greater freedom on how to meet their needs by allowing them to have a budget for a care plan agreed with their care co-ordinator. This scheme gives greater freedom than Direct Payments as the service user is not restricted to traditional care provisions. Complaints and PALS Issues identified through contact with PALS & via complaints are routinely monitored at weekly meetings for themes, including those relating to equality target groups. No complaints cited discrimination or problems with access in the past financial year.

7
Employee Diversity statement Equal Opportunities The Trust has a commitment to the continued development of equal opportunity in employment and dignity at work. It is important that potential and existing employees are treated equitably and fairly and that the Trust continues to develop a diverse workforce that reflects the community it serves. The Equality Act 2010 On 6 April 2011 Provisions in the Equality Act 2010 related to positive action in recruitment and promotion were commenced. These voluntary provisions cover the use of positive action in matters of recruitment and employment and can be used by an employer to address under-representation or other forms of disadvantage within the workforce. Equality and Human Rights commission The new Equality and Human Rights Commission (EHRC) codes of practice on employment, services and equal pay, reflecting the Equality Act 2010 as commenced on 1 October 2010, came into force on 6 April 2011. They will replace five existing codes issued by the predecessor bodies to the EHRC. On 1 April 2011 the Trust began an integration process between the existing services and Oxford Community Health NHS Trust. Over the forthcoming year a priority for the combined Trust will be to integrate Human Resource Departments and determine Trust wide policies. Data collection for equal opportunities monitoring will be combined during the year and joint objectives established. Recruitment departments at Oxford Health NHS Foundation Trust have on an interim basis been kept separate, but there is a high level of co-working to ensure that posts across the whole organisation are equally available to all employees. Dignity at Work policy The Trust introduced a Dignity at Work policy in May 2010. This was an update from the previous Bullying and Harassment policy. The new policy aims to prevent incidences of bullying and harassment and encourage employees to take responsibility for their actions. The Trust aims to create and maintain a culture in which all employees are treated with dignity and respect in a supportive and positive working environment. Staff members can view this policy on our intranet. Ethnicity Monitoring Figure 1 below shows the ethnic background of staff employed at 31 March 2011 compared to the population of Oxfordshire and Buckinghamshire. The chart shows that the Trust is meeting its equal opportunity objective to have a diverse workforce that is largely representative of the community it serves. The Trust has improved the disclosure of ethnicity by employees from 96.7% at 31st December 2009 to 97.2% at 31st March 2011.

8
Figure 1
Ethnic Background of OBMH Staff vs Oxon and Bucks PopulationsStaff in Post as at 31st March 2011
2.02%
6.28%
0.52% 0.39% 0.46% 0.59%
2.54%
0.88%0.13%
1.43%2.02%
8.56%
0.36% 0.52%1.30%
0.00%
1.00%
2.00%
3.00%
4.00%
5.00%
6.00%
7.00%
8.00%
9.00%
Whit
e Iris
h
Whit
e Othe
r Whit
e
Mixed W
hite a
nd B
lack C
aribb
ean
Mixed W
hite a
nd B
lack A
frican
Mixed W
hite a
nd A
sian
Mixed O
ther M
ixed
Asian o
r Asia
n Briti
sh In
dian
Asian o
r Asia
n Briti
sh P
akist
ani
Asian o
r Asia
n Briti
sh B
angla
desh
i
Asian o
r Asia
n Briti
sh O
ther A
sian
Black o
r Blac
k Briti
sh B
lack C
aribb
ean
Black o
r Blac
k Briti
sh B
lack A
frican
Black o
r Blac
k Briti
sh O
ther B
lack
Other E
thnic
Group C
hines
e
Other E
thnic
Group
OBMH Staff in Post (HC)
Oxon & Bucks Population %
White British %:Oxon & Bucks population = 88.6%OBMH Staff = 72.01%
Based on Staff who stated Ethnicity (HC) = 3072
88 Staff did not state Ethnic Background
Figure 2
Ethnic Background of Staff Employed by Oxfordshire and Buckinghamshire Mental Health NHS Foundation Trust
as at 31st March 2011
Not Stated, 2.8%Other Ethnic Group,
1.8%
Black or Black British, 10.6%
Asian or Asian British, 4.8%
Mixed, 1.9%
White, 78.1%
Headcount = 3160
This ethnic group is Black and Black British which accounts for 10.6% of the workforce whilst in the local population this figure is 1.3%. Figure 3 shows that these employees are primarily in qualified and unqualified Nursing and also as support staff. This is representative of a national picture. It should also be noted that 16.1% of the Medics are from an Asian and Asian British ethnic group.

9
Figure 3 Ethnic Background by Staff Group
Staff Employed by Oxfordshire and Buckinghamshire Mental Health NHS Foundation Trust as at 31st March 2011
0.0%
10.0%
20.0%
30.0%
40.0%
50.0%
60.0%
70.0%
80.0%
90.0%
100.0%
Not Stated 2.8% 1.9% 0.8% 5.2% 3.1% 4.6% 2.8% 0.6% 1.5%
Other Ethnic Group 1.8% 0.0% 0.6% 2.2% 3.5% 3.6% 2.3% 0.0% 1.1%
Mixed 1.9% 1.9% 1.1% 1.5% 3.1% 1.5% 4.1% 1.2% 1.8%
Asian or Asian British 4.8% 2.8% 2.6% 3.8% 7.3% 4.6% 16.1% 1.9% 3.9%
Black or Black British 10.6% 1.9% 2.4% 23.6% 19.5% 10.2% 2.8% 0.6% 2.0%
White 78.1% 91.5% 92.6% 63.7% 63.5% 75.6% 71.9% 95.7% 89.7%
Grand TotalManagers and
Senior Managers
Admin & Estates
Qualified Nursing
Unqualified Nursing Support Staff Medical AHPs ST&T
106 5431622171974827873160 659
Recruitment by Ethnic group. During 2009 39% of the Trust’s total applicants were from minority ethnic groups with Asian or Asian British plus Black or Black British accounting for 34% of these. During the 12 months to 31st March 2011 41.7% of the applicants to the Trust were from minority ethnic groups with 17.3% of these from Asian or Asian British and Black or Black British. There has been a 20% in applicants of mixed ethnicity. Figure 4
Ethnic Background of Applicants for Employment Oxfordshire and Buckinghamshire Mental Health NHS Foundation Trust
12 months to 31st March 2011
White56.8%
Mixed22.1%
Asian or Asian British4.3%
Black or Black British13.0%
Other Ethnic Group2.3%
Not Stated1.6%
Based on 9981 applications received for 460 advertised vacancies
10
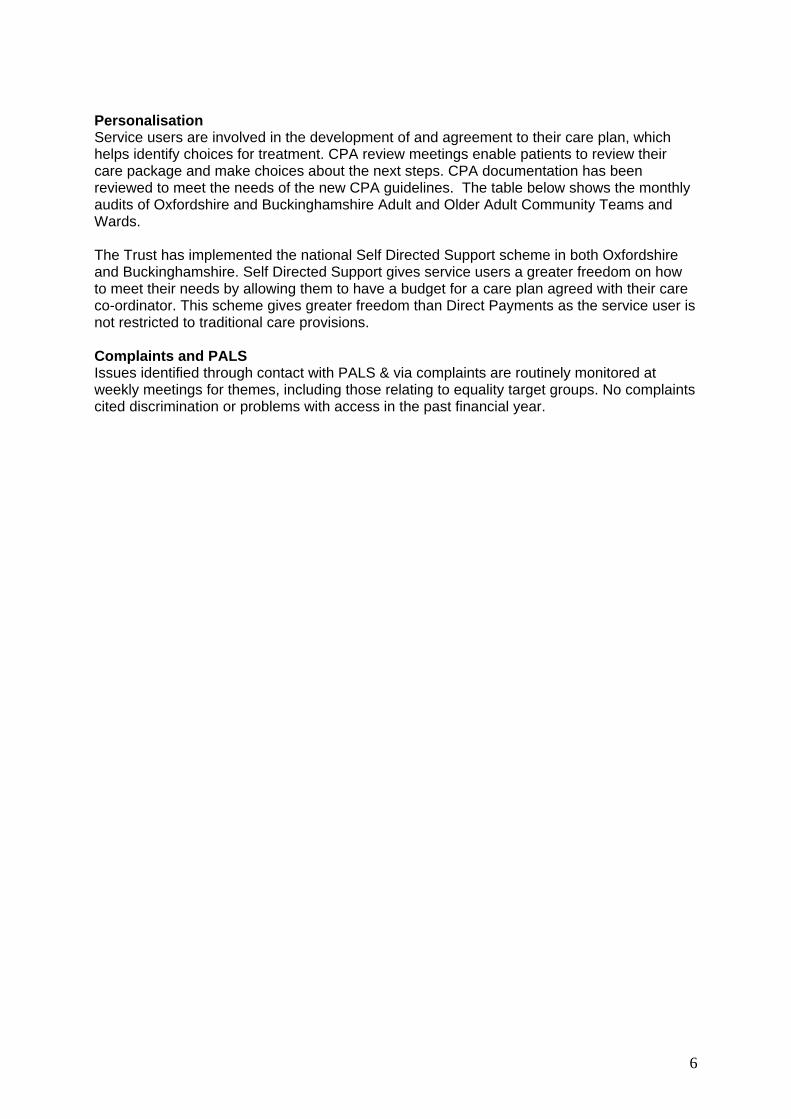
Figure 5
Ethnic Background of Shortlisted Candidates for Employment Oxfordshire and Buckinghamshire Mental Health NHS Foundation Trust
12 months to 31st March 2011
White63.1%
Mixed22.8%
Asian or Asian British3.0%
Black or Black British7.6%
Other Ethnic Group1.7%
Not Stated1.7%
Based on 2273 Shortlisted Candidates
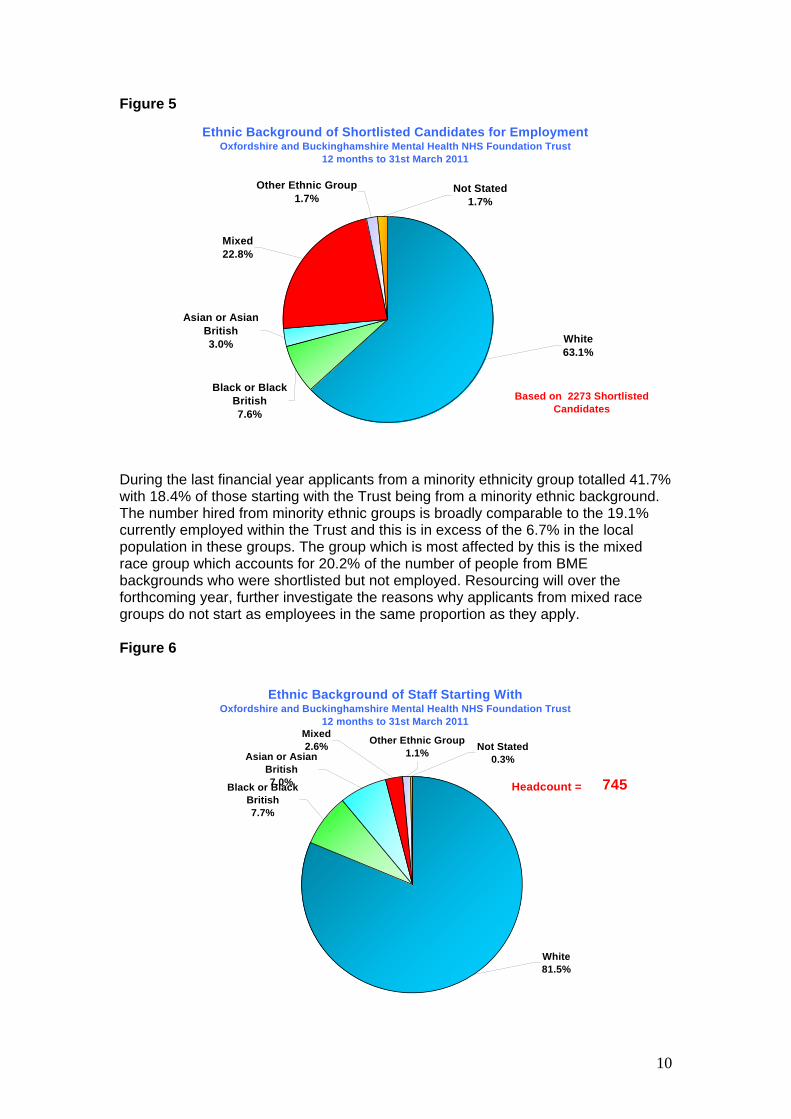
During the last financial year applicants from a minority ethnicity group totalled 41.7% with 18.4% of those starting with the Trust being from a minority ethnic background. The number hired from minority ethnic groups is broadly comparable to the 19.1% currently employed within the Trust and this is in excess of the 6.7% in the local population in these groups. The group which is most affected by this is the mixed race group which accounts for 20.2% of the number of people from BME backgrounds who were shortlisted but not employed. Resourcing will over the forthcoming year, further investigate the reasons why applicants from mixed race groups do not start as employees in the same proportion as they apply. Figure 6
Ethnic Background of Staff Starting WithOxfordshire and Buckinghamshire Mental Health NHS Foundation Trust
12 months to 31st March 2011
White81.5%
Mixed2.6%
Asian or Asian British7.0%Black or Black
British7.7%
Other Ethnic Group1.1% Not Stated
0.3%
Headcount = 745

11
Turnover by Ethnicity The Trust at 31st March 2011 employed 19.1% from minority ethnic groups. It is noted that 23.2% of leavers were from these groups. The Asian and Asian British and mixed ethnicity groups have a higher leaving rate compared to the percentage employed. Figure 7
Ethnic Background of Staff LeavingOxfordshire and Buckinghamshire Mental Health NHS Foundation Trust
12 months to 31st March 2011
White75.5%
Mixed3.6%
Asian or Asian British8.2%
Black or Black British9.9%
Other Ethnic Group1.5%
Not Stated1.3%
Headcount = 534
Figure 8
12 Monthly Turnover % by Ethnic BackgroundOxfordshire and Buckinghamshire Mental Health NHS Foundation Trust
12 months to 31st March 2011
11.412.8
9.2
15.5
5.9 5.6
11.3
0.00
2.00
4.00
6.00
8.00
10.00
12.00
14.00
16.00
18.00
White Black or BlackBritish
Asian or AsianBritish
Mixed Other EthnicGroup
Not Stated Total Trust
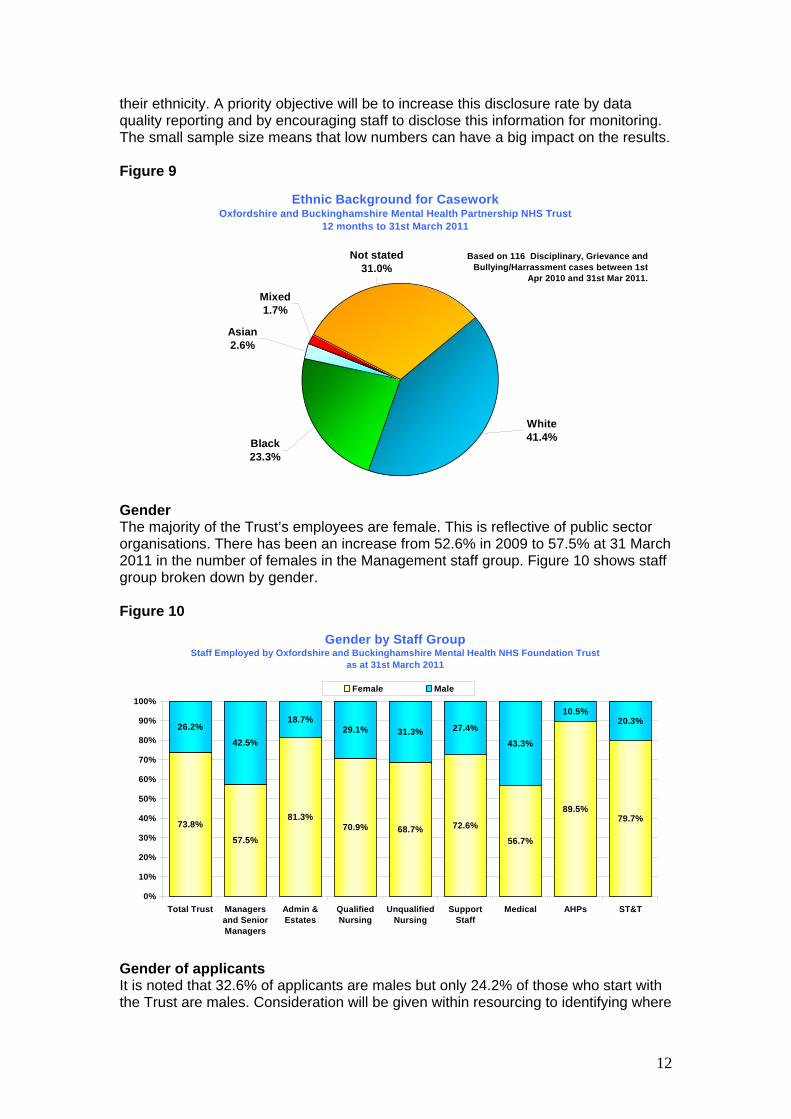
Casework by Ethnicity In reviewing the 166 cases it is noted that there are more cases from Black ethnic groups than would be expected compared to the 10.6% of staff employed of this ethnicity. Cases from white ethnic groups are lower than expected compared to the 78.1% employed of this ethnicity. However 31% of staff members have not stated
12
their ethnicity. A priority objective will be to increase this disclosure rate by data quality reporting and by encouraging staff to disclose this information for monitoring. The small sample size means that low numbers can have a big impact on the results. Figure 9
Ethnic Background for Casework Oxfordshire and Buckinghamshire Mental Health Partnership NHS Trust
12 months to 31st March 2011
White41.4%
Mixed1.7%
Asian2.6%
Black23.3%
Not stated31.0%
Based on 116 Disciplinary, Grievance and Bullying/Harrassment cases between 1st
Apr 2010 and 31st Mar 2011.
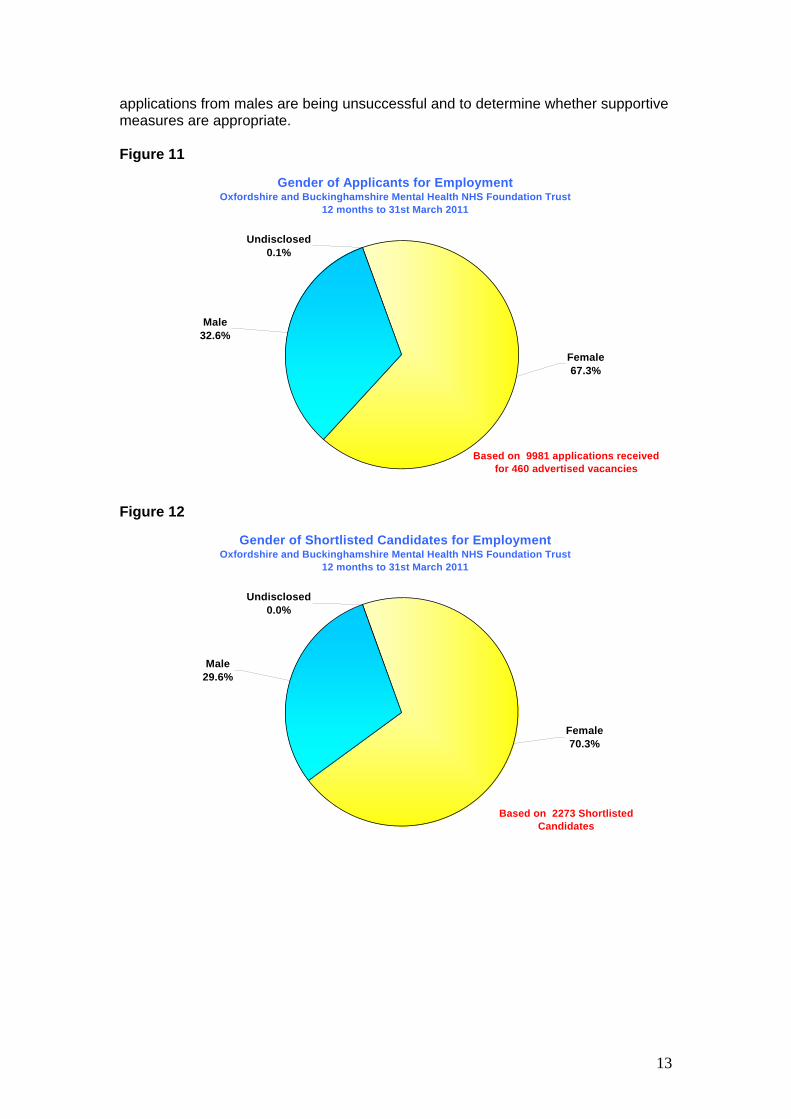
Gender The majority of the Trust’s employees are female. This is reflective of public sector organisations. There has been an increase from 52.6% in 2009 to 57.5% at 31 March 2011 in the number of females in the Management staff group. Figure 10 shows staff group broken down by gender. Figure 10
Gender by Staff GroupStaff Employed by Oxfordshire and Buckinghamshire Mental Health NHS Foundation Trust
as at 31st March 2011
73.8%
57.5%
81.3%70.9% 68.7% 72.6%
56.7%
89.5%79.7%
26.2%
42.5%
18.7%29.1% 31.3% 27.4%
43.3%
10.5%20.3%
0%
10%
20%
30%
40%
50%
60%
70%
80%
90%
100%
Total Trust Managersand SeniorManagers
Admin &Estates
QualifiedNursing
UnqualifiedNursing
SupportStaff
Medical AHPs ST&T
Female Male
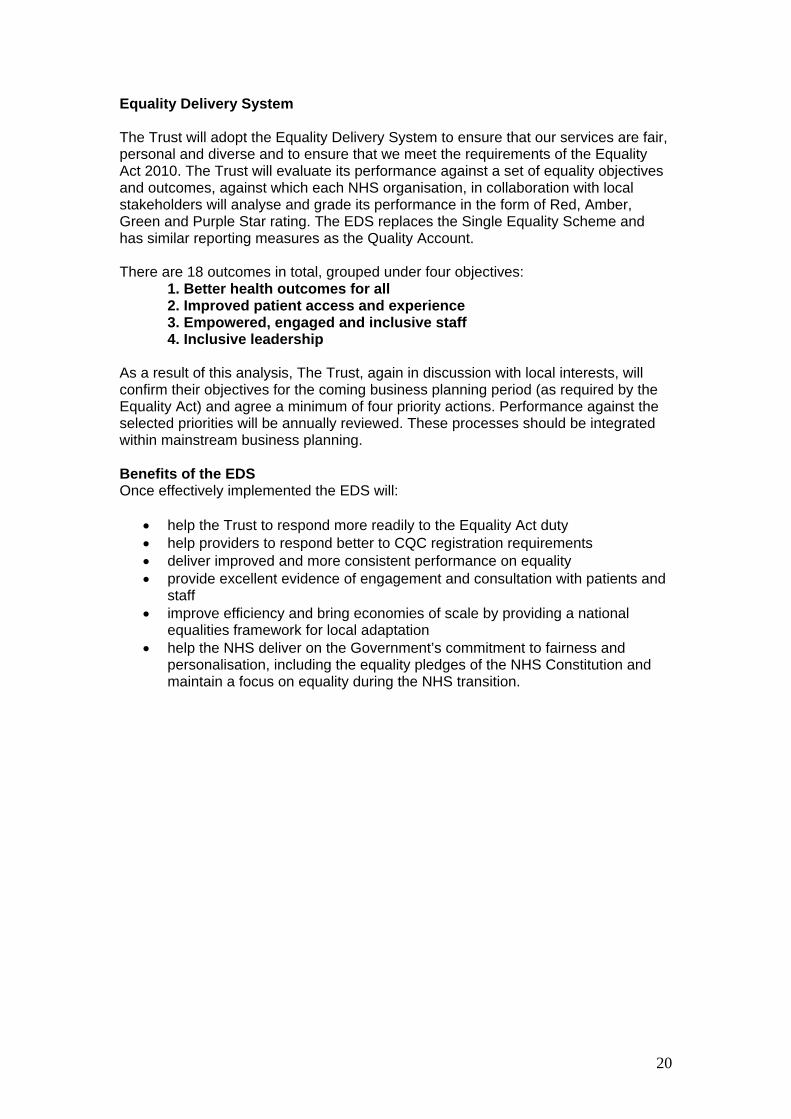
Gender of applicants It is noted that 32.6% of applicants are males but only 24.2% of those who start with the Trust are males. Consideration will be given within resourcing to identifying where
13
applications from males are being unsuccessful and to determine whether supportive measures are appropriate. Figure 11
Gender of Applicants for Employment Oxfordshire and Buckinghamshire Mental Health NHS Foundation Trust
12 months to 31st March 2011
Male32.6%
Undisclosed0.1%
Female67.3%
Based on 9981 applications received for 460 advertised vacancies
Figure 12
Gender of Shortlisted Candidates for Employment Oxfordshire and Buckinghamshire Mental Health NHS Foundation Trust
12 months to 31st March 2011
Male29.6%
Undisclosed0.0%
Female70.3%
Based on 2273 Shortlisted Candidates

14
Figure 13 Starters and Leavers by Gender
Oxfordshire and Buckinghamshire Mental Health NHS Foundation Trust 12 months to 31st March 2011
0.0%
10.0%
20.0%
30.0%
40.0%
50.0%
60.0%
70.0%
80.0%
Female 75.8% 72.5%Male 24.2% 27.5%
12 Monthly Starters 12 Monthly Leavers
Casework by Gender Casework during the year to shows a higher proportion of males than would be expected when compared with the number employed by the Trust. Priority will be given during the forthcoming year to breaking down the casework statistics. This will further identify whether there are particular areas that are generating a gender difference and where appropriate methods of addressing this. Figure 14
Gender for Casework Oxfordshire and Buckinghamshire Mental Health NHS Foundation Trust
12 months to 31st March 2011
47.4%52.6%
26.2%
73.8%
0.0%
10.0%
20.0%
30.0%
40.0%
50.0%
60.0%
70.0%
80.0%
Female Male
Trust Profile CaseworkBased on 116 Disciplinary, Grievance and Bullying/Harrassment
cases between 1st Apr 2010 and 31st Mar 2011.
Age profile within the Trust From the 1 April 2011 the Trust has revised the retirement policy to remove the retirement age. This becomes effective for employees reaching age 68 after 1st

15
October 2011. This will enable employment of those in the over 60 age band to increase and thus benefit the Trust through the skills and experience they bring. Figure 15
Age Band of Staff Employed byOxfordshire and Buckinghamshire Mental Health NHS Foundation Trust
as at 31st March 2011
Under 3016.7%
50-5923.1%
40-4927.9%
30-3924.8%
Over 607.5%
Headcount = 3160
Figure 16
Age Band by Staff GroupOxfordshire and Buckinghamshire Mental Health NHS Foundation Trust
as at 31st March 2011
0.0%
10.0%
20.0%
30.0%
40.0%
50.0%
60.0%
70.0%
80.0%
90.0%
100.0%
Over 60 7.5% 4.7% 11.2% 4.3% 7.7% 11.7% 4.1% 8.0% 6.4%
50-59 23.1% 25.5% 30.5% 24.0% 15.6% 25.4% 18.9% 17.9% 21.7%
40-49 27.9% 45.3% 23.4% 34.1% 22.2% 23.9% 29.5% 30.2% 26.9%
30-39 24.8% 21.7% 18.2% 28.1% 22.6% 20.3% 41.0% 23.5% 26.3%
Under 30 16.7% 2.8% 16.7% 9.5% 32.0% 18.8% 6.5% 20.4% 18.6%
Total TrustManagers and
Senior Managers
Admin & Estates
Qualified Nursing
Unqualified Nursing Support Staff Medical AHPs ST&T
Recruitment by age band Staff members under the age of 30 accounts for 16.7% of the total employees employed at 31 March 2011. It is noted that this age group is more mobile with 44.2% of the applicants to the Trust coming from this age group and 33.3% of those starting with the Trust are of this age band. The Trust also has a higher number in this age group leaving the organisation at 28.8%.Throughout the Trust initiatives at reducing employee turnover are yielding benefits in retaining experienced employees.

16
Figure 17
Age Band of Applicants for Employment Oxfordshire and Buckinghamshire Mental Health NHS Foundation Trust
12 months to 31st March 2011
Under 3044.2%
50-599.2%
40-4920.2%
30-3925.6%
Over 600.8%
Based on 9981 applications received for 460 advertised vacancies
Figure 18
Age Band of Shortlisted Candidates for Employment Oxfordshire and Buckinghamshire Mental Health NHS Foundation Trust
12 months to 31st March 2011
Under 3034.2%
50-5911.5%
40-4925.4%
30-3928.0%
Over 600.9%
Based on 2273 Shortlisted Candidates
Age band of applicants commencing employment with the Trust The Trust has fewer applicants that are aged 50 or over. However, their experience is highly valued in the Trust and the proportion employees starting with the Trust is greater than the proportion of those applying. Applications from those aged 50 to 60 accounts for 9.2% with the proportion of employees starting with the Trust in this age group being 16%. Applications from those aged over 60 accounts for 0.8% with the proportion of employees starting with the Trust in this age group being 4.6%. There were more people employed in the over 60 age group than applied for positions. This

17
is due to the transfer of staff in this age band from Wiltshire when we began providing services in this area. Figure 19
Age Band of Staff Starting With Oxfordshire and Buckinghamshire Mental Health NHS Foundation Trust
12 months to 31st March 2011
Under 3033.3%
50-5916.0%
40-4920.8%
30-3925.4%
Over 604.6%
Headcount = 745
Age band of employees leaving the Trust It is noted that there are significantly more staff leaving at age 60 or over than commencing due to the effect of retirement. Figure 20
Age Band of Staff of Staff LeavingOxfordshire and Buckinghamshire Mental Health NHS Foundation Trust
12 months to 31st March 2011
Under 3028.8%
50-5915.4%
40-4916.5%
30-3924.3%
Over 6015.0%
Headcount = 534
Disability status within the Trust The chart below shows the people who have indicated that they have a disability. There is concern that 38.2% of employees do not disclose whether they do or do not

18
have a disability. The Trust will continue to encourage employees to identify any disability. Figure 21
Disability Status of Staff Employed byOxfordshire and Buckinghamshire Mental Health NHS Foundation Trust
as at 31st March 2011
No59.9%
Undisclosed38.2%
Yes1.9%
Headcount = 3160
Religious belief of employees The chart below shows the religious beliefs of employees. There is concern that 43.5% of employees are undefined or do not wish to disclose their religious belief. Figure 22
Religious Belief of Staff Employed byOxfordshire and Buckinghamshire Mental Health NHS Foundation Trust
as at 31st March 2011
Christianity37.6%
Other6.9%
Atheism7.9%
Undefined25.7%
Islam1.8%
Hinduism1.2%
Buddhism0.6%
Sikhism0.2%
I do not wish to disclose my religion/belief
17.8%
Judaism0.3% 3160Headcount =
Sexual orientation of employees

19
Figure 23 below shows the sexual orientation of employees. There is concern that 43.4% of employees are undefined or do not wish to disclose their sexual orientation. Figure 23
Sexual Orientation of Staff Employed byOxfordshire and Buckinghamshire Mental Health NHS Foundation Trust
as at 31st March 2011
Undefined27.7%
I do not wish to disclose my sexual
orientation15.7%
Bisexual0.4%
Gay0.3%
Lesbian0.3% Heterosexual
55.5%
3160Headcount =
Equality Delivery System As part of the development of the Equality Delivery System the Human Resources Department will review the actions in this report. The information will be published by January 2012 and then assessed. From this data the Trust will identify priorities to work on and actions will be identified. Those areas that have been highlighted here will be closely monitored to assess the reasons for any apparent inequalities and areas of concern will be addressed in more detail by the working group.
20
Equality Delivery System The Trust will adopt the Equality Delivery System to ensure that our services are fair, personal and diverse and to ensure that we meet the requirements of the Equality Act 2010. The Trust will evaluate its performance against a set of equality objectives and outcomes, against which each NHS organisation, in collaboration with local stakeholders will analyse and grade its performance in the form of Red, Amber, Green and Purple Star rating. The EDS replaces the Single Equality Scheme and has similar reporting measures as the Quality Account. There are 18 outcomes in total, grouped under four objectives:
1. Better health outcomes for all 2. Improved patient access and experience 3. Empowered, engaged and inclusive staff 4. Inclusive leadership
As a result of this analysis, The Trust, again in discussion with local interests, will confirm their objectives for the coming business planning period (as required by the Equality Act) and agree a minimum of four priority actions. Performance against the selected priorities will be annually reviewed. These processes should be integrated within mainstream business planning. Benefits of the EDS Once effectively implemented the EDS will:
• help the Trust to respond more readily to the Equality Act duty • help providers to respond better to CQC registration requirements • deliver improved and more consistent performance on equality • provide excellent evidence of engagement and consultation with patients and
staff • improve efficiency and bring economies of scale by providing a national
equalities framework for local adaptation • help the NHS deliver on the Government’s commitment to fairness and
personalisation, including the equality pledges of the NHS Constitution and maintain a focus on equality during the NHS transition.

21
Action Plan Action Date Responsibility Implement a Trust wide interpreting service
April-June 2011 Sarah Coleman
Review length of mandatory training and add in Equality Act Requirements
April 2011 Sarah Coleman
Implementation of specific training for reasonable adjustments for people with learning disabilities
June 2011 Wendy Howard, Ros Alstead
Ensuring information provided by the Trust is accessible
September –December 2011
Sarah Coleman, Wendy Howard, Ros Alstead
Oxfordshire and Buckinghamshire NHS organisations to hold open meetings to raise awareness and inform the public about the EDS
September/October 2011
Sarah Coleman in partnership with other organisations.
Create EDS working group
September 2011 Ros Alstead, Sarah Coleman
Update Diversity Strategy to incorporate the EDS and changes to services
March 2012 Sarah Coleman
Publish data and Trust assessment against EDS objectives
January 2011 EDS working group
Publish EDS Action plan March 2012 EDS working group