Embed Size (px)
Citation preview

2CS E C T I O N
Outpatient dialysis services

R E C O M M E N D A T I O N S
2C-1 The Congress should update the composite rate in calendar year 2007 by the projected rate of increase in the end-stage renal disease market basket index less half the Commission’s expectation for productivity growth.
COMMISSIONER VOTES: YES 15 • NO 0 • NOT VOTING 0 • ABSENT 2
. . . . . . . . . . . . . . . . . . . . . . . . . . . . . . . . . . . . . . . . . . . . . . . . . . . . . . . . . . . . . . . . . . . . . . . . . . . .
2C-2 The Congress should direct the Secretary to: eliminate differences in paying for composite rate services between hospital-based and freestanding dialysis facilities; and combine the base composite rate and the add-on adjustment.
COMMISSIONER VOTES: YES 15 • NO 0 • NOT VOTING 0 • ABSENT 2

105 R epo r t t o t h e Cong r e s s : Med i ca r e Paymen t P o l i c y | Ma r ch 2006
Outpatient dialysis services
Section summary
Each year, the Commission makes a payment update recommendation
for outpatient dialysis services for the coming year. We first judge
whether payments for the current year (calendar year 2006) are
adequate by considering beneficiaries’ access to care, changes in
providers’ capacity, changes in the quality of care, providers’ access to
capital, changes in the volume of services, and Medicare’s payments
and costs for 2006.
Most of our indicators of payment adequacy are positive:
• Beneficiaries are not facing systematic problems in accessing care.
Our analysis suggests that facilities are not limiting care to certain
types of beneficiaries.
• Providers have sufficient capacity to meet patients’ demand, as
demonstrated by an increasing number of facilities and dialysis
treatment stations.
In this section
• Are Medicare payments adequate in 2006?
• How should Medicare payments change in 2007?
• Update and distributional recommendations
• Medicare payments for dialysis drugs changed in 2005
• The use of home dialysis is declining among dialysis patients
2CS E C T I O N

106 Ou tpa t i e n t d i a l y s i s s e r v i c e s : A s s e s s i ng paymen t adequacy and upda t i ng paymen t s
• The quality of care is improving for dialysis adequacy and anemia status.
However, vascular access and nutritional care are clinical areas needing
quality improvements. An important step in improving patient outcomes
is to broaden the payment bundle to include separately-billable drugs
and other services needed by dialysis patients, such as vascular access
services and nutritional management.
• The availability of private equity to fund acquisitions and increasing
trends in the number of dialysis facilities suggest that providers have
sufficient access to capital.
• Spending for dialysis treatments and dialysis drugs continues to grow.
Between 1996 and 2004, annual rates of spending for composite rate
services and dialysis drugs grew faster than the number of dialysis
patients.
• Between 1997 and 2003, per treatment costs for composite rate services
increased moderately, at a rate less than CMS’s market basket index for
dialysis services.
For this sector, we looked at the effect of using audited cost reports when
examining the appropriateness of current costs. The Congress mandated that
the Secretary audit cost reports of dialysis providers once every three years.
We compared cost per treatment calculated from audited and unaudited 2001
cost reports from the same providers. We find that providers’ allowable costs
are 94.5 percent of reported costs and have applied this correction to the
costs of composite rate services for facilities whose 2003 cost reports are not
yet settled by CMS. We do not correct the costs of other providers because
this information is not generally available for them. There is no statutory
requirement that CMS regularly audit the cost reports of other providers who
submit cost reports to the agency.
The Medicare margin for composite rate services and dialysis drugs was 2.4
percent in 2003. The Deficit Reduction Act of 2005 increases the composite
rate by 1.6 percent in 2006. We project the Medicare margin for composite

107 R epo r t t o t h e Cong r e s s : Med i ca r e Paymen t P o l i c y | Ma r ch 2006
rate services and dialysis drugs will be –0.3 percent in 2006 assuming
facilities achieve a 6 percent average margin for drugs and –1.7 percent in
2006 assuming facilities achieve a 2 percent margin for drugs. We believe
that given the design of the payment system, the long-run profit margin will
be 6 percent. The industry is transitioning to the new payment system in
2006, which might result in lower profits in the short term.
In summary, most of our indicators of payment adequacy are positive.
Nonetheless, the Commission is concerned about the trend in Medicare
margins. Balancing these considerations, the recommendation is to update
the composite rate in 2007 by the projected rate of increase in the end-stage
renal disease market basket less half of the Commission’s expectation for
productivity growth.
In addition to updating the composite rate, the Commission reiterates its
recommendation to improve the distribution of payments for composite
rate services (MedPAC 2005a). The Congress should eliminate differences
in paying for composite rate services between freestanding and hospital-
based facilities and should combine the base composite rate and the add-
on payment. Doing so is consistent with the principle of paying the costs
incurred by efficient providers who furnish appropriate care, regardless of
the care setting. It is also consistent with CMS’s recent action to use the same
method to pay for dialysis drugs provided by both facility types in 2006.
The Congress should update the composite rate in calendar year 2007 by the projected rate of increase in the end-stage renal disease market basket index less half the Commission's expectation for productivity growth.
Recommendation 2C-1
COMMISSIONER VOTES:
YES 15 • NO 0 • NOT VOTING 0 • ABSENT 2
The Congress should direct the Secretary to: eliminate differences in paying for composite rate services between hospital-based and freestanding dialysis facilities; and combine the base composite rate and the add-on adjustment.
Recommendation 2C-2
COMMISSIONER VOTES:
YES 15 • NO 0 • NOT VOTING 0 • ABSENT 2

108 Ou tpa t i e n t d i a l y s i s s e r v i c e s : A s s e s s i ng paymen t adequacy and upda t i ng paymen t s
Following the update and distribution recommendations, we summarize the
changes in payment for dialysis drugs in 2005 and discuss providers’ ability
to purchase them at the Medicare payment rate. This analysis suggests that
Medicare’s payment for the top 10 drugs together was, on average, greater
than providers’ acquisition cost in 2005. However, this analysis cannot speak
to providers’ ability to purchase any individual drug at less than Medicare’s
payment rate.
We conclude this chapter by examining factors that may be influencing
the use of home dialysis. Researchers report that clinical and nonclinical
factors may influence a patient selecting in-center hemodialysis versus
home dialysis. We also discuss the various Medicare policies that affect the
coverage and payment of home dialysis. We plan to continue to analyze this
topic in future work. �

109 R epo r t t o t h e Cong r e s s : Med i ca r e Paymen t P o l i c y | Ma r ch 2006
Background
End-stage renal disease (ESRD) is a chronic illness characterized by permanent kidney failure. ESRD patients include those who receive dialysis treatment—a process that removes wastes from the body—and those who have undergone kidney transplantation and have a functioning kidney transplant.1 Because of the limited number of kidneys available for transplantation, nearly three-quarters of all ESRD patients undergo dialysis.
The 1972 amendments to the Social Security Act extended Medicare benefits to people with ESRD who are eligible for Social Security benefits. This disease-specific entitlement is unique in Medicare. ESRD patients entitled to Medicare due to ESRD alone have the same benefits as other Medicare beneficiaries.
Medicare entitlement begins for most beneficiaries in the fourth month after the start of maintenance dialysis, except for patients who have undergone a kidney transplant or who receive training to perform dialysis at home. During the first three months, also known as the waiting period, the patient and other programs that the patient is eligible for (such as state Medicaid programs) are responsible for payment.
If an employer group health plan (EGHP) covers a patient when ESRD is diagnosed, then the EGHP is the primary payer for the first 33 months of care.2 Medicare is the secondary payer during this period. EGHPs include health plans that patients were enrolled in through their own employment or through a spouse’s or parent’s employment, before becoming eligible for Medicare due to ESRD.
In 2004, the Commission’s analysis shows that Medicare covered about 309,300 dialysis patients (either as a primary or secondary payer), nearly 93 percent of all such patients in the United States. About one-quarter of newly diagnosed ESRD patients were entitled to Medicaid benefits, and about one-quarter were covered by an EGHP (USRDS 2005).
Medicare’s policies for paying for outpatient dialysis services changed in 2005Beginning in 2005, the Medicare Prescription Drug, Improvement, and Modernization Act of 2003 (MMA) and regulations that CMS issued to implement the new law substantially changed the outpatient dialysis payments system by:
• paying the acquisition cost for separately billable dialysis drugs,
• shifting some of the profits previously associated with payments for separately billable drugs through an add-on payment to the prospective payment rate (called the composite rate) for outpatient dialysis services,
• adjusting the composite rate for differences in case mix, and
• updating the wage index and the definitions used to define the labor market areas.
However, the MMA does not change the two-part structure of the dialysis payment system—one, a prospective payment called the composite rate that covers the bundle of services routinely required for dialysis treatment and the other, separate payments for certain dialysis drugs that were not available when Medicare implemented the composite rate. Providers receive the composite rate for care provided in dialysis facilities (in-center) or in patients’ homes.
In calendar year 2006, the base composite rate for hospital-based facilities is $132—on average $4 more than that for freestanding facilities. (This difference stems from the Omnibus Budget Reconciliation Act of 1981, by which the Congress mandated separate rates for the two types of facilities.) In addition, CMS set the add-on payment at 14.7 percent of the composite rate for both freestanding and hospital-based facilities in 2006.
CMS will pay both provider types their acquisition cost—set at average sales price (ASP) plus 6 percent—for all separately billable drugs beginning in 2006. This change makes Medicare’s drug payment less profitable than before 2005, when the program paid either average wholesale price, reasonable cost, or a set (statutory) rate.
In 2004, Medicare spending for outpatient dialysis and drugs administered during dialysis totaled $7.6 billion for both freestanding and hospital-based facilities. Services paid for under the composite rate (referred to as composite rate services) accounted for about 58 percent of this total, and dialysis drugs accounted for the rest. On a per treatment basis, Medicare’s payment averaged $220 ($127 for composite rate services and $93 for dialysis drugs) with the beneficiary responsible for 20 percent of the payment. Medicare spending for composite rate services and dialysis drugs averaged about $25,000 per patient annually.

110 Ou tpa t i e n t d i a l y s i s s e r v i c e s : A s s e s s i ng paymen t adequacy and upda t i ng paymen t s
Are Medicare payments adequate in 2006?
The first question in applying the Commission’s approach for updating payments is whether the current level of Medicare payments for outpatient dialysis services is adequate. The Commission answers this question by looking at aggregate costs for composite rate services and dialysis drugs. We include the payments and costs for dialysis drugs because their use has increased significantly throughout the 1990s, and their effect on the financial performance of facilities is significant. Including these payments and costs gives a more accurate picture of the financial performance of dialysis providers and the adequacy of Medicare’s payments for dialysis services.
Most of our indicators of payment adequacy are positive. Beneficiaries are not facing systematic problems in accessing care, providers have sufficient capacity to meet demand and the number of facilities—particularly for profit—continues to increase, the volume of services is
increasing, quality is improving for some measures, and providers’ access to capital is good. Still, the Medicare margin for composite rate services and injectable drugs was 2.4 percent in 2003, and we project the Medicare margin will be –0.3 percent in 2006 assuming facilities achieve a 6 percent margin, on average, for drugs between 2005 and 2006 (which is consistent with Medicare’s payment of average sales price plus 6 percent) and –1.7 percent in 2006 assuming facilities achieve a 2 percent margin for drugs in 2006. These margin estimates include the 1.6 percent update of the composite rate in 2006 by the Deficit Reduction Act of 2005.
Beneficiaries’ access to careWe found no evidence of beneficiaries facing systematic problems in obtaining necessary care in 2004 and 2005 based on our review of websites and published literature. Facility closings tended to be linked to local issues, such as rising real estate prices and states’ certificate-of-need regulations.
Characteristics of beneficiaries vary somewhat according to the facility‘s business status in 2001 and 2002
Note: The 122 closed facilities are those that were open for business in 2001 but closed in 2002. The 3,752 facilities that remained in business are those that were open for business in 2001 and 2002. The 253 newly opened facilities are those that did not provide dialysis services until 2002. Patients may receive care from more than one facility. A total of 9,296 patients received care at closed facilities; 337,637 received care from facilities that remained in business; and 11,412 received care from facilities newly opened in 2002. We weighted results by the number of treatments patients received from each facility.
Source: Compiled by MedPAC from 2005 Renal Management Information System fi le (the number of dialysis treatments provided to each benefi ciary), 2001–2002 denominator fi les (benefi ciaries’ demographic characteristics and Medicaid eligibility status), 2000–2003 facility surveys, and 2003–2004 Compare database (facilities’ business status and characteristics) from CMS.
Per
cent
of
patien
ts t
reate
d
50
30
20
10
40
0
African American Female Elderly (age 75+ years) Medicaid
Newly opened facilities Closed facilitiesFacilities that remained in business
Patient characteristics
F IGURE2C–1

111 R epo r t t o t h e Cong r e s s : Med i ca r e Paymen t P o l i c y | Ma r ch 2006
Hurricanes Katrina and Wilma affected patients residing in the South, including Louisiana, Alabama, Mississippi, and Florida. CMS reported that Katrina affected about 6,000 dialysis patients and Wilma affected 7,300 patients (Clemons 2005). These patients are currently receiving care at reopened facilities or at other facilities. The American Kidney Fund’s Disaster Relief Program and other renal organizations are providing emergency financial assistance to these dialysis patients.
Access to in-center hemodialysis and home dialysis
Availability of specific types of in-center hemodialysis and modalities used in patients’ homes—peritoneal dialysis and home hemodialysis—shows little change over time. Between 1998 and 2005, at least 96 percent of all dialysis facilities offered in-center hemodialysis, while 45 percent offered some type of peritoneal dialysis—continuous cycler-assisted peritoneal dialysis (CCPD) or continuous ambulatory peritoneal dialysis (CAPD). In 2003 and 2005, about 12 percent of facilities offered home hemodialysis (these data are not available before 2003).
Nonetheless, fewer patients are receiving dialysis in their homes. The most recent data from the United States Renal Data System (USRDS) show that between 1996 and 2003, the number of patients receiving hemodialysis in facilities increased by 6 percent per year. By contrast, the number of patients treated at home (using peritoneal dialysis) declined by 2 percent per year.3 At the end of this chapter, we discuss some of the potential factors that may affect the use of home dialysis, such as the care patients receive prior to dialysis, physicians’ characteristics, patients’ clinical characteristics and preferences, and Medicare’s payment and coverage policies.
Do certain beneficiary groups face systematic problems in accessing care?
Besides monitoring the effect of local issues, we assessed whether specific groups of patients faced systematic problems accessing care. Previously, we found that facility closures may occur disproportionately in areas where a higher share of the population is African American (MedPAC 2005b). However, this finding was derived from an analysis of area-level data, which cannot provide direct information about the causality of a relationship.
Consequently, we compared the characteristics of patients treated by the 3,752 facilities that were open in 2001 and 2002 with those of patients treated in the 253 facilities that
newly opened in 2002 and the 122 facilities that closed in 2002.
Facilities that stayed in business in both years treated a greater proportion of patients who were African American or dually eligible for Medicaid compared with facilities that closed or were newly opened (Figure 2C-1). However, the characteristics of the patients treated by closed and newly opened facilities were similar—32 percent were African American, nearly half were female, nearly one-quarter were elderly, and 40 percent were dually eligible for Medicaid. In 2002, providers’ capacity to furnish care increased by 131 facilities and by about 2,000 hemodialysis stations (data not shown). These results together suggest that beneficiaries should not be experiencing problems accessing needed care.
The closures of the 122 facilities may be linked to their profitability, size, and economies of scale:
• The Medicare margin for closed facilities was –5.0 percent in 2001 but 4.1 percent for the facilities that remained in business. In addition, the average composite rate cost per treatment was 8 percent higher for closed facilities than for facilities that stayed in business.
• Compared with facilities that remained open, closed ones were smaller (12.5 versus 17.3 hemodialysis stations) and treated fewer patients (44 versus 74 patients, respectively). In addition, facilities that remained open were more productive: They provided 554 treatments per hemodialysis station compared with 462 treatments per station at closed facilities.
Our findings do not suggest that closures are linked to the share of Medicare treatments a facility provided to patients for whom Medicare was the primary payer. Closed facilities and those facilities that stayed open provided similar proportions of treatments paid by Medicare as the primary payer—78 percent and 79 percent, respectively.
However, the share of Medicare treatments (74 percent) was somewhat lower for newly opened facilities. Some dialysis providers have informed the Commission that the payment rates of commercial payers exceed Medicare’s and Medicaid’s, and they prefer to open in areas where employer insurance covers more people. In 2004, Medicare payment for composite rate services and dialysis drugs averaged $220 per treatment. By contrast, the large dialysis chains reported revenues per treatment from all

112 Ou tpa t i e n t d i a l y s i s s e r v i c e s : A s s e s s i ng paymen t adequacy and upda t i ng paymen t s
payers (Medicare, Medicaid, and commercial payers) ranging from $278 to $316 per treatment.
Finally, closures did not affect rural beneficiaries disproportionately: 26 percent of closed facilities were in rural areas, compared with 25 percent of those that stayed open. Furthermore, 26 percent of all newly opened facilities were located in rural areas.
What types of providers furnish dialysis care? Over time, an increasing proportion of dialysis providers are freestanding, bigger, operated for profit, and owned by publicly traded companies (Table 2C-1 and Figure 2C-2). These trends in the profit status, size, type, and consolidation of dialysis providers suggest that the dialysis industry is attractive to for-profit providers and providing dialysis care in larger facilities leads to efficiencies and economies of scale.
Between 1995 and 2005, the number of freestanding facilities increased from 74 percent to 86 percent of all facilities, while for-profit facilities increased from 65 percent to 78 percent of all facilities. The absolute number of hospital-based facilities decreased modestly (from 708 to 642) during this time. Most freestanding facilities (90
percent) are for profit; by contrast, most hospital-based facilities (92 percent) are nonprofit. In 2005, 60 percent of all facilities were affiliated with the largest four chains and 76 percent of all facilities were affiliated with any chain (these data are not available for 1995 and 2000).
Also, between 1995 and 2005, the average size of dialysis facilities increased, as measured by the number of hemodialysis stations. This trend is consistent with the finding that freestanding facilities are larger than those based in hospitals (18 versus 13 stations, respectively) and that chain-affiliated facilities are bigger than those not affiliated with a chain (18 versus 15 stations, respectively).
The dialysis industry has rapidly consolidated during the past decade.4 Currently, four national for-profit, publicly traded chains own 60 percent of all facilities and 70 percent of all freestanding facilities. In addition to these four chains, a nonprofit chain operates 4 percent of all facilities. Facilities not owned by these chains are:
• equally divided between for-profit and nonprofit facilities,
• more likely to be freestanding, and
• less likely to be affiliated with any chain.
T A B L E2C–1 The total number of dialysis facilities is growing; for-profit and
freestanding dialysis providers are a higher share over time
Average annual percent change
1995 2000 2005 1995–2000 1995–2005
Total number of:
Dialysis facilities 2,721 3,805 4,540 7% 5%
Hemodialysis stations 40,578 59,480 78,870 8 7
Mean number of hemodialysis stations 15 16 17 1 2
Percent of all facilities:
Hospital-based 26% 18% 14% 0 –1
Freestanding 74 82 86 9 7
Rural 23 25 25 8 6
Urban 76 74 75 6 5
For profi t 65 78 78 11 7
Nonprofi t 35 22 22 –3 0
Note: Nonprofi t includes facilities designated as either nonprofi t or government.
Source: Compiled by MedPAC from the 1995 and 2000 Facility Survey fi les from CMS and the 2005 Dialysis Compare database from CMS.

113 R epo r t t o t h e Cong r e s s : Med i ca r e Paymen t P o l i c y | Ma r ch 2006
Only the 5 largest chains operate facilities nationally (in 26 to 43 states). The other chains operate in no more than 11 states and most operate in only 1 to 3 states.
More consolidation will occur by 2006 when the four largest chains merge into two chains. Specifically, the merger of the second and third largest chains (DaVita and Gambro) became final in October 2005, and the first and fourth largest chains (Fresenius and Renal Care Group) announced their merger plans in May 2005. Once both mergers are complete, about one-third of all facilities will be affiliated with Fresenius, and about one-quarter will be affiliated with DaVita. The consolidation will also result in at least one new chain (Renal Advantage), which will own 70 facilities that the Federal Trade Commission required DaVita to divest.
Do providers have the capacity to meet patient demand? Trends in service volume and capacity suggest that the growth in the number of dialysis facilities and hemodialysis stations appears to have kept up with the demand for care during the past decade. Between 1995 and 2005, the total number of dialysis facilities and hemodialysis stations grew annually by 5 and 7 percent, respectively, while the number of dialysis patients grew annually by 5 percent (Table 2C-1).
“Same-store growth”—the change in the number of hemodialysis treatments provided in consecutive years by a given provider—is another indicator that suggests providers can meet the demand for care. Facilities can increase the number of treatments they furnish by treating more patients and by providing more treatments to existing ones.5 Between 2002 and 2003, same-store growth averaged 4.7 percent. This growth varied by type of provider; for example, treatments provided by freestanding providers increased by 4.9 percent, while treatments provided by hospital-based facilities increased by 3.4 percent.
Providers appear to have the capacity to provide more hemodialysis treatments than they furnished in 2003. We compared the number of dialysis treatments provided by freestanding facilities with the number they could have provided if they operated at full capacity. We derived full capacity by multiplying the number of hemodialysis stations and the shifts per week reported by providers on their cost reports. The nearly 3,500 freestanding providers who submitted cost reports in 2003 furnished 26.9 million in-center hemodialysis treatments. By comparison, these
facilities could have provided 32.6 million treatments if they had operated at full capacity, suggesting they operated at 82 percent capacity, on average, in 2003. This estimate may overstate providers’ capacity as stations may not always be available for patient care due to maintenance. In addition, this estimate does not account for treatments that providers did not furnish because patients skipped treatment or were hospitalized.
Analysis of trends in freestanding facilities’ work shifts also suggests that providers have unused capacity. The average number of in-center hemodialysis shifts per week increased from 8.6 in 1998 to 9.9 in 2003, but only one-fifth of all facilities offered treatments after 5 p.m.6 Some providers told the Commission that they do not offer evening care because their staff is unwilling to work in the evening, patients do not want to be treated then, or both.
F IGURE2C–2 The dialysis industry is composed
primarily of freestanding, for-profit facilities affiliated with a chain in 2005
Source: Compiled by MedPAC from the 2005 Dialysis Compare database from CMS.
24%
Fresenius
17%
DaVita
10%
Renal Care Group
9%
Gambro
14%
Hospital-based
13%
Freestanding
chain
13%
Freestanding
nonchain
For-profit, freestanding, publicly traded chains
All others

114 Ou tpa t i e n t d i a l y s i s s e r v i c e s : A s s e s s i ng paymen t adequacy and upda t i ng paymen t s
Quality of dialysis careCMS data show that the quality of dialysis care has improved for some measures. Between 1999 and 2003, the share of hemodialysis and peritoneal patients who received adequate dialysis and whose anemia was under control increased (Table 2C-2).
All hemodialysis patients require vascular access—the site on the patient’s body where blood is removed and returned during dialysis. Vascular access care is a clinical area in which substantial improvements in quality are needed. Use of arteriovenous (AV) fistulas, considered the best type of vascular access, increased from 27 percent to 35 percent of hemodialysis patients between 1999 and 2003. Clinical guidelines recommend that at least 40 percent of all hemodialysis patients have an AV fistula. CMS is leading a national quality initiative—Fistula First—to increase the use of fistulas. The agency’s goal is to have fistulas placed in at least half of all new hemodialysis patients and at least 66 percent of all patients who are already receiving dialysis. Eventually, CMS aims to improve fistula use rates to levels seen in Europe and Asia, which average 70 percent and 80 percent, respectively.
Nutritional care is another clinical area calling for substantial quality improvements. Malnutrition is common among dialysis patients; different studies have reported its prevalence varies from 18 percent to 70 percent of adult dialysis patients. Researchers have shown that poor nutritional status increases rates of hospitalization and
mortality of dialysis patients.7 CMS data show that the share of malnourished dialysis patients has remained relatively constant between 1999 and 2003.
The National Kidney Foundation (NKF) has developed a clinical guideline for nutrition in dialysis patients. This guideline recommends:
• Nutritional counseling—Dialysis patients should receive intensive nutritional counseling based on an individualized care plan before or at the time dialysis is initiated. Nutritional counseling should be provided every one to two months thereafter and more frequently if poor nutritional status is present. Medicare’s current conditions for coverage require that a dietician assess the nutritional and dietetic needs of patients, recommend therapeutic diets, counsel on prescribed diets, and monitor adherence and response to diets. CMS’s proposal to update the current conditions for coverage would require providers to monitor a nutritional measure—the serum albumin level—on a monthly basis. It would also require providers to include nutritional status in their quality assessment and performance improvement program.
• Nutritional support—Depending on the patients’ condition, providers can recommend oral nutritional supplements, enteral tube feeding, intradialytic parenteral nutrition, and total parenteral nutrition. The composite rate bundle includes nutritional counseling services provided by dieticians. However, Medicare
T A B L E2C–2 Dialysis outcomes continue to improve for some measures
Outcome measure 1999 2000 2001 2002 2003
Percentage of in-center hemodialysis patients:
Receiving adequate dialysis 90% 91% 92% 92% 94%
With anemia under control 66 71 75 78 81
Dialyzed with an AV fi stula 27 30 31 33 35
Not malnourished 80 80 82 81 81
Percent of all peritoneal dialysis patients:
Receiving adequate CAPD 68 69 68 71 70
Receiving adequate CCPD 65 62 70 66 65
With anemia under control 70 75 76 81 83
Not malnourished 56 56 61 60 63
Note: AV (arteriovenous), CAPD (continuous ambulatory peritoneal dialysis), CCPD (continuous cycler-assisted peritoneal dialysis). Data on dialysis adequacy, use of fi stulas, and anemia management represent percent of patients meeting CMS’s clinical performance criteria. Not malnourished includes patients with a serum albumin ≥ 3.5/3.2 g/dL.
Source: Compiled by MedPAC from 1999–2004 Annual Reports for ESRD Clinical Performance Measures Project from CMS.

115 R epo r t t o t h e Cong r e s s : Med i ca r e Paymen t P o l i c y | Ma r ch 2006
does not cover oral nutritional supplements, and the coverage policies for the other treatments are restrictive.8 Anti-kickback provisions in the statute limit the ability of providers to furnish patients nutritional supplements at no cost or at reduced prices.9
An important step in improving patient outcomes is to include vascular access and nutritional management services in the payment bundle. The Commission previously recommended that the Secretary expand the payment bundle and include separately-billable drugs and currently excluded services needed by dialysis patients so that Medicare could better achieve its objective of promoting access to quality services (MedPAC 2001, MedPAC 2003c). Dialysis care has changed since CMS defined the composite rate in 1983, but the Secretary has not rebased the composite rate. Similar to other prospective payment bundles, the product has changed: New technologies have replaced older technologies, and the bundle now includes services that were not available in 1983. In addition, the bundle might contain services that most providers no longer furnish. The Secretary needs to identify the medications, services, and equipment that will increase the efficiency of patient care and improve patient outcomes as part of designing the broader bundle.
Finally, we have seen few differences in the levels of dialysis adequacy and anemia status achieved by type of facility (e.g., rural versus urban or freestanding versus hospital-based) (MedPAC 2005a). For each provider type, more than 90 percent of patients received adequate dialysis and more than 87 percent of patients had their anemia under control.
Access to capitalRecent financial information and the increasing number of dialysis facilities suggest that providers have sufficient access to capital. Providers need capital to improve their equipment and to open new facilities to accommodate the growing number of patients requiring dialysis.
The four largest chains appear to have adequate access to capital, as demonstrated by their ability to acquire and open new facilities. Between 2004 and 2005, all of these chains (except for Gambro) increased the number of facilities they operated. Even smaller chains expanded during this time period. For example, the fifth, sixth, and seventh largest chains—Dialysis Clinic Inc., American Renal Associates, and Dialysis Corporation of America—increased the number of facilities they operated in 2005.10
Both small and large for-profit chains appear to have adequate access to capital, as demonstrated by the willingness of private investors to fund their acquisitions. For example:
• The mergers of Fresenius–Renal Care Group and DaVita–Gambro will be financed through bonds and bank debt. Fresenius is acquiring 425 dialysis facilities and paying $3.5 billion, or about $115,000 per patient. DaVita is acquiring 565 facilities and paying $3.05 billion, or about $70,000 per patient (Sullivan 2005).
• A private equity investor group funded the acquisition of 70 facilities (divested by DaVita due to the merger with Gambro) by a newly created company, Renal Advantage.
• National Renal Alliance, a chain that launched in 2002, secured about $43 million in private equity and debt financing to add 10 more facilities in 2006 to its 14 facilities (Nephrology News & Issues 2005b, Owens 2005).
During the upcoming year, the largest chains may reduce the number of facilities they acquire, which may lower their need for capital to fund acquisitions. Explaining the cut in its acquisitions budget, a Fresenius representative stated that “we decided that we no longer need to be as aggressive in acquisitions following the takeover of the Renal Care Group” (Forbes 2005). In July 2005, Fresenius announced the closure of five facilities in the Washington, DC, area owing to consolidation.
Data from industry sources show that between 1999 and 2004, the publicly held chains’ net revenues grew from 9 percent to 20 percent annually. Key operational ratios for the largest chains suggest average or above-average performance in 2004:
• Return on equity, a key measure of capital efficiency, ranged from 21 percent to 118 percent (pre-tax).
• Return on total capital, a measure of how effectively a company uses capital, ranged from 20 percent to 38 percent (pre-tax).
Financial investment analysts note that dialysis providers benefit from recurring revenues from dialysis treatments but also face potential pressures from private payers and Medicare. Although about three-quarters of these chains’ patients are insured by Medicare as the primary payer, the proportion of their revenues from Medicare ranges from 48 percent to 58 percent. Revenues from commercial

116 Ou tpa t i e n t d i a l y s i s s e r v i c e s : A s s e s s i ng paymen t adequacy and upda t i ng paymen t s
payers account for 30 percent to 42 percent of revenues for these chains.
The stocks of these for-profit chains have, in large part, enjoyed positive ratings from financial analysts in 2005, and their stock prices generally increased in 2005. Kiplinger included DaVita as one of its best picks in 2005. As expected, the mergers of the four largest chains resulted in downgrades in their credit ratings. Standard & Poor’s analysts lowered Fresenius’s and DaVita’s ratings due to the increased debt burden these companies assumed to finance the mergers. However, one stock analyst stated that
“The [dialysis] industry continues to see consolidation and it generates good cash flow. We feel good about the industry. But the financial cushion has been taken away [due to the mergers] and the stretching of balance sheets are some of the main reasons for the lower credit ratings” (Nephrology News & Issues 2005a).
Regulatory actions in 2006 could affect providers’ access to capital. As described earlier, Medicare’s policies for paying for outpatient dialysis services changed in 2005. In addition, CMS recently revised the policy for paying for erythropoietin, which accounts for a substantial share (29 percent) of total payments to facilities in 2004. This new policy, beginning in April 2006, will use a combination of a patient’s hematocrit level and erythropoietin dosage amounts to trigger a review of the medical justification for the dosage by the contractor processing the claim. We will continue to monitor the effect of these policy changes on providers’ access to the capital markets.
Factors other than Medicare’s payments may affect access to the capital markets for the largest chains because each chain operates other lines of business. The four largest chains operate clinical laboratories; one chain also manufactures dialysis equipment and supplies and provides dialysis services internationally.
The effect of Hurricanes Katrina and Rita on the financial performance of dialysis providers is unknown. As of mid-November 2005, 27 facilities remained closed in Alabama, Louisiana, and Mississippi (Clemons 2005). More than three-quarters of these facilities are affiliated with a chain. In the short term, all of them lost revenue, negatively affecting their financial performance. Some of the revenue losses may be offset if patients are treated by affiliated facilities in other areas. We will monitor the hurricanes’ effect on the financial performance of both the
independent and chain facilities, including their ability to reopen.
Finally, as we mentioned in last year’s March report, other recent events unrelated to Medicare’s payment policies, such as investigations by the Department of Justice, may also affect access to the capital markets for certain chains.11
Changes in the volume of servicesBetween 1996 and 2003, the growth in the number of in-center hemodialysis treatments generally kept pace with the growth in the number of dialysis patients. The number of dialysis treatments increased, on average, by 7 percent annually. In comparison, the number of dialysis patients rose, on average, by 5 percent during this period.
Freestanding facilities treat most dialysis patients and so account for nearly 90 percent ($6.7 billion) of spending for composite rate services and dialysis drugs. Between 1996 and 2004, dialysis spending by these facilities increased by 8 percent per year, from $2.1 billion to $3.9 billion, while spending for dialysis drugs increased by 15 percent annually, from $951 million to $2.8 billion. Two important trends in spending for dialysis services and drugs are worth noting:
• Spending for drugs increased from 31 percent of all payments in 1996 to 42 percent in 2004.
• Most drug spending is for erythropoietin, which accounted for 68 percent of drug spending in 2004. During the past 8 years, erythropoietin’s share of drug spending has decreased (from 74 percent of drug spending in 1996) because of increased growth in spending for other drugs.
We do not yet know the extent to which the MMA changed spending for drugs relative to composite rate services because the 2005 claims data are not yet available. We anticipate that the proportion of total spending devoted to drugs will be lower beginning in 2005, but we cannot anticipate whether volume will grow at past rates or level off.
Use of dialysis drugs has grown for two reasons. First, they are new and effective. The Food and Drug Administration approved many of the drugs—–including erythropoietin and iron supplements—in the early 1990s. Since then, the NKF has advocated using certain drugs in its clinical guidelines. The use of many of these medications has enhanced beneficiaries’ quality of care. Increased use of

117 R epo r t t o t h e Cong r e s s : Med i ca r e Paymen t P o l i c y | Ma r ch 2006
erythropoietin, for example, has reduced the proportion of dialysis patients with anemia, which reduces quality of life and decreases survival if not treated effectively. Medicare’s coverage decisions also affect use of these drugs. For example, CMS made a national decision to cover injections of levocarnitine for patients with ESRD as of January 1, 2003.12
Second, the profitability of certain dialysis drugs under pre-MMA policies gave providers financial incentives to furnish them to patients. Freestanding providers were able to purchase dialysis drugs at prices well below Medicare’s payment rate. The Office of Inspector General (2004) found that the acquisition costs for the top 10 dialysis drugs were 22 percent lower than Medicare’s pre-MMA payment rate for the 4 largest providers and 14 percent lower for other freestanding providers in 2003.
Under post-MMA policies, Medicare will continue to make separate payments for dialysis drugs. We anticipate that financial incentives for providers to furnish dialysis drugs will continue under post-MMA policies, but the incentives may be less because dialysis drugs will not be as profitable as they were under pre-MMA policies. Nonetheless, financial incentives will be present, and vary from drug to drug depending on the difference between each drug’s acquisition cost and Medicare’s payment rate.
Information from USRDS raises questions about whether providers furnish dialysis drugs efficiently. Using Medicare claims data, its research shows some variation in spending across different providers. Specifically, per patient per month spending varied from $449 to $568 for erythropoietin, $86 to $112 for injectable iron, and $73 to $169 for vitamin D analogs across freestanding and hospital-based facilities (USRDS 2005). Some of this variation may be due to case mix, as providers’ costs vary based on patients’ characteristics. But higher use does not lead to better outcomes: A previous MedPAC analysis showed no association between quality of care and providers’ costs for composite rate services and worse outcomes for providers with higher combined costs for composite rate services and dialysis drugs (MedPAC 2003d).
Payments and costs for 2006 We assess providers’ costs and the relationship between Medicare’s payments and providers’ costs by considering whether current costs approximate what efficient providers would be expected to spend on delivering high-quality care. We also consider the accuracy of the data providers
include in their cost reports. In this section, we first examine three indicators of the appropriateness of current costs:
• trends in the growth of cost per treatment for composite rate services,
• trends in the growth of cost per treatment for dialysis drugs, and
• differences in cost per treatment for composite rate services between audited and unaudited 2001 cost reports for the same facilities.
We then present our projection of the Medicare margin for composite rate services and dialysis drugs for calendar year 2006. The latest and most complete data available on providers’ costs is from 2003. In contrast to the analysis of costs for hospitals (included in this chapter) and for post-acute providers (included in Chapter 4), we were not able to use 2004 cost reports. Unfortunately, CMS provided us substantially fewer cost reports for calendar year 2004 than for 2003 (2,100 cost reports versus 3,600 reports, respectively). This 2004 sample was not representative of the industry, so we decided not to use it. The low number of 2004 cost reports is linked to delays experienced by the agency’s contractors (fiscal intermediaries) in processing 2004 reports submitted by dialysis facilities. (Beginning in 2005, CMS required that dialysis providers submit their cost reports electronically, and some fiscal intermediaries were delayed in updating their software used to process cost reports.)
In modeling 2006 payments, we incorporate policy changes that went into effect between the year of our most recent data, 2003, and our target year, 2006. In 2005, CMS paid freestanding providers an average acquisition payment for most dialysis drugs. The agency offset this decrease by setting the add-on payment to the composite rate at 8.7 percent. In 2006, CMS will pay freestanding providers ASP plus 6 percent for all dialysis drugs, and the agency will set the add-on payment to the composite rate at 14.7 percent. The 2006 add-on payment includes a 13.1 percent adjustment to offset the decrease in the prices of dialysis drugs relative to pre-MMA rates. It also includes an update of 1.4 percent to reflect the estimated growth in drug spending between 2005 and 2006. The MMA requires that CMS annually increase the add-on payment based on the estimated growth in drug spending beginning in 2006.

118 Ou tpa t i e n t d i a l y s i s s e r v i c e s : A s s e s s i ng paymen t adequacy and upda t i ng paymen t s
We also included the effect of CMS’s update to the wage index in 2006. The agency implemented this MMA provision budget neutral across all providers but estimated that the change in the wage index would lower aggregate payments to freestanding facilities by 0.1 percent and increase aggregate payments to hospital-based providers by 0.4 percent (CMS 2005). Finally, we also incorporated the increase in the composite rate in 2005 (1.6 percent).
Appropriateness of current costs
Because the composite rate is predetermined, providers have an incentive to restrain their costs for composite rate services. In contrast, because Medicare pays for dialysis drugs on a per unit basis, providers have little incentive to limit volume as long as the payment rate is at or above the acquisition cost. At issue is whether aggregate dialysis costs provide a reasonable representation of costs that efficient providers would incur in furnishing high-quality care.
Average dialysis cost per treatment peaked in 2002 and declined between 2002 and 2003 Between 1997 and 2003, three distinct trends in cost growth are apparent. The average cost per treatment for composite rate services grew modestly during the late 1990s, increasing by 1.5 percent annually between 1997 and 1999. Between 2000 and 2002, average cost per treatment increased substantially, by 4.4 percent annually. Most recently—between 2002 and 2003—the average cost per treatment declined by 0.7 percent. By contrast, the CMS market basket index suggests that prices for goods and services purchased by dialysis facilities increased by 2.6 percent, on average, between 2002 and 2003.
Overall, the cost per in-center hemodialysis treatment for freestanding facilities that reported costs in both 1997 and 2003 increased on average by 2.0 percent annually, a rate slower than the input price increases measured by CMS’s market basket for ESRD services (2.6 percent). That costs grew more slowly than input prices suggests that (if other things are equal) freestanding facilities have been able to achieve productivity gains. Furthermore, the variation in cost growth across freestanding dialysis facilities shows that some facilities held their cost growth well below others. For example, per treatment costs rose by 0.2 percent for facilities in the 25th percentile of cost growth, 1.9 percent for facilities in the 50th percentile, and 3.7 percent for facilities in the 75th percentile. Costs grew more rapidly between 1997 and 2003 for:
• facilities located in urban areas compared with those in rural areas (2.1 percent versus 1.5 percent, respectively);
• facilities not affiliated with any chain compared with facilities affiliated with one of the four largest chains (2.2 versus 1.9 percent, respectively); and
• nonprofit facilities compared with for-profit facilities (2.3 percent versus 1.9 percent, respectively).
This analysis does not account for differences in case mix among facilities, which may affect their cost growth.
Average cost per treatment for dialysis drugs increased faster than for dialysis services The cost per treatment for dialysis drugs increased by 14.5 percent annually between 1997 and 2003. The pre-MMA payment method for separately billable drugs gave providers no incentives to improve efficiency. How the changes mandated by the MMA—paying acquisition cost for most drugs—will affect the growth in drug costs in 2005 and beyond is uncertain.
The growth in erythropoietin and other drug costs partly reflects the growth of the dialysis population during this time period. Other factors contributing to the growth in drug costs include:
• Providers furnished higher doses of some dialysis drugs to patients. For example, the average weekly erythropoietin dose prescribed to adult in-center hemodialysis patients increased from 197 units per kilogram in 1997 to 271 units per kilogram in 2003 (CMS 2004).
• Providers prescribed dialysis drugs to a greater share of dialysis patients. For example, the proportion of in-center hemodialysis patients prescribed injectable iron increased from 51 percent in 1996 to 65 percent in 2003 (CMS 2004).
• Providers substituted newer, costlier drugs to treat certain comorbidities—such as bone disease—for older, less expensive ones.
Auditing cost reports lowered average dialysis cost per treatment in 2001
For dialysis providers, the Commission has looked at the effect of using audited cost reports when assessing the appropriateness of current costs. We do so because the Commission’s analysis of current costs uses only Medicare-allowable costs. In addition, audited cost reports

119 R epo r t t o t h e Cong r e s s : Med i ca r e Paymen t P o l i c y | Ma r ch 2006
are available for this sector. In the Balanced Budget Act of 1997 (BBA), the Congress mandated that the Secretary audit cost reports of dialysis providers once every three years. Prior to the BBA, the Commission’s predecessor—the Prospective Payment Assessment Commission (ProPAC)—raised concerns about the reliability of dialysis cost reports and the need to have an accurate measure of the cost of providing dialysis services (ProPAC 1997).
Dialysis providers have historically included nonallowable costs on their cost reports:
• The Health Care Financing Administration (HCFA) conducted audits of a random sample of 1988 and 1991 dialysis facility cost reports and found that providers’ allowable costs were about 90 percent and 89 percent, respectively, of reported costs.
• HCFA audited the 1996 reports and the Commission found that the allowable cost per treatment was about 96 percent of the reported cost per treatment.
Correcting costs to reflect the findings from these auditing efforts is not new. ProPAC corrected dialysis costs using the findings of HCFA’s 1988 and 1991 audits (ProPAC 1993, ProPAC 1997). MedPAC corrected dialysis costs using the findings from HCFA’s 1996 audit, and the Government Accountablity Office (GAO) adopted this correction in its analysis of dialysis payments and costs (GAO 2004, MedPAC 2003b).
We do not correct the costs of other providers—hospitals, skilled nursing facilities, and home health agencies—because this information is not generally available for them. There is no statutory requirement that CMS regularly audit the cost reports of other providers who submit cost reports to the agency. CMS rarely audits the cost reports of these other providers for accuracy, and the few audits that the agency does conduct tend to focus on variables that are unrelated to our cost analysis. If sufficient audited cost report data were available for these other providers, however, we would assess the effect of the audit and make a similar correction.
We used the most recent audited data that are available—2001—to examine the potential effect of CMS’s audit. We compared the cost per treatment calculated from audited and unaudited 2001 cost reports from the same providers.13 Each cost report includes an indicator reporting its status: as submitted, settled without an audit, settled with an audit, or reopened. The proportion of 2001 cost reports that CMS has settled with an audit has
increased from 1 percent to about 20 percent since 2003. By contrast, CMS has audited few of the 2002 and 2003 costs reports (2 percent and 0.2 percent, respectively).
For the same facilities, the cost per treatment from their audited cost reports differed from the cost per treatment before CMS audited their reports. The audit primarily affects the cost per treatment for composite rate services, not the drug cost per treatment. The cost per treatment for composite rate services decreased by $7 (from $144.41 to $136.51) for facilities whose cost reports were settled by an audit. We expected composite rate costs to change more than drug costs because the audits primarily target those cost fields that can affect the payment a facility receives. In particular, CMS considers the costs reported for composite rate services, not drug costs, when determining if the agency will reimburse providers for bad debt.
We determined payment margins by using the results of the 2001 audit. For facilities with audited cost reports, we calculated the ratio of allowable costs to reported costs in 2001—94.5 percent for the cost per dialysis treatment. We then applied this adjustment to the reported costs of composite rate services for all facilities for which CMS has not yet settled their cost reports (about one-quarter of facilities in 2003), which resulted in the cost per treatment for composite rate services decreasing by 1.5 percent for all facilities.
The Medicare margin for freestanding facilities
The Commission assesses current payments and costs for dialysis services by comparing Medicare’s payments for composite rate services and injectable drugs with providers’ Medicare-allowable costs. As mentioned earlier, the latest and most complete data available on providers’ costs are from 2003.
For 2003, we estimate that the aggregate Medicare margin for composite rate services and injectable drugs is 2.4 percent, after accounting for the effect of the audit (Table 2C-3, p. 120). Aggregate margins vary based on a facility’s size, affiliation with the four largest chains, and profit status. This finding stems from differences in the cost per treatment. For example, total cost per treatment was 6 percent higher for independent facilities than for facilities owned by the four largest chains and 4 percent higher for small facilities than for large facilities. In addition, this finding also reflects differences in the proportion of payments facilities receive from composite rate services, which were less profitable than dialysis injectables in 2003.

120 Ou tpa t i e n t d i a l y s i s s e r v i c e s : A s s e s s i ng paymen t adequacy and upda t i ng paymen t s
Aggregate margins for composite rate services and injectable drugs declined from 5.5 percent in 2000 to 2.4 percent in 2003. During this period, the composite rate increased twice, by 1.2 percent in 2000 and 2.4 percent in 2001. Providers’ cost per treatment for composite rate services spiked between 2000 and 2002, as discussed earlier in this section.
The Deficit Reduction Act of 2005 increases the composite rate by 1.6 percent in 2006. We project the Medicare margin will be –0.3 percent in 2006 assuming facilities achieve a 6 percent margin, on average, for drugs and –1.7 percent in 2006 assuming facilities achieve a 2 percent margin for drugs. We believe that given the design of the payment system, the long-run profit margin will be 6 percent. The industry is transitioning to the new payment system in 2006, which might result in lower profits in the short term. It is likely that the largest four dialysis chains, who furnish 60 percent of all dialysis treatments, will attain greater margins than nonchain facilities. The Office of Inspector General (OIG) reported that the largest four chains paid, on average, less for the top 10 drugs than nonchain providers in 2003 (OIG 2004).
These estimates reflect the net impact of the changes to drug payments and the wage index the MMA mandated for dialysis facilities. These estimates also reflect the Congress updating the composite rate in 2005 (1.6 percent).
How should Medicare payments change in 2007?
The Commission accounts for expected cost changes in the coming year by considering a forecast of input price inflation and assessing recent cost trends. CMS’s market basket index for composite rate services projects that input prices will increase by 3.1 percent between 2006 and 2007.
Our update framework reflects the expectation that, in the aggregate, providers should be able to reduce the quantity of inputs required to produce a unit of service while maintaining quality. Productivity increases should be expected from providers. The Commission uses the 10-year moving average of multifactor productivity in the economy as a whole, which is 0.9 percent.
Update and distributional recommendations
On the basis of our review of payment adequacy for outpatient dialysis services and expected cost changes in the coming year, the Commission recommends the following:
T A B L E2C–3 Aggregate Medicare margin for dialysis services varies
by type of freestanding dialysis facility in 2003
Facility type Aggregate marginPercentage of all treatments
Percentage of payments from dialysis drugs
All facilities 2.4% 100% 41%
Urban 2.7 84 41
Rural 1.4 16 42
For profi t 2.7 90 41
Nonprofi t –0.3 10 38
Four largest chains 3.7 73 42
Other chains –1.1 14 39
Nonchain –1.9 12 38
Furnishes:
≤10,000 treatments –2.2 27 42
>10,000 treatments 4.2 73 41
Source: Compiled by MedPAC from the 2001 and 2003 cost reports and the 2003 institutional outpatient fi le from CMS.

121 R epo r t t o t h e Cong r e s s : Med i ca r e Paymen t P o l i c y | Ma r ch 2006
R E C O M M E N D A T I O N 2 C - 1
The Congress should update the composite rate in calendar year 2007 by the projected rate of increase in the end-stage renal disease market basket index less half the Commission’s expectation for productivity growth.
R A T I O N A L E 2 C - 1
Most of our indicators of payment adequacy are positive, including beneficiaries’ access to care, volume of services, quality of care, and access to capital. Nevertheless, the Medicare margin for composite rate services and injectable drugs declined from 5.5 percent to 2.4 percent between 2000 and 2003. We project the Medicare margin will be –0.3 percent in 2006, assuming facilities achieve a 6 percent margin for drugs between 2005 and 2006, and –1.7 percent, assuming facilities achieve a 2 percent margin for drugs. Because we are concerned about the trend in the Medicare margin, we recommend that the Congress update the composite rate in 2007 by the ESRD market basket index less half the Commission’s expectation for productivity growth.
I M P L I C A T I O N S 2 C - 1
Spending
• Because there is no provision in current law to change the composite rate in 2007, this recommendation will increase federal program spending relative to current law by between $50 million to $200 million in the first year and less than $1 billion over five years.
Beneficiary and provider
• This recommendation increases beneficiary cost sharing, but no negative effects on beneficiary access to care are anticipated due to this increase. This recommendation is not expected to affect providers’ willingness and ability to provide quality care to Medicare beneficiaries.
Note that some dialysis providers help financially needy patients pay for Part B premiums and medigap policies through a fund administered by the American Kidney Fund. In addition, Medicare reimburses dialysis providers for bad debt incurred with furnishing composite rate services.
In addition to updating the composite rate, the Commission recommends a change to improve the distribution of payments for composite rate services. Currently, Medicare pays hospital-based facilities $4
more, on average, for composite rate services than it pays freestanding facilities. This difference began with the Omnibus Budget Reconciliation Act of 1981, which mandated separate rates for the two types of facilities. In the 1983 rule implementing the composite rate, the Secretary attributed this $4 difference to overhead, not to patient complexity or case mix.
The current payment method is not consistent with the Commission’s principle of paying the costs incurred by efficient providers who furnish appropriate care, regardless of the care setting. Consequently, we reiterate our recommendation that the Congress eliminate differences in paying for composite rate services between freestanding and hospital-based facilities and combine the composite rate and the add-on payment (MedPAC 2005a). These actions will result in a uniform payment policy across settings.
R E C O M M E N D A T I O N 2 C - 2
The Congress should direct the Secretary to:
• eliminate differences in paying for composite rate services between hospital-based and freestanding dialysis facilities; and
• combine the base composite rate and the add-on adjustment.
R A T I O N A L E 2 C - 2
This recommendation aims to implement a uniform payment policy across settings. Doing so will ensure that Medicare pays the same amount for the same services across different settings.
I M P L I C A T I O N S 2 C - 2
Spending
• Because this recommendation redistributes resources already in the system, it would not affect federal program spending relative to current law. The Commission’s June 2005 report provides a complete analysis of the implications of this recommendation.
Beneficiary and provider
• Some facilities could receive higher or lower payments. We do not expect this recommendation to affect providers’ willingness and ability to provide care to beneficiaries. This recommendation does not substantially change beneficiary cost sharing.
122 Ou tpa t i e n t d i a l y s i s s e r v i c e s : A s s e s s i ng paymen t adequacy and upda t i ng paymen t s
Medicare payments for dialysis drugs changed in 2005
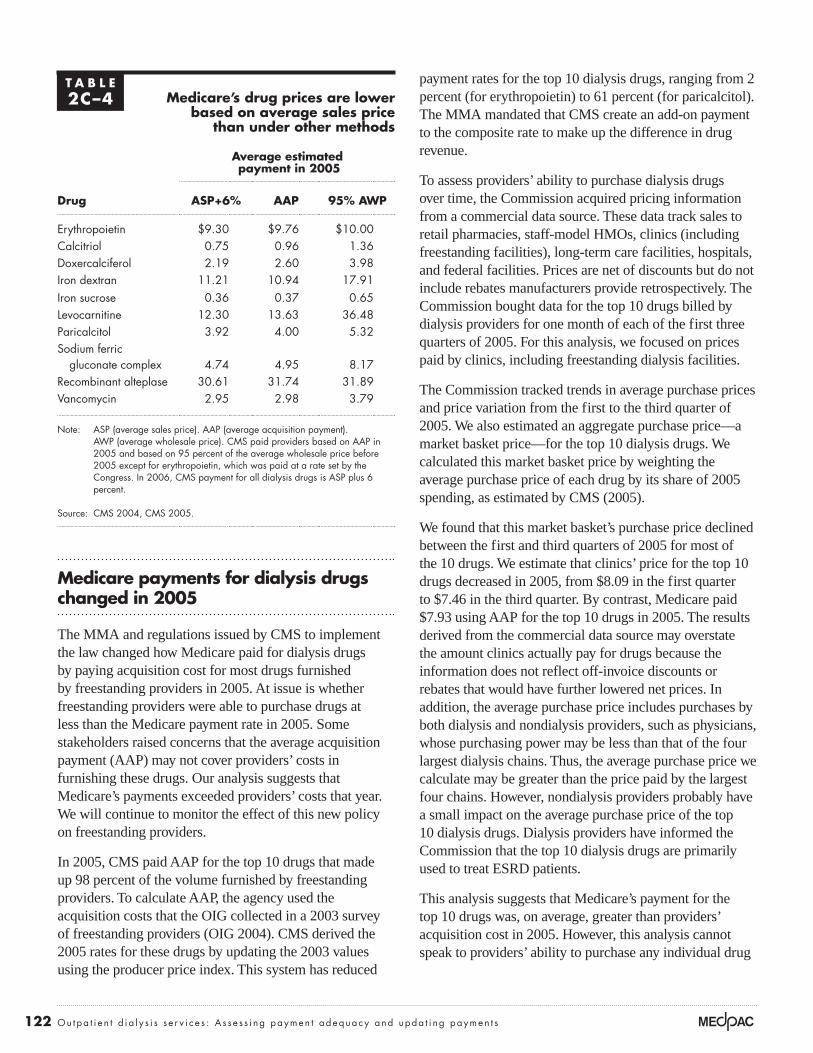
The MMA and regulations issued by CMS to implement the law changed how Medicare paid for dialysis drugs by paying acquisition cost for most drugs furnished by freestanding providers in 2005. At issue is whether freestanding providers were able to purchase drugs at less than the Medicare payment rate in 2005. Some stakeholders raised concerns that the average acquisition payment (AAP) may not cover providers’ costs in furnishing these drugs. Our analysis suggests that Medicare’s payments exceeded providers’ costs that year. We will continue to monitor the effect of this new policy on freestanding providers.
In 2005, CMS paid AAP for the top 10 drugs that made up 98 percent of the volume furnished by freestanding providers. To calculate AAP, the agency used the acquisition costs that the OIG collected in a 2003 survey of freestanding providers (OIG 2004). CMS derived the 2005 rates for these drugs by updating the 2003 values using the producer price index. This system has reduced
payment rates for the top 10 dialysis drugs, ranging from 2 percent (for erythropoietin) to 61 percent (for paricalcitol). The MMA mandated that CMS create an add-on payment to the composite rate to make up the difference in drug revenue.
To assess providers’ ability to purchase dialysis drugs over time, the Commission acquired pricing information from a commercial data source. These data track sales to retail pharmacies, staff-model HMOs, clinics (including freestanding facilities), long-term care facilities, hospitals, and federal facilities. Prices are net of discounts but do not include rebates manufacturers provide retrospectively. The Commission bought data for the top 10 drugs billed by dialysis providers for one month of each of the first three quarters of 2005. For this analysis, we focused on prices paid by clinics, including freestanding dialysis facilities.
The Commission tracked trends in average purchase prices and price variation from the first to the third quarter of 2005. We also estimated an aggregate purchase price—a market basket price—for the top 10 dialysis drugs. We calculated this market basket price by weighting the average purchase price of each drug by its share of 2005 spending, as estimated by CMS (2005).
We found that this market basket’s purchase price declined between the first and third quarters of 2005 for most of the 10 drugs. We estimate that clinics’ price for the top 10 drugs decreased in 2005, from $8.09 in the first quarter to $7.46 in the third quarter. By contrast, Medicare paid $7.93 using AAP for the top 10 drugs in 2005. The results derived from the commercial data source may overstate the amount clinics actually pay for drugs because the information does not reflect off-invoice discounts or rebates that would have further lowered net prices. In addition, the average purchase price includes purchases by both dialysis and nondialysis providers, such as physicians, whose purchasing power may be less than that of the four largest dialysis chains. Thus, the average purchase price we calculate may be greater than the price paid by the largest four chains. However, nondialysis providers probably have a small impact on the average purchase price of the top 10 dialysis drugs. Dialysis providers have informed the Commission that the top 10 dialysis drugs are primarily used to treat ESRD patients.
This analysis suggests that Medicare’s payment for the top 10 drugs was, on average, greater than providers’ acquisition cost in 2005. However, this analysis cannot speak to providers’ ability to purchase any individual drug
T A B L E2C–4 Medicare’s drug prices are lower
based on average sales price than under other methods
Average estimated payment in 2005
Drug ASP+6% AAP 95% AWP
Erythropoietin $9.30 $9.76 $10.00
Calcitriol 0.75 0.96 1.36
Doxercalciferol 2.19 2.60 3.98
Iron dextran 11.21 10.94 17.91
Iron sucrose 0.36 0.37 0.65
Levocarnitine 12.30 13.63 36.48
Paricalcitol 3.92 4.00 5.32
Sodium ferric
gluconate complex 4.74 4.95 8.17
Recombinant alteplase 30.61 31.74 31.89
Vancomycin 2.95 2.98 3.79
Note: ASP (average sales price). AAP (average acquisition payment). AWP (average wholesale price). CMS paid providers based on AAP in 2005 and based on 95 percent of the average wholesale price before 2005 except for erythropoietin, which was paid at a rate set by the Congress. In 2006, CMS payment for all dialysis drugs is ASP plus 6 percent.
Source: CMS 2004, CMS 2005.

123 R epo r t t o t h e Cong r e s s : Med i ca r e Paymen t P o l i c y | Ma r ch 2006
at less than Medicare’s payment rate. The Commission will continue to track providers’ ability to purchase drugs in 2006, when Medicare will pay ASP plus 6 percent (instead of AAP). Based on 2005 rates, Medicare’s payment under ASP is lower than the rate under AAP and under the average wholesale price (Table 2C-4).14
The use of home dialysis is declining among dialysis patients
The number of patients using peritoneal dialysis or hemodialysis in their homes has declined during the past decade. Between 1996 and 2003, use of peritoneal dialysis fell from 30,100 patients to 25,892 patients, and use of home hemodialysis fell from 1,944 patients to 1,325 patients (USRDS 2005). This decline has occurred even though some home dialysis patients rate their quality of dialysis care higher than those receiving in-center hemodialysis (Rubin et al. 2004).
In this section, we explore some of the factors that may be affecting the use of home dialysis. Our review of the literature shows that clinical factors (patients’ other health problems) and nonclinical factors (physician training) may influence a patient selecting in-center hemodialysis versus home dialysis. We also discuss the various Medicare policies that may affect the coverage and payment of dialysis services.
The Commission will continue to monitor the use of home dialysis post-MMA and is interested in exploring the effect of Medicare’s payment and coverage policies on the use of home dialysis. Policy options to consider include: using pay for performance to encourage the use of home dialysis, educating patients about the different treatment options before they start dialysis treatment, and screening at-risk patients for chronic kidney disease.
Clinical and nonclinical factors affect the use of home dialysisEach year, the nearly 100,000 new dialysis patients must select a dialysis method. Several factors—including the patient’s health and social circumstances, care before the start of dialysis, where the patient lives, physician preferences, and clinical and financial reasons—may influence the selection of one type of treatment over the other.
Patients’ characteristics influence the choice of the dialysis method. A survey of nephrologists showed that they are
more likely to recommend peritoneal dialysis for younger patients, men, patients with good compliance, patients who weighed less than 200 pounds, patients without diabetes, patients with some residual renal function, and patients living with a family (Thamer et al. 2000). Among patients residing in 19 states, comorbidities were less severe in peritoneal dialysis patients than in hemodialysis patients (Miskulin et al. 2002). These researchers also found the use of peritoneal dialysis was lower for patients that are older, African American, and have hypertension, after controlling for differences in case mix. Heaf (2004) reported that about one-fifth of dialysis patients are not suitable for peritoneal dialysis because of abdominal problems, physical disabilities, or psychological problems (such as dementia).
Social circumstances also influence the choice of dialysis. Certain patients either may prefer the interaction of in-center care or might not be sufficiently independent to perform home dialysis. Patients who selected peritoneal dialysis instead of hemodialysis were more likely to have progressed further in the educational system, be employed full-time, be physically independent, and be more autonomous in the decision-making process before the start of dialysis (Stack 2002). Miskulin and colleagues (2002) found that employed patients and those living more than 30 miles from the nearest dialysis unit were more likely to receive peritoneal dialysis.
Patients’ care during the 12-month period prior to dialysis may influence the dialysis treatment they receive. In particular, early referral to a nephrologist may increase the likelihood that patients will use peritoneal dialysis as their initial type of treatment. An earlier MedPAC analysis showed that 2.3 percent of patients who saw a nephrologist when starting dialysis treatment chose peritoneal dialysis compared with 5.8 percent of patients who saw a nephrologist more than 12 months before the start of dialysis (MedPAC 2004). Other researchers have also concluded that early nephrology referral and patient counseling before starting dialysis are strong determinants of choosing peritoneal dialysis (Lameire and Van Biesen 1999, Little et al. 2001, Stack 2002).
Some research suggests that use of peritoneal dialysis is associated with educating patients about alternative dialysis methods before they start dialysis. Only one-quarter of new patients who selected hemodialysis reported that medical professionals informed them about peritoneal dialysis (USRDS 1997). By contrast, at least 60 percent of patients choosing peritoneal dialysis had

124 Ou tpa t i e n t d i a l y s i s s e r v i c e s : A s s e s s i ng paymen t adequacy and upda t i ng paymen t s
this option discussed with them. A more recent survey found that the majority of dialysis patients are uninformed about peritoneal dialysis, home hemodialysis, or renal transplantation as options (66 percent, 88 percent, and 74 percent, respectively) (Mehrotra et al. 2005). Although Medicare covers nutritional counseling for patients with renal disease who are not yet undergoing maintenance dialysis, the program does not pay for any other type of pre-ESRD counseling for these patients.
Use of peritoneal dialysis varies by geographic location. The likelihood of new patients using peritoneal dialysis is lower in the South and higher in the Northwest (Stack 2002).
Most physicians believe that peritoneal dialysis is underused in the United States (Mendelssohn et al. 2001). Nonetheless, the length of time physicians have practiced and their training may affect the use of home dialysis. More years in practice were associated with a decreased likelihood of recommending peritoneal dialysis. Nephrologists who had practiced for 20 years or more were less likely to prescribe peritoneal dialysis compared with their colleagues who had been in practice for fewer than 5 years (Thamer et al. 2000). Burkart (2002) noted that many physicians lack training in peritoneal dialysis because they finished their training before this option was widely used or because their fellowship was at an institution that focused on basic research. The nature of the training that physicians receive may also affect the use of home dialysis. Mehrotra and others (2002) concluded that many training programs do not allocate enough time to ensure appropriate training in providing care for peritoneal dialysis patients. These researchers found that the amount of time spent by fellows in training for the care of peritoneal dialysis was significantly lower in the United States than in Canada, and that U.S. training programs provided care to significantly fewer patients undergoing either hemodialysis or peritoneal dialysis than those in Canada.
Finally, economics might influence the use of home dialysis versus in-center care. The rapid growth in the number of dialysis facilities throughout the 1990s has created an incentive to direct patients to treatment in-center so that facilities operate at capacity. Rubin and colleagues (2004) concluded that the current financial incentives may encourage clinicians to choose hemodialysis because once substantial investment in a facility has been made, the marginal costs of treating an
additional patient are likely lower for a new hemodialysis patient than for a new peritoneal dialysis patient.
Medicare policies that affect the payment of home dialysis servicesMedicare’s payment policies for composite rate services, dialysis drugs, self-dialysis training services, and physician services may also affect the use of home dialysis. Some studies show that home dialysis patients incur lower total costs and have higher quality of life than in-center patients.
Payment for composite rate services and dialysis drugs
The decline in the use of home dialysis has occurred even though the composite rate for in-center hemodialysis and home dialysis is the same. Historically, the cost per treatment for peritoneal dialysis—the home treatment most frequently used by dialysis patients—was less than the cost per treatment for in-center hemodialysis.
To encourage the use of home dialysis, the Congress called for the same rate when creating the current dialysis payment system in 1981. Specifically, section 1881 of the Social Security Act states that CMS should set the dialysis payment rate by finding: “…which [method] the Secretary determines, after detailed analysis, will more effectively encourage the more efficient delivery of dialysis services and will provide greater incentives for increased use of home dialysis than through the single composite weighted formulas.”
As discussed earlier, Medicare’s payment rate for dialysis drugs substantially exceeded providers’ costs before 2005. The profitability of dialysis drugs before 2005 may have given some providers an incentive to furnish in-center dialysis instead of peritoneal dialysis because:
• In-center hemodialysis patients on average use more dialysis drugs per treatment (as measured by payments) compared with peritoneal dialysis patients. Medicare’s payment for dialysis drugs averaged $90 per treatment for in-center hemodialysis patients compared with $31 per treatment for peritoneal dialysis patients in 2003.
• Medicare pays for drugs only when they are administered in a facility, with one exception—erythropoietin. Certain dialysis drugs, such as iron, may not be safe for patients to administer in their homes.

125 R epo r t t o t h e Cong r e s s : Med i ca r e Paymen t P o l i c y | Ma r ch 2006
Whether recent payment changes will affect the use of home dialysis remains to be seen. These changes made dialysis drugs less profitable by shifting most of the drug profits to the composite rate (through the add-on payment); thus, a provider’s incentive to treat patients in a facility might be reduced.
Payment for home hemodialysis
Medicare’s policy of covering three dialysis sessions per week may affect the use of home hemodialysis. Most home hemodialysis is provided more frequently—either in short daily sessions or at night five to six times weekly. Some providers contend that Medicare’s payments do not cover the costs of providing more frequent hemodialysis because CMS limits payment to three treatments weekly. Mohr and others (2001) showed that facilities would incur an additional 10 percent to 20 percent in costs per patient per year to provide daily dialysis. Some studies show improved clinical outcomes and quality of life for patients on daily hemodialysis, though the small sample sizes and limitations of study designs constrain conclusions by clinicians, patients, and policymakers. Consequently, the National Institute of Diabetes & Digestive & Kidney Diseases is currently funding a clinical trial comparing the potential benefits of more frequent hemodialysis—short daily or long nocturnal dialysis—to thrice-weekly hemodialysis.
Payment for self-dialysis training services
Payment policies for self-dialysis training services—instruction on how to dialyze in the home—may also affect the use of home dialysis. CMS augments facilities’ composite rate payment for providing training services. At issue is whether the number of sessions covered by Medicare is sufficient to provide patients with the necessary instruction to self-dialyze and whether the training payment covers providers’ costs of furnishing these services. Medicare covers a maximum of 15 training sessions for the two forms of peritoneal dialysis and pays $12 per training session for continuous ambulatory peritoneal dialysis and $20 per training session for continuous cycler-assisted peritoneal dialysis. By contrast, Medicare pays $20 per training session for hemodialysis and covers up to three sessions per week for no more than three months. These payment and coverage policies have remained the same for the past 15 years.
Payment for physicians caring for dialysis patients
CMS changed the payment for physicians treating dialysis patients in 2004, and this new policy decreased the work
relative value units (RVUs) assigned to physicians caring for home patients (Figure 2C-3).15 For example, for the monthly care of adults, the work RVUs declined from 4.47 RVUs in 2003 to 4.24 RVUs in 2005. Whether this policy change has altered physicians’ attitudes towards prescribing home dialysis to their patients is unknown.
CMS’s rationale for this payment change was to align payments with physician involvement in patient care, and thus make higher payments to physicians when they conduct more face-to-face visits. Before 2004, CMS valued the work RVUs the same regardless of the number of times the physician saw a patient during the month. The Commission agreed that the payment method before 2004 lacked both accountability and quality incentives but argued that the agency should collect and present baseline data on the type, frequency, and content of physician encounters (MedPAC 2003a).
Although we do not yet know the effect of this policy change on the use of home dialysis, one recent study suggests that physicians are seeing their in-center dialysis
F IGURE2C–3 Work RVUs decreased for monthly
care of home dialysis patients between 2003 and 2005
Note: RVU (relative value unit), ESRD (end-stage renal disease). This graph provides the work RVUs for the monthly care of home dialysis patients by physicians.
Source: CMS 2002, CMS 2004.
RV
U
12
8
6
4
2
10
0
2003
2005
<2 years 2–11 years 12–19 years 20+ years
ESRD care for patients aged:
126 Ou tpa t i e n t d i a l y s i s s e r v i c e s : A s s e s s i ng paymen t adequacy and upda t i ng paymen t s
patients more frequently since 2004. Among a sample of in-center hemodialysis patients, the number of physician visits increased from 1.5 per patient-month before the policy change (in 2003) to 3.1 per patient-month after the policy change (in 2004) (Mentari et al. 2005). Most of these visits occurred in the dialysis facility compared to the physician’s office (90 percent versus 10 percent, respectively). This policy change’s effect on the frequency of physician visits for home patients is unknown. Before the change in policy, home patients were typically seen less frequently than in-center patients.
In addition, we do not know the effect of the policy change on quality. Mentari and colleagues (2005) concluded that the increase in the number of physician visits that occurred after the payment policy change did not result in any clinically important improvement in quality. However, other research (not examining the effect of the 2004 policy change) found that more frequent physician contact is positively associated with achieving clinical performance targets (Plantinga et al. 2005).
Next stepsThe Commission plans to explore the effect of Medicare’s payment and coverage policies on the use of home dialysis. Next steps include obtaining more information about:
• the effect of medical factors on the use of home dialysis,
• the effectiveness of programs that educate patients about different dialysis treatments before they start dialysis,
• the association between the use of home dialysis and nonclinical factors such as where the patient lives and physician preference and training,
• differences in beneficiary and program spending associated with home and in-center dialysis,
• the relationship between providers’ costs in furnishing home dialysis training services and Medicare’s payments, and
• the economic incentives of home versus in-center dialysis under post-MMA payment policies. �

127 R epo r t t o t h e Cong r e s s : Med i ca r e Paymen t P o l i c y | Ma r ch 2006
1 The two types of dialysis—hemodialysis and peritoneal dialysis—remove wastes from a patient’s bloodstream differently. During hemodialysis, a machine removes wastes from the bloodstream. This procedure is usually performed in dialysis facilities. By contrast, peritoneal dialysis uses the lining of the patient’s abdomen as a filter to clear wastes and extra fluid and is usually performed in the patient’s home.
2 EGHPs are usually the primary payer for 33 months—the 3-month waiting period plus the 30-month coordination period.
3 USRDS reports that the number of in-center hemodialysis patients increased from 192,711 in 1996 to 296,776 in 2003. By contrast, the number of peritoneal patients decreased from 30,089 to 25,892.
4 For example, in May 1997, Gambro acquired the 262 facilities of Vivra Renal Care. In November 1997, Total Renal Care acquired the 358 facilities of Renal Treatment Centers. In February 2002, Renal Care Group acquired the 87 facilities of National Nephrology Associates.
5 Facilities can increase the number of treatments provided to a given patient by: (1) improving patients’ compliance in attending their thrice-weekly hemodialysis treatments; and (2) reducing the number of days that patients are hospitalized. CMS pays for three hemodialysis treatments per week.
6 We censored the data by assuming that facilities furnish no more than 24 shifts per week (i.e., operating 4 shifts per day, 6 days per week). Less than 1 percent of all providers reported furnishing more than 24 shifts per week.
7 The nutritional status of a patient may be affected by several factors, including physiological responses to ESRD, the dialysis process itself, presence of anemia, endocrine factors, and inadequate food intake secondary to certain conditions (such as anorexia and emotional distress).
8 CMS’s coverage policy for enteral and parenteral nutritional therapy limits coverage to patients who, because of chronic illness or trauma, cannot be sustained through oral feeding. Beneficiaries meeting this national coverage policy are those that must rely on either enteral or parenteral nutritional therapy, depending upon the particular nature of their medical condition. CMS states that typical examples of conditions that qualify for coverage are massive small bowel resection for parenteral therapy and head and neck cancer for enteral nutrition therapy.
9 Section 1128A(a)(5) of the Social Security Act prohibits a person from offering services to a beneficiary that would likely influence the beneficiary’s choice of a provider. The
Office of Inspector General’s interpretation is that this section does not apply to the provision of goods or services valued at less than $10 per item and $50 per patient annually.
10 American Renal Associates operated 14 facilities in 2004 and 29 facilities in 2005. Dialysis Corporation of America operated 18 facilities in 2004 and 23 facilities in 2005.
11 In October 2004, three of the largest chains received subpoenas from federal prosecutors concerning laboratory testing for parathyroid hormone levels and vitamin D therapies. Another large chain agreed in September 2004 to pay $350 million to settle claims by the Department of Justice related to Medicare and Medicaid payments and the chain’s relationships with physicians and pharmaceutical companies. In the short term investors have not reacted negatively. We will continue to monitor the effect of these events on the chains’ access to capital.
12 Levocarnitine supplements the loss of carnitine, a naturally occurring body substance that helps transport long-chain fatty acids for energy production by the body. Patients on hemodialysis can suffer carnitine deficiencies from dialytic loss, reduced renal synthesis, and reduced dietary intake. Patients must show improvement from the levocarnitine treatment within six months of starting treatment for Medicare to continue to pay for the treatment.
13 Audited 2001 cost reports refer to those obtained from CMS in September 2005; about 20 percent of these cost reports were settled by an audit. Unaudited 2001 cost reports refer to those obtained from CMS in September 2003; only 1 percent of these cost reports were settled by an audit.
14 Between 1994 and the implementation of the MMA, Medicare’s payment for erythropoietin remained unchanged—$10 per 1,000 units. In 2006, CMS will base payment for erythropoietin (and all other dialysis drugs) on its average sales price. Thus, Medicare’s payment rate post-MMA may be higher or lower than the pre-MMA rate.
15 Beginning in 2004, CMS began to pay physicians treating dialysis patients a monthly capitated payment based on the number of visits they furnished in a month. For in-center patients, CMS pays a monthly capitated payment based on the number of visits the physician has with the patient during the month—stratified into three payment categories: one visit per month, two or three visits per month, and four or more visits per month. For home patients, CMS pays physicians at the same rate paid for seeing in-center patients two to three times per month. Before 2004, CMS paid physicians at the same monthly capitated payment regardless of the number of times the physician saw each patient during the month.
Endnotes

128 Ou tpa t i e n t d i a l y s i s s e r v i c e s : A s s e s s i ng paymen t adequacy and upda t i ng paymen t s
Burkart, J. M. What is the evidence that peritoneal dialysis is underutilized as an ESRD therapy? 2002. Seminars in Dialysis 15, no. 3 (May–June): 157–161.
Center for Medicare & Medicaid Services, Department of Health and Human Services. 2005. Medicare program; revisions to payment policies under the physician fee schedule for calendar year 2006 and certain provisions related to the competitive acquisition program of outpatient drugs and biologicals under Part B. Final rule. Federal Register 70, no. 223 (November 21): 70163.
Center for Medicare & Medicaid Services, Department of Health and Human Services. 2004. Medicare program; revisions to payment policies under the physician fee schedule for calendar year 2005. Final rule. Federal Register 69, no. 219 (November 15): 66681.
Center for Medicare & Medicaid Services, Department of Health and Human Services. 2002. Medicare program; revisions to payment policies under the physician fee schedule for calendar year 2003 and inclusion of registered nurses in the personnel provision of the critical access hospital emergency services requirement for frontier areas and remote locations. Final rule. Federal Register 67, no. 251 (December 31): 80144.
Clemons, G. P. Lessons learned from Katrina. Presentation at Association of the Society of Nephrology. November 12, 2005.
Forbes. 2005. FMC cuts FY acquisition budget to 150–200 mln usd vs 200–250 mln. August 4. www.forbes.com.
Government Accountability Office. 2004. Medicare dialysis facilities. Beneficiary access stable and problems in payment system being addressed. Washington, DC: GAO.
Heaf, J. 2004. Underutilization of peritoneal dialysis. Journal of the American Medical Association 291, no. 6 (February 11): 740–742.
Lameire, N., and W. Van Biesen. 1999. The pattern of referral of patients with end-stage renal disease to the nephrologist—a European survey. Nephrology Dialysis Transplantation 14 (Suppl. 6): 16–23.
Little, J., A. Irwon, H. Rayner, et al. 2001. Predicting a patient’s choice of dialysis modality: Experience in a United Kingdom renal department. American Journal of Kidney Disease 37, no. 5 (May): 981–986.
Medicare Payment Advisory Commission. 2005a. Issues in a modernized Medicare program. Washington, DC: MedPAC.
Medicare Payment Advisory Commission. 2005b. Report to the Congress: Medicare payment policy. Washington, DC: MedPAC.
Medicare Payment Advisory Commission. 2004. New approaches in Medicare. Washington, DC: MedPAC.
Medicare Payment Advisory Commission. 2003a. Comments about the revisions to payment policies under the physician fee schedule for calendar year 2004. Washington, DC: MedPAC.
Medicare Payment Advisory Commission. 2003b. Medicare payment policy. Washington, DC: MedPAC.
Medicare Payment Advisory Commission. 2003c. Modernizing the outpatient dialysis payment system. Washington, DC: MedPAC.
Medicare Payment Advisory Commission. 2003d. Variation and innovation in Medicare. Washington, DC: MedPAC.
Medicare Payment Advisory Commission. 2001. Medicare payment policy. Washington, DC: MedPAC.
Mehrotra, R., P. Blake, N. Berman, et al. 2002. An analysis of dialysis training in the United States and Canada. American Journal of Kidney Diseases 40, no. 1 (July): 152–160.
Mendelssohn, D. C., S. R. Mullaney, B. Jung, et al. 2001. What do American nephrologists think about dialysis modality selection? American Journal of Kidney Diseases 37, no. 1 (January): 22–29.
Mentari, E. K., P. B. DeOreo, A. S. O’Connor, et al. 2005. Changes in Medicare reimbursement and patient-nephrologist visits, quality of care, and health-related quality of life. American Journal of Kidney Diseases 46, no. 4 (October): 621–627.
Miskulin, D.C., K. B. Meyer, N. V. Athienites et al. 2002. Comorbidity and other factors associated with modality selection in incident dialysis patients: The CHOICE study. American Journal of Kidney Diseases 39, no. 2 (February): 324–336.
Mohr, P. E., P. J. Neumann, S. J. Franco, et al. 2001. The case for daily dialysis: Its impact on costs and quality of life. American Journal of Kidney Disease 37, no. 4 (April): 777–789.
Nephrology News & Issues. 2005a. Dialysis industry stable despite lower credit ratings. August. www.nephronline.com.
Nephrology News & Issues. 2005b. National Renal Alliance secures $43 million for growth. May. www.nephronline.com.
References

129 R epo r t t o t h e Cong r e s s : Med i ca r e Paymen t P o l i c y | Ma r ch 2006
Office of Inspector General, Department of Health and Human Services. 2004. Medicare reimbursement for existing end-stage renal disease drugs. Washington, DC: OIG.
Owens, M. B. 2005. Bringing dialysis where it’s needed. Nashville City Paper. April 27. http://www.nashvillecitypaper.com.
Plantinga, L. C., B. G. Jaar, N. E. Fink, et al. 2005. Frequency of patient-physician contact in chronic kidney disease care and achievement of clinical performance targets. International Journal of Quality Health Care 17, no. 2 (April): 115–121.
Prospective Payment Assessment Commission. 1997. Report and recommendations to the Congress. Washington, DC: ProPAC.
Prospective Payment Assessment Commission. 1993. Report and recommendations to the Congress. Washington, DC: ProPAC.
Rubin, H. R., N. E. Fink, L. C. Plantinga, et al. 2004. Patient ratings of dialysis care with peritoneal dialysis vs. hemodialysis. Journal of the American Medical Association 291, no. 6 (February 11): 697–703.
Stack, A. G. 2002. Determinants of modality selection among incident US dialysis patients: Results from a national study. Journal of the American Society of Nephrology 13, no. 5 (May): 1279–1287.
Sullivan, J. D. 2005. Merger mania. Nephrology News & Issues. July. www.nephronline.com.
Thamer, M., H. Wenke, N. E. Fink, et al. 2000. US nephrologists’ recommendation of dialysis modality: Results of a national survey. American Journal of Kidney Diseases 36, no. 6 (December): 1155–1165.
United States Renal Data System, National Institute of Diabetes and Digestive and Kidney Diseases. 2005. USRDS 2005 annual data report. Bethesda, MD: NIDDK.
United States Renal Data System, National Institute of Diabetes and Digestive and Kidney Diseases. 1997. USRDS 1997 annual data report. Bethesda, MD: NIDDK.