Embed Size (px)
Citation preview


CHAPTER SIX
POTENTIAL DANGER TO HUMAN HEALTH AND THE ENVIRONMENT
6.0 INTRODUCTION . . . . . . . . . . . . . . . . . . . . . . . . . . . . . . . . . . . . . . . . . . . . . . . . . . . 6-1
Purpose and Scope . . . . . . . . . . . . . . . . . . . . . . . . . . . . . . . . . . . . . . . . . . . . . . . . 6-1
Overview of Approach . . . . . . . . . . . . . . . . . . . . . . . . . . . . . . . . . . . . . . . . . . . . . . 6-2
Major Results and Conclusions . . . . . . . . . . . . . . . . . . . . . . . . . . . . . . . . . . . . . . 6-4
6.1 INITIAL RISK SCREENING . . . . . . . . . . . . . . . . . . . . . . . . . . . . . . . . . . . . . . . . . . . 6-6
6.1.1 Approach and Methods . . . . . . . . . . . . . . . . . . . . . . . . . . . . . . . . . . . . . . . 6-6
CKD Composition Data . . . . . . . . . . . . . . . . . . . . . . . . . . . . . . . . . . . . . . . 6-6
Risk-Screening Criteria . . . . . . . . . . . . . . . . . . . . . . . . . . . . . . . . . . . . . . . 6-7
Other Constituent-Specific Factors . . . . . . . . . . . . . . . . . . . . . . . . . . . . . 6-10
6.1.2 Risk-Screening Results . . . . . . . . . . . . . . . . . . . . . . . . . . . . . . . . . . . . . . . 6-11
6.2 EVALUATION OF RISKS WHEN CKD IS MANAGED ON SITE . . . . . . . . . . . . . . . 6-14
6.2.1 Risk Potential Ranking of Initial Case Studies . . . . . . . . . . . . . . . . . . . . . 6-15
Approach and Methods . . . . . . . . . . . . . . . . . . . . . . . . . . . . . . . . . . . . . . . 6-15
Results of Risk Potential Ranking . . . . . . . . . . . . . . . . . . . . . . . . . . . . . . . 6-19
Risk Potential Ranking for the Ground-water Pathway . . . . . . . . . . . 6-20
Risk Potential Ranking for the Surface Water Pathway . . . . . . . . . . 6-23
Risk Potential Ranking for the Air Pathway . . . . . . . . . . . . . . . . . . . . 6-26
6.2.2 Risk Modeling of On-site CKD Management . . . . . . . . . . . . . . . . . . . . . . 6-29
Analytical Methodology . . . . . . . . . . . . . . . . . . . . . . . . . . . . . . . . . . . . . . . 6-29
Release, Fate, and Transport Modeling Methodology . . . . . . . . . . . 6-32
Characterization of Exposed Populations . . . . . . . . . . . . . . . . . . . . 6-34

Exposure Assessment and Risk Characterization . . . . . . . . . . . . . . 6-35
Sensitivity Analysis of Higher Risk Potential Scenarios . . . . . . . . . . 6-38
Results of On-site Risk Modeling . . . . . . . . . . . . . . . . . . . . . . . . . . . . . . . 6-40
Baseline On-site CKD Management . . . . . . . . . . . . . . . . . . . . . . . . . 6-40
Sensitivity Analysis of Potentially Higher Risk Scenarios . . . . . . . . . 6-45
6.2.3 Summary of Risks from On-site CKD Management . . . . . . . . . . . . . . . . . 6-51
Ground-Water Risks . . . . . . . . . . . . . . . . . . . . . . . . . . . . . . . . . . . . . . . . . . 6-51
Surface Water Risks to Human Health . . . . . . . . . . . . . . . . . . . . . . . . . . . 6-52
Aquatic Ecological Risks . . . . . . . . . . . . . . . . . . . . . . . . . . . . . . . . . . . . . . 6-52
Air Pathway Risks from Windblown Dust . . . . . . . . . . . . . . . . . . . . . . . . . 6-52
6.3 EVALUATION OF RISKS FROM OFF-SITE BENEFICIAL USES OF CKD . . . . . . 6-53
6.3.1 Approach and Methods . . . . . . . . . . . . . . . . . . . . . . . . . . . . . . . . . . . . . . . 6-54
6.3.2 Hazardous Waste Stabilization and Disposal . . . . . . . . . . . . . . . . . . . . . 6-54
6.3.3 Sewage Sludge Treatment and Use . . . . . . . . . . . . . . . . . . . . . . . . . . . . . 6-56
6.3.4 Building Materials Addition . . . . . . . . . . . . . . . . . . . . . . . . . . . . . . . . . . . . 6-57
6.3.5 Road Construction . . . . . . . . . . . . . . . . . . . . . . . . . . . . . . . . . . . . . . . . . . . 6-58
Analysis of Risk Factors . . . . . . . . . . . . . . . . . . . . . . . . . . . . . . . . . . . . . . 6-58
Risk Modeling Results for Unpaved Traffic Surfaces . . . . . . . . . . . . . . . 6-59
6.3.6 Agricultural Liming . . . . . . . . . . . . . . . . . . . . . . . . . . . . . . . . . . . . . . . . . . . 6-60
Analysis of Risk Factors . . . . . . . . . . . . . . . . . . . . . . . . . . . . . . . . . . . . . . 6-60
Risk Modeling Results for Liming . . . . . . . . . . . . . . . . . . . . . . . . . . . . . . . 6-62
6.3.7 Summary of Risks from Off-site Beneficial Uses . . . . . . . . . . . . . . . . . . . 6-63

LIST OF EXHIBITS
Exhibit 6-1 Overview of Risk Assessment Methodology . . . . . . . . . . . . . . . . . . . . . . . 6-3
Exhibit 6-2 Basis for Risk-Screening Criteria . . . . . . . . . . . . . . . . . . . . . . . . . . . . . . . 6-9
Exhibit 6-3 CKD Constituents That Exceeded Risk-Screening Criteria at EPASample Facilities . . . . . . . . . . . . . . . . . . . . . . . . . . . . . . . . . . . . . . . . . . . . . 6-12
Exhibit 6-4 Comparison of 15 Sample Facilities to Other Facilities . . . . . . . . . . . . . 6-16
Exhibit 6-5 Site Specific Factors Used to Evaluate Risk Potential of On-Site CKDManagement . . . . . . . . . . . . . . . . . . . . . . . . . . . . . . . . . . . . . . . . . . . . . . . . 6-18
Exhibit 6-6 Risk Potential Rankings for the Ground-water Pathway . . . . . . . . . . . . . 6-21
Exhibit 6-7 Risk Potential Rankings for the Surface Water Pathway . . . . . . . . . . . . 6-24
Exhibit 6-8 Particle Size Distribution of CKD by Kiln Type . . . . . . . . . . . . . . . . . . . . 6-27
Exhibit 6-9 Risk Potential Rankings for the Air Pathway . . . . . . . . . . . . . . . . . . . . . . 6-28
Exhibit 6-10 Graphical Illustration of On-site Risk Modeling Scenarios . . . . . . . . . . . 6-31
Exhibit 6-11 Aquatic Ecological Benchmark Levels . . . . . . . . . . . . . . . . . . . . . . . . . . . 6-38
Exhibit 6-12 Baseline On-Site Management Cancer Risks for Direct ExposurePathways for 15 Case Study Facilities . . . . . . . . . . . . . . . . . . . . . . . . . . . 6-41
Exhibit 6-13 Baseline On-Site Management Cancer Risks for Foodchain ExposurePathways for 15 Case Study Facilities . . . . . . . . . . . . . . . . . . . . . . . . . . . 6-42
Exhibit 6-14 Constituents Contributing to Adverse Health Effects In On-site CKDRisk Modeling Analysis . . . . . . . . . . . . . . . . . . . . . . . . . . . . . . . . . . . . . . . 6-43
Exhibit 6-15 Results of Central Tendency and High End Ecological EffectsAnalysis . . . . . . . . . . . . . . . . . . . . . . . . . . . . . . . . . . . . . . . . . . . . . . . . . . . . 6-45
Exhibit 6-16 Sensitivity Analysis of Maximum CDD/CDF Cancer Risks for DirectExposure Pathways . . . . . . . . . . . . . . . . . . . . . . . . . . . . . . . . . . . . . . . . . . 6-46
Exhibit 6-17 Sensitivity Analysis of Maximum CDD/CDF Cancer Risks forFoodchain Exposure Pathways . . . . . . . . . . . . . . . . . . . . . . . . . . . . . . . . . 6-47
Exhibit 6-18 Sensitivity Analysis of Location Adjacent to Agricultural Field forFoodchain Exposure Pathways . . . . . . . . . . . . . . . . . . . . . . . . . . . . . . . . . 6-48

LIST OF EXHIBITS (cont.)
Exhibit 6-19 Sensitivity Analysis of Location Adjacent to Surface Water for Direct andFoodchain Exposure Pathways . . . . . . . . . . . . . . . . . . . . . . . . . . . . . . . . . 6-49
Exhibit 6-20 Sensitivity Analysis of Highly Exposed Individuals for Foodchain ExposurePathways . . . . . . . . . . . . . . . . . . . . . . . . . . . . . . . . . . . . . . . . . . . . . . . . . . . 6-50
Exhibit 6-21 Off-site Beneficial Uses Examined in the Risk Assessment . . . . . . . . . . 6-54

CHAPTER SIX
POTENTIAL DANGER TO HUMAN HEALTH AND THE ENVIRONMENT
6.0 INTRODUCTION
Section 8002(o)(3) of RCRA requires that EPA's study of CKD waste analyze potentialdanger to human health and the environment from disposal. In response to this requirement,EPA assessed the risks of potential releases of CKD contaminants to the environment, bothduring the routine management of the dust at cement plants and when the dust is beneficiallyused at other locations. This assessment relies heavily on the information developed on theamounts and characteristics of CKD generated (discussed in Chapter 3), CKD managementpractices (discussed in Chapter 4), and alternative CKD management practices and uses(summarized in Chapter 8). In addition, the risk assessment is intended to complement thedamage case study presented in Chapter 5. The damage cases provide actual instances ofenvironmental contamination, sometimes attributable to management practices and facilitysettings not considered in the risk assessment. The risk assessment covers the potential forcertain more subtle or long-term risks that might not be evidenced in the damage case files.
This chapter summarizes the methods and results of EPA's risk assessment of CKDdisposal and use. Additional details on various aspects of the study are provided in TechnicalBackground Document, Human Health and Environmental Risk Assessment in Support of theReport to Congress on CKD Waste (referred to as the "Risk Assessment Technical BackgroundDocument" in the rest of this chapter). Before presenting the specific elements of the study, thissection provides background on the purpose and scope of the risk assessment, as well as anoverview of the study approach. This introduction also summarizes the major results andconclusions that are developed in greater detail in the remainder of the chapter.
Purpose and Scope
One of the primary objectives of the risk assessment was to investigate, as realisticallyas possible, the baseline risks of CKD management practices at actual sites. This wasaccomplished by focusing on a sample of case-study cement plants and off-site beneficial usescenarios that appeared to reasonably represent the universe of sites where CKD is disposedand used. For each sample site, EPA evaluated the potential for CKD contaminants to bereleased into the environment, migrate to possible human and ecological receptors, and resultin exposures and adverse effects. This evaluation included a combination of qualitativeanalyses designed to document and describe major factors contributing to (or limiting) risks, andquantitative modeling designed to estimate the magnitude of risks. The study focused on thepotential for releases and exposures through all media and pathways (ground water, surfacewater, air, and the food chain), and examined risks both to maximally exposed individuals andtotal populations around each case-study site.
Recognizing that potentially higher risk conditions may exist at other sites not included inthe case-study sample, EPA designed the study to evaluate potential adverse effects under avariety of hypothetical scenarios. These scenarios were constructed by modifying theconditions evaluated at the case-study sites to reflect a reasonable worst-case set of wastecharacteristics, environmental settings, or CKD management practices.
Overall, the study examines the range of conditions that exist across the industry, whilealso focusing on those scenarios that have the greatest potential for adverse effects. The casestudies are believed to fairly represent the range of risks that exist at "typical" sites. At thesame time, to characterize the upper end of the risk distribution, priority was given to identifyingand evaluating those management scenarios that pose the greatest threat.
Overview of Approach

6-2
The risk assessment approach consisted of three primary steps, as shown in Exhibit 6-1. First, the Agency conducted an "initial risk screening" of the chemical concentrations in CKD. Using EPA's sampling data for 20 cement plants, as well as data provided by industry, thisscreening compared chemical concentrations to a set of criteria. Concentrations that fell belowthese screening criteria were judged to pose a low or negligible risk that did not need furtherstudy. Conversely, concentrations above the criteria indicated that more detailed study wasneeded to determine the risks associated with certain CKD constituents, exposure pathways,and facility-specific waste streams under more realistic management conditions. This initial riskscreening is summarized in Section 6.1.
Second, those constituents, exposure pathways, and CKD waste streams that could notbe ruled out based on the initial risk screening were evaluated at a sample of actual cementplants. For each of the 15 plants visited during the 1992 sampling study, EPA collected site-specific data on a number of management practices and environmental factors that influencethe potential for damage through releases to ground water, surface water, and air when the dustis managed on site at cement plants. Based on an analysis of these factors, the facilities weregrouped into risk potential categories (negligible, low, moderate, and high) for each pathway. The Agency then performed quantitative modeling to estimate the human health andenvironmental risks at five of these 15 plants in order to estimate both central tendency andhigh end risks. In addition, the sensitivity of these modeled risk results to selected keyparameters was examined in order to identify potentially higher risk management scenarios andenvironmental settings not captured by the 15 sample sites. Section 6.2 summarizes thisevaluation of risks when CKD is managed on site at cement plants.
Third, those constituents, exposure pathways, and CKD waste streams that the initialrisk screening could not exclude from further study were evaluated in the context of off-sitebeneficial uses. The Agency reviewed data on the nature, extent, and location of off-site CKDuses to identify five case studies for further risk analysis. These cases represented five majorcategories of off-site use: 1) hazardous waste stabilization and disposal, 2) sewage sludgestabilization and use, 3) building materials addition, 4) road construction, and 5) agriculturalliming. EPA collected data on major risk factors for each case study to determine the potentialfor adverse effects and to prioritize the beneficial use categories for quantitative modeling. Hypothetical scenarios designed to represent the two categories that appeared to pose thehighest risk were then developed and modeled for the purpose of risk estimation. This analysisof off-site beneficial uses is presented in Section 6.3.

6-3
Exhibit 6-1Overview of Risk Assessment Methodology

6-4
Major Results and Conclusions
Major results and conclusions from the evaluation of potential danger to human healthand the environment from the management of CKD are presented below.
C The pH of CKD leachate measured in laboratory tests typically ranged from 11 to13. High pH levels in ground water and surface water may result in a variety ofadverse effects, including the mobilization of certain metals and otherconstituents that could pose toxicological problems, human tissue burns (at pHlevels above 12.5 or more), corrosion in pipes, and objectionable taste in drinkingwater. In addition, high pH levels could cause a wide variety of adverseecological effects.
C Seventeen radionuclides were found in detectable concentrations in CKD,including members of the naturally occurring uranium-238 and thorium-232decay chains and anthropogenic radionuclides that have been dispersedthroughout the environment along with fallout from nuclear weapons tests. Theconcentrations of these radionuclides in CKD, however, are not elevatedcompared to the range of natural background levels, and modeling results forthose nuclides with the highest potential for adverse health effects showednegligible risk.
C Based on a detailed qualitative review of site-specific risk factors at 15representative cement plants, on-site CKD handling and disposal does notappear to have a high potential for adverse human health and environmentalrisks. However, selected risk factors, observed or reported at these or othercement plants, required more detailed qualitative evaluations.
C Quantitative risk modeling of case-study plants yielded central tendency riskestimates for cancer and noncancer health effects that were below levels ofconcern. Of the seven potential exposure pathways examined in this baselineanalysis, including direct contact and indirect foodchain pathways, estimatedincreased individual cancer risks never exceeded a level of 1x10⁻⁶ (most pathwayrisks never exceeded 1x10⁻⁸). The noncancer hazard estimates were alwaysless than one order of magnitude of the noncancer effects threshold.
C Modeling estimates of high end risks from on-site management indicated agreater potential for human health effects. High end facility cancer risks due torecreational exposures to surface water reached an upper bound value of 2x10⁻⁵;the ingestion of vegetables grown in agricultural fields contaminated by CKDreached an upper bound cancer risk of 3x10⁻⁶, and consumption of recreationally-caught fish reached an upper bound risk of 4x10⁻⁵. The other high end direct andindirect exposure pathway estimates were all less than 1x10⁻⁶.
C Although the central tendency results for the baseline risk modeling analysisshowed no exceedances of ambient water quality criteria or other aquaticecological benchmarks, the high end results indicated a potential for aquaticecological damages. The high end ecological risks reflect contributions of CKDfrom overland run-off, atmospheric deposition, and ground-water discharge allentering the receiving water body. While most of the high end results indicatedthat aquatic ecological benchmarks would be exceeded by small amounts formost constituents, two constituents (cadmium and chromium) exceededbenchmarks by more than two orders of magnitude and two others (arsenic andlead) exceeded by a factor of ten or more.
C The sensitivity analysis of hypothetical but plausible (based on conditionsinfrequently observed) higher risk scenarios indicated a potential for moresignificant human health threats in a number of scenarios. These analysesindicated that the proximity to potential exposure points (such as agriculturalfields and surface water bodies), high end concentrations of individual toxic

6-5
constituents (such as dioxins, arsenic, or heavy metals), or the possible presenceof extreme exposure situations (such as subsistence food consumption), wouldbe major factors that could increase the potential for damages from CKD plants.
C Dioxins/furans did not contribute substantially to cancer risks for either the centraltendency or high end plants in the baseline case studies. Sensitivity analysis,based on high end measured dioxin concentrations, also suggested negligible orlow risks in the direct exposure pathways. However, for indirect foodchainpathways, high dioxin concentrations applied to base case plant settingsincreased central tendency cancer risks to levels as high as 1x10⁻⁴ and high endplant risks to as high as 1x10⁻³.
C Sensitivity analyses indicated that, other factors being equal, CKD units locatedadjacent to crop fields and pastures or surface water bodies (both settings havingbeen observed in field site visits) would increase general health and/or aquaticresource damages by an order of magnitude or more over the base-caseestimates.
C Although subsistence level food consumption exposure patterns were notobserved in the field or otherwise reported to the Agency, sensitivity analysesincorporating these extreme indirect foodchain exposure situations yielded thehighest estimated risks in the EPA studies. Although these subsistenceconsumption risks did not exceed levels of concern for the central tendency basecase plants, when combined with any other high end risk factor, cancer riskstypically exceeded 1x10⁻⁴ for subsistence fish consumption and 1x10⁻⁵ forsubsistence farming.
C Off-site beneficial byproduct use of CKD as a stabilizing agent for hazardouswaste, sewage sludge stabilizer, road sub-base, asphalt additive, and additive forbuilding materials (e.g., concrete and masonry block) does not appear to posesignificant risks to human health or the environment. Although there is somepotential for releases of CKD contaminants and subsequent exposures when thedust is used in the construction of unpaved roads and parking lots, modeling of aparking lot scenario indicates that this risk should be small (predicted cancerrisks of 1x10⁻⁷ or lower and noncancer risks of at least two orders of magnitudebelow effects thresholds for all potential exposure pathways).
C Utilization of CKD as an agricultural liming agent appears to pose more of a riskthan other byproduct beneficial uses. The Agency's analysis indicated thatcancer risks and noncancer effects could exceed relevant levels of concern in thefoodchain pathway in several scenarios for those CKD sources with very highconcentrations of arsenic and dioxins. While best estimate risks indicated amaximum exposure to a subsistence farmer of about 7x10⁻⁶ due to arsenic, theupper bound risks in this exposure scenario reached a maximum of 2x10⁻⁴ as aresult of dioxin exposures.
6.1 INITIAL RISK SCREENING
EPA started its risk assessment by comparing the concentrations of chemicalsmeasured in CKD to a set of benchmarks, or "risk-screening criteria." These criteria weredeveloped using accepted toxicity values and chemical release, transport, and exposureassumptions that represent reasonable mismanagement scenarios when CKD is managed onsite at cement plants. EPA first compared chemical concentrations to the screening criteria toidentify CKD constituents that need further study to determine if there is a potential to pose ahuman health or environmental risk when the dust is managed on site. The Agency thenevaluated other chemical and physical properties (i.e., mobility and persistence in theenvironment, and normal background concentrations) that may tend to mitigate, intensify, orotherwise qualify the risks associated with those CKD constituents found at levels above thescreening criteria.

6-6
1 EPA also measured the concentrations of chloride, total organic carbon, total cyanide, sulfate,and sulfide in CKD totals analyses during the 1992 sampling. The Agency did not examine thesechemicals in the risk screening, however, as there are no accepted toxicity values on which to basescreening criteria.
The purpose of this initial risk screening was threefold:
C To identify individual CKD constituents that may have the potential to pose risks,and, if so, how pervasively across cement plants;
C To identify exposure pathways that are most likely to convey risks (ground water,surface water, air, and direct contact); and
C To identify CKD waste and product streams on a facility-specific basis that mayhave the potential to pose risks under reasonable mismanagement scenarios.
Those CKD constituents, exposure pathways, and CKD streams believed to pose a low ornegligible risk based on the results of the risk screening could be excluded from furtheranalysis. Conversely, those constituents, pathways, and CKD streams that could not be ruledout based on this initial screening would warrant a closer, site-specific assessment. TheAgency then proceeded to analyze these constituents, pathways, and cement plants in moredetail in subsequent steps of the risk assessment.
The remainder of this section summarizes the methods and results of this initial riskscreening. More detail is provided in the Risk Assessment Technical Background Document. Section 6.1.1 provides a brief overview of the risk screening approach and methods. Section6.1.2 presents the risk-screening results for different exposure pathways, and discusses theirimplications for subsequent steps in the risk assessment.
6.1.1 Approach and Methods
This section describes the CKD composition data, risk-screening criteria, and otherconstituent-specific factors used in the initial risk screening.
CKD Composition Data
For the purpose of the initial risk screen, EPA examined the concentrations of 25 dioxinsand furans, 14 metals, 17 radionuclides, fluoride, and pH.1 The screening focused primarily onconcentrations measured during the Agency's 1992 and 1993 sampling study, introduced inChapter 1. EPA believes that it is appropriate to focus this risk screen on its own sampling data(as opposed to data from the PCA Survey, PCA Reports, and Bureau of Mines) for three mainreasons:
C EPA's data set is the only source of data on dioxins, furans, and radionuclides(the other sources do not provide any data on these constituents);
C The Agency data can be related in all instances to specific waste managementpractices and environmental settings for subsequent case-study purposes; and
C As discussed in Section 3.2.2 of this report, a statistical analysis indicates thatthe vast majority of calculated mean concentrations for metals in the EPAsampling data are not significantly different than the means from the other datasources.
Nevertheless, the Agency recognizes that the other data sources report higher concentrationsof some metals than observed in the EPA sampling, and that limiting this initial risk screening toonly the EPA sampling data might ignore some metal concentrations that would yield higher risk

6-7
2 EPA assumed a 70-year exposure duration in developing the risk-screening criteria as onemeans of ensuring that the criteria are conservative (i.e., to help avoid false negative conclusions inthis step of the analysis). In the risk modeling step of the analysis, EPA assumed an exposureduration of 9 years, which is the 50th percentile (median) duration of occupancy at one residence(Exposure Factors Handbook, U.S. EPA Office of Health and Environmental Assessment,EPA/600/8-89/043, July 1989). The Agency used 9 years in the risk modeling to develop a riskestimate that is more realistic than the conservative risk potential conclusions from the initial risk
conclusions. Therefore, the risk screen also considered the full range of metal concentrationsreported in the other data sources.
EPA's data set of constituent concentrations consists of a total of 45 CKD samples from20 different cement plants, including ten facilities that burn hazardous waste as fuel and tenfacilities that do not burn hazardous waste. Not all samples were analyzed for everyconstituent, however. Metals data (both totals and leach extract) are available for 15 facilities,and dioxins data are available for 11 facilities (although only six facilities have leachate data). The number of facilities for which radionuclide data are available ranges from seven to 20,depending on the particular radionuclide and test type. For this analysis, EPA did notdifferentiate between the "as generated" and "as managed" dust samples, but rather combinedthe sampling results (there were 24 "as generated" samples and 21 "as managed" samples). Similarly, the results from TCLP and SPLP extract analyses, discussed in Chapter 3, were notdifferentiated for the initial risk screen.
Leachate extract analyses were conducted for dioxins, furans, and radionuclides at thesix cement plants examined in the 1993 sampling, but not at the 15 plants examined in 1992. The Agency filled this data gap by estimating leachate concentrations of these constituents forthe 1992 sampling results. In particular, EPA determined the median ratio of totalconcentrations to leachate extract concentrations observed for each dioxin, furan, andradionuclide examined in the 1993 sampling, and then multiplied these ratios by thecorresponding total concentrations observed in 1992. These estimated leachate concentrationswere then pooled with the measured concentrations from 1993 for comparison to the risk-screening criteria.
Risk-Screening Criteria
Because this evaluation was intended to identify constituents, pathways, and CKDstreams that warrant further analysis and rule out those that present negligible risk, EPAdesigned the screening criteria to be reasonably "conservative" to avoid false negativeconclusions. That is, the criteria are based on release, transport, and exposure assumptionsthat are more likely to indicate risk than actual CKD management practices at cement plants.
Separate criteria were developed for four release and exposure pathways: groundwater, surface water, air, and on-site direct contact. For the ground-water pathway, the Agencyused two criteria to evaluate the potential for adverse health effects through drinking waterexposures: one based on the drinking water primary Maximum Contaminant Levels (MCLs) andthe other based on health-based levels (HBLs). Four criteria were used for surface water: twofor evaluating the potential for human exposure through drinking water (based on the sameMCLs and HBLs used for the ground-water criteria), one for evaluating the potential for aquaticecological effects (based on the Ambient Water Quality Criteria), and one for evaluating thepotential for human exposure through fish ingestion. One criterion was developed for the airpathway and the on-site direct contact pathway. The basis for each of the risk-screening criteriais summarized in Exhibit 6-2. The Risk Assessment Technical Background Document providesmore detail on the derivation of these criteria, as well as the numerical values used for thedifferent criteria.
An individual lifetime cancer risk of 1x10⁻⁵ was used as the basis for the screeningcriteria for carcinogens, indicating that the chance of an individual contracting cancer over a 70-year lifetime,2 as a result of the exposure being assessed, is approximately 1 in 100,000. This

6-8
screen.
3 Report to Congress on Special Wastes from Mineral Processing, Volume II, Methods andAnalyses, U.S. EPA Office of Solid Waste, July 1990.
risk level is consistent with EPA policy of selecting risk management targets between 1x10⁻⁴ and1x10-6 (55 FR 8716; March 9, 1990). An individual cancer risk of 1x10⁻⁵ is appropriate fordeveloping screening criteria in this context because the total population exposed to CKD isrelatively small, and because using a lower target risk in conjunction with the conservativeexposure assumptions underlying the screening criteria would unnecessarily compound theconservatism of the criteria. For example, assuming a 70-year exposure duration introducessubstantial conservatism compared to the 9-year average exposure duration assumed in mostcurrent generic risk assessments (assuming a 9-year exposure would raise the screeningcriteria for carcinogens by a factor of almost eight). Using a higher target risk would beinappropriate because the screening analysis was designed to be reasonably conservative andto minimize false negatives.
To develop the ground-water and surface water pathway criteria, EPA used a dilutionand attenuation factor (DAF) to account for the decrease in concentration that occurs ascontaminants are released from a waste management unit, mix in the flow of ground water orsurface water, and migrate to a location where a person, plant, or animal might be exposed. ADAF of 10 was used for the ground-water pathway and a DAF of 100 was used for the surfacewater pathway (i.e., adverse effect levels were multiplied by 10 for the ground-water criteria andby 100 for the surface water criteria). These are the same DAFs that EPA used in conducting asimilar risk-screening analysis in the Report to Congress on Special Wastes from MineralProcessing.3 The Agency believes that these factors account for a minimal amount of dilutionand attenuation in ground water and surface water under reasonable CKD mismanagementscenarios.
6-9
Exhibit 6-2Basis for Risk-Screening Criteriaa
Screening Criterion Major Underlying Assumptions and Parameters
Ground-waterPathway
10x Primary MCL The Primary Maximum Contaminant Levels (MCLs) established for drinking water supplies are designed to be protective of human health. Tentimes the primary MCL represents the constituent concentrations in CKD leachate that could result in an exceedance of the primary MCL (andthe risk of associated adverse human health effects) if the leachate is released and migrates in ground water to a downgradient drinking waterwell with less than a 10-fold dilution. In the case of pH, the Agency used one standard unit above the upper bound of the secondary MCL(equivalent to a factor of 10) because there is no primary MCL. The secondary MCL for pH is intended to limit corrosivity and taste effects, notnecessarily adverse health effects.
10x Health-Based Level
The Agency developed health-based levels (HBLs) using chemical-specific toxicological values along with equations for calculating preliminaryremediation goals for ground water at Superfund sites. These levels assume that an adult directly ingests contaminated ground water andinhales volatile contaminants from whole-house water use (such as from the shower or faucet). The HBLs are based on an individual lifetimecancer risk of 1x10⁻⁵ for carcinogens and noncancer effect thresholds for noncarcinogens. The Agency multiplied these HBLs by 10 to developcriteria that represent concentrations in CKD leachate that may pose health risks if leachate is released and migrates in ground water to anearby drinking water well with less than a 10-fold dilution.
SurfaceWaterPathway
100x PrimaryMCL
These are the same MCLs used for the ground-water criteria, simply multiplied by 100 rather than 10 to account for greater dilution expected insurface water.
100x Health-Based Level
These are the same HBLs used in deriving the ground-water criteria, but multiplied by 100 instead of 10.
100x AWQC When available, the Agency used chronic ambient water quality criteria (AWQC) for freshwater organisms. When AWQC were not available,the Agency derived "AWQC-like" values by extrapolating lowest observed adverse effect levels for chronic exposures of freshwater organisms. These criteria are designed to be protective of aquatic organisms (not humans), accounting for the potential for constituents to bioconcentrateand cause adverse effects through food chain exposures.
Human FishIngestion HealthFactor
The Agency developed human health screening criteria for contaminated fish ingestion using chemical-specific toxicological values andbioconcentration factors, along with equations for calculating exposure from the ingestion of contaminated fish at Superfund sites. The levelsare based on an individual lifetime cancer risk of 1x10⁻⁵ for carcinogens and noncancer effect thresholds for noncarcinogens. The Agencymultiplied these levels by 100 to develop criteria that represent concentrations in CKD leachate that may pose human health risks if constituentsare released, migrate to a surface water with only a 100-fold dilution, and bioconcentrate in fish that are consumed by humans.
Air Release-Off-site ExposurePathway
These criteria represent concentrations that, if CKD is suspended in air and transported to a downwind receptor location, could lead to anindividual lifetime cancer risk of 1x10⁻⁵ or an exceedance of a noncancer effect threshold. The underlying assumptions are that particulatesfrom a CKD pile are blown into the air by the wind, dispersed to a hypothetical "backyard gardener's" property located 230 meters (750 feet)away, and deposited onto soil and vegetables at that point. The receptor is then assumed to be exposed to CKD contaminants via four routes: (1) inhalation of particulates; (2) incidental ingestion of soil contaminated by airborne deposition of particulates (i.e., inadvertent ingestion ofsoils as a result of normal mouthing of objects or hands); (3) ingestion of leafy vegetables contaminated by deposited particulates; and (4) forradionuclides, exposure to direct radiation from the contaminated ground surface without any shielding.
On-site Direct ContactPathway
These criteria are based on a highly conservative, hypothetical scenario in which an individual is assumed to live directly on uncovered CKD,and over a lifetime, incidentally ingests the dust, inhales particulates suspended into the air, inhales constituents that have volatilized from thedust, and is exposed to direct radiation with no shielding. No dilution is taken into account; the exposed individual is assumed to live directly onCKD, not CKD mixed with soil or any other material. The criteria are based on an individual lifetime cancer risk of 1x10⁻⁵ for carcinogens andnoncancer effect thresholds for noncarcinogens. The Agency calculated these levels using equations and parameters developed for calculatingpreliminary remediation goals for soil at Superfund sites.
a See the Risk Assessment Technical Background Document for the numerical values used for each criterion and more detail on their derivation.

6-10
4 The term "congener" refers to any one member of the same chemical family. There are 75congeners of chlorinated dibenzo-p-dioxins; seven of these have chlorine substituted at the 2, 3, 7,and 8 carbons. Likewise, there are 135 congeners of chlorinated dibenzofurans; ten of these havechlorine substituted at the 2, 3, 7, and 8 carbons.
5 EPA assumed that all constituents would be mobile in surface water or air if released to thesemedia.
6 This partition coefficient, or Kd, represents the equilibrium ratio of a chemical adhering to soilthat is present in ground water. The Agency reviewed each constituent's Kd as developed by EPA'sOffice of Research and Development (ORD) (documented in EPA's Corrective Action chemicaldatabase). If a value was not developed by ORD, Kd values were selected from the Department ofEnergy's Chemical Data Bases for the Multimedia Environmental Pollutant Assessment System(MEPAS). Both of these sources provide Kd values for different pH categories, and EPA selectedvalues from the highest pH category to best represent conditions that are most likely to exist inCKD leachate.
To develop appropriate screening concentrations for dioxins and furans, EPA followedthe methodology presented in Interim Procedures for Estimating Risks Associated withExposures to Mixtures of Chlorinated Dibenzo-p-dioxins and -Dibenzofurans (CDDs and CDFs),1989 Update. According to this methodology, concentrations of 2,3,7,8-substituted CDDs andCDFs (i.e., CDDs and CDFs with a chlorine substituted on the 2, 3, 7, and 8 carbon atoms) areconverted to equivalent concentrations of 2,3,7,8-tetrachlorodibenzo-p-dioxin (2,3,7,8-TCDD),the most potent carcinogen that has been evaluated by EPA. Equivalent concentrations of2,3,7,8-TCDD for each 2,3,7,8-substituted congener4 are calculated by multiplying theconcentration of each 2,3,7,8-substituted congener by its respective toxicity equivalent factor(TEF). CDDs and CDFs that do not have chlorine substitutions at the 2, 3, 7, and 8 carbons areassigned a TEF of zero. After each congener is multiplied by its TEF, the concentrations for allthe congeners are summed to determine the 2,3,7,8-TCDD equivalent for the mixture.
Other Constituent-Specific Factors
For those constituents found to exceed one of the risk-screening criteria, the Agencyevaluated three other constituent-specific factors that may affect the potential for human healthand environmental risks. These other factors were used to qualify the results of the criteriacomparisons, not as a basis for excluding constituents of potential concern from the analysis. The values used in evaluating each of these factors are outlined in the Risk AssessmentTechnical Background Document.
First, the Agency evaluated each constituent's mobility in ground water5 by examining itssoil-water partition coefficient (Kd), which reflects the tendency of a chemical to attach to soil.6
EPA evaluated this factor because, even though a constituent may exist in CKD leachate inrelatively high concentrations, it may pose little or no risk to off-site receptors if it migrates veryslowly in ground water.
Second, each constituent's persistence in the environment was evaluated. A constituentthat degrades rapidly may not pose a substantial risk, even if it exists in relatively highconcentrations. Many constituents present in CKD are elements that do not degrade in theenvironment. However, EPA evaluated the half-life of dioxins in ground water as reported in theU.S. Department of Energy's (DOE's) MEPAS database. The persistence of dioxins in air orsurface water was not evaluated, because the travel time in these media to a possible exposurepoint is nearly instantaneous. For radionuclides, EPA used radioactive half-lives documented inthe Radiological Health Handbook (1970) published by the U.S. Public Health Service.

6-11
7 The absence of a chemical for a given facility in Exhibit 6-3 may be the result of a lack of datafor that facility, rather than the result of low chemical concentrations that fall below the screeningcriteria. Specifically, dioxins were not analyzed at Facilities B, C, G, I, J, L, N, Q, and S. Metalswere not analyzed at Facilities K, M, P, R, and T. Radionuclide data also are not available forevery facility.
Third, EPA evaluated the normal background concentrations of radionuclides in theenvironment. Most of the radionuclides detected in CKD are naturally occurring (such asmembers of the uranium-238 and thorium-232 decay chains), while others are anthropogenicbut have become ubiquitous in the environment (such as cesium-137 and plutonium-238/239,which exist essentially everywhere due to fallout from nuclear weapons tests). The Agencyreviewed background concentration data available in the literature and provided by DOE. If aradionuclide was found to exist in CKD in concentrations within the normal range found in theenvironment, it may not pose a risk that warrants special attention.
6.1.2 Risk-Screening Results
Although substantial variability was found in the concentrations of individualcontaminants at the 20 facilities sampled, all 20 facilities had one or more constituents thatexceeded the risk-screening criteria for every pathway. The constituents that exceededscreening criteria at each facility are presented in Exhibit 6-3.7 (For additional detail, includingthe magnitude of exceedances at each facility, see the Risk Assessment Technical BackgroundDocument.) As shown, every facility had at least four constituents that exceeded the ground-water pathway criteria, at least one constituent that exceeded the surface water pathwaycriteria, and at least five constituents that exceeded the very conservative on-site direct contactcriteria. In addition, every facility tested for metals had CKD that exceeded the air release off-site exposure criteria for at least one constituent.
Those facilities that burn hazardous waste as fuel are identified in Exhibit 6-3 with anasterisk. For the most part, the facilities that burn hazardous waste as fuel had the sameconstituents exceeding screening criteria by the same order of magnitude as the facilities thatdo not burn hazardous waste. However, dioxin, lead, chromium, pH, and Tl-208 levels athazardous waste burners tended to exceed certain criteria by a slightly wider margin than atother facilities. Conversely, thallium, Bi-214, Pb-214, and Ra-226 concentrations tended toexceed the criteria by a slightly wider margin at facilities that do not burn hazardous waste.
In terms of the results for individual constituents, the initial risk screening suggests thefollowing:
C Ground Water. The constituents needing further study for ground water areantimony, arsenic, thallium, and pH. Dioxins (2,3,7,8-TCDD equivalents), lead,beryllium, and cadmium also exceeded risk screening criteria, but theseconstituents are relatively immobile under the high pH conditions expected forCKD leachate (they would be expected to migrate readily only at sites wherefractures or solution cavities exist in the subsurface). In addition, K-40, Ra-228,and U-238 exceeded the screening criteria, but these radionuclides appear to bepresent in CKD in concentrations that are within the range of background levelsfound in normal rock and soil.

6-12
Exhibit 6-3CKD Constituents That Exceeded Risk-Screening Criteria
at EPA Sample Facilitiesa
Facility Ground-waterPathwayb
Surface Water Pathway Air Release -Off-site
ExposurePathwaya
On-site DirectContact Pathway
100x MCL or100x HBLb
100xAWQCb
FishIngestionb
Facility A* Sb, As, Pb, K-40, pH pH, K-40 Pb, pH Tl As, Cr As, Pb, Bi-214, K-40, Pb-214, Ra-226, Ra-228, Tl-208
Facility B As, Pb, Tl, K-40, pH K-40, pH pH Tl As, Cr As, Be, Bi-214, Pb-214, K-40, Ra-226,Ra-228, Tl-208
Facility C* As, Pb, K-40, pH Pb, K-40, pH Pb, pH As, Cr Pb-214, K-40, Ra-226, Ra-228, Tl-208
Facility D Sb, As, Tl, K-40, U-238, 2,3,7,8-TCDDequiv., pH
Tl, U-238,TCDDequiv., pH
pH Tl, 2,3,7,8-TCDD equiv.
As, Cr As, Tl, Bi-214, Pb-214, K-40, Ra-226,Ra-228, Tl-208,2,3,7,8-TCDDequiv.,TCDD+TCDF
Facility E Sb, As, Tl, K-40, pH K-40, pH pH Tl As, Cr As, Pb-214, K-40,Ra-226, Ra-228, Tl-208
Facility F* Sb, As, Pb, K-40, U-238, 2,3,7,8-TCDDequiv., pH
Pb, K-40, pH Pb, pH Tl, 2,3,7,8-TCDD equiv.
As, Cr As, Pb, Pb-214, K-40, Ra-226, Tl-208
Facility G Sb, As, Pb, Tl, K-40,pH
Pb, Tl, K-40,pH
Pb, pH Tl As, Cr As, Bi-214, Cs-137,Pb-214, K-40, Ra-226, Ra-228, Tl-208
Facility H* As, Pb, K-40, U-238,2,3,7,8-TCDD,equiv., pH
Pb, K-40, U-238, pH,2,3,7,8-TCDD equiv.
Pb, pH,2,3,7,8,-TCDD equiv.
Tl, 2,3,7,8-TCDD equiv.
As, Cr, 2,3,7,8-TCDD equiv.
As, Pb, Pb-214, K-40, Ra-226, Ra-228, Tl-208,2,3,7,8-TCDDequiv.,TCDD+TCDF
Facility I* Sb, As, Pb, Tl, Ra-228, K-40, pH
K-40, pH Pb, pH Tl As, Cr As, Bi-214, Pb-214,K-40, Ra-226, Ra-228, Tl-208
Facility J Sb, As, Pb, Tl, Ra-228, K-40, U-238,pH
K-40, U-238,pH
pH Tl As, Be, Cd, Cr As, Be, Bi-214, K-40, Pb-214, Ra-226, Ra-228, Tl-208
Facility K K-40, U-238,2,3,7,8-TCDD equiv.
K-40, U-238 2,3,7,8-TCDDequiv.
Bi-214, K-40, Pb-214, Ra-226, Ra-228, Tl-208
Facility L Sb, As, Pb, Tl, K-40,pH
Tl, pH pH Tl As, Cr, Tl Tl, Bi-214, K-40,Pb-214, Ra-226,Ra-228, Tl-208
Facility M K-40, U-238,2,3,7,8-TCDD equiv.
U-238 2,3,7,8-TCDDequiv.
Bi-214, K-40, Pb-214, Ra-226, Ra-228, Tl-208
Facility N* Sb, As, Pb, K-40, pH Pb, K-40, pH Pb, pH Tl As, Cr As, Be, Pb, Bi-214,Pb-214, K-40, Ra-226, Ra-228, Tl-208

Exhibit 6-3 (continued)CKD Constituents That Exceeded Risk-Screening Criteria
at EPA Sample Facilitiesa
6-13
Facility Ground-waterPathwayb
Surface Water Pathway Air Release -Off-site
ExposurePathwaya
On-site DirectContact Pathway
100x MCL or100x HBLb
100xAWQCb
FishIngestionb
Facility O* Sb, As, Pb, Tl, Ra-228, K-40, U-238,2,3,7,8-TCDDequiv., pH
K-40, U-238,pH
Pb, pH Tl, 2,3,7,8-TCDD equiv.
As, Be, Cr As, Be, Pb, Bi-214,K-40, Pb-212, Pb-214, Ra-226, Ra-228, Tl-208
Facility P* Ra-228, K-40, U-238, 2,3,7,8-TCDDequiv., pH
U-238, pH pH 2,3,7,8-TCDDequiv.
Th-228 Bi-214, K-40, Pb-214, Ra-226, Ra-228, Tl-208
Facility Q As, Tl, K-40, pH Tl Tl Tl As, Cr, Tl As, Tl, Bi-214, Pb-214, K-40, Ra-226,Ra-228, Tl-208
Facility R* K-40, U-238,2,3,7,8-TCDDequiv., pH
K-40, U-238,pH
2,3,7,8-TCDDequiv.
Bi-214, K-40, Pb-214, Pb-212, Ra-226, Ra-228, Tl-208
Facility S* Sb, As, Pb, Tl, K-40,pH
pH, K-40 pH Tl As, Cr As, Bi-214, Pb-214,K-40, Ra-226, Ra-228, Tl-208
Facility T Ra-228, K-40, U-238, 2,3,7,8-TCDDequiv., pH
K-40, U-238,pH
pH 2,3,7,8-TCDDequiv.
Bi-214, K-40, Pb-214, Ra-226, Ra-228, Tl-208
* Burns hazardous waste as fuel.a Dioxins were not analyzed at Facilities B, C, G, I, J, L, N, Q, and S. Metals were not analyzed at Facilities K, M, P, R, and T. Radionuclide data also are not available for every facility.b Metals data reported by industry (not developed by EPA) indicate that, in addition to the above exceedances, beryllium andcadmium occasionally exceed ground-water screening criteria, arsenic occasionally exceeds the HBL-based surface water criterion,and mercury occasionally exceeds the AWQC-based and fish ingestion criteria. Because the identity of the facilities exceeding thecriteria for these constituents is not known, they could not be displayed in this exhibit.
C Surface Water. Dioxins and furans (2,3,7,8-TCDD equivalents), lead, thallium,arsenic, K-40, U-238, and pH need further study to determine their potentialdrinking water threats. Dioxin, lead, thallium, mercury, and pH levels exceededthe AWQC-based criteria and require further study to determine their potential foraquatic ecological risk. Considering the potential for these constituents tobioconcentrate in fish tissue, dioxins, thallium, and mercury could pose an addedthreat of human exposures through the fish ingestion pathway. Of theseconstituents, dioxins, lead, thallium, and mercury are relatively immobile inground water (if fractures or solution cavities that facilitate flow do not exist) andthus would tend to migrate to surface water primarily by stormwater run-off oratmospheric deposition, rather than via ground-water discharge. In addition, thesurface water risks associated with K-40 and U-238 do not appear to be greaterthan the risks associated with natural background radioactivity.
C Air. The constituents needing further study to determine airborne releases andexposures include dioxins (2,3,7,8-TCDD equivalents), arsenic, beryllium,cadmium, thallium, and chromium (conservatively assuming all of the chromiumin CKD is present in its more toxic hexavalent form). Th-228 also could pose arisk via the air pathway, but no more than the risk associated with naturalbackground concentrations of this radionuclide.

6-14
C On-site Direct Contact. Dioxins, arsenic, beryllium, lead, thallium, and eightradionuclides may be present at some facilities in concentrations that may beharmful under the highly conservative scenario in which an individual livesdirectly on uncovered CKD. Although the radionuclides may pose a risk underthis exposure scenario, this radiation threat should not be any greater than thatassociated with natural background radioactivity.
Based on these screening results, EPA concluded that more detailed study was neededto determine the risks of several CKD constituents, exposure pathways, and facility-specificwaste streams. The Agency proceeded to evaluate these risks more closely by examiningexisting conditions at a sample of actual cement plants and off-site locations where CKD isbeneficially used.
6.2 EVALUATION OF RISKS WHEN CKD IS MANAGED ON SITE
In the second step of the risk assessment, EPA conducted a closer examination of thecement plants and CKD constituents that were found to have the potential for risks in the initialrisk-screening. The results of the preceding analysis of constituent concentrations in CKD werecombined with a site-specific evaluation of CKD management practices and environmentalsettings at a sample of actual cement plants.
This more detailed evaluation of risks was conducted in two phases. First, EPAevaluated the "risk potential" at initial case-study facilities by analyzing a number of site-specificfactors relating to the potential for on-site CKD management to pose risks via ground-water,surface water, and air pathways. The purpose of this evaluation was to document and describethe major factors contributing to or limiting risk at each case-study facility, and to prioritize thefacilities for further analysis through quantitative modeling. This evaluation of risk potential ispresented in Section 6.2.1.
Second, the Agency performed quantitative modeling to estimate the magnitude of risksassociated with on-site CKD management at cement plants. In particular, site-specific modelingwas performed to estimate the risks at case-study cement plants that could pose higher risksbased on the preceding evaluation of risk potential. The Agency also modeled potentiallyhigher risk scenarios not captured by the sample of cement plants considered in the evaluationof risk potential. This risk modeling of on-site CKD management is presented in Section 6.2.2.
6.2.1 Risk Potential Ranking of Initial Case Studies
This section summarizes the methods and results of the risk potential ranking conductedby EPA to determine factors that strongly influence the risks of on-site CKD management and toprioritize cement plants for risk modeling. The Risk Assessment Technical BackgroundDocument provides more detail on this evaluation.
Approach and Methods
EPA focused this ranking on a subset of the constituent concentration data and 20sample facilities analyzed in the initial risk screening. Only some of the constituents andfacilities were examined to develop an initial sample of case-study facilities that could beevaluated on a "level playing field." In particular:
C Dioxin concentrations were not considered because only 11 of the 20 samplefacilities were analyzed for dioxins. Considering dioxins, therefore, would haveresulted in artificially high risk potential rankings for some facilities that are basedmore on data availability than on true differences that exist across sites.

6-15
C The five cement plants sampled by EPA in 1993 were not considered. Thesefacilities were excluded from the risk potential ranking because their CKD wasnot tested for metals, which could result in a bias in the ranking.
It is important to clarify that EPA excluded dioxins and the five facilities sampled in 1993 onlyfrom this risk potential ranking and not from the rest of the risk assessment. As discussed inSection 6.2.2, the Agency modeled the risks of dioxins under several actual and hypotheticalmanagement scenarios, as well as potential higher-risk conditions found at some of the fivefacilities sampled in 1993, but not observed in the sample of 15 facilities sampled in 1992.
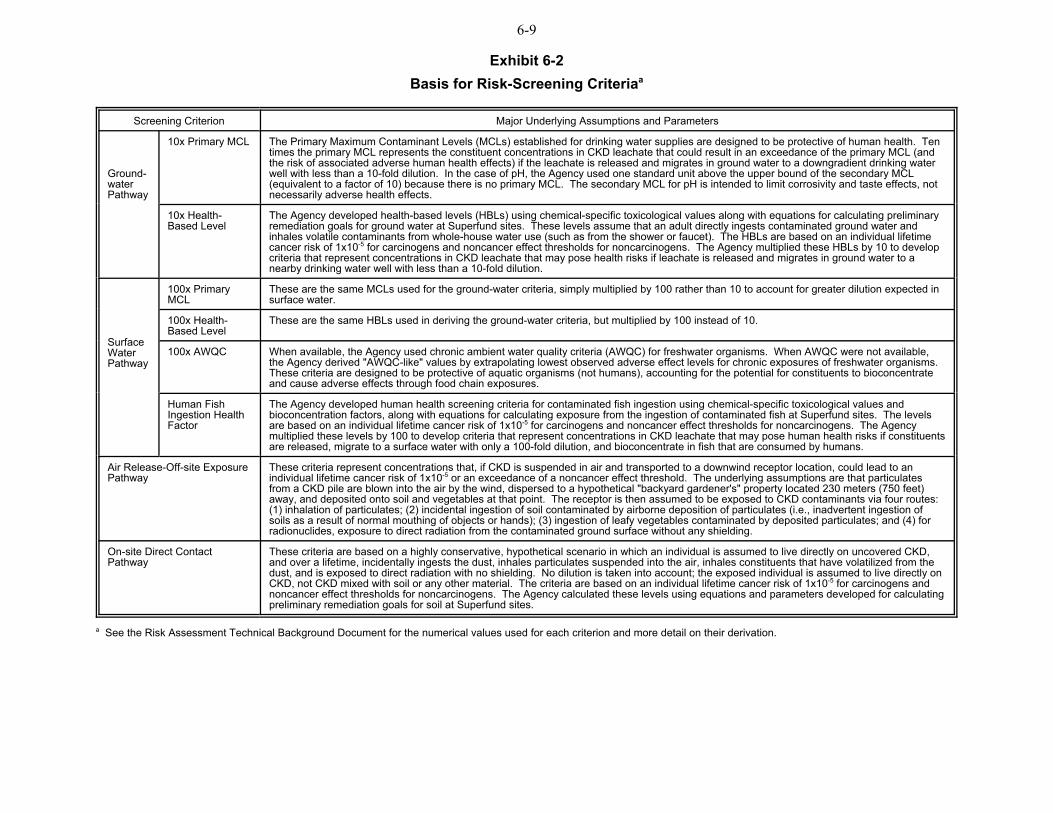
EPA believes that it is reasonable to focus on the 15 cement plants sampled in 1992 asinitial case-study facilities because they appear to provide a representative sample of othercement plants. Specifically, the sample is large and diverse, representing approximately 10percent of the universe of existing U.S. cement plants as well as a diversity of fuel types,process types, and geographic locations (e.g., eight of the facilities burn hazardous waste asfuel and seven do not). Moreover, the sample of 15 cement plants compares favorably with thecomplete set of 83 plants for which data are available, as shown in Exhibit 6-4. Specifically, thetwo sets of facilities are quite similar in terms of a number of factors that influence risk, includingCKD management unit types, the size of CKD management units, the proximity to "sensitive"environmental features (karst terrain, geological faults, 100-year floodplains, and endangeredspecies habitats), the number of residents presently within one mile, and the distance to thenearest existing residence. The 15 sample facilities, however, generate relatively large volumesof net CKD compared to the broader set of 83 plants, and do not represent the management ofCKD underwater (which is practiced at three of the 83 facilities). Finally, a statistical analysisindicates that the concentrations of metals in CKD at these 15 facilities are similar to theconcentrations observed at other cement plants. As discussed in Section 3.2.2, most of thecalculated mean concentrations for metals at the 15 sample facilities are not significantlydifferent than the means from other data sources that cover a larger sample of facilities(including PCA Report 2, which provides data on the concentration of metals in CKD from 79cement plants).
6-16
Exhibit 6-4
Comparison of 15 Sample Facilities to Other Facilities
Parameter Range of Values for 15 SampleFacilities
Range of Values for All 83 Facilities forWhich Data are Availablea
Total net CKD generated 25% > 63,500 MT (70,000 tons)50% > 40,500 MT (45,000 tons)75% > 16,500 MT (18,200 tons)
25% > 53,500 MT (59,000 tons)50% > 21,800 MT (24,000 tons)75% > 1,100 MT (1,200 tons)
CKD management unittype
60% landfill CKD in an on-site quarry27% manage CKD in an above-grade
pile13% (2 facilities) have no active CKD
unit
43% landfill CKD in an on-site quarry40% manage CKD in an above-gradepile11% landfill CKD in other units (mines,
slopes)1% (1 facility) manage CKD in a pond4% use other management units
CKD managedunderwater?
100% no 97% no3% (3 facilities) yes
Basal area of CKDmanagement unit(s)
25% > 63,500 m2 (683,000 ft2)75% > 6,700 m2 (72,000 ft2)
25% > 58,600 m2 (630,000 ft2)75% > 3,700 m2 (39,800 ft2)
Facility in karst area? 80% no20% yes
85% no15% yes
Facility in fault area? 67% no33% yes
86% no14% yes
Facility in 100-yearfloodplain?
47% no53% yes
60% no40% yes
Facility in endangeredspecies habitat?
100% no 98% no2% yes
Number of residentspresently within one mileof property boundary
25% > 1,020 people75% > 25 people
25% > 2,020 people75% > 33 people
Distance from propertyboundary to nearestexisting off-site residence
25% > 850 m (2,800 ft)75% > 15 m (50 ft)
25% > 790 m (2,600 ft)75% > 30 m (100 ft)
a A total of 79 cement plants, including 11 of 15 sample facilities, returned completed PCA mail surveyquestionnaires. Comparable data for the other four sample facilities were developed during the sampling visits.

6-17
8 EPA believes that leaving immobile ground-water contaminants and radionuclides out of thisranking provides a more realistic evaluation of risk potential. However, once a facility was selectedfor risk modeling based on this ranking, all constituents that exceeded one of the risk-screeningcriteria were modeled.
For the sample of 15 cement plants, the Agency analyzed site-specific information on anumber of factors that determine the degree to which CKD constituents are likely to be releasedinto the environment and transported to locations where humans or ecological receptors couldbe exposed. The particular factors considered are listed in Exhibit 6-5. As shown, EPAconducted separate analyses of factors that relate to the potential for CKD management to poserisks via the ground-water, surface water, and air pathways (including risks from the ingestion offood contaminated through these different pathways). For each pathway, four sets of factorswere systematically considered at every site:
C Factors related to the intrinsic hazard of CKD. These factors included thefrequency and magnitude with which chemical concentrations and pH levelsexceeded the risk-screening criteria discussed in Section 6.1. Again, dioxinswere not considered in this step to avoid biasing the ranking toward the subset offacilities whose CKD was analyzed for dioxins. In addition, EPA did not considerimmobile constituents in the ground-water pathway ranking, or radionuclides forany pathway because they were all measured in CKD at levels that fall within therange of typical background levels.8
C Factors related to ground-water, surface water, and air contamination potential. These factors included CKD management practices (size of pile, presence ofliners and run-off controls, dust suppression practices, etc.) and environmentalfeatures (e.g., depth to ground water, distance to surface water, and windspeeds) that have a bearing on the potential for contaminants to migrate fromwaste management units and contaminate environmental media.
C Factors related to transport potential. These factors included the presence ofnatural and man-made barriers to contaminant migration in environmental media,such as slurry walls or surface water bodies that might impede the migration ofground-water contaminants, and karst terrain or fractures that may facilitatecontaminant migration in ground water. The distance to closest potentialreceptors also was considered as a transport potential factor, giving the riskpotential ranking an element of a maximum exposed individual (MEI) riskassessment.
C Factors related to exposure potential. These factors included the present humanuses of nearby ground water, surface water, and air, as well as the size ofpotentially exposed populations. By considering the size of potentially exposedpopulations, the ranking also included elements of a population risk assessment. Depending on the size of the population, this factor had the effect of moderatingor intensifying the risk potential ranking based on MEI distances alone.
6-18
Exhibit 6-5
Site Specific Factors Used to Evaluate Risk Potential of On-Site CKD Management

6-19
The Agency assembled site-specific values for each of these factors using, whenavailable, information collected during the site visits. When data were not available from thesite visits, a variety of sources were used to fill in data gaps, including the PCA mail survey,local offices of State governments and the U.S. Geological Survey (USGS), USGS topographicmaps, the Graphical Exposure Modeling System (GEMS), and environmental data collected byEPA for nearby facilities as part of other risk assessment projects.
For each pathway (ground water, surface water, and air), the various factors werecombined to develop rankings (negligible, low, moderate, and high) regarding intrinsic hazard,contamination potential, transport potential, and exposure potential at each site. The Agencythen combined these four rankings to develop an overall ranking of the ground-water, surfacewater, and air risk potential at each plant. In developing this overall ranking for the differentmedia, the lowest ranking was selected from among the scores assigned to intrinsic hazard,contamination potential, transport potential, and exposure potential. For example, if the ground-water pathway at a facility was assigned a low intrinsic hazard, a high contamination potential, amoderate transport potential, and a moderate exposure potential, the facility was assigned anoverall low ground-water risk potential. In this way, the Agency evaluated the individual riskfactors to determine if there were any factors that would limit the potential for significant risk at agiven site. If a risk-limiting factor was identified (e.g., intrinsic hazard was low, as in the aboveexample), the overall risk for that pathway could not be high. Chapter 7 of the Risk AssessmentTechnical Background Document describes this methodology in more detail, presents theindividual factors and criteria used to develop risk potential rankings, and documents the resultsfor each of the 15 case-study facilities.
In performing this ranking, EPA considered only the current conditions that exist at eachcement plant, such as the current CKD pile sizes and containment features, the current landand water use practices in surrounding areas, and the current population distributions in off-siteareas. Insufficient data were available to support a meaningful analysis and prediction ofpossible future conditions. However, significant changes in the current conditions at these 15plants could result in some facilities being assigned higher or lower risk potential rankings.
Results of Risk Potential Ranking
The case-study site rankings represent best professional judgments on the potential forcurrent CKD management practices at the 15 sample plants to pose risks to human health andthe environment, based on the analysis of factors outlined above. The results provide a meansof evaluating the risk potential at each of the 15 sites relative to each other, not a definitiveassessment of the absolute risk at each site (e.g., a site ranking cannot be translated into anumeric cancer or non-cancer risk estimate). Considering the rigor of the methodology, thisranking provides a credible basis for prioritizing the sites and selecting plants that warrant riskmodeling. At the same time, the results indicate the general level of risk expected to exist ateach site, based on the Agency's understanding of risk-influencing parameters and the resultsof previous risk analyses and modeling projects. This is especially the case for sites that areassigned a negligible risk potential, where one or more site factors allow the Agency toconclude, with some certainty, that risks for a given release and exposure pathway are indeedsufficiently low to be ignored. As previously discussed, available information indicates that thesite conditions and distribution of risk potential rankings across the sample of 15 plantsreasonably represents the larger universe of active cement plants, but may not reflectparticularly high-risk conditions or factors that have been discovered at the damage case sitesor observed during site visits.
Risk Potential Ranking for the Ground-water Pathway
Exhibit 6-6 summarizes the risk potential rankings for the ground-water pathway at the15 sample cement plants. These rankings address only the potential for human health risksthrough drinking water ingestion, not the potential for health or ecological risks associated withthe discharge of contaminated ground water to a surface water body (which are considered inthe next section on surface water risk potential). As shown, the Agency developed separatehazard potential rankings for each plant based on the intrinsic hazard of chemicalconcentrations and pH levels in CKD leachate. The plants are ordered in the exhibit from

6-20
highest to lowest ground-water risk potential based on the concentrations of chemicals in CKDleachate. The risk potential ranking of the plants considering pH levels is slightly different, asindicated by the number in parentheses in the far right column.
Based on the results in Exhibit 6-6, none of the 15 facilities are expected to pose anoverall high ground-water risk. Although the Agency's methodology ranked certain factors inisolation as having a high risk potential, the scores for these individual factors were moderatedwhen combined with the other factors that determined overall site risk. For example, eventhough the potential for ground-water contamination was ranked high at Facility G, the overallrisk potential for the facility was ranked moderate considering the other factors (intrinsic hazard,transport potential, and exposure potential) that influence risks at the site.
The Agency ranked four facilities as having an overall moderate risk potential for theground-water pathway, considering the chemical concentrations in CKD leachate. In order ofdescending risk potential, these are Facilities G, A, C, and J. These same facilities also wereranked among the top considering pH levels of the CKD leachate. Facilities A and C burnhazardous waste as fuel, while Facilities G and J do not use hazardous waste as an alternativefuel. The primary factors that contributed to these facilities being ranked relatively highincluded:
C At Facility G, the potential for ground-water contamination appears high because,among other factors, the water table is shallow (0.3 to 1 meter [1 to 3 feet]beneath the CKD pile), the underlying soils are a permeable sand, and netrecharge is high (38 cm/year, or 15 in/year). However, the potential for ground-water contamination to migrate to off-site drinking water wells and result insignificant exposures is only moderate because the nearest downgradientresidence is approximately 1,600 meters (one mile) from the CKD pile. Furthermore, local water suppliers have stated that residences in the area derivetheir drinking water from community water systems (although ground water isused for domestic purposes in the area and the possibility of a private well atnearby residences cannot be ruled out). The size of the population that may beexposed to any ground-water contamination within a mile downgradient of thefacility's CKD pile is about 20 people.
C At Facility A, the contamination potential is not as high as at Facility G becausethe material underlying the CKD pile is a less permeable limestone and siltstoneand because the net recharge is smaller (15 cm/year). As at Facility G, groundwater is used for domestic purposes in the area, but according to local watersuppliers, residences around Facility A derive their drinking water from a nearbyriver. If any nearby residences do have private wells, the nearest downgradientresidence that may be exposed to ground-water contamination is about 490meters (1,600 feet) from the CKD pile and the total population within a miledowngradient is 450 people, larger than the potentially exposed population atFacility G.

6-21
Exhibit 6-6
Risk Potential Rankings for the Ground-water Pathway
Facility
Intrinsic HazardPotential
Ground-waterContamination
PotentialTransportPotential
CurrentExposurePotentiala
Overall Ground-water RiskPotential (Rank)
Chemical pH Chemical pH
Facility G Moderate High High Moderate Moderate Moderate (1) Moderate (2)
Facility A* Moderate Moderate
Moderate Moderate High Moderate (2) Moderate (3)
Facility C* Moderate Moderate
High Moderate Moderate Moderate (3) Moderate (5)
Facility J Moderate High Moderate Moderate Moderate Moderate (4) Moderate (4)
Facility D High High Low High High Low (5) Low (9)
Facility I* Low High Moderate Moderate High Low (6) Moderate (1)
Facility F* Low Moderate
Moderate Moderate High Low (7) Moderate (6)
Facility B Low Moderate
Moderate High Moderate Low (8) Moderate (8)
Facility S* Low High Moderate Moderate Moderate Low (9) Moderate (7)
Facility O* Moderate High Moderate Low Negligible Negligible (10) Negligible (10)
Facility H* Moderate Moderate
Moderate Low Negligible Negligible (11) Negligible (11)
Facility N* Moderate Moderate
Moderate Low Negligible Negligible (12) Negligible (13)
Facility E Low Moderate
Moderate Low Negligible Negligible (13) Negligible (12)
Facility Q Moderate Moderate
Negligible Negligible Negligible Negligible (14) Negligible (15)
Facility L Moderate High Negligible Negligible Negligible Negligible (15) Negligible (14)
* Burns hazardous waste as fuel.a Future development of ground-water uses around these facilities could increase the exposure potential rankings and, dependingon the risk rankings for the other site factors (intrinsic hazard, ground-water contamination potential, and transport potential), couldresult in higher overall ground-water risk potential rankings.
C At Facility C, there appears to be a high potential to contaminate ground waterbecause the water exists just three meters below the CKD pile, the unsaturatedzone is moderately permeable (a clayey sand), and net recharge is high (33cm/year). Although ground water is used as a drinking water source in the area,the nearest downgradient residence that may be affected is farther away from theCKD pile than at Facilities G and A (1,100 meters). Additionally, the onlyresidence that might be affected by any ground-water contamination is locatedon site, in between the CKD pile and a large river, which borders the site. Allother residences in the direction of ground-water flow are on the other side of theriver and are unlikely to be exposed to any ground-water contaminationoriginating from Facility C.
C At Facility J, the ground-water contamination potential appears moderatebecause the water table is moderately deep (9 meters), the net recharge ismoderate (20 cm/year), and the permeability of the shale underlying the site'sCKD pile is low. Ground water is presently used in the area for domesticpurposes, and the nearest downgradient residence that may have a private well

6-22
is roughly 550 meters from the CKD pile. There are approximately 40 peoplewithin a mile downgradient that may be exposed to any ground-watercontamination originating from the pile.
Five facilities were ranked as having an overall low ground-water risk potential. All ofthese facilities were ranked as low because one or more critical factors that determine overallsite risk potential were scored low according to the Agency's ranking methodology. Forexample, the intrinsic hazard of the chemical concentrations in CKD leachate at Facilities I, F,B, and S is low, making the overall ground-water risk potential low at those sites regardless ofthe ground-water contamination, transport, and exposure potential. Similarly, even though theintrinsic hazard of the dust at Facility D is ranked high, the overall ground-water risk potential atthe site appears low because of the low potential for ground-water contamination at the site (thewater table is about 30 meters deep, net recharge is very low, and the underlying clay and shaleis very impermeable).
Six facilities were ranked as having an overall negligible ground-water risk potential. Two of these facilities, Q and L, were assigned a negligible hazard because they presentlyrecycle all of their CKD and do not have an on-site CKD management unit. The other facilitieswere assigned a negligible hazard because there is a negligible potential for exposure to anyground-water contamination that might originate from on-site CKD management. In particular:
C All ground water at Facility O discharges directly into the site's quarry (groundwater is pumped at the site to dewater the quarry). Even after mining operationscease and ground-water contours are allowed to return to normal, any ground-water contamination originating from the plant's CKD pile would migrate just 150meters to the northern property boundary where it would discharge directly into asurface water body without being withdrawn for human use.
C If ground water beneath the CKD pile at Facility H were to become contaminated,it would likely discharge directly into a river with a large dilution potential located1,200 meters downgradient. All of the property between the pile and the river isowned by Facility H and presently uninhabited.
C There presently are no residences within a 1,600 meters downgradient from theCKD pile at Facility N. Also, the nearest downgradient property boundary whereoff-site exposures could occur is relatively far (1,400 meters) from the CKD pile.
C Any ground-water contamination originating from the CKD pile at Facility E isexpected to discharge directly to a river with a large dilution potential 370 metersdowngradient without being withdrawn for human use (all of the propertybetween the pile and the river is owned by Facility E and presently uninhabited). Even if all the contamination did not discharge into the river, the closestdowngradient residence that could be exposed to the contamination isapproximately 2,300 meters away.
Risk Potential Ranking for the Surface Water Pathway
Exhibit 6-7 summarizes the risk potential rankings of the 15 case-study cement plants forthe surface water pathway. These rankings address the potential for human health risk viadrinking water, fish ingestion, and other surface water uses, as well as the potential for risk toaquatic organisms. As for the ground-water pathway, the Agency developed two separaterankings, one considering only the concentrations of chemicals (not pH levels) in CKD leachateand the other considering both the concentrations of chemicals and pH levels. Contaminationpotential scores were developed by considering three contaminant migration pathways: stormwater run-off to surface water, ground water to surface water migration, and air depositionto surface water. The highest score from among these three scores at a given facility wasselected as that facility's surface water contamination potential. The overall surface water riskranking at a site was determined by selecting the lowest score for any of the critical factors atthat site (i.e., intrinsic hazard, contamination potential, transport potential, and current exposurepotential). The plants are ordered in Exhibit 6-7 from highest to lowest overall risk potential

6-23
considering the concentrations of chemicals in CKD leachate. The alternate rankingconsidering pH levels is indicated in the far right column of the exhibit.
Based on these results, none of the 15 facilities are expected to present a high risk tohuman health and aquatic organisms via the surface water pathway. As discussed for theground-water pathway, the Agency's methodology ranked some facilities high for one or moreaspects, but at each facility, at least one critical factor lowered the overall risk potential. Forexample, Facility F scored high for transport potential, but received an overall moderate riskranking when the other factors were considered.
As shown in Exhibit 6-7, EPA ranked seven facilities as having a moderate surface waterrisk potential. Five of these seven facilities (O, F, A, I, and N) burn hazardous waste as fuel. The main factors that contributed to these rankings include:
C At Facility O, CKD could blow into the air and deposit in a water body with a largesurface area just 150 meters to the north. Additionally, after current ground-water pumping to dewater the quarry ceases, any ground-water contaminationoriginating from the on-site CKD pile would be expected to migrate 150 meters tothe north and discharge into the same water body. Such contamination,including possible increases in pH levels in affected areas, has the potential tocause ecological damage, but would not be expected to pose a human drinkingwater threat because the water is not used for drinking. The potential for surfacewater contamination via stormwater run-off appears low, given surface drainagepatterns and ditches that divert run-off from the CKD pile into the quarry, througha series of settling ponds, and eventually out to the surface water body throughan NPDES-permitted outfall.
C At Facility J, there is a potential for stormwater run-off carrying contaminantsfrom the on-site CKD pile to migrate approximately 2,100 meters through adrainage ditch and discharge into a reservoir. Given the pile's containmentfeatures and the site's hydrogeology and meteorology, there also is a potentialfor CKD contaminants to migrate via ground-water discharge and airbornedeposition to this same reservoir, located 1,000 meters directly downgradient anddownwind from the on-site pile. This reservoir has minimal flow, so anycontamination reaching the water is unlikely to be transported downstream anddiluted significantly. In addition, there is a high potential for human exposuresthrough the fish ingestion pathway because the reservoir is actively fished.

6-24
Exhibit 6-7
Risk Potential Rankings for the Surface Water Pathway
Facility
Intrinsic HazardPotential
Surface WaterContamination
Potential by DifferentMigration Pathways
TransportPotential
CurrentExposurePotentiala
Overall Surface WaterRisk Potential (Rank)
Chemical pH StormWater
GroundWater
Air Chemical pH
Facility O* Mod. Mod. Low Mod. Mod. High High Mod. (1) Mod. (1)
Facility J Mod. Mod. Low Low Mod. High High Mod. (2) Mod. (2)
Facility F* Mod. Mod. Low Mod. Low High Mod. Mod. (3) Mod. (5)
Facility D Mod. Mod. Mod. Low Low High Mod. Mod. (4) Mod. (4)
Facility A* Mod. Mod. Mod. Neg. Low High Mod. Mod. (5) Mod. (3)
Facility I* Mod. Mod. Mod. Mod. Mod. Mod. Mod. Mod. (6) Mod. (6)
Facility N* Mod. Mod. Low Neg. Mod. Mod. Mod. Mod. (7) Mod. (7)
Facility G Mod. Mod. Neg. Low Low High Mod. Low (8) Low (8)
Facility S* Mod. Mod. Low Neg. Neg. High Mod. Low (10) Low (10)
Facility B Mod. Mod. Low Low Low High Mod. Low (9) Low (9)
Facility E Mod. Mod. Low Mod. Mod. Low Mod. Low (11) Low (11)
Facility C* Mod. Mod. Low Low Mod. Low High Low (12) Low (12)
Facility H* Mod. Mod. Low Low Mod. Neg. Mod. Neg. (13) Neg. (13)
Facility Q Mod. Mod. Neg. Neg. Neg. Neg. Neg. Neg. (14) Neg. (15)
Facility L Mod. Mod. Neg. Neg. Neg. Neg. Neg. Neg. (15) Neg. (14)
* Burns hazardous waste as fuel.a Future development of surface water uses around these facilities could increase the exposure potential rankings and, dependingon the risk rankings for the other site factors (intrinsic hazard, surface water contamination potential, and transport potential), couldresult in higher overall surface water risk potential rankings.
C At Facility F, there is a potential for contaminants to migrate through groundwater from the on-site CKD pile to a creek located 600 meters downgradient. There also is a potential for windblown dust from the pile to deposit in the samecreek, given the limited controls on dusting and the on-site meteorologicalconditions. This creek has a low flow and dilution capacity, and currently is usedin the vicinity of the cement plant for agricultural purposes, creating the potentialfor human exposures through the food chain. Lead and pH levels measured inextract analyses of this facility's CKD also exceed AWQCs, indicating a potentialfor aquatic ecological damage if the creek is contaminated.
C At Facility D, a moderate potential for surface water contamination throughstormwater run-off exists because run-off is only partly controlled and the nearestsurface water body that may receive run-off is 300 meters away. In addition,there is a potential for this same creek to be contaminated by airborne depositionof CKD, because windblown dusting from the pile is not prohibited entirely (e.g.,although the pile is occasionally wetted, it is not covered or compacted over itsentire surface). The potentially receiving water body has a very low flow (annualaverage of 0.06 m3/sec, or 2 cfs), and thus has a very limited dilution capacity. The low flow makes it unlikely that the water body is used as a human drinking

6-25
water supply. However, thallium and dioxin concentrations measured in leachateextracts of the facility's CKD indicate a potential for human health risks throughthe fish ingestion pathway. The high pH levels of CKD leachate at the facilityalso create the potential for aquatic ecological damage.
C At Facility A, there is a contamination potential via the stormwater run-off and airmigration pathways because of the close proximity of the nearest water body (15meters), a moderate potential for windblown dusting from the site's CKD pile, andlimited stormwater run-off controls. The potentially receiving surface water has alow dilution capacity (annual average flow of 2 m3/sec), and people could come indirect contact with the receiving water at the point of contamination (i.e., thewater body is off site and access to it is unrestricted). Given the water's low flow,any surface water contamination is probably not a human drinking water threat,although it could pose a health threat via the fish ingestion pathway (thalliumappears to the primary constituent of potential concern for this pathway). Also,elevated lead and pH levels measured in leachate extracts of the plant's CKDindicate a potential for adverse aquatic ecological effects.
C At Facility I, the nearest water body to the CKD pile is a river located only 90meters away. There is a potential for contaminants to migrate into the riverthrough ground-water discharges because there is a moderate potential forground-water contamination at the site (given limited engineering controls andthe site's hydrogeology), the river is located in a downgradient direction, and theriver is likely to receive ground-water inputs. A potential also exists forcontaminants to migrate to the river via stormwater run-off and windblowndusting, given site meteorology and limited controls on the pile (e.g., stormwateris not diverted in drainage ditches or subject to NPDES permitting prior todischarge). However, the water's relatively large flow (annual average of 132m3/sec) is expected to significantly dilute any contamination that enters the river.
C At Facility N, CKD containment features and site environmental conditionscombine to create a moderate potential for contaminants to blow into the air anddeposit in a river about 1,400 meters from the on-site CKD pile. There also is alow potential for contaminants to migrate to this same creek along withstormwater run-off, given the pile's run-off controls and distance from surfacewater. The potentially receiving river has a moderate flow (annual average ofalmost 100 m3/sec), can be accessed by people in the area where CKDcontaminants would enter the water, and is presently used for recreation, fishing,and irrigation. Elevated lead and pH levels measured in leachate extractanalyses of the facility's CKD also suggest the potential for aquatic ecologicaldamage.
The Agency ranked five facilities as having an overall low risk potential for the surfacewater pathway. All of these facilities were assigned a relatively low surface water risk becauseone or more critical factors (e.g., low contaminant concentrations, low transport potential) werefound to pose a low risk according to the Agency's ranking methodology.
Three facilities were ranked as having an overall negligible potential for surface waterrisk. As discussed for the ground-water rankings, two of these facilities, Facilities Q and L, wereassigned a negligible risk potential because they presently recycle 100 percent of their CKD. The other facility, Facility H, was assigned a negligible surface water risk potential because thenearest surface water is located 1,200 meters from the on-site CKD pile. This relatively longdistance makes it unlikely that the river will receive large CKD loads via any migration pathway(ground water, stormwater run-off, or air). Even if CKD migrated to the river, it would be quicklydiluted because of the river's high flow in the vicinity of Facility H (over 5,000 m3/sec onaverage).
When fully implemented, the Agency's recently promulgated stormwater runoff controlregulations (described in Section 7.2.1 of Chapter 7) could substantially mitigate or eliminatehuman health risks and aquatic ecological damages to surface waters attributable to stormwater

6-26
runoff of CKD contaminants. These regulations would not, however, control delivery of CKDcontaminants to surface waters via ground-water or air pathways.
Risk Potential Ranking for the Air Pathway
The air pathway is of concern for CKD because the dust is a fine particulate matter thatis readily suspendable, transportable, and respirable in air. In general, particles that are <100micrometers (:m) may be suspended in the wind and transported. Within this range, particlesthat are <30 :m can be transported for considerable distances downwind. However, onlyparticles <10 :m are respirable by humans. The significance of particulate size for CKD isillustrated in Exhibit 6-8, which displays the particle size distribution for dust samples by kilntype. Virtually all of the dust generated at the 15 case-study sites may be suspended andtransported in the wind (i.e., the vast majority of particles are <100 :m), and over two-thirds ofall dust particles generated may be transported over long distances. Additionally, a significantpercentage of the total dust generated (from 22 to 95 percent, depending on kiln type) iscomprised of respirable particles that are <10 :m.
In an effort to keep the dust down, many facilities add water to CKD prior to disposal toform larger clumps or nodules. In addition, as CKD sits in a pile exposed to the elements,occasional wetting by rainfall results in the formation of a thin surface crust in inactive areas ofthe pile. However, based on field observations during the site sampling trips, neither theformation of nodules nor the natural surface crusting eliminates the potential for CKD to blowinto the air. Nodulizing the dust prior to disposal provides incomplete and temporary controlbecause the entire dust volume is not nodulized and because the dust eventually dries andreturns to a fine particulate that is available for suspension and transport. Likewise, a surfacecrust may develop, but (1) the crust breaks when vehicles or people move on the pile, and (2)fresh dust is regularly added to the pile providing a continual, exposed reservoir of fine particles.
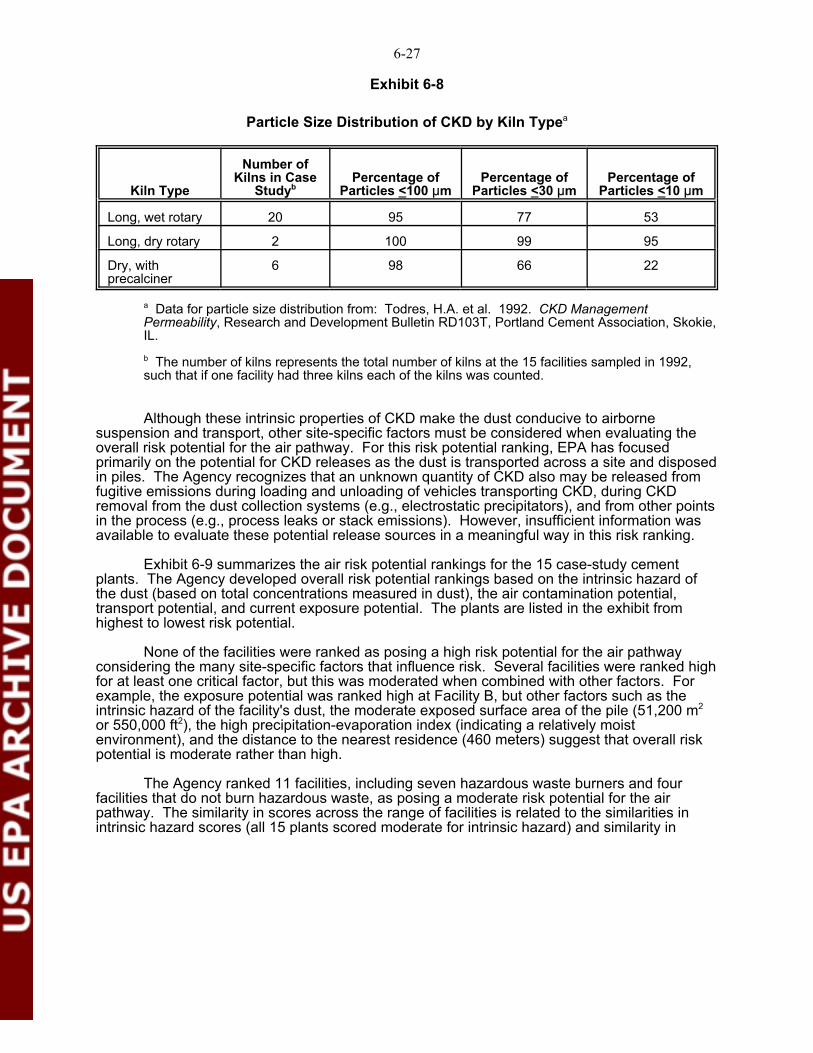
6-27
Exhibit 6-8
Particle Size Distribution of CKD by Kiln Typea
Kiln Type
Number ofKilns in Case
StudybPercentage of
Particles <100 :mPercentage of
Particles <30 :mPercentage of
Particles <10 :m
Long, wet rotary 20 95 77 53
Long, dry rotary 2 100 99 95
Dry, withprecalciner
6 98 66 22
a Data for particle size distribution from: Todres, H.A. et al. 1992. CKD ManagementPermeability, Research and Development Bulletin RD103T, Portland Cement Association, Skokie,IL.b The number of kilns represents the total number of kilns at the 15 facilities sampled in 1992,such that if one facility had three kilns each of the kilns was counted.
Although these intrinsic properties of CKD make the dust conducive to airbornesuspension and transport, other site-specific factors must be considered when evaluating theoverall risk potential for the air pathway. For this risk potential ranking, EPA has focusedprimarily on the potential for CKD releases as the dust is transported across a site and disposedin piles. The Agency recognizes that an unknown quantity of CKD also may be released fromfugitive emissions during loading and unloading of vehicles transporting CKD, during CKDremoval from the dust collection systems (e.g., electrostatic precipitators), and from other pointsin the process (e.g., process leaks or stack emissions). However, insufficient information wasavailable to evaluate these potential release sources in a meaningful way in this risk ranking.
Exhibit 6-9 summarizes the air risk potential rankings for the 15 case-study cementplants. The Agency developed overall risk potential rankings based on the intrinsic hazard ofthe dust (based on total concentrations measured in dust), the air contamination potential,transport potential, and current exposure potential. The plants are listed in the exhibit fromhighest to lowest risk potential.
None of the facilities were ranked as posing a high risk potential for the air pathwayconsidering the many site-specific factors that influence risk. Several facilities were ranked highfor at least one critical factor, but this was moderated when combined with other factors. Forexample, the exposure potential was ranked high at Facility B, but other factors such as theintrinsic hazard of the facility's dust, the moderate exposed surface area of the pile (51,200 m2
or 550,000 ft2), the high precipitation-evaporation index (indicating a relatively moistenvironment), and the distance to the nearest residence (460 meters) suggest that overall riskpotential is moderate rather than high.
The Agency ranked 11 facilities, including seven hazardous waste burners and fourfacilities that do not burn hazardous waste, as posing a moderate risk potential for the airpathway. The similarity in scores across the range of facilities is related to the similarities inintrinsic hazard scores (all 15 plants scored moderate for intrinsic hazard) and similarity in

6-28
Exhibit 6-9
Risk Potential Rankings for the Air Pathway
FacilityIntrinsic Hazard
Potential
AirContamination
PotentialTransportPotential
CurrentExposurePotentiala
Overall Air RiskPotential (Rank)b
Facility A* Moderate Moderate High High Moderate (1)
Facility J Moderate Moderate High Moderate Moderate (2)
Facility D Moderate Moderate High High Moderate (3)
Facility B Moderate Moderate Moderate High Moderate (4)
Facility G Moderate Moderate Moderate High Moderate (5)
Facility F* Moderate Moderate Moderate Moderate Moderate (6)
Facility O* Moderate Moderate Moderate Moderate Moderate (7)
Facility I* Moderate Moderate Moderate Moderate Moderate (8)
Facility N* Moderate Moderate Moderate Moderate Moderate (9)
Facility H* Moderate Moderate Moderate Moderate Moderate (10)
Facility S* Moderate Moderate Moderate Moderate Moderate (11)
Facility C* Moderate Moderate Low High Low (12)
Facility E Moderate Moderate Low Moderate Low (13)
Facility L Moderate Negligible Negligible Negligible Negligible (14)
Facility Q Moderate Negligible Negligible Negligible Negligible (15)
* Burns hazardous waste as fuel.a Future development of land uses around these facilities could increase the exposure potential rankings and,depending on the risk rankings for the other site factors (intrinsic hazard, air contamination potential, andtransport potential), could result in higher overall air risk rankings.b The distinction between pH and chemicals is not applicable for the air pathway. The intrinsic hazard rankingfor the air pathway is based only on results of totals analyses, which do not include pH (pH is only relevant forliquids).
management practices (13 of the 15 facilities scored moderate for contamination potential). However, to prioritize plants for risk modeling, EPA identified the individual plants posing thegreatest potential risk for the air pathway. The three plants ranked as having the greatest riskpotential were Facilities A, J, and D. Primary factors that contributed to their ranking included:
C At Facility A, a large exposed surface area of the dust pile (206,000 m2), limiteddust suppression measures (e.g., the pile is not wetted and is only partiallycompacted), moderate wind speeds, and a relatively moist setting (relativelyfrequent rainfall and limited evaporation) contributed to an overall moderateranking for air contamination potential. The close proximity of the CKD pile to thesite boundary (30 meters) and moderate distance to the nearest residence (490meters) suggest a high potential for CKD to be transported to receptors if it isreleased in the air. Finally, Facility A has a relatively large population within onemile (3,000 people) and much of the land surrounding the plant is used foragriculture (the facility leases some of its own property to nearby farmers),suggesting that both inhalation and food chain exposures could occur if CKD isreleased to air.
C At Facility J, limited dust suppression practices (e.g., the on-site CKD pile isuncovered, not wetted, and only partially compacted) and moderate rainfall and

6-29
wind speeds result in a moderate potential for wind erosion from the on-site CKDpile. The proximity to property boundaries (140 meters) and a residence (300meters) also suggests that CKD could be transported to receptors if released toair. Surrounding agricultural land and pastures provide a pathway for food chainexposure in addition to direct inhalation and incidental ingestion exposures.
C At Facility D, an active dust suppression program (e.g., wetting the pile)moderates the potential releases from a pile with a large exposed surface area(102,000 m2) in a dry climate. However, the close proximity of the CKD pile toproperty boundaries (150 meters) and the large nearby population (1,400 peoplewithin one mile) suggest that transport of dust and exposures to nearbypopulations may occur.
Only Facilities C and E were ranked as having a low risk potential for the air pathway. Both of these facilities were ranked low because the potential for transport to exposedindividuals for each facility was low. Specifically, the nearest residence at Facility C is 1,100meters from the pile, and the nearest residence at Facility E is over 1,600 meters from the pile. Therefore, it is unlikely that significant inhalation exposures would occur. However, the airpathway risks do not appear to be negligible because land around each facility is used, in part,for agricultural purposes, creating the potential for human exposures through the ingestion offood contaminated by atmospheric deposition.
Only two facilities were ranked as having a negligible risk potential for the air pathway. These facilities, Facilities L and Q, were assigned negligible risk because all generated CKD iscurrently recycled.
6.2.2 Risk Modeling of On-site CKD Management
This section presents the methodology and results of the Agency's quantitative fate andtransport modeling analysis of on-site CKD management. The first part presents the analyticalmethodology and the second part presents the results of the on-site risk modeling.
Analytical Methodology
The Agency conducted a quantitative fate and transport modeling analysis to estimatethe potential human health and environmental effects associated with current on-site CKDmanagement practices. This modeling analysis extended the results of the risk potentialranking analysis (presented in Section 6.2.1) by quantifying risks at five of the 15 facilitiesevaluated in that ranking analysis. For each of the three primary direct exposure pathwaysscored (i.e., air, surface water, and ground water), the two highest ranking facilities in eachexposure pathway were selected for the modeling analysis to provide a basis for quantifying theupper end of the risk distribution for the 15 case-study plants. Because some facilities were thefirst or second highest scoring facility in more than one pathway, this approach resulted in theselection of a total of five facilities for modeling.
As discussed in Section 6.2.1, the risk ranking evaluated a sample of 15 CKD facilitiesshown to be reasonably representative of the universe of 115 CKD facilities in the U.S. Byevaluating risks at two facilities believed to represent the highest risk potential in each of thethree direct pathways, EPA selected plants that would be most likely to include thosecombinations of CKD constituent characteristics, management practices, and exposure settingsthat might pose the greatest risk to human health from the larger 15-facility sample.
While the methodology focused on evaluating the potential high end of the riskdistribution, it also provided an estimate of the central tendency portion of the national riskdistribution, because three of the five modeled facilities represented midrange scores in each ofthe pathways. For example, while Facility G was selected as the highest ranking facility in theground-water pathway, it represented the eighth ranking facility out of 15 for the surface waterpathway. Thus, the modeled surface water risk estimates corresponding to this facility and twoothers could be used to represent the central portion of the national risk distribution. In this
6-30
manner, the Agency was able to characterize the central tendency portion of the national riskdistribution.
In focusing on the 15 case-study cement plants, it is possible that certain less frequentbut potentially high risk CKD management scenarios might not be represented, potentiallyunderstating the true high end nationwide risks from CKD disposal. Consequently, the case-study baseline analysis was supplemented with a number of potentially higher risk scenarios tomore fully characterize the upper tail of the distribution of national risks. Exhibit 6-10 illustratesthese six sensitivity analysis scenarios and their relationship to the baseline central tendencyand high end scenarios evaluated in the initial case study analysis.
The baseline on-site CKD management scenarios simulated, as closely as feasible, theactual waste management practices and environmental conditions at the five modeled facilitiesin order to estimate order-of-magnitude risks at relevant exposure points. Risks were estimatedusing a standard Agency screening-level model (MMSOILS), a mix of site-specific and regionalgeographical data, and standard Agency exposure assessment and risk characterizationmethods. Both individual cancer risks and noncancer human health effects were estimated viaair, ground- water, surface water, soils, and the foodchain pathways. Aquatic ecological effectsalso were estimated for potentially affected surface waters.
The sensitivity analyses of higher risk modeling scenarios were conducted to quantifyeffects from potentially higher risk waste characteristics, environmental settings, or CKDmanagement practices that have been observed nationally but that were not found at the fivebaseline facilities. Thus, they are hypothetical yet plausible. Each of these scenarios wasbased primarily on the baseline case-study facility characteristics; only key risk factors weremodified to simulate a potentially higher risk condition. For example, hypothetical upper bounddioxin risks were estimated by simulating dioxin/furan concentrations at the highest levelsmeasured by EPA at each of the five modeled facilities. Thus, this sensitivity analysis scenariocombined the basic transport and exposure characteristics of the five original baseline facilitieswith one selected high risk potential factor (increased dioxin concentrations) to provide an uppersensitivity estimate of the potential contribution of dioxins/furans to CKD risks.

6-31
Exhibit 6-10Graphical Illustration of On-site Risk Modeling Scenarios

6-32
9 The Agency is currently conducting a scientific reassessment of the cancer potency ofCDDs/CDFs. Because this reassessment has not yet been completed, the CDD/CDF risk estimatesare subject to revision.
10 U.S. Environmental Protection Agency, Office of Research and Development, MMSOILS: Multimedia Contaminant Fate, Transport, and Exposure Model, Documentation and User's Manual,September 1992 (updated in April 1993).
The six higher risk scenarios examined, in turn, the following waste characteristics,environmental settings, management practices, or exposure scenarios:
C Disposal of CKD with the highest levels of 2,3,7,8-substituted chlorinateddibenzo-p-dioxins (CDDs) and dibenzo-furans (CDFs) measured by EPA;9
C Disposal of CKD with the 95th percentile highest measured metalsconcentrations based on combined EPA and industry samples from nearly 100CKD facilities;
C Simulation of a CKD pile located directly adjacent to an agricultural field withuncontrolled erosion of CKD impacting the crops;
C Simulation of a CKD pile located directly adjacent to a surface water body (a lakeand a river) with uncontrolled CKD eroding directly to the water;
C Simulation of CKD management in the bottom of a quarry that is covered withwater resulting from ground-water seepage; and
C Simulation of potential risks to highly exposed individuals relying on locally-grownproduce, beef, and milk, and locally-caught fish for subsistence purposes.
The primary components of the risk modeling methodology used in the baseline on-sitescenarios, the higher risk scenarios, and the off-site use scenarios, are summarized below. Amore-detailed presentation of the modeling methodology is presented in Chapter 8 of the RiskAssessment Technical Background Document.
Release, Fate, and Transport Modeling Methodology
The CKD risk modeling analysis used the MMSOILS model, a screening-levelmultimedia contaminant release, fate, and transport model, to estimate ambient concentrationsof constituents of concern in ground water, air, surface water, soils, and the foodchain. MMSOILS was developed by EPA's Office of Research and Development to simulate therelease of hazardous constituents from a wide variety of waste management scenarios and theirsubsequent multimedia transport through key environmental pathways.10 MMSOILS alsosimulates numerous cross-media transfers of contaminants (e.g., atmospheric deposition to soiland ground water discharge to streams). As a screening-level model, MMSOILS was designedto provide rough order-of-magnitude exposure estimates in relatively simple environmentalsettings (e.g., granular porous aquifers and relatively flat terrain). Greater uncertainty isassociated with the model's application to more complex and heterogeneous environmentalsettings. See Chapter 8 of the Technical Background Document for a more detailed descriptionof MMSOILS and its use in this risk analysis.
The Agency adopted a screening-level methodology for this analysis both in theselection of MMSOILS and in the nature of the data used in the simulations. The Agency usedsite-specific, regional, and national level data to characterize the five actual cement kilnfacilities. Data for the baseline on-site facilities was obtained primarily from three sources:
C Site-specific data that were collected by the Agency from actual CKD facilities;

6-33
11 The 1991 Portland Cement Association mail survey.
12 These data were collected from EPA Regional offices and states for the Corrective ActionRegulatory Impact Analysis currently being conducted by EPA's Office of Solid Waste.
13 Because none of the five baseline facilities had drinking water supply intakes in any of therivers downstream of the CKD facilities, exposures from ingestion of surface water as a drinkingwater source were not estimated in this analysis.
14 U.S. EPA, 1992. Guidance on Risk Characterization for Risk Managers and Risk Assessors.
C PCA mail survey;11 and
C Previously collected data on facilities located in similar geographical regions asthe case study CKD facilities.12
These data represent the best readily available sources for simulating waste characteristics,CKD management practices, environmental settings, and receptor locations at the five baselineon-site facilities. Because many of the environmental setting data characterize the regionalsetting of a facility rather than its site-specific features, the modeling results represent a roughscreening-level indication of contaminant fate and transport in the various environmental media.
The Agency estimated ambient concentrations of CKD constituents of concern in thefollowing exposure pathways/routes:
• Direct inhalation of air;• Ingestion of contaminated ground water;• Recreational exposures to contaminated surface water13
• Incidental ingestion of contaminated soil; and• Foodchain ingestion of contaminated vegetables, beef, and milk.
The MMSOILS documentation describes the mathematical approaches used in estimatingambient concentrations in each of these pathways, along with key assumptions and limitations.
There are many sources of analytical uncertainty in any exposure or risk assessment. To better characterize this uncertainty, the Agency's guidance on risk characterizationrecommends developing both "central tendency" and "high end" risk estimates when conductingrisk assessments.14 The central tendency estimate represents the best estimate of risk, whilethe high end estimate represents a plausible estimate of the individual risk for those persons atthe upper end of the risk distribution. This study adopted the Agency's recommended approachby developing both central tendency and high end risk estimates for CKD facilities.
In addition, EPA guidance recommends accounting for analytical uncertainty whereverpossible in risk assessments. In developing this CKD risk assessment methodology, theAgency identified the most significant sources of uncertainty that could result in understatingindividual risks at the baseline facilities. Because no analytical data were available at the fivefacilities quantifying environmental concentrations of CKD constituents at exposure points, itwas not possible to calibrate the fate and transport modeling methodology with actual site data. Consequently, it was judged that the modeled exposure concentrations represented the mostsignificant source of analytical uncertainty. Accordingly, the Agency generated "best estimate"and "upper bound" constituent concentrations in each exposure pathway at each facility basedon best estimate and upper end characterizations of the key environmental transportparameters contributing most to uncertainties in the ambient concentration estimates.

6-34
Characterization of Exposed Populations
Data were collected on the locations of individuals that could be exposed to ambientconcentrations of CKD constituents in each of the exposure pathways analyzed with MMSOILS. The methodology focused on estimating plausible exposure that could reasonably be expectedbased on actual nearby residential exposure locations. The risk modeling did not estimate riskscorresponding to exposures directly on the CKD pile, because the Agency did not identify anyresidences on abandoned CKD piles; this hypothetical exposure scenario was not addressedfurther in the study. In addition, because the methodology was based on a risk screeningapproach, it was not possible to characterize the distribution of risks received by exposedpopulations surrounding each CKD facility. The approach used in characterizing the exposurepoints evaluated in the modeling analysis is briefly summarized below.
Direct Inhalation
For estimating individual exposure from direct inhalation of windblown CKDcontaminants, USGS quadrangle maps and site visits were used to identify the nearestresidence to the CKD pile in any compass direction. For estimating the total exposedpopulation at the site, the total number of residences surrounding the facility were identified outto a distance of 10 kilometers from the CKD pile. (In addition to estimating direct inhalation ofairborne contaminants, indirect exposure resulting from wind erosion of CKD particulates wereestimated in several of the other exposure pathways described below.)
Surface Water
Sources of drinking water in the vicinity of the five baseline facilities were identifiedthrough contacts with the water utilities serving the vicinity of each facility, and it wasdetermined that none of the five areas withdrew surface water for public water suppliesdownstream from the CKD facilities. Consequently, exposures were not estimated for ingestionof surface water as a source of drinking water. Surface water exposures through recreationalswimming were estimated at the point in the nearest surface water body closest to the CKD pile. (Exposures through ingestion of locally-caught fish in the nearest surface water body were alsoestimated as part of the foodchain analysis.)
Ground Water
The extent of ground-water usage as a local drinking water source was determinedthrough contacts with the water utilities serving communities around each facility. The Agencydetermined that one of the five facilities had significant private ground-water usagedowngradient of the site, while three facilities primarily served by public water supplies werelikely to have only limited private well usage; one of the facilities had no ground-water usagewithin one mile of the facility. Accordingly, individual ground-water exposures were estimated atthe nearest residence downgradient of the four facilities with potential ground water usage,while ground-water exposures were not estimated at the fifth facility. Exposure to the potentiallyaffected population at the one site with significant ground-water usage were based on allresidences located downgradient of the facility within a distance of two miles; at the other threefacilities population risks were not estimated (only individual risks).
Incidental Soil Ingestion
Exposure due to the incidental ingestion of soil were estimated at the residence nearestto each facility that could potentially receive atmospheric deposition and/or erosion from theCKD facility. This location generally represented the closest residence identified for estimatingdirect inhalation exposures.

6-35
15 The foodchain exposure pathway analysis was based on the assumption that vegetables grown for human consumption originate in a field located adjacentto the pasture used for grazing the beef and dairy cattle.
16 The Agency is currently revising its "Methodology for Assessing Health Risks Associatedwith Indirect Exposure to Combustor Emissions," Interim Final, EPA/600/6-90-003, January 1990,and consequently this foodchain risk methodology is subject to revision.
17 U.S. EPA, 1989. Risk Assessment Guidance for Superfund Volume I: Human HealthEvaluation Manual (Part A). Office of Emergency and Remedial Response. EPA/540/1-89/002.
18 U.S. EPA, 1991. Human Health Evaluation Manual, Supplemental Guidance: StandardDefault Exposure Factors. Office of Emergency and Remedial Response. OSWER Directive: 9285.6-03.
19 U.S. EPA, 1989. Exposure Factors Handbook. Office of Health and EnvironmentalAssessment. EPA/600/8-89/043.
20 U.S. Environmental Protection Agency, Integrated Risk Information System Database.
Foodchain Pathway
The foodchain pathway analysis generated constituent concentrations in vegetables,beef, milk, and fish at different exposure points in the vicinity of the facility. For vegetables,beef, and milk, foodchain concentrations were estimated at the agricultural field or pasturenearest to the facility. The locations of these fields were identified during the site visits (at onefacility), or estimated based on the percentage of agricultural land in the county (at the otherfour facilities). While these fields and grazing lands were intended to be located on family farmsfor purposes of the exposure assessment, the actual crops grown and use of these fields wasnot known (and thus may significantly overstate actual foodchain exposures).15 Constituentconcentrations in fish were estimated at the nearest point in the surface water body closest tothe facility. It was not known what edible species of fish were present in these streams orwhether the streams are actually used for recreational fishing. Consequently, this scenario mayalso overstate actual foodchain exposures through fish ingestion.16
Exposure Assessment and Risk Characterization
The Agency followed standard guidance, methods, and practice in estimating risks dueto exposures at the five baseline facilities.17,18,19 Best estimate and upper end individual lifetimecancer and noncancer effects were calculated at each exposure point using the best estimateand upper end exposure concentrations from the MMSOILS modeling results. (The TechnicalBackground Document for this human health and environmental risk assessment providessignificantly greater detail on the exposure and risk assessment methodologies.)
In this analysis, the Agency estimated individual excess cancer risk for each pathway,which represents the increase above background in the probability of developing cancer over anindividual's lifetime in response to contaminant exposures. To estimate excess cancer risks, theAgency multiplied the daily intake of each carcinogen by the cancer slope factor published inEPA's Integrated Risk Information System (IRIS).20 The highest individual risk for eachexposure pathway is the sum of cancer risks calculated for each carcinogenic constituentresulting from exposures at the nearest location to the facility at which an exposure through thatpathway could occur (e.g., for the ground-water pathway, the nearest point of ground-water usedowngradient of the facility). Total pathway cancer risks represent the constituent-specific risksaggregated across chemicals within each pathway (following Agency guidance, cancer riskswere not aggregated across exposure pathways).
The Agency evaluated noncancer effects by determining the ratio of the estimated doseof a particular contaminant to a standard Agency reference dose (RfD). These ratios are

6-36
21 U.S. EPA, 1991. "A PC Software Application of the Uptake/Biokinetic Model, Version 0.5,"Office of Health and Environmental Assessment (ECAO-CIN-2178A).
22 A threshold for the noncancer effects of lead is believed to lie within or below the 10 - 15ug/dL range. Note, however, that this range is regarded as a "level of concern" warranting attentionfrom a medical viewpoint and not a dose level or threshold below which no adverse health effectswould be expected to occur. (From U.S. Environmental Protection Agency, "Technical SupportDocument on Lead," Office of Research and Development, ECAO-CIN-757 (January 1991).
referred to as "hazard quotients." Hazard quotients greater than one for individual chemicalsrepresent an exceedance of an Agency threshold of concern and the possibility of an adversehealth effect. Total individual noncancer effects were evaluated by adding the chemical-specifichazard quotients within each pathway, referred to as the "hazard index."
Direct Ingestion Pathways
Exposures through direct inhalation, drinking water ingestion, incidental soil ingestion,and recreational ingestion of surface water were estimated using national average exposurerates, frequencies, and durations reported in standard Agency guidance documents.
Foodchain Pathways
Exposures for the vegetable, beef, and milk foodchain pathways were based on theassumption that the exposed individuals live on a family farm at which they raise a portion oftheir annual consumption of these food products (or live in a farming community where asignificant portion of their food could originate from one local source). Moreover, it wasassumed that the home-grown vegetables they consume all originate from the identifiedagricultural field receiving CKD from the facility, and that their beef and dairy cattle are providedfeed from pasture land in the same location. While the extent of consumption of home-grownvegetables, beef, and dairy products will vary significantly on a site-specific basis depending onthe types of crops grown, the type of farm, and individual behavior, the considerable variation inexposures on a site-specific basis could not be accounted for in this analysis. In general, it isbelieved that these exposure estimates may significantly overstate actual consumption patterns. Exposures through ingestion of recreationally caught fish were estimated using behaviorpatterns for the average individual in the general population as reported in standard Agencyguidance.
Sensitive Subpopulations (Childhood Exposures to Lead)
Exposures to lead were calculated for one sensitive subpopulation -- children up throughthe age of seven years located at the residence nearest to each baseline facility. Because EPAhas not published a reference dose for this systemic toxicant, the lead uptake/biokinetic (UBK)model was used to estimate the increased blood lead levels from exposure to lead in CKD.21 The lead uptake/biokinetic (UBK) model provides a method to predict blood lead levels in targetpopulations (i.e., children ages 0 to 7) exposed to lead in air, diet, drinking water, indoor dust,soil, and paint. Based on user-supplied lead concentrations in each of these potential sourcesof exposure, the UBK model estimates the relative contributions of each exposure source andthe total lead uptake from all sources.
The model presents several different indicators of potential health effect from lead. First,it generates a distribution of blood lead levels for each year of the exposure period (ages 0 to 7)based on the total lead uptake. Second, the UBK model estimates the geometric mean bloodlevel in the exposed population. Finally, the model estimates the percentage of the exposedpopulation that is expected to be at or above a specified blood-lead threshold level (a blood leadlevel greater than 10 :g/dL was assumed to be the threshold of interest, based on exposureand effect relationships that have been established in infants and children at blood leadconcentrations as low as 10 :g/dL).22

6-37
The UBK model accepts inputs for several sources of lead exposure not estimated inthis CKD risk analysis: paint ingestion, indoor dust, and drinking water exposures resulting fromlead solder pipes. For these sources, which were assumed to be unaffected by the CKDfacilities, average background lead concentration levels presented as default values in the UBKmodel were employed. For those exposure routes used in the UBK model that were estimatedby MMSOILS in this analysis, which included dietary intakes (through vegetables, beef and milk,and fish), soil intakes, and atmospheric exposures, the estimated lead concentrations fromMMSOILS were added to the national average background values presented in the UBK model. Thus, the blood lead levels estimated in this analysis represent an increment above the nationalaverage background childhood blood lead levels estimated by the UBK model resulting fromexposures to CKD.
Aquatic Ecological Effects
The Agency estimated potential aquatic ecological effects from CKD releases by relatingambient surface water constituent concentrations to benchmarks for the protection of aquaticlife. These benchmarks were either published EPA chronic ambient water quality criteria(AWQC) for the protection of aquatic life, or, where these were not available, lowest observedadverse effect levels (LOAELs) divided by a factor of 5 to account for variations in speciessensitivity. Exhibit 6-11 shows the eight constituents for which aquatic ecological benchmarkswere available based on AWQC documents and their values. AWQCs are intended to protectaquatic communities against adverse effects on structure or function by protecting 95 percent ofthe species against adverse population-level effects. These adverse effects are species-dependent and could include reduced reproduction, growth, or survival. Effects of contaminatedsediments on benthic communities are not considered.
Exhibit 6-11
Aquatic Ecological Benchmark Levels
Constituents Aquatic EcologicalBenchmark (mg/L)
Source
Antimony 3.2 x 10⁻¹ LOAEL
Arsenic (III) 1.9 x 10⁻¹ AWQC
Beryllium 1.1 x 10⁻³ LOAEL
Cadmium* 1.1 x 10⁻³ AWQC
Chromium (VI) 1.1 x 10⁻² AWQC
Lead* 3.2 x 10⁻³ AWQC
Thallium 8.0 x 10⁻³ LOAEL
2,3,7,8-TCDD 2.0 x 10⁻⁹ LOAEL
* Assumes a water hardness of 100 mg/L CaC03
Sensitivity Analysis of Higher Risk Potential Scenarios
The Agency conducted a sensitivity analysis of various factors that could indicate thepotential for higher risks from CKD management than exhibited in the baseline risk modelinganalysis. A selected number of low probability but potentially higher risk waste characteristics,

6-38
23 Portland Cement Association, 1991. op. cit.
environmental settings, and exposure assumptions were identified based on site visits, reportsfrom CKD facilities (other than those modeled in the baseline analysis), and in some cases,hypothetical scenarios that could potentially occur but were not specifically observed. In thissensitivity analysis, the Agency examined the extent to which these selected higher riskpotential factors, when combined with the baseline central tendency and high end modelingscenarios, could indicate a potential for more significant risks resulting from CKD management.
Two of the sensitivity analysis scenarios examined the sensitivity of the baseline resultsto changes in waste characteristics:
• The highest measured dioxins scenario estimated the risks associated with thedisposal of CKD containing the highest levels of 2,3,7,8-substituted chlorinateddibenzo-p-dioxins (CDDs) and dibenzo-furans (CDFs) measured by EPA duringits CKD facility sampling and analysis program. This scenario examined theextent to which the baseline central tendency and high end risk estimates wouldchange if this high CDD/CDF wastestream were present at each of the facilities.
• The 95th percentile inorganic constituent concentrations scenario evaluated thechange in risk associated with the disposal of CKD exhibiting the 95th percentilehighest constituent concentrations at all five baseline facilities. These 95thpercentile concentrations reflect data taken from the EPA sampling and analysiseffort and the PCA survey.23 Because of the low probability that a wastestreamcontaining each of the inorganic CKD constituents at their respective 95thpercentile concentration could be found at any single facility, this scenario doesnot examine the total incremental risk associated with this wastestreamcharacterization, but rather examines only the potential for individual constituentsto exceed health effects levels of concern.
Three sensitivity analysis scenarios examined the sensitivity of the baseline riskmodeling results to higher risk potential environmental transport scenarios or CKD managementpractices:
• An EPA damage case study identified a CKD pile located directly adjacent to anagricultural field with uncontrolled erosion of CKD impacting the field. Tosimulate this scenario, the transport characteristics at two of the facilitiesmodeled in the baseline analysis were modified to simulate exposuresassociated with the location of an agricultural field or pasture directly next to aCKD pile lacking erosion controls. This scenario focused on the potential effectsof this setting on the terrestrial foodchain pathway alone.
• Several EPA damage case studies identified CKD piles that were located directlyadjacent to surface water bodies with uncontrolled erosion of CKD entering thewater bodies. To simulate this scenario, the environmental transportcharacteristics at two of the facilities modeled in the baseline analysis weremodified to simulate the location of a surface water body (one facility had a riverand the other a lake) next to the CKD pile. This sensitivity scenario examinedthe incremental risks to the recreational swimming and fish ingestion exposurepathways.
• EPA identified several facilities practicing CKD management underwater in aquarry, at which CKD was disposed in a quarry that had been excavated duringcement production and that subsequently was filled with water entering thequarry through ground-water seepage. This scenario focused on examining thepotential for increased risks through the ground-water transport pathway,although it also examined potential reductions in risk potential through theatmospheric and soil erosion pathways.

6-39
The sixth scenario examined in the sensitivity analysis examined the incremental changein foodchain risks associated with an assumption that an individual could rely on vegetables,beef and milk, and fish originating in locations affected by the CKD pile as major components oftheir diet:
• Potential high exposure due to subsistence food consumption was addressed byestimating exposures of two categories of individuals: subsistence farming andsubsistence fishing. The subsistence farming scenario simulates the exposuresthat could be received by an individual ingesting a high percentage ofhomegrown produce, beef, and dairy products. For this hypothetical scenario,seventy-five percent of the subsistence farmer's beef, milk, and vegetables areassumed to originate in the CKD-contaminated agricultural field or pasture. Thesubsistence fishing scenario simulates the exposures to an individual that ingestsa high proportion of fish caught locally in a CKD-contaminated surface waterbody. For this scenario, 75 percent of the fish consumed by the subsistencefisherman is assumed to be caught in the contaminated water body nearest tothe facility. These exposure scenarios represent relatively infrequent behaviorpatterns that have not actually been observed or reported at any of the facilitiesexamined by the Agency.
Results of On-site Risk Modeling
The results from the on-site risk modeling analysis are presented in this section, first forthe baseline on-site facilities and then for the sensitivity analysis of higher risk scenarios. Unless otherwise indicated, all cancer risks are reported in terms of excess individual lifetimerisk of cancer. Noncancer effects are reported using the previously described hazard index.
Baseline On-Site CKD Management
The cancer and noncancer baseline modeling results are presented below for the directexposure pathways (i.e., air, ground water, surface water, and soil ingestion) and the foodchainpathways (i.e., vegetables, beef and milk, and fish).
Baseline Direct Exposure Pathway Risks
The Agency calculated a range of high end cancer risks corresponding to both a "bestestimate" of facility transport conditions and an "upper bound" characterization of facilitytransport parameters. This range of high end values presented for each pathway, as shown inExhibit 6-12, reflects the facility with the highest estimated risks in each respective pathwayfrom among the five modeled facilities. As anticipated in the previous qualitative ranking of riskpotential, different facilities were responsible for the highest risk estimated in each of thedifferent pathways.
The central tendency results for the distribution reflect the best estimate of risks from thethree facilities with the lowest risk estimates. The central tendency results are presented as arange "less than" the highest value estimated for these three facilities. Thus, the Agencybelieves that best estimate of the central tendency will generally be less than the reported value(see Exhibit 6-12).
The central tendency baseline modeling results generally indicate a low potential foradverse health effects from current CKD management via the direct exposure pathways. Of thefive pathways presented in Exhibit 6-12, the surface water pathway exhibited the highest centraltendency risks, estimated at less than an individual cancer risk level of 1x10⁻⁸. The other directexposure pathway risks were also negligible. The central tendency results for noncancer healtheffects were all more than four orders of magnitude below the health effects threshold (i.e., thehazard quotients were less than 1x10⁻⁴ in all five direct exposure pathways). These resultssuggest that most CKD management facilities will not present significant hazards through directexposure pathways.

6-40
The high end risks generally indicated a low threat through the direct exposurepathways, with the exception of the surface water pathway. High end risks resulting fromexposures during recreational swimming ranged from 4x10⁻⁶ to 2x10⁻⁵, attributable to arsenicconcentrations in the surface water body. The upper bound of the high end risks in the otherfour pathways never exceeded 1x10⁻⁶, while the best estimate risks at the high end facilitieswere all less than 1x10⁻⁹. The only noncancer effect within one order of magnitude of thereference dose were for recreational swimming exposures, resulting from the combinedsystemic effects of arsenic and cadmium. However, the noncancer estimates did not exceed ahazard quotient of 1.0, indicating a low potential threat in the surface water pathway. The highend noncancer estimates in the other four pathways were negligible.
These surface water risks reflect potential exposures in the lake located near Facility J. Because MMSOILS assumes that the lake acts as a sink both for CKD eroding from the pile andsubsequently traveling overland to the lake during its operating period, and for windblown CKDthat reaches the lake from the pile, it indicates a potential for accumulation of CKD constituentsin the lake bed sediments. The potential surface water effects are based on the partitioning ofthe CKD constituents from the lake bed sediments into the water column. Because of therelative simplicity of the lake simulation component of MMSOILS, the Agency believes theseresults could overstate the actual high end risks at this facility. Additionally, when fullyimplemented, the Agency's recently promulgated stormwater runoff control regulations(described in Section 7.2.1 of Chapter 7) could substantially mitigate or eliminate human healthrisks from surface waters contaminated by stormwater runoff from CKD piles. Theseregulations would not, however, control delivery of CKD contaminants to surface waters viaground-water or air pathways.
Exhibit 6-12
Baseline On-Site Management Cancer Risks for Direct Exposure Pathways for 15 Case Study Facilities
ExposurePathway
Excess Individual Lifetime Cancer Risk
High End Central Tendency
Best Estimate Upper Bound
Ground water 2x10⁻⁹ 6x10⁻⁸ Less than 1x10-18
Surface water 4x10⁻⁶ 2x10⁻⁵ Less than 1x10⁻⁸
Direct inhalation 2x10-12 3x10-12 Less than 1x10-14
Soil ingestion - adult 5x10-12 1x10⁻⁷ Less than 1x10-13
Soil ingestion - child 8x10-12 2x10⁻⁷ Less than 1x10-12
Baseline Foodchain Pathway Risks
As shown below in Exhibit 6-13, while the baseline foodchain pathway results indicateda somewhat higher potential for health effects than in the direct exposure pathways, the centraltendency individual cancer risks were still below 1x10⁻⁶, with the beef and milk and fishexposure routes showing negligible central tendency risks at levels less than 1x10⁻⁸. Thecentral tendency noncancer effects were also more than two orders of magnitude below thethreshold effects level (i.e., the hazard quotients were all less than 1x10⁻²), indicating anegligible likelihood of noncancer impact at those CKD facilities represented by the centraltendency estimate.
The high end foodchain estimates varied by pathway, with the ingestion of fish resultingin the highest risks (ranging from 4x10⁻⁶ to 4x10⁻⁵) due to the combined cancer effects of

6-41
arsenic, beryllium, and potassium-40. High end risks from the ingestion of vegetables rangedfrom 2x10⁻⁶ to 3x10⁻⁶, resulting from arsenic uptake into the vegetables. The beef and milkexposure pathway results were all less than 1x10⁻⁶ and ranged from 2x10⁻⁷ in the best estimateto 4x10⁻⁷ in the upper bound. The high end noncancer foodchain effects exceeded a hazardquotient of 1.0 in one pathway: ingestion of fish at Facility J resulted in an estimated high endhazard quotient ranging from 4.1 to 16 due to exposures to cadmium. In addition to cadmium,chromium also contributed to this high end noncancer effect with hazard quotients ranging from0.17 to 0.66. The high end noncancer effects were negligible in the other two foodchainpathways.
Exhibit 6-13
Baseline On-Site Management Cancer Risks for Foodchain Exposure Pathways for 15 Case Study Facilities
ExposurePathway
Excess Individual Lifetime Cancer Risk
High EndCentral Tendency
Best Estimate Upper Bound
Vegetable 2x10⁻⁶ 3x10⁻⁶ Less than 1x10⁻⁶
Beef & Milk 2x10⁻⁷ 4x10⁻⁷ Less than 1x10⁻⁸
Fish 4x10⁻⁶ 4x10⁻⁵ Less than 1x10⁻⁸
In estimating the terrestrial foodchain effects (i.e., vegetables, beef and milk), theassumptions concerning the amount of erosion transported from the CKD pile to the agriculturalfield may result in an overestimate of the impacts in the high end analysis. While the Agencyobserved effective erosion controls at the five baseline facilities that were believed to effectivelyrestrict the off-site movement of CKD by the erosion pathway, it was believed that these erosioncontrols could potentially fail in extreme storm events or due to failure of engineered controls. Consequently, the high end analysis adopted a worst case assumption at three of the facilitiesthat these erosion controls would completely fail. Because the high end risks in the terrestrialfoodchain pathway were associated with two of these facilities, these high end results mayoverstate the likely upper bound risks to the foodchain pathway at these facilities.
In total, the baseline modeling analysis simulated the release, fate, and transport of 14constituents (or in the case of CDDs and CDFs, groups of constituents) that have been detectedin CKD and have known cancer or noncancer health effects that could be modeled usingcurrent Agency guidance and available data. Exhibit 6-14 shows all of these constituents andthe exposure pathways where they exceeded a cancer risk of 1x10⁻⁶ or a hazard quotient of 0.1.

6-42
Exhibit 6-14
Constituents Contributing to Adverse Health Effects In On-site CKD Risk Modeling Analysis
Constituents ofConcern
Exposure Pathways
Dire
ctIn
hala
tion
Rec
reat
iona
lSw
imm
ing
Gro
und
Wat
erIn
gest
ion
Res
iden
tial S
oil
Inge
stio
n (A
dult)
Res
iden
tial S
oil
Inge
stio
n (C
hild
)
Veg
etab
les
Bee
f & M
ilk
Fish
Health Effects
CT HE CT HE CT HE CT HE CT HE CT HE CT HE CT HE Antimony Decreased blood cell synthesis Arsenic p p p Skin cancer and skin damage Barium Increased blood pressure Beryllium p Gross tumors Cadmium p p Kidney damage Chromium p Central nervous system effects Thallium p Liver damage 2378 TCDDEquivalents
Multiple cancers
Potassium 40 p Cancer Radium 226/228 Cancer Uranium 234 Cancer Uranium 238 Cancer Thorium 230 Cancer

6-43
Exhibit 6-14 illustrates on a constituent-specific basis that none of the central tendencyestimates exceeded a cancer risk of 1x10⁻⁶ or hazard quotient of 0.1. The exhibit shows that thehigh end risks were the result of exposures to six CKD constituents: arsenic, beryllium,cadmium, chromium, potassium-40, and thallium. Exposures to CDDs/CDFs were not ofconcern in the baseline risk analysis.
Arsenic, which can cause both systemic and carcinogenic effects, contributed to cancerrisks and/or noncancer effects in three high end exposure pathways: exposures duringswimming, ingestion of vegetables, and ingestion of recreationally-caught fish. In the swimmingand fish ingestion exposure pathways, arsenic exceeded both cancer and noncancer levels,while in the vegetable ingestion pathway, it only indicated a potential threat for its cancer effect(it reached a level just exceeding 1x10⁻⁶). Cadmium resulted in exposures exceeding anoncancer hazard quotient of 0.1 in two high end pathways at one facility: exposures duringswimming (ranging from 0.056 to 0.22) and ingestion of fish (ranging from 3.8 to 15). Theremaining three constituents contributed to health effects of potential concern only in the highend fish ingestion scenario. Of these constituents, beryllium and potassium-40 indicatedpotential cancer effects, while thallium exceeded a noncancer hazard quotient of 0.1 for fishingestion at one facility.
As mentioned previously, full implementation of the Agency's recently promulgatedstormwater runoff control regulations could substantially limit human health risks from theingestion of fish from surface waters contaminated by stormwater runoff from CKD piles. Theseregulations would not, however, limit the migration of CKD contaminants to surface waters viaground-water or air pathways.
Baseline Estimated Increased Blood Lead Levels
The Agency's methodology for characterizing potential adverse health effects resultingfrom exposures to lead generated an estimate of the increased blood lead levels above nationalbackground levels for children. Using the default assumptions in the UBK model for nationalaverage background lead concentrations in the various exposure routes through which childrencould be exposed to lead, it estimated a national average mean blood lead level of 3.14 :g/dL inchildren ages one through seven. Thus, in those cases where releases from the CKD facilitydid not increase exposures to lead above assumed national background levels, the UBK modelwould estimate a mean blood lead level of 3.14 :g/dL. Where releases from the CKD facilityincreased exposures to lead, the resulting estimate of the mean blood lead level wouldrepresent an increment above this national background estimate.
The estimated mean blood lead levels exceeded the baseline value of 3.14 :g/dL atthree of the five baseline facilities, while the two remaining facilities were estimated to result inno increase above national background levels. The estimates exceeded the blood lead effectlevel of concern of 10 :g/dL at two of these facilities. The highest exceedance took place atFacility J, where the best estimate mean blood lead level was approximately 14 :g/dL, while theupper bound estimate was approximately 48 :g/dL. These increased exposures abovebackground primarily reflect the simulated ingestion of lead in fish caught in the lake at thisfacility; exposure to lead through the other exposure routes were generally below the nationalaverage background levels. Facility A also exceeded the national average backgroundestimates with a best estimate mean blood lead level of about 5 :g/dL and a upper boundestimate of about 13 :g/dL. Finally, the central tendency estimates at Facility F did not exceedbackground, while the upper bound estimate was approximately 8 :g/dL (which is below thehealth effect level of concern for blood lead).
Most of the blood lead level estimates indicating an increase above the nationalbackground were attributable to ingestion of fish caught in the nearest surface water body to therespective facilities. Because these blood lead estimates are based on the conservativeassumption that 20 percent of the child's fish originates in the contaminated surface water body,the Agency believes that they most likely overstate that actual lead exposures associated withmost CKD facilities.
Baseline Aquatic Ecological Effects

6-44
The examination of aquatic ecological effects focused on eight constituents for whichaquatic ecological benchmarks were available (see Exhibit 6-11): antimony, arsenic, beryllium,cadmium, chromium (VI), lead, thallium, and 2,3,7,8-TCDD. In the high end analysis, five ofthese eight constituents exceeded their aquatic ecological benchmarks (arsenic, beryllium,cadmium, chromium [VI], and lead). The highest values occurred in the nearby lake at FacilityJ, and ranged from about two times the benchmark value for arsenic to about 300 times thebenchmark for cadmium (see Exhibit 6-15 below). Given the relative simplicity of the MMSOILSlake exposure model, it is likely that these values could significantly overstate the actualconstituent concentrations in this lake. As Exhibit 6-15 shows, none of the constituentsexceeded their respective aquatic ecological health effects benchmarks in the central tendencyanalysis.
Exhibit 6-15
Results of Central Tendency and High End Ecological Effects Analysis
ModelingScenario
Ratio of Surface Water Concentration to Ecological Effects Criteria
Arsenic Beryllium Cadmium Chromium Lead
High End 14 - 50 0.5 - 2 80 - 320 37 - 150 14 - 54
Central Tendency Below AWQC Below LOAEL Below AWQC Below AWQC Below AWQC
Again, as mentioned previously, full implementation of the Agency's recentlypromulgated stormwater runoff control regulations could substantially mitigate or eliminateaquatic ecological damages to surface waters attributable to stormwater runoff of CKDcontaminants. These regulations would not, however, limit the migration of CKD contaminantsto surface waters via ground-water or air pathways.
Sensitivity Analysis of Hypothetical Higher Risk Scenarios
The sensitivity analysis of potentially higher risk scenarios quantified the change in thebaseline risks associated with the superimposition of selected high risk potential facility andenvironmental setting characteristics on the baseline facility characterization. The Agencyexamined six high risk potential scenarios, which selectively modified the baseline facilityestimates as described earlier. The results for each of these six scenarios are presented belowin the following order: maximum measured dioxin concentrations; 95th percentile metalconcentrations; location directly adjacent to an agricultural field; location directly adjacent to areceiving surface water body; management underwater in a quarry; and risks to possibly highlyexposed farmers and fisherman.
Maximum Measured Dioxin Concentrations
This sensitivity analysis examined the change in risks that would occur at the fivebaseline facilities, based on the hypothetical management of CKD containing the highestmeasured CDD/CDF concentrations found in EPA's sampling at 11 cement plants (see theDocket for the report on the sampling and analysis results). In order to estimate the sensitivityof the original case-study plant risk estimates to CDD/CDF concentrations, the highestCDD/CDF measured concentrations were substituted into each of the five original facilitysettings. This scenario is presented to provide an upper tail estimate of potential CDD/CDFrisks nationwide. (Because the Agency has only published cancer slope factors for CDD/CDFcongeners and has not published reference doses, this sensitivity analysis only examinedincremental individual cancer risks and did not address noncancer effects.)
Exhibit 6-16 presents the high end and central tendency results for this sensitivityanalysis. In the three primary direct inhalation and ingestion pathways (i.e., ground water,surface, and air), the results were found to be identical to the original baseline risks (presented

6-45
previously in Exhibit 6-12). The lack of incremental increase in risks above the baselineestimates reflects the fact that CDDs/CDFs did not contribute to these baseline exposurepathway risks due to their lack of mobility in subsurface systems, low solubility in water, andrelatively low concentrations in air. The sensitivity analysis did indicate a potential increase inthe soil ingestion pathways. The central tendency risks increase by about three orders ofmagnitude, although they remain negligible (below 1x10⁻⁹). The high risks increased to a similardegree, resulting in risks to adults ranging from 3x10⁻¹⁰ (best estimate) to 7x10⁻⁶ (upper bound). The risks to children ingesting soil increased to 1x10⁻⁹ in the best estimate to 2x10⁻⁵ in the upperbound.
Exhibit 6-16
Sensitivity Analysis of Maximum CDD/CDF Cancer Risks for Direct Exposure Pathways
ExposurePathway
Excess Individual Lifetime Cancer Risk
High End CentralTendency
Best Estimate Upper Bound
Ground water Identical to Baseline Identical to Baseline Identical to Baseline
Surface water Identical to Baseline Identical to Baseline Identical to Baseline
Direct inhalation Identical to Baseline Identical to Baseline Identical to Baseline
Soil ingestion:adult
3x10⁻¹⁰ 7x10⁻⁶ Less than 1x10⁻¹⁰
Soil ingestion:child
1x10⁻⁹ 2x10⁻⁵ Less than 1x10⁻⁹
The sensitivity analysis indicated a similar increase in risks in the foodchain exposurepathways (Exhibit 6-17). Because the baseline estimates had been higher in the foodchainpathways, the foodchain risks in the sensitivity analysis were correspondingly higher. The risksto the central tendency facilities were about two orders of magnitude greater than in thebaseline analysis, and were less than 1x10⁻⁵ in the beef and milk and fish pathways, and lessthan 1x10⁻⁴ for the ingestion of vegetables. In the high end analysis, the highest risks werefound in the fish ingestion pathway and reached an upper bound value of 2x10⁻³. Ingestion ofvegetables and beef and milk resulted in risks ranging from 2x10⁻⁴ to 6x10⁻⁴.
In both the terrestrial foodchain scenarios and the soil ingestion scenarios, the upperbound risks reflect an assumption concerning the failure of erosion controls at the facilities. Aswas the case in the baseline analysis, the results presented in this maximum CDD/CDFconcentration sensitivity analysis are likely to overstate the risks associated with CKDmanagement.

6-46
Exhibit 6-17
Sensitivity Analysis of Maximum CDD/CDF Cancer Risks for Foodchain Exposure Pathways
ExposurePathway
Excess Individual Lifetime Cancer Risk
High EndCentral Tendency
Best Estimate Upper Bound
Vegetable 2x10⁻⁴ 3x10⁻⁴ Less than 1x10⁻⁴
Beef & Milk 2x10⁻⁴ 6x10⁻⁴ Less than 1x10⁻⁵
Fish 3x10⁻⁴ 2x10⁻³ Less than 1x10⁻⁵
95th Percentile Metals Concentrations
The 95th percentile metals concentration sensitivity analysis examined on a constituent-specific basis the potential for additional CKD constituents to exceed health effects levels ofconcern. This scenario was evaluated by scaling the baseline risk estimates for eachconstituent based on the ratio of the metals concentrations in the baseline facility sample andthe 95th percentile metals concentrations (see the Docket for the results of EPA's CKDsampling and analysis program). This simplified approach assumes that the risk results in eachexposure pathway will be linear with respect to constituent concentration. While this approachmay be as accurate as evaluating all of these scenarios directly with MMSOILS, the Agencybelieves it represents a reasonable estimation of the risks associated with these higherconstituent concentrations.
The primary incremental change over the baseline results in this sensitivity analysis wasthe increased noncancer effects associated with thallium. While it was only within one order ofmagnitude of the reference dose for the high end fish ingestion in the baseline analysis, it waswithin one order of magnitude of the reference dose in four additional high end exposurepathways using the 95th percentile concentrations: residential soil ingestion by adults andchildren, vegetables, and beef and milk. In one of these pathways, vegetable ingestion, thalliumwas within one order of magnitude of the threshold concentration in the central tendencyanalysis.
Only two other constituents were within one order of magnitude of the reference dose ina single pathway in addition to those found in the baseline. Antimony had a hazard quotient of0.12 in the high end surface water pathway. Chromium had a high end hazard quotient of 0.49in the surface water pathway.
Location Adjacent to an Agricultural Field
This sensitivity scenario focused on the potential for increased risks when an agriculturalfield or pasture was located directly adjacent to the CKD pile without erosion controls. Accordingly, this scenario only compares the baseline and sensitivity analysis results for theterrestrial foodchain pathways (i.e., ingestion of vegetables and ingestion of beef and milk). This sensitivity analysis only examined two of the five baseline facilities: Facility F (representingthe high end estimate) and Facility J (representing the central tendency estimate).
The sensitivity results indicated that risks could increase in the baseline vegetable andbeef and milk exposure pathways by between one and two orders of magnitude if the facilitieswere located directly next to an agricultural field (Exhibit 6-18). Because the scenario assumesno erosion loss during transport between the CKD pile and the field, this high risk scenariowould be expected to result in significantly higher risks than at the actual baseline facilities. Both the beef and milk and vegetable exposure routes had similar high end risks, approximately

6-47
4x10⁻⁵. The central tendency risks were somewhat lower, with the vegetable risks about oneorder of magnitude higher than the beef and milk risks.
Noncancer effects in this sensitivity analysis exceeded the reference dose, unlike in thebaseline analysis. The high end hazard quotient for the vegetable pathway was about 6, whilethe high end hazard quotient for the beef and milk pathway was about 3. The central tendencyvegetable pathway hazard quotient was about 5, while the central tendency beef and milkhazard quotient, with a value of about 0.8, did not exceed the reference dose.
Exhibit 6-18
Sensitivity Analysis of Location Adjacent to Agricultural Field for Foodchain Exposure Pathways
ExposurePathway
Excess Individual Lifetime Cancer Risk
High EndCentral Tendency
Best Estimate Upper Bound
Vegetable 3.8x10⁻⁵ 4.2x10⁻⁵ Less than 3x10⁻⁵
Beef & Milk 4.0x10⁻⁵ 4.3x10⁻⁵ Less than 4x10⁻⁶
Location Adjacent to a Surface Water Body
This sensitivity scenario focused on the potential for increased risks when a surfacewater body was located directly adjacent to the CKD pile. Because this scenario only affectsthe exposure pathways associated with the ambient concentrations in surface water, thisscenario only examined the recreational swimming and fish ingestion pathways. This sensitivityanalysis examined two of the five baseline facilities, both of which are representative of the highend risks: Facility F (representing the high end estimate for a facility bordering a river) andFacility J (representing the high end estimate for a facility bordering a lake). Central tendencyrisks were not estimated in this sensitivity analysis, which only examined potential changes tothe high end estimates.
The high end results for the adjacent surface water scenario showed increased healtheffects in the recreational swimming and fish ingestion pathways (Exhibit 6-19). In therecreational swimming scenario, the risks were about one order of magnitude higher than thebaseline risks, while the noncancer effects reached a maximum hazard quotient of 1.0 in onecase. In the fish ingestion scenario, the sensitivity analysis risks were between five and seventimes higher than in the baseline analysis. The most significant change in the sensitivityanalysis was associated with the increased noncancer effects in the fish ingestion scenario,which reached a maximum hazard quotient of 35 due to uptake of cadmium.

6-48
Exhibit 6-19
Sensitivity Analysis of Location Adjacent to Surface Waterfor Direct and Foodchain Exposure Pathways
ExposurePathway
Excess Individual Lifetime Cancer Risk
High End CentralTendency
BestEstimate
Upper Bound
RecreationalSwimming
2.4x10⁻⁵ 3.3x10⁻⁵ Not evaluated
Fish Ingestion 2.3x10⁻⁵ 3.2x10⁻⁴ Not evaluated
Management Underwater in a Quarry
This scenario simulated the increased potential for ground-water contamination resultingfrom disposal of CKD in a quarry that subsequently fills with water due to ground-waterseepage. This sensitivity analysis scenario generated the highest ground-water estimatesamong all the baseline and hypothetical scenarios. The best estimate ground-water effects,however, remained below a cancer risk of 1x10⁻⁷, and more than four orders of magnitude belowthe noncancer effects level. The high end individual cancer risks reached an upper bound valueof about 7x10⁻⁷, while the noncancer hazard quotient was within one order of magnitude of apotential effect.
While this sensitivity analysis scenario was not designed to examine risks in the otherpathways, the results indicated that this scenario would have the lowest air, surface water, andfoodchain effects. Because the CKD is managed underwater and below grade, there is minimalpotential for air emissions and erosion run-off, both of which were primary driving forces in thesoil and foodchain pathway effects.
Subsistence Level Food Consumption Risks
The Agency evaluated potential risks to individuals highly exposed through twosubsistence food consumption scenarios: subsistence farming and subsistence fishing. Thesehypothetical scenarios evaluated, respectively, potential exposures to an individual that receives75 percent of his/her vegetables, beef, and milk from sources contaminated by CKD, and anindividual that receives 75 percent of his/her diet of fish from a local stream contaminated byCKD. These increased exposure assumptions were superimposed, in turn, on the baselineanalysis, the maximum dioxin sensitivity analysis, the adjacent agricultural field scenario (for thesubsistence farmer), and in the adjacent surface water body scenario (for subsistence fishing). Thus, this sensitivity analysis examined the combined effects of high foodchain exposures withseveral individual central tendency and high end risk settings. Consequently, at least in thehigher risk scenarios, this analysis tends to compound certain of these highly conservativeassumptions related to both the surface water and soil erosion pathways. Accordingly, theseresults reflect worst case assumptions with a low probability of occurring, and should beevaluated as an indication of the sensitivity of the baseline results to combinations of high riskassumptions.
As would be expected, this scenario produced the highest estimates of risks from the on-site management of CKD. Exhibit 6-20 shows the high end and central tendency cancer risksfor subsistence fishing and farming in the baseline analysis, the maximum dioxins analysis, andin the respective adjacent locations sensitivity analyses.

6-49
Exhibit 6-20
Sensitivity Analysis of Subsistence Level Food Consumption Risks
ExposurePathway
Excess Individual Lifetime Cancer Risk
High End CentralTendency
Best Estimate Upper Bound
Subsistence Fishing
Baseline Analysis 2.0x10⁻⁴ 1.7x10⁻³ Less than 6x10⁻⁷
Maximum Dioxins 1.3x10⁻² 6.7x10⁻² Not estimated
Adjacent Surface Water 3.5x10⁻³ 1.4x10⁻² Not estimated
Subsistence Farming
Baseline Analysis 1.3x10⁻⁵ 2.0x10⁻⁵ Less than 7x10⁻⁶
Maximum Dioxins 4.7x10⁻³ 7.2x10⁻³ Not estimated
Adjacent Agricultural Field 6.1x10⁻⁴ 6.7x10⁻⁴ Not estimated
The baseline analysis of highly exposed individuals estimated maximum risks at thecentral tendency facilities of less than 7x10⁻⁶ for subsistence farming and less than 6x10⁻⁷ forsubsistence fishing. The central tendency noncancer effects were generally within one order ofmagnitude of the health effects threshold, but did not exceed a hazard quotient of 1. In reality,the Agency does not believe that the average facility represented by the central tendencyestimate is likely to have subsistence-level exposures, as this is believed to be a relativelyuncommon practice. But these central tendency results suggest that were such individualslocated near CKD facilities, most would receive risks ranging below these values.
The high end baseline and sensitivity estimates indicate the greatest risk potential inthese two subsistence exposure scenarios. The subsistence fishing scenario results rangedfrom 2x10⁻⁴ to 7x10⁻², with the highest risks in the upper bound estimate associated with themaximum dioxin concentration analysis. The subsistence farming results were somewhatlower, ranging from 1x10⁻⁵ to 7x10⁻³, with the highest risks again occurring in the maximumdioxin concentration scenario. Generally, the high end subsistence level cancer risks weredriven by dioxins, arsenic, and in some cases beryllium, while the noncancer effects were drivenby arsenic, cadmium, chromium, and thallium.
6.2.3 Summary of Risks from On-site CKD Management
Based on a limited comparison, the sample of cement plants examined in this analysisappears to be generally representative of typical cement plants across the nation in terms ofseveral factors that influence risks. By prioritizing the plants according to risk potential andfocusing the modeling on the five facilities that appear to pose the highest risks, EPA attemptedto quantify the upper range of the distribution of risks likely to be associated with the 15 case-study plants. In addition, the analysis was designed to quantify the middle range of this riskdistribution as characterized by the "central tendency" estimates. The Agency recognizes thatthe high end results do not necessarily capture the upper bound of the risks that exist acrossthe full universe of 115 active cement plants, as site-specific factors at some plants maycontribute to higher risks than estimated for the 15 sample facilities. Therefore, the Agency alsoconducted a sensitivity analysis of several hypothetical scenarios representing combinations ofpotentially higher risk scenarios that may exist at other facilities. The findings pertaining to eachprimary exposure pathway are presented below.

6-50
Ground-water Risks
On-site CKD management practices and hydrogeologic conditions create a moderatepotential for ground-water contamination at most of the 15 case-study plants. For example,none of the on-site CKD piles examined in the sample are equipped with a synthetic liner orother engineered control to prevent the migration of contaminants to the subsurface, and mostsites exist in locations where the net recharge, depth to ground water, subsurface permeability,and other factors could permit shallow ground-water contamination. However, the potential forany such contamination to pose significant risks is diminished greatly by other factors at themajority of sites, including relatively low concentrations of contaminants in CKD leachate, thetendency for several CKD contaminants to sorb to soil and migrate very slowly in ground water,the distance to potential downgradient receptors, and existing ground-water use patterns. Considering all of these factors on a site-specific basis, the central tendency estimate ofindividual risks for the ground-water pathway were low at each of the facilities modeled(generally, significantly less than an increased individual cancer risk of 1x10⁻¹⁰ and noncancereffects several orders of magnitude below the relevant effects thresholds). Even in the high endand sensitivity analyses, increased individual risks through ingestion of ground water neverexceeded 1x10⁻⁶. Additionally, no cancer cases or noncancer effects were predicted for thepopulations surrounding the model facilities.
Surface Water Risks to Human Health
The potential for significant human health risks from direct exposures to surface wateralso appears low at present at most of the case-study plants, due to the lack of surface waterusage for drinking purposes downgradient of the facilities. Because the surface water was notused for drinking water purposes, the risk modeling analysis examined exposures resulting fromrecreational swimming. In the central tendency analysis, the human health effects were belowan individual cancer risk of 1x10⁻⁸ and several orders of magnitude below relevant noncancereffect thresholds, based on a recreational swimming scenario assuming exposures from dermalabsorption and incidental ingestion of surface waters. In the high end analysis, the risk potentialwas shown to be greater, with individual risks ranging from 4x10⁻⁶ to 2x10⁻⁵. Important factorscontributing to the low central tendency risk estimates include the frequent practice ofintercepting and diverting stormwater run-off from CKD piles through on-site ditches prior todischarge to surface water bodies, as well as the distance to and dilution capacity (high flowrate) of receiving creeks and rivers. However, the high end and sensitivity analysis modelingresults indicate that higher risks from direct exposure to surface water may exist if stormwaterrun-off is not adequately controlled and receiving waters have a negligible dilution capacity.
Potential human health risk estimates are higher for ingestion of fish from contaminatedwaters. While central tendency estimate of effects from consumption of fish caughtrecreationally were found to be less than 1x10⁻⁸ for cancer and well below the noncancer effectthreshold, the high end results reached an increased individual cancer risk of about 4x10⁻⁵ and anoncancer hazard quotient for cadmium at a level about ten times higher than its correspondingthreshold.
In cases where CKD facilities are located directly adjacent to a surface water body, boththe best estimate recreational swimming and fishing scenarios showed increased cancer risksand noncancer effects roughly similar to the baseline high end estimates. In cases wherefacilities manage CKD containing the highest concentrations of dioxins measured by EPA,however, the estimated upper bound risks could exceed a cancer risk level of one in onethousand.
In cases where an exposed individual receives 75 percent of their fish from thecontaminated surface water body (a subsistence fisherman), the risk analysis predictedsignificant cancer and noncancer effects. While this may be a relatively rare scenario at actualfacilities, the modeling analysis showed this practice to be of relatively significant concern wereit to occur.
Aquatic Ecological Risks

6-51
The risk modeling analysis evaluated the potential for CKD constituents to exceedaquatic ecological benchmark values in receiving surface waters near the plant. The centraltendency results showed no values exceeding chronic ambient water quality criteria (AWQC) forthe protection of aquatic life. In the high end analysis, five of the fourteen modeled constituentswere shown to have a potential for exceeding ecological levels of concern.
Air Pathway Risks from Windblown Dust
The air pathway is of concern for on-site CKD management because the dust is a fineparticulate matter that is readily suspendable, transportable, and respirable in air. Many of thesample facilities add water to CKD prior to disposal to form larger clumps or nodules in an effortto keep the dust down, and some dust suppression is achieved naturally as thin surface crustsform on inactive portions of CKD piles as they are exposed to the elements. Nevertheless,these appear to be temporary and incomplete measures of fugitive dust control at most facilities.
Quantitative modeling of air pathway risks to people living near case-study facilitiesindicated that wind erosion and mechanical disturbances of on-site CKD piles do not result insignificant risks at nearby residences via direct inhalation (e.g., central tendency and high endrisks estimates were all less than 1x10-11 increased individual cancer risk at all five facilitiesmodeled). However, fugitive dust from on-site CKD piles was estimated to be one of twocontributors in some cases to higher risk estimates for indirect exposure pathways (which wereprimarily a result of direct surface run-off from the CKD pile reaching an agricultural field).
Central tendency foodchain cancer risk and noncancer effects for ingestion ofvegetables, beef, and milk, were below individual risks levels of 1x10⁻⁶ at all five facilities. In thehigh end baseline facility scenarios, foodchain risks for ingestion of vegetables reached amaximum of about 3x10⁻⁶. In the sensitivity analysis scenarios, however, these risks reached amaximum of about 2x10⁻⁴ due to uptake of maximum measured CKD dioxin concentrations invegetables. The estimated risks and hazards for the highly exposed subsistence farmer weresignificantly higher, reaching a maximum cancer risk exceeding 1x10⁻² in the upper boundsensitivity analysis scenario that simulated the worst case dioxin concentrations. While thefrequency of these less common exposure scenarios is likely to be relatively low on a nationalbasis, these risk estimates indicate a potentially significant threat were they to occur.
6.3 EVALUATION OF RISKS FROM OFF-SITE BENEFICIAL USES OF CKD
As discussed in Chapter 8, approximately 943,000 metric tons (1,040,000 tons) of CKDwas sold or given away in 1990 for off-site beneficial uses. Most commonly, the dust is used tostabilize hazardous and non-hazardous waste for disposal purposes. About 70 percent of off-site CKD use in 1990 was for this purpose, which is approximately six times more than for anyother single use. The next most common off-site use is as a soil amendment, in which CKDmixed with sewage sludge is used as a fertilizer, soil conditioner, or landfill cover. The thirdmost common single use is as a liming agent, in which raw CKD is land-applied directly toagricultural fields. Together, the amount of CKD used as a soil amendment and liming agentaccounts for roughly 17 percent (160,000 metric tons) of the total quantity of CKD sold or givenaway in 1990. A number of other uses also exist, but they are much less common, both interms of the number of cement plants and quantity of CKD involved. For example, three cementplants sold or gave away about 25,000 metric tons (3 percent of the total) to be used as anadditive to concrete and other building materials, and four plants sold or gave awayapproximately 11,000 metric tons (1 percent of the total) for use in the construction of roads.
This section evaluates the human health and environmental risks associated with thesevarious beneficial uses of CKD. It starts with an overview of the risk assessment approach andmethods. The section then evaluates the risks of the following major categories of beneficialuses in turn: hazardous waste stabilization and disposal, sewage sludge stabilization and use,building materials addition, road construction, and agricultural liming. Included in the discussionof sewage treatment and use is an evaluation of the use of stabilized sewage as a landfill cover(one example of soil amendment). Other uses of CKD as a soil amendment (e.g., soil stabilizer)are not addressed because they are expected to pose similar, if not smaller, risks than thedirect application of CKD as a liming agent to food crops and pastures. Furthermore, additional

6-52
uses of CKD, such as an ingredient in livestock feed, a lime-alum coagulant, a mineral filler, aningredient in lightweight aggregate manufacture, and in glass making, are not evaluated in thischapter because of their limited use. These potential beneficial uses are described in detail inChapter 8.
6.3.1 Approach and Methods
As a basis for evaluating risks of off-site uses, EPA collected information on how andwhere the dust is used. This information was obtained primarily through telephone interviewswith personnel at a sample of five principal independent companies that receive, process,and/or market CKD at off-site locations. These companies are listed in Exhibit 6-21.
These five companies were selected for three reasons. First, the Agency selected anumber of off-site recipients that is roughly proportional to the relative frequency of eachcategory of off-site use: four recipients that mix CKD with either hazardous waste or sewagesludge, and one recipient each for liming agent, road construction, and building materialsaddition. Second, each company receives and handles a relatively large amount of CKD. Withone exception, the sites received more than 900 metric tons (1,000 tons) of CKD from morethan one cement manufacturing plant in 1990. Third, the sample of off-site locations representsa diversity of geographical areas.
Exhibit 6-21Off-site Beneficial Uses Examined in the Risk Assessment
RECEIVINGLOCATION
BENEFICIAL USE QUANTITY OF CKDRECEIVED IN 1990
Metric Tons (Short Tons)
Farmland Ind.,Coffeyville, KS
Hazardous Waste Stabilization (petroleum refining sludge)
123,000 (136,000)
VFL Technology,Malverne, PA
Landfill Cover(sewage sludge mixture)
19,000 (20,900)
NewLime, Ravena, NY Waste Stabilization 53,000 (58,300)Road Construction 8,000 (8,800)
Liming Agent 23,000 (25,300)National N-Viro Energy
Systems, Sioux City, IA
Soil Amendment(sewage sludge mixture)
6,000 (6,600)
U.S. Ash Inc., Roanoke, VA
Materials Addition(concrete admixture)
10,400 (11,440)
Information was developed on productive processes at recipient companies and onbasic environmental features at locations where the dust is ultimately used. The Agency thenanalyzed the factors influencing CKD release, transport, and exposure potential for eachcategory of use, considering the conditions that exist at the sample off-site locations. Thepurpose of this analysis was to document and describe the major factors that could influencerisks from each beneficial use, and to prioritize the uses for further risk analysis throughquantitative modeling.
6.3.2 Hazardous Waste Stabilization and Disposal
Farmland Industries is a petroleum refinery that uses CKD to stabilize petroleum sludgesprior to land disposal. In 1990, Farmland received approximately 123,000 metric tons (136,000tons) of CKD, accounting for roughly 17 percent of all the CKD used off-site for wastestabilization that year.
Farmland has used CKD to stabilize a variety of petroleum refining wastewater treatmentsludges. The largest quantity of CKD was used as part of a project to close and renovate therefinery's oily sludge ponds in early 1990. These unlined ponds held various wastewaters and

6-53
24 Environmental Priorities Initiative, Preliminary Assessment, Farmland Industries Site,Coffeyville, KS, Ecology and Environment, Inc. prepared for U.S. EPA Hazardous Site EvaluationDivision, October 15, 1990.
25 Evaluation of the Potential for Migration of Hazardous Waste Constituents from theDisposal Site to Water Supply Sources, Farmland Industries, Coffeyville, Kansas, EngineeringEnterprises, Inc., 1991.
26 Inspection of Ground-water Monitoring, Farmland Industries, Coffeyville, Kansas, DraftReport, Harding Lawson Associates, 1984.
sludges, including API Separator Sludge (K051).24 Investigations conducted at the facility in theearly 1980s revealed that ground-water wells downgradient from the oily sludge pondscontained elevated levels of lead, phenols, and hexavalent chromium,25 as well as a thick layerof oil on top of the water.26 Therefore, before the land disposal restrictions for K051 becameeffective in November 1990, Farmland closed the ponds by excavating all the sludge, mixing itwith CKD to stabilize it, and disposing of the mixture in a specially created landfill on top of theexcavated sludge ponds. The landfill was lined and capped with a local clay.
Since this large closure project in 1990, Farmland has continued to use smallerquantities of CKD to stabilize other listed oil/water/solids separation sludges (i.e., F037 andF038). Farmland presently sends these sludges mixed with CKD off site for disposal in aSubtitle C landfill. Farmland indicates that once the land disposal restrictions for these otherhazardous sludges become effective in June 1994, it will begin using a reconfigured wastewatertreatment system that will eliminate the need to use CKD as a stabilizing agent.
The potential for CKD to cause or contribute to significant ground-water contaminationas it is used by Farmland appears remote. The liner and cap at the landfill containing stabilizedwastes from the old oily sludge ponds limit the extent to which water seeps through the wastesand percolates into the subsurface. Monitoring wells have been installed around the landfilland, according to Farmland personnel, have shown no sign of ground-water contamination thusfar. Additionally, the off-site landfill where Farmland presently sends its stabilized F037 andF038 is equipped with appropriate controls required under Subtitle C to minimize the risk ofground-water contamination.
The containment provided at the on-site (oily sludge) landfill and off-site Subtitle Clandfill also serves to limit the potential for CKD to significantly contaminate surface water. Forexample, the liner and cover used at the on-site landfill should significantly reduce the extent towhich landfill contaminants can migrate to the nearby Verdigris River, either via overland run-offalong with stormwater or via ground-water discharge. In addition, Farmland has constructeddikes and berms to control flooding and limit the direct flow of stormwater run-off from the siteinto the Verdigris River.
Similarly, once mixed with hazardous waste, the dust exists in an oily mixture that is notsusceptible to wind erosion. This mixture is ultimately disposed in a covered landfill thateffectively prohibits the potential for significant airborne emissions.
Prior to mixing CKD with hazardous waste, Farmland will accumulate a maximum of 9metric tons (10 short tons) of the dust in an unlined, uncovered pile at the site. Although thereis a potential for contaminants to migrate from this CKD pile into the environment, this potentialthreat appears small compared to that posed by the much larger piles kept on-site at somecement plants. Furthermore, there appears to be nothing unique about the environmentalsetting at the site that leads EPA to believe that the threat of releases from this small pile atFarmland is any greater than those evaluated for cement plants themselves.
Based on this case-study example, EPA believes that the use of CKD for hazardouswaste stabilization does not pose a significant threat to human health or the environment. When mixed with hazardous waste, CKD is subject to full Subtitle C regulation. In fact,

6-54
27 In October 1991, EPA promulgated expanded criteria in 40 CFR Parts 257 and 258 for solidwaste disposal facilities regulated under Subtitle D of RCRA, including the co-disposal of sewagesludge with household wastes in municipal solid waste landfills (56 FR 50978, October 9, 1991). This rule set forth minimum federal criteria for municipal solid waste landfills like the MiddlesexCounty Landfill, including location restrictions, facility design and operating criteria, ground-watermonitoring requirements, corrective action requirements, financial assurance requirements, andclosure and post-closure care requirements.
solidification with CKD and other similar agents has been designated as the Best DemonstratedAvailable Technology for the disposal of several metal-bearing wastes that exhibit a hazardouswaste characteristic (55 FR 22520; June 1, 1990). Small quantities of CKD are handled andpossibly released into the environment at off-site use locations before the dust is mixed withhazardous waste, but the risks associated with these releases are expected to be minimal. Forthese reasons, the Agency did not perform quantitative risk modeling for hazardous wastestabilization.
6.3.3 Sewage Sludge Treatment and Use
CKD is commonly used in the treatment of sewage sludge that is then used as landfillcover, fertilizer, or soil conditioner. One treatment approach, the N-Viro process, accounts for alarge amount of all of the CKD used in this manner. As discussed in more detail in Chapter 8,the N-Viro process combines CKD with sewage sludge through a patented reaction to producea "soil-like product."
To evaluate potential risks associated with the use of N-Viro soil, the Agency contactedtwo vendors that have licensed the process: National N-Viro Energy Systems in Sioux City, IA,and VFL Technology in Malverne, PA. National N-Viro produces and sells N-Viro soil for manyuses (e.g., landfill cover, soil fertilizer). VFL, in contrast, operates a production facility at theMiddlesex County Municipal Landfill in Middlesex, NJ for the exclusive purpose of producinglandfill cover. The VFL plant has an N-Viro soil production capacity of 120 dry tons per day, 7days per week. In evaluating risk potential, the Agency focused on the use of N-Viro soil as alandfill cover. Use as a soil fertilizer or conditioner is expected to pose similar, if not smaller,risks than the direct application of CKD as a liming agent (evaluated in Section 6.3.6).
The potential for contamination and adverse effects through the ground-water, surfacewater, and air pathways appears minor when CKD is combined with municipal sludge and usedas a landfill cover. At the Middlesex landfill, for example, the landfill itself must meet basicdesign and operating standards for Subtitle D municipal landfills, including standards designedto limit the seepage of constituents through the landfill base.27 Ground-water monitoring also isconducted, and according to VFL personnel, no ground-water contamination has been detectedsince the plant began operation in 1991. The Middlesex landfill also is equipped with bermsand dikes to limit stormwater run-on/run-off and subsequent contamination of surface water. The greatest potential for air releases exists during transport of the raw dust to the N-Virofacility. VFL, however, reportedly transports the dust in covered trucks and transfers it directlyinto the plant via enclosed pipelines. Once CKD is combined with wet sludge, the dust particlesare bound to the mixture and are prevented from being suspended in the air. When dried, thepotential for airborne releases from the N-Viro product is limited because the fines are bound inlarge soil-like clumps.
Although there is some potential for the highly alkaline nature of CKD leachate tomobilize certain trace metals that exist in sewage sludge, this threat appears substantiallylimited by physical processes and existing regulatory and administrative controls. When addedto sewage sludge, CKD raises the pH and chemically binds most heavy metals in the sludge. For example, barium, beryllium, cadmium, copper, mercury, nickel, lead, thallium, and zinc tendto be more immobile in ground water under high pH conditions than under low or neutral pHconditions; the reverse tends to be true only for arsenic, hexavalent chromium, antimony,

6-55
28 Based on soil-water partition coefficients (Kd's) in EPA's Corrective Action chemicaldatabase.
29 Portland Cement Association, 1992. An Analysis of Selected Trace Metals in Cement andKiln Dust. Skokie, IL.
30 Kriech, Anthony J., Leachability of Asphalt and Concrete Pavements, Heritage ResearchGroup,March 1992.
molybdenum, and selenium.28 In addition, EPA recently promulgated technical and permittingregulations that apply to sewage sludge beneficial use and disposal practices (40 CFR Part503). Thus, fertilizers and soil amendments derived from CKD-sewage sludge mixtures poseminimal risk because these final products are required to be tested to assure they comply withall provisions of 40 CFR 503, which are fully protective of human health and the environment. N-Viro routinely analyzes their sewage sludge to assure compliance with concentration limitsestablished in this "clean sludge" rule for arsenic, cadmium, chromium, copper, lead,molybdenum, mercury, nickel, selenium, and zinc. According to N-Viro personnel, this testinghas not detected any exceedances of the clean sludge levels since the facility opened in 1991.
Based on this review, mixing CKD with sewage sludge for use as a municipal landfillcover does not appear to pose a threat to human health or the environment, and the Agency didnot undertake more detailed risk analysis through modeling.
6.3.4 Building Materials Addition
To evaluate potential hazards of adding CKD to building materials, EPA contacted U.S.Ash, Inc. in Roanoke, VA, which purchased approximately 43 percent of all of the dust used forthis purpose in 1990. U.S. Ash uses CKD to replace cement in general use concrete. Thirtypercent of the cement is replaced with CKD and fly ash in equal proportions (i.e., 15 percent ofthe cementitious product from U.S. Ash is CKD). U.S. Ash does not purchase dust from kilnsthat burn hazardous waste. The dust is added in dry form to the cement, which is sold to manydifferent customers and used in many different applications.
The possible scenarios for using CKD-containing cement are as numerous and diverseas those that exist for normal cement, and can include its use as water distribution pipelines andstructural members of buildings and bridges. Therefore, it is difficult to generalize aboutpotential exposure scenarios associated with this category of use.
One generalization that may be possible, however, is that dust or leachate from CKD-containing cement is unlikely to be significantly different in composition than that from normalcement. This is based partly on the fact that CKD is mixed with cement in only smallproportions. Side-by-side leach test data for trace metals published by PCA also suggest thatthe composition of leachate from cement and CKD are similar.29 Although these PCA dataindicate that the concentrations of relatively volatile metals (mercury, selenium, thallium,cadmium, and lead) may be 13 to 40 times higher in CKD leachate than cement leachate, TCLPtests of both materials yielded metal concentrations that were non-detectable and/or below TCregulatory levels in virtually all cases. Perhaps more relevant results are provided by anindependent study30 that found that metals concentrations in leachate from concrete productswere below detectable limits for all metals tested with the exception of chromium, which wasmeasured at 72 ppb, well below the chromium MCL and TC regulatory level. These resultsindicate that metals, once bound into the cementitious matrix, are unlikely to leach from cementin appreciable quantities and probably do not pose a risk via waterborne pathways.
Similarly, once CKD is locked into concrete, the potential for airborne releases appearslow. A potential for air releases does exist during materials handling prior to forming of theconcrete, analogous to those observed at the cement production facilities. A potential forfugitive dusting from concrete also exists during use and when the concrete is cut apart or

6-56
31 That is, finely divided siliceous or siliceous and aluminous material that reacts chemicallywith slaked lime at ordinary temperature and in the presence of moisture to form a strong, slow-hardening cement.
32 Kriech, Anthony J., Evaluation of Hot Mix Asphalt for Leachability, Heritage ResearchGroup,October 1992.
broken up, either in construction or demolition projects. Such releases, however, would betemporary and the amount of dust emitted to the air is likely to be small compared to thatemitted from the large, uncovered CKD piles at cement plants.
For these reasons, EPA believes that the use of CKD as an additive in building materialsis not likely to result in significant incremental releases of contaminants to the environment. Additional modeling to quantify risks from this type of use was not conducted.
6.3.5 Road Construction
General evaluation of risk factors suggests that use of CKD in road construction couldpresent a potential threat greater than the other uses discussed above. To evaluate this threatin greater detail, the Agency performed quantitative modeling of a road construction scenario.
Analysis of Risk Factors
NewLime in upstate New York distributed almost 8,200 metric tons (9,000 short tons) ofthe CKD used in road construction, or approximately 76 percent of all CKD used for thispurpose in 1990. Based on telephone interviews with NewLime personnel, CKD can be used inthree different ways for road construction: as a road sub-base, mixed with asphalt that is usedfor the road surface, and in the construction of unpaved roads and parking lots. The potentialfor releases into the environment varies with these different types of uses.
The potential for releases appears small when the dust is used as a road sub-base. Inthese situations, the dust is usually mixed with gravel and fly ash. Because CKD and fly ash arepozzolanic,31 the sub-base sets up to form a solid layer that binds the CKD constituents inplace. Leaching and migration from the sub-base also is expected to be limited by little to nodirect contact with water, as the sub-base is overlain by relatively impermeable asphalt orconcrete. The primary occasions when water may flow under the road and leach CKDcontaminants are likely to be associated with freeze/thaw conditions. In addition, there appearsto be little potential for windblown dusting, except during the actual application of CKD as a sub-base and the brief period that it is uncovered.
When used as an additive to asphalt, dust in the asphalt could be submerged duringrainfall. In principle, CKD constituents could leach from the asphalt mixture and migrate toground water or flow overland to surface waters. However, a study by the Heritage ResearchGroup32 shows that metals normally present in asphalt do not tend to leach in appreciableconcentrations during TCLP tests. For almost every metal tested, concentrations in asphaltleachate were below detectable limits. The only exception was chromium, which was detectedin asphalt leachate at a level of 0.10 ppm, 50 times below its TC regulatory level. It is notknown how CKD affects the leachability of asphalt, if at all. However, the generally lowconcentrations of chemicals observed in CKD leach tests and the relatively small proportion(five percent or less) of CKD that is mixed with asphalt suggest that asphalt mixed with CKDwould produce leachates very similar to asphalt by itself. The potential for airborne releaseswhen CKD is used in asphalt also appears low because the dust is locked into a matrix througha pozzolanic (hardening) reaction. The presence of small proportions of CKD is not expected tosignificantly affect the quantity and quality of particulates that are suspended from the asphaltduring road use.

6-57
A greater potential for CKD contaminants to migrate into the environment appears toexist when the dust is mixed with clayey soils to form unpaved roads or parking lots. In thesecases, the dust may be applied in an indiscriminate manner that is not designed to optimize apozzolanic reaction. Moreover, the dust is not covered by a hardened road surface like asphaltor concrete, and engineered controls are not used to prevent CKD contaminants exposed to theelements from leaching into the subsurface or migrating to any nearby fields or surface watersalong with storm water run-off. CKD also could be blown into the air by the wind, and vehiculartraffic both during and after construction could periodically and temporarily suspend particulatematter into the air. The primary factors that would influence the amount of CKD suspended inthe air include the particle size of the material on the road surface, traffic volumes, the speedsand other characteristics of vehicles (e.g., number of wheels and weights), and rainfall patterns.
Based on this evaluation, there does not appear to be a significant human health orenvironmental risk associated with the use of CKD as either a road sub-base or an additive toasphalt. However, since there appears to be a greater potential for releases of CKDcontaminants and subsequent exposures when the dust is used in the construction of unpavedroads or parking lots, these risks were studied in greater detail through quantitative modeling.
Risk Modeling Results for Unpaved Traffic Surfaces
The Agency employed the same basic modeling methodology for quantifying the risksfrom off-site use of CKD for unpaved roads and parking lots as was used in the on-site analysis(Section 6.2.2). The primary difference relates to the design of the road paving scenario. Because such uses may take place in virtually any location in the U.S., this risk scenario islargely hypothetical and was developed using best professional judgment. Thus, the resultsfrom this analysis should be considered rough indications of the kinds of risks that mightcorrespond to this CKD management approach.
The Agency simulated direct addition of CKD to the other materials (clayey soils andaggregate) used in the construction of an hypothetical off-site parking lot. Because MMSOILSrequires a square source term, it cannot effectively simulate releases from a long thin sourcesuch as would be required to simulate a road. Accordingly, the analysis was limited to the useof CKD in unpaved parking lots. The release modeling for unpaved parking lots consideredthree of the four pathways evaluated in the on-site modeling: ground water, air, and surfacewater. Only one exposure pathway in the foodchain pathway was evaluated: ingestion of fish ina nearby stream.
Based on this modeling, the estimated risks associated with use of CKD as a surface forunpaved parking lots were generally quite low. None of the pathways examined were found tohave cancer risks exceeding the 10-6 risk range or noncancer effects exceeding the thresholddose.
The highest risks were in the foodchain pathway (for ingestion of fish in the nearbystream receiving run-off from the parking lot). The only foodchain pathway effect evaluated forunpaved parking lots corresponds to the ingestion of fish caught recreationally in the nearbystream. The increased individual cancer risk associated with recreational fishing was estimatedto be about 1x10⁻⁷, due to exposures to 2,3,7,8-TCDD. Noncancer effects were about twoorders of magnitude below the effects threshold, with thallium representing the highest intake toreference dose ratio.
The maximum ground-water risks from the unpaved parking lot were estimated at5.3x10-9, which were driven by potassium-40. The noncancer effect was nearly seven orders ofmagnitude below the effect threshold. The low ground-water effects resulted from the lowpermeability of the unpaved surface (resulting in minimal leachate generation) combined withthe relatively low concentrations of the CKD constituents in the leachate generated by theparking lot material.
The increased individual cancer risks through exposure to air emissions were estimatedto be 1.4x10⁻¹¹ to the individual living closest to the parking lot. Noncancer effects werenegligible and could not be quantified. These low air risks reflect the small size of the unpaved

6-58
33 Boynton, Robert S., Chemistry and Technology of Lime and Limestone, Second Edition,John Wiley & Sons, Inc., New York, Chichester, Brisbane, and Toronto.
parking lot, which is unlikely to serve as a large enough source to result in elevated ambientconcentrations of CKD constituents in the air.
The estimated maximum risk resulting from dermal absorption and incidental ingestion ofwater while swimming was 2.4 x 10⁻⁹, and was due primarily to arsenic. Noncancer effects wereestimated to be about five orders of magnitude below the health effects threshold.
6.3.6 Agricultural Liming
Because of the potential for bioaccumulation and the direct ingestion of contaminatedfood products, CKD used as a liming agent appears, on first evaluation, to pose more of apotential risk than any other CKD use. To further explore this risk potential, EPA performedquantitative modeling of an agricultural liming scenario.
Analysis of Risk Factors
Like agricultural lime, CKD is alkaline and contains a number of essential plant nutrients. According to the 1991 PCA Survey and the RCRA §3007 responses, approximately 53,000metric tons (58,000 tons) of dust were sold or given away in 1990 for liming from five cementplants (one plant each in New York, Pennsylvania, and Kansas, and two in Idaho). To evaluatethis application, the Agency contacted the NewLime Company in upstate New York. NewLimedistributes dust to over 1,600 farmers and accounted for approximately 46 percent of the totaldust used for liming in 1990.
NewLime is the exclusive CKD agent for Blue Circle Cement in Ravena, NY. The dust istransported from Blue Circle to storage silos at NewLime via enclosed trucks. CKD in storage atNewLime is subsequently transported from the silos to specific points of application via bulktanker trucks. The dust is not modified in any way prior to application. The typical point ofapplication is a 41-hectare (100-acre) farm that grows alfalfa, corn, and soybeans for livestockfeed. Alfalfa and corn account for about 90 percent of the crop output. Approximately half ofthe CKD from NewLime is applied in New York.
Liming may occur during any season of the year with the majority occurring in the fall. Once the dust arrives at a farm, it is placed in spreader boxes of spreader trucks. These boxescommonly hold up to 11 metric tons of CKD and measure approximately 10 meters (33 feet) inwidth. Two and a half centimeter (1-inch) diameter holes on the bottom of the spreader boxesare spaced every 10 centimeters, which enables CKD to be applied evenly to the fields. CKD isapplied in four steps. The farmer first disks the soil and harrows the ground; CKD is thenspread; the soil is disked again; and the farmer plows a final time. CKD is usually tilled to adepth of 15 to 20 centimeters. Typically, 4.5 metric tons of CKD are spread per hectare withCKD application occurring once every three to five years. This is the same as the applicationrate for regular lime.
A paucity of available data on the composition of agricultural lime prevents a completecomparison of CKD and lime in terms of trace contaminant concentrations. However, apreliminary analysis suggests that, compared to CKD, agricultural lime can contain higher totalsconcentrations of some constituents (such as barium), about equal concentrations of someconstituents (such as chromium), and lower concentrations of other constituents (including lead,nickel, silver, vanadium, and copper).33 Agricultural lime would not be expected to containdioxins because it is simply crushed limestone, and not, like CKD, manufactured in acombustion process along with chlorine precursors that might yield dioxins.
The potential for ground-water contamination from liming is a function of the amount ofCKD applied, dust leachability, and the particular environmental conditions that exist at a farm(e.g., rainfall and recharge rates, soil chemistry and permeability, and depth to ground water).

6-59
As noted above, the dust is applied infrequently in small amounts, just like regular lime. Nodata are available, however, to compare contaminant concentrations in leachate from regularlime to those measured in CKD leachate extracts. The environmental conditions where theCKD is applied may vary widely because CKD liming takes place not only throughout upstateNew York, but also in a few other locations in the United States. At some sites, theseconditions may be conducive to ground-water contamination, such as when net recharge ratesare high, soils are permeable, and ground water is shallow. Furthermore, because groundwater in rural areas around farms is often used for drinking and other purposes, any ground-water contamination associated with the use of CKD as a liming agent may have the potential toresult in human exposures.
Similarly, there is a potential for this use of CKD to result in surface water contamination. The only measures that may exist to prevent CKD contaminants from migrating into surfacewaters are likely to be occasional irrigation ditches and agricultural management techniquesdesigned to preserve topsoil, such as terracing. Vegetation may slow run-off to surface watersduring the growing season, but when CKD is applied initially, little or no vegetation exists. Evenduring the growing season, much bare soil is exposed to the elements in fields with row crops. Factors such as CKD application rates, CKD properties (e.g., chemical composition andleachability), annual rainfall, the slope of the land, the nature of on-site soils, the extent of cropcover, and the distance to surface waters will all contribute to the potential for surface watercontamination.
In general, when properly handled, the potential for release to air when CKD is used asa liming agent appears smaller than the potential for release to ground water and surface water. In the specific example of NewLime, the dust is covered and contained during all phases ofstorage and transport prior to the time it is applied to a field. In particular, CKD is transported inenclosed trucks to the NewLime storage facility, where it is then stored in enclosed silos. Thedust is then transported from NewLime to individual farms in enclosed tanker trucks where it isplaced in enclosed spreader boxes. The dust is dropped only centimeters above the groundand quickly tilled into the soil; it is not broadcast in the air and then allowed to settle onto theground. In the Agency's telephone interview, NewLime personnel indicated that little dustbecomes airborne even on windy days.
The greatest potential for contaminant exposures resulting from the use of CKD as aliming agent is through the foodchain. Crops cultivated in fields limed with CKD by NewLimeare used as feed for livestock. CKD constituents, therefore, may be ingested directly by animalsand concentrated in food products (milk, meat) that are ingested by humans.
Risk Modeling Results for Liming
The Agency conducted a quantitative analysis to estimate the potential magnitude ofrisks resulting from the agricultural use of CKD. As in the unpaved road analysis, the modelingmethodology for the agricultural applications of CKD was based largely on the approach used inanalyzing on-site risks. The primary differences concern the focus on the two foodchainexposure pathways relevant to agricultural applications: vegetables, and beef and milk. Because the CKD is assumed to be tilled directly into the soil, this analysis did not quantifypotential impacts to surface water, air, or fish ingestion, as it is assumed that these resultswould be significantly lower than risks from the ingestion of agricultural products. Anotherdifference from the on-site modeling analysis included the simulation of three basic riskscenarios: best estimate, high end, and upper bound. The best estimate analysis assumed thebest estimate CKD application rate and CKD concentrations representing CDD/CDF valuesfrom a facility that has been documented as selling CKD for use as a liming agent, and 50thpercentile values for the metals and radionuclides from the Agency's database on CKDconcentrations. The high end analysis used a high end CKD application rate and CKDconcentrations corresponding to the highest risk potential wastestream from the five baselinefacilities. Finally, the upper bound value used the high end application rate, and CKDconcentrations from the facility with the highest measured CDD/CDF concentrations from theAgency's sampling and analysis program.

6-60
The Agency simulated direct incorporation of CKD on a hypothetical agricultural fieldassumed to grow corn or alfalfa for use as cattle feed. The field used in the simulationrepresented a typical 41-hectare (100-acre) field. The analysis employed an assumed CKDloading rate of 4.5 metric tons per hectare (2 tons per acre) every four years in the best estimateand the same loading every two years in the high end and upper bound analyses.
The best estimate results for the liming agent analysis showed the following for the threefoodchain exposure scenarios examined. The highest best estimate risks were in thesubsistence farmer scenario, reaching a maximum cancer risk of 7x10⁻⁶ for arsenic, with thenext highest risk resulting from beryllium exposures (at 4.7x10⁻⁷). Ingestion of vegetables (non-subsistence) resulted in a risk of 8.4x10⁻⁷ for arsenic, while the ingestion of beef and milkresulted in a risk of 1.1x10⁻⁷.
The high end results (more frequent every two year application of CKD with higherconstituent concentrations) exceeded those in the best estimate by one to two orders ofmagnitude. The subsistence farming scenario had the highest total cancer risks of 2.5x10⁻⁵,resulting equally from exposures to arsenic and 2,3,7,8-TCDD equivalents. The risks foringestion of vegetables were 1.7x10⁻⁶ (due to arsenic), while the risks from beef and milkingestion were 1x10⁻⁶ due to 2,3,7,8-TCDD equivalents and arsenic.
The upper bound scenario simulated the tilling of CKD with EPA's highest measuredCDD/CDF concentrations in the field. This scenario produced the highest risk estimates, with amaximum risk of 2.1x10⁻⁴ for the subsistence farming scenario (due primarily to 2,3,7,8-TCDDequivalents), a cancer risk of 1.7x10⁻⁵ for beef and milk ingestion (dominated by 2,3,7,8-TCDD),and a cancer risk of 1.1x10⁻⁵ for the ingestion of vegetables (resulting from 2,3,7,8-TCDD,arsenic, and beryllium).
None of the noncarcinogens exceeded the effects threshold in the liming agent analysis,although several constituents resulted in hazards within one order of magnitude of the threshold(i.e., a hazard ratio between 0.1 and 1.0): antimony (high end subsistence farming only),cadmium (all subsistence farming scenarios and high end vegetables), and thallium(subsistence farming and beef and milk ingestion).
6.3.7 Summary of Risks from Off-site Beneficial Uses
By far, the most common off-site use of CKD is for waste stabilization, both forhazardous and non-hazardous waste prior to disposal and non-hazardous waste (municipalsewage sludge) prior to beneficial use. Based on an evaluation of the conditions that exist atsample off-site locations where CKD is used, EPA believes that these uses do not pose asignificant threat to human health or the environment. Hazardous waste stabilization presents alow risk because CKD mixed with hazardous waste is subject to full Subtitle C regulation,including requirements for disposal in lined units to prevent ground-water contamination,appropriate run-on and run-off controls to prevent surface water contamination, and capping oflandfills upon closure to prevent air releases. Releases to various media are further minimizedbecause CKD is generally mixed with sludges to form a stabilized solid that is less susceptibleto dispersion (e.g., via wind erosion) than CKD by itself. For non-hazardous waste stabilization,the risks are also expected to be small because at least half of the CKD used in this manner in1990 was used in the N-Viro process, which combines CKD with sewage sludge. Similar toSubtitle C regulations for hazardous wastes, sewage sludge disposal is controlled by recentlypromulgated permitting regulations (40 CFR Part 503). These regulations set forthconcentration limits for metals in sludge before disposal. Compliance monitoring of stabilizedsludge at a sample off-site use location indicates that no exceedances of clean sludge levelshave occurred.
Three other off-site uses — road sub-base, additive to asphalt, and materials addition —also do not pose significant risks. When used for these purposes, CKD is mixed with othermaterials, such as asphalt or cement, to form a solid matrix. In this form, it is unlikely that theCKD will contaminate environmental media because: (1) the CKD makes up only a smallfraction of the total solid matrix (e.g., less than five percent in the case of asphalt mixtures); and

6-61
(2) the solid matrix is generally not susceptible to significant releases to ground water, surfacewater, or air.
Preliminary evaluation identified two types of uses that could have a greater potential topose risk to human health and the environment: agricultural liming and construction of unpavedroads and parking lots. The primary risk conclusions for these off-site uses are as follows:
C For agricultural liming, releases to ground water and surface water are possibledue to leaching and surface run-off. Air releases are not expected to besignificant because the dust is covered and contained at all times duringtransport and delivery, dropped only centimeters from the ground duringapplication, and is quickly tilled below the surface. EPA's modeling predictedpotential risks via the foodchain pathway for this practice for ingestion ofvegetables from the field, beef and milk raised on feed from the field, and mostsignificantly, for a farmer subsisting on both vegetables, beef, and milk raisedfrom the field. The best estimate cancer risks reached a maximum of 7x10⁻⁶,while the maximum high end risks were 2.5x10⁻⁵. In the bounding analysis, thesubsistence farming scenario showed the greatest risk potential with a riskestimate of 2.1x10⁻⁴.
C For use in unpaved roads and parking lots, releases to ground water, surfacewater, and air could occur because the CKD is not fixed in a solid matrix, but isslightly compacted, exposed to the elements, and disturbed by vehicular traffic. However, the Agency's modeling predicted very low risks (less than 5x10⁻⁹) forthe ground-water, air, and surface water pathways, and only 1x10⁻⁷ for the worst-case scenario of fish ingestion in the adjacent surface water body. Noncancerrisks were found to be below the combined effects threshold for all pathwaysevaluated.


![An ecological systems approach to examining risk factors ...Potential risk factors Potential risk factors were chosen based on prior evidence,[10, 16-19] including previous research](https://img.dokumen.tips/doc/110x75/5ecfc103cd3f2311532c3036/an-ecological-systems-approach-to-examining-risk-factors-potential-risk-factors.jpg)