Embed Size (px)
Citation preview

R E P O R T TO CONGRESS
ON THE
NATIONAL DAIRY P R O M O T I O N AND R E S E A R C H P R O G R A M
AND THE
NATIONAL FLUID M I L K P R O C E S S O R P R O M O T I O N P R O G R A M
JULY 1, 2002

To obtain additional copies of the 2002 Report to Congress and the complete independent analysis of theprograms, please contact:
Promotion and Research BranchDairy Programs, Agricultural Marketing Service, USDAStop 0233, Room 2958-South1400 Independence Avenue, SWWashington, DC 20250-0233(202) 720-6909Internet site: http://www.ams.usda.gov/dairy/dairyrp.htm
To obtain copies of or for questions on the complete independent analysis report of the programs, pleasecontact:
Harry M. Kaiser, Ph.D.Cornell Commodity Promotion Research ProgramDepartment of Agricultural, Resource, and Managerial EconomicsCornell University349 Warren HallIthaca, NY 14853(607) 255-1620E-mail address: [email protected]
To obtain copies of or for questions on the Fluid Milk Market and Promotion Assessment by BeverageMarketing Corporation of New York, please contact:
Gary Hemphill850 Third Avenue, 14th FloorNew York, NY 10022(212) 688-7640
For additional information about the National Dairy Promotion and Research Board and DairyManagement Inc., please contact:
National Dairy Promotion and Research BoardDairy Management Inc.10255 West Higgins Road, Suite 900Rosemont, IL 60018-5616(847) 803-2000Internet site: http://www.dairyinfo.com
For additional information about the National Fluid Milk Processor Promotion Board, please contact:
National Fluid Milk Processor Promotion BoardMilkPEP1250 H Street, NW, Suite 950Washington, DC 20005(202) 737-0153Internet site: http://www.whymilk.com
The U.S. Department of Agriculture (USDA) prohibits discrimination in all of its programs and activities on the basis of race, color, national origin,gender, religion, age, disability, political beliefs, sexual orientation, and marital or familial status. (Not all prohibited bases apply to all programs.) Persons with disabilities who require alternative means for communication of program information (Braille, large print, audiotape, etc.) should contactthe USDA’s Target Center at (202) 720-2600. (voice and TDD).
To file a complaint of discrimination, write USDA Director, Office of Civil Rights, USDA, Room 326W, Whitten Building, 14th and Independence Avenue,SW, Washington, DC 20250-9410 or call (202) 720-5964 (voice or TDD). USDA is an equal opportunity provider and employer.
Report printed on recycled paper using vegetable-based ink.

TABLE OF CONTENTS Page
I N T R O D U C ~ O N . . . . . . . . . . . . . . . . . . . . . . . . . . . . . . . . . . . . . . . . . . . . . . . . . . . . . 5
Chapter 1 T H E D A I R Y P R O M O T I O N P R O G R A M S . . . . . . . . . . . . . . . . . . . . . . . . . . . . . . . . . 8
N A T I O N A L D A I R Y P R O M O T I O N A N D R E S E A R C H B O A R D . . . . . . . . . . . . . . . . . 8 Cheese . . . . . . . . . . . . . . . . . . . . . . . . . . . . . . . . . . . . . . . . . . . . . . . . . . . . . . . . . . . . . . 10 Communica t ions and Techno logy . . . . . . . . . . . . . . . . . . . . . . . . . . . . . . . . . . . . . . . . . 12
Expor t and Dry Ingredients . . . . . . . . . . . . . . . . . . . . . . . . . . . . . . . . . . . . . . . . . . . . . . 14 Research . . . . . . . . . . . . . . . . . . . . . . . . . . . . . . . . . . . . . . . . . . . . . . . . . . . . . . . . . . . . 16 Fluid Mi lk . . . . . . . . . . . . . . . . . . . . . . . . . . . . . . . . . . . . . . . . . . . . . . . . . . . . . . . . . . . 17
Q U A L I F I E D S T A T E OR R E G I O N A L D A I R Y P R O D U C T P R O M O T I O N , R E S E A R C H , O R N U T R I T I O N E D U C A T I O N P R O G R A M S . . . . . . . . . . . . . . . . . . . 18
N A T I O N A L F L U I D M I L K P R O C E S S O R P R O M O T I O N B O A R D . . . . . . . . . . . . . . 20 Medica l and Scientif ic . . . . . . . . . . . . . . . . . . . . . . . . . . . . . . . . . . . . . . . . . . . . . . . . . . 21
N A T I O N A L I N T E G R A T E D F L U I D M I L K P R O G R A M Sponsorships . . . . . . . . . . . . . . . . . . . . . . . . . . . . . . . . . . . . . . . . . . . . . . . . . . . . . . . . . . 22
Adver t i s ing . . . . . . . . . . . . . . . . . . . . . . . . . . . . . . . . . . . . . . . . . . . . . . . . . . . . . . . . . . 23 Promot ions . . . . . . . . . . . . . . . . . . . . . . . . . . . . . . . . . . . . . . . . . . . . . . . . . . . . . . . . . . . 25 Public Relat ions . . . . . . . . . . . . . . . . . . . . . . . . . . . . . . . . . . . . . . . . . . . . . . . . . . . . . . . 27 Strategic Thinking . . . . . . . . . . . . . . . . . . . . . . . . . . . . . . . . . . . . . . . . . . . . . . . . . . . . . 28 School Market ing . . . . . . . . . . . . . . . . . . . . . . . . . . . . . . . . . . . . . . . . . . . . . . . . . . . . . . 29 Other Research . . . . . . . . . . . . . . . . . . . . . . . . . . . . . . . . . . . . . . . . . . . . . . . . . . . . . . . 30
Chapter 2 U N I T E D S T A T E S D E P A R T M E N T O F A G R I C U L T U R E . . . . . . . . . . . . . . . . . . . 31
N A T I O N A L D A I R Y P R O M O T I O N A N D R E S E A R C H B O A R D O V E R S I G H T . . . . 31 Nomina t ions and Appointments . . . . . . . . . . . . . . . . . . . . . . . . . . . . . . . . . . . . . . . . . . 31 Fore ign Agricul tural Service . . . . . . . . . . . . . . . . . . . . . . . . . . . . . . . . . . . . . . . . . . . . . 32 Contracts . . . . . . . . . . . . . . . . . . . . . . . . . . . . . . . . . . . . . . . . . . . . . . . . . . . . . . . . . . . . 32 Contractor Audi ts . . . . . . . . . . . . . . . . . . . . . . . . . . . . . . . . . . . . . . . . . . . . . . . . . . . . . 32 Collect ions . . . . . . . . . . . . . . . . . . . . . . . . . . . . . . . . . . . . . . . . . . . . . . . . . . . . . . . . . . . 33 Compl iance . . . . . . . . . . . . . . . . . . . . . . . . . . . . . . . . . . . . . . . . . . . . . . . . . . . . . . . . . . 33 Qual i f ied Programs . . . . . . . . . . . . . . . . . . . . . . . . . . . . . . . . . . . . . . . . . . . . . . . . . . . . 33
N A T I O N A L F L U I D M I L K P R O C E S S O R P R O M O T I O N B O A R D O V E R S I G H T . . 34 Nomina t ions and Appointments . . . . . . . . . . . . . . . . . . . . . . . . . . . . . . . . . . . . . . . . . . . . 34 P rogram D e v e l o p m e n t . . . . . . . . . . . . . . . . . . . . . . . . . . . . . . . . . . . . . . . . . . . . . . . . . . 34 Contractor Audits . . . . . . . . . . . . . . . . . . . . . . . . . . . . . . . . . . . . . . . . . . . . . . . . . . . . . 34
Compl iance . . . . . . . . . . . . . . . . . . . . . . . . . . . . . . . . . . . . . . . . . . . . . . . . . . . . . . . . . . 35
Chapter 3 I M P A C T O F G E N E R I C F L U I D M I L K A N D D A I R Y A D V E R T I S I N G O N D A I R Y M A R K E T S : A N I N D E P E N D E N T A N A L Y S I S . . . . . . . . . . . . . . . . . . . . . . . . . . . 36
Highl ights . . . . . . . . . . . . . . . . . . . . . . . . . . . . . . . . . . . . . . . . . . . . . . . . . . . . . . . . . . . 37 Factors Affec t ing the Demand for Fluid Mi lk and Cheese . . . . . . . . . . . . . . . . . . . . . . 38 Factors Affec t ing Gener ic Adver t i s ing Effec t iveness . . . . . . . . . . . . . . . . . . . . . . . . . . . 41 Impact o f the Dairy and Fluid Mi lk Adver t i s ing Programs . . . . . . . . . . . . . . . . . . . . . . 44 Benef i t -Cos t o f Adver t i s ing by the Dairy P r o g r a m . . . . . . . . . . . . . . . . . . . . . . . . . . . . 45 Figures and Tables . . . . . . . . . . . . . . . . . . . . . . . . . . . . . . . . . . . . . . . . . . . . . . . . . . . . . 47

Chapter 4 FLUID M I L K M A R K E T AND PROMOTION ASSESSMENT . . . . . . . . . . . . . . . . 55
BMC's Assessment of Current Milk Industry Environment . . . . . . . . . . . . . . . . . . . . . . 55 BMC's Assessment of Current Milk Marketing Programs . . . . . . . . . . . . . . . . . . . . . . . 62
Appendix A National Dairy Promotion and Research Board A-1 Current Member Listing . . . . . . . . . . . . . . . . . . . . . . . . . . . . . . . . . . . . . . . . . . . . 69
National Fluid Milk Processor Promotion Board A-2 Current Member Listing . . . . . . . . . . . . . . . . . . . . . . . . . . . . . . . . . . . . . . . . . . . . 71
Appendix B B-1 Regions of the National Dairy Promotion and Research Board . . . . . . . . . . . . . . 73 B-2 Regions of the National Fluid Milk Processor Promotion Board . . . . . . . . . . . . . 74
Appendix C C-1 National Dairy Board Actual Income and Expenses, Fiscal Years '99-2001 . . . . 75 C-2 USDA Oversight Costs for the National Dairy Board, Fiscal Years '97-2001 . . . 76 C-3 National Dairy Board Approved Budgets, Fiscal Years 2000-2002 . . . . . . . . . . . 77 C-4 National Fluid Milk Board Actual Income and Expenses '97-2001 . . . . . . . . . . . 78 C-5 USDA Oversight Costs for the National Fluid Milk Board '97-2001 . . . . . . . . . . 79 C-6 National Fluid Milk Board Approved Budgets, Fiscal Years '98-2002 . . . . . . . . 80
Appendix D Financial Audits D-1 National Dairy Promotion and Research Board . . . . . . . . . . . . . . . . . . . . . . . . . . 81 D-2 National Fluid Milk Processor Promotion Board . . . . . . . . . . . . . . . . . . . . . . . . . 92
Appendix E E-1 National Dairy Board and Dairy Management Inc. Contracts Reviewed by USDA, 2001 . . . . . . . . . . . . . . . . . . . . . . . . . . . . . . . . . 110
E-2 National Fluid Milk Processor Promotion Board and International Dairy Foods Association Contracts Reviewed by USDA, 2001 . . 114
Appendix F National Dairy Board Dairy Foods and Nutrition Research Programs F-1 Nutrition and Health Research Institutes and Dairy Foods Research Cen te r s . . . 115 F-2 Dairy Foods Competitive Research Activities During 2001 . . . . . . . . . . . . . . . . 116 F-3 Nutrition Competitive Research Activities During 2001 . . . . . . . . . . . . . . . . . . 118
Appendix G Qualified State or Regional Dairy Product Promotion, Research, or Nutrition Education Programs, 2001 . . . . . . . . . . . . . . . . . . . . . . . . . . . . . . . . . . . . . . . . . . . . . . 121

USDA REPORT TO CONGRESS
ON THE DAIRY PROMOTION PROGRAMS
2002
INTRODUCTION
The enabling legislation of both the producer and processor dairy promotion programs (7 U.S.C. 4514 and
7 U.S.C. 6407) requires the U.S. Department of Agriculture (USDA) to submit an annual report to the House
Committee on Agriculture and the Senate Committee on Agriculture, Nutrition, and Forestry by July I. The
producer and processor programs are conducted under the Dairy Promotion and Research Order (Dairy Order)
(7 CFR 1150) and the Fluid Milk Promotion Order (Fluid Milk Order) (7 CFR 1160), respectively. This report
includes a description of activities for both the producer and processor programs and summarizes activities of their
national integrated fluid milk program. An accounting of funds collected and spent, an independent analysis of the
effectiveness of the advertising campaigns of the two programs, and an industry commissioned review of fluid milk
markets and program operations are included. This report addresses program activities for the fiscal period
January 1- December 31, 2001, of the Dairy Promotion Program and the Fluid Milk Processor Promotion Program,
unless otherwise noted.
PRODUCER DAIRY PROMOTION PROGRAM
The Dairy Production Stabilization Act of 1983 (Dairy Act) (7 U.S.C. 4501 et seq.) authorized a national
producer program for dairy product promotion, research, and nutrition education as part of a comprehensive
strategy to increase human consumption of milk and dairy products. Dairy farmers fund this self-help
program through a mandatory 15-cent per hundredweight assessment on all milk produced in the
contiguous 48 States and marketed commercially. Dairy farmers administer the national program through
the National Dairy Promotion and Research Board (Dairy Board). The Dairy Act provides that dairy
farmers can direct up to 10 cents per hundredweight of the assessment for contributions to qualified State or
regional dairy product promotion, research, or nutrition education programs (Qualified Programs).
The Dairy Order became effective on May 1, 1984. The Dairy Act required the Secretary of Agriculture to
conduct a referendum among dairy farmers by September 30, 1985, to determine i fa majority favored
continuation of the program. Nearly 90 percent of the dairy farmers voting in the August-September 1985
referendum favored continuing the program. USDA held a second referendum on the dairy promotion
program in August 1993. Approximately 71 percent of the dairy farmers who voted in the referendum
favored continuing the program. USDA will hold furore referenda at the direction of the Secretary or upon
the request of at least 10 percent of the affected dairy farmers.

The Dairy Board portion of the revenue from the 15-cent per hundredweight producer assessment was
$83.6 million for 2001. Qualified Programs revenue from the producer assessment was $170 million for
2001. Revenue from assessments for the Dairy Board and many of the Qualified Programs is integrated
through a joint process of planning and program implementation so that the programs on the national,
regional, State, and local level work together.
FLUID MILK PROCESSOR PROMOTION PROGRAM
The Fluid Milk Promotion Act of 1990 (Fluid Milk Act) (7 U.S.C. 6401 et seq.) authorized the
establishment of a national processor program for fluid milk promotion and education. The Fluid Milk
Order became effective December 10, 1993. The Secretary appointed the initial National Fluid Milk
Processor Promotion Board (Fluid Milk Board) on June 6, 1994.
Processors administer this program through the Fluid Milk Board. Processors marketing more than
3,000,000 pounds of fluid milk per month, excluding those fluid milk products delivered to the residence of
a consumer, fund this program through a 20-cent per hundredweight assessment on fluid milk processed
and marketed in consumer-type packages in the contiguous 48 States and the District of Columbia.
The Fluid Milk Board's revenue for the January 1 through December 31, 2001, period was $109 million.
Approximately 69 percent of program expenditures was used for fluid milk advertising, 9 percent for
promotions, and about 9 percent for public relations. The remaining funds were used for research and
general and administrative expenses.
The Fluid Milk Act required the Secretary to conduct a referendum among fluid milk processors to
determine if a majority favored implementing the program. In the October 1993 referendum, 72 percent of
the processors voted to approve the implementation of the fluid milk program. These processors
represented 77 percent of the volume of fluid milk products marketed by all processors during May 1993,
the representative period set for the referendum. USDA held a continuation referendum in February-
March 1996. Of the processors voting in that referendum, nearly 65 percent favored continuation of the
program. These processors represented 71 percent of the volume of fluid milk products marketed by all
processors during September 1995, the representative period set for the referendum. In November 1998,
USDA held a continuation referendum at the request of the Fluid Milk Board. Fluid milk processors voted
to continue a national program for fluid milk promotion established by the Fluid Milk Order. Of the
processors voting in this referendum, 54 percent favored continuation of the order. These processors
represented 86 percent of fluid milk products processed and marketed by fluid milk processors voting in
the referendum. The Fluid Milk Act and Order state that USDA will hold future referenda upon the request
of the Fluid Milk Board, processors representing 10 percent or more of the volume of fluid milk products
marketed by those processors voting in the last referendum, or when called by the Secretary.

NATIONAL INTEGRATED FLUID MILK PROGRAM
Dairy Management Inc. (DMI) - the staffing organization for the Dairy Board - and the Fluid Milk Board
completed the integration of their fluid milk programs in January 1999, and this continued in 2001. The
integration plan has enabled the Fluid Milk Board to fulfill the promotion program coordination
requirements of the Fluid Milk Act. The funding level of the integrated program totaled approximately
$163 million in 2001, with about $67 million from DMI and State and regional organizations and about $96
million from the Fluid Milk Board. The integrated plan, which includes both planning and implementation,
continues to be research-based, message-focused, and jointly managed.
A summary of the national integrated fluid milk program for fiscal year 2001 follows the Fluid Milk Board
section in Chapter 1 of this report.
USDA 0 VERSIGHT AND INDEPENDENT ANAL YSIS
USDA has oversight responsibility for both dairy promotion programs. The oversight objectives ensure
that the Boards and the Qualified Programs properly account for all program funds and that they administer
the programs in accordance with their respective Acts and Orders. USDA also has responsibility for
obtaining an independent evaluation of the programs. The Boards reimburse the Secretary, as required by
the Acts, for USDA's administrative costs of program oversight and for the independent analysis.
Chapter 1 of this Report describes the activities of the Dairy Board, Qualified Programs, and the Fluid Milk
Board. Chapter 2 reviews the oversight activities of USDA. Chapter 3 reports the results of the
independent analysis of the effectiveness of the programs conducted by Cornell University. Chapter 4
presents the industry commissioned fluid milk market and program operations review.

CHAPTER 1
THE DAIRY PROMOTION PROGRAMS
In 2001, the National Dairy Promotion and Research Board (Dairy Board) and the National Fluid Milk Processor
Promotion Board (Fluid Milk Board) continued to develop and implement programs to expand the human
consumption of fluid milk and dairy products. While each promotion program has many unique activities, the two
programs continued the integration of their fluid milk programs for the third year in 2001.
National Dairy Promotion and Research Board
The mission of the Dairy Board is to coordinate a promotion and research program that expands domestic and
foreign markets for fluid milk and dairy products produced in the United States. The Dairy Board is responsible for
administering the Dairy Promotion and Research Order (Dairy Order), developing plans and programs, and
approving budgets. Its dairy farmer board of directors administers these plans and monitors the results of the
programs.
The Secretary of Agriculture (Secretary) appoints 36 dairy farmers to administer the Dairy Order. The Secretary
makes the appointments from nominations submitted by producer organizations, general farm organizations,
qualified State or regional dairy product promotion, research, or nutrition education programs (Qualified Programs),
and by other means as determined by the Secretary (7 CFR 1150.133(a)). Dairy Board members serve 3-year terms
and represent one of 13 regions in the contiguous 48 States. Dairy Board members elect four officers: Chair, Vice-
Chair, Treasurer, and Secretary. Current Dairy Board members are in Appendix A-1. A map of the contiguous 48
States depicting the 13 geographic regions is in Appendix B-1.
Total Dairy Board actual revenue for 2001 was $84 million (includes assessments and interest). This amount was
less than the Dairy Board budget of $84.7 million for that period. The Dairy Board revised budget for 2002 projects
total revenue of $85 million from assessments and interest. The Dairy Board administrative budget continued to be
within the 5-percent-of-revenue limitation required by the Dairy Order. A list of actual income and expenses for
1999-2001 are in Appendix C-1. USDA's oversight and evaluation expenses for 1997-2001 are in Appendix C-2.
Appendix C-3 displays the Dairy Board's approved budgets and a comparison of program funding by function for
2000-2002. An independent auditor's report for 2001 is in Appendix D-1.
The Dairy Board has two standing committees: the Finance and Administration (F&A) Committee and the
Executive Committee. The F&A Committee is made up of the Dairy Board officers and appointees named by the
Dairy Board Chair. The Dairy Board Treasurer is the Chair of the F&A Committee, and the committee elects a
Vice-Chair. The full Dairy Board serves as the Executive Committee. The remaining committees for the Dairy
Board are joint program committees with the United Dairy Industry Association (UDIA).

In March 1994, the Dairy Board approved the creation of Dairy Management Inc. TM (DMI). DMI is a joint
undertaking between the Dairy Board and the LrDIA. UDIA is a federation of 19 of the 62 active Qualified
Programs under the direction of a board of directors. DMI merged the staffs of the Dairy Board and UDIA to
manage the Dairy Board programs as well as those of the American Dairy Association ® and National Dairy Council ®
throughout the contiguous 48 States. DMI is a merger of the two separate program and administrative staffs into a
single staffthat serves both boards and is structured into four support groups. The domestic marketing group
supports advertising, school marketing, nutrition and product research, product publicity, and retail promotion
activities. The industry relations/communications group provides outlets for news about dairy through its media
contacts as well as communication regarding the dairy checkoffprogram to producers and the rest of the dairy
industry. The research, planning, and evaluation group provides analysis of domestic and foreign marketplaces,
program effectiveness, consumption patterns, and consumer perceptions for effective program planning,
implementation, and measurement. The export group serves as a resource for U.S. dairy processors to improve
export capabilities of the U.S. dairy industry.
Since January 1, 1995, the Dairy Board and UDIA have developed their marketing plans and programs through
DMI. DMI facilitates the integration of producer promotion funds through a joint process of planning and program
implementation so that the programs on the national, regional, State, and local level work together. The goals of
DMI are to reduce administrative costs, to have a larger impact on the consumer, and to drive demand thereby
helping to increase human consumption of fluid milk and dairy products.
DMI fimds 1- to 3-year research projects that support marketing efforts. Six Dairy Foods Research Centers and two
Nutrition Institutes provide much of the research. Their locations and the research objectives are listed in Appendix
F-1. Additionally, lists of DMI's dairy foods and nutrition projects are contained in Appendices F-2 and F-3,
respectively. Universities and other industry researchers throughout the U.S. compete for these research contracts.
In 2000, the DMI Board consisted of 12 dairy farmers from the Dairy Board and 12 dairy farmers from the UDIA
Board. An amendment to the articles of incorporation of DMI to expand the DMI Board size took effect
January 1, 2001, and the expanded DMI Board now comprises all Dairy Board and all UDIA Board members.
The committees for program activities are comprised of board members from both the Dairy Board and UDIA
Boards. The Dairy Board and UDIA Board separately must approve the DMI budget and annual plan before they
can be implemented. In October 2000, both boards approved a 2001 unified dairy promotion plan budget and
national implementation programs. The 2001 unified dairy promotion plan was designed to invest dollars where
consumers are - not where dairy cows are. The unified dairy promotion plan was consistently implemented in
demand-building consumer markets nationwide.
During 2001, DMI hosted the second series of dairy director regional planning forums across the country to review
and develop marketing strategies for development of the 2002 untied dairy promotion plan. These forums were
originally designed to create one unified dairy promotion plan and allow opportunity for State and regional dairy
board members to ask questions, raise concerns, and offer their thinking on the direction and development of a

unified dairy promotion plan. At the 2001 forums, dairy directors across the country helped to finalize dairy
promotion's long-term unified marketing plan, which for fluid milk focuses on kids and the mothers of those young
children and for cheese focuses on adult segments called cheese "Cravers" and "Enhancers." Other outcomes from
the 2001 forums included dairy farmer input that (a) emphasized programs with less reliance upon television
advertising; (b) emphasized continuance of successful foodservice and retail activities; (c) highlighted the need for
heavier focus on kids and school milk problems; (d) stressed more focus on industry partnerships; and
(e) emphasized a stronger, more proactive image protection of dairy products. Combined spending for the unified
dairy promotion plan totaled more than $267 million. In addition to fimding from the Dairy Board, the unified dairy
promotion plan leverages resources from State and regional organizations, the Fluid Milk Board, the
U.S. Dairy Export Council, and UDIA. These organizations will turn their attention to developing a new five-year
strategic direction for the unified dairy promotion plan in 2002.
The joint Dairy Board and UDIA Board committee structure provides the framework for DMI program activities.
The Dairy Board and UDIA Board Chairs assign their respective board members to the following joint program
committees: Cheese, Communications and Technology, Export and Dry Ingredients, and Fluid Milk. Each
committee elects a Chair and a Vice-Chair. The joint committees and the DMI staff are responsible for setting
program priorities, planning activities and projects, and evaluating results. Two additional ad-hoc committees added
during 2000 that continued to operate in 2001 were the Joint Industry Partnering Committee and the Joint Evaluation
Committee. The Dairy Board and UDIA Board review and approve all DMI activities. During 2001, the Dairy
Board and UDIA Board met jointly six times.
The following information describes the activities for each program committee during 2001. Appendix E-1 contains
the DMI and Dairy Board contracts for projects reviewed by USDA during 2001.
CHEESE
The DMI umbrella cheese campaign "Ahh, the power of Cheese TM'' continued to promote cheese directly
toward "Cheese Lovers," with an emphasis on cheese "Cravers" and cheese "Enhancers." Cheese
"Cravers" eat cheese primarily as-is directly out of the package or off the block and consume cheese as an
important component of their food consumption routine. Cheese "Enhancers" have equally positive
attitudes toward cheese but their consumption primarily takes the form of cheese as an ingredient in meal
preparation. As in previous years, the DMI cheese television advertising campaign was recognized for
creative excellence, winning numerous awards, including Creative Best Spots for "Disaster," "No Pain, No
Gain," and "Break In" by Adweek Magazine. At the 2001 Chicago International Film Festival, DMI 2000
television executions won the Silver Plaque (Morn), Gold Plaque (Election), and the Gold Hugo Award
(entire cheese campaign) in the Food Products Category. Table 1-1 contains a listing of DMI's 2001
cheese advertising executions.
10

TABLE 1-1 2001 Dairy Management Inc. Cheese Advertising
Television Print Disaster Mighty Mouse No Pain, No Gain Crackers Big Cheese Fishing Break In Holiday Moon Kitchen Santa Peppers*
Chicken & Cheese* Artichoke*
SOURCE: Dairy Management Inc. (*Denotes Trade and Foodservice Print Advertising)
As in previous years, the cheese marketing effort included major retail co-marketing programs implemented
in supermarkets representing more than 60% of U.S. retail grocery sales volume. These accounts included
large national accounts like Kroger, Wal-Mart Supercenters, Safeway, and Albertsons. In these efforts,
DMI provides retailer-customized media (television, radio, or direct mail) and in-store sampling, which are
combined with the retailer's own advertising and merchandising support to drive cheese sales. Research
has consistently shown that these co-marketing programs contribute to increased cheese category volume in
participating stores.
In foodservice, DMI continued to implement trade advertising and public relations campaigns to keep
cheese top-of-mind with restaurant operators. The trade print advertising is listed in Table 1-1. DMI also
worked closely with four of the top five national restaurant chains, including Taco Bell ®, Wendy's ®, and
Pizza Hut ® to drive cheese volume and ensure that cheese was prominently featured in menu items. For
example, DMI staffprovided Taco Bell ® with consumer research and trend data to show the large impact of
cheese in how customers decide which menu option to choose. As a result, Taco Bell ® developed and
launched a new Chicken Quesadilla item, which featured a blend of Cheddar, Pepper Jack, and Mozzarella
cheeses. Taeo Bell ® reports using more than double their usual amount of cheese during the five-week
promotional debut of the Chicken Quesadilla. And, for the third straight year, Wendy's ® restaurant
introduced its popular Cheddar Lovers' Bacon Cheeseburger sandwich. During the four-week promotion
period, Wendy's ® sold more than 12 million sandwiches, each featuring two slices of Cheddar cheese and a
Cheddar sauce. The promotion used nearly 1.7 million pounds of cheese and the chain's cheese use grew
by 15 percent, compared to the same time period a year ago. DMI assisted Wendy's ® with the development
of this cheese-friendly sandwich in 1999.
DMI also executed a comprehensive product publicity program for cheese in 2001 that leveraged the
continued success of the "Ahh, the power of Cheese" advertising campaign. For the sixth consecutive year,
and to kick offNational Grilled Cheese Month in April 2001, DMI parmered with Mr. Food ® and executed
a new program called the "Mr. Food's ® Hometown Grilled Cheese Recipe Contest." The grand-prize
winning recipe - a Spicy Cajun Bayou Grilled Cheese recipe - was prepared on Mr. Food's ® nationally
syndicated television show and reached over 10 million viewers. Other cheese publicity highlights included
"Flights: Changing the Course of Cheese" and "Simply American" programs.
11

"Flights: Changing the Course of Cheese" capitalized on emerging consumer interest in wines by
showcasing flavorful pairings of domestic artisinal cheeses and wine. A large media event was held at a
New York City restaurant with more than 200 cheeses on its menu, featuring 25 domestic artisanal cheeses.
"Simply American" showcased Americans' love for comfort food and highlighted cheese as a versatile,
easy, and delicious ingredient that makes one-dish meals better. The program also used survey results to
generate additional cheese messages and regional media angles supporting the one-dish theme.
Also in 2001, website www.ilovecheese.com was enhanced with several new features aimed at triggering
cheese lovers' craving for cheese. It now includes a "Virtual Cheese Case, "which supplies detailed
information about 35 domestic cow's milk cheeses. Also, an interactive "Cheese Profiler Survey" assists
website visitors in determining which cheeses best fit their lifestyle and suggests meal combinations and
recipes. Website www.ilovecheese.com also promoted the full-page advertorial in Redbook magazine
"Warm up with Cheese!" The advertorial featured a three-cheese dish and tips on making familiar recipes
with cheese. Redbook sponsored a one-dish recipe contest that was announced in the advertorial. The
website is sponsored by the American Dairy Association ®, whose programs are managed by DMI.
DMI's product research activities for cheese during 2001 continued to feature extensive investigations of
manufacturing methodology, ripening, stability and physio-chemical rheology, and functional properties of
cheese. Of note, research through DMI's Extraordinary Dairy program (which is discussed further in the
Export and Dry Ingredient section) led to the development of a comprehensive descriptive sensory language
for Cheddar cheese flavor, which provides the dairy industry with a common language to define and
describe critical cheese characteristics. The language resource is known as the "Cheese Lexicon." It was
generated from the analysis of 220 Cheddar cheeses and 70 other cheeses representing age, fat content, and
geographical regions. The Lexicon can help cheesemakers and cheese users characterize their products and
improve quality issues by measuring and controlling the presence of chemical compounds associated with
flavor defects.
COMMUNICATIONS AND TECHNOLOGY
Consumers receive mixed messages through the media about the nutritional value and benefits of food.
DMI worked to provide consumers with education and information based on sound nutritional science and
communicated the value of dairy products to consumers, as well as to health professionals and educators.
DMI also worked to inform dairy farmers about how their assessment dollars were being used. DMI
continued to communicate to dairy producers and other industry audiences through publications (such as
the annual report, joint newsletters with State and regional dairy promotion groups, and dairy cooperative
check stuffers), dairy industry events (including major trade shows and producer meetings) and media
relations (including press releases, feature placements, and farm broadcast interviews). For the fourth year,
DMI continued its "Dairy Ambassadors" program, which uses a select group of dairy farmers to deliver
consistent messages about the dairy promotion program to dairy producers and other industry audiences.
12

DMI continued its support for butter through cooperation and public relations activities with the American
Butter Institute, including the website w'a~.butterisbest.com, a consumer resource center with current
cooking trends and ideas, butter recipes, and links to other butter-related sites. DMI also co-funded butter
promotion activities with the California Milk Advisory Board in 2001.
DMI's Chair, CEO, and board members participated in meetings with dairy cooperatives, industry
associations, processors, and other groups throughout the country. The Dairy Board and the UDIA House
of Delegates also agreed to continue dairy director regional planning forums in 2002. The 2001 national
dairy director forum, which brought together dairy farmers from all over the country to share ideas and
thoughts about future dairy promotion activities, was successful in solidifying industry support for
continued regional planning forums and a unified marketing plan approach to dairy promotion.
Another activity of the Communications and Technology program was the issues management program.
The objective of this program was to identify, monitor, and manage key issues that may influence
consumer perceptions of dairy products. DMI coordinated its issues management activities with State and
regional dairy promotion groups, as well as other dairy and agricultural groups. DMI worked with these
groups to bring forth sound, science-based information to address consumer issues. Dairy Reputation
Management, an industry-wide effort that interacts with the Issues Management, Industry Relations, and
Dairy Image Programs, continued a proactive program to educate and reinforce the positive attributes of
dairy foods, dairy farmers, and dairy farming practices to consumers.
A new program was designed and initiated in 2001 to enhance existing dairy image and issues management
programs. One important component of the new program included development of an industry-wide crisis
communications and preparedness plan to address a potential animal disease outbreak in the United States.
To support this initiative, DMI conducted research to better understand consumer perceptions and concerns
regarding animal diseases and to assist in the development of key messages that could be used in a national
animal disease crisis situation. A second component included the creation and distribution of a publication
entitled Dairy Dialogue, the purpose of which is to keep people informed about important research and
developments in the dairy industry.
Farmer-fimded nutrition research continues to demonstrate that dairy products are a necessary food
component in the diet of all people throughout the life cycle. Research continues to focus on improving
childhood nutrition and on diseases that may see decreasing occurrences as a result of consuming dairy
foods. Additionally, ongoing nutrition research is validating discoveries about the potential benefits of
dairy food consumption in reducing obesity. There is an emergence of research that promises to bring forth
cutting-edge health breakthroughs in the reduction of obesity and related diseases. Transfer of these
research outcomes has enhanced the image of the healthfulness of dairy foods by many health professional
organizations, which continue to endorse the role of dairy foods in a healthy diet.
13

Farmer-funded product research addresses safety and quality issues, continues to examine new milkfat-
based ingredients, and provides technical support to the marketing of these ingredients.
EXPORT and D R Y INGREDIENTS
DMI's export enhancement program is implemented by the U.S. Dairy Export Council (USDEC). USDEC
receives primary funding from three sources: DMI, USDA's Foreign Agricultural Service (FAS), and
membership dues from dairy cooperatives, processors, exporters, and suppliers. In 2001, USDEC received
$6.1 million from DMI; $2.1 million from USDA's Foreign Market Access Program and the Market
Promotion Program that support commodity groups in promotion of their commodities in foreign markets;
and $630 thousand from membership dues. USDEC began its sixth year of operation in 2001, and its total
budget was $10.2 million.
USDEC has offices in Mexico City, Tokyo, Seoul, Hong Kong, Shanghai, Bangkok, Taipei, London, and
Sao Paulo. Activities in Mexico concentrated on cheese; in 2001, cheese exports to Mexico posted a 63%
increase over 2000 levels. In Japan and Korea, cheese and dairy ingredients were highlighted; in China,
where cheese is not a part of the traditional diet, dairy ingredient promotions led to a 69% increase in
lactose exports and a 20% increase in whey exports. In other Southeast Asian markets, promotions focused
on value-added products such as cheese and ice cream, as well as dairy ingredients. Specific promotions
included in-store retail promotions and sampling in supermarkets, joint promotions with food service
companies, quarterly trade newsletters, exhibits at trade fairs, and seminars about U.S. dairy products
presented to the press, end-users, and food distributors.
Final 2001 export data confirm that U.S. dairy product exports for the third year eclipsed the $1 billion
mark, and 85% of that total were commercial, unsubsidized sales. Export volume, almost 9 billion pounds
on a milk equivalent, total solids basis, represented just over 5% of total U.S. production in 2001. Total
U.S. exports show a 28% increase in lactose exports, a 10% increase in cheese exports, and increases of 2%
and 11% for ice cream and fluid milk, respectively.
In Mexico, a joint promotion with Domino's Pizza featured the USDEC logo on all Domino's pizza boxes
with the slogan "Made with 100% U.S. Cheese." Domino's delivers more than 1.6 million pizzas a month
in Mexico. Restaurant promotions in Japan and Korea featured special menu items including cheese on
salads, cheese fries, and sandwiches featuring American cheese varieties. Enthusiastic consumer response
led to the addition of the dishes to the permanent menus. A Korean retail activity featured in-store
sampling at several multinational chains highlighting cream cheeses, Monterrey Jack, and cheddar cheeses;
participating stores reported sales increases of 100% on average during the three-week promotion.
14

USDEC continued working to improve the export capabilities of domestic dairy companies. USDEC
assists U.S. dairy exporters by providing up-to-date information on market conditions, global trade trends,
and regulatory requirements for export. Ongoing reverse trade mission activities provide opportunities for
domestic dairy product suppliers to meet potential importers visiting the U.S. Of note, in November 2001 a
Mexican and South American buyer reverse trade mission visited five U.S. cheese plants to increase
overseas trade knowledge of production, quality, and varieties of U.S. cheeses. The group also participated
in dairy case management and U.S. cheese seminars. USDEC staff estimates potential cheese exports as a
result of the mission could exceed 10,000 metric tons per year.
To increase customer knowledge of dairy ingredient functionality, USDEC produced 12 whey monographs
in 2001. These reports - addressing whey applications in baked goods, confections, ice cream and frozen
desserts, low-fat goods, and sports nutrition, among others - were translated and made available in markets
around the world. English-language versions of these and other valuable export information can be
accessed at www.usdec.com. For 2002, USDEC will continue to focus a significant portion of its market
development programming toward the dairy ingredient and cheese sectors.
Nonfat dry milk and whey promotion efforts were conducted via advertising, public relations, trade shows,
and the website www.doitwithdairv.com. The advertising theme "Do it with Dairy ®,, was utilized
throughout all activities. The "Do it with Dairy" ingredient marketing campaign reaches the food
manufacturing/processing industry with key market-driven whey research results and usage messages.
Several newsletters and other publications support this program. "Dairy Dimensions," a quarterly
newsletter, focuses on developments in dairy technology research. "Dairy Ingredients Insider," is a
newsletter where dairy ingredient suppliers are able to track buyer attitudes, behaviors, buying patterns, and
product development plans. The latter has become a key planning tool for some suppliers, as it enables
them to effectively utilize and leverage market research developed by DMI.
In 2001, DMI launched Mooru TM, a powerful new on-line search engine that encompasses a variety of
interactive service programs and acts as an information portal designed for multiple audiences within the
food and dairy industries. Mooru TM offers three different interactive elements including an ingredient
selector, dairy ingredient supplier database, and Pitch Notes, a self-guided educational tool to help the
processor sales force learn more about dairy ingredients.
Also for the third straight year, DMI sponsored the Discoveries in Dairy Ingredients Contest. The contest
allows undergraduate college students to develop an innovative food product formulation using dry milk,
whey, or whey derivatives, such as whey protein concentrate and whey protein isolate. The contest has a
dual purpose - to highlight the versatility and functionality of dairy ingredients while at the same time
provide food science students with practical, marketable experience. The three prize categories include:
Best Overall Product Award, Product Marketability Award, and Product Creativity Award. Winning
entries were featured at the 2001 Institute of Food Technologists Food Expo.
15

"Ingredient Insights," a newsletter designed expressly for food formulators and ingredient suppliers,
continues to provide news about dairy ingredients, specific applications, and technical support resources.
As a part of this program, DMI provides ingredient technical support systems for food technologists. The
system features four tiers, enabling food technologists to request the level of support they find the most
useful. The options range from requesting technical information via FAX-ON-DEMAND to direct dialogue
with a researcher.
"Innovations in Dairy," a technical bulletin that details new dairy science and technology information and
research, is executed through a series of authoritative, topical updates written from a practical perspective
for the lay reader.
Research continues to focus on nonfat dry milk and whey in the areas of functionality, quality, packaging,
and new applications. In addition, the application laboratory for nonfat dry milk at California Polytechnic
State University and the whey application laboratory at the University of Wisconsin Center for Dairy
Research continued to provide technical assistance to both those that produce the ingredients and those that
use the ingredients in finished products. The website www.extraordinarydairy.com provides a network of
resources and information to help the dairy and food industries bring innovative products, formulations, and
processes to market.
Research is also exploring additional health benefits of whey. Pre-clinical (non-human) trials are currently
exploring the role of specific whey proteins in reducing the risk of certain types of cancers, including breast
and prostate cancer. Research trials are investigating a potential link between whey proteins and reducing
the risk of hypertension, and specific whey proteins have shown anti-bacterial properties. Long term, this
may lead to whey's use as an ingredient in solving potential food safety concerns with certain perishable
foods like meats or produce.
RESEARCH
In June 2001, DMI (the National Dairy Council ®) sponsored a national human nutrition research forum,
enabling the National Dairy Council ® to provide key dairy industry leaders with cutting-edge dairy nutrition
science for potential use in new product marketing, development, and overall dairy product positioning.
Over 100 marketing representatives from private companies, new product development representatives,
nutrition scientists, government officials, and dairy council staffparticipated.
2001 National Dairy Council ® funded dairy nutrition research highlights included:
1. The role of dairy as part of a heart-healthy diet.
2. The role of calcium-rich dairy products in successful weight loss and maintenance.
3. Research showing that people diagnosed with lactose maldigestion can still consume dairy products.
4. Dairy's role in the prevention and reduction of colon cancer.
16

FLUID MILK
Information on integrated fluid milk advertising, promotions, public relations, school marketing, strategic
thinking, and other activities that include DMI, State and regional organizations, and the Fluid Milk Board
is detailed in the national fluid milk integrated program summary in this chapter.
17

Qualified State or Regional Dairy Product Promotion, Research, or
Nutrition Education Programs
Qualified Programs are certified annually by the Secretary. To receive certification, the Qualified Program
must: (1) conduct activities that are intended to increase human consumption of milk and dairy products
generally; (2) have been active and ongoing before passage of the Dairy Act, except for programs operated
under the laws of the United States or any State; (3) be primarily financed by producers, either individually
or through cooperative associations; (4) not use a private brand or trade name in its advertising and
promotion of dairy products (unless approved by the Dairy Board and USDA); and (5) not use program
funds for the purpose of influencing governmental policy or action (7 CFR 1150.153). A list of the 62
active programs is provided in Appendix G.
The aggregate revenue from the producers' 15-cent per hundredweight assessment directed to the Qualified
Programs in 2001 was $170 million (approximately 10 cents out of the 15-cent assessment). The Qualified
Programs manage State or regional dairy product promotion, research, or nutrition education programs
(Tables 1-2 and 1-3).
Some of these Qualified Programs participate in cooperative efforts conducted and coordinated by other
Qualified Programs and/or other organizations such as DMI, the Dairy Board, and UDIA. Their goal in
combining funding and coordinating projects is more effective and efficient management of producers'
promotion dollars through larger, broad-based projects. For example, UDIA coordinates nationally through
DMI the programs and resources for 19 federation members and their affiliated units to support the unified
dairy promotion plan*. (*See Unified Marketing Plan as noted in Table 1-2).
18

TABLE 1-2 Aggregate Income and Expenditure Data Reported by the 62 Active Qualified Programs to USDA
I N C O M E Carryover from Previous Years Producer Remittances Payments Transferred from Other Qualified Programs 2 Payments Transferred to Other Qualified Programs 2 Othel ~
Total Adjusted Annual Income
2000 2001 (in $000's) (in $000's)
50,0851 53,4221 169,996 170,585 52,402 58,134
(53,457) (60,437) 5,991 51624
225,017 227,328
EXPENDITURES General & Administrative Advertising & Sales Promotion Unified Marketing Plan 4 Dairy Foods & Nutrition Research Public & Industry Communications Nutrition Education Market & Economic Research OtheP
Total Annual Expenditures
7,375 [4.3%] 7,727 117,040 [69.0%] 77,015
NA 50,362 5,849 [3.4%] 4,859
13,691 [8.1%] 11,314 22,619 [13.3%] 15,077
1,787 [1.1%] 1,705 11293 [0.8%] 1,908
169,654 [100%] 170,967
[4.5%] [45.3%1 [29.6%]
[2.8%1 [6.7%] [8.9%] [1.o%1 [1.2%1
[lOO%1
Total Available for Future Year Programs 55,3631 57,361
Differences are due to audit adjustments and varying accounting periods. 2 Payments Iransferred between Qualified Programs differ due to different accounting methods and accounting periods. Includes interest, income from processors and handlers, sales of supplies and materials, contributions, and rental income.
4 Unified Marketing Plan - Reported local spending by United Dairy Industry Association (UDIA) units participating in the Dairy Management Inc. unified marketing plan to fund national implementation programs.
5 Includes capital expenses and contributions to universities and other organizations. SOURCE: Aggregate income and expenditure data reported by the 62 active QuaLified Programs to USDA.
TABLE 1-3 Aggregate Advertising Expenditures Data Reported by the 62 Active Qualified Programs to USDA
2000 2001 (in $000's) (in $000's)
ADVERTISING P R O G R A M S Fluid Milk 50,195 [42.9%] 19,7401 [25.6%] Cheese 58,865 [50.3%] 52,460 l [68.1%] Butter 217 [0.2%] 141 [0.2%1 Frozen Dairy Products 748 [0.6%] 656 [0.9%] Other 2 7,015 [6.0%] 4,017 [5.2%]
Total 117,040 [10o%] 77,0151 [10o%]
1 Figure does not include local unified marketing plan advertising expenditures previously reported separately by individual UDIA units.
:Includes "Real Seal," holiday, multi-product, calcium, evaporated milk, food service, product donations at State fairs and other events and contributions for displays or promotional events.
SOURCE: Aggregate income and expenditure data reported by the 62 active Qualified Programs to USDA.
19

National Fluid Milk Processor Promotion Board
The Fluid Milk Board, as authorized in the Fluid Milk Promotion Act of 1990 (Fluid Milk Act), administers a fluid
milk promotion and consumer education program that is funded by fluid milk processors. The program is designed
to educate Americans about the benefits of milk, increase fluid milk consumption, and maintain and expand markets
and uses for fluid milk products in the contiguous 48 States and the District of Columbia.
The Secretary of Agriculture appoints 20 members to the Fluid Milk Board. Fifteen members are fluid milk
processors who each represent a separate geographical region, and five are at-large members. Of the five at-large
members, at least three must be fluid milk processors and at least one must be from the general public. Three fluid
milk processors and two public members serve as at-large members on the current Fluid Milk Board. The members
of the Fluid Milk Board serve 3-year terms and are eligible to be appointed to two consecutive terms. Current Fluid
Milk Board members are listed in Appendix A-2. A map of the Fluid Milk Board regions is shown in
Appendix B-2.
The Fluid Milk Board elects four officers: Chair, Vice-Chair, Secretary, and Treasurer. Fluid Milk Board members
are assigned by the Chair to the following committees: Advertising, Finance, Promotions, Public Relations/Medical
and Scientific, Research, and Strategic Thinking. The program committees are responsible for setting program
priorities, planning activities and projects, and evaluating results. The Finance Committee reviews all program
authorization requests for funding sufficiency, the Fluid Milk Board's independent financial audit, and the work of
the Board's accounting farm. The Fluid Milk Board met four times during its 2001 fiscal year.
The Fluid Milk Program is fimded by a 20-cent per hundredweight assessment on fluid milk products processed and
marketed commercially in consumer-type packages in the contiguous 48 States and the District of Columbia. The
program exempts from assessment those processors who process and market 3,000,000 pounds or less of fluid milk
products each month, excluding fluid milk products delivered to the residence of a consumer. Assessments
generated $109 million in 2001. The Fluid Milk Order requires the Fluid Milk Board to return 80 percent of the
fimds received from Califomia processors to the California fluid milk processor promotion program. For 2001, the
amount returned to California from the assessments was approximately $10 million. The California fluid milk
processor promotion program uses the fimds to continue its promotion activities, which include the got milk? ®
advertising campaign.
The actual income and expenses for 1997-2001 are in Appendix C-4. The Fluid Milk Board's administrative
expenses continued to be within the 5-percent-of-assessments limitation required by the Fluid Milk Order. USDA's
oversight and evaluation expenses for 1997-2001 are in Appendix C-5. Appendix C-6 contains the Fluid Milk
Board's approved budgets for 1998-2002. Appendix D-2 contains an independent auditor's reports for the period of
January 1, 2001, through December 31, 2001.
20

The following summarizes Fluid Milk Board medical and scientific activities for the period of January 1, 2001,
through December 31, 2001. The Fluid Milk Board's sponsorships, advertising, promotions, public relations, school
marketing, and strategic thinking activities are incorporated in the National Fluid Milk Integrated Program summary.
MEDICAL AND SCIENTIFIC
The Fluid Milk Board has established a Medical Advisory Board (MAB) comprised of academic, medical,
and health care professionals with expertise relevant to the health benefits of fluid milk. The MAB
provided guidance to the Fluid Milk Board's development of key nutritional and health messages for
consumers and health professionals. The MAB also reviewed nutrition and health messages for accuracy.
The MAB members assisted the Fluid Milk Board in forging relationships with health organizations such as
the American Heart Association, the National Medical Association, the American Dietetic Association,
American Academy of Pediatrics, and the National Cancer Institute. They also appeared as medical
professionals in the media, providing science-based statements supporting the health benefits of milk.
The medical and scientific activities of the Fluid Milk Board also included preparing press materials and
acting as spokespersons on breaking research with relevance to fluid milk. The Fluid Milk Board created
consumer and health professional materials to explain research in areas such as breast cancer, hypertension,
and rickets. One of the health reports involved the reported cases of rickets among toddlers. Rickets is
caused by a deficiency in vitamin D and calcium and leads to soft bones and poor growth in children. Milk
is the only major nutritional source of vitamin D.
The Dietary Approaches to Stop Hypertension (DASH) diet continues to be a major focus of activity.
Research on the DASH diet shows that by eating a diet rich in nonfat or lowfat dairy products and fruits and
vegetables, many people can reduce their blood pressure with or without medication. In addition to the
"Reduce Your Risk" and "The Diet-Blood Pressure Connection" brochures and press materials about
DASH diets, the Fluid Milk Board implemented new initiatives on high blood pressure and lactose
intolerance.
The Fluid Milk Board continues to spotlight the high incidence of high blood pressure among African
Americans and to promote milk and milk products as a dietary solution as part of the DASH diet. The
program also addresses misconceptions about lactose intolerance and shows why it should not be a barrier
to including milk in the diet. The Board launched a new lactose intolerance initiative that focuses on
educating African Americans on the importance of incorporating milk into their diet. The programs
provided educational material on osteoporosis and lactose intolerance.
21

National Fluid Milk Integrated Program
The Fluid Milk Board and DMI continued during 2001 to implement an integrated fluid milk marketing plan which
is research-based, message-focused, and jointly managed. 2001 marks the third year of the totally integrated fluid
milk marketing effort. The 2001 fimding level totaled approximately $163 million, with $67 million from DMI and
State and regional organizations and about $96 million from the Fluid Milk Board.
The purpose of the integrated program is to positively change the attitudes and purchase behavior of the country
regarding fluid milk. The 2001 fluid milk marketing plan was designed to continue marketing and promotional
activities to promote and increase the consumption of fluid milk and to identify and support growth opporttmities for
the industry. Many communication mediums were used to accomplish this objective, including television and print
advertising, public relations, promotions, and others. The program's target audiences include: kids and young teen
girls and boys 6-14; teen girls and boys 15-17; adults 18-34; morns 18-34; and two specific ethnic target audiences -
Hispanics and African Americans.
In 2001, the got milk?®/Milk Mustache advertising campaign, which provides the basis for advertising activities and
other program delivery methods, was continued. A description follows of the 2001 integrated program activities for
the Fluid Milk Board and DMI.
SPONSORSHIPS
In 2001, the got milk?~/Milk Mustache Campaign began leveraging a multi-year partnership with Wak
Disney Corporation. The sponsorship provides a unique opportunity to raise milk's image among teens and
young adults by highlighting the message that milk is a great beverage of choice for teens and for athletes
of all ages. As part of the partnership, milk has been named "the official training fuel" of Disney's Wide
World of Sports. Additionally, a centerpiece arena of Disney's Wide World of Sports TM complex is named
the "Milk House." The "Milk House," which has got milk? ® signage and milk mustache posters
prominently positioned throughout the complex, is a state-of-the art facility that includes nine venues.
More than 40 Amateur Athletic Union national championships are held at the facility and it is home to and
affiliated with many professional sports teams.
The Fluid Milk Board and DMI also partnered with the National Basketball Association (NBA) during
2001 as part of a multi-year sponsorship. Through this sponsorship, the Fluid Milk Board has an additional
mechanism to reach teens with sports nutrition and growth messages. The partnership was used to enhance
the Spring "Chocolate: The Wilder Side of Milk" feature-incentive promotion, which is discussed in the
integrated promotion activity summary.
22
AD VER TISING
The Fluid Milk Board and DMI integrated advertising program consists of both television and print
advertising as well as media-driven promotions. The advertisements highlight specific, relevant, health-
benefit messages about milk and its nutrient content, while media-driven promotions serve to extend the
advertising campaign.
The first integrated television advertisements were launched in October 1999. During 2001, a national
chocolate milk television advertising campaign and a national Hispanic advertising campaign were
developed and launched. Prior to creativity concept development and testing, research was conducted on
teen and Hispanic audiences to gain knowledge to assist in developing several concepts. The national
chocolate milk television advertising campaign was launched as a major component of the marketing effort
to increase milk consumption among teens. The chocolate milk commercials "Chocolatier" and "Gargle"
communicate the unique taste of chocolate milk and remind teens how much they love the product. Both
ads feature teens making chocolate milk in unusual ways and demonstrate the lengths to which teens will
go to get it. Additionally, the "Sponge Bob Square Pants" and the "Power Puff Girls" ads, which target
kids, also promote chocolate milk. The chocolate milk advertising campaign builds on the growing
popularity of flavored milk products.
The first national Hispanic advertising campaign debuted as part of a new industry outreach to the ever-
growing Hispanic market. The commercials entitled "Wind-Up-Toy"(2 versions) focus on the nutrient
package of milk. The ads feature happy, active kids playing sports, skate-boarding, studying, and enjoying
friends and family. The ads' tagline "Familia, Amory Lethe" (Family, Love, and Milk) is used currently
in California's State-wide fluid milk advertising campaign.
Television and print advertising also continued to promote fluid milk. New commercials developed and
launched during 2001 were "Loan Shark" and two "Milk Carton Guy"ads, which targeted the adult, teen,
and kid audiences with health-benefit messages, and "Cyber Loot," which supported the second national
on-pack (cap) promotion. In addition to these commercials, "Super Heroes" and "Mario" ads also
continued to run during 2001. These were originally developed and launched in 2000.
The Fluid Milk Board and DMI television expenditures totaled $54.6 million. Total televison advertising
expenditures on each target audience were as follows: kids - $9.4 million, teens - $12.7 million, adults -
$31.5, million and Hispanics - $1.0 million. Table 1-4 provides a complete listing by target audience of the
2001 fluid milk television advertising.
23

TABLE 1-4 2001 Fluid Milk Television Advertising
Kids Television Teens Television Adult Television Hispanic Television Super Heroes Chocolatier Super Heroes Wind Up Toy Kids (Morn) MCG - Basketball Gargle Gargle Wind Up Toy Kids (Kids) MCG - Gym Cyber Loot Chocolatier The Secret* Sponge Bob Square Pants MCG - Basketball The Dragon Slayer* Cyber Loot MCG - Rest Home Memories 1" Mario MCG - Gym Memories 2*
Loan Shark Telephone TV* Cyber Loot I Don't Know (Nese)*
New Mother* Generation*
SOURCE: Dairy Management Inc. and the Fluid Milk Board. * Indicates advertising developed by California and used by State and Regional Organizations. "MCG," where used means Milk Carton Guy.
In addition to television advertising, the integrated program completed a full year of fluid milk print
advertising through the got milk?®/Milk Mustache campaign. The campaign used celebrity advertising in
over 100 magazines, outdoor billboards, and other print vehicles to deliver messages on osteoporosis,
growth, active/energy, bone health, and other important nutritional benefits of drinking milk. The Fluid
Milk Act and Fluid Milk Order state that the advertising coverage in each of the Board's regions is to be
proportionate to funds collected from each respective region. The integrated program used outdoor
billboards and regional magazines to fulfill this requirement. Table 1-5 contains a complete listing of the
2001 fluid milk print advertisements.
The integrated program also continued "Moment ads" that work around special events and create an
awareness of milk. Such ads included two "Super Bowl" ads, "Survivor II" winner ad, and "Make a Wish"
ad, which was done in partnership with the Make a Wish Foundation.
The integrated program also was able to generate media-driven promotions from the magazines that are
used to extend the campaign. These promotions were created to add a consumption-driven element to the
advertising program. Some successful promotions included the fifth annual "Mad About Milk" photo
contest in Seventeen Magazine, "Milk Mustache Mobile ESPN Nationwide Search" in ESPN The
Magazine, and the "Scholar Athlete Milk Mustache of the Year" (SAMMY) Award. The SAMMY
program, which continues to grow each year, rewards teenagers for academic, civic, and athletic excellence
while encouraging them to incorporate more milk into their active lifestyles. The winners receive a $7,500
college scholarship and appear in a milk mustache ad in USA Today, Sports Illustrated, and ESPN The
Magazine. SAMMY has become the largest event of its type in the country.
24

PROMOTIONS
The Fluid Milk Board and DMI conduct promotions to increase fluid milk sales in retail outlets. The
promotions work to move more milk out of the grocery store refrigerator and to increase sales in other retail
outlets such as convenience stores, independent grocery stores, drug stores, and mass merchandisers. Some
of the promotions work with partners to increase the appeal of the program when appropriate. After
carefully measuring the results of the numerous promotion strategies, promotion activity in 2001 focused on
feature incentives - a promotion vehicle used to increase advertisements and displays of milk - and on-pack
(cap) programs offering prizes directly to consumers to help drive incremental purchases.
The Fluid Milk Board and DMI conducted three national promotions. "Chocolate: The Wilder Side of
Milk II" was the milk industry's second national chocolate milk promotion designed to bring new
consumers to the category and increase chocolate milk sales through feature advertisements and dairy aisle
displays of chocolate milk. The March promotion leveraged the integrated milk marketing NBA
partnership by providing special NBA/Chocolate Milk logo prizes. Over 1,600 retailers participated in the
promotion representing over 28,000 stores.
The 5-week chocolate milk promotion surpassed the performance level of the 2000 event by generating
increased sales of chocolate milk, white milk, and other flavored milk products. Chocolate milk sales
increased more than 10% and weekly incremental sales of chocolate milk increased by 22% compared to
data for 2000. Sales of white milk and flavored milk also increased during the March promotion period.
Additionally, half of the consumers who purchased chocolate milk during the promotional period were new
chocolate milk purchasers, and one-third of consumers continued to purchase chocolate milk at higher rates
even after the promotion had ended. The promotion's success is largely attributed to greater product
availability and increased retailer participation. While the chocolate milk promotion was in stores, "The
Slam Dunk Drink" cafeteria promotion was extended to 650 schools districts. The promotion, which
promoted both chocolate and strawberry milk, reached 3.78 million middle and senior high school students
and 4.62 million elementary school students.
The "Cyber Loot" national retail promotion was the second national cap promotion for the dairy industry.
The integrated milk promotion included partners like America Online - which provided for an on-line game
component - and Electronic Arts - a popular video game manufacturer. The promotion featured more than
300 million game pieces on white milk gallons and provided consumers a chance to win promotional
discount coupons, free electronic games, and music cash certificates.
25

TABLE 1-5 2001 Fluid Milk Print Advertising
Celebrity, TarRet Theme Super Bowl Men/Women/Teens Active
(Trent Dilfer & Kerry Collins) Super Bowl Men/Women/Teens Active
(Trent Dilfer) Backstreet Boys Teen Girls/Teen Boys Osteoporosis Britney Spears Teens Girls/Teen Boys Bone Growth Cal Ripken, Jr. Teen Boys/Men Active Carson Daly Teen Girls/Teen Boys Growth Coaches Men/Teen Boys Active
(Joe Torres, Jeff Fisher, Pat Riley) Dixie Chicks Moms/Women/Men Strong Bones Elton John Women/Men Osteoporosis Erik Per Sullivan Morns Chocolate Milk Kevin Gamett Teen Boys Bone Growth Gisele B u n d c h e n Women/Men/Hispanics Bone Growth
(English & Espanola) Jackie Chan Men/Teen Boys Bone Growth Kurt Warner Men/Teen Boys Active Marion Jones Women/Teen Girls Active Marc Anthony Teen GMs/Hispanics Osteoporosis Mat Hoffman Teen Boys/Teen Girls Chocolate Milk Muhammed & Laila Ali Women/Men Active Noah Wyle Women Bone Growth Rulon Gardner Kids/Men/Teen Boys Active Power Puff Girls Kids/Teen Girls Flavored Milk/Chocolate Milk Ronald McDonald ® Moms/Kids/Hispanics Bone Growth/Nutrient Package Rugrats Moms/Kids/Hispanics Chocolate Milk Sela Ward Morns/Women Osteoporosis/Bone Growth Sponge Bob Square Pants Teen Boys/Teen Girls Kids Chocolate Milk Super Mario Morns/Kids Bone Growth Tony Meola Teen Boys/Teen Girls Active Venus & Serena Williams Women/Teen Girls Active Cyber Loot Teens/Women Promotional Halloween Ad Women/Men/Teens Chocolate Milk Pax Winner Women Osteoporosis Santa Ad Chocolate Milk Women/Men/Teens Survivor II Winner Women/Men/Teens Active
SOURCE: Fluid Milk Board.
The "Xtreme Flavors" back-to-school feature-incentive promotion, which featured all flavored milk
products, was implemented in the fall 2001. Similar to the spring 2001 chocolate milk promotion, retailers
were rewarded prizes for milk feature advertisements and dairy aisle displays of flavored milk products.
The 5-week promotion was successful in generating a 22% increase in incremental flavored milk sales. The
promotion also showed that flavored milk promotions do not negatively impact incremental sales of white
milk gallons, which increased 6% compared to the pre-promotional event period. The promotion was also
extended locally. With the participation of 1,000 school districts, it reached over 11 million elementary,
middle, and high school students.
26
The Fluid Milk Board and DMI worked with State and regional organizations to get their promotions
extended at the local level. Processors and Qualified Programs obtain the Fluid Milk Board's promotional,
advertising, and public relations materials from the Processor Hotline at 1-800-945-MILK (6455).
Additionally, a new milk reporting database was developed to provide both milk processors and State and
regional representatives with valuable, timely information on milk promotion, sign-up compliance, and
point-of-sale materials shipment confirmation. The database is located at www.milkstatus.com.
Additionally, a new computerized database called "CPG Network" was also developed as an additional tool
to assist milk processors and State and regional organizations in tracking their milk sales. The database,
developed through a partnership with Information Resources Inc., tracks sales and merchandising trends in
supermarkets and super centers and includes key pricing, promotion, and new product information.
PUBLIC RELATIONS
The public relations programs continued to focus on the nutritional benefits of milk, emerging scientific
studies which highlight milk's benefits, leveraging the high interest generated by the celebrities and the got
milk? ® / Milk Mustache campaign, and preparing for and responding to misconceptions and negative news
about milk or the educational campaign. A wide variety of initiatives were implemented to reach specific
target audiences. During 2001, over 1.87 billion media impressions were garnered through the integrated
public relations program. The program also provided support for three national retail promotions by
helping to build public awareness and increase retailer participation.
In January 2001, the Fluid Milk Board and DMI launched the "got milk? ® 3v3 Soccer Shootout Tour" to
remind American families about the importance of drinking milk for an active lifestyle and to position milk
as nature's sports drink with nine essential vitamins and minerals including calcium and protein. The 4-
month tour, which visited 43 cities nationwide, provided individuals the opportunity to win $1 million
through an interactive soccer game. The tour was launched at a Sports Nutrition Summit at Disney's Wide
World of Sports TM, where a new Sports Nutrition Food Guide Pyramid was unveiled. The new pyramid
promotes three to four servings of milk or dairy products every day as an important component of a healthy
diet. Trainers, nutritionists, pediatricians, and athletes were also available at the event to provide health,
nutrition, and fitness advice.
The "Chocolate Milk Mustache Mobile Taste Sensation Tour" educated Americans about the nutritional
and taste benefits of chocolate and other flavored milk. Kids and their parents were encouraged to drink at
least 3 glasses of milk each day to promote bone growth and to help protect against osteoporosis later in
life. The 98-city tour provided a computer-based health assessment for adults that tested their bone density,
a "calcium challenge" quiz on new interactive computer kiosks, and a milk mustache photo contest.
Additionally, fitness experts assisted registered dietitians in conducting health consultations with consumers
and in offering nutrition and fitness advice. Year 2001 was the fourth year of the tour.
27

The Fluid Milk Board and DMI's "School Principal Challenge" provided teens and parents with
information on the vital role that calcium in milk plays during the prime bone-building years of teens. The
program was launched at the National Association of School Principals Conference with a "Calcium
Commitment" pledge adopted by school principals in attendance. As part of the campaign, dairy producer
and processor promotion staff hosted a booth at the National Association of Secondary School Principals
Annual Convention. The more than 4,000 high school principals in attendance were provided nutrition
information kits with helpful tips for promoting better health and milk consumption at their schools.
The Fluid Milk Board and DMI also launched a new lactose intolerance initiative with emphasis on
minority outreach to offer simple ways for consumers to include milk and dairy products in their diets.
Brochures and other information on milk were made available to consumers through the website
www.whvmilk.com.
STRATEGIC THINKING
The Fluid Milk Strategic Thinking Initiative (FMSTI) is a joint effort of the Fluid Milk Board, DMI, the
Milk Industry Foundation, processors, and suppliers. This ongoing effort was established to address
barriers to fluid milk consumption not targeted by the advertising, promotion, and public relations activities
of the Fluid Milk Board and DMI. In 1998, the Task Force began a series of research projects on how to
improve fluid milk sales in five priority areas including vending, home-meal replacement, nutraceuticals,
convenience stores, and foodservice. The FMSTI is focusing on increasing and expanding the availability
of milk in these marketing channels. The results of research released during 2001 are discussed below.
Initial vending research has identified opportunities for increased milk sales through vending machines.
The Fluid Milk Board and DMI partnered with Maytag Commercial Solutions to place 100 milk vending
machines in middle and high schools in five markets across the United States. The 5-month milk vending
test was conducted to determine whether school vending is a viable business opportunity for processors.
The test measured the velocity of sales to determine the demand, sales, and profit potential of vending
machines placed in schools. The milk vending test revealed a strong interest from students and a promising
new market oppommity for the milk industry. The study proposes that if school milk vending were
widespread, it could potentially increase school milk consumption by 131 million single-serve units per
year. Milk vending provides an immediate sales and profit opportunity for processors and provides an
additional out-of-home consumption channel to market single-serve fluid milk products to teens.
Also released in mid-2001 was a comprehensive three-part nutraceuticals report which identified possible
functional food opportunities that exist for fluid milk products. The report revealed 12 ingredients that
potentially could be added to milk to create milk-based functional food products. Functional foods are
28

foods that provide certain health benefits beyond basic nutrition. Results from this research can be used to
assist processors in developing fluid-milk based nutraceutical products. Phase two of the study, which
begins in 2002, will explore consumer acceptance of the fortification concepts identified in phase one.
FMSTI currently is conducting a new market test in foodservice to develop proven ways to increase
foodservice channel milk sales. An advisory board of milk processors, food service distributors, and
restaurant operators has been comprised. The test is structured to address a number of questions relating to
the marketability of mill in the food service channel. A report of the test results should be available in
2002.
SCHOOL MARKETING
The National Dairy Council ® (www.nationaldairvcouncil.org), whose programs are managed by DMI,
works with school foodservice professionals and teachers to raise student awareness of the importance of
having milk and dairy products as a part of a healthy lifestyle. As noted earlier in the promotions section,
several integrated milk programs were extended into schools through school foodservice professionals
using posters and other tie-in activities. For example, as a part of the "Chocolate: The Wilder Side of Milk
II" retail promotion, the National Dairy Council ® and the American Dairy Association ® successfully
implemented "The Slam Dunk Drink" cafeteria promotion in 650 school districts. The promotion, which
promoted both chocolate and strawberry milk, reached 3.78 million middle and senior high school students
and 4.62 million elementary school students.
Another successful tie-in activity included the "Xtreme Flavors" back-to-school feature-incentive
promotion. This promotion featured all flavored milk products and was implemented in the fall 2001. The
National Dairy Council ® and the American Dairy Association ® were able to garner support and
participation from over 1,000 school districts (over 21,000 schools), and it reached over 11 million
elementary, middle, and high school students.
Reaching kids through the classroom with various programs continues to be the focus of nutrition education
efforts. "Pyramid Caf6 ®'' and "Pyramid Explorations~", ' ' targeted to second and fourth grades, reach over
12 million students with messages that mil l and dairy products are a key part of a healthy diet. Survey
results continue to show a very high utilization rate for these two programs, currently at over 70% of the
instructors that have the programs. In addition, 10 lessons featuring Chef Combo were adapted for use on
the Nutrition Explorations website, that had 90,219 visitors during 2001, an average of 7,500 visitors per
month.
Combined websites www.familvfoodzone.com and www.nutritionexplorations.org continue to deliver
valuable resources to teachers, school foodservice professionals, and consumers. The site includes lesson
plans for educators, resources for school foodservice directors, ideas for smart eating for families, and tim
activities for kids. In 2001, www.nutritionexplorations.or~ delivered over 70,000 lesson plans,
29

3 million dairy impressions, and also received another World Wide Web Health Award. The World Wide
Web Health Awards, organized by the Health Information Resource Center, recognizes the best health-
related web sites for consumers and professionals each year. This site has won the award every year
since 1999.
OTHER RESEARCH
2001 milk-related nutrition and product research was conducted in the following areas:
1. The role of milk and milk products in the prevention of colon cancer and reduction of blood pressure.
2. Establishing the genetic basis for the activity ofprobiotic cultures.
3. Demonstration of milk consumption by teens to meet their calcium needs without adversely affecting
weight.
4. The role of milk and calcium in the diet of kids and morns.
5. Investigation of added value of fortification through the use ofprobiotics, nutraceuticals, nutrient
delivery, and flavor enhancement.
6. Extended shelf life and shelf stability at ambient temperatures.
7. The impact of differing milk options and experiences in schools on childhood fluid milk consumption
behavior and attitudes.
30

CHAPTER 2
U N I T E D S T A T E S D E P A R T M E N T O F A G R I C U L T U R E
Dairy Programs of the U.S. Department of Agriculture's (USDA) Agricultural Marketing Service (AMS) has the
day-to-clay oversight responsibilities for the National Dairy Promotion and Research Board (Dairy Board) and the
National Fluid Milk Processor Promotion Board (Fluid Milk Board). Dairy Programs oversight activities include
reviewing and approving the Dairy and Fluid Milk Boards' budgets and budget amendments, contracts, advertising
campaigns, and investment plans. Approval of program materials is also a responsibility of USDA. Program
materials are monitored for conformance with their respective Acts and Orders and with other legislation such as the
Nutrition Labeling and Education Act.
Dairy Programs continues to insure that the collection, accounting, auditing, and expenditure of generic promotion
funds is consistent with the enabling legislation and orders; to qualify State or regional dairy product promotion,
research, or nutrition education programs (Qualified Programs); and to provide for evaluation of the effectiveness of
both programs' advertising campaigns. USDA also assists the Boards in their assessment collection, compliance,
and enforcement actions. Other USDA responsibilities relate to the nominating and appointing of Board members,
amending the orders, conducting referenda, and conducting periodic program audits. USDA representatives attend
full Board and Board committee meetings.
National Dairy Promotion and Research Board Oversight
N O M I N A T I O N S A N D A P P O I N T M E N T S
The 36 members of the Dairy Board who administer the program serve 3-year terms, with no member
serving more than two consecutive terms. Dairy Board members are selected by the Secretary of
Agriculture from nominations submitted by producer organizations, general farm organizations representing
other producers, Qualified Programs, or other interested parties.
Forty-four nominations were received by USDA for the 12 Dairy Board members whose terms expired
October 31, 2001, and one for a Dairy Board vacancy. A press release issued on October 3, 2001,
announced the appointment of nine new members and four incumbents. All except one will serve three
year terms ending October 31, 2004. Newly appointed members were: Marlin J. Rasmussen, St. Paul,
Oregon (Region 1); Robert R. Bignami, Chico, California (Region 2); Margaret A. Gambonini, Petaluma,
California (Region 2); Patricia M. Van Dam, Chino, California (Region 2); Rosalie M. Geiger, Reedsville,
Wisconsin (Region 6); Alice S. Moore, Frazeysburg, Ohio (Region 9); Deborah A. Benner, Mt. Joy,
Pennsylvania (Region 11); and David E. Hardie, Lansing, New York (Region 12). Re-appointed to serve
31
second terms were: William R. Ahlem, Jr., Hilmar, California (Region 2); Steve P. Frischknecht, Manti,
Utah (Region 3); Lynda S. Foster, Ft. Scott, Kansas (Region 4); and Robert K. Herman, Taylorsville, North
Carolina (Region 10).
There was one resignation from the Dairy Board in 2001. Ruth I. Laribee, Lowville, New York
(Region 12), resigned and was replaced by Audrey G. Donahoe, Frankfort, New York. Her term expires
October 31, 2002.
Lists of current Dairy Board members appear in Appendix A-1. Appendix B-1 is a map of the contiguous
48 States depicting the 13 geographic regions under the Dairy Promotion and Research Order (Dairy
Order).
FOREIGN AGRICULTURAL SER VICE
The Secretary of Agriculture has delegated oversight responsibility for all foreign market development
activities outside the United States to the Foreign Agricultural Service (FAS) (7 CFR 2.43(a)(24)). FAS
reviews the U.S. Dairy Export Council's (USDEC) foreign market development plan and related export
conl~acts. USDEC export contracts also are reviewed by AMS Dairy Programs to ensure conformance with
the Dairy Production Stabilization Act of 1983 (Dairy Act) and Dairy Order and with established policies.
The USDA's Foreign Market Access Program and the Market Promotion Program provided matching funds
to USDEC for dairy product promotion and market research in Japan, Mexico, Southeast Asia, South
Korea, and Latin America.
CONTRACTS
The Dairy Act and Dairy Order require that all contracts expending producer fimds be approved by the
Secretary (7 CFR 1150.140). During 2001, USDA reviewed and approved 172 Dairy Board and Dairy
Management Inc. (DMI) agreements, amendments, and annual plans. Funding approvals were from the
1996, 1997, 1998, 1999, 2000, and 2001 fiscal periods. See Appendix E for the contractors and the
initiatives approved by USDA during 2001.
CONTRA CTOR AUDITS
During 2001, DMI retained the certified public accounting fn-m of KPMG Peat Marwick to audit the
records of the following entities for projects in dairy foods research, media and advertising services,
marketing research services, public relations services, and export (through USDEC): California Dairy
32

Research Foundation, Bozell Worldwide Inc., Wirthlin Worldwide, Fleishman Hillard, Contacts
International Consulting Ltd., and National Milk Producers Federation, respectively. DMI is implementing
the audit recommendations for improving management and internal controls over contracts.
COLLECTIONS
The Dairy Act specifies that persons who pay producers and producers marketing milk directly to
consumers, commonly referred to as "responsible persons," shall remit assessments to the Dairy Board or to
Qualified Programs for milk produced in the United States and marketed for commercial use.
The Dairy Act provides that dairy farmers can direct up to 10 cents of their 15-cent per hundredweight
assessment to Qualified Programs. During 2001, the Dairy Board received about 5.11 cents of the 15-cent
assessment.
COMPLIANCE
Compliance by responsible persons in filing reports and remitting assessments continues in a timely manner
and at a high rate. Only minor differences were discovered when comparing the audit results to what was
reported by the responsible persons. The Dairy Board also verifies that the credits claimed by responsible
persons are actually sent to Qualified Programs. This verification is done by contracts with each Qualified
Program.
When non-compliance exists, the Dairy Board takes initial action on the matter. If the Dairy Board is
unsuccessful in resolving the violation, the matter is referred to USDA for further action.
QUALIFIED PROGRAMS
USDA reviewed applications for continued qualification from 62 Qualified Programs. A list of the 62
active Qualified Programs is provided in Appendix G. In line with its responsibility for monitoring the
Qualified Programs, USDA obtained and reviewed income and expenditure data from each of the Qualified
Programs. The data reported from the Qualified Programs are included in aggregate form for 2000 and
2001 in Tables 1-2 and 1-3.
33

National Fluid Milk Processor Promotion Board Oversight
NOMINATIONS AND APPOINTMENTS
The 20 members of the Fluid Mill Board serve 3-year terms, with no member serving more than two
consecutive terms. Fluid Milk Board members who fill vacancies with a term of 18 months or less are
permitted to serve two additional 3-year terms. Fluid Milk Board members are selected by the Secretary
from nominations submitted by fluid milk processors, interested parties, and eligible organizations. In a
news release issued on July 10, 2002, the Secretary of Agriculture announced five new appointments and
three reappointments to the Fluid Milk Board. Newly appointed members were: Joseph Cervantes,
Binghamton, New York (Region 4); James S. Jaskiewicz, Lakeland, Florida (Region 5); Gary L. Aggus,
Springfield, Missouri (Region 11); Lawrence V. Jackson, Pleasanton, California (Region 12); and
Charles D. Price, Johnstown, Pennsylvania (At-Large Processor). Reappointed to serve second terms were:
Mary Ellen Spencer, Chelsea, Massachusetts (Region 2); Roger D. Capps, Carlinville, Illinois (Region 8);
and Ronald M. Foster, Modesto, California (Region 14). The newly appointed and reappointed members
were seated at the July 11-13, 2002, Fluid Milk Board meeting.
Five vacancies occurred on the Fluid Board, due to company mergers and one resignation. The Fluid Milk
Promotion Order provides that no company shall be represented on the Board by more than three
representatives. The vacancies were: Sylvia C. Oriatti, Rosemont, Illinois (Region 3); Alan L. Faust,
Cincinnati, Ohio (Region 6); Michael H. Leb, Walnut Creek, California (Region 12); and Ann Puelz Ocana,
Phoenix, Arizona (At-Large Processor). The vacancies were filled by: Michael F. Nosewicz, Cincinnati,
Ohio; William R. McCabe, Orrville, Ohio; Lawrence V. Jackson, Pleasanton, California; and Michael A.
Kxueger, Phoenix, Arizona, respectively.
A list of current Fluid Milk Board members appears in Appendix A-2. Appendix B-2 shows a map
depicting the 15 geographic regions under the Fluid Mill Promotion Order (Fluid Mill Order).
PROGRAM DEVELOPMENT
The Fluid Mill Board contracted with the International Dairy Foods Association (IDFA) to manage the
program. IDFA contracted with Bozell Worldwide, Inc., Weber Shandwick, Inc., Marketing Drive
Worldwide, Inc. (formerly McCracken Brooks Communications, Inc.), and Flair Communications, Inc., to
develop the Fluid Mill Board's advertising, consumer education/public relations, and promotion programs,
respectively.
34

CONTRACTOR AUDITS
The Fluid Milk Board retained the certified public accounting fn-m of Synder, Cotm, Collyer, Hamilton &
Associates P.C. to audit the records of Bozell Worldwide, Inc., to determine if the agency had conformed
to the financial compliance requirements specified in their agreement with the Board for the period of
January 1, 2000, through December 31, 2000. Results of the audit were favorable in some areas such as
systems of internal controls but identified inconsistencies regarding expenditures and commissions billed to
the Board. The Board has worked with Bozell Worldwide, Inc. to resolve the issues noted in the
compliance audit. The Board is continuously working to enhance its internal contract control system to
ensure that the amounts invoiced to the Board are in compliance with established conlxacts and procedures.
COMPLIANCE
Compliance by fluid milk processors in filing reports and remitting assessments continues in a timely
manner and at a high rate. During this fiscal period, there have been no new cases of delinquent accounts
referred to USDA.
35

C H A P T E R 3
IMPACT OF GENERIC FLUID MILK AND DAIRY
ADVERTISING ON DAIRY MARKETS:
AN INDEPENDENT ANALYSIS
The Dairy Production and Stabilization Act of 1983 (Dairy Act; 7 U.S.C. 4514) and the Fluid Milk Promotion Act of
1990 (Fluid Milk Act; 7 U.S.C. 6407) require a yearly independent analysis of the effectiveness of milk industry
promotion programs. These promotion programs operate to increase milk awareness and thus the sale of fluid milk
and related dairy products. From 1984 to 1994, the U.S. Department of Agriculture (USDA) was responsible for the
independent evaluation of the National Dairy Promotion and Research Program (Dairy Program), as authorized by
the Dairy Act, and issued an annual report to Congress on the effectiveness of the Dairy Program. Beginning in
1995, the Congressional report began including third-party analyses of the effectiveness of the Dairy Program in
conjunction with the National Fluid Milk Processor Promotion Program (Fluid Program) authorized by the Fluid
Milk Act. While both programs utilize various types of marketing strategies to increase fluid milk and cheese
consumption, this report focuses solely on media advertising impacts since advertising remains the most important
marketing activity. In addition, data limitations on non-advertising promotion activities need to be addressed for
future modeling purposes. The effects of fluid advertising under both programs are combined because the objectives
of both programs are the same and data cannot be satisfactorily segregated to evaluate the two programs separately.
An evaluation of the effectiveness of cheese advertising by the Dairy Program, however, is conducted separately.
Most economic models (including those used in past Reports to Congress) used to evaluate the effects of generic
advertising programs over time measure the average impacts of various factors on demand. These "constant-
parameter" models can be problematic when the time period covered is relatively long and the marketing
environment has sufficiently changed. For example, the results of last year's report were based on data for the years
1975-2000, i.e., the effect of generic fluid milk and cheese advertising was measured as an average over this 26-year
period. A mean-response model of generic advertising may not accurately convey the current degree of advertising
effectiveness given changes in market environments, population profiles, and eating behavior over time. In addition,
advertising messages have changed, conversion of state to nationally run programs has occurred, and additional
groups (e.g., milk processors) have contributed to the national program since the inception of generic advertising
programs.
An alternative approach to measure the impacts of advertising, given a long history of time series data, is to use a
"time-varying parameter" model. These types of models measure how the impact of demand factors, including
generic advertising, vary over time. In this year's report such a model is adopted and, consequently, one can
examine how the effectiveness of generic fluid milk and cheese advertising has changed over time. Moreover, the
model is able to identify important factors that have influenced the changes in advertising effectiveness over time.
The model used is unique in its level of disaggregation of the U.S. dairy industry. For instance, the dairy industry is
divided into retail, wholesale (processing), and farm markets, and the retail and wholesale markets include fluid milk
and cheese separately. The model simulates market conditions with and without the Dairy and Fluid Programs.
36

The following summarizes the findings of the report. Copies of the complete evaluation report may be obtained from
Comell University, USDA, Dairy Management Inc., the National Dairy Promotion and Research Board, or the
National Fluid Milk Processor Promotion Board.
HIGHLIGHTS
Generic fluid milk and dairy product advertising conducted under the Dairy and Fluid Programs had a
major impact on dairy markets. Over the period 1997-2001, on average, the following market impacts
would have occurred if the advertising under the Fluid Program had not been in effect, and advertising
under the Dairy Program was equal to its level the year prior to the enactment of the national mandatory
program~:
Fluid milk consumption would have averaged 4.5 percent lower annually.
Cheese consumption would have averaged 1.0 percent lower annually.
Total consumption of milk in all dairy products would have averaged 1.9 percent, or roughly 3.6
billion pounds of milk fat equivalent, lower annually.
The average price received by dairy farmers would have averaged 6.9 percent, or $0.96 per
hundredweight, lower annually.
Commercial milk marketings by dairy farmers would have averaged 1.9 percent lower annually.
Over the same period, the following market impacts would have occurred if the Dairy Program were not in
existence but the Fluid Program were, and advertising expenditures by dairy farmers were equal to the level
that existed the year prior to enactment of this program:
Fluid milk consumption would have averaged 1.1 percent lower annually.
Cheese consumption would have averaged 1.1 percent lower annually.
Total milk consumption of all dairy products would have averaged 0.8 percent, or roughly 1.3
billion pounds of milk fat equivalent, lower annually.
The average price received by dairy farmers would have averaged 1.7 percent, or $0.23 per
hundredweight, lower annually.
Commercial milk marketings by dairy farmers would have been 0.8 percent lower annually.
The average benefit-cost ratio (BCR) for the Dairy Program was 6.26, meaning that each dollar
invested in fluid milk and cheese advertising remmed $6.26 in revenue to dairy farmers on
average.
1 It is important to note that there was generic milk and cheese advertising conducted by some states prior to passage of the 1983 Dairy Production Stabilization Act, which authorized the Dairy Program. As such, to measure the advertising impacts of the Dairy Program, this study simulated and compared market conditions with the Dairy Program versus market conditions reflecting advertising funding levels prior to when the Dairy Program was enacted. Throughout this report, any scenario referring to the absence of the Dairy Program reflects advertising funding at levels prior to enactment of the Dairy Program.
37
FACTORS AFFECTING THE DEMAND FOR FLUID MILK AND CHEESE
Because there are many factors that influence the demand for fluid milk and cheese besides advertising, an
econometric model was used to identify the effects of individual factors affecting the demand for these
products. The following variables were included as factors influencing per capita fluid milk demand: the
Consumer Price Index (CPI) for fluid milk, the CPI for non-alcoholic beverages used as a proxy for fluid
milk substitutes, per capita disposable income, the percentage of the U.S. population less than six years old,
the percentage of the U.S. population that is African American, variables to capture seasonality in fluid milk
demand, a trend variable to capture changes in consumer tastes for fluid milk over time, expenditures on
brand fluid milk advertising, and expenditures on generic fluid milk advertising. The following variables
were included as factors influencing per capita cheese demand: the CPI for cheese, the CPI for meat used
as a proxy for cheese substitutes, per capita disposable income, per capita food away from home (FAFH)
expenditures, the percentage of the U.S. population that is Asian/Other (specifically, non-White and non-
African American); the percentage of the U.S. population between 20 and 44 years old, variables to capture
seasonality in cheese demand, a trend variable to capture changes in consumer tastes for cheese over time,
expenditures on brand cheese advertising, and expenditures on generic cheese advertising.
The model was estimated with national quarterly data from 1975 through 2001. To account for the impact
of inflation, all prices and income were deflated. Brand and generic fluid milk and cheese advertising
expenditures were deflated by the Media Cost Index. Because advertising has a carry-over effect on
demand, past advertising expenditures also were included in the model as explanatory variables using a
distributed-lag structure.
Unlike most previously used "constant-parameter" models that measure the average impact each of the
above factors has on milk and cheese demand, the "time-varying parameter" model used in this report
measures each demand factor's impact on a quarterly basis. Moreover, the model used here is able to
identify what factors were most important to the variation of advertising response over time. This is
advantageous since the model not only allows one to measure the magnitude of each factor on demand, but
also how that magnitude has changed and what has impacted this change over time.
The relative impacts of variables affecting demand are represented with what economists call "elasticities."
Elasticities measure the percentage change in per capita demand given a one percent change in one of the
identified demand factors. Table 3-1 presents the estimated elasticity values for the primary demand
factors for fluid milk and cheese averaged over the most recent five-year period. For example, the price
elasticity of demand for fluid milk equal to -0.136 means that a one percent increase in the real, inflation-
adjusted fluid milk price decreases per capita fluid milk demand by 0.136 percent. While
Table 3-1 presents these elasticities as 5-year averages, discussion in the text and various figures that follow
display how these elasticities have varied annually over time. While the principal focus of this report is on
generic advertising elasticities for fluid milk and cheese, it also is important to examine the relative
importance of the other factors that affect per capita demand.
38

Fluid Milk
Since 1997, the primary factors that have influenced per capita fluid milk demand are: (1) the percentage of
the population under six years of age, (2) per capita disposable income, (3) the percentage of the population
that is African American, and (4) retail fluid milk price. However, most of these elasticities have changed
considerably over time. Price response for fluid milk increased relatively modestly through the first two-
thirds of the 1975-2001 sample period, ranging from approximately-0.05 in the mid-1980s to -0.18 in the
early 1990s (Figure 1). Since then, price response has decreased slightly to its current level of-0.12. This
relatively modest level of price response for fluid milk is similar to other estimates in the literature.
Somewhat surprising has been fluid milk demand response to income changes over time. While average
income elasticities for fluid milk remain below that for cheese (Table 3-1), increases in income elasticities
over time for fluid milk and cheese were quite similar (Figure 2). Since 1997, a one percent increase in
disposable income has resulted in an average 0.64 percent increase in per capita fluid milk demand. See
Table 4-1.
While the youngest-age cohort in the United States still remains an important factor affecting fluid milk
demand, reductions in the proportionate size of this cohort since the mid-1990s appear directly correlated
with reductions in this elasticity from around 1.30 in 1994 to 0.80 currently (Figure 3). For every one
percent decline in the proportion of the U.S. population less than six years old, there has been a 0.92
percent average decrease in per capita fluid milk demand since 1997 (Table 3-1).
Lower per capita fluid milk demand of African Americans relative to the rest of the population is well
recognized. Since 1997, a one percent increase in the proportion of the population that is African American
has resulted in an average decrease in per capita fluid milk demand of-0.24 (Table 3-1). A doubling in the
level of response has occurred over time, ranging from approximately -0.10 early in the sample period to
-0.30 in 1994-95, then rebounding to around -0.20 in 2001 (Figure 4).
Cheese
The primary factors influencing per capita cheese demand include: (1) per capita disposable income, (2)
the percentage of the population between 20 and 44 years of age, (3) the percentage of the population that is
Asian/Other, (4) retail cheese price, and (5) per capita expenditures on FAFH. As with fluid milk, cheese
demand is becoming increasingly responsive to changes in per capita disposable income. Since 1997, a one
percent increase in the per capita disposable income resulted in an average increase in per capital demand of
0.75 percent (Table 3-1). This factor has shown strong growth since the mid-1980s, but the level since the
mid-1990s has been relatively constant (Figure 2). Even so, the relatively high income elasticities for fluid
milk and cheese currently are intuitively attractive to future changes in per capita demand as real income
levels continue to increase.
39
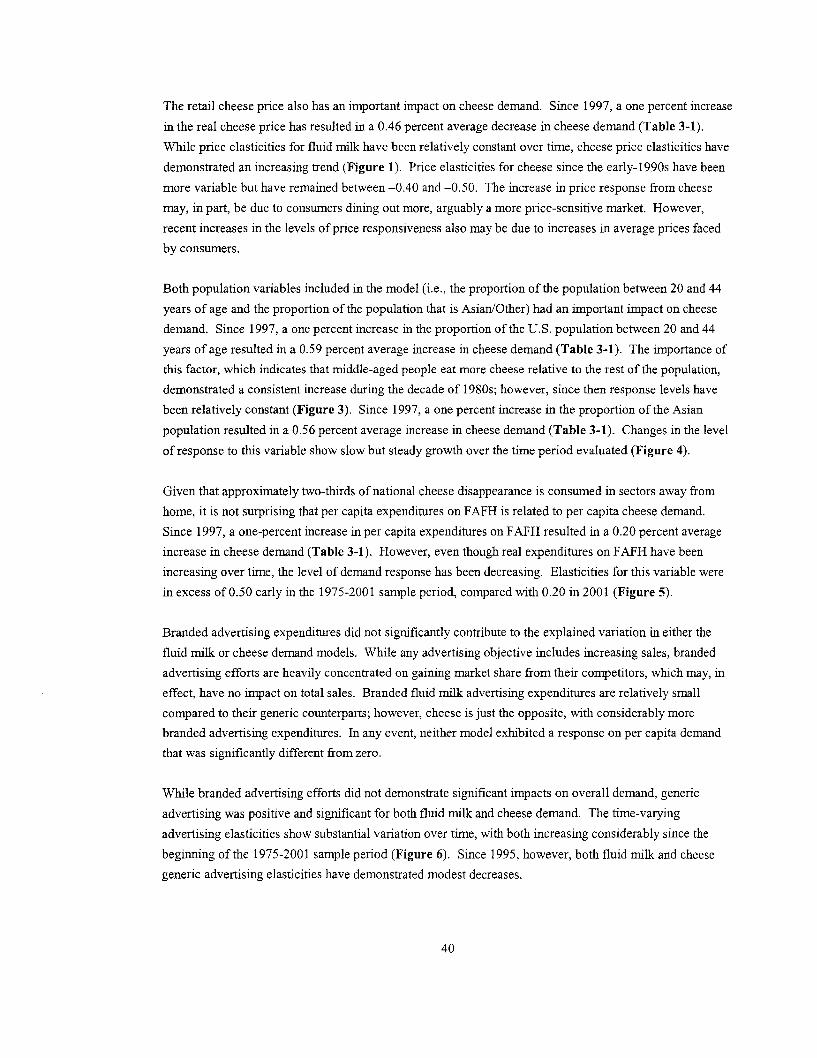
The retail cheese price also has an important impact on cheese demand. Since 1997, a one percent increase
in the real cheese price has resulted in a 0.46 percent average decrease in cheese demand (Table 3-1).
While price elasticities for fluid milk have been relatively constant over time, cheese price elasticities have
demonstrated an increasing trend (Figure 1). Price elasticities for cheese since the early-1990s have been
more variable but have remained between -0.40 and -0.50. The increase in price response from cheese
may, in part, be due to consumers dining out more, arguably a more price-sensitive market. However,
recent increases in the levels of price responsiveness also may be due to increases in average prices faced
by consumers.
Both population variables included in the model (i.e., the proportion of the population between 20 and 44
years of age and the proportion of the population that is Asian/Other) had an important impact on cheese
demand. Since 1997, a one percent increase in the proportion of the U.S. population between 20 and 44
years of age resulted in a 0.59 percent average increase in cheese demand (Table 3-1). The importance of
this factor, which indicates that middle-aged people eat more cheese relative to the rest of the population,
demonstrated a consistent increase during the decade of 1980s; however, since then response levels have
been relatively constant (Figure 3). Since 1997, a one percent increase in the proportion of the Asian
population resulted in a 0.56 percent average increase in cheese demand (Table 3-1). Changes in the level
of response to this variable show slow but steady growth over the time period evaluated (Figure 4).
Given that approximately two-thirds of national cheese disappearance is consumed in sectors away from
home, it is not surprising that per capita expenditures on FAFH is related to per capita cheese demand.
Since 1997, a one-percent increase in per capita expenditures on FAFH resulted in a 0.20 percent average
increase in cheese demand (Table 3-1). However, even though real expenditures on FAFH have been
increasing over time, the level of demand response has been decreasing. Elasticities for this variable were
in excess of 0.50 early in the 1975-2001 sample period, compared with 0.20 in 2001 (Figure 5).
Branded advertising expenditures did not significantly contribute to the explained variation in either the
fluid milk or cheese demand models. While any advertising objective includes increasing sales, branded
advertising efforts are heavily concentrated on gaining market share from their competitors, which may, in
effect, have no impact on total sales. Branded fluid milk advertising expenditures are relatively small
compared to their generic counterparts; however, cheese is just the opposite, with considerably more
branded advertising expenditures. In any event, neither model exhibited a response on per capita demand
that was significantly different from zero.
While branded advertising efforts did not demonstrate significant impacts on overall demand, generic
advertising was positive and significant for both fluid milk and cheese demand. The time-varying
advertising elasticities show substantial variation over time, with both increasing considerably since the
beginning of the 1975-2001 sample period (Figure 6). Since 1995, however, both fluid milk and cheese
generic advertising elasticities have demonstrated modest decreases.
40

Both products show significant increases in advertising elasticities following the inception of the Dairy
Program in 1984, with each reaching their highest levels around 1994. Fluid milk generic advertising
elasticities increased from 0.02 at the beginning of the sample period in 1977 to nearly 0.06 in 1994.
Currently, the fluid milk generic advertising elasticity is around 0.04. Generic advertising elasticities for
cheese ranged from 0.005 to 0.045 over the same time frame and are currently at levels very similar to that
for fluid milk generic advertising. A similar increase in advertising response was not exhibited following
the addition of advertising expenditures from the Fluid Program in 1995. This may be due, in part, to the
fact that the Fluid Milk Board expenditures are combined with the Dairy Program fluid milk expenditures in
the economic model, and while total fluid milk advertising expenditures have increased with the inception
of the Fluid Program, Dairy Program expenditures on fluid milk have been reduced somewhat as
advertising dollars were shifted to cheese advertising.
It is important to note that past constant-parameter advertising studies have consistently shown advertising
elasticities for cheese demand below that for fluid milk demand. Response levels over the entire sample
period clearly exhibit this characteristic as well. However, since the mid-1990s fluid milk and cheese
generic advertising elasticities have been very similar. In fact, since 1997, a one percent increase in generic
advertising for fluid milk resulted in an average 0.042 percent increase in per capita fluid milk demand,
compared with an average elasticity for generic cheese advertising of 0.039 (Table 3-1))
FACTORS AFFECTING GENERIC ADVERTISING EFFECTIVENESS
The model used in this study is able to measure how changes in variable levels have impacted generic
advertising effectiveness over time. That is, allowing advertising response to vary over time is important
and beneficial, but knowing what factors contributed to that variation, and by how much, provides valuable
information for crafting future advertising strategies or altering target audiences. We can define these
impacts mathematically from the time-varying parameter model specification, and we refer to them as
generic advertising response elasticities - in essence, an elasticity of an elasticity! Specifically, the generic
advertising response elasticity measures the percentage change in the generic advertising elasticity given a
one percent change in the variable of interest. For example, how are generic advertising elasticities affected
by changes in real income or by changes in food expenditure patterns? The signs of the generic advertising
response elasticities provide useful information for product marketers in crafting future market strategies.
Furthermore, by using the actual changes of the included variables, we can estimate the relative impacts of
these variables on estimated changes in advertising elasticities.
2 It is hypothesized that advertising of pizza and cheeseburgers has a positive effect on the consumption of cheese. Such variables were not included in the model due to a lack of data. Assuming pizza and cheeseburger advertising has a significantly positive effect on cheese consumption, omission of these variables could result in the impact of generic cheese advertising being somewhat overstated.
41

Advertising response elasticities were computed and averaged over the time period of 1997-2001 and are
presented in Table 3-2. The relatively low standard deviations indicate that these response elasticities have
been quite constant over the time period evaluated. The response elasticities do, however, differ
considerably between fluid milk and cheese. Price effects were negative in both cases; however, the generic
advertising response elasticity for cheese was considerably higher than that for fluid milk. The negative
signs indicate that advertising is more effective during periods of lower product prices. As such,
coordinating advertising efforts with price promotions would be an effective strategy to increase overall
advertising response.
Increasing income levels have increased the effectiveness of both fluid milk and cheese advertising,
although the effect was nearly 40% higher for cheese. The generic advertising response elasticity for
income was similar in magnitude to the price effect for cheese, but considerably higher for fluid milk. The
relatively large numbers and positive signs indicate that designing advertising messages targeting middle-
and high-income levels would be an effective strategy to increase overall generic advertising response.
The negative response elasticity for FAFH expenditures indicates that as per capita expenditures on FAFH
increase, the overall response to the generic cheese advertising message is reduced (Table 3-2). This may
be due to the fact that while two-thirds of cheese disappearance is away from home, nearly all generic
cheese advertising is focused on at-home consumption. As such, the advertising message is not effective at
getting consumers to eat more cheese in the away-from-home market. As such, it is reasonable to expect
that as consumers spend more of their budget away from home, the current generic cheese advertising
message becomes less effective. Given the importance of cheese disappearance from the away-from-home
sector, future direction of advertising campaigns specifically directed to this market may improve response
to the generic message.
Both age composition advertising response elasticities for fluid milk and cheese were large and positive
(Table 3-2). While we saw earlier that there exists a positive demand relationship between per capita
cheese consumption and the proportion of the population between 20 and 44 years of age, the positive
generic cheese advertising response elasticity indicates that this cohort also is more responsive to the
generic advertising message. A similar relationship exists for the fluid milk category and proportion of the
population under age six. It follows then that advertising strategies targeted towards these cohorts would be
an effective approach to increase generic advertising response. That is, targeted messages to middle-aged
consumers for cheese and to adults with young children (the implied decision makers for the youngest
cohort) would be expected to increase per capita advertising response to these programs.
Finally, both race-related advertising response elasticities for fluid milk and cheese are of the same sign as
their respective demand elasticities. That is, as the proportion of African Americans in the population
increases, there is both a negative demand effect for fluid milk as well as decreased advertising response.
Similarly, the positive demand impact of increases in the Asian population is reinforced with increases in
42

advertising elasticities. From an advertising perspective for cheese, this is a "win-win" situation. The
Asian population proportion has increased approximately 11% since 1997 and it appears that this segment
of the population is more responsive to the generic advertising message.
The advertising response elasticities highlighted in Table 3-2 indicate changes in generic advertising
elasticities for marginal (i.e., small) changes in the associated variables. However, the resulting effect on
changes in the generic advertising elasticity depends onboth the level of the response elasticity as well as
the actual change in the level of these variables over time. To evaluate the relative contributions of changes
in these markets and demographic variables on recent changes in generic advertising elasiticities, we
multiply the percentage changes in these variables over the time period of 1997-2001 by the associated
response elasticity in Table 3-2. The result of this decomposition is exhibited in Figure 7.
Looking at the generic advertising response elasticities in this framework indicates that decreases in the
proportion of the population under age six and increases in per capita income have had the largest impacts
on variation in advertising response for fluid milk over the last five years (Figure 7). Even though the age
advertising response elasticity was positive, the negative contribution of the age cohort effect is due to the
fact that the proportion of the population in this cohort has decreased since 1997.
The effect of price changes over this time period on variation in generic advertising elasticities for fluid
milk was about one-half of that exhibited by the other two variables, and race effects (via changes in the
proportion of the African American population) were minimal. This is similar to the ranking of advertising
response elasticities in Table 3-2; however, the actual African American race impact was reduced given its
small change over the time period (i.e., around 2%). The combined negative contribution of the price, age,
and race effects slightly outweigh the positive income contribution and reflects the modest reduction in the
generic fluid milk advertising elasticities since 1997.
The largest contributors to the variation in generic cheese advertising response were due to increases in per
capita income levels (positive) and per capita FAFH expenditures (negative), with each factor substantively
negating the effect of the other (Figure 7). That is, advertising gains from increases in real per capita
income were largely offset by increases in per capita FAFH expenditures. Race, price, and middle-aged
cohort effects were also significant but well below those of the income and FAFH effects. These rankings
are somewhat different than exhibited by the response elasticities in Table 2.
While the generic advertising response elasticities were relatively large for the price and age variables, the
decomposition effects since 1997 were reduced by relatively small changes in these variables since 1997
(+4% for price, -4% for the proportion of the population age 20-44). Again, the combined negative
contributions slightly outweigh the positive contributions, consistent with the overall decrease in generic
cheese advertising elasticities from 1997 to 2001.
43

IMPACT OF THE DAIRY AND FLUID MILK ADVERTISING PROGRAMS
To evaluate recent market impacts of the Dairy and Fluid Advertising Programs, the economic model was
simulated over the time period from 1999 through 2001. These two programs are complementary in that
they both share a common objective to increase fluid milk sales. To accomplish this objective, both
programs invest in generic fluid milk advertising, which is different from brand advertising in that the goal
is to increase the total market for fluid milk rather than a specific brand's market share. In the evaluation of
the programs, it is assumed that a dollar spent on fluid milk advertising by dairy farmers has the same effect
on demand as a dollar spent by processors on fluid milk advertising, since both programs have an identical
objective. The Dairy Program additionally has an objective to expand the market for cheese. Accordingly,
part of its budget is directed to generic cheese advertising.
To examine the impacts that the two advertising programs had on the markets for fluid milk and cheese over
this period, the economic model was initially simulated under two scenarios based on the level of genetic
advertising expenditures: (1) a baseline scenario, where genetic advertising levels were equal to actual
generic advertising expenditures under the two programs, and (2) a no-national program scenario, where
there was no fluid milk processor sponsored advertising and dairy farmer sponsored advertising was
reduced to 42 percent of actual levels to reflect the difference in assessment before and after the national
program was enacted. A comparison of these two scenarios provides a measure of the combined impacts of
the two programs.
Table 3-3 presents the annual averages for supply, demand, and price variables over the period 1999-2001
for the two scenarios. Generic advertising by the Dairy and Fluid Programs has had a positive impact on
fluid milk consumption over this period. Specifically, fluid milk consumption would have been 4.5 percent
lower had the two advertising programs not been in effect. Likewise, generic cheese advertising under the
Dairy Program had a positive impact on cheese consumption, (i.e., consumption would have been 1.0
percent lower without generic advertising.) Consumption of milk used in all dairy products would have
been 1.9 percent lower had these two programs not been in effect during 1999-2001.
Generic advertising by dairy farmers and milk processors also had an effect on the farm milk price and milk
marketings. The simulation results indicate that the all-milk price would have been $0.96 per
hundredweight lower without the generic advertising provided under the two programs. The farm milk
price impacts resulted in a slight increase in farm milk marketings. That is, had there not been the two
advertising programs, farm milk marketings would have been 1.9 percent lower over the 1999-2001 period
due to the lower milk price.
A third scenario was subsequently simulated to measure the market impacts of the advertising program
supported by the 15-cent checkoffprogram by dairy farmers; however, this scenario assumes that the
advertising program operated by the milk processors is still in effect. As in the earlier scenario, advertising
44

expenditures by dairy farmers were reduced to 42 percent of actual levels to reflect the situation prior to the
enaclxnent of the Dairy Program. A comparison of the third scenario with the baseline scenario gives a
measure of the advertising market impacts of the current mandatory Dairy Program.
The last two columns of Table 3-3 present the results of this scenario, which are similar to the combined
fluid milk processor and dairy farmer advertising program results. Had there not been fluid milk and cheese
advertising sponsored by dairy farmers, fluid milk demand would have been 1.1 percent lower, cheese
demand would have been 1.1 percent lower, and total milk demand would have been 0.8 percent lower than
it actually was. Advertising under the Dairy Program also had a significant impact on the farmer milk price.
The simulation results indicate that the all-milk price would have been $0.23 per hundredweight lower
without generic advertising by the Dairy Program. Finally, farm milk marketings would have been slightly
lower (0.8 percent) in the absence of the Dairy Program.
B E N E F I T - C O S T O F A D V E R T I S I N G B Y T H E D A I R Y P R O G R A M
One way to measure whether the benefits of a program outweigh the costs is to compute a benefit-cost ratio
(BCR). A BCR can be computed as the change in net revenue due to advertising divided by the cost of
advertising. While a BCR for producers can be estimated for the Dairy Program, it cannot be computed at
this time for milk processors with the Fluid Program because data on packaged fluid milk wholesale prices,
which is necessary in calculating processor net revenue, are proprietary information and not available.
The BCR for the Dairy Program was calculated as the change in dairy farmer net revenue (which
economists call "producer surplus") due to demand enhancement from advertising under the Dairy Program
divided by the advertising costs. The demand enhancement reflects increases in quantity and price as a
result of the advertising program. As such, costs allocated to the enhancement represent advertising costs.
Since advertising expenditures in the model only represent air-time, print space, and other direct media
costs, it is necessary to incorporate expenses that reflect general administration, overhead, and advertising
production costs in order to reflect the true complete costs of the advertising program supported by the
checkoff. Following conversations with staff at Dairy Management Inc. (DMI) and a review of Dairy
Program budgets, direct media expenditures were prorated upwards by a factor of 1.25. The results show
that the average BCR for the Dairy Program was 6.26 from 1999 through 2001. This means that each dollar
invested in generic fluid milk and cheese advertising by dairy farmers during the period returned $6.26, on
average, in net revenue to farmers.
Another way to interpret this figure is as follows: The increase in generic advertising expenditures resulting
from the enactment of the Dairy Program cost dairy producers an additional $67 million per year on average
since 1999, i.e. the difference between $213 million annually under the baseline scenario and $146 million
under the no-Dairy-Program scenario. The additional fluid milk and cheese advertising resulted in higher
milk demand, milk prices, and profits for dairy producers nationwide. Based on the simulations conducted
45

with the economic model, it is estimated that the average annual increase in producer surplus (reflecting
changes in both revenues and costs) since 1999 due to the additional advertising under the Dairy Program
was $420 million, which represents 1.8 percent of total farm cash receipts from milk marketings. Dividing
$420 million by the additional advertising costs of $67 million results in the benefit cost ratio estimate of
6.26.
It should be noted that the BCR estimate here is above those estimated in previous reports that used
constant parameter models. This is, in part, reflective of the higher fluid milk and cheese generic
advertising elasticities estimated over the more recent time period relative to the mean-response elasticities
estimated with constant parameter models over the entire sample period. In addition, previous reports
evaluated a five-year time horizon and compared changes in gains in producer net revenue to the value of
the entire dairy checkoff. Using a similar procedure, a constant parameter version of the above model was
also estimated with results comparable to previous estimates. The goal of this report was to enhance the
economic model by allowing advertising elasticities to change over time and with simulation results
reflective of current market indicators to evaluate returns to the generic advertising program. The results of
this approach indicate that generic advertising for fluid milk and cheese continues to be a viable and
worthwhile program for milk producers.
46

Table 3-1. Average elasticity values (199 7-2001)for factors affecting the retail demand
for fluid milk and cheese, a
Factors affecting demand Fluid Milk Cheese
Retail price -0.136
Per capita income 0.645
Per capita food away from home expenditures n.a.
Percent of population under 6 years of age 0.916
Percent of population 20 to 44 years of age n.a.
Percent of population African American -0.239
Percent of population Asian/Other n.a.
Generic Advertising 0.041
-0.459
0.753
0.197
n.a.
0.590
n . a .
0.557
0.039
a Example: A one-percent increase in the retail price of fluid milk is estimated to reduce per capita sales of fluid milk by 0.136 percent, n.a. means "not applicable."
47

Table 3-2. Average Gen eric Advertising Response Elasticities, 199 7-2001a
Oo
Fluid Milk Cheese
Variable Elasticity Std. Dev.
Retail price
Per capita income
Per capita food away from home expenditures
Percent of population under 6 years of age
Percent of population 20 to 44 years of age
Percent of population African American
!Percent of population Asian/Other
Elasticity Std. Dev.
-1.156 0.054 -6.115 0.216
4.416 0.114 7.331 0.189
n.a. n.a. -4.718 0.203
6.536 0.103 n.a. n.a.
n.a. n.a. 6.628 0.102
-1.628 0.013 n.a. n.a.
n.a. n.a. 2.757 0.093
a Interpreted as the percentage change in the long-run generic advertising elasticity for a one-percentage unit change in the assgciated variable.

' ,D
Table 3- 3. Simulated impacts of the Dairy and Fluid Milk Programs on selected market variables, annual average 1999-2001.
Baseline Scenario a No National Program Scenario b No Dairy Program Scenario c
Market Variable Unit Level
Fluid Milk Demand
Cheese Demand
Total Dairy Demand
Basic Formula Price
All Milk Price
Milk Marketings
Benefit-Cost Ratio d
bil lbs 55.5
bil lbs MFE 68.5
Level % Difference
53.0 -4.5
67.9 -1.0
Level % Difference
54.9 -1.1
67.8 -1.1
161.0 -0.8
11.54 -1.8
13.64 -1.7
162.8 -0.8
6.26
bil lbs 162.3
$/cwt 11.76
$/cwt 13.87
bil lbs 164.1
$ per $1
159.2 -1.9
10.92 -7.1
12.91 -6.9
161.0 -1.9
a . Baseline scenario reflects the current operation of the Dairy and Fluid Milk Programs. b. No National Program Scenario reflects no Fluid Milk Program and Dairy Program advertising at pre-national program spending levels. c. No Dairy Program reflects current Fluid Milk Program and Dairy program advertising at pre-national program spending levels. d. Benefit-Cost ratio computed for Dairy Program only.

Figure 1. Annual Price Elasticities for Fluid Milk and Cheese
0.6000
0.5000
0.4000
:~ 0.3000
0.2000
/
/
\ \ \ /
¢ / /
/ /
/
0.1000 ~'
0,0000 , , i
("4 t"4
Year
[ - m - F l u i d M i l k + C h e e s e ]
Figure 2. Annual Income Elasticities for Fluid Milk and Cheese
1.0000
0.9000
0.8000
0.7000
0.6000
"~ 0.5000
0.4000
0.3000
0.2000
0.1000
0.0000
\ y >... , , ~ _ = . , & . ~ ~ ,~ /
.o~..~I. ~=/ "~~,../ / ~
/,/ /
, ~ ~ . * - 7 ~ J "
Year
[---l- Fluid Milk .... -i..,.. Cheese I
50

Figure 3. Annual Age Composition Elasticities for Fluid Milk and Cheese
1.4000
t~
1.2000
1.0000
0.8000 S
0.8000 ,.~ \ / ~
0.4000 ! / -
0.0000 ~ _ . ~ . . ~ ' ~ ,
-0.2000
Year
I + F l u i d Milk, Age < 6 -~ Cheese, Age 20-44
Figure 4. Annual Race Elasticities for Fluid Milk and Cheese
O.70OO
0.6000
0.5000
I=IL • ~ 0.2000
0.1000
0.0000
-0.1000
-0.2000
-0.3000
-0.4000
- - - - -4 - - - - . , , ~ _ _ ~ . _ -_ _ . , , - - . - - - ' ~ __
i
Year
~ + F l u i d Milk, African American ~ Cheese, Asian ]
51

Figure 5. Annnal Per Capita Food Away From Home Expenditure Elasticities for Cheese
0 . 7 0 0 0
0.6000 _ , . - , . 0 4 ~ - - - - . . ~ ",
-,,
0 . 5 0 0 0 """
0.4000
0.3000
0.2000
\, \\
0.1000
~""~'" / / ~ ,
0.0000
Year
Figure 6. Annual Generic Advertising Elasticities for Fluid Milk and Cheese
0.0700
0.0600
0.0500
,~ 0.0400
0.0300
0 . 0 2 0 0
0,0100
, /
0,0000 I , , , - -
ox ox o-, ox c~ o~ o~ ox ox ct, ox o~ ox c~ ox ox ox o~ o~ o~ c ) c-i
Year
[ + F l u i d M i l k ~ C h e e s e ]
52

Figure 7. Generic Advertising Response Decomposition for Fluid Milk and Cheese, Percent of Total Advertising Parameter Variation 1997-2001.
125
i
-100
-125
AFRICAN AMERICA~
FLUID MILK CHEESE
Product
53

Appendix. Description o f Variables Used in Econometric Model. a
Variable
RFDPC
RCDPC
RBDPC
RCDPC
FMS
Description Consumption Variables
Quarterly retail fluid demand per capita
Quarterly retail cheese demand per capita
Quarterly retail butter demand per capita
Quarterly retail frozen demand per capita
Quarterly fluid milk production
Units Mean b
lbs. MFE 49.46 (1.40)
lbs. MFE 60.16 (3.11)
lbs. MFE 23.84 (2.85)
lbs. MFE 12.72 (1.96)
bil. lbs. 40.45 (I .47)
Prices and Price Indices RFPBEV Consumer retail price index for fresh milk and cream, deflated by #
retail consumer price index for nonalcoholic beverages (1982- 84=100) Consumer retail price index for cheese, deflated by consumer # retail price index for meats (1982-84=100) Wholesale fluid price index (1982-84= 100) #
Wholesale cheese price S/lb.
Basic formula price $/cwt.
All milk price $/cwt.
Class I differential $/cwt.
Producer energy index (1982-84= 100)
RCPMEAT
WFP
WCP
MW
AMP
DIFF
PFE
1.14 (0.05)
1.03 (O.04) 1.46
(0.09) 1.39
(0.22) 12.31 (2.13) 14.08 (1.57) 3.27
(1.94) 1.02
(0.14)
INCPC
BLACK
ASIAN
AGE5
AGE2044
Demographic Variables Per capita disposable income, deflated by the consumer retail $000 price index for all items (1982-84=100) Proportion of the population African American #
Proportion of the population Asian #
Proportion of the population under age 6 #
Proportion of the population age 20 to 44 #
14.22 (0.37) 11.95 (0.10) 4.71
(0.16) 6.94
(0.11) 36.91 (0.57)
GFAD
GFAD DMI
GFAD MILKPEP
GCAD
BFAD
BCAD
Advertising Expenditures Quarterly generic fluid milk advertising expenditures, deflated by $mil Media Cost Index (2001 = 100) Quarterly generic fluid milk advertising expenditures, Dairy Snail Program, deflated by Media Cost Index (2001 = 100) Quarterly generic fluid milk advertising expenditures, Fluid Milk $mil Program, deflated by Media Cost Index (2001=100) Quarterly generic cheese advertising expenditures, Dairy $mil Program, deflated by Media Cost Index (2001=100) Quarterly brand fluid milk advertising expenditures, deflated by $mil Media Cost Index (2001=100) Quarterly brand cheese advertising expenditures, deflated by $mil Media Cost Index (2001=100)
40.74 (9.69) 23.31
(10.09) 17.43 (5.37) 13.47 (2.36) 5.77
(2.93) 26.43
(10.16) a Quarterly dummy variables (Q1-Q3) are also included in the model to account for seasonality in demand. b Mean and standard deviation computed over most recent five-year period, 1997-2001. Standard deviation in parentheses.
54

CHAPTER 4
FLUID M I L K M A R K E T AND P R O M O T I O N A S S E S S M E N T
For the third consecutive year, Beverage Marketing Corporation (BMC) has been commissioned by dairy
Management Inc. and the Fluid Milk Processor Promotion Board to review the generic fluid milk advertising and
promotional programs. This review offers a subjective evaluation of the effectiveness of those programs. BMC
evaluates milk's position relative to milk's competitive beverage set - - its respective marketing efforts and market
performance. BMC believes milk's competitive set includes most non-alcoholic refreshment beverages, specifically
carbonated soft drinks, bottled water, fruit beverages, ready-to-drink teas, and sports beverages. This year BMC
examines both the overall milk industry's performance as well as the effect that targeted advertising and promotion
have had on milk consumption by the crucial demographic cohorts. The following summarizes our findings based
on the analysis of available data.
BMC'S ASSESSMENT OF CURRENT MILK INDUSTRY ENVIRONMENT
Total fluid milk consumption/volume has moved up and down within a narrow range of small declines and
gains over the past 30 years. Over the past decade, total volume has been essentially fiat, while per capita
consumption has slid downward. However, since 1995, the rate of decline in fluid milk consumption has
actually decreased in four out of the last six years in year-over-year comparisons. See Figure 4-1. BMC
believes that fluid milk volume declines would have been greater without the impact of the national generic
fluid milk advertising and promotional program. Additionally, targeted marketing to key demographics
such as kids, teens and Hispanics by the national generic program has been effective in increasing
consumption among these key targets.
Per Capita Consumption Percentage Change
1995 - 2001 o5 . f , 0.0% , , ~ ,
-o.5% f -1.0% , , , , ~ i p ¢,.
Figure 4-1
| |
-1.5% •
-2.0% l
-2.5% _
-3.0%
-3.5%
d'
41' -4.0% J
1995 1996 1997
Source." Beverage Markegng Co~., USDA
1998 1999 2 0 0 0 2001
55

The history of volume changes for fluid milk sales over the past five years is shown in Figure 4-2. Milk's
compound annual growth rate (CAGR) was -0.3% from 1997 to 2001. Milk volume in 2001 shrank 0.8%
to 6,305.2 million gallons. Along with the decline in volume, per capita milk consumption dropped 1.8%
to 22.2 gallons per capita in 2001.
Note: In past years, BMC relied largely on retail scanner data as the basis for milk volume/growth
analysis. BMC's milk data (based largely on scanner data) agrees directionally with the USDA data and
shows milk volume down in 2001. For 2001, USDA data are being used. To make an accurate point of
comparison, 2000 has been restated to be consistent with the USDA while data from 1997-1999 were
already consistent with USDA figures.
Figure 4-2
Flu id Milk Sales Volume and Growth 1 9 9 7 - 2001
7,000.0 J -0.5% -0.2% +0.5%
6,000.0
5,000.0 q
4,000.0
3,000.0
2,000.0 J
1,ooo.o i I
/ i i 6,385.0]
p;! -1.0% -0.8%
1997 1998 1999 2000 "', 2001 *~*
Per Capita I Consumption (r) 23.6 23.2 23.1 22.5 22.2 Ii
* In millions of gallons; ** Based on USDA milk data r = Revised Source." Beverage Marketing Corp.; USDA
56
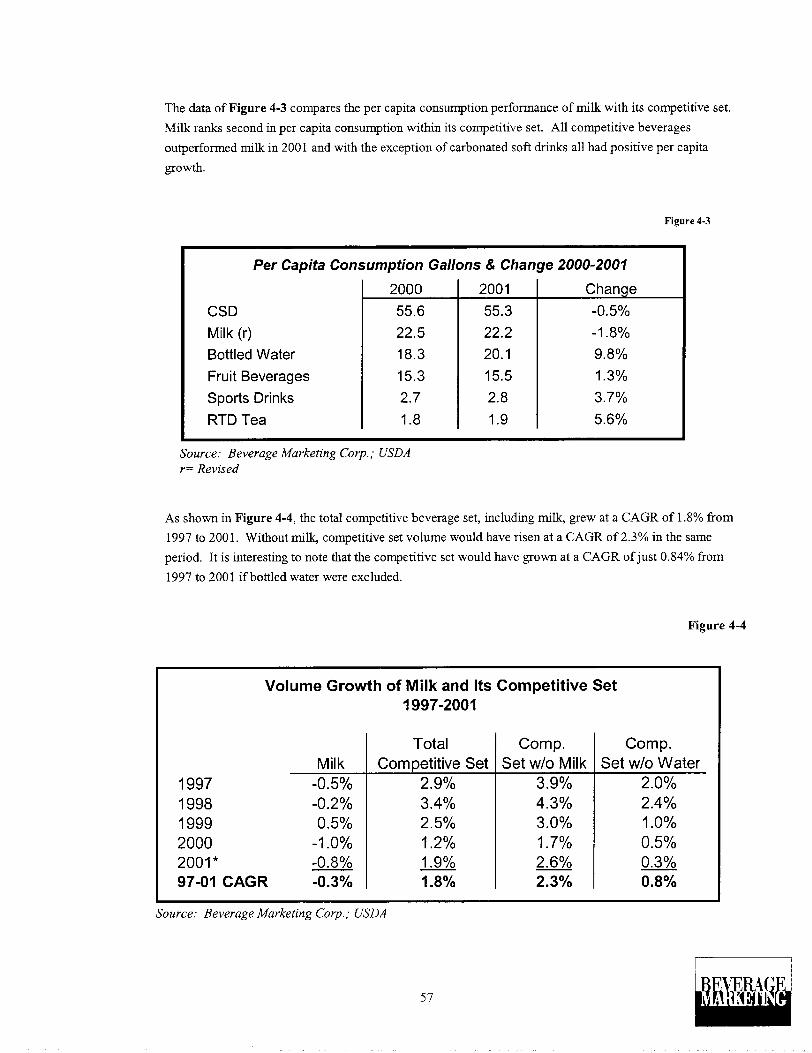
The data of Figure 4-3 compares the per capita consumption performance of milk with its competitive set.
Milk ranks second in per capita consumption within its competitive set. All competitive beverages
outperformed milk in 2001 and with the exception of carbonated soft drinks all had positive per capita
growth.
Figure 4-3
Per Capita Consumption Gallons & Change 2000-2001
2000 2001 Change
CSD Milk (r) Bottled Water Fruit Beverages Sports Drinks
RTD Tea
55.6 22.5 18.3 15.3 2.7 1.8
55.3 22.2 20.1 15.5 2.8 1.9
-0.5% -1.8% 9.8% 1.3% 3.7%
5.6%
Source." Beverage Marketing Corp.," USDA r= Revised
As shown in Figure 4-4, the total competitive beverage set, including milk, grew at a CAGR of 1.8% from
1997 to 2001. Without milk, competitive set volume would have risen at a CAGR of 2.3% in the same
period. It is interesting to note that the competitive set would have grown at a CAGR of just 0.84% from
1997 to 2001 if bottled water were excluded.
Figure 4-4
Volume Growth of Milk and Its Competitive Set 1997-2001
Milk 1997 -0.5% 1998 -0.2% 1999 O.5% 2000 -1.0% 2001" -O.8% 97-01 CAGR -0.3%
Total Competitive Set
2.9% 3.4% 2.5% 1.2% 1.9% 1.8%
Comp. Set w/o Milk
3.9% 4.3% 3.0% 1.7% 2.6% 2.3%
Comp. Set w/o Water
2.0% 2.4% 1.0% 0.5% 0.3% 0.8%
?ource: Beverage Marketing Corp.; USDA
57

BMC analyzed milk's annual share of the volume increase of the entire competitive set over the past 15
years. This measure of milk's performance is an index based on its share of competitive volume change,
divided by milk's market share of the competitive set at the beginning of the year. When this index is
greater than 1, milk is improving its share. When less than 1, milk's share of the competitive set is
declining. Milk's share of competitive remover from 1997 to 2001 is shown in Figure 4-5, along with data
for the competitive set. From 1997 to 1999, milk had shown improvement in competitive turnover rates,
though still losing share to competitors.
Milk's share of competitive remover declined the last two years, though its index recovered slightly from
restated 2000 (-0.8) to -0.4 in 2001. Bottled water was once again the strongest performer of the
competitive set, with a share of competitive turnover index of 5.1 in 2001. Sports beverages followed at a
distant 3.1.
8.0
Milk Indexed Share o f Competitive Turnover 1997- 2001
Figure 4-5
~ M i l k -.m-.B. Water ~ S p o r t s ~ F r u i t - -~ ' -CSD - 'e - -RTD Tea
7.0
6.0
5.0
4.0
3.0
2.0
1.0
0.0
-1.0
-2.0
1997 1998 1999 2 0 0 0 r 2001
Source." Beverage Marketing Corp.," USDA r." Revised
Gained Competitive Share
Lost Competitive Share
58

Milk's competitive environment remains one of the most challenging in beverage history. Recent years
have seen the increasing breadth and strength of major beverage brands, especially in the bottled water
business, which raised the level of competition for consumers' minds and dollars. Importantly, marketing
and advertising efforts of the competitive set have continued to climb significantly in all categories.
See Figure 4-6.
Competitive Set Advertising Spend per Gallon 1 9 9 9 - 2001
Figure 4.6
$0.180 $0.160" $0.140- $0.120" $0.100 $0.080 $0.060 $0.040 $0.020 $o.ooo
$0.148
~ A ~°'°8° ~ 5 5 7 0 . 0 4 2 $0.025
$o007
1999
$0.172
;0.082 N ~ $0.062 ~ ~ l f:;~.:._ $0.046 $0.024
N iiiiiiiiiii~illi~! $0.014
2000r
$0.180
$0.043 ~ [ i i i i i ............. $o.o2s i iiiilZiJi_=~'~:7~ $0.022
' ifiii!i!ii!iiiii!i l 2001
I [] Spor ts Dr inks [] Frui t B e v e r a g e s [] R T D T e a [] C SD [] B o t t l ed W a t e r [] Mi lk I
Source: Beverage Marketing Corp.; USDA; CMR Multimedia Service
In 2001, at $0.022 per gallon, milk spent the least on advertising per gallon of any of its competitors, nearly
three tenths of a cent less than its nearest competitor, bottled water, at $0.025 per gallon. In 2001, $137.7
million was spent on milk advertising. While most of that spending came from the national generic fluid
milk program, some of it came from individual processors. Again in 2001, carbonated soft drinks
accounted for essentially half of all advertising spending of the competitive set. See Figure 4-7.
Quantitative analysis of competitive beverages' promotional expenditure is impossible because the data are
kept confidential. However, BMC believes that milk is overspent by the competitive set to an even greater
degree on promotion and other marketing programs than it is on advertising. This competitive mismatch is
undoubtedly a key contributor to milk's flat sales performance.
59

Competitive Set Advertising Spending 2001
6~lillions of Dollars)
Figure 4-7
Source." Beverage Marketing Corp.," C34R Multimedia Service
~TD Tea $23.5
2%
Milk remains at a competitive disadvantage in several important respects:
C o n s u m er a t t en t ion
• An increasing an-ay of non-milk beverage products are competing for the attention of the
consumer. Many have co-opted milk's product attributes, such as a source of calcium.
• Reduced share of voice due to decreases in milk advertising spending and increases in
competitive spending.
Product attributes and innovation
• While milk has begun to innovate, it still lags behind almost every other category in the
competitive set in this respect. Milk still offers limited new products and flavors in
comparison to the competition.
• Milk consumption in single-serve plastic packages was up more than 4% in 2001 based on
limited IRI data, and likely grew more than that if convenience store data were included.
Plastic single-serve is likely to become milk's most important innovation in terms of brand,
product, inaage improvement and channel availability as food service, vending, and other
channels develop.
60

Branding
Milk's competitive set is dominated by world-class marketing organizations with powerful
brands. Milk has only a handful of large brands and is still largely viewed as a commodity.
• The majority of milk volume is private label, while just a fraction of the competitive set is
accounted for by private label. This lack of strong milk brands continues to hamper milk's
ability to compete, as we believe branded product advertising is more effective than generic
advertising in the beverage industry.
• Consolidation in the dairy industry should lead to brand development and innovation, but has
yet to yield significant brand marketing gains.
Distribution
Despite milk's inroads into fast-growing, non-traditional channels, including vending, quick-
serve (e.g., Dunkin' Donuts), and mass merchandisers (e.g., Wal-Mart), milk remains a
primarily supermarket-purchased, take-home product.
Milk vending is likely to become an important channel for processors, and has the potential to
improve the availability, merchandising, and consumption of milk in numerous locations, but
vending is currently underdeveloped relative to the competition.
Product perishability limits promotion and display efforts and eliminates retailer and
consumer stock-up. BMC believes that higher in-home inventories of beverage products can
lead to increased consumption levels. However, new pasteurization and packaging techniques
are beginning to create distribution, display and stock-up options. Consumer perception of
these products and their "freshness" needs to be modified in order to make them truly viable.
Marketing alignment
• Coordination and alignment between the national program developers, processors and
retailers have improved, but integration/alignment must be much tighter before milk can even
approach its competition in terms of marketing strength. In well-aligned programs, local
activities reference and reinforce the main themes of the national generic advertising.
Pricing
• The milk industry is limited (structurally and legally) in its use of price promotion.
Specifically, product perishability as well as state regulations limit the industry's ability to use
price promotions.
• Milk's competitive set uses price promotion aggressively to promote consumption and
stock-up.
61

BMC'S ASSESSMENT OF CURRENT MILK MARKETING PROGRAMS
Beverage Marketing believes the marketing campaign under the Dairy Act and the Fluid Milk Act has
successfully slowed milk's long historical slide in per capita consumption dating back to 1970, but the
downturn in 2000 and 2001 may be evidence of a lagged affect of the decline in milk's advertising
spending and share of voice. See Figure 4-8. The recent decline in milk's advertising expenditure since
1997 may be a contributing factor to the decline in volume sales.
Advertising expenditure is one very large piece of the total generic milk campaign, and decreases in
advertising expenditures have largely been made to increase promotional efforts and various strategic and
operational initiatives, such as supporting and encouraging processors to innovate and market their brands,
and the further development of school-related programs. These operational initiatives may now be
beginning to impact the consumption of milk, but may have enduring affects on milk availability and
consumption.
Figure 4-8
Combined Producer/Processor Milk Advertising Spend and Change
(Millions of Dollars) 1997-2001
Total 1997 $187.7 1998 $175.2 1999 $158.6 2000 $153.1 2001 $137.7
Chan,qe 27.9% -6.7% -9.5% -3.5%
-10.1%
Source: Beverage Marketing Corp.; Bozell
The "got milk?" campaign has been successful by almost any measure. It has won awards and realized
unprecedented awareness levels among all consumer groups. It has given milk an enduring contemporary
image with current, trendy celebrity endorsements. It has also allowed for highly targeted advertising in a
wide variety of media to a diverse consumer base. The flexibility of the "got milk?" campaign is one of its
greatest strengths. This strength will be crucial if the same campaign is to evolve as milk moves strongly
into single-serve packaging and new channels.
62

Beverage Marketing believes milk's volume declines would be greater without the national genetic
program. The milk marketing campaign has effectively defended milk against strong competition and has
done so with less advertising spending per gallon than any other segment in the competitive beverage set.
However, it is no surprise that milk per capita consumption is shrinking when we consider how it has been
competing for consumers. Milk has experienced four consecutive years of decreases in advertising
spending while no competitor has had two consecutive years of substantial decreases. Milk's competition
is leveraging substantial, steady advertising expenditure for higher share of voice. Bottled water once again
had a huge advertising spend increase and spent almost the same amount as milk, in absolute terms, but
surpassed milk in spending per gallon.
In line with past Beverage Marketing recommendations, the milk campaign has recently been more focused
on key segments likely to drive future industry growth (e.g., flavored milk, Hispanics, kids, and teens), and
has reduced efforts against non-core users, including male adults. While total industry performance and
two years of significant decline might indicate decreasing effectiveness of the genetic industry program,
closer examination of consumption trends among some targeted segments suggests that recent, targeted
efforts have been quite successful. These improvements are not likely to drive total industry gains over the
short-term, but rather will have a significant longer-term impact. This impact will likely accelerate as the
industry continues to enhance its growth-segment packaging, products, and availability in a manner that is
commensurate with the positioning and imagery of the national program.
The targeted strategy appears to be a powerful tool for increasing milk consumption. The crucial 6-12 year
old demographic has shown increases in per capita consumption for two years. In 2001, per capita
consumption for children ages 6-12 was 28 gallons of milk, regaining its highest point since 1991, and
continuing an upward trend since 1999. See Figure 4-9.
Figure 4-9
29
28 L _
2 7 >- ,.- 26
rn 25 e-,
o 24
O 23
22
Per Capita Milk Consumption by Children 6-12 1997-2001
24.3
/ 25.1
// 24 .7
I [ - - T - - T
26.2
27.8
Source." Beverage Marketing Corp.; SIP
63
1997 1998 1999 2000 2001

In terms of ad dollars spent against the target, milk is the top beverage advertiser in child-focused
television, spending nearly $7.5 million in 2001. See Figure 4-10. The next closest competitive brand,
Sunny Delight, spent just under $7 million. It is important to recognize, however, that this comparison is
between a generic industry program and a single brand program. There was no significant kid milk brand
advertising expenditures in 2001. Nevertheless, the generic advertising/promotional efforts have helped
enable milk to maintain its status as the dominant beverage (37% share of stomach) for 6-12 year olds.
Figure 4-10
2001 Top Children TV Beverage Advertising Spenders Share of Voice
(O00's of Dollars)
~ - C $1,906
4%
Coke Powerade $1.090 ~ . . . .
Minute
$2,4
6~,
Source. Beverage Marketing Corp.," Bozell," 2001 Ad Views
Similarly, taking a more targeted approach toward teens and shifting the advertising and promotional focus
to flavored milk seems to have had a powerful positive affect on milk consumption by teens. In 2001, per
capita consumption by, i3-17 year olds grew for the first time since 1996 up by 2.8%. See Figure 4-11.
Between 1997 and 2000, the change in per capita milk consumption by teens averaged -6.4%, annually and
had a CAGR of-4.2%. In 2001, milk's advertising expenditure targeted at teens increased more than four-
fold, from $5.3 million in 2000 to $22.9 million in 2001. Promotions and public relations efforts targeted
to teens were also increased as part of the re-focusing of the campaign. Reversing four years of decline and
posting a 2.8% gain is a significant accomplishment and seems largely attributable to the strong focus of
both advertising and promotional efforts on children and teens, and on flavored milk.
64
. . . . . . . . . . . . . . . . . . . . . . . . . . . . .

Change in Teen Per Capita Milk Consumption (1997-2001)
4.0%
2.0%
0.0% r 1
-2.0% -1.6%
-4.0%
-6.0%
-8.0%
-10.0% -9.0%
1997 1998
Source: Beverage Marketing Corp.," SIP
I
I -6.1%
-8.8%
1999
2.8%
/
2000 2001
Figure 4-11
Milk's gains with the 6-12 year-old and teen cohorts are important because it is at this age that children
begin to form life-long brand and product loyalties, as well as life-long eating and drinking habits. Kids
and teens have been targeted either directly through media channels, through school programs or through
"gatekeepers" like parents who control the options of children. Though still early in the program, the focus
on the Hispanic segment is likely also to be successful in increasing milk consumption, by capturing some
of the growth in this segment. During 2001, the marketing effort and advertising spend has been better
focused on key demographic segments and the results seem to show a distinct positive effect.
Overall, however, milk continues losing consumption share to competitive beverage segments.
See Figure 4-3. Milk's "healthy" position in the competitive set has been significantly undermined by the
aggressive introduction of products and marketing messages in direct challenge to milk. Calcium fortified
juices and vitamin enhanced bottled water, fruit drinks, and teas are the most popular examples of this
competitive trend. Bottled water is projected by BMC to eclipse milk (as well as coffee and beer) and gain
the second highest per capita consumption after carbonated soft drinks by 2004.
This year's total and per capita consumption decreases for milk indicate that milk programs may need some
strategic re-thinking. As suggested in last year's report, the messaging must shift to higher-order consumer
benefits, as competitors have co-opted the nutritional proposition (mainly calcium) supported by the milk
program. As product, package and channel innovations increase the potential usage occasions for milk, an
65

evolution of the campaign may be necessary to fully leverage these new opporttmities. There is increasing
room for improved demographic and usage occasion segmentation to enhance the efficiency and impact of
the campaign. This is essential in an atmosphere of static or decreasing budgets.
The milk program has evolved into a contemporary image-based campaign that still effectively
communicates the nutritional benefits of milk. A contemporary image, however, is not in itself
differentiating and shifting to a connection between milk's image and higher-order need states such as self-
esteem, well-being, and confidence will be crucial for milk in order to compete for consumers' minds and
hearts and not just their stomachs.
The positive consumption data reported for the crucial 6-12 year old and teen demographics is evidence of
milk successfully targeting younger consumers and their gatekeepers. In addition, the campaign has
responded to the need for strong, targeted messaging tailored to specific ethnic groups by tripling Hispanic
advertising expenditure. However, generic advertising is at an inherent disadvantage compared to brand
advertising. Without developing, marketing and innovating brands, milk will continue to be viewed as a
commodity. Once more branded products and marketing programs emerge, coordination will be crucial to
maximize the affect of the broad generic milk marketing programs with the targeted marketing of branded
milk products.
Milk's advertising expenditures versus its competitive set must be made more competitive. While there is
no proven quantitative link between share of advertising expenditures and sales, there is little doubt that the
substantial advantage milk's competitors have developed in the volume of their message puts milk at a
considerable disadvantage. Small targeted spending increases (generic and branded) can have significant
impact and effectively do more with less gross spending.
In 2001, the alignment of milk marketing programs among producers, processors, and retailers improved
markedly, but the opporttmity is also growing faster now than ever before. The advent of competitive
single-serve packages and the introduction of new flavors has increased the need for and the potential
effectiveness of promotional events. Participation in marketing and promotional programs by dairy
processors was up in 2001. Nevertheless, there are still sigmficant improvements to be made. Further
integrating the positioning, packaging, pricing, availability, and public relations efforts along with brand
programs will have a positive multiplier affect as each piece of the marketing program further supports all
others.
Retail educational programs in the areas of category management and merchandising may also provide
valuable synergies between advertising and promotion impact. Milk is not likely to quickly develop
executional expertise to rival its competitors in this area, but efforts to improve the merchandising, shelf
management, and point-of-sale (POS) capabilities of the milk industry will become increasingly important
as the mix of products grows and as milk begins to make inroads into more competitive channels.
Programs to train field staff in sales and merchandising are important but equally important is an effort to
change the attitude that milk does not need competitive point-of-sale and merchandising.
66

Once again, innovation remains the key to milk's future growth. New products, packages, flavors, and
channels must continue to be developed, brought to market by processors and supported by generic and
brand milk marketing programs. Milk has a strong advertising campaign but needs the products and
execution to match the messaging.
Moving forward, there are four crucial activities to be carried out to improve milk's position: evolve the
marketing message towards higher-order consumer need states, continue to heighten the focus on key
demographics/targets, continue to develop and make available new products for more diverse usage
occasions, including strong branded products/programs, and maximize distribution through non-traditional
channels.
67

APPENDICES
Appendix A
Appendix B
Appendix C
Appendix D
Appendix E
Appendix F
Appendix G
National Dairy Promotion and Research Board A-1 Current Member Listing
National Fluid Milk Processor Promotion Board A-2 Current Member Listing
B- 1 Regions of the National Dairy Promotion and Research Board B-2 Regions of the National Fluid Milk Processor Promotion Board
C-1 National Dairy Board Actual Income and Expenses, Fiscal Years '99-2001 C-2 USDA Oversight Costs for the National Dairy Board, Fiscal Years '97-2001 C-3 National Dairy Board Approved Budgets, Fiscal Years 2000-2002 C-4 National Fluid Milk Board Actual Income and Expenses '97-2001 C-5 USDA Oversight Costs for the National Fluid Milk Board '97-2001 C-6 National Fluid Milk Board Approved Budgets, Fiscal Years '98-2002
Financial Audits D-1 National Dairy Promotion and Research Board D-2 National Fluid Milk Processor Promotion Board
E-1 National Dairy Board and Dairy Management Inc. Contracts Reviewed by USDA, 2001
E-2 National Fluid Milk Processor Promotion Board and International Dairy Foods Association Contracts Reviewed by USDA, 2001
National Dairy Board Dairy Foods and Nutrition Research Programs F-1 Nutrition and Health Research Institutes and Dairy Foods Research Centers F-2 Dairy Foods Competitive Research Activities During 2001 F-3 Nutrition Competitive Research Activities During 2001
Qualified State or Regional Dairy Product Promotion, Research, or Nutrition Education Programs, 2001

APPENDIX A-1
N A T I O N A L D A I R Y P R O M O T I O N AND R E S E A R C H B O A R D
C U R R E N T M E M B E R L I S T I N G
REGION 1 (Oregon & Washington)
Marlin J. Rasmussen St. Paul, Oregon 1 ~ Term Expires 10/31/04
REGION 2 (California)
William R. Ahlem, Jr. Hilmar, California 2 ~ Term Expires 10/31/04
Robert R. Bignami Chico, California 1 n Term Expires 10/31/04
Margaret A. Gambonini Petaluma, California 1 s' Term Expires 10/31/04
Dennis A. Leonardi Femdale, California 1~t Term Expires 10/31/03
Patricia M. Van Dam Chino, California IS' Term Expires 10/31/04
John Zonneveld, Jr. Laton, California 1 s~ Term Expires 10/31/02
REGION 3 (Arizona, Colorado, Idaho, Montana, Nevada, Utah, & Wyoming)
Steve P. Frischknecht Manti, Utah 2 "d Term Expires 10/31/04
Pete 1L Lizaso Emmett, Idaho 2 nd Term Expires 10/31/03
Paul E. Rovey Glendale, Arizona (Vice-Chair 01/00-11/00) (Chair 11/00-Present) 24 Term Expires 10/31/02
REGION 4 (Arkansas, Kansas, New Mexico, Oklahoma, & Texas)
Charles W. Bryant Austin, Arkansas I ~t Term Expires 10/31/03
Lynda Foster Fort Scott, Kansas 2 na Term Expires 10/31/04
Neil A. Hoff Windthorst, Texas lS' Term Expires 10/30/02
REGION 5 (Minnesota, North Dakota, & South Dakota)
Arlon E. Fritsche New Ulna, Minnesota 1 s~ Term Expires 10/31/03
Loren E. Jons Bonesteel, South Dakota 1 st Term Expires 10/31/03
Glen E. Schroeder Caledonia, Minnesota 2 ~ Term Expires 10/31/02
REGION 6 (Wisconsin)
Patricia M. Boetteher Bloomer, Wisconsin 1 ~ Term Expires 10/31/02
Rosalie M. Geiger Reedsville, Wisconsin 1 st Term Expires 10/31/04
Janet M. Nelson Prairie Farm, Wisconsin I st Term Expires 10/31/02
Allard L. Peek Chippewa Falls, Wisconsin 1 ~t Term Expires 10/31/03
69

N A T I O N A L D A I R Y P R O M O T I O N AND R E S E A R C H BOARD C U R R E N T M E M B E R L I S T I N G ( C O N T I N U E D )
REGION 6 (Wisconsin) Continued
Connie M. Seefeldt Coleman, Wisconsin 1 st Term Expires 10/31/03
REGION 7 (Illinois, Iowa, Missouri, & Nebraska)
Wayne E. Dykshorn Ireton, Iowa 1 ~' Term Expires 10/31/03
William B. Siebenborn Trenton, Missouri (Secretary 01/00-11/00) (Vice-Chair 11/00-Present) 2 ~d Term Expires 10/31/02
REGION 8 (Alabama, Kentucky, Louisiana, Mississippi, & Tennessee)
James S. Cook Evergreen, Alabama 2 ~d Term Expires 10/31/02
REGION 9 (Indiana, Michigan, Ohio, & West Virginia)
Merle L. Chaplin Moundsville, West Virginia 2 nd Term Expires 10/31/03
Joseph P. Logan Kinsman, Ohio 1 st Term Expires 10/31/02
Alice S. Moore Frazeysburg, Ohio 1 ~ Term Expires 10/31/04
REGION 10 (Florida, Georgia, North Carolina, South Carolina, & Virginia)
Robert K. Herman Taylorsville, North Carolina 2 ~a Term Expires 10/31/04
Sanford L. Jones, Jr. Quitman, Georgia 1 st Term Expires 10/31/03
REGION 11 (Delaware, Maryland, New Jersey, & Pennsylvania)
Deborah A. Benner Mt. Joy, Pennsylvania 1 ~' Term Expires 10/31/04
Rita Kennedy Valencia, Pennsylvania 1 st Term Expires 10/31/02
Lewis Gardner Galeton, Pennsylvania 1 st Term Expires 10/31/03
REGION 12 (New York)
Audrey G. Donahoe Frankfort, New York 1 st Term Expires 10/31/02
David E. Hardie Lansing, New York 15~ Term Expires 10/31/04
Edgar A. King Schuylerville, New York 1 " Term Expires 10/31/03
REGION 13 (Connecticut, Marne, Massachusetts, New Hampshire, Rhode Island, & Vermont)
Claude J. Bourbeau Swanton, Vermont 1 s~ Term Expires 10/31/02
70
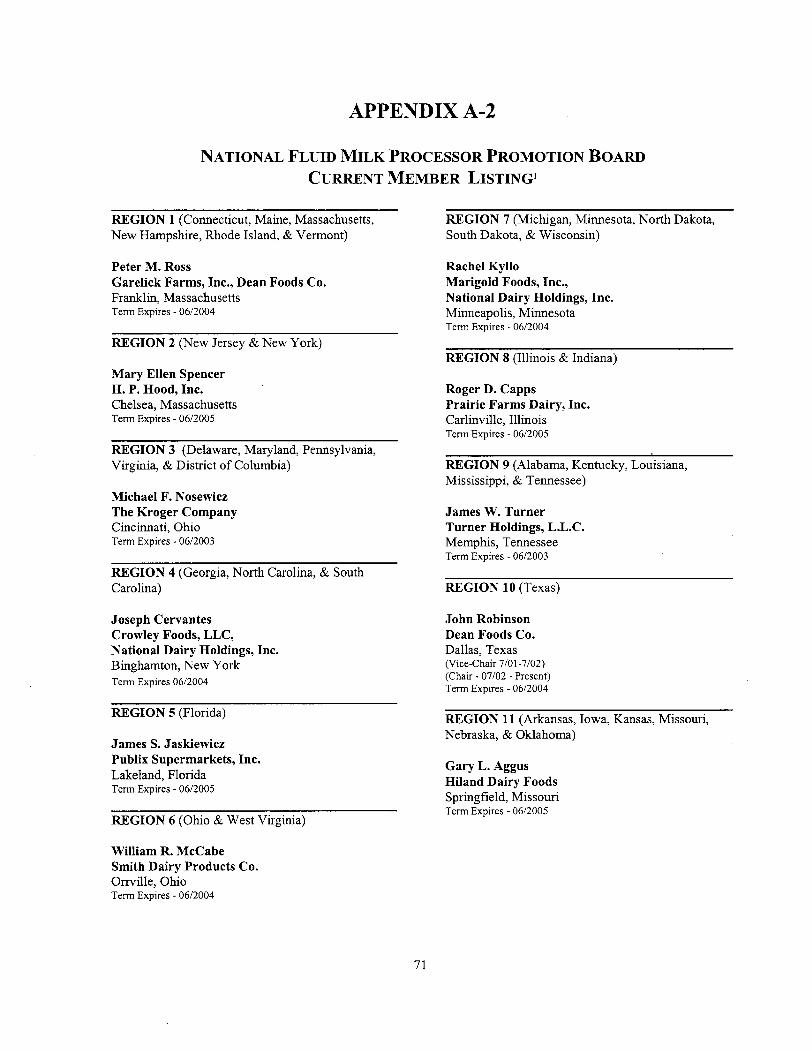
APPENDIX A-2
N A T I O N A L F L U I D M I L K P R O C E S S O R P R O M O T I O N B O A R D
C U R R E N T M E M B E R L I S T I N G 1
R E G I O N 1 (Connecticut, Maine, Massachusetts, New Hampshire, Rhode Island, & Vermont)
Peter M. Ross Garelick Farms, Inc., Dean Foods Co. Franklin, Massachusetts Term Expires - 06/2004
R E G I O N 2 (New Jersey & New York)
Mary Ellen Spencer H. P. Hood, Inc. Chelsea, Massachusetts Term Expires - 06/2005
R E G I O N 3 (Delaware, Maryland, Pennsylvania, Virginia, & District o f Columbia)
Michael F. Nosewicz The Kroger Company Cincinnati, Ohio Term Expires - 06/2003
R E G I O N 4 (Georgia, North Carolina, & South Carolina)
Joseph Cervantes Crowley Foods, LLC, National Dairy Holdings, Inc. Binghamton, New York Term Expires 06/2004
R E G I O N 5 (Florida)
James S. Jaskiewiez Publix Supermarkets, Inc. Lakeland, Florida Term Expires - 06/2005
R E G I O N 6 (Ohio & West Virginia)
William R. McCabe Smith Dairy Products Co. Orrville, Ohio Term Expires - 06/2004
R E G I O N 7 (Michigan, Minnesota, North Dakota, South Dakota, & Wisconsin)
Rachel Kyllo Marigold Foods, Inc., National Dairy Holdings, Inc. Minneapolis, Minnesota Term Expires - 06/2004
R E G I O N 8 (Illinois & Indiana)
Roger D. Capps Prairie Farms Dairy, Inc. Carlinville, Illinois Term Expires - 06/2005
R E G I O N 9 (Alabama, Kentucky, Louisiana, Mississippi, & Tennessee)
James W. Turner Turner Holdings, L.L.C. Memphis, Tennessee Term Expires - 06/2003
R E G I O N 10 (Texas)
John Robinson Dean Foods Co. Dallas, Texas (Vice-Chair 7/01-7/02) (Chair - 07/02 - Present) Term Expires - 06/2004
R E G I O N 11 (Arkansas, Iowa, Kansas, Missouri, Nebraska, & Oklahoma)
Gary L. Aggus Hiland Dairy Foods Springfield, Missouri Term Expires - 06/2005
71

REGION 12 (Arizona, Colorado, New Mexico, Nevada, & Utah)
Lawrence V. Jackson Safeway, Inc. Pleasanton, California Term Expires - 06 /2004
REGION 13 (Idaho, Montana, Oregon, Washington, & Wyoming)
James T. Wilcox HI Wilcox Dairy Farms, LLC Roy, Washington Term Expires - 06 /2004
REGION 14 (Northem California)
Ronald M. Foster Foster Dairy Farms Modesto, California Term Expires - 06/2005
REGION 15 (Southern California)
Richard Walrack Santee Dairies, Inc. City of Industry, California Term Expires - 06/2003
MEMBERS-AT-LARGE
Robert E. Baker 2 Omaha, Nebraska Term Expires - 06 /2003
John R. Jilbert Jilbert Dairy, Inc. Marquette, Michigan Term Expires - 06 /2003
Michael A. Krueger Shamrock Foods Company Phoenix, Arizona Term Expires - 0 6 / 2 0 0 4
Charles D. Price Galliker Dairy Company Johnstown, Pennsylvania Term Expires - 06 /2005
Joseph W. Van Treeck ~ Anchorage, Alaska Term Expires - 06 /2004
1 Newly appoin ted members are seated at the Fluid Milk Boa rd ' s
July annual meet ings , respect ively. 2 Publ ic Member .
72

APPENDIX B-I
Region I REGIONS OF THE NATIONAL DAIRY PROMOTION AND RESEARCH BOARD
"--.1 L ~
Region 2 [6]
Region 13 [11
Region 5 Region 12 (- ~ _ _ t3] , ~ [ 3 ] ~ "~
Region[3] 3 ~ ~ ~Regi°n 6 ~ ~ ~ " Region 9 ~ ~/ 2
[2]
Region 4 [3]
NOTE: The number in brackets below each region indicates the number of members within that region.
. . . . . . . . . . . . . . . . . i
l

APPENDIX B-2
REGIONS OF THE NATIONAL FLUID MILK PROCESSOR PROMOTION BOARD
Region 7 Region 1
Region 12 ~ ,
. Region 9
Region 2
- " ' 1 Region 6
• 5

APPENDIX C-1 NATIONAL DAIRY BOARD ACTUAL INCOME AND EXPENSES 1999 - 2 0 0 1
(in $000's)
1999 2000 2001
INCOME Assessments Interest Other
Total Income
80,832 84,746 83,633 447 599 369
81,279 85,345 84,002
L~
GENERAL EXPENDITURES
General & Administrative USDA
Total General Expenditures
PROGRAM EXPENDITURES
Communications & Member Relations Domestic Marketing Export Enhancement Planning & Research
Total Program Expenditures
Excess of Revenue (Under) Over Expenditures
Fund Balance, Beginning of Year
Fund Balance, End of Year
2,667 2,570 2,676 407 567 471
3,074 3,137 3,147
4,044 4,426 7,929 66,280 65,237 73,229
5,955 6,171 5,565 4,015 3,742 2,53..7.
80,294 79,576 89,260
(2,089) 2,632 (8,405)
15,631 13,541 16,173
13,541 16,173 7,768
SOURCE: Independent Auditor's Report of the National Dairy Board and USDA Records.
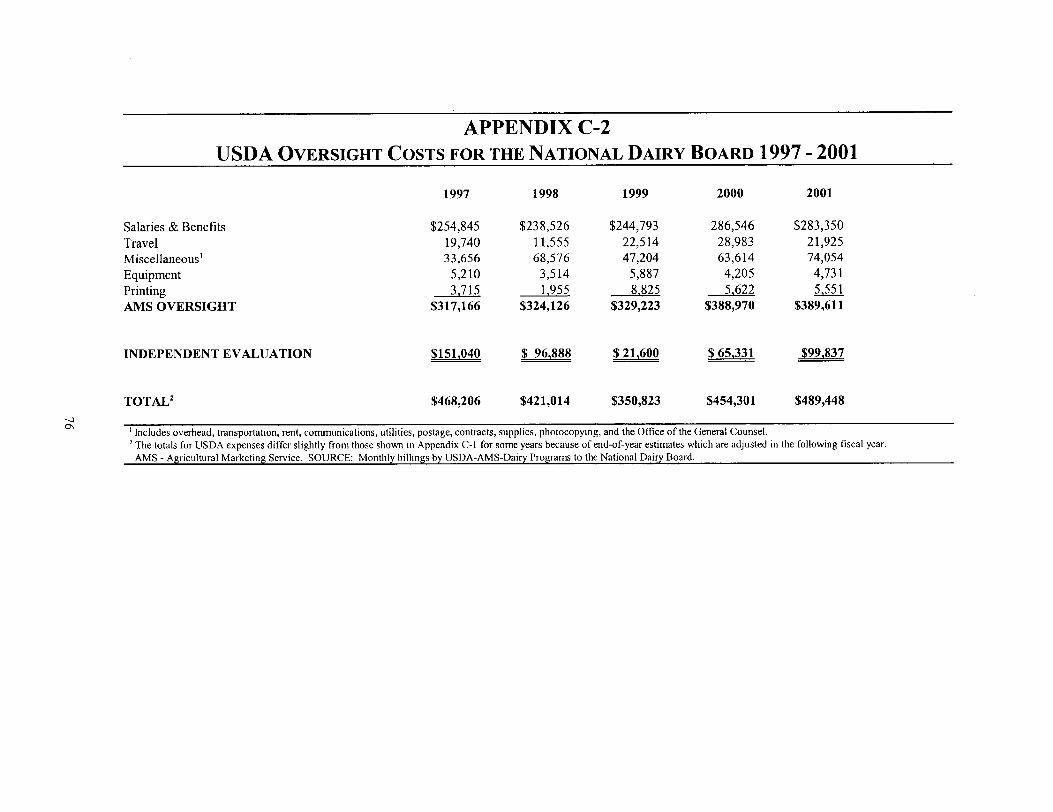
APPENDIX C-2 USDA OVERSIGHT COSTS FOR THE NATIONAL DAIRY BOARD 1997- 2001
1997 1998 1999 2000 2001
Salaries & Benefits $254,845 $ 2 3 8 , 5 2 6 $244,793 286,546 $283,350 Travel 19,740 11,555 22,514 28,983 21,925 Miscellaneous ~ 33,656 68,576 47,204 63,614 74,054 Equipment 5,210 3,514 5,887 4,205 4,731 Printing 3,715 1,955 8,825 5,622 5,551 A_MS OVERSIGHT $317,166 $ 3 2 4 , 1 2 6 $ 3 2 9 , 2 2 3 $ 3 8 8 , 9 7 0 $389,611
INDEPENDENT EVALUATION $151,040 $ 96~888 $ 21,600 $ 65,331 $99,837
O~
TOTAL 2 $468,206 $ 4 2 1 , 0 1 4 $ 3 5 0 , 8 2 3 $ 4 5 4 , 3 0 1 $489,448
Includes overhead, transportation, rent, communications, utilities, postage, contracts, supplies, photocopying, and the Office of the General Counsel. z The totals for USDA expenses differ slightly from those shown in Appendix C-1 for some years because of end-of-year estimates which are adjusted in the following fiscal year.
AMS - A~;ricultural Marketinl~ Service. SOURCE: Monthly billings by USI)A-AMS-Dair~ Programs to the National Dairy Board.

APPENDIX C-3 NATIONAL DAIRY BOARD APPROVED BUDGETS 2000 - 2 0 0 2
(in $ooo's)
".-4 --.1
REVENUES Assessments Interest
Total Income
Carryover from Previous FY Program Development Fund
Total Available Funds
EXPENSES
General & Administrative USDA - AMS Oversight Independent Evaluation
Subtotal
PROGRAM BUDGET
Domestic Marketing Communications & Member Relations Plammlg & Research Export Enhancement
Subtotal
Total Budget
2000 2001 2002
81,150 84,200 84,750 450 475 250
81,600 84,675 85,000
2,756 6,928 2,307 84,356 91,603 87,307
2,768 3,275 2,971 450 500 525
3,218 3,775 3,496
66,971 [82.5%] 74,413 [84.7%] 66,032 4,136 [ 5A%] 5,904 [ 6.7%] 9,651 3,937 [ 4.9%] 2,368 [ 2.7%] 3,532 6,094 I 7.5%1 5,143 [ 5.9%] 4,776
81,138 [100%1 87,828 [100%i 83,991
84,356 91,603 87,307
[78.7%] [11.2°] [ 4.3%] [ 5.8%1 ILOO%!
SOURCE: Budgets received and approved by USDA from the National Dair~ Board.
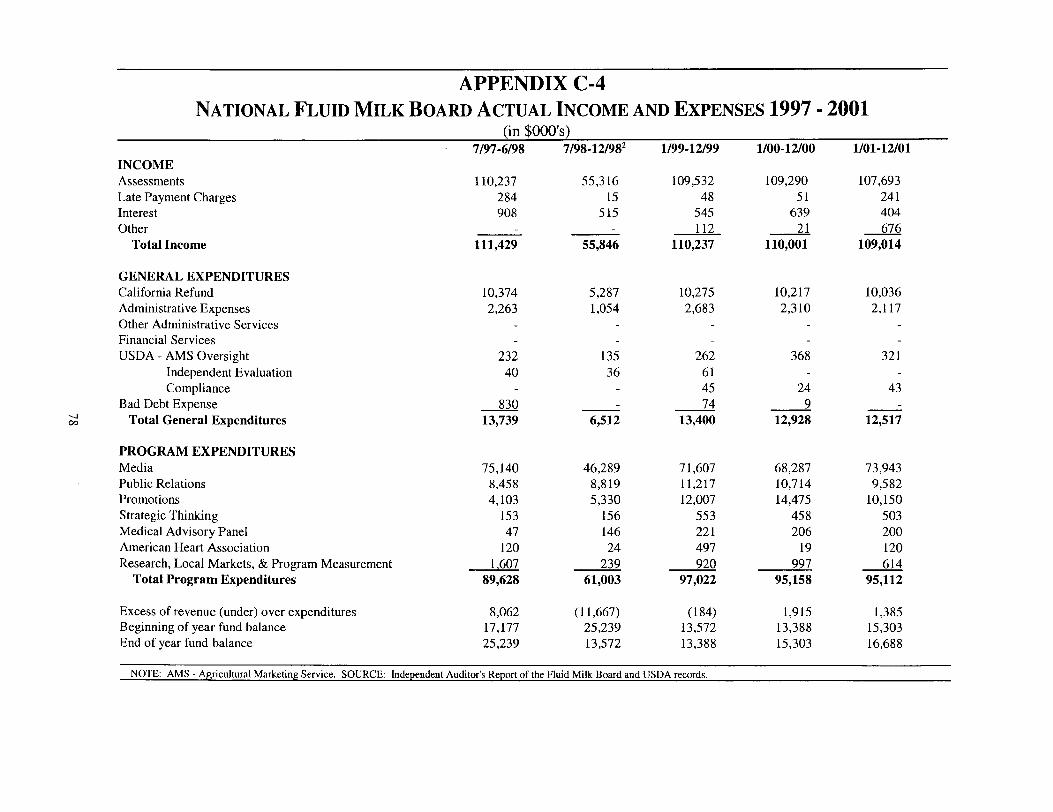
A P P E N D I X C-4
NATIONAL FLUID MILK BOARD ACTUAL INCOME AND EXPENSES 1997 - 2001 (in $000's)
INCOME Assessments Late Payment Charges Interest Other
Total Income
7/97-6/98 7/98-12/982 1/99-12/99 1/00-12/00 1/01-12/01
110,237 55,316 109,532 109,290 107,693 284 15 48 51 241 908 515 545 639 404
112 21 676 111,429 55,846 110,237 110,001 109,014
GENERAL EXPENDITURES California Refund Administrative Expenses Other Administrative Services Financial Services USDA - AMS Oversight
Independent Evaluation Compliance
Bad Debt Expense Total General Expenditures
10,374 5,287 10,275 10,217 10,036 2,263 1,054 2,683 2,310 2,117
232 135 262 368 321 40 36 61
45 24 43 830 74 9
13,739 6,512 13,400 12,928 12,517
PROGRAM EXPENDITURES Media Public Relations Promotions Strategic Thinking Medical Advisory Panel American Heart Association Research, Local Markets, & Program Measurement
Total Program Expenditures
75,140 46,289 71,607 68,287 73,943 8,458 8,819 11,217 10,714 9,582 4,103 5,330 12,007 14,475 10,150
153 156 553 458 503 47 146 221 206 200
120 24 497 19 120 1,607 239 920 997 614
89,628 61,003 97,022 95,158 95,112
Excess of revenue (under) over expenditures Beginning of year fund balance End of year fund balance
8,062 (11,667) (184) 1,915 1,385 17,177 25,239 13,572 13,388 15,303 25,239 13,572 13,388 15,303 16,688
NOTE: AMS - Agricultural Marketing Service. SOURCE: Independent Auditor's Report of the Fluid Milk Board and USDA records.

A P P E N D I X C-5
U S D A OVERSIGHT COSTS FOR THE NATIONAL FLUID MILK BOARD 1997 - 2001
1997 1998 1999 2000 2001
Salaries & Benefits $186,255 $161,057 $176,181 $243,281 $246,200 Travel 11,654 11,042 11,718 20,617 12,843 Miscellaneous ~ 32,254 62,332 39,525 48,090 50,771 Equipment 203 4,400 13,975 4,389 4,868 Printing 6,694 2,356 6,841 5,137 6,571 AMS O V E R S I G H T $237,060 $241,187 $248,240 $321,514 $321,253
I N D E P E N D E N T E V A L U A T I O N $61,300 $52,170 $14~400 $24~555 $32~667
T O T A L 2 $298,360 $293,357 $262,640 $346,069 $353,920
Includes overhead, transportation, rent, communications, utilities, postage, contracts, supplies, photocopying, and the Office of the General Counsel. 2 The totals for USDA expenses differ slightly from those shown in Appendix C-4 for some years because of end-of-year estimates which are adjusted in the following fiscal year. AMS - A~ricultural Marketin~ Service. Source: Monthly billings by USDA-AMS-Dairy Pro~ams to the National Fluid Milk Board.

APPENDIX C-6 NATIONAL FLUID MILK BOARD APPROVED BUDGETS 1998 - 2002
(in $000's)
REVENUES Assessments Interest
Total Revenues
7/98-6/991 19992 2000 2001 2002
106,800 109,000 110,000 110,000 106,650 600
106,800 109,600 110,000 110,000 106,650
California TV Rebate Carryover from Previous FY
Total Available Funds
601 800 11,310 10,900 4,410 3,184
118,100 120,500 115,011 113,984 3,508
110,158
oo
EXPENSES General and Administrative 1,980 2,830 2,308 3,000 2,280 USDA - AMS Oversight 280 280 280 350 350 Independent Evaluation 90 90 3 3 3 Processor Compliance 95 4 4 4 Reserve/Contingency - 3,000 California Refund 10,220 10,220 10,300 10,300 10,146
Subtotal 12,570 13,515 15,888 13,650 12,776
PROGRAM BUDGET Advertising 73,623 171.5%1 Public Relations 12,005 [11.7%1 Promotions 14,985 114.5~1 Strategic Thinking 1,000 l 1.o~1 Medical Advisory Panel 300 l o.3%l Research 1,000 t 1.o%1 Local Markets AHA On-Pack, Other Program Management Program Measurement
Subtotal 102,913 [lOO%1 Unallocated 2,627
77,180 [72.3%] 70,103 [71.1%1 74,640 11,563 ito.s%] 11,099 [11.3%1 9,390 15,455 i14.5%J 14,894 [15.1%l 13,529
1,000 [ 0.9%1 774 t o.8~1 700 400 I 0.4~1 263 [ 0.3~1 250
1,205 [ 1.1%1 854 [ 0.9~1 1,625 395 t o.4%1
213 I o.2%1 200 106,803 [100%] 98,595 D00%] 100,334
237 528
[74.4%1
[ 9.4%]
[13.5%1
[ 0.7%1
[ o.2%1
l 1.6%1
[ o.2%1 [loo%1
74,417 10,900 7,031
900 200
1,653
650 991 150
96,892 490
[76.8%]
[11.2%1
[7.3%1
[ 0.9%1
[ 0,2%1
[ 1.7%]
[o.7%1 [ 1.o%1
IlOO%l
Total Budget 110,600 118,110 115,011
IFourth fiscal period was 7/98-12/98. 2Fiscal year changed to calendar year. 3Independent Evaluation costs are included in Program
Measurement expenses. 4Processor Compliance included in General and Administrative expenses.
NOTE: AMS - Agricultural Marketing Service. SOURCE: Budgets received and approved by USDA from the Fluid Milk Board.
113,984 110,158

303 East Wacker Drive Chicago, IL 60601-5212
APPENDIX D-1
Independent Accountants' Report On Applying Agreed-upon Procedures
The Board of Directors National Dairy Promotion and Research Board:
We have performed the procedures enumerated below, which were agreed to by the U.S. Department of Agriculture (USDA) and National Dairy Promotion and Research Board (NDB), solely to assist the specified parties in evaluating the entities' compliance with The Dairy and Tobacco Adjustment Act of 1983 (Act), the Dairy Promotion and Research Order (Order), and the Agricultural Marketing Services Directive (Directive) entitled Investments of Public Funds as of and for the year ended December 3 l, 2001. This agreed-upon procedures engagement was conducted in accordance with attestation standards established by the American Institute of Certified Public Accountants. The sufficiency of these procedures is solely the responsibility of those parties specified in this report. Consequently, we make no representations regarding the sufficiency of the procedures described below either for the purpose for which this report has been requested, orfor,any other purpose., i ~ :
Our procedures and findings were as follows:
(a) We obtained NDB's budget for the year ended December 31, 2001 and sighted the signature ~' of the Secretary of the USDA.
- . . : , ~ ' - ; ~ . ~ . ' : • ~ - . .
(b) We selected four investment purchase transactions from calendar year 2001, compared them • ' . : •.against their respective brokers advices, and noted the following: . : "
• . : • " n The investments were ineither U.S. Government Securities or Federal Agency Securities,
• : 'm The investments had maturity periods of one year or less; . . . . ' • , , : . . : , . . . . .
: • The U.S. Government Securities and Federal Agency Securities were held in the name of .. . . : . NDB at the institution. " . - : - . "
. . . , , . , . . . . .
( c ) We obtained the l1995 iflvestment:files and sighted various broker's advices noting that the investment records have been maintained for sixyears.- -
We were not engaged to, and did not conduct an examination, the objective of which would be the expression of an opinion oil.compliance~ •Accordingly, we: do not express such an opinion. Had we performed additional .procedures, other, matters might have come to our attention that would have been reported toyou. " '
- . ' - : . . : i . , .
This report is intended solely for: the information and use of the USDAand NDB and is not intended to be and should not be used anyone other than these specified parties.
Ct.'V' . - . . •
April 1, 2002 . . . . 81

303 East Wacker Drive Chicago, L 60601-5212
The Board of Directors "
National Dairy Promotion and Research Board
April i, 2002
Ladies and Gentlemen:
We have audited the consolidated financial statements of the National Dairy Promotion and Resem-ch Board, for the year ended December 31, 2001, and have issued our report thereon dated April 1,. 2002. In planning and performing our audit of the financial statements of the National Dairy Promotion and Research. Board, we considered internal control in order to determine our auditing procedures for the purpose of expressing our opinion on the financial statements. An audit does not include examining the effectiveness of internal control and does not provide assurance on internal control.
Our consideration of internal control would not necessarily disclose ail?matters in internal control Bat might be material weaknesses under standards established by the American Institute of Certified Public Accountants. A material weakness is a condition in which .the design or operation of one or more internal control components does not reduce to a relatively 10 w level the risk that errors or fraud in amounts that would be material in relation to the financial statements being audited may.occur, and not be detected within a timely period by employees in the normal course of performing their assigned functions. However, we noted no matters involving internal control and its operation that we consider to be material weaknesses as defined above.
This r~0rt is' intended solely for the information and use of the United;States Department of Agriculture, the Board o f Di/ectors, maffagement and-otherg within tlae .organization and is not iniended to be and should not be used by anyone Other than these Specified parties.
Very truly yours;-
.... L L - P
m i n i m
82
303 East Wackier Drive Chicago, IL 60601-5212
Independent Auditors' Report
The Board of Directors National Dairy Promotion and Research Board:
We have audited the accompanying balance sheets o f National Dairy Promotion and Research Board (NDB) as of December 31, 2001 and 2000, and the related statements o f operations and changes in fund balance, and cash flows for the years then ended. These financial statements are the responsibility of the NDB's management. Our responsibility is to express an opinion on these financial statements based on our audits.
We conducted our audits in accordance with auditing standards generally accepted in the United States of America. Those standards require that we plan and perform the audit to obtain reasonable assurance about whether the financial Statements are free of material misstatement. An audit includes examining, on a test basis, evidence supporting the amounts and disclosures in the fmanciat statements. An audit also includes assessing the accounting principles used and significant estimates made by management, as well as evaluating the overall financial statement presentation. We believe that our audits provide a reasonable basis for our opinion.
In our opinion, the financial statements referred to above present fairly, in all material respects, the financial position o f National Dairy Promotion and Research Board at December 31, 2001 and 2000, and the results of its operations, and changes in its fund balance and its cash flows for the years then ended in conformity with accounting principles generally accepted in the United States of America.
Our 2001 audit was made for the purpose of forming an opinion on the basic financial statements taken as a whole. The supplementary information included in the supplemental schedule is presented for purposes of additional analysis and is not a required part of the baSic financial statements. Such information has been subjected to the auditing procedures applied in the audits of the basic financial statements and, in our opinion, is fairly stated in all material respects in relation to the basic financial statements taken as a whole.
April 1, 2002
LL-P
83

NATIONAL DAIRY PROMOTION AND RESEARCH BOARD
Balance Sheets
December 31, 2001 and 2000
Assets 2001 2000
Cash and cash equivalents Assessments receivable Accrued interest receivable Fixed assets (net of accumulated depreciation
of $100,279 and $94,720 in 2001 and 2000, respectively)
Liabilities and Fund Balance
Accounts payable: Related party - DMI Other
Accrued expenses and other liabilities
Total liabilities
Commitments (note 5)
Fund balance
Total liabilities and fund balance
See accompanying notes to financial statements.
7,829,872 13,554,973 8,657,497 10,271,926
5,009 75,391
34,517 12,690
-$ 16,526,895 23,914,980
8,362,285 7,277,510 59,817
336,714 464,642
8,758,816 7,742,152
7,768,079 16,172,828
$ 16,526,895 23,914,980
84

NATIONAL DAIRY PROMOTION AND RESEARCH BOARD
Statements of Cash Flows
Years ended December 31, 2001 and 2000
Cash flows from operating activities: Excess (deficiency) of revenue over expenses Adjustments to reconcile excess (deficiency) of revenue over
expenses to net cash provided by (used in) operating activities: Depreciation and amortization Changes in assets and liabilities:
Assessments receivable Accrued interest receivable Accounts payable Accrued expenses and other liabilities
Net cash provided by (used in) operating activities
Net cash used in investing activities: Acquisition of property and equipment
Net increase (decrease) in cash and cash equivalents.
Cash and cash equivalents at beginning of year
Cash and cash equivalents at end of year
2001 2000
$ (8,404,749) 2,631,422
5,560 10,741
1,614,429 (510,973) 70,382 (56,297)
1,144,592 362,641 (127,928) 276,267
(5,697,714) 2,713,801
(27,387) (14,100)
(5,725,101) 2,699,701
13,554,973 10,855,272
7,829,872 13,554,973
See accompanying notes to financial statements.
85

NATIONAL DAIRY PROMOTION AND RESEARCH BOARD
Notes to Financial Statements
December 31, 2001 and 2000
(1) Organization
The National Dairy Promotion and Research Board (NDB) was established on May 1, 1984, pursuant to The Dairy and Tobacco Adjustment Act of 1983 (Public Law 98-180), as part of a comprehensive strategy to reduce milk surplus supplies and increase human consumption of milk and dairy products. The purpose of NDB is to establish a coordinated program of promotion and research designed to strengthen the dairy industry's position in the marketplace and to maintain and expand domestic and foreign markets and uses for fluid milk and dairy products produced in the United States.
The United States Department of Agriculture (USDA) approved a joint venture between NDB and the United Dairy Industry Association (UDIA) to form Dairy Management Inc. (DMI) effective January 1, 1995. The purpose of DMI, a related organization, is to promote greater coordination, efficiency and effectiveness and avoid incompatibility and duplication in the programs and projects under taken by NDB and UDIA. NDB and UDIA will jointly plan, develop, and implement their various programs and activities through DMI, subject to the approval of the USDA.
NDB funds DMI on a cost reimbursement basis. Core costs, which include staff salaries and benefits, travel,. Board of Directors, and office overhead expenses are funded by NDB and UDIA. Core costs are primarily funded by NDB, with UDIA funding one-half of Board of Directors and executive office costs. Program costs, which include expenses associated with implementing the programs of NDB and UDIA, are funded by NDB and UDIA based on the planned funding source of the individual program. NDB has funded DMI core costs of $12,828,399 and $11,439,846 and program costs of $76,815,232 and $69,295,323, for activity related to the years ended December 31, 2001 and 2000, respectively.
The U.S. Dairy Export Council (USDEC) is a related organization that was founded by the boards of both NDB and UDIA and began operations effective January 1, 1996. The purpose of USDEC is to improve the marketing conditions of the U.S. dairy industry with respect to the export of U.S. dairy products and to promote the industry as a whole by improving the acceptability, consumption, and purchase of U.S. dairy products in foreign countries. For the years ended December 31, 2001 and 2000, NDB reimbursed DMI $5,362,806 and $6,094,000, respectively, for USDEC's program operations.
(2) Summary of Significant Accounting Policies
The financial statements of NDB have been prepared on the accrual basis of accounting in accordance with accounting principles generally accepted in the United States of America. To facilitate the understanding of data included in the financial statements, summarized below are the more significant accounting policies.
(a) Cash Equivalents
NDB considers debt instruments with an original maturity of three months or less to be cash equivalents.
86 (Continued)
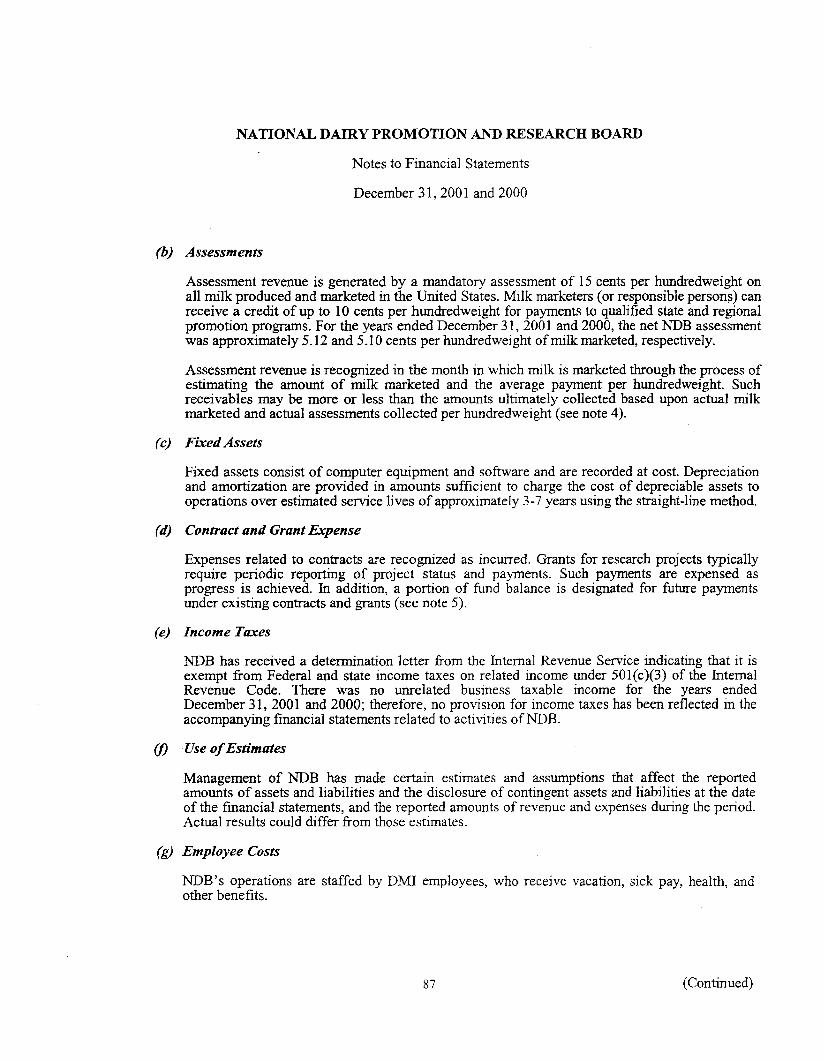
NATIONAL DAIRY P R O M O T I O N AND RESEARCH BOARD
Notes to Financial Statements
December 31, 2001 and 2000
(b) Assessments
Assessment revenue is generated by a mandatory assessment of 15 cents per hundredweight on all milk produced and marketed in the United States. Milk marketers (or responsible person.s) can receive a credit o f up to 10 cents per hundredweight for payments to qualified state and regional promotion programs. For the years ended December 31,2001 and 2000, the net NDB assessment was approximately 5.12 and 5.10 cents per hundredweight of milk marketed, respectively.
Assessment revenue is recognized in the month in which milk is marketed through the process of estimating the amount of milk marketed and the average payment per hundredweight. Such receivables may be more or less than the amounts ultimately collected based upon actual milk marketed and actual assessments collected per hundredweight (see note 4).
(c) Fixed Assets
Fixed assets consist of computer equipment and software and are recorded at cost. Depreciation and amortization are provided in amounts sufficient to charge the cost of depreciable assets to operations over estimated service lives of approximately 3-7 years using the straight-line method.
(d) Contract and Grant Expense
Expenses related to contracts are recognized as incurred. Grants for research projects typically require periodic reporting of project status and payments. Such payments are expensed as progress is achieved. In addition, a portion of fund balance is designated for future payments under existing contracts and wants (see note 5).
(e) Income Taxes
NDB has received a determination letter from the Internal Revenue Service indicating that it is exempt from Federal and state income taxes on related income under 501(c)(3) of the Internal Revenue Code. There was no unrelated business taxable income for the years ended December 31, 2001 and 2000; therefore, no provision for income taxes has been reflected in the accompanying financial statements related to activities of NDB.
09 Use o f Estimates
Management of NDB has made certain estimates and assumptions that affect the reported amounts o f assets and liabilities and the disclosure of contingent assets and liabilities at the date of the financial statements, and the reported amounts of revenue and expenses during the period. Actual results could differ from those estimates.
(g) Employee Costs
NDB's operations are staffed by DMI employees, who receive vacation, sick pay, health, and other benefits.
87 (Continued)

NATIONAL DAIRY PROMOTION AND RESEARCH BOARD
Notes to Financial Statements
December 31,2001 and 2000
(3) Cash and Cash Equivalents
Cash and cash equivalents consist of the following as of December 31:
2001 2060
Operating cash in banks and on hand Repurchase agreements with commercial banks Federal agency discounted securities
485,156 271,371 - - 5,885,000
7,344,716 7,398,602
$ 7,829,872 13,554,973
All cash and cash equivalents are insured (FDIC) and collateralized by U.S. government securities held in the name of NDB.
(4) Assessments Receivable
Assessments receivable are recorded at the estimated net amounts to be received based on the amount of milk marketed and the average payment per hundredweight. In accordance with Public Law 98-180, NDB forwards unpaid assessments to the USDA for further action and/or legal proceedings. As of December 31, 2001 and 2000, approximately $384,000 of cumulative unpaid assessments were at USDA pending further action. Such amounts are not included in assessments receivable as of December 31,2001 and 2000, and will not be recorded as revenue until such amounts are ultimately received. Civil penalties exist for any persons who do not pay the assessment and/or file reports with NDB.
(5) Fund Balance
During 2001 and 2000, NDB's Board designated a portion of fund balance for use in continued funding of programs and for cash reserves. Total designations of fund balance are as follows:
2001 2000
Domestic marketing $ 724,238 680,.502 Planning and Research 19,622 Export - - 1,935~ 125
Total program designations 743,860 2,615,627
Future year budget Cash reserves
Total designated fund balance
2,307,000 6,658,000 1,800,000 1,800,000
4,850,860 11,073,627
Undesignated fund balance
Total fund balance
2,917,219 5,099,201
$ 7,768,079 16,172,828
88 (Continued)

N A T I O N A L DAIRY P R O M O T I O N AND R E S E A R C H BOARD
Notes to Financial Statements
December 31,2001 and 2000
The program designations as of December 31, 2001 and 2000 relate to contract commitments made during the following years:
2001 2000
2001 $ 743,860 - - 2000 - - 1,966,797 1999 - - 648,830
Total contract commitments $ 743,860 2,615,627
(6) Transactions with the United States Department of Agriculture
NDB reimburses the USDA for the cost o f oversight activities and economic research services. These reimbursements amounted to $471,212 and $566,972 for the years ended December 31, 2001 and 2000, respectively.
89

Supplemental Schedule
NATIONAL DAIRY PROMOTION AND RESEARCH BOARD
Supplemental Schedule of Reconciliation of Operations Budget
Year ended December 31, 2001
Organizational group expenses: Domestic marketing group Planning and research group Communications/member relations group Export group DMI core general and administrative General and administrative United States Department of Agriculture
2001 2001 Commitments operations total expensed 2001 budget
expenses in 2001 commitments statement
$ 73,228,579 680,502 724,238 2,537,295 - - 19,622 7,929,008 - - - - 5,564,741 1,286,295 2,255,774 - - - -
420,383 - - - - 471,212 - - - -
Total organizational group expenses $ 92,406,992
73,272,315 2,556,917 7,929,008 4,278,446 2,255,774
420,383 471,212
1,966,797 743,860 91,184,055
This schedule reconciles the total expenses from the Statement of Operations and Changes in Fund Balance presented in accordance with accounting principles generally accepted in the United States of America to those reflected in the Operations Budget Statement which is used for management's internal purposes.
The commitments expensed in 2001 represent management's contract commitments established prior to January 1, 2001 which were expensed in the current year.
The 2001 commitments represent management's contract commitments established in 2001 against the 2001 approved program budget operations.
See accompanying independent auditors' report.
90

NATIONAL DAIRY PROMOTION AND RESEARCH BOARD
Statements of Operations and Changes in Fund Balance
Years ended December 31, 2001 and 2000
Revenue: Assessments Interest income
Total revenue
Expenses: Domestic marketing group Planning and research group Communications/member relations group Export group DMI core general and administrative General and administrative United States Department of Agriculture
Total expenses
Excess (deficiency) of revenue over expenses
Fund balance at beginning of year
Fund balance at end of year
2001 2000
$ 83,632,543 84,746,001 369,700 598,537
84,002,243 85,344,538
73,228,579 65,237,009 2,537,295 3,742,254 7,929,008 4,426,207 5,564,741 6,170,499 2,255,774 2,206,581
420,383 363,594 471,212 566,972
92,406,992 82,713,116
(8,404,749) 2,631,422
16,172,828 13,541,406
7,768,079 16,172,828
See accompanying notes to financial statements.
91

APPENDIX D-2
" ~" SNYDER-COHN'COLLYER 'HAMILTON & ASSOCIATES P.C. "% 2
Independent Auditor's Report
To the Board of Directors Nat ional Fluid Mi lk Processor
Promot ion Board : Washington, D.C.
We have audited the accompanying Balance Sheet of the National Fluid Milk Processor Promotion Board as of December 31, 2001, and the related Statements of Revenues, Expenses and Changes in Net Assets and Cash Flows for the year then ended. These financial statements are the responsibility of the National Fluid Milk Processor Promotion Board's management. Our responsibility is to express an opinion on these financial statements based on our audit.
We conducted our audit in accordance with auditing standards generally accepted in the' United States of America and the standards applicable to financial audits contained in Government Auditing Standards, issued by the Comptroller General of the United States. Those standards require that we plan and perform the audit to obtain reasonable assurance about whether the financial statements are free of material misstatement. An audit includes examining, on a test basis, evidence supporting the amounts and disclosures in the financial statements. An audit also includes assessing the accounting principles used and significant estimates made by management, as well as evaluating the overall financial statement presentation. We believe that our audit provides a reasonable basis for our opinion.
In our opinion, the financial statements referred to above present fairly, in all material respects, the financial position of the National Fluid Milk Processor Promotion Board as of December 31, 2001, and the results of its operations, changes in its net assets and its cash flows for the year then ended in conformity with accounting principles generally accepted in the United States of America.
In accordance with Government Auditing Standards, we have also issued our report dated March 8, 2002 on our consideration of the National Fluid Milk Processor Promotion Board's internal control over financial reporting and on our tests of its compliance with certain provisions of laws, regulations, contracts, and grants. That report is an integral part of an audit performed in accordance with Government Auditing Standards, and should be read in conjunction with this report in considering the results of our audit.
P.o .
March 8, 2002
Certified Public Accountants and Business Adv isors "
4520 East West Highway, Suite 520, Bethesda, MD 20814-3338 Phone: 301-652-6700 Fax: 301-986-1028
Web: cpahelp.corn E-Mail: advice@cpahelp:com
92
B K R ~m= I~ FHn~))~ Ci~i~ WorIdwlda
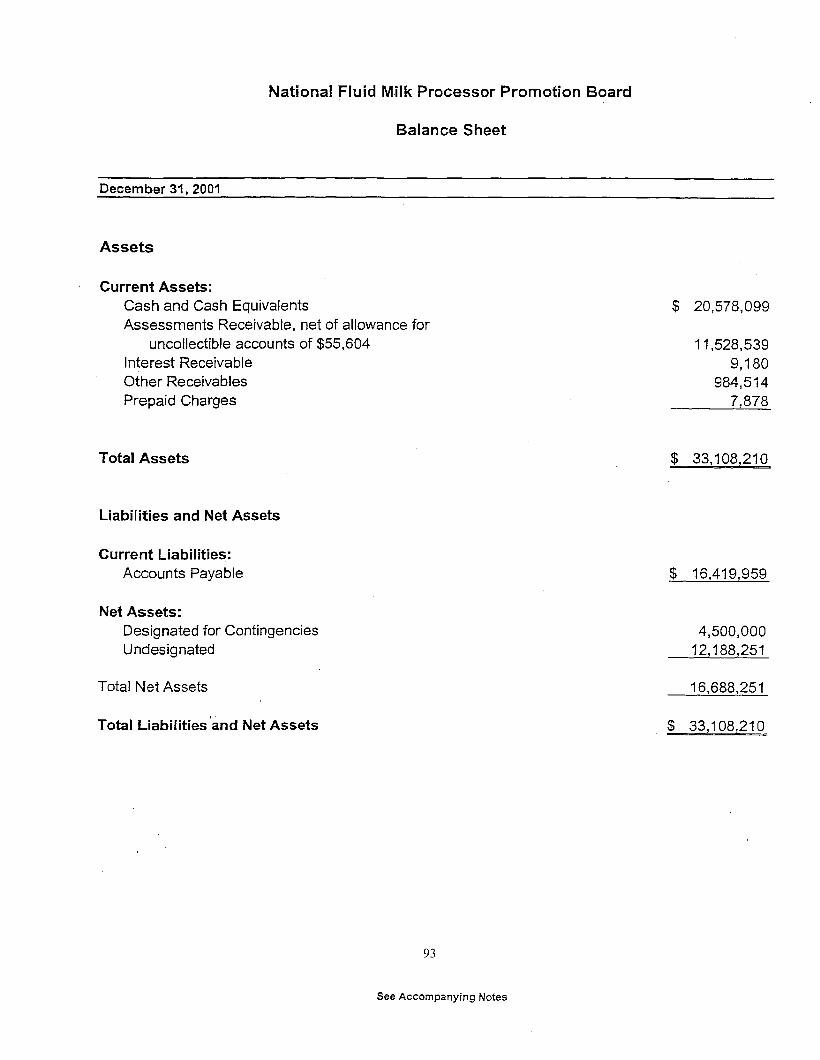
Nat ional Fluid Milk Processor Promotion Board
Balance Sheet
December 31, 2001
A s s e t s
Current Assets: Cash and Cash Equivalents Assessments Receivable, net of allowance for
uncollectible accounts of $55,604 Interest Receivable Other Receivables Prepaid Charges
$ 20,578,099
11,528,539 9,180
984,514 7,878
Total Assets $ 33,108,210
Liabilities and Net Assets
Current Liabilities: Accounts Payable
Net Assets: Designated for Contingencies Undesignated
Total Net Assets
Total Liabilities 'and Net Assets
$ 16,419,959
4,500,000 12,188,251
16,688,251
$ 33,108,210
£3
See Accompanying Notes

Nat ional Fluid Milk Processor Promot ion Board
S ta tement of Revenues , Expenses and Changes in Net Asse ts
For the year ended December 31, 2001
Revenues: Assessments California Cut-In Fees Late Payment Charges Interest Income Other
Total Revenues
Expenses: Program Expenses:
Media Promotions Public Relations Strategic Thinking Research Medical Advisory Panel American Heart Association Medical Research Program Measurement
Total Program Expenses
Other Expenses: California Grant Administrative USDA Oversight USDA Compliance Audit
Total Other Expenses
TotalExpenses
Excess of Revenues over Expenses
Net Assets - Beginning
$ 107,693,467 672,201 240,816 403,923
3,283
109,013,690
73,942,851 10,150,084 9,581,697
503,155 437,543 200,127 120,000 107,374 69,049
95,111,880
10,035,825 2,1i7,037
321,253 42,603
12,516,718
107,628,598
1,385,092
15,303,159
Net Assets - Ending
94
16,688,251
See Accompanying Notes

National Fluid Mi lk Processor Promot ion Board
Statement of Cash Flows
For the year ended December 31, 2001
Cash Flows from Operating Activities: Excess of Revenues over Expenses
Changes in Assets and Liabilities: Decrease in Assessments Receivable Decrease in Interest Receivable Increase in Qther Receivables Increase in Prepaid Charges Increase in Accounts Payable
Total Adjustments
Net Cash Provided by Operating Activities
Cash Flows from Investing Activities: Proceeds from Investments Maturing in Current Year
Net Increase in Cash and Cash Equivalents
Cash and Cash Equivalents - Beginning
$ 1,385,092
3,444,989 91,321
(725,554) (7,878)
3,633,726 6,436,604
7,821,696
1,499,898
9,321,594
11,256,505
Cash and Cash Equivalents - Ending $ 20,578,099
£5
See Accompanying Notes
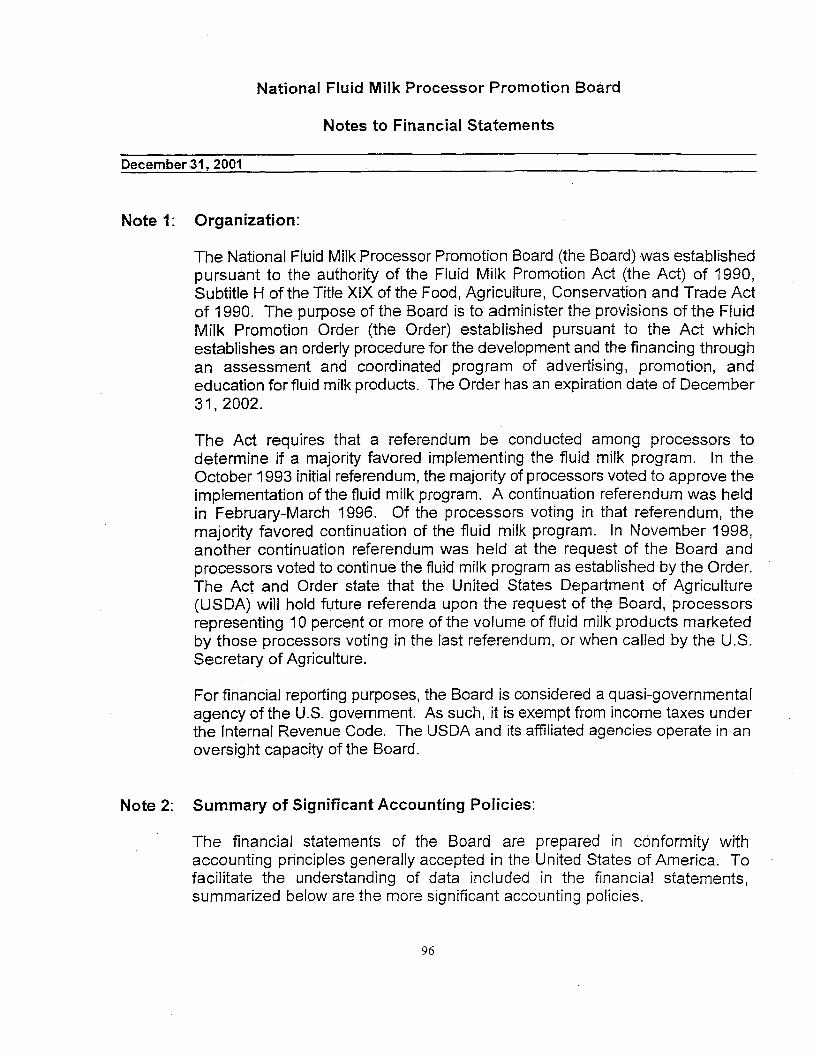
National Fluid Milk Processor Promotion Board
Notes to Financial Statements
December.31, 2001
Note 1: Organization:
The National Fluid Milk Processor Promotion Board (the Board) was established pursuant to the authority of the Fluid Milk Promotion Act (the Act) of 1990, Subtitle H of the Title XlX of the Food, Agriculture, Conservation and Trade Act of 1990. The purpose of the Board is to administer the provisions of the Fluid Milk Promotion Order (the Order) established pursuant to the Act which establishes an orderly procedure for the development and the financing through an assessment and coordinated program of advertising, promotion, and education for fluid milk products. The Order has an expiration date of December 31, 2002.
The Act requires that a referendum be conducted among processors to determine if a majority favored implementing the fluid milk program. In the October 1993 initial referendum, the majority of processors voted to approve the implementation of the fluid milk program. A continuation referendum was held in February-March 1996. Of the processors voting in that referendum, the majority favored continuation of the fluid milk program. In November 1998, another continuation referendum was held at the request of the Board and processors voted to continue the fluid milk program as established by the Order. The Act and Order state that the United States Department of Agriculture (USDA) will hold future referenda upon the request of the Board, processors representing 10 percent or more of the volume of fluid milk products marketed by those processors voting in the last referendum, or when called by the U.S. Secretary of Agriculture.
For financial reporting purposes, the Board is considered a quasi-governmental agency of the U.S. government. As such, it is exempt from income taxes under the Internal Revenue Code. The USDA and its affiliated agencies operate in an oversight capacity of the Board.
Note 2: Summary of Significant Accounting Policies:
The financial statements of the Board are prepared in conformity with accounting principles generally accepted in the United States of America. To facilitate the understanding of data included in the financial statements, summarized below are the more significant accounting policies.
96

National Fluid Milk Processor Promotion Board
Notes to Financial Statements
December 31, 2001
Note 2: Summary of Significant Accounting Policies: (Continued)
Assessments - Assessments are generated from those processors marketing more than 500,000 pounds of fluid milk per month by a 20-cent per hundred weight assessment on fluid milk products processed and marketed commercially in consumer-type packages in the 48 contiguous United States and the District of Columbia. Assessment revenue is recognized in the month in which the fluid milk product is processed.
Late payment charges are assessed, as provided under the Act, to processors who do not remit monthly assessments within 30 days following the month of assessment.
California Grant - In accordance with the Act, the Board is required to provide a grant to a third party equal to 80% of the assessments collected from Regions 14 and 15 to implement a fluid milk promotion campaign. Disbursements under these provisions are recorded as "California Grant" in the accompanying financial statements.
Cash Equivalents - For purposes of the statement of cash flows, the Board considers investments with an original maturity of three months or less to be cash equivalents.
Use of Estimates - The Board has made certain estimates and assumptions that affect the reported amounts of assets and liabilities and the disclosure of contingent assets and liabilities at the date of the financial statements, and the reported amounts of revenue and expenses during the period. Actual results could differ from those estimates.
Advertisin,q - In accordance with its mission, the Board has approved the development of direct and nondirect response advertising and promotional activities. All costs related to these activities are charged to expense as incurred.
97
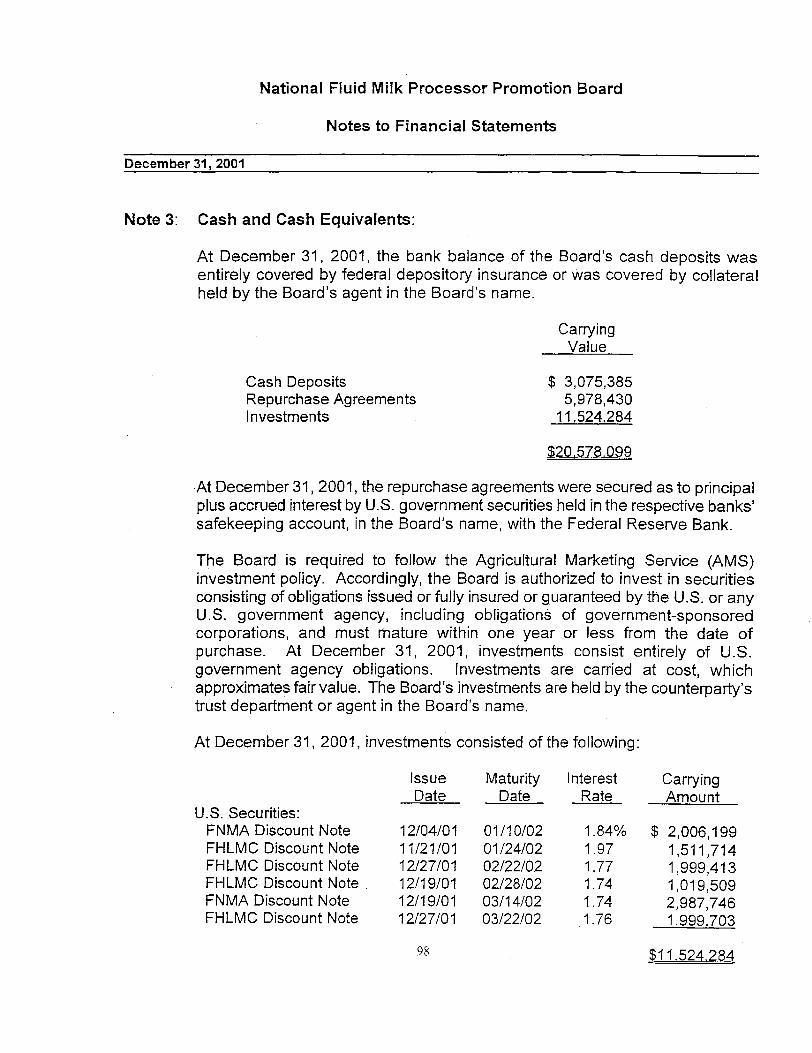
National Fluid Milk Processor Promotion Board
Notes to Financial Statements
December 31, 2001
Note 3: Cash and Cash Equivalents:
At December 31, 2001, the bank balance of the Board's cash deposits was entirely covered by federal depository insurance or was covered by collateral held by the Board's agent in the Board's name.
Carrying Value
Cash Deposits Repurchase Agreements Investments
$ 3,075,385 5,978,430
11,524,284
$20,578,099
At December 31,2001, the repurchase agreements were secured as to principal plus accrued interest by U.S. government securities held in the respective banks' safekeeping account, in the Board's name, with the Federal Reserve Bank.
The Board is required to follow the Agricultural Marketing Service (AMS) investment policy. Accordingly, the Board is authorized to invest in securities consisting of obligations issued or fully insured or guaranteed by the U.S. or any U.S. government agency, including obligations of government-sponsored corporations, and must mature within one year or less from the date of purchase. At December 31, 2001, investments consist entirely of U.S. government agency obligations. Investments are carried at cost, which approximates fair value. The Board's investments are held by the counterparty's trust department or agent in the Board's name.
At December 31, 2001, investments consisted of the following:
U.S. Securities: FNMA Discount Note FHLMC Discount Note FHLMC Discount Note FHLMC Discount Note FNMA Discount Note FHLMC Discount Note
Issue Maturity Interest Carrying Date Date Rate Amount
12/04/01 01/10/02 1.84% $ 2,006,199 11/21/01 01/24/02 1.97 1,511,714 12/27/01 02/22/02 1.77 1,999,413 12/19/01 02/28/02 1.74 1,019,509 12/19/01 03/14/02 1.74 2,987,746 12/27/01 03/22/02 1.76 1,999.703
98 $11.524,284

National Fluid Milk Processor Promotion Board
Notes to Financial Statements
December 31, 2001
Note 3: Cash and Cash Equivalents: (Continued)
At December 31, 2001, the Board was owed accrued interest of $9,180.
Cash and cash equivalents includes $4,500,000 of Board designated cash reserve.
Note 4: Compliance Matters:
In accordance with the Act and the Order, effective one year after the date of the establishment of the Board, the Board shall not spend in excess of 5% of the assessments collected for the administration of the Board. For the year ended December 31, 2001, the Board did not exceed this limitation.
Note 5: Commitments:
The Board entered into an agreement with the International Dairy Foods Association (IDFA) to administer the fluid milk program. IDFA contracted with Bozell Worldwide, Inc., Weber Schandwick Worldwide (formerly Bozel! Sawyer Miller Group), and Marketing Drive to develop the Board's advertising, consumer education, and promotion programs, respectively.
Additionally, the Board entered into an agreement during fiscal year 2000 with Walt Disney World Hospitality & Recreation Corporation (WDWHRC), whereby the Board will pay WDWHRC $1,800,000 each year for the next five years in exchange for the sponsorship and certain promotional rights at the Sports Complex in order to cooperatively develop programs to promote fluid milk products at Walt Disney World Resort.
Note 6: Transactions with the United States Department of Agriculture:
Under the provisions of the Act and the Order, the Board is required to pay the United States Department of Agriculture certain fees for oversight and evaluation costs.
99

National Fluid Milk Processor Promotion Board
Notes to Financial Statements
December 31, 2001
Note 7: Operating Lease:
The Company incurred $114,000 of rental expense during the year 2001, under a sublease agreement that has an automatic renewal agreement that was extended through December 31, 2002.
Note 8: Related Party:
Accounting services for the Board are performed by Rubin, Kasnett & Associates, P.C. (RK&A); the cost of these services was $225,000 during 2001. A principal of RK&A serves as the Chief Financial Officer of the Board and received compensation of $140,000 for services performed.
Note 9: Litigation:
The Board has been named as a defendant in two legal actions filed with agencies of the Federal Government. If these actions were to be found in the favor of the complainants, the Board could be exposed to civil penalties and financial losses.
The Board expects to vigorously defend its actions and believes it will prevail in each matter. No provision for losses has been made in these statements.
On June 25, 2001, the United States Supreme Court issued an opinion in the case United States v. United Foods, Inc., No. 00-276 (U.S. June 25, 2001) holding that the generic advertising component of the Mushroom Promotion Act (as established by the USDA) violated the First Amendment rights of the plaintiff. As a result, members of the mushroom industry are no longer required to pay assessments that fund advertising and promotion unless they so elect.
While the Board operates under a similar Act created by the USDA, it believes operating conditions in the milk industry differ from those in the mushroom industry, that the program is constitutional and the Board is not likely to be adversely impacted. Further, the Board believes the USDA will vigorously defend the program.
100

\ : SNYDER-COHN-COLLYER-HAMILTON & ASSOCIATES P.C.
Independent Auditor 's Report on Supplementary Information
To the Board of Directors National Fluid Milk Processor
Promotion Board Washington, D.C.
Our report on our audit of the basic financial statements of the National Fluid Milk Processor Promotion Board for 2001 appears on page 1. We conducted our audit for the purpose of forming an opinion on the basic financial statements taken as a whole. The supplemental information presented on pages 12 to 15 for the year ended December 31, 2001 is presented for purposes of addftional analysis and is not a required part of the basic financial statements. Such information has been subjected to the auditing procedures applied in the audit of the basic financial statements and, in our opinion, is fairly stated in all material respects in relation to the basic financial statements taken as a whole.
March 8, 2002
C b. i
Cer t i f i ed Public Accountan ts and Business Advisors "
4520 East West Highway, Suite 520, Bethesda, MD 20814-3.~38 Phone: 301-652-6790 Fax: 301-986-1028 Web: cpahelp.com E-Mail: advice@c~ahelp:com
101
B K R ]Rm~ In Pnncipl] Ci:ie~ Woeld~d~

National Fluid Milk Processor Promotion Board
Schedule of Revenues and Expenses Actual Compared to Budget
(Budget Basis)
For the year ended December 31, 2001
Reven ues: Assessments California Cut-In Fees Late Payment Charges Interest Income Other Carryover - Prior Years
Total Revenues
Expenses:
Program Expenses: Program - Current Year Program - Prior Years
Total Program Expenses
Other Expenses: California Grant Administrative USDA Oversight USDA Compliance Audit - Prior Years Unallocated Unallocated Reserve
Total Other Expenses
Less Encumbrances - Prior Years
Total Expenses
Excess (Deficit) of Revenues Over Expenses
Unexpended/ Amended
Budget
$ 110,000,000 800,000
6,532,138
117,332,138
101,310,394 823,060
102,133,454
I0,300,000 2,117,037
350,000 42,6O3
254,707 3,000,000
16,064,347
(865,663)
117,332,138
$
Current Year Actual
$ 107,693,467 672,201 240,816 403,923
3,283
109,013,690
94,288,820 823,060.
95,111,880
10,035,825 2,117,037
321,253 42,603
12,516,718
107,628,598
1,385,092
Actual Over (Under)
Budget
$ (2,306,533) (127,799) 240,816 403,923
3,283 (6,532,138)
(8,318,448)
(7,021,574)
(7,021,574)
(264,175)
(28,747)
(254,707) (3,0o0,o0o) (3,547,629)
865,663
(9,703,540)
$ (1,385,092)
102

National Fluid Milk Processor Promotion Board
Schedule of Program Expenses Actual Compared to Budget•
(Budget Basis)
For the year ended December 31, 2001
Current Year Expended Actual Prior Year Expended Actual Total Amended Current Year Over (Under) Unexpended Prior Year Over (Under) Program
Budget Actual _ Budget Budget Actual __ Budge t Acti'J.i!y__
Expenses - 2001 Budget
Media Promotions Public Relations Strategic Thinking Research Medical Advisory Panel American Heart Association Medical Research Program Measurement
$ 74,833,700 $ 73,945,305 $ (888,395) $ 1,423,820 $ (2,454) $ (1,426,274) $ 73,942,851 13,869,300 10,170,587 (3,698,713) 1 ,962,725 ( 2 0 , 5 0 3 ) (1,983,228) 10,150,084 • 9,548,650 9 , 2 2 6 , 4 3 0 (322,220) 871,896 3 5 5 , 2 6 7 ( 5 1 6 , 6 2 9 ) 9,581,697
776,000 207,977 ( 5 6 8 , 0 2 3 ) 4 6 7 , 9 7 9 295,178 (172,801 ) 503,155 1,546,500 417,374 (1,129,126) 167,098 20,169 (146,929) 437,543
316,244 194,499 ( 1 2 1 , 7 4 5 ) 221,940 5 ,628 (216,312) 200,127 - 812,475 1 2 0 , 0 0 0 (692,475) 120,000
210,000 107,374 (102,626) (4,862) 4,862 107,374 210,000 . . . . 19,274 1L90,726 ) 60,586 __ 49,775 (10,811) 69,049
Total Program Expenses $ 101,310,.394 $ 94,288,820 ~ $ 5,983,657 $ 823,060 $___(5,t60,597) $ 95,11!.,88().

National Fluid Milk Processor Promotion Board
Schedule of Administrative Expenses Actual Compared to Budget
(Budget Basis)
For the year ended December 31, 2001
Management Contract
Board Meeting Expenses
Staff Salaries and Benefits: Staff Salaries and Compensation Staff Retirement Benefit Payroll Taxes Health Insurance Life Insurance Disability Insurance Workers Compensation
Total Salaries and Benefits
Finance and Administration: Contract Staff Financial Services
Total Finance and Administration
Other Operating Expenses: Legal Audits Office Facilities Support and Maintenance Staff Travel Telephone Insurance Postage and Delivery USDA Processor Compliance Miscellaneous
Total Other Operating Expenses
Current Year Amended
Budget
$ 573,856
264,274
355,000 35,500 12,000 4,000 1,050 1,260
675 409485
140,000 225,000 365,000
183,471 50,000 96,500 18,000 75,000
5,000 30,451 13,000 30,000 3,000
5041422
$ 2,117,037
Current Year Actual
$ 573,856
275,317
359,003 31,688 10,608 3,474
823 1,399
303 407,298
139,989 224,742 364,731
183,471 67,057 96,000 18,000 68,470 3,127
30,451 28,814
445 495,835
$ 2,117,037
Actual Over (Under)
Budget
$
11,043
4,003 (3,812) (1,392)
(526) (227) 139
(372) (2,187)
(11) (258) (269)
17,057 (500)
(6,530) (1,873)
15,814 (30,000) (2,555) (8,587)
Total Administrative Expenses
104

National Fluid Milk Processor Promotion Board
Schedule of Cash Receipts and Disbursements
For the year ended December 31, 2001
Cash Receipts from Operations: Assessments California Cut-In Fees Late Payment Charges Interest Income Other
Total Revenues
$ 110,412,902 672,201 240,816 495,244
3,283 111,824,446
Cash Disbursements for Operations 104,002,750
Excess of Operating Receipts over Disbursements 7,821,696
Other Sources and Uses of Cash: Proceeds from Investments Maturing in Current Year 1,499,898
Excess of Receipts and Other Sources Over Disbursements and Other Uses of Cash 9,321,594
Cash and Cash Equivalents - Beginning 11,256,505
Cash and Cash Equivalents - Ending $ 20,578,099
105

SNYDER.COHN-COLLYER-HAMILTON & ASSOCIATES P.C.
m
Independent Auditor's Report on Compliance and on Internal Control Over Financial Reporting
Based on an Audit of Financial Statements Performed in Accordance with Standards of the
Agricultural Marketing Service Division of the United States Department of Agriculture
To the Board of Directors National Fluid Milk Processor
Promotion Board Washington, D.C.
We have audited the financial statements of the National Fluid Milk Processor Promotion " Board as of and for the year ended December 31, 2001, and have issued our report thereon
dated March 8, 2002. We conducted our audit in accordance with generally accepted auditing standards and the standards applicable to financial audits contained in the
• Agricultural Marketing Service Division guidelines for financial audits, issued by the Agricultural Marketing Service Division of the United States Department of Agriculture.
Compliance As part of obtaining reasonable assurance about whether the National Fluid Milk Processor Promotion Board's financial statements are free of material misstatement, we performed tests of its Compliance with certain provisions of laws, regulations, contracts and grants, noncompliance with which could have a direct and material effect on the determination of financial statement amounts. However, providing an opinion on compliance with those provisions was not an objective of our audit and, accordingly, we do not express such an opinion.
Internal Control Over Financial Reportinq In planning and performing our audit, we considered the National Fluid Milk Processor Promotion Board's internal control over financial reporting in order to determine our auditing
procedures for the purpose of expressing our opinion on the financial statements and not to provide assurance on the internal control over financial reporting. Our consideration of the internal control over financial reporting would not necessarily disclose all matters in the internal control over financial reporting that might be material weaknesses. A material weakness is a condition in which the design or operation of one or more of the internal 'control components does not reduce to a relatively low level the risk that misstatements in amounts that would be material in relation to the financial statements being audited may occur and not be detected within a timely period by employees in the normal course of performing their assigned functions. We noted no matters involving the internal control over
• financial reporting and its operation that we consider to be material weaknesses.
Certified Public Accountants and Business Advisors "
4520 East West Highway, Suite 520, Bethesda, MD 20814-.3338 Phone: 301-652-6700 Fax: 301-986-1028
Web: cpahelp.com E-Mail: advice@cpahelp:com
106 l~dcp~d~n~ ~mb~
g K R F ~ In FTir c~p4~ Citles Worldv~d¢

To the Board of Directors National Fluid Milk Processor
Promotion Board Page two
< =
= z
% 2
This report is intended solely for the information and use of the National Fluid Milk Processor Promotion Board, management of the National Fluid Milk Processor Promotion Board, and the Dairy Programs, Services and Resources Division of the Agricultural Marketing Service Division of the United States Department of Agriculture and is not intended to be and should not be used by anyone other than these specified parties.
March 8, 2002
107

= ~ SNYDER'COHN'COLLYER'HAMILTON & ASSOCIATES P.C.
m To the Board of Directors National Fluid Milk Processor
Promotion Board Washington, D.C.
We have audited, in accordancewith generally accepted auditing standards, the Balance Sheet of the National Fluid Milk Processor Promotion Board as of December 31, 2001, and the related Statements of Revenues, Expenses, and Changes in Net Assets and Cash Flows for the year then ended, and have issued our report thereon dated March 8, 2002. The financial statements were prepared in conformity with accounting principles generally accepted in the United States of America.
In connection With our audit, nothing came to our attention, insofar as it relates to accounting matters, that causes us to believe that the National Fluid Milk Processor Promotion Board:
• Failed to comply with laws and regulations applicable to the National Fluid Milk Processor Promotion Board;
Failed to comply with Section 1160.212, of the Fluid Milk Promotion Order, relating to the use of assessment funds for the purpose of influencing governmental policy or action;
• Expended assessment funds for purposes other than those authorized bythe Fluid Milk Promotion Act and the Fluid Milk Promotion Order.
Expended or obligated assessment funds on any projects prior to the fiscal year in which those funds were authorized to be expended by the National Fluid Milk Processor Promotion Board's approved Budget and Marketing Plan;
• Did not adhere to the original or amended Budget and Marketing Plan for the year ended December 31,2001;
• Did not obtain a written contract or agreement with any person or entity providing goods or services to the National Fluid Milk Processor Promotion Board;
Failed to comply with Section 1999H, paragraph (g)of the Fluid Milk Promotion Order, relating to the limitations on the types of investments which may be purchased by the National Fluid Milk Processor Promotion Board and the insurance or collateral that must be obtained for all National Fluid Milk Processor Promotion Board deposits and investments;
108 Certified Public Accountants and Business Advisors "
4520 EaR West Highway, Suite 520, Bethesda, MD 20814-3338 Phone: 301-652-6700 Fax: 30%986-1028
Web: cpahetp.com E-Mai[: advice@cpahelp:com
~d ~-'p~d~t Member
g KR F~'ns In Y'~x~eipL~Cide~ Wod d'.~e

To the Board of Directors National Fluid Milk Processor
Promotion Board Page two
" ~ i °
• Failed to complywith internal controls;
• Failed to comply with disclosure requirements for lease commitments; or
Failed to comply with the By-laws of the National Fluid Milk Processor Promotion Board or any other policy of the National Fluid Milk Processor Promotion Board, specifically as they relate to all financial matters, including time and attendance, and travel.
However, our audit was not directed primarily toward obtaining knowledge of such noncompliance.
This report is intended solely for the information and use of the National Fluid Milk Processor Promotion Board, management of the National Fluid Milk Processor Promotion Board, and the Dairy Programs, Services and Resources Division of the Agricultural Marketing Service Division of the United States Department of.Agriculture and is not intended to be and should not be used by anyone other than these specified parties.
March 8, 2002
109
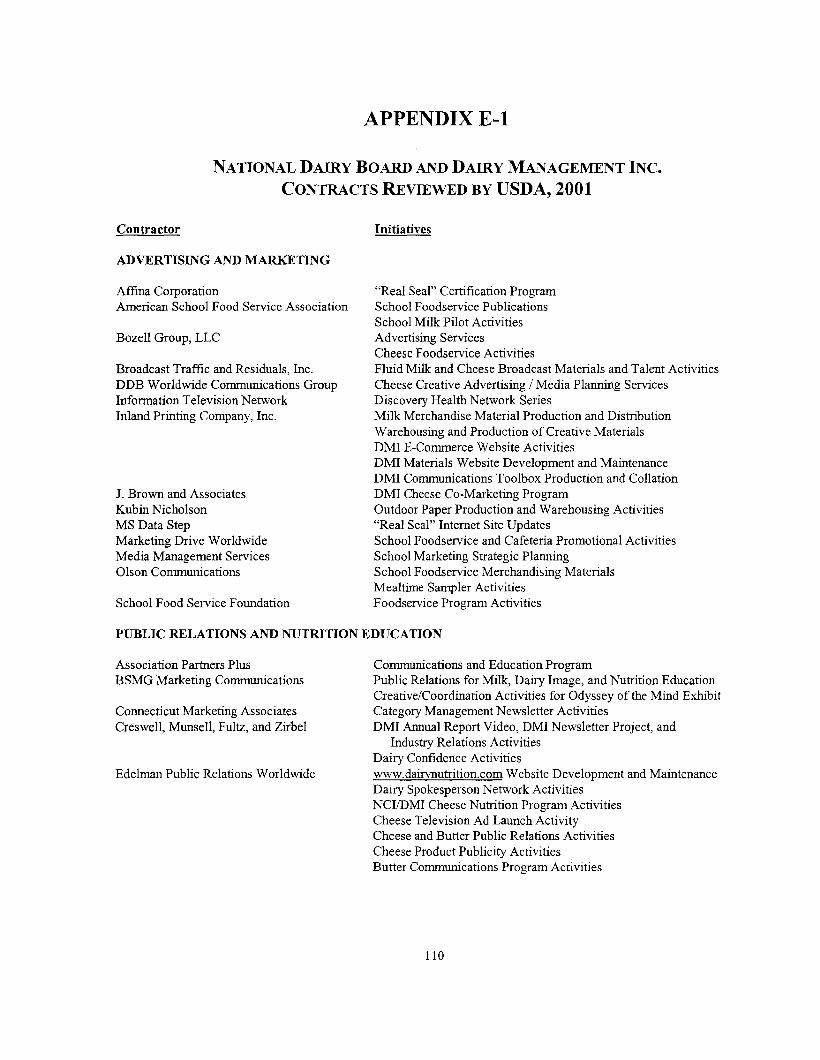
APPENDIX E-1
N A T I O N A L D A I R Y B O A R D AND D A I R Y M A N A G E M E N T INC.
C O N T R A C T S R E V I E W E D BY USDA, 2 0 0 1
Contractor Initiatives
ADVERTISING AND MARKETING
Affma Corporation American School Food Service Association
Bozell Group, LLC
Broadcast Traffic and Residuals, Inc. DDB Worldwide Communications Group Information Television Network Inland Printing Company, Inc.
J. Brown and Associates Kubin Nicholson MS Data Step Marketing Drive Worldwide Media Management Services Olson Communications
School Food Service Foundation
"Real Seal" Certification Program School Foodservice Publications School Milk Pilot Activities Advertising Services Cheese Foodservice Activities Fluid Milk and Cheese Broadcast Materials and Talent Activities Cheese Creative Advertising / Media Planning Services Discovery Health Network Series Milk Merchandise Material Production and Distribution Warehousing and Production of Creative Materials DMI E-Commerce Website Activities DMI Materials Website Development and Maintenance DMI Communications Toolbox Production and Collation DMI Cheese Co-Marketing Program Outdoor Paper Production and Warehousing Activities "Real Seal" Intemet Site Updates School Foodservice and Cafeteria Promotional Activities School Marketing Strategic Planning School Foodservice Merchandising Materials Mealtime Sampler Activities Foodservice Program Activities
PUBLIC RELATIONS AND NUTRITION EDUCATION
Association Partners Plus BSMG Marketing Communications
Connecticut Marketing Associates Creswell, Munsell, Fultz, and Zirbel
Edelman Public Relations Worldwide
Communications and Education Program Public Relations for Milk, Dairy Image, and Nutrition Education Creative/Coordination Activities for Odyssey of the Mind Exhibit Category Management Newsletter Activities DMI Annual Report Video, DMI Newsletter Project, and
Industry Relations Activities Dairy Confidence Activities www.dairvnutrition.com Website Development and Maintenance Dairy Spokesperson Network Activities NCI/DMI Cheese Nutrition Program Activities Cheese Television Ad Launch Activity Cheese and Butter Public Relations Activities Cheese Product Publicity Activities Butter Communications Program Activities
ii0

N A T I O N A L D A I R Y B O A R D AND D A I R Y M A N A G E M E N T INC.
C O N T R A C T S R E V I E W E D BY USDA, 2 0 0 1 ( C O N T I N U E D )
Contractor Initiatives
PUBLIC RELATIONS AND NUTRITION EDUCATION (Cont'd.)
Flair Communications Agency
Fleishman Hillard I-Site Web Design Jerry Dryer Group Media Management Services OM Association/Destination Imagination, Inc. Tucker-Knapp
Weber Shandwick Worldwide
Willard Bishop
Destination Imagination Program Development Fluid Milk Sales Promotion Activities Reputation Management Program Website www.familvfoodzone.com Maintenance Dairy Issues Management Activities Pyramid Caf6/Pyramid Explorations Newsletter Destination Imagination Sponsorship DMI Customer Service Technical Liaison Industry Relations Planning Activities Technology Transfer Marketing Program Activities Extraordinary Dairy Marketing Nonfat Milk/Whey Program Activities Prepared Foods New Products Conference Reputation and Issues Management Crisis Preparedness Animal Health Message Testing Expanding the Reach of Dairy Educational Series
EXPORT
American-Mexican Marketing
Arab Marketing Finance Contacts Intemational Consulting, Ltd. Eastern Strategic Consulting Ltd. Functional Ingredients Research, Inc. Global Trade Information Services International Dairy Foods Association International Trade Services IntNet J.J. Keller and Associates
Jerry Dryer Group LFRA, Ltd
Landell Mills Levitt Communication
Mexican Market Representation and Program Activities Domino's Pizza Cheese Promotion Middle East Market Representation and Program Activities South American Market Representation and Program Activities China/Taiwan Ice Cream and Cheese Market Analysis Korean Whey Nutri-Marketing Conference & Trade Mission Purchase of World Trade Atlas Update of USDEC Export Manuals Update of USDEC's International Reference Manuals Korean Market Representation and Program Activities Update of USDEC Export Manual Addition of CODEX Milk Standards to Export
Manual CD-ROM USDEC International Communications Activities U.S. Cream Cheese and Mozzarella Cheese Comparison with
Similar, Leading Cheese Products from Different Origins Canadian Whey/Lactose Market Development Study USDEC Membership Services
111

N A T I O N A L D A I R Y BOARD AND D A I R Y M A N A G E M E N T INC.
CONTRACTS REVIEWED BY USDA, 2001 (CONTINUED)
Contractor Initiatives
EXPORT (Cont'd.)
Market Directions Mistral Group, Ltd. National Milk Producers Federation
PR Consultants Pacrim Associates Pasm Group Patricia R. Fuchs & Associates Results Direct Promar International Soluciones Cualitativas
Stanton, Emms, & Sia Stratton Publishing & Marketing, Inc. Uniflex Marketing
Dairy Farmer Awareness and Attitude Study European Market Representation and Program Activities Global Research Activities Farm to Consumer Program Activities Chinese Market Representation and Program Activities Southeast Asian Market Representation and Program Activities Australia and New Zealand Trade Mission USDEC Annual Report Production USDEC Website Redesign (Phase II) Updated Market Study for Dairy Products in Mexico Mexican Consumer Awareness and Image Study of Leading Domestic
and Foreign Cheese Brands Southeast Asian Cheese Market Study Website Consulting Services Japanese Market Representation and Program Activities Japanese Dry Ingredients Program
MARKET AND ECONOMIC RESEARCH
Beverage Marketing Corporation of NY
Burelle's Newsclip Analysis Service CFE Solutions, Inc. CY Research, Inc. D.S. Howard and Associates Doyle Research Associates Elrick and Lavidge
Information Resources, Inc. Kaplan Levinson Associates MSW Market Decisions Market Facts
Milk Availability Research Study/School Milk Pilot Program Review of the Effectiveness of Generic Milk Programs Cheese Media Monitoring and Analysis School Milk Pilot Program Milk and Cheese Creative Testing Assessing Viability of Various Milk Sales Promotion Concepts Ad Concept Testing Cheese Advertising Tracking Activities Milk Advertising Tracking Activity Milk Claims Assessment Research Milk and Cheese Category Volume Reports Qualitative Research for Kid/Morn Strategic Exploration Milk and Cheese Advertising Copy Testing In-Store Chocolate Milk Promotion Audit Attitudes and Usage Trends Study
112

N A T I O N A L D A I R Y B O A R D AND D A I R Y M A N A G E M E N T INC.
C O N T R A C T S R E V I E W E D BY USDA, 2 0 0 1 ( C O N T I N U E D )
Contractor Initiatives
MARKET AND ECONOMIC RESEARCH (Cont'd.)
Marketecture
Meyers Research Center NFO Research NPD Group
Prime Consulting Group RSC - The Quality Measurement Co. Roper ASW
Shuster Laboratories Sparks Companies, Inc. Spectra Marketing Systems Strategic Marketing Teri Gacek Associates Widener-Burrows and Associates Wirthlin Worldwide
Attitudes and Usage Trends Study Analysis Survey of "Real Seal" Users Tracking Activities of Public Opinion toward Dairy Products
and the Dairy Industry Milk Promotion Concept Exploration Qualitative Research for Reputation Management Evaluation of Fame Game Milk Promotion Purchase and Analysis of Marketing Data Cheese Consumption Tracking Activity and CREST Foodservice Data Eating Patterns Data Report Consumer Food Safety Survey Milk Innovation Research Milk and Cheese Advertising Copy Testing Testing and Evaluation for Milk in Schools School Milk Pilot Consulting Phase II Milk Cooler Research Multi-Client Dairy Industry Study Marketing Research Activities Qualitative Marketing Research Assignments Qualitative Marketing Research Assignments Qualitative Research for Chocolate Milk Program Analysis Research Testing Activities Dairy Producer Survey Pyramid Nutrition Education Program Research
113

APPENDIX E-2
N A T I O N A L F L U I D M I L K P R O C E S S O R P R O M O T I O N B O A R D AND
I N T E R N A T I O N A L D A I R Y F O O D S A S S O C I A T I O N
CONTRACTS REVIEWED BY USDA, 2001
Contract Parties
Susan Baker, M.D. Susan Barr, Ph.D. Sarah Berga, M.D. Robert P. Heaney, M.D. - Creighton University
Medical School Beverage Marketing Corporation of New York Dairy & Food Communications, Inc. Diagnostic Research, Inc. Flair Communications FAF Marketing Information Resources, Inc. (IRI) Inland Printing Company Meyers Research Center Prime Consulting Group, Inc. Roslow Research Group SciLucent LLC
Publicidad Siboney Corporation (Siboney USA)
Smith Food and Drug Stores, Inc. Snyder, Cohn, Collyer, Hamilton & Associates, P.C. Quality Chekd Dairies, Inc. & Bravo! Foods, Inc. Uneeda Doll Co. Widner Burrows
Proiect Title
Medical Advisory Board Member Services Medical Advisory Board Member Services Medical Advisory Board Member Services Medical Advisory Board Member Services
Market Research Services Consulting Agreement Evaluation of Chocolate Milk Television Advertising Promotional Marketing Services Sports Marketing Consultant Services Promotion Measurement Services Milk Reporting Database Services Promotion Evaluation Services Market Research Agreement Hispanic Market Research Scientific Research Services Evaluation of Fluid Milk Health Claims Hispanic Market Research Hispanic Market Program Activities License Agreement Audit Services License Agreement License Agreement Testing of Chocolate Milk Television Advertisements
114

APPENDIX F-1
NUTRITION AND HEALTH RESEARCH INSTITUTES AND DAIRY FOODS RESEARCH CENTERS 2001
Nutrition and Health Research Institutes
Diet, Genetics, and Heart Disease Institute Louisiana State University Pennington Biomedical Research Center
Genetics and Nutrition Institute Children's Hospital, Oakland Research Institute
Research Focus
Relationship of Low-Fat Diets to Heart Disease
Relationship of Genetics, Dietary Fat (Especially Dairy Fat) and Heart Disease
Dairy Foods Research Centers
California California Polytechnic State University University of California at Davis
Minnesota/South Dakota University of Minnesota South Dakota State University
Northeast Comell University University of Vermont
Southeast North Carolina State University Mississippi State University
Western Utah State University Oregon State University Brigham Young University
Wisconsin University of Wisconsin at Madison
Research Objectives
Milk Component Characterization, Modification, and Utilization
Dairy Products and Process Technologies: Applications Dairy Food Safety
Genetics of Dairy Starter Cultures Dairy Food Quality and Safety Utilization of Dairy Components as Ingredients
Dairy Product Quality Functional Properties of Dairy Products and Milk
Components Dairy Product Safety Dairy Product Processing, Engineering, and Packaging New Product Development
Milk Component Functionality Microbial and Genetic Technologies Biological and Thermal Processing Technologies Applications to Innovative Products and Processes
Research of How Dairy Proteins Function and Interact
Practical Research of Dairy Proteins to Design Dairy Protein Systems for Their Use in Food Manufacture
Function of Proteins and Enzymes in Low-Fat Cheeses
Milkfat Management and Utilization Nonfat Solids Utilization Cheese Technology Quality and Safety
115

A P P E N D I X F-2
DAIRY FOODS C O M P E T I T I V E R E S E A R C H A C T I V I T I E S D U R I N G 2001
Principal Investigator & Institution Proiect Title
William R. Aimutis, Ph.D. Land O' Lakes
Physical and Biochemical Changes Associated with Shredded Cheese During Ripening [continued in 2001]
Polly Dinsmore-Courtney, Ph.D. Ohio State Univ Research Foundation
Susan E. Duncan, Ph.D. Virginia Polytechnic Institute
Control of Cheddar Cheese Ripening Via High Pressure Treatment [completed in 2001]
Controlled Release of Antioxidants by Polymer Films into Milk [continued in 2001]
Robert W. Hutkins, Ph.D. Virginia Polytechnic Institute
Utilization of Fructooligosaccharides by Probiotic Bacteria [began in 2001]
Michael E. Mangino, Ph.D. Ohio State University
Partial Denaturation to Improve Heat Stability of Whey Protein [completed in 2001]
Joseph E. Marcy, Ph.D. Virginia Polytechnic Institute
Improved Uses of Natamycin to Prevent Mold Spoilage of Cheese [continued in 2001]
Active Packaging to Improve the Quality of LrI-IT Milk [continued in 200 l ]
Teresa Marshall, Ph.D. University of Iowa, College of Dentistry
David J. McClements, Ph.D. University of Massachusetts
Identification of the Roles that Dairy Products, Particularly Fluid Milk, Play m Dental Cavities and Fluorosis of Young Children [began in 2001]
Application of Whey Proteins and Emulsifiers in Foods [completed m 2001]
John U. McGregor, Ph.D. Clernson University
Fluid Dairy Products as Ingredients in Freshly Prepared Coffee House Beverages [continued in 2001]
Enhancing the Shelf Life of Whole Milk Powder [continued in 20013
Ronald L. Richter, Ph.D. Texas A&M University System
Effects of Formulation and Processing on the Emulsion Stability and Sedimentation of Retort Sterilized Dairy-Based Nutritional Products [completed in 200I]
Scott Rankin, Ph.D. University of Wisconsin at Madison
Biochemistry of Full and Reduced Fat Cheddar Shred Ripening [continued in 2001]
116

A P P E N D I X F-2
D A I R Y F O O D S C O M P E T I T I V E R E S E A R C H A C T I V I T I E S D U R I N G 2 0 0 1
Principal Investigator & Institution
Judith Stable, Ph.D. International Dairy Foods Association
Debra Sullivan, Ph.D. University of Kansas Medical Center
Richard L. Stroshine, Ph.D. Purdue Research Foundation
Margaret Swearingen, Ph.D. Land O' Lakes
(CONTINUED)
Project Title
Study of Thermal Inactivation of Mycobacterium Paratuberculosis [completed in 2001 ]
Effects of Increased Dairy Product Consumption on Blood Pressure in a Multi-Ethnic Population of Elementary School Children [began in 2001]
Low Field Proton Magnetic Resonance for On-Line Monitoring of the Moisture Content of Processed Cheese and Other Dairy Products [continued in 200I]
Calcium Lactate Levels and Incidence of Crystals on Cheddar Cheese [continued in 2001]
117

APPENDIX F-3
N U T R I T I O N C O M P E T I T I V E R E S E A R C H A C T I V I T I E S D U R I N G 2001
Principal Investigator & Institution Proiect Title
Dale E. Bauman, Ph.D. Cornell University
Interrelationships Between Trans Fatty Acids and Conjugated Linoleic Acids and Their Role in Lipid Metabolism [completed m 2001]
Production of CLA-Enriched Butter for Animal Studies of Mammary Cancer [began in 2001]
Terri D. Boyston, Ph.D. Iowa State University
Development of A Yogurt with Increased CLA Content Produced with Probiotic Bacteria [continued in 2001]
Leann L. Birch, Ph.D. Pennsylvania State University
Parental Influence on Girls' Calcium Intake and Bone Mineral Density [continued in 2001 ]
Carol J. Boushey, Ph.D. Purdue Research Foundation
Qualitative Assessment of Lactose Consumption and Symptoms by Meta-Analysis [completed in 2001]
Gary M. Chart, M.D. Children's Medical Center Foundation
The Effects of Dairy Foods on Adolescent Pregnant Mothers and Theft Newborn [began in 2001]
Effects of Milk and Non-Milk Beverages on Young Children's Nutrition and Taste Preferences [continued in 2001]
Adam Drewnowski, Ph.D. University of Washington
Diet Quality Indices and the Use of Dairy Products by French Adults: The SUVIMAX Study [began in 2001]
Penny Kris-Eatherton, Ph.D. Pennsylvania State University
Fat Oxidation in Children and Adults [began in 200a]
Michael Falk, Ph.D. Life Sciences Research Office
Evidence for a Health Claim: Dairy Foods/Calcium and Colorectal C a n c e r [completed in 2001]
Rafael Jiminez-Florez, Ph.D. California Polytechnic State University Foundation
Isolation of Milk Membrane Components from Buttermilk and their Impact on Health [began in 2001]
Michael I. Goran, Ph.D. University of Alabama, Birmingham
Mikko Griinari, Ph.D. University of Hclsinki
Influence of Dairy Intake and Dietary Fat on Body Composition, Fat Distribution, and Health in Caucasian and African-American Children [completed in 2001]
Milk Fat Component, Trans- 11 C 18:1 (Vaccenic Acid), as a Precursor of Conjugated Linoleic Acid (CLA) in Humans Ecompleted in 2001]
118

APPENDIX F-3
NUTRITION COMPETITIVE RESEARCH ACTIVITIES DURING 2001 (CONTINUED)
Principal Investigator & Institution Proiect Title
Peter R. Holt, M.D. St. Luke's-Roosevelt Institute for Health Sciences
Dairy Product Inhibition of Colonic Neoplasms [completed in 200I]
Clement Ip, Ph.D. Roswell Park Cancer Institute
Mammary Cancer Prevention by Milkfat-CLA [completed in 2o011
Mammary Cancer Prevention by CLA- Butter [began in 2001]
Rachel K. Johnson, Ph.D. University of Vermont
The Effect of Flavored Milk on the Quality of Children's Diets [continued in 2001]
Susan L. Johnson, Ph.D. University of Colorado Health Sciences Center
Normal Development of Children's Energy Intake Regulation and Weight Status: Changes in Individual Responsiveness to Dietary Carbohydrate and Fat [completed in 2OO11
William J. Kramer, Ph.D. Ball State University
Effects of Increasing Consumption of Milk Products and Exercise Training Programs on Body Consumption, Bone Density, and Muscular Performance in Teenage Boys and Girls [completed in 20011
Martin Lipkin, M.D. Strang Cancer Research Laboratory at the Rockefeller University
Inhibition of Colon Cancer by Dairy Foods [completed in 2001]
Velmir Matkovic, Ph.D. Ohio State Univ. Research Foundation
Traits in Body Composition in Young Females Consuming Dairy Products vs. Calcium Supplements [completed in 200I]
pQCT of the Forearm m Children with Fractures [continued in 2001]
Jill A. Metz, Ph.D. Oregon Health Sciences University
Low-Fat Dairy Products Reduce Antihypertensive Drug Therapy [completed in 2001]
Lynn L. Moore, Ph.D. Boston University School of Medicine
Effects of Milk and Milk Products on Blood Pressure and Bone Density in Children [completed in 2001]
David Murdy, M.D. betterMD.net
Randomized Controlled Trial of Novel Milk Based Weight Loss in Well Supervised Outpatients [began in 2001]
Aviva Must, Ph.D. Tufts University
Influence of Milk and Milk Products Consumption on Incident Obesity and Changes in Children, Adolescents, and Young Adults [con~nued in 2001]
Mary Frances Picciano, Ph.D. Pennsylvania State University
Food Group Analyses for Development of Dietary Guidance during Early Childhood [completed in 2001]
Janet Rankin, Ph.D. Virginia Polytechnic Institute
Effect of Milk Consumption on Acute Muscle Protein Synthesis and Degradation after Resistance Exercise and on Chronic Muscle Hypertrophy [completed in 20011
119

APPENDIX F-3
N U T R I T I O N C O M P E T I T I V E R E S E A R C H A C T I V I T I E S D U R I N G 2 0 0 1 (CONTINUED)
Principal Investieator & Institution
Susan B. Roberts, Ph.D. New England Medical Center
Jean-Baptiste Roullet, Ph.D. Oregon Health Sciences University
Eva Maria Schmelz, Ph.D. Wayne State University
Jon A. Story, Ph.D. Purdue University Research Foundation
Dorothy Teegarden, Ph.D. Purdue Research Foundation
Warren Thompson, M.D. The Mayo Clinic
Project Title
Physiological and Cognitive Effects of Beverage Consumption [continued in 2001 ]
Dairy Products, Calcium Intake, and School Performance [completed in 2001]
Suppression of Colon Cancer by Dietary Sphigolipids and Calcium, Part II [continued in 2001]
Regulation of Cholesterol Metabolism by CLA-Rich Milkfat [completed in 2001]
Do Dairy Products Prevent Weight Gain in Young Women [completed in 2001 ]
Effects of High Dairy, High Fiber, Low Glycemic Index, Low Energy Density Diet on Weight, Body Fat, and Glucose Tolerance [began in 2001]
Kevin Tipton, Ph.D. University of Texas Medical Branch
John P. Vanden Heuvel, Ph.D. Pennsylvania State University
Michael B. Zemel, Ph.D. University of Tennessee
Ability to Enhance the Stimulation of Muscle Growth by Resistance Exercise [continued in 2001]
Modulation of Diabetes by Conjugated Linoleic Acid [continued in 2001]
Role of Whey Proteins in Enhancing the Anti-Obesity Effects of Dietary Calcium [began in 2001]
Effects of Calcium-Rich Dairy Products on Weight Loss in Obese Adults [completed in 2001]
Role of Dairy Foods in Reducing Body Fat and Enhancing Weight Loss in African-American Adults [continued in 20011
Interaction between Calcium Rich Dairy Products and Dietary Micronutrients in Modulating Weight Loss in Obese Mice [continued in 2001 ]
120

APPENDIX G
Q U A L I F I E D S T A T E OR R E G I O N A L D A I R Y P R O D U C T P R O M O T I O N ,
R E S E A R C H , OR N U T R I T I O N E D U C A T I O N P R O G R A M S , 2001
Allied Milk Producers' Cooperative, Inc. 495 Blough Road Hooversville, PA 15936-8207
American Dairy Association of South Carolina 5340 West Fayetteville Road Atlanta, GA 30349-5416
American Dairy Association &Dairy Council Mid East 5950 Sharon Woods Boulevard Columbus, OH 43229
American Dairy Association of South Dakota 2015 Rice Street St. Paul, MN 55113
American Dairy Association & Dairy Council, Inc. 219 South West Street, Suite 100 Syracuse, NY 13202
American Dairy Association of Virginia 5340 West Fayetteville Road Atlanta, GA 30349-5416
American Dairy Association Middle Atlantic, Inc. 325 Chestnut Street, Suite 600 Philadelphia, PA 19106
American Dairy Association of Alabama 5340 West Fayetteville Road Atlanta, GA 30349-5416
American Dairy Association of Georgia 5340 West Fayetteville Road Atlanta, GA 30349-5416
American Dairy Association of Illinois 1 West Front Street E1 Paso, IL 61738
American Dairy Association of Kentucky 9201 Bunsen Parkway, Suite 100 Louisville, KY 40220
American Dairy Association of Michigan, Inc. 2163 Jolly Road Okemos, MI 48864
American Dairy Association of Mississippi 5340 West Fayetteville Road Atlanta, GA 30349-5416
American Dairy Association of Nebraska, Inc. 8205 F Street Omaha, NE 68127-1779
American Dairy Association of North Carolina 5340 West Fayetteville Road Atlanta, GA 30349-5416
California Manufacturing Milk Producers Advisory Board
3800 Cornucopia Way, Suite D Modesto, CA 95358-9492
California Milk Producers Advisory Board 3800 Cornucopia Way, Suite D Modesto, CA 95358-9492
Dairy Council Middle Atlantic, Inc. 325 Chestnut Street, Suite 600 Philadelphia, PA 19106
Dairy Council of California 1101 National Drive, Suite B Sacramento, CA 95834-1945
Dairy Council of Michigan, Inc. 2163 Jolly Road Okemos, MI 48864
Dairy Council of Nebraska, Inc. 8205 F Street Omaha, NE 68127-1779
Dairy Council of Utah/Nevada 1213 East 2100 South Salt Lake City, UT 84106
Dairy Council of Wisconsin, Inc. 999 Oakmont Plaza Drive, Suite 510 Westmont, IL 60559
121
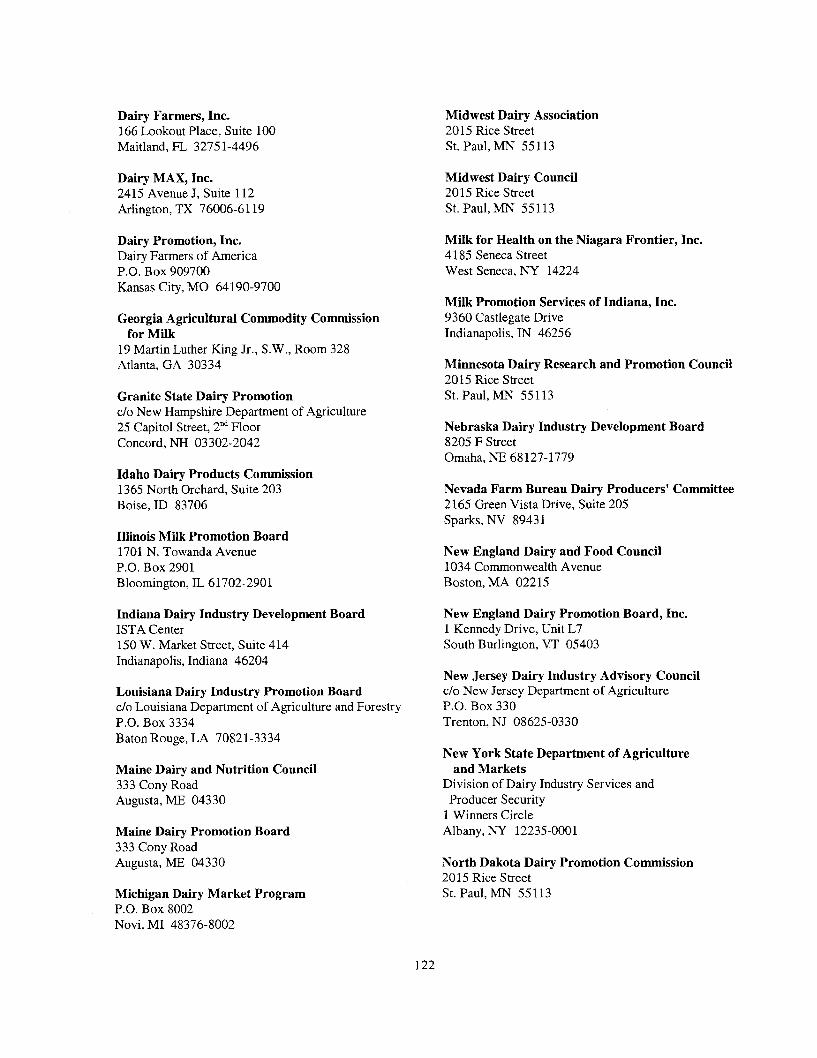
Dairy Farmers, Inc. 166 Lookout Place, Suite 100 Maitland, FL 32751-4496
Dairy MAX, Inc. 2415 Avenue J, Suite 112 Arlington, TX 76006-6119
Dairy Promotion, Inc. Dairy Farmers of America P.O. Box 909700 Kansas City, MO 64190-9700
Georgia Agricultural Commodity Commission for Milk
19 Martin Luther King Jr., S.W,, Room 328 Atlanta, GA 30334
Granite State Dairy Promotion c/o New Hampshire Department of Agriculture 25 Capitol Street, 2 na Floor Concord, NH 03302-2042
Idaho Dairy Products Commission 1365 North Orchard, Suite 203 Boise, ID 83706
Illinois Milk Promotion Board 1701 N. Towanda Avenue P.O. Box 2901 Bloomington, IL 61702-2901
Indiana Dairy Industry Development Board ISTA Center 150 W. Market Street, Suite 414 Indianapolis, Indiana 46204
Louisiana Dairy Industry Promotion Board c/o Louisiana Department of Agriculture and Forestry P.O. Box 3334 Baton Rouge, LA 70821-3334
Maine Dairy and Nutrition Council 333 Cony Road Augusta, ME 04330
Maine Dairy Promotion Board 333 Cony Road Augusta, ME 04330
Michigan Dairy Market Program P.O. Box 8002 Novi, MI 48376-8002
Midwest Dairy Association 2015 Rice Street St. Paul, MN 55113
Midwest Dairy Council 2015 Rice Street St. Paul, MN 55113
Milk for Health on the Niagara Frontier, Inc. 4185 Seneca Street West Seneca, NY 14224
Milk Promotion Services of Indiana, Inc. 9360 Castlegate Drive Indianapolis, IN 46256
Minnesota Dairy Research and Promotion Council 2015 Rice Street St. Paul, MN 55113
Nebraska Dairy Industry Development Board 8205 F Street Omaha, NE 68127-1779
Nevada Farm Bureau Dairy Producers' Committee 2165 Green Vista Drive, Suite 205 Sparks, NV 89431
New England Dairy and Food Council 1034 Commonwealth Avenue Boston, MA 02215
New England Dairy Promotion Board, Inc. 1 Kennedy Drive, Unit L7 South Burlington, VT 05403
New Jersey Dairy Industry Advisory Council c/o New Jersey Department of Agriculture P.O. Box 330 Trenton, NJ 08625-0330
New York State Department of Agriculture and Markets
Division of Dairy Industry Services and Producer Security
1 Winners Circle Albany, NY 12235-0001
North Dakota Dairy Promotion Commission 2015 Rice Street St. Paul, MN 55113
122
Oregon Dairy Products Commission 10505 Southwest Barbur Boulevard Portland, OR 97219
Pennsylvania Dairy Promotion Program c/o Pennsylvania Department of Agriculture 2301 North Cameron Street Harrisburg, PA 17110-9408
Promotion Services, Inc. 5340 West Fayetteville Road Atlanta, GA 30349-5416
Rochester Health Foundation, Inc. c/o American Dairy Association & Dairy Council, Inc 219 South West Street, Suite 100 Syracuse, NY 13202
St. Louis District Dairy Council 1254 Hanley Industrial Court St. Louis, MO 63144-1912
Southeast United Dairy Industry Association, Inc. 5340 West Fayetteville Road Atlanta, GA 30349-5416
Southwest Dairy Museum, Inc. P.O. Box 936 Sulphur Springs, TX 75483
Tennessee Dairy Promotion Committee 5340 West Fayetteville Road Atlanta, GA 30349-5416
United Dairymen of Arizona 2008 South Hardy Drive Tempe, AZ 85282
Utah Dairy Commission 1213 East 2100 South Salt Lake City, UT 84106
Vermont Dairy Promotion Council 116 State Street, Drawer 20 Montpelier, VT 05620-2901
Washington State Dairy Council 4201 198th Street, S.W., Suite 102 Lyrmwood, WA 98036-6757
Washington State Dairy Products Commission 4201 198th Street, S.W., Suite 101 Lyrmwood, WA 98036
Western Dairyfarmers' Promotion Association 12000 North Washington Street, Suite 200 Thornton, CO 80241
Wisconsin Milk Marketing Board, Inc. 8418 Excelsior Drive Madison, WI 53717
123


