Embed Size (px)
Citation preview

REPORT 487
Review of Australian equity market cleanliness
August 2016
About this report
In this report we seek to measure Australian equity market cleanliness with a focus on possible insider trading and information leakage ahead of material, price-sensitive announcements.
We applied a number of methods, evaluated their efficacy and examined their differences through time and across industry sectors, market capitalisation and announcement types.
REPORT 487: Review of Australian equity market cleanliness
About ASIC regulatory documents
In administering legislation ASIC issues the following types of regulatory documents.
Consultation papers: seek feedback from stakeholders on matters ASIC is considering, such as proposed relief or proposed regulatory guidance.
Regulatory guides: give guidance to regulated entities by: explaining when and how ASIC will exercise specific powers under
legislation (primarily the Corporations Act) explaining how ASIC interprets the law describing the principles underlying ASIC’s approach giving practical guidance (e.g. describing the steps of a process such
as applying for a licence or giving practical examples of how regulated entities may decide to meet their obligations).
Information sheets: provide concise guidance on a specific process or compliance issue or an overview of detailed guidance.
Reports: describe ASIC compliance or relief activity or the results of a research project.
Disclaimer
This report does not constitute legal advice. We encourage you to seek your own professional advice to find out how the Corporations Act and other applicable laws apply to you, as it is your responsibility to determine your obligations.
Examples in this report are purely for illustration; they are not exhaustive and are not intended to impose or imply particular rules or requirements.
© Australian Securities and Investments Commission August 2016 Page 2

REPORT 487: Review of Australian equity market cleanliness
Contents A Introduction ............................................................................................ 4
Background .............................................................................................. 4 Purpose and scope .................................................................................. 6 Summary of findings ................................................................................ 8
B Measuring market cleanliness ............................................................. 9 Methodology of the established market cleanliness measure ................. 9 Limitations and interpretation.................................................................11 Established market cleanliness measure results...................................13
C Evaluating change in market cleanliness .........................................16 Event study ............................................................................................16 Event study results ................................................................................18 Robustness checks ................................................................................20
D New measure of market cleanliness ..................................................22 Proposed new market cleanliness measure ..........................................22 Methodology of the new market cleanliness measure ..........................23 New market cleanliness measure results ..............................................25
E Analysis by industry sector, market capitalisation and announcement type .............................................................................27 Analysis of the established market cleanliness measure ......................27 Analysis of the new market cleanliness measure ..................................30 Correlation between the new and established measures ......................35
Appendix 1: Accessible versions of figures .............................................38 Appendix 2: Summary of bootstrap methodology ...................................46 Appendix 3: Summary of the Intralinks report .........................................47 Appendix 4: Unlucky traders ......................................................................49 Key terms .....................................................................................................50
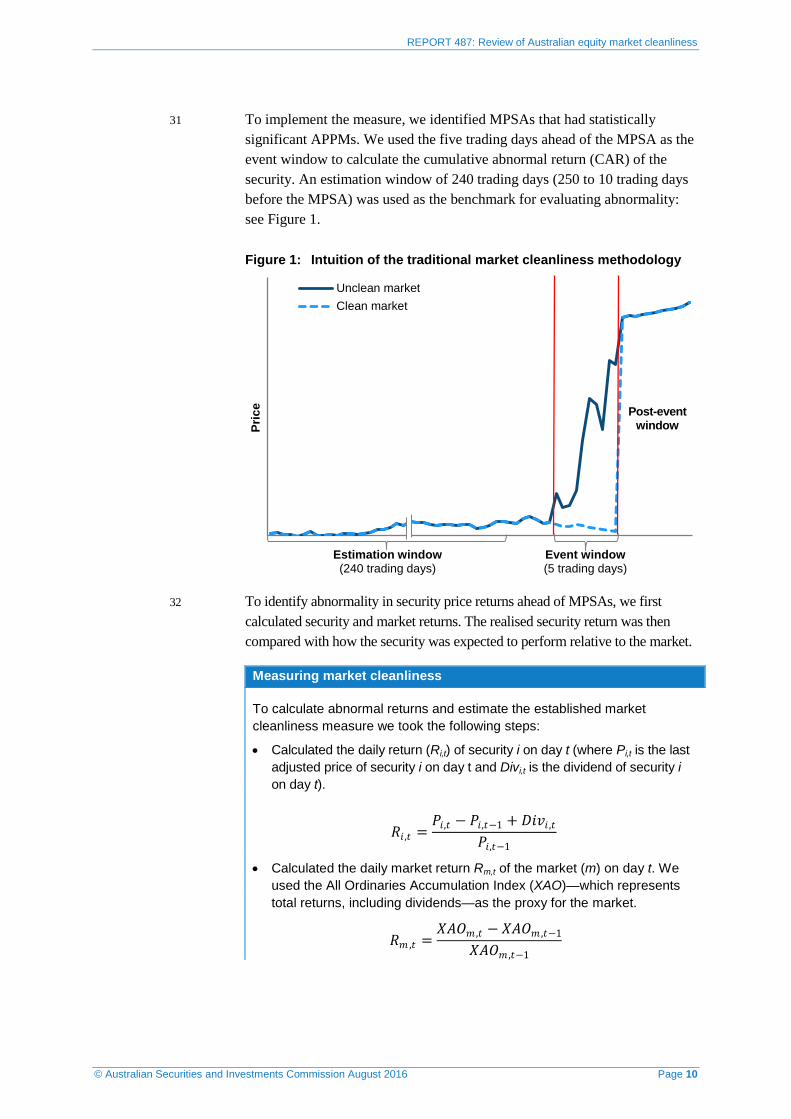
© Australian Securities and Investments Commission August 2016 Page 3

REPORT 487: Review of Australian equity market cleanliness
A Introduction
Key points
Market integrity is fundamental to well-developed financial markets. We consider it important to measure and monitor market cleanliness to provide an overview of market integrity in order to better inform our regulatory work.
In this report, we have measured Australian equity market cleanliness using a number of methods, evaluated their efficacy and examined their differences through time and across segments of the market. Specifically, we have:
• estimated an established measure of market cleanliness that has beenwidely applied in regulatory and academic settings;
• assessed changes in the established measure over time and evaluatedthe statistical significance of any changes in market cleanliness;
• developed and applied a new methodology for measuring marketcleanliness; and
• conducted detailed analysis into these measures to examine theircorrelation and variation across listed equity market segments.
Background
1 Financial markets play a central role in the growth and prosperity of our economy by facilitating the raising of capital and the efficient allocation of resources and risks by investors.
2 Market integrity is fundamental to a well-developed financial market. Financial markets cannot fund the real economy without trust and confidence. Confidence in market integrity:
(a) encourages investor participation;
(b) contributes to liquidity;
(c) stimulates more competitive pricing; and
(d) leads to a lower cost of capital.
3 As Australia’s corporate, market and financial services regulator, we are responsible for supervising trading activity of market participants on Australia’s domestic licensed markets. One of our strategic priorities is the promotion of investor confidence through fair and efficient markets. Crucial to the pursuit of this priority is the surveillance and enforcement of market misconduct.
4 In markets where investors perceive they are at an unfair informational disadvantage they tend to protect themselves by reducing their exposure to the market or demanding a higher return, to compensate for the adverse selection risk they experience as a result of information asymmetry.
© Australian Securities and Investments Commission August 2016 Page 4

REPORT 487: Review of Australian equity market cleanliness
5 Reduced investor participation and confidence in markets can lead to lower turnover, higher cost of trading and inefficient allocation of capital from investors to entities seeking funding.
6 Empirical academic evidence suggests the mere existence of insider trading laws does not promote investor confidence or lower costs of capital. Rather, effective detection of insider trading and enforcement of insider trading laws are associated with lower cost of capital for listed companies across international markets.1
7 A 2002 study found that, in a sample of 103 countries, effective insider trading enforcement was associated with a lower cost of capital, ranging from 0.3%–7%.2 For the financial year ended 30 June 2015, companies listed on ASX had a total market capitalisation of around $1.6 trillion and raised around $89 billion. A small change in the cost of capital can significantly affect listed companies’ valuations and cost of funds.3
8 An earlier study of the relationship between information asymmetry and market participant behaviour concluded that participants would withdraw from a market if they faced severe information disadvantages—leading to lower asset valuation, liquidity and, in the most extreme cases, market failure.4
9 Given the significance of market integrity to financial markets and the broader economy, our strategic priority of ensuring fair and efficient markets is vitally important. As a result, we think it is important to measure the extent to which information leakage is impacting on the prices and trader’s behaviour for securities on listed markets. Measures of this type are known as market cleanliness measures.
10 Overseas, securities market regulators have sought to measure the cleanliness of their markets. For example, the UK Financial Conduct Authority (FCA) conducted three market cleanliness studies for their listed securities markets over the past 13 years, and has estimated yearly updates on their market cleanliness measures.5 A recent study by UK-based Intralinks Holdings, Inc. (Intralinks) applied a similar methodology to a number of international markets and found that Australia had one of the lowest indicators of information leakage ahead of mergers and acquisitions:
1 Utpal Bhattacharya and Hazem Daouk, ‘The world price of insider trading’, The Journal of Finance, vol. 57 issue 1, February 2002, pp 75–108. 2 Utpal Bhattacharya and Hazem Daouk, ‘The world price of insider trading’, The Journal of Finance, vol. 57 issue 1, February 2002, pp 75–108. 3 For example, a 0.1% increase in cost of capital has the potential to decrease valuations by around $1.6 billion and increase cost of capital by around $89 million per year. 4 George A. Akerlof, ‘The market for ‘lemons’: Quality uncertainty and the market mechanism’, The Quarterly Journal of Economics, Vol. 84, No. 3, August 1970, pp. 488–500. 5 The FCA has cautioned against directly comparing the established market cleanliness measure between jurisdictions because each jurisdiction has different continuous disclosure regimes for determining the threshold at which disclosures must be made, see FCA, Why has the FCAs market cleanliness statistic for takeover announcements decreased since 2009, Occasional Paper Series 4, July 2014, pp 21–23.
© Australian Securities and Investments Commission August 2016 Page 5
REPORT 487: Review of Australian equity market cleanliness
see Intralinks, Intralinks M&A Leaks Report, 2015 (the Intralinks report) and Appendix 3.
11 We consider it important to measure and monitor macro-level market cleanliness—to provide an overview of market integrity through time and across listed equity market segments—in order to better inform our regulatory work.
Purpose and scope
12 In this report we have measured macro-level market cleanliness in our listed securities markets by estimating the extent of information leakage ahead of material, price-sensitive announcements (MPSAs). We applied a number of methods, evaluated their efficacy, and examined their differences through time and across segments of the market. Specifically, we:
(a) estimated equity market cleanliness using an established market cleanliness measure (similar to that used by the FCA), with minor adjustments (see Section B);
(b) assessed the established market cleanliness measure over time and evaluated any statistically significant changes (see Section C);
(c) developed and applied a new methodology for measuring market cleanliness (see Section D); and
(d) conducted detailed analysis into these measures across different industry sectors, market capitalisation quintiles and announcement types (see Section E).
Application of established market cleanliness measures
13 We applied an established market cleanliness measure to the Australian market that examines abnormal pre-announcement price movements (APPMs) ahead of MPSAs.
14 Price movements immediately before an MPSA—in the same direction and significantly different from normal volatility—can raise concerns about market integrity and efficiency. This established methodology has been widely applied by international financial market regulators, exchange market operators, industry think tanks and academics. We have sought to replicate the application of this methodology with minor adjustments. The result will form the basis for further analysis through time and across equity market segments (i.e. industry sectors, market capitalisation quintiles and announcement types).
15 Because of the reliance on APPMS, we have suggested the measure (i.e. APPMs as a percentage of MPSAs) can be indicative of an inefficient and potentially unfair market. APPMs may arise from either illegal conduct (e.g. insider trading or leaked information) or legal activity (e.g. tangible rumours,
© Australian Securities and Investments Commission August 2016 Page 6
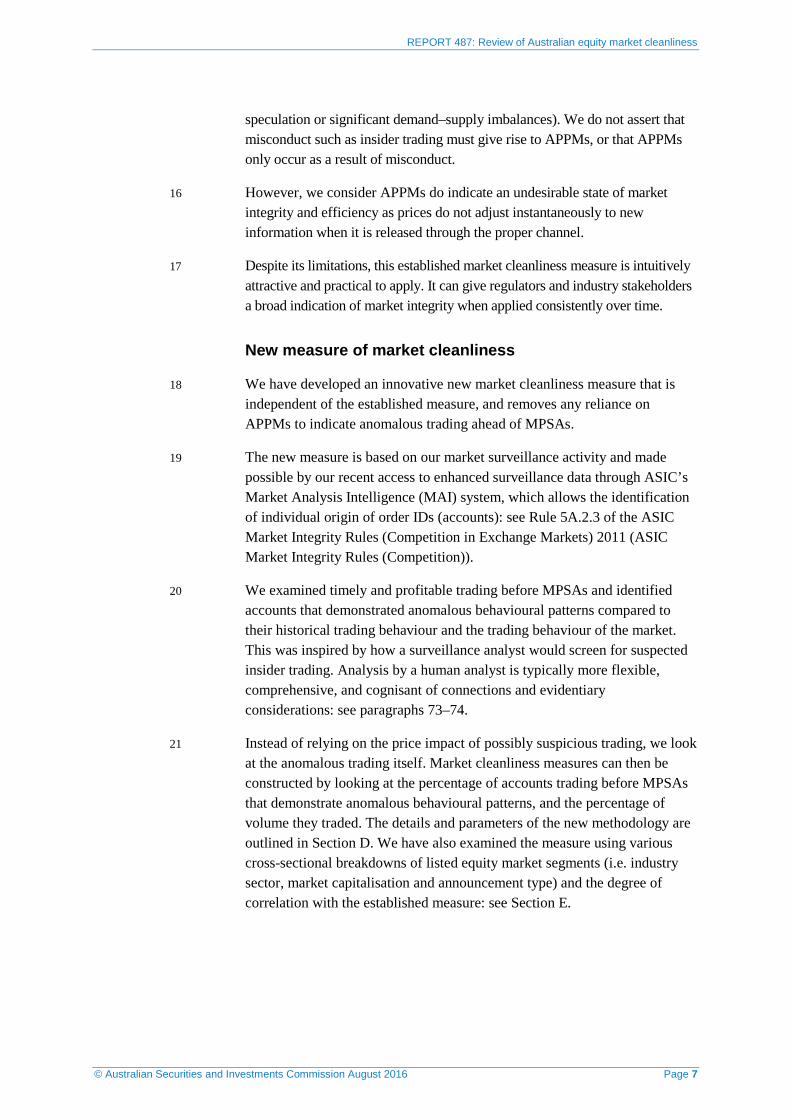
REPORT 487: Review of Australian equity market cleanliness
speculation or significant demand–supply imbalances). We do not assert that misconduct such as insider trading must give rise to APPMs, or that APPMs only occur as a result of misconduct.
16 However, we consider APPMs do indicate an undesirable state of market integrity and efficiency as prices do not adjust instantaneously to new information when it is released through the proper channel.
17 Despite its limitations, this established market cleanliness measure is intuitively attractive and practical to apply. It can give regulators and industry stakeholders a broad indication of market integrity when applied consistently over time.
New measure of market cleanliness
18 We have developed an innovative new market cleanliness measure that is independent of the established measure, and removes any reliance on APPMs to indicate anomalous trading ahead of MPSAs.
19 The new measure is based on our market surveillance activity and made possible by our recent access to enhanced surveillance data through ASIC’s Market Analysis Intelligence (MAI) system, which allows the identification of individual origin of order IDs (accounts): see Rule 5A.2.3 of the ASIC Market Integrity Rules (Competition in Exchange Markets) 2011 (ASIC Market Integrity Rules (Competition)).
20 We examined timely and profitable trading before MPSAs and identified accounts that demonstrated anomalous behavioural patterns compared to their historical trading behaviour and the trading behaviour of the market. This was inspired by how a surveillance analyst would screen for suspected insider trading. Analysis by a human analyst is typically more flexible, comprehensive, and cognisant of connections and evidentiary considerations: see paragraphs 73–74.
21 Instead of relying on the price impact of possibly suspicious trading, we look at the anomalous trading itself. Market cleanliness measures can then be constructed by looking at the percentage of accounts trading before MPSAs that demonstrate anomalous behavioural patterns, and the percentage of volume they traded. The details and parameters of the new methodology are outlined in Section D. We have also examined the measure using various cross-sectional breakdowns of listed equity market segments (i.e. industry sector, market capitalisation and announcement type) and the degree of correlation with the established measure: see Section E.
© Australian Securities and Investments Commission August 2016 Page 7

REPORT 487: Review of Australian equity market cleanliness
Summary of findings
22 Our sample period for the established market cleanliness measure includes each of the five years before and the five years after the transfer of market supervision to ASIC (i.e. 1 November 2005 to 31 October 2015) (the relevant period). Throughout the relevant period, we found a general improvement in market integrity, shown by the decrease in anomalous trading ahead of MPSAs.
23 Tests before and after 1 November 2010,6 examine the statistical significance of any improvements in market cleanliness over time, after controlling for other explanatory variables. The results indicate a statistically significant improvement in market cleanliness.
24 We developed a new market cleanliness measure that examines trading by individual accounts leading up to MPSAs. The new market cleanliness measure correlates positively with the established market cleanliness measure, lending support to each other.
25 The new market cleanliness measure result for the year 1 November 2014 to 31 October 2015 indicates that roughly 62% of MPSAs exhibit no anomalous trading behaviour leading up to the MPSA, while around 5% of MPSAs contain more than 2% of accounts demonstrating anomalous trading patterns. Around 5% of MPSAs contain more than 12% of trading volume by accounts demonstrating anomalous trading patterns.
26 Analysis of the results indicate that:
(a) there has been a general decline in anomalous trading activity ahead of MPSAs over the relevant period, indicating an improvement in market integrity;
(b) larger capitalisation securities with greater liquidity tend to exhibit lower APPMs;
(c) established market cleanliness measures for securities in certain industries tend to be consistently higher or lower than others (see Section E);
(d) mergers and acquisitions tend to exhibit a lower percentage of APPMs, but more pre-announcement anomalous trading than other MPSAs;
(e) there has been no significant difference in pre-announcement anomalous trading and APPMs between positive and negative MPSAs; and
(f) the established and new market cleanliness measures are positively correlated with each other, suggesting that MPSAs with a higher measure of anomalous trading are more likely to exhibit APPMs.
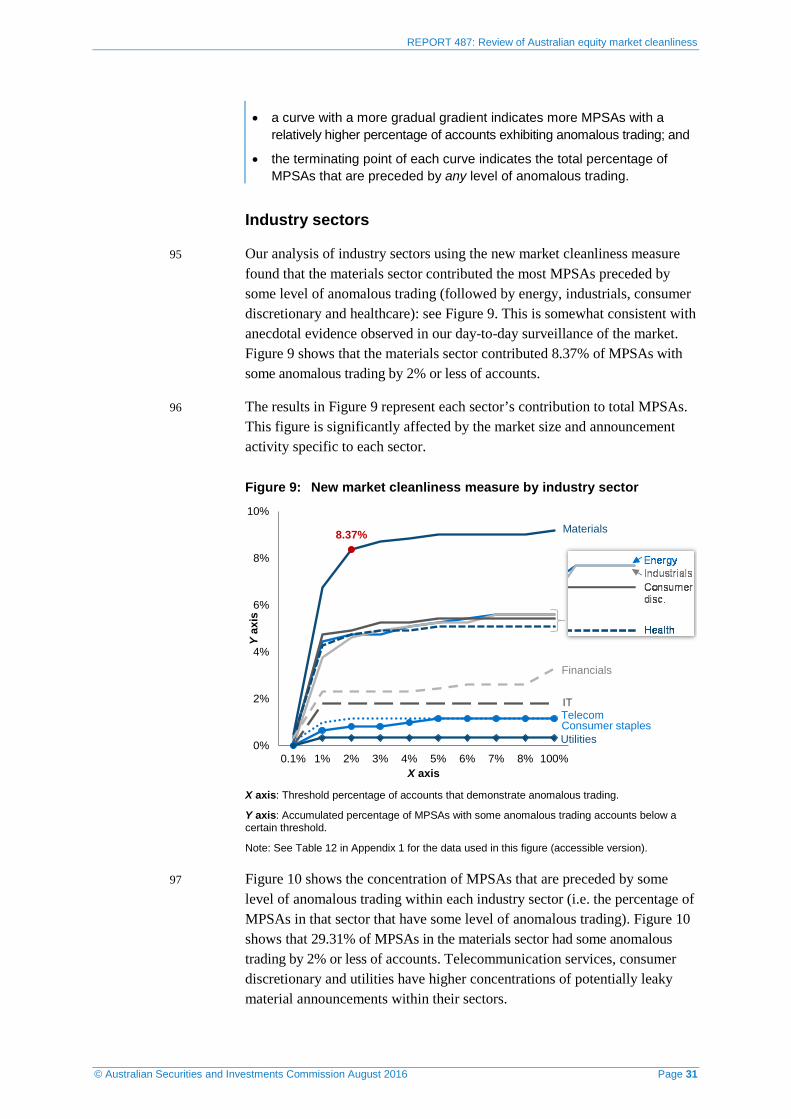
6 1 November 2010 was chosen to align with the start date of the new market cleanliness methodology (i.e. 1 November 2014). Origin of order IDs (accounts) came into effect on 28 July 2014 and three months of lead time in data collection is required to calculate the new market cleanliness measure, resulting in a start date of 1 November 2014.
© Australian Securities and Investments Commission August 2016 Page 8

REPORT 487: Review of Australian equity market cleanliness
B Measuring market cleanliness
Key points
In this section, we measure market cleanliness in the Australian equity market using an established methodology.
Our findings indicate that there has been a general improvement in market integrity over the 10 years to 31 October 2015 (the relevant period), as measured by the decreasing occurrence of APPMs ahead of MPSAs.
Methodology of the established market cleanliness measure
27 The methodology used to measure market cleanliness was applied in a regulatory setting by the UK Financial Services Authority (FSA) in 2006. Their analysis was broadly based on the identification of APPMs in security prices ahead of MPSAs from 2000–04. The FSA, and later the FCA, conducted two subsequent studies for the periods 2000–05 and 2002–13.7
28 In this report, we reviewed price-sensitive announcements that had a material effect on the market in the relevant period. We examined the change in the measure over the relevant period and evaluated the statistical significance of the change between the first half (i.e. 1 November 2005–31 October 2010) and the second half (i.e. 1 November 2010–31 October 2015).8
29 The rationale behind the established market cleanliness methodology is an intuitively simple one: see Figure 1. It is assumed that, in an efficient (‘clean’) market, security prices react instantaneously to announcements. Significant and abnormal price reactions ahead of an announcement may signal information leakage and be indicative of an ‘unclean market’.
30 A broad indication of market cleanliness can be estimated from the proportion of MPSAs preceded by an APPM. An APPM occurs when:
(a) a positive MPSA is preceded by a positive abnormal return in the security; and
(b) a negative MPSA is preceded by a negative abnormal return in the security.
7 FSA, Measuring market cleanliness (PDF 365 KB), Occasional Paper Series 23, March 2006. The FSA and the FCA carried out the study with minor adjustments to the methodology in Updated measurement of market cleanliness (PDF 366 KB), Occasional Paper Series 25, March 2007 and Why has the FCAs market cleanliness statistic for takeover announcements decreased since 2009, Occasional Paper Series 4, July 2014, respectively. 8 We have replicated the FCA’s application of this measure with minor adjustments. For example, three of the FSA and FCA market cleanliness studies used mergers and acquisitions and/or other types of material announcements. We included all material announcements, including mergers and acquisitions, because of the limited number of mergers and acquisitions that occur in the Australian market each year.
© Australian Securities and Investments Commission August 2016 Page 9
REPORT 487: Review of Australian equity market cleanliness
31 To implement the measure, we identified MPSAs that had statistically significant APPMs. We used the five trading days ahead of the MPSA as the event window to calculate the cumulative abnormal return (CAR) of the security. An estimation window of 240 trading days (250 to 10 trading days before the MPSA) was used as the benchmark for evaluating abnormality: see Figure 1.
Figure 1: Intuition of the traditional market cleanliness methodology Pr
ice
Unclean marketClean market
Event window(5 trading days)
Post-eventwindow
Estimation window(240 trading days)
32 To identify abnormality in security price returns ahead of MPSAs, we first calculated security and market returns. The realised security return was then compared with how the security was expected to perform relative to the market.
Measuring market cleanliness
To calculate abnormal returns and estimate the established market cleanliness measure we took the following steps:
• Calculated the daily return (Ri,t) of security i on day t (where Pi,t is the lastadjusted price of security i on day t and Divi,t is the dividend of security ion day t).
𝑅𝑅𝑖𝑖 ,𝑡𝑡 =𝑃𝑃𝑖𝑖,𝑡𝑡 − 𝑃𝑃𝑖𝑖,𝑡𝑡−1 + 𝐷𝐷𝑖𝑖𝐷𝐷𝑖𝑖 ,𝑡𝑡
𝑃𝑃𝑖𝑖,𝑡𝑡−1
• Calculated the daily market return Rm,t of the market (m) on day t. Weused the All Ordinaries Accumulation Index (XAO)—which representstotal returns, including dividends—as the proxy for the market.
𝑅𝑅𝑚𝑚 ,𝑡𝑡 =𝑋𝑋𝑋𝑋𝑋𝑋𝑚𝑚 ,𝑡𝑡 − 𝑋𝑋𝑋𝑋𝑋𝑋𝑚𝑚 ,𝑡𝑡−1
𝑋𝑋𝑋𝑋𝑋𝑋𝑚𝑚 ,𝑡𝑡−1
© Australian Securities and Investments Commission August 2016 Page 10

REPORT 487: Review of Australian equity market cleanliness
• Calculated the contemporaneous beta of security i between the returnsfor individual securities (Ri,t) and the return to market (Rm,t).
𝛽𝛽𝑖𝑖 =𝐶𝐶𝑋𝑋𝐶𝐶𝑖𝑖 ,𝑚𝑚𝐶𝐶𝑋𝑋𝑅𝑅𝑚𝑚
• Applied the beta to the capital asset pricing model (CAPM) to estimate theexpected return (E(Ri,t)) of the security, where Rf,t is the risk free rate (f)on day t.
𝐸𝐸(𝑅𝑅𝑖𝑖 ,𝑡𝑡) = 𝑅𝑅𝑓𝑓 ,𝑡𝑡 + 𝛽𝛽𝑖𝑖(𝑅𝑅𝑚𝑚 ,𝑡𝑡 − 𝑅𝑅𝑓𝑓 ,𝑡𝑡) • Calculated the abnormal return (ARi,t):
𝑋𝑋𝑅𝑅𝑖𝑖 ,𝑡𝑡 = 𝑅𝑅𝑖𝑖 ,𝑡𝑡 − 𝐸𝐸(𝑅𝑅𝑖𝑖 ,𝑡𝑡) • The daily abnormal returns were aggregated for the event window to
calculate the cumulative abnormal returns (CARi,n) ahead of the MPSAfor the security (i) for n days ahead of the MPSA:
𝐶𝐶𝑋𝑋𝑅𝑅𝑖𝑖 ,𝑛𝑛 = �𝑋𝑋𝑅𝑅𝑖𝑖 ,𝑡𝑡−𝑗𝑗
𝑛𝑛
𝑗𝑗=1
• We then looked at whether there was a statistically significant pre-announcement CAR in the ‘right’ direction for each individualannouncement (i.e. a positive APPM for good news and a negative APPMfor bad news) in our sample of MPSAs. To satisfy our statisticalsignificance test, the CARs associated with the MPSA needed to be largeenough that the probability they were driven by random volatility in theprice of the security was extremely low (i.e. at or below 1%). To calculatethis we applied the bootstrap methodology set out in Appendix 2.
• Calculated the measure of market cleanliness as the percentage ofMPSAs preceded by APPMs.
𝑃𝑃𝑃𝑃𝑃𝑃𝑃𝑃𝑃𝑃𝑛𝑛𝑡𝑡𝑃𝑃𝑃𝑃𝑃𝑃 𝑜𝑜𝑓𝑓 𝑋𝑋𝑃𝑃𝑃𝑃𝐴𝐴𝐴𝐴 =𝑁𝑁𝑜𝑜.𝑜𝑜𝑓𝑓 𝑋𝑋𝑃𝑃𝑃𝑃𝐴𝐴𝐴𝐴
𝑇𝑇𝑜𝑜𝑡𝑡𝑃𝑃𝑇𝑇 𝑛𝑛𝑜𝑜. 𝑜𝑜𝑓𝑓 𝐴𝐴𝑃𝑃𝑀𝑀𝑋𝑋𝐴𝐴
Limitations and interpretation
33 The established market cleanliness measure calculated using this methodology should be interpreted in the context of its limitations. Like earlier studies, we consider APPMs can be indicative of an unfair or inefficient market, without asserting that all insider trading gives rise to APPMs or that APPMs arise only as a result of insider trading. Trades can be executed in ways that minimise their price impact and APPMs can be caused by trading from leaked information or rumours.
34 To the extent an APPM is caused by rumours, an MPSA in the same direction as the APPM confirms those rumours. Although not insider trading, this is undesirable and could point to market efficiency and integrity
© Australian Securities and Investments Commission August 2016 Page 11

REPORT 487: Review of Australian equity market cleanliness
issues, as prices no longer adjust instantaneously when new information is released through the proper channels.
35 We also attempted to filter out mergers and acquisitions where the bidder increases its toehold in the target leading up to the announcement, to eliminate APPMs associated with bidder buying.
36 Despite the general reliance on APPMs as a traditional measure of market cleanliness, past studies have used outcomes from regulators to establish links between insider trading and price reactions ahead of MPSAs.
37 For example, in a 1992 study examining regulatory actions taken by the SEC, APPMs were identified ahead of merger and acquisition announcements where insider trading had occurred.9 It was found that the market detects the possibility of informed trading and impounds this information into the price of the security. Specifically, the abnormal return on an insider trading day averages 3%,10 and almost half of the APPMs observed before takeovers occurred on insider trading days. Both the amount traded by the insider and additional trade-specific characteristics (e.g. company size and liquidity) affected prices leading up to the announcement.
38 This lends some support to the theory that price movements immediately before an MPSA, in the same direction, and significantly different to normal prices movements, can be indicative of market misconduct such as insider trading. It is also widely accepted that insider trading can contribute to price impact even if it is through derivative instruments. This is because hedging and arbitrage transmit changes in the price of one instrument to the other.11
39 This report does not seek to prove whether insider trading will necessarily affect equity returns and lead to statistically significant APPMs. Only a proportion of APPMs are driven by insider trading and only a proportion of insider trading will give rise to APPMs. However, as long as the proportion of insider trading remains stable over time, the established market cleanliness measure is not invalidated.12 Indeed, when applied consistently over time, the measure can give a broad indication of market integrity.
40 Because we have drawn our results from a subset of all MPSAs, we need to be cautious of drawing conclusions about changes in market cleanliness until we see a long-term trend in those changes. The results may be affected by a weakening or strengthening link between insider trading and price impact.
9 Lisa K Meulbroek, ‘An empirical analysis of illegal insider trading’, The Journal of Finance, Vol. 47, No. 5, December 1992, pp 1661–1699. 10 Lisa K Meulbroek, ‘An empirical analysis of illegal insider trading’, The Journal of Finance, Vol. 47, No. 5, December 1992, pp 1661–1699. 11 Narayanan Jayaraman, Melissa B. Frye and Sanjiv Sabherwal, ‘Informed trading around merger announcements: An empirical test using transaction volume and open interest in options market’, Financial Review, Vol 36, Issue 2, May 2001, pp 45–75. 12 FCA, Why has the FCAs market cleanliness statistic for takeover announcements decreased since 2009, Occasional Paper Series 4, July 2014.
© Australian Securities and Investments Commission August 2016 Page 12

REPORT 487: Review of Australian equity market cleanliness
41 Insiders may be more cognisant to disguise their trades to minimise their price impact. On the other hand, high-frequency traders may become more adept at detecting the risk of adverse selection from traders with potentially superior information from order flow changes, which may exacerbate their price impact.
Established market cleanliness measure results
42 Factors other than market misconduct may cause an APPM ahead of MPSAs.13 Our analysis also controlled for other price impact factors (e.g. liquidity, company size, market volatility and announcement type) of potentially informed trading in our logistic regression: see Section C.
43 Figure 2 shows market cleanliness in Australia based on our sample of MPSAs in the relevant period: see Table 7 in Appendix 1 for the underlying data used in this figure. Analysis of the established market cleanliness measure over the relevant period is encouraging. Despite a degree of volatility, we found a general decrease in anomalous trading (APPMs ahead of MPSAs) which suggests an improvement in market integrity over the relevant period.
Figure 2: Established market cleanliness measure
11.11%
4.01%
150
23
0
40
80
120
160
0%
2%
4%
6%
8%
10%
12%
'06 '07 '08 '09 '10 '11 '12 '13 '14 '15
No.
APP
Ms
APP
Ms
as a
% o
f MPS
As
Year*
APPMs (%)
No. APPMs
* Year ended 31 October.Note: See Table 7 in Appendix 1 for the data used in this figure (accessible version).
13 Like the FCA, we consider it is possible for significant non-insider trades to fall before an announcement and affect the market, or for individual investors to anticipate positive or negative developments in the absence of leakage, rumours or media speculation.
© Australian Securities and Investments Commission August 2016 Page 13

REPORT 487: Review of Australian equity market cleanliness
Data
44 To calculate the established market cleanliness measure we used data collected from a number of sources, including:
(a) daily price and volume data obtained from IRESS Limited;
(b) historical company announcement data and merger and acquisition data obtained from Morningstar Australasia Pty Ltd (Morningstar) and Bloomberg L.P. (Bloomberg); and
(c) changes in substantial shareholding data obtained from Morningstar.
45 We applied the following filters to arrive at our sample MPSAs for the relevant period:
(a) Liquidity: Securities needed to be actively traded and have positive trading volume for 180–240 trading days during the estimation window.
(b) Price-sensitive announcements: We obtained all company announcements that were marked ‘price sensitive’. The data was required to contain the date, time, company and headline of the announcement.
(c) MPSAs: Not all company announcements marked ‘price sensitive’ are actually material—some announcements are marked ‘price sensitive’ by nature, irrespective of whether they cause a material price impact. Therefore, the sample was filtered by materiality.14
(d) Announcement proximity: The trading and price reaction ahead of an MPSA can be obscured by other MPSAs that closely precede it. If an MPSA is followed by another MPSA for the same security within 10 trading days, the latter was deleted from the sample. In the case of multiple MPSAs for a security in a short period of time, an MPSA was only included if there was no MPSA in the preceding 10 trading days for the same security.
(e) Pre-merger bidder toehold purchase: We filtered out isolated instances of pre-merger bidder toehold purchases which may affect target price. Changes in substantial shareholder notices data was collated and matched with all mergers and acquisitions. If the change in substantial shareholding involved the bidder increasing its holdings shortly before the merger and acquisition announcement, that announcement was excluded.
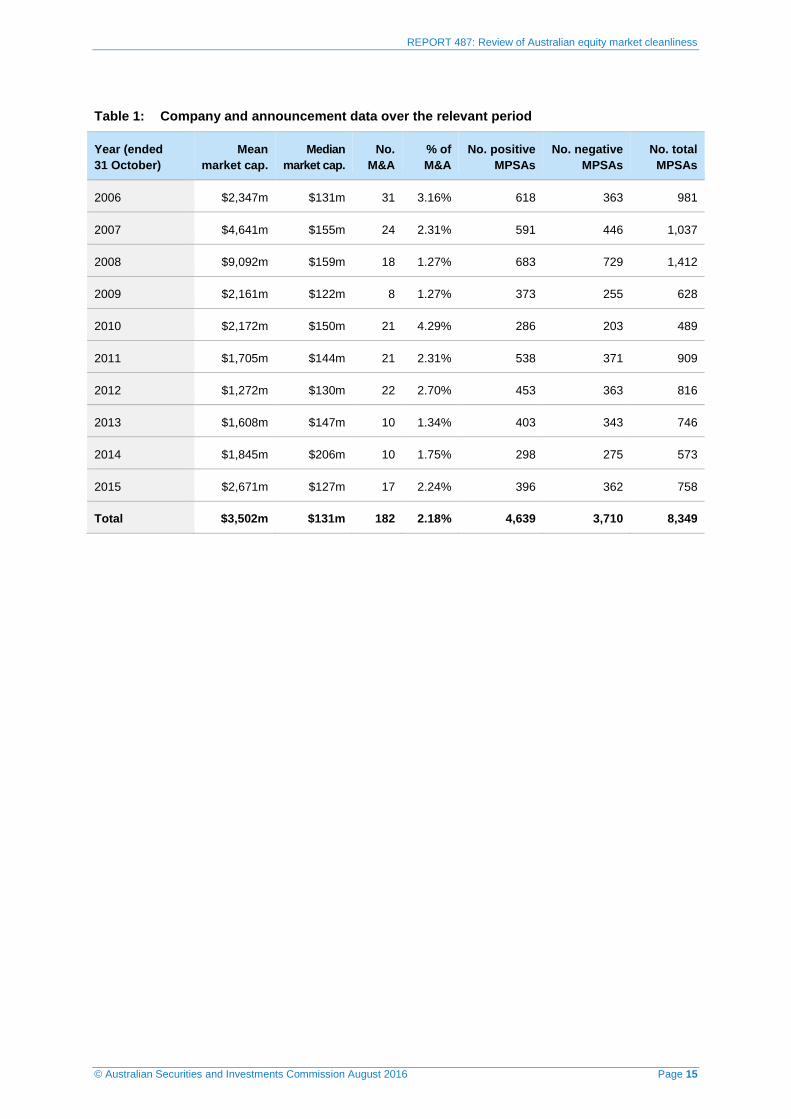
46 Table 1 shows a summary of company and announcement data, which reveals that the composition of the sample has not changed dramatically over the relevant period.
14 The CAR (from two trading days before to one trading day after the announcement) needs to be significantly different from the mean four-day CAR in a bootstrapped sample from an estimation window. We deem the actual CAR to be statistically significant at the 1% level if it is less than or equal to the 100th most negative simulated CAR or greater than or equal to the 100th most positive simulated CAR.
© Australian Securities and Investments Commission August 2016 Page 14
REPORT 487: Review of Australian equity market cleanliness
Table 1: Company and announcement data over the relevant period
Year (ended 31 October)
Mean market cap.
Median market cap.
No. M&A
% of M&A
No. positive MPSAs
No. negative MPSAs
No. total MPSAs
2006 $2,347m $131m 31 3.16% 618 363 981
2007 $4,641m $155m 24 2.31% 591 446 1,037
2008 $9,092m $159m 18 1.27% 683 729 1,412
2009 $2,161m $122m 8 1.27% 373 255 628
2010 $2,172m $150m 21 4.29% 286 203 489
2011 $1,705m $144m 21 2.31% 538 371 909
2012 $1,272m $130m 22 2.70% 453 363 816
2013 $1,608m $147m 10 1.34% 403 343 746
2014 $1,845m $206m 10 1.75% 298 275 573
2015 $2,671m $127m 17 2.24% 396 362 758
Total $3,502m $131m 182 2.18% 4,639 3,710 8,349
© Australian Securities and Investments Commission August 2016 Page 15

REPORT 487: Review of Australian equity market cleanliness
C Evaluating change in market cleanliness
Key points
Our analysis in Section B suggests a general improvement in Australian equity market cleanliness over time. In order to draw any conclusions about the change in market cleanliness with a certain degree of confidence, we need to make sure the change is not due to random volatility, or wholly explicable by contemporaneous changes in other explanatory variables.
In this section, the event study shows that the improvement in market cleanliness is statistically significant, and remains statistically significant after controlling for other explanatory variables.
Event study
47 We conducted an event study to explore whether the level of anomalous trading differed before and after 1 November 2010 (the event). An event study involves empirically assessing changes in a certain variable around a particular point in time (i.e. the event). The results indicate a statistically significant improvement in market cleanliness.
Univariate test
48 A statistical univariate test evaluates the difference of a single statistic between two point estimates for a given confidence interval. We performed a univariate test to evaluate the statistical significance of a change between the aggregate APPM ratio before and after the transfer of market supervision.
49 We conducted our univariate test by estimating the z-statistic on the difference in the established market cleanliness measure between the first and second half of the relevant period (i.e. before and after 1 November 2010). This univariate test assumes that each announcement within a given group has the same chance of being an APPM, without accounting for any other explanatory variables.15
𝑍𝑍 =𝑃𝑃1 − 𝑃𝑃2
�𝑃𝑃𝑃𝑃(𝑛𝑛1−1 + 𝑛𝑛2
−1)
50 If n1 is the number of observations in group one, P1 is the probability of an announcement being an APPM, Q1=1 – P1; n1P1 ≥ 5 and n1Q1 ≥ 5, where P and Q=1 – P are the average proportion of both groups and the proportion is the actual proportion observed as opposed to the underlying probability.
15 FCA, Why has the FCAs market cleanliness statistic for takeover announcements decreased since 2009, Occasional Paper Series 4, July 2014, p 8.
© Australian Securities and Investments Commission August 2016 Page 16

REPORT 487: Review of Australian equity market cleanliness
Logistic regression
51 To draw more meaningful regulatory observations about the change in the measure over the relevant period, we accounted for explanatory variables. By design, the established market cleanliness measure may be affected by naturally varying sample characteristics year-on-year.
52 For example, a year that contains more MPSAs by larger, more liquid, companies may indicate an improvement in aggregate market cleanliness because it is more difficult for any trading to result in significant price impact. Furthermore, some types of announcements, and announcements made by companies in certain industries, may be more or less prone to insider trading and information leakages. By accounting for them we can focus on the different probability of MPSAs being preceded by APPMs during different time periods.
53 We applied the following logistic regression model where the dependent variable is binary (i.e. whether the MPSA is preceded by APPM).
Logit(PAPPM ) = log �PAPPM
1 − PAPPM�
= α0 + β log𝑋𝑋𝐷𝐷𝑃𝑃𝑃𝑃𝑃𝑃𝑃𝑃𝑃𝑃 𝑚𝑚𝑃𝑃𝑃𝑃𝑚𝑚𝑃𝑃𝑡𝑡 𝑃𝑃𝑃𝑃𝑐𝑐𝑖𝑖𝑡𝑡𝑃𝑃𝑇𝑇𝑖𝑖𝐴𝐴𝑃𝑃𝑡𝑡𝑖𝑖𝑜𝑜𝑛𝑛5 𝑑𝑑𝑃𝑃𝑑𝑑𝐴𝐴 𝑐𝑐𝑃𝑃𝑖𝑖𝑜𝑜𝑃𝑃 +γ log𝑋𝑋𝐷𝐷𝑃𝑃𝑃𝑃𝑃𝑃𝑃𝑃𝑃𝑃 𝑑𝑑𝑃𝑃𝑖𝑖𝑇𝑇𝑑𝑑 𝐷𝐷𝑜𝑜𝑇𝑇𝑣𝑣𝑚𝑚𝑃𝑃5 𝑑𝑑𝑃𝑃𝑑𝑑𝐴𝐴 𝑐𝑐𝑃𝑃𝑖𝑖𝑜𝑜𝑃𝑃 +𝜕𝜕 𝑋𝑋𝑛𝑛𝑛𝑛𝑜𝑜𝑣𝑣𝑛𝑛𝑃𝑃𝑃𝑃𝑚𝑚𝑃𝑃𝑛𝑛𝑡𝑡 𝑡𝑡𝑑𝑑𝑐𝑐e +δ 𝐴𝐴𝑃𝑃𝑃𝑃𝑚𝑚𝑃𝑃𝑡𝑡 𝐷𝐷𝑜𝑜𝑇𝑇𝑃𝑃𝑡𝑡𝑖𝑖𝑇𝑇𝑖𝑖𝑡𝑡𝑑𝑑240 𝑑𝑑𝑃𝑃𝑑𝑑𝐴𝐴 𝑐𝑐𝑃𝑃𝑖𝑖𝑜𝑜𝑃𝑃 +τ 2005~2010 𝑑𝑑𝑣𝑣𝑚𝑚𝑚𝑚𝑑𝑑 +θ 𝐼𝐼𝑛𝑛𝑑𝑑𝑣𝑣𝐴𝐴𝑡𝑡𝑃𝑃𝑑𝑑 +ζ 𝑀𝑀𝑃𝑃ℎ𝑃𝑃𝑑𝑑𝑣𝑣𝑇𝑇𝑃𝑃𝑑𝑑 +ϵ0
54 The dependent variable in the equation, log(PAPPM/(1 – PAPPM)), represents the logged odds of an MPSA being preceded by APPM. It is calculated as the logged odds ratio of the PAPPM to 1 – PAPPM. An odds ratio of one indicates that an MPSA is as likely to occur with an APPM as without an APPM; if the odds ratio is greater than one, then an APPM is more likely to occur and vice versa.16
55 The explanatory variable of interest in the event study is the τ 2005~2010 dummy variable. All other things being the same, a statistically significant positive coefficient would indicate an improvement in market cleanliness, and vice versa.
56 The following explanatory variables were included:
(a) Market capitalisation of the entity right before making the MPSA (β log Average market capitalisation 5 days prior): Larger companies may have more resources devoted to punctual disclosure of information and
16 FCA, Why has the FCAs market cleanliness statistic for takeover announcements decreased since 2009, Occasional Paper Series 4, July 2014, pp 21–23.
© Australian Securities and Investments Commission August 2016 Page 17

REPORT 487: Review of Australian equity market cleanliness
internal controls over insiders. Larger companies also tend to have greater liquidity.17
(b) Trading activity (γ log Average daily volume 5 days prior): APPMs are typically accompanied by increased trading volume in the days leading up to the MPSAs.
(c) Announcement type (∂ Announcement type): Different types of inside information are generally known to different groups of insiders and also differ in their materiality. The more widely known and material the information, the higher likelihood of potential leakage and insider trading. The Intralinks report only used merger and acquisition announcements in their study—distinguishing between different types of MPSAs makes our results more informative.
(d) Market volatility (δ Market volatility 240 days prior): Both the CAPM estimates and the bootstrapping results may be affected by differences in volatility, and need to be controlled for. The trailing index volatility, measured by its standard deviation, was used as a continuous proxy for this effect.
(e) Industry (θ Industry): The risk profile and information asymmetry of companies may vary across industries. Some industries may be more vulnerable to information leakage and insider trading than others.
(f) Scheduled vs unscheduled MPSAs (ζ Scheduled): The presence of the announcement on Bloomberg’s schedule of upcoming announcements was used as a proxy indicator of the expected or unannounced nature of the company announcement. This measure does not include additional information on expected sentiment or direction of the announcement, only includes the known or unknown nature of a potentially significant upcoming announcement.
Event study results
57 Table 2 and Table 3 show the univariate and logistic regression results. Table 2 shows the difference of the market cleanliness statistics between the first and second half of the relevant period. Statistical significance of the difference is tested using a univariate z-test against a null hypothesis (H0) of APPM equivalence across both periods.
58 Under the assumptions of the univariate test, average market cleanliness has improved significantly and the null hypothesis could be rejected with a high degree of confidence. The z-statistic for the univariate test is at –4.89, which is statistically significant at the 0.01% level—this means the probability of the decreasing APPM being driven purely by random volatility is extremely low.
17 FCA, Updated measurement of market cleanliness (PDF 366 KB), Occasional Paper Series 25, March 2007
© Australian Securities and Investments Commission August 2016 Page 18

REPORT 487: Review of Australian equity market cleanliness
Table 2: Univariate test results
Period (ended 31 October) APPM Non-APPM MPSA APPM%
2006–10 454 4,093 4,547 9.98%
2011–15 265 3,537 3,802 6.97%
Difference –189 –556 –745–3.01%
(Z-statistic: –4.89)
59 A multivariate logistic regression was also performed to evaluate the statistical significance of the difference between the first and second half of the relevant period after controlling for other potentially explanatory variables: see Table 3. During the relevant period, we found a general decrease in anomalous trading ahead of MPSAs, indicating an improvement in market integrity. The results confirm a statistically significant improvement in market cleanliness. We also found that larger market capitalisation securities tend to be less leaky.
60 Both the trailing market volatility and event direction explanatory variables do not appear statistically significant, all other things being equal, in our logistic regression. No conclusion can be made about the effect, positive or otherwise, of these explanatory variables over the relevant period.
Table 3: Logistic regression results
Explanatory variables Sensitivity coefficients Standard. error P value
(Intercept) 3.290 0.449 2.36E-13
Log. average daily volume 0.099 0.022 4.53E-06
Log. average market capitalisation. –0.036 0.021 0.079
Trailing market volatility 0.268 0.260 0.302
Mergers and acquisitions dummy variable –1.479 0.509 0.003
Positive MPSA dummy variable 0.023 0.080 0.772
Scheduled dummy variable –0.679 0.171 6.84E-05
2005~2010 dummy variable 0.372 0.088 2.25E-05
Utilities sector dummy variable 0.369 0.265 0.164
Telecom sector dummy variable –0.011 0.364 0.975
IT sector dummy variable 0.181 0.211 0.391
© Australian Securities and Investments Commission August 2016 Page 19

REPORT 487: Review of Australian equity market cleanliness
Explanatory variables Sensitivity coefficients Standard. error P value
Financial sector dummy variable –0.024 0.164 0.884
Healthcare sector dummy variable 0.048 0.180 0.790
Consumer staples sector dummy variable –0.087 0.288 0.762
Consumer discretionary sector dummy variable –0.135 0.186 0.467
Industrial sector dummy variable 0.179 0.152 0.242
Materials sector dummy variable 0.175 0.116 0.130
61 Surprisingly, merger and acquisition announcements had a statistically significant lower contribution to the APPM logistic regression than other MPSAs, despite being known by a greater number of people and entities before release. It is possible that there are tighter controls and procedures around confidential merger and acquisition information compared to other MPSAs. This result is supported by the Intralinks report which found that Australia has a low rate of leakages for mergers and acquisitions: see Appendix 3.
62 Another interesting observation is that scheduled MPSAs tend to be preceded by fewer APPMs than unscheduled MPSAs at a statistically significant level. This may indicate less information leakage and possible insider trading ahead of scheduled MPSAs despite the market being aware of their impending release. On the other hand, it is possible that market awareness of upcoming scheduled MPSAs may attract speculation and liquidity to that market, reducing the likelihood of APPMs arising from any informed trading.
63 Indicator factors controlling for Global Industry Classification Standard (GICS) industry sectors did not present statistically significant coefficients within the logistic regression.
Robustness checks
64 To ensure our results are robust as to the choice of event window length, we have, in addition to a five day event window, carried out our analysis using two to eight day event windows. Our findings are presented in Figure 3 and confirm the robustness of our results.18
18 Further robustness checks using other parameters and model specifications were also performed and confirmed that market cleanliness has been gradually improving over time.
© Australian Securities and Investments Commission August 2016 Page 20

REPORT 487: Review of Australian equity market cleanliness
Figure 3: Robustness of the results using 2–8 day event windows
3%4%5%6%7%8%9%
10%11%12%13%14%15%16%17%18%19%
'06 '07 '08 '09 '10 '11 '12 '13 '14 '15
APP
Ms
as a
% o
f MPS
As
Year*
2 days
3 days
* Year ended 31 October.
65 Past studies applying the established market cleanliness methodology chose different event windows to capture abnormal price reactions ahead of MPSAs. For example, the FCA used a two-day event window, while other studies used a five-day event window.19 Based on the experience of ASIC surveillance staff we decided to use an event window of five trading days.
66 There are trade-offs with all parameter specifications, particularly for the length of the event window. The longer the window, the more difficult it is to detect statistically significant returns, while a shorter window may not capture enough relevant trading ahead of MPSAs.
19 George Bulkley and Renata Herrerias, Stock returns following profit warnings (PDF 682 KB), 04/02, University of Exeter Xfi Centre for Finance & Investment, 2002.
© Australian Securities and Investments Commission August 2016 Page 21

REPORT 487: Review of Australian equity market cleanliness
D New measure of market cleanliness
Key points
In this section, we outline and apply an innovative measure of market cleanliness that is independent of the conventional measure and removes any reliance on APPMs to indicate anomalous trading ahead of MPSAs.
We examine the percentage of accounts trading ahead of MPSAs that were not only timely and profitable, but also demonstrated potentially suspicious behavioural patterns.
Proposed new market cleanliness measure
67 The new market cleanliness measure eliminates the dependence on APPMs as a measure of market cleanliness. Instead of relying on the price impact of potentially suspicious trading, the new measure examines the anomalous trading itself.
68 There are a number of limitations and caveats to the traditional methodology: see paragraphs 33–41. For example, market misconduct (e.g. insider trading) may not cause meaningful price impact and result in APPMs. It may also be possible for insiders to trade in ways that disguise price impact.
69 Where securities are volatile, it is difficult to distinguish what is abnormal. Even where there is no price movement we are still concerned with illegal and unfair activity. Therefore, in addition to price reactions, advanced market surveillance systems should examine the nature and pattern of trading by each account over time.
70 As shown in Figure 4, we attempt to distinguish between different types of trading by accounts ahead of MPSAs. Based on their timeliness, profitability and trading patterns, some accounts stand out as potentially suspicious and warrant further inquiries. We do not require an APPM to identify anomalous trading associated with an MPSA.
© Australian Securities and Investments Commission August 2016 Page 22

REPORT 487: Review of Australian equity market cleanliness
Figure 4: New market cleanliness methodology intuition
Pric
e
Anomalous volume
Clean volume
MPSAs with APPMs
MPSAs without APPMs
Reference period(10 trading days)
Postperiod
Pre-period(60 trading days)
Anomalousaccounts
Clean accounts
Data
71 The new market cleanliness measure is made possible because of our recent access to enhanced surveillance data that allows the identification of individual accounts: see Section E of Consultation Paper 168 Australian equity market structure: Further proposals (CP 168) and Rule 5A.2.3 of the ASIC Market Integrity Rules (Competition).
72 The data used to calculate the new market cleanliness measure in this section is collected using ASIC’s MAI surveillance system. The requirement for market participants to provide accounts in the regulatory data feed came into effect on 28 July 2014. This report implements the new measure for one calendar year from 1 November 2014 to 31 October 2015. All other data has been gathered from the same sources as Section B.
Methodology of the new market cleanliness measure
73 We examined timely and profitable trading in the right direction before MPSAs and identified accounts that demonstrate highly anomalous trading behaviour when compared to their historical trades and trading by rest of the market. This is consistent with how a surveillance analyst would screen for suspected insider trading for further analysis.
74 For example, the methodology attempts to identify traders who exhibit various combinations of certain characteristics, including (but not limited to) traders who:
(a) have not traded the security of interest for an extended period of time, but have suddenly started aggressively trading in the security of interest just ahead of the MPSA;
© Australian Securities and Investments Commission August 2016 Page 23

REPORT 487: Review of Australian equity market cleanliness
(b) changed from historical trading and portfolio diversification behaviours to increased trading and position concentration in the security of interest just ahead of the MPSA;
(c) significantly increased the size of trading in the security of interest just ahead of the MPSA; and/or
(d) made a material profit as a result of the timely trading.
75 The reference period used was the 10 trading days leading up to the MPSA. Unlike the established market cleanliness measure that uses end-of-day data, the new market cleanliness measure uses intraday data to measure returns and trading around the MPSA. If the MPSA is announced intraday, the measure looks at all intraday trading leading up to the MPSA and the 10 trading days before it (the reference period). The pre-period for evaluating historical account behaviour is 60 trading days before the reference period (i.e. –11 to –70 trading day before the MPSA).
76 We isolated accounts that not only traded timely and profitably during the reference period, but had notably diverged from how they had behaved historically during the pre-period and/or how the rest of the market behaves. In doing so, we measured the extent and intensity of anomalous trading (rather than price reaction) ahead of MPSAs.
77 This was done by systematically filtering timely buying or selling, profitability, the ratio of trading in the relevant security to the entire portfolio during the pre-period compared to the reference period, and abnormal trading volume. For example:
(a) A large average stock-to-portfolio ratio in the reference period indicated that the account bought a concentrated stake in the relevant security or liquidated existing holdings in the portfolio to buy the relevant security ahead of a positive MPSA.
(b) A much lower average stock-to-portfolio ratio in the pre-period showed that the account historically traded a diversified range of securities.
(c) The account accumulated a much larger stake in the relevant security during the reference period compared to what it bought during the pre-period.
(d) The accumulated relevant security during the reference period was substantial, relative to its historical trading in other securities.
(e) The total profit from trading ahead of the MPSA was significant.
78 The exact quantitative thresholds and parameters used to generate the new market cleanliness measure are designed to profile and stylise general sets of trading patterns informed by our internal surveillance activity. Like APPMs in the traditional market cleanliness methodology, the new measure provides an indication of possible undesirable activity (e.g. insider trading and information leakage) while not asserting that the entire measure is
© Australian Securities and Investments Commission August 2016 Page 24
REPORT 487: Review of Australian equity market cleanliness
attributable to such conduct. We apply a flexible, robust and detailed analysis process in our business-as-usual (BAU) surveillance that goes beyond quantitative thresholds and parameters in many aspects. We are constantly seeking to:
(a) alter and test our alerting and analysis parameters for robustness; and
(b) conduct various thematic reviews to detect insider trading, market manipulation and other types of market misconduct.
New market cleanliness measure
Measures of market cleanliness can be estimated using the following:
• New market cleanliness measure 1: Percentage of accounts demonstrating timely and anomalous trading ahead of the MPSAs.
𝑀𝑀𝑣𝑣𝐴𝐴𝑐𝑐𝑖𝑖𝑃𝑃𝑖𝑖𝑜𝑜𝑣𝑣𝐴𝐴 𝑃𝑃𝑃𝑃𝑃𝑃𝑜𝑜𝑣𝑣𝑛𝑛𝑡𝑡𝐴𝐴 % =
𝑁𝑁𝑜𝑜. 𝑜𝑜𝑓𝑓 𝑃𝑃𝑃𝑃𝑃𝑃𝑜𝑜𝑣𝑣𝑛𝑛𝑡𝑡𝐴𝐴 𝑤𝑤𝑖𝑖𝑡𝑡ℎ 𝑃𝑃𝑛𝑛𝑜𝑜𝑚𝑚𝑃𝑃𝑇𝑇𝑜𝑜𝑣𝑣𝐴𝐴 𝑡𝑡𝑃𝑃𝑃𝑃𝑑𝑑𝑖𝑖𝑛𝑛𝑃𝑃 𝑃𝑃ℎ𝑃𝑃𝑃𝑃𝑑𝑑 𝑜𝑜𝑓𝑓 𝐴𝐴𝑃𝑃𝑀𝑀𝑋𝑋𝑖𝑖
𝑇𝑇𝑜𝑜𝑡𝑡𝑃𝑃𝑇𝑇 𝑛𝑛𝑜𝑜. 𝑜𝑜𝑓𝑓 𝑃𝑃𝑃𝑃𝑃𝑃𝑜𝑜𝑣𝑣𝑛𝑛𝑡𝑡𝐴𝐴 𝑃𝑃ℎ𝑃𝑃𝑃𝑃𝑑𝑑 𝑜𝑜𝑓𝑓 𝐴𝐴𝑃𝑃𝑀𝑀𝑋𝑋𝑖𝑖
• New market cleanliness measure 2: Percentage of volume traded using
the accounts ahead of the MPSAs.
𝑀𝑀𝑣𝑣𝐴𝐴𝑐𝑐𝑖𝑖𝑃𝑃𝑖𝑖𝑜𝑜𝑣𝑣𝐴𝐴 𝐷𝐷𝑜𝑜𝑇𝑇. % =
𝐶𝐶𝑜𝑜𝑇𝑇. 𝑡𝑡𝑃𝑃𝑃𝑃𝑑𝑑𝑃𝑃𝑑𝑑 𝑏𝑏𝑑𝑑 𝑃𝑃𝑛𝑛𝑜𝑜𝑚𝑚𝑃𝑃𝑇𝑇𝑜𝑜𝑣𝑣𝐴𝐴 𝑃𝑃𝑃𝑃𝑃𝑃𝑜𝑜𝑣𝑣𝑛𝑛𝑡𝑡𝐴𝐴 𝑃𝑃ℎ𝑃𝑃𝑃𝑃𝑑𝑑 𝑜𝑜𝑓𝑓 𝐴𝐴𝑃𝑃𝑀𝑀𝑋𝑋𝑖𝑖
𝑇𝑇𝑜𝑜𝑡𝑡𝑃𝑃𝑇𝑇 𝐷𝐷𝑜𝑜𝑇𝑇.𝑃𝑃ℎ𝑃𝑃𝑃𝑃𝑑𝑑 𝑜𝑜𝑓𝑓 𝐴𝐴𝑃𝑃𝑀𝑀𝑋𝑋𝑖𝑖
79 In the future, as we continue to accumulate enhanced surveillance data using MAI, an analysis of the new market cleanliness measure can be constructed to track the percentage of MPSAs that exhibit high concentrations of anomalous accounts and/or anomalous trading volume over time (as we have done with the established market cleanliness measure).
New market cleanliness measure results
80 The new market cleanliness measure for the year 1 November 2014 to 31 October 2015 indicates that roughly 62% of MPSAs exhibit no anomalous trading behaviours at the account level.
81 Of the 38% of MPSAs that had some level of anomalous trading, around 5% contained more than 2% of accounts demonstrating anomalous trading patterns ahead of the announcement—and around 5% of MPSAs contain more than 12% of volume traded by anomalous accounts: see Figure 5.20
82 Figure 5 shows that accounts engaging in anomalous trading make disproportionately larger trades at each level of the cumulative distribution.
20 Despite the abnormal pattern of the timely and profitable trading ahead of the MPSAs, a proportion of this trading is purely coincidental and due to random luck: see Appendix 4 for a discussion of unlucky trading ahead of MPSAs.
© Australian Securities and Investments Commission August 2016 Page 25

REPORT 487: Review of Australian equity market cleanliness
Figure 5: Cumulative distribution of MPSAs by percentage level of anomalous trading
Note: See Table 8 in Appendix 1 for a sample of the data used in this figure (accessible version).
83 This measure is subject to the strictness of our quantitative filters that deem trading patterns as timely, profitable and anomalous, based on our BAU surveillance activities. We have conducted various sensitivity and robustness checks by altering some of the parameters (see paragraph 77) and applying different model specifications in our day-to-day surveillance.
84 Further analysis of how these measures evolve over time can be conducted as the MAI accounts are accumulated in the future. See Section E for our analysis of the differences in the new and established market cleanliness measures across industry sectors, market capitalisation and announcement types.
0%
5%
10%
15%
20%
25%
30%
35%
40%
0% 5% 10% 15%
MPS
As
with
ano
mal
ous
acco
unts
Anomalous accountstrading before MPSAs
2%
0%
5%
10%
15%
20%
25%
30%
35%
40%
0% 20% 40% 60% 80%
MPS
As
with
ano
mal
ous
volu
me
Anomalous volumetrading before MPSAs
12%
© Australian Securities and Investments Commission August 2016 Page 26

REPORT 487: Review of Australian equity market cleanliness
E Analysis by industry sector, market capitalisation and announcement type
Key points
This section shows the results of our analysis of the established and new market cleanliness measures and examines any differences across industry sectors, market capitalisation quintiles and announcement types.
We found that:
• certain industries and announcement types consistently exhibited better or worse market cleanliness;
• larger companies exhibited better market cleanliness than smaller companies; and
• the new market cleanliness measure correlates positively with the established market cleanliness measure, lending support to each other.
Analysis of the established market cleanliness measure
Industry sector
85 To examine market cleanliness across industry sectors we used the 10 sectors that make up the structure of GICS (i.e. energy, materials, industrials, consumer discretionary, consumer staples, healthcare, financials, information technology (IT), telecommunication services (telecom) and utilities). We grouped the announcements made by companies in each industry sector to explore whether there were any industry-specific factors driving variation in the traditional market cleanliness measure over the relevant period.
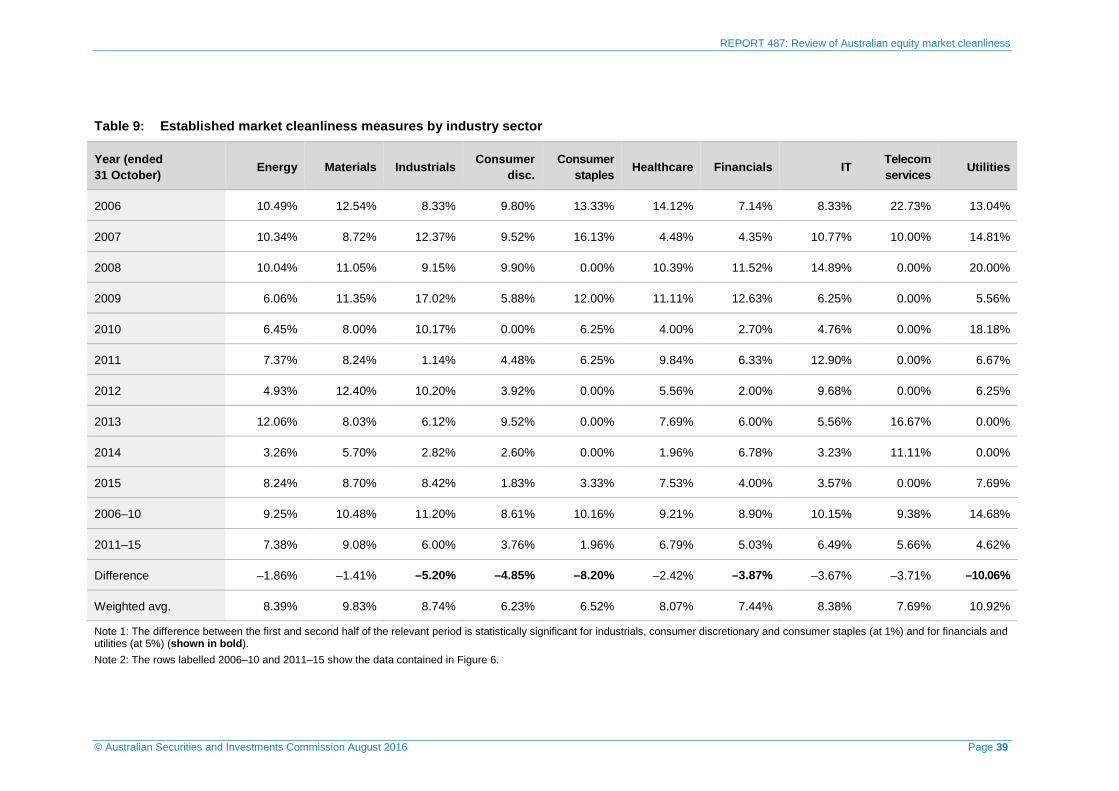
86 Our analysis of the sectors using the traditional measure indicates that all sectors experienced an improvement in market cleanliness in the first half (i.e. 2006–10) compared to the second half (i.e. 2010–15) of the relevant period: see Figure 6.
87 The utilities sector showed the biggest improvement in market cleanliness followed by consumer staples. Year-on-year analysis identified the utilities, materials and industrials sectors as demonstrating the highest number of APPMs ahead of MPSAs: see Table 9 in Appendix 1. The measures are consistently elevated for the materials and industrials sectors, while demonstrating more year-on-year variation in utilities. Specifically, we found that small capitalisation utilities securities experience frequent APPMs ahead of MPSAs.
© Australian Securities and Investments Commission August 2016 Page 27

REPORT 487: Review of Australian equity market cleanliness
Figure 6: Established market cleanliness measures by industry sector
7.38%
9.08%
6.00%
3.76%
1.96%
6.79%
5.03%
6.49%
5.66%
4.62%
9.25%
10.48%
11.20%
8.61%
10.16%
9.21%
8.90%
10.15%
9.38%
14.68%
0% 5% 10% 15%
Energy
Materials
Industrials
Consumerdiscretionary
Consumer staples
Healthcare
Financials
IT
Telecom
Utilities
Traditional market cleanliness measure
2006-10
2011-15
Note: See the rows labelled 2006–10 and 2011–15 in Table 9 in Appendix 1 for the data used in this figure (accessible version).
Market capitalisation quintiles
88 To examine market cleanliness by company size we grouped companies into quintiles according to their market capitalisation—quintile one being the 20% of companies with the smallest market capitalisation and quintile five being the 20% of companies with the largest market capitalisation. Market capitalisation for each company was determined using the average market capitalisation for the five days before the MPSA.
89 Our analysis of market cleanliness by market capitalisation quintile indicates that all quintiles experienced an improvement in market cleanliness, when comparing the first half of the relevant period to the second half: see Figure 7.
© Australian Securities and Investments Commission August 2016 Page 28

REPORT 487: Review of Australian equity market cleanliness
Figure 7: Established market cleanliness measure by market capitalisation quintile
8.33%
7.63%
7.10%
6.74%
5.11%
11.27%
10.86%
10.15%
9.05%
8.52%
0% 2% 4% 6% 8% 10% 12%
1
2
3
4
5
Traditional market cleanliness measure
Qui
ntile
2006–10
2011–15
Note: See the rows labelled 2006–10 and 2011–15 in Table 10 in Appendix 1 for the data used in this figure (accessible version).
90 Consistent with our findings in Section C, the results indicate that APPMs are less frequent for larger companies than smaller companies: see Table 10 in Appendix 1 for the year-on-year results of the established market cleanliness measure across the quintiles.
91 This may be because larger companies have more resources devoted to compliance with continuous disclosure and management of confidential information. Larger companies also tend to have greater liquidity, which can limit the price impact of anomalous trading ahead of announcements.
Announcement type
92 We also examined how the established market cleanliness measure varied by announcement type. Surprisingly, merger and acquisition announcements had less APPMs than other MPSAs despite typically being known by a greater number of people and entities ahead of release. This result is supported by data from the Intralinks report, which found that Australia has a low rate of leakages for mergers and acquisitions: see Appendix 3.
93 Figure 8 shows that there is little difference between positive MPSAs and negatives MPSAs. All announcement types except for scheduled MPSAs experienced an improvement in market cleanliness, when comparing the first half of the relevant period to the second half—however, the increase in scheduled MPSAs was not statistically significant: see Table 11 in Appendix 1 for the year-on-year results of the established market cleanliness measure by announcement type.
© Australian Securities and Investments Commission August 2016 Page 29

REPORT 487: Review of Australian equity market cleanliness
Figure 8: Established market cleanliness measure by announcement type
1.25%
7.09%
7.33%
6.53%
4.48%
7.50%
2.94%
10.15%
9.80%
10.22%
4.07%
10.40%
0% 2% 4% 6% 8% 10% 12%
M&A
Other
Positive
Negative
Scheduled
Unscheduled
Traditional market cleanliness measure
Ann
ounc
emen
t typ
e
2006–102011–15
Note: See the rows labelled 2006–10 and 2011–15 in Table 11 in Appendix 1 for the data used in this figure (accessible version).
Analysis of the new market cleanliness measure
94 We performed a similar analysis of the new market cleanliness measure (for the period 1 November 2014 to 31 October 2015) across industry sectors, market capitalisation quintiles and announcement types: see paragraphs 95–107.
How to interpret Figure 9 to Figure 13
Figure 9 to Figure 13 show the percentage of MPSAs by level of anomalous trading (i.e. the percentage of MPSAs that contain some anomalous trading below a certain level, as broken down by industry sector, market capitalisation and announcement type):
• the horizontal (x) axis shows the threshold percentage of accounts that demonstrate anomalous trading ahead of the MPSAs; and
• the vertical (y) axis shows the accumulated percentage of MPSAs with some anomalous trading accounts below a certain threshold.
Unlike Figure 5, which shows the cumulative percentage of MPSAs by level of anomalous trading above a certain level, Figure 9 to Figure 13 show the cumulative percentage of MPSAs with anomalous trading below a certain level. (e.g. Figure 11 shows that 11% of MPSAs in the smallest quintile of securities had some anomalous trading by 4% or less of accounts).This approach was taken to provide visual clarity by avoiding the overlapping of converging curves towards zero.
Generally:
• a curve with a steeper gradient indicates more MPSAs with a lower percentage of accounts exhibiting anomalous trading;
© Australian Securities and Investments Commission August 2016 Page 30
REPORT 487: Review of Australian equity market cleanliness
• a curve with a more gradual gradient indicates more MPSAs with a relatively higher percentage of accounts exhibiting anomalous trading; and
• the terminating point of each curve indicates the total percentage of MPSAs that are preceded by any level of anomalous trading.
Industry sectors
95 Our analysis of industry sectors using the new market cleanliness measure found that the materials sector contributed the most MPSAs preceded by some level of anomalous trading (followed by energy, industrials, consumer discretionary and healthcare): see Figure 9. This is somewhat consistent with anecdotal evidence observed in our day-to-day surveillance of the market. Figure 9 shows that the materials sector contributed 8.37% of MPSAs with some anomalous trading by 2% or less of accounts.
96 The results in Figure 9 represent each sector’s contribution to total MPSAs. This figure is significantly affected by the market size and announcement activity specific to each sector.
Figure 9: New market cleanliness measure by industry sector
8.37%
0%
2%
4%
6%
8%
10%
0.1% 1% 2% 3% 4% 5% 6% 7% 8% 100%
Y ax
is
X axis
Telecom
Materials
Financials
UtilitiesConsumer staples
IT
X axis: Threshold percentage of accounts that demonstrate anomalous trading.
Y axis: Accumulated percentage of MPSAs with some anomalous trading accounts below a certain threshold.
Note: See Table 12 in Appendix 1 for the data used in this figure (accessible version).
97 Figure 10 shows the concentration of MPSAs that are preceded by some level of anomalous trading within each industry sector (i.e. the percentage of MPSAs in that sector that have some level of anomalous trading). Figure 10 shows that 29.31% of MPSAs in the materials sector had some anomalous trading by 2% or less of accounts. Telecommunication services, consumer discretionary and utilities have higher concentrations of potentially leaky material announcements within their sectors.
© Australian Securities and Investments Commission August 2016 Page 31

REPORT 487: Review of Australian equity market cleanliness
Figure 10: MPSAs preceded by some level of anomalous trading by industry sector
X axis: Threshold percentage of accounts that demonstrate anomalous trading.
Y axis: Accumulated percentage of MPSAs with some anomalous trading accounts below a certain threshold.
Note: See Table 13 in Appendix 1 for the data used in this figure (accessible version).
Market capitalisation quintiles
98 Smaller market capitalisation securities have a consistently higher percentage of MPSAs preceded by some level of anomalous trading than larger market capitalisation securities: see Figure 11.
99 This confirms the results in Section C and paragraphs 88–91 using the established market cleanliness measure, which relies on APPMs. It also supports the notion that APPMs in smaller capitalisation securities probably occur because of anomalous trading, rather than price volatility and limited liquidity.
100 Figure 11 shows each quintile’s contribution to total leaky MPSAs and indicates that the concentration of leaky MPSAs within each quintile is consistent: see Table 14 in Appendix 1 for a comprehensive analysis of the new market cleanliness measure for each quintile.
© Australian Securities and Investments Commission August 2016 Page 32

REPORT 487: Review of Australian equity market cleanliness
Figure 11: New market cleanliness measure by market capitalisation quintile
11.00%
Quintile 1Quintile 2
Quintile 3Quintile 4
Quintile 5
0%
2%
4%
6%
8%
10%
12%
14%
0.1% 1% 2% 3% 4% 5% 6% 7% 8% 100%
Y ax
is
X axis X axis: Threshold percentage of accounts that demonstrate anomalous trading.
Y axis: Accumulated percentage of MPSAs with some anomalous trading accounts below a certain threshold.
Note: See Table 14 in Appendix 1 for the data used in this figure (accessible version).
Announcement type
101 The new market cleanliness measure indicates that mergers and acquisitions only contributed to a small percentage of total MPSAs preceded by anomalous trading: see Figure 12. This is mainly because of the limited number of mergers and acquisitions compared to all other MPSAs.
102 We found that there were an approximately equal number of positive and negative MPSAs. Positive MPSAs contribute to a slightly smaller percentage of MPSAs preceded by some level anomalous trading, while negative leaky MPSAs tend to have a smaller concentration of anomalous trading.
103 There was also a higher number of unscheduled MPSAs compared to scheduled MPSAs in the relevant period. This drove the contribution of unscheduled MPSAs to total unclean MPSAs: see Table 15 in Appendix 1 for a comprehensive analysis of the new market cleanliness measure for each announcement type.
© Australian Securities and Investments Commission August 2016 Page 33

REPORT 487: Review of Australian equity market cleanliness
Figure 12: New market cleanliness measure by announcement type
M&A
Other
PositiveNegative
Scheduled
Unscheduled
0%
10%
20%
30%
40%
0.1% 1% 2% 3% 4% 5% 6% 7% 8% 100%
Yax
is
X axis X axis: Threshold percentage of accounts that demonstrate anomalous trading.
Y axis: Accumulated percentage of MPSAs with some anomalous trading accounts below a certain threshold.
Note: See Table 15 in Appendix 1 for the data used in this figure (accessible version).
104 Figure 13 shows the concentration of MPSAs preceded by anomalous trading for each announcement type (i.e. the percentage of MPSAs for a given type of announcement that had some level of anomalous trading).
105 Contrary to previous findings using the established market cleanliness measure, a higher percentage of mergers and acquisitions exhibited some degree of anomalous trading, albeit not necessarily leading to APPMs.
106 We also found contradictory results for scheduled versus unscheduled MPSAs. While scheduled MPSAs demonstrate lower APPMs (see Section B), a higher percentage of scheduled MPSAs are preceded by some abnormal trading—although the concentration of abnormal trading is low.
107 This could have two possible explanations:
(a) a higher percentage of scheduled MPSAs are preceded by anomalous trading, but those trading failed to create any APPMs due to increased speculation and liquidity ahead of the scheduled MPSAs; or
(b) the abnormal trading that we picked up was the increased speculation.
© Australian Securities and Investments Commission August 2016 Page 34

REPORT 487: Review of Australian equity market cleanliness
Figure 13: MPSAs preceded by some level of anomalous trading by announcement type
0%
10%
20%
30%
40%
50%
60%
70%
0% 1% 2% 3% 4% 5% 6% 7% 8% 100%
Yax
is
X axis
ScheduledM&A
X axis: Threshold percentage of accounts that demonstrate anomalous trading.
Y axis: Accumulated percentage of MPSAs with some anomalous trading accounts below a certain threshold.
Note: See Table 16 in Appendix 1 for the data used in this figure (accessible version).
Correlation between the new and established measures
108 We decided to examine the correlation between the established market cleanliness measure (i.e. odds of an APPM) and the new market cleanliness measure (i.e. concentration of anomalous trading ahead of MPSAs) to determine whether the measures were independent, complementary or contradictory to each other.
109 The simple correlation analysis in Table 4 and Table 5 showed the new market cleanliness measure to be positively correlated with the established market cleanliness measure. This suggests that MPSAs preceded by higher concentrations of anomalous trading tended to have a higher probability of also demonstrating APPMs.
110 This supports the use of APPMs as a measure of market cleanliness, and the introduction a new methodology that directly identifies the anomalous trading.
Table 4: Univariate correlation between APPMs and anomalous volume
Explanatory variable Estimate Standard. error P value
(Intercept) -2.778 0.158 <2e-16
Anomalous volume (%) 3.380 1.683 0.045
© Australian Securities and Investments Commission August 2016 Page 35
REPORT 487: Review of Australian equity market cleanliness
Table 5: Univariate correlation between APPMs and anomalous accounts
Explanatory variable Sensitivity coefficient
Standard. error P value
(Intercept) -2.912 0.170 <2e-16
Anomalous accounts 5.676 0.010 0.00091
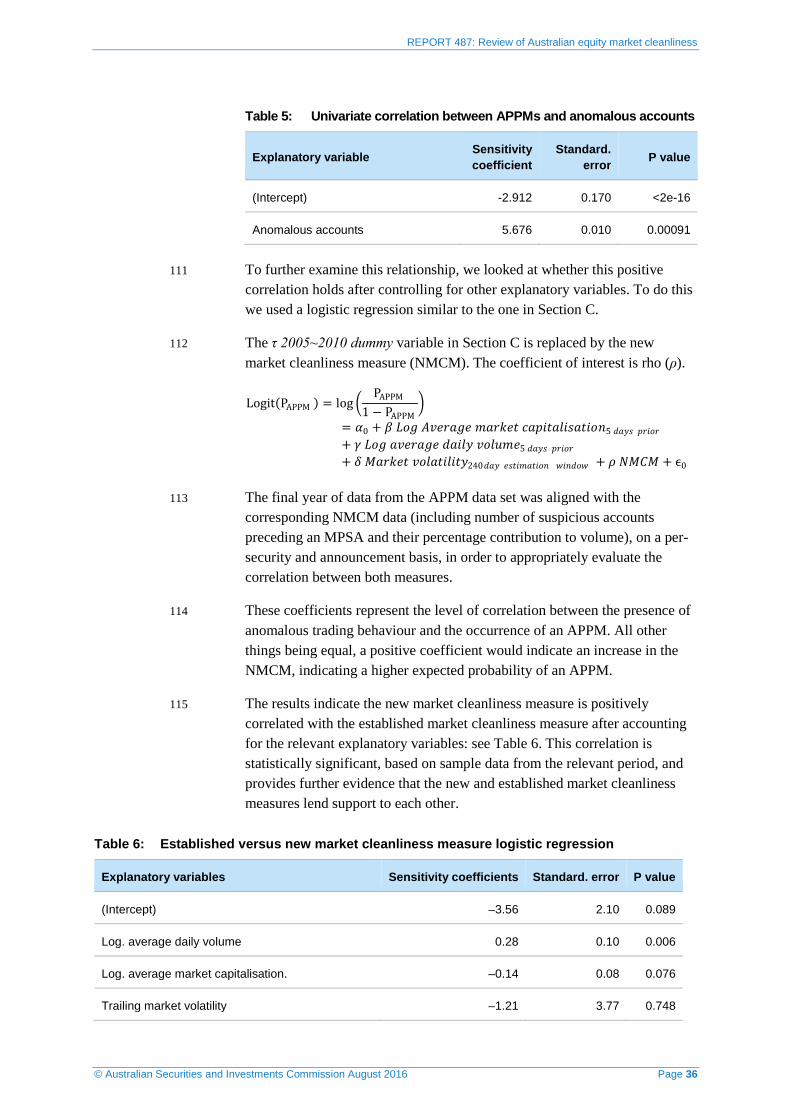
111 To further examine this relationship, we looked at whether this positive correlation holds after controlling for other explanatory variables. To do this we used a logistic regression similar to the one in Section C.
112 The τ 2005~2010 dummy variable in Section C is replaced by the new market cleanliness measure (NMCM). The coefficient of interest is rho (ρ).
Logit(PAPPM ) = log �PAPPM
1 − PAPPM�
= 𝛼𝛼0 + 𝛽𝛽 𝐿𝐿𝑜𝑜𝑃𝑃 𝑋𝑋𝐷𝐷𝑃𝑃𝑃𝑃𝑃𝑃𝑃𝑃𝑃𝑃 𝑚𝑚𝑃𝑃𝑃𝑃𝑚𝑚𝑃𝑃𝑡𝑡 𝑃𝑃𝑃𝑃𝑐𝑐𝑖𝑖𝑡𝑡𝑃𝑃𝑇𝑇𝑖𝑖𝐴𝐴𝑃𝑃𝑡𝑡𝑖𝑖𝑜𝑜𝑛𝑛5 𝑑𝑑𝑃𝑃𝑑𝑑𝐴𝐴 𝑐𝑐𝑃𝑃𝑖𝑖𝑜𝑜𝑃𝑃+ 𝛾𝛾 𝐿𝐿𝑜𝑜𝑃𝑃 𝑃𝑃𝐷𝐷𝑃𝑃𝑃𝑃𝑃𝑃𝑃𝑃𝑃𝑃 𝑑𝑑𝑃𝑃𝑖𝑖𝑇𝑇𝑑𝑑 𝐷𝐷𝑜𝑜𝑇𝑇𝑣𝑣𝑚𝑚𝑃𝑃5 𝑑𝑑𝑃𝑃𝑑𝑑𝐴𝐴 𝑐𝑐𝑃𝑃𝑖𝑖𝑜𝑜𝑃𝑃+ 𝛿𝛿 𝐴𝐴𝑃𝑃𝑃𝑃𝑚𝑚𝑃𝑃𝑡𝑡 𝐷𝐷𝑜𝑜𝑇𝑇𝑃𝑃𝑡𝑡𝑖𝑖𝑇𝑇𝑖𝑖𝑡𝑡𝑑𝑑240𝑑𝑑𝑃𝑃𝑑𝑑 𝑃𝑃𝐴𝐴𝑡𝑡𝑖𝑖𝑚𝑚𝑃𝑃𝑡𝑡𝑖𝑖𝑜𝑜𝑛𝑛 𝑤𝑤𝑖𝑖𝑛𝑛𝑑𝑑𝑜𝑜𝑤𝑤 + 𝜌𝜌 𝑁𝑁𝐴𝐴𝐶𝐶𝐴𝐴 + ϵ0
113 The final year of data from the APPM data set was aligned with the corresponding NMCM data (including number of suspicious accounts preceding an MPSA and their percentage contribution to volume), on a per-security and announcement basis, in order to appropriately evaluate the correlation between both measures.
114 These coefficients represent the level of correlation between the presence of anomalous trading behaviour and the occurrence of an APPM. All other things being equal, a positive coefficient would indicate an increase in the NMCM, indicating a higher expected probability of an APPM.
115 The results indicate the new market cleanliness measure is positively correlated with the established market cleanliness measure after accounting for the relevant explanatory variables: see Table 6. This correlation is statistically significant, based on sample data from the relevant period, and provides further evidence that the new and established market cleanliness measures lend support to each other.
Table 6: Established versus new market cleanliness measure logistic regression
Explanatory variables Sensitivity coefficients Standard. error P value
(Intercept) –3.56 2.10 0.089
Log. average daily volume 0.28 0.10 0.006
Log. average market capitalisation. –0.14 0.08 0.076
Trailing market volatility –1.21 3.77 0.748
© Australian Securities and Investments Commission August 2016 Page 36

REPORT 487: Review of Australian equity market cleanliness
Explanatory variables Sensitivity coefficients Standard. error P value
Mergers and acquisitions dummy variable –0.21 1.08 0.844
Positive MPSA dummy variable –0.27 0.37 0.458
Number of suspicious accounts 0.04 0.01 0.003
Percentage of volume done by suspicious accounts 4.53 1.90 0.017
© Australian Securities and Investments Commission August 2016 Page 37

REPORT 487: Review of Australian equity market cleanliness
Appendix 1: Accessible versions of figures
116 This appendix provides accessible table data for the figures in this report.
Table 7: Established market cleanliness measure
Year (ended 31 October) APPM Non-APPM MPSA APPM%
2006 109 872 981 11.11%
2007 95 942 1037 9.16%
2008 150 1262 1412 10.62%
2009 67 561 628 10.67%
2010 33 456 489 6.75%
2011 64 845 909 7.04%
2012 71 745 816 8.70%
2013 61 685 746 8.18%
2014 23 550 573 4.01%
2015 46 712 758 6.07%
Total 719 7,630 8,349 8.61%
Note: This is the data contained in Figure 2.
Table 8: Cumulative distribution of MPSAs by percentage level of anomalous trading
Threshold % of anomalous account or volume
Anomalous accounts
Anomalous volume
Ratio of volume and accounts
35% 0.10% 0.34% 3.58
30% 0.22% 1.03% 4.67
25% 0.33% 1.81% 5.53
20% 0.46% 3.22% 7.07
15% 0.61% 5.18% 8.46
10% 0.94% 7.19% 7.66
5% 1.96% 12.35% 6.30
0% 15.63% 68.14% 4.36
Note 1: Anomalous accounts, anomalous volume and ratio of volume and accounts are represented as a cumulative percentage of MPSAs with anomalous trading above a certain threshold. Note 2: This a summary of the data contained in Figure 5.
© Australian Securities and Investments Commission August 2016 Page 38
REPORT 487: Review of Australian equity market cleanliness
Table 9: Established market cleanliness measures by industry sector
Year (ended 31 October) Energy Materials Industrials Consumer
disc. Consumer
staples Healthcare Financials IT Telecom services Utilities
2006 10.49% 12.54% 8.33% 9.80% 13.33% 14.12% 7.14% 8.33% 22.73% 13.04%
2007 10.34% 8.72% 12.37% 9.52% 16.13% 4.48% 4.35% 10.77% 10.00% 14.81%
2008 10.04% 11.05% 9.15% 9.90% 0.00% 10.39% 11.52% 14.89% 0.00% 20.00%
2009 6.06% 11.35% 17.02% 5.88% 12.00% 11.11% 12.63% 6.25% 0.00% 5.56%
2010 6.45% 8.00% 10.17% 0.00% 6.25% 4.00% 2.70% 4.76% 0.00% 18.18%
2011 7.37% 8.24% 1.14% 4.48% 6.25% 9.84% 6.33% 12.90% 0.00% 6.67%
2012 4.93% 12.40% 10.20% 3.92% 0.00% 5.56% 2.00% 9.68% 0.00% 6.25%
2013 12.06% 8.03% 6.12% 9.52% 0.00% 7.69% 6.00% 5.56% 16.67% 0.00%
2014 3.26% 5.70% 2.82% 2.60% 0.00% 1.96% 6.78% 3.23% 11.11% 0.00%
2015 8.24% 8.70% 8.42% 1.83% 3.33% 7.53% 4.00% 3.57% 0.00% 7.69%
2006–10 9.25% 10.48% 11.20% 8.61% 10.16% 9.21% 8.90% 10.15% 9.38% 14.68%
2011–15 7.38% 9.08% 6.00% 3.76% 1.96% 6.79% 5.03% 6.49% 5.66% 4.62%
Difference –1.86% –1.41% –5.20% –4.85% –8.20% –2.42% –3.87% –3.67% –3.71% –10.06%
Weighted avg. 8.39% 9.83% 8.74% 6.23% 6.52% 8.07% 7.44% 8.38% 7.69% 10.92%
Note 1: The difference between the first and second half of the relevant period is statistically significant for industrials, consumer discretionary and consumer staples (at 1%) and for financials and utilities (at 5%) (shown in bold). Note 2: The rows labelled 2006–10 and 2011–15 show the data contained in Figure 6.
© Australian Securities and Investments Commission August 2016 Page 39

REPORT 487: Review of Australian equity market cleanliness
Table 10: Established market cleanliness measures by market capitalisation quintile
Year (ended 31 October) Quintile 1 Quintile 2 Quintile 3 Quintile 4 Quintile 5
2006 15.31% 13.57% 7.54% 9.74% 8.94%
2007 12.44% 6.86% 8.29% 9.22% 8.74%
2008 11.04% 9.95% 10.24% 11.07% 10.59%
2009 6.37% 17.65% 15.63% 7.45% 5.31%
2010 8.24% 7.26% 11.83% 3.06% 3.37%
2011 10.06% 6.00% 6.81% 6.52% 6.29%
2012 14.37% 9.76% 8.74% 8.07% 1.42%
2013 4.58% 8.19% 10.46% 9.04% 8.00%
2014 3.33% 6.09% 4.51% 3.51% 2.48%
2015 5.84% 8.09% 4.20% 5.59% 6.63%
2006–10 11.27% 10.86% 10.15% 9.05% 8.52%
2011–15 8.33% 7.63% 7.10% 6.74% 5.11%
Difference –2.94% –3.23% –3.05% –2.31% –3.41%
Weighted avg. 10.07% 9.34% 8.68% 7.96% 7.01%
Note 1: The difference between the first and second half of the relevant period is statistically significant for quintile 5 (at 1%), and for quintile 1, quintile 2, quintile 3 and quintile 4 (at 5 %) (shown in bold).
Note 2: The rows labelled 2006–10 and 2011–15 show the data contained in Figure 7.
Table 11: Established market cleanliness measures by announcement type
Year (ended 31 October) M&A Other Positive Negative Scheduled Unscheduled
2006 6.45% 11.26% 11.65% 10.19% 8.00% 11.28%
2007 4.17% 9.28% 8.46% 10.09% 3.23% 9.54%
2008 0.00% 10.76% 8.49% 12.62% 4.71% 11.00%
2009 0.00% 10.81% 12.60% 7.84% 2.22% 11.32%
2010 0.00% 7.05% 8.04% 4.93% 1.89% 7.34%
2011 0.00% 7.21% 6.69% 7.55% 5.93% 7.21%
© Australian Securities and Investments Commission August 2016 Page 40

REPORT 487: Review of Australian equity market cleanliness
Year (ended 31 October) M&A Other Positive Negative Scheduled Unscheduled
2012 0.00% 8.94% 9.93% 7.16% 3.17% 9.71%
2013 0.00% 8.29% 8.68% 7.58% 8.80% 8.05%
2014 0.00% 4.09% 4.03% 4.00% 0.86% 4.81%
2015 5.88% 6.07% 6.31% 5.80% 3.80% 6.79%
2006–10 2.94% 10.15% 9.80% 10.22% 4.07% 10.40%
2011–15 1.25% 7.09% 7.33% 6.53% 4.48% 7.50%
Difference –1.69% –3.05% –2.47% –3.69% 0.42% –2.89%
Weighted avg. 2.20% 8.75% 8.69% 8.52% 4.36% 9.17%
Note 1: The difference between the first and second half of the relevant period is statistically significant for other, positive, negative and unscheduled announcements (at 1%) (shown in bold).
Note 2: The rows labelled 2006–10 and 2011–15 show the data contained in Figure 8.
© Australian Securities and Investments Commission August 2016 Page 41
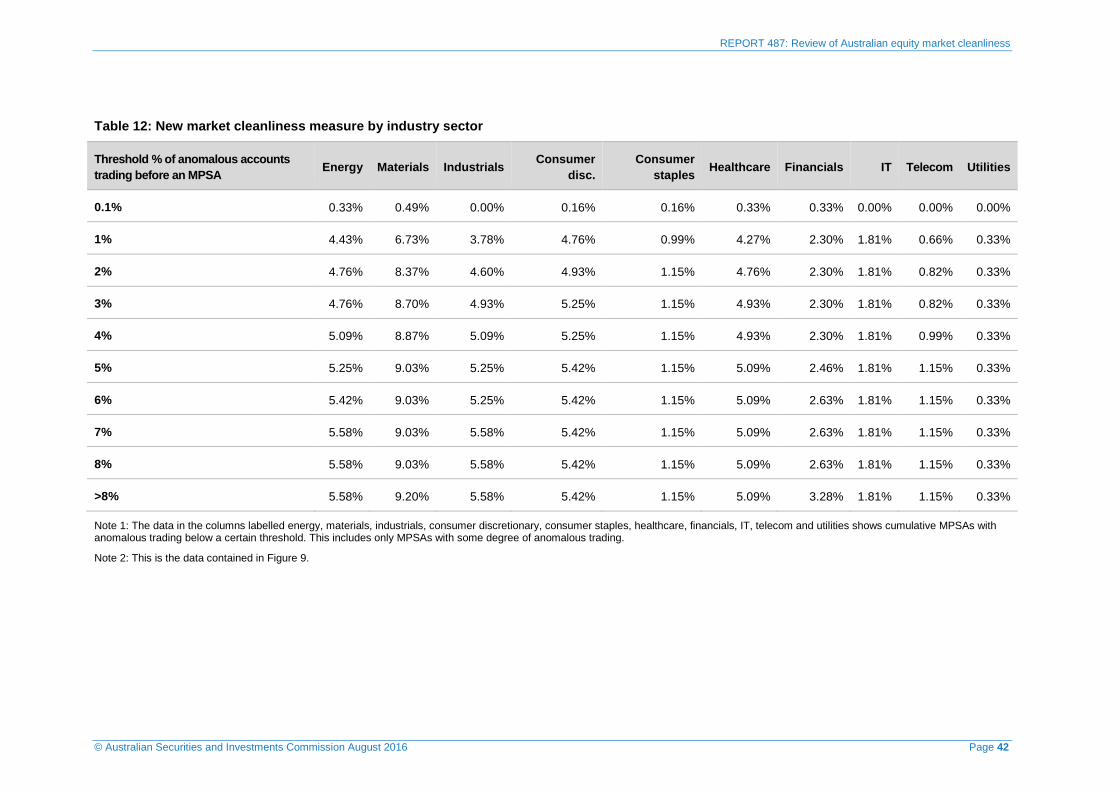
REPORT 487: Review of Australian equity market cleanliness
Table 12: New market cleanliness measure by industry sector
Threshold % of anomalous accounts trading before an MPSA Energy Materials Industrials Consumer
disc. Consumer
staples Healthcare Financials IT Telecom Utilities
0.1% 0.33% 0.49% 0.00% 0.16% 0.16% 0.33% 0.33% 0.00% 0.00% 0.00%
1% 4.43% 6.73% 3.78% 4.76% 0.99% 4.27% 2.30% 1.81% 0.66% 0.33%
2% 4.76% 8.37% 4.60% 4.93% 1.15% 4.76% 2.30% 1.81% 0.82% 0.33%
3% 4.76% 8.70% 4.93% 5.25% 1.15% 4.93% 2.30% 1.81% 0.82% 0.33%
4% 5.09% 8.87% 5.09% 5.25% 1.15% 4.93% 2.30% 1.81% 0.99% 0.33%
5% 5.25% 9.03% 5.25% 5.42% 1.15% 5.09% 2.46% 1.81% 1.15% 0.33%
6% 5.42% 9.03% 5.25% 5.42% 1.15% 5.09% 2.63% 1.81% 1.15% 0.33%
7% 5.58% 9.03% 5.58% 5.42% 1.15% 5.09% 2.63% 1.81% 1.15% 0.33%
8% 5.58% 9.03% 5.58% 5.42% 1.15% 5.09% 2.63% 1.81% 1.15% 0.33%
>8% 5.58% 9.20% 5.58% 5.42% 1.15% 5.09% 3.28% 1.81% 1.15% 0.33%
Note 1: The data in the columns labelled energy, materials, industrials, consumer discretionary, consumer staples, healthcare, financials, IT, telecom and utilities shows cumulative MPSAs with anomalous trading below a certain threshold. This includes only MPSAs with some degree of anomalous trading.
Note 2: This is the data contained in Figure 9.
© Australian Securities and Investments Commission August 2016 Page 42

REPORT 487: Review of Australian equity market cleanliness
Table 13: MPSAs preceded by some level of anomalous trading by industry sector
Threshold % of anomalous accounts trading before an MPSA Energy Materials Industrials Consumer
disc. Consumer
staples Healthcare Financials IT Telecom Utilities
0.1% 2.13% 1.72% 0.00% 1.79% 5.56% 2.56% 3.08% 0.00% 0.00% 0.00%
1% 28.72% 23.56% 31.51% 51.79% 33.33% 33.33% 21.54% 30.56% 36.36% 50.00%
2% 30.85% 29.31% 38.36% 53.57% 38.89% 37.18% 21.54% 30.56% 45.45% 50.00%
3% 30.85% 30.46% 41.10% 57.14% 38.89% 38.46% 21.54% 30.56% 45.45% 50.00%
4% 32.98% 31.03% 42.47% 57.14% 38.89% 38.46% 21.54% 30.56% 54.55% 50.00%
5% 34.04% 31.61% 43.84% 58.93% 38.89% 39.74% 23.08% 30.56% 63.64% 50.00%
6% 35.11% 31.61% 43.84% 58.93% 38.89% 39.74% 24.62% 30.56% 63.64% 50.00%
7% 36.17% 31.61% 46.58% 58.93% 38.89% 39.74% 24.62% 30.56% 63.64% 50.00%
8% 36.17% 31.61% 46.58% 58.93% 38.89% 39.74% 24.62% 30.56% 63.64% 50.00%
>8% 36.17% 32.18% 46.58% 58.93% 38.89% 39.74% 30.77% 30.56% 63.64% 50.00%
Note 1: The data in the columns labelled energy, materials, industrials, consumer discretionary, consumer staples, healthcare, financials, IT, telecom and utilities shows cumulative MPSAs with anomalous trading below a certain threshold reweighted to a proportion of that sector’s MPSA announcement total. This includes only MPSAs with some degree of anomalous trading.
Note 2: This is the data contained in Figure 10.
© Australian Securities and Investments Commission August 2016 Page 43

REPORT 487: Review of Australian equity market cleanliness
Table 14: New market cleanliness measure by market capitalisation quintile
Threshold % of anomalous accounts trading before an MPSA Quintile 1 Quintile 2 Quintile 3 Quintile 4 Quintile 5
0.1% 1.64% 0.00% 0.16% 0.00% 0.00%
1% 10.02% 10.51% 4.60% 3.45% 1.48%
2% 10.67% 11.00% 5.25% 4.11% 2.79%
3% 10.84% 11.49% 5.42% 4.43% 2.79%
4% 11.00% 11.66% 5.58% 4.60% 2.96%
5% 11.49% 12.15% 5.58% 4.76% 2.96%
6% 11.82% 12.15% 5.58% 4.76% 2.96%
7% 12.32% 12.15% 5.58% 4.76% 2.96%
8% 12.32% 12.15% 5.58% 4.76% 2.96%
>8% 12.97% 12.32% 5.58% 4.76% 2.96%
Note 1: The data in the columns labelled quintile 1, quintile 2, quintile 3, quintile 4 and quintile 5 shows cumulative MPSAs with anomalous trading below a certain threshold. This includes only MPSAs with some degree of anomalous trading.
Note 2: This the data contained in Figure 11.
Table 15: New market cleanliness measure by announcement type
Threshold % of anomalous accounts trading before an MPSA M&A Other Positive Negative Scheduled Unscheduled
0.1% 0.00% 1.81% 1.64% 0.16% 0.33% 1.48%
1% 0.82% 29.23% 11.00% 19.05% 6.40% 23.65%
2% 1.31% 32.51% 13.30% 20.53% 7.22% 26.60%
3% 1.31% 33.66% 14.29% 20.69% 7.39% 27.59%
4% 1.31% 34.48% 15.11% 20.69% 7.55% 28.24%
5% 1.31% 35.63% 16.09% 20.85% 7.55% 29.39%
6% 1.48% 35.80% 16.42% 20.85% 7.72% 29.56%
7% 1.48% 36.29% 16.91% 20.85% 7.88% 29.89%
8% 1.48% 36.29% 16.91% 20.85% 7.88% 29.89%
>8% 1.48% 37.11% 17.73% 20.85% 8.05% 30.54%
Note 1: The data in the columns labelled M&A, other, positive, negative, scheduled and unscheduled shows cumulative MPSAs with anomalous trading below a certain threshold. This includes only MPSAs with some degree of anomalous trading.
Note 2: This the data contained in Figure 12.
© Australian Securities and Investments Commission August 2016 Page 44
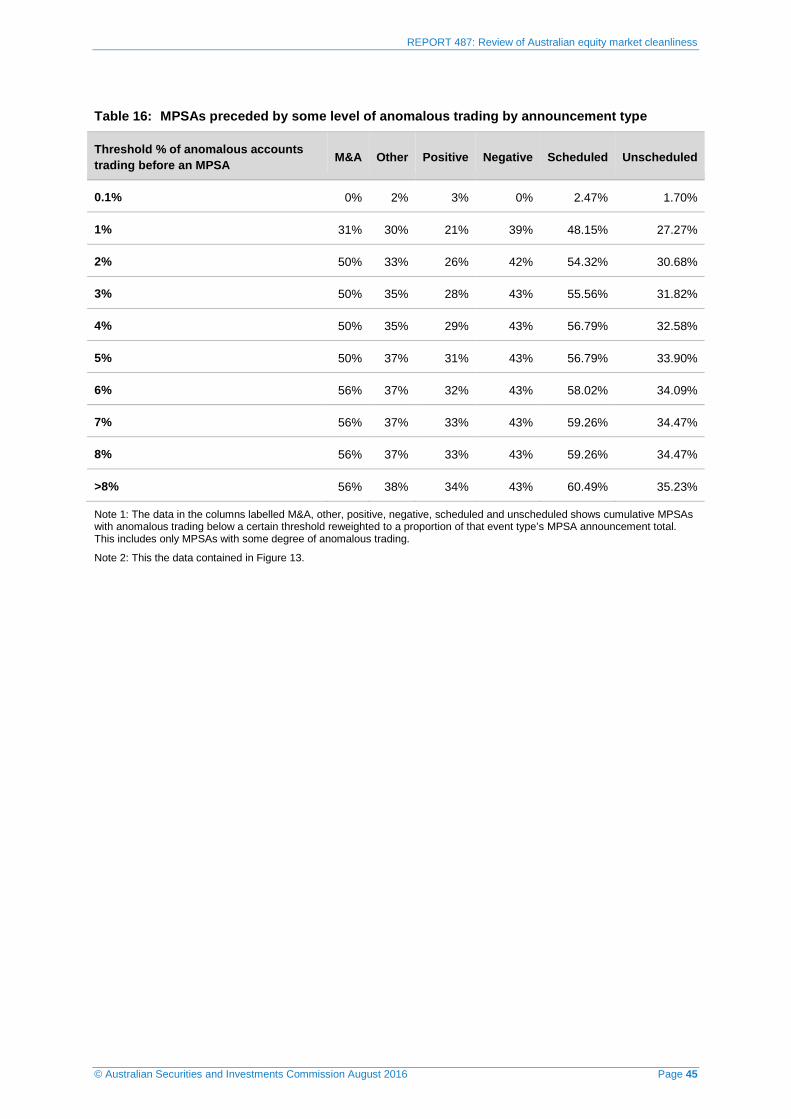
REPORT 487: Review of Australian equity market cleanliness
Table 16: MPSAs preceded by some level of anomalous trading by announcement type
Threshold % of anomalous accounts trading before an MPSA M&A Other Positive Negative Scheduled Unscheduled
0.1% 0% 2% 3% 0% 2.47% 1.70%
1% 31% 30% 21% 39% 48.15% 27.27%
2% 50% 33% 26% 42% 54.32% 30.68%
3% 50% 35% 28% 43% 55.56% 31.82%
4% 50% 35% 29% 43% 56.79% 32.58%
5% 50% 37% 31% 43% 56.79% 33.90%
6% 56% 37% 32% 43% 58.02% 34.09%
7% 56% 37% 33% 43% 59.26% 34.47%
8% 56% 37% 33% 43% 59.26% 34.47%
>8% 56% 38% 34% 43% 60.49% 35.23%
Note 1: The data in the columns labelled M&A, other, positive, negative, scheduled and unscheduled shows cumulative MPSAs with anomalous trading below a certain threshold reweighted to a proportion of that event type’s MPSA announcement total. This includes only MPSAs with some degree of anomalous trading.
Note 2: This the data contained in Figure 13.
© Australian Securities and Investments Commission August 2016 Page 45

REPORT 487: Review of Australian equity market cleanliness
Appendix 2: Summary of bootstrap methodology
117 We applied the bootstrap methodology in Table 17 to assess whether the CAR associated with a particular announcement was significant or not.
Table 17: Bootstrap methodology used to calculate the established market cleanliness measure
Step 1 For each announcement we took the data for daily security returns for the 240 trading days ending 10 days before that announcement.
We then calculated the abnormal return for each of the 240 days as the difference between the expected and actual return for each day.
Step 2 We looked at the significance of a CAR (–2 to +1 trading days to determine announcement materiality, and –5 to –1 trading days to determine APPMs) and drew (four one-day abnormal returns to determine announcement materiality and five one-day abnormal returns to determine APPMs) from the set of 240, at random, and summed them to calculate a bootstrap-simulated CAR.
Step 3 We repeated this exercise 10,000 times yielding 10,000 bootstrap-simulated CARs.
Step 4 We compared the actual CARs associated with the announcement with the 10,000 bootstrap-simulated CARs.
We deemed the actual CAR to be statistically significant at the 1% level if it was:
less than or equal to the 100th most negative MPSAs; or
greater than or equal to the 100th most positive MPSAs.
© Australian Securities and Investments Commission August 2016 Page 46

REPORT 487: Review of Australian equity market cleanliness
Appendix 3: Summary of the Intralinks report
118 Commissioned by Intralinks and conducted by the M&A Research Centre at Cass Business School, the Intralinks report examined more than 4,475 mergers and acquisitions from 2009–14 for evidence of information leakage about the deals before their public announcement.
Note: See also Philip Whitchelo, Globally, M&A deal leaks are at a six-year low, Intralinks, 20 November 2015.
119 The study found a general improvement in market cleanliness over the six-year sample period, with Australia having one of the lowest indicators of information leakage ahead of mergers and acquisitions compared to other international jurisdictions. Intralinks and Cass Business School have suggested the global improvement is due to stronger regulatory enforcement, tighter internal governance, and increased risks to a transaction when leaking a deal.
Table 18: Percentage of leaked deals in target primary listing countries
Target primary listing country 2009 2010 2011 2012 2013 2014 Avg.
Hong Kong 40.0% 26.7% 9.5% 7.1% 13.3% 22.2% 18.6%
India 20.0% 8.8% 16.7% 6.7% 23.8% 15.8% 15.2%
United Kingdom 15.3% 21.0% 8.3% 10.8% 26.3% 5.3% 14.1%
Germany 0.0% 18.2% 14.3% 12.5% 22.2% 0.0% 10.3%
South Korea 2.9% 12.0% 13.3% 16.2% 13.0% 2.9% 9.7%
United States 6.0% 5.4% 9.7% 3.1% 7.7% 8.0% 6.6%
France 7.1% 0.0% 2.9% 5.0% 12.0% 10.0% 6.2%
Canada 14.0% 2.6% 1.9% 4.8% 1.8% 7.7% 5.6%
Norway 0.0% 7.7% 30.0% 0.0% 0.0% 0.0% 5.6%
Japan 6.2% 8.0% 3.5% 3.0% 1.9% 0.0% 4.4%
Australia 3.8% 6.3% 2.0% 3.9% 0.0% 2.0% 3.5%
120 Globally, there appears to be a declining trend in leaked deals as a percentage of all deals over the past six years.
121 Geographically, deals in Europe, the Middle East and Africa showed the highest six-year average percentage of leaked deals, whereas North America showed the lowest.
© Australian Securities and Investments Commission August 2016 Page 47

REPORT 487: Review of Australian equity market cleanliness
122 The top two locations for leaked deals were Hong Kong (18.6%) and India (15.2%). Australia had the lowest average percentage of leaked deals over the period, at 3.5%, while the United States, at 6.6%, had the median percentage of leaked deals.
123 Over the period, the median takeover premium for targets in completed leaked deals was 51.2% compared to 29.2% for non-leaked deals, a difference of 22 percentage points. This may be because leaked deals have a higher tendency to attract rival bids. Leaking a deal also appears to increase the period between announcement and completion of the deal, and attract increased attention from the media and regulators.
© Australian Securities and Investments Commission August 2016 Page 48

REPORT 487: Review of Australian equity market cleanliness
Appendix 4: Unlucky traders
124 We explored the role that luck plays in accounts being deemed anomalous by examining the percentage of unlucky traders ahead of MPSAs.
125 Unlucky trader are traders that exhibit similar trading patterns ahead of MPSAs as suspicious and profitable traders, but who trade in the opposite direction. Figure 14 shows the cumulative distribution of unlucky traders: see Figure 5 for the cumulative distribution of anomalous traders.
126 Although ‘luck’ in financial markets may not be ‘symmetrical’ (i.e. the proportion of lucky and unlucky traders are not equivalent), the proportion of unlucky traders could provide a rough indication of the role that luck may play. We observed that unlucky traders represent a much smaller proportion of trading ahead of MPSAs than timely, profitable and anomalous traders (i.e. lucky and informed). However, it is worth noting that there is limited overlap between the MPSAs that contain abnormal trading in both the right and wrong directions.
Figure 14: Cumulative distribution of MPSAs by percentage level of unlucky trading
0%
2%
4%
6%
8%
10%
0.0% 0.5% 1.0% 1.5%
MPS
As
with
unl
ucky
trad
ing
acco
unts
Unlucky accounts trading before MPSAs
0%
2%
4%
6%
8%
10%
0% 20% 40%
MPS
As
with
unl
ucky
trad
ing
volu
me
Unlucky volume trading before MPSAs
© Australian Securities and Investments Commission August 2016 Page 49
REPORT 487: Review of Australian equity market cleanliness
Key terms
Term Meaning in this document
account (origin of order ID)
For each side (buy and/or sell) of the order or transaction where the participant acts as agent for a client, a unique notation, code or number used by the participant to identify the person on whose instructions the order is submitted or transaction was executed
adverse selection Process where undesired results occurs for one party of the transaction when buyers and sellers have access to different/imperfect information
APPM Abnormal pre-announcement price movement
ASIC Australian Securities and Investments Commission
ASIC Market Integrity Rules (Competition)
ASIC Market Integrity Rules (Competition in Exchange Markets) 2011—rules made by ASIC under s798G of the Corporations Act that are common to markets dealing in equity market products quoted on ASX
ASX ASX Limited or the exchange market operated by ASX Limited
bootstrapping The process of estimating properties of an estimator by measuring those properties when sampling from an approximating distribution. One standard choice for an approximating distribution is the empirical distribution function of the observed data
CAPM Capital asset pricing model
CAR Cumulative abnormal return
Corporations Act Corporations Act 2001, including regulations made for the purposes of that Act
cost of capital The rate of return required to persuade an investor to make a given investment, which is equivalent to the rate of return the company promises to generate in order to raise capital
established market cleanliness measure
Market cleanliness measure based on APPMs in the security ahead of MPSAs
FCA Financial Conduct Authority (UK)
financial market As defined in s767A of the Corporations Act, a facility through which offers to acquire or dispose of financial products are regularly made or accepted
FSA Financial Services Authority (UK)
© Australian Securities and Investments Commission August 2016 Page 50

REPORT 487: Review of Australian equity market cleanliness
Term Meaning in this document
GICS Global Industry Classification Standard, an industry taxonomy developed in 1999 by MSCI Inc. and Standard & Poor’s Financial Services LLC.
high-frequency trading
There is no internationally agreed, formal definition of high-frequency trading. For the purposes of this report, we have used the description provided by IOSCO: see paragraph 27 in Report 452 Review of high-frequency trading and dark liquidity (REP 452)
information asymmetry
A situation where one party in a transaction has more or superior information compared to another
Intralinks Intralinks Holdings, Inc.
Intralinks report Intralinks M&A Leaks Report, 2015
IOSCO International Organization of Securities Commissions
logistic regression Regression model where the dependent variable is binary (yes/no) or discretely categorical (win/draw/lose)
MAI ASIC’s Market Analytics and Intelligence surveillance system
market cleanliness Measure of market integrity based on the perceived indicators of insider trading and information leakage ahead of MPSAs
MPSA Material, price-sensitive announcements
new market cleanliness measure
Market cleanliness measure based on anomalous trading behaviour by accounts ahead of MPSAs
relevant period 1 November 2005 to 31 Oct 2015
SEC Securities and Exchange Commission (US)
stock-to-portfolio ratio The time-weighted proportion of the relevant security to the entire portfolio of securities accumulated by an entity during a period of time.
© Australian Securities and Investments Commission August 2016 Page 51