Embed Size (px)
Citation preview

Edmund G. Brown Jr. Governor
RESEARCH FINDINGS ON CONSUMER AND OFFICE ELECTRONICS
PIER
FIN
AL P
ROJE
CT R
EPOR
T
Prepared For: California Energy Commission Public Interest Energy Research Program
Prepared By: Ecos
April 2011 CEC-500-2011-028

Prepared By: Ecos Portland, OR Commission Contract No. 500-06-007
Prepared For:Public Interest Energy Research (PIER)
California Energy Commission
Bradley C. Meister, Ph.D., P.E.
Contract Manager Chris Scruton
Program Area Lead PIER Buildings Group Virginia Lew
Office Manager Energy Efficiency Research Office
Laurie ten Hope
Deputy Director ENERGY RESEARCH AND DEVELOPMENT DIVISION
Melissa Jones
Executive Director
DISCLAIMER
This report was prepared as the result of work sponsored by the California Energy Commission. It does not necessarily represent the views of the Energy Commission, its emplo yees or t he State of California. The Energy Commission, the State of California, its employees, contractors and subcontractors make no warrant, express or implied, and assume no legal liability for the information in this rep ort; nor does any party represent that the uses of t his information will not infringe upon privat ely owned rights. This re port has not been approved or disapproved by the California Energy Commission nor has the California Energy Commission passed upon the accuracy or adequacy of the information in this report.

Acknowledgements Multiple people from different organizations contributed to the success of this three‐year research project. Ecos Consulting served as the prime contractor to the Public Interest Energy Research Program for this project; EPRI was the major subcontractor providing technical expertise throughout the course of the project, and RLW Analytics, a key subcontractor, contributed their knowledge and expertise to the commercial field data collection portion of the project. In particular, the team would like to recognize the following individuals for their significant contributions to this research:
Chris Calwell, Ecos Consulting
Laura Moorefield, Ecos Consulting
Paul Bendt, Ecos Consulting
Catherine Mercier, Ecos Consulting
Craig Billingsley, Ecos Consulting
Peter May‐Ostendorp, Ecos Consulting
Suzanne Foster Porter, Ecos Consulting
Melanie Gillette, Ecos Consulting
Brooke Frazer, Ecos Consulting
Baskar Vairamohan, Electric Power Research Institute
Brian Fortenbery, Electric Power Research Institute
Tom Geist, Electric Power Research Institute
Anish Gaikwad, Electric Power Research Institute
Joel Silver, Imaging Sciences Foundation
John Stoops, RLW Analytics
Please cite this report as follows:
Moorefield, Laura and Chris Calwell. 2011. Research Findings on Consumer and Office Electronics. California Energy Commission, PIER Energy‐Related Environmental Research Program. CEC‐500‐2011‐028.
i

Preface
The California Energy Commission’s Public Interest Energy Research (PIER) Program supports public interest energy research and development that will help improve the quality of life in California by bringing environmentally safe, affordable, and reliable energy services and products to the marketplace.
The PIER Program conducts public interest research, development, and demonstration (RD&D) projects to benefit California.
The PIER Program strives to conduct the most promising public interest energy research by partnering with RD&D entities, including individuals, businesses, utilities, and public or private research institutions.
• PIER funding efforts are focused on the following RD&D program areas:
• Buildings End‐Use Energy Efficiency
• Energy Innovations Small Grants
• Energy‐Related Environmental Research
• Energy Systems Integration
• Environmentally Preferred Advanced Generation
• Industrial/Agricultural/Water End‐Use Energy Efficiency
• Renewable Energy Technologies
• Transportation
Research Findings on Consumer and Office Electronics is the final report for the Energy Saving in Electronics project (contract number 500‐06‐007), conducted by Ecos Consulting, Inc. The information from this project contributes to PIER’s Buildings End‐Use Energy Efficiency Program.
For more information about the PIER Program, please visit the Energy Commission’s website at www.energy.ca.gov/research/.
ii

Table of Contents
Executive Summary ........................................................................................................................... 1
1.0 Introduction .......................................................................................................................... 6
1.1. Background and Overview ........................................................................................... 6
1.2. Project Objectives ........................................................................................................... 8
1.3. Report Organization ...................................................................................................... 9
2.0 Project Approaches and Methods ..................................................................................... 9
2.1. Commercial Plug Loads ................................................................................................ 9
2.1.1. Field Research ............................................................................................................ 9
2.1.2. Grid Impacts .............................................................................................................. 11
2.1.3. Power Supply Census Update ................................................................................ 11
2.1.4. Medical Device Research ......................................................................................... 11
2.2. Televisions and Secondary Power Supplies ............................................................... 12
2.2.1. Televisions.................................................................................................................. 12
2.2.2. Secondary Power Supplies ...................................................................................... 12
2.3. Energy‐Efficient Computing ......................................................................................... 13
2.4. Stakeholder Outreach and Policy Priorities ............................................................... 13
3.0 Project Outcomes and Results ........................................................................................... 14
3.1. Commercial Plug Loads ................................................................................................ 14
3.1.1. Field Research ............................................................................................................ 14
3.1.2. Power Supply Census Update ................................................................................ 16
3.1.3. Medical Device Research ......................................................................................... 17
3.1.4. Grid Impacts .............................................................................................................. 18
3.2. Televisions ....................................................................................................................... 19
3.3. Secondary Power Supplies............................................................................................ 21
3.4. Energy‐Efficient Computing ......................................................................................... 23
3.5. Emerging Technologies ................................................................................................. 28
3.5.1. Smart Plug Strips....................................................................................................... 28
3.5.2. Power Over Ethernet ................................................................................................ 30
3.5.3. Displays ...................................................................................................................... 32
3.5.4. Home Audio .............................................................................................................. 33
3.5.5. Home Area Networks .............................................................................................. 34
3.6. Stakeholder Outreach and Policy Priorities ............................................................... 35
iii

4.0 Conclusions and Recommendations................................................................................. 37
4.1. Conclusions ..................................................................................................................... 37
4.2. Recommendations .......................................................................................................... 38
4.3. Benefits to California ..................................................................................................... 39
Reference List ...................................................................................................................................... 40
iv

List of Figures
Figure 1. U.S. commercial and residential annual electricity use projections ................................... 6
Figure 2. Californiaʹs office electricity consumption ............................................................................. 7
Figure 3. Policy pathways to address plug load efficiency .................................................................. 8
Figure 4. Office plug load categories with percentages of total energy use .................................... 14
Figure 5. Average hourly desktop computer energy use (weekday) ............................................... 15
Figure 6. Average hourly notebook computer energy use (weekday) ............................................. 16
Figure 7. Effect of screen settings and picture brightness on active mode power: 50” plasma HDTV ................................................................................................................................................. 20
Figure 8. On mode power consumption of HDTVs at various screen settings ............................... 21
Figure 9. Duty cycle and power demand by mode for typical ENERGY STAR desktop computer ............................................................................................................................................................ 24
Figure 10. Duty cycle and power demand by mode for ultimate efficiency desktop computer .. 25
Figure 11. Idle mode power reduction with efficient computer components ................................. 26
Figure 12. Annual energy consumption of high‐efficiency computer prototypes ......................... 27
Figure 13. Smart plug strip: BITS Limited #LCG3 load‐sensing smart strip ................................... 28
Figure 14. Monitor and television data compared to ENERGY STAR monitor specification ....... 33
Figure 15. Linear amp power loss (60 W) compared to Class‐D amp power loss (11.25 W) ........ 34
v

List of Tables
Table 1. Efficiency opportunities for medical power supplies .......................................................... 17
Table 2. Impacts of efficient component upgrades on desktop computers ..................................... 26
Table 3. Overview of evaluated smart plug strips and features ....................................................... 29
Table 4. EPS checklist for PoE ................................................................................................................ 31
vi

Abstract
This report summarizes the final results of research on consumer and office electronics efficiency conducted from 2006 through 2009 by Ecos Consulting, the Electric Power Research Institute, and RLW Analytics on behalf of the California Energy Commission’s Public Interest Energy Research Program. Key outcomes of this work were development of desktop computer prototypes that use up to 70 percent less energy than standard desktops; in‐store and laboratory power measurements from 120 new televisions; evaluation of a test procedure to measure energy consumption of secondary power supplies; an overview of power supplies used with medical devices; research into emerging consumer electronics technologies such as smart plug strips and home area networks; and collection and analysis of power, energy, and time‐of‐use data recorded from more than 400 office electronics in California offices. Findings showed that computers and monitors make up the largest share of office plug load electricity use; basic changes in desktop computer components can greatly reduce energy use cost‐effectively, particularly in active and idle modes; and power management is widely under used in California’s offices. In addition, the ever‐increasing penetration of electronic office plug loads reduces the effectiveness of conservation voltage reduction efforts that many utilities employ as an energy‐saving measure. Research on five emerging technologies highlighted new opportunities for energy savings in California.
Keywords: Plug loads, office electronics, consumer electronics, computers, field measurement, televisions, power supplies, emerging technologies, power over Ethernet, smart plug strips, home audio, home area networks, displays, monitors, conservation voltage reduction, medical power supplies
vii

viii

Executive Summary Background
Studies continue to show that plug load devices such as computers, monitors, and printers are the fastest growing segment of commercial and residential electricity consumption in the United States (Energy Information Administration (EIA) 2008). Plug loads now account for approximately 20 percent of electricity use in commercial offices; however, little was known about how and when these products were used in their everyday settings. Over the past several decades, energy efficiency programs, standards, and building codes have addressed lighting and heating, ventilation, and air conditioning (HVAC). Plug load energy use is not as well‐documented, and thus these devices are less often regulated by voluntary and mandatory efficiency standards.
Purpose
This research investigated the energy use and usage patterns of plug loads such as office electronics and televisions. Understanding the effects these products have on energy consumption and on grid congestion will enable the California Energy Commission and other stakeholders to identify high priority electronics products that require immediate focus for the most cost‐effective energy savings.
Research Objectives
• Through field metering in California offices, measure standby and active energy consumption and average duty cycles of the highest energy using plug loads within California’s commercial office sector.
• Quantify the grid effects of voltage reduction for various penetration levels of commercial electronic plug loads.
• Through updates to the 2003 ‐ 2005 Power Supply Census, quantify cost savings potential to California ratepayers from using high‐efficiency power supplies and electronic devices.
• Measure conversion losses, including secondary power supply conversion losses, for the three to five largest plug load end uses in California’s commercial sector.
• Investigate power supplies used in medical equipment and associated opportunities for energy savings.
• Document TV power demand by mode, and the energy effects of properly calibrated screen settings.
• Identify technically feasible improvements in secondary power supply efficiency and the associated cost/benefit analysis of implementing these high‐efficiency designs.
• Identify the desktop computer/desktop‐derived server subsystems that most heavily influence total computer energy use; quantify the implications of using the most efficient computer subsystems in desktop computers and desktop‐derived servers.
• Identify and prepare scoping studies on five emerging technology electronic devices.
1

Research Outcomes
• By time‐series metering plug load devices in 47 California offices, the research team found that plug loads consume up to 30 percent of commercial office electricity. Power demand by mode, duty cycles, and total energy use were recorded for more than 400 office plug load devices.
• Through computer modeling of collected plug load device data and lab testing of the effects of voltage reduction, the research team found that as the percentage of electronic plug loads increases, energy savings from conservation voltage reduction decrease.
• Power supply census findings suggested that California could save more than $1 billion annually from improvements to power supplies across all sectors. This energy savings would account for a reduction of more than 2.5 million (short) tons of carbon dioxide (CO2) equivalent.
• Power supply census findings also revealed that power supply conversion losses are greatest in the following five product categories: televisions, desktop computers, set top boxes, computer monitors, and electric forklifts.
• The research team documented nine varieties of power supplies used in medical equipment. Researchers estimated the potential for energy savings in each of the power supply types and outlined medical power supply design considerations.
• TV power measurements were documented for 120 current models. Screen brightness settings had a notable effect on overall TV energy use.
• Investigation into secondary power supplies showed that secondary power supply efficiency should be considered as part of whole‐product efficiency measures rather than in a stand‐alone prescriptive standard due to difficulties of testing secondary power supplies once incorporated into the end‐use product.
• Researchers demonstrated 40 percent to 70 percent energy use reductions in desktop computers from replacing computer subsystems that contribute most heavily to overall computer energy use.
• The team prepared an Emerging Technologies Report on the following topics: displays, power over Ethernet, smart plug strips, home audio transformers, and home automation. All represent opportunities ripe for energy savings and warrant further investigation by the Energy Commission and other interested stakeholders.
Conclusion
By documenting the significant contribution of electronic plug loads to overall commercial office electricity consumption, researchers provided further evidence to the Energy Commission that plug load energy consumption must be dramatically reduced if California intends to meet its goals of net‐zero energy commercial buildings by 2030. Energy savings from computers can be achieved through right‐sizing of components and use of internal power management settings. Energy use of other electronics will be most effectively reduced though continual efficiency improvements combined with internal power management settings and external control devices such as smart plug strips. Conservation voltage reduction becomes less effective
2

at reducing overall energy consumption as the penetration rate of electronic plug loads rises, particularly if those devices are not power factor corrected.
Recommendations
Efficiency improvements to consumer and office electronics will continue to slow California’s growing need for electricity, but efficiency improvements alone are not enough to turn absolute consumption downward. With the growing number of devices per person combined with the ever‐increasing capabilities of these devices, California should explore the potential of progressive efficiency specifications (increasingly stringent as product size or amenity level increases) for consumer electronics and appliances as well as automated control of device and home energy use. In addition, the research team recommends:
• Aggressive consumer education on the energy use of office electronics.
• Promotion of office electronics whose power management settings cannot be disabled.
• Promotion of highly efficient products and power supplies.
• Further investigation of the potential energy savings achievable by smart metering devices.
• Consideration of office electronics in California Code of Regulations, Title 20 – Public Utilities and Energy.
• Consideration of switched outlets in California Code of Regulations, Title 24 – Building Efficiency Standards.
Benefits to California
The short‐term, direct benefits to California are:
• Findings from the office plug load field metering enable policy makers and stakeholders to identify the top priority plug load products to target for efficiency standards and measures.
• Grid effects research provides information for utility efforts and future research design regarding the effect that the increasing number of plug‐in electronics has on conservation voltage reduction.
• California has new data on the cumulative energy consumption of its power supplies and can use these findings to continue efforts to require the most efficient power supplies available.
• Data on the effect of television screen settings can be used to improve future test procedures so that all TVs are compared fairly.
• Updated and redesigned, www.efficientproducts.org and www.efficientpowersupplies.org are useful consumer resources for information on product and power supply efficiency.
3

• Product procurement specifications posted to www.efficienctproducts.org enable purchasing agents and consumers to select the most efficient desktop computers, laptops, and monitors.
• Emerging technology scoping studies highlight opportunities for California to pursue energy savings through new technologies.
4

5

1.0 Introduction The research conducted under this contract was a follow‐on project to the authors’ 2005 – 2006 PIER funded research on consumer electronics. For the current project, the research team leveraged previous findings and research designs to investigate current energy use and savings opportunities from commercial office electronics, televisions, computers and secondary power supplies. In addition, the team conducted forward‐looking research into five emerging technologies that pertain to consumer electronics: power over Ethernet, displays, smart plug strips, home audio, and home area networks.
1.1. Background and Overview Consumer and office electronics, as well as other miscellaneous plug‐in devices, are now well‐documented as the fastest growing segment of residential and commercial electricity consumption. According to the Energy Information Administration’s 2008 Annual Energy Outlook report, the electricity use of all plug‐in devices is expected to almost double from 2006 to 2030. Only minor increases in energy use from hard‐wired lighting; heating, ventilating and air conditioning (HVAC); water heating and large appliances are expected due to existing, comprehensive efficiency standards for these end‐uses.
Figure 1. U.S. commercial and residential annual electricity use projections
Source: Ecos Consulting
Furthermore, the most recent California Commercial End Use Survey (CEUS) highlights office plug loads. According to this study, office equipment accounts for 18 percent of electricity in California’s small and large offices, making it the third‐largest end use behind HVAC and
6

lighting. The CEUS miscellaneous category includes other plug loads not specified elsewhere. Separately, this category accounts for 5 percent of small and large office electricity use (see Figure 2). Findings from these two important studies highlight the urgency of addressing energy‐reduction opportunities in office plug loads. As improvements continue to be made to HVAC and lighting efficiency through Title 24, office plug loads, if not addressed, will account for an even larger share of commercial electricity consumption.
Miscellaneous 5%
Water Heating, Refrigeration and
Cooking5%
Compressors, Motors and Process
4%
Office Equipment
18%
HVAC36%
Lighting32%
Figure 2. California's office electricity consumption Source: Itron 2006
Starting in the late 1990’s, the Lawrence Berkeley National Laboratory (LBNL) began conducting numerous research projects on the energy consumption of plug loads when devices are not in use and operate in standby or other low power modes. See http://standby.lbl.gov/docs.html for a list of their extensive research in this area.
Ecos and EPRI’s prior PIER‐funded research efforts to understand plug load energy use focused on residential plug loads and specifically the external ac‐dc power supplies and battery charger systems that many of these devices use. Because power supplies are found in the majority of today’s plug loads, and battery chargers in many, wholesale efficiency improvements to these components improves efficiency across many product types.
Today, power supply, battery charger, and standby power have been well‐researched; power supply mandatory standards are now largely complete and battery charger mandatory standards are underway. The current body research focused heavily on consumer and office electronics products that have internal power supplies and no battery charging systems. This
7

device group, indicated by an orange circle in Figure 3 below, includes televisions, set‐top boxes, computers, and monitors.
Figure 3. Policy pathways to address plug load efficiency
Source: Ecos Consulting
1.2. Project Objectives The 2006 – 2009 PIER Program research on consumer and office electronics had three key objectives:
1) Gather a comprehensive dataset in the field on power demand, energy use and time of use of office electronics
2) Assess the extent to which secondary power supplies (dc‐dc) affect the overall system efficiency in consumer and office electronics
3) Conduct in‐depth investigations of two consumer and office electronics products that were identified in previous research as having significant potential for energy savings: televisions (TVs) and desktop computers.
Other objectives were:
• Evaluate the grid impacts of the increasing numbers of electronic plug loads
• Examine the potential for energy savings measures targeted at power supplies used in medical equipment
8

• Update previous estimates of potential energy savings through improvements to both internal and external power supply efficiency.
• Investigate and conduct scoping studies on five emerging technologies that are likely to be of interest to California and the Energy Commission in the coming years
1.3. Report Organization Many detailed reports on separate investigations were delivered to the Energy Commission over the course of this three‐year project. This report summarizes the key research methodologies and findings from the entire body of work completed under contract #500‐06‐007. Section 2.0 outlines project approaches and methodologies. Section 3.0 summarizes project outcomes and results, and Section 4.0 presents conclusions and recommendations.
2.0 Project Approaches and Methods
2.1. Commercial Plug Loads The overarching goal of the commercial plug load research was to identify and to prioritize the electronic end uses in commercial buildings that represent the best opportunities for reducing energy consumption in California. To do so, researchers from Ecos Consulting and RLW Analytics first characterized the commercial office market by conducting an in‐depth field metering study. EPRI then utilized collected data to make estimates of grid impacts of electronic devices. Also included in this task was a scoping study of medical power supplies to determine if future research and efficiency efforts are warranted in this sector, and an update of the 2003 – 2005 Power Supply Census Spreadsheet that was developed under a previous PIER contract.
2.1.1. Field Research This project built on the methodology of the residential plug load field monitoring study conducted in 2006 by Ecos Consulting, RLW Analytics, and the Lawrence Berkeley National Laboratory (LBNL) on behalf of the California Energy Commission’s Public Interest Energy Research Program (PIER). (See Porter et al. 2006 for details.) The goal of the investigation was, through product inventories and metering, to identify and to prioritize the electronic end uses in commercial buildings that represent the best opportunities for reducing energy consumption. Therefore, we evaluated only electrically powered, 120 volt, plug‐in office products. The scope did not include hard‐wired lighting, large appliances (white goods), HVAC, or other hard‐wired loads such as GFCI outlets. A secondary goal of this research was to develop sound data collection and analysis methodologies for future plug load field measurement research in commercial settings. Our methodology consisted of five key steps:
1) Device Selection. Ecos Consulting developed a prioritization system to select how many and what types of devices to meter at each site. All devices were grouped into the following categories: computers, monitors, computer peripherals, imaging equipment, miscellaneous business equipment, telephony and audio/visual. The product categories were largely based on
9

the taxonomy developed by Nordman and Sanchez (2006) in Electronics Come of Age: A Taxonomy for Miscellaneous and Low Power Products.
2) Participant Selection. Due to costs associated with the extended travel needed for a statistically valid sample, researchers elected not to undertake a sample statistically mapped to California as a whole. Instead, they attempted to diversify the participant sample as much as possible so that the data represented the range of possible California plug load energy use profiles. The research design considered three variables that are likely to have the most significant impact on plug load energy use profiles:
• Geographic location. The sample includes both rural (Sonoma County) and urban (San Diego County) counties.1 Selecting these counties enabled researchers to collect data from Southern and Northern California as well as from different utility territories.
• Office type. The three offices types represented in the sample are 1) legal, accounting, and tax services; 2) architectural and engineering; and 3) computer systems design.
• Office size. Both small (up to nine employees) and large (10 or more employees) office sizes for each office type and county are included.
A total of 47 office participants, evenly distributed by the county, office type, and size variables outlined above were selected for site visits.
3) Recruitment. Researchers recruited offices to participate in the study by first sending out inquiry letters from the research team and the Energy Commission describing the study goals and options for participation, then following‐up via phone to determine if the business was eligible and willing to participate. Participants were offered a monetary incentive or a plug load energy usage report in exchange for their voluntary involvement in the study.
4) Data Collection. Data collection occurred in two phases. During Phase 1, researchers form Ecos Consulting and RLW Analytics conducted on‐site walk‐throughs of 22 office spaces to create an inventory of all plug load devices found in those spaces. Phase 2 visits occurred at 25 additional sites and consisted of the same kind of on‐site walk‐throughs as those of Phase 1. In addition, researchers installed individual plug load meters on a subset of the inventoried products in Phase 2 sites. Meters collected and stored data for a period of two weeks at one‐minute intervals.
5) Data Analysis. The five main goals for the data analysis were:
1. Site plug load characterization. Determine the number of and types of plug load devices at each of the 47 sites in the study.
2. Average power demand by mode. Determine the average power demand of each device type according to the mode of operation.
1. These counties also have different climates, but because plug load usage is likely to be independent of climate, this is not necessarily significant.
10

3. Duty cycles. Determine the percentage of time each device type spent in each of its operational modes during the two‐week metering period. Use these percentages to predict annual duty cycles.
4. Energy consumption. Determine total energy consumed in each mode for each device type during the two‐week metering period. Scale those findings up to predict the energy consumption by mode annually.
5. Time of use. Evaluate the real‐time energy consumption of selected metered devices.
2.1.2. Grid Impacts As a follow‐on inquiry to the office field research, EPRI utilized both raw and analyzed data from the field metering project to determine how the increasing penetration of office plug loads impacts electrical grid distribution systems, and if conservation voltage reduction (CVR) could be an effective strategy to reduce the energy consumed by office plug loads.
To answer these questions, researchers undertook the following steps:
• Conducted laboratory testing of devices that have the highest energy consumption among office plug loads. This testing provided information about steady state power consumption and the impact on the device of voltage reduction.
• Ran distribution feeder simulations for different percentages of office plug loads. From the simulations, the researchers were able to determine the impact of plug loads on annual energy consumption and annual peak load.
• Conducted CVR simulations for the different percentages of office plug loads to assess the impact of CVR.
2.1.3. Power Supply Census Update In 2003 ‐ 2005, under contract 500‐04‐030, Ecos Consulting developed a power supply census for the PIER Program. This spreadsheet documented the vast majority of devices that contain internal and external power supplies, and then, based on stock data and typical power supply efficiencies, presented calculations of California’s statewide potential for savings from efficiency improvements to power supplies. Under the current PIER contract, the research team updated the 2003 ‐ 2005 spreadsheet with new product categories, revised baseline and improved efficiency scenarios, and updated stock estimates for certain products to reflect recent changes in consumer electronics.
2.1.4. Medical Device Research The goal of this task was to make preliminary estimates of energy use and market transformation priorities for medical equipment. This study was meant to serve as the groundwork to inform a larger scale effort on medical devices in future PIER work.
11
The research team documented current hospital efficiency efforts underway, medical power supply types used in medical settings, medical power supply product specifications, and hospital energy densities. The team then assessed the potential efficiency improvements as well as barriers to design changes in medical equipment.
2.2. Televisions and Secondary Power Supplies This task’s goal was to complete the necessary technical investigations for TVs and secondary power supplies in order to facilitate appropriate policy and/or future research actions for both opportunities.
2.2.1. Televisions The Ecos Consulting and Imaging Science Foundation (ISF) research team conducted laboratory and in‐store metering on 120 TVs currently available to consumers. The team recorded make/model, retail price, technology type, screen size, resolution, rated inputs, factory default settings, standby power, active power, and power factor.
Then, informed by previous NRDC research conducted by Ecos in 2004 and 2005, the team conducted a sensitivity analysis to examine the relationship between a TV’s picture settings and its power consumption in the active mode of operation. ISF testers used a series of standard Institute of Radio Engineers (IRE) test patterns to assess the power consumption of the displays across a range of content with varying signal brightness. Each set was measured across a range of six test patterns and picture settings. The testers fed precisely controlled static images into the TVs and measured the resulting power consumption of the sets. Finally, using a laboratory‐grade colorimeter, the testers measured the luminance of the displays to assess how the set’s light output changed across different screen settings. In total, researchers evaluated 8 plasma TVs, 4 LCD TVS, and 2 DLP rear projection TVs.
To update PIER on recent developments in TV policy, the team compiled a summary report of current TV efficiency efforts including the Europeans’ EuP (energy using products) minimum standards and mandatory labeling program, Australia’s Mandatory Energy Performance Standards (MEPS) and mandatory labeling program, and the voluntary ENERGY STAR® program. Finally, the team supplied collected data and policy analyses to assist the Pacific Gas and Electric Company (PG&E) in the development of Title 20 standards recommendations.
2.2.2. Secondary Power Supplies The purpose of this project was to quantify the power conversion losses in secondary power supplies and to identify the most efficient designs, assess their cost‐effectiveness, and make recommendations to encourage industry adoption of better technologies and system designs.
Researchers targeted electronic products suspected to contain secondary power supplies (e.g. those products with a large number of microprocessor devices) that also have large overall energy consumption levels. The team then used manufacturer literature and laboratory testing to assess the efficiency of a variety of secondary power supplies. Based on laboratory testing, the research team identified opportunities for efficiency improvements in SPSs, conducted cost‐
12

benefit analyses of improvements, and evaluated the feasibility of a comprehensive secondary power supply test procedure
2.3. Energy-Efficient Computing This task’s goal was to showcase highly efficient computer technology by examining system efficiency and identifying where other sub‐system components can cost‐effectively improve energy efficiency.
Through laboratory testing, the research team identified the computer sub‐systems that most heavily influence total computer energy use. Components evaluated included central processing units, power supplies, secondary power supplies, video cards, and hard drives. Researchers then forged partnerships with industry to determine the cost and performance of various product options.
Using findings from the above steps, the team assembled and tested two prototype computer systems:
• Market‐ready. Contained cost‐effective components available readily available to consumers, and
• Ultimate efficiency. Demonstrated the efficiency possibilities of new technologies not yet widely available in the marketplace
Researchers documented the laboratory test procedures, components used, and results in a detailed white paper and a summary brochure. In addition, the computer prototypes were demonstrated at the 2008 Applied Power Electronics Conference (APEC), 2008 American Council for an Energy‐Efficient Economy and Consortium for Energy Efficiency (ACEEE) Market Transformation Conference, and the 2008 Emerging Technologies Coordinating Council (ETCC) Summit.
2.4. Stakeholder Outreach and Policy Priorities This task had two primary goals:
1) Synthesize the various energy efficiency efforts being developed worldwide to ensure that near‐term opportunities were promoted and brought to market through the support of procurement programs, California standards, international coordination, and utility program development, and
2) Identify future policy and research opportunities that will benefit California ratepayers.
In addition, the research team identified and investigated five emerging technologies that Commission and interested stakeholders can look to in the coming years for new efficiency research, as well as program and policy opportunities.
13

3.0 Project Outcomes and Results
3.1. Commercial Plug Loads 3.1.1. Field Research The research team visited 47 offices. Almost half of these had fewer than 10 full‐time employees; the rest ranged in size from 10 to 275 full‐time employees. Researchers inventoried a total of 6,943 plug load devices and recorded two‐week meter files from a subset of 430 of these devices. In addition, the team collected one year of electricity billing data from 21 offices as well as limited qualitative information on the purchasing and IT practices at each business.
On average, plug loads consumed about 30 percent of total office electricity in the sites that participated in the study. This was calculated by dividing the average annual plug load energy per square foot by the annual energy reported in the electricity billing data collected from the participating sites. Because researchers did not receive billing data from all of the surveyed businesses and were not able to get precise information on what building systems the utility bills covered, the annual energy reported in the billing data may not include heating, cooling, and/or lighting in some cases. Therefore, a 30 percent estimate for plug load energy use is likely to be somewhat high. However, the findings are similar to those reported in the most recent Commercial End Use Survey (CEUS) report, where researchers concluded that plug loads consume approximately 23 percent of total electricity usage for small and large offices (Itron 2006).
Computers and monitors accounted for the largest share (66 percent) of plug load energy use. Office electronics such as printers, faxes, multifunction devices, and computer speakers accounted for 17 percent of plug load energy use. Miscellaneous devices such as portable lighting, telephones, and coffee makers made up the remaining 17 percent. See Figure 4.
Miscellaneous, 17%
Office Electronics, 17% Computers and
Monitors, 66%
Figure 4. Office plug load categories with percentages of total energy use
Source: Ecos Consulting
14

One important finding was that much of this energy is consumed on nights and weekends, when no one is at work. Researchers created load profiles of device groups with the highest energy use. On average, desktop computers consumed significant amounts of energy throughout the night whereas the energy use by laptops dropped off to nearly zero at the end of the work day. This indicated that power management settings are not widely employed in desktop computers, whereas they may be more commonly used with laptops, or workers are typically taking laptops home over evenings.
0
5
10
15
20
25
30
35
40
45
50
55
60
12-1
am
1-2
am
2-3
am
3-4
am
4-5
am
5-6
am
6-7
am
7-8
am
8-9
am
9-1
0 a
m
10-1
1 a
m
11-1
2 a
m
12-1
pm
1-2
pm
2-3
pm
3-4
pm
4-5
pm
5-6
pm
6-7
pm
7-8
pm
8-9
pm
9-1
0 p
m
10-1
1 p
m
11-1
2 p
m
Wh
activeidle
sleepstandby
Figure 5. Average hourly desktop computer energy use (weekday) Source: Ecos Consulting
15

0
5
10
15
20
25
30
12-1
am
1-2
am
2-3
am
3-4
am
4-5
am
5-6
am
6-7
am
7-8
am
8-9
am
9-1
0 a
m
10-1
1 a
m
11-1
2 a
m
12-1
pm
1-2
pm
2-3
pm
3-4
pm
4-5
pm
5-6
pm
6-7
pm
7-8
pm
8-9
pm
9-1
0 p
m
10-1
1 p
m
11-1
2 p
m
Wh
activeidlesleepstandby
Figure 6. Average hourly notebook computer energy use (weekday) Source: Ecos Consulting
In total, researchers estimated that California’s office plug loads consume more than 3,000 GWh annually, costing business owners over $400 million each year. The associated carbon dioxide emissions of these plug loads is more than 770,000 tons (short) annually—equivalent to the carbon dioxide emissions of 140,000 cars during one year.
3.1.2. Power Supply Census Update Researchers updated the 2003 ‐ 2005 Power Supply Census spreadsheet (prepared under the previous PIER Program contract CEC 500‐04‐030) by adding in telecommunications data, updated stock and power supply efficiency estimates on multiple products including audio and video equipment, desktop and laptop computers, forklifts, and game consoles. In addition, the team added savings estimates for efficiency improvements to secondary power supplies for products for which data were available from the team’s secondary power supply research.
The five product types that could yield the greatest energy savings through power supply efficiency improvements were: televisions, set top boxes, desktop computers, monitors (LCD and CRT), and forklifts. Researchers estimated that, in California, power supplies in these five product types lose more than 5.5 billion kWh per year in the power conversion process alone. Researchers estimated that California could save more that 7 billion kWh per year from feasible efficiency improvements to power supplies in all electronic products. The annual value of these is approximately one billion dollars, or 2,500,000 (short) tons of carbon dioxide equivalent.
Because new product categories were added and market growth of existing power supply containing products were included, Ecos identified 30% more power supply containing
16

products in the 2008 Census than the 2005 Census. The total energy use associated with these power supply products increased from 2005 to 2008 by a slightly lower percentage (25%). Since 2005, external power supply efficiency has become subject to mandatory standards in the California, the U.S., Australia, and the EU, and various market based initiatives have targeted internal power supply products such as computers. As a result, overall average market efficiency of power supplies has improved since 2005, and the potential savings opportunity as a percentage of total power supply energy use has decreased from 18% in 2005 to 16% in 2008. The work that Energy Commission and others have done to improve power supply efficiency has greatly influenced the market, but there are still substantial opportunities that have yet to be realized to further reduce the energy use of power supplies.
3.1.3. Medical Device Research Many of the efficiency improvement opportunities identified for consumer electronics power supplies also exist for power supplies used with medical equipment. However, medical sector power supplies require additional safety and performance considerations. Through research conducted for the medical device scoping study, the team identified opportunities for medical power supply efficiency improvements that ranged from 1 – 94% depending on the type of power supply and its application. See table below.
Table 1. Efficiency opportunities for medical power supplies
Power Supply Technology Application Power
Demand Duty Cycle Efficiency Opportunity for improvement
Linear Portable equipment <200 W 90%, High <50% Change to switch-
mode
Switch-mode All <1,000 W 90%, High 65-90%
Up to 94%, large range of efficiency,
benefits from efficiency
improvement in non-med PS.
High voltage dc X-ray, CT <3,000 W,
2,000W average
5%, Low 60-70% 5-10%
RF power supply MRI <80 kW 50%, Medium 70-80% 5-10%
Pulsed power supply Lasers <2,000W 5%, Low 60-70% 5-10%
Thyristor-controlled heater
ESU, Ventilators, Therapeutic
<1,000 W +90%, High Approx. 90% 1-2%
DC servo/stepper drive
Beds, imaging systems, ventilators
<300 W Low to Medium 70-80% 5-10%
Battery Charger Infusion pumps,
defibulators, blood pressure monitor
<150 W Low 40-60% 40%
Source: Ecos Consulting
17

The largest opportunities for medical power supply energy use reductions are, in order of opportunity size:
• Change from inefficient linear power supplies to high efficiency switch‐mode supplies
• Change from linear battery chargers to switch‐mode battery chargers
• Right sizing of power supplies for the application
• Use of advanced components, topologies, and control methods in the design of both power supply and charger circuits.
Challenges of associated with efficiency opportunities in medical power supplies are:
• Long lead times for obtaining certification of FDA‐regulated medical devices might require more advance notice in efficiency standards.
• Lack of data on usage patterns makes it difficult to estimate overall energy use and savings opportunities.
• Concerns about electromagnetic emissions. For example, all applications, including those that use battery chargers, are candidates for switch‐mode power supplies. Some manufacturers have made the change. However, there is legacy product in the field and some manufacturers have not switched due to potential technical challenges; i.e. the presence of electromagnetic emissions from the switch‐mode power supply while trying to make a sensitive electrical measurement.
The research team made the following recommendations to PIER:
• The energy efficiency community lacks solid data about the prevalence, duty cycles, and measured power use by mode of various types of electronic medical equipment. PIER or groups of utilities should consider funding detailed measurements in medical facilities recognizing that such measurements could be intrusive and cause concerns in liability‐conscious hospitals.
• Laboratory testing of medical power supplies is also warranted to see what progress manufacturers have made with improving efficiency, even if they are exempted from mandatory standards
• It would also be worth seeking out a hospital that has devoted particular focus to whole‐facility energy use and enlist its help in making detailed plug load energy use estimates.
• If plug loads turn out to be a small fraction of whole‐facility energy use, further research may not be warranted.
3.1.4. Grid Impacts Findings of the team’s plug load grid impacts research revealed that an increase in prevalence of office plug loads on a distribution system could result in increase of annual energy consumed
18

by the distribution system2. This is due to the poor power factors common in many electronic plug loads as well as the duration for which these devices operate in active mode. For the modeled test feeder, the annual energy consumed increased from 39.17 GWh to 41.19 GWh as office plug load percentage was increased from 1% to 25% of the total feeder load.
Annual energy saved on a feeder due to conservation voltage reduction may be reduced as the penetration of office plug load is increased. The reason is that office plug loads are almost all electronic devices whose power supplies maintain a constant power regardless of changes in voltage. Utilities should be aware of the changing effectiveness of CVR as more and more end‐use devices become electronics.
The team’s conclusions, while intuitive, were based on a very limited study. More research is needed to quantify the impact of plug loads on the grid before extrapolating the results to the state of California. The approach developed in this work can be used for further work in this area. Some of the steps that can be taken are:
• More office sites should be monitored in all of California to come up with a sample size that is statistically valid to quantify the energy use and load profiles of plug loads.
• Note that the penetration of office plug load will be different on different feeders (depending on how much the office load is connected). Therefore the utilities can initially target only the feeders that have a high concentration of office loads. A few of these feeders should be monitored over a period of time to gain more insight into the overall feeder energy usage, typical load variability etc.
• Using utilities’ billing records and other survey information, an estimate of total energy consumed by the office plug loads and impact of CVR should be found out using the modeling approach described in this report.
3.2. Televisions Ecos and its subcontractor Imaging Science Foundation (ISF) prepared a TV Test Data Spreadsheet to support test procedure development as well as current and planned TV efficiency standards. The research team tested 120 popular TV models at various screen settings using the IEC 62087 Ed. 2 active mode test procedure and the IEC 62301 standby mode test procedure to provide comprehensive energy use information on current TVs. For each TV model measured, the team recorded make, model number, year of manufacture, manufacturer suggested retail price, display type, resolution, aspect ratio, and various dimensions. All TVs were measured at a given factory preset screen setting. Data from the spreadsheet were used to support PG&E’s Codes and Standards Enhancement Initiative for the California Title 20 rule‐making on televisions, as well as to design concept efficiency specifications that highlight best‐in‐class TVs.
2 Note that the total system load was kept constant. Percentage of plug loads was increased and percentage of non-plug load was correspondingly decreased to see the impact of plug loads penetration.
19

The sensitivity analysis of screen brightness compared to active, or on, mode power highlighted the importance of TV energy savings through proper calibration. The basic phenomenon observed in most measurements of TV brightness was a consistent drop in on mode power consumption due to changes in TV screen settings. Figure 7 illustrates the typical effect on an individual TV (a 50” plasma TV). Each curve in the chart represents a series of power measurements using various Institute of Radio Engineers (IRE) test patterns at a given screen setting. The test pattern used is shown on the x axis and the corresponding power consumption of the screen on the y axis. The signal brightness or average picture level of the test pattern increases from 7.5% at far left (effectively a black screen) to 100% at far right (a completely white screen). Note for each set of measurements that as the signal brightness of the test clip increases, so does the power consumption of the TV.
Figure 7. Effect of screen settings and picture brightness on active mode power: 50” plasma HDTV Source: Ecos Consulting
The power consumption (and luminance) of the TV also drops significantly with each screen setting modification. For the set shown, the low power factory preset yielded an average 7.8% savings over factory defaults; the professionally calibrated settings yielded a 16% savings. The effects naturally vary from model to model and from one TV technology to another. The power savings, for example, are more pronounced in plasma TVs than in LCDs. Figure 8 provides summary of measurements made on 13 different TVs representing 3 technologies. Each bar represents the average on mode power consumption at a given screen setting using the 100 IRE 18% window test pattern. The black dots indicate how large of a power savings, if any, was
20

generated by modifying the screen settings. We observed power savings as high as 21% in plasma TVs and as high as 12% in LCDs.
Figure 8. On mode power consumption of HDTVs at various screen settings Source: Ecos Consulting
3.3. Secondary Power Supplies The research team conducted extensive laboratory testing to identify the energy consumption and the savings opportunities for secondary (dc‐dc) power supplies. Researchers identified five high priority electronics products (HPEPs) to examine the ways that secondary power supplies were commonly implemented. These products were:
• Computers
• LCD computer monitors
• Televisions
• Printers
• Set‐top boxes
Using best available measurement data and knowledge of secondary power supply design, researchers evaluated the incremental cost and energy/environmental benefits of the following secondary power supply efficiency improvements:
• Copper loss
• Linear regulator
21

• Voltage Regulator Module
• Idle Losses
Up to 55% of energy lost through resistance of excess copper (known as copper loss) could be prevented at an increased bill of materials cost of $0.66. This translates into a 2.5 W dc power savings on the computer motherboard or an additional 3.2 W of ac power. A typical desktop computer might actually draw this level of peak current for one to two hours per day, resulting in an annual energy savings of 2 to 3 kWh. Although desktop computers spend significantly more time in Idle Mode, the current during this mode is too small to contribute to any significant copper losses. Server and workstation computers might spend a much larger portion of their overall duty cycle in this peak current state due to the higher utilization of their processors. For a server that is effectively utilized 100% of the time, the annual energy savings opportunity for thicker copper traces looks much more promising, on the order of 28 kWh per year. It must be pointed out this is an approximate calculation and more accurate projections can be made by the motherboard PCB manufacturers for their specific designs.
Motherboards contain several linear regulators ranging from 1 to 5 W. Most linear regulators are notoriously inefficient, with efficiencies in the 60% to 70% range. Linear regulators can be replaced by high efficiency synchronous buck converters called “switchers”. Efficiency figures for switchers often quoted by manufacturers in their datasheets typically exceed 95% and can result in significant power savings. While the linear regulator is a single‐chip component, a switcher circuit consists of several sub‐circuits: PWM controller/MOSFET, inductor, input, and output capacitors. The linears are fixed regulators and usually operate at their full load. As these linear regulators are always drawing a small amount of power, and since there are so many of them, the total power quickly adds up. Most electronic equipment has about 2 to 5 linear regulators consuming a total power of 3 to 10 W.
Because these linears are expected to be operating whenever a product is turned on, we can look toward products with a very large active mode duty cycle to find the largest energy savings opportunities. Set‐top boxes, for example, effectively run 24 hours per day as they are currently designed. Replacing the linear regulators in these products could yield about 26 kWh of energy savings. A family’s main TV can operate up to 8 hours per day in some households. Replacing the linear regulators in a TV could save up to 9 kWh per year per TV.
Desktop computers may spend 8 to 16 hours per day in Idle Mode depending on whether they are operated in a residential or commercial environment, according to energy savings estimates made by the U.S. EPA ENERGY STAR program. 3 This means that the seemingly small 2.4 W ac power savings would translate into 7 to 14 kWh of annual energy savings per computer. Reducing idle losses in secondary power supplies will prove a valuable design strategy for computer manufacturers wishing to meet Idle Mode and annual energy consumption targets.
3 Summary of Assumptions for EPA ENERGY STAR ® Savings Estimates: ENERGY STAR Preliminary Draft Computer Specification (version 4.0). May 3, 2005. Available at: http://www.energystar.gov/ia/partners/prod_development/revisions/downloads/computer/Assumptions_Prelim_Draft_Comp_Spec.pdf.
22

So much of the focus on energy savings opportunities in electronic products has been directed at ac‐dc power supplies, that this savings potential from more efficient dc‐dc conversion has largely gone unnoticed in the market transformation community.
This study began the development process for a standardized test method for measuring secondary power supply efficiency. A framework for a standardized SPS test method was developed with slight variations for different SPS implementations such as VRD/VRM and POL. A lack of easily accessible test points meant that the measurements made for this research project would be extremely difficult, but not impossible, to repeat on a larger scale and standardized basis. Measurement instrumentation will likely have to be specially adapted for the specific products in question, and destructive testing is likely to be unavoidable. However, the study showed that measurements of SPS efficiency are possible for certain key energy‐using product categories such as IT equipment and consumer electronics. It is highly recommended that industry groups pursuing secondary power supply measurements clearly define measurement instrumentation and methods for loading secondary power supplies to ensure repeatable results.
Results further demonstrated that definite opportunities currently exist to increase efficiency in SPS designs for key electronics and IT products. Even so, we do not recommend that policy makers and efficiency advocates push for prescriptive efficiency targets for secondary power supplies. The complications of standardized testing and in situ verification might complicate any attempts to prescriptively address efficiency in these products. However, efficiency measures identified in this research should be carefully considered when addressing whole product efficiency as the improvement of SPS efficiency can be a key strategy in reducing the overall electricity consumption and associated carbon footprint of various IT and consumer electronics products.
3.4. Energy-Efficient Computing For this project, researchers built prototype desktop computers that achieved energy savings of 40 percent to 70 percent using today’s most efficient available technology. Findings showed that the trade‐off between performance and efficiency is very small. Every computer tested in our study uses significantly less energy than typical desktops today and exceeded ENERGY STAR’s Category B desktop requirements by significant margins. Energy savings were largely achieved through drastic reductions in Idle Mode power consumption. A significant part of this research was industry outreach. The research team contacted leading computer processor manufacturers: Intel, AMD, and Via Technologies. These companies provided their most efficient desktop computer platforms. The computer systems were then assembled with other components — including power supplies, hard drives, memory, and CPUs — that were carefully selected to have comparable performance and higher efficiency compared to stock desktop parts. We conducted a battery of tests on these systems to determine the optimal configuration of components. Finally, we ran performance benchmark tests on the final system builds to ensure that the energy efficiency modifications did not adversely affect the performance of the systems while conducting standard office productivity tasks.
23
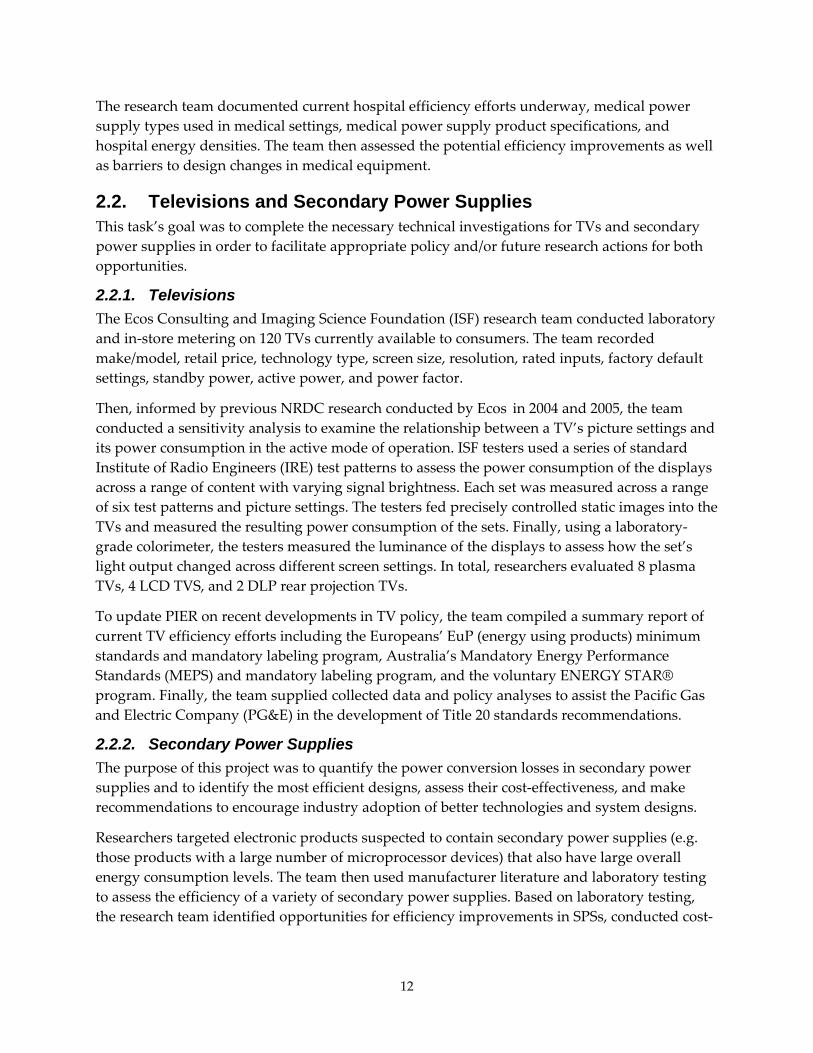
The graphs below illustrate a typical ENERGY STAR compliant desktop computer’s annual power demand by mode and the reduced power demand by mode for the most efficient computer prototype (referred to as the “ultimate efficiency” computer) that the research team built. Power consumption by mode is represented on the y axis. Hours of use per day by mode is shown on the x axis, based on a weighted average of observed commercial computer use (Roberson, Webber et al. 2004).
Figure 9. Duty cycle and power demand by mode for typical ENERGY STAR desktop computer Source: Ecos Consulting
24

Figure 10. Duty cycle and power demand by mode for ultimate efficiency desktop computer Source: Ecos Consulting Researchers found that today’s ENERGY STAR computers could consume 40% to 70% less power in Idle Mode by utilizing high efficiency platforms and components. Our base test platforms outfitted with stock components were already as much as 27% below the ENERGY STAR program’s Category B desktop Idle Mode power requirements. Idle power dropped further by 6 to 9W by building out platforms with right‐sized 80 PLUS power supplies, efficient case fans, and single memory modules. Idle power dropped by an additional 5 to 6 W after exchanging conventional hard drives for similarly sized hybrid hard drives. On average idle power consumption dropped an additional 25% to 36% simply by outfitting computers with improved components, as illustrated in Figure 11 and Table 2.
25

Figure 11. Idle mode power reduction with efficient computer components Source: Ecos Consulting
Table 2. Impacts of efficient component upgrades on desktop computers
Component Improvement
Idle Power Saved (W ac)
Percent Idle Power Saved
Total Annual Energy Savings
(kWh)
Percent Energy Saved
Power Supply 3‐4 6% ‐ 9% 18 ‐24 6% ‐ 10%
Hard Drive 5‐6 10% ‐ 14% 31 ‐ 37 10% ‐ 15%
Physical Memory 1‐2 3% ‐ 5% 6 ‐ 12 2% ‐ 5%
Case Fan 2‐3 6% ‐ 8% 12 ‐ 18 4% ‐ 8%
TOTAL 11‐15 25% ‐ 36% 67 ‐ 91 22% ‐ 38%
Source: Ecos Consulting
Using a series of measurements of power consumption in all modes of operation coupled with assumptions about usage patterns for commercial computers (Roberson, Webber et al. 2004; ENERGY STAR 2005), the project team developed standard annual energy use estimates for every system measured, illustrated in Figure 12.
26

Figure 12. Annual energy consumption of high-efficiency computer prototypes Source: Ecos Consulting
Based on energy efficiency and benchmarked system performance, the Intel® 3 Series Chipset, 2.2 GHz model was selected as our “market ready” prototype, with an estimated retail cost of system hardware at $374. The Intel Biscayne Bay reference platform, 2.2 GHz, was selected as our “ultimate efficiency” model. Because the reference platform used in this prototype was not commercially available at the time of the research, the retail cost of this system is unknown. Researchers estimated a retail cost of >$500.
These dramatic energy savings have of course only been realized in a small number of computer systems sitting on a lab bench; however, this research has demonstrated that the technology exists today for large organizations to cost‐effectively save over 40 percent of their computer operational costs, even if they already exclusively purchase ENERGY STAR qualified desktops. The challenge in realizing this is ensuring that savvy procurers demand this technology. Corporations and other large IT equipment procurers could save tens of thousands of dollars per year on operational costs and exceed ENERGY STAR and Climate Savers Computing Initiative targets by requesting desktop platforms and components like these. If anything, the time that has transpired since this research project was completed has served to validate the assumptions that very low idle power levels can be achieved in today’s desktop computers affordably. Apple’s Mac Mini desktops now offer a fairly similar level of performance to our prototype systems at an idle power level of only 13 watts and a purchase price of $600 to $800, depending on configuration. The market has made dramatic advances in the time since we completed our research, in part because this project demonstrated what was possible with commercially available components.
27

3.5. Emerging Technologies The team conducted laboratory testing and literature reviews on five emerging technologies to enable the Energy Commission to anticipate new opportunities for programs and policies. The research resulted in five emerging technology scoping studies that made up individual chapters in the Assessment of Emerging Technologies report. Two of the investigated technologies, power over Ethernet (PoE) and displays (the merging of TV and monitor technology) were specified in the project’s scope of work. The remaining three topics were left unspecified so that the team could select technologies that were ripe for investigation during the course of the three‐year contract period. In consultation with the PIER Program contract manager as well as the project advisory committee (PAC) members, the research team selected smart plug strips, home audio, and home area networks.
3.5.1. Smart Plug Strips Smart plug strips are based on typical plug strip designs, but also incorporate additional technologies to automatically disconnect power to certain equipment when not in use. Most smart plugs strip have one “master” control outlet, four to six controlled outlets that will automatically power down designated devices when the control load is turned off by the user, and one or two uncontrolled outlets that are always on. See Figure 13.
For example, if a TV is plugged into the control outlet and a VCR, DVD, and stereo receiver are plugged into control outlets, the VCR, DVD, and stereo receiver will receive no power when the TV is switched off. In this way, smart plug strips can eliminate standby or inactive power from devices that are not in use. The team’s work on smart plug strips was very timely because many utilities are beginning to investigate this product for its potential to save energy in homes and offices.
Six controlled outlets
Hard switch
One control outlet Three
uncontrolled outlets
Figure 13. Smart plug strip: BITS Limited #LCG3 load-sensing smart strip Source: Ecos Consulting
Researchers began by reviewing existing literature and conducting market research. In mid‐2008, the team purchased commercially available smart plug strips samples for evaluation. Researchers then conducted laboratory testing to determine if the purchased smart plug strips performed as advertised, and how much, if any, power demand they added to the plugged‐in loads in active as well as standby modes. Finally, the team conducted two brief field studies with selected smart plug strips and generalized these results to “typical” users by using product
28

duty cycles recorded in 2006 and 2008 PIER residential and commercial field monitoring studies. (See Porter, et al. 2006 and Moorefield, et al. 2008.)
Table 3 provides an overview of the smart plug strip models we evaluated and their features.
Table 3. Overview of evaluated smart plug strips and features
Product name Manufacturer Technology
# of control outlets
# of controlled
outlets
# of uncontrolled
outlets
Surge protection
Power or time
threshold
Max load (W)
Price Availability
Isole IDP-3050
The Watt Stopper Inc.
Passive infrared
occupancy sensor
6 2 Yes Adjustable 30 sec. - 30 min.
1600 $85-95
Available
Smart Strip SCG5
BITS Limited Load sensor 1 4 2 Yes Adjustable 28 - 300 W
1800 $30-43
Available
Smart Strip LCG2
BITS Limited
Load sensor
fax/modem and coaxial
surge protection
1 6 3 Yes Adjustable 28 - 300 W
1800 $31-35
Available
Smart surge
protection Power Sentry Load sensor 1 4 1 Yes
Not adjustable
5 W
$20-25
Available
Plug Miser
U.S.A Technologies
Passive infrared
occupancy sensor 1 modem
1 No Adjustable 3 sec. – 3
hrs 1230
$79-84
Available
USB Ecostrip Beamingsun
USB
1 5 Yes
Not adjustable
1250
$35-40
Out of stock
APC Battery Backup
ES Series BE750G
APC
Load sensor, cable
modem/video and data line protection.
70 minutes of battery backup
1 3 5 Yes Not
adjustable 450
$85-98
Available
APC Surge
Protector P7GT
APC
Load sensor 1 3 3 Yes
Not adjustable
19 W
$21-35
Available
Kill-A-Watt
P3 international
Monitors power,
voltage, line frequency, and power factor
8 Yes N/A 1980 $90-100
Available
Conserve Belkin Wireless
remote-control 2 6 Yes N/A
$34-55
Available
Source: Ecos Consulting After testing the above smart plug strips in the lab, researchers found that the smart plug strips in our data set performed as designed and advertised. Most models drew a small amount of power—between 0 and 1.8 watts—on their own. The UPS drew just over 3 watts of power to maintain the charge of its battery. None of the plug strips had an effect on the power factor. Energy savings from smart plug strips should, in most cases, exceed the energy they consume.
29

Through field metering, researchers observed notable energy savings as well as product limitations. The team first metered the baseline energy use of both a home entertainment center and home office with Watts UP Pro ES field meters. Then, researchers connected the home entertainment equipment to a load‐sensing smart plug strip and the home office equipment to a USB smart plug strip. Meters were installed between the smart plug strips and the wall outlets to record any changes in energy use caused by the smart plug strips.
During the metering period, smart plug strip reduced the home entertainment energy use by nearly 30% and the home office energy use by just over 10%. Researchers observed that savings from smart plug strips are highly dependent on the users as well as the selection of devices installed on the smart plug strip. In addition, researchers noted that the individual smart plug strips used in field testing were not flexible enough to meet the needs of both the home office and the home entertainment center. For example, when the user of the home office powered down the computer (control device), the modem and wireless router were also powered down. However, the user often worked on a laptop from another room when the desktop was powered down and needed wireless access to the internet. Similarly, the user of the home entertainment center relied on the set‐top box to record TV shows during hours when the rest of the center could be powered down. Installation of programmable timers on devices that required different hours of operation was an effective solution; however, we did not find a product on the market that incorporated both load/USB signal sensing for some outlets as well as a programmable timers for other outlets.
When researchers modeled expected energy savings using typical product power levels and duty cycles, findings showed potential savings of between 80 and 115 kWh per year in a home entertainment center, and approximately 40 kWh per year in a standard home office. This study produced some of the first product testing results and savings estimates for smart plug strips. It is important to note that savings can vary greatly depending on the numbers and types of devices plugged into smart plug strips. Outcomes of this preliminary research can form the basis for future, comprehensive field monitoring efforts to document the user experience and energy savings potential of smart plug strips.
3.5.2. Power Over Ethernet The power over Ethernet research occurred in 2007, and the purpose of the investigation was to explore the potential for this technology to replace certain external ac‐dc power supplies. The team conducted technical literature reviews on the technology, assessed the market potential, and made recommendations for future applications of this technology.
What makes PoE possible is that within the standard Ethernet cable (CAT5e) there are four twisted‐pairs (8 total wires). For common communication protocols such as 10Base‐T and 100Base‐TX, only two pairs of twisted‐wire are used for data transmission leaving two twisted‐pairs free for use as conductors for low‐voltage DC power. Researchers reported that, accounting for loss due to the Ethernet cable, the overall transmission efficiency of PoE is about 65‐70%. However, there is opportunity for improvement. One possible area is the end‐use device’s dc‐dc converters. Previous work on switch mode power supplies has shown that the efficiency of this circuit can reach 95% by using existing technology and converter designs. In
30
some areas this is already happening, for example, new PoE controllers from TI and National Semiconductors (LM5070) allow implementation of dc‐dc converter with efficiencies up to 90%. A 90% efficient end‐use device would increase the overall efficiency to 77%.
Researchers also reported that the following devices adhere to the PoE standards (IEEE Std 802.3af) and are appropriate for use with PoE technology:
• VoIP Phones
• Security cameras
• Wireless Access Points
• Lighting control
• Industrial Automation
• Home Automation
• Security Access Control and Monitoring Systems
• Point of Sale Terminals
• Lighting Control
• Gaming and Entertainment
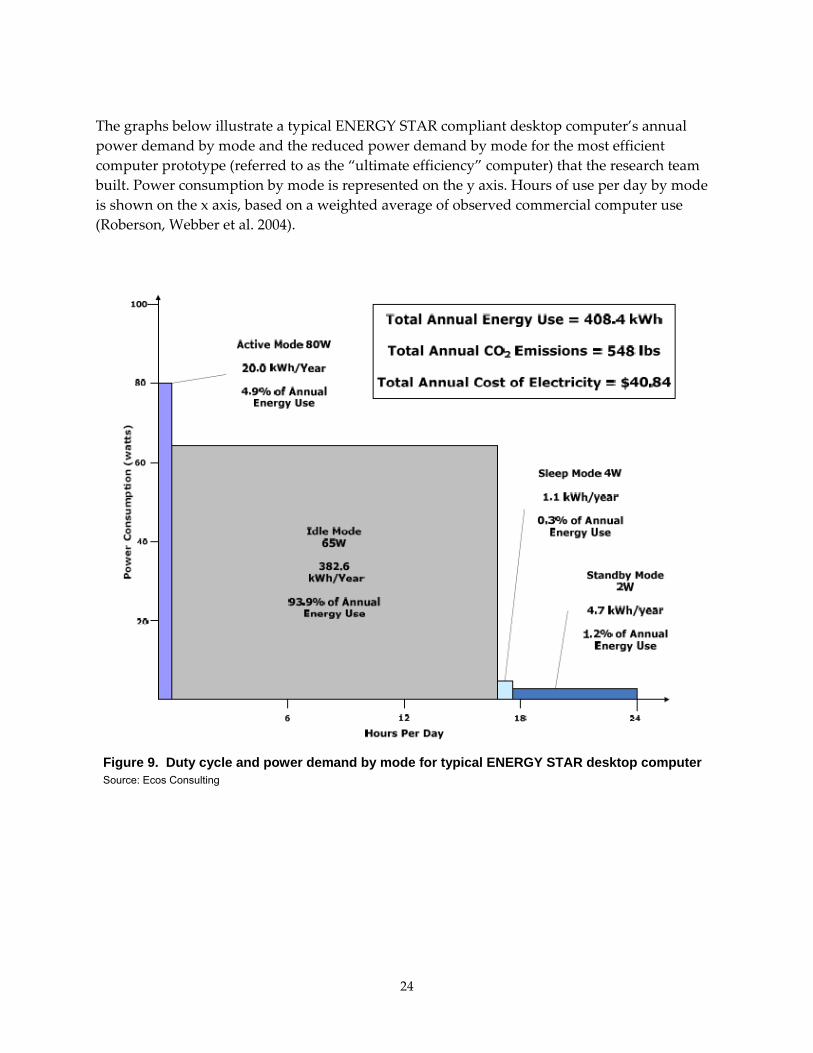
The team then evaluated the applicability of PoE to serve as external power supplies. The criterion for evaluation was simply that it should be possible to measure the efficiency of the PoE device using the existing EPS test protocol and test bench without modification. This seems a logical extension of the definition given that if the device is classified as an external power supply the next question is how to test it. The devices that comprise the market of PoE devices vary in features. For example, some accept AC voltage while some accept DC. Some are designed for a single port, while others serve multiple ports. Some have surge suppression, while others have reverse polarity protection. The various features may or may not be important in order to define a PoE device as an external power supply. Given this, a check list was created against which the various PoE devices can be examined (see Table 4). The table has three main columns headings: Feature, Variation and External Power Supply Classification. If the PoE device of interest has the listed feature and variation, an “X” is placed in the box under the Yes or No sub‐column of the External Power Supply Classification heading.
Table 4. EPS checklist for PoE
Feature Variation EPS Classification Yes No
Input Voltage AC X
DC X
Port Single X
Multi X
Injection Type Direct (Passive) X
Powerline Carrier (Common on Tbase1000) X
Housing Stand-alone X
Integrated with Switch (or other power consuming X
31

circuitry)
Output Connector
RJ45 X
Splitter X
Both X
Protection Surge X
Reverse Polarity X Source: Ecos Consulting
It is of interest to note that only three feature variations will exclude a PoE from the designation of external power supply. They are: DC input voltage, non‐direct injection of voltage, and housing with other power consuming circuitry such as within an Ethernet switcher. Application of the check list against a sample of products available within the market indicated that some PoE devices could be considered external power supplies, while others are not. What is not clear, and were more research is needed, is what percentage of devices within the PoE market meet the criteria of external power supply.
3.5.3. Displays
Research on displays focused on the feasibility of testing and regulating TVs and monitors under unified requirements. Traditionally, these two device types have been evaluated and regulated as separate, stand‐alone categories. Different manufacturers produced them, pricing for televisions and monitors differed widely for products of similar size, and resolutions were typically higher in monitors than televisions. However, now that high‐resolution flat panel technology is beginning to dominate both product types, it is increasingly possible to group these products together into a single category known as “displays.”
For this topic, Ecos Consulting researched monitor and TV technologies, functionalities, industry trends, and market data. The team also reviewed current TV and monitor test procedures and efficiency specifications. The ENERGY STAR Program Requirements for Displays (version 5.0) document is the first widely‐adopted efficiency specification to include both displays used mainly for computer use and displays that include tuners and are marketed as “dual function display and television” (ENERGY STAR 2009). This new specification focuses on the universal nature of displays and proposes a test procedure that can be applied to both types of displays listed above. Although ENERGY STAR is moving towards a more comprehensive specification, the requirements do not yet include a minimum luminance for qualifying products. Figure 14 illustrates how monitor and TV active mode power could be compared once a universal test procedure is established. Note that this graph does not fairly reflect the difference in monitor and TV test procedures, including the video content and brightness settings.
32

0
20
40
60
80
100
120
140
160
180
200
0 50 100 150 200 250 300 350 400 450 500
Screen Area (in2)
Pow
er (W
)ENERGY STAR Monitor Spec
LCD Monitors
CRT Monitors
TVs
Figure 14. Monitor and television data compared to ENERGY STAR monitor specification Source: Ecos Consulting
3.5.4. Home Audio The research team investigated the energy savings opportunities in the rapidly changing landscape of home audio equipment. Beyond the low power mode consumption already being addressed by ENERGY STAR and Title 20 standards, the amplification of audio signals is the primary energy‐consuming function. The majority of audio amplifiers continue to rely on analog power amplification techniques. These amplifiers are structured and designed to accurately reproduce audio programming with little regard to power consumption. Efficiencies of analog audio power amplifiers often fall below 50 percent, due to the nature of linear amplifier and their low‐efficiency linear power supplies. Linear power supplies have been preferred due to their inherent low‐noise capabilities and simple design. However, the linear amplifiers dissipate most of the power in the form of heat, which is why linear amplifiers have large heat sinks attached to them to transfer heat from the device.
Over the past few years, two technologies have matured that set the stage to allow the design of very efficient home audio products. The first innovation, which has been around for more than a decade, is the switching power supply. Switch‐mode power supplies have now achieved wide market penetration in most other consumer product areas, allowing for designs that can achieve efficiencies in the 90 percent to 95 percent range. The second technology, which was first found in automotive audio amplifier design, is the Class D amplifier. Class D audio amplifiers are to analog amplifiers what a switch‐mode power supply is to a linear power supply. Efficiencies of
33

90‐95% are possible. See Figure 15 for comparison of heat dissipation between linear and Class D amplifiers.
80W Input
40W to Amp
40W to Heat
20W to Speaker
20W to Heat
Power Supply
Audio Amplifier
Linear Power Supply/Linear Amp
31.25W Input
25W to Amp
6.25W to Heat
20W to Speaker
5W to Heat
Power Supply
Audio Amplifier
Switch Power Supply/Class-D Amp
Figure 15. Linear amp power loss (60 W) compared to Class-D amp power loss (11.25 W) Source: Ecos Consulting
Given that highly efficient power supply designs are now readily available and that Class D audio amplification, which previously required complex discrete designs, is now easily implemented based on integrated circuit designs, there is great potential to reduce waste power in home audio products. The reduction of waste power can be used to offset the cost increases incurred in the more complex design by reducing materials cost for circuit boards, heat sinks, fans (in some cases) and packaging. In addition, the reduction of waste power allows for more compact product designs.
Researchers estimated that a Class D amplifier could save about 40 to 50 watts in active mode compared to its Class AB counterpart. With millions of home audio equipment proliferated in the country the energy savings could be in the order of several thousand kWh. Assuming that all of today’s home audio equipment uses linear amplifiers, the U.S could realize energy savings of about 1,200 MWh through the use of Class D amplifiers. This savings does not include the installed capacity of the home audio equipment in the country, or the savings potential from reduced standby power consumption. More research is warranted to determine how efficiency and overall power consumption vary with the degree of amplification, and to learn the actual duty cycles of audio equipment for purposes of improving estimates of energy use and savings potential.
3.5.5. Home Area Networks A Home Area Network (HAN) consists of networks of appliances/devices that help consumers monitor the energy use of the appliances/devices in their homes. Typically, HANs include a
34

display screen mounted inside the home that receives information on energy use from the home’s lighting, appliances, HVAC system, and other outlets.
HANs also allow the automation of the control of electronic devices and electrical appliances in the home for greater comfort, convenience, security, and energy conservation. A HAN can be created between an Energy Management System (EMS) and the end use appliances using a mutually accepted automation and control communication protocol. With the development of this technology, utilities and policy‐makers have become interested in the potential energy savings and consumer acceptance of such “smart” metering systems.
For this report, researchers provided an overview of the home area network (HAN) products and communication protocols available today. The team also reported laboratory test results from several models evaluated at EPRI’s Living Laboratory in Knoxville, Tenn. A literature review of previous studies showed that in residential settings, savings from home area networks could range of 0% to 20%. Energy savings attributed to home area networks are somewhat difficult to predict because they are dependent on user behavior.
3.6. Stakeholder Outreach and Policy Priorities During this contract, Ecos Consulting and EPRI engaged with multiple stakeholders to disseminate findings from PIER research and to collaborate on state, federal and international efficiency efforts.
• November 2007: Chris Calwell (Ecos Consulting) met with staff and consultants at Australian Greenhouse Office in Canberra. The purpose of this trip was to share information about developments in California, the U.S. government, and Australia regarding external power supplies, battery charging systems, televisions, set top boxes, computers, servers, and general service lighting.
• February 2007: Suzanne Foster Porter, Ecos Consulting, presented PIER research finding at ACI (Affordable Comfort) NW 2007.
• February 2007, 2008, 2009: Researchers from Ecos Consulting and EPRI attended the Applied Power Electronics Conference and Exposition in 2007, 2008, and 2009. At the 2008 conference, both Ecos and EPRI presented PIER research findings.
• December 2007: Chris Calwell presented consumer electronics efficiency findings from PIER research to a CPUC‐convened strategic planning group of California utilities in Sacramento. Many of these proposals were incorporated into the group’s final report to the CPUC and subsequent three‐year program filings.4
• March 2008: Chris Calwell and Peter May‐Ostendorp, Ecos Consulting, attended ACEEE’s 2008 National Symposium on Market Transformation conference in
4 See http://www.californiaenergyefficiency.com/docs/EEStrategicPlan.pdf, pages 21-22.
35

Washington, DC, where they demonstrated the performance of the Market Ready and Ultimate Efficiency computer prototypes.
• August 2008: Chris Calwell presented many of the PIER research findings to the senior management of Maxim Integrated Products – a major semiconductor manufacturer.
• October 2008: Chris Calwell, Laura Moorefield, and Jonathan Livingston, Ecos Consulting, displayed numerous efficient consumer electronics and gave presentations on recent PIER consumer electronics research at the Emerging Technologies Summit 2008 in San Diego, CA (Emerging Technologies Coordinating Council).
• November 2008: Chris Calwell presented key PIER electronics findings at Global Product Efficiency 2008, an international efficiency dialogue held in Brussels, Belgium.
• April 2009: Laura Moorefield, Ecos Consulting, presented PIER research findings on consumer electronics to workshop attendees at the California Center for Sustainable Energy in San Diego, CA.
36

4.0 Conclusions and Recommendations
4.1. Conclusions Through literature reviews, collaborations with manufacturers, laboratory testing, and field metering, the research team generated a broad body of work on many end‐uses. Despite the number of topics addressed, conclusions emerged that are consistent with many of the philosophies of efficiency developed by Ecos under previous PIER funding:
• Convert power efficiently
Research on the potential for PoE to replace external power supplies in selected applications highlighted the potential for a centralized power source to deliver required low‐voltage dc to electronic end‐uses. Efficiency improvements to only one source (PoE network) may be easier to achieve than efficiency improvements to multiple power supplies. The secondary power supply research revealed a significant potential to improve dc‐dc power conversion efficiencies on computer motherboards and in other electronic products, even if the test procedure challenges for doing so are daunting.
The power supply census updates revealed the significant energy, cost and carbon savings potential from continued improvements to both internal and external power supply efficiency.
• Match power consumption to service provided (HAN, SPS, home audio)
This is an elegant design practice that is often overlooked in the development of consumer and office electronics. Devices should use appropriate amounts of energy to perform their functions and no more. For example, computers and printers should not consume energy overnight when delivering no functional service, even if their energy consumption might be significant in offices occupied only during the day. Set top box duty cycles should reveal a wide range of power demands to reflect when they are recording shows, playing back recordings, or doing nothing. Instead, many of these devices have a constant power draw, even when they are not in use. Game consoles, similarly, can draw similarly large amounts of power whether playing a graphics‐intensive game, simply displaying a menu screen, idling, or playing a DVD, even though dedicated DVD players can draw far less power to play the same movie. Power use does not scale appropriately with the level of service being provided. Two emerging technologies researched under this contract, smart plug strips and home area networks, present valuable opportunities to limit energy use to times when devices are performing their intended functions. Broader inclusion and utilization of devices’ internal power management settings would also yield notable energy savings.
• Communicate operating state to users and networks
The newer video connection technologies (DVI/HDMI and USB) allow two‐way data transfer. This enables devices to communicate to and receive information from connected devices. An early application of this technology is a TV that sends a signal to connected entertainment peripherals when it is turned off. Connected devices, such as DVD players and speakers, can
37

then power down as well since they will not be used until the TV is turned on again. Computers can perform similar function via USB cables. The potential for device group power management and other “smart” controls should be aggressively investigated.
4.2. Recommendations Efficiency improvements to consumer and office electronics will continue to curb California’s growing need for electricity, but efficiency improvements alone are not enough. With the growing number of devices per person and the ever‐increasing capabilities of these devices, California should explore the potential of progressive efficiency specifications for consumer electronics and appliances. Such specifications increase allowable power consumption with product size or functionality up to a point and then reach a sufficiency limit beyond which allowable power levels cease to increase.5
Other related program changes may be warranted with regard to utility incentives that would slow the continued move toward ever‐larger, more luxurious, and more numerous energy‐using devices, whose collective energy use can swamp the savings attained through a focus on higher product efficiency. Similarly, an increasing emphasis on the automated display and control of the energy used by individual devices and the whole home would help attain reductions in the hours of product operation when note in use.
The Commission and others should continue to promote the highest efficiency end‐use products and power supplies on the market today. Such products would need to include software features to ensure power management occurs in operation, given the evidence from our commercial field monitoring study that even products shipped with power management enabled by default often see those settings overridden once in operation. Aggressive consumer education will augment savings from new and existing consumer and office electronics. Actions like enabling power management settings, turning devices off when not in use, and installing smart plugs strips and other more sophisticated smart metering technologies can result in near term energy savings that would not be possible in product design changes alone.
The Emerging Technology report on home audio points to significant energy savings potential from improving internal power supply efficiencies, migrating toward inherently more energy efficient amplifier designs (primarily Class D), and more fully enabling power management to shut down loads during long periods of inactivity. This theoretical research should be put into practice with actual audio equipment (either purely commercially available devices or prototypes assembled from commercially available components). The research team believes energy savings of greater than 50% are achievable through a mix of the above strategies, though few tests have been done to date to confirm this. The opportunity is particularly timely now, given ENERGY STAR’s ongoing effort to update its specification for audio products.
5 See Chris Calwell, Is Efficient Sufficient? The Case for Shifting our Emphasis in Energy Specifications to Progressive Efficiency and Sufficiency, publication pending, Ecos Consulting (on behalf of eceee and EPA ENERGY STAR).
38

Similarly, the initial work the team has conducted on power factor has consistently shown an opportunity for additional energy savings resulting from lower I2R losses in building distribution wiring. Definitive research is needed to make the case for synergistic savings (theory predicts greater savings as more electronic devices share the same circuits in homes and offices). Ultimately, such research could allow the Commission to include power factor correction requirements in virtually all of its Title 20 and Title 24 efficiency requirements for electronic devices, potentially increasing energy savings in those devices by 5 to 10% or more.
4.3. Benefits to California The research that was conducted under this contract enables the Energy Commission, electric utilities, and efficiency advocates to pursue policies, programs, and market intervention strategies to reduce the energy consumption of consumer and office electronics. Summarized below are the near‐term direct benefits to California.
• Current data on which office electronics and other plug loads are in use in California’s offices, how these devices are operated, and how much energy they consume are now in the public domain, allowing utilities to better target efficiency and peak load reduction efforts.
• Findings from field research highlight the energy savings potential of under‐utilized power management capabilities in electronic office devices and establish a methodology that can be replicated and expanded by California utilities for longer measurement periods and greater statistical significance.
• Smart plug strip findings enable California utilities to add these technologies to their energy efficiency programs and select particular models likely to maximize resulting savings.
• The groundwork has been laid for utilities and energy service companies to pursue additional energy savings opportunities in the medical sector, not just by focusing on design features of the building and hard‐wired loads, but also by addressing the considerable plug loads found in those facilities.
• California now has the opportunity to modify its procurement policies to focus on the most efficient computers and monitors, minimizing lifecycle costs compared to purchasing at current ENERGY STAR levels.
39

40
Reference List
Energy Information Administration. 2008. Annual Energy Outlook 2008, with Projections to 2030. DOE/EIA‐0383 (2008).
ENERGY STAR (2005). Summary of Assumptions for EPA ENERGY STAR® Savings Estimates ENERGY STAR Preliminary Draft Computer Specification (Version 4.0).
Itron Inc. 2006. California Commercial End‐Use Survey. California Energy Commission, CEC‐400‐2006‐005.
Nordman and Sanchez (2006), Electronics Come of Age: A Taxonomy for Miscellaneous and Low Power Products.
Porter, Suzanne Foster, Laura Moorefield, Peter May‐Ostendorp. 2006. Final Field Research Report. California Energy Commission, CEC‐500‐04‐030
Roberson, J. A., C. A. Webber, et al. (2004). After‐hours Power Status of Office Equipment and Energy Use of Miscellaneous Plug‐Load Equipment. Berkeley, CA, LBNL.