Embed Size (px)
Citation preview

1
Report
Preliminary Design of Evaporation Dam and Water Conveying Structures
at Lefa Coal Mine
Solution 1 – Single Dam
Submitted to:
Mr Lazarus Kgwetiane
Analisa Mining and Industrial Services
Prepared by
Dr Nicholas Papenfus Pr. Eng.
Dams for Africa (Pty) Ltd.
2011.07.21

2
Report – Preliminary Design of Evaporation Dam and Water Conveying Structures at
Lefa Coal Mine : Solution 1 – Single Dam
1.0 Introduction
On 2011-06-07 Mr L Kgwetiane requested Dr N Papenfus to assist with the design of an
evaporation dam and water conveying structures for the proposed Lefa Coal Mine.
On 23/6/2011 Dr N Papenfus in the company of Mr D Ferreira and J Mare visited the site of
the proposed mine on the farm Kaalplaats 453 J.S. Portion 4. Sufficient time was spent on the
site for the writer to acquaint himself with the general lie of the land, gain an appreciation of
where the mining excavations will be, as well as the proposed evaporation dam. The existing
cut off berm was also observed along its full length, but there was insufficient time to take
measurements.
The evaporation dam will be considered first, followed by the water conveying structures.
2. Proposed Evaporation Dam
As stated in the environment management plan report (EMPR) an evaporation dam (ED) is
required to contain the dirty water that is pumped out of the open cast pit as well as the rain
runoff from the run of mine (ROM) stockpile and ‘dirty’ areas. The water from the pit may
either be the result of direct rainfall into the pit, or alternatively groundwater that seeps into
the pit. Either way the water will be contaminated by fine carbonaceous materials associated
with the mining of the coal, and hence must be isolated in the ED. The runoff water from the
ROM stockpile and ‘dirty’ areas (areas contaminated with excessive coal dust) must similarly
go to the ED.
2.1 Design of Dam
The design of the ED is indicated in figure 1, which is a typical section through the dam.
3
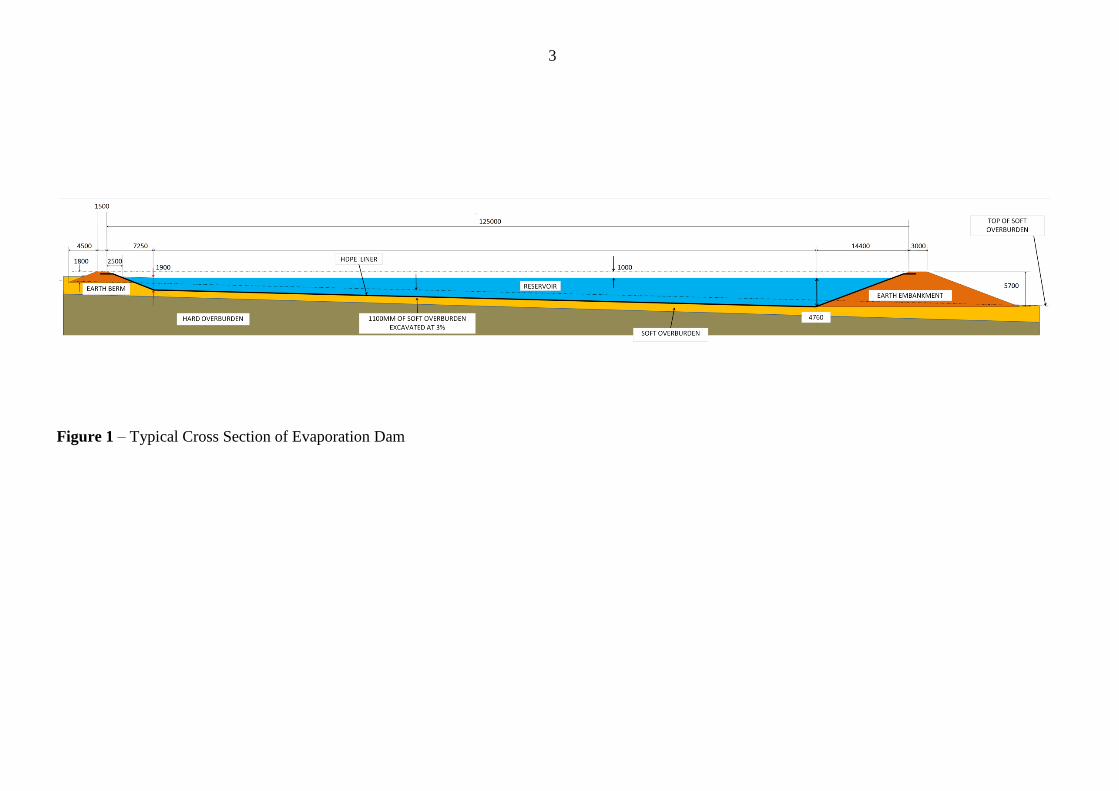
Figure 1 – Typical Cross Section of Evaporation Dam
4
The main features of the design are discussed below:
(a) The reservoir is created by constructing an earth embankment on one side and an
earth berm on the other, and these two structures run parallel to each other and on
contour. At the two ends the earth embankment turns 90 degrees, and then runs until
it meets up with the berm. The reservoir is therefore roughly rectangular in plan,
except that it may have a few minor bends so that it stays on contour – see figure 2.
(b) The reservoir will be lined with 1.5mm thick HDPE to ensure that no contaminants
escape into the underlying aquifers.
(c) Prior to commencement of construction, the topsoil will be cleared away from the
whole construction area, and stockpiled uphill.
(d) The earth embankment is 5.7 m in height, 3m wide at the crest, and has an up and
downstream slope of 1 : 2.5. Its base is founded at a level of 500mm to 1000mm
below the topsoil layer. (The topsoil layer is removed and suitably stockpiled prior
to commencement of construction).
(e) The earth berm on the opposite side is 1.8m high, 1.5m wide at the crest, and has an
up and downstream slope of 1 : 2.5. The berm is founded just below the topsoil
layer.
(f) At full supply level, FSL, (=100% of capacity) the reservoir (water body) has an
upper width of 120m.
(g) The cross section of the reservoir at FSL is constant at 377m3 for every running
meter of embankment and berm. Thus the volume of the reservoir may be increased
or decreased as required simply by changing the length.
(h) The lower base of the reservoir is 103.4m long and follows a slope of 3% until it
meets the beginnings of the earth embankment on the one side and the berm on the
other. (This angle is used since it is similar to the lie of the land).
(i) The distance between the inside toe of the berm and that of the embankment is
103.3m. The depth of the excavation is 1.1m below the topsoil layer all along the
lower base.
(j) The embankment it built up in layers of 150mm layers, which are watered to achieve
the ideal moisture content, and then suitably compacted with appropriate compaction
equipment. The excavated ground is approximately 5.5% more in volume than the
combined volume of the earth embankment/berm (see appendix F), but parity in
volume is achieved following compaction. However, the degree of compactability of
the soft overburden must be confirmed prior to the final design.
(k) The geometry of the design is thus fixed according to the parameters given above,
such that for every running meter of embankment and berm 377m3 of water is
confined at full supply level (FSL) – see appendix F. To do this 98.3m3 of
compacted soil is required for the embankment and 10.8m3 for the berm, and as
already mentioned this material is obtained by scraping out of soft overburden from
the basin (115.5m3 in total per running meter which is reduced to 109m
3 after
compaction) – see appendix F.

5
(l) The gradient of the upstream and downstream slopes, assumed to be 1 : 2.5, can only
be confirmed once the shear strength tests have been done on the ‘soft-overburden’
material from which it is to be constructed. Trial pits should be dug with a backhoe
at regular intervals along the length of the proposed embankment to allow samples
to be taken at various depths. At the same time samples can be taken for compaction
testing. The permeability of the compacted material should also be determined,
although a degree of permeability can be tolerated given that the embankment is to
be lined with HDPE.
(m) The crest of the ED is 1m above full supply level (FSL). FSL is determined by the
height of the spillway’s emergency crest. Note that in the design of an ED the
spillway is not meant to have any discharge, even if there is a 1:100 year x 24 hour
storm. However, in the event of say a 1: 200 year storm, or worse, some overflow
down the spillway may occur. A spillways that is too narrow can result in the crest
of the ED’s embankment being topped resulting in erosion damage to its
downstream slope.
(n) The incoming contaminated water will enter into the ED via a ‘dirty water’ canal
which enters through the back of the berm. The canal has an invert level 1000 mm
below the crest of the berm, and a width of 1000mm, which is sufficient to ensure
that the canal can take the maximum inflow (see section 9 for a discussion of the
design). Note that the crest of the berm is at the same height as that of the
embankment – see figure 1.
(o) The distance between the crest of the embankment and the crest of the berm is
125m. This width defines the catchment width of the reservoir.
2.2 Construction of Evaporation dam
Initially all the topsoil is removed with an excavator, and loaded onto an articulated dump
truck (ADT). The ADT travells uphill, and dumps the topsoil about 40m above the line of the
proposed berm, thus creating a relatively large berm that will shield the ED from too much
runoff. A front end loader (FEL) can be used to make this stockpile about 3m high, to save on
storage space.
With all the topsoil removed, the excavator begins digging out the soft overburden, where the
earth embankment is to be built, removing approximately 1m of overburden and transporting
it nearby temporarily. Next a grader is used to level this area. Next a sheeps-foot roller or
equivalent compaction machine is used to traverse the length and breadth of the prepared
area, but not before a water truck has provided the required level moisture to facilitate
compaction. Thereafter the excavator begins to excavate the basin of the reservoir, to a depth
of 1.1m, and the ADT dumps this material in long straight rows where the embankment is to
be. This material is then spread out in a layer of 150mm, using either a grader or bulldozer.
The layer is watered again with the dump truck, and then compacted. This process is repeated
in successive layers until the embankment has been completed.
The same procedure is used to build the berm, although the berm can be founded just below
the level of the top soil.

6
With 1.1m of overburden having been removed from the floor of the dam, according to the
dimensions, slope and shape indicated in figure 1, the grader makes several passes to ensure a
surface. relatively even floor. Nest a smooth vibrating drum roller is used to compact the
surface. Similarly the embankment and berm are smoothed and compacted.
Finally the HDPE contractor installs this material, which amounts to rolling out long sheets
and welding them together.
3 Rainwater Inflows
The ED must be able to contain the rainfall that falls (a) into the open areas of the pit (b) on
the ROM stockpile and other ‘dirty’ areas, and (c) directly into the ED. These three areas
combined are referred to as the ‘total affected area’ in appendices A through E.
The rainfall can be divided into two events. The first is that of normal rainfall, expressed in
terms of average annual rainfall, or mean annual precipitation (MAP) and according to
Midgley et al (1974), amounts to 44.5mm/year for the X11C sub-catchment rainfall area. The
second is a 1:100 year x 24 hour storm event, and amounts to 137mm, based on the readings
taken at the nearest representative rainfall station, Wonderfontein school. A storm of this
magnitude is predicted to have a 1% chance of recurrence annually. The operating level of
the ED is kept at a level low enough to accommodate this inflow without water exiting the
emergency spillway.
The effects of the MAP and 100 year x 24 hr storm on the water balance are discussed in
section 5.
4 Groundwater Inflows
The open cast pit is a substantial excavation, typically 440m long, 90m wide, and 16m deep.
The geology is such that there are a number of semi-permeably layers that are in effect
underground aquifers, of varying permeability. Clearly these aquifers will drain into the open
cast pit, at greater or lesser rate depending on their permeabilities.
Five groundwater inflows are discussed in this section, under the headings of Case 1 through
Case 5.
Three of these cases are also presented in the ERPR, with groundwater inflows of
150m3/day, 250m3/day and 450m3/day. In this report various water balance calculations
have been made for these cases, which are respectively shown in appendices C, D and E. A
further two cases of 0 m3/day, and 75m3 per day are also considered – see appendices A and
B respectively.
However, these various groundwater inflows apply to the estimated inflows that can be
expected after all the coal has been mined out by the end of year five. It is therefore possible
to assume that the groundwater inflows will reduce linearly going back in time to year 1, and
provision for this has been made in the water balance calculations (see appendices A to E).

7
4.1 Case 1
In case 1 it is assumed that the dividing wall between the Onverdacht colliery and the
proposed Lefa Mine is drilled and grouted to form an impervious grout curtain. (Perhaps
Onverdacht may be willing to share some of these costs). It is further assumed that on the
remaining three sides of the open case pit, boreholes are drilled at strategic intervals such that
the ground water can be intercepted before it gets to the pit. If the quality of this water
conforms to the minimum DWA requirements it can be pumped and discharged into the
natural water courses. If this intervention is substantially effective, then this may approach
the case of zero groundwater infiltration, and this implies that substantially smaller ED will
be required.
The main characteristics of the ED relating to case 1 along with the corresponding water
balance calculations are given in appendix A and summarised in table 1.
The length of this reservoir is 123m.
The sectional properties of the dam were illustrated in figure 1 and discussed in section 2.
When the dam is 100% full, it will have a maximum water depth of 4.76 m, corresponding to
46371m3 of storage capacity (see table 1). It is evident from table 1 that the ED fills up
progressively until it is 81.7% of capacity at the end of year 5. (Note that the maximum
permissible level is 82.9% - the remaining 17.1% is sufficient to contain the eventuality of a
1:100 year x 24 hr storm). At the end of the five year mining period there are no further
inflows into the dam, other than direct rain fall, and it then is allowed to evaporate dry, which
takes place in the year eight.
While case 1 only requires a relatively short dam, this saving in cost must be weighed against
the cost of the grout curtain and the boreholes, and in the case of the boreholes there will be
running costs (diesel for the generator) for 5 years. The effectiveness of the boreholes and
grout curtain in keeping out the ground water will also have to be weighed up.
item description units Case 1 Case 2 Case 3 Case 4 Case 5
(a) Groundwater inflow m3/day 0 75 150 250 450
(b) Length of reservoir m 123 212 304 429 681
(c) Maximum depth m 4.76 4.76 4.76 4.76 4.76
(d) Width of dam from crest to crest m 125 125 125 125 125
(e) Equivalent rain inflow surface area m2 15375 26500 38000 53625 85125
(f) Width at FSL m 120 120 120 120 120
(g) Cross sectional area at FSL m2 377 377 377 377 377
(h) Storage Volume at FSL m3 46371 79924 114608 161733 256737
(i) Evaporational width of reservoir at 50% m 111 111 111 111 111
(j) Inflow from 1:100 yr x 24 hr storm m3 7943 9467 11042 13183 17498
(k) Corresponding % wrt FSL % 17.1 11.8 9.6 8.2 6.8
(l) Permissible operating % (for 1:100x24hr storm) % 82.9 88.2 90.4 91.8 93.2
(m) Volume in dam after year 1 % 16.3 3.8 -1.7 -5.4 -8.8
(n) Volume in dam after year 2 % 32.7 14.4 8.0 5.9 4.0
(o) Volume in dam after year 3 % 49.0 31.9 25.7 23.1 20.9
(p) Volume in dam after year 4 % 65.4 56.2 53.1 51.6 50.5
(q) Volume in dam after year 5 % 81.7 87.4 90.2 91.4 92.9
(r) Volume in dam after year 6 - decommission % 51.8 57.5 59.9 61.4 63.0
(s) Volume in dam after year 7 - decommission % 21.9 27.5 29.5 31.5 33.1
(t) Volume in dam after year 8 - decommission % -8.0 -2.4 -0.8 1.6 3.1
Table 1 - Main Characterisics of Five Evaporation Dams indicating Cases 1 through 5.

8
4.2 Case 2
Case 2 is similar to Case 1, except that here it is assumed that the measures taken to limit the
ingress of ground water (grout curtain, borehole pumps) are only partially effective, and that
a maximum of 75m3/day by year 5 must be pumped out of the pit. It is assumed that the
groundwater increases incrementally from 15m3 in year 1, to 30m
3 in year 2, to 45m
3 in year
3, to 60m3 in year 4, to 75m
3 in year 5.
To cope with these inflows, as well as the MAP and 1:100year x 24hr storm, a capacity of
83028m3 is required (100% capacity). This will require a dam of length 212m. The cross
section of the dam/reservoir remains unchanged as indicated in figure 1. In this case the
permissible operating capacity is 88.2% - this and the other characteristics of this ED are
given in appendix B and summarised in table 1.
4.3 Case 3
This case corresponds to a maximum groundwater flow of 150m3/day in year 5, where again
it is assumed that this flow will build up in increments of 30m3/day from year one to year five
as indicated in appendix C. To contain this water, as well as the rainwater, a dam as shown in
figure 2 will be required, with a length of 304m, and surface area of 38000m2 (see table 1).
Note that ‘Scenario 1’ in the EMPR is also based on a groundwater flow of 150m3/day, and
the ED, shown in dotted lines in figure 2, is 350m x 180m = 63000m2 in area (according to
the EMPR). With a catchment surface area of 304 x 125m the Case 3 dam therefore only has
60.3% of the dam in the EMPR. This represents a substantial saving, given that the installed
cost of a 1.5mm HDPE liner is R43/m2.
Also the shape of the EMPR dam embankment does not follow the contour at the deep end,
and there are better places on the property to site a dam of this shape to make optimum use of
the natural topography.
Other details of the proposed ‘Case 3’ dam are indicated in appendix C, and summarised in
table 1.

9
Figure 2 – Layout showing proposed Evaporation Dam for 150m3/day groundwater
4.4 Case 4
Case 4 corresponds to a year 5 groundwater flow of 250m3/day. This flow was chosen as it is
discussed in ‘Scenario 2’ in the EMPR report, for the case where (a) the whole mined area is
left open and (b) a 200m unmined strip will be left between the opencast and the
neighbouring opencast to the NW. The first assumption is too conservative since the roll over
mining method will be used, while the second condition is unlikely to be observed. But again,
it may be possible to effectively provide a grout curtain between the proposed and the current
opencast of Onverdacht colliery, and in this event the groundwater is likely to be less than
250m3/day given that strip mining will be practiced.
Whatever the case, if a year 5 flow of 250m3/day is to be accommodated in the ED, and in
addition provision is made for annual rain and a 1:100 x 24 hr storm, a dam with the
characteristics shown in Table 1 will be required.
Note that this dam cannot be compared to an equivalent ED in the EMPR as no ‘design’ or
drawing was done for ‘Scenario 2’. (It was only done for ‘Scenario 1’ – discussed in Case 3
above).
4.5 Case 5
Case 5 corresponds to a year 5 groundwater flow of 450m3/day, over and above the MAP and
1:100 x 24 hr storm inflows. The reason this flow was analysed is that it is also discussed in
the EMPR under the heading of ‘Scenario 2’, where it was assumed that there is no 200m
strip left between the existing opencast at Onverdacht colliery and the proposed mine,
resulting in a substantial increase in groundwater into the mine.
OPEN CAST PIT (afteryear 5)
WORK SHOP
HARDS DUMP
ONVERWACHT BERM
GRAVELROAD
ALTERNATIVE350m x 180m
EVAPORATION DAM
DIRTYWATER CANAL
N GRAVEL ROAD
RESERVOIRBERM-CHANNEL
EMMERGENCYSPILLWAY
10
Once again the characteristics of the required ED required to contain these flows is given in
the appendices (see appendix E) and is summarised in table 1.
5 Explanatory notes on the Water Balance Calculations - Appendices A through E.
This section explains the inputs and calculations associated with the water balance
calculations on a line by line basis. There is therefore a degree of repetition of some aspects
discussed in the preceding sections – with the idea that this section may be complete on its
own. It is however recognised that not every reader may be interested in this level of detail,
and in this event the reader is advised to skip this section. On the other hand, other things are
explained here that were not covered in the preceding sections, and by reading on the reader
will gain a more in depth understanding.
Appendices A through E contain the water balance calculations over an eight year period for
the five cases of groundwater inflows, also taking into account the rainwater inflows and the
evaporation ‘outflows’. The first five years correspond to the period in which active mining
takes place, while the last three, correspond to the post mining period, where no more ‘dirty
water’ goes to the ED, only rainfall that falls directly into the ED. After year 5, the dam is at
its fullest, and hence three additional years are required for the dam to evaporate empty
before the dam can be dismantled.
Appendices A through E are arranged in five blocks. Blocks 1 through 4 contain information
required in the actual water balance calculations of block 5. The information and workings of
each block are explained below:
5.1 Block 1 – Reservoir Volume
Line (c) shows the storage volume of the reservoir at full supply level = 100% of capacity. It
is determined by multiplying the ‘length of reservoir’ in line (a) by the cross sectional area at
FSL in line (b). As explained earlier, any further water added after this will run out of the
spillway into the natural water courses. For this reason provision is made to keep the water
level below FSL – explained further on. (Note that the calculations for determining the cross
section of the reservoir are given in Appendix F, and the associated dimensions are shown in
figure 1).
Line (d) gives the width of the dam from the inside crest of the embankment to the opposing
inside crest of the berm, which is 125m as shown in figure 1. This width defines the width of
the dam’s catchment, and is used to calculate the ‘catchment area of reservoir’ see line (e),
which in turn is used to calculate the total volume of water entering directly into the dam
through annual rain as well as through a 1:100 x 24 hour storm.
Line (f) gives the width of the reservoir when it is at 50% of capacity, and this width is used
in the evaporation calculations in block 5(e). In reality however, the average width will
decrease from a maximum of 120m at 100% capacity to zero when empty. This level of
refinement can be built into the calculations if considered necessary, although the error in the
current model is relatively small for most cases.

11
5.2 Block 2 – Areas Affected by ‘Dirty’ Water
The principal function of the evaporation dam is to contain water that is contaminated in the
mining process. This water arises from two sources, the open cast pit and the ROM stockpile
and other ‘dirty’ areas. These areas are calculated in this block, and then used for the
calculations to determine the volume of the contaminated water in block 5.
The width of a typical mining strip in the open cast pit is given in (a), while (b) is the length.
The area of a typical strip is given in (c), determined by multiplying (a) by (b). The number
of uncovered strips exposed to mining operations at any one time is given in (d), and by
multiplying this with (c) the total exposed area in the open cast pit may be obtained, in (e).
The total area of the ROM and other dirty areas is given in (f), and is obtained from the area
of the ROM stockpile plus an additional allowance for other areas that may have
unacceptable levels of coal dust.
5.3 Block 3 – Runoff and evaporation data
(a) is the mean annual runoff reported by Midgley (74) for sub-catchment X11C. This MAR
is used in block 5(c) to determine the annual volume of water running off the ROM and other
dirty areas.
(b) is the mean evaporation for the area (obtained from the EMPR). This information is used
in Block 5(e) to determine the volume of water that evaporates out of the ED.
(c) is the mean annual precipitation (MAP) for the area, obtained from the EMPR. This
information is used in Block 5(b) to determine the volume of normal rain water entering the
pit and the ED. (It excludes the rain from a 1:100 year x 24 hr storm).
5.4 Block 4 – Maximum Permissible Operating Capacity
According to GN704 provision must be made for a 1:50 year x 24 hour storm when designing
the capacity of a ED. This is over and above the provision made for MAP. However, the
EMPR makes provision for a 1:100 year x 24 hr storm, which is a conservative approach.
The nearest representative rainfall station to the catchment is Wonderfontein School
(516708). Based on that data a precipitation depth of 137mm is chosen for a 1:100 x 24hr
storm – see 4(a). This rainfall is multiplied by the ‘total affected area’, see 4(b) resulting in
the ‘inflow from the storm’, see 4(c). Note that the ‘total affected area’ is the sum of the areas
given in 1(e), 2(e) and 2(f) – i.e. the dam itself , the open cast pit, and the ROM and other
dirty areas. It is evident that the storm falling on these areas will all end up in the ED,
although some of the storm will seep into ground in the case of the ‘ROM and other dirty
areas’. Conservatively the same precipitation is used for all three of the affected areas.
Note that the equivalent precipitation depth of a1:50 year x 24 hour storm is 120mm. Thus
adopting the 1:100 storm event does not make much difference in the required capacity of the
EDs, rather it adds a degree of ‘peace of mind’ to the design approach.

12
The maximum permissible operating level in 4(d) is calculated by reducing the total capacity
of the reservoir (see 1(c)) by an amount equal to the 1:100 year x 24 hr storm amount
calculated in 4(c). This may also be expressed as a percentage, as in 4(e).
5.5 Block 5 - Water Balance Calculations
The water balance in the dam is simply the quantity of water expressed in m3 remaining in
the dam at the end of each year of consideration, of which there are eight. In the first 5 years
the level in the dam rises year on year as a result of the various inflows. After year five, it is
assumed that mining operations have ceased, the pit has been filled, and that no further pit
water enters the ED. Likewise the ROM and other dirty areas will have been cleaned up, so
that further rainfall from these areas will henceforth go into the natural water courses and not
into the ED. Therefore the level of the ED will decrease in years 6, 7 and 8 with ongoing
evaporation. However, the annual rain will continue to fall into the ED, but as evaporation is
substantially more than MAP, the levels in the ED will drop to zero or almost zero at the end
of year 8 – see line 5(g).
The water balance calculation is done by summing the opening balance for each year, 5(a),
the mean annual precipitation, 5(b), the mean annual runoff 5(c), the ground water inflow
5(d), and subtracting mean annual evaporation, 5(e). The result in 5(f) represents the amount
of water in the reservoir at the end of the year under consideration. This balance may be
divided by the ‘storage volume at FSL’ in line 1(c) to obtain the ‘operating level %’, which is
recorded in 5(g) as a percentage. In 5(h) the permissible operating % is replicated from 4(e).
If 5(g) is less than 5(h) then the message ‘OK’ is returned in 5(i), if it is more then the
message ‘TOO FULL’ is returned.
Note that a negative value in 5(g) indicates that the dam is empty. A negative value in any
given year is returned as a zero in the opening balance of the following year – see line 5(a). A
positive balance on the other hand is brought forward to the next year.
The idea is to get 5(g) as near to 5(h) as possible, without exceeding it. This is done by
adjusting the length of the reservoir in 1(a), which has the effect of increasing the quantity of
water in the reservoir as well as its evaporation surface. Generally after a few iterations the
ideal length of the reservoir is obtained.
In 5(e) it may be seen that an allowance is made for evaporation from the pit, i.e. 20% of the
water that enters the open cast pit is assumed to evaporate. This seems to be a reasonable
assumption for the following reasons:
Any rainfall on weekends will undergo evaporation
Soft rainfall is likely to evaporate as fast as it precipitates
Rainfall in the working areas that lies in shallow craters cannot be pumped out and
will eventually evaporate when the rain stops
Areas of the pit that are not actively being blasted can tolerate a degree of water
without causing disturbance

13
Loose coal that has been blasted, especially the fine fractions, will adsorb and absorb
some water, and this water will end up on the ROM stockpiles and be removed from
the site via the coal trucks rather than go to the evaporation dam.
It is estimated that these factors cumulatively add up to 20% of MAP.
6.0 Recommendations relating to the evaporation dam
6.1 If the design philosophy set out in the preceding section is accepted, then the cost of
the ED should be determined.
6.2 It is proposed that rather than construct the ED where originally indicated in the
EMPR, it should rather be located as indicated in figure 2, to the left of the road, since this
will result in a dity water shorter canal, but more importantly, the contours are straighter in
this region, and the general slope appears to be more consistent and closer to 3%, the slope
the design is based on.
6.3 A backhoe or excavator should be established on site to make some trenches at
regular intervals along the line of the proposed embankment. The trenches will give an
indication of the depth of the top soil (which is not suitable for construction) and should also
reveal the quality of the underlying material, to a depth of at least 2.5m. This material should
ideally be digable with a backhoe, and also be useable for the construction of the
embankment. (It does seem from figure 4 that the hard rock is sufficiently far down for the
first 1.8m below the topsoil to be excavatable). In addition the material is described in the
EMRP as ‘sandy loamy’ to ‘sandy clay’).
Samples must be taken at strategic levels in order to determine the shear strength and
permeability characteristics of the soil after it has been suitably compacted. Its plasticity,
dissolution and heave potential characteristics should be determined. The consolidation,
shear, bearing, permeability, dissolution, and heave potential characteristics of the soil
beneath the proposed dam should also be assessed. A suitably qualified/experienced civil
engineer should be on hand to profile the trenches and take the sample for testing in a
geotechnical laboratory.
Another important observation during this process is to determine the level of the water table
– which should be at least 1.1m below the topsoil layer, since this is the depth of excavation
required in order to have sufficient material for the earth embankment and berm of the ED. If
the water table is too high some adjustments to the design will be required.
6.4 In the interests of time saving, no allowance has been made in the water balance
calculations of appendices A through E for seasonal variations in precipitation and
evaporation. It is however recommended that this refinement be done before the design and
costing of the dam is finalised. The outcome may require a slightly reduced permissible
operating percentage, which will require increased dam capacity – although any increase is
likely to be minor, since periods of high precipitation generally also occur in periods of high
evaporation, and vice versa.

14
6.5 The emergency spillway has not been designed as yet – although it is indicated on
figure 2. This will be a simple structure, as it is not likely to ever be put to use, unless there is
an exceptional storm, say a 1:200 year x 24 hour flood or worse, coupled with a very wet
rainy season. It should be stated that should such a wet season occur, some ‘dirty’ escaping
form the EDs will not have serious consequence. It is well known that excessive quantities of
pure rain water coursing the rivers substantially improve the quality of the water in the
downstream dams. In other words the cleansing benefits that occur from heavy rainfalls
outweigh any pollution effects by several orders of magnitude.
6.6 More attention must be given to defining the extent of the ‘ROM stockpile and other
dirty areas’. In 2(f) this is taken as 3000m2. These areas should be kept as small as possible in
order to limit the size of the ED. There are a number of measures that can be taken in this
regard. It should be noted that a conservative approach was used for determining the runoff to
the ED from this area in that a 100% runoff was assumed for the 100 year x 24 hr storm
event.
6.7 The adjacent open cast pit belonging to Onverdacht colliery has a very large
evaporation surface and storage capacity (see figure 3). Considerable expense and time would
be saved if permission could be obtained to use this as an evaporation dam! However, in this
event a grout curtain would most probably be required to prevent seepage into the proposed
Lefa mine pit. It will also be important to do materials strength calculations to ensure that the
unmined strip separating the two open cast pits does not shear off into the void created by the
newer excavation.
A strong motivation can be made for using this dam as an ED if it can be shown that ground
water seepage out of the dam is minimal. This can be done by installing and monitoring a rain
and evaporation gauge at the dam. If there is a net gain in height after accounting for
precipitation and evaporation, and if this gain is sustained over time, then this means that
there is less groundwater outflow than inflow, and moreover this can be quantified. If the
outflow can be shown to be relatively insignificant, then a strong case can be made for using
the Onverdacht dam as an ED. It is probable that groundwater outflow can be minimised by
installing a grout curtain on the downstream/outflow side of the reservoir.

15
Figure 3 - Parts of the open cast pit at the Onverdacht colliery have not been closed up, and it
may be possible to obtain permission to use this as an ED for the proposed Lefa Coal Mine.
Figure 4 – It appears that the soil to within about a meter of waterline is excavatable. This
depth exceeds the required depth of excavation of approximately 1.8m below the topsoil .

16
7. The Onverdacht Berm
The best waste water management strategy is to prevent the water from becoming
contaminated in the first place. For this reason a berm has been constructed that runs along
the NW border of the property, adjacent to the Onverdacht colliery. Its position is indicated in
figure 2, and there is a gravel road running alongside it. It is strategically positioned to
prevent runoff from the Onverdacht colliery (which is at a higher elevation) running into the
area where the proposed Lefa mine open cast pit is to be situated. In figure 5 the berm is to
the right of the road and is generally 1.5m to 2.5m in height, made simply by dumping soil
using a front end loader, and therefore approximately triangular in shape. It may be seen that
the berm is vegetated with grass and some bushes.
An indication of its extent may be gauged from figure 6 where it runs on the right of the
gravel road as far as the trees in the distance.
The berm may be considered in four sections. The first section begins at the eastern most
point of the property, and runs in a NW direction for approximately 200m (to be confirmed)
to the beginning of the Onverdacht water filled pit/dam. The berm has been broken down in
some sections along this stretch and is in need of repair. In other places the berm consists of a
double berm, with a vegetated canal in between the two berms.
The second section of the berm runs along an open cast pit, which is now a relatively large
dam (see figure 3), belonging to the Onverdacht colliery. The berm runs on the top of the
pit’s SE bank (see LHS of figure 4) and on the right of the road shown in figure 6. Although
there is a berm along this section it is clear that any rain runoff from Onverdacht in this
section will be trapped in the reservoir. The level of the water is estimated to be 5m below the
gravel road and the pit walls are steep, perhaps 70 degrees, (see figure 4).
The third section of the berm starts where the dam ends, and continues in a NW direction for
about 200m (to be confirmed). The ground rises very slightly to a high point which occurs
just before the trees (see figure 6). This high point is a watershed between the east and the
west catchments mentioned in the EMPR. The runoff arriving at the berm is re-directed in a
SE direction, relieving into the west corner of the Onverdacht pit/dam.
Assuming that the catchment for this section is 1000m uphill, and 200m in width (to be
confirmed), and that it has a runoff coefficient of 0.39 (corresponding to an average slope of
3% and a soil type that is loamy clay and is vegetated with grass), and assuming further that
the rainfall intensity from a 1:50 year x 24hr storm amounts to 120mm (see EMPR), then
according to the ‘rational method’ it may be calculated that there will be a flow of 2.6 m3/s
along this berm at the point that the water reaches the dam/pit, and that the depth of this flow
will be 1.01m – see appendix G. To convey this runoff, it is assumed that the berm has a
minimum slope towards the dam of 1 in 500, which seems to be realistic based on the
contours given in the EMPR.
Section four continues in a NW direction until it reaches the N corner of the property. It starts
at the high point near the trees, and descends in elevation to the N corner, although the berm
is only required for a distance of about 400 m beyond the trees. Beyond the berm the water

17
will run on downhill and eventually reach the Leeubankspruit. Most of the berm in this
section is yet to be constructed.
Based on the contour drawings, the catchment for this section is triangular in shape, about
400m uphill, and 400m in width. It may be assumed to have a runoff coefficient of 0.39
(corresponding to an average slope of 3% and a soil type that loamy clay and is vegetated
with grass), and assuming further that the rainfall intensity from a 1:50 year x 24hr storm
amounts to 120mm (see EMPR), then according to the ‘rational method’ it may be calculated
that there will be a flow of 1.06 m3/s at the exit point of the berm, and that the depth of this
flow will be 0.34 m – see appendix G. To convey this runoff, the channel created by the berm
needs a minimum gradient of 3% - based on the contours given in the EMPR this is realistic.
There is no need for the berm to take a corner, either at its starting point in section 1 or at its
terminal point in section 4, since the lie of the land is such that the runoff will run away from
the proposed open cast pit at both ends. Based on the extent of the proposed mining
operations superimposed on the surveyor’s contour drawings, the total length of the berm will
need to be 1000m long, broken down approximately as follows: 200m for section 1, 200m for
section 2, 200m for section 3, and 400m for section 4. These section lengths should be
confirmed.
Figure 5 - The berm to the right of the gravel road and varies in height from 1.5m to 2.5m in
height. It forms an effective barrier for diverting water away from the proposed open cast pit,
which will be to the left of the road.

18
Figure 6 – The berm runs to the right of the road, which is on the NW border of the Lefa
Coal mine property, past the water logged open cast pit, and beyond the trees in the distance.
7.1 Observations and Recommendations
(a) The berm is assumed to be located within 1 km from the top of the hill (to be confirmed),
which limits the amount of runoff that needs to be conveyed.
(b) In sections 1, 2 and 3 the gradient along the berm is very slight (evident from contour
lines), and therefore the velocity of the water along in the berm channel will be slight. Even
in section 4 the velocity is not expected to exceed 0.27m/s (see appendix G) and erosion at
the toe of the berm is therefore unlikely to occur, particularly once grass establishes.
(c) The depth of flow in section three will be the worst at 1010 mm. However, given the
uncertainty on the size of the catchment area, it is recommended that the minimum height of
the berm be 2m in this section.
(d) In section 2 (adjacent to the dam) the berm can be left as is, but there is a short section in
this area where there is no berm, and here a berm should be established to a minimum height
of 1.5m.
(e) In section 1 the berm is largely shielded by a high stockpile of overburden – perhaps 15m
high (see RHS of figure 6), which runs virtually the full length of the first section. However,
it is not known to what extent water will flow from behind and around this mound and on
towards the berm. It is therefore recommended that the berm be a minimum of 2m in this
section as well.

19
It is not known to what extent the level in the Onverdacht dam is at equilibrium given the
inflows from precipitation and groundwater (relating to sections 2 and 3) and outflows from
evaporation and groundwater outflows. However, given that the water level in the dam is
about 5m below the gravel road, and considering the large plan area of the reservoir, the dam
has more than sufficient storage capacity to accommodate the section 2 and 3 precipitation
inflows so that no water is passed on to section 1.
On the other hand, if the Onverdacht dam is to be filled up with overburden before the mining
at Lefa is completed, this potentially means that the berm in section 2 will have to be
reassessed to contain the flow from section 3, and likewise the berm in section 1 will need to
be reconsidered to take the flow from sections 2 and 3.
(f) In section 4 most of the berm is still to be constructed. The maximum flow along this
berm is not expected to exceed 1.06m3/s at a calculated depth of 340 mm. Moreover the
catchment area in this section is observable from the available contour drawings, and
therefore the incoming flows can be predicted with some degree of certainty. It is therefore
recommended that the mimimum height of the earth berm in this section be 1m.
(g) In building the berm no special compaction effort is required other than a single pass of a
front end loader’s front wheels, incrementally travelling half way up and down the slope. The
final angles should not be greater than the natural angel of repose.
8. The ‘Reservoir-Berm’ Canal
A way of diverting the clean uncontaminated rain runoff that falls behind (i.e. uphill) the
evaporation dam is required, especially since this structure is built on contour. The design of
the evaporation dam is such that it’s earth berm runs parallel to the earth embankment (see
figure 1). It is therefore evident that the upslope side of this berm creates a natural ‘reservoir
berm-channel’ that can be used to collect water from uphill runoff, and convey it around the
ED – see arrows in figure 2.
However, to limit the amount of runoff that this berm will need to divert, the topsoil that is
removed during the construction of the dam will be stockpiled approximately 40m uphill of
the dam, in such a way that it acts as a diversion berm in its own right. Limiting the
catchment in this way, a flow depth of 430mm is sufficient to divert the water around the
berm, assuming a manning coefficient of 0.03, and a gradient of 1 in 1000 (see appendix G).
At this gradient the depth will increase further away from the discharge point (which is at the
end of the reservoir) by 100mm for every 100m, which means that to divert the rain around a
330m long reservoir the depth of the berm-channel would increase to 760mm. (Note that the
depth of the stream must increase progressively away from the discharge point in order to
create its own slope, given that the berm-channel is built on contour). Actually the maximum
flow depth will be substantially less than 760mm since the cross sectional area of the berm-
channel increases very substantially as the water depth increases, owing to the sloping
triangular shape of the channel’s bed. In any case, since the crest of the berm is 1.5m above
the berm-channel’s bed at its deepest point (where the channel meets the berm), this leaves a
good safety margin (1500mm – 760mm = 740mm) against runoff water entering into the ED.

20
9. The ‘Dirty Water’ Canal
An earth canal should be constructed that starts near to the open cast pit, for the purpose of
conveying water from the pit to the evaporation dam as indicated in figure 2. The canal can
be made simply by an excavator digging a trench. The excavated material should be spoiled
immediately downhill of the trench, to give the effect of increasing the overall depth of flow
in the event of an unexpectedly large flow.
It is possible to predict a flow of 0.307m3/sec (see appendix G), assuming a trench of capacity
1m wide and 1m deep, based on a Manning coefficient of n = 0.025, and a minimum slope of
1:40.
From appendix C it may be determined that an inflow into the open cast pit of 4752m3
(120mm x 39600m2) may occur in the event of a 1:50 year x 24 hr storm (required by GN
704). If this storm were to be pumped out at the capacity of the ‘dirty water’ canal, then it
would take 4752/0.31/3600 = 4.3 hours to dewater the pit. This is not considered to be too
slow for such a major storm event.
The corresponding average velocity in the trench at maximum flow will be 0.31 m/sec, and
this is will not give rise to erosion in the short term. However, regular flows in the trench
from dewatering of groundwater and normal rain may eventually lead to some erosion of the
canal bed/s. Furthermore, a degree of infiltration of dirty water into the underlying aquifers
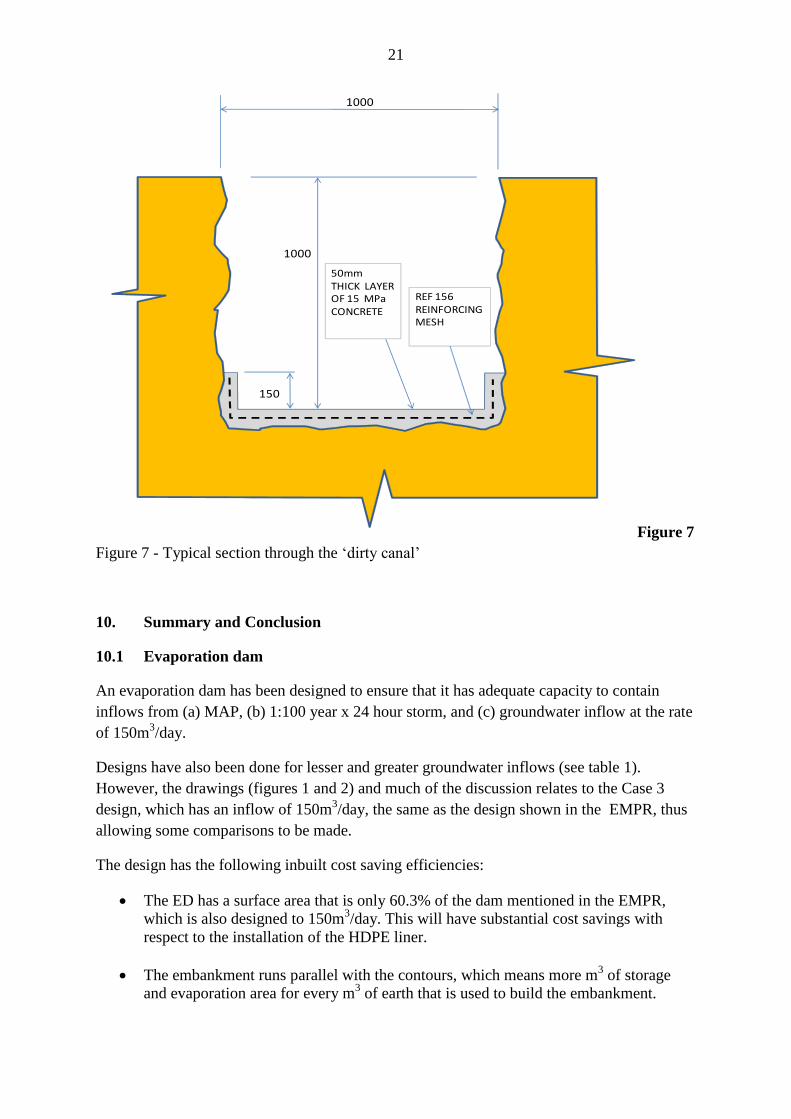
will occur from ongoing dewatering. For these two reasons it is recommended that the floor
and a small extent of the walls be lined with a thin screed of mesh reinforced concrete as
illustrated in figure 7.
21
1000
1000
150
50mmTHICK LAYER OF 15 MPa CONCRETE
REF 156REINFORCING MESH
Figure 7
Figure 7 - Typical section through the ‘dirty canal’
10. Summary and Conclusion
10.1 Evaporation dam
An evaporation dam has been designed to ensure that it has adequate capacity to contain
inflows from (a) MAP, (b) 1:100 year x 24 hour storm, and (c) groundwater inflow at the rate
of 150m3/day.
Designs have also been done for lesser and greater groundwater inflows (see table 1).
However, the drawings (figures 1 and 2) and much of the discussion relates to the Case 3
design, which has an inflow of 150m3/day, the same as the design shown in the EMPR, thus
allowing some comparisons to be made.
The design has the following inbuilt cost saving efficiencies:
The ED has a surface area that is only 60.3% of the dam mentioned in the EMPR,
which is also designed to 150m3/day. This will have substantial cost savings with
respect to the installation of the HDPE liner.
The embankment runs parallel with the contours, which means more m3 of storage
and evaporation area for every m3 of earth that is used to build the embankment.

22
The ground that is removed from the soft overburden (1.1m) is just enough for the
construction of the embankment and berm. Thus no unnecessary excavation is
required, and the ADT goes directly from the excavator to the embankment.
The relatively shallow excavation of 1.1m means that problems are not likely to be
encountered with high groundwater.
The only way to make the design more efficient would be to make it wider (and this
means it does not have to be so long) but this would also makes it deeper, and it is
already 5.7m high. (However, this is something that can be considered).
The slope used in the basin of the reservoir follows that of the general topography,
and again this ensures that the minimum of earth needs to be excavated.
10.2 Water conveying structures
Designs have also been done for three types of water conveying structure:
(a) the Onverdacht berm – to ensure that it has sufficient capacity to channel rain runoff from
the uphill areas around the proposed Lefa mine open cast pit.
(b) the Reservoir berm channel – to ensure that it has sufficient capacity to convey clean
runoff around the evaporation dam
(c) the Dirty water canal – to ensure that it has sufficient capacity to dewater the pit in 4.3
hours after a major storm event. The canal is partially lined with lightly reinforced concrete to
prevent erosion as well as prevent dirty water polluting the underlying aquifers.
Finally it is recommended that a full costing be done on the above named structures, followed
by the final design. The final length of the various water conveying structures will also be
determined in this process.
Final Note: An alternative solution would be to build multiple dams which have the
combined storage and performance of a single larger dam. These dams can be strategically
phased in as required, given that the groundwater only builds up incrementally as more and
more of the open cast pit is mined. Clearly there are cash flow benefits to this approach.
However, the combined construction costs will be more. (The larger dam has a smaller
footprint than the three smaller dams and therefore requires substantially less HDPE and less
excavation, and it uses less earth to create the embankment/berm).
This alternative approach has been considered under the title:
Report – Preliminary Design of Evaporation Dam and Water Conveying Structures at Lefa
Coal Mine : Solution 2 – Multiple Dams.
Note that much of that document is the same as this one – however the reader can gain a
quick understanding of the main differences by simply looking as figures 1 and 2.

23
Appendix A : Water balance Calculations for the purpose of determining the length and storage capacity of the evaportion dam - assuming 0 m3 groundwater inflow per day
Block 1 - Reservoir volume Block 5 - Water Balance Calculations for 0 m3/day Ground Water Inflow
(a) Length of reservoir/s 123 m year 1 year 2 year 3 year 4 year 5 year 6 year 7 year 8
(b) Cross sectional area at FSL 377 m2 m3 m3 m3 m3 m3 m3 m3 m3
(c) Storage Volume at FSL 46371 m3 (a) Quantity in Dam brought forward 0 7581 15162 22743 30324 37905 24032 10159
(d) Width of dam from crest to crest 125 m Area m2 mm
(e) Catchment area of reservoir 15375 m2
(f) Evaporational width of reservoir at 50% 111 m (b) Add Mean Annual Rainfall
- for open cast pit 39600 673 26651 26651 26651 26651 26651 0 0 0
Block 2 - Areas affected by Dirty Water - for Evaporation dam 15375 673 10347 10347 10347 10347 10347 10347 10347 10347
(a) Estimated Strip width in mining pit 30.0 m
(b) Estiamted Strip length 440 m (c) Add Mean Annual Runoff
(c) Estimated Area of a strip 13200 m2 - for ROM stockpile & dirty areas 3000 44.5 134 134 134 134 134 0 0 0
(d) No of concurrent open strips 3
(e) Total surface area of 3 strips 39600 m2 (d) Add Groundwater inflow
(f) ROM stockpile & other dirty areas 3000 m2 - for open cast pit @ 150m3/day 0 m3/day extra/yr 0 0 0 0 0 0 0 0
Block 3 - Runoff and Evaporation Data (e) Subtract Mean Annual Evaporation
(a) MAR reported for X11C 44.5 mm/yr - for Evaporation dam 13653 -1774 -24220 -24220 -24220 -24220 -24220 -24220 -24220 -24220
(b) Mean evaportation 1774 mm - for pit @ 20% of MAP 39600 -135 -5330 -5330 -5330 -5330 -5330 0 0 0
(c) Mean Annual Precipitation 673 mm
(f) Balance excl 24hr x 1:50 storm 7581 15162 22743 30324 37905 24032 10159 -3714
Block 4 - Maximum Permissible Operating Capacity (allow for 1:100 yr storm)
(a) 1:100yr x 24 hr storm 137 mm (g) Operating level % 16.3 32.7 49.0 65.4 81.7 51.8 21.9 -8.0
(b) Total Affected Area 57975 m2
(c) Inflow from storm 7943 m3 (h) Permissible operating % (for 1:100x24hr storm) 82.9 82.9 82.9 82.9 82.9 82.9 82.9 82.9
(d) Maximum permissible operating level 38428 m3
(e) Maximum permissible operating level % 82.9 % (i) Check that (g) < (h). OK OK OK OK OK OK OK OK
24
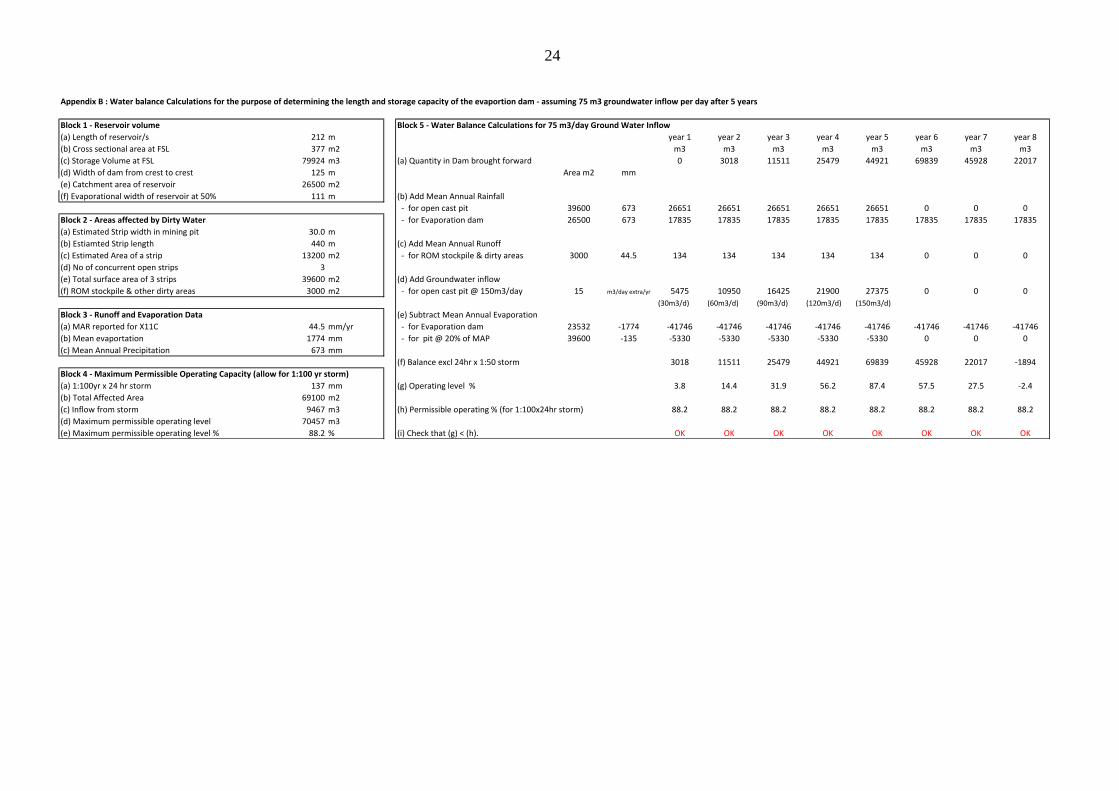
Appendix B : Water balance Calculations for the purpose of determining the length and storage capacity of the evaportion dam - assuming 75 m3 groundwater inflow per day after 5 years
Block 1 - Reservoir volume Block 5 - Water Balance Calculations for 75 m3/day Ground Water Inflow
(a) Length of reservoir/s 212 m year 1 year 2 year 3 year 4 year 5 year 6 year 7 year 8
(b) Cross sectional area at FSL 377 m2 m3 m3 m3 m3 m3 m3 m3 m3
(c) Storage Volume at FSL 79924 m3 (a) Quantity in Dam brought forward 0 3018 11511 25479 44921 69839 45928 22017
(d) Width of dam from crest to crest 125 m Area m2 mm
(e) Catchment area of reservoir 26500 m2
(f) Evaporational width of reservoir at 50% 111 m (b) Add Mean Annual Rainfall
- for open cast pit 39600 673 26651 26651 26651 26651 26651 0 0 0
Block 2 - Areas affected by Dirty Water - for Evaporation dam 26500 673 17835 17835 17835 17835 17835 17835 17835 17835
(a) Estimated Strip width in mining pit 30.0 m
(b) Estiamted Strip length 440 m (c) Add Mean Annual Runoff
(c) Estimated Area of a strip 13200 m2 - for ROM stockpile & dirty areas 3000 44.5 134 134 134 134 134 0 0 0
(d) No of concurrent open strips 3
(e) Total surface area of 3 strips 39600 m2 (d) Add Groundwater inflow
(f) ROM stockpile & other dirty areas 3000 m2 - for open cast pit @ 150m3/day 15 m3/day extra/yr 5475 10950 16425 21900 27375 0 0 0
(30m3/d) (60m3/d) (90m3/d) (120m3/d) (150m3/d)
Block 3 - Runoff and Evaporation Data (e) Subtract Mean Annual Evaporation
(a) MAR reported for X11C 44.5 mm/yr - for Evaporation dam 23532 -1774 -41746 -41746 -41746 -41746 -41746 -41746 -41746 -41746
(b) Mean evaportation 1774 mm - for pit @ 20% of MAP 39600 -135 -5330 -5330 -5330 -5330 -5330 0 0 0
(c) Mean Annual Precipitation 673 mm
(f) Balance excl 24hr x 1:50 storm 3018 11511 25479 44921 69839 45928 22017 -1894
Block 4 - Maximum Permissible Operating Capacity (allow for 1:100 yr storm)
(a) 1:100yr x 24 hr storm 137 mm (g) Operating level % 3.8 14.4 31.9 56.2 87.4 57.5 27.5 -2.4
(b) Total Affected Area 69100 m2
(c) Inflow from storm 9467 m3 (h) Permissible operating % (for 1:100x24hr storm) 88.2 88.2 88.2 88.2 88.2 88.2 88.2 88.2
(d) Maximum permissible operating level 70457 m3
(e) Maximum permissible operating level % 88.2 % (i) Check that (g) < (h). OK OK OK OK OK OK OK OK

25
Appendix C : Water balance Calculations for the purpose of determining the length and storage capacity of the evaportion dam - assuming 150 m3 groundwater inflow per day after 5 years
Block 1 - Reservoir volume Block 5 - Water Balance Calculations for 150 m3/day Ground Water Inflow
(a) Length of reservoir/s 304 m year 1 year 2 year 3 year 4 year 5 year 6 year 7 year 8
(b) Cross sectional area at FSL 371.9 m2 m3 m3 m3 m3 m3 m3 m3 m3
(c) Storage Volume at FSL 93000 113058 m3 (a) Quantity in Dam brought forward 0 0 9066 29083 60049 101965 67677 33389
(d) Width of dam from crest to crest 125 m Area m2 mm
(e) Catchment area of reservoir 63000 38000 m2
(f) Evaporational width of reservoir at 50% 111 m (b) Add Mean Annual Rainfall
- for open cast pit 39600 673 26651 26651 26651 26651 26651 0 0 0
Block 2 - Areas affected by Dirty Water - for Evaporation dam 38000 673 25574 25574 25574 25574 25574 25574 25574 25574
(a) Estimated Strip width in mining pit 30.0 m
(b) Estiamted Strip length 440 m (c) Add Mean Annual Runoff
(c) Estimated Area of a strip 13200 m2 - for ROM stockpile & dirty areas 3000 44.5 134 134 134 134 134 0 0 0
(d) No of concurrent open strips 3
(e) Total surface area of 3 strips 39600 m2 (d) Add Groundwater inflow
(f) ROM stockpile & other dirty areas 3000 m2 - for open cast pit @ 150m3/day 30 m3/day extra/yr 10950 21900 32850 43800 54750 0 0 0
(30m3/d) (60m3/d) (90m3/d) (120m3/d) (150m3/d)
Block 3 - Runoff and Evaporation Data (e) Subtract Mean Annual Evaporation
(a) MAR reported for X11C 44.5 mm/yr - for Evaporation dam 33744 -1774 -59862 -59862 -59862 -59862 -59862 -59862 -59862 -59862
(b) Mean evaportation 1774 mm - for pit @ 20% of MAP 39600 -135 -5330 -5330 -5330 -5330 -5330 0 0 0
(c) Mean Annual Precipitation 673 mm
(f) Balance excl 24hr x 1:50 storm -1884 9066 29083 60049 101965 67677 33389 -898
Block 4 - Maximum Permissible Operating Capacity (allow for 1:100 yr storm)
(a) 1:100yr x 24 hr storm 137 mm (g) Operating level % -1.7 8.0 25.7 53.1 90.2 59.9 29.5 -0.8
(b) Total Affected Area 80600 m2
(c) Inflow from storm 11042 m3 (h) Permissible operating % (for 1:100x24hr storm) 90.2 90.2 90.2 90.2 90.2 90.2 90.2 90.2
(d) Maximum permissible operating level 102015 m3
(e) Maximum permissible operating level % 90.2 % (i) Check that (g) < (h). OK OK OK OK OK OK OK OK

26
Appendix D : Water balance Calculations for the purpose of determining the length and storage capacity of the evaportion dam - assuming 250 m3 groundwater inflow per day after 5 years
Block 1 - Reservoir volume Block 5 - Water Balance Calculations for 250 m3/day Ground Water Inflow
(a) Length of reservoir/s 429 m year 1 year 2 year 3 year 4 year 5 year 6 year 7 year 8
(b) Cross sectional area at FSL 377 m2 m3 m3 m3 m3 m3 m3 m3 m3
(c) Storage Volume at FSL 161733 m3 (a) Quantity in Dam brought forward 0 0 9568 37385 83453 147771 99384 50998
(d) Width of dam from crest to crest 125 m Area m2 mm
(e) Catchment area of reservoir 53625 m2
(f) Evaporational width of reservoir at 50% 111 m (b) Add Mean Annual Rainfall
- for open cast pit 39600 673 26651 26651 26651 26651 26651 0 0 0
Block 2 - Areas affected by Dirty Water - for Evaporation dam 53625 673 36090 36090 36090 36090 36090 36090 36090 36090
(a) Estimated Strip width in mining pit 30.0 m
(b) Estiamted Strip length 440 m (c) Add Mean Annual Runoff
(c) Estimated Area of a strip 13200 m2 - for ROM stockpile & dirty areas 3000 44.5 134 134 134 134 134 0 0 0
(d) No of concurrent open strips 3
(e) Total surface area of 3 strips 39600 m2 (d) Add Groundwater inflow
(f) ROM stockpile & other dirty areas 3000 m2 - for open cast pit @ 150m3/day 50 m3/day extra/yr 18250 36500 54750 73000 91250 0 0 0
(30m3/d) (60m3/d) (90m3/d) (120m3/d) (150m3/d)
Block 3 - Runoff and Evaporation Data (e) Subtract Mean Annual Evaporation
(a) MAR reported for X11C 44.5 mm/yr - for Evaporation dam 47619 -1774 -84476 -84476 -84476 -84476 -84476 -84476 -84476 -84476
(b) Mean evaportation 1774 mm - for pit @ 20% of MAP 39600 -135 -5330 -5330 -5330 -5330 -5330 0 0 0
(c) Mean Annual Precipitation 673 mm
(f) Balance excl 24hr x 1:50 storm -8682 9568 37385 83453 147771 99384 50998 2611
Block 4 - Maximum Permissible Operating Capacity (allow for 1:100 yr storm)
(a) 1:100yr x 24 hr storm 137 mm (g) Operating level % -5.4 5.9 23.1 51.6 91.4 61.4 31.5 1.6
(b) Total Affected Area 96225 m2
(c) Inflow from storm 13183 m3 (h) Permissible operating % (for 1:100x24hr storm) 91.8 91.8 91.8 91.8 91.8 91.8 91.8 91.8
(d) Maximum permissible operating level 148550 m3
(e) Maximum permissible operating level % 91.8 % (i) Check that (g) < (h). OK OK OK OK OK OK OK OK

27
Appendix E : Water balance Calculations for the purpose of determining the length and storage capacity of the evaportion dam - assuming 450 m3 groundwater inflow per day after 5 years
Block 1 - Reservoir volume Block 5 - Water Balance Calculations for 450 m3/day Ground Water Inflow
(a) Length of reservoir/s 681 m year 1 year 2 year 3 year 4 year 5 year 6 year 7 year 8
(b) Cross sectional area at FSL 377 m2 m3 m3 m3 m3 m3 m3 m3 m3
(c) Storage Volume at FSL 256737 m3 (a) Quantity in Dam brought forward 0 0 10345 53540 129584 238479 161670 84861
(d) Width of dam from crest to crest 125 m Area m2 mm
(e) Catchment area of reservoir 85125 m2
(f) Evaporational width of reservoir at 50% 111 m (b) Add Mean Annual Rainfall
- for open cast pit 39600 673 26651 26651 26651 26651 26651 0 0 0
Block 2 - Areas affected by Dirty Water - for Evaporation dam 85125 673 57289 57289 57289 57289 57289 57289 57289 57289
(a) Estimated Strip width in mining pit 30.0 m
(b) Estiamted Strip length 440 m (c) Add Mean Annual Runoff
(c) Estimated Area of a strip 13200 m2 - for ROM stockpile & dirty areas 3000 44.5 134 134 134 134 134 0 0 0
(d) No of concurrent open strips 3
(e) Total surface area of 3 strips 39600 m2 (d) Add Groundwater inflow
(f) ROM stockpile & other dirty areas 3000 m2 - for open cast pit @ 150m3/day 90 m3/day extra/yr 32850 65700 98550 131400 164250 0 0 0
(30m3/d) (60m3/d) (90m3/d) (120m3/d) (150m3/d)
Block 3 - Runoff and Evaporation Data (e) Subtract Mean Annual Evaporation
(a) MAR reported for X11C 44.5 mm/yr - for Evaporation dam 75591 -1774 -134098 -134098 -134098 -134098 -134098 -134098 -134098 -134098
(b) Mean evaportation 1774 mm - for pit @ 20% of MAP 39600 -135 -5330 -5330 -5330 -5330 -5330 0 0 0
(c) Mean Annual Precipitation 673 mm
(f) Balance excl 24hr x 1:50 storm -22505 10345 53540 129584 238479 161670 84861 8051
Block 4 - Maximum Permissible Operating Capacity (allow for 1:100 yr storm)
(a) 1:100yr x 24 hr storm 137 mm (g) Operating level % -8.8 4.0 20.9 50.5 92.9 63.0 33.1 3.1
(b) Total Affected Area 127725 m2
(c) Inflow from storm 17498 m3 (h) Permissible operating % (for 1:100x24hr storm) 93.2 93.2 93.2 93.2 93.2 93.2 93.2 93.2
(d) Maximum permissible operating level 239239 m3
(e) Maximum permissible operating level % 93.2 % (i) Check that (g) < (h). OK OK OK OK OK OK OK OK

28
Capacity of Reservoir
Length of dam 1 m
Width of reservoir at FSL 120 m
Width of dam along 3% slope 103.35 m
Width of large triangle 11.9 m
Slope of embankment 0.4
Height of large triangle 4.76 m
Area of large triangle 28.3 m2
Width of small triangle 4.75 m
Slope of berm 0.4
Height of small triangle 1.9 m
Area of small triangle 4.5 m2
Area of middle section 344.2 m2
Total cross section 377.0 m2
Volume at FSL 377.0 m3
Volume of Earth Embankment
Height of dam 5.7 m
Slope of embankments 0.4 m
Width of triangles 14.25 m
Width at top of embankment 3 m
Sectional area 98.3 m2
Total volume of embankment 98.3 m3
Volume of Earth Berm
Height of dam 1.8 m
Slope of embankments 0.4 m
Width of triangles 4.5 m
Width at top of embankment 1.5 m
Sectional area 10.8 m2
Total volume of berm 10.8 m3
Total volume of compacted Earthworks 109 m3
Excavation
Average Length of dig out 105 m
Average Depth of excavation 1.1 m
Total Excavated volume 115.5 m3
Allowance for Consolidation 5.5 %
Appendix F - Capacity Calculations for Unit Length of Reservoir and Earth Embankments

29
Rational method Flow
from Catchment dirty canal
reservoir berm-
channel
Onverdaght berm -
section 3
Onverdaght berm -
section 4
Rainfall Intensity mm/hr 120 120 120 120
Rainfall Intensity inch/hr 4.72 4.72 4.72 4.72
length of catchment m 304 1000 400
width of catchment m 40 200 200
area of catchment m2
42600 15160 203000 83000
area of catchment acres 10.5 3.7 50.2 20.5
rational coefficient 0.80 0.39 0.39 0.39
Flow from catchment ft3/sec 39.8 6.90 92.4 37.8
Flow from catchment m3/sec 1.12 0.194 2.60 1.06
WARNING OK OK OK
Manning Flow in
Channels dirty canal
reservoir berm-
channel
Onverdaght berm -
section 3
Onverdaght berm -
section 4
selected slope 0.0250 0.001 0.002 0.03
width of flow ft 3.289 33.8 76.0 38.0
width of flow m 1.000 10.3 23.1 11.6
depth of flow ft 3.289 1.41 3.32 1.12
iterate depth of flow m 1.00 0.430 1.01 0.34
sectional wetted area ft2 10.8 47.8 252.6 42.5
sectional wetted area m2 1.0 4.4 23.3 3.9
wetted perimeter ft 9.9 51.0 119.7 40.3
hydraulic radius ft 1.1 0.9 2.1 1.1
Manning coefficient ft 0,16666 0.025 0.03 0.03 0.03
Velocity ft/s 1.01 0.15 0.37 0.90
Velocity m/s 0.307 0.05 0.11 0.27
flow in channel m3/s 0.307 0.203 2.611 1.072
Appendix G - Capacity of Channels