Embed Size (px)
Citation preview

u.s. Department of the Interior U.S. Geological Survey
ARSENIC AND METALS IN SOILS IN THE VICINITY OF THE IMPERIAL OIL COMPANY SUPERFUND SITE, MARLBORO TOWNSHIP, MONMOUTH COUNTY, NEW JERSEY
u.s. GEOLOGICAL SURVEY
Water-Resources Investigations Report 98-4016
Prepared in cooperation with the
U.S. ENVIRONMENTAL PROTECTION AGENCY and the
NEW JERSEY DEPARTMENT OF ENVIRONMENTAL PROTECTION

ARSENIC AND METALS IN SOILS IN THE VICINITYOF THE IMPERIAL OIL COMPANY SUPERFUND SITE,MARLBORO TOWNSHIP, MONMOUTH COUNTY,NEW JERSEY
By Julia L. Barringer, Zoltan Szabo, and Thomas H. Barringer
u.s. GEOLOGICAL SURVEY
Water-Resources Investigations Report 98-4016
Prepared in cooperation with the
U.S. ENVIRONMENTAL PROTECTION AGENCY and the
NEW JERSEY DEPARTMENT OF ENVIRONMENTAL PROTECTION
West Trenton, New Jersey
1998
_USGSscience for achanging world

u.s. DEPARTMENT OF THE INTERIOR
BRUCE BABBITT, Secretary
u.s. GEOLOGICAL SURVEY
Thomas J. Casadevall, Acting Director
For additional information Copies of this report can bewrite to: purchased from:
District Chief U.S. Geological SurveyU.S Geological SUivey Branch of InfOimation ServicesMountain View Office Park Box 25286810 Bear Tavern Road, Suite 206 Denver, CO 80225-0286West Trenton, NJ 08628

CONTENTS
Page
Abstract 1Introduction 2
Acknowledgments 4Historical background 5
DiscovelY of arsenic contamination of soils 5Past activities at the Imperial Oil Company site 5FOlmer land use in the study area 6
Undeveloped forested and agricultural areas 6Residential area 1 7Residential area 2 10
Geology and soils 10Geology 10Soils 12
Mobility of metallic substances in soils 15Arsenic : 17Barium 17Copper 17Lead 18Zinc 18
Study approach and methods 19Design of study 19
Sampling-network development 19Analytical strategy 25
Soil sampling. sample preparation. and soil analysis .26Soil sampling 26Sample preparation 27Soil analysis 28
Air-flow modeling 28Data analysis 29
Data conditioning 29Statistical analysis 31
Quality-assurance program 32Objectives 32Design 33
Sample collection and prcparation 35Sample analysis 36Air-flow modeling 37
Soil-profile characteristics and mineralogy at sample-collection sites 37Characteristics of soil profiles at sample-collection sites 37Mineralogy of soil sanlples 38
Distribution of arsenic and metals in soils .38Vertical distribution of arsenic and metals in undisturbed soil profiles .38
III

CONTENTS--Continued
Page
Arsenic 41Barium 43Copper 43Lead 44Zinc 44Other metals 44
Geochemical associations among selected metallic constituents .45Relations of soil characteristics and concentrations of arsenic and metals to land use .48
Relation of soil characteristics to land use 48Absence of soil horizons 48Presence of foreign debris 48
Relation of concentrations of arsenic and metals to land use 51Imperial Oil Company Superfund site 53Study area 55
Arsenic 55Barium: : 63Copper 65Lead 65Lead isotopes 70Zinc 72Other metals 72
Relation of geochemical associations among constituentli to land use 75Classification of soils by land use 80
Nonrepresentative soil samples 80Representative soil samples 82
Classification of soil samples by lcad-isotope ratios 86Sources of arsenic and metals in soils 89
Natural sources 89Imperial Oil Company Superfund site 90
Smokestack plume 90Earth-moving and other activities 94
Orchard pesticides 95Summary and conclusions 97References cited 99Appendix I--Summary of analytical methods and chemical and field data for soil samples
collected during 1995-96, Imperial Oil Company Superfund site study area,New Jersey 106
Appendix 2--Sample collection, preparation, and documentation 211Appendix 3--Preliminary air-emission model 219Appendix 4-Quality assurance 223Appendix 5-Statistical analysis of chemical data 235
IV

ILLUSTRATIONS
Page
Figure l. Map showing location of Imperial Oil Company Superfund site and nearbyresidential areas, Marlboro Township, Monmouth County, New Jersey 3
2. Map showing part of the study area, showing orchards and forests digitizedfrom aerial photographs taken in 1932 8
3. Aerial photographs showing part of the study area in 1932 and 1940 9
4. Map showing outcrop areas of the Woodbury, Englishtown, andMarshalltown Formations in the study area II
5. Section showing stratigraphy of soils and sediments at eight locations north ofOrchard Parkway in residential area 2, Marlboro Township, MonmouthCounty, New Jersey 13
6. Section showing stratigraphy of soils and sediments at seven locations south ofOrchard Parkway in residential area 2, Marlboro Township, Monmouth County,New Jersey 14
7. Diagram showing idealized soil profile, New Jersey Coastal Plain soils 16
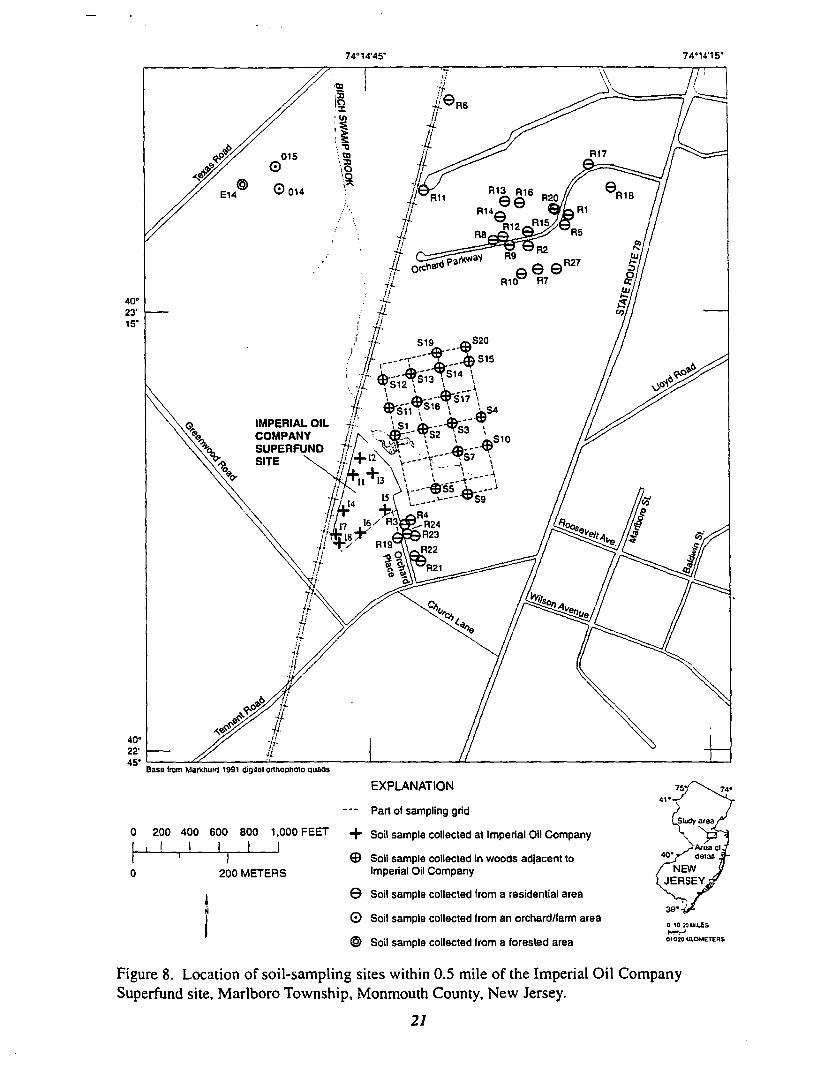
8. Map showing location of soil-sampling sites within 0.5 mile of the ImperialOil Company Superfund site, Marlboro Township, Monmouth County,New Jersey 21
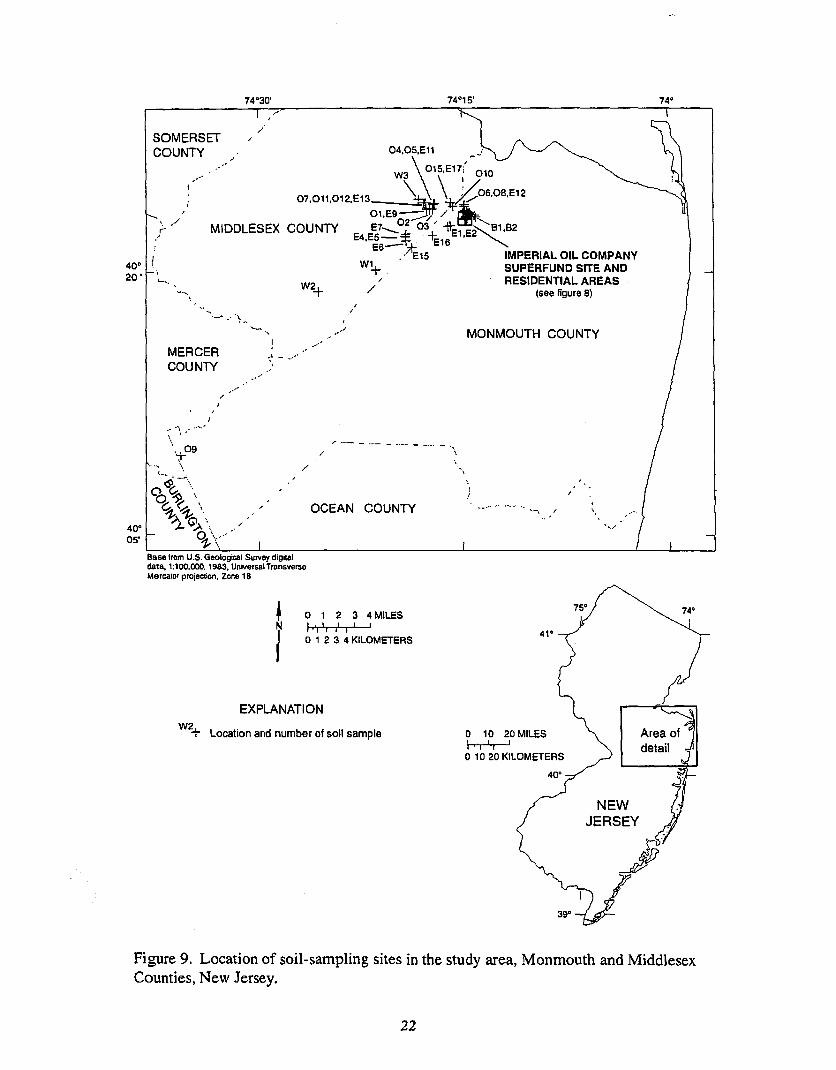
9. Map showing location of soil-sampling sites in the study area, Monmouth andMiddlesex Counties, New Jersey .22
10. Graphs showing concentrations of arsenic and lead in soil profiles fromundeveloped areas, orchards, and residential areas, Monmouth andMiddlesex Counties, New Jersey .42
II. Graph showing relation of arsenic concentrations to iron concentrations andaluminum concentrations in A-horizon soil samples, Monmouth andMiddlesex Counties, New Jersey .46
12. Boxplots showing distribution of arsenic concentrations in soil and claysamples from undeveloped forested areas, Monmouth and MiddlesexCounties, New Jersey 47
13. Graphs showing relation of lead concentrations and copper concentrations tototal organic carbon concentrations in A-horizon soil samples, Monmouthand Middlesex Counties, New Jersey .49
14. Photographs of cindery slag and brick fragments from soils at and near theImperial Oil Company Superfund site, Marlboro Township, MonmouthCounty, New Jersey 50
15. Map showing locations of buildings and other features at, and metalconcentrations in soil samples from, the Imperial Oil Company Superfund site,Marlboro Township, Monmouth County, New Jersey 52
v

ILLUSTRATIONS-Continued
Page
Figure 16. Boxplots showing distribution of arsenic concentrations in soil horizons andclays by endmember usc, Monmouth and Middlesex Counties, New Jersey 56
17. Boxplots showing distribution of arsenic concentrations in soil horizons andclays in woods and residential areas adjacent to and near the Imperial OilCompany Superfund site, Marlboro Township, Monmouth County, NewJersey 60
18. Map showing arsenic concentrations in A-horizon soils in the vicinity of theImperial Oil Company Superfund site, Marlboro Township, MonmouthCounty. New Jersey 61
19. Map showing arsenic concentrations in A-horizon soils more than 0.5 milefrom the Imperial Oil Company Superfund site. Marlboro Township,Monmouth County, New Jersey 62
20. Boxplots showing distribution of barium concentrations in samples from soilhorizons and clays by land use, Monmouth and Middlesex Counties,New Jersey 64
21. Boxplots showing distribution of copper concentrations in samples from soilhorizons and clays by land use, Monmouth and Middlesex Counties,New Jersey 66
22. Boxplots showing distribution of lead concentrations in samples from soilhorizons and clays by endmember land use, Monmouth and MiddlesexCounties, New Jersey 68
23. Boxplots showing distribution of lead concentrations in samples from soilhorizons and clays in residential arcas in the vicinity ofthe Imperial OilCompany Superfund site, Marlboro Township, Monmouth County, NewJersey 69
24. Boxplots showing distribution of zinc concentrations in samples from soilhorizons and clays by land use, Monmouth and Middlesex Counties, NewJersey 73
25. Boxplots showing distribution of iron concentrations in samples from soilhorizons and clays by land use, Monmouth and Middlesex Counties, NewJersey 74
26. Graph showing proportions of arsenic, barium, and zinc in A-horizon soilsamples from different land-usc areas, Monmouth and Middlesex Counties,New Jersey 76
27. Graph showing relation of nickel concentration to total organic carbonconcentration in A-hOlizon soil samples from different land-use areas,Monmouth and Middlesex Counties, New Jersey 78
28. Graph showing logarithmic relation between barium and copper concentrationsin A-horizon soils from different land-use areas, Monmouth and MiddlesexCounties, New Jersey 79
vi
ILLUSTRATIONS-Continued
Page
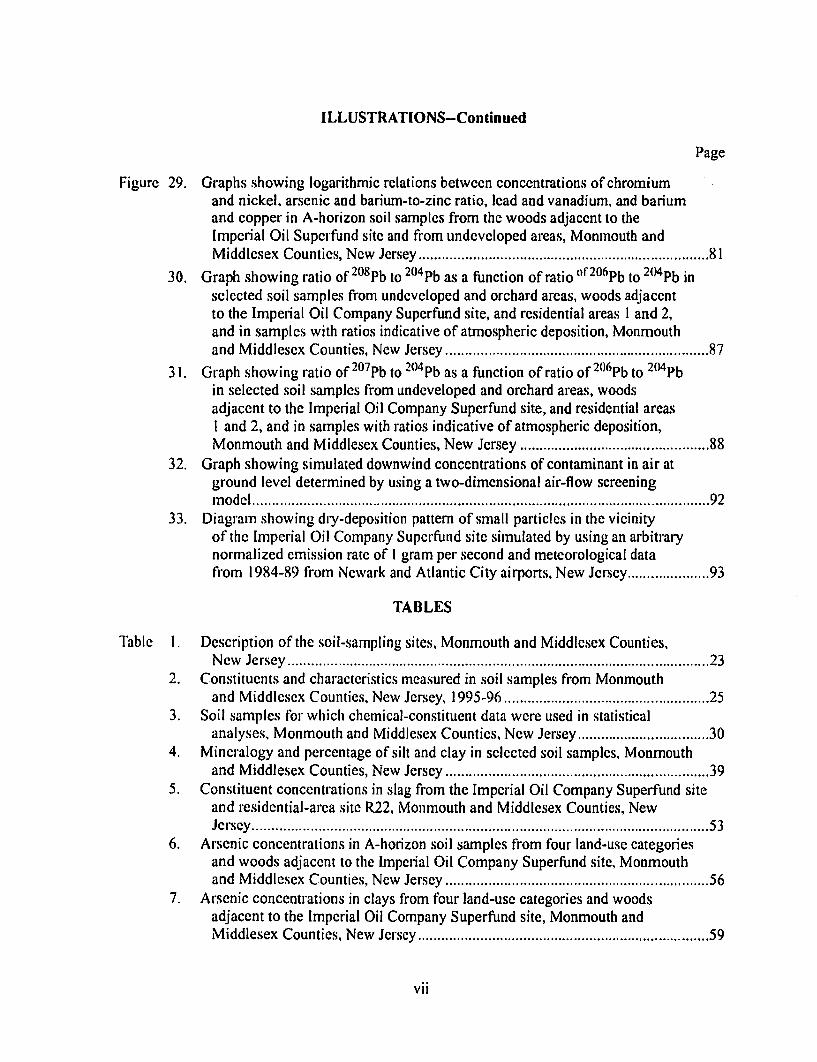
Figure 29. Graphs showing logarithmic relations between concentrations of chromiumand nickel, arsenic and barium-to-zinc ratio, lead and vanadium, and bariumand copper in A-horizon soil samples from the woods adjacent to theImperial Oil Superfund site and from undeveloped areas, Monmouth andMiddlesex Counties, New Jersey 81
20830. Graph showing ratio of Pb to 204Pb as a function of ratio or206Pb to 204Pb inselected soil samples from undeveloped and orchard areas, woods adjaccntto the Imperial Oil Company Superfund site, and residential areas I and 2,and in samples with ratios indicative of atmospheric deposition, Monmouthand Middlesex Counties, New Jersey 87
31. Graph showing ratio of 207Pb to 204Pb as a function of ratio of 2Cl6Pb to 2Cl4Pbin selected soil samples from undeveloped and orchard areas, woodsadjacent to thc Imperial Oil Company Superfund site, and residential areasI and 2, and in samples with ratios indicative of atmospheric deposition,Monmouth and Middlesex Counties, New Jersey 88
32. Graph showing simulated downwind concentrations of contaminant in air atground level determined by using a two-dimensional air-flow screeningmodel 92
33. Diagram showing dry-deposition pattern of small particles in the vicinityof the Imperial Oil Company Superfund site simulated by using an arbitrarynormalized emission rate of I gram per second and meteorological datafrom 1984-89 from Newark and Atlantic City airports, New Jersey 93
TABLES
Table I. Description of the soil-sampling sites, Monmouth and Middlesex Counties,New Jersey 23
2. Constituents and characteristics measured in soil samples from Monmouthand Middlescx Counties, New Jersey, 1995-96 25
3. Soil samples for which chemical-constituent data were used in statisticalanalyses, Monmouth and Middlesex Counties. New Jersey 30
4. Mineralogy and percentage of silt and clay in selccted soil samples, Monmouthand Middlesex Counties, New Jersey .39
5. Constituent concentrations in slag from the Imperial Oil Company Superfund siteand residential-area site R22, Monmouth and Middlesex Counties, NewJersey 53
6. Arsenic concentrations in A-horizon soil samples from four land-use categoriesand woods adjacent to the Impcrial Oil Company Superfund site, Monmouthand Middlesex Counties, New Jersey 56
7. Arsenic concentrations in clays from four land-use categories and woodsadjacent to the Impetial Oil Company Superfund site, Monmouth andMiddlesex Counties. New Jersey 59
VII
TABLES-Continued
Page
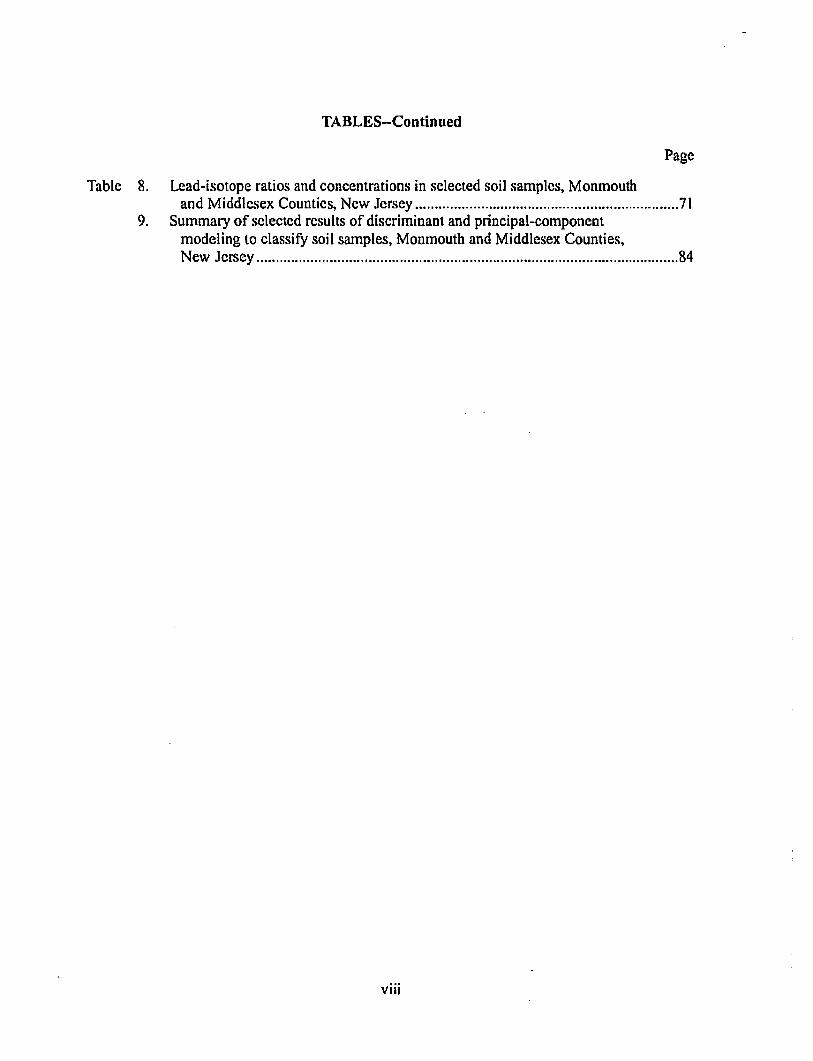
Table 8. Lead-isotope ratios and concentrations in selected soil samples, Monmouthand Middlesex Counties, New Jersey 71
9. Summary of selected results of discriminant and principal-componentmodeling to classify soil samples, Monmouth and Middlesex Counties,New Jersey 84
viii

CONVERSION FACTORS, VERTICAL DATUM, ANDABBREVIATIONS
Multiply ~ To obtain
Length
inch (in.) 25.4 millimeter (mm)inch (in'> 2.54 centimeter (cm)foot (ft) 0.3048 meter (m)mile (mi) 1.609 kilometer
acre 4,047 square meter (m2)
acre 0.4047 hectaresquare foot (ft2) 0.09294 square meter
Volume
ounce, fluid (fl. oz) 29.57 milliliter (mL)ounce, fluid (fl. oz) 0.02957 liter (L)pint (pt) 0.4732 literquart (qt) 0.9464 litergallon (gal) 3.785 liter
ounce, avoirdupois (oz) 28.35 gram (g)ounce, avoirdupois (oz) 28,350 milligram (mg)ounce, avoirdupois (oz) 28,350,000 microgram (J..lg)pound, avoirdupois (lb) 0.4536 kilogram (kg)
Temperature
degree Fahrenheit (OF) degree Celsius (0C)
Vertical Datum
Sea level: In this report "sea level" refers to the National Geodetic Vertical Datum of 1929-- ageodetic datum derived from a general adjustment of the first-order level nets of the UnitedStates and Canada, formerly caUed Sea Level Datum of 1929.
Abbreviations
gls - grams per secondJ..lg/s - micrograms per secondmls - meters per secondmg/kg - milligrams per kilogramJ..lg/kg - micrograms per kilogrammg/m2 - milligrams per square meterppm - parts per million (equivalent to mg/kg)
IX

CONVERSION FACTORS, VERTICAL DATUM, AND'ABBREVIATIONS--Confinued'
AI -aluminumAs' - arsenicBa - bariumCa -calciumCr -chromiumCu -copperFe - ironH -hydrogenK - potassiumMg -magnesiumMn -manganeseNi - nickelo -oxygenPb -leads - sulfurTOe - total o!ganic carbonv -vanadiumZn -zinc
x

ARSENIC AND METALS IN SOILS IN THE VICINITYOF THE IMPERIAL OIL COMPANY SUPERFUND SITE,
MARLBORO TOWNSHIP, MONMOUTH COUNTY,NEW JERSEY
Julia L. Barringer, Zoltan Szabo, and Thomas H. Barringer
ABSTRACT
Concentrations of arsenic exceed the New Jersey State Cleanup Criterion of 20 parts permillion in sandy and clay-rich soils of two residential areas in the vicinity of the Imperial OilCompany Superfund site in Marlboro Township, Monmouth County, New Jersey. Industrial activities at this Superfund site included possible roasting of arsenical ores and the production ofarsenical pesticides from about 1917 to 1945; arsenic concentrations that grcatly exceed 20 partsper million have been measured in soils at the Superfund site. Although the Imperial Oil Company Superfund site potentially is a source of the arsenic found in the soi Is of nearby residentialareas, identification of the source is complicated by the presence of minerals in the geologic substrate that can contain arsenic, and possible past use of arsenical pesticides in the orchards uponwhich the residential areas were built. Residential area I is adjacent to the Superfund site; residential area 2 is 0.5 mile to the north-northeast and was developed on former orchard land.
In order to determine the source of the arsenic and metals in soils in the two residentialarcas, soil samples were collected from (I) long-term forested areas, to determine backgroundgeologic and regional atmospheric inputs of arsenic and metals; (2) former and current orchards,to assess the range of concentrations ofarsenic and metals that could be contributed by past use ofpesticides; (3) the Imperial Oil Company Superfund site, to characterize the chemical composition of contamination from activities at the site; (4) a wooded area adjacent to the Superfund site,to detelmine whether arsenic and metals from the Superfund site were evident; and (5) the tworesidential areas, to compare soil chemistry in these areas with the chemistry of soils from forests,orchards, and the Superfund site.
The soil samples were divided by soil horizon and were analyzed for 23 metals and metalloids, total organic carbon, and total sulfur. Results of chemical analyses were stratified by horizon and analyzed statistically to compare data scts among land uses. A chemical signature for Ahorizon soils in each "endmember" land-usc group (undeveloped, geologic and regional atmospheric input; orchard, pesticide input; and Imperial Oil Company Superfund site, industrialinput) was developed by using graphical methods and multivariate statistical procedures. Additionally, air-flow models were used to determine whether roasting of arsenic at the Imperial OilCompany Superfund site was a possible source of arsenic in the soils.
The precision and accuracy of the soil analyses achieved by the laboratories did not meetthe low analytical uncertainty required in the workplan developed at the beginning of the study,and analytical difficulties prevented use of data for a few analytes. Nor was it possible to collectundisturbed, contaminated soil samples from the Imperial Oil Company Superfund site. as specified in the workplan. Nevertheless. despite these modifications to the workplan, the chemistry of
1
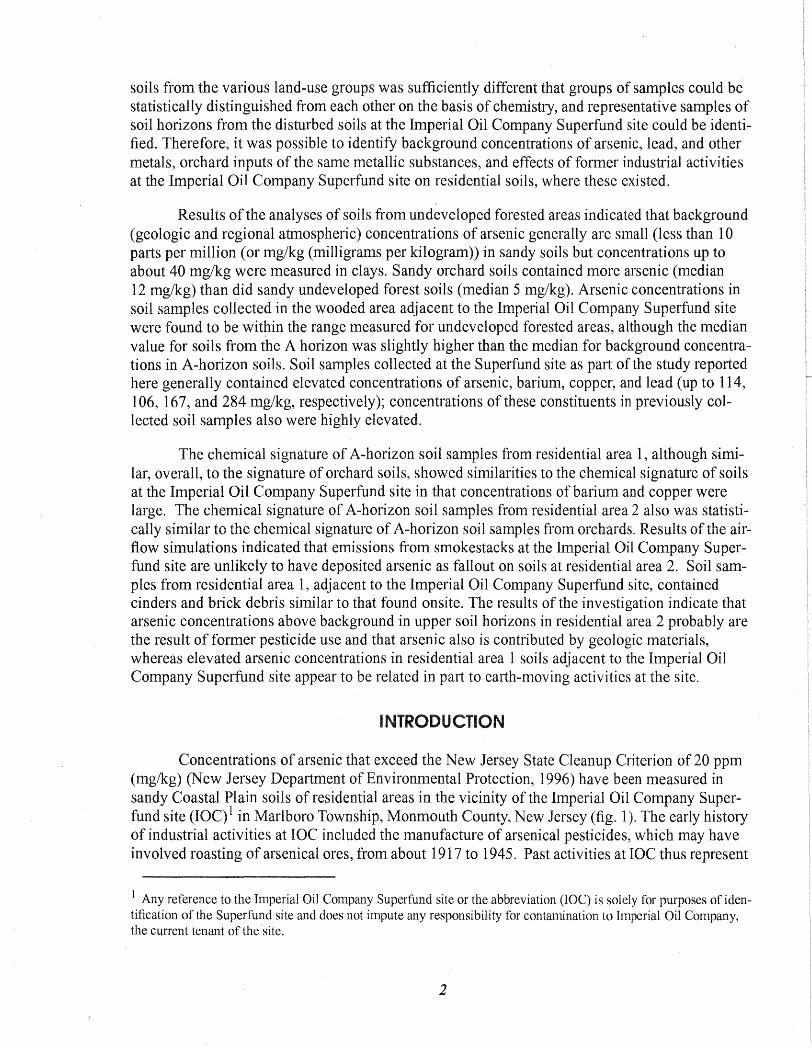
soils from the various land-use groups was sufficiently different that groups of samples could be statistically distinguished from each other on the basis of chemistry, and representative samples of soil horizons from the disturbed soils at the Imperial Oil Company Superfund site could be identified. Therefore, it was possible to identify background concentrations of arsenic, lead, and other metals, orchard inputs of the same metallic substances, and effects of former industrial activities at the Imperial Oil Company Superfund site on residential soils, where these existed.
Results of the analyses of soils from undeveloped forested areas indicated that background (geologic and regional atmospheric) concentrations of arsenic generally are small (less than 10 parts per million (or mg/kg (milligrams per kilogram)) in sandy soils but concentrations up to about 40 mg/kg were measured in clays. Sandy orchard soils contained more arsenic (median 12 mg/kg) than did sandy undeveloped forest soils (median 5 mg/kg). Arsenic concentrations in soil samples collected in the wooded area adjacent to the Imperial Oil Company Superfund site were found to be wit~in the range measured for undeveloped forested areas, although the median value for soils from the A horizon was slightly higher than the median for background concentrations in A-horizon soils. Soil samples collected at the Superfund site as part of the study reported here generally contained elevated concentrations of arsenic, barium, copper, and lead (up to 114, 106, 167, and 284 mg/kg, respectively); concentrations of these constituents in previously collected soil samples also were highly elevated.
The chemical signature of A-horizon soil samples from residential area 1, although similar, overall, to the signature of orchard soils, showed similarities to the chemical signature of soils at the Imperial Oil Company Superfund site in that concentrations of barium and copper were large. The chemical signature of A-horizon soil samples from residential area 2 also was statistically similar to the chemical signature of A-horizon soil samples from orchards. Results of the airflow simulations indicated that emissions from smokestacks at the Imperial Oil Company Superfund site are unlikely to have deposited arsenic as fallout on soils at residential area 2. Soil samples from residential area 1, adjacent to the Imperial Oil Company Superfund site, contained cinders and brick debris similar to that found onsite. The results of the investigation indicate that arsenic concentrations above background in upper soil horizons in residential area 2 probably are the result of former pesticide use and that arsenic also is contlibuted by geologic materials, whereas elevated arsenic concentrations in residential area 1 soils adjacent to the Imperial Oil Company Superfund site appear to be related in P~Ht to earth-moving activities at the site.
INTRODUCTION
Concentrations of arsenic that exceed the New Jersey State Cleanup Criterion of 20 ppm (mg/kg) (New Jersey Department of Environmental Protection, 1996) have been measured in sandy Coastal Plain soils of residential areas in the vicinity of the Imperial Oil Company Super
1 fund site (IOC) in Marlboro Township, Monmouth County, New Jersey (fig. 1). The early history of industrial activities at IOC included the manufacture of arsenical pesticides, which may have involved roasting of arsenical ores, from about 1917 to 1945. Past activities at IOC thus represent
1 Any reference to the Imperial Oil Company Superfund site or the abbreviation (IOC) is solely for purposes of identification of the Superfund site and does not impute any responsibility for contamination to Imperial Oil Company, the current tenant of the site.
2

40° 23' ~ 15" Inset, figures 5 and 6
40° 22' 45" '-Ba-s-e -fro...£.m"-M-a-rk-hu-rd-1-LJ.9-91-d-jg-jta-1 o-rt-hP-h---'ot-o q-u-art-e-r q-U-ad-s.L1.----------------'------'
o 200 400 600 800 1,000 FEET
o 200 METERS
Newar~
o 10 20 MILES
o ~
1020 KILOMETERS
NEW JERSEY
Figure 1. Location of Imperial Oil Company Superfund site and nearby residential areas, Marlboro Township, Monmouth County, New Jersey.
3

a possible source of the arsenic found in the residential soil. Additionally, parts of the residentialareas were built on former orchard land where arsenical pesticides may have been used, and theunderlying geologic substrate of the Englishtown Formation may include minerals that containarsenic. The presence of multiple possible sources of arsenic complicates the identification of theactual source or sources of the elevated arsenic concentrations, and adds complexity to decisionsregarding remediation effons.
In August 1995, the u.s. Geological Survey (USGS) designed a study of the possiblesources of arsenic and of metals such as lead, also found in elevated concentrations in the soils,for the U.S. Environmental Protection Agency (USEPA). The study was conducted for theUSEPA by the USGS, with the assistance of the New Jersey Department of Environmental Protection (NJDEP), beginning in October 1995.
The overall purpose of the study was to determine the source or sources of arsenic andmetals that occur in elevated concentrations in the soils of the residential areas adjacent to andnonh ofiOC. The study had three specific objectives: (1) to determine "background" (geologicand regional atmospheric) concentrations of arsenic and metals in area soils; (2) to assess therange of concentrations of arsenic and metals that could be introduced to area soils by possibleemanations from IOC, either as smokestack fallout or from dumping of wastes, and by pesticideapplications in an agricultural setting; and (3) to determine "chemical signatures" of soils fromdifferent land uses for comparison with chemical signatures of soils from the residential areas.
The results of the investigation are presented in this report. These include results of identification, sampling, and chemical and mineralogical analysis of soils developed on the Englishtown and Woodbury Formations from (1) 17 sites in long-term forested areas where backgroundconcentrations of arsenic, lead. and other metals could be measured; (2) 15 sites in former or current orchards where agricultural contributions of arsenic, lead, and other metals to soils could bedetermined; and (3) 8 sites at 10C and 17 sites in the woods adjacent to 10C, where alterations tosoil chemistry from industrial activities could be determined. Results ofanalyses ofsoils from 29sites in residential areas adjacent to and near 10C also are presented, and chemical characteristicsof residential, industrial, orchard, and background soils are compared. Additionally, results of airflow modeling, used to detennine the possible extent of deposition from a smokestack plume, arepresented and discussed.
Ackoowledgmeof§
The authors gratefully acknowledge Trevor Anderson of USEPA and Joseph Maher,project manager at NJDEP, for their assistance. NJDEP staff Steven Byrnes and John Evensonworked closely with the authors in collecting and shipping samples; Chad Van Sciver ofNJDEPalso assisted in sample collection. Mindy Mumford ofNJDEP gave invaluable assistance inobtaining permission from landowners to sample soils. The authors thank Kathleen Grimes, Winnie Chu, Joseph Sanguiliano, and Gregory Toffoli ofNJDEP for validating the analytical data.Kevin Schick, William Lowery, Paul Zarillo, and Thomas Cozzi of NJDEP also assisted theauthors. Peter Sugarman of the New Jersey Geological Survey (NJGS) gave unstintingly of histime and knowledge of area geology.Thanks are due to John Dooley and Frederick L. Muller ofNJGS. who perfonned the mineral analyses, and to Paul Lamothe of the USGS, who coordinated
4

the total-sulfur analyses. The authors also acknowledge Joann Held and Roben Huizer ofNJDEPfor constructing the dry-deposition simulation model. Dennis Dunn of the Sachs Group providedadvice on statistical analyses.
The authors thank their USGS colleagues Nicholas Smith, Robert Rosman, and TimothyOden for collecting the soil samples. Thanks are also due to Donald Rice and William Ellis,USGS, for GIS and cartographic work, and to Vincent DePaul, who helped with field work andillustrations. The authors are grateful to Timothy Wilson and Eric Vowinkcl, also of USGS, forhelp and advice throughout the course of the project, and to Dale Simmons, Ruth Larkins, IngridHeerwagen, and Melicia Morgan for their work on the final report.
The authors thank Elizabeth Poulsen of the Burnt Fly Bog/Imperial Oil Citizens' ActionCommittee for assistance in obtaining access for soil sampling, and Lester Jargowski, MonmouthCounty Health Department, for supplying valuable background information on the area. Finally,the authors extend their gratitude to the property owners who allowed us access to their prope11yfor soil sampling.
J:Uitorjcal Background,
Past land use in Marlboro Township can be determined from aerial photographs takenover the past 60 years. Although the general character of the industrial activities at the site ofIOCis known, many details are not readily available or have never been recorded; therefore, the depthof historical information about activities at IOC and in the surrounding area is limited.
Discovery of Arsenic Contamination of Soils
As part of the routine investigation ofcontamination at IOC, 16 samples of soils from several nearby residences were collected during 1994-95 by the contractor for NJDEP. Some of thesoil samples were found to contain elevated concentrations of arsenic and (or) lead, and metalssuch as beryllium, cadmium. and mercury were present in measurable concentrations in severalsamples (L. Robert Kimball and Associates, 1995). Subsequent sampling of soils in 1995 byNJDEP at residences next to IOC (residential area I) and about 0.5 mi north-northeast of IOC(residential area 2) confinned earlier findings and revealed a more widespread pattern of elevatedarsenic and lead concentrations. Arsenic concentrations in the residential areas in samples fromthe upper 6 in. ofsoil range from 1.2 to 220 mg/kg (Steven Byrnes, New Jersey Department ofEnvironmental Protection, written commun., 1995); lead concentrations ranged from 7.0 to417 mg/kg. Arsenic and lead concentrations as large as 92 and 836 mg/kg, respectively, weremeasured in samples from depths of 12 to 18 in.
Past Activities at the Imperial Oil Company Site
Industrial activities at the IOC location, the active part of which consists of about 4.2acres, began in 1912 when the original buildings were constructed. Tomato ketchup and pastewere produced at the site until 1917, when Stratford Chemical Company2 began producing
2 Usc of company names is for identification Jlurposes only. and docs not impute responsibility for contamination tothe companies identified.
5

arsenic acid and calcium arsenate (E.C. Jordan Co., 1992). Calcium arsenate is a pesticide formerly used on some vegetable crops and on cotton crops until recently, and arsenic acid was usedas a desiccant for cotton bolls before harvesting. Arsenical copper ores are believed to have beenroasted at the site (Steven Byrnes, oral commun., 1995), and two ovens with smokestacks about30 ft high still exist as part of the original brick buildings. As a result of later modifications byImperial Oil Company, the ovens arc not accessible at this time.
The company name was changed to Brocker Chemical Company in the 1930's. Production of arsenical compounds continued until about 1945, when the bankrupt Brocker ChemicalCompany sold the site to S.B. Penick and Company, which manufactured flavors and essencesuntil 1949 (E.C. Jordan Co., 1992).
Subsequent industrial activities involved oil reclamation operations and oil blending.Champion Chemical Company bought the property in about 1950 and began to reclaim usedmotor oil. The process included washing used oil with caustics, distilling it, and clarifying the distilled oil in large holding tanks with a filter clay (diatomaceous earth). InfOlmation gathered during a remedial investigation by E.C. Jordan Co. indicates that waste washwater was discharged toa lagoon onsite and was also used to oil local dirt roads. The waste filter clay was both piled onsiteand removed to a local dump; oil-contaminated soil also was disposed ofonsite (E. C. Jordan Co.,1992).
In 1969, Imperial Oil Company leased the site from Champion Chemical Company andhas conducted an oil-blending operation there since that time. The site was added to USEPA'sNational Priorities List of hazardous-waste sites in 1982, and currently includes an off.f)ite areawhere industrial wastes apparently accumulated in a wooded wetlands area northwest of theactive part of the site (E. C. Jordan Co., 1992).
Former Land Use in the Study Area
Undeyeloped Forested and Agricultural Areas
The sandy soils and forests of the Pine BalTens in the New Jersey Coastal Plain were considered suitable for grazing cattle and for lumbering in the late 17th century (Wacker, 1979). Thestudy area, which lies partly within the area defined as the Pine Barrens (McCormick and Forman,1979), is likely to have been grazed and extensively lumbered during the 18th century, and someareas probably were farmed during the 18th and 19th centuries; thus, forested areas in the early20th century are unlikely to represent virgin forest.
Agriculture in the study area was devoted largely to general farm crops throughout mostof the 19th century. The sandiest soils are best suited to vegetables such as asparagus (Jenningsand others, 1916), and potatoes were an important crop during the 19th and early 20th centuries(Lee and Tine, 1932). In the early 20th century, vegetable growing was the dominant form of agriculture, and fruit growing had "not been developed to that point where careful attention is givento the selection of orchard sites" (Jennings and others, 1916, p. 12). In the next decade, however,fruit growing apparently increased in the area, as Lee and Tine (1932, p. 13), writing in 1927,
6

state that "The production of fruit. mainly apples with some peaches, is of considerable importance in the...area." Thus, the extensive orchards shown in the 1932 aerial photographs (shown infigure 2 as a geographic information system (GIS) coverage prepared from those photographs)probably had been developed largely during the previous 15 years. After World War II, residential development of former agricultural land began throughout much of New Jersey, and, by themid-1950's, some of the orchards near laC were being converted to housing developments. Residential and commercial development has continued in the area to the present (1997). A few activeorchards can still be found several miles west ofIOC in Monmouth and Middlesex Counties.
Mature forested land shown in aerial photographs from 1932 (see fig. 2) would be likely tocontain trees that are at least 30 to 40 years old and, thus, if formerly cleared, represents reforestation from the late 19th century or earlier. In an 1899 assessment of forests Vermeule (1900, p. 18)repOits that "Monmouth, Mcrcer, and all counties falther north excepting Sussex, show stationaryforest area after 1860" which, according to Vermeule (1900, pl. III), would have been 10 to 20percent forest in the immediate area of laC and 40 to 60 percent forest to the west. Most of theland clearing for agriculture at the turn of the century was taking place in the counties south ofMonmouth and Mercer (Vermeule. 1900). Thus, most of the forested land in the study area identified in aerial photographs taken in 1932 probably has been forested since 1900 or earlier.
Whether arsenical compounds were used on the vegetable crops that were dominant in theagricultural parts of the study area during the 19th century cannot be deciphered from formerland-usc information. Use of inorganic arsenical compounds as insecticides dates to the late 17thcentury, and Paris Green (C4H6As6CU4016) was used in the mid-19th century in the easternUnited States to control the Colorado potato beetl~ (Walsh and Keeney. 1975). In addition to theuse of arsenicals as pesticides, several studies in the 1920's and 1930's indicated that smallamounts of arsenic acted as a growth stimulant for various vegetable and grain crops (Woolsonand others, 1971). Lead arsenate, the current formulations ofwhich were developed at the end ofthe 19th century, was used primarily as a pesticide spray on orchard fruits during the first half ofthe 20th century; larger amounts were used on apples than on peaches.
Resjdentjgl Area 1
The houses of residential area I were built on farmland adjacent to the lot on which theoriginal buildings at lac are visible in an aerial photograph from 1932 (fig. 3a). A rectangularpatch of orchard is present about 400 to 500 ft east of the properties that front Orchard Place,which runs from Tennent Road to the gates at lac. Fragments of orchard may be present at therear of some of the properties on Orchard Place in the 1932 photograph; they are not visible in the1940 aerial photograph (fig. 3b). although the orchard to the east, in an area that is now a parkinglot. is visible. Two large. apparently old. apple trees are present in the yards of the two propertiesclosest to IOC, on either side of Orchard Place.
Large open fields were present between lac and Tennent Road to the west of OrchardPlace in 1932; fields were present east of Orchard Place in 1940, and several structures, includinga long, bam-like structure, had been added. In a 1954 photograph, the barn is not present, andexpansion at the lac property is apparent, with the addition of tanks and other structures.
7

IIJ
40"123' ,
40°19'
74°18'
o 0.25 O.S 0.7S 1 MILEI ,I I I I
I I I I I00.25 0.5 0.75 1 KILOMETER
74°14'
EXPLANATION
~ Forest
III Orchard
• Imperial Oil Company
o Other land use
Road
County boundary
Figure 2. Part of the study area, showing orchards and forests digitized from aerial photographstaken in 1932. (From New Jersey Department of Environmental Protection, Tidelands, Trenton,New Jersey)
8

'0
(a)
o 200 400 600 800 1,000 FEET
o 200 METERS
Residential Area 2
Imperial Oil Superfund site
Residential Area 1
(b)
Tennent Road ------.."C~~4~~~
State Route 79 --~;:-~~~b+~~~l
75°
o 200 400 600 800 1,000 FEET
o 200 METERS
40°
• r
Figure 3. Aerial photographs showing part of the study area in (a) 1932 and (b) 1940. ((a), from New Jersey Department of Environmental Protection, Tidelands, New Jersey, and (b) from Aerial Viewpoint, Houston, Texas: by permission).

Residential Area 2
Residential area 2 is a housing development built mostly on former orchard land. The orchard was active in 1932 and 1940 (fig. 3) and, although several houses had been built by 1954, part of the orchard was still active in the 1950's. Orchard Parkway, which runs through the southern part of the residential area and along which most of the soil sampling has been conducted, was laid out in the 1950's. Old apple trees that are remnants of the former orchards were observed on more than a dozen residential properties in this area during the reconnaissance phase of this study.
Geology and Soils
Geologic units and soils in the study area were mapped in detail within the past decade. Stratigraphy and mineralogy are described by Owens and others (1995). Soils in Monmouth County and Middlesex County are described by Jablonski and Baumley (1989) and Powley (1987), respectively.
Geology
The study area is underlain by unconsolidated sediments of the Atlantic Coastal Plain that form a seaward-thickening wedge of sands and gravels interspersed with silt and clay layers; these sediments, where of regional extent, form a series of aquifers and confining units. The geologic formations range in age from Cretaceous to Holocene (Zapecza, 1989).
Three Cretaceous formations crop out in the vicinity of IOC; the outcrops trend southwest-northeast. The oldest unit, the Woodbury Formation, crops out to the northwest of IOC, and underlies some of the soils sampled for this study. IOC and the nearby residential areas are directly underlain by the Englishtown Formation (fig. 4). The youngest unit, the glauconitic Marshalltown Formation, overlies the Englishtown Formation and crops out to the southeast ofIOe. The Marshalltown Formation does not crop out in any of the areas sampled for this study.
The Englishtown Formation constitutes a major aquifer, as do other sandy units in the New Jersey Coastal Plain. Locally, the sands of the Englishtown Formation contain beds or lenses of clay (Owens and Sohl, ] 969). Soil sampling conducted during the present study indicates that clay lenses are common at shallow depths on hilltops. The Englishtown Formation, which ranges in thickness from 90 to 140 ft, is composed primari ly of quartz sand with some pebbles; feldspar constitutes up to 10 percent of the sand fraction, and muscovite is present in amounts that range from sparse to moderate (Owens and others, 1995). Lignite is found locally and is particularly abundant in the clay layers; pyrite and marcasite also are present, both as finely disseminated grains and as large masses, and are most abundant in carbonaceous layers. Opaque heavy minerals are primarily ilmenite and leucoxene and nonopaque minerals include zircon, tourmaline, rutile, and a variety of metamorphic minerals (Owens and others, 1995). Siderite concretions are found in sands near the base of the formation (Owens and others, 1995).
10

400
23'
400
19'
740 22'
750 740
41 0
o 10 20 MILES
~ o 10 20 KILOMETERS
400
NEW JERSEY
Base modified from U.S. Geological Survey digital data, 1:100,000, and New Jersey Department of Environmental Protection digital data, 1:100,000, 1995
o 0.5 1.0 1.5 2 MILES
I I I I I I I I I
o 0.5 1.0 1.5 2 KILOMETERS
740 18'
MARSHALLTOWN FORMATION
EXPLANATION
Outcrop-area boundary (from Owens and others, 1995)
Road
County boundary
740 14'
""'-t ""'-t
Figure 4. Outcrop areas of the Woodbury, Englishtown, and Marshalltown Formations in the study area. (From Owens and others, 1995)

Welch and others (1988), who summarize geologic sources of arsenic, point out that pyrite and organic matter in marine clays contain arsenic, whereas arsenic tends to be sorbed to nonmarine clays. Sedimentary iron ores and coal also contain substantial amounts of arsenic (Onishi, 1969). Of the minerals reported to be present in the Englishtown Formation, the most likely to contain arsenic are pyrite and marcasite, iron oxyhydroxides, and clay minerals; lignite also may contain arsenic.
The contact of the Englishtown Formation with the underlying Woodbury Formation is gradational over several feet, with the frequency of clay lenses increasing near the base of the Englishtown Formation. Basal clay lenses within the Englishtown Formation are similar in composition to the clays ofthe Woodbury Formation. The distinction between the formations is drawn on the basis of the abundance of sandy strata (Owens and others. 1995), as the Woodbury Formation is composed almost entirely of dark-gray clay-silt with iron oxides present as fracture fillings and as layers in weathered beds near the land surface. Thin stringers of glauconite are found locally near the top of the Woodbury Formation. Both carbonaceous matter and pyrite are generally abundant in the micaceous clays that compose this unit. Thin quartz sand layers are present at the base of the unit (Owens and others, 1995). In addition to lignite, minerals in the Woodbury Formation that can contain arsenic are glauconite, pyrite, iron oxyhydroxides, and clays.
The Woodbury Formation lies about 50 ft below IOC and crops out about 1 mi northwest of the site. A clay lens within the basal Englishtown Formation underlies IOC and the adjacent woods to the east at depths ranging from about 2 to about 20 ft below land surface. Residential area 2 (0.5 mi to the north-northeast of IOC) is underlain by a similar clay lens. This clay is encountered below the top of a small rise at depths of about 2 to 4 ft from land surface (fig. 5). A second clay lens is encountered at lower altitudes in residential area 2 at depths of about 4 ft from land surface (fig. 6, sampling site R 18).
Soils
The soils developed on the Englishtown Formation typically are sandy, but contain substantial amounts of clay where they are developed on clay lenses near the surface. Soil development is controlled by the texture and composition of underlying geologic material, slope, drainage, and length of time the surface is exposed to weathering processes. As weathering proceeds, the geologic material is altered as material is leached from it and plants supply organic debris to the land surface. As a result of weathering and accumulation of organic material, a soil profile develops that is characterized by a sequence of layers or horizons. These horizons are generally classified on the basis of various properties such as amounts of organic material (humus), silicate clays, and iron and aluminum oxides.
In New Jersey Coastal Plain soils, organic (0) horizons that contain organic material in various stages of decomposition may develop at the land surface. Beneath the 0 horizons or at the land surface are gray to dark brown A horizons that contain decomposed organic matter and mineral soil from which iron and aluminum oxides and clays have been leached. In some soils, an E (eluviated) horizon is found beneath the A horizon; this horizon also is leached and contains little organic material, resulting in a paler color soil than that of the A horizon. The materials leached from A and E horizons accumulate at greater depths, creating the B horizons, which
12

126 rf 125
124
123
122
....J 121 w > w 120 ....J
« w 119 (f)
w > 118 0 co « l- ii? w w LL 116 ~
w- 115 0 ::::> I- 114 f= ....J « 113
112
111
110
100
99 0
74°14'40"
40° 23' 25"
40°
~ T""
a: ct) ,... a: N a:
I
74°14'30"
l.q!)(j
<0
II
I.Ci II
EXPLANATION
Line of section
SUI1:::l '-lCe
23' f- rm~ -l e Soil sample collected 20"1 ,,~~n.:. 1 from residential area
o 200 400 600 800 1,000 FEET
o 200 METERS
100 200 300 400
DISTANCE, IN FEET
EXPLANATION
c:=J SAND
PEBBLES/IRONSTONE
SILT/SAND
.. CLAY
o C\I a:
I
R12 SAMPLING SITE
00= 00
DATUM IS SEA LEVEL
VERTICAL SCALE GREATLY EXAGGERATED
500 600
t-
a:
I
700
"-~
Figure 5. Stratigraphy of soils and sediments at eight locations north of Orchard Parkway in residential area 2, Marlboro Township, Monmouth County, New Jersey. (See fig. 1 for location of inset.)

0 T""
131 a:
EXPLANATION 0)-
r-... a: -130 c=J SAND
129 Iggl PEBBLESIIRONSTONE
128
127 ....J W [ij 126 ....J
i1i 125 (J)
W > 124 0 CO « 123 I-W W LL 122
~
W- 121 0 ::> !::: 120
~ « 119
118
117
116
115 0
74°14'40"
40° 23' 25"
40°
74°14'30"
EXPLANATION
Line of section
23' f- Htl~ / 'hJ -l e Soil sample c<?lIected 20" I ,,~ ~ ny I from reSIdentIal area
o 200 400 600 800 1,000 FEET
o 200 METERS
100 200 300 400
DISTANCE, IN FEET
SILT/SAND .. CLAY
R12 SAMPLING SITE
a:
DATUM IS SEA LEVEL VERTICAL SCALE GREATLY EXAGGERATED
500 600 700
co a:
800 850
~
~
Figure 6. Stratigraphy of soils and sediments at seven locations south of Orchard Parkway in residential area 2, Marlboro Township, Monmouth County, New Jersey. (See fig. 1 for location of inset.)

contain iron and aluminum oxides and clays. B horizons typically are orange or yellow-brown because of the iron oxyhydroxides that have accumulated. Below the B horizons are C horizons, which are composed mostly of nearly unaltered geologic materials.
A vertical section through all the soil horizons, extending into the parent geologic materials, is referred to as a soil profile. Soils that are similar in the major characteristics of their soil . profiles are classified by soil scientists as a discrete, basic unit known as a soil series (Brady, (974). An idealized soil profile for the Coastal Plain soils of the study area that includes all of the horizons discussed above is shown in figure 7.
Three soil series are dominant at and in the immediate vicinity ofIOC. The soils at IOC, in the woods east of 10C, and in much of residential area 2, north-northeast of 10C, are the Keypon soil series, which are either loam., or sandy loams, depending on whether the substrate is clayey or sandy. These are moderately well-drained, medium-acid to very strongly acid (pH 4.5-6.0) soils. The Evesboro soil series, excessively drained and extremely acid (PH less than 4.5), also is present in the woods east of IOC and residential area 2. The Klej series of very strongly acid (pH 4.5-5.0) loamy sands is found in the eastern part of this residential area (Jablonski and Baumley, 1989).
The soil series described above are found throughout the study area. Additional soil series are present in the study area as well. Strongly acid to extremely acid (pH less than 4.5-5.5) sandy soils of the Sassafras and Lakehurst series are encountered southwest and west, respectively, of the site. North and cast of 10C, the poorly drained, extremely acid soil series of the Elkton loam and Atsion sand are found near and adjacent to Birch Swamp Brook, the stream that traverses 10C property and flows north through the study area.
Mobility of Metallic Substances in Soils
The term "metal" refers to the majority of elements in the periodic table, and includes alkali and alkali-earth metals as well as transition metals. Elements that have some characteristics of metals, such as arsenic, are known as metalloids; however, metalloids commonly are lumped with true metals for discussion purposes (see, for example, McLean and Bledsoe (1992». In this report, arsenic, a metalloid, is referred to as "metallic."
The differing affinities of metals and metalloids for various materials present in soils depend mostly on the characteristics of the element, but also, in some cases, on the oxidation state of the element, which can affect solubility. Some metallic species bind strongly to organic matter, others to iron oxides or clays. Thus, some metallic substances are more mobile in soils than others, and this mobility (or lack thereof) affects the distribution of substances that are input at the land surface through the soil profile. A brief summary of factors affecting the mobility of several metallic substances that are present in elevated concentrations in the soils at IOC and in some of the soils in the larger study area is given below.
15

o horizon
A horizon
E horizon
8 horizon
C horizon
Clay lens
Figure 7. Idealized soil profile, New Jersey Coastal Plain soils.
16

Arsenic
Arsenic ions can occur in three stable oxidation states (3-, 3+,5+); two forms with positive oxidation numbers, As(V) and As(III), typically are found in the soil environment (McLean and Bledsoe, 1992). As(V) occurs as the arsenate ion (As0 3
4 -); As(IlI) occurs as the arsenite ion . (As0 -), 2 which is the more toxic of the two inorganic species. In addition to these inorganic species, arsenic can be methylated by bacterial action to form as many as four methylated species.
Several studies have shown that arsenic species have an affinity for iron and aluminum oxides (Anderson and others, 1976; Griffin and Shimp, 1978; Leckie and others, 1980). In a study of arsenic sorption by iron oxides and oxyhydroxides, Bowell (1994) found that arsenic (V) sorbed most strongly, arsenic (III) least strongly, and the methylated species moderately strongly at pH's less than 7. Ferric hydroxide sorbs dissolved arsenic species more strongly than does ferrous hydroxide (Matisotf and others, 1982).
Arsenic sorption is controlled, in part, by pH (Anderson and others, 1976; Griffin and Shimp, 1978; Pierce and Moore, 1980; Elkhatib and others, 1984). In general, sorption of arsenic species to aluminum and iron oxides or oxyhydroxides is greatest at acid pH's (about 3-5), although Pierce and Moore (1980) found that sorption of arsenite to iron oxides was greatest at pH 7. Masscheleyn and others (1991) reported that increasing pH promoted desorption of arsenate from contaminated soils; they also found redox potential to be an important factor in arsenic mobility, as oxidizing conditions promote the predominance of less soluble arsenic (V). The chemical behavior of arsenate is similar to that of phosphate (McLean and Bledsoe, 1992), and it appears that inputs of phosphate fertilizer to soils could displace sorbed arsenate (Davenport and Peryea, 1991).
Barium
Barium is an alkali-ealth metal with a II oxidation state. It is geochemically similar to calcium and strontium (Adriano, 1986)~ Barium substitutes for potassium, calcium, and sodium in feldspars (Deer and others, 1976) and also can be incorporated in micas (Fairbridge, 1972); consequently, barium appears as a trace element in clays that are formed from weathered feldspars and micas. Two common barium ore minerals are barite (BaS04) and witherite (BaC03) (Fairbridge, 1972).
Barium can be removed from solution by adsorption on clay minerals and on manganese oxides (Fairbridge, 1972; Adriano, 1986). Barium in soils tends to be immobilized by additions of lime or sulfur, which result in precipitation of the carbonate or sulfate, both of which are only sparingly soluble (Adriano, 1986).
Copper
Copper, a transition metal, occurs in both I and II oxidation states, and is found in nature as the native metal, and as sulfide, oxide, sulfate, and carbonate minerals (Adriano, 1986). Copper can fonn complexes with various inorganic ligands, including nitrate, chloride, and ammoni1llTl.
17

and forms stable complexes with humic substances (Moore and Ramamoorthy, 1984). Copper applied to soils tends to be strongly fixed by organic matter, some clay minerals (Farrah and others, 1980), and iron, manganese, and aluminum oxides, and therefore tends to be immobile in the soil profile (Adriano, 1986), although Slavek and Pickering (1985) found that some copper sorbed to manganese oxides could be removed by strong acids. McLean and Bledsoe (1992) suggest that mobility of copper in soils can be enhanced because of the affinity of copper for soluble organic ligands.
Several studies have examined the role of pH in copper mobility. Tyler and McBride (1982) report low mobility of copper in an acid (PH 5) mineral soil, and viI1uai immobility in a highly organic soil with even lower pH. King (1988) found that copper (sorbed and nonexchangeable) in the A horizon of a southeastern Coastal Plain soil was unaffected by pH, but that most of the variation in sorbed copper in Band C horizons could be explained by change in pH. Huang and others (1977) found an increase in copper adsorption by hydrous oxides in Coastal Plain soils between pH 5 and 6, which agrees with results of studies of metal sorption by goethite (Forbes and others, 1976) and ferromanganese grain coatings (Robinson, 1983). Cavallaro and McBride (1978) indicate that copper is less likely to be removed from solution in low-pH soils than in neutral or high-pH soils.
Lead
Lead has two stable oxidation states, Pb(II) and Pb (IV), but, of these, the divalent state as the plumbous ion Pb2+ is the more abundant in the environment (Davies, 1990). Although biological methylation of lead has been obselVed in laboratory experiments, it is not clear whether this process occurs in natural systems (Moore and Ramamoorthy, 1984).
Both naturally occurring and anthropogenic lead tends to accumulate in soil surface horizons; the organic fraction generally sequesters most of the lead in the system (Davies, 1990). Lead also sorbs to hydrous oxides (Huang and others, 1977), although the amount of lead fixed to iron oxides is less than that found in organic phases (Davies, 1990). In addition, lead has been found to have an affinity for clays (Riffaldi and others, 1976). The amount of lead fixed by clays (montmorillonite, illite, and kaolinite) was found to decrease with decreasing pH (Hildebrand and Blum, 1974); lead fixation was greatest with montmorillonite and least with kaolinite. Nevertheless, SClUdato and Estes (1975) found that kaolinite strongly sorbed lead at pH's from 3.0 to 4.5. In an acidic environment, lead generally is preferentially sorbed by humic acids in organic matter rather than by clays (Moore and Ramamoorthy, 1984).
Zinc
Zinc ion occurs in only one oxidation state as Zn2+. Zinc precipitates as a hydroxide at alkaline pH, and, in solution, forms complexes not only with hydroxyl ions, but also with chloride, phosphate, nitrate, sulfate, ammonium, and cyanate ions (Adriano, 1986). Studies of zinc sorption to constituents of soils such as organic matter, clays, and iron and aluminum hydroxides indicate that zinc is less strongly sorbed than either lead or copper (King, 1988; Tyler and McBride, 1982; Farrah and others, 1980; Forbes and others, 1976). Under some experimental
18

conditions. however. zinc is sorbed more strongly by clays and goethite than other metals such as nickel and cadmium (Tiller and others, 1984). Studies of soils contaminated with heavy metals indicate that lead and copper tend to remain in surface soils, whereas zinc is more mobile (Elliot and others, 1986). Mobility of zinc is affected by pH and redox conditions; zinc is most soluble in acidic soils but forms an insoluble sulfide under strongly reducing conditions (Adriano, 1986) ..
STUDY APPROACH AND METHODS
The study approach was to determine sources of arsenic and other metals in soils by developing chemical signatures or "fingerprints" that would be indicative of different sources. A chemical signature is based on the presence/absence and (or) concentrations of various analytes in a group of samples. To develop signatures, soil samples were collected from soil horizons in areas with three different ("endmember") land uses--undeveloped. orchard, and industrial--which represent single land uses (and their effects on the soil). rather than a succession of land uses such as that found in residential areas I and 2. The endmember land uses were defined as representing soils that had received only geologic and atmospheric inputs (undeveloped areas), soils that likely would have received lead arsenate pesticide inputs (former or current orchards), and soils that contained inputs of industrial contaminants (lOC). Air-flow modeling was used to test the hypothesis that some of the arsenic was derived from a contaminant plume emitted by smokestacks at the IOC location.
pesign of Study
Three major considerations guided the design of the study. First. the sampling network was designed so that samples from soils deemed unlikely to be affected by industrial activities at IOC could be compared with samples that potentially were affected by activities at IOC in order to identify inputs of arsenic. lead, and other metals from sources other than IOC. Second, the soil samples were analyzed for constituents that would yield information about both the magnitude of metals concentrations and the processes involving sequestration or mobilization that control the distribution of metals within the soil column. Finally, because the samples were collected from different soil series in different land-use areas, soil-sample chemistry was compared on a horizonby-horizon basis so that differences in chemistry as a function of soil characteristics would be revealed. These differences may be obscured by sampling at fixed depth increments because different soil horizons may be combined in a sample.
Sampling~Network Development
Soils were sampled in several stages. The first stage was designed to determine soil chemistry in endmember land-use areas by collecting samples that would reflect background geologic and regional atmospheric contributions of metals to soils and orchard pesticide contributions. In addition, samples that were considered to represent possible contributions from industrial activities at IOC were collected from soils at and adjacent to the site.
19
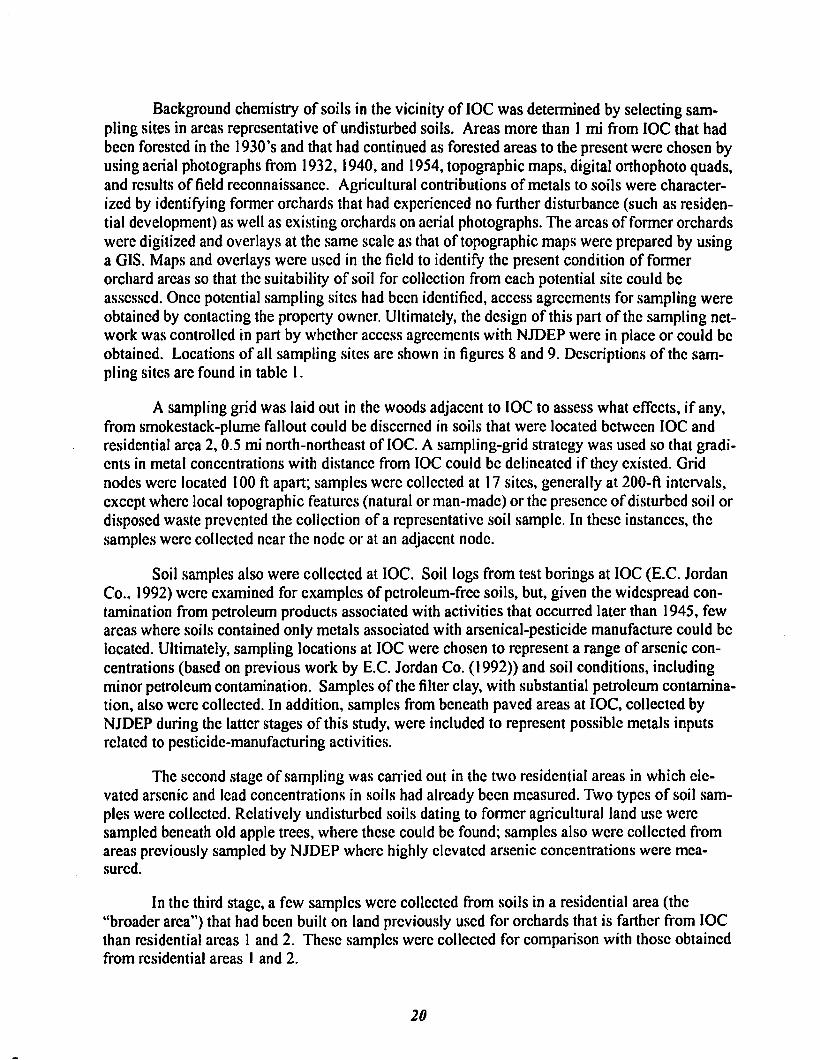
Background chemistry of soils in the vicinity of 10C was detennined by selecting sampling sites in areas representative of undisturbed soils. Areas more than I mi from 10C that had been forested in the 1930's and that had continued as forested areas to the present were chosen by using aerial photographs from 1932, 1940. and 1954. topographic maps, digital orthophoto quads. and results of field reconnaissance. Agricultural contributions of metals to soils were characterized by identifying former orchards that had experienced no further disturbance (such as residential development) as well as existing orchards on aerial photographs. The areas of former orchards were digitized and overlays at the same scale as that of topographic maps were prepared by using a GIS. Maps and overlays were used in the field to identify the present condition of fonner orchard areas so that the suitability of soil for collection from each potential site could be assessed. Once potential sampling sites had been identified. access agreements for sampling were obtained by contacting the property owner. Ultimately. the design of this part of the sampling network was controlled in part by whether access agreements with NJDEP were in place or could be obtained. Locations of all sampling sites are shown in figures 8 and 9. Descriptions of the sampling sites are found in table 1.
A sampling grid was laid out in the woods adjacent to 10C to assess what effects, if any, from smokestack-plume fallout could be discerned in soils that were located between 10C and residential area 2, 0.5 mi north-northeast oflOC. A sampling-grid strategy was used so that gradients in metal concentrations with distance from 10C could be delineated if they existed. Grid nodes were located 100 ft apart; samples were collected at 17 sites, generally at 200-ft intervals, except where local topographic features (natural or man-made) or the presence of disturbed soil or disposed waste prevented the collection of a representative soil sample. In these instances, the samples were collected ncar the node or at an adjacent node.
Soil samples also were collected at 10C. Soil logs from test borings at 10C (E.C. Jordan Co., 1992) were examined for examples of petroleum-free soils. but. given the widespread contamination from petroleum products associated with activities that occurred later than 1945, few areas where soils contained only metals associated with arsenical-pesticide manufacture could be located. Ultimately, sampling locations at 10C were chosen to represent a range of arsenic concentrations (based on previous work by E.C. Jordan Co. (1992» and soil conditions, including minor petroleum contamination. Samples of the filter clay. with substantial petroleum contamination, also were collected. In addition, samples from beneath paved areas at 10C, collected by NJDEP during the latter stages of this study, were included to represent possible metals inputs related to pesticide-manufacturing activities.
The second stage of sampling was can'ied out in the two residential areas in which elevated arsenic and lead concentrations in soils had already been measured. Two types of soil samples were collected. Relatively undisturbed soils dating to fonner agricultural land use were sampled beneath old apple trees, where these could be found; samples also were collected from areas previously sampled by NJDEP where highly elevated arsenic concentrations were measured.
In the third stage, a few samples were collected from soils in a residential area (the "broader area") that had been built on land prcviously used for orchards that is farther from 10C than residential areas 1 and 2. Thesc samples were collected for comparison with those obtained from residential areas I and 2.
20
40° 23' 15·
40· 22'
@ E14
015 o 0014
IMPERIAL OIL COMPANY SUPERFUND SITE
74°14'45·
'-r! .; 7r I'9A6 If
oiL
t ~ All it 'I
R1~ R16 R20
R14 9 e 7/ if tt dparK'lla'i
tf- o~ar
!I 7i
-i.L II
7t 71'
l #. S19 _-~S20 .1/. _--"1"---.' 515 . /1 ,- \ ,~--
! "it- ...h.--:GrS13 \ 514 \, ", -h.. ~S12 \ \ .I ','i \ \ ~-;-, i/ '_-~--"CI?S17 \ 7r ~S11\S16 \ _--$54
-rt- \51 ~--~ \
R12
II" ,,--. ~-WCS2 ~S3 \ '/ r ,," , \ 510 -f~;"~ ~ \ Jr...---$ of + 20.. ~\ . \ ... ---W5~7 \ .J/. L" \-_--,1:, • \
j '. 11 13 .. \ _---t--- , ;/ 1_---$'55 .$c---J II + >\ \-~\'-4
it~, 14 15 L_--->---- 59
~ .tf/~ 16/'t~ ~~24 I ttl: 18::1-" R23 IL 'T/ A19 A22 //' -0 Q It Ol. ~ R21 Ii CD a. 17~ J"
1/ I, ~~
jj
-4 ."
74°14'15.
45· ~----~~------~------------~~----------~----------------------------------~~ Base from Mari<hu/t11991 lIig,lal crthcllhOlo quails
o 200 400 600 800 1,000 FEET
I ,I I I I I I
o 200 METERS
EXPLANATION
Part of sampling grid
+ Soil sample collected at Imperial Oil Company
e Soil sample collected In woods adjacent to Imperial Oil Company
9 Soil sample collected from a residential area
o Soil sample collected from an orchard/farm area
@ Soil sample collected from a forested area
Q ,02QUu.£S M-'r' 01020 <II.OMETERS
Figure 8, Location of soil-sampling sites within 0.5 mile of the Imperial Oil Company Superfund site, Marlboro Township, Monmouth County, New Jersey.
21
40' 20'
40° 05'
SOMERSET COUNTY
"
74"30'
/
74'15'
O:O\E~1'5'E17( -~10
07,011,0'2,'13 ~ \J{06,oa,.'2
/ 01,E9-::::-/ / ~
MIDDLESEX COUNTY E7 __ ~ 03+.' ""\, E~B1,B2 E4,E5-~. E16 ,- ~ r
ES-'.,I.. . /'E15 IMPERIAL OIL COMPANY
W'4- . SUPERFUND SITE AND
/ / RESIDENTIAL AREAS
MERCER COUNTY
,,I
f -- .... ,
/
, ,
r ~_ _ _ _ .. ~__ _ ___ .__ _~ ..
" \
OCEAN COUNTY
Base trom U.S. Geotogical SUlVey digrtal dala, 1:100.000. 1983. Universal Transverse Mercato< projection. Zone 18
o 1 2 3 4 MILES I' I I , ,
,,' i ; I o 1 2 3 4 KILOMETERS
EXPLANATION
W2+ Location and number of soil sample
(see figure BJ
MONMOUTH COUNTY
' ..
41·
o 10 20 MILES 1'1', I
o 10 20 KILOMETERS
'.
75°
NEW JERSEY
74°
Figure 9. Location of soil-sampling sites in the study area, Monmouth and Middlesex Counties, New Jersey.
22
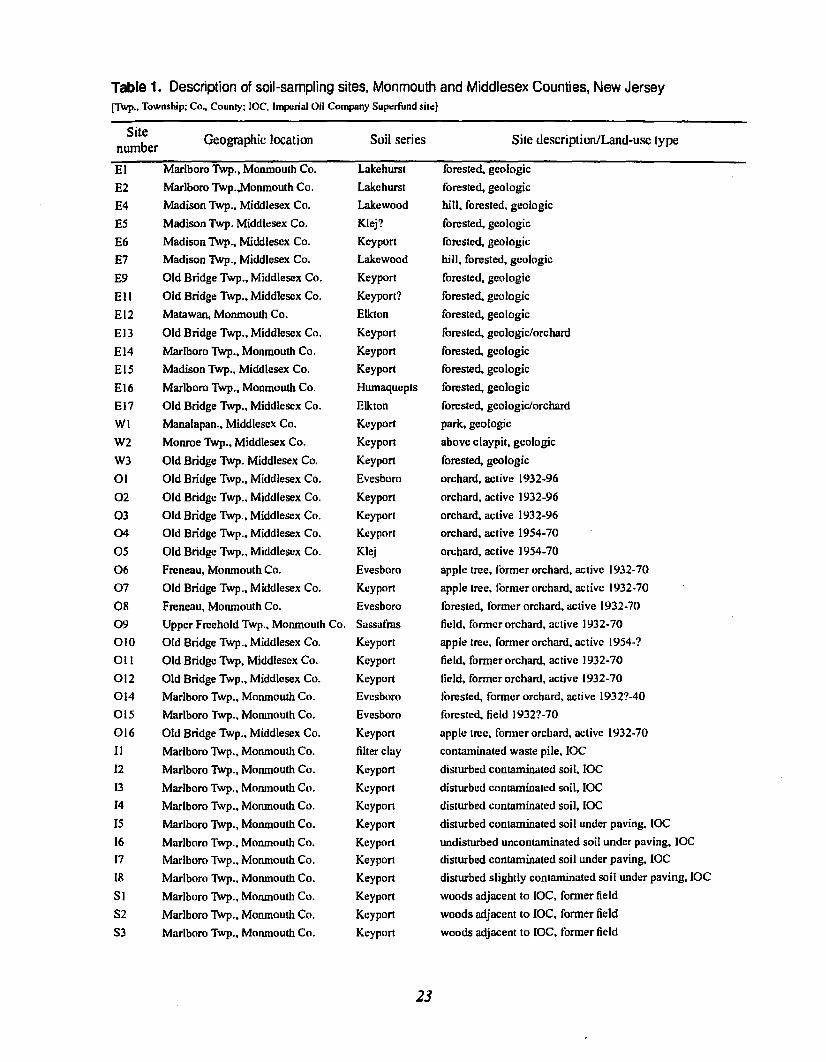
Table 1. Description of soil-sampling sites, Monmouth and Middlesex Counties, New Jersey [Twp., Township; Co., County; IOC. Imperial Oil Company Superfund sile)
Site Geographic location Soil series Site description/Land-use type
number
EI Marlboro Twp., Monmouth Co. Lakehurst forested. geologic
E2 Marlboro Twp . .Monmouth Co. Lakehurst forested. geologic
E4 Madison Twp .• Middlesex Co. Lakewood hill. forested, geologic
E5 Madison Twp. Middlesex Co. Klej? forested. geologic
E6 Madison Twp .• Middlesex Co. Keyport forested. geologic
E7 Madison Twp .• Middlesex Co. Lakewood hill. forested. geologic
E9 Old Bridge Twp •• Middlesex Co. Keyport forested. geologic
Ell Old Bridge Twp .• Middlesex Co. Keyport? forested. geologic
EI2 Matawan, Monmouth Co. Elkton forested, geologic
EI3 Old Bridge Twp., Middlesex Co. Keyport forested. geologic/orchard
EI4 Marlboro Twp., Monmouth Co. Keyport forested, geologic
EI5 Madison Twp., Middlesex Co. Keyport forested, geologic
EI6 Marlboro Twp., Monmouth Co. Hwnaquepts forested. geologic
EI7 Old Bridge Twp., Middlesex Co. Elkton forested, geologic/orchard
WI Manalapan., Middlesex Co. Keyport park, geologic
W2 Monroe Twp .• Middlesex Co. Keyport above claypit. geologic
W3 Old Bridge Twp. Middlesex Co. Keyport forested. geologic
01 Old Bridge Twp., Middlesex Co. Evesboro orchard. active 1932-96
02 Old Bridge Twp .. Middlesex Co. Keyport orchard. active 1932-96
03 Old Bridge Twp., Middlesex Co. Keyport orchard, active 1932-96
04 Old Bridge Twp .• Middlesex Co. Keyport orchard, active 1954-70
05 Old Bridge Twp., Middlesex Co. KI~i orchard, active 1954-70
06 Freneau. Monmouth Co. Evesboro apple tree. former orchard. active 1932-70
07 Old Bridge Twp., Middlesex Co. Keyport apple tree.lormerorchard, active 1932-70
as Freneau, Monmouth Co. Evesboro forested, former orchard. active 1932-70
09 Upper Freehold Twp .• Monmouth Co. Sassalros field. former orchard, active 1932-70
010 Old Bridge Twp., Middlesex Co. Keyport apple tree, former orchard, active 1954-?
011 Old Bridge Twp, Middlesex Co. Keyport field. former orchard. active 1932-70
012 Old Bridge Twp., Middlesex Co. Keyport field, former orchanJ, active 1932-70
014 Marlboro Twp .• Monmouth Co. Evcsboro forested, former orchard. active 1932?-40
015 Marlboro Twp., Morunouth Co. Evesboro forested, field 1932?-70
016 Old Bridge Twp., Middlesex Co. Keyport apple tree, former orchard. active 1932-70
II Marlboro Twp .• Monmouth Co. filter clay contaminated waste pile. laC
12 Marlboro 1Wp .• Monmouth Co. Keyport disturbed contaminated soil. IOC
13 Marlboro Twp .• Monmouth Co. Keyport disturbed contaminated soil. IOC
14 Marlboro Twp .• Monmouth Co. Keyport disturbed contaminated soil. IOC
15 Marlboro Twp .• Monmouth Co. Keyport disturbed contaminated soil under paving, IOC
16 Marlboro Twp., Monmouth Co. Keyport undisturbed uncontaminated soil under paving. IOC
17 Marlboro Twp., Monmouth Co. Keyport disturbed contaminated soil under paving. laC
IS Marlboro Twp., Monmouth Co. Keyport disturbed slightly contaminated soil under paving. IOC
SI Marlboro Twp .• Monmouth Co. Keyport woods adjacent to lac. former field
S2 Marlboro Twp., Monmouth Co. Keyport woods adjacent to laC. former field
S3 Marlboro Twp .• Monmouth Co. Keyport woods adjacent to 10C, former field
23

Table 1. Description of soil-sampling sites, Monmouth and Middlesex Counties, New Jersey--Continued ITwp .• Township: Co .. County: IOC. Imperial Oil Company Superfund sile)
Site Geographic location Soil series Site description/Land-use type number
S4 Marlboro Twp .• Monmouth Co. Keyport woods adjacent to IOC. former field
SS Marlboro Twp .• Monmouth Co. Keyport woods adjacent to IOC
S7 Marlboro Twp .• Monmouth Co. Keyport woods adjacent to IOC
S9 Marlboro Twp •• Monmouth Co. Keyport woods adjacent to IOC
SIO Marlboro Twp., Monmouth Co. Keyport woods adjacent to IOC
SII Marlboro Twp .• Monmouth Co. Keyport woods adjacent to IOC. fonner orchard (?). 1932
SI2 Marlboro Twp .• Monmouth Co. Keyport woods adjacent to IOC. former field
S13 Marlboro Twp .• Monmouth Co. Keyport woods adjacent to IOC. former field
SI4 Marlboro Twp .• Monmouth Co. Keyport wnods adjacent to IOC. former field
SIS Marlboro Twp .• Monmouth Co. Keyport woods adjacent to IOC. former field
S16 Marlboro Twp .• Monmouth Co. Keyport woods adjacent to IOC. fonner orchard. 1932
S17 Marlboro Twp .• Monmouth Cn. Keyport woods adjacent to IOC. former orchard. 1932
SI9 Marlboro Twp .. Monmouth Co. Keyport woods adjacent to IOC. former orchard. 1932
S20 Marlboro Twp .• Monmouth Co. Keyport woods adjacent to IOC. fonner orchard. 1932
RI Marlboro Twp .• Monmouth Co. Klej apple tree. reside~tial area 2. former orchard
R2 Marlboro Twp .• Monmouth Co. Keyport apple tree. residential area 2. former orchard
R3 Marlboro Twp .• Monmouth Co. Keyport forested. rcsidential area I. former orchard/farm
R4 Marlboro Twp .• Monmouth Co. Keyport forested. residential area I. former orchard/farm
R5 Marlboro Twp .• Monmouth Co. KI~i front yard. residential area 2. former orchard
R6 Marlboro Twp .• Monmouth Cn. Keyport back yard. residential area 2. former farm
R7 Marlboro Twp .• Monmouth Co. Keyport back yard. residential area 2. former orchard
RR Marlboro Twp .• Monmouth Co. Keyport front yard. residential area 2. former orchard
R9 Marlboro Twp .• Monmouth Co. Keyport front yard. residential area 2, former orchard
RIO Marlboro Twp .• Monmouth Co. Keyport back yard. residential area 2. former orchard
RII Marlboro Twp .• Monmouth Co. Keyport trees. residential area 2. former farm
RI2 Marlboro Twp .• Monmouth Co. Keyport front yard. residential area 2. former orchard
RI3 Marlboro Twp .• Monmouth Co. Keyport back yard. residential area 2. former orchard
RI4 Marlboro Twp .• Monmouth Co. Keyport apple tree. residential/orchard
RI5 Marlboro Twp .• Monmouth Co. Keyport front yard. residential area 2. former orchard
RI6 Marlboro Twp .• Monmouth Co. Keyport back yard. residential area 2. former orchard
RI7 Marlboro Twp .• Monmouth" Co. Keyport apple tree. residential area 2. former orchard
RIR Marlboro Twp •• Monmouth Co. Klej apple tree. residential area 2, former orchard
RI9 Marlboro Twp., Monmouth Co. Keyport front yard. residential area I, former orchard/farm
R20 Marlboro Twp .• Monmouth Co. Keyport apple tree. residential area 2. former orchard
R21 Marlboro Twp .• Monmouth Co. Keyport back yard. residential area I. former orchard/farm
R22 Marlboro Twp •• Monmouth Co. Keyport near garden, residential area I. former orchard/farm
R23 Marlboro Twp .• Monmouth Co. Keyport back yard. residential area I. former orchard/farm
R24 Marlboro Twp .• Monmouth Co. Kcyport front yard. residential area I. former orchard/farm
R27 Marlboro Twp., Monmouth Co. Keyport apple tree. residential area 2. former orchard
81 Marlboro Twp .• Monmouth Co. Keyport? disturbed soil near apple tree. residential area. former orchard
82 Marlboro Twp .• Monmouth Co. Freehold apple tree. residential area. former orchard
24

In all, soil samples were collected from four present and (or) past land-use areas: undeveloped land, agricultural land (specifically orchards), industrial land, and residential land. The first three land uses represent the endmember land uses used to construct the statistical models.
Analytical Strategy
Soil samples were analyzed for 23 target analyte list (TAL) metals (table 2). Total organic carbon (TOC) concentrations also were determined, as certain metals, such as lead, bind strongly to naturally occurring organic matter. On the basis of limited information about possible ore roasting activities at the 10C site, it appeared that if deposition from a smokestack plume had occurred, sulfur concentrations in soils near 10C might be elevated as a result of roasting sulfide ores. Therefore, concentrations of total sulfur also were determined. The pH of selected samples of surficial (A- horizon) soils, where the effects of metals inputs were most apparent, was measured in the field. Appendix 1 contains the chemical data.
Table 2. Constituents, and characteristics measured in soil samples from Monmouth and Middlesex Counties, New Jersey, 1995-96
[CROL; contract-required detection limit; values in milligrams per kilogram; NA, not applicable]
Constituent! Constituent! characteristic CRDL characteristic CRDL Constituent!characteristic CRDL
aluminum 19.8 iron 3.7 thallium 0.6
antimony 0.44 lead 0.3 vanadium 0.22
arsenic 0.42 magnesium 18.5 zinc 5.0
barium 0.68 manganese 0.08 total organic carbon NA
beryllium 0.04 mercury 0.002 total sulfur NA
cadmium 0.06 nickel 0.1 pH (selected samples) NA
calcium 17.4 potassium 21.04 mineralogy (selected samples) NA
chromium 0.1 selenium 0.74 grain size (selected samples) NA
cobalt 0.2 silver 0.16 lead isotopes (selected sam· NA pies)
copper 0.14 sodium 40.04
Isotopes of various clements have been used in other studies to establish source "fingerprints," or chemical signatures (Faure. 1977; Mazor, 1991). In the absence of multiple isotopes of arsenic, isotopes of lead were determined to have potential as a component of the chemical signature, at least with regard to separating inputs of a commonly used arsenical pesticide, lead arsenate (PbHAs04), from in~uts from other lead sources. Thus, lead-isotope ratios e06Pb/204Pb, 207Pb;204Pb, and 208Pbl o4Pb) were determined in selected soil samples.
25

Grain size and soil mineralogy were recorded in the field for each core sample. A detailed analysis of grain size and mineralogy was performed for selected representative samples to help explain differences in metal concentrations between different land uses as a function of processes within the soil as well as inputs resulting from human activities.
Soil Sgmpling. Sgmple Preparation. and Soil Analysis
Soil Sampling
The various soils in the study area have developed under slightly different conditions, and the soil horizons do not have fixed thicknesses; therefore, sampling to predetermined depths can have the effect of blending pa11s of adjacent soil horizons that may have different properties and affinities for metals. Consequently. soil samples were collected so that subsamples of particular horizons could be extracted. FU11hermore, because some of the metals input to the soils was believed to have resulted from atmosphelic deposition or surficial applications, sampling methods that would prevent soils from upper soil horizons (with possibly higher metal contents) from mixing with soils from lower horizons were necessary. Therefore, continuous cores were collected wherever possible. and the cores were subsampled thereafter.
Cores of sandy soils were collected by using 3-ft-long stainless-steel corebarrels with carbon-steel cutter heads; the corebarrels were lined with 2-in.-diameter butyl acetate transparent liners in I-ft sections that contained a plastic cone-shaped corecatcher just above the cutter head. The corers were driven into the soil with a slide hammer, typically to a depth of about 4 ft. Because the soil sample is compacted during coring, a 4-ft soil profile could be sampled and collected in less than 3 ft of corebarrel. Before each core was collected, the various horizons and other features of the soils at that location were determined by hand-augering a sample to a depth of about 4 ft, and recording soil properties such as color, texture, presence of pebbles and cobbles, channen; (thin, flat fragments of iron hydroxide). lignite fragments, and gross mineralogy, such as quartz sand. clay minerals, and muscovite flakes. The depths from land surface at which soil properties changed were measured with an accuracy of about 1 in. The collection of the auger sample permitted identification of disturbed soils or buried wastes.
Samples of 0 horizons. where found, were collected with a clean stainless-steel trowel and placed in clean. labelled plao.;tic bags. During the winter months the A-horizon soils also were collected in this manner if they were frozen; samples containing frozen ground could not be collected with the corer because the frozen soil acted as a plug and was driven deeper into the ground with each blow of the slide hammer. Under these circumstances, the corccatcher failed, the plug of frozen soil remained at the end of the cOl'cban'c1 or fell into the borehole, and no sample was driven up into the corcbalTclliner. Therefore. when the ground was frozen. coring was begun whcre unfrozen soil was encountered, typically at the bottom of the A or E horizon.
Samples with a high clay content were difficult to retrieve because the plastic corecatcher at the end ofthe corebarrel also failed when subjected to suction from wet clays. Hardened-steel 2-ft-long split spoons that contain 2-ft-long. I-in.-diameter polyethylene liners were used to col-
26

lect clay samples. The corecatcher for the split spoons is constructed of thicker plastic than the corecatcher used in the 3-ft-long corers. and thus retained the sample in the corebarrel despite suction. Details of the sampling procedure can be found in appendix 2.
The corebarrelliners were retlieved from the 3-ft-long corers and the split spoons once the sampling device had been brought to the surface by upward blows from the slide hammer, or, for clayey soils, with a jack. The corebarrelliners were capped and marked with sample number, date, time of sampling, "up" direction, and other information that was deemed important, such as position and approximate depth of interfaces between soil horizons. The capped liners were placed in a clean, dedicated cooler with icepacks and were transported to the USGS, New Jersey District, laboratory in West Trenton. New Jersey, where they were refrigerated until subsampling began. The personnel handling the corebarrel liners and caps wore clean, disposable vinyl gloves that were changed each time a different facet of the procedure began (for example, augering, driving the corer, retrieving the corebarrel liner).
Prior to use in the field, the corebarrelliners, corecatchers, and caps were cleaned by using the following procedure: equipment was first scrubbed with tapwater and detergent; second, rinsed with tap water; and finally, copiously rinsed with analyte-free deionized water. Cleaning generally was performed in the laboratory at the end of a sampling day, but the metal parts of the coring devices were cleaned in the same manner in the field when necessary. Equipment parts were air-dried and covered with clean laboratory tissues, except for the split spoons which, because they are hardened carbon steel, rusted easily and therefore were wiped dry with clean laboratory tissues. Personnel cleaning the equipment wore disposable vinyl gloves, and changed gloves between the tapwater rinse and the deionized-water rinse. All equipment parts were sealed in clean plastic bags after washing. Details of the cleaning procedure are given in appendix 2.
A soil pH probe that operates on the principle of measuring the electrical potential between two dissimilar metal plates was used to determine of pH in A-horizon soils. The probe was inserted in soil that had been moistened with deionized water, and pH was recorded after 3 minutes or when the meter reading stabilized.
Sample Preparation
Soil cores. which were refrigerated at 4 °e, were subsampled by soil horizon within I week of the date of collection on a lab bench covered with clean laboratory tissues that were changed between each horizon subsampling. Personnel performing the subsampling procedures wore disposable vinyl gloves that were changed between each horizon subsampling. The sample was removed from the corebarrel liner with a disposable plastic spatula; for the clay samples, which required a stronger spatula, clean stainless-steel or Tefton-coated spatulas were used. The inner part of the core was sampled, and soil adhering to the corebarrel liner was not included in the sample. Parts of the soil cores in contact with the caps and interfaces between horizons also were discarded. The soil removed from the liner was thoroughly homogenized in a clean gla'is bowl (cleaned with the same procedure as field equipment; that is, washed with tapwater and detergent, tapwater-rinsed, and rinsed copiously with analyte-free deionized water) and placed in the sample bottles with the appropriate spatula. The sample bottles for TAL-metals and TOC analysis were supplied by the laboratory conducting the analysis and were precleaned by using the
27

prescribed USEPA procedures. Polyethylene sample bottles for total-sulfur analysis were precleaned at the District laboratory (same procedure as glass bowls). Samples for lead-isotope analysis were placed in clean plastic "whirl-pack" bags; samples for mineralogical and grain-size analysis were placed in clean plastic jars or bags.
Sample jars containing subsamples for TAL-metals and TOC analysis were refrigerated until they were packed for shipping; the jars were packed in clean coolers with ice packs and were shipped by overnight-delivery service (TAL-metals) or by a courier for the contract laboratory (TOe). Chain-of-custody forms accompanied the samples for TAL-metals and TOC analysis. Samples to be analyzed for total sulfur and lead isotopes were refrigerated and were shipped by overnight-delivery service. All leftover sample material was archived under refrigeration. Details of the sample-preparation procedures are found in appendix 2.
Soil Analysis
Analysis of soils for TAL metals was performed by inductively coupled plasma spectroscopy for all alkali metals, semi-metals, and metals, except mercury, which was analyzed by the cold-vapor atomic absorption method (US EPA Methods 200.7 CLP-M and 245.5 CLP-M, respectively). TOe analyses were performed by using the Lloyd Kahn method (USEPA Method for the Determination of Total Organic Carbon in Sediment, July 27. 1988). Total sulfur in soil was detennined by infrared-adsorption spectroscopy. Lead-isotope analyses were performed by mass spectrometry. A summary of the analytical methods for TAL metals, TOC. total sulfur, and lead isotopes is included in appendix 1.
Grain-size analysis was performed by the hydrometer method (Day. 1965. p. 562) and by sieving, mineralogy of the sand fraction was determined optically, and clay mineralogy was determined by using X-ray diffraction.
Air-Flow Modeling
Emissions from the chimney stacks at IOC were hypothesized as a possible source of arsenic in residential areas 1 and 2. To supplement the geochemical data, two air-flow models were used. A preliminary air-flow screening model (Christian, 1995) was programmed in Fortran. This model is based on a double Gaussian distribution that is typically used in modeling of continuous processes (Christian, 1995). The equations used in the model are given in appendix 3. The model was run to determine possible contaminant-distribution patterns in air at ground level, given various relevant meteorological conditions. Meteorological data for Lakehurst Naval Air Station, 28 mi south oflOe, were used as input to the model (app. 3).
The preliminary model was not used to quantify contaminant levels in air at ground level because no data are available on possible emissions from the stacks. Several hypothetical emissions rates ranging from 1,200 to 12,600 J..lgls were used in the model to detelmine the distance from the stacks to the location where the maximum contaminant deposition was likely to occur.
28
On the basis of results of the preliminary simulation, a second air-flow model was constructed at NJDEP, Bureau of Air Quality Evaluation, to simulate patterns of dry deposition in the vicinity ofIOC. Deposition was analyzed by using the Industrial Source Complex Short Term (ISCST3) model (Version 96113) with dry-deposition plume depletion algorithms (Robert Huizer, New Jersey Department of Environmental Protection, written commun., 1996). Surface-meteorological data from Newark Airport for 1984-97 and 1989 were used with concurrent upper-air data from Atlantic City Airport; terrain heights were obtained from USGS 7.5-minute quadrangle topographic maps. Because no information is available for possible stack-emissions rates, a normalized emission rate of I gls was used. As with the preliminary air-flow model, the goal of this simulation of dry deposition was to determine the likely distribution pattern of contaminants (primarily arsenic) on the ground rather than to quantify expected concentrations. Details of this modeling procedure are available from NJDEP, Trenton, New Jersey.
Patg Anglysis
Data Conditioning
Chemical data received from the analyzing laboratory were validated by NJDEP (app. 4), and the results were transmitted to USGS. For contractual reasons, three laboratories were used to perform the TAL-metals analyses. Although the laboratories provided analysis results with instrument detection limits (IDL's) less than the contract-required detection limit (CRDL), the IDL's' differed among the three laboratories. Therefore, for the purposes of statistical analysis, the highest IDL (or reporting limit) was used in every case. For some elements, most of the analysis results were reported in a range less than the IDL (that is, the values are "no detects"). These elements (antimony, beryllium, cadmium, cobalt, mercury, selenium, silver, sodium, and thallium) were excluded from the statistical analysis. Additionally, some samples were found not to be representative of the soils they were collected to represent; these are not included in the statistical analyses.
The analyzing laboratories experienced difficulties in achieving viable results for antimony and silver; many analysis results were rejected, although most concentrations apparently were less than the IDL. The complete chemical data (less antimony and silver results) arc shown in appendix 1; the numbers of the samples used in the statistical analyses, including discriminant analyses and boxplots, are shown in table 3. Where spatial-replicate data for a sampling site were available, the decision to use one of each pair of replicates was random, based on a coin toss.
Data used in the statistical analysis included a few values less than the IDL. Where multiple censoring limits were present as a result of analytic instrument limitations, the highest censoring limit was chosen as the censoring threshold for the data. Any value reported that was less than the censoring threshold for that constituent was considered a "no detect." Furthermore, distributions of constituent concentrations generally were not symmetrical about the mean, but tended to be right-skewed. Therefore, rank-transformed data were used to ameliorate censoring and skewing effects. To apply a rank transformation, the largest constituent concentration is assigned a value equal to the number of measurements (N) and the smallest value is assigned a valuc of I. Equal ranks between 1 and N are assigned to samples with equal concentrations.
29

Table 3. Soil samples for which chemical-constituent data were used in statistical analyses, Monmouth and Middlesex Counties, New Jersey
[Samples are listed by type, as follows: E, W--geologic; 0, orchard; I, Imperial Oil Company Superfund site; S, adjacent woods; R, B--residential. Within each type, samples are listed by sampling-site number and soil horizon]
ElDO EllA OlE 090A I7CI S70 SI9A R8CL2 RIM RI9CL4
EIA EIIBI OIBI 09081 17BI S7A SI9Bl R9A Rl6BI R21A
EIE EIIB2 OISBI 09B2 17C2 S7CLI SI9CLl R9BI RI6CLI R2IBl
EtBI EIICLl 0lB2 OIIA I7CLl S7CL2 SI9CL2 R9B2 RI6CL2 R21B2
EtB2 EIICL2 020 OIIBI 18CLI S90 S20A R9CLl R 17 A R22A
E20 El2DO 02A 01lB2 18BI S9A S20B I R9CL2 R 17B I R22B I
E2A EI2DA 02E OIICLI 18CI SIOSO S20B2 RIOA RI7B2 R22B2
E2BI E 12E 02B I 0I2CLI 18C2 SIOA RIDA RIOBI RI8A R23A
E2B2 EI2BI 02B2 0I2CL2 SIO SIOBI RIBI RIOCLI RISBI R23CLl
E40 EI2B2 03A 0I2CL3 SIA SIOC R I B2 R IOCL2 R I SB2 R23CL2
E4A EI4A 03BI 014A SIBI SIIA RIB3 RIOC RI8C R23C
E4E EI4Bl 0382 014BI SIB2 SIIE R2A RIIA Rl8CLI R24A
E4BI EI4B2 0400 014B2 S20 SI181 R2BI RIIBI RI8CL2 R24CLI
E4B2 EI5A 04A 014C S2A SIIC R2B2 RIICLI R20A R24CL2
E5E EI5BI 04081 OIM S2BI SI2A R2CLI RIICL2 R20BI BIA
E5Bl El5CLl 0482 016CLI S2CLI SI2E R2CL2 RIIC R20B2 BIA2
E5B2 El5CL2 040B3 0I6CL2 S2CL2 SI2BI R5A Rl2A R20B3 BICLI
E5C EI5DCL3 05A 12A S30 SI2C R5BI RI2BI R27A BIBI
E6A ElM 05B I 12CLI S3A SI3A R5C RI2B2 R2781 BICL2
E6E E 16B I 0582 12CL2 S3B I SI3BI R6A RI2CLI R27C B2A
E6BI E 16B2 05C 13A S3B2 SI3C R6BI RI3A R27CLI B2BI
E6C WICLI 06DA I3BI S40 SI40 R6B2 RI3BI R27CL2 B2CLI
E6CLI WICL2 06DE 14A S4A SI4B R6B3 R I 3DB2 R3CLI B2CL2
E7E WICL3 06BI 14BI S4BI SI5A R6C RI3B3 R3DB2
E7Bl WICU 06B2 14B2 S4B2 SI5BI R7A Rl4A R4BI
E782 W2CLI 07A 14CLI S50 SI5B2 R7E Rl4BI R4B2
E90 W2CL2 07CLI 14B3 S5A SI6A R7B2 Rl4B2 R4CL2
E9A W2CL3 07CL2 1484 S5BI SI6BI R8A Rl5A RI9A
E9Bl W2CL4 080 15A S5B2 SI6CLl R8BI RI5BI RI9CLI
E982 W2CL5 OSA 15CLI S5CLI SI7A RSB2 R 150CLl R 19CL2
E9C OlA 08BI 17A S5CL2 SI781 RSCLI RI5CL2 RI9CL3
30

Because a goal of the investigation was to c1assi fY samples on the basis of their chemical characteristics, discriminant analysis (DA) was used as a classification procedure. A nonparametric discriminant model (which uses rank-transformed data) was used because of its lack of distributional assumptions regarding the variables. Given the data distribution, use of nonparametric techniques is appropriate; the shortcomings of a nonparametric model include loss of infonnation due to rank ordering of the data and, presumably, lower power relative to a nonnal discriminant when applied to normally distributed data.
Statistical Analysis
The goal of the statistical analysis was to determine whether samples designated as background, orchard, or IOC endmembers could be accurately classified into those categories on the basis of their chemical signatures. If the endmember sample groups could be adequately classified, the resulting best-fit statistical model would then be used to classify unknown samples (soils from the residential areas) into one of the three endmember groups in order to determine the dominant land-use effect on the residential-soil chemistry.
Following data conditioning, descriptive statistics and graphics were computed by using the univariate procedure of SAS (SAS Institute Inc., 1990a). Variable (analyte) distributions for endmember categories were generated and illustrated with boxplots; other graphical representations of analyte distributions among and between categories also were prepared.
Nonparametric OA, a statistical classification procedure, was used to classify the groups of soil samples by chemistry. Nonparametric DA is based on the assumption that variables do not follow the multivariate normal distribution.
Nonparametric OA, as used in this study, is based on a nearest-neighbor classification method. The nearest neighbors were selected on the basis of statistical similarity of geochemical attributes. In the simplest case, a set of observations is first assigned, on the basis of prior assumptions about classification, to one or the other of two groups. Common attributes are then observed that are useful in discriminating between groups. Samples (observations) with unknown group characteristics can then be assigned to a group on the basis of how closely the attributes resemble the attribute range of one of the two groups previously identified. In other words, which group of nearest neighbors does an unknown most closely resemble?
In this study, soil samples from undeveloped forested areas (geologic + regional atmospheric inputs), from orchards (geologic + pesticide inputs), and from IOC (geologic + industrial inputs) were identified as three separate endmember groups that fonned a "training" data set. Ahorizon, B-horizon, and clay samples from all three groups were examined; A-horizon samples exhibited the largest differences in distribution of chemical constituents, and thus most clearly fonned three separate groups, each of which has a distinctive pattern of concentrations of chemical constituents, referred to as a "chemical fingerprint" or "chemical signature."
Chemical signatures are not sharply defined because many factors affect the inputs of chemicals to soils in different land-use areas and the subsequent movement of those chemicals through the soil. Group membership in the DA models, therefore, is assigned on the basis of
31

cross-validated "posterior probability." Cross-validation is the procedure whereby an observation is dropped from its group so that it will have no effect on the group, and then classified as an unknown to detennine whether it classifies correctly. Posterior probability is the probability that a specific samplc belongs to a particular category, given the signature observed for other samples (observations) in that category. Thus. a sample (observation) can have, for example, a 20-percent probability that it belongs in (hypothetical) Group 1. a zero probability that it belongs in Group 2. and an 80-percent probability that it belongs in Group 3. As a result, the observation is assigned to Group 3. Observations for which the posterior probability of membership in two or more groups is equal are assigned by the DA model to an "other" category.
The discriminant models developed by using various combinations of chemical constituents as signatures of the three endrnember groups were then used to classify the soil samples from residential areas] and 2, the woods adjacent to IOC, and the broader area.
The classification models used the nonparametric kernel-density discriminant (SAS DISCRlM) procedure. The models were fitted by assuming both equal variances and unequal variances. In addition, both constant-number and constant-radius models were tested. (These terms refer to the method of choosing neighbors of an observation in model space.) Finally, the effect of proportional rather than equal prior probabilities was investigated. (Prior, or pre-experimental, probabilities reflect the analyst's estimate of the state of the categories before observing the experimental evidence provided by the chemical concentrations.) These models were applied to ranks of individual elements as well as to principal components derived from those variables. The selected model incorporated the assumptions of equal variances. proportional prior probabilities, and constant numbers of neighbors.
Quality-Assurance program
Objectives
The study objectives included detelmining (I) the concentrations of arsenic and metals in soils in several different land-use areas in order to define ranges of concentrations, and (2) the combinations of metals that could be used as chemical signatures, or "fingerprints," to identify the possible sources of arsenic and some of the metals. Therefore, quality-assurance procedures initially were envisioned as being significantly more rigorous than they would have been were the sole objective the identification of contaminant levels in soil known to be (or suspected to be) contaminated.
The initial data-quality objectives of the study, as discussed in the sampling QualityAssurance/Quality-Control (QAlQC) workplan (unpublished document on file at the USEPARegion II office, New York, New York) developed at the beginning of the study, required that the
. analytical precision should be high and that the distribution of the analyzed metals be definitive in soils from different land uses even when the metal concentrations were small. To statistically define chemical signatures of soil from different land uses, the analyses needed to be sufficiently precise to clearly distinguish among metal-concentration popUlation distributions that might be only slightly different. Random variation introduced by imprecise measurementc; could result in a
32
sufficiently large variance in the measured metal-concentration distribution in soils from the different land uses so that the populations would appear to overlap when, in fact, they were slightly different.
The quality-assurance program included -in this study was designed to evaluate and ensure the precision of analyses at small concentrations; to evaluate and ensure accurate determinations of both small and large concentrations of constituents; to provide documentation for assessing performance during sample collection, preparation, and analysis; and to provide an assessment of the total measurement error or variance resulting from sample acquisition and analysis.
The analytical rigor envisioned in the sampling QAlQC workplan could not, in practice, be attained and, thus, the QNQC goals of the study were modified to accept less precise data for further analysis. Nevertheless, the differences in chemistry of soils from different land uses were sufficiently large that a higher level of imprecision in the data could be tolerated and meaningful results achieved.
Design
No previous studies of background metal concentrations in soils in the study area are available, nor is there any documentation of the concentration ranges of metals in orchards soils in the study area. Therefore, given the possibility of overlapping concentration ranges for soils from different land-usc areas, minimum analytical error was sought. Analytical error was addressed by analyzing split subsamples taken from thoroughly mixed soil-horizon samples. Splits were submitted to the analyzing laboratory as blind samples. These analysis results are reported in appendix 1. Additionally, a randomly selected split subsample from each batch of 20 samples submitted was analyzed. Analytical results for these latter splits were evaluated by NJOEP during the data-validation procedure.
In general, the analytical techniques selected can deliver a precision of about 5 percent difference from the mean. In practice, precision generally ranged from about 3 to 16 percent difference from the mean, but some of this difference may have resulted from incomplete mixing of the samples. Unlike water samples, soil samples are composed of particles, each with a particular chemistry. Although samples are thoroughly mixed during preparation for bottling, it is impossible to determine whether splits ofa sample contain exactly the same number and sizes of particles of different materials. In some cases, the presence of small particles of a particular material in only one of the split samples could result in a larger variance in concentration than is related to analytical precision.
The IOL's for metals differed depending on the metal, and reporting limits differed among laboratories. In most cases. the laboratories achieved detections well below the CRDL's (table 2).
To address the issue of laboratory analytical accuracy at different concentrations, three different soil standard reference materials (SRM's) containing arsenic and metals were submitted as blind samples to the analyzing laboratory. For one SRM (1646a), no data for acid-extracted material were available, and results of the analysis of this SRM were used to check for reproducibility of analysis, much as a split sample would be used. The other two SRM's were used to
33

check laboratory accuracy. Although many of the analyte concentrations closely matched published values for the SRM's. some values were less accurate. In general, values reported for a given analyte in this study were within the range of published values (app. 4, table 3). Some of the variance noted may be the result of differences in the method of sample preparation between the laboratories initially analyzing the SRM's and the laboratories conducting analyses for this study.
In addition to the measures described above, the analyzing laboratories spiked split subsamples and spike recovery was documented. Initial and continuing analytical-instrument calibration and methods for analyte quantification were approved by NJDEP in order to meet CRDL's; laboratory performance in meeting these requirements was reviewed and evaluated by NJDEP throughout the course of the study. The data-validation procedures performed on the analytical data by NJDEP are discussed in appendix 4.
Factors other than the precision of the analyses that may contribute to the variance in the sample population include the spatial variability of constituents in adjacent soil samples, differences in the soil matrix that result in different extraction efficiencies for metals, and variance introduced by using different sample-collection and -preparation techniques. To determine the expected variance in spatially colocatcd samples, spatial replicates of soil samples were collected at about 15 percent of the sampling sites. These replicates were two adjacent soil samples that were collected, processed, and analyzed independently. The relative percent difference in concentrations of selected constituents between replicate pairs is reported in appendix 4. Although the variances in metal concentrations for spatial replicates spanned a wide range, the variance for many constituents generally was smaller than the differences in ranges of concentrations for samples from different land uses.
The USEPA method for TAL-metals analysis was designed to extract solved metals efficiently and thoroughly. The analyzing laboratories spike samples with various analytes in both pre- and post-digestion phases of sample preparation. Thus, matrix effects can be evaluated on the basis of spiked-sample recovery. Evaluation of these results is pal1 of the NJDEP data-validation process, outlined in appendix 4.
Variance that could be introduced by changes in sampling procedures and sample preparation was addressed by establishing a protocol (outlined in the sampling QAlQC workplan) developed by using "practice" samples prior to actual sample collection. Frozen ground and substantial clay lenses encountered as sampling progressed necessitated changes in sampling protocol; these changes are discussed earlier in this report. Use of the split-spoon samplers is documented in an addendum to the sampling QAlQC workplan. These minor changcs in sample-collection protocol are unlikely to affect the comparability of samples, particularly as virtually all clay samples were collected with the split-spoon samplers.
The project requirement for data precision at small concentrations also necessitated the collection and preparation of soil samples by methods that minimized contamination of samples .
. The introduction of random, low-level metal contamination to soil samples during the sampling. preparation, and analysis procedures could result in metals-concentration data with larger variances than actually exist. Thus, low-level contamination could increase the likelihood that ranges of metals concentrations in samples from different land-use areas would overlap. The potential amount of low-level random contamination attributable to the soil-sampling equipment and pro-
34

cedures was documented and evaluated, as was the degree of sample contamination during sample preparation and analysis at the analyzing laboratories. The issue of contamination during sampling was addressed by collecting rinsate blanks of soil-sampling equipment by using both analyte-free water supplied by the laboratories and analyte-free water generated at the USGS, New Jersey District, laboratory in West Trenton, New Jersey. Sample-collection quality-assurance procedures are summarized below; details are presented in appendix 4. The issue of contamina- -tion during sample preparation and analysis was addressed by the laboratories by analysis of method blanks. Evaluation of results of method-blank analysis was part of the NJDEP data-validation procedure, as discussed in appendix 4.
Sample Collection and Preparation
Because accurate analyses of small concentrations of metals were required, it was essential to minimize contamination of the soil samples. In previous studies of soil-sampling equipment, NJDEP had determined that, given appropriate care in cleaning the equipment, contamination of soil samples was not detected (John Evenson, New Jersey Department of Environmental Protection, oral commun., 1995). Unlike water samples, much of which can be in contact with the sampling equipment, allowing any contamination to travel easily through the sample. very little of the soil collected by corers or split spoons actually comes in contact with the sampling equipment. Furthennore, the concentrations of most metal constituents in water samples are exceedingly small (parts-per-trillion to parts-per-billion range) relative to those in soils (parts-permillion range); hence, aqueous-concentration data can be biased high by even the slightest amount of contamination (Windom and others, 1991; Ivahnenko and others, 1996).
Procedures designed to minimize sample contamination in the parts-per-billion range were appropriate for analytical work because leachate concentrations were measured in that range and then converted to equivalent concentrations in the solid. Sampling procedures aimed at minimizing contamination in the same range also were considered adequate for collection of soil samples, which are less vulnerable to sampling and processing contamination than are water samples.
Contamination of the soil samples with metals from the sampling equipment was minimized by use of the 3-ft corers (described in appendix 2). The soil sample came in contact only with the cutter head (about 1-3/4 in. long) and the 2-ft sections of butyl acetate corebarrelliner; furthermore, only the outer surfaces of the soil grains were in contact with the equipment. A conservative estimate of the amount of sample that might be subject to contamination from contact with sampling equipment can be made by assuming that a depth equal to one-half the diameter of the largest grains (about 0.02 in., or 0.5 mm) would be affected. Using this estimate, only about 3.9 percent of the sample collected with the 3-ft corers (diameter about 2 in .• or 5.08 em). potentially could be affected by contamination. Only about 7.8 percent of the sample collected by the split spoon (diameter I in., or 2.54 cm) could be affected. Moreover, the first soil entering the corehead in the study area, except where a thick 0 horizon is present, is abrasive quartz sand that would likely remove all or most of any residue left from previously sampled material that might not have been removed by the samplcr-c1eaning process or mctals leached from the steel equipment during washing. Additionally, the first 0.5 to I in. of soil at the top of the core typically was discarded, and soil clinging to the walls of the corebarrel liner was not included in the samples bottled for chemical analysis.
35
Equipment rinsate blanks were used to detennine equipment cleanliness in a "worst-case" scenario in which all parts of the equipment were assumed to come in contact with the sample. Therefore, 1 L of analyte-free water supplied by the analyzing laboratories was poured in about 200-mL increments down the entire length of the corer or split spoon in fully assembled condition. Some of the water ran down the inside of the plastic liner, across the cutter head, and into a glass mixing bowl. About 20 to 25 percent of the water ran over the upper corebarrel threads and down along the wall of the corebarrel underneath the liner. and dripped into the glass mixing bowl. A clean plastic spatula was placed in the glass mixing bowl in which the water was collected so that all equipment used in sample preparation was touched by the water. The water was then decanted into the sample bottle provided by the analyzing laboratory, and the process was repeated until the entire liter of analyte-free water was used. A similar procedure was completed using USGS, New Jersey District, laboratory analyte-free water. One equipment blank of the exterior of a split spoon also was prepared, by pouring the water over the outside of the steel split spoon into aglass mixing bowl and then decanting it into the sample bottle. The samples were acidified to a pH of less than 2 with nitric acid for TAL-metals analysis.
Sample Analysis
The contract laboratories were required to conduct an internal quality-assurance program, which included collection and analysis of method preparation blanks, analysis of SRM's during analysis of each batch of samples, addition of a known amount of analyte spike to 1 sample of each batch of 20 unknown samples, and analysis of a split of 1 sample from each batch (New Jersey Department of Environmental Protection, 1992). Three SRM's (SRM 2711, SRM 2709, and SRM 1646a) obtained from the National Institute of Standards and Technology (NIST) were sent as blind samples to each laboratory. Lab duplicates (splits) of several samples also were sent as blind samples to the contract laboratories analyzing for metals, TOC, and sulfur. Data for splits and field replicates are presented in appendix 1. Data for SRM's and equipment rinsate blanks are presented in appendix 4.
The USGS laboratory performing total-sulfur analyses analyzed a standard soil (NIST SRM 1633b) with each batch of samples analyzed; batches typically ranged from 15 to 25 samples. At least one blank also was analyzed per batch; two blanks were analyzed with large batches.
Lead-isotope analyses were carried out in a better-than-Class 100 ultraclean laboratory by using quartzlTeflon-distilled reagents and quartz or Teflon labware. Lead in process blanks did not exceed 100 picograms. National Bureau of Standards (NBS) SRM's for lead isotopes typically were analyzed during the procedure; these include SRM 981 and SRM 982. The lead-isotope ratios measured on the samples for this study were normalized to SRM 981. Total-process blanks were collected and analyzed as well (R. W. Hurst, Chempct Research, written commun., 1996).
36

Air-Flow Modeling
The parameters and calculations used in the preliminary air-flow model are given in Christian (1995). A Fortran program was written to perform the calculations. To check whether the program would produce accurate simulation results, the example of contaminant-plume distribu-: tion in Christian (1995) was run. Identical results were achieved with the model as programmed·· by USGS personnel.
SOIL-PROFILE CHARACTERISTICS AND MINERALOGY AT SAMPLE-COLLECTION SITES
Characteristics of Soil Profiles at Sample-Collection Sites
Although the charactelistics of the soil series sampled differed in some respects. certain features remained relatively constant. A typical soil profile contained a leached A horizon that was gray to dark brown, depending on the amount of organic matter present. In some soils, an E (eluviated) horizon was found below the A horizon; this was typically light gray to pale brown. Below the A or E horizon was a B horizon. where eluviated materials accumulate. The B horizons contained clays and sand grains coated with iron oxides and typically were yellowish-brown to reddish-yellow. In some soils the B horizon could be subdivided, on the basis of color changes, structure or texture, or presence of mottles.
The C horizon below the B horizon consisted of geologic materials that had undergone little of the pedogenesis that created the overlying soil horizons. In some parts of the study area, the essentially unaltered. pale yellowish-brown to whitish sands of the Englishtown Formation were encountered; in other pal1s. gray to brownish-gray clay lenses were found. Some of the soils sampled lacked an organic (0) horizon at the land surface because it had been removed by various human activities; other, undisturbed soils lacked a well-developed 0 horizon, apparently because the vegetation was too sparse to provide sufficient organic matter.
Although sampling of undisturbed soils was a desired goal, as discussed in the sampling QNQC workplan. in practice this goal could not always be achieved.The soils sampled in the study area included some that had undergone little or no modification due to human activity. and some that had been substantially modified. The soils that had undergone substantial modification primarily were present at 10C and in residential area I. Because the soils at JOe are disturbed in the areas sampled. some horizons are altered. obliterated. or superimposed. A horizons. whatever the local stratigraphy. were identified on the basis of texture (sandy) and color (gray to brown). B horizons. regardless of stratigraphy, were identified as sandy and orangey-brown. e horizons were identified as sandy and pale brown to whitish; geologic materials also included gray to brown clay with stringers of reddish silt.
37

Mineralogy of Soil Samples
Mineralogical analyses of selected soil samples were performed by the New Jersey Geological Survey (table 4). The sand- and silt-size fractions were dominated by quartz. Iron oxyhydroxide coatings of sand grains were ubiquitous in the samples. Small flakes of muscovite and fragments of lignite were abundant in most sand fractions examined in the laboratory and in the field. Metamorphic and (or) hcavy minerals such as ilmenite. tourmaline. staurolite. and zircon were identified in trace amounts. A few samples contained trace amounts of a sulfide phase. Foreign materials such as brick and cinder or slag fragments also were encountered in some samples. Trace amounts of limonitic materials in small (2-3 rrun) fragments with a vesicular appearance that superficially resemble the large cindery slag pieces were found in a few samples from undeveloped forested areas (Frederick R. Muller, New Jersey Geological Survey. written commun., 1996).
The dominant clay mineral in the clay fraction was kaolinite~ illite and fine-grained muscovite also were present. Small amounts of glauconite were found in several samples. and chamosite also was detected in a sample (John Dooley, New Jersey Geological Survey, written commun., 1996). Of the minerals that have been determined to be present in the samples, those most likely to contribute arsenic to the soils are clays. glauconite, and sulfide minerals such as pyrite.
Some clay samples for which mineralogy was not determined were analyzed for total sulfur~ those samples in which sulfur was measured at detectable levels are presumed to contain sulfide minerals. Typically. thesc clays also contained elevated concentrations of arsenic. such as those in samples El5 CL3. W2 e12, W2 CL3, W2 CL4. and E17 CL2 (app. 1).
DISTRIBUTION OF ARSENIC AND METALS IN SOilS
Vertical Distribution of Arsenic and Metals in Undisturbed Soil Profiles
For the purposes of this study, an undisturbed soil profile is defined as a profile in which all horizons that define the soil series are present and identifiable, and are in the correct sequence with depth. Undisturbed soil profiles were found plimarily in undeveloped areas. Any land use that involves human activities is likely to disturb the soil profile. but these disturbances can range from relatively minor, where most of the profile is intact. to extreme, where no vestige of the original soil stratigraphy can be discerned.
The disturbance alisociated with agricultural land usc was considered to be relatively minor, as most cultivation does not extend deeper than about 6 in., except where holes were dug to plant apple tree seedlings. The soil logs from auger samples at the edge of the mature tree can-
0. opies indicate that, with the exception of the absence of 0 horizons in many orchard-soil sampling sites, the soil horizons were intact. Relatively undisturbed soil profiles also were found where samples were collected under apple trees in residential area 2. Soil profiles in lawn areas distant from the apple trees showed varying degrees of disturbance~ most were relatively undisturbed. Soil profiles in residential area 1 ranged from relatively undisturbed to extremely disturbed. and only one undisturbed profile was observed among the eight sampling sites at IOe.
38

Table 4. Mineralogy and percentage of silt and clay in selected soil samples, Monmouth and Middlesex Counties, New Jersey
[>, greater than; <, less than; %, percent; "ironstone," a colloquial term for iron oxyhydroxides of indeterminate crystallinity; N/A, not analyzed; --, not present; 1 T, one-layer trigonal unit cell; 3T, three-layer trigonal unit cell; 1 M, one-layer monoclinic unit cell; 2M1, 2M2, two-layer monoclinic unit cells]
Major phases Minor phases Silt! Sample (> lO%), (2-10%), clay number sand size sand size Trace phases «2%), sand size % Clay mineralogy
EIBI quartz muscovite organic matter, ilmenite, leucoxene, feld- 10 N/A spar, aluminosilicates, rutile, zircon, monazite, magnetite, tourmaline, stauro-lite
E2A quartz glauconite, muscovite, ilmenite, rutile, leucoxene, 15 N/A organic matter lignite, tourmaline, "ironstone," magne-
tite, staurolite, hematite, aluminosilicates, monazite
E6B2 quartz, "iron- muscovite tourmaline, glauconite, feldspar, ilme- 22 N/A stone " nite, chloritoid, magnetite, rutile, leucox-
ene, zircon, organic matter, vivianite?
EIICLl quartz, "iron- muscovite, feld- ilmenite, tounnaline, rutile, leucoxene, 27 kaolinite, illite 2Ml, stone" spar organic matter muscovite 3T, glauc-
onite 1M
E13CL "ironstone," organic matter, hematite, glauconite, magnetite, rutile, 85 N/A quartz muscovite ilmenite, aluminosilicates, feldspar, zir-
con, monazite, tourmaline
EI5CL! "ironstone," muscovite, lignite, leucoxene, tourma- 85 kaolinite IT, kaolin-quartz line, aluminosilicates, chlorite, stauro- ite/smectite inter-
lite, monazite, zircon stratified, illite 2M I, glauconite 1M
EI5 CL2 "ironstone," muscovite chlorite, tourmaline, lignite, aluminosili- 76 generally similar to quartz cates, rutile, zircon, monazite, ilmenite, EI5eLI
organic matter
EI5DCL3 "ironstone," chloritoid, chlorite, zircon, monazite, 68 kaolinite 1 T, kaolin-quartz, musco- glauconite, magnetite, feldspar ite/smectite, illite vite 1M, muscovite 3T,
glauconite 1M
W2CL! quartz, musco- chlorite "ironstone," organic matter, aluminosili- 80 N/A vite, lignite cates, tourmaline, zircon, glauconite?
W2CL2 quartz, musco- chlorite "ironstone," pyrite, amber glauconite? 95 N/A vite, lignite tourmaline, ilmenite, zircon, aluminosili-
cates, monazite
OlE quartz "ironstone" organic matter, glauconite, muscovite, 13 N/A lignite, ilmenite, aluminosilicates, zircon, rutile, feldspar, monazite?
02E quartz organic matter feldspar, lignite, ilmenite, tourmaline, 7 N/A muscovite, aluminosilicates, staurolite, zircon, leucoxene, rutile
05A quartz organic matter, feldspar, ilmenite,aluminosilicates,tour- 16 N/A lignite maline, muscovite, limonite, rutile, mon-
azite, leucoxene, staurolite
39

Table 4. Mineralogy and percentage of silt and clay in selected soil samples, Monmouth ·and Middlesex Counties, New Jersey--Continued
Major phases Minor phases Siltl Sample (>10%), (2-10%), clay number sand size sand size Trace phases «2%), sand size % Clay mineralogy
06Bl quartz organic matter, glauconite, ilmenite, tour- N/A maline, rutile, aluminosilicates, leucox-ene, magnetite, feldspar, zircon, monazite
06B2 quartz "ironstone" ilmenite, aluminosilicates, rutile, lignite, 16 N/A tourmaline, feldspar, muscovite, zircon, monazite, tourmaline, magnetite, stauro-lite
09A quartz feldspar "ironstone," glauconite, ilmenite, rutile, 30 N/A leucoxene, magnetite, lignite, tourmaline, monazite, epidote, staurolite
OlIBI quartz muscovite, glauconite, aluminosilicates, tounnaline, 17 N/A "ironstone"/sid- zircon, monazite erite, feldspar
Ol2CL "ironstone" quartz glauconite, ilmenite, tounnaline, zircon 76 kaolinite 1 T, kaolin-ite/smectite, illite, montmorillonite, muscovite 3T,2M, tosudite
S5CL quartz, musco- glauconite, monazite, tourmaline, lignite 91 kaolinite 1M, illite, vite muscovite 2M2, chli-
nochlore, chamosite
S1OC2 quartz muscovite, chlorite, staurolite, silliman- 27 \ 'kaolinite/s,mectite ite, ilmenite, monazite interstratified, illite,
muscovite 3T glauc-onite
S19CL2 quartz, "iron- muscovite organic matter, chlorite, rutile, alumino- 80 N/A stone" silicates, tounnaline, lig?ite, ilmenite,
zircon
RIBl quartz glauconite organic matter, "ironstone," Ieucoxene, 10 N/A aluminosilicates, ilmenite, tourmaline, rutile, muscovite, magnetite, zircon, monazite
R2A quartz organic matter "ironstone," glauconite, tourmaline, mag- 21 N/A netite, ilmenite, leucoxene, rutile, zircon, monazite
R2 BI quartz glauconite "ironstone," organic matter, magnetite, 35 N/A ilmenite, rutile, leucoxene, lignite, alumi-nosilicates, staurolite, zircon, monazite, chlorite, muscovite, feldspar
R2CLI quartz muscovite, feld- rutile, magnetite, ilmenite, sillimanite 62 kao lini te, kao lini tel spar, "iron- smectite, illite, mus-stone," zircon covite 3T, glauconite,
paly gorskite?
R3DCLI "ironstone," slag muscovite, lignite, glauconite, zircon 95 N/A quartz
40

Table 4. Mineralogy and percentage of silt and clay in selected soil samples, Monmouth and Middlesex Counties, New Jersey--Continued _
Major phases Minor phases Silt! Sample (> 10%), (2-1 O(~»), clay number
R5A
sand size
quartz
sand size
"ironstone, "
Trace phases «2%), sand size
organic matter, muscovite, lignite, feld-
%
23
Clay mineraiob'Y
N/A glauconite spar, aluminosilicates, ilmenite, zircon,
chlorite, hematite, monazite
RIICL quartz "ironstone, " ilmenite, rutile, tourmaline, zircon, mon- 86 kao linite, illite, organic matter, azite, chlorite, staurolite muscovite 3 T, muscovite chlinochlore
RI4B 112 quartz "ironstone "I sid- feldspar, muscovite, tourmaline, glauco- 27 N/A erite nite, ilmenite, rutile, zircon, monazite,
leucoxene, staurolite, chlorite
Rl7Bl quartz, "iron- muscovite, glau- organic matter, tourmaline, ilmenite, alu- 45 N/A stone" conite minosilicates, feldspar, lignite, stauro-
lite, magnetite, hematite, rutile, zircon, leucoxene, monazite
R21A quartz glauconite, slag muscovite, coal, lignite, staurolite, tour- 52 N/A maline, zircon, monazite, ilmenite, feld-spar
R23CL quartz muscovite feldspar, chlorite, siderite, hematite, lig- 54 N/A nite, tourmaline, ilmenite, rutile, zircon, monazite, alwninosilicates
BIB quartz glauconite, lig- l'eldspar, zircon, chlorite, monazite 5S N/A nite. "ironstone-'
BICL quartz, "iron- glauconite, mus- zircon, monazite, tourmaline 38 N/A stone" covite
B2CLl quartz, "iron- glauconite, feld- staurolite, ilmenite, sillimanite, rutile, 21 N/A stone" spar zircon, monazite
Arsenic
Arsenic concentrations in soil profiles from representative soil-sampling locations in three land-use areas are shown in figure 10a. In samples from undeveloped forest soils, concentrations of arsenic tended to be larger in the B horizon than the A horizon. The vertical distribution of arsenic in orchard soils and residential soils, which include former orchard soils, tended to differ from the distIibution in undeveloped forest soils. Although arsenic concentrations in the orchard and residential soils sampled varied over a wide range (from less than 3.5 mg/kg to 149 mg/kg), the largest concentrations in orchard and residential soil profiles generally were associated with the A oc where it was identified, the E horizon. At a few sites in the residential areas, the larger arsenic concentrations were measured in samples from the upper B horizon rather than the A horizon. The sample with 149 mg/kg of arsenic is from a B horizon; however, the soil profile at this site does not appear intact.
41

SAMPLING SITE
(a) E2 E6 01 011
I I I
R16 RiB
As As As As
01 A , A A A
~ ~ ,
\ I " I \ I " I \
, " I
\ E ~ " " I \ ). t z A • \ E 81 81
0 t::! I \ / a: I \ / I
/ I 0 I 81 4t / I I \ / I
---l \ / I
~ 81 ~ \ 81 ( 82 .. CL1 \ " \ Cli • I \.
\ / I \. \. \ / I \.
\ / I \. 82 I • /
82 • CL1 ~ Cl2 C •
As , I I I I
+ , I , I • I I I I I •
A , I
I , \ \
+ , I ., , , , • \
\ \ •
81
82
C
Cli
Cl2
I , , , , I I I
0 5 10 0 10 20 30 0 20 40 0 20 40 o 20 40 o 10 20 30
CONCENTRATION OF ARSENIC, IN MilLIGRAMS PER KilOGRAM
.--r~--T--T---T--T---T--T I I a--T---l
Pb Pb Pb Pb Pb
AI " A /"
/ A , A " A /.,. //
/ I / / I /
~/// //
/ I / 81 ~ (/ / EI I / I
I / I I E ; 81 1 81 I I 82 • I I I 1 I
81 I ~ I I
, I I I
, \ I I
, I \ I , , C • \ 81 82 CL1 , , , \ I \
CL1 I , \ I
CL1 t I \ I I \
, I \
, I
C I , 82 CL1 • CL2 • I Cl2 •
1""1,,,,1 I , " , I , , , , I , , , , 1 I , I , , 1 0 10 20 30 0 100 200 300 0 20 40 0 50 100 0 50 100
(b) r o , I
I I
I I
z A , 0
I t::! I a:
0 I I I ---l I
(5 81 Cf)
I I I I
B2Il"" I", ,1 50 0
CONCENTRATION OF LEAD, IN MilLIGRAMS PER KilOGRAM
~
Figure 10. Concentrations of (a) arsenic and (b) lead in soil profiles from undeveloped areas, orchards, and residential areas, Monmouth and Middlesex Counties, New Jersey. (Sampling locations shown in figs. 8 and 9)

The difference in vertical distribution of arsenic in undeveloped and orchard soils indicates that. as weathering of geologic materials produces soil horizons, naturally occurring arsenic tends to remain with iron and (or) aluminum hydroxide phases and accumulates with them in the B horizon, whereas arsenic resulting from human activities, introduced at the surface most likely as arsenic (V), apparently is sparingly mobile and sorbs to organic matter or any residual clays or, iron hydroxides present in A or E horizons. At some sites (R22, R9, Rl3, and R20), however, sub- . stantial amounts of arsenic appear to have moved to the upper B horizons. Unless the anthropogenic arsenic is mobilized by some agent such as phosphate fertilizer, as suggested by Davenport and Peryea (1991), it appears likely to remain in the upper parts of the soil profile. The amounts
. - and types of fertilizers added are likely to have varied among the orchards sampled, and, where residential development has supplanted the orchards, among residential properties as well. Thus the amount of anthropogenic arsenic that could be mobilized by this mechanism and translocated to deeper soil horizons probably varies spatially.
In undeveloped areas, arsenic concentrations in the geologic materials below the soil column typically were small in sands (less than 10 mg/kg) but substantially larger in the clays (ranging up to 41 mg/kg). Where clays were encountered below orchard and residential soils, arsenic concentrations typically ranged from about 15 to about 40 mg/kg.
Clays in the study area can contain naturally large concentrations of arsenic and probably can trap any anthropogenic arsenic that leaches from the soil horizons above them. Wherever clay lenses were encountered during soil sampling, the clays were subsampled at the top of each clay lens and again at a location deeper within the lens (typically at the bottom of the interval sampled, or about 8 to lOin. from the uppennost subs ample ) to determine whether arsenic concentration decreased with depth. If arsenic from upper soil horizons were leached and sorbed to the clay lenses at depth, clay at the top of each lens would contain larger arsenic concentrations than clay at greater depth in the lens. This vertical distribution was anticipated because water bearing arsenic in soluble form would move slowly through the clay, and movement of arsenic by diffusion would be even slower. No consistent pattern of decrease in arsenic concentration with depth in clay lenses was observed in areas where anthropogenic inputs of arsenic were likely, however.
Barium
Barium concentrations tended to be larger in samples from the 0 horizon than in those from other horizons in soils from undisturbed soil profiles in undeveloped areas. In orchard-soil samples, barium concentrations tended to be larger in A horizons ,than in underlying horizons; the same pattern was seen in samples from relatively undisturbed profiles in residential areas.
Copper
Concentrations of copper tended to be largest in O-horizon samples, and to decrease with depth in soil profiles in undeveloped areas and in the woods adjacent to IOC. Although few 0 horizons were found in orchard soils, copper concentrations typically were larger in samples from o horizons than in those from A horizons, and, overall, tended to be largest in samples from the shallowest horizon (usually an A horizon) and to decrease with depth. The same pattern was
43

observed for samples from soil profiles in residential areas. In samples of the relatively unaltered geologic materials underlying the soils, clays tended to have slightly larger copper contents than sands of the C horizon.
Lead
Lead concentrations in soil profiles from representative soil-sampling locations in three land-use areas are shown in figure lOb. Lead concentrations were largest in samples from the 0 horizon (both 01 (organic debris) and 02 (decayed organic matter» in forested soils, ranging up to 238 mg/kg in samples from the woods adjacent to IOC. Although few orchard soils contained enough organic matter to be considered 0 horizons, lead concentrations were larger in samples from vestigial 0 horizons than in those from underlying A horizons. Typically, the upper soil horizon in orchards was identified as an A horizon; lead concentrations were as large as 187 mgt kg in the A-horizon samples collected. Lead concentrations in samples of orchard B-horizon soils generally were less than 10 mg/kg. Although lead concentrations decreased with depth in the soil profile, they tended to range from 10 to 20 mg/kg in those locations where clays were encountered.
Zinc
Where 0 horizons exist (in undeveloped areas and some orchards), zinc concentrations were larger in samples from 0 horizons than in those from deeper horizons. Where 0 horizons were absent (in residential areas and some orchards), zinc concentrations were larger in samples from A horizons than in those trom deeper horizons. Zinc concentrations also tended to be larger in clays than in the mineral soil horizons.
Other Metals
Iron concentrations varied widely in the soils sampled, but, at a given location, tended to be larger in the B horizon and in clay lenses than elsewhere in the soil and geologic profile. Manganese concentrations did not appear to follow a discernible pattern. Vanadium concentrations tended to follow the pattern of iron concentrations.
No patterns were discerned for chromium and nickel concentrations in the soil samples collected trom the undisturbed soil profiles. Chromium concentrations tended to be larger in clays than in sands, however. Concentrations of aluminum and potassium typically were largest in samples from clay-rich horizons and clays.
Beryllium, cadmium, cobalt, and selenium were not detected in many of the samples~ when detected, the concentrations generally were less than 2 mg/kg. Additionally, sodium was
' . .seldom detectable. Although most of the samples did not contain detectable mercUl)" the samples from both residential areas tended to contain larger mercury concentrations than any other groups of samples, including those collected at 10C during the present investigation. Results of previous
44
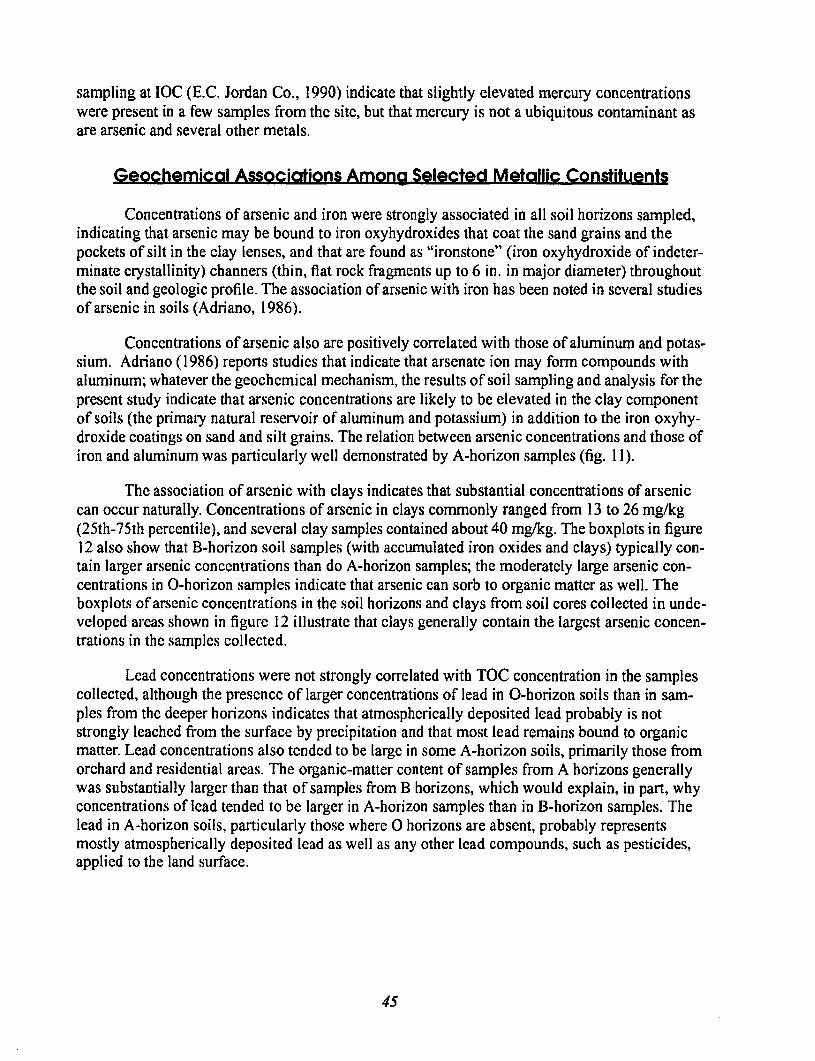
sampling at IOC (E.e. Jordan Co., 1990) indicate that slightly elevated mercury concentrations were present in a few samples from the site. but that mercury is not a ubiquitous contaminant as are arsenic and several other metals.
Geochemical Associations Among Selected Metallic Constituents
Concentrations of arsenic and iron were strongly associated in all soil horizons sampled. indicating that arsenic may be bound to iron oxyhydroxides that coat the sand grains and the pockets of silt in the clay lenses. and that are found as "ironstone" (iron oxyhydroxide of indeterminate crystallinity) channers (thin. flat rock fragments up to 6 in. in major diameter) throughout the soil and geologic profile. The association of arsenic with iron has been noted in several studies of arsenic in soils (Adriano. 1986).
Concentrations of arsenic also are positively correlated with those of aluminum and potassium. Adriano (1986) reports studies that indicate that arsenate ion may form compounds with aluminum; whatever the geochemical mechanism, the results of soil sampling and analysis for the present study indicate that arsenic concentrations are likely to be elevated in the clay component of soils (the primary natural reservoir of aluminum and potassium) in addition to the iron oxyhydroxide coatings on sand and silt grains. The relation between arsenic concentrations and those of iron and aluminum was particularly well demonstrated by A-horizon samples (fig. 11).
The association of arsenic with clays indicates that substantial concentrations of arsenic can occur naturally. Concentrations of arsenic in clays commonly ranged from 13 to 26 mg/kg (25th-75th percentile), and several clay samples contained about 40 mglkg. The boxplots in figure 12 also show that B-horizon soil samples (with accumulated iron oxides and clays) typically contain larger arsenic concentrations than do A-horizon samples; the moderately large arsenic concentrations in O-horizon samples indicate that arsenic can sorb to organic matter as well. The boxplots of arsenic concentrations in the soil horizons and clays from soil cores collected in undeveloped areas shown in figure 12 illustrate that clays generally contain the largest arsenic concentrations in the samples collected.
Lead concentrations were not strongly correlated with TOC concentration in the samples collected. although the presence of larger concentrations of lead in O-horizon soils than in samples from the deeper horizons indicates that atmospherically deposited lead probably is not strongly leached from the surface by precipitation and that most lead remains bound to organic matter. Lead concentrations also tended to be large in some A-horizon soils, primarily those from orchard and residential areas. The organic-matter content of samples from A horizons generally was substantially larger than that of samples from B horizons. which would explain. in part, why concentrations of lead tended to be larger in A-horizon samples than in B-horizon samples. The lead in A-horizon soils, particularly those where 0 horizons are absent. probably represents mostly atmospherically deposited lead as well as any other lead compounds. such as pesticides, applied to the land surface.
45
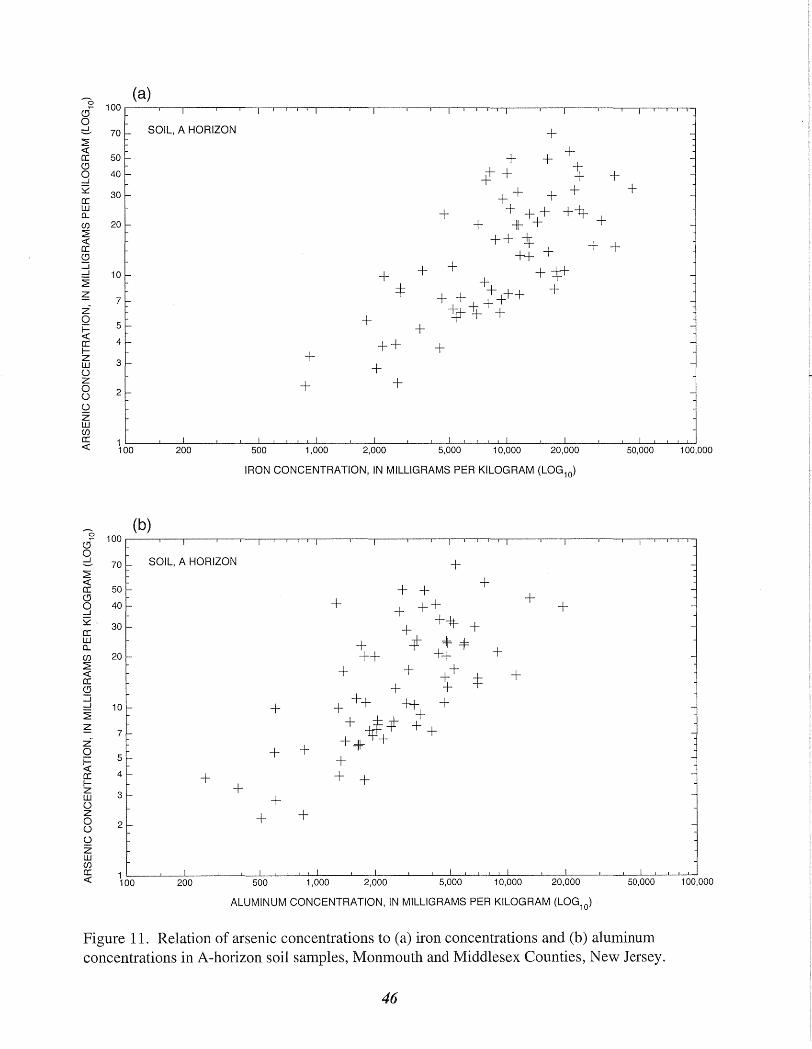
(a) '0 ci 100'---'--r--~--~'-~~,,---'--'---'--'-'-'~~~--~--~--~~~~~~ o :::!- 70 ~ <t: a: CJ o ..J
S2 a: w Cl. (f)
~ « a: CJ :::::i ..J
~
~ Zo i= <t: a: IZ W () Z o ()
()
Z w (f)
50
40
30
20
10
7
5
4
3
2
SOIL, A HORIZON
+
+
+
+
* ++
+ +
+
+
+ +
+ + + +
t+ 4:-++ + + + + + +-It- +
+ ++
+
++ +
+t++
+ +
+
a: <t: ~0~0--~--20~0--~--~5~00~~~1,~00-0--~-2,~00-0--~~~~~~10..J,O-0-0--~20-,OLO-0--~-L5-0,LOO-0~~10~O,OOO
~ zo i= <t: a: Iz W () Z o ()
()
z w (f) a: «
7
5
4
3
2
(b)
SOIL, A HORIZON
+ +
200
IRON CONCENTRATION, IN MILLIGRAMS PER KILOGRAM (LOG10)
+
+ +
+ + +
500 1,000
+
+ +
+ ++ + ,i:t
+=jl=-if1+ + + +
+
+
+
2,000 5,000
+ + +
+
+
10,000 20,000
ALUMINUM CONCENTRATION, IN MILLIGRAMS PER KILOGRAM (LOG10)
50,000 100,000
Figure 11. Relation of arsenic concentrations to (a) iron concentrations and (b) aluminum concentrations in A-horizon soil samples, Monmouth and Middlesex Counties, New Jersey.
46

44~------~------------------~----------------~----------------__ .-______ -. 42 40
38
36
34
~ 32
~ 30 9 52 a: 28
~ en 26 ~ a: ~ 24 :3 :lE ~ 22
Z o 20
~ a: !z 18 w o Z 16
8 o Z 14 w en ~ 12
10
8
6
4
2
EXPLANATION
(to) Number of observations
o
*
(5)
Outlior data value mora than 3 limes tIIa Intolquartlla range outside tile lluall~D
Outlier date valuo loss than or equal to 3 and mOle than I.SlImes the in18111ualllle range outside the lIuallUe
Date value less than or equal to 1.5 tlmes tile intorCIuartile range outside tile quartile
75th percentile
Median
25th pelcentlle
(10)
(15)
(22)
O~--------=-------____________ ~ __________________ ~~ ________________ ~~I~ ______ ~
o A B CLAY
SOIL HORIZON OR GEOLOGIC FEATURE
Figure 12. Distribution of arsenic concentrations in soil and clay samples from undeveloped forested ~eas, Monmouth and Middlesex Counties, New Jersey.
47

Copper and TOC concentrations were positively correlated; this relation demonstrates, as shown by studies reported in Adriano (1986), that copper tends to bind to organic matter. Concentrations oflead and copper as a function of TOe concentration in A-horizon soil samples collected from all land-use arcas are shown in figure 13.
RELATIONS OF SOIL CHARACTERISTICS AND CONCENTRATIONS OF ARSENIC AND METALS TO LAND USE
The results of sampling and analysis of soils to determine concentrations of arsenic and metals in undeveloped forested areas and orchards, at 10C, and in residential areas indicate that concentrations of arsenic and of some metals can be related to land use. Moreover, some changes to natural soil characteristics are directly related to land use and can have a substantial effect on the observed disttibution and magnitude of arsenic and metal concentrations in the soil samples collected during this study.
Relation of Soil Characteristics to Land Use
Absence of Soil Horizons
Although some soil series in undeveloped areas do not have discernible 0 horizons, o horizons are likely to form where sufficient organic matter is contributed by natural vegetation. o horizons typically were present on soils in the undcveloped forested areas from which soil samples were collected. and in the woods adjacent to IOC. In developed areas, existing 0 horizons typically are removed. As noted earlier, 0 horizons generally were absent in orchard soils and were not encountered either at IOC or in the residential areas. Lawns in residential areas may contribute sufficient organic matter so that new 0 horizons can form, but lawn turf was not sampled during this study. A section of lawn turf and the associated shallow soil in the root zone was removed. set aside, and then replaced during the sampling process.
The soil horizons that generally are common to all land uses investigated are the A (occasionally E) and B horizons. At some locations, however, one or more of these horizons is missing as a result of soil disturbance. In particular, the horizon sequence in soil profiles at 10C commonly was disturbed; various horizons were buried or removed. In part of residcntial area 1, clays from the lens beneath IOC and the surrounding area had been brought to the surface, burying either the natural A horizon or, where this had been removed, the B horizon.
Presence of Foreign Debris
Debris such as brick and coal fragments and pieces of slag or cindery material was found .'. in both sands and clays at several of the sampling sites in residential area 1. Additionally, small.
whitish fragments of what appear to be mortar and (or) roasted limestone were present in some samples. Moreover, the fragments of brick and mortar, coal, and cinders or slag material in samples of residential area I soils were similar to fragments and cindery slag found at depth and on the surface in samples of IOC soils (fig. 14).
48

(a) 500,-----.---,�,-----.---,---'�--.-,-,-,-.-�----,----~1----,---~--~1--~,-,-~
400 -a c.i o 300-:::::!. ~ 250-« a:: CJ o -1
~ cr: W Q..
CJ)
~ <C cr: CJ ::::i -1
~
200 -
150 -
100 -90 -80 -70 -
60 -
~ 50-
Z o 40-i= <C cr: fZ W o z o o o « w -1
30 -
25 -
20 -
15 -
SOIL, A HORIZON
+ + +
+
+
+ +
+ ++
++
+
++ +
+ +
+
+ {
+ +
+
: +
+ =1=
+ + + + ++ ++
+ +
+
++ +
+
+
+ +
+ + + +
-
-
-
+ + -
-
---
+ -
-
-
-
-
-
-
-
10L-____ L-__ ~I ______ ~ __ ~ __ LI __ ~~J_~L-I ____ ~ ___ L_I ____ ~ __ _L __ ~I __ ~~J_~ 1,000 2,000 5,000 10,000 20,000 50,000 100,000
TOTAL ORGANIC CARBON CONCENTRATION, IN MILLIGRAMS PER KILOGRAM (LOG1o)
(b) 500,-----.---,1,-----.---,---'1--.-,-,-,-.-1----,----~1----,---~--~1--~,-,-~
400 -a c.i 300 -o -1 - 200-~ <C cr: CJ 9 100!~ cr: 70-W Q.. 50-CJ)
~ 40-<C ffi 30-::::i -1 ~ 20 i-
~
z o 10-
~ cr: fZ W o z o o cr:
7,-
5i-
4i-
3i-
~ 2-Q..
o o
SOIL, A HORIZON
+
+
+ + +
+ ++ +
+
+ +
-
-
-
-
-
-
+ -
-
+ -
-
-
--
-
-
1L-____ ~ __ ~I ______ ~ __ ~ __ ~I __ ~~J-~~I ____ ~ ___ L_I ____ ~ __ _L __ ~I __ ~~~~
100,000 1,000 2,000 5,000 10,000 20,000 50,000
TOTAL ORGANIC CARBON CONCENTRATION, IN MILLIGRAMS PER KILOGRAM (LOG lO)
Figure 13. Relation of (a) lead concentrations and (b) copper concentrations to total organic carbon concentrations in A-horizon soil samples, Monmouth and Middlesex Counties, New Jersey.
49

RESIDENCE Sampling site R-24; depth 15 in. - 20 in. Brick fragments in gray clay
1 2 inches I I I I I I
RESIDENCE Sampling site R-22; various depths Slag
o 2 inches II I I
IMPERIAL OIL SITE Sampling site 1-4; depth 39 in. - 45 in. Brick fragments from brown sand
o 1 2 inches
II I I I I
IMPERIAL OIL SITE Sampling site 1-4; depth 3 in. - 7 in. Slag
o 2 inches I I I I
Figure 14. Photographs of cindery slag and brick fragments from soils at and near the Imperial Oil Company Superfund site, Marlboro Township, Monmouth County, New Jersey.
50

At some point in the history of activities at IOC, clay-rich soils containing debris from IOC probably were moved offsite and onto the adjacent area that is now residential. Some sandy soils also may have been moved from the site to the adjacent residential area; debris similar to that found at IOC appears to be mixed into A-horizon sandy soils from land surface to a depth of23 in. in residential area I.
The brick fragments may be from the oldest buildings at IOC; the origin of the cindery slag fragments is unknown. The slag pieces resemble cinders from coal burning and may be related to coal-burning steam locomotives that supplied the pesticide company from the railroad siding onsite (fig. 15). Similar cindery slag is found along the tracks of the main line west ofIOC, and in the large fill area cast of the IOC fenceline and south of the fire pond, which contains black oil sludge as well as solid debris (E.C. Jordan Co., 1992). Several soil samples from the fill area contained arsenic concentrations that exceeded 100 mg/kg (E.C. Jordan Co .. 1990). The railroad siding runs along the south side of the large brick building (refelTed to as tbe masonry building (E.C. Jordan Co., 1992» where elevated arsenic concentrations (greater than 100 mg/kg) have been measured in sediment collected from the floor (E.C. Jordan Co., 1990). The masonry building and siding are about 300 to 400 ft from the residential properties from which soil samples containing elevated arsenic concentrations have been collected.
Whether some of the slag could have come from the ovens at the site cannot be determined at this time, as it is currently not possible to gain access to the old ovens. Two pieces of the slag, one from IOC and one from soils at a residence about 400 ft from IOC, were analyzed; they contained 55 and 72 mg/kg of arsenic, respectively (table 5).
The type of debris found in soils in residential area I was not found in soil samples from residential area 2. The soil profiles in the latter area retain natural horizons, particularly soils beneath old apple trees; however, the natural sequence of soil horizons could not be discerned in a few locations. The disturbed soils contain a mix of qual1z pebbles and ironstone fragments similar to those found in undisturbed soils in the area. In undisturbed soils. however, the pebbles tend to be present in layers. as do ironstone channers.
Relation of Concentrations of Arsenic and Metals to Land Use
The concentrations ofmetallic constituents measured in soils are controlled, in part, by the materials to which they sorb. Therefore. the gross characteristics of the soil, such as the different horizons, degree of disturbance, and presence of foreign materials, can affect the observed distribution ofmetallic constituents. Because disturbance of natural soil horizons commonly (although not always) is the result of human activities, and metallic substances can be introduced to soils by various human activities, land usc is an important cxplanatOl)' variable with respect to interpretation of metallic-constituent concentrations in soil samples.
51

As <2 - 68
As 268 - 548 Ba 168 - 402 Ca 3,760 - 7,960 Cu 85.9 - 647 Pb 455 - 1,000 Mg 1,600 - 6,940 Zn 502 - 2,710
Ba <40 - 2,590 Ca <1 ,000 - 3,160 Pb 18.6 - 14,700 Mg <1,000 - 3,580
Base modified from E.C. Jordan Co. (1992)
EXPLANATION
/ /
I
As 130 - 172 METAL--Number is concentration range, in milligrams per kilogram
< Lessthan
As Arsenic Ba Barium Ca Calcium Cu Copper Pb Lead Mg Magnesium Zn Zinc
../..L..Li- Extent of paved area
Trees
/
0 I 0
Private homes / (Residential area 1)
• I 0 • 100 200 FEET
I I
I I
30 60 METERS
t I
Figure 15. Locations of buildings and other features at, and metal concentrations in soil samples from, the Imperial Oil Company Superfund site, Marlboro Township, Monmouth County, New Jersey.
52

Table 5. Constituent concentrations in slag from the Imperial Oil Company Superfund site and residential-area site R22, Monmouth and Middlesex Counties, New Jersey
[IOC, Imperial Oil Company Superfund site; <, less than; concentrations are in milligrams per kilogram; sampling-site locations shown in fig. 8]
Consti tuent IOC slag R22 slag Constituent IOC slag R22 slag
Alumimun 582 856 Magnesium 98.8 108
Antimony 1.4 1.4 Manganese 2.8 5.4
Arsenic 75.1 55.1 Mercury 0.08 0.06
Barium 72.4 30.6 Nickel 3.1 83
Beryllium 0.09 0.14 Potassium 350 561
Cadmium <0.14 0.57 Selenium <0.98 <0.98
Calcium 386 270 Silver <0.12 <0.12
Chromium 5.4 9.7 Sodium 221 <130
Cobalt 0.85 4.3 Thallium <0.76 <0.76
Copper 15.1 10.2 Vanadium 3.9 21.8
Iron 2280 7010 Zinc 7.2 61.7
Imperial Oil Company Superfund Site
Because industrial activities at IOC have varied over time, it is difficult to ascribe the presence or amount of some metals in the soils there to any particular time period or activity. Nevertheless, results of previous analyses of borings into the filter-clay wastepile, of soil samples from IOC, and of sediments from within or beneath some of the buildings at the site can provide some infolmation about the composition of materials processed at IOC during and after the production of arsenical pesticides. (The tanks, drum-washing building, shed and repair building, restroom, and house trailer shown in figure 15 all postdate pesticide production at IOC.)
Analyses of the filter-clay wastepile materials sampled in 1989 indicate that arsenic concentrations ranged from less than 2 to 68 mg/kg, barium concentrations ranged from less than 40 to 2,590 mg/kg, calcium concentrations ranged from less than 1,000 mg/kg to 3,160 mg/kg, lead concentrations ranged from 18.6 to 14,700 mg/kg, and magnesium concentrations ranged from less than 1,000 to 3,580 mg/kg (E.C. Jordan Co., 1990, app. G, table 3). Concentrations of all other constituents were within ranges of naturally occurring concentrations for soils in the area. Polychlorinated biphenyls (PCB's) and volatile organic compounds (VO~'s) were detected in several of the wastepile samples.The filter-clay wastepile is associated with waste-oil-processing activities at IOC, and, according to aerial photographs, was not present in 1940, about 5 years before arsenical pesticide production ceased (E.C. Jordan Co., 1992).
53

In contrast to the filter clay, soils from areas ofIOC near the tanks, the drum-washing building, and the septic system contained small concentrations of barium; all but one of 19 samples contained barium concentrations less than 40 mg/kg. Arsenic concentrations ranged from less than 2 to 874 mg/kg; the largest concentration was measured in a sample from orange-brown sands (B-horizon?) at a depth of 5 to 7 ft. Seven samples contained arsenic concentrations greater than 100 mg/kg; concentrations in the other 12 samples ranged up to 17.4 mg/kg. Zinc concentrations ranged from 9.8 to 156 mg/kg, with a median concentration of71.4 mg/kg. Calcium concentrations generally were small; 11 of 19 samples contained less than 1,000 mg/kg, but a concentration of 11.900 mg/kg was reported for one sample from brown sand with brick fragments at a depth of 2 to 4 ft. Magnesium concentrations also were less than 1,000 mg/kg with one exception (1.580 mglkg) (E.C. Jordan Co., 1990. app. E~ app. G. table 3). VOC's were detected in a few samples; one sample contained low levels of PCB's (E.C. Jordan Co., 1990).
In three samples of soi I collected beneath the floor of the old warehouse building, arsenic concentrations ranged from 201 to 464 mg/kg, barium concentrations ranged from less than 40 to 129 mg/kg, calcium concentrations ranged from 1,750 to 25,400 mg/kg, lead concentrations ranged from 33.8 to 228 mg/kg, magnesium concentrations ranged from less than 1,000 to 2,230 mg/kg, zinc concentrations ranged from 136 to 218 mg/kg (fig. 15), and an elevated copper concentration was measured in one sample (206 mg/kg). VOe's and PCB's also were detected in these samples. Two samples of sediment from the floor of the masonry buil ding yielded sl ightly smaller concentrations of arsenic (130 and 172 mg/kg), but larger bali urn concentrations (266 and 756 mg/kg) and much larger zinc concentrations (4,840 and 11,700 mg/kg) and copper concentrations (1,150 and 3,340 mg/kg) than the soil samples from beneath the warehouse. Calcium concentrations were within the range ofthe concentrations measured in the samples from the warehouse, but magnesium concentrations were larger (7,420 and 14,600 mglkg) (fig. 15). Lead was measured in one sample at 600 mg/kg, but was less than 40 mg/kg in the other. Additionally, chromium and nickel concentrations were about an order of magnitude larger than in the samples from other areas of IOC discussed above. In three samples of sediment from the old pipe shop, arsenic concentrations ranged from 268 to 548 mg/kg, barium concentrations ranged from 168 to 402 mg/kg, calcium concentrations ranged from 3,760 to 7,960 mg/kg, magnesium concentrations ranged from 1,600 to 6,940 mg/kg, zinc concentrations ranged from 502 to 2,710 mg/kg, copper concentrations ranged from 85.9 to 647 mg/kg, and lead concentrations ranged from 455 to 1,010 mg/kg (fig. 15). Chromium and nickel concentrations were less than those in soils from the masonry building (85.9-647 mg/kg and 24.3-260 mg/kg, respectively) (E.C. Jordan Co., 1990, app. G, table 3).
If the analytical results for the filter-clay wastepile are compared with those for soil samples and for sediments collected in or beneath the three buildings, it appears that the constituents that tended to be more abundant in the wastepile samples are barium, calcium,lead, magnesium, and zinc. The calcium and magnesium probably were contributed by the clay, the barium also may have been contributed by the clay, and the lead and zinc probably are related to the petroleum products that were passed through the filter clay. By process of elimination, arsenic, chromium,
. copper, and nickel are likely to be relatcd to activities that occurred earlier than waste-oil processing, which may include roasting of arsenical coppcr ores. Roasting of copper ores also can release some lead and manganese (Adriano, 1986). Some calcium, magnesium, and barium also may be related to roasting activities, as limestone (CaC03' with magnesium and barium as impurities)
54

may have been used as a flux, and, if calcium arsenate was being produced, some source of calcium would be necessary. The soils and sediments sampled in and beneath the buildings probably contain a mixture of constituents from roasting and from waste-oil processing, as do the soil samples from the tank areas, drum-washing area, and septic-system area, although the sediments in the buildings are more highly contaminated with metals than are the soils outside.
Mercury is not commonly measured in highly elevated concentrations in 10C soils. In 1989, mercury concentrations were reported as less than 0.1 mg/kg in most of the soil and sediment samples. Concentrations ranged from 0.39 to 0.76 mglkg in sediments from the old pipe shop, from 0.18 to 0.21 mg/kg in sediment from the masonry building, and from 0.15 to 0.22 mg/kg in soils from the various tank farms (E.C. Jordan Co., 1990). A slightly larger concentration range is reported for soils from beneath the old warehouse (0.13-1.1 mglkg) (E.C. Jordan Co., 1990).
Study Area
Insufficient samples were collected from O-horizon soils in the various land-use areas during this study to perform meaningful statistical analyses of the chemical constituents therein. The most apparent differences in metal concentrations in soils among land-use categories were in Ahorizon soil samples. Concentrations of arsenic and metals in B-horizon soil samples differed among land uses, but the differences were less distinct than those seen in A-horizon soil samples. and preliminary statistical models do not adequately classify each of the endmember land uses using B-horizon metal-concentration data. Chemistry of clays from different land-use areas was similar, except for that of a few samples from IOC. Therefore, the geochemical relations illustrated in element-element plots and the statistical models developed to create the chemical signatures of soils from each land-use type are based on data from the A horizons.
Because the soils at IOC are disturbed, the grouping of the soils sampled there into soil horizons is arbitrary and is based primarily on characteristics such as color and texture, regardless of stratigraphy. A-horizon soils could be identified on the basis of their sandy texture and gray to brown color. A few B-horizon soils were identified by a higher proportion of clay to sand than that found in A-horizon soils, and also by an orangey-brown color. C-horizon soils are identified by their sandy texture and tan color. In the following discussions of the relation between concentrations of selected constituents and land use, results of analyses of A-horizon soil samples are emphasized.
Arsenic
The distribution of arsenic in soil samples from various horizons in undeveloped forested areas, orchards, and IOC is shown in figure 16. Concentrations in samples from the soil horizons in undeveloped areas were small (typically less than 10 mg/kg) compared with those in samples from orchards and 10C. The range of concentrations of arsenic in the A-horizon samples from orchard soils overlapped the arsenic concentrations found in A-horizon samples from undeveloped areas, but both maximum and median values of arsenic in orchard A-horizons soils were larger than those in undeveloped-area A-horizon soils.
55

130 130
120 120 SOIL, 0 HORIZON SOIL, A HORIZON
100 100
80 80
~ « 60 a:
60 CD 0 ....J (12) S2
40 a: 40 '* (5) w a..
B (5) Cf)
20 ~ 20
~ (3) <C (10)
a: c::::J CD
:::::i 0 ....J 0
G 0 ~ G 0 I ~ ENDMEMBER LAND-USE CATEGORY ~ ENDMEMBER LAND-USE CATEGORY <C a: Z~ CJ 0 130 0 130 ....J ~ 52 120 « 120 a: a: SOIL, E HORIZON I- SOIL, B HORIZON w Z a... w Cf) 100
() 100
~ Z <C 0 a: () CJ g :::::i 80 Z 80 ....J
~ W Cf)
~ a:
60 <C 60 Z~
0 ~ (3) <C 40 40 (7) a: I-Z W (22) 0 20 20 Z (6) 0 ()
() 0 0 Z
w G 0 G 0 CJ) ENDMEMBER LAND-USE CATEGORY ENDMEMBER LAND-USE CATEGORY a: <C
130 I I I EXPLANA TION 120 I- (6) -
CLAY G Soils from undeveloped areas
100 - - 0 Soils from orchards
Soils from Imperial Oil Company Superfund site 80 - -
(10) Number of observations 60 f- - 0 Outlier data value more than 3 times the
interquartile range outside the quartile (15) (8) Outlier data value less than or equal to 3
40 f-
~ - * and more than 1.5 times the
g interquartile range outside the quartile
f-- Data value less than or equal to 1.5 times the
~ interquartile range outside the quartile
20 f- -75th percentile
+ Median
0 I I 25th percentile G 0
ENDMEMBER LAND-USE CATEGORY
Figure 16. Distribution of arsenic concentrations in soil horizons and clays, by endmember use, Monmouth and Middlesex Counties, New Jersey.
56
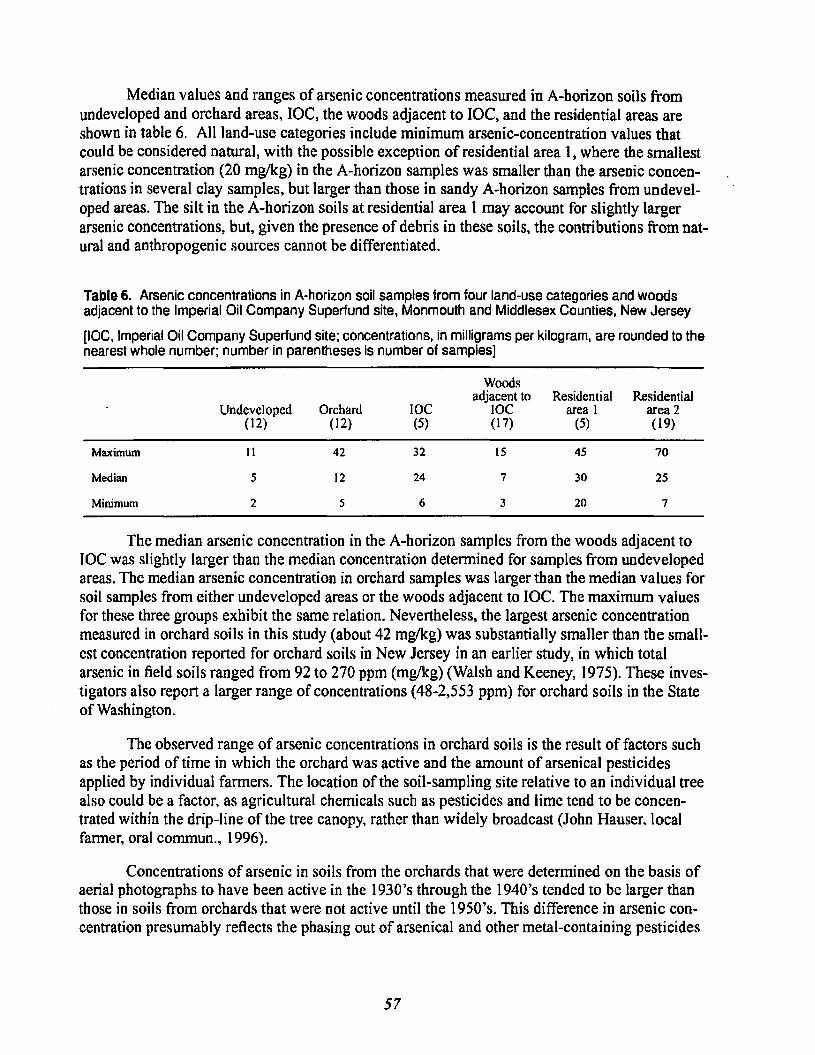
Median values and ranges of arsenic concentrations measured in A-horizon soils from undeveloped and orchard areas, IOC, the woods adjacent to IOC, and the residential areas are shown in table 6. All land-use categories include minimum arsenic-concentration values that could be considered natural, with the possible exception of residential area 1, where the smallest arsenic concentration (20 mglkg) in the A-horizon samples was smaller than the arsenic concentrations in several clay samples, but larger than those in sandy A-horizon samples from undeveloped areas. The silt in the A-horizon soils at residential area 1 may account for slightly larger arsenic concentrations, but, given the presence of debris in these soils, the contributions from natural and anthropogenic sources cannot be differentiated.
Table 6. Arsenic concentrations in A-horizon soil samples from four land-use categories and woods adjacent to the Imperial Oil Company Superfund site. Monmouth and Middlesex Counties. New Jersey
[IOC. Imperial Oil Company Superfund site; concentrations, in milligrams per kilogram. are rounded to the nearest whole number; number in parentheses is number of samples]
Woods adjacent to Residential Residential
Undeveloped Orchard IOC IOC area 1 area 2 (12) (12) (5) (17) (5) (19)
Maximum II 42 32 15 45 70
Median 5 12 24 7 30 25
Minimum 2 5 6 3 20 7
The median arsenic concentration in the A-horizon samples from the woods adjacent to IOC was slightly larger than the median concentration determined for samples from undeveloped areas. The median arsenic concentration in orchard samples was larger than the median values for soil samples from either undeveloped areas or the woods adjacent to IOC. The maximum values for these three groups exhibit the same relation. Nevertheless, the largest arsenic concentration measured in orchard soils in this study (about 42 mglkg) was substantially smaller than the smallest concentration reported for orchard soils in New Jersey in an earlier study, in which total arsenic in field soils ranged from 92 to 270 ppm (mglkg) (Walsh and Keeney, 1975). These investigators also report a larger range of concentrations (48-2,553 ppm) for orchard soils in the State of Washington.
The observed range of arsenic concentrations in orchard soils is the result of factors such as the period of time in which the orchard was active and the amount of arsenical pesticides applied by individual farmers. The location of the soil-sampling site relative to an individual tree also could be a factor, as agricultural chemicals such as pesticides and lime tend to be concentrated within the drip-line of the tree canopy, rather than widely broadcast (John Hauser, local fanner, oral commun., 1996).
Concentrations of arsenic in soils from the orchards that were determined on the basis of aerial photographs to have been active in the 1930's through the 1940's tended to be larger than those in soils from orchards that were not active until the 1950's. This difference in arsenic concentration presumably reflects the phasing out of arsenical and other metal-containing pesticides
57

in favor of organic pe!iticide!i. which gained in popularity following World War II. Although use of lead arsenate in orchards has declined. use of organic arsenical herbicides for weed control on turf as well as on citrus and cotton crops increased during the 1970's (Adriano, 1986).
Arsenic concentrations in the A-horizon soil samples (sands with variable amounts of !iilt and clay) indicate that the median arsenic concentration in samples from IOC wa!i larger than the median concentrations for samples from all other land-use groups, except samples from the residential-area groups, where the medians were slightly larger. Additionally. the maximum arsenic concentrations measured in A-horizon soils were in samples of residential soils. A comparison of arsenic concentrations in soils at IOC with those in residential soils must take into account soil characteristics, however.
Clays were encountered at valious depths in the soil cores collected at IOC. At some sampling locations, they may represent deposits at the surface from excavation activities or wastes from industrial activities at the site. Concentrations of arsenic in the sandy layers vary, and some are within the range measured in samples from undeveloped areas. which represent natural conditions. Arsenic concentrations in the samples from IOC tended to be largest in the clays; elevated concentrations also were measured in some samples that contained cindery slag and brick fragments.
None of the samples collected at IOC during the present study contained arsenic concentrations as large a!i those measured previously in the northern and eac;tern parts of the site. which ranged up to 198 mg/kg in surficial samples (0-2 ft below land surface) and from 231 to 812 mglkg in three samples collected from 2 to 5 ft below land surface (E.C. Jordan Co .• 1990). Selection of appropriate sampling locations for 10C soils was difficult because the soils were disturbed, information about activities involving soil movement was lacking, and. consequently, the constituent concentrations varied greatly over short distances, both vertically and horizontally. Many ofthe samples collected are soils that contain a mixture of debris, some of which appears to be traccable to early activities at the site--that is. brick, slag or cinders, and what appear to be mortar or roasted-limestone fragmentc;. These soils. then, are appropriate for comparison with soils from residentiai area I. where !iimilar debris is present and arsenic concentrations are generally in the same range.
One soil core was collected during this study in a wastepile deposit of the oil-soaked filter clay from the tanks used during the waste-oil reprocessing activities at 10C. Arsenic concentrations in subsamples of the filter clay are not shown in figure 16, as the filter clay is not part of the local soil. Nevertheless, arsenic is present in the filter clay; in the samples collected during this study, arsenic concentrations ranged from 4.4 mg/kg at the bottom of the 4-ft augered hole to 41.3 mglkg at the top of the hole. Given that the arsenic concentrations decreased with depth in the core, the arsenic in the filter clay may be derived from arsenical debris previously deposited at the site. At tbe hand-specimen level. the filter clay is distinctive and is unlike any of the naturally occurring clays in the study area. The filter clay has not been identified in any other samples col-
'lected during the present study, but, if dusts from the wastepile had blown onto adjacent properties, small particles of filter clay would probably be indistinguishable in the matrix of local soils except. perhaps, at the microscopic level.
58

Concentrations of arsenic in soil samples from residential areas 1 and 2 were large relative to those in samples from the woods adjacent to IOC (fig. 17), which were similar to those in samples from undeveloped areas (fig. 16). Although the median arsenic concentration in A-horizon soils from the woods adjacent to IOC was slightly larger than the median arsenic concentration in A-horizon soils from undeveloped land, many of the soil samples from the woods adjacent to IOC contained arsenic in concentrations that were not significantly different, statistically, from those in soils from undeveloped areas. Exceptions are samples from an area about 500 ft north-northeast of the fenceline at IOC that fOlmerly was orchard land. Arsenic concentrations were slightly larger in two A-hOlizon samples (S 16A, 10.6 mg/kg; S 19 A, 15.1 mg/kg) than in the rest of the A-horizon samples from the woods adjacent to IOC, where arsenic concentrations all were less than 10 mg/kg. Surficial soils in the woods adjacent to IOC, which lie between IOC and residential area 2, generally do not contain eievated concentrations of arsenic and metals that can be attributed to fallout from a smokestack plume.
Arsenic concentrations in soils from the two residential areas generally overlap concentrations found in orchard soils and in soils onsite at IOe. In residential area 2, arsenic concentrations in A-horizon soil samples (sites R6 and R11) from two properties that border the former orchards were smaller than arsenic concentrations in A-horizon soil samples from elsewhere in this area; on the basis of aerial photographs, R6 and R11 are not located on fOlmer orchard land. The spatial distributions of arsenic in the A horizon in the vicinity ofIOe and in the study area more than 0.5 mi from IOC are shown in figures 18 and 19, respectively.
Arsenic concentrations did not differ substantially among clay samples from undeveloped areas, orchards, and the woods adjacent to IOC (table 7). The arsenic concentrations in clay samples fi'om the vv'oods adjacent to IOC were in the range of naturally occurring concentrations in clays, as were those in samples from clays underlying orchards, although the median arsenic concentration in clay samples from orchards was slightly larger than that in clay samples from undeveloped land or the woods adjacent to IOC.
Table 7. Arsenic concentrations in clays from four land-use categories and woods adjacent to the Imperial Oil Company Superfund site, Monmouth and Middlesex Counties, New Jersey
[IOC, Imperial Oil Company Superfund site; concentrations, in milligrams per kilogram, are rounded to the nearest whole number; number in parentheses is number of samples]
Undeveloped (20)
Orchard (9)
Imperial Oil Company
(IOC) (6)
Woods adjacent to
IOC (9)
Residential area 1 (14)
Residential area 2 (21 )
Maximum 41 39 114 25 156 42
Median 19 22 30 15 47 18
Minimum 8 14 4 3 12 11
59

160
140
120
100
80
60
40
20
0 ~ « a: C) 0 160 ....J
~
a: 140 W
0... CJ)
~ 120 <C a: C) :J ....J
100
~
~ 80 Z-0 i= 60 « a: I-
40 Z w () z 0 20 U U Z 0 w CJ) a: <C
160
140
120
100
80
60
40
20
0
WOODS ADJACENT TO IMPERIAL OIL COMPANY SUPERFUND SITE
(10)
o
(17)
(21)
* A B
SOil HORiZON OR GEOLOGIC FEATURE
RESIDENTIAL AREA 1
(5)
(7)
*
(10)
A B CLAY SOil HORIZON OR GEOLOGIC FEATURE
RESIDENTIAL AREA 2
(18) (33)
* (19)
*
A B CLAY SOIL HORIZON OR GEOLOGIC FEATURE
(10)
o
*
(9)
EXPLANATION
Number of observations
Outlier data value more than 3 times the interquartile range outside the quartile
Outlier data value less than or equal to 3 and more than 1.5 times the interquartile range outside the quartile
Data value less than or equal to 1.5 times the interquartile range outside the quartile
75th percentile
Median
25th percentile
Figure 17. Distribution of arsenic concentrations in soil horizons and clays in woods and residential areas adjacent to and near the Imperial Oil Company Superfund site, Marlboro Township, Monmouth County, New Jersey.
60

Greenwood Road
Tennent Road
Orchard
Place
Lloyd Road
Church Lane
Wilson Avenue
Roosevelt Ave. Mar
lbor
o St
.
Bald
win
St.
Orchard Parkway
Texa
s Roa
d
STAT
E RO
UTE
79
EXPLANATION
Sampling grid
Soil sample collected at Imperial Oil Company siteSoil sample collected adjacent to Imperial Oil Company siteSoil sample collected from residential area
Soil sample collected from an orchard
Soil sample collected from an undeveloped area
74°14'45" 74°14'15"
40°23'15"
40°22'45"
Base from Markhurd 1991 digital orthophoto quads
R17
R18R1
R5
R16R13
R14R15
R27
R7R10
R2R9
R12R8
R20R11
R6
R21
R23R22R19
R24
014E14
IMPERIAL OILCOMPANYSUPERFUNDSITE
S20
S15
S4
S10
S9S5
S7
S3S2S1
S17S16S11
S12 S13 S14
S19
I4
I3
I2
I5
I7
0-10 10-20 20-30 30-40 >40ARSENIC CONCENTRATION,IN PARTS PER MILLION
0 200 400 600 800 1,000 FEET
0 200 METERS
74°
40°
41°
39°
75°
Area of detail
Study area
0 10 20 MILES
01020 KILOMETERS
BIRC
H SW
AMP BR
OO
K
Figure 18. Arsenic concentrations in A-horizon soils in the vicinity of the Imperial Oil Company Superfund site, Marlboro Township, Monmouth County, New Jersey.
61

Base modified from U.S. Geological Survey digitaldata, 1:100,000, 1983, Universal TransverseMercator projection, Zone 18
74°18' 74°14'
40°23'
40°21'
IMPERIAL OILCOMPANYSUPERFUNDSITE
EXPLANATION
County boundary
Soil sample collected from residential area
Soil sample collected from an orchard
Soil sample collected from an undeveloped area
Road
0-10 10-20 20-30 30-40 >40ARSENIC CONCENTRATION,IN PARTS PER MILLION
Area shown infigure 18
0 10.5 1.5 2 MILES
0 0.5 1 1.5 2 KILOMETERS74°
40°
41°
39°
75°
Area of detail
Study area
0 10 20 MILES
01020 KILOMETERS
Tenn
ent R
oad
STAT
E R
OU
TE 7
9
MIDDLESEX C
OUNTY
MONMOUTH COUNTY
Figure 19. Arsenic concentrations in A-horizon soils more than 0.5 mile from the ImperialOil Company Superfund site, Marlboro Township, Monmouth County, New Jersey.
62

Arsenic concentrations in clay samples collected beneath residential area 2 typically ranged from about 11 to about 25 mg/kg, although concentrations in two samples were about 31 and 42 mg/kg. The largest concentrations of arsenic measured during this study were those in clay samples from IOC and from a wooded area on a residential property immediately adjacent to IOC (sampling site R3). The clay at R3 contained many pieces of cindery slag to about 20 in. below land surface.
Overall, arsenic concentrations in soils from residential area 1 tended to be largest in those samples in which slag or cinder pieces are most abundant. Concentrations in soils from residential area 2 were largest in samples from soils beneath some of the apple trees and from some areas where the soils appear to have been disturbed by earth-moving activities. No foreign materials such as the slag/cinder fragments or coal found in soils at residential area 1 have been identified in the soils from residential area 2. The B-horizon soil sample from the broader area that contained 149 mg/kg arsenic is from a site where some of the natural soil horizons appear to be disturbed.
Barium
Barium concentrations in soil samples from undeveloped areas generally were less than 10 mg/kg, except in O-horizon and clay samples, where the concentrations ranged from about 10 to about 40 mg/kg (fig. 20). A similar range of concentrations was found in samples from orchard soils. Some soil samples collected from IOC, however, contained larger barium concentrations (up to 204 mg/kg) than soils from undeveloped or orchard areas; these IOC samples also contained elevated arsenic and (or) lead concentrations. The largest barium concentrations in samples from IOC (714-2,290 lug/kg) were measured in the filter clay.
Barium concentrations in soils from residential area 1 ranged from 18.2 to 166 mg/kg; the larger concentrations tended to be present in A-horizon soil samples. The large barium contents of the soils in residential area 1 probably are not due solely to a high clay content relative to that in other soils sampled, because the barium concentrations in some of the sandy A-horizon samples, in particular, were substantially larger than the balium concentrations not only in A-horizon samples collected elsewhere, but in clay samples as well. The A horizons in soils from residential area 1 typically contained some slag or cinder debris and, in some instances, brick fragments. The elevated barium concentrations in soils of residential area 1 may be related to the transpOli of contaminated soil to the residential propeliies as part of the debris that apparently Oliginated at IOC.
The elevated barium concentrations (3.2-204 mg/kg) in soil samples from IOe may derive from the filter clay used in waste-oil processing or from limestone used in the ore-roasting process; calcium concentrations in IOC soils also were large. FUl1hermore, the barium contents of the two slag samples from IOC and residential area 1 (30.6 and 72.4 mg/kg) also were large, as were barium concentrations in samples of sediment collected in 1989 from buildings onsite, the masonry building, the pipe shop, and the old warehouse (168-756 mg/kg) (E.C. Jordan Co., 1990).
63

250'---~----------r---------~--------~----~
UNDEVELOPED FOREST SOILS
200
150
100
(15)
50
0 0 A B CLAY
~ SOIL HORIZON OR GEOLOGIC FEATURE « a: c:l 0 250 .....J S2 a: ORCHARD SOILS w 0..
200 (J)
~ « a: c:l :::J 150 .....J
~
~
Z 100 0
i= « a: (12) (22) I-
5:t j Z
0 8 w () (3) (8) Z 0 D B ()
~ ~ EE I :::> a: 0 A B CLAY
« SOIL HORIZON OR GEOLOGIC FEATURE CD
250
IMPERIAL OIL COMPANY (6) SUPERFUND SITE SOILS
200
150
(5) (7)
100
50
OL-____ -L ____________ -L ____________ ~ ______ ~
A B CLAY
SOIL HORIZON OR GEOLOGIC FEATURE
100
50
0
~ « a: c:l
250 0 .....J S'2 a: w Q..
200 (J)
~ « a: c:l :::J 150 .....J
~
~
Z 100 0 i= « a: I-Z
50 W () z 0 ()
~ 0 ;2 a: « CD
100
50
0
SOILS IN WOODS ADJACENT TO
(10) IMPERIAL OIL COMPANY SUPERFUND SITE
0 A B CLAY
SOIL HORIZON OR GEOLOGIC FEATURE
RESIDENTIAL AREA 1 SOILS
(5)
(10)
(7) * 8 B
A B CLAY
SOIL HORIZON OR GEOLOGIC FEATURE
RESIDENTIAL AREA 2 SOILS
(18) (33) (19)
* ~ ~
A B CLAY
SOIL HORIZON OR GEOLOGIC FEATURE
(10)
o
*
EXPLANATION
Number of observations
Outlier data value more than 3 times the interquartile range outside the quartile
Outlier data value less than or equal to 3 and more than 1.5 times the interquartile range outside the quartile
Data value less than or equal to 1.5 times the interquartile range outside the quartile
75th percentile
Median
25th percentile
Figure 20. Distribution of barium concentrations in samples from soil horizons and clays by land use, Monmouth and Middlesex Counties, New Jersey.
64

Overall, the soil samples from residential area 1 contained barium in concentrations that typically were larger than those measured in the soils from residential area 2 (fig. 20). Barium concentrations in residential area 2 soil samples tended to be between 10 and 20 mg/kg; these are similar to the concentrations found in samples of some orchard soils and the more clay-rich horizons of soils from undeveloped areas.
Copper
Copper concentrations in samples from 0 horizons of soils in undeveloped areas tended to be larger than those in samples from the other horizons (maximum 38 mg/kg) (fig. 21). Copper concentrations in samples from undeveloped areas generally were slightly larger in clays than in the sandy soil horizons. Copper concentrations generally were larger in samples of A-horizon orchard soils (4.9-24.3 mg/kg) than in samples of A-horizon soils from undeveloped forested areas (5.5-15.2 mg/kg), possibly as a result of the use of copper-bearing pesticides, such as Paris Green (C4H6As6CU4016)' in orchards or of the addition of copper, typically as copper sulfate, to soils as a micronutrient (Adriano, 1986).
Copper concentrations in soil samples from IOC vary widely (0.48-167 mg/kg); the largest copper concentration measured during this study was in soils sampled at IOC (167 mg/kg). A concentration of 1,020 mg/kg in a surface soil sample from an area north of the old warehouse at IOC was reported previously, and copper concentrations in sediment samples, both sandy and clayey, from the floor of the masonry building, the pipe shop, and beneath the old warehouse were highly elevated (85.9-3,340 mg/kg (E.C. Jordan Co., 1990)). The ores processed at IOC are believed to have been arsenical copper sulfides (Steven Byrnes, oral C0111mun., 1996); elevated copper concentrations in IOC soils and in the sediments in the old buildings there probably are related to ore-processing activities, as discussed earlier.
Copper concentrations in soil samples from the residential areas were larger than those in soil samples from undeveloped forested areas. In residential area 1, copper concentrations ranged from 3.8 to 69.9 mg/kg in all horizons and clays sarnpled; copper concentrations in most of the samples ranged from 10 to 20 mg/kg. Concentrations of copper in residential area 1 soils were largest inA-horizon samples (30.0-69.9 mg/kg). In residential area 2, copper concentrations commonly were larger in A-horizon soil samples (9.7-42.7 mg/kg) than in samples from Band C horizons (0.74-33.7 mg/kg); the largest concentration was measured in an A-horizon sample that also contained 70.5 mg/kg of arsenic.
lead
Elevated (greater than natural geologic) lead concentrations in soils, even in undeveloped areas, result from regional atmospheric fallout, which derives from industrial emissions and, until recently, gasoline-powered vehicle exhaust. Several studies have shown that this atmospheric lead accumulates in the 0 horizons of soils (Siccama and others, 1980; Friedland and others, 1984; Friedland and Johnson, 1985). The lead measured in O-hotizon soils in the study area probably removed, such as orchard and residential soils, would contain more lead derived from atmosphelic fallout than soils in which the 0 horizon has been preserved because the lead that
65

:2: « c:r: o
200.---.--------,--------.--------.--~
UNDEVELOPED FOREST SOILS
150
100
50 (5)
(10) (15)
O~--~------~A------~~------C-L~A-Y--~
SOIL HORIZON OR GEOLOGIC FEATURE
o 200.---.--------,--------.--------.--~ --l
S2 c:r: UJ !l. (J)
:2: 150 « c:r: o ::J --l
~ ~ 100
Z o ~ c:r: ~ 50 UJ o Z o o
ORCHARD SOILS
(3) (12)
(8)
ffi O~--~------~------~~------~--~ !l. !l. o o
SOIL HORIZON OR GEOLOGIC FEATURE
200.----.1-----------.1----------'1-----.
(5)
150 -
100 -
50 -
IMPERIAL OIL COMPANY SUPERFUND SITE SOILS
(7)
*
-
-
(6)
-
~ o~_~~ ____ ~[J=-____ ~I __ ~ A B CLAY
SOIL HORIZON OR GEOLOGIC FEATURE
100
50
::2! « c:r: 0 0 --l 0 S2 c:r: UJ !l. (f)
100 :2: « c:r: 0 ::J --l
~
~ 50
Z-0 i= « c:r: I- 0 Z UJ 0 Z 0 0 100 c:r: UJ !l. !l. 0 0
50
0
(10)
o
*
SOILS IN WOODS ADJACENT TO IMPERIAL OIL COMPANY SUPERFUND SITE
(10) (17)
0 (9)
A B CLAY
SOIL HORIZON OR GEOLOGIC FEATURE
(5) RESIDENTIAL AREA 1 SOILS
0 (7) (10)
A B CLAY
SOIL HORIZON OR GEOLOGIC FEATURE
RESIDENTIAL AREA 2 SOILS
(18)
* (33)
0
8 A
SOIL HORIZON OR GEOLOGIC FEATURE
EXPLANATION
Number of observations
Outlier data value more than 3 times the interquartile range outside the quartile
Outlier data value less than or equal to 3 and more than 1.5 times the interquartile range outside the quartile
Data value less than or equal to 1.5 times the interquartile range outside the quartile
75th percentile
Median
25th percentile
Figure 21. Distribution of copper concentrations in samples from soil horizons and clays by land use, Monmouth and Middlesex Counties, New Jersey.
66

accumulated before soil-churning activities would have been removed with the 0 horizon. Therefore, lead in A horizons of soils developed for orchard or residential use would include any atmospheric lead accumulated since the removal of the 0 horizon as well as any other surficial inputs associated with the presence of orchards or residences, such as the application of pesticides containing lead.
Lead concentrations in samples from the 0 horizons of soils on undeveloped land were smaller than those in samples from the 0 horizons of soils on orchard land, and the median concentration of lead for A-horizon samples from undeveloped soils was smaller than the median concentration for A-horizon samples from orchard soils (fig. 22). These concentrations indicate that pesticides containing lead may have been used on at least some of the orchard soils sampled. Coupled with anecdotal evidence from area farmers that lead arsenate pesticides were used on orchards, these soil lead-concentration data indicate that pesticide residues can be found in soils from former orchards, including residential areas built on former orchard land.
The range of lead concentrations in A-horizon soil samples from IOC (6.1-284 mg/kg) is similar to the range of lead concentrations in orchard A-horizon soil samples (20.4-204 mg/kg) (fig. 22). Several soil samples from IOC identified as B-horizon soils contained larger lead concentrations (38.9-224 mg/kg) than did B-horizon soil samples from orchards or undeveloped areas, where lead concentrations typically were less than 10 mg/kg. Nevertheless, some lead concentrations in IOC soils were found to be at background levels measured in soils from undeveloped areas. Lead concentrations in IOC samples were largest in samples from the filter clay (713-4,450 mg/kg) (not shown).
Lead concentrations typically were largest in those IOC soil samples that contained petroleum, indicating that some of the lead may derive from that source. Previous sampling at IOC yielded a few samples in which lead concentrations approached the largest value measured in the filter clay during this investigation. Three samples from the wastepile area (within 150 ft of the location of USGS samples of the filter clay) contained lead concentrations of 3,0 1 0, 2,730, and 1,350 mg/kg; these were found at depths of 7 to 9 ft, 13 to 15 ft, and 2 to 4 ft, respectively (E.C. Jordan Co., 1990).
On the basis of available data from this and previous studies, elevated lead concentrations are not always associated with elevated arsenic concentrations in soil samples from IOC, possibly because the mobilities are different (arsenic is the more mobile). Alternatively, the sources of these two contaminants may be different; the bulk of the arsenic contamination could be related to pesticide production and much of the lead contamination could be related to the oil-reprocessing activities at IOC. As discussed earlier, results of analyses of samples from the filter-clay wastepile indicate that elevated lead concentrations are associated with processing of waste oil.
Lead concentrations in residential area 1 were largest (88.3-348 mg/kg) in samples of the sandy A-horizon soils (fig. 23). TOC concentrations in these soil samples also were larger than those in samples from other horizons, which may explain the accumulation of lead in A-horizon soils in residential area 1. Nevertheless, no VOC's and only small concentrations of semivolatile compounds associated with coal tar were detected during previous sampling for organic compounds at two sites in residential area 1; these samples were collected from the top 6 in. of soil (L. Robert Kimball and Associates, 1995).
67

~ « 0: (9 0 .....J
~ 0: ill 0.. (J)
~ « 0: C) ::; .....J
~
~
z· 0 i= « 0: I-Z ill 0 Z 0 ()
0 « ill .....J
500
400
300
(5)
200
100 B 0
0
500 (3)
400
300
200
100
0 o
UNDEVELOPED FOREST SOILS
(10) (22)
A B
SOil HORiZON OR GEOLOGiC FEATURE
ORCHARD SOILS
(12)
(22)
o A B
SOil HORIZON OR GEOLOGIC FEATURE
(15)
CLAY
(8)
CLAY
500~----~--------~--------~----~
400
300
200
100
IMPERIAL OIL COMPANY SUPERFUND SITE SOILS
(5)
(7)
o
(6)
o----~L---~~~~~==~~~ A B CLAY
SOIL HORIZON OR GEOLOGIC FEATURE
EXPLANATION
(10) Number of observations
o
*
Outlier data value more than 3 times the interquartile range outside the quartile
Outlier data value less than or equal to 3 and more than 1.5 times the interquartile range outside the quartile
Data value less than or equal to 1 .5 times the interquartile range outside the quartile
75th percentile
Median
25th percentile
Figure 22. Distribution of lead concentrations in samples from soil horizons and clays by endmember land use, Monmouth and Middlesex Counties, New Jersey.
68

400 ~ « a: CJ 0 350 ....J
S2 a: ill Cl.. 300 Cf)
~ « a: 0 250 ::J ....J
~
~ Z- 200
0 i= « a: 150 f-Z ill 0 Z 0 100 ()
0 « ill ....J 50
0
450
400 ~ « a: 0 0 350 ....J
S2 a: ill Cl.. 300 (f)
~ « a: 0 250 ::J ....J
~
~
Z 200
0 i= « a: 150 f-Z ill () Z 0 100 ()
0 « ill ....J 50
0
RESIDENTIAL AREA 1 SOILS
(5)
(10)
* - '--- (7)
EJ 0 A B CLAY
SOIL HORIZON OR GEOLOGIC FEATURE
RESIDENTIAL AREA 2 SOILS
(33)
(18) 0
* (19)
A B CLAY
SOIL HORIZON OR GEOLOGIC FEATURE
(10)
o
*
EXPLANATION
Number of observations
Outlier data value more than 3 times the interquartile range outside the quartile
Outlier data value less than or equal to 3 and more than 1.5 times the interquartile range outside the quartile
Data value less than or equal to 1.5 times the interquartile range outside the quartile
75th percentile
Median
25th percentile
Figure 23. Distribution of lead concentrations in samples from soil horizons and clays in residential areas in the vicinity of the Imperial Oil Company Superfund site, Marlboro Township, Monmouth County, New Jersey.
69

Some samples of B-horizon soils and clays collected in this area also contained relatively large lead concentrations, ranging from 16.6 mg/kg in a B-horizon sample to 124 mg/kg in a clay containing cindery slag and other debris. Lead concentrations in the B-horizon and clay samples from residential area 1 were larger than would be expected in B-horizon soils and clays from long-term undeveloped forested areas (fig. 22), where lead derives from geologic inputs.
In residential area 2, lead concentrations generally were largest in samples from the A horizon (16.9-392 mg/kg), with more than half the samples containing greater than 100 mg/kg (fig. 23). These concentrations overlap the largest lead concentrations measured in orchard A-holizon soil samples (20.9-474 mg/kg). Two of the smaller lead concentrations (16.9 and 66.3 mg/kg) in the A-horizon samples from residential area 2 were in soils from the two properties that border the former orchards; lead concentrations in samples of soils from these two properties are within the range measured in samples of soils from undeveloped areas.
Lead concentrations in the soils from two sampling sites in the broader area (20.8-54.2 mg/kg) generally were in the upper end of the concentration range measured in soil samples from undeveloped, long-term forested areas or in the low end of the concentration range measured in samples from orchard areas (typically soils from orchards active only after 1950). The exceptions are the sample from a disturbed B horizon (sample BIB 1, app. 1), which contained 149 mg/kg of arsenic and 400 mg/kg of lead, and a clay sample (sample B2eI2), which contained 18.3 mg/kg of arsenic and 95.6 mg/kg of lead. On the basis of the limited number of samples collected from former orchard land southeast of residential area 2 (the broader area), highly elevated arsenic and lead concentrations do not appear to be confined to residential areas 1 and 2.
lead Isotopes
Selected soil samples were analyzed for four lead isotopes (table 8). Three isotores of lead, 206Pb, 207Pb, and 208Pb, are derived from radioactive decay of uranium and thorium ( 38U, 235U, and 232Th, respectively). The fourth isotope, 204Pb, is not radiogenic. The ratios of the activities of radiogenic isotopes to activity of nonradiogenic 204Pb measured in geologic materials are a function of (1) the amounts of uranium, thorium, and 204Pb present in the original geologic materials and (2) the length of time during which the uranium and thorium have decayed. Thus, because the composition and geologic history of lead ores are unique to a given area and formation, the ratios can be used to identify particular geologic sources of lead (Faure, 1986). Additionally, because industrial sources of lead have been derived from known ore sources, lead-isotope ratios have proved useful in distinguishing an anthropogenic source of lead such as an ore smelter from other anthropogenic sources such as leaded gasoline or house paint (Hurst, 1994).
The lead isotopes measured in soils from the study area were expected to indicate input from more than one source. Regional fallout from leaded-gasoline emissions was considered likely to be ubiquitous. Lead from lead arsenate pesticides was expected to be confined to areas that are or formerly were orchards, where it is added to lead deposited as regional fallout.
Because 206Pb, 207Pb, and 208Pb are all isotopes of lead derived from radioactive decay, ratios of the activities of these isotopes to that of 204Pb, which is not radiogenic, can indicate the degree to which the lead that is present in the sample is radiogenic. The larger the ratio, the more
70

Table 8. Lead-isotope ratios and concentrations in selected soil samples, Monmouth and Middlesex Counties, New Jersey [ppm, parts per million; sampling locations stiown in figs. 8 and 9]
Sample Pb extract 1 Total Pb2
number (ppm) (ppm)
E20 18.888 15.660 38.513 1.2061 782.0 38.45
E2A 18.292 15.615 38.237 1.1714 1836 27.14
E6A 18.547 15.631 38.343 1.1865 1006 17.61
E9A 18.605 15.636 38.428 1.1899 1340 11.85
E90 18.615 15.616 38.301 1.1920 2056 149.5
E14DA 18.600 15.687 38.496 J.l857 1522 10.35
E7E 18.646 15.665 38.534 1.1903 345.8 4.999
OIA 18.523 15.635 38.335 1.1847 2977 189.8
OlE 18.30S 15.627 38.252 1.1716 7931 180.3
02E 18.234 15.597 38.118 1.1691 20236 298.0
03A 18.468 15.717 38.586 1.1750 7935 104.6
04A 18.646 15.673 38.425 1.1897 2547 63.12
040 18.876 15.690 38.598 1.2031 1426 96.62
06A 18.682 15.678 38.560 1.1916 898.4 15.52
07A 18.295 15.614 38.170 1.1717 1237 39.63
ORO 18.742 15.653 38.484 1.1973 1075 23.74
09A 18.677 15.651 38.613 1.1933 1664 51.98
Ol6A 18.305 15.662 38.312 1.1687 4085 159.7
SIO 18.839 ! 5.651 38.466 l.20]7 2292 53.56
SIA 18.635 15.681 38.516 1.1884 1043 20.17
S4A 18.607 15.633 38.388 1.1902 1358 19.28
S50 18.413 15.647 38.196 1.1768 1933 62.29
S5A J 8.547 15.665 38.412 1.1840 946.2 34.66
S70 18.741 15.695 38.538 1.1941 2822 1]7.0
S7A 18.679 15.664 38.589 1.1925 716.3 21.41
R2A J 8,Cl25 15.624 37.922 1.1537 14660 294.1
R3 17 18.168 15.623 38,Cl97 1.1629 3083 50.40
R3B2 18.488 15.664 38.474 1.1803 1396 25.38
R6A 18.618 15.608 38.423 1.1928 2634 46.20
R7A 18.100 15.614 37.938 1.1592 10282 134.8
R7E 18.120 15.639 38.043 1.1586 12544 142.2
R9A 18.383 15.653 38.401 1.1744 5031 60.89
RlOA 18.165 15.623 38.100 1.1627 3419 64.12
R13DBI 18.106 15.603 37.951 1.1604 14983 185.4
R19A 18.427 15.669 38.398 1.1760 2797 66.19
R20A UUl88 15.604 37.938 1.1592 7744 146.6
R21A 18.654 15.694 38.568 1.1880 10075 235.1
R23A 18.823 15.684 38.723 1.2001 11849 332.0
I "Extra(;t" is based on the amount of sample digested in 8N HN03 at room temperature (typically tens of mi lligrams).
2"Total" is based on the total amount of sample used (typically 0.5 grams).
71

radiogenic the source of the lead. Mixed sources of lead that differ from each other can be identified by plotting one ratio as a function of another. Such plots may delineate mIxing lines, which are linear trends in the ratios, permitting a separation of samples into different source categories. The results of these analyses indicate that lead-isotope ratios in soil samples from residential area 1 and the woods adjacent to IOC generally are similar~ ratios in soil samples from some of the orchards and from residential area 2 tend to be similar. The relation of the lead-isotope data to possible arsenic sources is discussed in the subsequent section on arsenic sources.
Regional atmospheric input of zinc to the study-area soils is evidenced by the presence of larger concentrations of this metal in the 0 horizon than in the A and B horizons in soils from undeveloped areas and in some orchard soils (fig. 24). Several relatively large zinc concentrations (59.5-74.8 mg/kg) were measured in orchard soil samples. Zinc concentrations also were large in three soil samples from IOC (72.2-205 mg/kg), and in 7 of the 28 samples from residential area I (70.8-330 mg/kg). Only 3 of the 88 samples from residential area 2 contained similar concentrations of zinc (65 A-I 05 mg/kg); these are from areas on two properties where concentrations of arsenic also were highly elevated. The addition of zinc as a micronutrient to some of the orchard soils sampled (John Hauser, oral commun., 1996) may explain some of the zinc concentrations encountered in the former orchard soils of residential area 2. Any metal ores processed at IOC probably contained zinc as well as arsenic; sediment samples collected in 1989 from the floor of the masonry building, the old pipe shop, and beneath the floor of the old warehouse at IOC all contained highly elevated concentrations of zinc (502-11,700 mg/kg (E.C. Jordan Co., 1990)).
Other Metals
Throughout the study area, iron concentrations tended to be larger in clay-rich B horizons and clayey geologic substrate than in sandy soils and sandy geologic substrate. The clays typically contain stringers and blebs of orange silty sand; in some of the stlingers, ironstone is fonning.
Iron concentrations in A and B horizons tended to be larger in samples from residential soils than in soil samples from the undeveloped areas and orchards (fig. 25). This difference may be related, in part, to differences in vegetative cover, as trees in forests have deeper root systems and intercept precipitation at greater depths than do grasses. Thus meteoric water is most effective at leaching soils in forests. Acidic conditions in soils in the forested areas, particularly where conifers abound, also could promote an increase of iron in the soil solution and greater availability of iron to plants (Foth, 1978). Available geochemical data do not provide a clear explanation for the difference in iron concentrations, however.
For the most part, soils in residential areas 1 and 2 are developed on clay lenses containing iron hydroxide-coated silt, which may explain the large iron contents of residential soils. Iron oxyhydroxides in these soils provide sorption sites for arsenic that has entered the soil system, either through weathering of arsenic-bearing minerals or through inputs such as arsenical pesticides or industlial activities. Waychunas and others (1993) have demonstrated that adsorption, rather than coprecipitation or solid solution, appears to be the dominant process by which
72

:2 « cr: (9 0 ..J
S2 cr: ill CL (f)
:2 « cr: (9 :::::::i ..J
~
~
Z 0 i= « cr: I-Z ill () Z 0 () () Z N
400~--~------~--------~------~--~
300
200
100
0
400
300
200
100
0
400
300
200
100
UNDEVELOPED FOREST SOILS
(5)
0 A B
(15)
*
CLAY
SOIL HORIZON OR GEOLOGIC FEATURE
ORCHARD SOILS
(8)
0 (3) (12) (22)
* 0
A B CLAY
SOIL HORIZON OR GEOLOGIC FEATURE
IMPERIAL OIL COMPANY SUPERFUND SITE SOILS
(5) (7)
0
(6)
OL---~L---------~=---------~----~
A B SOIL HORIZON OR GEOLOGIC FEATURE
200,---.--------,--------.--------,--~
100
(10)
o
*
SOILS IN WOODS ADJACENT TO IMPERIAL OIL COMPANY SUPERFUND SITE
(10)
EXPLANATION
Number of observations
Outlier data value more than 3 times the interquartile range outside the quartile
Outlier data value less than or equal to 3 and more than 1.5 times the interquartile range outside the quartile
Data value less than or equal to 1.5 times the interquartile range outside the quartile
75th percentile
Median
25th percentile
Figure 24. Distribution of zinc concentrations in samples from soil horizons and clays by land use, Monmouth and Middlesex Counties, New Jersey.
73

130,000
120,000
100,000
80,000
60,000
40,000
20,000
0
~ « a: <.9 130,000 0 ~ 120,000
a: W 0... Cf) 100,000
~ « a: <.9 80,000 :J -l
~
~ 60,000
Z-0 i= 40,000 « a: I-Z W 20,000 () Z 0 ()
Z 0 0 q;
80,000
60,000
40,000
20,000
UNDEVELOPED FOREST SOILS
(10)
(22)
*
(15)
o A B CLAY
SOIL HORIZON OR GEOLOGIC FEATURE
ORCHARD SOILS
(12)
(22)
o
(8)
*
o A B C~Y
SOIL HORIZON OR GEOLOGIC FEATURE
IMPERIAL OIL COMPANY SUPERFUND SITE SOILS
(5) (6)
(7)
130,000
120,000
100,000
80,000
60,000
40,000
20,000
0 ~ « a: <.9 130,000 0 ~ 120,000 f-
a: W 0... Cf) 100,000 I-
~ « a: <.9 80,000 f-:J -l
~
~ 60,000 -
Z-0 i= 40,000 -« a: I-Z W 20,000 -() Z 0 ()
Z 0 0 q;
80,000
60,000
40,000
20,000
SOILS IN WOODS ADJACENT TO IMPERIAL OIL COMPANY SUPERFUND SITE
(17)
* (21)
* (9)
o A B CLAY
SOIL HORIZON OR GEOLOGIC FEATURE
I I I
RESIDENTIAL AREA 1 SOILS
(10)
-,--
(5)
(7) I--
B I I I
A B CLAY
SOIL HORIZON OR GEOLOGIC FEATURE
(18)
* *
RESIDENTIAL AREA 2 SOILS
(33)
(19)
*
*
-
-
-
-
-
-
0 OL------L------------~------------~----~
A B C~Y
SOIL HORIZON OR GEOLOGIC FEATURE
(10)
o
*
EXPLANATION
Number of observations
A B C~Y
SOIL HORIZON OR GEOLOGIC FEATURE
Outlier data value more than 3 times the interquartile range outside the quartile
Outlier data value less than or equal to 3 and more than 1.5 times the interquartile range outside the quartile
Data value less than or equal to 1.5 times the interquartile range outside the quartile
75th percentile
Median
25th percentile
Figure 25. Distribution of iron concentrations in samples from soil horizons and clays by land use, Monmouth and Middlesex Counties, New Jersey.
74
arsenate associates with iron oxides, either ferrihydrite (poorly ordered hydrous ferric oxide) or goethite (crystalline FeOOH). Thus, soil iron concentrations can be indicators of the amount of arsenic that is present, as much of the arsenic is likely to be sorbed to the iron hydroxides.
Nickel concentrations in soil samples from orchards and from the woods adjacent to IOC generally were similar to those in samples from undeveloped areas; concentrations in most sandy samples were less than 2 mg/kg. Nickel concentrations in soil samples from the two residential areas generally were larger than those in samples from undeveloped areas and most orchards. The soil samples from residential area 1 generally contained nickel in concentrations larger than those in samples from residential area 2 «0.98-9.4 mg/kg and <0.28-6.8 mg/kg, respectively). Nickel concentrations in soil samples from 10C ranged from <0.28 to 333 mg/kg. Chromium concentrations among soil samples from different land-use areas generally followed the same pattern as nickel concentrations. The larger concentrations of both metals typically were measured in clayrich samples. Only one sample (R 7E) from residential area 2 contained an anomalously large amount of chromium (166 mg/kg); this sample also contained an anomalously large amount of zinc (105 mg/kg) and a substantial amount of arsenic (38.5 mg/kg).
Relation of Geochemical Associations Among Constituents to Land Use
Differences in concentrations of arsenic and metals as a function of land use are demonstrated by the boxplots showing distributions of various metals in soils from the different land-use areas (figs. 16, 20-25). Nevertheless, the ranges of concentrations associated with the different land uses typically overlap_ To establish chemical signatures for soils from different land uses,
.c. t... 1 de groups 01 constituents must ue eva uate lor proportIons .~. .." " ot the constItuents as welt as ranges or concentrations. Those metallic constituents of soils likely to be derived in part from anthropogenic sources are most useful i.n this regard; these include arsenic, barium, calcium, copper, lead, magnesium, mercury, nickel, potassium, and zinc. Constituents that appear to be contributed primarily by geologic materials in the study area include aluminum, chromium, iron, manganese, and vanadium.
Many of the inorganic contaminants (arsenic, barium, copper, lead, and zinc) identified in soils and sediments at IOC, presumably contributed by industrial activities, also can be contributed to soils by agricultural chemicals. Pesticide use can contribute arsenic, copper, lead, and mercury; barium also is present in some inorganic orchard sprays (Jones and Hatch, 1937). Barium, as well as calcium and magnesium, also is contributed to soils by lime; zinc is a micronutrient in some fertilizers. As a consequence, similarities in chemistry between IOC soils and orchard soils could be anticipated. Nevertheless, certain groups of constituents appear to be distinctive in their proportions or concentrations.
Proportions (calculated as a percentage of the sum of the concentrations of the three con:;tituents illustrated) of arsenic, barium, and zinc in A-horizon soil samples from orchards, IOC, and residential areas 1 and 2 are shown in figure 26. Samples from IOC and residential area 1 tend to be grouped near the base of the trilinear diagram, whereas samples from orchards and residential area 2 tend to be grouped nearer the middle and right side of the diagram. Despite some overlap, proportions of these three constituents in the A-horizon soils sampled at 10C and in orchards
75

& OL---_--JJ. __ ~ __ ..lL._ __ :.L._ _ __l/. __ ~ __ ~ __ lL..__~'___ _ ___l)o..",;
ARSENIC
EXPLANATION Values in percent
• Orchard
o Imperial Oil Company Superfund site
A Residential area 1
+ Residential area 2
o
Figure 26. Proportions of arsenic, barium, and zinc in A-horizon soil samples from different land-use areas, Monmouth and Middlesex Counties, New Jersey.
76

generally are distinctive, and proportions of these constituents in the A-horizon soils from the two residential areas tend to (1) be different from each other and (2) resemble those in soils from one or the other of the two endmember land-use areas shown.
Nickel is present at elevated concentrations (l 0.3-1,320 mg/kg) in some of the soil and sediment samples collected previously from IOC (E.C. Jordan Co., 1990). Background concentrations in A-horizon soils determined during this study typically were less than 1 mg/kg, although larger concentrations were present in O-horizon samples and some clay samples. Some of the Ahorizon samples collected from IOC during this study also contained large concentrations of TOC (10,100-67,200 mg/kg), most likely as a result of minor petroleum contamination. TOe was not measured during previous investigations at IOC, but anthropogenic components of TOe, such as total petroleum hydrocarbons, VOC's, and semivolatile con1pounds, were measured and found to be major contaminants in some samples. The range of background concentrations of Toe in Ahorizon soil samples collected duting this study was smaller (7,880-40,100 mg/kg) than the range in samples from lOCo
Despite some overlap, A-horizon soil samples from IOC can be distinguished from Ahorizon samples from orchards on the basis of nickel and TOC concentrations. Additionally, Ahorizon soils from residential areas 1 and 2 differ with respect to nickel and TOC concentrations (fig. 27). Furthermore, the soil samples from residential area 1 are similar with respect to nickel and TOC concentrations to some of the soil samples from IOC, but different from many of the orchard samples, whereas the samples from residential area 2 generally are similar to the orchard samples.
Of all the combinations of constituents investigated, the most distinctive with regard to a chemical signature for soils from IOC is the grouping of barium and copper. Concentrations of barium and copper in A-horizon soil samples tended to be smallest in soils from orchards and residential area 2, and largest in soils from IOC and residential area 1 (fig. 28). (Concentrations in four samples collected earlier from soils in the old pipe shop and beneath the old warehouse (E.C. Jordan Co., 1990) are included in the graph to emphasize that the trend of high barium and high copper concentrations is characteristic of soils at IOC.)
Mercury seldom was detectable in soil samples from any of the land-use areas except those from residential area 2 and the broader area. In A-horizon soils from these areas, arsenic and mercury concentrations are positively correlated; the cOlTelation is significant at the 0.05 level. The correlation is less strong in B-horizon soils and clays from these areas. Although mercury was detected previously in some soil samples from IOC (E.C. Jordan Co., 1990), no statistically significant correlation, with arsenic concentrations was found in samples in which both constituents were measured~ fuiihermore, mercury was detected in IOC samples that did not contain arsenic, and vice versa. No statistically significant relation between arsenic and mercury is apparent in those few samples from undeveloped or orchardland or residential area 1 in which mercury was detected.
Chemistry of soil samples from the woods adjacent to IOC was evaluated to determine whether effects of a hypothetical smokestack plume during the early industrial phase of the site could be discerned. Relations among concentrations of several constituents, two of which probably are related to geologic inputs (chromium and vanadium) and six of which are contaminants at
77

11
D • Orchard
10 D Imperial Oil Company Superfund site
6. Residential area 1
9 + Residential area 2
::2: « 0:: 8 CJ 0 -l S2 cr: w 7 D 0.. (f)
::2: « cr: c:l ::::i 6 -l
~
~
z-5 + 0
i= « cr: f-Z w 4 () z 0 u + -l + + w t :::c: 3 + () + z + + +
+ + • 2 + +
• + • + D
+ • • • • D
• 0
0 5 10 15 20 25 30 35 40 45 50 55 60
CONCENTRATION OF TOTAL ORGANIC CARBON, IN MILLIGRAMS PER KILOGRAM
65
D
•
70
Figure 27. Relation of nickel concentration to total organic carbon concentration in A-horizon soil samples from different land-use areas, Monmouth and Middlesex Counties, New Jersey.
78

1,000
700 Orchard •
500 D Imperial Oil Company Superfund site (this study)
400 • Imperial Oil Company Superfund site (E.C. Jordan Co., 1990)
~ 300 ~ Residential area 1 • « a: + Residential area 2 CJ 200 0 .....I ~ . 52 a: • w
100 D a... ~
if)
~ 70 ~ D « a: ~ CJ 50 • ~ .....I .....I
40 ~
z 30 D + z D 0 20 + • + ~ +.+ « .+ a:
++++ I-Z + W 0 10 lj-+ z 0 7 0 • ~ • :::> 5 • a: « 4 CO •
3
2
1 1 2 5 10 20 50 100 200 500
COPPER CONCENTRATION, IN MILLIGRAMS PER KILOGRAM
•
1,000
Figure 28. Logarithmic relation between barium and copper concentrations in A-horizon soils from different land-use areas, Monmouth and Middlesex Counties, New Jersey.
79

IOC (arsenic, balium,copper, lead, nickel, and zinc) in background samples from A-horizon soils in undeveloped forested land and A-horizon soils in the woods adjacent to IOC are shown in figure 29. Nearly all of the data points for soil samples from the adjacent woods lie within the clusters defined by concentrations in background soils.
Although the chemical data were not ligorously precise, soil chemistry of A-horizon soil samples differed among land-use groups, and the samples from the two residential areas differed from each other but were similar to soils from one of two other endmember groups. Therefore, statistical analysis of the constituent-concentration data could be used to classify samples on the basis of chemistry.
Classification of Soils by land Use
Nonrepresentative Soil Samples
A few samples were excluded from the statistical characterization of the endmember group (although results for these samples are included in appendix 1) because information acquired subsequent to sampling indicated they were not suitable or representative samples for the groups. The sampling was conducted to obtain soils from particular land uses such that the chemistry of the soils would represent the chemical inputs associated with that land use. In a few cases, previous land uses initially were incorrectly identified or samples were inadvertently collected in the wrong location for the paliicular land-use area.
Samples from sampling site 015 were collected specifically to detennine whether an orchard signature could be discerned in the soils, as it was not possible to determine conclusively from the aelial photographs if that pali of the farm field had been planted as an orchard. The nearby sampling site, 014, is located where rows of trees are visible in a 1940's aerial photograph. The chemistry of 015 samples indicated that they probably are not from an orchard site, and the best interpretation of the aerial photographs indicates that the site is located in a former farm field. Thus the 015 sample did not fit any of the previously defined land-use categories investigated.
Sampling site 0 lOis located beneath an apple tree, but information received after sampling from a descendant of the original owner indicates that the tree is a recent replanting at the edge of a former orchard and thus it received no arsenical pesticide spray. Because soils from this sampling site do not represent what the orchard samples are intended to represent--that is, agricultural inputs from the period of time in which arsenical pesticides were used--this sample is not representative of orchard soils as defined at the beginning of the study.
Sampling site E13 is located at the edge of a wooded area that borders a farm field that previously was an orchard. Careful measurements on the ground and on aerial photographs indicate that the woods appear to have encroached slightly on the field, and that the site was originally at the edge of the orchard. Further, this site is downhill from the former orchard and the soils there may have received runoff from the former orchard. Sampling site E17 is in woods adjacent to a former orchard~ evaluation of the altitude of this site indicates that it, too, could have received
80
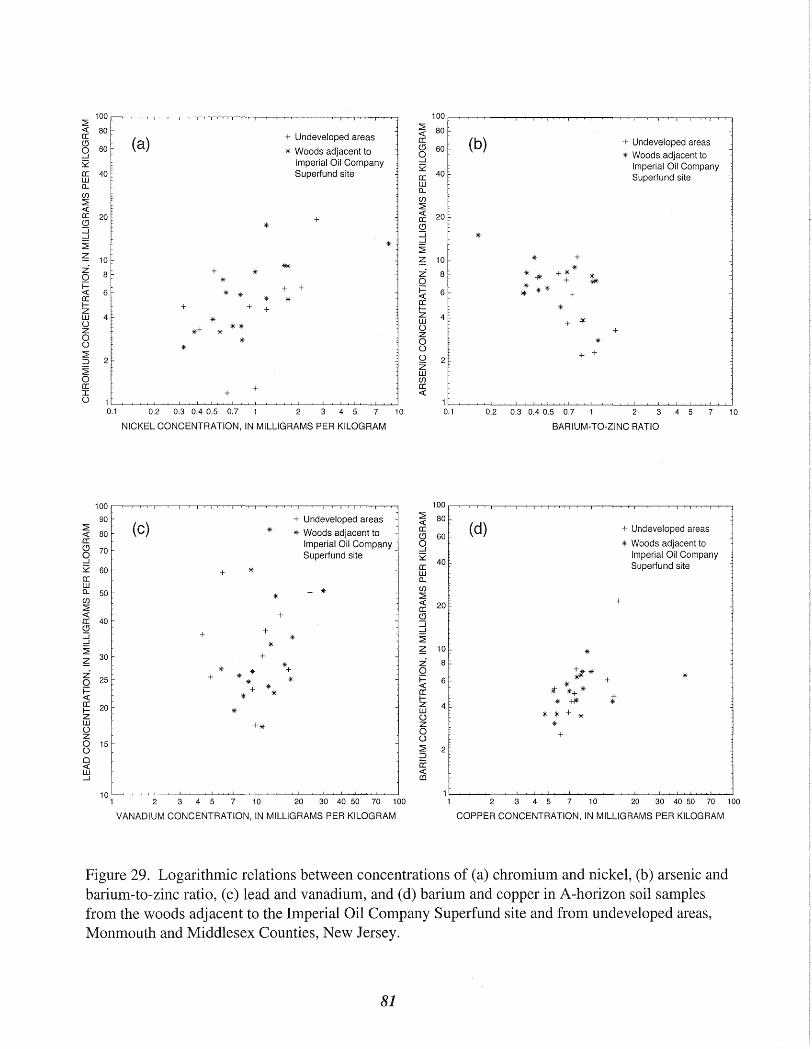
100 100 ~
~ « 80 80 ([ + Undeveloped areas « (') (a) ([ (b) + Undeveloped areas 0 60 * Woods adjacent to
(') 60 ...J 0 * Woods adjacent to ~ Imperial Oil Company ...J
~ Imperial Oil Company ([ 40 Superfund site ([ 40 Superfund site w Cl... w
Cl... (J)
(J) ~ « ~ ([ 20 « 20 + ([ (') * (') ::::i ...J ::::i * ~ *
...J
~ ~ 10 ~ 10 * + z + ** + * * 8 * Z 8 * -fIf 0 * 0 + ~ 1= + + 1= : * * « 6 * * « 6 + ([ * * I- + + ([
* z + I-W 4 *
Z 4 -t 0 w + ** 0 Z *+ * + 0 z
* 0 * 0 * 0 ~ 0 + + :::> 2
Z 2
~ w 0 (J) ([ + ([ I + « 0 1 1
0.1 0.2 0.3 0.4 0.5 0.7 2 3 4 5 7 10 0.1 0.2 0.3 0.4 0.5 0.7 3 4 5 10
NICKEL CONCENTRATION, IN MILLIGRAMS PER KILOGRAM BARIUM-TO-ZINC RATIO
100 f 100
+ Undeveloped areas ~ 80 90 /~\ «
~ /,.J\
\l,;) * * Woods adjacent to a: \U) + Undeveloped areas « 80 (') 60 ([ Imperial Oil Company 0 * Woods adjacent to (') 70 ...J 0 Superfund site ~ Imperial Oil Company ...J 40 Superfund site ~ 60 *
([ + w
([ Cl... W (J) Cl... 50 + * * ~ (J) « 20 + ~ ([ « + (') ([ 40 ::::i (') + ...J ::::i + * ~ ...J * ~ ~ 10 * ~
30 + Z *+ 8
Z * * 0 ~* 25 + * * 1= + * 0 * 6 **+ * 1= + * «
*" * ([ « * I- ~ t ([ Z 4 * I- 20 * w * * + * Z 0 W +* Z * 0 0 + z 0 0 15
~ 2 0 0
:::> « a: w « ...J Ol
10 1 1 3 4 5 7 10 20 30 40 50 70 100 1 2 3 4 5 7 10 20 30 40 50 70 100
VANADIUM CONCENTRATION, IN MILLIGRAMS PER KILOGRAM COPPER CONCENTRATION, IN MILLIGRAMS PER KILOGRAM
Figure 29. Logarithmic relations between concentrations of (a) chromium and nickel, (b) arsenic and barium-to-zinc ratio, (c) lead and vanadium, and (d) barium and copper in A-horizon soil samples from the woods adjacent to the Imperial Oil Company Superfund site and from undeveloped areas, Monmouth and Middlesex Counties, New Jersey.
81

runoff from the adjacent orchard. Moreover, the surficial soil sampled at E17 appears to be developed directly on the WoodbulY Formation rather than on basal Englishtown Formation sediments. The so-called A hoIizon at E17 is silty clay that is unlike any other A horizons sampled, and is more correctly designated as a clay sample. Given the textural nature of soil samples from E17 and the uncertainty in assigning the chemistry o.f both E 13 and E 17 samples to either the geologic or orchard category, they were not included in the endmember groups.
Sampling site W3 also was excluded from the geologic endmember group because it is unclear whether the site is underlain by the basal Woodbury Formation or the underlying Merchantville Formation; the core was collected near the mapped contact between these two units. Only Englishtown Formation sands and clays from the Englishtown and Woodbury Formations were sampled for this study because of their association with the area in which IOC and the residential areas are located and because of mineralogical and, presumably, geochemical similarities.
Finally, samples from sites 11 and 16 at IOC were not included in an endmember group. The IOC endmember group of samples was defined as soils containing industrial contamination; sampling site II is in a filter-clay deposit that is not a soil and that postdates the arsenical pesticide production, and samples from 16 contained no discernible contaminants and, therefore, do not represent IOC endmember land use.
The exclusion of the nonrepresentative samples from sampling sites 010 and 0] 5 resulted in no significant bias to the overall distribution of the chemical signature, as some other orchard soils contained arsenic and metal concentrations in the same range, and the median arsenic concentration for orchard A-horizon soils is greater than 10 mg/kg whether or not these samples are included. One of the largest orchard arsenic concentrations (38.8 mg/kg) was measured in an Ehorizon soil, but the smaller concentration in the A-hOlizon sample (16.4 mg/kg) from this site was used in the model because the E-horizon sample did not meet the critelia used to identify A horizons.
The geologic endmember group of soils contains no A-horizon samples with arsenic concentrations nearly as high as those from the two excluded sampling sites (E 13 and E 17); this fact indicates that the A horizons at these two sampling sites probably either are not representative of A-hoIizon soils containing arsenic from only geologic sources, as in the case of E 13, or are not representative of A hoIizons in the study area, as in the ease of E 17, where the upper layer of the silt/clay is more representative of a clay sample, in both texture and arsenic concentration (21.7 mg/kg). A-horizon arsenic concentrations in both samples are extreme outliers, and their exclusion from the geologic endmember group barely changed the median value or the population distribution because all but one of the remaining samples contained arsenic in concentrations less than 10 mg/kg.
Representative Soil Samples
DA (using the SAS DISCRIM procedure, option npar (SAS Institute Inc., 1990b)) was used to obtain a model that correctly classified samples into their endmember groups. Results of preliminary modeling indicated that, in general, a better fit was obtained by using ranked concentrations of chemical valiables than by using reported concentrations. Use of ranked data yields
82

more robust results when data distributions are skewed and some data are censored. Thus the skewness is reduced, and only the relations of one observation to another within the ordered set are important. This data transformation is particularly useful if a variable includes some censored ("no-detect") observations, because these, which have no actual value, simply occupy the lowest rank in the ordered set of observations.
The discriminant models were compared for accuracy in classifying the three endmember groups in the "training" data set by cross~validation. This procedure consists of extracting, one by one, each of the observations used to form the training set so that they could not affect the model, and then running the extracted observation as a "tese (unknown) observation to see whether it classified correctly. Those models with about 50 percent or less accuracy of classification were discarded. Some of the models with the greatest accuracy in categorizing the endmember groups were then used to categorize the groups in the "test" data set~ these included the samples from the woods adjacent to IOC, residential area 1, residential area 2, and the broader area. In fitting a model, the chemical data for both the training and the test data sets were combined and ranked. Selected modeling results are summarized in table 9.
Principal components analysis (PCA) was used as a data-reduction technique in some of the initial models. Principal components are linear combinations of the ranked variables; each successive component represents a smaller fraction of the total variance in the data set than did the preceding component and each is independent of the other components. As modeling progressed, discrimination using principal components resulted in models with less than 88-percent classification accuracy. Ultimately, models that discriminated on principal components were discarded because simpler models were found to classify samples with greater accuracy.
Several simple models that use two to three constituents (variables), the concentration distributions of which generally overlapped least among land-use groups, were able to discriminate among endmember groups with a classification accuracy of about 80 percent to more than 90 percent. Both two-category (lumped orchard and background category and IOC category) and threecategory (separate background, orchard, and IOC categories) training models were used. A threecategory training model using ranks of arsenic concentration and barium to zinc ratio and four nearest neighbors separated the endmembers with an 81-percent classification accuracy. Because this model was more successful in correctly classifying background and orchard observations than IOC observations, it was lun again as a two-category model using only background and orchard observations. Classification accuracy increased to 91 percent. To discriminate between IOC observations and background plus orchard observations, a second two-category model was run using ranks of barium and copper and four nearest neighbors. The observations were correctly classified with an overall accuracy of 93 percent. This model was then used to classify the test observations; it classified all but two residential area 2 observations as lumped orchard and background, and all residential area 1 observations as IOC category. This was the only model that classified residential area lA-horizon soils as IOC; this is not a surprising result, insofar as barium and copper concentrations in samples from IOC and residential area 1 were clearly different from those in samples of orchard and residential area 2 soils (fig. 28), whereas a greater overlap in concentration ranges is apparent for other constituents.
83

Table 9. Summary of selected results of discriminant and principal-component modeling to classify soil samples, Monmouth and Middlesex Counties, New Jersey
Number of neighbors in Classification
Model discriminant accuracy (percent)
As, BalZn; 2 categories 4 91
Ba, Cu; 2 categories 4 93
As, BalZn; 3 categories 4 81
AI, As, Ba, Ca, Cr, Cu, Fe, Mg, Mn, Pb, Ni, K, V, Zn; 3 categories 4 92
AI, As, Ba, Ca, Cr, Cu, Fe, Mg, Mn, Pb, Ni, K, V, Zn, TOC; 3 cat 4 88 egories
4 to 13 principal components; 3 categories 4 All less than 88
AI, AsIFe, Ba, Ca, Cr, CuJTOC, Pb/TOC, Mg, Mil, Ni, K, V, Zn; 3 4 96 categories
AI, AsIFe, Ba, Ca, Cr, CuJTOC, Pb/TOC, Mg, Mn, Ni, K, V, Zn; 3 5 100 categories
The constituents that were useful discriminants among endmember land-use groups were not always apparent from simple graphical geochemical plots because the relations in multidimensional space are impossible to depict graphically or to imagine. For example, plots depicting combinations of arsenic, barium, copper, nickel, zinc, and TOe concentrations graphically demonstrated some degree of separation of the land-use groups in element/element space; however, a model using ranks of these constituents (TOe concentration was divided by 1,000 to improve compatibility with the other values) and five nearest neighbors achieved only a overall classification accuracy of 58 percent.
In some cases the variables that discriminated relatively well were not immediately apparent from inspection of the geochemical data. A parametric step-wise discriminant procedure on ranks, using stepwise and forward selection options, was used to identify constituents that discriminated strongly. Both options resulted in a four-variable model that included ranks of arsenic, barium, manganese, and aluminum. These latter two constituents were not anticipated because their source was thought to be geologic materials rather than anthropogenic inputs related to land use. Neveliheless, the nonparametlic discriminant model using these four variables and five nearest neighbors achieved an overall classification accuracy of 68 percent.
Several more complete models were developed that used up to 15 variables and four nearest neighbors; accuracy in correctly classifying endmember A-horizon samples ranged from 88 to 96 percent. In general, classification accuracy tended to increase with the number of variables used, indicating that some of the geochemical differences and similarities among soils from the different land-use areas were subtle.
84
Classification accuracy also tended to increase when the number of nearest neighbors was increased. One model, which used ranks of 13 variables and five nearest neighbors, could discriminate among the three endmember categories with IOO-percent accuracy. The variables used in the I3-variable, five-nearest-neighbor model were ranks of concentrations of aluminum, barium, calcium, chromium, magnesium, manganese, nickel, potassium, vanadium, and zinc, and three normalized variables--arsenic nonnalized to iron (ratio of arsenic to (ironil ,000» and copper and lead nonnalized to TOC (ratios of copper and lead to (TOCIl,OOO». (Because iron and TOC concentrations generally were at least three orders of magnitude greater than arsenic, copper, and lead concentrations, dividing iron and TOC concentrations by 1,000 is geochemically appropriate, as the smaller value is representative of the number of sites to which the measured amounts of arsenic, copper, or lead could sorb.) Deletion of selected variables from this model increased the number of misclassifications, indicating that the model was not overfitted. This model, therefore, was used to classify the "test" samples (residential areas 1 and 2, woods adjacent to IOC, and broader area).
Of the three signatures developed with the final model, statistical similarities were noted between the orchard signature and the IOC signature, but they were not sufficiently similar to cause misidentification of the groups using a cross-validated model, which is the most robust test of similarities. (See appendix 5 for the SAS printout of the results obtained with the final model.)
When this model (13 variables, five nearest neighbors) was applied to the test data set, all but 2 of the 18 samples from residential area 2 classified as orchard type; one classified as undeveloped (geologic), which was appropriate because this sample is from an area that apparently was not orchard land, and the other sample classified as "other." (The "other" category is specified when the model gives an equal probability of membership in two or more groups.) The samples from the woods adjacent to IOC classified as a mix of undeveloped (geologic) and orchard type. Broader area samples were classified· as orchard. This model also classified the residential area 1 samples as orchard, but they contained a substantial IOC component.
The residential areal chemical signature is the most complex signature encountered during this study. The samples from all land-use categories contain the geologic chemical imprint; added to that are agricultural inputs in orchards, in fonner orchard land such as residential area 2, and in farm fields and orchards that preceded residential area 1. As discussed above, the orchard chemical signature is composed of metals added by pesticide use; fertilizer inputs, which can contribute copper and zinc; and lime additions, which contribute calcium, magnesium, and barium.
The residential area 1 soil samples were collected from land detennined from aerial photographs to be mostly former farm fields, with possible remnants of an area of orchards in 1932. Therefore, it is likely that an agricultural signature, which may include lead and arsenic from pesticide sprays, existed in these soils before debris apparently derived from the IOC site was added. Consequently, the DA model is likely to classify residential area 1 A-horizon soils as orchard soils; the agricultural signature, which may include elevated concentrations of arsenic and lead, apparently is overprinted by additional arsenic, as well as barium, copper, and nickel, associated with an industrial source. The concentrations of these constituents in residential area 1 A-horizon soils are not sufficiently large to cause the 13-variable model to unequivocally assign residential area 1 A-horizon soils to the IOC category, given the distribution of the other constituents. Further, using five nearest neighbors, instead of four, means that, for observations (concentrations)
85

from IOC and residential area 1 A-hOlizon samples, at least one of the nearest neighbors must be classified in another endmember group, because only five samples each of A-horizon soils from IOC and from residential area 1 were collected.
Another factor that affects the strength of the IOC chemical signature in residential area 1 soils is that the A-horizon soil samples contain smaller contaminant concentrations and less debris than do some of the samples from B horizons and clays. Therefore, the IOC signature is weaker in A-horizon soils in residential area 1 than in the B horizons and clays. Neither B-horizon soils nor clays from endmember groups were found to produce models that discriminated among endmember samples with an accuracy greater than about 60 percent, however; these models, therefore, could not be used to classify the residential soils. Although the residential area 1 A-horizon soils retain an agricultural chemical signature, the debris common to IOC and residential area 1 soils indicates that materials from the Superfund site are a likely source of at least some of the arsenic, barium, copper, and nickel in residential area 1 soils.
PCA did not provide the most useful group of discriminants in the modeling effort but did identify a major discriminating factor for soils in the study area--mass loading. There are clear differences in mass loading of the soils from different categOlies--that is, the mass of constituents present in endmember A-hOlizon soils increases from geologic background to orchard to IOC samples. The mass loading for soils from both residential areas is large. Some of this mass loading is from anthropogenic inputs, but some is probably natural, as soils of both residential areas are developed on clay lenses. Overall, the A-horizon soil samples from the two residential areas contained more aluminum and more potassium than A-horizon soil samples from undeveloped areas and most of the orchards. These larger concentrations indicate that the clay content of the residential A-horizon soils is greater than the clay content of the background A-horizon soils and at least some of the A-horizon orchard soils. Results of limited grain-size analyses and field observations appear to support this assessment. Therefore, the higher clay content of the residential soils means that larger concentrations of metals in general, and of arsenic in paIiicular, that derive from geologic materials are present.
Although A-horizon soil samples from both residential areas 1 and 2 are classified by the final model as orchard-type soils, the samples from the two residential areas are chemically distinct (figs. 26-28). When observations from the two residential areas are entered in the final model as a two-category training set, the 13-variable, five-nearest-neighbor model separates residential area 1 samples from residential area 2 samples with 100-percent accuracy. This indicates that some of the anthropogenic effects on soil chemistry observed in samples from residential area 1 are different from those observed in samples from residential area 2.
Classification of Soil Samples by lead-Isotope Ratios
Lead-isotope ratios for soil samples E2A, E20, and E6A, all from undeveloped forested areas, are consistent with ratios established for atmospherically deposited gasoline lead (R. W. Hurst, Chempet Research, written commun., 1996) and ratio/ratio plots may delineate an atmospheric trend for the region (figs. 30 and 31). The atmospheric trend illustrated in figure 31 is similar to that shown in Faure (1986, p. 333, fig. 19.11), which is defined by the average lead-isotope ratios of galena from the Mississippi Valley, a source of lead in gasoline in pre-1940's, and later
86

38.80 " -----------------.------------------,-----------------~----------------~----------------__,
38.60
.0 38.40 0...
-::t o ('IJ -.0
0... OJ
~ 38.20
38.00
R9AX
_ DiE
R10A * R7E >481 * 07 A X R317 02E
X R20A>«< R13BID
R2A R7A
03A*
Ri9A 181
DS50
R3B2 181
09A ~S7A
R21AI8I *06A OS70
*080
181 R23A
*040
37.80L, ________________ ~ ________________ L_ ______________ ~ ________________ _L ______________ ~
18.00 18.20 18.40 18.60 18.80
206Pb/204Pb
EXPLANATION
• Atmospheric deposition on undeveloped soil
o Woods adjacent to Imperial Oil Company Superfund site
181 Residential area 1
+ Undeveloped forest soil
X Residential area 2
* Orchard soil
19.00 00 ~
204Figure pb 20430. Ratio of 208 to Pb as a function of ratio of 206 pb to pb in selected soil samples from
undeveloped and orchard areas, woods adjacent to the Imperial Oil Company Superfund site, and residential areas 1 and 2, and in samples with ratios indicative of atmospheric deposition, Monmouth and Middlesex Counties, New Jersey.

.0 a..
"<t 0 C\J -.0 a..
I'--0 C\J
15.74 1, --------------~--------------~------------~--------------~--------------~
15.70
15.66
R7EX
15.62 R10A~
~R317
016A
*
03A*
Ri9A ~~
R9A X
°S50
R382 I8J
*01E
*02E
R~A OS70
S1AO *06A
* OSSA 04A OS7A
+E90
X R6A
*040
I8J R23A
15.58 L' ________________ ~ __________________ ~ ________________ _L ________________ ~ ________________ ~
18.00 18.20 18.40 18.60 18.80
206Pb/204Pb
EXPLANATION
• Atmospheric deposition on undeveloped soil
o Woods adjacent to Imperial Oil Company Superfund site
I8J Residential area 1
+ Undeveloped forest soil
X Residential area 2
* Orchard soil
19.00 00 00
Figure 31. Ratio of 207 Pb to 204Pb as a function of ratio of 206 Pb to 204 Pb in selected soil samples from undeveloped and orchard areas, woods adjacent to the Imperial Oil Company Superfund site, and residential areas 1 and 2, and in samples with ratios indicative of atmospheric deposition, Monmouth and Middlesex Counties, New Jersey.
(1960's), less radiogenic lead from gasoline. The lead-isotope ratios developed for soils from sampling sites in residential area 1 (R3, R19, R21, and R23) generally plot above the atmospheric trend, as do those for most soil samples from the woods adjacent to IOC (all "5" samples). Leadisotope ratios for soils from sampling sites R3, R19, 55, and 57 (all within 100 ft of IOC) appear to define a mixing curve whereby a statistically significant trend indicates mixing of leads of different isotopic compositions (R. W. Hurst, written commun., 1996). The isotope ratios, in general, illustrate that lead in soil samples from areas near IOC, whether from woods or residential land, tends to be isotopically distinct from lead in soil samples from some orchards and from residential area 2; isotope ratios for these latter soil samples tend to plot below the regional atmospheric trend or at the less radiogenic region of the figures, near the origin. Those samples that plot near the regional atmosphelic trend, such as many of the "R" samples, may contain some lead from atmospherically deposited gasoline lead (R. W. Hurst, written commun., 1996), as well as lead from some other source.
The isotopic similarity of lead in soils from residential area 1 and the woods adjacent to IOC may be related to industrial activities at IOC; although no chemical evidence exists for contaminants deposited from a smokestack plume, wind-blown dust from wastepiles could have been distributed in the areas adjacent to IOC. The isotopic similality of lead in soils from residential area 2 and some orchards indicates that some of the lead in the soil samples from residential area 2 may be derived from lead-bearing pesticides. Overall, the lead-isotope ratios differ between soils of residential area 1 and residential area 2, and thus support other chemical evidence that some inputs of metals to soils from these two areas derive from different sources.
SOURCES OF ARSENIC AND METALS IN SOilS
The goal of the study described herein was plimarily to determine the sources of arsenic in soils of the residential areas and, secondarily, to determine the sources of metals in the residential soils. Three possible sources were considered likely candidates: natural (geologic) sources, manufacturing activities at IOC, and pesticides fOlmerly used in orchards.
Natural SQurces
The soils in the study area have developed both from sandy and from clayey geologic materials. The limited number of samples of sandy geologic materials (C horizons) collected during this study, when contrasted with the clay samples collected, contained'small concentrations of metals. Concentrations of arsenic, lead, copper, barium, and zinc were less than 10 mg/kg. The clays, however, contained much larger concentrations of arsenic--from 8.2 to 41.2 mg/kg in the samples from undeveloped forested areas (representing natural geologic inputs). Possible mineral sources of the arsenic in the clays sampled include iron oxyhydroxides, glauconite grains, and sulfides. As a result, arsenic concentrations were smaller in A and B horizons of soils developed on a sandy substrate than in those of soils developed on a clay-rich substrate.
Concentrations of metals in soil samples from undeveloped areas tended to be larger in clays than in sandy soils. The presence of relatively large concentrations of copper in O-horizon samples from undeveloped-area soils several miles from IOC indicates input from regional atmo-
89

spheric fallout of copper over the study area. Lead in soil samples from undeveloped areas derives partly from geologic materials~ but, in 0- and A-hOlizon samples, reflects substantial atmospheric deposition as well. Iron, manganese, and vanadium in samples from undeveloped areas appear to derive mostly from geologic matelials. Aluminum, barium, and potassium in soils from undeveloped areas are contributed mostly by clay minerals. Although some zinc is contributed by geologic materials, the presence of larger concentrations of zinc in A-horizon soil samples than in deeper horizons indicates that much of the zinc is contributed by regional atmospheric deposition; Moore and Ramamoolihy (1984, p. 190) report that "large quantities of zinc are transported and deposited by precipitation" on a worldwide basis.
Imperial Oil Company Superfund Site
Large concentrations of arsenic and metals have been measured in soils from the 10C site. One of the questions to be resolved by this study is whether inorganic contamination at 10C has migrated offsite to the woods adjacent to 10C, to residential area 1, or to residential area 2, through either atmospheric fallout, ealih-moving activities, or some other means.
Smokestack Plume
If activities at IOC have contlibuted arsenic and metals to residential area 2, contaminants would have to have been transported about 0.5 mi nOlih-nOliheast of the site. One hypothesis that has been advanced is that a contaminant plume emanated from the stacks of the roasting ovens at IOC (Steven Byrnes, oral commun., 1995). For material in the hypothesized plume to have been transported by the wind from 10C to residential area 2, the wind would have to have been blowing from the south-southwest.
Data from the National Weather Service for the Naval Air Station at Lakehurst, New Jersey, about 28 mi south of IOC, indicate that the prevailing wind direction south of the study area is from the west. DUling the 1 O-year period from 1973 to 1982, west winds blew 12.7 percent of the time; west-northwest and n0l1hwest winds blew 9.7 and 8.5 percent of the time, respectively. South-southwest winds blew only 4.6 percent of the time. Data for 1984-87 and 1989 at Newark Airport, about 24 mi north-northeast of IOC where north-northeast winds are more prevalent because of proximity to the ocean, indicate that west winds blew about 7 percent of the time, northwest winds about 8.8 percent of the time, southwest winds about 11.5 percent of the time, and south-southwest winds about 6.5 percent of the time. No data are available for the Morganville airport, about 1 mi south of IOC, but airport personnel state that the prevailing wind direction is west. Data for Lakehurst, New Jersey, and a windrose for Newark, New Jersey, are presented in appendix 3.
Contaminants issuing from the stacks at IOC would likely have been deposited in an arc , from the northeast to the southeast of IOC more often than in other directions, on the basis of
available wind-direction data. Therefore, if arsenic and lead in soils from residential area 2 were deposited by fallout from a smokestack plume, the contaminants would be borne on a soutb-
90

southwest wind, which probably blew 6.5 percent of the time at most (using the Newark winddirection data). Any fallout measured in the soils, therefore, probably would represent only a small percentage of the total amount of contaminants deposited in the area.
The highest wind speed for a south-southwest wind recorded at Lakehurst is in the range of 11 to 16 knots. Stability classes range from very unstable (A) to stable (F). At the surface wind speed of 8.2 mis, stability classes A through D are most likely to be applicable. Results of the preliminary air-flow simulation, conducted by using an arbitrary contaminant emission (mass flow) of 12,000 /-lgls, a virtual stack height of 12.2 m (a 30-ft stack and 10-ft plume rise), a wind speed of 8.2 mls (16 knots), and three meteorological air-stability classes (A, D, and F), are shown in figure 32. The peak contaminant concentration moves farther from the source as stability increases~ nevertheless, even under unrealistic conditions (a relatively high wind speed and stable meteorological conditions (F)), the peak contaminant concentration at ground level cannot be moved in the simulation farther than about 0.5 km (about 0.3 mi) from the source. Residential area 2 is about 0.5 mi, or 0.8 km, from the chimney stacks at lOCo
The more sophisticated model used by NJDEP takes into account the terrain surface and upper-air wind speeds and directions and the height of the original buildings at lOCo It uses surface-air data from Newark and upper-air data from Atlantic City. Various particle-size distributions can be simulated; arsenic emitted during the hypothetical ore-roasting is assumed to be associated with particles less than 1.25 /-lm in diameter. An arbitrary stack emission of 1 gls is used. (A complete discussion of the model is presented in an unpublished report available at the NJDEP office in Trenton, New Jersey.)
The results of the simulation done by NJDEP are shown in figure 33. Although use of surface-wind data from Newark tends to emphasize winds blowing from the southwest and southsouthwest, the bulk of deposition from the hypothetical smokestack plume falls near IOC and east-northeast and southeast of IOC because of the terrain. Relatively tittle deposition occurs to the north-northeast, and nearly all of it is shown to occur within 150 m of IOC. This distribution is similar to that predicted with the preliminary model. An arbitrary emission rate was used in both models because no data on actual emissions were available; therefore, amounts of contaminant deposition shown are completely hypothetical.
Soil samples from the woods adjacent to IOC contained arsenic, balium, copper, lead, nickel, and zinc in concentrations that are within the range of concentrations measured in the background satnples. The area of the woods from which the samples were collected lies on a north-nonnwest line between IOC and residential area 2. Therefore, if smokestack-plume fallout were contlibuting arsenic and other contaminants to the soil, some of that fallout would likely be deposited on the soils in the woods adjacent to lOCo Additionally, analyses of soil samples collected by NJDEP during 1995 from an area near the corner of Tennent Road and Route 79, due east of 10C, show that arsenic concentrations in the uppermost 6 in. of soil are small (Steven Byrnes, written commun., 1996) and are in the range of concentrations measured in samples of sandy A-horizon soils from undeveloped areas. Thus no evidence currently exists for elevated arsenic concentrations that could be attributed to smokestack-plume deposition north-northeast and due east of laC.
91
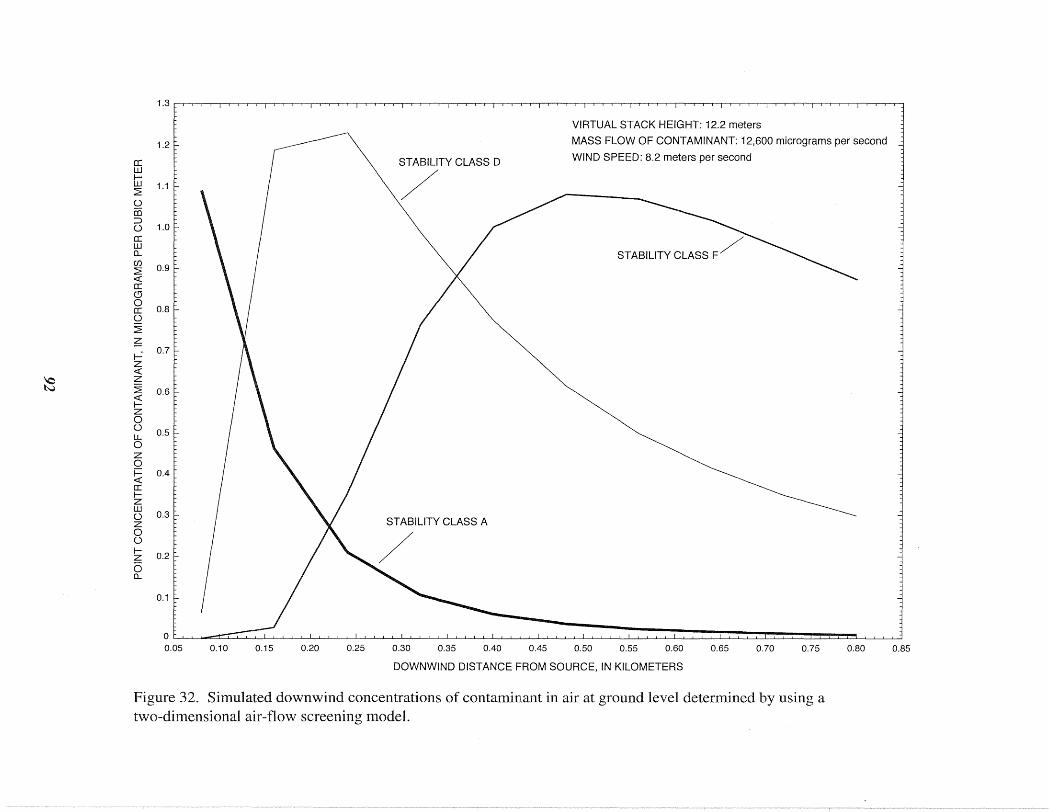
1~
12
rr W ~
1.1 W ~
0 m ~
0 1.0 rr w ~
w O~ ~
~ rr ~ 0
Q8 ~
0 ~ Z -~
OJ Z ~ Z ~ O~ ~ ~ Z 0 0
O~ ~
0 Z 0 ~ Q4 ~ rr ~ z w
Q3 0 Z 0 0 ~ Q2 Z 0 ~
0.1
O~III~I 0.05 0.10 0.15 0.20 0.25
STABILITY CLASS 0
/
STABILITY CLASS A
0.30 0.35 0.40 0.45
VIRTUAL STACK HEIGHT: 12.2 meters
MASS FLOW OF CONTAMINANT: 12,600 micrograms per second
WIND SPEED: 8.2 meters per second
STABILITY CLASS F/~
~
0.50 0.55 0.60 0.65 0.70 0.75 0.80
DOWNWIND DISTANCE FROM SOURCE, IN KILOMETERS
0.85
~
Figure 32. Simulated downwind concentrations of contaminant in air at ground level determined by using a two-dimensional air-flow screening model.

1,000.00
750.00
500.00
CI) a:
~ N
~ O. 00 ...I.-~---+-------1f--":"::::;;::.:J...:.....:..::L:..:::.:.r-r-=::::.:..:::...-t-,etii w ~
R6e
-250'00D=n~1[[J -500.00
-1,000.00 l __ J.[~--l~~zk~~~~~~ii~i;li;~~~~a -1,000.00 -750.00 -500.00 -250.00 0.00
METERS 250.00
EXPLANATION Isopleths in grams per square meter
Soil sample collected from residential area and sampling-site number
o I o
ISCST3 Version (96113)
I 0.25
1984-89, 1989 Newark/Atlantic City meterological data Normalized emission rate of 1 gram per second
0.25 I
I 0.5
500.00
Represents particulates with an aerodynamic diameter less than 1.25 micrometer
750.00 1,000.00
0.5 MILE I I
0.75 KILOMETER
Figure 33. Dry-deposition pattern of small particles in the vicinity of Imperial Oil Company Superfund site simulated by using an arbitrary normalized emission rate of 1 gram per second and meterological data from 1984-89 from Newark and Atlantic City airports, New Jersey. (From unpublished report available at New Jersey Department of Environmental Protection office in Trenton, New Jersey)
93

A smokestack plume hypothetically could also deposit sulfur, as sulfide ores typically are roasted to obtain various metals. Sulfur was detected in some IOC soil samples at concentrations generally greater than those found elsewhere in the study area, although sulfur also was detected in several clayey soils and clay samples from undeveloped and orchard areas. One clay sample from the Woodbury Formation contained 3.35 percent sulfur, the largest concentration measured during this study. Sulfide minerals were visible in this sample.
The absence of sulfur in nearly all the A- and B-horizon soil samples from the woods adjacent to IOC militates against significant fallout from the hypothetical smokestack plume. A study of sulfur and heavy metals in organic soil horizons near copper and nickel smelters in Russia indicates that, although sulfur is more easily leached than some metals, some atmospherically deposited sulfur is retained by humic materials (Niskavaara and others, 1996). Sulfur ( as sulfate) also is adsorbed by acid soils (Chao and others, 1962), such as those in the vicinity of IOC. Sulfur was present in O-horizon samples from the woods adjacent to IOC in small concentrations similar to those measured in 0 horizons in undeveloped and orchard soils throughout the study area. Sulfur in O-horizon soils in the study area probably derives from acid precipitation, which has been enriched in anthropogenic sulfur for decades (see Hileman, 1981; Gould, 1983)
Although sulfur was seldom detected in sandy soils from the other land-use areas, two Ahorizon samples from residential area 1 contained sulfur at the limit of detection (0.05 percent), indicating that some sulfur from the IOC site may have migrated to adjacent soils. Sulfur also was found in the A-horizon soil at sampling site S4, in the woods immediately east of lOCo In the broader area, about 1 mi east ofIOC, samples from both sites contained detectable sulfur in some of the horizons; the largest concentration measured was 0.13 percent in a clay sample that contained 26.1 mg/kg of arsenic. Both arsenic and sulfur in this sample could be geologic in origin, on the basis of concentrations measured in other background samples in the study area.
No sulfur was detected in soil samples from residential area 2. Currently available data do not conclusively support the existence of fallout from a smokestack plume and therefore do not demonstrate that the arsenic and other contaminants in soils from residential area 2 can be attributed to dry deposition of airborne material emanating from lOCo
Earth-Moving and Other Activities
The soils at IOC show clear evidence of disturbance. Buildings and tank farms were added to the site after pesticide production ceased and the property was sold; much of the expansion appears to have taken place during the 1950's, as documented by aerial photographs from 1940, 1951 (E.C. Jordan Co., 1990), and 1954 (this study). A pile of material, located where the filterclay wastepi1e was identified during initial investigations in the late 1980's, is visible in a 1962 aerial photograph (E.C. Jordan Co., 1990). The fire pond north ofIOC apparently was constructed some time during 1962-74, as it appears in a 1974 aerial photograph, as does an area otexcavated soils (now about 250 by 200 ft) immediately south of the fire pond (E.C. Jordan Co., 1990). More recently (1976), contaminated soil at the oil/water separators is reported to have been excavated and replaced with clean sand and an earthen berm constlllcted along the nOltheastern boundary of the active part of the site. Several tanks then were removed, apparently in the late 1980 's (E.C. Jordan Co., 1990).
94

Although waste-disposal practices at IOC during the first half of this century are not documented, the soils that were disturbed in the 1950's are likely to be contaminated with wastes from earlier arsenical pesticide production. More recently disturbed soils also could contain oily wastes from later industrial activities. The large area of fill that extends northward from IOC's eastern fenceline to the fire pond contains pieces of brick, concrete, and other construction debris, as welJ as fragments of cindery slag similar to the pieces extracted from soil cores at IOC and found on the surface at IOC near the site of the filter-clay wastepiie. Samples from the fill contain elevated arsenic, barium, copper, and lead concentrations (E.C. Jordan Co., 1990). Although the history of earth-moving activities at IOC is poorly known, it is apparent that contaminated soils have been moved, and that some of the soil and debris probably was moved to the adjacent properties that are part of residential area 1.
The soils in residential area 1 at the land surface that contain the largest concentrations of arsenic are clays similar to the clay underlying IOC and the adjacent woods. No sequence ofnaturally occurring soil horizons is present at these sampling sites (R3 and R4); these soils clearly are disturbed, and they contain debris that is similar to that found both dispersed at the land surface and at depth at IOC and in the adjacent area offill. Smaller amounts of the same type of debris are present in the adjacent, less disturbed topsoil. Moreover, samples of the cindery slag debris, one piece from IOC and one from a private property in residential area 1, contain elevated concentrations of arsenic.
Other, less visible sources of arsenic also may be present in the residential area 1 soils; these may be sources of elevated barium, copper, and lead concentrations as well. In addition to the elevated barium and copper concentrations measured in some of these soils during this study, elevated arsenic, barium, and copper concentrations were measured earlier in three soil samples collected near sites R3 and R4, near sites R21 and R22, and on the property south of site R22 (L. Robert Kimball and Associates, 1995). A lead concentration of 611 mg/kg in one sample and zinc concentrations greater than 200 mg/kg in two samples also were measured. These inorganic contaminants commonly are associated with activities at IOC, and it is possible that, in addition to arsenic being distributed during moving of excavated soils from IOC to adjacent areas, arsenic and these other contaminants could have been distributed as dust by the wind.
The chemistry of soils from residential area 2, on the other hand, generally is not indicative of contamination from IOC. Although contaminants could have been transported by means other than smokestack-plume fallout from IOC to residential area 2, none of the debris common to IOe soils and soils from residential area 1 has yet been found in soils from residential area 2. The chemical signature of most of the soil samples collected from residential area 2 is consistent with geologic and orchard inputs.
Orchard Pesticides
Elevated arsenic concentrations are, in some cases, associated with orchard soils, particularly in the A and E horizons. Overall, arsenic concentrations tended to be higher in the A and (or) E horizons of orchard soils than in the same horizons in soils from undeveloped forested areas.
95

The median arsenic concentration in orchard A- and E- horizon samples combined was 11.3 mg/kg, whereas the median arsenic concentration in A- and E-horizon samples from undeveloped areas was 4.25 mg/kg.
Arsenic concentrations in B-horizon soils from most of the undeveloped areas tended to be larger than the concentrations in A- or E-horizon soils, particularly those developed on a clayrich geologic substrate. Arsenic concentrations in B-horizon soils from orchards tended to be smaller than those in the A or E horizons, however. The decrease in arsenic concentration with depth in the soil profile is less pronounced in clay-rich soils from orchards than in sandy soils, indicating a fairly homogeneous distribution of elevated arsenic concentrations in the clayey geologic substrate. The vertical distIibution of arsenic in soils of residential area 2 tends to follow the pattern seen in clay-rich orchard soils.
Lead concentrations, which were greater than 100 mg/kg in some of the A and E horizons of orchard soils, also tended to be)arge in the A horizons of soils in residential area 2. The distribution of lead in the soil profiletn orchards and at some sampling sites in residential area 2 tended to be similar.
Copper inputs to orchard soils can be atmospheric and (or) the result of applications of copper-bearing pesticides or fertilizers such as copper sulfate. Potassium also may have been added to soils by feltilizers used in the orchards. Barium can be contributed by lime added to agricultural soils to raise the pH. Kozinski and others (1995) found barium to be a useful marker of ground water recharged through agricultural land in the Coastal Plain~ the soil in agricultural areas likely contains elevated concentrations of barium. Some zinc may be contributed to studyarea orchard soils by agricultural chemicals, as zinc is added to fruit trees as a micronutrient (John Hauser, oral commun., 1996). All these constituents tended to be present in larger concentrations in sandy soil samples from orchards than in sandy soil samples from undeveloped areas; concentrations of these constituents also were larger in samples containing clay, regardless of land use. Concentrations of these constituents in soil samples collected at sites 07, 012, and 016, all in orchards underlain by the Woodbury Formation (and therefore lich in clay), most closely resemble those in many of the soil samples collected from residential area 2, also underlain by clay.
In general, the chemistry of soils from sampling sites in residential area 2, many of which are located beneath old apple trees (see table 1), resembles the chemistry of soils from orchards (figs. 26-28). In a few of the soil samples from residential area 2, arsenic concentrations were highly elevated (49.5-73.9 mg/kg in samples from sites R2, R 12, R 13 and R27); these values are larger than any concentrations measured in other orchard soils collected duIing this study. Orchard pesticide inputs of arsenic could increase naturally occurring arsenic concentrations, which appear to be on the order of about 20 mg/kg in the clays underlying many of the residential area 2 sampling sites. Furthermore, because organic arsenical pesticides were used increasingly in the United States during the 1970's to control crabgrass (Adriano, 1986), additional inputs of arsenic from lawn-care products also are possible.
The significant positive correlation between arsenic and mercury concentrations in residential area 2 A-horizon soils and the broader area samples is not present in soils from other landuse groups, including 10C. The cause of this relation is unknown; perhaps mercurial pesticides also were used for control of crabgrass and other weeds in some of the residential areas.
96

It is unclear whether the confluence of naturally occurring arsenic and arsenical pesticides could result in the "hotspots~' of 77.4 and 151 mg/kg of arsenic measured previously by NJDEP (Steven Byrnes, wlitten commun., 1996) in soils adjacent to sampling sites Rl5 and R13, respectively. The large arsenic concentration (149 mg/kg) in a sample collected about I mi east of 10C, in the broader area, indicates that "hotspots" of arsenic-contaminated soil are not limited to the two residential areas investigated during this study. Storage of arsenical pesticides, or mixing of them, or spills related to the filling of spraying equipment, could be responsible for the isolated instances of highly elevated arsenic concentrations in residential area 2 and the broader area. Alternatively, the arsenic "hotspots" may result from activities unrelated to the former orchards in the area. The available data do not permit a definitive interpretation at this time.
SUMMARY AND CONCLUSIONS
In order to determine sources of arsenic and metals found in elevated concentrations in residential soils in the vicinity of the Imperial Oil Company Superfund site (IOC), the U.S. Geological Survey collected soil cores from long-term forested areas (undeveloped land), from former and existing orchards, and from 10C to determine the amounts of arsenic contributed by geologic material, by use of arsenical pesticides, and by industrial activities. Soil cores also were collected in the woods adjacent to IOC, and at two residential areas near 10C where elevated arsenic and lead concentrations had been measured previously in the soils. Residential area 1, formerly farm and orchard land, is adjacent to 10C; residential area 2, built on former orchard land, is located beyond the woods about 0.5 mi north-northeast of LOCo Two soil cores also were collected in a residential area built on former orchard land about I mi east of LOCo
The soil cores were divided by horizon into samples that were analyzed for 23 metallic constituents, total organic carbon, and total sulfur. Arsenic concentrations generally were smaller than 10 mg/kg in samples of sandy soils from undeveloped areas, but were as large as 40 mg/kg in clay samples. Arsenic concentrations in samples of orchard soils were found to be as large as 40 mg/kg in A and E horizons, and were greater than 20 mg/kg in samples from underlying clay lenses. Arsenic concentrations in soil samples from IOC typically were smaller than 50 mg/kg, but a few clay samples contained concentrations of about 100 mg/kg. Barium, copper, and zinc concentrations tended to be larger in soil samples from 10C than in those from undeveloped and orchard land.
Chemical signatures indicative of background (geologic and regional atmospheric input), orchard (pesticide input), and industrial (pesticide-manufacturing input) concentrations of arsenic and metals in soils of the area were determined graphically and statistically and were compared to the chemistry of soils from the residential areas. Discriminant analysis of the chemical data provided chemical signatures for soils from undeveloped land, from orchards, and from IOC on the basis of ranks of 13 chemical-constituent concentrations. The chemistry of most of the soils from residential area 2 is statistically similar to that of orchard soils. Much of residential area 2 is underlain by clay lenses; therefore, the natural geologic contribution of arsenic also tends to be large. Soils from residential area I are chemically similar to orchard soils, but show some chemical similarities (larger barium and copper concentrations) to soils at IOC~ moreover, debris (slag and brick fragments) found at IOC also is found in the adjacent residential soils.
97

The hypothesis that arsenic in the soils was derived from a smokestack plume during the years when arsenical pesticides were produced at IOC was tested by air-flow modeling of possible contaminant distributions emitted from the stacks. The wind direction from which the hypothetical smokcstack plume would travel to residential area 2 is south-southwest; winds, however, blow from that direction less than 7 percent of the year. Contaminant distributions at ground level simulatcd by the air-flow model do not match the distributions of contaminants measured in soils. The soil samples from the woods locatcd between IOC and residential area 2 contained arsenic and metals in concentrations that were small and within the ranges found in forested, undeveloped-area soils, although concentrations were slightly larger in the area of woods that had been an orchard. The distribution of arsenic and metals in the soils, lack of detectable sulfur in the soils, and results of air-flow modeling do not support the hypothesis of arsenic deposition from a smokestack plume.
Overall, the chemical data and soil characteristics indicate the following:
1. Arsenic concentrations in sandy soils of the area are small (generally less than 10 mg/kg), but are substantially larger in clays (up to 40 mg/kg).
2. Arsenic concentrations in orchard soils can range from background levels (less than 10 mg/kg) to at least 40 mg/kg in A and E soil horizons.
3. Elevated concentrations of arsenic in soils from residential area 1 are likely to be derivcd, in part, from waste matcrials from IOC, on the basis ofthc presence of debris, bricks, and cindery slag comrDon to soils at IOC and residential area 1.
4. Concentrations of copper and barium are elevated (above background levels) in soils from IOC and residential area 1, which is interpreted as being indicative of a connection between IOC and residential area 1.
5. Elevated concentrations of arsenic in soils from residential area 2 appear, for the most part, to be derived from geologic sources and from use of arsenical pesticides in the former orchards there. A few instances of highly elevated arsenic concentrations (greater than 50 mg/kg) cannot be interpreted on the basis of available data.
6. Soils in a third residential area on former orchard land (broader area) about 1 mi from IOC also contain elevated concentrations of arsenic.
7. Lead-isotope ratios indicate that some lead in soils in the study area is contributed by atmospheric deposition. Lead-isotope ratios in residential and woods soils nearest to IOC are similar to each other but different from lead-isotope ratios in some soil samples from orchards and residential area 2.
98

REFERENCES CITED
Adriano, D.C., 1986, Trace elements in the terrestrial environment: New York, Springer-Verlag, 533 p.
Anderson, M.C., Ferguson, IF., and Gavis, l, 1976, Arsenate adsorption on amorphous aluminum hydroxide: Journal of Colloid Interface Science, v. 72, p. 413-427.
Bowell, RJ., 1994, Sorption of arsenic by iron hydroxides and oxyhydroxides in soils: Applied Geochemistry, v. 9, p. 279-286.
Brady, N.C., 1974, The nature and properties of soils (8th ed): New York, MacMillan Publishing Company, 639 p.
Cavallaro, N., and McBride, M.B., 1978, Copper and cadmium adsorption characteristics of selected acid and calcareous soils: Soil Science Society of America Journal, v. 42, p.550-556.
Chao, T.T., Howard, M.E., and Fang, S.C., 1962, Adsorption and desorption phenomena of sulfate ions: Soil Science Society of America Proceedings, v. 26, p. 234-237.
Christian, lB., 1995, Estimate the effects of air emissions with this process screening model: Chemical Engineering Progress, June 1995, p. 59-62.
Curry, K.l, 1990, Detelmination of total sulfur in geologic materials by combustion, in Arbogast, B.F., ed., Quality assurance manual for the Branch of Geochemistry: U.S. Geological Survey Open-File Report 90-668, p. 131-135.
Davenport, lR., and Peryea, F.l, 1991, Phosphate fertilizers influence leaching of lead and arsenic in a soil contaminated with lead arsenate: Water, Air, and Soil Pollution, v. 57/58, p.l0l-110.
Davies, B.E., 1990, Lead, in Alloway, B.J., ed., Heavy metals in soils: New York, John Wiley and Sons, p. 177-196.
Day, P.R., 1965, Particle fractionation and particle-size analysis, in Black, C.A., Evans, D.D., Ensminger, L.E., White, lL., Clark, F.E., and Dinauer, R.S., eds., Methods of soil analysis--Part I, Madison, Wisconsin, American Society of Agronomy, Inc., p. 545-567.
Deer, W.A., Howie, R.A., and Zussman, l, 1976, An introduction to the rock-forming minerals: London, Longman Group, Ltd., 528 p.
E.C. Jordan Co., 1990, Remedial investigation of Imperial Oil/Champion Chemicals site, Morganville, New Jersey, v. I: Unpublished draft consultanfs report prepared for the New Jersey Department of Environmental Protection, 409 p.
99

REFERENCES CITED- -Continued
E.C. Jordan Co., 1992, Groundwater control feasibility study--Imperial Oil Company/Champion Chemicals site, Morganville, New Jersey: Unpublished consultant's report prepared for the New Jersey Department of Environmental Protection, 94 p.
Elkhatib, E.A., Bennett, O.L., and Wright, RJ., 1984, Arsenite sorption and desorption in soils: Soil Science Society of America Journal, v. 48, p. 1025-1030.
Elliot, H.A., Liberati, M.R., and Huang, C.P., 1986, Competitive adsorption of heavy metals by soils: Journal of Environmental Quality, v. 15, p. 214-219.
Fairbridge, R.W., ed., 1972, The encyclopedia of geochemistry and environmental sciences: New York, Van Nostrand Reinhold Co., 1,321 p.
Farrah, H., Hatton, D., and Picketing, W.F., 1980, The affinity of metal ions for clay surfaces: Chemical Geology, v. 28, no. 1/2, p. 55-68.
Faure, Gunter, 1986, Principles of isotope geology (2d ed.): New York, John Wiley and Sons, 589 p.
Forbes, E.A., Posner, A.M., and Quirk, J.P., 1976, The specific adsorption of divalent Cd, Co, Cu, Pb, and Zn on goethite: Journal of Soil Science, v. 27, p. 154-166.
Foth, H.D., 1978, Fundamentals of soil science (6th ed.): New York, John Wiley and Sons, 436 p.
Fliedland, AJ., Johnson, A.H., Siccama, T.G., and Mader, D.L., 1984, Trace metal profiles in the forest floor of New England: Soil Science Society of America Journal, v. 48, p. 422-425.
Friedland, AJ., and Johnson, A.H., 1985, Lead distribution and fluxes in a high-elevation forest in northern Vermont: Journal of Environmental Quality, v. 14, p. 332-336.
Gould, R.R., 1983, Acid rain: Regional and transnational dilemma: Chemical and Engineering News, October 10, 1983, p. 28-29.
Griffin, R.A., and Shimp, N.F., 1978, Attenuation of pollutants in municipal landfill leachate by clay minerals: U.S. Environmental Protection Agency EPA-600/2-78-157.
Hildebrand, E.E., and Blum, W.E., 1974, Lead fixation by clay minerals: Naturwissenschaften, v.61,p.169.
Hileman, Bette, 1981, Acid precipitation: Environmental Science and Technology, v. 15, no. 10, p. 1119-1124.
Huang, C.P., Elliott, H.A., and Ashmead, R.M., 1977, Interfacial reactions and the fate of heavy metals in soil-water systems: Journal of the Water Pollution Control Federation, v. 49, p.745-756.
100

REFERENCES CITEO- ... Continued
Hurst, R. W., 1994, Chemical fingerprinting using lead isotopes--New techniques for environmental litigation: Shepard's California Environmental Law and Regulation Reporter, v. 4, no. 10, p. 171-175.
Ivahnenko, Tamara, Szabo, Zoltan, and Hall, G.S., 1996, Use of an ultra-clean sampling technique with inductively coupled plasma-mass spectrometry to determine trace-element concentrations in water from the Kirkwood-Cohansey aquifer system, Coastal Plain, New Jersey: U.S. Geological Survey Open-File Report 96-142,30 p.
Jablonski, C.F., and Baumley, R.l, 1989, Soil survey of Monmouth County, New Jersey: U.S. Department of Agriculture, Soil Conservation Service, 170 p.
Jennings, H., Dickey, lB.R., and Lee, L.L., 1916, Soil survey of the Freehold area, New Jersey: U.S. Department of Agriculture, 51 p.
Jones, lS., and Hatch, M.B., 1937, The significance of inorganic spray residue accumulations in orchard soils: Soil Science, v. 44, p. 37-63.
King, L.D., 1988, Retention of metals by several soils of the southeastern United States: Journal of Environmental Quality, v. 17, no. 2, p. 239-246.
Kozinski, Jane, Szabo, Zoltan, Zapecza, O.S., and Barringer, T.H., 1995, Natural radioactivity in, and inorganic chemistry of, ground water in the Kirkwood-Cohansey aquifer system, southern New Jersey, 1983-89: U.S. Geological Survey Water-Resources Investigations Report 92-4144, 130 p.
Leckie, lO., Benjamin, M.M., Hayes, K., Kaufman, G., and Altman, S., 1980, Adsorption/ coprecipitation of trace elements from water with ferric oxyhydroxide: Palo Alto, California, Electric Power Research Institute Report CS-1513, 230 p.
Lee, L.L., and Tine, lE., 1932, Soil survey of the Freehold area, New Jersey: U.S. Depat1ment of Agriculture, Bureau of Chemistry and Soils, series 1927, no. 33, 53 p.
L. Robert Kimball and Associates, 1995, Field sampling and analysis report for the Imperial Oil off-site areas 1 and 2, Marlboro Township, Monmouth County, New Jersey: Unpublished consultant's report prepared for the New Jersey Department of Environmental Protection, 61 p.
Martin, D.O., 1976, The change of concentration standard deviation with distance: Journal of the Air Pollution Control Association, v. 26, no. 2, p; 145-146.
Matisoff, Gerald, Khourey, C.J., Hall, lB., Varnes, A. W., and Strain, W.H., 1982, The nature and source of arsenic in northeastern Ohio ground water: Ground Water, v. 20, no. 4, p.446-456.
101

REFERENCES CITED- .. Continued
McCormick, Jack, and Forman, R.T.T., 1979, Introduction--Location and boundaries of the New Jersey Pine Barrens, in Forman, R.T.T., ed., Pine Barrens--Ecosystem and landscape: New York, Academic Press, p. xxxv-xlii.
McLean, lE., and Bledsoe, B.E., 1992, Behavior of metals in soils: U.S. Environmental Protection Agency, EPA Ground Water Issue, EPAl540/S-92/0 18, 25 p.
Moore, J.W., and Ramamoorthy, S., 1984, Heavy metals in natural waters: New York, SpringerVerlag, 268 p.
New Jersey Department of Environmental Protection, 1992, Quality assurance data validation of analytical deliverables--TAL---inorganics; Division of Publicly Funded Site Remediation SOP No. : 5.A.02, Revision No.2: Unpublished document, New Jersey Department of Environmental Protection, Trenton, New Jersey.
__ 1996, Soil cleanup criteria, adopted from Cleanup standards for contaminated sites, N.lA.C. 7:26D, February 3, 1992, revised July 11, 1996: Unpublished document, New Jersey Department of Environmental Protection, Trenton, New Jersey.
Niskavaara, Heikki, Reimann, Clemens, and Chekushin, Viktor, 1996, Distribution and pathways of heavy metals and sulphur in the vicinity of the copper-nickel smelters in Nikel and Zapoljamij, Kola Peninsula, Russia, as revealed by different sample media: Applied Geochemistry, v. 11, p. 25-34.
Onishi, H., 1969, Arsenic, in Wedepohl, K.H., ed., Handbook of geochemistry, Berlin, SpringerVerlag, chap. 33.
Owens, J.P., and Sohl, N.F., 1969, Shelf and deltaic paleoenvironments in the Cretaceous-Tertiary formations of the New Jersey Coastal Plain, in Subitsky, Seymour, ed., Geology of selected areas in New Jersey and eastern Pennsylvania and guidebook of excursions, New Brunswick, New Jersey, Rutgers University Press, p. 235-278.
Owens, J.P., Sugatman, P.J., Sohl, N.F., Parker, R.A., Houghton, H.F., Volkert, R.A., Drake, A.A., and Orndorff, R.C., 1995, Geologic map of New Jersey: Central sheet: U.S. Geological Survey Open-File Report 95-253, 60 p.
Pierce, M.L., and Moore, C.B., 1980, Adsorption of arsenite on amorphous iron hydroxide from dilute aqueous solution: Environmental Science and Technology, v. 14, p. 214-216.
Powley, V.R., 1987, Soil survey of Middlesex County, New Jersey: U.S. Department of Agriculture, Soil Conservation Service, 218 p.
'Riffaldi, Riccardo, Levi-Minzi, Renato, and Soldatini, Gian Franco, 1976, Pb adsorption by soils: II. Specific adsorption: Water, Air, and Soil Pollution, v. 6, p. 119-128.
102

REFERENCES CITED--Continued
Robinson, G.D., 1983, Heavy-metal adsorption by felTomanganese coatings on stream alluvium: Natural controls and implications for exploration: Chemical Geology, v. 38, p. 157-174.
SAS Institute Inc., 1990a, SAS Procedures Guide, Version 6 (3rd ed.): Cary, North Carolina, SAS Institute Inc., 703 p.
SAS Institute Inc., 1990b, SAS/STAT User's Guide, v. 1, Version 6 (4th ed.): Cary, North Carolina, SAS Institute Inc., 942 p.
Scrudato, R.I, and Estes, E.L., 1975, Clay-lead sorption relations: Environmental Geology, v. 1, p.167-170.
Siccama, T.G., Smith, W.H., and IvIader, D.L., 1980, Changes in lead, zinc, copper, dty weight, and organic matter content of the forest floor of white pine stands in central Massachusetts over 16 years: Environmental Science and Technology, v. 14, no.1, p. 54-56.
Slavek, l, and Pickering, W.F., 1985, Chemical leaching of metal ions sorbed on hydrous manganese oxide: Chemical Geology, v. 51, p. 213-223.
Stoughton, Bradley, 1966, Metallic materials: Iron and steel, in Eschback, O. W., ed., Handbook of engineeling fundamentals: New York, John Wiley and Sons, p. ] 2-36 to 12-41.
Tiller, K.G., Gerth, J., and Brummer, G., 1984, The relative affinities of Cd, Ni, and Zn for different soil clay fractions and goethite: Geodenna, v. 34, p. 17-35.
Turner, D.B., 1970, Workbook of atmospheric dispersion estimates, U.S. Environmental Protection Agency, Washington, D.C., in Cooper, C.D., and Alley, F.C., eds., 1986, Air pollution control: A design approach: Prospect Heights, Illinois, Waveland Press, p. 530.
Tyler, L.D., and McBride, M.D., 1982, Mobility and extractability of cadmium, copper, nickel, and zinc in organic and mineral soil columns: Soil Science, v. 134, no. 3, p. 198-205.
Vermeule, C.C., 1900, The forests of New Jersey, in Geological Survey of New Jersey, Annual Report of the State Geologist for the year 1899: Trenton, New Jersey, MacCrellish and Quigley, p. 13-172.
Wacker, P.O., 1979, Human exploitation of the New Jersey Pine Barrens, in Forman, R.T.T., ed., Pine Barrens--Ecosystem and landscape: New York, Academic Press, p. 3-23.
Walsh, L.M., and Keeney, D.R., 1975, in Woolson, E.A., ed., Arsenical pesticides, Washington D.C., American Chemical Society, p. 35-52.
Waychunas, G.A., Rea, B.A., Fuller, C.C., and Davis, lA., 1993, Surface chemistry of fen"ihydrite: Part 1. EXAFS studies of the geometry of coprecipitated and adsorbed arsenate: Geochimi ca et Cosmochimica Acta, v. 57, p. 2251-2269.
103

REFERENCES CITED--Continued
Welch,A.H., Lico, M.S., and Hughes, lL., 1988, Arsenic in ground water of the western United States: Ground Water, v. 26, no. 3, p. 333-347.
Windom, H.L., Byrd, IT., Smith, R.G., Jr., and Huan, Feng, 1991, Inadequacy ofNASQAN data for assessing metals trends in the Nation's rivers: Environmental Science and Technology, v. 25, no. 6, p. 1137-1142.
Woolson, A.E., Axley, J.H., and Kearney, P.C., 1971, The chemistry and phytotoxicity of arsenic in soils: 1. Contaminated field soils: Soil Science Society of America Proceedings, 36th Annual Meeting, Miami Beach, Florida, v. 35, p. 938-943.
Zapecza, O.S., 1989, Hydrogeologic framework of the New Jersey Coastal Plain: U.S. Geological Survey Professional Paper 1404-B, 49 p., 24 pI.
104

APPENDIXES
105

APPENDIX 1
Analytical Methods
Samples for inductively coupled plasma spectroscopy (ICP) analysis are prepared by digesting 1 g of soil in nitric acid and hydrogen peroxide and refluxing the digestatewith nitric acid or hydrochloric acid. In the Iep spectrometer, the sample is nebulized, and characteristic atomic-line emission spectra produced by plasma are dispersed by a grating spectrometer and intensities increased by photomultiplier tubes; the photocurrents are then processed by computer. Samples for mercury analysis by cold-vapor atomic absorption (CVAA) undergo oxidation with potassium permanganate and potassium persulfate; sodium chloride-hydroxylamine sulfate is added to reduce excess permanganate~ the headspace in the sample bottle is purged and stannous sulfate is added to reduce the mercury. The sample bottle is attached to an aeration apparatus and the mercury vapor passes through a cell placed in the light path of an AA spectrophotometer.
Determination of total organic carbon by the Lloyd Kahn method first involves removal of inorganic carbon (from carbonates and bicarbonates) by acid treatment. Second, organic compounds are decomposed by pyrolysis, and the carbon dioxide thus formed is measured. The carbon dioxide determination can be made by direct nondispersive infrared detection, flameionization gas chromatography following catalytic conversion of carbon dioxide to methane, or thermal-conductivity detection on samples from which water is removed.
The concentration of total sulfur in soil is determined by infrared-adsorption spectroscopy (IR) on the evolved sulfur dioxide gas from combustion of a 0.25-g air-dried sample, ground to pass through an 80-mesh « 180 micron) sieve and mixed with 1 g of vanadium pentoxide flux, in a pressurized oxygen atmosphere at 1,370 °C (Curry, 1990). Twigs and pebbles were removed from the sample before grinding with a coarse 10-mesh sieve. The precision of the technique is about ± 0.0] percent.
Lead-isotope analyses are performed by mass spectrometry on samples from which the labile lead has been extracted by reaction with 8N nitric acid for 10 minutes. The extracted sample is weighed and split into two aliquots, one of which is used for isotopic analysis; the other is spiked with enriched 206Pb for lead-concentration determinations. The lead is separated by anionexchange chromatography, concentrated by using hydrobromic acid, and purified with hydrochlo-
acid, resulting in a lead chloride salt. The lead salt is dissolved in phosphoric acid and loaded on a rhenium filament, and lead isotopes e04Pb, 206Pb, 207Pb, 208Pb) are determined by repeated scans in a thermal ionization mass spectrometer. Fractionation effects are corrected by running lead-isotope standards (R. W. Hurst, Chempet Research Corporation, written commun., 1996).
106

"""'" ~ ~
Appendix 1
Table 1. Concentrations of constituents measured in soH samples from undeveloped forested areas in Monmouth and Middlesex Counties, New Jersey [All concentrations in milligrams per kilogram (parts per million) unless otherwise noted; B, detectable value but below the contract-required detection limit; U, below the instrument detection limit; J, qualified--data may exhibit bias; <, less than~ NA, not analyzed; see figs. 8 and 9 for locations]
Sample number l
Sample date Aluminum Arsenic Barium Beryllium Cadmium Calcium Chromium Cobalt Copper Iron Lead Magnesium Manganese
El 0
E 1 D 0
El A
E 1 E
E 1 Bl
E 1 B2
E2 0
E 2 S 0
E2 A
E 2 B1
E 2 B2
E4 o E4 A
E4 E
E4 Bl
E4 B2
E4 e
E5 E
E5 Bl
E5 B2
E5 e
E6 A
E6 E
E6 Bl
E6 e E6 ell
951130
951130
951130
951130
951130
951130
951201
951201
951201
951201
951201
960206
960206
960206
960206
960206
960206
960206
960206
960206
960206
960206
960206
960206
960227
960206
1020
793
843
527
3250
1010
1230
1470
1630
4570
3380
922 J
508
286 J
1800 J
1330
435 J
709 J
913 J
2440 J
1920 J
388
986 J
4410 J
2510
6290
2.1 B
2.2 B
2.3
1.0 B
2.9
0.97 B
2.3 B
2.3 B
5.9
5.7
704
2.8 B
2.2 B
1.6 B
3.1
2.2 B
1.2 B
504
6.3
7.1
6.0
3.3
4.7
8.5
4.7
17.6
J
J
J
J
J
J
J
J
704 B
4.7 B
4.4 B
3.5 B
7.4 B
2.8 B
10.8 B
14.4 B
5.4 B
11.6 B
7.7 B
42.9 B
3.7 B J
1.7 B J
3.9 B J
3.0 B J
1.8 B J
1.8 B J
1.4 B J
3.1 B J
2.3 B J
4.4 B J
3.8 B J
7.5 B J
8.0 B J
12.0 B J
0.03 U
0.02 U
0.02 U
0.02 U
0.06 B
0.02 U
0.03 U
0.03 U
0.02 U
0.10 B
0.05 B
0.21 B J
0.08 B J
0.09 B J
0.07 B J
0.11 J
0.06 B J
0.05 U
0.07 U
0.11 U
0.08 U
0.02 U
0.04 U
0.11 B J
0.19 B J
0.25 B J
0.14B
0.07U
0.07 U
0.05 U
0.05 U
0.05U
0.13 B
0.18 B
0.06U
0.07U
0.06U
1.1 B
0.16 U
0.15 U
O.27U
0.19 U
O.lOU
0.05 U
0.05 U
0.08 B J
0.04 U
0.09U
O.22U
0.52 U
0.05 U
0.97 B J
283 B
125 B
31.1 U
24.2 U
25.3 U
24.2 U
348 B
650 B
30.9 U
32.1 U
1119 B
1690
26.0 U
Jl9.1 U
15.1 U
16.5 U
13.1 U
24.0 U
22.2 U
23.9 U
21.3 U
28.9 U
23.3 U
8.3 U
24.7 U
17.2 U
J
2.9
2.9
3.2
1.1
9.2
2.5
3.7
7.5
8.4
8.6
14.9
5.0 J
1.3 J
0.79 U
2.2 J
2.2
1.3 J
1.8
2.7
4.6
5.0
1.2
2.0
7.5
20.8
15.9 J
0.39 U
0.32 U
0.31 U
0.24 U
0.31 B
0.24 U
0040 U
0.36 U
0.30 U
0.31 U
0.61 B
0.92 U
0.3
0.28 U
0.18 U
0.18 U
0.17 U
0.24 U
0.22 U
0.23 U
0.21 U
0.18 U
0.18 U
0.24 U
0.36 B
0.37 U
J
10.8
9.3
7.2
1.3 B
1.5 B 0.55 B
13.2
15.2
5.5
2.9 B
4.2 B
20.0 J
6.9 J
l.6 U
304 B J
l.8 U
0.51 U
2.2 B J
2.6 B J
1.2 B J
0.91 B J
7.6 J
5.0 J
3.3 B J
6.7
5.7 J
2290
3060
2660
1360
8010
1100
2660
5280
6980
8540
5640
2340
876
357
2260
1280
557
4220
6330
5220
3330
925
2110
5680
7500
9520
J
J
J
J
J
J
44.0
34.5
58.7
3.0
2.9
1.3
59.2
6204
23.1
3.5
5.1
104
35.9
6.7
604
3.0
1.7
8.6
5.7
7.7
3.7
25.5
9.1
5.7
4.2
9.7
J
J
J
J
J
J
J
144 B 12.9
101 B 8.3
88.4 B 7.5
24.7 B 6.8
66.0 B 10.9
31.7 B 3.1
140 B 12.1
213 B 21.1
127 B 12.6
150 B 13.2
318 B 10.6
546 B J 99.7
24.5 U 2.0 J
16.0 U 1.8 J
38.2 U 2.7 J
25.6 U 1.8 J
9.1 U LO J
31.7 B J 4.9 J
33.4 B J 3.9 J
75.5 B J 3.6 J
79.2 B J 2.5 J
1204 U 1.5
27.3 U 1.5
68.3 U 2.2 J
58.1 B J 8.2
163 B J 3.1 J
IThe initial letter denotes sample sites in the undeveloped areas; the following number is the number of the individual site. In the next two columns, samples marked D are duplicates; samples marked S are splits. The final letter refers to the soil horizon; CL denotes clays. The final number denotes increasing depth with increase in value.

soil samples undeveloped forested areas
Sample Sample number! date Aluminum Arsenic Barium Beryllium Cadmium Calcium Chromium Cobalt Copper Iron Lead
] E7 E 960206 2900 J 10.3 3.5 B J 0.17 B J 0.05 U 22.0 U 12.4 0.28 B 6.9 47300 J 20.2 J 48.2 B J 15.6
E 7 B1 960206 6120 ] ll.S 10.1 B J 0.28 B J 0.06 U 26.4 U 23.3 0.57 B 4.5 B J 21100 J 6.2 J 204 B J 12.6 J
0.85 B ] 8.5 233 B J J E 7 B2 960206 6230 14.2 10.4 B J 0.28 B J 0.05 U 23.4 U 34.1 6.3 35500 16.4
3240 J 209 154 B J 17.8 E9 o 960206 874 J 8.2 16.7 B J 0.08 U 0.65 B J 615 B J 5.1 2.0 B 38.0
17.4 9.4 U E9 A 960206 258 J 3.8 2.6 B J 0.02 U 0.25 B J 26.0 U 4.8 0.18 U 6.1 2210 J 3.0
4.4 51.4 U E9 Bl 960206 1650 4.4 3.5 B J 0.04 U 0.52 B J 37.9 U 4.2 0.18 U 4.7 J 5550 3.3
0.27 B ] 10700 5.2 77.1 U 6.0 E9 B2 960206 3080 9.2 5.1 B J 1.1 J 25.4 U 24.0 0.20 TJ 3.4
0.10 B ] 4.1 61.6 U 37.7 E9 C 960206 3170 8.6 5.2 B J 0.68 U 22.0 U 10.0 J 0.19 U 2.1 7280
0.05 B] 0.06 U 7.6 37.0 J 93.3 B J Ell A 960227 2040 7.4 5.0 B J 90.8 B 4.8 0.28 U 5760 8.1
0.08 B] 0.06 U 0.29 U 5.8 9.1 ] 50.9 B J 6.3 Ell Bl 960227 2270 3.6 4.1 B J 29.1 U 6.8 19100
10.7 B J 0.15 B] 0.06 U 0.55 B 4.4 B 5.1 ] 178 B] Ell B2 960227 6650 7.0 27.1 U 13.0 13000 8.5
9.9 B J 0.17 B] 0.07 U 0.36 B ] 6.2 15800 5.5 144 B J 7.2 Ell CLl 960227 6140 9.0 33.1 U 16.3
6.7 B] 7.3 6.8 74.5 B ] 4.9 Ell CL2 960227 3320 8.2 0.16 B] 0.06 U 28.1 U 20.1 0.28 B 10500
6.2 J 42.7 B] El2 0 960131 1150 0.05 U 0.88 B ] 2470 6.5 1.9 B J 28.6 4600 126 303 B J 63.9
128 J 237 B J 21.1 E12D 0 960131 2110 16.3 J 13.1 B] 0.03 U 0.17B] 390 B J 13.2 1.1 B J 31.8 12400
4.3 2.5 B] 18.5 J 75.7 U 2.5 El2 A 960131 427 0.03 U 0.19 U 62.3 U 2.2 J 0.26 B J 5.1 2730
4.8 B] 42.0 ] 128 B J E12D A 960131 1480 8.2 ] 0.02 U 0.05 U 40.4 B J 6.4 0.33 B J 14.2 8360 9.4
1.3 U 4.0 B] 0.22 TJ 5.9 J 735 11.1 ] 25.5 U El2 E 960131 485 0.03 U O.lOU 12.5 U 2.0 J 2.6
1.9 1.7 B] 0.02 U 0.26 TJ 2.2 B J 1670 7.9 J 25.9 B J 6.6 E12D E 960131 352 0.07 B J 26.1 U 1.9
0.95 U 2.6 B J 0.12 U ] 1.6 TJ 4.1 B J 722 1.9 J 13.4 U 0.79 B J El2 B1 960131 667 J 0.68 U 3.3 U 1.9
0.71 B] 2.0 B J 0.02 U 0.22 U 1.3 B J 292 1.9 21.0 U 1.9 B J E12D Bl 960131 424 0.05 U 22.0 U 1.2 B J
] 24.9 B] 0.21 B J 0.38 B J 968 B 13.9 1.2 B 17.7 21600 139 508 B] 52.8 E13 o 960201 4870 42.8
J 17.6 B] 0.19 B ] 0.18 B] 316 B J 11.6 1.1 B 15.2 19400 136 417 B] 55.1 E13 A 960201 4540 45.5
] 36.0 B J 0.77 B ] 0.19B] 108 B J 51.0 3.2 B 18.4 52400 24.1 2020 57.3 E13 CLl 960201 22400 34.3
3.7 6.2 B] 0.11 B ] 0.06 U 129 B J 4.6 0.30 U 12.8 4440 30.2 ] 90.7 B ] 9.3 E14 A 960212 1760 J
2.9 8.1 B] 0.14 B ] 0.05 U 22.9 U 7.2 0.27 B ] 5.3 5910 J 7.1 95.3 B J 10.7 ] E14 Bl 960212 3000 J
9.4 B J 0.18 B J 0.06U 30.9 U 5.8 0.30 U 5.5 5140 J 4.7 J 95.8 B J 9.9 J E14D B1 960212 3810 J 2.6
4.1 6.2 B J 0.21 B J 0.06U 29.5 U 8.9 0.29 U 2.6 B J 5140 J 2.3 J 70.4 B J 5.8 E14 B2 960212 2450 J
7.7 7.4 B] 0.23 B J 1.1 B J 129 B J 6.5 0.37 B J 7.8 ]l1700 J 27.1 191 B J 18.8 E15 A 960422 2430
8.1 J 13.1 B J 0.23 B J 0.94 B J 24.3 B J 7.8 J 0.34 B J 10.2 11100 J 25.5 J 242 B J 9.5 J E15 B1 960422 4250
18.8 J 33.2 B] 0.58 B J 3.3 ] 34.0 B ] 29.9 J 0.52 B J 12.4 48400 J 19.8 813 B J 20.7 J E15 CLl 960422 10800
~
~ Qe

~
~ '0
Table 1. Concentrations of constituents measured in soil samples from undeveloped forested areas in Monmouth and Middlesex Counties, New Jersey--Continued
Sample number l
Sample date Aluminum Arsenic Barium Beryllium Cadmium Calcium Chromium Cobalt Copper Iron Lead Magnesium Manganese
E15
E15 D
E15
E15 D
E16
E16
E16
E17
E17
E17
WI
WI
WI
WI
W2 W2 W2 W2 W2 W2
W3 W3 W3 W3 W3
CL2
CL2
CLJ
CLJ
A
Bl
B2
A
CLl
CL2
CLl
CL2
CLJ
CL4
B2
CLO
CLl
CL2
CLJ
CL4
A
Bl
B2 B3
CLl
960422
960422
960422
960422
960513
960513
960513
960513
960513
960513
960424
960424
960424
960424
960509
960509
960509
960509
960509
960509
960513
960513
960513
960513
960513
13900
8520
9530
11600
4640
5110
966
9680
14200
17300
3970
12200
9960
11500
7290
8340
10700
14500
7500
10200
1230
1620
3280
3190
7370
41.2
17.9
18.3
15.9
10.7
11.0
2.2
21.7
25.5
40.0
13.6
25.5
23.4
29.2
7.9
8.1
18.2
21.
18.1
34.3
5.2
5.1
11.4
10.5
12.8
J
J
J
J
J
J
J
J
J
J
J
J
J
J
J
J
J
J
J
25.0
38.2
36.3
25.3
22.0
26.0
3.1
21.7
20.6
20.4
15.9
27.6
24.4
27.2
13.5
24.6
34.9
34.1
36.1
51.6
3.9
3.8
5.2
4.6
15.3
B
B
B
B
B
B
B
B
B
B
B
B
B
B
B
B
B
B
B
B
B
B
B
B
B
J
J
J
J
J
J
J
J
J
J
J
J
J
J
J
J
J
J
J
0.58 B J
0.36 B J
0.35 B J
0.43 B
0.44 B J
0.48 B J
0.09 B J
0.30 B J
0.48 B J
0.81 B J
0.44 B
0.51 B
0.50 B
0.53 B
0.21 B J
0.36 B J
0.43 B J
0.73 B J
0.89 B J
1.3 J
0.08 B J
0.07 B J
0.15 B J
0.18 B J
0.34 B J
4.0
0.19 U
2.2
0.18 U
0.16 U
0.16 U
0.15U
0.23 U
0.22 U
0.20 U
0.16 U
0.32 B
0.47 B
0.52 B
0.16 U
0.17 U
0.18 U
0.18 U
0.17 U
0.18 U
0.16U
0.17U
0.17 U
0.17U
0.17 U
J
35.D
23.7
35.4
42.3
973
317
26.0
96.9
74.6
142
508
473
368
274
480
327
204
216
1980
2670
36.6
21.3
20.5
23.3
41.0
B J
B
B J
B
B J
B J
B J
B J
B J
B J
B
B
B
B
B J
B J
B J
B J
B J
B J
B J
B J
B J
31.1
26.1
23.7
23.7
19.4
23.3
2.9
18.3
31.4
54.6
12.4
28.6
27.3
31.0
18.9
27.7
25.1
31.6
23.3
37.4
3.9
4.4
8.4
9.6
22.2
J 0.19
2.2
1.3
2.0
1.7
2.0
0.31
1.5
1.5
2.2
0.91
1.5
1.5
1.6
1.1
1.4
2.0
2.0
11.3
14.8
0.49
0.43
0.76
0.84
1.2
U B
B J
B
B J
B J
B J
B J
B J
B J
B
B
B
B
B J
B J
B J
B J
B J
B J
B J
B J
B J
B J
12.0
14.8
9.1
12.5
15.3
8.3
1.3
35.6
15.8
12.0
8.8
14.9
18.3
18.0
4.7
13.0
14.3
15.5
13.6
18.7
7.2
3.2
1.5
1.4
10.0
B J
J
J
B J
B
57100
36500
31500
21000
20000
22700
2770
35100
61600
118000
27600
62100
75300
80500
20100
23200
35900
110000
26900
35500
11800
12700
22000
25600
93600
J
J
19.7
16.7
23.7
16.4
50.2
45.2
3.4
69.7
26.7
16.5
17.1
13.9
16.0
17.9
6.7
13.4
17.5
14.8
13.7
19.0
18.1
2.4
2.5
3.1
7.0
J
J
J
J
J
J
J
J
J
J
J
J
J
J
J
J
1190
692
852
1080
696
845
149
572
868
1530
301
787
623
801
674
710
1130
829
2890
3690
97.7
105
219
289
401
B J
B
B J
B
B J
B J
B J
B J
B
B
B
B
B
B J
B J
B J
B J
B J
B J
B J
B J
B J
21.9
14.6
l7.9
23.0
36.9
43.6
5.3
16.1
15.9
18.1
32.4
16.2
11.2
14.5
11.7
14.6
21.6
22.3
149
155
8.8
6.4
7.7
12.1
18.6
J
J

~ ~
~
Appendix 1
Table 1. Concentrations of constituents measured in soil samples from undeveloped forested areas in Monmouth and Middlesex Counties, New Jersey--Continued
Sample number l
Sample date Mercury Nickel Potassium Selenium Sodium Thallium Vanadium Zinc
Total organic carbon
Total sulfur
(percent)
El
E 1 D
E 1
E E E
E2
E 2 S
E2
E 2
E 2
E 4
E 4
E 4
E 4
E 4
E 4
E 5
E 5
E 5
E 5
E 6
E 6
E 6
E 6
E 6
0
0
A
E Bl B2
0
0
A
Bl B2
o A
E
Bl B2
e
E
Bl B2
e
A
E
Bl e eLl
951130
951130
951130
951130
951130
951130
951201
951201
951201
951201
951201
960206
960206
960206
960206
960206
960206
960206
960206
960206
960206
960206
960206
960206
960227
960206
0.07 B
0.08 B
0.05U
0.04 U
0.05U
0.04 U
0.16
0.15
0.04B
0.04U
0.03 U
0.44
0.12 U
0.11 U
0.11 U
0.11 U
0.11 U
0.05 U
0.05U
0.05 U
0.05U
0.11 U
0.11 U
0.11 U
0.04U
0.12 U
2.4 B
1.6 B
0.41B
0.24U
1.4 B
O.27B
2.9 B
4.4 B
0.52B
2.0 B
1.0 B
9.5 J
1.0
0.32U
0.46 J
0.60 J
0.32U
0.31 B J
0.22U
0.62 B J
0.53 B J
0.64B J
0.33 U
1.1U
0.41B J
0.43
320 B
257 B
290 B
107 B
102 B
56.3 B
282 B
381 B
453 B
202 B
394 B
912 J
84.8 U
68.0 U
90.7 U
87.6 U
73.7 U
65.1 B J
65.3 B J
153 B J
201 B J
85.6 U
128 U
241 B J
298 BJ
600 B J
1.3 B
0.83 B
0.48 U
0.37U
0.66B
0.37U
1.0 B
1.5
0.48 U
0.79 B
0.42 U
2.7 U
1.1 U
1.0 U
1.0 U
1.0 U
0.99U
0.37U
0.34U
0.37U
0.33 U
1.0 U
1.0 U
1.1 U
1.1
1.1U
J
52.1
42.2
40.8
31.6
33.1
31.6
53.9
48.0
40.5
42.0
36.0
253
80.1
73.6
82.1
73.9
68.2
31.5
29.0
31.3
27.9
76.7
72.4
84.9
32.3
90.3
U
U
U
U
U
U
U
U
U
U
U
B
U
U
U
U
U
U
U
U
U
U
U
U
U
U
0.64 U
0.52 U
0.50U
0.39U
0.41 U
0.39U
0.66U
0.59U
0.50U
0.52U
0.44U
2.4 U
0.97U
0.89U
0.93 U
0.90U
0.88U
0.39U
0.43U
0.39U
0.34U
O.92U
0.93U
0.96U
0.40U
1.00U
9.0
8.8
5.9
2.4
8.4
1.5
9.4
12.8
9.5
13.2
8.2
8.7
4.3
2.4
5.0
3.1
1.3
28.3
33.3
37.5
29.5
4.9
5.9
16.3
18.2
16.1
B
B
B
B
B
B
B
B
B
J
J
J
J
J
J
J
22.5
14.7
4.2 B
1.7 B
13.1
3.0 B
22.1
34.2
7.3
23.3
3.9
64.7 J
4.1 J
0.90 U
1.4 U
3.1 J
1.1 U
2.2 B J
2.3 B J
5.0
2.5 B J
3.0 J
2.1 U
9.8
3.0 B J
4.1
115000
69700
10300
NA 4490
1140
154000
279000
7880
5250
NA
545000
24500
311 0
5200
863
2450
3760
3280
1930
973
16200
8070
4480
5250
3350
J
J
J
J
J
J
J
J
J
J
<0.05
NA <0.05
NA <0.05
<0.05
<0.05
NA <0.05
<0.05
<0.05
0.08
<0.05
<0.05
<0.05
<0.05
<0.05
<0.05
<0.05
<0.05
<0.05
<0.05
<0.05
<0.05
<0.05
<0.05

....... .......
.......
Table 1. Concentrations of constituents measured in soil samples from undeveloped forested areas in Monmouth and Middlesex Counties, New Jersey--Continued
Sample number!
Sample date Mercury Nickel Potassium Selenium Sodium Thallium Vanadium Zinc
Total organic carbon
Total sulfur
(percent)
E 7
E 7
E 7
E 9
E 9
E 9
E 9
E 9
Ell Ell Ell Ell Ell
El2
E12 D
E12
E12 D
El2
El2 D
El2
El2 D
El3
E13
ED
E14
E14
E14 D
E14
E
B1
B2
o A
Bl
B2
C
A
B1
B2
CLl
CL2
0
0
A
A
E
E
B1
Bl
o A
eLl
A
B1
Bl
B2
960206
960206
960206
960206
960206
960206
960206
960206
960130
960130
960130
960130
960130
960131
960131
960131
960131
960131
960131
960131
960131
960201
960201
960201
960212
960212
960212
960212
0.06U
0.05U
0.06U
0.27 B J
0.11 U
0.11 U
0.12U
0.12 U
0.05U
0.04U
0.04U
0.04U
0.05U
0.24 U
0.38 J
0.12 U
0.06 U J
0.14 U
0.06 U J
0.12 U
0.05 U J
0.10 B J
0.06 B J
0.09 B J
0.05 B J
0.13 J
0.03 U J
0.05 U J
0.88 B J
2.0 B J
2.9 B J
5.3 B J
0.34U
0.34U
0.37U
0.35U
0.91 B J
0.29U J
1.2 B J
0.63 B J
0.28U
8.7 J
7.3 B J
0.50 B J
1.6 B J
0.54B J
0.90 B J
0.37 B J
0.22U
7.2 B J
3.8 B J
8.2 B J
1.2 B J
1:3 B J
1.3 B J
1.2 B J
176 B J
424 B J
692 B J
232 B J
79.8 U
114 J
198 J
201 J
210 B J
129 B J
324 B J
361 B J
293 B J
579 B J
660 B J
126 U
310 B J
125 U
81.9 B J
95.2 U
41.5 B J
1250
1060
4320
147 B J
166 B J
156 B J
234 B J
0.34U
0.41U
0.36U
1.6 U
1.1 U
1.1 U
1.2 U
1.1 U
0.49 B J
0.91 B J
0,42 U
0.68 B J
0.43B
3.6 J
2.2 J
1.1U
0.34U
1.3 U
O.40U
0.47 U
0.34U
0.65 B J
0.45 U
0.68 B J
0.47U
0.35U
0.48 U
O.46U
28.7
34.6
30.6
162
85.8
74.2
96.6
80.3
37.1
38.1
35.4
43.3
36.8
185
56.4
72.7
28.5
87.4
34.2
73.7
28.7
41.3
38.4
92.2
39.5
30.0
40.4
38.7
U
U
U
B
U
U
U
U
U
U
U
U
U
B
U
U
U
U
U
U
U
U
U
B
U
U
U
U
J
1.2 U
0.82U
0.85U
1.4 U
0.94 U
0.96U
1.0 U
0.99U
0.46U
0.47U
0.44U
0.53 U
0.45U
2.0 U
0.69U
0.99U
0.35U
1.2 U
0.42 U
0.47U
0.35U
0.51 U
0.47U
0.58 U
0.49U
0.37U
0.50U
0.48U
64.2
70.7
52.6
18.9
10.0
14.5
25.9
17.8
11.8
10.5
18.5
22.4
16.7
18.3
41.0
8.9
15.0
3.3
4.5
2.2
1.4
43.9
38.1
104
11.2
10.3
7.2
6.4
J
J
J
J
J
J
B J
J
B J
J
B J
9.1
13.2
27.4
29.0
3.0 J
1.9 U
4.8 J
3.1 J
7.4
5.0
8.6
6.3
3.6 B J
69.9 J
32.1 J
4.3 J
8.1 J
4.3 J
4.1 J
1.6 U
0.81 U
53.3 J
34.4
47.0 J
9.0
5.3
5.0
3.8 B J
3330
2510
l600
131000
9940
10500
4260
1930
13800
3960
1910
1750
2600
585000
117000
11300
NA 6550
2360
3070
1840
49200
19600
7240
29600
5130
4360
2290
J
J
J
J
J
J
J
J
J
J
J
J
J
J
J
J
J
J
J
J
J
J
J
J
J
J
<0.05
<0.05
<0.05
0.07
<0.05
<0.05
<0.05
<0.05
<0.05
<0.05
<0.05
<0.05
<0.05
0.12
NA <0.05
<0.05
<0.05
<0.05
<0.05
<0.05
<0.05
<0.05
<0.05
NA NA NA NA

10"",;
"""" ~
Table 1. Concentrations of constituents measured in soil samples from undeveloped forested areas in Monmouth and l\'liddlesex Counties, New Jersey--Continued
Sample number l
Sample date Mercury Nickel Potassium Selenium Sodium Thallium Vanadium Zinc
Total
organic carbon
Total
sulfur (percent)
NA <0.05
<0.05
NA NA 0.86
NA
<0.05
0.06
<0.05
NA NA 0.07
NA <0.05
0.05
0.05
<0.05
<0.05
<0.05
0.15
0.99
3.35
<0.05
<0.05
<0.05
<0.05
0.18
E15
E15
E15
E15
E15 D E15
E15 D
E16
E16
E16
E17
E17
E17
WI
WI
Wl
WI
W2
W2 W2
W2
W2
W2
W3 W3
W3
W3 W3
A
B1
CLl
CL2
CL2 CL3
CL3
A
B1
B2
A
CLl CL2
CLl CL2
CL3
CL4
B2
CLO
CLl CL2
CL3
CL4
A
B1
B2
B3
CLl
960422
960422
960422
960422
960422
960422
960422
960513
960513
960513
960513
960513
960513
960424
960424
960424
960424
960509
960509
960509
960509
960509
960509
960513
960513
960513
960513
960513
0.13 J
0.14 J
0.11 B J
0.11 B J
0.07U
0.13 J
0.11 B
0.06U
0.06U
0.05U
0.13 B J
0.08U
0.07U
0.07B
0.12
0.10 B
0.12
0.06U
0.06U
0.06U
0.07U
0.06U
0.07U
0.06U
0.06U
O.06U
0.06U
0.07 B J
2.1 B J
1.4 B J
2.7 B J
2.3 B J
3.0 B
5.4 B J
3.2 B
2.7 B J
2.9 B J
0.56 B J
2.3 B J
0.34 B
0.32 U
2.1 B
3.1 B
2.4 B
3.0 B
1.2 B
0.90B
2.2 B J
0.29U
19.9
29.2
0.25U
0.26U
O.26U
0.26U
0.26B
145
199
1840
2230
2510
1980
2770
983
1200
346
1280
1720
4190
435
1790
1650
1940
1030
1540
1890
2030
2300
2640
320
257
573
864
1140
U
U
B J
B
B J
B J
B
B J
J
B
B
B J
B J
B J
1.3U
1.2 U
1.3U
1.3U
1.3U
1.3 U
1.3U
1.1 U J
1.1 U J
1.0 U J
1.6 U J
2.8
2.1 J
1.1 U
1.9
1.6
1.4
1.1 U J
1.2 U J
1.2 U J
1.3 U J
1.2 U J
1.3 J
1.1 U J
1.2 U J
1.2 U J
1.2 U J
1.2 U
167
157
177
176
175
170
248
150
151
137
209
200
188
150
162
180
211
349
383
350
325
450
239
148
154
188
377
156
U
U
U U
U
U B
U
U
U
U
U
U
U U
B
B
B
B J
B J
B
B J
B J
U
U
B B
U
1.1 B J
0.91 U
2.5 B J
3.8
1.0 U
2.2 B J
1.0 U
0.88U
0.88 U
0.80U
1.2 U
1.2 U
1.1 U
0.88 U
0.95 U
0.95 U
0.95 U
0.85 U
0.92 U
0.96 U
1.00 U
0.94 U
0.99U
0.86U
0.90U
0.90U
0.90U
0.91 U
17.0
21.7
77.9
69.2
62.0
33.2
39.2
24.1
27.5
4.5
59.1
78.7
151
56.8
106
126
107
36.7
69.3
80.0
83.8
56.0
104
17.9
18.9
31.1
34.9
44.6
17.4
12.2
33.2
27.7
53.6
21.9
19.5
27.4
20.3
2.2
17.8
16.1
26.3
23.8
19.2
14.2
19.1
6.8
7.3
12.9
45.5
71.8
94.7
4.3
5.3
5.9
5.5
26.2
J
J
J
J
J
J
J
J
B J
J
J
J
40100
25100
13100
7220
NA 10300
8530
12800
12400
927
68900
36600
8200
10900
NA 9000
7380
1550
. 7350
11600
12400
25900
54000
7900
33JO
1700
1430
4310
J
J
J
J
J
J
J
J
J
J

~ ~
Y..l
Appendix 1
able 2. Concentrations of constituents measured in soil samplles from former and active orchards in Monmouth and Middlesex ounties, New Jersey ll concentrations in milligrams per kilogram (parts per million) unless otherwise noted~ B, detectable value but below the contract-required detection limit; U, below the instrument
etection limit; J, qualified--data may exhibit bias; <, less than~ NA, not analyzed; see figs. 8 and 9 for locations]
Sample Sample number! date Aluminum Arsenic Barium Beryllium Cadmium Calcium Chromium Cobalt Copper Iron Lead Magnesium Manganese
--~==-----=~--~====--~~------------~----------,----------~-------------------------------------------8750 o 0.67 J 24.3 204 2490 A 960205 1310 J 16.4 J 15.8 B J 0.29 B J 1.4 J 5360 11.9 J 75.5
J 15300 o 38.3 7.6 B J 0.16 B J 1.5 572 0.18 U 13.1 125 125 B J E 960205 1870 J 12.5 11.8
2.5 U 4410 o 1 Bl 960205 486 J 9.4 2.2 B J 0.11 B J 0.42 U 52.1 U 2.0 J 0.17 U 3.7 J 18.4 U 2.8 B
o 1 S B1 960205 506 J 8.9 1.6 B J 0.10U 0.05 U 34.6 B J 1.5 B J 0.22U 1.3 B J 4170 J 2.9 J 21.9 U 1.4 B J
o 1 B2 960205 381 J 8.4 1.7 B J 0.08 B J 0.39 60.4 U 1.9 0.17 U 1.5 J 3990 J 2.0 J 35.3 U 2.7 B
o 1 S B2 960200 516 J 8.3 5.5 B J 0.11 U 0.05U 25.8 U 1.8 B J 0.25 U 1.1 B J 3830 J 2.4 J 24.7 U 3.4 J
02 o 960205 898 9.5 17.7 B J 0.07U 0.70 4180 13.2 0.70 33.8 2830 474 J 463 54.1
o 2 A 960205 605 9.9 4.1 B J 0.02U 0.19 U 383 B J 3.8 0.25 B J 13.2 2260 187 54.6 U 5.9
o 2 E 960205 276 2.8 J 1.8 B J 0.02U 0.09U 35.8 U 0.70 J 0.27 B J 1.1 U 636 1.9 J 11.3 U 4.5
02 Bl 960205 693 J 12.1 J 3.3 B J 0.03 U 0.17 U 114 U 0.95 B J 0.17U 1.9 B 1850 2.1 J 79.8 U 2.2 B J
960205 2360 16.9 J 4.4 B J 0.02U 0.14 U 43.9 U 2.1 J 0.19 B J 2.3 B J 2640 2.1 J 51.5 U 2.3 B J
o 3 0.24 B J A 960205 1790 10.7 J 9.6 B J 0.03 U 0.27 B J 739 J 3.9 8.8 3610 99.5 J 167 J 20.5
o 3 Bl 960205 6090 8.5 J 8.9 B J 0.06 B J 0.53 B J 341 J 10.0 0.44 B J 5.8 J 12000 5.7 J 201 B 6.8
7.0 B J 0.30 B J 2.5 B J 7550 2.8 J o 3 B2 960205 2230 5.7 J 0.02U 0.32 B J 56.4 U 4.5 68.8 U 4.8
04 0 960130 1530 9.7 J 13.5 B J 0.03U 0.25 B J ]l070 B J 7.4 0.37 B J 17.7 4580 165 J 306 B J 17.7
J 26.9 B J 0.03U 0.50 B J 20.0 3960 04D 0 960130 1960 5.6 0.69 B J 3230 J ILl 155 J 686 B J 84.1
04 A 960130 1600 11.3 J 7.0 B J 0.02U 0.10 B J 156 B J 4.3 0.31 U 13.7 5210 79.0 J 101 B J 6.8
15.5 o 4D A 960130 2240 10.6 J 8.7 B J 0.02U 0.16BJ 215 BJ ILl 0.24U 7450 60.7 J 133 B J 8.7
o 4 Bl 960130 3160 7.9 J 11.9 B J 0.02U 0.05 U 51.6 B J 5.7 0.26 B 6.0 4150 10.8 J 93.2 B J 9.6
4.4 4300 o 4D Bl 960130 3830 7.7 J 15.8 B J 0.03 B J 0.04 U 30.9 B J 5.7 0.24B 6.6 J 85.5 B J 19.5
0.03 B J 4.1 B J 5930 o 4 B2 960130 4040 9.3 J 12.7 B J 0.06 U 52.0 B J 7.4 0.31 B J 6.2 J 104 B J 10.0
2.9 B 4590 4.8 J 88.2 B J o 4D B2 960130 3330 5.4 J 9.1 B J 0.04B J 0.05 U 39.9 B J 7.6 0.32 B 13.6
7.7 B J 0.09 B J 0.04U 33.2 B J 0.23 B J 2.4 B J 8570 3.6 J 50.8 B J o 4D B3 960130 2660 6.2 8.7 7.1
The initial letter denotes sample sites in fonner and active orchards~ the following number is the number of the individual site. In the next two columns, samples marked Dare spatial duplicates; samples marked S are splits. The final letter refers to the soil horizon; CL denotes clays. The fmal number denotes increasing depth with increase in value.
TC[Ad

~ ~
~
2. Concentrations of constituents measured in soil samples from former and active orchards in Monmouth and Middlesex Counties, Ne,v Jersey--Continued
Sample Sample number! date Aluminum Arsenic Barium Beryllium Cadmium Calcium Chromium Cobalt Copper Iron Lead Magnesium Manganese
o 5 A 960130 599 5.4 J 5.4 B J 0.06 U 0.21 U 292 B J 2.0 0.34 B J 9.7 1830 49.7 J 101 U 7.5
o 5 Bl 960130 330 3.3 J 2.1 B J 0.02 U 0.17 U 97.7 U 0.69 0.18 B J 2.6 2300 9.1 J 67.5 U' 2.4 J
o 5 B2 960130 2580 6.8 J 6.8 B J 0.10 B J 0.30 B J 22.6 U 4.2 0.36 B J 6.4 8540 3.0 J 29.6 U 7.3
o 5 C 960130 1700 3.9 3.0 B J 0.11 U 0.18 B J 11.9 U 3.5 0.18 B J 1.9 B J 5090 1.3 15.4 U 1.9
06 A 960131 755 5.5 4.5 B J 0.08U 0.33 B J 36.9 U 3.7 0.43 B J 6.7 5150 20.9 J 86.1 U 5.1
06D A 960131 857 5.6 J 4.7 B J 0.02U 0.09 B J 46.6 B J 3.9 0.29U 7.1 5440 23.9 J 94.2 B J 6.0
06 E 960131 550 2.4 3.3 B J 0.02U O.17U 7.3 U 2.2 0.25 J 3.4 3830 5.0 J 24.8 U 24.2
o 6D E 960131 745 3.0 3.7 B J 0.02U 0.05 U 24.3 U 3.7 0.24U 3.0 B J 4650 5.8 J 48.0 B J 22.7
o 6 Bl 960J31 702 J 3.9 J 2.4 B J 0.07 J 0.50 68.6 U 5.3 0.40 B J 2.7 B J 10500 J 1.7 79.5 B J 9.8
o 6D Bl 960131 1200 8.5 J 2.7 B 0.02U 0.07 B J 27.4U 71.1 0.27U 2.1 B J 27100 4.6 J 32.3 B J 14.4
o 6 B2 960131 2640 5.4 J 5.4 B J 0.11 B J 0.50 19.4 U 10.5 0.48 B J 3.8 B J 10300 2.5 J 116 U 8.6
o 6D B2 960131 3080 11.4 J 5.7 B J 0.02U 0.09 B J 28.3 U 15.4 0.28 U 2.9 B J 22700 5.1 J 123 B J 10.5
07 A 960227 5930 23.4 16.4 B J 0.32 B J 0.06 U 892 B J 16.8 0.95 B J 12.5 25000 64.4 J 593 B J 25.5
07 CLl 960227 6020 17.8 15.6 J 0.21 B J 0.06 U 946 17.6 0.62 B J 8.4 17900 23.7J 444 BJ 12.0
07 CLl 960227 6830 22.4 15.4 B J 0.25 B J 0.04 U 383 B J 19.7 0.67 B J 7.6 23500 13.3 J 432 BJ 7.8
o 8 o 960112 1180 J 6.0 18.3 B J 0.15 B J 0.12 B J 747 B J 7.9 0.35 B J 11.2 11300 J 44.9 J 225 B J 38.5
o 8 A 960112 1290 J 9.9 J 9.2 B J 0.13 B J 1.9 J 201 B J 14.2 0.18U 8.6 18300 31.4 158 B J 19.8
o 8 Bl 960112 3980 J 14.3 J 7.1 B J 0.51 B J 5.8 J 117 U 38.5 0.17U 5.5 64700 6.6 194 B J 38.1
09 A 960209 6640 J 18.1 47.6 J 0.60 B J 1.1 368 B J 12.4 4.3 J 9.9 10800 48.8 J 628 B J 169
o 9D A 960209 11100 J 15.6 51.8 0.76 B J 0.15 B J 369 B J 13.4 5.2 B J 15.2 13100 64.8 J 789 BJ 206
o 9 Bl 960209 10000 5.3 J 112 0.68 B J 1.3 118 U 13.7 6.2 J 5.9 13300 9.0 868 B J 170
o 9D Bl 960209 11200 12.7 44.5 0.67 B J 0.07 B J 98.5 B J 12.0 5.3 B J 11.5 11400 J 45.2 J 707 B J 171 J
o 9 B2 960209 llOOO 5.9 J 52.4 0.75 B J 1.7 78.4U 20.3 7.3 J 7.0 17800 7.3 940 B J 187
010 A 960227 1540 4.3 27.4 B J 0.09 B J 0.27 B J 1770 8.0 0.50 B 12.8 7650 86.3 J 867 B J 23.5
010 Bl 960227 1080 3.3 16.8 B J 0.06 B J 0.28 B J 394 B J 3.3 0.28BJ 5.1 5560 15.3 J 113 B J 25.5
010 B2 960227 2290 4.7 8.2 B J 0.12 B J 0.06 U 321 B J 10.9 0.29 B J 3.0 J 13400 9.7 J 121 B J 10.7
010 CLl 960227 4930 13.6 8.8 B J 0.16 B J 0.07 U 730 B J 23.3 0.41 B J 7.5 43300 7.2 J 219 B J 5.5

Table 2. (:oncentrations of constituents measured in soil saroples from former and active orchards in Monmouth and Middlesex Counties, New Jersey--Continued
Sample number l
Sample date Aluminum Arsenic Barium Cadmium Calcium Chromium Cobalt Copper Iron Lead Magnesium Manganese
011
Oll
011
011
012
012
012
014
014
014
014
015
015
015
016
016
016
A
Bl
B2
CLl
CLl
CL2
CL3
A
B1
B2
C
A
Bl
B2
A
CLl
CLl
960326
960326
960326
960326
960326
960326
960326
960209
960209
960209
960209
960209
960209
960209
960513
960513
960513
2570
4200
3980
13300
9500
12200
13500
1260
1200
286
1190
1170
1620
2830
4200
12000
8510
J
J
J
J
J
J
13.0
14.0
8.1
33.4
28.1
39.2
22.7
41.5
3.5
0.79B
1.7
4.2
3.5
3.3
40.9
16.3
17.9
J
J
J
J
J
J
J
J
7.8
8.1
7.4
20.6
18.9
24.6
27.9
3.5
4.7
2.3
4.2
3.6
4.7
6.5
20.5
23.3
17.7
B J
B J
B J
B 1
B J
B
B J
B J
B J
B J
B J
B J
B J
B J
B J
B J
B J
0.06B J
0.17 B J
0.03U
0.51 B J
0.24B J
0.23 B
0.31 B J
0.13 B J
0.13 B J
0.05 U
0.07U
0.08U
0.09 B J
0.12 U
0.12 B J
0.33 B J
0.29 B J
0.07U
0.16B
0.09 B J
1.2 B J
0.52 B J
0.31 B
0.25 B J
0.06 B
0.15 B
0.05 U
0.09 B J
0.05 B J
0.07 B J
0.06 B
0.18 U
0.17U
0.18 U
179 BJ
192 BJ
357 B J
338 B J
995 B J
251 B
117 B J
29.4 U
27.3 U
23.6 B
28.7 B
20.6 U
26.6 U
26.5 U
1360 J
304 B J
218 B J
7.3
13.4
11.8
47.9
30.7
32.9
35.3
5.8
2.3
0.61 B
1.5 B J
3.8
3.5
4.6
9.9
23.1
23.4
0.53 B J
0.87 B J
0.60 B J
6.2 B J
2.9 B 1
1.6 B
1.7 B 1
0.46 B J
0.46 B
0.23 B
0.27 B 1
0.22 B J
0.34 B J
0.33 B 1
0.75 B 1
1.7 B J
1.3 B 1
4.9 B J 13100
3.3 B 23300
2,,7 B J 13300
17.6 J 117000
12.2 49500
14.0 40700
14.2 37300
7.6 8220
3.9 B J 2820
0.51 B 1 448
0.73 B J 2160
5.6 3590
6.1 3030
7.0 4120
15.2 10100
7.2 17200
7.3 22000
J
J
J
J
1
J
1
25.2
4.4
4.7
11.4
28.1
16.8
15.8
22.2 J
14.5 1
1.31
3.3 1
20.4 1
15.0 J
6.3 1
169 J
12.3 J
14.3 J
257 B J
338 B J
401 B J
977 B 1
1230
1470
1610
90.9 B J
64.7 B J
22.3 U
38.0 B J
67.6 B J
77.4 B J
81.9 B J
280 B J
970 B J
803 B J
30.6
23.3
15.9
180
94.4
28.2
25.4
9.3
17.5
5.1
10.6
7.7
13.1
12.9
21.9
22.1
18.4
1
J
1
J
J
J
J
""v-.

~ ~
0\
Appendix 1
Table 2. Concentrations of constituents measured in soil samples from former and active orchards in Monmouth and Middlesex Counties, New Jersey--Continued
Sample number 1
Sample date Mercury Nickel Potassium Selenium Sodium Thallium Vanadium Zinc
Total organic carbon
Total sulfur
(percent)
01 A
01 E
01 Bl
01 S Bl
01 B2
01 S B2
02 o 02 A
02 E
02 Bl
02 B2
03 A
03 Bl
03 B2
04 0
04D 0
04 A
04D A
04 Bl
04 D Bl
04 B2
04 D B2
04 D B3
960205
960205
960205
960205
960205
960205
960205
960205
960205
960205
960205
960205
960205
960205
960130
960130
960130
960130
960130
960130
960130
960130
960130
0.16 U
0.11 U
0.11 U
0.05 U
0.11 U
0.05 U
0.15 U
0.19
0.11 U
0.11 U
0.11 U
0.13 U
0.12 U
0.10 U
0.10 B J
0.12 B J
0.06 U J
0.07 B J
0.05 U J
0.05 U J
0.05 U J
0.05 U J
0.05 U
2.0 B J
0.34U
0.32 U
O.22U
0.32U
0.32 J
4.0 B J
0.90 B J
0.32 U
0.32 U
0.67 B J
0.88 B J
0.96 B J
0.30U
3.3 B J
5.8 B J
1.7 B J
1.5 B J
1.5 B J
l.0 B J
1.5 B J
1.5 B J
1.3 B J
351 B J
350 B J
108 U
74.4 B
77.6 U
65.6 B J
327 B J
180 B J
110 U
137 B J
121 U
355 B J
326 B J
207 B J
570 B J
703 B J
387 B J
448 B J
307 B J
274 B J
323 B J
328 B J
344 B J
1.5 U
hI U
0.99U
0.35 B
1.00U
0.72 B J
1.4 U
l~ U
1~ U
1~ U
1~ U
1.3 U
l.lU
0.95U
0.78 B J
0.67U
0.49U
0.38 U
0.38U
0.31 U
0.42 U
0.37U
0.28U
125
80.6
80.2
29.9
67.4
33.8
113
71.3
67.9
65.8
74.8
91.8
85.1
68.7
48.9
56.8
41.6
32.0
32.7
26.2
35.4
31.3
24.1
U
U
U
U
U
U
U
U
U
U
U
U U
U
U
U
B
U
B
U
U
U
U
1.4 U
0.96U
0.89U
0.41U
0.89U
0.61 U
1.2 U
0.94U
0.90U
0.91 U
O.92U
1.1 U
0.97U
0.85U
0.60U
0.70U
0.51 U
0.39U
0.40 U
0.32 U
0.44 U
0.39U
0.30 U
11.2
15.3
1.9
2.5
2.1
3.0
12.3
7.5
2.2
4.3
5.6
7.4
20.9
10.6
16.6
15.0
15.3
17.4
15.3
14.8
17.9
15.9
29.9
J
B J
B J
B J
J
J
B
74.8
17.9
4.6
2.7
1.7
2.2
68.8
10.2
2.6
1.8
4.9
21.1
6.6
4.5
32.8
59.5
12.8
12.7
7.1
6.0
9.2
9.8
3.8
J
B J
B J
B J
J
J
67300
18400
713
NA 572
NA
83700
10500
1150
2100
2160
24200
2190
756
69800
99900
21100
19800
5840
3870
2830
1890
NA
J
J
J
J
0.06
<0.05
<0.05
NA <0.05
NA
0.07
<0.05
<0.05
<0.05
<0.05
<0.05
<0.05
<0.05
NA <0.05
<0.05
<0.05
<0.05
<0.05
<0.05
<0.05
NA

""""'" """"'" ~
Table 2. Concentrations of constituents measured in soil samples from former and active orchards in Monmouth and Middlesex Counties, New Jersey--Continued
Sample number l
Sample date Mercury Nickel Potassium Selenium Sodium Thallium Vanadium Zinc
Total organic carbon
Total sulfur
(percent)
05
05
05
05
06
06 D
06
06 D
06
06 D
06
06 D
07
07 07
08
08
08
09
09D
09
09 D
09
010 010
010
010
A
B1
B2
C
A
A
E
E
B1
Bl
B2
B2
A
CLl
CL2
o A
Bl
A
A
Bl
Bl
B2
A
Bl
B2
CLl
960130
960130
960130
960130
960131
960131
960131
960131
960131
960131
960131
960131
960227
960227
960227
960112
960112
960112
960209
960209
960209
960209
960209
960227
960227
960227
960227
0.11 U
0.11 U
0.11 U
0.11 U
0.11 U
0.10 J
0.10U
0.05 U J
0.11 U
0.04 U J
0.11 U
0.05 U J
0.05 B J
0.07 B J
0.04 U
0.06 B J
0.11 U
0.11 U
0.13 U
0.10 J
0.11 U
0.11
0.11 U
0.13
0.07
0.04 B J
0.04U
1.1 B J
0.32 U
7.7 B J
0.45 B J
0.81 J
1.00 B J
0.36 B J
0.25 B J
0.54 B J
0.47 B J
1.2
1.4 B J
2.2 B J
0.94 B J
1.0 B J
2.5 B J
0.34U
1.1 J
6.2 B
9.4 B J
7.6 J
7.6
8.2
2.6 B J
0.79 B, J
1.0 B J
0.54 B J
155
101
140
126
257
399
144
223
115
155
228
336
1360
963
1150
479
273
475
372
650
409
429
483
348
255
216
500
U
U
U
U
B J
B J
U
B J
U
B J
B J
B J
B J
B J
B J
B J
B J
BJ
B J
B J
B J
B J
B J
B J
1.1 U
1.0 U
1.1 U
0.44 U
1.0 U 0.68 B J
0.96U
0.37U
0.44 U
0.42 U
1.0 U
0.44 U
1.7
1.2
0.88
0.51 B J
1.1 U
1.0 U
1.1 U
0.60U
1.1 U
0.36 U
1.1 U
0.47 U
0.38 U
1.5
0.80 B J
77.8
71.5
82.3
88.9
72.9
39.4
65.3
31.8
67.0
35.8
87.2
37.1
36.9
69.2
31.5
40.3
75.5
74.0
95.5
44.3
83.5
30.3
87.8
39.6
48.0
37.7
40.6
U
U U
U
U
B J
U
U
U
U
U
U
U
B
U
U
U
U
U
U
U
U
U
U
U
U
U
0.97U
0.91 U
0.94U
0.44 U
0.91 U
0.48 U
0.86U
0.39 U
0.44 U
0.44 U
0.94U
0.46U
0.45U
0.43 U
0.33 U
0.50U
0.95U
0.92U
1.0 U
0.54U
0.95U
0.37U
0.94U
0.49 U
0.40 U
0.46 U
0.50U
6.5
5.1
8.4
6.9
11.1
11.3
6.5
7.7
12.0
49.4
18.9
35.1
44.4
40.6
69.3
23.6
24.9
58.3
14.7
20.1
17.1
16.9
22.9
13.8
9.0
17.2
42.8
J
J
B J
J
J
J
11.6
3.7
8.9
4.2
11.3
11.6
4.3
4.3
8.1
9.5
14.5
17.1
29.4
9.0
7.5
40.2
19.2
72.9
32.2
44.0
24.8
27.9
26.7
42.5
47.6
20.2
11.9
J
J
J
J
J
J
J
J
J
J
J
J
J
J
J
J
18800
2660
2100
933
11400
15500
2690
3870
1120
1020
1910
1940
43100
5050
4950
62900
7920
2260
18900
21400
2670
7170
1970
18400
3850
2870
2530
J
J
J
J
J
J
J
J
J
J
J
J
J
J
J
J
J
J
J
J
<0.05
<0.05
<0.05
<0.05
<0.05
<0.05
<0.05
NA
<0.05
<0.05
<0.05
NA
<0.05
<0.05
<0.05
<0.05
<0.05
<0.05
<0.05
<0.05
<0.05
NA
<0.05
<0.05
<0.05
<0.05
NA

Table 2. Concentrations of constituents measured in :soil samples from former and active orchards in Monmouth and Middlesex Counties, New Jersey--Continued
Total Total Sample Sample organic sulfur number l date Mercury Nickel Potassium Selenium Sodium Thallium Vanadium Zinc carbon (percent)
23.7 4960 J Oll A 960326 0.06U 1.6 B J 610 BJ 1.4 J 37.0 U O.77U 14.3 <0.05
40.5 2810 J 011 Bl 960326 0.06U 1.8 B J 814 BJ 2.2 36.5 U 0.76U 16.0 <0.05
39.1· U 2660 J 011 B2 960325 0.05 U 1.9 B J 1130 BJ 1.7 0.82 U 29.1 9.3 <0.05
10400 011 CLl 960326 0.06U 10.4 2830 7.5 J 42.7 U 3.0 74.6 III 6 J 0.06
012 70.6 7720 CLl 960326 0.05 U 5.3 B J 2430 3.7 41.2 U 0.86U 39.0 J <0.05
012 CLl 960326 0.06U 3.6 B J 3310 3.6 J 45.4 U 0.95 U 57.5 23.8 7230 J <0.05
012 CL3 960326 0.05U 3.8 B J 4090 2.7 45.0 U 0.94 U 59.8 22.6 9220 J <0.05
014 6.4 4140 J A 960209 0.05 U J 0.68 B J 225 BJ 1.3 38.5 U 0.47 U J 3.8 <0.05
014 B1 960209 0.06 B J 0.54 B J 151 BJ 0.42 U 35.8 U 0.44 U 3.7 B J 5.3 3460 J <0.05
014 873 B2 960209 0.05 U J 0.23 U 25.1 B J 0.36 U J 30.5 U 0.38 U 1.3 B 3.6 J <0.05
014 C 960209 0.04 U J 0.23 U 66.6 B J 0.55 B 30.5 U 0.38 U 4.3 B J 4.6 1760 J <0.05
015 A 960209 0.08 J 0.64 B J 207 BJ 0.46 U J 27.0 U 0.33 U 6.8 B J 4.0 5670 J NA
015 B1 960209 0.06 B J 0.55 B J 222 BJ 0.41U 34.8 U 0.43 U 6.2 B J 3.5 B J 4550 J NA
015 B2 960209 0.06U 0.73 B 214 BJ 0.46 U 34.7 U 0.43 U 8.3 B J 4.9 4840 J NA
016 29.9 A 960513 0.10 B J 2.2 B J 583 BJ 1.2 U J 165 U 0.96U 38.5 20400 <0.05
016 CLl 960513 0.06U 2.5 B J 1810 J 1.2 U J 280 B J 0.91 U 41.4 10.8 4640 J <0.05
016 CLl 960513 0.06U 1.5 B J 1430 1.2 U J 273 B J 0.96U 109 8.9 4480 J <0.05
~ ~
Ce

......
...... '0
Appendix 1
Table 3. Concentrations of constituents measured in soil sam,pies from the Imperial Oil Company Superfund site, Morganville, Monmouth County, New Jersey [All concentrations in milligrams per kilogram (parts per million) unless othenvise noted; B, detectable value but below the contract-required detection limit; U, below the instrument detection limit; J, qualified--data may exhibit bias; <, less than; NA, not analyzed; see fig. 8 for locations]
Sample Sample numberl date Aluminum Arsenic Barium Beryllium Cadmium Calcium Chromium Cobalt Copper Iron Lead Magnesium Manganese
960411 II CLl 14700 41.3 1140 0.26 B 1.6 5520 30.4 1.4 B 63.3 10700 1520 9010 123
I 1 CL2 960411 12300 12.9 714 0.13 B 1.3 B 6100 18.3 3.1 B 50.5 11300 713 6550 112
II CLJ 960411 12600 12.2 823 0.08U 1.2 B 4210 12.5 1.2 B 55.3 11300 822 4510 81.6
I 1 CL4 960411 7710 4.4 2290 0.07U 1.5 2490 4.4 0.16U 33.0 6470 4550 1520 39.6
12 A 960411 2000 20.1 24.2 B 0.07U 0.51 B 265 B 6.5 0.17U 6.1 7100 71.8 135 B 5.2
13.0 ' 12 CLl 960411 10700 34.2 117 0.11 B 1.7 746 B 24.7 0.19U 19100 61.3 750 B 16.7
12 CL2 960411 5970 114 204 0.08U 0.97B 653 B 15.8 0.32B 22.5 10700 257 472 B 15.0
13 A 960411 1700 23.3 III 0.07U 0.45B 538 B 7.6 0.16U 18.2 4700 284 263 B 8.8
960411 I 3 Bl 251 7.2 15.5 B 0.08U 0.18U 57.9 B 1.4 B 0.18U 1.3 B 1890 38.9 26.9 B 4.0
14 A 960411 5040 32.5 78.3 0.24B 2.5 3100 34.9 2.2 B 75.1 22600 157 860 B 55.1
14 Bl 960411 6160 31.6 106 0.07U 1.9 9480 34.4 3.6 B 49.5 13800 224 1130 B 63.8
14 B2 960411 6490 28.2 47.0 B 0.08U 0.61 B 4740 14.8 0.75 B 13.9 8360 49.5 496 B 26.1
14 CLl 960411 10000 10.0 33.1 B 0.08U 0.48B 1280 B 21.1 0.19U 8.2 7370 28.1 422 B 9.7
10.6 14 B3 960411 4090 9.6 B 0.07U 0.33 B lOlO B 7.8 0.16U 3.1 B 6800 8.3 294 B 8.0
14 B4 960411 2060 3.9 9.4 B 0.07U O.22B 622 B 6.4 0.28B 2.0 B 5640 7.1 352 B 21.4
960611 31.5 15 A 5240 J 79.9 0.99 B J 0.34B J 5430 58.7 3.4 B J 167 11500 118 J 1850 70.4
960611 15 CLl 3850 J 94.3 26.6 B J 0.18 U 0.37 B J 4790 8.2 0.94B J 8.9 7380 16.9 J 662 BJ 27.0
960611 5.9 16 A 4600 J 10.7 B J 0.14U 0.27 B J 297 B J 7.0 0.41 B J 5.7 6950 6.1 J 282 B J 10.3
960611 5040 J 5.2 11.0 B J 16 Bl 0.15U 0.32B J 535 BJ 7.3 0.77 B J 5.3 J 6160 5.9 J 425 B J 17.3
I 6 Cl 960611 656 J 3.3 2.3 B J 0.57U 0.11 U 42.5 B J 1.8 B J 0.15U 0.48 B J 1120 2.5 J 27.5 B J 5.6 960611 3850 J 5.4 10.0 B J 16 C2 0.11 U 0.18 B J 322 B J 11.0 0.62 B J 6.3 5090 5.9 J 324 B J 15.0
1 The initial letter denotes sample sites within the fenced area of the hnperial Oil Company Superfund site; the following number is the number of the individual site. The fmal letter refers to the soil horizon; CL denotes clays. The fmal number denotes increasing depth with increase in value.
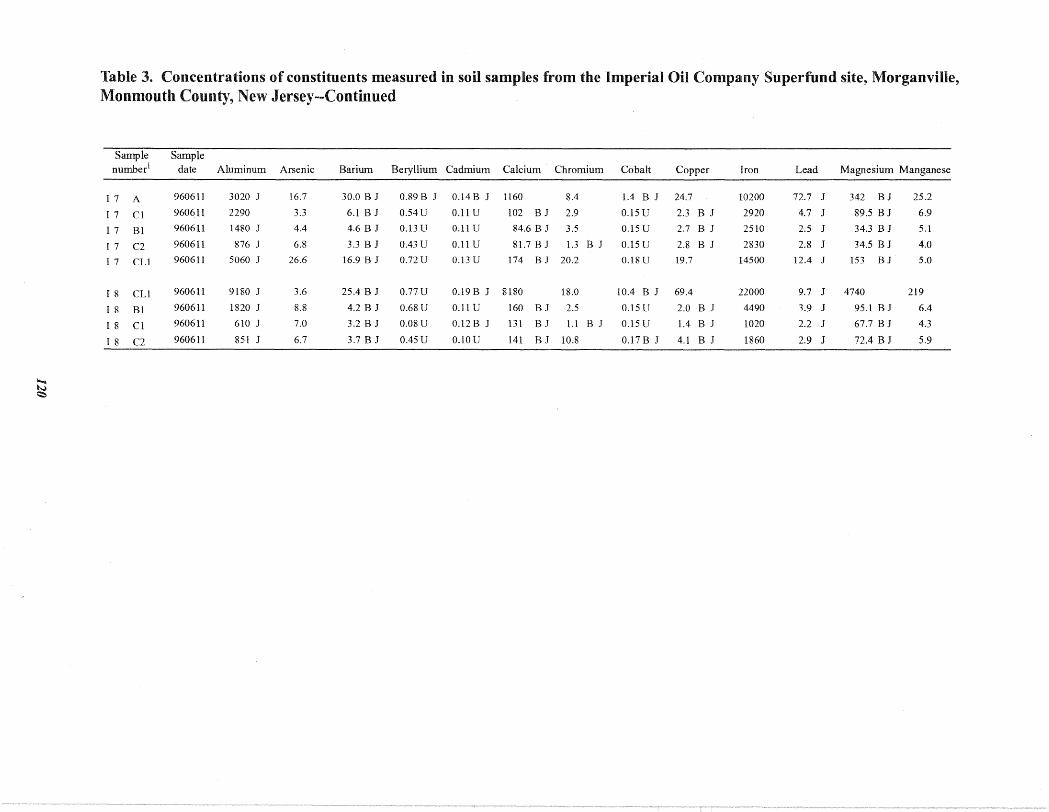
..... ~ ~
Table 3. Concentrations of constituents measured in soil samples from the Imperial Oil Company Superfund site, Morganville, Monmouth County, New Jersey--Continued
Sample Sample number1 date Aluminum Arsenic Barium Beryllium Cadmium Calcium Chromium Cobalt Copper Iron Lead Magnesium Manganese
I 7 A 960611 3020 J 16.7 30.0 B J 0.89 B J 0.14 B J 1160 8.4 1.4 B J 24.7 10200 72.7 J 342 BJ 25.2
I 7 Cl 960611 2290 3.3 6.1 B J 0.54U 0.11 U 102 BJ 2.9 0.15U 2.3 B J 2920 4.7 J 89.5 B J 6.9
I 7 Bl 960611 1480 J 4.4 4.6 B J 0.13 U 0.11 U 84.6 B J 3.5 0.15 U 2.7 B J 2510 2.5 J 34.3 B J 5.1
I 7 C2 960611 876 J 6.8 3.3 B J 0.43 U 0.11 U 81.7 B J 1.3 B J 0.15 U 2.8 B J 2830 2.8 J 34.5 B J 4.0
I 7 CLl 960611 5060 J 26.6 16.9 B J O.72U O.13U 174 BJ 20.2 0.18U 19.7 14500 12.4 J 153 BJ 5.0
r 8 CLl
I 8 Bl
I 8 Cl
I 8 C2
960611 9180 J 3.6
960611 1820 J 8.8
960611 610 J 7.0
960611 851 J 6.7
25.4 B J O.77U 0.19 B J 8180 18.0
4.2 B J 0.68U 0.11 U 160 BJ 2.5
3.2 B J 0.08U 0.12 B J 131 BJ 1.1 B J
3.7 B J 0.45U O.lOU 141 BJ 10.8
10.4 B J
0.15 U
0.15 U
0.17 B J
69.4
2.0 B J
1.4 B J
4.1 B J
22000
4490
1020
1860
9.7 J
3.9 J
2.2 J
2.9 J
4740
95.1 B J
67.7 B J
72.4 B J
219
6.4
4.3
5.9

Po...... N Po......
Appendix 1
Table 3. Concentrations of constituents measured in soil samples from the Imperial Oil Company Superfund site, Morganville, Monmouth County, New Jersey--Continued
Total Total Sample Sample organic sulfur
date Mercury Nickel Potassium Selenium Sodium Thallium Vanadium Zinc carbon (percent)
II CLl 960411 0.06U 13.8 1290 B 1.3 U 164 B 1.0 U 26.3 67.3 341000 J 0.71
I 1 CL2 960411 0.06U 14.9 1050 B 1.4 U 341 B 1.1 U 19.8 76.8 278000 J 0.84
I 1 CLJ 960411 0.06U 7.1 B 879 B 1.4 U 347 B 1.1 U 15.3 40.3 358000 J 0.62
11 CL4 960411 0.05U 6.1 B 349 B 1.1 U 417 B 0.86 U 6.5 B 33.9 259000 J 0.72
I 2 A 960411 0.04 U 0.56 B 266 B 1.2 U 66.3 B 0.91 U 27.1 24.0 39700 J NA
12 CLI 960411 0.06U 2.0 B 1870 1.4 U 169 B 1.1 U 43.6 16.7 NA <0.05
I 2 CL2 960411 0.08U 3.0 B 869 B 1.2 U 112 B 0.96 U 29.0 55.7 24900 J 0.16
I 3 A 960411 0.06U 1.4 B 231 B 1.1 U 61.1 B 0.85 U 14.3 62.8 28700 J 0.05
I 3 Bl 960411 0.05 U 0.28 U 84.8B 1.2 U 52.5 B 0.95 U 3.6 B 3.1 B 1140 J <0.05
14 A 960411 0.07U 7.0 B 632 B 1.3 U 99.2 B 1.0 U 24.8 205 42600 J NA
I 4 Bl 960411 0.15 7.0 B 689 B 1.2 U 211 B 0.92 U 19.9 189 26200 J 0.06
14 B2 960411 0.04U 3.3 B 766 B 1.2 U 108 B 0.96 U 21.2 39.7 29700 J NA
14 CLl 960411 0.07U 2.3 B 763 B 1.3 U 224 B 1.0 U 45.5 16.7 50200 J <0.05
I 4 B3 960411 0.06U 0.43 B 532 B 1.1 U 63.7 B 0.89 U 14.7 5.6 3520 J <0.05
I 4 B4 960411 0.04U 0.94 B 809 B 1.1 U 54.8 B 0.85 U 7.2 B 9.3 4790 J <0.05
I 5 A 960611 0.09B 10.3 664 B 1 0.84 B1 235 B 1 0.79 U 27.6 72.2 10100 J NA
IS CLl 960611 0.51 7.2 1 677 B 1 0.91 B1 201 B 1 0.87 U 16.6 14.7 27300 J NA
I 6 A 960611 0.06U 1.6 B1 361 B 1 1.0 B1 143 B 1 0.77 U 13.7 8.4 3510 J NA
I 6 B1 960611 0.05U 2.4 B1 447 B 1 0.80 B1 117 B J 0.76 U 13.7 23.3 NA NA
I 6 Cl 960611 0.05U 0.53 U 100 B 1 0.76 U 38.1 U J 0.74 U 1.2 B J 1.9 B J 612 J NA
I 6 C2 960611 0.05 U 30.2 371 B 1 0.77 U 153 B 1 0.75 U 10.8 7.2 3980 J NA
I 7 A 960611 0.05U 3.7 BJ 497 B J 1.0 BJ 63.9 B J 0.77 U 16.3 18.5 67200 J NA
I 7 Cl 960611 0.05U 1.1 B1 244 B 1 0.77 U 75.4 B 1 0.75 U 5.1 B J 6.8 1880 J NA
I 7 Bl 960611 0.05U 0.33 U 196 B 1 0.79 U 52.2 B 1 0.77 U 1.6 B J 8.4 5600 J NA
17 C2 960611 0.05U 0.73 B1 192 B 1 0.87 B1 61.1 B 1 0.75 U 1.7 B J 5.2 619 J NA
I 7 CLI 960611 0.06U 0.77 B1 753 B 1 0.90 U 45.3 U J 0.88 U 9.5 B J 8.6 3540 J NA

Table 3. Concentrations of constituents measured iln soil samples from the Imperial Oil Company Superfund site, Morganville, Monmouth County, New Jersey--Continued
Total Total Sample Sample organic sulfur number1
I 8 CLl
date Mercury Nickel Potassium Selenium Sodium Thallium Vanadium Zinc carbon (percent)
960611 0.05U 31.8 560 B J 0.76 U 1560 0.74 U 81.2 34.6 36600 J NA
I 8 Bl 960611 0.05U 0.69 BJ 252 B J 0.77 U 41.1 B J 0.75 U 7.2 B J 3.3 B J 1300 J NA
I 8 Cl 960611 0.05U 0.46 BJ 129 B J 0.76 U 39.1 B J 0.74 U 2.5 B J 3.4 B J 1440 J NA
I 8 C2 960611 0.05U 333 152 B J 0.75 U 37.6 U J 0.73 U 3.2 B J 3.0 B J NA NA
~
~

~
Appendix 1
Table 4. Concentrations of constituents measured in soil samples from the woods adjacent to the Imperial Oil Company Superfund site, Morganville, Monmouth County, New Jersey
[All data in milligrams per kilogram (parts per million) unless otherwise noted; B. detectable value but below the contract-required detection limit; U, below the instrument detection limit; J, qualified--data may exhibit bias; <, less than; NA, not analyzed; see fig. 8 for locations]
Sample Sample number! date Aluminum Arsenic Barium Beryllium Cadmium Calcium Chromium Cobalt Copper Iron Lead Magnesium Manganese
Sl 0 051128 1290 4.7 15.9 B 0.07 U 0.15 B 448 B 4.5 0.49 B 18.3 4040 70.4 230 B 16.7
S 1 DS 0 951130 1870 5.2 27.4 B 0.1 U 0.32 B 699 B 6.4 0.74 B 35.5 5230 137 346 B 22.3
SID 0 951130 1230 4.9 9.6 B 0.03 U 0.1 B 581. B 5.5 0.44 B 16.9 3940 39.6 254 B 15.9
S 1 DD 0 951130 1400 3.3 B 28 B 0.03 U 0.37 B 760 B 6.9 0.82 B 18.3 3700 78.9 334 B 31.9
S DD 02 951130 1350 2.6 B 26 B 0.13 U 0.36 B 1270 B 4.7 0.64 B 22 3730 78.9 329 B 41.9
S A 951128 1870 7.3 5.2 B 0.05 U 0.05 U 20.3 B 3.2 0.23 B 5.4 4570 26.7 123 B 11.6
S Bl 951128 2160 3.3 5.5 B 0.13 B 0.05 U 15 U 4.2 0.29 B 1.3 B 10000 2.7 45.6 B 4.4
S 1 B2 951128 3590 5.2 11.1 B 0.08 B 0.06 U 37.3 B 6.3 0.2 U 1.4 B 17400 2.4 110 B 5.1
S2 o 951128 3660 8.8 23.7 B 0.12 B 0.12 B 916 B 7.5 0.64 B 22.5 7170 86.7 413 B 24.3
S2 A 951128 3460 9.1 9.8 B 0.11 B 0.07 U 35.9 B 5.8 0.23 U 9.3 7670 28.2 203 B 13.9
S2 Bl 951128 11600 7.9 22.4 B 0.24 B 0.06 U 54.9 B 14.3 0.73 B 5.7 15900 8 580 B 12.9
S2 CLl 960226 16500 15.6 30.3 B J 0.55 B J 0.08 U 42.6 B J 29.7 1.7 B J 13.9 28000 16.5 J 1150 B J 26.1
S2 CL2 960226 15200 12.6 27.7 B J 0.57 B J 0.07 U 170 B J 26.2 1.8 B J 14.4 17700 18.6 1350 28.6
S3 o 951128 1420 4.8 13.7 B 0.08 B 0.13 B 686 B 4.8 0~1 B 21.7 3650 115 212 B 36.9
S3 A 951128 1330 4.8 3.5 B 0.05 U 0.06 U IS.4 B 3.5 Q19 U 8.4 3490 60.2 124 B 4.4
S3 Bl 951128 3360 2.7 6.1 B 0.07 B 0.06 U 16 U 4.5 022 B 0.7 B 5630 3.6 125 B 4.3
S3 B2 951128 6860 10.8 9.3 B 0.16 B 0.06 U 16.1 U 11 0.41 B 1.9 B 18500 4.9 220 B 3.6
S4 o 951128 1490 4.5 20.6 B 0.1 B 0.15 B 1090 B 5.4 0.5 B 25.5 3980 146 209 B 24.6
S4 A 951128 1300 3.9 3.6 B 0.06 U 0.06 U IS.7 U 3.2 0.22 U 4.7 B 2600 19.5 92.8 B 6.4
S4 Bl 951128 2380 3.7 4.9 B 0.09 B 0.06 U 16.4 U 5.7 0.19 U 0.98 B 7240 2.3 117 B 4.8
S4 B2 951128 2870 7 6.2 B 0.08 B 0.05 U 21.4 B 5.3 0.19 B 1.4 B 4440 2.5 167 B 3.3
1 The initial letter denotes sample sites in the woods adjacent to the Imperial Oil Company Superfund site; the following number is the number of the individual site. In the next two columns, samples marked D are spatial duplicates; samples marked DD are additional spatial duplicates; samples marked S are splits. The finalletier refers to the soil horizon; CL denotes clays. The fmal number denotes increasing depth with increase in value.
~~

~
~ ~
Table 4. Concentrations of constituents measured in soil samples from the woods adjacent to the Imperial Oil Company Superfund site, Morganville, Monmouth County, New Jersey--Continued
Sample Sample number1 date Aluminum Arsenic Barium Beryllium Cadmium Calcium Chromium Cobalt Copper Iron Lead Magnesium Manganese
S5 o 951128 2090 6.6 ILl B 0.09 B 0.07 U 320 B 8.2 1.4 B 26.6 3530 59.4 191 B 17.8
S5 OA 951128 2220 8.8 11.5 B 0.Q3 B 0.08 B 248 B 5.2 0.57 B 24.4 3610 94.6 181 B 14.4
S 5 A 951128 2060 8.4 4.5 B 0.05 U 0.06 U 16.7 B 2.8 0.19 U 7.8 2760 24.6 95 B 5.9
S5 Bl 951128 340 1.7 B 2.9 B 0.02 U 0.06 U 27.7 U 0.74 B 0.27 U 0.37 B 429 2.5 26.6 U 1.5 B S5 B2 951128 5300 25.4 13.5 J 0.22 B 0.05 U 148 B 6.2 0.64 B 1.7 B 6790 3.7 274 B 12.1
S5 CLI 960226 9830 25.3 21.9 B J 0.37 B J 0.06 U 74.1 B] 22.8 0.97 B J 13.1 13200 17.5 ] 358 B] 6.1
S 5 CLl 960226 9760 14.6 26.6J B J 0.80 B J 0.07 U 422 B J 22.4 2.5 B] 15.6 25300 19.2 ] 872 B] 17.9
S7 o 951129 5740 11.6 36.9 0.15 B 0.34 1860 10.9 1.2 59.2 9280 238 466 59.2
S7 A 951129 3990 7.2 7.1 0.13 B 0.07 47 7.2 0.31 9.9 9400 25.1 102 5.0
S7 CL 1 960226 9080 3.1 J 15.8 B] 0.15 B] 0.06 U 22.3 B J 14.8 ] 0.64 B J 4.1 B] 9860 ] 11.2 ] 427 B J 5.7 ]
S7 CL2 960226 10800 8.2 ] 19.2 B J 0.25 B] 0.07 U 20.7 B J 24.9 ] 0.93 B J 6.6 25500 ] 16.9 ] 543 B J 7.4
S9 0 951130 694 3.0 4.6 B 0.08 B 0.07 U 148 ,B 2.6 0.31 U 8.7 2020 ] 46.9 75.8 B 6.7
S 9 S 0 951130 883 3.2 9.9 B 0.02 U 0.07 B 427 B 3.2 0.31 U 10.3 2100 41.5 110 B ILl
S9D 0 951130 979 3.0 B 23.4 B 0.15 B Q17 B 1280 B 3.8 0.54 B 19.1 2350 53.6 222 B 35.2
S9 A 951130 607 2.8 5.8 B 0.08 B 0.06 U 27.4 U 2.3 0.27 U 6.7 2060 27.2 37.8 B 3.4
SlO 0 951130 3050 5.3 36.5 B 0.04 U 0.44 B 1720 B 6.8 0.82 B 39.5 4870 141 455 B 25.4
SlO S 0 951130 2860 4.2 B 49.9 B 0.24 B 0.39 B 2910 5.1 0.67 U 43.4 3920 174 546 B 50.7
SID A 951130 2070 7.9 5.4 B 0.12 B 0.07 U 32.7 U 3.7 0.32 U 8.7 2750 21.9 114 B 2.4 B
SlO Bl 951130 3450 10.6 5.7 B 0.11 B 0.06 U 29 U 7.9 0.28 U 2.4 B 6350 4.7 114 B 1.9 B
SlO C 951130 6120 9.9 14.4 B 0.21 B 0.07 U 34.9 U 18.3 0.34 U 6.5 6230 8.9 207 B 2.3 B
Sll A 960207 1400 6.3 3.1 B J 0.12 B] 0.06 U 69.3 B J 3.5 0.32 B 5.5 5240 ] 25.8 ] 148 B] 11.7 ]
Sll E 960207 2010 ] 4.5 5.1 B] 0.11 U 0.05 B 30.5 B J 3.1 0.24 U 4.7 3690 ] 6.5 J 78.4 B] 11.4 J
Sll Bl 960207 2510 ] 3.1 5.9 B J 0.12 B] 0.06 U 28.9 U 2.9 0.28 U 1.2 B J 3210 ] 2.6 J 58.0 B J 4.7 ]
Sll C 960207 2000 5.6 9.6 B] 0.09 U 0.05 U 53.2 B] 3.8 0.27 B] 2.1 B J 4030 ] 2.6 J 49.4 B] 4.6 ]
S12 A 960207 1640 J 6.0 4.4 B J 0.22 B] 0.05 U 34.6 B] 9.2 0.35 B 5.8 9230 ] 17.2 ] 198 B] 13.7 ]
S12 S A 960207 1690 J 5.4 6.1 B J 0.19 B] 0.08 B] 192 B] 8.5 0.51 B] 8.5 9060 ] 29.1 ] 271 B] 14.4 ]
S12 E 960207 453 J 1.2 B] 2.0 B] 0.10 U 0.05 U 23.7 U 0.99 B] 0.23 U 0.84 B] 1450 ] 1.6 J 22.7 U 6.3 ]
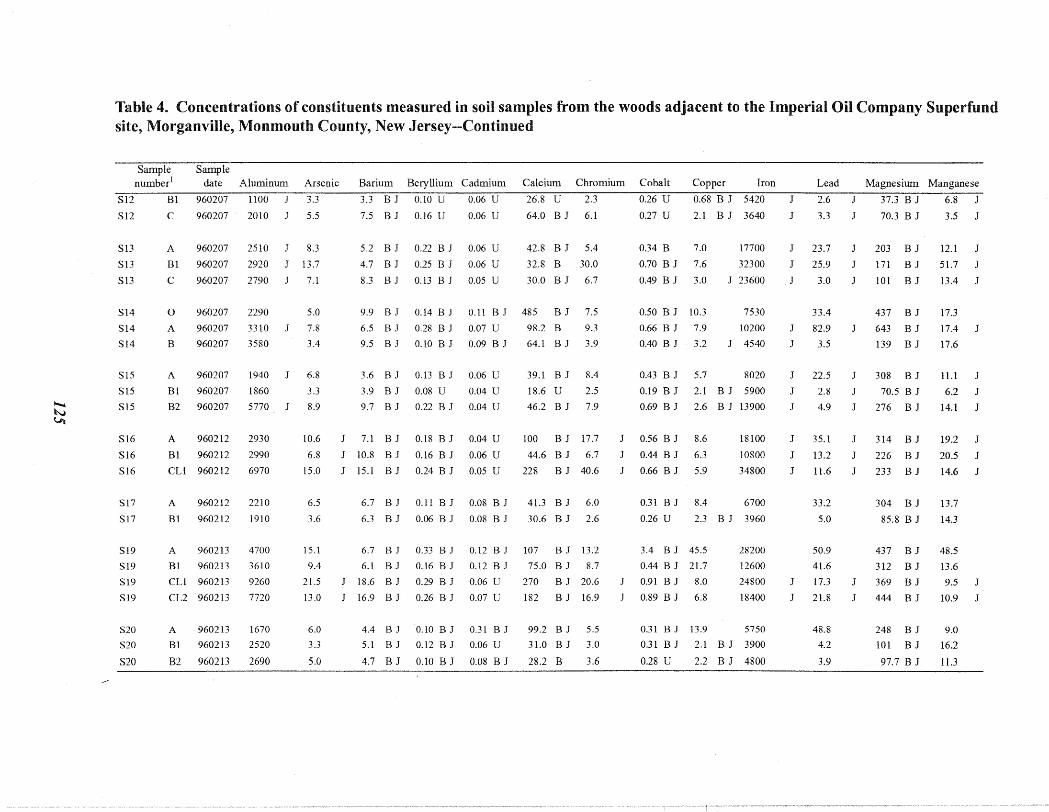
~
~ v.
Table 4. Concentrations of constituents measured in soil samples from the woods adjacent to the Imperial Oil Company Superfund site, Morganville, Monmouth County, New Jersey--Continued
Sample Sample number l date Aluminum Arsenic Barium Beryllium Cadmium Calcium Chromium Cobalt Copper Iron Lead Magnesium Manganese
S12 Bl 960207 1100 1 3.3 3.3 B 1 0.10 U 0.06 U 26.8 U 2.3 0.26 U 0.68 B 1 5420 J 2.6 J 37.3 B J 6.8 J
S12 C 960207 2010 1 5.5 7.5 B 1 0.16 U 0.06 U 64.0 B 1 6.1 0.27 U 2.1 B J 3640 J 3.3 1 70.3 B 1 3.5 1
S13 A 960207 2510 1 8.3 5.2 B 1 0.22 B 1 0.06 U 42.8 B 1 5.4 0.34 B 7.0 17700 1 23.7 1 203 B 1 12.1 1
S13 Bl 960207 2920 1 13.7 4.7 B 1 0.25 B 1 0.06 U 32.8 B 30.0 0.70 B J 7.6 32300 1 25.9 171 B J 51.7 J
S13 C 960207 2790 7.1 8.3 B 1 0.13 B 1 0.05 U 30.0 B 1 6.7 0.49 B J 3.0 23600 .1 3.0 J 101 B 1 13.4 J
S14 o 960207 2290 5.0 9.9 B 1 0.14 B 1 0.11 B 1 485 B 1 7.5 0.50 B J 10.3 7530 33.4 437 B J 17.3
S14 A 960207 3310 7.8 6.5 B 1 0.28 B 1 0.07 U 98.2 B 9.3 0.66 B J 7.9 10200 J 82.9 643 B 1 17.4 J
S14 B 960207 3580 3.4 9.5 B 1 0.10 B J 0.09 B 1 64.1 B J 3.9 0.40 B J 3.2 4540 J 3.5 139 BJ 17.6
SI5 A 960207 1940 1 6.8 3.6 B J 0.13 B J 0.06 U 39.1 B J 8.4 0.43 B J 5.7 8020 J 22.5 308 B J ILl J
Sl5 Bl 960207 1860 3.3 3.9 B J 0.08 U 0.04 U 18.6 U 2.5 0.19 B J 2.1 B J 5900 J 2.8 J 70.5 B J 6.2 J
SI5 B2 960207 5770 1 8.9 9.7 B J 0.22 B J 0.04 U 46.2 B J 7.9 0.69 B J 2.6 B J 13900 J 4.9 J 276 B J 14.1 J
S16 A 960212 2930 10.6 1 7.1 BJ 0.18 BJ 0.04 U 100 B J 17.7 J 0.56 B J 8.6 18100 J 35.1 J 314 B J 19.2 J
S16 Bl 960212 2990 6.8 J 10.8 B 1 0.16 B J 0.06 U 44.6 B J 6.7 J 0.44 B 1 6.3 10800 J 13.2 226 BJ 20.5 1
S16 CLl 960212 6970 15.0 J 15.1 B J 0.24 B J 0.05 U 228 B J 40.6 0.66 B J 5.9 34800 J 11.6 233 B J 14.6 J
S17 A 960212 2210 6.5 6.7 B J 0.11 B J 0.08 B J 41.3 B J 6.0 0.31 B J 8.4 6700 33.2 304 B J 13.7
S17 Bl 960212 1910 3.6 6.3 B J 0.06 B J 0.08 B J 30.6 B J 2.6 0.26 U 2.3 B J 3960 5.0 85.8 B J 14.3
S19 A 960213 4700 15.1 6.7 B J 0.33 B J 0.12 B J 107 B J 13.2 3.4 B J 45.5 28200 50.9 437 B J 48.5
S19 Bl 960213 3610 9.4 6.1 B J 0.16 B J 0.12 B J 75.0 B J 8.7 0.44 B 1 21.7 12600 41.6 312 B J 13.6
S19 CLl 960213 9260 21.5 18.6 B J 0.29 B J 0.06 U 270 B 1 20.6 0.91 B J 8.0 24800 J 17.3 369 B J 9.5 J
S19 CL2 960213 7720 13.0 16.9 B J 0.26 B J 0.07 U 182 B J 16.9 0.89 B J 6.8 18400 J 21.8 444 B J 10.9 J
S20 A 960213 1670 6.0 4.4 B J 0.10 B J 0.31 B J 99.2 B J 5.5 0.31 B J 13.9 5750 48.8 248 B J 9.0
S20 Bl 960213 2520 3.3 5.1 BJ 0.12 BJ 0.06 U 31.0 B 1 3.0 0.31 B J 2.1 B J 3900 4.2 101 B J 16.2
S20 B2 960213 2690 5.0 4.7 B J 0.10 B J 0.08 B 1 28.2 B 3.6 0.28 U 2.2 B J 4800 3.9 97.7 B 1 11.3
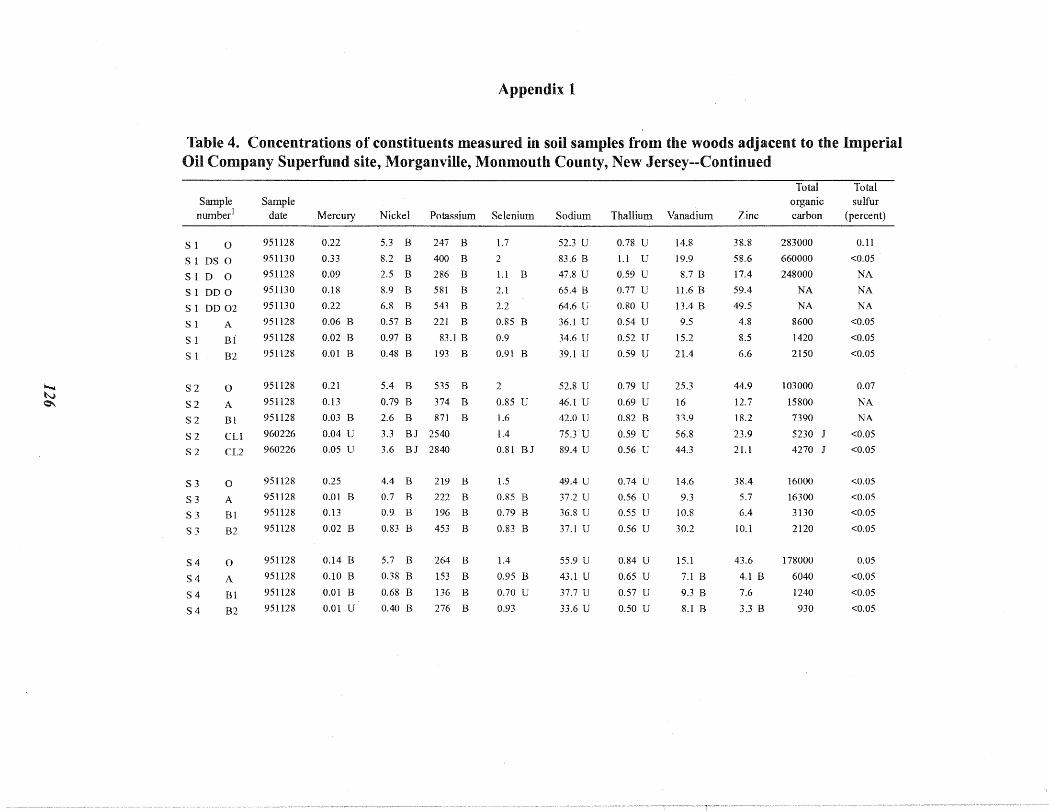
Appendix 1
Table 4. Concentrations of constituents measured in soil samples from the woods adjacent to the Imperial Oil Company Superfund site, Morganville, Monmouth County, New Jersey--Continued
Total Total Sample Sample organic sulfur number!
S 1 0
date
951128
Mercury
0.22
Nickel
5.3 B
Potassium
247 B
Selen
1.7
ium Sodium
52.3 U
Thallium
0.78 U
Vanadium
14.8
Zinc
38.8
carbon
283000
(percent)
0.11
S 1 DS 0 951130 0.33 8.2 B 400 B 2 83.6 B 1.1 U 19.9 58.6 660000 <0.05
SID 0 951128 0.09 2.5 B 286 B 1.1 B 47.8 U 0.59 U 8.7 B 17.4 248000 NA
S 1 DD 0 951130 0.18 8.9 B 581 B 2.1 65.4 B 0.77 U 11.6 B 59.4 NA NA
S 1 DD 02 951130 0.22 6.8 B 543 B 2.2 64.6 U 0.80 U 13.4 B 49.5 NA NA
S 1 A 951128 0.06 B 0.57 B 221 B 0.85 B 36.1 U 0.54 U 9.5 4.8 8600 <0.05
S 1 Bi 951128 0.02 B 0.97 B 83.1 B 0.9 34.6 U 0.52 U 15.2 8.5 1420 <0.05
S 1 B2 951128 0.01 B 0.48 B 193 B 0.91 B 39.1 U 0.59 U 21.4 6.6 2150 <0.05
S2 0 951128 0.21 5.4 B 535 B 2 52.8 U 0.79 U 25.3 44.9 103000 0.07
S2 A 951128 0.13 0.79 B 374 B 0.85 U 46.1 U 0.69 U 16 12.7 15800 NA
S2 Bl 951128 0.03 B 2.6 B 871 B 1.6 42.0 U 0.82 B 33.9 18.2 7390 NA
S2 CLl 960226 0.04 U 3.3 BJ 2540 1.4 75.3 U 0.59 U 56.8 23.9 5230 J <0.05
S2 CL2 960226 0.05 U 3.6 BJ 2840 0.81 BJ 89.4 U 0.56 U 44.3 21.l 4270 J <0.05
S3 0 951128 0.25 4.4 B 219 B 1.5 49.4 U 0.74 U 14.6 38.4 16000 <0.05
S3 A 951128 0.01 B 0.7 B 222 B 0.85 B 37.2 U 0.56 U 9.3 5.7 16300 <0.05
S3 Bl 951128 0.13 0.9 B 196 B 0.79 B 36.8 U 0.55 U 10.8 6.4 3130 <0.05
S3 B2 951128 0.02 B 0.83 B 453 B 0.83 B 37.1 U 0.56 U 30.2 10.1 2120 <0.05
S4 0 951128 0.14 B 5.7 B 264 B 1.4 55.9 U 0.84 U 15.1 43.6 178000 0.05
S4 A 951128 0.10 B 0.38 B 153 B 0.95 B 43.1 U 0.65 U 7.1 B 4.1 B 6040 <0.05
S4 Bl 951128 0.01 B 0.68 B 136 B 0.70 U 37.7 U 0.57 U 9.3 B 7.6 1240 <0.05
S4 B2 951128 0.01 U 0.40 B 276 B 0.93 33.6 U 0.50 U 8.1 B 3.3 B 930 <0.05
~ W 0...

~
~ ~
Table 4. Concentrations of constituents measured in soil samples from the woods adjacent to the Imperial Oil Company Superfund site, Morganville, Monmouth County, New Jersey--Continued
Total Total Sample Sample organic sulfur
number! date Mercury Nickel Potassium Selenium Sodium Thallium Vanadium Zinc carbon (percent)
S5 o 951128 0.10 7.2 B 426 B B 44.7 U 0.55 U ILl B 36.8 74200 0.07
S5 OA 961128 0.18 3.4 B 446 B 1.2 44.0 U 0.54 U 17.8 27.2 NA NA
S5 A 951128 0.13 0.81 B 135 B 1.3 37.9 U 0.57 U 8.9 B 6.6 27800 <0.05
S5 BI 951128 0.04 U 0.27 U 47.4 B 0.43 U 36.3 U 0.45 U 1.3B 0.59B 627 <0.05
S5 B2 951128 0.02 U 2.0 B 463 B 0.34 U 29.0 U 0.36 U 13.9 14.2 1970 <0.05
S5 CLl 960226 0.06 B1 1.9 B1 1280 0.70 BJ 49.5 U 0.45 U 43.4 20.3 9260 1 <0.05
S5 CL2 960226 0.04 U 3.8 BJ 2380 1.00 BJ 85.6 U 0.51 U 43.2 24.5 14400 1 <0.05
S7 o 951129 0.48 lO.5 B 754 B 3.2 72.3 U 0.89 U 34.3 65.8 260000 0.17
S7 A 951129 0.10 0.60 B 267 B 1.3 40.8 U 0.50 U 17.6 6.9 32900 <0.05
S7 CLl 960226 0.03 U 1.1 B1 913 B 1 0.72 UJ 46.2 U 0.99 U 20.4 6.9 7520 <0.05
S7 CL2 960226 0.04 U 1.6 B1 1380 1.5 1 50.9 U 1.1 U 40.4 9.8 J 9690 1 <0.05
S9 0 951130 0.09 B 1.0 B 216 B 0.55 B 41.3 U 0.51 U 6.2 B 9.9 36600 <0.05
S9 S 0 951130 0.09 2.3 B 198 B 0.89 B 41.3 U 0.51 U 7.9 B 19.4 13lO00 NA
S9 D 0 951130 0.20 4.7 B 335 B 1.6 57.3 U 0.70 U 8 B 41.1 52200 <0.05
S9 A 951130 0.06 B 0.27 B 127 B 0.55 BJ 35.8 U 0.44 U 5.8 B 5.2 9410 <0.05
SlO 0 951130 0.09 U 8.6 B 741 B 1.9 70.5 U 0.87 U 18.0 B 58.9 431000 0.12
SlO S 0 951130 0.27 lO B 837 B 2.3 B 89.0 U 1.1 U 16.3 B 77.1 339000 NA
SlO A 951130 0.15 0.51 B 259 B 0.79 B 42.8 U 0.53 U 8.2 B 5.3 24200 <0.05
S10 Bl 951130 0.04 U1 0.28 U 322 B 0.91 B 38.0 U 0.47 U 18.7 3.9 B 2660 <0.05
SlO C 951130 0.06 U1 0.57 B 862 B 1.1 B 45.6 U 0.56 U 26.1 6.9 4880 <0.05
Sll A 960207 0.05 U1 0.80 B1 419 B 1 0.42 U 36.0 U 0.44 U 7.7 B 1 7.2 4200 <0.05
Sll E 960207 0.05 U1 1.6 BJ 191 B 1 0.38 U 32.0 U 0.40 U 4.0 B 1 11.2 J 2350 J <0.05
Sll Bl 960207 0.04 U1 0.68 B1 94.8 B 1 0.55 B1 37.8 U 0.46 U 3.6 B 1 6.9 1330 <0.05
Sll C 960207 0.03 UJ 0.99 BJ 176 B J 0.40 U 34.3 U 0.42 U 3.1 B J 1.8 B J 940 J <0.05

~
~ Qo
Table 4. Concentrations of constituents measured in soil samples from the woods adjacent to the Imperial Oil Company Superfund site, Morganville, Monmouth County, New Jersey--Continued
Total Total Sample Sample organic sulfur
number] date Mercury Nickel Potassium Selenium Sodium Thallium Vanadium Zinc carbon (percent)
<0.05 S12 A 960207 0.08 J 1.7 BJ 580 B J 0.39 U 30.4 U 0.56 BJ ILl 12.8 7790
S12 S A 960207 0.06 BJ 2.8 B 726 BJ 0.47 U 90.8 B 0.49 U 13.4 16.9 19600 NA <0.05 S12 E 960207 0.04 UJ 0.23 U 88.3 B J 0.63 U 31.0 U 0.39 BJ 3.0 B J 1.9 B J 1420
S12 Bl 960207 0.05 UJ 0.29 BJ 59.0 B J 0.43 U 35.1 U 0.43 U J 7.0 B J 3.6 B J 1120 <0.05
<0.05 S12 C 960207 0.04 UJ 0.81 BJ 122 B J 0.43 U 36.4 U 0.45 U 5.9 B J 2.7 B J 3560
S13 <0.05 A 960207 0.05 BJ 1.7 BJ 600 B J 0.45 U 38.3 U 0.47 U 12.3 14.6 12200
S13 Bl 960207 0.05 U 1.0 BJ 453 B J 0.43 U 36.6 U 0.45 U 29.8 20.6 4340 <0.05
<0.05 S13 C 960207 0.05 U 1.0 B 203 B J 0.51 BJ 31.3 U 0.38 U 9.8 10.8 1220 J
S14 o 960207 0.09 BJ 1.9 B J 1430 0.52 U 44.2 U 0.54 UJ 15.3 20.4 50100 NA
S14 A 960207 0.08 BJ 1.6 BJ 2150 J 1.2 U 42.0 U 0.52 U 12.6 14.8 13000 J <0.05
S14 B 960207 0.05 U 1.9 BJ 258 B J 1.1 36.5 U 0.45 UJ 9.7 J 15.5 J 3190 J <0.05
SI5 8620 J <0.05 A 960207 0.07 BJ 1.0 BJ 942 B J 0.81 BJ 38.3 U 0.47 U 13.4 10.2
SI5 <0.05 Bl 960207 0.05 UJ 0.39 BJ 127 B J 0.44 B 24.3 U 0.30 U 15.6 3.4 3130 J
Sl5 <0.05 B2 960207 0.06 UJ 1.9 BJ 513 BJ 0.58 BJ 26.1 U 0.32 U 23.2 16.5 NA
S16 <0.05 A 960212 0.14 1.2 BJ 991 0.44 UJ 28.6 U 0.61 U 18.2 17.6 J 14200
S16 Bl 960212 0.07 BJ 0.55 BJ 671 B J 0.73 UJ 47.2 U 1.0 U 14.8 10.4 4120 NA <0.05 S16 CLl 960212 0.09 BJ 2.2 BJ 512 B J 0.94 35.8 U 0.77 U 47.4 24.9 J 4750 J
NA S17 13.5 J 12500 A 960212 0.07 BJ 0.63 BJ 1000 B J 0.84 BJ 40.9 U 0.50 UJ 12.8
NA S17 7.4 B J 4.2 J 2030 J Bl 960212 0.05 U 0.26 UJ 194 B J 0.42 U 35.4 U 0.44 UJ
NA S19 30.0 41.2 J 17000 A 960213 0.05 U 8.6 BJ 1290 0.67 BJ 41.2 U 0.51 UJ
NA S19 Bl 960213 0.06 U 1.1 BJ 987 0.39 U 33.4 U 0.41 U J 21.4 13.2 J 10700
S19 4600 <0.05 CLl 960213 0.06 BJ 1.3 BJ 1000 B J 0.70 UJ 45.2 U 0.97 U 37.5 13.1 J
<0.05 S19 6.6 J 2780 CL2 960213 0.06 B1 1.1 B1 1030 B J 0.74 U1 47.4 U 1.0 U 40.1
13.8 13.1 27700 NA S20 0.18 J 1.2 BJ 939 0.37 BJ 29.1 U 0.36 UJ A 960213
8.4 B J 5.9 J 3270 NA S20 0.06 U 1.2 BJ 261 B J 0.43 U 36.6 U 0.45 UJ Bl 960213
NA S20 7.3 J 1980 B2 960213 0.06 U 0.82 BJ 204 B J 0.43 U 36.9 U 0.45 UJ 11.1

~
~ '\Q
Appendix 1
Table 5. Concentrations of constituents measured in soil samples from residential areas 1 and 2 and the broader area, Marlboro Township, Monmouth County, New Jersey
concentrations in milligrams per kilogram (parts per million) unless otherwise noted; B, detectable value but below the contract-required detection limit; U, below the instrument detection limit, J, qualified--data may exhibit bias; <, less than; NA, not analyzed; see figs. 8 and 9 for locations]
Sample Sample number! date Aluminum Arsenic Barium Beryllium Cadmium Calcium Chromium Cobalt Copper Iron Lead Magnesium Manganese
Residential area 1
R3 CLl 960301 13500 146 J 35.8 B J 0.52B J 0.07 U 1010 B J 25.4 1.7 B J 18.9 22800 J 124 J 1060 B J 29.3
R3D CLl 960301 11800 67.9 J 25.9 B J 0.42B J 0.06 U 899 B J 22.9 1.6 B J 14.5 20200 J 64.8 J 902 B J 22.5
R 3 B2 960301 13800 J 54.9 J 29.6 B J 0.51B J 0.06 U 834 B J 25.3 J 1.7 B J 14.9 25500 J 51.8 J 985 B J 22.9
R 3D B2 960301 15400 10.3 24.8 B J 0.56B J 0.11 BJ 811 B J 30.4 1.6 B J 19.5 26700 J 17.3 J 1140 16.4 J
R 3 17 960301 13500 J 156 J 29.2 B J 0.52B J 0.06 U 815 B J 24.7 J 1.7 B J 14.4 23400 88.2 J 1030 B J 22.1
R 3 710 960301 14900 J 84.7 J 28.9 B J 0.61B J 0.06 U 786 B J 29.6 J 1.8 B J 15.8 33100 109 J 1160 21.7
R 3 1015 960301 13800 J 94.3 J 28.7 B J 0.59B J 0.07 U 859 B J 26.5 J 1.9 B J 15.7 25500 105 J 1110 J 20.5
R4 Bl 960301 11900 23.0 28.0 B J 0.52B J 0.14 B J 748 B J 25.3 1.6 B J 16.4 26000 J 46.9 960 B J 24.8 J
R4 B2 960301 11000 15.4 21.9 B J 0.44B J 0.09 B J 431 B J 20.7 1.3 B J 11.3 22800 J 16.5 J 777 B J 15.1 J
R4 960301 10300 11.7 22.0 B J 0.47B J 0.08 U 190 B J 23.0 1.4 B J 14.9 CL2 15100 J 17.2 J 695 B J 7.0 J
RI9 A 960318 19400 J 39.6 J 73.8. J 0.66B J 0.07 U 1650 35.7 J 2.5 B J 30.0 36600 88.3 J 1630 J 48.0 J
RI9 CLl 960318 16200 J 18.1 J 27.4 BJ 0.57B J 0.09 U 558 B J 32.0 J 1.8 B J 17.9 52800 J 22.9 J 1430 J 28.6 J
RI9 eL2 960318 9440 14.4 J 20.8 B J 0.15B J 0.14 B J 326 B J 21.1 1.3 B J 15.6 15500 16.9 597 B J 9.4
238 B' J R19 CLJ 960318 9800 17.6 J 28.6 B J O.13B J 0.15 B J 20.7 1.9 B J 14.4 17300 17.6 1040 B J 21.0
960318 8710 15.6 J 22.0 B J 161 B J 19.9 1.8 B J 14.2 23600 R19 CL4 0.15B J 0.27 B J 17.2 909 B J 17.7
R21 A 960322 6770 30.0 90.8 0.15B J 0.73 B J 1870 22.9 1.6 B 47.1 17200 348 752 B J 93.8
R21 B1 960322 2770 13.6 J 18.2 B J 0.03U 0.09 B J 405 B J 7.7 0.35 B J 8.2 8670 67.4 215 B J 27.1
R21 B2 960322 3860 10.8 J 15.4 B J 0.03U 0.07 B J 230 B J 4.7 0.24 B 3.8 B J 5550 23.2 171 B J 15.1
1 The initial letter denotes sample sites in residential areas; the following number is the number of the individual site. In the next two columns, samples marked D are spatial duplicates; samples marked S are splits. The fmalletter refer~ to the soil horizon; CL denotes clays. The final number denotes increasing depth with increase in value. R3 sruryples followed by 17, 710, and 1015 are auger samples collected from depths of 1-7, 7-10, and 10-15 inches, respectively.

~
~ ~
Table 5. Concentrations of constituents measured in soil samples from residential areas 1 and 2 and the broader area, Marlboro Township, Monmouth County, New Jersey--Continued
Sample Sample
date Aluminum Arsenic BarilUll BeryllilUll CadmilUll Calcium Chromium Cobalt Copper Iron Lead Magnesium Manganese
Residential area l--Continued
R22 A 960322 4770 20.1 56.9 J 0.06B J 0.56 B J 1530 24.8 1.2 B J 58.7 11300 256 626 B J 54.2
R22 Bl 960322 5770 26.2 42.9 0.14B J 0.07 U 2130 17.3 0.86 B J 13.4 14600 67.9 552 B J 56.9 J
R22 B2 960322 4060 10.5 23.8 B J 0.05B 0.07 U 827 B J 9.8 0.56 B J 10.8 7930 54.7 390 B J 44.4 J
R23 A 960325 4800 24.7 166 0.31B J 0.59 B J 1120 B J 28.8 2.3 B J 69.9 23900 317 468 B J 73.3 J
R23 CLl 960325 16000 61.9 58.7 0.03U 0.07 U 1510 22.9 0.72 B J 16.1 40900 44.6 887 B J 22.7 J
R23 CL2 960325 14400 88.4 33.6 B J 0.03U 0.08 U 1030 B J 24.0 0.53 B J 13.2 74200 38.8 671 B J 16.3 J
R23 C 960325 6420 35.9 13.6 B J 0.03U 0.07 U 393 B J 11.1 0.24 U 8.3 53100 19.7 268 B J 10.0 J
R24 A 960325 13100 44.7 51.1 0.31BJ 0.08 U 1500 J 30.5 1.0 B J 38.5 23500 204 1200 B J 62.5 J
R24 CLl 960325 18400 33.2 37.2 B J 0.37B J 0.08 U 909 B J 31.5 1.6 B J 17.7 34600 54.5 1390 33.7 J
R24 CL2 960325 12700 16.2 23.7 B J 0.29B J 0.08 U 228 B J 26.7 1.2 B J 15.3 31800 20.5 858 B J 12.6 J
Residential area 2
RIA 960228 1600 27.1 8.5 B J 0.16B J 0.04 U 559 B J 10.7 J 0.80 B J 17.7 17600 159 J 244 BJ 25.2 J
R ID A 960228 1760 20.1 9.0 B J 0.16B J 0.04 U 543 B J 7.4 J 0.56 B J 9.2 11500 136 J 309 B J 15.0 J
R 1 Bl 960228 1560 27.0 8.3 B J 0.15B J 0.24 B J 497 B J 6.6 J 0.61 B J 11.9 12900 158 193 B J 17.2 J
R ID Bl 960228 1590 16.8 6.3 B J 0.14B J 0.05 U 373 B J 5.1 J 0.52 B J 7.7 6770 83.7 312 B J 1l.2 J
R 1 B2 960228 1890 25.2 J 9.4 B J 0.14B J 0.04 U 419 B J 8.8 J 0.39 B J 7.7 12700 J 15.0 212 B J 21.0 J
R 1 B3 960228 5620 29.4 J 12.1 B J 0.54B J 0.05 U 448 B J 29.0 J 1.1 B J 7.6 43600 J 13.1 206 B J 21.5 J
R ID B3 960228 4430 16.7 J 9.3 BJ 0.24B J 0.06 U 350 B J 19.6 0.76 B J 5.5 32300 J 7.9 166 B J 11.1 J
R 2 A 960228 5370 70.5 J 20.0 B J 0.33B J 0.06 U 798 B J 14.5 J 1.2 B J 42.7 17200 J 392 622 B J 46.7 J
R 2 B1 960228 5770 33.2 J 12.7 B J 0.21B J 0.05 U 773 11.7 J 0.87 B J 12.9 15600 J 37.8 J 479 B J 13.1 J
R 2 B2 960228 8920 25.2 13.5 B J 0.31B J 0.07 U 1000 B J 22.8 J 1.0 B J 7.4 30000 15.0 655 B J 11.6 J
R 2 eLl 960228 9830 25.9 J 13.6 B J 0.39B J 0.06 U 753 BJ 21.6 J 1.2 B J 10.8 31400 J 15.6 790 B J 13.2 J
R 2 17.0 J 16.8 B J CL2 960228 12200 J 0.44B J 0.05 U 316 B J 19.8 J 1.4 B J 8.7 24400 J 12.5 J 933 J 14.6
R2 SCL2 960228 14000 J 20.0 J 19.5 B J 0.50B J 0.06 U 381 B J 24.5 J 1.6 B J 14.6 33800 J 17.1 J 1060 17.8

~ y.,. ~
Table 5. Concentrations of constituents measured in soil samples from residential areas 1 and 2 and the broader area, Marlboro Township, Monmouth County, New Jersey--Continued
Sample Sample number l date Aluminum Arsenic Barium Beryllium Cadmium Calcium Chromium Cobalt Copper Iron Lead Magnesium Manganese
Residential area 2--Continued
R 5 A 960304 4350 J 20.9 J 28.4 B J 0.31B J 0.07 U 754 B J 12.1 J 1.8 B J 13.3 14500 J 87.1 652 B J 190
R 5 Bl 960304 13500 J 13.5 J 20.5 B J 0.55B J 0.07 U 515 B J 25.3 J 4.0 BJ 7.8 23800 J 16.7 3110 60.3 J
R 5 SBI 960304 12300 J 13.9 J 18.8 B J 0.49B J 0.06 U 497 B J 23.3 J 3.7 B J 7.2 23200 J 15.4 2780 54.4
R 5 C 960304 9220 J 32.4 J 15.9 B J 0.34B J 0.07 U 444 B J 18.1 J 1.3 B J 13.8 22300 J 70.4 J 739 B J 16.0
R6 A 960304 3220 10.4 J 1l.8 B J O.22B J 0.07 U 104 B J 12.1 J 0.75 B J 16.5 15000 66.3 J 346 B J 21.9
960304 R6 Bl 2110 5.39 11.7 B J 0.15B J 0.11 B J 82.9 B J 6.5 0.65 B J 11.0 J 9470 J 39.5 J 137 B J 32.7 J
R6 B2 960304 1270 4.1 7.5 B J 0.06B J 0.10 B J 57.7 B J 3.3 0.51 B J 4.2 J 4600 J 20.3 J 144 B J 24.8 J
R6 B3 960304 2890 3.3 J 7.5 B J 0.05U 0.05 U 146 B J 2.8 0.21 B J 1.7 B J 4220 3.3 J 48.9 B J 5.5
R6 C 960304 71.4 0.84U 2.5 B J 0.02U 0.09 B J 25.7 B J 0.51B J 0.26 B J 0.74B J 156 1.68 J 7.6 U 2.1 B
R7 A 960304 3590 39.2 18.1 B J 0.38B 0.21 B J 832 B J 20.7 1.0 B J 22.1 J 23900 J 220 J 420 B J 34.6 J
R7 E 960304 6540 38.5 17.3 B J 1.2 0.37 B J 846 166 1.7 B J 24.4 77400 184 J 517 B J 39.8 J
R7 B2 950304 4810 11.5 11.2 B J 0.47B J 0.07 B J 551 B J 27.7 1.0 B J 6.5 36000 19.7 489 B J 24.1 J
960305 R 8 A 6990 14.9 19.7 B J 0.41B J 0.10 B J 413 B J 29.3 1.1 B J 11.4 36800 J 39.8 J 571 B J 27.2 J
R 8 Bl 960305 9530 21.5 12.2 B J 0.45B 0.06 U 781 B J 24.0 1.3 B J 6.2 37500 J 10.7 J 907 B J 21.3 J
R 8 B2 960305 10900 14.0 13.4 BJ 0.61B J 0.05 U 340 B J 52.9 1.6 B J 7.7 50600 J 8.17 J HOO 24.5 J
R 8 CLl 960305 8570 13.7 14.7 B J 0.39B J 0.07 U 441 B J 20.5 1.2 BJ 9.6 26500 J 11.5 J 806 BJ 18.3 J
R 8 CL2 960305 11500 21.0 20.1 B J 0.46B J 0.08 U 509 B J 22.9 1.5 B J 13.1 27900 14.7 J 927 B J 15.1 J
960305 4420 R9 A 33.2 10.2 B J 0.58B J 0.08 B 127 BJ 54.1 1.9 B J 11.3 45400 J 87.2 J 341 B J 41.3 J
R9 Bl 960305 3650 43.6 13.2 B J 0.20B J 0.06 U 235 B J 14.9 0.60 B J 6.0 16100 J 49.8 J 270 B J 10.6 J
R9 B2 960305 4940 21.2 13.0 B J 0.34B J 0.08 U 650 B J 14.9 0.67 B 3.5 B 24600 J 6.61 J 243 B J 7.0 J
R9 CLl 960305 6900 13.0 ILl B 0.43B 0.06 B 1090 21.4 0.93 B 5.7 34900 8.2 J 510 B 11.4
R 9 CL2 960305 11400 15.1 14.6 B J 0.44B J 0.07 U 823 B J 24.9 1.4 B J 9.5 33100 J 9.88J 868 BJ 13.1
RIO 960305 A 5960 J 24.2 J 12.6 B J , 0.30B J 0.06 U 853 B J 19.3 J 1.00 B J 21.1 20900 J 71.6 J 626 BJ 22.8
RIO Bl 960305 9590 J 24.2 J 12.8 B J 0.51B J 0.07 U 841 B J 32.9 J 1.3 B J 10.8 40300 20.7 J 795 B J 17.8
960305 9470 J RIO CLl 25.1 J 14.8 B J 0.34B J 0.08 U 891 B J 22.1 1.2 B J 8.9 31300 13.9 J 747 B J 15.2
RIO CL2 960305 9050 21.9 J 15.0 B J O.4lB J 0.06 B 616 BJ 18.5 J 1.3 BJ 9.5 39300 16.8 J 654 B J 13.3
960305 RlO C 4040 19.3 J 14.5 B J 0.23B J 0.05 U 183 B J ILl 0.62 B J 3.3 B J 15100 J 16.9 310 B J 6.5

"~ w
Table 5. Concentrations of constituents measured in soil samples from residential areas 1 and 2 and the broader area, Marlboro Township, Monmouth County, New Jersey--Continued
Sample Sample number1 date Aluminum Arsenic Barium Beryllium Cadmium Calcium Chromium Cobalt Copper Iron Lead Magnesium Manganese
Residential area 2--Continued
Rll 960311 4840 A 13.2 14.9 B J 0.18B J 0.07 U 214 B J 12.8 0.71 B J 9.7 11800 J 16.9 J 340 B J 13.1
Rll Bl 960311 5450 12.1 10.9 B J 0.14B J 0.05 U 63.3 B J 9.4 0.66 B J 3.1 B J 13100 J 5.7 J 189 B J 7.0 J
Rll CLl 960311 7150 15.5 25.1 B J 0.20B J 0.06 U 181 B J 16.1 0.58 B J 6.6 16800 J 15.6 J 258 B J 4.9 J
Rll CL2 960311 6800 11.4 19.4 B J O.22B J 0.05 U 109 BJ 14.4 0.65 B J 6.8 J 10500 J 16.8 J 278 B J 4.8 J
Rll C 960311 397 4.3 1.7 B J 0.02B J 0.07 B J 8.2 U 2.3 0.18 U 0.44B J 3000 J 2.3 J 16.9 B J 0.04U J
R12 A 960311 3660 49.5 13.8 B J 0.33 B J 0.13 B J 500 B J 15.7 0.76 B J 25.0 16400 J 260 513 B J 19.0
R12 Bl 960311 3250 35.6 14.4 B J 0.32B J 0.12 B J 535 B 15.2 0.74 B J 14.4 J 19600 J 62.5 J 366 B J 18.6 J
R12 B2 960311 6590 15.5 9.7 B J 0.45B J 0.05 U 813 33.3 0.94 B J 5.2 B J 37800 J 9.2 J 697 B J 15.7 J
R12 CLl 960311 8650 21.4 14.8 B J 1.0 0.05 U 859 B J 89.0 J 1.3 B J 8.3 61600 J 20.2 J 763 BJ 16.1 J
Rl3 A 960312 2800 50.0 13.3 B J O.21B J 0.15 B J 552 B J 10.7 0.58 B J 27.2 10600 J 360 J 473 B J 19.8 J
R13 Bl 960312 2300 62.3 12.3 B J 0.18B J 0.16 B J 465 B J 7.5 0.50 B J 33.7 9120 J 416 J 323 B J 17.3 J
R13D Bl 960312 2230 73.9 10.5 B J O.22B J 0.10 B J 357 B J 10.3 J 0.50 B J 27.1 12000 J 242 J 271 B J 14.3 J
R13 B2 960312 2620 30.6 6.0 B J O.21B J 0.06 U 176 B 12.9 J 0.53 B J 5.2 B J 12700 J 12.0 J 154 B J 12.3 J
R13D B2 960312 4910 29.2 8.3 B J 0.38B J 0.05 U 286 B J 20.8 J 0.81 B J 4.6 29500 J 8.3 J 327 B J 31.8 J
R13 B3 960312 4980 12.0 10.9 B J 0.29B J 0.06 U 527 B J 15.1 J 0.86 B J 2.9 B J 23600 J 4.4 J 441 BJ 12.0 J
R14 17.4 A 960312 2690 37.1 14.1 B J 0.14B J 0.22 B J 688 B J 8.7 0.59 B J 22.5 7840 J 241 J 340 B J
R14 26.3 J 7.4 Bl 960312 3370 23.3 6.8 B J 0.17B J 0.07 B J 230 B J 11.9 0.45 B J 6.3 10200 J 213 B J
R14 B2 960312 6330 15.3 8.9 B J 0.33B J 0.06 U 400 B J 15.8 0.98 B J 4.4 B J 24600 J 7.0 J 610 B J 20.1 J
456 B J 27.1 J R15 A 960313 2950 28.7 16.6 B J O.22B J 0.15 B J 535 B J 9.0 0.67 B J 26.9 9580 J 211 J
37.3 R15D A 960313 3820 J 29.9 J 19.4 B J O.llB J 0.07 U 797 B J 13.7 0.63 B J 20.4 11600 J 236 J 628 B J J
13.6 R15 Bl 960313 5290 31.0 11.3 B J 0.51B J 0.08 B J 434 B J 43.2 0.87 B J 5.0 50300 J 15.4 J 272 B J J
10.8 14.6 R15D Bl 960313 3070 J 19.0 J 9.3 B J 0.03U 0.07 U 437 B J 9.0 0.25 B J 3.4 B J 13200 J 286 B J
19.0 J 777 B J 14.9 J R15 CLl 960313 9720 17.6 J 12.7 BJ 0.36B J 0.07 U 1000 B J 33.2 J 0.80 B J 6.6 63500 J
16.3 841 B J 13.7 J R15D CLl 960313 10300 J 42.3 J 13.1 B J 0.19B J 0.07 U 1260 18.7 J 0.80 B J 10.0 28300
16.7 1040 B J 18.2 J R15 CL2 960313 13400 J 19.0 J 19.8 B J 0.32B J 0.08 U 525 B J 23.8 J 1.0 B J 10.7 28600 J
0.10B J 0.07 U 3.5 B J 23300 J 5.0 528 B J 10.0 R15D CL2 960313 6730 J 13.0 J 8.9 B J 783 B J 18.0 J 0.48 B J

;....... Y..l Y..l
Table 5. Concentrations of constituents measured in soil samples from residential areas 1 and 2 and the broader area, Marlboro Township, Monmouth County, New Jersey--Continued
Sample Sample nlll11ber l date Aluminum Arsenic Barilll11 Beryllilll11 Cadmilll11 Calcium Chromium Cobalt Copper Iron Lead Magnesium Manganese
Residential area 2--Continued
R16 A 960313 3230 J 23.3 J 15.7 B J 0.18B J 0.07 U ~81 B J ILl J 0.58 B J 10.5 13200 J 84.8 J 659 B J 28.6 J
R16 Bl 960313 4440 J 18.7 J ILl B J O.22B J 0.07 U 220 B J 39.4 J 0.64 B J 3.4 B J 42100 J 8.7 J 488 B J 19.4 J
R16 CLl 960313 11900 J 16.0 J 18.7 B J 0.17B J 0.08 U 574 B J 27.3 J 0.85 B J 12.1 36800 J 14.8 J 888 B J 12.3 J >
R16 CLl 960313 15700 J 15.8 J 24.6 B J 0.31B J O.OS" U 570 B J 30.5 1.2 B J 13.2 J 35500 J 19.7 J U50 B J 15.9 J
R17 A 960318 4840 J 24.1 15.2 B J 0.16B J 0.08 U 1850 12.3 0.70 B J 14.0 J 15800 J 103 J 756 B J 40.6 J
R17 Bl 960318 9620 J 25.3 J 14.6 B J 0.25B J 0.07 U 1150 39.6 0.73 B J 7.6 43700 J 22.9 J 719 B J 17.1 J
R17 B2 960318 5920 J 21.3 J 14.3 B J 0.09B J 0.07 U 584 B J 13.5 0.41 B J 3.9 B J 19900 J 14.3 479 B J 16.9 J
RI8 A 960318 5260 J 16.9 J 14.4 B J 0.21B J 0.08 U 938 BJ 14.6 J 0.87 B J 11.9 12800 J 78.6 J 979 B J 29.6 J
RI8 Bl 960318 5510 J 11.3 J 10.9 B J 0.06B J 0.07 U 473 B J 12.5 J 0.36 B J 2.8 B J 15100 J 8.9 J 382 B J 12.3 J
RI8 B2 960318 6960 J 13.0 J 12.0 B J 0.03U 0.07 U 762 BJ 14.0 J 0.41 B J 3.6 B J 21400 J 7.8 J 629 B J 12.3 J
RI8 C 960318 6020 J 12.2 J 9.8 B J O.lOB J 0.07 U 419 B J 23.4 J 0.42 B J 4.2 B J 34300 J 9.3 J 477 B J 8.8 J
RI8 CLl 960318 10500 13.6 J 17.9 B J 0.19B J 0.07 U 1950 23.2 J 0.62 B J 10.9 29500 J 14.6 J 959 B J U.5 J
RI8 CL2 960318 9290 J 19.9 J 15.3 B J 0.71BJ 0.08 U 964 B J 49.5 J 0.68 B J 8.6 42300 J 15.7 J 734 B J 19.9 J
R20 A 960322 3340 25.1 J 16.5 B J O.l1B J 0.18 B J 1280 10.0 0.81 B J 17.3 10500 182 686 B J 57.3
R20 Bl 960322 3380 45.6 J 16.1 B J O.13B J 0.25 B J 759 B J 12.2 0.73 B J 19.4 12800 153 622 B J 37.5
R20 B2 960322 3800 23.9 J 12.7 B J 0.13B J 0.10 B J 430 B J 10.1 0.81 BJ 6.6 11800 28.1 970 B J 45.6
R20 B3 960322 2480 9.6 J 7.7 B J 0.03U 0.07 U 156 B J 3.4 0.23 U 2.5 B J 3990 12.9 202 B J 14.3
R27 A 960424 7610 55.1 J 14.7 B J 0.34B J 1.7 J 857 B J 16.9 l.l B J 18.4 21400 J 132 J 736 B J 16.1 J
R27 Bl 960424 11800 37.2 J 15.2 B J 0.45B J 3.5 J 357 B J 22.1 0.17 U 5.0 B J 48800 J 17.9 J 840 B J 13.2 J
R27 960424 4380 0.26B J 2.5 C 16.9 J 7.4 B J J 110 BJ 14.9 0.18 U 3.7 B J 36000 J 9.5 J 354 B J 5.8 J
R27 CLl 960424 12700 18.7 J 22.3 B J 0.46B J 1.4 J 521 B J 23.7 J 0.77 B 9.7 J 21300 J 18.5 J 1100 B J 20.1 J
R27 CLl 960424 11100 30.9 J 20.6 B J 0.44B J 2.1 J 284 B J 23.3 0.27 B J 6.1 B J 32400 J 20.5 J 1030 B J 18.9 J

Table 5. Concentrations of constituents measured in soil samples from residential areas 1 and 2 and the broader area, Marlboro Township,
Sample
number1
Monm
Sample
date
outh Cou
Aluminum
nty, N
Arsenic
ew Jersey-
Barium
-Contin
Beryllium
ued
Cadmium Calcium
Broader area
Chromium Cobalt Copper Iron Lead Magnesium Manganese
Bl A 960417 8880 21.4 33.2 0.44B 3.5 407 B 29.3 1.2 B 10 31100 45.9 1160 B 110
Bl A2 960417 8500 30A 29.7 B 0.33B 4.7 162 B 39A 0.39 B 11.8 44200 54.2 980 B 67.7
Bl eLl 960417 5190 26.1 26.0 B 0.07U 2.3 198 B 15.8 0.36 B 11.6 24000 40.1 678 B 21.9
Bl Bl 960417 11500 149 40A B O.78B 2.8 316 B 34.7 2.7 B 28A 28900 400 1950 57A
Bl eL2 960417 13400 28.3 50.3 0.75B 3.8 1350 45.1 7.8 B 12.4 36100 30.8 2360 163
B2 A 960424 6990 13.9 J 44.9 BJ 0.40B J 1.3 J 5780 19.8 B J 1.9 BJ 17.8 16500 35.3 J 1620 180
B2 Bl 960424 5330 13.9 J 18.9 BJ 0.33B J 1.3 J 1IlO BJ 15.5 J 0.65 B J 6.2 18500 J 28.9 J 813 BJ 57.5 J
B2 eLl 960424 10900 21.0 J 21.5 BJ 0.51B J 1.9 J 645 BJ 25.4 J 0.75 B J 6.9 27400 J 20.8 J 1240 J 36.4 J
B2 eL2 960424 7730 18.3 23.2 BJ 0.53B J 1.9 559 BJ 36.7 0.36 B J 5.6 B J 32600 95.6 967 BJ 32.2
""""" ~ ~

100....; Y..l v-.
Table 5. Concentrations of constituents measured in soil samples from residential areas 1 and 2 and the broader area, Marlboro Township, Monmouth County, New Jersey··-Continued
Sample number l
Sample date Mercury Nickel Potassium Selenium Sodium Thallium Vanadium Zinc
Total organic carbon
Total sulfur
(percent)
R3 CLl
R3DCLl
R 3 B2
R 3DB2
R3 17
R 3 710
R 3 1015
R 4 B 1
R 4 B2
R 4 CL2
R19 A
R19 CLl
R19 CL2
R19 CL3
R19 CL4
R21 A
R21 B 1
R21 B2
R22 A
R22 B 1
R22 B2
960301
960301
960301
960301
960301
960301
960301
960301
960301
960301
960318
960318
960318
960318
960318
960322
960322
960322
960322
960322
960322
0.16
0.09
0.05
0.07
0.26
0.20
0.11
0.07
0.04
0.05
0.05
0.03
0.07
0.10
0.06
0.22
0.06
0.05
0.15
0.14
0.09
J
J
U J
U J
J
J
J
B J
U J
U J
U J
U
U J
B J
U J
U
U
U
4.3
3.2
3.1
2.6
3.6
3.3
3.0
3.7
2.2
1.5
6.4
3.3
1.8
2.9
2.6
5.6
1.3
1.2
4.2
2.8
1.8
B J
B J
B J
B J
B J
B J
B J
B J
B J
B J
B J
B J
B J
B J
B J
B J
B J
B J
B J
B J
B J
2320
1910
2220
2560
2310
2610
2600
2060
1640
2100
3470
3400
2130
2200
2130
1490
459
324
1070
1230
991
J
J
J
J
J
J
J
B J
B J
B J
B J
Residential area 1
1.5 J 65.2 U
1.9 J 45.1 U
1.7 59.3 U
1.6 J 84.3 U
1.8 J 67.5 U
1.4 J 44.3 U
2.3 J 96.4 U
1.4 J 69.8 U
1.1 BJ 51.4B
0.91 U 58.3 U
2.9 J 88.6 U
3.1 J 51.0 U
1.2 B J 47.3 U
1.9 J 46.4 U
2.2 J 46.7 U
1.8 J 39.5 U
0.70 U 34.8 U
1.3 J 37.8 U
1.2 J 40.1 U
1.8 J 37.2 U
0.75 U 54.3 B J
1.0
0.88
0.99
1.1
0.99
0.86
1.2
1.0
1.1
1.3
1.1
1.4
0.99
0.97
0.98
0.83
0.73
0.79
0.84
0.75
0.79
U
U
U
U U
U
U
U
U
U
B J
B J
U
U
U
U
U
U
U
U
U
46.3
45.6 /)
44.5
71.1 J
48.3
70.3
46.6
46.8 J
41.7 J
29.1 J
65.7 J
62.0 J
29.2
50.0
43.0
29.4
12.2
10.6 B J
19.3
24.5
14.4
41.8
3 1.3
28.6
18.1
30.8
29.0
26.8
44.6
22.0
12.9
,70.8
31.4
17.2
23.8
25.1
149
32.8
15.3
llO5
68.3
29.9
J
J
J
J
J
J
J
J
J
J
J
J
28000
27100
11400
8660
14200
18900
10700
19000
11100
9110
26500
6610
9390
8650
9650
31700
5470
4220
27600
23600
12500
J
J
J
J
J
J
J
J
J
J
J
J
J
J
J
J
J
J
J
J
J
<0.05
<0.05
<0.05
<0.05
<0.05
<0.05
<0.05
<0.05
<0.05
<0.05
NA
<0.05
<0.05
<0.05
<0.05
<0.05
<0.05
<0.05
<0.05
<0.05
<0.05

~
Y..l Q\
Table 5. Concentrations of constituents measured in soil samples from residential areas 1 and 2 and the broader area, Marlboro Township, Monmouth County, New Jersey--Continued
Sample
number1 Sample
date Mercury Nickel Potassium Selenium Sodium Thallium Vanadium linc
Total organic
carbon
Total sulfur
(percent)
R23 A
R23 CLl
R23 CL2
R23 C
R24 A
R24 CLl
R24 CL2
RIA
R ID A
RIB 1
R ID B 1
RIB 2
R 1 B3
R ID B3
R 2 A
R 2 B 1
R 2 B2
R 2 CLl
R 2 CL2
R 2 S CL2
R 5 A
R 5 B 1
R 5 S B 1
R 5 C
960325
960325
960325
960325
960325
960325
960325
960228
960228
960228
960228
960228
960228
960228
960228
960228
960228
960228
960228
960228
960304
960304
960304
960304
0.25
0.10 U 0.09 U
0.07 U
0.23
0.12 J
0.14 U
0.07 B J
0.07 B J
0.08
0.05 B J
0.03 U
0.04 B J
0.03 B J
0.31 J
0.10
0.03 B J
0.05 U
0.05 U J
0.04 B J
0.11 J
0.05 U J
0.04 U J
0.14 J
9.4
3.8
2.2
0.98
6.0
4.1
1.9
3.2
1.7
1.6
0.95
1.0
6.7
2.0
3.3
2.2
2.4
1.7
2.4
2.9
3.2
6.6
5.7
2.3
B J
B J
B J
B J
B J
B J
B J
B J
B J
B J
B J
B J
B J
B J
B J
B J
B J
B J
B J
B J
B J
B J
B J
B J
Residential area l--Continued
985 B J 1.7 42.4 U
2090 3.6 39.3 U
1680 6.2 41.9 U
696 B J 4.1 39.1 U
2550 2.4 J 41.9 U
3210 2.8 J 42.5 U
2820 2.4 J 45.2 U
Residential area 2
543 B J 0.51 B J 26.3 U
837 0.51 B J 30.5 U
400 BJ 0.61 U J 39.4 U
1010 0.59 U J 48.2 B J
500 B J 0.49 U J 54.5 B J
451 B J 1.4 J 39.3 U
410 BJ 1.3 J 44.8 B J
1590 0.71 U J 46.0 U
796 0.82 J 37.5 B J
1310 0.78 U J 50.4 U
1770 1.0 J 42.4 U
2240 J 1.9 J 39.5 U
2590 J 2.2 J 58.3 U
1370 J 1.4 J 79.2 U
3820 J 1.7 J 53.3 U
3400 J 0.70 U J 45.1 U
1710 B J 1.2 J 49.6 U
0.89
0.90
2.3
1.2
0.88
0.89
1.1
0.56
0.66
0.85
0.82
0.67
0.84
0.92
0.99
0.71
1.1
0.91
0.83
0.98
1.1
1.1
0.97
1.1
U
B J
B J
B J
U
U
B J
U
U
U
U
U
U
U
U
U
U U
U
U
U
U
U
B J
29.8
87.5
210
183
47.8
60.5
63.0
19.6
14.2
12.6
8.6 B J
18.3
63.3
51.5
26.1
23.5
45.6
48.9
44.1
53.2
19.5
27.7
26.1
36.9
330
250
111
52.0
107
58.6
18.6
29.8
26.9
29.0
14.4
10.2
70.1
15.0
44.9
12.9
17.2
13.1
13.1
1:5.6
27.2
42.4
37.1
15.4
J
J
J
J
J
J
J
J
J
J
J
J
J
J
J
39200
8300
6860
4240
51500
15300
9140
7430
9230
3390
1980
3120
3480
3230
17900
3920
5530
4440
4820
NA
22200
5340
NA NA
J
J
J
J
J
J
J
J
J
J
J
J
J
J
J
J
J
J
J
J
J
0.05
<0.05
<0.05
<0.05
0.05
<0.05
<0.05
<0.05
<0.05
<0.05
<0.05
<0.05
<0.05
NA
<0.05
<0.05
<0.05
<0.05
<0.05
NA
<0.05
<0.05
NA NA

"""" Yy ~
Table 5. Concentrations of constituents measured in soil samples from residential areas 1 and 2 and the broader area, Marlboro Township, Monmouth County, New Jersey--·Continued
Sample numberl
Sample date Mercury Nickel Potassium Selenium Sodium Thallium Vanadium Zinc
Total organic carbon
Total sulfur
(percent)
R 6
R6
R6
R6
R 6
R7
R7
R7
R 8
R 8
R 8
R 8
R 8
R9 R9 R9 R9 R9
RIO
RlO
RIO
RIO
RIO
Rll
Rll
A
B 1
B2
B3
C
A
E
B2
A
Bl
B2
CLl
CL2
A
B 1
B2
CLl
CL2
A
B 1
CLl
CL2
C
A
B 1
960304
960304
960304
960304
960304
960304
960304
950304
960305
960305
960305
960305
960305
960305
960305
960305
960305
960305
96030S
960305
960305
960305
96030S
960311
960311
0.23
0.23 J
0.10 J
0.04 B J
0.03 U J
0.21
0.24
0.06 B J
0.08 J
0.03 B J
0.04 U J
0.06 U J
0.12
0.18
0.13
0.06 B J
0.04 U
0.04 B J
0.10
0.06 B J
0.05 U J
0.06 U J
0.04 U J
0.05 U
0.04 U
3.1
1.1
0.53
0.80
0.31
2.9
5.0
3.1
3.3
2.8
2.8
1.8
2.1
5.0
1.6
1.6
2.3
6.8
2.7
3.0
2.2
1.8
0.83
1.2
1.7
B J
B J
B J
B J
U
B J
B J
B J
B J
B J
B J
B J
B J
B J
B J
B J
B
B J
B J
B J
B J
B J
B J
B J
B J
Residential area 2--Continued
916 B J 0.76 U J 49.2 U
329 B J 0.62 U 39.6 U
411 B J 0.54 U 51.3 U
53.lB J 0.73 B J 35.2 U
16.5B J 0.65 U 41.7 U
1120 1.1 B J 47.6 U
1440 2.0 J 31.5 U
1110 0.99 J 44.5 U
1150 1.1 B J 48.S U
1790 1.0 J 44.3 U
2900 1.8 J 35.2 U
1930 1.2 J 51.2 U
2380 0.88 U 56.3 U
851 BJ 1.4 J 75.2 U
610 B J 0.53 U 40.5 U
415 BJ 0.93 BJ 46.3 U
1000 0.64 U 41.1 U
2130 0.77 U 62.7 U
ISS0 1.3 49.9 U
1980 2.0 51.0 U
1790 J 1.6 J 54.8 U
1560 J 1.4 J 41.7 U
858 J 1.3 J 36.1 B
851 B J 1.2 J 48.4 U
537 B J 0.61 U J 39.4 U
1.1 U 0.85 U
0.75 U
0.76 U
0.90 U
1.0 U
0.68 U
0.93 U
1.0 U
0.95 U
0.76 U
1.1 U 1.2 U
1.0 U
0.73 U
0.99 U
0.88 U
1.1 U
0.98 U
1.1 U 1.2 U
0.90 U
0.73 U
1.0 U
0.85 U
18.0
9.4 J
5.1 B J
6.5 B J
0.70BJ
28.2 J
90.0 J
39.2 J
51.7 J
43.5 J
61.3 J
36.9 J
42.0 J
69.2 J
20.8 J
29.1 J
41.1
5S.9
34.0
67.9
107
64.5
20.5
24.6
25.4
45.7
17.6
11.0
8.0
4.2
41.3
105
27.4
36.2
19.9
23.7
1l5.6
1l5.4
54.8
21.6
15.4
21.7
65.4
38.4
36.5
20.6
18.7
6.9
7.8
9.5
J
J
J
J
J
J
J
J
J
J
J
J
J
J
J
J
J
J
J
J
J
J
J
J
22500
15400
7780
3490
792
18700
12700
4230
14100
5480
3900
NA 6410
15800
6000
3680
3760
4200
11600
4520
3580
4190
NA
8320
4940
J
J
J
J
J
J
J
J
J
J
J
J
J
J
J
J
J
J
J
J
J
J
J
NA <0.05
<0.05
NA <0.05
<0.05
NA <0.05
<0.05
<0.05
<0.05
NA <0.05
<0.05
<0.05
<0.05
NA <0.05
<O.OS
<0.05
<0.05
<0.05
NA
<0.05
<0.05

Concentrations of constituents measured in soil samples from residential areas 1 and 2 broader area, Marlboro Township, Monmouth County, New Jersey--Continued
Sample Sample date Mercury Nickel Potassium Selenium Sodium Thallium Vanadium Zinc
Total organic carbon
Total sulfur
(percent)
Rll
Rll
Rll
R12
R12
R12
R12
R13
R13
R13D
R13
R13D
R13
R14
R14
R14
R15
R15D
R15
R15D
R15
R15D
R15
R15D
R16
R16
CLl
eL2
C
A
B 1
B2
eLl
A
Bl
B1
B2
B 2
B3
A
B 1
B 2
A
A
B 1
B 1
eLl
eLl
eLl
eL2
A
B 1
960311
960311
960311
960311
960311
960311
960311
960312
960312
960312
960312
960312
960312
960312
960312
960312
960313
960313
960313
960313
960313
960313
960313
960313
960313
960313
0.08 B J
0.05 B J
0.03 U
0.23
0.15
0.03 U
0.04 U
0.12
0.14
0.10
0.04 U
0.04 U
0.04 U
0.09 B J
0.04 U
0.04 U
0.24
0.23
0.12
0.07
0.04 U
0.06 B J
0.05 U
0.04 U
0.10
0.03 U
0.59
0.71
0.31
2.2
2.1
2.1
4.0
2.3
1.7
1.6
1.5
2.9
1.5
1.7
1.7
2.1
2.0
2.8
4.4
1.4
2.5
2.1
2.4
2.0
2.1
4.2
B J
B J
U
B J
B J
B J
B J
B J
B J
B J
B J
B J
B J
B J
B J
B J
B J
B J
B J
B J
B J
B J
B J
B J
B J
B J
Residential area 2--Continued
1020 BJ 1.1 46.5 U
1030 0.57 U J 36.4
66.2B J 0.66 U J 42.6 U
1360 0.69 U J 44.7 U
924 0.57 U J 36.8 U
1570 1.3 J 34.2 U
2170 1.4 J 39.7 U
1410 1.1 B J 50.6 U
959 0.74 29.1 U
790 0.50 B J 31.2 U
353 BJ 1.0 BJ 47.0U
637 B J 0.65 B J 36.5 U
1050 1.1 J 41.8 U
749 B J 0.85 B J 45.9 U
439 B J 0.67 U J 43.2 U
1260 J 0.95 B J 47.0 U
1270 0.75 U J 48.4 U
1880 J 1.0 B J 67.0 U
627 J 1.0 26.5 U
705 B J 0.97 B J 41.3 U
2140 J 3.9 J 39.6 U
2040 2.0 40.3 U
2890 J 1.9 44.5 U
1100 J 1.2 37.5 U
2150 J 1.1 BJ 42.1 U
1530 J 2.2 36.9 U
1.00 U 0.78 U
0.92 U
0.96 U
0.79 U
0.74 U
0.85 U
1.1 U 0.63 U
0.67 U
1.0 U
0.78 U
0.90 U
0.99 U
0.93 U
1.0 U
1.0 U.
0.77 U
0.57 U
0.74 U
1.7 B J
0.81 U
0.90 U
0.95 B J
0.80 U
0.77 U
31.3
14.5
9.1 B J
29.1
19.5
37.9
61.4
14.3
11.8
13.4
13.5
25.6
29.7
12.6
14.6
37.3
13.3
16.6 J
50.8
15.0
50.2
40.0 J
53.0 J
32.2 J
15.9 J
45.5
4.9 J
3.4 J
0.60BJ
30.8
28.1
22.5
37.4 J
39.6
33.6
26.2 J
16.1
17.4
12.6
35.9 J
12.1 J
13.5 J
42.6
41.3
34.9 J
11.9 J
29.4 J
17.3 J
14.9 J
12.9
32.9 J
30.3
2910
5230
NA
13500
7350
3030
3470
16400
11500
7630
11500
3510
2360
22400
5590
2430
12500
NA
3640
NA
5170
NA
5870
NA
15400
3140
J
J
J
J
J
<0.05
<0.05
NA
NA
NA
<0.05
NA
NA <0.05
<0.05
<0.05
<0.05
<0.05
<0.05
<0.05
<0.05
<0.05
<0.05
<0.05
<0.05
<0.05
<0.05
<0.05
<0.05
<0.05
<0.05
"""" ~ Oe

"""'" Y.I \C
Table 5. Concentrations of constituents measured in soil samples from residential areas 1 and 2 and the broader area, Marlboro Township, Monmouth County, New Jersey--Continued
Sample number l
Sample date Mercury Nickel Potassium Selenium Sodium Thallium Vanadium Zinc
Total organic carbon
Total sulfur
(percent)
R16
R16
R17
RI7
R17
Rl8
RI8
RI8
RI8
R18
RI8
R20
R20
R20
R20
R27
R27
R27
R27
R27
CLl
CL2
A
Bl
B2
A
Bl
B2
C
CLl
CL2
A Bl
B2
B3
A
Bl
C
CLl
CL2
960313
960313
960318
960318
960318
960318
960318
960318
960318
960318
960318
960322
960322
960322
960322
960424
960424
960424
960424
960424
0.05 U
0.05 U
0.14
0.05 U
0.04 B J
0.12
0.04 U
0.03 U
0.03 U
0.04 B
0.05 U
0.12
0.13
0.05 B J
0.05 U
0.22 J
0.10 B J
0.10 B J
0.11 B J
0.11 B J
1.8
2.6
2.6
2.4
1.8
3.0
2.3
1.2
1.3
1.6
3.8
2.6
2.5
2.5
1.2
3.4
1.2
0.28
2.2
2.2
B J
B J
B J
B J
B J
B J
B J
B J
B J
B J
B J
B J
B J
B J
B J
B J
B J
U
B J
B J
Residential area 2--Continued
2690 J 2.7 J 45.4 U
3590 J 2.1 J 50.0 U
1930 J 1.5 J 53.6 U
1540 J 3.1 J 37.6 U
1080 J 1.5 J 48.4 U
2960 J 0.83 U J 88.2 U
938 B J 1.3 J 53.9 U
1600 J 1.2 J 61.2 U
1450 J 1.2 J 35.8 U
2210 J 1.6 J 84.1 U
2050 J 2.7 J 78.5U
2270 1.7 J 40.8 U
2210 1.3 J 38.4 U
3180 0.76 B J 35.3 U
537 B J 0.73 U 36.3 U
1270 J 1.3 U 171 U
1850 J 1.2 U 163 U
927 B 1.3 U 166 U
2380 1.4 U 182 U
2060 J 1.3 U 172 U
1.5 B J
1.3 B J
0.85 U
1.4 B J
0.74 U
0.87 U
0.77 U
0.82 U
1.00 B J
1.1 B J
1.3 B J
0.85 U
0.80 U
0.74 U
0.76 U
1.9 B J
2.7
2.0 B J
1.6 BJ
2.1 B J
55.2 J
72.0 J
22.3 J
73.9 J
27.2 J
17.9 J
22.2 J
35.9 J
42.3 J
60.7 J
62.1 J
14.5
16.4
10.1 BJ
6.5 B J
42.5 J
92.6 J
120 J
31.3 J
95.2 J
16.6
20.2
30.1
23.3
12.4
30.3
12.4
8.8
14.1
10.9
25.8
38.6
30.4
15.3
6.8
35.6
17.9
10.1
12.1
16.3
J
J
J
J
J
J
J
J
J
J
J
J
J
J
J
J
5730
7020
24200
4350
2330
13800
3580
2320
NA 6100
5410
27300
10900
5970
3110
26700
5210
3360
6770
6140
J
J
J
J
J
J
J
J
J
J
J
<0.05
<0.05
NA <0.05
<0.05
<0.05
<0.05
<0.05
NA NA
<0.05
<0.05
<0.05
<0.05
<0.05
<0.05
<0.05
NA <0.05
<0.05

Table 5. Concentrations of constituents measured in soil samples from residential areas 1 and 2 and the broader area, Marlboro Township, Monmouth County, New Jersey--Continued
Total Total Sample Sample organic sulfur number l date Mercury Nickel Potassium Selenium Sodium Thallium Vanadium Zinc carbon (percent)
Broader area
60.0 19800 J <0.05 B 1 960417 0.14 5.7 76.3 B B 39.6 A B 1810 1.2 U 1.3
960417 0.06 U 77.1 B 0.90 U 54.5 48.2 16400 0.06 B 1 A2 4.2 B 1730 1.2 U
0.94 U 46.8 25.2 15800 J 0.13 B 1 CLl 960417 0.06 U 2.7 B 1480 1.2 U 110 B
960417 0.92 U 45.0 57.1 16800 J 0.06 B 1 B I 0.64 8.5 B 3150 1.2 U 77.3B
0.95 U 52.4 83.0 16700 J 0.05 B 1 960417 90.5 B CL2 0.25 14.7 3340 1.2 U
28200 J 0.05 B 2 0.91 U 29.2 J 66.7 A 960424 0.12 J 6.2 BJ 1600 J 1.2 U 155 U
BJ 26.0 29.2 5500 J <0.05 B 2 Bl 960424 0.19 J 3.1 BJ 1110 J 1.1 U 148 U 1.3 J
5790 J NA B 2 CLl 960424 0.12 J 3.2 BJ 2590 1.3 J 160 U 1.9 BJ 38.9 J 23.9 J
960424 0.06 U 5.6 BJ 1980 2.3 156 U 1.4 BJ 44.6 J 37.7 4800 J <0.05 B 2 CL2 J
"""'" ~ ~

Table 6. Field pH measurements, A- and (or) E-horizon soils, Monmouth and Middlesex Counties, New Jersey
Site pH Site pH number (units) number (units)
El 5.8 01 5.6
E2 5.8 02 6.3
E4 6.0 03 6.2
E5 6.1 04 6.0
E6 6.2 05 6.4
E7 5.9 06 5.8
E9 6.0 08 5.4
E12 5.2 015 5.4
E15 6.2
E16 6.0
E17 5.0
141

Field Oata- -Soil Logs
During soil sampling, soil-horizon samples initially were identified by the nomenclature used in the U.S. Department of Agriculture soil surveys for Middlesex and Monmouth Counties. For example, a sample collected at site E2, in the Bw horizon would be identified as sample E2Bw. A few samples collected in disturbed soils at the Imperial Oil Company Superfund site were designated as fill (for example 17Fl, 17F2), in that A-, B-, and C-horizon soils and clays were not found in order of natural occurrence. Samples that represented a resampling of some areas as a result of unforeseen difficulties in securing timely analytical services were marked R, as in E4RO.
When the chemical data set was prepared for statistical analysis, this systemof sample identification was found to be overly complicated and cumbersome, and samples of similar characteristics could not be compared easily. Therefore, sample identifications were changed to be consistent from one set of samples to another. All samples of disturbed soils that could readily be identified as belonging to A, B, or C horizons were renamed, regardless of order of occurrence in the sotl profile. All samples of bleached soils below the A horizon were designated as E horizon. All B-horizon samples that were collected consecutively at increasing depths in the soil profile were numbered B 1, B2, B3, and so on. Additionally, one set of samples was inadvertently designated as E18, indicating an Englishtown Formation substrate, rather than a "w" designation, indicating a Woodbury Formation substrate. This set of samples also was renumbered. Split samples, originally numbered with a 9, were identified with an S following the site number and horizon designation~ similarly, spatial replicates were identified with a D instead of "Dup." The R was deleted from samples representing a rcsampling event.
The soil logs include the estimated depths from which the individual samples were collected. These depths are estimated from the soil logs noted from the auger samples; depths cannot be measured accurately from the cores because of compaction during the cOling process.
The sample numbers given in appendix 1, tables 1 to 5, represent the renumbered sample identifications used in the statistical analyses. Table 7 gives the original field-sample designations and the renumbered sample identifications so that samples indicated on the following soil logs can be compared with the samples listed in the tables of chemical data.
142

Table 7. Conversion of field-sample designations to renumbered statistical-analysis sample identifications, soil samples collected 1995-96, Imperial Oil Company Superfund site study area, New Jersey
[FSD, field-sample designation; SASI, statistical-analysis sample identification]
Geologic samples Orchard samples
Imperial Oil Company
Superfund site samples
Adjacent woods samples
Residential-area samples
FSD SASl FSD SASl FSD SASl FSD SASl FSD SASl
E10D
EIBC
E20D
E20DD
E4RO
E4RA
E4RE
E4RBH
E4RBC
E4RC
E5RE
E5RBI
E5RB2
E5RC
E6RA
E6RE
E6RB
E6RC
E7RE
E7RBI
E7RB2
E9RO
E9RA
E9RBl
E9RCB
E9RC
El20D
El2AD
E12ED
E12BID
EIDO
E1B2
E20
E2S0
E40
E4A
E4E
E4BI
E4B2
E4C
E5E
E5BI
E5B2
E5C
E6A
E6E
E6Bl
E6CLI
E7E
E7Bl
E7B2
E90
E9A
E9Bl
E9B2
E9C
El2DO
E12DA
El2DE
E12DBl
OIBWS
01BWD
OIRA
OIBWS
01BWD
02RO
02RE
02RBI
02RC
03RA
03FBW1
03RBW2
040DUP
04ADUP
ORBW
04BWD
04B2D
05BWI
05BW2
OSBW2/C
06DUPA
06E/B
06DUPB
06BW
06DBW
015Bl
01SB2
OIA
OIBI
0lB2
020
ORE
02BI
02B2
03A
03Bl
03B2
04DO
04DA
04B2
04DB2
04DB3
05Bl
05B2
05C
06DA
06E
06DE
06Bl
06DBI
IIW
IIX
IIY
lIZ
13B
14B
14B1I2
I4CLA
15SA
I5S
I6D
I6SA
I6C
I7F
17F2
17F3
17C
18BC
18C
180
IIC1
IICL2
IlCL3
IICL4
13B1
14Bl
14B2
14CLI
I5A
15CLI
I6C2
I6Bl
I6Cl
I7A
17Cl
17Bl
17C2
18B1
18Cl
18C2
S10D
S9IO
S910D
SID
S9DUP
S90D
Sto
SIOO
SIC2
SllRA
SllRE
SIIRBI
SlIRC
SI2RA
S12RAD
SI2RE
S12RBW
S12RC
S13RA
Sl3RB
S13RCI
Sl4RO
S14RA
S14RB
S15RA
SlSRBI
SlSRB2
S16B
Sl6CL
S19B
SIDSO
SIDO
SIDDO
SlDD02
S9S0
S9DO
SlOG
SIOSO
SIOC
SllA
SllE
SllBl
SllC
S12A
S12SA
S12E
S12Bl
S12C
S13A
Sl3BI
SIBC
SI40
Sl4A
S14Bl
S15A
S15BI
Sl5B2
S16BI
Sl6CLl
S19Bl
R92CL2
R3DA
R3A
R4A
R5B
R95B
R6BC
R7A2
RIOB
RI2E
R13BID
R13B2U
R13B20D
R13B2L
R23S
R27B
OBILA
OBIA
OBICL!
OBIB
OBICL22
OB2B
OB2A
OB2CLl
OB2CL2
R2SCL2
R3DCLI
R3CLl
R4Bl
R5BI
R5SBl
R6B3
R7E
RIOBI
R12A
R13DBI
R13B2
R13DB2
R13B3
R2BC
R27BI
BIA
BIA2
BICLI
BIBI
BICL2
B2Bl
B2A
B2CLl
B2CL2
143

Table 7. Conversion of field-sample designations to renumbered statistical-analysis sample identifications, soil samples collected 1995-96, Imperial Oil Company Superfund site study area, New Jersey--Continued
Geologic samples, continued
FSD SASI
E13RMA E130
E13B22 E13CL
E14BID E14DBl
E15B E15BI
WI014 WICLI
W12025 WIC2
W12529 WICL3
Wl2934 WICL4
El8A W3A
E18Bl W3Bl
El8B2 W3BC
E18B3 W3B
EI8CLl W3CLI
In the soil description on the soil-sampling field sheets that follow, descriptions of color use standard notations from the Munsell color chart (for example, 10 YR4/3). "Below land surface" commonly is abbreviated BLS. Personnel initials refer to the following: TDO or TO, Timothy Oden; NPS or NS, Nicholas Smith; RR, Robert Rosman; ZS, Zoltan Szabo; JLB, Julia Barringer; VdP, Vincent dePaul; GCS, Gregory Steckroat; EV, Eric Vowinkel (all of the U.S. Geo- . logical Survey). SB, JE, DS, and JS refer to Steven Byrnes, John Evenson, David Springer, and Jerry Schoenlever, respectively, of the New Jersey Department of Environmental Protection (NJDEP). Chad VanSciver also is NJDEP personnel; Peter Sugarman is New Jersey Geological Survey personnel. Corrections to spelling and grammar have not been made.
144

U.S. Geological Survey Project: Imperial Oil 810 Bear Tavern Road, West Trenton, New Jersey 08628 SOil SAMPLING
Site number: E 1 Date: 11130/95 Time (auger): Time (core): 1430 Personnel: T. Oden R.Rosman Quadrangle: South Amboy Formation: Englishtown Location: Behind house in woods Weather: Sunny & cold (40's) snow on ground Soil series: Lakehurst (LaA) Sampler: corer Hole Depth: 4 ft
DESCRIPTION
Thickness Horizon Color Texture (in inches)
0 black, roots, organic mat organic mat 0-2" A brownish gray sandy 2-9" E light gray, yellowish sandy 9-14" Bh brownish to orange sand, some clay 14-18" Bw brownish orange sand, some clay 18-21 " BC paler brownish orange pebbles 21-21" C pale yellow clay 27-35"
COMMENTS
Cored to 4 ft. Soil augered and logged 11/8/95 - JLB's field notes Samples B 1 correspond to the Bw, pebbles appear at the bottom of Bw.
Samples: EI0 EIOD EIA EIBI EIBC EIE 1 Date bottled: 12/6/95 Depths: 0-2" 0-2" 2-9" 14-18" 24-30" 9-14" Comments: E 1 BC-TOC, metals, sulfUr; E 1 E-metals only.
Site number: E2 Date: 12/1195 Time (auger): Time (core): 1140 Personnel: Oden, Rosman Quadrangle: South Amboy F ormation: Englishtown Location: In woods ~ 100 ft from E 1 Weather: Partly cloudy, 40 Soil series: LoA Sampler: corer Hole Depth: 36"
DESCRIPTION
Thickness Horizon Color Texture (in inches)
A grey sandy, root hairs 0-8"
E pale tan sandy same as El Bh orangy yellowish brown sandy; pebbles at about 22" same as El BC orangy yellowish brown much more clay compared w/ layer above pebbles 28-1"
Samples: E20D 20DD E2A E2Bl E2BC 1 Date bottled: 12/6/95 Depths: 0-1" 1-8" 9-14" 28-35"
Comments: E2BC, metals and Sulfur (not TOC)
145

u.s. Geological Survey Project: Imperial Oil 810 Bear Tavern Road, West Trenton, New Jersey 08628 SOIL SAMPLING FIELD SHEET
Site number: E4 Date: 12112/95 Time (auger): 1020 Time (core): 1050 Personnel: Z. Szabo, J. Barringer, V. dePaul, N. Smith, P. Sugarman F ormation: Englishtown Location: Marlboro Rd., top of hill wi side of road Quadrangle: Freehold Weather: Clear, cold, mid-20's Soil series: Lakewood Sampler: Hole Depth: 4 ft
DESCRIPTION
Thickness Horizon Color Texture (in inches)
0 10 YR 3/1 v. dark gray roots 0-1"
A 10 YR 411 dark gray fine sand 1-5"
E 10 YR 5/2 grayish brown medium sand 5-13" Bh 7.5 YR 4/6 strong brown medium sand 13-16"
BC 10 YR 5/6 yellowish brown fine to medium sand 15-31" 10 YR 6/6 brownish yellow 24-31"
C 10 YR 7/6 yellow fine sands, we ll-sorted 31-37"
10 YR 8/6 yellow fine sands, we ll-sorted 37-42"
10 YR 7/6 yellow fine sands, well-sorted 42-45"
1 I Date bottled:
Depths: r
Site number: E4-Repeat Date: 2/6/96 Time (auger): Time (core): 0940 Personnel: RR, NPS, TO, EY, ZS, JB Quadrangle: Freehold Formation: Englishtown Location: Weather: Cold (teens), sunny Soil series: Sampler: corer Hole Depth: 48" BLS
DESCRIPTION
Thickness Horizon Color Texture (in inches)
Same as E4
146
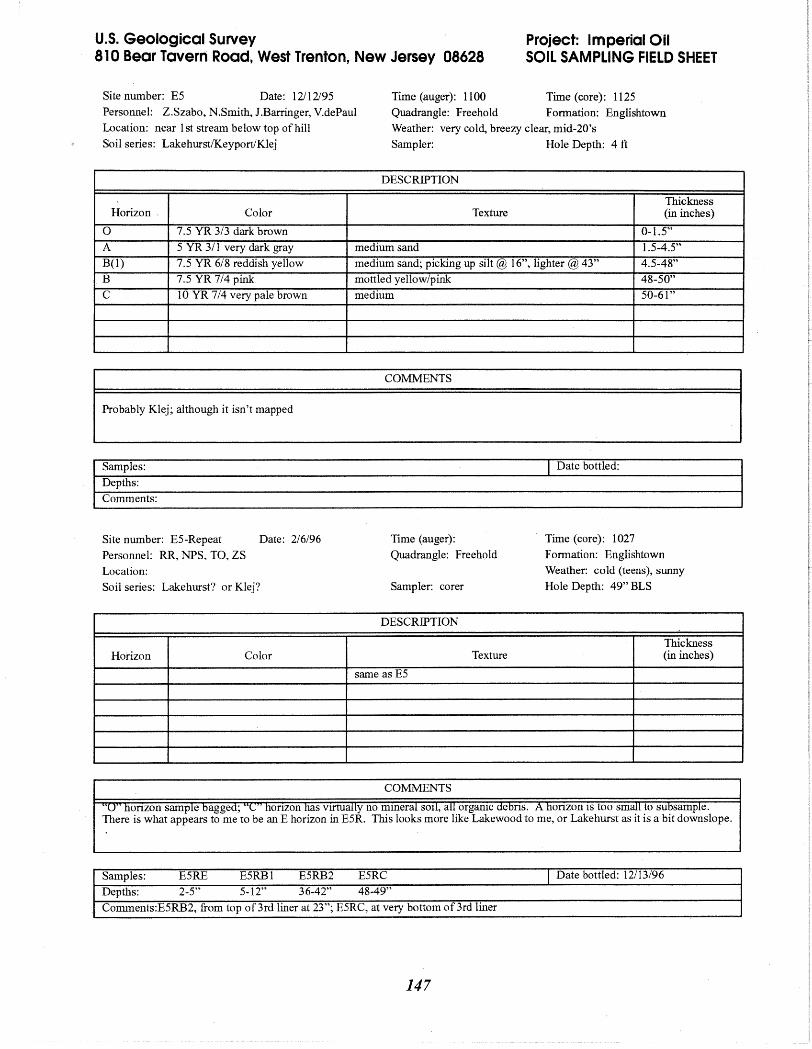
U.S. Geological Survey Project: Imperial Oil 810 Bear Tavern Road, West Trenton, New Jersey 08628 SOIL SAMPLING FIELD SHEET
Site number: ES Date: 12112/9S Time (auger): 1100 Time (core): 112S Personnel: Z.Szabo, N.Smith, J.Barringer, Y.dePaul Quadrangle: Freehold Fonnation: Englishtown Location: near I st stream below top of hill Weather: very cold, breezy clear, mid-20's Soil series: LakehurstlKeyportlKlej Sampler: Hole Depth: 4 ft
DESCRIPTION
Thickness Horizon. Color Texture (in inches)
0 7.S YR 3/3 dark brown 0-1.S"
A S YR 3/1 very dark gray medium sand I.S-4.S"
B(l) 7.S YR 6/8 reddish yellow medium sand; picking up silt @ 16", lighter @ 43" 4.S-48"
B 7.S YR 7/4 pink mottled yellow/pink 48-S0"
C 10 YR 7/4 very pale brown medium SO-61 "
COMMENTS
Probably Klej; although it isn't mapped
Samples: Date bottled:
Depths: Comments:
Site number: ES-Repeat Date: 2/6/96 Time (auger): Time ( core): 1027
Personnel: RR, NPS, TO, ZS Quadrangle: Freehold F onnation: Englishtown
Location: Weather: cold (teens), sunny
Soil series: Lakehurst? or Klej? Sampler: corer Hole Depth: 49" BLS
DESCRIPTION
Thickness Horizon Color Texture (in inches)
same as ES
COMMENTS
'U' honzon sample bagged; 'C honzon has vIrtually no mmeral SOlI, all orgamc debns. A honzon IS too small to subsample. There is what appears to me to be an E horizon in E5R. This looks more like Lakewood to me, or Lakehurst as it is a bit downslope.
Samples: E5RE E5RBl E5RB2 E5RC I Date bottled: 12/13/96
Depths: 2-5" 5-12" 36-42" 48-49"
Comments:ESRB2, from top of3rd liner at 23"; E5RC, at very bottom of3rd liner
147

u.s. Geological Survey 810 Bear Tavern Road, West Trenton, New Jersey 08628
Project: Imperial Oil SOIL SAMPLING FIELD SHEET
Site number: E6 Date: 12112/95 Time (auger): 1430 Time (core): 1440 Personnel: N.Smith, Y.dePaul, Z.Szabo Quadrangle: F onnation: Englishtown Location: Weather: Soil series: Keyport Sampler: corer Hole Depth: 26"
DESCRIPTION
Horizon Color Texture Thickness (in inches)
0 10 YR 3/2 very dark grayish brown
roots 0-1"
A 10 YR 3/2 very dark grayish brown
sand, med 1-4"
EorBl 10 YR 4/4 dark yellowish brown sand, med; getting darker slowly below 5" 4-9"
B2 10 YR 5/6 yellowish brown sand, med; becomes silty i 5-22", mostly silt, then at 22" becomes wet fine sand
9-2605"
26.5-31 " Clay to YR 611 light gray massive clay; mottled w 10 YR 5/6 clay
COMMENTS
Clay - geologic material, basal Englishtown
Samples: Date bottled:
Depths: Comments:
Site number: E6-Repeat Personnel: RR, NPS, TO, ZS
Date: 2/6/96 Time (auger): Quadrangle:
Time (core): 1155 Fonnation:
Location: Weather: cold (-20), sunny
Soil series: Keyport Sampler: corer Hole Depth: 25"
DESCRIPTION
Horizon Color Texture Thickness (in inches)
Same as E6
COMMENTS
"0" horizon sample bagged. This is mostly root mat & leaf debris - not a real 02
Samples: E6RA E6RED E6RB E6RC I Date bottled: 2/12/96
Depths: 1-4" 4-9" 10-16" 25"+ Comments: E6RC from 25" quite clayey - rename E6CL
148

U.S. Geological Survey 810 Bear Tavern Road, West Trenton, New Jersey 08628
Project: Imperial Oil SOil SAMPLING SHEET
Site number: E6-Clay Date: 2/27/96 Time (auger): Time (core): 1347 Personnel: T.Oden, R.Rosman Quadrangle: F ormation: Englishtown Location: Weather: Sunny, warm-upper 50's-60 Soil series: Sampler: split spoon Hole Depth: 50"
DESCRIPTION
Horizon Color Texture Thickness (in inches)
Same as E6
COMMENTS
Augered to 26" then 2 ft split spoon 26-50"
Samples: E6C I Date bottled: 8/4/96
Depths: 40-50"
Comments: silty, rather dark brown layer. This is adjacent to original E6 but did not hit the clay lens present at E6.
Site number: E7 Date: 121l2/95 Time (auger): 1500
Personnel: Z.Szabo, N.Smith, V.dePaul Quadrangle:
Time (core): Formation:
Location: Highest hill on E side after coming off hill, adjacent to large water seep Weather: clear, cold, mid-20's
Soil series: Lakewood Sampler: corer Hole Depth: 50"
DESCRIPTION
Horizon Color Texture Thickness (in inches)
0 roots, dense tangle 0-2"
A 10 YR 5/3 brown sand, med very organic 2-4"
EI 5 YR 6/1 gray sand, med and fine 4-5"
E2 5 YR 5/3 reddish brown sand fine 5-6"
Bl 10 YR 6/6 brownish yellow silty sand, med to fine; grades to very wet silty sand at 8" 6-31 "
B2 10 YR 5/8 yellowish brown silty sand, wet blocky 31-35"
Cl 10 YR 5/4 yellowish brown sand, fine to med 35-41"
C2 10 YR 4/4 dark yellowish brown sand, fine wet 41-45"
C3 10 YR 4/2 dark yellowish brown silt, sahd wet mottled with 10 YR 6/6 45-52"
I Date bottled: Depths:
149

U.S. Geological Survey 810 Bear Tavern Road, West Trenton, New Jersey 08628
Project: Imperial Oil SOIL SAMPLING FIELD SHEET
Site number: E7 -Duplicate Date: 12/15/95 Time (auger): PersOimel: Y.dePaul, N.Smith Quadrangle:
Time (core): 1510 Formation:
Location: Soil series: Lakewood Sampler: corer
Weather: cloudy, cold, 30's Hole Depth: 38"
DESCRIPTION
Horizon Color Texture Thickness (in inches)
Same as E7
COMMENTS
Pounded sampler 11 , augered to 1) --stuck!! Huge rocks; could not remove, even by hand, moved over 1 , augered to 11 huge rocks), pounded to 36" (top of sampler flush with growld); actual hole depth measured at 38".
(more
Samples: Date bottled:
Depths: Comments:
Site number: E7 -Repeat Date: 2/6/96 Time (auger): Time (core): 1120
Personnel: ZS, NPS Quadrangle: Formation:
Location: Weather:
Soil series: Lakewood Sampler: corer Hole Depth: 36"
DESCRIPTION
Horizon Color Texture Thickness (in inches)
Same as E7
COMMENTS
Drove sampler to 1) , augered out -4 SOlI, then drove trom -11}' to jb
No real humic layer; "0" is only organic ---little mineral horizon .... Virtually no A was retrieved - not enough for a sample.
; 'U honzon sample bagged
Samples: E7RE E7RBI E7RB2 I Date bottled: 2/13/96
Depths: 4-6" 7-14" 35-36"
Comments: E7RB2, from bottom of 3rd liner @ -36" silty sand
150

U.S. Geological Survey 810 Bear Tavern Road, West Trenton, New Jersey 08628
Project: Imperial Oil SOIL SAMPLING FIELD SHEET
Site number: E8 Date: 12/13/95 Time (auger): 1145 Personnel: JLB, VdP, NPS, ZS Quadrangle: South Amboy Location: Farm in woods next to ditch east of housing development
Time (core): Formation: Englishtown Weather: Overcast, cold
Soil series: Atsion Sampler: corer
DESCRIPTION
Horizon Color Texture
0 organic A 5 YR 3/2 dark brown sandy, organic; 8-10" wettish
COMMENTS
Ketusal ot auger @ 1$ - too many roots. :start second auger hole. ~ame refusal. Abandoned
Samples: No sample collected. Depths: Comments:
Site number: E9 Date: 12/13/95 Time (auger): 1200
Hole Depth:
Thickness (in inches)
0-1" 1-8"
hole.
I Date bottled:
Time (core): 1428 Personnel: JLB, ZS, NS, VdP Quadrangle: South Amboy Formation: Englishtown Location: Farm, woods, south of fields Weather: cloudy, cold, mid- to hi-20's
Soil series: Keyport Sampler: corer Hole Depth: 36"
DESCRIPTION
Thickness Horizon Color Texture (in. inches )
0 blackish organic 0-1.5"
A 10 YR 4/2 graylbrown sandy loam to loam 1.5-13"
Bl 10 YR 5/4 yellowish brown sandy loam; becomes slightly clayey with depth 13-24" BC? 10 YR 6/4 pale yellowish brown sandy, some clay 24-28" BC? 10 YR 5/6 faint mottle at 36" 28-38" C 10 YR 6/3 grayer clayeyer, moister 38-41 "
COMMENTS
Kemove trozen U honzon wItn trowel and bagged. Remove A to 6" with trowel and bagged.
Samples: Date bottled: Depths: Comments:
151

Geological Survey 810 Road, West Trenton, New Jersey 08628
Project: Imperial Oil SOIL SAMPLING FIELD SHEET
Site number: E9-Repeat Date: 2/6/96 Time (auger): Personnel: RR, NPS Quadrangle: South Amboy Location:
Soil series: Keyport Sampler: Corer
Time (core): 1338
F ormation: Englishtown Weather: Cold (20's), sunny Hole Depth: 36"
DESCRIPTION
Horizon Color Texture Thickness (in inches)
Same asE9
Samples: E9Ro E9RA E9RBI E9RBC E9RC I Date bottled: 2112/96 Depths: 0-1 " 2-12" 13-23" 30-35" 38-41"
Comments:
Site number: E 10 Date: 12115/95 Time (auger): 1152 Time (core): Personnel: Z.Szabo, VdePaul, N.Smith Quadrangle: Formation: Englishtown Location: woods east of orchard, Ticetown Road Soil series: Atsion Sampler:
Weather: cloudy, cold (30's) Hole Depth:
DESCRIPTION
Horizon Color Texture Thickness (in inches)
01 10 YR 2/2 roots 0-4" 02 peaty 4-8"
10 YR 5/2 grayish brown 8-12" 10 YR 511 gray 12-18" 10 YR 4/3 brown 18-23"
-" I Date bottled: bepths (
152

u.s. Geological Survey Project: Imperial Oil 810 Bear Tavern Road, West Trenton, New Jersey 08628 SOIL SAMPLING FIELD SHEET
Site number: Ell Date: 1130/96 Time (auger): 1316 Time (core): 1340 Personnel: JLB, RR, NPS Quadrangle: South Amboy F ormation: Englishtown Location: woods east of orchard on east side of Higgins Rd. Weather: cloudy, cool - low 40's Soil series: Keyport Sampler: corer Hole Depth:
DESCRIPTION
Thickness Horizon Color Texture (in inches)
A 10 YR 4/4 dark yellowish grayish brown sandy 0-1.5" Bl 10 YR 5/6 brownish yellowish orange sandy, some clay; cobbles! 1.5-19" B2 10 YR 5/6 yellowish orangey brown clay eyer with depth; grades into clayeyer soil 19-28" B3 10 YR 5/4 yellowish brown and orange clayey sand; mottled gray brown & orangey yellow brown 28-35"
10 YR 7/3 pale yellowish brown clay; mottles - grades into sandier soil @ 38" 35-40" greyish yellow brown sandy; grades into darker brown sand 40-47"
COMMENTS
Drove to -4' with sampler, pulled up no sample!! Drove to 3', no sample!!
Samples: Date bottled: Depths: Comments:
Site number:EII-Clay Date: 2/27/96 Time (auger): Time (core): 1045 Personnel: T.Oden, R.Rosman Quadrangle: South Amboy Formation: Englishtown Location: Weather: Partly sunny, 50's Soil series: Sampler: corer + split spoon Hole Depth: 48"
DESCRIPTION
Thickness Horizon Color Texture (in inches)
Same as Ell
COMMENTS
Top 2 ft 2 core liners with 3' spoon bottom 2 ft with 1 liner in 2 ft split spoon
Samples: EllA EIIBI EIIB2 EIICLI EllCL2 I Date bottled: 3111196 Depths: 0-2" 2-10" 25-28" 35-40" 42-46" Comments: EIICLI-clayey, silty lens orangey brown; EIICL2-clayey silty-bottom of clay lens
153

Geological Survey Project: Imperial Oil 810 Bear Tavern Road, West Trenton, New Jersey 08628 SOIL SAMPLING FIELD SHEET
Site number: E 12 Date: 1/31/96 Time (auger): 1144 Time (core): 1155 Personnel: JLB, RR, NS Quadrangle: Keyport F ormation: Englishtown Location: Wilson Road in woods across from 06, 08 Weather: Cold, 30 or colder, snowing Soil series: Elkton Sampler: corer Hole Depth: 36"
DESCRIPTION
Thickness Horizon Color Texture (in inches)
0 black organic, some sand 0-2" A dark brown 10 YR 3/2 sandy 2-6"
E yellowish 10 YR 5/4 sandy 6-14" EorBI gray 10 YR 3/3 sandy; getting wetter with depth 14-30" B lighter yellow 10 YR 6/4 sandy; water at -30" 30-36"
Samples: E120 El2A El2E E12Bl r Date bottled: 2/5/96
Depths: 0-2" 2-6" 6-12" 14-20"
I Comments:
Site number: E12-Dup Date: 1131196 Time (auger): Time (core): 1200
Personnel: JLB, RR, NS Quadrangle: Keyport Formation: Englishtown
Location: Wilson Rd., woods, across from 06, 08 Weather: Cold, snowing
Soil series: Elkton Sampler: corer Hole Depth: 36"
DESCRIPTION
Thickness Horizon Color Texture (in inches)
Same as E12
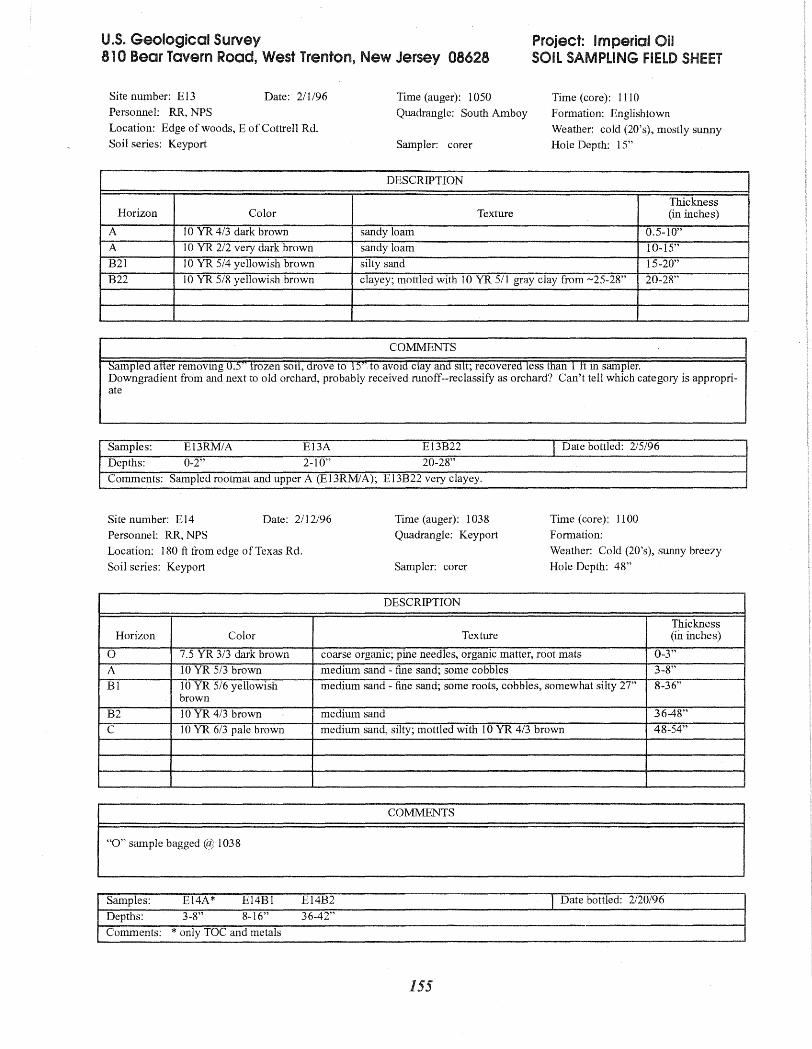
U.S. Geological Survey Project: Imperial Oil 810 Bear Tavern Road, West Trenton, New Jersey 08628 SOIL SAMPLING fiELD
Site number: E13 Date: 2/1/96 Time (auger): 1050 Time (core): 1110 Personnel: RR, NPS Quadrangle: South Amboy F ormation: Englishtown Location: Edge of woods, E of Cottrell Rd. Weather: cold (20's). mostly sunny Soil series: Keyport Sampler: corer Hole Depth: 15"
DESCRIPTION
Thickness Horizon Color Texture (in inches)
A 10 YR 4/3 dark brown sandy loam 0.5-10" A 10 YR 2/2 very dark brown sandy loam 10-15" B21 10 YR 5/4 yellowish brown silty sand 15-20"
B22 10 YR 5/8 yellowish brown clayey; mottled with 10 YR 511 gray clay from ~25-28" 20-28"
COMMENTS
SampLed atler removmg u.) trozen soil, drove to 15' to avoid clay and SIlt; recovered less than 1 tt m sampler. Downgradient from and next to old orchard, probably received runoff--reclassify as orchard? Can't tell which category is appropriate
Samples: E13RM1A E13A E13B22 I Date bottled: 2/5/96
Depths: 0-2" 2-10" 20-28"
Comments: Sampled rootmat and upper A (E13RMJA); E13B22 very clayey.
Site number: E14 Date: 2112/96 Time (auger): 1038 Time (core): 11 00
Personnel: RR, NPS Quadrangle: Keyport Formation:
Location: 180 ft from edge of Texas Rd. Weather: Cold (20's), sunny breezy
Soil series: Keyport Sampler: corer Hole Depth: 48"
DESCRIPTION
Thickness Horizon Color Texture (in inches)
0 7.5 YR 3/3 dark brown coarse organic; pine needles, organic matter, root mats 0-3"
A 10 YR 5/3 brown medium sand - fine sand; some cobbles 3-8"
Bl 10 YR 5/6 yellowish medium sand - fine sand; some roots, cobbles, somewhat silty 27" 8-36" brown
B2 10 YR 4/3 brown medium sand 36-48"
C 10 YR 6/3 pale brown medium sand, silty; mottled with 10 YR 4/3 brown 48-54"
Samples: E14A* E14Bl E14B2 I Date bottled: 2/20/96
Depths: 3-8" 8-16" 36-42"
Comments: * only TOC and metals
155

U.S. Geological Survey 810 Bear Tavern Road, West Trenton, New Jersey 08628
Site number: E14-Duplicate Date: 2/12/96 Time (auger): Personnel: RR, NPS Quadrangle: Keyport Location: 180 ft from edge of Texas Rd.
Soil series: Sampler: corer
Project: Imperial Oil SOIL SAMPLING FIELD SHEET
Time (core): 11 07
Formation:
Weather: Cold (20's), sunny breezy
Hole Depth: 48"
DESCRIPTION
Horizon Color Texture Thickness (in inches)
Same as E14
Site number: E 15 Date: 4/22/96 Time (auger): 0925
Personnel: NS, TDO, JLB Quadrangle: Freehold
Location: Woods at swim club
Soil series: Keyport Sampler: split spoon
Time (core): 1030
F ormation: Englishtown
Weather: Clear, sunny, warm (65-70)
Hole Depth: 34"
DESCRIPTION
Horizon Color Texture Thickness (in inches)
0 organic mat 0-5"
A 10 YR 3/3 dark brown loamy, medium sand, some roots 5-8"
B 2.5 YR 4/4 olive brown siltier, some clay; some mottling-darker 5 YR 311; clay 10 YR 4/3 brown
8-12"
Clay 5 YR 2.5/1 black clay silty clay, tiny silty blobs 10 YR 5/8; small ironstone fragments; brown clay becomes dominant at ~ 15"; also lighter clay below 10 YR 5/3 brown
12-22"
Clay clay becomes olive colored mica flakes, clay, silty blobs; 2.5 YR 6/4 light yellowish brown 22-23"
Clay 10 YR 5/3 brown dark clay, silty blobs that are partly lithified to ironstone; light grey effiorence in some areas - 10 YR 7/1 - slightly reflective to reflectivey silty texture; small flecks of lighter more larger medium sand layers with depth 10 YR 6/6 brownish yellow
23-40"
Etown sand
10 YR 5/6 yellowish brown sand, damp, mottled; 10 YR 6/2 light brownish grey, very light to yel-lowish brown - lighter bits, grades to a greener shade at ~4T'
40-48"
COMMENTS
Original land surface-area was cleared at some point. Trees are ~25 ft high; larger trees -100 ft to west, but there's trash near them. Area is shown as wood in 1932, 1940, 1954 (aerial photos)
Samples: EISA E15B E15CLI El5CL2 EI5CL3 I Date bottled: 4/25/96
Depths: 5-8" 8-12" 14-20" 22-23" 25-30"
Comments: EISA - TOC, TAL only very small amount; El5B - sand, small amount of clay; EI5CLI - top of clay few ironstone channers, lenses of orangy silty sand; E 15CL2 - middle of clay sampled; E 15CL3 - blacker clay below sand stringer slight sulfuric smell, ironstone channers.
156

u.s. Geological Survey Project: Imperial Oil 810 Bear Tavern Road, West Trenton, New Jersey 08628 SOIL SAMPLING FIELD SHEET
Site number: ElS-Dup Date: 4/22/96 Time (auger): Time (core): 1100 Personnel: NS, IDO Quadrangle: Formation: Location: Weather: Soil series: Sampler: Split spoon Hole Depth: 34"
DESCRIPTION
Thickness Horizon Color Texture (in inches)
Same as ElS
COMMENTS
Samples: E1SD-SI ElSD-S2 ElSD-S3 E lSD-CL2 E lSD-CL3 I Date bottled: 5/2/96 E1SD-SSl E1SD-SS2 E1SD-SS3
Comments: acid- soap & soap & washed water water mixing rinse rinse dish del rinse
Site number: E16 Date: 5/13/96 Time (auger): 0920 Time (core): 1020
Personnel: IDO, GCS Quadrangle: Freehold F ormation: Englishtown
Location: SE side of Road near creek (Deep Run) Weather: Sunny, cold (SO)
Soil series: Humaquepts Sampler: Hole Depth:
DESCRIPTION
Thickness Horizon Color Texture (in inches)
A 10 YR 4/3 brown medium sand, very little silt; few root hairs, few pebble 1-19" minor clay balls 10 YR S/l gray
Bl 10 YR S/3 brown med-course sand; ironstone @ 27", 2-Sy 311 very dark 19-30" gray silt; minor pebbles, no silt, minor clay 10 YR 6/8 brownish yellow
B2 10 YR 6/2 light brownish gray medium-coarse sand; some root hairs, ~obbles, small 30-41 " tree fragments; finer grained; some clay 7.5 YR 6/2 pinkish gray, little silt wldepth 2.5 y 4/2 dark grayish brown clay 7.5 YR 6/2 & SI2 intermixed layered clay balls some silty clay 10 YR 6/4 light yellowish brown
10 YR 3/4 dark yellowish brown fine silty sand; some roots 4l-S0"
7.5 YR 4/6 strong brown fine sand clean 50-?"
COMMENTS
No continuous clay, some minor "pieces" throughout the auger.
Samples: E16A E16Bl E16B2 I Date bottled: 5/16196
Depths:
Comments: E16A - S, TOC, Metals, Isotopes; E16Bl - S, TOC, Metals; E16B2 - S, TOe, Metals
157

U.S. Geological Survey Project: Imperial Oil 810 Bear Tavern Road, West Trenton, New Jersey 08628 SOIL SAMPLING FIELD SHEET
Site number: E 17 Date: 5/13/96 Time (auger): 1220 Time (core): 1335 Personnel: TDO, GCS Quadrangle: South Amboy F ormation: EnglishtOWn/Woodbury Location: 110 yds from road in woods toward stream 25 yds from edge of woods Weather: Sunny, 55 Soil series: Elkton Sampler: split spoon Hole Depth:35+"
DESCRIPTION
Horizon Color Texture Thickness (in inches)
0 Black root mat Rooty 0-1" A 10 YR 3/2 very dark grayish
brown Clayey silt; lots of roots, some mixing of the "0" 10 YR 2/1 black
1-4"
CLI 10 YR 5/6 yellowish brown clay; lots of roots 4-10"
I 7.5 YR 5/6 strong brown clay; mottled with 7.5 YR 6/8 reddish yellow & 10 YR
6/2 light brownish gray; hit water, hole filling w/water @ 20"; @ 32" no more 7.5 YR 5/6 just 7.5 YR 6/8 & 10 YR6/2
10-35"
10 YR 6/1 gray clay; mottled with 7.5 YR 6/8 reddish yellow; very wet, water in the hole
35-?"
COMMENTS
Samp Ie -110 yds from road going toward the creek.
Samples: E17A E17CLI E17CL2 1 Date bottled: 5/16/96
Depths: 1-4" 4-10" 28-34"
Comments: E17A, TOC, metals; E17CLl, TOC, metals; EI7CL2, TOC, metals, S
Site number: WI Date: 4/24/96 Time (auger): 1355 Time (core): 1455
Personnel: TDO, NPS Quadrangle: Freehold Formation: Woodbury
Location: Field east of Pension Rd., just north of Raceway Park Weather: Sunny, warm (60), breezy Soil series: Sampler: split spoon Hole Depth: 34"
DESCRIPTION
Horizon Color Texture Thickness (in inches)
sod 0-1" 10 YR 4/4 dark yellowish brown medium-fine sand; fine roots, little whitish medium sand
grains 1-9"
10 YR 6/6 brownish yellow fine sandy silt to clay; 10 YR 611 gray mottle at -14", becomes silty clay at -12", more gray mottles, more prevalent 19-25"; lOmyr 5/2 grayish brown clay mottles along with 10 YR 6/1 gray mottles -25-29"; 10 YR 6/8 brownish yellow clay mottles, in addition from -29-34"; from -34-48", 10 YR 6/6 absent; 10 YR 5/2 and 10 YR 6/8 dominate with little 10 YR 611.
9-48"
Samples: WICLI WICL2 WICL3 WICL4 I Date bottled: 5/2/96 Depths: 0-14" -20-25" -25-29" -29-34"
Comments:
158

U.S. Geological Survey Project: Imperial Oil 810 Bear Tavern Road, West Trenton, New Jersey 08628 SOIL SAMPLING fiELD SHEET
Site number: W2 Date: 5/9/96 Time (auger): Time (core): 1000 Personnel: ZSzabo/Chad VanSciver Quadrangle: Jamestown Formation: Woodbury Location: At end of dirt road behind house at cliff face Weather: slight drizzle or mist, 50 Soil series: Sampler: DEP Geoprobe Hole Depth: 24 ft
DESCRIPTION
Thickness Horizon Color Texture (in inches)
2.5 YR 5/6 clay and fill clay; admixed with white quartz gravel 1 '3"-2'8" 2.5 YR 5/2 clay and fill clay; admixed with quartz gravels & brick fragments 4'
Clay 2.5 YR 5/2 grayish brown clay; mottled with orange Fe oxide every 6" or so, large 4-11 ' diagonal & horizontal fractures
Clay 2.5 YR 2.5/ 1 black clay; massive plastic with large grey concretions 11' -13' 8"
10 YR 5/6 yellowish brown sand - cave in; admixed clay pieces 13'8"-14'3" Clay 2.5 YR 2.5/ I black interbedded clay & sand; clay:sand, 3: 1; highly mica-
ceous at 24' sand is likely wash down from cave in -only clay is native; hit water at about 12', lost water before 16', possibly at 14' in sand; sand is cave-in from surface. No sample 16-23'. l' native clay 23-24'.
COMMENTS
Samples: W2B2 W2CLO W2CLl W2CL2 W2CL3 W2CL4 I Date bottled: 5/16/96
Depths: 44-48" 5.5'-6.5' 6.5'-7' -10' 14.7'-15.25' 23.5'-24'
Comments:
Site number: W3 Date: 5/13/96 Time (auger): 1450 Time (core): 1555
Personnel: TDO, GCS Quadrangle: Formation: Woodbury
Location: East side of on ramp to Rt. 9N in woods, 60 yds NW of police garage Weather: Partly sunny, 58 Soil series: Sampler: Corer / split spoon Hole Depth: -48"
DESCRIPTION
Thickness Horizon Color Texture (in inches)
Black rooty, leaf litter 0-2" ° A 10 YR 3/3 dark brown fine sand; root hairs 2-10" B1 7.5 YR 5/6 strong brown medium-fine sand; root hairs and roots, wet 10-18" B2 75. YR 5/8 strong brown medium-fine sand; very wet, water in hole, some sand- 18-42 B3 stone CL1 2.5 YR 4/8 red clay, sandy; sand, red clay, hole collapsing @ 36"; mot- 42-?"
tIed with 10 YR 611 gray.
COMMENTS
Hole collapsing very fast; augered 2 more times, can't get past 48", collapsing so fast. Pounded 3' sampler 30"-2 ft sampler 24" in same hole. Originally E 18, rename W3; this is not Englishtown.
Samples: E18A E18B1 E18B2 E18B3 E18CLl I Date bottled: 5/16/96 Depths: 2-10" 11-18" 20-30" 30-40" 42-48"
Comments: E18B3 - siltier & more clayey than B2; E18CLl -layer pocket of red orange silt sand & gray clay Rename samples W3, etc. Not Englishtown; it's either Woodbury or Merchantville
159

U.S. Geological Survey Project: Imperial Oil 810 Bear Tavern Road, West Trenton, New Jersey 08628 SOIL SAMPLING FIELD SHEET
Site number: near E6 Date: 5/9/96 Time (auger): Time (core): Personnel: ZSzabolChad VanSciver Quadrangle: Formation: Location: Roadcut immediately north of fork in road Weather: cloudy, 50 Soil series: Sampler: DEP Geoprobe Hole Depth:
DESCRIPTION
Thickness Horizon Color Texture (in inches)
A 10 YR 7/2 light gray medium sand
B 10 YR 7/3 very pale brown medium sand
C 2.5 YR 5/2 grayish brown medium sand; organic 4' E 2.5 YR 5/2 grayish brown medium sand; very organic 8'
E 2.5 YR 7/2 light gray medium sand; numerous organic horizons, occasional 12' 2.5 YR 8/2 pale yellow layers yellow sand
E 10 YR 6/8 brownish yellow medium to fine sand; homogenous, no organic matter, 16' saturated
COMMENTS
Hit water about 13'; hole collapsed.
S:lmnle." . I Date bottled:
Depths: ( N lpl, analyzed
Site number: near E5 Date: 5/9/96 Time (auger): Time (core):
Personnel: ZSzabo/Chad VanSciver Quadrangle: Formation:
Location: Dirt road into woods -30 ft 0 ff road Weather: Mist, 50
Soil series: Sampler: DEP Geoprobe Hole Depth: 12 ft
DESCRIPTION
Thickness Horizon Color Texture (in inches)
Al 7.5 YR 711 light brray medium sand; organic matter
A2 7.5 YR 7/1 light gray medium sand; clean medium sand
Bl 7.5 YR 6/8 reddish yellow medium sand; well-sorted clean sand 4' Cor. Geol 10 YR 7/1 light gray fine & medium sand; organic black laminae
ET 10 YR 712 light gray medium & fine sand; saturated at -8' , increasingly 7' -8' stained with organic matter
ET 10 YR 211 black fine organic sand 11.5'-12'
COMMENTS
Hit water 7 or 8 ft. Hole had to be abandoned at 12'. San1ples could not be collected in saturated sand.
160
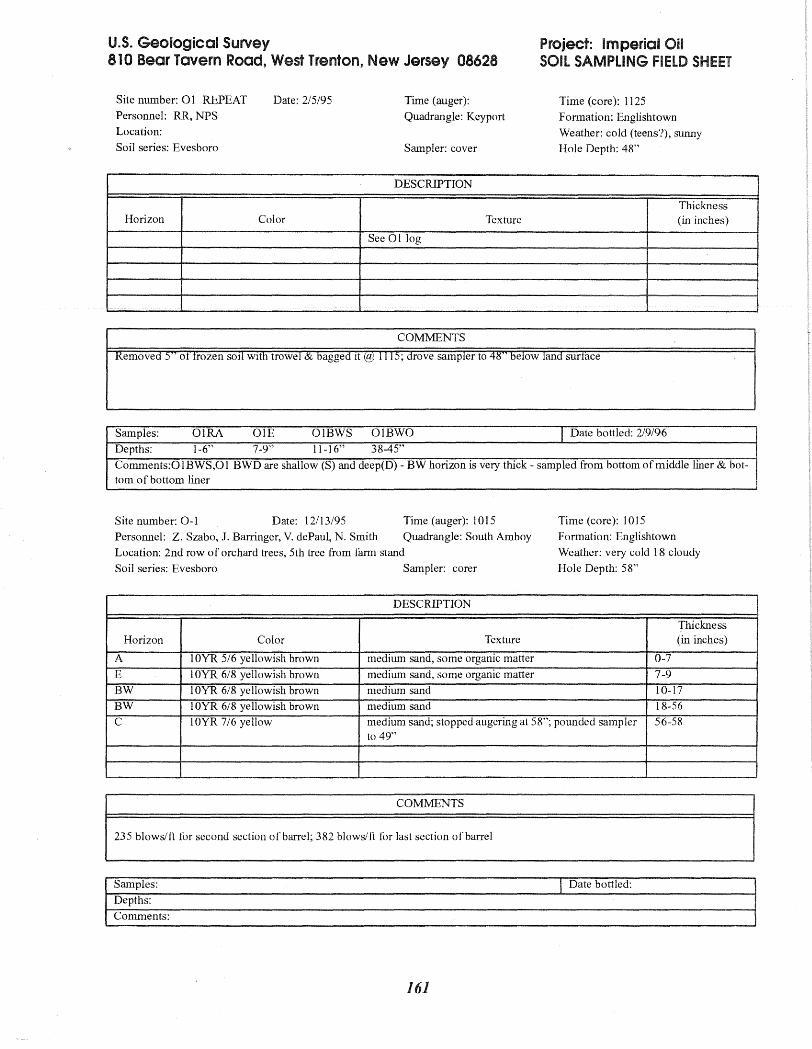
u.s. Geological Survey Project: Imperial Oil 810 Bear Tavern Road, West Trenton, New Jersey 08628 SOIL SAMPLING FIELD SHEET
Site number: 01 REPEAT Date: 2/5/95 Time (auger): Time (core): 1125 Personnel: RR, NPS Quadrangle: Keyport Formation: Englishtown Location: Weather: cold (teens?), sunny Soil series: Evesboro Sampler: cover Hole Depth: 48"
DESCRIPTION
Thickness Horizon Color Texture (in inches)
See 01 log
I
COMMENTS
Removed 5 ont-ozen soli WIth trowel & bagged It (gJ 1115; drove sampler to 415 below land surtace
Samples: OlRA OlE OIBWS 01BWO I Date bottled: 2/9/96
Depths: 1-6" 7-9" 11-16" 38-45"
Comments:OlBWS,Ol BWD are shallow (S) and deep(D) - BW horizon is very thick - sampled from bottom of middle liner & bot-tom of bottom liner
Site number: 0-1 Date: 12/13/95 Time (auger): 1015 Time (core): 1015
Personnel: Z. Szabo, J. Barringer, V. dePaul, N. Smith Quadrangle: South Amboy F ormation: Englishtown
Location: 2nd row of orchard trees, 5th tree from farm stand Weather: very cold 18 cloudy
Soil series: Evesboro Sampler: corer Hole Depth: 58"
DESCRIPTION
Thickness Horizon Color Texture (in inches)
A 10YR 5/6 yellowish brown medium sand, some organic matter 0-7
E 10YR 6/8 yellowish brown medium sand, some organic matter 7-9
BW 10YR 6/8 yellowish brown medium sand 10-17
BW 10YR 6/8 yellowish brown medium sand 18-56
C 10YR 7/6 yellow medium sand; stopped augering at 58"; pounded sampler to 49"
56-58
. I Date bottled: Depths (
161
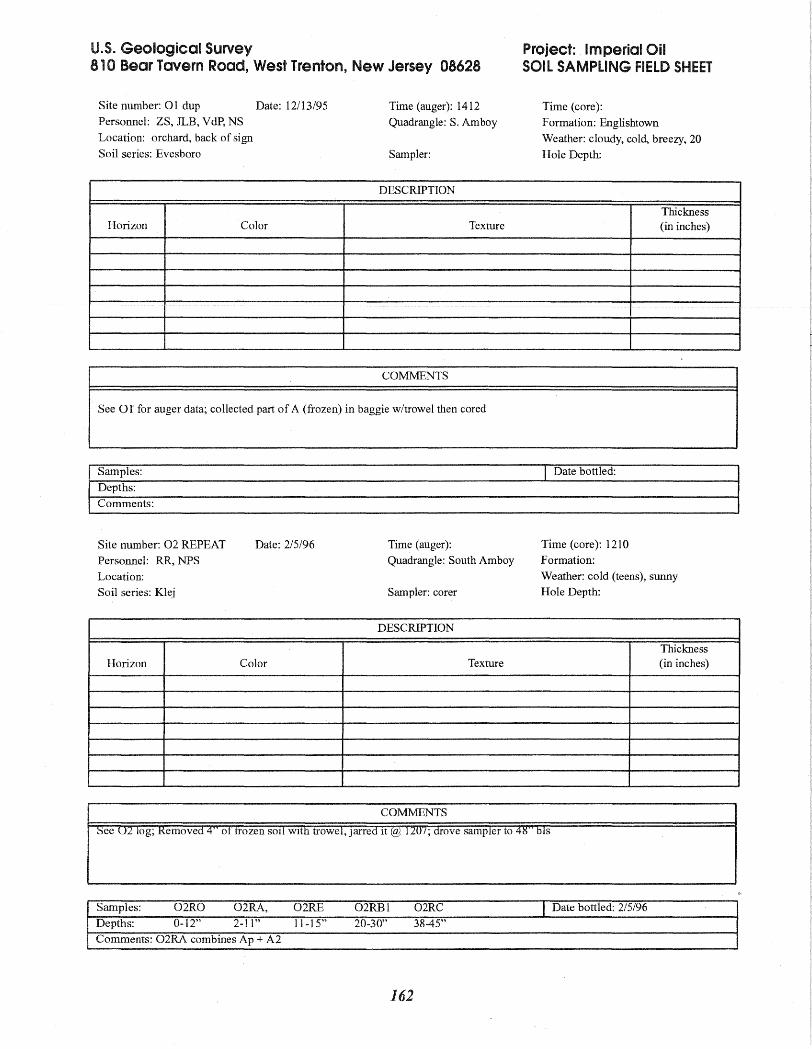
u.s. Geological Survey Project: Imperial Oil 810 Bear Tavern Road, West Trenton, New Jersey 08628 SOIL SAMPLING FIELD SHEET
Site number: 01 dup Date: 12/13/95 Time (auger): 1412 Time (core): Personnel: ZS, JLB, V dP, NS Quadrangle: S. Amboy Formation: Englishtown Location: orchard, back of sign Weather: cloudy, cold, breezy, 20 Soil series: Evesboro Sampler: Hole Depth:
DESCRIPTION
Thickness Horizon Color Texture (in inches)
COMMENTS
See or for auger data; collected part of A (frozen) in baggie w/trowel then cored
Samples: Date bottled: Depths: Comments:
Site number: 02 REPEAT Date: 2/5/96 Time (auger): Time (core): 1210
Personnel: RR, NPS Quadrangle: South Amboy Formation:
Location: Weather: cold (teens), sunny Soil series: Klej Sampler: corer Hole Depth:
DESCRIPTION
Thickness Horizon Color Texture (in inches)
COMMENTS
See U2 log; Removed 4 otirozen SOli WIth trowel,prred It @ I1U/; drove sampler to 4g bls
Samples: 02RO 02RA, 02RE 02RBl 02RC I Date bottled: 2/5/96 Depths: 0-12" 2-11 " 11-15" 20-30" 38-45" Comments: 02RA combines Ap + A2
162

U.S. Geological Survey Project: Imperial Oil 810 Bear Tavern Road, West Trenton, New Jersey 08628 SOIL SAMPLING
Site number: 02 Date: 12115/95 Time (auger): 945 Time (core): 1010 Personnel: Z Szabo, N Smith, V DePaul Quadrangle: S. Amboy Formation: Location: Weather: ET Soil series: Klej Sampler: corer Hole Depth: 48"
DESCRIPTION
Thickness Horizon Color Texture (in inches)
0 mulch + organic matter + sand 1 Ap 10YR 3/2 very dark greyish sand, med~ mulch and roots 1-6
brown A2 10 YR 5/2 grayish brown sand, med 6-11
El 10 YR 6/3 pale brown sand, med 11-13 F2 10 YR 5/3 brown sand, med 13-18 Bl lOYR 5/6 yellowish brown; sand, med. slightly blocky 18-35
color grades to lOYR 5/8 at about 26"
C IOYR 6/8 brownish yellow; sand, med 35-57 grades to 10YR 7/6 yellow at about 39"; becomes mottled at 44" of the 2 colors
~~ ~ T -Date-bOttled: T
Depths: ('
Site number: 03 REPEAT Date: 2/5/96 Time ( auger): Time (core): 1240
Personnel: RR, NPS Quadrangle: South Amboy Formation: Location: Weather: cold (teens), sUnny Soil series: Klej Sampler: corer Hole Depth: 48"
DESCRIPTION
Thickness Horizon Color Texture (in inches)
COMMENTS
see 03 log; Removed 4" frozen soil and jarred it @ 1236; drove to 48" BLS
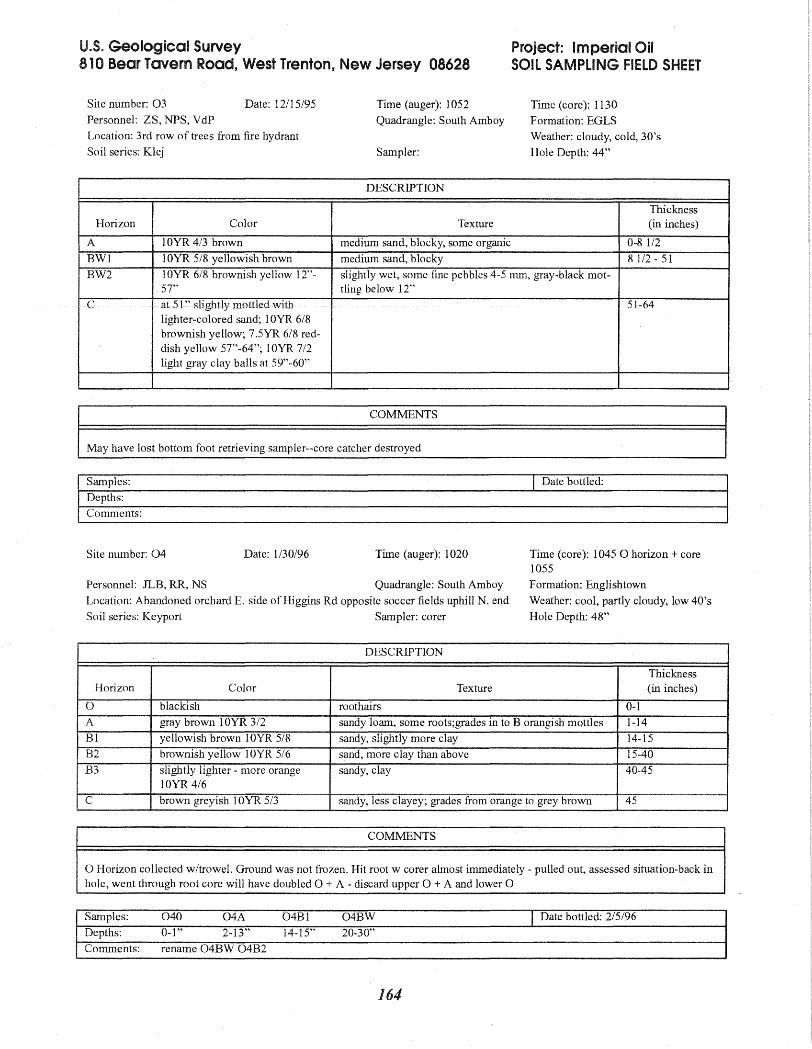
U.S. Geological Survey Project: Imperial Oil 810 Bear Tavern Road, West Trenton, New Jersey 08628 SOIL SAMPLING FIELD SHEET
Site number: 03 Date: 12115/95 Time (auger): 1052 Time (core): 1130 Personnel: ZS, NPS, VdP Quadrangle: South Amboy Formation: EGLS Location: 3rd row of trees from fire hydrant Weather: cloudy, cold, 30's Soil series: Klej Sampler: Hole Depth: 44"
DESCRIPTION
Thickness Horizon Color Texture (in inches)
A 10YR 4/3 brown medium sand, blocky, some organic 0-8 112
BWI 10YR 5/8 yellowish brown medium sand, blocky 8 1/2 - 51 BW2 10YR 6/8 brownish yellow IT~ slightly wet, some fine pebbles 4-5 mm, gray-black mot-
5T' tling below IT
C at 51" slig.l}tly mottled with 51-64 lighter-colored sand; 10YR 6/8 brownish yellow; 7.5YR 6/8 red-dish yellow 57"-64"; lOYR 7/2 light gray clay balls at 59"-60"
COMMENTS
May have lost bottom foot retrieving sampler--core catcher destroyed
Q, . I Date bottled: Depths (
Site number: 04 Date: 1/30196 Time (auger): 1020 Time (core): 10450 horizon + core 1055
PersOlmel: JLB, RR, NS Quadrangle: South Amboy F ormation: Englishtown Location: Abandoned orchard E. side of Higgins Rd opposite soccer fields uphill N. end Weather: cool, partly cloudy, low 40's Soil series: Keyport Sampler: corer Hole Depth: 48"
DESCRIPTION
Thickness Horizon Color Texture (in inches)
0 blackish roothairs 0-1 A gray brown 10YR 3/2 sandy loam, some roots;grades in to B orangish mottles 1-14 Bl yellowish brown 10YR 5/8 sandy, slightly more clay 14-15 B2 brownish yellow lOYR 5/6 sand, more clay than above 15-40 B3 slightly lighter - more orange sandy, clay 40-45
10YR 4/6
C brown greyish 10YR 5/3 sandy, less clayey; grades from orange to grey brown 45
COMMENTS
o Horizon collected wltrowel. Ground was not frozen. Hit root w corer almost immediately - pulled out, assessed situation-back in hole, went through root core will have doubled 0 + A - discard upper 0 + A and lower 0
164

U.S. Geological Survey 810 Bear Tavern Road, West Trenton, New Jersey 08628
Site number: 04 dup Date: 1/30196 Time (auger): see previous sheet
Personnel: JLB, NS, RR Quadrangle: S. Amboy
Location: Higgins Rd - same as 04, dup 2' from 04
Soil series: Keyport Sampler:
Project: Imperial SOil SAMPLING
Time (core): 1105
F ormation: Englishtown
Weather: cool - low 40's
Hole Depth: 48"
DESCRIPTION
Horizon Color Texture Thickness
COMMENTS
See 04; cap br()ke on cores; dug to cores, to remove remams 01 cap; screwed captrom otlier corer on + Jacked corer out w7 second slam bar
Site number: 05 Date: 1/30196 Time (auger): 1450
Personnel: RR, NPS Quadrangle: S. Amboy
Location: low-lying section of orchard, 2nd row of trees from road
Soil series: Klej Sampler: corer
Time (core): 1535
Formation:
Weather: cloudy, cool
Hole Depth: 48"
- low 40's
DESCRIPTION
Horizon Color Texture Thickness (in inches)
0 roots 0-1 A 10YR 21 I black fine sand w/root mats 1-11 BWI 10YR 6/3 pale brown medium-fine sand 11-15 BW2 10YR 5/3 brown medium-fine sand; mix of colors going from brown thru
red to yellow 15-18
BW2 5YR 3/4 dark reddish brown medium fine sand; cobbles at 20" 18-26 C 10YR 6/8 brownish yellow medium-fine sand 26-40
10 YR 7/8 yellow medium fine sand 40-46
lOYR 6/8 brownish yellow; & 5YR 5/8 strong brown
medium-fine sands of two colors intermixed 46-56
Samples: 05A 05BWl 05BW2 05BW2C I Date bottled: 2/2/96
Depths: 2-10" II-IS" 21-26" 26-36"
Comments: 05BW2--taken from below 26-36" the pebble/cobble layer; 05BW1 bottled 2/5/96
165

U.S. Geological Survey Project: Imperial Oil 810 Bear Tavern Road, West Trenton, New Jersey 08628 SOIL SAMPLING FIELD SHEET
Site number: 06 Date: 1/31196 Time (auger): 1015 Time (core): 1033 no 0 Horizon Personnel: JLB, RR, NS Quadrangle: Keyport F ormation: Englishtown Location: Wilson Rd, W of house, old orchard area Weather: cold, 30, light snow Soil series: Evesboro Sampler: corer Hole Depth: 48"
DESCRIPTION
Thickness Horizon Color Texture (in inches)
0 black root mat; not real soil,just rootlet mat 0-1 A dark grayish brown lOYR 4/2 sandy; roots in A - grades to E 1-7 E lighter yellowish brown 10YR 41 sandy 7-11
4
BW yellowish brown 1O,)"R 5/4 sandy 11-23
B2(this getting yellower 10YR 5/6 sandy; slightly clayey; pebbles @ 31" slightly more clay 23-52 may be C with depth JLB 2/1/ 96)
C slightly lighter than B2
Samples: 06A 06EIB 06BW 06B2 I Date bottled: 2/2/96 Depths: 1-7" 7-11" 12-20" 33-40"
Comments:
Site number: 06 dup Date: 1131196 Time (auger): see 06 Time (core): 1036 Personnel: JLB, RR, NS Quadrangle: Formation: Location: same as 06 Weather: cold snowing Soil series: Evesboro Sampler: Corer Hole Depth: 48"
DESCRIPTION
Thickness Horizon Color Texture (in inches)
Samples: 06duPA 06DUPEIB06DUPBW 06DUPB2 I Date bottled: 2/5/96 Depths:
Comments: 06DUPB2 includes part of pebble layer
166
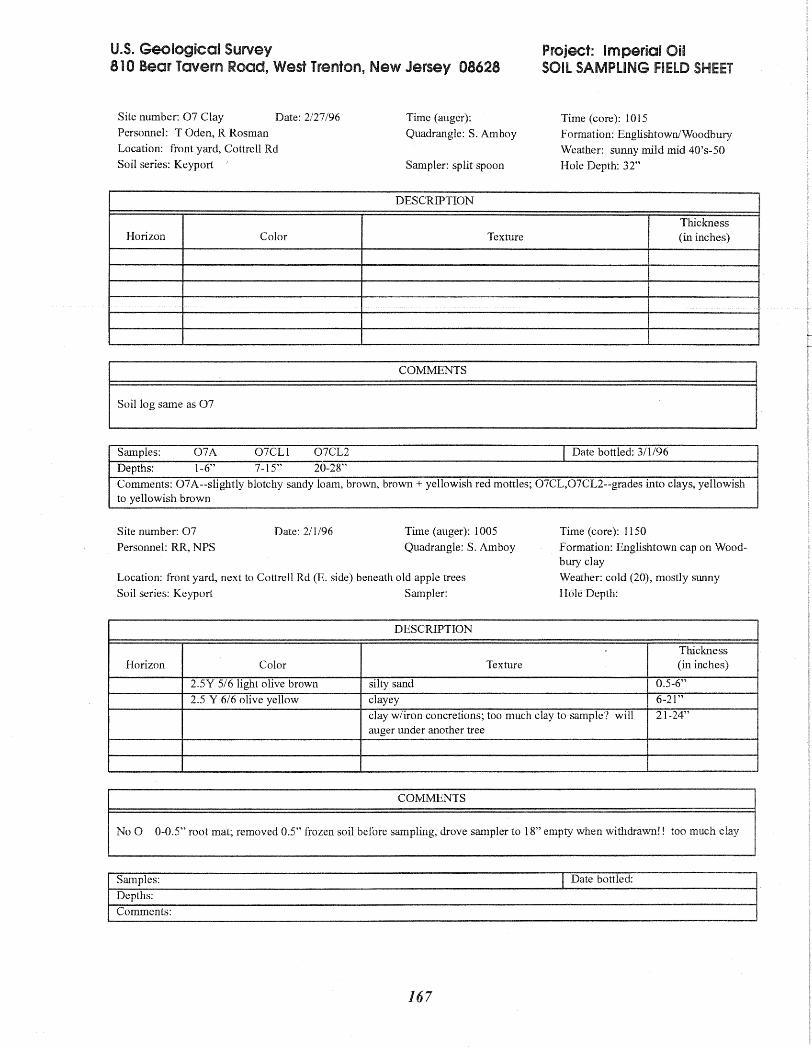
u.s. Geological Survey Project: Imperial on 810 Bear Tavern Road, West Trenton, New Jersey 08628 SOIL SAMPLING
Site number: 07 Clay Date: 2/27/96 Time (auger): Time (core): 1015 Personnel: T Oden, R Rosman Quadrangle: S. Amboy Formation: Englishtown/Woodbury Location: front yard, Cottre 11 Rd Weather: sunny mild mid 40's-50 Soil series: Keyport Sampler: split spoon Hole Depth: 32"
DESCRIPTION
Thickness Horizon Color Texture (in inches)
Samples: 07A 07CLI 07CL2 I Date bottled: 3/1/96
Depths: 1-6" 7-15" 20-28"
Comments: 07 A--slightly blotchy sandy loam, brown, brown + yellowish red mottles; 07CL,07CL2--grades into clays, yellowish to yellowish brown
Site number: 07 Date: 2/1/96 Time (auger): 1005 Time (core): 1150
Personnel: RR, NPS Quadrangle: S. Amboy F ormation: Englishtown cap on Woodbury clay
Location: front yard, next to Cottrell Rd (E. side) beneath old apple trees Weather: cold (20), mostly sunny
Soil series: Keyport Sampler: Hole Depth:
DESCRIPTION
Thickness Horizon Color Texture (in inches)
2.5Y 5/6 light olive brown silty sand 0.5-6"
2.5 Y 6/6 olive yellow clayey 6-21"
clay w/iron concretions; too much clay to sample? will 21-24" auger under another tree
T I Date bottled:
Depths: (
167

u.s. Geological Survey Project: Imperial Oil 810 Bear Tavern Road, West Trenton, New Jersey 08628 SOIL SAMPLING FIELD SHEET
Site number: 08 Date: 2/12/96 Time (auger): 1215 Time (core): 1245 Personnel: RR, NPS Quadrangle: Keyport Formation: Location: Wilson Rd., back end of old orchard,30 before land slopes to creek Weather: cold (20's), sunny, breezy Soil series: Evesboro Sampler: corer Hole Depth: 48"
DESCRIPTION
Thickness Horizon Color Texture (in inches)
O/A 10YR 3/2 very dark grayish medium sand 0-1 brown
A 1 OYR 4/4 dark yellowish brown medium sand; cobbles at 12", ironstone @ 13" 1-19 BI 10YR 5/6 yellowish brown medium sand-coarse sand; more cobbles throughout to 19-47
30"
B2 7.5 YR 5/8 strong brown medium sand; 7.5 YR 6/8 reddish yellow mottles 47-51"
COMMENTS
"0" smaple bagged @ 1220; core-catcher driven 5" up barrel
Samples: 080 08A 08131 I Date bottled: 2113/96
Depths: 0-1" 2-15" 20-30" Comments: no B2 collected - bottom ofliner 3 is same material as higher up - sand + lots of cobbles, same color
Site number: 09 duplicate Date: 2/9/96 Time (auger): 1400 Time (core): 1455 Personnel: T Oden, R Rosman Quadrangle: Allentown Formation: Location: off Ellisdale Road (130), blw hooses by electric pole Weather: cloudy, breezy 30's Soil series: Sassafras Sampler: corer Hole Depth: 4', lost 1 f of core down
hole
DESCRIPTION
Thickness Horizon Color Texture (in inches)
A 10YR 3/4 dark yellowish brown clean fine grained; 0-13 0-13 BI 10YR 5/6 yellowish brown fine, grain; getting clumpy (blocky) more silt 13-29 B2 7.5 YR 6/8 reddish yellow medium-fine grained; little blocky minor coarse grains, 29-53
less silt than B 1
168

U.S. Geological Survey 810 Bear Tavern Road, West Trenton, New Jersey 08628
Site number: 09 Date: 2/9/96 Time (auger): 1400 Time (core): 1415 Personnel: T Oden, R Rosman Quadrangle: Allentown Formation: Location: offEllisdale Road (130) b/w hooses by electric pole Weather: cloudy, breezy, 30's Soil series: Sassafras Sampler: corer Hole Depth: 4', lost -/+ lfofcore
down hole
DESCRIPTION
Thickness Horizon Color Texture (in
A 10YR 3/4 dark yellowish brown clean fine grained 0-13 Bl lOYR 5/6 yellowish brown fine grain; getting clumpy (blocky) more silt? 13-29 B2 7.5 YR 6/8 reddish yellow medium-fine grained 29-53
Samples: 09A 09Bl 09B2 I Date bottled: 2/12/96 Depths: 1-12" 14-21" 30-34"
Comments: 09B l--above core catcher, which got shoved up the barrel. 09B2 from soil below core catcher - stiffer, sample has more clay
Site number: 010 Date: 2/27/96 Time (auger): 1155 Time (core): 1215 Personnel: T Oden, R Rosman Quadrangle: S. Amboy Formation: Englishtown into Wood
bury Location: apple tree behind gray house off of Morganville Rd Weather: sunny 50's Soil series: KfBlKEB Keyport Sampler: corer Hole Depth: 4'
DESCRIPTION
Thickness Horizon Color Texture (in inches)
A 10YR 3/2 very dark grayish clean, medium-fine grained; minor pebbles 0-9 brown
BI lOYR 4/4 dark yellowish brown cobbles, some orangey sand; lots of cobbles 9-17 B2 10YR 5/8 yellowish brown fine grained, minor cobbles 17-26
10YR 6/8 brownish yellow little silty fine grained; wetter w/depth 26-39 CL lOYR 6/8 mottled w/lOYR618 mottled clay; clay is probably Woodbury fm 39-
Samples: o lOA o lOB 1 010B2 OlOCL I Date bottled: 3/4/96 Depths: 1-8" 10-16" 24-30" 39-45"
Comments: o lOB2--dk gray, mottles; OlOB2--still some mottles but brighter yellowish above pebble layer
169

u.s. Geological Survey Project: Imperial Oil 810 Bear Tavern Road, West Trenton, New Jersey 08628 SOIL SAMPLING FIELD SHEET
Site number: 011 Date: 3/26/96 Time (auger): 1030 Time (core): 1115, 1135 Personnel: TDO, NPS Quadrangle: F ormation: Woodbury Location: in field off Maiden Lane, 148' A2 268 degrees from E-13 Weather: sunny, warm (50's) Soil series: Keyport Sampler: corer, splitspoon Hole Depth: 30"corer, 49"splitspoon
DESCRIPTION
Thickness Horizon Color Texture (in inches)
A 10YR 5/5 yellowish + brown medium sand, clean; at 10", mottled with, 10YR 211 0-12" black organic material
BI 10YR 5/6 yellowish brown medium sand, clean; wet at 16" very few cobbles; small 12 amounts of 7 .5YR 4/6 strong brown sand 20-26"; from 27"·32" 7.5\K 4/6 sand more prevalent; some ironstone at 35"
B2 7.5YR 4/6 strong brown medium sand; bottled with lOYR 5/1 gray fine sand; wet 32-37 Clay 10YR 511 gray, 10YR 411 dark clay, fine sand; 3 colors: 2 gray clays, 1 yel. br. fine sand; 37-49
gray, 10YR 5/6 yellowish brown II: water in 49" hole
COMMENTS
Drove 3-ft sampler to 30" BLS @ 1115; drove split-spoon from 25"-49" @ 1135; top liner of3 ft sampler empty
Samples: OllA OllBI 011B2 01ICL I Date bottled: 3/27/96 Depths: 1-12" 12-16" 32-36" 40-45"
Comments:
Site number: 012 Date: 3/26/96 Time (auger): 1215 Time (core): 1250
Personnel: lDO, NPS Quadrangle: F ormation: Woodbury
Location: in field off Maiden Lane, 216' , az 268 degrees from 011 Weather: sunny, warm (50's), breezey Soil series: Keyport Sampler: split spoon Hole Depth: 36"
DESCRIPTION
Thickness Horizon Color Texture (in inches)
10YR 5/4 yellowish brown mixture of clay; well-mixed clay, sand to 8", not as 0-10 sandy below 10"
lOYR 411 dark gray, lOYR 511 gray mottles of clay more prevalent below 10" 10-15 some small amounts of IOYR 211 black organic material at 15" 15-24 10YR 5/3 brown clay more prev- Getting massive clay, same color w/depth 24-30 alent 24"
10YR 5/8 yellowish brown inter- 30-39 mixed wi 1 OYR 5/3 @ 30"
170

U.S. Geological Survey Project: Imperial 810 Bear Tavern Road, West Trenton, New Jersey 08628 SOil SAMPLING
Site number: 014 Date: 2/8/96 Time (auger): 1015 Time (core): 1045 Personnel: T Oden, R Rosman Quadrangle: F ormation: Englishtown Location: In the woods 1110 mile from Greenwood Rd + Texas int Weather: cloudy, cool, 40"s Soil series: Keyport Sampler: corer Hole Depth: 48"
DESCRIPTION
Thickness Horizon Color Texture (in inches)
0 black-dk brown rooty mat 0-2" A 2.5 Y 5/4 light olive brown some roots, fine grained 2-8 E 10YR 5/4 yellowish brown graditional into next layer 8-15 Bl lOYR 511 gray clean fine grained 15-21 B2 lOYR 7112 light gray mottled w/light brown below 21-25
7.5YR 5/6 strong brown small pebbles 25-36 7.5YR 6/8 reddish yellow iron concretions + cobbles 36-50 10YR 7/6 yellow stopped @ 53 in. 50-
Site number: 015 Date: 2/9/96 Time (auger): 1115 Time (core): 1140
Personnel: R Rosman, T Oden Quadrangle: Keyport F ormation: Englishtown
Location: 200' off road in woods sight flagged in yellow Weather: cloudy low 40's
Soil series: Evesboro Sampler: Hole Depth: 24"
DESCRIPTION
Thickness Horizon Color Texture (in inches)
0 dark brown rooty mat 0-1.5 A 2.5 Y 3/2 very dark greyish very fine sand 1.5-8"
brown
B 2.5Y 5/4 light olive brown v. fine-fine sand; some cobbles, some mottled orangy 8-13" sand
B 2.5 Y 6/6 olive yellow very fine sand some silt; stones + cobbles 13-19 B 2.5Y light olive brown silty sand, large cobbles + ironstone 19-23 B 2.5Y' 5/6 light olive brown silty sand; becomes clayey towards bottom flat ironstone 23-27
at 27" B lOYR 711 mottled gray clay very silty at top; clay 1" from top
(28") TD=33"; ironstone then clay below 23" - took core to 24"
171
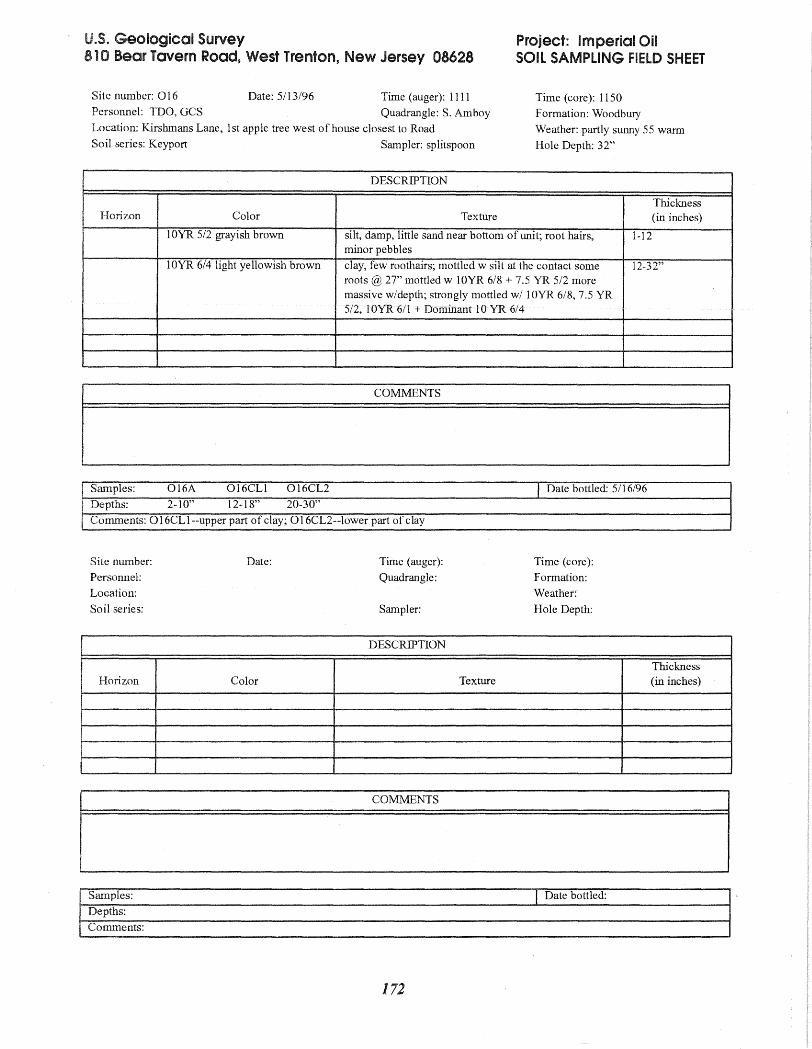
Geological Survey 810 Bear Tavern Road, West Trenton, New Jersey 08628
Project: Imperial Oil SOIL SAMPLING FIELD SHEET
Site number: 016 Date: 5/13/96 Time (auger): 1111 Personnel: TDO, GCS Quadrangle: S. Am boy Location: Kirshmans Lane, 1st apple tree west of house closest to Road
Soil series: Keyport Sampler: splitspoon
Time (core): 1150 F ormation: Woodbury Weather: partly sUlmy 55 warm Hole Depth: 32"
DESCRIPTION
Thickness Horizon Color Texture (in inches)
10YR 5/2 grayish brown silt, damp, little sand near bottom of unit; root hairs, minor pebbles
1-12
10YR 6/4 light yellowish brown clay, few roothairs; mottled w silt at the contact some roots @ 27" mottled w 10YR 6/8 + 7.5 YR 5/2 more massive w/depth; strongly mottled w/ 10YR 6/8, 7.5 YR 5/2, iOYR 611 + Dominant iO 'lR 6/4
12-32"
COMMENTS
Samples: O16A O16CLI OI6CL2 I Date bottled: 5/16/96 Depths: 2-10" 12-18" 20-30" Comments: 0 16CL I--upper part of clay; 0 16CL2--lower part of clay
Site number: Date: Time (auger): Time (core): Personnel: Quadrangle: Formation: Location: Weather: Soil series: Sampler: Hole Depth:
DESCRIPTION
Thickness Horizon Color Texture (in inches)
COMMENTS
. I Date bottled: Depths: ("
172

U.S. Geological Survey Project: Imperial Oil 810 Bear Tavern Road, West Trenton, New Jersey 08628 SOIL SAMPLING FIELD SHEET
Site number: II Date: 4/11/96 Time (auger): 1130 Time (core): 1150 Personnel: NPS, ZS, TDO Quadrangle: Formation: Location: 6' S of Piezometer 7 under edge of black tarp Weather: sunny, windy, 50"s Soil series: oil-laden filter clay Sampler: hand auger Hole Depth: N/A
DESCRIPTION
Thickness Horizon Color Texture (in inches)
filter clay black 2.5 Y N 2/0 silty-clay; oi11aden, water logged, shiny; saturated com- 0-47" pletely at T'
CL W from auger 0-6 CL2 X from auger 7-13 CL3 Y from auger 19-25 CL4 Z from auger 42-47
COMMENTS
Collected baggied samples at 0-6, 7-18, 19-25; all samples from deconned hand auger 42-47"; no evidence of "natural" soil
Samples: IlW IlX IlY lIZ r Date bottled: 4111196
Depths: 0-6" 7-13" 19-25" 42-47"
Comments:
Site number: 12 Date: 4111/96 Time (auger): 1235 Time (core): 1430
Personnel: NPS, ZS, TDO Quadrangle: Formation:
Location: 30' S of old rusted tank in N comer Weather: 55 sunny breezy
Soil series: Sampler: split spoon Hole Depth: 38"
DESCRIPTION
Thickness Horizon Color Texture an inches)
A 2.5 Y 5/6 light olive brown silty sand 0-5
CLI 10YR 3/1 very dark gray & bright clay, plastic; petroleum odor, mixed in orange sand 5-8 orange mottles of iron sand
CL2 lOYR 311 very dark gray plastic clay; bright red mottles & orange mottles; 7.5 YR 8-16 6/8 (reddish yellow); extreme oil smell at 16" & below; no orange mottles below 16"
becomes exceedingly "tight" below 27" slightly more 44 112" sand below 37"
COMMENTS
Samples: I2A I2CLI 12CL2 T Date bottled: 4111/96
Depths: 0-5" 5-8" 8-16"
Comments:
173

U.S. Geological Survey Project: Imperial Oil 810 Bear Tavern Road, West Trenton, New Jersey 08628 SOIL SAMPLING FIELD SHEET
Site number: 13 Date: 4/11/96 Time (auger): 1525 Time (core): Personnel: ZS/TO/NS Quadrangle: Formation: Location: 35' SW of old pipe bldg, S' SE of 4 yellow steel poles, from under tarp Weather: Soil series: Sampler: ss Hole Depth: 25"?
DESCRIPTION
Thickness Horizon Color Texture (in inches)
gravel, trap rx, & brick mixed w. med. sand; road-sur- 0-6 face material; mixed clay-sand-oillayer at 6"
A 2.5 Y 5/4 light olive brown medium sand; stained black w. oil,mottled white & yel- 6-11 low & orange; 7.5 YR 5/6 strong brown
B 2.5 Y 5/4 light olive brown medium sand; black spots w. oil & blobs of filter clay & 11-20 brick pieces
COMMENTS
Samples: I3A I3B I Date bottled: 4/11196
Depths: -11-16" 2-25"
Comments:
Site number: 14 Date: 4111196 Time (auger): 1625 Time (core): 1800
Personnel: ZS, NPS, IDO Quadrangle: Formation:
Location: 10' NE of drum washing bldg center door next to stake SS-11 0 Weather: sunny, breezy, 50's
Soil series: Sampler: corer Hole Depth: 47"
DESCRIPTION
Thickness Horizon Color Texture (in inches)
14 A 10YR 3/3 dark brown fine sand, roots brick fragments, mica 0-3
14 B2 2.5 Y 4/3 olive brown medium sand; some glass; some pebbles, slag?, possible 3-13 small amounts hydrocarbon
2.S Y 4/3 olive brown; 7.S YR S/ Med sand mixed w. gravel; black hydrocarbon layer, 13-14 6 strong brown mottled strong brown
14 B 112 SYR 2.S/1 black gravel, rounded; mixed w. fine black sand, water & 14-16 hydro C saturated
I4B2 SYR 2.S/1 black silt grading to clay; micaeous; possible hydrocarbon 16-19
14 CLA SYR 2.5/1 black massive clay; possible hydrocarbon - dry 19-21
I4B3 10YR 5/4 yellowish brown medium sand;hydrocarbon ooze in 1st inch; black 21-34 organic layers (natural organics layers; mottled 7.5 YR 5/8 strong brown mottling
14 B4 10YR 5/3 brown medium sand - dry 34-44
lOYR 7/6 yellow medium sand - dry 44-58
Samples: 14CLA 14 A 14 B 14 B 112 I4B3 14 B4 I Date bottled: 4/15/96
Depths: 19-21" 0-3" 3-13" 14-16"/16-19" 21-34" 34-44"
Comments:CLA--clay from auger; A--wet,roots, sand, high water content; B--sand & pebbles, roots; B 112--can't differentiate lay-ers; mixed together quartz pebbles 3/4-1"; B4--s.G. found brick and "cinders" in this zone - baggied them.
174

U.S. Geological Survey Project: Imperial 810 Bear Tavern Road, West Trenton, New Jersey 08628 SOil SAMPLING
Site number: IS Date: 6111196 Time (auger): Time (core): N/A Personnel: JLB, SB, JE, JS, DS Quadrangle: Keyport F ormation: Englishtown Location: Imperial on Company Weather: warm, sunny Soil series: disturbed Sampler: Geoprobe Hole Depth: -8 ft
DESCRIPTION
Thickness Horizon Color Texture (in inches)
dry brown brown dry clayey fill shards of asphalt Fill
Rubble brick frags. etc
SA dk brown sand w. faint petrol smell -4'
grey SS Silt grey silt - wet, full of brick & concrete shards -6'
Samples: 15SS 15SA I Date bottled: 6/13/96
Depths: -72-80" -48-55"
Comments: ISSS--siit from 6'. I5SS has enough clay to be considered a CL sample. Although ISSA has rubble on top, it is really an A horizon that appears to have been buried. Call this A to conform with other A samples.
Site number: 16 Date: 6111196 Time (auger): N/ A Time (core): 1050
Personnel: JLB, SB, JE Quadrangle: Keyport F ormation: Englishtown
Location: Imperial Oil Comapny Weather: warm, sunny
Soil series: disturbed Sampler: Geoprobe Hole Depth: -54"
DESCRIPTION
Thickness Horizon Color Texture (in inches)
A 10YR 5/3 sand, few sm. blackened pebbles; some admixture of 0-12 (less asphalt other colors, disturbance, few roots v. faint organic smell thickness) (from the overlying asphalt?)
B brown sand 12-24
B ]0 YR 6/6 sandy, black flecks, mica -2.5 -3.0'
C ("0" 10YR 6/4 sand, black flecks; looks like E'town sand 3.0'-3.5' horizon is OK)
C 10YR 6/3 sand, dark pebbles, mica, ironstone channers -4.0-4.5
Samples: IA6A 16Cl 16C2 16B 1 Date bottled: 6/12/96
Depths: 2-8" 3.0'-3.5' 4.0'-4.5' brown sand from -14"
Comments:
175

U.S. Geological Survey 810 Bear Tavern Road, West Trenton, New Jersey 08628
Site number: I7 Date: 6111196 Time (auger): Personnel: JLB Quadrangle: Keyport Location: Imperial Oil Company
Soil series: Disturbed Sampler: Geoprobe
Project: Imperial Oil SOIL SAMPLING FIELD SHEET
Time (core): 1140-1200
Formation: Englishtown
Weather: warm, sunny
Hole Depth: -5'6"
DESCRIPTION
Horizon Color Texture Thickness (in inches)
A? Fill? Blackish sand with debris; pebbles, flakes of concrete: dark slag or coal pieces, mica flakes
0-12"
C? F2 10YR 5/6 sand, black flecks; mica, some black debris, becomes more natural looking w/depth
12-26"
Cor B? F3 predom. lOYR 515 lOYR 5/2 sand, mica flakes; mixed colors - more or3.J.'1ge 10'{R 6/8, + lOYR 7/4
26-42
C mostly 10 YR 7/2 tan sand, some iron; staining mica black flecks probably not disturbed
42-60
CL yellowish brown! gray clay & silt stringers 5'-5.5'
Samples: 17F 17F2 17F3 17C 17CLl I Date bottled: 6/12/96 Depths: 0-12" 12"-26" 26"-40" -42"-50"
Comments: 17F may not be in place but basically it's topsoil (A) with lots of debris mixed in. I7F3 appears to be B horizon material
Site number: 18 Date: 6/11/96
Personnel: JLB
Location: Imperial Oil Company
Soil series: Disturbed
Time (auger):
Quadrangle: Keyport
Sampler: Geoprobe
Time (core): 1210-1220
Formation: Englishtown
Weather: warm, sunny
Hole Depth: -9 ft
DESCRIPTION
Horizon Color Texture Thickness (in inches)
CL dis-turbed material
1 OYR 4/2 bI. gray silty clay - very dry; less thickness of asphalt 6-18"
C, Fill? Disturbed? Cor E'town
10 YR 7/3 10YR 2/2 sand - lots of black stuff mixed in top of this section, looks more like E'town w/depth
-18-24"
C? may be disturbed
10 YR 7/3 sand, black flecks, mica, looks like E'town 24-30"
BC 10YR4/4 sand, mica flakes more clayey
- iron staining - looks like B horizon 30"-33"
Geologic sand 3.6'-9'
Samples: 18CLl 18C 18BC 18G I Date bottled: 6/12/96 Depths: -8-14" 18-24" 30-32" -40-46
Comments: 18G geologic? at -3.5', call this 18C2 for consistency
176

U.S. Geological Survey 810 Bear Tavern Road, West Trenton, New Jersey 08628
Site number: S 1 Duplicate Date: 11130/95 Time (auger): 0840 Time (core): Personnel: Rosman, Oden, Barringer, Szabo Quadrangle: Keyport Formation: Englishtown Location: IOC woods Weather: Sunny & cold snow on ground Soil series:KeB Sampler: Hole Depth:4 feet
DESCRIPTION
Thickness Horizon Color Texture (in
~!C SID I Date bottled: 12/5/95
Depths: 0-1 7'
Site number: S 1 Date: 11128/95 Time (auger): 9:57 Time (core): 10:20
Personnel: RR, JLB, SB Quadrangle: Keyport Formation: Englishtown
Location:wooded, slopes Weather: warm, partly sunny 60 0
Soil series: Keyport Sampler: Hole Depth: -40"
DESCRIPTION
Thickness Horizon Color Texture (in inches)
0 black root mat. very thin 2.5
A 10 YR 4/3 sandy loam 5-11
BI 10 YR 5/6 sandy loam 11-37
B2 10 YR 4/6 clayey sandy loam,mottles; appears to contain flecks 0 f 37-58 pyrite or mica
COMMENTS
approachmg C at S~ - silll mottles, SOIL IS becommg clayeyer ana greyer
177

u.s. Geological Survey 810 Bear Tavern Road, West Trenton, New Jersey 08628
Project: Imperial Oil SOIL SAMPLING FIELD SHEET
Site number: S2 clay Date: 2/26/96 Time (auger): Time (core): 1200 Personnel: TO, NPS Quadrangle: Formation: Location: Soil series: Sampler: split spoon
Weather: sunny; warm (50's) Hole Depth: 37"
DESCRIPTION
Thickness Horizon Color Texture (in inches)
COMMENTS
see S2 log
Samples: S2CLl S2CL2 I Date bottled: 2/29/96 Depths: -15"-26" ~29"-36"
Comments: S2CLI--from top ofliner - no mottling - yellowbrown; S2CL2--from bottom ofliner - very mottled grey & brown
Site number: S2 Date: 11128/95 Time (auger): 1045 Time (core): Personnel: Z Szabo, T Oden, J Evenson Quadrangle: Keyport Formation: Englishtown Location: N roc woods Weather: 60 OF Soil series: Keyport Sampler: corer Hole Depth: 3 feet
DESCRIPTION
Thickness Horizon Color Texture (in inches)
0 dark brown 0-2 Ag 1 OYR 4/2 dk brown sandy 2-8 Bl lOYR 6/6 clay 8-18 B2 lOYR 6/6 grading to lOYR 4/2 clay, mottled, orange & gray 18-27 B2 mottled 10YR 4/2 w. 10YR 6/6 clay, mottled gray & orange 27-42
COMMENTS
core recovery 0-8"=O&Ag 1-2' = compacted; 1-3' B 1 & B2
Samples:. S20 S2A S2Bl I Date bottled: 11128, 11130 Depths: 0-2" ~3-T' -9-15" Comments:
178
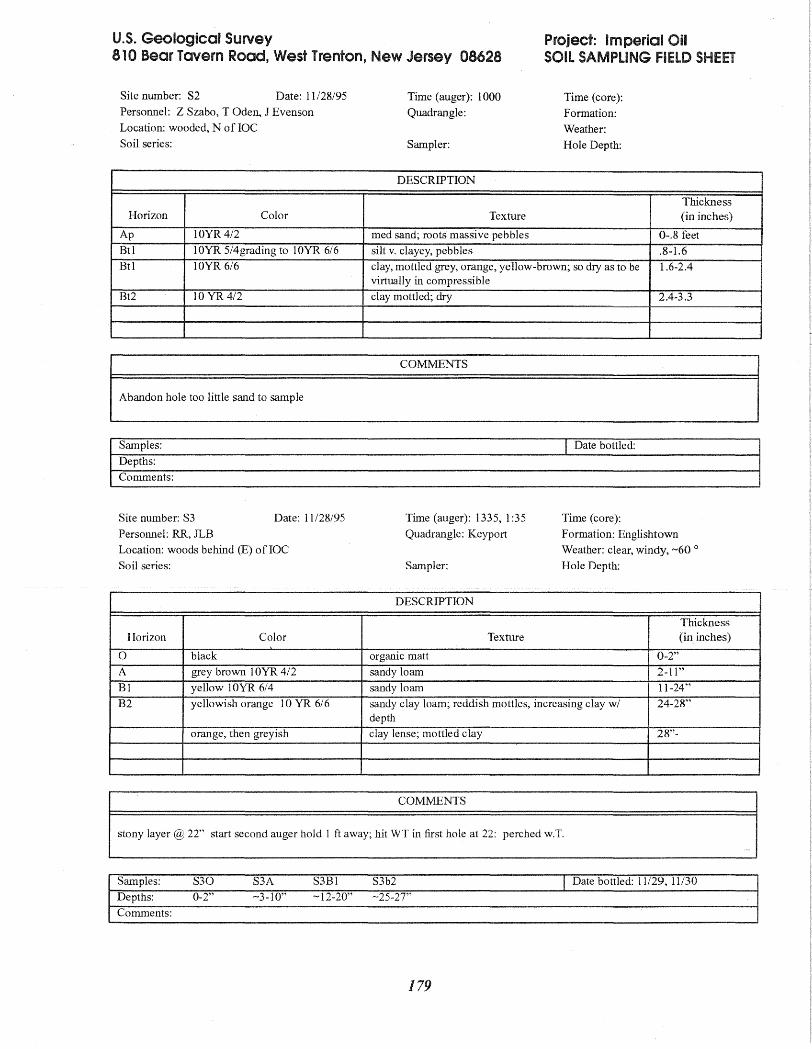
U.S. Geological Survey Project: Imperial on 810 Bear Tavern Road, West Trenton, New Jersey 08628 SOil SAMPLING fiELD
Site number: S2 Date: 11/28/95 Time ( auger): 1000 Time (core): Personnel: Z Szabo, T Oden, J Evenson Quadrangle: Formation: Location: wooded, N of IOC Weather: Soil series: Sampler: Hole Depth:
DESCRIPTION
Thickness Horizon Color Texture (in inches)
Ap 10YR 4/2 med sand; roots massive pebbles 0-.8 feet Btl 10YR 5/4grading to lOYR 6/6 silt v. clayey, pebbles .8-1.6 Btl 10YR 6/6 clay, mottled grey, orange, yellow-brown; so dry as to be 1.6-2.4
virtually in compressible
Bt2 10 YR 4/2 clay mottled; dry 2.4-3.3
, r Date bottled: Depths: (
Site number: S3 Date: 11128/95 Time (auger): 1335, 1 :35 Time (core):
Personnel: RR, JLB Quadrangle: Keyport F ormation: Englishtown
Location: woods behind (E) of IOC Weather: clear, windy, ~60 0
Soil series: Sampler: Hole Depth:
DESCRIPTION
Thickness Horizon Color Texture (in inches)
0 black organic matt 0-2"
A grey brown 10YR 4/2 sandy loam 2-11"
B1 yellow lOYR 6/4 sandy loam 11-24"
B2 yellowish orange 10 YR 6/6 sandy clay loam; reddish mottles, increasing clay w/ 24-28" depth
orange, then greyish clay lense; mottled clay 28"-
179

U.S. Geological Survey 810 Bear Tavern Road, West Trenton, New Jersey 08628
Site number: S4 Date: 11128/95 Time (auger): 1355 Personnel: Z Szabo, J Evenson T Oden Quadrangle Keyport Location: woods near burial mound Soil series: Keyport Sampler: corer
Project: Imperial Oil SOIL SAMPLING FIELD SHEET
Time (core): Formation: Englishtown Weather: warm, windy, -60 0
Hole Depth: 4' auger, -3' corer
DESCRIPTION
Horizon Color Texture Thickness (in inches)
0 2 A 10YR 4/2 grayish brown
A 10YR 7/2 light gray sand 12-17 B1 10YR 6/6 brownish yellow sand 17-19 BI 10)'R 5/8 yellowish brown sand many ironstone, roots & silt balls at 30" 19-31 B2 mottled 10YR 5/8 & lesser sand
IOYR 6/6 mottled, large chunks of ironstone at -43"; extremely bright color mottling
-48"
C 10YR 5/2 grayish brown sand; loose at 51"
COMMENTS
Samples: S40 S4A S4B1 S4B2 I Date bottled: 11129, 11130 Depths: 0-2" -3-9" -18-22 -27-36 Comments: S4B2 (may just be S4Bl deep)
Site number: S5 clay Personnel: TO, NPS Location: Soil series:
Date:2/26/96 Time (auger): Quadrangle:
Sampler: split spoon
Time (core): 1325
Formation: Weather: Partly cloudy, warm (50's) Hole Depth: 32"
DESCRIPTION
Horizon Color Texture Thickness (in inches)
rOM1\.
Samples: S5CLI s5CL2 I Date bottled: 3/1/96 Depths: -1-8 -20-30"
Comments:
180

U.S. Geological Survey 810 Tavern Road, West Trenton, New Jersey 08628
Site number: S5 Date: 11/28/95 Time (auger): 1545 Time (core): Personnel: R Rosman, Z Szabo Quadrangle: Keyport F ormation: Englishtown Location: IOC woods Weather: warm, windy, 60 0
Soil series: Keyport Sampler: Hole Depth:
DESCRIPTION
Thickness Horizon Color Texture
0 0-0.1 ' A lOYR 411 dark gray sand 0.1'-0.6' Bl 1 OYR 4/4 dark yellowish brown sand; massive 0.6' -1.1' B2 10YR 6/4 light yellowish brown sand; massive 1.1-1.6' B3 lOYR 7/3 very pale brown sand; massive, saturated, probably perched on clay 1.6'-2.6' B3 same colors as before massive fine sand, same colors with very large bright 2.6-3.0
orange mottles; perched water table!
Site number: S6 Date: 11129/95 Time (auger): Time (core): Abandoned 1342 Personnel: T aden, R Rosman Quadrangle: Keyport F ormation: At Location: laC woods Weather: Cold, Snow cover Soil series: Sampler: Hole Depth:
DESCRIPTION
Thickness Horizon Color Texture (in inches)
a Black 3"
A Black 10YR 2/2 26"
, I Date bottled: Depths: (
181

U.S. Geological Survey 810 Bear Tavern Road, West Trenton, New Jersey 08628
Project: Imperial Oil SOIL SAMPLING FIELD SHEET
Site number: S7 clay Date: 2/26/96 Time (auger): Personnel: TO, NPS Quadrangle: Location: IOC woods
Soil series: Sampler: split spoon
DESCRIPTION
Time (core): 1230
Formation:
Weather: sunny, warm (50's)
Hole Depth: 32"
Thickness Horizon Color Texture
COMMENTS
See S7 soil log
Samples: S7CLl S7CL2
Depths: -13-18" -25-32"
Comments:
Site number:S7 Date: 11/29/95 Time (auger): 1345
Personnel: R Rosman, T Oden Quadrangle: Keyport
(in inches)
I Date bottled: 2/29/96 (CL2), 3/1196(CLl)
Time (core):
Formation: Englishtown
Location: IOC woods Weather: cold cloudy snow covered
Soil series:KEB? May be Atsion JLB Sampler:
DESCRIPTION
Hole Depth:
Thickness Horizon Color Texture
0 dark brown sand with roots dark brown root mats; sand & loam darker than co lor chart 10YR 2/2
A dark brown sand with light gray sand & loam sticky, some cobbles sand
B gray orange mottled clay massive & blocky
COMMENTS
Total depth of hole 20"; mottled grey & orange clay from 12"-20"
(in inches)
0-2"
2-12"
starts at l'
182

U.S. Geological Survey Project: Imperial Oil 810 Bear Tavern Road, West Trenton, New Jersey 08628 SOIL SAMPLING FIELD SHEET
Site number:S8 Date: 11130/95 Time (auger): 9:50 Time (core): Personnel: JLB, TO, RR, ZS Quadrangle: Keyport Formation: Location: Weather: Soil series: Sampler: Hole Depth:
DESCRIPTION
Thickness Horizon Color Texture (in inches)
blackish clay o-? in first 6"
COMMENTS
I Abandon; no sample collected
I Date bottled: . Depths: (
Site number: S9 duplicate Date: 11130/95 Time (auger): 1135 Time (core):
Personnel: Szabo, Rosman Quadrangle: Keyport F ormation: Englishtown
Location: woods behind 10C Weather:
Soil series: KEB Sampler: Hole Depth: 4'
DESCRIPTION
Thickness Horizon Color Texture (in inches)
COMMENTS
Pounded core to 18" removed core barrel; dug out large cobble augering to 18". Resume coring to 4'.
183

u.s. Geological Survey Project: Imperial Oil 810 Bear Tavern Road, West Trenton, New Jersey 08628 SOIL SAMPLING FIELD SHEET
Site number: S-9 Dup Date: Time (auger): 11130/95 Time (core): Personnel: ZS, JLB, TO, RR Quadrangle: Keyport Formation: Englishtown Location: IOC woods Weather: cold, snow cover Soil series: Sampler: Hole Depth:
DESCRIPTION
Thickness Horizon Color Texture (in inches)
rl .1 L
n.~
L I Date h lttled:
Depths: (
Site number: S9 Date: 11/30/95 Time (auger): 9:55 Time (core): 1040 Personnel: ZS, JLB, TO, RR Quadrangle: Keyport Formation: Englishtown Location: IOC woods Weather: cold, snow cover -30 0
Sciil series: Sampler: Hole Depth:
DESCRIPTION
Thickness Horizon Color Texture (in inches)
0 black organic mat & sand 0-1" A dk grey lOYR 3/2 sandy, root hairs 1-12" A2 yellowish tan lOYR 5/2 sandy loam; brown mottles begin @ 15" 12-18 Bl brown 7.5 YR 5/5 sandy loam; mottles - ironstone layer @ 19.5" 18-26 B2 yellow brown 10 YR 5/6 clayey sand; sandy, some clay 26-32 B3: or C paler yellow tan getting wet - W.T. @ 42" 32-57
COMMENTS
A horizon has faint sweetish smell - organic contaminant? Start second auger hole because of refusal @ 19.5"; second hole - refusal at same depth; start 3rd auger hole - Abandon, removed cemented layer in 2nd hole
184
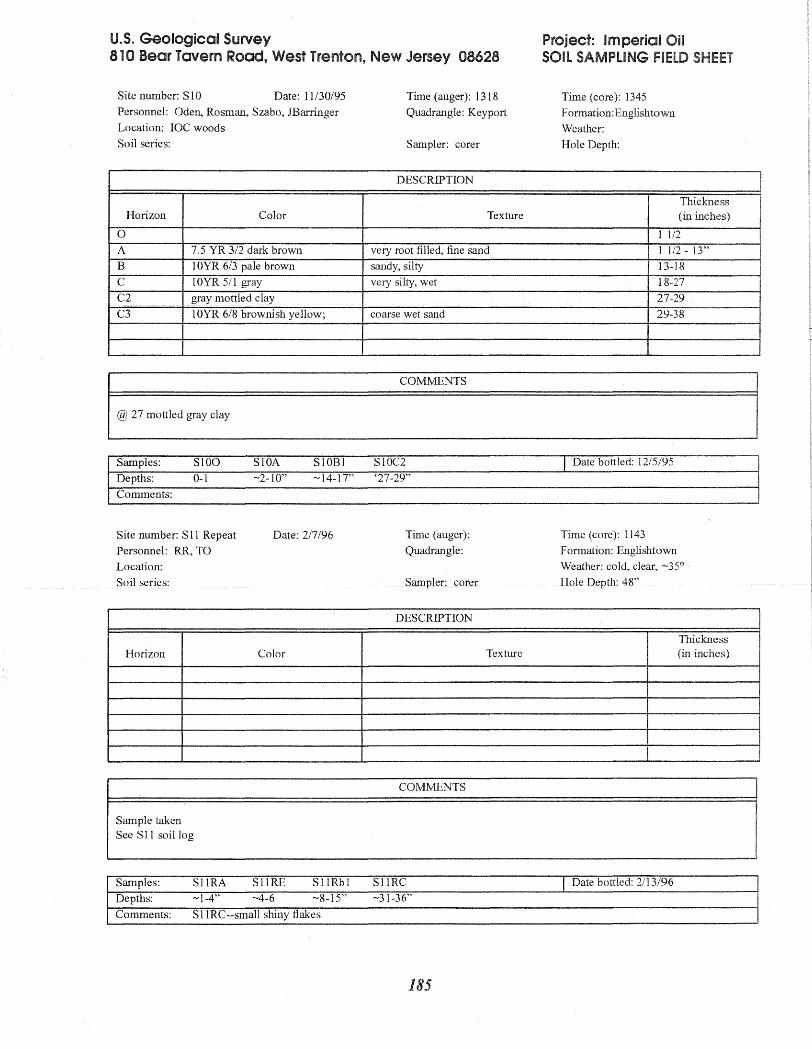
U.S. Geological Survey 810 Bear Tavern Road, West Trenton, New Jersey 08628
Site number: S 10 Date: 11/30/95 Time (auger): l318 Personnel: Oden, Rosman, Szabo, JBarringer Quadrangle: Keyport Location: IOC woods
Time (core): 1345
F ormation:Englishtown Weather:
Soil series: Sampler: corer
DESCRIPTION
Hole Depth:
Thickness Horizon Color
0
A 7.5 YR 3/2 dark brown very root filled, fine san
B lOYR 6/3 pale brown sandy, silty
C lOYR 511 gray very silty, wet
C2 gray mottled clay
C3 lOYR 6/8 brownish yellow; coarse wet sand
Site number: S 11 Repeat Date: 217/96 Time (auger):
Personnel: RR, TO Quadrangle:
Texture
d 1 112
1 112 - 13" 13-18 18-27
27-29
29-38
Time (core): 1143 F ormation: Englishtown
Location: Weather: cold, clear, -35 0
Soil series: Sampler: corer
DESCRIPTION
Hole Depth: 48"
Thickness Horizon Color
COMMENTS
Sample taken See S II soil log
Texture (in inches)
185

U.S. Geological Survey Project: Imperial Oil 810 Bear Tavern Road, West Trenton, New Jersey 08628 SOIL SAMPLING FIELD SHEET
Site number: Sll Date: 12111/95 Time (auger): 10:00 Time (core): Personnel: ZS, TO, JLB, NS Quadrangle: Keyport F ormation: Englishtown Location: N of IOC woods Weather: clear, very cold, 20 as Soil series: Evesboro Sampler: Hole Depth:
DESCRIPTION
Thickness Horizon Color Texture (in inches)
A greyish brown 10YR 5/2 sandy 0-4"
E yellowish brown 10YR 5/2-5/4 sandy 4-6
BN yellowish brown lOYR 5/6 sandy; yobbles & pebbles @ 14" & ironstone 6-30
C greyish brown 10YR 5/3 sandy layer; wetter @ 40" 30-
COMMENTS
Will sample later - this area may have been orchard; No sample collected 12111195
Samples: Date bottled:
Depths: Comments:
Site number: S 12 Repeat Date: 1217/96 Time (auger): Time (core): 1125
Personnel: T Oden, R Rosman Quadrangle: Keyport F ormation: Englishtown
Location: IOC woods Weather: clear, cold 30's
Soil series: Evesboro Sampler: corer Hole Depth: 4 ft 3 inches
DESCRIPTION
Thickness Horizon Color Texture (in inches)
A
E
Bw C? C
COMMENTS
Moved hole 14 1/2 inches from previous ironstone @ 30" augered out next 4" reinserted @ 34" drove to 51"; no "0" horizon Frozen Top - A horizon top 5 inches put in Bag & labeled @ 1028
Samples: Sl2RA S12RAD S12RE RS12RBw S12RC I Date bottled: 2/14/96
Depths: -1-8 ~1O-l6 -20-30" -47-50"
Comments: S12RAD (duplicate/split)(from bag)
186

u.s. Geological Survey 810 Bear Tavern Road, West Trenton, New Jersey 08628
Project: Imperial Oil SOIL SAMPLING
Site number: S 12 Date: 12111195 Time (auger): 10:30 Personnel: JLB Quadrangle: Keyport Location: lOC woods Soil series: Evesboro Sampler: corer
Time (core): 11:00
Formation: Englishtown Weather: Clear, very cold, 20's Hole Depth:
DESCRIPTION
Thickness Horizon Color Texture (in inches)
A brownish grey 10YR 5/3 sand 0-9" E pale yellow lOYR 6/4 sand 9-18
Bw orangey yellow IOYR 5/6 sand; cobbles & ironstone @ 27"; slightly wetter, faint mottles @40"
18-46
C? greyer 10YR 5/3 sandy 46-57
C grey 10YR 5/2 sand 57+
COMMENTS
Went to 2 ft, pulled out, augered past ironstone layer 26"-36" missing, reinserted corer @ 36"
\,;''}"",n !"<" . I Date bottled:
Depths: (
Site number: S 13 Repeat Date: 217196 Time (auger): Time (core): 1408
Personnel: R Rosman, T Oden Quadrangle: Keyport F ormation: Englishtown
Location: Weather: clear cold 30's
Soil series: Evesboro Sampler: Hole Depth:4'
DESCRIPTION
Thickness Horizon Color Texture (in inches)
~
COMMENTS
Core catcher pushed into middle barrel. Only I t1 of sample recovery. (middle barrel) See S 13 soil log
Samples: S13RA S13RB S13RC! I Date bottled: 2/14/96
Depths: -2-10 -15-22 -46-47"
Comments: "0" (0-1 ")(horizon) frozen top bagged; S 13RC 1--taken from below ironstone fragments
187

u.s. Geological Survey Project: Imperial Oil 810 Bear Tavern Road, West Trenton, New Jersey 08628 SOIL SAMPLING FIELD SHEET
Site number: S 13 Date: 12/11195 Time (auger): 12/11195 Time (core): 1145 Personnel: Tim Oden, Z Szabo Quadrangle: Formation: Location: Imperial Oil Woods, briar patch near main trail Weather: sunny, windy, cold -20 of
Soil series: Evesboro Sampler: corer Hole Depth: 4 ft
DESCRlPTION
Horizon Color Texture Thickness (in inches)
0 nearly black sandy 0-1 AorE 1 OYR 4/3 dark brown, grading to
1 OYR 4/4 dark yellowish brown at 6"
sandy fine dry 1-12
Bj 7.5 YR 5/8 strong brown sand, fine very; micaceous, no structure no pebbles, some roots, very dry
12-45
C j 10YR 5/4 yellowish brown sand, fine; mottled with strong brown & yellow dry 45-47 C2 10YR 7/6 yellow sand, fine to medium; mottled with yellowish brown;
mottles large scale grainy black material or mica dry 47-55
COMMENTS
No 0 collected in jars w. trowell; Did not appear to reach C despite driving to 49" Compaction?
Samples: Date bottled:
Depths:
Comments:
Site number: S 14 Repeat Date: 217/96 Time (auger): Time (core): 1453
Personnel: R Rosman, T Oden Quadrangle: Keyport F ormation:KEt Englishtown Location: JOC woods Weather: clear cold 30's
Soil series:Evesboro Sampler: corer Hole Depth: 24"
DESCRlPTJON
Horizon Color Texture Thickness (in inches)
0 0-1
COMMENTS
"0" horizon "0"-1 - Frozen at surface. Sampled & bagged & Labeled; wrong--will not drive any farther than 30; past 24 inches lost core catcher
Samples: S14RO S14RA S14RB I Date bottled: 2/15/96
Depths: 0-1 " -2-9" -20-24"
Comments: S14RO--No S sample
188

Geological Survey 810 Bear Tavern Road, 08628
Site number: S 14 Date: 12111/95 Time (auger): Time (core): Personnel: N Smith, T Oden, Z Szabo Quadrangle: Formation: K Et Location: clear patch woods, IOC Weather: sunny, windy, cold -25 OF Soil series: Evesboro Sampler: corer Hole 3'
DESCRIPTION
nnckness Horizon Color Texture
0 nearly black roots 0-1
A 10YR 4/2 dark grayish brawn sand, fine 1-10
E? 10YR 6/4 light yellowish brown sand, fine 10-13"
10YR 7/6 yellow sand, fine i3-19"
B 10YR 6/6 brownish yellow silt, w. fine sand; wet, sticks together-plastic 19-25"
10YR 6/6 massive wet clay 25-31 "
I Date bottled: c
Depths: (
Site number: S 15 Repeat Date: 217196 Time (auger): Time (core): 1220
Personnel: R Rosman, T Oden Quadrangle: Keyport Formation: Englishtown
Location: IOC woods Weather: clear cold 30's
Soil series: Sampler: corer Hole Depth: 4'
DESCRIPTION
Thickness Horizon Color Texture (in inches)
0 0-1
COMMENTS
O-Horizon 0-1" sampled, bagged & labeled @ 1216 See S15 soil log
189

U.S. Geological Survey Project: Imperial Oil 810 Bear Tavern Road, West Trenton, New Jersey 08628 SOIL SAMPLING FIELD SHEET
Site number: S 15 Date: 12111/95 Time (auger): 1446 Time (core): Personnel: TO, ZS, JLB, NS Quadrangle: Keyport F ormation:Englishtown Location: IOC woods Weather: clear, very cold, low 20's Soil series: Sampler: Hole Depth:
DESCRIPTION
Horizon Color Texture Thickness (in inches)
0 roots 0-1.5" A Brown lOYR 4/3 sandy 1.5-6 B1 yellowish brown 10YR 4/4 sandy 6-15 B2 orange brown lOYR 5/8 sand, some clay; pebbles: a few also roots wetter & siIt-
ier @ 32" more clay 15-37
<.
COMMENTS
Samples: Date bottled:
Depths: Comments:
Site number: S 16 clay Date: 2/26/96 Time (auger): Time (core): 1045 Personnel: TO, NPS Quadrangle: F ormation: Englishtown Location: N of IOC woods Weather: sunny, warm (50's) Soil series: Sampler: split spoon Hole Depth: 24"
DESCRIPTION
Horizon Color Texture Thickness (in inches)
COMMENTS
Cleared leaves, drove split-spoon sampler to 24" BLS See S 16 soil log
Samples: S16A S16B S16CL I Date bottled: 2129/96
Depths: -2-10" -14-20 -30-34 Comments: S 16A--probably has a little 0 included, somwhat gradational A is V. organic W lots of roots, etc.; S-16CL--clay-silty clay, getting stiffer in depth composited - 4" at bottom ofliner JLB
190

U.S. Geological Survey Project: Imperial Oil , 810 Bear Tavern Road, West Trenton, New Jersey 08628 SOIL SAMPLING FIELD SHEET
Site number: S 16 Date: 2/12/96 Time (auger): 1427 Time (core): 1445lbst Personnel: RR, NPS Quadrangle: Keyport Formation: Location: woods near IOC Weather: cold (20's), partly sunny, breeay Soil series: Sampler: corer Hole Depth:24" lost sample
DESCRIPTION
Thickness Horizon Color Texture (in inches)
0 7.5 YR 3/2 dark brown medium sandy loam 0-0.5 A 10 YR 4/3 brown medium sand 0.5-12" B 10YR 5/6 yellowish brown fine sand, becoming a silty clay at 14" at 21:, some gray-
ish clay mottles (10YR 5/1) virtually all silty clay from 14"-35"
COMMENTS
Drove to 24", sampler came up empty - too clayey; "0" horizon bagged at 1433; no sample
Samples: Date bottled:
Depths: Comments:
Site number: S 17 Date: 2112/96 Time (auger): 1500 Time (core): 1515 Personnel: RR, NPS Quadrangle: Keyport Formation:
Location: woods near IOC Weather: cold (20's), partly sunny, breezy
Soil series: Sampler: corer Hole Depth: 19"
DESCRIPTION
Thickness Horizon Color Textufe (in inches)
0 7.5YR 3/2 dark brown sandy loam 0-0.5" 10 YR 4/3 brown medium sand 0.5-12" 10YR 5/6 yellowish brown fine sand, bedding A silty clay at -20", mottled with 12-
(lOYR511 gray) clay 27"-37.5"
COMMENTS
"0" Horizon bagged @ 1500; Drove sampler to 19" to avoid clay
Samples: S17A S17Bl 1 Date bottled:2/20/96
Depths: -2-9" -13-18"
Comments:
191

U.S. Geological Survey Project: Imperial Oil 810 Bear Tavern Road, West Trenton, New Jersey 08628 SOIL SAMPLING FIELD SHEET
Site number: S 19 clay Date: 2/26/96 Time (auger): Time (core): 1025 Personnel: TO, NPS Quadrangle: F ormation: Englishtown Location: N of lac woods Weather: Sunny, warm (50's) Soil series: Sampler: split spoon Hole Depth: 36"
DESCRIPTION
Horizon Color Texture Thickness (in inches)
COMMENTS
Augered to 12", drove split spoon sampler to 36" BLS See S19 soil log
Samples: S19CLl S19CL2 I Date bottled: 2/29/96
Depths: ~20-25" ~29-35"
Comments: S 19CL l--yellow brown, stiff clay; S 19CL2--mottled greyish clay & strongly orangey brown sand
Site number: S 19 Date: 2/13/96 Time (auger): 1230 Time (core): 1255 LOST, 1305 OK
Personnel: TO, NPS Quadrangle: Formation: E'town Location: N of laC woods Weather: cold (20's), sunny, breezy
Soil series: Sampler: corer Hole Depth: 14 " LOST, 12" OK
DESCRIPTION
Horizon Color Texture Thickness (in inches)
a 7.5 YR 3/2 dark brown organic, roots (frozen) 0-1 A 10 YR 4/3 brown fine-medium sand 1-5
B 10YR 5/4 yellowish brown slightly silty sand 5-10 10YR 5/6 yellowish brown silt 10-14 10YR 5/6 yellowish brown clay 14-28
COMMENTS
1" frozen soil removed before augering and bagged @ 1250; drove to 14" BLS, sampler empty; replaced liner and core-catcher in bottom section of sampler, drove to 12" - OK
Samples: S19A S19B I Date bottled: 2/16/96 Depths: ~2-5" ~6-10"
Comments:
192

u.s. Geological Survey 810 Bear Tavern Road, West New Jersey 08628
Site number: S20 Duplicate Date: 2/13/96
Personnel: TO, NPS
Location: N of lOC woods
Soil series:
Time (auger):
Quadrangle:
Sampler:
DESCRIPTION
Time (core): 1215
Formation:
Weather: cold (20's), sunny, Hole Depth: 44"
Thiclmess Horizon Color
Samples: S20DA S20DBI
Depths: -3-8 ~12-15
Comments: metals only sent to determine if there's alsOK
Site number: S20 Date: 2/13/96
Texture
systematic loss to liner walls over t
Time (auger): 1130
(in
I Date bottled: 3/21/96
ime. Hg will be over holding time; other met-
Time (core): 1205
Personnel: TO, NDS Quadrangle: F ormation: Englishtown
Location: woods near Imperial Oil Weather: cold (20's), sunny, windy
Soil series: Sampler: corer
DESCRIPTION
Hole Depth: 44"
Thickness Horizon Color Texture (in inches)
7.5 3/2 dark brown organic (frozen) 0-2" ° A 10 YR 4/3 brown fine-to-medium sand; some roots 2-10
Bl 10YR 4/4 dark yellowish brown fine-to-medium sand 10-16
B2 10YR 5/6 brownish yellow fine-to-medium sand; roots at 27"; mottled with above 16-45 horizon from 16-20
10YR 5/6 yellowish brown sandy silt; few roots, few small cobbles 45-53
193

U.S. Geological Survey 810 Bear Tavern Road, West Trenton, New Jersey 08628
Site number: S21 Date: 3/1196 Time (auger): 1420 Personnel: Z Szabol T Oden Quadrangle: Location: woods behind house - halfway to "S" "pit"
Soil series: Keb on map - description appears to be Sampler: Lakehurst LaA
Project: Imperial Oil SOIL SAMPLING FIELD SHEET
Time (core): none taken for sample Formation: Weather: sunny 34 of dry cold Hole Depth:
DESCRIPTION
Horizon Color Texture Thickness (in inches)
0 black root mat I
A 10YR 3/2 v. dark grayish brown med sand w. roots~ roots, friable 11
F 10YR 6/2 light brownish gray med sand, quartzose 18
Bh ! OYR 5/3 brown sand, med 20
BW" B2 10YR 5/4 yellowish brown sand, med, some sand fine 26
BC,B3 10YR 6/3 pale brown sand, fine some sand med; wet
C 10YR 6/2 light brownishcgray sand, med - wet; at 41" mottled w. lOYR 7/4 & 7/6 sand very pale brown & yellow; at 48" mottles become 10YR 6/8; also standing water brownish yellow after about 45"; quit hole at 56"
en
Samples: Date bottled:
Depths: Comments:
Site number: Personnel: Location: Soil series:
Date: Time (auger): Quadrangle:
Sampler:
Time (core): Formation: Weather: Hole Depth:
DESCRIPTION
Horizon Color Texture Thickness (in inches)
C" . I Date bottled:
Dept~s~ (
194

U.S. Geological Survey Project: Imperial Oil 810 Bear Tavern Road, West Trenton, New Jersey 08628 SOil SAMPLING
Site number: R 1 Date: 2/28/96 Time (auger): 1115 Time (core): 1215 Personnel: TDO, NPS Quadrangle: Keyport F ormation: Englishtown Location: Under apple tree, frontcomer of lot Weather: Cool, cloudy (40s) Soil series: Keyport Sampler: Corer Hole Depth: 48"
DESCRIPTION
Thickness Horizon Color Texture (in inches)
A 10 YR 4/3 Brown Medium sand 1-5"
Bl 10 YR 5/4 Yellowish brown Medium sand~ few pebbles, roots near top of interval 5-21" Bl 10 YR 5/5 Yellowish brown Medium sand 21-23"
B2 10 YR 5/6 Yellowish brown Medium sand; ma'1Y cobbles 23-38, ironstone, conglom- 23-40" erate (saved)
B3 7.5 YR 5/6 Strong brown Medium sand 40-46"
B3 10 YR 4/4 Dark yellowish brown 46-57"
COMMENTS
Removed 1" sod before augering, sampling; large ironstone conglomerate pulled from augered hole and saved. Bottom 4" of sample lost with core-catcher.
Samples: RIA R91A RIBI RIB2 RIB3 I Date bottled: 3/6/96
Depths: 1-5" 8-15" 23-28" 28-40"
Comments: RIB2 mottled; RIB3 wet, more orangy, and more clayey sand. Many cobbles above and in samples. (Removed cobbles)
Site number: RI-Dup Date: 2/28/96 Time (auger): Time (core): 1330
Personnel: IDO, NPS Quadrangle: Keyport F ormation: Englishtown
Location: Same as R 1 Weather:
Soil series: Sampler: Hole Depth: 48"
DESCRIPTION
Thickness Horizon Color Texture (in inches)
Same as Rl
COMMENTS
Removed 1" sod before sampling. Core-catcher pushed up to top of bottom section of sampler; removed from sampler and bagged.
195

u.s. Geological Survey Project: Imperial Oil 810 Bear Tavern Road, West Trenton, New Jersey 08628 SOIL SAMPLING FIELD SHEET
Site number: R2 Date: 2/28/96 Time (auger): 1410 Time (core): 1450,1510 Personnel: TDO, NPS Quadrangle: Keyport Formation: Englishtown Location: Under apple tree Weather: Cool, cloudy Soil series: Sampler: 2 split spoons Hole Depth: 48"
DESCRIPTION
Thickness Horizon Color Texture (in inches)
A 10 YR 4/3 Brown Medium sand 1-7" Bl 10 YR 5/6 Yellowish brown Fine-medium sand 7-9"
B2 10 YR 4/6 Dark yellowish brown Fine-medium sand; silty 9-42"
7.S YR 6/8 Reddish yellow Fine-medium sand w/ clay 42-51 "
COMMENTS
Removed 1 sod betore augenng, sampling; Pounded spilt-spoon sampler to 24" BLS, wIthdrew; Pounded second split-spoon sampler from 23" to 48" BLS
Samples: R2A R2Bl R2B2 R2CLl R2CL2 R92CL2 I Date bottled: 3/4/96
Depths: 1-7" 8-12" 14-24" 26-30" 38-48" 48"
Comments: R2CL2 just like clay beneath roc woods, grey with mottles of red-orange silt
Site number: R3 Date: 3/1/96 Time (auger): 1015 Time (core): 1200
Personnel: ZS, TO Quadrangle: Keyport Formation: ET
Location: contaminated comer 220 Weather: Sunny, cold (30), dry
Soil series: Keb from map; fill + keb from coring Sampler: spJi t spoon Hole Depth: 32"
DESCRIPTION
Thickness Horizon Color Texture (in inches)
lay 10 YR 5/3 Brown Clay, mottled w/ sand mixed in as orangish mottles 10"
10 YR 6/6 Brownish yellow for sandy mottles; clay blocks 7.5YR 5/2-brown; cinder material mixed thru clay, possible charcoal, blocky, mottled many roots
pne black orgaic sand in places looks layered; sand very micaceous, large blocks of rorizons massive clay peds?
7.5 YR 5/2 brown blocky clay dominant mixed w. copius black cinder? glass pieces; 20" small amounts of bright intermixed sand 7.5YR 6/8 reddish yel-low; clay & cinder; 15-20" sudden increase in slag/cinder amounts also presence of masses of granular white quartz abrupt change at 20" sudden disappearance of cinders;no sign of cinders below 20"
~tl 10YR 5/4 yellowish brown clay, mixed thoroughly w. silt, some sand; roots, massive, occa- 26" sionally blocky, occasional pebbles, no mottles
Bt2 IOYR 5/4 yellowish brown clay, blocky, plastic, finn; mottled w. gray (lOYR 6/1) & brown- 39" ish yellow (lOYR 6/8)
Bt2-mottle 7.5 YR 6/8 reddish yellow med. sand w. silt & plastic clay; wildly mottled w. gray lOYR 6/1, 41" various shades of orange & 7.5 YR 5/4 brown; brown almost in layers or concentric bands around sand pockets; some IOYR 6/8 brownish yellow
COMMENTS
appears as natura onzon
Samples: R3 R3 R3 R3B2 R3A I Date bottled:3/6/96, 3/11/96,
Depths: 1-1" 7-10" 10-15" 20-32 1-20"
Comments: R3B2, R3a core samples; rest auger samples. R3A not a true A horizon; clayey, some cinders, sand
196

Geological Survey a 1 0 Bear Tavern Road, West New
Site number:R3 spatial dup Date:3/l/96 Time (auger):No Time (core): 1325 Personnel:Z SzabolT Oden/N Smith Quadrangle:Keyport Formation: ET Location: contaminated comer 220 Weather: sunny cold dry 30 Soil series: Keb + possible fill material Sampler:split spoon Hole Depth: 37.5"
DESCRIPTION
Thickness Horizon Color Texture (in inches)
Sanlples: R3DA, R3DB2 I Date bottled:31l1l96 Depths:
Comments: R3Da somewhat clayey, more cinders than R3A. R3DB2 sampled clay over larger interval than R3B2.
Site number:R4 Date:3/1196 Time (auger): 1445 Time (core): 1550
Personnel: ZS, TDO, NPS Quadrangle: Keyport Formation: Englishtown Location: near hole 2, 191 ppm site Weather: cold 35 sunny dry
Soil series: Keb Sampler: split spoon Hole Depth: 36"
DESCRIPTION
Thickness Horizon Color Texture (in inches)
A? proba- 10 YR 5/3 brown silt; few roots, small amts clay 1-11 " blyBI B2 10 YR 5/3 brown clay w. minor amts silt; 7.5 YR 5/6 strong brown, 10 YR 11-44"
5/2 grayish brown at 14" becomes very blocky 7.5 YR 5/ 2 brown in color, at 21" bright 1 0 YR 6/8 brownish yel-low mottles very common, at 28" becomes more 7.5 YR 5/3 brown, 10 YR 611 gray mottles more prevalent at 35-40"
COMMENTS
Drove sampler to 36" BLS Small cinders at 14"
Samples: R4A R4B2 R4CL2 J Date bottled:3111196 Depths: 2-10" 12-20" 30-40"
Comments:R4B2--Some cinders (?) + Brick specks but otherwise looks like clay at IOC woods w/ red silty stringers; R4CL2--Bot-tom of core, this is clay like that at IOC woods
197
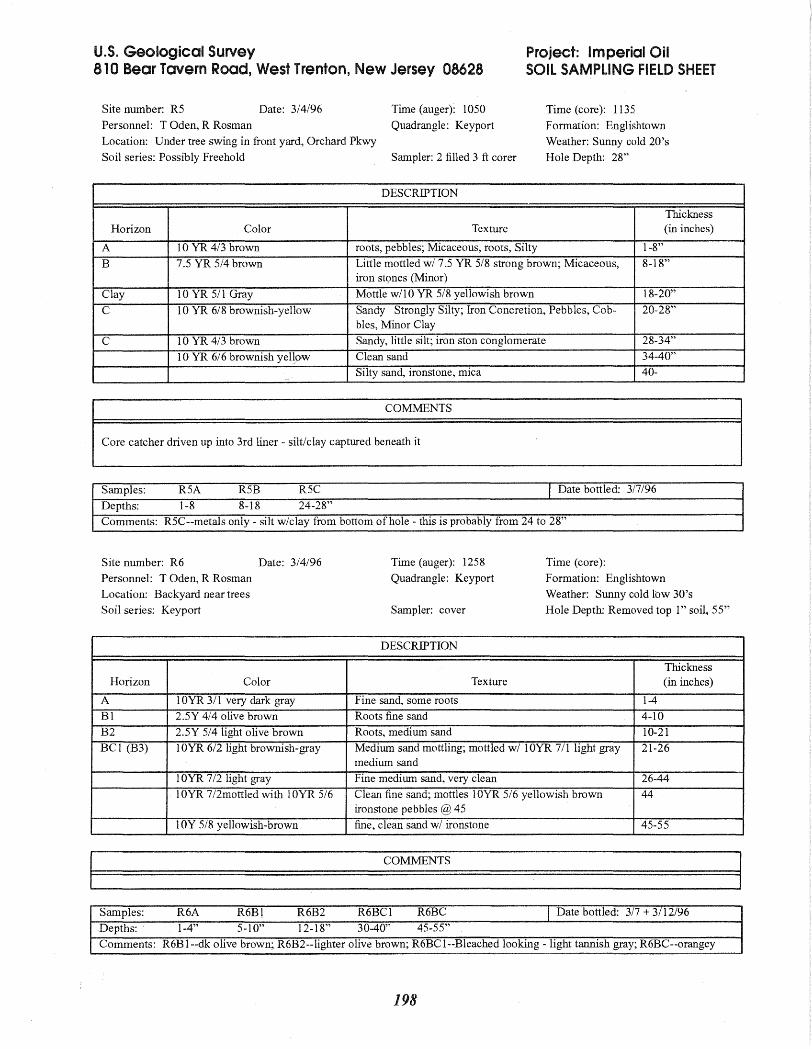
u.s. Geological Survey 810 Bear Tavern Road, West Trenton, New Jersey 08628
Site number: R5 Date: 3/4/96 Time (auger): 1050 Personnel: T Oden, R Rosman Quadrangle: Keyport Location: Under tree swing in front yard, Orchard Pkwy Soil series: Possibly Freehold Sampler: 2 filled 3 ft corer
Project: Imperial Oil SOil SAMPLING FIELD SHEET
Time (core): 1135 F ormation: Englishtown Weather: Sunny cold 20's Hole Depth: 28"
DESCRIPTION
Horizon Color Texture Thickness (in inches)
A 10 YR 4/3 brown roots, pebbles; Micaceous, roots, Silty 1-8"
B 7.5 YR 5/4 brown Little mottled w/ 7.5 YR 5/8 strong brown; Micaceous, iron stones (Minor)
8-18"
Clay 10 YR 511 Gray Mottle wi 10 YR 5/8 yellowish brown 18-20"
C 10 YR 6/8 brownish-yellow Sandy Strongly Silty; Iron Concretion, Pebbles, Cob-bles, Minor Clay
20-28"
C 10 YR 4/3 brown Sandy, little silt; iron ston conglomerate 28-34"
10 YR 6/6 brownish yellow Clean sand 34-40" Silty sand, ironstone, mica 40-
COMMENTS
Core catcher driven up into 3rd liner - silt/clay captured beneath it
Samples: R5A R5B R5C I Date bottled: 3/7/96
Depths: 1-8 8-18 24-28"
Comments: R5C--metals only - silt w/clay from bottom of hole - this is probably from 24 to 28"
Site number: R6 Personnel: T Oden, R Rosman Location: Backyard near trees Soil series: Keyport
Date: 3/4/96 Time (auger): 1258 Quadrangle: Keyport
Sampler: cover
Time (core): Formation: Englishtown Weather: Sunny cold low 30's Hole Depth: Removed top I" soil, 55"
DESCRIPTION
Horizon Color Texture Thickness (in inches)
A 1 OYR 3/1 very dark gray Fine sand, some roots 1-4 BI 2.5Y 4/4 olive brown Roots fine sand 4-10 B2 2.5Y 5/4 light olive brown Roots, medium sand 10-21 BCI (B3) 10YR 6/2 light brownish-gray Medium sand mottling; mottled wI 10YR 7/1 light gray
medium sand 21-26
10YR 7/2 light gray Fine medium sand, very clean 26-44 10YR 7/2mottled with IOYR 5/6 Clean fine sand; mottles 10YR 5/6 yellowish brown
ironstone pebbles @ 45 44
lOY 5/8 yellowish-brown fine, clean sand w/ ironstone 45-55
Samples: R6A R6Bl R6B2 R6BC1 R6BC I Date bottled: 3/7 + 3/12/96 Depths: . 1-4" 5-10" 12-18" 30-40" 45-55"
Comments: R6Bl--dk olive brown; R6B2--1ighter olive brown; R6BC1--B1eached looking - light tannish gray; R6BC--orangey
198

u.s. Geological Survey Project: Imperial Oil 810 Bear Tavern Road, West Trenton, New Jersey 08628 SOIL SAMPLING fiELD SHEET
Site number: R 7 Date: 3/4/96 Time (auger): 1410 Time (core): 1500 Personnel: T Oden, R Rosman Quadrangle: Keyport Formation: Englishtown Location: Backyard halfway up hiU10 feet from grove of trees Weather: Sunny, cold, low 30's, windy Soil series: Keyport Sampler: Hole Depth: 48"
DESCRlPTION
Thickness Horizon Color Texture (in inches)
A 10YR 3/4 dark yellowish brown Roots, cobbles, fine grained; Micaceous 1-7 A2 10YR 4/6 dark yellowish brown Fine grained cobbles 7-12 B 10YR 5/8 yellowish brown Silty cobbles wet, fine grained; cobble layer + ironstone 12
@ 17" getting wetter w/depth, large boulder @ 28 auger-ing next to hole
COMMENTS
Try 3 logs for hole couldn't get passed 25-28"; tried sampling it anyway pounded to 48 got 1 foot recovery too -20-24"
Samples: R7A R7A2 R7B2 J Date bottled: 2/11/96 Depths: 1-5" 5-7" 12 + 17 Comments: upper layers may be disturbed; R7 A2--bottom of soil horizon, at cobble layer which is at interface with clayey, silty, B horizon
Site number: R8 Date: 3/5/96 Time (auger): 0955 Time (core): 0-2' - 1020; 2-4' - 1045 Personnel: T Oden, R Rosman Quadrangle: Keyport F ormation: Englishtown Location: Looking at the house from Rd--Right side of Driveway 10' from Rd Weather: Cloudy, cool, 45, breezey Soil series: Keyport Sampler: split spoon Hole Depth: 48" Removed top 1" of soil
DESCRlPTION
Thickness Horizon Color Texture (in inches)
A lOYR 3/3 dark brown very fine roots; Micaceous, little,silty 1-5 Bl 10 YR 5/8 yellowish brown Silty, fine sand, blocky; iron pebbles, siltier with depth 5-35
,,/
(13-18) less silty 18- , B2 10 Yr 5/8 yellowish brown Mottled wllOYR 5/1 + 7.5 YR 6/8 35-39 Cl1+2 10YR 5/6 yellowish brown Clay mottled w/sand; clay @ 45 10YR 511 gray 39-53
COMMENTS
Stopped augering @ 53"; split spoon samples
Samples: R8A, R8B1, R8B2, R8CL1, R8CL2 I Date bottled: 3/12/96 Depths: 1-5", 6-12", 35-39", 40-46" 46-50"
Comments: R8B2--orangey silt, some clay; R8CL1--metals only - top of clay mixed w/some silt; R8CL2-clay w/silt blebs+stringers
199

U.S. Geological Survey 810 Bear Tavern Road, West Trenton, New Jersey 08628
Site number: R9 Date: 3/5/96 Time (auger): 1230
Personnel: T Oden, R Rosman Quadrangle: Keyport
Location: In front yard-5 feet from road in the middle of Circle Drive
Soil series: Keyport Sampler: split spoon
Project: Imperial Oil SOIL SAMPLING FIELD SHEET
Time (core): 1250
Formation: Englishtown
Weather: Sunny, Cool, 45, breezey
Hole Depth: 32"
DESCRIPTION
Horizon Color Texture Thickness (in inches)
a Rooty, black; organic rich 1-2
A 10YR 4/4 dark yellowish brown Minor roots few ironstone pebbles; ironstone pebbles, fine sand, siltier w/depth
4-10
B2 10YR 6/8 brownish yellow Clayey, ironstone; extremely silty, massive iron stains 10-
C 10YR 6/8 mottled with lOYR 511 gray + 10YR 5/6 yellowish brown
Clayey, mottling; sand and clay mix; stopped @ 35" 26-
COMMENTS
Used magnatometer @ site; sprinkler system in front yard will stop between 18-24"; 0 sample @ 1233
Samples: R9A, R9Bl, R9B2, R9CL1, R9CL2 Date bottled: 3/13/96
Depths: 2-4" 4-10" 10-20" 28-30" 30-34"
Site number: RIO Date: 3/5/96 Time (auger): 1330
Personnel: T Oden, R Rosman Quadrangle: Keyport
Location: Backyard 15 feet east of shed in front of swing set
Soil series: Keyport Sampler: split spoon
Time (core):
Formation: Englishtown
Weather: SUll.'1Y, warmer, 50-55
Hole Depth: 38"
DESCRIPTION
Horizon Color Texture Thickness (in inches)
'" A 1 OYR 4/2 dark grayish brown Wet rooty fine sand; few pebbles, little mica 1-3
B 10YR 6/6 brownish yellow Silty sand; mottles 10YR 6/8 + 10 YR 511 appears to have some cinders, some iron stains, mottling @ 12"
3-15
CLI Clay 10YR 5/1 gray mottled with lOYR 5/8 + 10YR 6/4
Clay becomes dominant; massive sand through the mix medium grains 7-5YR 6/8 reddish yellow
15-25
lOYR 8/6 yellow little silt, fine grained sand; mixed with 10 YR 5/8 medium sand, 10YR 5/1 gray (very little)
25-27
CL2 10YR 5/2 IDa brown massive; mottled clay 27-31
C 1-5YR 5/8 strong brown medium sand intermixed; 59R 5/6 yellowish-red; the 5YR 4/6 seems to be a minor amount running through some clay mottles, sandy, silt clay lOYR 711 light gray
31-36
COMMENTS
Very intermixed hard to distinguish sandy silt 36-38; very intermixed hard to distinguish sandy silty clay 38-; extremely massive clay + silt stopped augering @ 46 inches
Samples: RIOA, RI0b, RlOCL1, RIOCL2, RLIOC I Date bottled: 3/7/96
Depths: 1-3" 4-12" 16-22" 25-27" 30-32"
Comments: Rl OCL2--This is the same clay as that underlying lOCw; R 1 OC--metals only samples from 30-32" medium sand-orangey brown, some black bits in it, might be lignite
200

U.S. Geological Survey 810 Bear Tavern Road, West
Site number: R 11 Date: 3111196 Personnel: RR, NPS
Location: Between trees Soil series:
New Jersey 08628
Time (auger): 0950 Quadrangle: Keyport
Sampler: Split spoons
Time (core): 1045; 1110 F ormation: Englishtown Weather: Sunny, 20's Hole Depth: 2"-26,26"-49"
DESCRIPTION
Horizon Color Texture n (in
7.5YR 3/3 dark brown SOD 0-1"
A 1 OYR 5/6 yellowish brown, 7.5 YR 41 2 dark brown 3 -color mottled, lOYR 5/1 gray
sandy clay, Micaceous; some roots, clay color moves to 10YR 5/2 grayish brown @ 10", ironstone at 16"
1 "-16"
Bl one color sand, 10YR 5/6-25Y 5/6 light olive brown
fine-medium sand; some mica flecks as large as black silty flecks @ 28"
1116"; some 16-30"
CL1+2 10YR 5/6 yellowish brown sand 10YR 5/2 grayish brown clay
sandy clay; some roots 30-48"
C 10YR 5/8 yellowish brown medium sand 48-50
COMMENTS
Drove split-spoon sampler (cleaner one) from 2" BLS to 26" BLS, de-contaminated sampler, drove it (with new liner and catcher) fl'om 26" BLS to 49" BLS
Samples: RIlA, RIlBl, RllCLl, RIICL2, RIIC I Date bottled: 3/15/96
Depths: 1-10" 16-25" 30-35" 36-42" 48-50"
Comments: R 11 A --This is a mottled mixture 0 f clay + sand - looks disturbed; R 11 B 1--This looks like ordinary undisturbed B hori-zon; RllCLI--grey + brown clay -less silt than CL2 - mica flakes, mottled; RIICL2--the usual gray clay w/silty blebs; RllC--met-als only, small sample of sand (E'town) from 50 +"
Site number: R 12 Date: 3111196 Time (auger): 1240
Personnel: RR, NPS Quadrangle: Keyport Location: front yard in middle of group of trees (not apple trees) Soil series: Keyport Sampler: split spoons
Time (core): 1325, 1340, 1405
Formation: Englishtown Weather: Sunny, 20's Hole Depth: 50"
DESCRIPTION
Horizon Color Texture Thickness(in inches)
1 OYR 3/2 very dark grayish brown sod 0-2"
A I OYR 3/3 dark brown fine sand 2-4
BI 10YR 4/4 dark yellowish brown medium-flne sand 4-12
B2 lOYR 6.5/6 brownish yellow medium-flne sand 12-15
I OYR 5/6 yellowish brown silty flne sand; some ironstone, mottled with I OYR 4/2 dark grayish brown 20-23", siltier at 36"-40", clayey at 40"-42"
15-42"
CL grayish brown lOYR 5/2 clay
yellowish brown lOYR 5/6 sand
mottled sandy clay roots 42-51"
COMMENTS
Pounded 3' sampler to 3', but lost part of sample down hole - recovered l' sample; pounded split spoon from 2" taminated sampler and drove from 32" to 50"
to 32"; then de-con
Samples: RI2E RI2B1 R12B2 RI2C I Date bottled: 311 5/96
Depths: 2-4" 6-12" 12-15" 42-48
Comments: R12A--corer sample, metals toe, no S.; R12C--metals, TOC, no S. RI2E should be R12A
201

U.S. Geological Survey 810 Bear Tavern Road, West Trenton, New Jersey 08628
Project: Imperial Oil SOIL SAMPLING FIELD SHEET
Site number:R13 Date: 3/12/96 Time (auger): 0950 Personnel: mo, NPS Quadrangle: Keyport
Time (core): 1040 F ormation: Englishtown
Location: Backyard behind old shed Weather: sUlmy, cool(40's) Soil series: Sampler: corer Hole Depth: 45"
DESCRIPTION
Thickness Horizon Color Texture (in inches)
A 10YR 4/2 dark grayish brown medium-fine sand 1-4"
BI 10YR 5/3 brown medium-fine sand 4-10"
B2 10YR 5/3 brownish yellow medium:fine sand; getting wet at 14", 10-14 grading from lOYR 5/3 to 10YR 6/6; some rocks 18-34:, getting silty at 24" (slightly); wet at 39"-52"
10-52"
/"
COMMENTS
Bottle notes: B2U = upper part of B2 B2L = lower part ofB2
Samples: RI3A, R13Bl, R13B2U, R13B2L I Date bottled: 3/15/96
Depths: 1-4" 4-10" 12-18" 28-38" Comments: R13A--TOC, metals no S.; RI3Bl, R13B2U, R13B2L--metals, TOC, S.
Site number RI3 Replicate: Date: 311 2/96 Time (auger): Time (core): 1105
Personnel: TDO, NPS Quadrangle: Keyport Formation: Englishtown
Location: back yard behind old shed Weather: sunny, 40's
Soil series: Sampler: Hole Depth: 43"
DESCRIPTION
Thickness Horizon Color Texture (in inches)
COMMENTS
Sample taken at 1055 lost down hole; took another at 1105, driving to only 43" BLS
Samples: R13Bl-dup, R13B2U-dup I Date bottled: 3/15/96
Depths: 1-4" 12-20" Comments:
202

U.S. Geological Survey 810 Bear Tavern Road, West Trenton
Project: Imperial , New 08628 SOil SAMPLING
Site number: R 14 Date:3/12/96 Time (auger): 1135 Time (core): 1455
Personnel: IDO, NPS Quadrangle: Keyport Formation: Englishtown
Location: Back yard under old apple tree Weather: sunny, 40's
Soil series: Keyport Sampler: split spoon Hole Depth: 38"
DESCRIPTION
Thickness Horizon Color Texture (in inches)
A 10YR 3/3 dark brown medium-fine sand 1-8" Bl 10YR 5/4 yellowish brown medium-fine sand; few cobbles, roots, getting wetter with depth 8-18" B2 10YR 5/6 yellowish brown slightly silty medium-fine sand; somewhat wet: some lOYR 4/2 18-52"
dark grayish brown mottles; few quartz pebbles at 44" some grayish sandstreaks at 49-50"
1 OYR 4/2 dark grayish brown
Pounded sampler to depth of 46", lost bottom foot of sam@ 1455 - good recovery
Samples: RI4A, R14Bl, R14B2
Depths: 2-8" 9-18" 30-37"
Site number: R 15 Date: 3/13/96
clay with little sand 52-55"
COMMENTS
ple; pounded sampler to 40" - lost whole sample; pounded split spoon sampler to 38" BLS
Date bottled: 3/15/96
Time (auger): 1000 Time (core): 1100, 1120
Personnel: RR, NPS Quadrangle: Formation:
Location: Orchard Pkwy, front yard Weather: sunny, mid 50's
Soil series: Sampler: split spoons Hole Depth: 35" BLS, 51" BLS
DESCRIPTION
Thickness Horizon Color Texture (in inches)
A 10YR 4/2 dark, grayish brown very fine sand; grass-root mat first 2-3" 0-5"
B 10YR 4/2 dark grayish brown till 10" 10YR 5/3 brown 10"; very fine sand-lightens at 10"; ironstone + 5-10" some black cinders present
B1 10YR 5/6 color change at 14" to yellow brown very fine sand minor dark-silt; sample still moist, cobbles present 10-16"
B 10YR 5/8 yellowish brown matrix with col- less moisture massive and few cobbles; increase in 10YR 5/1 gray 23-33" ored silt as above sandy silt same as above silt lose olive brown silt
CLl silty sand crumbling sand, very little moisture; increase in 10YR 4/1 dark 33-38" gray silt decrease in 5/1 gray silt
CL2 very tight gray clay with 10YR 5/8 yellowish brown sand; 5YR 5/ 38-43" 8 yellowish red sand, dark gray silt still present (as above) new gray lOYR 7/1 lite gray silt very minor at about 42";
43-47" layer of very fine 7.5 YR 5/8 strong brown; 43-47"
47-50" tight massive clay with rusty colored sand; lOYR 5/3 47-50" brown clay clinging to clay
10 YR 5/1 gray clay; 10YR 5/2 grayish brown 50-54" mottled gray with rust orange sand (lOYR 5/8 yellowish 50-54" to 54" brown sand)
COM1\,
203

u.s. Geological Survey 810 Bear Tavern Road, West Trenton, New Jersey 08628
Project: Imperial Oil SOIL SAMPLING FIELD SHEET
Site number: RlS replicate Date: 3/13/96 Time (auger): Time (core): J J S5, 1215 Personnel: RR, NPS Quadrangle: Formation: Location: Orchard Pkwy, front yard Weather: sunny, warm (SO's) Soil series: Sampler: split spoons Hole Depth: 2"-35", 35-S0"
DESCRIPTION
Thickness Horizon Color Texture (in inches)
COMMENTS
Removed 2"sod, drove to 3S" BLS with split spoon; de-contaminated spoon, drove from 3S" to 50"
Samples: RISDA, R15DBl, R15DCLI R1SDCL2 I Date bottled: 3/20/96(R lSDA,
Depths: 1-5" 10-16" 38-40" 4S-50" R15DCL1)
Comments: R 15DB l--metals +S only; R 15DCL2--metals + S only bottled 3/21/96
Site number: R 16 Date: 3/ 13/96 Time (auger): 1325 Time (core): 1415,1425
Personnel: RR, NPS Quadrangle: Keyport Formation: Englishtown
Location: Orchard Parkway, back yard Weather: sunny, 50's
Soil series: Keyport Sampler: split spoons Hole Depth: 1-34", 34-53"
DESCRIPTION
Thickness Horizon Color Texture (in inches)
A 10YR 4/3 brown fine-medium sand; some roots throughout, cobbles 2.5-9"
B1 10YR 5/6 yellowish brown medium-fine sand; pebbles, small ironstone bits, damp 10-12",2-3" cobbles 16-20"
9-25"
B2 few lOR 3/2 dusky red mottles 24"; iron concretions 25-28" 7.5 YR 5/6 strong brown sandy silt; mottled with 10YR 4/3 brown clay throughout 25-34"
CLI 10YR 4/3 brown clay 34-47" CL2 mottled with 7.5 YR 5/6 strong
brown sandy silt water at 45"
COMMENTS
Bagged continuous augered sanlple from 36-41"; drove 1 st spoon to 34", drove 2nd from 34-53"
Samples: R16A R16B1 R16CLl R6CLI R16CL2 I Date bottled: R16A+BI 3115/96, ~~~------~=-----~~~--~~~----------~~~------------~ Depths: 3-9" 10-16 25-28 40-50" I R16CLl + R16CL2 3/20/96
Comments:
204

U.S. Geological Survey 810 Tavern Road, West Trenton, New Jersey 08628
Site number: R 17 Date: 3/18/96 Time (auger): 0950 Time (core): 1050 Personnel: TDO, NPS Quadrangle: Keyport F ormation: Englishtown Location: Orchard Parkway under apple tree close to driveway Weather: sunny, cool, 50 Soil series: Keyport Sampler: corer Hole Depth: 40" bottom 5.5" lost
DESCRIPTION
Thickness Horizon Color Texture
A 1 OYR 3/3 dark brown medium sand; some fine roots 1-5" Bl 10YR 5/8 yellowish brown silty sand; few quartz pebbles some 7.5 YR 2/0 black; 5-2B
lOYR 3/3 dark brown mottles, few ironstone pebbles; large ironstone concretions at 15"
B2 10YR 4/3 brown medium-fine sand 28-32"
2.5Y light ollive brown medium-fine sand 32-40" 10 YR 6/6 brownish yellow medium-fine sand 40-56"
COMMENTS
Sampler retneved; tound bottom ot bottom tiller bent up lllslde core; core-catcher dnven mto middle lmer. Hole measured, depth of 40". Upper liner empty.
Site number: R 18 Date: 311BI96 Time (auger): 1134 Time (core): 1315
Personnel: TDO, NPS Quadrangle: Keyport F ormation: Englishtown
Location: Orchard Parkway, apple tree east side of house Weather: clear, sunny, 50's
Soil series: Keyport Sampler: split spoon Hole Depth: 46"
DESCRIPTION
Thickness Horizon Color Texture (in
A 10YR 3/3 dark brown medium fine sand; few cobble, some roots, wet 1-12" BI 2.5 Y 5/4 light olive brown wet, few pebbles, some mottles lOYR 211 black; pebble, 12-25"
cobble layer @ 18 B2 10YR 5/6 yellowish brown drier, silty medium sand; some mottles 10YR 4/3 brown! 25-35"
dk brown, small ironstone? flecks
C 10YR 5/6 yellowish born drier medium sand; graditional w/layer above, some 35-38" cobbles, small ironstone flakes?
CLI 10YR 5/6 yellowish brown med.-fine sand; mottled clay 10YR 511 gray, ironstone + 38-45" quartz pebbles; lots of small black flakes + chips, water in hole, very wet
CL2 1 OYR 4/2 dark grayish brown clay, dry, intermixed w/sand 10YR 5/6 yellowish brown; 45-50" 1 112 water in hole
COMMENTS
e mer to top
Samples: RI8A RIBBI RIBB2 RI8CL! R18CL2 RI8C I Date bottled: 3/25/96 Depths: 2-12 13-24 26-34 34-45 45-49 35-38
Comments:
205
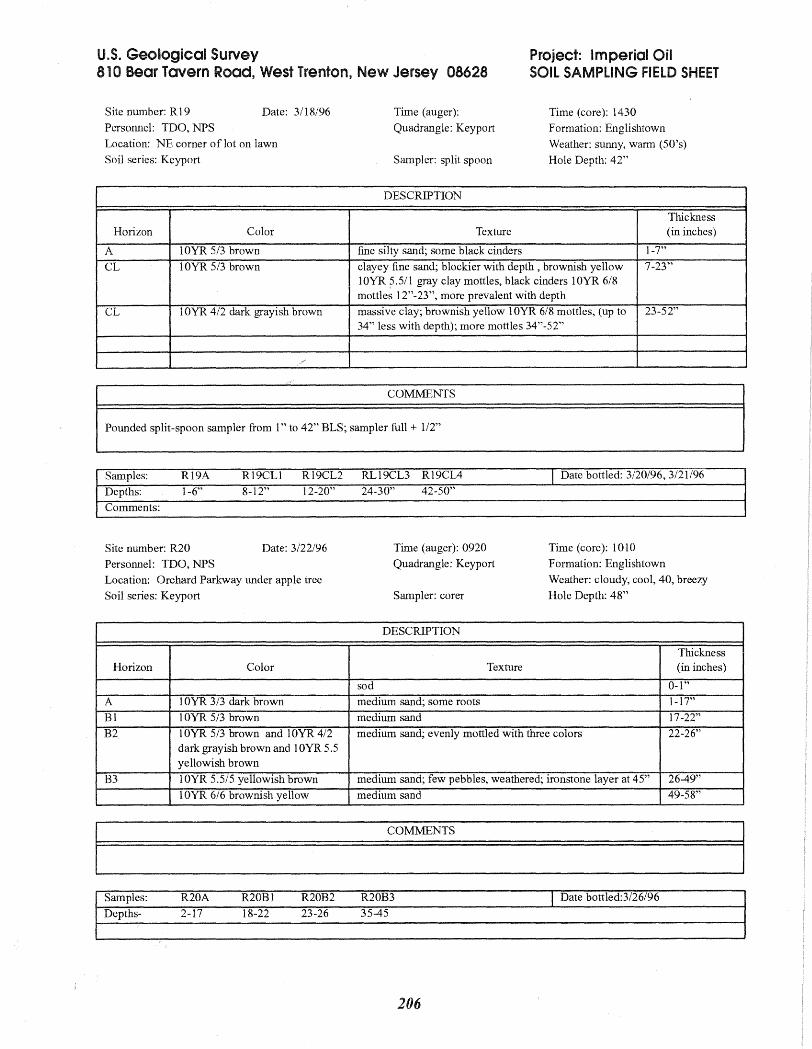
U.S. Geological Survey 810 Bear Tavern Road, West Trenton, New Jersey 08628
Project: Imperial Oil SOIL SAMPLING FIELD SHEET
Site number: R 19 Date: 3/18/96 Time (auger): Time (core): 1430 Personnel: TDO, NPS Quadrangle: Keyport Formation: Englishtown Location: NE corner of lot on lawn Weather: sunny, warm (50's) Soil series: Keyport Sampler: split spoon Hole Depth: 42"
DESCRIPTION
Thickness Horizon Color Texture (in inches)
A lOYR 5/3 brown fine silty sand; some black cinders 1-1"
CL 10YR 5/3 brown clayey fine sand; blockier with depth, brownish yellow lOYR 5.511 gray clay mottles, black cinders 10YR 6/8 mottles 12"-23", more prevalent with depth
7-23"
CL 10YR 4/2 dark grayish brown massive clay; brownish yellow 10YR 6/8 mottles, (up to 34" less with depth); more mottles 34"-52"
23-52"
/c~
COMMENTS
Pounded split-spoon sampler from 1" to 42" BLS; sampler full + 112"
Samples: R19A R19CL1 R19CL2 RLl9CL3 R19CL4 I Date bottled: 3/20/96, 3121196
Depths: 1-6" 8-12" 12-20" 24-30" 42-50"
Comments:
Site number: R20 Date: 3/22/96 Time (auger): 0920 Time (core): 1010
Personnel: TDO, NPS Quadrangle: Keyport Formation: Englishtown
Location: Orchard Parkway under apple tree Weather: cloudy, cool, 40, breezy
Soil series: Keyport Sampler: corer Hole Depth: 48"
DESCRIPTION
Thickness Horizon Color Texture (in inches)
sod 0-1"
A 10YR 3/3 dark brown medium sand; some roots 1-17" Bl 10YR 5/3 brown medium sand 17-22" B2 lOYR 5/3 brown and lOYR 4/2
dark grayish brown and 10YR 5.5 yellowish brown
medium sand; evenly mottled with three colors 22-26"
B3 10YR 5.5/5 yellowish brown medium sand; few pebbles, weathered; ironstone layer at 45" 26-49"
10YR 6/6 brownish yellow medium sand 49-58"
Samples: R20A R20BI R20B2 R20B3 I Date bottled:3/26/96
Depths- 2-17 18-22 23-26 35-45
206

U.S. Geological Survey Project: Imperial 810 Bear Tavern Road, West Trenton, New Jersey 08628 SOIL SAMPLING
Site number: R20 Duplicate Date: 3/22/96 Time (auger): Time (core): 1020 Personnel: TDO, NPS Quadrangle: Formation: Location: Orchard Parkway under apple tree Weather: mostly cloudy, cool Soil series: Sampler: Hole Depth: 48"
DESCRIPTION
Thickness Horizon Color Texture (in inches)
. I Date bottled: Depths: (
Site number: R21 Date: 3/22/96 Time (auger): 1100 Time (core): 1130
Personnel: TDO, NPS Quadrangle: Formation:
Location: hot spot back of garden Weather: mostly cloudy, cool (40's)
Soil series: Sampler: cover Hole Depth: 48"
DESCRIPTION
Thickness Horizon Color Texture (in inches)
A 1 OYR 3/3 dark brown medium sand; some roots, cinders from 5"-16"; slightly 0-22" silty 12"-16"
Bl lOYR 5/4 yellowish brown medium sand; slightly mottled with 10YR 3/2 very dark 22-48" grayish brown silty sand; wet from 35"-48"
B2 lOYR 6/6 brownish yellow medium sand; wet throughout, hole collapsing 48-51"
Samples: R21A R21Al R21Bl R21B2 I Date bottled: 3/27/96
Depths: 1-10" 22-30" 48-51"
Comments:
207

U.S. Geological Survey Project: ImperialOil 810 Bear Tavern Road, West Trenton, New Jersey 08628 SOIL SAMPLING FIELD SHEET
Site number: R22 Date: 3/22/96 Time (auger): 1300 Time (core): 1350 Personnel: IDO, NPS Quadrangle: Keyport F ormation: Englishtown Location: hot spot between house & garden Weather: partly sunny, 40's Soil series: Keyport Sampler: split spoon Hole Depth: 38"
DESCRIPTION
Horizon Color Texture Thickness (in inches)
A 10YR 4/2 dark grayish brown medium sand; cinders, big black ants, little glass; slightly silty 13"-18"
0-18"
BI 10YR 4/3 brown silty medium sand; cinders; not silty 25"-30" 18-30" B2 2.5Y 5/4 light olive brown medium sand; some roots 36"-40"; wet throughout; hole
collapsing to 40" 30-51 "
COMMENTS
Bagged several samples at various depths; also bagged cinders from land surface near hole, and in garden
Samples: R22A, R22bl, R22B2 I Date bottled: 3/27/96 Depths: 1-12" 18-28" 32-42"
Comments:R22A--has some mica flakes; R22Bl--cinders, concrete(?) bits flecks of brick also mica; R22B2--sandy, little or no debris visible
Site number: R23 Date: 3/25/96 Time (auger): 1005 Time (core): 1115 Personnel: IDO, NPS Quadrangle: Keyport F ormation: Englishtown Location: backyard hot spot Weather: sunny, warm (50's) Soil series: Keyport Sampler: split spoon Hole Depth: 38"
DESCRIPTION
Horizon Color Texture Thickness (in inches)
A 1 OYR 4/2 dark grayish brown slightly silty medium-fine sand; numerous pebbles top of interval, some cinders
0-9"
CLI lOYR 5/3 brown clay; mottled with 7.5 YR 5/6 strong brown clay; 10YR 4/2 sand; and 10YR 3/2 v. dark grayish brown medium-fine sand; few cinders
9-12"
CL2 10YR 4/6 dark yellowish brown clay w/ ; mottled with 10YR 4/2 medium sand; some cobbles at 15"
12-18"
S 7.5YR 5/8 strong brown sandy clay; few pe bbles 18-22" 18-23" S 10YR 5/8 yellowish brown silty medium sand; wet at 30", not silty 30"-54" 23-54"
COMMENTS
Samples: R23A R23CLl R23CL2 R23S -r Date bottled: 3/27/96 Depths: 1-8" 9-12" 13-18" 25-30"
Comments: R23CLl--brown, some cinders - some concrete (set aside in baggy); R23S--Silty layer beneath clay
208

Geological Survey 810 Bear Tavern Road, West
Site number: R24 Date: 3/25196 Personnel: TDO, NPS
Location: front yard hot spot
Soil series: Keyport
Horizon Color
A 10YR 4/3 brown
B lOYR 5/3 brown
CL 10YR 5/2 grayish brown
Site number: R27 Date: 4/24/96
Personnel: TDO, NPS
Location: backyard under fruit tree Soil series: Keyport
Horizon Color
A 10YR 2/2 very dark brown
B 10YR 5/8 yellowish brown
CLI,CL2 C 7,5YR 5/7 strong brown
Jersey
Time (auger): 1135 Time (core): 1340
Quadrangle: Keyport F ormation: Englishtown
Weather: sunny, warm Sampler: split spoon Hole Depth: 38"
DESCRIPTION
Thickness Texture (in
sod 0-1 " slightly silty sand; some roots, few cinders, siltier with 1-13" depth, slightly clayey silt; slightly mottled with 10YR 41i dark gray clay 13-15" clay; some roots at 21-30" mottled with 7,5YR 5/8 15-52" strong brown clay at 35", clay becomes quite massive; 1 piece of 10YR 6/2 light brownish gray, 40", size 1 cubic inch
co
Time (auger): 0945 Time (core): 1035
Quadrangle: Keyport F ormation: Englishtown Weather: sunny, cool (50), windy
Sampler: split spoon Hole Depth: 36"
DESCRIPTION
Thickness Texture (in inches)
sod 0-1"
slightly silty medium,sand; roots 1-3"
fine sandy silt; few cobbles, few roots; at 17", little mot- 3-30" tles of 10YR 6/2 light brownish gray clay through to 30" water at 25"
medium-coarse sand; mixed with some 10YR 5/3 brown 30-46" clay at 37-46", small amounts of 10YR 711 light gray medium-coarse sand; 20,S" water standing in 46" hole
209

U.s. Geological Survey 810 Bear Tavern Road, West Trenton, New Jersey 08628
Site number: OBI Date: 4/17/96 Time (auger): 1045 Personnel: IDO, NPS Quadrangle: Location: Lloyd Rd., ~20' from trunk of apple tree Soil series: Sampler: split-spoon
Project: Imperial Oil SOIL SAMPLING FIELD SHEET
Time (core): 1145 Formation: Weather: partly sunny, breezy, 40's Hole Depth: 42"
DESCRIPTION
Horizon Color Texture Thickness (in inches)
Loamy A 10YR 4/3 brown medium sand; few cobbles, roots 0-6 Probably dis-turbed JLB A
clay: SYR 3/1 very dark gray Sands: 10YR 3/4 dark
mix of clay and medium-fine sands (2 colors sand) 6-22
eLI at 20", 7.5 YR 4/6 strong brown clay mottles appear for only -2"
B I OYR 4/3 brown medium sand; small amounts of silt JO YR 5/4 yellowish brown 22-25 B 10YR 5/4 yellowish brown slightly silty medium sand 25-30
eL22 JOYR 4/3 brown sandy silt; mottled with 7.5 YR 5/8 strong brown medium sand grades into a silty clay at about 38"
30-49
COMMENTS
Augered to 56"; from 49"-54" a sandy, orangey layer was bagged
Samples: OBILA OBIA OBICLI OBIB OBICL22 I Date bottled: 4/18/96
Depths: ~2-6: 6"-22" 22-30" ~45
Comments:OB I LA --loam, some sand; OB 1 A --more sandy; OB 1 CL l--upper clay-like local clay-greyish w. stringers of silt, mica flakes, prob. distrbed, 19 H2 pebble in clay "lignite" bits also; OB IB--sandy layer; OBICL22--lower part of 2nd clay samples - typ-ical grey clay w. silt strirlgers
Site number: OB2 Date: 4/24/96 Time (auger): 1120 Personnel: TDO, NPS Quadrangle: Keyport
Location: N.W. side of house under neighbor'S appletree canopy Soil series: Sampler:split spoon
Time (core): 1205 Formation: Weather: sunny, 50's, breezy Hole Depth: 38"
DESCRIPTION
Horizon Color Texture Thickness (in inches)
sod 0-1 A 10YR 3/3 dark brown medium-fine sand; fine roots 1-4 B lOYR 6/6 brownish yellow slightly silty fine sand; color grading slowly from 4-9" to 10YR 6/6, from
lOYR 3/3 pebbles at IS" ironstone conglomerates; color goes to lOYR 5/8 yellowish brown from 20"-25"
4-25
eLI 1 OYR 5/4 brown fine sandy clay; mottled with 10YR 511 gray clay; 1" diameter root at 30"; black clay laminae at 31" (2.5YN 2/0)
25-43
eL2 ironstone at 33-34:; few pebbles
10YR 5/8 yellowish brown fine sandy silt 43-51
COMMENTS
Augered to 56"; from 49"-54" a sandy, orangey layer was bagged
Samples: OB2A OB2B OB2CLI OB2CL2 I Date bottled: 4/24/96 Depths: ~1-4 -6-10" -25-30 -30-38
Comments:
210

APPENDIX 2
Sample Collection. Preparation. and Documentation
Soil-Sampling Procedures
The sampling sites were selected by using aerial photographs, GIS coverages, and, in most cases, a site visit. At the time of sampling, the site was checked carefully for disturbance of soil, such as evidence of bulldozing or excavation activity, and trash that might indicate either disturbed soils or potential sources of sample contamination. The soils map for the sampling site was checked (either Powley, 1987, or Jablonski and Baumley, 1989), and the expected soil series description was reviewed.
The soil sample was collected by using the following procedure.
1. Preparation of a clean sampling area
A clean plastic tarp was spread near the area where sampling would take place. The sampling equipment, stored in sealed plastic bags, was placed on it. A second plastic sheet was laid on the ground where the sampling would take place.
2. Removal of leaf litter or lawn
The leaf litter was removed with a clean stainless-steel trowel or a plastic rake, and was set aside. If the sampling took place on a lawn, a cylinder of grass was removed and set aside; this was used to cover the hole when sampling was completed.
3. Description of soil horizons
A clean bucket auger was used to collect soil samples. The samples were examined in order to describe the soil horizons, to determine the depths at which they are found, and to compare the results with descriptions of the soil series mapped at that location. The. depths at which the different horizons were encountered were determined by augering until the bucket was full, removing the auger, and tipping it upside down at an angle of about 30° to the ground. The bucket was tapped to loosen the soil, which was scooped or dumped out onto the plastic sheet in about 2-in. intervals. The soil was examined closely for change in color, signifying a change in horizon. Because the height of the bucket is known, the depth of a soil change in the bucket could be measured, and the depth of the hole was measured with each bucket load. Therefore, the depth of a change in horizon could be determined with an accuracy of ±1 in., which is adequate for the purposes of description. The Munsell Color Chart was used to assign a color code to each soil horizon. The texture, induration, structure, and mottling (if present) of each horizon was described on the field form for each site. Pebble layers or other unusual features were noted as well. Augering continued to a depth of at least 4 fi, or to the C horizon, whichever was encountered first. If the augering revealed the presence offill material, buried waste, or absence of soil horizons, the sampling location was abandoned except in the case
211

of soils at the Imperial Oil Company Superfund site, where virtually all soils are disturbed. In all cases, the soil collected on the plastic sheet was returned to the hole and tamped down.
4. Infonnation required for the field form
The description of the soil horizons was matched to descriptions of expected soil series. Weather conditions, an estimate or measurement of air temperature, time of augering, and time at which the coring began also were recorded on the field sheet.
5. Documentation of the location of the sampling site
A description of the sampling site was recorded, and the location was marked on a map of the area. The site was flagged, and the sampling-site designation was written on the flagging.
6. Use of latex glove~ to ensure that samples are not contaminated during collection
The field team typically consisted of two persons, one of whom wore clean gloves at all times for handling sampling equipment that had been previously decontaminated, and for handling the butyl acetate corer liners and the sample bottles. All field personnel wore disposable gloves to minimize contact with the soils, particularly when sampling near IOC and at orchard sites, where elevated concentrations of metals might be encountered~ however, one of the pair was responsible for maintaining clean gLoves during sampling, and handling only the decontaminated equipment, the core liners, and sample jars.
7. Collection of O-horizon sample
A second area for coring was selected within about 2 ft of the auger hole. The leaf litter or grass was removed as before. If an 0 horizon was present, a sample of 0-horizon soil was collected with a clean stainless-steel trowel by field personnel wearing disposable gloves. A small square of soil was outlined with the trowel, which was then used to cut through the root mat. The soil sample was placed in a sample jar, which was capped immediately and labeled with the sample number, date, and time. The jars were placed in a clean cooler with plastic freezer packs.
8. Collection of soil sample with the corer
The corer was removed from the sealed plastic bag by a field person wearing fresh disposable gloves. The person with the clean gloves held the corer while other field person attached the slide hammer to the corer cap. The corer was placed vertically in the area to be sampled and driven into the soil by using downstrokes of the slide hammer.
When the desired depth was reached with the corer, the corer was retrieved by upward strokes of the slide hammer. The corer was placed in a plastic bag, which was labeled with the sample-site designation, to await transport to the field vehicle,
212

while other samples were collected with the second and (or) third corers at a nearby location. All sample holes were filled with available soil or clean coarse sand and tamped down. In the case of lawns, the grass plug was replaced.
9. Recovery of core from the corer and sample labeling
When sampling was complete, each corer was carried back to the field vehicle and placed on a plastic sheet in the vehicle. The field person with the clean gloves opened a plastic zip bag containing prewashed red and blue plastic caps, retrieved the butyl acetate liners, one by one, and capped them after the corer head was removed by the other member of the field team. Gloves were changed between samples. As each liner was capped (a red cap at the lower end and a blue cap at the top end), it was labeled with the sample-site designation and an "up" arrow, and individual horizons, if visible, were labeled.
10. Sample transport from the field
The capped liners were placed upright in a clean cooler with plastic freezer packs for transport. Upon arrival at the USGS, New Jersey District, laboratory, the liners were refrigerated until the soil samples were processed for shipment to the contract laboratory.
11. Coring through pebble layers
Because some of the soils encountered in the study area contain pebble layers or indurated hOlizons at depth, additional steps sometimes were needed to ensure sampling through the entire soil profile. If it proved impossible to drive the corer through one of these layers, the corer was retracted from the hole and laid on clean lab wipes on a clean plastic sheet. A clean, decontaminated bucket auger was removed from its plastic bag, and the hole was enlarged to the depth of the layer where refusal occurred. The auger was used to remove the pebbles or indurated material. If this could not be done, a field person, wearing clean gloves, reached into the hole and attempted to remove the pebbles or indurated material. If this was successful, the corer was disassembled as described above, and the filled liners capped and labeled as above. Then new, clean liners and a core catcher were placed in the corer. The hole, which was now larger in diameter than when coring began, was checked for loose material, and the corer was inserted and driven to the final depth. In this case, when the core liners were retrieved, the first 1 to 3 in. of soil collected in the upper liner were discarded, as they might contain fragments of soils from upper levels of the hole. This departure from the sampling procedure was noted on the field sheet, and the place in the soil profile where the core was not continuous was labeled on the butyl acetate liners. If the pebble or indurated layer could not be removed by using the above procedure, the sample site was moved several feet distant, and coring with a new, clean corer began.
213
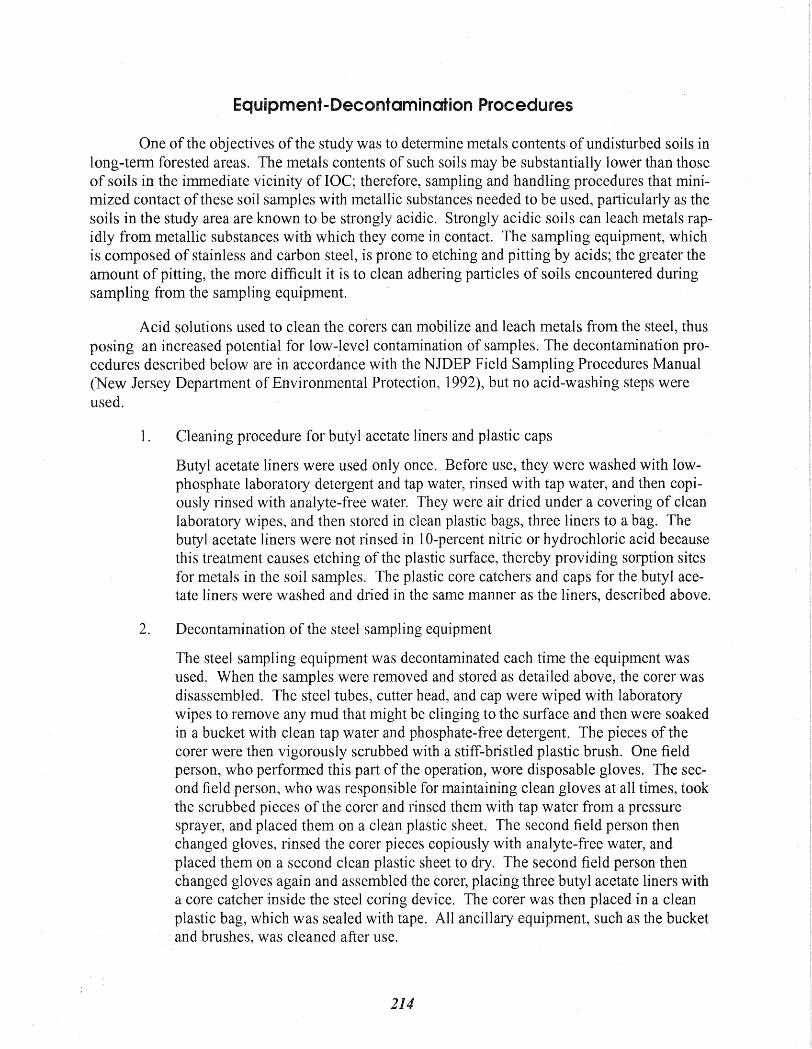
Equipment-Decontamination Procedures
One of the objectives of the study was to determine metals contents of undisturbed soils in long-term forested areas. The metals contents of such soils may be substantially lower than those of soils in the immediate vicinity of IOC; therefore, sampling and handling procedures that minimized contact of these soil samples with metallic substances needed to be used, particularly as the soils in the study area are known to be strongly acidic. Strongly acidic soils can leach metals rapidly from metallic substances with which they come in contact. The sampling equipment, which is composed of stainless and carbon steel, is prone to etching and pitting by acids; the greater the amount of pitting, the more difficult it is to clean adhering particles of soils encountered during sampling from the sampling equipment.
Acid solutions used to clean the corers can mobilize and leach metals from the steel, thus posing an increased potential for low-level contamination of samples. The decontamination procedures described below are in accordance with the NJDEP Field Sampling Procedures Manual (New Jersey Department of Environmental Protection, 1992), but no acid-washing steps were used.
1. Cleaning procedure for butyl acetate liners and plastic caps
Butyl acetate liners were used only once. Before use, they were washed with lowphosphate laboratory detergent and tap water, rinsed with tap water, and then copiously rinsed with analyte-free water. They were air dried under a covering of clean laboratOlY wipes, and then stored in clean plastic bags, three liners to a bag. The butyl acetate liners were not rinsed in 10-percent nitric or hydrochloric acid because this treatment causes etching of the plastic surface, thereby providing sorption sites for metals in the soil samples. The plastic core catchers and caps for the butyl acetate liners were washed and dried in the same manner as the liners, described above.
2. Decontamination of the steel sampling equipment
The steel sampling equipment was decontaminated each time the equipment was used. When the samples were removed and stored as detailed above, the corer was disassembled. The steel tubes, cutter head, and cap were wiped with laboratory wipes to remove any mud that might be clinging to the surface and then were soaked in a bucket with clean tap water and phosphate-free detergent. The pieces of the corer were then vigorously scrubbed with a stiff-bristled plastic brush. One field person, who performed this part of the operation, wore disposable gloves. The second field person, who was responsible for maintaining clean gloves at all times, took the scrubbed pieces of the corer and rinsed them with tap water from a pressure sprayer, and placed them on a clean plastic sheet. The second field person then changed gloves, rinsed the corer pieces copiously with analyte-free water, and placed them on a second clean plastic sheet to dry. The second field person then changed gloves again and assembled the corer, placing three butyl acetate liners with a core catcher inside the steel coring device. The corer was then placed in a clean plastic bag, which was sealed with tape. All ancillary equipment, such as the bucket and brushes, was cleaned after use.
214

3. Decontamination of steel trowels and steel bucket augers
The stainless-steel trowels and steel bucket auger were decontaminated in the same manner as described above.
4. Transport of dirty equipment
If brought back to the laboratory for decontamination, the dirty equipment was placed in plastic bags in order to keep the interior of the field vehicle clean.
Sample Preparation
The soil samples were extracted by soil horizon--that is, soils from each horizon within a given core liner were removed from the liner separately and were bottled separately. The procedure was as follows:
a. The field sheet for each sample site was examined to detennine which horizons were encountered during collection of the auger sample prior to coring; the number of horizons to be extracted was detennined.
b. The laboratory counteliop was covered with clean laboratolY paper wipes, which were changed between horizons. Disposable gloves were worn at all times and were changed between horizons.
c. The cap at the upper end of the uppermost core liner was removed. A clean laboratory wipe was used to hold the core liner at all times. A Teflon-coated spatula was used to remove the small amount of 0 horizon that might be present as well as any soil that represented the interface between 0 and A horizons. A-horizon soil was collected in a decontaminated glass bowl by digging into the soil with a disposable plastic spatula. The sample was taken from the center of the core and was examined carefully for any change in color that might signify an interface between the A and the next horizon (E or B, depending on soil series). Any large roots or pebbles were removed and discarded.
d. When the bowl was full, the sample was mixed thoroughly with the spatula and was ladled into the sample jars (a glass jar,for TAL-metals analysis, a brown glass jar for TOC analysis, a plastic j,!r for total-sulfur analysis, and a plastic bag for lead-isotope analysis). The jars had been previously cleaned by using the appropriate certified method. At least 50 g of sample was placed in the TAL-metals jar, at least 109 in the TOC jar, at least 109 in the total-sulfur jar, and at least 5 g in the lead-isotope bag.
e. F or the next horizon within the liner (typically either E or B I), the sample was accessed from the nearest liner end by removing the cap, discarding material that was in contact with the cap, and discarding any material that represented a soil-horizon interface; the procedure for the A horizon, described above, was repeated.
f. Any soil matelial remaining on the walls of the liner from each horizon, as well as any soil remaining in the glass bowl after the previous sample jars were filled, was collected in a separate jar for identification of minerals and for grain-size analysis.
215

g. The sample jars for TAL-metals and TOC analyses had been labeled previously by NJDEP; the sample numbers, date and time of sampling, and location were added to the labels on each set of jars as soon as they were filled.
h. The sample jars were placed in a clean cooler with freezer packs; the coolers were transmitted to NJDEP personnel.
1. A chain-of-custody (COC) form filled out and signed for each TAL-metals and each TOC sample jar was shipped by NJDEP with the jars. COC forms are not required for total-sulfur, Pb-isotope, clay-mineralogy, or grain-size samples.
J. Any remaining sample material was stored in a refrigerator at the USGS, New Jersey District, laboratory or warehouse for future reference.
Sample Documentation
All sample documents were completed legibly and in ink. Any corrections or revisions were made by lining through the original entry and initialling the change. The following sample documentation was maintained.
Field Logbook
The field logbook is a descriptive notebook detailing field-reconnaissance activities, which include investigation and selection of potential sampling sites. All entries were signed by the individuals making them. The field logbook is kept by the Task Manager/Project Chief, and is dedicated specifically to this investigation. The field logbook also contains a log of activities in the New Jersey District laboratory involving sample preparation and bottling.
Entries include, at a minimum, the following: • site name and project number on first page of notebook .. names of personnel present at field activities • dates of all entries • descriptions of activities, including observations and (or) data collected • records of noteworthy events and discussions • records of any photographs taken • site sketches, if relevant.
Contents of the field notebook are photocopied periodically and the copies are filed.
Field-Data Sheets
Field data sheets were used to identify core-sample locations and to document field sampling conditions and activities. Field data and activities at the time of sample collection were entered on the field-data sheets; these include
• site name • saniplers • sample location and core-sample number • sample location plotted on topographic map (attached)
216

• date and time the auger sample was collected • date and time the core sample was collected • brief description of the site • weather conditions • description of sampling procedures that deviate from SOP, problems encountered, or
other observations relevant to conditions encountered at the sampling location • log of the soil horizons encountered during augering with measurements of depths at
which horizons were encountered and descriptions of soil textures and grain sizes • identification of soil series • name of USGS topographic quadrangle on which site is located • map showing sample location (attached to the field sheet).
Field-data sheets were completed when the core samples were extracted and soil-horizon samples were bottled. Information added at this time included
• horizon sample number (core sample number + horizon designation) • date sample was processed.
Copies of field sheets are filed separately from the original field sheets. Data from field sheets are included in appendix 1.
Sample Containers and Labels
Samples were not preserved, and sample containers were prescribed in advance by NJDEP.
a. All TAL-metals samples were placed in the glass jars provided by the laboratory contracted by NJDEP; the jars were labeled in advance by NJDEP.
b. All TOC samples were placed in the glass jars, which were labeled and provided in advance by NJDEP.
c. All total-sulfur samples were placed in plastic jars provided by USGS. d. All Pb-isotope samples were placed in plastic bags provided by USGS.
Sample labels were securely affixed to the sample container. They clearly identify the sample, and include the following information:
• site name and proj ect number • sample number (core sample number + hOlizon designation) • date and time the sample was collected • analysis requested • sampling location.
Sulfur and Pb-isotope containers were labeled with the same information as that placed on TAL and TOC sample containers.
217

Chain of Custody Record
COC forms are supplied by NJDEP to USGS. A COC Record was maintained from the time of sample collection until final disposition. Every transfer of custody was noted and signed for, and a copy of the record was kept by each individual who signed it.
Authorized signatures
The soil cores were placed by the field personnel in the custody of the Task ManagerlProject Chief, Julia L. Barringer, who was responsible for the core samples until they were processed and the sample bottles were transmitted to NJDEP for shipment to the analyzing laboratory.
Chain of custody requirements for vatious sample types
A COC Record is maintained for each of the horizon samples (subsets of the core samples) that were bottled and sent for TAL and TOe analysis. COC Records were necessary only for those samples sent for TAL analysis, because the metals constitute the contaminants investigated during this study. TOC analyses were used only to define the naturally occuning organic-matter contents of the soils (twigs, rootlets, humic and fulvic substances), which were used as an explanatOlY variable when assessing the metals contents of the vatious soil horizons. Although COC Records are not deemed necessary to account for a naturally occurring matetial, they were maintained because the TOC analyses were performed by using a USEPA method that specifies a certain holding time and other strict adherences to analytical protocols. COC Records were deemed unnecessmy for samples analyzed for total sulfur, Pb isotopes, clay mineralogy, or grain size because these constituents/charactetistics are not contaminants.
The COC Records include at least the following information: • sample identification • sample location • sample-collection date • sample information, such as mattix and number of bottles collected • signatures of all individuals who had custody of the samples.
Custody Seal
When samples were not under direct control of the individual currently responsible for them, they were stored in a locked container that was sealed with a Custody Seal. Custody Seals demonstrate that a sample container has not been opened or tampered with. The individual who had custody of the samples signed and dated the seal and affixed it to the container in such a manner that it could not be opened without breaking the seal.
Sample Shipment
NJDEP personnel alTanged for contract couriers to deliver samples to the contract labora-tories.
218

APPENDIX 3
Preliminary Air-Emission Model /.
The air-emission model is based on the following equation, which is a double Gaussian distribution used in most models of this type (Christian, 1995).
2 2 2 C = Q/2 rq!crycrz exp (-1 y2/2 cr y) {exp( -1I2(z-H)2/cr z) + exp( -112 (z + H2)/cr z)} ,
where C = point concentration, mg/m3;
H = virtual stack height (stack height + plu..lJ1erise), m; Q = mass flow of contaminant, I-tg/s; u = wind speed, mls; x,y,z = ground level coordinates of stack, m; cry = standard deviation from mean path in y plane, m; crz = standard deviation from mean path in z plane, m.
The local meteorological conditions are placed into six stability classes:
A = very unstable B = moderately unstable C = slightly unstable D = neutral E = slightly stable F = stable.
The conditions that relate to these stability classes are shown in table 1, below (Turner, 1970).
219

Table 1. Stability classifications for local meteorological conditions
[A through E, stability classes; <, less than; >, greater than; mIs, meters per second]
Surface wind speed (m/s)
Day, solar insolation
Day, solar insolation
Day, solar insolation
Night, cloudiness
Night, cloudiness
Clear
E
Strong Moderate Slight Cloudy
<2 A A-B B E
2-3 A-B B C E E
3-5 B B-C C D E
5-6 C CoD D D D
>6 C D D D D
The standard deviations O'y and O'z are calculated by:
b 0' = axy
0' = cxd + f z
The curve-fitting parameters a through f are given in table 2, below (from Martin, 1986).
Table 2. Parameters used to calculate standard deviations for each stability class
[x, distance from source; <, less than; >, greater than; km, kilometer; A through F, stability classes; a through f, curve-fitting parameters]
x < 1 km x< 1 km x< 1 km x < 1 km x< 1 km x> 1 km x> 1 km x> 1 km Stability class a b c d f c d f
A 213 0.894 440.8 1.941 9.27 459.7 2.094 -9.6
B 156 0.894 106.6 1.149 3.3 108.2 1.098 2
C 104 0.894 61 0.911 0 61 0.911 0
D 68 0.894 33.2 0.725 -1.7 44.5 0.516 -13
E 50.5 . 0.894 22.8 0.678 -1.3 55.4 0.305 -34
F 34 0.894 14.35 0.74 -0.35 62.6 0.18 -48.6
220

The summary table of wind data for Lakehurst, New Jersey (station 14780), for the years 1973-82, used in the USGS interpretation and simulation, is given below (table 3); a windrose summarizing wind data for Newark Airport, 1984-87 and 1989, used in the NJDEP simulation, is shown in figure 1.
Table 3. Percent frequency of wind direction and speed, from hourly observations, Lakehurst, New Jersey, 1973-82.
[Number of observations = 24,066; Dir., direction; N/A, not applicable; VAR, variable directions and speeds; a blank space indicates no entry; windspeeds greater than 40 knots were not recorded during the period of record-therefore, those columns are not reproduced from the data summary; data table is supplied by the Naval Weather Service, Asheville, North Carolina]
Speed (knots) All speeds Mean (per- wind
Dir. 1-3 4-6 7-10 11-16 17-21 22-27 28-33 34-40 cent) speed
N 1.6 1.6 0.7 0.1 0.0 3.9 4.5
NNE 1.1 1.1 0.4 0.1 2.7 4.5
NE 1.0 1.1 0.9 0.1 3.0 5.2
ENE 0.9 1.3 1.1 0.3 0.0 0.0 3.6 6.1
E 1.2 1.7 1.1 0.3 0.0 0.0 4.3 5.7
ESE 0.9 1.3 0.7 0.0 2.9 5.0
SE 0.9 1.5 1.0 0.1 0.0 3.5 5.4
SSE 1.3 1.3 1.0 0.3 0.0 0.0 3.9 5.6
S 1.8 2.2 1.9 0.7 0.1 0.0 6.6 6.3
SSW 1.1 1.5 1.4 0.6 0.0 4.6 6.3
SW 1.4 1.5 1.5 0.5 0.0 5.0 6.2
WSW 1.3 2.1 1.8 0.8 0.1 0.0 6.1 6.8
W 2.4 3.2 3.9 2.6 0.5 0.1 0.0 0.0 12.7 7.9
WNW 1.7 2.2 3.0 2.2 0.4 0.1 0.0 9.7 8.3
NW 1.4 2.2 2.8 1.8 0.3 0.1 8.5 8.0
NNW 1.3 1.7 1.4 0.5 0.0 0.0
VAR 4.9 6.1
CALM N/A N/A N/A N/A N/A N/A N/A N/A 14.1
0.1 . Total * 21.3 27.3 24.5 10.8 1.5 0.4 100.0 5.7
*Colurrms do not sum to totals due to rounding.
221

,/
/
Newark 84-87,89Met Data
January i-December 31,· Mitlnight-11 PM N
--- - -.,.......,
/
" ---/ ../'
"- " " \
/ \ \ \ /
I I
I W
\ \
\ \
\
"" "
CALM WINDS 2.11%
NOTE: Fnqllmcin lIU%lClllt 4irtcftOft
from which 1M wind is bluwin8.
---'- ----... --
J-3
\ \ \8~ \ 10"
{X, 6~ , J
J I / /
/ I I ,/ / /
./' - / I /' /
~
/' ~
----
s WIND SPEED (KNOTS)
E
Figure 1. Windrose summarizing wind-speed and wind-direction data for Newark Airport, New Jersey, 1984-87 and 1989.
222

APPENDIX 4
Quality Assurance
NJDEP personnel reviewed all data from contract laboratories that used USEPA-approved procedures for quantification of contaminants. The validation of quality-assurance data followed procedures adopted by NJDEP, as modified from the USEPA Contract Lab Program (CLP) Statement of Work (SOW) Document ILM02.0. The data-validation guidelines in this document apply predominantly to data generated by using techniques documented and approved by the US EPA; these are the USEPA SW-846 (3rd edition) 6010 and 7000 series and the USEPA Methods for Chemical Analysis of Water and \Vastes 200 series. A generalized summary of the data-validation process is given below.
Results of analyses of standard reference materials submitted as blind samples and of duplicate and split samples are given below. Results of analyses of equipment wash blanks are included. Conclusions regarding the quality of the analytical work also are presented.
Data-Validation Process
The data-validation process consists of a preliminary review followed by a detailed stepby-step review procedure resulting in acceptance, qualification, or rejection of the data in question. The preliminary review ensures that chain-of-custody documentation exists, that appropriate quality-assurance procedures were followed, and that any problems affecting the analyses-complex matrix effects, inadequate sample size, unusual events--are documented. The steps of the data-validation process are outlined in summary form below, with a general level of detail given for the steps of particular importance to this project.
1. Sample holding times A. Requirements
a. Metals: 180 days b. Mercury: 26 days
B. Evaluation a. Rejection: samples analyzed after the holding time for a particular analyte b. Qualified: samples analyzed up to 10 days after the holding time c. Acceptance: not rejected
2. Initial instrument calibration A. Requirements
a. Daily calibration: for inductively coupled plasma-atomic emission spectroscopy (lCP-AES), calibration is done according to manufacturer's specifications
b. One blank and eight standards in graduated amounts are used for mercury analysis by cold-vapor atomic absorption spectroscopy (CVAA)
B. Evaluation
223

a. Rejection: calibration not perfonned or the initial calibration-solution results are outside the range of 65 to 135 percent of the known values
b. Qualified: initial calibration-solution results are outside the acceptance range of 90 to 110 percent but within the range of 65 to 135 percent of the known values
c. Acceptance: not rejected
3. Continuing calibration verification A. Requirements
a. Calibration is perfotmed every 2 hours or for every 10 percent of sample load, whichever is more frequent
B. Evaluation a. Rejection: initial calibration-solution results are outside the range of 65 to
135 percent of the known values b. Qualified: calibration not perfonned or initial calibration-solution results
are outside the acceptance range of 90 to 110 percent but within the range of 65 to 135 percent of the known values
c. Acceptance: not rejected
4. Analyses of required detection level standards A. Requirements
a. Analysis is perfonned twice every 8 hours or for every run with a sample load, whichever is more frequent, after analysis of the initial calibration standard
B. Evaluation a. Rejection: standard analysis is not performed or standard-solution result is
outside the range of 30 to 175 percent of the known value b. Qualified: standard solution is analyzed before the calibration solution or
standard-solution result is outside the acceptance range of 80 to 120 percent but within the range of 30 to 175 percent of the known value
c. Acceptance: not rejected
5. Initial and continuing calibration blank A. Requirements
a. Analysis of blank after analysis of the initial and each successive continuing calibration standard
B. Evaluation a. Rejection: analysis of initial calibration blank is not performed or result is
greater than the contract-required detection limit b. Qualified: analysis of continuing calibration blank is not perfonned after
analysis of each successive continuing calibration standard solution analyzed
c. Acceptance: not rejected
6. Laboratory process blanks and field blanks A. Requirements
a. Process blank is analyzed after analysis of 20 samples of a given matrix
224

b. One field blank is collected and analyzed per sampling date for aqueous samples. (NJDEP does not require field blanks for soil samples.)
B. Evaluation a. Rejection: (1) analysis of process blank not performed or (2) result of
blank analysis is greater than the contract-required detection limit (CRDL) and the result of sample analysis is less than 10 times greater than the result of b lank analysis or (3) the result of blank analysis is greater than the instrument detection limit but less than the CRDL and the result of sample analysis is less than 3 times greater than the result of blank analysis
b. Qualified: (1) analysis of process blank is not performed after 25 sample analyses or (2) the result of blank analysis is greater than the CRDL and the result of sample analysis is more than 10 times greater than the result of blank analysis or (3) the result of blank analysis is greater than the instrument detection limit but less than the CRDL and the result of sample analysis is more than 3 times greater than the result of blank analysis
c. Acceptance: not rejected
7. ICP-AES interference-check-sample analysis A. Requirements
a. Analysis of two check samples (major cations, metallic trace elements) twice every 8 hours or for every run with a sample load, whichever is more frequent, after analysis of the initial calibration standard
B. Evaluation a. Rejection: check-sample analysis is not performed or standard-solution
result is outside the range of 50 to 150 percent of the known value b. Qualified: check sample is analyzed 8 to 12 hours after the initial calibra
tion solution or standard solution result is outside the acceptance range of 80 to 120 percent but within the range of 50 to 150 percent of the known value, and steps are being taken to adjust the instrument to generate results within the acceptance range of 80 to 120 percent
c. Acceptance: not rejected
8. Spiked-sample analysis A. Requirements
a. Spiked sample is analyzed after analysis of 20 samples of a given matrix b. One spiked sample is used for each analytical method employed
B. Evaluation a. Rejection: analysis of spiked sample is not performed or spiked-sample
recovery is outside the range of 30 to 200 percent of the expected amount b. Qualified: analysis of spiked sample is not performed until after 25 sample
analyses, or an inappropriate spike concentration is used, or result is outside the acceptance range of 75 to 125 percent but within the range of 30 to 200 percent of the expected amount
c. Acceptance: not rejected
9. Post-digestion spike recovery
225

A. Requirements a. Analysis of post-digestion spiked sample if pre-digestion spike recovery is
outside the acceptance range of 75 to 125 percent and the sample result does not exceed four times the concentration of the added spike
B. Evaluation a. Rejection: analysis of post-digestion spiked sample is not performed when
required by unacceptable results of pre-digestion spiked sample analysis or the post-digestion spiked-sample recovery is outside the range of 30 to 200 percent of the expected amount
b. Qualified: inappropliate spike concentration is used or analysis result is outside the acceptance range of 75 to 125 percent but within the range of 30 to 200 percent of the expected amount
c. Acceptance: not rejected
10. Duplicate samples A. Requirements
a. Analysis of a duplicate sample after analysis of 20 samples of a given matrix
B. Evaluation a. Rejection: analysis of duplicate sample is not performed b. Qualified: analysis of duplicate sample is not performed until after 25 sam
ple analyses or duplicate result is outside the range of +/- 20 percent of the paired sample
c. Acceptance: not rej ected
11. Laboratory control samples
These quality-assurance sample types are required only for an aqueous matrix.
12. ICP-AES serial dilution analyses A. Requirements
a. Analysis of a five-fold dilution sample after analysis of 20 samples of a given matrix
B. Evaluation a. Rejection: analysis of dilution sample is not performed or, for an analyte
with a concentration more than 50 times the instrument detection limit, the difference between the initial analysis result and the normalized dilution result is greater than 100 percent
b. Qualified: analysis of duplicate sample is not performed until after 25 sample analyses or, for an analyte with a concentration more than 50 times the instrument detection limit, the difference between the initial analysis result and the normalized dilution result is greater than 10 percent
c. Acceptance: not rejected
13. Graphite furnace atomic absorption quality assurance
This technique was not used for this study.
226

14. Quarterly verification of instrument parameters A. Requirements
a. A suite of analyses verifying instrument detection limits, linear ranges, and interelement corrections for ICP-AES analyses must be completed quarterly
B. Evaluation a. Rejection: analyses are not performed b. Qualified: analyses are performed as much as 15 days late c. Acceptance: not rejected
15. Verification of sample-analysis result
The accuracy of data computation and transcription, validity of calibration curves, and correct usage of data codes are checked. The evaluation is described in detail in the unpublished NJDEP manual (on file at NJDEP office in Trenton, New Jersey) and is too complex to review here.
16. Preparation log A. Requirements
a. Submit one form describing in detail quality-control preparations, weights, and volumes for every 32 preparations
B. Evaluation a. Rejection: logs are not submitted b. Acceptance: not rejected
17. Analysis-run log A. Requirements
a. Submit one form describing in detail a run containing field samples and quality-assurance samples for every 32nd batch
B. Evaluation a. Rejection: logs are not submitted b. Acceptance: not rejected
Results of Quality Assurance
1. Field-equipment blanks
A worst-case contamination scenario for the field-equipment blanking program was assumed where the analyte-free blanking solution was poured in such a way as to contact the entire surface area of the stainless-steel sampling equipment, even though the soil sample itself contacted only the cutting head of the soil corer. The worst-case scenario, therefore, overestimates the degree of contamination that is possible from contact of the soil sample with the sampling equipment. Only samples FB 10 and FB 11 are washblanks from the split-spoon and corer cutting heads alone
227

(see table 1), and these also constitute a worst-case scenario in that both the inside and outside of the cutting heads were rinsed, whereas the sample comes in contact only with the interior of the cutting head.
The field-equipment blanks were collected in the U.S. Geological Survey, New Jersey District, laboratory because that was the location of all sampling of soil cores, all bottling of samples, and most of the equipment decontamination.
Some of the field blanks were found to be slightly contaminated with iron and chromium after contact with the sampling equipment. Maximum iron concentrations were about 123 ppb (or 0.12 ppm), and maximum chromium concentrations were less than 10 percent of the iron concentrations. Field blanks containing the highest chromium concentrations were from a batch of samples in which the laboratory preparation blank contained chromium. Both iron and chromium are common contaminants in aqueous blank samples in contact with stainless-steel pumping equipment or stainless-steel screens used in water sampling (Tamara Ivahnenko, U.S. Geological Survey, written commun., 1996; Stoughton, 1966). Constituent concentrations in soils were reported in parts per million. Therefore, the amounts of iron and chromium noted in the worst-case contamination scenario are barely detectable by the analysis of the soil samples. Furthermore, the concentration of iron was generally greater than 1,000 ppm in the soil samples, or at least four orders of magnitude greater than the largest measured iron content of a soil sample. In general, the chromium concentration of the soil was also several orders of magnitude greater than the measured level of contamination. See table 1 (this appendix) for analytical results.
2. Sample-processing (sample-homogenization bowl) splits
The significant amount of contact of the sample with the surface area of the glass bowl used for sample homogenization could result in sample cross-contamination by adsorption of metals or soil particles from samples to the side of the glass bowl. Cleaning techniques used for the sample-homogenization bowls were evaluated to determine the levels of contamination associated with sample processing.
Six sets of split samples (three splits, each of which was split into two samples) were prepared in the sample-homogenization bowls after various cleaning techniques were used. Two split samples were prepared in a sample-homogenization bowl after one of the three following cleaning techniques was used: (1) acid wash and deionized-water rinse, (2) soap wash and deionized water rinse, and (3) soap wash and tapwater rinse. Chemical analysis of the split samples resulted in no significant differences regardless of the cleaning technique used, indicating the sample-homogenization bowl was unlikely to be a source of contamination (see table 2, this appendix). The soap wash and deionized-water rinse technique was used throughout the study to maintain consistency with the cleaning technique used for the field-sampling equipment, although the results of analysis of the split samples indicate a tapwater rinse would have been adequate.
228

3. Analysis of Standard Reference Materials submitted blind
Three Standard Reference Materials (SRM Montana Soil 2711 , SRM San Joaquin Soil 2709, and SRM Estuarine Sediment 1646a) containing a wide range of arsenic and metallic-trace-element concentrations were submitted blind to the contract laboratories. Analytical results generally were within the range of accepted values for the mild acid leaching of SRM 2711 and SRM 2709. No mild-acid-Ieaching results are available for SRM 1646a; analytical results for this SRM were used to compare accuracy among laboratories. See tables 3 and 4, this appendix, for analytical results and evaluation.
4. Data-validation results
Antimony~concentration data for many of the samples were rejected because of low spike recovery; therefore, these data were not used in the study. Silver-concentration data commonly were rejected, or were negated (considered as undetected) because of low spike recovery or preparation-blank contamination. Silver-concentration data were not used in this study. Sodium-concentration data were negated for some samples because of contamination of preparation blanks. Sodium-concentration data are reported, but were not used in any statistical models. Some of the laboratory preparation blanks were contaminated with chromium; however, this contamination was not large or frequent enough to warrant rejection of the chromium-concentration data.
Arsenic- and lead-concentration data from one batch were rejected. These analyses were subsequently performed by another laboratory and results were acceptable. Analytical results for many constituents in one batch of 20 samples were found to be of questionable quality; the entire batch was rerun by the laboratory, using new equipment. The results of the reanalysis were acceptable. Only the acceptable data from these batches are presented in appendix 1.
Many of the data are qualified because a. The concentration was at the low end of instrument performance, b. the possibility of instrument drift existed, c. the percent recovery and the CRDL standard were outside the control lim-
its of 80 to 120 percent, d. the spike recovery was outside the control limits of 75 to 125 percent, e. the analyte was detected in the preparation blank, or f. the Iep serial dilution percent recovery was outside specified limits.
Therefore, high or low biases may exist in some of the data. For most of the qualified data, the bias is unknown. Because the samples were analyzed in batches of 20 that typically contained samples from two or three different land uses, there appears to be no systematic bias introduced into the data; rather, the biases are randomly distributed. See table 4 (this appendix) for evaluation of analytical precision and accuracy.
229

5. Field replicates
Data are presented in appendix 1. Variability in constituent concentrations in samples from adjacent soil cores is large, to the degree that adjacent soil cores (spatial duplicates) can be considered independent observations. Nevertheless, the variability between duplicates generally is not larger than the variability between samples from different land uses.
230

~ Y... "'-
Table 1. Concentrations of constituents measured in washblanks collected from sampling equipment
[All concentrations in micrograms per liter (parts per billion); letters I, 0, GS, EE following FB in sample identifiers have the following meaning: I, interior of sampler; 0, exterior of sampler; GS, washblank using U.S. Geological Survey analyte-free water; EE, washblank using contract laboratory analyte-free water. U, below instrument detection limit; B, detectable but below contract-equipment detection limit; *, interior assembled 3-foot corer; **, interior assembled split spoon;: ,3-foot corer head only: : *, split spoon head only; AI, aluminum; As, arsenic; Ba, barium: Be, beryllium; Cd, cadmium: Ca, calcium; Cr, chromium: Co, cobalt; Cu, copper; Fe, iron; Pb, lead; Mg, magnesium; Mn, manganese; Hg, mercury; Ni, nickel; K, potassium; Na, sodium; V, vanadium; Zn, zinc]
Sample Sample identifier date Al As Ba Be Cd Ca Cr Co Cu Fe Pb Mg Mn Hg Ni K Na v Zn
FB1* 951207 11.3U 3.1B 5.4U 0.31B 0.30U 143 U 0.60U l.4U LOU 17.8B 1.6U 137 U 0.50U 0.10U 1.4U 136U 187U 1.6U 1.3 B
FB2* 951207 11.3 U 2.8 U 5.4 U 0.28B 0.30U 143 U 0.60U 1.4 U 1.0 U 10.6 U 1.6U 137 U 0.68 B 0.10 U l.4U 136 U 187 U 1.6 U 2.2 B
FB3* 960215 11.3 U 3.3 B 5.4 U 0.49B 0.30U 143 U 2.2 B 1.4 U 1.0 U 24.2 B 1.6U 137 U 0.50 U 0.10 U 3.1 B 136 U 187 U 1.6 U 1.1 B
FBGS* 960215 122 B 4.7U 0.80U 0.11 U 0.30U 122 B 5.7 B 0.80U 0.60U 89.7 B 2.3 U 92.4 B 0.20 U 0.20U 2.9 B 35.5 B 223 B 0.80U 0.50U
FBEE* 960215 87.6 B 4.7 U 1.4 B 0.11 U 0.30U 94.8 B 0.40U 0.80U 0.60U 52.1 B 2.3 U 71.1 B 0.20 U 0.20U 1.5U 25.1 U 174 B 0.80U 0.50U
FB4I** 960304 13.5 B 2.8 U 5.4 U 0.10U 0.36B 143 U 0.60U 1.4 U 3.4 B 28.7 B 1.6U 137 U 0.61 B 0.10 U l.4U 136 U 187 U 1.6 U 1.7 B
FB50** 960304 44.1 B 2.8 U 5.4 U 0.10U 0.32B 1660 B 0.60U 1.4 U 7.0 B 105 7.6 137 U 4.2 B 0.10U l.4U 192 B 187 U 1.6 U 5.1 B
FB6* 960304 11.3 U 2.8 U 5.4 U 0.10U 0.30U 143 U 8.0 B 1.4 U 1.0 U 39.9 B 1.6U 137 U 0.82 B 0.10 U 3.1 B 136 U 336 B 1.6 U 1.4 B
FB8** 960425 30.5 B 3.7 U 0.75B 0.31 B 0.70U 63.1 U 2.0 B 0.70U 1.3 B 123 2.1U 114 B 2.1 B 0.10 U 1.2 B 499 U 651 U 0.50U 0.40U
FBlO: * 960516 21.0U 3.7 U 1.7 B 0.30U 0.70U 63.1 U 0.50U O.72B 0.50U 1l.8 U 2.1 U 88.3 U 0.11 U 0.10U 1.1 U 725 B 708 B 0.50U l.7 B
FBll: 960516 2l.0U 3.7U 0.70U 0.30U 0.70U 65.4 B 3.0 B 0.70U 0.64B 18.2 B 2.1 U 88.3 U 0.36 B 0.10U 1.1U 562 B 817B 0.89B 1.4 B
Table 2. Concentrations of constituents measured in splits of B-horizon soils (E15D) mixed in bowls cleaned using three preparations [Concentrations in milligrams per kilogram (parts per million). U, below instrument detection limit: B, detectable, but less than contract-required detection limit; *, soap-and-tapwater, acid-washed, deionized water wash; **, soap-and-tapwater, deionized water wash;: soap-and-tapwater wash: AI, aluminum; As, arsenic; Ba, barium; Be, beryllium; Cd, cadmium; Ca, calcium; Cr, chromium; Co, cobalt; Cu, copper; Fe, iron; Pb, lead; Mg, magnesium; Mn, manganese: Hg, mercury; Ni, nickel: K, potassium: Na, sodium; V, vanadium; Zn, zinc]
Sample number
Sample date Al As Ba Be Cd Ca Cr Co Cu Fe Pb Mg Mn Hg Ni K Na V Zn
Sl* 960422 3650 6.0 8.2 B 0.14 B 0.17 U 22.3 B 5.7 0.71 B 7.5 10700 16.3 223 B 11.2 0.09 B 1.4 B 674 B 210 B 15.0 8.0
SSl* 960422 3050 5.5 7.5 B 0.12 B 0.17 U 40.1 B 4.9 0.42 B 7.9 7630 17.0 161 B 7.1 0.12 B l.2 B 550 B 164 B 13.5 7.9
S2** 960422 3890 6.4 8.9B 0.12 B 0.17 U 34.6 B 5.9 0.61 B 7.9 9600 16.7 242 B 9.5 0.12 1.4 B 773B 251B 15.9 7.8
SS2** 960422 4250 6.0 9.7 B 0.13 B 0.17 U 36.0 B 6.4 0.54 B 8.6 11400 17.0 241 B 9.5 0.09 B 1.5 B 742 B 224 B 15.7 11.1
S3: 960422 3330 6.6 8.0 B 0.12 B 0.16U 39.1 B 5.4 0.55 B 7.7 9920 17.2 184 B 7.4 0.12 1.3B 614 B 170B 15.7 8.9
SS3: 960422 3350 5.2 7.7 B 0.15 B 0.16 U 24.6 B 5.8 0.66 B 7.7 15000 16.5 201 B 7.8 0.07 B 1.4 B 662 B 199 B 15.3 11.0
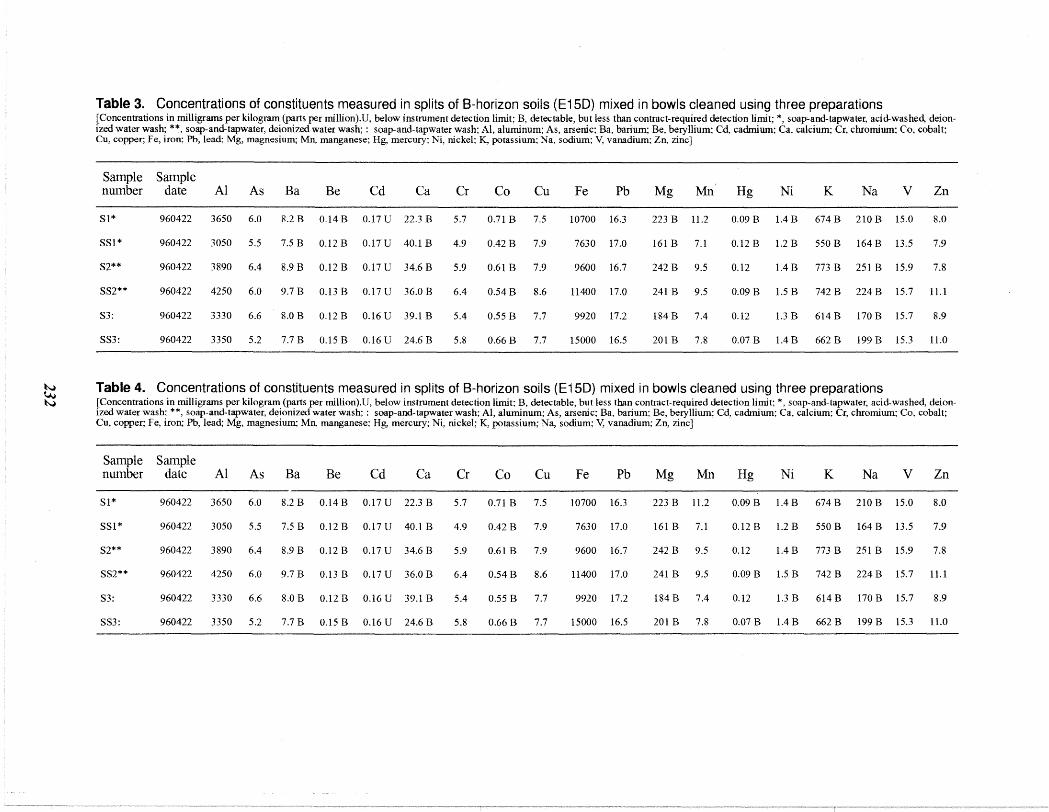
Table 3. Concentrations of constituents measured in splits of B-horizon soils (E15D) mixed in bowls cleaned using three preparations [Concentrations in milligrams per kilogram (parts per million).U, below instrument detection limit; B, detectable, but less than contract-required detection limit; *, soap~and-tapwater, acid-washed, deionized water wash; **, soap-and-tapwater, deionized water wash;: soap-and-tapwater wash; AI, aluminum; As, arsenic; Ba, barium; Be, beryllium; Cd, cadmium; Ca, calcium; Cr, chromium: Co, cobalt: Cu, copper; Fe, iron; Ph, lead; Mg, magnesium; MIl, manganese; Hg, mercury; Ni, nickel; K, potassium; Na, sodium; V, vanadium; Zn, zinc]
Sample number
Sample date Al As Ba Be Cd Ca Cr Co Cu Fe Pb Mg Mn Hg Ni K Na v Zn
Sl*
SSl*
S2**
SS2**
960422
960422
960422
960422
3650
3050
3890
4250
6.0
5.5
6.4
6.0
8.2B
7.5B
8.9 B
9.7 B
0.14B
0.12B
0.12 B
0.13 B
0.17U
0.17U
0.17 U
0.17 U
22.3B
40.1B
34.6 B
36.0 B
5.7
4.9
5.9
6.4
0.71 B
0.42 B
0.61 B
0.54 B
7.5
7.9
7.9
8.6
10700
7630
9600
11400
16.3
17.0
16.7
17.0
223 B
161 B
242 B
241 B
11.2
7.1
9.5
9.5
0.09 B
0.12B
0.12
0.09B
1.4 B
1.2B
1.4 B
1.5B
674 B
550B
773 B
742B
210 B
164B
251 B
224B
15.0
13.5
15.9
15.7
8.0
7.9
7.8
11.1
S3: 960422 3330 6.6 8.0 B 0.12 B 0.16 U 39.1 B 5.4 0.55 B 7.7 9920 17.2 184 B 7.4 0.12 1.3B 614B 170B 15.7 8.9
SS3: 960422 3350 5.2 7.7 B 0.15 B 0.16 U 24.6 B 5.8 0.66 B 7.7 15000 16.5 201 B 7.8 0.07B l.4B 662B 199B 15.3 11.0
Table 4. Concentrations of constituents measured in splits of B-horizon soils (E15D) mixed in bowls cleaned using three preparations [Concentrations in milligrams per kilogram (parts per million).U, below instrument detection limit; B, detectable, but less than contract-required detection limit; *, soap-and-tapwater, acid-washed, deionized water wash; **, soap-and-tapwater, deionized water wash;: soap-and-tapwaterwash; AI, aluminum; As, arsenic; Ba, barium; Be, beryllium; Cd, cadmium; Ca, calcium; Cr, chromium; Co, cobalt; Cu, copper; Fe, iron; Pb, lead; Mg, magnesium; MIl, manganese; Hg, mercury; Ni, nickel; K, potassium; Na, sodium; V, vanadium; ZIl, zinc]
Sample number
Sample date Al As Ba Be Cd Ca Cr Co Cu Fe Pb Mg Mn Hg Ni K Na v Zn
Sl*
SSl*
S2**
SS2**
960422
960422
960422
960422
3650
3050
3890
4250
6.0
5.5
6.4
6.0
8.2B
7.5 B
8.9B
9.7B
0.14B
0.12 B
0.12B
0.13B
0.17U
0.17 U
0.17U
0.17U
22.3B
40.1 B
34.6B
36.0B
5.7
4.9
5.9
6.4
0.71 B
0.42 B
0.61 B
0.54 B
7.5
7.9
7.9
8.6
10700
7630
9600
11400
16.3
17.0
16.7
17.0
223 B
161 B
242 B
241 B
11.2
7.1
9.5
9.5
0.09 B
0.12B
0.12
0.09B
1.4 B
1.2B
1.4 B
1.5B
674 B
550B
773 B
742B
210 B
164B
251 B
224B
15.0
13.5
15.9
15.7
8.0
7.9
7.8
11.1
S3:
SS3:
960422
960422
3330
3350
6.6
5.2
8.0 B
7.7 B
0.12 B
0.15 B
0.16 U
0.16 U
39.1 B
24.6 B
5.4
5.8
0.55 B
0.66 B
7.7
7.7
9920
15000
17.2
16.5
184 B
201 B
7.4
7.8
0.12
0.07 B
1.3B
1.4 B
614B
662 B
170B
199 B
15.7
15.3
8.9
11.0
~ ~

Table 5. Range and median of reported values* and analytical results for National Institute of Standards and Technology Standard Reference Materials (SRM) submitted as blind samples [AI, aluminum; As, arsenic: Ba, barium; Cd, cadmium; Ca, calcium: Cr, chromium; Co, cobalt: Cu, copper; Fe, iron; Pb, lead; Mg, magnesium; Mn, manganese; Ni, nickel; K, potassium; Na, sodium; V, vanadium; Zn, zinc; wt.%, weight percent; ppm, parts per million; <, less than; N/A, data not available]
SRM*/ blind AI, As, Ba, Cd, Ca, Cr, Co, Cu, Fe, Pb, Mg, Mn, Ni, K, Na, V, Zn,
sample wt.% ppm ppm ppm wt.% ppm ppm ppm wt.% ppm wt.% ppm ppm wt.% wt.% ppm ppm
Montana 1.2-2.3 ; 88-110; 170- 260; 32-46; 2.0-2.5; 15-25; 20 7-12; 91-110; 1.7-2.6; 930-1500; 0.72-0.89; 400-620; 14-20; 0.26-0.53; 0.02-.029; 34-50; 290-340; Soil 2711 * 1.8 90 200 40 2.1 8.2 100 2.2 1100 0.81 490 16 0.38 0.026 42 310
MONS 2.03 94.9 191 36.1 2.1 21.3 8.6 107 2.23 1070 0.77 476 15.1 0.51 0.028 48.5 300
M27ll 1.25 103 203 44.8 2.18 12.9 8.6 119 1.41 1130 0.717 525 15.5 0.406 0.03 27.5 329
MS2711 1.33 89.5 171 35.4 1.94 13.9 7.7 101 1.60 1020 0.65 450 13.8 0.38 0.051 28.8 '283
San Joaquin 2.0-3.3; <20 392-400; <1 1.4-1.7; 60-115; 10-15: 26-40; 2.5-3.3; 12-18; 1.2-1.5; 1.4 360-600; 65-90; 0.26-0.37; 0.063-0.11; 51-70; 87-120; Soil 2709* 2.6 398 1.5 79 12 32 3.0 13 470 78 0.32 0.068 62 100
SJS 2.91 16.4 391 <0.06 1.47 75.4 12.2 32.0 3.14 13.3 1.36 462 70.9 0.45 0.046 77.0 94.1
SJ2709 1.90 16.1 411 1.1 1.46 59.5 13.0 33.3 2.51 11.3 1.27 494 75.2 0.407 0.091 60.6 96.0
SJ2709 2.60 16.8 384 0.08 1.42 72.0 12.6 31.8 2.98 12.9 1.29 465 71.6 0.43 0.049 70.5 93.9
Estuarine N/A N/A N/A N/A N/A N/A N/A N/A N/A N/A N/A N/A N/A N/A N/A N/A N/A Sediment 1646a*
ES&S 0.723 5.5 20.2 <0.05 0.369 21.7 4.2 9.6 1.69 8.0 0.318 109 18.5 0.217 0.396 21.7 36.8
ESI646a 0.436 5.7 16.5 0.68 0.343 17.4 4.0 9.7 1.35 7.2 0.28 97.9 18.0 0.181 0.416 16.6 40.3
E1646A 0.502 5.0 16.3 <0.05 0.345 19.3 3.9 10.8 1.50 7.9 0.278 97.7 18.0 0.191 0.389 17.6 36.3
~ ~ ~

~ ~ ~
Table 6. Results of statistical analyses of quality-assurance samples
[AI, aluminum; Ag, silver; As, arsenic; Ba, barium: Be, beryllium; Cd, cadmium; Ca, calcium; Cr, chromium; Cu, copper; Fe, iron; K, potassium; Mg, magnesium: Mn, manganese; Na, sodium: Ni, nickel: Pb, lead; Sb, antimony: Se, selenium: V, vanadium: Zn, zinc; TM, trace metals; PQL, practical quantitation limit: IDL, instrument detection limit; SRM, standard reference material; %, percent: ppb, parts per billion]
Type of sample and number of samples (x) Purpose, results, and conclusions
Spatial duplicates (33) Purpose: To determine variability in results between soil samples from cores collected from adjacent sites. Results, As: Range of difference from the mean is 0 to 87%, median 24%. Highly variable: about one-half the samples have a difference of more than 25%. As extremely variable in samples from residential area 1, less variable in samples from residential area 2. Least variability in A-horizon samples .. Results, TM: Median difference from the mean 12 to 14.5% for At Fe, Mg, and Zn, 15 to 17.5<% for Ba, Cr, Cu, K, and V, and 18 to 20% for Ca, Pb, Mn., and Ni. Pb extremely variable in samples from residential area 1, generally less variable in samples from residential area 2. Conclusions: Variability of constituent concentrations in adjacent soil samples is greater than precision of analyses; the spatial variability in analyte distribution represents the greatest source of variability in the analytical results. This conclusion is especially true for As (except for A-horizon samples) and is true to a lesser degree for Ca, Mo, and Ni.
Splits (lO) Purpose: To determine analytical precision and variability in results because of sample heterogeneity. Results, As: Range difference from the mean is Q to 12%, median 3%, or comparable to two of three SRM's. Results, TM: Median difference from the mean is 2.4% for Fe, 6 to 10% for AI, Cr. Pb, and Ni, 11 to 16% for Ba, Cu, Mg, Mn, Ni, V, and Zn, and 25% for Ca. Conclusions: Analytical results are generally reproducible, though minor sample heterogeneity is evident, especially for Ba, Ca, Cu, Pb, Mg, Mn, Ni, V, and Zn.
Blanks, field (11) Purpose: To determine whether analytical results could be biased by random contamination by field equipment during sampling procedures. Results, As: Detected in only two blanks at estimated concentrations as great as 3.3 ppb; this concentration is less than the PQL for other analyses offield blanks. Results, TM: V detected in only one blank at an estimated concentration of 0.89 ppb. Cu, Pb, Mn, and Zn detected in 1 to lO blanks at estimated concentrations of7.6 ppb or less. Ba, Cr, and Ni detected in three to five blanks at estimated concentrations of8 ppb or less. Al detected in five blanks: maximum estimated concentration 122 ppb. Mg and K detected in three to four blanks at an estimated concentration of725 ppb or less; PQL for K is highly variable depending on laboratory and on batch. Ca generally reported at concentrations less than 143 ppb; one detection at 1,660 ppb. Fe detected in eight blanks; maximum concentration 123 ppb. Conclnsions: Field sampling methods may produce extremely minor contamination that is too small to bias analytical results.
Reference samples (SRM's), blind (9; 3 Purpose: To determine the accuracy and precision of analytical results reported by the laboratory. standards analyzed 3 times each) Results, As: Analyses within the range of values expected: small variance from the median reported values.
Results, TM: Most analyses are within the range of reported values for SRM's 2711 and 2709. Exceptions are one each analysis for Ba, Cd, Pb, Na, and V biased high; three analyses for K biased high. One each analysis for Ca, Mg, Ni, and Zn biased low; two each analyses for Cr, Fe, and Na biased low. Three analyses for K biased high, relative to median values, by as much as 26%. As many as two analyses for Fe and Mg biased low by as much as 17%. As many as two analyses for Cr and Pb biased low by as much as 45%. Range of average difference from the median is less than 8% for Ba, Ca, Cu, Mg, Mn., Ni, and Zn; is as great as 20% for AI, Fe, and K; and is as great as 30% for Pb and V. No mild-acid leaching results for SR,.\11646a are available, but analyses of this SRM by two laboratories used in this study produced generally comparable results. Conclusions: Analytical results generally are accurate and reproducible, though occasional random high bias for K can be expected.
Laboratory calibration standards, prepara Purpose: To determine whether analytical resul ts may be biased by random contamination in the laboratory or by analytical interferences or instrument drift. tion blanks, spiked samples, post-digestion Results, As: Occasionally qualified. Both high and low possible biases are identified; these are distributed randomly among samples from all land uses. spiked samples, duplicate samples (at least Results, TM: Many constituents, particularly Ba, Be, Cd, Ca, Mg, Ni, and K, qualified in one or more batches as a result of small concentrations near the 1 each required with each batch of 20 anal IDL. Many constituents qualified with unknown bias as a result of recovery of spikes and (or) standards outside required limits or duplicate results outside yses) limits. Some constituents, most notably Be, but also Cr, Na, and occasionally Pb, detected in preparation blanks. Be, Cd, Na, and Se results were commonly
below detection, and, if qualified, mostly negated (detected concentration reported as undetected). Ca, Cu, K, and Mg results occasionally were negated. Ag and Sb results were commonly below detection and commonly qualified or rejected (quality of data not acceptable). Some Pb analyses were biased high; these are distributed across samples from different land uses. Conclusions: Laboratory analytical techniques probably did not introduce significant bias into results for As and most other analytes; however, results for Ag and Sb could not be used. Results for Be, Cd, and Na are reported but not used in statistical analyses. Any negated values are reported as undetected and are treated as such in statistical analyses.

APPENDIX 5
Statistical Analysis of Chemical Data
The following pages are printout from the SAS nonparametric discriminant models (SAS Institute Inc., 1990b) used to analyze the chemical data for soils from differing land uses. Summary pages from three preliminary models are shown. These include:
(l) a model that classifies geologic (G), orchard (0), and Imperial Oil Company (I) soils as the training set, by using ranked barium-to-zinc ratio and ranked arsenic concentrations, and that classifies soils from residential area 1 (A), residential area 2 (R), broader area (B), and woods adjacent to IOC (S) as the test data set;
(2) a model that classifies lumped orchard and geologic (N) soils and Imperial Oil Company soils (I) as the training set, using ranked barium and ranked copper concentrations, and that classifies soils from residential area I (A), residential area 2 (R), broader area (B), and woods adjacent to IOC (S) as the test data set; and
(3) a model that classifies geologic (G) and orchard (0) soils as the training set, using ranked arsenic and ranked barium-to-zinc ratio, and that classifies soils from residential area 1 (A), residential area 2 (R), broader area (B), and woods adjacent to IOC (S) as the test data set.
In addition, printout of the final model is included. This model uses 13 ranked concentration variables, three of which are normalized (arsenic to iron/l ,000, lead and copper to TOC/ 1,000). The other variables are aluminum, barium, calcium, chromium, magnesium, manganese, nickel, potassium, vanadium, and zinc.
This model first classifies geologic (G), orchard (0), and Imperial Oil Company (I) soils as the training set, and then classifies soils from residential area 1 (A), residential area 2 (R), broader area (B), and woods adjacent to IOC (S) as the test data set.
235

Table 1 a. SAS classification-summary printout of discriminant-analysis results for test A-horizon samples classified as three end member land-use types, using ranked barium-to-zinc ratios and ranked arsenic concentrations
[A, residential area 1; R, residential area 2; S, broader area; S, woods adjacent to the Imperial Oil Company Superfund site; G, geologic; 0, orchard; I, Imperial Oil Company Superfund site; obs, observation; PRIOR, prior probabilities estimated by model before analyzing data distribution; posterior probabilities are computed after determining the data distribution; 0, distance; X, Y, vectors; j, k, groups (land-use types); Pr, probability; COV-1, inverse covariance matrix; ., not computed when priors are zero]
The SAS System 14:14 Tuesday, July 2,1996 23
Discriminant Analysis Classification SummaI)' for Test Data: WORK.TESTDAT
Classification SummaI)' using 4 Nearest Neighbors
Squared Distance Function: Posterior Probability of Membership in each TIPE:
D2 (X, Y) = (X-Y)' COY! (X-Y) mk (X) = Proportion ofobs in group k in 4 nearest neighbors of X
Pr UIX) = m (X) PRlOR / SUM (m (X) PRlOR ) j j k k k
Number of Observations and Percent Classified into TIPE:
From TYPE G 0 Total B 0 0 2 2
0.00 0.00 100.OO 100.00 R 0 2 16 18
CI.OO ILlI 88.89 100.00 S 9 0 8 17
52.94 0.00 47.06 100.00 A 0 1 4 5
0.00 20.00 80.00 100.00 Total 9 3 30 42 Percent 21.43 7.14 71.43 100.00
Priors 0.3704 0.1852 0.4444
Error Count Estimates for TYPE:
B R S A Total
Rate Priority 0.0000 0.0000 0.0000 0.0000 0.0000
236

Table 1 b. SAS classification of A-horizon soil samples from residential areas 1 and 2, the broader area, and woods adjacent to the Imperial Oil Company Superfund site as one of three possible endmember land-use types using ranked barium-to-zinc ratios and ranked arsenic concentrations
[A, residential area 1 ; R, residential area 2; B, broader area; S, woods adjacent to the Imperial Oil Company Superfund site; G, geologic; 0, orchard; I, Imperial Oil Company Superfund site; obs, observation; PRIOR, prior probabilities estimated by model before analyzing data distribution; posterior probabilities are computed after determining the data distribution; 0, distance; X, Y, vectors; j, k, groups (land-use types); Pr, probability; COV-1, inverse covariance matrix]
The SAS System 14:14 Tuesday, July 2, 1996 21
Discriminant Analysis Classification Summary for Test Data: WORK.TESTDAT
Classification Summary using 4 Nearest Neighbors
Squared Distance Function: Posterior Probability of Membership in each TYPE:
D2 (X, Y) = (X-Y)' COV1 (X-Y) mk (X) = Proportion of obs in group k in 4 nearest neighbors of X
Pr UIX) = m (X) PRIOR / SUM (m (X) PRIOR ) j j k k k
Posterior Probability of Membership in TYPE:
From Classified into Site Obs TYPE TYPE G 0 RI 1 R 0 0.0000 0.2500 0.7500 R 2 2 R 0 0.0000 0.2500 0.7500 R 5 3 R I 0.0000 0.7500 0.2500 R 6 4 R 0 0.2500 0.0000 0.7500 R 7 5 R 0 0.0000 0.2500 0.7500 R 8 6 R 0 0.0000 0.0000 1.0000 R 9 7 R 0 0.0000 0.2500 0.7500 RIO 8 R 0 0.0000 0.2500 0.7500 RII 9 R I 0.2500 0.5000 0.2500 R12 10 R 0 0.0000 0.2500 0.7500 RI3 II R 0 0.0000 0.2500 0.7500 RI4 12 R 0 0.0000 0.2500 0.7500 RI5 13 R 0 0.0000 0.2500 0.7500 RI6 14 R 0 0.0000 0.0000 1.0000 RI7 15 R 0 0.0000 0.0000 1.0000 RI8 16 R 0 0.0000 0.0000 1.0000 R20 17 R 0 0.0000 0.2500 0.7500 R27 18 R 0 0.0000 0.2500 0.7500 RI9 19 A I 0.0000 0.7500 0.2500 R21 20 A 0 0.0000 0.2500 0.7500 R22 21 A 0 0.0000 0.0000 1.0000 R23 22 A 0 0.0000 0.2500 0.7500 R24 23 A 0 0.0000 0.2500 0.7500 S 1 24 S G 1.0000 0.0000 0.0000 S 2 25 S G 0.7500 0.0000 0.2500 S 3 26 S G 1.0000 0.0000 0.0000 S 4 27 S G 1.0000 0.0000 0.0000 S 5 28 S G 0.7500 0.0000 0.2500 S 7 29 S G 1.0000 0.0000 0.0000 S 9 30 S G 1.0000 0.0000 0.0000 SIO 31 S G l.OOOO 0.0000 0.0000 S II 32 S 0 0.2500 0.0000 0.7500 SI2 33 S 0 0.2500 0.0000 0.7500 S 13 34 S 0 0.2500 0.0000 0.7500 S14 35 S 0 0.2500 0.0000 0.7500 SI5 36 S 0 0.2500 0.0000 0.7500 SI6 37 S 0 0.2500 0.0000 0.7500 SI7 38 S G 0.7500 0.0000 0.2500 Sl9 39 S 0 0.0000 0.2500 0.7500 S20 40 S 0 0.2500 0.0000 0.7500 BI 41 B 0 0.0000 0.2500 0.7500 B 2 42 B 0 0.2500 0.2500 0.5000
237

Table 2a. SAS classification-summary printout of discriminant-analysis results for test A-horizon samples classified as Imperial Oil Company Superfund site land-use type or lumped geologic and orchard land-use types, using ranked barium and copper concentrations
[A, residential area 1; R, residential area 2; B, broader area; S, woods adjacent to the Imperial Oil Company Superfund site; G, geologic; 0, orchard; I, Imperial Oil Company Superfund site; obs, observation; PRIOR, prior probabilities estimated by model before analyzing data distribution; posterior probabilities are computed after determining the data distribution; 0, distance; X, V, vectors; j, k, groups (land-use types); Pr, probability; COV-1, inverse covariance matrix; ., not computed when priors are zero]
The SAS System 11 :51 Tuesday, July 2, 1996 23
Discriminant Analysis Classification SummaI)' for Test Data: WORK.TESTDAT
Classification SummaI)' using 4 Nearest Neighbors
Squared Distance Function: Posterior Probability of Membership in each TVPE:
D2(X, V) = (X-V)' COV1 (X-V) mk (X) = Proportion of obs in group k in 4 nearest neighbors of X
Pr (j/X) = m (X) PRIOR / SUM (m (X) PRIOR ) j j k k k
Number of Observations and Percent Classified into TYPE:
From TYPE N Total B 0 2 2
0.00 100.00 100.00 R 2 16 18 '
11.11 88.89 100.00 S 0 17 17
0.00 100.00 100.00 A 5 0 5
100.00 0.00 100.00 Total 7 35 42 Percent 16.67 83.33 100.00
Priors 0.1852 0.8148
Error Count Estimates for TVPE:
B R S A Total Rate Priority 0.0000 0.0000 0.0000 o.OO()O 0.0000
238

Table 2b. SAS classification of A-horizon soil samples from residential areas 1 and 2, the broader area and woods adjacent to the Imperial Oil Company Superfund site as either Imperial Oil Company Superfund site land-use type or lumped geologic and orchard land-use types, using ranked barium and copper concentrations
[A, residential area 1; R, residential area 2; S, broader area; S, woods adjacent to the Imperial Oil Company Superfund site; G, geologic; 0, orchard; N, G+O; I, Imperial Oil Company Superfund site; obs, observation; PRIOR, prior probabilities estimated by model before analyzing data distribution; posterior probabilities are computed after determining the data distribution; 0, distance; X, Y, vectors; j, k, groups (land-use types); Pr, probability; COV-1, inverse covariance matrix]
The SAS System 11 :51 Tuesday, July 2, 1996 21
Discriminant Analysis Classification Summary for Test Data: WORK.TESTDAT
Classification Summary using 4 Nearest Neighbors
Squared Distance Function: Posterior Probability of Membership in each TIPE:
D2 (X, Y) = (X-Y)' COV1 (X-Y) ffik (X) = Proportion ofobs in group k in 4 nearest neighbors of X
Pr (j/X) = m (X) PRIOR I SUM (m (X) PRIOR ) j j k k k
Posterior Probability of Membership in TIPE:
From Classified into N Site Obs TYPE TYPE (G+O) RI R N 0.0000 1.0000 R 2 2 R I 0.7500 0.2500 R 5 3 R N 0.0000 1.0000 R 6 4 R N 0.0000 1.0000 R 7 5 R N 0.2500 0.7500 R 8 6 R N 0.0000 1.0000 R 9 7 R N 0.0000 1.0000 RIO 8 R N 0.2500 0.7500 Rll 9 R N 0.0000 1.0000 Ri2 10 R N 0.2500 0.7500 R13 11 R N 0.0000 1.0000 R14 12 R N 0.2500 0.7500 R15 13 R I 0.7500 0.2500 R16 14 R N 0.0000 1.0000 R17 15 R N 0.0000 l.OOOO R18 16 R N 0.0000 l.OOOO R20 17 R N 0.2500 0.7500 R27 18 R N 0.2500 0.7500 R19 19 A 0.7500 0.2500 R21 20 A 1.0000 0.0000 R22 21 A 0.7500 0.2500 R23 22 A 1.0000 0.0000 R24 23 A 0.7500 0.2500 S 1 24 S N O.O()O() l.OO()O S 2 25 S N 0.0000 1.0000 S 3 26 S N 0.0000 1.0000 S 4 27 S N 0.0000 1.0000 S 5 28 S N 0.0000 1.0000 S 7 29 S N 0.0000 l.OOOO S 9 30 S N 0.0000 1.0000 SIO 31 S N 0.0000 1.0000 Sll 32 S N 0.0000 1.0000 S 12 33 S N 0.0000 1.0000 S13 34 S N 0.0000 1.0000 SI4 35 S N 0.0000 1.0000 SI5 36 S N 0.0000 1.0000 S16 37 S N 0.0000 1.0000 SI7 38 S N 0.0000 1.0000 S19 39 S N 0.0000 1.0000 S20 40 S N 0.0000 1.0000 B 1 41 B N 0.2500 0.7500 B 2 42 B N 0.2500 0.7500
239
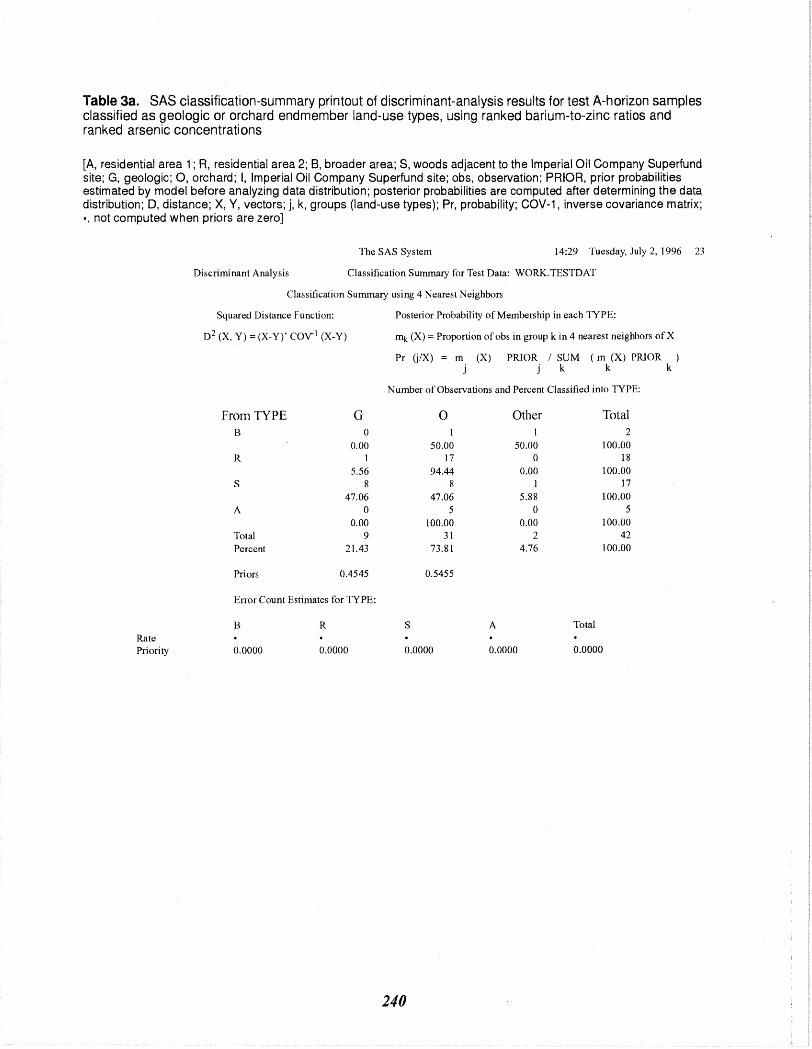
Table 3a. SAS classification-summary printout of discriminant-analysis results for test A-horizon samples classified as geologic or orchard endmember land-use types, using ranked barium-to-zinc ratios and ranked arsenic concentrations
[A, residential area 1; R, residential area 2; S, broader area; S, woods adjacent to the Imperial Oil Company Superfund site; G, geologic; 0, orchard; I, Imperial Oil Company Superfund site; obs, observation; PRIOR, prior probabilities estimated by model before analyzing data distribution; posterior probabilities are computed after determining the data distribution; 0, distance; X, Y, vectors; j, k, groups (land-use types); Pr, probability; COV-1, inverse covariance matrix; " not computed when priors are zero]
The SAS System 14:29 Tuesday, July 2,1996 23
Discriminant Analysis Classification Summary for Test Data: WORK.TESTDAT
Classification Summary using 4 Nearest Neighbors
Squared Distance Function: Posterior Probability of Membership in each TIPE:
D2 (X, Y) = (X-Y)' COY! (X-Y) mk (X) Proportion of obs in group kin 4 nearest neighbors of X
Pr UIX) = m (X) PRIOR / SUM (m (X) PRIOR ) j j k k k
Number of Observations and Percent Classified into TIPE:
From TYPE G 0 Other Total B 0 2
0.00 50.00 50.00 100.00 R I 17 0 18
S 5.56
8 94.44
8 0.00
1 100.00
17 47.06 47.06 5.88 100.00
A 0 5 0 5 0.00 100.00 0.00 100.00
Total 9 31 2 42 Percent 21.43 73.81 4.76 100.00
Priors 0.4545 0.5455
Error Count Estimates for TYPE:
B R S A Total Rate Priority 0.0000 0.0000 0.0000 0.0000 0.0000
240

Table 3b. SAS classification of A-horizon soil samples from residential areas 1 and 2, the broader area, and woods adjacent to the Imperial Oil Company Superfund site as either geologic or orchard land-use types, using ranked barium-to-zinc ratios and ranked arsenic concentrations
[A, residential area 1; R, residential area 2; 8, broader area; S, woods adjacent to the Imperial Oil Company Superfund site; G, geologic; 0, orchard; I, Imperial Oil Company Superfund site; obs, observation; PRIOR, prior probabilities estimated by model before analyzing data distribution; posterior probabilities are computed after determining the data distribution; 0, distance; X, Y, vectors; j, k, groups (land-use types); Pr, probability; COV-1, inverse covariance matrix; T, tie (occurs when posterior probabilities are equal)]
The SAS System 14:29 Tuesday, July 2, 1996 21
Discriminant Analysis Classification Summary for Test Data: WORK.TESTDAT
Classification Summary using 4 Nearest Neighbors
Squared Distance Function: Posterior Probability of Membership in each TYPE:
D2 (X, Y) = (X-Y)' COV 1 (X-Y) mk eX) = Proportion of obs in group kin 4 nearest neighbors of X
Pr (j/X) = m (X) PRIOR / SUM (m (X) PRIOR ) j j k k k
Posterior Probability of Membership in TYPE:
From Classified into Site Obs TYPE TYPE G 0 RI 4 R 0 0.2500 0.7500 R 2 5 R 0 0.0000 1.0000 R 5 6 R 0 0.2500 0.7500 R6 7 R 0 0.2500 0.7500 R 7 8 R 0 0.0000 1.0000 R 8 9 R 0 0.0000 1.0000 R 9 10 R 0 0.0000 1.0000 RIO 11 R 0 0.0000 1.0000 Rll 12 R G 0.7500 0.2500 R12 13 R 0 0.0000 1.0000 R13 14 R 0 0.0000 1.0000 RI4 15 R 0 0.0000 1.0000 RI5 16 R 0 0.0000 1.0000 RI6 17 R 0 0.0000 1.0000 RI7 18 R 0 0.0000 1.0000 RI8 19 R 0 0.0000 1.0000 R20 20 R 0 0.0000 1.0000 R27 21 R 0 0.0000 1.0000 RI9 22 A 0 0.0000 1.0000 R21 23 A 0 0.0000 1.0000 R22 24 A 0 0.0000 1.0000 R23 25 A 0 0.0000 1.0000 R24 26 A 0 0.0000 1.0000 S I 27 S G 1.0000 0.0000 S 2 28 S G 0.7500 0.2500 S 3 29 S G 1.0000 0.0000 S 4 30 S G 1.0000 0.0000 S 5 31 S G 0.7500 0.2500 S 7 32 S G 1.0000 0.0000 S 9 33 S G 1.0000 0.0000 S10 34 S G 1.0000 0.0000 SII 35 S 0 0.2500 0.7500 SI2 36 S 0 0.2500 0.7500 S 13 37 S 0 0.2500 0.7500 SI4 38 S 0 0.2500 0.7500 SI5 39 S 0 0.2500 0.7500 S16 40 S 0 0.2500 0.7500 SI7 41 S OtherT 0.5000 0.5000 S19 42 S 0 0.2500 0.7500 S20 43 S 0 0.2500 0.7500 B 1 44 B 0 0.0000 1.0O()O B 2 45 B OtherT 0.5000 0.5000
241

Tables 4a-j. SAS printout of discriminant-analysis results, using a I3-variable, five-nearest-neighbor model classifying A-horizon soils from endmember land-use types (geologic), orchard, and Imperial Oil Company Superfund site as the training set, and classifying A-horizon soils from residential areas 1 and 2, the broader area, and woods adj acent to Imperial Oil Company Superfund site as the test data set. This model uses 13 ranked concentration variables, 3 of which are normalized (arsenic to iron/l ,000, lead to TOC/l ,000, and copper to TOCIl,OOO); the other variables are aluminum, barium, calcium, chromium, magnesium, manganese, nickel, potassium, vanadium, and zinc.
Table 4a. SAS frequency, assigned weight, proportion, and prior probability for A-horizon soils from three endmember land-use types used in the training set of a 13-variable discriminant-analysis classification model
[OF, degrees of freedom; G, geologic; I, Imperial Oil Company Superfund site; 0, orchard]
The SAS System 12:29 Monday, August 26, 1996 1
Discriminant Analysis
26 Observations 25 DF Total 13 Variables 23 DF Within Classes 3 Classes 2 DF Between Classes
Class Level Infonnation
Prior TYPE Frequency Weight Proportion Probability
G 9 9.0000 0.346154 0.346154 5 5.0000 0.192308 0.192308
o 12 12.0000 0.461538 0.461538
242

Table 4b. Descriptive statistics for variables in training set of A-horizon soil samples from endmember land-use types used in 13-variable discriminant-analysis classification model
[N, number of samples; Std Dev, standard deviation; R preceding variable denotes a rank transformation of the concentration; AL, aluminum; ASN, arsenic normalized to (iron concentration/1,OOO); BA, barium; CA, calcium; CR, chromium; CUN, copper normalized to (total organic carbon concentration/1,OOO); PBN, lead normalized to (total organic carbon concentration/1 ,000); MG, magnesium; MN, manganese; NI. nickel; K, potassium; V, vanadium; ZN. zinc; G. geologic; I. Imperial Oil Company Superfund site; 0, orchard]
The SAS System 12:29 Monday, August 26,1996 Discriminant Analysis Simple Statistics
Total-Sample
Sum Mean Variance Std Dev Variable N Label RAL 26 651.50000 25.05769 408.44654 20.21006 Rank for Variable AL RASN 26 1011 38.88462 446.82615 21.13826 Rank for Variable ASN RBA 26 867.50000 33.36538 480.85115 21.92832 Rank for Variable BA RCA 26 934.00000 35.92308 355.57385 18.85667 Rank for Variable CA RCR 26 768.00000 29.53846 423.63846 20.58248 Rank for Variable CR RCUN 26 739.00000 28.42308 438,(19385 20.93069 Rank for Variable CUN RPBN 26 785.00000 30.19231 372.64154 19.30393 Rank for Variable PBN RMG 26 704.50000 27.09615 452.90038 21.28146 Rank for Variable MG RMN 26 775.50000 29.82692 444.51885 21.08362 Rank for Variable MN RNI 26 767.50000 29.51923 405.00962 20.12485 Rank for Variable NI RK 26 556.50000 21.40385 180.12038 13.42089 Rank for Variable K RV 26 763.00000 29.34615 403.11538 20.07773 Rank for Variable V RZN 26 788.00000 30.30769 408.36154 20.20796 Rank for Variable ZN
TYPE G
2
Variable N Sum Mean Variance Std Dev Label RAL 9 159.50000 17.72222 272.19444 16.49832 Rank for Variable AL
RASN 9 248.00000 27.55556 429.52778 20.72505 Rank for Variable ASN
RBA 9 173.00000 19.22222 256.88194 16.02754 Rank for Variable BA
RCA 9 199.00000 22.11111 206.54861 14.37180 Rank for Variable CA
RCR 9 171.50000 19,(15556 291.34028 17,(16869 Rank for Variable CR
RCUN 9 198.00(lOO 22.00000 292.50000 17.10263 Rank for Variable CUN
RPBN 9 176.00000 19.55556 270.27778 16.44013 Rank for Variable PBN RMG 9 152.00000 16.88889 262.67361 16.20721 Rank for Variable MG
RMN 9 170.00000 18.88889 282.67361 16.81290 Rank for Variable MN
RNI 9 183.50000 20.38889 257.42361 16.04443 Rank for Variable NI
RK 9 128.00000 14.22222 193.19444 13.89944 Rank for Variable K
RV 9 160.00000 17.77778 259.88194 16.12085 Rank for Variable V
RZN 9 129.00000 14.33333 177.93750 LU3932 Rank for Variable ZN
243

Table 4b. Descriptive statistics for variables in training set of A-horizon soil samples from endmember land-use types used in 13-variable discriminant-analysis classification model--Continued
The SAS System 12:29 Monday, August 26, 1996 3Discriminant Analysis Simple Statistics
TYPE = I
Variable N Sum Mean Variance Std Dev Label RAL 5 197.00000 39.40000 285.80000 16.90562 Rank for Variable AL RASN 5 254.00000 50.80000 159.70000 12.63725 Rank for Variable ASN RBA 5 313.00000 62.60000 27.80000 5.27257 Rank for Variable BA RCA 5 271.00000 54.20000 204.20000 14.28986 Rank for Variable CA RCR 5 218.00000 43.60000 463.17500 21.52150 Rank for Variable CR RCUN 5 167.00000 33.40000 867.30000 29.44996 Rank for Variable CUN RPBN 5 175.00000 35.00000 611.5(1000 24.72853 Rank for Variable PBN RMG 5 222.00000 44.40000 403.30000 20.08233 Rank for Variable MG RMN 5 190.00000 38.00000 598.50000 24.46426 Rank for Variable MN RNI 5 228.00000 45.60000 685.80000 26.18778 Rank for Variable NI RK 5 131.00000 26.20000 93.70000 9.67988 Rank for Variable K RV 5 224.00000 44.90000 111.05000 10.53803 Rank for Variable V RZN 5 260.00000 52.00000 264.50000 16.26346 Rank for Variable ZN
TYPE 0
Variable N Sum Mean Variance Std Dev Label RAL 12 295.00000 24.58333 488.62879 22.10495 Rank for Variable AL RASN 12 509.00000 42.41667 461.90152 21.49189 Rank for Variable ASN RBA 12 381.50000 31.79167 341.06629 18.46798 Rank for Variable BA RCA 12 464.00000 38.66667 267.51515 16.35589 Rank for Variable CA RCR 12 378.50000 31.54167 398.33902 19.95843 Rank for Variable CR RCUN 12 374.00000 31.16667 414.33333 20.35518 Rank for Variable CUN RPBN 12 434.00000 36.16667 285.96970 16.91064 Rank for Variable PBN RMG 12 330.50000 27.54167 47(l.06629 21.68101 Rank for Variable MG RMN 12 415.50000 34.62500 433.68750 20.82517 Rank for Variable MN RNI 12 356.00000 29.66667 298.10606 17.26575 Rank for Variable NI RK 12 297.50000 24.79167 169.61174 13.02351 Rank for Variable K RV 12 378.50000 31.54167 462.06629 21.49573 Rank for Variable V RZN 12 399.00000 33.25000 270.38636 16.44343 Rank for Variable ZN
244

Table 4c. SAS computation of squared distances between end member groups of A-horizon samples used in 13-variable discriminant-analysis classification model
[G, geologic; I, Imperial Oil Company Superfund site; 0, orchard; 0, distance in 13-variable space; ilj, group i given group j; X, centroid (multivariate mean) of group; COV-1, inverse of covariance matrix]
The SAS System 12:29 Monday, August 26, 1996 4
Discriminant Analysis Pairwise Squared Distances Between Groups
D2 (ilj) = (Xi -Xj). covl (Xi - Xj)
Squared Distance to TIPE
From TYPE G o G o 32.64027 26.08696 I 32.64027 o 17.12096 o 26.08696 17.12096 o
Table 4d. SAS computation of squared distances between end member groups of A-horizon samples used in 13-variable discriminant-analysis classification model
[S, M, N, parameters underlying the joint distribution of the eigenvalues; F, F statistic for the test; Num OF, numerator degrees of freedom; Den OF, denominator degrees of freedom; Pr > F, probability greater than F statistic]
The SAS System 12:29 Monday, August 26, 1996 5
Discriminant Analysis
Multivariate Statistics and F Approximations
S = 2 M = 5 N = 4.5
Statistic Value F NumDF DenDF Pr> F Wilks' Lambda 0.03798389 3.4954 26 22 0.0020 PiHai's Trace 1.58650774 3.5417 26 24 O.OOl3 HoteHing-Lawley Trace 8.88598900 3.4177 26 20 0.0032 Roy's Greatest Root 6.25937591 5.7779 13 12 0.0023
NOTE: F Statistic for Roy's Greatest Root is an upper bound. NOTE: F Statistic for Wilks' Lambda is exact.
245
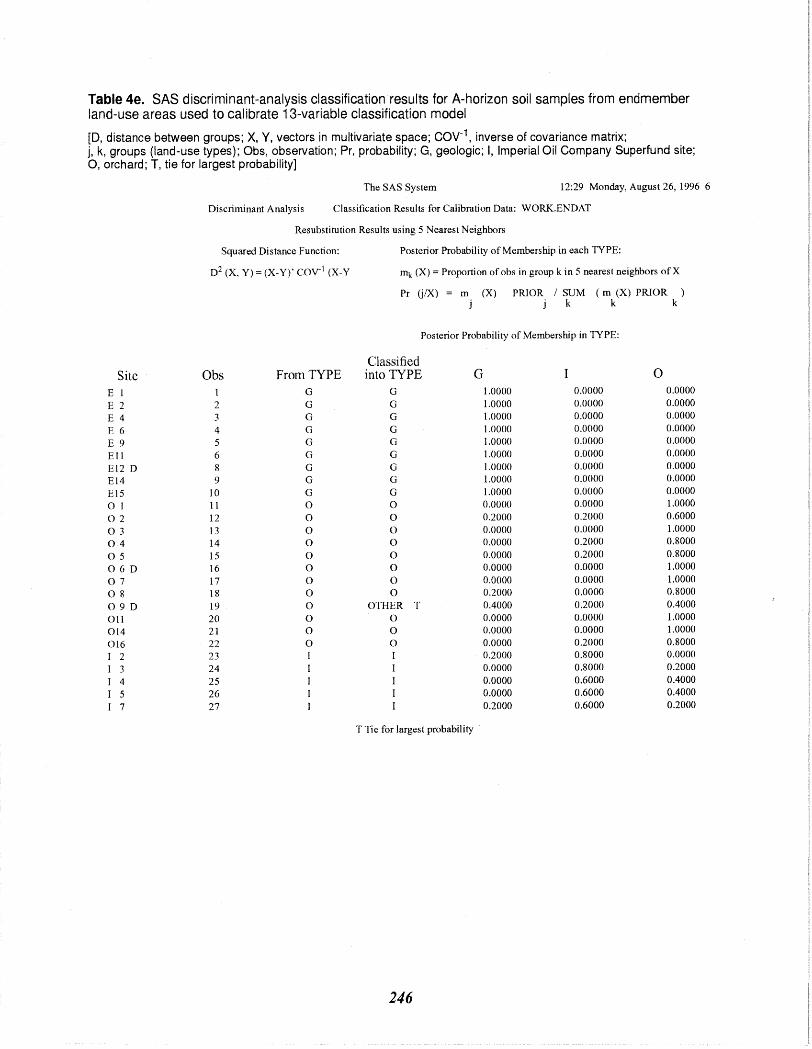
Table 4e. SAS discriminant-analysis classification results for A-horizon soil samples from endmember land-use areas used to calibrate 13-variable classification model
[0, distance between groups; X, V, vectors in multivariate space; COV-1, inverse of covariance matrix; j, k, groups (land-use types); Obs, observation; Pr, probability; G, geologic; I, Imperial Oil Company Superfund site; 0, orchard; T, tie for largest probability]
The SAS System 12:29 Monday, August 26, 1996 6
Discriminant Analysis Classification Results for Calibration Data: WORK.ENDAT
Resubstitution Results using 5 Nearest Neighbors
Squared Distance Function: Posterior Probability of Membership in each TYPE:
D2 (X, Y) = (X-V)' COV- l (X-y ffiK. (X) = Proportion of obs in group k in 5 nearest neighbors of X
Pr (j/X) = m (X) PRIOR / SUM (m (X) PRIOR ) j k k k
Posterior Probability of Membership in TYPE:
Classified Site Obs From TYPE into TYPE G 0
E 1 G G 1.0000 0.0000 0.0000
E 2 2 G G 1.0000 0.0000 0.0000
E 4 3 G G 1.0000 0.0000 0.0000
E 6 4 G G 1.0000 0.0000 0.0000
E 9 5 G G 1.0000 0.0000 0.0000
Ell 6 G G 1.0000 0.0000 0.0000
E12 D 8 G G 1.0000 0.0000 0.0000
EI4 9 G G 1.0000 0.0000 0.0000
EI5 10 G G 1.0000 0.0000 0.0000
01 11 0 0 0.0000 0.0000 1.0000
02 12 0 0 0.2000 0.2000 0.6000
03 13 0 0 0.0000 0.0000 1.0000
04 14 0 0 0.0000 0.2000 0.8000
05 15 0 0 0.0000 0.2000 0.8000
06D 16 0 0 0.0000 0.0000 1.0000
07 17 0 0 0.0000 0.0000 1.0000
08 18 0 0 0.2000 0.0000 0.8000
09D 19 0 OTHER T 0.4000 0.2000 0.4000
011 20 0 0 0.0000 0.0000 1.0000
014 21 0 0 0.0000 0.0000 1.0000
016 22 0 0 0.0000 0.2000 0.8000
I 2 23 I I 0.2000 0.8000 0.0000
3 24 0.0000 0.8000 0.2000
4 25 0.0000 0.6000 0.4000
5 26 0.0000 0.6000 0.4000
7 27 0.2000 0.6000 0.2000
T Tie for largest probability
246

Table 4f. SAS discriminant-analysis classification summary for A-horizon soil samples from end member land-use areas used as training set to calibrate 13-variable classification model
[0, distance between groups; X, Y, vectors in multivariate space; COV-1, inverse of covariance matrix; j, k, groups (land-use types); Obs, observation; Pr, probability; G, geologic; I, Imperial Oil Company Superfund site; 0, orchard; T, tie for largest probability]
The SAS System 12:29 Monday, August 26,1996 7
Discriminant Analysis Classification Results for Calibration Data: WORK.ENDAT
Resubstitution Summary using 5 Nearest Neighbors
Squared Distance Function: Posterior Probability of Membership in each TYPE:
D2 (X, V) = (X-V)' COV I (X-V) IT1\( (X) = Proportion of obs in group k in 5 nearest neighbors of X
Pr (j/X) = m (X) PRIOR / SUM (m (X) PRIOR ) k k k
Number of Observations and Percent Classified into TYPE:
From TYPE G 0 Other Total G 9 0 0 0 9
lOO.OO Cl.OO 0.00 0.00 100.00 0 5 0 0 5
0.00 100.00 0.00 0.00 100.00 o 0 0 11 1 12
0.00 0.00 91.67 8.33 100.00
Total 9 5 11 26 Percent 34.62 19.23 42.31 3.85 100.00
Priors 0.3462 0.1923 0.4615
Error Count Estimates for TYPE:
G o Total Rate 0.0000 0.0000 0.0833 0.0385 Priors 0.3462 0.1923 0.4615
247
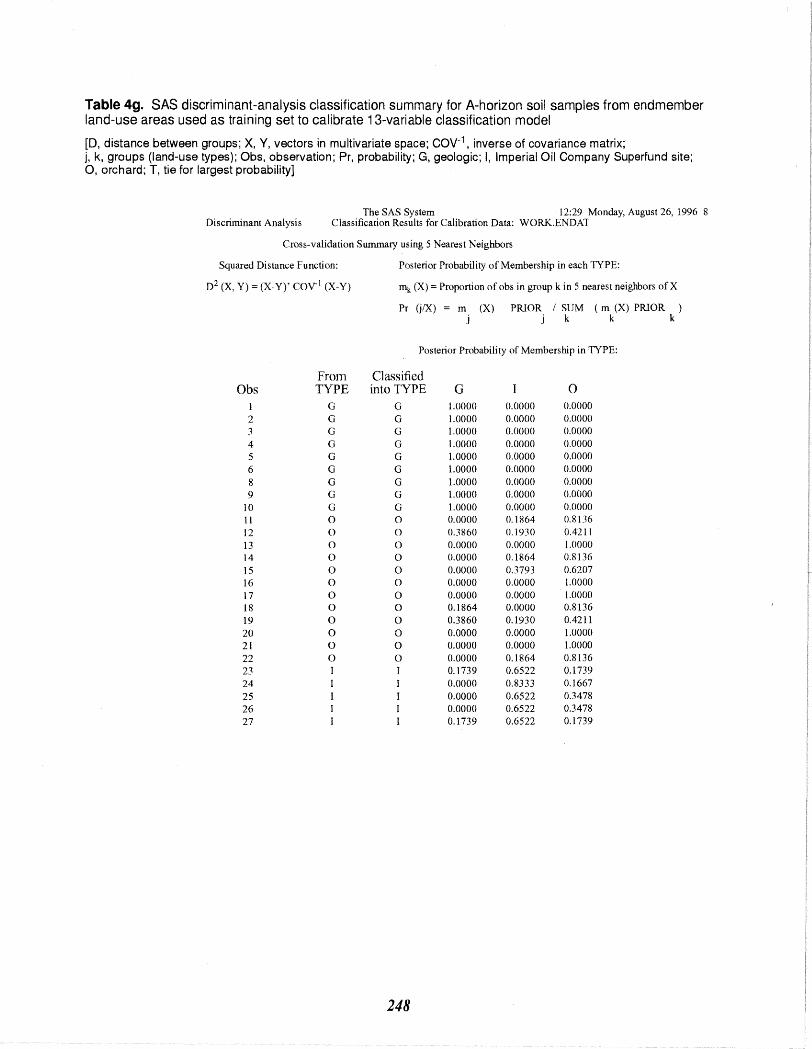
Table 4g. SAS discriminant-analysis classification summary for A-horizon soil samples from endmember land-use areas used as training set to calibrate 13-variable classification model
[0, distance between groups; X, Y, vectors in multivariate space; cov-l, inverse of covariance matrix; j, k, groups (land-use types); Obs, observation; Pr, probability; G, geologic; I, Imperial Oil Company Superfund site; 0, orchard; T, tie for largest probability]
The SAS System 12:29 Monday, August 26, 1996 8 Discriminant Analysis Classification Results for Calibration Data: WORK.ENDAT
Cross-validation Summary using 5 Nearest Neighbors
Squared Distance Function: Posterior Probability of Membership in each TIPE:
D2 (X, Y) = (X-Y)' COVI (X-Y) lTl\( eX) = Proportion of obs in group k in 5 nearest neighbors of X
Pr UIX) = m (X) PRIOR I SUM (m (X) PRIOR ) j j k k k
Posterior Probability of Membership in TIPE:
From Classified Obs TYPE into TYPE G 0
1 G G 1.0000 0.0000 0.0000 2 G G 1.0000 0.0000 0.0000 3 G G 1.0000 0.0000 0.0000 4 G G 1.0000 0.0000 0.0000 5 G G 1.0000 0.0000 0.0000 6 G G 1.0000 0.0000 O.O{)OO
8 G G 1.0000 0.0000 0.0000 9 G G 1.0000 0.0000 0.0000
10 G G 1.0000 0.0000 0.0000 11 0 0 0.0000 0.1864 0.8136 12 0 0 0.3860 0.1930 0.4211 13 0 0 0.0000 0.0000 l.OOOO 14 0 0 0.0000 0.1864 0.8136 15 0 0 0.0000 0.3793 0.6207 16 0 0 0.0000 0.0000 1.0000 17 0 0 0.0000 0.0000 1.0000 18 0 0 0.1864 0.0000 0.8136 19 0 0 0.3860 0.1930 0.4211 20 0 0 0.0000 0.0000 1.0000 21 0 0 0.0000 0.0000 1.0000 22 0 0 0.0000 0.1864 0.8136 23 I I 0.1739 0.6522 0.1739 24 0.0000 0.8333 0.1667 25 0.0000 0.6522 0.3478 26 0.0000 0.6522 0.3478 27 0.1739 0.6522 0.1739
248

Table 4h. SAS discriminant-analysis classification summary of cross-validated results for A-horizon soil samples from end member land-use areas used to calibrate 13-variable classification model
[0, distance between groups; X, Y, vectors in multivariate space; COV-1, inverse of covariance matrix; j, k, groups (land-use types); Obs, observation; Pr, probability; G, geologic; I, Imperial Oil Company Superfund site; 0, orchard; T, tie for largest probability]
The SAS System 12:29 Monday, August 26, 1996 9
Discriminant Analysis Classification Results for Calibration Data: WORK.ENDAT
Cross-validation Summary using 5 Nearest Neighbors
Squared Distance Function: Posterior Probability of Membership in each TYPE:
mk (X) = Proportion ofobs in group k in 5 nearest neighbors of X
Pr U/X) = m (X) PRIOR I SUM (m (X) PRIOR ) k k k
Number of Observation and Percent Classified into TYPE:
From TYPE G 0 Total G 9 0 0 9
100.00 0.00 (1.00 100.00 0 5 0 5
0.00 100.00 0.00 100.00 o 0 0 12 12
0.00 0.00 100.00 100.00
Total 9 5 12 26 Percent 34.62 19.23 46.15 100.00
Priors 0.3462 0.1923 0.4615
Error Count Estimates for TYPE:
G 0 Total Rate 0.0000 0.0000 0.0000 O'(lOOO
Priors 0.3462 0.1923 0.4615
249

Table 4i. SAS discriminant-analysis classification of A-horizon soil samples from residential areas 1 and 2, the broader area, and woods adjacent to Imperial Oil Company Superfund site as one of three possible end member land-use types, using the 13-variable classification model
[0, distance between groups; X, V, vectors in multivariate space; COV-1, inverse of covariance matrix; j, k, groups (land-use types); Obs, observation; Pr, probability; G, geologic; I, Imperial Oil Company Superfund site; 0, orchard; T, tie for largest probability]
The SAS System 12:29 Monday, August 26,1996 10
Discriminant Analysis Classification Results for Calibration Data: WORK.TESTDAT
Classification Results using 5 Nearest Neighbors
Squared Distance Function: Posterior Probability of Membership in each TYPE:
D2 (X, Y) = (X-V)' COY 1 (X-Y) mk (X) = Proportion of obs in group kin 5 nearest neighbors of X
Pr (j/X) = m (X) PRlOR I SUM (m (X) PRIOR ) j k k k
Posterior Probability of Membership in TYPE:
From Classified Site Obs TYPE into TYPE G 0 RI 1 R 0 0.0000 0.0000 1.0000 R2 2 R 0 0.0000 0.0000 1.0000
R 5 3 R 0 0.0000 0.0000 1.0000 R6 4 R 0 0.0000 O.200() 0.8000
R7 5 R 0 0.0000 0.0000 1.0000
R 8 6 R 0 0.0000 0.4000 0.6000 R9 7 R 0 0.0000 0.0000 1.0000
RIO 8 R 0 0.0000 0.0000 1.0000
Rll 9 R G 1.0000 0.0000 0.0000
R12 10 R 0 0.0000 0.0000 1.0000 R13 11 R 0 0.0000 0.0000 1.0000 R14 12 R 0 0.0000 0.2000 0.8000
R15 13 R 0 0.0000 0.2000 0.8000 R16 14 R 0 0.0000 0.0000 1.0000 R17 15 R 0 0.0000 0.0000 1.0000 R18 16 R 0 0.0000 0.2000 0.8000 R20 17 R 0 0.0000 0.0000 1.0000 R27 18 R OtherT 0.4000 0.2000 0.4000 R19 19 A 0 0.0000 0.4000 0.6000 R21 20 A 0 0.0000 0.2000 0.8000 R22 21 A 0 0.0000 0.4000 0.6000 R23 22 A 0 0.0000 0.2000 0.8000 R24 23 A 0 0.0000 0.2000 0.8000 S 1 24 S G 1.0000 0.0000 0.0000 S 2 25 S G 0.8000 0.0000 0.2000 S 3 26 S G 1.0000 0.0000 0.0000 S 4 27 S G 1.0000 0.0000 0.0000 S 5 28 S G 1.0000 O.()OOO 0.0000 S 7 29 S G 1.0000 0.0000 0.0000 S 9 30 S G 1.0000 0.0000 0.0000 SIO 31 S G 1.0000 0.0000 0.0000 Sll 32 S G 0.8000 0.0000 0.2000 S 12 33 S 0 0.4000 0.0000 0.6000 S13 34 S G 0.8000 0.0000 0.2000 S14 35 S G 0.8000 0.0000 0.2000 SI5 36 S 0 0.4000 0.0000 0.6000 S 16 37 S 0 0.2000 0.0000 0.8000 S17 38 S 0 0.2000 0.0000 0.8000 S19 39 S 0 0.0000 0.0000 1.0000 S20 40 S 0 0.0000 0.0000 1.0000 B 1 41 B 0 0.0000 0.0000 1.0000 B 2 42 B 0 0.0000 0.2000 0.8000
250

Table 4j. SAS discriminant-analysis classification summary for A-horizon soil samples from residential areas 1 and 2, the broader area, and woods adjacent to Imperial Oil Company Superfund site used as test data in the 13-variable classification model
[A, residential area 1 ; R, residential area 2; B, broader area; S, woods adjacent to the Imperial Oil Company Superfund site; G, geologic; 0, orchard; I, Imperial Oil Company Superfund site; obs, observation; PRIOR, prior probabilities estimated by model before analyzing data distribution; posterior probabilities are computed after determining the data distribution; D, distance; X, Y, vectors; j, k, groups (land-use types); COV-1, inverse covariance matrix;·, not computed when priors are zero J
The SAS System 12:29 Monday, August 26, 1996 12
Discrimi nan! Analysis Classification Summary for Test Data: WORK.TESTDAT
Classification Summary using 5 Nearest Neighbors
Squared Distance function: Posterior Probability of Membership in each TYPE:
D2 (X, Y) (X-Y)' COV1 (X-Y) mk (X) = Proportion ofohs in group k in 5 nearest neighbors of X
Pr (j/X) = m (X) PRlOR I SUM (m (X) PRlOR ) j k k k
Number of Observations and Percent Classified into TYPE:
From TYPE G 0 Other Total B 0 0 2 0 2
0.00 0.00 100.00 0.00 100.00
R 1 0 16 I 18
5.56 0.00 88.89 5.56 100.00
S II 0 6 0 17
64.71 0.00 35.29 0.00 IOO.OO
A 0 0 5 0 5
0.00 (l.00 100.00 0.00 100.00
Total 12 0 29 42
Percent 28.57 0.00 69.05 2.38 100.00
Priors 0.3462 0.1923 0.4615
Error Count Estimates for TYPE:
B R s A Total
Rate Priority 0.0000 0.0000 0.0000 0.0000 0.0000
251