Embed Size (px)
Citation preview

2007
Report on the State of the Environment in
China
Ministry of Environmental Protection
The People’s Republic of China

The “2007 Report on the State of the Environment of
China” is hereby released in accordance with the Environmental
Protection Law of the People’s Republic of China.
Zhou Shengxian
Minister
Ministry of Environmental Protection
June 4, 2008

Table of Contents
REDUCTION OF THE TOTAL AMOUNT OF MAJOR POLLUTANTS .......................................8
WATER ENVIRONMENT..................................................................................................................13
MARINE ENVIRONMENT................................................................................................................32
ATMOSPHERIC ENVIRONMENT ..................................................................................................41
ACOUSTIC ENVIRONMENT ...........................................................................................................47
SOLID WASTE.....................................................................................................................................50
RADIATION ENVIRONMENT.........................................................................................................53
NATURAL ECOLOGY .......................................................................................................................58
LAND AND RURAL ENVIRONMENT.............................................................................................64
FOREST................................................................................................................................................68
GRASSLAND .......................................................................................................................................71
CLIMATE AND NATURAL DISASTERS.........................................................................................74
Boxes
National Eleventh Five-Year Plan on Environmental
Protection…………………………………..…………………………??
Developing Environment-friendly Economic
Policies………………………………………….……………………??
“Five Battles”………………………………………………………… ??
Extraordinarily Serious and Major Environmental
Accidents across China…………………………………………………??
International Environmental Cooperation and
Exchanges ………………………………………………………………??
Quantitative Examination of Integrated Improvement of Urban
Environment ……………………………………………………………??
National Action Plan for Environment and
Health ………………………………..…………………………………??

The First National Census of Pollution
Sources …………………………………………………………………??
Study on Macro Strategy for China’s
Environment ……………………....……………………………………??
Special Environmental Campaigns to Harshly Crack Down on
Environmental Infringements ……………………………..……………??
Environmental Publicity and
Education ……………….………………………………………………??
Activity on the Year for Strengthening Local Environmental Protection
Work ……………………………………………………………………??

On October 15, 2007, the 17th National Congress of the Communist Party of China was held in
Beijing. President Hu Jintao reported to the meeting and clearly proposed to build the
conservation culture.
Photo by Xinhua News Agency
On April 27, 2007, the State Council held the National Teleconference on Energy
Saving and Pollution Reduction. Premier Wen Jiabao presented the meeting and
delivered important remarks.
Photo by Xinhua News Agency

In 2007, under the wise leadership of the CPC Central Committee and the State
Council, all provinces, autonomous regions & municipalities and government
departments thoroughly implemented the scientific outlook on development, took
pollution reduction as one of the major tasks, adopted comprehensive measures, sped
up pollution control, made more efforts, and further carried out relevant policies and
measures. As a result, they made a breakthrough in pollution reduction with both
decrease of COD and SO2 emissions, and made active progress in environmental
protection work.
First, the CPC Central Committee and the State Council highly valued environmental
protection work. President Hu Jintao gave important instructions on intensifying the
administration by law, devoting more efforts to pollution treatment and striving for
the achievement of the target for the control of total amount of pollutants. The State
Council printed and distributed a number of important documents, including the
Circular on Printing and Distributing the Integrated Work Plan on Energy Saving
and Emissions Reduction, Circular on Printing and Distributing the 11th Five-Year
Plan on Environmental Protection, and Circular on Transmitting the Implementation
Plan and Approach for Statistics, Monitoring and Assessment of Energy Saving and
Emissions Reduction. The 17th National Congress of the CPC included the efforts to
build a resource-saving and environment-friendly society in the CPC Constitution,
and regarded the building of conservation culture as a new requirement for achieving
the target of building a Xiaokang Society in an all-round way.
Second, a breakthrough was achieved in pollution reduction. COD and SO2 emissions
decreased by 3.2% and 4.7% respectively than that of 2006, it is the first time to
experience a drop in both COD and SO2 emissions.
Third, the government tried hard to solve prominent environmental problems that
threaten public health and adversely affect sustainable development. More efforts
were made to prevent and control pollution in key basins and regions with active
progress in cracking down on illegal pollutant discharge enterprises. Special law
enforcement inspection was carried out in the drinking water source protection areas,
investigating the basic information of such areas. Environmental protection work was
launched in rural areas in an all-round way, and all kinds of environmental
emergencies were actively responded to and properly handled.
Fourth, the government adopted the policy of regional ban the approval of new
projects due to excessive environmental pressure, in order to control pollution at the
source. The environmental authority suspended the approval of environmental impact
assessment statements of ten cities, two counties, five development zones and four
power groups, which frightened the behaviors in violation of environmental laws.
Fifth, the government further improved the legal and economic policies and

standardization systems in the environmental sector. It has amended the Law of the
People’s Republic of China on Prevention and Control of Water Pollution, identifies
enterprises with outdated production capacity in heavy pollution industries,
introduced environment-friendly fiscal, tax, credit, trade, securities, insurance, and
pricing policies, and issued 104 national standards for environmental protection.
Sixth, the government launched three fundamental and strategic projects, i.e., the first
national census on pollution sources, study on China’s macro environmental strategy,
and the special S&T project on treatment and control of water pollution.
Seventh, the supervision on nuclear and radiation safety was intensified.
Eighth, the environmental publicity was also intensified. The environmental authority
issued the Measures for the Disclosure of Environmental Information (for Trial) in
order to safeguard public right to know about, participate in and supervise on
environmental protection.
Ninth, the government actively implemented environmental conventions with major
breakthrough in international environmental cooperation. Both multilateral and
bilateral environmental cooperation have been intensified, and the Chinese
government further enhanced its resolute resolve to intensify environmental
protection and erected the image of a responsible country in the new era, which won
the positive comments from the international community.
In 2007, the overall environmental quality of the whole country turned better but the
situation was not inspiring. Surface water pollution was still serious, the seven major
water systems suffered from medium pollution, and the offshore areas at large
experienced light pollution. The air quality in urban areas was good at large, but some
cities still suffered from heavy pollution. Acid rain distribution areas remained stable.
The overall urban acoustic environment was good across China and the overall
ecological environment remained stable.

2
Reduction of the Total Amount of Major Pollutants
Basic goals
The Outline of the 11th Five-Year Plan on National Economic and Social
Development proposes the obligatory target to reduce energy consumption per unit
GDP by around 20% and the total amount of major pollutants by 10% during the 11th
Five-Year Plan period. The two obligatory targets for pollution reduction during that
period are, by 2010, to reduce both COD and SO2 emissions by 10% compared with
that of 2005. That is, COD emission will be cut down at 12.728 million tons from
14.142 million tons in 2005, and SO2 emission be cut down at 22.944 million tons
from 25.494 million tons.
The main targets for pollution reduction in 2007 included the followings. Cities that
have subordinate county-level cities would have sewage treatment capacity up by 12
million tons/year, the capacity of using recycled water at one million tons/year, and
the capacity to cut down COD at 600,000 tons/year. The existing coal-fired power
plants would have desulfurization facilities for 35 million kW output, reducing SO2
emissions at 1.23 million tons/year. A total of 31.5 million tons of coal equivalent
would be saved, reducing 400,000 tons of SO2. More efforts are devoted to phase out
outdated production capacity in paper making, alcohol, monosodium glutamate, and
citric acid sectors with COD reduction by 620,000 tons.
Reduction of major pollutants
In 2007, COD emission in the country amounted to 13.818 million tons, down by
3.2% than the previous year; SO2 emission amounted to 24.681 million tons, down by
4.7% than that of 2006. COD and SO2 emissions decreased by 2.3% and 3.2%
respectively compared with that of 2005, being the first time of both drop of COD and
SO2 emissions.
After efforts, 60% of urban sewage water was treated in 2007, up from 57% in 2006.
The installed capacity of the thermal power units equipped with desulfurization
facilities amounted to 266 million kW. 48% of the units were equipped with such
facilities in 2007, up from 32% last year. In 2007, permanganate index in 759 surface
water sections under national monitoring program was 6.5mg/L on average, down by
7% than that of the previous year. The proportion of the days in a year with good air
quality in the 113 major cities on environmental protection was up by 2.3 percentage
points.

2
Major measures
In 2007, the State Council held the National Teleconference on Energy Saving and
Emissions Reduction, printed and distributed the Integrated Work Plan on Energy
Saving and Emissions Reduction, approved & transmitted the Implementation Plan
and Approach on Statistics, Monitoring, and Assessment for Energy Saving and
Emissions Reduction. All provinces, autonomous regions and municipalities as well as
government departments paid close attention to these documents and issued a series of
policies and measures to promote the work on energy saving and emission reduction
with more efforts. Each province (autonomous region and municipality directly under
the Central Government) organized working meetings on energy saving and emission
reduction, arranged relevant work, and enhanced the guidance and coordination for
such work.
Centering on the overarching task of emissions reduction, environmental authority
organized meetings on prevention and control of pollution in the Songhua River
Basins and major lake and river basins, proposed the policy to rehabilitate the rivers,
lakes and seas unable to bear heavy loads, identified new ideas and measures for
treatment of water environment, and promoted the pollution control in major basins;
amended and promulgated a number of pollutant discharge standards and clean
production standards to reduce pollutant load of major industries. The government has
issued fiscal, tax, credit, pricing, insurance and trade policies and measures, and
established a long-term mechanism to encourage emission reduction. With “regional
banning the approval of new projects” and higher environmental access to new
projects; it controlled new pollution at the source. It launched special campaigns on
environmental protection to severely punish environmental infringement. With the
special funds on emission reduction from the Central budgets, the government
focused on its support to the development of three key systems, that is, the statistic
system, monitoring system and assessment systems for emission reduction, which
provided a solid foundation for emission reduction work. It has printed out and
distributed the Guidelines for Developing Plans on Reduction of Total Amount of
Major Pollutants (on Trial), Measures for the Inspection on the Reduction of Major
Pollutants Specified in the 11th Five-Year Plan (on Trial) and Detailed Rules for
Measurement of the Reduction of Total Amount of Major Pollutants (on Trial), and
established a number of management systems for the assessment and filing of
pollution reduction plans, on-the-spot inspection, quarterly regulation, and early
warning of emission reduction projects, and management systems for the joint review,
examination, and release of data on emissions reduction.
The decreases of both COD and SO2 emissions in 2007 were mainly attributed to
three key measures which gradually played their roles. The three key measures
included introducing new pollution treatment projects, industrial restructuring, and
regulation. The first key measure of emission reduction is by new pollution treatment

2
projects. A total of 482 sewage treatment plants were built in urban areas during 2007
with total new treatment capacity at 13 million tons/day. As a result, 60% of the urban
sewage was treated, up from 57% in 2006. A total of 2,700 enterprises in major
sectors have newly built tertiary effluent treatment facilities. 345 new coal-fired
power units equipped with desulfurization facilities were built up with installed
capacity of 120 million kW. The installed capacity of thermal power units with
desulfurization facilities amounted to 266 million kW, accounting for 48% of the total
thermal power units, up from 32% last year. A group of projects were completed for
desulfurization of the flue gas from sintering machine and for recycling coal gas from
coking plant and sulfur from flue gas of oil refinery. The second key measure of
emission reduction is by industrial restructuring. The authority has shut down 2,018
outdated paper mills, nearly 500 chemical enterprises and 400 enterprises in textile,
printing and dyeing industry. Small thermal power units with total capacity of 14.38
million kW were suspended and shut down, and 52 million tons of outdated cement
production capacity, 46.59 million tons of outdated iron making capacity, 37.47
million tons of outdated steel making capacity and 6.5 million heavy containers of
plate glass productivity were phased out. The third key measure of emission reduction
is by supervision & regulation. The authority took intensified examination on clean
production as one of the important tools to promote pollution reduction and enhanced
the examination on clean production and environmental management in major
industries including manganese electrolysis industry. It provided training programs
for 2,746 managerial and technical staff on clean production and made public 1,855
major enterprises subject to mandatory examination on clean production. Local
capacity in statistics, monitoring and law enforcement supervision was enhanced at
large, and on-line monitoring systems for pollutant sources were gradually established
at provincial level environmental protection departments, and connected with
desulfurization facilities, urban sewage treatment plants and key enterprises under
national monitoring program. As a result, more and more enterprises discharged
pollutants in compliance with relevant national standards.

2
The Eleventh Five-Year National Plan for Environmental Protection
On November 22, 2007, the State Council issued the Eleventh Five-Year National
Plan for Environmental Protection (hereinafter referred to as the Plan). It is the first
time for the State Council to print and distribute a special plan as one of the
documents issued by it. The Plan, a guideline for thorough implementation of the
scientific outlook on development and balanced development of the economy,
society and environment, is a milestone in the history of environmental protection
in China.
The Plan identifies the guidelines, targets, major tasks and main measures for
environmental protection during the 11th Five-Year Plan period. The main
characteristics of the Plan are to simplify the indicators, highlight priority areas,
identify the funding channels, and add the climate change issue. The essence of the
Plan can be nailed down as upholding one guideline, grasping one philosophy,
identifying one planning goal, highlighting capacity building of one area, and
paying attention to a new area. The above said guideline is that the key to doing
well environmental protection during the 11th Five-Year Plan period is to speed up
the historical transformations. The philosophy is to make progress in all sectors
with breakthroughs in priority areas. The said target of the Plan is that by 2010,
SO2 and COD emissions will be under control, the environmental quality in key
regions and cities will be improved, the ecological degradation trend will be under
basic control, and nuclear and radiation safety will be guaranteed. To highlight
capacity building means actively carrying out the projects on capacity building for
environmental supervision & regulation. The said new area in need of close
attention is the control of greenhouse gas emissions. All these are practical
measures to carry out the spirit of the 17th National Congress of the CPC.

2
Developing Environment-friendly Economic Policies
One of the important guarantees for making a leapfrog progress in pollution reduction is, centering on the
promotion of the historical transformations in environmental protection, to consider environmental protection
issues in the context of economic and social development, solve environmental problems at the macro and
strategic level, and develop environmental economic policies in the life-cycle process.
First, develop green credit policies. The environmental authority, together with People’s Bank of China and
China Banking Regulatory Commission, issued the Opinions on Implementing Environmental Policies, Laws
and Regulations and Guarding against Credit Risks. The authority also printed and distributed the Circular on
Relevant Issues on Sharing Environmental Information among Enterprises with People’s Bank of China,
incorporating information about environmental infringements of 18,000 enterprises into the bank’s credit
information system. According to estimate, five large banks retrieved 3.934 billion yuan of loans from the
enterprises not following the State’s policy on energy saving and emissions reduction. For the first time, the
environmental authority signed an information-sharing agreement with China Banking Regulatory Commission.
Second, carry out pilot projects on green insurance policy. The environmental authority has issued the Guiding
Opinions on Environmental Pollution Liability Insurance with China Insurance Regulatory Commission,
developed environmental pollution liability insurance products in selected high-risk industries, enhanced
environmental management through market mechanism, and improved the enterprises’ ability to guard against
environmental risks.
Third, improve environmental inspection system for listed companies. The environmental authority printed and
distributed the Circular on Further Standardizing Environmental Inspection of Production or Operation
Companies Applying for Being Listed or Refinancing in Heavy Pollution Industrie, and has stopped ten
companies with environmental problems from financing through going listed.
Fourth, issue the catalogue of products with heavy pollution and high risks. The environmental authority
developed the catalogue for two times, including more than 190 kinds of such products, and suggested canceling
their export rebate and forbidding their processing and trade.
Fifth, issue the Measures on the Dispatch of the Power from Energy-saving or Environment-friendly Generation
Sets (on trial) and Measures on the Administration of Pricing of Electricity Generated by Coal-fired Power Units
with Desulfurization Facilities and the Operation of Such Facilities. The environmental authority, together with
Ministry of Finance, issued the Interim Measures on the Administration of Special Funds Allocated from the
Central Budget for Reduction of Major Pollutants and Interim Measures on the Administration of the Supporting
Pipes of Urban Sewage Treatment Facilities and of the Funds Used as Post-event Awards to Replace Initial
Subsidies. The government added 0.015 yuan to the unit price of the electricity generated by coal-fired power
units equipped with desulfurization facilities, and facilitated scientific dispatching of the power from
energy-saving and environment-friendly generating sets as well as the development of the urban sewage
collection pipes.
Sixth, the environmental authority in active cooperation with NDRC and other departments identified the list of
small thermal power plants to be suspended and closed during the 11th Five-Year Plan period and the list of
enterprises with outdated iron and steel making capacities. Departments concerned made public the access

2
0
20
40
60
80
100
Pearl
River
Songhua
River
Yellow
River
Huaihe
River
Liaohe
River
Haihe
River
Grade I~III Grade IV, V Worse than Grade VProportion%
Proportions of Various Water Qualities of the
Seven Major Rivers
Yangtze
River
Water Environment
General Situation
The country still suffered from serious surface water pollution. The seven major rivers
were under intermediate pollution, rivers in Zhejiang Province and Fujian Province
and southwest and northwest China enjoyed good water quality. Lakes had prominent
eutrophication problems.
� Rivers
The water quality of the
seven major rivers, i.e., the
Yangtze River, Yellow
River, Pearl River,
Songhua River, Huaihe
River, Haihe River and
Liaohe River remained the
same as in the previous
year. Among 407 monitored
sections of 197 rivers, 49.9%,
26.5% and 23.6% had Grade
I-III,
Grade IV-V, and worse than Grade V water quality respectively. Among others, the
Pearl River and Yangtze River enjoyed good water quality, Songhua River was
slightly polluted, Yellow River and Huaihe River were moderately polluted, and
Liaohe River and Haihe River were under heavy pollution.
The Yangtze River Waters – The Yangtze River waters enjoyed good water quality
on the whole. 81.5%, 3.9%, 7.8% and 6.8% of the 103 surface water sections under
national monitoring program fell into Grade I-III, Grade IV, Grade V, or worse than
Grade V standards. The major pollutants were ammonia nitrogen, oils, and BOD5.
The mainstream of the Yangtze River enjoyed excellent water quality, and compared
with last year, there were no obvious change in water quality.
In general, the tributaries of the Yangtze River enjoyed good water quality, which
turned better compared with that of the last year. The Yalong River, Dadu River,
Jialing River, Wujiang River, Yuanjiang River, and Hanjiang River had excellent
water quality. The Minjiang River, Tuojiang River, Xiangjiang River, and Ganjiang
River had good water quality. However, the Minjiang River section in Meishan city

2
was under heavy pollution, and the Tuojiang River section in Zigong city and
Ganjiang River section in Nanchang city were under moderate pollution. The major
pollutant was ammonia nitrogen.
The Yellow River Waters – The Yellow River waters were under moderate pollution.
63.7%, 9.1%, 4.5% and 22.7% of the 44 surface water sections under national
monitoring program had water quality at Grade II-III, Grade IV, Grade V standards or
worse than Grade V standards respectively. The major pollutants were ammonia
nitrogen, oils and BOD5.
The mainstream of Yellow River enjoyed excellent water quality, which turned better
compared with that of the previous year. The river sections in Heze city of Shandong
Province and Sanmenxia city of Henan Province were slightly polluted. Other
sections enjoyed excellent or good water quality.
The tributaries of Yellow River were under heavy pollution, and no obvious changes
were observed in water quality compared with in last year. Apart from the Yihe River,
Luohe River, and Qinhe River, which enjoyed excellent or good water quality, other
tributaries were generally badly polluted. Among others, the Xi’an section and
Weinan section in the lower reaches of Weihe River, Xining section in the lower
reaches of Huangshui River, Taiyuan, Linfen, and Yuncheng sections of Fenhe River,
Weinan section of Beiluo River, and Yuncheng section of Sushui River were under
heavy pollution.
Water Quality of the Yangtze River Waters

2
The Pearl River Waters – In general, the Pearl River waters had good water quality.
81.8%, 15.2% and 3.0% of the 33 surface water sections under national monitoring
program had water quality at Grade I-III, Grade IV, or worse than Grade V
respectively. The major pollutants were oils, dissolved oxygen and ammonia nitrogen.
In general, the mainstream of the Pearl River enjoyed good water quality with no
obvious change compared with that of the last year. Guangzhou section of the Pearl
River was under slight pollution.
The tributaries of Pearl River had good water quality in general with no obvious
Water Quality of the Yellow River Waters
Water Quality of the Pearl River Waters

2
change as compared with that of 2006. But the Shenzhen River was badly polluted.
Of the rivers in Hainan Island, the Wanquan River enjoyed excellent water quality,
and Haidian Brook was under slight pollution. The major pollutant was oils.
Compared with last year, no obvious change was observed in water quality.
The Songhua River Waters- In general, the Songhua River waters were under slight
pollution. 23.8%, 52.4%, 4.8% and 19.0% of the 42 surface water sections under
national monitoring program had water quality at Grade I-III, Grade IV, Grade V, or
worse than Grade V respectively. The major pollutants were permanganate index, oils
and BOD5.
The mainstream of the Songhua River was slightly polluted with no obvious change
in water quality as compared with that of 2006.
The tributaries of Songhua River were under moderate pollution with water quality
turning better as compared with that of the last year.
The Huaihe River Waters – The Huaihe River waters were under moderate pollution
in general. 25.6%, 39.5%, 9.3% and 25.6% of the 86 surface water sections under
national monitoring program had water quality at Grade II-III, Grade IV, Grade V, or
worse than Grade V respectively. The major pollutants were permanganate index,
BOD5 and ammonia nitrogen.
The mainstream of Huaihe River was under slight pollution with some degradation in
water quality as compared with that of 2006.
In general, the tributaries of the Huaihe River were under moderate pollution with no
Water Quality of the Songhua River

2
obvious change in water quality as compared with that of 2006. Among the main
primary tributaries, the Shiguan River enjoyed excellent water quality, Xifei River
and Huanghe River had good water quality; Honghe River, Tuohe River, Shihe River,
and Kuaihe River were slightly polluted, and Wohe River and Yinghe River were
under heavy pollution. The Yihe River, Shuhe River and Sihe River waters were
under moderate pollution at large.
The Haihe River Waters – In general, the Haihe River waters were under heavy
pollution. Among 62 surface water sections under national monitoring program,
25.9% was at Grade I-III water quality, 9.7% at Grade IV, 11.3% at Grade V, and
53.1% was worse than Grade V. The major pollutants were ammonia nitrogen,
permanganate index and BOD5.
In general, the mainstream of Haihe River was under heavy pollution with no obvious
change in water quality as compared with that of the last year.
Other main rivers of the Haihe River waters were also badly polluted with no obvious
change in water quality as compared with that of the last year. The Yongding River
and Luanhe River enjoyed good water quality. Beiyun River, Zhangweixin River,
Dasha River, Ziya River, Majia River and Tuhai River suffered from heavy pollution.
Water Quality of the Huaihe River

2
The Liaohe River Waters – In general, the Liaohe River waters suffered from heavy
pollution. Among 37 surface water sections under national monitoring program,
43.2% of them had water quality at Grade II-III, 10.8% at Grade IV, 5.5% at Grade V,
and 40.5% was worse than Grade V. The major pollutants were ammonia nitrogen,
BOD5 and permanganate index.
The mainstream of Liaohe River was unbder moderate pollution in general. The
Laoha River, Xiliao River and Dongliao River enjoyed good water quality, but the
Liaohe River was under heavy pollution. Compared with that of the last year, Xiliao
River and Dongliao River had better water quality. But there was no obvious change
in water quality of the Laoha River and Liaohe River.
In general, the tributaries of Liaohe River suffered from heavy pollution. However,
the Xilamulun River was under slight pollution, and Tiaozi River and Zhaosutai River
were badly polluted. No obvious change occurred in water quality compared with that
of the previous year.
Water Quality of the Haihe River

2
The Daliao River and its tributaries were badly polluted in general with no obvious
change in water quality compared with that of 2006. The Daling River was also under
heavy pollution. The major
pollutants were ammonia
nitrogen, permanganate index
and BOD5.
The Rivers in Zhejiang
Province and Fujian Province –
In general, rivers in Zhejiang
Province and Fujian Province
enjoyed good water quality.
78.2% of the 32 surface water
sections under national
monitoring program were at
Grade I-III water quality, and
21.8% of them at Grade IV. The
major pollutants were oils,
ammonia nitrogen and BOD5.
� Rivers in Southwest and Northwest China
Rivers in Southwest China – In general, rivers in Southwest China enjoyed good
water quality. Among 17 surface water sections under national monitoring program,
82.4% of them had water quality at Grade I-III, 11.7% of them at Grade IV-V and
5.9% was worse than Grade V. The major pollutants were lead, permanganate index
and oils.
Water Quality of the Liaohe River Waters
Water Quality of Rivers in Zhejiang Province and
Fujian Province

2
Rivers in Northwest China - Rivers in Northwest China enjoyed good water quality
in general. Among 28 surface water sections under national monitoring program,
82.1% had water quality at Grade I-III, 14.3% at Grade IV, and 3.6% was worse than
Grade V. The major pollutant was ammonia nitrogen.
� Lakes (Reserviors)
Among the 28 major lakes (reservoirs) under national monitoring program, two had
Grade II water quality, accounting for 7.1%; six had Grade III water quality,
accounting for 21.4%; four had Grade IV water quality, accounting for 14.3%; five
had Grade V water quality, accounting for 17.9%; and 11 had water quality worse
than Grade V, accounting for 39.3%. The major pollutants were total nitrogen and
Water Quality of Rivers in Southwest China
Water Quality of Rivers in Northwest China

2
total phosphorus. Among the 26 monitored lakes (reservoirs), two suffered from
heavy eutrophication, taking up 7.7%; three suffered from moderate eutrophication,
taking up 11.5% and nine experienced mild eutrophication, taking up 34.6%.
Category of Water Quality in Major Lakes (Reservoirs)
No.
Waters No. Grade I GradeⅡ Grade III Grade IV Grade V
Worse
than
Grade V
Three major
lakes 3 1 2
Large freshwater
lakes 10 2 4 1 3
Lakes in cities 5 1 4
Large reservoirs 10 2 3 3 2
Total 28 2 6 4 5 11
Proportion (%) 0 7.1 21.4 14.3 17.9 39.3
Taihu Lake - The overall water quality of Taihu Lake was worse than Grade V.
Among 21 sites under national monitoring program, 23.8% had Grade IV water
quality, 19.0% had Grade V water quality, and 57.2% had water quality worse than
Grade V. Its water quality turned better compared with that of the previous year. The
proportion of waters having water quality worse than Grade V decreased by 28
percentage points. The lake was under moderate eutrophication with major
pollutanteing total nitrogen.
0102030405060708090
100
T
a
i
h
u
L
a
k
e
D
i
a
n
c
h
i
L
a
k
e
C
h
a
o
h
u
L
a
k
e
B
a
i
y
a
n
g
d
i
a
n
D
a
l
a
i
L
a
k
e
J
i
n
g
b
o
L
a
k
e
B
o
s
i
t
e
n
g
L
a
k
e
H
o
n
g
z
e
L
a
k
e
N
a
n
s
i
L
a
k
e
D
o
n
g
t
i
n
g
L
a
k
e
P
o
y
a
n
g
L
a
k
e
E
r
h
a
i
L
a
k
e
D
o
n
g
h
u
L
a
k
e
D
a
m
i
n
g
L
a
k
e
X
u
a
n
w
u
L
a
k
e
X
i
h
u
L
a
k
e
K
u
n
m
i
n
g
L
a
k
e
D
a
h
u
o
f
a
n
g
Y
u
q
i
a
o
R
e
s
e
r
v
i
D
a
n
j
i
a
n
g
k
o
u
L
a
o
s
h
a
n
R
e
s
e
r
v
o
S
o
n
g
h
u
a
L
a
k
e
D
o
n
g
p
u
R
e
s
e
r
v
o
M
e
n
l
o
u
R
e
s
e
r
v
i
M
i
y
u
n
R
e
s
e
r
v
i
Q
i
a
n
d
a
o
L
a
k
e
Index for Nutrition
State
serious eutrophication
mild entrophication
moderate eutrophication
Index for Nutrition State of Major Lakes (Reserviors)

2
The rivers surrounding the Taihu Lake were moderately polluted with no obvious
change in water quality compared with that of the last year. The major pollutants were
ammonia nitrogen, BOD5 and oils.
Dianchi Lake -The overall water quality of Dianchi Lake was worse than Grade V.
Caohai Lake suffered from serious eutrophication with Waihai Lake under moderate
eutrophication. The major pollutants were total nitrogen, total phosphorus and
permanganate index.
Rivers surrounding the Dianchi Lake were badly polluted. Among the eight surface
water sections under the national monitoring program, 25.0% had Grade II-III water
quality, 12.5% had Grade IV water quality and 62.5% had water quality worse than
Grade V. There was no obvious change in water quality compared with that of the last
year. The major pollutants were BOD5, ammonia nitrogen and permanganate index.
Chaohu Lake – In general, Chaohu Lake
had Grade V water quality with no obvious
change as compared with that of 2006. The
western part of the Lake suffered from
moderate eutrophication and the east part
mild eutrophication. The major pollutants
were total phosphorus, total nitrogen and
BOD5.
Rivers surrounding the Chaohu Lake were under heavy pollution. Among 12 surface
water sections under national monitoring program (including two sections for the
control of the pollutant bearing capacity), 8.3% had Grade II water quality, 41.7% of
them had Grade IV water quality and 50.0% had water quality worse than Grade V.
The major pollutants were oils, ammonia nitrogen and BOD5.
Grade IV
22.7%
Grade III
18.2%
Grade II
2.3%
Grade V
22.7%
Worse than Grade Ⅴ
34.1%
Proportions of Different Water Quality of Rivers Surrounding Dianchi
Grade
Ⅳ12.5%
Grade
Ⅲ12.5%
Grade II
12.5%Worse
than
Grade V
62.5%
Proportions of Different Water Quality of Rivers
Surrounding Chaohu Lake
Worse
than Grade
V
50.0%
Grade Ⅳ41.7%
Grade Ⅱ8.3%
Proportions of Different Water Quality
of Rivers Surrounding Taihu Lake

2
Other large freshwater lakes - Among the ten major freshwater lakes under national
monitoring program, the Bositeng Lake and Erhai Lake had Grade III water quality;
Jingbo Lake, Dongting Lake, Poyang Lake and Xingkai Lake had Grade IV water
quality; Nansi Lake had Grade V water quality; Baiyangdian Lake, Dalai Lake and
Hongze Lake had water quality worse than Grade V. Compared with that of the last
year, Nansi Lake, Dongting Lake and Poyang Lake saw better water quality, and other
large freshwater lakes had no obvious changes in water quality. The major pollutants
were total nitrogen and total phosphorus.
The Erhai Lake, Poyang Lake and Dongting Lake were under mesotrophic state;
Nansi Lake, Hongze Lake, Bositeng Lake and Jingbo Lake had mild eutrophication;
Dalai Lake had moderate eutrophication and Baiyangdian Lake suffered from serious
eutrophication.
Water Quality of Major Large Freshwater Lakes
Levels of water quality Name
Index for
nutrition
state
Nutrition state
2007 2006
Major
pollutants
Baiyangdian
Lake 83 Serious eutrophication
Worse than
Grade V
Worse
than
Grade V
Ammnonia
nitrogen, total
phosporus, total
nitrogen
Dalai Lake 64 Moderate eutrophication Worse than
Grade V
Worse
than
Grade V
pH value,
permanganate
index
Jingbo Lake 59 Mild eutrophication IV IV Volatile phenol,
total phosphorus
Bositeng
Lake 57 Mild eutrophication III III -
Hongze
Lake 56 Mild eutrophication
Worse than
Grade V
Worse
than
Grade V
Total
nitrogen,toal
phosphor
Nansi Lake 53 Mild euthrophication V
Worse
than
Grade V
Total
phosphorus,tot
al nitrogen, oils
Dongting
Lake 45 Mesotrophic state IV V
Total
phosphorus,
total nitrogen
Poyang
Lake 45 Mesotrophic state IV V
Total
phosphorus,
total nitrogen
Erhai Lake 40 Mesotrophic state III III -
Xingkai
Lake - - IV II Volatile phenol

2
Lakes in cities – The Kunming Lake (Beijing) had Grade III water quality, Xihu Lake
(Hangzhou), Donghu Lake (Wuhan), Xuanwu Lake (Nanjing) and Daming Lake
(Jinan) had water quality worse than Grade V. There was no obvious change in water
quality compared with that of the last year. The major pollutants were total nitrogen
and total phosphorus.
The Kunming Lake was undere mesotrophic state. Xuanwu Lake, Xihu Lake and
Daming Lake suffered from mild eutrophication, and Donghu Lake was under
moderate eutrophication.
Evaluation Results of the Water Quality of Lakes in Cities
Levels of water quality
Name
Index for
nutrition
state
Nutrition state 2007 2006
Major pollutants
Donghu Lake 65
Moderate
eutrophication
Worse than
Grade V
Worse than
Grade V
Total phosphorus,
total nitrogen
Daming Lake 56
Mild
eutrophication
Worse than
Grade V
Worse than
Grade V
Total nitrogen, BOD
Xuanwu Lake 55
Mild
eutrophication
Worse than
Grade V
Worse than
Grade V
Total nitrogen, total
phosphorus
Xihu Lake 55
Mild
eutrophication
Worse than
Grade V
Worse than
Grade V
Total nitrogen, total
phosphorus
Kunming Lake 47 Mesotrophic state III III -
Large reservoirs - Compared with that of the last year, Dahuofang Reservoir and
Miyun Reservoir had better water quality and Yuqiao Reservoir had worse quality.
Other seven major reservoirs experienced no obvious change in water quality. The
major pollutant was total nitrogen.
Dahuofang Reservoir had mild eutrophication and eight large reservoirs including
Yuqiao Reservoir were under mesotrophic state.
Evaluation Results of the Water Quality of Large Reservoirs
Levels of water quality Name
Index for
nutrition Nutrition state
2007 2006
Main
pollutants
Dahuofang
Reservoir 54 Mild eutrophication V
Worse than
Grade V
Total
nitrogen
Yuqiao Reservoir 48 Mesotrophic state V IV Total
nitrogen
Danjiangkou
Reservoir 47 Mesotrophic state III III -

2
Laoshan Reservoir 47 Mesotrophic state Worse than
Grade V
Worse than
Grade V
Total
nitrogen
Songhua Lake 44 Mesotrophic state V V Total
nitrogen
Dongpu Reservoir 43 Mesotrophic state III III -
Menlou Reservoir 42 Mesotrophic state Worse than
Grade V
Worse than
Grade V
Total
nitrogen
Miyun Reservoir 32 Mesotrophic state II III -
Qiandao Lake 32 Mesotrophic state III III -
Shimen Reservoir - - II II -
� Groundwater
Compared with last year, groundwater tables in the sites under national monitoring
program remained stable, and deep-layer groundwater tables changed more than
lower-layer tables. Groundwater quality in major sites of the monitored areas ranged
from good to poor. The quality of deep-layer groundwater was better than that of
shallow-layer groundwater, and the quality of groundwater in areas with lower
groundwater exploitation level was better than areas with higher level exploitation.
Groundwater table - According to the monitoring results of groundwater tables in
169 cities, groundwater tables in monitored areas did not fluctuate much and
remained stable at large compared with that of 2006 with bigger change of deep-layer
groundwater table than that of shallow-layer. The areas with obvious change in
groundwater tables were mainly concentrated in the North, Northeast, Northwest and
East China, where more groundwater was exploited. Among others, East China had
obvious rise in the groundwater table due to rainfall and the policy of sealing wells
and limiting the exploitation of groundwater resources. However, groundwater in
North, Northeast and Northwest China still had high development intensity with the
decline of groundwater table in most areas.
Among the 148 cities under shallow-layer groundwater table monitoring program, 25
of them witnessed rising trend in their water tables, 98 of them were stable and 25 had
declining trend compared with that of the previous year.
Among the 71 cities under deep-layer groundwater table monitoring program, 10 of
them had rising water tables, 40 of them were stable and 21 had declining water tables
compared with that of the previous year.
Groundwater quality - According to the monitoring data of the groundwater quality
in 189 cities, groundwater quality in major sites of the monitored areas ranged from
good to relatively poor. The quality of deep-layer groundwater was better than that of
shallow layer, and the quality of groundwater in areas with less groundwater
exploitation was better than areas with intensive exploitation. The overall

2
groundwater quality across China did not change much compared with in 2006, and
areas with deteriorating water quality were mainly distributed in North, Northeast,
and Northwest China. Areas with improving groundwater quality were sparsely
distributed.
Among the 159 cities under shallow-layer groundwater quality monitoring program,
16 of them had deteriorating trend of the groundwater quality in major monitoring
sites, 137 were stable and six were improved compared with that of the last year.
Among the 76 cities under deep-layer groundwater quality monitoring program, four
of them witnessed the groundwater quality in major monitoring sites deteriorating, 68
remained stable and four had improvement compared with that of the last year.
Groundwater drawdown funnel - There were 212 regional groundwater drawdown
funnels across the country. Among them, 136 were shallow drawdown funnels, 65
were deep drawdown funnels and 11 were karst drawdown funnels. Compared with
last year, groundwater drawdown funnel situation remained stable, and the funnels
experiencing obvious change were mainly distributed in North and East China, where
were seriously affected by groundwater exploitation.
� Major Water Conservancy Projects
The Three Gorges Reservoir Area – The Three Gorges Reservoir area enjoyed
excellent water quality. All the six sections under national monitoring program in the
reservoir area had water quality ranging from Grade I to Grade III. Among others,
Cuntan section, Shaiwangba section and Peishi section of the Yangtze River enjoyed
Grade I or II water quality; Qingxichang section of the Yangtze River, Daxigou
section of the Jialing River and Maliuzui section of the Wujiang River had Grade II or
III water quality. No obvious changes were observed in water quality compared with
that of the last year.
Waters along the East Line of the South-to-North Water Diversion Project-
Waters along the East Line of the South-to-North Water Diversion Project were under
moderate pollution in general. Among the ten sections under national monitoring
program, 30% had Grade II-III water quality, 40% had Grade IV-V water quality, and
30% had water quality worse than Grade V. No obvious change was observed in water
quality compared with that of the last year. The major pollutants were permanganate
index, BOD5 and ammonia nitrogen.
� Amount of the discharge of wastewater and major pollutants
In 2007, the total amount of wastewater discharged was 55.67 billion tons, up by

2
3.7% than the previous year; COD emission was 13.818 million tons, down by 3.2%
than the previous year. The discharge of ammonia nitrogen was 1.323 million tons,
down by 6.4% compared with that of the last year.
Amount of Wastewater and Major Pollutants Discharged in China during the
Past Three Years
Wastewater discharged
(100 million tons)
COD emissions
(10,000 tons)
Ammonia nitrogen discharge
(10,000 tons)
Item
Year
Total From
industrial
source
From
Domestic
source
Total From
industrial
source
From
Domestic
source
Total From
industrial
source
From
Domestic
source
2005 524.5 243.1 281.4 1414.2 554.8 859.4 149.8 52.5 97.3
2006 536.8 240.2 296.6 1428.2 542.3 885.9 141.3 42.5 98.8
2007 556.7 246.5 310.2 1381.8 132.3 34.0 98.3
Measures and Actions
【【【【Initiating the Major S&T Projects on the Control and Treatment of Pollution
of Water Bodies】】】】In order to increase the inputs in environmental science and
technology and enhance the staying power of the environmental cause, the State took
the project of “control and treatment of pollution of water bodies” (hereinafter
referred to as Water Project) as one of the 16 national major science and technology
projects. The project, included in the Outline of the National Plan for Medium- and
Long-term Scientific and Technological Development (2006-2020), aimed to provide
scientific and technological support to achieving the target of 10% reduction of the
discharge of major pollutants during the 11th Five-Year Plan period and rehabilitating
the rivers, lakes and seas that cannot bear any pollution load, and solve water
pollution problem, a major bottleneck restraining economic and social development of
China.
On December 26, 2007, Premier Wen Jiabao chaired the standing meeting of the State
Council, which adopted the implementation plan for Water Project. Water Project
included 33 projects targeting at the following six topics, that is, control and treatment
of eutrophication of lakes; integrated treatment of water environment of rivers;
control of water pollution and urban water environment; guarantee of safe drinking
water; monitoring, early warning and integrated management of water environment of
river basins; and strategies, policies and management of water environment. Focusing
on the studies of the “three rivers” (the Huaihe River, Haihe River and Liaohe River),
“three lakes” (Taihu Lake, Chaohu Lake and Dianchi Lake), “one large river” (the
Songhua River) and “one reservoir” (the Three Gorges Reservoir), the Water Project
will integrate key technologies on the control of pollutant sources and ecological
restoration, make breakthroughs in the protection of drinking water sources and

2
guarantee of safe drinking water, and make innovations in the monitoring and early
warning technologies as well as policy management mechanism for water quality in
river basins. The State will invest more than 30 billion yuan in the Water Project,
which, according to the principle of making steady progress, will be implemented in
three stages over the neat 13 years, in order to establish two technological systems
that comply with our national conditions, that is, the monitoring and early warning
technology for the prevention and control of water pollution and the water pollution
control system, which facilitates the development of national technical platform for
comprehensive management of water environment.
【【【【Implementing the policy of “regional banning EIA approval of new projects in
areas with excessive environmental load”】】】】In early 2007, targeting on a number of
construction projects in the iron & steel, power and metallurgy industries which
seriously violated the environmental impact assessment regulations and the “three
simultaneities” system, the former State Environmental Protection Administration
(SEPA) carried out “regional banning EIA approval of new projects in areas with
excessive environmental load (hereinafter referred to as ‘regional banning’)” for all
construction projects in Tangshan city of Hebei Province, Lvliang city of Shanxi
Province, Laiwu city of Shandong Province and Liupanshui city of Guizhou Province
as well as Datang International Power Generation Co., Ltd., China Huaneng Group,
China Huadian Corporation and China Guodian Corporation. On July 3, 2007, SEPA
also carried out ‘watershed banning’ policy in six cities (Baiyin, Bayannaoer, Weinan,
Zhoukou, Bengbu, and Chaohu), two counties or county-level cities (Hejin, Xiangfen)
and five zones (Lanzhou High-tech Development Zone, Handan Economic
Development Zone, Puyang Economic Development Zone of Henan Province,
Shenxian Industrial Park of Shandong Province, and Wuhu Economic Development
Zone) in the Yellow River basins, Huaihe River basins, Haihe River basins and Anhui
section of the Yangtze River, which had heavy water pollution and serious
environmental infringements. With the implementation of ‘watershed banning’ policy,
a total of 1,162 construction projects were sorted out. Among them, 400 were shut
down, 249 suspended production for correction, and 102 were ordered to complete
pollution control within a given period of time. Focusing on addressing serious
environmental problems within a region, ‘regional banning’ has not only solved a
group of prominent environmental problems but also promoted economic
restructuring and transformation of the growth pattern in the region.
【【【【 Carrying out China-Russia joint monitoring program 】】】】 To enhance
China-Russia joint monitoring is the embody to intensify environmental regulation
over cross-border rivers and display the image of a responsible country. As arranged
by the Environment Subcommittee under the Committee for China-Russia Premiers’
Regular Meeting and according to the Plan for China-Russia Joint Monitoring of the
Quality of Cross-border Water Bodies and the 2007 Implementation Plan for Joint
Monitoring of the Quality of Cross-border Water Bodies that were developed by both
sides, the two countries monitored in June and August 2007 respectively cross-border

2
water bodies including Argun River, Heilongjiang River, Ussuri River, Suifen River,
and Xingkai Lake. The monitoring results were recognized by both sides.
【【【【Developing the Eleventh Five-Year Plan for Major River Basins】】】】The State
Council wrote instructions and approved the plan for prevention and control of
pollution in the Songhua River basins, Danjiangkou Reservoir and its upper reaches,
developed plans for the prevention and control of pollution in major river basins
including the “three rivers and three lakes”, the Three Gorges Reservoir area and the
mid and upper reaches of the Yellow River. With the implementation of environmental
control of major river basins and regions, the authority carried out the idea of “making
progress in all sectors and making breakthrough in priority areas” in terms of
environmental management and pollution treatment. It is expected that by 2010, all
centralized drinking water sources in the six major river basins including the Huaihe
River, Haihe River, Liaohe River, Chaohu Lake, Dianchi Lake basins and the mid and
upper reaches of the Yellow River will be treated and protected, the water quality of
trans-province boundary sections will enjoy remarkable improvement. All major
industrial enterprises will meet pollution discharged standards in an all round way.
Higher percent of urban sewage will be treated. The total discharge amount of water
pollutants will be under effective control. The capacity in supervising water
environment and the capacity in early warning of and emergency response to water
pollution accidents will enjoy obviously improvement. Plans for major river basins
are the basis for the prevention and control of their water pollution, and the economic
activities of these river basins must comply with such plans.
【【【【Rehabilitating rivers and lakes】】】】The practice of rehabilitation is the important
experience in Chinese history to make the country prosperous and stable and
embodies the care for water environment. Rehabilitating rivers and lakes means
exercising the strictest system for controlling the total amount of pollutants, and
identifying the development pattern and scale according to the capacity of water
environment; showing respect for the law of nature, giving full play to the
self-restoration capacity of the water ecological system, and gradually curbing the
ecological degradation; applying engineering, technical and ecological approaches,
intensifying the efforts in the control of water environment in order to promote water
ecological system entering a benign circle; fully using legal, economic and necessary
administrative approaches, imposing strong pressure by discharging pollutants strictly
following standards and conducting development activities in a rational way, creating
initiatives to treat water environment, and solving longstanding environmental
problems with effective methods.
Rehabilitating rivers and lakes is a process to treat water environment in an all-round
way, and also a process of sound economic and social development. The policy of
rehabilitation means promoting the change of economic development mode and
following the path towards scientific development; promoting the development of
environmental infrastructure and resolutely controlling the total amount of pollutants;

2
respecting for the law of nature, treating water environment and pollution with
humanism, and arousing public awareness to cherish water resources and protect
water environment. With such measures as strict environmental access to new projects,
phasing out outdated production capacity, preventing and controlling pollution in an
all-round way, intensifying the comprehensive measures, and encouraging public
participation, the State will obviously improve the quality of water environment of
rivers and lakes, enable the ecological system of some rivers and lakes to form a
benign circle, and lay a solid foundation for a comprehensive, coordinated, and
sustainable development with the efforts of the next twenty years or more.
【【【【Work Meeting on Prevention and Control of Water Pollution of the Three
Lakes】】】】 The State Council held a work meeting on prevention and control of water
pollution of the “three lakes” in Wuxi, Jiangsu Province on June 30, 2007. Premier
Wen Jiabao attended the meeting and noted that efforts should be made to review
experience and lessons according to newly emerged situations and problems during
pollution control of the three lakes. A separate strategy was needed for each of the
three lakes and a guiding principle should be implemented that required overall
consideration of the situation near and afar to address problems through both
temporary and permanent solutions, targeted guidance to different situations to suit
local conditions, scientific planning and comprehensive treatment and strengthened
leadership and effective implementation. Practical measures would be taken to
prevent another burst of blue-green algae bloom on a large scale; enhance industrial
restructuring and construction of pollution treatment facilities and guaranteeing their
normal operation. We should conduct strict control of agricultural non-point pollution,
actively promote ecological control projects, increase investment in pollution control
and make science and technology play a larger role. We should further enhance
coordination and cooperation among all stakeholders to intensify the supervision on
environmental law enforcement and earnestly take on the responsibility for the
prevention and control of pollution.
【【【【Strengthening Protection of Drinking Water Source Areas】】】】 Protecting drinking water sources is an important part to safeguard the life of people. The State
Council reviewed and adopted National Plan for Safeguarding Drinking Water
Sources for Urban Areas (2006-2020) to provide a guidance for the protection of
drinking water sources. National Environmental Protection Plan for Drinking Water
Safety in Urban Areas and National Plan for Prevention and Control of Groundwater
Pollution were prepared under the leadership of MEP. MEP took the protection of
drinking water source areas as an important component of the special campaign on
rectifying illegal polluters and protecting human health. It has banned or closed all
sewage outlets within Level I drinking water source protection areas and cracked
down all illegal pollution discharges in Level II protection areas according to law.
MEP has carried out special investigations to understand the protection of
concentrated drinking water source areas for cities at or above county level and issued
a technical specifications on the zoning of drinking water source areas.

2
“Five Battles”
On July 4, 2007, SEPA announced such five major tasks as exercising the policy of
watershed banning in the river basins with serious environmental infringements, enhancing
comprehensive control of water environment in major lakes, strengthening prevention and
control of water pollution in major river basins, intensifying prevention and control of
industrial pollution and accelerating environmental protection in the countryside. It called for
conscientious efforts to enhance environmental law enforcement so as to win these five battles.
—— Regional banning will be introduced in the following cases: areas failing to fulfill the
target of phasing out outdated production capacity, areas plagued by serious environmental
infringements, areas achieving the target of total discharges but failing to meet the target set for
key projects as well as areas having poor municipal sewage treatment facilities, not
implementing discharge fee policy, water treatment volume less than 60% of the designed
capacity within the first year of operation and inactive sewage treatment facilities without
rational reasons despite their establishment. Environmental infringements will be subject to
heavy punishment and deterioration of water quality in key river basins will be put under
control in an all-round way.
——We need to adhere to the principle that requires overall consideration of situation near
and afar to address problems through both temporary and permanent solutions, targeted
guidance to different situations to suit local conditions, scientific planning and comprehensive
treatment and strengthened leadership and serious implementation. A separate strategy should
be made for each lake according to different priority and crux of the treatment efforts and try to
curb the trend of worsening eutrophication of key lakes.
——We should extend the policy of rehabilitating the Songhua River, as put forward at the
meeting for prevention and control of water pollution of the Songhua River, to other important
river basins. A number of measures will be taken to strengthen environmental management of
river basins such as having strict control of environmental standard, eliminating outdated
production capacity, comprehensive prevention and control of pollution, enhancing
comprehensive measures and encouraging public participation with a view to effectively
containing continued deterioration of environmental status.
——Focusing on the central task of pollution reduction, study and arrangement will be
made to facilitate rational distribution of industries and businesses, development and
management of industrial parks, phasing out outdated production capacity, removing hidden
risk to environmental safety posed by industrial production, as well as prevention of pollution
from toxic and hazardous substances and improvement of environmental supervision. More
efforts are needed to enhance policies and measures concerning finance and taxation, pricing,
credit, investment and trade. Industrial enterprises will face more stringent total pollution
discharge and pollution discharge permit system.
——In light of the requirement of building a new socialist countryside, environmental
protection in urban and rural area should be taken into overall consideration, particularly for the
protection of drinking water sources of rural areas, proper treatment of domestic sewage and
disposal of refuse, actively preventing and controlling pollution from livestock and poultry
raising on a large scale and carrying out investigation on soil pollution across the country.

2
Marine Environment
General Situation
� Marine Water Quality
The overall water quality in offshore waters was under slight pollution, which
recorded a small decline as compared with that of 2006. Most of the water offshore
was clean and water quality in high seas remained good.
62.8% of offshore waters were at Grade I or Grade II, down by 4.9 percentage points
compared with that of the previous year. 11.8% of the water was at Grade III water
quality standard, up by 3.8 percentage points, while water falling into the category of
Grade IV and worse than Grade IV accounted for 25.4%, up by 1.1 percentage points.
Among the four sea areas in offshore waters, the South China Sea and the Yellow Sea
recorded good water quality, Bohai Sea was slightly polluted and the East China Sea
suffered from heavy pollution.
The Bohai Sea 63.3% of offshore water met Grade I or Grade II standard, down by
6.3 percentage points compared to that of 2006; 22.4% of the water met Grade IV or
worse than Grade IV standard, up by 0.7 percentage point. The major pollutants
included inorganic nitrogen and lead. Water quality at the Yellow River estuary was
good while Liaodong Bay and Bohai Bay were seriously polluted.
The Yellow Sea 85.2% of offshore water in the Yellow Sea met Grade I or Grade II
standard, up by 1.5 percentage points compared with that of 2006 whereas 5.5% of
seawater met Grade IV or worse than Grade IV standard, down by 0.6 percentage
point. The major pollutants were inorganic nitrogen and activated phosphate.
Jiaozhou Bay suffered from heavy pollution.
The East China Sea 28.4% of offshore water met Grade I or Grade II standard,
Water quality distribution of offshore waters of China
Grade IV
7.1%
Grade III
11.8%Grade II
36.8%
Grade I
26.0%
Inferior to
Grade IV
18.3%

2
down by 13.1 percentage points while 55.8% of water met Grade IV or worse than
Grade IV standard, up by 3.6 percentage points. Major pollutants included activated
phosphate, inorganic nitrogen and lead. The Minjiang river estuary experienced
moderate pollution and the Yangtze River estuary and Hangzhou Bay were under
heavy pollution.
The South China Sea 83.7% of offshore water met Grade I or Grade II standard
and 8.1% met Grade IV or worse than Grade IV standard, same as that of the previous
year. The major pollutants were activated phosphate and inorganic nitrogen. Beibu
Bay maintained good water quality but the Zhujiang River estuary was seriously
polluted.

2
Water quality distribution of coastal sea area

2
Offshore Water quality of the four seas in China
� Drainage of land-based pollutants into Sea
Rivers flowing into sea The overall water quality of the 169 sections of rivers
flowing into sea was poor, leading to more drainage of pollutants from rivers than that
from pollution sources directly discharged into seas. The East China Sea had much
more pollutants carried by rivers flowing into sea than other sea areas.
Water quality of the monitored sections of rivers flowing into sea
Water Quality
Sea area Grade I
Grade
II
Grade
III Grade IV Grade V
Worse
than
Grade V
Total
The Bohai Sea 0 0 1 6 11 28 46
The Yellow Sea 0 5 6 4 4 7 26
The East China Sea 0 3 14 14 6 13 50
The South China Sea 0 8 9 11 2 17 47
Total 0 16 30 35 23 65 169
G rade
III
14.3%
G rade II
38.8%
G rade I
24.5%
Worse
than
G rade
IV
12.2%
G rade
IV
10.2%
G rade I
35 .2%
G rade II
50 .0%
G rade
III
9 .3%
G rade
IV
1 .8%
W orse
t han
G rade
IV
3 .7%
Worse
than
Grade
IV
41.1%
Grade
IV
14.7%
Grade
III
15.8%
Grade II
26.3%
Grade I
2.1% Grade I
44.9%
Grade II
38.8%
Grade
III
8.2%
Grade
IV
1.0%
Worse
than
Grade
IV
7.1%
The Bohai Sea The Yellow Sea
The East China Sea The South China Sea

2
The total drainage of major pollutants monitored at the 169 sections included 4.4321
million tons of permanganate index, 841,500 tons of NH3-N, 60,200 tons of petroleum
and 249,700 tons of total phosphorus.
Total pollutants drained into the four seas by rivers flowing into sea
Sea area Permanganate
index (10,000
tons)
NH3-N
(10,000 tons )
Petroleum
(10,000 tons)
total
phosphorus
(10,000 tons )
The Bohai Sea 17.08 3.68 0.15 0.33
The Yellow Sea 28.41 4.14 0.40 0.81
The East China Sea 295.09 57.62 3.27 20.74
The South China Sea 102.63 18.71 2.20 3.09
Total 443.21 84.15 6.02 24.97
Pollution sources directly discharging into seas 607 industrial pollution sources,
domestic pollution sources and general pollution discharge outlets with daily direct
discharge capacity of more than 100 tons had a total discharge of 4.159 billion tons of
wastewater, which included 414,900 tons COD, 2,842 tons petroleum, 50,560 tons
NH3-N, 4,812.8 tons of total phosphorus, 0.23 tons of mercury, 27.13 tons of
Chromium (VI), 14.5 tons of lead and 2.24 tons of cadmium.
Pollutants discharged directly into sea from pollution sources
Pollution
sources
Sewage
(100
million
tons)
COD
(10,000
tons)
Petroleum
(ton)
NH3-N
(ton)
Total
phosphorus
(ton)
Mercury
(ton)
Chromium
(VI) (ton)
Lead
(ton)
Cadmium
(ton)
Total 41.59 41.49 2842 50560 4812.8 0.23 27.13 14.50 2.24
Industrial 10.97 4.09 467 2375 196.3 0 2.80 0.69 0.45
Domestic 6.90 9.00 970 10179 1366.3 - - - -
General 23.72 28.40 1405 38006 3250.2 0.23 24.33 13.79 1.79

2
0
20
40
60
80
Inorganic
nitrogen
Activated
phosphate
Oil
substances
COD Mercury Copper
%
2006 2007
Pollutant absorbed by the four seas
Sea area
Sewage (100
million tons)
COD
(10,000
tons)
NH3-N
(10,000
tons)
Petroleum
(ton)
Total
phosphorus
(ton)
The Bohai Sea 2.79 4.84 0.66 134.7 70.6
The Yellow Sea 7.69 8.52 0.99 501.1 1099.1
The East China Sea 20.42 17.15 1.90 1077.1 1556.3
The South China Sea 10.70 10.97 1.52 1129.2 2086.7
� Water Environment of Marine Fisheries
Among the 16.09 million ha
water environment of major
natural marine fishery areas
across the country under
monitoring program, 74.4%
of them failed to meet
national standard for
inorganic nitrogen, 66.9%
failed to meet activated
phosphate standard, 40.4%
failed to meet the petroleum
std, 17.4% failed to meet
COD standard, 3.4% failed to
meet mercury standard and 3.2%
failed to meet copper standard.
Compared with that of 2006, area
failing to meet petroleum standard
has increased and there was also a slight increase in area failing to meet inorganic
nitrogen standard. However, the area failing to meet mercury and copper standard had
some drop. The sea area failing to meet activated phosphate and COD standard
remained the same level as that of the previous year.
� Marine Pollution Accidents
The coastal area had 107 pollution accidents caused by vessels, among which 38
accidents led to oil spill of at least 0.1 tons for each with a total spill of 748~898 tons
including 5 major such accidents each with over 50 tons of oil spill. There were 3
Proportion of area with excessive major pollutants
in main natural marine fisheries

2
chemical spills, resulting in 42 tons of leakage. The most serious accident caused
36.89 tons of chemical leakage.
A total of 73 pollution accidents took place in marine fishery waters, contaminating a
total water area of 23,500 hectares and leading to direct economic losses of 131
million yuan. 4 extraordinarily serious fishery pollution accidents (with economic
losses over 10 million yuan) occurred. Pollution accidents were most frequent in
Zhejiang Province while Shandong Province suffered from the biggest economic
losses.
� Red Tides
The sea areas saw 82 events of red tides, registering a decrease of 12% compared to
that of 2006. Of all the cases, 25 were toxic red tides. Red tides occurred 7 times in
the Bohai Sea, 5 in the Yellow Sea, 60 in the East China Sea and 10 in the South
China Sea. The total affected area was 11,610 km2, down by 41% over that of 2006.
And toxic red tides involved 1,906 km2. Red tide disaster led to 6 million yuan of
direct economic losses in 2007.
The whole sea areas recorded 30 events of red tides which covered more than 100
km2 each, with a total affected area of 10,253 km2, accounting for 37% of the total
incidence and 88% of the accumulated affected area. Of all the major events, there
was one case of red tide involving over 1,000 km2, six times less than that of 2006
and the affected area was only one fifth of the previous year. Red tides made
concentrated appearance still in the waters of the East China Sea that saw 73% of the
total events and 84% of total affected area.
75
60
10
0
10
20
30
40
50
60
frequency of red tide
The Bohai
Sea
The Yellow
Sea
The East
China Sea
The South
China Sea
sea area
The East China Sea
9787
The Bohai Sea 672
The Yellow Sea 655
The South China Sea
496
Frequency of red tide in all sea areas Area affected by red tide in all sea areas
unit: km2

2
Measures and Actions
【【【【Blue Sea Action Plan for Major Sea Areas】】】】A General Plan for Environmental
Protection of the Bohai Sea was developed which identified several planning tasks
according to the principle of coordinating the protection of marine and land
environment and giving attention to both rivers and seas. The tasks included
prevention and control of marine pollution and ecological rehabilitation, control and
comprehensive treatment of land-based pollution sources, integrated management and
control of water resources and water environment of river basins, technical support
for environmental protection of the Bohai Sea as well as marine monitoring system of
the Bohai Sea. The development of the Blue Sea Action Plan of the Yangtze River
Estuary and Neighboring Waters and the Blue Sea Action Plan of the Pearl River
Estuary and its Waters was initiated.
【【【【Improving Ecological and Environmental Management of Fisheries】】】】A total of
40 national protection zones for germplasm resources of aquaculture, the first of its
kind in China, have been established and announced. These zones were distributed in
the bays, islands and tidal flat of the Bohai Sea, the Yellow Sea, the East China Sea
and the South China Sea as well as rivers and lakes of such water systems as the Pearl
River, Yangtze River, Yellow River and Heilongjiang River basins. These protection
zones have played an important role in protecting over 300 key aquatic lives and rare
endemic aquatic species under state protection like pseudosciaena crocea, Chinese
shrimp, herring, grass carp, chub and aristichthysnobilis and their habitats and
breeding sites.
【【【【Strengthening the Development of Special Protection Zones】】】】 Related authority
has issued some regulations and standards such as the Interim Measures for the
Administration of Special Marine Protection Zones and Guidelines for Overall Plan
and Function Zoning of Special Marine Protection Zones. Three special protection
zones have been set up and Sea Area Use Certificates were issued for the core area of
national marine nature reserves. Examination has been made to projects subject to
administrative approval, and related work was further regulated. Approval procedures
were worked out for various activities within the marine nature reserves. Marine
Surveillance Headquarters was set up to enhance law enforcement concerning marine
ecology.

2
Extraordinarily Serious and Major Environmental
Accidents across China
SEPA received and handled 110 environmental emergencies including 1 case of
extraordinarily serious accident, 8 major accidents and 35 big accidents. Sorted by
the cause of accidents, 39 cases were caused by work safety, accounting for 35.5%
of the total, 28 by traffic accidents, taking up 25.4%, 14 by illegal discharge of
pollutants from firms, accounting for 12.7% and 29 accidents due to natural
disasters and other reasons, taking up 26.4%. As for the type of pollution
accidents, air pollution and water pollution took up 55.5% and 30.9% of the total
respectively. Environmental emergencies concentrated in such areas as East China,
South China, the Southwest and the Northwest. Most provinces (municipalities
and autonomous regions) experienced environmental accidents except Tianjin,
Shanghai, Ningxia Autonomous Region, Tibet, Qinghai and Hainan Province.
Thanks to the concerted efforts of local governments at all levels and related
environmental protection departments, these accidents have basically been handled
properly.

2
Atmospheric Environment
General Situation
The overall air quality of Chinese cities was good with some cities still suffering from
relatively heavy pollution. Acid rain remained a stable distribution but still caused
relatively heavy pollution.
� Air Quality
Cities at or above prefecture level (including the capital of prefecture,
autonomous region and league) Cities with air quality meeting Grade I national air
quality standard accounted for 2.4%; 58.1% of the cities met Grade II standard and
36.1% met Grade III standard. Cities with air quality worse than Grade III took up
3.4% of the total.
72% of cities met Grade II standard in
terms of annual average level of PM and
2.2% of cities failed to meet Grade III
standard. The heavily polluted cities were
mostly distributed in Qinghai Province,
Xinjiang Uygur Autonomous Region,
Ningxia Hui Autonomous Region,
Zhejiang Province, Sichuan Province,
Beijing, Jiangsu Province, Hubei
Province, Inner Mongolia Autonomous
Region, Shaanxi Province, Gansu
Province, Liaoning Province, Hunan
Province, Hebei Province, Shanxi
Province, Shandong Province, Henan
Province and Chongqing Municipality.
79.1% of the cities met Grade II standard in terms of annual average SO2
concentration and 1.2% failed to meet Grade III standard. Cities with heavy SO2
pollution were mainly distributed in Shanxi Province, Guizhou Province, Inner
Mongolia Autonomous Region, Yunnan Province, Chongqing, Hunan Province,
Hebei Province, Xinjiang Uygur Autonomous Region, Guangxi Zhuang Autonomous
Region, Gansu Province, Anhui Province, Henan Province, Liaoning Province,
Shaanxi Province, Zhejiang Province, Jiangsu Province and Tianjin Municipality.
All cities at or above prefecture level met Grade II standard in terms of annual
average NO2 concentration with 86.9% meeting Grade I standard. A relative high
0
20
40
60
80
up tostandard
Grade III Worse thanGrade III
Ratio of cities (%)
0
20
40
60
80
up to standard Grade III Worse than
Ratio of cities (%)

2
concentration of NO2 was found in Xinjiang Uygur Autonomous Region, Beijing,
Guangdong Province, Zhejiang Province, Jiangsu Province and Shanghai
Municipality.
Key Cities Air quality in 113 key cities of environmental protection maintained stable
with 44.2% meeting Grade II national air quality standard, 54.9% meeting Grade III
standard and 0.9% inferior to Grade III standard. The proportion of cities with air
quality worse than Grade III dropped by 6.2 percentage points compared with that of
2006.
� Acid Rain
Acid Rain Incidence Out of the 500 cities (counties) under monitoring program,
acid rain appeared in 281 cities, accounting for 56.2% of the total; 171 cities, or
34.2% of the total, had acid rain incidence higher than 25% and 65 cities (13%) had
acid rain as frequent as 75% plus.
Statistics of Acid Rain Incidence across China
Acid rain incidence (%) 0 0~~~~25% 25%~~~~50% 50%~~~~
75% ≥75%
Number of cities 219 110 47 59 65
Proportion (%) 43.8 22.0 9.4 11.8 13.0
Comparison of cities with varied incidence of acid rain between 2006 and 2007
Precipitation acidity Compared with 2006, the proportion of cities with relatively
heavy acid rain (precipitation pH value <5.0) declined by 3.2 percentage points and
the ratio of cities suffering from heavy acid rain (precipitation pH value <4.5) dropped
by 1.3 percentage points.
0%
10%
20%
30%
40%
50%
>25% >50% >75%Frequency of acid rain
2006 2007
Proportions of Cities %

2
Statistics of annual average pH value of precipitation across China
Range of annual
average pH value <<<<4.5 4.5~~~~5.0 5.0~~~~5.6 5.6~~~~7.0 ≥7.0
Number of cities 47 79 70 219 85
Ratio (%) 9.4 15.8 14.0 43.8 17.0
Distribution of Acid Rain Acid rain mainly concentrated in areas to the south of the
Yangtze River, and to the east of Sichuan Province and Yunnan Province, including
Zhejiang, Jiangxi, Hunan, Fujian, and Chongqing as well as the Yangtze River Delta
and the Pearl River Delta.
Isoline of annual average pH value of precipitation in China
pH value <4.5 4.5~5.0 5.0~5.6 >5.6
Comparison of cities with different average of pH value between 2006 and 2007
0%
10%
20%
30%
40%
50%
>25% >50% >75%Frequency of acid rain
2006 2007
Prop
ortio
ns of C
ities %

2
Compared with 2006, the acid rain distribution area in China remained stable. The
southern part of Hunan Province, central Guizhou, northeast of Sichuan and northwest
of Guangxi Zhuang Autonomous Region had alleviation in acid rain pollution.
� Emissions of major pollutants from waste gas
In 2007 the total SO2 emissions was 24.681 million tons, down by 4.7% compared
with that of 2006. Emissions of soot and dust registered 9.863 million tons and that of
industrial dust amounted to 6.99 million tons, down by 9.4% and 13.5% respectively
compared with that of 2006.
Emissions of Major Pollutants from Waste Gas in Recent
Years (Unit: 10,000 tons)
SO2 Emissions Soot and Dust Emissions Item
Year Total Industrial Domestic Total Industrial Domestic
Industrial Dust
Emissions
2005 2549.3 2168.4 380.9 1182.5 948.9 233.6 911.2
2006 2588.8 2237.6 351.2 1088.8 864.5 224.3 808.4
2007 2468.1 986.3 770.8 215.5 699.0
Measures and Actions
【Release of the Eleventh National Five-Year National Plan for the Prevention
and Control of Acid Rain and SO2 Pollution】The development of the Eleventh
National Five-Year National Plan for the Prevention and Control of Acid Rain and
SO2 Pollution was completed. The Plan set out the general target of significant
reduction of total SO2 emissions and control of the growing trend of NOx emission.
By 2010 sulfur deposition intensity will be effectively reduced, and areas subject to
serious acid deposition will be reduced. Regional particulate pollution will be
mitigated and SO2 level in urban atmosphere lowered. Major tasks defined in the Plan
included the followings: allocating targets for total emission control of SO2,
implementing industrial SO2 control program focusing on desulphurization of
coal-fired power plants, intensifying industrial restructuring, controlling sulfur content
of fuels and NOx emissions and building up the capacity in environmental
supervision.
【【【【Active Response to Climate Change】】】】 China has actively taken part in
international affairs concerning climate change. It has participated in a number of
meetings such as G8 (USA, United Kingdom, France, Germany, Italy, Canada, Japan
and Russia) +5 (China, India, Brazil, South Africa and Mexico) Dialogue and
successive ministerial meetings, 15th APEC Economic Leaders’ Meeting, Major

2
Economies Meeting on Energy Security and Climate Change and the Asia-Pacific
Partnership on Clean Development and Climate. At these meetings, the Chinese
government has set forth its position, measures and achievements on climate change
and showcased China’s image as a big and responsible country. A national leading
group on climate change has been set up with Premier Wen Jiabao as the group leader.
China's National Climate Change Program was also unveiled. Altogether 885 CDM
projects were approved with the contracted amount of 1.5 billion tons of CO2
equivalent.
【Protection of Ozone Layer】 Since July 1, 2007 China has stopped the production
and consumption of CFCs (except some necessary use) and halon, accomplishing the
target of Montreal Protocol on Substances that Deplete the Ozone Layer two and a
half years ahead of schedule. The delivery of China’s commitment to international
communities has drawn world recognition. At COP19 of Montreal Protocol, SEPA
and China General Administration for Customs were awarded for their excellent
implementation and the Beijing Organizing Committee for the 2008 Olympic Games
won an award for public awareness.
【【【【Coordination and Supervision of Air Quality Guarantee Work for the 29th
Olympics】】】】Approved by the State Council, Beijing and its neighboring six provinces
(autonomous region and municipality) and SEPA jointly established a coordination
team to guarantee Beijing’s air quality during the Olympic Games. They have
developed the Measures to Guarantee Beijing’s Air Quality for the 29th Olympics to
ensure a Green Olympic Games through concerted efforts. SEPA and Beijing
Municipal Government, together with the governments of Tianjin, Hebei, Shanxi,
Inner Mongolia and Shandong Province as well as Beijing Organizing Committee for
the 2008 Olympic Games and Infrastructure Barracks Division of PLA General
Logistics discussed and arranged the work to guarantee good air quality. Beijing was
spoken highly by the United Nations for its environmental protection measures and
remarkable improvement in air quality.

2
International Environmental Cooperation and Exchanges
President Hu Jintao, Premier Wen Jiabao and other CPC and state leaders have successively
taken part in 8 international environmental cooperation and exchange activities. Top leaders of
SEPA went abroad 9 times for visit or international conferences. SEPA received 37 foreign
delegations at or above ministerial level and participated in 227 activities for high-level
meetings at home and abroad. Throughout the year, 524 delegations (1,659 person-times) were
dispatched to 59 countries and regions and 255 foreign delegations (622 person-times) were
invited to visit China. 150 person-times of the environmental protection system received
training abroad.
China-Russia Joint Monitoring Trans-boundary Waters was carried out smoothly.
Environmental protection was an important topic for the discussions of the second and third
China-U.S Strategic Economic Dialogue as well as the first China-Japan High-level Economic
Dialogue. China has signed or renewed 14 bilateral agreements on environmental cooperation
and nuclear safety cooperation with 10 countries such as USA, Japan, France, Australia,
Uzbekistan, Cyprus and Chile. China has actively taken part in the negotiation of international
legal instruments and inter-governmental mechanism such as the Stockholm Convention, Basel
Convention, Montreal Protocol, Convention on Biological Diversity, UNFCCC, the
Coordinating Body on the Seas of East Asia (COBSEA) and NOWPAP. SEPA and UNEP
signed an emergency cooperation agreement on chemical safety and also jointly hosted a news
briefing on Global Environment Outlook (IV) and International Forum on Innovation and
Sustainable Development in China. In cooperation with the World Bank, ADB, UNDP and
other international organizations, SEPA has promoted the disclosure of environmental
information and the development of circular economy. Premier Wen Jiabao pledged to set up a
China-ASEAN Cooperation Center for Environmental Protection at the 11th China-ASEAN
Summit and proposed to establish a mechanism of ASEAN-China environment ministerial
meeting as appropriate. The 9th Environmental Ministerial Meeting among China, Japan and
Korea was held smoothly, which helped to address dust and sand storm and other
environmental issues in Northeast Asia. The fourth phase of China Council for International
Cooperation on Environment and Development (CCICED) was established with a great success
in its first annual general meeting. Environmental cooperation was developed with Italy,
Germany, Australia, EU and other regional organizations for the protection of drinking water
source areas, prevention and control of water pollution of river basins, hazardous waste
disposal, management of chemicals, strategic environmental impact assessment and
early-warning of and emergency response to environmental accidents. Foreign funds worth
USD100 million were put in place or utilized throughout the year.

2
Acoustic Environment
General Situation
72% of the cities in China enjoyed good or fairly good urban regional acoustic
environment. Among the key cities of environmental protection 75.2% had good or
fairly good regional acoustic environment. 58.6% of cities had good road traffic
acoustic environment. Among the key cities of environmental protection, 92.9%
recorded good or fairly good road traffic acoustic environment. Among all the
function zones of cities, the up-to-standard rate in daytime was 84.7% and 64.1% at
night.
Regional Environmental Noise
Among the 350 cities monitored,
5.7% registered good regional
acoustic environment, 66.3%
recorded fairly good level, 26.6%
had slight noise pollution and 1.4%
suffered from intermediate pollution.
The range of equivalent sound level
of regional environment noise for
key cities under environmental
protection was within
46.2~60.1dB(A).
75.2% of cities
enjoyed good or fairly
good regional
acoustic environment,
23.9% had slight
noise pollution and
0.9% was subject to
medium-level
pollution.
Compared with 2006,
among these key
cities 5 had a reduction of
average equivalent sound level by 3dB (A) and 2 cities had 3dB (A) rise.
good 5.7%
fairly good
66.3%
slight
pollut ion
26.6%
medium level
pollut ion
1.4%
Quality of Regional Acoustic Environment
46
50
54
58
62
Lhasa
Deyang
Shijiazhuang
Qinhuangdao
Kaifeng
Yibin
Kunming
Zhenjiang
Shizuishan
Mianyang
Dalian
Jining
Jingzhou
Changzhou
Baoji
Linfen
Xianyang
Zhengzhou
Anyang
Weinan
Taian
Beihai
Wenzhou
Tongchuan
Yan'an
Hangzhou
(Cities with change range of or over 1dB (A))
Year-on-year Comparison of Equivalent Sound Level of Urban Regional Noise
reductio increase
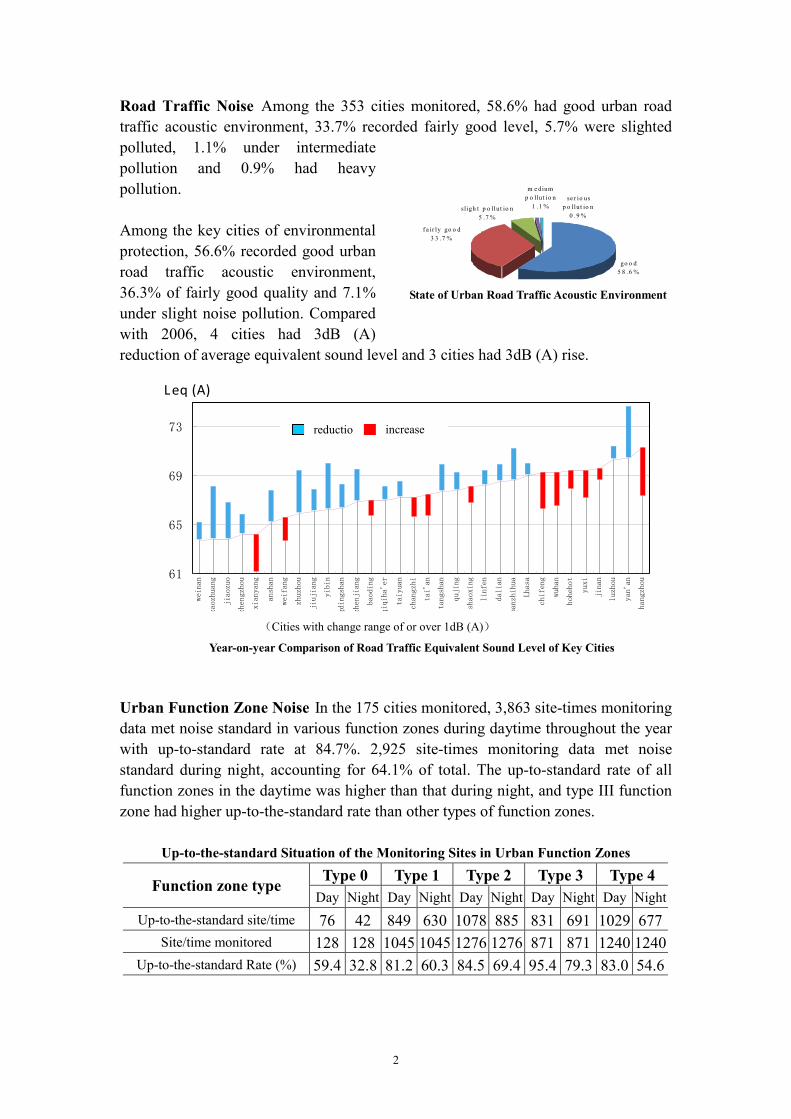
2
Road Traffic Noise Among the 353 cities monitored, 58.6% had good urban road
traffic acoustic environment, 33.7% recorded fairly good level, 5.7% were slighted
polluted, 1.1% under intermediate
pollution and 0.9% had heavy
pollution.
Among the key cities of environmental
protection, 56.6% recorded good urban
road traffic acoustic environment,
36.3% of fairly good quality and 7.1%
under slight noise pollution. Compared
with 2006, 4 cities had 3dB (A)
reduction of average equivalent sound level and 3 cities had 3dB (A) rise.
61
65
69
73
weinan
zaozhuang
jiaozuo
zhengzhou
xianyang
anshan
weifang
zhuzhou
jiujiang
yibin
pingdingshan
zhenjiang
baoding
qiqiha'er
taiyuan
changzhi
tai'an
tangshan
qujing
shaoxing
linfen
dalian
panzhihua
Lhasa
chifeng
wuhan
hohehot
yuxi
jinan
luzhou
yan'an
hangzhou
Leq (A)
Urban Function Zone Noise In the 175 cities monitored, 3,863 site-times monitoring
data met noise standard in various function zones during daytime throughout the year
with up-to-standard rate at 84.7%. 2,925 site-times monitoring data met noise
standard during night, accounting for 64.1% of total. The up-to-standard rate of all
function zones in the daytime was higher than that during night, and type III function
zone had higher up-to-the-standard rate than other types of function zones.
Up-to-the-standard Situation of the Monitoring Sites in Urban Function Zones
Type 0 Type 1 Type 2 Type 3 Type 4 Function zone type
Day Night Day Night Day Night Day Night Day Night
Up-to-the-standard site/time 76 42 849 630 1078 885 831 691 1029 677
Site/time monitored 128 128 1045 1045 1276 1276 871 871 1240 1240
Up-to-the-standard Rate (%) 59.4 32.8 81.2 60.3 84.5 69.4 95.4 79.3 83.0 54.6
(Cities with change range of or over 1dB (A))
Year-on-year Comparison of Road Traffic Equivalent Sound Level of Key Cities
go o d
5 8 .6 %
f a ir ly go o d
3 3 .7 %
sligh t p o llut io n
5 .7 %
m edium
p o llut io n
1 .1 %
se r io us
p o llut io n
0 .9 %
State of Urban Road Traffic Acoustic Environment
reductio increase

2
Quantitative Examination of Integrated Improvement
of Urban Environment
The targets of quantitative examination of integrated improvement of urban
environment were the municipal governments at all levels. The quantitative
examination has played an active role in improving environment, strengthening
pollution prevention and control, speeding up environmental development,
intensified environmental management and promoting pollution reduction since
the 1980s when it was introduced.
In 2007 cities taking part in the examination totaled 617, taking up 94% of the
total. A special website was devoted to the quantitative examination to provide
online reporting service. Over 900 people have attended related training program.
1 1
33
22 21
3128 30
1
40
34
22 2320
48
38
15 14
44
21
8
1
32
1317
1
14 16
1
8
19
0
10
20
30
40
50
60
Beijing
Tianjing
Hebei
Shanxi
Inner Mongolia
Liaoning
Jilin
Heilongjiang
Shanghai
Jiangsu
zhejiang
Anhui
Fujian
Jiangxi
Shandong
Henan
Hubei
Hunan
Guangdong
Guangxi
Hainan
Chongqin
Sichuan
Guizhou
Yunnan
Tibet
Shanxi
Gansu
Qinghai
Ningxia
Xinjiang
Province
Num
ber
of c
itie
s
Number of Cities Taking Part in the Examination
For the first time, the 2006 examination results were distributed to provincial
(autonomous regions and municipalities) governments, provincial EPBs and
government of key cities of environmental protection and major indicators were
also published on urban water environment, air quality, acoustic environment and
infrastructure construction so as to facilitate pollution control and achieve the
target of pollution reduction.

2
Solid Waste
General Situation
In 2007 a total of 1,757.67 million tons of industrial solid wastes were generated
across the country, up by 16% compared with that of 2006, among which 11.97
million tons were discharged, down by 8.1% compared to the previous year. 1104.07
million tons of wastes (including stockpile of previous years) were comprehensively
utilized, 241.53 million tons were stored and 413.55 tons were disposed, accounting
for 62.8%, 13.7% and 23.5% respectively of the total. The generated amount of
hazardous wastes was 10.79 million tons, 736 tons of them were discharged; 6.5
million tons were utilized comprehensively, 1.54 million tons were stored; and 3.46
million tons were disposed.
Generation and Disposal of Industrial Solid Waste in China Unit: 10,000 tons
Generation Volume Discharge Comprehensive use Storage Disposal
Total Hazardous
waste
Total Hazardous
waste
Total Hazardous
waste
Total Hazardous
waste
Total Hazardous
waste
175767 1079 1197 0.074 110407 650 24153 154 41355 346
Measures and Actions
【【【【 Strengthening Environmental Management of Hazardous Wastes and
Imported Wastes】】】】 The environmental authority has issued such regulations as the
Regulations on the Prevention and Control of Environmental Pollution by Electronic
Waste, Regulations on the Approval of Exporting Hazardous Waste and Guidelines
for the Development of Contingency Plans by Hazardous Waste Operators. Over 800
operation permits for hazardous waste were issued, 2000 plus on-the-spot inspections
were launched, and more than 20 illegal operators were sanctioned. In specific, many
illicit hideouts labeling indigenous mercury smelting in Tongren, Guizhou were
banned. The authority carried out special inspections on the generation of waste
mercury chloride catalyst and units that incinerate hazardous waste. It printed out and
distributed a Technical Guideline on the Control of Pollution by Chromium Slag and
supervised the progress of such pollution control. Efforts were made to promote pilot
work on notification and registration of medical waste. It has strengthened
environmental supervision on imported waste and issued the Notice on the
Adjustment of Relevant Application Items for Imported Solid Waste and Notice on
the Approval and Management of Imported Waste Paper. The authority has signed a
cooperation arrangement on regulating waste movement between the Mainland and
HK SAR with Hong Kong Environmental Protection Department. It has carried out a
special campaign named “Sky Hole Patching” to crack down on illegal movement of
waste to China. In 2007, SEPA issued 10,038 permits on the import of solid waste,

2
allowed the import of 102.56 million tons of waste including waste of automatic
import and that under import restriction. The actual import volume totaled 42.24
million tons.
【【【【 Implementation of the Stockholm Convention on Persistent Organic
Pollutants and Other International Conventions】】】】 The State Council approved the
National Action Plan for the Implementation of the Stockholm Convention on
Persistent Organic Pollutants and issued Terms of Reference on National
Coordination Team for Convention Implementation as well as the Measures for the
Management of Expert Committee of National Coordination Team for Convention
Implementation. Over 90 policies, standards and guidelines related were improved. A
national investigation on persistent organic pollutants was launched. Cooperation with
Norway and Sweden has opened new areas such as the implementation of POPs
Convention and emission reduction of dioxin for papermaking industry. The prior
informed consent procedure stipulated in the Basel Convention and Rotterdam
Convention were strictly carried out. Applications of 15 batches of export hazardous
waste were handled with a total volume of 6814.93 tons. In accordance with relevant
laws and regulations, the authority has issued 153 registration certificates for the
import and export of toxic chemicals with approved amount of 1.5 million tons. A
total of 9031 clearance forms for the environmental management of import and export
of toxic chemicals were issued involving 1.26 million tons of chemicals.
Environmental management registration certificates were issued including 2,187 for
new chemical substances exempted from notification and 91 copies for new chemical
substances.
【【【【Supervision of Ecological Environment of Mines】】】】Rules on Supervision of Mine
Ecological Environment was printed and issued to enhance environmental law
enforcement in mines. State Administration of Work Safety, National Development
and Reform Commission, Ministry of Land and Resources and SEPA jointly launched
a campaign on tailing pond. Environmental protection departments at all levels have
conducted investigation to find out hidden environmental risks of tailing ponds in
drinking water source areas, nature reserves and river courses to ensure environmental
safety. They also checked the compliance of tailing pond facilities in terms of EIA
regulations and the “three synchronizations” system and the implementation of the
measures for the prevention and control of pollution. As a result, about 1000 tailing
ponds were banned or shut down for being located in prohibited areas or failing to
meet rectification requirements. Approximately 1500 ponds had finished their
correction. Some provinces and autonomous regions have established an early
warning and emergency response mechanism for environmental accidents at tailing
pond.

2
National Action Plan for Environment and Health
To safeguard people’s environmental rights and interests, the Ministry of Health,
SEPA and other 16 state departments under the State Council jointly printed out
and issued the National Action Plan for Environment and Health (2007-2015) on
Nov. 6, 2007. This is the first guiding document of China in the area of
environment and health. It aims to improve related laws, management and science
and technologies on environment and health, control adverse environmental
factors and their impact on health, reduce environment-related diseases, protect
public health and promote the achievement of MDGs.
According to the plan, China will improve its laws, regulations and standard on
environment and health; set up national environmental health monitoring network;
build up capacity in assessment and early warning of environmental health risks
and emergency response; establish an information sharing and service system on
environment and health; carry out investigation on current status of environmental
health; and strengthen technical support to environmental health activities. In
addition, China will make more efforts to strengthen publicity and education,
actively conduct domestic & international exchanges, improve legal basis for
claims against damage by environmental pollution and develop regulations for the
identification of environmental damages, compensation procedures & scope and
aid measures.

2
Radiation Environment
General Situation
In 2007 the overall situation of radiation environment was good. The ionizing
radiation level was stable and the radiation level surrounding nuclear facilities and
nuclear technology application activities was in normal condition. Environmental
electromagnetic radiation level was generally sound except that some area around
high power transmission facilities with slightly stronger comprehensive field intensity
than the national standard. Electromagnetic radiation level around most of
electromagnetic facilities and equipment met national standard.
Environmental ionizing radiation The rate of atmospheric absorption dose of γ
radiation, overall radioactivity of aerosol and air precipitum and the concentration of
HTO in the air met normal environmental standard. No change was found in terms of
various radioactive nuclide levels in the water system of seven major rivers,
Beijing-Hangzhou Canal, major trans-boundary rivers, lakes and reservoirs. The level
of natural radioactive nuclide maintained at the same level as the national natural
radioactive level between 1983 and 1990. Radioactivity of total α and total β in
drinking water under the monitoring system was both lower than the limit in Hygienic
Standard of Domestic Drinking Water (GB5749-2006). In coastal waters, the level of
Sr-90 and Cs-137 stood within the limit defined in the Sea Water Quality Standard
(GB3097-1997). Radioactive nuclide content in soil has not changed and the specific
activity of natural radionuclides was in the same order of magnitude as the national
natural radioactive level from 1983 to 1990.
Environmental ionizing radiation surrounding nuclear power plants In 2007 the
Qinshan Nuclear Power Facilities in Zhejiang Province, Dayawan/Ling’ao Nuclear
Power Plant in Guangdong Province and Tianwan Nuclear Power Plant in Jiangsu
Province were in safe and normal operation. Among them the rate of annual average
atmospheric absorption dose of γ radiation was 102nGy/h (not deducting the cosmic
rays response value) surrounding Qinshan Nuclear Power Facilities, 119nGy/h around
Dayawan/Ling’ao Nuclear Power Plant and 98nGy/h (not deducting the cosmic rays
response value) surrounding Tianwan Nuclear Power Plant. The air-absorbed dose
rates of γ radiation surrounding the above three nuclear plants were within the natural
background fluctuations of the local area. Some environmental media at key
residential sites around Qinshan Nuclear Power Facilities of Zhejiang Province saw a
slight increase in the content of tritium and the concentration of tritium in the waters
near the discharge outlets of Dayawan/Ling’ao Nuclear Power Plant was higher than
that of the control site. However, they had little contribution to the additional dose
posed on the public and were lower than national standard. The content of
radionuclides in all the media around Tianwan Nuclear Power Plant remained the

2
same level as before the plant was put into operation.
Environmental ionizing radiation level in the vicinity of other nuclear fuel cycle
facilities The rate of air-absorbed dose of γ radiation, accumulated dose and content
of radionuclides in groundwater of nuclear research facilities such as China Atomic
Energy Scientific Research Academy, Institute of Nuclear and New Energy
Technology, Tsinghua University, Shandong Institute and Laboratory of Geological
Sciences and Nuclear Power Institute of China were in line with local environmental
standard. The rate of air-absorbed dose of γ radiation surrounding nuclear fuel
production and processing plants such as Baotou Nuclear Fuel Plant, China
Jiangzhong Nuclear Fuel Co., Ltd., Shaanxi Uranium Enrichment Co., Ltd., Lanzhou
Uranium Enrichment Co., Ltd., China Nuclear Corp. 404, Northwest Disposal Site for
Low and Intermediate Level Radioactive Solid Waste and Beilong Disposal Site for
Low and Intermediate Level Radioactive Solid Waste also remained consistent with
local environmental background level and abnormal increase in the content of
radionuclides in other environmental media was not detected either.
Environmental ionizing radiation surrounding uranium mines and smelters and
associated radioactive mines The rate of air-absorbed dose of γ radiation and radon
content in the atmosphere remained normal around Xinjiang Tianshan Uranium Co.,
Ltd. of China Nuclear Corporation, Hengyang Xinhua Chemical Metallurgy Co., Ltd.
and the radioactive landfills of the former state-owned Qinghai Factory 221. Natural
radionuclides U and Ra-226 in surface water, groundwater, soil and sediment were all
within local environmental background level. Sporadic monitoring sites surrounding
several uranium mines and their hydrometallurgical facilities witnessed slightly
higher level of radionuclides. Some development and utilization activities of
associated radioactive minerals have brought about some impact on local
environment.
Environmental radiation surrounding electromagnetic radiation facilities With
rapid increase of pollution sources of electromagnetic radiation some areas
experienced excessive pollution level, but the overall environmental quality of
electromagnetic radiation remained relatively good. Some sensitive points at the
buildings around a few television towers and medium wave broadcasting launchers
had higher comprehensive field intensity than the derived limit of public exposure, or
40V/m. Electromagnetic radiation level around the antenna of base station of mobile
communications was lower than the limit specified in the Regulations for
Electromagnetic Radiation Protection (GB8702-88). All the values measured at
power-frequency electric field and magnetic field of the sensitive points around
transformer substations were within the derived limit of public exposure.
Measures and Actions

2
【【【【Intensifying supervision of nuclear and radiation safety】】】】The State Council
issued the Regulations on Supervision and Management of Nuclear Safety Equipment
for Civil Use and approved the Plan for Nuclear Safety and Prevention and Control of
Radioactive Pollution (2006-2010). All the operators of nuclear facilities and nuclear
technology application organizations have paid much attention to the management of
nuclear and radiation safety. Environmental protection departments at all levels also
strengthened routine supervision on nuclear facilities and related technology
applications. Safe operations have been maintained in nuclear plants, research reactors,
nuclear fuel cycle facilities and facilities for storage and disposal of radioactive
wastes. No safety accidents above level I occurred in the above places and the quality
of nuclear facilities under construction was brought under effective control. There
were 24 radiation accidents in 2007, a dramatic reduction compared with that of the
previous years. No serious or extremely serious accidents happened. No casualty was
reported. Among these accidents one was relatively big and the other 23 were general
accidents.
【【【【Strengthening monitoring of radiation environment】】】】 The first group of
state-controlled monitoring sites in national radiation environment monitoring
network were put into operation. They mainly included 36 automatic monitoring
stations on radiation environment in key cities; 108 water body monitoring sites in
major river basins, boundary rivers, drinking water sources, groundwater and coastal
waters; 332 land monitoring sites; 175 soil monitoring sites; 84 monitoring sites for
electromagnetic radiation and early warning sites set up around 28 key nuclear and
radiation facilities.
【【【【Proper disposal of radioactive waste】】】】 The country invested RMB 413 million
yuan to build storehouses for urban radioactive waste. Radioactive sources and
radioactive waste collected and stored across the country were finally disposed of.
Efforts were made in the building of 23 new radioactive waste storehouses, expansion
of 5 and rebuilding of 4 storehouses. 24 laboratories were built as supporting facilities
and 3 old ones were rebuilt.

2
14
The First National Census of Pollution Sources
The First National Census of Pollution Sources represented a major investigation
of China’s national situation and also an important means to fully understand the
country’s state of environment. It aimed to learn about environment-related
information of of companies and institutions of different kinds, improve records
on various key pollution sources and database at all levels so as to provide basis
for the development of socioeconomic policies.
Efforts were made to vigorously build up capacity in legal and institutional
system, human resources and technical strength to ensure smooth progress of the
Census. The authority issued Regulations on National Census of Pollution
Sources, set up a leading group office for the first national Census and an office
for national census of pollution sources. The Work Plan for the First National
Census of Pollution Sources was printed out and distributed, which identified the
target, scope, major tasks, technical approach, implementation, financial
guarantee, information reporting and management of the Census. Nine technical
provisions were developed concerning industrial pollution sources, concentrated
pollution treatment facilities, agricultural pollution sources, general investigation
of domestic pollution sources, quality assurance, data input and transmission.
On-site monitoring was conducted on nearly 30,000 key industrial pollution
sources and concentrated pollution treatment facilities. A large scale estimation of
pollutant generation and discharge coefficient was launched for industrial,
agricultural, domestic and concentrated pollution treatment facilities and nearly
30,000 coefficients were worked out. Pilot work was carried out in three
prefecture-level cities and 11 counties (cities and districts) to verify the feasibility
of technical provisions and work specifications of the Census and applicability of
relevant forms and computer software. CCTV and other media also gave much
publicity to the Census to create an atmosphere that all social circles care for and
support to the investigation of pollution sources, which laid a foundation for the
implementation of the Census in 2008.

2
Study on Macro Strategy for China’s Environment
The State Council approved the launching of the study on macro strategy for
China’s environment in order to develop major strategies of coordinated
development of economy, society and environment fitting into China’s national
conditions in the new phase and provide support to decision-making on
environment and development. The research was headed by President of the
Chinese Academy of Engineering Xu Kuangdi and jointly implemented by SEPA,
Chinese Academy of Engineering and Chinese Academy of Sciences.
On May 11, 2007, the first leading group meeting of the study on macro strategy
for China’s environment was held. Former Vice Premier Zeng Peiyan attended the
meeting and made important remarks, identifying the direction and focus of the
study.
The strategic study represents great significance which reviews the past
experience, provides guidance for present and looks ahead into the future. Led by
the Scientific Outlook on Development and centering on the Decision of the State
Council on the Implementation of the Outlook on Scientific Development and
Strengthening Environmental Protection and the spirit of the 6th National Congress
on Environmental Protection, the research will propose macro strategy, guidelines,
targets, tasks and focus of China’s environment. The research covers 29 special
topics in four sections, including introduction, protection strategy of
environmental elements, protection strategies of major environmental fields and
strategy assurance. The introduction part will analyze the environmental situation
and trend of future development, putting forward strategic targets and major tasks
of the two phases by 2020 and 2050. Protection strategy of environmental
elements will consist of such elements as water, air, soil, ecosystem and species
resources. Protection strategies of major environmental fields will include the
strategy for industrial pollution control, strategy for urban and rural environmental
protection, strategy on environment and health and strategy for global and regional
environmental protection. Strategy assurance will include such measures as legal
system, institutional development, economic policies, investment, science and
technology and public participation.

2
Natural Ecology
General Situation
In recent years, China has established a fairly complete national nature reserve
network boasting comprehensive varieties, rational distribution and sound functions.
Rare and endangered wildlife and their habitats under state protection were well
protected and recovered in various protected areas including 85% of terrestrial natural
ecological systems, most natural relics, 85% of wildlife populations, over 65% of
higher plant communities and particularly the giant panda, crested ibis, Asian
elephant, Chinese alligator, dovetree and cycads.
Species The diverse ecological environment of China gave birth to rich wildlife
resources. In addition to fish, there were 2,619 species of vertebrates including 581
species of mammals, 1,331 species of birds, 412 species of reptiles and 295 species of
amphibians. Higher plants amounted to over 30,000 species. Hundreds of rare and
endangered wild animals and more than 17,000 plants were unique in China, such as
the giant panda, crested ibis, snub-nosed monkey, south China tiger, przewalski's
gazelle, yellow-bellied tragopan, Chinese alligator, Chinese crocodile lizard, dawn
redwood, Cathaya argyrophylla, Beshanzu fir and Henry emmenopterys. 31 panda
puppies were born through artificial breeding of which 25 survived. The number of
penned giant panda across the country reached 239 and crested ibis exceeded 1,000.
Northeast tigers had more presence in outdoor activity and expanded their habitat.
Reintroduction of crested ibis, David's deer, wild horse, Chinese alligator and other
endangered species into nature was progressing steadily.
Rapid economic development and population growth led to excessive consumption of
plant resources at a fast speed and soaring number of endangered species. Around
4,000~5,000 higher plants were on the verge of extinction or being threatened,
accounting for 15~20% of the total in China, higher than the world average level.
Biodiversity of Wetland China has a complete variety and large number of wetlands.
All types of wetland are distributed in the country except tundra wetland. The area of
28 types of wetlands larger than 100 ha was 38.48 million ha. (excluding those in
Hong Kong, Macao and Taiwan), or 4% of the total land territory. Of these wetlands,
natural wetland accounted for 36.2 million ha including 5.94 million ha coastal
wetlands, 8.2 million ha river wetlands, 8.35 million ha lake wetlands and 13.7
million ha marsh wetlands.
Species in the wetlands are rich in variety. For instance, there are 31species of
mammals belonging to 12 families under 7 orders, 271 species of birds under 32
families of 12 orders, 122 species of reptiles under 13 families of 3 orders and 300

2
species of amphibians falling into 11 families of 3 orders. The amount of fish species
was over 1000. In addition, there are abundant species of vertebrate and invertebrate,
such as crustacean, shrimps and seashells. Higher plants growing in wetlands include
2,276 species under 815 genus and 225 families. Specifically, there are 267 species of
bryophytes under 139 genus and 64 families, 70 species of fern belonging to 42 genus
and 27 families, 20 species of gymnosperm under 9 genus and 4 families, 1,919
species of angiosperm under 625 genus and 130 families. Density of plant species in
the wetlands is 0.0056 species/ km2, overtaking Brazil which boasts the richest flora.
Nature Reserves There were 19 newly built nature reserves at national level,
bringing the total number of nature reserves in the country to 2,531 with a total area
of 151.88 million ha. Among them, 303 were national nature reserves, covering 93.65
million ha, accounting for 12% of the total amount and 61.7% of the total area of
national nature reserves. A total of 28 nature reserves have joined UNESCO’s World
Man and Biosphere Protected Area Network, and 33 were put on the name list of
wetlands of international importance. A dozen of nature reserves were recognized as
world natural heritages.
Statistics of Nature Reserves in China
Amount Area (ha.)
Province
NL PL CiL CL Total NL PL CiL CL Total
% of land
territory
Beijing 2 12 6 0 20 26403 71413 36150 0 133966 7.96
Tianjin 3 5 0 0 8 100949 61821 0 0 162770 14.36
Hebei 11 18 2 3 34 216507 330226 8806 10326 565865 3.02
Shanxi 5 41 0 0 46 82936 1056626 0 0 1139562 7.29
Inner
Mongolia 23 52 33 84 192 3843784 7162614 436311 2128068 13570777 11.47
Liaoning 12 27 35 22 96 936404 825984 794093 102204 2658685 10.41
Jilin 11 14 3 6 34 783705 1431067 20564 22981 2258317 12.50
Heilongjiang 20 59 35 72 186 2058352 2601895 419367 853692 5933306 13.06
Shanghai 2 2 0 0 4 66175 27646 0 0 93821 14.79
Jiangsu 3 10 10 8 31 336211 85448 167937 21937 611533 5.96
Zhejiang 9 10 0 34 53 96724 127783 0 37573 262080 2.57
Anhui 6 27 6 64 103 164282 281796 5622 80706 532406 4.09
Fujian 12 25 9 46 92 205821 138542 75147 92839 512349 3.09
Jiangxi 8 22 2 106 138 140204 288081 3609 554618 986512 5.92
Shandong 7 23 24 21 75 256766 454603 252850 133122 1097341 6.63
Henan 11 21 1 2 35 442968 324191 163 1400 768722 4.61
Hubei 9 15 21 18 63 217577 319728 312260 143764 993329 5.34
Hunan 14 28 0 53 95 451932 402458 0 256439 1110829 5.24
Guangdong 11 52 119 165 347 236437 549290 375227 2309633 3470587 4.68

2
Guangxi 15 44 3 11 73 286193 846062 118947 147910 1399112 5.78
Hainan 9 24 22 13 68 102026 2617122 52257 40067 2811472 5.28
Chongqing 3 20 0 27 50 195512 373445 0 328522 897479 10.91
Sichuan 22 62 31 48 163 2100476 3461751 1453108 2047896 9063231 18.56
Guizhou 8 4 22 95 129 243539 58362 219794 434501 956196 5.44
Yunnan 16 52 71 59 198 1431715 1888471 557307 349846 4227339 10.73
Tibet 9 6 3 22 40 37153065 3816144 4870 1504 40975583 34.15
Shaanxi 9 34 4 3 50 320040 629768 61534 34602 1045944 5.08
Gansu 13 40 0 4 57 6861230 2900630 0 114900 9876760 21.67
Qinghai 5 6 0 0 11 20252490 1569711 0 0 21822201 30.28
Ningxia 6 7 0 0 13 439208 67575 0 0 506783 9.78
Xinjiang 9 18 0 0 27 13606151 7830814 0 0 21436965 13.39
Total 30
3 780 462 986
253
1 93655782 42601067 5375923 10249050 151881822 15.19
Note: PL refers to national level, CiL city level and CL county level.
1. Statistics of Hong Kong, Macao and Taiwan were not included.
2. Of the total area covered by nature reserves land area accounted for 145.88 million ha and sea area 6 million ha.
Percentage of land territory refers to the proportion between land nature reserves and land territory.
Types of Nature Reserves (GB Classification)
Amount Area Type
Total Percent Total area (10,000 ha.) Percent
Natural ecosystem 1717 67.84 10529.18 69.32
Forest ecosystem 1314 51.92 3372.76 22.21
Grassland and meadow ecosystem 45 1.78 316.05 2.08
Desert ecosystem 29 1.15 4027.45 26.52
Inland wetland and water area ecosystem 261 10.31 2713.02 17.86
Marine and coastal ecosystem 68 2.69 99.91 0.66
Wild biological species 683 26.99 4483.38 29.52
Wild animals reserves 523 20.66 4220.86 27.79
Wild plants reserves 160 6.32 262.52 1.73
Natural relics 131 5.18 175.62 1.16
Geological relics 99 3.91 123.04 0.81
Ancient creature relics 32 1.26 52.58 0.35
Total 2531 100 15188.18 100

2
Measures and Actions
【【【【Development and distribution of the Guidelines for the Plan on Key Ecological
Function Protection Zones and Guidelines for the Plan on Protection and
Utilization of Biological Resources】】】】 The Guidelines for National Plan on Key
Ecological Function Protection Zones was printed out and released. The Guidelines
proposed to have rational distribution of national key ecological function protection
zones, establish a group of protection zones able to conserve water and soil, break
wind and fix sand, adjust and store flood and maintain biodiversity so as to form a
full-fledged system of eco-function protection zones, put in place sound policies, laws
and regulations, standards and technical specifications on eco-function protection
zones and contain the deteriorating trend of China’s eco-function protection zones.
The Guidelines for National Plan on the Protection and Utilization of Biological
Resources was also printed out and distributed, which sets forth short-term and
med-to-long term plans in twelve key areas including animals, plants and
microorganism according to the scope and requirement of biological resource
conservation.
【【【【Earnestly promoting pilot work on eco-compensation】】】】 Opinions on Piloting
Eco-compensation was printed out and distributed which aims to establish and
improve eco-compensation mechanism on the four major fields, namely nature
reserves, key eco-function zones, development of mineral resources and protection of
water environment of river basins. The authority guided some provinces including
Shanxi Province on the trial work of eco-compensation for mineral resource
development and carried out research on eco-compensation for the Xin’an River to
promote eco-compensation trial work in river basins.
【【【【 Energetically implementing the Convention on Biological Diversity and
Cartagena Protocol on Biosafety】】】】 China has presented 12 topic reports and the
First National Report on China’s Implementation of Cartagena Protocol on Biosafety
to the Secretariat of the Convention on Biological Diversity, which covers such areas
as the funds for biodiversity protection, biofuels, carbon sink and climate regulation.
China also dispatched delegations to take part in the 5th meeting on genetic resource
access and benefit sharing, the 12th meeting of SBSTTA to have an in-depth
discussion on such topics as the application of ecosystem approach, application of
global strategy for plant conservation, biodiversity in arid and semi-arid areas,
biodiversity and climate change. China also took part in the 4th meeting of the
working group on liability and redress of Cartagena Protocol on Biosafety. It
launched 18 local demonstration projects featuring China-EU biodiversity.
【【【【Assessment of the management of National Nature Reserves】】】】To strengthen the
management of nature reserves, SEPA has assessed the management of 12 national
nature reserves from 10 aspects ranging from the organization structure and personnel,

2
day-to-day management to the change of major subjects under protection. Among the
12 state-level nature reserves, 4 obtained the score of excellent, 6 good and 2
mediocre.
【【【【Investigation, protection, development and utilization of agricultural wild
plant resources】】】】 Investigations were made in 12 provinces (districts and cities)
including Gansu Province and Anhui Province on the geographical distribution,
ecological environment and state of endangerment of over 1,300 key species under
state protection such as wild rice, wild soybean, wild fruit tree and wild tea camellia.
Over 2000 plant specimens were identified and produced with new discovery of over
20 wild plants species under major national protection program. 17 sites were newly
set up to protect agricultural wild plant habitats involving 10 species and their habitats,
namely Chinese lawngrass, wild rice, wild soybean, wild tea plant, wild kiwifruit,
wild lotus, wild Trapa, wild water shield, wild Fagopyrum dibotrys and aweto. Rescue
collection of wild plant resources aggregated 1,043 sample-times. Researchers
selected 2 genes from wild rice which may resist Nilaparvata lugens and white
backed rice planthoppers and 2 genes from wild soybean with anti-drought and salt
tolerance capacity. These genes were applied to the selection and breeding of new
cultivars.
【【【【 Investigation, monitoring and elimination of invasive alien species 】】】】
Investigation was made on 10 invasive plants dangerous to agriculture with the
establishment of a database recording the information of 120 invasive alien species.
Monitoring work was intensified in 8 sensitive ecological areas including Hainan
Province and on 10 major dangerous agricultural invasive species. Some invasive
species such as Eupatorium adenophorum Spreng, Alternanthera philoxeroides,
Solidago Canadensis, Flaveria bidentis Kuntze and Golden Apple Snail were
eliminated in over 12 million mu (15 mu = 1 ha) area. The elimination rate in some
important areas hit 70%. Demonstration areas covering more than 300,000 mu were
established to showcase comprehensive control of 10 major dangerous agricultural
invasive species with an elimination rate of over 65%.

2
Special Environmental Campaigns to Harshly Crack Down on
Environmental Infringements
From April to December 2007, the seven departments including SEPA,
NDRC, Ministry of Supervision, State Administration for Industry and Commerce,
Ministry of Justice, State Administration of Work Safety and State Electricity
Regulatory Commission (SERC) continued to carry out special environmental
campaign against illegal polluting enterprise to protect public health. Law
enforcement was strengthened focusing on pollution reduction, protection of
drinking water sources and environmental supervision of industrial parks.
Altogether over 2.3 million person-times were dispatched for law enforcement,
inspecting more than 1 million enterprises-times. 31,000 cases were put on record
and dealt with, and 5,530 cases were blacklisted for rectification. The inspectors
examined over 8,000 papermaking enterprises and ordered 2,194 to phase out or
shut down outdated facilities. 280 companies involving lead production were shut
down or suspended production. The campaign led to the inspection of 15,000
centralized drinking water source areas, banning 942 pollutant discharge outlets in
Grade I protected areas, stopping 1,294 projects constructed in Grade II protected
areas, and 931 projects were subject to mandatory pollution control within a given
period of time. A total of 2,250 industrial parks were inspected and 649 local
policies against national environmental protection regulations were rectified. In
cooperation with Ministry of Supervision, SEPA blacklisted 22 environmental
cases for rectification and proposed suggestions for a claim for legal liability
against 22 organizations and 122 people. A band of illegal polluters causing
serious pollution were severely punished and some notorious environmental
problems affecting public health were basically solved.

2
Land and Rural Environment
General Situation
� Lands
There was little change in the total area of major types of land in 2007. The area was
1.826 billion mu for farmland, 177 million mu for orchard, 3.542 billion mu for forest,
3.928 billion mu for pasture and 382 million mu for other agricultural land.
Residential area and independent industrial and mining land occupied 400 million mu,
transportation 37 million mu, water conservancy facilities 54 million mu and the rest
was unused land. Compared with in 2006, there was a 0.03%, 0.04%, 0.002% and
0.03% reduction of farmland, orchard, forest and pastureland respectively. However,
the land area went up by 1.11% for residential area and independent industrial and
mining; 2.05% for transportation and 0.37% for water conservancy. Net loss of
farmland across China amounted to 610,000 mu.
A total of 3.56 million km2 of land suffered from water and soil erosion, accounting
for 37.08% of the total land area. Among them, 1.65 million km2 was eroded by water
and 1.91 million km2 by wind, taking up 17.18% and 19.9% respectively of the total.
1.62 million km2 was subject to slight water & soil erosion; 800,000 km
2 to moderate
water & soil erosion; 430,000 km2 to heavy water & soil erosion; 330,000 km
2 to very
heavy water & soil erosion and 380,000 km2 extremely erosion.
The deteriorating trend of farmland was aggravated with degraded area accounting for
more than 40% of the total. The soil was beset with unbalanced nutrition. 51% of
farmland lacked enough phosphorus and 60% was short of potassium. Of all the
fertilizer applied organic fertilizer only took up 25%. Pollution of farmland from
waste gas, waste water and waste residues caused by industrial and mining companies
should not be ignored. The practice of occupying prime farmland and compensating
poor one still went on. In general, the quality of farmland occupied by
non-agricultural construction was 2~3 grade better than that of newly reclaimed land.
� Rural Environment
The situation of environmental protection in rural areas remained grim. Point
pollution and non-point pollution coexisted, domestic pollution was coupled with
industrial pollution and newly emerged pollution and old pollution were interwoven.
Industrial and urban pollution have gradually shifted to rural area, threatening the
safety of drinking water and farm produce. The rural areas faced the dual menaces of
environmental pollution and ecological damage. This was represented by exacerbated

2
domestic pollution and non-point pollution, striking pollution from industrial and
mining sources, hidden risk of drinking water and ineffective control of ecological
degradation.
The aggregate rural population benefiting from access to water sanitation
improvement accounted for 92.05%. 62.71% of the population had access to tap water
supply and 56.97% had access to sanitary toilet facilities. Environment-friendly toilet
facilities covered 34.81% of the rural population. 63.28% of domestic refuse was
collected to the dumping sites while 36.72% was dumped at random. Of the collected
refuse 57.03% was under landfill, 14.26% burnt, 13.88% composted in high
temperature and 14.83% directly reused.
Measures and Actions
【【【【 Steadily promoting the investigation of soil pollution】】】】 The national
investigation of soil pollution was launched in an all-round way. 35,000 samples have
been collected and analyzed and the design and test of the collection system of soil
pollution investigation database was also completed. Smooth progress has been made
in 7 pilot projects on remediation and comprehensive control of typical contaminated
sites. A special investigation titled “health risk assessment of the population subject to
pollution from cadmium, lead, mercury and arsenic in the soil of typical areas” was
carried out.
【【【【 Carrying out key projects on the control of water & soil erosion】】】】
Comprehensive water & soil erosion control has been finished in 6,236 small river
basins covering a total area of 78,000 km2. 170,000 small water conservation
facilities were constructed and 900 check dams were newly built. The water and soil
conservation program was implemented in the upper and mid reaches of the Yangtze
River and Yellow River, wind & sand source area of Beijing and Tianjin, black soil
area in Northeast China and the south and north Panjiang River in the upper reaches
of the Pearl River. A key project for water and soil conservation was initiated in
Danjiangkou Reservoir area and its upper reaches. Water and soil erosion control
project was carried out in China’s northeast black soil area for national
comprehensive agricultural development. The central government input 1.439 billion
yuan to control soil erosion of 9,600 km2. A total of 33,000 km2 of land was
harnessed by closing hillsides to facilitate afforestation. 22,100 water and soil
conservation programs of development and construction projects were approved.
【【【【Initiative of 100 Day National Land Law Enforcement】】】】 Efforts were made to
crack down on violations of land laws and regulations since 2005 on a large scale
such as land-renting instead of land acquisition, expanding land use scale in breach of
land use plan and using land ahead of approval. Over 31,000 cases of the above three
kinds of infringements were handled involving over 3.3 million mu of land, and over

2
150,000 mu such land was returned.
【【【【Strengthening environmental protection in rural areas】】】】 The General Office of
the State Council relayed the Opinions on Strengthening Environmental Protection in
Rural Areas, which defined the guidelines, basic principle and objectives of
environmental protection in rural areas. It called for efforts to address seven major
environmental problems in rural areas. It is a guiding document directing the
coordinated development of rural economy, society and environment. SEPA printed
out and issued the Guidelines of National Plan for the Prevention and Control of
Environmental Pollution in Rural Areas, which identifies the following six fields as
the focus and priority of pollution control in rural China, namely pollution control of
rural drinking water source areas, control of domestic pollution in densely inhabited
areas, control of pollution from industries and mines, control of pollution from
livestock, poultry and aquaculture farms, control of soil pollution and control of
non-point pollution.
【【【【Safeguarding drinking water safety in rural areas and preventing endemic
diseases】】】】 SEPA printed out and issued the Notice on Strengthening Hygienic
Assessment of Drinking Water Safety Program and Monitoring of Water Quality
Hygiene in Rural Areas. The central government earmarked 45.42 million yuan as
subsidy to facilitate access to water sanitation and toilet improvement in rural areas.
Monitoring network covered no less than 25% of the counties and water quality
hygienic monitoring of drinking water continued to expand. 25.13% of the rural
population used surface water as drinking water source and 74.87% relied on
groundwater. Centralized supply of drinking water covered 55.1% of the rural
population, while 44.9% depended on decentralized supply. From 2004 to 2007 the
central government subsidized local areas with 590 million yuan to prevent and
control endemic diseases including 370 million yuan for improving cooking
conditions in areas haunted by fluorosis and arsenic poisoning due to coal burning, 80
million yuan for screening the content of fluorin and arsenic in drinking water,
examination of water sanitation improvement projects and investigation of diseases in
areas prone to fluorosis and arsenic poisoning, 60 million yuan for the prevention &
control of iodine deficiency, 30 million yuan for the prevention & control of
kashin-beck disease and Keshan disease. 60 million yuan were appropriated for other
purposes.
【【【【Scientific application of chemical fertilizers and comprehensive utilization of
straw】】】】 The assessment was conducted in 1,200 counties with a total land area of
640 million mu to determine fertilizer application doze according to soil fertility. 100
million farmers had access to this service which raised the utilization rate of fertilizers
by 3 percentage points. Sales and use of five highly toxic pesticides including
methamidophos were fully banned across the country, and 873 registration certificates
of highly toxic pesticides were revoked. Efforts were made to promote protective
cultivation and demonstration work on straw-returning-to-field by agricultural

2
machines. As a result, 173 demonstration counties at national level and 328 at
provincial level were established with protective cultivation and mechanized
application of straw returning to field covering an area of 30.62 million and 300
million mu respectively. The demonstration area of protective cultivation saved
1.2~1.8 billion m3 of irrigation water and reduced 1.24~2.59 million tons of GHG
emissions. Around 220 million tons of straw were used as feeding stuff, accounting
for one third of the total in the country.
=

68
Forest
General Situation
With vast areas, complex natural climate conditions, rich plant species and abundant
forest resources, China has evident geological distribution of its forest resources.
From the north to south, main type of forests are the followings: coniferous forest,
coniferous and broad-leaved mixed forest, deciduous broad-leaved forest,
broad-leaved evergreen forest, seasonal rain forest and rain forests. According to the
findings of the 6th National Investigation on Forest Resources (1999~2003), China
had forest area of 174.9092 million ha, up by 15.9683 million ha compared with the
findings of the 5th National Investigation on Forest Resources (1994~1998). The
forest coverage was 18.21%, up by 1.66 percentage points compared with that of the
findings of the 5th National Investigation on Forest Resources. The total reserve of
living trees was 13.618 billion m3; and forest reserve was 12.456 billion m
3. Per
capita forest area was 0.132 ha, up by 0.004 ha compared with the findings of the 5th
National Investigation on Forest Resources. Average annual net forest growth was
497 million m3 and average annual logging amount was 365 million m
3.
Plant Diseases and Insect Pests 2007 saw 12.57 million ha forests affected by plant
disease and insect pests (including 1.57 million ha forests severely affected and 300
thousand ha forests afflicted by relevant disasters), up by 14% than that of the
previous year. In specific, 9 million ha suffered from insect pests, 1.04 million ha
plant diseases and 2.2 million ha subject to the damage caused by rats and rabbits. In
addition, 340,000 ha forests were subject to hazardous plants.
Forest Fire In 2007, a total of 9,260 forest fires occurred across China. Among them,
the amount of forest fire alarm, general fire and very big forest fire was 6,051, 3,205
and 4 respectively. Total area suffering from forest fires reached 125 ,000 ha and
29,000 ha forests were affected. A total of 94 people were injured or died due to forest
fire, among which 61 were dead and 33 injured. Forest fires had led to the loss of
572,000 m3 of mature forests, 144 million very young trees and other losses
equivalent to 124 million yuan. A total of 1.194 million work days were spent by
manpower and 109 million yuan were spent for firefighting.
Measures and Actions
【【【【Promotion of the work on the conservation of biodiversity】】】】 The compilation of
the “China’s Strategy for Plant Conservation” was completed. Based on the
framework of the 16 targets of “Global Strategy for Plant Conservation” (GSPC), the

69
work echoed each target of GSPC with the deliberation from three aspects of current
situation overview, existing problems and action plan in line with the “China’s
Strategy for Plant Conservation” and requirements of mid-and-long term planning. It
is the action program for the conservation and management of plants in biodiversity
conservation work of China.
【【【【Development of major forestry projects】】】】 The afforestation of 2.6816 million ha
area was completed in 2007, accounting for 68.62% of the total afforeatation areas of
3.9077 ha. Projects for the protection of natural forest resources have developed a
total of 732,900 ha of various kinds of forests for public interests. Among them,
113,700 ha were planted by people, 70,000 ha were planted by plane, and 549,200 ha
new mountainous areas of non-forest or less-forest land were closed to facilitate
afforestation. A total of 99.3083 million ha forests were under management and
protection. A total of 1.1247 million ha areas finished the “grain for green” project
(including 68,700 ha covered in the project for the control of sand & dust sources of
Beijing and Tianjin). Among them, 85,300 ha were from “grain for green”, 1.0025
million ha were new forest in wilderness suitable for afforestation, and 36,900 ha
were new mountainous area of non-forest or less-forest land closed to facilitate
afforestation. Regarding the control project on wind dust sources to Beijing and
Tianjin, the treatment of 573,200 ha of land has been finished. Among them, 134,000
ha were artificial forest, 33,900 ha were afforested by airplane, 147,300 ha were new
mountain area of non-forest or less-forest land closed to facilitate afforestation. The
treatment of 186,600 ha of grassland was finished, and 71,500 ha land of small river
basins had completed the comprehensive treatment. A total of 13,900 water
conservancy supporting facilities had been constructed. 14,900 people were removed
due to ecological conservation involving 3,700 households. The projects on the
development of “Sanbei Shelter” forest and shelter forests in the Yangtze river basins
had finished afforestation of 574,200 ha; 417,000 ha of them were planted by people,
13,300 ha of them by air sowing, and 143,900 ha additional mountain area of
non-forest or less-forest land were closed to facilitate afforestation. A total of 21,100
ha low-yield and low-efficiency shelter forests had undergone improvement.
Regarding the project for the conservation of wildlife and development of nature
reserves, 26 new nature reserves had been established, driving the total amount of
nature reserves to 1,766 with an area of 123 million ha, registering 12.8% of the total
land territory of China. 67 protects over the conservation and restoration of wetland
had been implemented, increasing the total amount of international key wetland sites
to 30 (including 18 state-level wetland parks) in China, covering a total area of 3.58
million ha. Regarding the project on the development of fast-growing commercial
forest bases in key regions, a total of 5,827 ha fast-growing commercial forest were
developed, 3,393 ha of them appeared in desolate mountains and waste land and 667
ha forest in marginal land area. In addition, 23,800 ha forest were improved.

70
Environmental Publicity and Education
Work on the publicity of environmental news and environmental education has
been carried out in an all round way. With various publicity and education
activities, all social sectors have been mobilized to actively participate in
environmental protection.
Enhance the publicity of environmental news. A total of 1,798 pieces of news
reports on environmental protection were published or broadcasted by central
media, and altogether 148 cases of application for interview by domestic media
and 59 by foreign media have been handled. Major moves like emission
reduction, water pollution prevention and control as well as suspension of EIA for
construction projects have been vigorously initiated, and all leading media have
reported major environmental protection policies and planning, major meetings
and activities as well as environmental protection related hot issues, thus drawing
great attention from all social sectors with positive response. On June 5 of 2007,
the State Council held a special news briefing to notify reporters at home and
abroad on the state of the environment of China in 2006 and answered their
questions over the progress in the reduction of major pollutants.
Strengthen publicity and education. Over 30 environmental publicity and
education campaigns have been coordinated, planned or organized, and over 20
groups of organizations interested in environmental protection and volunteers
were received. A series of activities under the theme of “pollution reduction and
environment-friendly society” on the World Environment Day were organized.
The Conference on the 2007 World Environment Day & Commending the
Establishment of National Green Organizations was held, honoring 10 “Green
Guardians”, 217 advanced “Green Schools”, 124 “National Green Communities”
as well as 468 “Green Households”. In addition, the topic exhibition with the
theme of “pollution reduction and environment-friendly society” was held.

71
Grassland
General Situation
China has nearly 0.4 billion ha various natural grassland, taking up 41.7% of total
national land area. The top 10 provinces or regions boasting the largest area of
grassland were Tibet Autonomous Region, Inner Mongolia Autonomous Region,
Xinjiang Uygur Autonomous Region, Qinghai, Sichuan, Gansu, Yunnan, Guangxi
Zhuang Autonomous Region, Heilongjiang and Hunan, covering a total of 330
million ha of grassland, representing 82.5% of the nation’s total. The six major
pasturing areas of Tibet, Inner Mongolia, Xinjiang, Qinghai, Sichuan and Gansu
cover a total area of 290 million ha, accounting for 75.1% of the total.
Grassland Productivity In 2007, fresh grass output across China was 952.14 million
tons, equivalent to about 298.65 million tons of dry grass, which could support about
233.69 million sheep, up by 1% than that of the previous year. The top ten provinces
(autonomous regions) of grassland output were Inner Mongolia, Xinjiang, Sichuan,
Tibet, Qinghai, Yunnan, Gansu, Guangxi, Heilongjiang and Hubei with the total
output of 663.97 million tons of fresh grass, accounting for 69.7% of total output. The
livestock overgrazing rate of major natural grasslands was 33%, 1 percentage point
lower than the previous year. The overgrazing rate of six major pasturing areas of
Inner Mongolia, Qinghai, Gansu, Xinjiang, Sichuan and Tibet stood at 20%, 38%,
38%, 39%, 39% and 40% respectively. Among 266 pastoral areas and
semi-agricultural and semi-pastoral districts or counties (banners), 178 counties
(banners) saw the overgrazing rate over 20%.
Grassland Fire In 2007, 248 fires occurred on grassland in China. Among them, 200
were fire alarms, 47 were general fire disasters, 1 were big fire disaster and there was
no very big fire disaster. A total of 11,419.2 ha grassland were affected by fire. The
number of grassland fires was down by 29% with the areas affected 76% less than
that of 2006. Grassland fires mainly occurred in Hebei, Shanxi, Inner Mongolia,
Liaoning, Jilin, Heilongjiang, Sichuan, Shaanxi, Gansu, Qinghai, Xinjiang and
Shandong. In particular, Sichuan, Heilongjiang and Jilin were rather seriously
affected with the affected areas of 3,379 ha, 2,800 ha and 2,443 ha, accounting for
29.6%, 24.5% and 21.4% of the total affected respectively.
Grassland Rat and Insect Pests In 2007, 38.94 million ha grassland suffered from
damage by rats, up by 3.9% than that of 2006. Among them, 17.66 million ha were
subject to serious damage, down by 14% compared with that of 2006. Relatively
serious rat damage occurred in Qinghai, Inner Mongolia, Gansu, Tibet, Xinjiang and
Sichuan with 33.63 million ha affected in total. Rat species causing serious damages
mainly include mousehare, sand rat, zokor, field mouse and ground squirrel. In 2007,

72
the accumulated grassland area finishing the prevention and control of rat damages
was 93.26 million mu. 17.58 million ha grassland suffered from insect pests, up by
4.5% compared with that of 2006. Among them, 7.95 million ha were subject to
serious insect pests, up by 9.4% compared with that of 2006. Inner Mongolia,
Xinjiang, Qinghai, Gansu, Ningxia and Sichuan witnessed rather serious insect pest
disasters with 14.74 million ha affected and 6.6 million ha seriously affected,
accounting for 83.8% and 83% of their respective affected area. Insect species causing
most serious damages were grassland locust, white puncture vine moth, grassland
larva, caterpillars, etc. In 2007, accumulated 4.29 million ha grassland had finished
the prevention and control of insect pests, taking up 24.4% of the total areas affected.
Among them, 3.42 million ha finished the prevention and control of grassland locust,
accounting for 32.1% of total area affected by locusts.
Measures and Actions
【【【【Implementation of major projects on grassland protection】】】】Started in 2003,
8.569 billion yuan from the central budget have been accumulatively earmarked for
the implementation of the Project of Returning Grazing Land for Grassland, the
fencing of 519 million mu of grassland and supplement sowing of 98.6 million mu of
deteriorated grassland. Starting from 2000, the Sub-project of Grassland Construction
under the Project for the Control of Sand & Dust Sources of Beijing and Tianjin had
accumulatively appropriated 2.75 billion yuan fund from the central budget for the
treatment of 37.149 million mu grassland including 5.2344 million mu artificial
grassland, 2.1117 million mu pasture sowing by airplane, 26.826 million mu grassland
fenced for cultivation, the construction of 2.6817 million mu of basic grassland and
294,960 mu of pasture seed bases. 85.267 million mu grassland were banned or
suspended for grazing, 6.119 million m2 of pens and sheds for livestock were built,
840 silage silos were set up, and 71,935 units (sets) of machines for manufacturing
forage grass and feed were available. Compared with the non-project areas, the green
coverage of the areas covered by the project had witnessed an average growth of 16
percentage points, forest height up by 51% and grass output up by 64%.
【【【【Strict law enforcement】】】】In 2007, there were 15,677 cases of grassland law
infringements with 1.62 million mu grassland damaged. 13,712 cases were put on
record, 13,362 cases were ended, accounting for 97.4%. Judged from the amount of
cases of different types of law infringement, the cases in violation of grassland
grazing prohibition or suspension and those in violation of regulations purporting the
balance between grassland carrying capacity and number of livestock topped the list.

73
Activity on the Year for Strengthening Local Environmental Protection Work
In order to earnestly resolve the prominent problem of weak capacity in
environmental monitoring and failing to accommodate to the need of
environmental protection causes in local areas, great efforts have been made to
beef up grassroots force for environmental protection and relevant capacity
building to improve their capability for the promotion of the historic
transformations while making use of the “Year for Strengthening Local
Environmental Protection Work”.
The central budget has established the special fund for pollution reduction to
specially support the capacity building in three major systems, i.e. environmental
statistics, monitoring and examination. Four projects on the development of
emission reduction capacity were also initiated with the overall investment of 2.4
billion yuan. Together with the fund from other sources, the investment from the
central government in local capacity building totaled 3.2 billion yuan, 4.2 times of
that of the previous year.
The item of “211 environmental protection” was set up for the first time in fiscal
budgeting. Throughout 2007, the central budget had used 14.6 billion yuan to
support projects on energy conservation and emission reduction, environmental
protection and ecological development. In addition, the central budget earmarked
23.5 billion yuan to support key projects on energy conservation and emission
reduction and environmental protection.
The planning index management system of documents and meetings were
implemented strictly. 137 documents for the arrangement of local work were
issued, and 30 national meetings were held for work deployment. Various
activities for evaluation, checkup and commending were seriously examined with
the cancellation and consolidation of 37 activities, accounting for 86% of the total.
Consequently, only 6 such activities were remained.

74
Climate and Natural Disasters
General Situation of Climate
In 2007, some parts of China experienced abnormal climate with the frequent
occurrence of extreme climatic events and many combined appearance of climatic
disasters. The annual average temperature of the year was 1.3℃ higher than that of
the historical average, the highest of all years with observation records. The annual
average precipitation of China was close to the historical average but with uneven
distribution. In specific, the spatial distribution of precipitation appeared to be more in
the west and less in the east compared with that of historical average. In particular, the
central and western part of northwest China saw apparently more precipitation, and
the central part saw more precipitation and northern and southern part saw less in east
China.
Precipitation In 2007, national annual average precipitation was 607.9 mm, close to
the historical average with uneven annual spatial distribution. The western part of
northeast China and eastern part of Inner Mongolia, the northern part of Jiangxi and
western part of South Xinjiang witnessed 20% ~ 50% less precipitation than that of
historical average, while central and western part of northwest China, Shandong
peninsular and the northern part of Jiangsu-Anhui saw 20% ~ 50% more precipitation
than that of historical average with central and southern part of Xinjiang,
northwestern part of Gansu and northern part of Qinghai saw over 50% of increment.
The precipitation of most of the rest parts of China was the same as the historical
average.
National precipitation distribution in 2007 (mm)
[图例 Legend 南海诸岛 Islands of the South China Sea]

75
Temperature Distribution In 2007, the annual average temperature of China was
10.1℃, 1.3℃ higher than the historical average. It was the warmest year for all years
with observation record and also the 11th consecutive warmer year than historical
average. Different parts of China all witnessed higher annual average temperature
with remarkably higher temperature in north China and central and eastern part of
China in particular. The temperature of northeast China, most parts of north China and
the watersheds of the Yellow River and Huaihe River, the watersheds of the Yangtze
River and Huaihe River, most parts of south of the lower reaches of the Yangtze River
and of northwest China as well as central and western part of Tibet were 1 ~ 2℃
higher than the historical average.
Yearly change of annual average temperature in China (℃℃℃℃)
General Situation of Natural Disasters
� Meteorological Disaster
In 2007, all kinds of meteorological disasters had incurred 234.2 billion yuan of
direct economic losses, higher than the average since 1991. Drought and storms and
flood were still the leading kind of meteorological disaster with the areas affected
registering 82% of the total areas affected by all kinds of meteorological disasters.
The areas of cropland affected by drought saw substantial increase than that of the
previous year, while the proportion of hails, tropical cyclones, freezing damage and
snow disaster were all less than that in 2006.
【【【【Storms and Flood】】】】 Some parts of south China suffered from severe storm and
flood in early summer of 2007; during the flood season, the Huaihe River basins was
afflicted by great floods with the level only less than the one of 1954 ever since the
founding of the new China; Chongqing, Jinan and other cities experienced serious
storm and flood disaster in their urban area; and Henan, Shaanixi and Shanxi
witnessed special great mountain torrents in late July. Yunnan saw special great
7.5
8.0
8.5
9.0
9.5
10.0
10.5
1951 1955 1959 1963 1967 1971 1975 1979 1983 1987 1991 1995 1999 2003 2007
Year
Average temperature(℃
)
annual average temperature 1971-2000 average

76
mud-stone flow and landslide disaster from July 18 to 21.
【【【【Drought】】】】 In 2007, north China was afflicted by large-scale spring drought; some
parts of northeast China saw severe summer drought; and the south of the lower
reaches of the Yangtze River and south China was struck by severe high-temperature
summer drought and special great autumn drought once in 50 years lasting till early
winter. The scale and level of drought disasters were relatively serious. In early May
of the peak season of drought, the affected areas nationwide mounted to 14.93 million
ha, 3 million ha more than the historical average. 8.97 million people and 7.52 million
livestock experienced temporary difficulty in drinking water supply caused by
drought.
【【【【Sand and dust storm】】】】In 2007, the northern part of China witnessed 2 days of sand
and dust on average, 3.6 days less than the historical average, ranking the third least
year between 1961~2007 in terms of amount of sand and dust days in spring. In the
spring of 2007, 15 sand and dust days occurred in north China, less than that of the
same period in 2006; 1 case of strong sand and dust storm appeared, 4 times less than
that of 2006. The occurrence of sand and dust days was rather concentrated within a
certain period of time with 5 occurrences during the 11 days from March 24 to April 3
with the average occurrence of one case in tow days. The strong sand and dust storm
weather from March 30 to 31 was the one of the largest scale and strongest level
which had affected most parts of northwestern part and northern part of China.
【【【【Tropical cyclone and lightning strike】】】】In 2007, 8 tropical cyclones landed in
China, 1 more than the historical average. They had caused 84 deaths with 29.77
billion yuan of direct economic losses. Local strong convective weather had made
frequent appearance, and lightning strikes had caused severe damage. In particular,
Jiangxi, Chongqing and Zhejiang were heavily impacted, causing the death of 50
people.
【【【【High temperature and heat wave & freezing damage/snow disasters】】】】In 2007,
most regions across China experienced 10 ~ 15 more high temperature days than the
historical average, and the longest consecutive high temperature days of some parts of
Guangdong, Fujian, Zhejiang, Jiangxi and Guangxi exceeded the maximum record
compared with the same period in history. 4.072 million ha cropland across China
suffered from freezing damage and snow disaster.
� Earthquake Disasters
There were 17 earthquakes at Richter scale above Grade 5 across China in 2007.
Among them, 7 were at Grade 6~7 by Richter scale; and 10 were at Grade 5~6. 6 of
them occurred in the mainland of China and 11 of them in seas or Taiwan region.
3 earthquake disasters occurred in the mainland of China in 2007, affecting about

77
767,000 people and total area of 8,258 km2 with 3 death, 28 serious injuries and 391
slight injuries. They also caused the following damages to buildings: 1,370,605 m2
under destruction, 301,919 m2 under serious damage, 5,809,546 m
2 under moderate
damage and 2,817,720 m2 under slight damage. Total direct economic loss was about
2.019 billion yuan.
Earthquake disasters and their losses in the mainland of China in 2007
Time Casualty Building damage (m2)
No.
Month-Day Hour
Place Richter
Scale Death SD LD Destructed Serious Moderate Slight
Direct Economic
Loss (10,000 yuan)
1 Mar. 13 10:22 Shunchang, Fujian 4.7 0 0 0 3462 31012 1001.73
2 Jun. 3 05:34 Ning’er, Yunnan 6.4 3 28 391 1355210 156187 5200629 2052103 189860.00
3 Jul. 20 18:06 Tekes, Xinjiang 5.7 0 0 0 15395 145732 605455 734605 11060.33
Total 3 28 391 1370605 301919 5809546 2817720 201922.06
� Geological Disaster
In 2007, there were 25,364 cases of various geological disasters across China with the
casualty of 1,123 people including 598 deaths, 81 missing and 444 injured. 920 cases
of geological disasters were successively avoided with the safe transfer of over 37,900
people and the saving of 554 million yuan economic losses. The number of casualty
and property damage caused by such disasters were both less than that of the previous
year.
� Marine Disasters
A total of 163 marine disasters such as storm surge, sea wave, sea ice, red tide and
tsunami occurred in 2007 with direct economic loss at 8.837 billion yuan and 161
deaths (including missing). In specific, 30 were storm surge, leading to 18 deaths
(including missing) and 8.715 billion yuan of direct economic loss; 50 were sea wave,
leading to 143 deaths (including missing) and 116 million yuan of direct economic
loss; and 82 were red tides resulting in 6 million yuan of direct economic loss.
Measures and Actions
【【【【Early warning and forecasting of meteorological disasters】】】】 Various types of
forecasting such as rainfall, waterlogging and geological disasters were timely
forecasted during the flood season, and work on traffic meteorological forecasting and
the forecasting on high temperature prone to causing heat stroke were strengthened
while taking consideration of the impact of meteorological disaster on transportation.
The meteorological services covers such fields as agriculture, fishery, forestry, water

78
conservancy, civil affairs, land resources, transportation, tourism, aviation, radio, film
and television, telecommunication, urban construction, electric power, tobacco,
building, ocean and sports. In addition, technical training was organized to relevant
personnel of 18 areas subject to relatively severe geological disasters.
【【【【Earthquake disaster prevention and emergency rescue】】】】 In 2007, over 970
seismic stations and more than 610 earthquake precursory observatory stations were
established, the work on the detection of active fault of 20 key cities for monitoring
and prevention and for the earthquake zoning of 22 cities were completed. A total of
12 cities (districts) under earthquake monitoring program carried out the
demonstration work on the prevention and alleviation of earthquake disaster. Around
2 million rural residents moved into new aseismatic houses. 68 large and
medium-sized cities of 20 provinces (autonomous regions or municipalities) had set
up over 400 earthquake emergency shelters. National earthquake emergency response
and rescue team and 26 similar teams at provincial level were established with a total
of over 3,000 professionals. The total amount of earthquake emergency response and
rescue team at city or county level and the community rescue team of volunteers was
more than 100,000 people. They had played a crucial role in offering 7 batches in 5
times of international humanitarian emergency relief aid, various domestic disaster
relief efforts and relevant emergency and rescue activities.
Note: National data other than administrative zoning, national land area and
earthquake disasters in the current report does not include that of Taiwan Province,
Hong Kong Special Administrative Region and Macao Special Administrative
Region.

79
Departments Participating in the Compilation
of the 2007 Report
Leading Department
The Ministry of Environmental Protection
Contributing Ministries and Administrations
National Development and Reform Commission
The Ministry of land and Resources
The Ministry of Housing and Urban-Rural Development
The Ministry of Water Resources
The Ministry of Agriculture
The Ministry of Health
National Bureau of Statistics
State Forestry Administration
China Meteorological Administration
China Seismological Bureau
State Oceanic Administration