Embed Size (px)
Citation preview

REPORT ON THE IMPLEMENTATION OF THE P.A. 295
RENEWABLE ENERGY STANDARD AND THE COST-EFFECTIVENESS
OF THE ENERGY STANDARDS
John D. Quackenbush, Chairman Greg R. White, Commissioner
Sally A. Talberg, Commissioner
MICHIGAN PUBLIC SERVICE COMMISSION Department of Licensing and Regulatory Affairs
In compliance with Public Act 295 of 2008
February 14, 2014

i
Table of Contents
Page
Introduction .................................................................................................................................... 1
Report Criteria ......................................................................................................................... 1
Renewable Energy Plans and Commission Approval ............................................................. 2
Renewable Energy Cost Reconciliation Cases and Commission Approval ............................ 4
Summary of Renewable Energy Data Collected ........................................................................... 5
Renewable Energy Credit Requirements – 2012 Compliance ................................................. 5
Status of Renewable Energy .......................................................................................................... 8
Michigan Renewable Energy Certification System (MIRECS) .............................................12
Competition in Areas Served by Multiple Providers .....................................................................14
Cost-Effectiveness of Power Purchase Agreements and Owned Generation ................................16
Impact of the Renewable Energy Standard on Employment .........................................................20
Impact of Percentage Limits on the Use of Advanced Cleaner Energy Credits ............................24
The Cost of Renewable Energy Compared to the Cost of New Coal Energy ...............................25
Cost-Effectiveness of Renewable Energy and Energy Optimization Standards ...........................30
Effect of the Renewable Energy and Energy Optimization Standard on Electricity Prices ..........33
Recommendations ..........................................................................................................................34
Appendices
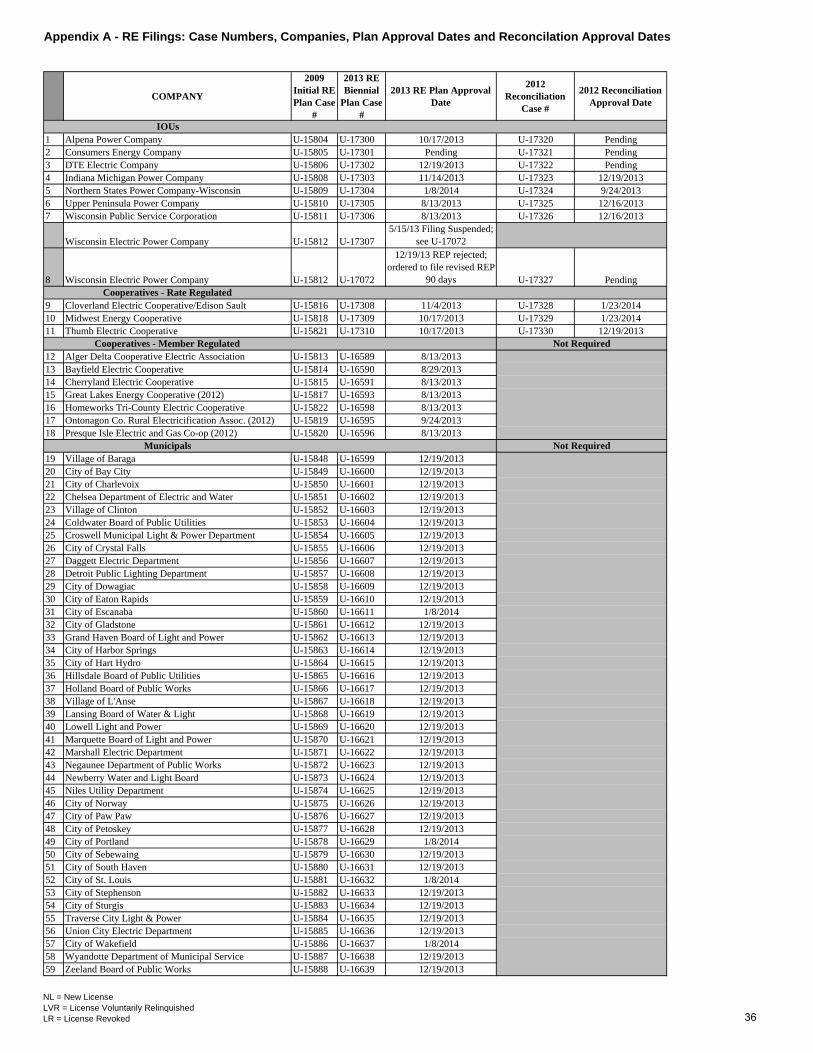
A: Renewable Energy Filings: Case Numbers, Companies, Plan Approval Dates and
Reconciliation Approval Dates ...............................................................................................36
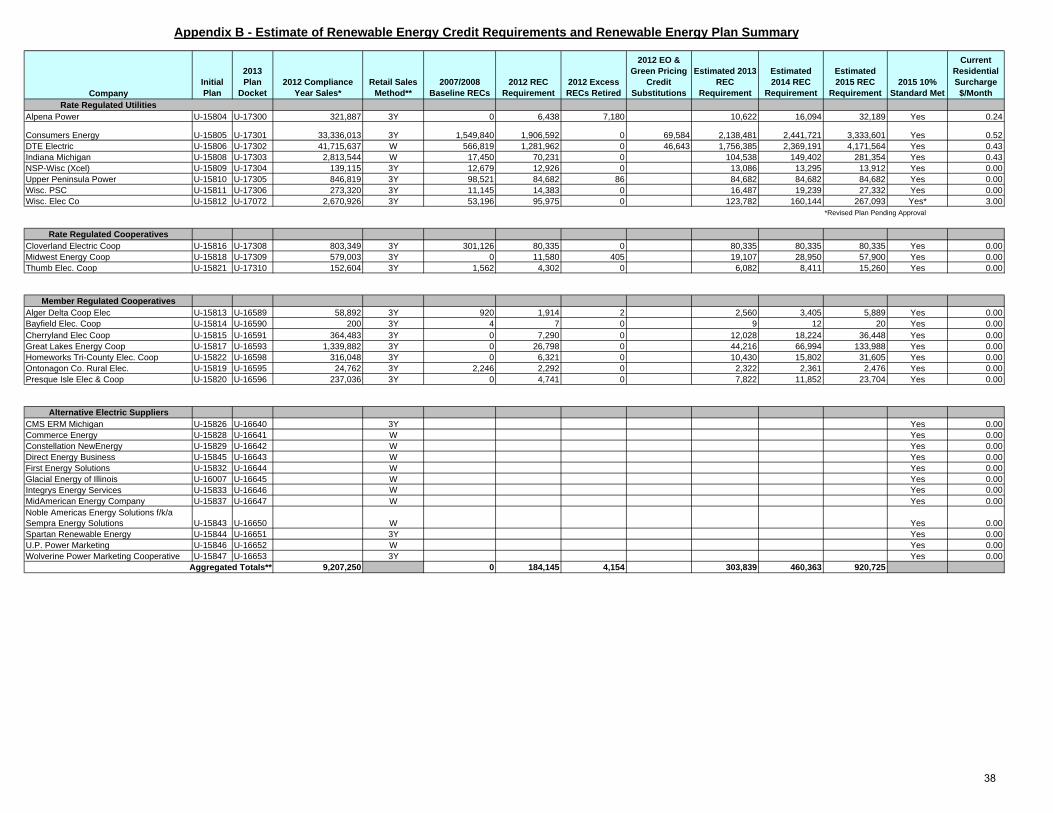
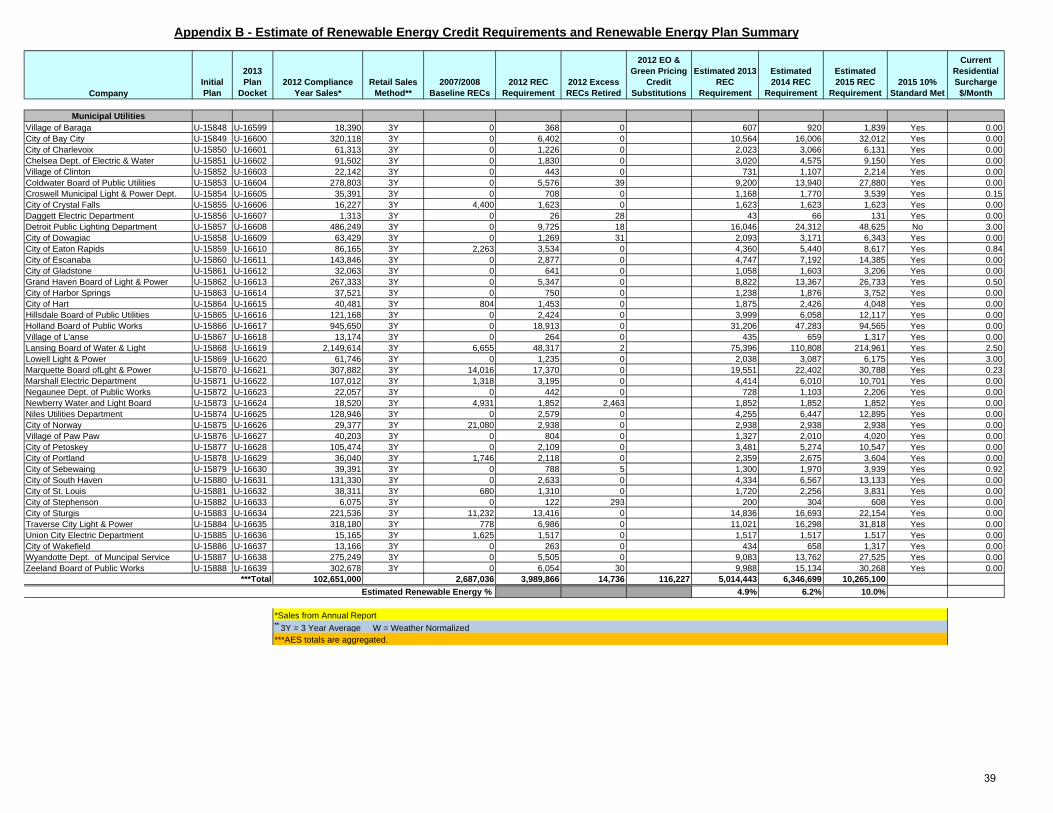
B: Estimate of Renewable Energy Credit Requirements and Renewable Energy Plan
Summary ..................................................................................................................................38
C: Electric Provider Renewable Energy Annual Report Data Summary .....................................40
D: Michigan’s Solar Programs......................................................................................................41
E: MIRECS Energy Credit Summary ...........................................................................................44
F: Contract Summary ...................................................................................................................47
G: Requests for Proposals Summary - DTE Electric and Consumers Energy .............................50
H: PA 295 Contract Renewable Energy Projects .........................................................................52
I: Michigan Utility Scale Wind Farms .........................................................................................54
1
Introduction
Report Criteria
In October 2008, Public Act 295 of 2008 (PA 295 or the Act) was enacted. Section 51(5)
(MCL 460.1051(5)) requires that by February 15, 2011, and each year thereafter, the Michigan Public
Service Commission (MPSC or Commission) submit to the standing committees of the Senate and
House of Representatives with primary responsibility for energy and environmental issues a report that
does all of the following:
a) Summarizes data collected under this section.
b) Discusses the status of renewable energy and advanced cleaner energy in this state and the
effect of Subparts A and B on electricity prices.1
c) For each of the different types of renewable energy sold at retail in this state, specifies the
difference between the cost of the renewable energy and the cost of electricity generated from
new conventional coal-fired electric generating facilities.
d) Discusses how the Commission is ensuring that actions taken under this Act by electric
providers serving customers in the same distribution territory do not create an unfair
competitive advantage for any of those electric providers.
e) Evaluates whether Subpart A has been cost-effective.
f) Provides a comparison of the cost effectiveness of the methods of an electric utility with one
million or more retail customers in this state as of January 1, 2008, obtaining renewable energy
credits from renewable energy systems owned by the electric provider and from contracts that
do not require the transfer of ownership of the renewable energy system.
g) Describes the impact of Subpart A on employment in this state. The Commission shall consult
with other appropriate agencies of the department of labor and economic growth in the
development of this information.2
h) Describes the effect of the 10 percent limit on using energy optimization credits or advanced
cleaner energy credits to meet the renewable energy credit standards.
1 Subpart A (MCL 460.1021-1053) deals with renewable energy standards. Subpart B (MCL 460.1071-1097) deals with
energy optimization standards. 2 A State government reorganization took place in 2011 which moved employment-related agencies outside the newly-
formed Department of Licensing and Regulatory Affairs (LARA). Consultation with the appropriate agencies is
continuing.
2
i) Makes any recommendations the Commission may have concerning amendments to Subpart A,
including changes in the 10 percent limits described in (h) or changes in the definition of
renewable energy resource or renewable energy system to reflect environmentally preferable
technology.
Additionally, Section 97 of the Act (MCL 460.1097) requires the following:
(6) By February 15, 2011 and each year thereafter and by September 30, 2015, the Commission
shall submit to the standing committees described above a report that evaluates and determines
whether Subpart B and Subpart A have each been cost-effective and makes recommendations
to the legislature. The report shall be combined with any concurrent report by the Commission
under section 51.
This fourth annual report provides information on Commission renewable energy activities
related to the Act through calendar year 2013 and summarizes data from the electric provider annual
reports through the 2012 calendar year.3 This report also includes a new section presenting 2012
renewable energy credit compliance data for the first interim step compliance year.
Renewable Energy Plans and Commission Approval
Subpart A of the Act requires electric providers to meet a 10 percent renewable energy standard
based on retail sales by the end of 2015. The Act includes interim compliance steps for 2012 – 2014.
For 2016 and each year thereafter, the Act requires electric providers to maintain the same amount of
renewable energy credits (RECs) needed to meet the standard in 2015.
The renewable energy standard is applicable to Michigan’s investor-owned electric utilities,
cooperative electric utilities, municipal electric utilities and alternative electric suppliers (AESs). The
Act directed electric providers to file initial renewable energy plans (REPs) in 2009.4 The 74 initial
REPs described how each electric provider intended to meet the renewable energy standard
requirements. The Act also directs electric providers to file REPs biennially for Commission review.
3 See: the Commission’s February 15, 2013 report:
http://www.michigan.gov/documents/mpsc/implementation_of_PA295_renewable_energy_411615_7.pdf?20140102105631 4 There are currently a total of 86 electric providers. Of those 86, 15 are AESs not serving customers and therefore are not
required to file annual reports or register in MIRECS, the REC tracking system. Seventy-one electric providers are
required to meet the REC standard in the Act.
3
A listing of case numbers, electric provider names, and approval dates for this reporting period can be
found in Appendix A. Commission Staff created a web page with links to each electric provider’s
renewable energy plan case docket.
The Act allows providers to recover the incremental costs of compliance with the renewable
energy standard requirements through a renewable energy surcharge on customer bills. Commission
approval is only required for rate-regulated electric providers. Section 45 of the Act limits the retail
rate impact (surcharge amount) of the renewable energy standard to the following:
(a) $3.00 per month per residential customer meter.
(b) $16.58 per month per commercial secondary customer meter.
(c) $187.50 per month per commercial primary or industrial customer meter.
Through 2013, there are five rate-regulated providers collecting renewable energy surcharges
on customer bills. Additionally, there are eight non-rate-regulated electric providers with revenue
recovery mechanisms. Consumers Energy Company (Consumers Energy) has a case pending to
reduce its renewable energy surcharge to zero, and DTE Electric Company’s (DTE Electric) renewable
energy plan filing, approved on December 19, 2013, includes a residential surcharge reduction from
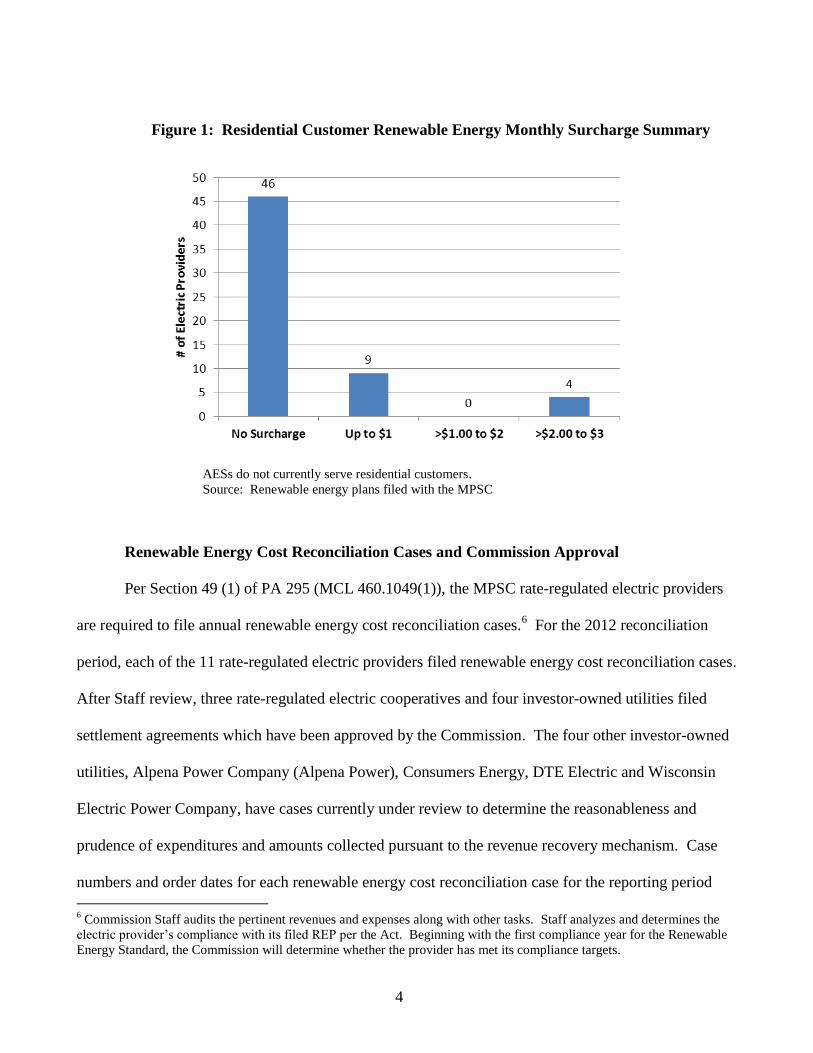
$3.00 per meter per month to $0.43 per meter per month effective January 2014. Forty-six providers
do not collect surcharges. Figure 1 summarizes the residential surcharges for all Michigan electric
providers. Details about the surcharges can be found in Appendix B.
Based upon a review of REPs filed with the Commission, all providers are expected to be able
to meet the 10 percent renewable energy standard in 2015, with the exception of Detroit Public
Lighting Department.5
5 Wisconsin Electric Power Company’s initial REP did not show the Company achieving the full 10 percent standard. The
Company’s most recently filed REP filed on September 5, 2012 in Case No. U-17072, although rejected by the
Commission, shows that the Company will reach the full 10 percent requirement. The Commission has suspended all of
Detroit Public Lighting renewable energy filings during the city’s bankruptcy process.
4
Figure 1: Residential Customer Renewable Energy Monthly Surcharge Summary
Renewable Energy Cost Reconciliation Cases and Commission Approval
Per Section 49 (1) of PA 295 (MCL 460.1049(1)), the MPSC rate-regulated electric providers
are required to file annual renewable energy cost reconciliation cases.6 For the 2012 reconciliation
period, each of the 11 rate-regulated electric providers filed renewable energy cost reconciliation cases.
After Staff review, three rate-regulated electric cooperatives and four investor-owned utilities filed
settlement agreements which have been approved by the Commission. The four other investor-owned
utilities, Alpena Power Company (Alpena Power), Consumers Energy, DTE Electric and Wisconsin
Electric Power Company, have cases currently under review to determine the reasonableness and
prudence of expenditures and amounts collected pursuant to the revenue recovery mechanism. Case
numbers and order dates for each renewable energy cost reconciliation case for the reporting period
6 Commission Staff audits the pertinent revenues and expenses along with other tasks. Staff analyzes and determines the
electric provider’s compliance with its filed REP per the Act. Beginning with the first compliance year for the Renewable
Energy Standard, the Commission will determine whether the provider has met its compliance targets.
AESs do not currently serve residential customers.
Source: Renewable energy plans filed with the MPSC

5
can be found in Appendix A. Commission Staff created a web page with links to each electric
provider’s reconciliation case docket.
Summary of Renewable Energy Data Collected
Electric providers are directed by Section 51(1) of PA 295 (MCL 460.1051(1)) to file annual
reports for each plan year beginning with 2009. Michigan electric provider annual reports for 2009
through 2012 are available on the Commission’s website.7 Commission Staff worked with electric
providers to develop an annual report template based on Section 51 of the Act. A summary of data
from annual reports is shown in Appendix C.
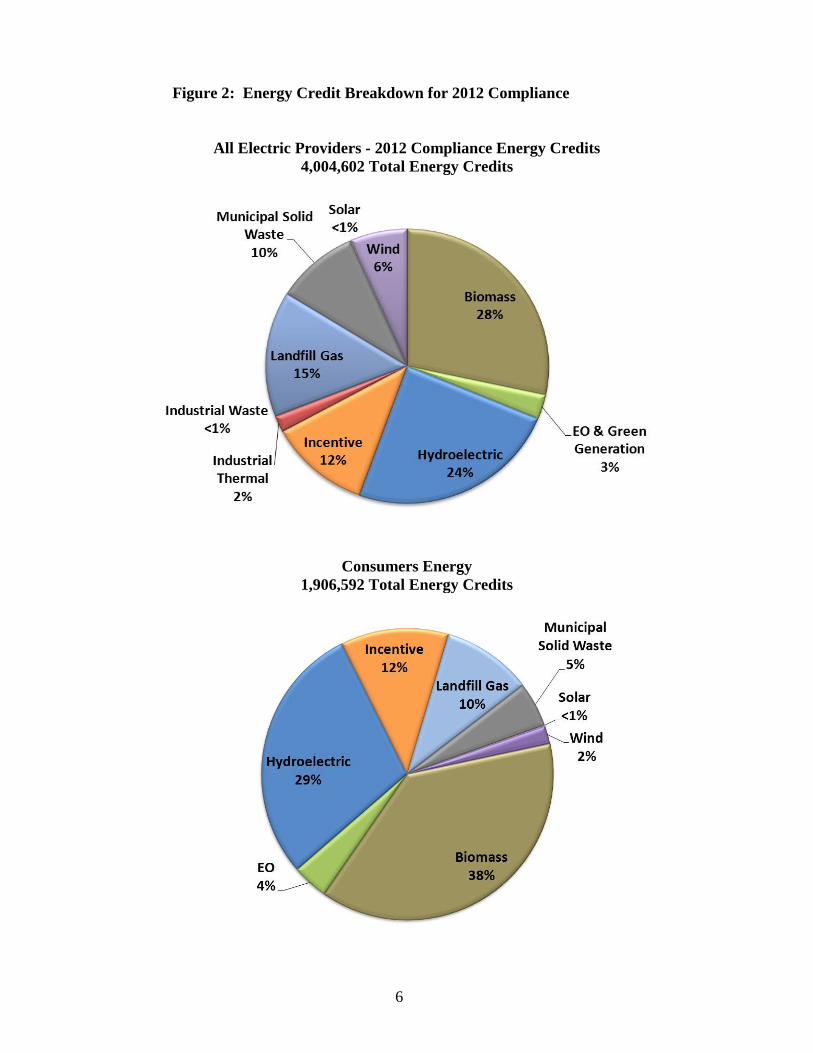
Renewable Energy Credit Requirements – 2012 Compliance
In 2012, electric providers were required to meet the first interim compliance step on the path
to the full 10 percent standard. The number of renewable energy credits required for 2012 compliance
varies by electric provider and is calculated by “closing the gap” between the full 10 percent
compliance level and each electric provider’s pre-Act 295 baseline renewable energy credits by 20
percent.8 All of Michigan’s 71 electric providers (alternative electric suppliers not serving customers
are not included in this total) met the 2012 requirements and retired9 a total of 4,004,602 energy
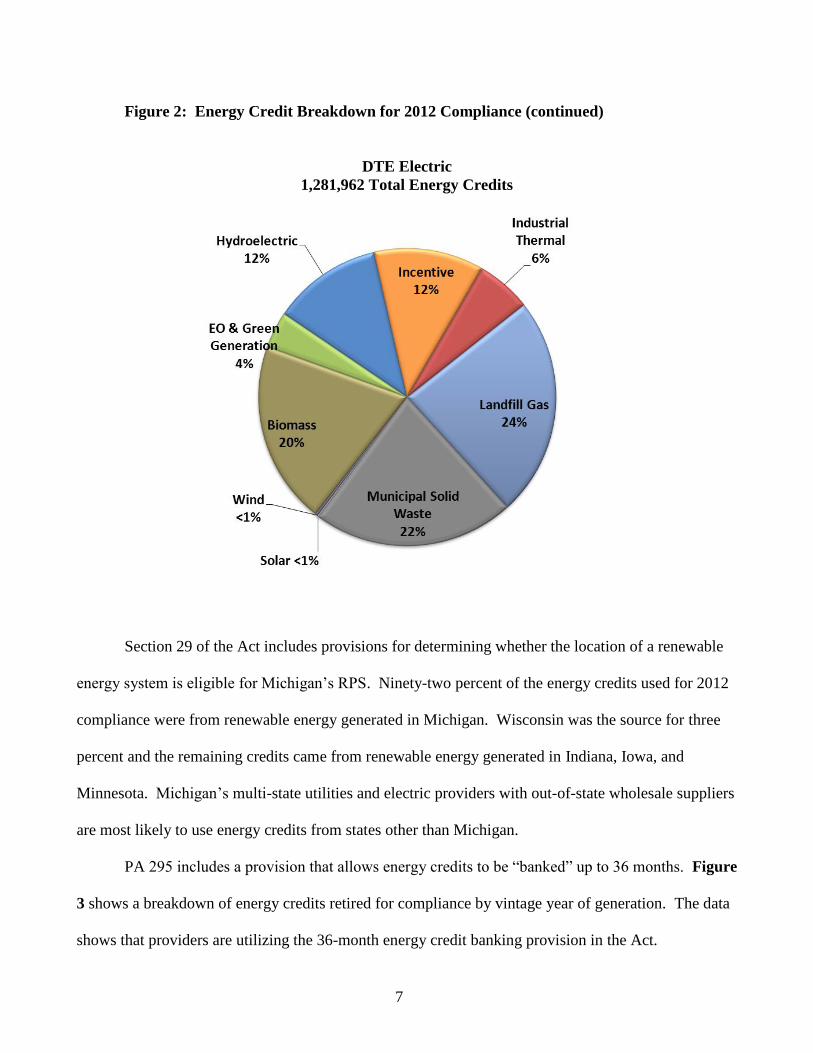
credits. Figure 2 shows the different renewable energy technology types used to generate the credits
used for compliance for all electric providers and separately for both Consumers Energy and DTE
Electric.
7See: http://www.michigan.gov/mpsc/0,1607,7-159-16393_53570-240179--,00.html.
8 The number of baseline renewable energy credits is the sum of the number of renewable energy credits that would have
been transferred to the electric provider plus the number of credits that would have been generated by the electric provider
during the year preceding the effective date of the Act. 9 Energy credits are “retired” when used for compliance.
6
Figure 2: Energy Credit Breakdown for 2012 Compliance
All Electric Providers - 2012 Compliance Energy Credits
4,004,602 Total Energy Credits
Consumers Energy
1,906,592 Total Energy Credits
7
Figure 2: Energy Credit Breakdown for 2012 Compliance (continued)
DTE Electric
1,281,962 Total Energy Credits
Section 29 of the Act includes provisions for determining whether the location of a renewable
energy system is eligible for Michigan’s RPS. Ninety-two percent of the energy credits used for 2012
compliance were from renewable energy generated in Michigan. Wisconsin was the source for three
percent and the remaining credits came from renewable energy generated in Indiana, Iowa, and
Minnesota. Michigan’s multi-state utilities and electric providers with out-of-state wholesale suppliers
are most likely to use energy credits from states other than Michigan.
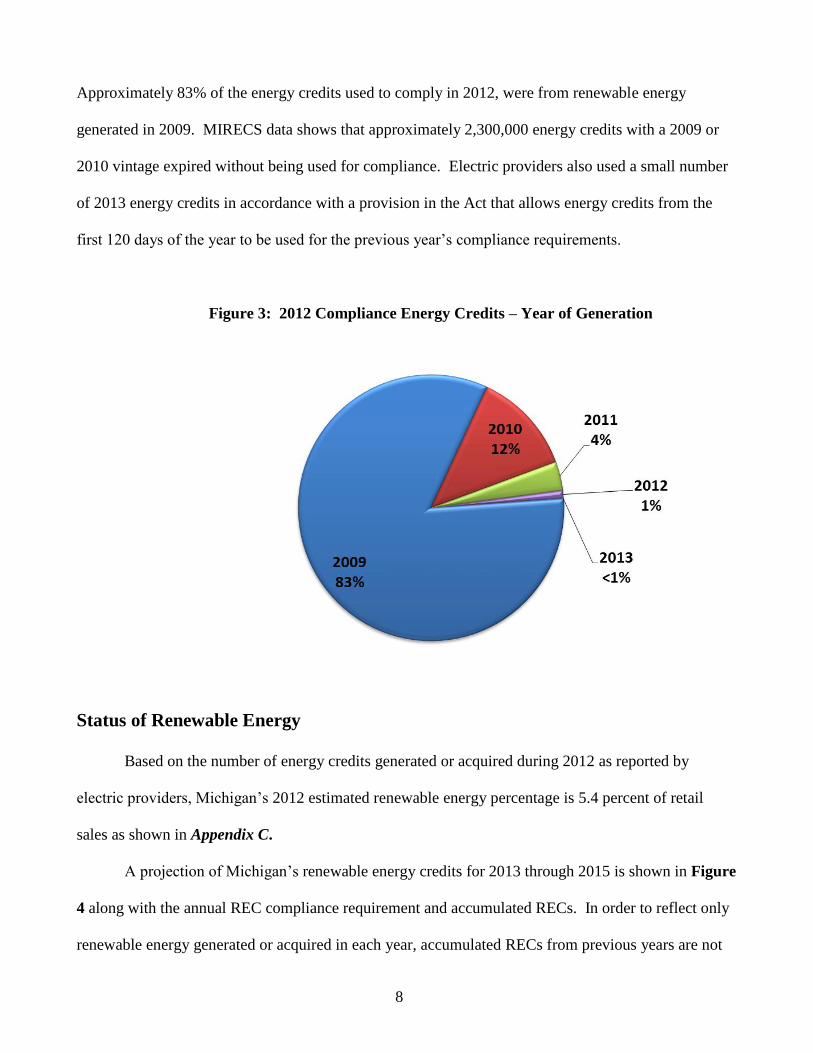
PA 295 includes a provision that allows energy credits to be “banked” up to 36 months. Figure
3 shows a breakdown of energy credits retired for compliance by vintage year of generation. The data
shows that providers are utilizing the 36-month energy credit banking provision in the Act.
8
Approximately 83% of the energy credits used to comply in 2012, were from renewable energy
generated in 2009. MIRECS data shows that approximately 2,300,000 energy credits with a 2009 or
2010 vintage expired without being used for compliance. Electric providers also used a small number
of 2013 energy credits in accordance with a provision in the Act that allows energy credits from the
first 120 days of the year to be used for the previous year’s compliance requirements.
Figure 3: 2012 Compliance Energy Credits – Year of Generation
Status of Renewable Energy
Based on the number of energy credits generated or acquired during 2012 as reported by
electric providers, Michigan’s 2012 estimated renewable energy percentage is 5.4 percent of retail
sales as shown in Appendix C.
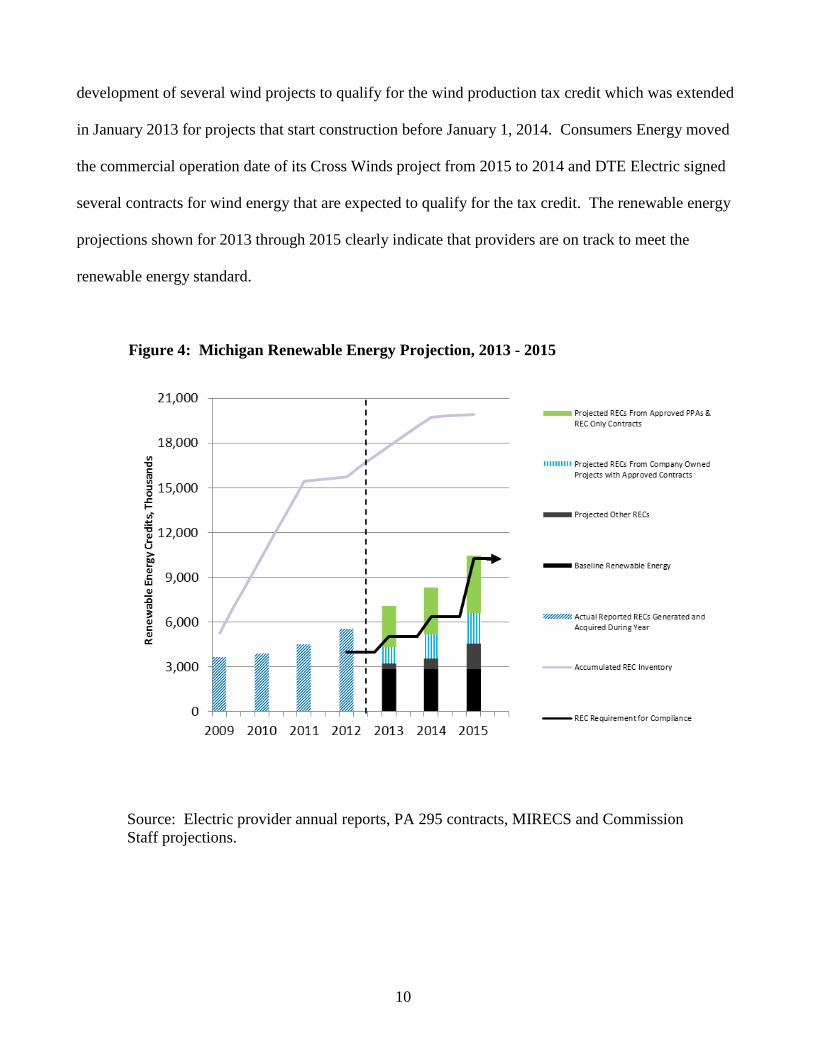
A projection of Michigan’s renewable energy credits for 2013 through 2015 is shown in Figure
4 along with the annual REC compliance requirement and accumulated RECs. In order to reflect only
renewable energy generated or acquired in each year, accumulated RECs from previous years are not

9
included in the yearly renewable energy totals but are shown separately in the line called accumulated
REC inventory. The projected renewable energy includes: i) baseline renewable energy (renewable
energy that was operational prior to the passage of PA 295); ii) a projection of other RECs from non-
rate regulated providers and contracts that do not require Commission approval under PA 295; iii) an
estimate of RECs from PA 295 approved contracts for company-owned renewable energy projects; and
iv) power purchase agreements and REC-only contracts.
There are several changes from the data presented last year. Last year’s forecast of
accumulated REC inventory showed a peak of approximately 16 million credits in 2014 and a decrease
in 2015. The updated projection peaks at about 19.5 million energy credits in 2014 and stays about the
same in 2015. In previous reports, the accumulated REC inventory projection was calculated using
data reported by electric providers which may have undercounted RECs that were held in inventory by
wholesale providers or renewable energy generators. Additionally, the accumulated REC inventory for
2012 must reflect energy credits that were retired for 2012 compliance, voluntary retirements and 2009
energy credits that expired, due to the 36-month banking provision, without being used.
Based on these factors, a new methodology was used for the 2012 accumulated REC inventory
using data in the Michigan Renewable Energy Certification System (MIRECS). The new methodology
takes all RECs in MIRECS into account while the method used in previous years was based on the
number of RECs held in inventory and reported by electric providers. Accumulated REC totals for
2009 through 2011 were updated to reflect all 2009 – 2011 RECs in MIRECS.
Additionally, last year’s report projected renewable energy generation in 2015 at about 9
percent of total retail sales and showed that energy credits from accumulated REC inventory would be
needed to reach the 10 percent requirement. Figure 4 incorporates Michigan’s current renewable
energy status and projects that renewable energy generation will reach 10% of total retail sales in
2015. The increase in expected renewable energy generation in 2015 is largely due to the accelerated
10
development of several wind projects to qualify for the wind production tax credit which was extended
in January 2013 for projects that start construction before January 1, 2014. Consumers Energy moved
the commercial operation date of its Cross Winds project from 2015 to 2014 and DTE Electric signed
several contracts for wind energy that are expected to qualify for the tax credit. The renewable energy
projections shown for 2013 through 2015 clearly indicate that providers are on track to meet the
renewable energy standard.
Figure 4: Michigan Renewable Energy Projection, 2013 - 2015
Source: Electric provider annual reports, PA 295 contracts, MIRECS and Commission
Staff projections.
11
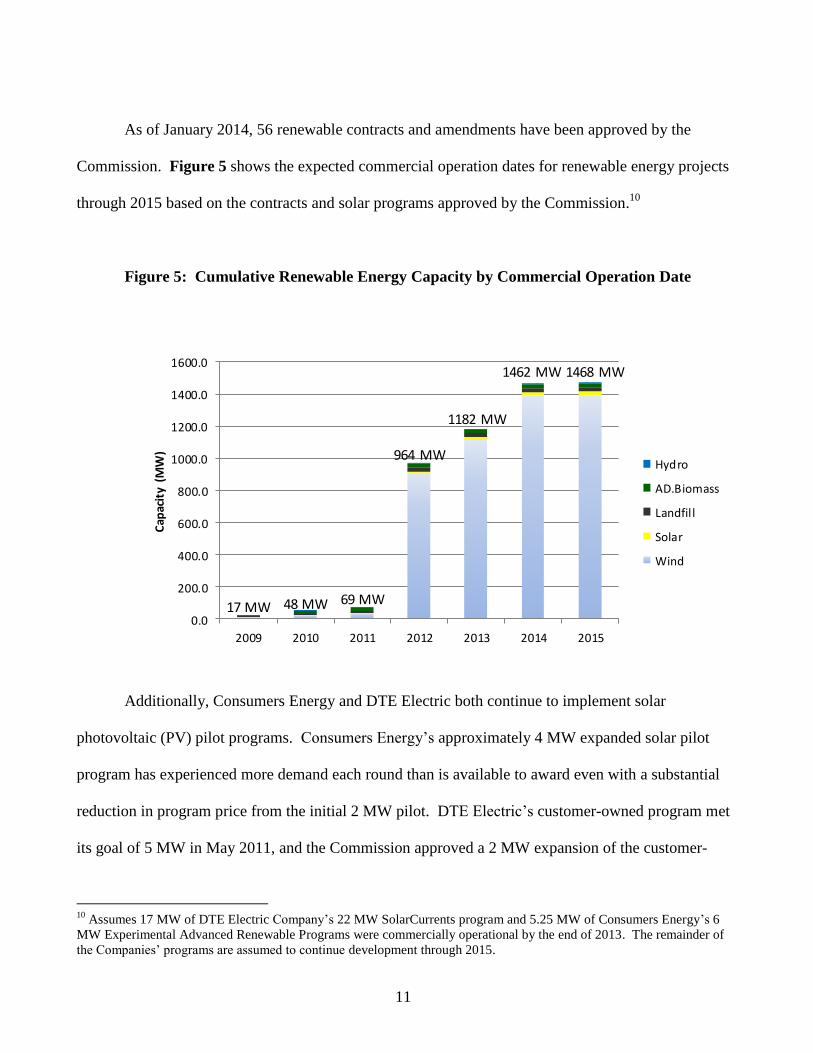
As of January 2014, 56 renewable contracts and amendments have been approved by the
Commission. Figure 5 shows the expected commercial operation dates for renewable energy projects
through 2015 based on the contracts and solar programs approved by the Commission.10
Figure 5: Cumulative Renewable Energy Capacity by Commercial Operation Date
17 MW 48 MW 69 MW
964 MW
1182 MW
1462 MW 1468 MW
0.0
200.0
400.0
600.0
800.0
1000.0
1200.0
1400.0
1600.0
2009 2010 2011 2012 2013 2014 2015
Cap
acit
y (M
W)
Hydro
AD.Biomass
Landfil l
Solar
Wind
Additionally, Consumers Energy and DTE Electric both continue to implement solar
photovoltaic (PV) pilot programs. Consumers Energy’s approximately 4 MW expanded solar pilot
program has experienced more demand each round than is available to award even with a substantial
reduction in program price from the initial 2 MW pilot. DTE Electric’s customer-owned program met
its goal of 5 MW in May 2011, and the Commission approved a 2 MW expansion of the customer-
10
Assumes 17 MW of DTE Electric Company’s 22 MW SolarCurrents program and 5.25 MW of Consumers Energy’s 6
MW Experimental Advanced Renewable Programs were commercially operational by the end of 2013. The remainder of
the Companies’ programs are assumed to continue development through 2015.
Source: Renewable energy credits generated or acquired during each year as reported in electric
provider renewable energy annual reports, PA 295 contracts, MIRECS and Commission Staff.
projections.

12
owned SolarCurrents program in November 2012. Additionally, DTE Electric is continuing
development under its 15 MW Company-owned SolarCurrents program. These PV pilots are
discussed in more detail in Appendix D.
Electric providers have secured nearly all of the renewable energy necessary for compliance
with the Act.11
Looking forward, electric providers, with the exception of one, are on pace to hit the
interim targets as well as the 10 percent by 2015 renewable energy standard.
Michigan Renewable Energy Certification System (MIRECS)
Compliance with the renewable energy standard is demonstrated through the use of RECs. One
REC is created for each megawatt-hour (MWh) of renewable energy generated. Additionally, the Act
provides for Michigan incentive renewable energy credits (IRECs) and the substitution of energy
optimization credits (EOCs)12
and advanced cleaner energy credits (ACECs) for RECs. RECs may be
sold separately from energy as shown in Figure 6.
Figure 6: Renewable Energy Credits
Section 41 of PA 295 (MCL 460.1041) directed the Commission to “establish a renewable
energy credit certification and tracking program.” On August 11, 2009, the Commission approved the
11
Nearly all AESs are purchasing unbundled renewable energy credits to meet the renewable energy credit portfolio
requirements. The terms and conditions of these purchases are unknown. 12
At this time, energy optimization credits are not transferable from one electric provider to another, meaning that they
cannot be sold or otherwise traded.
13
contract between the Department of Energy, Labor and Economic Growth (now Licensing and
Regulatory Affairs or LARA) and APX, Inc., that designates APX, Inc. as the State of Michigan
Administrator of the renewable energy credit and tracking program. MIRECS was launched on
October 30, 2009.13
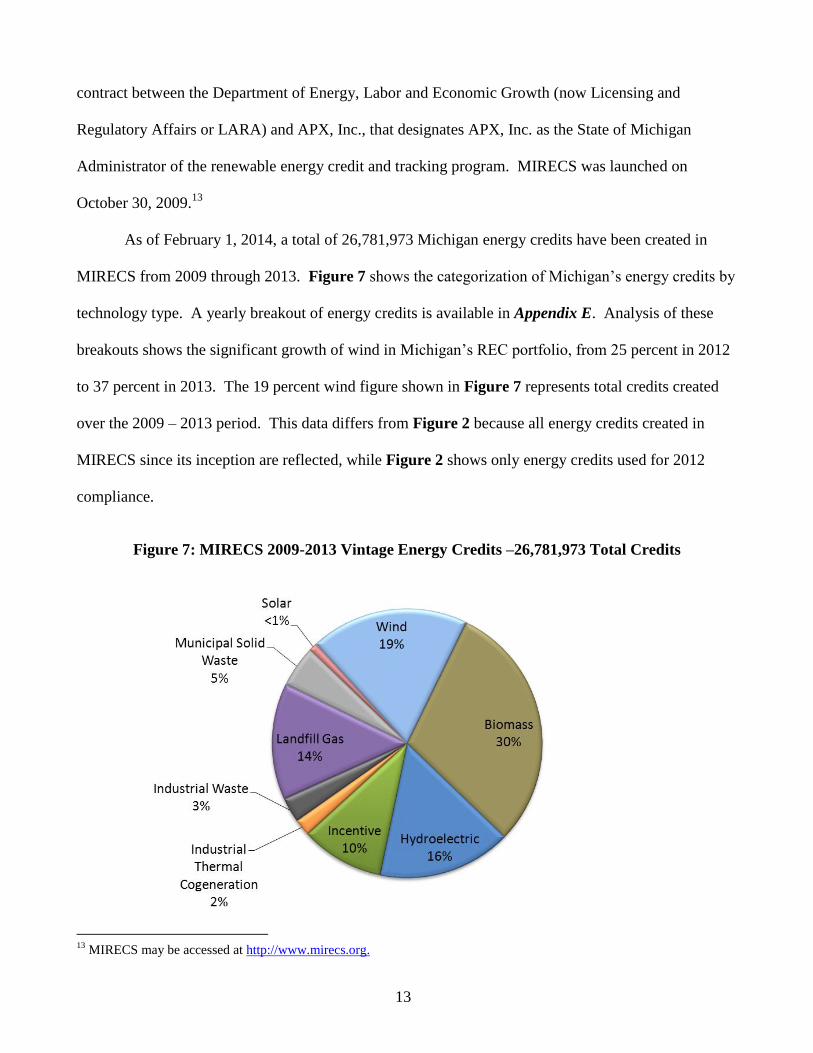
As of February 1, 2014, a total of 26,781,973 Michigan energy credits have been created in
MIRECS from 2009 through 2013. Figure 7 shows the categorization of Michigan’s energy credits by
technology type. A yearly breakout of energy credits is available in Appendix E. Analysis of these
breakouts shows the significant growth of wind in Michigan’s REC portfolio, from 25 percent in 2012
to 37 percent in 2013. The 19 percent wind figure shown in Figure 7 represents total credits created
over the 2009 – 2013 period. This data differs from Figure 2 because all energy credits created in
MIRECS since its inception are reflected, while Figure 2 shows only energy credits used for 2012
compliance.
Figure 7: MIRECS 2009-2013 Vintage Energy Credits –26,781,973 Total Credits
13
MIRECS may be accessed at http://www.mirecs.org.
14
The number of generating units within MIRECS continues to grow. As of February 1, 2014,
there were 216 registered projects (generators) in MIRECS. MIRECS has 135 account holders which
include electric service providers, generator owners and others.
MIRECS is able to fully integrate with other tracking systems such as the Midwest Renewable
Energy Tracking System (M-RETS) and North American Renewables Registry (NAR). This
integration allows both businesses and individual citizens to sell their product to a wider market.
Generators registered with other tracking systems have, as of February 1, 2014, registered 56 projects
for the purpose of importing RECs into MIRECS. Commission Staff assists electric providers with the
compliance process and will continue to hold training/information meetings.
Competition in Areas Served by Multiple Providers
Consumers Energy and DTE Electric have made substantial progress toward complying with
the renewable energy standard. Consumers Energy has filed renewable energy contracts with the
Commission totaling 501.8 MW, and DTE Electric totaling 889.4 MW, as shown in Appendix F. In
addition to meeting the requirement in PA 295 for RECs that is applicable to all electric providers,
both Consumers Energy and DTE Electric have renewable capacity requirements pursuant to Section
27 of PA 295 (MCL 460.1027). By the end of 2013, Consumers Energy was required to obtain 200
MW of nameplate capacity that was not in commercial operation before the effective date of the Act.
Similarly, DTE Electric’s capacity portfolio requirement for 2013 was 300 MW. By the end of 2015,
Consumers Energy’s and DTE Electric’s total capacity portfolio requirement increases to 500 MW and
600 MW, respectively. At the end of 2013, both companies had obtained Commission approval of
PPA and company-owned renewable energy projects that provide the necessary capacity to exceed the
2015 legislative capacity requirements. Planned new cumulative capacity and capacity portfolio
requirements are shown for each company in Figure 8.

15
Figure 8: Planned New Cumulative capacity through 2015 for Consumers Energy and
DTE Electric14
AESs are required to meet the energy credit requirement contained in the Act. Almost all
AESs have indicated through REPs and 2012 annual reports that they will purchase RECs instead of
building and owning renewable energy projects or signing long term renewable energy purchase
agreements to meet the renewable energy standard requirement. Customer choice participation levels
for DTE Electric and Consumers Energy are at the maximum amount allowed by law and both electric
providers currently have customers waiting to switch providers. Through building or contracting to
purchase energy, capacity and RECs from new renewable energy projects, the two largest utilities in
Michigan have driven the expansion of renewable energy and have incurred most of the associated
14
Data shows planned capacity through 2015 only. Both companies expect to build or acquire additional capacity after
2015. Consumers Energy source data is from biennial REP Case No. U-17301. DTE Electric source data is from biennial
REP Case No. U-17302.

16
costs while the AESs reported intentions of compliance by purchasing RECs instead of building new
capacity.
Cost-Effectiveness of Power Purchase Agreements and Owned Generation
Section 33 of PA 295 (MCL 460.1033) includes a provision for electric providers who serve
more than 1,000,000 electric customers in this state as of January 1, 2008 with regard to competitive
bidding and unsolicited contracts. Consumers Energy and DTE Electric fall under this provision.
Pursuant to Section 33, the companies are required to obtain RECs necessary to meet the REC
standard in 2015 by one or more of the following methods:
(i) Renewable energy systems that were developed by and are owned by the electric
provider. An electric provider shall competitively bid any contracts for engineering,
procurement, or construction of any new renewable energy systems…
(ii) Renewable energy systems that were developed by 1 or more third parties pursuant
to a contract with the electric provider under which the ownership of the renewable
energy system may be transferred to the electric provider, but only after the renewable
energy system begins commercial operation. Any such contract shall be executed after
a competitive bidding process conducted pursuant to guidelines issued by the
commission.
Additionally:
(b) At least 50 percent of the renewable energy credits shall be from renewable energy
contracts that do not require transfer of ownership of the applicable renewable energy
system to the electric provider or from contracts for the purchase of RECs without the
associated renewable energy. A renewable energy contract or contract for the purchase
of RECs under this subdivision shall be executed after a competitive bidding process
conducted pursuant to guidelines issued by the commission. However, an electric
provider may consider unsolicited proposals presented to it outside of a competitive bid
process by a renewable energy system developer that is not affiliated with the electric
provider. If the provider determines that such an unsolicited proposal provides
opportunities that may not otherwise be available or commercially practical, the
provider may enter into a contract with the developer.
The companies have conducted 22 requests for proposals (RFPs) in total. Consumers Energy
has conducted eight RFPs and three requests for qualifications. DTE Electric has conducted 14 RFPs,
two pre-qualification events, one solar solicitation of interest, a request for information, and an auction

17
for 2009 and 2010 vintage RECs. In response to the majority of the companies’ RFPs, Commission
Staff has reviewed competitive bidding activities through process audits. The purpose and design of
the audits were to ensure that the companies followed the processes and procedures outlined in the
Commission’s December 4, 2008 Temporary Order in MPSC Case No. U-15800, Attachment D15
and
pursuant to Section 33 of PA 295. Details about each company’s competitive bidding activities are
shown in Appendix G.
Pursuant to Section 37 of the Act (MCL 460.1037), renewable energy power purchase and
REC-only agreements entered into by any electric provider whose rates are regulated by the
Commission must be submitted to the Commission for determination of whether the terms are
reasonable and prudent. Appendix F lists all renewable energy contracts that have been approved by
the MPSC to date.
There has been significant renewable energy development as a result of PA 295. Appendix H
lists all of the renewable energy projects that have approved PA 295 contracts. The Appendix F and
Appendix H map key corresponds to the map in Figure 9. Wind energy has been the primary source
of new renewable energy in Michigan. At the end of 2013, there were over 1,100 MW of utility scale
wind projects in operation in Michigan as indicated in Appendix I.
15
See: http://efile.mpsc.state.mi.us/efile/docs/15800/0001.pdf.

18
Figure 9: Locations of Renewable Energy Projects
*Numbers shown on map correspond to the Map Key Column provided on Appendices F and H.
19
The MWh contract prices represented in Appendix F are levelized cost calculations and
reflect the prices over the contract term for all power purchase agreements or, in the case of a
company-owned project, the depreciable composite life.16
The levelized cost value is used to
compare multiple contracts with varying terms and conditions. Of the 56 contracts and
amendments from five electric providers approved by the Commission to date, all but four have
been from Consumers Energy or DTE Electric and 11 have been unsolicited. With the exception
of several early contracts for small renewable energy projects, the contract prices have been
much lower than expected and have continued to decline.
Pricing for wind farms has declined rapidly in Michigan which makes the timing of wind
farm development a major factor in the price. A comparison of the cost-effectiveness of the
renewable energy resource acquired through power purchase agreements using the methods
described in Section 33 of the Act (MCL 460.1033) to company-owned projects, shows that
company-owned projects have been almost equally cost effective when compared to similar
power purchase agreements. Consumers Energy filed two applications for approval of company-
owned wind farms totaling 206.2 MW. DTE Electric filed four applications for approval of
Company-owned wind farms totaling 322.8 MW and applications for 15 MW of company-
owned solar through its SolarCurrents program. Since no large scale solar installations have
been contracted through power purchase agreements, only the above-mentioned wind contracts
are compared for purposes of this section of the report.
Consumers Energy filed contracts to purchase wind turbines from Vestas Wind
Technology and utilize White Construction for the construction of its Lake Winds Energy Park
16
MPSC Staff performed audits of the companies’ levelized cost calculations starting in the early part of 2011.
Additionally, through RFP process audits, Staff reviewed actual costs of contracts obtained through most of the
companies’ competitive solicitations. Staff was provided an opportunity to review the actual costs of all contracts
listed in Appendix F.
20
wind farm. The combined levelized cost of these contracts is $110 per MWh.17
During 2013,
Consumers Energy filed contracts to purchase wind turbines from General Electric Company and
use Barton Malow Company for the construction of its second wind farm, Cross Winds Energy
Park. The combined levelized cost of the 105.4 MW Cross Winds contracts is $59.00 per MWh.
DTE Electric filed contracts to purchase the output of the 20 MW Big Turtle Wind Farm at $53
per MWh and the 74.8 MW Pheasant Run at up to $49.25 per MWh. DTE Electric filed build-
transfer contracts for the 74.8 MW Pheasant Run II project also at $49.25 per MWh. DTE
Electric filed contracts for a build-transfer arrangement with Gratiot County Wind that has an
expected levelized cost of approximately $91.43 per MWh.18
In addition, it filed contracts to
purchase wind turbines from General Electric and use Barton Malow for the construction of its
second and third wind farms, Thumb Wind and Echo Wind, respectively. The combined
levelized cost of the Thumb Wind contracts is approximately $62.50 per MWh and the combined
levelized cost of the Echo Wind contracts is approximately $52.50 per MWh. To compare these
costs, a weighted average of the levelized wind contract costs equal to $76.27 per MWh was
calculated based on 12 wind power purchase agreements from non-Company-owned contracts
filed by DTE Electric and Consumers Energy. This cost compares to the weighted average
levelized cost of Company-owned wind projects of $76.48 per MWh.
Impact of the Renewable Energy Standard on Employment
One purpose of PA 295 is to “provide improved air quality and other benefits to energy
consumers and citizens of this state.” An added benefit of the additional investment,
17
The contracts originally approved by the Commission stated a levelized cost of $95 per MWh. Based primarily
on the Company’s decision to substitute the Federal Cash Grant for the Production Tax Credit and the accounting
treatment of the Grant, the levelized cost increased to $110 per MWh as stated in the Company’s 2011 biennial REP
available at: http://efile.mpsc.state.mi.us/efile/docs/16581/0008.pdf. 18
Based on updated information provided by DTE Electric to Commission Staff, the levelized price was reduced
from $94.43 per MWh.
21
manufacturing, installation, administration and development of clean and renewable energy has
been the effect on jobs.
The clean and renewable energy sector continues to contribute to employment
opportunities in Michigan. In 2013, generating facilities were constructed utilizing Michigan
equipment and labor; contracts for utility scale projects, which will employ Michiganders, were
approved; and solar pilot programs that utilize Michigan labor for installations continued and
expanded. During 2013, the 100 MW Tuscola Bay Wind II project in Tuscola and Bay Counties
and the 74.8 MW Pheasant Run project in Huron County began commercial operation and four
wind farms with expected 2014 commercial operation dates totaling 312.2 MW were under
construction.
In September 2013, the Commission approved DTE Electric’s contract for the Big Turtle
Wind Farm in Huron County. This 20 MW wind farm will have at least 50% of the total cost of
the project including materials, components, logistics and labor sourced in Michigan. Ventower,
located in Monroe, will be providing the turbine towers. Big Turtle will be the first utility scale
wind farm in Michigan with 100% of its towers manufactured by Ventower in Michigan.
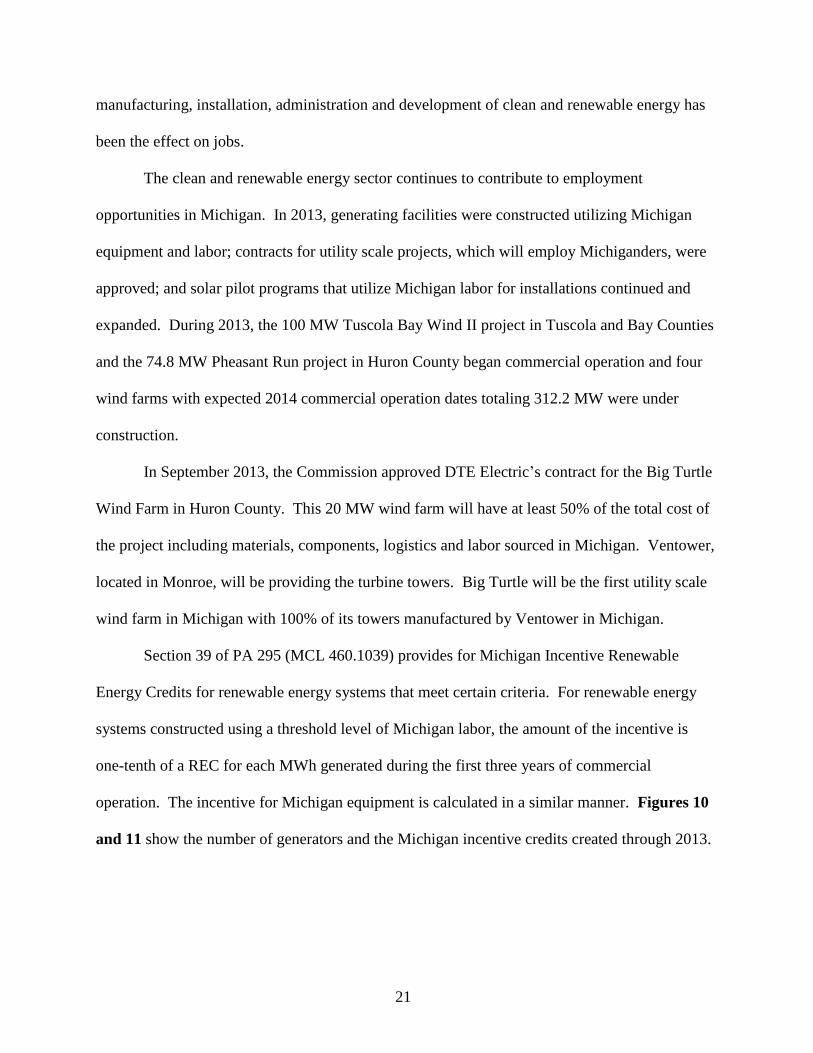
Section 39 of PA 295 (MCL 460.1039) provides for Michigan Incentive Renewable
Energy Credits for renewable energy systems that meet certain criteria. For renewable energy
systems constructed using a threshold level of Michigan labor, the amount of the incentive is
one-tenth of a REC for each MWh generated during the first three years of commercial
operation. The incentive for Michigan equipment is calculated in a similar manner. Figures 10
and 11 show the number of generators and the Michigan incentive credits created through 2013.
22
Figure 10: Michigan Equipment Incentive Credits
Figure 11: Michigan Labor Incentive Credits

23
Statewide, there has been significant investment in the renewable energy sector since the
passage of PA 295 in 2008. Conservatively, assuming an installed cost of $2,000 per kW19
for
new renewable energy projects, over $2.2 billion has been invested to bring 1,113 MW20
of new
renewable energy projects on-line through 2013 in Michigan. The $2.2 billion includes both
incremental cost of compliance and the portion of costs recovered as energy costs.
As noted in prior annual reports, the Michigan Green Jobs Report 200921
was optimistic
about the job creation potential of the renewable energy industry and pointed to the renewable
energy standard as a driver for growth in this field. The report found that “…Michigan boasts
109,067 total green jobs—both direct and support positions—among private sector employers.
There are 96,767 direct green jobs and 12,300 support green jobs. This is big news, but it also
shows the potential for growth of the green economy. Michigan’s overall private sector
employment is 3.2 million; green jobs are currently 3 percent of that total.” A 2010 Regional
Analysis complementing the 2009 Green Jobs Report found that the largest numbers of green
jobs were in Southeast Michigan.22
The Michigan Workforce Development Agency in partnership with the Office of Labor
Market Information and Strategic Initiatives issued an Energy Cluster Workforce Analysis in
January 2013 which tracked eight detailed industry sectors as a proxy for employment trends in
19
DTE Electric reported an installed cost of $2,225 to $2,438 per kW for its Echo Wind Park contract approval
application filed on August 10, 2012. 20
This number does not include 67.5 MW of wind generation attributable to contracts filed by Indiana Michigan
Power Company as these projects are outside of Michigan or 1.05 MW of hydro and anaerobic bio-digestion
projects that were commercially operational prior to PA 295. 21
See: http://www.michigan.gov/documents/nwlb/GJC_GreenReport_Print_277833_7.pdf 22
See http://milmi.org/admin/uploadedPublications/1747_Green_Jobs_Regional_Report_2010.pdf

24
the Renewable and Alternative Energy cluster. The analysis found the cluster grew from 6,775
jobs in 2005 to 8,200 jobs in 2013.23
Michigan is continuing to realize its position as a regional leader in the development and
manufacturing of renewable energy systems, building on the state’s engineering expertise,
modernized machining, and RPS compliance efforts. It appears that Michigan’s incentive REC
provision is meeting its intended purpose to encourage developers to maximize utilization of
Michigan equipment and labor. The Commission will continue to monitor data on the impact of
the renewable energy standard on employment in Michigan.
Impact of Percentage Limits on the Use of Advanced Cleaner Energy Credits
Advanced cleaner energy (ACE) is defined in PA 295 as any of the four following
facilities: 1) gasification, 2) industrial cogeneration, 3) coal-fired electric generating if at least 85
percent of the carbon dioxide emissions are captured and permanently geologically sequestered,
or 4) electric generating that uses technologies not in commercial operation on the effective date
of PA 295. Energy produced from these facilities is eligible for ACE credits (ACECs); the
credits are tracked within MIRECS. Electric providers may substitute ACECs for RECs to meet
the renewable energy standard. However, there are conditions on the substitution and there is a
statutorily imposed limit on the percentage of ACEC’s eligible to be used each year for the
renewable energy standard.
Section 27(7) of PA 295 (MCL 460.1027(7)) describes the conditions and substitution
limits. ACECs from industrial cogeneration may be substituted for RECs without Commission
approval. For other types of ACECs, substitution may only be made with Commission approval
23
The report’s author provided additional information to MPSC staff showing job data for 2005 and 2013. Data
presented in the report is for 2011. See
http://milmi.org/admin/uploadedPublications/1992_WDA_EnergyFINAL.pdf.

25
and if the advanced cleaner energy is both cost effective and provides a carbon dioxide emission
benefit. The combination of energy optimization credits and ACECs may not account for more
than 10 percent of the total energy credits used to meet the standard in a given year. Older non-
plasma arc gasification advanced cleaner energy systems (in existence on January 1, 2008)
cannot be used to meet more than 70 percent of the 10 percent limit. The substitution ratio of
plasma arc gasification or industrial cogeneration is one ACEC to one REC while the ratio for
other forms of advanced cleaner energy is 10 ACECs to one REC.
The Commission has found no negative impact on advanced cleaner energy development
based on the above-described percentage limits. To better answer this question, the MPSC Staff
asked the question “Did the percentage limits in Section 27(7) affect development of advanced
cleaner energy by the electric provider? How so?” in the annual reports required under Section
51. No electric provider indicated the percentage limits in Section 27(7) affected development of
advanced cleaner energy. Advanced cleaner energy generation has decreased substantially to
46,983 MWh in 2013 with only two facilities of one electric service provider generating
advanced cleaner energy in 2013. Given this, advanced cleaner energy continues to be a small
percentage of the Michigan renewable energy portfolio (just greater than 2.0 percent of the 2012
compliance portfolio). The percentage limits, which in all cases are far from being met, do not
appear to be affecting the development of advanced cleaner energy in Michigan.
The Cost of Renewable Energy Compared to the Cost of New Coal Energy
Pursuant to Section 21(6)(b) (MCL 460.1021(6)(b)), rate-regulated electric providers’
REPs were required to show that the life cycle cost of renewable energy acquired, less the life
cycle net savings associated with Energy Optimization Plans, did not exceed the life cycle cost of
26
electricity generated by a new conventional coal-fired facility. The Commission Staff filed a
letter in MPSC Case No. U-15800 to provide the required life cycle cost of electricity generated
by a new conventional coal plant:
The Commission’s temporary order implementing 2008 PA 295, Case Number
U-15800, directed the Staff to work with the providers to develop the required life cycle
cost of electricity generated by a new conventional coal-fired facility in terms of a
guidepost consisting of a levelized busbar rate, in $/MWh, of an advanced-supercritical
pulverized coal plant with a life cycle of 40 years. The Commission directed the Staff to
submit the number to the Commission by January 30, 2009. The Staff has diligently
worked with the providers to develop the guidepost rate and finds that the number is $133
per MWh.24
This guidepost rate was derived from data provided to Consumers Energy as a result of
the Company’s inquiry into building a new 830 MW coal fired power facility, and was adopted
by all electric providers. In its amended REP in Case No. U-16543, Consumers Energy updated
the levelized cost of a conventional coal plant to $107 per MWh using the same construction cost
estimates used in determining the $133 per MWh rate. The decrease in cost was primarily due to
updated emissions assumptions.25
However, the cost of coal had declined compared to the costs
in 2008 when the original analysis had taken place. This had the effect of reducing the long-term
fuel price projections. Additionally, federal legislation regarding carbon emissions had not been
enacted, which resulted in emissions costs having less of an impact on the cost of a coal plant in
the company’s revamped calculation. Given all of this, the Commission continues to find that
the $133 per MWh guidepost is reasonable as discussed below.
On December 21, 2011 the U.S. Environmental Protection Agency (EPA) finalized the
Mercury and Air Toxics Rule (MATS)26
which regulates emissions of mercury, filterable
24
Source: Excerpt from Commission Staff January 30, 2009 Guidepost Rate Letter,
http://efile.mpsc.state.mi.us/efile/docs/15800/0023.pdf. 25
See: http://efile.mpsc.state.mi.us/efile/docs/16543/0010.pdf. 26
Mercury and Air Toxics Standards: http://www.epa.gov/mats/basic.html

27
particulate matter and hydrogen chloride. There are other proposed regulations that have the
potential to dramatically impact electric providers' generation sources, primarily coal-fired
plants. In December 2011, the EPA supplemented its rulemaking under the Cross State Air
Pollution Rule (CSAPR)27
to require Michigan, along with four other states, to reduce
summertime NOx emissions under an ozone season control program. CSAPR continues to be
debated in the Supreme Court and the Clean Air Interstate Rule (CAIR)28
remains in effect. The
Clean Water Act Cooling Water Intake rule seeks to reduce the impingement and entrainment of
aquatic organisms. EPA issued final standards in January 2014.29
Affected sources must comply
within eight years of the 2014 date. EPA regulations regarding Coal Combustion Residual (Ash)
handling has the potential to be very costly for coal plant operators if it is considered hazardous
waste under future rule making.30
The EPA plans to align Ash with Effluent Limitations
Guidelines (ELG) to reduce the regulatory burden.31
Finally, in March 2012, the EPA proposed
the Greenhouse Gases New Source Performance Standards (GHG NSPS) which would require
all new fossil-fueled plants to meet an emissions standard of 1,000 pounds of CO2 per MWh.
President Obama’s Climate Action Plan has directed the EPA to issue carbon standards by June
2014 with final rules in place a year later.32
These EPA regulations could have a considerable
impact on the price of electricity going forward, as electric providers will have to make the
decision to either retire or retrofit existing generators. Any new coal capacity would likely
27
Cross State Air Pollution Rule: http://www.epa.gov/crossstaterule/ 28
Clean Air Interstate Rule: http://www.epa.gov/cair/ 29
Clean Water Act: http://www.epa.gov/lawsregs/laws/cwa.html; 30
Easterm Interconnection States’ Planning Coucil, Current State and Future Direction of Coal-fired Power in the
Eastern Interconnection, White Paper, June 2013 31
Coal Combustion Residuals: http://www.epa.gov/wastes/nonhaz/industrial/special/fossil/ccr-rule/index.htm.
32
http://www.whitehouse.gov/the-press-office/2013/06/25/presidential-memorandum-power-sector-carbon-
pollution-standards
28
require significant capital costs making the cost of new renewable energy development even
more competitive.
By comparing the levelized cost of $133 per MWh for a new conventional coal-fired
power facility with the combined weighted average levelized contract prices in Table 1, the cost
of all renewable energy technologies is less than the coal guidepost rate with the exception of
two anaerobic digester contracts representing less than 4 MW of capacity. These contracts were
the result of Consumers Energy’s first solicitation for small (under 5 MW) facilities. Consumers
Energy and DTE Electric have since seen much lower prices for renewable energy. Even using
Consumers Energy's revised $107 per MWh levelized cost, wind and biomass still compare
favorably while landfill gas is competitive. As solar development in Michigan only includes
small-scale projects or pilot programs, it was not analyzed in this section or included in Table 1.

29
Table 1: Weighted Average Levelized Renewable Energy Contract Prices
Consumers Energy
Technology Wind Digester Biomass Landfill Hydro
Weighted Average $90.60 $137.77 NA $106.21 $121.31
Detroit Edison
Technology Wind Digester Biomass Landfill Hydro
Weighted Average $66.79 NA $98.94 $98.97 NA
Combined Weighted Average $76.37 $137.02 $98.94 $104.05 $121.31
While the Commission is required to make a determination about the cost effectiveness
of the renewable energy standard as compared to the life- cycle cost of electricity of coal-fired
generation, it should be noted that renewable energy wind resources are not equivalent on a
capacity basis when compared to coal-fired or other base load generation. The differences in
energy availability during peak loads can be significant. For example, regional transmission
organizations such as Midcontinent Independent Transmission System Operator (MISO),
discounted the capacity value of wind resources during the peak load to as low as 14.1 percent in
the most recent planning year, compared to an availability ranging as high, or higher than 80
percent for base load generation plants. Comparing per unit energy costs of different generation
types may not reflect the true value of the resource to the reliability of the electric system as a
whole.
30
Cost-Effectiveness of Renewable Energy and Energy Optimization Standards
Section 51(5)(e) of PA 295 (MCL 460.1051(5)(e)) requires an evaluation of the cost-
effectiveness of the renewable energy standard. In a similar vein, Section 97 of PA 295 (MCL
460.1097) requires the Commission to evaluate and determine whether the energy optimization
and renewable energy standards have been cost-effective.
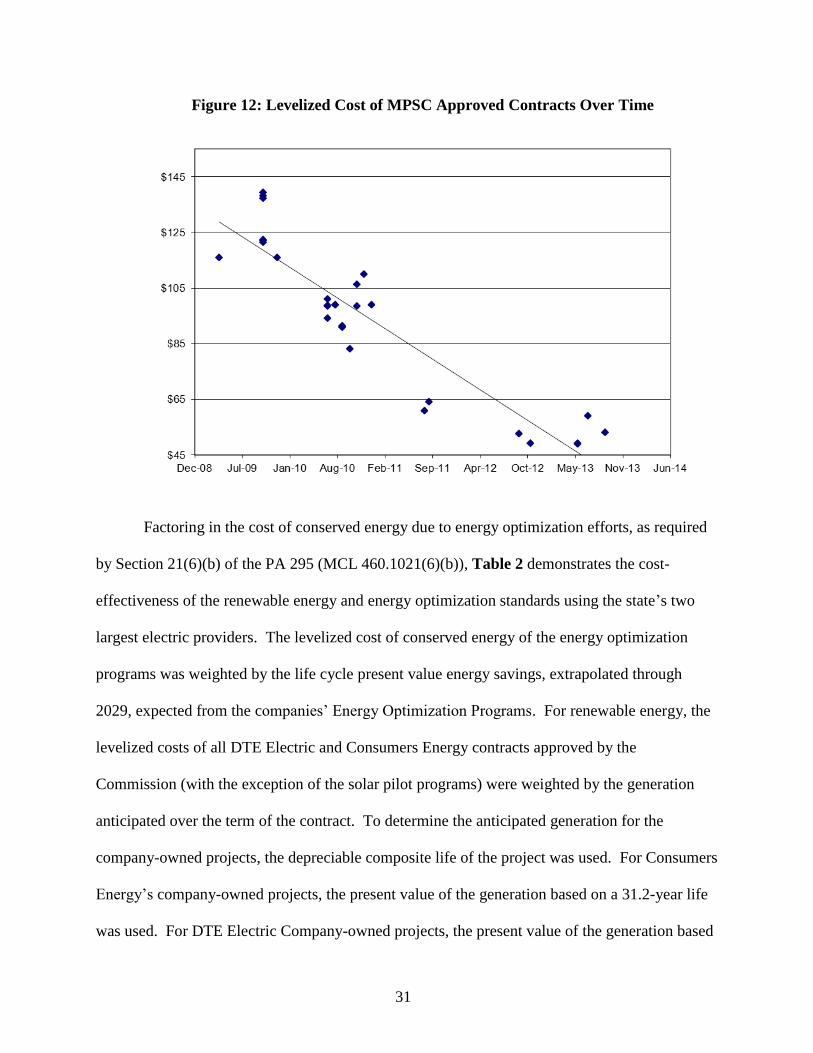
The actual cost of renewable energy contracts submitted to the Commission to date
continues to show a downward pricing trend. This trend was the case in the previous reports,
and continues. The most recent contracts approved by the Commission for new wind capacity
have levelized costs in the $50 to $59 per MWh range which is about 10 percent less than the
cheapest levelized contract prices from 2011 and half of the levelized cost of the first few
renewable energy contracts approved in 2009 and 2010. Contracts submitted to the Commission
through 2013 total approximately 1,400 MW33
of renewable capacity. Weighting the levelized
costs of these contracts by the generation in MWh results in an average cost of $78.39 per MWh.
Almost all renewable energy contract prices are lower than the $133 per MWh coal guidepost
rate as shown in Figure 12. This calculation does not include the DTE Electric’s and Consumers
Energy’s solar programs as these are considered pilot programs and make up less than two
percent of the REC and IREC creation from contracts and projects approved by the Commission
to date.
33
This includes DTE Electric Company’s 22 MW SolarCurrents program and Consumers Energy Company’s 6 MW
EARP programs. Additionally, this only accounts for Michigan’s allocation (67.5 MW) of Indiana Michigan Power
Company’s two wind contracts.
31
Figure 12: Levelized Cost of MPSC Approved Contracts Over Time
Factoring in the cost of conserved energy due to energy optimization efforts, as required
by Section 21(6)(b) of the PA 295 (MCL 460.1021(6)(b)), Table 2 demonstrates the cost-
effectiveness of the renewable energy and energy optimization standards using the state’s two
largest electric providers. The levelized cost of conserved energy of the energy optimization
programs was weighted by the life cycle present value energy savings, extrapolated through
2029, expected from the companies’ Energy Optimization Programs. For renewable energy, the
levelized costs of all DTE Electric and Consumers Energy contracts approved by the
Commission (with the exception of the solar pilot programs) were weighted by the generation
anticipated over the term of the contract. To determine the anticipated generation for the
company-owned projects, the depreciable composite life of the project was used. For Consumers
Energy’s company-owned projects, the present value of the generation based on a 31.2-year life
was used. For DTE Electric Company-owned projects, the present value of the generation based

32
on a 22-year life was used. IRECs were not factored into the weighting of any of the renewable
energy projects; however, doing so would increase the cost effectiveness of renewable energy.
When combined, a cost of $34.06 per MWh for both Subpart A (Renewable Energy Standard)
and Subpart B (Energy Optimization Standard) of 2008 PA 295 is approximately 26 percent of
the cost of a new conventional coal plant, using $133 per MWh as the coal plant cost. The
$78.39 per MWh cost of the renewable energy standard only is substantially lower than the cost
of a new coal-fired plant, but the combined cost of $34.06 per MWh, is less than any new
generation including new natural gas combined cycle plants when compared to the Energy
Information Administration levelized plant costs.34
If the Federal Production Tax Credit is
extended in 2014, as it has been in previous years, it will continue to be a major contributor to
the cost effectiveness of renewable energy in Michigan. Going forward, Commission Staff
anticipates that the cost of renewable energy will level off at a competitive rate as compared with
traditional fossil fuel generation.
Table 2: Cost Effectiveness of Energy Optimization and Renewable Energy
Standards
Energy Optimization Cost of Conserved Energy Weighted Average ($/MWh) $10.97
Renewable Energy Weighted Average Cost ($/MWh) $78.39
Combined Weighted Average Cost of Energy Optimization and Renewable Energy ($/MWh) $34.06
Source: The significant reduction in the combined weighted average cost of EO and RE compared to what was reported last year ($45.98/MWh) is due to two factors. First, EO cost data used this year assumes EO plans renew similar measures on a yearly basis through 2029 (corresponding to the 20 year period of renewable energy plans). Last year’s weighted average was calculated with EO programming only through the 2015 plan year, resulting in energy savings peaking in 2015, and declining thereafter through 2029. Second, the EO cost of conserved energy was lower this year, primarily due to significant learning and progress gained from experience implementing energy optimization programs, leading to improved economics. Renewable energy cost data is based on levelized costs provided as part of the renewable energy contract approval process.
34
See: http://www.eia.gov/forecasts/aeo/electricity_generation.cfm

33
Effect of the Renewable Energy and Energy Optimization Standard on
Electricity Prices
For the 2012 calendar year, Michigan had five rate-regulated electric providers collecting
revenue through a renewable energy surcharge. Alpena Power, Consumers Energy, and DTE
Electric all began collecting the surcharge in September 2009. Wisconsin Electric Power
Company’s renewable energy surcharge began during the January 2010 billing month and
Indiana Michigan’s surcharge began in 2012. Renewable energy surcharge amounts are listed in
Appendix B. All investor-owned, cooperative and municipal electric providers (as well as
Commission-regulated natural gas utilities) assess energy optimization surcharges. Specific
surcharge amounts are detailed in the Commission’s 2013 Report on the Implementation of the
P.A. 295 Utility Energy Optimization Programs, issued on November 26, 2013.35
As noted in previous sections, the cost of energy generated by renewable sources
continues to decline and is cheaper than new coal-fired generation. Using recent cost of service
data for Consumers Energy and DTE Electric, Commission Staff calculated $64 per MWh36
as
the combined weighted average of all power supply costs (conventional, renewable and other),
including purchased power, which is higher than the combined cost of the renewable energy and
energy efficiency standards of $34.06 per MWh.
While the renewable energy and energy optimizaion surcharges have an impact on
electric rates, there are other benefits attributable to an increase in renewable energy generation
sources and improved energy efficiency. Wind generation has increased to over 12 GW
throughout the MISO footprint.37
In June 2011, MISO introduced Dispatchable Intermittent
Resource (DIR) provisions for wind resources to help control the intermittency by allowing wind
35
See: http://www.michigan.gov/documents/mpsc/eo_report_441092_7.pdf 36
The $64 per MWh weighted average is based on 2012 filings and excludes transmission costs. 37
See: https://www.misoenergy.org/WhatWeDo/StrategicInitiatives/Pages/GrowthofWindCapacity.aspx
34
generators to respond to economic market signals. The MISO DIR improves the integration of
wind into the grid. This has the effect of allowing wind farm operators to better respond to
market signals and grid congestion and not allow wind generation onto the grid when potentially
cheaper resources are available to meet electricity demand. Michigan’s wind generation
continues to contribute to MISO’s overall wind capacity with approximately 1,100 MW of
operational wind generation. Michigan’s wind generation is expected to increase to over 1,400
MW by the end of 2014. In addition, the Commission's 2013 Report on the Implementation of
the P.A. 295 Utility Energy Optimization Programs found that for every dollar spent on energy
optimization, customers realize a cost of service benefit of $4.07.38
As implementation of the
renewable energy and energy optimization standards continues, these broader economic benefits
must be taken into account.
Recommendations
The first interim compliance requirement was accomplished successfully by all of
Michigan’s electric providers for 2012, and progress toward the 10 percent renewable energy
target in 2015 is going smoothly. Michigan’s electric providers are on track to meet the 10
percent renewable energy requirement. The renewable energy standard is resulting in the
development of new renewable capacity and can be credited with over 1,100 MW of new
renewable energy projects becoming commercially operational since the Act took effect. The
weighted average price of existing renewable energy contracts is $78.39 per MWh, which is less
than forecasted in REPs, and is continuing to trend downward. The combined weighted average
cost of the companies’ energy optimization and renewable energy is $34.06 per MWh,
significantly lower than the cost of all types of new fossil fuel generation plants. The
38
See: http://www.michigan.gov/documents/mpsc/eo_report_441092_7.pdf

35
Commission will continue to monitor electric provider progress toward meeting the requirements
of the standards as provided under the Act.
The Commission has no recommendation for legislation at this time. The Commission
participated in the 2013 public process for informing Michigan’s energy future and assisted in
the preparation of a report on renewable energy as directed in the Governor’s Special Message
on Energy and the Environment in November 2012.[1]
In 2014, the Commission intends to
participate in continuing stakeholder discussions in furtherance of the Readying Michigan to
Make Good Energy Decisions process related to renewable energy, and stands ready to assist
policymakers as they consider Michigan’s future energy policy.
[1]
Readying Michigan to Make Good Energy Decisions: Electric Choice, released November 20,2013,
http://www.michigan.gov/documents/energy/electricc_report_440539_7.pdf.
Appendix A - RE Filings: Case Numbers, Companies, Plan Approval Dates and Reconcilation Approval Dates
COMPANY
2009 Initial RE Plan Case
#
2013 RE Biennial
Plan Case #
2013 RE Plan Approval Date
2012 Reconciliation
Case #
2012 Reconciliation Approval Date
1 Alpena Power Company U-15804 U-17300 10/17/2013 U-17320 Pending2 Consumers Energy Company U-15805 U-17301 Pending U-17321 Pending3 DTE Electric Company U-15806 U-17302 12/19/2013 U-17322 Pending4 Indiana Michigan Power Company U-15808 U-17303 11/14/2013 U-17323 12/19/20135 Northern States Power Company-Wisconsin U-15809 U-17304 1/8/2014 U-17324 9/24/20136 Upper Peninsula Power Company U-15810 U-17305 8/13/2013 U-17325 12/16/20137 Wisconsin Public Service Corporation U-15811 U-17306 8/13/2013 U-17326 12/16/2013
Wisconsin Electric Power Company U-15812 U-173075/15/13 Filing Suspended;
see U-17072
8 Wisconsin Electric Power Company U-15812 U-17072
12/19/13 REP rejected; ordered to file revised REP
90 days U-17327 Pending
9 Cloverland Electric Cooperative/Edison Sault U-15816 U-17308 11/4/2013 U-17328 1/23/201410 Midwest Energy Cooperative U-15818 U-17309 10/17/2013 U-17329 1/23/201411 Thumb Electric Cooperative U-15821 U-17310 10/17/2013 U-17330 12/19/2013
12 Alger Delta Cooperative Electric Association U-15813 U-16589 8/13/201313 Bayfield Electric Cooperative U-15814 U-16590 8/29/201314 Cherryland Electric Cooperative U-15815 U-16591 8/13/201315 Great Lakes Energy Cooperative (2012) U-15817 U-16593 8/13/201316 Homeworks Tri-County Electric Cooperative U-15822 U-16598 8/13/201317 Ontonagon Co. Rural Electricification Assoc. (2012) U-15819 U-16595 9/24/201318 Presque Isle Electric and Gas Co-op (2012) U-15820 U-16596 8/13/2013
19 Village of Baraga U-15848 U-16599 12/19/201320 City of Bay City U-15849 U-16600 12/19/201321 City of Charlevoix U-15850 U-16601 12/19/201322 Chelsea Department of Electric and Water U-15851 U-16602 12/19/201323 Village of Clinton U-15852 U-16603 12/19/201324 Coldwater Board of Public Utilities U-15853 U-16604 12/19/201325 Croswell Municipal Light & Power Department U-15854 U-16605 12/19/201326 City of Crystal Falls U-15855 U-16606 12/19/201327 Daggett Electric Department U-15856 U-16607 12/19/201328 Detroit Public Lighting Department U-15857 U-16608 12/19/201329 City of Dowagiac U-15858 U-16609 12/19/201330 City of Eaton Rapids U-15859 U-16610 12/19/201331 City of Escanaba U-15860 U-16611 1/8/201432 City of Gladstone U-15861 U-16612 12/19/201333 Grand Haven Board of Light and Power U-15862 U-16613 12/19/201334 City of Harbor Springs U-15863 U-16614 12/19/201335 City of Hart Hydro U-15864 U-16615 12/19/201336 Hillsdale Board of Public Utilities U-15865 U-16616 12/19/201337 Holland Board of Public Works U-15866 U-16617 12/19/201338 Village of L'Anse U-15867 U-16618 12/19/201339 Lansing Board of Water & Light U-15868 U-16619 12/19/201340 Lowell Light and Power U-15869 U-16620 12/19/201341 Marquette Board of Light and Power U-15870 U-16621 12/19/201342 Marshall Electric Department U-15871 U-16622 12/19/201343 Negaunee Department of Public Works U-15872 U-16623 12/19/201344 Newberry Water and Light Board U-15873 U-16624 12/19/201345 Niles Utility Department U-15874 U-16625 12/19/201346 City of Norway U-15875 U-16626 12/19/201347 City of Paw Paw U-15876 U-16627 12/19/201348 City of Petoskey U-15877 U-16628 12/19/201349 City of Portland U-15878 U-16629 1/8/201450 City of Sebewaing U-15879 U-16630 12/19/201351 City of South Haven U-15880 U-16631 12/19/201352 City of St. Louis U-15881 U-16632 1/8/201453 City of Stephenson U-15882 U-16633 12/19/201354 City of Sturgis U-15883 U-16634 12/19/201355 Traverse City Light & Power U-15884 U-16635 12/19/201356 Union City Electric Department U-15885 U-16636 12/19/201357 City of Wakefield U-15886 U-16637 1/8/201458 Wyandotte Department of Municipal Service U-15887 U-16638 12/19/201359 Zeeland Board of Public Works U-15888 U-16639 12/19/2013
IOUs
Cooperatives - Rate Regulated
Municipals
Cooperatives - Member Regulated
Not Required
Not Required
NL = New LicenseLVR = License Voluntarily RelinquishedLR = License Revoked 36

Appendix A - RE Filings: Case Numbers, Companies, Plan Approval Dates and Reconcilation Approval Dates
COMPANY
2009 Initial RE Plan Case
#
2013 RE Biennial
Plan Case #
2013 RE Plan Approval Date
2012 Reconciliation
Case #
2012 Reconciliation Approval Date
60 CMS ERM Michigan LLC U-15826 U-16640 7/11/201361 Commerce Energy Inc U-15828 U-16641 7/11/201362 Constellation NewEnergy Inc U-15829 U-16642 7/11/201363 Direct Energy Business LLC U-15845 U-16643 7/11/201364 FirstEnergy Solutions Corp U-15832 U-16644 7/11/201365 Glacial Energy of Illinois U-16007 U-16645 Pending due 12/16/1366 Integrys Energy Services Inc U-15833 U-16646 6/28/201367 MidAmerican Energy Company U-15837 U-16647 6/28/2013
68Noble Americas Energy Solutions LLC f/k/a Sempra Energy Solutions LLC U-15843 U-16650 6/28/2013
69 Spartan Renewable Energy Inc U-15844 U-16651 7/11/201370 U.P. Power Marketing LLC U-16586 U-16652 8/13/201371 Wolverine Power Marketing Cooperative Inc U-15847 U-16653 6/28/2013
72 AEP Energy, Inc (formerly BlueStar Energy) U-15825 U-15825 Pending73 Direct Energy Services LLC U-15830 U-15830 Pending74 Duke Energy Retial Sales, LLC U-16767 Pending75 Exelon Energy Company U-15831 U-15831 1/17/13 LVR76 energy.me Midwest LLC d/b/a energy.me U-17455 Pending NL
77Energy Service Providers, Inc d/b/a Michigan Gas & Electric U-17010 Due 9/11/14
78 GearyEnergy LLC U-16264 8/29/13 LVR79 Interstate Gas Supply, Inc d/b/a IGS Energy U-17338 Pending NL80 Lakeshore Energy Services, LLC U-16979 Due 7/6/1481 Liberty Power Delaware U-15834 U-15834 Pending82 Libery Power Holdings LLC U-15835 U-15835 Pending83 Nordic Marketing LLC U-15838 U-15838 2/28/13U-17137 LR84 Plymouth Rock Energy LLC U-17549 Due 6/30/14 NL85 PowerOne Corporation U-15840 U-15840 Pending86 Premier Energy Marketing LLC U-15841 U-16648 Pending87 Santana Energy Services U-17254 6/28/13 NL88 Quest Energy LLC U-15842 U-16649 1/23/14 LVR89 TERM Power & Gas d/b/a ENCOA U-17518 Due 3/6/14 NL90 Texas Retail Energy, LLC U-17168 5/29/13 NL
Not RequiredAlternative Electric Suppliers (AES) Not Serving Customers
Not RequiredAlternative Electric Suppliers (AES) Serving Customers
NL = New LicenseLVR = License Voluntarily RelinquishedLR = License Revoked 37
CompanyInitial Plan
2013 Plan
Docket2012 Compliance
Year Sales*Retail Sales
Method**2007/2008
Baseline RECs2012 REC
Requirement2012 Excess RECs Retired
2012 EO & Green Pricing
Credit Substitutions
Estimated 2013 REC
Requirement
Estimated 2014 REC
Requirement
Estimated 2015 REC
Requirement 2015 10%
Standard Met
Current Residential Surcharge $/Month
Rate Regulated UtilitiesAlpena Power U-15804 U-17300 321,887 3Y 0 6,438 7,180 10,622 16,094 32,189 Yes 0.24
Consumers Energy U-15805 U-17301 33,336,013 3Y 1,549,840 1,906,592 0 69,584 2,138,481 2,441,721 3,333,601 Yes 0.52DTE Electric U-15806 U-17302 41,715,637 W 566,819 1,281,962 0 46,643 1,756,385 2,369,191 4,171,564 Yes 0.43Indiana Michigan U-15808 U-17303 2,813,544 W 17,450 70,231 0 104,538 149,402 281,354 Yes 0.43NSP-Wisc (Xcel) U-15809 U-17304 139,115 3Y 12,679 12,926 0 13,086 13,295 13,912 Yes 0.00Upper Peninsula Power U-15810 U-17305 846,819 3Y 98,521 84,682 86 84,682 84,682 84,682 Yes 0.00Wisc. PSC U-15811 U-17306 273,320 3Y 11,145 14,383 0 16,487 19,239 27,332 Yes 0.00Wisc. Elec Co U-15812 U-17072 2,670,926 3Y 53,196 95,975 0 123,782 160,144 267,093 Yes* 3.00
*Revised Plan Pending Approval
Rate Regulated CooperativesCloverland Electric Coop U-15816 U-17308 803,349 3Y 301,126 80,335 0 80,335 80,335 80,335 Yes 0.00Midwest Energy Coop U-15818 U-17309 579,003 3Y 0 11,580 405 19,107 28,950 57,900 Yes 0.00Thumb Elec. Coop U-15821 U-17310 152,604 3Y 1,562 4,302 0 6,082 8,411 15,260 Yes 0.00
Member Regulated CooperativesAlger Delta Coop Elec U-15813 U-16589 58,892 3Y 920 1,914 2 2,560 3,405 5,889 Yes 0.00Bayfield Elec. Coop U-15814 U-16590 200 3Y 4 7 0 9 12 20 Yes 0.00Cherryland Elec Coop U-15815 U-16591 364,483 3Y 0 7,290 0 12,028 18,224 36,448 Yes 0.00Great Lakes Energy Coop U-15817 U-16593 1,339,882 3Y 0 26,798 0 44,216 66,994 133,988 Yes 0.00Homeworks Tri-County Elec. Coop U-15822 U-16598 316,048 3Y 0 6,321 0 10,430 15,802 31,605 Yes 0.00Ontonagon Co. Rural Elec. U-15819 U-16595 24,762 3Y 2,246 2,292 0 2,322 2,361 2,476 Yes 0.00Presque Isle Elec & Coop U-15820 U-16596 237,036 3Y 0 4,741 0 7,822 11,852 23,704 Yes 0.00
Alternative Electric SuppliersCMS ERM Michigan U-15826 U-16640 172,640 3Y 0 3,453 1,318 5,697 8,632 17,264 Yes 0.00Commerce Energy U-15828 U-16641 16,958 W 0 339 0 560 848 1,696 Yes 0.00Constellation NewEnergy U-15829 U-16642 2,338,404 W 0 46,768 2,230 77,167 116,920 233,840 Yes 0.00Direct Energy Business U-15845 U-16643 306,690 W 0 6,134 182 10,121 15,335 30,669 Yes 0.00First Energy Solutions U-15832 U-16644 1,908,142 W 0 38,163 0 62,969 95,407 190,814 Yes 0.00Glacial Energy of Illinois U-16007 U-16645 427,551 W 0 8,551 293 14,109 21,378 42,755 Yes 0.00Integrys Energy Services U-15833 U-16646 745,623 W 0 14,912 0 24,606 37,281 74,562 Yes 0.00MidAmerican Energy Company U-15837 U-16647 85,682 W 0 1,714 131 2,828 4,284 8,568 Yes 0.00Noble Americas Energy Solutions f/k/a Sempra Energy Solutions U-15843 U-16650 1,990,480 W 0 39,810 0 65,686 99,524 199,048 Yes 0.00Spartan Renewable Energy U-15844 U-16651 64,071 3Y 0 1,281 0 2,114 3,204 6,407 Yes 0.00U.P. Power Marketing U-15846 U-16652 19,493 W 0 390 0 643 975 1,949 Yes 0.00Wolverine Power Marketing Cooperative U-15847 U-16653 1,131,516 3Y 0 22,630 0 37,340 56,576 113,152 Yes 0.00
9,207,250 0 184,145 4,154 303,839 460,363 920,725
Appendix B - Estimate of Renewable Energy Credit Requirements and Renewable Energy Plan Summary
Aggregated Totals**
38
CompanyInitial Plan
2013 Plan
Docket2012 Compliance
Year Sales*Retail Sales
Method**2007/2008
Baseline RECs2012 REC
Requirement2012 Excess RECs Retired
2012 EO & Green Pricing
Credit Substitutions
Estimated 2013 REC
Requirement
Estimated 2014 REC
Requirement
Estimated 2015 REC
Requirement 2015 10%
Standard Met
Current Residential Surcharge $/Month
Appendix B - Estimate of Renewable Energy Credit Requirements and Renewable Energy Plan Summary
Municipal UtilitiesVillage of Baraga U-15848 U-16599 18,390 3Y 0 368 0 607 920 1,839 Yes 0.00City of Bay City U-15849 U-16600 320,118 3Y 0 6,402 0 10,564 16,006 32,012 Yes 0.00City of Charlevoix U-15850 U-16601 61,313 3Y 0 1,226 0 2,023 3,066 6,131 Yes 0.00Chelsea Dept. of Electric & Water U-15851 U-16602 91,502 3Y 0 1,830 0 3,020 4,575 9,150 Yes 0.00Village of Clinton U-15852 U-16603 22,142 3Y 0 443 0 731 1,107 2,214 Yes 0.00Coldwater Board of Public Utilities U-15853 U-16604 278,803 3Y 0 5,576 39 9,200 13,940 27,880 Yes 0.00Croswell Municipal Light & Power Dept. U-15854 U-16605 35,391 3Y 0 708 0 1,168 1,770 3,539 Yes 0.15City of Crystal Falls U-15855 U-16606 16,227 3Y 4,400 1,623 0 1,623 1,623 1,623 Yes 0.00Daggett Electric Department U-15856 U-16607 1,313 3Y 0 26 28 43 66 131 Yes 0.00Detroit Public Lighting Department U-15857 U-16608 486,249 3Y 0 9,725 18 16,046 24,312 48,625 No 3.00City of Dowagiac U-15858 U-16609 63,429 3Y 0 1,269 31 2,093 3,171 6,343 Yes 0.00City of Eaton Rapids U-15859 U-16610 86,165 3Y 2,263 3,534 0 4,360 5,440 8,617 Yes 0.84City of Escanaba U-15860 U-16611 143,846 3Y 0 2,877 0 4,747 7,192 14,385 Yes 0.00City of Gladstone U-15861 U-16612 32,063 3Y 0 641 0 1,058 1,603 3,206 Yes 0.00Grand Haven Board of Light & Power U-15862 U-16613 267,333 3Y 0 5,347 0 8,822 13,367 26,733 Yes 0.50City of Harbor Springs U-15863 U-16614 37,521 3Y 0 750 0 1,238 1,876 3,752 Yes 0.00City of Hart U-15864 U-16615 40,481 3Y 804 1,453 0 1,875 2,426 4,048 Yes 0.00Hillsdale Board of Public Utilities U-15865 U-16616 121,168 3Y 0 2,424 0 3,999 6,058 12,117 Yes 0.00Holland Board of Public Works U-15866 U-16617 945,650 3Y 0 18,913 0 31,206 47,283 94,565 Yes 0.00Village of L'anse U-15867 U-16618 13,174 3Y 0 264 0 435 659 1,317 Yes 0.00Lansing Board of Water & Light U-15868 U-16619 2,149,614 3Y 6,655 48,317 2 75,396 110,808 214,961 Yes 2.50Lowell Light & Power U-15869 U-16620 61,746 3Y 0 1,235 0 2,038 3,087 6,175 Yes 3.00Marquette Board ofLght & Power U-15870 U-16621 307,882 3Y 14,016 17,370 0 19,551 22,402 30,788 Yes 0.23Marshall Electric Department U-15871 U-16622 107,012 3Y 1,318 3,195 0 4,414 6,010 10,701 Yes 0.00Negaunee Dept. of Public Works U-15872 U-16623 22,057 3Y 0 442 0 728 1,103 2,206 Yes 0.00Newberry Water and Light Board U-15873 U-16624 18,520 3Y 4,931 1,852 2,463 1,852 1,852 1,852 Yes 0.00Niles Utilities Department U-15874 U-16625 128,946 3Y 0 2,579 0 4,255 6,447 12,895 Yes 0.00City of Norway U-15875 U-16626 29,377 3Y 21,080 2,938 0 2,938 2,938 2,938 Yes 0.00Village of Paw Paw U-15876 U-16627 40,203 3Y 0 804 0 1,327 2,010 4,020 Yes 0.00City of Petoskey U-15877 U-16628 105,474 3Y 0 2,109 0 3,481 5,274 10,547 Yes 0.00City of Portland U-15878 U-16629 36,040 3Y 1,746 2,118 0 2,359 2,675 3,604 Yes 0.00City of Sebewaing U-15879 U-16630 39,391 3Y 0 788 5 1,300 1,970 3,939 Yes 0.92City of South Haven U-15880 U-16631 131,330 3Y 0 2,633 0 4,334 6,567 13,133 Yes 0.00City of St. Louis U-15881 U-16632 38,311 3Y 680 1,310 0 1,720 2,256 3,831 Yes 0.00City of Stephenson U-15882 U-16633 6,075 3Y 0 122 293 200 304 608 Yes 0.00City of Sturgis U-15883 U-16634 221,536 3Y 11,232 13,416 0 14,836 16,693 22,154 Yes 0.00Traverse City Light & Power U-15884 U-16635 318,180 3Y 778 6,986 0 11,021 16,298 31,818 Yes 0.00Union City Electric Department U-15885 U-16636 15,165 3Y 1,625 1,517 0 1,517 1,517 1,517 Yes 0.00City of Wakefield U-15886 U-16637 13,166 3Y 0 263 0 434 658 1,317 Yes 0.00Wyandotte Dept. of Muncipal Service U-15887 U-16638 275,249 3Y 0 5,505 0 9,083 13,762 27,525 Yes 0.00Zeeland Board of Public Works U-15888 U-16639 302,678 3Y 0 6,054 30 9,988 15,134 30,268 Yes 0.00
102,651,000 2,687,036 3,989,866 14,736 116,227 5,014,443 6,346,699 10,265,1004.9% 6.2% 10.0%Estimated Renewable Energy %
*Sales from Annual Report
***AES totals are aggregated.
** 3Y = 3 Year Average W = Weather Normalized
***Total
39

Total Plan PeriodAnticipated
2009-2011 2012 Remaining Incremental Energy Reported Reported Anticipated Cost of
2012 2012 Credits Incremental Incremental Incremental ComplianceGenerated Generated Sold Cost of Cost of Cost of (Prior Years plusor Aquired or Aquired in 2012 Compliance Compliance Compliance Anticipated)
Company Name (RECs) (ACECs) (RECs) ($) ($) ($) ($)Investor Owned Utilities:Alpena Power Company 6,438 0 0 1,115,994 390,735 4,666,400 6,173,129Consumers Energy Company 2,215,235 0 0 12,929,989 19,838,182 483,000,000 515,768,171Detroit Edison Company** 1,989,411 57,802 0 46,214,314 64,115,822 544,124,765 654,454,901Indiana Michigan Power Company** 70,023 0 11,721 0 0 669,647 669,647Northern States Power Company** 22,876 0 2,017 0 0 0 0Upper Peninsula Power Company** 143,284 0 90,000 0 0 0 0Wisconsin Public Service Corporation** 67,536 0 42,156 0 0 0 0Wisconsin Electric Power Co** 125,029 0 0 153,495 0 19,056,000 19,209,495
4,639,832 57,802 145,894 60,413,792 84,344,739 1,051,516,812 1,196,275,343
Rate Regulated Cooperatives:Cloverland Electric Cooperative** 351,019 0 5493 0 0 0 0Midwest Energy Cooperative** 26,553 0 0 0 0 0 0Thumb Electric Cooperative** 0 0 0 0 0 0 0
377,572 0 5,493 0 0 0 0
Member Regulated Electric Cooperatives:Alger Delta Cooperative Electric Association** 0 0 0 0 0 0 0Bayfield Electric Cooperative** 7 0 0 0 0 0 0Cherryland Electric Cooperative** 16,252 0 0 0 0 0 0Great Lakes Energy Cooperative** 59,356 0 0 0 0 0 0Homeworks Tri-County Electric Cooperative** 14,231 0 0 0 0 0 0Ontonagon County Rural Electricification Association** 2,329 0 0 0 0 0 0Presque Isle Electric and Gas Co-op** 10,328 0 0 0 0 0 0
102,503 0 0 0 0 0 0
Municipally-Owned Electric Utilities:City of Bay City 9,162 0 0 524,647 70,221 0 594,868City of Charlevoix 1,839 0 0 21,190 14,122 0 35,312City of Crystal Falls 4,358 0 3,035 0 0 0 0City of Dowagiac 1,300 0 0 7,146 0 0 7,146City of Eaton Rapids 2,965 0 350 154,274 6,936 729,540 890,750City of Escanaba 11,655 0 0 0 0 847,463 847,463City of Gladstone 0 0 0 0 0 0 0City of Harbor Springs 1,833 0 0 21,190 0 0 21,190City of Hart Hydro 2,056 0 0 10,595 0 0 10,595City of Norway 22,117 0 22,698 0 0 0 0City of Petoskey 3,068 0 0 42,380 28,071 0 70,451City of Portland 2,578 0 0 6,357 1,591 0 7,948City of Sebewaing 935 0 0 0 0 416,096 416,096City of South Haven 0 0 0 7,719 0 0 7,719City of St. Louis 2,894 0 0 6,301 21,517 0 27,818City of Stephenson 634 0 0 0 0 0 0City of Sturgis 7,253 0 0 12,051 0 0 12,051City of Wakefield 0 0 0 0 0 0 0Chelsea Dept of Electric & Water 1,266 0 0 105,414 8,461 56,395 170,270Coldwater Board of Public Utilties 12,849 0 0 0 3,411 0 3,411Croswell Municipal Light & Power Dept 0 0 0 0 0 225,336 225,336Daggett Electric Dept 120 0 0 1,905 0 0 1,905Detroit Public Lighting Dep 0 0 0 23,598 4,704 0 28,302Grand Haven Board of Light & Power 7,330 0 0 175,449 212,215 5,058,526 5,446,190Hillsdale Board of Public Utilities 5,547 0 0 0 1,473 0 1,473Holland Board of Public Works 53,213 0 0 6,352,628 0 0 6,352,628Lansing Board of Water & Light 92,831 0 5,132 3,727,247 2,623,402 52,916,307 59,266,956Lowell Light & Power 2,561 0 0 53,217 48,160 5,036,528 5,137,905Marquette Board of Light & Power 60,274 0 0 0 42,175 1,262,194 1,304,369Marshall Electric Dept** 7,552 0 959 0 7,186 0 7,186Negaunee Dept of Public Works 0 0 0 0 0 0 0Newberry Water & Light Board 5,493 0 0 2,173,289 0 0 2,173,289Niles Utility Dept 0 0 0 7,529 0 0 7,529Traverse City Light & Power 31,135 0 0 0 0 0 0Union City Electric Dept 4,358 0 1,448 0 506 0 506Wyandotte Dept of Municipal Service 3,659 0 0 110,168 28,051 0 138,219Village of Baraga 0 0 0 0 0 0 0Village of Clinton 1,014 0 0 0 269 0 269Village of L'Anse 0 0 0 0 0 0 0Village of Paw Paw** 0 0 0 2,505 0 0 2,505Zeeland Board of Public Works 8,034 0 0 0 1,106 0 1,106
371,883 0 33,622 13,546,799 3,123,577 66,548,385 83,218,761
Alternative Electric Suppliers (AES):CMS ERM Michigan LLC 0 340 0Commerce Energy Inc 0 0 0Constellation NewEnergy Inc 12,206 0 0Direct Energy Business LLC 13,500 0 0FirstEnergy Solutions Corp 38,163 0 0Glacial Energy of Illinois, Inc. 0 0 0Integrys Energy Services Inc 56,000 0 0Midamerican Energy Company 0 0 0Noble Americas Energy Solutions LLC f/k/a Sempra Energy Solutions LLC 52,000 0 0Spartan Renewable Energy Inc 31,500 0 31,500UP Power Marketing LLC 0 0 0Wolverine Power Marketing Cooperative Inc 8,515 0 8,515
211,884 340 40,015
*Totals: 5,703,674 58,142 225,024 73,960,591 87,468,316 1,118,065,197 1,279,494,104
Michigan Retail Sales (MWh): 102,651,000 (Based on Appendix B Retail Sales Total)
Michigan Estimated Renewable Energy %: 5.4%
Source: PA 295 Annual Reports:http://www.michigan.gov/mpsc/0,4639,7-159-16393_53570-240179--,00.html*AES totals are aggregated
Appendix C - ELECTRIC PROVIDER RENEWABLE ENERGY ANNUAL REPORT SUMMARY
2012 Reporting Year
40

Appendix D – Michigan’s Solar Programs
Michigan’s Solar Programs
Consumers Energy and DTE Electric continued previously established solar programs designed to incentivize solar installations. During 2013, Cherryland Electric Cooperative and Traverse City Light & Power implemented Michigan’s first community solar program.
Experimental Advanced Renewable Program
Consumers Energy’s original EARP was approved by the Commission in 2009. The maximum program size was 2 MW (2,000 kW) with 1,500 kW reserved for commercial projects and the remaining 500 kW allotted to residential projects. In June 2011, the company announced that the program had become fully subscribed after completing 102 agreements. After careful review and design, Consumers Energy expanded the program by an additional 3 MW. The Commission approved the expanded program in May 2011 with the option for additional capacity should program funding allow. Later in 2011, the Commission approved an addition 0.25 MW for a total of 5.25 MW. As of its most recent biennial renewable energy plan review filed on May 28, 2013, the company expects to solicit a total of 6 MW of solar installations under its EARP.
Under Consumers Energy’s original EARP (phase 1 and 2), customers receive a firm
price for each kWh generated by the customer’s solar generation system over a 12 year period. Phase 1 agreements began in September 2009 paying $0.65 per kWh for residential systems up to 20 kW and $0.45 per kWh for commercial systems up to 150 kW. Phase 2 agreements began in May 2010 paying $0.525 per kWh for residential systems up to 20 kW and $0.375 per kWh for commercial systems up to 150 kW.
The 4 MWs of capacity under the expanded program is split between residential and
non-residential customers and will be awarded in phases pertaining to the respective customer class. The price is set with a maximum offer of $0.259 per kWh, which is dynamic; increasing or decreasing based on interest in prior phases. Additionally, the company offers a $0.001 per kWh bonus for systems constructed using both Michigan labor and Michigan materials.
A system’s size is limited to the customer’s annual electricity use, similar to the net-
metering program. This is a change from the original phase 1 and 2 of the EARP that allowed for systems larger than customer use within the respective category. The program will continue to add new participants for three years from the Commission approval and agreements will have 15 year terms or will expire at the end of the Renewable Energy Plan period in 2029, whichever comes first.
Consumers Energy has awarded agreements through 13 phases under the expanded
program (15 phases have been awarded including phase 1 and phase 2 of the original program). Eight have been residential phases and five have been non-residential phases. One hundred fourteen residential projects are expected to be completed totaling 811.5 kW of installed capacity. As a result of the five non-residential phases, 25 non-residential projects totaling 1,223.1 kW are expected to be completed. Consumers Energy currently has a total of 4.06 MW of solar capacity participating or under construction as part of the EARP.
41

Appendix D – Michigan’s Solar Programs
SolarCurrents
DTE Electric’s 20 MW SolarCurrents pilot program includes a 5 MW customer-owned program and a 15 MW company-owned program. In May 2011, DTE Electric announced that the customer-owned program was fully subscribed. On December 20, 2011, the Commission ordered MPSC Staff to convene a collaborative to explore opportunities for the continuation of the customer-owned SolarCurrents program. Pursuant to the collaborative, the company filed an application for a 2 MW expansion on October 8, 2012 and the Commission approved the application on November 16, 2012.
The 5 MW phase 1 customer-owned SolarCurrents program provided an up-front REC payment equal to $2.40 per Watt of installed solar PV which is approximately half of the total system cost. The company will purchase the remaining RECs through a monthly payment/on-bill credit equal to $0.11 per kWh for 20 years. System size is limited by the customer's annual electricity use or by the 20 kW size cap (whichever is smaller).
Phase 2 will provide for an up-front purchase of approximately 30% of the RECs that the company anticipates will be generated over the life of the system. The remaining RECs will be purchased via monthly payments based on actual generation. This purchase is done through cents per kWh payments starting on the agreement execution date and ending on August 31, 2029, for a maximum term of 16 years. The company will be accepting applications for the 2 MW phase 2 program from residential customers up to 1.5 MW of the program and non-residential customers making up the remaining 0.5 MW of the program through four 500 kW tranches. The agreements will be awarded using random selection events starting in 2013 with the last tranche being awarded in 2014. Any remaining kW will be awarded during a fifth offering in early 2015. To date, the company has contracted for 5,030 kW from 589 customers representing full participation for phase 1 of SolarCurrents. The company has contracted for 207 kW representing 38 projects from the first offering of phase 2, and 245 kW from 36 projects currently installed from this offering.
DTE Electric’s 15 MW company-owned SolarCurrents program includes large scale solar PV projects that are either located on DTE Energy property or on customer premises. Customers selected to host a solar project receive a one-time, upfront construction payment to cover any inconvenience during installation in addition to an annual easement payment for the life of the installation. Pursuant to two separate competitive solicitations, the company contracted with Nova Consultants to construct up to 15 MW of solar. The panels will be provided by either McNaughton-McKay Electric Company or Inovatus Solar, LLC. Currently, 19 projects are complete totaling 7.315 MW of solar PV capacity. An additional three projects are in the construction, design or feasibility phase totaling over 2.571 MW of capacity.
Community Solar
Cherryland Electric Cooperative and Traverse City Light & Power are the first electric
providers in Michigan to offer a joint community solar program – Solar Up North (SUN) Alliance Program. The framework for this program comes from the energy optimization standard of Act 295 as opposed to net metering or the renewable energy standard. Cherryland Electric Cooperative members and Traverse City Light & Power customers can purchase solar shares for a one time investment of $470.00 each. The participants receive a $75.00 Energy Optimization rebate per panel. The electric providers use the wholesale electric market prices to determine the amount of monthly bill credit to provide to the participants. It is estimated that the
42

Appendix D – Michigan’s Solar Programs
credit will be an average of $2.00 per month. This amount will be based on total monthly array output and will vary based on weather conditions. The community solar program has been very successful and is continuing to grow. As of July 2013, one hundred thirty six shares had been purchased.1
1 See A Guidebook for Community Solar Programs in Michigan Communities http://glrea.org/
43
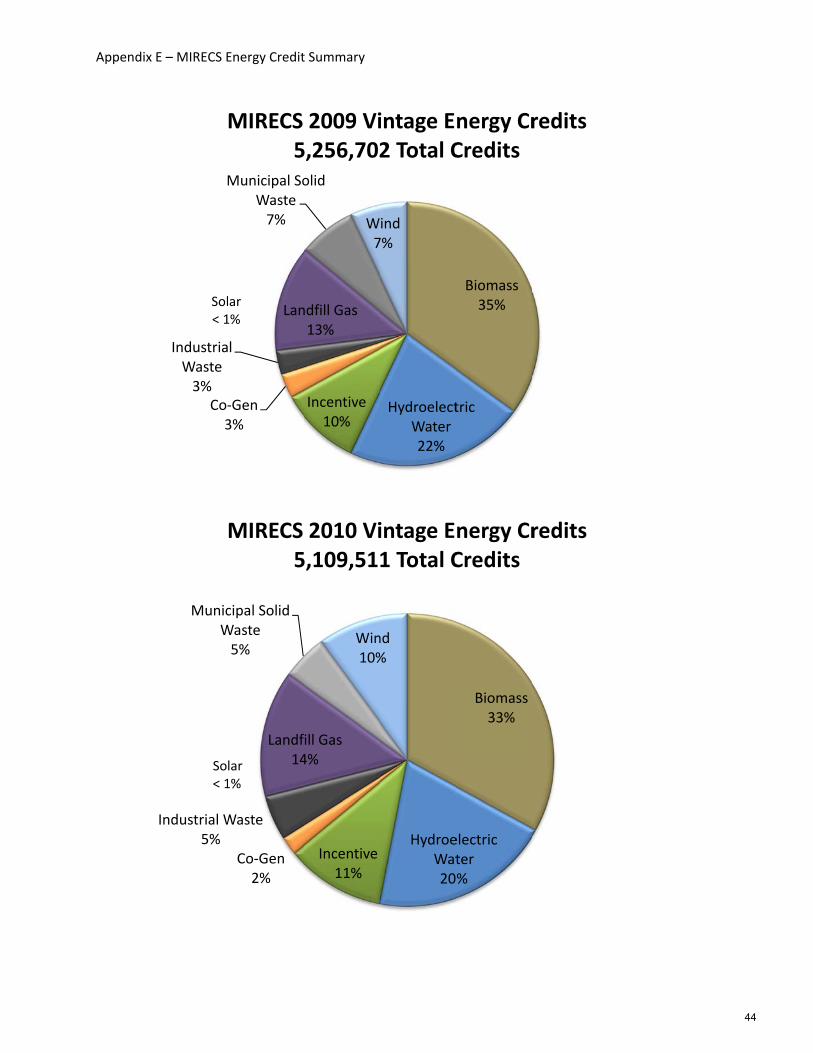
Appendix
E – MIRECS E
Co‐3
IndustriaWaste3%
M
Sol< 1
Industrial W5%
MunicW
So< 1
Energy Credit
‐Gen3%
l
Lan
Municipal SoWaste7%
MIRECS 5
ar1%
Co‐Gen2%
Waste
Landf14
cipal Solid Waste5%
MIRECS 5
lar1%
t Summary
Incentive10%
ndfill Gas13%
olid
W7
2009 Vi5,256,702
Incentive11%
ill Gas4%
Win10%
2010 Vi5,109,51
HydroelectWater22%
ind7%
intage E2 Total C
HydroeWat20
nd%
intage E1 Total C
Biomass35%
tric
nergy CrCredits
Biomass33%
electric ter%
nergy CrCredits
redits
redits
44
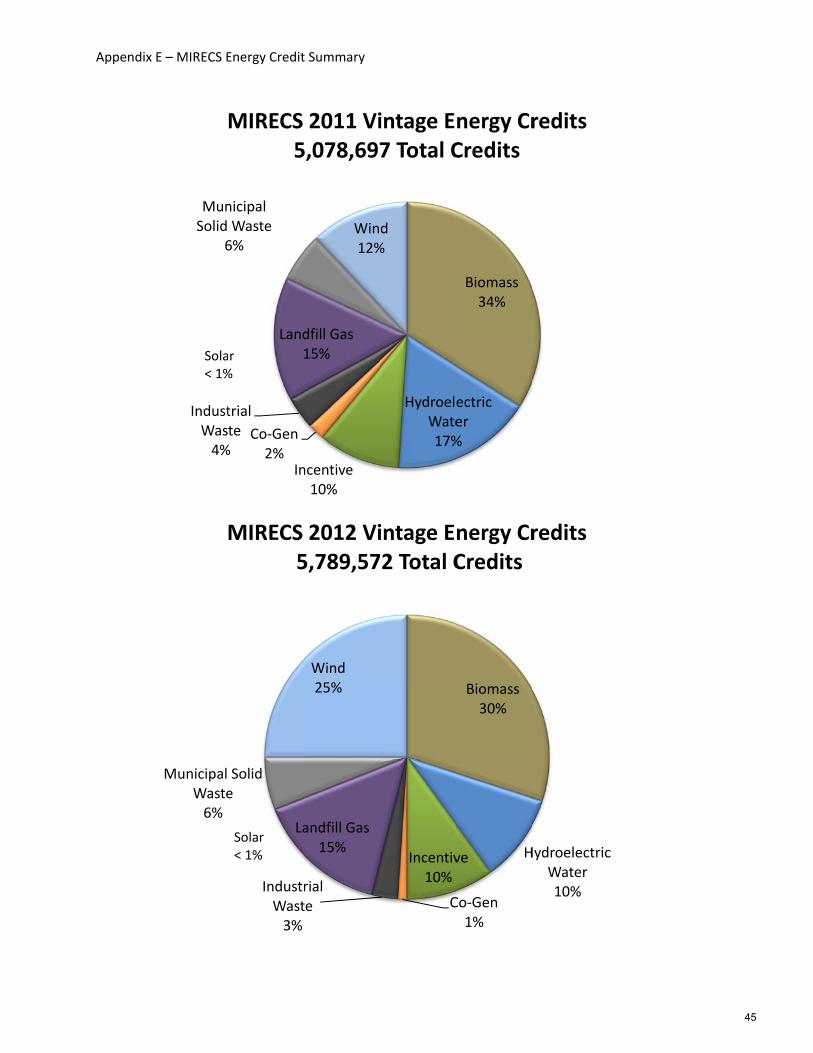
Appendix
E – MIRECS E
IndustWas4%
MunSolid
6
Sola< 1%
Municipal Waste6%
Energy Credit
In
Co‐Gen2%
trial te
%
Land1
nicipal Waste6%
MIRECS 5
r%
IndustrWast3%
La
Solid e
MIRECS 5
Solar< 1%
t Summary
ncentive10%
dfill Gas15%
Win12%
2011 Vi5,078,697
rial te
andfill Gas15%
Wind25%
2012 Vi5,789,57
HydroeleWate17%
d%
intage E7 Total C
Incentiv10%
C
intage E2 Total C
Biomass34%
ectric er%
nergy CrCredits
Biomass30%
Hve
Co‐Gen1%
nergy CrCredits
redits
HydroelectricWater10%
redits
c
45
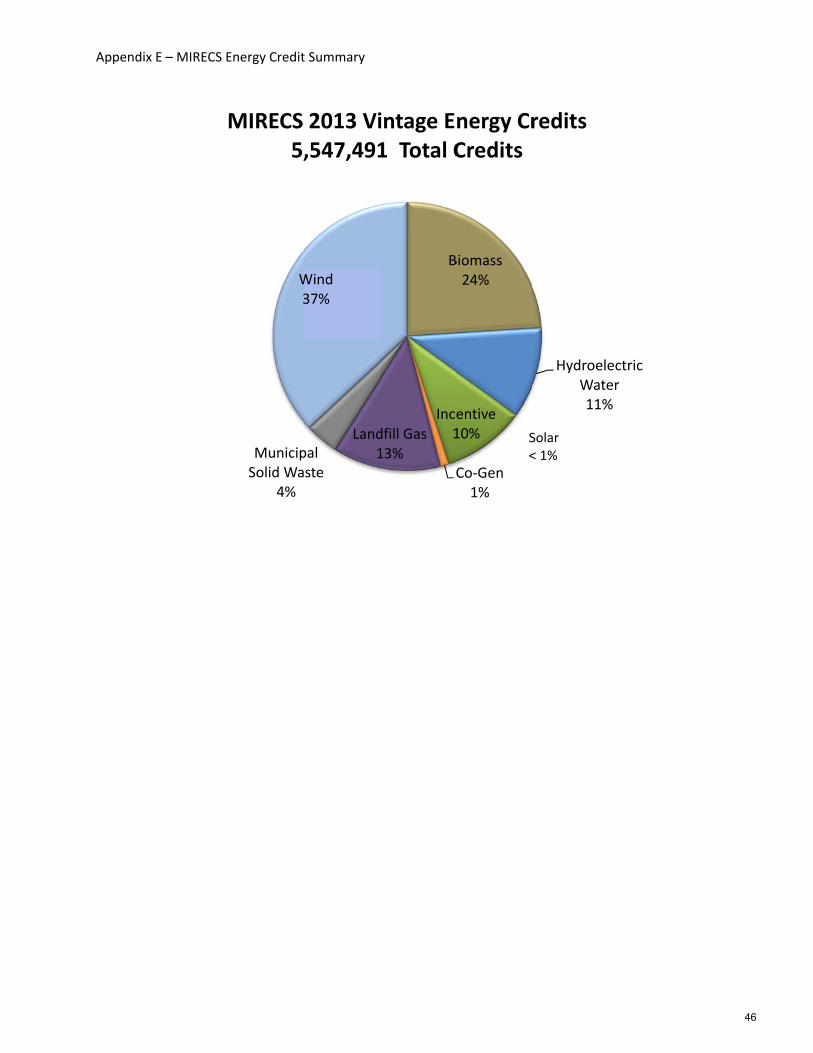
Appendix
E – MIRECS EEnergy Credit
MunicipSolid Wa
4%
W3
MIRECS 5,
t Summary
Land1pal
ste
Wind37%
2013 Vi,547,491
B
Ince1
C
dfill Gas13%
intage E1 Total C
Biomass24%
entive10%
Co‐Gen1%
nergy CrCredits
S<
HydroeleWate11%
redits
Solar< 1%
ectric er%
46
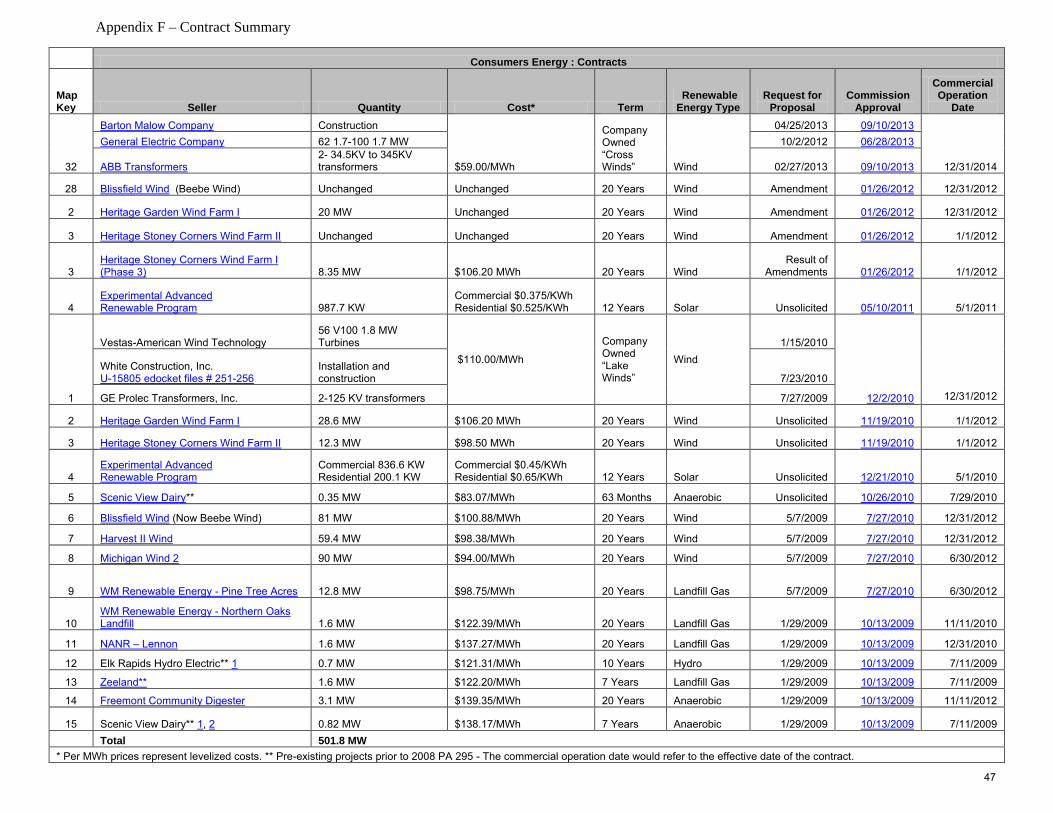
Appendix F – Contract Summary
Consumers Energy : Contracts
Map Key Seller Quantity Cost* Term
Renewable Energy Type
Request for Proposal
Commission Approval
Commercial Operation
Date
32
Barton Malow Company Construction
$59.00/MWh
Company Owned “Cross Winds” Wind
04/25/2013 09/10/2013
12/31/2014
General Electric Company 62 1.7-100 1.7 MW 10/2/2012 06/28/2013
ABB Transformers 2- 34.5KV to 345KV transformers 02/27/2013 09/10/2013
28 Blissfield Wind (Beebe Wind) Unchanged Unchanged 20 Years Wind Amendment 01/26/2012 12/31/2012
2 Heritage Garden Wind Farm I 20 MW Unchanged 20 Years Wind Amendment 01/26/2012 12/31/2012
3 Heritage Stoney Corners Wind Farm II Unchanged Unchanged 20 Years Wind Amendment 01/26/2012 1/1/2012
3 Heritage Stoney Corners Wind Farm I (Phase 3) 8.35 MW $106.20 MWh 20 Years Wind
Result of Amendments 01/26/2012 1/1/2012
4 Experimental Advanced Renewable Program 987.7 KW
Commercial $0.375/KWh Residential $0.525/KWh 12 Years Solar Unsolicited 05/10/2011 5/1/2011
1
Vestas-American Wind Technology 56 V100 1.8 MW Turbines
$110.00/MWh
Company Owned “Lake Winds”
Wind
1/15/2010
12/2/2010
12/31/2012
White Construction, Inc. U-15805 edocket files # 251-256
Installation and construction 7/23/2010
GE Prolec Transformers, Inc. 2-125 KV transformers 7/27/2009
2 Heritage Garden Wind Farm I 28.6 MW $106.20 MWh 20 Years Wind Unsolicited 11/19/2010 1/1/2012
3 Heritage Stoney Corners Wind Farm II 12.3 MW $98.50 MWh 20 Years Wind Unsolicited 11/19/2010 1/1/2012
4 Experimental Advanced Renewable Program
Commercial 836.6 KW Residential 200.1 KW
Commercial $0.45/KWh Residential $0.65/KWh 12 Years Solar Unsolicited 12/21/2010 5/1/2010
5 Scenic View Dairy** 0.35 MW $83.07/MWh 63 Months Anaerobic Unsolicited 10/26/2010 7/29/2010
6 Blissfield Wind (Now Beebe Wind) 81 MW $100.88/MWh 20 Years Wind 5/7/2009 7/27/2010 12/31/2012
7 Harvest II Wind 59.4 MW $98.38/MWh 20 Years Wind 5/7/2009 7/27/2010 12/31/2012
8 Michigan Wind 2 90 MW $94.00/MWh 20 Years Wind 5/7/2009 7/27/2010 6/30/2012
9 WM Renewable Energy - Pine Tree Acres 12.8 MW $98.75/MWh 20 Years Landfill Gas 5/7/2009 7/27/2010 6/30/2012
10 WM Renewable Energy - Northern Oaks Landfill 1.6 MW $122.39/MWh 20 Years Landfill Gas 1/29/2009 10/13/2009 11/11/2010
11 NANR – Lennon 1.6 MW $137.27/MWh 20 Years Landfill Gas 1/29/2009 10/13/2009 12/31/2010
12 Elk Rapids Hydro Electric** 1 0.7 MW $121.31/MWh 10 Years Hydro 1/29/2009 10/13/2009 7/11/2009
13 Zeeland** 1.6 MW $122.20/MWh 7 Years Landfill Gas 1/29/2009 10/13/2009 7/11/2009
14 Freemont Community Digester 3.1 MW $139.35/MWh 20 Years Anaerobic 1/29/2009 10/13/2009 11/11/2012
15 Scenic View Dairy** 1, 2 0.82 MW $138.17/MWh 7 Years Anaerobic 1/29/2009 10/13/2009 7/11/2009
Total 501.8 MW
* Per MWh prices represent levelized costs. ** Pre-existing projects prior to 2008 PA 295 - The commercial operation date would refer to the effective date of the contract.
47
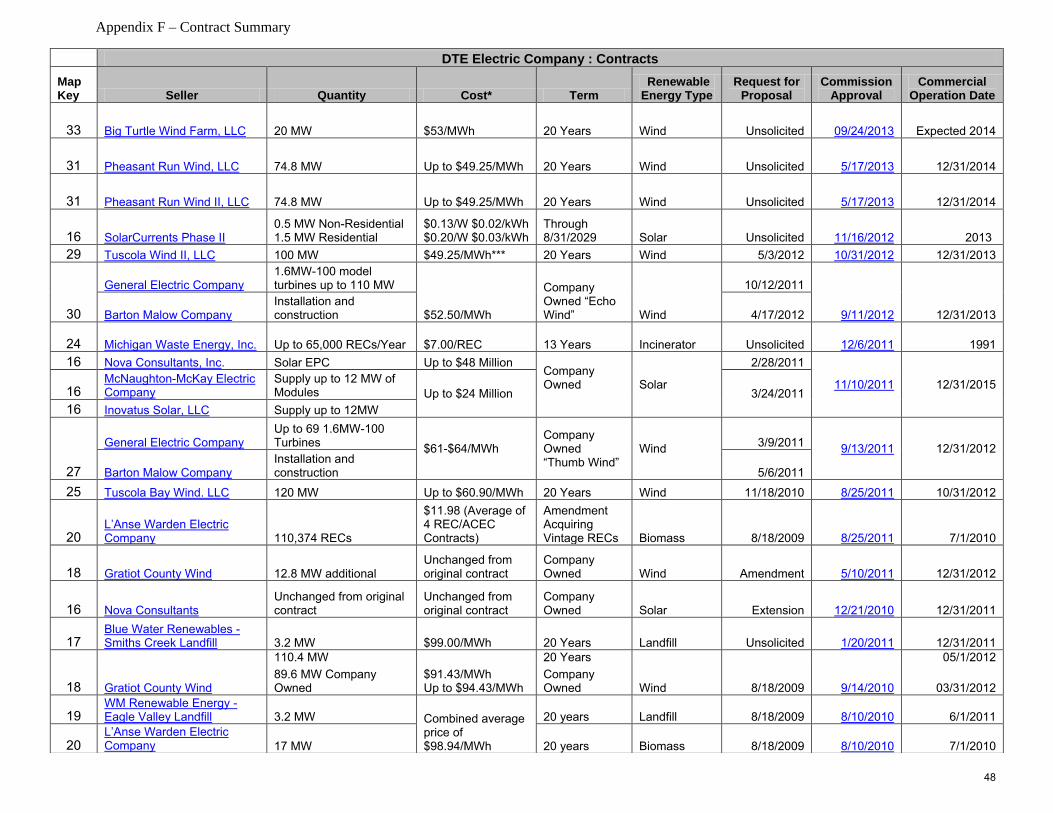
Appendix F – Contract Summary
DTE Electric Company : Contracts
Map Key Seller Quantity Cost* Term
Renewable Energy Type
Request for Proposal
Commission Approval
Commercial Operation Date
33 Big Turtle Wind Farm, LLC 20 MW $53/MWh 20 Years Wind Unsolicited 09/24/2013 Expected 2014
31 Pheasant Run Wind, LLC 74.8 MW Up to $49.25/MWh 20 Years Wind Unsolicited 5/17/2013 12/31/2014
31 Pheasant Run Wind II, LLC 74.8 MW Up to $49.25/MWh 20 Years Wind Unsolicited 5/17/2013 12/31/2014
16 SolarCurrents Phase II 0.5 MW Non-Residential 1.5 MW Residential
$0.13/W $0.02/kWh $0.20/W $0.03/kWh
Through 8/31/2029 Solar Unsolicited 11/16/2012 2013
29 Tuscola Wind II, LLC 100 MW $49.25/MWh*** 20 Years Wind 5/3/2012 10/31/2012 12/31/2013
30
General Electric Company 1.6MW-100 model turbines up to 110 MW
$52.50/MWh
Company Owned “Echo Wind” Wind
10/12/2011
9/11/2012 12/31/2013 Barton Malow Company Installation and construction 4/17/2012
24 Michigan Waste Energy, Inc. Up to 65,000 RECs/Year $7.00/REC 13 Years Incinerator Unsolicited 12/6/2011
1991
16 Nova Consultants, Inc. Solar EPC Up to $48 Million Company Owned
Solar
2/28/2011
11/10/2011
12/31/2015 16
McNaughton-McKay Electric Company
Supply up to 12 MW of Modules Up to $24 Million 3/24/2011
16 Inovatus Solar, LLC Supply up to 12MW
27
General Electric Company Up to 69 1.6MW-100 Turbines
$61-$64/MWh Company Owned “Thumb Wind”
Wind 3/9/2011
9/13/2011 12/31/2012
Barton Malow Company Installation and construction 5/6/2011
25 Tuscola Bay Wind. LLC 120 MW Up to $60.90/MWh 20 Years Wind 11/18/2010 8/25/2011 10/31/2012
20 L’Anse Warden Electric Company 110,374 RECs
$11.98 (Average of 4 REC/ACEC Contracts)
Amendment Acquiring Vintage RECs Biomass 8/18/2009 8/25/2011 7/1/2010
18 Gratiot County Wind 12.8 MW additional Unchanged from original contract
Company Owned Wind Amendment 5/10/2011 12/31/2012
16 Nova Consultants Unchanged from original contract
Unchanged from original contract
Company Owned Solar Extension 12/21/2010 12/31/2011
17 Blue Water Renewables - Smiths Creek Landfill 3.2 MW $99.00/MWh 20 Years Landfill Unsolicited 1/20/2011 12/31/2011
18 Gratiot County Wind
110.4 MW
$91.43/MWh Up to $94.43/MWh
20 Years
Wind 8/18/2009 9/14/2010
05/1/2012
89.6 MW Company Owned
Company Owned 03/31/2012
19 WM Renewable Energy - Eagle Valley Landfill
3.2 MW Combined average price of $98.94/MWh
20 years Landfill 8/18/2009 8/10/2010 6/1/2011
20 L’Anse Warden Electric Company 17 MW 20 years Biomass 8/18/2009 8/10/2010 7/1/2010
48

Appendix F – Contract Summary
DTE Electric Company : Contracts
Map Key Seller Quantity Cost* Term
Renewable Energy Type
Request for Proposal
Commission Approval
Commercial Operation Date
21
Boyce Hydro**
Firm 210,000 RECs w/additional 112,000 RECs dependent on generation $7.75/ REC 7 Years Hydro 12/23/2009 4/27/2010 3/16/2010
16 Nova Consultants Up to 3 MW Up to $18 Million Company Owned Solar 11/23/2009 3/2/2010 12/31/2010
22 Heritage Sustainable Energy Stoney Corners Wind Farm 12.2 MW
Unchanged from original contract 20 Years Wind Unsolicited 12/1/2009 1/1/2011
23 UPPCO** Firm 500,000 RECs Combined average price of $12.46/REC
7 Years Hydro 12/23/2009 12/1/2009 10/1/2009
Not Shown Sterling Planet** Firm 2,500,000 RECs 10 Years MISC 12/23/2009 12/1/2009 10/1/2009
22 Heritage Sustainable Energy Stoney Corners Wind Farm 14 MW $116.00/MWh 20 Years Wind Unsolicited 4/30/2009 12/21/2009
Total 889.4 MW
* Per MWh prices represent levelized costs. ** Pre-existing projects prior to 2008 PA 295 - The commercial operation date would refer to the effective date of the contract. ***Staff calculated levelized cost, does not include gross-up for taxes.
Alpena Power Company : Contracts
Seller Quantity Cost Term Renewable Energy Type
Request for Proposal
Commission Approval
Commercial Operation Date
26 Consumers Energy "Bulk of RECs needed to meet the RPS"
$30.37/REC (estimated) 20 Years MISC Unsolicited 9/15/2009 8/4/2009
AEP/Indiana Michigan : Contracts
Seller Quantity Cost Term Renewable Energy Type
Request for Proposal
Commission Approval
Commercial Operation Date
Fowler Ridge Wind Farm II 50 MW Redacted 20 Years Wind Unsolicited 9/15/2009 2/15/2010
100 MW Redacted 20 years Wind Competitive Solicitation 8/25/2011 12/31/12 Wildcat I Wind Farm, LLC
Wisconsin Electric Power Company : Contracts
Seller Quantity Cost Term Renewable Energy Type
Request for Proposal
Commission Approval
Commercial Operation Date
Cadillac Renewable
Energy. LLC REC-Only Redacted Redacted Redacted Biomass Competitive Solicitation 01/23/2014 Redacted
49

Appendix G - Requests for Proposal (RFP) Summary
Issue Date Type Description Requested CapacityCompany
OwnedApplicable
Technology* Responses
4/25/2013 RFPRequested bids for the Installation of a Utility Owned Wind Farm (Cross Winds) 6 Proposals
2/27/2013 RFPRequested Substation Transformer Bids for Utility Owned Wind Farm (Cross Winds) 5 Proposals
10/2/2012 RFPRequested bids for Utility Owned Wind Turbines (Cross Winds)
9 Proposals/ 6 Suppliers
May-12 RFQRequest for Qualifications for 105 MWs of Utility Owned Wind Turbines N/A Yes Wind 12 Recipiants
7/23/2010 RFPRequested bids for the Installation of a Utility Owned Wind Farm 7 Proposals
1/15/2010 RFP Requested bids for Utility Owned Wind Turbines11 Proposals/ 4 Suppliers
7/27/2009 RFPRequested Substation Transformer Bids for Utility Owned Wind Farm 4 Proposals
2/19/2010 RFQRequest for Qualifications for the Installation of a 100 MW Utility Owned Wind Farm N/A Yes Wind 8 Recipients
7/14/2010 RFQRequest for Qualifications for 100 MWs of Utility Owned Wind Turbines N/A Yes Wind 8 Recipients
5/7/2009 RFP Requested CEREC** 100 MW by 2012 / 150 MW by 2014 No All 80 Proposals
1/29/2009 RFP Requested CEREC** 17.4 MW No All12 Proposals/ 11 Suppliers
Consumers Energy : Request for Proposals/Requests for Information/Pre-Qualifications
100 MW by 2012 Yes Wind
105 MW by Yes Wind
* All=Any Renewable Energy Resource defined by 2008 PA 295; REC=Renewable Energy Credit; ACEC=Advanced Cleaner Energy Credit ** CEREC=Capacity, Energy, and Renewable Energy Attributes
50

Appendix G - Requests for Proposal (RFP) Summary
Issue Date Type Description Requested CapacityCompany
OwnedApplicable
Technology* Responses
5/3/2012 RFP 100 MW of Wind 100 MW by 12/31/2013 No Wind17 proposals / 16
suppliers
4/17/2012 RFP EPC (Echo) NA Yes Wind13 proposals / 13
suppliers
12/7/2011 Auction Requested RECs* Without the Associated Energy 2009 and 2010 Vintage No All NA
10/12/2011 RFP 110 MW of Utility Owned Wind Turbines (Echo) 110 MW by 12/31/2013 Yes Wind14 proposals / 7
suppliers
5/6/2011 RFP EPC (Thumb) N/A Yes Wind6 proposals / 6
suppliers
3/24/2011 RFP Solar Panels 12 MW Yes Solar38 proposals, 24
companies
3/10/2011 RFP Wind Ownership Option 50 MW by 12/31/2014 Yes All38 proposals / 15
suppliers
3/9/2011 RFP 109 MW of Utility Owned Wind Turbines (Thumb) 109 MW by 12/31/2012 Yes Wind17 proposals / 7
suppliers
2/28/2011 RFPRequested bids for the Installation of Utility
Owned Solar N/A Yes Solar27 companies, 27
proposals
2/10/2011 RFP O&M Services N/A Yes Wind5 proposals / 5
suppliers
11/18/2010 RFP Requested CEREC** 245 MW by 12/31/2014 No All146 proposals / 46
Suppliers
7/26/2010 Pre-QPre-qualification for 100-200 MW of Utility Owned
Wind Turbines N/A Yes Wind27 proposals / 17
Suppliers
3/29/2010 SOISolicitation of Interest to Host Utility Owned Solar at the Customers Location N/A Yes Solar 10 Responses
11/23/2009 RFPRequested bids for the Installation of Utility Owned Solar 3 MW Yes Solar 11 Proposals
10/23/2009 Pre-QPre-Qualification for the Installation of 3 MW of Utility Owned Solar N/A Yes Solar 30 Responses
8/18/2009 RFP Joint Development for Utility Owned Wind 75 MW by 12/31/2011 Yes Wind12 Proposals/ 9 Suppliers
8/18/2009 RFP Requested CEREC** 106 MW by 12/31/2011 No All
35 Proposals/ 21 Suppliers
5/22/2009 RFIRequest for Information for the Joint Development of Wind Farms N/A Yes Wind
155 Registered 27 Responses
12/23/2008 RFPRequested RECs* and ACECs* Without the Associated Energy 250,000 RECs*/Year No All
43 Proposals/ 11 Suppliers
DTE Electric Company : Request for Proposals/Requests for Information/Pre-Qualifications
* All=Any Renewable Energy Resource defined by 2008 PA 295; REC=Renewable Energy Credit; ACEC=Advanced Cleaner Energy Credit ** CEREC=Capacity, Energy, and Renewable Energy Attributes
51
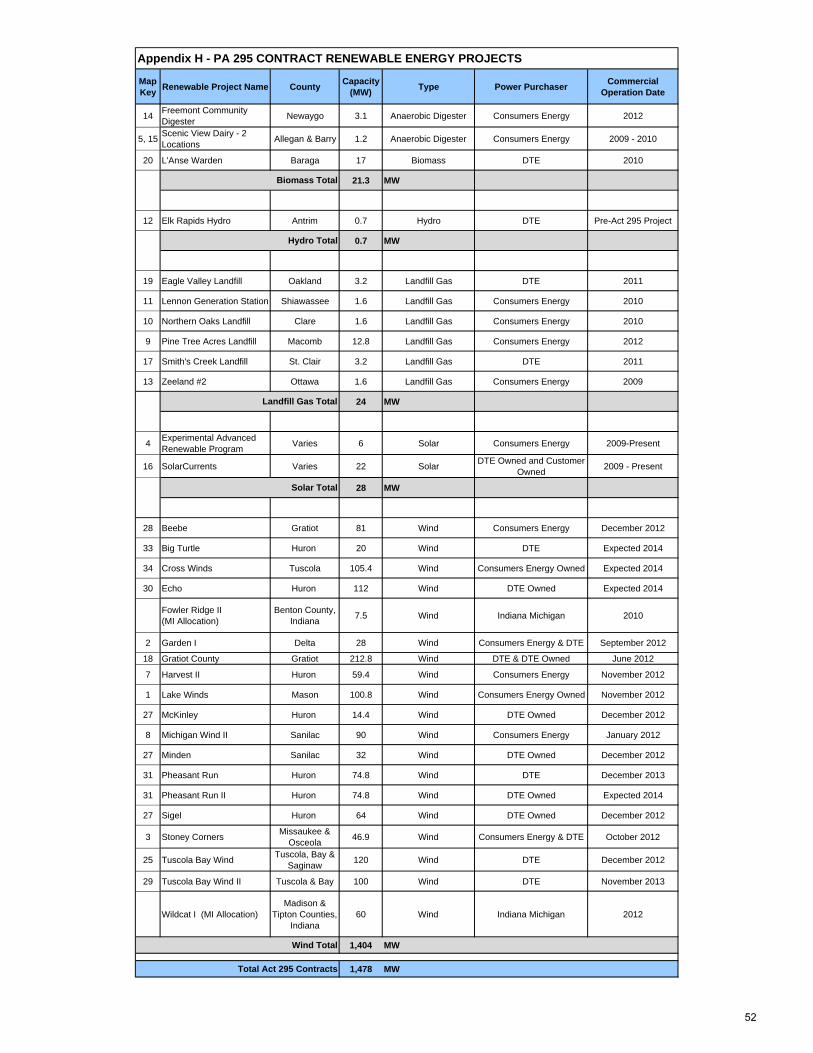
Map Key Renewable Project Name County Capacity
(MW) Type Power Purchaser Commercial Operation Date
14 Freemont Community Digester Newaygo 3.1 Anaerobic Digester Consumers Energy 2012
5, 15 Scenic View Dairy - 2 Locations Allegan & Barry 1.2 Anaerobic Digester Consumers Energy 2009 - 2010
20 L'Anse Warden Baraga 17 Biomass DTE 2010
21.3 MW
12 Elk Rapids Hydro Antrim 0.7 Hydro DTE Pre-Act 295 Project
0.7 MW
19 Eagle Valley Landfill Oakland 3.2 Landfill Gas DTE 2011
11 Lennon Generation Station Shiawassee 1.6 Landfill Gas Consumers Energy 2010
10 Northern Oaks Landfill Clare 1.6 Landfill Gas Consumers Energy 2010
9 Pine Tree Acres Landfill Macomb 12.8 Landfill Gas Consumers Energy 2012
17 Smith's Creek Landfill St. Clair 3.2 Landfill Gas DTE 2011
13 Zeeland #2 Ottawa 1.6 Landfill Gas Consumers Energy 2009
24 MW
4 Experimental Advanced Renewable Program Varies 6 Solar Consumers Energy 2009-Present
16 SolarCurrents Varies 22 Solar DTE Owned and Customer Owned 2009 - Present
28 MW
28 Beebe Gratiot 81 Wind Consumers Energy December 2012
33 Big Turtle Huron 20 Wind DTE Expected 2014
34 Cross Winds Tuscola 105.4 Wind Consumers Energy Owned Expected 2014
30 Echo Huron 112 Wind DTE Owned Expected 2014
Fowler Ridge II (MI Allocation)
Benton County, Indiana 7.5 Wind Indiana Michigan 2010
2 Garden I Delta 28 Wind Consumers Energy & DTE September 2012
18 Gratiot County Gratiot 212.8 Wind DTE & DTE Owned June 2012
7 Harvest II Huron 59.4 Wind Consumers Energy November 2012
1 Lake Winds Mason 100.8 Wind Consumers Energy Owned November 2012
27 McKinley Huron 14.4 Wind DTE Owned December 2012
8 Michigan Wind II Sanilac 90 Wind Consumers Energy January 2012
27 Minden Sanilac 32 Wind DTE Owned December 2012
31 Pheasant Run Huron 74.8 Wind DTE December 2013
31 Pheasant Run II Huron 74.8 Wind DTE Owned Expected 2014
27 Sigel Huron 64 Wind DTE Owned December 2012
3 Stoney Corners Missaukee & Osceola 46.9 Wind Consumers Energy & DTE October 2012
25 Tuscola Bay Wind Tuscola, Bay & Saginaw 120 Wind DTE December 2012
29 Tuscola Bay Wind II Tuscola & Bay 100 Wind DTE November 2013
Wildcat I (MI Allocation)Madison &
Tipton Counties, Indiana
60 Wind Indiana Michigan 2012
1,404 MW
1,478 MW
Appendix H - PA 295 CONTRACT RENEWABLE ENERGY PROJECTS
Total Act 295 Contracts
Wind Total
Solar Total
Landfill Gas Total
Biomass Total
Hydro Total
52

Project Name County Capacity (MW) Turbine Size (MW)
Number of Turbines
Turbine Manufacturer Developer Power Purchaser Commercial Operation
Date
Beebe Gratiot 81 2.4 34 Nordex Exelon & Great Lakes Wind Consumers Energy December 2012
Big Turtle Huron 20 2.0 10 Gamesa Heritage Sustainable Energy DTE Expected 2014
Cross Winds Tuscola 105.4 1.7 62 GE Energy Consumers Energy N/A Expected 2014
Echo Huron 112 1.6 70 GE Energy DTE N/A Expected 2014
Garden I Delta 28 2.0 14 Gamesa Heritage Sustainable Energy Consumers Energy & DTE September 2012
Gratiot County Gratiot 212.8 1.6 133 GE Energy Invenergy & DTE DTE June 2012
Harvest Huron 52.8 1.65 32 Vestas Exelon Wolverine Power Cooperative 2008
Harvest II Huron 59.4 1.8 33 Vestas Exelon Consumers Energy November 2012
Lake Winds Mason 100.8 1.8 56 Vestas Consumers Energy N/A November 2012
McKinley Huron 14.4 1.6 9 GE Energy DTE N/A December 2012
Mackinaw City Emmet 1.8 0.9 2 NEG Micon Mackinaw Power Consumers Energy 2001
Michigan Wind I Huron 69 1.5 46 GE Energy Exelon Consumers Energy 2008
Michigan Wind II Sanilac 90 1.8 50 Vestas Exelon Consumers Energy January 2012
Minden Sanilac 32 1.6 20 GE Energy DTE N/A December 2012
Pheasant Run Wind Huron 74.8 1.7 44 GE Energy NextEra Energy DTE December 2013
Pheasant Run Wind II Huron 74.8 1.7 44 GE Energy NextEra Energy DTE Expected 2014
Sigel Huron 64 1.6 40 GE Energy Detroit Edison N/A December 2012
Stoney Corners Missaukee & Osceola 60 2 - 2.5 29
Repower, Fuhrlander,
Northern Power Systems
Heritage Sustainable Energy
Consumers Energy, DTE, Traverse City
Light & PowerOctober 2012
Tuscola Bay Wind Tuscola, Bay & Saginaw 120 1.6 75 GE Energy NextEra Energy DTE December 2012
Tuscola Wind II Tuscola & Bay 100.3 1.7 59 GE Energy NextEra Energy DTE Electric November 2013
1,473.3 MW 862 TurbinesOperational Totals 1,161.1 MW 746 Turbines
* Prepared by MPSC Staff and includes all wind farms operational, planned or under contract with an MPSC-rate-regulated electric provider.
Totals
Bold text indicates the wind farm is operational.
Michigan Utility Scale Wind Farms*Appendix I - Michigan Utility Scale Wind Farms
53

Beebe Wind, 81 MW
Echo Wind, 110 MW
Garden Wind Farm, 20 MW
Gratiot County Wind, 212.8 MW
Harvest I Wind, 52.8 MW
Harvest II Wind, 59.4 MW
Lake Winds Energy Park, 100.8 MW
Mackinaw City, 1.8 MW
McKinley, 14.4 MW
Michigan Wind I, 69 MW
Michigan Wind II, 90 MW
Minden, 32 MW
Sigel, 64 MW
Stoney Corners, 60 MW
Tuscola Bay Wind, 120 MW
Cross Winds, 150 MW
Tuscola Bay Wind II, 100 MW
Pheasant Run Wind, 74.8 MW
Pheasant Run Wind II, 74.8 MW
Cross Winds, 105 MW
Big Turtle, 20 MW
1161.1 MW Total Operational
Wind Energy Zone (Region 1)
Primary Wind Energy Zone (Region 4)
3
7 611
4
15
2
Michigan Wind Farms
1
12
9
13
1
2
3
4
7
8
9
10
11
12
13
15
14
5
10
8
Currently Operational Under Development
5
6
Map includes wind farms currently operating or under development for MPSC rate-regulated electric providers.
14
16
16
17
17
18
19
18
19
20
20
21
21
Appendix I – Michigan Utility Scale Wind Farms
54


![Zhen Zhen 1, Lindi J. Quackenbush 2,* and Lianjun Zhang 3 · individual species identification [10,23]. The complementary nature of multi-source data provides great opportunities](https://img.dokumen.tips/doc/110x75/5e9ecb9a07ba18423716afdb/zhen-zhen-1-lindi-j-quackenbush-2-and-lianjun-zhang-3-individual-species-identiication.jpg)


