Embed Size (px)
Citation preview

CAPI Processed Food Research Program Project 3a
The Performance of Canada’s Food Manufacturing Industry
David Sparling, PhDProfessor & ChairAgri-food InnovationIvey Business School
Erin CheneyResearch AssociateIIvey Business School

About the CAPI Processed Food Research Program
Food and beverage processing is one of the country’s largest manufacturing sectors and an essential
channel for Canadian agricultural products. Companies are succeeding yet the sector has been facing
challenges, including record trade deficits in secondary processing. Working closely with a variety of
partners, CAPI’s research is focused on better understanding the issues and opportunities facing this
sector and their implications for policy and strategy, and to generate a dialogue on ways to support the
sector’s future growth and competitiveness.
Project 3a: The Performance of Canada’s Food Manufacturing Industry: Food manufacturing is an
important but generally under‐appreciated part of the Canadian economy. The Ivey Business School
reviews the performance of this sector and compares it to that of other manufacturing sectors. The
work also provides context on the competitive environment in which food manufacturers operate by
portraying where this sector has shown a certain amount of resilience and where this sector is facing
particular pressures.
Phase 1 Phase 2 Phase 3 Diagnosis Inspiring Practices Competitive Advantage
1a. Diagnosing the trade deficit 1b. Reasons for the trade deficit
4a. Case studies on company success 4b. Cross‐Case study analysis
7. Conclusions
2. Explaining the trade data 5. Consumer and markets 8. Implications for policy & strategy3a. Manufacturing sector performance 3b. Plant Openings and closures, investments
6. Innovation insights 9. Dialogues on outcomes
All completed projects, along with supporting material and data, can be found online at www.capi‐
icpa.ca
About Agri‐food@Ivey at Ivey Business School
Located at the Ivey Business School at Western University, Agri‐food @Ivey aims to be Canada’s leading
source of accessible and relevant knowledge about agri‐food innovation and policy. Ivey (www.ivey.ca)
is Canada’s leading provider of relevant, innovative and comprehensive business education.Drawing on
extensive research and business experience, Ivey faculty provide the best classroom experience,
equipping graduates with the skills and capabilities they need to tackle the leadership challenges in
today’s complex business world. Ivey offers world‐renowned undergraduate and graduate degree
programs as well as Executive Development at campuses in London (Ontario), Toronto and Hong Kong.

2
Sparling&Cheney The Performance of Canada's Food Manufacturing Industry
ExecutiveSummary
Food manufacturing is an important, but generally under‐appreciated, part of the Canadian economy.
This paper is the first of a two paper series intended to shed light on the industry and its role in the
economy. It examines the performance of Canada’s food manufacturing industry over the period 2004‐
2011 and compares it to that of other manufacturing sectors. Data for the analysis was obtained from
Statistics Canada CANSIM industry database.
KeyFindings
1. Food manufacturing is an important part of the Canadian economy. With revenue of more than
$88 billion in 2011, it is the second largest Canadian manufacturing industry.
2. Food manufacturing was the largest manufacturing employer in Canada, employing more than
236,000 people in 2011, exceeding employment in second place transportation equipment
industry, which includes the auto sector.
3. Food manufacturing is different. During the recent recession food manufacturers faced similar
challenges to other industries but food industry performance was much different. Food
manufacturing proved to be remarkably resilient in both revenue and employment compared to
other manufacturing industries.
4. Employment in the food industry changed slightly over the period, shedding direct
manufacturing jobs but picking up more indirect jobs, for an overall net gain.
5. The resilience displayed by the entire food industry was also apparent among the different food
manufacturing sectors but there were some significant differences in performance.
6. The environment has become more challenging for food manufacturers. The recession, higher
Canadian dollar, increased foreign competition, retail concentration and higher input costs are
all squeezing margins for food manufacturers. Consequently, there was little real growth in
output and value added over the period.
7. In spite of the challenges, the Canadian food manufacturing industry managed to make gains of
over 20% in both margins and net income which is greater than the rate of inflation over that
period of roughly 14%.
8. Food manufacturing companies began to significantly increase their investment in equipment in
2010. Other investments were relatively unchanged.
9. Although food manufacturing is important to Canada’s economy and to Canadian farmers, it has
received very little attention from policy makers. That needs to change if Canada is to continue
to reap the economic and employment benefits of a healthy food manufacturing industry.
3
Sparling&Cheney The Performance of Canada's Food Manufacturing Industry
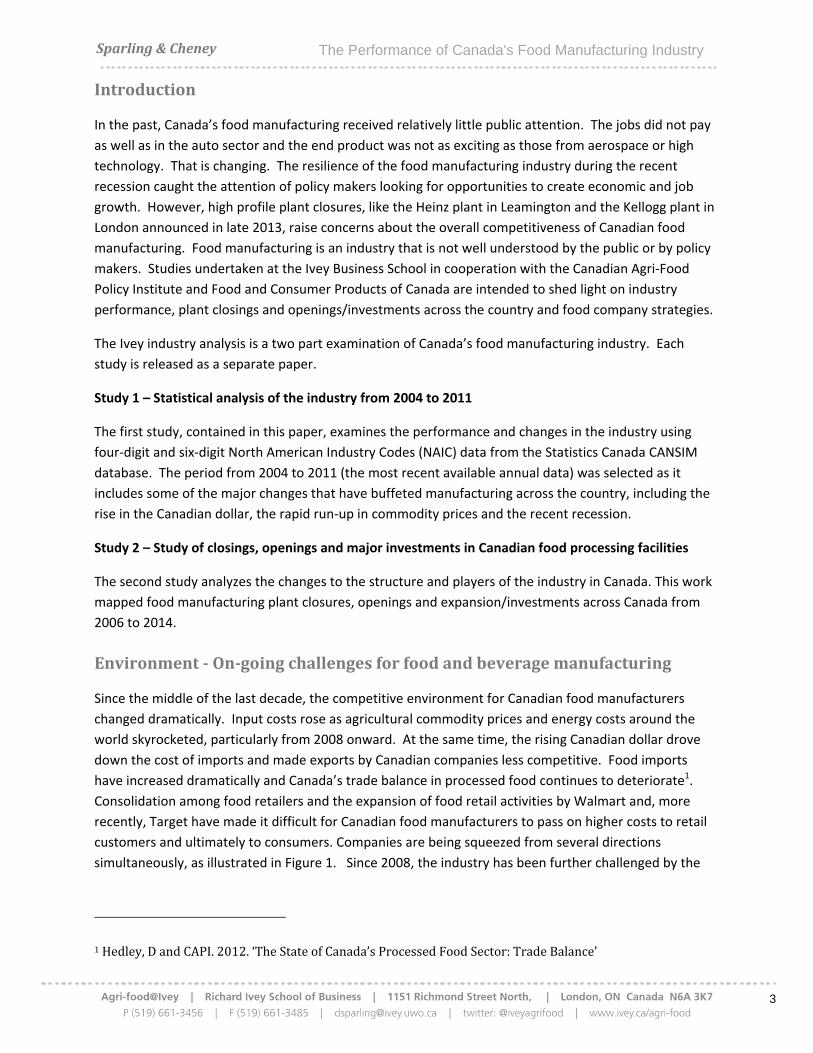
Introduction
In the past, Canada’s food manufacturing received relatively little public attention. The jobs did not pay
as well as in the auto sector and the end product was not as exciting as those from aerospace or high
technology. That is changing. The resilience of the food manufacturing industry during the recent
recession caught the attention of policy makers looking for opportunities to create economic and job
growth. However, high profile plant closures, like the Heinz plant in Leamington and the Kellogg plant in
London announced in late 2013, raise concerns about the overall competitiveness of Canadian food
manufacturing. Food manufacturing is an industry that is not well understood by the public or by policy
makers. Studies undertaken at the Ivey Business School in cooperation with the Canadian Agri‐Food
Policy Institute and Food and Consumer Products of Canada are intended to shed light on industry
performance, plant closings and openings/investments across the country and food company strategies.
The Ivey industry analysis is a two part examination of Canada’s food manufacturing industry. Each
study is released as a separate paper.
Study 1 – Statistical analysis of the industry from 2004 to 2011
The first study, contained in this paper, examines the performance and changes in the industry using
four‐digit and six‐digit North American Industry Codes (NAIC) data from the Statistics Canada CANSIM
database. The period from 2004 to 2011 (the most recent available annual data) was selected as it
includes some of the major changes that have buffeted manufacturing across the country, including the
rise in the Canadian dollar, the rapid run‐up in commodity prices and the recent recession.
Study 2 – Study of closings, openings and major investments in Canadian food processing facilities
The second study analyzes the changes to the structure and players of the industry in Canada. This work
mapped food manufacturing plant closures, openings and expansion/investments across Canada from
2006 to 2014.
Environment‐On‐goingchallengesforfoodandbeveragemanufacturing
Since the middle of the last decade, the competitive environment for Canadian food manufacturers
changed dramatically. Input costs rose as agricultural commodity prices and energy costs around the
world skyrocketed, particularly from 2008 onward. At the same time, the rising Canadian dollar drove
down the cost of imports and made exports by Canadian companies less competitive. Food imports
have increased dramatically and Canada’s trade balance in processed food continues to deteriorate1.
Consolidation among food retailers and the expansion of food retail activities by Walmart and, more
recently, Target have made it difficult for Canadian food manufacturers to pass on higher costs to retail
customers and ultimately to consumers. Companies are being squeezed from several directions
simultaneously, as illustrated in Figure 1. Since 2008, the industry has been further challenged by the
1Hedley,DandCAPI.2012.‘TheStateofCanada’sProcessedFoodSector:TradeBalance’

Sparling
global eco
world.
Figure 1. P
Foodvs
Thefood
Recent ye
firms inte
regions lik
Canadian
equipmen
actually in
manufact
consistenc
g&Cheney
onomic recess
Pressures on
sOtherMa
industrywa
ars have bee
nsified and th
ke China and
manufacturin
nt plummeted
ncreased. By
uring leader,
cy of food ma
sion, which d
Canadian foo
anufacturi
asoneofthe
n difficult for
he search for
Mexico. Duri
ng sectors (Fig
d by more tha
2011, revenu
transportatio
anufacturing,
The Perfo
ecimated ma
od manufactu
ing–Simil
efewtoexpe
r all Canadian
cheap labour
ng the recess
gure 2). Food
an one third b
ue from food
on equipment
which displa
ormance of C
nufacturing a
urers
larPressu
eriencereal
manufacturi
r drove many
sion of 2009 r
d was the exc
before startin
was almost a
t. The other
yed consider
Canada's Fo
activities in C
ures,Differ
revenuegro
ng companie
y North Amer
revenue decli
ception. Whi
ng to recover,
as large as tha
distinguishing
rably less vari
ood Manufac
anada and ot
rentOutco
owth
es. Competiti
ican manufac
ned significan
le revenue in
, food manufa
at of the trad
g feature was
ability than o
cturing Indus
ther parts of t
omes
on from fore
cturers to low
ntly in most
n transportati
acturing reve
itional
s the remarka
other industri
stry
the
ign
w cost
on
nue
able
es.
4

5
Sparling&Cheney The Performance of Canada's Food Manufacturing Industry
Figure 2. Total revenue in the top 5 Canadian manufacturing sectors 2004‐2011
Data Source: Statistics Canada CANSIM database from 2004 to 2011
The five top manufacturing industries also exhibited different price patterns through 2004‐2011, as their
respective industrial price indices show in Figure 3. Energy prices rose the most over the period, while
the industrial product price index for transportation equipment manufacturing fell. Food prices showed
moderate inflation over the period.
Figure 3. Industrial product price indices (IPPI) for Canadian manufacturing sectors (2000=100)
Data Source: Statistics Canada CANSIM database 2004 to 2011
When the nominal revenues of Figure 2 are adjusted using their respective industrial product price
index, the picture of real industry output is somewhat different (Figure 4). Food remains the only
industry showing real growth in output relative to 2004 levels over the period but that growth is small.
0
20
40
60
80
100
120
140
2004 2005 2006 2007 2008 2009 2010 2011
CAD $ Billions
Transportation equipmentmanufacturing [336]Food manufacturing [311]
Petroleum and coal productmanufacturing [324]Chemical manufacturing [325]
Primary metal manufacturing[331]
0
50
100
150
200
250
2004 2005 2006 2007 2008 2009 2010 2011
IPPI food
IPPI primary metals
IPPI chemicals
IPPI Petroleum and coalproducts
IPPI Transportation equipmentmanufacturing

6
Sparling&Cheney The Performance of Canada's Food Manufacturing Industry
Falling prices in the transportation equipment industry meant that the recovery in industry output was
actually greater than indicated by nominal revenue, although 2011 output was still far below pre‐
recession levels.
Figure 4. Manufacturing output in real terms ‐ revenue adjusted by industry IPPI to constant 2004
dollars
Data Source: Statistics Canada CANSIM database, 2004 to 2011
Foodmanufacturing‐thenumberonemanufacturingemployerinCanada
Canada’s food manufacturing industry was the largest manufacturing employer in Canada over the
entire period, and the gap between it and the other sectors grew during the recession (Figure 5). The
industry showed remarkable resilience, shedding jobs in the middle of the decade due to the higher
Canadian dollar and higher commodity prices but recovering from 2009 onward. Transportation
equipment manufacturing experienced the largest decline over the period, losing close to one quarter of
industry jobs.
0
20
40
60
80
100
120
140
2004 2005 2006 2007 2008 2009 2010 2011
CAD $ Billions
Transportation equipmentmanufacturing [336]
Food manufacturing
Petroleum and coal productmanufacturing [324]
Chemical manufacturing[325]
Primary metal manufacturing[331]
7
Sparling&Cheney The Performance of Canada's Food Manufacturing Industry
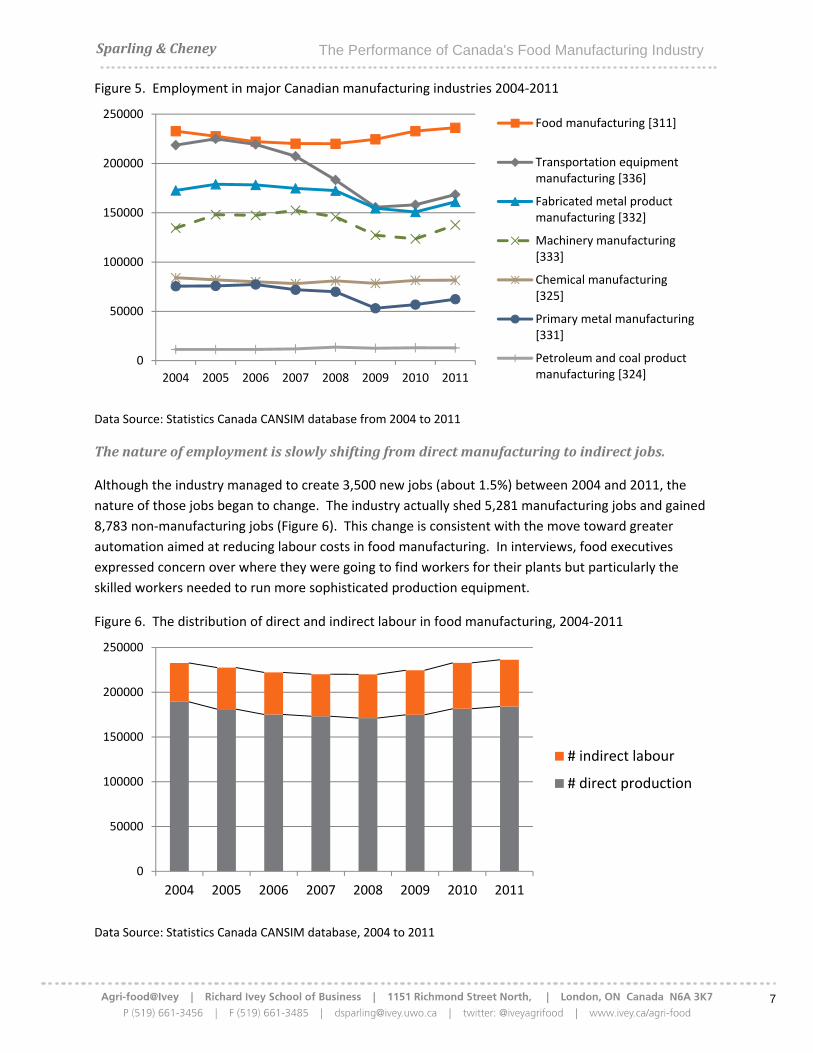
Figure 5. Employment in major Canadian manufacturing industries 2004‐2011
Data Source: Statistics Canada CANSIM database from 2004 to 2011
Thenatureofemploymentisslowlyshiftingfromdirectmanufacturingtoindirectjobs.
Although the industry managed to create 3,500 new jobs (about 1.5%) between 2004 and 2011, the
nature of those jobs began to change. The industry actually shed 5,281 manufacturing jobs and gained
8,783 non‐manufacturing jobs (Figure 6). This change is consistent with the move toward greater
automation aimed at reducing labour costs in food manufacturing. In interviews, food executives
expressed concern over where they were going to find workers for their plants but particularly the
skilled workers needed to run more sophisticated production equipment.
Figure 6. The distribution of direct and indirect labour in food manufacturing, 2004‐2011
Data Source: Statistics Canada CANSIM database, 2004 to 2011
0
50000
100000
150000
200000
250000
2004 2005 2006 2007 2008 2009 2010 2011
Food manufacturing [311]
Transportation equipmentmanufacturing [336]
Fabricated metal productmanufacturing [332]
Machinery manufacturing[333]
Chemical manufacturing[325]
Primary metal manufacturing[331]
Petroleum and coal productmanufacturing [324]
0
50000
100000
150000
200000
250000
2004 2005 2006 2007 2008 2009 2010 2011
# indirect labour
# direct production
Sparling
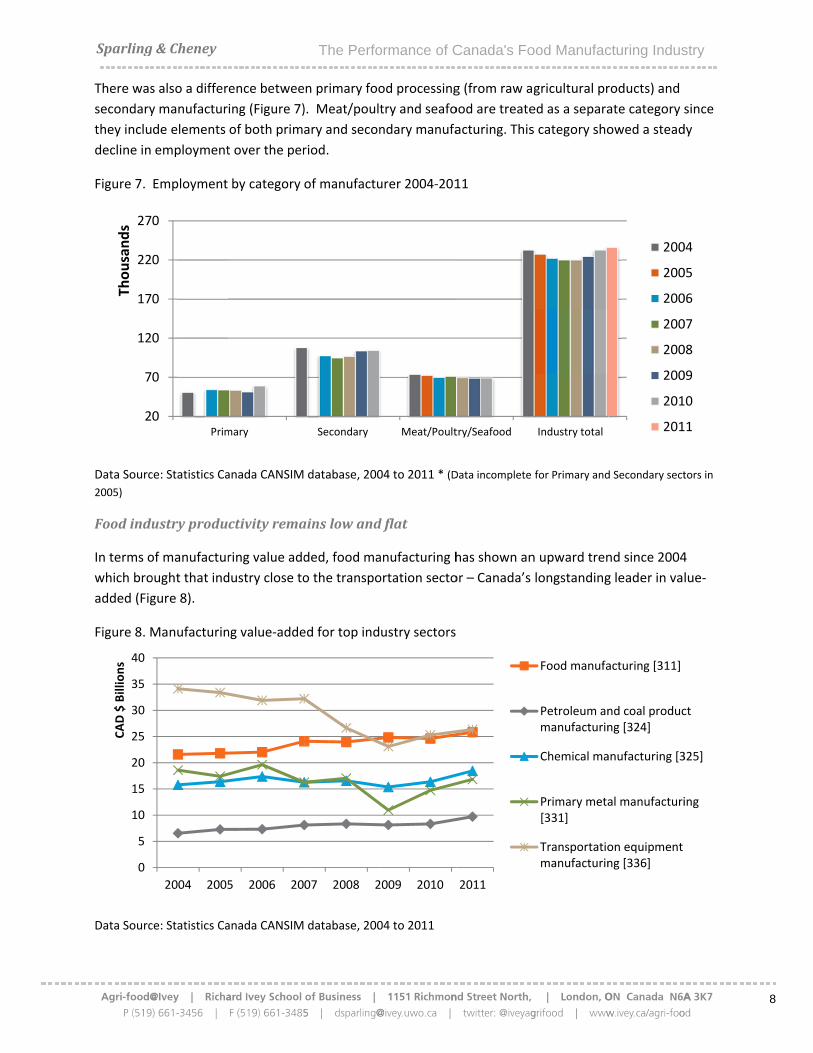
There was
secondary
they inclu
decline in
Figure 7.
Data Sourc
2005)
Foodindu
In terms o
which bro
added (Fig
Figure 8. M
Data Sourc
2
7
12
17
22
27
Thousands
0
5
10
15
20
25
30
35
40
CAD $ Billions
g&Cheney
s also a differ
y manufactur
de elements
employment
Employment
ce: Statistics Ca
ustryprodu
of manufactur
ought that ind
gure 8).
Manufacturin
ce: Statistics Ca
0
0
0
0
0
0
Prim
2004 2005
ence betwee
ing (Figure 7)
of both prim
t over the per
by category
anada CANSIM
ctivityrema
ring value add
dustry close to
ng value‐adde
anada CANSIM
mary
5 2006 20
The Perfo
n primary foo
). Meat/poult
ary and secon
riod.
of manufactu
database, 200
ainslowand
ded, food ma
o the transpo
ed for top ind
database, 200
Secondary
07 2008 2
ormance of C
od processing
try and seafo
ndary manufa
urer 2004‐201
04 to 2011 * (D
dflat
anufacturing h
ortation secto
ustry sectors
04 to 2011
Meat/Poult
2009 2010
Canada's Fo
g (from raw a
ood are treate
acturing. This
11
Data incomplete
has shown an
or – Canada’s
try/Seafood
2011
ood Manufac
gricultural pr
ed as a separa
s category sho
for Primary and
n upward tren
longstanding
Industry total
Food manufa
Petroleum anmanufacturin
Chemical ma
Primary meta[331]
Transportatiomanufacturin
cturing Indus
roducts) and
ate category s
owed a stead
d Secondary sect
nd since 2004
g leader in va
200
200
200
200
200
200
201
201
acturing [311]
nd coal producng [324]
anufacturing [3
al manufacturi
on equipmentng [336]
stry
since
dy
tors in
4
lue‐
04
05
06
07
08
09
10
11
ct
325]
ing
8
9
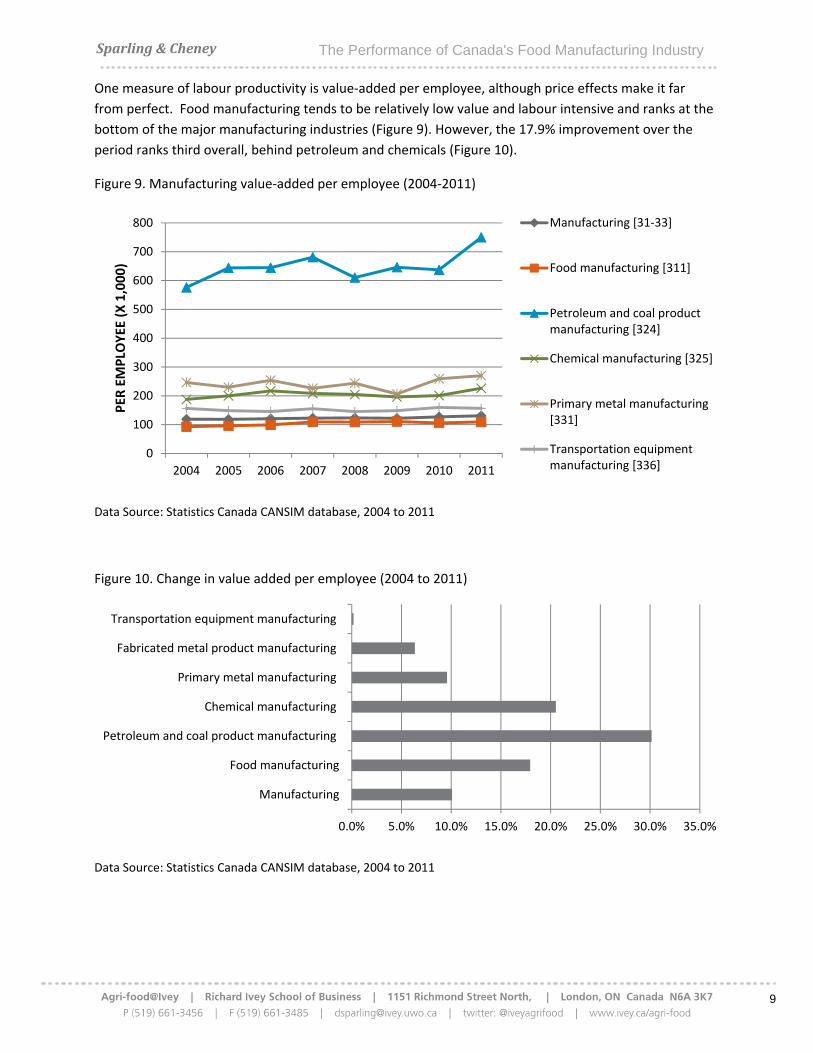
Sparling&Cheney The Performance of Canada's Food Manufacturing Industry
One measure of labour productivity is value‐added per employee, although price effects make it far
from perfect. Food manufacturing tends to be relatively low value and labour intensive and ranks at the
bottom of the major manufacturing industries (Figure 9). However, the 17.9% improvement over the
period ranks third overall, behind petroleum and chemicals (Figure 10).
Figure 9. Manufacturing value‐added per employee (2004‐2011)
Data Source: Statistics Canada CANSIM database, 2004 to 2011
Figure 10. Change in value added per employee (2004 to 2011)
Data Source: Statistics Canada CANSIM database, 2004 to 2011
0
100
200
300
400
500
600
700
800
2004 2005 2006 2007 2008 2009 2010 2011
PER
EMPLO
YEE (X 1,000)
Manufacturing [31‐33]
Food manufacturing [311]
Petroleum and coal productmanufacturing [324]
Chemical manufacturing [325]
Primary metal manufacturing[331]
Transportation equipmentmanufacturing [336]
0.0% 5.0% 10.0% 15.0% 20.0% 25.0% 30.0% 35.0%
Manufacturing
Food manufacturing
Petroleum and coal product manufacturing
Chemical manufacturing
Primary metal manufacturing
Fabricated metal product manufacturing
Transportation equipment manufacturing

10
Sparling&Cheney The Performance of Canada's Food Manufacturing Industry
Manufacturing intensity which is the ratio of value‐added to revenue from goods manufactured
provides one picture of industry margins. Authors Martin and Stiefelmeyer (2001) contend that
manufacturing intensity can reveal the progress of industries attempting to move away from a low cost
orientation toward differentiation. Stronger margins would be reflected in higher manufacturing
intensity.
Figure 11 shows how the top manufacturing industries fared. Food manufacturing intensity rose slightly
in 2008 but in 2011 showed virtually no change from 2004. As an industry, the positioning has not
changed over the period. Changes in manufacturing intensity are more likely to occur at the firm level
than the industry level.
Figure 11. Manufacturing intensity: Value‐added/revenue from manufactured goods
Data Source: Statistics Canada CANSIM database, 2004 to 2011
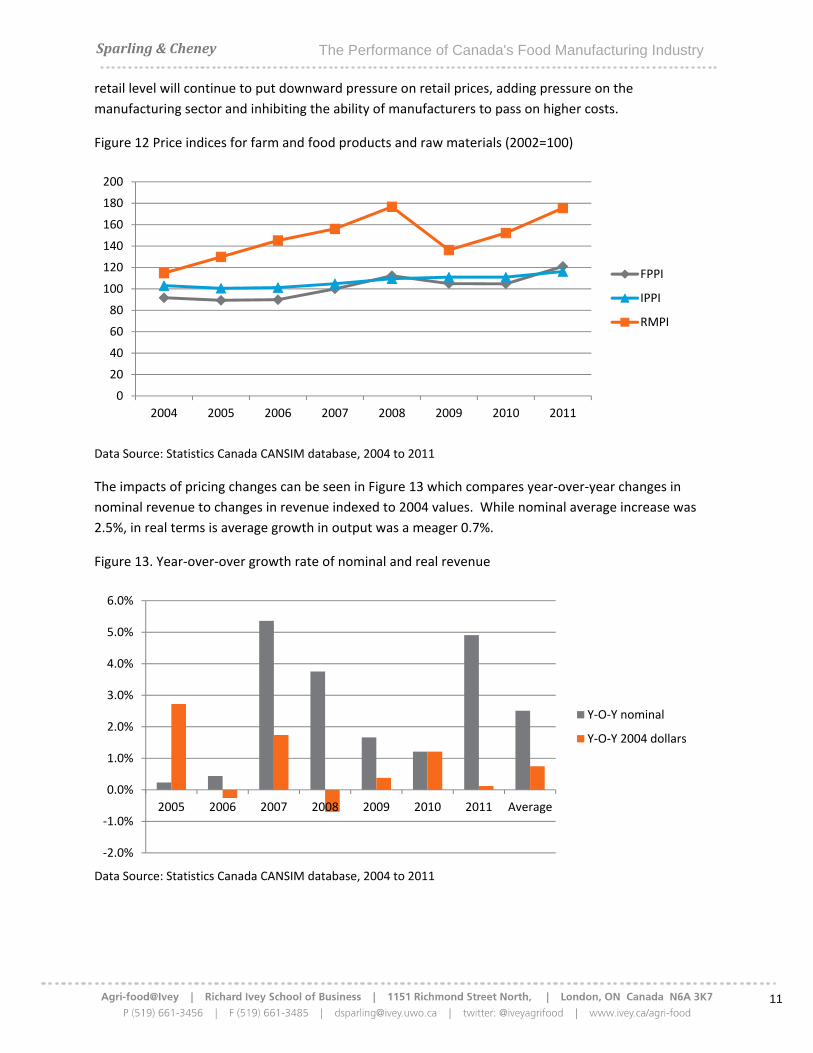
Foodprocessingmargins–squeezedbutsteady
Although the food manufacturing industry has shown remarkable resilience, food companies are under
margin pressure. Material input costs, measured by the farm product price index (FPPI), rose 32% from
2004‐2011 (Figure 12). During that same period, the industrial product price index for food (IPPI)
increased only 12.8%. Farm products make up the majority of input costs for food manufacturers, but
the impact of increases in other input costs such as energy and water cannot be overlooked. The rate of
increase for both farm product and food industry prices was still much lower than the broader Raw
Material Price Index (RMPI).
In an industry that functions primarily on low margins, the interplay of the FPPI and the IPPI can be an
important indicator of the cost situation for the industry. The output prices for the industry (IPPI) have
not kept pace with either the farm input prices (FPPI) or the prices of other inputs (RMPI). On the
output side, a recent study by Grier and Sweetland (2014) suggests the increasing competition at the
0.0%
5.0%
10.0%
15.0%
20.0%
25.0%
30.0%
35.0%
40.0%
45.0%
50.0%
2004 2005 2006 2007 2008 2009 2010 2011
Food manufacturing [311]
Petroleum and coal productmanufacturing [324]
Chemical manufacturing [325]
Primary metal manufacturing[331]
Transportation equipmentmanufacturing [336]
11
Sparling&Cheney The Performance of Canada's Food Manufacturing Industry
retail level will continue to put downward pressure on retail prices, adding pressure on the
manufacturing sector and inhibiting the ability of manufacturers to pass on higher costs.
Figure 12 Price indices for farm and food products and raw materials (2002=100)
Data Source: Statistics Canada CANSIM database, 2004 to 2011
The impacts of pricing changes can be seen in Figure 13 which compares year‐over‐year changes in
nominal revenue to changes in revenue indexed to 2004 values. While nominal average increase was
2.5%, in real terms is average growth in output was a meager 0.7%.
Figure 13. Year‐over‐over growth rate of nominal and real revenue
Data Source: Statistics Canada CANSIM database, 2004 to 2011
0
20
40
60
80
100
120
140
160
180
200
2004 2005 2006 2007 2008 2009 2010 2011
FPPI
IPPI
RMPI
‐2.0%
‐1.0%
0.0%
1.0%
2.0%
3.0%
4.0%
5.0%
6.0%
2005 2006 2007 2008 2009 2010 2011 Average
Y‐O‐Y nominal
Y‐O‐Y 2004 dollars
12
Sparling&Cheney The Performance of Canada's Food Manufacturing Industry
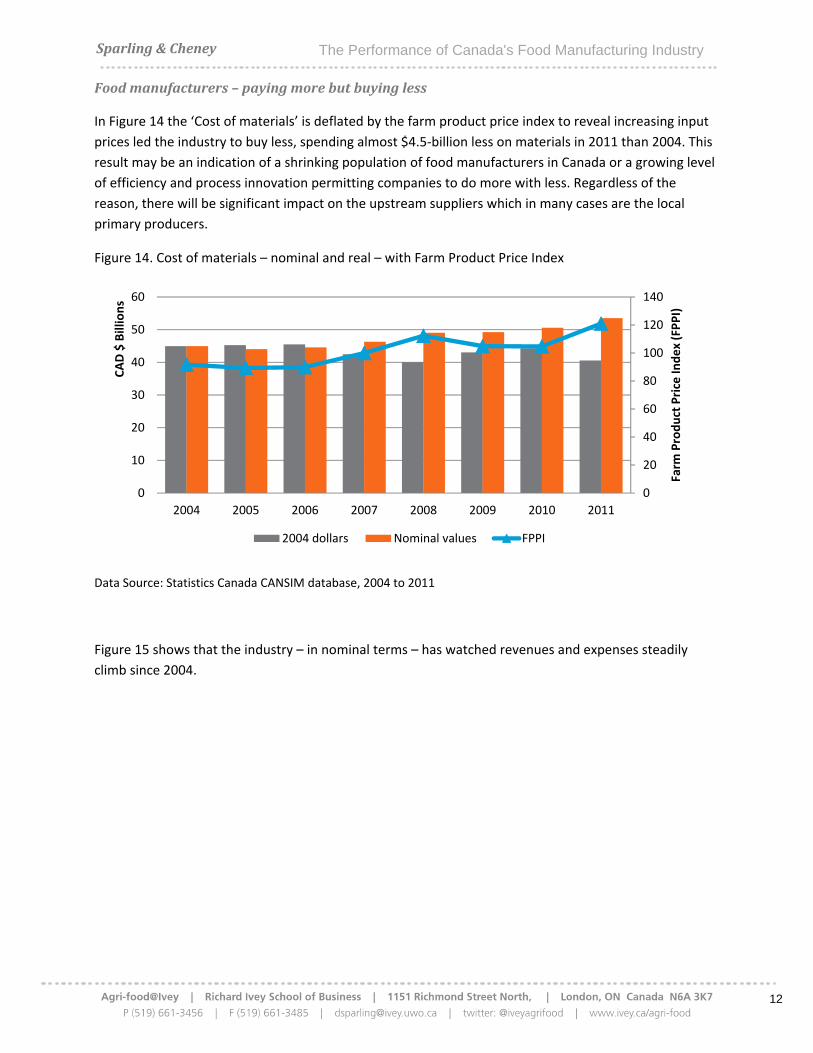
Foodmanufacturers–payingmorebutbuyingless
In Figure 14 the ‘Cost of materials’ is deflated by the farm product price index to reveal increasing input
prices led the industry to buy less, spending almost $4.5‐billion less on materials in 2011 than 2004. This
result may be an indication of a shrinking population of food manufacturers in Canada or a growing level
of efficiency and process innovation permitting companies to do more with less. Regardless of the
reason, there will be significant impact on the upstream suppliers which in many cases are the local
primary producers.
Figure 14. Cost of materials – nominal and real – with Farm Product Price Index
Data Source: Statistics Canada CANSIM database, 2004 to 2011
Figure 15 shows that the industry – in nominal terms – has watched revenues and expenses steadily
climb since 2004.
0
20
40
60
80
100
120
140
0
10
20
30
40
50
60
2004 2005 2006 2007 2008 2009 2010 2011
Farm
Product Price In
dex (FPPI)
CAD $ Billions
2004 dollars Nominal values FPPI

Sparling
Figure 15
Data Sourc
A detailed
in the indu
resale (as
expenses
Purchases
noted in F
compared
Canada –
increasing
2OtherrevrevenuesfsaleofgoomachineryfromotherSource:htt3Forafullhttp://wwang=en&d
0
10
20
30
40
50
60
70
80
90
100CAD $ Billions
g&Cheney
Breakdown o
ce: Statistics Ca
d analysis of f
ustry. Captur
is), sub‐contr
tapered off in
s would cover
Figure 15. As
d to the cost o
and more no
g squeeze bei
venuereferstfromtotalrevodspurchasedyorequipmenrservicesrendtps://www.ic
breakdownoww23.statcan.gdb=imdb&adm
2004 2005
of food manuf
anada CANSIM
ood industry
red in ‘Other
racts, amortiz
n 2010 and 20
r expenses re
a percent of
of materials a
tably in Onta
ng placed on
onon‐manufaenues.Thisredforresaleintnt,revenuesfrdered.c.gc.ca/app/sc
of’otherexpengc.ca/imdb/pm=8&dis=2
2006 2007
The Perfo
facturing reve
database, 200
expenses (Fig
expenses’ are
zation and de
011, having p
lated to the i
total, labour
and supplies.
rio – should n
the food ma
acturingactiviesidualamounthesamecondromtheopera
cr/sbms/sbb/
nses’queriedi3Instr.pl?Fun
7 2008 200
ormance of C
enues and ex
04 to 2011
gure 16) reve
e 21 expense
epreciation, ta
peaked (as a p
mport of goo
and utility/en
Recent publi
not be overlo
nufacturers.
ityandwasobntisusuallycodition,revenutionofcafeter
cis/performan
intheASMLsection=assemb
09 2010 2
Canada's Fo
xpenses2 (nom
eals the consis
e items includ
axes, and pro
percent of tot
ods for resale
nergy costs a
ic discussion f
ooked given th
btainedbysubomposedofthuesfromthelerias,laborator
nce.html?code
eeStatisticCableInstr&Item_
011
ot
Co
Toan
Toan
Ot
Rem
ood Manufac
minal values)
stency of exp
ing purchase
omotion/adve
tal) in 2007.
– part of the
re very const
focused on e
he tight marg
btractingmanhefollowing:Reaseorrentalriesandthelik
e=311&lang=e
anadaarchived_Id=113548&
ther expenses
ost of material
otal cost of enend vehicle fuel
otal salaries annd indirect labo
ther revenue
evenue from goanufactured
cturing Indus
pense breakdo
s of good for
ertising3. Thes
e ‘other reven
tant and mino
nergy costs in
gins and
nufacturingRevenuesfromofproperty,keandrevenu
eng#per5
dsurveyat&a=1&LI=1360
s and supplies
ergy, water uti(7)
d wages, direcour
oods
stry
own
se
nue’
or
n
mthe
ues
072&l
(5)
lity
ct
13

14
Sparling&Cheney The Performance of Canada's Food Manufacturing Industry
Figure 16 Distribution of major expenses for food manufacturers in Canada 2004‐2011
Data Source: Statistics Canada CANSIM database, 2004 to 2011
Foodmanufacturingmarginsandprofitability
Using nominal data, net income4 and gross margins5 were calculated for the industry from 2004 to 2011
(Figure 17).
4NetincomewascalculatedasTotalRevenueminusTotalExpenses5GrossprofitmarginwascalculatedasTotalRevenueminusCostofmaterialsminusUtilityminusProductionlabour[dividedbyTotalRevenueX100%ifreportedasapercentage]
11.5% 11.6% 11.6% 11.2% 11.1% 11.3% 11.6% 11.3%
2.0% 2.2% 2.3% 2.2% 2.2% 2.2% 2.1% 2.1%
66.0% 64.3% 64.7% 64.4% 65.4% 65.1% 65.6% 66.3%
20.4% 21.8% 21.4% 22.2% 21.4% 21.4% 20.6% 20.3%
0%
10%
20%
30%
40%
50%
60%
70%
80%
90%
100%
2004 2005 2006 2007 2008 2009 2010 2011
other expenses
Cost of materials and supplies(5)
Total cost of energy, waterutility and vehicle fuel (7)
Total salaries and wages, directand indirect labour

15
Sparling&Cheney The Performance of Canada's Food Manufacturing Industry
Figure 17. Food manufacturing total revenue, gross margin and net income
Data Source: Statistics Canada CANSIM database, 2004 to 2011
Revenue, gross margin and net income all increased at a similar pace. Revenue was up 18.8% in 2011
relative to 2004 levels. Gross margin and net income were up 20.6% and 20.9% respectively suggesting
the industry as a whole is managing expenses and passing more revenue to the bottom line. This is
above the 14% general inflation over the period6.
Foodmanufacturinginvestmentinequipmentisincreasing
In 2010 food manufacturing company began to ramp up their investment in equipment, while holding
other investment categories relatively constant (Figure 18).
6CalculatedusingtheBankofCanadainflationcalculator.http://www.bankofcanada.ca/rates/related/inflation‐calculator/
0
10
20
30
40
50
60
70
80
90
100
2004 2005 2006 2007 2008 2009 2010 2011
CAD $ Billions
Food manufacturing revenue
Gross margin
Net income

16
Sparling&Cheney The Performance of Canada's Food Manufacturing Industry
Figure 18. Capital stock and flow: investment in constant 2007 dollars ($ millions)
Data Source: Statistics Canada CANSIM database, 2004 to 2011
Sub‐sectorcomparisons
The low variability in revenue experienced by the food manufacturing industry can also be observed at
the sector level (Figure 19). The most notable exception is in grain and oilseed manufacturing, which
saw the largest commodity price increase and resultant spikes in revenue.
Figure 19. Revenue for 4‐digit NAIC sub‐sectors food manufacturing
Data Source: Statistics Canada CANSIM database, 2004 to 2011
0
500
1000
1500
2000
2500
2001 2002 2003 2004 2005 2006 2007 2008 2009 2010 2011 2012
Total assets Building
Engineering Machinery and equipment
Intellectual property products
0
5
10
15
20
25
2004 2005 2006 2007 2008 2009 2010 2011
CAD $ Billions
Animal food manufacturing [3111]
Grain and oilseed milling [3112]
Sugar and confectionery productmanufacturing [3113]
Fruit and vegetable preserving andspecialty food manufacturing [3114]
Dairy product manufacturing [3115]
Meat product manufacturing [3116]
Seafood product preparation andpackaging [3117]
Bakeries and tortilla manufacturing[3118]
Other food manufacturing [3119]

17
Sparling&Cheney The Performance of Canada's Food Manufacturing Industry
While employment across the food manufacturing industry increased just 1.5% from 2004‐2011, the
experiences in the different food manufacturing sectors were quite different (Figure 20). Other food,
dairy, grain and oilseed and bakeries were the winners with gains of 26%, 18%, 9% and 9% respectively.
Losing sectors included sugar and confectionaries, animal food and fruit and vegetable and seafood with
losses of 30%, 17%, 9% and 6% respectively. Since 2011, bakeries have been hit with the gluten‐free
trend which has likely taken away earlier gains.
Figure 20. Total employment by 4‐digit NAIC codes by sector 2004‐2011
Data Source: Statistics Canada CANSIM database, 2004 to 2011
Employment trends and the magnitude of the shift from direct to indirect labour varied by sector as
illustrated in Table 1.
0
10000
20000
30000
40000
50000
60000
70000
80000
2004 2005 2006 2007 2008 2009 2010 2011
Number of employees
Animal food manufacturing[3111]
Grain and oilseed milling [3112]
Sugar and confectionery productmanufacturing [3113]
Fruit and vegetable preservingand specialty food manufacturing[3114]Dairy product manufacturing[3115]
Meat product manufacturing[3116]
Seafood product preparation andpackaging [3117]
Bakeries and tortillamanufacturing [3118]
Other food manufacturing [3119]

18
Sparling&Cheney The Performance of Canada's Food Manufacturing Industry
Table 1 Direct manufacturing and in‐direct non‐manufacturing jobs by sub‐sectors in Canada
Sector
Type of job Employ‐ment 2011
Change since 2004
Percent change since 2004
Percent Direct 2004
Percent Direct 2011
Food manufacturing Direct 184,060 ‐5,281 ‐2.8% 81.4% 77.9%
In‐direct 52,177 8,783 20.2%
Animal food manufacturing Direct 4,783 ‐1,139 ‐19.2% 59.5% 58.1%
In‐direct 3,454 ‐578 ‐14.3%
Grain and oilseed milling Direct 6,146 524 9.3% 78.3% 78.3%
In‐direct 1,706 146 9.4%
Sugar, confectionery product manufacturing
Direct 7,893 ‐3784 ‐32.4% 79.8% 76.6%
In‐direct 2,412 ‐538 ‐18.2%
Fruit, vegetable, specialty food manufacturing
Direct 16,512 ‐2,744 ‐14.3% 79.8% 75.0%
In‐direct 5,494 624 12.8%
Dairy product manufacturing Direct 17,746 2,415 15.8% 76.7% 75.1%
In‐direct 5,879 1,221 26.2%
Meat product manufacturing Direct 56,471 ‐2,063 ‐3.5% 86.7% 82.5%
In‐direct 11,997 3,030 33.8%
Seafood product preparation and packaging
Direct 28,618 ‐2,061 ‐6.7% 90.6% 89.7%
In‐direct 3,285 89 2.8%
Bakeries, tortilla manufacturing
Direct 28,890 298 1.0% 79.7% 73.9%
In‐direct 10,228 2,940 40.3%
Other food manufacturing Direct 17,001 3,273 23.8% 70.0% 68.8%
In‐direct 7,722 1,849 31.5%
Data Source: Statistics Canada CANSIM database, 2004 to 2011
Table 2 (below) delves into the sector level financial data and reveals the differences among sectors.
Fruit and vegetable processing and seafood processing both saw declines in revenue. For fruit and
vegetable processors the scale of the decline climbed significantly at the gross margin and net income;
increasing expenses outstripped the flat line revenue. Surprisingly, seafood processing saw improved

19
Sparling&Cheney The Performance of Canada's Food Manufacturing Industry
gross margins and net income (up 100%) suggesting a significant improvement in efficiency and control
of expenses, although the industry is still at the bottom in on revenue. Animal food manufacturers and
meat processors experienced falling net income on gains in revenue and low return on revenue. The
data suggests that these sectors were particularly challenged by increasing expenses not directly related
to production.
Table 2. Sector and sub‐sector revenue, gross margin, net income and percent change 2004 to 2011
Sector Revenue
(millions)
2011
%
change
04 to 11
Gross
margin
2011
(millions)
%
change
04 to 11
Net
income
2011
(millions)
%
change
04 to 11
Return
on
revenue
Food manufacturing [311] $88,300 18.8% $27,000 20.6% $7,600 20.9% 8.6%
Animal food manufacturing $7,100 11.6% $1,830 ‐3.7% $419 ‐15.5% 5.9%
Grain and oilseed milling $11,000 65.4% $3,160 66.3% $1,370 91.7% 12.5%
Sugar and confectionery
product manufacturing
$4,600 12.0% $1,500 ‐4.7% $400 38.9% 8.7%
Fruit and vegetable preserving
and specialty food
manufacturing
$6,600 ‐0.2% $2,650 ‐0.7% $620 ‐27.3% 9.4%
Dairy product manufacturing $14,700 19.3% $4,400 44.6% $907 148.5% 6.2%
Meat product manufacturing $23,600 10.1% $5,150 1.7% $1,450 ‐19.6% 6.1%
Seafood product preparation
and packaging
$4,400 ‐3.6% $1,100 12.5% $255 101.0% 5.8%
Bakeries and tortilla
manufacturing
$8,300 32.9% $3,700 40.7% $804 87.4% 9.7%
Other food manufacturing $7,900 32.6% $3,580 33.2% $1,360 13.6% 17.2%
Data Source: Statistics Canada CANSIM database, 2004 to 2011
Gross margin patterns reveal significant differences between sectors but also considerable variability
within sectors (Figure 21). Grain and oilseed milling, dairy and bakeries show healthy gains at the gross

20
Sparling&Cheney The Performance of Canada's Food Manufacturing Industry
margin with increases of 66%, 45% and 41% respectively (Table 2). Meat processing and seafood
product preparation were considered neutral with increases of 1.7% and 12.5% since 2004. Negative
change was seen again in gross margins for animal food manufacturing and fruit and vegetable
processing.
Figure 21. Gross profit margins7 (percentage of revenue) using nominal data
Data Source: Statistics Canada CANSIM database, 2004 to 2011
Regionalanalysis
An examination of total revenue from food manufacturing by region reveals the concentration of
revenue and growth in the most populous regions of the country (Figure 22). Firms in Ontario and
Quebec generate almost 50% of Canadian food manufacturing revenue with total revenues of $34.5‐
billion and $21.1‐billion respectively. Quebec experienced a 31% increase in food manufacturing
revenue from 2004 to 2011 which Ontario revenue grew 15%. A significant part of the Prairie region
revenue increase of 22% can be attributed to a 71% increase in Saskatchewan. The Atlantic region has
7Grossprofitmargin(%)calculatedas(TotalrevenueminuscostofmaterialsminusutilityminusproductionlabourdividedbyTotalRevenue)X100%
20.0%
25.0%
30.0%
35.0%
40.0%
45.0%
50.0%
2004 2005 2006 2007 2008 2009 2010 2011
Food manufacturing [311]
Animal food manufacturing [3111]
Grain and oilseed milling [3112]
Sugar and confectionery productmanufacturing [3113]
Fruit and vegetable preserving andspecialty food manufacturing [3114]
Dairy product manufacturing [3115]
Meat product manufacturing [3116]
Seafood product preparation andpackaging [3117]
Bakeries and tortilla manufacturing[3118]
Other food manufacturing [3119]

21
Sparling&Cheney The Performance of Canada's Food Manufacturing Industry
suffered a regional decline in revenue of 2.2%, with food manufacturing revenue dropping in all Atlantic
Provinces except New Brunswick.
Figure 22. Regional food manufacturing revenue
Data Source: Statistics Canada CANSIM database from 2004 to 2011
Figure 23 shows the regional breakdown of employment in food manufacturing. Most regions
experienced job losses from2004‐2007 and followed by some recovery. However, only Quebec and BC
actually increased employment over the entire period.
Figure 23. Regional employment in food manufacturing
Data Source: Statistics Canada CANSIM database, 2004 to 2011
0
5
10
15
20
25
30
35
40
Quebec Ontario British Columbia Prairie Region Atlantic Region
CAD $ Billions
2004
2005
2006
2007
2008
2009
2010
2011
0
10
20
30
40
50
60
70
80
90
Atlantic Region Prairie Region Quebec Ontario British Columbia
Number of employees (Th
ousands)
2004
2005
2006
2007
2008
2009
2010
2011

22
Sparling&Cheney The Performance of Canada's Food Manufacturing Industry
Implicationsforpolicy
The analysis in this paper reveals the remarkable resilience of Canada’s food manufacturing industry.
During the recent recession both revenue and employment in Canadian food manufacturing fared
remarkably well compared to other manufacturing industries. This is an industry that Canada has been
able to count on for both GDP and jobs. While it may not be as exciting as high technology and
aerospace, in a recession being steady and unexciting is something to get excited about. Although
performance varied among individual food manufacturing sectors, all showed considerable stability
compared to other manufacturing sectors.
On almost every dimension of productivity and profitability the industry statistics stayed steady. Steady
is fine but, in today’s economic environment, Canada needs growth industries. Growth for Canada’s
food manufacturing industry has to include exports. From a policy perspective this means two things:
First, developing trade agreements and policy regulatory environments that support the export of
Canadian food products must be a priority for governments. Trade can also be supported through
government trade programs and by creating regulatory regimes that are aligned and coordinated with
those of major trading partners.
Second, there is a role for governments in assisting the food manufacturing industry to become more
globally competitive and export ready. For example, it was apparent that productivity in the industry
has not been increasing and that creates concerns over the ability of food manufacturers to compete in
the long term. Although the industry has increased its investment in equipment since 2010, the results
are not yet apparent. It is obvious that more is needed. Programs which encourage investment in new
technologies and more efficient processes can support and encourage industry investment in innovation
and improve industry productivity.
Although food manufacturing is important to Canada’s economy and farmers, it has received very little
focus from policy makers. Attention needs to come, not only from agriculture and agri‐food
departments, but also from economic development, trade and industry focused ministries. Food is
intrinsically linked to agriculture, but the business of food is first and foremost a manufacturing and
marketing industry. Policies and resource allocations for food manufacturing should not be integrated
with, and masked by, primary agriculture’s business risk management policies which continue to be the
primary focus of provincial and federal agri‐food policy. With access to a wide range of farm products
and large markets, revenue near that of transportation manufacturing and a consistent track record
through economic downturns, food manufacturing can be – and should be – a powerhouse industry for
Canada. Economic conditions are moving in favour of the Canadian food manufacturing industry, with
the world slowly recovering from the recession and the Canadian dollar drifting lower. If Canada is to
continue to reap the economic and employment benefits of a healthy food manufacturing industry
government must take notice and act.

23
Sparling&Cheney The Performance of Canada's Food Manufacturing Industry
References
McInnes D. and D. Yeon. Understanding the Processed Food Trade Balance. Canadian Agri‐Food Policy
Institute. 2013. http://www.capi‐icpa.ca/proc‐food/project1/CAPI_Processed_Food_Project1.pdf
Grier, K. and J. Sweetland. Taking out the Mystery of Food Inflation Prospects for 2014. George Morris
Centre Report. 2014.
Marin, L. and K. Stiefelmeyer. A comparative analysis of productivity in agri‐food and other industries in
Canada. George Morris Centre Report. 2001.

24
Sparling&Cheney The Performance of Canada's Food Manufacturing Industry
Appendix
Figure a. Provincial breakdown Total food manufacturing revenue
Figure b. Provincial breakdown Total Employment in food manufacturing
0
5
10
15
20
25
30
35
40
2004 2005 2006 2007 2008 2009 2010 2011
CAD $ Billions
Newfoundland and Labrador
Prince Edward Island
Nova Scotia
New Brunswick
Quebec
Ontario
Manitoba
Saskatchewan
Alberta
British Columbia
0
10000
20000
30000
40000
50000
60000
70000
80000
90000
2004 2005 2006 2007 2008 2009 2010 2011
Employm
ent in food m
anufacturing
Newfoundland and Labrador
Prince Edward Island
Nova Scotia
New Brunswick
Quebec
Ontario
Manitoba
Saskatchewan
Alberta
British Columbia

25
Sparling&Cheney The Performance of Canada's Food Manufacturing Industry
Figure c. Provincial labour productivity (manufacturing value‐added per employee)
0
50
100
150
200
250
300
2004 2005 2006 2007 2008 2009 2010 2011
Labour productivity ( X 1,000)
Newfoundland andLabrador
Prince Edward Island
Nova Scotia
New Brunswick
Quebec
Ontario
Manitoba
Saskatchewan
Alberta
British Columbia

Partners & Acknowledgements
The Chair of Agri‐Food Innovation is supported by the Agricultural Adaptation Council. Ivey also
acknowledges the generous support of Agricultre and Agri‐Food Canada.
CAPI and Ivey acknowledge Food & Consumer Products of Canada’s support of this project.
We also acknowledge the in‐kind support and/or advice provided by:
Agriculture and Agri‐Food Canada
Alberta Agriculture and Rural Development
George Morris Centre
Government of Saskatchewan – Ministry of Agriculture
Innovation PEI
Ministère de l'Agriculture, des Pêcheries et de l'Alimentation du Québec
Ontario Ministry of Agriculture and Food
Université de Laval
Telephone: 613‐232‐8008 or toll‐free 1‐866‐534‐7593
Email: info@capi‐icpa.ca Follow: @CdnAgriFood
www.capi‐icpa.ca
Telephone: 519-661-3456
Email: [email protected] [email protected] Follow: @iveyagrifood sites.ivey.ca/agri‐food