Embed Size (px)
Citation preview

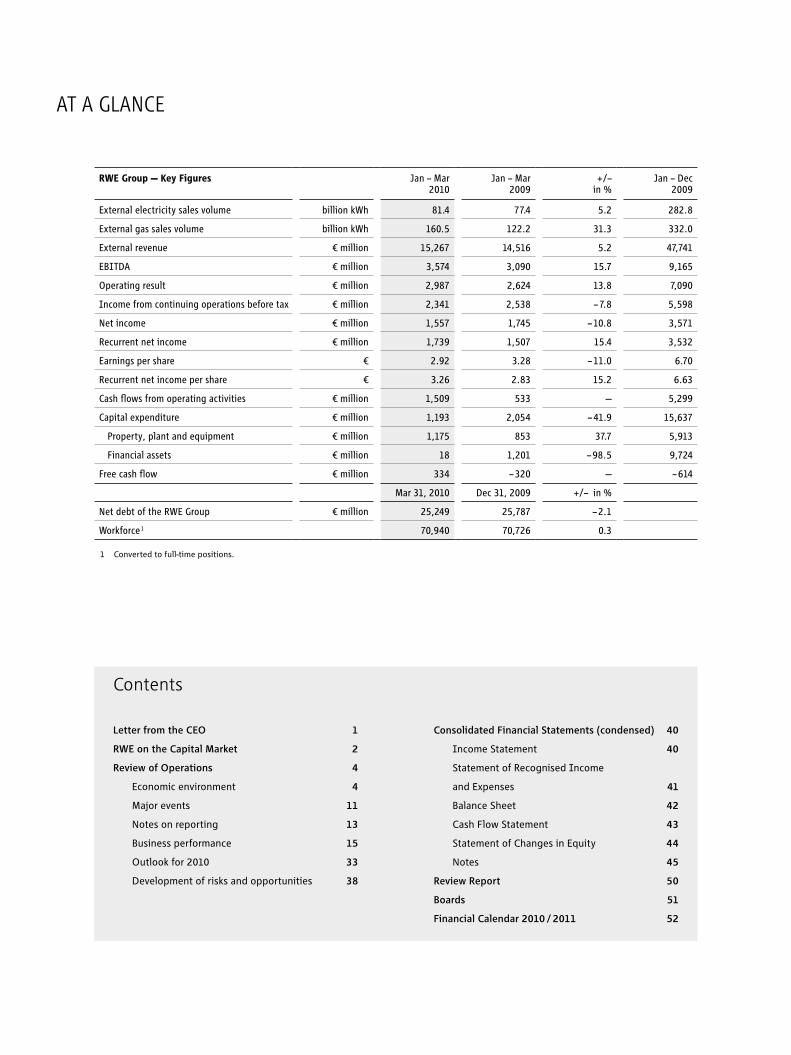
RePORT On The fiRsT QUARTeR Of 2010 • Operatingresult14%upyearonyear • Recurrentnetincomeimprovedby15% • Earningsforecastfor2010confirmed
RWE Group — Key Figures Jan – Mar Jan – Mar +/– Jan – Dec
2010
2009
in %
2009
External electricity sales volume
billion kWh
81.4
77.4
5.2
282.8
External gas sales volume
billion kWh
160.5
122.2
31.3
332.0
External revenue
€ million
15,267
14,516
5.2
47,741
EBITDA
€ million
3,574
3,090
15.7
9,165
Operating result
€ million
2,987
2,624
13.8
7,090
Income from continuing operations before tax
€ million
2,341
2,538
– 7.8
5,598
Net income
€ million
1,557
1,745
– 10.8
3,571
Recurrent net income
€ million
1,739
1,507
15.4
3,532
Earnings per share
€
2.92
3.28
– 11.0
6.70
Recurrent net income per share
€
3.26
2.83
15.2
6.63
Cash flows from operating activities
€ million
1,509
533
—
5,299
Capital expenditure
€ million
1,193
2,054
– 41.9
15,637
Property, plant and equipment
€ million
1,175
853
37.7
5,913
Financial assets
€ million
18
1,201
– 98.5
9,724
Free cash flow
€ million
334
– 320
—
– 614
Mar 31, 2010 Dec 31, 2009
+/– in %
Net debt of the RWE Group
€ million
25,249
25,787
– 2.1
Workforce 1 70,940 70,726 0.3
1 Converted to full-time positions.
Contents
Letter from the CEO 1
RWE on the Capital Market 2
Review of Operations 4
Economic environment 4
Major events 11
Notes on reporting 13
Business performance 15
Outlook for 2010 33
Development of risks and opportunities 38
Consolidated Financial Statements (condensed) 40
Income Statement 40
Statement of Recognised Income
and Expenses 41
Balance Sheet 42
Cash Flow Statement 43
Statement of Changes in Equity 44
Notes 45
Review Report 50
Boards 51
Financial Calendar 2010 / 2011 52
AT A glAnce

This year has begun well for RWE, as you can see from the key figures for the first quarter. Our operating result
was 14 % higher than a year ago. Recurrent net income — the basis for determining your dividend — rose by
15 %. A contributing factor was that we included the earnings achieved by Essent in our figures for the first
time. Our activities in the United Kingdom and Central Eastern Europe also contributed substantially to earn-
ings, but they should not be extrapolated for the full year because of the seasonal nature of our operations.
Conversely, as expected, in energy trading and in the gas midstream business, we fell significantly short of the
unusually strong earnings we achieved a year earlier.
What about the energy consumption in our markets? Has the economy bottomed out? Initial signs point in
this direction. Industrial production picked up considerably in the first few months of the year. This and the
unusually cold winter are the main reasons why demand for electricity and gas was up significantly in some
cases. I am confident that the economy will continue to recover. Nevertheless, it may take years for energy
usage to return to the levels witnessed before the economic crisis.
What are our plans for the year underway? Centre stage is taken by our investment programme. We plan to
spend a total of € 28 billion on property, plant and equipment in 2010 and the three following years. Half of
this has been earmarked for growth projects. Our priorities in this context are environmentally friendly elec-
tricity generation and the expansion of gas and oil production. We are making good progress in these areas.
Only recently did we commission our state-of-the-art gas-fired power station in Lingen, Germany. Integrating
Essent is another important item on our agenda. It is going so well that we expect to realise the anticipated
synergies in excess of € 100 million earlier than originally assumed.
This brings me to the earnings forecast for 2010 as a whole: We still expect to increase both the operating
result and recurrent net income by approximately 5 %. This is good news — especially for you, our shareholders.
After all, this means you can expect to receive an attractive dividend for fiscal 2010.
Sincerely yours,
Dr. Jürgen Großmann
President and CEO of RWE AG
Essen, May 2010
» RWE had a good start to the year. We are thus confident of being able to achieve our earnings targets for 2010. «
1Letter from the ceo

Greek crisis keeps capital market on edge
The upturn witnessed on stock markets since the spring of 2009 began to stall in 2010. Doubts about the
rapid continuation of the economic recovery initially dampened sentiment on the stock markets. Furthermore,
the Greek state finance crisis triggered concerns over the destabilisation of the Eurozone. Later on, positive
economic indicators and corporate results brightened sentiment on the stock market somewhat. March saw
the German lead index, the DAX 30, hit its high since September 2008. It closed the month at 6,154 points,
up 3 % on its quotation at the end of 2009. Share price developments in the European utility sector were
slightly weaker overall. The main reasons were persistently low prices in electricity and gas wholesale markets.
Moreover, utility stocks generally show disproportionately little reaction to economic cycles. RWE's common
and preferred shares slipped 3 % to € 65.60 and 2 % to € 60.89, respectively. They were thus on a par with
the European utility index, the Dow Jones STOXX Utilities (– 3 %). Share prices trended upwards in April 2010
before losing substantial ground as the Greek crisis became more severe and rating agencies downgraded the
creditworthiness of further Eurozone countries.
RWE common share
Dow Jones STOXX Utilities
DAX 30
Performance of the RWE common share compared with the DAX 30 and the Dow Jones STOXX Utilities Indices in %
10
5
0
– 5
– 10
Average weekly figures. Dec 31, 09 Mar 31, 10 Apr 30, 10
Development of RWE's five-year credit default swap (CDS) and the iTraxx Europe CDS Index in basis points
iTraxx Europe
RWE
100
80
60
40
20
0
Average weekly figures. Dec 31, 09 Mar 31, 10 Apr 30, 10
2 rWe on the capitaL market
The Greek crisis also left its mark on the bond markets. However, companies with stable ratings were hardly
affected by this. In general, interest rates have been displaying lateral movement at a low level for months.
The same applies to the credit spreads charged on top of the interbank interest rate. The price for hedging
RWE credit risk via five-year credit default swaps (CDSs) ranged between 40 and 50 basis points from January
to April 2010. It averaged 80 basis points in the same period of 2009. Companies of good creditworthiness
like RWE can currently raise funds at conditions similar to those before the financial crisis. We took advan-
tage of this by issuing a three-year US dollar bond with a total volume of about € 180 million on February 11.
This was followed a few days later by a private placement with a term of 30 years and a volume of about
€ 160 million. It is usually much more expensive to hedge credit risks outside of the utility sector. The iTraxx
Europe Index, which consists of the CDS prices of 125 major European companies, fluctuated between 70 and
90 basis points in the first four months of the year. It roughly halved compared to the same period last year.
3rWe on the capitaL market
Economic recovery continues
The world economy is back on course for growth following the most severe financial and economic crisis in
the post-war era. The upward trend witnessed since the second half of 2009 continued at the beginning of
2010. Many companies ramped down production and reduced inventories during the crisis. In view of their
empty warehouses, they have now increased manufacturing levels. State economic stimulus packages con-
tinue to have a reviving effect. Initial estimates have the gross domestic product (GDP) of OECD countries in
the period from January to March 2010 more than 2 % up on the level seen in last year’s first quarter. A gain of
just under 1 % has been estimated for the Eurozone. Economic output in Germany, the biggest economy in the
currency zone, is likely to have risen by 1.5 %. In January and February, industrial production, the force driv-
ing the economy in this country, was 3 % and 7 % higher year on year. After the first recession in almost three
decades, the Netherlands reported slight growth. The UK economy is still suffering from the incisive develop-
ments in its real estate and finance sectors. In addition, consumer spending still tends to be weak. In the first
three months of 2010, UK GDP hovered around the level witnessed in the first quarter of last year. Most of the
countries of Central Eastern Europe got off to a good start to the new year, in particular Poland, where GDP is
likely to have risen by more than 3 %.
Weather much colder than long-term average
Whereas the economic trend is reflected above all in industrial demand for energy, residential consumption is
significantly influenced by the weather. The temperature dependency of demand for heating comes to bear in
this context. It is reflected in seasonal revenue and earnings fluctuations, among other things. We generate
around two thirds of our gas sales volume in the winter and autumn months (Q1 and Q4). However, weather
conditions also play a role when comparing various fiscal years. The weather in our markets, namely Germany,
the United Kingdom and the Netherlands, was unusually cold in the first quarter of 2010. In some cases,
temperatures were far below the year-earlier level, which was already very low. The winter months of January
and February were extremely cold. Some compensation was felt by the very mild second half of March. The
winter in Central Eastern Europe was also colder than usual. However, developments were disparate compared
to 2009: Lower average temperatures were measured in Poland, whereas slightly higher ones were measured
in the region's south eastern countries (including Hungary). Weather in the Czech Republic and Slovakia was
similar to the same period a year ago. In addition to energy consumption, weather conditions also influence
the generation of electricity, especially from wind turbines. Wind levels in Germany and the United Kingdom
were much lower than the long-term average. However, the decline measured compared to the first quarter of
2009 was marginal. In contrast, it was much windier in Spain than a year earlier.
economic environment
4 revieW of operations
Cold winter weather and economic recovery stimulate energy consumption
Unusually low temperatures in January and February 2010 and the economic recovery revitalised demand for
energy in our core markets. Available data shows that electricity usage in Germany in the period under review
was approximately 3 % higher than in the first quarter of 2009. Demand in the UK (1.7 %) and in the Nether-
lands initially displayed less dynamic development. Based on the latest figures, in our electricity markets in
Central Eastern Europe, Poland posted the strongest growth (3.1 %), followed by Hungary (1.9 %) and Slovakia
(0.7 %). Gas consumption in Germany and the United Kingdom increased by an estimated 14 %. The corre-
sponding figure for the Netherlands was just over 5 %. Countries such as the Czech Republic and Slovakia, in
which temperatures were around the year-earlier level, saw volumes change marginally.
Crude oil more expensive than in 2009
Despite the improved general economic prospects, prices on fuel markets were still far below the levels wit-
nessed just before the economic crisis. So far, the economic recovery has been reflected the most in crude oil
prices, which have risen significantly since the beginning of 2009. A barrel of Brent crude traded at an average
of US$ 76 in the first quarter of 2010. It was much more expensive than in the comparable period last year
(US$ 44). Increased demand from emerging Asian countries, with China leading the way, was largely respon-
sible for this. Moreover, many are investing in raw materials for fear of inflation, which also drives up prices.
Strong price decrease in gas business
As a large portion of gas imports to Continental Europe is based on long-term contracts, which are linked to
oil prices, the latter also influence developments on the gas market. However, this typically occurs with a time
lag of several months. Since oil prices declined substantially until the beginning of 2009, the price of gas im-
ports to Germany fell in the first quarter of 2010, declining by some 30 % year on year. Trading freely available
volumes has gained significance in recent years. Prices for these trades are not directly influenced by the price
of oil. Major trading hubs are the National Balancing Point (NBP) in the UK and the Title Transfer Facility (TTF)
in the Netherlands. These markets experienced a more substantial reduction in prices than was the case for
oil-indexed contracts. This caused end-customer prices to come under increased pressure, especially for large
buyers. In the first quarter, tariffs for households and industrial enterprises were down an average of 20 %
and 28 % on the levels seen in the comparable period in 2009. The aforementioned customer groups saw their
bills shrink by 12 % and 19 % in the Czech Republic, 5 % and 29 % in the UK, 21 % and 32 % in the Netherlands,
and 15 % and 18 % in Hungary. The situation in forward trading was as follows: Contracts for delivery in the
coming calendar year (2011 forward) sold for an average of € 17 per MWh on the TTF wholesale market in the
period being reviewed. This is € 4 less than was paid for the 2010 forward in the first quarter of 2009.
5revieW of operations

Demand for hard coal remains weak in Europe and the USA
Prices of thermal coal on international markets remain moderate. In the first quarter of 2010, a metric ton
(including freight and insurance) cost an average of US$ 78 in Rotterdam spot trading, as opposed to US$ 71
in the comparable period in 2009. The price increase is slightly smaller in euro terms. Demand for hard coal
is still restrained in Europe and North America, whereas it is displaying dynamic development in Asia. Hard
coal quotations also reflect sea freight rates. Most recently, the need for transport capacity has grown con-
siderably, e. g. in the steel industry. This is reflected in the rise in freight rates: In the period under review,
the standard route from South Africa to Rotterdam cost an average of US$ 13 per metric ton, up US$ 5 on last
year’s first quarter. German hard coal prices are determined by the German Federal Office of Economics and
Export Control (BAFA). Since these prices track those of imported hard coal, they follow developments on in-
ternational markets, albeit with a time lag. No BAFA price was available for the first quarter of 2010 when this
report went to print, but experts estimate it to be € 74 per metric ton of hard coal equivalent. The comparable
year-earlier figure was € 91.
Average monthly figures.Source: RWE Supply & Trading.
50
40
30
20
10
0
Trading year: 2008 Trading year: 2009 Trading year: 2010
Development of one-year forward prices on the Dutch gas wholesale market (TTF) € / MWh
Forward for delivery in 2009 Forward for delivery in 2010 Forward for delivery in 2011
6 revieW of operations

Prices in European CO2 emissions trading still marked by the effects of the economic crisis
Prices in European trading of CO2 emission allowances (referred to as EU Allowances — EUAs) have also main-
tained their low level. In the first quarter, EUAs for 2010 traded at an average of € 13 per metric ton of CO2.
Prices did not change much compared with 2009. The need for certificates among utilities and energy-inten-
sive industries continues to be significantly lower than before the recession. This also trickles down to quota-
tions for Certified Emission Reductions (CERs). These are credits earned from emission-reducing measures
taken in developing and newly industrialising countries. European companies may cover domestic emissions
up to a predetermined level by submitting CERs obtained through projects within the scope of the “Clean
Development Mechanism” created by the Kyoto Protocol. The advantage is that the costs for these types of
certificates are usually lower than the market prices of EUAs. In the period under review, 2010 CERs traded at
an average of € 12 per metric ton of CO2.
Prices on European electricity markets maintain low level
The persistent slump in fuel and emission allowance prices is mirrored on Europe’s wholesale electricity
markets. In German spot trading on the European Energy Exchange (EEX), base-load contracts in the first
three months of 2010 traded at an average of € 41 per megawatt hour (MWh), while peak-load contracts sold
for € 51 per MWh. They were 13 % and 17 % down on the corresponding figures for the first quarter of 2009.
Prices in German forward trading also declined. Supply agreements for the coming calendar year (2011 for-
ward) traded at an average of € 48 per MWh for base-load power and € 64 per MWh for peak-load electricity.
This was 2 % and 11 % less than was paid for comparable contracts in the year-earlier period.
Development of CO2 certificate prices in the European Emission Trading System € / metric ton of CO2
40
30
20
10
0
Trading year: 2008 Trading year: 2009 Trading year: 2010
EU Allowance (EUA) for 2010
Certified Emission Reduction (CER) for 2010
Average monthly figures.Source: RWE Supply & Trading.
7revieW of operations
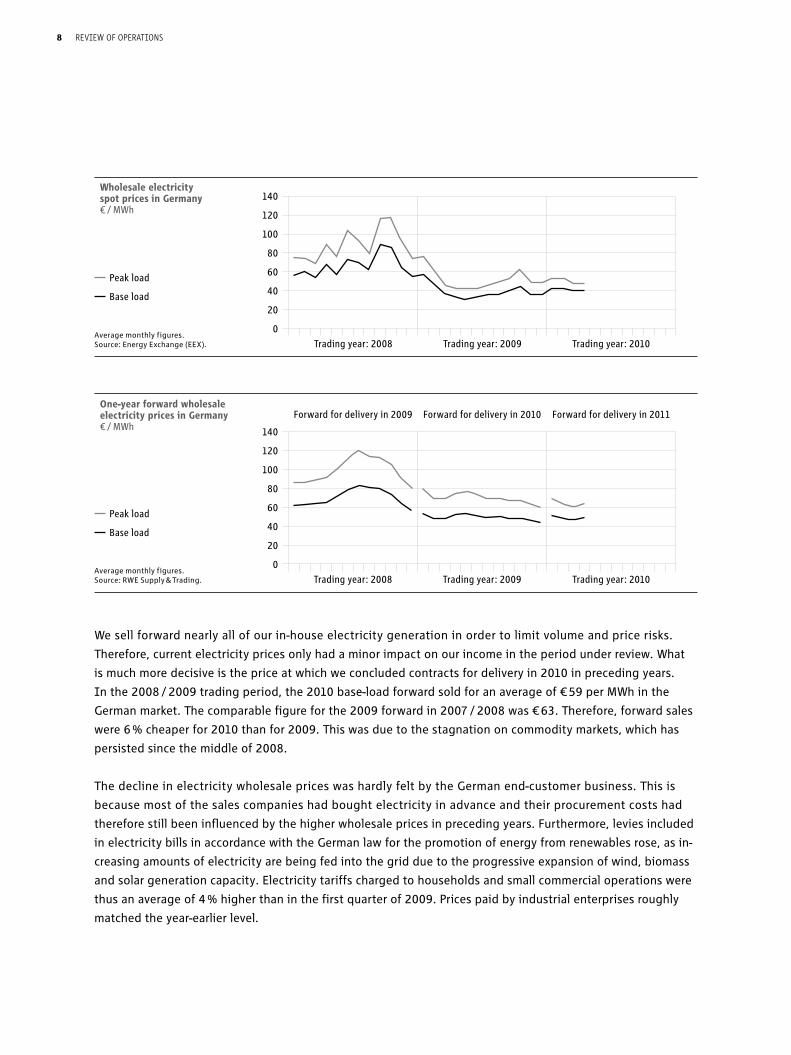
We sell forward nearly all of our in-house electricity generation in order to limit volume and price risks.
Therefore, current electricity prices only had a minor impact on our income in the period under review. What
is much more decisive is the price at which we concluded contracts for delivery in 2010 in preceding years.
In the 2008 / 2009 trading period, the 2010 base-load forward sold for an average of € 59 per MWh in the
German market. The comparable figure for the 2009 forward in 2007 / 2008 was € 63. Therefore, forward sales
were 6 % cheaper for 2010 than for 2009. This was due to the stagnation on commodity markets, which has
persisted since the middle of 2008.
The decline in electricity wholesale prices was hardly felt by the German end-customer business. This is
because most of the sales companies had bought electricity in advance and their procurement costs had
therefore still been influenced by the higher wholesale prices in preceding years. Furthermore, levies included
in electricity bills in accordance with the German law for the promotion of energy from renewables rose, as in-
creasing amounts of electricity are being fed into the grid due to the progressive expansion of wind, biomass
and solar generation capacity. Electricity tariffs charged to households and small commercial operations were
thus an average of 4 % higher than in the first quarter of 2009. Prices paid by industrial enterprises roughly
matched the year-earlier level.
Wholesale electricity spot prices in Germany € / MWh
140
120
100
80
60
40
20
0
Trading year: 2008 Trading year: 2009 Trading year: 2010Average monthly figures.Source: Energy Exchange (EEX).
Peak load
Base load
One-year forward wholesale electricity prices in Germany € / MWh 140
120
100
80
60
40
20
0
Forward for delivery in 2009 Forward for delivery in 2010 Forward for delivery in 2011
Trading year: 2008 Trading year: 2009 Trading year: 2010Average monthly figures.Source: RWE Supply & Trading.
Peak load
Base load
8 revieW of operations

UK wholesale electricity prices were also down. The average spot price of a MWh of electricity was £ 36 (€ 41)
for base-load power and £ 41 (€ 46) for peak-load power. These figures represent drops of 22 % and 27 %, re-
spectively. The price curve also trended downwards in the UK electricity forward market. Contracts for delivery
in the 2011 calendar year were settled for an average of £ 41 (€ 46) per MWh of base-load power in the first
three months of 2010. This is 15 % less than the price of the 2010 forward in the same period last year. The
price for peak-load electricity dropped by 20 % to £ 47 (€ 53).
Wholesale electricity spot prices in the UK £ / MWh
Peak load
Base load
140
120
100
80
60
40
20
0Trading year: 2008 Trading year: 2009 Trading year: 2010
Average monthly figures.Source: RWE Supply & Trading.
One-year forward wholesale electricity prices in the UK £ / MWh 120
100
80
60
40
20
0
Forward for delivery in 2009 Forward for delivery in 2010 Forward for delivery in 2011
Trading year: 2008 Trading year: 2009 Trading year: 2010Average monthly figures.Source: RWE Supply & Trading.
Peak load
Base load
9revieW of operations

RWE sells forward most of the production from its UK power stations, similar to the policy it pursues in Ger-
many. However, absolute electricity prices are only of limited informational value as regards RWE npower’s
earnings. This is because our UK generation portfolio largely consists of hard coal and gas-fired power plants,
the generation costs of which are also subject to significant market fluctuations. RWE npower’s earnings
development is therefore predominantly influenced by so-called “clean dark spreads” (hard coal) and “clean
spark spreads” (gas). These are calculated by deducting the costs for the respective fuel and CO2 certificates
from the market price of electricity. Clean dark spreads realised on the forward market worsened substan-
tially in 2009 and 2010, whereas clean spark spreads improved slightly. Margins of short-term spot market
transactions realisable from hard coal and gas-fired power stations remain low. These power plants, which are
predominantly used to generate mid-merit and peak-load electricity, are significantly affected by the fact that
demand for electricity continues to be low due to the economic cycle.
Most UK energy suppliers lowered their tariffs in the end-customer segment over the course of last year.
Therefore, in the first quarter of 2010, prices were down 7 % year on year for households and small commercial
enterprises and down 12 % for industrial and corporate customers.
Prices declined in the Netherlands as well. They were down 9 % for households and 12 % for industrial
enterprises.
End-customer prices displayed varied developments in our Central Eastern European electricity markets. On
average, industrial customers had to pay less than in the first quarter of 2009 — 9 % in Poland, 8 % in Hungary,
and 6 % in Slovakia. In contrast, residential electricity bills in all the aforementioned markets grew, rising by
11 % in Poland, 12 % in Hungary, and 0.5 % in Slovakia.
10 revieW of operations

In the period under review
RWE Innogy places winning bid for further offshore wind projects in the UK
Within the scope of an invitation to tender, in early January 2010, the UK government granted RWE Innogy
permission to develop the Atlantic Array and Dogger Bank offshore wind projects. We will initially develop the
Atlantic Array project alone, which will have up to 1.5 gigawatts (GW) in generation capacity. For Dogger Bank,
however, we placed the winning bid as part of a consortium called “Forewind”, in which RWE Innogy holds a
25 % stake. Around 9 GW of wind capacity are to be built in this area. By taking charge of these projects, we
have undertaken to develop both zones to approval. We are not committed to build the wind farms thereafter.
RWE Innogy builds pellet factory in Georgia, USA
In March, RWE Innogy started to build a large-scale wood pelletising plant in the US state of Georgia. The fac-
tory will have an annual production of 750,000 metric tons, making it the biggest and most modern of its type
in the world. The project is being carried out in collaboration with Swedish-based BMC Management AB. The
company specialises in the development of biomass manufacturing solutions. The pellets will be used in pure
biomass power plants as well as for the co-firing of coal and biomass. The pellet plant is due to begin opera-
tions in 2011. The total investment amounts to € 120 million.
After the period under review
Green light for the construction of a gas-fired power plant in Turkey
RWE took an investment decision on the construction of a combined-cycle gas turbine (CCGT) power plant in
Denizli in the west of Turkey. The 775 megawatt (MW) facility will be owned and operated by a joint venture
between RWE (70 %) and the Turkish energy company Turcas (30 %). The capex budget totals around € 500 mil-
lion. It is envisaged that construction will begin in the middle of 2010. The power station is scheduled to go
online at the end of 2012.
State-of-the-art gas power plant goes online in Lingen
On April 14, we commissioned the two units of the new CCGT power station in Lingen, Germany, in the pres-
ence of the Prime Minister of Lower Saxony, Christian Wulff. The plant's installed capacity of 887 MW and
efficiency of nearly 60 % ranks it among the most modern of its kind worldwide.
RWE Innogy and municipal utilities set to co-operate to expand the renewable generation base
In April, RWE Innogy and 26 municipal and regional utilities established the Green GECCO joint venture.
The partners aim to jointly develop and carry out projects in the field of renewable energy production.
RWE Innogy owns a 51 % stake in Green GECCO. Co-operation will extend beyond Germany. By the autumn of
2010, a 20 MW wind farm in the north of Scotland may become the first project in the new company’s port-
folio. By 2020, Green GECCO intends to have invested about € 1 billion in the generation of electricity and
heat from renewables.
major events
11revieW of operations

RWE purchases generation quota of Stade nuclear power station
RWE Power acquired the remaining 4.8 terawatt hour generation quota allotted to the decommissioned Stade
nuclear power plant from E.ON Kernkraft GmbH. The Stade power station was commissioned in 1972 and pro-
duced electricity until 2003. The unused quota is sufficient to run a 1,200 MW nuclear power plant such as the
Biblis A reactor at full capacity for approximately six months. Both parties have agreed to maintain confidenti-
ality with regard to the contractual conditions. The lifetimes of Germany’s nuclear power stations are currently
limited by the German Nuclear Energy Act (REA). The REA establishes their maximum allowable output, which
corresponds to 32 years of normal operation. The Act also allows for generation quotas to be transferred from
one power station to another if certain conditions are met. By purchasing the residual quota, RWE intends to
increase the remaining amount of electricity that Biblis A is allowed to generate. The objective is to ensure
that the reactor is allowed to continue operating until the German government adopts its energy concept, at
which point the lifetime cap could be reversed.
12 revieW of operations
New segment structure
Reporting for the first quarter of 2010 is based on the new segment structure, which was used as a basis for
the 2009 full-year financial statements for the first time. To ensure year-on-year comparability of first-quarter
data, we have put the figures for the first quarter of 2009 in line with the new structure. The segment split is
now more in line with national markets. The interim holding company, RWE Energy, has ceased to exist. This
results in a breakdown into the seven following divisions:
• Germany:Thisdivisionconsistsofthe“PowerGeneration”and“SalesandDistributionNetworks”Business
Areas. The first one includes RWE Power’s activities and the second one encompasses the new companies
RWE Rheinland Westfalen Netz AG (including RWE Gasspeicher GmbH) and RWE Vertrieb AG (including
eprimo and RWE Aqua). It also contains the German regional utilities, which operate their own electric-
ity generation facilities to a small extent, besides handling the network and end-customer business. RWE
Effizienz GmbH belongs to this business area as well. This also applies to some non-German activities: our
minority interest in Austrian-based KELAG and Luxembourg-based Enovos as well as our water business in
Zagreb, Croatia, which is run by RWE Aqua.
• Netherlands/Belgium:ThisisthedivisionunderwhichwereportonEssent,whichwasconsolidatedforthe
first time as of September 30, 2009. We started disclosing the company’s wind power generation under the
Renewables Segment in 2010. A further reclassification relates to Essent’s trading business: From now on,
we will report on it under the Trading / Gas Midstream Division. To ensure transparency, we will state the
results from these Essent activities as a separate item. Our former Dutch energy sales organisation (RWE
Energy Nederland) was transferred to Essent effective from October 1, 2009. It has been assigned to the
“Other, consolidation” item for the period before that.
• UnitedKingdom:WepresentRWEnpowerinthisitem.ItencompassesourUKgenerationandsupplybusi-
ness with the exception of electricity production from renewables, which is overseen by RWE Innogy.
• CentralandEasternEurope:ThisdivisioncoversourcompaniesinPoland,Hungary,theCzechRepublicand
Slovakia. In Poland, we focus on electricity supply and the electricity distribution network. In Hungary, we
also concentrate on lignite-based electricity generation, which is managed by our subsidiary Mátra. Before
the reorganisation Mátra belonged to RWE Power. Via minority interests, we are also active in gas sales and
water supply in Hungary. In the Czech Republic, our main activity is gas. Our local operations encompass
regional supply, distribution, supraregional transmission, transit and storage. In Slovakia, we are active in
the electricity network and electricity end-customer businesses through our minority interest in VSE and in
the gas supply sector via RWE Gas Slovensko.
notes on reporting
13revieW of operations

• Renewables:ThisdivisionencompassesalloftheactivitiesofRWEInnogy,whichspecialisesinelectricity
and heat generation from renewable sources of energy. As mentioned earlier, we started reporting Essent’s
wind power generation under this division in 2010.
• UpstreamGas&Oil:ThissegmentconsistsofRWEDea’sbusiness.Thecompanyproducesgasandoil,focusing
on Europe and northern Africa.
• Trading/GasMidstream:WereportonRWESupply&TradingandEssent’stradingactivitiesunderthisitem.
In addition to energy trading and gas midstream activities, this division also encompasses sales to major
German industrial and corporate customers previously handled by RWE Key Account before it was incorpo-
rated into RWE Supply & Trading in 2009.
The “Other, consolidation” item covers, among others, Amprion (formerly RWE Transportnetz Strom) and
Thyssengas (formerly RWE Transportnetz Gas), the latter of which is for sale. It also includes the Group holding
company, RWE AG, our internal service providers, namely RWE Service, RWE IT and RWE Consulting, as well as
RWE Technology, which was established with effect from January 1, 2010.
14 revieW of operations
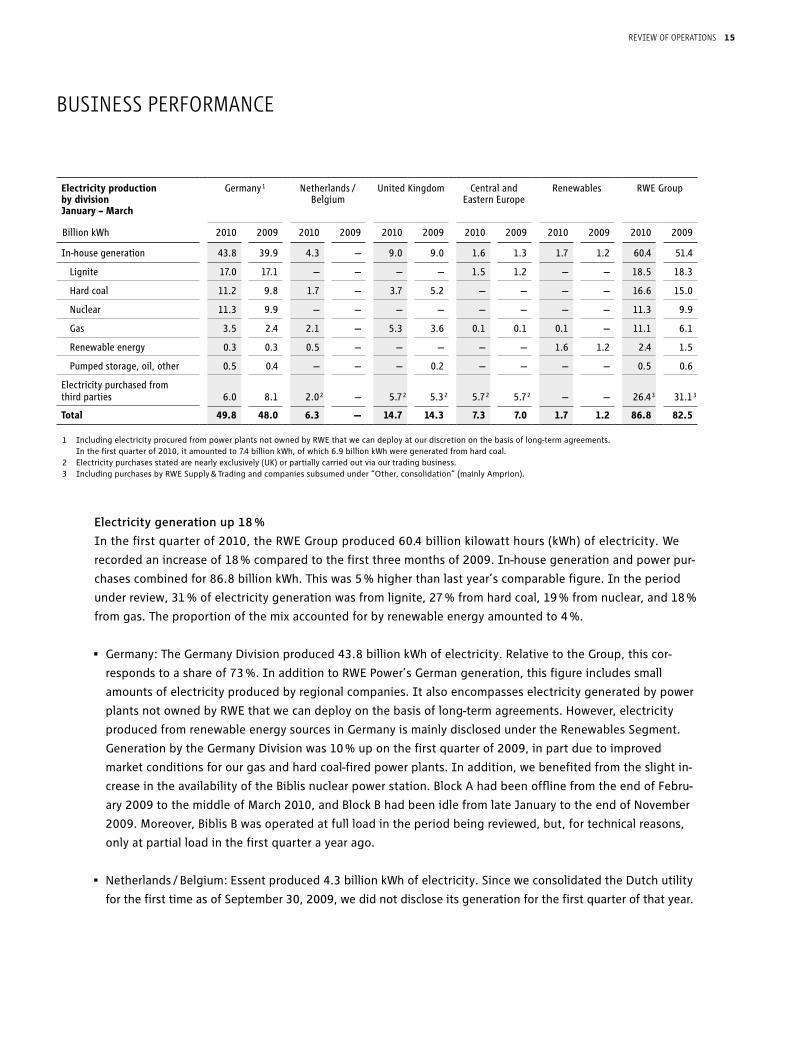
Electricity generation up 18 %
In the first quarter of 2010, the RWE Group produced 60.4 billion kilowatt hours (kWh) of electricity. We
recorded an increase of 18 % compared to the first three months of 2009. In-house generation and power pur-
chases combined for 86.8 billion kWh. This was 5 % higher than last year’s comparable figure. In the period
under review, 31 % of electricity generation was from lignite, 27 % from hard coal, 19 % from nuclear, and 18 %
from gas. The proportion of the mix accounted for by renewable energy amounted to 4 %.
• Germany:TheGermanyDivisionproduced43.8billionkWhofelectricity.RelativetotheGroup,thiscor-
responds to a share of 73 %. In addition to RWE Power’s German generation, this figure includes small
amounts of electricity produced by regional companies. It also encompasses electricity generated by power
plants not owned by RWE that we can deploy on the basis of long-term agreements. However, electricity
produced from renewable energy sources in Germany is mainly disclosed under the Renewables Segment.
Generation by the Germany Division was 10 % up on the first quarter of 2009, in part due to improved
market conditions for our gas and hard coal-fired power plants. In addition, we benefited from the slight in-
crease in the availability of the Biblis nuclear power station. Block A had been offline from the end of Febru-
ary 2009 to the middle of March 2010, and Block B had been idle from late January to the end of November
2009. Moreover, Biblis B was operated at full load in the period being reviewed, but, for technical reasons,
only at partial load in the first quarter a year ago.
• Netherlands/Belgium:Essentproduced4.3billionkWhofelectricity.SinceweconsolidatedtheDutchutility
for the first time as of September 30, 2009, we did not disclose its generation for the first quarter of that year.
Electricity production by division January – March
Germany 1 Netherlands / Belgium
United Kingdom Central and Eastern Europe
Renewables RWE Group
Billion kWh
2010 2009
2010 2009
2010 2009
2010 2009
2010 2009
2010 2009
In-house generation
43.8
39.9
4.3
—
9.0
9.0
1.6
1.3
1.7
1.2
60.4
51.4
Lignite
17.0
17.1
—
—
—
—
1.5
1.2
—
—
18.5
18.3
Hard coal
11.2
9.8
1.7
—
3.7
5.2
—
—
—
—
16.6
15.0
Nuclear
11.3
9.9
—
—
—
—
—
—
—
—
11.3
9.9
Gas
3.5
2.4
2.1
—
5.3
3.6
0.1
0.1
0.1
—
11.1
6.1
Renewable energy
0.3
0.3
0.5
—
—
—
—
—
1.6
1.2
2.4
1.5
Pumped storage, oil, other
0.5
0.4
—
—
—
0.2
—
—
—
—
0.5
0.6
Electricity purchased from third parties
6.0
8.1
2.0 2
—
5.7 2
5.3 2
5.7 2
5.7 2
—
—
26.4 3
31.1 3
Total 49.8 48.0 6.3 — 14.7 14.3 7.3 7.0 1.7 1.2 86.8 82.5
1 Including electricity procured from power plants not owned by RWE that we can deploy at our discretion on the basis of long-term agreements. In the first quarter of 2010, it amounted to 7.4 billion kWh, of which 6.9 billion kWh were generated from hard coal.
2 Electricity purchases stated are nearly exclusively (UK) or partially carried out via our trading business. 3 Including purchases by RWE Supply & Trading and companies subsumed under “Other, consolidation” (mainly Amprion).
Business performance
15revieW of operations
• UnitedKingdom:RWEnpowergenerated9.0billionkWhofelectricity,matchingtheyear-earlierlevel.As
set out on page 10, the market conditions for hard coal-fired power plants in the UK deteriorated consider-
ably. In contrast, those for gas power stations improved. This was reflected in the utilisation of capacity at
RWE npower’s plants.
• CentralandEasternEurope:Generationinthisregiontotalled1.6billionkWhandlargelycamefromthe
Hungarian lignite-based power producer Mátra. It rose substantially thanks to improved plant availability; in
the first quarter of 2009, one of our lignite units had an outage for maintenance purposes.
• Renewables:Thisdivisionproduced1.7billionkWhofelectricity,nearlyexclusivelyfromrenewablesources
of energy — up 42 % from 2009. This was in part because we started disclosing generation from Dutch-
based Essent’s wind turbines under this segment on January 1, 2010. The initial consolidation of Danta
de Energías also had a positive impact; in May 2009, we had increased our stake in the Spanish wind farm
operator from 49.33 % to 98.65 %. Organic growth made a contribution to the rise in production as well. For
instance, the 90 MW UK Rhyl Flats offshore wind farm was fully commissioned in December 2009.
In addition to our in-house generation, we also procure electricity from external suppliers. These purchases
totalled 26.4 billion kWh (2008: 31.1 billion kWh). This includes electricity fed into RWE’s network by third par-
ties, in accordance with the German Renewable Energy Act.
Gas and oil production down year on year
In the period under review, RWE Dea produced 841 million cubic metres of gas and 577 thousand cubic
metres of oil. Converted to oil equivalent, output totalled 1,391 thousand cubic metres (8.7 million barrels)
and was thus 8 % down on the comparable figure for 2009 (9.5 million barrels). Gas production dropped by
5 %. In our German and UK concession areas, we experienced a natural drop in output as existing reserves
are being depleted. The start of additional production wells in the Völkersen field in Lower Saxony, Germany,
had a counteracting effect. Moreover, we began to produce gas from a newly developed field in the UK North
Sea. Crude oil volumes were 11 % lower than in the same period last year. The ramifications of the progressive
depletion of reserves were felt here too, above all in our German Mittelplate oil field and at production sites in
the Gulf of Suez (Egypt). Measures to improve yield and the commissioning of a Danish field have been unable
to offset the production shortfall so far.
16 revieW of operations
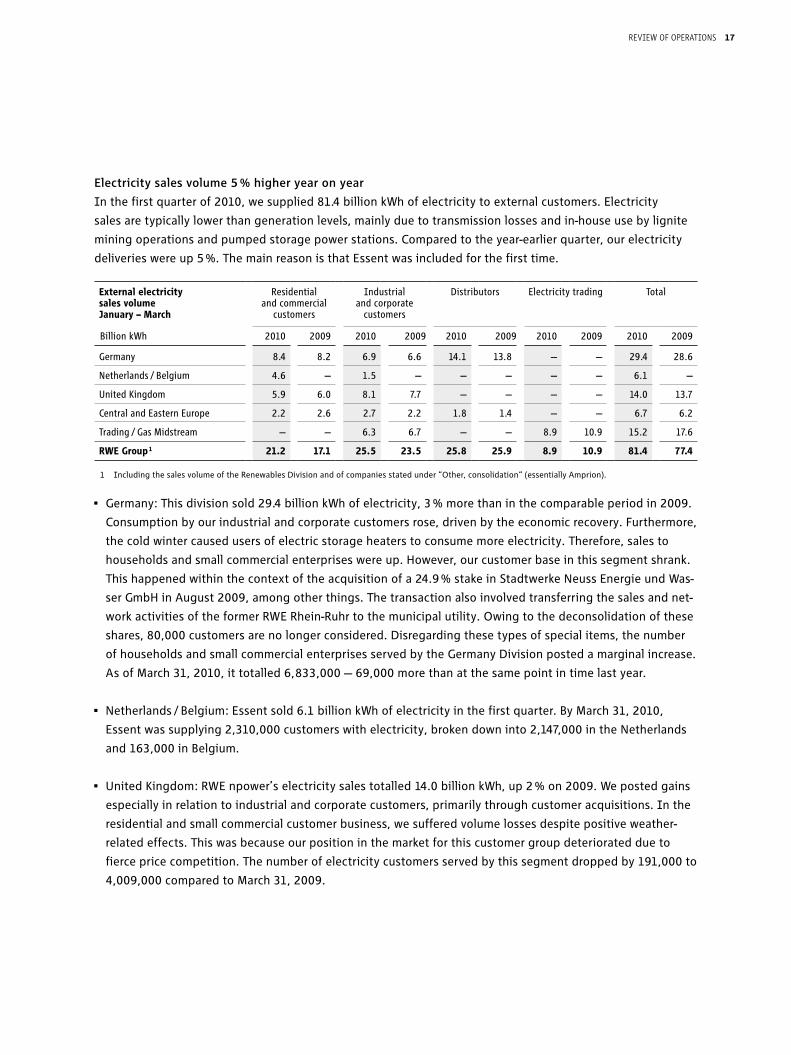
Electricity sales volume 5 % higher year on year
In the first quarter of 2010, we supplied 81.4 billion kWh of electricity to external customers. Electricity
sales are typically lower than generation levels, mainly due to transmission losses and in-house use by lignite
mining operations and pumped storage power stations. Compared to the year-earlier quarter, our electricity
deliveries were up 5 %. The main reason is that Essent was included for the first time.
• Germany:Thisdivisionsold29.4billionkWhofelectricity,3%morethaninthecomparableperiodin2009.
Consumption by our industrial and corporate customers rose, driven by the economic recovery. Furthermore,
the cold winter caused users of electric storage heaters to consume more electricity. Therefore, sales to
households and small commercial enterprises were up. However, our customer base in this segment shrank.
This happened within the context of the acquisition of a 24.9 % stake in Stadtwerke Neuss Energie und Was-
ser GmbH in August 2009, among other things. The transaction also involved transferring the sales and net-
work activities of the former RWE Rhein-Ruhr to the municipal utility. Owing to the deconsolidation of these
shares, 80,000 customers are no longer considered. Disregarding these types of special items, the number
of households and small commercial enterprises served by the Germany Division posted a marginal increase.
As of March 31, 2010, it totalled 6,833,000 — 69,000 more than at the same point in time last year.
• Netherlands/Belgium:Essentsold6.1billionkWhofelectricityinthefirstquarter.ByMarch31,2010,
Essent was supplying 2,310,000 customers with electricity, broken down into 2,147,000 in the Netherlands
and 163,000 in Belgium.
• UnitedKingdom:RWEnpower’selectricitysalestotalled14.0billionkWh,up2%on2009.Wepostedgains
especially in relation to industrial and corporate customers, primarily through customer acquisitions. In the
residential and small commercial customer business, we suffered volume losses despite positive weather-
related effects. This was because our position in the market for this customer group deteriorated due to
fierce price competition. The number of electricity customers served by this segment dropped by 191,000 to
4,009,000 compared to March 31, 2009.
External electricity sales volume January – March
Residential and commercial
customers
Industrial and corporate
customers
Distributors Electricity trading Total
Billion kWh
2010 2009 2010 2009 2010 2009 2010 2009 2010 2009
Germany
8.4
8.2
6.9
6.6
14.1
13.8
—
—
29.4
28.6
Netherlands / Belgium
4.6
—
1.5
—
—
—
—
—
6.1
—
United Kingdom
5.9
6.0
8.1
7.7
—
—
—
—
14.0
13.7
Central and Eastern Europe
2.2
2.6
2.7
2.2
1.8
1.4
—
—
6.7
6.2
Trading / Gas Midstream
—
—
6.3
6.7
—
—
8.9
10.9
15.2
17.6
RWE Group 1 21.2 17.1 25.5 23.5 25.8 25.9 8.9 10.9 81.4 77.4
1 Including the sales volume of the Renewables Division and of companies stated under “Other, consolidation“ (essentially Amprion).
17revieW of operations
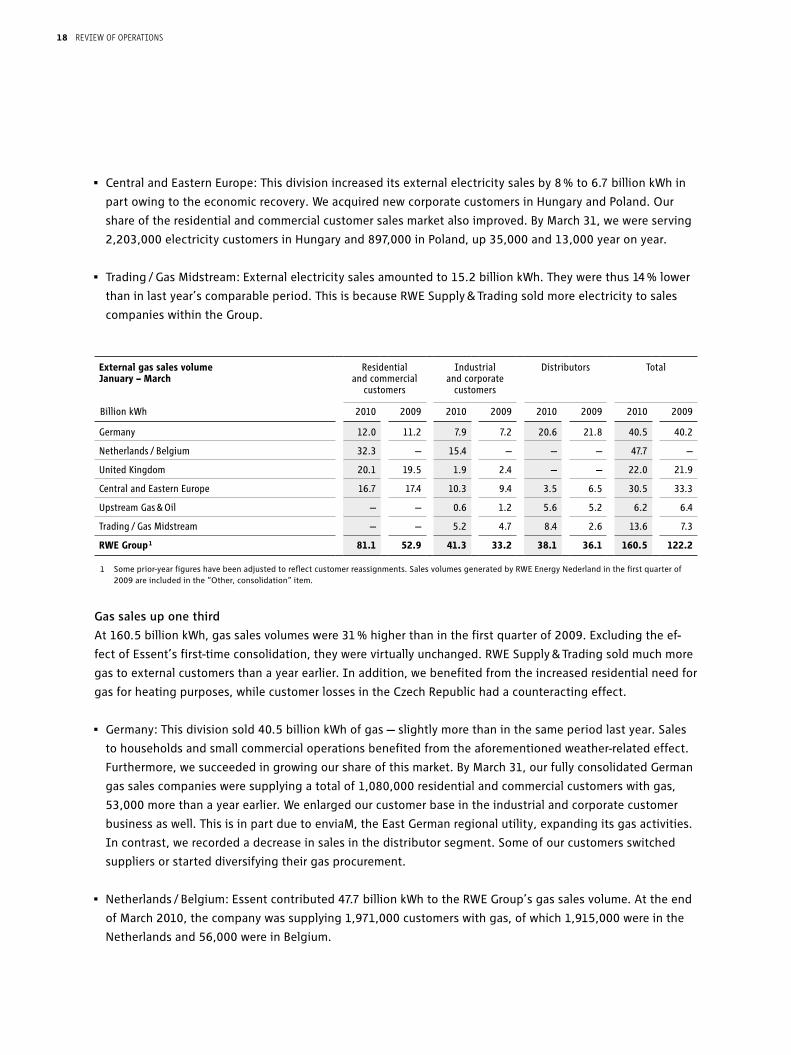
• CentralandEasternEurope:Thisdivisionincreaseditsexternalelectricitysalesby8%to6.7billionkWhin
part owing to the economic recovery. We acquired new corporate customers in Hungary and Poland. Our
share of the residential and commercial customer sales market also improved. By March 31, we were serving
2,203,000 electricity customers in Hungary and 897,000 in Poland, up 35,000 and 13,000 year on year.
• Trading/GasMidstream:Externalelectricitysalesamountedto15.2billionkWh.Theywerethus14%lower
than in last year’s comparable period. This is because RWE Supply & Trading sold more electricity to sales
companies within the Group.
Gas sales up one third
At 160.5 billion kWh, gas sales volumes were 31 % higher than in the first quarter of 2009. Excluding the ef-
fect of Essent’s first-time consolidation, they were virtually unchanged. RWE Supply & Trading sold much more
gas to external customers than a year earlier. In addition, we benefited from the increased residential need for
gas for heating purposes, while customer losses in the Czech Republic had a counteracting effect.
• Germany:Thisdivisionsold40.5billionkWhofgas—slightlymorethaninthesameperiodlastyear.Sales
to households and small commercial operations benefited from the aforementioned weather-related effect.
Furthermore, we succeeded in growing our share of this market. By March 31, our fully consolidated German
gas sales companies were supplying a total of 1,080,000 residential and commercial customers with gas,
53,000 more than a year earlier. We enlarged our customer base in the industrial and corporate customer
business as well. This is in part due to enviaM, the East German regional utility, expanding its gas activities.
In contrast, we recorded a decrease in sales in the distributor segment. Some of our customers switched
suppliers or started diversifying their gas procurement.
• Netherlands/Belgium:Essentcontributed47.7billionkWhtotheRWEGroup’sgassalesvolume.Attheend
of March 2010, the company was supplying 1,971,000 customers with gas, of which 1,915,000 were in the
Netherlands and 56,000 were in Belgium.
External gas sales volume January – March
Residential and commercial
customers
Industrial and corporate
customers
Distributors Total
Billion kWh
2010 2009
2010 2009
2010 2009
2010 2009
Germany
12.0
11.2
7.9
7.2
20.6
21.8
40.5
40.2
Netherlands / Belgium
32.3
—
15.4
—
—
—
47.7
—
United Kingdom
20.1
19.5
1.9
2.4
—
—
22.0
21.9
Central and Eastern Europe
16.7
17.4
10.3
9.4
3.5
6.5
30.5
33.3
Upstream Gas & Oil
—
—
0.6
1.2
5.6
5.2
6.2
6.4
Trading / Gas Midstream
—
—
5.2
4.7
8.4
2.6
13.6
7.3
RWE Group 1 81.1 52.9 41.3 33.2 38.1 36.1 160.5 122.2
1 Some prior-year figures have been adjusted to reflect customer reassignments. Sales volumes generated by RWE Energy Nederland in the first quarter of 2009 are included in the “Other, consolidation“ item.
18 revieW of operations
• UnitedKingdom:Despitethecoldweather,at22.0billionkWh,gassalesbyRWEnpowerwereessentially
unchanged. Our position in the market worsened somewhat, due to fierce price competition, particularly
in relation to our industrial customers. Residential and small commercial enterprise customer figures were
down as well. As of the balance-sheet date, they amounted to 2,593,000 and were thus 81,000 lower than
at the end of March 2009; 2,225,000 customers were being supplied by RWE npower with both electricity
and gas.
• CentralandEasternEurope:Gassalesrecordedbythisdivisiondeclinedby8%to30.5billionkWh.Some
of our key accounts in the Czech Republic switched suppliers or started diversifying their gas purchases.
This primarily related to distributors. Decreases in sales were also experienced in the residential and small
commercial customer business, where customer figures declined by 22,000 to 2,125,000. A positive effect
was felt from the fact that we now market gas in Slovakia as well. RWE Gas Slovensko, the sales subsidiary
we established in July 2008, delivered 2.7 billion kWh of gas to corporate customers in the quarter being
reviewed. The corresponding number for 2009 was 0.6 billion kWh.
• UpstreamGas&Oil:RWEDeadelivered6.2billionkWhofgastoexternalcustomers,fallingbelowtheprior-
year figure by 3 %. This was due to the decline in gas production.
• Trading/GasMidstream:RWESupply&Trading’sexternalgassalesvolumetotalled13.6billionkWh.This
company focuses on procuring gas for RWE Group companies and therefore predominantly generates inter-
nal sales. The company’s external sales consist of supplies to major industrial and corporate customers. They
also reflect sales of surplus purchases, which we sell directly to distributors or on wholesale markets. In the
latter case, similar to electricity, this portion is not included in sales. The share of total sales accounted for
by direct sales to distributors recently posted a strong increase. This was one of the reasons that external
sales generated by RWE Supply & Trading were much higher than in the same quarter a year ago. The rise in
volume is in part due to the fact that we now disclose the key account business of Essent's trading compa-
nies in the Trading / Gas Midstream Segment.
19revieW of operations
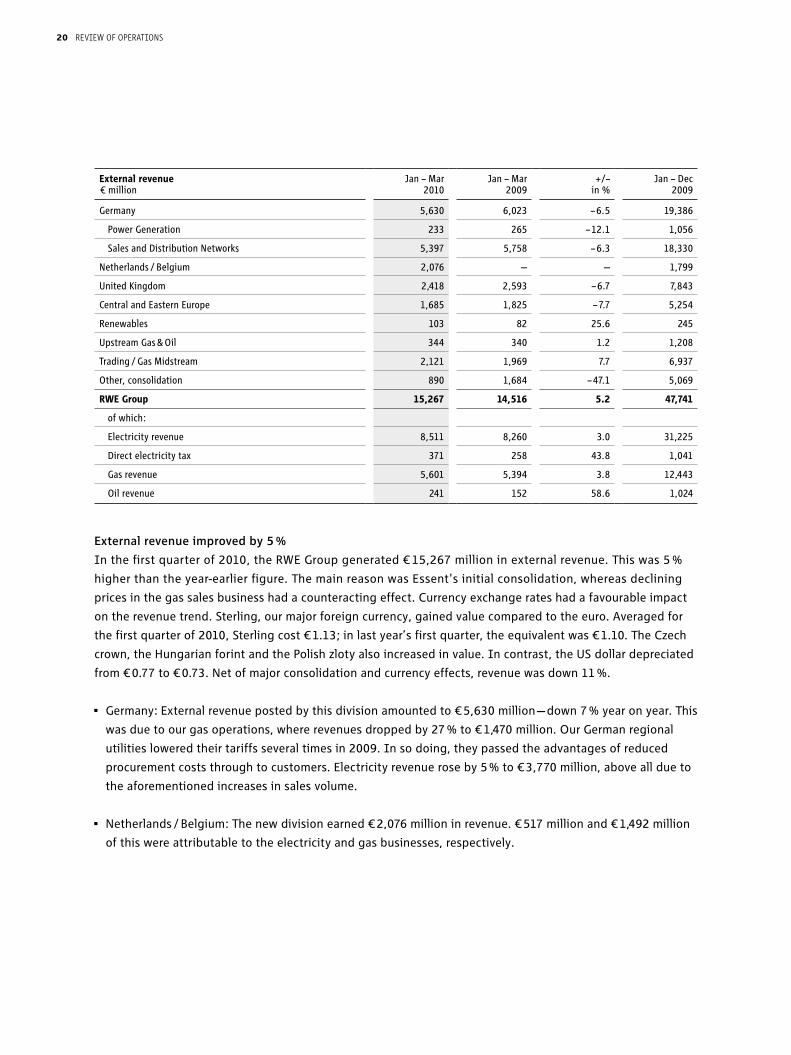
External revenue improved by 5 %
In the first quarter of 2010, the RWE Group generated € 15,267 million in external revenue. This was 5 %
higher than the year-earlier figure. The main reason was Essent's initial consolidation, whereas declining
prices in the gas sales business had a counteracting effect. Currency exchange rates had a favourable impact
on the revenue trend. Sterling, our major foreign currency, gained value compared to the euro. Averaged for
the first quarter of 2010, Sterling cost € 1.13; in last year’s first quarter, the equivalent was € 1.10. The Czech
crown, the Hungarian forint and the Polish zloty also increased in value. In contrast, the US dollar depreciated
from € 0.77 to € 0.73. Net of major consolidation and currency effects, revenue was down 11 %.
• Germany:Externalrevenuepostedbythisdivisionamountedto€5,630million—down7%yearonyear.This
was due to our gas operations, where revenues dropped by 27 % to € 1,470 million. Our German regional
utilities lowered their tariffs several times in 2009. In so doing, they passed the advantages of reduced
procurement costs through to customers. Electricity revenue rose by 5 % to € 3,770 million, above all due to
the aforementioned increases in sales volume.
• Netherlands/Belgium:Thenewdivisionearned€2,076millioninrevenue.€517millionand€1,492million
of this were attributable to the electricity and gas businesses, respectively.
External revenue Jan – Mar Jan – Mar +/– Jan – Dec€ million
2010
2009
in %
2009
Germany
5,630
6,023
– 6.5
19,386
Power Generation
233
265
– 12.1
1,056
Sales and Distribution Networks
5,397
5,758
– 6.3
18,330
Netherlands / Belgium
2,076
—
—
1,799
United Kingdom
2,418
2,593
– 6.7
7,843
Central and Eastern Europe
1,685
1,825
– 7.7
5,254
Renewables
103
82
25.6
245
Upstream Gas & Oil
344
340
1.2
1,208
Trading / Gas Midstream
2,121
1,969
7.7
6,937
Other, consolidation
890
1,684
– 47.1
5,069
RWE Group
15,267
14,516
5.2
47,741
of which:
Electricity revenue
8,511
8,260
3.0
31,225
Direct electricity tax
371
258
43.8
1,041
Gas revenue
5,601
5,394
3.8
12,443
Oil revenue 241 152 58.6 1,024
20 revieW of operations

• UnitedKingdom:ExternalrevenuegeneratedbyRWEnpowerdroppedby7%to€2,418million.Excluding
currency effects, revenue would have declined by 9 %. Electricity revenue amounted to € 1,444 million, expe-
riencing a year-on-year drop of 11 %, and 13 % excluding the currency impact. A contributing factor was the
aforementioned decrease in sales volume, but price effects were the main cause. RWE npower had lowered
tariffs for residential customers by an average of 8 % with effect from March 31, 2009. Gas revenue totalled
€ 853 million — slightly down on the comparable figure for 2009. It slipped by 4 % in Sterling terms, in part
due to price reductions for industrial and corporate customers. In the residential and commercial customer
segment, RWE npower lowered gas tariffs by an average of 7 %. Since this did not take effect until March 26,
2010, it did not have a significant bearing on the development of revenue in the first quarter.
• CentralandEasternEurope:At€1,685million,externalrevenueearnedinthisdivisionwas8%lowerthan
a year earlier. Net of foreign exchange effects, it was down 17 %. This is due to the gas business, which
generated € 987 million in external revenue. The division was thus 19 % down year on year, and as much as
27 % excluding the impact of currencies. As mentioned earlier, the drop in volume in the Czech Republic was
the main reason. In contrast, electricity revenue grew by 16 % to € 674 million. Deducting currency effects
results in a rise of 3 %, which is largely due to increased sales volumes.
• Renewables:Externalrevenuewasboostedby26%to€103million.Thiswasprimarilybecauseweassigned
revenue from Essent's wind power activities to this division, which amounted to € 21 million. The initial con-
solidation of Danta de Energías and the commissioning of new wind farms also added to external revenue.
The fact that the level of prices on wholesale electricity markets was lower year on year also had a dampen-
ing effect. This predominantly related to our run-of-river power stations in Germany and our wind turbines in
Spain.
• UpstreamGas&Oil:Thisdivisionpostedamarginalincreaseinexternalrevenueto€344million.RWEDea
sold its crude oil production at much higher dollar prices than in the same period last year. The impact on
revenue was slightly mitigated by the US currency’s drop versus the euro. Another dampening effect was felt
from the fact that the gas prices we realised were lower than in 2009 and that oil and gas sales were down.
• Trading/GasMidstream:Externalrevenuetotalled€2,121million,climbingby8%overthesameperiodlast
year. This was mainly because revenue from Essent's trading activities was included for the first time.
21revieW of operations
Internal revenue Jan – Mar Jan – Mar +/– Jan – Dec€ million
2010
2009
in %
2009
Germany
3,732
3,744
– 0.3
14,587
Power Generation
2,766
2,673
3.5
9,804
Sales and Distribution Networks
966
1,071
– 9.8
4,783
Netherlands / Belgium
109
—
—
158
United Kingdom
2
2
—
11
Central and Eastern Europe
116
126
– 7.9
465
Renewables
53
41
29.3
138
Upstream Gas & Oil
42
94
– 55.3
262
Trading / Gas Midstream 6,611 6,769 – 2.3 19,308
Reconciliation of income from operating activities to EBITDA
Jan – Mar 2010
Jan – Mar 2009
+/– in %
Jan – Dec 2009
€ million
Income from operating activities 1
2,652
2,885
– 8.1
7,326
+ Operating income from investments
90
67
34.3
321
+ Non-operating income from investments
1
96
—
– 59
– Non-operating result
244
– 424
—
– 498
Operating result
2,987
2,624
13.8
7,090
+ Operating depreciation and amortisation
587
466
26.0
2,075
EBITDA 3,574 3,090 15.7 9,165
1 See the income statement on page 40.
EBITDA Jan – Mar Jan – Mar +/– Jan – Dec€ million
2010
2009
in %
2009
Germany
2,087
1,940
7.6
5,811
Power Generation
1,294
1,161
11.5
3,889
Sales and Distribution Networks
793
779
1.8
1,922
Netherlands / Belgium
346
—
—
277
United Kingdom
274
236
16.1
445
Central and Eastern Europe
509
372
36.8
1,285
Renewables
64
35
82.9
126
of which: Essent wind activities
18
—
—
—
Upstream Gas & Oil
204
167
22.2
437
Trading / Gas Midstream
90
362
– 75.1
986
of which: Essent trading activities
87
—
—
—
Other, consolidation
—
– 22
—
– 202
RWE Group 3,574 3,090 15.7 9,165
22 revieW of operations

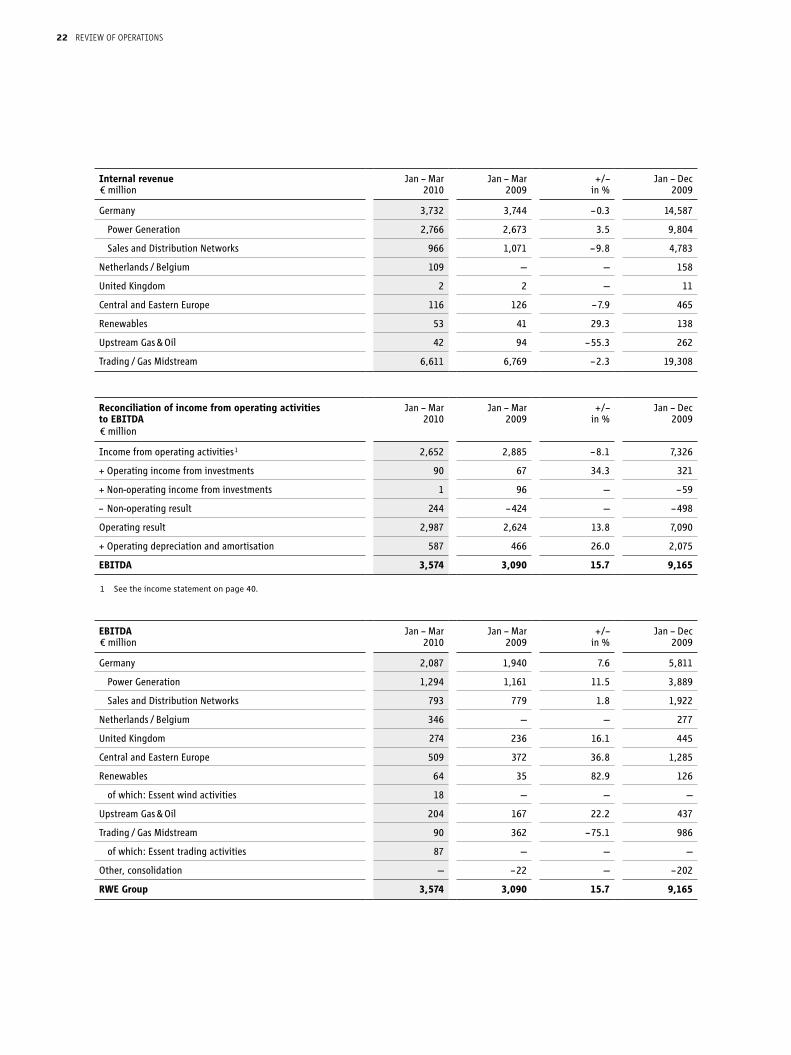
Operating result 14 % up year on year
The RWE Group’s earnings improved further in the first quarter of 2010. EBITDA increased by 16 % to € 3,574
million, and the operating result rose by 14 % to € 2,987 million. The main driver was the inclusion of Essent
for the first time. Excluding consolidation and currency effects, our earnings were stable. As expected, the
operating result achieved by RWE Supply & Trading was far below the high level recorded a year ago, whereas
all the other divisions posted gains. As before, we anticipate that the RWE Group’s EBITDA will improve by
between 5 % and 10 % for the year as a whole. We expect our operating result to grow by approximately 5 %.
• Germany:Thedivisionpostedanoperatingresultof€1,828million.Thisrepresentsanincreaseof8%over
2009. Developments in the "Power Generation" and "Sales and Distribution Networks" Business Areas were
as follows:
Power Generation: The operating result achieved by our German electricity production improved by 11 % to
€ 1,173 million, although we sold our generation at lower market prices than in the same period last year.
We benefited from price-induced relief in fuel procurement in the order of € 212 million for hard coal and
€ 20 million for gas. At € 183 million, the expense we incurred owing to the shortage of CO2 emission al-
lowances was much lower than in the comparable period in 2009 (€ 284 million). The increase in electricity
generated by the Biblis nuclear power plant also had a positive impact (€ 97 million). Changes in nuclear and
mining provisions had a negative effect on balance.
Sales and Distribution Networks: This business area increased its operating result by 2 % to € 655 million. In
the sales business, we benefited from the influence the weather had on the gas sales volume, but realised
lower electricity margins. In the networks business, the cold weather caused construction and maintenance
projects to be postponed, resulting in a reduction of associated expenses. Conversely, the following situa-
tion had a negative effect: The German Federal Network Agency is of the opinion that our revenue from the
network fees we charged at the beginning of network regulation (2005 to 2007) was too high. The excess
amounts must be refunded via appropriately reduced network fees from 2010 onwards.
Operating result Jan – Mar Jan – Mar +/– Jan – Dec€ million
2010
2009
in %
2009
Germany
1,828
1,700
7.5
4,780
Power Generation
1,173
1,055
11.2
3,428
Sales and Distribution Networks
655
645
1.6
1,352
Netherlands / Belgium
281
—
—
180
United Kingdom
227
192
18.2
247
Central and Eastern Europe
447
322
38.8
1,055
Renewables
30
20
50.0
56
of which: Essent wind activities
6
—
—
—
Upstream Gas & Oil
128
107
19.6
203
Trading / Gas Midstream
88
362
– 75.7
985
of which: Essent trading activities
86
—
—
—
Other, consolidation
– 42
– 79
46.8
– 416
RWE Group 2,987 2,624 13.8 7,090
23revieW of operations
• Netherlands/Belgium:Inthefirstquarter,thenewdivisionrecordedanoperatingresultof€281million.
However, due to typical seasonal influences, this performance should not be extrapolated for the full year.
Essent’s gas activities achieved a particularly strong operating result. The cold weather was a contribut-
ing factor.
• UnitedKingdom:RWEnpower’soperatingresultadvancedby18%to€227million.Netofforeignexchange
effects, the gain amounted to 15 %. The growth is largely attributable to the end-customer business, where
we benefited from the colder weather. Furthermore, gas margins improved owing to declining procure-
ment prices. However, as we lowered our residential gas tariffs at the end of March 2010, this effect will
be weaker for the year as a whole. In the electricity supply business, we felt the negative impact of the
price reduction implemented at the end of March 2009. RWE npower’s power generation activities closed
the quarter with an operating result that was much lower than a year before. The deterioration in market
conditions for our hard coal-fired power plants led to a reduction in earnings, which could not be offset by
the rise in production by gas-fired power plants. Expenses incurred to purchase CO2 emission allowances
decreased from € 27 million to € 7 million. RWE npower cut costs last year in order to stabilise earnings. This
had positive effects on earnings in the first quarter of 2010 as well, because to a significant degree, the
measures had not yet been taken in last year’s comparable period.
• CentralandEasternEurope:Theoperatingresultweachievedinthisdivisiongrewby39%to€447million.
This was in part due to the impact of foreign exchange rates. Net of currency effects, the rise amounted to
28 %, which predominantly stemmed from our gas activities in the Czech Republic. Lower procurement costs
provided some relief to our regional sales companies. However, decreases in gas sales to key accounts and
reduced transit fees had a negative impact on our Czech operating result. Our Hungarian and Polish electric-
ity sales businesses improved earnings, in part on the strength of marginal increases in sales volumes. In
Hungary, more favourable procurement conditions were a further contributing factor, while in Poland, the
rise in sales prices was an additional driver.
• Renewables:Theoperatingresultwasup€10millionto€30million.Essent’swindpoweractivities,which
were disclosed under this division for the first time, contributed € 6 million. But its operating result was un-
usually weak, owing to the small amount of wind in Germany and the Netherlands. The initial consolidation
of Danta de Energías and the commissioning of the Rhyl Flats offshore wind farm also added to the result.
Negative effects were felt from RWE Innogy’s extensive capital expenditure programme, as it goes hand in
hand with run-up costs and requires additional manpower. On top of that, the operating result was curtailed
by the lower level of electricity prices.
• UpstreamGas&Oil:RWEDealifteditsoperatingresultby20%to€128million.Thebasisforthiswas
higher realised oil prices. On top of that, the decline in exploration costs in North Africa provided some
relief. Furthermore, production fees as well as production and operating costs dropped in Germany. This
was contrasted by the negative impact resulting from the fall in realised gas prices and lower production
volumes.
24 revieW of operations
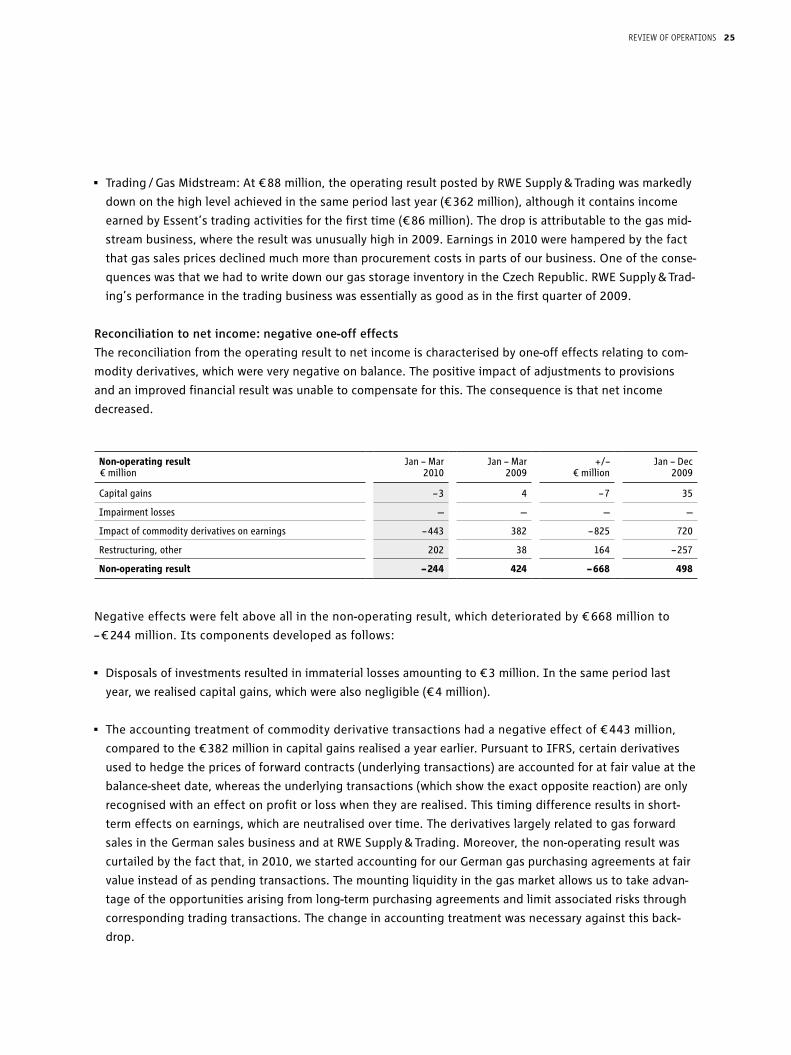
• Trading/GasMidstream:At€88million,theoperatingresultpostedbyRWESupply&Tradingwasmarkedly
down on the high level achieved in the same period last year (€ 362 million), although it contains income
earned by Essent’s trading activities for the first time (€ 86 million). The drop is attributable to the gas mid-
stream business, where the result was unusually high in 2009. Earnings in 2010 were hampered by the fact
that gas sales prices declined much more than procurement costs in parts of our business. One of the conse-
quences was that we had to write down our gas storage inventory in the Czech Republic. RWE Supply & Trad-
ing’s performance in the trading business was essentially as good as in the first quarter of 2009.
Reconciliation to net income: negative one-off effects
The reconciliation from the operating result to net income is characterised by one-off effects relating to com-
modity derivatives, which were very negative on balance. The positive impact of adjustments to provisions
and an improved financial result was unable to compensate for this. The consequence is that net income
decreased.
Negative effects were felt above all in the non-operating result, which deteriorated by € 668 million to
– € 244 million. Its components developed as follows:
• Disposalsofinvestmentsresultedinimmateriallossesamountingto€3million.Inthesameperiodlast
year, we realised capital gains, which were also negligible (€ 4 million).
• Theaccountingtreatmentofcommodityderivativetransactionshadanegativeeffectof€443million,
compared to the € 382 million in capital gains realised a year earlier. Pursuant to IFRS, certain derivatives
used to hedge the prices of forward contracts (underlying transactions) are accounted for at fair value at the
balance-sheet date, whereas the underlying transactions (which show the exact opposite reaction) are only
recognised with an effect on profit or loss when they are realised. This timing difference results in short-
term effects on earnings, which are neutralised over time. The derivatives largely related to gas forward
sales in the German sales business and at RWE Supply & Trading. Moreover, the non-operating result was
curtailed by the fact that, in 2010, we started accounting for our German gas purchasing agreements at fair
value instead of as pending transactions. The mounting liquidity in the gas market allows us to take advan-
tage of the opportunities arising from long-term purchasing agreements and limit associated risks through
corresponding trading transactions. The change in accounting treatment was necessary against this back-
drop.
Non-operating result Jan – Mar Jan – Mar +/– Jan – Dec€ million
2010
2009
€ million
2009
Capital gains
– 3
4
– 7
35
Impairment losses
—
—
—
—
Impact of commodity derivatives on earnings
– 443
382
– 825
720
Restructuring, other
202
38
164
– 257
Non-operating result – 244 424 – 668 498
25revieW of operations

• Theresultstatedunder“Restructuring,other”roseby€164millionto€202millionprimarilyduetothe
reversal of provisions for impending losses. As in the same quarter last year, we recognised € 63 million
in amortisation on RWE npower’s customer base. Unlike before, we do not disclose income resulting from
changes in nuclear and mining provisions as part of the non-operating result. Instead, they are recognised
in the operating result of the German generation business.
The financial result improved by € 108 million to – € 402 million. Its components developed as follows:
• Netinterestdeterioratedby€85millionto–€199million.Thiswasduetoourgrowthinvestmentsandthe
acquisition of Essent. We covered the increased need for financing by issuing bonds and selling securities,
among other things. This caused interest expenses to increase and interest income to decrease.
• At€218million,theinterestaccretiontonon-currentprovisionswasofasimilarorderasthecorresponding
figure for 2009 (€ 221 million).
• The“Otherfinancialresult”roseby€190millionto€15million.Themainreasonwastheabsenceofcharg-
es from the year-earlier period incurred in connection with the crisis on financial markets. In the first quarter
of 2009, we had realised write-downs on securities and book losses on the sale of securities. Conversely, we
generated income from such sales in 2010.
Financial result Jan – Mar Jan – Mar +/– Jan – Dec€ million
2010
2009
€ million
2009
Interest income
104
178
– 74
589
Interest expenses
– 303
– 292
– 11
– 1,224
Net interest
– 199
– 114
– 85
– 635
Interest accretion to non-current provisions
– 218
– 221
3
– 957
Other financial result
15
– 175
190
– 398
Financial result – 402 – 510 108 – 1,990
26 revieW of operations
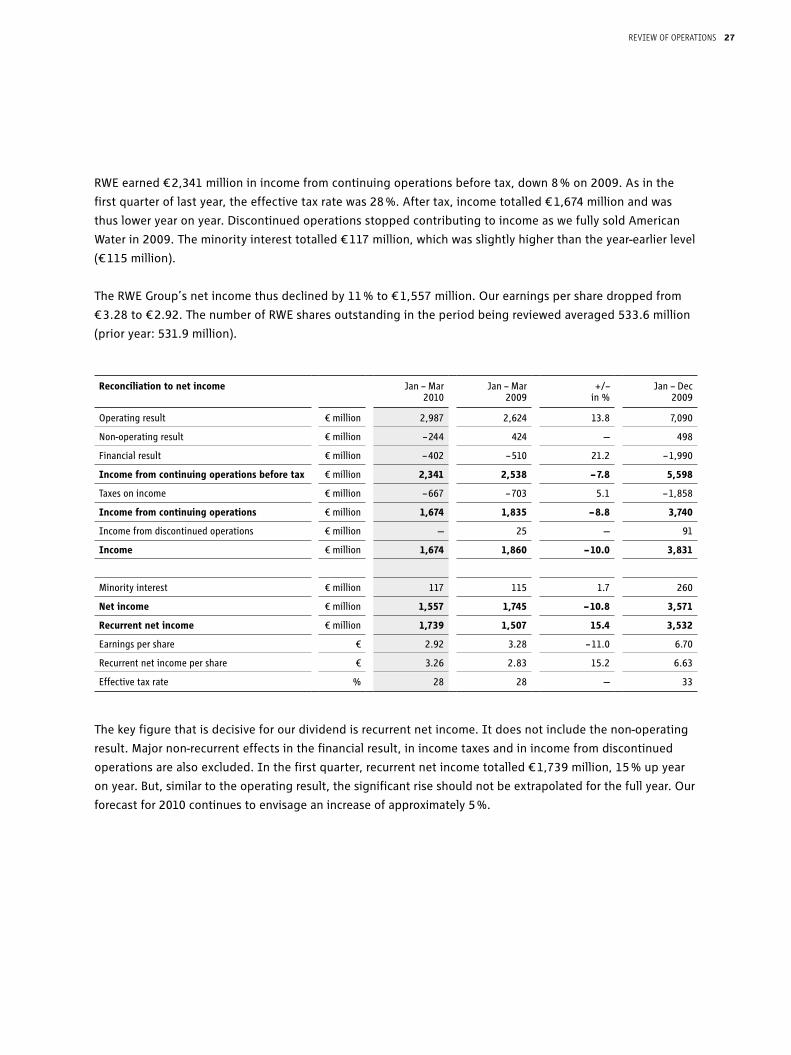
RWE earned € 2,341 million in income from continuing operations before tax, down 8 % on 2009. As in the
first quarter of last year, the effective tax rate was 28 %. After tax, income totalled € 1,674 million and was
thus lower year on year. Discontinued operations stopped contributing to income as we fully sold American
Water in 2009. The minority interest totalled € 117 million, which was slightly higher than the year-earlier level
(€ 115 million).
The RWE Group’s net income thus declined by 11 % to € 1,557 million. Our earnings per share dropped from
€ 3.28 to € 2.92. The number of RWE shares outstanding in the period being reviewed averaged 533.6 million
(prior year: 531.9 million).
The key figure that is decisive for our dividend is recurrent net income. It does not include the non-operating
result. Major non-recurrent effects in the financial result, in income taxes and in income from discontinued
operations are also excluded. In the first quarter, recurrent net income totalled € 1,739 million, 15 % up year
on year. But, similar to the operating result, the significant rise should not be extrapolated for the full year. Our
forecast for 2010 continues to envisage an increase of approximately 5 %.
Reconciliation to net income Jan – Mar Jan – Mar +/– Jan – Dec
2010
2009
in %
2009
Operating result
€ million
2,987
2,624
13.8
7,090
Non-operating result
€ million
– 244
424
—
498
Financial result
€ million
– 402
– 510
21.2
– 1,990
Income from continuing operations before tax
€ million
2,341
2,538
– 7.8
5,598
Taxes on income
€ million
– 667
– 703
5.1
– 1,858
Income from continuing operations
€ million
1,674
1,835
– 8.8
3,740
Income from discontinued operations
€ million
—
25
—
91
Income
€ million
1,674
1,860
– 10.0
3,831
Minority interest
€ million
117
115
1.7
260
Net income
€ million
1,557
1,745
– 10.8
3,571
Recurrent net income
€ million
1,739
1,507
15.4
3,532
Earnings per share
€
2.92
3.28
– 11.0
6.70
Recurrent net income per share
€
3.26
2.83
15.2
6.63
Effective tax rate % 28 28 — 33
27revieW of operations
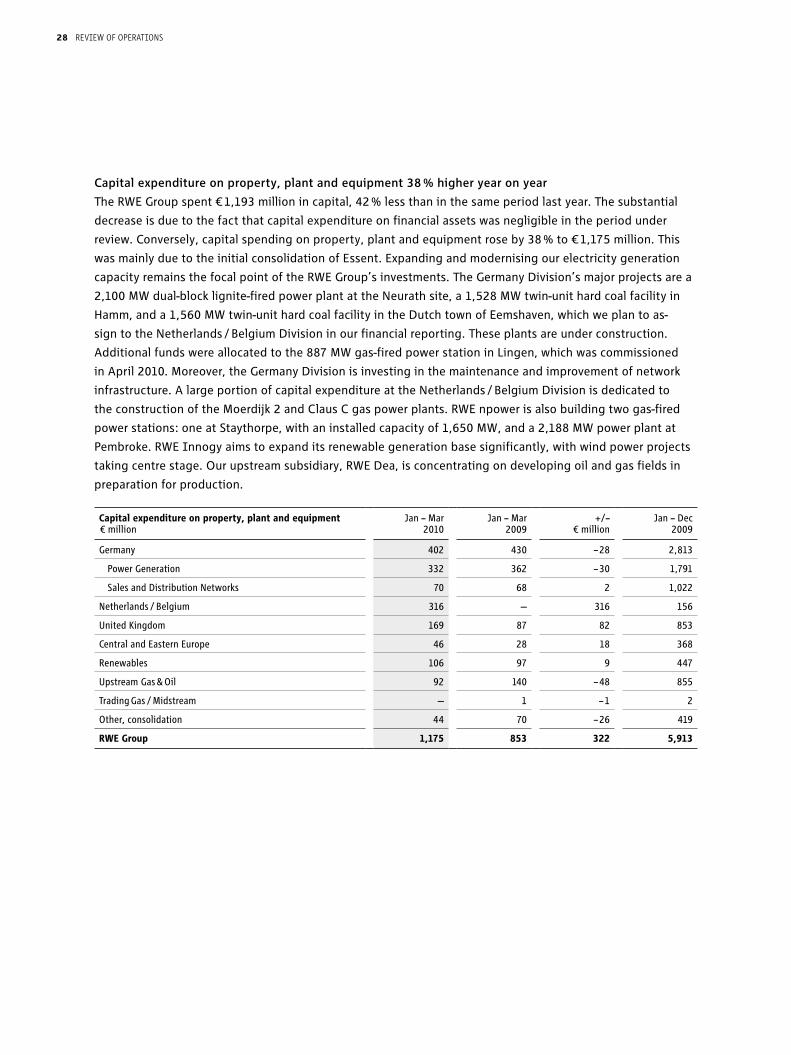
Capital expenditure on property, plant and equipment 38 % higher year on year
The RWE Group spent € 1,193 million in capital, 42 % less than in the same period last year. The substantial
decrease is due to the fact that capital expenditure on financial assets was negligible in the period under
review. Conversely, capital spending on property, plant and equipment rose by 38 % to € 1,175 million. This
was mainly due to the initial consolidation of Essent. Expanding and modernising our electricity generation
capacity remains the focal point of the RWE Group’s investments. The Germany Division’s major projects are a
2,100 MW dual-block lignite-fired power plant at the Neurath site, a 1,528 MW twin-unit hard coal facility in
Hamm, and a 1,560 MW twin-unit hard coal facility in the Dutch town of Eemshaven, which we plan to as-
sign to the Netherlands / Belgium Division in our financial reporting. These plants are under construction.
Additional funds were allocated to the 887 MW gas-fired power station in Lingen, which was commissioned
in April 2010. Moreover, the Germany Division is investing in the maintenance and improvement of network
infrastructure. A large portion of capital expenditure at the Netherlands / Belgium Division is dedicated to
the construction of the Moerdijk 2 and Claus C gas power plants. RWE npower is also building two gas-fired
power stations: one at Staythorpe, with an installed capacity of 1,650 MW, and a 2,188 MW power plant at
Pembroke. RWE Innogy aims to expand its renewable generation base significantly, with wind power projects
taking centre stage. Our upstream subsidiary, RWE Dea, is concentrating on developing oil and gas fields in
preparation for production.
Capital expenditure on property, plant and equipment Jan – Mar Jan – Mar +/– Jan – Dec€ million
2010
2009
€ million
2009
Germany
402
430
– 28
2,813
Power Generation
332
362
– 30
1,791
Sales and Distribution Networks
70
68
2
1,022
Netherlands / Belgium
316
—
316
156
United Kingdom
169
87
82
853
Central and Eastern Europe
46
28
18
368
Renewables
106
97
9
447
Upstream Gas & Oil
92
140
– 48
855
Trading Gas / Midstream
—
1
– 1
2
Other, consolidation
44
70
– 26
419
RWE Group 1,175 853 322 5,913
28 revieW of operations
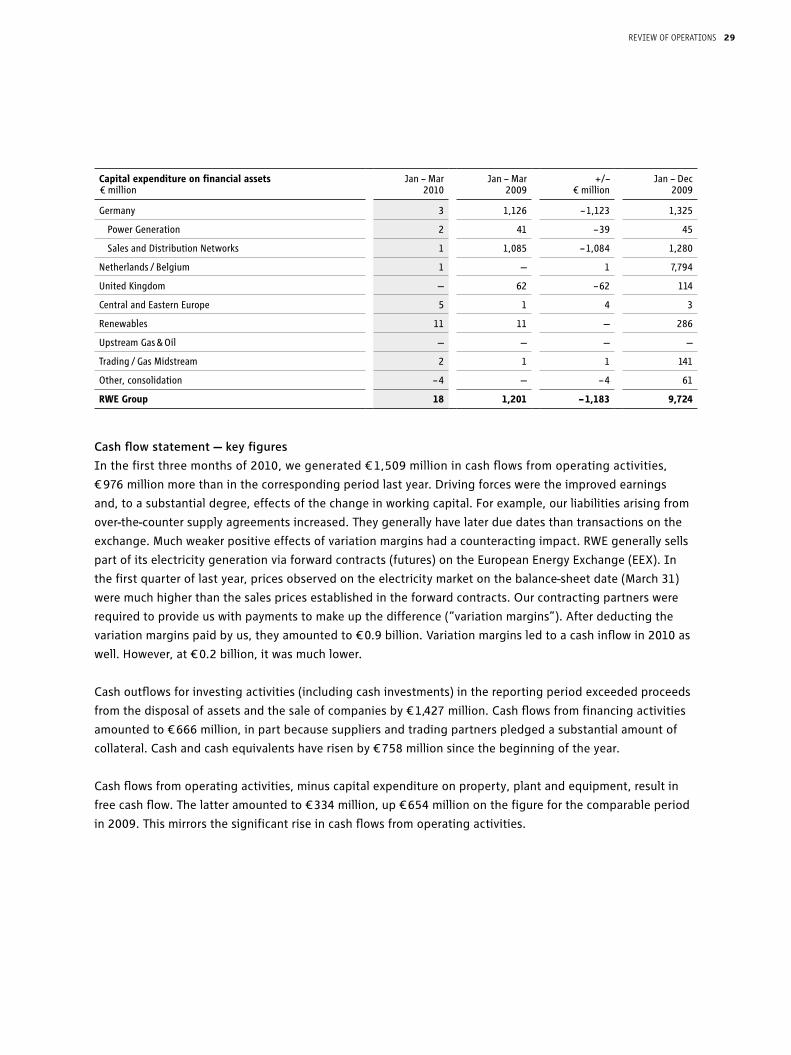
Cash flow statement — key figures
In the first three months of 2010, we generated € 1,509 million in cash flows from operating activities,
€ 976 million more than in the corresponding period last year. Driving forces were the improved earnings
and, to a substantial degree, effects of the change in working capital. For example, our liabilities arising from
over-the-counter supply agreements increased. They generally have later due dates than transactions on the
exchange. Much weaker positive effects of variation margins had a counteracting impact. RWE generally sells
part of its electricity generation via forward contracts (futures) on the European Energy Exchange (EEX). In
the first quarter of last year, prices observed on the electricity market on the balance-sheet date (March 31)
were much higher than the sales prices established in the forward contracts. Our contracting partners were
required to provide us with payments to make up the difference (“variation margins”). After deducting the
variation margins paid by us, they amounted to € 0.9 billion. Variation margins led to a cash inflow in 2010 as
well. However, at € 0.2 billion, it was much lower.
Cash outflows for investing activities (including cash investments) in the reporting period exceeded proceeds
from the disposal of assets and the sale of companies by € 1,427 million. Cash flows from financing activities
amounted to € 666 million, in part because suppliers and trading partners pledged a substantial amount of
collateral. Cash and cash equivalents have risen by € 758 million since the beginning of the year.
Cash flows from operating activities, minus capital expenditure on property, plant and equipment, result in
free cash flow. The latter amounted to € 334 million, up € 654 million on the figure for the comparable period
in 2009. This mirrors the significant rise in cash flows from operating activities.
Capital expenditure on financial assets Jan – Mar Jan – Mar +/– Jan – Dec€ million
2010
2009
€ million
2009
Germany
3
1,126
– 1,123
1,325
Power Generation
2
41
– 39
45
Sales and Distribution Networks
1
1,085
– 1,084
1,280
Netherlands / Belgium
1
—
1
7,794
United Kingdom
—
62
– 62
114
Central and Eastern Europe
5
1
4
3
Renewables
11
11
—
286
Upstream Gas & Oil
—
—
—
—
Trading / Gas Midstream
2
1
1
141
Other, consolidation
– 4
—
– 4
61
RWE Group 18 1,201 – 1,183 9,724
29revieW of operations

Marginal decline in net debt
As of March 31, 2010, the RWE Group's net debt totalled € 25.2 billion. It was slightly lower than at December
31, 2009 (€ 25.8 billion). Free cash flow, which was just commented on, made a contribution to this decline.
Cash flow statement Jan – Mar Jan – Mar +/– Jan – Dec€ million
2010
2009
€ million
2009
Cash flows from operating activities
1,509
533
976
5,299
of which: impact of the change in working capital
– 853
– 1,407
554
– 795
Cash flows from investing activities
– 1,427
– 4,559
3,132
– 8,326
Cash flows from financing activities
666
4,368
– 3,702
4,839
Effects of changes in foreign exchange rates and other changes in value on cash and cash equivalents
10
– 7
17
13
Total net changes in cash and cash equivalents
758
335
423
1,825
Cash flows from operating activities
1,509
533
976
5,299
Minus capital expenditure on property, plant and equipment and on intangible assets
– 1,175
– 853
– 322
– 5,913
Free cash flow 334 – 320 654 – 614
Net debt Mar 31, Dec 31, +/–€ million
2010
2009
in %
Cash and cash equivalents
3,832
3,074
24.7
Marketable securities
3,671
3,443
6.6
Other financial assets
2,911
3,247
– 10.3
Financial assets
10,414
9,764
6.7
Bonds, other notes payable, bank debt, commercial paper
17,689
17,707
– 0.1
Other financial liabilities
2,456
2,439
0.7
Financial liabilities
20,145
20,146
—
Net financial debt
9,731
10,382
– 6.3
Provisions for pensions and similar obligations
3,221
3,281
– 1.8
Surplus of plan assets over benefit obligations
84
79
6.3
Provisions for nuclear waste management
9,652
9,491
1.7
Mining provisions
2,729
2,712
0.6
Net debt of the RWE Group 25,249 25,787 – 2.1
30 revieW of operations
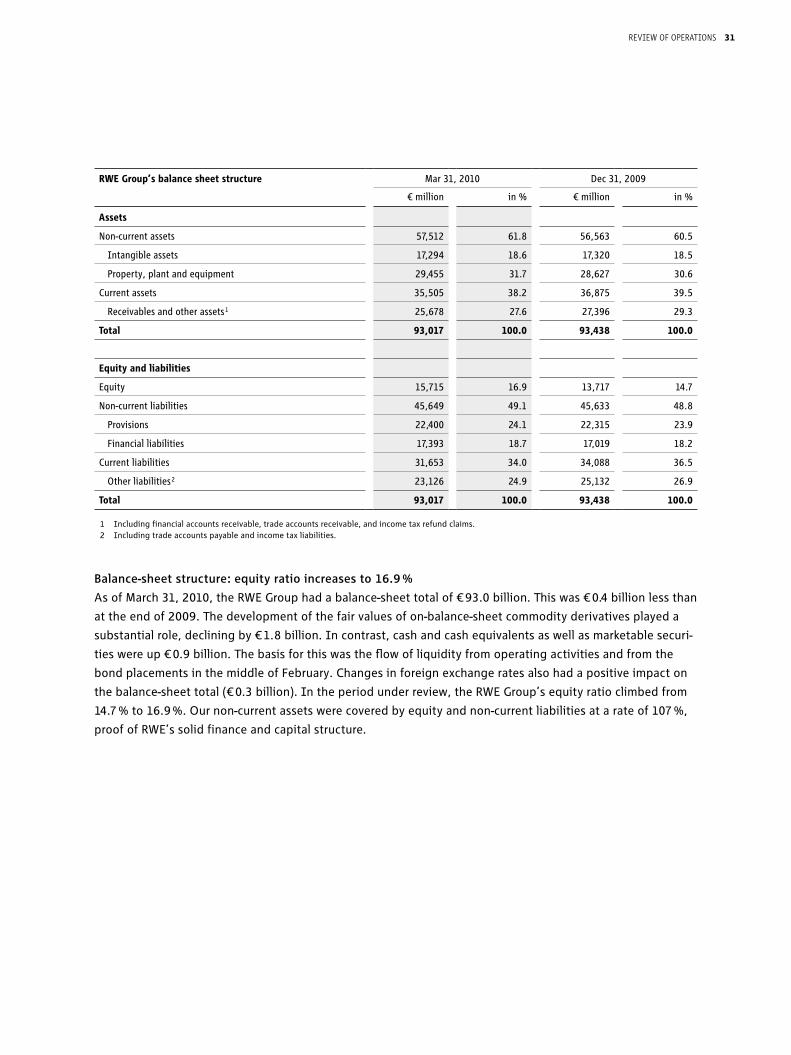
Balance-sheet structure: equity ratio increases to 16.9 %
As of March 31, 2010, the RWE Group had a balance-sheet total of € 93.0 billion. This was € 0.4 billion less than
at the end of 2009. The development of the fair values of on-balance-sheet commodity derivatives played a
substantial role, declining by € 1.8 billion. In contrast, cash and cash equivalents as well as marketable securi-
ties were up € 0.9 billion. The basis for this was the flow of liquidity from operating activities and from the
bond placements in the middle of February. Changes in foreign exchange rates also had a positive impact on
the balance-sheet total (€ 0.3 billion). In the period under review, the RWE Group’s equity ratio climbed from
14.7 % to 16.9 %. Our non-current assets were covered by equity and non-current liabilities at a rate of 107 %,
proof of RWE’s solid finance and capital structure.
RWE Group’s balance sheet structure Mar 31, 2010 Dec 31, 2009
€ million in %
€ million in %
Assets
Non-current assets
57,512
61.8
56,563
60.5
Intangible assets
17,294
18.6
17,320
18.5
Property, plant and equipment
29,455
31.7
28,627
30.6
Current assets
35,505
38.2
36,875
39.5
Receivables and other assets 1
25,678
27.6
27,396
29.3
Total
93,017
100.0
93,438
100.0
Equity and liabilities
Equity
15,715
16.9
13,717
14.7
Non-current liabilities
45,649
49.1
45,633
48.8
Provisions
22,400
24.1
22,315
23.9
Financial liabilities
17,393
18.7
17,019
18.2
Current liabilities
31,653
34.0
34,088
36.5
Other liabilities 2
23,126
24.9
25,132
26.9
Total 93,017 100.0 93,438 100.0
1 Including financial accounts receivable, trade accounts receivable, and income tax refund claims.2 Including trade accounts payable and income tax liabilities.
31revieW of operations
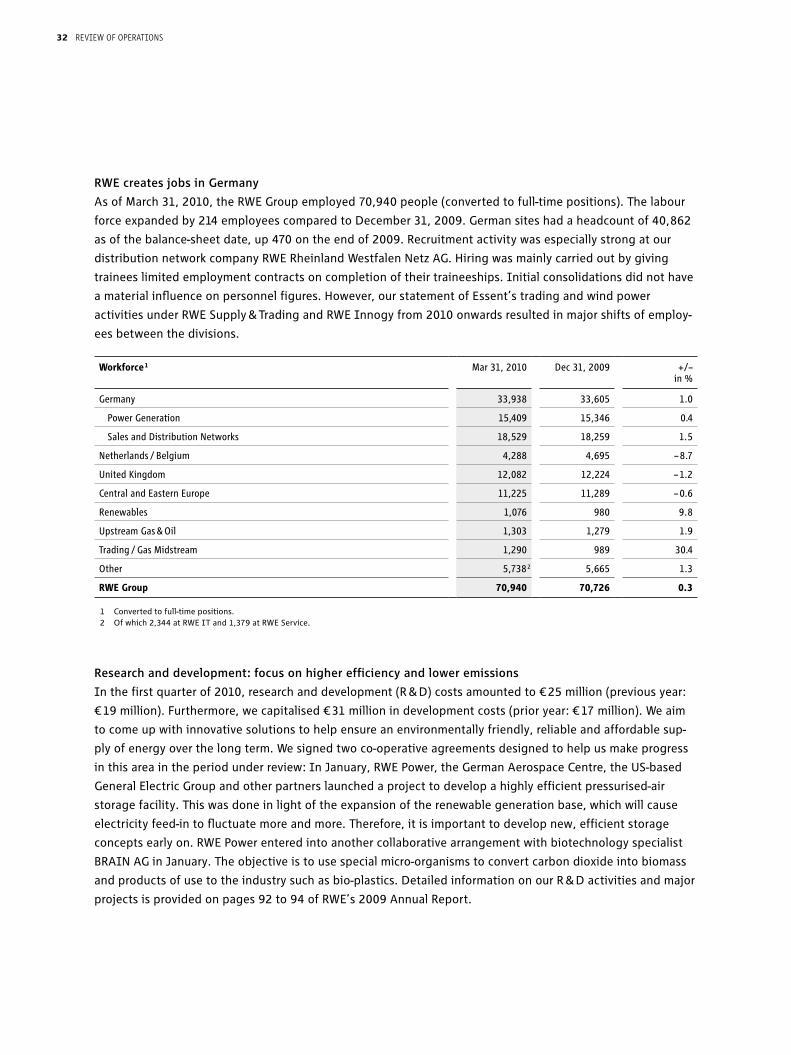
RWE creates jobs in Germany
As of March 31, 2010, the RWE Group employed 70,940 people (converted to full-time positions). The labour
force expanded by 214 employees compared to December 31, 2009. German sites had a headcount of 40,862
as of the balance-sheet date, up 470 on the end of 2009. Recruitment activity was especially strong at our
distribution network company RWE Rheinland Westfalen Netz AG. Hiring was mainly carried out by giving
trainees limited employment contracts on completion of their traineeships. Initial consolidations did not have
a material influence on personnel figures. However, our statement of Essent’s trading and wind power
activities under RWE Supply & Trading and RWE Innogy from 2010 onwards resulted in major shifts of employ-
ees between the divisions.
Research and development: focus on higher efficiency and lower emissions
In the first quarter of 2010, research and development (R & D) costs amounted to € 25 million (previous year:
€ 19 million). Furthermore, we capitalised € 31 million in development costs (prior year: € 17 million). We aim
to come up with innovative solutions to help ensure an environmentally friendly, reliable and affordable sup-
ply of energy over the long term. We signed two co-operative agreements designed to help us make progress
in this area in the period under review: In January, RWE Power, the German Aerospace Centre, the US-based
General Electric Group and other partners launched a project to develop a highly efficient pressurised-air
storage facility. This was done in light of the expansion of the renewable generation base, which will cause
electricity feed-in to fluctuate more and more. Therefore, it is important to develop new, efficient storage
concepts early on. RWE Power entered into another collaborative arrangement with biotechnology specialist
BRAIN AG in January. The objective is to use special micro-organisms to convert carbon dioxide into biomass
and products of use to the industry such as bio-plastics. Detailed information on our R & D activities and major
projects is provided on pages 92 to 94 of RWE’s 2009 Annual Report.
Workforce 1 Mar 31, 2010 Dec 31, 2009 +/–
in %
Germany
33,938
33,605
1.0
Power Generation
15,409
15,346
0.4
Sales and Distribution Networks
18,529
18,259
1.5
Netherlands / Belgium
4,288
4,695
– 8.7
United Kingdom
12,082
12,224
– 1.2
Central and Eastern Europe
11,225
11,289
– 0.6
Renewables
1,076
980
9.8
Upstream Gas & Oil
1,303
1,279
1.9
Trading / Gas Midstream
1,290
989
30.4
Other
5,738 2
5,665
1.3
RWE Group 70,940 70,726 0.3
1 Converted to full-time positions.2 Of which 2,344 at RWE IT and 1,379 at RWE Service.
32 revieW of operations

outLook for 2010
Economy picks up again
The economy’s recovery witnessed since the middle of 2009 is likely to continue this year. In the first quarter,
stimulus packages in many industrial nations were unable to take full effect due to the tough winter. There-
fore, recapture effects are expected to occur in the second quarter. Based on initial forecasts, global economic
output in 2010 will be more than 2 % higher than last year. We estimate that in the Eurozone, it will grow by
almost 2 %. Investing activity will be moderate, given the European industry’s persistently low capacity utilisa-
tion. Germany’s economy may achieve a growth rate of up to 2 % in 2010. However, gross domestic product
(GDP) will return to its 2008 level no earlier than 2012. Germany’s strong dependency on exports may prove to
be a pillar of the economy once again in 2010, owing to the strong momentum displayed by foreign demand.
We anticipate that Dutch GDP will grow by more than 1 % and Belgian GDP will advance by about 1 %. The
forecast is similar for the United Kingdom. The substantial devaluation of assets resulting from the real estate
crisis and mounting unemployment continue to hamper consumer spending in the UK. Our Central Eastern
European core markets paint an inconsistent picture. Significant economic revitalisation is forecast for Poland
(+ 2.8 %), the Czech Republic (+ 1.5 %) and Slovakia (+ 2.4 %), whereas Hungary’s economy is set to continue
shrinking in 2010 (– 0.2 %).
Strong recovery of energy consumption
The expected marginal economic recovery will have a positive effect on demand for energy. Industrial output
at the beginning of the year in Germany displayed far more dynamic development than initially assumed.
Furthermore, the significant rise in the ifo business climate index for trade and industry in April and the rise in
orders, especially in energy-intensive branches of industry, are indicators of a strong second quarter. German
electricity consumption for the full year should be at least 3 % higher than the low level recorded in 2009. Our
forecast for the Netherlands is similar. In the UK, demand for electricity had already been on the decline in the
years before the recession due to progress made in the field of energy efficiency. It will probably only post a
marginal gain in 2010. Electricity usage in Central Eastern Europe may increase by more than 2 %.
We expect demand for gas in our Western European core markets to rise this year, because of the tough win-
ter. A continuance of the economic recovery would also trigger an increase in demand. In contrast, mounting
levels of energy efficiency are resulting in permanent energy savings. In sum, we anticipate that gas demand
in Germany, the Netherlands and the United Kingdom will be 2 % to 4 % higher than in 2009. Consumption in
our Central Eastern European markets, namely the Czech Republic, Slovakia and Hungary, will post a moder-
ate increase at best. This is because the weather has provided little to no stimulus so far. However, demand in
these countries should regain momentum in the medium term. In addition to the growth prospects for these
economies, which are more promising than for other European nations, the increasing significance of gas com-
pared to other energy sources is a factor.
33revieW of operations
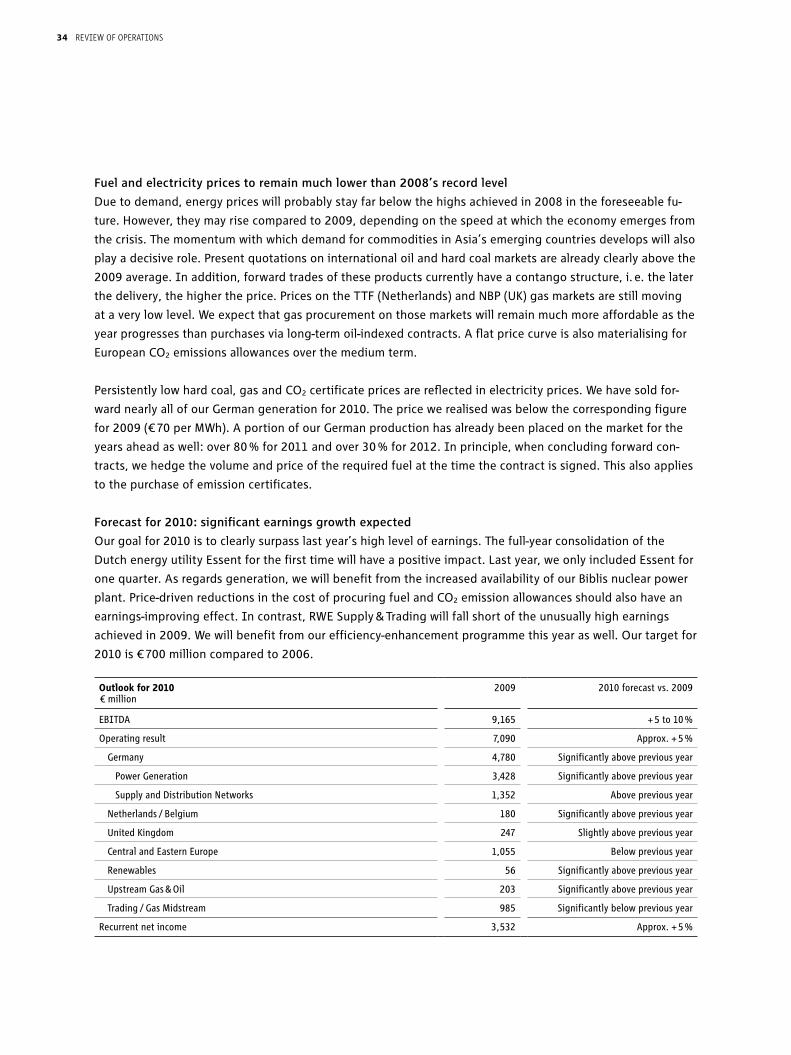
Fuel and electricity prices to remain much lower than 2008’s record level
Due to demand, energy prices will probably stay far below the highs achieved in 2008 in the foreseeable fu-
ture. However, they may rise compared to 2009, depending on the speed at which the economy emerges from
the crisis. The momentum with which demand for commodities in Asia’s emerging countries develops will also
play a decisive role. Present quotations on international oil and hard coal markets are already clearly above the
2009 average. In addition, forward trades of these products currently have a contango structure, i. e. the later
the delivery, the higher the price. Prices on the TTF (Netherlands) and NBP (UK) gas markets are still moving
at a very low level. We expect that gas procurement on those markets will remain much more affordable as the
year progresses than purchases via long-term oil-indexed contracts. A flat price curve is also materialising for
European CO2 emissions allowances over the medium term.
Persistently low hard coal, gas and CO2 certificate prices are reflected in electricity prices. We have sold for-
ward nearly all of our German generation for 2010. The price we realised was below the corresponding figure
for 2009 (€ 70 per MWh). A portion of our German production has already been placed on the market for the
years ahead as well: over 80 % for 2011 and over 30 % for 2012. In principle, when concluding forward con-
tracts, we hedge the volume and price of the required fuel at the time the contract is signed. This also applies
to the purchase of emission certificates.
Forecast for 2010: significant earnings growth expected
Our goal for 2010 is to clearly surpass last year’s high level of earnings. The full-year consolidation of the
Dutch energy utility Essent for the first time will have a positive impact. Last year, we only included Essent for
one quarter. As regards generation, we will benefit from the increased availability of our Biblis nuclear power
plant. Price-driven reductions in the cost of procuring fuel and CO2 emission allowances should also have an
earnings-improving effect. In contrast, RWE Supply & Trading will fall short of the unusually high earnings
achieved in 2009. We will benefit from our efficiency-enhancement programme this year as well. Our target for
2010 is € 700 million compared to 2006.
Outlook for 2010 2009 2010 forecast vs. 2009€ million
EBITDA
9,165
+ 5 to 10 %
Operating result
7,090
Approx. + 5 %
Germany
4,780
Significantly above previous year
Power Generation
3,428
Significantly above previous year
Supply and Distribution Networks
1,352
Above previous year
Netherlands / Belgium
180
Significantly above previous year
United Kingdom
247
Slightly above previous year
Central and Eastern Europe
1,055
Below previous year
Renewables
56
Significantly above previous year
Upstream Gas & Oil
203
Significantly above previous year
Trading / Gas Midstream
985
Significantly below previous year
Recurrent net income 3,532 Approx. + 5 %
34 revieW of operations

We anticipate that EBITDA will rise by between 5 % and 10 % compared to 2009 (€ 9,165 million). The operat-
ing result (€ 7,090 million) is expected to post a gain of approximately 5 %. The same applies to recurrent net
income (€ 3,532 million), the basis for the dividend.
• Germany:Thedivision’soperatingresultfor2010isanticipatedtobesignificantlyhigheryearonyear.
Power Generation: The earnings growth forecast for the Germany Division will largely come from RWE Power.
The Biblis nuclear power plant’s two units, which were only online for a short period of time in 2009 due to
maintenance, will make a much larger contribution to production this year. We have already sold forward
nearly all our 2010 German generation. As mentioned earlier, the electricity price realised is lower than in
2009. However, this is likely to be more than compensated for by the fact that expenses incurred for fuel
and CO2 emission certificates have declined. We also expect power station maintenance to have a less nega-
tive effect.
Sales and Distribution Networks: This business area is predicted to close 2010 up year on year. We expect to
see slight operating improvements in terms of both margins and volume in our gas sales activities. In addi-
tion, one-off charges in the gas business, which had a negative effect on last year’s operating result, will not
occur this year. Moreover, we plan to cut costs. We anticipate that the refunding of excess fees charged by
network operators at the beginning of German network regulation will have a negative effect (see page 23).
However, this will be slightly mitigated by relief in other areas. For instance, we anticipate that expenses
incurred by distribution system operators to compensate for network losses will experience a price-induced
drop.
• Netherlands/Belgium:Thenewdivisionwillclosetheyearsignificantlyuponthelastone,duetoconsolida-
tion effects. Having included the Dutch energy utility Essent only for one quarter in 2009, the company will
be considered for a full twelve months for the first time this year. As mentioned earlier, in 2010 we began
stating earnings contributed by Essent’s trading activities under the Trading / Gas Midstream Segment and
reporting on electricity produced by the company’s wind turbines as part of the Renewables Segment.
• UnitedKingdom:RWEnpower’soperatingresultisexpectedtorecoverslightlyin2010,followingtheweak
2009 fiscal year. We anticipate to see some additional earnings contributions from the commissioning of
our new gas-fired power station at Staythorpe. The four units are scheduled to go online in the second
half of the year. However, our generation margins are likely to decline overall. In the supply business, RWE
npower benefits from the fact that procurement costs are lower than in 2009. However, this is contrasted by
the income shortfall owing to the aforementioned reduction in electricity and gas tariffs. Furthermore, we
anticipate that higher electricity network fees will have a negative effect. In fiscal 2009, RWE npower had
already taken extensive cost-related measures, which positively affected earnings by € 120 million last year.
The task at hand now is to safeguard the sustainability of the realised savings. On top of that, we are work-
ing on additional efficiency measures.
35revieW of operations

• CentralandEasternEurope:Thisdivisionisunlikelytofullymatchtheoperatingresultrecordedlastyear.
Margins in the Czech gas supply business are expected to deteriorate. Furthermore, we will probably be
unable to match the high operating result achieved in the Hungarian electricity business last year. However,
we anticipate that we will benefit from higher income from our Czech gas network companies.
• Renewables:Theoperatingresultfromthisdivisionisexpectedtoimprovesignificantlyduetotheinclusion
of Essent’s wind farms and the continued expansion of the generation base. However, the ongoing invest-
ment projects are causing substantial run-up costs. The earnings increase will accelerate in the years ahead.
• UpstreamGas&Oil:RWEDeaanticipatespostingstrongearningsgrowthcomparedtotheweak2009fig-
ure, driven above all by higher realised oil prices. Conversely, earnings in the gas business will deteriorate
somewhat, in terms of both volume and price.
• Trading/GasMidstream:DespitetheinclusionofEssent’sactivities,RWESupply&Tradingiscurrently
expected to close the year with an operating result that is significantly lower than last year’s unusually high
figure. Margins in the energy trading business are unlikely to match the very high level achieved in 2009.
Furthermore, the operating result of our gas midstream activities will remain far below last year’s figure,
which was extremely good as we reversed provisions following successful price revisions. In 2010, we antici-
pate to experience a negative effect from the fact that, in some parts of our business, realisable gas sales
prices are much lower than the procurement costs established contractually.
Dividend for fiscal 2010
Our dividend proposal for fiscal 2010 will be in line with our usual payout ratio of 50 % to 60 %. The basis for
calculating the payout ratio is recurrent net income, which is adjusted for one-off effects and which is expect-
ed to be approximately 5 % higher than last year.
Capital expenditure on property, plant and equipment much higher
We will spend much more capital on property, plant and equipment in 2010. The strongest growth is antici-
pated to occur in the Netherlands / Belgium segment, owing to Essent’s full-year consolidation for the first
time. The RWE Group’s investment activity will focus on the construction of renewable generation capacity
and highly efficient fossil fuel-fired power plants. We will set aside even more funds for this. Our electricity
and gas networks as well as gas storage are other areas in which we plan to increase spending. RWE Dea will
dedicate itself to expanding oil and gas production. The regional areas of focus are Norway, Egypt and the UK.
In total, the RWE Group’s capital expenditure on property, plant and equipment is likely to reach around
€ 7 billion in 2010. This would be nearly 20 % more than in 2009.
36 revieW of operations

Net debt about three times as high as EBITDA
Our net debt, which amounted to € 25.8 billion at the end of 2009, is expected to continue to increase this
financial year. We expect a rise of approximately € 4 billion, which will largely be caused by our comprehensive
investment programme. Our leverage factor, which reflects the ratio of net debt to EBITDA, will therefore
probably be slightly higher than in 2009 (2.8). In the future, we want to orientate ourselves towards an upper
limit of 3.0.
Marginal growth in headcount expected
We anticipate that our workforce will expand further this year. Nearly all divisions are creating jobs as they
implement their investment programmes.
Research and development budget raised
Our research and development (R & D) expenditure will grow further. As before, we are concentrating on
measures to improve the efficiency and reduce the emissions of our electricity generation activities. More than
half of our R & D budget has been set aside for this.
37revieW of operations

DeveLopment of risks anD opportunities
Risk management within the RWE Group
The proactive management of risks and opportunities is a core element of our business activities. The
RWE Group has a groupwide risk management system for the early identification, standardised reporting,
assessment, control and monitoring of risks. We also identify opportunities and associated earning potential.
We have reported on the organisation and processes of our risk management, the committees entrusted with
it, and measures taken to control and monitor major risks in detail on pages 95 to 104 of our 2009 Annual
Report.
Overall assessment of the risk and opportunity situation by executive management
The markets in which we are primarily active are among the most politically and economically stable in the
world. But, even here, we are exposed to substantial risks. As a utility, we plan our investments decades in ad-
vance. We are thus especially dependent on reliable political framework conditions in the energy sector. How-
ever, they harbour significant uncertainty in some respects, such as the future of nuclear energy in Germany,
trading of CO2 emission allowances, and approval processes for large-scale power plant projects. These topics
demand a lot of our attention. We believe this is associated with risks. However, opportunities may also arise.
In particular, the German government may abolish the obligation to shorten the lifetimes of German nuclear
power stations, which was established in 2002.
In addition to energy policy, the economy’s development has lasting effects on our earning power. If the
economic slump persists, it will cause demand for energy to drop and prices of our main products — electric-
ity and gas — to be low. There is a danger of our electricity margins being curtailed for years. We largely sell
our electricity generation and gas purchasing volumes forward, in order to limit the earnings risks arising from
the short-term volatility of prices. In Germany, we have sold forward almost all of our generation for 2010
and over 80 % of our generation for 2011 (as of April 30, 2010). Our gas purchases have been fully hedged for
2010 and partially hedged for 2011. Counterparty defaults have been moderate so far.
Risks also arise due to the fact that some of our gas purchases are based on long-term agreements linked to
the price of oil. This primarily relates to our German and Czech businesses. Purchase prices in these markets
are currently much higher than quotations on Europe’s wholesale markets, which are increasingly used as a
reference, especially by large buyers. This means that there is a danger of declining margins and customer losses.
The persistently difficult economic situation also provides opportunities. For instance, RWE continues to be
considered a safe bond issuer and is thus in a position to finance projects, the implementation of which has
become much more difficult for other companies. Further opportunities arise from the lower prices of capital
goods such as power plant components — above all in the field of renewable energy.
Overall, the risk structure of our business has not changed. At present, there are no identifiable risks that
jeopardise the continued operation of RWE AG or the RWE Group.
38 revieW of operations
Current key Value-at-Risk figures
We control and monitor risks and opportunities arising from the fluctuation of commodity prices and financial
risks (foreign currency risks, interest-rate risks and risks in connection with investments in securities) using
key risk indicators such as the Value at Risk (VaR). The VaR indicates the maximum loss that might occur from
a risk position assuming a certain probability and a certain horizon. The VaR figures within the RWE Group are
generally based on a confidence interval of 95 %. The assumed holding period for a position is one day. This
means that, with a probability of 95 %, the maximum daily loss does not exceed the VaR. As the central risk
controlling parameter for commodity positions, the Global VaR averaged € 12.3 million in the first quarter of
2010. Its maximum daily value was € 15.0 million. The average VaR for interest-rate risks (including hedges)
was € 119.6 million for financial debt and € 7.7 million for interest-bearing investments. For share investments
it amounted to € 11.0 million and for the foreign currency position it was € 0.1 million.
This report contains forward-looking statements regarding the future development of the RWE
Group and its companies as well as economic and political developments. These statements are
assessments that we have made based on information currently available to us. In the event that
the underlying assumptions do not materialise or additional risks arise, actual performance can
deviate from the performance expected at present. Therefore, we cannot assume responsibility for
the correctness of these statements.
39revieW of operations
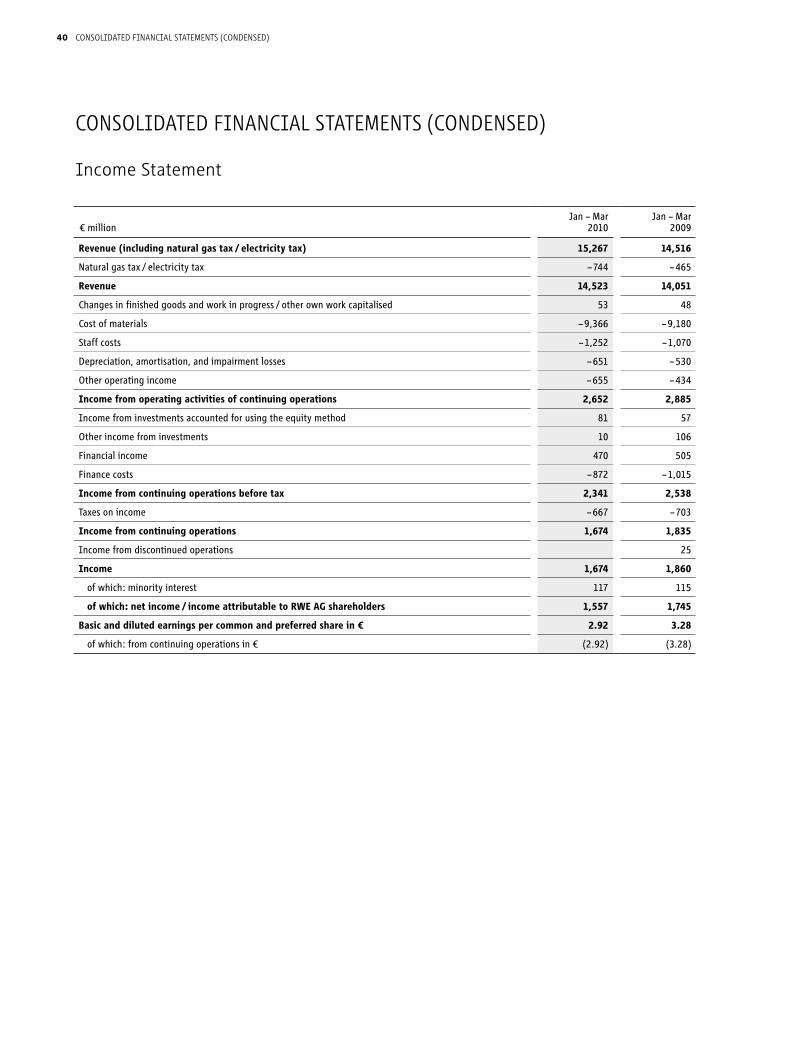
Income Statement
Consolidated FinanCial statements (Condensed)
Jan – Mar Jan – Mar € million 2010
2009
Revenue (including natural gas tax / electricity tax) 15,267
14,516
Natural gas tax / electricity tax – 744
– 465
Revenue 14,523
14,051
Changes in finished goods and work in progress / other own work capitalised 53
48
Cost of materials – 9,366
– 9,180
Staff costs – 1,252
– 1,070
Depreciation, amortisation, and impairment losses – 651
– 530
Other operating income – 655
– 434
Income from operating activities of continuing operations 2,652
2,885
Income from investments accounted for using the equity method 81
57
Other income from investments 10
106
Financial income 470
505
Finance costs – 872
– 1,015
Income from continuing operations before tax 2,341
2,538
Taxes on income – 667
– 703
Income from continuing operations 1,674
1,835
Income from discontinued operations
25
Income 1,674
1,860
of which: minority interest 117
115
of which: net income / income attributable to RWE AG shareholders 1,557
1,745
Basic and diluted earnings per common and preferred share in € 2.92
3.28
of which: from continuing operations in € (2.92) (3.28)
40 Consolidated FinanCial statements (Condensed)

Jan – Mar Jan – Mar € million
2010
2009
Income
1,674
1,860
Currency translation adjustment
231
– 171
Fair valuation of financial instruments available for sale
12
– 19
Fair valuation of financial instruments used for hedging purposes
49
363
Other comprehensive income of investments accounted for using the equity method (pro rata)
– 2
Actuarial gains and losses of defined benefit pension plans and similar obligations
81
– 317
Other comprehensive income
371
– 144
Total comprehensive income
2,045
1,716
of which: attributable to RWE AG shareholders
(1,920)
(1,643)
of which: attributable to minority interests ( 125) ( 73)
1 Figures stated after taxes.
Statement of Recognised Income and Expenses 1
41Consolidated FinanCial statements (Condensed)

Balance Sheet
Assets Mar 31, 2010 Dec 31, 2009€ million
Non-current assets
Intangible assets
17,294
17,320
Property, plant and equipment
29,455
28,627
Investment property
165
182
Investments accounted for using the equity method
3,776
3,736
Other non-current financial assets
686
709
Receivables and other assets
4,219
4,113
Deferred taxes
1,917
1,876
57,512
56,563
Current assets
Inventories
2,544
3,115
Trade accounts receivable
9,789
9,530
Receivables and other assets
15,889
17,866
Marketable securities
3,451
3,290
Cash and cash equivalents
3,832
3,074
35,505
36,875
93,017 93,438
Equity and Liabilities Mar 31, 2010 Dec 31, 2009€ million
Equity
RWE AG shareholders’ interest
14,710
12,792
Minority interest
1,005
925
15,715
13,717
Non-current liabilities
Provisions
22,400
22,315
Financial liabilities
17,393
17,019
Other liabilities
3,402
3,972
Deferred taxes
2,454
2,327
45,649
45,633
Current liabilities
Provisions
5,775
5,829
Financial liabilities
2,752
3,127
Trade accounts payable
7,586
9,697
Other liabilities
15,540
15,435
31,653
34,088
93,017 93,438
42 Consolidated FinanCial statements (Condensed)
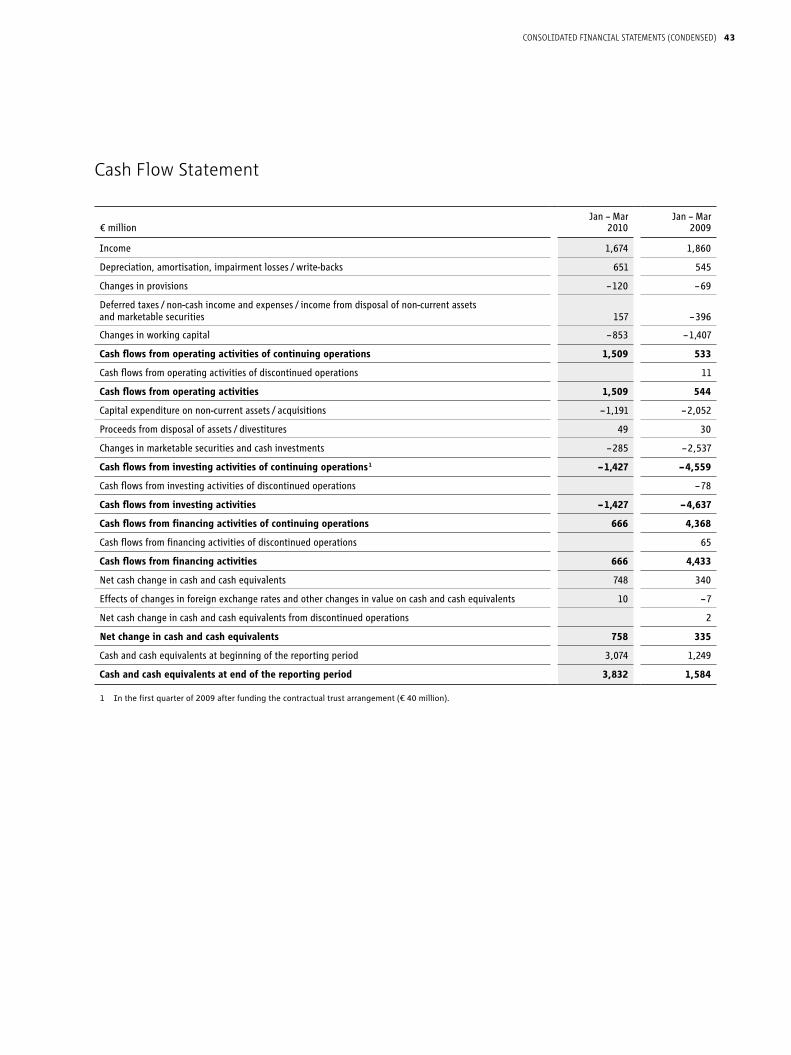
Jan – Mar Jan – Mar€ million
2010
2009
Income
1,674
1,860
Depreciation, amortisation, impairment losses / write-backs
651
545
Changes in provisions
– 120
– 69
Deferred taxes / non-cash income and expenses / income from disposal of non-current assets and marketable securities
157
– 396
Changes in working capital
– 853
– 1,407
Cash flows from operating activities of continuing operations
1,509
533
Cash flows from operating activities of discontinued operations
11
Cash flows from operating activities
1,509
544
Capital expenditure on non-current assets / acquisitions
– 1,191
– 2,052
Proceeds from disposal of assets / divestitures
49
30
Changes in marketable securities and cash investments
– 285
– 2,537
Cash flows from investing activities of continuing operations 1
– 1,427
– 4,559
Cash flows from investing activities of discontinued operations
– 78
Cash flows from investing activities
– 1,427
– 4,637
Cash flows from financing activities of continuing operations
666
4,368
Cash flows from financing activities of discontinued operations
65
Cash flows from financing activities
666
4,433
Net cash change in cash and cash equivalents
748
340
Effects of changes in foreign exchange rates and other changes in value on cash and cash equivalents
10
– 7
Net cash change in cash and cash equivalents from discontinued operations
2
Net change in cash and cash equivalents
758
335
Cash and cash equivalents at beginning of the reporting period
3,074
1,249
Cash and cash equivalents at end of the reporting period 3,832 1,584
1 In the first quarter of 2009 after funding the contractual trust arrangement (€ 40 million).
Cash Flow Statement
43Consolidated FinanCial statements (Condensed)
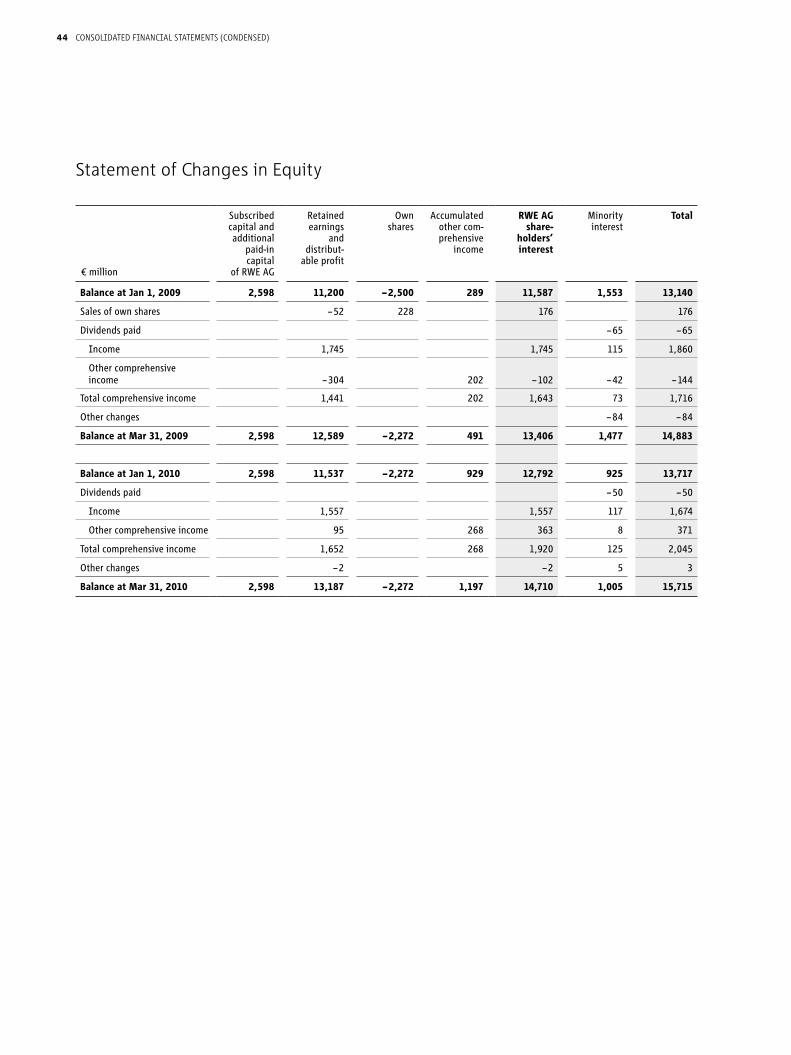
€ million
Subscribed capital and additional
paid-in capital
of RWE AG
Retained earnings
and distribut-
able profit
Own shares
Accumulated other com- prehensive
income
RWE AG share-
holders’ interest
Minority interest
Total
Balance at Jan 1, 2009
2,598
11,200
– 2,500
289
11,587
1,553
13,140
Sales of own shares
– 52
228
176
176
Dividends paid
– 65
– 65
Income
1,745
1,745
115
1,860
Other comprehensive income
– 304
202
– 102
– 42
– 144
Total comprehensive income
1,441
202
1,643
73
1,716
Other changes
– 84
– 84
Balance at Mar 31, 2009
2,598
12,589
– 2,272
491
13,406
1,477
14,883
Balance at Jan 1, 2010
2,598
11,537
– 2,272
929
12,792
925
13,717
Dividends paid
– 50
– 50
Income
1,557
1,557
117
1,674
Other comprehensive income
95
268
363
8
371
Total comprehensive income
1,652
268
1,920
125
2,045
Other changes
– 2
– 2
5
3
Balance at Mar 31, 2010 2,598 13,187 – 2,272 1,197 14,710 1,005 15,715
Statement of Changes in Equity
44 Consolidated FinanCial statements (Condensed)

notes
Accounting policies
RWE AG, headquartered at Opernplatz 1, 45128 Essen,
Germany, is the parent company of the RWE Group (“RWE” or
“Group”).
The consolidated interim report as of March 31, 2010, which
was approved for publication on May 10, 2010, was prepared
in accordance with the International Financial Reporting Stan-
dards (IFRSs) applicable in the EU.
In line with IAS 34, the scope of reporting for the presenta-
tion of the consolidated financial statements of RWE AG for the
period ended March 31, 2010 was condensed compared with
the scope applied to the consolidated financial statements for
the full year. With the exception of the changes and new rules
described below, this consolidated interim report was prepared
using the accounting policies applied in the consolidated finan-
cial statements for fiscal 2009. For further information, please
see the consolidated financial statements for the period ended
December 31, 2009, which provide the basis for this interim
report.
The interest rate applied to provisions for nuclear waste
management and provisions for mining damage is 5.00 % (De-
cember 31, 2009: 5.00 %). Provisions for pensions and similar
obligations are discounted at an interest rate of 5.00 % in
Germany and 5.50 % abroad (December 31, 2009: 5.25 % and
5.70 %, respectively).
Changes in accounting policies
The International Accounting Standards Board (IASB) and the
International Financial Reporting Interpretations Committee
(IFRIC) have approved a number of changes to the existing
International Financial Reporting Standards (IFRSs) and adopted
several new IFRSs and interpretations, which became effective
for the RWE Group as of fiscal 2010.
IFRS 3 (2008) “Business Combinations” contains amended
regulations on the accounting of business combinations. Com-
pared to the original version of IFRS 3, these changes relate to
the scope of application and the treatment of successive share
purchases. Furthermore, IFRS 3 (2008) offers companies an
option: Non-controlling interests can be measured at fair value
or at the proportionate share of net assets individually for each
transaction. Depending on which option a company exercises,
any goodwill is recognised in full or only in proportion to the
majority owner’s interest. The changes will have a corresponding
impact on the accounting treatment of company transactions.
IAS 27 (2008) “Consolidated and Separate Financial State-
ments”: In particular, by revising IAS 27, the IASB changed the
regulations for the treatment of transactions with non-control-
ling interests of a group. Transactions which result in a parent
company changing its ownership interest in a subsidiary without
a loss of control are to be accounted for as equity transactions
without an effect on profit or loss. Regulations for treatment
in the event of a loss of control over a subsidiary were also
changed: The standard regulates how deconsolidation gains or
losses are to be calculated and how residual ownership interest
in the former subsidiary is to be measured following a partial
sale. The changes will thus affect the accounting treatment of
certain company transactions.
The following standards and interpretations, which are appli-
cable for the first time in the fiscal year, do not have a material
effect on the RWE Group’s consolidated financial statements:
• ImprovementstotheInternationalFinancialReportingStan-
dards (2009)
• IFRS1(restructuredin2008)–First-timeAdoptionofInterna-
tional Financial Reporting Standards
• AmendmenttoIFRS2(2009)–GroupCash-settledShare-
based Payment Transactions
• AmendmenttoIAS39(2009)–EligibleHedgedItems
• IFRIC12–ServiceConcessionArrangements
• IFRIC15–AgreementsfortheConstructionofRealEstate
• IFRIC16–HedgesofaNetInvestmentinaForeignOperation
• IFRIC17–DistributionsofNon-cashAssetstoOwners
• IFRIC18–TransfersofAssetsfromCustomers
45Consolidated FinanCial statements (Condensed)
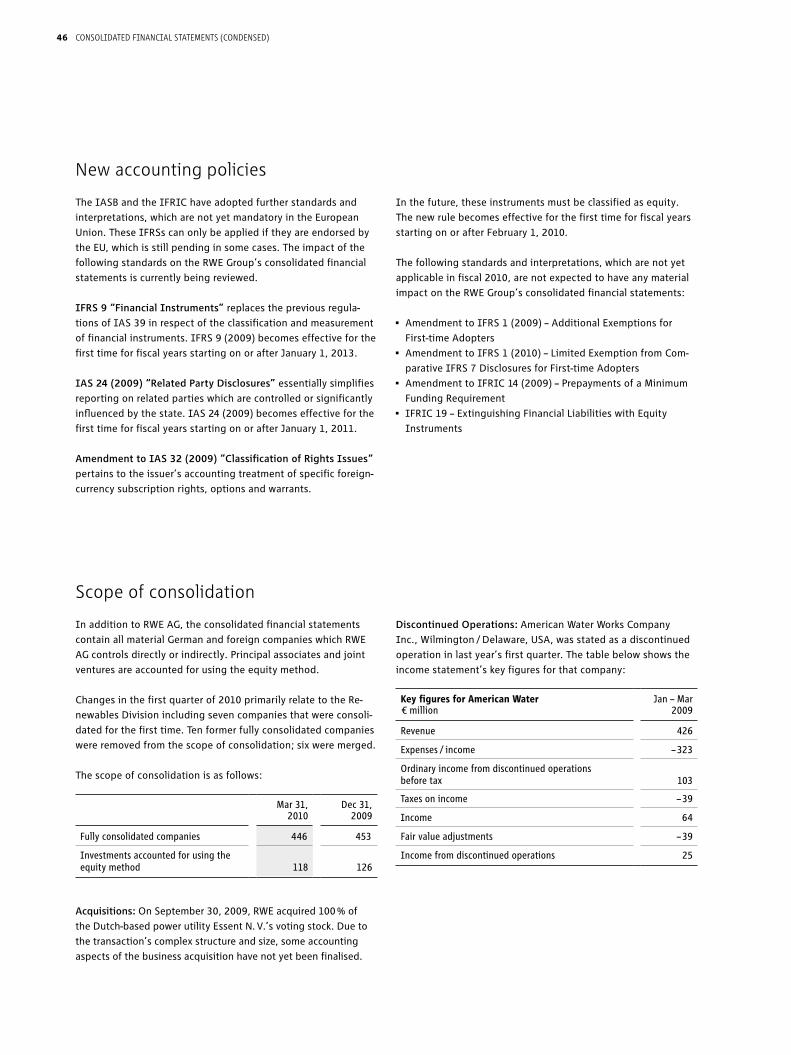
New accounting policies
The IASB and the IFRIC have adopted further standards and
interpretations, which are not yet mandatory in the European
Union. These IFRSs can only be applied if they are endorsed by
the EU, which is still pending in some cases. The impact of the
following standards on the RWE Group’s consolidated financial
statements is currently being reviewed.
IFRS 9 “Financial Instruments” replaces the previous regula-
tions of IAS 39 in respect of the classification and measurement
of financial instruments. IFRS 9 (2009) becomes effective for the
first time for fiscal years starting on or after January 1, 2013.
IAS 24 (2009) “Related Party Disclosures” essentially simplifies
reporting on related parties which are controlled or significantly
influenced by the state. IAS 24 (2009) becomes effective for the
first time for fiscal years starting on or after January 1, 2011.
Amendment to IAS 32 (2009) “Classification of Rights Issues“
pertains to the issuer’s accounting treatment of specific foreign-
currency subscription rights, options and warrants.
In the future, these instruments must be classified as equity.
The new rule becomes effective for the first time for fiscal years
starting on or after February 1, 2010.
The following standards and interpretations, which are not yet
applicable in fiscal 2010, are not expected to have any material
impact on the RWE Group’s consolidated financial statements:
• AmendmenttoIFRS1(2009)–AdditionalExemptionsfor
First-time Adopters
• AmendmenttoIFRS1(2010)–LimitedExemptionfromCom-
parative IFRS 7 Disclosures for First-time Adopters
• AmendmenttoIFRIC14(2009)–PrepaymentsofaMinimum
Funding Requirement
• IFRIC19–ExtinguishingFinancialLiabilitieswithEquity
Instruments
In addition to RWE AG, the consolidated financial statements
contain all material German and foreign companies which RWE
AG controls directly or indirectly. Principal associates and joint
ventures are accounted for using the equity method.
Changes in the first quarter of 2010 primarily relate to the Re-
newables Division including seven companies that were consoli-
dated for the first time. Ten former fully consolidated companies
were removed from the scope of consolidation; six were merged.
The scope of consolidation is as follows:
Mar 31, Dec 31, 2010 2009
Fully consolidated companies 446 453
Investments accounted for using the equity method
118
126
Acquisitions: On September 30, 2009, RWE acquired 100 % of
the Dutch-based power utility Essent N. V.’s voting stock. Due to
the transaction’s complex structure and size, some accounting
aspects of the business acquisition have not yet been finalised.
Discontinued Operations: American Water Works Company
Inc., Wilmington / Delaware, USA, was stated as a discontinued
operation in last year’s first quarter. The table below shows the
income statement’s key figures for that company:
Key figures for American Water Jan – Mar € million 2009
Revenue 426
Expenses / income – 323
Ordinary income from discontinued operations before tax
103
Taxes on income – 39
Income 64
Fair value adjustments – 39
Income from discontinued operations 25
Scope of consolidation
46 Consolidated FinanCial statements (Condensed)

Equity
Revenue generated by energy trading operations is stated as net
figures, i. e. reflecting only realised gross margins.
Revenue
Research and development costs
In the first quarter of 2010, research and development costs
totalled € 25 million (first quarter of 2009: € 19 million).
Pursuant to a resolution passed by the Annual General Meeting
on April 17, 2008, the Executive Board of RWE AG was authorised
to increase the company’s capital stock, subject to the Supervi-
soryBoard’sapproval,byupto€287,951,360.00untilApril16,
2013, through the issuance of new bearer common shares in
return for contributions in cash or in kind (authorised capital).
In certain cases, the subscription rights of shareholders can be
waived, with the approval of the Supervisory Board.
Pursuant to a resolution passed by the Annual General Meeting
on April 22, 2009, the company was authorised to purchase
shares of any class in RWE totalling up to 10 % of the company’s
share capital until October 21, 2010. Share buybacks may also be
conducted by exercising put or call options. This resolution was
replaced by the resolution passed by the Annual General Meet-
ing on April 22, 2010, which authorises the company to conduct
share buybacks accounting for up to 10 % of the company’s capi-
tal stock and to sell own common shares waiving shareholder
subscription rights under certain conditions until October 21,
2011. Based on the resolution, the company’s Executive Board
is also authorised to withdraw own shares. As per the preceding
authorisation, the purchase and sale of these shares can also be
carried out using put and call options.
Pursuant to a resolution passed by the Annual General Meeting on
April 22, 2009, the Executive Board was authorised to withdraw
own shares without requiring an additional resolution by the An-
nualGeneralMeetingor–undercertainconditionsandwaiverof
shareholders’subscriptionrights–tosellthemtothirdparties.
Pursuant to a resolution passed by the Annual General Meeting
on April 22, 2009, the Executive Board was further authorised
to issue option or convertible bonds until April 21, 2014. The
totalnominalvalueofthebondsislimitedto€6,000million.
Shareholders’ subscription rights may be waived under certain
conditions. The Annual General Meeting decided to establish
€144millioninconditionalcapital,dividedinto56million
bearer common shares in order to redeem the bonds. Shares
from the authorised capital are to be deducted from the shares
from the conditional capital, insofar as they are both issued with
a waiver of shareholders’ subscription rights. Accordingly, the
share capital may not be increased by more than 20 % by the
issue of new shares.
AsofMarch31,2010,RWEAGheld28,846,473no-par-value
common shares in RWE AG. The acquisition costs of own shares
amounting to € 2,272 million were deducted from the carrying
amountofequity.Theyaccountfor€73,846,970.88ofthecom-
pany’s share capital (5.13 % of subscribed capital).
Furthermore, in the first quarter of 2010, RWE Group companies
bought 1,580 common shares on the capital market at an aver-
agecostof€66.04pershareforissuancetoemployeesofRWE
AG and its subsidiaries. The proportionate share capital totals
€ 4,044.80 (0.003 ‰ of subscribed capital). Employees were is-
sued a total of 40 common shares at an average price of € 50.97
per share within the scope of capital formation schemes and
1,540commonsharesatanaveragepriceof€45.61pershare
on the occasion of service anniversaries. Proceeds from the
share issuances amounted to € 72,278.20. The purchase price
rebates offered to employees were recognised in the income
statement as share-based payments at the fair value they had at
their time of issuance.
47Consolidated FinanCial statements (Condensed)
Share-based payment
Dividend distribution
Financial liabilities
Other liabilities
Detailed information was provided on groupwide share-based
payment plans for executive staff at RWE AG and at subsidiaries
in the consolidated financial statements for the period ended
December 31, 2009.
In the first quarter of 2010, another tranche was issued within
theframeworkoftheLong-TermIncentivePlanforexecutive
staff (“Beat”).
The plan conditions for the newly issued tranche were amended
in comparison to the conditions applicable to “Beat” presented
in the consolidated financial statements for the period ending
on December 31, 2009. The main amendments are a manda-
tory personal investment for all programme participants, the
extension of the waiting period to 4 years, the introduction of
additional exercise dates following the waiting period and the
extension of the term of the plan to five years.
RWE AG’s April 22, 2010 Annual General Meeting decided to
pay a dividend of € 3.50 per individual, dividend-bearing share
forfiscal2009.Thedividendpaymenttotalled€1,867million.
In the first quarter of 2010, a US$ 250 million public bond with
a term of three years and a nominal interest rate of 2 % was
issued. The bond was placed primarily in Switzerland and Ger-
many.Furthermore,fundsof€160millionwithaninterestrate
of4.76%,eachafterswapsintoeuros,wereraisedforatermof
30 years via a private placement.
Otherliabilitiesinclude€1,562million(December31,2009:
€1,562million)incurrentredemptionliabilitiesfromputop-
tions of minority interests that are recognised in accordance
with IAS 32.
48 Consolidated FinanCial statements (Condensed)
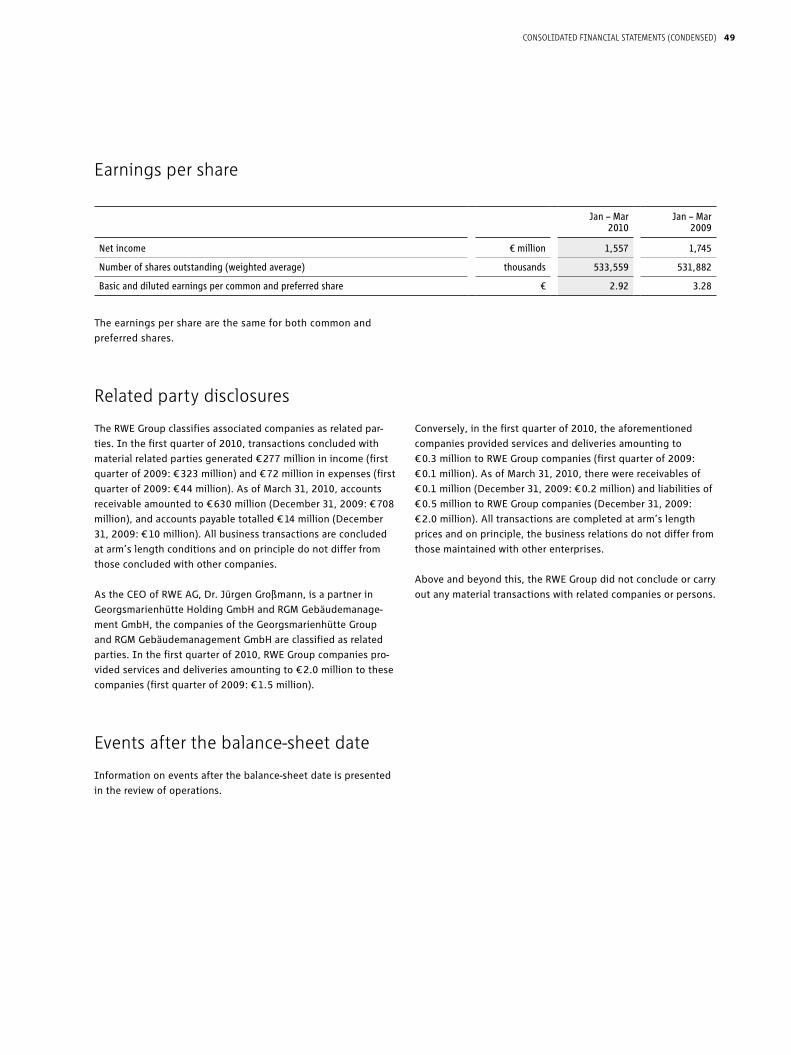
Related party disclosures
Earnings per share
The RWE Group classifies associated companies as related par-
ties. In the first quarter of 2010, transactions concluded with
material related parties generated € 277 million in income (first
quarter of 2009: € 323 million) and € 72 million in expenses (first
quarter of 2009: € 44 million). As of March 31, 2010, accounts
receivableamountedto€630million(December31,2009:€708
million), and accounts payable totalled € 14 million (December
31, 2009: € 10 million). All business transactions are concluded
at arm’s length conditions and on principle do not differ from
those concluded with other companies.
As the CEO of RWE AG, Dr. Jürgen Großmann, is a partner in
GeorgsmarienhütteHoldingGmbHandRGMGebäudemanage-
mentGmbH,thecompaniesoftheGeorgsmarienhütteGroup
andRGMGebäudemanagementGmbHareclassifiedasrelated
parties. In the first quarter of 2010, RWE Group companies pro-
vided services and deliveries amounting to € 2.0 million to these
companies (first quarter of 2009: € 1.5 million).
Conversely, in the first quarter of 2010, the aforementioned
companies provided services and deliveries amounting to
€ 0.3 million to RWE Group companies (first quarter of 2009:
€ 0.1 million). As of March 31, 2010, there were receivables of
€ 0.1 million (December 31, 2009: € 0.2 million) and liabilities of
€ 0.5 million to RWE Group companies (December 31, 2009:
€ 2.0 million). All transactions are completed at arm’s length
prices and on principle, the business relations do not differ from
those maintained with other enterprises.
Above and beyond this, the RWE Group did not conclude or carry
out any material transactions with related companies or persons.
Jan – Mar Jan – Mar 2010 2009
Net income € million 1,557 1,745
Number of shares outstanding (weighted average) thousands 533,559 531,882
Basic and diluted earnings per common and preferred share € 2.92 3.28
The earnings per share are the same for both common and
preferred shares.
Events after the balance-sheet date
Information on events after the balance-sheet date is presented
in the review of operations.
49Consolidated FinanCial statements (Condensed)
Review RepoRt
We have reviewed the condensed consolidated interim financial
statements–comprisingtheincomestatementandstate-
ment of recognised income and expense, balance sheet, cash
flow statement, statement of changes in equity and selected
explanatorynotes–andtheinterimgroupmanagementreport
of RWE Aktiengesellschaft, Essen, for the period from January 1
to March 31, 2010 which are part of the interim financial report
pursuantto§37x,Para.3WpHG(“Wertpapierhandelsgesetz”:
German Securities Trading Act). The preparation of the con-
densed consolidated interim financial statements in accordance
with the IFRS applicable to interim financial reporting as
adopted by the EU and of the interim group management report
in accordance with the provisions of the German Securities
Trading Act applicable to interim group management reports is
the responsibility of the parent Company‘s Board of Managing
Directors. Our responsibility is to issue a review report on the
condensed consolidated interim financial statements and on the
interim group management report based on our review.
We conducted our review of the condensed consolidated interim
financial statements and the interim group management report
in accordance with German generally accepted standards for the
review of financial statements promulgated by the Institut der
Wirtschaftsprüfer (Institute of Public Auditors in Germany) (IDW)
and additionally observed the International Standard on Review
Engagements “Review of Interim Financial Information Per-
formed by the Independent Auditor of the Entity“ (ISRE 2410).
Those standards require that we plan and perform the review so
that we can preclude through critical evaluation, with moderate
assurance, that the condensed consolidated interim financial
statements have not been prepared, in all material respects, in
accordance with the IFRS applicable to interim financial report-
ing as adopted by the EU and that the interim group manage-
ment report has not been prepared, in all material respects, in
accordance with the provisions of the German Securities Trading
Act applicable to interim group management reports.
A review is limited primarily to inquiries of company personnel
and analytical procedures and therefore does not provide the as-
surance attainable in a financial statement audit. Since, in accor-
dance with our engagement, we have not performed a financial
statement audit, we cannot express an audit opinion.
Based on our review, no matters have come to our attention that
cause us to presume that the condensed consolidated interim
financial statements have not been prepared, in all material
respects, in accordance with the IFRS applicable to interim
financial reporting as adopted by the EU nor that the interim
group management report has not been prepared, in all mate-
rial respects, in accordance with the provisions of the German
Securities Trading Act applicable to interim group management
reports.
Essen, May 11, 2010
PricewaterhouseCoopers
Aktiengesellschaft
Wirtschaftsprüfungsgesellschaft
Manfred Wiegand Markus Dittmann
Wirtschaftsprüfer Wirtschaftsprüfer
(German Public Auditor) (German Public Auditor)
To RWE Aktiengesellschaft, Essen
50 Review RepoRt

Dr. Manfred Schneider
Chairman
Dr. Thomas R. Fischer
–untilJanuary31,2010–
Frank Bsirske
Deputy Chairman
Dr. Paul Achleitner
Werner Bischoff
Carl-Ludwig von Boehm-Bezing
Heinz Büchel
Dieter Faust
Andreas Henrich
Heinz-Eberhard Holl
–untilJanuary31,2010–
Frithjof Kühn
–sinceFebruary1,2010–
Hans-Peter Lafos
Dr. Gerhard Langemeyer
Dagmar Mühlenfeld
Dr. Wolfgang Reiniger
Günter Reppien
Dagmar Schmeer
Dr.-Ing. Ekkehard D. Schulz
Dr. Wolfgang Schüssel
–sinceMarch1,2010–
Uwe Tigges
Manfred Weber
Dr. Dieter Zetsche
Dr. Jürgen Großmann
CEO
Dr. Leonhard Birnbaum
Alwin Fitting
Dr. Ulrich Jobs
Dr. Rolf Pohlig
Dr. Rolf Martin Schmitz
As of May 10, 2010
supeRvisoRy BoaRd
exeCutive BoaRd
51BoaRds
August 12, 2010 Interim report for the first half of 2010
November 11, 2010 Interim report for the first three quarters of 2010
February 24, 2011 Annual report for fiscal 2010
April 20, 2011 Annual General Meeting
April 21, 2011 Dividend payment
May 12, 2011 Interim report for the first quarter of 2011
August 11, 2011 Interim report for the first half of 2011
November 10, 2011 Interim report for the first three quarters of 2011
The interim report for the first quarter of 2010 was published on May 12, 2010.
This is a translation of the German interim report. In case of divergence from the German version,
the German version shall prevail.
The Annual General Meeting and all events concerning the publication of the financial reports are broadcast
live on the internet and recorded. We will keep the recordings on our website for at least twelve months.
FinanCial CalendaR 2010 / 2011
52 FinanCial CalendaR 2010 / 2011


RWE Aktiengesellschaft
Opernplatz 1 45128 Essen Germany
T +49 201 12-00 F +49 201 12-15199 I www.rwe.com
Investor Relations
T +49 201 12-15025 F +49 201 12-15265 E [email protected]
Private investors are welcome to call our Investor Relations hotline:
T +49 1801 451280