Embed Size (px)
Citation preview
Report on the Burden of Chronic Diseases in Mississippi, 2014

ACKNOWLDEGMENTS
Cassandra Dove, MPH Director, Chronic Disease Bureau Mississippi State Department of Health
Latonya Lott, MS, MPH Epidemiologist Mississippi State Department of Health
Ron McAnally Mississippi BRFSS Coordinator Mississippi State Department of Health
Vincent Mendy, DrPH, MPH, CPH Epidemiologist Mississippi State Department of Health
Amel Mohamed, MPH Epidemiologist Mississippi State Department of Health
Caroline Newkirk, MPH Director, Coordinated Chronic Disease Prevention and Health Promotion Program Mississippi State Department of Health
Larry Smith, PhD Epidemiologist Mississippi State Department of Health
Victor Sutton, PhD, MPPA Director, Office of Preventive Health Mississippi State Department of Health
Evelyn Walker, MD, MPH Director, Office of Health Promotion and Health Equity Mississippi State Department of Health
Lei Zhang, PhD, MSc, MBA Director, Office of Health Data and Research Mississippi State Department of Health
AUTHOR
Vanessa Short, PhD, MPH Senior Epidemiologist Mississippi State Department of Health
September 2014

Table of Contents
Section Page Number
Introduction 7
In this Report 14
List of chronic disease indicators and definitions 15
Findings/Indicators
Heart Disease and Stroke 21
Diabetes 29
Cancer 34
Arthritis 39
Asthma 42
Oral Health 45
Nutrition, Physical Activity, and Weight Status 49
Tobacco and Alcohol Use 53
Special Section on women of Reproductive Age 57
Special Section on Youth 60
Summary and Future Directions 66
Appendices 70
Data Sources 71
Statistical Techniques 73
List of Abbreviations 74
References 75
Burden of Chronic Diseases in Mississippi 3

List of Tables and Figures
Figure Number Figure Title Page Number
1. Leading causes of death in Mississippi, 2011 8
2. Hospital discharge rates per 1,000 by disease, Mississippi, 2010 9
3. Estimated hospital discharge charges (in millions) by disease, Mississippi, 2010 9
4. Projected medical costs for Mississippi for 2010-2020 10
5. Social determinants vary by race in Mississippi 13
6. Percentage of adults with and without self-reported high blood pressure, Mississippi and U.S., 2011 22
7. Percentage of adults with self-reported high blood pressure among subgroups, Mississippi, 2011 22
8. Percentage of adults with and without self-reported high blood cholesterol, Mississippi and U.S., 2011 23
9. Percentage of adults with self-reported high blood cholesterol among subgroups, Mississippi, 2011 23
10. Percentage of adults who did and did not have their blood cholesterol checked within the preceding 5 years, Mississippi and U.S., 2012 24
11. Percentage of adults who had their blood cholesterol checked within the preceding 5 years among subgroups, Mississippi ,2012 24
12. Age-adjusted death rate related to heart disease among subgroups, Mississippi, 2011 25
13. Age-adjusted death rates due to heart disease by county, 2007-2011 26
14. Age-adjusted death rate related to stroke by race and gender, Mississippi, 2010 27
15. Age-adjusted death rates due to stroke by county, 2007-2011 28
16. Percentage of adults with and without self-reported diabetes, Mississippi and U.S., 2012 30
17. Percentage of adults with self-reported diabetes among subgroups, Mississippi, 2012 30
18. Percentage of Mississippi adults with diabetes who have undergone screening tests and the Healthy People 2020 goals for these screening tests 31
19. Age-adjusted death rate related to diabetes among subgroups, Mississippi, 2010 32
20. Age-adjusted death rates due to diabetes by county, 2007-2011 33
Burden of Chronic Diseases in Mississippi 4

List of Tables and Figures
Figure Number Figure Title Page Number
21. Death rates due to cancer in Mississippi (2010) and the U.S. (2009) and the Healthy People 2020 Goal 35
22. Age-adjusted death rates due to cancer by county, 2007-2011 36
23. Percentage of adults who have undergone cancer screening tests, Mississippi, 2012 37
24. Incidence rate per 100,000 for late-stage breast, colorectal and cervical cancer, Mississippi and U.S., 2003-2010 38
25. Percentage of adults with and without arthritis, Mississippi and U.S., 2012 40
26. Percentage of adults with arthritis among subgroups, Mississippi, 2012 40
27. Percentage of adults with arthritis who experienced activity limitation, Mississippi and U.S., 2011 41
28. Percentage of adults with arthritis who experienced activity limitation among subgroups, Mississippi, 2011 41
29. Percentage of adults who were and were not ever told that they have asthma, Mississippi and U.S., 2012 43
30. Percentage of adults who were ever told that they have asthma among subgroups, Mississippi, 2012 43
31. Prevalence of asthma attack in the past 12 months among adults with asthma, Mississippi, 2010 44
32. Prevalence of asthma attack in the past 12 months among adults with asthma among subgroups, Mississippi, 2010 44
33. Percentage of adults who visited a dentist of dental clinic within the past year, Mississippi and U.S., 2012 46
34. Percentage of adults who visited a dentist of dental clinic among subgroups, Mississippi, 2012 46
35. Percentage of adults aged > 65 years who did and did not have all natural teeth extracted Mississippi and U.S., 2012 47
36. Percentage of adults of adults aged > 65 years who had all natural teeth extracted, Mississippi, 2012 47
37. Percentage of adults aged > 65 years who did and did not have any teeth extracted, Mississippi and U.S., 2012 48
38. Percentage of adults of adults aged > 65 years who had any teeth extracted among subgroups, Mississippi, 2012 48
39. Percentage of adults who reported a normal, overweight or obese BMI, Mississippi and U.S., 2012 50
40. Percentage of adults who are obese among subgroups, Mississippi, 2012 50
Burden of Chronic Diseases in Mississippi 5

List of Tables and Figures
Figure Number Figure Title Page Number
41. Percentage of adults who reported any and no leisure time physical activity, Mississippi, 2012 51
42. Percentage of adults who reported no leisure time physical activity among characteristic, Mississippi, 2012 51
43. Percentage of adults who consume < 1 or > 1 fruits and vegetables per day, Mississippi, 2011 52
44. Percentage of adults who are and are not current smokers, Mississippi and U.S., 2012 54
45. Percentage of adults who are current smokers among subgroups, Mississippi, 2012 54
46. Percentage of adults who did and did not report binge drinking in the past 30 days, Mississippi and U.S., 2012 55
47. Percentage of adults who reported binge drinking in the past 30 days among subgroups, Mississippi, 2012 55
48. Prevalence of chronic diseases and related risk factors and behaviors among women of reproductive age (18-44 years), Mississippi, 2012 58
49. Prevalence of nutrition, physical activity and weight status related factors and behaviors among Mississippi youth, 2011 61
50. Prevalence of nutrition, physical activity and weight status related factors and behaviors among Mississippi youth by race and gender, 2011 62
51. Prevalence of tobacco and alcohol use among Mississippi youth, 2011 63
52. Prevalence of tobacco and alcohol use among Mississippi youth by race and gender, 2011 64
Burden of Chronic Diseases in Mississippi 6

Introduction

Chronic diseases are among the most common of all health problems in Mississippi.
Figure 1. Leading causes of death in Mississippi, 2011.
(2.1% of all deaths)
(2.3% of all deaths)
(3.3% of all deaths)
(3.4% of all deaths)
(5.3% of all deaths)
(5.8% of all deaths)
(5.8% of all deaths)
(21.4% of all deaths)
(25.1% of all deaths)
0 50 100 150 200 250 300
Influenza/Pneumonia
Kidney diseases
Alzheimer's disease
Diabetes mellitus
Stroke
Chronic obstructive pulmonary disease
Unintentional injuries
Cancer
Diseases of the Heart
Age-adjusted death rate per 100,000 population
Burden of Chronic Diseases in Mississippi 8
In 2011, 7 of the leading causes of death in Mississippi were chronic disease-related. These included deaths with diseases of the heart, cancer, chronic obstructive
pulmonary disease, stroke, Alzheimer’s disease, diabetes and kidney disease. Over half (55%) of all deaths in Mississippi were due to cardiovascular-related
diseases, cancer and diabetes.

Chronic diseases are among the most costly of all health problems in Mississippi.
Figure 2. Hospital discharge rates per 1,000 by disease, Mississippi, 2010.
1.61
2.06 2.15
2.49
3.29
3.83
0
0.5
1
1.5
2
2.5
3
3.5
4
4.5
Rat
es p
er 1
,00
0
Figure 3. Estimated hospital discharge charges (in millions) by disease, Mississippi, 2010.
131
189
194
289
289
354
$0 $200 $400
Stroke
Diabetes mellitus with complications
Chronic obstructive pulmonary disease
Osteoarthritis
Congestive Heart Failure
Myocardial Infarction
$ in millions
Burden of Chronic Diseases in Mississippi 9
In 2010, there were 155,629 (41.2%) discharges due to chronic conditions in Mississippi and the total charges for chronic related conditions was over $4 billion.
Congestive heart failure was the most prevalent followed by chronic obstructive pulmonary disease and diabetes mellitus with complications. Myocardial infarction,
congestive heart failure and osteoarthritis were the most costly.
Source: Hospital Discharge Data Report, 2010

Medical spending on chronic health conditions has grown rapidly in recent years and is placing a significant burden
on state budgets. Medical costs associated with chronic health conditions are expected to continue to increase.
Medical costs associated with chronic health conditions are expected to increase
up to 70% between 2010 and 2020. Below is a list of projected percent increases
in medical costs for some of the most common chronic health conditions in
Mississippi.
Condition Projected % increase in costs, 2010-2020
Stroke 70.7%
Disease of the Heart 70.3%
Total CVD 69.1%
Diabetes 67.9%
Hypertension 65.4%
Burden of Chronic Diseases in Mississippi 10
Figure 4. Projected medical costs for Mississippi for 2010-2020.
Source: Centers for Disease Control and Prevention: Chronic Disease Cost Calculator: http://www.cdc.gov/chronicdisease/resources/calculator/index.htm

The prevalence of chronic diseases and related risk factors is generally higher in Mississippi than in other states.
• Mississippi's cardiovascular disease death rate is the highest in the nation. Heart Disease and
Stroke
• Mississippi ranks 2nd in the U.S. for overall diabetes prevalence among adults. Diabetes
• Mississippi had the 2nd highest age-adjusted death rate due to cancer in the nation. Cancer
• Mississippi ranks 2nd in the U.S. for obesity prevalence among adults. Obesity
• Mississippi ranks 6th in the U.S. for overall smoking prevalence among adults. Tobacco
Burden of Chronic Diseases in Mississippi 11
Source: 2013 America’s Health Rankings: www.americashealthrankings.org

Chronic diseases are among the most preventable of all health problems in Mississippi.
Burden of Chronic Diseases in Mississippi 12
Age
Gender
Race
Family history
Non-modifiable
Risk Factors Tobacco use
Alcohol consumption
Physical activity
Diet
High blood pressure
High cholesterol
Weight
Modifiable
Risk Factors
Risk factors for chronic disease may be generally categorized into one of two categories: modifiable and non-modifiable. Four modifiable health risk
behaviors—lack of physical activity, poor nutrition, tobacco use, and excessive alcohol consumption—are responsible for much of the illness, suffering, and
early death related to chronic disease. It has been estimated that if the major risk factors for chronic diseases were eliminated, at least 80% of all heart
disease, stroke and type 2 diabetes, and 40% of all cancer cases would be prevented.

Sociodemographic Snapshot of Mississippi
Source: 2011 U.S. Census Bureau
2,984,926 Residents
1 in 5 (22%) live below the poverty level
(14% in the U.S.)
1 in 5 (20%) have less than a high school education
(15% in the U.S.)
Median Household Income is $38,718 (Median Household Income in the U.S. is $52,762)
40% of adults are non-white
(21.1% in the U.S.) Figure 5. Social determinants vary by race in Mississippi.
15.3
8.2
16.8
12.8
20.8
17.1
29.2
35.7
% Without health insurance
% Unemployed
% With less thana high school education
% Living below poverty
0 10 20 30 40
Percentage (%)
Black White
Burden of Chronic Diseases in Mississippi 13
Determinants of health are factors
that contribute to a person's current
state of health. These factors may be
biological, socioeconomic,
psychosocial, behavioral, or social in
nature. Social determinants of health
include such things as education,
income, occupation, and access to
health care.
Chronic diseases rates are frequently
elevated among socioeconomically
disadvantaged groups and some
minority populations, including blacks
and persons with low incomes and
education levels. Mississippi has the
highest percentage of non-whites
(40%) among all 50 states and the
population is generally poorer and
less educated than the rest of the
nation. Further, within Mississippi,
social determinants of health differ
between racial/ethnic groups.
A higher percentage of blacks live
below poverty, have less than a high
school education, are unemployed
and lack any kind of health care
coverage, compared to whites (Figure
5). The demographic profile of
Mississippi and the inequalities
between blacks and whites may
influence the chronic disease burden
in the state.
Social determinants of health may influence the burden of chronic burden in Mississippi.

In This Report
This report begins with the description and list of health indicators (health
conditions, risk factors, and behaviors) identified as being relevant to public
health practice and to public health efforts to prevent and control chronic
disease and for which surveillance data were available at the state level.
The bulk of the report details state-level information for each indicator.
Data through the most recent year available and differences between
subgroups are illustrated. Accompanying each indicator is a discussion of
the importance of the indicator to overall health and highlights of the data,
as well as the Healthy People 2020’s National Goal and Target, if available .
Many, but not all , of the health measures were selected based on the
Indicators for Chronic Disease Surveillance, which was developed jointly by
the Council of State and Territorial Epidemiologists, the Association of State
and Territorial Chronic Disease Program Directors, and the Centers for
Disease Control and Prevention (CDC). The Chronic Disease Indicators (CDI)
are a cross-cutting set of indicators that were developed by consensus and
that allows states, territories and large metropolitan areas to uniformly
define, collect, and report chronic disease data that are important to public
health practice and available for states, territories and large metropolitan
areas . The CDI are divided into eight categories that represent a wide
spectrum of conditions and risk factors as well as social context, including:
physical activity and nutrition; tobacco and alcohol use; cancer;
cardiovascular disease (CVD); diabetes; arthritis; overarching conditions;
and other diseases and risk factors. For more information about the CDI,
visit: http://www.cdc.gov/nccdphp/CDI/overview.htm.
The tables on the following pages list and define the indicators that were
examined and specifies the data source for each indicator. Results related
to each chronic disease domain are organized into eight distinct sections
within this report:
• Heart Disease and Stroke
• Diabetes
• Cancer
• Arthritis
• Asthma
• Oral Health
• Nutrition, Physical Activity and Obesity
• Tobacco
There are also special sections focusing on chronic diseases in women of
reproductive age and youth. Finally, the results are summarized and a
discussion is provided. This is followed by a description of the methods
and data sources used.
Burden of Chronic Diseases in Mississippi 14

List of Chronic Disease Indicators, Definitions and Data Sources
Section/Indicator Definition Data Source
Heart Disease and Stroke
High blood pressure awareness Percentage of adults who report having been told by a health professional of having high blood pressure BRFSS
High blood cholesterol awareness Percentage of adults years who report having been told by a health professional of having high blood cholesterol
BRFSS
Cholesterol screening Percentage of adults aged who report having their cholesterol checked within the previous 5 years BRFSS
Deaths related to coronary heart disease Deaths with ICD-10 codes I11, I20–I25 as the underlying cause of death among residents during a calendar year MS Vital Statistics and CDC Wonder
Deaths related to stroke Deaths with ICD-10 codes I60–I69 as the underlying cause of death among residents during a calendar year MS Vital Statistics
and CDC Wonder
Diabetes
Diabetes awareness Percentage of adults who report having been told by a health professional of having diabetes* BRFSS
Daily self blood glucose monitoring Adults with self-reported diabetes* who report self-blood glucose monitoring at least once daily
BRFSS
Diabetes self management class Adults with self-reported diabetes* who report attending a diabetes self-management class
CDC NDSS
Daily foot examination Adults with self-reported diabetes* who report having daily foot examinations
CDC NDSS
Annual foot examination Adults with self-reported diabetes* who report having received at least one clinical foot examination within the previous year
CDC NDSS
Annual dilated eye examination Adults with self-reported diabetes* who report having received a dilated eye exam within the previous year
CDC NDSS
Annual hemoglobin A1c examination Adults with self-reported diabetes* who report having > 2 hemoglobin A1c tests in the past year
CDC NDSS
Death related to diabetes Deaths with ICD-10 codes E10–E14 as an underlying or contributing cause of death among residents during a calendar year MS Vital Statistics and CDC Wonder
Note: All indicators refer to adults > 18 years of age unless otherwise noted. Abbreviations: BRFSS=Behavioral Risk Factor Surveillance System; CDC=Centers for Disease Control and Prevention; ICD=International Classification of Diseases; MS=Mississippi.; NDSS=National Diabetes Surveillance System. * Excluding women who were told only when pregnant.
Burden of Chronic Diseases in Mississippi 15

List of Chronic Disease Indicators, Definitions and Data Sources
Section/Indicator Definition Data Source
Cancer
Cancer (all sites combined), death Deaths with ICD-10 codes C00–C97 as the underlying cause of death among residents during a calendar year MS Cancer Registry
Cancer of the lung and bronchus, death Deaths with ICD-10 codes C34 as the underlying cause of death among residents during a calendar year MS Cancer Registry
Cancer of the prostate, death
Deaths with ICD-10 codes C61 as the underlying cause of death among male residents during a calendar year MS Cancer Registry
Cancer of the colon and rectum, death Deaths with ICD-10 codes C18–C20, C26.0 as the underlying cause of death among residents during a calendar year MS Cancer Registry
Cancer of the female breast, death Deaths with ICD-10 codes C50 as the underlying cause of death among female residents during a calendar year
MS Cancer Registry
Screening for breast cancer Percentage of women aged > 50 years who report having had a mammogram within the previous 2 years BRFSS
Screening for cervical cancer Percentage of women aged > 18 years who report having had a Papanicolaou (Pap) smear within the previous 3 years BRFSS
Screening for colorectal cancer Percentage of adults > 50 years who report having either a fecal occult blood test within the previous year or a sigmoidoscopy or colonoscopy exam within the previous 5 years
BRFSS
Invasive cancer of the female breast, incidence
Incidence based on ICD-0-3 codes C500-C509 and ICD-0-3 histology (type) excluding 9050-9055, 9140, 9590-9992 MS Cancer Registry
Invasive cancer of the colon and rectum, incidence
Incidence based on ICD-0-3 codes C180-C189, C199, C209, C260 and ICD-0-3 histology (type) excluding 9050-9055, 9140, 9590-9992
MS Cancer Registry
Invasive cancer of the cervix, incidence
Incidence based on ICD-0-3 codes C530-C539 and ICD-0-3 histology (type) excluding 9050-9055, 9590-9992
MS Cancer Registry
Arthritis
Arthritis Percentage of adults who report having doctor-diagnosed arthritis BRFSS
Activity limitation due to arthritis Percentage of adults aged who report doctor-diagnosed arthritis and an activity limitation due to arthritis or joint symptoms BRFSS
Burden of Chronic Diseases in Mississippi 16
Note: All indicators refer to adults > 18 years of age unless otherwise noted. Abbreviations: BRFSS=Behavioral Risk Factor Surveillance System; CDC=Centers for Disease Control and Prevention; ICD=International Classification of Diseases; MS=Mississippi.

List of Chronic Disease Indicators, Definitions and Data Sources
Section/Indicator Definition Data Source
Asthma
Ever having asthma Percentage of adults who were ever told that they have asthma BRFSS
Asthma episode in past 12 months Percentage of adults who reported an asthma attack in the past 12 months among adults with asthma BRFSS
Oral Health
Visits to dentist or dental clinic Percentage of adults who report having been to the dentist or dental clinic in the previous year BRFSS
Any teeth extracted Percentage of adults > 65 years of age who report having any natural teeth extracted BRFSS
All teeth extracted Percentage of adults > 65 years of age who report having all natural teeth extracted BRFSS
Nutrition, Physical Activity and Obesity
Obesity Percentage of adults who have a body mass index > 30.0 kg/m² calculated from self-reported weight and height BRFSS
Leisure time physical activity Percentage of adults who report any leisure time physical activity BRFSS
Daily fruit/vegetable consumption Percentage of adults who report eating fruits and vegetables > 1 times/day BRFSS
Tobacco and Alcohol Use
Current smoking Percentage of adults who smoked > 100 cigarettes in their lifetime and are current smokers on every day or some days
BRFSS
Binge drinking Percentage of adults who report having > 5 drinks (men) or > 4 drinks (women) on > 1 occasion during the previous 30 days BRFSS
Burden of Chronic Diseases in Mississippi 17
Note: All indicators refer to adults > 18 years of age unless otherwise noted. Abbreviations: BRFSS=Behavioral Risk Factor Surveillance System; CDC=Centers for Disease Control and Prevention; ICD=International Classification of Diseases; MS=Mississippi.

List of Chronic Disease Indicators, Definitions and Data Sources
Section/Indicator Definition Data Source
Special Section on Women of Reproductive Age
Annual visit to a health care provider
Percentage of women aged 18-44 years who report visiting a doctor for a routine checkup in the past year
BRFSS
Diabetes/Prediabetes Percentage of women aged 18-44 years who report ever having physician-diagnosed diabetes or prediabetes other than diabetes during pregnancy
BRFSS
High blood pressure Percentage of women aged 18-44 years who report having been told by a health professional of having high blood pressure
BRFSS
Obesity Percentage of women aged 18-44 years who have a body mass index > 30.0 kg/m² calculated from self-reported weight and height BRFSS
Current cigarette smoking Percentage of women aged 18-44 years who report having smoked a cigarette on ≥ 1 day during the previous 30 days BRFSS
Binge drinking Percentage of women aged 18-44 years who report having > 4 drinks on > 1 occasion during the previous 30 days
BRFSS
Note: All indicators refer to women 18-44 years of age. Abbreviations: BRFSS=Behavioral Risk Factor Surveillance System.
Burden of Chronic Diseases in Mississippi 18

List of Chronic Disease Indicators, Definitions and Data Sources
Section/Indicator Definition Data Source
Special Section on Youth
Overweight Percentage of students who were > 85th percentile but < 95th percentile for body mass index*
YRBSS
Obesity Percentage of students who were > 95th percentile for body mass index*
YRBSS
Participation in physical education class Percentage of students who attended physical education class at least once in an average school week
YRBSS
TV viewing Percentage of students who report watching television for more than 3 hours on an average school day YRBSS
Computer use Percentage of students who report playing video or computer games or using a computer for 3 or more hours/day on an average school day for something that was not school work
YRBSS
Fruit consumption Frequency of fruit/100% fruit juice consumption among students YRBSS
Vegetable consumption Frequency of vegetable consumption among students YRBSS
Ever tried smoking Percentage of students who have ever tried cigarette smoking
Current cigarette smoking Percentage of students who report having smoked a cigarette on ≥ 1 day during the previous 30 days YRBSS
Current smokeless tobacco use Percentage of students who report having used smokeless tobacco on ≥ 1 day during the previous 30 days YRBSS
Ever tried alcohol Percentage of students who have ever tried alcohol
Current alcohol use Percentage of students who report consumption of ≥ 1 drink of alcohol during the past 30 days YRBSS
Binge drinking Percentage of students who report having ≥ 5 drinks of alcohol within a couple of hours on ≥ 1 day during the past 30 days YRBSS
Note: All indicators refer to students in grades 9–12. Abbreviations: YRBSS= Youth Risk Factor Surveillance System. * Based on sex- and age-specific reference data from the 2000 CDC growth charts.
Burden of Chronic Diseases in Mississippi 19

Definitions of Demographic and Social Determinants of Health Related Variables
Section/Indicator Definition Data Source
Socioeconomic Indicators and Social Determinants of Health
Age Self-reported age in years BRFSS
Gender Self-reported gender BRFSS
Race/ethnicity Self-reported race/ethnicity BRFSS
Education Level Self-reported highest level of education completed BRFSS
Federal poverty level Based on self-reported annual household income and federal guidelines published by Social Security Administration
BRFSS and U.S. Census
Health care coverage Self-report having any type of health care coverage (yes, no) among adults 18-64 years
BRFSS
Burden of Chronic Diseases in Mississippi 20

Heart Disease and Stroke Indicators

High blood pressure awareness among adults High blood pressure, also known as hypertension, increases the risk for heart disease and stroke. It is called the "silent killer" because it often has no warning signs. Lifestyle risk factors for high blood pressure include high sodium intake, excessive caloric intake, physical inactivity, and high alcohol consumption. Healthy People 2020 Goal: Reduce the proportion of adults with high blood pressure Healthy People 2020 Target: 26.9%
Figure 6. Percentage of adults with and without self-reported high blood pressure, Mississippi and U.S., 2011.
60.7 69.2
39.3 30.8
0
10
20
30
40
50
60
70
80
90
100
Mississippi U.S.
Pe
rce
nta
ge (
%)
No high blood pressure High blood pressure
Figure 7. Percentage of adults with self-reported high blood pressure among subgroups, Mississippi, 2011.
32.6
35.8
47.1
49.1
34.7
41.1
41.5
35.8
31.3
43.3
49.7
≥ 300% FPL
200-299% FPL
100-199% FPL
0-99% FPL
> High School
High School
< High School
White Males
White Females
Black Males
Black Females
0 10 20 30 40 50 60
Age-adjusted percentage (%)
2011 DATA HIGHLIGHTS
• 4 out of 10 adults in Mississippi reported high blood pressure.
• Black females had the highest prevalence of high blood pressure.
• A higher proportion of blacks reported high blood pressure than whites.
• Adults with more than a high school education had a lower prevalence of high blood pressure than those with a high school education or less.
• The prevalence of high blood pressure increased as poverty increased. Those living at 0-99% FPL had a 66% higher prevalence of high blood pressure than those living at > 300% FPL.
Burden of Chronic Diseases in Mississippi 22
Race/Ethnicity and Gender
Federal Poverty Level (FPL)
Education Level

High blood cholesterol awareness among adults High blood cholesterol is one of the major modifiable risk factors for heart disease and stroke. As a results, public health agencies and their partners have attempted to reduce the prevalence of high blood cholesterol through screening and by increasing public awareness of high blood cholesterol and strategies for reducing it. Cholesterol levels can be reduced through dietary changes (e.g., reduced intake of saturated fats and dietary cholesterol), increased physical activity, and drug treatment.
Figure 9. Percentage of adults with self-reported high blood cholesterol among subgroups, Mississippi, 2011.
35.4
37.3
37.3
46.2
39.4
39.1
34.1
35.9
37.9
35.2
35.9
≥ 300% FPL
200-299% FPL
100-199% FPL
0-99% FPL
> High School
High School
< High School
White Males
White Females
Black Males
Black Females
0 10 20 30 40 50
Age-adjusted percentage (%)
2011 DATA HIGHLIGHTS
• More than 40% adults in Mississippi reported high blood cholesterol.
• Those living at 0-99% FPL had a higher prevalence of high blood cholesterol than those living at > 300% FPL.
• There were no significant differences by gender, race, or level of education.
Burden of Chronic Diseases in Mississippi 23
Race/Ethnicity and Gender
Federal Poverty Level (FPL)
Education Level
Figure 8. Percentage of adults with and without self-reported high blood cholesterol, Mississippi and U.S., 2011.
57.8 61.6
42.3 38.4
0
10
20
30
40
50
60
70
80
90
100
Mississippi U.S.
Pe
rce
nta
ge (
%)
No high cholesterol High cholesterol

Cholesterol screening among adults High cholesterol usually has no signs or symptoms, however, a simple blood test can tell a person’s cholesterol level. The National Cholesterol Education Program recommends that healthy adults get their cholesterol levels checked every five years. Healthy People 2020 Goal: Increase the percentage of adults aged 18 years and older had their blood cholesterol checked within the preceding 5 years Healthy People 2020 Target: 82.1%
Figure 11. Percentage of adults who had their cholesterol checked within the preceding 5 years among subgroups, Mississippi, 2012.
97.8
95.5
94.4
91.6
96.4
95.2
91.4
94.9
94.3
94.8
97.9
≥ 300% FPL
200-299% FPL
100-199% FPL
0-99% FPL
> High School
High School
< High School
White Males
White Females
Black Males
Black Females
0 10 20 30 40 50 60 70 80 90 100
Age-adjusted percentage (%)
2012 DATA HIGHLIGHTS
• Just over 70% of adults in Mississippi had their blood cholesterol checked within the preceding 5 years. This is below the Healthy People 2020 target of 82.1%.
• No differences were seen by race, gender, education or poverty level.
Burden of Chronic Diseases in Mississippi 24
Race/Ethnicity and Gender
Federal Poverty Level (FPL)
Education Level
Figure 10. Percentage of adults who did and did not have their cholesterol checked within the preceding 5 years, Mississippi and U.S., 2012.
71.3 75.5
28.7 24.5
0
10
20
30
40
50
60
70
80
90
100
Mississippi U.S.
Pe
rce
nta
ge (
%)
Checked Not checked

Deaths related to coronary heart disease During 2011, heart disease was the leading cause of death in Mississippi, accounting for 25% of all deaths. Modifiable risk factors for heart disease include behaviors (e.g., tobacco use, physical inactivity), health status (e.g., hypertension, overweight, diabetes), and public health policies (e.g., tobacco free laws). Healthy People 2020 Goal: Reduce coronary heart disease deaths Healthy People 2020 Target: 100.8 deaths per 100,000
Figure 12. Age-adjusted death rate related to heart disease among subgroups, Mississippi, 2011.
283.4
183.4
321.9
233.6
228.1
271.5
294.1
197.2
239.7
White Males
White Female
Black Males
Black Females
White
Black
Male
Female
Overall
0 50 100 150 200 250 300 350
Age-adjusted death rate per 100,000
2011 DATA HIGHLIGHTS • In 2011, the age-adjusted death rate related to heart disease in MS was
239.7 per 100,000 persons.
• Black males had the highest death rate due to heart disease (321.9 per 100,000).
• The death rate related to heart disease was about 1.5 times higher for
males than females.
• The death rate related to heart disease was nearly 20% higher for blacks than whites.
Burden of Chronic Diseases in Mississippi 25
Gender
Race and Gender
Race
Diseases of the Heart
Leading causes of death in Mississippi, 2011.

Burden of Chronic Diseases in Mississippi 26
Figure 13. Age-adjusted death rates due to heart disease by county, 2007-2011.
Deaths related to coronary heart disease (continued) 2007-2011 DATA HIGHLIGHTS • For the years 2007-2011, the overall age-adjusted death rate due to heart disease
for the state was 251.6 deaths per 100,000.
• Geographic differences exist; the death rate ranged from a low of 191.0 deaths per 100,000 (Pontotoc) to a high of 422.5 deaths per 100,000 (Tunica).
• Several of the counties with the highest death rates due to heart disease were clustered in the Northwest part of the state.
• The counties with the 10 highest death rates due to heart disease were:
Rank County Death rate per 100,000
1 Tunica 422.5
2 Quitman 379.5
3 Leflore 341.1
4 Humphreys 336.7
5 Panola 331.9
6 Claiborne 330.8
7 Greene 328.1
8 Webster 324.7
9 Noxubee 324.5
10 Tishomingo 319.0
Source: Mississippi Vital Statistics: The Mississippi STatistically Automated Health Resource System (MSTAHRS), 2012

Deaths related to stroke During 2010, stroke was the 5th leading cause of death in the Mississippi. Modifiable risk factors for stroke include behaviors (e.g., tobacco use, physical inactivity, and improper nutrition) and health status (e.g., untreated hypertension, hyperlipidemia, overweight, or diabetes). Healthy People 2020 Goal: Reduce stroke deaths Healthy People 2020 Target: 33.8 deaths per 100,000
Figure 14. Age-adjusted death rate related to stroke by race and gender, Mississippi, 2010.
45.7
45.5
74.2
55.3
46.3
63.3
53.0
48.5
51.0
White Males
White Female
Black Males
Black Females
White
Black
Male
Female
Overall
0 10 20 30 40 50 60 70 80
Age-adjusted death rate per 100,000
2011 DATA HIGHLIGHTS • In 2011, the age-adjusted death rate related to stroke in MS was 51 deaths
per 100,000 persons.
• Black males had the highest death rate due to stroke (74.2 deaths per 100,000).
• The death rate related to stroke was higher for males than females.
• The death rate related to stroke was higher for blacks than whites.
Burden of Chronic Diseases in Mississippi 27
Gender
Race and Gender
Race
Leading causes of death in Mississippi, 2011.
Burden of Chronic Diseases in Mississippi 28
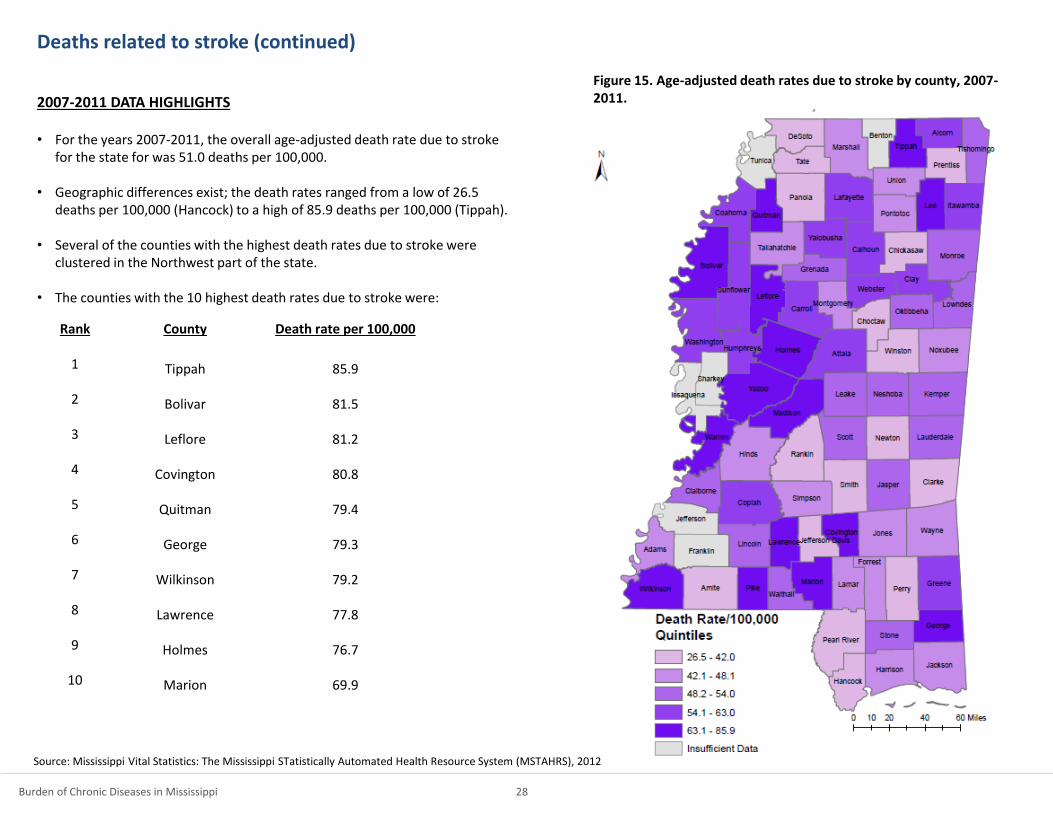
Figure 15. Age-adjusted death rates due to stroke by county, 2007-2011.
Deaths related to stroke (continued) 2007-2011 DATA HIGHLIGHTS • For the years 2007-2011, the overall age-adjusted death rate due to stroke
for the state for was 51.0 deaths per 100,000.
• Geographic differences exist; the death rates ranged from a low of 26.5 deaths per 100,000 (Hancock) to a high of 85.9 deaths per 100,000 (Tippah).
• Several of the counties with the highest death rates due to stroke were clustered in the Northwest part of the state.
• The counties with the 10 highest death rates due to stroke were:
Rank County Death rate per 100,000
1 Tippah 85.9
2 Bolivar 81.5
3 Leflore 81.2
4 Covington 80.8
5 Quitman 79.4
6 George 79.3
7 Wilkinson 79.2
8 Lawrence 77.8
9 Holmes 76.7
10 Marion 69.9
Source: Mississippi Vital Statistics: The Mississippi STatistically Automated Health Resource System (MSTAHRS), 2012

Diabetes Indicators

Diabetes awareness among adults Diabetes is a group of diseases marked by high levels of blood glucose resulting from defects in insulin production, insulin action, or both. Diabetes can lead to serious complications, including heart disease, blindness, kidney failure, and lower-extremity amputations, and premature death.
Figure 17. Percentage of adults with self-reported diabetes among subgroups, Mississippi, 2012.
7.7
13.8
14.7
18.8
9.9
12.1
16.1
10.1
9.3
14.2
17.6
≥ 300% FPL
200-299% FPL
100-199% FPL
0-99% FPL
> High School
High School
< High School
White Males
White Females
Black Males
Black Females
0 10 20
Age-adjusted percentage (%)
2012 DATA HIGHLIGHTS
• The prevalence of self-reported diabetes among adults was higher in Mississippi than the U.S.
• Black females reported the highest prevalence of diabetes.
• A higher proportion of blacks reported diabetes than whites.
• The prevalence of diabetes decreased with increasing education.
• The prevalence of diabetes increased with increasing poverty; the prevalence of diabetes was 2.5 times higher among adults living at 0-99% FPL compared to adults living at > 300% FPL.
Burden of Chronic Diseases in Mississippi 30
Race/Ethnicity and Gender
Federal Poverty Level (FPL)
Education Level
Figure 16. Percentage of adults with and without self-reported diabetes, Mississippi and U.S., 2012.
87.5 90.3
12.5 9.7
0
10
20
30
40
50
60
70
80
90
100
Mississippi U.S.
Pe
rce
nta
ge (
%)
No diabetes Diabetes

Preventive measures among adults with diabetes
Multiple long-term complications of diabetes can be prevented through improved
patient education and self-management and provision of adequate and timely
screening services and medical care, such as glucose, lipid, and blood pressure
regulation, as well as screening and treatment for eye and foot abnormalities.
2009 DATA HIGHLIGHTS
Among Mississippi adults with self-reported diabetes:
- Over two-thirds self-monitor their blood glucose on daily basis;
- Less than half ever attended a diabetes self-management class;
- 60% and 65% received an annual dilated eye and foot exam, respectively; and
- 7 out of 10 had > 2 hemoglobin A1c tests in the past year.
Mississippi adults with diabetes seem to be on target for meeting the Healthy
People 2020 goals for:
- Daily self-monitoring for blood glucose;
- Having an annual dilated eye exam; and
- Having > 2 annual hemoglobin A1c tests.
Figure 18. Percentage of Mississippi adults with diabetes who have undergone screening tests and the Healthy People 2020 goals for these screening tests.
71.1
74.8
58.7
62.5
70.4
71.0
65.8
60.6
46.0
68.8
>2 Hemoglobin A1ctests in last year
Annual foot exam
Annual dilated eye exam
Ever attended diabetesself-management class
Daily self-monitoringof blood glucose
0 10 20 30 40 50 60 70 80
Age-adjusted percentage (%)
Mississippi Healthy People 2020 Goal
Burden of Chronic Diseases in Mississippi 31
Source: Centers for Disease Control and Prevention: National Diabetes Surveillance System: http://www.cdc.gov/diabetes/statistics.

Deaths related to diabetes During 2011, diabetes was the 8th leading cause of death in Mississippi, accounting for over 3% of deaths. Healthy People 2020 Goal: Reduce the diabetes death rate Healthy People 2020 Target: 65.8 deaths per 100,000
Figure 19. Age-adjusted death rate related to diabetes among subgroups, Mississippi, 2010.
28.8
19.5
60.5
48.5
23.8
53.6
36.7
27.8
31.8
White Males
White Female
Black Males
Black Females
White
Black
Male
Female
Overall
0 10 20 30 40 50 60 70
Age-adjusted death rate per 100,000
2011 DATA HIGHLIGHTS • In 2011, the age-adjusted death rate related to diabetes in Mississippi was
31.8 deaths per 100,000 persons.
• Black males had the highest death rate due to diabetes (60.5 deaths per 100,000).
• The death rate related to diabetes was 32% higher for males than females.
• The death rate related to diabetes was more than twice as high among blacks than whites.
Burden of Chronic Diseases in Mississippi 32
Gender
Race and Gender
Race
Leading causes of death in Mississippi, 2011.
Burden of Chronic Diseases in Mississippi 33
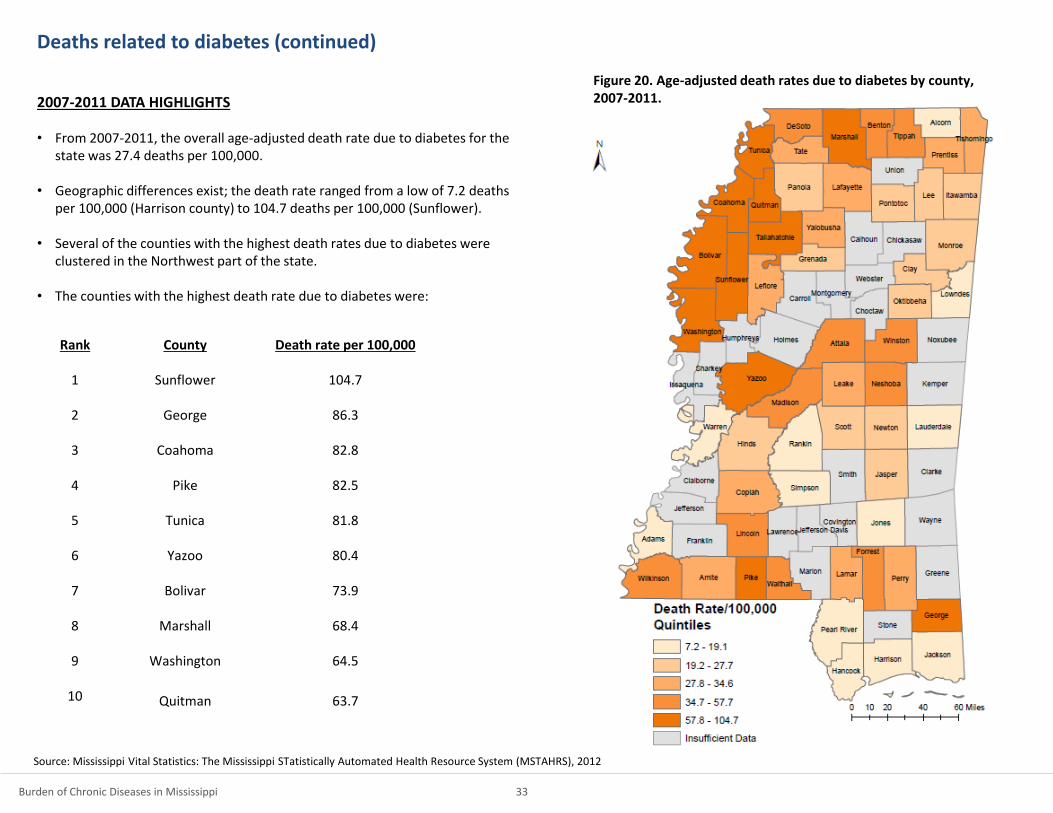
Figure 20. Age-adjusted death rates due to diabetes by county, 2007-2011.
Deaths related to diabetes (continued) 2007-2011 DATA HIGHLIGHTS • From 2007-2011, the overall age-adjusted death rate due to diabetes for the
state was 27.4 deaths per 100,000.
• Geographic differences exist; the death rate ranged from a low of 7.2 deaths per 100,000 (Harrison county) to 104.7 deaths per 100,000 (Sunflower).
• Several of the counties with the highest death rates due to diabetes were clustered in the Northwest part of the state.
• The counties with the highest death rate due to diabetes were:
Rank County Death rate per 100,000
1 Sunflower 104.7
2 George 86.3
3 Coahoma 82.8
4 Pike 82.5
5 Tunica 81.8
6 Yazoo 80.4
7 Bolivar 73.9
8 Marshall 68.4
9 Washington 64.5
10 Quitman 63.7
Source: Mississippi Vital Statistics: The Mississippi STatistically Automated Health Resource System (MSTAHRS), 2012

Cancer Indicators

Cancer
Each year, more than 13,000 Mississippians are diagnosed with cancer and about
6,000 die from cancer, making it the second leading cause of death in Mississippi.
However, the number of new cancer cases can be reduced, and many cancer deaths
can be prevented. Screening for cervical, colorectal, and breast cancers - some of
the most common types of cancers - helps find these diseases at an early, often
highly treatable stage. The Healthy People objectives for 2020 highlight the
importance of monitoring the incidence of invasive cancer (cervical and colorectal)
and late-stage breast cancer, which are intermediate markers of cancer screening
success.
DATA HIGHLIGHTS
The death rate is higher in Mississippi compared to the United States for all sites,
lung and bronchus, prostate, colorectal and female breast.
Death rates in Mississippi are higher than the Healthy People 2020 Goals.
Figure 21. Death rates due to cancer in Mississippi (2010) and the U.S. (2009) and the Healthy People 2020 Goal.
Burden of Chronic Diseases in Mississippi 35
20.6
14.5
21.2
45.5
160.6
22.2
15.7
22
48.5
173.1
24.8
20.3
29.7
61.8
200.3
0 50 100 150 200 250
Breast (females only)
Colorectal
Prostate (males only)
Lung and Bronchus
All Sites
Age-adjusted death rate per 100,000
Mississippi U.S. HP 2020 Goal

Burden of Chronic Diseases in Mississippi 36
Figure 22. Age-adjusted death rates due to cancer by county, 2007-2011.
Death related to cancer (all sites)
2007-2011 DATA HIGHLIGHTS • For the years 2007-2011, the overall age-adjusted death rate due to cancer
for the state was 198.5 deaths per 100,000.
• Geographic differences exist; the death rate ranged from a low of 144.8 deaths per 100,000 (Union county) to 339.9 deaths per 100,000 (Madison).
• The counties in the Northwest part of the state generally had the highest death rates due to cancer.
• The counties with the highest death rate due to cancer were:
Rank County Death rate per 100,000
1 Madison 339.9
2 Lee 272.9
3 Coahoma 261.6
4 Wilkinson 256.5
5 Leake 243.8
6 Quitman 237.7
7 Leflore 237.1
8 Humphreys 235.5
9 Stone 234.8
10 Perry 234.1
Note: The death rate for Madison county may not be a true reflection due to hospices operated in that county. Please interpret with caution. Source: Mississippi Vital Statistics: The Mississippi STatistically Automated Health Resource System (MSTAHRS), 2012

Cancer screenings
Getting screening tests regularly may find cancers early, when treatment is likely to work best. Breast Cancer – Mammography Healthy People 2020 Goal: Increase the proportion of women who receive a breast cancer screening based on the most recent guidelines Healthy People 2020 Target: 81% - 3 out of 4 women aged 40 years or older in Mississippi received breast cancer screening in the past 2 years. Cervical Cancer - Pap test Healthy People 2020 Goal: Increase the proportion of women who receive a cervical cancer screening based on the most recent guidelines Healthy People 2020 Target: 93.0% - Approximately 77% of women aged 18 years or older in Mississippi received cervical cancer screening in the past 2 years. Colorectal Cancer Healthy People 2020 Goal: Increase the proportion of adults who receive a colorectal cancer screening based on the most recent guidelines in 2008 Healthy People 2020 Target: 70.5% - One third of adults aged 50 years or older in Mississippi ever had a sigmoidoscopy or colonoscopy. - Less than 10% of adults aged 50 years or older in Mississippi had a blood stool test in the past 2 years. Prostate Cancer - PSA test Healthy People 2020 Goal: None Healthy People 2020 Target: None - 40% of men aged 40 years or older in Mississippi had a PSA test in the past 2 years.
Figure 23. Percentage of adults who have undergone cancer screening tests, Mississippi, 2012.
41.2
9.3
37.0
75.7
75.3
37.9
8.4
31.7
77.6
78.6
40.3
9.1
35.5
76.7
76.2
PSA testwithin past 2 years
(men 40+ years)
Blood stool testwithin past 2 years(adults 50+ years)
Sigmoidoscopy/colonoscopy ever(adults 50+ years)
Pap smearwithin past 2 years(women 18+ years)
Mammogramwithin past 2 years(women 40+ years)
0 10 20 30 40 50 60 70 80 90
Age-adjusted percentage (%)
Overall Blacks Whites
Burden of Chronic Diseases in Mississippi 37

Cancer incidence
The Healthy People objectives for 2020 highlight the importance of monitoring the incidence of invasive cancer (cervical and colorectal) and late-stage breast cancer, which are intermediate markers of cancer screening success. Incidence of late-stage female breast cancer Healthy People 2020 Goal: Reduce late-stage female breast cancer Healthy People 2020 Target: 41.0 new cases per 100,000 females In 2010, the incidence of late-stage female breast cancer in Mississippi was approximately 113 per 100,000 females . Incidence of colorectal cancer Healthy People 2020 Goal: Reduce invasive colorectal cancer Healthy People 2020 Target: 38.6 new cases per 100,000 population In 2010, the incidence of colorectal cancer in Mississippi was approximately 53 per 100,000 population. Incidence of cervical cancer Healthy People 2020 Goal: Reduce invasive uterine cervical cancer Healthy People 2020 Target: 7.1 new cases per 100,000 females In 2010, the incidence of cervical cancer in Mississippi was approximately 10 per 100,000 females.
Burden of Chronic Diseases in Mississippi 38
0
20
40
60
80
100
120
140
2003 2004 2005 2006 2007 2008 2009 2010
Rat
e p
er
10
0,0
00
Year
Mississippi U.S.
Late-stage breast (females only)
Cervical (females only)
Colorectal
Figure 24. Incidence rate per 100,000 for late-stage breast, colorectal and cervical cancer, Mississippi and U.S., 2003-2010.

Arthritis Indicators

Arthritis among adults Arthritis includes more than 100 different rheumatic diseases and conditions, the most common of which is osteoarthritis. Arthritis is the nation’s most common cause of disability. Annual direct and indirect costs associated with arthritis are estimated to be about $1.5 billion.
Figure 26. Percentage of adults with arthritis among subgroups, Mississippi, 2012.
22.8
26.3
33.4
39.7
25.9
29.0
37.9
27.1
31.1
28.2
30.9
≥ 300% FPL
200-299% FPL
100-199% FPL
0-99% FPL
> High School
High School
< High School
White Males
White Females
Black Males
Black Females
0 10 20 30 40 50
Age-adjusted percentage (%)
2012 DATA HIGHLIGHTS • Nearly 1 in 3 adults in Mississippi reported arthritis.
• The prevalence generally increased with increasing poverty; the percentage
of adults living below poverty reporting arthritis was 80% higher compared to adults living at > 300% poverty.
• The prevalence generally decreased with increasing education; the
prevalence of arthritis among adults without a high school education was 50% higher compared to adults with a high school education.
• There were no significant differences by race or gender.
Burden of Chronic Diseases in Mississippi 40
Race/Ethnicity and Gender
Federal Poverty Level (FPL)
Education Level
Figure 25. Percentage of adults with and without arthritis, Mississippi and U.S., 2012.
69.2 74.3
30.8 25.7
0
10
20
30
40
50
60
70
80
90
100
Mississippi U.S.
Pe
rce
nta
ge (
%)
No arthritis Arthritis

Activity limitation due to arthritis among adults For people with arthritis, physical activities such as walking, bicycling, and swimming can have many benefits. These benefits include less pain and better physical function, mental health, and quality of life. However, activity limitation due to arthritis is a common problem. Healthy People 2020 Goal: Reduce the proportion of adults with doctor-diagnosed arthritis who experienced a limitation in activity due to arthritis Healthy People 2020 Target: 35.5%
Figure 28. Percentage of adults with arthritis who experienced activity limitation among subgroups, Mississippi, 2011.
43.7
41.6
58.5
52.7
48.3
53.9
64.9
54.7
53.2
62.3
57.1
≥ 300% FPL
200-299% FPL
100-199% FPL
0-99% FPL
> High School
High School
< High School
White Males
White Females
Black Males
Black Females
0 10 20 30 40 50 60 70
Age-adjusted percentage (%)
2011 DATA HIGHLIGHTS • Over half of adults with arthritis experienced activity limitation. • Activity limitation was more prevalent among adults with less than a high
school education than adults with more than a high school education.
• There were no significant differences by race, gender, or poverty level.
Burden of Chronic Diseases in Mississippi 41
Race/Ethnicity and Gender
Federal Poverty Level (FPL)
Education Level
Figure 27. Percentage of adults with arthritis who experienced activity limitation, Mississippi, 2011.
44.8
55.2
0
10
20
30
40
50
60
70
80
90
100
Mississippi
Pe
rce
nta
ge (
%)
No limitation Limitation

Asthma Indicators

Ever having asthma among adults Asthma is a chronic disease that affects the airways in the lungs. Asthma is a serious health and economic concern in the U.S. Asthma costs the U.S. about $56 billion each year. In the last decade, the proportion of people with asthma in the U.S. increased by nearly 15%. There is no cure for asthma, but a person can control asthma by taking medicines and by avoiding triggers that can lead to an attack.
Figure 30. Percentage of adults who were ever told that they have asthma among subgroups, Mississippi, 2012.
6.8
6.2
13.5
23.1
9.5
13.1
15.6
9.3
13.3
11.6
12.6
≥ 300% FPL
200-299% FPL
100-199% FPL
0-99% FPL
> High School
High School
< High School
White Males
White Females
Black Males
Black Females
0 5 10 15 20 25
Age-adjusted percentage (%)
2012 DATA HIGHLIGHTS
• In Mississippi, nearly 12% of adults reported ever having asthma.
• The prevalence increased with increasing poverty; the percentage of adults
who reported asthma was 4 times as high among those living below the poverty line than those living at > 300% above the FPL.
Burden of Chronic Diseases in Mississippi 43
Race/Ethnicity and Gender
Federal Poverty Level (FPL)
Education Level
Figure 29. Percentage of adults who were and were not ever told that they have asthma, Mississippi and U.S., 2012.
88.3 86.7
11.7 13.3
0
10
20
30
40
50
60
70
80
90
100
Mississippi U.S.
Pe
rce
nta
ge (
%)
No asthma Asthma

Adults who had an asthma episode or attack in the past 12 months During an asthma attack, airways become inflamed, making it hard to breathe. Asthma attacks can be mild, moderate, or serious — and even life threatening. An asthma attack can happen when a person is exposed to “asthma triggers”, such as tobacco smoke, dust mites, pets, pollution and mold. Triggers can vary from person to person, so it is important for a person with asthma to know his or her triggers and learn how to avoid them.
Figure 32. Prevalence of asthma attack in the past 12 months among adults with asthma among subgroups, Mississippi, 2010.
46.7
49.4
42.3
50.8
47.0
41.9
45.1
50.3
43.7
38.5
45.8
≥ 300% FPL
200-299% FPL
100-199% FPL
0-99% FPL
> High School
High School
< High School
White Males
White Females
Black Males
Black Females
0 10 20 30 40 50 60
Age-adjusted prevalence (%)
2010 DATA HIGHLIGHTS • Nearly half of adults with asthma reported having an asthma attack in the
past 12 months.
• No significant differences in reporting an asthma attack were seen by gender, race, education, or poverty status.
Burden of Chronic Diseases in Mississippi 44
Race/Ethnicity and Gender
Federal Poverty Level (FPL)
Education Level
Figure 31. Prevalence of asthma attack in the past 12 months among adults with asthma, Mississippi, 2010.
52.9
47.1
0
10
20
30
40
50
60
70
80
90
100
Mississippi
Pe
rce
nta
ge (
%)
No asthma attack Asthma attack

Oral Health Indicators
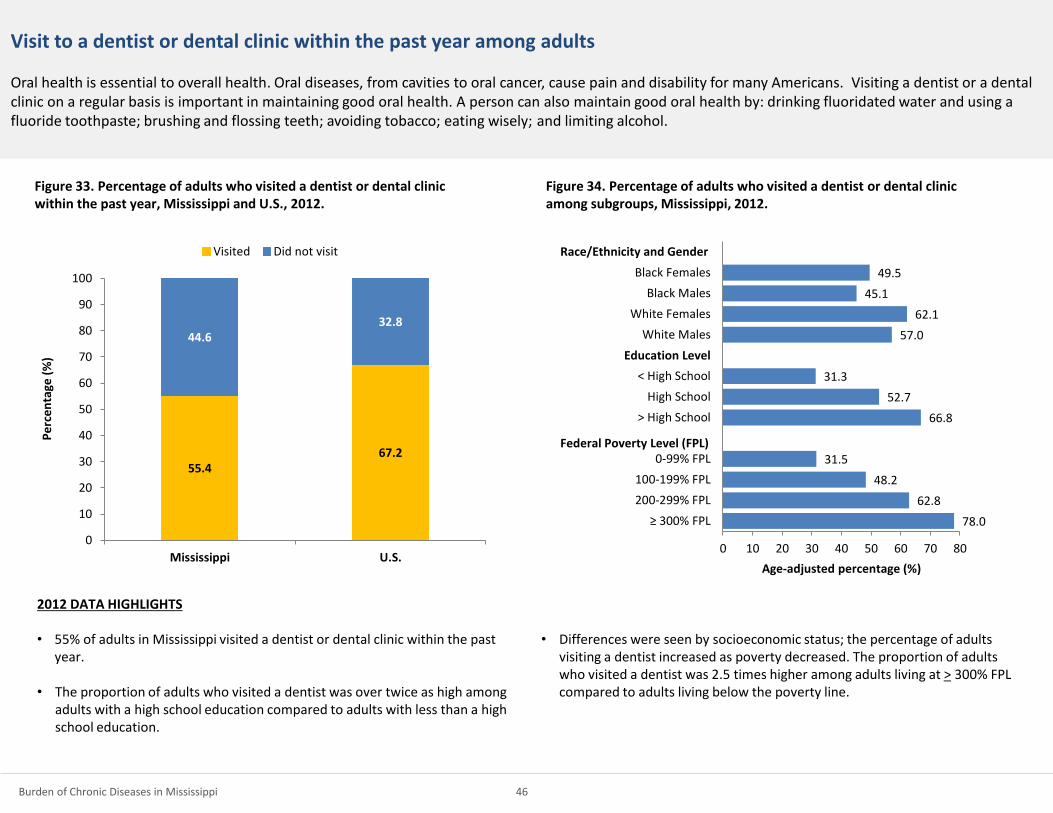
Visit to a dentist or dental clinic within the past year among adults Oral health is essential to overall health. Oral diseases, from cavities to oral cancer, cause pain and disability for many Americans. Visiting a dentist or a dental clinic on a regular basis is important in maintaining good oral health. A person can also maintain good oral health by: drinking fluoridated water and using a fluoride toothpaste; brushing and flossing teeth; avoiding tobacco; eating wisely; and limiting alcohol.
Figure 34. Percentage of adults who visited a dentist or dental clinic among subgroups, Mississippi, 2012.
78.0
62.8
48.2
31.5
66.8
52.7
31.3
57.0
62.1
45.1
49.5
≥ 300% FPL
200-299% FPL
100-199% FPL
0-99% FPL
> High School
High School
< High School
White Males
White Females
Black Males
Black Females
0 10 20 30 40 50 60 70 80
Age-adjusted percentage (%)
2012 DATA HIGHLIGHTS
• 55% of adults in Mississippi visited a dentist or dental clinic within the past year.
• The proportion of adults who visited a dentist was over twice as high among adults with a high school education compared to adults with less than a high school education.
• Differences were seen by socioeconomic status; the percentage of adults visiting a dentist increased as poverty decreased. The proportion of adults who visited a dentist was 2.5 times higher among adults living at > 300% FPL compared to adults living below the poverty line.
Burden of Chronic Diseases in Mississippi 46
Race/Ethnicity and Gender
Federal Poverty Level (FPL)
Education Level
Figure 33. Percentage of adults who visited a dentist or dental clinic within the past year, Mississippi and U.S., 2012.
55.4 67.2
44.6 32.8
0
10
20
30
40
50
60
70
80
90
100
Mississippi U.S.
Pe
rce
nta
ge (
%)
Visited Did not visit

All natural teeth extracted among adults aged ≥ 65 years Periodontal (gum) disease or tooth decay (cavities) are the most frequent causes of tooth loss. Having missing teeth can affect nutrition, since people without their teeth often prefer soft, easily chewed foods. Because dentures are not as efficient for chewing food as natural teeth, denture wearers also may choose soft foods and avoid fresh fruits and vegetables. Healthy People 2020 Goal: Reduce the proportion of adults aged 65 to 74 years who have lost all of their natural teeth Healthy People 2020 Target: 21.6%
Figure 36. Percentage of adults of adults aged > 65 years who have had all natural teeth extracted among subgroups, Mississippi, 2012.
8.6
20.1
30.4
42.3
12.9
23.1
44.5
26.1
18.8
32.5
36.9
≥ 300% FPL
200-299% FPL
100-199% FPL
0-99% FPL
> High School
High School
< High School
White Males
White Females
Black Males
Black Females
0 10 20 30 40 50
Age-adjusted percentage (%)
2012 DATA HIGHLIGHTS
• 1 in 4 adults aged 65 years or older had all of their natural teeth extracted. This is above the national median and the Healthy People 2020 goal.
• The proportion of adults who were missing all teeth was nearly 4 times higher among adults with less than a high school education compared to adults with more than a high school education.
• The proportion of adults who had all natural teeth extracted was nearly 5
times higher among adults living below poverty compared to adults living at > 300% FPL.
Burden of Chronic Diseases in Mississippi 47
Race/Ethnicity and Gender
Federal Poverty Level (FPL)
Education Level
Figure 35. Percentage of adults aged > 65 years who have and have not had all natural teeth extracted, Mississippi and U.S., 2012.
75 83.8
25 16.2
0
10
20
30
40
50
60
70
80
90
100
Mississippi U.S.
Pe
rce
nta
ge (
%)
Not all teeth extracted All teeth extracted

Any teeth extracted among adults aged ≥ 65 years There are important associations between poor oral health status and other systemic diseases, such as diabetes. Moreover, risk factors for oral diseases, such as tobacco use, are shared with other systemic diseases. Poor oral health also impacts diet and nutrition and affects social activities, such as school and work.
Figure 38. Percentage of adults of adults aged > 65 years who had any teeth extracted, Mississippi, 2012.
61.3
65.6
57.1
50.1
62.2
63.8
47.2
56
61.1
60.9
54.7
≥ 300% FPL
200-299% FPL
100-199% FPL
0-99% FPL
> High School
High School
< High School
White Males
White Females
Black Males
Black Females
0 10 20 30 40 50 60 70 80
Age-adjusted percentage (%)
2012 DATA HIGHLIGHTS
• 6 out of 10 adults aged 65 years or older reported having any teeth extracted.
Burden of Chronic Diseases in Mississippi 48
Race/Ethnicity and Gender
Federal Poverty Level (FPL)
Education Level
Figure 37. Percentage of adults aged > 65 years who did and did not have any teeth extracted, Mississippi and U.S., 2012.
41.7
55.5
58.3
44.5
0
10
20
30
40
50
60
70
80
90
100
Mississippi U.S.
Pe
rce
nta
ge (
%)
No teeth extracted Any teeth extracted

Nutrition, Physical Activity, and Weight Status Indicators

Obesity among adults Obesity increases the risk for multiple chronic diseases, including heart disease, stroke, hypertension, type 2 diabetes, osteoarthritis, and certain cancers. The estimated annual medical cost of obesity in the U.S. was $147 billion in 2008. Nutrition and physical activity play an important role in obesity. Healthy People 2020 Goal: Reduce the proportion of adults who are obese Healthy People 2020 Target: 30.5%
Figure 42. Percentage of adults who are obese among subgroups, Mississippi, 2012.
28.7
36.3
42.5
46.8
33.9
34.6
38.3
30.1
30.2
36.7
49.5
≥ 300% FPL
200-299% FPL
100-199% FPL
0-99% FPL
> High School
High School
< High School
White Males
White Females
Black Males
Black Females
0 10 20 30 40 50
Age-adjusted percentage (%)
2012 DATA HIGHLIGHTS
• Over 1 in 3 adults were obese in Mississippi.
• Black females reported the highest prevalence of obesity; nearly half of black females were obese.
• A higher proportion of females than males were obese.
• A higher proportion of blacks than whites were obese.
• The prevalence of obesity generally decreased with decreasing poverty; the prevalence of obesity among adults living at 0-99% FPL was 1.5 higher than adults living at > 300% FPL.
Burden of Chronic Diseases in Mississippi 50
Race/Ethnicity and Gender
Federal Poverty Level (FPL)
Education Level
Figure 41. Percentage of adults who reported a normal, overweight or obese BMI, Mississippi and U.S., 2012.
29.3 34.2
34.3 35.8
34.6 27.6
0
10
20
30
40
50
60
70
80
90
100
Mississippi U.S.
Pe
rce
nta
ge (
%)
Normal Overweight Obese

Leisure-time physical activity among adults Physical activity reduces the risk for heart disease, colon cancer, stroke, type 2 diabetes and its complications, overweight, and osteoporosis. It is recommended that adults get 150 minutes of physical activity per week. Healthy People 2020 Goal: Reduce the proportion of adults who engage in no leisure-time physical activity Healthy People 2020 Target: 32.6%%
Figure 44. Percentage of adults who reported no leisure time physical activity among subgroups, Mississippi, 2012.
17.4
26.6
33.6
44.9
21.4
34.5
48.7
25.1
29.9
31.4
37.9
≥ 300% FPL
200-299% FPL
100-199% FPL
0-99% FPL
> High School
High School
< High School
White Males
White Females
Black Males
Black Females
0 10 20 30 40 50
Age-adjusted percentage (%)
2012 DATA HIGHLIGHTS
• Nearly 1 in 3 adults in Mississippi reported no leisure time physical activity.
• Black females had the highest prevalence of no leisure time physical activity.
• The percentage of females reporting no leisure time physical activity was greater than males.
• The percentage of blacks reporting no leisure time physical activity was greater than whites.
• The prevalence of no leisure time activity decreased with increasing education.
• The prevalence of no leisure time activity decreased with decreasing poverty.
Burden of Chronic Diseases in Mississippi 51
Race/Ethnicity and Gender
Federal Poverty Level (FPL)
Education Level
Figure 43. Percentage of adults who reported any and no leisure time physical activity, Mississippi, 2012.
69.5
30.5
0
10
20
30
40
50
60
70
80
90
100
Mississippi
Pe
rce
nta
ge (
%)
Any leisure time physical activity No leisure time physical activity

Fruit and vegetable consumption among adults Fruits and vegetables contribute important nutrients for the human body. Eating fruits and vegetables lowers the risk of developing many chronic diseases and can also help with weight management.
2011 DATA HIGHLIGHTS • About half of adults reported eating 1 or more fruits daily.
• The median intake of fruits and vegetables (times per day) was 0.9.
• About two-thirds of adults reported eating 1 or more vegetables daily.
• The median intake of vegetables (times per day) was 1.4.
Burden of Chronic Diseases in Mississippi 52
49.2
67.7
50.8
32.3
0
10
20
30
40
50
60
70
80
90
100
Fruits Vegetables
Pe
rce
nta
ge (
%)
1 or more times per day Less than 1 time per day
Figure 45. Percentage of adults who consume < 1 or > 1 fruits and vegetables per day, Mississippi, 2011.

Tobacco and Alcohol Use Indicators

Current smoking among adults Smoking is the single most preventable cause of death and disease in the U.S. Nationally, cigarette smoking accounts for 1 of every 5 deaths and secondhand smoke accounts for over 53,000 deaths of nonsmokers annually. Smoking increases the risk of heart disease, cancer, stroke, and chronic lung disease. Healthy People 2020 Goal: Reduce cigarette smoking by adults Healthy People 2020 Target: 12.0%
Figure 47. Percentage of adults who are current smokers among subgroups, Mississippi, 2012.
11.6
21.1
30.4
35.0
17.0
26.6
43.1
27.9
25.4
28.5
16.2
≥ 300% FPL
200-299% FPL
100-199% FPL
0-99% FPL
> High School
High School
< High School
White Males
White Females
Black Males
Black Females
0 10 20 30 40 50
Age-adjusted percentage (%)
2012 DATA HIGHLIGHTS
• Nearly 1 in 4 adults in Mississippi reported current smoking.
• A higher proportion of males reported current smoking than females.
• A higher proportion of whites reported current smoking than blacks.
• The prevalence of smoking among adults with less than high school education was nearly 2.5 times higher than adults with more than a high school education.
• The prevalence of smoking among adults living at 0-99% FPL was about 3 times higher than adults living at > 300% FPL.
Burden of Chronic Diseases in Mississippi 54
Race/Ethnicity and Gender
Federal Poverty Level (FPL)
Education Level
Figure 46. Percentage of adults who are and are not current smokers, Mississippi and U.S., 2012.
76.0 80.4
24.0 19.6
0
10
20
30
40
50
60
70
80
90
100
Mississippi U.S.
Pe
rce
nta
ge (
%)
Non smoker Current smoker

Binge drinking among adults Alcohol abuse is strongly associated with injuries, violence, fetal alcohol syndrome, chronic liver disease, and risk of other acute and chronic health effects. Healthy People 2020 Goal: Reduce the proportion of adults engaging in binge drinking during the past 30 days Healthy People 2020 Target: 24.4%
Figure 49. Percentage of adults who reported binge drinking in the past 30 days among subgroups, Mississippi, 2012.
13.9
9.6
9.8
14.5
12.1
13.7
13.1
19.6
8.0
16.8
7.0
≥ 300% FPL
200-299% FPL
100-199% FPL
0-99% FPL
> High School
High School
< High School
White Males
White Females
Black Males
Black Females
0 5 10 15 20 25
Age-adjusted percentage (%)
2012 DATA HIGHLIGHTS • Over 12% of Mississippi adults reported binge drinking in the past month.
• White males had the highest percentage of binge drinkers.
• The percentage of males who reported binge drinking was 2.5 times higher
than the percentage of women.
• The percentage of black males who reported binge drinking was 2.5 times higher than the percentage of black women.
• The percentage of white males who reported binge drinking was 2.5 times higher than the percentage of white women.
Burden of Chronic Diseases in Mississippi 55
Race/Ethnicity and Gender
Federal Poverty Level (FPL)
Education Level
Figure 48. Percentage of adults who did and did not report binge drinking in the past 30 days, Mississippi and U.S., 2012.
87.9 83.1
12.1 16.9
0
10
20
30
40
50
60
70
80
90
100
Mississippi U.S.
Pe
rce
nta
ge (
%)
No binge drinking Binge drinking

Special Focus on Women of Reproductive Age
The Impact of Chronic Disease, Risk Behaviors, and Risk Factors among Women of Reproductive Age
Preconception (before pregnancy) and interconception (between
pregnancies) care provide an opportunity to identify existing health risks
and to prevent future health problems for women and their children.
Diabetes
Women with diabetes before pregnancy have an increased risk for
preeclampsia, hypertension during pregnancy, cesarean delivery, and
adverse birth outcomes such as spontaneous abortions, birth defects,
preterm delivery, and fetal and infant death.
Hypertension
Hypertension before pregnancy is associated with an increased risk for
preeclampsia, placental abruption, and gestational diabetes. These women
also face an increased risk for adverse birth outcomes such as preterm
delivery, small for gestational age, and infant death.
Obesity
Obesity increases a woman’s risk for pregnancy complications, such as
gestational diabetes, hypertension, and preeclampsia as well as the risk for
a cesarean section. Infants of obese mothers also face increased risk for
future chronic disease. If overweight and obese women reduced their
weight to a normal level before pregnancy, the number of women with
gestational diabetes could be reduced by almost 50%.
Tobacco Use
Smoking during pregnancy increases a woman’s risk for pregnancy
complications including placenta previa, placental abruption, and preterm
rupture of membranes. It also increases the infants’ risk for low birth
weight, preterm delivery, sudden infant death syndrome, and preterm-
related infant death. If all pregnant smokers quit smoking, as many as 5%–
8% of preterm infants and 13%–19% of term low birthweight infants could
be born a normal weight. In addition, as many as 23%–34% of infant deaths
from SIDS and 5%–7% of infant deaths from preterm births could be
prevented.
Alcohol Use
Drinking during pregnancy can lead to sudden infant death syndrome and
fetal alcohol spectrum disorders. Binge drinking can lead to unintended
pregnancies.
Burden of Chronic Diseases in Mississippi 57

Despite the known risks, the prevalence of these chronic diseases and related risk factors and behaviors are high
among women of reproductive age in Mississippi and racial differences exist.
DATA HIGHLIGHTS
Among women of reproductive age (18-44 years):
• Nearly 70% did not have an annual checkup with a health care provider in the
past year.
– Fewer black women visited a healthcare provider in the past year compared
to white women.
• Nearly 20% reported hypertension and 13% reported diabetes or prediabetes.
• 4 out of 10 were obese.
– The prevalence of obesity was higher among black women than white
women.
• Nearly 1 out of 4 were current smokers.
– The prevalence of smoking was more than 2 times higher among white
women than black women.
• 1 in 10 reported heavy or binge drinking in the past month.
Burden of Chronic Diseases in Mississippi 58
67.0
13.2
19.7
38.0
23.0
10.2
75.6
15.8
23.8
38.5
14.2
9.0
59.9
10.9
17.1
26.2
30.2
12.1
0
10
20
30
40
50
60
70
80
Pe
rce
nta
ge (
%)
Overall Blacks Whites
Figure 50. Prevalence of chronic diseases and related risk factors and behaviors among women of reproductive age (18-44 years), Mississippi, 2012.

Special Focus on Mississippi Youth

The Impact of Chronic Disease, Risk Behaviors, and Risk Factors on Youth
Tobacco use
Cigarette smoking is the leading cause of preventable death in the United States and accounts for approximately 440,000 deaths each year. Cigarette smoking increases risk of heart disease; chronic obstructive pulmonary disease; acute respiratory illness; stroke; and cancers of the lung, larynx, oral cavity, pharynx, pancreas, and cervix. In addition, as compared to nonsmokers, cigarette smokers are more likely to drink alcohol, use marijuana and cocaine, engage in risky sexual behaviors, engage in physical fighting, carry a weapon, and attempt suicide.
Smokeless tobacco contains 28 known human carcinogens. Use of smokeless tobacco products increases the risk of developing cancer of the oral cavity, leukoplakia (a lesion of the soft tissue that consists of a white patch or plaque that cannot be scraped off) and recession of the gums. Smokeless tobacco use also causes an increased risk of heart disease and stroke.
Alcohol use
On average, alcohol is a factor in the deaths of approximately 4,700 youths in the United States per year, shortening their lives by an average of 60 years. Underage drinking cost the U.S. $24 billion in 2006. Studies have determined that delaying the age when drinking is initiated until age 21 years or later substantially reduces the risk of experiencing alcohol-related problems. Underage drinking is also strongly associated with injuries, violence, fetal alcohol syndrome, and risk of other acute and chronic health effects.
Weight status
Obesity is of public health importance: it increases the development of risk factors for cardiovascular disease and diabetes.
Physical activity
The U.S. Department of Health and Human Services recommends that young people aged 6–17 years participate in at least 60 minutes of physical activity daily. Regular physical activity in childhood and adolescence improves strength and endurance, helps build healthy bones and muscles, helps control weight, reduces anxiety and stress, increases self-esteem, and may improve blood pressure and cholesterol levels.
Screen time
Excessive television viewing is associated with obesity. There is also evidence that TV viewing time is positively associated with reported intakes of high fat foods, and TV viewing during mealtime is associated with lower consumption of fruits and vegetables and higher consumption of salty snacks and soda. TV viewing as a potential risk factor for obesity is of public health importance as it increases the development of risk factors for cardiovascular disease and diabetes.
Research findings examining the association between screen media use such as videotapes/ video games/computers and obesity show mixed results. As with TV viewing, these media may involve exposure to food advertising which can affect food choices, and, if students are eating while viewing videotapes, for example, they may reduce their awareness of satiety cues.
Nutrition
The Dietary Guidelines for Americans, 2010 recommends Americans eat more fruits and vegetables as part of a healthy diet because they contribute important nutrients, can reduce the risk for many chronic diseases, and can also help with weight management.
Burden of Chronic Diseases in Mississippi 60

Nutrition, physical activity, and weight status among youth
Burden of Chronic Diseases in Mississippi 61
16.5 15.8
53.2
42.9
28.8
17.0
9.5
15.2 13
48.2
32.4 31.1
11.7
5.7
0
10
20
30
40
50
60
Overweight Obese No participation inweekly physicaleducation class
Daily TV viewingtime > 3 hours
Daily computer screentime > 3 hours
No fruits No vegetables
Pe
rce
nta
ge (
%)
Mississippi U.S.
Figure 51. Prevalence of nutrition, physical activity, and weight status related factors and behaviors among Mississippi youth, 2011.
2011 DATA HIGHLIGHTS
• Generally, Mississippi youth fared worse than the nation when it came to nutrition, physical activity, and weight related indicators.
• Mississippi youth had a higher prevalence of: • overweight, • obesity, • physical inactivity, • daily TV viewing time, and • low daily fruit and vegetable consumption

Racial and gender differences in nutrition, physical activity, and weight status among Mississippi youth
Burden of Chronic Diseases in Mississippi 62
19.9 18.2
43.9
54.4
33.5
17
11.8 12.6 13.1
63.8
31.2
23.2
17.6
7.2
14.9 18.2
44.8 42.4
31.6
17.1
11.2
18.1
13.5
61.4
43.7
25.9
17
7.8
0
10
20
30
40
50
60
70
Overweight Obese No participation inweekly physicaleducation class
Daily TV viewingtime > 3 hours
Daily computer screentime > 3 hours
No fruits No vegetables
Pe
rce
nta
ge (
%)
Black White Male Female
Figure 52. Prevalence of nutrition, physical activity, and weight status related factors and behaviors among Mississippi youth by race and gender, 2011.
2011 DATA HIGHLIGHTS • More blacks than whites were overweight or obese.
• Males had a higher prevalence of obesity than females.
• More blacks watched 3 or more hours of television per day than whites . • The prevalence of 3 or more hours per day of computer screen time was
higher among blacks than whites.
• Whites were more likely to not participate in physical activity classes than blacks.
• Females were more likely to not participate in physical activity classes than males.
• Daily vegetable consumption was lower among blacks than whites.

Tobacco and alcohol use among youth
Burden of Chronic Diseases in Mississippi 63
48.0
17.9
10.2
64.8
36.2
19.3
44.7
18.1
7.7
70.8
38.7
21.9
0
10
20
30
40
50
60
70
80
Ever tried smoking Current cigarette smoker Current smokelesstobacco use
Ever tried alcohol Current alcohol use Current binge drinker
Pe
rce
nta
ge (
%)
Mississippi U.S.
Figure 53. Prevalence of tobacco and alcohol use among Mississippi youth, 2011.
2011 DATA HIGHLIGHTS • Generally, Mississippi youth fared worse than the nation when it came to
tobacco use.
• Mississippi youth had a higher prevalence of: • ever trying smoking • current smokeless tobacco use
• Generally, Mississippi youth fared better than the nation when it came to alcohol use.
• Mississippi youth had a lower prevalence of: • ever trying alcohol • current alcohol use, and • current binge drinking
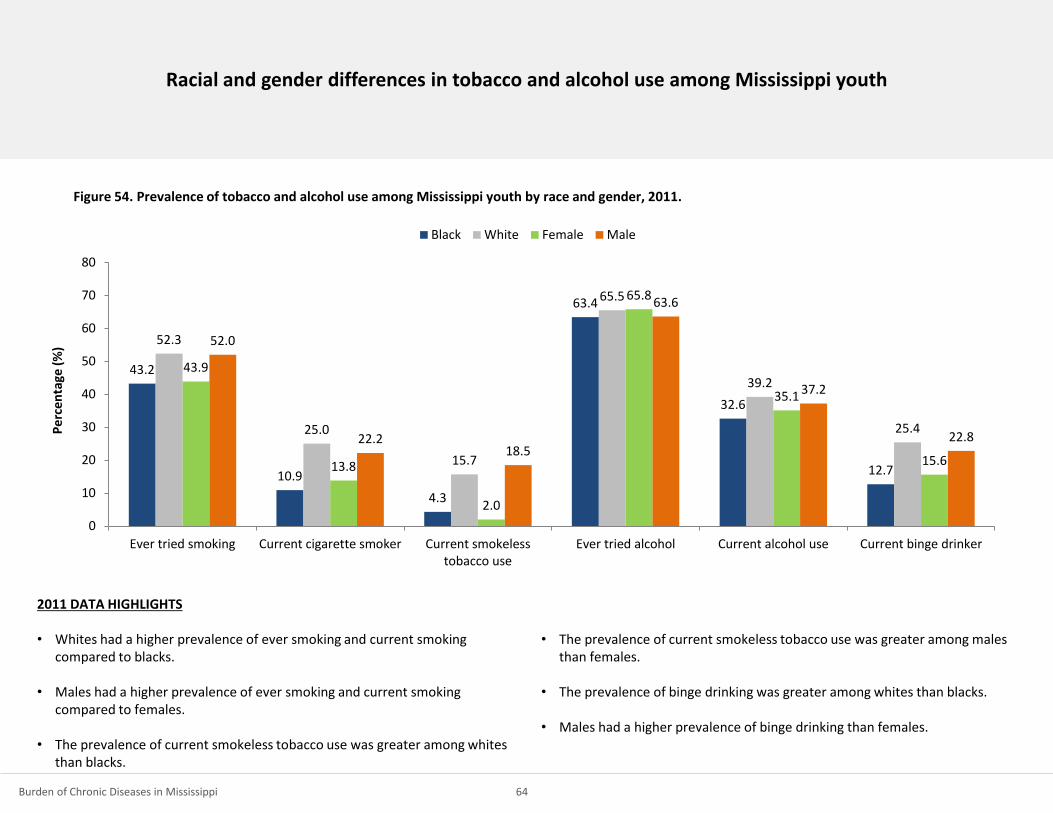
Racial and gender differences in tobacco and alcohol use among Mississippi youth
Burden of Chronic Diseases in Mississippi 64
43.2
10.9
4.3
63.4
32.6
12.7
52.3
25.0
15.7
65.5
39.2
25.4
43.9
13.8
2.0
65.8
35.1
15.6
52.0
22.2 18.5
63.6
37.2
22.8
0
10
20
30
40
50
60
70
80
Ever tried smoking Current cigarette smoker Current smokelesstobacco use
Ever tried alcohol Current alcohol use Current binge drinker
Pe
rce
nta
ge (
%)
Black White Female Male
Figure 54. Prevalence of tobacco and alcohol use among Mississippi youth by race and gender, 2011.
2011 DATA HIGHLIGHTS • Whites had a higher prevalence of ever smoking and current smoking
compared to blacks.
• Males had a higher prevalence of ever smoking and current smoking compared to females.
• The prevalence of current smokeless tobacco use was greater among whites than blacks.
• The prevalence of current smokeless tobacco use was greater among males than females.
• The prevalence of binge drinking was greater among whites than blacks.
• Males had a higher prevalence of binge drinking than females.

Summary, Highlights, and Future Directions

Summary and Future Directions
Summary
The Report on the Burden of Chronic Diseases in Mississippi, 2014 provides
a baseline snapshot of the current state of chronic disease in Mississippi
and provides valuable information on state-specific needs. This report
indicates that chronic diseases are common in Mississippi, and
Mississippians often have a higher prevalence of chronic diseases and
related risk factors than the general U.S. population. Moreover, the report
highlights the most prominent health disparities among the state’s
population.
Chronic diseases do not affect all Mississippians equally - there are clear
racial and socioeconomic disparities in chronic disease and chronic disease-
related risk factors. Specifically, compared to whites, blacks had higher age-
adjusted death rates due to chronic diseases, including heart disease,
stroke and diabetes. This is not all that unexpected, as a higher percentage
of black adults also reported chronic disease related risk factors, including
high blood pressure, obesity, physical inactivity and poor oral health.
There were clear differences between socioeconomic groups, too.
Compared to those living well above poverty, those living below poverty
report higher prevalence of diabetes, high blood pressure, high blood
cholesterol, obesity, smoking, physical inactivity, asthma, arthritis, and
poor oral health.
Addressing the underlying social determinants of health in Mississippi is
eminent if the state is to improve its health. Findings from this report could
be used to determine priorities for public health messages and to inform
evidence-based, culturally-appropriate intervention strategies aimed at
reducing, and ultimately eliminating chronic diseases in Mississippi.
Focusing on those most at risk, specifically minority communities and those
with lower socioeconomic status and low levels of education, may help to
eliminate health disparities and improve the health of the state as a whole.
Differences in health by race/ethnicity and socioeconomic status may
reflect differences in health literacy and behaviors, attitudes toward health
and health care, and access to and use of health services and types of
treatment received. Future public health programs and interventions
should consider these factors to improve their effectiveness.
Burden of Chronic Diseases in Mississippi 66

Summary and Future Directions (continued)
Decreasing the prevalence of risk factors for chronic disease is difficult and
heavily reliant on behavior change, leaving no single approach as the “best”
method for intervention. For successful strategies to be sustainable and to
have greater population reach, interventions should be multi-level and
multi-disciplinary. Strategies to promote health must include input from
multiple entities at the local- and state-levels, and must address social and
cultural contexts and various environments, including the home,
neighborhood, school, workplace, recreational, faith-based, and food
settings. Social, cultural and economic factors that influence health are
easily defined, however impacting the context of these factors remains a
challenge and thus requires collaboration from multiple sectors, including
economic development corporations, public health, educational systems,
policy-makers, advocates, healthcare practitioners and insurance providers,
and more. Environmental and policy approaches aimed to reduce exposure
to the complex interaction of risk factors linked to the development and
onset of chronic disease should be considered as these are designed to
provide opportunities, support, and cues to help people develop and
maintain healthy lifestyle behaviors.
Future Directions
In an effort to address chronic disease risk factors and health conditions,
the Mississippi State Department of Health Office of Preventive Health
engaged categorically funded chronic disease prevention and health
promotion programs to develop the Mississippi State Plan for Chronic
Disease Prevention and Health Promotion. This plan provides an efficient
and effective collaborative approach for the implementation of evidence-
based strategies, which support the four key domains established by the
Centers for Disease Control and Prevention to address chronic disease
prevention and health promotion. The Plan also takes into account health
inequities and the contributing social determinants of health to identify
opportunities for improving population health and shaping the systems put
in place to address chronic disease.
This plan reflects strategies aimed toward building capacity to address
chronic disease in a coordinated, collaborative approach and to delay the
development of serious chronic diseases as long as possible. The plan
interventions seek to 1) promote personal health behaviors and supportive
environments where we live, learn, work and play, to prevent disease, to
slow the progress of disease, to reverse it where possible, and to prevent
the development of complications; and 2) encourage the use of screening
and early diagnosis that can lead to better disease identification,
treatment, and management or delay complications.
Burden of Chronic Diseases in Mississippi 67

Appendix

Data Sources
Behavioral Risk Factor Surveillance System (BRFSS)
The BRFSS is an ongoing, state-based, random digit-dialed telephone survey of non-
institutionalized U.S. adults aged 18 years or older. The survey collects information on
health risk behaviors, preventive health practices, and health care access primarily related
to chronic disease and injury. The BRFSS operates in 50 states, the District of Columbia, and
three U.S. territories (Puerto Rico, U.S. Virgin Islands, and Guam). As with all self-reported
sample surveys, BRFSS data might be subject to systematic error resulting from non-
coverage (e.g., lower telephone coverage among populations of low socioeconomic
status), non-response (e.g., refusal to participate in the survey or to answer specific
questions), or measurement (e.g., social desirability or recall bias). Further information on
BRFSS, including information on survey data quality, question history, or module
information is available from the survey website at: http://www.cdc.gov/brfss/.
CDC Chronic Disease Cost Calculator
To help states estimate the economic burden of chronic diseases, the Centers for Disease
Control and Prevention and RTI International developed the Chronic Disease Cost
Calculator version 2. Specifically, the Cost Calculator provides the following estimates for
each chronic condition: medical expenditures are for the entire state population (all payers
and the uninsured) and separately for Medicaid, Medicare, and privately insured;
absenteeism costs and estimates of missing work days; and, projections of medical costs
until 2020. More information can be found at:
http://www.cdc.gov/chronicdisease/resources/calculator/index.htm.
Compressed Mortality File
The Compressed Mortality File (CMF) is produced by the National Center for Health
Statistics (NCHS), at the CDC. CMF is a county-level national mortality and population
database spanning the years 1968-2008. On CDC WONDER (http://wonder.cdc.gov/), data
are available for the years 1979-2008. Compressed Mortality data on CDC WONDER are
updated annually. Mortality data on the CMF are based on NCHS mortality files that
include a record for every death of a U.S. resident recorded in the U.S. Mortality data are
used to monitor the underlying and contributing causes of death for persons dying and to
determine life expectancy. A limitation to this data source is that causes of death and other
variables listed on the death certificate might be inaccurate. Please see the visit the
following website for more information: http://www.cdc.gov/nchs/data_access/cmf.htm.
Healthy People 2020
Healthy People provides science-based, 10-year national objectives for improving the
health of all Americans. For 3 decades, Healthy People has established benchmarks and
monitored progress over time in order to: encourage collaborations across communities
and sectors; empower individuals toward making informed health decisions; and measure
the impact of prevention activities. There are nearly 600 objectives in Healthy People 2020
with more than 1,300 measures. Each Healthy People 2020 objective has a: 1) reliable data
source; 2) baseline measure; and 3) target for specific improvements to be achieved by the
year 2020. More information about Healthy People can be found at:
http://www.healthypeople.gov/2020/default.aspx.
Burden of Chronic Diseases in Mississippi 69

Data Sources (continued)
Hospital Discharge Data
Hospital discharge data are the abstracted records associated with a patient’s stay in a
short-term hospital. These data typically contain patient demographics, patients’ length of
hospital stay, diagnosis, treatment, and payment information. MS-based hospital discharge
data are collected, maintained, and analyzed by MSDH personnel. Diagnoses listed on
hospital discharge data may be inaccurate. Practice patterns and payment mechanisms can
affect decisions by health-care providers to hospitalize patients. Residents of one state
might be hospitalized in another state and not be reflected in the first state’s hospital data
set. Multiple admissions for an individual patient can falsely elevate the number of persons
hospitalized. Data provided in this report are per event.
Mississippi Vital Statistics
Mortality statistics are compiled from death certificates which are filed with the MSDH,
Office of Vital Records as required by MS state law and regulation. Mortality data in the MS
STatistically Automated Health Resource System (MSTAHRS) represents deaths of MS
residents. Deaths from 1999 forward are coded using the Tenth Revision of the
International Classification of Diseases (ICD-10).
Mississippi Cancer Registry
The Mississippi Cancer Registry (MCR) is a population-based registry that collects
information on cancer cases in Mississippi. In 1993, the Mississippi Legislature passed a law
(Mississippi Code 41-91) mandating the collection of these data. Under the authorizing
legislation, clinical laboratories, hospitals, physician’s offices, cancer treatment centers,
and other health care providers are required to report diagnostic and treatment
information on cancer cases they diagnose or treat to the Mississippi Cancer Registry. The
law stresses the confidential nature of data released to the MCR. MCR requires that the
data collected include information which indicates diagnosis, stage of disease, medical
history, patient demographics, laboratory data, tissue diagnosis and radiation, surgical or
other methods of diagnosis or treatment for each cancer diagnosed or treated in
Mississippi. MCH data are used: to inform health professionals and educate citizens
regarding specific cancer risks; to answer public questions and concerns about cancer; to
focus cancer control activities in the state; to monitor the occurrence of cancer; to aid in
research studies; and to develop health services and screening programs. More
information can be found at: http://www.umc.edu/mcr/.
Youth Risk Behavior Surveillance System (YRBSS)
YRBSS monitors priority health risk behaviors that contribute markedly to the leading
causes of death, disability, and social problems among youth in the U.S. These behaviors,
often established during childhood and early adolescence, include tobacco use, unhealthy
dietary behaviors, inadequate physical activity, alcohol and other drug use, risky sexual
behaviors, and behaviors that contribute to unintentional injuries and violence. Conducted
as a school-based survey every two years, YRBSS includes national, state, and local
representative samples of students in grades 9 - 12. As with all self-reported sample
surveys, YRBSS data might be subject to systematic error resulting from noncoverage (e.g.,
no participation by certain schools), nonresponse (e.g., refusal to participate in the survey
or to answer specific questions), or measurement (e.g., social desirability or recall bias).
Further information on YRBSS is available from the survey website at:
http://www.cdc.gov/HealthyYouth/yrbs.
Burden of Chronic Diseases in Mississippi 70

Statistical Techniques
Statistical Analyses
Data for the indicators from the Indicators for Chronic Disease Surveillance report were
analyzed using numerators and denominators specified in the report. The specified
numerators and denominators were used to calculate and report on chronic disease
prevalence, hospitalizations and mortality rates. All prevalence estimates from BRFSS and
YRBSS used survey weights and accounted for design effects. Estimates were not reported
for those categories in which there were fewer than 50 respondents.
Age-Adjusted Estimates
The age-adjusted percentage is an artificial estimate that minimizes the effects of different
age distributions and allows comparisons between different populations. It represents
what the crude percentage would have been in the study population if that population had
the same age distribution as a standard population (that is, a population in which the age
composition is known precisely, for example, as a result of a census). In other words, age
adjustment can make different groups more comparable. For this report, we used the U.S.
2000 standard population distribution to adjust death and hospitalization rates. The age-
adjusted rates are rates that would have existed if the population under study had been
distributed by age the same way as in the "standard" population. Therefore, they are
summary measures adjusted for differences in age distributions.
Testing for Significance
For BRFSS and YRBSS data, confidence intervals were used to test for significant differences
between subgroups (e.g., gender, race, education and poverty level). Z-scores were used to
test for differences in mortality rates between subgroups (e.g., age, gender and race).
Reported differences between subgroups are statistically significant unless otherwise
noted.
Burden of Chronic Diseases in Mississippi 71

List of Abbreviations
BRFSS: Behavioral Risk Factor Surveillance System
CDC: Centers for Disease Control and Prevention
CDI: Chronic Disease Indicators
CI: Confidence Interval
CSTE: Council of State and Territorial Epidemiologists
CVD: Cardiovascular Disease
FPL: Federal Poverty Level
GIS: Geographic Information System
ICD: International Classification of Diseases
MS: Mississippi
MSDH: Mississippi State Department of Health
MSTAHRS: Mississippi STatistically Automated Health Resource System
NCHS: National Center for Health Statistics
US: United States
YRBSS: Youth Risk Behavior Surveillance System
Burden of Chronic Diseases in Mississippi 72

References
• America’s Health Rankings. Available online at: http://www.americashealthrankings.org/
• Centers for Disease Control and Prevention. Chronic diseases the power to prevent, the call to control: at a glance, 2009. Atlanta, GA: U.S. Department of Health and Human Services,
Centers for Disease Control and Prevention, 2009.
• Centers for Disease Control and Prevention. National diabetes fact sheet: national estimates and general information on diabetes and prediabetes in the United States, 2011. Atlanta, GA:
U.S. Department of Health and Human Services, Centers for Disease Control and Prevention, 2011.
• Centers for Disease Control and Prevention: National Diabetes Surveillance System. Available online at: http://www.cdc.gov/diabetes/statistics.
• Commission on Social Determinants of Health (CSDH), Closing the gap in a generation: health equity through action on the social determinants of health. Final report of the Commission
on Social Determinants of Health. 2008, World Health Organization: Geneva.
• Indicators for chronic disease surveillance. MMWR Recomm Rep. 2004; 53(RR-11):1-6.
• Isaacs SL and SA Schoroederr. Class-The Ignored Determinant of the Nation’s Health. N Engl J Med (2004): 351; 1137-1142.
• Kochanek KD, Arias E, Anderson RN. How did cause of death contribute to racial differences in life expectancy in the United States in 2010? NCHS data brief, no 125. Hyattsville, MD:
National Center for Health Statistics. 2013.
• Kuczmarski RJ, Ogden CL, Guo SS, et al. 2000 CDC Growth Charts for the United States: methods and development. Vital Health Stat 11. 2002; (246):1-190.
• Minkler, M, Fuller-Thompson E, Guralnik JM. Gradient disability across the socioeconomic spectrum in the Untied States. N Engl J Med (2006): 355; 695-703.
• Mississippi Cancer Registry. Available online at: http://www.umc.edu/mcr/.
• Mississippi Comprehensive Tobacco Control Program. Available online at: http://mstobaccodata.org/.
• Murphy SL, Xu JQ, Kochanek KD: Final Data for 2010. National Vital Statistics Reports; vol 61 no 4. Hyattsville, MD: National Center for Health Statistics. 2013.
• U.S. Census Bureau: State and County QuickFacts. Available online at: http://quickfacts.census.gov/qfd/index.html.
Burden of Chronic Diseases in Mississippi 73


![Skin Inflammation, [Acute, Suppurative, Chronic, Chronic ... · Skin – Inflammation, [Acute, Suppurative, Chronic, Chronic Active, Granulomatous] presence of mononuclear cells (lymphocytes,](https://img.dokumen.tips/doc/110x75/5f0eb0c97e708231d44075f1/skin-inflammation-acute-suppurative-chronic-chronic-skin-a-inflammation.jpg)