Embed Size (px)
Citation preview

Report on the Brazilian Retail Payment System
Statistical update – Figures for 2009
Department of Banking Operations and Payment Systems Division of Payment Systems

Report on the Brazilian Retail Payment System Statistical update – Figures for 2009 Published by Central Bank of Brazil /Department of Banking Operations and Payment Systems
This document updates statistical data of the Report on the Brazilian Retail Payment System, which was published in May 2005. Reproduction is allowed provided the source is cited. Statistical conventions: … data not available - nil or non-existence of the event considered
0 or 0.0 less than half the final digit shown Hyphen (-) between years (1970-1975) indicates the years covered, including the first and the last. Bar (/) between years (1970/1975) indicates the average for the whole period, including the first and the last year. Minor discrepancies between the sum of data and the total are due to rounding.
Department of Banking Operations and Payment Systems SBS - Quadra 3 Bloco B – Ed. Sede do Banco Central do Brasil – 15 º andar Mailbox: 08670 70.074-900 - Brasília – DF Internet: http://www.bcb.gov.br E-mail:[email protected]

Report on the Brazilian retail payment system.
Statistical update – Figures for 2009
Contents Introduction ............................................................................................................................................................ 3 Table 1: Clearing and settlement systems – Volume and value of transactions .................................................. 8 Table 2: Clearing and settlement systems – Distribution of transactions per value ............................................. 8 Table 3: Use of payment instruments – Volume ................................................................................................... 8 Table 3a: Use of payment instruments – Volume (including both intrabank and interbank transactions) ............ 9 Table 4: Use of payment instruments – Number of transactions per inhabitant ................................................... 9 Table 5: Use of payment instruments – Value ...................................................................................................... 9 Table 5a: Use of payment instruments – Value (including both intrabank and interbank transactions) ............. 10 Table 6: Use of payment instruments – Average value per transaction ............................................................. 10 Table 7: Number of payment cards in circulation (end of year) .......................................................................... 10 Table 8: Number of payment cards per deposit account (end of year) ............................................................... 10 Table 9: Payment cards – Volume of transactions ............................................................................................. 11 Table 10: Payment cards – Value of transactions............................................................................................... 11 Table 11: Relative use of non-cash payment instruments in selected countries (%) ......................................... 11 Table 12: Payment cards – Average number of transactions per function in selected countries ....................... 12 Table 13: ATM network – Quantity of terminals per type of access (end of year) .............................................. 12 Table 14: Distribution of ATM and POS terminals per Brazilian state ................................................................ 13 Table 15: ATM network - Volume of transactions ............................................................................................... 13 Table 16: ATM network – Volume of transactions per type of access and function ........................................... 14 Table 17: ATM network – Value of transactions ................................................................................................. 14 Table 18: ATM network – Transactions carried out through open access terminals .......................................... 15
Table 19: ATM network – Number of terminals, volume of transactions and average value per transaction in selected countries ............................................................................................................................................... 15 Table 20: ATM network – Volume of transactions per terminal in selected countries ........................................ 16 Table 21: POS network – Number of terminals (end of year) ............................................................................. 16 Table 22: POS network - Debit card transactions in selected countries ............................................................. 17 Table 23: POS network - Credit card transactions in selected countries ............................................................ 17 Table 24: Remote access to banking services – Volume of transactions .......................................................... 18 Table 25: Remote access to banking services – Value of transactions ............................................................. 18 Table 26: Remote access – Number and value of transaction per user ............................................................. 18 Table 28: ATM network - Use of shared terminals .............................................................................................. 19 Table 29: Access to banking services – Number of transactions per access channel ....................................... 19 Table 29a: Access to non-face-to-face payment services – Number of transactions per access channel......... 19 Graph 1: Clearing and settlement systems – Relative participation ................................................................... 20 Graph 2: Clearing and settlement systems – Percentage of transactions with value lower than R$ 5 thousand
............................................................................................................................................................................. 20 Graph 3: Clearing and settlement systems – Percentage of transactions with value equal or larger than R$ 5 thousand .............................................................................................................................................................. 20 Graph 4: Relative use of payment instruments - Volume ................................................................................... 21 Graph 4a: Relative use of payment instruments – Volume (including intrabank transactions) .......................... 21 Graph 5: Relative use of payment instruments - Value ...................................................................................... 21 Graph 5a: Relative use of payment instruments – Value (including intrabank transactions) ............................. 22 Graph 6: Evolution in quantity of payment cards ................................................................................................ 22 Graph 7: Payment cards – Evolution in volume of transactions ......................................................................... 23 Graph 8: Payment cards – Evolution in value of transactions ............................................................................ 23 Graph 9: Use of payment instruments in selected countries (2008) ................................................................... 24 Graph 10: ATM network – Evolution in number of terminals .............................................................................. 24 Graph 11: ATM terminals – Geographical distribution ........................................................................................ 25 Graph 12: ATM network – Relative use per type of transaction – Volume ......................................................... 25 Graph 13: ATM network – Relative use per type of transaction – Value ............................................................ 26 Graph 14: ATM network – Number of transactions per inhabitant in selected countries (2008) ........................ 26 Graph 15: ATM network – Number of transactions per terminal in selected countries (2008) ........................... 27 Graph 16: POS network – Evolution in number of terminals .............................................................................. 27 Graph 17: POS network – Geographical distribution .......................................................................................... 28 Graph 18: POS network – Debit card transactions in selected countries (2008) ................................................ 28 Graph 19: POS network – Credit card transactions in selected countries (2008) .............................................. 29

Report on the Brazilian retail payment system.
Statistical update – Figures for 2009
ii
Graph 20: Remote access to banking services – Number of users .................................................................... 29 Graph 21: Remote access to banking services – Relative use per type of transaction – Volume ..................... 30 Graph 22: ATM network – Average number of transactions per terminal ........................................................... 30

Report on the Brazilian retail payment system. Statistical update – Figures for 2009
3
Introduction
In May 2005, the Central Bank of Brazil published the Report on the Brazilian Retail Payment System as part of its Payment Instrument Modernization Project, whose main objective is to foster the use of electronic payment instruments in lieu of paper-based ones. The relevant statistics have been yearly updated, and this report contains data related to 2009. For the first time, bill payments, tax payments and credit transfers are separately shown by the channel used for initiating these transactions (Table 29a).
It is also important to note that there was a change in the methodology used for calculating the volume and value of direct debits, and consequently the time series data for previous years have changed in this report. Up to the last report, interbank direct debits were informed together with the intra-bank ones. Under the new methodology, it is being considered as interbank direct debits only those carried out by means of TecBan. Regarding intra-bank direct debits, now they are broken down as follows: i) direct debits involving a third party (beneficiary of the payment is anyone other than the bank where the payer holds the account used to make the payment); and ii) direct debits not involving a third party (beneficiary of the payment is the bank where the payer holds the account used to make the payment). Hence, even though the new data better reflect the reality, analyses regarding direct debit's evolution of use are impaired.
Another methodological change concerns the number of customers using either Internet or mobile phone as a channel to banking services. Throughout this publication, in case of joint accounts, each account holder is counted as a user, so that if a joint account has, for instance, three account holders using these channels, three users will be considered. On the other hand, in case of juridical persons, only one user is counted regardless the number of natural persons having access to the account.
After these clarifications, the most recent and relevant developments in the Brazilian retail payment system infrastructure are highlighted below, as well as the main conclusions emerging from the statistical data analysis.
In March 2009, the access to the Reserves Transfer System (STR) was extended to non-bank financial institutions, so that they are now able to be a direct participant in some clearing and settlement systems. As an example, since then credit unions can be direct participants in the Check Clearinghouse (COMPE) as well as in interbank funds transfer systems. Furthermore, in July 2009, they were authorized to participate in systems settling securities, derivatives and foreign exchange transactions (in these cases, concerning their own transactions only).
These important initiatives were adopted with a view to: i) eliminating the need of a bank to settle transactions carried out by non-bank financial institutions; ii) redistributing risk among financial institutions; and iii) reducing costs for non-bank financial institutions providing payment services. These initiatives enable, for instance, brokers to directly settle their own transactions in systems settling securities, and also credit unions to provide check and "bloqueto de cobrança" services to their members,1 without having to use a bank to settle the related obligations in the relevant systems.
It is also worth mentioning that, in October 2009, the Brazilian banks implemented a new service called Authorized Direct Debit (DDA), jointly developed by some Brazilian bankers associations and the Payment Interbank Clearinghouse (CIP) as a market response to one of the inefficiencies pointed out by the Central Bank of Brazil in the aforementioned report. DDA is basically an arrangement for electronic submission of "bloquetos de cobrança" to the relevant debtors, and it is expected to: i) reduce costs since paper-based "bloquetos de cobrança" will not be sent anymore to debtors accepting electronic presentation; ii) enhance lead times to present the information to the debtors; iii) provide more convenience for the related payment (electronically-submitted "bloquetos de cobrança" will be paid through either a direct debit or an individually-authorized credit transfer), as well as greater security against fraud.
1 "Bloqueto de cobrança" is a bar-coded standardized document that allows bills to be paid in any bank (typically,
the relevant payment is initiated by electronic means).

Report on the Brazilian retail payment system. Statistical update – Figures for 2009
4
At the end of 2009, 2.5 million customers (80% were individuals), corresponding to 3.3% of customers holding active accounts, had already authorized the electronic submission of "bloquetos de cobrança". On the other hand, 31 banks had adopted the new procedure.
Throughout 2009, 28.6 million "bloquetos de cobrança" were electronically submitted to the relevant debtors, juridical persons in the vast majority (90%). Two-thirds of them had interbank settlement. The electronically-submitted "bloquetos de cobrança" represented 8,3% of the total number of "bloquetos de cobrança" issued during the period.
It is expected that, in the coming years, DDA will contribute to disseminate the use of interbank direct debits in Brazil. Nowadays, this payment instrument is mainly used for intra-bank payments, which obligates providers of goods and services receiving payments through this instrument to hold account in several banks. The migration of these payments to the DDA procedure will be beneficial, as it should enable these providers to contract a single bank for direct debit-related services, thus reducing costs and enhancing efficiency.
Also with respect to changes in the retail payment infrastructure, in June 2009 Visanet (Companhia Brasileira de Meios de Pagamento S.A.), an important acquirer in the Brazilian payment card market and also a payment card-related settlement service provider, became a listed company (in November 2009, the name of the company was changed to Cielo). At the time it became a listed company, there was not an initial public offering, so that banks then detaining its stocks offered part of them for sale. Still in 2009, Visa Inc. sold its stake (10%) in the company's capital, while Banco Santander reduced its share from about 15% to 7% (this stake was transferred to Santander Espanha). At the end of 2009, 43% of Cielo´s stocks were freely traded (free float).
Redecard, another important acquirer and payment card-related settlement service provider, which is also a publicly traded company since 2007, underwent some changes in its controlling capital. Mainly as a result of the merger between Banco Itaú and Banco Unibanco, the conglomerate Itaú-Unibanco became its main stockholder. The remaining stocks, a little less than half, are freely traded.
Concentration of Cielo and Redecard's capital in hands of banks impairs the desirable neutrality concerning payment card-related clearing and settlement services, and represents a barrier for new entrants in the acquirer market. Minimizing this problem, as of November 2009 transactions relating to the Mastercard's payment card scheme that are captured by other acquirer than Redecard began to be settled through SILOC, a CIP-operated settlement system. This more recent development is in line with both the directive concerning defragmentation of retail payment clearing and settlement infrastructure, and the directive related to neutrality in clearing and settlement service provision. The former directive was published by the Central Bank of Brazil through the Report on the Brazilian Payment Card Industry, and the latter through the Report on the Brazilian Payment Card Industry, jointly published by the Central Bank of Brazil, the Secretariat of Economic Law (SDE) and the Secretariat for Economic Monitoring (SEAE).
In 2009, together, Cielo and Redecard processed some 61% of retail non-cash payments in volume, and 4% in value. This illustrates that the vast majority of these payments is related to low-ticket transactions.
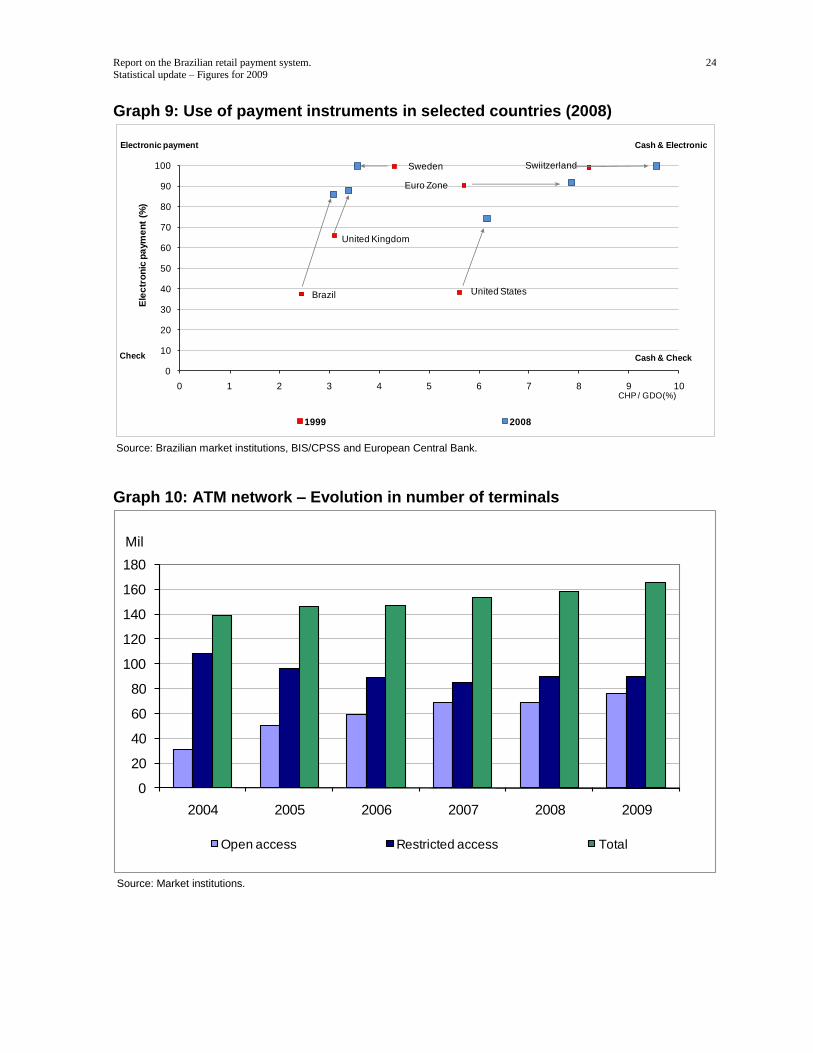
Concerning paper-based payment instruments, following the trend observed in the last years, the average value of currency held by the public (CHP) increased 12.7 % in 2009 as compared to 2008. The CHP per capita, R$ 408.93 in 2008, increased to R$ 459.94 in 2009. In the same period, the indicator CHP/GDP increased from 2.7% to 2.8%. These indicators show the increasing use of cash as a payment instrument, mainly for small-value payments.
The diminishing trend in check usage was again verified. This is shown, for example, by the volume of checks having interbank settlement, which showed a reduction of 8.2% in 2009, against a reduction of 1.8% in 2008. On the other hand, the average value of a check increased 6%, from R$ 835 in 2008 to R$ 884 in 2009. Thus, the replacement of checks has occurred mainly in low value transactions, being mainly replaced by payment cards. However, in some market niches, checks continue to be widely used.

Report on the Brazilian retail payment system. Statistical update – Figures for 2009
5
Taking into account only payments having a value lower than R$ 5 thousand, the relative participation of checks having interbank settlement decreased 3.2 percentage points from 2008 to 2009 (from 18.6% to 15.4%). On the other hand, in the same period payments card transactions increased 3 percentage points. Considering only payments having value equal to or larger than R$ 5 thousand, checks having interbank settlement showed a slight reduction in terms of relative participation, from 33.9% to 32.1%. Such evolution shows that the replacement of checks has occurred mainly in low value transactions, meaning that there is room for additional facilities that make possible larger value electronic payments to be carried out from the point of sale.
Still concerning checks, in 2009 32% of them were "on us" checks. This participation has been increasing marginally in the last four years. The average value of these checks was 181% larger than the ones having interbank settlement, what emphasizes that "on us" checks are often written by juridical persons, for bill payments and withdrawals in the same financial institution holding the relevant deposit account. The use of checks in these cases seems to stem from the fact that they facilitate control over liabilities, since they typically require more than one signature. Thus, there is room for a further development on internet banking channel, specific regarding the electronic control of payments made by account holders. Another possible action is the dissemination of direct debt requiring more than one authorization.
In 2009, the clients' interbank credit transfers, which are settled by means of STR, SITRAF and SILOC, increased 7.5% in volume and 0.7% in value as compared to 2008, entailing a reduction in the average value of the credit transfers settled through these systems. The growth pace in the volume of credit transfers declined in the last four years, although the average yearly growth observed in the 2004-2009 period, 12.7%, is still relatively high. In value, the average yearly growth rate reached about 16% in the period, even though there was a reduction in 2009 as compared to 2008.
Taking into account the electronic payment instruments having interbank settlement, their use increased 9.5% in volume in 2009 as compared to 2008, below the average yearly growth seen in the 2004-2008 period (19%). Although this growth reduction has been observed in the use of all electronic payment instruments, it was mainly observed with respect to payment cards: in 2009 the use of payment cards showed an increment that is 11 percentage points below the average yearly growth rate seen in the previous five years. Nevertheless, payment cards still show the highest growth rate in the period. In 2009, they accounted for 63% of all non-cash payments, continuing to be the instrument presenting the highest relative share.
In 2009, both credit cards and debit cards showed an increment of about 10% in volume, as compared to 2008, which is lower than the average yearly growth rate observed in the 2004-2008 period, 19% and 23%, respectively. There was no change in the number of transactions/card/year, i.e. 18 and 10 transactions, respectively. As regards credit cards, this indicator is slightly lower than the one observed in more developed economies (24 transactions). Concerning debit cards, however, the difference is still significant (in more developed economies, the relevant indicator reaches some 67 transactions). Thus, it is possible to conclude that there is room to increase the debit card usage in Brazil.
Concerning value, unlike what happened in the previous year, in 2009 the increment observed in the use of credit cards was higher than in debit cards, 16.6% and 15.4%, respectively. These changes, along the ones observed in the number of transactions, entailed an increment in the average value per transaction of 5.8% and 4.8% regarding credit cards and debit cards, respectively.
Regarding number of payment cards in circulation, there was deceleration in the growth rate related to credit cards, once the 2004-2008 period showed an average yearly increase of 27%, against 11% in 2009. The same was observed concerning debit cards, which deceleration, however, was lower (a growth of 7% in 2009, against an average yearly growth of 9% in the 2004-2008 period). With respect to the yearly average value of transaction per debit card, there was an increase of 8.4% in 2009 as compared to 2008, higher than the one observed in the case of credit cards (5.5%).
The ratio between the number of debit cards in circulation and the number of deposit accounts remained stable, what indicates that future increases in the number of debit cards in circulation should have a direct relationship with the increment in the number of deposit accounts. As regards credit

Report on the Brazilian retail payment system. Statistical update – Figures for 2009
6
cards, this indicator showed an average yearly increase of 4.2% in the last two years, against 21% in the 2004-2007 period.
As demonstrated by the relevant data, which now are broken down in the aforementioned way, the use of interbank direct debits is not significant yet. Even if one considers intra-bank direct debits only, most of them (86%) are related to transactions between clients and the respective banks holding their accounts.
The low use of this instrument stems mainly from the way it is provided in Brazil, already mentioned at the beginning of this introduction (see paragraph related to DDA). Another reason for the limited use of direct debits is the low level of financial inclusion in the country.
It is important to highlight again that direct debit is an efficient payment instrument since it enables a better control of payments by both payers and payees, and also continuous processing of transactions. Table 11 shows that this instrument is largely used, for example, in Germany, Spain, Netherlands and United Kingdom. As already noted, it is expected an increase in its use in Brazil as a result of the recently launched DDA arrangement.
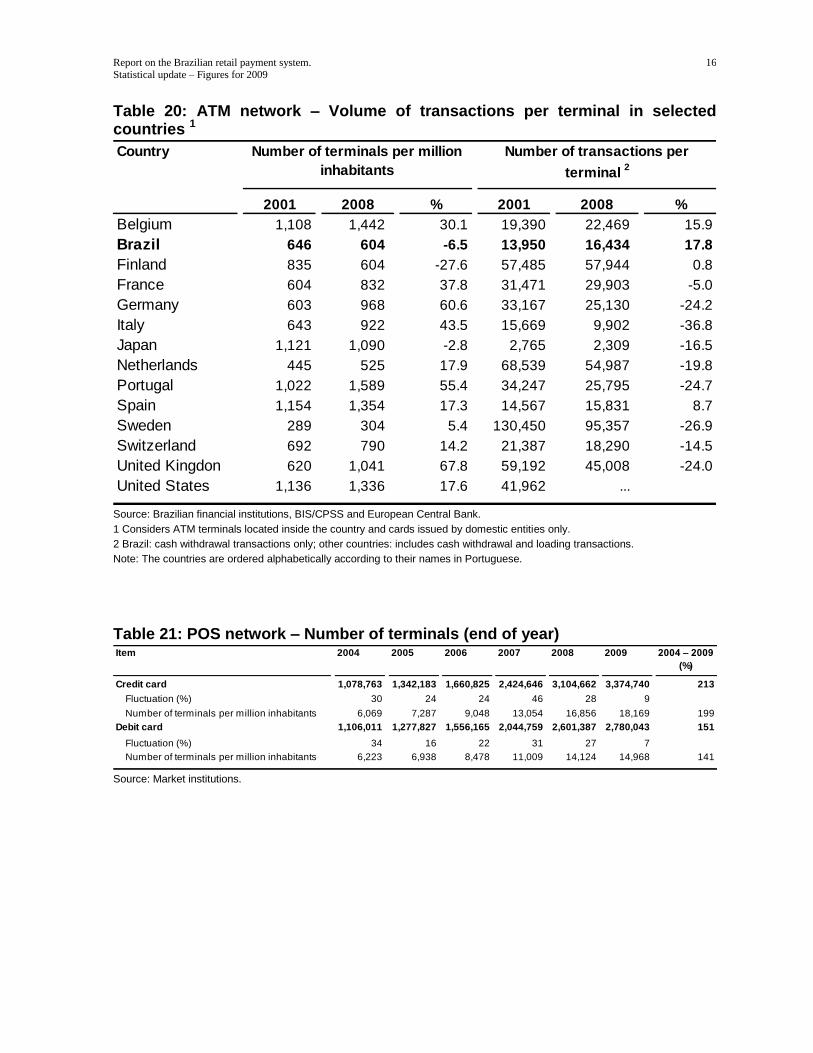
With respect to payment channels, there was a reduction in the growth rate of the number of POS terminals, whether in case of credit or debit function. In 2009, the number of credit card-related terminals and debit card-related terminals increased 9% and 7%, respectively, against an average yearly growth of 30% and 24% in the 2004-2008 period, also respectively.
The expansion of the POS-terminal base has a direct relation with the increase in the number of payment cards. The southeastern region, which already has a high level of supply, had the lowest growth rate, 5.6%. The north region, in turn, showed an increase of 7.2% and the remaining regions, a growth rate of about 10%.
The low level of interoperability among networks of POS terminals continues to generate inefficiency and unnecessary costs to society. In 2009, on average, there were about 823 credit card transactions per terminal, which is equivalent to a little more than one-third of the relevant indicator observed in developed countries. Concerning debit cards, the difference is still larger: 831 transactions per terminal, a little less than one-fourth of the average ratio seen in developed countries.
As regards banking service access channels, in 2009 "internet, home and office banking" was more used than "ATM terminals", accounting for 30.6% of all banking transactions carried out in that year. Together, the cannels "internet, home and office banking", "ATM terminals", "call centers", "mobile phones and PDAs" accounted for 66.7% of these transactions, meaning that the relative share of these channels remained virtually stable in the last four years. Also in 2009, the channel "banking branches" accounted for 23.8% of all banking transactions and "banking correspondents", in turn, for 9.5%. Even though the access through "mobile phones and PDAs" increased almost 250% in 2009 as compared to 2008, the use of this channel is not significant yet.
Taking into account bill payments, tax payments and credit transfers only, "banking correspondents" continue to be the main access channel, accounting for 36% of these transactions. It is worth noting that these transactions are carried out by the public at large and do not require them to hold a banking account. This highlights the importance of banking correspondents in the provision of services to non-banked people. Furthermore, this channel enables banks to extend their services to a larger base of clients without having to augment their number of branches.
In turn, the channels "internet, home and office banking" and "banking branches" accounted, each one, for 27% of these transactions. These channels, however, showed different trends: as compared to 2008, in 2009 the number of transactions carried out through the former channel increased 17%, while the latter decreased 2%.
As compared to 2008, the transactions carried out through "internet, home and office banking" increased 15% in volume, and 18% in value. Of the total transactions, 26% were financial transactions, of which 56% were related to credit transfers. It is important to point out that the decrease in the number of transactions per user is a consequence of the aforementioned methodological changes.

Report on the Brazilian retail payment system. Statistical update – Figures for 2009
7
Concerning ATM networks, in 2009 there was a 3.1% increase in the total number of banking transactions as compared to 2008, which was slightly lower than the one in the number of terminals. As a result, in the same period there was a 1.4% decrease in the number of transactions per terminal. The participation of shared terminals in relation to the total number of terminals increased from 43% in 2008 to 46% in 2009. It should also be noted that the number of transactions carried out through shared terminals in relation to the total number of ATM transactions reached 13% in 2009.
On the other hand, the percentage of transactions carried out by users that are not client of the banking owning the used ATM terminal increased from 4% in 2008 to 5.3% in 2009. These low percentages can be explained by the low number of banks authorizing their clients to make transactions by means of open-access networks.
It is also important to note that there is a certain concentration of transactions in a relatively small number of networks. Regarding that, it is enough to say that only six networks present average number of transactions per terminal above the average of the system as a whole.
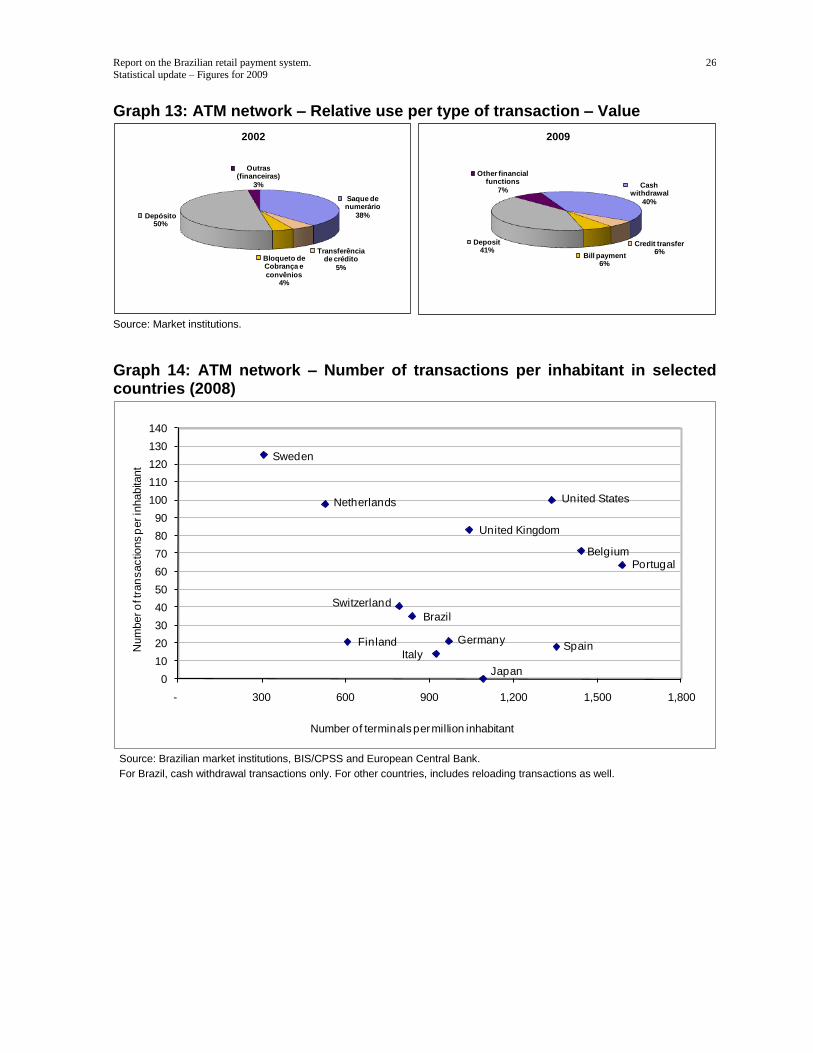
The large number of terminals per inhabitant and the low number of transactions per terminal and also per inhabitant, as compared to other countries, highlights the Brazilian ATM networks' low level of efficiency. This is possibly a result of their low level of interoperability and sharing. Broadly speaking, although the Brazilian ATM networks provide a reasonable number of terminals as compared to the size of the population, their level of use is still low, as compared to other countries. Despite the considerable growth observed in recent years regarding the average number of transactions per inhabitant, in 2009 the number of transactions per terminal was about half of the average one observed in developed countries.
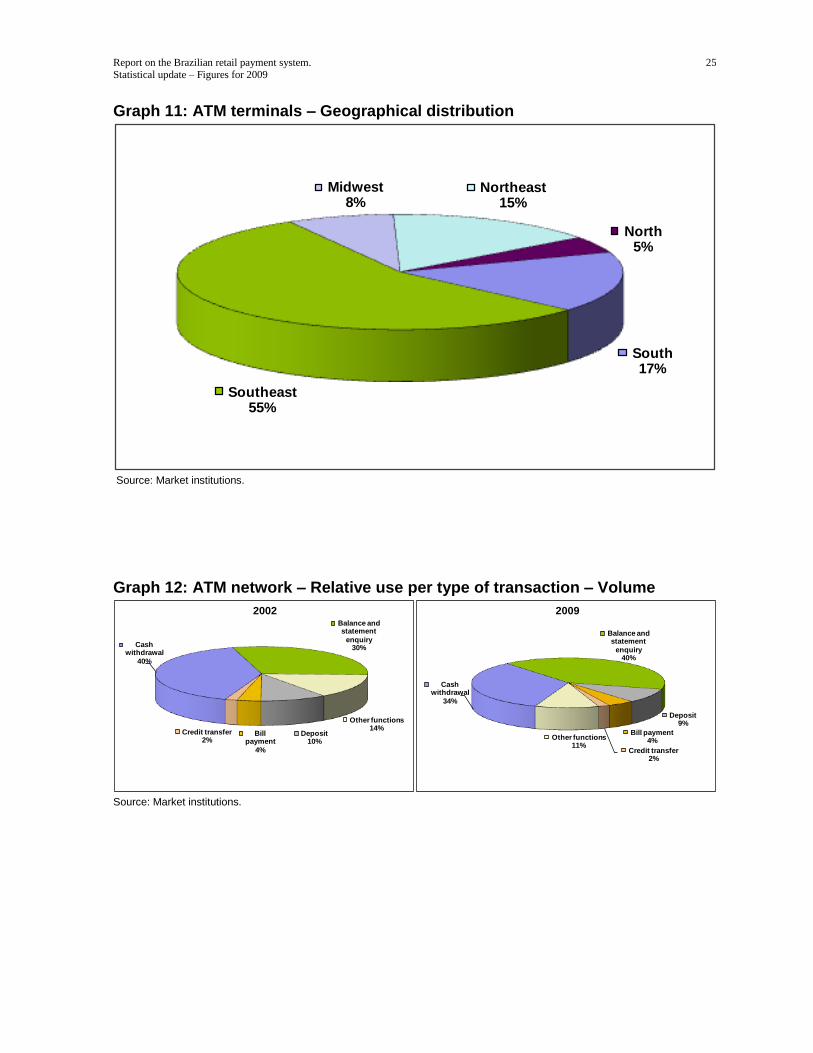
Such as in the case of POS terminals, there was a reduction in the ATM terminals' level of concentration concerning the Brazilian states. The Southeastern region showed the smallest growth (3.3%), while the North region had the largest one (12.6%).
In light of what has been previously noted, it is possible to conclude that the retail payment system continues to evolve towards the replacement of checks with electronic payment instruments, especially payment cards. On one hand, therefore, there were efficiency gains in the retail payment system, both from the users' point of view and with respect to interbank settlement. On the other hand, however, it is once again highlighted the need to have additional efficiency gains also concerning infrastructure, especially through greater level of interoperability or sharing in case of both ATM networks and POS networks. In the segment of payment cards, in particular, there is room for greater level of competition and, as a result, efficiency, especially concerning acquiring services related to four party schemes, as already pointed out in the aforementioned report on the Brazilian payment card industry.

Report on the Brazilian retail payment system. Statistical update – Figures for 2009
8
Table 1: Clearing and settlement systems – Volume and value of transactions
System Average value
(Million) % (R$ million) % (R$)
CIP – Sitraf 1 55 0.7 4,706,874 53.1 85,451
CIP – Siloc 1,760 22.4 918,329 10.4 522
STR 1 4 0.0 1,898,587 21.4 483,604
Compe 1,228 15.6 987,513 11.1 804
Redecard 1,980 25.2 144,909 1.6 73
Cielo 2,839 36.1 203,375 2.3 72
Total 7,866 100.0 8,859,587 100.0 1,126
Volume Value
Source: Central Bank of Brazil, and clearing and settlement system operators. 1 Client transactions only.
Table 2: Clearing and settlement systems – Distribution of transactions per value System
Average value Average value
(Million) % (R$ million) % (R$) (Million) % (R$ million) % (R$)
CIP – Sitraf 1
7 0.1 8,175 0.4 1,243 49 63.9 4,698,699 67.6 96,870
CIP – Siloc 2
1,760 22.6 918,329 48.2 522 – – – – –
STR 1
1 0.0 1,152 0.1 1,264 3 4.0 1,897,435 27.3 629,378
Compe 1,203 15.4 629,942 33.1 523 24 32.1 357,571 5.1 14,683
Redecard 2
1,980 25.4 144,909 7.6 73 – – – – –
Cielo 2
2,839 36.4 203,375 10.7 72 – – – – –
Total 7,790 100.0 1,905,882 100.0 245 76 100.0 6,953,704 100.0 91,651
Value Volume Value
Transactions lower than R$ 5 thousand Transactions larger than R$ 5 thousand
Volume
Source: Central Bank of Brazil, and clearing and settlement system operators.
1 Client transactions only.
2 All transactions were considered lower than R$ 5 thousand, for methodological purposes.
Table 3: Use of payment instruments – Volume 1
Million
2004 2005 2006 2007 2008 2009 2004 – 2009
(%)
5,149 5,510 6,174 6,819 7,709 8,167 59
Check 1,967 1,839 1,622 1,449 1,373 1,233 -37
Debit card 912 1,141 1,428 1,700 2,097 2,309 153
Credit card 1,253 1,501 1,814 2,160 2,520 2,777 122
Direct debit 2 2 1 1 1 1 -66
Credit transfer 1,016 1,027 1,309 1,509 1,718 1,848 82
Total
Payment instrument
Source: Central Bank of Brazil and market institutions.
1 In case of check, direct debit and credit transfer, takes into account transactions having interbank settlement only.

Report on the Brazilian retail payment system. Statistical update – Figures for 2009
9
Table 3a: Use of payment instruments – Volume (including both intrabank and interbank transactions)
M illio n
2005 2006 2007 2008 2009 2005 – 2009
(%)
Total: 10,714 11,555 12,667 14,103 18,311 71
Check 2,527 2,210 1,999 1,963 1,803 -29
Debit card 1,141 1,428 1,700 2,097 2,309 102
Credit card 1,501 1,814 2,160 2,520 2,777 85
Direct debit 783 841 853 872 4,265 445
Payment involving a third party 1
... ... ... ... 576
Payment not involving a third party 2
... ... ... ... 3,689
Credit transfer 4,764 5,261 5,954 6,651 7,158 50
Source: Central Bank of Brazil and market institutions. 1 Beneficiary of the payment is anyone other than the bank where the payer holds the account used to make the payment.
2 Beneficiary of the payment is the bank where the payer holds the account used to make the payment.
Table 4: Use of payment instruments – Number of transactions per inhabitant 1
2004 2005 2006 2007 2008 2009 2004– 2009
(%)
Total 33 34 38 41 45 43 31
Check 11 10 9 8 7 6 -41
Debit card 5 6 8 9 11 12 137
Credit card 7 8 10 12 14 15 107
Direct debit 0 0 0 0 0 0 -68
Credit transfer 6 6 7 8 9 10 69
Payment instrument
Source: Central Bank of Brazil and market institutions.
1 In case of check, direct debit and credit transfer, takes into account transactions having interbank settlement only.
Table 5: Use of payment instruments – Value 1
R$ billion
2004 2005 2006 2007 2008 2009 2004 – 2009
(%)
Total 3,853 4,153 4,889 5,974 7,233 7,144 85
Check 1,003 1,025 1,011 1,038 1,147 1,090 9
Debit card 42 53 67 83 105 122 188
Credit card 93 117 146 182 218 254 173
Direct debit 1 1 0 0 0 0 -82
Interbank credit transfer 2,714 2,957 3,665 4,672 5,763 5,678 109
Payment instrument
interbancários
Source: Central Bank of Brazil and market institutions.
1 In case of check, direct debit and credit transfer, takes into account transactions having interbank settlement only.

Report on the Brazilian retail payment system. Statistical update – Figures for 2009
10
Table 5a: Use of payment instruments – Value (including both intrabank and interbank transactions)
M illio n
2005 2006 2007 2008 2009 2005 – 2009
(%)
Total: 10,714 11,555 12,667 14,103 18,311 71
Check 2,527 2,210 1,999 1,963 1,803 -29
Debit card 1,141 1,428 1,700 2,097 2,309 102
Credit card 1,501 1,814 2,160 2,520 2,777 85
Direct debit 783 841 853 872 4,265 445
Payment involving a third party 1
... ... ... ... 576
Payment not involving a third party 2
... ... ... ... 3,689
Credit transfer 4,764 5,261 5,954 6,651 7,158 50
Source: Central Bank of Brazil and market institutions. 1 Beneficiary of the payment is anyone other than the bank where the payer holds the account used to make the payment.
2 Beneficiary of the payment is the bank where the payer holds the account used to make the payment.
Table 6: Use of payment instruments – Average value per transaction 1
R$
2004 2005 2006 2007 2008 2009 2004 – 2009
(%)
Check 510 558 623 716 835 884 73
Debit card 46 46 47 49 50 53 14
Credit card 74 78 80 84 86 92 24
Direct debit 421 338 317 256 254 227 -46
Credit transfer 2,672 2,879 2,799 3,096 3,355 3,073 15
Payment instrument
Source: Central Bank of Brazil and market institutions.
1 In case of check, direct debit and credit transfer, takes into account transactions having interbank settlement only.
Table 7: Number of payment cards in circulation (end of year)
Payment card 2004 2005 2006 2007 2008 2009 2004 – 2009
(%)
53,499 67,543 85,230 117,723 137,793 152,290 184.7
21 26 26 38 17 11
149,148 163,919 174,493 182,396 207,937 221,474 48.5
19 10 6 5 14 7
With credit function
With debit function
Fluctuation (%)
Fluctuation (%)
Source: Market institutions.
Table 8: Number of payment cards per deposit account (end of year)
Item 2004 2005 2006 2007 2008 2009 2004 – 2009
(%)
Deposit accounts (thousand) 90,240 95,147 102,644 112,130 125,667 133,628 48.1
Number of debit card/account 1.65 1.72 1.70 1.63 1.65 1.66 0.3
Number of credit card/account 0.59 0.71 0.83 1.05 1.10 1.14 92.2
Source: Central Bank of Brazil and market institutions.

Report on the Brazilian retail payment system. Statistical update – Figures for 2009
11
Table 9: Payment cards – Volume of transactions
Payment instrument 2004 2005 2006 2007 2008 2009 2004 – 2009
(%)
Credit card (thousand) 1,252,557 1,501,249 1,813,981 2,160,403 2,519,832 2,776,909 122
Fluctuation (%) 16 20 20 19 17 10
Number of transactions per inhabitant 7 8 8 12 13 15 109
Number of transactions per card 19 18 15 16 18 18 -2
Debit card (thousand) 912,070 1,140,653 1,427,684 1,700,128 2,097,227 2,309,407 153
Fluctuation (%) 38 25 25 19 23 10
Number of transactions per inhabitant 5 6 6 9 11 12 137
Number of transactions per card 6 7 8 8 10 10 87
Source: Market institutions.
Table 10: Payment cards – Value of transactions
Transações 2004 2005 2006 2007 2008 2009 2004 – 2009
(%)
Credit card (R$ million) 92,505 116,578 145,778 181,567 217,835 254,109 175
Fluctuation (%) 20 26 26 25 20 17
Average value per transaction (R$) 74 78 78 72 86 92 24
Average value per card (R$) 1,729 1,726 1,726 1,318 1,581 1,669 -3
Debit card (R$ million) 42,345 52,902 66,896 83,133 105,283 121,529 187
Fluctuation (%) 43 25 25 24 27 15
Average value per transaction (R$) 46 46 46 40 50 53 14
Average value per card (R$) 284 323 323 400 506 549 93
Source: Market institutions.
Table 11: Relative use of non-cash payment instruments in selected countries (%) 1
Country
2001 2008 % 2001 2008 % 2001 2008 % 2001 2008 %
Belgium 3.9 0.5 -87.2 32.6 41.0 25.8 48.2 42.8 -11.2 11.5 11.4 -0.9
Brazil 252.1 16.0 -69.3 23.9 53.8 124.9 16.0 20.0 25.5 8.0 10.2 26.7
Finland 0.1 0.0 -63.6 39.1 54.1 38.5 55.5 41.3 -25.5 5.2 4.5 -14.5
France 35.4 23.8 -32.8 30.0 40.0 33.3 17.8 17.0 -4.5 16.8 19.0 13.1
Germany 2.6 0.5 -80.8 13.2 13.5 2.3 45.4 36.8 -18.9 38.6 48.9 26.7
Italy 21.3 12.5 -41.3 27.3 39.0 42.9 38.2 32.1 -16.0 13.2 14.9 12.9
Japan 5.6 1.5 -73.2 60.6 ... 33.8 17.0 -49.7 ... ...
Netherlands 0.2 – 31.9 38.0 19.1 39.1 31.7 -18.9 17.9 26.4 47.5
Portugal 27.0 13.9 -48.8 56.3 63.8 13.4 4.1 10.0 145.8 11.8 12.3 4.6
Spain 9.9 3.0 -69.9 ... 38.0 21.1 14.3 -32.3 68.9 43.4 -37.0
Sweden 0.2 0.0 -100.0 31.7 56.8 79.2 60.3 34.4 -43.0 7.7 8.8 14.3
Switzerland 0.8 0.1 -87.5 34.1 38.2 12.0 57.4 56.4 -1.7 5.4 10.4 92.6
United Kingdon 23.1 10.7 -53.7 40.1 48.4 20.7 17.4 21.0 20.7 19.4 19.9 2.6
United States 53.8 28.6 -46.8 36.6 54.5 48.9 5.7 6.5 14.0 3.9 10.4 166.7
Direct debitDebit card/ Credit card Credit transferCheck
Source: Central Bank of Brazil, Brazilian market institutions, BIS/CPSS and European Central Bank.
1 Card-based e-money is considered on the calculus of the payment instrument's relative use, except in case of Brazil.
2 Includes interbank payments only.

Report on the Brazilian retail payment system. Statistical update – Figures for 2009
12
Table 12: Payment cards – Average number of transactions per function in selected countries
Country
2001 2008 % 2001 2008 % 2001 2008 %
Belgium 15.5 17.7 13.8 39.6 55.7 40.8 ... 25.8
Brazil2 14.4 12.5 -13.1 3.2 10.1 212.6 23.3 18.3 -21.6
Finland 40.3 29.6 -26.7 84.2 159.3 89.2 ... 21.6
France 26.9 16.7 -38.0 ... 64.4 ... 32.7
Germany 13.1 16.4 25.3 ... 17.3 ... ...
Italy 18.2 12.2 -33.2 17.4 24.9 43.1 15.7 14.6 -7.1
Japan ... ... 0 0.0 49.8 9.2 ...
Netherlands 15.8 15.1 -3.9 36.6 63.4 73.4 ... 14.7
Portugal 22.1 26.7 20.5 39.8 40.7 2.3 ... 26.3
Spain ... 12.9 – 27.4 ... 23.9
Sweden 70.3 30.3 -56.8 67.7 127.0 87.7 9.9 28.4 186.1
Switzerland 0.6 9.1 1,404.5 37.2 44.3 19.3 30.0 30.1 0.5
United Kingdon 16.4 17.2 4.9 50.8 71.0 39.8 28.2 26.8 -4.7
United States ... ... 43.5 110.4 154.1 13.6 17.8 31.1
Cash withdrawal function1
Debit function2
Credit function2
Source: Brazilian market institutions, BIS/CPSS, and European Central Bank.
1 Includes withdrawals through cards issued in the country using domestic ATMs only.
2 Includes cards issued in the country and domestic transactions only.
3 Cards presenting debit function are considered as denominator of the withdrawals function.
Note: The countries are ordered alphabetically according to their names in Portuguese.
Table 13: ATM network – Quantity of terminals per type of access (end of year)
Type of access 2004 2005 2006 2007 2008 2009 2004 – 2009
(%)
139,457 146,795 147,535 153,162 158,414 165,567 19
Open access 1/
30,747 50,382 59,187 68,268 68,594 76,086 147
Percentage of the total (%) 22 34 40 45 43 46 108
Fluctuation (%) -9 64 17 15 0 11
Restricted access 2/
108,710 96,413 88,348 84,894 89,820 89,481 -18
Percentage of the total (%) 78 66 60 55 57 54 -31
Fluctuation (%) 7 -11 -8 -4 6 0
Total
Source: Market institutions. 1 Open access - ATM terminals that allow the holder of a card that has not been issued by the institution that owns the network perform any type of transaction.
2 Restricted access - ATM terminals that allow only the use of cards issued by the institution that owns the network.

Report on the Brazilian retail payment system. Statistical update – Figures for 2009
13
Table 14: Distribution of ATM and POS terminals per Brazilian state
State
Number % Number %
Acre 429 0.3 6,646 0.2
Alagoas 1,305 0.8 38,110 1.1
Amapá 400 0.2 7,154 0.2
Amazonas 1,775 1.1 34,224 1.0
Bahia 7,618 4.6 199,147 5.8
Ceará 3,451 2.1 88,549 2.6
Distrito Federal 3,797 2.3 83,271 2.4
Espírito Santo 2,933 1.8 57,807 1.7
Goiás 4,630 2.8 94,283 2.8
Maranhão 2,133 1.3 39,547 1.2
Mato Grosso 2,348 1.4 44,378 1.3
Mato Grosso do Sul 2,086 1.3 35,490 1.0
Minas Gerais 16,483 10.0 292,096 8.6
Pará 3,007 1.8 52,360 1.5
Paraíba 1,964 1.2 46,560 1.4
Paraná 10,340 6.2 216,655 6.4
Pernambuco 4,547 2.7 129,882 3.8
Piauí 1,220 0.7 20,536 0.6
Rio de Janeiro 18,141 11.0 366,592 10.8
Rio Grande do Norte 1,790 1.1 44,538 1.3
Rio Grande do Sul 11,894 7.2 207,280 6.1
Rondônia 892 0.5 17,362 0.5
Roraima 269 0.2 6,027 0.2
Santa Catarina 5,927 3.6 129,839 3.8
São Paulo 53,987 32.6 1,116,510 32.8
Sergipe 1,298 0.8 20,455 0.6
Tocantins 903 0.5 12,262 0.4
Total 165,567 100.0 3,407,560 100.0
ATM POS
Source: Market institutions.
Table 15: ATM network - Volume of transactions
Item 2004 2005 2006 2007 2008 2009 2004 – 2009
(%)
Number of transactions (million) 6,192 6,782 7,342 7,553 7,954 8,197 32
Number of transactions per inhabitant 35 37 40 41 42 43 24
Number of transactions per terminal 44,400 46,203 49,762 49,314 50,210 49,507 12
Source: Market institutions
Report on the Brazilian retail payment system. Statistical update – Figures for 2009
14
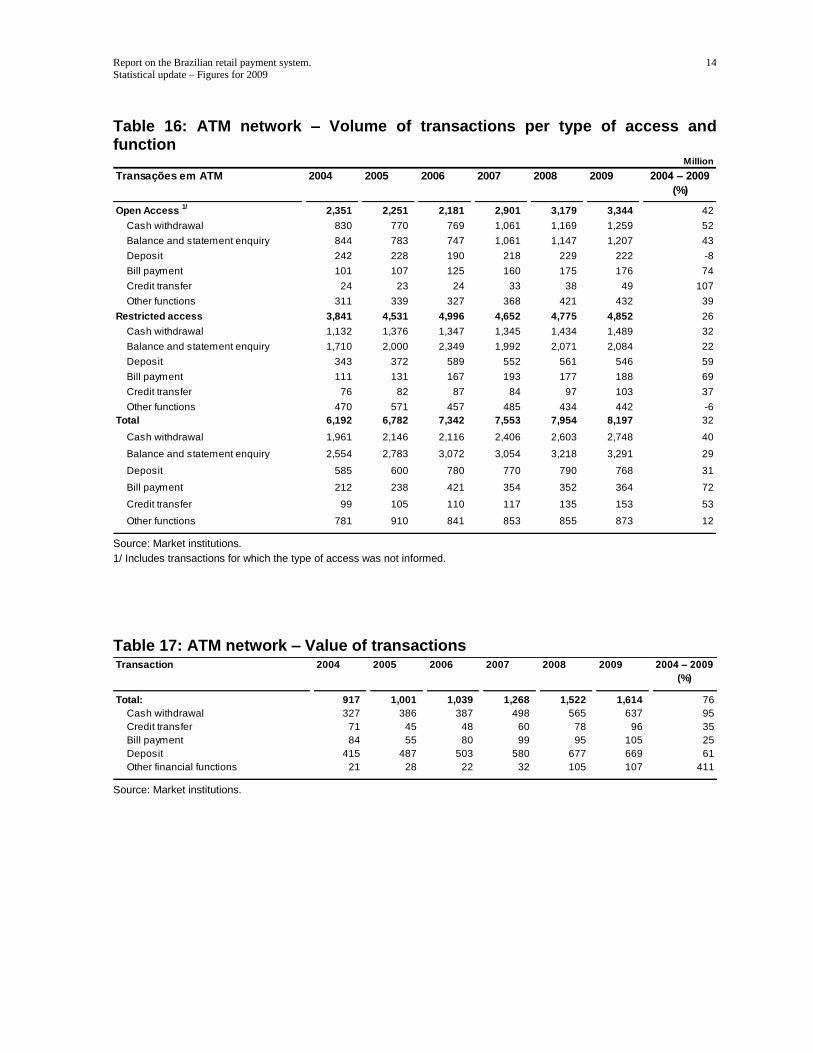
Table 16: ATM network – Volume of transactions per type of access and function
Million
Transações em ATM 2004 2005 2006 2007 2008 2009 2004 – 2009
(%)
Open Access 1/
2,351 2,251 2,181 2,901 3,179 3,344 42
Cash withdrawal 830 770 769 1,061 1,169 1,259 52
Balance and statement enquiry 844 783 747 1,061 1,147 1,207 43
Deposit 242 228 190 218 229 222 -8
Bill payment 101 107 125 160 175 176 74
Credit transfer 24 23 24 33 38 49 107
Other functions 311 339 327 368 421 432 39
3,841 4,531 4,996 4,652 4,775 4,852 26
Cash withdrawal 1,132 1,376 1,347 1,345 1,434 1,489 32
Balance and statement enquiry 1,710 2,000 2,349 1,992 2,071 2,084 22
Deposit 343 372 589 552 561 546 59
Bill payment 111 131 167 193 177 188 69
Credit transfer 76 82 87 84 97 103 37
Other functions 470 571 457 485 434 442 -6
6,192 6,782 7,342 7,553 7,954 8,197 32
Cash withdrawal 1,961 2,146 2,116 2,406 2,603 2,748 40
Balance and statement enquiry 2,554 2,783 3,072 3,054 3,218 3,291 29
Deposit 585 600 780 770 790 768 31
Bill payment 212 238 421 354 352 364 72
Credit transfer 99 105 110 117 135 153 53
Other functions 781 910 841 853 855 873 12
Restricted access
Total
Source: Market institutions.
1/ Includes transactions for which the type of access was not informed.
Table 17: ATM network – Value of transactions
Transaction 2004 2005 2006 2007 2008 2009 2004 – 2009
(%)
Total: 917 1,001 1,039 1,268 1,522 1,614 76
Cash withdrawal 327 386 387 498 565 637 95
Credit transfer 71 45 48 60 78 96 35
Bill payment 84 55 80 99 95 105 25
Deposit 415 487 503 580 677 669 61
Other financial functions 21 28 22 32 105 107 411
Source: Market institutions.

Report on the Brazilian retail payment system. Statistical update – Figures for 2009
15
Table 18: ATM network – Transactions carried out through open access terminals
Number
(thounsand)
% Number
(thounsand)
% Number
(thounsand)
% Number
(thounsand)
% Number
(thounsand)
% Number
(thounsand)
%
Total: 2,518,578 86.8 382,763 13.2 2,861,540 90.0 317,292 10.0 2,913,906 87.1 430,569 12.9
Cash withdrawal 830,110 78.3 230,408 21.7 958,515 82.0 210,782 18.0 975,669 77.5 283,302 22.5
Credit transfer 31,513 96.4 1,175 3.6 37,571 99.2 302 0.8 49,235 99.9 49 0.1
Bill payment 154,290 96.3 5,990 3.7 173,437 99.2 1,427 0.8 173,991 98.8 2,079 1.2
Deposit 197,788 90.8 20,125 9.2 226,478 99.0 2,361 1.0 220,887 99.6 810 0.4
Balance and statement enquiry 938,027 88.4 123,426 11.6 1,045,362 91.2 101,493 8.8 1,063,290 88.1 143,400 11.9
Other functions 366,849 99.6 1,639 0.4 420,177 99.8 927 0.2 430,834 99.8 929 0.2
200920082007Transaction
Non-shared1 Shared2Non-shared1 Shared2 Non-shared1 Shared2
Source: Market institutions. 1 Transactions carried out through cards issued by the ATM network owner.
2 Transactions carried out through cards not issued by the ATM network owner.
Table 19: ATM network – Number of terminals, volume of transactions and average value per transaction in selected countries 1
Country
2001 2008 % 2001 2008 % 2001 2008 %
Belgium 1,108 1,442 30.1 21.5 32.5 51.4 90.8 163.0 79.5
Brazil 646 809 25.2 9.0 42.0 365.9 55.0 111.2 102.1
Finland 835 604 -27.6 48.0 35.0 -27.0 62.5 130.6 108.8
France 604 832 37.8 19.1 24.9 30.2 54.6 105.4 93.0
Germany 603 968 60.6 20.0 24.3 21.7 141.6 225.5 59.3
Italy 643 922 43.5 9.9 9.1 -7.7 114.3 264.5 131.4
Japan 1,121 1,090 -2.8 3.1 2.5 -18.8 526.7 494.4 -6.1
Netherlands 445 525 17.9 30.5 29.0 -4.9 81.5 169.8 108.2
Portugal 1,022 1,589 55.4 35.0 41.0 17.1 41.7 97.1 132.7
Spain 1,154 1,354 17.3 17.0 21.4 26.1 ... 164.6
Sweden 289 304 5.4 37.7 28.7 -23.8 81.3 139.9 72.1
Switzerland 692 790 14.2 14.8 14.5 -2.1 149.0 201.0 34.9
United Kingdon 620 1,041 67.8 36.8 46.8 27.3 ... ...
United States 1,136 1,336 17.6 47.7 ... ... ...
Number of terminals per
million inhabitants
Number of transactions
per inhabitant 2
Average value per
transaction (USD) 3
Source: Brazilian market institutions, BIS/CPSS and European Central Bank.
1 Considers ATM terminals located inside the country and cards issued by domestic entities only.
2 Brazil: cash withdrawal transactions only; other countries: includes cash withdrawal and loading transactions.
3 Value converted at annual average exchange rate.
Note: The countries are ordered alphabetically according to their names in Portuguese.
Report on the Brazilian retail payment system. Statistical update – Figures for 2009
16
Table 20: ATM network – Volume of transactions per terminal in selected countries 1
Country
2001 2008 % 2001 2008 %
Belgium 1,108 1,442 30.1 19,390 22,469 15.9
Brazil 646 604 -6.5 13,950 16,434 17.8
Finland 835 604 -27.6 57,485 57,944 0.8
France 604 832 37.8 31,471 29,903 -5.0
Germany 603 968 60.6 33,167 25,130 -24.2
Italy 643 922 43.5 15,669 9,902 -36.8
Japan 1,121 1,090 -2.8 2,765 2,309 -16.5
Netherlands 445 525 17.9 68,539 54,987 -19.8
Portugal 1,022 1,589 55.4 34,247 25,795 -24.7
Spain 1,154 1,354 17.3 14,567 15,831 8.7
Sweden 289 304 5.4 130,450 95,357 -26.9
Switzerland 692 790 14.2 21,387 18,290 -14.5
United Kingdon 620 1,041 67.8 59,192 45,008 -24.0
United States 1,136 1,336 17.6 41,962 ...
Number of terminals per million
inhabitants
Number of transactions per
terminal 2
Source: Brazilian financial institutions, BIS/CPSS and European Central Bank.
1 Considers ATM terminals located inside the country and cards issued by domestic entities only.
2 Brazil: cash withdrawal transactions only; other countries: includes cash withdrawal and loading transactions.
Note: The countries are ordered alphabetically according to their names in Portuguese.
Table 21: POS network – Number of terminals (end of year)
Item 2004 2005 2006 2007 2008 2009 2004 – 2009
(%)
1,078,763 1,342,183 1,660,825 2,424,646 3,104,662 3,374,740 213
30 24 24 46 28 9
Number of terminals per million inhabitants 6,069 7,287 9,048 13,054 16,856 18,169 199
1,106,011 1,277,827 1,556,165 2,044,759 2,601,387 2,780,043 151
Fluctuation (%) 34 16 22 31 27 7
6,223 6,938 8,478 11,009 14,124 14,968 141
Fluctuation (%)
Number of terminals per million inhabitants
Credit card
Debit card
Source: Market institutions.

Report on the Brazilian retail payment system. Statistical update – Figures for 2009
17
Table 22: POS network - Debit card transactions in selected countries Country
2001 2008 % 2001 2008 % 2001 2008 %
Belgium 14,047 11,640 -17.1 42.0 71.6 70.4 44.82 69.00 53.9
Brazil 2,589 13,734 430.5 1.9 11.1 485.2 18.44 25.77 39.7
Finland 13,878 28,797 107.5 56.5 20.7 -63.3 37.26 43.03 15.5
France 14,795 21,469 45.1 ... ... ... ...
Germany 5,291 7,221 36.5 16.2 21.1 30.2 62.36 83.80 34.4
Italy 13,509 22,490 66.5 7.6 14.0 85.1 66.91 127.00 89.8
Japan 7,755 13,361 72.3 0.0 0.1 105.3 403.23 565.60 40.3
Netherlands 10,333 19,179 85.6 59.7 97.9 64.1 41.49 59.20 42.7
Portugal 10,063 21,276 111.4 51.3 63.6 24.0 25.13 58.21 131.7
Spain 20,949 31,162 48.8 ... 18.0 ... 70.71
Sweden 9,917 21,178 113.6 36.6 125.5 242.6 55.21 64.10 16.1
Switzerland 10,139 18,222 79.7 27.5 40.6 47.4 100.45 134.80 34.2
United Kingdon 13,060 17,838 36.6 46.6 83.4 78.8 51.69 91.30 76.6
United States 10,864 17,020 56.7 36.9 100.1 171.4 36.71 39.10 6.5
Average value per
transaction (USD) 1/
Number of terminals per
million inhabitants
Number of transactions per
inhabitant
Source: Brazilian market institutions, BIS/CPSS and European Central Bank.
1 Value converted at annual average exchange rate.
Table 23: POS network - Credit card transactions in selected countries Country
2001 2008 % 2001 2008 % 2001 2008 %
Belgium 14,047 11,640 -17.1 ... 105.9 ... 153.05
Brazil 2,555 16,391 541.5 4.8 13.3 178.0 28.45 44.37 55.9
Finland 13,878 28,797 107.5 ... 20.7 ... 75.81
France 14,795 21,469 45.1 ... nav ... ...
Germany 5,291 7,221 36.5 ... 0.5 ... ...
Italy 13,509 22,490 66.5 5.5 8.8 60.4 83.97 158.20 88.4
Japan 7,755 13,361 72.3 17.8 ... 84.81 ...
Netherlands 10,333 19,179 85.6 ... 94.2 ... 133.55
Portugal 10,063 21,276 111.4 ... 20.5 ... 105.45
Spain 20,949 31,162 48.8 ... 25.1 ... 71.98
Sweden 9,917 21,178 113.6 2.6 15.9 515.3 95.65 80.10 -16.3
Switzerland 10,139 18,222 79.7 13.5 18.2 35.2 113.94 178.60 56.8
United Kingdon 13,060 17,838 36.6 24.6 29.2 18.5 78.64 116.90 48.7
United States 10,864 17,020 56.7 58.7 78.6 33.9 77.21 89.90 16.4
Number of terminals per
million inhabitant
Number of transactions per
inhabitant
Average value per
transaction (USD) 1/
Source: Brazilian market institutions, BIS/CPSS, and European Central Bank.
1/ Value converted at annual average exchange rate.

Report on the Brazilian retail payment system. Statistical update – Figures for 2009
18
Table 24: Remote access to banking services 1 – Volume of transactions
Million
2004 2005 2006 2007 2008 2009 2004 – 2009
(%)
3,311 3,766 5,095 6,401 7,274 8,415 154
339 434 464 530 601 681 101
246 566 405 540 655 788 220
1,475 1,529 1,953 2,346 2,567 3,338 126
1,250 1,236 2,274 2,984 3,451 3,607 189
– Financial 727 213 398 621 737 744 2
– Non-financial 523 1,023 1,876 2,363 2,714 2,863 447
Transaction
Total
Credit transfer 2
Bill payment 3
Balance and statement enquiry
Other:
Source: Market institutions.
1 Internet, home and office banking.
2 TED, DOC, TEC and intrabank funds transfers.
3 Taxes, contributions, "bloquetos de cobrança", utility bills etc.
Note: includes intrabank and interbank transactions.
Table 25: Remote access to banking services 1 – Value of transactions
Transaction 2004 2005 2006 2007 2008 2009 2004 – 2009
(%)
1,881 3,176 3,064 5,213 6,213 7,309 289
Credit transfer 2
1,099 1,415 1,605 2,535 3,425 3,942 259
Bill payment 3
737 818 595 826 1,082 1,261 71
Other 45 943 864 1,852 1,706 2,107 4,568
568 843 601 814 854 869 53
Credit transfer 2
3,241 3,258 3,462 4,778 5,700 5,785 78
Bill payment 3
2,994 1,444 1,468 1,530 1,651 1,600 -47
Other 62 4,426 2,173 2,981 2,316 2,831 4,461
Total value (R$ billion)
Average value per transaction (R$)
Source: Market institutions.
1 Internet, home and office banking.
1/ TED, DOC, TEC and intrabank funds transfers.
2/ Taxes, contributions, "bloquetos de cobrança", utility bills etc.
Note: includes intrabank and interbank transactions.
Table 26: Remote access – Number and value of transaction per user
Item 2004 2005 2006 2007 2008 2009 2004– 2009
(%)
Number of transactions per user 143 127 164 200 235 174 22
Value of transactions per user 72,121 107,227 98,433 162,804 206,882 151,926 111
Source: Market institutions.

Report on the Brazilian retail payment system. Statistical update – Figures for 2009
19
Table 28: ATM network - Use of shared terminals
2004 2005 2006 2007 2008 2009
Open access terminal 22 34 40 45 43 46
Restricted access terminal 78 66 60 55 57 54
Shared transactions 2 7 9 13 10 13
Non-shared transactions 98 93 91 87 90 87
ItemRelative participation (%)
Source: Market institutions.
Table 29: Access to banking services – Number of transactions per access channel
Access channel 2006 2007 2008 2009 2006– 2009
(%)
Internet, home and office banking 5,107 6,410 7,234 8,365 64
ATM terminals 7,158 7,546 7,921 8,133 14
Banking branches 5,427 5,587 5,603 6,501 20
Banking correspondents 1,806 2,166 2,297 2,589 43
Call centers 1,246 1,606 1,528 1,613 29
Mobile phones and PDAs 48 37 29 100 108
Source: Market institutions.
Table 29a: Access to non-face-to-face payment services – Number of transactions per access channel
Access channel 2006 2007 2008 2009 2006– 2009
(%)
Banking correspondents 1,338 1,612 1,702 1,929 44
Internet, home and office banking 869 1,070 1,256 1,469 69
Banking branches 1,428 1,432 1,492 1,466 3
ATM terminals 383 470 487 517 35
Call centers 22 23 25 29 29
Mobile phones and PDAs 0 2 3 7 2,204
Source: Market institutions.

Report on the Brazilian retail payment system. Statistical update – Figures for 2009
20
GRAPHS
Graph 1: Clearing and settlement systems – Relative participation
CIP-Sitraf0.7%
CIP-Siloc22.4%
STR0.0%
Compe15.6%
Redecard25.2%
Cielo36.1%
Volume
CIP-Sitraf53.1%
CIP-Siloc10.4%
STR21.4%
Compe11.1%
Redecard1.6%
Cielo2.3%
Value
Source: Central Bank of Brazil, and clearing and settlement system operators.
Note: In case of STR and Cip-Sitraf, client transactions only.
Graph 2: Clearing and settlement systems – Percentage of transactions with value lower than R$ 5 thousand
CIP-Sitraf0.1%
CIP-Siloc22.6%
STR0.0%
Compe15.4%
Redecard25.4%
Cielo36.4%
Volume
CIP-Sitraf0.4%
CIP-Siloc48.2%
STR0.1%
Compe33.1%
Redecard7.6%
Cielo10.7%
Value
Source: Central Bank of Brazil, and clearing and settlement system operators. Note: In case of STR and Cip-Sitraf, client transactions only.
Graph 3: Clearing and settlement systems – Percentage of transactions with value equal or larger than R$ 5 thousand
CIP-Sitraf63.9%
STR4.0%
Compe32.1%
Volume
CIP-Sitraf67.6%
STR27.3%
Compe5.1%
Value
Source: Central Bank of Brazil, and clearing and settlement system operators. Note: In case of STR and Cip-Sitraf, client transactions only.

Report on the Brazilian retail payment system. Statistical update – Figures for 2009
21
Graph 4: Relative use of payment instruments - Volume
Check50%
Debit card10%Credit card/
21%
Direct debit0%
Interbank credit transfer
19%
2002
Check15%
Debit Card28%
Credit card34% Direct debit
0%
Interbank credit transfer
23%
2009
Source: Central Bank of Brazil, and clearing and settlement system operators. 1 In case of check, direct debit and credit transfer, takes into account transactions having interbank settlement only.
Graph 4a: Relative use of payment instruments – Volume (including intrabank transactions)
Check24%
Debit card11%Credit card
14%
Direct debit/
7%
Credit transfer44%
2005
Cheque12%
Cartão de débito
16%
Cartão de crédito
19%Débito direto –Conv. terceiros
4%
Transferência de crédito
49%
2009
Source: Central Bank of Brazil, and clearing and settlement system operators.
Graph 5: Relative use of payment instruments - Value
Check38%
Debit card0%
Credit card2%
Direct debit0%
Interbank credit transfer
60%
2002
Check15%
Debit card2%
Credit card
4%
Direct debit0%
Interbank credit transfer
79%
2009
Source: Central Bank of Brazil, and clearing and settlement system operators. 1 In case of check, direct debit and credit transfer, takes into account transactions having interbank settlement only.
Report on the Brazilian retail payment system. Statistical update – Figures for 2009
22
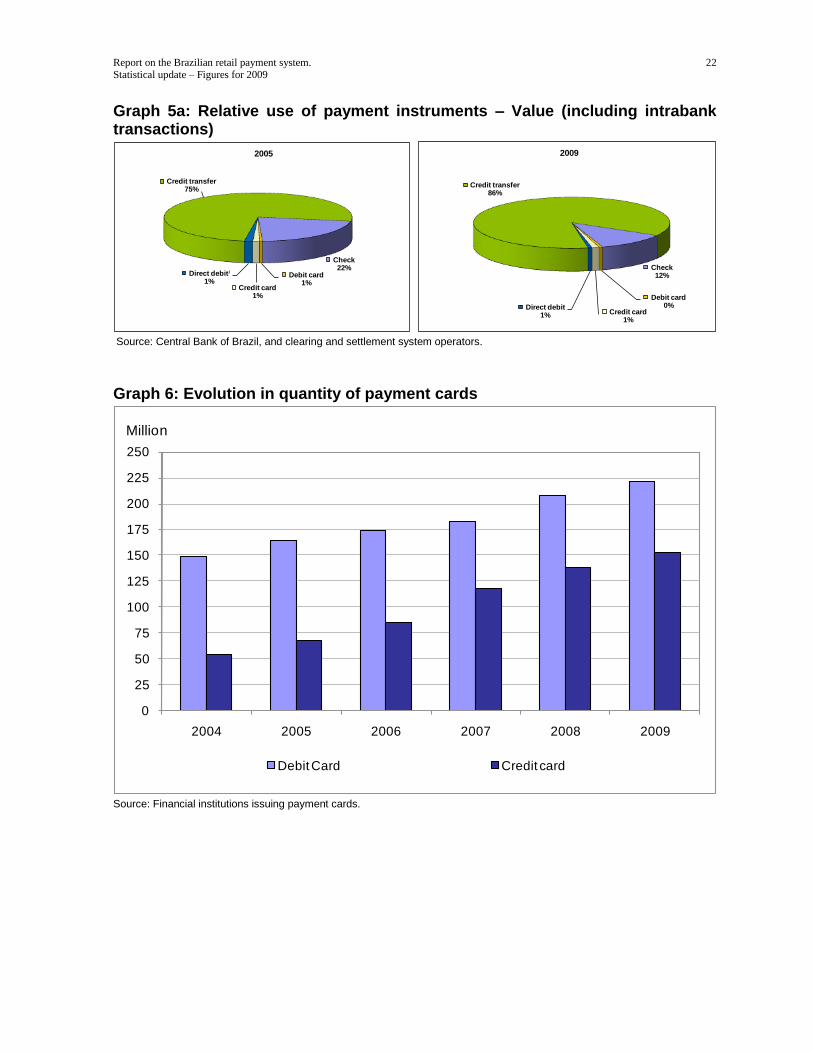
Graph 5a: Relative use of payment instruments – Value (including intrabank transactions)
Check22%
Debit card1%
Credit card1%
Direct debit/
1%
Credit transfer75%
2005
Check12%
Debit card0%
Credit card1%
Direct debit1%
Credit transfer86%
2009
Source: Central Bank of Brazil, and clearing and settlement system operators.
Graph 6: Evolution in quantity of payment cards
0
25
50
75
100
125
150
175
200
225
250
2004 2005 2006 2007 2008 2009
Debit Card Credit card
Million
Source: Financial institutions issuing payment cards.

Report on the Brazilian retail payment system. Statistical update – Figures for 2009
23
Graph 7: Payment cards – Evolution in volume of transactions
0
500
1,000
1,500
2,000
2,500
3,000
2004 2005 2006 2007 2008 2009
Million
Debit card Credit card
Source: Financial institutions issuing payment cards.
Graph 8: Payment cards – Evolution in value of transactions
0
25
50
75
100
125
150
175
200
225
250
275
2004 2005 2006 2007 2008 2009
Debit card Credit card
R$ billion
Source: Financial institutions issuing payment cards.
Report on the Brazilian retail payment system. Statistical update – Figures for 2009
24
Graph 9: Use of payment instruments in selected countries (2008)
Brazil United States
Euro Zone
United Kingdom
Sweden Swiitzerland
0
10
20
30
40
50
60
70
80
90
100
0 1 2 3 4 5 6 7 8 9 10
Ele
ctr
on
ic p
aym
en
t (%
)
CHP / GDO(%)
1999 2008
Electronic payment
Check Cash & Check
Cash & Electronic
Source: Brazilian market institutions, BIS/CPSS and European Central Bank.
Graph 10: ATM network – Evolution in number of terminals
0
20
40
60
80
100
120
140
160
180
2004 2005 2006 2007 2008 2009
Mil
Open access Restricted access Total
Source: Market institutions.
Report on the Brazilian retail payment system. Statistical update – Figures for 2009
25
Graph 11: ATM terminals – Geographical distribution
South17%
Southeast55%
Midwest8%
Northeast15%
North5%
Source: Market institutions.
Graph 12: ATM network – Relative use per type of transaction – Volume
Cash withdrawal
34%
Balance and statement
enquiry40%
Deposit9%
Bill payment4%
Credit transfer2%
Other functions 11%
2009
Cash withdrawal
40%
Balance and statement
enquiry30%
Other functions 14%
Deposit10%
Bill payment
4%
Credit transfer2%
2002
Source: Market institutions.
Report on the Brazilian retail payment system. Statistical update – Figures for 2009
26
Graph 13: ATM network – Relative use per type of transaction – Value
Saque de numerário
38%
Transferência de crédito
5%
Bloqueto de Cobrança e
convênios4%
Depósito50%
Outras (financeiras)
3%
2002
Cash withdrawal
40%
Credit transfer6%
Bill payment6%
Deposit41%
Other financial functions
7%
2009
Source: Market institutions.
Graph 14: ATM network – Number of transactions per inhabitant in selected countries (2008)
Germany
Belgium
Brazil
Spain
United States
Finland
Netherlands
Italy
Japan
Portugal
United Kingdom
Sweden
Switzerland
0
10
20
30
40
50
60
70
80
90
100
110
120
130
140
- 300 600 900 1,200 1,500 1,800
Num
ber o
f tra
nsactio
ns
per in
habita
nt
Number of terminals per million inhabitant
Source: Brazilian market institutions, BIS/CPSS and European Central Bank.
For Brazil, cash withdrawal transactions only. For other countries, includes reloading transactions as well.

Report on the Brazilian retail payment system. Statistical update – Figures for 2009
27
Graph 15: ATM network – Number of transactions per terminal in selected countries (2008)
GermanyBelgium
Brazil Spain
Finland
France
Netherlands
ItalyJapan
Portugal
Sweden
Switzerland
0
20
40
60
80
100
120
- 300 600 900 1,200 1,500 1,800
Num
ber o
f tra
nsactio
ns
per te
rmin
al
Number of terminals per million inhabitant
Thousand
Source: Brazilian market institutions, BIS/CPSS and European Central Bank.
Note: For Brazil, cash withdrawal transactions only. For other countries, includes reloading transactions as well.
Graph 16: POS network – Evolution in number of terminals
0
500
1,000
1,500
2,000
2,500
3,000
3,500
4,000
2004 2005 2006 2007 2008 2009
Thousand
Debit card Credit card
Source: Market institutions.

Report on the Brazilian retail payment system. Statistical update – Figures for 2009
28
Graph 17: POS network – Geographical distribution
South16%
Southeast54%
Midwest8%
Northeast18%
North4%
Source: Market institutions.
Graph 18: POS network – Debit card transactions in selected countries (2008)
Germany
Belgium
BrazilSpain
United States
Finaland
Netherlands
Italy
Portugal
United Kingdom
Sweden
Switzerland
0
20
40
60
80
100
120
140
- 5 10 15 20 25 30 35
Number of terminals per million inhabitan
thousand
Num
ber o
f tra
nsactio
ns
per
Source: Brazilian market institutions, BIS/CPSS and European Central Bank.

Report on the Brazilian retail payment system. Statistical update – Figures for 2009
29
Graph 19: POS network – Credit card transactions in selected countries (2008)
Germany
Belgium
Brazil
Spain
United States
Finland
Netherlands
Italy
Portugal
United Kingdom
SwedenSwitzerland
0
20
40
60
80
100
120
- 5 10 15 20 25 30 35
Number of terminals per million inhabitant
Thousand
Num
ber o
f tra
nsactio
ns
per in
habita
nt
Source: Brazilian market institutions, BIS/CPSS and European Central Bank.
Graph 20: Remote access to banking services – Number of users
0
10
20
30
40
50
60
2004 2005 2006 2007 2008 2009
Million
Source: Market institutions.

Report on the Brazilian retail payment system. Statistical update – Figures for 2009
30
Graph 21: Remote access to banking services – Relative use per type of transaction – Volume
Credit transfers2,5%
Other payments5,5%
Inquiries60,6%
Other transactions
31,4%
2002
Credit transfers8,1%
Other payments9,4%
Inquiries 39,7%
Other transactions
42,9%
2009
Source: Market institutions.
Graph 22: ATM network – Average number of transactions per terminal
0
10
20
30
40
50
60
70
80
n1 n2 n3 n4 n5 n6 n7 n8 n9 n10 n11 n12 n13 n14 n15 n16 n17 n18 n19 n20 n21
Thousand
Networks
Average per network Average of the system as a whole
Fontes: Bancos, Source: Market institutions.


