Embed Size (px)
Citation preview

LEAD CONTRACTOR
JRC – JOINT RESEARCH CENTRE, EUROPEAN COMMISSION
Report on SWOT analysis of
monitor ing
D e l i v e r a b l e 1 . 4
WP 1 Deliverable 1.4
SUBMISSION DATE
31 | January | 2014
Dissemination level
Public
This document contains four annexes, including an interactive pdf. Please, refer to Annex 2 for instructions of how to use the interactive pdf.
AUTHORS
Joana Patrício (JRC), Sally Little (UHULL), Krysia Mazik (UHULL), Shona Thomson (UHULL), Nikolaos Zampoukas (JRC),
Heliana Teixeira (JRC), Oihana Solaun (AZTI), Maria C. Uyarra (AZTI), Nadia Papadopoulou (HCMR), Gokhan Kaboglu
(DEU), Martynas Bucas (KUCORPI), Tanya Churilova (MHI-NASU), Olga Kryvenko (MHI-NASU), Snejana Moncheva (IO-
BAS), Kremena Stefanova (IO-BAS), Ángel Borja (AZTI), Maria Alvarez (UHULL), Argyro Zenetos (HCMR), Chris Smith
(HCMR), Anastasija Zaiko (KUCORPI), Roberto Danovaro (CONISMA), Laura Carugati (CONISMA), Mike Elliott (UHULL).

Contents
1. Technical summary 1
2. Introduction 2
2.1. Rational and scope of the deliverable ........................................................................................................ 2 2.2. Monitoring for EU legislation and Regional Sea Conventions .................................................................... 6
2.2.1. Monitoring parameters according to MSFD .......................................................................................... 6 2.2.2. Monitoring parameters under other community legislation ............................................................... 10 2.2.3. Monitoring under the Regional Seas Conventions (RSCs) ................................................................... 17
3. Overview of the DEVOTES Catalogue of Monitoring Networks 18
4. Gap and SWOT analysis per Regional Sea: 32
4.1. North Eastern Atlantic .............................................................................................................................. 32 4.1.1. Monitoring Networks - overview ......................................................................................................... 32 4.1.2. Identification of gaps ........................................................................................................................... 40 4.1.3. SWOT analysis – North Eastern Atlantic .............................................................................................. 42
4.2. Baltic Sea .................................................................................................................................................. 45 4.2.1. Monitoring Networks - overview ......................................................................................................... 45 4.2.2. Identification of gaps ........................................................................................................................... 52 4.2.3. SWOT analysis – Baltic Sea................................................................................................................... 54
4.3. Black Sea and the Sea of Marmara ........................................................................................................... 56 4.3.1. Monitoring Networks - overview ......................................................................................................... 56 4.3.2. Identification of gaps ........................................................................................................................... 65 4.3.3. SWOT analysis – Black Sea and the Sea of Marmara ........................................................................... 68
4.4. Mediterranean Sea ................................................................................................................................... 70 4.4.1. Monitoring Networks - overview ......................................................................................................... 70 4.4.2. Identification of gaps ........................................................................................................................... 83 4.4.3. SWOT analysis – Mediterranean Sea ................................................................................................... 84
5. Concluding Remarks 86
5.1. Overall Gap analysis .................................................................................................................................. 86 5.2. Overall SWOT analysis .............................................................................................................................. 88
5.2.1. Strengths .............................................................................................................................................. 88 5.2.2. Weaknesses ......................................................................................................................................... 88 5.2.3. Opportunities ....................................................................................................................................... 90 5.2.4. Threats ................................................................................................................................................. 90
6. References 97
7. List of annexes 100

1
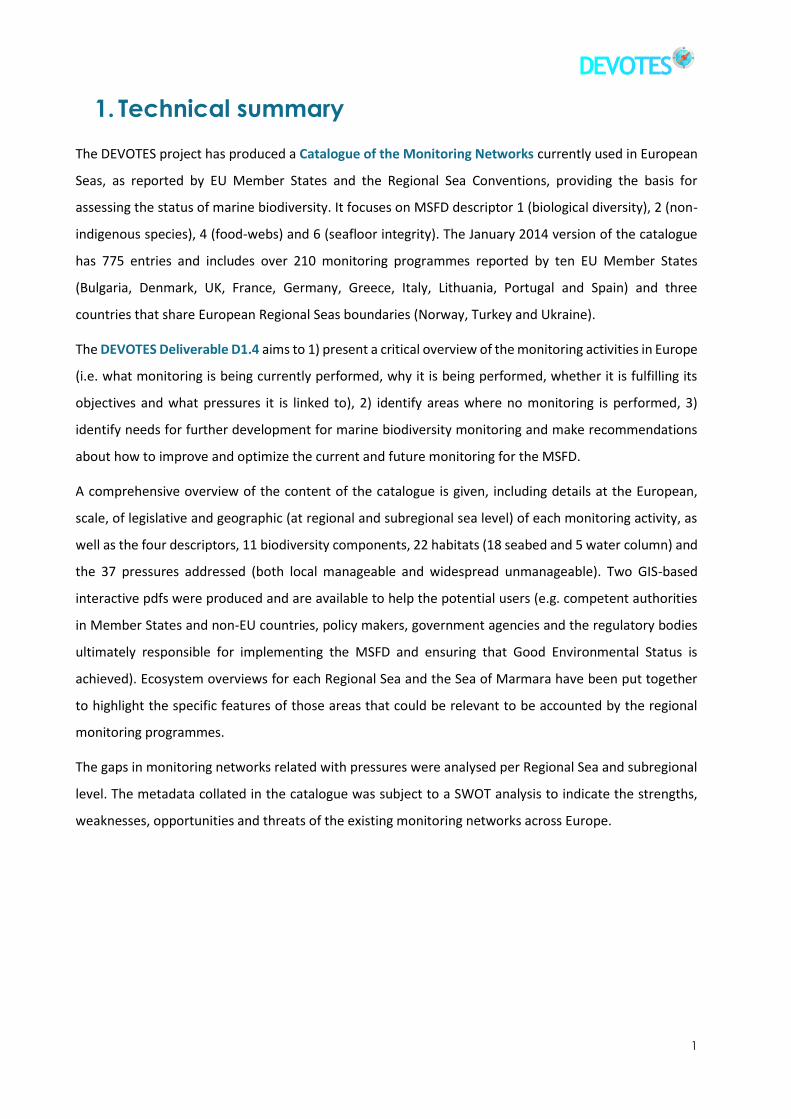
1. Technical summary
The DEVOTES project has produced a Catalogue of the Monitoring Networks currently used in European
Seas, as reported by EU Member States and the Regional Sea Conventions, providing the basis for
assessing the status of marine biodiversity. It focuses on MSFD descriptor 1 (biological diversity), 2 (non-
indigenous species), 4 (food-webs) and 6 (seafloor integrity). The January 2014 version of the catalogue
has 775 entries and includes over 210 monitoring programmes reported by ten EU Member States
(Bulgaria, Denmark, UK, France, Germany, Greece, Italy, Lithuania, Portugal and Spain) and three
countries that share European Regional Seas boundaries (Norway, Turkey and Ukraine).
The DEVOTES Deliverable D1.4 aims to 1) present a critical overview of the monitoring activities in Europe
(i.e. what monitoring is being currently performed, why it is being performed, whether it is fulfilling its
objectives and what pressures it is linked to), 2) identify areas where no monitoring is performed, 3)
identify needs for further development for marine biodiversity monitoring and make recommendations
about how to improve and optimize the current and future monitoring for the MSFD.
A comprehensive overview of the content of the catalogue is given, including details at the European,
scale, of legislative and geographic (at regional and subregional sea level) of each monitoring activity, as
well as the four descriptors, 11 biodiversity components, 22 habitats (18 seabed and 5 water column) and
the 37 pressures addressed (both local manageable and widespread unmanageable). Two GIS-based
interactive pdfs were produced and are available to help the potential users (e.g. competent authorities
in Member States and non-EU countries, policy makers, government agencies and the regulatory bodies
ultimately responsible for implementing the MSFD and ensuring that Good Environmental Status is
achieved). Ecosystem overviews for each Regional Sea and the Sea of Marmara have been put together
to highlight the specific features of those areas that could be relevant to be accounted by the regional
monitoring programmes.
The gaps in monitoring networks related with pressures were analysed per Regional Sea and subregional
level. The metadata collated in the catalogue was subject to a SWOT analysis to indicate the strengths,
weaknesses, opportunities and threats of the existing monitoring networks across Europe.
Deliverable 1.4 Report on SWOT analysis of monitoring
2
2. Introduction
2.1. Rational and scope of the deliverable
This Deliverable aims to identify gaps in monitoring networks used by Member States and Regional Sea
Conventions, related to pressures and climate change. The metadata collated in the DEVOTES Catalogue
of Monitoring Networks (see Annex 1) was subject to a SWOT (Strengths, Weaknesses, Opportunities,
Threats) analysis to indicate the successes, failings and opportunities in the present monitoring systems
(i.e. spatial and temporal adequacy, duplication of sampling efforts, availability of GIS data and supporting
physicochemical parameters, data sources and key contacts, etc) especially in relation to the different
types of pressures (managed and/or unmanaged), the biodiversity components and the biodiversity-
related Marine Strategy Framework Directive (MSFD) descriptors of Good Environmental Status (GEnS)
(i.e. D1: biological diversity; D2: Non-indigenous species; D4: food-webs and D6: seafloor integrity). This
exercise forms an initial step in assessing the potential for Member States to meet the requirements of
the MSFD, highlighting geographical areas where monitoring for particular biodiversity components or
pressures may be completely lacking.
This report aims to:
present a critical overview of the monitoring activities in Europe (i.e. what monitoring is being currently performed, why it is being performed, whether it is fulfilling its objectives and what pressures it is linked to);
identify areas where no monitoring is performed;
identify needs for further development for marine biodiversity monitoring, focusing on MSFD descriptors 1 (biological diversity), 2 (non-indigenous species), 4 (food-webs), and 6 (seafloor integrity) and;
make recommendations about how to improve and optimize the current and future monitoring for the MSFD;
Two GIS-based interactive pdfs were produced to visualize the spatial distribution of monitoring activities
at Regional and subregional Sea level (see Annex 2). The interactive pdf ‘Regional Overviews’ provides a
summary of monitoring at the regional sea level, whilst interactive pdf ‘Summary Maps’ provides a
summary of monitoring at subregion level. These pdfs provide interactive layered maps which can be
selected and de-selected to provide a graphical representation of information provided in the DEVOTES
Catalogue of Monitoring Networks. These maps identify the presence or absence and nature
(independent or simultaneous) of monitoring currently undertaken in regional and subregional seas which
are relevant for the MSFD. The maps identify and sum (number) the monitored descriptors and identify

3
and sum (total number) the monitored biodiversity components and habitats and pressures that are
currently being assessed.
It is of note that the catalogue has been compiled by DEVOTES partners and therefore monitoring
activities carried out by Member States not involved in DEVOTES may not necessarily be fully covered.
Development of the catalogue will continue throughout the DEVOTES project to encompass as many
monitoring programmes as possible. Therefore, whilst the presence or absence of monitoring within each
Regional Sea is representative, any outputs relating to numbers of monitoring programmes should be
considered preliminary. It is of note that as the deadline for Member States reporting their MSFD
monitoring strategy to the European Commission is July 2014 then at the time of this deliverable many
Member States are still formulating these strategies.
Brief summary of the structure of this report
This report is organised in seven sections:
1. Technical Summary: recapitulates the main aims of the deliverable, indicates the structure of the
document, summarises the monitoring activities in Europe and highlights the major strengths,
weaknesses, opportunities and threats of the current monitoring programmes reported in the
DEVOTES Catalogue of Monitoring Networks (Annex 1).
2. Introduction: it is divided in two subsections. The rational and scope of the deliverable are
addressed and the GIS-based interactive pdfs (Annex 2), produced to visualize the spatial
distribution of monitoring activities at regional and subregional sea level, are briefly explained
(section 2.1). In addition, to assist the project stakeholders (e.g. Member States, Regional
Authorities, etc.) in developing and/or planning MSFD monitoring in the most effort efficient
manner, we include a brief screening of the monitoring requirements imposed by the MSFD and
other EU legislation and international agreements (section 2.2). With this exercise we aim to
indicate where the MSFD monitoring requirements overlap with the requirements of EU
legislation and international agreements and emphasize that these programmes should already
provide some of the data required for MSFD monitoring.
3. DEVOTES Catalogue of Monitoring Networks – overall content: it is a comprehensive overview
of the content of the catalogue (January 2014 version), including details, at the European scale,
of legislative and geographic scope (at regional and subregional sea level) of each monitoring
activity as well as the descriptors, biodiversity components, habitats and the pressures addressed.

Deliverable 1.4 Report on SWOT analysis of monitoring
4
4. Gap and SWOT analysis per Regional Sea: a comprehensive analysis of the current situation,
structure, spread and coverage of monitoring programmes identified as suitable to address the
GEnS of the MSFD descriptors D1, D2, D4 and D6 in the four Regional Seas (i.e. North Eastern
Atlantic, Baltic Sea, Mediterranean Sea and Black Sea) and in the Sea of Marmara (non-EU marine
waters connecting the Mediterranean Sea with the Black Sea) is given (sections 4.1.1, 4.2.1, 4.3.1
and 4.4.1). For a better understanding of the ecosystems from each regional sea, a comprehensive
description can be seen in Annex 3. In addition, we present a gap analysis at regional and
subregional sea scale, highlighting the aspects missing in the current monitoring situation
(sections 4.1.2., 4.2.2., 4.3.2. and 4.4.2.) Finally, we carry out a detailed SWOT analysis specifying
the strengths, weaknesses, opportunities and threats in the present monitoring networks of each
Regional Seal and the Sea of Marmara (sections 4.1.3., 4.2.3., 4.3.3 and 4.4.3). The raw data (excel
files) used to support the analysis can be consulted in Annex 4.
5. Concluding Remarks: this section summarises the results per regional sea, presenting an overall
gap (section 5.1.) and SWOT analysis (section 5.2) of the current existing monitoring networks
used across the North Eastern Atlantic, Baltic Sea, Black Sea, Mediterranean Sea and the Sea of
Marmara.
6. References
7. List of annexes: the four supporting annexes of the results presented in this report are outlined
at the end of the document.

5
Note
Box 1 below includes definitions of terms frequently used throughout the report. Although different
definitions would be possible, these reflect the meaning they were attributed while used in the present
document.
BOX 1. D E F I N I T I O N O F T E R M S
_ _ _ _ _ _ _ _ _ _ _ _ _ _ _ _ _ _ _ _ _ _ _ _ _ _ _ _ _ _ _ _ _ _ _ _ _ _ _ _ _ _ _ _ _ _ _ _ _ _ _ _ _ _ _ _
SWOT (Strengths, Weaknesses, Opportinities, Threats) analysis – is a commonly-used assessment tool employed, in this report, to critique the monitoring networks in Europe, thus allowing us to:
explore possibilities for new efforts or solutions to problems;
make decisions about the best practices for MSFD monitoring. Identifying opportunities for success in the context of threats to success can clarify directions and choices;
determine where amendments/ adjustments are possible and write recommendations.
Gaps analysis – is a commonly-used term in management allowing the determination of aspects missing in the current situation and hence allowing an analysis of what is required to fill those gaps.
Marine Monitoring – the systematic, repeated measurement of biotic and abiotic parameters of the marine environment, with predefined spatial and temporal schedule, having the purpose to produce datasets that can be used for application of assessment methods and derive credible conclusions on whether the desired state or target is achieved or not and on the trend of changes for the marine area concerned. In this frame, monitoring includes the choice of the elements to measure, the location of sampling sites, the periodicity of sampling, the collection of field samples and data from other observation techniques, processing of the samples in the laboratory and of alternatively gained data (e.g. satellite imagery) and the compilation and management of the data. Development of assessment methods and classification of status as good or less than good is not included although closely related to monitoring. In a nutshell, monitoring should provide the data to allow assessment methods to classify a marine area as reaching or failing to reach GEnS (Zampoukas et al., 2014).
Monitoring Programme – all substantive arrangements for carrying out monitoring, including general guidance with cross-cutting concepts, monitoring strategies, monitoring guidelines, data reporting and data handling arrangements. Monitoring programmes include a number of scheduled and coordinated activities to provide the data needed for the ongoing assessment of environmental status and related environmental targets (Zampoukas et al., 2014). A monitoring programme can include one or several monitoring activities.
Monitoring Activities – the repeated sampling and analysis in time or space of one or more ecosystem components and carried out by an individual agency or institution. Data and marine information are obtained on a routine or specific basis, using sea surveys, remote sensing (i.e. teledetection), ferry boxes, data mining, or any other way.
Monitoring Network – a group of monitoring programmes undertaken or used within broader programmes, such as International Conventions, Regional Sea, EU Directives and/or national monitoring.
Web-platform and database levels – this makes the distinction between data sets which are collated in widely accessible formats (i.e. a website) and those that are collated and stored by individual agencies. These may or may not be accessible on request.

Deliverable 1.4 Report on SWOT analysis of monitoring
6
2.2. Monitoring for EU legislation and Regional Sea Conventions
2.2.1. Monitoring parameters according to MSFD
According to the MSFD Articles 5 and 11, EU Member States should by the 15th of July 2014, establish and
implement coordinated monitoring programmes for the ongoing assessment of the environmental status
of their marine waters and the assessment and regular updating of environmental targets. The scope of
the MSFD includes marine waters under the sovereignty and jurisdiction of EU Member States, i.e.coastal
and territorial waters and, where applicable, also Exclusive Economic Zones and the sea bottom and sub-
soil of the extended continental shelf.
BOX 1. D E F I N I T I O N O F T E R M S ( c o n t . )
_ _ _ _ _ _ _ _ _ _ _ _ _ _ _ _ _ _ _ _ _ _ _ _ _ _ _ _ _ _ _ _ _ _ _ _ _ _ _ _ _ _ _ _ _ _ _ _ _ _ _ _ _ _ _ _
Types of monitoring – Condition monitoring specifically relates to the conservation objectives and favourable conservation status. In contrast, surveillance monitoring can be any ‘look-see’ process; compliance monitoring relates to thresholds and trigger values which are stipulated in permits, investigative/diagnostic monitoring is the ability to determine the causes of change detected by the other types of monitoring (Elliott, 2011).
Pressure – the mechanism through which an activity has an actual or potential effect on any part of an ecosystem (Robinson et al., 2008).
Local and manageable pressure – pressures that occur as a result of human activities taking place on a localised scale (i.e. a discharge, a specific dredge disposal or aggregate extraction site, at the scale of the management unit). These pressures can be managed through permits/consents and monitoring. They are referred to as ENDOGENIC MANAGED PRESSURES where the causes are managed as well as the consequences (Elliott, 2011).
Widespread and unmanageable pressures – are those that are beyond the control of management that are occurring at regional scales and often outside the management unit. For example, temperature and hydrological changes associated with climate change, pH change due to volcanic activity (may be local but is not manageable). This is referred to as EXOGENIC UNMANAGED PRESSURES where the consequences are managed rather than the causes (Elliott, 2011).
Impacts –the adverse consequences of human activities and natural phenomena which require to be detected by monitoring over and above natural and inherent variability (summarized as a ‘signal’ of an activity over the environmental ‘noise’).
Human uses and users – the list of activities of the marine environment which may be summarized as activities which remove space and materials (habitat, fishing, aggregate extraction, water, salt, etc.) and those which input space-occupation or materials (building for land claim, bridges, heated effluents, pollutants, etc). The activity is the use and those performing it are the users.
7
Monitoring programmes should be based on the initial assessment undertaken in 2012 where, according
to Article 8, Member States were required to provide:
an analysis of the essential features, characteristics and current environmental status of their marine waters;
an analysis of the predominant pressures and impacts and;
an economic and social analysis of the use of their marine waters and the cost of degradation of the marine environment.
Consequently, before drafting their monitoring programmes Member States should be well aware of the
species and habitats they host, their current condition and the pressures impacting on them. Before
finalizing monitoring programmes, Member States shall publish them and make them available for public
consultation.
Member States sharing a marine region or subregion should aim for coherence and coordination by
ensuring that monitoring methods are consistent across the marine region or subregion and that
transboundary impacts and features are taken into account. Moreover, monitoring programmes should
be based on and be compatible with the European acquis, such as the Habitats and Birds Directives and
other international agreements, such as the RSCs. Further specifications can be found in Annex V of the
Directive.
Member States shall notify the Commission of their monitoring programmes within three months of their
establishment, i.e. by the 15th October 2014. According to Article 12, the Commission will assess within
six months of receiving these notifications if the monitoring programmes constitute an appropriate
framework to meet the requirements of the Directive and it may ask Member States for additional
available required information. The Commission will particularly consider the coherence of frameworks
within the different marine regions and subregions and across the EU and will inform Member States on
the outcomes of this assessment and it will provide guidance on necessary modifications.
Member States shall in a coordinated manner review their monitoring programmes every six years after
their initial establishment, i.e. in 2020, 2026 and so on, following the six years cycle of the MSFD that
includes assessment, determination of GEnS, setting of environmental targets, establishment of
monitoring programmes and identification and implementation of programmes of measures (see Figure
1, from Claussen et al., 2011). Monitoring programmes should include the characteristics, the pressures
and impacts included in the Directive’s Annex III.

Deliverable 1.4 Report on SWOT analysis of monitoring
8
Figure 1. Marine Strategy Framework Directive management cycle (from Claussen et al., 2011).
Table 1 of this report summarises the information on the criteria for GEnS and indicators (COM DEC
2010/477/EU) relevant to the Descriptor 1 (Biological Diversity), Descriptor 2 (Non-indigenous species),
Descriptor 4 (Food-webs) and Descriptor 6 (Sea-floor integrity) of Annex I to Directive 2008/56/EC.

9
Table 1. Criteria for GEnS and indicators (COM DEC 2010/477/EU) relevant to the Descriptors 1, 2, 4 and 6 of Annex I to Directive 2008/56/EC.
DESCRIPTOR CRITERIA INDICATORS
1.1.1 Distributional range
1.1.2 Distributional pattern within the latter, where appropriate
1.1.3 Area covered by the species (for sessile/benthic species)
1.2 Population size 1.2.1 Population abundance and/or biomass, as appropriate
1.3.1 Population demographic characteristics (e.g. body s ize or age class s tructure, sex ratio, fecundity rates , surviva l/morta l i ty rates )
1.3.2 Population genetic structure, where appropriate
1.4.1 Distributional range
1.4.2 Distributional pattern
1.5.1 Habitat area
1.5.2 Habitat volume, where relevant
1.6.1 Condition of the typical species and communities
1.6.2 Relative abundance and/or biomass, as appropriate
1.6.3 Physical, hydrological and chemical conditions
1.7 Ecosystem structure 1.7.1 Composition and relative proportions of ecosystem components (habitats and species)
2.1 Abundance and state characterisation
of non-indigenous species, in particular
invasive species
2.1.1 Trends in abundance, temporal occurrence and spatial distribution in the wild of non-indigenous species, particularly
invasive non-indigenous species, notably in risk areas, in relation to the main vectors and pathways of spreading of such
species
2.2.1 Ratio between invasive non-indigenous species and native species in some well studied taxonomic groups (e.g. fi sh,
macroalgae, mol luscs ) that may provide a measure of change in species composition (e.g. further to the displacement of native
species )
2.2.2 Impacts of non-indigenous invasive species at the level of species, habitats and ecosystem, where feasible
4.1 Productivity (production per unit
biomass) of key species or trophic groups 4.1.1 Performance of key predator species using their production per unit biomass (productivi ty)
4.2 Proportion of selected species at the
top of food webs 4.2.1 Large fish (by weight)
4.3 Abundance/distribution of key
trophic groups/species 4.3.1 Abundance trends of functionally important selected groups/species
6.1.1 Type, abundance, biomass and areal extent of relevant biogenic substrate
6.1.2 Extent of the seabed significantly affected by human activities for the different substrate types
6.2.1 Presence of particularly sensitive and/or tolerant species
6.2.2 Multi-metric indexes assessing benthic community condition and functionality, such as species diversity and richness,
proportion of opportunistic to sensitive species
6.2.3 Proportion of biomass or number of individuals in the macrobenthos above some specified length/size
6.2.4 Parameters describing the characteristics (shape, s lope and intercept) of the size spectrum of the benthic community
6.2 Condition of benthic community
1.6 Habitat condition
Descriptor 6: Sea-floor integrity is at a level that
ensures that the structure and functions of the
ecosystems are safeguarded and benthic ecosystems,
in particular, are not adversely affected.
Descriptor 1: Biological diversity is maintained. The
quality and occurrence of habitats and the distribution
and abundance of species are in line with prevailing
physiographic, geographic and climate conditions.
Descriptor 2: Non-indigenous species introduced by
human activities are at levels that do not adversely
alter the ecosystem.
Descriptor 4: All elements of the marine food webs, to
the extent that they are known, occur at normal
abundance and diversity and levels capable of ensuring
the long-term abundance of the species and the
retention of their full reproductive capacity.
1.1 Species distribution
1.3 Population condition
1.4 Habitat distribution
1.5 Habitat extent
2.2 Environmental impact of invasive non-
indigenous species
6.1 Physical damage, having regard to
substrate characteristics
Deliverable 1.4 Report on SWOT analysis of monitoring
10
Table 2 of this document details the 58 monitoring requirements (of MSFD Annex III) that we considered
related to Descriptors 1, 2, 4 and 6. Monitoring requirements related to litter and noise, although they
impact biodiversity, are not included in this list as they are not directly related to one of the D1, 2, 4 and
6 indicators and are explicitly addressed by Descriptors 10 and 11, respectively. Requirements related to
physical, hydrological and chemical conditions are included as they relate to indicator 1.6.3 (physical,
hydrological and chemical conditions of the habitat) and are usually measured as elements supporting
biodiversity monitoring. Requirements related to contaminants are not included, although it could be
argued that they are related to indicator 1.6.3, as they are not usually considered as standard supporting
elements and are explicitly addressed by Descriptors 8 and 9.
2.2.2. Monitoring parameters under other community legislation
The pieces of EU legislation most related to marine biodiversity are the Habitats Directive1 and Birds
Directive2 that apply to all areas where Member States have sovereignty and jurisdiction. The Water
Framework Directive3 (WFD), the Urban Waste-water Treatment Directive and the Common Fisheries
Policy are also relevant. In particular, given the overlap in spatial jurisdiction between the WFD and MSFD,
Member States appear to be using WFD monitoring to achieve the MSFD monitoring. In this
subsectionmarine biodiversity related monitoring requirements of the European acquis are presented and
related to MSFD indicators. This relationship does not necessarily mean that monitoring for these
requirements fully covers monitoring required for MSFD descriptors.
The Habitats Directive includes species and habitats ‘of community interest’ that should be protected in
order to be in “favourable conservation status”. Member States should report every six years the
measures taken and their impact on the conservation status of concerned habitats and species.
Monitoring requirements are not explicitly defined but in order to assess the conservation status of
species and habitats, data on the natural and current range and population dynamics of species and size
of the habitats are required. According to the Technical Guidance on MSFD Monitoring (Zampoukas et al.,
2014) that is based on MSFD CIS (2012), there are eight marine or potentially marine habitats and 82
marine or potentially marine species listed in the annexes of the Habitats Directive. Potentially marine
species and habitats are the ones that could occur in marine waters but possibly also outside them (e.g.
1 Council Directive 92/43/EEC of 21 May 1992 on the conservation of natural habitats and of wild fauna and flora.
2 Directive 2009/147/EC of the European Parliament and of the Council of 30 November 2009 on the conservation of wild birds.
3 Directive 2000/60/EC of the European Parliament and of the Council of 23 October 2000 establishing a framework for Community action in the field of water policy

11
in transitional waters). There are 15 monitoring requirements in the Habitats Directive and 13 that are
relevant to MSFD descriptors 1, 2, 4 and 6 (Table 3).
Table 2. Marine biodiversity related monitoring requirements of the Marine Strategy Framework Directive (MSFD) Annex III and their relevant MSFD indicators of the COM DEC 2010/477/EU (based on Zampoukas et al., 2012).
Parameter Relevant MSFD
Indicators
1 Angiosperms biomass and its annual/seasonal variability 1.2.1, 1.6.1, 1.6.2, 1.7.1, 4.3.1,
6.1.2
2 Angiosperms species composition and its annual/seasonal variability 1.6.2, 1.7.1, 2.1.1, 2.2.1, 4.3.1,
6.2.1, 6.2.2
3 Fish abundance 1.2.1, 1.7.1, 2.1.1, 2.2.1, 4.1.1,
4.2.1, 4.3.1
4 Fish age / size structure 1.3.1, 1.6.1, 4.1.1, 4.2.1
5 Fish distribution 1.1.1, 2.1.1, 2.2.1
6 Genetically distinct forms of native species abundance 1.3.2, 2.2.1, 4.3.1
7 Genetically distinct forms of native species occurrence 1.3.2
8 Genetically distinct forms of native species spatial distribution 1.1.1, 1.1.2, 2.2.1
9 Habitats’(predominant, special, protected and endangered) characteristics 1.4.1, 1.4.2, 1.5.1, 1.5.2, 1.7.1,
6.1.1
10 Introduction of non-indigenous species 2.1.1, 2.2.1
11 Invertebrate bottom fauna biomass and its annual/seasonal variability 1.2.1, 1.6.1, 1.6.2, 1.7.1, 2.1.1,
2.2.1, 4.3.1, 6.1.2
12 Invertebrate bottom fauna species composition and its annual/seasonal
variability 1.6.2, 1.7.1, 2.1.1, 2.2.1, 4.3.1,
6.1.1, 6.2.1, 6.2.2
13 Macro-algae biomass 1.2.1, 1.6.1, 1.6.2, 1.7.1, 2.1.1,
2.2.1, 4.3.1, 6.1.2
14 Macro-algae species composition 1.6.2, 1.7.1, 2.1.1, 2.2.1, 6.2.1,
6.2.2
15 Marine mammals actual range 1.1.1
16 Marine mammals natural range 1.1.1
17 Marine mammals population dynamics 1.3.1, 4.1.1, 4.3.1
18 Marine mammals status 1.2.1, 1.3.1, 1.6.1
19 Non-indigenous or exotic species abundance 2.1.1, 2.2.1
20 Non-indigenous or exotic species occurrence 2.1.1, 2.2.1
21 Non-indigenous or exotic species spatial distribution 2.1.1, 2.2.1
22 Other protected species actual range 1.1.1
23 Other protected species natural range 1.1.1
24 Other protected species population dynamics 1.3.1

Deliverable 1.4 Report on SWOT analysis of monitoring
12
25 Other protected species status 1.2.1, 1.3.1, 1.6.1
26 Phytoplankton spp. composition and its geographical/seasonal variability 1.7.1, 2.1.1, 2.2.1
27 Reptiles actual range 1.1.1
28 Reptiles natural range 1.1.1
29 Reptiles population dynamics 1.3.1, 4.3.1
30 Reptiles status 1.2.1, 1.3.1, 1.6.1
31 Seabirds actual range 1.1.1
32 Seabirds natural range 1.1.1
33 Seabirds population dynamics 1.3.1, 4.1.1, 4.3.1
34 Seabirds species’ status 1.2.1, 1.3.1, 1.6.1
35 Translocations of non-indigenous species 2.1.1, 2.2.1
36 Zooplankton spp. composition and its geographical/ seasonal variability 1.6.2, 1.7.1, 2.1.1, 2.2.1
37 Acidification 1.6.3
38 Abrasion 1.6.3, 6.1.1, 6.1.2
39 Currents 1.6.3
40 Depth 1.6.3
41 Extraction 6.1.2
42 Ice cover 1.6.3
43 Mixing characteristics 1.6.3
44 Nutrient concentrations 1.6.3, 5.1.1
45 Oxygen 1.6.3
46 Residence time 1.6.3
47 Salinity 1.6.3
48 Seabed Bathymetry 1.6.3
49 Seabed Structure 6.1.1, 6.1.2
50 Seabed Substrata Composition 6.1.1, 6.1.2
51 Seabed Topography 6.1.1, 6.1.2
52 Sealing 6.1.2
53 Siltation (changes in) 1.6.3
54 Smothering 6.1.2
55 Temperature 1.6.3
56 Turbidity 1.6.3
57 Upwelling 1.6.3
58 Wave exposure 1.6.3

13
Table 3. Monitoring requirements of the Habitats Directive and their relevant Marine Strategy Framework Directive (MSFD) indicators (COM DEC 2010/477/EU) (based on Zampoukas et al., 2012).
Habitats Directive Parameter Relevant MSFD
Indicators
1 Natural range of natural habitat types of community interest 1.4.1, 6.1.1
2 Area covered by natural habitat types of community interest 1.4.1, 1.6.2, 1.7.1, 6.1.1
3 Specific structure of natural habitat types of community interest 6.1.1
4 Status of conservation of species in natural habitat types of community
interest 1.6.1
5 Population dynamics of animal and plant species of community interest 1.3.1, 1.6.1
6 Natural range of animal and plant species of community interest 1.1.1
7 Presence of habitat for animal and plant species of community interest 1.5.1, 1.5.2
8 Population dynamics of animal and plant species of community interest in
need of strict protection 1.3.1, 1.6.1
9 Natural range of animal and plant species of community interest in need of
strict protection 1.1.1
10 Presence of (sufficiently large) habitat of animal and plant species of
community interest in need of strict protection 1.5.1, 1.5.2
11 Population dynamics of animal and plant species of community interest in
need of strict protection 1.3.1, 1.6.1
12 Natural range of animal and plant species of community interest in need of
strict protection 1.1.1
13
Presence of (sufficiently large) habitat of animal and plant species of community interest whose taking in the wild and exploitation may be
subject to management measures
1.5.1, 1.5.2
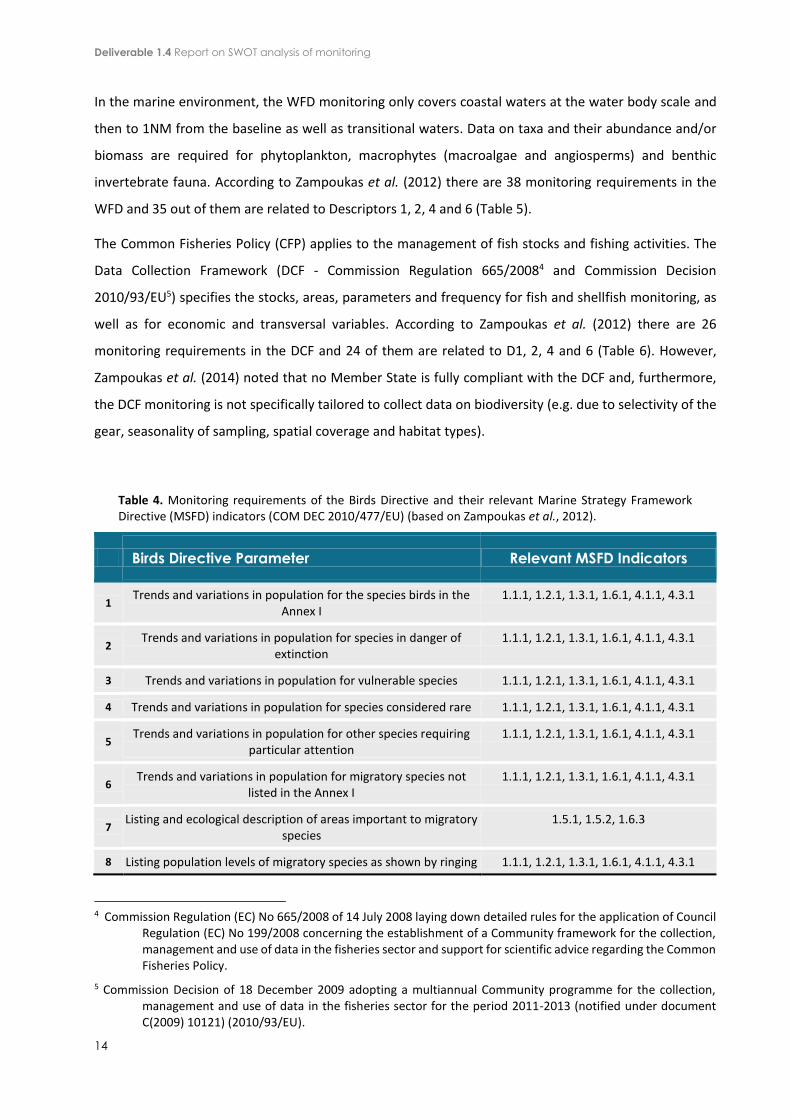
The Birds Directive requires Member States to take measures to maintain the population of listed species
and report these measures every three years. This directive lists 68 marine or potentially marine bird
species that require special protection areas (Zampoukas et al., 2014). Monitoring requirements are not
explicitly mentioned but for the setting of conservation measures Member States should take into
account trends and variations in populations (Table 4).
According to Zampoukas et al. (2012), there are 38 monitoring requirements in the WFD of which 35 are
related to Descriptors 1, 2, 4 and 6 (Table 5). It is assumed here that the MSFD will be implemented by
Member States up to the tidal limit but excluding transitional waters; this may be represented by the bay-
closing lines.
Deliverable 1.4 Report on SWOT analysis of monitoring
14
In the marine environment, the WFD monitoring only covers coastal waters at the water body scale and
then to 1NM from the baseline as well as transitional waters. Data on taxa and their abundance and/or
biomass are required for phytoplankton, macrophytes (macroalgae and angiosperms) and benthic
invertebrate fauna. According to Zampoukas et al. (2012) there are 38 monitoring requirements in the
WFD and 35 out of them are related to Descriptors 1, 2, 4 and 6 (Table 5).
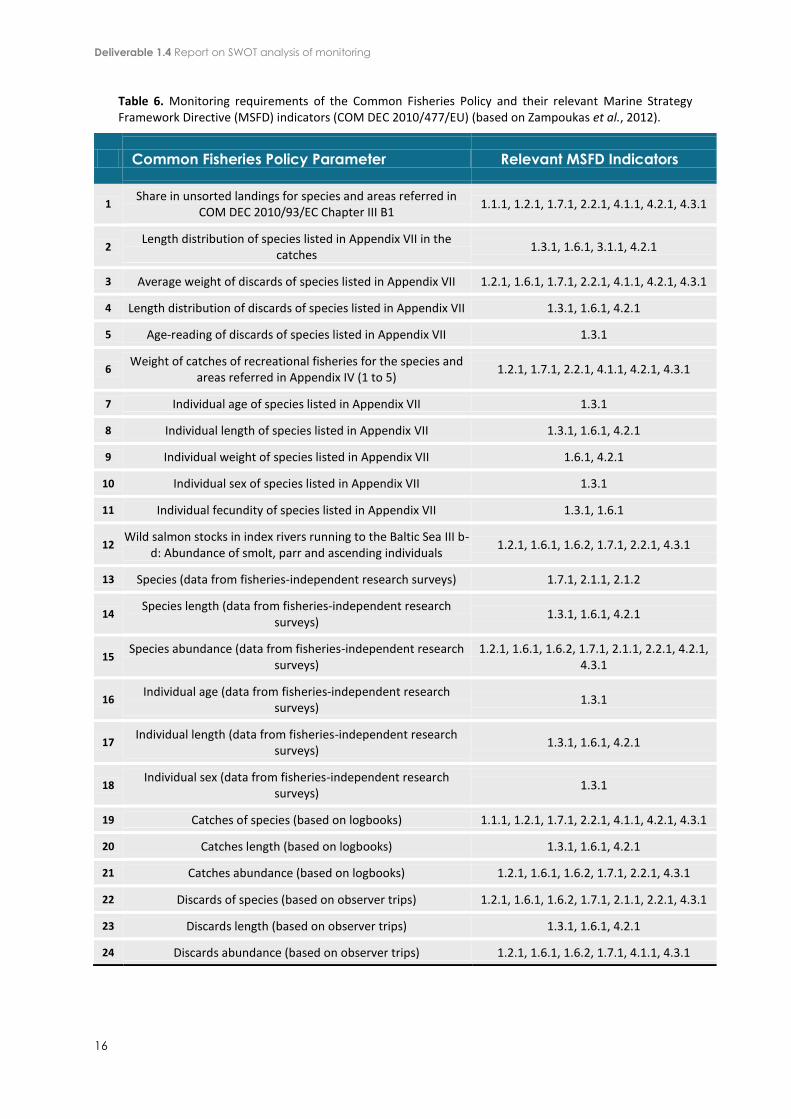
The Common Fisheries Policy (CFP) applies to the management of fish stocks and fishing activities. The
Data Collection Framework (DCF - Commission Regulation 665/20084 and Commission Decision
2010/93/EU5) specifies the stocks, areas, parameters and frequency for fish and shellfish monitoring, as
well as for economic and transversal variables. According to Zampoukas et al. (2012) there are 26
monitoring requirements in the DCF and 24 of them are related to D1, 2, 4 and 6 (Table 6). However,
Zampoukas et al. (2014) noted that no Member State is fully compliant with the DCF and, furthermore,
the DCF monitoring is not specifically tailored to collect data on biodiversity (e.g. due to selectivity of the
gear, seasonality of sampling, spatial coverage and habitat types).
Table 4. Monitoring requirements of the Birds Directive and their relevant Marine Strategy Framework Directive (MSFD) indicators (COM DEC 2010/477/EU) (based on Zampoukas et al., 2012).
Birds Directive Parameter Relevant MSFD Indicators
1 Trends and variations in population for the species birds in the
Annex I 1.1.1, 1.2.1, 1.3.1, 1.6.1, 4.1.1, 4.3.1
2 Trends and variations in population for species in danger of
extinction 1.1.1, 1.2.1, 1.3.1, 1.6.1, 4.1.1, 4.3.1
3 Trends and variations in population for vulnerable species 1.1.1, 1.2.1, 1.3.1, 1.6.1, 4.1.1, 4.3.1
4 Trends and variations in population for species considered rare 1.1.1, 1.2.1, 1.3.1, 1.6.1, 4.1.1, 4.3.1
5 Trends and variations in population for other species requiring
particular attention 1.1.1, 1.2.1, 1.3.1, 1.6.1, 4.1.1, 4.3.1
6 Trends and variations in population for migratory species not
listed in the Annex I 1.1.1, 1.2.1, 1.3.1, 1.6.1, 4.1.1, 4.3.1
7 Listing and ecological description of areas important to migratory
species 1.5.1, 1.5.2, 1.6.3
8 Listing population levels of migratory species as shown by ringing 1.1.1, 1.2.1, 1.3.1, 1.6.1, 4.1.1, 4.3.1
4 Commission Regulation (EC) No 665/2008 of 14 July 2008 laying down detailed rules for the application of Council
Regulation (EC) No 199/2008 concerning the establishment of a Community framework for the collection, management and use of data in the fisheries sector and support for scientific advice regarding the Common Fisheries Policy.
5 Commission Decision of 18 December 2009 adopting a multiannual Community programme for the collection, management and use of data in the fisheries sector for the period 2011-2013 (notified under document C(2009) 10121) (2010/93/EU).

15
Table 5. Monitoring requirements of the Water Framework Directive (WFD) and their relevant Marine Strategy Framework Directive (MSFD) indicators (COM DEC 2010/477/EU) (Zampoukas et al., 2012).
Water Framework Directive Parameter Relevant MSFD Indicators
1 Angiosperms Abundance 1.2.1, 1.6.1, 1.6.2, 1.7.1, 4.3.1, 6.1.2
2 Angiosperms Composition 1.6.2, 1.7.1, 2.1.1, 2.2.1, 6.2.1, 6.2.2
3 Angiosperms Cover 1.1.3, 1.2.1, 1.6.1, 1.6.2, 1.7.1, 4.3.1, 6.1.2
4 Angiosperms Depth Distribution 1.1.1, 1.2.1, 1.6.1, 1.7.1, 4.3.1
5 Angiosperms Presence of Sensitive Taxa 6.2.1
6 Benthic Invertebrate Fauna - Presence of Sensitive Taxa 6.2.1
7 Benthic Invertebrate Fauna Abundance 1.2.1, 1.6.1, 1.6.2, 1.7.1, 4.3.1, 6.1.2
8 Benthic Invertebrate Fauna Composition 1.6.2, 1.7.1, 2.1.1, 2.2.1, 6.1.1, 6.2.1, 6.2.2
9 Benthic Invertebrate Fauna Diversity 1.7.1, 6.2.2
10 Macro-algae - Presence of Sensitive Taxa 6.2.1
11 Macro-algae Abundance 1.2.1, 1.6.1, 1.6.2, 1.7.1, 4.3.1, 6.1.2
12 Macro-algae Cover 1.1.3, 1.2.1, 1.6.1, 1.6.2, 1.7.1, 4.3.1, 6.1.2
13 Macro-algae Depth Distribution 1.1.1, 1.2.1, 1.6.2, 1.6.1, 1.7.1
14 Macro-algae Species Composition 1.6.2, 1.7.1, 2.1.1, 2.2.1, 6.2.1, 6.2.2
15 Phytoplankton Abundance 1.2.1, 1.6.1, 1.6.2, 1.7.1, 4.3.1
16 Phytoplankton Biomass 1.6.2, 1.7.1, 4.3.1
17 Phytoplankton Bloom Frequency / Intensity 4.3.1
18 Phytoplankton Composition 1.7.1, 2.1.1, 2.2.1
19 Phytoplankton Diversity 1.7.1
20 Acidification 1.6.3
21 Ammonium 1.6.3
22 Nitrates 1.6.3
23 Nutrient Conditions 1.6.3
24 Oxygenation 1.6.3
25, 26, 27 Bed Quantity, structure and substrate 1.6.3, 6.1.1, 6.1.2
28 Conductivity 1.6.3
29 Depth Variation 1.6.3
30 Direction of Dominant Currents 1.6.3
31 pH 1.6.3
32 Salinity 1.6.3
33 Temperature 1.6.3
34 Transparency 1.6.3
35 Residence Time 1.6.3
Deliverable 1.4 Report on SWOT analysis of monitoring
16
Table 6. Monitoring requirements of the Common Fisheries Policy and their relevant Marine Strategy Framework Directive (MSFD) indicators (COM DEC 2010/477/EU) (based on Zampoukas et al., 2012).
Common Fisheries Policy Parameter Relevant MSFD Indicators
1 Share in unsorted landings for species and areas referred in
COM DEC 2010/93/EC Chapter III B1 1.1.1, 1.2.1, 1.7.1, 2.2.1, 4.1.1, 4.2.1, 4.3.1
2 Length distribution of species listed in Appendix VII in the
catches 1.3.1, 1.6.1, 3.1.1, 4.2.1
3 Average weight of discards of species listed in Appendix VII 1.2.1, 1.6.1, 1.7.1, 2.2.1, 4.1.1, 4.2.1, 4.3.1
4 Length distribution of discards of species listed in Appendix VII 1.3.1, 1.6.1, 4.2.1
5 Age-reading of discards of species listed in Appendix VII 1.3.1
6 Weight of catches of recreational fisheries for the species and
areas referred in Appendix IV (1 to 5) 1.2.1, 1.7.1, 2.2.1, 4.1.1, 4.2.1, 4.3.1
7 Individual age of species listed in Appendix VII 1.3.1
8 Individual length of species listed in Appendix VII 1.3.1, 1.6.1, 4.2.1
9 Individual weight of species listed in Appendix VII 1.6.1, 4.2.1
10 Individual sex of species listed in Appendix VII 1.3.1
11 Individual fecundity of species listed in Appendix VII 1.3.1, 1.6.1
12 Wild salmon stocks in index rivers running to the Baltic Sea III b-
d: Abundance of smolt, parr and ascending individuals 1.2.1, 1.6.1, 1.6.2, 1.7.1, 2.2.1, 4.3.1
13 Species (data from fisheries-independent research surveys) 1.7.1, 2.1.1, 2.1.2
14 Species length (data from fisheries-independent research
surveys) 1.3.1, 1.6.1, 4.2.1
15 Species abundance (data from fisheries-independent research
surveys) 1.2.1, 1.6.1, 1.6.2, 1.7.1, 2.1.1, 2.2.1, 4.2.1,
4.3.1
16 Individual age (data from fisheries-independent research
surveys) 1.3.1
17 Individual length (data from fisheries-independent research
surveys) 1.3.1, 1.6.1, 4.2.1
18 Individual sex (data from fisheries-independent research
surveys) 1.3.1
19 Catches of species (based on logbooks) 1.1.1, 1.2.1, 1.7.1, 2.2.1, 4.1.1, 4.2.1, 4.3.1
20 Catches length (based on logbooks) 1.3.1, 1.6.1, 4.2.1
21 Catches abundance (based on logbooks) 1.2.1, 1.6.1, 1.6.2, 1.7.1, 2.2.1, 4.3.1
22 Discards of species (based on observer trips) 1.2.1, 1.6.1, 1.6.2, 1.7.1, 2.1.1, 2.2.1, 4.3.1
23 Discards length (based on observer trips) 1.3.1, 1.6.1, 4.2.1
24 Discards abundance (based on observer trips) 1.2.1, 1.6.1, 1.6.2, 1.7.1, 4.1.1, 4.3.1

17
2.2.3. Monitoring under the Regional Seas Conventions (RSCs)
Table 7, modified from Zampoukas et al. (2014), summarizes monitoring requirements in the four RSCs
and relates them to MSFD indicators without necessarily implying that contracting parties are fully
compliant.
Table 7. Monitoring requirements of HELCOM, OSPAR, Barcelona and Bucharest Conventions that are related to indicators within the Marine Strategy Framework Directive (MSFD) Descriptors 1, 2, 4 and 6.
HELCOM * OSPAR** Barcelona
Convention***
Bucharest
Convention****
Related MSFD
indicators
Chl-a Chl-a Chl-a Chl-a 1.6.2, 1.7.1, 4.3.1
Phytoplankton Phytoplankton indicator species
Phytoplankton (total density, total
biomass)
1.1.3, 1.2.1, 1.6.1, 1.6.2, 1.7.1, 4.3.1, 6.1.2
Phytobenthos Macrophytobenthos 1.1.3, 1.2.1, 1.6.1, 1.6.2, 1.7.1, 4.3.1, 6.1.2
Zooplankton Mesozooplankton, Biomass of Noctilluca
1.1.3, 1.2.1, 1.6.1, 1.6.2, 1.7.1, 4.3.1, 6.1.2
Zoobenthos Benthic communities Macrozoobenthos 1.1.3, 1.2.1, 1.6.1, 1.6.2, 1.7.1, 4.3.1, 6.1.2
Birds 1.1.1, 1.2.1, 1.3.1, 1.6.1, 4.1.1, 4.3.1
Mammals 1.1.1, 1.2.1, 1.3.1, 1.6.1, 4.1.1, 4.3.1
Fish Fish landings
1.1.1, 1.2.1, 1.3.1, 1.6.1, 4.1.1, 4.3.1
Non-indigenous species
2.1.1, 2.2.1, 2.2.2
Hydrography Salinity, Temperature, Oxygen
Temperature, Salinity, Dissolved
oxygen
Oxygen, pH, Salinity, Secchi depth, Temperature
1.6.3
Nutrients NH4-N2, NO2-N2, NO3-N2, PO4-P3, SiO4-Si4
NO3-N, NO2-N, NH4-N, PO4-P, SiO4
N (NH4, NO2, NO3, N-total), P (PO4 & P-total),
SiO4
1.6.3
TOC, POC Total Suspended Solids 1.6.3
*Monitoring requirements listed are the ones included in the revised monitoring strategy.
** Information is based on existing formal monitoring programmes. Many of the existing monitoring activities and data streams (e.g. for EcoQOs or human activities) are not yet organised through a formal “monitoring programme” while still follow agreed and coordinated approaches, procedures, methods and standards.
*** With regard to biodiversity the countries do not implement yet a regionally coordinated biodiversity monitoring programme. However, biodiversity monitoring is included in the SPA/ Birds Directive Protocol (Articles 3, 7 and 20) as an obligation for the Contracting Parties.
**** Frequency of monitoring is affected by funding that is not always adequate and monitoring in the open sea seems to be only sporadic.

Deliverable 1.4 Report on SWOT analysis of monitoring
18
The four European RSCs are coordinating marine monitoring of their contracting parties. The MSFD
strengthened the role of the RSCs in ensuring coordinated implementation of the Directive. The
coordination appears to vary across the four RSCs. According to Zampoukas et al. (2014), HELCOM, in its
revised strategy, seems to be much advanced in including the whole range of MSFD requirements and
OSPAR has also developed plans to include more elements related to progress in developing and agreeing
Ecological Quality Objectives (EcoQOs). In the Mediterranean, issues related to monitoring of biodiversity
components additional to contaminants and eutrophication has not yet been agreed, while in the Black
Sea, biodiversity related monitoring activities focus on plankton, benthos and fish.
3. Overview of the DEVOTES Catalogue of Monitoring
Networks
The DEVOTES Catalogue of Monitoring Networks was produced under DEVOTES Task 1.2.1 and
Deliverable D1.3 (Patrício et al., 2013). This is the first catalogue to provide an overall perspective to
Member States on ongoing monitoring programmes and networks that can be used to assess the response
of specific biodiversity components to managed and un‐managed pressures in all Regional Seas at a range
of spatial scales (subregion to subdivision to ecological assessment area). For a better understanding of
the ecosystems from each regional sea, a comprehensive description can be seen in Annex 3. The focus
of our analysis was on four MSFD descriptors, i.e. biological diversity (D1), non-indigenous species (D2),
food-webs (D4), and seafloor integrity (D6). The structure and potential uses and value of the catalogue
are described in detail in the Deliverable D1.3. (Patrício et al., 2013) and are summarized only briefly here.
The catalogue includes details of the legislative and geographic scope (at regional and subregional sea
level) of each monitoring activity, together with details of the descriptors, biodiversity components,
habitats and the pressures addressed. Associated information include the existence of related quality
assurance (QA), programmes, and the availability of GIS data and the supporting parameters, as an
indication of data quality. Thus, the DEVOTES Catologue of Monitoring Networks provides an essential
resource to competent authorities in Member States and non‐EU countries for identifying ongoing
monitoring, research and datasets for ecologically important species and habitats.
The catalogue also provides an indication of whether the MSFD can already effectively be implemented
in all regions and whether additional monitoring is required. Through this approach, the catalogue is of
value in the development of comprehensive and coordinated monitoring networks throughout Europe. It

19
will therefore be of potential use to policy makers, government agencies and the regulatory bodies
ultimately responsible for implementing the MSFD and ensuring that GEnS is achieved.
The information presented in the catalogue will enhance opportunities for data collation and sharing,
coordination and harmonisation of monitoring programmes between Member States. Importantly, details
of key contacts, data sources and timescales for data collection associated with each monitoring
programme are contained within the catalogue. This will enable Member States to optimise their sampling
by collating details of the spatial distribution, parameters and sampling frequency associated with existing
monitoring, thus enabling optimal sampling design to complement (rather than replicate) existing
monitoring efforts. Potentially, this could help to prevent duplication of sampling effort between nations
and help Member States to coordinate their monitoring in terms of timing of their sampling, the
parameters/data being collected and the geographical location, resulting in large, coordinated datasets
for the subregions of each Regional Sea.
This coordinated approach can provide important information for Member States when establishing or
recommending pressure—related monitoring strategies in their own waters (e.g. for the MSFD), by
assessing whether the existing monitoring is fit for purpose, providing remedies to deficiencies,
highlighting monitoring gaps, identifying elements that should be added to existing programmes and
making recommendations for future monitoring. Ultimately, such coordinated monitoring will result in a
better assessemnt of whether or not GEnS has been achieved at the Regional Sea level.
The current version of the catalogue (January 2014) considers the depth and breadth of marine
monitoring of ten EU Member States (Bulgaria, Denmark, UK, France, Germany, Greece, Italy, Lithuania,
Portugal and Spain) and three non-EU countries that share European Regional Seas boundaries (Norway,
Turkey and Ukraine) (Figure 2). The information was gathered mainly by national research institutions
that are partners in DEVOTES, often in collaboration with national authorities but not necessarily
corresponding to the national official MSFD monitoring activities. In subsequent updates of the catalogue,
additional EU Member States are expected to provide information regarding their monitoring activities.
The analysis of the meta-data provided by countries where the recorded monitoring programmes are
based has revealed gaps in the geographic distribution of monitoring activities. However, the gaps should
be interpreted carefully. They do not necessarily indicate lack of monitoring activities. At this stage, gaps
in the monitoring should be interpreted as “missing data” rather than actual gaps. The Baltic Sea region
is a good example of this constrain.

Deliverable 1.4 Report on SWOT analysis of monitoring
20
Figure 2. Countries that filled in the DEVOTES Catalogue of Monitoring Networks (green). (Figure taken and adapted from EMIS website: EMIS-EU-bathymetry-maritime boundaries-borders; http://emis.jrc.ec.europa.eu/4_1_gismap.php)
The catalogue is deliberately broad in scope and includes a very diverse set of programmes. This version
has 775 entries and includes over 210 monitoring programmes. Several monitoring programmes include
more than one monitoring activity that target distinct biodiversity components, and/or habitat types,
and/or pressures, and /or marine regions, subregions or subdivisions.
The actual distribution of monitoring activity is not best represented by plotting the country carrying out
the monitoring activity. Official marine region and subregion shapefiles for the MSFD are currently under
development (by the Directorate-General for the Environment and the European Environment Agency)
but are not yet available for external use due to the need to first formally recognise area boundaries.The
marine region and subregion shapefiles which form the basis of the interactive pdf in this report (Annex
2) were therefore compiled using information from the OSPAR convention and FAO Major Fishing Areas.
These shapefiles should therefore be used as general indicators of marine region and subregion spatial
extent, but are not geo-referenced and should not be considered as official delineations of boundary
extents (Figure 3).

21
Figure 3. Marine regions used in the DEVOTES GIS-based interactive pdfs.
Concerning types of monitoring, in most countries, the prevailing one is surveillance (see Box 1 for
definition). Condition monitoring represents only 13% of the reported activities (Figure 4A).
Figure 4. A. Number of monitoring programmes reported per country. Condition vs Surveillance and B. Percentage of ongoing vs completed monitoring programmes.
Deliverable 1.4 Report on SWOT analysis of monitoring
22
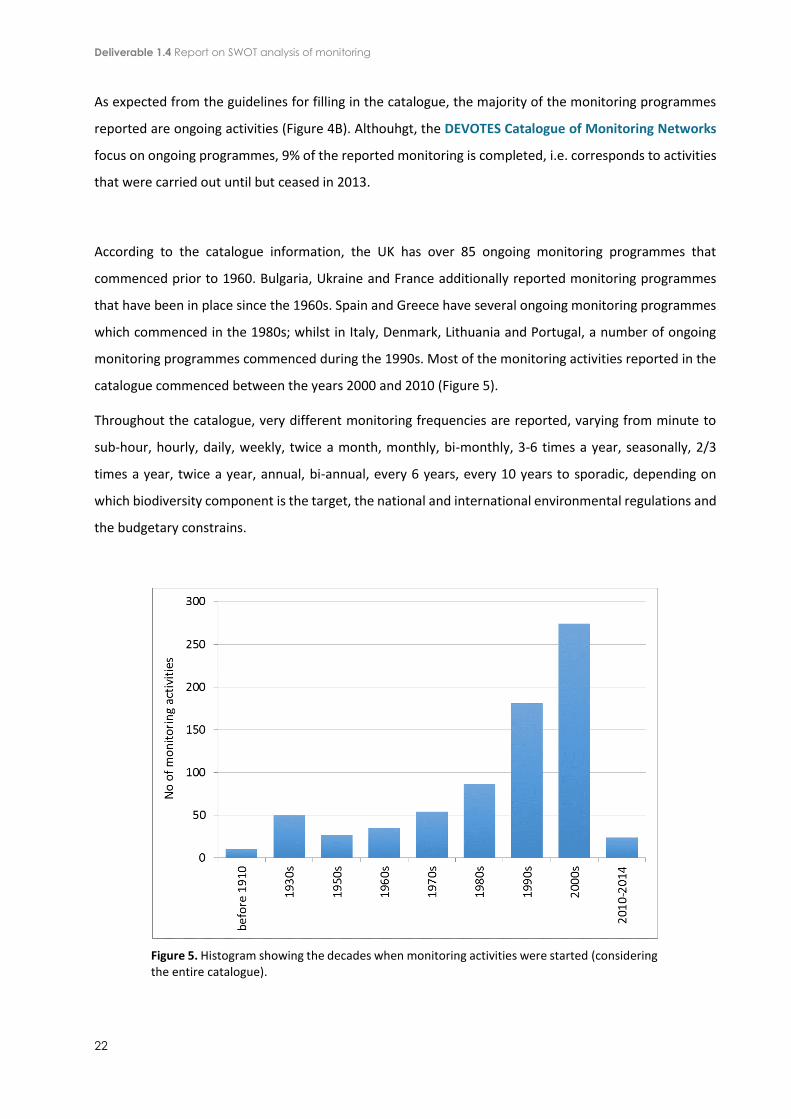
As expected from the guidelines for filling in the catalogue, the majority of the monitoring programmes
reported are ongoing activities (Figure 4B). Althouhgt, the DEVOTES Catalogue of Monitoring Networks
focus on ongoing programmes, 9% of the reported monitoring is completed, i.e. corresponds to activities
that were carried out until but ceased in 2013.
According to the catalogue information, the UK has over 85 ongoing monitoring programmes that
commenced prior to 1960. Bulgaria, Ukraine and France additionally reported monitoring programmes
that have been in place since the 1960s. Spain and Greece have several ongoing monitoring programmes
which commenced in the 1980s; whilst in Italy, Denmark, Lithuania and Portugal, a number of ongoing
monitoring programmes commenced during the 1990s. Most of the monitoring activities reported in the
catalogue commenced between the years 2000 and 2010 (Figure 5).
Throughout the catalogue, very different monitoring frequencies are reported, varying from minute to
sub-hour, hourly, daily, weekly, twice a month, monthly, bi-monthly, 3-6 times a year, seasonally, 2/3
times a year, twice a year, annual, bi-annual, every 6 years, every 10 years to sporadic, depending on
which biodiversity component is the target, the national and international environmental regulations and
the budgetary constrains.
Figure 5. Histogram showing the decades when monitoring activities were started (considering the entire catalogue).

23
In addition to the specific scope of each monitoring activity, the majority of the actions are undertaken or
used within broader programmes (Table 8).
Table 8. Scope of monitoring: list of entries collected from the DEVOTES Catalogue of Monitoring Networks.
International
Conventions
Regional Sea
Conventions EU Directives National Monitoring
AEWA – Agreement on the Conservation of
African-Eurasian Migratory Waterbirds
HELCOM MSFD – Marine Strategy
Framework Directive (2008/56/EC)
PNAB (Portugal)
ASCOBANS - Agreement on the Conservation of Small
Cetaceans of the Baltic and North Seas
OSPAR WFD – Water Framework
Directive (2000/60/EC)
VMP (Denmark)
CBD -Convention on Biological Diversity
UNEP/MAP – United Nations Environment
Programme/Mediterranean Action Plan for the Barcelona
Convention
Habitats Directive (92/43/EEC)
RNN, RESOMAR, Code Minier and Code de
l’Environnement (France)
IPA Adriatic Cross-Border Cooperation Programme
BSSAP - Black Sea Strategic Action Plan
Dangerous Substances Directive (67/548/EEC)
Biodiversity Action Plan, UK Marine Science
Strategy, UK Wildlife and Countryside Act, GB
Conservation of Seals Act, UK Biodiversity Action Plan for Cetaceans, Marine Act
Scotland, Food and Environment Protection
Act, SAP, London Convention (UK)
IWC - International Waterbird Census
BSIMAP – Black Sea Integrated Monitoring and
Assessment Programme
Birds Directive
(2009/147/EC) SEPA, MAREM (Turkey)
CITES – Convention on International Trade in
Endangerous Species of Wild Fauna and Flora
DCR – EU Data Collection
Regulation
MEM - Programme for the Environmental Monitoring of the Black and Azov Seas
(Ukraine)
ICES - International Council for the Exploration of the Sea
DCF - EU Data Collection
Framework
TMAP - Trilateral Monitoring and Assessment Programme
Nitrates Directive
(91/676/EEC)
UWWTD - Urban Waste
Water Treatment Directive (91/271/EEC)
CFP – Common Fisheries
Policy

Deliverable 1.4 Report on SWOT analysis of monitoring
24
This broader context includes International Conventions (e.g. Convention on Biological Diversity,
International Council for the Exploration of the Sea, Convention on International Trade in Endangerous
Species of Wild Fauna and Flora, IPA Adriatic Cross-Border Cooperation Programme), Regional Sea
Conventions (e.g. HELCOM, OSPAR, UNEP/MAP, BSSAP, BSIMAP), EU Directives (e.g. MSFD, WFD, Habitats
Directive, Birds Directive, Nitrates Directive, Common Fisheries Policy) and national monitoring (e.g. PNAB
in Portugal, VMP in Denmark, RNN, RESOMAR, Code Minier in France, SEPA, MAREM in Turkey, MEM in
Ukraine and Biodiversity Action Plan, Marine Science Strategy, Wildlife and Countryside Act, London
Convention in the UK). The Continuous Plankton Recorder programme, coordinated by SAHFOS (Sir
Alistair Hardy Foundation for Ocean Science) in Plymouth, has been monitoring using commercial
plankton recorders since the 1940s and in some countries, e.g. the UK, will produce most of the data
required for plankton. In addition, a few of the reported monitoring activities are undertaken within
research programmes (e.g. MESH, MISTRALS and POPEX French research programmes).
The number of monitoring activities identified in all regions as suitable to address the GEnS of the MSFD
descriptors (D1: biological diversity; D2: non-indigenous species; D4: food-webs; and D6: seafloor
integrity) are represented in Figure 6A. Monitoring activities which address the descriptors biological
diversity (D1) and food-webs (D4), are the most abundant. Although non-indigenous species (D2) and
seafloor integrity (D6) descriptors are also covered these are addressed through a smaller number of
monitoring programmes. In general, the monitoring programmes assess more than one descriptor
simultaneously (for a detailed description per marine subregion see section 4 of this report).
Figure 6. A. Number of monitoring activities per MSFD descriptor. D1: biological diversity; D2: non-indigenous species; D4: food-webs; and D6: seafloor integrity. B.Percentage of monitoring activities where supporting physicochemical data are collected.
B

25
In 43% of the ongoing monitoring activities, supporting physicochemical data are collected (Figure 6B).
For more details regarding the list of parameters and/or physicochemical data measured, the
measurement units and the list of associated biodiversity component/s please see the “Param &
physicochemical data” worksheet of the catalogue (Annex 1). Inclusion of this information provides a
broad indication of the level of detail and quality of a monitoring programme, providing information of
the nature of the explanatory variables which may be linked to changes in environmental status. In
addition, the information contained in these fields provide the opportunity to link the monitoring
activities reported here to the “Data requirements” field of the DEVOTES Catalogue of Indicators
(Deliverable 3.1, Teixeira et al., 2014, available in http://www.devotes-project.eu/deliverables-and-
milestones/).
This link is useful in order to:
Select, among the biodiversity indicators, those for which data are already being collected by ongoing programmes, thus optimizing human and financial resources.
adjust the monitoring activities to better cover data requirements crucial to calculate the selected marine biodiversity indicators.
The catalogue provides information on the biodiversity components covered by the monitoring activities,
including whether there is any quality assurance (Q/A) associated with the programme. Biodiversity
components considered in the catalogue include microbes, phytoplankton, zooplankton, angiosperms,
macroalgae, benthic invertebrates, fish, cephalopods, marine mammals, reptiles (i.e. sea-turtles) and
birds. Benthic invertebrates and fish are targeted by many of the monitoring activities. Very few actions
address microbes and cephalopods (Figure 7). Quality assurance (Q/A) protocols associated with the
monitored biodiversity components vary per component, monitoring country and institute (for a detailed
description per marine subregion see section 4 of this report).
The biodiversity component fish, cephalopods, marine mammals and birds are further divided into family
or functional groups, which is broadly linked to differences in the associated sampling techniques. This
level of detail allows differention between programmes which monitor one or more functional groups.

Deliverable 1.4 Report on SWOT analysis of monitoring
26
Figure 7. Number of monitoring activities per biodiversity component and if there is quality assurance (QA) associated with the programme. N/I: Not Identified.
The biodiversity component fish is divided into diadromous fish, coastal fish, pelagic fish, pelagic
elasmobranchs, demersal fish, demersal elasmobranchs, deep-sea elasmobranchs, ice-associated fish and
other (Figure 8). Across the European seas, most monitoring activities related with the biodiversity
component fish target more than one family or functional group simultaneously (i.e. “Other”option).
Figure 8. Number of monitoring activities related with different groups of fish showing those activities where there is quality qssurance (QA) and those where not. N/I: Not Identified.

27
The biodiversity component cephalopods is divided into two groups: coastal/shelf pelagic and deep-sea
pelagic. According to the monitoring activities reported in the catalogue, few actions target this
component (Figure 9). Although there are no activites exclusively dedicated to deep-sea pelagic
cephalopods, Greece, Spain and Norway have ongoing activities that monitored simultaneously
coastal/shelf and deep-sea cephalopods.
Figure 9. Number of monitoring activities related with different groups of cephalopods showing those activities where there is quality assurance (QA) and those where not.
The biodiversity component marine mammals is divided into toothed whales, baleen whales, seals, ice-
associated mammals and “other” (i.e when more than one group is targeted and also other species are
included). No activities related with ice-associated mammals are reported (Figure 10). Most monitoring
activities target more than one group simultaneously (e.g. toothed whales, baleen whales and seals).
Several activities also target porpoises and dolphins.

Deliverable 1.4 Report on SWOT analysis of monitoring
28
Figure 10. Number of monitoring activities related with different groups of marine mammals showing those activities where there is quality assurance (QA) and those where not.
The biodiversity component birds is divided into intertidal benthic-feeding, inshore surface-feeding,
inshore pelagic-feeding, inshore benthic-feeding, offshore surface-feeding, offshore pelagic-feeding, Ice-
associated birds and other (i.e. when more than one group is monitoried simultaneously). The majority of
the activities monitoring more than one group and actions targeting ice-associated birds were not
reported (Figure 11).
Figure 11. Number of monitoring activities related with different groups of Birds showing those activities where there is quality assurance (QA) and those where not.

29
The habitat types addressed in the catalogue include seabed, water column and ice habitats. None of the
reported monitoring programmes assess ice habitats. The catalogue addresses 18 seabed habitat types:
littoral rock and biogenic reef, littoral sediment, shallow sublittoral rock and biogenic reef, shallow
sublittoral coarse sediment, shallow sublittoral sand, shallow sublittoral mud, shallow sublittoral mixed
sediment, shelf sublittoral rock and biogenic reef, shelf sublittoral coarse sediment, shelf sublittoral sand,
shelf sublittoral mud, shelf sublittoral mixed sediment, upper bathyal rock and biogenic reef, upper
bathyal sediment, lower bathyal rock and biogenic reef, lower bathyal sediment, abyssal rock and biogenic
reef, abyssal sediment and other (more than one habitat). From these, nine are not targeted in isolation
by the reported monitoring activities (see Figure 12 for details), they are monitored together with other
habitat types (i.e. accounted in the “other” category). Most of the ongoing programmes that identified
the type of habitat monitored more than one seabed habitat.
The five water column habitats [i.e. marine water: oceanic, marine water: shelf, marine water: coastal,
variable salinity (estuarine) water and reduced salinity water] are addressed by the monitoring
programmes included in the report but not in all European marine subregions (for a comprehensive
description per marine subregion see section 4 of this report). Most of the ongoing programmes that
identified the type of habitat monitored more than one water column habitat.
Figure 12. Number of monitoring activities per habitat type: seabed habitats and water column habitats.

Deliverable 1.4 Report on SWOT analysis of monitoring
30
The pressures (both local manageable and widespread unmanageable) addressed by the monitoring
programmes are considered within the catalogue. The pressures list is consistent with that proposed by
Koss et al. (2011) and includes 37 pressures (e.g. substratum loss, selective extraction of non-living
resources, marine litter, introduction of synthetic compounds, etc.). Figure 13 shows the number of
monitoring activities per pressure type, considering the overall content of the catalogue. Further details
on what pressures are being monitored in each Regional Sea are described in section 4 of this report.
Figure 13. Number of monitoring activities per pressure type.

31
From the reported monitoring activities, 59% do not have GIS data available (Figure 14). In the 23% that
have, the link to GIS data and the contact person responsible for GIS data is specified.
Figure 14. Number of monitoring activities that have GIS data available.
The DEVOTES Catalogue of Monitoring Networks is structured into three levels: monitoring programme
level, monitoring networks level and web-platform level. The above summarises the content of the first
level. The Monitoring Networks level of the catalogue includes information relating to collaborations
between countries. This level aims to answer questions such as: are the monitoring programmes
undertaken within a monitoring network of institutions? If so, what is the monitoring network name and
what are the countries involved in that network? In the current version of the catalogue, 338 monitoring
activities are undertaken within a network of institutions (Figure 15A).
In addition, most of those monitoring programmes provide data to international web platforms (e.g.
MyOcean2, SeaDataNet, EMODnet, British Oceanographic Data Centre, CEDaR – Centre for Enviromental
Data and Recording, NBN Gateway – National Biodiversity Network, DCR – Data Collection Regulation,
DATRAS – ICES, JellyWatch, Si.Di.Mar., etc). Only 3% of the monitoring programmes take information from
existing web platforms (Figure 15B).

Deliverable 1.4 Report on SWOT analysis of monitoring
32
Figure 15. A. Number of monitoring activities that are undertaken within a monitoring network of institutions. B. Percentage of monitoring activities that provide or take information and/or data to/from any international web platform.
4. Gap and SWOT analysis per Regional Sea:
4.1. North Eastern Atlantic
4.1.1. Monitoring Networks - overview
The information of the DEVOTES Catalogue of Monitoring Networks (Annex 1) relating to the North
Eastern Atlantic, upon which this analysis is based, has been categorised on the basis of the four
subregions established in the MSFD into the North Eastern Atlantic marine region (Figure 16):
The Greater North Sea, including the Kattegat, and the English Channel;
The Celtic Seas;
The Bay of Biscay and the Iberian Coast;
The Macaronesian biogeographic region, being the waters surrounding the Azores, Madeira and the Canary Islands.
The monitoring catalogue includes a number of programmes which monitor outside of these listed
subregions, and as such are classified as “Non EU”. Programmes listed in the catalogue that do not state
the subregion within which monitoring occurs are classified as “Not specified” (N/I).
There are 141 ongoing monitoring programmes reported in the catalogue of monitoring networks for the
North Eastern Atlantic region. The Celtic Seas subregion has the greatest number of monitoring
programmes, followed by the Greater North Sea subregion (Figure 17 and Table 9). It is likely that more
A B

33
monitoring programmes exist within the Macaronesian biographic region than those currently listed in
the catalogue of monitoring networks. If that is the case, these programmes should be identified and
added to the catalogue. This, in principle, indicates that monitoring activities exist within each subregion
of the North East Atlantic and implies that implementation of the MSFD is feasible and likely to be
successful in this region, assuming that the spatial and temporal scale of the monitoring is adequate and
that the relevant biodiversity components and pressures are addressed.
Figure 16. North Eastern Atlantic marine subregions used in the DEVOTES GIS-based interactive pdfs. The DEVOTES Catalogue of Monitoring Networks includes a number of monitoring programmes that are being conducted, in the context of OSPAR and ICES programmes, in other non-EU waters besides those represented in this figure (e.g. Faroe islands, the Norwegian Sea, the Barents Sea). Although these activities are being carried out in non-MSFD subregions, they are listed in the catalogue and were considered in the analysis.
The analysis described in the present section is based on current ongoing monitoring programmes that
are relevant to the implementation of the MSFD. Three research programmes are reported in the
catalogue for the Bay of Biscay and Iberian Coast subregions have been excluded from the SWOT analysis,
as they have already been concluded (Figure 17).

Deliverable 1.4 Report on SWOT analysis of monitoring
34
Figure 17. Number of ongoing and completed monitoring programmes in the North Eastern Atlantic (NEA) region and subregions.
Monitoring programmes classified as “Non EU” correspond to programmes undertaken in the Barents Sea
and the Norwegian Sea, as well as well as two additional programmes undertaken in the wider area of the
North Eastern Atlantic, which is not covered by the MSFD. These programmes correspond to the
“Continuous Plankton Recorder” in the Va, Vb, Xb, XIIa, XIIc, XIVa, XIVb and XIIa ICES areas, and the
“Atlantic Meridional Transect” in the XIIc, Xb and Xa ICES areas.
It should be noted that the total number of monitoring programmes in the North Eastern Atlantic cannot
be a straightforward addition of the different monitoring programmes in each subregion/category, as a
number of monitoring programmes are undertaken within several subregions.
The number of monitoring programmes identified in the North Eastern Atlantic region as suitable to
address the GEnS of the MSFD descriptors (D1: biological diversity; D2: non-indigenous species; D4: food-
webs; and D6: seafloor integrity) are represented in Figure 18. It is of note that the number of non-EU
programmes is low compared to other regions and that this may be a function of the fact that most of the
OSPAR contracting parties are EU Member States.

35
Figure 18. Number of ongoing monitoring programmes covering the D1, D2, D4 and D6 MSFD descriptors to achieve GEnS in the North Eastern Atlantic (NEA) region and subregions.
Monitoring programmes which address the descriptors biological diversity (D1) and food-webs (D4), are
the most abundant in all subregions and, subsequently, the North Eastern Atlantic region as a whole.
There are 138 and 115 monitoring programmes addressing addressing D1 and D4, respectively. Although
non-indigenous species (D2) and seafloor integrity (D6) descriptors are also covered in the catalogue,
these are addressed through a smaller number of monitoring programmes (Figure 18 and Table 9).
Table 9. Number of ongoing monitoring programmes in the North Eastern Atlantic region and subregions. MSFD: Marine Strategy Framework Directive; PQ: physicochemical; N/I: Not identified.
Within the North Eastern Atlantic region, monitoring programmes generally assess two or three of the
relevant descriptors simultaneously (38% and 35% of the monitoring programmes, respectively), whilst a
small number assess all four descriptors simultaneously (16%) or a single descriptor only (11%) (Annex 4).
This pattern is similar in the Greater North Sea and Celtic Sea subregions, but in the Bay of Biscay and
North Eastern Atlantic
subregions
No of
pressures
D1 D2 D4 D6 Seabed Water Mic Phy Zoo Ang MacAlg Binv Fish Cep Mam Rep Bir Yes No N/I
Greater North Sea 75 30 69 36 37 12 4 3 17 15 11 12 33 22 3 17 9 17 33 43 1
Celtic Seas 95 32 86 48 37 17 5 2 15 14 15 14 46 33 1 16 10 10 47 50 0
Bay of Biscay and Iberian Coast 43 9 31 14 25 14 5 4 13 15 6 6 13 16 4 10 9 15 23 19 2
Macaronesian biogeographic region 4 1 1 0 11 0 3 0 1 1 1 1 1 1 1 2 2 3 2 2 0
Non-EU 4 2 4 2 10 0 3 1 4 4 0 0 2 0 2 2 0 2 4 0 0
Not Specified 2 0 1 0 8 0 3 0 2 1 0 0 0 0 0 0 0 0 1 1 0
OVERALL NEA 138 43 115 69 37 18 5 6 34 34 22 22 68 49 8 31 14 28 74 65 2
Supp. PQMSFD DescriptorNo of
habitatsBiodiversity components

Deliverable 1.4 Report on SWOT analysis of monitoring
36
Iberian Coast subregion the percentage of monitoring programmes that assess individual descriptors is
greater (27%). In the Macaronesian biogeographic region two of the monitoring programmes recorded
assess two of the considered descriptors simultaneously, and the remaining two programmes address
individual descriptors.
The biodiversity components considered in the catalogue include microbes, phytoplankton, zooplankton,
angiosperms, macroalgae, benthic invertebrates, fish, cephalopods, marine mammals, reptiles and birds,
all of which are monitored throughout the North Eastern Atlantic, although to differing extents. Benthic
invertebrates are included in many of the catalogued monitoring programmes, particularly in Greater
North Sea and Celtic Seas subregions. A large number of monitoring programmes address the biodiversity
components fish, phytoplankton and zooplankton within the North Eastern Atlantic subregions. In
contrast, very few monitoring programmes address the biodiversity components microbes, cephalopods
and reptiles at either the subregion or region level (Figure 19 and Table 9).
Figure 19. Percentage of ongoing monitoring programmes per biodiversity component in the North Eastern Atlantic region and subregions. Biodiversity components addressed include: microbes (Mic), phytoplankton (Phy), zooplankton (Zoo), angiosperms (Ang), macroalgae (MacAl), benthic invertebrates (Binv), fish, cephalopods (Cep), marine mammals (Mam), reptiles (Rep) and birds (Bir).

37
Of the monitoring programmes recorded in the North Eastern Atlantic, 47%, 23% and 13% simultaneously
assess one, two or three, biodiversity components respectively. Details of this are presented for each
subregion in Annex 4. An exception to this is the M@rBis (Marine Biodiversity Information System)
monitoring programme, which simultaneously assesses eight biodiversity components in the subregions
of the Bay of Biscay and Iberian Coast, and the Macaronesian biogeographic regions.
Quality assurance (QA) protocols associated with the monitored biodiversity components vary per
component, monitoring country and institute. In the UK for example, the National Marine Biological
Analytical Quality Control (NMBAQC) scheme is a national programme whereby members of the scheme
are annually assessed. Other QA schemes may only apply to a single laboratory. Overall, Q/A is not
associated with all of the monitored biodiversity components or this information has not been or cannot
be provided. However, supporting physicochemical data are collected in association with the majority of
the monitoring programmes (Figure 20 and Table 9).
Figure 20. Number of ongoing monitoring programmes that collect supporting physicochemical parameters in the North Eastern Atlantic region and subregions. N/I: no information provided.
In the Greater North Sea and the Celtic Seas subregion all 37 listed pressures are addressed through
monitoring programmes, while in the Bay of Biscay and Iberian Coast subregion 25 out of 37 are
addressed, and in the Macaronesian biogeographic region only 11 out of 37 (Figure 21 and Table 10).
Whereas some of the pressures best covered by the catalogued programmes include e.g. increase in
siltation, selective extraction of living resources, organic matter enrichment, etc., other pressures (e.g.

Deliverable 1.4 Report on SWOT analysis of monitoring
38
selective extraction of mearl or seaweed, and introduction of radionuclides) are only covered by one or
two of the monitoring programmes recorded in this catalogue.
Figure 21. Number of different pressures monitored in the North Eastern Atlantic region and subregions.
Most monitoring programmes recorded for the North Eastern Atlantic, simultaneously assess four or
fewer pressures (Table 10). However, there are three monitoring programmes in the Greater North Sea
and Celtic Seas subregions (SAC and SPA Monitoring, Western Channel Observatory and Dove Marine
Station Long Term Monitoring) that can assess up to 20 pressures simultaneously. Full details of the
pressures monitored under each programme are presented in Annex 4, at the subregional sea level.
The habitat types addressed through the monitoring programmes include seabed, water column and ice
habitats. For obvious reasons, ice habitats are not monitored throughout the entire North Eastern Atlantic
marine region. The catalogue considers 18 seabed habitats, all of which are addressed within the North
Eastern Atlantic (Figure 22 and Table 9), however not in all subregions (e.g., reported monitoring
programmes throughout the Bay of Biscay and Iberian Coast subregion do not cover “upper bathyal rock
and biogenic reef” or “upper bathyal sediment”).
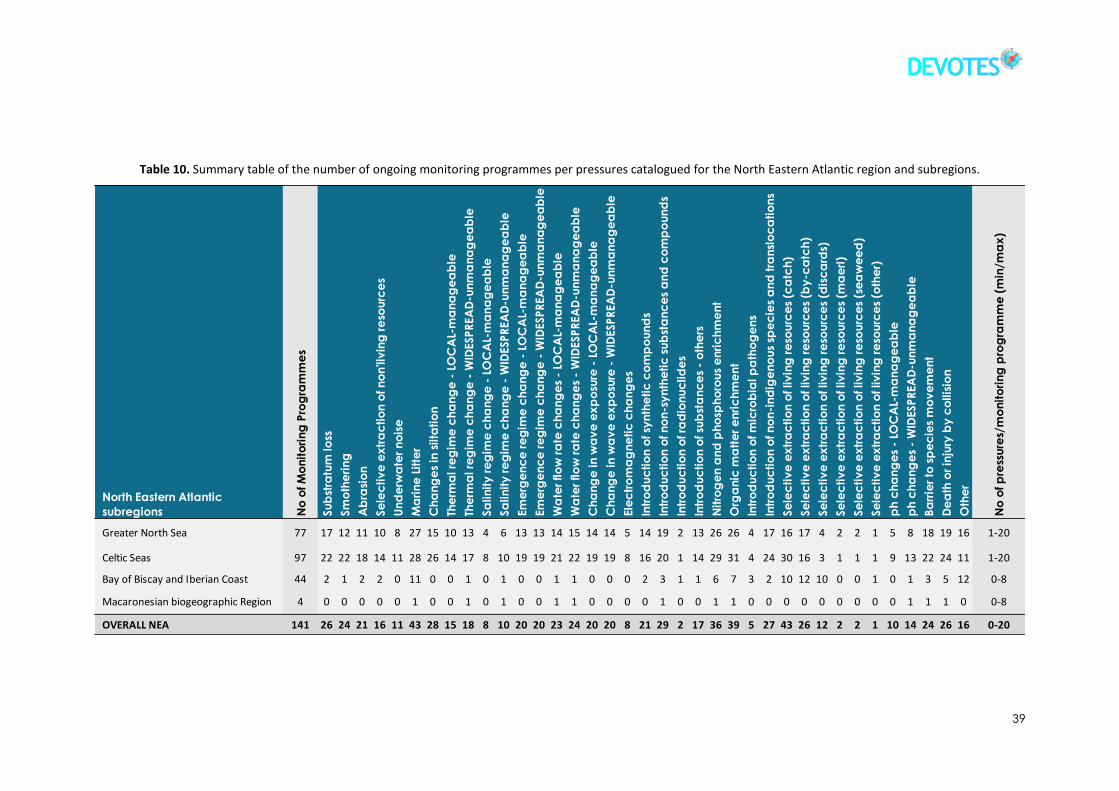
39
Table 10. Summary table of the number of ongoing monitoring programmes per pressures catalogued for the North Eastern Atlantic region and subregions.
North Eastern Atlantic
subregions No
of M
on
ito
rin
g P
rog
ram
me
s
Su
bst
ratu
m lo
ss
Sm
oth
eri
ng
Ab
rasi
on
Se
lec
tiv
e e
xtr
ac
tio
n o
f n
on
'liv
ing
re
sou
rce
s
Un
de
rwa
ter
no
ise
Ma
rin
e L
itte
r
Ch
an
ge
s in
silta
tio
n
The
rma
l re
gim
e c
ha
ng
e -
LO
CA
L-m
an
ag
ea
ble
The
rma
l re
gim
e c
ha
ng
e -
WID
ESP
REA
D-u
nm
an
ag
ea
ble
Sa
lin
ity
re
gim
e c
ha
ng
e -
LO
CA
L-m
an
ag
ea
ble
Sa
lin
ity
re
gim
e c
ha
ng
e -
WID
ESP
REA
D-u
nm
an
ag
ea
ble
Em
erg
en
ce
re
gim
e c
ha
ng
e -
LO
CA
L-m
an
ag
ea
ble
Em
erg
en
ce
re
gim
e c
ha
ng
e -
WID
ESP
REA
D-u
nm
an
ag
ea
ble
Wa
ter
flo
w r
ate
ch
an
ge
s -
LOC
AL-
ma
na
ge
ab
le
Wa
ter
flo
w r
ate
ch
an
ge
s -
WID
ESP
REA
D-u
nm
an
ag
ea
ble
Ch
an
ge
in
wa
ve
ex
po
sure
- L
OC
AL-
ma
na
ge
ab
le
Ch
an
ge
in
wa
ve
ex
po
sure
- W
IDESP
REA
D-u
nm
an
ag
ea
ble
Ele
ctr
om
ag
ne
tic
ch
an
ge
s
Intr
od
uc
tio
n o
f sy
nth
eti
c c
om
po
un
ds
Intr
od
uc
tio
n o
f n
on
-sy
nth
eti
c s
ub
sta
nc
es
an
d c
om
po
un
ds
Intr
od
uc
tio
n o
f ra
dio
nu
clid
es
Intr
od
uc
tio
n o
f su
bst
an
ce
s -
oth
ers
Nit
rog
en
an
d p
ho
sph
oro
us
en
ric
hm
en
t
Org
an
ic m
att
er
en
ric
hm
en
t
Intr
od
uc
tio
n o
f m
icro
bia
l p
ath
og
en
s
Intr
od
uc
tio
n o
f n
on
-in
dig
en
ou
s sp
ec
ies
an
d t
ran
slo
ca
tio
ns
Se
lec
tiv
e e
xtr
ac
tio
n o
f liv
ing
re
sou
rce
s (c
atc
h)
Se
lec
tiv
e e
xtr
ac
tio
n o
f liv
ing
re
sou
rce
s (b
y-c
atc
h)
Se
lec
tiv
e e
xtr
ac
tio
n o
f liv
ing
re
sou
rce
s (d
isc
ard
s)
Se
lec
tiv
e e
xtr
ac
tio
n o
f liv
ing
re
sou
rce
s (m
ae
rl)
Se
lec
tiv
e e
xtr
ac
tio
n o
f liv
ing
re
sou
rce
s (s
ea
we
ed
)
Se
lec
tiv
e e
xtr
ac
tio
n o
f liv
ing
re
sou
rce
s (o
the
r)
ph
ch
an
ge
s -
LOC
AL-
ma
na
ge
ab
le
ph
ch
an
ge
s -
WID
ESP
REA
D-u
nm
an
ag
ea
ble
Ba
rrie
r to
sp
ec
ies
mo
ve
me
nt
De
ath
or
inju
ry b
y c
ollis
ion
Oth
er
No
of p
ress
ure
s/m
on
ito
rin
g p
rog
ram
me
(m
in/m
ax
)
Greater North Sea 77 17 12 11 10 8 27 15 10 13 4 6 13 13 14 15 14 14 5 14 19 2 13 26 26 4 17 16 17 4 2 2 1 5 8 18 19 16 1-20
Celtic Seas 97 22 22 18 14 11 28 26 14 17 8 10 19 19 21 22 19 19 8 16 20 1 14 29 31 4 24 30 16 3 1 1 1 9 13 22 24 11 1-20
Bay of Biscay and Iberian Coast 44 2 1 2 2 0 11 0 0 1 0 1 0 0 1 1 0 0 0 2 3 1 1 6 7 3 2 10 12 10 0 0 1 0 1 3 5 12 0-8
Macaronesian biogeographic Region 4 0 0 0 0 0 1 0 0 1 0 1 0 0 1 1 0 0 0 0 1 0 0 1 1 0 0 0 0 0 0 0 0 0 1 1 1 0 0-8
OVERALL NEA 141 26 24 21 16 11 43 28 15 18 8 10 20 20 23 24 20 20 8 21 29 2 17 36 39 5 27 43 26 12 2 2 1 10 14 24 26 16 0-20

Deliverable 1.4 Report on SWOT analysis of monitoring
40
Similarly, the five water column habitats considered in the catalogue are all addressed in the North Eastern
Atlantic region although “reduced salinity water” and “variable salinity (estuarine) water” habitats are
only addressed in some subregions (i.e. Celtic Seas and Greater North Sea). This may be a function of the
fact that partners were asked to include programmes which they felt were of relevance to the MSFD.
Reduced and variable salinity habitats may have been excluded by some partners on the basis of their
greater relevance to the WFD. Therefore, this apparent gap is unlikely to be reflective of a lack of
monitoring in these habitats. Furthermore, and as indicated previously, inputs depended on those
participating in the “development of the catalogue”, providing more complete data information for
certain areas.
Figure 22. Number of different seabed habitats and water column types monitored in the North Eastern Atlantic region and subregions.
4.1.2. Identification of gaps
Regular OSPAR monitoring was initially established for the OSPAR thematic strategies Hazardous
Substances and Eutrophication, followed by other pollutants. Monitoring for the thematic strategy
‘Biodiversity and ecosystems’ is more recent and still in development. In 2012-2013 the process of

41
reviewing and, when necessary, adjusting the OSPAR monitoring programmes has continued (OSPAR,
2013).
The current gap analysis is based on the results presented in the Monitoring Networks - overview section
(4.1.1). Results suggest that monitoring undertaken in the northern subregions of the North Eastern
Atlantic marine region may be more robust than monitoring undertaken in southern subregions (i.e. a
greater number of monitoring programmes simultaneously addressing multiple pressures, descriptors
and components). The results suggest that the Macaronesian biogeographic region and the wider Atlantic
(offshore areas) may be poorly monitored.
Although all MSFD descriptors are monitored within the North Eastern Atlantic region, the DEVOTES
Catalogue of Monitoring Networks does not currently include monitoring programmes for the descriptor
seafloor integrity (D6) in the Macaronesian biogeographic region (Table 9). This may however be due to
incomplete reporting as not all monitoring programmes for all subregions have been included.
Nevertheless, it may also be an indication of poorer monitoring in this biographic region.
A small number of biodiversity components have limited coverage in the North Eastern Atlantic region.
These include microbes, cephalopods and reptiles. It is however important to explore whether these
existing monitoring programmes are sufficient or require further development. Considering there are also
few indicators for these biodiversity components (DEVOTES Deliverable 3.1, Teixeira et al., 2014), it is
likely that a significant effort may be required to monitor these components once indicators are
developed.
Despite extensive monitoring of the main pressures of the North Eastern Atlantic, there are pressures,
which are not monitored in the Macaronesian biogeographic region or are in general poorly monitored
(e.g. underwater noise and Introduction of radionuclides). Furthermore, as indicated in the DEVOTES
Deliverable 3.1. (Teixeira et al., 2014), there are few indicators developed for such pressures and,
consequently, possibly less related monitoring. It is also worth noting that even where underwater noise
is monitored, the impact of noise on many biodiversity components is not well understood and the
outputs of such monitoring cannot be used effectively at the present time.
Monitoring of bathyal and abysal habitats is not undertaken in many subregions. The water column
habitats are, in general, covered throughout the North Eastern Atlantic region.
Finally, it is of note that for a number of biodiversity components quality assurance is either non-existent
(or unreported), which should be rectified in future monitoring programmes.While chemical

Deliverable 1.4 Report on SWOT analysis of monitoring
42
contaminants have been subjected to AQC/QA (Analytical Quality Control/Quality Assurance) since the
1970s, biological AQC/QA has only been used since the 1990s and even then only for the benthos and
sediment particle size analysis (e.g. Gray and Elliott, 2009). A similar scheme for macroalgae is under
development.
4.1.3. SWOT analysis – North Eastern Atlantic
Almost all GEnS descriptors and biological components are addressed through monitoring programmes within the North Eastern Atlantic, although there is a high degree of spatial variability in where this monitoring occurs.
A large number of monitoring programmes address GEnS Descriptors 1 and 4.
All ongoing monitoring programmes simultaneously address more than one descriptor. This catalogue only focuses on the four biodiversity-related descriptors relevant to the MSFD; therefore, it is likely that the catalogued monitoring programmes will also be suitable to address more descriptors of the MSFD.
The northern subregions of the North Eastern Atlantic have an extensive system of monitoring programmes (i.e. Greater North Sea and Celtic Seas).
In general, the proportions of monitoring programmes for the different biological components are similar across the different subregions.
A higher proportion of monitoring programmes address benthic invertebrates and fish.
In contrast with other subregions, the proportions of monitoring programmes for birds, reptiles, and marine mammals are higher in the Macaronesia.
The collection of physicochemical data in conjunction with biodiversity component monitoring is a common practice in monitoring programmes undertaken in the North Eastern Atlantic.
Overall, monitoring programmes undertaken within the North Eastern Atlantic region address all pressures.
The monitoring programmes undertaken within southern subregions of the North Eastern Atlantic (i.e. Bay of Biscay and Iberian Coast, and specially the Macaronesian biographic region) apparently are of limited number and scope (i.e. simultaneous monitoring) when compared to northern subregions (i.e. Greater North Sea and Celtic Seas). However, factors such as the geographic scope of these monitoring programmes and the sampling intensity is not known and it is entirely possible that a single, large scale programme may be equally adequate to numerous smaller scale programmes.
Collating monitoring programme information at the subregion scale masks information about the spatial extent and distribution of monitoring within that subregion. Within each subregion of the North Eastern Atlantic, monitoring programmes address a specific focus (e.g. habitat, species, pressure, etc.), resulting in an uneven distribution of spatial monitoring stations/sites, sampling interval and frequency and monitored components. Coverage of monitored attributes (e.g. descriptors, biological components, habitats and pressures) may therefore be shown as addressed at a subregion level; however, in reality monitoring may only take place in a small number of specific subregion sub-sections.
In the North Eastern Atlantic region the number of monitoring programmes that address Descriptors 2 and 6 are limited, compared to programmes which address Descriptors 1 and 4.
In the Bay of Biscay and Iberian Coast subregion the proportion of monitoring programmes that assess descriptors individually is high (if compared with more northern subregions of the North Eastern Atlantic).
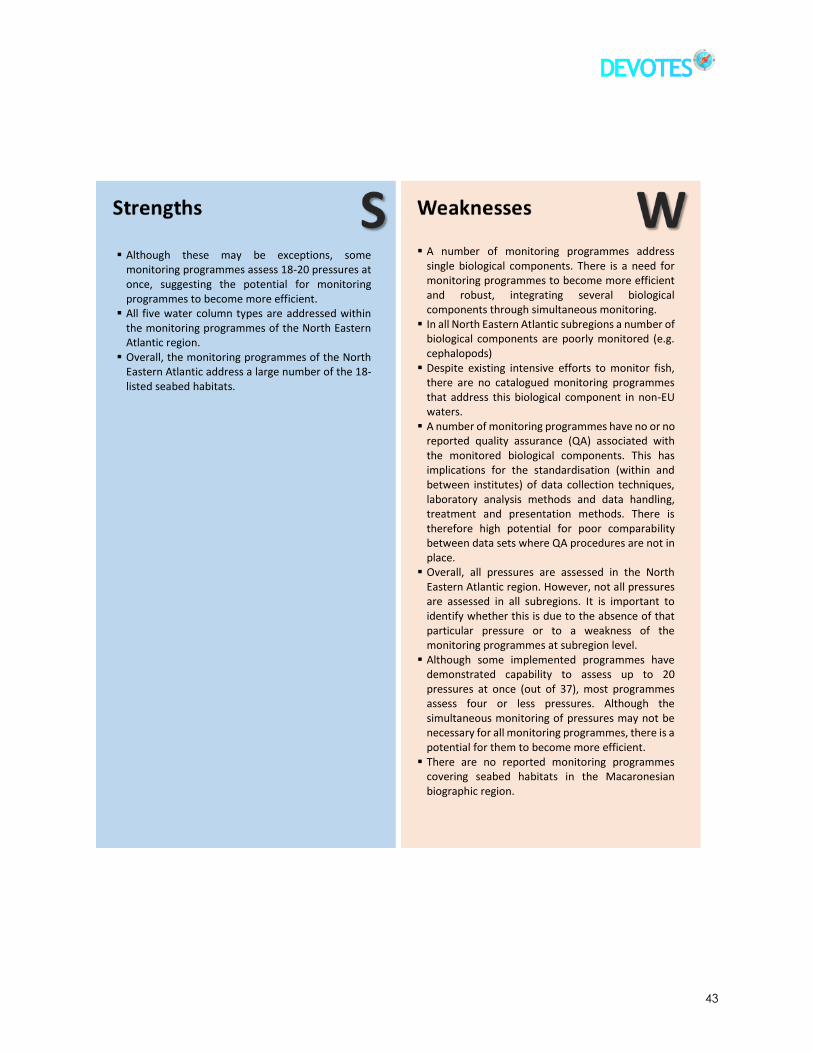
43
A number of monitoring programmes address single biological components. There is a need for monitoring programmes to become more efficient and robust, integrating several biological components through simultaneous monitoring.
In all North Eastern Atlantic subregions a number of biological components are poorly monitored (e.g. cephalopods)
Despite existing intensive efforts to monitor fish, there are no catalogued monitoring programmes that address this biological component in non-EU waters.
A number of monitoring programmes have no or no reported quality assurance (QA) associated with the monitored biological components. This has implications for the standardisation (within and between institutes) of data collection techniques, laboratory analysis methods and data handling, treatment and presentation methods. There is therefore high potential for poor comparability between data sets where QA procedures are not in place.
Overall, all pressures are assessed in the North Eastern Atlantic region. However, not all pressures are assessed in all subregions. It is important to identify whether this is due to the absence of that particular pressure or to a weakness of the monitoring programmes at subregion level.
Although some implemented programmes have demonstrated capability to assess up to 20 pressures at once (out of 37), most programmes assess four or less pressures. Although the simultaneous monitoring of pressures may not be necessary for all monitoring programmes, there is a potential for them to become more efficient.
There are no reported monitoring programmes covering seabed habitats in the Macaronesian biographic region.
Although these may be exceptions, some monitoring programmes assess 18-20 pressures at once, suggesting the potential for monitoring programmes to become more efficient.
All five water column types are addressed within the monitoring programmes of the North Eastern Atlantic region.
Overall, the monitoring programmes of the North Eastern Atlantic address a large number of the 18-listed seabed habitats.

Deliverable 1.4 Report on SWOT analysis of monitoring
44
The Gap and SWOT analysis has highlighted a number of inadequacies in the monitoring currently being carried out in the North Eastern Atlantic. At a high level, this presents an opportunity to develop new monitoring programmes or to modify and expand existing ones. In particular, this exercise has pinpointed where those monitoring gaps are. This presents an opportunity to the Monitoring Agencies within the North Eastern Atlantic region and subregions to collaborate and to form collaborations with other Member States in order to develop harmonised monitoring programmes that maximise the use of the best available data.
Opportunities for knowledge transfer on efficiency (e.g. monitoring programmes capable for simultaneously assessing many pressures at once) and specialized skills (e.g. marine mammals, birds and reptiles monitoring programmes from the Macaronesia).
This catalogue indicates that several monitoring can simultaneously assess indicators from different descriptors, which provides an opportunity for monitoring programmes to widen their scope and improve integration of all monitoring programmes.
Since most monitoring programmes have no or no reported quality assurance (QA) associated with the monitored biological components, there is an opportunity for defining and/or implementing commun QA protocols across the differing EU regional seas.
The catalogue indicates which biological components, descriptors and pressures are currently addressed but does not indicate the adequacy of the associated monitoring. There is now an opportunity to investigate pressure-impact links, our ability to quantify them and implement this knowledge more effectively in the assessment of GEnS in the North Eastern Atlantic region and subregions.
There is a general lack of monitoring associated with microbes in the context of MSFD but microbial quality of shellfish and bathing waters is routinely monitored. There is an opportunity to expand and adapt this monitoring.
These opportunities form the basis of further research requirements.
The most obvious and significant threat to monitoring includes budgetary constraints within the EU Member States concerned with the North Eastern Atlantic Region (e.g. several programmes have recently been cancelled).
Each EU Member State within the North Eastern Atlantic region has a long history of monitoring which has been expanded, modified and developed over time. As a result of these developments, together with methodological differences between nations, integration and holistic assessment of the data (at a Regional Sea level) may be difficult.
Furthermore, lack of quality assurance on monitoring programmes may hinder harmonization and comparability across the EU.
Certain indicators, descriptors, pressures, habitats and even subregions have limited monitoring programmes; such gaps may be an important constrain in monitoring the advance towards achieving the GEnS.

45
4.2. Baltic Sea
4.2.1. Monitoring Networks - overview
The Baltic Sea is one of the most intensively studied regional seas in the world; some continuous datasets
date back to the early 1950s. Despite this, substantial gaps in marine monitoring still occur and some of
the pressing issues are discussed below according to the monitoring information obtained during this
project and analysis of current HELCOM monitoring programmes (HELCOM MORE, 2013). The Baltic Sea
is surrounded by nine coastal countries: Denmark, Estonia, Finland, Germany, Latvia, Lithuania, Poland,
Russia and Sweden. According to HELCOM the Baltic Sea area is divided into subregions or sub-basins
(Figure 23). At least one national marine monitoring programme is ongoing in each Baltic country. National
ongoing monitoring programmes of biodiversity components (related to D1, D2, D4 and D6 descriptors)
have started differently in each country (e.g. in Lithuania it started since 1980s, while in Germany – since
2008).
Figure 23. The Baltic Sea region map with subregions (blue polygons).

Deliverable 1.4 Report on SWOT analysis of monitoring
46
Biological parameters are being monitored in all subregions (Figure 24), however the number of
monitoring stations per subregion differs greatly: from two (e.g. Aland Sea) to 214 (i.e. Bothnian Sea),
mostly due to the size of the subregion.
Figure 24. Categorized (map) and exact (table) number of marine monitoring stations (where biological parameters are measured) per Baltic Sea subregion. Data source is HELCOM MORE (2013).
There is clear variation in the number of monitoring programmes of relevance to each of the MSFD
descriptors. Biological diversity (D1), food webs (D4) and seafloor integrity (D6) descriptors are being
monitored in almost all Baltic countries (Figure 25), whereas non-indigenous species (D2) are monitored
only in Finland (Table 11).

47
Figure 25. Number of ongoing programmes per MSFD descriptor (D1, D2, D4, D6) in the Baltic Sea, according to the monitoring data obtained during this project and analysis of current HELCOM monitoring data (HELCOM MORE, 2013).
Differences in the number of ongoing programmes are found also among the biodiversity components
(Figure 26 and Table 11). Cephalopods and reptiles are not found in the Baltic, therefore there are no
special programmes for them. There are only two programmes for microbes; such low number is most
likely due to lack of information reported from member countries. Other biodiversity components (i.e.
phytoplankton, zooplankton, angiosperms, macroalgae, benthic invertebrates, fish and birds) are being
monitored in all Baltic countries, except marine mammals in Estonia, Latvia, Poland and Russia. Relatively
small populations or solitary individuals of seals are being reported in these countries, therefore there is
no need of monitoring programmes there. Angiosperms are not found in the exposed coast of Lithuania,
therefore they are not monitored either. Monitoring data of phytoplankton and zooplankton is absent in
the relatively smaller sub-basins of the Baltic Sea (i.e. The Quark and Little Belt).
All biodiversity components listed in the catalogue are associated with quality assurance (QA) protocols,
except microbes (in Lithuania) (Table 11).
0
1
2
3
4
5
6
7
8
9
10
D1 D2 D4 D6
No
of
mo
nit
ori
ng
pro
gram
mes

Deliverable 1.4 Report on SWOT analysis of monitoring
48
Figure 26. Percentage of monitoring programmes per biodiversity component in the Baltic Sea, according to the monitoring data obtained during this project and analysis of current HELCOM monitoring data (HELCOM MORE, 2013).
Quality assurance protocols associated with the monitored biodiversity components vary per component,
monitoring country and research institute, although there is a general guidance proposed by HELCOM
COMBINE Programme. It seems that QA of phytoplankton is the most developed. In 1991 HELCOM PEG
was established with the main aim to unify methods of collection, counting and identification of
phytoplankton species. Other QA schemes, may only apply to a single laboratory. Overall, quality
assurance is not associated with all of the monitored biodiversity components, or this information has not
been or cannot be provided.
There are nine ongoing monitoring programmes that collect supporting physicochemical parameters
(Table 11). The main supporting physical-chemical parameters of the marine environment, including
temperature, salinity, waves, currents, turbidity, nutrients, dissolved oxygen, pH, carbon, Chlorophyll a
and contaminants, are used for the interpretation of biological data. However, frequency and location of
measurements of physical-chemical parameters is generally not sufficient for most biodiversity
components. For example, according to HELCOM monitoring data (HELCOM MORE, 2013) out of 270
phytoplankton monitoring stations there are only 101 stations, where additional parameters (including
hydrography and water chemistry) are being measured. A similar pattern is found for other biodiversity
components: zooplankton – 35 out of 142, zoobenthos – 114/1490, phytobenthos – 133/827, fishes –
19/139, sea birds – 10/48, marine mammals – 10/17.

49
In total, 16 pressures are covered through monitoring programmes in the Baltic Sea: substratum loss,
changes in siltation, thermal regime change (widespread-unmanageable - wu), salinity regime change
(wu), emergence regime change (wu), change in wave exposure (wu), introduction of synthetic
compounds, introduction of non-synthetic substances and compounds, introduction of radionuclides,
introduction of substances - other, nitrogen and phosphorus enrichment, organic matter enrichment,
introduction of non-indigenous species and translocations, selective extraction of living resources (active
removal of target and non-target species), ph changes (wu), other (Figure 27 and Table 11).
There are thirteen pressures being covered in the southern Baltic proper (mostly of them belong to
Lithuania) whereas pressures in other subregions range from five to seven. These results should be
consider with caution because most probably the huge difference can explained by the detail of
information presented by Lithuania, whereas the data from other subregions were taken from HELCOM
(2010). Nutrient inputs and different methods of fishing—pressures causing eutrophication and a decline
of biodiversity—were rated the top pressures in all subregions. Despite decreasing during recent decades,
inputs of heavy metals are still an issue of concern in all basins. The following concerns should also be
highlighted: (1) hunting of seals is an issue in the Bothnian Bay, the Åland and Archipelago Seas, and the
Belt Sea, (2) underwater noise from shipping is an issue in the Northern Baltic Proper, the Arkona Basin,
Kiel Bight and Mecklenburg Bight, and (3) bottom trawling, including its physical disturbance impact, is a
significant issue in the Kattegat, Belt Sea, Kiel Bight, Mecklenburg Bight, Arkona Basin and Bornholm Basin.
Nine different seabed habitats are included within the Baltic Sea monitoring programmes reported (Figure
28 and Table 11): shallow sublittoral rock and biogenic reef, shallow sublittoral coarse sediment, shallow
sublittoral sand, shallow sublittoral mud, shallow sublittoral mixed sediment, shelf sublittoral coarse
sediment, shelf sublittoral sand, shelf sublittoral mud, shelf sublittoral mixed sediment. Shallow water
habitats such as littoral rock and biogenic reef, littoral sediment are not monitored due to reduced littoral
zone in the major subregions of the Baltic Sea. Other habitats are not monitored since they are rare or
not found at all (e.g. shelf sublittoral rock and biogenic reef).
There are three water habitats monitored in the Baltic Sea (Figure 28 and Table A): variable salinity
(estuarine) water, marine water: coastal and marine water: shelf. The reduced salinity water could be
found only in the Bothnian Bay.

Deliverable 1.4 Report on SWOT analysis of monitoring
50
Figure 27. Number of different pressures monitored in each subregion and Baltic Sea region, according to the monitoring data obtained during this project and analysis of current HELCOM monitoring data (HELCOM MORE, 2013).
Figure 28. Number of seabed and water habitats monitored in each subregion and Baltic Sea region, according to the monitoring data obtained during this project and analysis of current HELCOM monitoring data (HELCOM MORE, 2013).
In the DEVOTES Catalogue of Monitoring Networks, there are no programmes which are being used to
assess simultaneously all different biodiversity components/descriptors/pressures/habitats/water
column (Table 11). The current version of the catalogue includes solely the Lithuanian and German
monitoring programmes. In these two countries, the programmes cover almost all categories.
0
2
4
6
8
10
12
14
16
Bo
thn
ian
Bay
The
Qu
ark
Bo
thn
ian
Sea
Åla
nd
Sea
Arc
hip
ela
go S
ea
Gu
lf o
f Fi
nla
nd
Gu
lf o
f R
iga
No
rth
ern
Bal
tic
Pro
per
We
ste
rn G
otl
and
East
ern
Go
tlan
d
Sou
ther
n B
alti
c P
rop
er
Gu
lf o
f G
dan
sk
Bay
of
Me
ckle
nb
urg
Kie
l Bay
Litt
le B
elt
Gre
at B
elt
The
So
un
d
Ove
rall
Bal
tic
SeaN
o o
f m
on
ito
rin
g p
rogr
amm
es
0
2
4
6
8
10
Bo
thn
ian
Bay
The
Qu
ark
Bo
thn
ian
Sea
Åla
nd
Sea
Arc
hip
elag
o S
ea
Gu
lf o
f Fi
nla
nd
Gu
lf o
f R
iga
No
rth
ern
Bal
tic…
Wes
tern
Go
tlan
d
East
ern
Go
tlan
d
Sou
ther
n B
alti
c…
Gu
lf o
f G
dan
sk
Bay
of
Mec
klen
bu
rg
Kie
l Bay
Litt
le B
elt
Gre
at B
elt
The
Sou
nd
Ove
rall
Bal
tic
Sea
No
of
hab
itat
s m
on
ito
red seabed water

51
Table 11. Summary of the information about the ongoing monitoring programmes per marine subregions and entire Baltic Sea region according to MSFD descriptors, biodiversity components, supporting physicochemical (PQ), and number of pressures and habitats covered. Phyto: phytoplankton; Zoo: Zooplankton; Angio: angiosperms; MAlg: macroalgae; BInv: benthic invertebrates; Ceph: cephalopods; Mam: sea mammals; Rep: reptiles. According to the monitoring data obtained during this project and analysis of current HELCOM monitoring data (HELCOM MORE, 2013).
Baltic Sea
subregions
No of
pressures
D1 D2 D4 D6 Seabed Water Mic Phy Zoo Ang MacAlg Binv Fish Cep Mam Rep Bir Yes No
Bothnian Bay 2 1 2 1 5 0 1 0 2 2 2 2 2 2 0 2 0 2 2 0
The Quark 2 1 2 1 5 0 0 0 0 2 2 2 2 2 0 2 0 2 2 0
Bothnian Sea 2 1 2 1 6 0 0 0 2 2 2 2 2 2 0 2 0 2 2 0
Åland Sea 1 0 1 1 5 0 0 0 1 1 1 1 1 1 0 1 0 1 1 0
Archipelago Sea 1 1 1 1 5 0 0 0 1 1 1 1 1 1 0 1 0 1 1 0
Gulf of Finland 2 1 2 1 5 0 0 0 2 2 2 2 2 2 0 2 0 2 2 0
Gulf of Riga 2 0 2 1 6 0 0 0 2 2 2 2 2 2 0 2 0 2 2 0
Northern Baltic Proper 4 0 4 1 7 0 0 0 4 4 4 4 4 4 0 4 0 4 4 0
Western Gotland 1 0 1 1 6 0 0 0 1 1 1 1 1 1 0 1 0 1 1 0
Eastern Gotland 2 0 2 1 5 0 0 0 2 2 2 2 2 2 0 2 0 2 2 0
Southern Baltic Proper 5 0 5 1 13 8 3 1 5 5 5 5 5 5 0 5 0 5 5 0
Gulf of Gdansk 1 0 1 1 5 0 0 0 1 1 1 1 1 1 0 0 0 1 1 0
Bay of Mecklenburg 1 0 1 1 6 5 1 1 1 1 1 1 1 1 0 1 0 1 1 0
Kiel Bay 1 0 1 1 6 5 1 1 1 1 1 1 1 1 0 1 0 1 1 0
Little Belt 1 0 0 1 5 0 0 0 1 0 1 1 1 1 0 1 0 1 1 0
Great Belt 1 0 1 1 5 0 0 0 1 1 1 1 1 1 0 1 0 0 1 0
The Sound 1 0 1 1 6 0 0 0 1 1 1 1 1 1 0 1 0 1 1 0
OVERALL Baltic * 9 1 9 9 16 9 3 2 9 9 8 9 9 9 0 5 0 9 9 0
* The overall result is the sum of the programmes of the Baltic countries
Supp.
PQMSFD Descriptor
No of
habitatsBiodiversity components

Deliverable 1.4 Report on SWOT analysis of monitoring
52
4.2.2. Identification of gaps
The current gap analysis is based on the results presented in the previous overview (section 4.2.1.). As
previously stated, in the DEVOTES Catalogue of Monitoring Networks, the Baltic Sea monitoring
programmes are not well represented because only Lithuania and Germany filled in the compilation.
Information from Finland, Estonia, Latvia, Poland, Sweden (and Russia) is missing. In order to overcome
this weakness, the identification of gaps for the Baltic Sea was based both in the monitoring catalogue
and the information given in HELCOM MORE (2013).
The first evidence is that the non-indigenous species (D2) descriptor is not monitored in most of the sub-
regions of the Baltic Sea (Table 11).
There are few biodiversity components which are not adequately monitored (i.e. microbes, mammals,
phytoplankton and zooplankton). The first two biodiversity components (i.e. microbes and mammals) are
poorly monitored, most likely due to incomplete information reported from the Baltic countries. The
phytoplankton and zooplankton have low monitoring stations cover in a minor area, such as the Quark
and Little Belt areas. According to the monitoring analysis of the Baltic Sea (HELCOM MORE, 2013) there
are a smaller number of offshore stations in all relevant biodiversity components compared to coastal
stations. Whether this kind of a coast-to-off-shore distribution of the monitoring stations is representative
and corresponds, for example, with the natural variability of the two environments and management
needs, should be further discussed when adequacy of monitoring is analysed. Some coastal areas also
seem underrepresented for some biodiversity components (e.g. phytobenthos). Zoobenthos and seabed
habitats are also underrepresented in the offshore areas.
According to HELCOM MORE (2013) macrophytobenthos (i.e. angiosperms and macroalgae) in most of
the stations (695) is monitored every year (Figure 29), whereas in the Estonian and Lithuanian coast it is
monitored every three years (36 and 9 stations, respectively) and in Germany - every two years (93
stations). Possible gaps in the distribution of phytoplankton monitoring stations are in the Northern Baltic
Proper, Bornholm Basin, Western Gotland Basin and Eastern Gotland Basin. There are areas without
stations along some parts of the coasts of Finland and Sweden (except in the Kattegat), which contrasts
with the larger number of stations along the coasts of Denmark, Germany, Lithuania and Estonia (532,
111, 9 and 48, respectively). The zoobenthos monitoring is greatly biased to coastal areas whereas the
offshore areas, especially in the central Baltic Proper are monitored at a small number (<100) of stations.
Moreover, the offshore monitoring stations do not overlap with the shallow water areas (<40 m), which
are the main feeding areas of the diving seabirds and many benthic fish species. The spatial coverage of
zooplankton monitoring is poor in a number of sub-basins: Gulf of Bothnia – five monitoring stations and
the Bornholm Basin - nine, the Western Gotland Basin and Arkona Basin – two. No monitoring is
undertaken in a Kiel Bay and Bay of Meckelburg. Many coastal areas also lack monitoring stations (i.e.
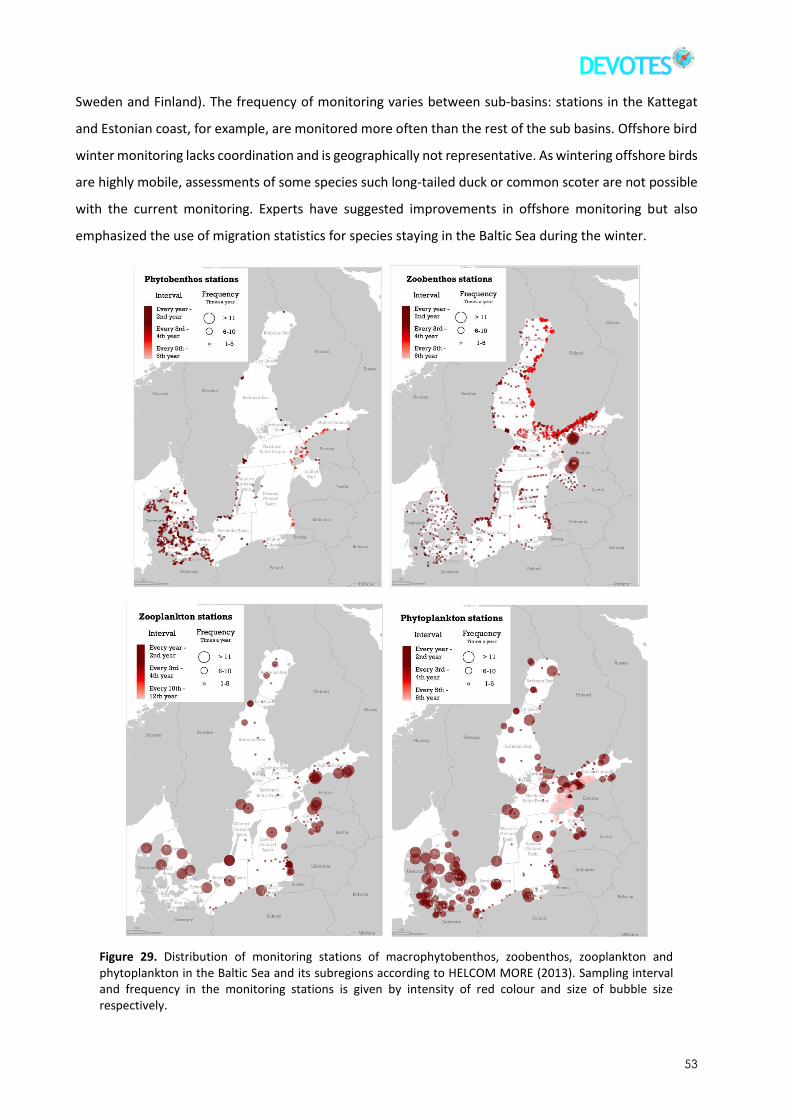
53
Sweden and Finland). The frequency of monitoring varies between sub-basins: stations in the Kattegat
and Estonian coast, for example, are monitored more often than the rest of the sub basins. Offshore bird
winter monitoring lacks coordination and is geographically not representative. As wintering offshore birds
are highly mobile, assessments of some species such long-tailed duck or common scoter are not possible
with the current monitoring. Experts have suggested improvements in offshore monitoring but also
emphasized the use of migration statistics for species staying in the Baltic Sea during the winter.
Figure 29. Distribution of monitoring stations of macrophytobenthos, zoobenthos, zooplankton and phytoplankton in the Baltic Sea and its subregions according to HELCOM MORE (2013). Sampling interval and frequency in the monitoring stations is given by intensity of red colour and size of bubble size respectively.

Deliverable 1.4 Report on SWOT analysis of monitoring
54
It is worth noting that for most biodiversity components, quality assurance is non-existent (or
unreported), therefore this aspect should be considered in future monitoring programmes.
Despite extensive monitoring of the main pressures of the Baltic Sea, there are pressures which are poorly
monitored in all subregions (i.e. marine litter and noise). It is also worth noting that even where
underwater noise is monitored, the impact of noise on many biodiversity components is not well
understood and the outputs of such monitoring cannot be used effectively at the present time. The
introduction of non-indigenous species and translocations is also insufficiently monitored.
Monitoring of mixed bottom habitats is still unsatisfactory in many subregions. Rare seabed habitats, such
as shelf sublittoral rock and biogenic reef, are also poorly monitored.
4.2.3. SWOT analysis – Baltic Sea
Almost all GEnS descriptors and biological components are addressed through monitoring programmes within the the Baltic region.
At least nine national monitoring programmes of each Baltic country address GEnS Descriptors 1, 4 and 6.
All ongoing monitoring programmes simultaneously address more than one descriptor. This catalogue only focuses on the four biodiversity-related descriptors relevant to the MSFD; therefore, it is likely that the catalogued monitoring programmes will also be suitable to address more descriptors of the MSFD.
Major subregions of the Baltic Sea have an extensive system of monitoring programmes (i.e. Bothnian Sea, Eastern and Western Gotland Basins, Northern and Southern Baltic Propers, Kattegat).
In general, the proportions of monitoring programmes for the different biological components are similar across the different subregions.
A higher proportion of monitoring programmes address phytoplankton, zooplankton, angiosperms, macroalgae, benthic invertebrates, fish and birds.
Collating monitoring programme information at the subregion scale masks information about the spatial extent and distribution of monitoring within that subregion. Within each subregion of the Baltic Sea, monitoring programmes address a specific focus (e.g. habitat, species, pressure etc.), resulting in an uneven distribution of spatial monitoring stations/sites, sampling interval and frequency and monitored components. Coverage of monitored attributes (e.g. descriptors, biological components, habitats and pressures) may therefore be shown as addressed at a subregion level; however, in reality monitoring may only take place in a small number of specific subregion sub-sections.
In the Baltic region the number of monitoring programmes that address Decriptor D2 is limited, compared to programmes which address D 1, 4 and 6.
There seem to be gaps in geographical distribution of monitoring stations, sampling interval and frequency in the monitoring stations. These gaps of monitoring design over many subregions may underestimate GEnS of major biodiversity components, especially in the offshore areas, macrophytobenthos, zoobenthos and birds.

55
In contrast with other subregions, the proportions of monitoring programmes for all biological components, except microbes, reptiles and cephalopods, are higher in the Northern Baltic Proper and Southern Baltic Proper.
The monitoring programmes of fishes and mammals seem to be without any serious drawbacks.
The collection of physicochemical data in conjunction with biodiversity component monitoring is a common practice in monitoring programmes undertaken in the Baltic Sea.
Overall, monitoring programmes undertaken within the Baltic region address all pressures, especially the major ones: eutrophication and extraction of living resources.
All water habitats and most of seabed habitats (e.g. hard and soft bottoms) are addressed within the monitoring programmes of the Baltic Sea.
Although there is general guidance of quality assurance (QA) associated with the monitored biological components in the Baltic Sea, however its development highly varies among biological components. This has implications for the standardisation (within and between institutes) of data collection techniques, laboratory analysis methods and data handling, treatment and presentation methods. There is therefore high potential for poor comparability between data sets where QA procedures are not in place.
Absence of regional methodology on monitoring marine litter, noise and introduction of non-indigenous species and translocations may result in underestimation of impact by these pressures to GEnS in almost all subregions of the Baltic Sea.
There are no reported monitoring programmes covering benthic habitats, mixed bottom, sublittoral rock and biogenic reef, in the Baltic region.
In general, absence of regional uniform monitoring system results in uneven coverage of stations, simultaneous assessment intervals and frequency for many biological components, habitats and pressures. There is a need for monitoring programmes to become more efficient and robust, integrating data of biological components, habitats and pressures through simultaneous monitoring. Reduction of overlapping measurements and/or changing their distribution and sampling frequency may also improve the efficiency of regional monitoring.

Deliverable 1.4 Report on SWOT analysis of monitoring
56
4.3. Black Sea and the Sea of Marmara
4.3.1. Monitoring Networks - overview
The Black Sea monitoring networks are analysed in this section as two geographical areas: EU and non-EU
waters (Figure 30). This geographical division is used as there are no defined MSFD subregions within the
Black Sea. In addition, the monitoring networks covering the Sea of Marmara (currently included in the
non EU Seas) are also included in this analysis (Figure 30). The Sea of Marmara connects two EU Seas (the
Black Sea and the Mediterranean Sea) and is under the sovereignty of Turkey (a candidate EU country). It
is therefore deemed relevant within this deliverable to consider and assess the marine monitoring
undertaken in the Sea of Marmara in association with monitoring undertaken in the Black Sea.
The existing long-term monitoring programmes (including relatively dense cover of monitoring stations and frequency of measurements) in the Baltic Sea and implementation of the MSFD by each member state make a great platform for the further development of GEnS and their monitoring methods, which should be harmonized within the Baltic region.
The obtained data during monitoring programmes within the Baltic Sea may have scientific value in the regional and inter-regional scale, where different comparisons and predictions could be performed.
Although marine litter and noise pressures have not been well monitored, many research activities have recently started concerning these topics.
Regionally coordinated (by HELCOM) and obtained long-term monitoring data may serve good database for online information system on the aquatic non-indigenous species (AquaNIS), which is being developed in the framework of EU project VECTORS. AquaNIS seeks to ensure the long-term maintenance and reliability of the database by continuous update and scientific validation of its data, making it useful for risk assessments of bioinvasions and decisions of measures.
Recently the monitoring programmes have not been fully harmonized among the Baltic countries, most likely due to the differences in size of national budgets, assigned to the marine monitoring programmes. Therefore this problem may remain in the future, highly depending on the national policy and/or economic status.
The policy of non-EU country (Russia) may have evident impact on the monitoring system at least in the subregional scale.
There could be potential effect on some vulnerable and rare species or habitats by intensive monitoring activities, especially using destructive methods such as nets, trawls, grabs and frames.

57
Figure 30. Black Sea (EU, non-EU waters) and the Sea of Marmara: (Source: Connor, 2012).
The Black Sea is surrounded by six countries (i.e. Bulgaria, Romania, Turkey, Ukraine, Russia, Georgia) and
each of them are obliged to control the state of the marine environment in a relevant sea sector as per
implementation of the ratified Bucharest Convention (http://www.blacksea-commission.org/_table-
legal-docs.asp). All countries have their own national programmes concerning the monitoring of particular
ecological components of the Black Sea environment. These programmes are structured in coherence
with the Integrated Monitoring and Assessment Program (BSIMAP), which was adopted in 2006 under the
umbrella of the Black Sea Commission (BSC). BSIMAP aimed to compile existing data from national
monitoring and integrate datasets to improve the assessment of the chemical and ecological status of the
Black Sea. The EU member states of the region also implement EU directives, programs and policies such
as the Water Framework Directive, Marine Strategy Framework Directive, Habitats Directive, Birds
Directive, NATURA 2000, Bathing Water Directive and Common Fisheries Policy.
EU
NON-EU
SEA OF MARMARA
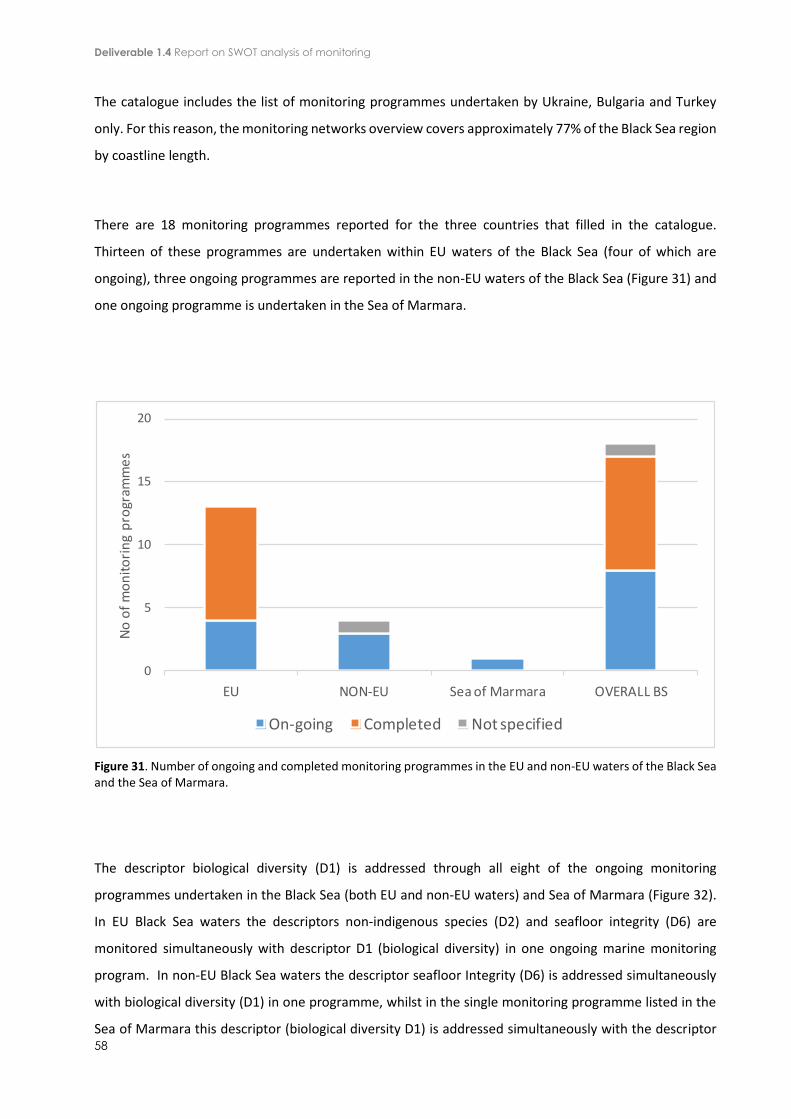
Deliverable 1.4 Report on SWOT analysis of monitoring
58
The catalogue includes the list of monitoring programmes undertaken by Ukraine, Bulgaria and Turkey
only. For this reason, the monitoring networks overview covers approximately 77% of the Black Sea region
by coastline length.
There are 18 monitoring programmes reported for the three countries that filled in the catalogue.
Thirteen of these programmes are undertaken within EU waters of the Black Sea (four of which are
ongoing), three ongoing programmes are reported in the non-EU waters of the Black Sea (Figure 31) and
one ongoing programme is undertaken in the Sea of Marmara.
Figure 31. Number of ongoing and completed monitoring programmes in the EU and non-EU waters of the Black Sea and the Sea of Marmara.
The descriptor biological diversity (D1) is addressed through all eight of the ongoing monitoring
programmes undertaken in the Black Sea (both EU and non-EU waters) and Sea of Marmara (Figure 32).
In EU Black Sea waters the descriptors non-indigenous species (D2) and seafloor integrity (D6) are
monitored simultaneously with descriptor D1 (biological diversity) in one ongoing marine monitoring
program. In non-EU Black Sea waters the descriptor seafloor Integrity (D6) is addressed simultaneously
with biological diversity (D1) in one programme, whilst in the single monitoring programme listed in the
Sea of Marmara this descriptor (biological diversity D1) is addressed simultaneously with the descriptor
0
5
10
15
20
EU NON-EU Sea of Marmara OVERALL BS
No
of
mo
nit
ori
ng
pro
gram
me
s
On-going Completed Not specified

59
non-indigenous species (D2). No monitoring programmes in the Black Sea (EU or non-EU waters) or Sea
of Marmara address the descriptor food-webs (D4) (Figure 32 and Table 12).
Figure 32. Ongoing monitoring programmes per descriptor in the EU and non-EU waters of the Black Sea (BS) and the Sea of Marmara (D1: Biological diversity, D2: Non-indigenous species, D4: Food webs, D6: Seafloor integrity).
As there are no cephalopod or reptile species recorded in the Black Sea, microbes are the only biodiversity
component not currently monitored in the ongoing marine monitoring programmes (EU and non-EU
waters). Eight biodiversity components are monitored in EU Black Sea waters (i.e. Phytoplankton,
zooplankton, angiosperms, macroalgae, benthic invertebrates, fish, marine mammals and birds),
compared to six biodiversity components monitored in non-EU waters (i.e. phytoplankton, zooplankton,
angiosperms, macroalgae, benthic invertebrates and fish). Three biodiversity components (i.e.
phytoplankton, zooplankton and benthic invertebrates) are monitored in the Sea of Marmara (Figure 33
and Table 12).

Deliverable 1.4 Report on SWOT analysis of monitoring
60
Figure 33. Percentage of each biodiversity component monitored in the ongoing programmes in the EU and non-EU waters of the Black Sea (BS) and the Sea of Marmara.
Half of the monitoring programmes recorded in the Black Sea marine region do not collect any supporting
physicochemical parameters in conjunction with biodiversity component monitoring (Figure 34).
Figure 34. Number of ongoing programmes collecting supporting physicochemical parameters in the EU and non-EU waters of the Black Sea (BS) and the Sea of Marmara.
0%
10%
20%
30%
40%
50%
60%
70%
80%
90%
100%
EU NON-EU Sea of Marmara OVERALL BS
Mic Phy Zoo Ang MacAl Binv Fish Cep Mam Rep Bir
0
2
4
6
8
10
EU NON-EU Sea of Marmara OVERALL BS
No
of
mo
nit
ori
ng
pro
gram
me
s
YES NO

61
In EU Black Sea waters, only one out of four ongoing monitoring programmes collects supporting
physicochemical data, compared to two out of three programmes in the non-EU Black Sea region (Figure
34). The single recorded monitoring programme in the Sea of Marmara collects supporting
physicochemical parameters in conjunction with biodiversity component monitoring (Figure 34). Where
supporting parameters are collected, these mainly relate to the physical (e.g. temperature, salinity,
density, Secchi disk) and/or chemical state of the ecosystem (e.g. nitrates, nitrites, dissolved oxygen,
phosphates, silicates, pH, metals, organic pollutants, PAHs).
Out of the 31 pressures identified in the catalogue of monitoring networks, only nine are addressed
through monitoring programmes in the Black Sea and Sea of Marmara (Figure 35). The pressures ‘nitrogen
and phosphorus enrichment’ and ‘organic matter enrichment’ are simultaneously addressed through one
monitoring programme in both EU and non-EU Black Sea waters. The pressures ‘local thermal regime
change’, ‘local salinity regime change’, ‘introduction of synthetic compounds’, ‘introduction of non-
synthetic substances and compounds’, ‘introduction of other substances’, ‘nitrogen and phosphorus
enrichment’, ‘organic matter enrichment’ and ‘manageable pH changes’ are addressed simultaneously
through a single monitoring programme in the non-EU waters of the Black Sea (eight pressures; Figure
35).
Figure 35. Number of ongoing programmes monitoring pressures monitored in the Black Sea (BS) and the Sea of Marmara regions.
0
2
4
6
8
10
EU NON-EU Sea of Marmara OVERALL BS
No
of
pre
ssu
res
be
ing
mo
nit
ore
d
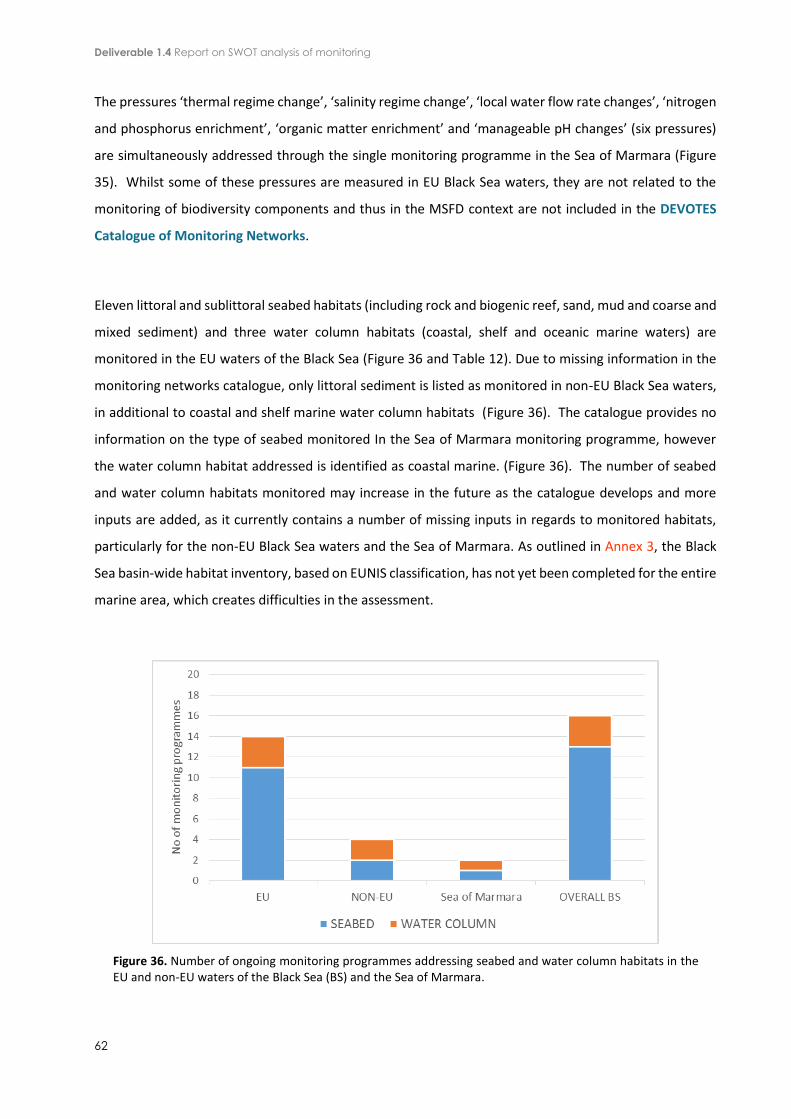
Deliverable 1.4 Report on SWOT analysis of monitoring
62
The pressures ‘thermal regime change’, ‘salinity regime change’, ‘local water flow rate changes’, ‘nitrogen
and phosphorus enrichment’, ‘organic matter enrichment’ and ‘manageable pH changes’ (six pressures)
are simultaneously addressed through the single monitoring programme in the Sea of Marmara (Figure
35). Whilst some of these pressures are measured in EU Black Sea waters, they are not related to the
monitoring of biodiversity components and thus in the MSFD context are not included in the DEVOTES
Catalogue of Monitoring Networks.
Eleven littoral and sublittoral seabed habitats (including rock and biogenic reef, sand, mud and coarse and
mixed sediment) and three water column habitats (coastal, shelf and oceanic marine waters) are
monitored in the EU waters of the Black Sea (Figure 36 and Table 12). Due to missing information in the
monitoring networks catalogue, only littoral sediment is listed as monitored in non-EU Black Sea waters,
in additional to coastal and shelf marine water column habitats (Figure 36). The catalogue provides no
information on the type of seabed monitored In the Sea of Marmara monitoring programme, however
the water column habitat addressed is identified as coastal marine. (Figure 36). The number of seabed
and water column habitats monitored may increase in the future as the catalogue develops and more
inputs are added, as it currently contains a number of missing inputs in regards to monitored habitats,
particularly for the non-EU Black Sea waters and the Sea of Marmara. As outlined in Annex 3, the Black
Sea basin-wide habitat inventory, based on EUNIS classification, has not yet been completed for the entire
marine area, which creates difficulties in the assessment.
Figure 36. Number of ongoing monitoring programmes addressing seabed and water column habitats in the EU and non-EU waters of the Black Sea (BS) and the Sea of Marmara.

63
Table 12. Summary table of ongoing monitoring programmes in the EU and non-EU waters of the Black Sea (BS) and the Sea of Marmara. MSFD: Marine Strategy Framework Directive; PQ: physicochemical.
All biodiversity-related marine monitoring programmes currently ongoing in the EU waters of the Black
Sea are those undertaken by Member States (Bulgaria) in relation to implementation of EU directives,
programmes and policies (listed above). This monitoring is undertaken, at a regional level, through the
Bucharest Convention (BSIMAP) and, at a national level, through the national institutes (Institute of
Oceanology and Institute of Biodiversity and Ecosystem Research- Bulgarian Academy of Sciences and
Institute of Fishery Resources – Agricultural Academy) and NGOs.
The ongoing monitoring programmes included in the catalogue of monitoring networks include the
Bulgarian National Black Sea Monitoring Program, which is the responsibility of the Ministry of
Environment and Water. According to the National Water Act (state gaz. 61/6.08.2010) the responsible
authorities include the Executive Environment Agency and the Black Sea Basin Directorate, Executive
Agency for Exploration and maintenance of the Danube River, Institute of Hydrometeorology – BAS (IHM-
BAS) and the Institute of Oceanology – BAS (IO-BAS). Between 2006 and 2011 the National Black Sea
Monitoring Program consisted of a number of fragmented campaigns. However the legitimate
programme commenced in 2012 and is mainly related to the Water Framework Directive and some
descriptors of Marine Strategy Framework Directive with a focus on biodiversity components and
physicochemical parameters, while pollutants are not fully addressed (responsible IO-BAS). IHM-BAS is in
charge of monitoring of complementary hydrometeorological parameters. The MSFD related monitoring
is limited to six stations located in the coastal, shelf and open sea with four surveys undertaken per year
(May-November).
Two monitoring programmes undertaken in EU Black Sea waters and listed in the catalogue monitor
marine mammals (Ministry of Environment and Water - MOEW) and birds (NGOs). Fish biodiversity
monitoring as part of a fish stock assessment program commence in 2007 and is under responsibility of
Black Sea and Sea of
Marmara regions
No of
pressures
D1 D2 D4 D6 Seabed Water Mic Phy Zoo Ang MacAlg Binv Fish Cep Mam Rep Bir Yes No
EU waters 4 1 0 1 2* 11 3 0 1 1 1 1 1 1 − 2 − 2 1 3
non-EU waters 3 0 0 1 8 2 2 0 2 1 1 2 1 1 − 0 − 0 2 1
Sea of Marmara 1 1 0 0 6 1* 1* 0 1 1 0 0 1 0 0 0 − 0 1 0
OVERALL BS 8 2 0 2 9 11 3 0 4 3 2 3 3 2 0 2 − 2 4 4
* information incompletely reported in the catalogue; − biodiversity components not present in the EU and non‐EU waters of the Black Sea and Sea of Marmara regions.
MSFD DescriptorNo of
habitatsBiodiversity components
Supp.
PQ
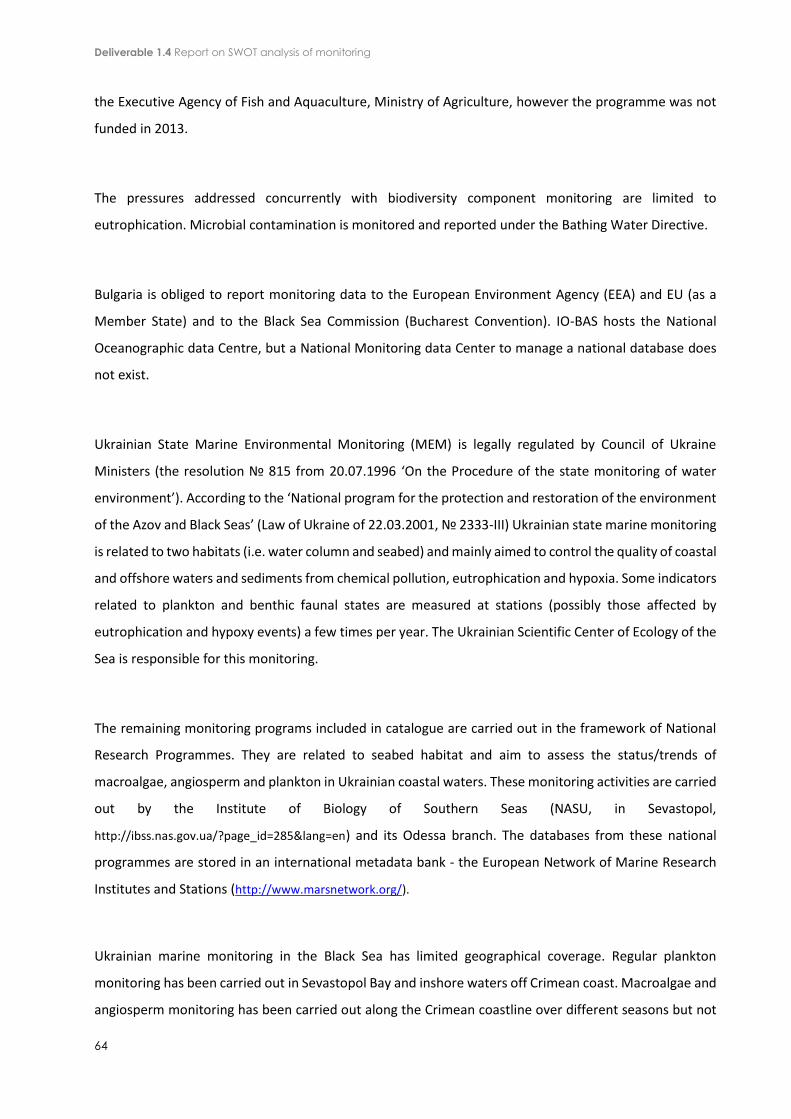
Deliverable 1.4 Report on SWOT analysis of monitoring
64
the Executive Agency of Fish and Aquaculture, Ministry of Agriculture, however the programme was not
funded in 2013.
The pressures addressed concurrently with biodiversity component monitoring are limited to
eutrophication. Microbial contamination is monitored and reported under the Bathing Water Directive.
Bulgaria is obliged to report monitoring data to the European Environment Agency (EEA) and EU (as a
Member State) and to the Black Sea Commission (Bucharest Convention). IO-BAS hosts the National
Oceanographic data Centre, but a National Monitoring data Center to manage a national database does
not exist.
Ukrainian State Marine Environmental Monitoring (MEM) is legally regulated by Council of Ukraine
Ministers (the resolution № 815 from 20.07.1996 ‘On the Procedure of the state monitoring of water
environment’). According to the ‘National program for the protection and restoration of the environment
of the Azov and Black Seas’ (Law of Ukraine of 22.03.2001, № 2333-III) Ukrainian state marine monitoring
is related to two habitats (i.e. water column and seabed) and mainly aimed to control the quality of coastal
and offshore waters and sediments from chemical pollution, eutrophication and hypoxia. Some indicators
related to plankton and benthic faunal states are measured at stations (possibly those affected by
eutrophication and hypoxy events) a few times per year. The Ukrainian Scientific Center of Ecology of the
Sea is responsible for this monitoring.
The remaining monitoring programs included in catalogue are carried out in the framework of National
Research Programmes. They are related to seabed habitat and aim to assess the status/trends of
macroalgae, angiosperm and plankton in Ukrainian coastal waters. These monitoring activities are carried
out by the Institute of Biology of Southern Seas (NASU, in Sevastopol,
http://ibss.nas.gov.ua/?page_id=285&lang=en) and its Odessa branch. The databases from these national
programmes are stored in an international metadata bank - the European Network of Marine Research
Institutes and Stations (http://www.marsnetwork.org/).
Ukrainian marine monitoring in the Black Sea has limited geographical coverage. Regular plankton
monitoring has been carried out in Sevastopol Bay and inshore waters off Crimean coast. Macroalgae and
angiosperm monitoring has been carried out along the Crimean coastline over different seasons but not

65
regularly. The Ukrainian monitoring has been designed to address pressures related to pollution and
eutrophication: ‘nitrogen and phosphorus enrichment’, ‘organic matter enrichment’ and ‘introduction of
synthetic and non-synthetic substances and compounds’.
The Turkish monitoring programme is performed according to the BSIMAP of the Black Sea Commission.
The national responsible authority for the programme is the Ministry of Environment and Urbanization.
Like Ukrainian monitoring, Turkish monitoring can also be assessed as pollution and eutrophication
monitoring since the parameters monitored are mainly physicochemical, rather than biological. Annual
data is collected across 22 transects, at 66 stations along the Turkish Black Sea coast. Eight out of 22 sites
are evaluated as hotspots for the Black Sea Action Plan. The Turkish monitoring programme also contains
three sites in the Sea of Marmara to monitor the effects of the Danube River input. The results are
reported to the Black Sea Commission every year.
Data for 26 categorized parameters are collected from the sea and bottom sediment environments. Some
of the parameters are related to coastal bathing waters and some others represent some biota of the
Turkish Black Sea coasts. There are studies to enhance Turkish marine monitoring programmes, especially
to structure them according to the EU directives in the accession period. Some ministries have been re-
organized in the last three years; legislative arrangements are continuing and a national project was
completed by the end of 2013 which will be the basis for re-structuring the monitoring programmes in
the next years, according to MSFD, WFD and other EU directives.
4.3.2. Identification of gaps
As mentioned in the previous subsection, the Black Sea monitoring networks catalogue covers the
monitoring activities of three of the six countries in this region. Thus, this cataloguing has a geographic
gap of around 23% of the region represented by coastline length. The gaps are listed for descriptors,
biodiversity components, habitats and pressures, which are not covered by the ongoing monitoring
programmes identified in the catalogue of monitoring networks.
Among the four descriptors that DEVOTES addresses, monitoring programmes associated with MSFD
descriptor food webs (D4) are completely lacking in the region or are not reported in the current version
of the catalogue. The descriptors non-indigenous species (D2) and seafloor integrity (D6) are also only

Deliverable 1.4 Report on SWOT analysis of monitoring
66
addressed through a small number of monitoring programmes in the Black Sea (EU and non-EU waters)
and Sea of Marmara. The descriptors food webs (D4) and seafloor integrity (D6) are not addressed in the
Sea of Marmara monitoring programme. According with the catalogue current version, the descriptors
non-indigenous species (D2) and food-webs (D4) are not addressed in monitoring programmes in non-EU
waters and descriptor D4 (food-webs) is also not addressed in EU Black Sea waters.
The biodiversity component microbes are not monitored in the Black Sea (EU and non-EU waters) or Sea
of Marmara (Table 12). Marine mammals and birds are monitored within EU Black Sea Waters, but are
not monitored in non-EU Black Sea waters or the Sea of Marmara. Angiosperms, macroalgae and fish are
not monitored in the Sea of Marmara (Table 12).
Among the seabed habitat types considered in the catalogue, the presence of the habitat ‘upper bathyal
rock and biogenic reef’ in the Black Sea region is scientifically debated due to a lack of data and
information. The habitats ‘upper bathyal sediment’, ‘lower bathyal rock and biogenic reef’, ‘lower bathyal
sediment’, ‘abyssal rock and biogenic reef’ and ‘abyssal sediment’ are mainly lacking in the Black Sea (no
biota) due to the presence of H2S (Todorova, 2013: BG Initial Assessment Report). With reference to the
relevant habitats for this region, shelf sublittoral rock and biogenic reef and upper bathyal rock and
biogenic reef (if existent) are not addressed in EU waters; only littoral sediment is addressed in non-EU
Black Sea waters (likely due to a lack of information in the catalogue) and there is no information available
(i.e. not specified) regarding the seabed habitats covered by the ongoing monitoring programme in the
Sea of Marmara (see Table 13).
The water column habitat types ‘reduced salinity water’ and ‘variable salinity (estuarine) water’ are not
valid for the Bulgarian marine environment, but are present in the North-Western EU areas (Romania),
which are not included in the Catalogue of Monitoring Networks. Coastal, shelf and oceanic marine waters
are addressed in EU Black Sea waters and coastal and shelf marine waters are addressed in non-EU waters
(see Table 13). The single ongoing marine monitoring programme in the Sea of Marmara addresses coastal
marine water column habitats.

67
Table 13. Gaps of ongoing monitoring programmes for habitat types in the EU and non EU waters of the Black Sea and Sea of Marmara.
In accordance with the Catalogue for Monitoring Networks, a total of 29 pressures are not monitored in
the EU waters of the Black Sea. A greater number of pressures are monitored in the non-EU waters of the
Black Sea (although there are still 23 unmonitored pressures). Twenty-five pressures are not monitored
in the Sea of Marmara: substratum loss, smothering, abrasion, selective extraction of non-living resources,
underwater noise, marine litter, changes in siltation, widespread thermal regime change, widespread
salinity regime change, local emergence regime change, widespread emergence regime change, local
change in wave exposure, widespread change in wave exposure, electromagnetic changes, introduction
of synthetic compounds, introduction of non-synthetic substances and compounds, introduction of radio-
nuclides, introduction of other substances, introduction of microbial pathogens, introduction of non-
indigenous species and translocations, selective extraction of living resources, widespread pH changes,
barrier to species movement and death or injury by collision.
The most significant gap in the reported monitoring programmes is the lack of an integrated monitoring
strategy with relevant frequency and spatial coverage which would allow a better understanding of the
changes in the pelagic and benthic communities to construct a relevant assessment system aimed at
achieving GEnS.
Black Sea and
Sea of Marmara
regions Litt
ora
l ro
ck
an
d b
iog
en
ic r
ee
f
Litt
ora
l se
dim
en
t
Sh
allo
w s
ub
litt
ora
l ro
ck
an
d b
iog
en
ic r
ee
f
Sh
allo
w s
ub
litt
ora
l c
oa
rse
se
dim
en
t
Sh
allo
w s
ub
litt
ora
l sa
nd
Sh
allo
w s
ub
litt
ora
l m
ud
Sh
allo
w s
ub
litt
ora
l m
ixe
d s
ed
ime
nt
Sh
elf s
ub
litt
ora
l ro
ck
an
d b
iog
en
ic r
ee
f
Sh
elf s
ub
litt
ora
l c
oa
rse
se
dim
en
t
Sh
elf s
ub
litt
ora
l sa
nd
Sh
elf s
ub
litt
ora
l m
ud
Sh
elf s
ub
litt
ora
l m
ixe
d s
ed
ime
nt
Up
pe
r b
ath
ya
l ro
ck
an
d b
iog
en
ic r
ee
f
Up
pe
r b
ath
ya
l se
dim
en
t
Low
er
ba
thy
al ro
ck
an
d b
iog
en
ic r
ee
f
Low
er
ba
thy
al se
dim
en
t
Ab
yss
al ro
ck
an
d b
iog
en
ic r
ee
f
Ab
yss
al se
dim
en
t
Re
du
ce
d s
alin
ity
wa
ter
Va
ria
ble
sa
lin
ity
(e
stu
ari
ne
) w
ate
r
Ma
rin
e w
ate
r: c
oa
sta
l
Ma
rin
e w
ate
r: s
he
lf
Ma
rin
e w
ate
r: o
ce
an
ic
EU waters 1 1 1 1 1 1 1 0 1 1 1 1 0* − − − − − 0§ 0§ 1 1 1
non-EU waters 0 1 0 0* 0* 0* 0* 0 0 0 0 0 0* − − − − − 0 0 1 1 0
Sea of Marmara
OVERALL 1 2 1 1* 1* 1* 1* 0 1 1 1 1 0* − − − − − 0§ 0§ 2 2 1
--------------------------------------------------------------------- NOT SPECIFIED --------------------------------------------------------------
* information uncertain or not present in the current version of the catalogue (Jan 2014); − habitat type not present in the
Black Sea (EU and non-EU waters); § habitats missing from Bulgarian waters but present in North Western EU waters (i.e.
Romania)
SEABED HABITATS WATER COLUMN HABITATS
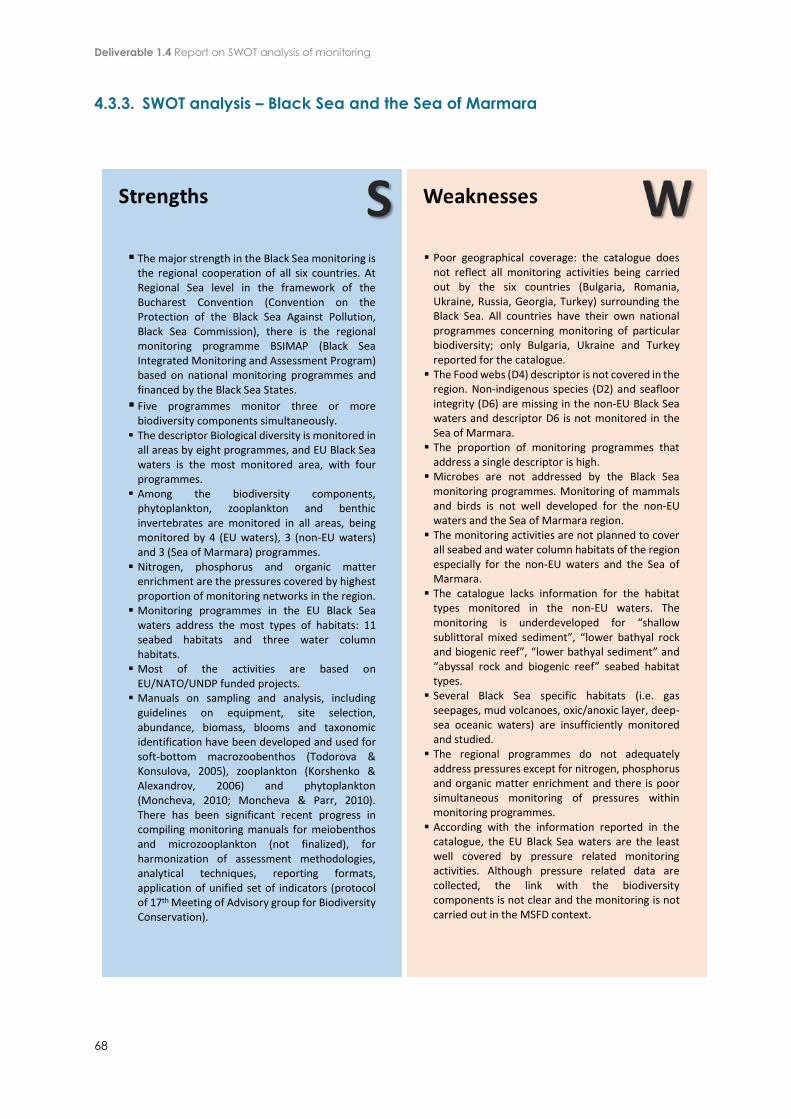
Deliverable 1.4 Report on SWOT analysis of monitoring
68
4.3.3. SWOT analysis – Black Sea and the Sea of Marmara
The major strength in the Black Sea monitoring is the regional cooperation of all six countries. At Regional Sea level in the framework of the Bucharest Convention (Convention on the Protection of the Black Sea Against Pollution, Black Sea Commission), there is the regional monitoring programme BSIMAP (Black Sea Integrated Monitoring and Assessment Program) based on national monitoring programmes and financed by the Black Sea States.
Five programmes monitor three or more biodiversity components simultaneously.
The descriptor Biological diversity is monitored in all areas by eight programmes, and EU Black Sea waters is the most monitored area, with four programmes.
Among the biodiversity components, phytoplankton, zooplankton and benthic invertebrates are monitored in all areas, being monitored by 4 (EU waters), 3 (non-EU waters) and 3 (Sea of Marmara) programmes.
Nitrogen, phosphorus and organic matter enrichment are the pressures covered by highest proportion of monitoring networks in the region.
Monitoring programmes in the EU Black Sea waters address the most types of habitats: 11 seabed habitats and three water column habitats.
Most of the activities are based on EU/NATO/UNDP funded projects.
Manuals on sampling and analysis, including guidelines on equipment, site selection, abundance, biomass, blooms and taxonomic identification have been developed and used for soft‐bottom macrozoobenthos (Todorova & Konsulova, 2005), zooplankton (Korshenko & Alexandrov, 2006) and phytoplankton (Moncheva, 2010; Moncheva & Parr, 2010). There has been significant recent progress in compiling monitoring manuals for meiobenthos and microzooplankton (not finalized), for harmonization of assessment methodologies, analytical techniques, reporting formats, application of unified set of indicators (protocol of 17th Meeting of Advisory group for Biodiversity Conservation).
Poor geographical coverage: the catalogue does not reflect all monitoring activities being carried out by the six countries (Bulgaria, Romania, Ukraine, Russia, Georgia, Turkey) surrounding the Black Sea. All countries have their own national programmes concerning monitoring of particular biodiversity; only Bulgaria, Ukraine and Turkey reported for the catalogue.
The Food webs (D4) descriptor is not covered in the region. Non-indigenous species (D2) and seafloor integrity (D6) are missing in the non-EU Black Sea waters and descriptor D6 is not monitored in the Sea of Marmara.
The proportion of monitoring programmes that address a single descriptor is high.
Microbes are not addressed by the Black Sea monitoring programmes. Monitoring of mammals and birds is not well developed for the non-EU waters and the Sea of Marmara region.
The monitoring activities are not planned to cover all seabed and water column habitats of the region especially for the non-EU waters and the Sea of Marmara.
The catalogue lacks information for the habitat types monitored in the non-EU waters. The monitoring is underdeveloped for “shallow sublittoral mixed sediment”, “lower bathyal rock and biogenic reef”, “lower bathyal sediment” and “abyssal rock and biogenic reef” seabed habitat types.
Several Black Sea specific habitats (i.e. gas seepages, mud volcanoes, oxic/anoxic layer, deep-sea oceanic waters) are insufficiently monitored and studied.
The regional programmes do not adequately address pressures except for nitrogen, phosphorus and organic matter enrichment and there is poor simultaneous monitoring of pressures within monitoring programmes.
According with the information reported in the catalogue, the EU Black Sea waters are the least well covered by pressure related monitoring activities. Although pressure related data are collected, the link with the biodiversity components is not clear and the monitoring is not carried out in the MSFD context.

69
Although, monitoring data are used in Ukrainian legislation for the designation of MPAs for integrated coastal zone management, the data are poorly used in legislation regarding the identification of operational objectives and development of measures for marine management. The Ukrainian marine policy is currently being reformed in line with MFSD.
There is insufficient financial support of monitoring and poor coordination between responsible authorities.
Despite the Black Sea regional initiatives such as Black Sea GOOS (ARGO floats and other drifters in the Black Sea), as well as participation in the MyOcean program, the bio-ecological operational oceanography is still poorly developed. Infrastructure improvements and effective introduction of less applied approaches (such as remote sensing, underwater video surveys, Continuous Plankton Recorders, side-scan sonar techniques for habitat mapping, Ship of opportunity / FerryBox system) should be considered as overarching and critical issues for implementation of the MSFD.
Lack of advanced genetic and genomic methodologies for taxonomic revisions including microbes and viruses.
Lack of a fixed network of sampling stations with regular and long-term observations.
Lack of efficient data exchange and integrated outputs (intercalibration between different networks) stands as an obstacle for data management and quality issues in inter-governmental levels.
Several inter-comparison exercises have been organized and collaboration within recent WFD/MSFD supporting projects (SESAME, PERSEUS, CoCoNet, MISIS, EMBLAS) contribute to generating new data and advance application of harmonized approaches and indicators.
A regional database (known as Mnemiopsis) hosted by the Black Sea Commission was developed in 2008 (BlackSeaScene infrastructure Project) but needs further updating. An interoperable GIS enabled Regional Pollution Data Base, hosted by Regional Activity Centre (RAC) Pollution Monitoring Assessment (PMA) is being developed in the framework of Baltic2Black (BSC and HELCOM) Project. A common tool for assessment of eutrophication (BEAST) has been adopted (Baltic2Black Project).

Deliverable 1.4 Report on SWOT analysis of monitoring
70
4.4. Mediterranean Sea
4.4.1. Monitoring Networks - overview
A formal analysis of the current situation, structure, spread and coverage of monitoring programmes in
the Mediterranean and its four subregions (Figure 37) was done. The Mediterranean analysis of the
catalogue reports on numbers and types of monitoring programmes for four biodiversity components and
several habitats addressed by ongoing monitoring programmes overall and by subregion.
A total of 48 biodiversity related monitoring programmes have been registered in the Mediterranean Sea,
nine of which were completed by 2013, and the remaining 39 are reported to run to date (Figure 38).
With the exception of four programmes aiming at reporting the environmental condition of impacted
sites (all in the Eastern Mediterranean) the rest are surveillance programmes. Special mention should be
made to two programmes, namely MEDITS and MEDPOL, which have been running across the
Mediterranean Region following the same sampling protocol.
The Black Sea has a catchment drainage area of 2,000,000 km2 and suffers from land-based sources through river inputs. This large drainage area obliges the involvement of states without direct connection with the Black Sea in the monitoring and management programmes.
For the non-EU Member States, Russian Federation, Ukraine, Georgia and Turkey, which have 86% of the Black Sea's coastline length, the EU directives are not obligatory, which is a potential threat for the integrated regional monitoring activities. The lack of integrated monitoring could generate difficulties in identifying the most adequate cause/effect relationships and formulation of proper management options.
In spite of accomplished standardizations in data collection, analysis and assessment methods and representativeness of different water bodies of the Black Sea, a serious deficiency in spatial and temporal resolutions in the areas monitored is apparent.
The deficiency of D4 (food -web) monitoring affects the level of knowledge that might be crucial for adequate understanding of the ecosystem processes.
Integrating the Sea of Marmara monitoring activities in the international networks it is not straightforward because it is an inland sea of Turkey.
The catalogue provides evidence for various sampling frequencies within the Black Sea monitoring networks. This points to the necessity to address scales (temporal and spatial) as a crucial issue for adequate monitoring efforts.
The catalogue assesses the gaps of existing QA/QC procedures and thus provides opportunities to further addressing the issue towards improving the reliability of the assessments.
Among the six Black Sea countries, only Bulgaria and Romania are EU Member States. Turkey, with almost 35% of coastline length coverage, is a candidate state and proceeds efforts to reorganize its monitoring activities to be integrated with the EU directives.
There is increasing cooperation between the Black Sea countries and progress on the integration of monitoring with EU directives. This opportunity enhances the state-of-art of monitoring in the region.
The Sea of Marmara, although not an EU Regional Sea, is the connection between the Mediterranean and Black Sea (EU seas). Integrating the local ongoing monitoring programmes within the regional networks will improve the MSFD implementation in the neighbour regional seas.
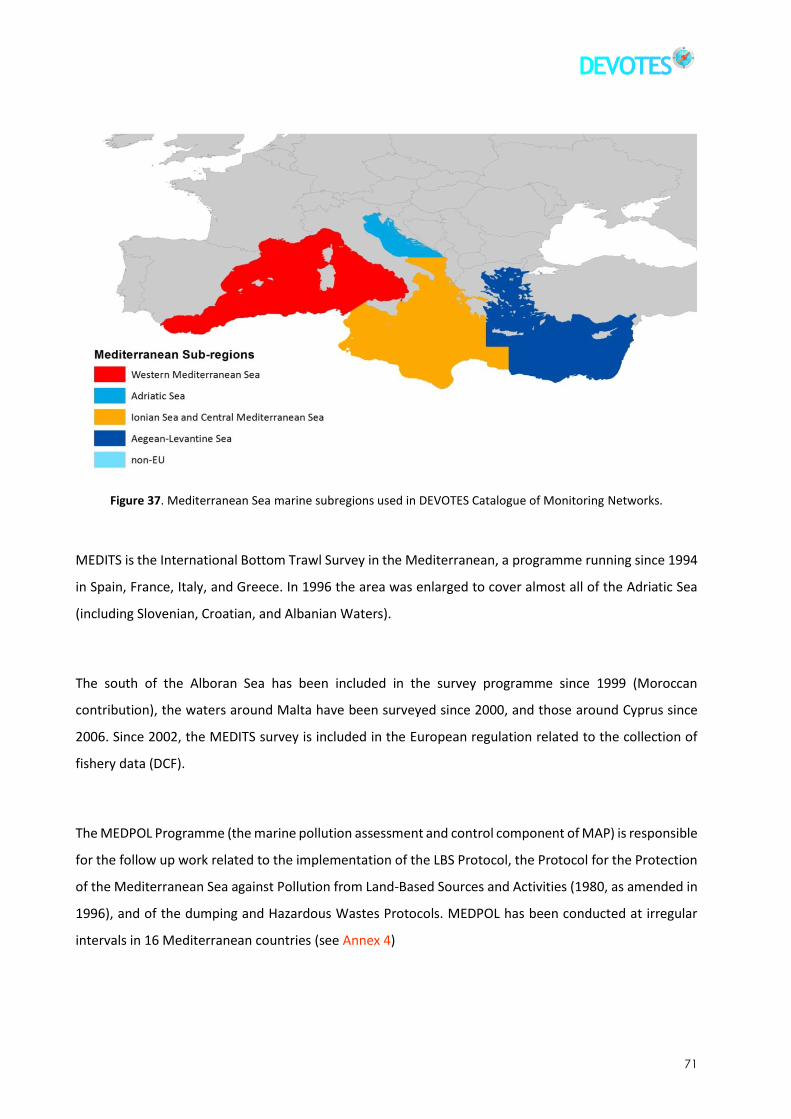
71
Figure 37. Mediterranean Sea marine subregions used in DEVOTES Catalogue of Monitoring Networks.
MEDITS is the International Bottom Trawl Survey in the Mediterranean, a programme running since 1994
in Spain, France, Italy, and Greece. In 1996 the area was enlarged to cover almost all of the Adriatic Sea
(including Slovenian, Croatian, and Albanian Waters).
The south of the Alboran Sea has been included in the survey programme since 1999 (Moroccan
contribution), the waters around Malta have been surveyed since 2000, and those around Cyprus since
2006. Since 2002, the MEDITS survey is included in the European regulation related to the collection of
fishery data (DCF).
The MEDPOL Programme (the marine pollution assessment and control component of MAP) is responsible
for the follow up work related to the implementation of the LBS Protocol, the Protocol for the Protection
of the Mediterranean Sea against Pollution from Land-Based Sources and Activities (1980, as amended in
1996), and of the dumping and Hazardous Wastes Protocols. MEDPOL has been conducted at irregular
intervals in 16 Mediterranean countries (see Annex 4)

Deliverable 1.4 Report on SWOT analysis of monitoring
72
Figure 38. Number of ongoing and completed monitoring programmes in the Mediterranean region and subregions. WMED: western Mediterranean; ADRIA: Adriatic Sea; CMED: central Mediterranean; EMED: eastern Mediterranean (Aegean & Levantine Seas).
The vast majority of ongoing monitoring programmes (29 programmes) are carried out in the Western
Mediterranean (WMED) followed by the Eastern Mediterranean (EMED) (six programmes) (Figure 38,
Table 14). Only four programmes are included in the catalogue for the Ionian Sea and three for the
Adriatic. However, this estimation is likely to be biased as only Italy (of the different countries surrounding
the Adriatic) has reported on monitoring activities in this subregion. In Croatia, Slovenia and Albania for
example the implementation of the Convention on Biological Diversity and the need for harmonization
with the Habitats Directive, WFD and MSFD has created a demand for the recognition of areas of high
biodiversity. As a result a relatively large amount of funding has been targeted at the development of
NGO capacities to help develop nature protection and monitoring in parallel with institutional bodies
(Henkens et al., 2010; Mackelworth et al., 2011;
http://www.grida.no/enrin/biodiv/biodiv/national/albania/home.htm).
Compliance with the Barcelona Convention has also motivated non-EU countries across the
Mediterranean to establish monitoring networks focusing on certain taxa such as marine mammals. These
however are not reflected in Figure 38.
0
10
20
30
40
50
60
WMED ADRIA CMED (incl IO) EMED NON EU Non specified OVERALL MED
No
of
pro
gram
mes
ongoing completed by 2013
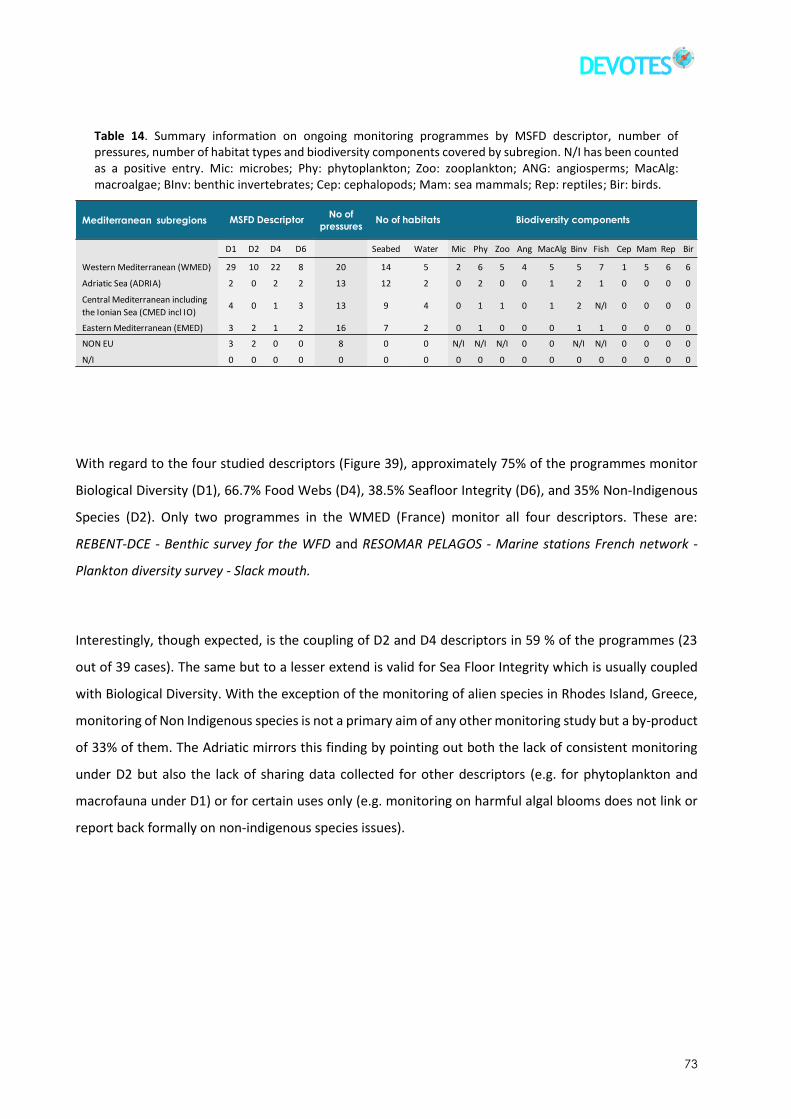
73
Table 14. Summary information on ongoing monitoring programmes by MSFD descriptor, number of pressures, number of habitat types and biodiversity components covered by subregion. N/I has been counted as a positive entry. Mic: microbes; Phy: phytoplankton; Zoo: zooplankton; ANG: angiosperms; MacAlg: macroalgae; BInv: benthic invertebrates; Cep: cephalopods; Mam: sea mammals; Rep: reptiles; Bir: birds.
With regard to the four studied descriptors (Figure 39), approximately 75% of the programmes monitor
Biological Diversity (D1), 66.7% Food Webs (D4), 38.5% Seafloor Integrity (D6), and 35% Non-Indigenous
Species (D2). Only two programmes in the WMED (France) monitor all four descriptors. These are:
REBENT-DCE - Benthic survey for the WFD and RESOMAR PELAGOS - Marine stations French network -
Plankton diversity survey - Slack mouth.
Interestingly, though expected, is the coupling of D2 and D4 descriptors in 59 % of the programmes (23
out of 39 cases). The same but to a lesser extend is valid for Sea Floor Integrity which is usually coupled
with Biological Diversity. With the exception of the monitoring of alien species in Rhodes Island, Greece,
monitoring of Non Indigenous species is not a primary aim of any other monitoring study but a by-product
of 33% of them. The Adriatic mirrors this finding by pointing out both the lack of consistent monitoring
under D2 but also the lack of sharing data collected for other descriptors (e.g. for phytoplankton and
macrofauna under D1) or for certain uses only (e.g. monitoring on harmful algal blooms does not link or
report back formally on non-indigenous species issues).
Mediterranean subregionsNo of
pressures
D1 D2 D4 D6 Seabed Water Mic Phy Zoo Ang MacAlg Binv Fish Cep Mam Rep Bir
Western Mediterranean (WMED) 29 10 22 8 20 14 5 2 6 5 4 5 5 7 1 5 6 6
Adriatic Sea (ADRIA) 2 0 2 2 13 12 2 0 2 0 0 1 2 1 0 0 0 0
Central Mediterranean including
the Ionian Sea (CMED incl IO)4 0 1 3 13 9 4 0 1 1 0 1 2 N/I 0 0 0 0
Eastern Mediterranean (EMED) 3 2 1 2 16 7 2 0 1 0 0 0 1 1 0 0 0 0
NON EU 3 2 0 0 8 0 0 N/I N/I N/I 0 0 N/I N/I 0 0 0 0
N/I 0 0 0 0 0 0 0 0 0 0 0 0 0 0 0 0 0 0
MSFD Descriptor No of habitats Biodiversity components

Deliverable 1.4 Report on SWOT analysis of monitoring
74
Figure 39. Number of ongoing monitoring programmes covering the D1, D2, D4 and D6 Marine Strategy Framework Directive descriptors to achieve GEnS in the Mediterranean region and subregions.
Note: The number of programmes addressing all biodiversity issues is not the sum of the separate descriptors as many programmes conduct integrated monitoring.
Many of the monitoring activities have been conducted under the context of broader programmes such
as Natura 2000 and the Habitats Directive, the WFD, the fisheries Data Collection Regulation (DCR) and
Data Collection Framework (DCF) programme under the Common Fisheries Policy, and other policy drivers
such as the Barcelona Convention. In addition a few programmes have been undertaken in the framework
of European Research projects. Consequently, in approximately 60% of them, biodiversity data are
complemented by physicochemical data.
The seabed habitats covered, vary among geographical sectors (Figure 40). In the WMED it appears that
most habitats from Littoral to the Abyssal zone (soft and hard substrata) are monitored (14 habitats in
total) with the exception of the upper and lower bathyal, as opposed to the EMED (Aegean Sea) where
monitoring is being carried out in the shallow sublittoral to shelf sublittoral zone mostly on soft substrata
(seven habitats in total). (Figure 40). In the Adriatic, the programme ‘Monitoring the quality of coastal
marine waters’ is carried out at the shallow sublittoral zone, whereas the ‘Network for the Conservation
of Cetaceans and Sea Turtles in the Adriatic‘ monitors a wide range of habitats (nine in total). Six seabed
habitat types are not monitored in the Adriatic but two of these do not exist in the area, namely abyssal
rock and biogenic reef and abyssal sediment. Four water column habitat types are not monitored in the
Adriatic but one of these does not exist in the area, namely ice-associated habitats. In the Ionian Sea
0
5
10
15
20
25
30
35
40
45
50
D1 D2 D4 D6 D1,D2,D4,D6
No
of
mo
nit
ori
ng
pro
gram
mes
NON EU
EMED
CMED (incl IO)
ADRIA
West MED

75
(CMED), although there is less scientific effort than in the Aegean Sea, monitoring appears to include more
habitats. This is mostly attributed to the monitoring of the MEDITS programme.
Figure 40: Sea bed habitats covered in monitoring in the Mediterranean region and subregions.
The biodiversity components covered vary among geographical sectors (Figure 41 and Table 14). With the
exception of the WMED the coverage by all other regions is less comprehensive and the coverage of the
components cephalopods, reptiles, mammals, birds and microbes is non-existent. Some spatially and
temporally fragmented information exists for example in the Adriatic for mammals and birds while
information collected for microbes in the context of the bathing water directive (e.g. in Italy and Greece)
does not fit the needs of the MSFD under D1.
The pressures covered vary among geographical sectors (Figure 42 and Table 14). The WMED has the most
comprehensive list of pressures (20); even so a number of pressures are missing including for example
underwater noise, barrier to species movements, electromagnetic changes, and a number of locally
0
1
2
3
4
5
6
7
Litt
ora
l ro
ck a
nd
bio
gen
ic r
eef
Litt
ora
l se
dim
en
t
Shal
low
su
blit
tora
l ro
ck a
nd
bio
gen
ic r
eef
Shal
low
su
blit
tora
l co
arse
se
dim
en
t
Shal
low
su
blit
tora
l san
d
Shal
low
su
blit
tora
l mu
d
Shal
low
su
blit
tora
l mix
ed s
ed
ime
nt
She
lf s
ub
litto
ral r
ock
an
d b
ioge
nic
ree
f
She
lf s
ub
litto
ral c
oar
se s
edim
ent
She
lf s
ub
litto
ral s
and
She
lf s
ub
litto
ral m
ud
She
lf s
ub
litto
ral m
ixed
sed
ime
nt
Up
pe
r b
ath
yal s
edim
ent
Ab
yssa
l ro
ck a
nd
bio
gen
ic r
eef
WMED
ADRIA
CMED (incl IO)
EMED

Deliverable 1.4 Report on SWOT analysis of monitoring
76
managed salinity-temperature-emergence regime changes. The Aegean-Levantine subregion is reported
to provide data and/or to monitor 16 pressures, with again a considerable number of pressures missing.
The monitoring programmes of the Adriatic and Central Mediterranean (including the Ionian Sea)
subregions are reported to cover 13 pressures. In the Adriatic a number of locally managed and climate
related unmanaged pressures are missing along with pressures missing from other subregions (e.g.
substrate loss, underwater noise, electromagnetic changes, death or injury by collision). The reported
coverage by all other regions is in reality less comprehensive than required in terms of data quality and
spatial and temporal spread as well as in terms of providing data relevant to state pressure relationships
(wherever these might exist). A number of pressures are missing: underwater noise, emergence regime
change WIDESPREAD-unmanageable, Change in wave exposure WIDESPREAD-unmanageable,
electromagnetic changes, and introduction of radionuclides. Major regional pressures are not monitored
in all the subregions (e.g. habitat loss is only monitored in the WMED) while some pressures are reported
to be monitored in all subregions. Among these are the introduction of non-synthetic substances and
compounds, nitrogen and phosphorus enrichment, organic matter enrichment and marine litter.
Surprisingly this also includes the introduction of NIS when the gap analysis for monitoring for Descriptor
2 highlights the less than perfect coverage of the data collected in at least two subregions. There are no
programmes targetting simultaneously all different biodiversity components, descriptors, habitats and
pressures.
Figure 41: Biodiversity components covered in monitoring in the Mediterranean region and subregions.
0
1
2
3
4
5
6
7
8
Mic
Ph
y
Zoo
An
g
Mac
Al
Bin
v
Fish
Cep
Mam Rep Bir
No
of
mo
nit
ori
ng
pro
gram
mes
WMED
ADRIA
CMED (incl IO)
EMED
NON EU

77
Figure 42: Number of pressures covered in monitoring in the Mediterranean region and subregions.
D1 - Biodiversity
Higher Trophic level biodiversity components (marine mammals, reptiles and birds) appear to be
monitored exclusively in the WMED. However, as the DEVOTES monitoring catalogue includes mostly
institutional programmes, NGO’s activities in the Adriatic, Ionian and Aegean Sea, targeted mostly on
these taxa that are missing. For example beach monitoring of Caretta caretta in the National Marine Park
of Zakynthos (Ionian Sea) has been fully undertaken since 1984 by the Sea Turtle Protection Society, NGO
ARCHELON (Margaritoulis, 2005). Similarily, the Mediterranean monk seal, which has been categorized as
critically endangered on the IUCN Red list is monitored not only in the WMED but across all subregions
(EMED: National Marine Park Alonnisos, Northern Sporades: Dendrinos et al., 2007). The best studied
groups are in decreasing order fish, phytoplankton, zooplankton, macroalgae and benthic invertebrates.
This stems from the implementation of the DCF (fish), WFD (macroalgae, benthic invertebrates) and
eutrophication. Surprising is the lack of monitoring programmes in the Aegean (EMED) and Ionian Sea on
Posidonia oceanica, identified as a priority habitat type species in the Mediterranean. Although its
distribution has been mapped in the framework of NATURA 2000, the habitat is not monitored by any
programme in the Greek Aegean and/or Ionian Sea.
0
5
10
15
20
25
30
35
WMED ADRIA CMED (inclIO)
EMED NON EU N/I OVERALLMED
No
of
pre
ssu
res
cove
red

Deliverable 1.4 Report on SWOT analysis of monitoring
78
D2 - Non-Indigenous species
The introduction of alien species appears to be relatively well monitored (by ten programmes) in the
western Mediterranean. However, on looking closer at the ongoing programmes only one of them focuses
on introduced species per se, namely the invasive macroalgal Caulerpa taxifolia. Of the remaining species,
Jellyfishes operation, Jellywatch CIESM and jellywatch PACA are expected to record non-indigenous
pelagic species, whereas monitoring for the MSFD will shed more light to on the issue. Nevertheless, the
habitats and the target groups studied in the framework of the relative DEVOTES listed programmes are
not ideal for collection of qualitative data/impact assessment attributed to non indigenous species. In the
eastern Mediterranean, for example, efforts should be channeled to data collection in the framework of
the Common Fisheries Policy (Data Collection Framework Regulation) for fisheries and in the western
Mediterranean and in the Adriatic Sea in aquaculture sites where alien species are thriving (Zenetos et al.,
2012). Considering the significance of shipping as a pathway/vector for species introductions in the
Mediterranean (Figures 43 and 44), hotspot habitats such as ports should be permanently monitored.
Figure 43. Number of Non-Indigenous Species (NIS) known to be or likely to be introduced by each of the main pathways. Percentages add to more than 100% (i.e. 113%) as some species are linked to more than one pathway. source: Zenetos et al., 2012.

79
Figure 44. Maps illustrating locations of new alien species introductions in European waters, for the three main pathways of introduction: (A) Shipping (619 records); (B) Aquaculture (183 records); and (C) the Suez Canal (435 records). The circle size represents the number of new species introduced per location, arriving through a specific pathway. Source: Nunes et al., in press.
Once an alien species is established it is almost impossible to remove it from its new habitat, not to
mention its spreading. Thus, the more sensible way is to remove it at its very early stage. Early warning
and early detection are the best ways as indicated by the recent EU Regulation.
Besides the MSFD, the introduction of non-indigenous species is directly addressed by the Protocol
concerning Specially Protected Areas and Biological Diversity in the Mediterranean and the Action Plan
concerning species introductions and invasive species in the Mediterranean Sea. To this end, UNEP/MAP
RAC/SPA has developed MAMIAS: Marine Mediterranean Invasive Alien Species database (mamias.org,),
which includes a tool for extracting trends in introductions at country and MSFD level. In addition,

Deliverable 1.4 Report on SWOT analysis of monitoring
80
Mediterranean countries are developing their own systems/networks for archiving alien species [Italy:
Si.Di.MAr., Greece: ELNAIS].
Biological invasions are almost always large-scale processes, so tracking their onset followed by their
subsequent spread is certainly challenging for the scientific community. To overcome this difficulty, one
effective solution is to involve citizen-scientists and NGOs in the monitoring of NIS or in reporting historical
information through national, regional, and European networks such as the CIESM JellyWatch Program
and MAMIAS (UNEP-MAP-RAC/SPA, 2012). Recently, participative actions have started to be
experimented with in the Mediterranean Sea and at European level (COST 1209: Aliens Challenge). The
establishment of networks has been very rewarding in terms of new data (see Boero et al., 2009; Azzurro
et al., 2013; Zenetos et al., 2013).
D4 - Food-webs
With respect to D4, a total of 23 programmes and 43 activities (i.e. entries) have been considered. The
vast majority of the studies have been carried out in the Western Mediterranean, whereas in the Central
and Eastern parts of the basin, there is currently no focus on D4 in the programmes (Figure 45). Among
programmes that have been conducted and completed in the areas of the Aegean and Ionian Seas, only
the phytoplankton and zooplankton components were examined.
Figure 45. Spatial distribution of the current programmes dealing with the MSFD Descriptor 4 (food webs).

81
The 11 biodiversity components (i.e. microbes, phytoplankton, zooplankton, angiosperms, macroalgae,
benthic invertebrates, reptiles, fish, cephalopods, marine mammals, and birds) were grouped into two
major classes: those of low trophic level (LTCs) (i.e. microbes, phytoplankton, zooplankton, angiosperms,
macroalgae, benthic invertebrates, and reptiles) and those of high trophic level (HTCs) (i.e. fish,
cephalopods, marine mammals, and birds). For this classification, the trophic levels of each individual
taxon, as provided in TrophLab (Pauly et al., 2000) were used.
None of the 23 programmes takes into account all biodiversity components. The maximum number of
components that appear in a single programme is four (Project REBENT-DCE - Benthic survey for the WFD).
As far as LTCs are concerned, they are examined in 31 out of the 43 activities. Out of those 31 activities,
21 take into account solely LTCs and disregard the HTCs. Correspondingly, HTCs are examined in 21
activities out of the total of 43. In eleven of the 21 activities, only HTCs are being examined and LTCs are
excluded. Additionally, only eleven out of the 43 monitoring activities span both LTCs and HTCs.
Finally, there is no programme that is restricted to the sole examination of one group (i.e. only LTCs or
only HTCs) that takes into consideration all the components of the group.
Large monitoring programmes applied in the Mediterranean, such as MEDITS and MEDIAS as well as
sampling on board commercial vessels, which are actions incorporated in the Data Collection Framework
(DCF), provide information on the abundance of megafaunal organisms (fish, cephalopods, and large
crustaceans). Specifically, the MEDIAS programme provides abundance indices for small pelagic fish, the
MEDITS programme for demersal species while sampling on board commercial vessels provides data on
landings and by-catch. This information is crucial and useful for estimating and testing of indicators related
to D4, such as the "Large fish (by weight)" indicator as well as "abundance trends of functionally important
selected groups/species", which are explicitly stated in the Commission Decision 2010/477/EU as
indicators 4.2.1 and 4.3.1, respectively. In addition, biological sampling performed in the framework of
DCF as well as stock assessments are important sources of information on the productivity of high trophic
level species (4.1).
Furthermore, biological traits and abundance indices estimated in the framework of these programmes
have been used as input information for the construction of food web models. Such models integrate
biological, ecological (e.g. feeding habits) and fisheries information and can be useful to identify key
trophic groups/species as well as, more importantly, to provide estimates of more complex metrics (e.g.
flow ratios, abundance ratios of groups of species, simulation trends) related to D4. Several food web
models have been used to explore trophic flows and the structure of the food webs in all four
Mediterranean subregions defined by the MSFD (WMED: e.g. Coll et al., 2006, Banaru et al., 2013;
Adriatic: e.g. Coll et al., 2007; CMED: e.g. Piroddi et al., 2010, Hattab et al., 2013, Moutopoulos et al.,
2013; EMED: e.g. Tsagarakis et al., 2010), however, not covering all subdivisions.

Deliverable 1.4 Report on SWOT analysis of monitoring
82
D6 - Seafloor integrity
Generally the MSFD D6 is covered by overlapping parameters of the WFD, which is literally the criterion
6.2. "condition of benthic communities". Indicators (Criteria) 6.2.1. “presence of particularly sensitive
and/or tolerant species” and 6.2.2. “multi-metric indexes assessing benthic community condition and
functionality” are fully covered by indices applied under the WFD or by indices or schemes that are derived
secondarily from the benthic species taxonomy provided under the WFD work for benthic
macroinvertebrates Environmental Quality Standards assessment. Indicators 6.2.3 “Proportion of
biomass or numbers of individuals in the macrobenthos above some specified length/size” and 6.2.4
“Parameters describing the characteristics (shape, slope and intercept) of the size spectrum of the benthic
community” related to size parameters are mostly applied in transitional waters.
For the Criterion 6.1. regarding physical damage of the seafloor substrates, information is more scarce
and scant and may be derived indirectly through bottom trawl surveys (assessing the fisheries pressure
inflicted on the sea floor) or by habitat mapping surveys which seem to be mostly related to sea grass bed
(Posidonia) mapping or other natural reserves monitoring (Habitats Directive, MPAs) also providing
information for D1. Both methodological gaps and data gaps are reported for this criterion by a number
of EU MS (Laroche et al., 2013).
In Spain, the active monitoring relates to Posidonia oceanica meadows and D6 is covered in relation to
this habitat and related benthic communities (6.2.). Hence the criterion 6.1. regarding physical damage of
the seafloor substratum characteristics may also be assessed (depth extend of Posidonia meadows). CNRS
covers D6 under the Benthic survey for the WFD addressing presumably the biological quality elements
of benthic macroinvertebrates, seagrasses and macroalge under the WFD. Bottom trawling surveys also
address epifaunal benthic macroinvertebrates and presumably provide an aspect of the criterion 6.1. of
D6 in relation to criterion 6.1. and specifically the indicator 6.1.2. “extent of the seabed significantly
affected by human activities for the different substrate types”. The French natural reserves monitoring,
relating to the Habitats Directive provides some habitat mapping and probably also assesses criterion
6.1.1. regarding “type, abundance, biomass and areal extent of relevant biogenic substrate”.
Most of the Adriatic Sea countries have data from their regional monitoring programmes, and some of
them have already developed the infrastructural and operational monitoring needs and actions within the
WFD and the Habitats Directive and their implementation. The analysis of the spatial cover of monitoring
programmes along the Adriatic subregion reveals that, overall, the Northern sector of the Adriatic Sea is
covered much better than the southern sector with good monitoring practices. A similar gradient in the
efficiency of monitoring coverage applies to the transition from the west to the east coasts of the Adriatic
Sea, also partly because some Member States entered the Community very recently (e.g. Croatia). Despite
the spatial-temporal fragmentation of the data collected, large sectors of the Adriatic subregion are

83
subject to the monitoring of D1 (Biological diversity), D4 (Food webs), and D6 (Seafloor integrity)
descriptors (6.2. criteria).
In the Aegean Sea and Levantine, Greece and Cyprus (although not reported in the catalogue) cover D6
through the monitoring program of the WFD for coastal and transitional waters i.e. 6.2. benthic
communities condition (benthic macroinvertebrates and macroalgae as WFD biological quality elements)
addressing diversity and sensitivity indices pertaining to indicators 6.2.1., 6.2.2. However size indicators
(6.2.3., 6.2.4.) are only applied in transitional waters. For coastal waters more localized monitoring
programmes address the same parameters as the WFD for coastal waters. Bottom trawl surveys (MEDITS)
may also give an aspect of the damage inflicted by fisheries on the sea floor (6.1.) and a number of seafloor
integrity studies on potential indicators are underway (Simboura et al., 2012). Along the Turkish coast, D6
is covered by the monitoring of Izmir Bay addressing benthic communities and macroalgae condition.
4.4.2. Identification of gaps
The analysis of the reported monitoring programmes of the Mediterranean Sea, allowed the identification
of the following gaps:
Insufficient Mediterranean coverage of monitoring networks.
Country data deficiencies in a number of networks.
Uneven habitat coverage (Figure 40). Monitoring in the Western Mediterranean addresses a wide range of habitats from the littoral zone to abyssal sediments. In the Eastern Mediterranean monitoring is channeled to soft/mixed substrata in the sublittoral zone. Only one programme is studying hard substrata in the littoral zone.
Uneven study of biodiversity components (Figure 41). Fish, benthic invertebrates and phytoplankton are monitored in all four subregions. Reptiles, mammals, birds and microbes are not monitored at all although some fragmented but unavailable data do exist.
Uneven study of pressures. Data on a number of pressures are missing. This includes a few unmanageable pressures (e.g. emergence regime widespread change) along with underwater noise, electromagnetic changes and Introduction of radionuclides. Major regional pressures are not monitored in all subregions (eg habital loss) and/or seemingly complete regional coverage (eg for marine litter and aliens) is in reality very patchy and sub-optimal at the subregional level.
All seabed and water habitat types appear to be monitored although the coverage is very patchy and far from adequate. Looking at finer resolution habitat types (e.g. EUNIS level 5 or more) and at habitats protected by EU legislation or regional policies (Habitats Directive, Mediterranean Regulation, UNEP MAP), a number of habitats including Posidonia and maerl habitats are not monitored in some subregions (and mapping is far from comprehensive). No data are reported for the ice-associated habitats although this is not relevant in the Mediterranean region.
Data gaps, knowledge gaps and the need for further development of assessment methodologies (e.g. D4) and monitoring networks (e.g. D2) have been reported by a number of EU Member States in their initial assessments. Lack of methodological standards (e.g. for D6) and lack of common or harmonized methodologies (e.g for D1) have also been reported.

Deliverable 1.4 Report on SWOT analysis of monitoring
84
4.4.3. SWOT analysis – Mediterranean Sea
The prior experience gained through the WFD (especially for D1 and D6)
The role of NGOs is increasingly important in recording and monitoring native and alien biodiversity (especially for D1 and D2).
Joint efforts by different policy instruments acting on different scales i.e. MSFD, UNEP MAP and individual countries enhance recording and monitoring capabilities
Joined up efforts and support in data collection through other EU policies, for example, through incorporating additional marine litter data collection to so far purely fisheries data collection and monitoring schemes under the CFP such as MEDITS
Support by citizen science and associated established networks in recording and monitoring biodiversity components
Misreporting: The level of reporting in the monitoring catalogue has not always been ideal. These shortcomings are detailed in Patrício et al. (2013) although use of expert knowledge in D1.4 report has remedied some of these issues.
Under-reporting: Although the WMED is sufficiently covered, at least its European area, reporting was limited for the Ionian and Central Mediterranean (lack of input for Malta, Italy); the Adriatic (input only from Italy); and the EMED (input only from Greece).
Whilst some countries reported programmes carried out by NGOs, others did not. Thus, even well-known existing information derived from projects such as MEDPOL is not analysed herewith (however MEDPOL covers a number of non-DEVOTES partner countries).
Data on most descriptors are limited in space and time. Moreover, it is not debatable whether any of the projects addressing descriptor D4, are indeed examining prey-predator relationships and the structure of the food webs
There is a deficiency of data concerning pressures. However, the lack of monitoring programmes dealing with pressures should not be considered as a full lack of data about most of them. Many data about pressures can be mined from multiple sources, under the premises of specific research or monitoring actions but with spatially and temporally fragmented and multiple purposes designs. Mismatch of scales between for example data collection needs for biodiversity components and pressures can be an issue.

85
Long-term studies and successful monitoring programmes reported significant modifications of the environment conditions (e.g. in the Northern Adriatic Sea), due to climatic fluctuations and changes of the anthropogenic pressure (e.g. Danovaro et al., 2009; Conversi et al., 2010).
Previous studies also reported warming of surface waters at the Adriatic regional scale and acidification of dense waters due to the increase of atmospheric CO2 (Giani et al., 2012; Russo et al., 2002).
Major regional and subregional reviews are making use of historical data trends and findings of existing successful monitoring programmes to enhance our understanding of how the whole ecosystem can respond to these pressures and environmental changes.
There is an opportunity to learn (and build on) from past and recent experiences and very recently through the first cycle of the implementation of the WFD. This can be used to highlight areas of attention for MSFD such as harmonization of methods, data sharing and to identify potential hot spot areas for additional monitored parameters. Good practice examples (e.g. MEDITS) could be replicated for other components and/or expand its spatial and temporal spread to fit the needs of MSFD and more than one descriptor/pressure.
There is an opportunity to build synergies and formal communication and data sharing channels between policies to support wider monitoring of components-habitats-pressures.
There is an opportunity to fully align and support the regional seas programme with the MSFD by providing both the science base and a structured and standardised approach to assessment and monitoring.
Limited power to detect GEnS because of the few ecosystem components monitored, biodiversity indicators are still under development, monitoring is not standardized in terms of methods of sampling, policy and use of the available data require optimization.
Since monitoring has not necessarily been designed to address specific pressures, there is currently insufficient information to adequately address pressure-impact relationships (D1.3, Patrício et al., 2013).
Type and frequency of sampling and the sampling scales of the monitoring programmes are often constrained by available expertise, limited number of, human and other resources and/or insufficient financial support to identify the potential changes in biodiversity.
Data collected are not easily available and this hampers a wider control and an appropriate utilization of information. Data on monitoring details, scales, methods, sampling and statistical power as well as spatial data and maps are not readily available. Open Access data are still limited and access is usually restricted
Even good examples of monitoring networks in terms of countries participating and/or standardised protocols (e.g. MEDITS and MEDPOL) suffer from data gaps in years missed in their data collection due to budgetary constraints. Adequate funding is required for EU member states to maintain ambition levels (not to back-down to minimums, and for non-EU member states to be able to access funding whether it is national or international. A sustainable funding scheme and a rapid response/intervention framework is necessary for a successful monitoring scheme.
Knowledge and data gaps might not be addressed if not backed up by a sufficient research budget (e.g. with dedicated proposal calls) or if priority shifts from environmental concerns to blue growth initiatives and for example mapping and monitoring needs give way to employment and growth and development needs.

Deliverable 1.4 Report on SWOT analysis of monitoring
86
5. Concluding Remarks
5.1. Overall Gap analysis
GEnS Descriptors: Monitoring programmes which address the descriptors D1 ‘Biological Diversity’ and D4
‘Food webs’ are the most numerous in all regional seas when taken as a whole, whereas monitoring
associated with D2 ‘Non-indigenous species’ and D6 ‘Seafloor integrity’ are the least numerous. The
distribution of monitoring programmes that address these descriptors however varies both within and
between regional seas. In the Mediterranean for example, most of the 23 catalogued programmes
addressing descriptor D4 ‘Food webs’, have been carried out in the West Mediterranean, whilst no
monitoring currently addresses this descriptor in the East Mediterranean. In the Black Sea, monitoring
associated with this descriptor is completely lacking. Monitoring addressing descriptor D2 ‘Non-
indigenous species’ is lacking or the scope of the monitoring is of concern in all regional seas with the
exception of the North Eastern Atlantic.
Some of the above highlighted gaps were expected. For example, monitoring for non-invasive species was
not explicitly required by EU law before the MSFD entered into force although some EU MS have been
collecting data on non-invasive species and using them for coastal water quality assessment. The lack of
D2 monitoring is in line with the finding of Vandekerkhove and Cardoso (2010) that most existing
monitoring programmes fail to detect some indicative non-indigenous species. Zampoukas et al. (2014)
recommended that existing monitoring programmes (e.g. for the WFD) should be complemented to
explicitly record non-indigenous species and to include high priority samplings sites.
Biodiversity components: In general, monitoring programmes which address high trophic level (HTC)
biodiversity components (including cephalopods, reptiles, mammals and birds) are lacking or limited in all
regional seas (North Eastern Atlantic, Baltic Sea, Black Sea and Mediterranean Sea).
Monitoring programmes which address fish were not identified as lacking or limited in any regional sea;
however, monitoring for this biodiversity component is not evenly distributed throughout the sub-
categories, with monitoring for deep sea fish, deep sea elasmobranchs and ice-associated fish lacking or
limited to a small number of programmes; a pattern which is mirrored in the habitats which lack or have
limited monitoring (i.e. deep sea and ice-associated habitats). In addition, most of the fish monitoring
focuses on commercial species and less in non-commercial or focussed on the fish in transitional waters
as dicatated by the WFD. Considering there are also few indicators for these biodiversity components
(DEVOTES Deliverable 3.1, Teixeira et al., 2014), it is likely that a significant effort may be required to
monitor these components once indicators are developed.

87
The lack of monitoring for reptiles, mammals and birds was not expected since, as presented in chapter
2.2.2, such monitoring requirements are already included the Habitats and Birds Directives. The same
applies to the identified gaps in cephalopods monitoring that it would be expected to be already
operational for the Common Fisheries Policy. If these gaps are not due to incomplete reporting they may
indicate that the implementation of the EU environmental and fisheries related acquis has been limited.
Contrary to cephalopods, it seems that CFP monitoring is better implemented for fish.
Monitoring programmes which address microbes are lacking or limited in all regional seas. With the
exception of microbes, biodiversity components that belong to low trophic levels (LTCs) are generally well
addressed by monitoring programmes in all regional seas. The exception to this is in the Baltic Sea, where
monitoring programmes addressing phytoplankton and zooplankton are limited in offshore areas.
The rather good coverage of LTC monitoring could be related to the long European tradition of
eutrophication monitoring and to the similar requirements of the WFD (see chapter 2.2.2). The lack of
microbial diversity monitoring is expected as, with the exception of pathogens in the Bathing Water
Directive, it was not previously addressed at the European level.
Quality Assurance and Supporting physicochemical data: For a number of biodiversity components
Quality Assurance is lacking and in some regional seas (e.g. North Eastern Atlantic and Black Sea) around
half of the monitoring activities do not collect supporting physicochemical data.
Habitats: Monitoring programmes that address bathyal and abyssal habitats (e.g. sediment, rock and
biogenic reef) are lacking or limited in all regional seas in which they occur (i.e. North Eastern Atlantic,
Mediterranean Sea, Black Sea EU waters). Mixed sediment habitats are also reported as having no or
limited only monitoring in the Baltic and Black Seas, along with rare seabed habitats (such as shelf
sublittoral rock and biogenic reef) in the Baltic Sea. The uneven coverage of habitat types monitored is
also reported as problematic both within and between marine regions. In the Mediterranean Sea for
example, monitoring in western subregions addresses a wide range of habitats from the littoral zone to
abyssal sediments, whilst in eastern subregions monitoring is channelled to soft/mixed substratum in the
sublittoral zone. Monitoring programmes addressing ice-associated habitats are recorded as completely
lacking in all regional seas, however this is most likely a relic of the inadequacies of the current catalogue
(lack of input from more Northern countries, particularly in the North Eastern Atlantic).
Pressures: Monitoring programmes addressing the pressure ‘underwater noise’ are lacking or limited in
all regional seas. It is of note that even where underwater noise is monitored, the impact of noise on many
biodiversity components is not well understood and the outputs of such monitoring cannot be used
effectively at the present time. Monitoring programmes addressing the pressures ‘introduction of
radionucleides’, ‘electromagnetic changes’, ‘marine litter’ and ‘introduction of non-indigenous species
and translocations’ are also lacking or limited in most regional seas.

Deliverable 1.4 Report on SWOT analysis of monitoring
88
5.2. Overall SWOT analysis
5.2.1. Strengths
In most regional seas, current monitoring practices are built on a strong foundation of scientific
knowledge (i.e. good-practice, standardised techniques and methodologies) through a long history of
national and international monitoring programmes and networks, policies and EU Directives. For example
the collection of supporting physicochemical data (essential to explain changes in the biological
parameters or indicators) is generally common practice in monitoring programmes and biodiversity
component monitoring is associated with formal Quality Assurance guidelines in a number of cases. This
significant record of marine monitoring has resulted in an extensive system of monitoring programmes
and networks in most regional seas and/or subregions. This provides a good foundation for
implementation of the MSFD with the aim to achieve good GEnS, as overall (i.e. in all regional seas)
monitoring programmes address all descriptors, biodiversity components, habitats and pressures.
Additionally, nearly all monitoring programmes address more than one descriptor, with descriptor D1 and
D4 (Biological diversity) particularly well addressed through a large number of monitoring programmes.
In most regional seas, the 11 biodiversity components are being covered and several are monitored
simultaneously. Similarly, most monitoring programmes address more than one seabed and water column
habitat at the same time, optimizing the sampling efforts.
In general, most monitoring programmes address more than one pressure. Although these are exeptions
some monitoring activities assess 18-20 pressures at once (e.g. Celtic Seas subregion), suggesting the
potential for monitoring programmes to become more efficient.
A full breakdown of the strengths of current marine monitoring in all regional seas is shown in the Overall
SWOT table (Table 15).
5.2.2. Weaknesses
The major weakness found within this catalogue is that it is currently under development and is therefore
not a complete representation of all monitoring programmes operating within the regional seas. In
proposing that this exercise was undertaken, it was assumed, wrongly, that all Member States readily
knew their monitoring and so this merely required collating. The catalogue also currently provides no
indication of the intensity or adequacy (i.e. methodologies) of monitoring and only provides information
on spatial coverage. The analysis in this report has highlighted the fact that in order to assess the adequacy

89
of the monitoring programmes and networks in addressing pressures on biodiversity components, it is
necessary to have information on specific details of methodological procedures (i.e. sampling design,
frequency, temporal and spatial scales, standardized procedures between Member States). This
information is currently not contained within the monitoring networks catalogue.
Despite the strengths listed above, one of the main weaknesses of using current monitoring programmes
in the implementation the MSFD is the spatial variability of current monitoring and the robustness of
current monitoring programmes. In a number of subregions, monitoring programmes address a specific
focus (e.g. habitat, species, pressure, etc.) resulting in an uneven distribution of spatial (e.g. sites) and
temporal (e.g. sampling interval and frequency) monitoring scales and monitored components (i.e. not all
components are monitored in all subregions). At the spatial scale required for implementation of the
MSFD (region and subregion), the uneven spatial and temporal scales of individual monitoring
programmes are masked and monitoring (the descriptors, components, habitats and pressures) is shown
to occur, however in reality, monitoring may only take place in a small number of specific subregion sub-
sections.
The number of monitoring programmes that address simultaneous biodiversity components, descriptors,
habitats and pressures (managed and unmanaged) is used in this report as a measure of the robustness
of ongoing monitoring to potentially meet the requirements of the MSFD (to achieve GEnS) in all regional
seas. A number of monitoring programmes both within and between regional seas address single or a
limited number of components, habitats and pressures and although not explicitly investigated within the
catalogue, may be limited in terms of spatial (e.g. geographic area, sampling locations) and temporal
(time-series, sampling frequency) scale. There is a need for monitoring programmes to become more
efficient and robust, integrating several biodiversity components, habitats and pressures through
simultaneous monitoring. Additionally, despite the extensive system of monitoring programmes that exist
in most regional seas, a number of biodiversity components (e.g. microbes), descriptors (e.g. non-
indigenous species), habitats (e.g. ice or deep sea habitats) and pressures (e.g. noise, introduction of
radionuclides, selective extraction of living resources such as seaweed and maerl) are poorly or not
addressed.
In addition, quality assurance (QA) protocols associated with the monitored biodiversity components vary
per component, monitoring country and institute. Overall, QA is not associated with all of the monitored
biodiversity components or this information has not been or cannot be provided.
A full breakdown of the strengths of current marine monitoring in all regional seas is shown in the Overall
SWOT table (Table 15).

Deliverable 1.4 Report on SWOT analysis of monitoring
90
5.2.3. Opportunities
This report has highlighted a number of inadequacies in the monitoring currently undertaken in the
regional seas. This presents a number of opportunities to develop new monitoring programmes or to
modify and/or expand existing ones and to collaborate with Member States both within and between
regional seas to develop collaborative, harmonised and robust monitoring programmes and networks that
maximise use of the best available data. This would mean the introduction and/or integration of validated
external Quality Assurance protocols, standardised verification of analyses and species identification and
a focus on upgrading the spatial and temporal resolution of monitoring and inter-calibration procedures.
It would also mean increasing the robustness of monitoring by introducing the simultaneous monitoring
of descriptors, biodiversity components, habitats and pressures within single, large monitoring
programmes and ensuring that monitoring is designed to address specific pressures. This may also lead
to an oppurtunity to create an online bank of all monitoring programme data accesable to all EU Member
States.
Implementation of the MSFD also provides the opportunity for collaborative work with non-member
states to address actions to improve and/or develop monitoring programmes to achieve GEnS in some
regional seas (i.e. the Black Sea). For example, through the Black Sea Commission, non-EU member states
of the Black Sea may be encouraged to develop more EU-integrated monitoring programmes (especially
for the descriptors related to biodiversity monitoring). Regional cooperations with non-member states
may prove essential for achieving GEnS in regional seas that border non-EU nations. It is of note that as
of January 2014 some countries are already carrying out public consultation exercises on the monitoring
currently performed and that required to fulfil the demands of the MSFD (e.g. for the UK see
https://consult.defra.gov.uk/marine/msfd-proposals-for-uk-marine-monitoring-programmes). It is
expected that such consultations will both indicate monitoring programmes and their adequacy for the
MSFD.
Our findings regarding the inadequacies in the monitoring currently undertaken in the European regional
seas form the basis of further research requirements.
A full breakdown of the strengths of current marine monitoring in all regional seas is shown in the Overall
SWOT table (Table 15).
5.2.4. Threats
The most obvious and significant threat to monitoring is budgetary constraints within EU Member States
(e.g. Borja and Elliott 2013). For example, even good examples of countries participating in monitoring
networks with standardised protocols (e.g. MEDITS and MEDPOL) suffer from data gaps from years missed
91
due to budgetary constraints. As identified above, in order to implement the MSFD and achieve GEnS, it
is necessary to improve the current and future monitoring of marine biodiversity in all regional seas. In
order to achieve this, it is important to increase the number of ecosystem components monitored and to
develop specific monitoring programmes to analyse pressures and pressure-impact relationships. In some
regional seas it may also be necessary to increase sampling frequency, intensify sampling design and
standardize sampling methods. A sustainable funding scheme and/or research budget and a rapid
response/intervention framework may be necessary ensure successful integrative monitoring schemes
within and between regional seas. In the current economic climate, it is difficult to envision which, if any,
EU Member States would be able to provide an appropriate budget for this.
Each EU Member State has a long history of monitoring which has been expanded, modified and
developed over time. As a result of these developments, together with methodological differences
between nations, integration and holistic assessment of the data (at a regional sea level) may be difficult,
time consuming and economically restrictive. Furthermore, Member States may be reluctant to generate
new monitoring programmes and so rely on existing programmes; however, those may have been
designed for other purposes and so may be inadequate for fulfilling the MSFD needs.
Whilst implementation of the MSFD requires collaborative regional cooperation between Member and
Non-Member States, Non-Member States are under no legislative requirement to achieve GEnS in their
respective regional seas. Achieving this cooperation may put undue additional pressure on Member States
and if agreements with Non-Member States are not in place, or infractions (i.e. pressure impacts) cannot
be prosecuted, GEnS in the regional sea may not be achieved.
A full breakdown of the strengths of current marine monitoring in all regional seas is shown in the Overall
SWOT (Table 15).

Deliverable 1.4 Report on SWOT analysis of monitoring
92
Table 15. Overall SWOT analysis: Strengths of the existing monitoring networks across the four European Regional Seas (North Eastern Atlantic, Baltic Sea, Mediterranean and Black Sea) and the Sea of Marmara, based on the monitoring activities reported in DEVOTES Catalogue of Monitoring Networks.
STRENGTHS
GEnS Descriptors
In all Regional Seas, GEnS Descriptor 1 (biological diversity) is addressed through the greatest number of ongoing monitoring programmes.
The GEnS Descriptor 4 (food-webs) is addressed through a considerable number of monitoring activities in the North Eastern Atlantic, Baltic Sea and in the Mediterranean Sea
(particularly in Western Mediterranean subregion).
Most ongoing monitoring programmes simultaneously address more than one GEnS descriptor.
In the Mediterranean Sea, NGOs are increasingly involved in recording and monitoring native and alien species biodiversity (especially for D1 and D2).
Biological Components
In most regional seas, all eleven biodiversity components identified in the DEVOTES Catalogue of Monitoring Networks are monitored, and several are monitored simultaneously.
Supporting physicochemical data
The collection of supporting physicochemical data (essential to explain changes in the biological parameters or indicators) is generally common practice in monitoring programmes
(around half of the activities in the North Eastern Atlantic, Black Sea and Mediterranean Sea, the vast majority in the Baltic Sea) although is not always associated with all biodiversity
components.
Pressures Most monitoring programmes address more than one pressure.
Overall, monitoring undertaken within the North Eastern Atlantic address all pressures considered in the catalogue.
Some monitoring activities assess 18-20 pressures (e.g. Celtic Sea subregion), demonstrating the potential more efficient and integrated monitoring programmes.
Nitrogen, phosphorus and organic enrichment are the main pressures covered.
Habitats
Most monitoring programmes address more than one seabed and water column habitat simultaneously.
All five water column habitats considered in the catalogue are all addressed by the ongoing monitoring activities.
Others
In most regional seas, and in particular in the NEA and Baltic Sea, current monitoring practices are built on a strong foundation of scientific knowledge (i.e. good-practice,
standardised techniques and methodologies) through a long history of national and international monitoring programmes and networks, policies and EU Directives.
There is some degree of regional cooperation, supported by RSCs and other international initiatives.
There are synergies between different policies and instruments operating on different scales (i.e. EU Directives, RSC agreements, and national legislation and initiatives) that
enhance recording and monitoring activities.

93
Table 15. Overall SWOT analysis: Weaknesses (I) of the existing monitoring networks across the four European Regional Seas (North Eastern Atlantic, Baltic Sea, Mediterranean and Black Sea) and the Sea of Marmara, based on the monitoring activities reported in DEVOTES Catalogue of Monitoring Networks.
WEAKNESSES (I)Geographical coverage
The major weakness of the catalogue is that it is currently under development and is therefore not a complete representation of all monitoring programmes operating within the
regional seas.
In the analysed version of the catalogue, the Baltic Sea monitoring programmes are not well represented, with contributions from only Lithuania and Germany. Information from
Finland, Estonia, Latvia, Poland, Sweden (and Russia) is missing. Further efforts are underway to fill this critical gap.
The catalogue does not reflect monitoring activities carried out by all six countries that surround the Black Sea. Only Bulgaria, Ukraine and Turkey provided information for the
catalogue, therefore, 23% of the region represented by coastline length is not covered.
Under-reporting in several subregions and detailed reporting in others has contributed to a lack of coherence in the information provided in the catalogue.
The catalogue currently only provides information on spatial coverage but no indication of the intensity or adequacy (i.e. methodologies) of monitoring.
Spatial aggregation The lowest spatial unit of the catalogue is the subregion. Consequently, coverage of monitored attributes (e.g. descriptors, components, habitats and pressures) may be shown as
addressed in a subregion, in reality, monitoring is only taking place in a small number of specific sub-sections.
GEnS Descriptors
In all Regional Seas, GEnS Descriptor 2 (non-indigenous species) is addressed by the lowest number of ongoing monitoring programmes
The number of monitoring programmes that address Descriptor 6 are limited, particularly in the NEA, Black Sea and Mediterranean Sea. In the Sea of Marmara, this descriptor is not
addressed at all.
The GEnS Descriptor 4 (food-webs) is not addressed through monitoring programmes in the Black Sea and the Sea of Marmara.
Biological Components
A number of monitoring programmes address single biodiversity components. There is a need for monitoring programmes to become more efficient and robust, integrating several
biodiversity components through simultaneous monitoring.
In all Regional Seas, microbes are the biodiversity component monitored through the lowest number of programmes. Microbes are not addressed at all in the Black Sea and the Sea
of Marmara.
In addition to microbes, marine mammals, birds, angiosperms, macroalgae and fish are not monitored in the Sea of Marmara.
Cephalopods are addressed through a small number of monitoring programmes in the North Eastern Atlantic and Mediterranean Sea (they are not present in the Baltic Sea and the
Black Sea, and for that reason there are no monitoring activities with them as targets).

Deliverable 1.4 Report on SWOT analysis of monitoring
94
Table 15. Overall SWOT analysis: Weaknesses (II) of the existing monitoring networks across the four European Regional Seas (North Eastern Atlantic, Baltic Sea, Mediterranean and Black Sea) and the Sea of Marmara, based on the monitoring activities reported in DEVOTES Catalogue of Monitoring Networks.
WEAKNESSES (II)Pressures Monitoring programmes addressing the pressure ‘underwater noise’ are lacking or limited in all seas.
Monitoring programmes addressing the pressures ‘introduction of radionuclides’, ‘electromagnetic changes’, ‘marine litter’ and ‘introduction of non‐indigenous species and
translocations’ are also lacking or limited in most regional seas.
Habitats Monitoring programmes addressing ice-associated habitats are recorded as completely lacking in all regional seas.
Monitoring programmes that address bathyal and abyssal habitats (e.g. sediment, rock and biogenic reef) are lacking or limited in all regional seas in which they occur (i.e. North
Eastern Atlantic, Mediterranean Sea, Black Sea EU waters).
Mixed sediment habitats are reported as having no or limited monitoring in the Baltic and Black Seas, along with rare seabed habitats (such as shelf sublittoral rock and biogenic
reef) in the Baltic Sea.
The uneven coverage of habitat types monitored is also reported as problematic both within and between marine regions. There are no reported monitoring programmes covering the seabed habitats in the Macaronesian biogeographic region In the Sea of Marmara, the monitoring programmes do not specify the type of habitat covered.
Quality assurance (QA)
QA protocols associated with the monitored biological components vary per component, monitoring country and institute. Overall, QA is not associated with all of the monitored
biodiversity components or this information has not been or cannot be provided. There is therefore considerable risk for poor comparability between datasets where QA is not
standardised or not included. Others
Across all European Seas, there are very few (if any) reported monitoring programmes simultaneously targeting all descriptors, biodiversity components, habitats and relevant
pressures.
Whilst some countries reported programmes carried out by NGOs, others did not.

95
Table 15. Overall SWOT analysis: Opportunities of the existing monitoring networks across the four European Regional Seas (North Eastern Atlantic, Baltic Sea, Mediterranean and Black Sea) and the Sea of Marmara, based on the monitoring activities reported in DEVOTES Catalogue of Monitoring Network
OPPORTUNITIES
By highlighting inadequacies in the monitoring currently undertaken in the regional seas, this analysis identifies a number of opportunities to develop new monitoring programmes
or to modify and/or expand existing ones and to foster collaboration between countries both within and across regional seas to develop coordinated, harmonized and robust
monitoring programmes and networks.
MSFD monitoring requirements considerably overlap with the requirements of other EU legislation and international agreements, therefore the ongoing programmes should already
provide some of the data required for MSFD monitoring.
Introduction and/or integration of validated external Quality Assurance protocols, standardized verification of analyses and species identification and a focus on upgrading the
spatial and temporal resolution of monitoring and inter-calibration procedures ongoing or to be implemented.
This catalogue demonstrates that single, large monitoring programmes can simultaneously address different descriptors, biological components, habitats and pressures with
adequate specificity and thus there is potential for existing monitoring programmes to widen their scope and improve integration of activities.
There is a lack of monitoring associated with microbes in the context of MSFD but microbial quality of shellfish and bathing waters is routinely monitored. There is an opportunity to
expand and adapt this monitoring, learning from past experience.
An online database of all monitoring programme data accessible to all EU Member States seems feasible.
There is considerable potential to increase synergies, communication and data sharing between policies to support wider monitoring of components-habitats-pressures
There is an opportunity to fully align and support the regional seas programmes with the MSFD by providing both the science base and a structured and standardised approach to
monitoring.
The implementation of the MSFD provides the opportunity for collaborative work between EU and non-EU contracting parties to improve and/or develop monitoring programmes to
achieve GEnS in some regional seas (i.e. the Black Sea).
The Sea of Marmara, although not an EU Regional Sea, is the connection between the Mediterranean and the Black Sea (EU seas). Integrating the local ongoing monitoring
programmes within the Mediterranean and Black Sea networks will improve coherence in MSFD implementation.
The findings regarding the inadequacies in the monitoring currently undertaken in the European regional seas form the basis of further research requirements.

Deliverable 1.4 Report on SWOT analysis of monitoring
96
Table 15. Overall SWOT analysis: Threats of the existing monitoring networks across the four European Regional Seas (North Eastern Atlantic, Baltic Sea, Mediterranean and Black Sea) and the Sea of Marmara, based on the monitoring activities reported in DEVOTES Catalogue of Monitoring Networks.
THREATS
The most obvious and significant threat to monitoring is budgetary constraints within EU Member States. A sustainable funding scheme and/or research budget and a rapid
response/intervention framework may be necessary to ensure successful integrative monitoring schemes within and across regional seas. In the current economic climate, it is
difficult to envision which, if any, EU Member States would be able to provide an appropriate budget for this.
Each EU member state has a long history of monitoring which has been expanded, modified and developed over time. As a result of these developments, together with
methodological differences between countries, integration and holistic assessment of the data (at a regional sea level) may be difficult, time consuming and economically restrictive.
Member States may be reluctant to generate new monitoring programmes and so rely on existing programmes.
Lack of Quality Assurance protocols in monitoring programmes may hinder harmonization and comparability across the EU.
Certain descriptors, biodiversity components, pressures, habitats and even subregions have limited monitoring programmes; such gaps may be an important constrain in monitoring
the advances towards achieving the GEnS.
Intensive monitoring activities, that use destructive methods (e.g. nets, trawls, grabs and frames), can have a negative impact on vulnerable and rare species or habitats.
Data collected are often not easily available and this might limit their appropriate utilization. Data on monitoring details, scales, methods, sampling and statistical power as well as
spatial data and maps are not readily available. Open Access data are still limited.
Cooperation between EU and non-EU countries is often based on agreements that are non-binding or binding but non enforceable and thus achievement of GEnS in the regional sea
may not be particularly difficult.
Integrating the Sea of Marmara monitoring activities into the European networks it is not straightforward because Turkey is, currently, a non-EU country.

97
6. References
Azzurro E, Broglio E, Maynou F, Bariche M (2013) Citizen science detects the undetected: the case of Abudefduf saxatilis from the Mediterranean Sea. Management 4(2):167-170.
Bănaru D, Mellon-Duval C, Roos D, Bigot JL, Souplet A, Jadaud A, Beaubrun P, Fromentin JM (2013) Trophic structure in the Gulf of Lions marine ecosystem (north-western Mediterranean Sea) and fishing impacts. Journal of Marine Systems 111-112:45-68
Boero F, Putti M, Trainito E, Prontera E, Piraino S, Shiganova TA (2009) First records of Mnemiopsis leidyi (Ctenophora) from the Ligurian, Thyrrhenian and Ionian Seas (Western Mediterranean) and first record of Phyllorhiza punctata (Cnidaria) from the Western Mediterranean. Aquatic Invasions 4(4):675-680.
Borja Á, Elliott M (2013) Marine monitoring during an economic crisis: the cure is worse than the disease. Marine Pollution Bulletin 68: 1-3.
Claussen U, Connor D, de Vrees L, Leppänen JM, Percelay J, Kapari M, Mihail O, Ejdung G, Rendell J (2011) Common Understanding of (Initial) Assessment, 639 Determination of Good Environmental Status (GES) and Establishment of Environmental Targets (Art. 8, 9 & 10 640 MSFD). WG GES EU MSFD. https://circabc.europa.eu/sd/d/ce7e2776-6ac6-4a41-846fa04832c32da7/05_Info_Common_understanding_final.pdf
Coll M, Palomera I, Tudela S, Sarda F (2006) Trophic flows, ecosystem structure and fishing impacts in the South Catalan Sea, Northwestern Mediterranean. Journal of Marine Systems 59:63- 96.
Coll M, Santojanni A, Palomera I, Tudela S, Arneri E (2007) An ecological model of the Northern and Central Adriatic Sea: Analysis of ecosystem structure and fishing impacts. Journal of Marine Systems 67:119-154.
Commission Decision of 18 December 2009 adopting a multiannual Community programme for the collection, management and use of data in the fisheries sector for the period 2011-2013 (notified under document C(2009) 10121) (2010/93/EU).
Commission Regulation (EC) No 665/2008 of 14 July 2008 laying down detailed rules for the application of Council Regulation (EC) No 199/2008 concerning the establishment of a Community framework for the collection, management and use of data in the fisheries sector and support for scientific advice regarding the Common Fisheries Policy.
Conversi A, Umani SF, Peluso T, Molinero JC, Santojanni A, Edwards M (2010) The Mediterranean Sea regime shift at the end of the 1980s, and intriguing parallelisms with other european basins. PLoS ONE 5, e10633.
Council Directive 92/43/EEC of 21 May 1992 on the conservation of natural habitats and of wild fauna and flora.
Danovaro R, Fonda S, Pusceddu A (2009) Climate change and the spreading of marine mucilage and pathogenic microbes in the Mediterranean Sea. PLoS ONE 4(9), e7006.
Directive 2000/60/EC of the European Parliament and of the Council of 23 October 2000 establishing a framework for Community action in the field of water policy.
Directive 2008/56/EC of the European Parliament and of the Council of 17 June 2008 establishing a framework for community action in the field of marine environmental policy (Marine Strategy Framework Directive).
Directive 2009/147/EC of the European Parliament and of the Council of 30 November 2009 on the conservation of wild birds.
Elliott M (2011) Marine Science and management means tackling exogenic unmanaged pressures and endogenic managed pressures – a numbered guide. Marine Pollution Bulletin 62:651-655.
EU Commission Decision of 1 Septemebr 2010 on criteria and methodological standards on good environmental status on marine waters (2010/477/EU).
Giani M, Djakovac T, Deggobis D, Cozzi S, Solidoro C, Umani SF (2012) Recent changes in the marine ecosystems of the northern Adriatic Sea. Estuarine, Coastal and Shelf Science 115:1-13.
Gray JS, Elliott M (2009) Ecology of Marine Sediments: science to management. OUP, Oxford, 260pp.
Deliverable 1.4 Report on SWOT analysis of monitoring
98
Hattab T, Ben Rais Lasram F, Albouy C, Romdhane MS, Jarboui O, Halouani G, Cury P, Le Loc'h F (2013) An ecosystem model of an exploited southern Mediterranean shelf region (Gulf of Gabes, Tunisia) and a comparison with other Mediterranean ecosystem model properties. Journal of Marine Systems 128:159-174.
HELCOM MORE (2013) Overview of the marine environmental monitoring in the Baltic Sea. Version corrected after MORE 5. 92 p. http://maps.helcom.fi/website/HelcomMORE/index.html
HELCOM (2010) Ecosystem Health of the Baltic Sea 2003–2007: HELCOM Initial Holistic Assessment. Balt. Sea Environ. Proc. No. 122.
Henkens RJHG, Ottburg FGWA, Sluis T, Klok TC (2010). Biodiversity monitoring in the Kornati Archipelago, Croatia: Protocols for the monitoring of Natura 2000 and Croatian red list habitats and species.
Korshenko A, Alexandrov B (2006) Zooplankton Manual of Biological methodology in the Black Sea area. http://bsc.ath.cx/documents/ExpertNetwork/default.asp?I=/Expert%20Network%20-%20Zooplankton
Koss RS, Knights AM, Eriksson A, Robinson LA (2011) ODEMM Linkage Framework Userguide. ODEMM Guidance Document Series No1. EC FP7 project (244273) Options for Delivering Ecosystem-based Marine management. University of Liverpool, ISBN: 978-0-906370-66-7.
Laroche S, Andral B, Cadiou J-F, Pantazi M, Gonzalez Fernandez D, Vasile D, Vasilopoulou V et al. (2013) Identified gaps on MSFD assessment elements. Perseus Deliverable D.5.2. PERSEUS Project. ISBN 978-960-9798-01-3
Mackelworth P, Holcer D, Jovanović J, Fortuna C (2011) Marine conservation and accession: the future for the Croatian Adriatic. Environmental management 47(4):644-655.
Margaritoulis D (2005) Nesting activity and reproductive output of loggerhead sea turtles, Caretta caretta, over 19 seasons (1984–2002) at Laganas Bay, Zakynthos, Greece: the largest rookery in the Mediterranean. Chelonian Conservation and Biology 4(4):916-929.
Dendrinos P, Karamanlidis AA, Androukaki E, McConnell BJ (2007) Diving development and behavior of a rehabilitated Mediterranean monk seal (Monachus monachus). Marine Mammal Science 23(2):387 397.
Moncheva S (2010) Guidelines for QC/QA of Biological Data-Phytoplankton. 18 pp. http://documents.blacksea-commission.org/Downloads/Guidlines-Phytoplankton-QC-QA.pdf
Moncheva S, Par B (2005) (updated 2010). Manual for Phytoplankton Sampling and Analysis in the Black Sea, 67 pp. http://documents.blacksea-commission.org/Downloads/Phytoplankton_%20Mannual-Final-1.pdf
Moutopoulos DK, Libralato S, Solidoro C, Stergiou KI (2013) Towards ecosystem approach to fisheries in the Mediterranean Sea: multi-gear/multi-species implications from an ecosystem model of the Greek Ionian Sea. Journal of Marine Systems 113–114:13-28
MSFD Common Implementation Strategy (2012) Links between MSFD and the Nature Directives. Prepared by DG Environment (B3) and presented at the 7th meeting of the Marine Strategy Coordination Group.
Nunes A, Katsanevakis S, Zenetos A, Cardoso AC (in press). Gateways to alien invasions in the European Seas. Aquatic Invasions
OSPAR (2013) 2012 Status Report on the OSPAR Network of Marine Protected Areas. OSPAR Commission, London, UK. 64 pp.
Patrício J, Teixeira H, Mazik K, Little S, Elliott M, Zampoukas N, Churilova T, Kryvenko O, Moncheva S, Papadopoulou N, Solaun O, Uyarra M, Wilson C, Zenetos A (2013) Report cataloging the Monitoring Networks used within EU Member States (DEVOTES Deliverable 1.3), DEVOTES FP7 Project. JRC88150, 28pp. http://www.devotes-project.eu/deliverables-and-milestones/
Pauly D, Froese R, PS Sa-a, Palomares ML, Christensen V, Rius J (2000) Trophlab manual.ICLARM, Manila, Philippines.
Piroddi C, Bearzi G, Christensen V (2010) Effects of local fisheries and ocean productivity on the northeastern Ionian Sea ecosystem. Ecological Modelling 221:1526-1544
Robinson LA, Rogers S, Frid CLJ (2008). A marine assessment and monitoring framework for application by UKMMAS and OSPAR – Assessment of Pressures and Impacts. Phase II: Application for regional assessmens. Joint Nature Conservation Committee contract No. C-08-0007-0027.
Russo A, Rabitti S, Bastianini M (2002) Decadal Climatic Anomalies in the Northern Adriatic Sea inferred from a New Oceanographic Data Set. Marine ecology 23:340-351.

99
Simboura N, Zenetos A, Pancucci-Papadopoulou MA, Reizopoulou S, Stretaris N (2012) Indicators for the Sea-floor Integrity of the Hellenic Seas under the European Marine Strategy Framework Directive: establishing the thresholds and standards for Good Environmental Status. Mediterranean. Marine Science 13:140-152
Teixeira H, Torsten B, Fürhaupter K, Uusitalo L, Papadopoulou N, Bizsel KC, Cochrane S, Churilova T, Heiskanen A-S,Uyarra MC, Zampoukas N, Borja A, Akcali B, Andersen JH, Beauchard O, Berzano M, Bizsel N, Bucas M, Camp J, Carvalho S, Flo E, Garces E, Herman P, Katsanevakis S, Kavcioglu R, Krause-Jensen D, Kryvenko O, Lynam C, Mazik K, Moncheva S, Neville S, Ozaydinli M, Pantazi M, Patrício J, Piroddi C, Queirós AM, Ramsvatn S, Rodriguez JG, Rodriguez-Ezpeleta N, Smith C, Stefanova K, Tempera F, Vassilopoulou V, Veríssimo H, Yilmaz EC, Zaico A, Zenetos A (2014) Existing biodiversity, non-indigenous species, food-web and seafloor integrity GEnS indicators (DEVOTES Deliverable 3.1) DEVOTES FP7 Project. http://www.devotes-project.eu/deliverables-and-milestones/
Todorova V, Konsulova TS (2005) Manual for collection and treatment of soft bottom macrozoobenthos samples. http://bsc.ath.cx/documents/ExpertNetwork/docs/Expert%20Network%20-20Zoobenthos /Todorova%20Manual_zoobenthos.doc
Todorova V (2013) Benthic habitats. Initial Assessment Report (Bulgaria), 77-166. http://www.bsbd.org/v2/bg/page_1722859.html
Tsagarakis K, Coll M, Giannoulaki M, Somarakis S, Papaconstantinou C, Machias A (2010) Food-web traits of the North Aegean Sea ecosystem (Eastern Mediterranean) and comparison with other Mediterranean ecosystems. Estuarine, Coastal and Shelf Science 88:233-248.
UNEP-MAP-RAC/SPA (2012) Marine Mediterranean Invasive Alien Species (MAMIAS), 2012:http://www.mamias.org.accessed on 28 January 2014.
Vandekerkhove J, Cardoso AC (2010). Alien Species and the Water Framework Directive ‐Questionnaire Results. JRC Scientific and Technical Report. EUR 24257EN– 2010.
Zampoukas N, Piha H, Bigagli E, Hoepffner N, Hanke G, Cardoso AC (2012). Monitoring for the Marine Strategy Framework Directive: Requirements and options. JRC Scientific and Technical Reports. http://publications.jrc.ec.europa.eu/repository/bitstream/111111111/23169/1/lbna25187enn.pdf
Zampoukas N, Palialexis A, Duffek A, Graveland J, Giorgi G, Hagebro C, Hanke G, Korpinen S, Tasker M, Tornero V, Abaza V, Battaglia P, Caparis M, Dekeling R, Frias Vega M, Haarich M, Katsanevakis S, Klein H, Krzyminski W, Laamanen M, Le Gac JC, Leppanen JM, Lips U, Maes T, Magaletti E, Malcolm S, Marques JM, Mihail O, Moxon R, O'Brien C, Panagiotidis P, Penna M, Piroddi C, Probst WN, Raicevich S, Trabucco B, Tunesi L, van der Graaf S, Weiss A, Wernersson AS, Zevenboom W (2014) Technical guidance on monitoring for the Marine Stategy Framework Directive. JRC Scientific and Policy Report EUR 26499 EN http://publications.jrc.ec.europa.eu/repository/bitstream/111111111/30508/1/lb-na-26499-en-n.pdf
Zenetos Α, Gofas S, Morri C, Rosso A, Violanti D, Raso JG, Ηinar M, Almogi-Labin A, Ates A, Azzurro E (2012) Alien species in the Mediterranean Sea by 2012. A contribution to the application of European Union’s Marine Strategy Framework Directive (MSFD). Part 2. Introduction trends and pathways. Mediterranean Marine Science 13:328-352.
Zenetos A, Koutsogiannopoulos D, Ovalis P, Poursanidis D (2013) The role played by citizen scientists in monitoring marine alien species in Greece. Cahiers de Biologie Marine 54(3): 419-426.
Website links:
DEVOTES link project website: http://devotes-project.eu/
EMIS-EU-bathymetry-maritime boundaries-borders: http://emis.jrc.ec.europa.eu/4_1_gismap.php)
European Network of Marine Research Institutes and Stations: http://www.marsnetwork.org/

Deliverable 1.4 Report on SWOT analysis of monitoring
100
7. List of annexes
Annex 1 – DEVOTES Catalogue of Monitoring Networks
Annex 2 – Interactive .pdf files (‘Marine Region Overviews’ and ‘Marine Region and subregion
Summaries’)
Annex 3 – Ecosystem Overview of the European Regional Seas
Annex 4 – Supporting Gap and Monitoring Tables