Embed Size (px)
Citation preview

Report on
Soil Erosion Processes in the Nile Basin
Consultancy within the framework of the FRIEND/Nile Project supported
by
United Nations Educational, Scientific and Cultural Organization –
UNESCO
By
Dr. Armando Molina
May 2009
TABLE OF CONTENTS
1. Introduction 3
2. Methodology 4
3. Actualization of the erosion map for six erosion risk zones 8
Lower Nile 8
Blue Nile River 9
Blue Nile River: Sudanese Side 9
Blue Nile/Abbay River: Ethiopian Side 10
Lake Victorian Basin 11
Kenya 12
Tanzania 12
Uganda 13
4. Comparison of erosion map with erosion data published in literature 14
5. References 22
6. Annexes 23
2
1. INTRODUCTION
The Nile Basin is undergoing severe soil erosion that has led to a deterioration of soil
and water resources mainly due to a loss of soil fertility on the hill slopes and an
excessive transport of sediment in the rivers. The latter has caused a reduction of
water storage in reservoirs so that irrigated land of the Nile valley is threatened. These
problems have high economic costs both for the governments and for the population;
therefore it is primordial to study the sediment production and transport processes
within the Nile Basin in order to enhance water resource management.
Six countries that are part of the Nile Basin now participate actively in a research
project, FRIEND/Nile. One of the components of this project focuses at the
management of sediment and watershed in the basin. After a successful first phase of
four years, the FRIEND/Nile Project built good baseline knowledge on the processes
of sediment transport and its implications on watershed management in the Nile
Basin. Based on the results of the first phase, a second phase was launched with the
overall scientific aims to study the effect of the implementation of soil conservation
measures and to provide guidelines to improve watershed management. During the
first phase of the FRIEND/Nile project, the team mainly focused on sediment
transport and management in streams, and did not include all components of sediment
production and transfer within the Nile Basin. To achieve the goals proposed by the
FRIEND/Nile Project, the team should not only focus on sediment transport but also
on the identification of sources and sinks of sediment so that the most relevant erosion
and deposition processes can be included.
Before undertaking detailed research on erosion for specific case-studies, basic
information on overall soil erosion processes within the Nile Basin should be
gathered. For this purpose, an overall soil erosion map is primordial. During the
workshop held in Mekelle, the research group of the Erosion, Sediment Transport and
Watershed Management Component of the FRIEND/Nile Project decided to elaborate
an actual erosion map of the Nile Basin based on a previous global assessment of soil
erosion by ISRIC: the Global Assessment of Soil Erosion (GLASOD) map.
3
Given the timeframe of the FRIEND/Nile project, it was not possible to produce an
actual erosion map of the entire Nile Basin. The teams have decided to work on
specific ‘erosion risk’ zones. Based on data from soil erosion measurements,
complementary information on land use, precipitation, soil type and expert judgment,
the different teams realized an update of the Glasod map.
During the workshop in Nairobi, each team presented his actualization of the erosion
map for his specific ‘erosion risk’ zone. As the maps from the various teams
presented major inconsistencies with respect to the legend, coordinate system and set-
up of the attribute table, homogenization was necessary. The objective of this
consultancy was to (i) homogenize and standardize all erosion risk information that
was compiled for the erosion risk zones, and (ii) compare these results from this
research activity from the FRIEND/Nile project with existing soil erosion information
from literature.
2. METHODOLOGY
The soil erosion maps that are presented in this report are based on the information
that was collected by the ESTWM team of the FRIEND/Nile project. This team of
international scientists has worked for two years on an update and regionalization of
the Glasod erosion map for the Nile Basin. In 1987, the United Nations Environment
Programme (UNEP) and the International Soil Reference and Information Centre
(ISRIC) executed a project entitled “Global Assessment of Soil Degradation”
(Glasod). The output of this project was the elaboration of world map on the status of
human-induced soil degradation at a scale of 1:10 M (Oldeman et al., 1990). A
topographic map was the base to display the different continents and create mapping
units which were then related to climate, soil, vegetation and land use to elaborate the
Global Assessment of Soil Erosion map. This map is a qualitative assessment, and is
largely based on expert judgment.
The six erosion risk zones selected within the FRIEND/Nile Project were grouped
into three zones: (i) the lower Nile catchment (Egypt), (ii) the Blue Nile catchment
(Sudan and Ethiopia) and (iii) the lake Victoria region (Kenya, Uganda and
Tanzania). For each zone, three erosion maps were elaborated. They represent the
4

erosion type, its extent and its degree (see Annexes). These maps are actualizations of
the Glasod erosion map, as they contain all modifications that are made to the Glasod
map within the framework of the FRIEND/Nile Project. Below, an overview map is
shown to highlight the location of the erosion risk zones within the Nile basin.
5
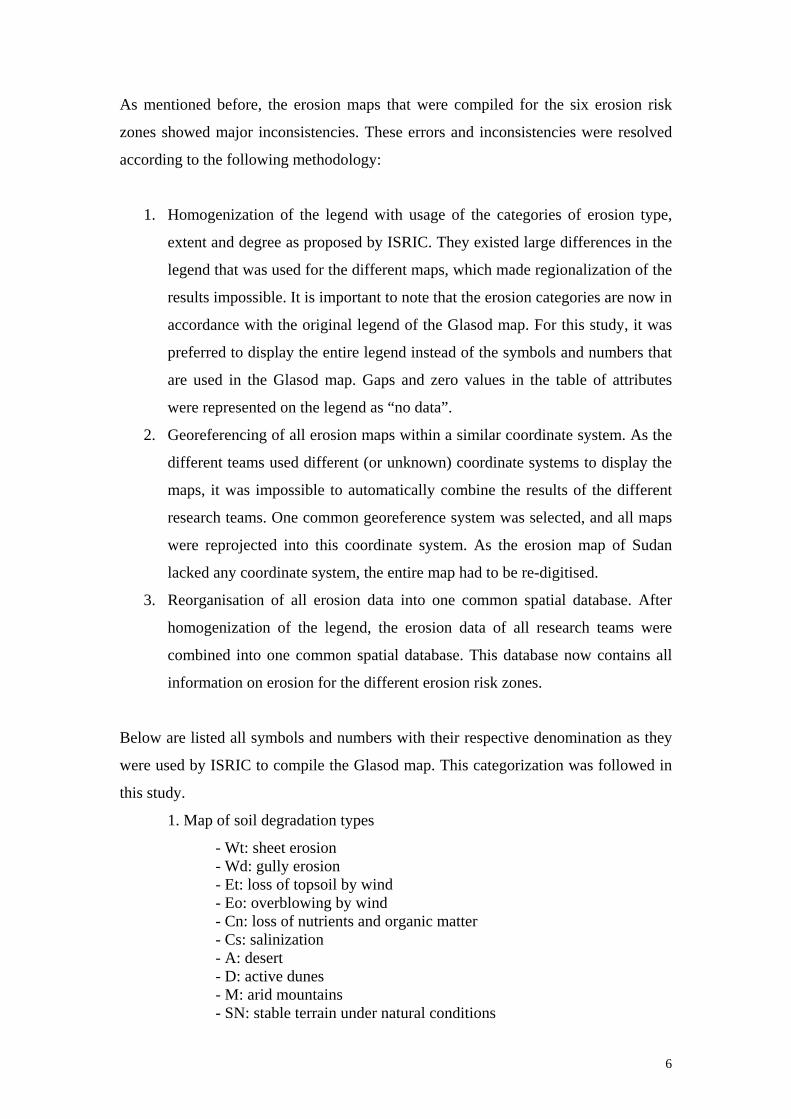
As mentioned before, the erosion maps that were compiled for the six erosion risk
zones showed major inconsistencies. These errors and inconsistencies were resolved
according to the following methodology:
1. Homogenization of the legend with usage of the categories of erosion type,
extent and degree as proposed by ISRIC. They existed large differences in the
legend that was used for the different maps, which made regionalization of the
results impossible. It is important to note that the erosion categories are now in
accordance with the original legend of the Glasod map. For this study, it was
preferred to display the entire legend instead of the symbols and numbers that
are used in the Glasod map. Gaps and zero values in the table of attributes
were represented on the legend as “no data”.
2. Georeferencing of all erosion maps within a similar coordinate system. As the
different teams used different (or unknown) coordinate systems to display the
maps, it was impossible to automatically combine the results of the different
research teams. One common georeference system was selected, and all maps
were reprojected into this coordinate system. As the erosion map of Sudan
lacked any coordinate system, the entire map had to be re-digitised.
3. Reorganisation of all erosion data into one common spatial database. After
homogenization of the legend, the erosion data of all research teams were
combined into one common spatial database. This database now contains all
information on erosion for the different erosion risk zones.
Below are listed all symbols and numbers with their respective denomination as they
were used by ISRIC to compile the Glasod map. This categorization was followed in
this study.
1. Map of soil degradation types
- Wt: sheet erosion - Wd: gully erosion - Et: loss of topsoil by wind - Eo: overblowing by wind - Cn: loss of nutrients and organic matter - Cs: salinization - A: desert - D: active dunes - M: arid mountains - SN: stable terrain under natural conditions
6
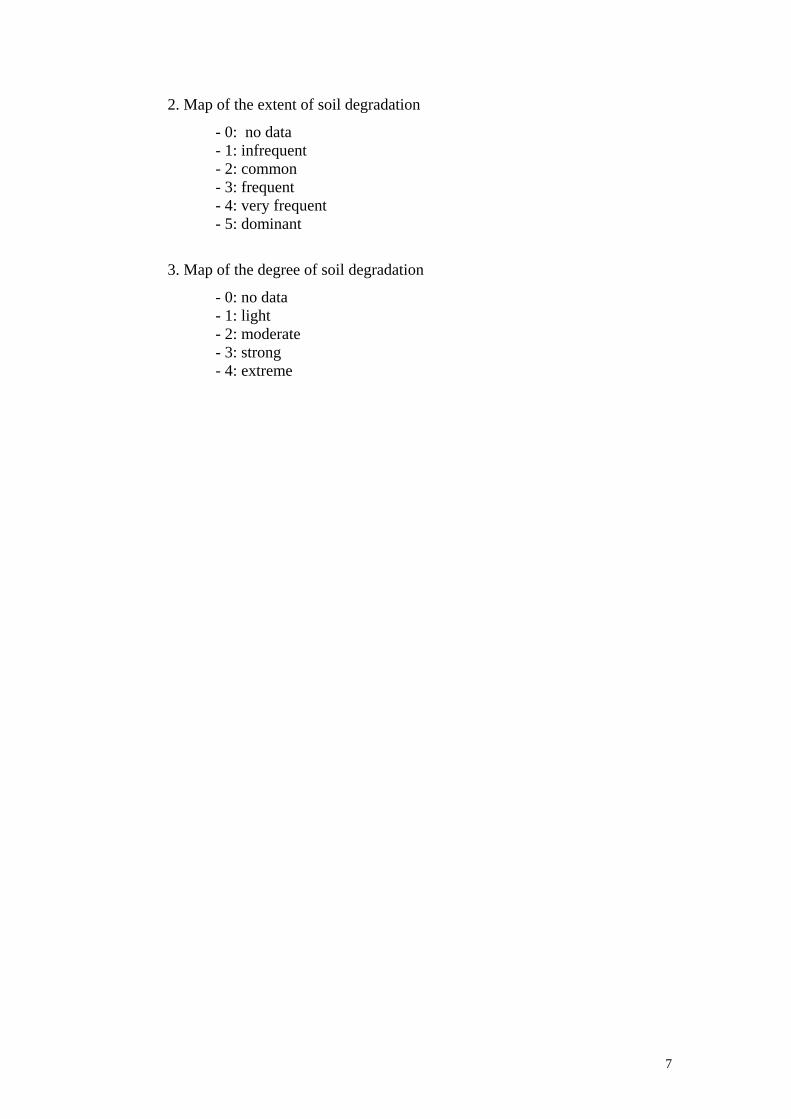
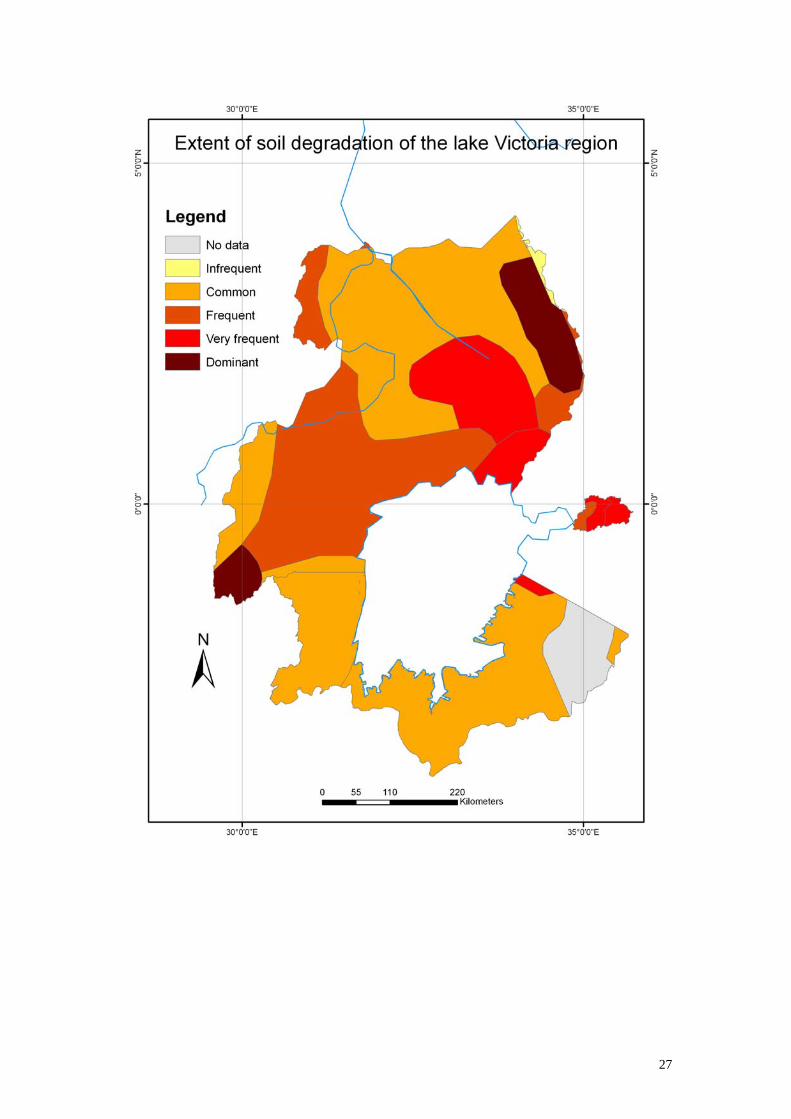
2. Map of the extent of soil degradation
- 0: no data - 1: infrequent - 2: common - 3: frequent - 4: very frequent - 5: dominant
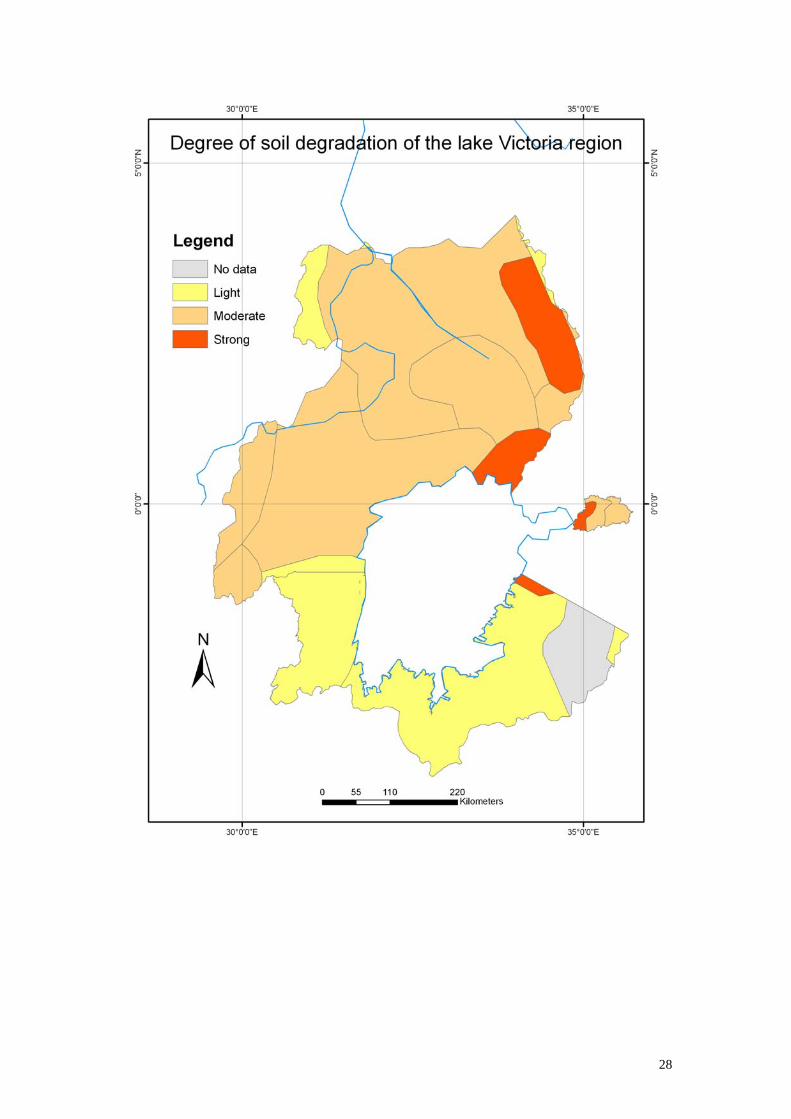
3. Map of the degree of soil degradation
- 0: no data - 1: light - 2: moderate - 3: strong - 4: extreme
7
3. ACTUALIZATION OF THE EROSION MAP FOR SIX EROSION RISK ZONES
LOWER NILE
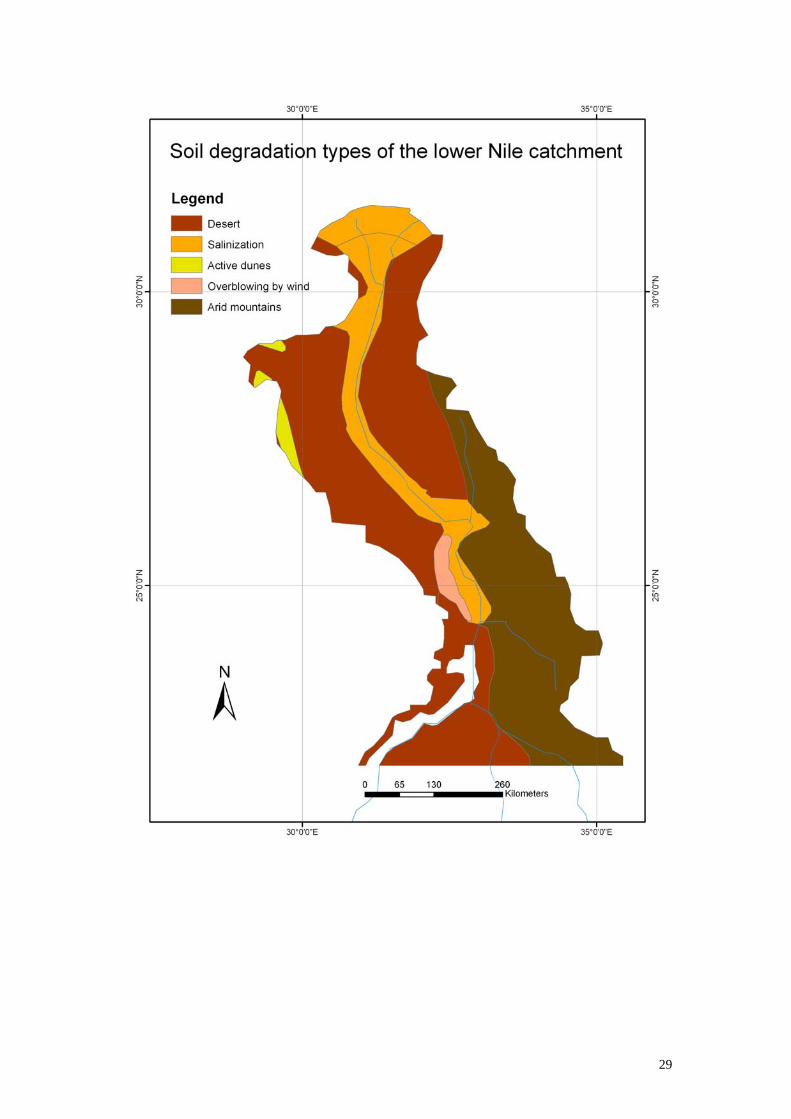
The actualization of the erosion map for Egypt was limited to the area within the
water divide of the Nile basin. The maps in the annexes clearly indicate the type,
degree and extent of soil erosion as identified by the Egyptian research team. The
valley from Aswan dam to the delta of Nile river is frequently affected by soil
degradation, but the degree of soil degradation can generally be considered as ‘light’
with the exception of the area around the delta of the Nile River where moderate soil
degradation is found. The main human-induced soil degradation types are related to
salinization (Cs) which is a major problem in the Nile valley from Aswan dam to
Cairo. Natural or semi-natural erosion processes affect other areas. Notably, the
following degradation features are observed: an arid mountain region (M) located
around the Aswan High Dam reservoir, active dunes (D) present in the north-east and
desert (A) covering the surroundings of the Nile valley.
The Egyptian team has realized modifications to the Glasod map based on
information from published erosion records. It should be mentioned that a lot of this
documentation on erosion processes is patchy and anecdotical, and that regional
assessments of soil degradation are lacking. The following changes were made:
Type of soil degradation :
- The Egyptian research team identified a section of the Nile River that is
prone to ‘Sand encroachment’. This area was delineated with an additional
polygon in ArcGIS, and corresponds to the area between Aswan and Isna
Barrage. The area that is affected by sand encroachment is about 30 km in
length. To homogenize the legends of the erosion maps, this new polygon
was given the symbol of Eo (Overblowing).
Degree of soil degradation:
- The Egyptian researchers highlighted that the Nile Valley between Aswan
dam to Cairo is not affected by high levels of soil erosion. They changed
accordingly the degree of soil degradation of this area from ‘moderate’ to
‘light’.
8

- The area that is affected by overblowing (Eo), is given an erosion level of
moderate.
Extent of soil degradation:
- The area of the delta beach from Alexandria to El-Arish is now affected
frequently by erosion. The attribute of this polygon has been changed
accordingly (‘frequent’ instead of ‘dominant’.
- The area of overblowing (Eo) is given an erosion extent of ‘frequent’.
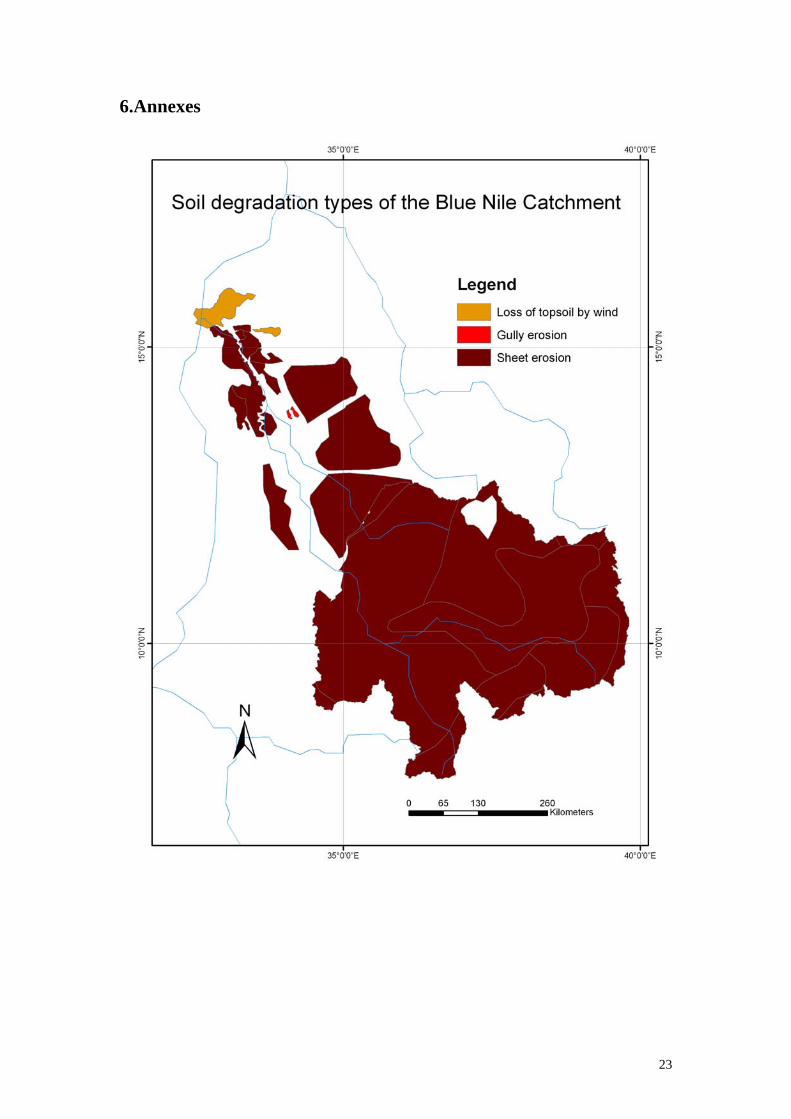
BLUE NILE RIVER
Two research teams have worked together on different sections of the Blue Nile
catchment. The Sudanese research team has focused on the Sudanese part of the Blue
Nile catchment, DS of the Ethiopian border, while the Ethiopian team worked on the
Ethiopian side of the Blue Nile (Abbay) catchment. To enhance the regionalization of
the results, the data from both teams were compared and homogenized. From the
figures in the annexes, it is clear that the soil degradation map of Sudan contains more
detailed than the map from Ethiopia.
As there was a major issue with the georeferencing of the Sudanese erosion map, this
map had to be digitised completely. This was done in ArcGIS.
Blue Nile River: Sudanese Side
The soil degradation map that exists for the Sudanese side of the Blue Nile catchment
from ISRIC (Glasod map) is very coarse, and does not contain information on soil
degradation for a large part of the territory. The Sudanese research team has made a
major effort in updating this soil degradation map. Notably, the polygons that existed
in the Glasod map were further subdivided into 16 ‘soil degradation’ polygons. These
polygons were all related to soil degradation information. All voids or zero values
were replaced by a soil degradation category. As this soil degradation map is a
thorough reworking of the original Glasod map, we only mention the actual soil
degradation processes here as indicated by the Sudanese research team.
As there were some major inconveniences due to the lack of any information on
coordinate systems for the Sudanese map, and due to some mismatch in the
organisation of the attribute tables, the soil degradation information had to be re-
9
digitised and the information on the attributes had to be entered into a spatial
database. Three new ‘soil degradation’ fields were added in the attribute table (type,
extent and degree) to represent the different types of soil degradation for all 16
polygons. Based on these new fields, soil degradation maps were generated.
Based on expert knowledge and some sporadic information from erosion studies in
Sudan, the Sudanese research team indicates that sheet erosion (Wt) is predominant in
the basin. Gully erosion (Wd) is limited to very small area located in the centre, and is
indicated as polygons 13 and 16 in the attribute table. Although this area of gully
erosion is relatively small, the degree of erosion is strong. It has been reported that
these areas are heavily affected by gullies, and that agricultural activities are now
impossible in these areas. Additionally, the loss of topsoil by wind (Et) is
predominant in the most northern part, and is indicated as polygon 1 in the attribute
table.
Blue Nile/Abbay River: Ethiopian Side
The Ethiopian team has realized the update of the Glasod map for the Abbay River
basin based on reports (Abbay River Basin Integrated Master Plan), land use/cover
maps, erosion plots and expert knowledge. As detailed information is available from
soil erosion plots, this information was used as a major input source for the updates. It
should be noted that these erosion plot data are often representative for only a small
area (50 to 100m2), and that extrapolation of these erosion measures to larger scales
might be problematic.
Soil degradation in the Abbay River basin is mainly caused by water erosion. Sheet
erosion (Wt) is the main type of water erosion and is covering the entire study area.
There are some strong regional differences in the extent and degree of soil
degradation. Soil degradation is most severe and frequent in the Eastern and Southern
part of Abbay River Basin. Moderate levels of water erosion are occurring in the lake
Tana region, while the Western and Central parts of the Abbay basin are less affected
by water erosion.
The Ethiopian experts have made several changes to the soil degradation
classification as proposed in the Glasod map. The major modifications are linked to
the degree and extent of soil degradation. No changes were made to the type of soil
10
degradation. As such the main composition of the soil degradation map and its
attribute table is very similar to the one proposed by the ISRIC team.
Concerning the degree of soil degradation, some modifications were made:
- Two polygons covering the western part of the Abbay basin with the degree of
soil degradation of ‘moderate’ are replaced by ‘light’.
- Two polygons covering the southeastern and eastern part of the Abbay basin
with soil degradation degree ‘strong’ are now replaced by ‘extreme’.
Concerning the extent of soil degradation, the following changes were made:
- The polygon around lake Tana and a small polygon in the northwestern part of
the Abbay basin with extent of soil degradation ‘frequent’ are replaced by the
extent of degradation ‘common’.
- A small polygon in the southeast with indication of the extent of degradation
‘infrequent’ is replaced by ‘common’.
- A polygon located in the southwest with indication of ‘very frequent’ extent of
degradation is replaced by ‘common’.
- Two polygons in the southern part of the Abbay basin with indication of ‘very
frequent’ extent of soil degradation are replaced by ‘dominant’ extent of
degradation.
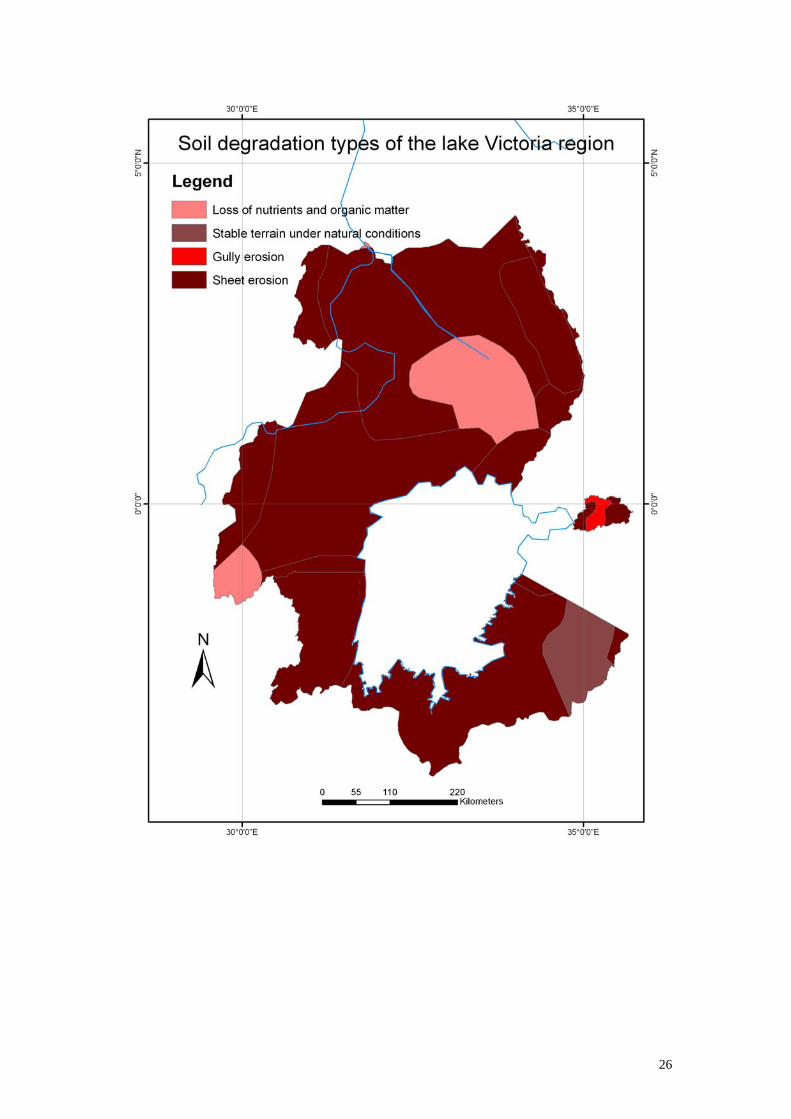
LAKE VICTORIA BASIN
Three research teams (Kenya, Uganda, and Tanzania) have worked on soil
degradation around Lake Victoria. The size of the area that is covered by the different
research teams is highly variable. The Ugandan and Tanzanian team worked on
relatively large areas: the Ugandans districts that are part of the Lake Victoria basin
and the Tanzanian part of the Lake Victoria basin respectively. The Kenyan team
limited their efforts to the Nyando basin, which is very small compared to the other
study areas. It is questionable if this area is representative for the Kenyan part of the
Lake Victoria basin. In the future, the soil degradation should be extended so that it
includes the entire Kenyan part of the Lake Victoria basin.
The main problems related to soil degradation are caused by water erosion. Sheet
erosion is very common in most of the Lake Victoria basin, and is threatening
agricultural production as a lot of fertile topsoil is being lost. The enhanced levels of
water erosion by sheet wash are causing increased levels of sediment transport in
11

streams, and may contribute to further deterioration of the environmental quality of
Lake Victoria. In some specific areas in Uganda, loss of nutrients and organic matter
is a real soil degradation problem. Gully erosion is limited to some specific regions. It
has been observed in several catchments in the Kenyan side of the Lake Victoria
basin, and was documented by the Kenyan team for the Nyando catchment.
Kenya
The Kenyan team focused their efforts on the Nyando catchment as some basic
information on soil degradation processes was collected in the past for this drainage
basin. As the legend of the Kenyan soil degradation map was not conform with the
Glasod standards, homogenisation of the attribute tables and legend was necessary.
Two major soil degradation types caused by water erosion are identified: sheet and
gully erosion.
For the Nyando catchment, three different zones of soil degradation were identified,
corresponding with the lower, middle and upper catchment. According to the Glasod
map, sheet erosion (Wt) is the dominant soil degradation process in the catchment.
However, recent studies indicate that the middle part of the Nyando catchment is
undergoing gully erosion (Wd) due to deforestation, removal of natural vegetation and
agricultural activities. Therefore, the Kenyan team decided to add an extra polygon
and replace the soil erosion type ‘sheet erosion (Wt)’ by gully erosion (Wd) for the
middle part of the Nyando catchment.
Tanzania
The Tanzanian soil erosion experts used quantitative information on sediment yields
for the major streams draining into Lake Victoria for the update of the Glasod map.
As this information from the Tanzanian National Water Quality Synthesis Report is
much more detailed than the scale of the Glasod map, the Tanzanian team did adapt
the soil degradation map accordingly. Some information on sediment yields for the
Tanzanian part of the Lake Victoria Basin was added to the attribute table of the
Glasod map. As no information was added on the types, extent and degree of soil
degradation in the attribute table of the partitioned map, it was not possible to update
the soil degradation map. In this report, the maps of the soil degradation types, extent
12
and degree are created based on the original information of Glasod map as no further
partitioning was done by the Tanzanian erosion experts.
According to expert judgment and some quantitative information on sediment yields,
the main processes of soil degradation are linked to water erosion by sheet erosion.
There is one natural area where human-induced soil degradation is not existing. From
the maps, it is clear that the degree and extent of the erosion problems in Tanzania are
much smaller than in Uganda and Kenya. So, in general, this information seems to
indicate that soil degradation is less an issue in Tanzania than in Uganda or Kenya. It
is likely that regional differences in population and cattle density among these
countries can explain these differences in soil degradation degree and extent.
Uganda
The Ugandan erosion experts used published information on soil erosion rates as basic
information to update the Glasod map. This information is available at the level of the
districts. The Glasod map was then combined with the map of the district boundaries
of Uganda to further partition the map units. Expert judgment was important to
translate the quantitative information on soil rates and/or degradation status of each
district into the Glasod legend.
The main types of soil degradation in Uganda are related to water erosion by sheet
wash (Wt) and by deterioration of soils by loss of nutrients and organic matter (Cn).
Soil erosion in Uganda is generally moderate with dominant extent. Some strong
degree of soil erosion is found in the Eastern part of the country. Soil erosion is
mainly linked to areas with steep topography and high population density in rural
areas.
Based on soil erosion data, the following modifications were made to the Glasod map:
For the districts of Iganga, Busia and Tororo, the main modification is related to the
degree of soil degradation. Regions for which ‘extreme’ soil degradation was
mentioned on the Glasod map were changed to ‘moderate’ degree of soil degrdation.
The degree of soil degradation of the polygons that are covering the districts of
Pallisa, Kumi and Soroti and lower parts of Mbale (Lake Kyoga districts) were
13
changed to the level of ‘moderate’. The districts of Mbale and Kapchorwa are mainly
composed by strong degrees of soil degradation.
4. COMPARISON OF EROSION MAP WITH EROSION DATA PUBLISHED IN
LITERATURE A literature review has been done on soil erosion and sediment yield in the Nile Basin
to compare the outputs of the soil degradation map with existing or published data.
Although there is a general awareness of the negative effects of soil erosion on soil
and water resources in the Nile basin (Wasson, 2002), very few studies have been
carried out to quantify soil degradation in the region. Most erosion studies have
focused at very small plot scale experiments, which are often difficult to extrapolate
to larger regional units.
From the published records on sediment yield and erosion, it seems that Ethiopia is
one of the best-documented countries of the Nile Basin. Only marginal information is
found for other countries. This is particularly true for Sudan and Egypt where wind
and water erosion might affect agricultural production. Table 1 and 2 summarize the
information found in the literature for Ethiopia on soil erosion and sediment yield,
whereas table 3 summarizes some data on sediment yields for Tanzania. All values of
soil erosion from literature were converted into the same unit, t/km²/year in order to
have comparable numbers. It is clear that these tables on soil erosion rates for the Nile
Basin are far from being complete, but they give a first estimation of soil erosion
values based on information that is publicly available. In the future, this database
should be further elaborated with information on sediment yields from gauging
stations and from reservoir sites from all around the Nile Basin.
In order to validate the regional assessment of soil degradation that was made by the
different research teams, the information that is given on the regional soil degradation
maps was compared with the spatial patterns in erosion rates from the literature
review. First, a spatial database of soil erosion rates was compiled from the review.
Second, this information on soil erosion was then compared with the information
displayed on the updated soil degradation map by overlaying the geographical
coordinates of the two databases. For each data on soil erosion that was found in
14
literature, the respective information from the soil degradation map was extracted.
This information is given in Table 1, 2 and 3 (see last columns: type, degree and
extent of soil degradation). This comparison not only allows validating and
homogenizing the information on soil degradation, it also allows providing some
quantitative information on erosion rates for the different regions within the Nile
basin.
Table 1 shows information on erosion rates that are compiled from plot erosion
studies. These studies are typically done based on small-scale experiments. It has
often been discussed that the erosion rates that are derived from such experiments are
not representative for the overall sediment export from large basins. However, some
basic information on local soil erosion rates can give us some indication of regional
patterns in erosion. The data that are compiled in Table1 clearly show that soil erosion
is highly variable in the Abbay basin ranging from ∼ 0 to 28200 ton/km²/yr. It is clear
that the erosion rates that are measured on these erosion plots are often very high,
with extreme values of more than 10,000 ton/km²/year of soil eroded. When we
compare this information on erosion rates with the spatial patterns of erosion on the
regional soil degradation map, some major inconsistencies become clear. In general,
grass and cultivated land present soil erosion rates lower than 7800 ton/km²/yr and
occur mainly in soils such as Luvisol, Vertisols, Nitisols and Phaeozems. These
results slightly agree with the soil degradation map that indicates that these areas are
prone to moderate soil erosion by sheet erosion (Table1). The main inconsistencies
between the regional soil degradation map and the erosion rates are observed for the
high to very high erosion rates. For several basins, we observe very high erosion rates
(> 10,000 ton/km²/year) for regions that are indicated as having a ‘light’ degree of soil
erosion.
There might be two reasons for these differences.
(1) Soil erosion measures from soil erosion plots tend to over-estimate the overall
soil erosion in a certain region. This observation has been made for several
regions worldwide, where it has been ascertained that soil erosion plots tend
to be installed on steep slopes with shallow soils, and seem not to be too
representative of the overall erosion problems of a region.
15

(2) The soil degradation map is far to capture all processes of soil degradation,
and erosion experts tend to focus mainly on sheet erosion as the dominant
erosion problem. It is known that some smaller erosion features such as
gullies, or badlands might be limited in space but very important for the
overall erosion rates.
For the Abbay basin, there is probably a combination of these two reasons that
explains why the regional patterns of the soil degradation map do not correspond with
the observed spatial patterns in erosion rates from erosion plots.
16

Table 1
Soil erosion in Ethiopia (Only measured soil erosion data is given below, N.A.=not
available)
Basin Source Land use Soil type Measured data Regional soil degradation map
Erosion rate
ton/km²/yr Type Degree Extent
Abbay
Tolcha
1991,
Hurni
1985
Grass Luvisols,
vertisols
∼0 to 7200
Sheet
erosion Moderate Common
Abbay
Tolcha
1991,
Hurni
1985
Teff
Leptosols,
Cambisols
and
Vertisols
~ 28200 Sheet
erosion
Moderate,
strong and
exterme
Frequent,
very
frequent and
dominant
Abbay
Tolcha
1991,
Hurni
1985
Cultivated Nitosols,
Vertisols ~13900
Sheet
erosion Light Common
Abbay
Tolcha
1991,
Hurni
1985
Cultivated Nitisols,
Phaeozems
7800 –to 21800
Sheet
erosion
Light and
moderate Common
Gilgel
Abbay
MOWR,
1989 N.A. N.A.
> 10000
Sheet
erosion Moderate Common
Gumara MOWR,
1989 N.A. N.A.
3000 to
2000 Sheet
erosion Moderate Common
Abay at
Bahir
Dar
MOWR,
1989 N.A. N.A.
5000 to
4000 Sheet
erosion Moderate Common
Ardi MOWR,
1989 Cultivated N.A.
2500 to
2000 Sheet
erosion Strong Frequent
17

As the data from the erosion plots might be affected by locally extreme erosion rate
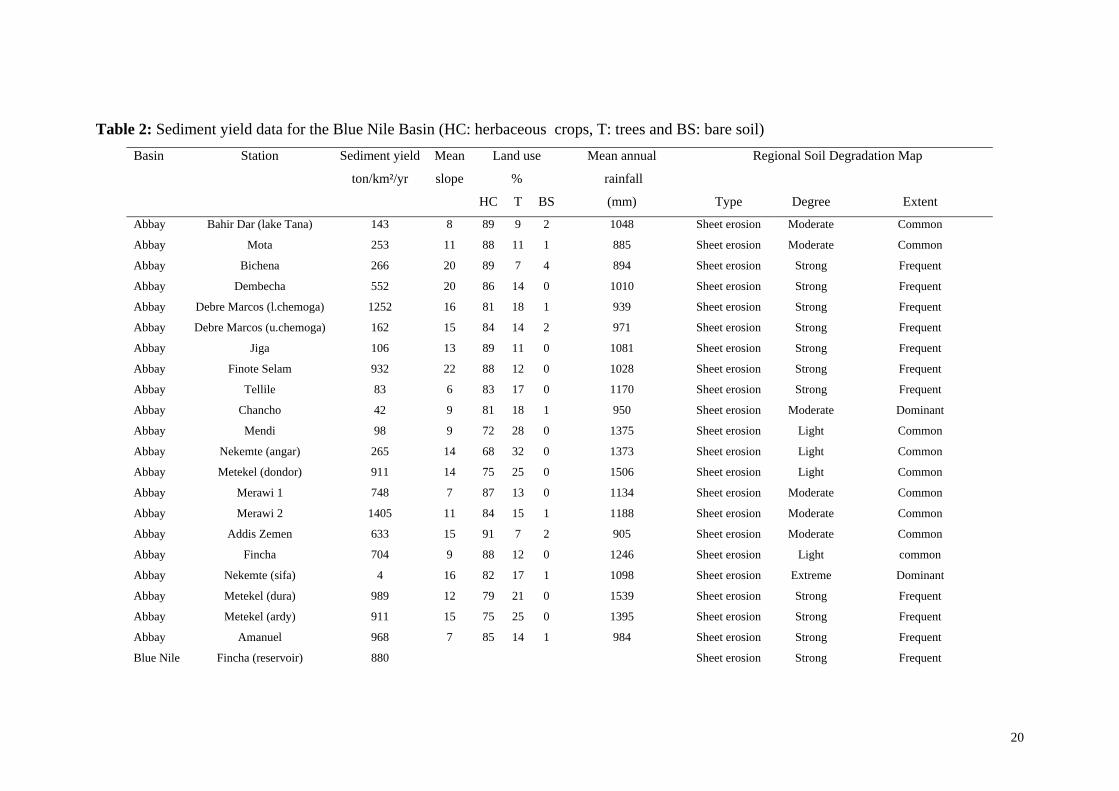
measurements, we also compiled information on sediment yields from publicly
available information. These measures are given in Table 2 (Humphreys et al., 1997).
They are representative of the overall catchment-wide erosion rates for larger
catchments that vary in size from a few km² to a few thousands of km². On average,
these data are representative for the Abbay River basin in Ethiopia. The data indicate
that about 80% of the land of all catchments is composed by herbaceous crops or
cultivated land , 19% by tress and only 1% by bare soil. Annual rainfall ranges
between 885 and 1539 mm and the mean slope gradient between 6 and 22%.
Sediment yield in the Abbay Basin varies from 4 to 1405 ton/km²/yr (Table 2).
Catchments with the lowest mean slopes present values of sediment yield lower than
100 ton/km²/yr. Sediment yield measured at the outlet of the catchment represents all
erosion processes in the system such as hillslope erosion, transport and sediment
deposition, but also bank erosion along the rivers and landslides. The Glasod map was
mainly developed to represent hillslope erosion where cultivated land and rangeland
are the main land use classes. Relating data on sediment yield to the types of soil
degradation on the Glasod map can be inappropriate because only land degradation on
hillslopes is represented. However, we can assume that the majority of sediment from
these agricultural catchments comes from the hillslopes and is produced by water
erosion.
On the regional soil degradation map, sheet erosion was identified as the dominant
type of soil degradation. It is probable that gully erosion is also important in some of
these areas because farmed land with scarce vegetation cover can be very prone to
undergo soil erosion with the contact of the rain drops. This indeed occurs as the
region is rather humid with annual precipitation over 900 mm. Heavy rains can cause
severe gully erosion and shallow landslides. From the data presented in Table 2, it is
clear that the regional soil degradation assessment is incapable of representing local
detailed information on the complexity of soil degradation processes, and is mainly
constrained to the major erosion types in the region.
When comparing the map of the degree of soil degradation with the data on sediment
yield, we observe some agreement between the two datasets. The degree of soil
18
19
degradation in the Abbay Basin roughy corresponds with the regional pattern in
sediment yield data. However, there are some inconsistencies: as for example, values
of sediment yield of 911 and 704 ton/km²/yr are giving a level of light degree of soil
degradation while an area that is characterised by a value of sediment yield of 4
ton/km²/yr is given an extreme degree of soil degradation. Similar inconsistencies are
observed for the extent of soil degradation. Thus, although the information on the
regional soil degradation map roughly corresponds with the sediment yield measures,
it becomes clear that the soil degradation map should be used as a first qualitative
overall assessment.
20
Basin Station
Sediment yield
ton/km²/yr
Mean
slope
Land use
%
Mean annual
rainfall
Regional Soil Degradation Map
HC T BS (mm) Type Degree Extent
Abbay Bahir Dar (lake Tana) 143 8 89 9 2 1048 Sheet erosion Moderate Common
Abbay Mota 253 11 88 11 1 885 Sheet erosion Moderate Common
Abbay Bichena 266 20 89 7 4 894 Sheet erosion Strong Frequent
Abbay Dembecha 552 20 86 14 0 1010 Sheet erosion Strong Frequent
Abbay Debre Marcos (l.chemoga) 1252 16 81 18 1 939 Sheet erosion Strong Frequent
Abbay Debre Marcos (u.chemoga) 162 15 84 14 2 971 Sheet erosion Strong Frequent
Abbay Jiga 106 13 89 11 0 1081 Sheet erosion Strong Frequent
Abbay Finote Selam 932 22 88 12 0 1028 Sheet erosion Strong Frequent
Abbay Tellile 83 6 83 17 0 1170 Sheet erosion Strong Frequent
Abbay Chancho 42 9 81 18 1 950 Sheet erosion Moderate Dominant
Abbay Mendi 98 9 72 28 0 1375 Sheet erosion Light Common
Abbay Nekemte (angar) 265 14 68 32 0 1373 Sheet erosion Light Common
Abbay Metekel (dondor) 911 14 75 25 0 1506 Sheet erosion Light Common
Abbay Merawi 1 748 7 87 13 0 1134 Sheet erosion Moderate Common
Abbay Merawi 2 1405 11 84 15 1 1188 Sheet erosion Moderate Common
Abbay Addis Zemen 633 15 91 7 2 905 Sheet erosion Moderate Common
Abbay Fincha 704 9 88 12 0 1246 Sheet erosion Light common
Abbay Nekemte (sifa) 4 16 82 17 1 1098 Sheet erosion Extreme Dominant
Abbay Metekel (dura) 989 12 79 21 0 1539 Sheet erosion Strong Frequent
Abbay Metekel (ardy) 911 15 75 25 0 1395 Sheet erosion Strong Frequent
Abbay Amanuel 968 7 85 14 1 984 Sheet erosion Strong Frequent
Blue Nile Fincha (reservoir) 880 Sheet erosion Strong Frequent
Table 2: Sediment yield data for the Blue Nile Basin (HC: herbaceous crops, T: trees and BS: bare soil)
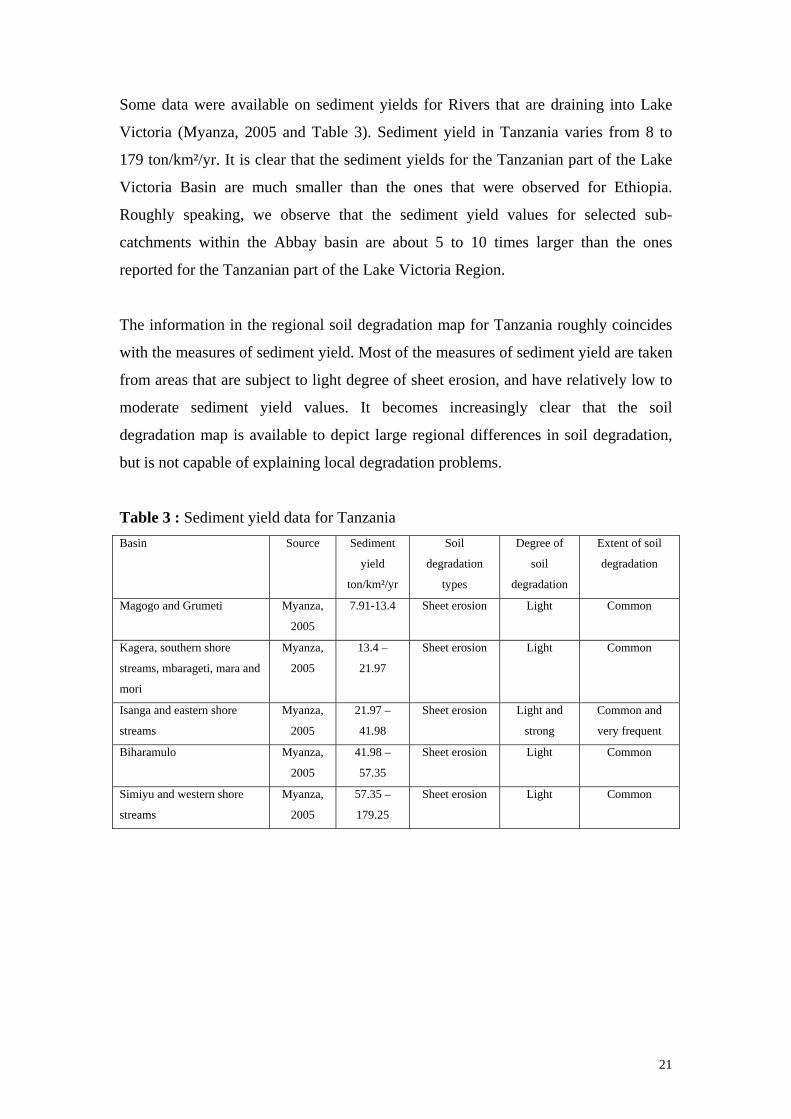
Some data were available on sediment yields for Rivers that are draining into Lake
Victoria (Myanza, 2005 and Table 3). Sediment yield in Tanzania varies from 8 to
179 ton/km²/yr. It is clear that the sediment yields for the Tanzanian part of the Lake
Victoria Basin are much smaller than the ones that were observed for Ethiopia.
Roughly speaking, we observe that the sediment yield values for selected sub-
catchments within the Abbay basin are about 5 to 10 times larger than the ones
reported for the Tanzanian part of the Lake Victoria Region.
The information in the regional soil degradation map for Tanzania roughly coincides
with the measures of sediment yield. Most of the measures of sediment yield are taken
from areas that are subject to light degree of sheet erosion, and have relatively low to
moderate sediment yield values. It becomes increasingly clear that the soil
degradation map is available to depict large regional differences in soil degradation,
but is not capable of explaining local degradation problems.
Table 3 : Sediment yield data for Tanzania Basin Source
Sediment
yield
ton/km²/yr
Soil
degradation
types
Degree of
soil
degradation
Extent of soil
degradation
Magogo and Grumeti Myanza,
2005
7.91-13.4 Sheet erosion Light Common
Kagera, southern shore
streams, mbarageti, mara and
mori
Myanza,
2005
13.4 –
21.97
Sheet erosion Light Common
Isanga and eastern shore
streams
Myanza,
2005
21.97 –
41.98
Sheet erosion Light and
strong
Common and
very frequent
Biharamulo Myanza,
2005
41.98 –
57.35
Sheet erosion Light Common
Simiyu and western shore
streams
Myanza,
2005
57.35 –
179.25
Sheet erosion Light Common
21
5. References
Annual Sediment study in Aswan High Dam Reservoir, Nile Research Institute (NRI)
reports, National Water Research Center (NWRC), Cairo, (1998- 2002).
Humphreys, H., Bellier, C., Kennedy, R., Dokin, K., 1997. Tekeze Medium
Hydropower Report. Annex B-hydrology report, Ministry of Water Resources, p. 264
Addis Ababa.
Hurni, H., 1985. Erosion-productivity-conservation systems in Ethiopia. Proceedings
of the 4th international conference on soil conservation, Maracay Venezuela. Pp 654-
674.
Michael, A.H., 2001. Reservoir sedimentation and sustainable sediment management
in Ethiopia. Proceeding of the symposium on sustainable water resource development,
5, 99-102.
Ministry of Water Resources (MOWR), 1998. Abbay River Basin Integrated
Development Master Plan Project, Addis Ababa, Ethiopia.
Myanza, O.I., Rutagemwa, D.K. and Mwanuzi, F. L. (2005). Non-Point Pollution
Loading in Tanzania, In Mwanuzi, F.L. Edit, Tanzania National Water Quality
Synthesis Report, Water Quality and Ecosystem Management Component, LVEMP
Oldeman, L.R., Hakkeling, R.T.A., Sombroek, W.G., 1990. World map on status of
human-induced soil degradation (GLASOD). Nairobi, Kenya, UNEP/ISRIC.
Nile Basin Capacity Building Network (NBCBN), UNESCO-IHE, Cairo, Egypt,
2005.
Tolcha, T., 1991. Aspects of soil degradation and conservation measures in Agucho
catchments, soil conservation research project, research report 19.
Wasson, R.J., 2002. What approach to the modelling of catchment scale erosion and
sediment transport should be adopted? In: Wolfgang Summer and Desmond
E.Walling (ed.), Modelling erosion, sediment transport and sediment yield. IHP-VI
Technical Documents in Hydrology, No.60, pp1-12
22
6.Annexes
23

24

25
26
27
28
29

30

31