Embed Size (px)
Citation preview

Report on
Social Audit of Government
Schemes
Gujarat Social Infrastructure Development Society, Govt. Of Gujarat
Foreword Government of Gujarat has initiated several program and activities to ensure sustained human
development in the state, including participation from vulnerable section of the society.
Government promoted GSIDB as an autonomous body to improve the overall social
infrastructure of the State. GSIDBS with an interest to make the service delivery system
transparent and accountable and also to strengthen the policies, wishes to conduct social audit
for following schemes:
Society for Creation of Opportunity through Proficiency in English (SCOPE) Chiranjeevi Yojana(CY) Janani Suraksha Yojana(JSY) Mission Mangalam
Dexter Consultancy Pvt. Ltd, Ahmedabad has been awarded the study by GSIDS to analyse the impact of the above mentioned schemes.
Part I in the report, includes Acknowledgement, Executive Summary, Study Objectives along with detailed interpretation of the four schemes.
Part II consists of the Research Mechanism and Methodology used for each scheme along with detailed sampling plan and analysis outline with the study limitations.
Part III details the observations, trends and assessment of the current scenario, including current reach and perception and problems in implementations.
Part IV consists of case studies discussing impact and success of the scheme amongst the beneficiaries

Table of Contents Foreword ............................................................................................................................................... 2
1. Acknowledgement ............................................................................................................................. 6
2. Executive Summary ........................................................................................................................... 6
3. Introduction....................................................................................................................................... 7
3.1 Gujarat ......................................................................................................................................... 7
3.2 Gujarat Social Infrastructure Development Society.................................................................... 9
3.2.1 Functions of the Directorate, GSIDS ..................................................................................... 9
3.2.2 Organizational Framework ................................................................................................. 10
3.2.3 Initiatives ............................................................................................................................ 10
3.2.4 Reports and Evaluation ....................................................................................................... 11
3.3 Rendition to SCOPE Scheme ....................................................................................................... 13
3.3.1 About Scheme ...................................................................................................................... 13
4. Objectives and Approach .................................................................................................................. 17
4.1 Objective and Research Agenda ................................................................................................. 17
4.1.1 Overall Objectives ................................................................................................................ 17
4.1.2 Research Agenda Scheme wise ........................................................................................... 18
4.2 Approach ................................................................................................................................... 18
4.2.1 Sampling ............................................................................................................................. 19
4.2.2 Analysis Outline .................................................................................................................. 19
5. Methodology and Research Mechanisms ........................................................................................ 23
5.1 Sampling Plan ............................................................................................................................ 23
5.2 Execution Plan for Quantitative Study ...................................................................................... 24
5.3 Overall Monitoring and evaluation plan ................................................................................... 25
5.3.1 Data Collection .................................................................................................................... 25
5.3.2 Quality Control .................................................................................................................... 26
6. Detailed Sampling Coverage............................................................................................................ 28
Summary of the findings from Exploratory Study .......................................................................... 32
Demographic Details of the Beneficiaries ....................................................................................... 33
Age of the Respondents ............................................................................................................... 33
Educational Level of the respondents ......................................................................................... 36
Number of Working Members in the household ......................................................................... 38
Type of House .............................................................................................................................. 39
Chief Wage Earner’s Occupation ................................................................................................. 42
Chief Wage Earner’s Education Qualification ............................................................................. 44

Annual Household Income .......................................................................................................... 46
Ownership of Land ...................................................................................................................... 48
Scheme and the Beneficiaries ......................................................................................................... 48
Awareness regarding Scope ........................................................................................................ 50
Availed admission under SCOPE ................................................................................................. 50
Willingness to undertake Benefits under SCOPE ......................................................................... 51
Medium of Awareness ................................................................................................................. 52
University/College partnered to SCOPE ..................................................................................... 52
Ease in the Registration Process ................................................................................................. 56
Entrance Exam ............................................................................................................................. 58
Convenient Batch Timing ............................................................................................................ 60
Reason for Denial ........................................................................................................................ 64
Ability to manage Regular Studies .............................................................................................. 68
Awareness regarding Morning and Evening Batches for SCOPE ................................................ 68
Course Schedule in a week .......................................................................................................... 72
Tutor’s Proficiency in English ..................................................................................................... 72
Tutor’s Problem Solving Skill ...................................................................................................... 76
Use of English language during the Session ................................................................................ 78
Punctuality of the Tutors ............................................................................................................. 80
Delay by Tutors ........................................................................................................................... 80
Availability of Computers ............................................................................................................ 84
Working of the Computers .......................................................................................................... 86
Availability of computer to every student................................................................................... 88
Occurrence of issues while using Computer Programs and Software ........................................ 90
Availability of proper Audio facility ............................................................................................ 92
Reason for Denial ........................................................................................................................ 92
Availability of proper material .................................................................................................... 96
Reason for Denial ........................................................................................................................ 98
Increase in Self Confidence ........................................................................................................ 100
Usefulness of the Course ............................................................................................................ 102
Improvement in Skills ............................................................................................................... 104
Scope of Improvement in the scheme ....................................................................................... 104
Appeared for Exam under the Course ....................................................................................... 108
Reasons for not giving exam ...................................................................................................... 110
Appeared for Exam on time ........................................................................................................ 112

Delay in Exam Time .................................................................................................................... 112
Drawbacks in the exam system .................................................................................................. 116
Reason of Drawback ................................................................................................................... 116
Availability of proper Audio Facility during Exam..................................................................... 120
Problems in Audio Facility during Exam .................................................................................... 122
Received Result on Time ............................................................................................................ 122
Delay in receiving result ............................................................................................................. 126
Need of Improvement and Aspects that require Improvement................................................. 126
Annexure ............................................................................................................................................ 130

1. Acknowledgement We would like to express our gratitude towards GSIDS for their constant support and cooperation
during the study. We would also like to thank the effort of dozens of individuals at Dexter who have
interviewed various stakeholders with respect to the study, namely Commissioners, Education
Officials, SCOPE Team, Zonal Training Partners (ZTP), Implementing Agencies and other officials of
various bodies involved in SCOPE. We are also thankful to these above mentioned stake-holders for
their co-operation and responses that helped us to structure and conduct this entire report.
2. Executive Summary A social audit is a way of measuring, understanding, reporting and ultimately improving a
programme. This will help Government to narrow gaps between vision and reality, between
efficiency and effectiveness.
The objective of this assignment is to conduct a primary research based social audit with following
activities:
Identify the relevant sources or stakeholder(s) for each scheme from where information needs to be generated
Undertake a structured and statically sound primary research based survey for all the
schemes, involving all the relevant stakeholders as applicable for each scheme.
Create awareness about the scheme and information about the benefits of the scheme by
sharing success stories among beneficiaries and community for which scheme is designed
Prepare a in-depth report covering detail assessment of current scenario including current
reach, perception toward the scheme among each stake holder, identify problem in
implementation etc. for each scheme
Provide inputs on corrective prospects for each scheme with action plan.

3. Introduction
3.1 Gujarat
Gujarat is a state in the western part of India known locally as Jewel of the West. It has an area of
196,204 km2 (75,755 sq mi) with a coastline of 1,600 km (990 mi), most of which lies on the
Kathiawar peninsula, and a population in excess of 60 million. The state is bordered by Rajasthan
to the north, Maharashtra to the south, Madhya Pradesh to the east, and the Arabian Sea as well as
the Pakistani province of Sindh to the west. Its capital city is Gandhinagar, while its largest city is
Ahmedabad.

Gujarat has played an important role in the economic history of India. Gujarat, the most urbanized
state of India, is situated on the western coast of India having the coastline of 1600 km.
Government of Gujarat has touched upon almost all the key sectors covering Industry, Power,
Ports, Roads, Agriculture and Mineral. It is one of India’s most prosperous state, having per capita
GDP significantly above India’s average. Looking at the demographic profile, Gujarat is the state
having more than 60% of the population in between age group of 15-59. Gujarat’s State Domestic
Product (SDP) had been rising at an average growth rate of 10.1% since 2005 to 2013, this is more
than the national average. Best infrastructure coupled with skilled workforce supported by best
industrial policies makes the state to drive the country’s growth. It contributes more than 7.5% to
India’s GDP and 18% to India’s fixed capital. 28% of GSDP contribution comes from manufacturing
sector and accounts more than 10% factories in India. During past 4 years the state government
has brought down the fiscal deficit from 3.54% of GSDP to 2.57% of GSDP in 2013-14.
Therefore public debt is being utilized for developmental and infrastructural investment which can be seen strong economic growth and tax revenues. Inspite of decline in global economic meltdown, Gujarat achieved an annual growth rate of 9.51% during 11th plan. It is estimated that it have been continued by Gujarat’s development vision emphasizing human development and inclusive growth. There would be harmonious balanced development in agriculture, manufacturing and services which increases livelihood opportunities. Focusing on agriculture economy, it can be said total crop area is more than one half of the total land area. Gujarat produces cotton, groundnuts, dates, sugarcane, milk and milk products. At the same time, Gujarat is also one of the most industrialized states in many of the industry sectors such as textile, engineering, chemicals, petrochemicals, drugs and pharmaceuticals, dairy, cement and ceramics, gems and jewellery to name a few, have been flourished. 91% of India’s required soda ash has been produced by Gujarat and 66% of India’s requirement of salt has been produced by the State. Chemical Industries in Gujarat count for more

than 35% of Indian Chemical production. Moreover, Gujarat is considered as the petro capital of the nation as Kalol, Khambhat and Ankleshwar are known for their oil and natural gas production. Private sector has been highly entertained by Gujarat. It is involving integrated development of areas like SIRs, PCPIR and DMIC to reform the industrial sector in the state. State based SEZ contributed more than 66% of overall export by national SEZs. Gujarat has provided new opportunities under global financial services GIFT in Gandhinagar.
3.2 Gujarat Social Infrastructure Development Society Gujarat aims at becoming a model state on all fronts of human development. Together we shall create a state, which would stand out for its achievements in agriculture, infrastructure, industry, and last but not the least, human development. This should make Gujarat a benchmark for development not only for all other states in India but also for other developing countries.
With a view to improve Standard of living for the public at large in the state, to satisfy their basic need, to carry out programmes for the social services, health, education, woman, and child welfare, labour welfare, environment, water supply and cleanliness, social welfare, rural housing and cottage industry etc. so as to enhance the human development index and to fulfil all the above objectives, State Government had decided to establish a “Gujarat Social Infrastructure Development Society – GSIDS” in Gujarat as an Autonomous Body in 2007.
3.2.1 Functions of the Directorate, GSIDS
1. To collect, process and compile data pertaining to various sectors of Human Development 2. To organize training programmes on Human Development for various levels of
functionaries working in the Secretariat, HODs, District offices and Taluka offices 3. To update the State Human Development Report published earlier. 4. To prepare and publish the District Human Development Report (s) 5. To implement the work plan of Gujarat Social Infrastructure Development Society. 6. To implement the UNDP project on Strengthening State Plan for Human Development. 7. DHD is administrative as well as Research Unit. Since Human Development is pervasive in -
different sectors, it plays a vital role in upliftment of underprivileged.

3.2.2 Organizational Framework
Figure 1 illustrates the organisational framework of GSIDS.
3.2.3 Initiatives
The Gujarat Social Infrastructure Development Board Society is a project initiated by the
Government of Gujarat to uplift the standard of living of the people residing in the State and also,
ensure participation from the vulnerable sections of society in doing so. Several flagship events
have been initiated with the objective of sustained human development under the same. The main
initiatives undertaken by the State Government after the establishment of GSIDS in 2007 are listed
as under:
Seeking services of Senior Project Associates and Consultants for GSIDS:
The services of senior project associates and consultants is sought to gather statistical data
and information of the implementation of various schemes implemented in other States for
human development, analyse the information and further design a strategy for the way of
action and implementation in Gujarat.
Appointment of National UN volunteers:
The State government signed an MoU with UNDP and the Planning Commission in 2006, to
strengthen the State Plan for Human Development (SSPHD) under the GOI-UNDP project.
Under this project, UNDP appointed three national volunteers for Gujarat State to assist the
Government of Gujarat in implementation of the project and coordination with UNDP and
the Planning Commission.
"An Introduction on Human Development (with key Indicators)" is a booklet published by
Director, GSIDS for circulation among government officials to better their understanding
and facilitate the implementation of the project.
"Guidelines for Preparation on projects for Socio-Economic Development - 30 Developing
Talukas" was published to equip the government as they took up the challenge of removing
the persistent backwardness of the talukas of Gujarat. This booklet also includes 15 key
indicators of Human Development.
"Guidelines for Preparation on projects for Socio-Economic Development - Sagarkhedu
Sarvangi Vikas Yojana" published by Director, GSIDS includes attempts to develop a
strategy with a clear objective to develop the Coastal regions of the talukas. It is a time
bound plan to implement the Twelve Point Programme.
District Human Development Reports (DHDR):
This report was prepared for five districts of the State namely, Jamnagar, Surendranagar,
Surat, Sabarkantha and the Dangs. This was entrusted to three Universities and two
Research Institues under SSPHD, GOI-UNDP project.
For preparation of District Human Development Reports the State organized a workshop
on preparation of DHDRs on 19th and 20th September, 2008. The objective of the
workshop was to initiate the preparation of District Human Development Report for
the five selected districts and also to discuss various issues related to data availability and
types of data gaps. It also aimed to orient the stake holders (Research Institutes and
Universities) regarding the sampling methodology to be adopted and certain uniformity in
the reports having certain common chapters and adopting participatory approach.
Capacity Building Programmes:
Under SSPHD capacity building programmes, 60 training classes conducted and 1735
offices sensitized about Human Development.
Advocacy:
30 drama shows were organized in 26 districts of the State during December, 2009.
3.2.4 Reports and Evaluation
The following research studies / impact assessment third party evaluation studies / analytical reports have been undertaken:
Evaluation of Mid-Day Meal (MDM) Scheme in Gujarat (Gandhinagar, Valsad, Surat, Navsari, Vadodra district).
Livelihood study of Sakhimandal-SWOT Analysis. (Sabarkantha & Surendranagar district) Socio-Economic Status of Unorganized Labourers in Construction Sector. A follow up study complementing the Pilot Survey on Migration. Impact Assessment of Window Financial Assistance Scheme of Gujarat. Impact Assessment of Joint Forest Management (JFM) in Gujarat and its Cross district
analysis. Impact Assessment of Development projects in Forest Settlements in Gujarat, Integrated Village Development Plan-Kaprada village Taluka & District valsad. Feasibility study for setting up APMC / Market yard-Nana Pondha village, Kaprada Taluka,
Valsad District. Reasons for out of school in the blocks having maximum rate of out of school children and
remedial strategies to minimize it.

Present status of Human Development in 30 Developing Talukas Role of Soy Fortified Wheat Atta in Improving Nutritional Status in Vulnerable Population
(Six districts from all regions). Development of communication strategy on Save Water & Save Electricity campaign,
targeting rural for the state of Gujarat (Phase-1). Socio-Economic Impact Assessment for Forest and non-Forest programmes in Tribal
Districts (Gujarat) (Six Tribal Districts-Banaskantha, Sabarkakantha, Panchmahal, Dahod, Narmada, and Tapi).
Current Socio-Economic Status of the Most Deprived among the Scheduled Caste Communities: A Study with Human Development Perspective.
Evaluation of Mid-Day Meal Scheme in Western and North-East Regions of Gujarat Development in Selected Developing Talukas and Adjoining Developed Talukas in State of
Gujarat. Evaluation: “MCH services in Gujarat: A Rapid Household survey” in 26 districts of Gujarat
(26 districts of Gujarat State). Impact Assessment of Krushi Mahotsav in Gujarat (2005-2010). Retrospective and concurrent evaluation and monitoring of the ‘School Health Programme’
or ‘School Health Week’ in Gujarat (Phase-1) (26 districts of Gujarat State). Evaluation of Mid-Day Meal Scheme in Central and Southern Regions of Gujarat. Preparation of proposal for Planing Commission on Construction of Nand Ghars in Gujarat The Study to revise/Modify the format of "Socio-Economic Review, Gujarat State"(Budget
Publication) Evaluation cum Documentation of initiatives in Public Private Partnership (PPP) Under
Rashtriya Krishi Vikas Yojana (RKVY) in Gujarat. Evaluation of the Efficacy of Fair Price Shops and Anna Purna Yojana of Gujarat.
Various reports have been produced and circulated for sharing the outcomes and learning of these analysis projects. Also, initiatives have repeatedly been taken to spread awareness about these schemes so that the people can avail the facilities and benefit from them.

3.3 Rendition to SCOPE Scheme
3.3.1 About Scheme
Society for Creation of Opportunity through Proficiency in English (SCOPE) has been setup by the
Government of Gujarat to build English language proficiency in the youth of Gujarat and thereby
provide employment opportunities for the youth. SCOPE is a PPP model with an established network
of 630 centres through five Zonal Training Partners (ZTPs) for the purpose of providing English
language training to candidates. Another 325 colleges are also SCOPE centres. To enhance the
employability and to showcase the proficiency of English, SCOPE has roped in Cambridge ESOL, UK as
an assessment partner.
3.3.1.1 Background
English is a globally accepted language and one of the chief channels of communication in trade and
commerce. Basic understanding and fluency is a must for any candidate looking for a prosperous and
global career in today’s world. The state of Gujarat has always been ever growing with a fast growth
rate. However, lack of affluence in English might hold an individual from attaining results to the best of
his potential. As a result, the Government of Gujarat decided to establish SCOPE.
SCOPE is a Public Private Partnership model with an established network of 630 centers through five
Zonal Training Partners (ZTPs) for the purpose of providing English language training to candidates.
Another 325 colleges are also SCOPE centers. To enhance the employability and to showcase the
proficiency of English, SCOPE has roped in Cambridge ESOL, UK as an assessment partner along with,
Gujarat Technical University, Times Foundation and Azure Knowledge Cooperation, Ahmedabad.
Centred on the three basic challenges of education namely, Access, Equity and Quality, the SCOPE
programme aims to enable the youth of Gujarat to easily learn and master the basics of the English
language. While keeping in mind the schedules and ease for student access, the programme is spread
across the State with the help of various stakeholders and charges a nominal fee for students who
register for the same. The assessment and certification is done with the help of Cambridge ESOL, UK.
The system of evaluation is through online examinations which are conducted three times a year.
3.3.1.2 Implementation
3.3.3.2.1 Implementation Level and Process
As mentioned earlier, the chief target group for SCOPE is the youth of Gujarat. The best way to reach
this group is through Universities and training institutes. The process of implementation involves
multiple stakeholder management (both public and private), infrastructural development in terms of
equipment (computers, LAN, software, LCD projectors, etc.) required, workspace for the programme
and teachers to run the programme. Trained professionals need to be hired for each of these centres
who can assist and supervise the students who enrol for the course.
SCOPE offers six levels of functional English assessment. The duration of each level is 90 hours and
then three types of assessment exams, namely, CPT (Cambridge Placement Test), BULATS (Business
Language Testing Service) and BULATS Speaking. These are different combinations of reading,
writing, speaking and listening skills assessment tests.
3.3.1.2.2 Implementation through Stakeholders
Since the basic objective of the scheme is to improve proficiency in English of the youth of Gujarat, the
state has been divided into three zones for the ease of implementation. Each of these zones is
equipped with a digital infrastructure and necessary human resource with the help of the Zonal
Training Partners under Public Private Partnership. These include Universities, private training
institutes and computer agencies. Training centres have been put up in partnership with these
institutions and students can avail the facilities and study materials through these.
The stakeholders involved in the process are the training institutions and Universities as they are a
direct link to the students. It facilitates ease of outreach to the students. The training centres are well-
equipped with computers and human resource infrastructure required to run the programme.
Additionally, Cambridge ESOL, UK is the assessment partner. This increases the credibility and
reliability of the course as the Cambridge certification is recognized worldwide. This makes it an
advantage for the students when they apply for employment opportunities.
The major partners for SCOPE are Cambridge ESOL, UK, Knowledge Consortium of Gujarat,
Commissionerate of Higher Education and the Department of Education, Government of Gujarat.
3.3.1.2.3 Implementation through Flowchart
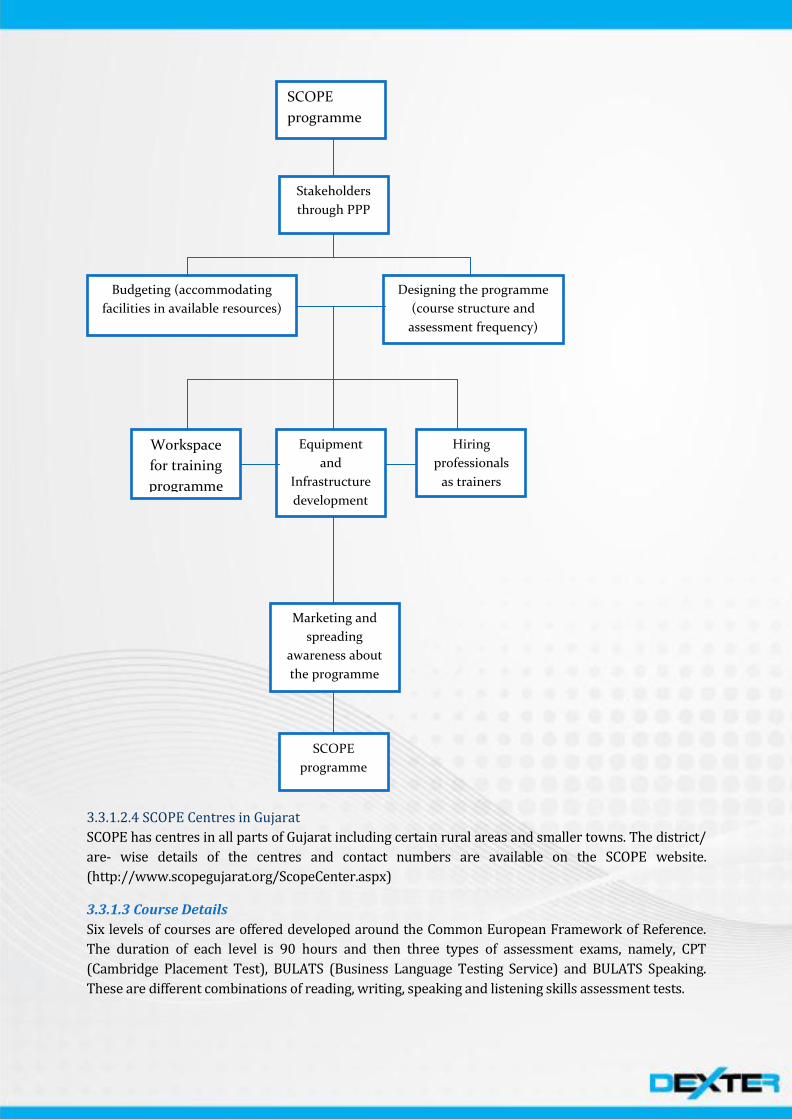
3.3.1.2.4 SCOPE Centres in Gujarat
SCOPE has centres in all parts of Gujarat including certain rural areas and smaller towns. The district/
are- wise details of the centres and contact numbers are available on the SCOPE website.
(http://www.scopegujarat.org/ScopeCenter.aspx)
3.3.1.3 Course Details
Six levels of courses are offered developed around the Common European Framework of Reference.
The duration of each level is 90 hours and then three types of assessment exams, namely, CPT
(Cambridge Placement Test), BULATS (Business Language Testing Service) and BULATS Speaking.
These are different combinations of reading, writing, speaking and listening skills assessment tests.
Designing the programme
(course structure and
assessment frequency)
Budgeting (accommodating
facilities in available resources)
Stakeholders
through PPP
SCOPE
programme
SCOPE
programme
Marketing and
spreading
awareness about
the programme
Equipment
and
Infrastructure
development
Workspace
for training
programme
Hiring
professionals
as trainers
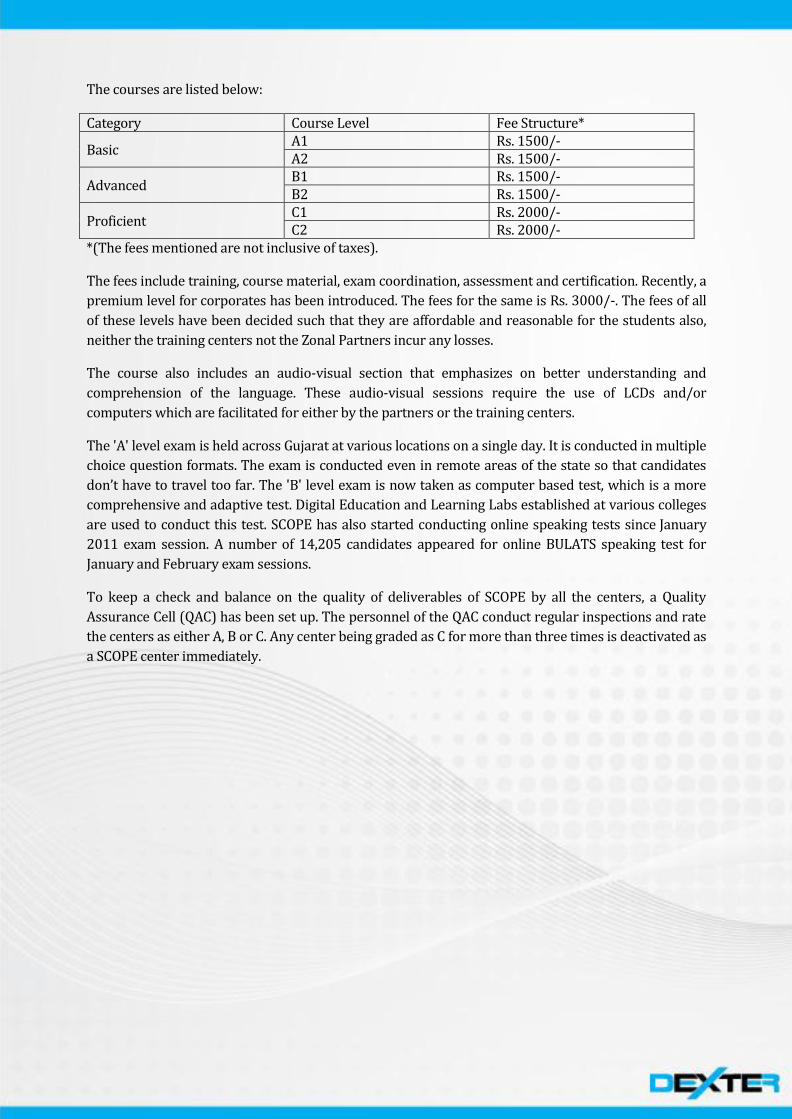
The courses are listed below:
Category Course Level Fee Structure*
Basic A1 Rs. 1500/- A2 Rs. 1500/-
Advanced B1 Rs. 1500/- B2 Rs. 1500/-
Proficient C1 Rs. 2000/- C2 Rs. 2000/-
*(The fees mentioned are not inclusive of taxes).
The fees include training, course material, exam coordination, assessment and certification. Recently, a
premium level for corporates has been introduced. The fees for the same is Rs. 3000/-. The fees of all
of these levels have been decided such that they are affordable and reasonable for the students also,
neither the training centers not the Zonal Partners incur any losses.
The course also includes an audio-visual section that emphasizes on better understanding and
comprehension of the language. These audio-visual sessions require the use of LCDs and/or
computers which are facilitated for either by the partners or the training centers.
The 'A' level exam is held across Gujarat at various locations on a single day. It is conducted in multiple
choice question formats. The exam is conducted even in remote areas of the state so that candidates
don’t have to travel too far. The 'B' level exam is now taken as computer based test, which is a more
comprehensive and adaptive test. Digital Education and Learning Labs established at various colleges
are used to conduct this test. SCOPE has also started conducting online speaking tests since January
2011 exam session. A number of 14,205 candidates appeared for online BULATS speaking test for
January and February exam sessions.
To keep a check and balance on the quality of deliverables of SCOPE by all the centers, a Quality
Assurance Cell (QAC) has been set up. The personnel of the QAC conduct regular inspections and rate
the centers as either A, B or C. Any center being graded as C for more than three times is deactivated as
a SCOPE center immediately.

3.3.1.4 Beneficiaries
There is an online application form available for SCOPE - http://application.scopegujarat.org/- which
is open for all.
SCOPE centers are established in the whole of Gujarat in most of the districts through tie-ups with
Universities and training institutes. These are open for all students and anyone can enroll for the
SCOPE program. Recently, a premium level for corporates is included into the program and it is
targeted to improve the proficiency of working professionals and government officials in Gujarat.
3.3.1.5 Current Scenario- Challenges
When it was launched in 2007, the scheme had the target of training 5 lakh students across the state.
However, most companies did not recognize their Cambridge ESOL certificate and the trainers weren’t
very well -versed with the system either. With persistent efforts from the stakeholders involved in the
PPP for the scheme, the program is improving in terms of outreach and implementation.
4. Objectives and Approach
4.1 Objective and Research Agenda The objective of this assignment is to conduct a primary research based social audit with
following activities:
Identify the relevant sources or stakeholder(s) for each scheme from where information
needs to be generated
Undertake a structured and statically sound primary research based survey for all the
schemes, involving all the relevant stakeholders as applicable for each scheme.
Create awareness about the scheme and information about the benefits of the scheme by
sharing success stories among beneficiaries and community for which scheme is
designed
Prepare a in-depth report covering a detail assessment of current scenario including
current reach, perception toward the scheme among each stake holder, identify
problem in implementation etc. for each scheme
Provide inputs on corrective prospects for each scheme with action plan.
4.1.1 Overall Objectives
Other than the above mentioned, the following are key objectives applicable for all the schemes:
To estimate the level of overall scheme coverage among the eligible beneficiaries
To examine the awareness level of scheme and perceived benefits of the scheme
To assess the perspectives of both the providers as well as beneficiaries on quality and
satisfaction on each of the scheme
To understand the experience of beneficiaries who used the scheme
To examine the nature of involvement of the community in all the schemes and
perception among users as well as non users of each scheme
To examine various components of the functioning of the scheme.
To evaluate the implantation issues faced by team engaged into execution of scheme.
To identify the process improvement scope
To provide a realistic action plan for making the scheme better and increase coverage

4.1.2 Research Agenda Scheme wise
The social audit carried for the exploratory study was designed with several specific parameters.
For each of the four schemes these parameters have been specified below:
Beneficiary Profiles (i.e. Students and Non Students) within your coverage area.
Define the coverage area where your sub-centres offer the course training and assessment
exam.
Detail the implementation process within the coverage area defined above
Problems faced during mobilisation of beneficiaries, imparting training, assessment of
beneficiaries as well as help from SCOPE team in the above defined areas.
Course details & fees offered including seasonality (February/July/October-November).
Problem at the time of giving training.
Problems/Issues faced at beneficiaries’ end and means deployed to solve them.
Issues faced in case of payment by SCOPE or centres or beneficiaries.
SCOPE implementation in other scheme (Beneficiaries selection, Course profile, involved
person).
MoU Details with SCOPE and problems faced.
District Wise Penetration of the scheme according to you (Data required to support the
ZTPs information on the above point).
4.2 Approach The research design for all the schemes with mix of Quantitative and Qualitative mechanisms to
better address the holistic purpose of entire social audit has been given in the following figure.

4.2.1 Sampling
Though the approach for the study have been same wherein first we have been doing
exploratory research, than in-depth qualitative and quantitative study and then again qualitative
study. Only scheme wise respondent category, sample size and sampling selection methodology
is different and is in accordance as per best fit to scheme. Total sample size proposed for study
of all the schemes is mentioned below:
Qualitative interview Scheme In-depth Qualitative
Interviews
FGD Quantitative interview
SCOPE 130 120 2750
One FGD will consists of 7/8 members.
* In case of Sakhi Mandal scheme, there have been approx 1020 FGDs with minimum 3 members
Scheme wise details on respondents to be covered, method of interaction for survey,
respondent selection process and size of respondents to be surveyed are given in next section.
4.2.2 Analysis Outline
The following standard approach has been followed for all the studies (of all four schemes).
4.2.2.1 Brief on Step 1: Exploratory research
This stage is mainly aimed at checking the suitability of the proposed research methodology or
inputs for robust coverage of all stakeholders in the study. In this step at first discussions have
been done with state level senior officers of the project, consultants etc. Perceived issues of the
Exploratory Research
Aimed at checking the suitability of the
proposed research methodology or inputs for robust coverage of
all stakeholders
Secondary Research, Internal Data,
Discussion with state level senior officers,
Academician’s opinion and Community inputs
FGD
Qualitative Interviews
Qualitative Study
Identify indicators and to
understand ground level
issues.
Discussion with district level senior
officers/Consultants
Vendors
FGD Qualitative Interviews
Quantative Study
Measures the indicators
Beneficiaries interview
Interview of eligible citizens not availed
benefits
Quantitative Interviews
Validation Suggest an action
plan for implementation
Cross verification of recommendations
Discussion with State/district level
officers/Consultants
Beneficiaries’interview
FGD
Qualitative Interviews

schemes among management of the project and area to be given importance or priorities have
been discussed in detailed.
Secondary research has been done in detail. Reports, case study or research paper developed for
similar study or same studies have been reviewed thoroughly. Internal data available with the
client has been also analysed. Also some FGDs has been conducted with some stake holders
including beneficiaries who availed the service and the ones who have not availed the service,
team engaged in implementation of scheme, vendors engaged for specific activities, community
leaders etc. Activities done in this stage however have not been a simulation of our later stages of
qualitative studies. The focus has been to judge the ease of operationalzing our current proposed
methodology. Detailed profile of respondents and number of respondents are covered in this step
and mentioned in detailed methodology of each scheme.

4.2.2.2 Brief on Step 2: Qualitative & Quantitative Study
This step consists of Qualitative study and Quantitative study.
Qualitative study has been done to cover various objectives from various stake holders. Key
mechanisms for reaching objectives have been covered through focused group discussions as well
as In-depth interviews
Government staff of all level has been interviewed to understand the ground level issues faced in
implementation of the scheme. Beneficiaries and community leaders have been interviewed and
also FGDs have been conducted among them to understand their awareness level about scheme,
perception toward the scheme and their satisfaction level.
FGDs and in-depth interview have been covered in such manner so that samples from all the
possible heterogeneous behaviour geographies are covered in the study. Utmost efforts have
been putted to cover samples from each of the district of Gujarat.
Based on secondary research done in step 1 and activities done in step 2, “Status Paper” has been
developed for each of the district. Best practices and success stories have been identified and case
studies have been developed.
This step has helped in identifying the key parameters as well as to get cues on the relative
importance of these parameters (Indicators) in the larger context of the objectives of the study.
While this will also give indicative idea on the solutions which will help to suggest an action plan
which is realistic.
Quantitative study has been done to quantify the indicators defined through qualitative study. The
key objective of this study is to conduct social audit of the scheme including impact among stake
holders on identified indicators during the qualitative stage as described earlier, provide inputs in
relative relevance of multiple indicators and also highlighting ways to increase efficiency of the
scheme. In quantitative study, face to face interviews with the selected sample respondents using
structured questionnaires have been done to understand the above described aspects.
In quantitative, sampling plan is very important aspect and it should be robust enough to
conclude generic output for policy makers. Separate sampling plan for all the schemes is proposed
in the methodology part of this report.
4.2.2.3 Brief on Step 3: Re-Qualitative
One of the objectives of this study was to suggest an action plan for implementation which should
be realistic. In this above step, we have proposed the process of doing detailed diagnosis on
current scenario. This step of doing Qualitative survey again has aided in throwing up ideas
on the suitability of these solutions from the implementation view-point from various
stakeholders and accordingly arrive at the final set of recommendations for the Government as
well as other related stakeholders. So, here again, we went back to the same set of important
Government Functionaries as well as other related stakeholders and did In-depth Interviews and
FGDs. The key difference here have been that while in the step 1 and 2, we were seeking to
understand the problem, in step 3, we are seeking to capture the advantages and disadvantages of
various solutions and freeze a workable mechanism.

Part II

5. Methodology and Research Mechanisms
5.1 Sampling Plan Below table indicates the category of respondent and number of respondent has been
covered in each step for conducting social audit for SCOPE scheme:
Step
Type of approach
Method
Respondents No. of respondents
1
Exploratory study
In-depth Qualitative interviews
Senior state level officers/Project Directors, Recruiting companies, Language experts, Franchise partners of SCOPE, Certificate partners, MoU partners, Trainers
15
FGD
Recruitment officers from companies, Youth who have availed service, Eligible youth who have not availed service, Teachers & Principle of colleges.
10 FGDs (7/8 Respondents in each FGD)
Secondary research
Literature review, Reviewing report/working paper/case studies prepared earlier for same scheme, Internal data
2
Qualitative Approach
In-depth Qualitative interviews
All district's Sr.Officers, Language experts, Franchise partners of SCOPE, training centre partner, MoU partners, Recruiting companies, Trainers, Examiners
100
FGD
Teachers of English language, Community leaders, Opinion leaders, Beneficiaries who have taken the advantage of scheme, aspiring youth, current students
100 FGDs (7/8 Respondents in each FGD)
Quantitative Approach
One to one interview based primary survey
Current Students
2750
Pass out recently in last one year
Pass out more than a year back but within last 4 years
Aspiring Students
3
Qualitative Approach
In-depth interviews
Senior state level officers, Community leaders, Recruiting companies, training centre partner
15
FGD
Beneficiaries, Trainers, Language experts
10 FGDs (7/8 Respondents in each FGD)
Below find the detail execution plan for Quantitative study of step 2, given above. In quantitative
study of this scheme we have been covering following stakeholders:

Current Student Pass out students in last one year Students passed out more than a year back but less than 3 years Aspiring students
5.2 Execution Plan for Quantitative Study The following sampling strategy for Current students and pass out students has been used for the same:
From secondary sources came to know as, by the end of March 2013, SCOPE had crossed a mark
of 3, 50,000 enrolments. Herein, we propose to cover sample size of 0.5% of total enrolment.
Respondent selection has been done in following manner.
Sampling strategy for aspiring students is as following:

5.3 Overall Monitoring and evaluation plan
5.3.1 Data Collection
Before commencement of field survey, training was provided to the investigators and
supervisors(In house only)
Firstly, In house training was provided on :
Domain knowledge, survey objectives, conceptual understanding of the study,
survey tools, sampling design, sampling process to be followed, respondent
selection criteria, expected data quality, local language terms and dialect, etc.
Research tools (on each question and its significance in the questionnaire).
Second then on field training through the following process was provided:

5.3.2 Quality Control
Data Quality Check is an important and vital step to ensure quality and productivity of the data so
that we get authentic results. We follow an in-depth process for data quality check which is
summarized by the following chart:
Data Collection
Data Validation
Data Verification
• Pilot Survey by Supervisor throughPrimary Interactions
• Desk Research and Secondary Data Support
• Listing of Target Group
• Training the Investigator
• On field Data Collection
• Supervision of the Investigator
• On Field Validation
• Backend Validation
• Putting Remarks on missing data
• Giving detailed feedback in the data entry sheets through comments
•Confirming the data fields through telephonic conversations
•Confirming the data through visiting •Collecting the missing data •Checking Quality of Data

Anywhere in between these three steps, if the supervisor is not contented, the data is given back
to the investigator to verify the details again. The supervisor ensures his constant interaction with
field team on individual issues with each profile in terms of quality of data and his co-ordination
with the Operations Monitoring incharge in case of any operational issues leading to data quality
reduction.
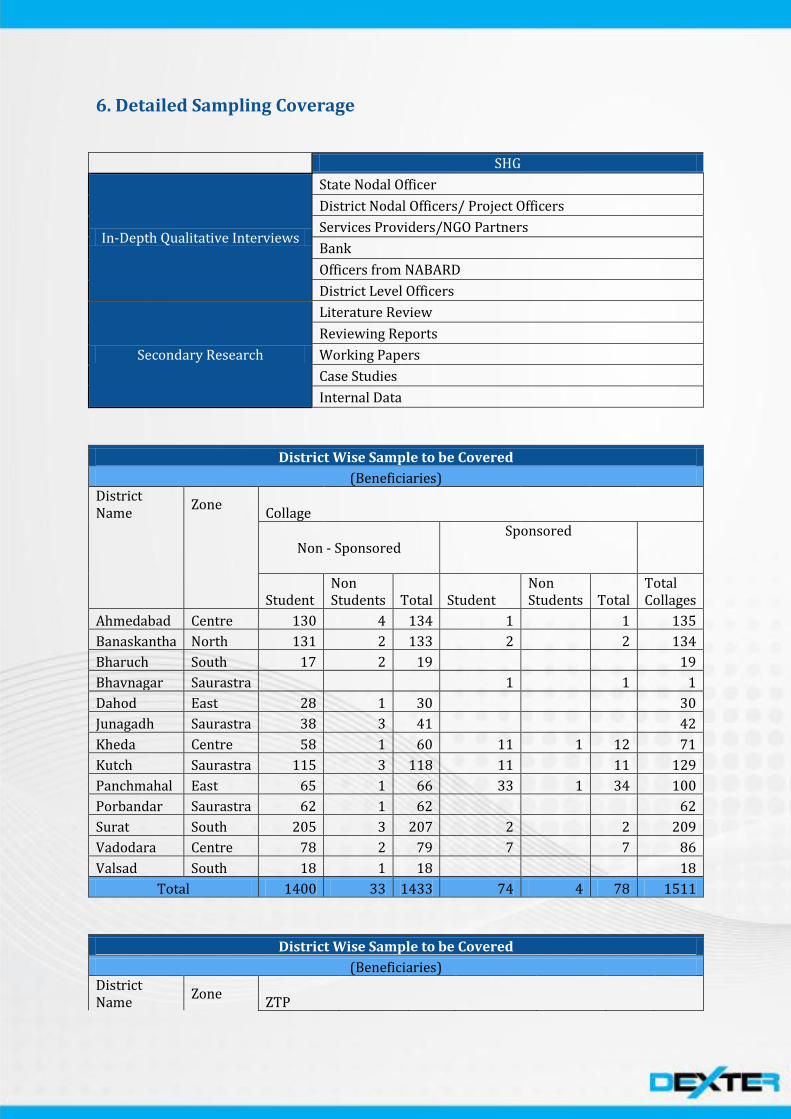
6. Detailed Sampling Coverage
SHG
In-Depth Qualitative Interviews
State Nodal Officer
District Nodal Officers/ Project Officers
Services Providers/NGO Partners
Bank
Officers from NABARD
District Level Officers
Secondary Research
Literature Review
Reviewing Reports
Working Papers
Case Studies
Internal Data
District Wise Sample to be Covered
(Beneficiaries) District Name
Zone Collage
Non - Sponsored
Sponsored
Student
Non Students Total Student
Non Students Total
Total Collages
Ahmedabad Centre 130 4 134 1 1 135
Banaskantha North 131 2 133 2 2 134
Bharuch South 17 2 19 19
Bhavnagar Saurastra 1 1 1
Dahod East 28 1 30 30
Junagadh Saurastra 38 3 41 42
Kheda Centre 58 1 60 11 1 12 71
Kutch Saurastra 115 3 118 11 11 129
Panchmahal East 65 1 66 33 1 34 100
Porbandar Saurastra 62 1 62 62
Surat South 205 3 207 2 2 209
Vadodara Centre 78 2 79 7 7 86
Valsad South 18 1 18 18
Total 1400 33 1433 74 4 78 1511
District Wise Sample to be Covered
(Beneficiaries) District Name
Zone ZTP

Non Sponsored Sponsored
Student
Non Students Total Student
Non Students Total
Total ZTP
Ahmedabad Centre 9 1 10 10
Banaskantha North 5 2 7 68 4 72 79
Bharuch South 5 5 9 9 15
Bhavnagar Saurastra 11 1 12 26 2 28 40
Dahod East 4 4 13 1 15 18
Junagadh Saurastra 11 1 13 49 2 51 64
Kheda Centre 6 6 17 18 24
Kutch Saurastra 5 5 9 9 14
Panchmahal East 18 18 10 10 28
Porbandar Saurastra 2 2 13 13 16
Surat South 28 3 31 128 3 131 161
Vadodara Centre 13 3 16 89 21 111 126
Valsad South 3 3 13 13 16
Total 133 17 150 544 45 589 739
District Wise Sample to be Covered
(Non-Beneficiaries)
District Name Zone No of Sample
Ahmedabad Centre 32
Banaskantha North 47
Bharuch South 7
Bhavnagar Saurastra 9
Dahod East 11
Junagadh Saurastra 23
Kheda Centre 21
Kutch Saurastra 32
Panchmahal East 28
Porbandar Saurastra 17
Surat South 82
Vadodara Centre 47
Valsad South 8
Total 500
District Wise Sample to be Covered
(Non-Beneficiaries +Beneficiaries)
District Name Zone Grand Total
Ahmedabad Centre 177
Banaskantha North 260

Bharuch South 41
Bhavnagar Saurastra 50
Dahod East 59
Junagadh Saurastra 129
Kheda Centre 116
Kutch Saurastra 175
Panchmahal East 156
Porbandar Saurastra 95
Surat South 453
Vadodara Centre 260
Valsad South 42
Total 2750
Part III

Summary of the findings from Exploratory Study The data for this scheme was collected from Vadodra, Kutch, Surat, Amreli, Ahmedabad, Dang,
Junagadh and Rajkot districts of Gujarat.
Beneficiary Profiles (i.e. Students and Non Students) within your coverage area.
Majority of the beneficiaries are school and college students. In some cases, corporates
have courses for their employees as well but the majority of beneficiaries are currently
students which were intended initially as per the scheme design which incorporated
non student profile as well.
Define the coverage area where your sub-centres offer the course training and
assessment exam.
Detail the implementation process within the coverage area defined above
In most cases, the centres are established through Public Private Partnership models
wherein, small training centres are funded by the stakeholders of the PPP model and are
provided with the required facilities in terms of infrastructure and funding to hire
human resources. Since the final assessment test is Cambridge certified and is online,
the centres simply require the affiliation and then they can conduct the examination
with ease.
Problems faced during mobilisation of beneficiaries, imparting training, assessment of
beneficiaries as well as help from SCOPE team in the above defined areas.
Course details & fees offered including seasonality (February/July/October-November).
Category Course Level Fee Structure* Basic A1 Rs. 1500/- A2 Rs. 1500/- Advanced B1 Rs. 1500/- B2 Rs. 1500/- Proficient C1 Rs. 2000/- C2 Rs. 2000/-
Problem at the time of giving training.
Problems/Issues faced at beneficiaries’ end and means deployed to solve them.
Issues faced in case of payment by SCOPE or centres or beneficiaries.
SCOPE implementation in other scheme (Beneficiaries selection, Course profile, involved
person).
SCOPE should incorporate an employment scheme through which students can learn
English and then be able to find suitable jobs so as to earn a living.
MoU Details with SCOPE and problems faced.
District Wise Penetration of the scheme according to you (Data required to support the
ZTPs information on the above point).
Demographic Details of the Beneficiaries
Zone wise Classification of the sample
Age of the Respondents
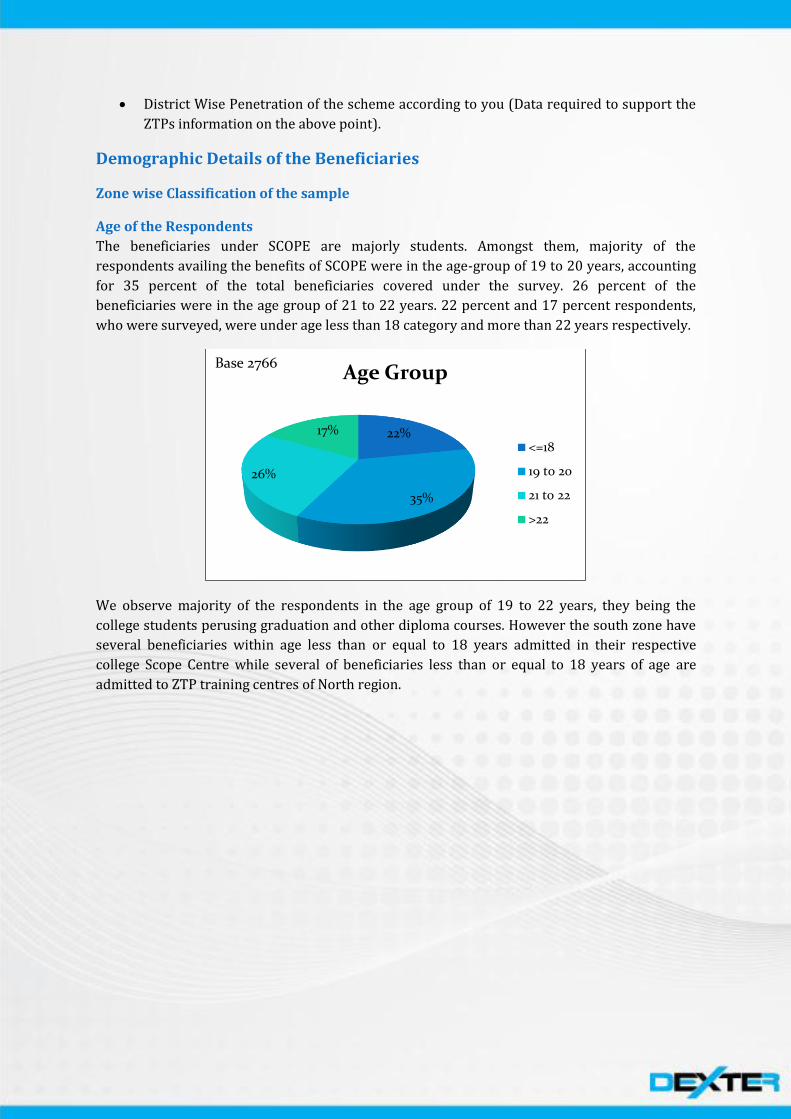
The beneficiaries under SCOPE are majorly students. Amongst them, majority of the
respondents availing the benefits of SCOPE were in the age-group of 19 to 20 years, accounting
for 35 percent of the total beneficiaries covered under the survey. 26 percent of the
beneficiaries were in the age group of 21 to 22 years. 22 percent and 17 percent respondents,
who were surveyed, were under age less than 18 category and more than 22 years respectively.
We observe majority of the respondents in the age group of 19 to 22 years, they being the
college students perusing graduation and other diploma courses. However the south zone have
several beneficiaries within age less than or equal to 18 years admitted in their respective
college Scope Centre while several of beneficiaries less than or equal to 18 years of age are
admitted to ZTP training centres of North region.
22%
35%
26%
17%
Age Group
<=18
19 to 20
21 to 22
>22
Base 2766
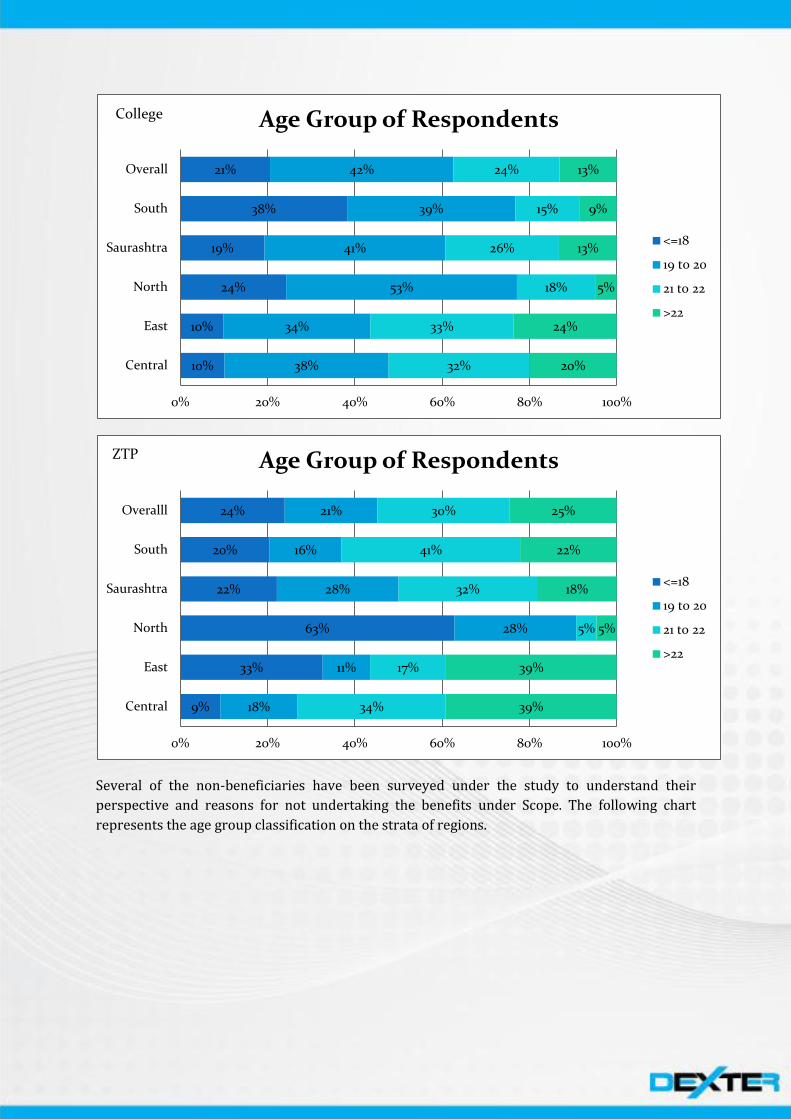
Several of the non-beneficiaries have been surveyed under the study to understand their
perspective and reasons for not undertaking the benefits under Scope. The following chart
represents the age group classification on the strata of regions.
10%
10%
24%
19%
38%
21%
38%
34%
53%
41%
39%
42%
32%
33%
18%
26%
15%
24%
20%
24%
5%
13%
9%
13%
0% 20% 40% 60% 80% 100%
Central
East
North
Saurashtra
South
Overall
Age Group of Respondents
<=18
19 to 20
21 to 22
>22
College
9%
33%
63%
22%
20%
24%
18%
11%
28%
28%
16%
21%
34%
17%
5%
32%
41%
30%
39%
39%
5%
18%
22%
25%
0% 20% 40% 60% 80% 100%
Central
East
North
Saurashtra
South
Overalll
Age Group of Respondents
<=18
19 to 20
21 to 22
>22
ZTP

10%
48%
31%
15%
32%
22%
32%
24%
45%
32%
42%
36%
29%
26%
18%
29%
18%
24%
30%
2%
6%
24%
8%
17%
0% 20% 40% 60% 80% 100%
Central
East
North
Saurashtra
South
Overalll
Age Group of Respondents
<=18
19 to 20
21 to 22
>22
NB
Educational Level of the respondents
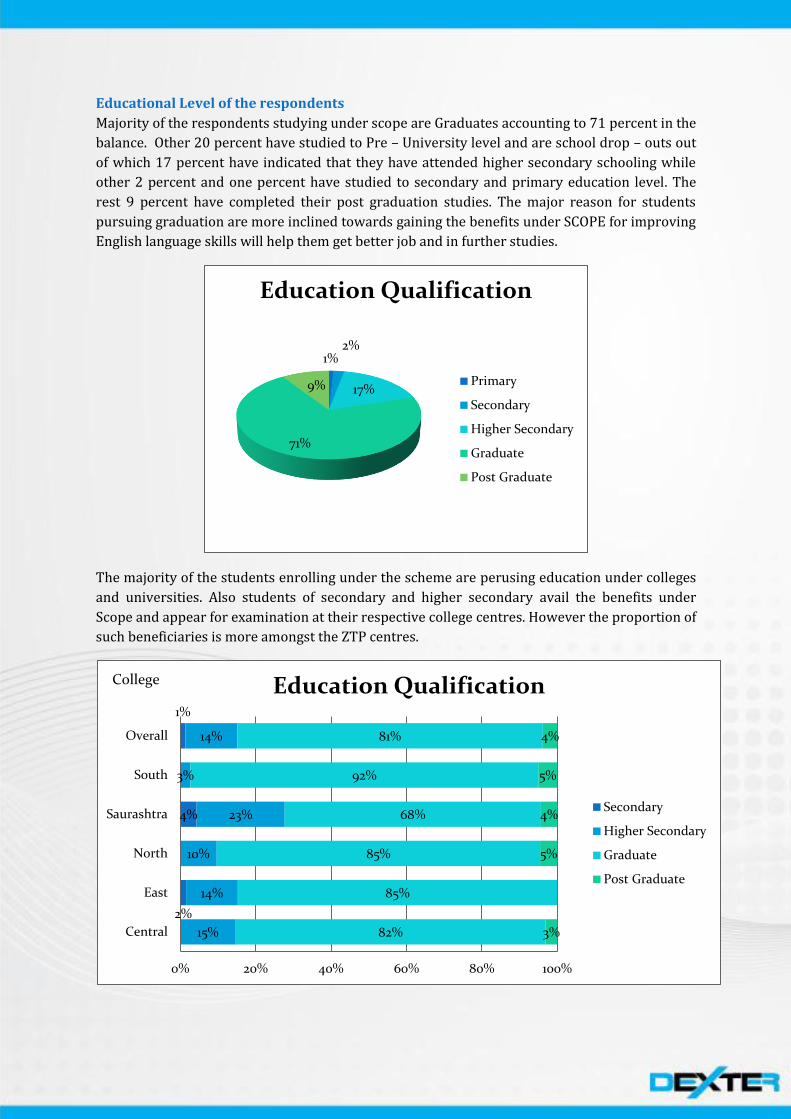
Majority of the respondents studying under scope are Graduates accounting to 71 percent in the
balance. Other 20 percent have studied to Pre – University level and are school drop – outs out
of which 17 percent have indicated that they have attended higher secondary schooling while
other 2 percent and one percent have studied to secondary and primary education level. The
rest 9 percent have completed their post graduation studies. The major reason for students
pursuing graduation are more inclined towards gaining the benefits under SCOPE for improving
English language skills will help them get better job and in further studies.
The majority of the students enrolling under the scheme are perusing education under colleges
and universities. Also students of secondary and higher secondary avail the benefits under
Scope and appear for examination at their respective college centres. However the proportion of
such beneficiaries is more amongst the ZTP centres.
1% 2%
17%
71%
9%
Education Qualification
Primary
Secondary
Higher Secondary
Graduate
Post Graduate
2%
4%
1%
15%
14%
10%
23%
3%
14%
82%
85%
85%
68%
92%
81%
3%
5%
4%
5%
4%
0% 20% 40% 60% 80% 100%
Central
East
North
Saurashtra
South
Overall
Education Qualification
Secondary
Higher Secondary
Graduate
Post Graduate
College

The sample survey amongst Non-beneficiaries overall has majority of respondents perusing
graduation, they being the major target audience.
9%
1%
3%
13%
7%
2%
1%
1%
5%
23%
20%
57%
15%
9%
21%
56%
74%
41%
49%
31%
47%
33%
59%
24%
0% 20% 40% 60% 80% 100%
Central
East
North
Saurashtra
South
Overall
Education Qualification
Primary
Secondary
Higher Secondary
Graduate
Post Graduate
ZTP
1%
2%
1%
1%
2%
1%
21%
43%
12%
34%
8%
22%
75%
57%
84%
55%
79%
71%
2%
2%
8%
13%
5%
0% 20% 40% 60% 80% 100%
Central
East
North
Saurashtra
South
Overall
Education Qualification
Primary
Secondary
Higher Secondary
Graduate
Post Graduate
NB
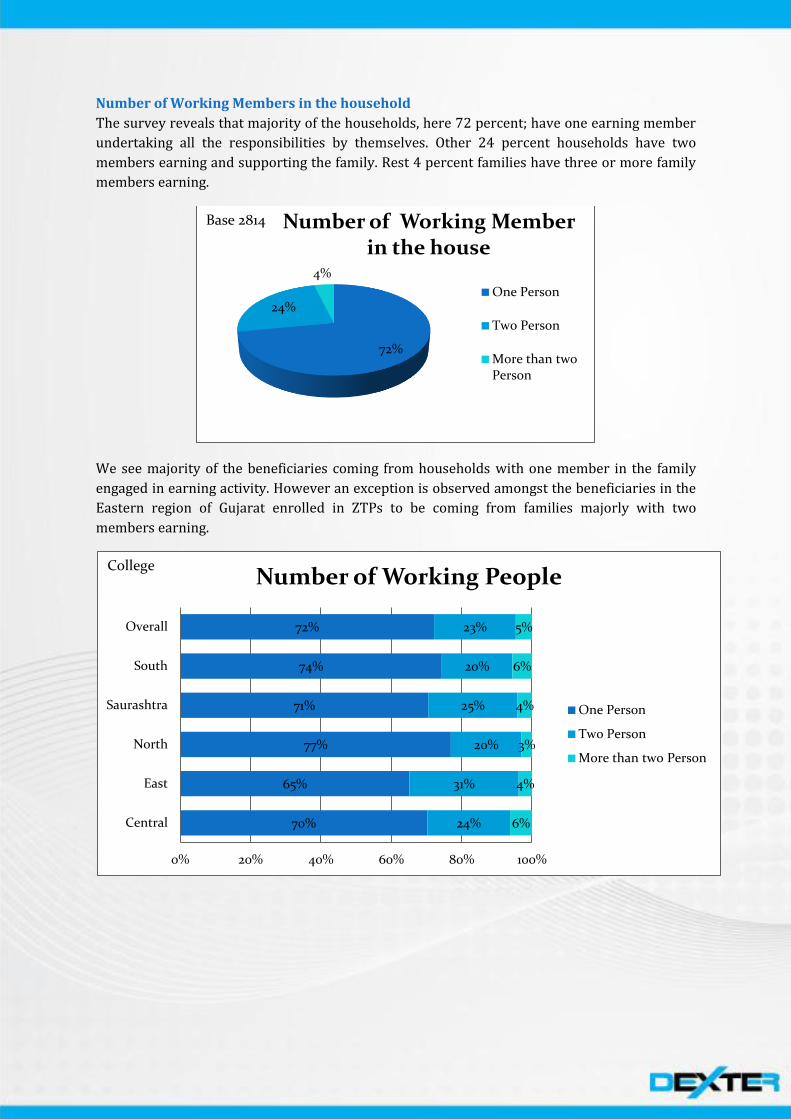
Number of Working Members in the household
The survey reveals that majority of the households, here 72 percent; have one earning member
undertaking all the responsibilities by themselves. Other 24 percent households have two
members earning and supporting the family. Rest 4 percent families have three or more family
members earning.
We see majority of the beneficiaries coming from households with one member in the family
engaged in earning activity. However an exception is observed amongst the beneficiaries in the
Eastern region of Gujarat enrolled in ZTPs to be coming from families majorly with two
members earning.
72%
24%
4%
Number of Working Member in the house
One Person
Two Person
More than two Person
Base 2814
70%
65%
77%
71%
74%
72%
24%
31%
20%
25%
20%
23%
6%
4%
3%
4%
6%
5%
0% 20% 40% 60% 80% 100%
Central
East
North
Saurashtra
South
Overall
Number of Working People
One Person
Two Person
More than two Person
College
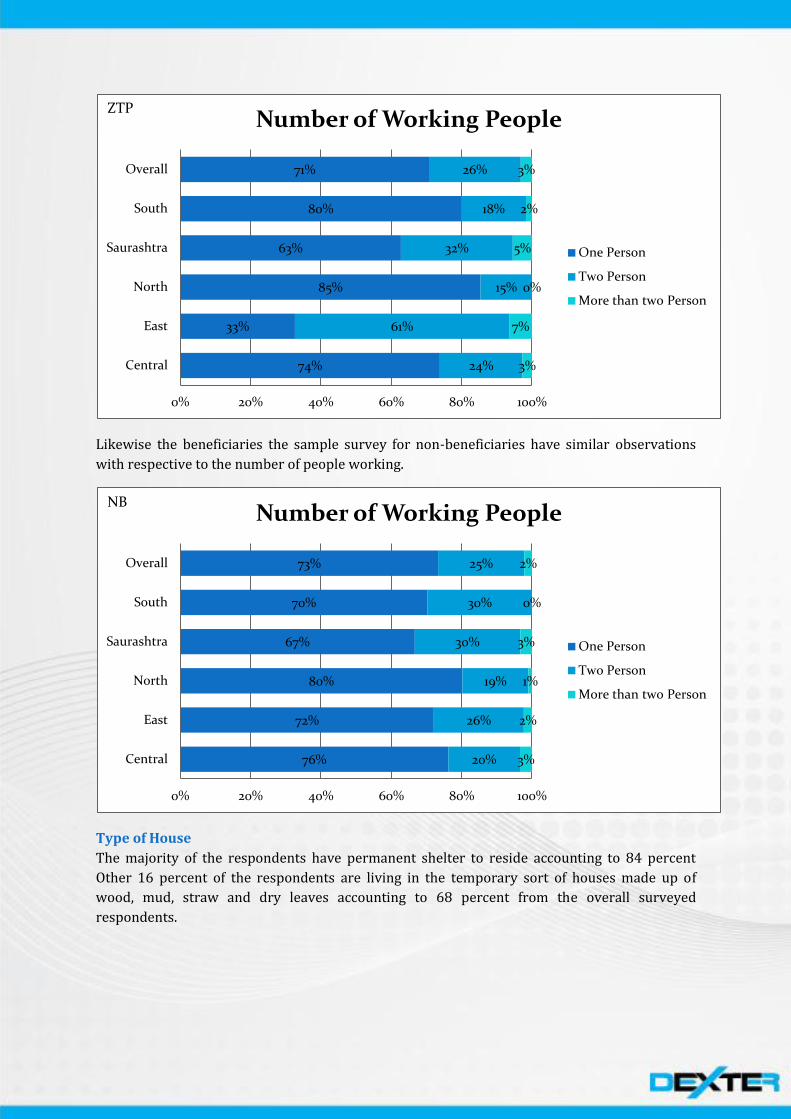
Likewise the beneficiaries the sample survey for non-beneficiaries have similar observations
with respective to the number of people working.
Type of House
The majority of the respondents have permanent shelter to reside accounting to 84 percent
Other 16 percent of the respondents are living in the temporary sort of houses made up of
wood, mud, straw and dry leaves accounting to 68 percent from the overall surveyed
respondents.
74%
33%
85%
63%
80%
71%
24%
61%
15%
32%
18%
26%
3%
7%
0%
5%
2%
3%
0% 20% 40% 60% 80% 100%
Central
East
North
Saurashtra
South
Overall
Number of Working People
One Person
Two Person
More than two Person
ZTP
76%
72%
80%
67%
70%
73%
20%
26%
19%
30%
30%
25%
3%
2%
1%
3%
0%
2%
0% 20% 40% 60% 80% 100%
Central
East
North
Saurashtra
South
Overall
Number of Working People
One Person
Two Person
More than two Person
NB

We observe a very similar trend amongst the beneficiaries of different strata, enrolled in both
college and ZTPs wherein the majority of beneficiaries have permanent type of houses.
84%
16%
Type of house structure
Pakka
Kaccha
Base 2542
87%
86%
87%
79%
86%
85%
13%
14%
13%
21%
14%
15%
0% 20% 40% 60% 80% 100%
Central
East
North
Saurashtra
South
Overall
Type of House
Pakka
Kaccha
College
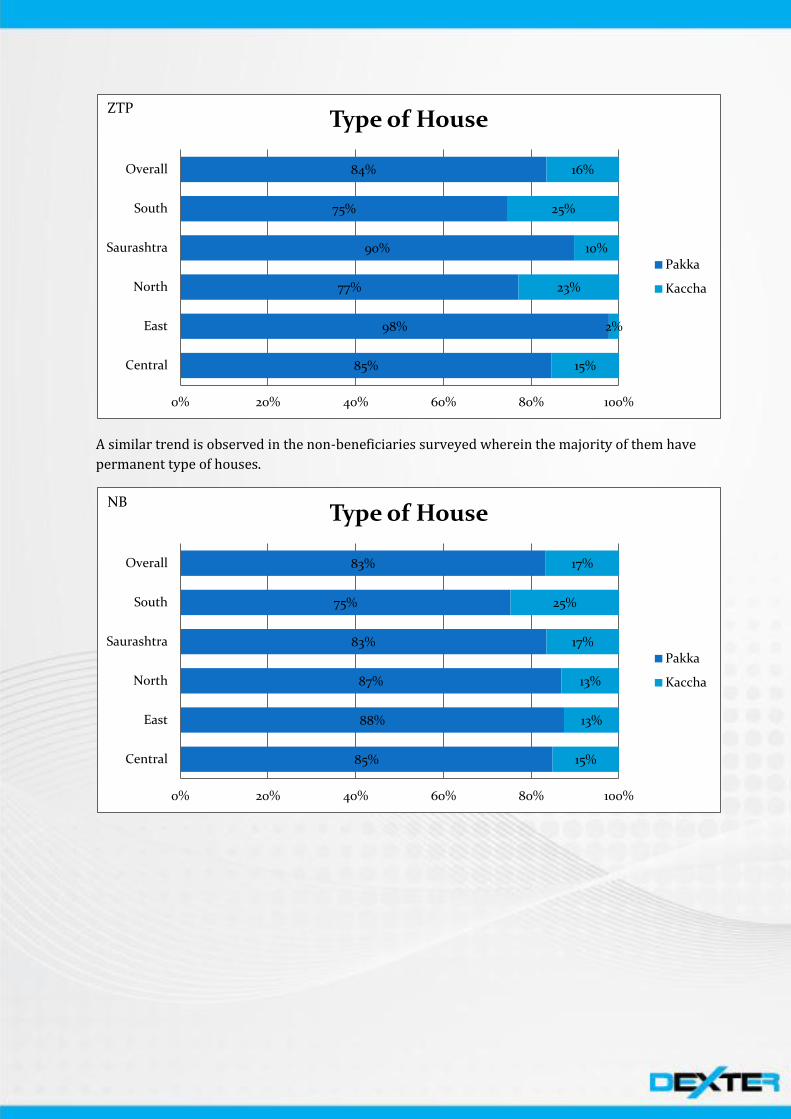
A similar trend is observed in the non-beneficiaries surveyed wherein the majority of them have
permanent type of houses.
85%
98%
77%
90%
75%
84%
15%
2%
23%
10%
25%
16%
0% 20% 40% 60% 80% 100%
Central
East
North
Saurashtra
South
Overall
Type of House
Pakka
Kaccha
ZTP
85%
88%
87%
83%
75%
83%
15%
13%
13%
17%
25%
17%
0% 20% 40% 60% 80% 100%
Central
East
North
Saurashtra
South
Overall
Type of House
Pakka
Kaccha
NB

Chief Wage Earner’s Occupation
Majority of the Chief Wage Earner in the respondents’ families are engaged in Business or own
venture (47 percent) such as Farming, Small hotel, Cloth shop, Shop owner, Tailor, Plastic, Gruh
Udhyog, Animal Husbandry. Other 38 percent of the surveyed respondents’ families have the
Chief Wage Earner engrossed in skilled jobs like government clerical jobs, working in Private
company and factory, Driver, Wireman, watchman, Painter, Masonry work etc.. Rest 15 percent
of such families have their Chief Wage Earner are occupied in Jobs which are not skill specific
like Daily Wage Earners majorly Agriculture labourers and Construction Workers.
We observe majority of the beneficiaries coming from families engaged in entrepreneurial
ventures. Other several beneficiaries have the family chief wage earner involved in skilled jobs.
However the majority of the beneficiaries enrolled in ZTPs are from families wherein the chief
wage earner is occupied in skilled jobs. Beneficiaries from Saurashtra enrolled in ZTPs are more
engaged in unskilled jobs.
47%
38%
15%
Chief Wage Earner's Occupation
Business
Job-Skilled
Job-Unskilled
Base 2687
54%
54%
51%
48%
40%
49%
6%
15%
13%
21%
8%
13%
40%
31%
36%
31%
52%
38%
0% 20% 40% 60% 80% 100%
Central
East
North
Saurashtra
South
Overall
Chief Wage Earner's Occupation
Business
Job-Unskilled
Job-Skilled
College

The lines of trend of observations are quite similar to the beneficiaries however we see more
number of chief wage earners of the beneficiaries’ families coming from families in business like
the ones enrolled in college centres.
49%
33%
32%
30%
37%
37%
4%
24%
30%
39%
13%
21%
46%
43%
38%
31%
50%
42%
0% 20% 40% 60% 80% 100%
Central
East
North
Saurashtra
South
Overall
Chief Wage Earner's Occupation
Business
Job-Unskilled
Job-Skilled
ZTP
58%
65%
50%
50%
42%
52%
12%
9%
14%
18%
14%
14%
30%
26%
36%
32%
44%
34%
0% 20% 40% 60% 80% 100%
Central
East
North
Saurashtra
South
Overall
Chief Wage Earner's Occupation
Business
Job-Unskilled
Job-Skilled
NB

Chief Wage Earner’s Education Qualification
Education level of the Chief Wage Earner amongst the surveyed respondents’ families indicates
77 percent of them are either school dropouts or have completed their schooling. The balance
consisted of 17 percent graduates, 4 percent post graduates and 2 percent illiterates. Majority
being school dropouts are involved in small entrepreneurial ventures and unskilled job and that
is what leads to low household income.
We observe a very similar trend amongst the education level of the chief wage earners amongst
the beneficiaries’ households across different strata regions, enrolled in both college and ZTPs.
5%
15%
33% 24%
17%
4% 2%
Chief Wage Earners's Education Qualification
Lower Primary
Primary
Secondary
Higher Secondary
Graduate
Post Graduate
Illiterate
16%
3%
3%
2%
4%
6%
18%
16%
13%
14%
11%
14%
17%
32%
35%
45%
31%
32%
15%
27%
25%
25%
24%
23%
22%
19%
17%
12%
23%
18%
7%
3%
5%
3%
5%
5%
4%
3%
2%
2%
0% 20% 40% 60% 80% 100%
Central
East
North
Saurashtra
South
Overall
Chief Wage Earners's Education Qualification
Lower Primary
Primary
Secondary
Higher Secondary
Graduate
Post Graduate
Illiterate
College

The lines of trend of observations are quite similar to the beneficiaries however we see more
number of chief wage earners amongst the beneficiaries’ families being drop-outs from
secondary schooling.
7%
5%
3%
4%
4%
12%
37%
24%
13%
25%
19%
25%
23%
31%
33%
33%
30%
27%
37%
27%
24%
22%
25%
25%
2%
9%
18%
14%
16%
3%
1% 5%
3%
3%
1%
4%
4%
1%
2%
0% 20% 40% 60% 80% 100%
Central
East
North
Saurashtra
South
Overall
Chief Wage Earners's Education Qualification
Lower Primary
Primary
Secondary
Higher Secondary
Graduate
Post Graduate
Illiterate
ZTP
4%
6%
2%
4%
4%
16%
16%
14%
6%
11%
12%
27%
54%
31%
43%
42%
38%
26%
14%
19%
39%
14%
24%
22%
8%
19%
9%
22%
17%
8%
5%
1%
5%
3%
4%
5%
3%
3%
0% 20% 40% 60% 80% 100%
Central
East
North
Saurashtra
South
Overall
Chief Wage Earners's Education Qualification
Lower Primary
Primary
Secondary
Higher Secondary
Graduate
Post Graduate
Illiterate
NB

Annual Household Income
35 percent of those interviewed had an annual self-reported income less than Rs. 25,000. Those
in the bracket of Rs. 25,000 to 50,000 were 21 percent. 25 percent of the respondent families
have annual income more than Rs. 1,00,000, 13 percent households have annual household
income in the bracket of Rs. 75,000 to Rs. 1,00,000 while the rest 6 percent have an annual
income between Rs. 50,000 and Rs. 75,000.
We observe similar trends in North and Central regions of Gujarat for the beneficiaries’ annual
household income for both, ones who have been admitted in ZTPs as well as ones in college.
However we see well-off families of East region prefer college centres above ZTPs while affluent
beneficiaries from Saurashtra and South prefer ZTPs.
35%
21%
6%
13%
25%
Annual Household Income
<25000
25000 to 50000
50000 to 75000
75000 to 100000
>100000
Base 1460
20%
20%
49%
48%
31%
37%
34%
16%
16%
20%
10%
3%
3%
6%
13%
7%
6%
17%
17%
11%
50%
12%
30%
60%
15%
19%
6%
24%
0% 20% 40% 60% 80% 100%
Central
East
North
Saurashtra
South
Overall
Annual Household Income
<25000
25000 to 50000
50000 to 75000
75000 to 100000
>100000
ZTP

The following chart shows the segregation of the non - beneficiaries surveyed on the basis of
their annual household income as under the study.
25%
58%
42%
20%
11%
34%
16%
15%
22%
20%
13%
19%
6%
2%
7%
6%
2%
6%
10%
10%
11%
12%
41%
13%
42%
14%
18%
41%
33%
28%
0% 20% 40% 60% 80% 100%
Central
East
North
Saurashtra
South
Overall
Annual Household Income
<25000
25000 to 50000
50000 to 75000
75000 to 100000
>100000
College
32%
39%
43%
21%
50%
35%
28%
39%
19%
33%
27%
2%
7%
7%
4%
20%
10%
11%
14%
50%
15%
20%
10%
20%
26%
19%
0% 20% 40% 60% 80% 100%
Central
East
North
Saurashtra
South
Overall
Annual Household Income
<25000
25000 to 50000
50000 to 75000
75000 to 100000
>100000
NB
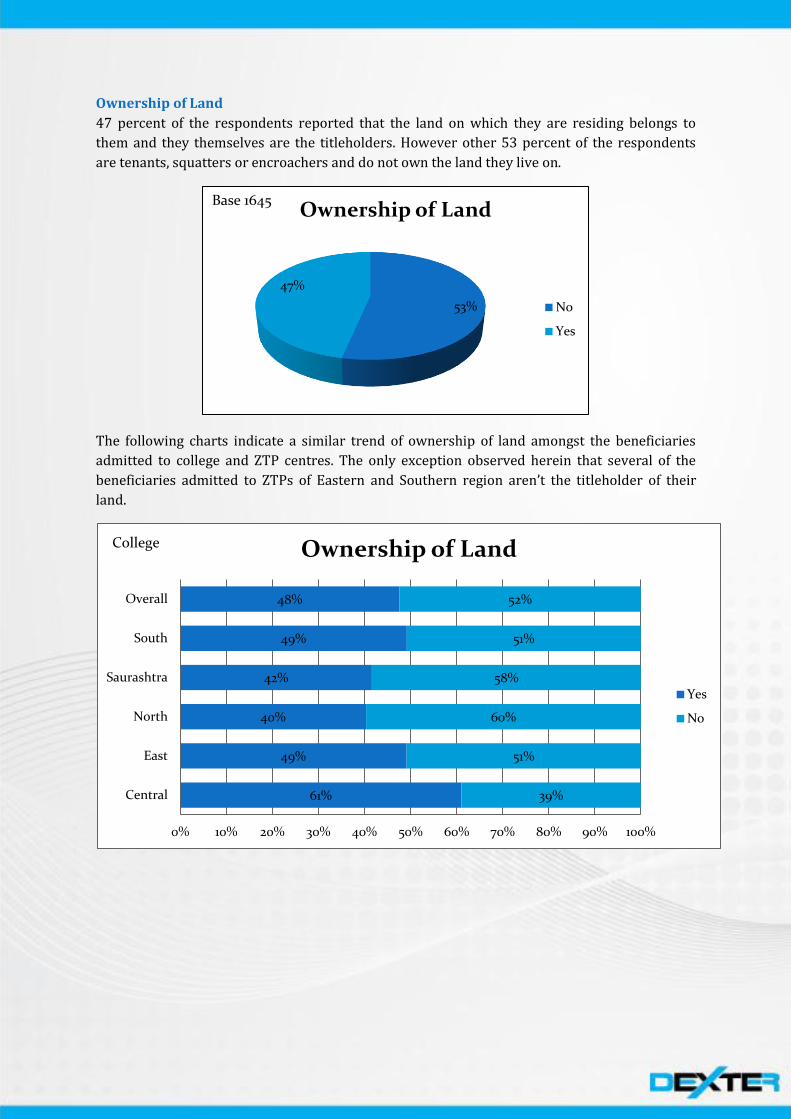
Ownership of Land
47 percent of the respondents reported that the land on which they are residing belongs to
them and they themselves are the titleholders. However other 53 percent of the respondents
are tenants, squatters or encroachers and do not own the land they live on.
The following charts indicate a similar trend of ownership of land amongst the beneficiaries
admitted to college and ZTP centres. The only exception observed herein that several of the
beneficiaries admitted to ZTPs of Eastern and Southern region aren’t the titleholder of their
land.
53%
47%
Ownership of Land
No
Yes
Base 1645
61%
49%
40%
42%
49%
48%
39%
51%
60%
58%
51%
52%
0% 10% 20% 30% 40% 50% 60% 70% 80% 90% 100%
Central
East
North
Saurashtra
South
Overall
Ownership of Land
Yes
No
College

The following chart shows the segregation of the non - beneficiaries on the basis of their
ownership of land as surveyed under the study wherein we see several of them from the South
region do not possess the tile of their land.
63%
10%
46%
43%
22%
47%
37%
90%
54%
57%
78%
53%
0% 10% 20% 30% 40% 50% 60% 70% 80% 90% 100%
Central
East
North
Saurashtra
South
Overall
Ownership of Land
Yes
No
ZTP
52%
47%
50%
32%
13%
43%
48%
53%
50%
68%
88%
57%
0% 10% 20% 30% 40% 50% 60% 70% 80% 90% 100%
Central
East
North
Saurashtra
South
Overall
Ownership of Land
Yes
No
NB

Scheme and the Beneficiaries
Awareness regarding Scope
90 percent of the surveyed respondents were cognizant to SCOPE and were aware about the
same. Only 10 percent others were unaware of the same. Partnering with colleges and
universities has helped to disseminate awareness to a large target audience. ZTPs have also
played a crucial role as a medium in spreading awareness.
The following chart shows the segregation of the non - beneficiaries surveyed on the basis of
their awareness regarding Scope as under the study.
90%
10%
Awareness about SCOPE
Yes
No
89%
100%
86%
98%
80%
90%
11%
14%
3%
20%
10%
0% 10% 20% 30% 40% 50% 60% 70% 80% 90% 100%
Central
East
North
Saurashtra
South
Overall
Awareness about SCOPE
Yes
No
NB

Willingness to undertake Benefits under SCOPE
Out of the above 10 percent of the respondents who know of SCOPE and its benefits, only 30
percent have shown their willingness to get admitted under the scheme and improve their
language skills. The other 70 percent showed no interest for the same.
It is observed that majority of the non – beneficiaries from all of the regions except for North
(where 100 percent of the non – beneficiary respondents have shown their willingness to avail
the gains under the scheme) have denied to avail the benefits under Scope.
30%
70%
Willingness to undertake Benefits
Yes
No
2%
27%
100%
24%
30%
98%
73%
76%
100%
70%
0% 10% 20% 30% 40% 50% 60% 70% 80% 90% 100%
Central
East
North
Saurashtra
South
Overall
Willingness to undertake Benefits
Yes
No
NB

Medium of Awareness
The respondents got to know about SCOPE from various sources, majorly from classmates,
teachers and other staff of their colleges and educational institutions. Relatives and Friends also
played the role of being a prominent medium in spreading awareness about the scheme
amongst the aspiring beneficiaries. Advertisements, Banners and Hoardings also disseminated
information regarding the scheme. ZTPs have also supported as an important mediator in
spreading awareness.
College staff and faculty have played the most prominent role in disseminating awareness
amongst beneficiaries admitted to both and notably even to those who have been admitted to
ZTPs.
71%
15%
6% 8%
Medium of Awareness
College
Relatives
Advertisement
Friends
79%
77%
61%
69%
80%
71%
9%
14%
18%
15%
12%
14%
2%
7%
8%
8%
2%
6%
10%
2%
13%
8%
6%
9%
0% 20% 40% 60% 80% 100%
Central
East
North
Saurashtra
South
Overall
Medium of Awareness
College
Relatives
Advertisement
Friends
College

Similar to the beneficiaries, College staff and administrators have been the most significant in
spreading awareness for the non-beneficiaries.
87%
67%
42%
63%
85%
70%
11%
21%
32%
16%
6%
16%
1%
5%
22%
4%
7%
7%
1%
7%
4%
17%
1%
7%
0% 20% 40% 60% 80% 100%
Central
East
North
Saurashtra
South
Overall
Medium of Awareness
College
Relatives
Advertisement
Friends
ZTP
87%
75%
65%
65%
95%
78%
25%
25%
20%
2%
11%
3%
4%
6%
4%
4%
10%
6%
9%
6%
0% 20% 40% 60% 80% 100%
Central
East
North
Saurashtra
South
Overall
Medium of Awareness
College
Relatives
Advertisement
Friends
NB

University/College partnered to SCOPE
86 percent of the total respondents indicated that their University or College has been affiliated
as partner with SCOPE. Only 14 percent other respondents’ college or universities aren’t
partnered to SCOPE.
We observe majority of beneficiaries admitted to the college centre have their respective
colleges partnered to SCOPE. However several beneficiaries from the ZTPs indicated that their
respective knowledge institutions haven’t been amalgamated to SCOPE which is very obvious.
86%
14%
University/College partnered to SCOPE
Yes
No
Base 2365
87%
100%
82%
96%
91%
90%
13%
0%
18%
4%
9%
10%
0% 10% 20% 30% 40% 50% 60% 70% 80% 90% 100%
Central
East
North
Saurashtra
South
Overall
University/College partnered to SCOPE
Yes
No
College
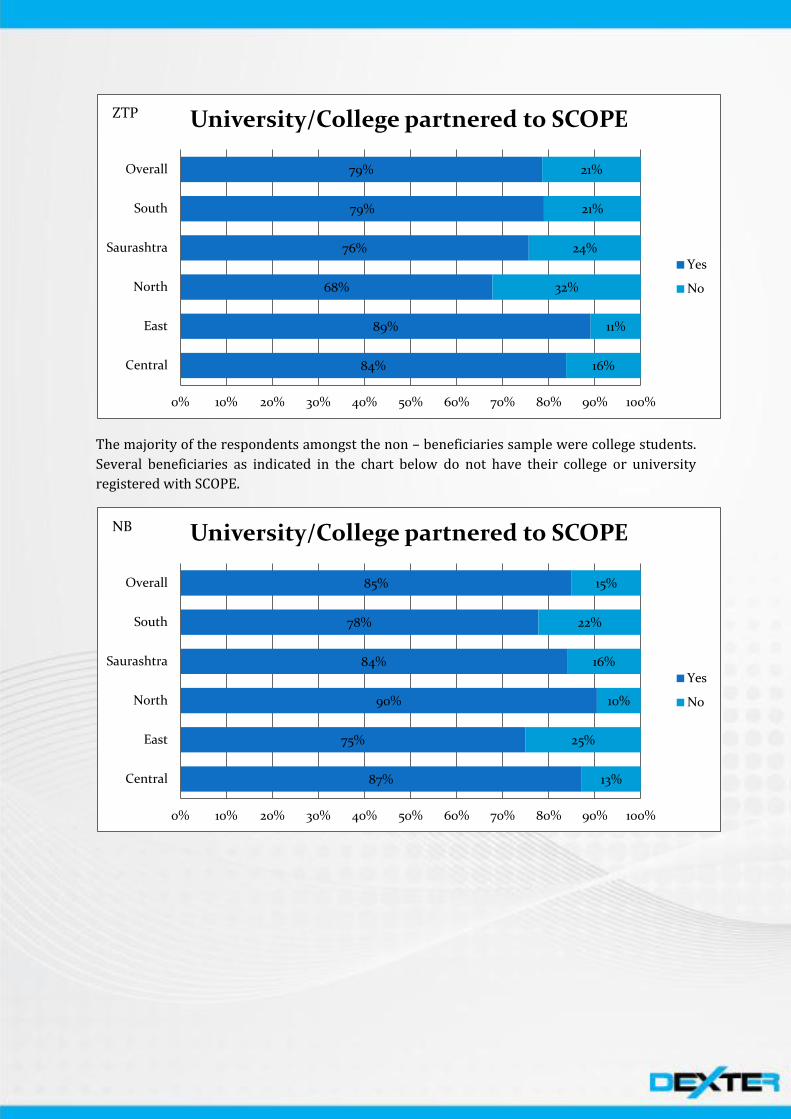
The majority of the respondents amongst the non – beneficiaries sample were college students.
Several beneficiaries as indicated in the chart below do not have their college or university
registered with SCOPE.
84%
89%
68%
76%
79%
79%
16%
11%
32%
24%
21%
21%
0% 10% 20% 30% 40% 50% 60% 70% 80% 90% 100%
Central
East
North
Saurashtra
South
Overall
University/College partnered to SCOPE
Yes
No
ZTP
87%
75%
90%
84%
78%
85%
13%
25%
10%
16%
22%
15%
0% 10% 20% 30% 40% 50% 60% 70% 80% 90% 100%
Central
East
North
Saurashtra
South
Overall
University/College partnered to SCOPE
Yes
No
NB

Ease in the Registration Process
97 percent of the respondents indicated that registering for SCOPE was easy and simple for
them. Other 3 percent however contrasts with the above and indicated that the process to
register for SCOPE to them was bit difficult for in-depth and lengthy documentation had to be
done.
We observe similar trends across regions shown by beneficiaries both admitted to college
centre as well as ZTPs regarding the convenience in registration process, which results to be
very much handiness to most of them.
97%
3%
Ease in the Registration Process
Yes
No
Base 2333
98%
98%
92%
98%
99%
97%
2%
2%
8%
2%
1%
3%
0% 10% 20% 30% 40% 50% 60% 70% 80% 90% 100%
Central
East
North
Saurashtra
South
Overall
Ease in the Registration Process
Yes
No
College
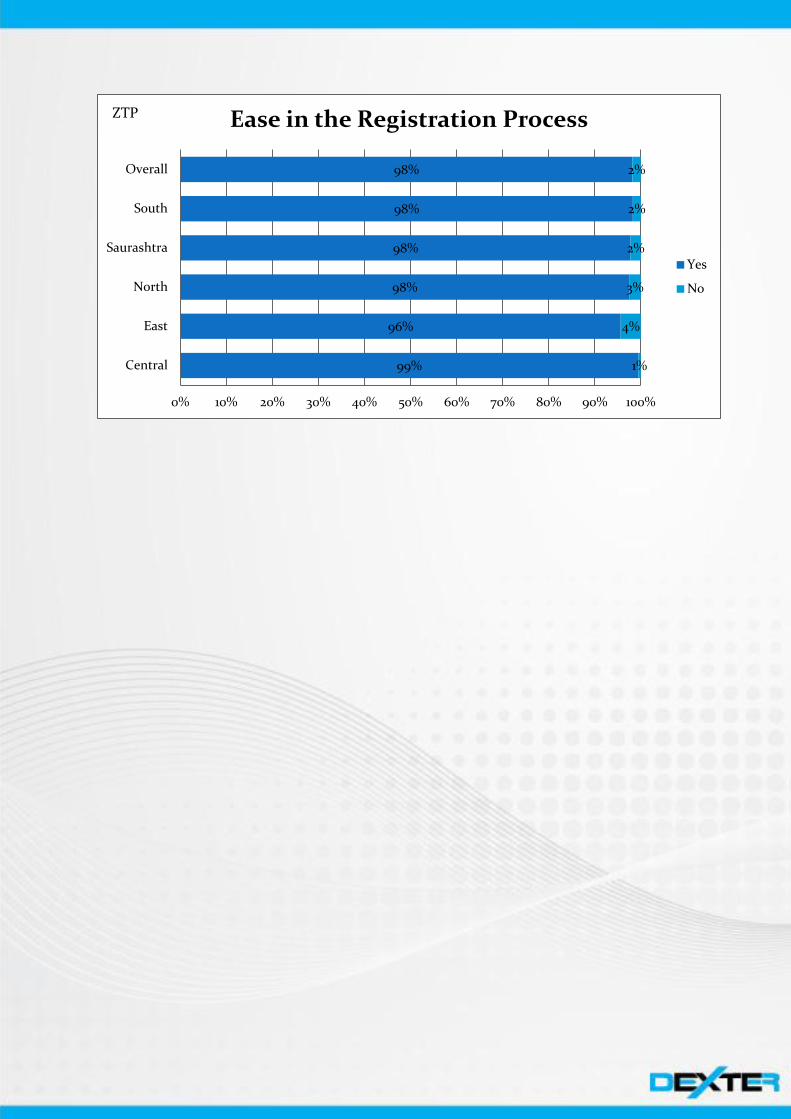
99%
96%
98%
98%
98%
98%
1%
4%
3%
2%
2%
2%
0% 10% 20% 30% 40% 50% 60% 70% 80% 90% 100%
Central
East
North
Saurashtra
South
Overall
Ease in the Registration Process
Yes
No
ZTP
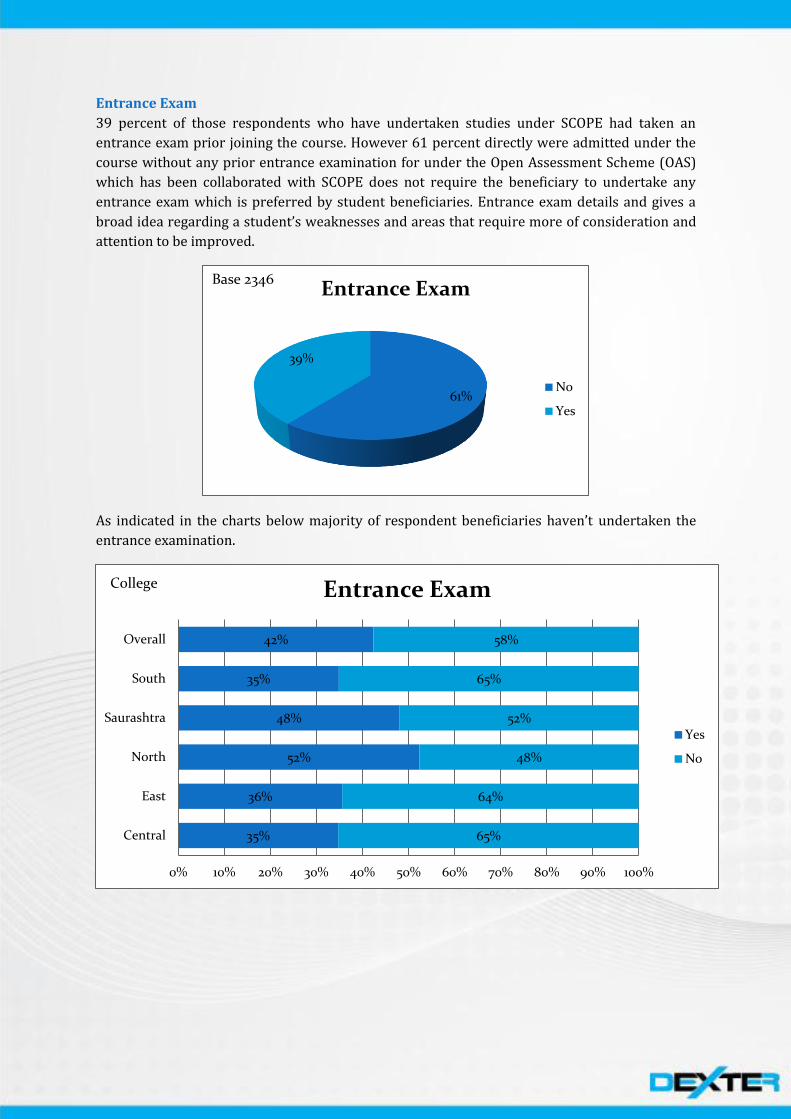
Entrance Exam
39 percent of those respondents who have undertaken studies under SCOPE had taken an
entrance exam prior joining the course. However 61 percent directly were admitted under the
course without any prior entrance examination for under the Open Assessment Scheme (OAS)
which has been collaborated with SCOPE does not require the beneficiary to undertake any
entrance exam which is preferred by student beneficiaries. Entrance exam details and gives a
broad idea regarding a student’s weaknesses and areas that require more of consideration and
attention to be improved.
As indicated in the charts below majority of respondent beneficiaries haven’t undertaken the
entrance examination.
61%
39%
Entrance Exam
No
Yes
Base 2346
35%
36%
52%
48%
35%
42%
65%
64%
48%
52%
65%
58%
0% 10% 20% 30% 40% 50% 60% 70% 80% 90% 100%
Central
East
North
Saurashtra
South
Overall
Entrance Exam
Yes
No
College

21%
59%
43%
43%
28%
34%
79%
41%
58%
57%
72%
66%
0% 10% 20% 30% 40% 50% 60% 70% 80% 90% 100%
Central
East
North
Saurashtra
South
Overall
Entrance Exam
Yes
No
ZTP

Result of Entrance Exam
The majority of the beneficiaries who appeared for the examination at the time of enrolment
scored A2 (49 percent). Other 19 percent of the respondent beneficiaries scored B1, 5 percent
others scored B2 and 16 percent others scored C1. 10 percent of the beneficiaries scored A1
while only one percent failed the examination.
We observe comparatively poor average result amongst the sample surveyed respondents from
the university and colleges of East while the result amongst students enrolled at ZTPs relatively
to colleges is superior.
10%
49% 19%
5% 16%
1%
Result of Entrance Exam
A1
A2
B1
B2
C1
Fail
20%
1%
14%
5%
9%
30%
31%
59%
52%
19%
44%
21%
14%
19%
44%
21%
6%
13%
9%
5%
1%
6%
22%
56%
14%
11%
26%
18%
3%
5%
2%
0% 20% 40% 60% 80% 100%
Central
East
North
Saurashtra
South
Overall
Result of Entrance Exam
A1
A2
B1
B2
C1
Fail
College

12%
38%
13%
83%
64%
82%
54%
41%
61%
6%
27%
10%
15%
12%
9%
7%
3%
11%
9%
9%
15%
5%
10%
2%
1%
0% 20% 40% 60% 80% 100%
Central
East
North
Saurashtra
South
Overall
Result of Entrance Exam
A1
A2
B1
B2
C1
Fail
ZTP

Level in which got the admission
Accordingly to the result received by the individual beneficiary in the examination undertaken
during enrolment, they were segregated amongst different levels in their respective SCOPE
centres. Out of the surveyed sample, 34 percent have been enrolled in A1 level, 19 percent in
A2 and 29 percent in B1 level. Other 4 percent were enrolled in B2 category and rest 14 percent
in the C1 category.
It is notable that the beneficiaries across ZTP centres have been enrolled in superior levels
under SCOPE (as the above discussion they have better level of understanding and knowledge
of the language). We also observe the beneficiaries form South both enrolled at colleges and
ZTPs having an upper hand on language skills over other beneficiaries.
34%
19%
29%
4% 14%
Level in which got the admission
A1
A2
B1
B2
C1
41%
39%
34%
34%
12%
31%
6%
7%
20%
18%
20%
19%
67%
24%
6%
16%
7%
5%
24%
10%
25%
20%
16%
0% 20% 40% 60% 80% 100%
Central
North
Saurashtra
South
Overall
Level in which got the admission
A1
A2
B1
B2
C1
College
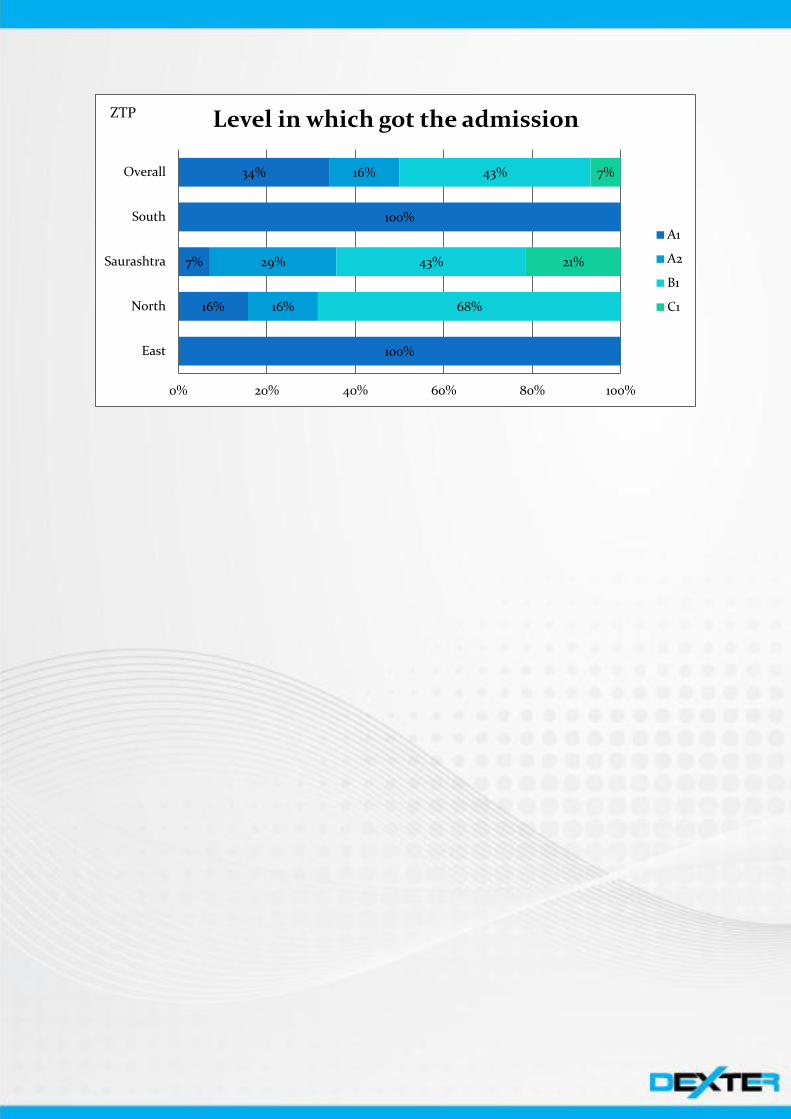
100%
16%
7%
100%
34%
16%
29%
16%
68%
43%
43%
21%
7%
0% 20% 40% 60% 80% 100%
East
North
Saurashtra
South
Overall
Level in which got the admission
A1
A2
B1
C1
ZTP
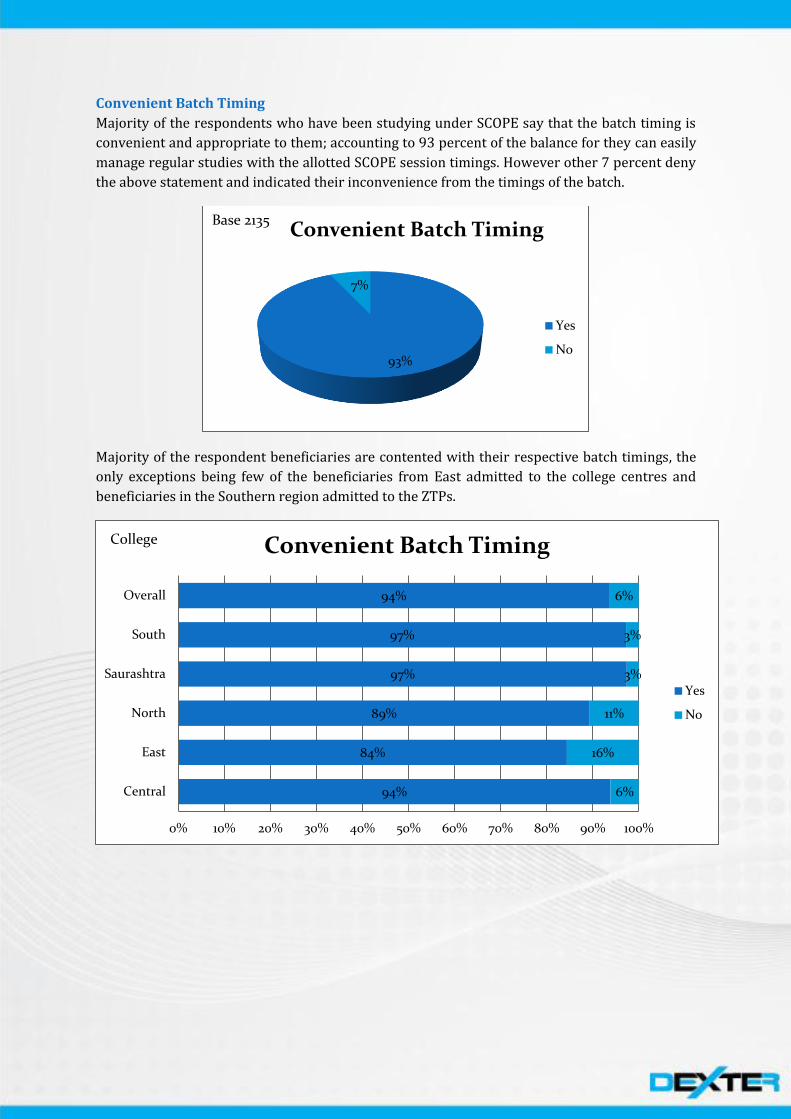
Convenient Batch Timing
Majority of the respondents who have been studying under SCOPE say that the batch timing is
convenient and appropriate to them; accounting to 93 percent of the balance for they can easily
manage regular studies with the allotted SCOPE session timings. However other 7 percent deny
the above statement and indicated their inconvenience from the timings of the batch.
Majority of the respondent beneficiaries are contented with their respective batch timings, the
only exceptions being few of the beneficiaries from East admitted to the college centres and
beneficiaries in the Southern region admitted to the ZTPs.
93%
7%
Convenient Batch Timing
Yes
No
Base 2135
94%
84%
89%
97%
97%
94%
6%
16%
11%
3%
3%
6%
0% 10% 20% 30% 40% 50% 60% 70% 80% 90% 100%
Central
East
North
Saurashtra
South
Overall
Convenient Batch Timing
Yes
No
College

94%
100%
97%
98%
80%
93%
6%
3%
2%
20%
7%
0% 10% 20% 30% 40% 50% 60% 70% 80% 90% 100%
Central
East
North
Saurashtra
South
Overall
Convenient Batch Timing
Yes
No
ZTP
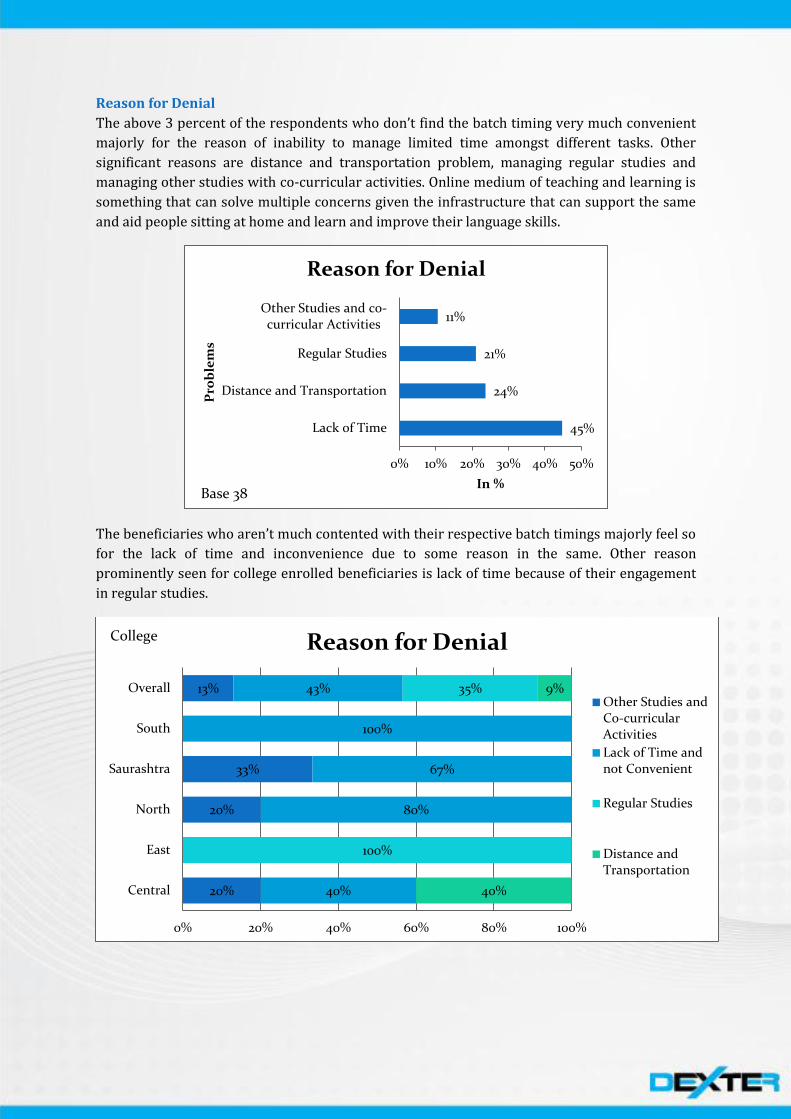
Reason for Denial
The above 3 percent of the respondents who don’t find the batch timing very much convenient
majorly for the reason of inability to manage limited time amongst different tasks. Other
significant reasons are distance and transportation problem, managing regular studies and
managing other studies with co-curricular activities. Online medium of teaching and learning is
something that can solve multiple concerns given the infrastructure that can support the same
and aid people sitting at home and learn and improve their language skills.
The beneficiaries who aren’t much contented with their respective batch timings majorly feel so
for the lack of time and inconvenience due to some reason in the same. Other reason
prominently seen for college enrolled beneficiaries is lack of time because of their engagement
in regular studies.
45%
24%
21%
11%
0% 10% 20% 30% 40% 50%
Lack of Time
Distance and Transportation
Regular Studies
Other Studies and co-curricular Activities
In %
Pro
ble
ms
Reason for Denial
Base 38
20%
20%
33%
13%
40%
80%
67%
100%
43%
100%
35%
40%
9%
0% 20% 40% 60% 80% 100%
Central
East
North
Saurashtra
South
Overall
Reason for Denial
Other Studies and Co-curricular Activities
Lack of Time and not Convenient
Regular Studies
Distance and Transportation
College

50%
7%
50%
46%
47%
54%
47%
0% 20% 40% 60% 80% 100%
Saurashtra
South
Overall
Reason for Denial
Other Studies and Co-curricular Activities
Lack of Time and not Convenient
Distance and Transportation
ZTP

Ability to manage Regular Studies
The majority of the respondents said of having no troubles in managing their regular major
course studies along with studying under SCOPE. Other 10 percent however faces issues in
carrying and handling both together.
As indicated in the charts below majority of respondent beneficiaries have been able to manage
their regular studies. However the same is comparatively more for the college enrolled
beneficiaries for obvious reason that majority of them are students perusing academic degree.
90%
10%
Ability to Manage Regular Studies
Yes
No
Base 2161
89%
98%
84%
91%
93%
90%
11%
2%
16%
9%
7%
10%
0% 10% 20% 30% 40% 50% 60% 70% 80% 90% 100%
Central
East
North
Saurashtra
South
Overall
Ability to Manage Regular Studies
Yes
No
College
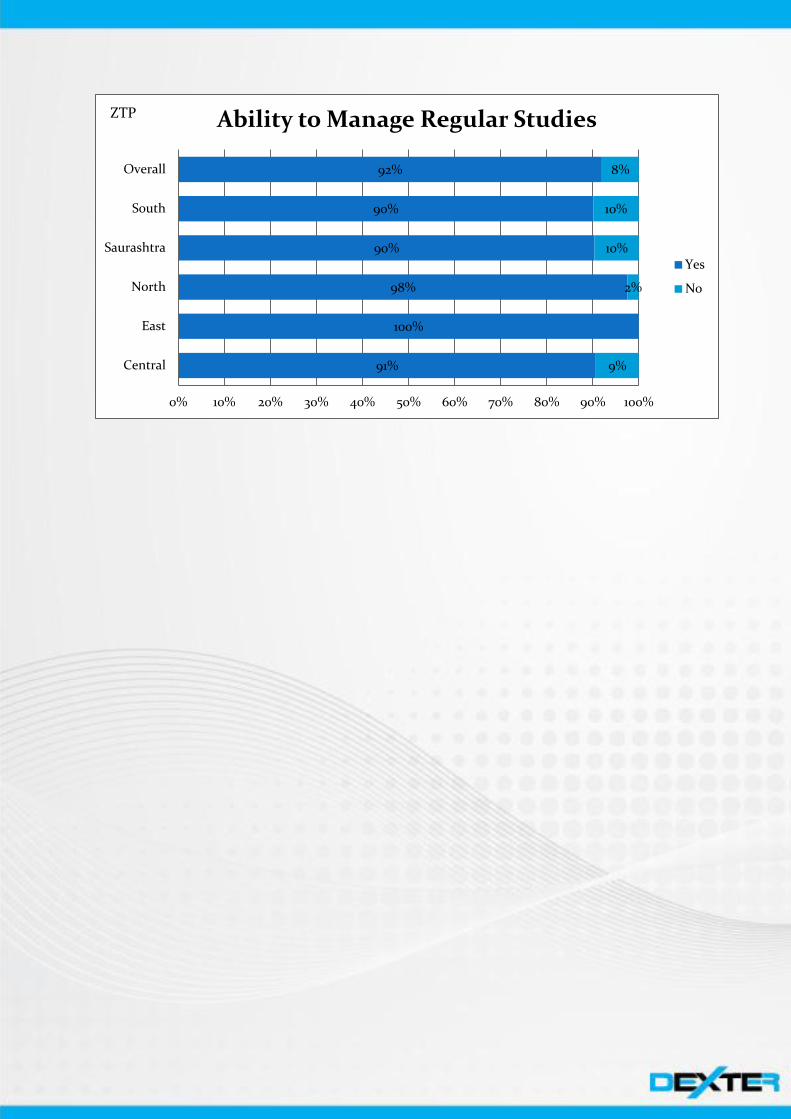
91%
100%
98%
90%
90%
92%
9%
2%
10%
10%
8%
0% 10% 20% 30% 40% 50% 60% 70% 80% 90% 100%
Central
East
North
Saurashtra
South
Overall
Ability to Manage Regular Studies
Yes
No
ZTP
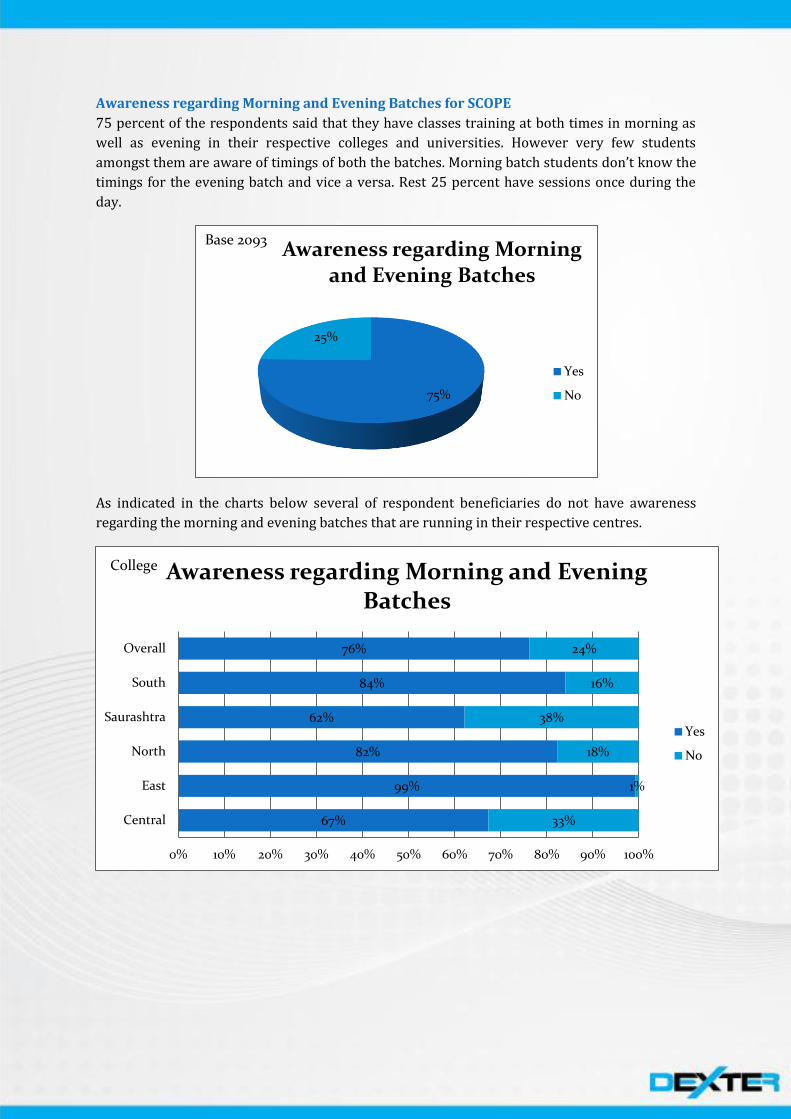
Awareness regarding Morning and Evening Batches for SCOPE
75 percent of the respondents said that they have classes training at both times in morning as
well as evening in their respective colleges and universities. However very few students
amongst them are aware of timings of both the batches. Morning batch students don’t know the
timings for the evening batch and vice a versa. Rest 25 percent have sessions once during the
day.
As indicated in the charts below several of respondent beneficiaries do not have awareness
regarding the morning and evening batches that are running in their respective centres.
75%
25%
Awareness regarding Morning and Evening Batches
Yes
No
Base 2093
67%
99%
82%
62%
84%
76%
33%
1%
18%
38%
16%
24%
0% 10% 20% 30% 40% 50% 60% 70% 80% 90% 100%
Central
East
North
Saurashtra
South
Overall
Awareness regarding Morning and Evening Batches
Yes
No
College

63%
100%
87%
86%
65%
76%
37%
13%
14%
35%
24%
0% 10% 20% 30% 40% 50% 60% 70% 80% 90% 100%
Central
East
North
Saurashtra
South
Overall
Awareness regarding Morning and Evening Batches
Yes
No
ZTP
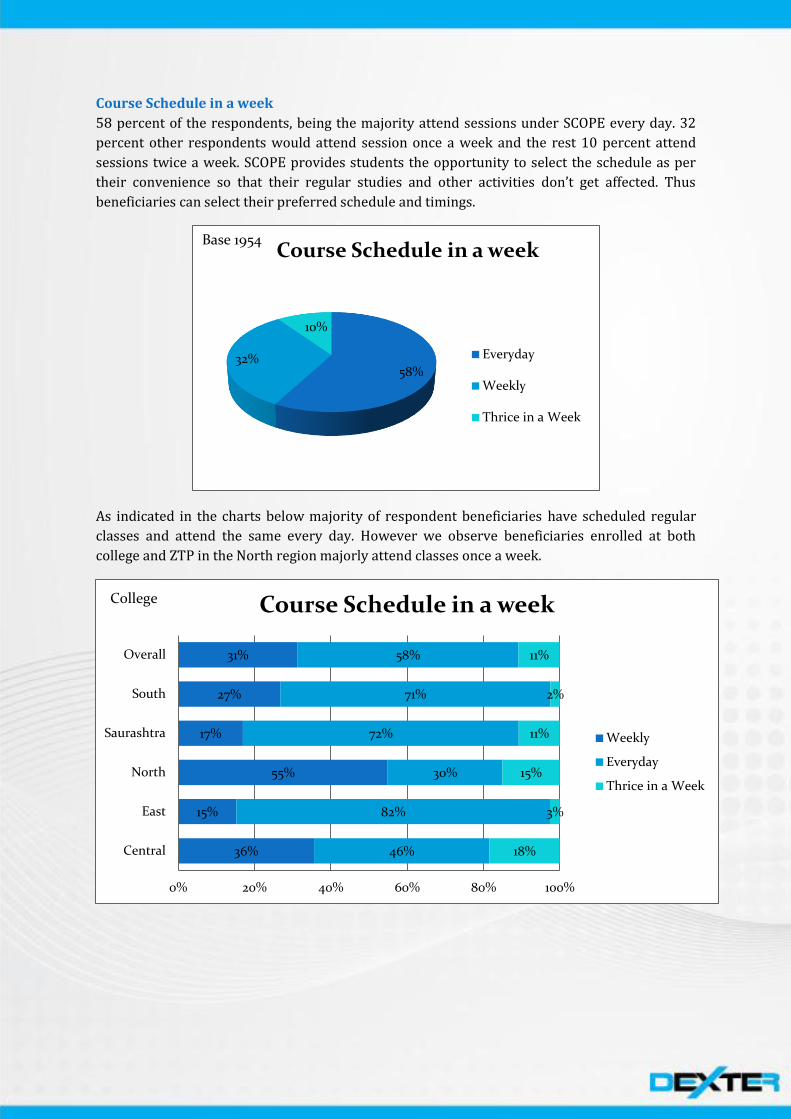
Course Schedule in a week
58 percent of the respondents, being the majority attend sessions under SCOPE every day. 32
percent other respondents would attend session once a week and the rest 10 percent attend
sessions twice a week. SCOPE provides students the opportunity to select the schedule as per
their convenience so that their regular studies and other activities don’t get affected. Thus
beneficiaries can select their preferred schedule and timings.
As indicated in the charts below majority of respondent beneficiaries have scheduled regular
classes and attend the same every day. However we observe beneficiaries enrolled at both
college and ZTP in the North region majorly attend classes once a week.
58% 32%
10%
Course Schedule in a week
Everyday
Weekly
Thrice in a Week
Base 1954
36%
15%
55%
17%
27%
31%
46%
82%
30%
72%
71%
58%
18%
3%
15%
11%
2%
11%
0% 20% 40% 60% 80% 100%
Central
East
North
Saurashtra
South
Overall
Course Schedule in a week
Weekly
Everyday
Thrice in a Week
College
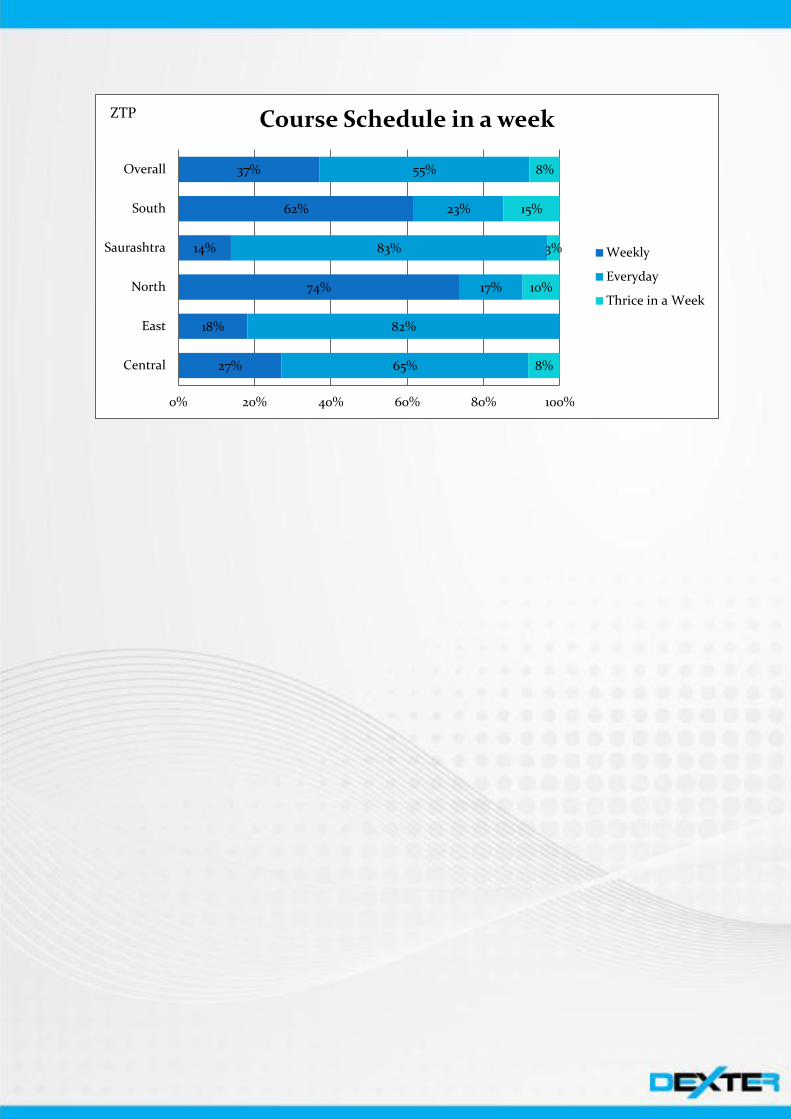
27%
18%
74%
14%
62%
37%
65%
82%
17%
83%
23%
55%
8%
10%
3%
15%
8%
0% 20% 40% 60% 80% 100%
Central
East
North
Saurashtra
South
Overall
Course Schedule in a week
Weekly
Everyday
Thrice in a Week
ZTP

Tutor’s Proficiency in English
The majority of the respondents rated tutor’s proficiency in English as very good and fluent.
Other 11 percent suggested it is well satisfying and good, 30 percent commented that the
proficiency of their respective tutors is merely acceptable and neutral. However rest 15 percent
respondents rated it below satisfying and non-acceptable. SCOPE has alliance with Cambridge
University, wherein the tutors receive language and teaching skills training from professors of
Cambridge.
As indicated in the charts below majority of respondent beneficiaries fairly rate the proficiency
if the tutor in English. However the beneficiaries enrolled at both colleges and ZTPs in the
central Gujarat cited low satisfaction rate from the proficiency of tutor in the language.
44%
11%
30%
8% 7%
Tutor's Proficiency in English
Very Good
Good
Neutral
Bad
Very Bad
Base 2814
26%
52%
37%
76%
62%
50%
13%
12%
17%
13%
15%
14%
39%
5%
21%
8%
14%
20%
10%
8%
14%
2%
5%
8%
13%
23%
10%
2%
4%
9%
0% 20% 40% 60% 80% 100%
Central
East
North
Saurashtra
South
Overall
Tutor's Proficiency in English
Very Good
Good
Neutral
Bad
Very Bad
College

27%
65%
78%
60%
57%
53%
4%
17%
9%
15%
9%
10%
25%
13%
11%
17%
22%
19%
27%
2%
2%
4%
5%
10%
17%
2%
5%
7%
8%
0% 20% 40% 60% 80% 100%
Central
East
North
Saurashtra
South
Overall
Tutor's Proficiency in English
Very Good
Good
Neutral
Bad
Very Bad
ZTP

Tutor’s Problem Solving Skill
40 percent of the respondents rated tutor’s problem solving skills worth appreciating. Other 13
percent suggested the same skills satisfying and helpful, 32 percent commented that the
proficiency in problem solving of their respective tutors is merely acceptable and neutral.
However rest 13 percent respondents rated it not to be helpful and unaccommodating.
It is noteworthy that all of the Zonal Training Partners are very serious about tutor’s ability.
They schedule trainings for the tutors and also enhance their skills which maintain their
proficiency, so that they are able to impart knowledge properly to the students in the SCOPE
sessions.
As indicated in the charts below majority of respondent beneficiaries fairly rate the proficiency
if the tutor in Problem Solving. However the beneficiaries enrolled at both colleges and ZTPs in
the central Gujarat cited low satisfaction rate from the proficiency of tutor in the solving
problem. It is also noted that several beneficiaries enrolled in colleges of North and East are not
much contented with the tutors’ proficiency.
40%
15%
32%
6%
7%
Tutor’s Problem Solving Skill
Very Good
Good
Neutral
Bad
Very Bad
Base 2814
24%
52%
32%
66%
61%
45%
9%
14%
28%
22%
23%
19%
46%
11%
25%
10%
12%
23%
9%
3%
5%
1%
1%
4%
13%
21%
10%
1%
4%
8%
0% 20% 40% 60% 80% 100%
Central
East
North
Saurashtra
South
Overall
Tutor’s Problem Solving Skill
Very Good
Good
Neutral
Bad
Very Bad
College

26%
43%
69%
61%
48%
48%
2%
35%
17%
12%
16%
12%
26%
20%
13%
19%
23%
21%
32%
2%
6%
11%
14%
2%
1%
6%
7%
7%
0% 20% 40% 60% 80% 100%
Central
East
North
Saurashtra
South
Overall
Tutor’s Problem Solving Skill
Very Good
Good
Neutral
Bad
Very Bad
ZTP

Use of English language during the Session
The majority of the respondents indicated that healthy and constructive communication and use
of English language during the sessions is very much appreciable and helpful and has
substantially helped them gain confidence and helped them in day to day level communication.
Other 10 percent suggested the use of English language in the class helps them to be fluent. 32
percent commented that the use of English language while communicating doesn’t helps them
much and are neutral about the same. However rest 15 percent respondents say it is not at all
assistive and useful.
As indicated in the charts below majority of respondent beneficiaries fairly rate the usage of
English language in the class. However the beneficiaries enrolled at both colleges and ZTPs in
the central Gujarat cited poor satisfaction rate from the usability of English for communication.
It is also noted that several beneficiaries enrolled in colleges of North and East are not much
contented with the same.
43%
10%
32%
7% 8%
Use of English language during the Session
Base 2814
24%
53%
35%
71%
72%
50%
9%
8%
14%
15%
10%
12%
42%
14%
27%
9%
11%
22%
10%
8%
13%
3%
4%
7%
15%
18%
12%
1%
4%
9%
0% 20% 40% 60% 80% 100%
Central
East
North
Saurashtra
South
Overall
Use of English language during the Session
Very Good
Good
Neutral
Bad
Very Bad
College

25%
63%
72%
55%
49%
48%
5%
17%
11%
20%
13%
13%
34%
15%
12%
17%
18%
21%
19%
2%
1%
8%
7%
18%
4%
2%
5%
12%
10%
0% 20% 40% 60% 80% 100%
Central
East
North
Saurashtra
South
Overall
Use of English language during the Session
Very Good
Good
Neutral
Bad
Very Bad
ZTP

Punctuality of the Tutors
98 percent of the respondents who have undertaking training to enhance English language skills
say that their respective tutors were punctual and started session on time. Only rest 2 percent
suggested that that their tutors delayed in starting their sessions.
The following charts indicate that majority of the beneficiaries both, the ones enrolled in college
centres as well as the ZTPs say that their respective tutors have been coming to lectures on
time.
98%
2%
Punctuality of the Tutors
Yes
No
Base 2145
97%
100%
97%
98%
99%
98%
3%
0%
3%
2%
1%
2%
0% 10% 20% 30% 40% 50% 60% 70% 80% 90% 100%
Central
East
North
Saurashtra
South
Overall
Punctuality of the Tutors
Yes
No
College

99%
98%
100%
98%
98%
99%
1%
2%
2%
2%
1%
0% 10% 20% 30% 40% 50% 60% 70% 80% 90% 100%
Central
East
North
Saurashtra
South
Overall
Punctuality of the Tutors
Yes
No
ZTP

Delay by Tutors
It is noteworthy that 50 percent of the respondents from the above minimal 2 percent who
denied the punctuality from the tutors complained that the tutors would skip classes and
sessions few times. Other 29 percent of the respondents indicated that the tutors would come
late by half an hour to conduct the sessions while rest 21 percent commented that the tutors get
sometimes even delayed by two to three hours for sessions and lectures. Technological
advancements can be used here to check regularity and punctuality amongst the tutors.
The respondent beneficiaries amongst the ones who have cited the delay by tutors in arriving
for lectures also indicated the delay in time by them as indicated in charts below. Sometimes the
tutors may also not come to the class as per few of the respondents.
50%
29%
21%
Delay by Tutors
Sometimes not come
Half hour late
2 - 3 hours late
Base 14
33%
100%
50%
100%
63%
67%
50%
38%
0% 20% 40% 60% 80% 100%
Central
North
Saurashtra
South
Overall
Delay by Tutors
Sometimes not come
2 - 3 hours late
College

100%
100%
33%
100%
67%
0% 20% 40% 60% 80% 100%
Central
Saurashtra
South
Overall
Delay by Tutors
Sometimes not come
Half hour late
ZTP

Availability of Computers
97 percent of the respondents indicated that their respective SCOPE centres have the facility of
accessing and learning through computers. Only 3 percent other respondents are devoid of the
same facilities. Under SCOPE for any new centre it is mandatory to have computers to teach
students. This ensures centres to have computers. However it is observed that Quality of
computers, software, hardware and other components are averagely efficient and not very
much advanced.
The following charts indicate that majority of the beneficiaries both, the ones enrolled in college
centres as well as the ZTPs say that availability of computers in the centres is not a major issue.
However we note that the beneficiaries enrolled at both college centre as well as ZTPs in
Saurashtara face some issues on the above line.
97%
3%
Availability of Computers
Yes
No
Base 2372
99%
100%
100%
92%
99%
98%
1%
8%
1%
2%
0% 10% 20% 30% 40% 50% 60% 70% 80% 90% 100%
Central
East
North
Saurashtra
South
Overall
Availability of Computers
Yes
No
College
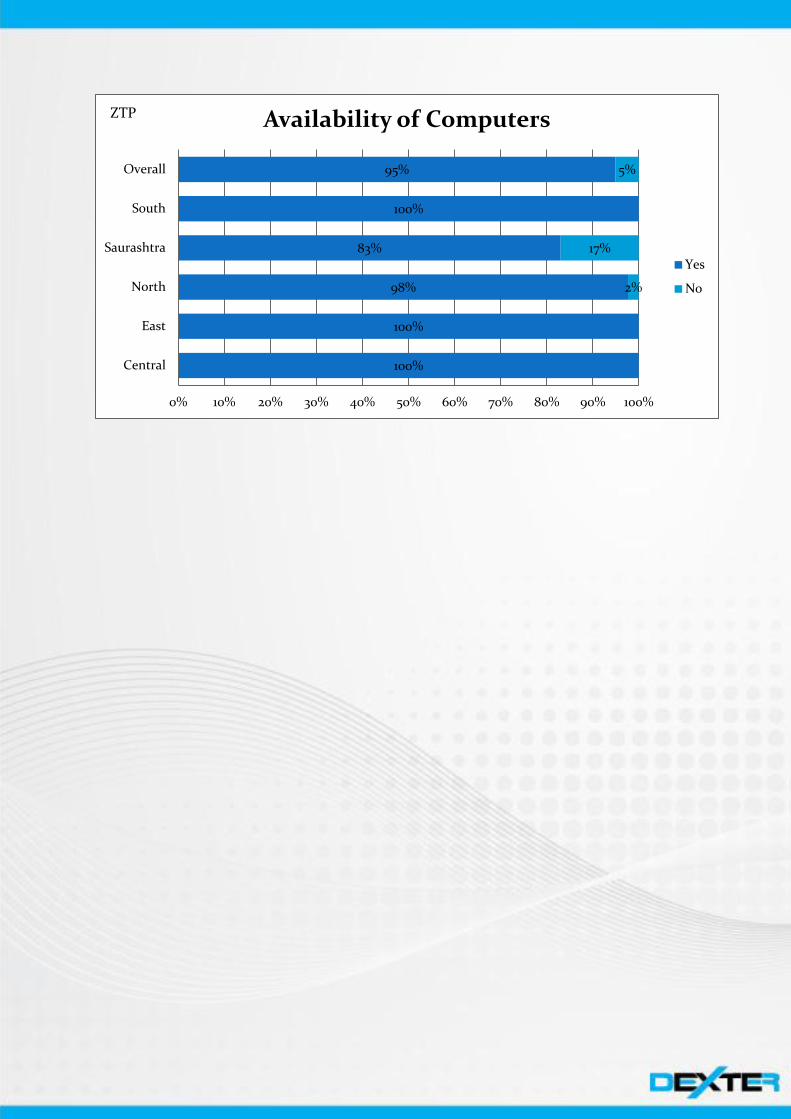
100%
100%
98%
83%
100%
95%
2%
17%
5%
0% 10% 20% 30% 40% 50% 60% 70% 80% 90% 100%
Central
East
North
Saurashtra
South
Overall
Availability of Computers
Yes
No
ZTP
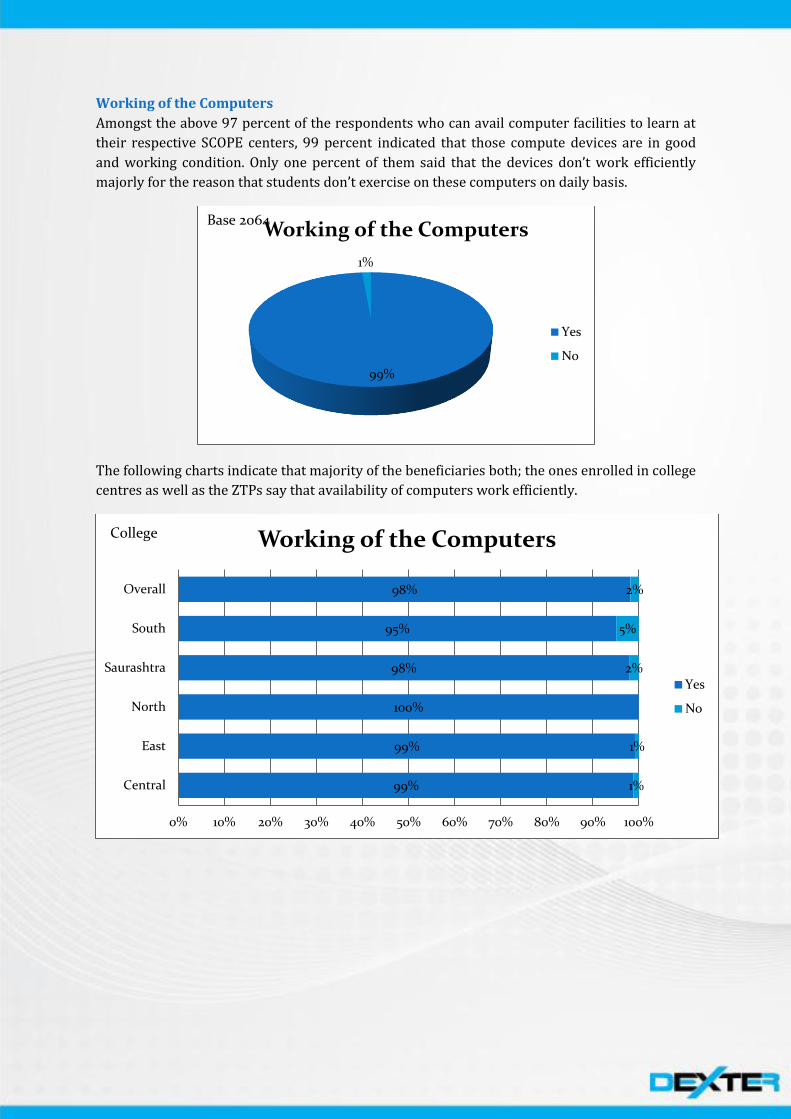
Working of the Computers
Amongst the above 97 percent of the respondents who can avail computer facilities to learn at
their respective SCOPE centers, 99 percent indicated that those compute devices are in good
and working condition. Only one percent of them said that the devices don’t work efficiently
majorly for the reason that students don’t exercise on these computers on daily basis.
The following charts indicate that majority of the beneficiaries both; the ones enrolled in college
centres as well as the ZTPs say that availability of computers work efficiently.
99%
1%
Working of the Computers
Yes
No
Base 2064
99%
99%
100%
98%
95%
98%
1%
1%
2%
5%
2%
0% 10% 20% 30% 40% 50% 60% 70% 80% 90% 100%
Central
East
North
Saurashtra
South
Overall
Working of the Computers
Yes
No
College

100%
98%
100%
99%
99%
99%
2%
1%
1%
1%
0% 10% 20% 30% 40% 50% 60% 70% 80% 90% 100%
Central
East
North
Saurashtra
South
Overall
Working of the Computers
Yes
No
ZTP
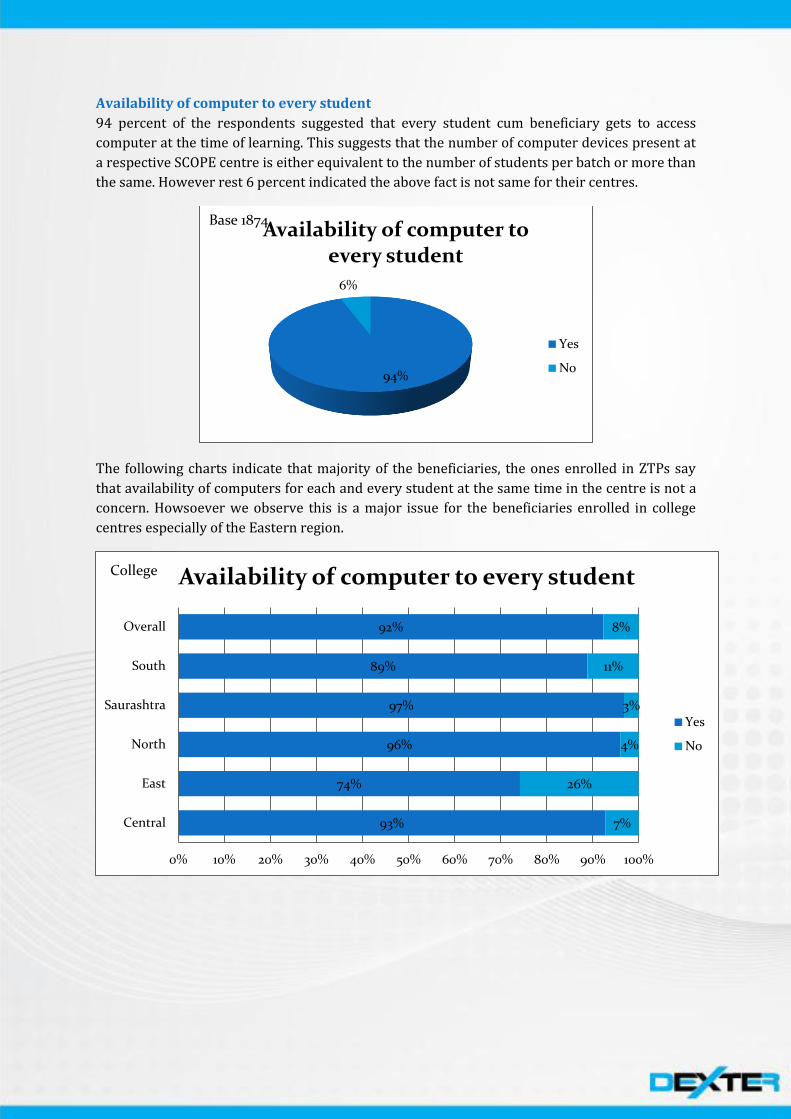
Availability of computer to every student
94 percent of the respondents suggested that every student cum beneficiary gets to access
computer at the time of learning. This suggests that the number of computer devices present at
a respective SCOPE centre is either equivalent to the number of students per batch or more than
the same. However rest 6 percent indicated the above fact is not same for their centres.
The following charts indicate that majority of the beneficiaries, the ones enrolled in ZTPs say
that availability of computers for each and every student at the same time in the centre is not a
concern. Howsoever we observe this is a major issue for the beneficiaries enrolled in college
centres especially of the Eastern region.
94%
6%
Availability of computer to every student
Yes
No
Base 1874
93%
74%
96%
97%
89%
92%
7%
26%
4%
3%
11%
8%
0% 10% 20% 30% 40% 50% 60% 70% 80% 90% 100%
Central
East
North
Saurashtra
South
Overall
Availability of computer to every student
Yes
No
College

99%
100%
96%
98%
100%
99%
1%
4%
2%
1%
0% 10% 20% 30% 40% 50% 60% 70% 80% 90% 100%
Central
East
North
Saurashtra
South
Overall
Availability of computer to every student
Yes
No
ZTP
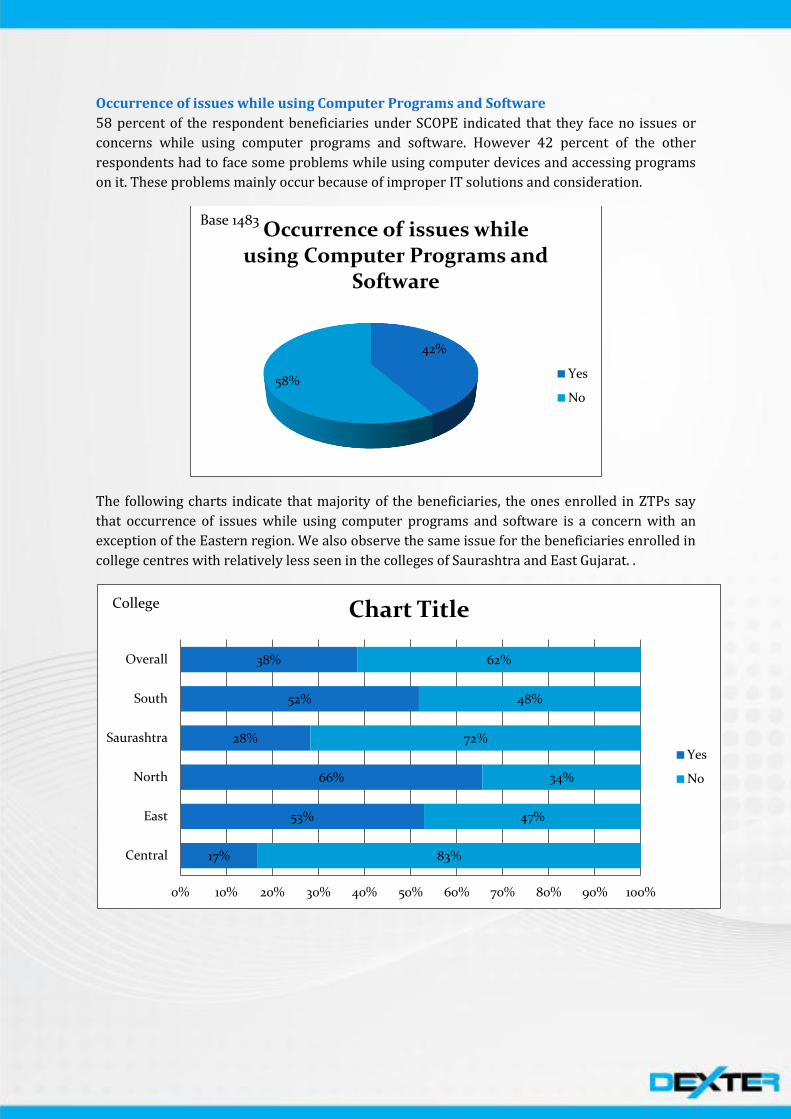
Occurrence of issues while using Computer Programs and Software
58 percent of the respondent beneficiaries under SCOPE indicated that they face no issues or
concerns while using computer programs and software. However 42 percent of the other
respondents had to face some problems while using computer devices and accessing programs
on it. These problems mainly occur because of improper IT solutions and consideration.
The following charts indicate that majority of the beneficiaries, the ones enrolled in ZTPs say
that occurrence of issues while using computer programs and software is a concern with an
exception of the Eastern region. We also observe the same issue for the beneficiaries enrolled in
college centres with relatively less seen in the colleges of Saurashtra and East Gujarat. .
42%
58%
Occurrence of issues while using Computer Programs and
Software
Yes
No
Base 1483
17%
53%
66%
28%
52%
38%
83%
47%
34%
72%
48%
62%
0% 10% 20% 30% 40% 50% 60% 70% 80% 90% 100%
Central
East
North
Saurashtra
South
Overall
Chart Title
Yes
No
College

20%
91%
82%
56%
51%
46%
80%
9%
18%
44%
49%
54%
0% 10% 20% 30% 40% 50% 60% 70% 80% 90% 100%
Central
East
North
Saurashtra
South
Overall
Occurrence of issues while using Computer Programs and Software
Yes
No
ZTP

Availability of proper Audio facility
The majority of the respondents suggested that proper audio practising facilities are provided
to them by their respective SCOPE centres. However other 8 percent of the respondents in the
balance deny the same fact.
The following charts indicate that majority of the beneficiaries, the ones enrolled in college
centres as well as ZTPs say that availability of proper audio facility in the centre is not a
concern. Howsoever we observe the exception in the same at the college centres of the East as
well as ZTP centres in the South.
92%
8%
Availability of proper Audio facility
Yes
No
Base 1526
95%
78%
91%
96%
89%
92%
5%
22%
9%
4%
11%
8%
0% 10% 20% 30% 40% 50% 60% 70% 80% 90% 100%
Central
East
North
Saurashtra
South
Overall
Availability of proper Audio facility
Yes
No
College

98%
96%
95%
91%
79%
91%
2%
4%
5%
9%
21%
9%
0% 10% 20% 30% 40% 50% 60% 70% 80% 90% 100%
Central
East
North
Saurashtra
South
Overall
Availability of proper Audio facility
Yes
No
ZTP

Reason for Denial
As per the above 8 percent of the respondents, who suggested of absence of proper audio
facilities to learn majorly indicated lack of number of computers in the centre in accordance to
number of students accounted by 66 percent of them. Other significant reasons for the same are
audio software not running properly, technical concerns etc.
Lack of enough number of computers is the significant reason for dissatisfaction in proper audio
services amongst the beneficiaries enrolled at college centres as well as ZTPs.
66%
16%
8% 10%
Reason for Denial
Not enough Computers
Audio was not run properly some times
Technical Problem
Others
Base 110
44%
55%
65%
100%
60%
11%
24%
17%
33%
8%
10%
11%
45%
3%
12%
0% 20% 40% 60% 80% 100%
Central
North
Saurashtra
South
Overall
Reason for Denial
Not enough Computers
Audio was not run properly some times
Technical Problem
Others
College

50%
91%
9%
69%
73%
16%
50%
9%
6%
9%
9%
8%
0% 20% 40% 60% 80% 100%
Central
Saurashtra
South
Overall
Reason for Denial
Not enough Computers
Audio was not run properly some times
Technical Problem
Others
ZTP

Availability of proper material
79 percent of the respondent beneficiaries indicated that they were provided with proper
material for learning by their respective SCOPE centres. However several respondents cited that
the reading material they received from their respective centres wasn’t proper, accounted by
the other 21 percent respondents of the balance.
The following charts indicate that majority of the beneficiaries both, the ones enrolled in college
centres as well as the ZTPs say that availability of proper reading material in the centre is not a
major issue. However we note that the beneficiaries enrolled at both college centre as well as
ZTPs in North region face some issues on the above line.
79%
21%
Availability of proper material
Yes
No
Base 2355
79%
72%
54%
88%
95%
78%
21%
28%
46%
12%
5%
22%
0% 10% 20% 30% 40% 50% 60% 70% 80% 90% 100%
Central
East
North
Saurashtra
South
Overall
Availability of proper material
Yes
No
College

80%
100%
55%
96%
82%
83%
20%
45%
4%
18%
17%
0% 10% 20% 30% 40% 50% 60% 70% 80% 90% 100%
Central
East
North
Saurashtra
South
Overall
Availability of proper material
Yes
No
ZTP
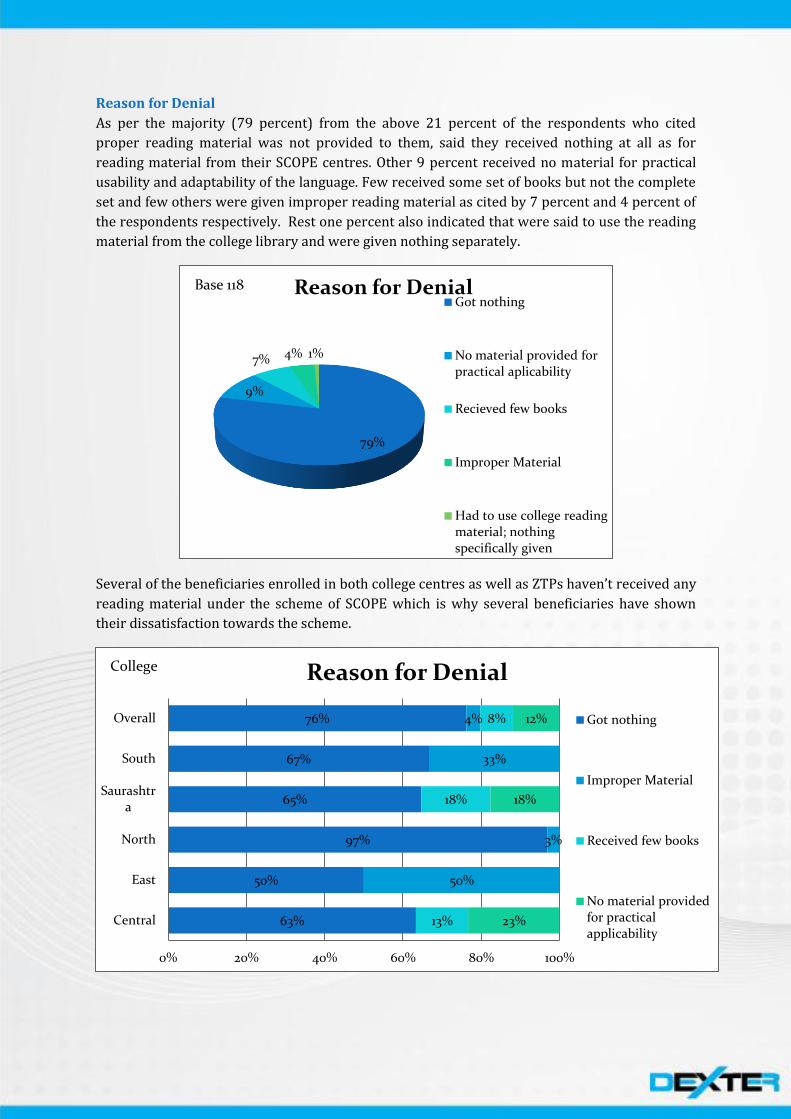
Reason for Denial
As per the majority (79 percent) from the above 21 percent of the respondents who cited
proper reading material was not provided to them, said they received nothing at all as for
reading material from their SCOPE centres. Other 9 percent received no material for practical
usability and adaptability of the language. Few received some set of books but not the complete
set and few others were given improper reading material as cited by 7 percent and 4 percent of
the respondents respectively. Rest one percent also indicated that were said to use the reading
material from the college library and were given nothing separately.
Several of the beneficiaries enrolled in both college centres as well as ZTPs haven’t received any
reading material under the scheme of SCOPE which is why several beneficiaries have shown
their dissatisfaction towards the scheme.
79%
9%
7% 4% 1%
Reason for Denial Got nothing
No material provided for practical aplicability
Recieved few books
Improper Material
Had to use college reading material; nothing specifically given
Base 118
63%
50%
97%
65%
67%
76%
50%
3%
33%
4%
13%
18%
8%
23%
18%
12%
0% 20% 40% 60% 80% 100%
Central
East
North
Saurashtra
South
Overall
Reason for Denial
Got nothing
Improper Material
Received few books
No material provided for practical applicability
College

78%
100%
85%
84%
15%
8%
11%
4%
11%
4%
0% 20% 40% 60% 80% 100%
Central
Saurashtra
South
Overall
Reason for Denial
Got nothing
Improper Material
No material provided for practical applicability
Had to use college reading materials; nothing specifically given
ZTP
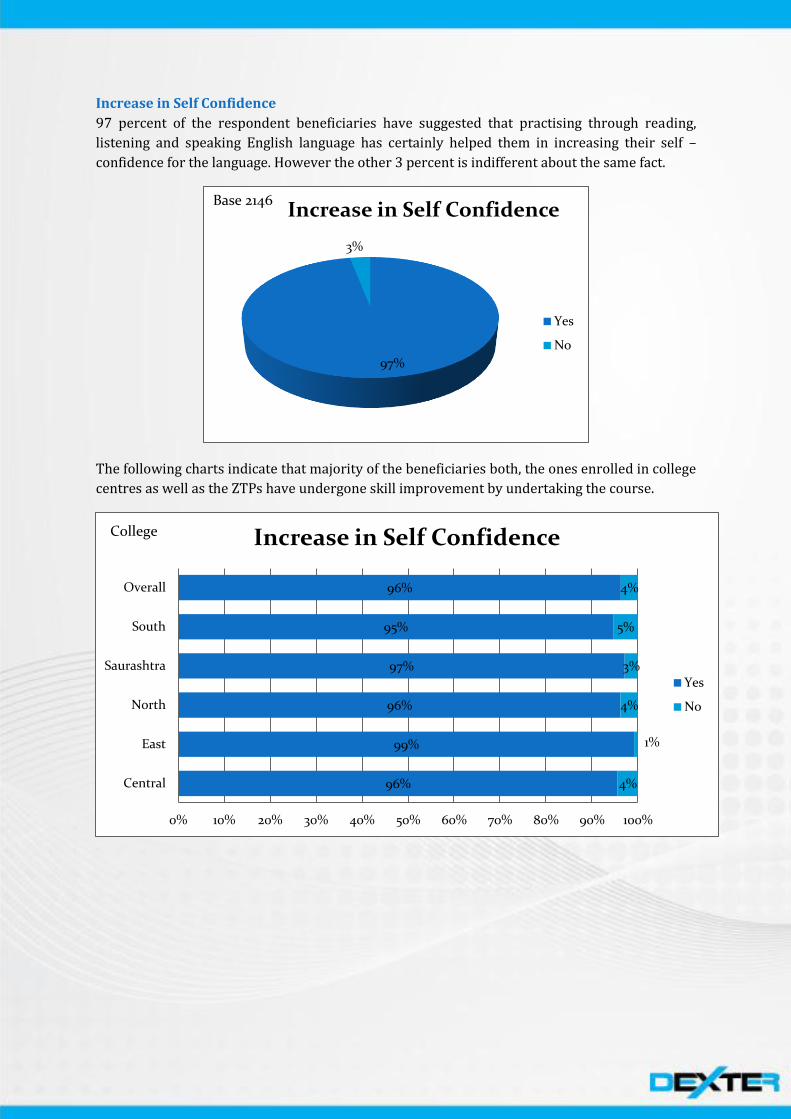
Increase in Self Confidence
97 percent of the respondent beneficiaries have suggested that practising through reading,
listening and speaking English language has certainly helped them in increasing their self –
confidence for the language. However the other 3 percent is indifferent about the same fact.
The following charts indicate that majority of the beneficiaries both, the ones enrolled in college
centres as well as the ZTPs have undergone skill improvement by undertaking the course.
97%
3%
Increase in Self Confidence
Yes
No
Base 2146
96%
99%
96%
97%
95%
96%
4%
1%
4%
3%
5%
4%
0% 10% 20% 30% 40% 50% 60% 70% 80% 90% 100%
Central
East
North
Saurashtra
South
Overall
Increase in Self Confidence
Yes
No
College

97%
100%
100%
100%
96%
98%
3%
4%
2%
0% 10% 20% 30% 40% 50% 60% 70% 80% 90% 100%
Central
East
North
Saurashtra
South
Overall
Increase in Self Confidence
Yes
No
ZTP

Usefulness of the Course
The respondent beneficiaries cited various gains from their objective of joining the course as
well as experience up till yet; the major being help in future growth and development of oneself
and career as suggested by 32 percent of the respondents. Other 23 percent indicated that
improving English language would help them in their job, 21 percent of the respondents
suggested SCOPE program helps to improve overall language and communication skills, 10
percent suggested it helps in improving soft skills while 7 percent other said it can help in
studies. 3 percent of the total respondents denied the fact of it being much helpful. Rest 2
percent suggested it to be useful for regular conversation. Other little significant reason quoted
by the beneficiaries were improvement in overall knowledge, helpful while settling in foreign
countries and so as to gain and increase self confidence.
The major usefulness conceived by the college as well as ZTPs enrolled beneficiaries is the
helpfulness that is perceived in future growth. However it is observed that the beneficiaries in
East generally foresee the benefits availed from Scope in getting a job.
2% 2% 3%
7%
10%
21%
23%
32%
Usefulness of course
Others
Useful in daily routine life conversation
Not much Needed
Useful in study
Improve soft skills
To read, write & communicate in english
Useful in job
Help in future growth
Base 1156
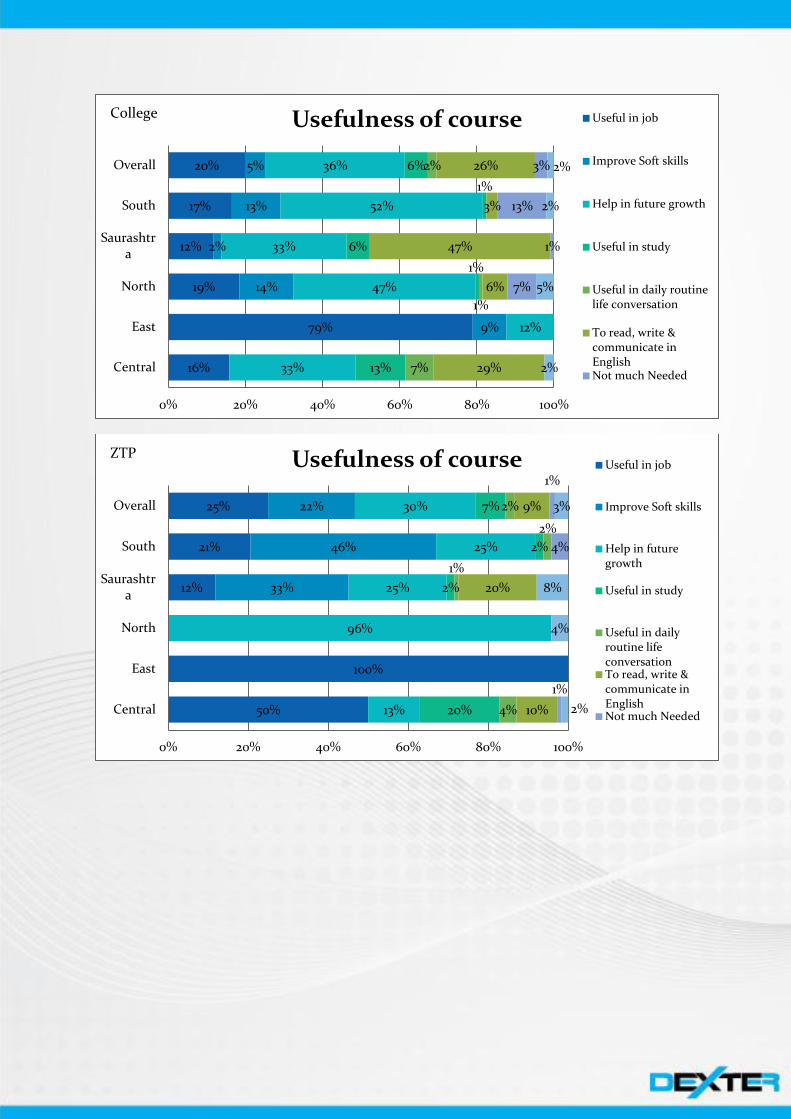
16%
79%
19%
12%
17%
20%
9%
14%
2%
13%
5%
33%
12%
47%
33%
52%
36%
13%
1%
6%
1%
6%
7%
1%
2%
29%
6%
47%
3%
26%
7%
1%
13%
3%
2%
5%
2%
2%
0% 20% 40% 60% 80% 100%
Central
East
North
Saurashtra
South
Overall
Usefulness of course Useful in job
Improve Soft skills
Help in future growth
Useful in study
Useful in daily routine life conversation
To read, write & communicate in English Not much Needed
College
50%
100%
12%
21%
25%
33%
46%
22%
13%
96%
25%
25%
30%
20%
2%
2%
7%
4%
1%
2%
2%
10%
20%
9%
1%
4%
1%
2%
4%
8%
3%
0% 20% 40% 60% 80% 100%
Central
East
North
Saurashtra
South
Overall
Usefulness of course Useful in job
Improve Soft skills
Help in future growth
Useful in study
Useful in daily routine life conversation To read, write & communicate in English Not much Needed
ZTP

Improvement in Skills
97 percent of the respondents indicated that they have undergone substantial improvement in
their communication and language skills from undertaking and learning within the course.
However rest 3 percent are not much helped by the course either because of irregularity shown
by the tutors or the students. Also several loopholes in the teaching as well as examination
process don’t deliver the desired results.
The following charts indicate that majority of the beneficiaries both, the ones enrolled in college
centres as well as the ZTPs have undergone skill improvement by undertaking the course.
97%
3%
Improvement in Skills
Yes
No
Base 2088
96%
100%
95%
99%
93%
96%
4%
5%
1%
7%
4%
0% 10% 20% 30% 40% 50% 60% 70% 80% 90% 100%
Central
East
North
Saurashtra
South
Overall
Improvement in Skills
Yes
No
College

96%
100%
99%
99%
97%
97%
4%
1%
1%
3%
3%
0% 10% 20% 30% 40% 50% 60% 70% 80% 90% 100%
Central
East
North
Saurashtra
South
Overall
Improvement in Skills
Yes
No
ZTP

Scope of Improvement in the scheme
The above 23 percent unhappy beneficiaries cited several aspects wherein improvement can be
made significantly in the following areas: increasing number of courses which will give students
more options to choose from so that they can select their preferable course, managing lectures
properly so that students regularly attend sessions, tutors and the process can be regularly
managed to uphold constancy and effective teaching, increasing number of lectures for those
students who are weak or require more of assistance, improving methods to develop soft skills,
giving proper guidance and attention, managing time properly and avoiding delays,
restructuring guidelines etc.
We observe different trends across regions in both college centres and ZTPs in terms of the
suggestions regarding scope of improvement given by the beneficiaries as indicted in the charts
below.
14%
12%
12%
9% 9%
9%
7%
7%
21%
Scope of Improvement
Increase number of courses
Manage lectures properly
Increase number of lectures
Soft Skill related improvements
Give training
Give proper guidance
Proper time management
Proper Guideline
Others
Base 57

50%
20%
18%
25%
8%
17%
40%
10%
21%
13%
10%
14%
25%
10%
14%
25%
10%
21%
13%
10%
29%
8%
25%
40%
23%
0% 20% 40% 60% 80% 100%
Central
North
Saurashtra
South
Overall
Scope of Improvement Increase number of courses
Proper time management
Proper Guideline
Give proper guidance
Give training
Manage lectures properly
Increase number of lectures
Others
College
13%
6%
33%
6%
63%
29%
17%
6%
17%
6%
33%
12%
33%
33%
18%
33%
25%
18%
0% 20% 40% 60% 80% 100%
Central
Saurashtra
South
Overall
Scope of Improvement Increase number of courses
Proper time management
Soft Skill related improvements
Give proper guidance
Give training
Manage lectures properly
Increase number of lectures
Others
ZTP

Appeared for Exam under the Course
The majority of the respondent beneficiaries have appeared for examination under the course
so as to get evaluated for their knowledge and learning gained from the course (80 percent).
However rest 20 percent haven’t appeared for any exam since joining of the course.
The following charts indicate that several beneficiaries both, the ones admitted to college
centres as well as the ZTPs couldn’t undertake the examination to complete their course at
Scope. The number for the same is larger for college enrolled beneficiaries however we observe
several beneficiaries amongst the North region ZTP enrolled respondents haven’t undertaken
the examination.
80%
20%
Appeared for Exam under the Course
Yes
No
Base 2373
92%
67%
76%
72%
82%
79%
8%
33%
24%
28%
18%
21%
0% 10% 20% 30% 40% 50% 60% 70% 80% 90% 100%
Central
East
North
Saurashtra
South
Overall
Appeared for Exam under the Course
Yes
No
College

97%
96%
46%
75%
88%
82%
3%
4%
54%
25%
12%
18%
0% 10% 20% 30% 40% 50% 60% 70% 80% 90% 100%
Central
East
North
Saurashtra
South
Overall
Appeared for Exam under the Course
Yes
No
ZTP
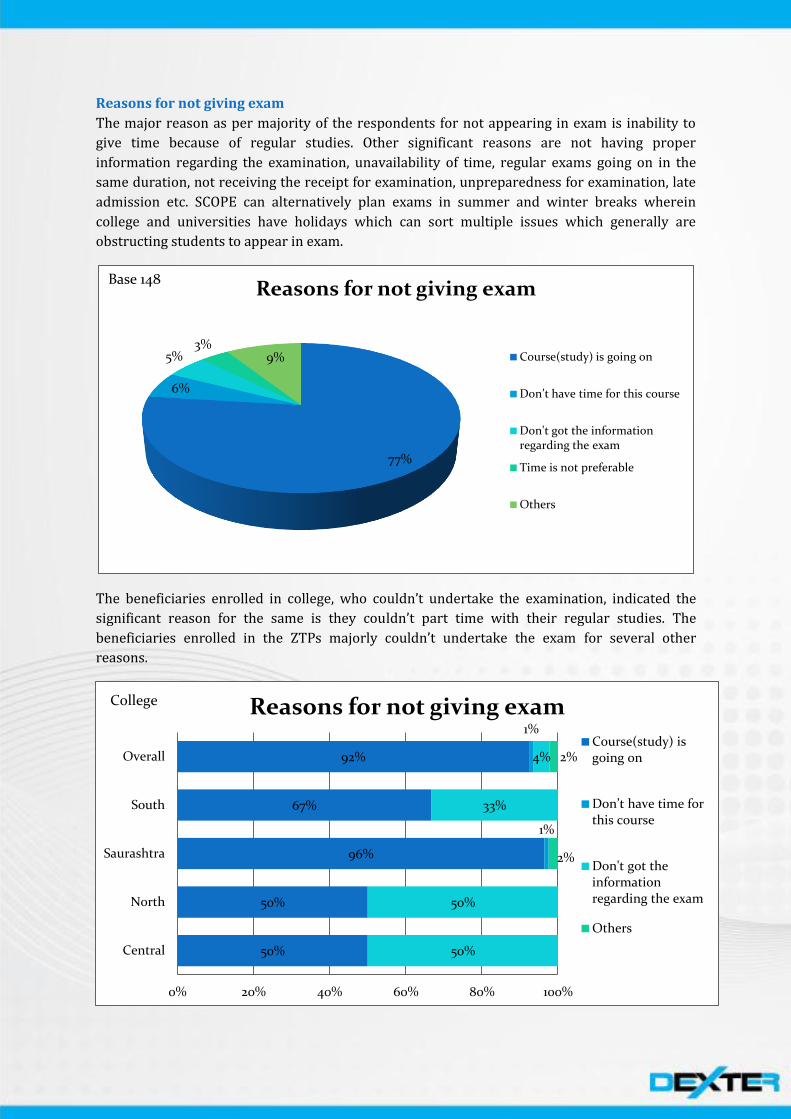
Reasons for not giving exam
The major reason as per majority of the respondents for not appearing in exam is inability to
give time because of regular studies. Other significant reasons are not having proper
information regarding the examination, unavailability of time, regular exams going on in the
same duration, not receiving the receipt for examination, unpreparedness for examination, late
admission etc. SCOPE can alternatively plan exams in summer and winter breaks wherein
college and universities have holidays which can sort multiple issues which generally are
obstructing students to appear in exam.
The beneficiaries enrolled in college, who couldn’t undertake the examination, indicated the
significant reason for the same is they couldn’t part time with their regular studies. The
beneficiaries enrolled in the ZTPs majorly couldn’t undertake the exam for several other
reasons.
77%
6%
5% 3%
9%
Reasons for not giving exam
Course(study) is going on
Don’t have time for this course
Don't got the information regarding the exam
Time is not preferable
Others
Base 148
50%
50%
96%
67%
92%
1%
1%
50%
50%
33%
4%
2%
2%
0% 20% 40% 60% 80% 100%
Central
North
Saurashtra
South
Overall
Reasons for not giving exam
Course(study) is going on
Don’t have time for this course
Don't got the information regarding the exam
Others
College
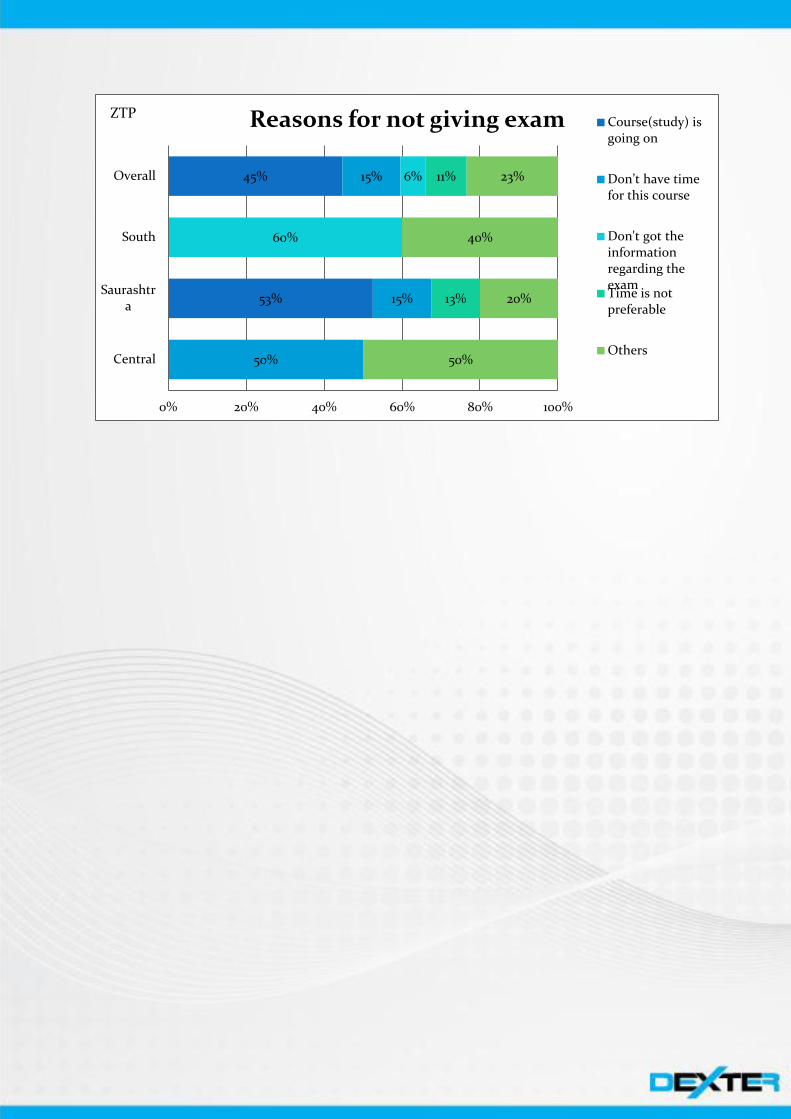
53%
45%
50%
15%
15%
60%
6%
13%
11%
50%
20%
40%
23%
0% 20% 40% 60% 80% 100%
Central
Saurashtra
South
Overall
Reasons for not giving exam Course(study) is going on
Don’t have time for this course
Don't got the information regarding the exam Time is not preferable
Others
ZTP

Appeared for Exam on time
93 percent of the respondent beneficiaries, who have appeared for exams, had given the same
on time. However 7 percent other had delayed in appearing for exams.
Few of the beneficiaries amongst the surveyed sample referred to the delay in the conduct of
examination by the officials. The number of beneficiaries indicating the same is slightly larger
who have been enrolled in the ZTPs in the South region.
93%
7%
Appeared for Exam on time
Yes
No
Base 2196
94%
97%
91%
95%
94%
94%
6%
3%
9%
5%
6%
6%
0% 10% 20% 30% 40% 50% 60% 70% 80% 90% 100%
Central
East
North
Saurashtra
South
Overall
Appeared for Exam on time
Yes
No
College

98%
98%
87%
93%
82%
91%
2%
2%
13%
7%
18%
9%
0% 10% 20% 30% 40% 50% 60% 70% 80% 90% 100%
Central
East
North
Saurashtra
South
Overall
Appeared for Exam on time
Yes
No
ZTP

Delay in Exam Time
The majority of the respondents indicated that their exam delayed by an hour or less than it (39
percent). Other 31 percent cited that their exam started late by more than an hour from the
given time. 25 percent said that the exam timing was not fixed while rest 5 percent said that the
exam was not taken at all. A delay of one hour or less than it is acceptable to one point however
delay of more than that demotivates students towards the examination process as well as the
scheme. The officials can see to the same problem that the exam commences on time and proper
materials along with computer devices efficiently working are provided to students while
appearing the exam.
It is notable that the beneficiaries admitted to college centres in Northern region were not given
any specific time to appear for the exam. Other several beneficiaries amongst the other
surveyed beneficiaries had to wait more than an hour from the time allotted to undertake the
exam.
39%
31%
25%
5%
Delay in exam time
<=1 Hour
>1 Hour
Exam time was not fix
Exam was not taken
Base 36
75%
75%
100%
77%
25%
100%
25%
23%
0% 20% 40% 60% 80% 100%
Central
North
Saurashtra
South
Overall
Delay in exam time
<=1 Hour
Exam time was not fix
College
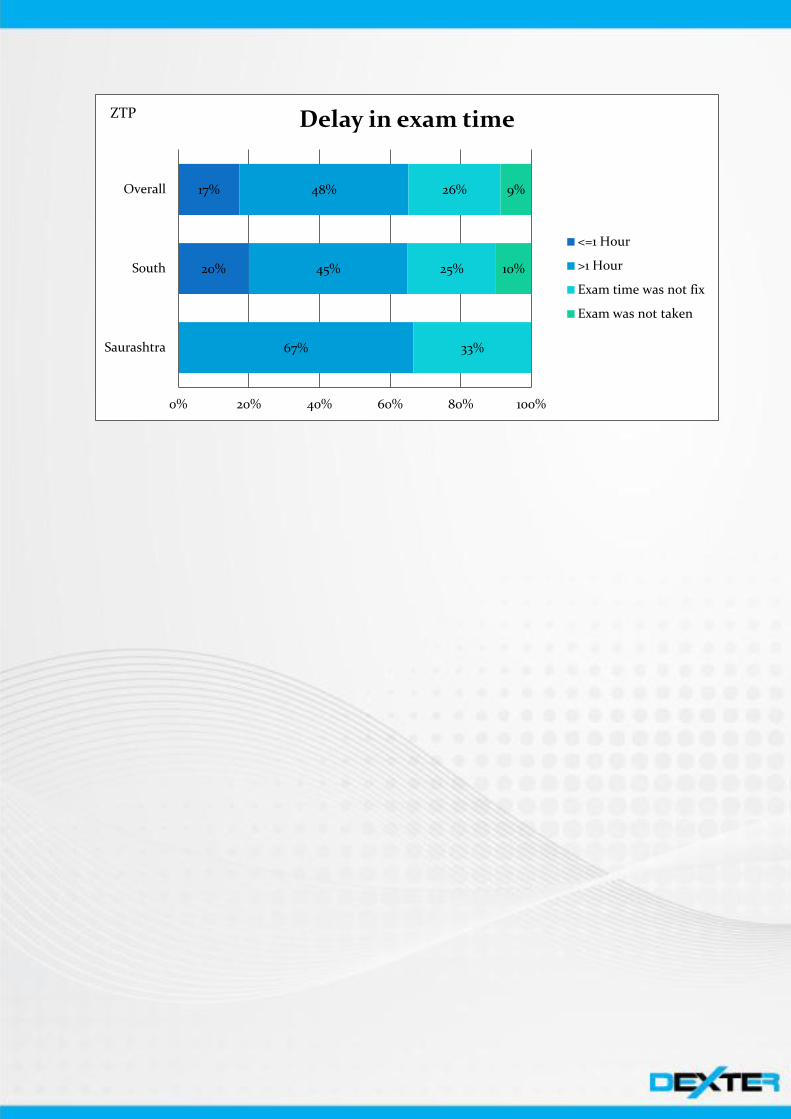
20%
17%
67%
45%
48%
33%
25%
26%
10%
9%
0% 20% 40% 60% 80% 100%
Saurashtra
South
Overall
Delay in exam time
<=1 Hour
>1 Hour
Exam time was not fix
Exam was not taken
ZTP

Drawbacks in the exam system
83 percent suggest that there prevail no flaws in the examination system conducted by SCOPE.
However other 17 percent of the other respondents indicated that there are several drawbacks
in the examination system and the process needs to be improved and more efficiently managed.
The following charts indicate that several beneficiaries both, the ones admitted to college
centres as well as the ZTPs aren’t contented and happy with the examination system.
17%
83%
Drawbacks in exam system
Yes
No
Base 2184
16%
3%
21%
22%
11%
16%
84%
97%
79%
78%
89%
84%
0% 10% 20% 30% 40% 50% 60% 70% 80% 90% 100%
Central
East
North
Saurashtra
South
Overall
Drawbacks in exam system
Yes
No
College
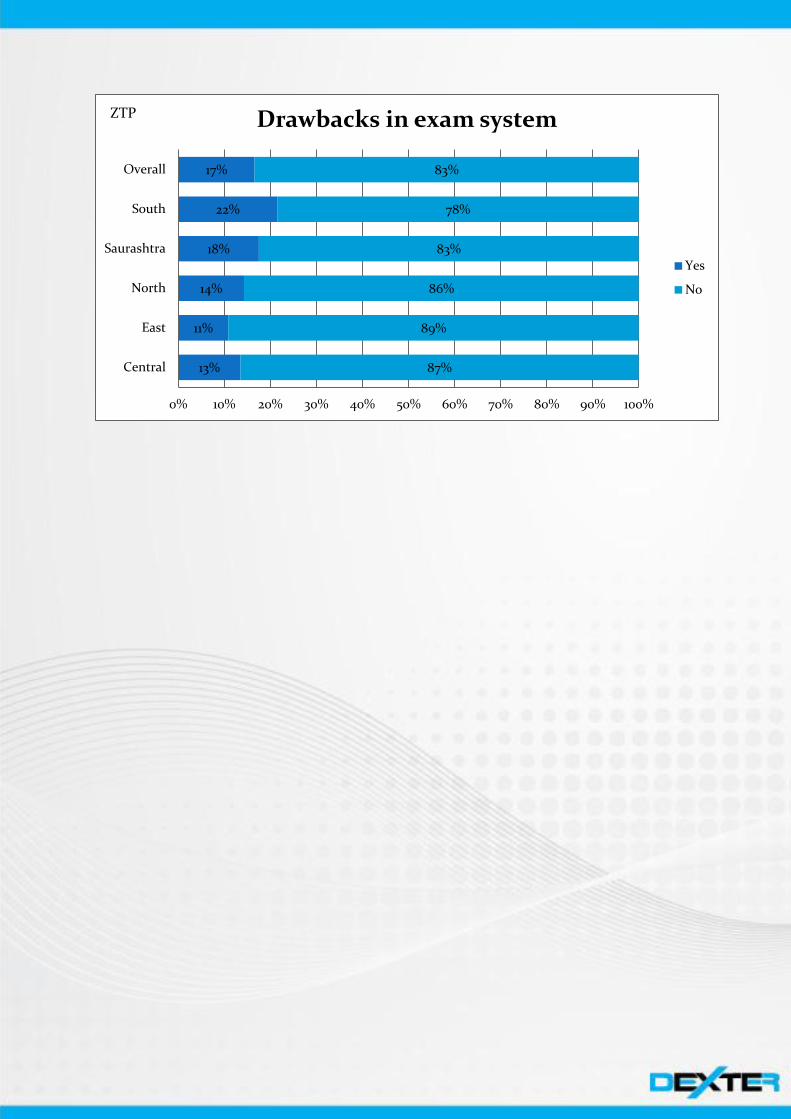
13%
11%
14%
18%
22%
17%
87%
89%
86%
83%
78%
83%
0% 10% 20% 30% 40% 50% 60% 70% 80% 90% 100%
Central
East
North
Saurashtra
South
Overall
Drawbacks in exam system
Yes
No
ZTP

Reason of Drawback
The above 17 percent of the respondents cited various reasons for the flaws prevailing in the
examination system carried by SCOPE. The significant ones are less time being given to write
the exam which ends with students not finishing paper on time, audio facilities not being proper
that detains students to hear properly, exam time being inconvenient, improper seating
arrangements, computer devices not working properly, delay in exam that discourages
students, no proper guidance and instructions given prior to exam. Other reasons indicated by
the respondent beneficiaries were exam centre being very far, unavailability of proper material
etc.
The beneficiaries admitted to ZTPs majorly complain about the time given to complete the
examination not being ample. It is indicated that several beneficiaries from college centres of
Northern region cited that they weren’t provided with sufficing level of instruction. Several
other reasons are indicated in the following chart.
17%
16%
14% 12%
13%
9%
8% 11%
Reasons of Drawbacks
Less time to write the exam
Audio facilities weren't proper
Exam time was not convenient
Seating arrangement was not proper
Computer was not working properly
Exam was delayed
Instructions weren't properly provided
Others
Base 69

6%
9%
4%
7%
33%
45%
15%
13%
35%
17%
13%
18%
27%
17%
7%
18%
7%
20%
18%
13%
67%
4%
40%
24%
22%
0% 20% 40% 60% 80% 100%
Central
North
Saurashtra
South
Overall
Reasons of Drawbacks Less time to write the exam
Audio facilities weren't proper
Exam time was not convenient
Seating arrangements was not proper
Computer was not working properly
Exam was delayed
Instructions weren't properly provided
Others
College
100%
43%
43%
19%
17%
100%
4%
24%
22%
14%
13%
0% 20% 40% 60% 80% 100%
Central
Saurashtra
South
Overall
Reasons of Drawbacks
Less time to write the exam
Audio facilities weren't proper
Exam time was not convenient
Computer was not working properly
Instructions weren't properly provided
ZTP
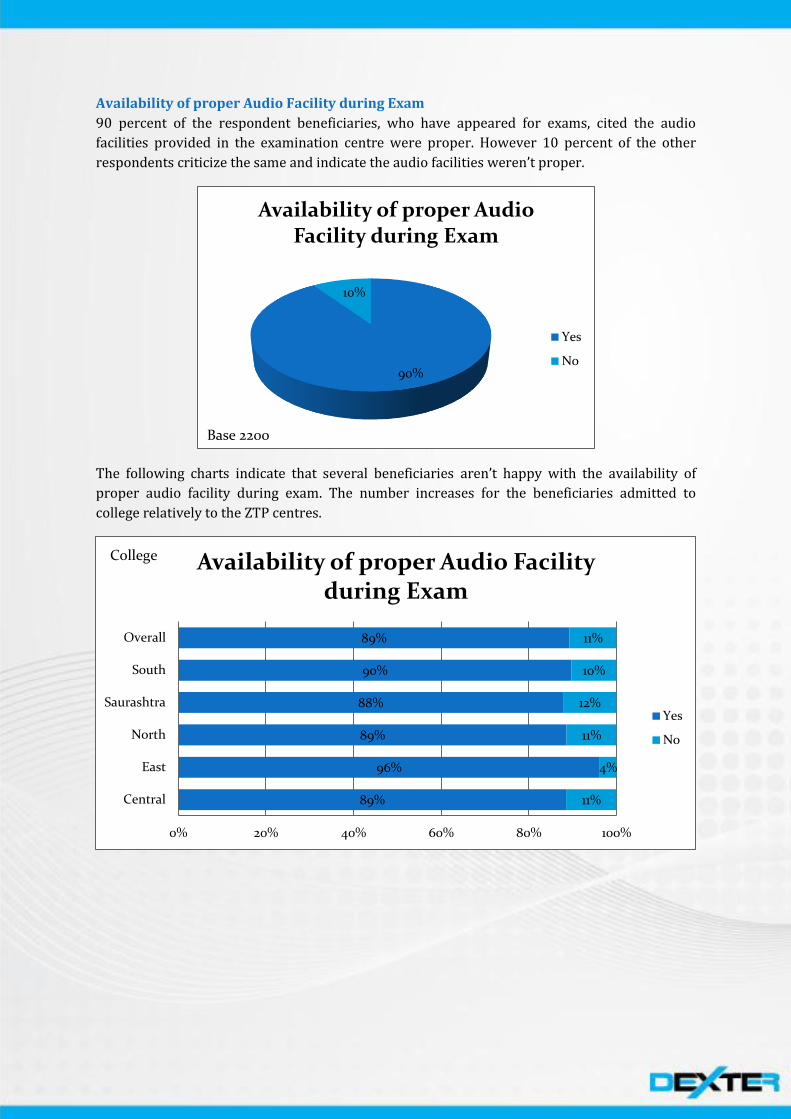
Availability of proper Audio Facility during Exam
90 percent of the respondent beneficiaries, who have appeared for exams, cited the audio
facilities provided in the examination centre were proper. However 10 percent of the other
respondents criticize the same and indicate the audio facilities weren’t proper.
The following charts indicate that several beneficiaries aren’t happy with the availability of
proper audio facility during exam. The number increases for the beneficiaries admitted to
college relatively to the ZTP centres.
90%
10%
Availability of proper Audio Facility during Exam
Yes
No
Base 2200
89%
96%
89%
88%
90%
89%
11%
4%
11%
12%
10%
11%
0% 20% 40% 60% 80% 100%
Central
East
North
Saurashtra
South
Overall
Availability of proper Audio Facility during Exam
Yes
No
College

98%
91%
93%
94%
86%
93%
2%
9%
7%
6%
14%
8%
0% 10% 20% 30% 40% 50% 60% 70% 80% 90% 100%
Central
East
North
Saurashtra
South
Overall
Availability of proper Audio Facility during Exam
Yes
No
ZTP

Problems in Audio Facility during Exam
59 percent of the respondents amongst the above 10 percent who cited that the audio facility
during the examination wasn’t proper said the clarity was missing, while other 33 percent said
the headphones weren’t working properly. Other 6 percent respondents cited that speech of the
speaker wasn’t proper and rest 2 percent said the computer device wasn’t working properly.
The major constraint observed while hearing through the audio system majorly revolves
around the audio quality being unclear. Other significant issue faced by several beneficiaries is
inefficiency of the headphone.
59%
33%
6% 2%
Problems in Audio Facility
Audio was not clear
Headphones not work properly
Speed was not good
Problem in computer
Base 46
50%
17%
6%
50%
50%
64%
67%
58%
43%
36%
17%
33%
7%
3%
0% 20% 40% 60% 80% 100%
Central
North
Saurashtra
South
Overall
Problems in Audio Facility
Speed was not good
Audio was not clear
Headphones not work properly
Problem in computer
College

11%
8%
100%
100%
56%
67%
33%
25%
0% 20% 40% 60% 80% 100%
Central
Saurashtra
South
Overall
Problems in Audio Facility
Speed was not good
Audio was not clear
Headphones not work properly
ZTP

Received Result on Time
92 percent of the respondent beneficiaries, who have appeared for exams, received the results
on time. However 8 percent haven’t yet received their results or were provided results very late.
The following charts indicate that several beneficiaries didn’t receive the result on time. The
number increases for the beneficiaries admitted to college relatively to the ZTP centres,
especially in the East.
92%
8%
Received Result on Time
Yes
No
Base 2193
98%
82%
90%
96%
91%
91%
2%
18%
10%
4%
9%
9%
0% 10% 20% 30% 40% 50% 60% 70% 80% 90% 100%
Central
East
North
Saurashtra
South
Overall
Received Result on Time
Yes
No
College

99%
96%
96%
98%
92%
96%
1%
4%
4%
2%
8%
4%
0% 10% 20% 30% 40% 50% 60% 70% 80% 90% 100%
Central
East
North
Saurashtra
South
Overall
Received Result on Time
Yes
No
ZTP

Delay in receiving result
50 percent of the respondents amongst the above 8 percent who didn’t receive the examination
result on time said that their result got delayed by three to six months, while other 10 percent
said it took them more than six months to receive the result. The rest 40 percent cited that they
haven’t received the result yet. Again here delay by one month is still permissible and
acceptable however delay more than that will reduce the motivation of the student from the
scheme.
It is notable that several beneficiaries didn’t receive their results of the final examination in
Saurashtra and Central Gujarat. Also several beneficiaries received the same after six months
from the date of examination specifically those in the college centres of Southern and Eastern
region.
40%
50%
10%
Delay in Results
Don't get the result
<= 6 Months
> 6 Months
Base 2193
75%
57%
49%
17%
100%
21%
100%
40%
8%
21%
11%
0% 20% 40% 60% 80% 100%
Central
East
Saurashtra
South
Overall
Delay in Results
Don't get the result
<=6 Months
>6 Months
College
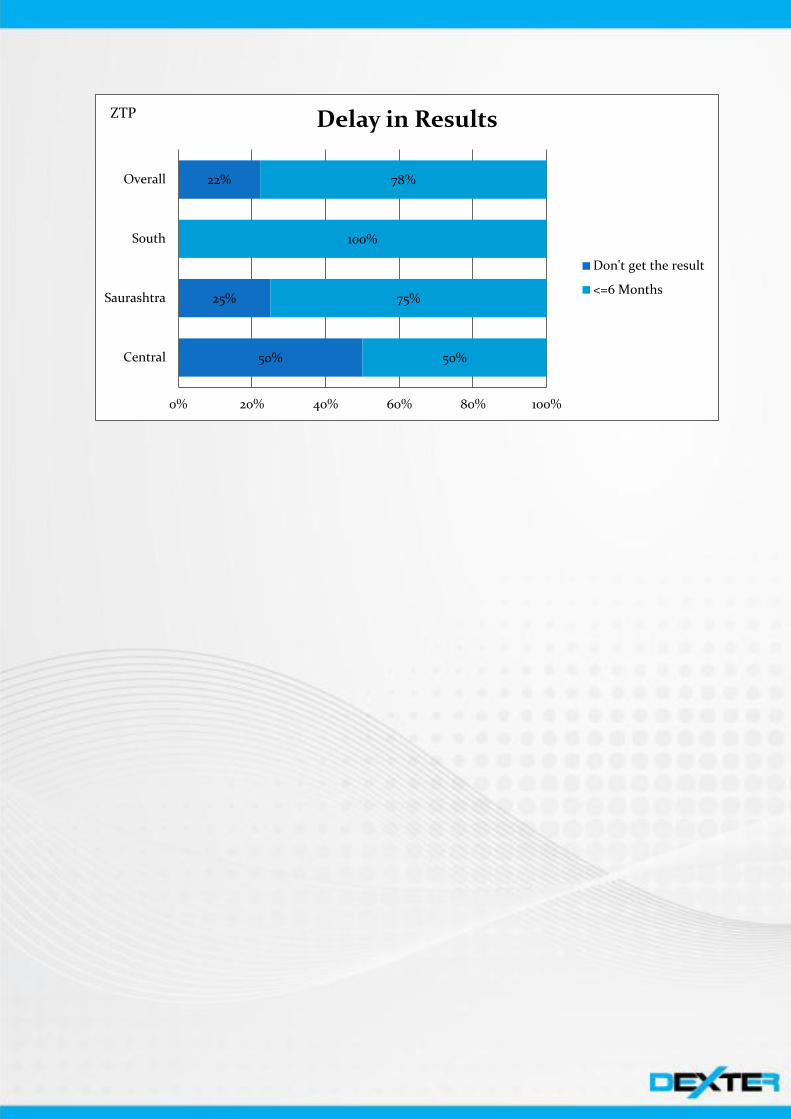
50%
25%
22%
50%
75%
100%
78%
0% 20% 40% 60% 80% 100%
Central
Saurashtra
South
Overall
Delay in Results
Don't get the result
<=6 Months
ZTP

Need of Improvement and Aspects that require Improvement
23 percent of the respondent beneficiaries are happy and satisfied with the things and process
prevailing under the scheme of SCOPE and do not suggest any further need of improvement.
However rest 77 percent are not happy with the overall approach and suggested improvements
in the same.
We observe several beneficiaries indicating the need of improvement in the scheme especially
the ones who have been admitted at ZTP centres of the North and South region.
23%
77%
Need of Improvement
Yes
No
Base 2309
39%
56%
45%
30%
45%
61%
44%
55%
70%
55%
0% 10% 20% 30% 40% 50% 60% 70% 80% 90% 100%
East
North
Saurashtra
South
Overall
Need of Improvement
Yes
No
College
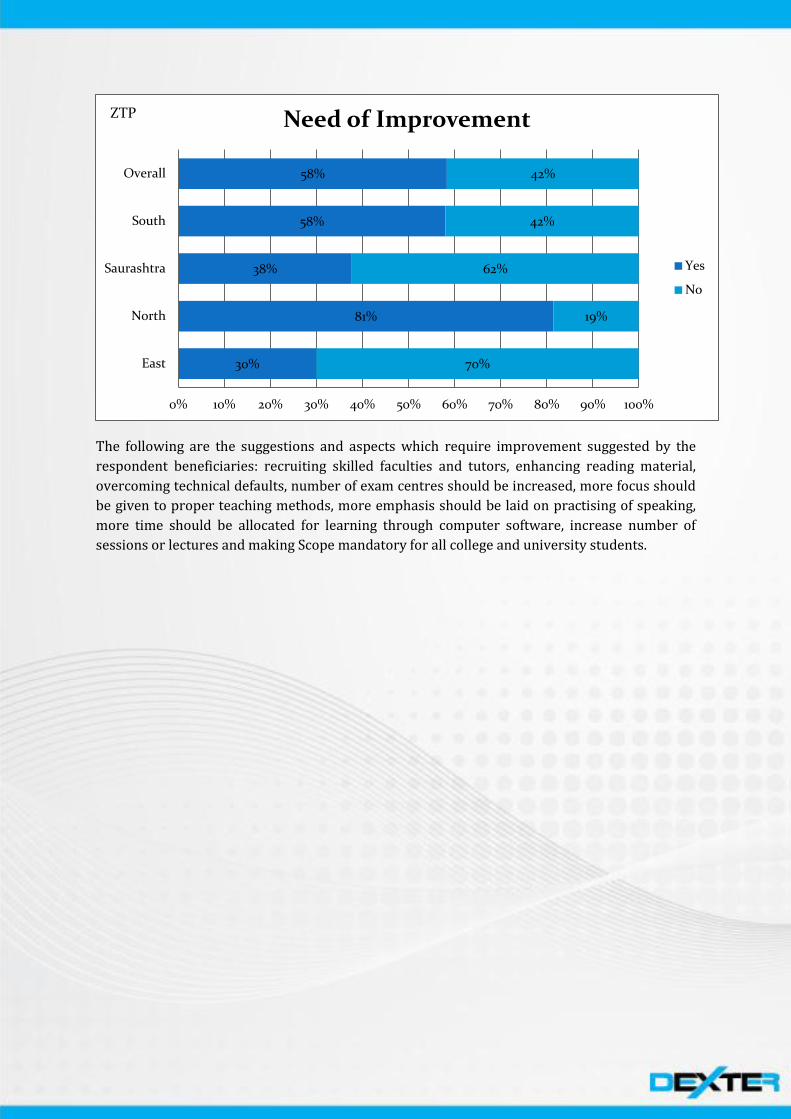
The following are the suggestions and aspects which require improvement suggested by the
respondent beneficiaries: recruiting skilled faculties and tutors, enhancing reading material,
overcoming technical defaults, number of exam centres should be increased, more focus should
be given to proper teaching methods, more emphasis should be laid on practising of speaking,
more time should be allocated for learning through computer software, increase number of
sessions or lectures and making Scope mandatory for all college and university students.
30%
81%
38%
58%
58%
70%
19%
62%
42%
42%
0% 10% 20% 30% 40% 50% 60% 70% 80% 90% 100%
East
North
Saurashtra
South
Overall
Need of Improvement
Yes
No
ZTP
Annexure Gujarat Social Infrastructure Development Society, Govt. of Gujarat
http://gujhd.gujarat.gov.in/
Gujarat Socio Economic Profile, 2013
http://gujecostat.gujarat.gov.in/wp-content/uploads/2013/34%20-
%20Socio%20Economic%20Review%20%28English%29.pdf
Introduction to SCOPE
http://www.dnaindia.com/india/report-scope-fails-to-realise-gujarat-govt-s-english-
language-dream-1770583 (Last Accessed: 23 August 2014)
http://timesofindia.indiatimes.com/india/Society-for-Creation-of-Opportunity-
through-Proficiency-in-English-head-keen-to-replicate-project-across-India-seeks-time-
with-Modi/articleshow/37619555.cms (Last Accessed: 23 August 2014)
http://www.scopegujarat.org/ (Last Accessed: 23 August 2014)
Centre For Innovations in Public Systems Report,
(https://www.google.co.in/url?sa=t&rct=j&q=&esrc=s&source=web&cd=8&cad=rja&ua
ct=8&ved=0CE0QFjAH&url=http%3A%2F%2Fwww.cips.org.in%2Fpublic-sector-
systems-government-innovations%2Fdownload-innovations-as-
pdf.php%3Fid%3D17&ei=fCPjU9fdLsmMuATZvYJg&usg=AFQjCNFYMqaJhb8kiCsElnLr__
6y4xAtvA&sig2=WYYFdzwOJXKZFqlizxQC2A&bvm=bv.72676100,d.c2E) (Last Accessed:
16 August 2014)
SCOPE Information Dissemination document