Embed Size (px)
Citation preview

Report on Pradhan Mantri
Yojana (PMMY) Survey 2018
Labour Bureau Ministry of Labour & Employment
Government of India

Report on
Pradhan Mantri MUDRA
Yojana (PMMY)
Survey
(2018)
GOVERNMENT OF INDIA
MINISTRY OF LABOUR & EMPLOYMENT
LABOUR BUREAU
CHANDIGARH


Foreword
Financial Inclusion is very much essential for sustainable and
inclusive growth. The main aim behind the financial inclusion is to cover all
sections of population under financial and banking services. Government of
India (GOI) has introduced some major steps to funding the unfunded micro
enterprises segment through a new financial inclusion initiative like Pradhan
Mantri Mudra Yojana (PMMY). Pradhan Mantri Mudra Yojana (PMMY) was
launched on April 8, 2015 by the Hon’ble Prime Minister Shri. Narendra
Modi to provide funding to the non-corporate small business sector through
various Financial Institutions like Banks, NBFCs and MFIs.
In order to assess employment generation under Pradhan Mantri
Mudra Yojana (PMMY), Ministry of Labour & Employment has taken a
decision to initiate a survey for this purpose. Labour Bureau, an attached
office of the Ministry, has been entrusted with this Survey work. Report of
this survey contains detailed information on generation of employment in
different sectors broadly categorized as manufacturing, services, allied
agriculture, trading and other sectors excluding agriculture which have been
assisted under the PMMY.
I am confident that this report will help policy-makers and Central
Government/ State Governments, research scholars and other stakeholders
for making effective policies for the Labour Market. This Report is the
outcome of efforts made by Expert Group under the chairmanship of Dr. B.
N. Nanda, Principal Labour & Employment Advisor, MoL&E. In particular, I
express my gratitude to Dr. B.N. Nanda & other members of Expert Group
for extending necessary guidance and valuable suggestions all through the
survey. I am also grateful to Ministry of Labour and Employment for giving
the onerous responsibility of conducting the Pradhan Mantri Mudra Yojana
(PMMY) Survey.
I appreciate the efforts of the officers of Labour Bureau who were
associated with PMMY survey in reaching towards its objective of the survey.
I am also thankful to all the selected lending institutions like

Banks/MFI/NBFCs for providing useful information on employment and
extending cooperation to our field officers during the survey. We look forward
to your kind suggestions/comments to enrich the report further.
Chandigarh (Amar Singh)
October, 2019 Director General

INDEX
Report on Pradhan Mantri MUDRA Yojana (PMMY) Survey
Executive Summary
2-3
Chapter-I Introduction 4-8
Chapter-II Sample Characteristics 9-19
Chapter-III Employment Estimates 20-26
Annexure I Concepts and Definitions 27-33
Annexure II Sampling Design & Estimation Procedure 34-39
Annexure III Description of Activity as per NIC-2008 40-41
Annexure IV Schedules of Enquiry 42-50
Annexure V Detailed Tables 51-78
Annexure VI Constitution of Expert Group 79-81

A Note on Using PMMY Estimates
The field work of present survey was carried out from 10 April
2018 to 30 Nov 2018 to estimate employment generation through
PMMY. The reference period for present survey was from 08 April
2015, the launch date of MUDRA, to the day preceding to the date
of survey.
Complete list of 1.4 lakh branches of Banks/MFI/NBFCs was used
as frame for drawing a sample of 5318 branches. The list included
branches which were not involved in disbursement of Loan under
MUDRA. As the information on branch wise loan disbursal was not
readily available, it was not possible to exclude the branches having
no beneficiary under MUDRA from the frame. In the total sample of
5318, around 820 branches did not disburse Loan under MUDRA.
The state wise estimates are provided only for States/UTs having at
least 100 number of beneficiary accounts (combined for FY 15-16,
16-17 & FY 17-18 till Dec 2017), which accounted for 99.3% of the
total loan sanctioned, under PMMY (25 States/UTs) and remaining
11 States/UTs are grouped under residual for arriving at all India
estimates.
PMMY Survey results need to used strictly in light of note
above and limitations mentioned at para 1.10, Chapter I

2 Report on Pradhan Mantri Yojna (PMMY) Survey-2018
Executive Summary
PMMY Survey provides All India & State-wise estimates for 25 major States
& UTs accounting for 99 percent of amount of total MUDRA Loan
sanctioned till December, 2017. Remaining 11 States/UTs were grouped
under residual for providing all India estimate.
The field work of the survey was spread over April, 2018 to November, 2018.
Under PMMY survey, the list of beneficiaries under MUDRA from 08 April,
2015 (date of launch of MUDRA scheme) to the date of survey of branch of
Bank/MFI/NBFCs was used for selection of sample beneficiary.
The data on employment and other characteristics was captured for the
establishments owned by the beneficiaries who availed the MUDRA Loan.
The main objective of MUDRA was financial inclusion by funding the
unfunded. As per the survey results, the MUDRA Scheme helped in
generation of 1.12 crore net additional employment during a period of
approximately 3 years (i.e. from 2015 to 2018).
Estimates
As on the date of survey, around 5 crore persons (3.1 crore Self-employed
and 1.95 crore Hired worker) were working in establishments, for which
MUDRA loan was availed. The findings reveal that these loans enabled
beneficiaries to sustain the economic activities they were engaged in.
As per the survey results the Shishu Loan (Loan upto Rs 50,000) accounted
for nearly 65 percent of the estimated net additional employment. Thus, the
small loan beneficiaries were not only able to sustain the establishments/
work already engaged in (for which the loan was availed) but were also able
to generate 73.9 lakh of estimated additional employment during the said
period. Further, Kishore loan (Loan above 50,000 & upto 5 lakh) accounted
for 21.11 lakh and Tarun loan (Loan above 5 lakh & upto10 lakh) accounted
for 16.96 lakh of additional employment.

3 Report on Pradhan Mantri Yojna (PMMY) Survey-2018
Out of 1.12 crore net additional employment, 43.03 lakh (38%) were Male
and 68.92 lakh (62%) were Female.
Of the 68.92 lakh increase in Female worker, maximum estimated increase
was reported in Shishu Loan (63.04 lakh) followed by Kishore (4.52 lakh)
and Tarun (1.36 lakh). Whereas, in case of Male (43.03 lakh), the maximum
estimated increase was reported in Kishore ( 16.59 lakh) followed by Tarun
(15.61 lakh) and Shishu (10.87 lakh).
Services (other than Trading) recorded highest addition of employment of
38.46 lakh followed by Trading (37.21 lakh), Allied-Agri (22.77 lakh),
Manufacturing (13.1 lakh) & Others excluding Agriculture (0.45) lakh.
The complete list of around 1.4 lakh branches of banks/MFIs/NBFCs at all
India was considered for selection of branches for the survey. A total of 5318
branches (3011- Rural: 2307- Urban) of Banks & MFI/NBFCs were surveyed
at all India level.
Sample
A total of 96996 beneficiaries were surveyed from 5318 branches at all India
level.
Out of 96996 beneficiaries, detailed schedule was canvassed for 94375
beneficiaries (remaining beneficiaries were either misclassified by lending
institutions or found to be casualty).
Of the total 94375 beneficiaries surveyed, 64240 belong to Shishu, 22599
were from Kishore and 7536 from Tarun category of loan.
39424 from OBC followed by, 32088 from others, 17411 from SC and 5452
from ST Category were surveyed.
There were 50537 female beneficiaries & 43838 male beneficiaries in the
sample.

4 Report on Pradhan Mantri Yojna (PMMY) Survey-2018
Chapter – I
Introduction
1.1 Labour Bureau, an attached Office of Ministry of Labour & Employment
has been collecting and disseminating information on various facets of labour
such as wages, earnings, productivity, absenteeism, labour turn-over,
industrial relations, working and living conditions and evaluation of working of
various labour enactments. Information disseminated by Labour Bureau plays
an important role for the Government for formulation and implementation of
employment policies and procedures in the country. Labour Bureau works
independently and with high professional standards to provide relevant, timely
and reliable labour statistics in the country as well as to International
organizations.
1.2 Labour Statistics play an essential role for the formulation and evaluation
of policies, which helps in increasing understanding of problems, explain
actions and mobilize interests related to employment in the country.
Employment emerges as one of the key indicator for achieving the Sustainable
Development Goals (SDGs). Therefore, Government of India (GoI) has adopted a
multidimensional approach to generate employment opportunities through
various several self-employment programmes. With a view to generate credible
data on employment creation under PMMY, Labour Bureau has conducted a
large-scale survey across all major State/UTs to provide estimates of
employment generation under PMMY.
About Pradhan Mantri MUDRA Yojana Survey:
1.3 Micro Units Development and Refinance Agency Ltd. (MUDRA) is a Non Banking
Finance Company (NBFC) supporting development of micro enterprise sector in the
country. MUDRA provides refinance support to Banks/Micro Finance Institutions
(MFI/NBFCs) for lending to micro units having loan requirement upto 10 lakh.

5 Report on Pradhan Mantri Yojna (PMMY) Survey-2018
MUDRA provides refinance to micro business under the Scheme of Pradhan Mantri
MUDRA Yojana and other products for development support to the sector.
An amount of ` 5.71 lakh crore has been sanctioned under the programme, benefiting
nearly 12.27 crore loan accounts, in the first three years of the programme (From 08
April 2015 to 31 March 2018) {source: Annual Report of MUDRA 2017-18}. Under
the aegis of Pradhan Mantri Mudra Yojana (PMMY), MUDRA has created products /
schemes to signify the stages of development and funding needs of the beneficiary
{micro unit / entrepreneur} and also provide a reference point for the next phase of
graduation / growth to look forward to. The interventions have been named 'Shishu',
'Kishore' and 'Tarun'
Shishu: covering loans upto ₹50,000/-
Kishore: covering loans above ₹50,000/- and upto ₹5 lakh
Tarun: covering loans above ₹5 lakh and upto ₹10 lakh
1.4 PMMY survey is an establishment survey for capturing the information on
generation of employment mainly under broad economic activity categories
such as manufacturing, services (other than trading), allied agriculture,
trading and any other sectors excluding agriculture which have been assisted
under the PMMY.
1.5 Ministry of Labour & Employment constituted an Expert Group under the
Chairmanship of Dr. B N Nanda, Principal Labour & Employment Advisor,
Ministry of Labour & Employment with other experts on the subject as
members, for guiding Labour Bureau in respect of technicalities of the survey
such as schedules of inquiry, sampling design, instruction manual & other
technical details of the survey. Composition of the Expert group is annexed
(Annexure-VI).

6 Report on Pradhan Mantri Yojna (PMMY) Survey-2018
Objective:
1.6 Objective of the PMMY survey is to provide employment estimates under
MUDRA loans i.e. Estimation of Employment generation in all non-farm
economic activities under Pradhan Mantri MUDRA Yojana (PMMY).
Scope and Coverage:
1.7 In order to target one lakh beneficiaries under PMMY survey the Expert
Group recommended, a total sample of around 5318 First Stage Units (FSUs)
i.e. Banks/MFI/NBFCs branches, which was further allocated in all 36
States/UTs based on amount of loan disbursed under MUDRA Yojana as on
31st December, 2017. Further, listing schedule (Schedule-A) has been
canvassed by field investigators by visiting the selected Bank/MFI/NBFCs
branch and 13 Shishu, 6 Kishore, 6 Tarun loan beneficiaries amounting to 25
beneficiaries per Bank/MFI/NBFCs branch have been selected for canvassing
detailed beneficiary schedule (Schedule-B). In case, number of beneficiaries
listed in each loan type category or in total was less than desired number,
same was canvassed by investigator by applying short-fall criteria. (Details
provided in Annexure-II)
Sampling Frame:
1.8 The frame for first stage units (branch of lending institutions i.e. Banks or
MFIs or NBFCs) for the survey has been taken from the MUDRA/RBI as on 31st
December, 2017. The beneficiaries of the loan from different banks have been
covered as different accounts under 'Shishu', 'Kishore' and 'Tarun’ accounts
who availed loans as Micro enterprises.

7 Report on Pradhan Mantri Yojna (PMMY) Survey-2018
Schedule / Questionnaire of the Survey:
1.9 The schedules for PMMY contains information on identification particulars
of FSU and beneficiary, list and record of beneficiaries, details and sources of
loans and category/gender wise details of employment generated under
MUDRA loans. The detailed schedules of inquiry i.e. listing schedule
(Schedule-A) and beneficiary schedule (Schedule-B) are placed at Annexure-IV
Limitations of PMMY Survey:
1.10 In this survey every effort has been made to reduce and minimize
sampling and non-sampling errors by way of carefully designing the
questionnaire, training the field & supervisory staff, data validations and
efficient operating procedures. However, the estimates of PMMY survey are
based on sample survey having some limitations as mentioned below:
(i) The PMMY survey is essentially an establishment survey for collecting
information on employment status through sample beneficiaries under
MUDRA loans as reported by Banks/MFI/NBFCs. PMMY survey does not
provide any information on overall employment and unemployment in the
country like other household and enterprise surveys.
(ii) A beneficiary under MUDRA loan might have MUDRA Loan account in
different branches of the same/different banks/MFI/NBFCs. In the
absence of any unique identifier to assess such cases, present survey could
not capture such cases.
(iii) The PMMY survey does not capture information on generation of
employment in agriculture sector as Loan under MUDRA Scheme excludes
Agriculture Sector.
(iv) The reference period for the present survey was from April, 2015 (the
launch date of MUDRA) to the day preceding to the date of survey.
Therefore, yearly estimates could not be provided under PMMY survey.

8 Report on Pradhan Mantri Yojna (PMMY) Survey-2018
(v) The survey is based on either record or response of the Banks/MFI/NBFCs
and beneficiaries.
(vi) No Loan under MUDRA was disbursed in around 15% of the branches of
banks/MFI/NBFCs surveyed, as on the date of survey of the branch. As
such they were treated as Zero Cases; (around 820 branches out of total
5318 branches).
(vii) Out of 96996 MUDRA Loan beneficiaries around 2300 cases of
misclassification of other loans (like Personal loan/Gold Loan/other non-
productive loan) as MUDRA loans along with non-response were found
during detailed inquiry of sample beneficiaries. Subsequently these cases
were omitted and detailed schedule of 94375 beneficiaries was canvassed.

9 Report on Pradhan Mantri Yojna (PMMY) Survey-2018
Chapter –II
SAMPLE CHARACTERISTICS
2.1 The Survey of Estimation of Employment generation under Pradhan
Mantri MUDRA Yojana (PMMY), was spread over April, 2018 to November, 2018
and covered all the MUDRA loan beneficiaries from 08 April, 2015 (Launch of
PMMY) to the date of survey of banks/MFIs/NBFCs branches. The present
survey report provides sample characteristics of First Stage Units(FSUs),
beneficiaries by type of loan, by type of lending institutions, by gender and
sector-wise, by social group, by level of education, by broad economic activity,
by awareness and expansion of establishments. Detailed Tables are presented
in the Annexure-V.
2.2 In the present survey, the state wise estimates are provided only for 25
states which were having at least 100 accounts (combined for Financial Year
2015-16, 2016-17 & 2017-18 till Dec 2017), which together accounts for 99.3%
of the Loan Sanctioned, under PMMY till Dec 2017 and remaining 11
States/UTs are grouped under Rest of the States/UTs (residual stratum), for
generating all India estimates. The data as on Dec 2017, on number of
accounts and Loan disbursed under MUDRA, was utilised for allocation of
sample size over various strata (i.e. State X Type of lending Institute etc) ,
explained in detail in Sampling Design and Estimation Procedure: Annexure-
II, Whereas the reference period used for survey was the date of launch of the
MUDRA Scheme, i.e. 08 April 2015, to the date of Survey.
2.3 Out of the total 144461 branches of Banks/MFIs/NBFCs , 5318 branches
as a First Stage Units were surveyed at all India. The total of 5318 was
allocated to the states (Table 2.1) in proportion to the Amount of MUDRA Loan
sanctioned by the states till Dec 2017. The maximum branches were allocated
to the state of Karnataka followed by Tamil Nadu and Maharashtra.

10 Report on Pradhan Mantri Yojna (PMMY) Survey-2018
Table-2.1: Number of First stage Units i.e. branches of Banks / MFI’s /
NBFCs Surveyed.
Sl No Name of State/UTs Surveyed branches of Banks/MFIs/NBFCs
(1) (2) (3)
1 Karnataka 573
2 Tamil Nadu 562
3 Maharashtra 469
4 Uttar Pradesh 491
5 West Bengal 399
6 Bihar 286
7 Madhya Pradesh 321
8 Rajasthan 223
9 Odisha 244
10 Gujarat 226
11 Andhra Pradesh 217
12 Kerala 206
13 Punjab 149
14 Assam 129
15 Haryana 123
16 Jharkhand 102
17 Telangana 127
18 Delhi 100
19 Chhattisgarh 103
20 Uttarakhand 65
21 J & K 64
22 Himachal Pradesh 35
23 Tripura 26
24 Puducherry 15
25 Goa 10
Rest of the States/UTs 53
All India 5318

11 Report on Pradhan Mantri Yojna (PMMY) Survey-2018
2.4 In the 5318 branches, a total of 96996 beneficiaries were surveyed. Out of
the 96996 beneficiaries the information on employment & establishment
characteristics has been collected for 94375 beneficiaries. Remaining
beneficiaries are either Non-response or have reported to have availed the loan
for purpose other than pursuing income generating activity.
2.5 Out of the total 94375 beneficiaries surveyed, 53181 (56%) were from
Public sector banks followed by 30327 (32%) from MFIs/NBFCs and 10867
(12%) from Private sector banks (Figure 2.1).
Figure 2.1: MUDRA beneficiaries surveyed by banks/MFIs/NBFCs
2.6 BENEFICIARIES BY TYPE OF LOAN
Out of the total beneficiaries surveyed under PMMY, 64240 (68%) of
beneficiaries were surveyed from Shishu loan, followed by 22599 (24%) from
Kishore loan and 7536 (8%) were from Tarun category of loan Figure 2.2.
56%12%
32%
Public Banks Private Banks MFI/NBFCs

12 Report on Pradhan Mantri Yojna (PMMY) Survey-2018
Figure 2.2: Beneficiaries surveyed by type of loan
2.7 BENEFICIARIES BY TYPE OF LENDING INSTITUTIONS
Table 2.2: Number of Beneficiaries surveyed by type of loan by lending
institutions
Loan Type Public Bank Private Bank MFI/NBFCs Total
Shishu 27631 7486 29123 64240
Kishore 19380 2089 1130 22599
Tarun 6170 1292 74 7536
Total 53181 10867 30327 94375
As reveled in table 2.2, as far as different types of MUDRA Loan lending
institutions under Shishu category are concerned maximum numbers of
beneficiaries surveyed were from MFIs/NBFCs followed by Public Bank and
68%
24%8%
MUDRA beneficiaries surveyed
Shishu Kishore Tarun

13 Report on Pradhan Mantri Yojna (PMMY) Survey-2018
Private bank. However, under Kishore and Tarun category of loan, maximum
numbers of beneficiaries surveyed were from Public bank followed by Private
bank and MFI/NBFCs. Under Tarun Loan category only 74 beneficiaries were
surveyed in MFIs/NBFCs. Overall the maximum beneficiaries surveyed were
from Public bank (53181) followed by MFI/NBFCs (30327) and Private Bank
(10867) Table 2.2.
As depicted in Figure 2.3, among the beneficiaries surveyed, the
proportion of Shishu beneficiaries was around 96% in MFIs/NBFCs followed by
69 % in Private sector Banks and around 52 % in Public sector Banks. The
proportion of Kishore beneficiaries surveyed was approximately 36% in Public
sector banks followed by 19 % in Private sector banks and around 4 % in
MFIs/NBFCs whereas proportion of Tarun beneficiaries surveyed was around
12% each in Public & Private sector banks respectively whereas it was almost
negligible in MFIs/NBFCs.
Figure 2.3: Distribution of beneficiaries surveyed by type of loan, by lending
institutions under PMMY survey
0% 20% 40% 60% 80% 100%
Public Bank
Private Bank
MFI/NBFCs
Shishu
Kishore
Tarun

14 Report on Pradhan Mantri Yojna (PMMY) Survey-2018
2.8 BENEFICIARIES BY SECTOR AND GENDER
Table 2.3: Sector–wise and Gender-wise distribution of beneficiaries
Sector Male Female Overall
Rural 19541 31024 50565
Urban 24297 19513 43810
Rural+ Urban 43838 50537 94375
The tables 2.3 (figure 2.4) gives sector-wise and gender- wise distribution of the
beneficiaries surveyed. Out of total 94375 surveyed beneficiaries, 43838 (46%)
were found to be male and 50537 (54%) were female. Similarly In rural sector,
out of the surveyed beneficiaries’ proportion of female beneficiaries (61%) was
found to be more in comparison to male beneficiaries (39%). Whereas in urban
sector the proportion of the male beneficiaries (55%) surveyed was higher in
comparison to female beneficiaries (45%).
Figure 2.4: Sector-wise & Gender-wise distribution of MUDRA beneficiaries
surveyed
39 55
61 45
Rural Urban
MUDRA beneficiaries surveyed by Sector & Gender
Female
Male

15 Report on Pradhan Mantri Yojna (PMMY) Survey-2018
2.9 BENEFICIARIES BY SOCIAL GROUP
Table 2.4: Number of beneficiaries under PMMY survey by Social group
Social Group Beneficiaries Surveyed
Schedule Tribe 5452
Schedule Caste 17411
Other Backward Classes 39424
Others 32088
Total 94375
Going by the social group of the beneficiaries surveyed, the maximum numbers
of beneficiaries were from other backward classes 39424 (42%), followed by
others 32088 (34%), schedule caste 17411 (18%) and schedule Tribe 5452 (6
%). (Table 2.4 and figure 2.5)
Figure 2.5: MUDRA beneficiaries surveyed by Social Group
2.10 BENEFICIARIES BY LEVEL OF EDUCATION
Out of the total beneficiaries surveyed, around 70% of the beneficiaries were
having secondary and below level of education as reported under PMMY survey.
Out of the total beneficiaries reported under secondary & below education level,
significant number of beneficiaries was reported under ‘below secondary
6%
18%
42%
34%
Schedule Tribe Schedule Caste Other Backward Classes Others

16 Report on Pradhan Mantri Yojna (PMMY) Survey-2018
category’ of education. About 15 % of reported beneficiaries under this survey
were Graduate and above. About 6,000 beneficiaries were reported under not
literate category.
Figure 2.6: Number of MUDRA beneficiaries surveyed by level of education
2.11 BENEFICIARIES BY BROAD ECONOMIC ACTIVITY
Almost two third of the sample beneficiaries have reported to utilize the loans
for Services and Trading activities. The Trading activity alone accounted for
the highest percentage of MUDRA loan beneficiaries surveyed (44.03%) followed
by Services (other than trading) (30.3%), Allied Agriculture (15.6%),
Manufacturing (9.8%) and others excluding agriculture (0.32%).
Figure 2.7: Distribution of MUDRA beneficiaries surveyed by Broad Economic
Activity
Not
lite
rate
Lite
rate
w
ithou
t fo
rmal
sc
hool
ing
Belo
w
Seco
ndar
y
Seco
ndar
y
High
er
Seco
ndar
y
Grd
uate
PG &
abo
ve
5911 9812
28767 21,541
14,239 11,561
2,544
9.830.3
15.6
44.030.32
Manufacturing Services (other than trading)Allied agriculture Trading

17 Report on Pradhan Mantri Yojna (PMMY) Survey-2018
2.12 BENEFICIARIES LISTED AND SURVEYED
Table 2.5: Beneficiaries Listed & Surveyed
Table Shishu Kishore Tarun Total
Total beneficiaries in
selected branches 3784161 113522 18379 3916062
Surveyed beneficiaries 64240 22599 7536 94375
Percentage of Beneficiaries
Surveyed 1.7% 20% 41% 2.41%
A total of 39.16 lakh MUDRA beneficiaries were listed in 5318 branches. Out
of which information on employment and other variables were collected for
94375 beneficiaries which is around 2.41 % of the total listed beneficiaries. In
case of Kishore and Tarun the sampling fraction (percentage of beneficiaries
surveyed) was to the tune of 20% & 41% respectively.
Figure 2.8: Beneficiaries Listed In Selected Branches & Beneficiaries Surveyed
0% 20% 40% 60% 80% 100%
Shishu
Kishore
Tarun
Total beneficiaries in selected branches
Surveyed beneficiaries

18 Report on Pradhan Mantri Yojna (PMMY) Survey-2018
2.13 AVERAGE AMOUNT OF LOAN AVAILED BY BENEFICIARIES
To lay emphasis on the growth and need, the MUDRA loan is categorised as
Shishu loan upto ₹50,000, Kishore loan from ₹50,001 and upto ₹5 lakh &
Tarun above ₹5 lakh and upto ₹10 lakh. The average amount of loan availed by
MUDRA beneficiaries under the present survey was found to be ₹8,08,112
under Tarun category followed by ₹2,14,649 under Kishore category and
₹36,315 under Shishu category of loan.
Figure 2.9: Average amount of loan availed by beneficiary under various
MUDRA loan categories
2.14 MUDRA AWARENESS
A question was put up to the beneficiaries regarding awareness about MUDRA
Scheme and further how they came to know about MUDRA (source of
awareness about MUDRA). Among the person who reported to know about
MUDRA, the maximum beneficiaries reported that their source of awareness
about MUDRA was through Banks/MFIs/NBFCs (37%) followed by friends &
relative (33%), another MUDRA beneficiaries (15%), advertisement (14%) and
Others (1%).
ShishuKishore
Tarun
₹ 36,315
₹ 2,14,649
₹ 8,08,112
Average Amount of Loan Availed by Beneficiary under various category

19 Report on Pradhan Mantri Yojna (PMMY) Survey-2018
Figure 2.10: Beneficiaries by Source of Awareness about MUDRA Scheme
2.15 UTILISATION OF MUDRA LOAN FOR EXPANSION OF
ESTABLISHMENT
Figure 2.11 depicts utilisation of MUDRA loan by beneficiaries. Among the
beneficiaries surveyed, 79 % reported that MUDRA loan was availed for
expansion of existing establishments and about 21% have taken MUDRA loan
for setting up of new establishments.
Figure 2.11: Beneficiaries by utilization of MUDRA loan.
Advertisement14%
Friends and Relative
33%
Another MUDRA
Beneficiary 15%
Banking/ NBFC 37%
Others1%
Source of Awareness about MUDRA Scheme
21%
79%
Utilisation of MUDRA loan by beneficiaries
Setting up new Establishment Expansion of existing Establishment

20 Report on Pradhan Mantri Yojna (PMMY) Survey-2018
Chapter –III
EMPLOYMENT ESTIMATES
3.1 The PMMY survey report presents key estimates of employment and
establishment related characteristics for the establishments owned by MUDRA
beneficiaries by type of economic activity, by loan category, by broad economic
activity, by gender and type of workers (self-employed or employee).
3.2 EMPLOYMENT BY TYPE OF LOAN & GENDER
The estimated increase in employment after availing MUDRA loan as reported
by the beneficiaries was found to be 1.12 crore (approx.). Around 29% of
estimated beneficiaries accounted for increase in employment. Among the
beneficiaries reporting increase in employment, the proportion of beneficiaries
under Shishu category (66%) was the highest followed by Kishore (19%) and
Tarun (15%) categories, as shown in Figure 3.1.
Figure 3.1: Percentage distribution of beneficiaries reporting an increase in
employment of 1.12 crore, by type of MUDRA loan.
15%
19%
66%
shishu
kishore
tarun

21 Report on Pradhan Mantri Yojna (PMMY) Survey-2018
3.3 ESTIMATED INCREASE IN EMPLOYMENT AFTER AVAILING MUDRA
LOAN
3.3.1: By Type of Loan & Gender
Out of the 1.12 crore of estimated increase in employment, female accounted
for 69 lakh (62%) and male accounted for 43 lakh (38%) . At overall level,
Shishu category of loan has about 66% of share among additional employment
generated by establishments owned by the MUDRA beneficiaries followed by
Kishore (19%) and Tarun (15%) categories respectively.
Table 3.1: Estimated Increase in Employment by Gender for different type of
Loan. (In lakh)
Type of Loan Male Female Total
Shishu 10.87 63.04 73.92 (66%)
Kishore 16.59 4.52 21.11 (19%)
Tarun 15.61 1.36 16.97 (15%)
Total 43.08 (38%) 68.92 (62%) 112 (100%)
Out of the total estimated increase of 73.92 lakh under Shishu category of loan
female accounted for 63.04 lakh (85 %) and male accounted for 10.87 lakh
(15%). On the other hand, under Kishore and Tarun category of loan male
beneficiaries accounted more for increase in employment i.e. 16.59 lakh (79%)
under Kishore and 15.61 lakh (15.61%) under Tarun Table3.1.

22 Report on Pradhan Mantri Yojna (PMMY) Survey-2018
Figure 3.2: Proportion of beneficiaries by gender for different type of MUDRA
loan.
3.3.2: By Broad Economic Activities
Table 3.2: Estimated Increase in Employment by Broad Economic Activities.
(In lakh)
Broad Economic Activities Shishu Kishore Tarun Total
Manufacturing 7.49 3.56 2.05 13.1 (11.7%)
Services
(Other than trading)
24.56 9.22 4.68 38.46 (34.4%)
Allied Agriculture 21.50 9.73 0.29 22.77 (20.3%)
Trading 20.25 7.19 9.76 37.21 (33.2%)
Others (Excluding Agriculture) 0.11 0.16 0.17 0.45 (0.4%)
Total 73.92 21.11 16.97 112 (100%)
The Services (Other than trading) and Trading activities together accounted for
almost 68 % share of total estimated increase in employment. Under Shishu
category of loans, maximum increase in employment was found to be in
Services (Other than trading) followed by Allied Agriculture and Trading
activities. Similarly, under Kishore category of loans, Allied Agriculture was
found to have highest share followed by Services (other than trading) and
0%
20%
40%
60%
80%
100%
Shishu Kishore Tarun
Male Female

23 Report on Pradhan Mantri Yojna (PMMY) Survey-2018
trading activities. However, Trading got the highest share in increase in
employment after availing MUDRA loan followed by services (other than
trading) under Tarun category of loan.
Figure 3.3: Distribution of beneficiaries by Type of Loan and by Broad
Economic Activity
3.3.3: By Type of Employment
Table 3.3: Employment for each category of employment (In lakh)
An estimated total of about 5 crore persons were employed in establishments
owned by MUDRA beneficiaries at all India level as on day previous to schedule
of enquiry. Out of which around 61 % (3.1 crore) were self-employed/working
owners including unpaid family members and rest 39% (1.9 crore)) were hired
workers.
0%10%20%30%40%50%60%70%80%90%
100%
Manufacturing Services (Other than trading)
Allied Agriculture Trading Others
Shishu Kishore Tarun
Type of employment
On the last working day of month preceding to the month in which Loan sanctioned/ Disbursed
As on day previous to Schedule enquiry
Self Employed
259.03 310.10
Hired workers
133.77 194.70
Total 392.80 504.80

24 Report on Pradhan Mantri Yojna (PMMY) Survey-2018
3.3.4: By Type of Employment for Loan categories
Table 3.4: Estimated number of persons increased by Employment Category
for each type of loan
(In lakh)
Type of
Loan
Self Employed/
Working Owners
Employee/Hired
worker(s)
Total
Shishu 43.64 30.28 73.92
Kishore 6.26 14.86 21.12
Tarun 1.17 15.80 16.97
Total 51.06 60.94 112.00
Around 66 percent of total estimated increase in employment was observed
under Shishu category followed by Kishore (19 %) and Tarun(15%) categories.
Under Shishu category, around 59 % employment emanated from self-
employed/working owner and rest 41 % from employee/hired workers. About
70 % of estimated increase in employment among Kishore category of loan was
found to be in employee/hired workers category and the rest (30%) was found
to be in the self-employed/working owners category. However, under the Tarun
category of loans, self employed accounted for merely 7% of total increase in
employment and predominant share of 93% was occupied by employee/hired
workers.

25 Report on Pradhan Mantri Yojna (PMMY) Survey-2018
Figure 3.4: Increase in Employment by Employment Category for Each Type of
Loan
3.3.5: By Type of Employment for Broad Economic Activities
Table 3.5: Estimated number of persons increased by Employment Category
for each Broad Economic Activities
(In lakh)
Broad Economic Activities Self Employed/
Working Owners
Employee/
Hired worker
Total
Manufacturing 3.83 9.27 13.10
Services
(Other than Trading)
14.86 23.60 38.46
Allied Agriculture 16.38 6.40 22.77
Trading 15.83 21.38 37.21
Others (Excluding
Agriculture)
0.17 0.28 0.45
Total 51.06 60.94 112.00
0% 10% 20% 30% 40% 50% 60% 70% 80% 90% 100%
Shishu
Kishore
Tarun
Self Employed/ Working Owners Employee/Hired worker(s)

26 Report on Pradhan Mantri Yojna (PMMY) Survey-2018
Table 3.5 reveals estimated number of persons increased by employment
category for each broad economic activity. On the basis of total estimated
increase in employment, the highest percentage (34%) was observed in Services
(other than trading) followed by Trading (33%) and Allied agriculture (20%) and
Manufacturing (12%). Underself-employed/working owners’ category, highest
increase of employment was observed under Allied agriculture activities (32%)
followed by Trading (31%) and Services (other than Trading) (29%) and
Manufacturing (8%). Under employee/hired worker category, maximum
increase (38%) was witnessed under Services (other than Trading) followed by
Trading (35%), Manufacturing (15%) and Allied agriculture (10%).
Figure 3.5: Beneficiaries by Employment Category for each Broad Economic
Activities
0% 10% 20% 30% 40% 50% 60% 70% 80% 90% 100%
MANUFACTURING
SERVICES
ALLIED AGR.
TRADING
OTHERS
Self Employed/ Working Owners Employee/Hired worker

27 Report on Pradhan Mantri Yojna (PMMY) Survey-2018
Concepts and Definitions
Annexure-I
In order to identify the bank branches and beneficiaries under the purview of
PMMY, important concepts and definitions are illustrated below in the
succeeding paragraphs.
1. MUDRA: MUDRA is an acronym / abbreviation for Micro Units
Development & Refinance Agency Ltd. The main objective of MUDRA is to
develop the micro enterprise sectors in the country by extending various
supports including financial support in the form of refinance, so as to
achieve the goal of “funding the unfunded”. It was announced by the
Hon’ble Finance Minister while presenting the Union Budget for FY 2016.
2. Micro Enterprises: Micro enterprises constitute a major economic
segment in our country and provide large employment after agriculture.
This segment includes micro units engaged in manufacturing, processing,
trading and services sector. Many of these units are proprietary/ single
ownership or Own Account enterprises and many a time referred as Non
Corporate Small Business sector.
3. Refinance: Commercial banks, RRBs, cooperative banks, NBFCs, and
MFIs engaged in financing micro enterprises are eligible for refinance
support from MUDRA subject to fulfilling prescribed conditions, referred
to as the Benchmarks for Sanction.
4. Mudra Card: In the MUDRA target segment, the need for working capital
is beyond any doubt. Most micro enterprises need flexible credit.
Realizing this MUDRA introduced the MUDRA card, a RuPay Debit card,

28 Report on Pradhan Mantri Yojna (PMMY) Survey-2018
operable on all ATMs and PoS machines where RuPay is operative. The
Mudra card is a flexible credit product that meets the working capital
needs of micro and small entrepreneurs as cash can be withdrawn from
any ATM or merchandise purchased using PoS(Point of Sale) machine so
that interest burden is reduced. Most of the banks have accepted the
product and introduced it in the first year.
5. Public Sector Banks (PSBs): If the majority stake (more than 50 per
cent) of a bank is held by the government (generally, central government),
then it is known as Public Sector Bank (PSB).
6. Private Sector Banks: If some private entity or individual holds the
majority stake (more than 50 per cent) of a bank, then it is a Private
Sector Bank.
7. Micro Finance Institution (MFI): A microfinance institution is an
organization that offers micro loans to low income group for relatively
short duration without any collateral. The loans offered are generally for
income generating activity and are to be repaid with high frequency.
8. Non-Banking Finance Company (NBFC): A Non-Banking Finance
Company (NBFC) is a company registered under the Companies Act, 1956
engaged in the business of loans and advances, acquisition of
shares/stocks/bonds/debentures/securities issued by Government or
local authority or other marketable securities of a like nature, leasing,
hire-purchase, insurance business, chit business but does not include
any institution whose principal business is that of agriculture activity,
industrial activity, purchase or sale of any goods (other than securities) or
providing any services and sale/purchase/construction of immovable
property. A non-banking institution which is a company and has

29 Report on Pradhan Mantri Yojna (PMMY) Survey-2018
principal business of receiving deposits under any scheme or
arrangement in one lump sum or in installments by way of contributions
or in any other manner, is also a non-banking financial company
(Residuary non-banking company).
9. MUDRA Loan or Loan Under MUDRA: Under MUDRA, after its launch
on April 08, 2015, loans are sanctioned for non farm income generating
activities in Allied-agriculture activities, Manufacturing, Trading, Service
and Other sector excluding Agriculture, upto a loan size of 10 lakh by
Banks, Micro Finance Institutions and NBFCs. MUDRA Ltd. provides
refinance support to such Banks, Micro Micro Finance Institutions and
NBFCs.
10. Type of MUDRA Loan under Pradhan Mantri MUDRA Yojana (PMMY):
MUDRA loan is sanctioned upto loan size of 10 lakh for a non farm
economic activity. Further, to focus on the need and growth, the MUDRA
loan has three categories namely Shishu Loan, Kishore Loan and Tarun
Loan. The financial limit for these types of MUDRA Loans are :-
i) Shishu : All loan of size upto ₹ 50,000/-
ii) Kishore : All loan of size above ₹ 50,000/- and upto ₹ 5 lakh
iii) Tarun : All loan above ₹ 5 lakh and upto ₹ 10 lakh
11. Economic Activity: An income generating activity in the non farm sector
in manufacturing, processing, trading or service sector was considered as
an Economic activity for the present Survey. For the purpose of PMMY,
broad economic activities are characterized as manufacturing, services
(Other than trading), allied agriculture, trading and others excluding
agriculture.

30 Report on Pradhan Mantri Yojna (PMMY) Survey-2018
12. Establishment: The establishment is a unit situated in a single location
in which predominantly one kind of economic activity is carried out such
that at least a part of the goods and/or services produced by the unit
goes for sale (i.e. entire produce is not for sole consumption).The
establishment is a physical entity where mainly one entrepreneurial
activity (or sometimes more than one, with no separate accounts) is
carried out. The examples of a unit are: workshop, factory,
manufacturing plant, warehouse, shop, office, firm, school, and hospital,
place of worship, depot, mine, etc.
13. Beneficiary: A person who has availed loan from Banks, Micro Finance
Institutions and NBFCs of size upto 10 lakh under PMMY after 08 April
2015 and till the date of survey of the branch of the Bank/MFI/NBFCs,
for a non farm economic activity in manufacturing, services (other than
trading), allied agriculture, trading and any other sectors excluding
agriculture is considered as beneficiary under MUDRA for the present
survey.
14. Worker: All persons engaged in an economic activity /establishment
either as owner, members of the household working as co-owner or
partner or helping the owner in running the establishment, whether hired
or not, besides regular and salaried employees, casual/ daily wage
labourers would be considered as workers for that establishment.
Persons, who despite their attachment to economic activity, abstained
themselves from work for reason of illness, injury or other physical
disability, bad weather, festivals, social or religious functions or other
contingencies necessitating temporary absence from work, constitute
workers

31 Report on Pradhan Mantri Yojna (PMMY) Survey-2018
15. Self-employed: Persons who operate their own establishment or are
engaged independently in a profession or trade on own-account or with
one or a few partners are deemed to be self-employed. The essential
feature of the self-employed is that they have autonomy (decide how,
where and when to produce) and economic independence (in respect of
choice of market, scale of operation and finance) for carrying out their
operation. Self employed also includes unpaid family members working in
establishment.
16. Employee/Hired Worker: Employee relates to the person engaged,
excluding self employed, by the unit whether for wages or not, in work
connected directly or indirectly with the process and includes all
administrative, technical and clerical staff, supervision or management,
as also labour in production/ services.
17. Type of Education: Education is broadly divided into three categories:
a. General education,
b. Technical and professional education,
c. Vocational education.
General education in this survey includes general school
education from the primary to the higher secondary level, normal
college/university education for a degree,
whereas technical/professional courses involve usually hands-on
training in addition to theoretical classes. Engineering, Medicine,
Agriculture, Management, Chartered Accountancy, Cost
Accountancy, etc. are examples of technical/professional courses.
The education which aims at imparting training in very specific
fields through usually involves significant ‘hands-on’ experience in
acquiring necessary skill which will make them employable or
create for them opportunities of self employment and the

32 Report on Pradhan Mantri Yojna (PMMY) Survey-2018
diploma/certificate awarded by the institute which have recognition
by State/Central Government/public sector or similar employers is
included under vocational education. Education courses offered by
ITIs, polytechnics, etc. are examples of vocational training.
18. Proprietary Establishments: When an individual is the sole owner of an
establishment it is a proprietary one.
19. Partnership Establishments: Partnership is defined as the ‘relation
between persons who have agreed to share the profits of a business
carried on by all or any one of them acting for all’. There may be two or
more owners, belonging to the same or different households, on a
partnership basis, with or without formal registration (where there is a
tacit understanding about the distribution of profit among the so-called
partners). Thus when two or more individuals are engaged in production
of goods and services as co-owners such an enterprise is known as a
partnership firm.
20. Private limited company: It is a company which is privately held for a
business. The liability of the members of a Private Limited Company is
limited to the amount of shares respectively held by them. Shares of
Private Limited Company cannot be publically traded.
21. Hindu Undivided Family (HUF): It consists of all person lineally
descended from a common ancestor and includes their wives and
unmarried daughters.
22. Self Help Group (SHG): A self-help group (SHG) is a financial
intermediary usually composed of between 10-20 local persons. Members
make small regular savings/ contributions over a few months until there

33 Report on Pradhan Mantri Yojna (PMMY) Survey-2018
is enough capital in the group to begin lending. Funds are then lent back
to the members or to others in the village for any purpose. Many SHGs
are 'linked' to banks for the delivery of microcredit. SHG need not be
registered.
23. National Industrial Classification (NIC)-2008: The National Industrial
Classification (NIC) is an essential Statistical Standard for developing and
maintaining comparable data base according to economic activities. Such
classifications are frequently used in classifying the economically active
population, statistics of industrial production and distribution, the
different fields of labour statistics and other economic data such as
national income. The latest NIC-2008 is being used in this survey.

34 Report on Pradhan Mantri Yojna (PMMY) Survey-2018
Sampling Design and Estimation Procedure
Annexure-II
1. Unit of Enumeration:
The units of enumeration for the survey on estimation of employment
generation under PMMY were the Loan beneficiaries under PMMY from April
2015, the launch of MUDRA, to the date of survey. The First Stage Units (FSU)
was the branches of Lending Institutions (viz Banks/MFIs/NBFCs) and the
Ultimate Stage Units (USU) was the Loan beneficiaries of the surveyed branch.
2. Coverage and Reference period:
The present survey covers whole of the Indian Union. The state wise estimates
are provided only for States/UTs having at least 100 number of beneficiary
accounts (combined for FY 15-16, 16-17 & FY 17-18 till Dec 2017), which
accounted for 99.3% of the Loan Sanctioned till Dec 2017, under PMMY ( i.e.
25 States/UTs) and remaining 11 States/UTs were grouped under residual
stratum, for generating all India estimates.
The reference period for present survey was from 08 April 2015, the launch
date of MUDRA, to the day preceding to the date of survey.
3. Sampling Design:
A stratified multistage design has been adopted for the PMMY Survey. The first
stage units (FSU) are the branches of Lending Institution viz. Banks/
MFI/NBFC. The ultimate stage units (USU) are the beneficiary under PMMY.
Sampling Frame for the FSUs was the list of branches of all the Banks (Public
& Private including Regional Rural Banks) & MFI’s/NBFC’s. The above updated
list was considered as the sampling frame for the FSU for present survey.

35 Report on Pradhan Mantri Yojna (PMMY) Survey-2018
4. Stratification of the first stage units:
The total 5318 branches of Banks/ MFI/NBFC’s as First Stage Units (FSU)
were covered at all India. The total sample of 5318 branches was allocated to
different State/UTs in proportion of the Amount of MUDRA Loan sanctioned by
the respective State/UTs till Dec 2017.
In order to have appropriate representation of different types of lending
institute (banks/MFI/NBFCs) within a State/UT all the Banks/Lending
Institutes were grouped into following three Strata.
(i) Stratum 1- All Public Sector Banks (Including RRBs)
(ii) Stratum 2- All Private Sector Banks
(iii) Stratum 3- Remaining (MFIs, NBFCs & Others)
The sample allotted to a State/UT was allocated to above three strata in
proportion to the ‘Amount of MUDRA Loan ‘Sanctioned till Dec 2017 by the
Lending Institutions in the respective strata. Further, within above stratum, in
a state, all Lending institution with at least 10% share in the Amount of
MUDRA Loan sanctioned under PMMY were grouped in Sub-Stratum1, (for the
Sub-Stratum where banks with at least 10% share in Amount of MUDRA Loan
sanctioned were not available, the threshold limit of 10% was relaxed to 7 %)
and the remaining Lending institution in Sub-Stratum2 for the selection of
branches.
(i) Sub-Stratum 1- All banks /Lending institution with at-least 10%/7%
share in the Amount of Loan sanctioned
(ii) Sub-Stratum 2- Remaining banks /Lending institution in the stratum
The sample allotted to a Stratum within a state was again allocated in above
two Sub-Stratums in proportion to the ‘Amount of MUDRA Loan’ Sanctioned.

36 Report on Pradhan Mantri Yojna (PMMY) Survey-2018
Further for substratum 1 & 2, 60 % FSU were selected from Urban and 40 %
from Rural Sector for Banks (Public & Pvt.) branches only. Whereas for MFI
and NBFCs, Rural/Urban sector segregation was not resorted to as the
information was not available.
Therefore stratification for selection of FSU was resorted to as under
Type of Lending
Institutions
Stratification
Banks (Public & Private) State X Type of bank X Substarta 1/2 X Sector
MFI/NBFCs State X Type of bank X Substarta 1/2
5. Selection of FSUs:
From each sub-stratum, required numbers of sample branches of Lending
Institutions were selected by Simple Random Sampling without Replacement
(SRSWOR).
6. Sample size:
The Expert Group decided that based on past experience of Labour Bureau in
conducting nationwide survey Viz Annual Employment & Unemployment
Survey, Quarterly Employment Survey e.t.c a Sample size of around one lakh
beneficiaries as Ultimate Stage Units (USU) would be sufficient for generating
all India & State wise estimate. Therefore it was decided to cover around 5300
branches of Banks/ MFI/NBFC’s as First Stage Units (FSU). The total of 5318
FSU’s was allocated over 25 States & UT’s and one residual stratum
proportional to the Amount of Loan sanctioned under PMMY. Within each FSU
a maximum of 25 beneficiary accounts, subject to availability, was surveyed.
Thus overall, at all India level about 97,000 beneficiary accounts were
surveyed. The FSUs with zero beneficiary accounts has been treated as a valid
sample, which account for 15% of the total sample (820 are of 5318).

37 Report on Pradhan Mantri Yojna (PMMY) Survey-2018
7. Formation of second stage strata and allocation of beneficiary
accounts:
Three Second Stage Strata (SSS) were formed based on the type of loan i.e.
SSS1, SSS2 & SSS3 for Shishu, Kishore & Tarun Loan respectively. A total of
25 beneficiaries were surveyed in an FSU with 13 from Shishu and 6 each from
Kishore &Tarun category.
Second Stage Strata
Amount (Rs) of Loan availed under MUDRA
Classification under MUDRA
Number of beneficiaries to be covered
SSS1 Upto ₹ 50,000
Shishu 13
SSS2 From ₹ 50,001 Upto ₹ 5,00,000
Kishore 6
SSS3 From ₹ 5,00,001 Upto ₹10,00,000
Tarun 6
The list of beneficiaries provided by selected bank branch by category of loan
was further grouped under different code, on the basis of amount of loan i.e.
for Shishu, Loan, upto 10,000- Code 1, from 10,001 to 30,000- Code 2, from
30,001 to 50000- Code 3.
for Kishore, Loan, from 50,001 to 1,00,000- Code 1, from 1,00,001 to
3,00,000- Code 2, from 3,00,001 and 5 lakh- Code3
for Tarun Loan, upto 6,00,000- Code 1, from 6,00,001 to 8,00,000- Code 2,
from 8,00,001 and 10 lakh- Code 3

38 Report on Pradhan Mantri Yojna (PMMY) Survey-2018
Further, with a SSS the beneficiaries were arranged in ascending order of
the code mentioned above. Thereafter Circular Systematic Sampling was
adopted for selection of sample beneficiaries within each SSS.
8 Estimation procedures:
8.1 Notations:
i = subscript for ith State/UT [i= 1 to 36]
j= subscript for jth Stratum (viz. PSB, Pvt. bank, MFI/NBFCs)
[j= 1 to 3]
k= subscript for kth Sub-stratum (viz. Banks/MFI/NBFCs’ with at least 10%/7% share in a stratum; Remaining Banks in the stratum)
[k= 1 to 2]
s= subscript for sth Second stage stratum (viz. Shishu, Kishore, Tarun)
[s= 1 to 3]
N = Total number of FSUs (Banks/MFI/NBFCs Branches) in a Stratum.
n = number of sample FSUs (Banks/MFI/NBFCs Branches) surveyed including FSUs with zero beneficiary account in a stratum.
r = subscript for rth FSU [r= 1 to n]
m = subscript for mth Sector (Urban/Rural) [m= 1 to 2] B = total number of beneficiary listed in a Second Stage Stratum (SSS) of an FSU
b = number of beneficiary surveyed in a SSS of an FSU y = observed value of characteristic y under estimation.
Ŷ = estimates of population total Y for characteristics y.
Therefore, yijkmrst will be the observed value of the characteristic y for tth unit in
sth second stage stratum of rth FSU belonging to the mth sector of kth sub-
stratum of jth stratum of ith state.
8.2 Estimation of aggregates:
For sth second stage stratum (Shishu, Kishore and Tarun) of a sub stratum as:

39 Report on Pradhan Mantri Yojna (PMMY) Survey-2018
Ŷ𝑠𝑠 = Bs
bs� yt
𝑏𝑏s
t=1
For all second stage stratum (Shishu, Kishore, Tarun) combined of a sub
stratum i.e. Estimate for rth branch (Bank/MFI/NBFCs) of a substratum:
Ŷ𝑠𝑠𝑠𝑠 = �Ŷ𝑠𝑠
3
s=1
The estimate Y of the characteristic y of the mth sector in kth sub stratum within
jth stratum (Public bank, Pvt. bank, MFI/NBFCs) in the ith State denoted by Ŷijkm
is obtained as:
Ŷijkm =Nijkm
nijkm� Ŷ𝑠𝑠𝑠𝑠
nijkm
r=1
8.3 Overall Estimates of aggregates:
The overall estimate Ŷ at the State/UT/all-India level is obtained by summing
the stratum estimate over all strata belonging to the State/UT/all-India.
Ŷ = ����Ŷijkmmkji

40 Report on Pradhan Mantri Yojna (PMMY) Survey-2018
Description of Broad Economic Activity as per NIC-2008 (At 2 digit Level)
Annexure-III
NIC - 2 Digit level code
Description of the Activity
10 Manufacture of food products 11 Manufacture of beverages 12 Manufacture of tobacco products 13 Manufacture of textiles 14 Manufacture of wearing apparel 15 Manufacture of leather and related products 16 Manufacture of wood and products of wood and cork, except
furniture; manufacture of articles of straw and plaiting materials
17 Manufacture of paper and paper products 18 Printing and reproduction of recorded media 19 Manufacture of coke and refined petroleum products 20 Manufacture of chemicals and chemical products 21 Manufacture of pharmaceuticals, medicinal chemical and
botanical products 22 Manufacture of rubber and plastics products 23 Manufacture of other non-metallic mineral products 24 Manufacture of basic metals 25 Manufacture of fabricated metal products, except machinery
and equipment 26 Manufacture of computer, electronic and optical products 27 Manufacture of electrical equipment 28 Manufacture of machinery and equipment n.e.c. 29 Manufacture of motor vehicles, trailers and semi-trailers 30 Manufacture of other transport equipment 31 Manufacture of furniture 32 Other manufacturing 33 Repair and installation of machinery and equipment 41 Construction of buildings 42 Civil engineering 43 Specialized construction activities 45 Wholesale and retail trade and repair of motor vehicles and
motorcycles

41 Report on Pradhan Mantri Yojna (PMMY) Survey-2018
46 Wholesale trade, except of motor vehicles and motorcycles 47 Retail trade, except of motor vehicles and motorcycles 49 Land transport and transport via pipelines 50 Water transport 51 Air transport 52 Warehousing and support activities for transportation 53 Postal and courier activities 55 Accommodation 56 Food and beverage service activities 62 Computer programming, consultancy and related activities 63 Information service activities 85 Education 86 Human health activities 87 Residential care activities 88 Social work activities without accommodation

42 Report on Pradhan Mantri Yojna (PMMY) Survey-2018
GOVERNMENT OF INDIA
Annexure-IV
MINISTRY OF LABOUR & EMPLOYMENT LABOUR BUREAU
Pradhan Mantri Mudra Yojana (PMMY) Survey Schedule-A (Listing Schedule)
BLOCK -1
Identification Particulars of Sampled FSU
Sl. No Item State Code
Bank/MFI/NBFCs Code
Branch Code
1 State Code, Bank/MFI Code, Branch Code
2 Name of the Bank
3 Address of the bank
4 IFSC Code
5 Name of the Officer contacted
6 Designation
7 Email ID
8 Contact No. of the officer
9
Survey Code (original sample covered-1, substituted -2, inaccessible-3)

43 Report on Pradhan Mantri Yojna (PMMY) Survey-2018
BLOCK- 2: List of Beneficiaries and record of selected Beneficiaries: Type of Loan :____________( specify the column of Table of Random Number)
Slr.
No.
Nam
e of
the
Ben
efic
iary
Add
ress
of
the
Ben
efic
iary
Dat
e of
dis
burs
emen
t o
f lo
an
Am
ount
(In
Rs)
Fina
ncia
l Yea
r
Shishu Loan Kishore Loan Tarun Loan
Cla
ssif
icat
ion
of L
oan
Am
ount
(cod
e)
Sam
plin
g s
eria
l nu
mbe
r
(N1
= )
Ord
er o
f se
lect
ion
(n1
=
;
I1 =
; R
1 =
)
Cla
ssif
icat
ion
of L
oan
Am
ount
(cod
e)
Sam
plin
g s
eria
l nu
mbe
r (N
2 =
)
Ord
er o
f se
lect
ion
(n
2 =
;
I2 =
; R
2 =
)
Cla
ssif
icat
ion
of L
oan
Am
ount
(cod
e)
Sam
plin
g s
eria
l nu
mbe
r (N
3 =
)
Ord
er o
f se
lect
ion
(n3
=
; I3
=
; R3
=
)
Page Total
Cumulative Total
Code for classification of loan amount:
Shishu (loan upto 50,000):for Loan upto 10,000- Code 1, for 10,001 to 30,000- Code
2, for 30,001 to 50000- Code 3
Kishore (covering 50,000 and upto 5 lakh), for 50,001 to 1,00,000- Code 1, for
1,00,001 to 3,00,000- Code 2, for 3,00,001 and 5 lakh- Code3
Tarun (covering from 5 lakh and upto 10 lakh): for upto 6,00,000- Code 1, for
6,00,001 to 8,00,000- Code 2, for 8,00,001 and 10 lakh- Code 3

44 Report on Pradhan Mantri Yojna (PMMY) Survey-2018
BLOCK- 3: Summary of Beneficiaries covered
BLOCK - 4
Particulars of field operation
Sl. No.
Item Investigator (Field
Enumerator)
Supervisor Consultant
(1) (2) (3) (4) (5)
1. i) Name
ii) Code
2. date(s) of : DD MM YY DD MM YY DD MM YY
(i)survey/inspection
(ii) receipt
(iii) scrutiny
(iv) dispatch
3. Total time taken to canvass the schedule (hrs)
4. Signature /
Type of
Loan
No. of beneficiaries covered
Originally Substitute
Total
(col 2 +
col 3)
Casualty
Total
(col 4 +
col 5)
(1) (2) (3) (4) (5) (6)
Shishu(1)
Kishore (2)
Tarun (3)
Total

45 Report on Pradhan Mantri Yojna (PMMY) Survey-2018
BLOCK – 5 BLOCK – 6
Remarks by Investigator
Comments by Supervisor
Summary of Beneficiary Listing
Type of Loan
Total Loan
amount in the
frame ( as per
bank branch)
Total number
of beneficiary
listed ( as per
bank branch)
Total Loan
amount
among the
Sampled
beneficiaries
Number of
beneficiary loan
accounts
covered/selected
(1) (2) (3) (4) (5)
Shishu(1)
Kishore (2)
Tarun (3)
Total
(4)=(1)+ (2)+
(3)

46 Report on Pradhan Mantri Yojna (PMMY) Survey-2018
RURAL 1 * GOVERNMENT OF INDIA Original* 1
URBAN 2 MINISTRY OF LABOUR & EMPLOYMENT
LABOUR BUREAU Substituted 2
(PRADHAN MANTRI MUDRA YOJNA SURVEY)
[I] Identification Particulars of Sample Beneficiary
SCHEDULE-B (Beneficiary Schedule)
1. Name and Address: 5. Education Level (Code): 6. Phone/Mobile Number: 7. Stratum Number (Public Bank -1, Private Bank-2, MFI/NBFC-3)
8. Loan Type (as per frame) (Shishu-1, Kishore-2, Traun-3):
2. Age (in completed years):
9. Sample Serial No. (as per sample list)
3. Social Group (Code): 10. Sample Beneficiary No. 4. Gender (Male-1, Female- Transgender-3):
11 No of units /establishment owned by the beneficiary
[2] Description of Current Economic Activity of Sample Beneficiary (activity for which listed as beneficiary under PMMY) 1. Broad Economic Activity (Code):
4. NIC 2008 at the time of visit (3-digit level) (to be filled by supervisor):
2. Description of the Broad Economic Activity
5. Usual nature of operation(perennial – 1, seasonal – 2, casual -3):
6. Ownership (Code):
3. Description of goods produced/traded or services provided: 7. Year Since Operation
started:
8. In case of Substitution, the reasons thereof(code):
*Strike out whichever is not applicable Codes for Block [1]
Item 3: Social Group code: scheduled tribe -1, scheduled caste -2, other backward class -3, others -9. Item 5: Educational Level code: not literate – 1, literate: without formal schooling-2, below secondary-3, secondary-4, higher secondary-5, graduate-6, post-graduate & above-7
Item 1: Broad Economic Activity code: manufacturing-1, services-2, allied agriculture-3, trading-4, others-9 Codes for Block [2]
Item 6: Ownership Code=(proprietorship -1, partnership-2, HUF-3, Private Ltd company-4, other-9, Specify) Item 8:Substitution Code: unit not in existence-1, unit locked out for some time /temporary shutdown-2,
access denied -3, adequate co-operation not extended-4, shifted to distant place-5 others -9

47 Report on Pradhan Mantri Yojna (PMMY) Survey-2018
[3] Details of Loans as on the date of survey
1. Do you know about MUDRA (Yes-1, No -2)
2. If Yes in Item 1 above, from where you came to know about MUDRA
(Code):
3. Whether any loan was availed since April, 2015 (Yes-1, No-2)
4. If No in Item above when you availed loan last time (MM/YYYY)
5. If Yes in item 3 above
Sl.
No.
Date of
receipt of
Loan
(MM/YY)
Amoun
t of
Loan
Purpose
code
Nature of Loan
(Joint -1,
Individual - 2)
Is it under
PMMY/
MUDRA
(Yes-1, No-2)
If Code 1 in col 6
then type of Loan
Code
(1) (2) (3) (4) (5) (6) (7)
If code 1 in Col 6 above:
6. Availed Loan under MUDRA for already existing establishment(Yes-1, No-2):
7. After availing Mudra any new unit(s) setup by the beneficiary (Yes-1, No-2):
8. Whether the beneficiary is in the process of establishing a unit (Yes-1, No-2):
9. if yes in item 8 above, time (in months) by which new unit would be set up:
Codes for Block [3] Item 2 (Codes):advertisement -1, friends or relative -2, another beneficiary under MUDRA -3,banking /NBFC officials -4, others-9. Item-5 (Col 4): setting up of new establishment-1, expansion of already existing establishment-2, others reasons-3 Item 5 (Col 7): Type of Loan: Shishu-1, Kishore-2, Tarun-3.

48 Report on Pradhan Mantri Yojna (PMMY) Survey-2018
[4] Additional Details of loan availed 1. Whether the Loan Sanctioned under PMMY is sufficient for
the purpose for which it is taken? (Yes-1, No-2)
2. If No in item 1 above, have you taken any other loan from any other source for the same purpose (Yes-1, No-2):
3. If yes, in item 2 above, the amount of loan (from all sources except
MUDRA including friends and relative) :
Sl No.
Source of Loan Loan Amount (Rs)
i) Relatives/friends ii) Money lender iii) Trader iv) Other………………………………………...(Specify)
Total 4. Was there any expansion in your business after receipt of loan
amount? (Yes-1, No-2)
5. Did the Loan sanctioned under PMMY directly/ indirectly helped /utilised in expansion of the number of person working in the establishment/unit (Yes-1, No-2):
6. If yes above Number of additional worker(s) (including owner) employed in the activity after receival of loan under PMMY

49 Report on Pradhan Mantri Yojna (PMMY) Survey-2018
How many establishment(s) owned by beneficiary on the date of survey ______________
[5] Details of Employment generated by beneficiary under MUDRA Loan 1. Broad Economic Activity (Code): 5. Description of the Broad Economic Activity 2. Year Since Operational 3. Ownership (Code): 4. Whether this unit was setup after availing Mudra Loan (Yes-1: No/already existing unit-2)
6.. NIC 2008 (3-digit level)
7 (a) Employment Details (FY:) Sl. No.
Category On the Last working day of Month proceeding to the month in which Loan Sanctioned/ Disbursed
As on day previous to Schedule enquiry
Maximum Number of Person employed at any given time since Loan Disbursal.
Male Female Total Male Female Total Total (1) (2) (3) (4) (5) (6) (7) (8) (9) 1. Self Employed
/Working Owner(s)
2. Employee/ Hired worker(s)
3. Total 4. If employment decreased after availing the Loan, the reasons thereof 5. Whether beneficiary had owned establishment but that is closed down
on the date of Survey (Yes-1, No-2)
6. How many workers were working there? (If code-1 in item 5) 7. Reasons for closure of establishment? (If code-1 in item 5)
*Block [5] to be separately filled for each establishment with same/different Economic activity for which MUDRA loan was availed by the beneficiary.
Codes for Block [5] Item 4: Reason of decrease in employment code: automation -1, utilisation of loan for other purpose-2, switching over to new to economic activity requiring less number of workers -3, others-9. Item 7: Reason of Closure: Non-availability of additional funds-1, Shortage of raw material-2, Non-availability of manpower-3, others-9. [5] Details of Employment generated by beneficiary under MUDRA Loan (continued) 7 (b) Employment Details based on duration of employment generated (after availing loan under MUDRA)
Sl. No.
Category Number of persons Employed for less than 1 month (30 days)
Number of persons Employed for 1 month to less than 6 months
Number of persons Employed for 6 months & above
(1) (2) (3) (4) (5) 1 Self Employed
/Working Owner(s)
2 Employee/ Hired worker(s)
3 Total *Block [5] to be separately filled for each establishment with same/different Economic activity for which MUDRA loan was availed by the beneficiary.

50 Report on Pradhan Mantri Yojna (PMMY) Survey-2018
[7] Particulars of Field Operations
Name of the Investigator
Contact No./Mobile Date of Visit Signature of the Investigator Name of the Supervisor Signature of the Supervisor with date
Date of Scrutiny/inspection Name of the Officer/Consultant in charge
[8] Comments by Investigator
[9] Comments by Supervisors

51 Report on Pradhan Mantri Yojna (PMMY) Survey-2018
Annexure-V
Detailed Tables

Rural Urban Rural+ Urban1 Karnataka 356 217 5732 Tamil Nadu 359 203 5623 Maharashtra 280 189 4694 Uttar Pradesh 277 214 4915 West Bengal 215 184 3996 Bihar 168 118 2867 Madhya Pradesh 204 117 3218 Rajasthan 128 95 2239 Odisha 170 74 244
10 Gujarat 122 104 22611 Andhra Pradesh 87 130 21712 Kerala 102 104 20613 Punjab 78 71 14914 Assam 74 55 12915 Haryana 67 56 12316 Jharkhand 53 49 10217 Telangana 50 77 12718 Delhi 38 62 10019 Chhattisgarh 61 42 10320 Uttarakhand 33 32 6521 J & K 25 39 6422 Himachal Pradesh 19 16 3523 Tripura 14 12 2624 Puducherry 6 9 1525 Goa 7 3 10
18 35 533011 2307 5318
52 Report on Pradhan Mantri
Table 1 :Distribution of Number of Bank/MFI/NBFC branches surveyed by sector for each State/UT
Yojna (PMMY) Survey-2018
All India
Actual number of Bank/MFI/NBFC branches surveyedName of State/UTSr. No.
Rest of the State/UT

53
Rural Urban Rural+ Urban
Rural Urban Rural+ Urban
Rural Urban Rural+ Urban
Rural Urban Rural+ Urban
1 Karnataka 2,625 3,431 6,056 136 458 594 3,637 1,011 4,648 6,398 4,900 11,298 2 Tamil Nadu 1,749 2,467 4,216 356 462 818 1,676 1,171 2,847 3,781 4,100 7,881 3 Maharashtra 1,539 2,059 3,598 186 315 501 2,762 657 3,419 4,487 3,031 7,518 4 Uttar Pradesh 4,576 833 5,409 211 150 361 2,659 226 2,885 7,446 1,209 8,655 5 West Bengal 1,341 1,407 2,748 1,122 1,380 2,502 1,490 578 2,068 3,953 3,365 7,318 6 Bihar 1,068 1,450 2,518 732 500 1,232 875 1,250 2,125 2,675 3,200 5,875 7 Madhya Pradesh 791 2,172 2,963 123 199 322 2,006 765 2,771 2,920 3,136 6,056 8 Rajasthan 807 1,309 2,116 192 407 599 956 410 1,366 1,955 2,126 4,081 9 Odisha 755 1,233 1,988 149 187 336 2,451 499 2,950 3,355 1,919 5,274
10 Gujarat 497 922 1,419 177 239 416 709 352 1,061 1,383 1,513 2,896 11 Andhra Pradesh 1,869 2,652 4,521 7 171 178 - - - 1,876 2,823 4,699 12 Kerala 786 2,104 2,890 30 193 223 325 25 350 1,141 2,322 3,463 13 Punjab 754 1,039 1,793 109 67 176 577 65 642 1,440 1,171 2,611 14 Assam 554 310 864 518 322 840 714 - 714 1,786 632 2,418 15 Haryana 536 651 1,187 77 58 135 549 178 727 1,162 887 2,049 16 Jharkhand 490 849 1,339 100 153 253 275 100 375 865 1,102 1,967 17 Telangana 774 1,516 2,290 19 100 119 - - - 793 1,616 2,409 18 Delhi 75 480 555 5 142 147 - 188 188 80 810 890 19 Chhattisgarh 349 725 1,074 95 137 232 693 6 699 1,137 868 2,005 20 Uttarakhand 248 775 1,023 49 39 88 150 150 300 447 964 1,411 21 J & K 163 226 389 224 357 581 - - - 387 583 970 22 Himachal Pradesh 425 264 689 4 11 15 25 - 25 454 275 729 23 Tripura 125 106 231 50 100 150 75 - 75 250 206 456 24 Puducherry 71 174 245 4 45 49 - 25 25 75 244 319 25 Goa 80 99 179 - - - 8 13 21 88 112 200
231 650 881 - - - - 46 46 231 696 927 23,278 29,903 53,181 4,675 6,192 10,867 22,612 7,715 30,327 50,565 43,810 94,375
Table 2: Distribution of Sample Beneficiaries by Sector for each State/UT
Rest of the State/UT
BanksPublic Private
MFI/NBFCName of State/UT
Yojna (PMM
Y) Survey-2018Report on Pradhan M
antri
Sr. No.
All India
Overall

54
Shishu Kishore Tarun Shishu Kishore Tarun Shishu Kishore Tarun Shishu Kishore Tarun Total 1 Karnataka 3,035 2,348 673 209 250 135 4,492 156 - 7,736 2,754 808 11,298 2 Tamil Nadu 2,219 1,609 388 513 215 90 2,846 1 - 5,578 1,825 478 7,881 3 Maharashtra 1,850 1,231 517 302 110 89 3,214 159 46 5,366 1,500 652 7,518 4 Uttar Pradesh 2,780 1,979 650 209 59 93 2,877 8 - 5,866 2,046 743 8,655 5 West Bengal 1,189 1,188 371 2,216 211 75 1,911 157 - 5,316 1,556 446 7,318 6 Bihar 1,475 809 234 1,133 67 32 1,962 163 - 4,570 1,039 266 5,875 7 Madhya Pradesh 1,596 914 453 198 89 35 2,662 108 1 4,456 1,111 489 6,056 8 Rajasthan 1,131 709 276 326 142 131 1,341 25 - 2,798 876 407 4,081 9 Odisha 1,002 818 168 257 55 24 2,733 205 12 3,992 1,078 204 5,274
10 Gujarat 540 656 223 190 113 113 938 108 15 1,668 877 351 2,896 11 Andhra Pradesh 2,546 1,587 388 82 69 27 - - - 2,628 1,656 415 4,699 12 Kerala 1,343 1,157 390 166 27 30 350 - - 1,859 1,184 420 3,463 13 Punjab 1,178 505 110 109 43 24 642 - - 1,929 548 134 2,611 14 Assam 583 229 52 678 113 49 711 3 - 1,972 345 101 2,418 15 Haryana 631 444 112 54 42 39 727 - - 1,412 486 151 2,049 16 Jharkhand 700 457 182 193 37 23 363 12 - 1,256 506 205 1,967 17 Telangana 1,209 820 261 33 37 49 - - - 1,242 857 310 2,409 18 Delhi 343 132 80 24 36 87 169 19 - 536 187 167 890 19 Chhattisgarh 563 353 158 167 40 25 693 6 - 1,423 399 183 2,005 20 Uttarakhand 481 408 134 72 10 6 300 - - 853 418 140 1,411 21 J & K 126 205 58 196 295 90 - - - 322 500 148 970 22 Himachal Pradesh 276 324 89 1 11 3 25 - - 302 335 92 729 23 Tripura 152 62 17 132 6 12 75 - - 359 68 29 456 24 Puducherry 123 97 25 26 12 11 25 - - 174 109 36 319 25 Goa 112 50 17 - - - 21 - - 133 50 17 200
448 289 144 - - - 46 - - 494 289 144 927 27,631 19,380 6,170 7,486 2,089 1,292 29,123 1,130 74 64,240 22,599 7,536 94,375
Table 3: Distribution of Sample Beneficiaries by type of loan availed under MUDRA for each State/UT
Rest of the State/UTAll India
BanksName of State/UT Public Private
Report on Pradhan Mantri
Yojna (PMM
Y) Survey-2018
MFI/NBFC OverallSr. No.

Sr. No. Name of State/UTSchedule
TribeSchedule
Caste
Other Backward
ClassesOthers Total
1 Karnataka 772 1926 3947 4653 11298
2 Tamil Nadu 154 1641 5661 425 7881
3 Maharashtra 561 1329 2597 3031 7518
4 Uttar Pradesh 210 1838 3839 2768 8655
5 West Bengal 180 1603 1187 4348 7318
6 Bihar 87 867 3792 1129 5875
7 Madhya Pradesh 608 1378 3054 1016 6056
8 Rajasthan 400 679 1678 1324 4081
9 Odisha 754 1090 1718 1712 5274
10 Gujarat 164 452 1241 1039 2896
11 Andhra Pradesh 86 531 2301 1781 4699
12 Kerala 48 214 2130 1071 3463
13 Punjab 79 1040 381 1111 2611
14 Assam 189 301 816 1112 2418
15 Haryana 23 680 561 785 2049
16 Jharkhand 173 150 1060 584 1967
17 Telangana 176 385 1127 721 2409
18 Delhi 9 167 188 526 890
19 Chhattisgarh 298 381 822 504 2005
20 Uttarakhand 53 214 459 685 1411
21 J & K 23 103 152 692 970
22 Himachal Pradesh 16 187 87 439 729
23 Tripura 76 113 128 139 456
24 Puducherry 2 42 249 26 319
25 Goa 9 19 79 93 200
302 81 170 374 927
5452 17411 39424 32088 94375
55
Table 4: Distribution of Sample Beneficiaries by Social Group for each State/UT
All India
Rest of the State/UT
Report on Pradhan Mantri Yojna (PMMY) Survey-2018

56
Sr. No. Name of State/UT Not literate Literate without formal schooling
Below Secondary
Secondary Higher
Secondary Grduate
PG & above
Total
1 Karnataka 1,075 982 3,573 2,998 1,644 923 103 11,298 2 Tamil Nadu 494 560 2,469 2,001 1,293 884 180 7,881 3 Maharashtra 413 455 2,163 1,937 1,505 828 217 7,518 4 Uttar Pradesh 652 1,224 2,154 1,524 1,205 1,417 479 8,655 5 West Bengal 221 820 3,072 1,525 822 749 109 7,318 6 Bihar 477 1,353 1,675 980 737 578 75 5,875 7 Madhya Pradesh 457 969 2,009 950 824 678 169 6,056 8 Rajasthan 327 676 1,124 600 534 578 242 4,081 9 Odisha 363 720 2,021 1,203 458 425 84 5,274
10 Gujarat 298 322 884 621 362 323 86 2,896 11 Andhra Pradesh 136 267 1,109 1,643 786 662 96 4,699 12 Kerala 5 55 657 1,176 767 723 80 3,463 13 Punjab 216 198 753 566 459 330 89 2,611 14 Assam 21 182 1,105 504 343 226 37 2,418 15 Haryana 201 145 762 391 273 231 46 2,049 16 Jharkhand 40 163 581 455 352 331 45 1,967 17 Telangana 86 136 534 743 406 412 92 2,409 18 Delhi 57 55 208 199 154 184 33 890 19 Chhattisgarh 216 205 557 354 334 263 76 2,005 20 Uttarakhand 92 159 364 241 211 249 95 1,411 21 J & K 21 67 215 252 224 155 36 970 22 Himachal Pradesh 14 16 166 161 178 149 45 729 23 Tripura 2 30 215 116 48 40 5 456 24 Puducherry 2 9 108 88 49 56 7 319 25 Goa 9 23 38 71 37 21 1 200
16 21 251 242 234 146 17 927 5,911 9,812 28,767 21,541 14,239 11,561 2,544 94,375
Report on Pradhan Mantri
Yojna (PMM
Y) Survey-2018
Rest of the State/UTALL INDIA
Table 5: Distribution of Sample Beneficiaries by Level of Education for each State/UT
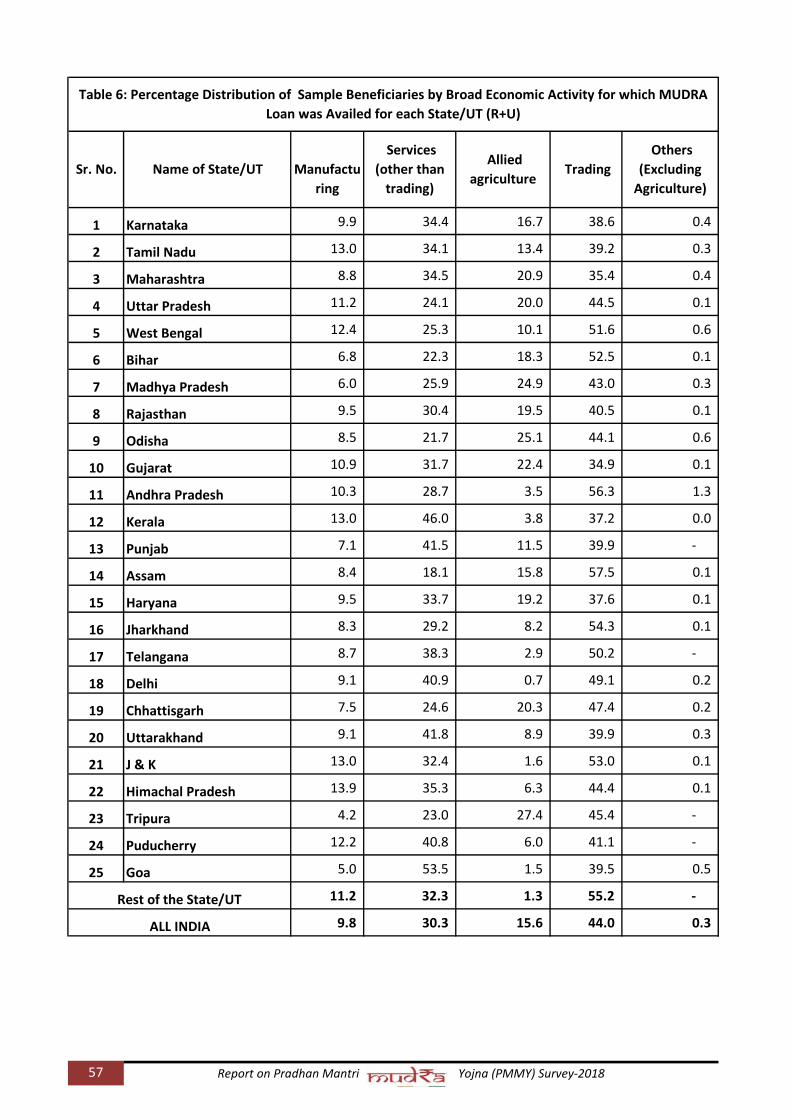
1 Karnataka 9.9 34.4 16.7 38.6 0.4
2 Tamil Nadu 13.0 34.1 13.4 39.2 0.3
3 Maharashtra 8.8 34.5 20.9 35.4 0.4
4 Uttar Pradesh 11.2 24.1 20.0 44.5 0.1
5 West Bengal 12.4 25.3 10.1 51.6 0.6
6 Bihar 6.8 22.3 18.3 52.5 0.1
7 Madhya Pradesh 6.0 25.9 24.9 43.0 0.3
8 Rajasthan 9.5 30.4 19.5 40.5 0.1
9 Odisha 8.5 21.7 25.1 44.1 0.6
10 Gujarat 10.9 31.7 22.4 34.9 0.1
11 Andhra Pradesh 10.3 28.7 3.5 56.3 1.3
12 Kerala 13.0 46.0 3.8 37.2 0.0
13 Punjab 7.1 41.5 11.5 39.9 -
14 Assam 8.4 18.1 15.8 57.5 0.1
15 Haryana 9.5 33.7 19.2 37.6 0.1
16 Jharkhand 8.3 29.2 8.2 54.3 0.1
17 Telangana 8.7 38.3 2.9 50.2 -
18 Delhi 9.1 40.9 0.7 49.1 0.2
19 Chhattisgarh 7.5 24.6 20.3 47.4 0.2
20 Uttarakhand 9.1 41.8 8.9 39.9 0.3
21 J & K 13.0 32.4 1.6 53.0 0.1
22 Himachal Pradesh 13.9 35.3 6.3 44.4 0.1
23 Tripura 4.2 23.0 27.4 45.4 -
24 Puducherry 12.2 40.8 6.0 41.1 -
25 Goa 5.0 53.5 1.5 39.5 0.5
11.2 32.3 1.3 55.2 -
9.8 30.3 15.6 44.0 0.3
57
Table 6: Percentage Distribution of Sample Beneficiaries by Broad Economic Activity for which MUDRA Loan was Availed for each State/UT (R+U)
Rest of the State/UT
Manufactu
ring
Services (other than
trading)
Allied agriculture
Sr. No.
Report on Pradhan Mantri Yojna (PMMY) Survey-2018
ALL INDIA
Trading Others
(Excluding Agriculture)
Name of State/UT

58
M F P M F P M F P 1 Karnataka 1,984 4,414 6,398 2,686 2,214 4,900 4,670 6,628 11,298 2 Tamil Nadu 1,207 2,574 3,781 1,671 2,429 4,100 2,878 5,003 7,881 3 Maharashtra 1,324 3,163 4,487 1,660 1,371 3,031 2,984 4,534 7,518 4 Uttar Pradesh 4,110 3,336 7,446 801 408 1,209 4,911 3,744 8,655 5 West Bengal 1,254 2,699 3,953 1,275 2,090 3,365 2,529 4,789 7,318 6 Bihar 887 1,788 2,675 1,270 1,930 3,200 2,157 3,718 5,875 7 Madhya Pradesh 771 2,149 2,920 1,775 1,361 3,136 2,546 3,510 6,056 8 Rajasthan 821 1,134 1,955 1,413 713 2,126 2,234 1,847 4,081 9 Odisha 727 2,628 3,355 1,044 875 1,919 1,771 3,503 5,274
10 Gujarat 507 876 1,383 917 596 1,513 1,424 1,472 2,896 11 Andhra Pradesh 1,324 552 1,876 1,865 958 2,823 3,189 1,510 4,699 12 Kerala 535 606 1,141 1,330 992 2,322 1,865 1,598 3,463 13 Punjab 620 820 1,440 829 342 1,171 1,449 1,162 2,611 14 Assam 497 1,289 1,786 285 347 632 782 1,636 2,418 15 Haryana 461 701 1,162 495 392 887 956 1,093 2,049 16 Jharkhand 424 441 865 762 340 1,102 1,186 781 1,967 17 Telangana 562 231 793 1,118 498 1,616 1,680 729 2,409 18 Delhi 67 13 80 503 307 810 570 320 890 19 Chhattisgarh 312 825 1,137 624 244 868 936 1,069 2,005 20 Uttarakhand 194 253 447 600 364 964 794 617 1,411 21 J & K 311 76 387 458 125 583 769 201 970 22 Himachal Pradesh 293 161 454 211 64 275 504 225 729 23 Tripura 97 153 250 111 95 206 208 248 456 24 Puducherry 40 35 75 134 110 244 174 145 319 25 Goa 64 24 88 62 50 112 126 74 200
148 83 231 398 298 696 546 381 927 19,541 31,024 50,565 24,297 19,513 43,810 43,838 50,537 94,375
M: Male F: Female
Yojna (PMM
Y) Survey-2018Report on Pradhan M
antri
Sr. No.
Table 7: Distribution of the Sample Beneficiaries by Sector and Gender for each State/UT
Rest of the State/UTALL INDIA
Rural Urban Rural + Urban Name of State/UT

Rural+Urban
Sr. No. Name of State/UT Proprietorship Others
1 Karnataka 97.1 2.9
2 Tamil Nadu 99.0 1.0
3 Maharashtra 94.9 5.1
4 Uttar Pradesh 99.9 0.1
5 West Bengal 98.3 1.7
6 Bihar 100.0 0.0
7 Madhya Pradesh 98.6 1.4
8 Rajasthan 98.4 1.6
9 Odisha 92.3 7.7
10 Gujarat 96.7 3.3
11 Andhra Pradesh 97.8 2.2
12 Kerala 97.6 2.5
13 Punjab 98.2 1.8
14 Assam 98.0 2.0
15 Haryana 98.5 1.5
16 Jharkhand 99.0 1.0
17 Telangana 98.7 1.3
18 Delhi 98.3 1.7
19 Chhattisgarh 99.0 1.1
20 Uttarakhand 97.6 2.4
21 J & K 98.7 1.3
22 Himachal Pradesh 97.9 2.1
23 Tripura 98.9 1.1
24 Puducherry 95.9 4.1
25 Goa 94.5 5.5
99.9 0.1
97.8 2.2
59 Report on Pradhan Mantri Yojna (PMMY) Survey-2018
ALL INDIA
Rest of the State/UT
Table 8: Percentage Distribution of sample establishments by Ownership Type for each State/UT

60
Shishu Kishor Tarun Shishu Kishor Tarun Shishu Kishor Tarun 1 Karnataka 9,82,168 16,299 1,150 7,736 2,754 808 0.8 16.9 70.32 Tamil Nadu 6,41,322 9,728 789 5,578 1,825 478 0.9 18.8 60.63 Maharashtra 1,45,258 5,494 1,747 5,366 1,500 652 3.7 27.3 37.34 Uttar Pradesh 11,376 8,946 2,643 5,866 2,046 743 51.6 22.9 28.15 West Bengal 2,70,300 5,514 997 5,316 1,556 446 2.0 28.2 44.76 Bihar 3,28,663 13,680 513 4,570 1,039 266 1.4 7.6 51.97 Madhya Pradesh 17,215 4,166 899 4,456 1,111 489 25.9 26.7 54.48 Rajasthan 1,08,285 2,953 1,340 2,798 876 407 2.6 29.7 30.49 Odisha 6,79,616 3,521 276 3,992 1,078 204 0.6 30.6 73.9
10 Gujarat 1,65,232 6,549 2,380 1,668 877 351 1.0 13.4 14.711 Andhra Pradesh 13,182 10,283 575 2,628 1,656 415 19.9 16.1 72.212 Kerala 1,30,941 4,698 781 1,859 1,184 420 1.4 25.2 53.813 Punjab 56,429 4,607 397 1,929 548 134 3.4 11.9 33.814 Assam 67,315 1,244 210 1,972 345 101 2.9 27.7 48.115 Haryana 64,653 2,158 454 1,412 486 151 2.2 22.5 33.316 Jharkhand 30,419 2,222 380 1,256 506 205 4.1 22.8 53.917 Telangana 4,142 3,401 792 1,242 857 310 30.0 25.2 39.118 Delhi 15,283 1,088 612 536 187 167 3.5 17.2 27.319 Chhattisgarh 8,523 1,204 454 1,423 399 183 16.7 33.1 40.320 Uttarakhand 23,303 1,222 230 853 418 140 3.7 34.2 60.921 J & K 642 1,475 254 322 500 148 50.2 33.9 58.322 Himachal Pradesh 691 1,433 185 302 335 92 43.7 23.4 49.723 Tripura 4,016 432 46 359 68 29 8.9 15.7 63.024 Puducherry 6,038 552 50 174 109 36 2.9 19.7 72.025 Goa 7,374 113 17 133 50 17 1.8 44.2 100.0
1,775 540 208 494 289 144 27.8 53.5 69.237,84,161 1,13,522 18,379 64,240 22,599 7,536 1.7 19.9 41.0
Report on Pradhan Mantri
Yojna (PMM
Y) Survey-2018
Percentage of Beneficiaries surveyed to Beneficiaries listed.
ALL INDIA
Total number of Beneficiaries listed as per Surveyed Bank/MFI/NBFC
Branch Name of State/UT
Number of Beneficiaries Surveyed Sr. No.
Table 9: Distribution of Beneficiaries under MUDRA Loan for the Surveyed Bank/MFI/NBFC for each State/UT
Rest of the State/UT

Shishu Kishor Tarun Shishu Kishor Tarun S K T
1 Karnataka 2,937.14 236.61 85.24 32.44 53.90 60.43 1 23 71
2 Tamil Nadu 3,235.04 133.22 91.59 17.67 37.13 39.46 1 28 43
3 Maharashtra 397.99 132.47 155.02 19.18 36.64 47.20 5 28 30
4 Uttar Pradesh 54.58 205.22 207.50 22.76 45.11 65.75 42 22 32
5 West Bengal 805.92 129.29 80.65 16.41 37.05 35.51 2 29 44
6 Bihar 1,388.18 269.70 40.30 13.95 18.93 21.76 1 7 54
7 Madhya Pradesh 49.33 97.62 68.37 13.68 24.96 35.98 28 26 53
8 Rajasthan 293.71 80.93 100.27 9.65 21.81 35.38 3 27 35
9 Odisha 2,580.40 78.05 20.13 15.18 19.11 13.89 1 24 69
10 Gujarat 422.49 185.89 169.64 5.54 24.01 32.65 1 13 19
11 Andhra Pradesh 51.55 266.68 49.44 12.09 29.67 34.05 23 11 69
12 Kerala 340.53 88.25 61.78 8.93 24.28 33.31 3 28 54
13 Punjab 169.32 29.45 29.47 7.47 11.83 11.11 4 40 38
14 Assam 156.79 46.93 14.83 6.84 7.67 7.21 4 16 49
15 Haryana 173.40 51.01 34.58 5.17 10.69 14.47 3 21 42
16 Jharkhand 77.13 49.44 28.27 4.34 11.92 15.07 6 24 53
17 Telangana 15.50 73.05 66.45 4.71 17.65 26.29 30 24 40
18 Delhi 47.33 26.75 47.39 2.01 5.11 13.53 4 19 29
19 Chhattisgarh 22.45 28.58 37.22 4.64 8.96 16.39 21 31 44
20 Uttarakhand 71.12 27.42 19.17 3.32 8.95 11.96 5 33 62
21 J & K 2.87 34.41 20.38 1.33 12.19 11.90 46 35 58
22 Himachal Pradesh 12.09 24.14 16.17 1.39 6.47 7.83 12 27 48
23 Tripura 13.52 7.01 3.54 1.32 1.21 2.22 10 17 63
24 Puducherry 16.79 9.02 3.75 0.61 1.89 2.72 4 21 72
25 Goa 20.91 2.71 1.39 0.58 1.12 1.39 3 41 100
7.64 12.57 17.27 2.06 6.83 11.53 27 54 67
13,363.71 2,326.41 1,469.78 233.29 485.09 608.99 2 21 41
S - Shishu : K- -Kishore; T-Tarun
61
Table 10: Distribution of Total Amount of MUDRA Loan Disbursed among Beneficiaries of the Surveyed Bank/MFI/NBFC for each State/UT (in crore) Percentage
Distribution of Sample Loan by Amount of loan
Disbursed. Sr. No. Name of State/UT
Total Amount of MUDRA Loan Disbursed Among Beneficiaries Listed as per Bank
Branch
Total Amount MUDRA Loan Disbursed Among Beneficiaries
Surveyed
Report on Pradhan Mantri Yojna (PMMY) Survey-2018
Rest of the State/UT
ALL INDIA

Sr. No.
Name of state/UT Advertisement
Friends and Relative
Another Beneficiary of MUDRA
Bank/ MFI/NBFC
Others
1 Karnataka 10.8 35.4 17.8 35.4 0.7
2 Tamil Nadu 5.4 29.5 23.5 41.2 0.5
3 Maharashtra 16.5 37.6 12.7 32.7 0.6
4 Uttar Pradesh 16.5 33.3 14.3 35.7 0.2
5 West Bengal 11.5 21.8 19.9 46.3 0.5
6 Bihar 17.4 30.6 15.2 36.6 0.1
7 Madhya Pradesh 19.1 43.7 11.4 25.3 0.6
8 Rajasthan 19.2 53.4 8.9 18.2 0.4
9 Odisha 13.2 39.9 18.6 27.4 1.0
10 Gujarat 12.5 42.0 6.3 36.9 2.3
11 Andhra Pradesh 23.2 26.4 12.9 37.4 0.2
12 Kerala 15.8 29.9 17.7 36.6 0.0
13 Punjab 11.8 29.7 10.3 47.8 0.4
14 Assam 5.4 31.3 8.6 54.6 0.1
15 Haryana 13.7 37.1 16.1 30.0 3.1
16 Jharkhand 13.7 33.6 5.6 47.1 0.1
17 Telangana 14.1 27.6 5.4 52.2 0.6
18 Delhi 15.2 23.7 3.5 45.2 12.4
19 Chhattisgarh 19.7 18.7 20.9 40.3 0.5
20 Uttarakhand 21.3 19.8 3.8 53.4 1.6
21 J & K 13.9 29.2 22.7 33.9 0.2
22 Himachal Pradesh 18.7 24.2 12.0 43.5 1.5
23 Tripura 15.8 7.9 11.1 65.2 -
24 Puducherry 5.7 12.3 20.4 61.6 -
25 Goa 18.7 19.2 - 61.7 0.5
8.1 38.5 10.9 42.4 0.1
14.2 32.8 14.8 37.5 0.7
62
ALL INDIA
Table 11: Percentage distribution of Sample Beneficiaries by Source of Awareness about MUDRA Yojana for each State/UT
Rest of the State/UT
Report on Pradhan Mantri Yojna (PMMY) Survey-2018

M F T M F T
1 Karnataka 1,571 1,874 3,445 3,099 4,754 7,853
2 Tamil Nadu 344 687 1,031 2,534 4,316 6,850
3 Maharashtra 798 1,478 2,276 2,186 3,056 5,242
4 Uttar Pradesh 1,033 1,414 2,447 3,878 2,330 6,208
5 West Bengal 279 560 839 2,250 4,229 6,479
6 Bihar 224 646 870 1,933 3,072 5,005
7 Madhya Pradesh 551 728 1,279 1,995 2,782 4,777
8 Rajasthan 310 464 774 1,924 1,383 3,307
9 Odisha 195 381 576 1,576 3,122 4,698
10 Gujarat 279 469 748 1,145 1,003 2,148
11 Andhra Pradesh 429 232 661 2,760 1,278 4,038
12 Kerala 340 255 595 1,525 1,343 2,868
13 Punjab 305 344 649 1,144 818 1,962
14 Assam 91 235 326 691 1,401 2,092
15 Haryana 248 340 588 708 753 1,461
16 Jharkhand 215 200 415 971 581 1,552
17 Telangana 223 135 358 1,457 594 2,051
18 Delhi 94 92 186 476 228 704
19 Chhattisgarh 99 170 269 837 899 1,736
20 Uttarakhand 197 139 336 597 478 1,075
21 J & K 205 76 281 564 125 689
22 Himachal Pradesh 74 62 136 430 163 593
23 Tripura 24 16 40 184 232 416
24 Puducherry 37 29 66 137 116 253
25 Goa 22 11 33 104 63 167
109 63 172 437 318 755
8,296 11,100 19,396 35,542 39,437 74,979
M- Male: F- Female: T- Total
63 Report on Pradhan Mantri Yojna (PMMY) Survey-2018
Sr. No.
ALL INDIA
Table 12: Distribution of Sample Beneficiaries by Purpose of Loan Availed by each State/UT
Name of State/UT Setting up new Establishment
Expansion of existing Establishment
Rest of the State/UT

Sr. No. Name of State/UT
Sample beneficiaries
who took loan for new
establishment
percentage of
beneficiaries who took
loan for new establishmen
Sample beneficiaries who
took loan for existing
establishment
percentage of beneficiaries who
took loan for existing
establishments
TOTAL
1 Karnataka 3,445 30.5 7,853 69.5 11,298
2 Tamil Nadu 1,031 13.1 6,850 86.9 7,881
3 Maharashtra 2,276 30.3 5,242 69.7 7,518
4 Uttar Pradesh 2,447 28.3 6,208 71.7 8,655
5 West Bengal 839 11.5 6,479 88.5 7,318
6 Bihar 870 14.8 5,005 85.2 5,875
7 Madhya Pradesh 1,279 21.1 4,777 78.9 6,056
8 Rajasthan 774 19.0 3,307 81.0 4,081
9 Odisha 576 10.9 4,698 89.1 5,274
10 Gujarat 748 25.8 2,148 74.2 2,896
11 Andhra Pradesh 661 14.1 4,038 85.9 4,699
12 Kerala 595 17.2 2,868 82.8 3,463
13 Punjab 649 24.9 1,962 75.1 2,611
14 Assam 326 13.5 2,092 86.5 2,418
15 Haryana 588 28.7 1,461 71.3 2,049
16 Jharkhand 415 21.1 1,552 78.9 1,967
17 Telangana 358 14.9 2,051 85.1 2,409
18 Delhi 186 20.9 704 79.1 890
19 Chhattisgarh 269 13.4 1,736 86.6 2,005
20 Uttarakhand 336 23.8 1,075 76.2 1,411
21 J & K 281 29.0 689 71.0 970
22 Himachal Pradesh 136 18.7 593 81.3 729
23 Tripura 40 8.8 416 91.2 456
24 Puducherry 66 20.7 253 79.3 319
25 Goa 33 16.5 167 83.5 200
172 151.5 755 648.5 927
19,396 20.6 74,979 79.4 94,375
64
ALL INDIA
Rest of the State/UT
Table 13: Distribution of Sample Beneficiaries by Utilisation of Loan for New/Exisiting establishment for each State/UT
Report on Pradhan Mantri Yojna (PMMY) Survey-2018

65
M F M F M F M F M F M F1 Karnataka 9.6 90.5 38.6 61.4 19.4 80.6 32.2 67.8 55.4 44.6 42.4 57.62 Tamil Nadu 44.7 55.3 62.5 37.5 51.9 48.1 31.6 68.4 40.4 59.6 36.2 63.83 Maharashtra 20.7 79.3 49.0 51.0 29.2 70.8 30.3 69.8 55.1 44.9 40.4 59.64 Uttar Pradesh 71.6 28.4 62.5 37.5 71.1 28.9 54.9 45.1 66.3 33.7 56.5 43.55 West Bengal 18.2 81.8 47.2 52.8 33.5 66.5 32.3 67.7 37.4 62.6 34.6 65.46 Bihar 63.4 36.6 66.7 33.3 64.6 35.4 32.7 67.3 39.5 60.5 36.4 63.67 Madhya Pradesh 33.3 66.7 82.7 17.3 73.1 26.9 26.4 73.6 56.0 44.0 41.6 58.48 Rajasthan 60.0 40.0 92.5 7.5 88.9 11.1 42.0 58.1 66.0 34.0 54.4 45.69 Odisha 12.9 87.1 31.8 68.2 21.7 78.3 21.9 78.1 55.5 44.5 34.0 66.0
10 Gujarat 34.3 65.7 59.8 40.2 50.3 49.7 36.8 63.2 60.7 39.3 49.1 50.911 Andhra Pradesh 71.8 28.2 69.1 30.9 69.8 30.3 70.6 29.5 65.9 34.1 67.8 32.212 Kerala 64.0 36.0 47.4 52.6 54.0 46.0 46.5 53.5 57.4 42.6 53.9 46.213 Punjab 38.8 61.2 79.4 20.7 65.3 34.8 43.2 56.8 70.1 29.9 54.9 45.114 Assam 0.0 100.0 12.0 88.0 9.1 90.9 28.0 72.1 46.5 53.5 32.7 67.315 Haryana 66.7 33.3 85.7 14.3 80.0 20.0 39.5 60.5 55.1 44.9 46.2 53.816 Jharkhand 55.6 44.4 75.0 25.0 68.0 32.0 49.0 51.1 69.1 30.9 60.2 39.817 Telangana 85.7 14.3 66.7 33.3 72.0 28.0 70.7 29.3 69.2 30.8 69.7 30.318 Delhi 75.0 25.0 60.0 40.0 63.2 36.8 84.2 15.8 62.1 37.9 64.1 35.919 Chhattisgarh 1.9 98.1 64.3 35.7 14.9 85.1 28.7 71.3 72.0 28.0 47.8 52.220 Uttarakhand 71.4 28.6 82.8 17.2 80.6 19.4 43.0 57.1 61.6 38.4 55.6 44.421 J & K 89.5 10.5 90.9 9.1 90.0 10.0 79.9 20.1 78.3 21.7 78.9 21.122 Himachal Pradesh 77.8 22.2 66.7 33.3 75.0 25.0 64.3 35.7 76.8 23.2 69.0 31.023 Tripura --- --- --- --- --- --- 38.8 61.2 53.9 46.1 45.6 54.424 Puducherry --- --- 66.7 33.3 66.7 33.3 53.3 46.7 54.5 45.5 54.2 45.825 Goa 80.0 20.0 0.0 100.0 66.7 33.3 72.3 27.7 55.9 44.1 62.9 37.1
66.7 33.3 39.2 60.8 40.7 59.3 64.0 36.0 58.6 41.4 60.0 40.030.0 70.0 56.6 43.4 42.5 57.5 38.9 61.1 55.4 44.6 46.6 53.4
M- Male: F- Female
Yojna (PMM
Y) Survey-2018Report on Pradhan M
antri
ALL INDIA
Table 14: Percentage distribution of sample beneficiaries by nature of Loan availed for each State/UT (in percentage)
Sr. No. Rural Urban
Rest of the State/UT
Rural + Urban Name of State/UT Individual LoanJoint Loan
Rural Urban Rural + Urban

RelativesMoney lender
Trader others
1 Karnataka 8.2 59.0 7.2 7.1 26.8
2 Tamil Nadu 11.2 34.1 15.5 3.4 47.0
3 Maharashtra 12.7 62.9 4.9 3.4 28.7
4 Uttar Pradesh 14.4 76.5 6.7 9.4 7.3
5 West Bengal 15.9 18.3 13.8 5.4 62.5
6 Bihar 9.5 52.4 8.3 2.1 37.2
7 Madhya Pradesh 16.8 63.6 10.2 8.2 18.1
8 Rajasthan 10.9 70.0 11.9 2.9 15.2
9 Odisha 16.1 33.9 12.5 1.5 52.1
10 Gujarat 10.9 59.7 4.4 1.8 34.1
11 Andhra Pradesh 16.9 55.1 22.9 4.6 17.4
12 Kerala 4.9 63.7 12.1 0.5 23.6
13 Punjab 9.1 68.0 17.8 2.0 12.2
14 Assam 1.7 26.2 7.1 0.0 66.7
15 Haryana 13.4 40.4 30.5 3.3 25.7
16 Jharkhand 15.2 65.8 6.8 6.8 20.7
17 Telangana 5.1 71.1 14.8 6.7 7.4
18 Delhi 8.2 79.7 6.3 0.0 14.1
19 Chhattisgarh 7.6 63.3 15.1 5.8 15.8
20 Uttarakhand 1.6 66.7 16.7 4.2 12.5
21 J & K 0 -- -- -- --
22 Himachal Pradesh 6.6 61.5 15.4 19.2 3.8
23 Tripura 1.5 85.7 0.0 14.3 0.0
24 Puducherry 7.2 41.7 33.3 8.3 16.7
25 Goa 11 80.8 11.5 0.0 7.7
1.6 61.5 15.4 0.0 23.1
11.3 51.9 11.3 4.8 32.0
66 Report on Pradhan Mantri Yojna (PMMY) Survey-2018
Percentage distribution of beneficiaries who availed loan from other source for the same
Economic Activity (by source of loan)Sr. No.
Table 15: Percentage of the Sample Beneficiaries Availing loan from Other Source for the same economic activity.
ALL INDIA
Percentage of beneficiaries
reported MUDRA loan insufficient and
availed loan from other sources
Name of State/UT
Rest of the State/UT

Sr. No. Name of State/UT Rural Urban Rural+Urban
1 Karnataka 6,237 4,757 10,994
2 Tamil Nadu 3,709 4,003 7,712
3 Maharashtra 4,351 2,889 7,240
4 Uttar Pradesh 7,122 1,151 8,273
5 West Bengal 3,880 3,256 7,136
6 Bihar 2,662 3,185 5,847
7 Madhya Pradesh 2,906 3,086 5,992
8 Rajasthan 1,886 2,010 3,896
9 Odisha 3,331 1,870 5,201
10 Gujarat 1,323 1,465 2,788
11 Andhra Pradesh 1,864 2,816 4,680
12 Kerala 1,129 2,306 3,435
13 Punjab 1,361 1,114 2,475
14 Assam 1,776 626 2,402
15 Haryana 1,104 857 1,961
16 Jharkhand 828 1,083 1,911
17 Telangana 788 1,610 2,398
18 Delhi 79 773 852
19 Chhattisgarh 1,124 834 1,958
20 Uttarakhand 443 933 1,376
21 J & K 382 581 963
22 Himachal Pradesh 429 269 698
23 Tripura 250 206 456
24 Puducherry 75 244 319
25 Goa 88 111 199
229 689 918
49,356 42,724 92,080
67 Report on Pradhan Mantri
ALL INDIA
Table 16: Distribution of Sample Beneficiaries who reported expansion in business after receipt of Loan by sector
Rest of the State/UT
Yojna (PMMY) Survey-2018

1 Karnataka 2,660 2,445 5,105
2 Tamil Nadu 1,255 1,288 2,543
3 Maharashtra 1,971 1,412 3,383
4 Uttar Pradesh 3,640 541 4,181
5 West Bengal 1,264 1,092 2,356
6 Bihar 904 1,083 1,987
7 Madhya Pradesh 818 1,217 2,035
8 Rajasthan 817 896 1,713
9 Odisha 884 485 1,369
10 Gujarat 537 661 1,198
11 Andhra Pradesh 833 1,166 1,999
12 Kerala 394 890 1,284
13 Punjab 470 455 925
14 Assam 382 135 517
15 Haryana 458 309 767
16 Jharkhand 353 480 833
17 Telangana 204 576 780
18 Delhi 37 337 374
19 Chhattisgarh 256 287 543
20 Uttarakhand 139 341 480
21 J & K 204 217 421
22 Himachal Pradesh 233 100 333
23 Tripura 24 53 77
24 Puducherry 28 78 106
25 Goa 37 41 78
74 319 393
18,876 16,904 35,780
68 Report on Pradhan Mantri Yojna (PMMY) Survey-2018
ALL INDIA
Table 17: Distribution of establishments owned by Sample Beneficiaries reporting addition in the number of persons after receipt of MUDRA loan by sector for each State/UT
Name of State/UT
Rest of the State/UT
Sr. No. Rural+Urban Urban Rural

69
Male Female Total Male Female Total Male Female Total Male Female Total1 Karnataka 95,414 13,44,321 14,39,735 1,31,033 44,610 1,75,643 50,657 7,620 58,277 2,77,104 13,96,551 16,73,655 2 Tamil Nadu 83,623 6,02,200 6,85,823 1,19,397 30,577 1,49,973 52,939 19,309 72,248 2,55,959 6,52,085 9,08,045 3 Maharashtra 61,184 6,66,762 7,27,946 1,02,509 47,385 1,49,894 8,16,153 24,175 8,40,328 9,79,845 7,38,322 17,18,167 4 Uttar Pradesh 1,23,466 35,431 1,58,897 2,49,305 20,672 2,69,976 1,29,904 15,512 1,45,416 5,02,674 71,614 5,74,288 5 West Bengal 48,769 5,79,424 6,28,192 1,05,279 16,818 1,22,097 24,392 2,036 26,428 1,78,440 5,98,277 7,76,717 6 Bihar 43,213 6,15,888 6,59,101 1,23,794 29,336 1,53,130 1,26,595 2,445 1,29,040 2,93,602 6,47,668 9,41,271 7 Madhya Pradesh 42,201 91,710 1,33,911 79,377 21,779 1,01,156 28,937 6,462 35,399 1,50,515 1,19,951 2,70,466 8 Rajasthan 57,913 1,95,830 2,53,743 71,213 9,138 80,351 43,502 3,755 47,257 1,72,628 2,08,722 3,81,351 9 Odisha 79,688 7,03,370 7,83,057 52,930 14,665 67,595 12,377 6,071 18,448 1,44,994 7,24,106 8,69,100
10 Gujarat 46,781 3,76,913 4,23,694 70,445 10,730 81,175 47,097 6,481 53,577 1,64,322 3,94,124 5,58,446 11 Andhra Pradesh 1,37,720 43,414 1,81,134 1,15,838 34,404 1,50,242 15,552 4,931 20,483 2,69,110 82,749 3,51,858 12 Kerala 57,842 2,74,562 3,32,405 1,32,557 39,477 1,72,034 62,797 20,664 83,461 2,53,197 3,34,704 5,87,900 13 Punjab 32,306 2,76,837 3,09,143 19,668 42,883 62,551 7,299 425 7,724 59,273 3,20,144 3,79,418 14 Assam 17,384 76,628 94,012 36,387 6,127 42,514 6,571 867 7,438 60,342 83,623 1,43,964 15 Haryana 57,730 1,36,744 1,94,474 44,460 6,768 51,229 11,476 1,319 12,796 1,13,667 1,44,831 2,58,498 16 Jharkhand 29,221 1,71,649 2,00,871 37,821 5,258 43,079 18,139 2,608 20,746 85,181 1,79,515 2,64,696 17 Telangana 15,615 11,018 26,633 37,004 22,930 59,934 21,015 1,888 22,902 73,634 35,836 1,09,470 18 Delhi 12,437 13,055 25,492 13,186 3,088 16,274 28,398 1,829 30,227 54,022 17,972 71,993 19 Chattisgarh 13,695 19,274 32,969 21,857 9,129 30,986 20,851 836 21,687 56,403 29,239 85,642 20 Uttarakhand 6,487 29,947 36,434 26,700 7,198 33,897 9,152 1,009 10,161 42,338 38,154 80,492 21 J & K 5,572 2,084 7,656 24,139 4,835 28,974 5,815 585 6,400 35,526 7,505 43,031 22 Himachal Pradesh 8,805 6,119 14,924 21,295 15,554 36,849 9,814 1,998 11,812 39,914 23,671 63,585 23 Tripura 746 15,131 15,877 2,668 791 3,459 445 85 530 3,859 16,006 19,866 24 Pudducherry (308) 7,775 7,467 4,112 1,385 5,497 873 513 1,387 4,677 9,673 14,350 25 Goa 2,596 231 2,827 4,564 1,116 5,681 672 197 868 7,832 1,543 9,376
Rest of the State/UT 7,514 8,044 15,557 11,540 5,422 16,962 9,737 2,097 11,833 28,790 15,562 44,352 ALL INDIA 10,87,613 63,04,360 73,91,974 16,59,078 4,52,073 21,11,150 15,61,159 1,35,713 16,96,872 43,07,850 68,92,146 111,99,996
Report on Pradhan Mantri
Yojna (PMM
Y) Survey-2018
Overall
Table 18: Estimated increase in employment after recepit of MUDRA loan by type of loan and gender for each State/UT.
Sr. No.
Name of State/UT
Shishu Kishore Tarun

70
S K T S K T S K T S K T S K T
1 Karnataka 1,25,852 23,044 11,498 4,06,457 86,019 36,270 5,35,062 8,566 1,154 3,70,841 57,461 9,080 1,522 553 275 16,73,655
2 Tamil Nadu 97,036 32,609 30,780 2,04,307 37,036 20,858 1,92,895 8,603 351 1,89,012 69,394 16,013 2,573 2,332 4,246 9,08,045
3 Maharashtra 60,060 19,935 30,819 2,89,823 87,391 79,716 2,11,189 6,920 3,843 1,65,195 34,262 7,14,947 1,679 1,386 11,002 17,18,167
4 Uttar Pradesh 27,427 49,992 29,454 56,534 1,04,450 45,040 8,697 7,734 18,736 66,126 1,02,636 52,142 113 5,164 43 5,74,288
5 West Bengal 81,743 29,985 4,047 3,02,000 52,053 15,107 82,496 898 44 1,61,877 38,479 7,198 76 682 32 7,76,717
6 Bihar 20,467 8,230 4,268 1,40,749 72,365 1,04,909 2,19,921 763 258 2,77,915 71,772 19,605 49 - - 9,41,271
7 Madhya Pradesh 4,861 12,207 6,377 95,197 47,641 10,279 8,088 3,168 815 25,717 36,106 17,928 46 2,034 - 2,70,466
8 Rajasthan 22,382 10,338 8,786 88,356 36,341 15,809 93,148 2,416 355 49,826 31,257 22,306 31 - - 3,81,351
9 Odisha 75,039 10,618 2,700 1,28,339 39,879 7,747 3,37,389 775 - 2,38,156 16,063 8,001 4,134 260 - 8,69,100
10 Gujarat 16,945 27,604 19,749 1,69,265 27,539 23,989 1,62,849 2,575 1,454 74,348 23,355 8,385 287 101 - 5,58,446
11 Andhra Pradesh 57,716 20,494 4,438 40,087 47,958 9,970 1,866 5,914 1,149 80,856 72,060 4,818 609 3,817 108 3,51,858
12 Kerala 45,885 34,179 11,270 1,80,723 96,697 38,256 18,640 2,139 93 87,156 39,018 33,843 - - - 5,87,900
13 Punjab 21,087 1,687 2,982 1,85,074 27,857 2,488 95,109 21,738 66 7,874 11,269 2,188 - - - 3,79,418
14 Assam 4,071 23,491 946 33,609 12,370 4,237 33,663 1,091 21 22,670 5,459 2,149 - 103 84 1,43,964
15 Haryana 45,874 9,912 4,113 3,768 19,681 1,689 72,279 10,932 - 72,554 10,704 6,994 - - - 2,58,498
16 Jharkhand 25,956 4,616 4,369 60,404 11,207 10,034 56,169 2,857 107 58,341 24,399 6,009 - - 227 2,64,696
17 Telangana 2,557 13,192 7,916 10,527 33,536 8,951 - 650 356 13,548 12,556 5,679 - - - 1,09,470
18 Delhi 1,624 2,274 8,719 9,771 8,985 9,785 564 42 23 13,491 4,972 11,700 42 - - 71,993
19 Chhattisgarh 2,018 3,495 4,370 7,376 12,273 4,223 1,612 1,850 16 21,964 13,352 11,691 - - 1,387 85,626
20 Uttarakhand 1,746 5,742 2,174 17,696 20,991 6,938 12,209 1,711 - 4,782 5,433 1,050 - 21 - 80,492
21 J & K 1,361 4,396 839 3,472 8,988 1,212 355 183 148 2,449 15,407 4,202 19 - - 43,031
22 Himachal Pradesh 4,075 3,578 1,970 5,708 14,359 3,874 1,293 4,736 748 3,848 14,176 5,220 - - - 63,585
23 Tripura - 83 - 3,667 3,117 414 2,593 72 - 9,617 187 115 - - - 19,866
24 Puducherry 23 1,689 755 4,114 2,907 26 2,093 157 4 1,237 744 602 - - - 14,350
25 Goa 2 449 - 2,085 3,593 508 - 718 - 651 921 361 90 - - 9,376
3,727 1,894 1,838 6,597 6,928 5,546 - 122 48 5,234 8,017 4,401 - - - 44,352
7,49,531 3,55,732 2,05,178 24,55,706 9,22,163 4,67,875 21,50,180 97,329 29,790 20,25,284 7,19,459 9,76,627 11,272 16,452 17,403 111,99,980
Report on Pradhan Mantri
Yojna (PMM
Y) Survey-2018
Table 19: State/UT wise Increase in employment by Type of Loan and by Broad Economic Activity
Overall Name of State/UT
Sr. No.
Others (Excluding Agriculture)
ALL INDIA
Manufacturing Services (Other than Trading) Allied Agriculture Trading
Rest of the State/UT

1 Karnataka 31,25,214 42,05,132 10,79,918
2 Tamil Nadu 27,03,404 30,83,957 3,80,553
3 Maharashtra 18,03,473 22,34,752 4,31,279
4 Uttar Pradesh 6,21,452 8,00,809 1,79,357
5 West Bengal 24,09,861 26,59,914 2,50,053
6 Bihar 27,00,045 32,43,007 5,42,962
7 Madhya Pradesh 3,88,505 4,77,717 89,212
8 Rajasthan 6,84,465 8,49,209 1,64,744
9 Odisha 36,29,002 40,28,464 3,99,462
10 Gujarat 12,24,680 16,13,894 3,89,214
11 Andhra Pradesh 6,42,235 7,73,270 1,31,035
12 Kerala 17,07,261 18,83,096 1,75,834
13 Punjab 14,59,462 17,27,896 2,68,434
14 Assam 7,30,624 8,22,045 91,421
15 Haryana 5,29,214 7,09,664 1,80,450
16 Jharkhand 4,65,268 6,11,787 1,46,519
17 Telangana 1,74,680 2,08,451 33,771
18 Delhi 1,18,984 1,38,640 19,656
19 Chhattisgarh 2,32,334 2,60,891 28,556
20 Uttarakhand 1,90,611 2,35,132 44,521
21 J & K 39,524 54,621 15,097
22 Himachal Pradesh 65,801 99,883 34,081
23 Tripura 93,439 98,787 5,349
24 Puducherry 31,051 39,570 8,518
25 Goa 62,226 64,813 2,587
69,887 83,771 13,884
259,02,702 310,09,169 51,06,466
71 Report on Pradhan Mantri Yojna (PMMY) Survey-2018
Table 20: Estimated number of Self employed/working owners for each State/UT
Name of State/UT Sr. No.
Rest of the State/UT
ALL INDIA
On the last working day of
month preceding to the month in
which loan
As on day previous to
Schedule enquiry
Change in employment

1 Karnataka 9,06,400 15,00,137 5,93,737
2 Tamil Nadu 10,45,620 15,73,111 5,27,491
3 Maharashtra 27,94,195 40,81,084 12,86,888
4 Uttar Pradesh 4,74,179 8,69,111 3,94,931
5 West Bengal 13,00,452 18,27,116 5,26,664
6 Bihar 4,50,263 8,48,571 3,98,308
7 Madhya Pradesh 2,51,669 4,32,923 1,81,254
8 Rajasthan 2,91,253 5,07,859 2,16,606
9 Odisha 13,69,057 18,38,695 4,69,638
10 Gujarat 2,69,701 4,38,933 1,69,232
11 Andhra Pradesh 2,70,590 4,91,414 2,20,824
12 Kerala 24,55,688 28,67,754 4,12,066
13 Punjab 1,68,996 2,79,979 1,10,983
14 Assam 1,45,690 1,98,234 52,544
15 Haryana 1,68,075 2,46,124 78,049
16 Jharkhand 1,78,557 2,96,734 1,18,177
17 Telangana 1,72,955 2,48,654 75,699
18 Delhi 1,97,429 2,49,767 52,338
19 Chhattisgarh 1,71,534 2,28,603 57,069
20 Uttarakhand 76,138 1,12,110 35,972
21 J & K 43,138 71,071 27,934
22 Himachal Pradesh 58,251 87,754 29,504
23 Tripura 11,909 26,426 14,517
24 Puducherry 45,907 51,739 5,832
25 Goa 22,898 29,687 6,789
36,919 67,387 30,468
133,77,463 194,70,977 60,93,514
72 Report on Pradhan Mantri Yojna (PMMY) Survey-2018
Table 21: Estimated number of Employee/Hired Workers for each State/UT
On the last working day of month
preceding to the
As on day previous to Schedule enquiry
Change in employment
Sr. No.
Name of State/UT
Rest of the State/UT
ALL INDIA

73
Self Employed/ Working Owners
Employee /Hired worker(s)
Self Employed/ Working Owner(s)
Employee /Hired worker(s)
Self Employed/ Working Owner(s)
Employee /Hired worker(s)
1 Karnataka 9,97,216 4,42,519 70,367 1,05,276 12,335 45,942 16,73,655 2 Tamil Nadu 3,52,420 3,33,403 24,388 1,25,585 3,746 68,503 9,08,045 3 Maharashtra 3,30,860 3,97,086 64,882 85,012 35,536 8,04,791 17,18,167 4 Uttar Pradesh 78,608 80,289 86,168 1,83,808 14,580 1,30,835 5,74,288 5 West Bengal 2,19,120 4,09,072 28,957 93,140 1,976 24,452 7,76,717 6 Bihar 5,22,634 1,36,466 19,611 1,33,519 717 1,28,323 9,41,271 7 Madhya Pradesh 46,274 87,637 35,273 65,883 7,665 27,734 2,70,466 8 Rajasthan 1,50,117 1,03,626 11,416 68,935 3,211 44,045 3,81,351 9 Odisha 3,79,656 4,03,401 17,368 50,227 2,438 16,009 8,69,100
10 Gujarat 3,52,109 71,585 30,514 50,660 6,591 46,986 5,58,446 11 Andhra Pradesh 84,940 96,194 43,365 1,06,877 2,730 17,753 3,51,858 12 Kerala 1,29,547 2,02,858 38,268 1,33,766 8,019 75,442 5,87,900 13 Punjab 2,37,484 71,659 29,783 32,768 1,167 6,556 3,79,418 14 Assam 78,084 15,929 11,600 30,914 1,737 5,700 1,43,964 15 Haryana 1,58,304 36,170 22,170 29,059 (24) 12,820 2,58,498 16 Jharkhand 1,32,428 68,443 11,618 31,461 2,473 18,273 2,64,696 17 Telangana 16,538 10,095 14,913 45,022 2,320 20,583 1,09,470 18 Delhi 14,208 11,284 2,981 13,293 2,466 27,761 71,993 19 Chhattisgarh 20,724 12,245 6,569 24,401 1,263 20,423 85,626 20 Uttarakhand 32,296 4,138 11,494 22,403 731 9,431 80,492 21 J & K 4,094 3,562 10,038 18,936 965 5,436 43,031 22 Himachal Pradesh 7,708 7,216 23,517 13,332 2,856 8,956 63,585 23 Tripura 2,572 13,305 2,671 787 105 425 19,866 24 Puducherry 7,059 408 1,408 4,088 52 1,335 14,350 25 Goa 1,185 1,642 1,238 4,442 164 704 9,376
7,904 7,653 4,997 11,964 983 10,850 44,352 43,64,088 30,27,886 6,25,575 14,85,559 1,16,803 15,80,069 111,99,980
Table 22: Distribution of Estimated Increase in employment by Type of Employment for each State/UT
Shishu Kishore Tarun
Rest of the State/UT
Overall
Report on Pradhan Mantri
Yojna (PMM
Y) Survey-2018
Name of State/UT Sr. No.
ALL INDIA

74
1 Karnataka 75,390 85,004 2,72,768 2,55,979 4,28,230 1,16,552 3,03,233 1,34,150 297 2,053 16,73,655 2 Tamil Nadu 29,614 1,30,811 90,610 1,71,590 1,45,305 56,544 1,13,955 1,60,465 1,070 8,081 9,08,045 3 Maharashtra 32,549 78,265 1,68,418 2,88,512 94,748 1,27,204 1,25,402 7,89,003 10,162 3,905 17,18,167 4 Uttar Pradesh 25,913 80,960 49,105 1,56,920 13,859 21,307 88,647 1,32,257 1,833 3,487 5,74,288 5 West Bengal 24,054 91,722 89,349 2,79,811 34,232 49,206 1,02,196 1,05,357 222 568 7,76,717 6 Bihar 13,305 19,660 98,972 2,19,051 2,02,807 18,135 2,27,873 1,41,419 6 43 9,41,271 7 Madhya Pradesh 6,389 17,056 32,245 1,20,873 7,770 4,301 41,332 38,419 1,476 604 2,70,466 8 Rajasthan 8,699 32,807 36,246 1,04,260 84,425 11,495 35,343 68,046 31 - 3,81,351 9 Odisha 21,361 66,996 55,528 1,20,437 1,73,100 1,65,065 1,49,166 1,13,054 308 4,086 8,69,100
10 Gujarat 15,168 49,130 1,52,883 67,911 1,50,772 16,107 70,003 36,085 388 - 5,58,446 11 Andhra Pradesh 40,146 42,502 30,363 67,651 2,941 5,988 56,515 1,01,218 1,070 3,464 3,51,858 12 Kerala 20,404 70,929 99,340 2,16,337 8,395 12,477 47,695 1,12,323 - - 5,87,900 13 Punjab 14,325 11,432 1,52,648 62,770 1,04,477 12,436 (3,015) 24,346 - - 3,79,418 14 Assam 4,121 24,387 32,871 17,345 28,707 6,067 25,721 4,557 - 187 1,43,964 15 Haryana 25,215 34,683 (379) 25,517 81,702 1,508 73,911 16,341 - - 2,58,498 16 Jharkhand 13,340 21,602 39,776 41,869 52,526 6,607 40,839 47,910 38 189 2,64,696 17 Telangana 2,321 21,345 14,752 38,262 881 125 15,816 15,967 - - 1,09,470 18 Delhi 134 12,483 9,262 19,279 444 185 9,815 20,348 - 42 71,993 19 Chhattisgarh 1,553 8,330 5,268 18,603 309 3,169 21,426 25,581 - 1,387 85,626 20 Uttarakhand 2,163 7,500 23,040 22,585 13,487 432 5,820 5,445 11 11 80,492 21 J & K 2,434 4,162 4,642 9,030 409 277 7,592 14,465 19 - 43,031 22 Himachal Pradesh 2,295 7,328 13,014 10,927 5,124 1,653 13,648 9,596 - - 63,585 23 Tripura - 83 2,621 4,577 709 1,957 2,019 7,900 - - 19,866 24 Puducherry 488 1,979 4,766 2,281 2,068 186 1,197 1,387 - - 14,350 25 Goa 46 404 1,511 4,674 - 718 940 992 90 - 9,376
1,652 5,807 6,149 12,923 146 24 5,938 11,714 - - 44,352 3,83,077 9,27,364 14,85,770 23,59,974 16,37,574 6,39,724 15,83,026 21,38,344 17,019 28,107 111,99,980
ALLIED AGR.
Self Employed/
Working Owners
Employee /Hired worker
Self Employed/ Working Owners
Employee /Hired worker
Self Employed/ Working Owners
Employee /Hired worker
Report on Pradhan Mantri
Yojna (PMM
Y) Survey-2018
ALL INDIA
Table 23: Distribution of Estimated Increase in employment by broad economic activity for each State/UT
Sr. No.
TRADING OTHERS (Excluding Agriculture)
Rest of the State/UT
Self Employed/ Working Owners
Employee /Hired worker
Self Employed/ Working Owners
Employee /Hired worker
OverallName of State/UT
MANUFACTURING SERVICES
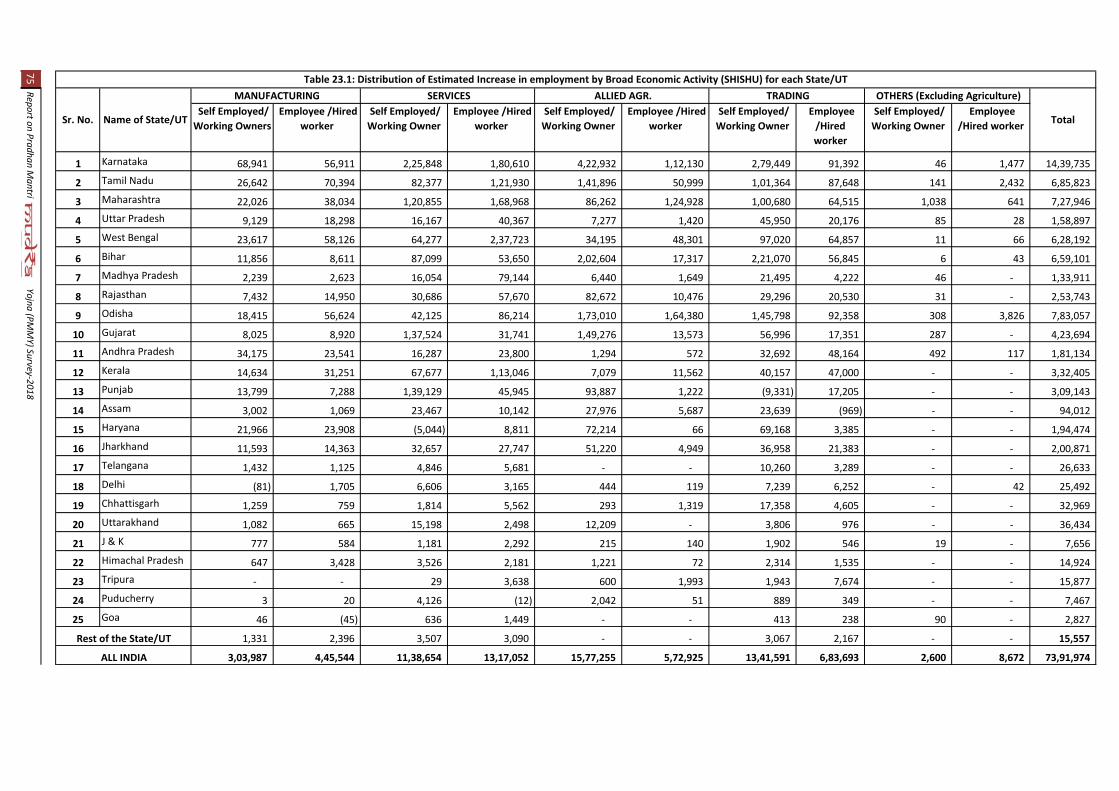
75
Self Employed/ Working Owners
Employee /Hired worker
Self Employed/ Working Owner
Employee /Hired worker
Self Employed/ Working Owner
Employee /Hired worker
Self Employed/ Working Owner
Employee /Hired worker
Self Employed/ Working Owner
Employee /Hired worker
1 Karnataka 68,941 56,911 2,25,848 1,80,610 4,22,932 1,12,130 2,79,449 91,392 46 1,477 14,39,735
2 Tamil Nadu 26,642 70,394 82,377 1,21,930 1,41,896 50,999 1,01,364 87,648 141 2,432 6,85,823
3 Maharashtra 22,026 38,034 1,20,855 1,68,968 86,262 1,24,928 1,00,680 64,515 1,038 641 7,27,946
4 Uttar Pradesh 9,129 18,298 16,167 40,367 7,277 1,420 45,950 20,176 85 28 1,58,897
5 West Bengal 23,617 58,126 64,277 2,37,723 34,195 48,301 97,020 64,857 11 66 6,28,192
6 Bihar 11,856 8,611 87,099 53,650 2,02,604 17,317 2,21,070 56,845 6 43 6,59,101
7 Madhya Pradesh 2,239 2,623 16,054 79,144 6,440 1,649 21,495 4,222 46 - 1,33,911
8 Rajasthan 7,432 14,950 30,686 57,670 82,672 10,476 29,296 20,530 31 - 2,53,743
9 Odisha 18,415 56,624 42,125 86,214 1,73,010 1,64,380 1,45,798 92,358 308 3,826 7,83,057
10 Gujarat 8,025 8,920 1,37,524 31,741 1,49,276 13,573 56,996 17,351 287 - 4,23,694
11 Andhra Pradesh 34,175 23,541 16,287 23,800 1,294 572 32,692 48,164 492 117 1,81,134
12 Kerala 14,634 31,251 67,677 1,13,046 7,079 11,562 40,157 47,000 - - 3,32,405
13 Punjab 13,799 7,288 1,39,129 45,945 93,887 1,222 (9,331) 17,205 - - 3,09,143
14 Assam 3,002 1,069 23,467 10,142 27,976 5,687 23,639 (969) - - 94,012
15 Haryana 21,966 23,908 (5,044) 8,811 72,214 66 69,168 3,385 - - 1,94,474
16 Jharkhand 11,593 14,363 32,657 27,747 51,220 4,949 36,958 21,383 - - 2,00,871
17 Telangana 1,432 1,125 4,846 5,681 - - 10,260 3,289 - - 26,633
18 Delhi (81) 1,705 6,606 3,165 444 119 7,239 6,252 - 42 25,492
19 Chhattisgarh 1,259 759 1,814 5,562 293 1,319 17,358 4,605 - - 32,969
20 Uttarakhand 1,082 665 15,198 2,498 12,209 - 3,806 976 - - 36,434
21 J & K 777 584 1,181 2,292 215 140 1,902 546 19 - 7,656
22 Himachal Pradesh 647 3,428 3,526 2,181 1,221 72 2,314 1,535 - - 14,924
23 Tripura - - 29 3,638 600 1,993 1,943 7,674 - - 15,877
24 Puducherry 3 20 4,126 (12) 2,042 51 889 349 - - 7,467
25 Goa 46 (45) 636 1,449 - - 413 238 90 - 2,827
1,331 2,396 3,507 3,090 - - 3,067 2,167 - - 15,557
3,03,987 4,45,544 11,38,654 13,17,052 15,77,255 5,72,925 13,41,591 6,83,693 2,600 8,672 73,91,974
Report on Pradhan Mantri
Yojna (PMM
Y) Survey-2018
Total
Table 23.1: Distribution of Estimated Increase in employment by Broad Economic Activity (SHISHU) for each State/UT
ALL INDIA
Sr. No.
TRADING OTHERS (Excluding Agriculture)
Rest of the State/UT
Name of State/UT
MANUFACTURING SERVICES ALLIED AGR.

76
Self Employed/ Working Owners
Employee /Hired worker
Self Employed/ Working Owner
Employee /Hired worker
Self Employed/ Working Owner
Employee /Hired worker
Self Employed/ Working Owner
Employee /Hired worker
Self Employed/ Working Owner
Employee /Hired worker
1 Karnataka 5,440 17,604 36,740 49,279 5,124 3,442 22,903 34,558 160 393 1,75,643 2 Tamil Nadu 2,087 30,522 6,773 30,263 3,315 5,287 11,349 58,045 864 1,468 1,49,973 3 Maharashtra 8,750 11,186 32,373 55,018 6,282 638 17,477 16,785 - 1,386 1,49,894 4 Uttar Pradesh 11,590 38,403 30,948 73,502 6,566 1,168 35,345 67,290 1,719 3,445 2,69,976 5 West Bengal 386 29,599 24,133 27,920 34 864 4,196 34,283 208 474 1,22,097 6 Bihar 1,320 6,910 11,393 60,972 178 585 6,719 65,053 - - 1,53,130 7 Madhya Pradesh 3,267 8,940 14,316 33,325 1,198 1,970 15,063 21,043 1,429 604 1,01,156 8 Rajasthan 754 9,584 4,103 32,237 1,637 780 4,923 26,334 - - 80,351 9 Odisha 2,414 8,204 12,136 27,742 90 685 2,727 13,336 - 260 67,595
10 Gujarat 5,013 22,591 12,338 15,201 1,402 1,174 11,660 11,695 101 - 81,175 11 Andhra Pradesh 5,571 14,922 12,452 35,506 1,417 4,497 23,364 48,696 560 3,257 1,50,242 12 Kerala 4,893 29,286 25,687 71,011 1,316 823 6,372 32,646 - - 1,72,034 13 Punjab 192 1,496 12,911 14,946 10,540 11,197 6,141 5,128 - - 62,551 14 Assam 1,071 22,420 8,094 4,277 732 359 1,704 3,755 - 103 42,514 15 Haryana 2,921 6,991 6,171 13,510 9,489 1,443 3,590 7,115 - - 51,229 16 Jharkhand 997 3,619 6,151 5,056 1,306 1,550 3,163 21,236 - - 43,079 17 Telangana 837 12,355 8,739 24,797 650 - 4,686 7,870 - - 59,934 18 Delhi 215 2,059 1,800 7,185 - 42 966 4,006 - - 16,274 19 Chhattisgarh 201 3,293 3,202 9,071 8 1,842 3,158 10,195 - - 30,970 20 Uttarakhand 1,053 4,689 7,270 13,721 1,278 432 1,882 3,550 11 11 33,897 21 J & K 1,515 2,881 3,130 5,858 145 38 5,248 10,159 - - 28,974 22 Himachal Pradesh 1,583 1,994 8,403 5,956 3,769 967 9,761 4,414 - - 36,849 23 Tripura - 83 2,487 630 108 (36) 76 111 - - 3,459 24 Puducherry 449 1,240 640 2,267 26 131 293 451 - - 5,497 25 Goa - 449 744 2,849 - 718 494 426 - - 5,681
261 1,633 2,228 4,700 122 - 2,385 5,632 - - 16,962 62,781 2,92,952 2,95,363 6,26,800 56,734 40,595 2,05,646 5,13,813 5,051 11,400 21,11,134
Report on Pradhan Mantri
Yojna (PMM
Y) Survey-2018
Total
Table 23.2: Distribution of Estimated Increase in employment by broad economic activity (KISHORE) for each State/UT
Rest of the State/UT
ALLIED AGR. TRADING OTHERS (Excluding Agriculture)
ALL INDIA
Sr. No. Name of State/UT
MANUFACTURING SERVICES

77
Self Employed/ Working Owners
Employee /Hired worker
Self Employed/ Working Owner
Employee /Hired worker
Self Employed/ Working Owner
Employee /Hired worker
Self Employed/ Working Owner
Employee /Hired worker
Self Employed/ Working Owner
Employee /Hired worker
1 Karnataka 1,009 10,489 10,180 26,090 174 980 881 8,199 92 183 58,277
2 Tamil Nadu 885 29,895 1,460 19,398 94 258 1,242 14,771 65 4,180 72,248
3 Maharashtra 1,773 29,046 15,190 64,526 2,204 1,639 7,245 7,07,703 9,124 1,878 8,40,328
4 Uttar Pradesh 5,195 24,260 1,989 43,051 17 18,720 7,351 44,791 28 14 1,45,416
5 West Bengal 50 3,997 938 14,168 3 41 981 6,217 3 29 26,428
6 Bihar 129 4,139 480 1,04,429 25 233 84 19,522 - - 1,29,040
7 Madhya Pradesh 884 5,493 1,875 8,404 132 682 4,773 13,155 - - 35,399
8 Rajasthan 514 8,273 1,457 14,353 117 239 1,124 21,181 - - 47,257
9 Odisha 531 2,169 1,266 6,481 - - 641 7,360 - - 18,448
10 Gujarat 2,130 17,619 3,021 20,969 94 1,360 1,347 7,039 - - 53,577
11 Andhra Pradesh 399 4,039 1,625 8,345 230 919 459 4,359 18 91 20,483
12 Kerala 877 10,392 5,976 32,280 - 93 1,166 32,677 - - 83,461
13 Punjab 334 2,648 608 1,879 49 16 175 2,013 - - 7,724
14 Assam 48 899 1,310 2,927 - 21 379 1,770 - 84 7,438
15 Haryana 329 3,785 (1,506) 3,195 - - 1,153 5,841 - - 12,796
16 Jharkhand 749 3,619 968 9,066 - 107 718 5,291 38 189 20,746
17 Telangana 51 7,865 1,167 7,785 231 125 870 4,808 - - 22,902
18 Delhi - 8,719 857 8,929 - 23 1,610 10,090 - - 30,227
19 Chhattisgarh 92 4,277 253 3,970 8 8 910 10,781 - 1,387 21,687
20 Uttarakhand 28 2,146 572 6,366 - - 131 919 - - 10,161
21 J & K 142 697 331 880 49 99 442 3,760 - - 6,400
22 Himachal Pradesh 64 1,906 1,085 2,789 134 614 1,573 3,647 - - 11,812
23 Tripura - - 105 309 - - - 115 - - 530
24 Puducherry 36 719 - 26 - 4 15 587 - - 1,387
25 Goa - - 131 376 - - 33 328 - - 868
60 1,778 414 5,133 24 24 485 3,915 - - 11,833
16,310 1,88,868 51,752 4,16,123 3,585 26,205 35,788 9,40,838 9,368 8,035 16,96,872
Report on Pradhan Mantri
Yojna (PMM
Y) Survey-2018
Table 23.3: Distribution of Estimated Increase in employment by broad economic activity (TARUN) for each State/UT
Total
Rest of the State/UT
ALLIED AGR. TRADING OTHERS (Excluding Agriculture)
ALL INDIA
Sr. No. Name of State/UT
MANUFACTURING SERVICES

Sr. No. Name of State/UT Services
(Other than trading)
Allied Agriculture
Trading Others
(Excluding Agriculture)
Overall
1 Karnataka 5,28,747 5,44,782 4,37,383 2,350 16,73,655
2 Tamil Nadu 2,62,200 2,01,849 2,74,420 9,151 9,08,045
3 Maharashtra 4,56,930 2,21,952 9,14,405 14,066 17,18,167
4 Uttar Pradesh 2,06,025 35,167 2,20,904 5,319 5,74,288
5 West Bengal 3,69,160 83,438 2,07,553 790 7,76,717
6 Bihar 3,18,023 2,20,942 3,69,292 49 9,41,271
7 Madhya Pradesh 1,53,118 12,072 79,751 2,080 2,70,466
8 Rajasthan 1,40,506 95,920 1,03,389 31 3,81,351
9 Odisha 1,75,965 3,38,165 2,62,220 4,394 8,69,100
10 Gujarat 2,20,794 1,66,879 1,06,088 388 5,58,446
11 Andhra Pradesh 98,014 8,929 1,57,734 4,534 3,51,858
12 Kerala 3,15,677 20,872 1,60,018 - 5,87,900
13 Punjab 2,15,418 1,16,912 21,330 - 3,79,418
14 Assam 50,217 34,774 30,278 187 1,43,964
15 Haryana 25,138 83,211 90,252 - 2,58,498
16 Jharkhand 81,645 59,133 88,750 227 2,64,696
17 Telangana 53,015 1,006 31,783 - 1,09,470
18 Delhi 28,542 629 30,163 42 71,993
19 Chhattisgarh 23,872 3,478 47,007 1,387 85,626
20 Uttarakhand 45,625 13,920 11,264 21 80,492
21 J & K 13,672 686 22,058 19 43,031
22 Himachal Pradesh 23,941 6,778 23,244 - 63,585
23 Tripura 7,198 2,665 9,919 - 19,866
24 Puducherry 7,047 2,254 2,583 - 14,350
25 Goa 6,186 718 1,932 90 9,376 19,072 170 17,652 - 44,352
38,45,744 22,77,299 37,21,370 45,127 111,99,980
78
Rest of the State/UT
ALL INDIA
Table 24 : Distribution of Estimated Increase in employment by Broad Economic Activity
Yojna (PMMY) Survey-2018Report on Pradhan Mantri

79 Report on Pradhan Mantri Yojna (PMMY) Survey-2018

80 Report on Pradhan Mantri Yojna (PMMY) Survey-2018

81 Report on Pradhan Mantri Yojna (PMMY) Survey-2018

…………….about the Labour Bureau An apex organization for providing data base at the national level for policy formulation, evaluation and research, the Labour Bureau in the Union Ministry of Labour and Employment is the epicenter of all activities involving planning, collection and dissemination of data on various facets of Labour which forms a sound basis for decision making in the Government, industry and by various other user organizations/individuals. Labour Bureau is a store house of important economic indicators like the Consumer Price Index Numbers for industrial and agricultural workers, wage rates, industrial relations, socio-economic conditions in un-organized sector, evaluation and review of working of labour legislations in the country and the like. Labour Bureau has been providing an uninterrupted service to the national and international fora like ILO for more than fifty years. Today, it has assumed an important role in the labour matters and has acquired an un-disputed and indispensible status in the field of labour statistics. Equipped with the expertise of conducting surveys at the national/regional level in diverse fields and in providing in-depth analysis, the organization continues in its pursuit of excellence.
Printed by Labour Bureau, SCO 28-31, Sector 17-A, Chandigarh – 160 017


![(UPA - MEPMA · 2018. 11. 20. · As y u are aware. Pradhan Mantri MUDRA Yojana f PMMY] launched by the Hori'ble Prime !\](https://img.dokumen.tips/doc/110x75/609d7e955518dc6083792c9b/upa-mepma-2018-11-20-as-y-u-are-aware-pradhan-mantri-mudra-yojana-f-pmmy.jpg)