Embed Size (px)
Citation preview

REPORT ON MONITORING OF NOISE
POLLUTION DURING DIWALI, 2008
MAHARASHTRA POLLUTION CONTROL BOARD “Kalpataru Point”, Sion (E)
Mumbai- 400 022 http://mpcb.mah.nic.in

Maharashtra Pollution Control Board
CONTENTS Sr. No.
Title Page No.
1. Introduction 3
2. Objective 3
3. Noise Pollution and its effect on Environment
3
4. Noise Level Measurement and Noise Pollution Standards
3
5. Methodology of the survey 4
6. Noise Levels at Various Locations in the City
7
7. Six Hourly tables and Graphs 36
8. Conclusion 86
9. Glimpse of the event 95
Noise Level Monitoring During Diwali Festival 2008 2
Maharashtra Pollution Control Board
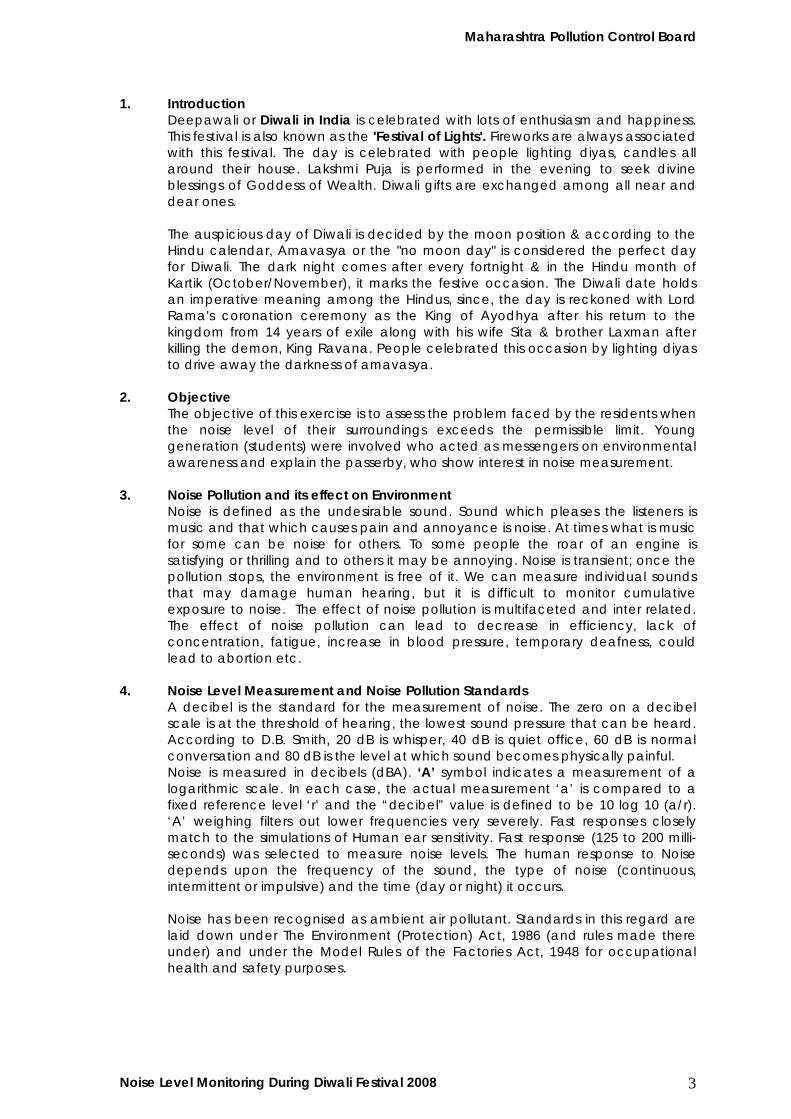
1. Introduction Deepawali or Diwali in India is celebrated with lots of enthusiasm and happiness. This festival is also known as the 'Festival of Lights'. Fireworks are always associated with this festival. The day is celebrated with people lighting diyas, candles all around their house. Lakshmi Puja is performed in the evening to seek divine blessings of Goddess of Wealth. Diwali gifts are exchanged among all near and dear ones. The auspicious day of Diwali is decided by the moon position & according to the Hindu calendar, Amavasya or the "no moon day" is considered the perfect day for Diwali. The dark night comes after every fortnight & in the Hindu month of Kartik (October/November), it marks the festive occasion. The Diwali date holds an imperative meaning among the Hindus, since, the day is reckoned with Lord Rama's coronation ceremony as the King of Ayodhya after his return to the kingdom from 14 years of exile along with his wife Sita & brother Laxman after killing the demon, King Ravana. People celebrated this occasion by lighting diyas to drive away the darkness of amavasya.
2. Objective The objective of this exercise is to assess the problem faced by the residents when the noise level of their surroundings exceeds the permissible limit. Young generation (students) were involved who acted as messengers on environmental awareness and explain the passerby, who show interest in noise measurement.
3. Noise Pollution and its effect on Environment Noise is defined as the undesirable sound. Sound which pleases the listeners is music and that which causes pain and annoyance is noise. At times what is music for some can be noise for others. To some people the roar of an engine is satisfying or thrilling and to others it may be annoying. Noise is transient; once the pollution stops, the environment is free of it. We can measure individual sounds that may damage human hearing, but it is difficult to monitor cumulative exposure to noise. The effect of noise pollution is multifaceted and inter related. The effect of noise pollution can lead to decrease in efficiency, lack of concentration, fatigue, increase in blood pressure, temporary deafness, could lead to abortion etc.
4. Noise Level Measurement and Noise Pollution Standards A decibel is the standard for the measurement of noise. The zero on a decibel scale is at the threshold of hearing, the lowest sound pressure that can be heard. According to D.B. Smith, 20 dB is whisper, 40 dB is quiet office, 60 dB is normal conversation and 80 dB is the level at which sound becomes physically painful. Noise is measured in decibels (dBA). ‘A’ symbol indicates a measurement of a logarithmic scale. In each case, the actual measurement ‘a’ is compared to a fixed reference level ‘r’ and the “decibel” value is defined to be 10 log 10 (a/r). ‘A’ weighing filters out lower frequencies very severely. Fast responses closely match to the simulations of Human ear sensitivity. Fast response (125 to 200 milli-seconds) was selected to measure noise levels. The human response to Noise depends upon the frequency of the sound, the type of noise (continuous, intermittent or impulsive) and the time (day or night) it occurs.
Noise has been recognised as ambient air pollutant. Standards in this regard are laid down under The Environment (Protection) Act, 1986 (and rules made there under) and under the Model Rules of the Factories Act, 1948 for occupational health and safety purposes.
Noise Level Monitoring During Diwali Festival 2008 3

Maharashtra Pollution Control Board
The Central Pollution Control Board constituted a National Committee of Experts on Noise Pollution Control. The Committee recommended noise standards for ambient air and for automobiles, domestic appliances and construction equipment, which were later notified under The Environment (Protection) Act, 1986 as given below:
Area Code Category of Area Limits in dB(A) Leq Day time Night time A Industrial area 75 70 B Commercial area 65 55 C Residential Area 55 45 D Silence Zone 50 40
Note:
1. Day time is reckoned from 6 A.M. To 10 P.M. 2. Night time is reckoned in from 10 P.M. and 6 A.M. 3. Silence zone is referred as areas within 100 meters around premises such as
hospitals, educational institutions and courts. The Silence zones are to be declared by the Competent Authority.
4. Use of vehicular horns, loudspeakers and bursting of crackers shall be banned in these zones.
5. Mixed categories of areas should be declared as one of the four above mentioned categories by the Competent Authority and the corresponding standards shall apply.
5. Methodology of the survey
The noise pollution monitoring was carried out from October 28th to 30th 2008. Noise level measurement was done in two sessions; morning and evening. In the morning it was carried out from 0500 hrs upto 1100 hrs on the 28th and 29th October while the evening session was carried out from 1800 hrs upto midnight (2400 hrs) on the 28th, 29th and 30th October. The monitoring was carried out at locations closer to the residential buildings. The main purpose of this exercise was to determine how the environment is disturbed and what effect it has on a normal human being residing in that area or closer to the area. There were a total of 115 locations covered during Diwali festival in Maharashtra. The detailed list of location is as follows:-
Sr. No. City Location 1. Mumbai South Colaba Mantralaya Mazgaon Girgaon Worli Prabhadevi Mahim Parel Byculla Dadar Sion Hindu Colony Matunga Kamathipura Malabar Hills
Noise Level Monitoring During Diwali Festival 2008 4

Maharashtra Pollution Control Board
2. Mumbai Eastern Suburbs Chembur (E) Trombay Kurla Ghatkopar East Ghatkopar West Mulund East Mulund West Sakinaka Powai Wadala Dharavi Sewree Kalina Vikhroli (W) Bhandup (W) 3. Mumbai Western Suburbs Sahar Santacruz (E) Vile Parle Bandra Goregaon Jogeshwari Versova Marve Borivali East Borivali West Dindoshi Kandivli (E) Dahisar (E) Juhu Malad (W) 4. Navi Mumbai CBD Nerul Sector 11 Vashi Sec. 1 Sector 9 Sector 15 Kopar Khairne Sec 10 Airoli Rabale Ghansoli Kopar Khairne 5. Thane Shiv Mandir Tembhi Naka Gokhle Road Pokharan Wagle Estate 6. Pune Shivaji Nagar Karve Road Swar Gate Balaji Nagar Shaniwar Peth Yerawada Khadaki Kothrud
Noise Level Monitoring During Diwali Festival 2008 5

Maharashtra Pollution Control Board
Mahatma Phule Madai Shagun Chowk M G Road Sarus Baug Parvati Hadapsar Koregaon Park 7. Nashik CBS Panchavati Dahipool CIDCO Bytco Point 8. Aurangabad Gulmandi City Chowk Kranti Chowk Cidco Residential Usmanpura 9. Nagpur Ajani Chowk Civil Lines Dharam Peth Itwari Civil Hospital Deshpande Layout Shankar Nagar Mahal Sadar Kalamna 10. Kalyan Katemanivali Birla College Bail Bazar 11. Dombivali Municipal Office East Kopar Village Navapada 12. Ambernath Kansai Section Near Railway Station Sai Section 13. Ulhasnagar Shivaji Chawnk No.3 Camp No. 5 Bus Stop Camp No. 1 Gol Maidan 14. Kolhapur Tarabai Park Shivaji Peth Kalam Baug Rajaram Puri Road Mahaduar road Laxmi Puri CPR Hospital Bauda Road
Noise Level Monitoring During Diwali Festival 2008 6
Maharashtra Pollution Control Board
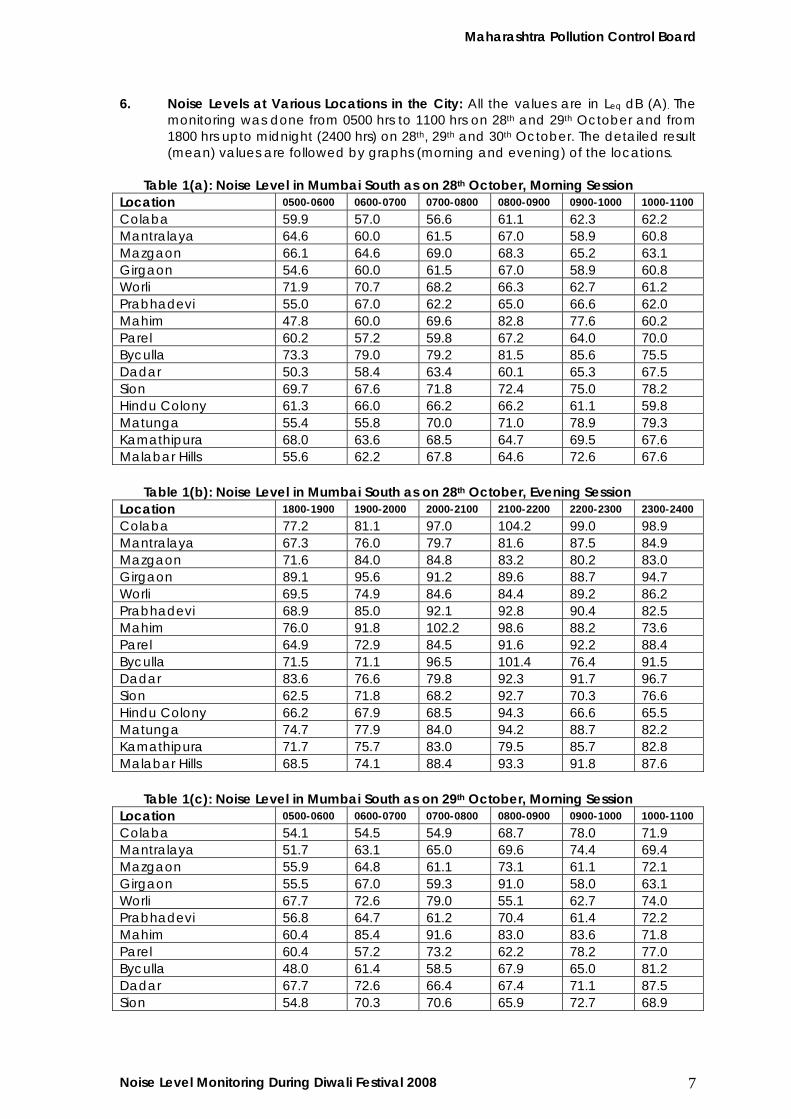
6. Noise Levels at Various Locations in the City: All the values are in Leq dB (A). The monitoring was done from 0500 hrs to 1100 hrs on 28th and 29th October and from 1800 hrs upto midnight (2400 hrs) on 28th, 29th and 30th October. The detailed result (mean) values are followed by graphs (morning and evening) of the locations.
Table 1(a): Noise Level in Mumbai South as on 28th October, Morning Session
Location 0500-0600 0600-0700 0700-0800 0800-0900 0900-1000 1000-1100 Colaba 59.9 57.0 56.6 61.1 62.3 62.2 Mantralaya 64.6 60.0 61.5 67.0 58.9 60.8 Mazgaon 66.1 64.6 69.0 68.3 65.2 63.1 Girgaon 54.6 60.0 61.5 67.0 58.9 60.8 Worli 71.9 70.7 68.2 66.3 62.7 61.2 Prabhadevi 55.0 67.0 62.2 65.0 66.6 62.0 Mahim 47.8 60.0 69.6 82.8 77.6 60.2 Parel 60.2 57.2 59.8 67.2 64.0 70.0 Byculla 73.3 79.0 79.2 81.5 85.6 75.5 Dadar 50.3 58.4 63.4 60.1 65.3 67.5 Sion 69.7 67.6 71.8 72.4 75.0 78.2 Hindu Colony 61.3 66.0 66.2 66.2 61.1 59.8 Matunga 55.4 55.8 70.0 71.0 78.9 79.3 Kamathipura 68.0 63.6 68.5 64.7 69.5 67.6 Malabar Hills 55.6 62.2 67.8 64.6 72.6 67.6
Table 1(b): Noise Level in Mumbai South as on 28th October, Evening Session
Location 1800-1900 1900-2000 2000-2100 2100-2200 2200-2300 2300-2400 Colaba 77.2 81.1 97.0 104.2 99.0 98.9 Mantralaya 67.3 76.0 79.7 81.6 87.5 84.9 Mazgaon 71.6 84.0 84.8 83.2 80.2 83.0 Girgaon 89.1 95.6 91.2 89.6 88.7 94.7 Worli 69.5 74.9 84.6 84.4 89.2 86.2 Prabhadevi 68.9 85.0 92.1 92.8 90.4 82.5 Mahim 76.0 91.8 102.2 98.6 88.2 73.6 Parel 64.9 72.9 84.5 91.6 92.2 88.4 Byculla 71.5 71.1 96.5 101.4 76.4 91.5 Dadar 83.6 76.6 79.8 92.3 91.7 96.7 Sion 62.5 71.8 68.2 92.7 70.3 76.6 Hindu Colony 66.2 67.9 68.5 94.3 66.6 65.5 Matunga 74.7 77.9 84.0 94.2 88.7 82.2 Kamathipura 71.7 75.7 83.0 79.5 85.7 82.8 Malabar Hills 68.5 74.1 88.4 93.3 91.8 87.6
Table 1(c): Noise Level in Mumbai South as on 29th October, Morning Session
Location 0500-0600 0600-0700 0700-0800 0800-0900 0900-1000 1000-1100 Colaba 54.1 54.5 54.9 68.7 78.0 71.9 Mantralaya 51.7 63.1 65.0 69.6 74.4 69.4 Mazgaon 55.9 64.8 61.1 73.1 61.1 72.1 Girgaon 55.5 67.0 59.3 91.0 58.0 63.1 Worli 67.7 72.6 79.0 55.1 62.7 74.0 Prabhadevi 56.8 64.7 61.2 70.4 61.4 72.2 Mahim 60.4 85.4 91.6 83.0 83.6 71.8 Parel 60.4 57.2 73.2 62.2 78.2 77.0 Byculla 48.0 61.4 58.5 67.9 65.0 81.2 Dadar 67.7 72.6 66.4 67.4 71.1 87.5 Sion 54.8 70.3 70.6 65.9 72.7 68.9
Noise Level Monitoring During Diwali Festival 2008 7

Maharashtra Pollution Control Board
Location 0500-0600 0600-0700 0700-0800 0800-0900 0900-1000 1000-1100 Hindu Colony 60.3 71.4 56.9 65.0 58.9 56.5 Matunga 62.3 66.0 66.4 69.8 69.5 80.8 Kamathipura 62.6 75.4 63.0 59.9 58.2 59.1 Malabar Hills 61.4 63.6 71.6 71.1 65.8 61.5
Table 1(d): Noise Level in Mumbai South as on 29th October, Evening Session
Location 1800-1900 1900-2000 2000-2100 2100-2200 2200-2300 2300-2400 Colaba 82.0 81.0 84.6 92.0 93.4 83.3 Mantralaya 62.1 64.0 66.2 68.9 73.5 65.0 Mazgaon 75.5 85.0 88.2 89.0 84.0 84.7 Girgaon 70.1 77.3 79.7 80.6 92.5 82.6 Worli 72.4 87.3 85.9 84.2 71.7 71.9 Prabhadevi 64.9 75.5 99.7 77.0 77.0 83.5 Mahim 72.2 91.0 89.4 95.2 75.8 73.6 Parel 70.3 76.8 90.8 97.9 100.2 83.2 Byculla 79.8 100.5 88.9 89.0 90.4 84.7 Dadar 71.5 83.1 90.8 95.4 90.4 73.7 Sion 76.5 77.6 76.5 77.7 77.7 78.5 Hindu Colony 52.3 78.4 78.5 75.2 76.4 73.7 Matunga 73.9 74.1 70.7 84.3 83.1 79.4 Kamathipura 75.3 75.8 78.8 84.0 91.7 82.5 Malabar Hills 71.9 72.5 73.7 85.4 84.1 79.8
Table 1(e): Noise Level in Mumbai South as on 30th October, Evening Session
Location 1800-1900 1900-2000 2000-2100 2100-2200 2200-2300 2300-2400 Colaba 79.4 79.8 96.8 87.8 92.6 76.6 Mantralaya 61.3 83.6 83.2 79.1 84.3 87.1 Mazgaon 71.0 71.4 88.8 86.7 84.0 78.3 Girgaon 65.6 73.6 79.5 73.6 78.4 77.4 Worli 77.1 81.6 82.7 91.7 82.0 71.5 Prabhadevi 90.4 80.5 97.2 96.6 99.1 95.7 Mahim 72.2 93.0 95.8 93.4 97.2 82.8 Parel 67.8 86.6 82.9 98.6 97.1 90.7 Byculla 69.3 78.5 85.5 85.6 89.1 98.3 Dadar 71.2 79.0 85.0 94.9 94.9 93.9 Sion 75.8 77.5 77.3 78.1 79.3 75.2 Hindu Colony 65.9 70.6 74.9 79.5 75.9 74.1 Matunga 87.2 90.8 94.7 95.9 85.0 88.3 Kamathipura 74.1 71.4 74.6 73.5 74.5 75.5 Malabar Hills 76.6 83.5 75.4 86.7 70.2 75.1
Noise Level Monitoring During Diwali Festival 2008 8

Maharashtra Pollution Control Board
In MUMBAI SOUTH, a total of 15 locations were monitored from October 28 to 30, between 0500 hrs to 1100 hrs and 1800 hrs to 2400 hrs. It was observed that the minimum mean of sound level was 47.8 dBA and maximum mean was 91.6 dBA during the morning session. During the evening session the minimum mean of sound level was 52.3 dBA and maximum mean was 104.2dBA
Noise Level Monitoring During Diwali Festival 2008 9

Maharashtra Pollution Control Board
Table 2(a): Noise Level in Mumbai Eastern Suburb as on 28th October, Morning Session Location 0500-0600 0600-0700 0700-0800 0800-0900 0900-1000 1000-1100 Chembur (E) 69.2 69.4 68.4 66.6 69.4 69.2 Trombay 54.2 53.0 48.4 60.0 60.6 47.8 Kurla 64.1 60.6 62.5 64.4 60.0 47.8 Ghatkopar East 56.6 61.4 63.8 60.8 61.2 67.4 Ghatkopar West 66.5 67.3 82.0 74.0 67.9 61.0 Mulund East 62.0 64.6 75.7 73.9 75.9 76.9 Mulund West 73.8 75.2 74.1 74.3 77.3 82.2 Sakinaka 67.4 68.4 65.7 69.2 67.6 60.8 Powai 64.1 76.1 71.6 71.9 72.5 79.3 Wadala 74.0 81.4 81.0 76.6 78.2 71.6 Dharavi 65.0 60.0 70.0 75.0 72.0 75.0 Sewree 64.2 62.3 64.2 70.6 66.2 64.0 Kalina 62.1 66.1 71.6 70.8 65.9 66.8 Vikhroli (W) 76.4 76.8 80.4 86.0 84.6 83.8 Bhandup (W) 59.8 56.0 69.4 73.8 76.6 85.4
Table 2(b): Noise Level in Mumbai Eastern Suburb as on 28th October, Evening Session
Location 1800-1900 1900-2000 2000-2100 2100-2200 2200-2300 2300-2400 Chembur (E) 69.0 71.2 76.2 84.2 80.6 77.0 Trombay 62.6 72.2 72.8 87.0 86.0 87.8 Kurla 73.2 72.3 69.8 75.5 65.8 66.8 Ghatkopar East 70.1 83.3 76.9 86.3 80.5 75.2 Ghatkopar West 80.1 74.8 88.2 84.7 75.6 71.1 Mulund East 67.8 77.2 75.7 79.1 78.2 80.0 Mulund West 77.5 75.9 74.2 71.3 63.8 71.8 Sakinaka 75.2 83.2 98.5 81.8 83.4 65.2 Powai 67.8 68.9 77.4 72.3 75.7 66.4 Wadala 69.8 88.2 83.4 82.2 75.6 84.8 Dharavi 76.8 73.4 72.5 73.8 65.6 64.7 Sewree 79.0 75.8 86.2 83.9 79.0 78.7 Kalina 65.8 75.8 98.2 92.2 86.2 86.0 Vikhroli (W) 80.5 81.5 75.9 82.7 84.5 79.7 Bhandup (W) 99.2 77.0 83.4 104.8 87.8 90.2
Table 2(c): Noise Level in Mumbai Eastern Suburb as on 29th October, Morning Session
Location 0500-0600 0600-0700 0700-0800 0800-0900 0900-1000 1000-1100 Chembur (E) 52.8 58.0 67.6 69.2 67.8 60.6 Trombay 55.7 50.4 48.3 57.3 49.3 47.3 Kurla 60.7 72.7 65.9 72.7 68.9 80.5 Ghatkopar East 52.0 64.4 58.7 64.9 56.9 66.7 Ghatkopar West 61.4 57.0 59.9 59.9 58.2 59.1 Mulund East 67.7 72.6 79.0 73.8 75.5 75.0 Mulund West 84.1 78.1 74.8 65.1 74.4 69.2 Sakinaka 60.8 70.4 84.8 80.8 85.0 87.2 Powai 78.9 65.0 73.2 78.1 78.0 72.8 Wadala 81.8 83.4 79.6 79.6 80.6 71.2 Dharavi 62.6 64.2 74.0 76.8 82.4 74.0 Sewree 70.3 62.6 56.9 57.2 56.8 63.5 Kalina 62.6 73.4 78.6 75.8 81.6 84.8 Vikhroli (W) 61.1 69.3 78.8 81.0 78.3 73.9 Bhandup (W) 59.6 58.6 60.8 68.0 67.0 77.2
Noise Level Monitoring During Diwali Festival 2008 10

Maharashtra Pollution Control Board
Table 2(d): Noise Level in Mumbai Eastern Suburb as on 29th October, Evening Session Location 1800-1900 1900-2000 2000-2100 2100-2200 2200-2300 2300-2400 Chembur (E) 73.0 73.4 72.2 71.2 67.0 74.8 Trombay 60.1 80.8 66.9 63.2 83.1 86.1 Kurla 75.8 78.3 73.0 75.0 71.7 78.5 Ghatkopar East 76.5 75.1 60.7 75.5 77.1 80.6 Ghatkopar West 79.5 69.0 75.6 95.7 65.4 71.1 Mulund East 71.7 77.5 81.1 88.1 78.7 90.1 Mulund West 72.3 74.1 85.1 79.1 79.3 76.3 Sakinaka 76.4 87.4 80.0 76.0 76.4 70.6 Powai 69.3 69.5 69.0 81.4 82.0 72.8 Wadala 73.8 71.4 82.4 81.8 76.8 69.2 Dharavi 83.8 91.1 94.2 94.8 94.9 78.8 Sewree 70.9 80.3 80.0 78.1 68.2 67.8 Kalina 75.2 80.2 90.6 88.6 91.2 75.2 Vikhroli (W) 82.2 83.0 82.0 85.0 87.8 82.6 Bhandup (W) 99.6 95.0 97.6 97.6 92.6 94.0
Table 2(e): Noise Level in Mumbai Eastern Suburb as on 30th October, Evening Session
Location 1800-1900 1900-2000 2000-2100 2100-2200 2200-2300 2300-2400 Chembur (E) 68.0 70.0 79.0 72.8 77.2 73.6 Trombay 57.2 66.4 64.8 73.5 73.8 64.3 Kurla 79.0 79.0 72.4 69.9 83.0 78.2 Ghatkopar East 79.8 70.9 72.4 73.9 69.2 76.0 Ghatkopar West 75.4 62.5 70.0 82.9 85.4 67.9 Mulund East 82.1 75.3 76.1 79.4 80.4 73.8 Mulund West 77.5 77.8 85.0 81.1 72.2 69.0 Sakinaka 76.2 76.4 86.0 68.8 66.8 72.2 Powai 71.3 68.5 66.7 65.6 67.4 65.2 Wadala 74.2 78.4 77.6 81.2 81.8 72.8 Dharavi 76.1 90.5 94.3 102.6 86.3 97.4 Sewree 69.1 73.4 77.0 80.5 65.0 70.2 Kalina 74.6 89.4 84.8 83.4 87.6 76.8 Vikhroli (W) 78.1 75.9 76.3 72.4 84.5 86.0 Bhandup (W) 92.0 104.2 102.8 106.8 105.0 93.0
Noise Level Monitoring During Diwali Festival 2008 11

Maharashtra Pollution Control Board
In MUMBAI EASTERN SUBURBS , a total of 15 locations were monitored from October 28 to 30, between 0500 hrs to 1100 hrs and 1800 hrs to 2400 hrs. It was observed that the minimum mean of sound level was 52.0 dBA and maximum mean was 87.2 dBA during the morning session. During the evening session the minimum mean of sound level was 57.2 dBA and maximum mean was 106.8 dBA
Noise Level Monitoring During Diwali Festival 2008 12

Maharashtra Pollution Control Board
Table 3(a): Noise Level in Mumbai Western Suburb as on 28th October, Morning Session Location 0500-0600 0600-0700 0700-0800 0800-0900 0900-1000 1000-1100 Sahar 85.0 73.1 58.4 83.6 85.4 86.3 Santacruz (E) 61.8 60.7 58.9 63.0 67.9 67.6 Vile Parle 63.2 69.6 71.8 76.2 73.4 75.0 Bandra 61.6 61.6 59.8 68.6 71.6 70.0 Goregaon 53.3 71.8 64.0 61.3 56.6 53.8 Jogeshwari 62.0 74.8 67.2 70.0 71.4 66.2 Versova 65.0 66.3 65.1 61.3 60.6 58.1 Marve 76.0 65.0 78.0 80.0 81.0 80.0 Borivali East 72.7 58.2 64.0 69.0 72.0 78.5 Borivali West 57.0 83.0 75.5 64.2 73.5 61.2 Dindoshi 52.6 57.0 63.6 59.3 69.6 68.0 Kandivli (E) 67.0 74.0 77.0 77.0 75.0 78.0 Dahisar (E) 71.8 64.3 67.5 61.4 58.7 69.4 Juhu 48.0 55.0 61.0 65.0 70.0 56.0 Malad (W) 76.0 78.0 78.0 71.0 73.0 72.0
Table 3(b): Noise Level in Mumbai Western Suburb as on 28th October, Evening Session
Location 1800-1900 1900-2000 2000-2100 2100-2200 2200-2300 2300-2400 Sahar 80.6 88.0 100.0 98.0 99.6 82.4 Santacruz (E) 72.1 80.3 74.4 75.8 72.6 69.3 Vile Parle 74.6 75.0 78.8 94.2 87.6 86.4 Bandra 69.6 70.8 70.4 73.4 71.6 56.6 Goregaon 60.8 85.5 81.2 90.4 81.8 86.3 Jogeshwari 90.0 99.8 90.2 96.4 97.6 100.4 Versova 67.4 92.6 87.8 92.4 97.4 92.4 Marve 78.0 76.2 79.6 84.8 84.8 80.2 Borivali East 81.1 89.9 96.5 87.7 85.8 86.3 Borivali West 57.0 83.0 75.5 64.2 73.5 61.2 Dindoshi 78.2 74.4 90.4 93.0 106.2 103.4 Kandivli (E) 69.0 80.0 86.7 95.4 90.3 95.2 Dahisar (E) 83.4 87.8 103.4 106.0 111.0 107.8 Juhu 73.0 73.8 67.6 74.8 79.8 63.4 Malad (W) 73.1 78.0 75.3 76.0 77.7 66.8
Table 3(c): Noise Level in Mumbai Western Suburb as on 29th October, Morning Session
Location 0500-0600 0600-0700 0700-0800 0800-0900 0900-1000 1000-1100 Sahar 70.0 89.4 78.8 94.8 80.6 75.4 Santacruz (E) 79.2 66.6 65.1 66.8 67.2 69.5 Vile Parle 66.4 75.0 75.8 76.8 81.0 75.8 Bandra 51.4 65.6 62.6 70.2 70.0 70.0 Goregaon 60.2 74.8 70.5 71.7 74.1 73.6 Jogeshwari 79.4 67.0 67.8 83.8 70.2 76.6 Versova 70.8 56.6 62.0 56.8 91.8 66.0 Marve 80.0 76.0 75.6 79.4 79.8 83.8 Borivali East 57.7 65.7 70.5 62.0 76.4 70.2 Borivali West 72.7 71.0 72.5 68.4 67.5 69.1 Dindoshi 66.2 70.4 68.6 60.6 61.6 67.8 Kandivli (E) 66.6 69.6 65.1 76.7 75.8 73.6 Dahisar (E) 102.2 104.8 108.2 83.4 80.0 91.0 Juhu 50.4 49.0 51.8 58.8 71.4 76.2 Malad (W) 78.0 75.4 75.6 72.6 74.0 66.4
Noise Level Monitoring During Diwali Festival 2008 13

Maharashtra Pollution Control Board
Table 3(d): Noise Level in Mumbai Western Suburb as on 29th October, Evening Session Location 1800-1900 1900-2000 2000-2100 2100-2200 2200-2300 2300-2400 Sahar 66.8 79.4 73.8 78.3 68.6 58.7 Santacruz (E) 75.0 81.6 88.9 74.0 72.7 75.7 Vile Parle 79.8 84.2 84.0 76.2 76.8 84.6 Bandra 68.0 75.8 71.8 70.6 66.0 61.0 Goregaon 83.7 82.0 79.8 87.0 82.5 81.5 Jogeshwari 87.2 89.4 92.4 87.0 85.2 81.0 Versova 73.6 85.6 93.8 81.6 96.8 86.8 Marve 87.8 82.0 83.8 84.2 86.8 89.8 Borivali East 73.8 88.1 88.9 82.6 77.4 82.5 Borivali West 72.0 74.8 76.7 75.0 78.1 70.0 Dindoshi 77.8 78.7 76.4 74.9 81.2 84.3 Kandivli (E) 74.2 74.8 76.3 78.4 77.6 62.2 Dahisar (E) 74.5 78.0 79.1 80.2 76.9 73.6 Juhu 73.0 69.6 69.0 74.4 62.0 62.2 Malad (W) 71.6 74.2 78.4 79.3 71.6 69.3
Table 3(e): Noise Level in Mumbai Western Suburb as on 30th October, Evening Session
Location 1800-1900 1900-2000 2000-2100 2100-2200 2200-2300 2300-2400 Sahar 65.1 80.5 80.5 76.5 68.4 70.6 Santacruz (E) 68.5 73.9 76.6 91.1 87.7 77.2 Vile Parle 76.6 75.4 76.4 80.8 83.8 81.4 Bandra 73.0 73.8 74.6 71.0 76.0 60.0 Goregaon 76.9 79.1 81.4 74.5 70.6 62.3 Jogeshwari 83.4 83.4 95.8 102.4 102.4 95.4 Versova 64.6 85.4 93.6 86.8 91.2 97.8 Marve 81.4 89.6 81.0 90.4 83.4 81.2 Borivali East 78.2 78.4 91.1 79.4 81.1 77.1 Borivali West 72.8 73.9 60.3 69.2 84.3 86.2 Dindoshi 69.6 82.8 95.6 91.8 91.6 86.4 Kandivli (E) 66.3 73.7 84.4 76.2 72.5 77.8 Dahisar (E) 65.4 63.8 70.8 66.6 90.2 82.0 Juhu 69.8 68.2 69.6 69.8 62.4 63.8 Malad (W) 68.7 71.9 70.8 70.2 71.4 72.5
Noise Level Monitoring During Diwali Festival 2008 14

Maharashtra Pollution Control Board
In MUMBAI WESTERN SUBURB, a total of 15 locations were monitored from October 28 to 30, between 0500 hrs to 1100 hrs and 1800 hrs to 2400 hrs. It was observed that the minimum mean of sound level was 48.0 dBA and maximum mean was 108.2 dBA during the morning session. During the evening session the minimum mean of sound level was 56.6 dBA and maximum mean was 110.0 dBA
Noise Level Monitoring During Diwali Festival 2008 15

Maharashtra Pollution Control Board
Table 4(a): Noise Level in Navi Mumbai as on 28th October, Morning Session Location 0500-0600 0600-0700 0700-0800 0800-0900 0900-1000 1000-1100 CBD 62.4 62.1 64.8 63.4 60.8 59.8 Nerul Sector 11 60.4 74.0 69.6 64.4 74.2 74.8 Vashi Sec. 1 61.2 59.8 70.8 63.4 70.8 70.6 Sector 9 61.6 60.8 56.8 62.0 64.6 66.4 Sector 15 62.8 82.4 77.0 80.8 81.8 78.6 Kopar Khairne Sec 10 57.6 60.6 62.3 80.4 75.1 67.4 Airoli 59.8 58.0 66.4 64.0 65.0 71.6 Rabale 61.0 85.8 71.6 70.4 81.4 94.4 Ghansoli 51.0 65.4 69.2 74.6 72.4 74.4 Kopar Khairne 53.3 56.0 63.4 70.4 71.0 74.8
Table 4(b): Noise Level in Navi Mumbai as on 28th October, Evening Session
Location 1800-1900 1900-2000 2000-2100 2100-2200 2200-2300 2300-2400 CBD 79.4 76.5 70.5 68.8 65.6 64.7 Nerul Sector 11 68.4 77.4 81.2 76.8 89.2 75.2 Vashi Sec. 1 60.1 81.3 83.9 75.0 66.8 64.9 Sector 9 71.6 70.3 81.4 82.4 81.4 89.9 Sector 15 74.7 77.2 80.5 79.5 85.4 85.8 Kopar Khairne Sec 10 83.6 79.2 87.3 89.8 81.6 77.8 Airoli 79.8 80.0 87.6 99.6 65.4 68.0 Rabale 93.2 81.6 95.6 108.2 103.0 85.6 Ghansoli 75.6 72.3 83.7 89.8 86.5 84.3 Kopar Khairne 70.3 85.1 88.2 90.3 83.3 69.0
Table 4(c): Noise Level in Navi Mumbai as on 29th October, Morning Session
Location 0500-0600 0600-0700 0700-0800 0800-0900 0900-1000 1000-1100 CBD 70.2 68.7 64.1 71.7 71.2 74.5 Nerul Sector 11 66.0 64.4 58.2 68.6 73.2 73.6 Vashi Sec. 1 56.9 60.6 60.7 55.1 62.7 74.0 Sector 9 55.5 67.7 66.4 67.4 71.1 87.5 Sector 15 61.6 62.7 76.4 75.7 85.0 88.5 Kopar Khairne Sec 10 55.4 67.2 78.7 83.4 87.8 89.1 Airoli 72.2 67.9 78.2 63.2 63.9 73.6 Rabale 62.6 75.4 63.0 73.2 98.2 83.0 Ghansoli 54.8 70.3 70.6 74.3 69.9 74.3 Kopar Khairne 68.2 69.7 68.7 69.5 71.3 71.9
Table 4(d): Noise Level in Navi Mumbai as on 29th October, Evening Session
Location 1800-1900 1900-2000 2000-2100 2100-2200 2200-2300 2300-2400 CBD 102.6 86.3 76.3 93.7 68.1 80.3 Nerul Sector 11 67.2 70.0 75.0 68.8 70.4 72.2 Vashi Sec. 1 65.0 66.3 67.4 71.3 65.3 64.1 Sector 9 70.3 71.3 72.5 87.1 71.1 80.9 Sector 15 76.6 76.3 78.6 76.3 85.5 88.0 Kopar Khairne Sec 10 88.1 89.1 82.1 90.5 81.9 76.4 Airoli 78.0 74.2 67.2 103.4 81.2 76.0 Rabale 82.8 80.0 89.8 96.8 83.2 87.4 Ghansoli 74.0 79.1 71.7 79.7 82.7 78.5 Kopar Khairne 61.4 78.3 77.6 72.9 75.1 66.6
Noise Level Monitoring During Diwali Festival 2008 16

Maharashtra Pollution Control Board
Table 4(e): Noise Level in Navi Mumbai as on 30th October, Evening Session Location 1800-1900 1900-2000 2000-2100 2100-2200 2200-2300 2300-2400 CBD 84.8 90.3 81.4 81.5 71.1 75.6 Nerul Sector 11 67.6 77.4 80.2 75.8 75.6 67.4 Vashi Sec. 1 63.9 69.0 67.6 71.9 69.7 65.7 Sector 9 77.5 79.3 78.9 77.7 77.1 65.3 Sector 15 76.6 76.3 78.6 76.3 85.5 88.0 Kopar Khairne Sec 10 97.0 112.4 95.2 83.9 87.8 79.3 Airoli 76.0 66.4 73.4 86.1 75.1 64.8 Rabale 81.6 77.2 80.8 89.4 84.6 88.6 Ghansoli 82.5 78.8 87.2 95.3 83.8 78.0 Kopar Khairne 64.0 72.1 94.6 78.8 74.2 66.8
Noise Level Monitoring During Diwali Festival 2008 17

Maharashtra Pollution Control Board
In NAVI MUMBAI, a total of 10 locations were monitored from October 28 to 30, between 0500 hrs to 1100 hrs and 1800 hrs to 2400 hrs. It was observed that the minimum mean of sound level was 51.0 dBA and maximum mean was 98.2 dBA during the morning session. During the evening session the minimum mean of sound level was 61.4 dBA and maximum mean was 112.4 dBA
Table 5(a): Noise Level in Thane as on 28th October, Morning Session
Location 0500-0600 0600-0700 0700-0800 0800-0900 0900-1000 1000-1100 Shiv Mandir 63.1 63.7 76.7 73.3 78.1 79.0 Tembhi Naka 70.0 71.2 74.0 75.8 73.4 77.6 Gokhle Road 59.2 61.8 73.2 78.2 74.6 69.6 Pokharan 55.8 68.2 73.8 68.0 71.0 87.0 Wagle Estate 58.1 69.6 71.1 71.8 66.7 68.2
Table 5(b): Noise Level in Thane as on 28th October, Evening Session
Location 1800-1900 1900-2000 2000-2100 2100-2200 2200-2300 2300-2400 Shiv Mandir 77.4 79.6 89.5 90.8 85.8 89.4 Tembhi Naka 74.0 80.0 80.9 92.8 78.5 86.3 Gokhle Road 88.8 86.6 100.6 80.9 87.8 73.6 Pokharan 74.0 80.8 99.4 85.8 86.2 90.2 Wagle Estate 80.1 75.5 87.6 77.5 83.2 77.2
Table 5(c): Noise Level in Thane as on 29th October, Morning Session
Location 0500-0600 0600-0700 0700-0800 0800-0900 0900-1000 1000-1100 Shiv Mandir 57.5 74.3 84.0 86.6 77.8 79.5 Tembhi Naka 81.7 67.1 79.7 77.2 76.8 78.6 Gokhle Road 45.6 57.9 68.4 72.5 75.6 68.7 Pokharan 68.4 76.6 73.6 87.2 79.8 81.2 Wagle Estate 53.4 61.0 64.3 87.1 75.4 75.5
Noise Level Monitoring During Diwali Festival 2008 18

Maharashtra Pollution Control Board
Table 5(d): Noise Level in Thane as on 29th October, Evening Session Location 1800-1900 1900-2000 2000-2100 2100-2200 2200-2300 2300-2400 Shiv Mandir 80.1 74.8 71.8 84.2 71.7 71.9 Tembhi Naka 78.9 78.3 77.7 73.4 70.4 86.7 Gokhle Road 72.7 76.5 77.3 78.4 75.4 76.8 Pokharan 84.0 94.4 94.4 88.8 92.0 98.0 Wagle Estate 72.2 76.6 76.5 96.1 79.9 82.8
Table 5(e): Noise Level in Thane as on 30th October, Evening Session
Location 1800-1900 1900-2000 2000-2100 2100-2200 2200-2300 2300-2400 Shiv Mandir 69.1 71.4 75.8 68.5 102.6 97.2 Tembhi Naka 72.6 75.1 75.7 78.5 80.5 80.4 Gokhle Road 74.8 76.5 76.1 76.8 75.4 74.7 Pokharan 81.0 85.0 96.2 87.8 84.2 89.8 Wagle Estate 78.2 71.3 82.1 83.4 72.5 68.7
Noise Level Monitoring During Diwali Festival 2008 19

Maharashtra Pollution Control Board
In Thane , a total of 5 locations were monitored from October 28 to 30, between 0500 hrs to 1100 hrs and 1800 hrs to 2400 hrs. It was observed that the minimum mean of sound level was 45.6 dBA and maximum mean was 87.2 dBA during the morning session. During the evening session the minimum mean of sound level was 68.5 dBA and maximum mean was 102.6 dBA
Table 6(a): Noise Level in Pune as on 28th October, Morning Session
Location 0500-0600 0600-0700 0700-0800 0800-0900 0900-1000 1000-1100 Shivaji Nagar 40.0 47.0 58.0 64.0 66.0 68.0 Karve Road 43.0 51.0 56.0 61.0 64.0 69.0 Swar Gate 41.0 48.0 53.0 59.0 66.0 70.0 Satara Road 46.0 54.0 58.0 60.0 65.0 69.0 Shaniwar Peth 42.0 49.0 56.0 63.0 69.0 73.0 Yerawada 45.0 52.0 63.0 60.0 68.0 72.0 Khadaki 43.0 56.0 65.0 62.0 61.0 67.0 Kothrud 41.0 52.0 58.0 63.0 65.0 68.0 Mahatma Phule Madai 49.0 59.0 64.0 68.0 63.0 70.0
Laxmi Road 42.0 47.0 51.0 55.0 65.0 68.0 M G Road 39.0 45.0 52.0 56.0 64.0 66.0 Sarus Baug 38.0 46.0 57.0 61.0 66.0 64.0 Parvati 40.0 44.0 58.0 62.0 65.0 68.0 Hadapsar 43.0 50.0 54.0 65.0 63.0 67.0 Koregaon Park 42.0 48.0 54.0 63.0 60.0 65.0
Noise Level Monitoring During Diwali Festival 2008 20

Maharashtra Pollution Control Board
Table 6(b): Noise Level in Pune as on 28th October, Evening Session Location 1800-1900 1900-2000 2000-2100 2100-2200 2200-2300 2300-2400 Shivaji Nagar 75.0 77.0 86.0 79.0 77.0 58.0 Karve Road 79.0 80.0 82.0 80.0 81.0 51.0 Swar Gate 72.0 89.0 75.0 85.0 87.0 71.0 Satara Road 78.0 80.0 84.0 81.0 78.0 76.0 Shaniwar Peth 70.0 87.0 77.0 65.0 66.0 61.0 Yerawada 76.0 87.0 83.0 73.0 69.0 60.0 Khadaki 77.0 73.0 80.0 91.0 79.0 62.0 Kothrud 79.0 80.0 84.0 78.0 80.0 76.0 Mahatma Phule Madai 88.0 84.0 84.0 74.0 66.0 58.0
Laxmi Road 67.0 78.0 74.0 72.0 64.0 59.0 M G Road 78.0 81.0 76.0 98.0 67.0 62.0 Sarus Baug 75.0 79.0 82.0 77.0 67.0 59.0 Parvati 72.0 83.0 81.0 86.0 73.0 63.0 Hadapsar 73.0 81.0 83.0 73.0 74.0 61.0 Koregaon Park 73.0 76.0 87.0 74.0 55.0 56.0
Table 6(c): Noise Level in Pune as on 29th October, Morning Session
Location 0500-0600 0600-0700 0700-0800 0800-0900 0900-1000 1000-1100 Shivaji Nagar 38.0 40.0 46.0 58.0 62.0 60.0 Karve Road 40.0 47.0 51.0 57.0 60.0 65.0 Swar Gate 39.0 46.0 50.0 55.0 64.0 61.0 Satara Road 43.0 49.0 54.0 65.0 58.0 63.0 Shaniwar Peth 41.0 46.0 51.0 59.0 64.0 68.0 Yerawada 43.0 50.0 68.0 70.0 62.0 66.0 Khadaki 40.0 51.0 66.0 69.0 64.0 66.0 Kothrud 42.0 55.0 61.0 67.0 68.0 64.0 Mahatma Phule Madai 44.0 52.0 58.0 67.0 72.0 65.0
Laxmi Road 40.0 45.0 52.0 60.0 64.0 68.0 M G Road 41.0 49.0 54.0 67.0 62.0 67.0 Sarus Baug 40.0 48.0 52.0 61.0 64.0 68.0 Parvati 37.0 49.0 54.0 63.0 70.0 66.0 Hadapsar 41.0 47.0 55.0 68.0 59.0 70.0 Koregaon Park 38.0 44.0 49.0 54.0 61.0 68.0
Table 6(d): Noise Level in Pune as on 29th October, Evening Session
Location 1800-1900 1900-2000 2000-2100 2100-2200 2200-2300 2300-2400 Shivaji Nagar 68.0 65.0 65.0 65.0 61.0 51.0 Karve Road 75.0 77.0 71.0 73.0 66.0 61.0 Swar Gate 64.0 67.0 68.0 68.0 60.0 58.0 Satara Road 74.0 75.0 72.0 67.0 68.0 59.0 Shaniwar Peth 67.0 74.0 72.0 75.0 68.0 52.0 Yerawada 67.0 64.0 68.0 66.0 60.0 59.0 Khadaki 66.0 64.0 64.0 66.0 60.0 54.0 Kothrud 75.0 72.0 67.0 71.0 62.0 57.0 Mahatma Phule Madai 69.0 75.0 70.0 68.0 63.0 57.0
Laxmi Road 72.0 71.0 75.0 65.0 57.0 57.0 M G Road 74.0 74.0 75.0 73.0 57.0 42.0 Sarus Baug 67.0 69.0 62.0 64.0 63.0 54.0 Parvati 66.0 64.0 66.0 63.0 64.0 57.0
Noise Level Monitoring During Diwali Festival 2008 21

Maharashtra Pollution Control Board
Location 1800-1900 1900-2000 2000-2100 2100-2200 2200-2300 2300-2400 Hadapsar 75.0 77.0 76.0 74.0 71.0 60.0 Koregaon Park 62.0 61.0 65.0 67.0 60.0 55.0
Table 6(e): Noise Level in Pune as on 30th October, Evening Session
Location 1800-1900 1900-2000 2000-2100 2100-2200 2200-2300 2300-2400 Shivaji Nagar 69.0 70.0 64.0 67.0 68.0 63.0 Karve Road 76.0 74.0 72.0 66.0 68.0 63.0 Swar Gate 64.0 64.0 62.0 67.0 62.0 58.0 Satara Road 73.0 75.0 72.0 65.0 63.0 59.0 Shaniwar Peth 59.0 68.0 72.0 74.0 63.0 52.0 Yerawada 66.0 63.0 75.0 65.0 60.0 52.0 Khadaki 68.0 65.0 66.0 68.0 59.0 53.0 Kothrud 70.0 74.0 68.0 70.0 66.0 61.0 Mahatma Phule Madai 65.0 64.0 67.0 62.0 56.0 48.0
Laxmi Road 62.0 69.0 64.0 70.0 59.0 50.0 M G Road 76.0 74.0 76.0 76.0 54.0 43.0 Sarus Baug 64.0 66.0 61.0 69.0 57.0 55.0 Parvati 63.0 68.0 61.0 69.0 56.0 56.0 Hadapsar 60.0 65.0 60.0 68.0 58.0 55.0 Koregaon Park 73.0 77.0 74.0 72.0 70.0 53.0
Noise Level Monitoring During Diwali Festival 2008 22

Maharashtra Pollution Control Board
In Pune, a total of 15 locations were monitored from October 28 to 30, between 0500 hrs to 1100 hrs and 1800 hrs to 2400 hrs. It was observed that the minimum mean of sound level was 37.0 dBA and maximum mean was 73.0 dBA during the morning session. During the evening session the minimum mean of sound level was 42.0 dBA and maximum mean was 98.0dBA
Table 7(a): Noise Level in Nashik as on 28th October, Morning Session Location 0500-0600 0600-0700 0700-0800 0800-0900 0900-1000 1000-1100 CBS 54.2 60.2 59.8 57.6 66.8 69.8 Panchavati 58.7 71.2 75.0 74.6 74.2 68.3 Dahipool 68.5 75.3 69.1 76.0 70.7 69.9 CIDCO 58.6 56.3 63.9 65.2 67.2 70.4 Bytco Point 55.4 56.8 64.6 66.2 65.3 66.7
Table 7(b): Noise Level in Nashik as on 28th October, Evening Session
Location 1800-1900 1900-2000 2000-2100 2100-2200 2200-2300 2300-2400 CBS 61.9 70.7 70.2 72.7 70.7 68.2 Panchavati 66.1 70.2 72.8 77.0 72.8 66.9 Dahipool 72.2 75.2 76.6 85.9 67.1 70.9 CIDCO 61.6 71.8 84.3 75.0 70.2 68.7 Bytco Point 67.7 71.4 73.5 81.4 74.9 74.6
Table 7(c): Noise Level in Nashik as on 29th October, Morning Session
Location 0500-0600 0600-0700 0700-0800 0800-0900 0900-1000 1000-1100 CBS 57.2 60.1 67.2 58.5 60.4 57.7 Panchavati 61.5 71.5 72.8 75.0 74.0 75.7 Dahipool 76.8 79.3 81.5 82.7 71.2 71.7 CIDCO 54.7 75.9 70.2 57.9 56.7 58.5 Bytco Point 61.5 66.7 64.2 56.9 55.0 59.0
Noise Level Monitoring During Diwali Festival 2008 23

Maharashtra Pollution Control Board
Table 7(d): Noise Level in Nashik as on 29th October, Evening Session Location 1800-1900 1900-2000 2000-2100 2100-2200 2200-2300 2300-2400 CBS 58.1 70.1 69.7 75.0 70.2 67.7 Panchavati 70.2 73.2 77.0 70.5 60.6 60.1 Dahipool 75.8 78.8 74.2 75.6 71.7 68.5 CIDCO 56.7 68.6 60.1 72.9 70.2 68.2 Bytco Point 56.2 57.1 62.3 57.4 57.5 57.2
Table 7(e): Noise Level in Nashik as on 30th October, Evening Session
Location 1800-1900 1900-2000 2000-2100 2100-2200 2200-2300 2300-2400 CBS 59.2 68.4 68.2 70.5 67.2 64.6 Panchavati 68.3 71.9 69.7 66.5 64.9 62.5 Dahipool 72.7 73.9 73.1 71.7 66.8 64.3 CIDCO 62.2 68.4 78.0 77.3 67.0 64.2 Bytco Point 58.0 62.4 65.2 61.4 58.0 56.2
Noise Level Monitoring During Diwali Festival 2008 24

Maharashtra Pollution Control Board
In Nashik, a total of 5 locations were monitored from October 28 to 30, between 0500 hrs to 1100 hrs and 1800 hrs to 2400 hrs. It was observed that the minimum mean of sound level was 54.2 dBA and maximum mean was 82.7 dBA during the morning session. During the evening session the minimum mean of sound level was 56.2 dBA and maximum mean was 85.9dBA.
Table 8(a): Noise Level in Aurangabad as on 28th October, Morning Session Location 0500-0600 0600-0700 0700-0800 0800-0900 0900-1000 1000-1100 Gulmandi 67.8 63.0 71.0 62.0 60.4 54.4 City Chowk 53.4 82.6 70.0 58.6 61.7 49.6 Kranti Chowk 62.5 70.8 75.7 72.4 73.8 54.6 Cidco Residential 60.0 78.6 73.3 81.6 58.2 50.1 Usmanpura 52.2 72.0 66.3 65.8 62.5 60.3
Table 8(b): Noise Level in Aurangabad as on 28th October, Evening Session
Location 1800-1900 1900-2000 2000-2100 2100-2200 2200-2300 2300-2400 Gulmandi 72.3 70.7 85.3 84.1 79.3 72.1 City Chowk 72.6 73.0 64.1 66.2 70.9 64.9 Kranti Chowk 73.7 77.6 81.1 78.6 73.8 71.0 Cidco Residential 72.9 69.7 82.1 83.6 74.2 72.2 Usmanpura 70.7 69.0 79.0 80.6 76.1 64.0
Table 8(c): Noise Level in Aurangabad as on 29th October, Morning Session
Location 0500-0600 0600-0700 0700-0800 0800-0900 0900-1000 1000-1100 Gulmandi 62.1 59.3 68.7 60.5 57.3 55.4 City Chowk 50.6 71.4 72.3 64.2 54.1 52.2 Kranti Chowk 56.4 64.7 70.2 69.5 65.1 50.2 Cidco Residential 54.2 60.5 65.8 69.1 59.4 52.3 Usmanpura 58.2 66.4 71.3 62.4 56.2 55.3
Noise Level Monitoring During Diwali Festival 2008 25
Maharashtra Pollution Control Board
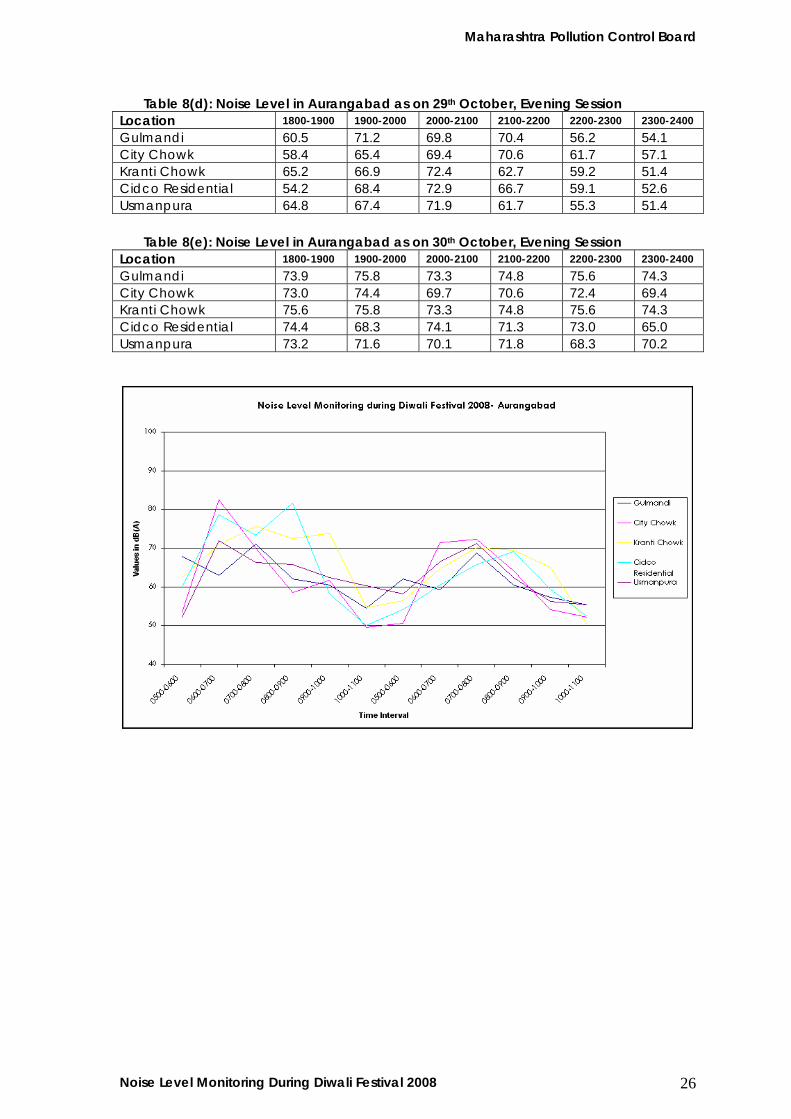
Table 8(d): Noise Level in Aurangabad as on 29th October, Evening Session Location 1800-1900 1900-2000 2000-2100 2100-2200 2200-2300 2300-2400 Gulmandi 60.5 71.2 69.8 70.4 56.2 54.1 City Chowk 58.4 65.4 69.4 70.6 61.7 57.1 Kranti Chowk 65.2 66.9 72.4 62.7 59.2 51.4 Cidco Residential 54.2 68.4 72.9 66.7 59.1 52.6 Usmanpura 64.8 67.4 71.9 61.7 55.3 51.4
Table 8(e): Noise Level in Aurangabad as on 30th October, Evening Session
Location 1800-1900 1900-2000 2000-2100 2100-2200 2200-2300 2300-2400 Gulmandi 73.9 75.8 73.3 74.8 75.6 74.3 City Chowk 73.0 74.4 69.7 70.6 72.4 69.4 Kranti Chowk 75.6 75.8 73.3 74.8 75.6 74.3 Cidco Residential 74.4 68.3 74.1 71.3 73.0 65.0 Usmanpura 73.2 71.6 70.1 71.8 68.3 70.2
Noise Level Monitoring During Diwali Festival 2008 26

Maharashtra Pollution Control Board
In Aurangabad, a total of 5 locations were monitored from October 28 to 30, between 0500 hrs to 1100 hrs and 1800 hrs to 2400 hrs. It was observed that the minimum mean of sound level was 50.1 dBA and maximum mean was 82.6 dBA during the morning session. During the evening session the minimum mean of sound level was 51.4 dBA and maximum mean was 85.3 dBA
Table 9(a): Noise Level in Nagpur as on 28th October, Morning Session Location 0500-0600 0600-0700 0700-0800 0800-0900 0900-1000 1000-1100 Ajani Chowk 43.0 45.5 50.6 65.3 65.6 67.4 Civil Lines 59.9 56.4 57.7 53.3 57.7 60.5 Dharam Peth 47.8 54.0 57.7 59.7 64.5 68.1 Itwari 62.2 64.7 68.3 67.5 69.5 72.7 Civil Hospital 49.8 50.4 53.0 60.6 69.9 75.9 Deshpande Layout 55.5 54.9 61.8 66.2 66.2 66.1 Shankar Nagar 56.7 56.9 59.3 60.3 60.9 63.2 Mahal 46.5 47.2 53.0 52.2 52.3 51.7 Sadar 64.5 65.1 63.1 63.2 62.4 65.5 Kalamna 61.0 62.4 68.8 66.3 65.2 65.2
Table 9(b): Noise Level in Nagpur as on 28th October, Evening Session
Location 1800-1900 1900-2000 2000-2100 2100-2200 2200-2300 2300-2400 Ajani Chowk 63.1 68.9 70.0 65.8 59.6 67.6 Civil Lines 65.3 64.9 67.9 67.1 66.9 54.8 Dharam Peth 65.4 68.1 74.2 71.7 66.9 64.7 Itwari 69.8 71.7 76.6 77.8 72.7 72.7 Civil Hospital 70.4 73.6 76.2 62.2 75.6 67.8 Deshpande Layout 67.3 68.4 71.0 74.7 75.8 76.0 Shankar Nagar 63.2 65.8 72.1 70.2 68.0 62.6 Mahal 68.1 75.6 76.4 72.7 70.1 55.3 Sadar 71.5 67.5 71.3 76.2 79.9 66.4 Kalamna 67.1 69.8 72.7 73.0 70.2 67.0
Noise Level Monitoring During Diwali Festival 2008 27

Maharashtra Pollution Control Board
Table 9(c): Noise Level in Nagpur as on 29th October, Morning Session Location 0500-0600 0600-0700 0700-0800 0800-0900 0900-1000 1000-1100 Ajani Chowk 47.9 54.8 63.8 69.3 66.6 69.6 Civil Lines 50.5 56.0 66.2 59.6 64.3 65.7 Dharam Peth 56.2 56.6 54.4 56.0 63.8 70.2 Itwari 60.9 59.0 66.0 63.9 67.3 64.4 Civil Hospital 54.0 68.4 57.3 66.6 67.5 70.8 Deshpande Layout 60.4 60.3 64.6 66.3 68.1 69.7 Shankar Nagar 53.7 54.5 60.9 61.6 62.0 63.3 Mahal 55.0 48.2 53.6 54.5 50.7 53.0 Sadar 57.0 65.7 72.6 64.4 63.2 64.0 Kalamna 42.8 65.3 65.7 63.4 64.3 75.9
Table 9(d): Noise Level in Nagpur as on 29th October, Evening Session
Location 1800-1900 1900-2000 2000-2100 2100-2200 2200-2300 2300-2400 Ajani Chowk 73.9 68.3 67.6 67.4 64.5 63.6 Civil Lines 67.4 66.9 68.4 64.5 60.5 59.7 Dharam Peth 68.9 68.6 68.2 68.1 57.3 53.1 Itwari 71.5 68.8 70.8 69.8 68.2 64.3 Civil Hospital 70.6 66.0 76.0 74.4 76.1 67.0 Deshpande Layout 62.3 68.8 67.4 67.7 65.2 64.2 Shankar Nagar 65.6 64.8 63.4 61.6 59.5 58.9 Mahal 70.8 73.4 71.5 67.8 66.7 64.6 Sadar 68.0 68.0 66.5 65.9 62.6 53.0 Kalamna 66.5 66.2 67.8 67.6 65.6 63.0
Table 9(e): Noise Level in Nagpur as on 30th October, Evening Session
Location 1800-1900 1900-2000 2000-2100 2100-2200 2200-2300 2300-2400 Ajani Chowk 69.4 69.2 67.8 67.4 64.5 66.0 Civil Lines 69.4 65.8 65.6 62.6 60.1 66.1 Dharam Peth 69.8 68.6 71.6 67.5 67.9 82.9 Itwari 69.7 69.8 69.7 69.7 67.7 69.8 Civil Hospital 74.8 75.3 75.4 71.5 69.5 77.3 Deshpande Layout 67.9 67.3 68.7 67.6 64.9 69.5 Shankar Nagar 63.9 62.5 62.5 61.4 59.8 62.2 Mahal 69.6 69.3 73.5 69.0 65.8 70.0 Sadar 68.1 67.5 66.6 59.8 56.0 62.5 Kalamna 67.5 68.5 66.6 70.1 66.7 68.9
Noise Level Monitoring During Diwali Festival 2008 28
Maharashtra Pollution Control Board
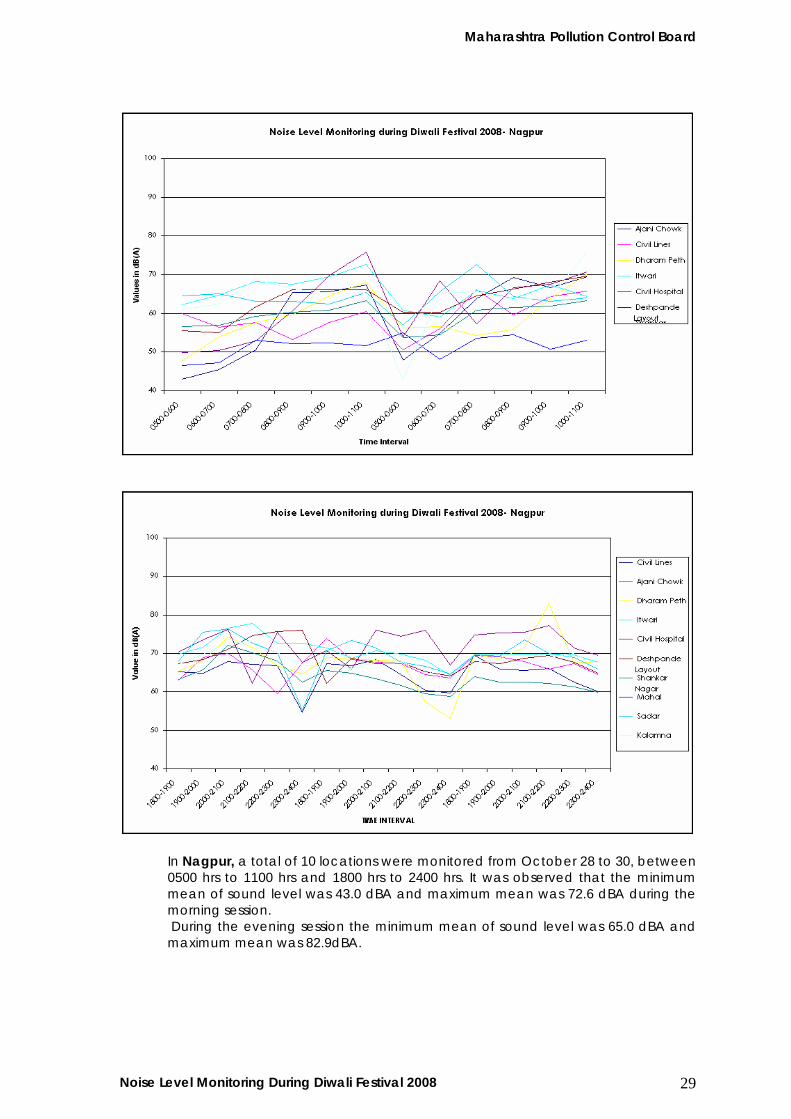
In Nagpur, a total of 10 locations were monitored from October 28 to 30, between 0500 hrs to 1100 hrs and 1800 hrs to 2400 hrs. It was observed that the minimum mean of sound level was 43.0 dBA and maximum mean was 72.6 dBA during the morning session. During the evening session the minimum mean of sound level was 65.0 dBA and maximum mean was 82.9dBA.
Noise Level Monitoring During Diwali Festival 2008 29

Maharashtra Pollution Control Board
Table 10(a): Noise Level in Kalyan and Dombivali as on 28th October, Morning Session Location 0500-0600 0600-0700 0700-0800 0800-0900 0900-1000 1000-1100 Katemanivali 65.8 62.2 81.6 76.2 69.6 64.0 Birla College 52.2 71.5 71.2 83.5 82.0 85.8 Bail Bazar 55.3 53.9 64.9 66.2 67.5 66.8 Municipal Office East 50.0 63.0 61.2 63.0 68.0 64.0 Kopar Village 46.8 71.4 67.6 69.2 73.2 63.2 Navapada 74.1 68.7 75.6 78.6 74.4 81.9
Table 10(b): Noise Level in Kalyan and Dombivali as on 28th October, Evening Session
Location 1800-1900 1900-2000 2000-2100 2100-2200 2200-2300 2300-2400 Katemanivali 71.1 92.1 101.8 94.8 86.3 83.5 Birla College 79.2 81.8 88.2 98.2 92.6 90.2 Bail Bazar 75.0 72.8 77.9 80.4 75.7 75.9 Municipal Office East 72.5 76.8 84.8 88.9 98.1 78.3 Kopar Village 70.5 73.7 79.5 80.4 74.2 69.4 Navapada 72.2 76.9 80.4 81.7 79.5 72.6
Table 10(c): Noise Level in Kalyan and Dombivali as on 29th October, Morning Session
Location 0500-0600 0600-0700 0700-0800 0800-0900 0900-1000 1000-1100 Katemanivali 62.5 75.1 69.0 66.5 76.0 82.9 Birla College 59.9 59.0 72.5 61.5 64.4 76.9 Bail Bazar 56.6 59.2 64.8 71.5 78.5 79.9 Municipal Office East 56.9 65.5 57.5 76.7 78.5 77.7 Kopar Village 68.4 71.7 68.5 70.5 74.5 71.9 Navapada 67.0 68.9 72.2 70.4 74.8 73.5
Table 10(d): Noise Level in Kalyan and Dombivali as on 29th October, Evening Session
Location 1800-1900 1900-2000 2000-2100 2100-2200 2200-2300 2300-2400 Katemanivali 73.4 95.5 93.8 85.6 80.7 78.3 Birla College 70.6 82.4 80.0 85.2 79.0 63.8 Bail Bazar 75.6 73.8 78.7 69.4 73.5 70.0 Municipal Office East 70.4 78.0 76.1 70.5 69.1 84.4 Kopar Village 66.8 65.8 70.6 68.2 70.8 67.9 Navapada 88.9 81.1 74.5 79.5 88.5 86.4
Table 10(e): Noise Level in Kalyan and Dombivali as on 30th October, Evening Session
Location 1800-1900 1900-2000 2000-2100 2100-2200 2200-2300 2300-2400 Katemanivali 70.9 84.1 94.7 91.7 94.4 89.1 Birla College 60.0 79.6 80.0 92.2 90.6 78.6 Bail Bazar 77.4 71.7 72.2 74.1 73.0 73.1 Municipal Office East 77.3 70.0 80.8 74.4 82.2 73.8 Kopar Village 68.4 70.2 80.9 92.6 79.6 71.3 Navapada 80.4 81.5 82.4 80.8 86.1 81.7
Noise Level Monitoring During Diwali Festival 2008 30

Maharashtra Pollution Control Board
In Kalyan and Dombivali, a total of 6 locations were monitored from October 28 to 30, between 0500 hrs to 1100 hrs and 1800 hrs to 2400 hrs. It was observed that the minimum mean of sound level was 46.8 dBA and maximum mean was 85.8 dBA during the morning session. During the evening session the minimum mean of sound level was 60.0 dBA and maximum mean was 101.8 dBA
Noise Level Monitoring During Diwali Festival 2008 31

Maharashtra Pollution Control Board
Table 11(a): Noise Level in Ambernath and Ulhasnagar as on 28th October, Morning Session Location 0500-0600 0600-0700 0700-0800 0800-0900 0900-1000 1000-1100 Near Railway Station 59.0 60.4 73.8 60.4 72.6 65.8 Kansai Section 60.8 71.6 76.2 79.4 83.6 70.0 Sai Section 57.6 54.0 68.6 73.6 82.8 69.6 Shivaji Chawnk No.3 77.0 71.0 71.0 84.4 82.2 85.4 Camp No. 5 Bus Stop 64.0 73.6 73.0 76.6 75.2 82.0 Camp No. 1 Gol Maidan 64.0 60.8 74.6 73.4 77.6 80.0
Table 11(b): Noise Level in Ambernath and Ulhasnagar as on 28th October, Evening Session
Location 1800-1900 1900-2000 2000-2100 2100-2200 2200-2300 2300-2400 Near Railway Station 75.4 78.6 71.2 66.0 67.2 68.6 Kansai Section 74.4 70.7 77.3 87.6 79.5 100.9 Sai Section 74.0 70.4 84.4 91.6 80.2 82.2 Shivaji Chawnk No.3 77.4 79.2 76.4 78.6 84.6 81.4 Camp No. 5 Bus Stop 82.8 83.4 88.8 86.4 81.8 84.4 Camp No. 1 Gol Maidan 77.0 80.8 75.4 82.6 80.4 83.6
Table 11(c): Noise Level in Ambernath and Ulhasnagar as on 29th October, Morning Session
Location 0500-0600 0600-0700 0700-0800 0800-0900 0900-1000 1000-1100 Near Railway Station 57.2 56.0 63.4 62.6 62.6 62.8 Kansai Section 53.6 63.2 63.2 64.5 69.2 66.8 Sai Section 58.0 66.6 69.4 68.8 70.0 76.2 Shivaji Chawnk No.3 61.8 75.6 69.6 68.8 68.4 72.4 Camp No. 5 Bus Stop 63.2 66.6 69.4 73.0 76.4 76.8 Camp No. 1 Gol Maidan 65.6 68.0 70.4 77.8 79.0 82.2
Table 11(d): Noise Level in Ambernath and Ulhasnagar as on 29th October, Evening Session
Location 1800-1900 1900-2000 2000-2100 2100-2200 2200-2300 2300-2400 Near Railway Station 63.1 73.3 80.4 73.1 78.1 64.7 Kansai Section 61.4 67.0 71.2 67.4 77.2 69.8 Sai Section 60.6 65.4 74.2 86.4 87.2 67.4 Shivaji Chawnk No.3 73.3 78.1 64.7 63.1 80.4 73.1 Camp No. 5 Bus Stop 67.0 77.2 69.8 61.4 71.2 67.4 Camp No. 1 Gol Maidan 65.4 87.2 67.4 60.6 74.2 86.4
Table 11(e): Noise Level in Ambernath and Ulhasnagar as on 30th October, Evening Session
Location 1800-1900 1900-2000 2000-2100 2100-2200 2200-2300 2300-2400 Near Railway Station 57.4 73.4 65.6 80.0 72.4 63.6 Kansai Section 59.2 67.0 71.2 88.0 90.0 75.0 Sai Section 66.4 72.8 80.4 91.0 80.6 72.8 Shivaji Chawnk No.3 82.0 77.8 79.4 78.6 80.4 80.2 Camp No. 5 Bus Stop 76.4 74.8 81.5 78.1 79.6 81.1 Camp No. 1 Gol Maidan 83.4 84.4 93.2 84.8 84.4 85.2
Noise Level Monitoring During Diwali Festival 2008 32

Maharashtra Pollution Control Board
In Ambernath and Ulhasnagar, a total of 6 locations were monitored from October 28 to 30, between 0500 hrs to 1100 hrs and 1800 hrs to 2400 hrs. It was observed that the minimum mean of sound level was 54.0 dBA and maximum mean was 85.4dBA during the morning session. During the evening session the minimum mean of sound level was 60.6 dBA and maximum mean was 100.9 dBA.
Noise Level Monitoring During Diwali Festival 2008 33

Maharashtra Pollution Control Board
Table 12(a): Noise Level in Kolhapur as on 28th October, Morning Session Location 0500-0600 0600-0700 0700-0800 0800-0900 0900-1000 1000-1100 Tarabai Park 40.0 60.0 65.0 68.0 70.0 66.0 Shivaji Peth 42.0 56.0 61.0 67.0 72.0 70.0 Kalam Baug 41.0 56.0 62.0 65.0 60.0 68.0 Rajaram Puri Road 39.0 49.0 54.0 61.0 65.0 71.0 Mahaduar road 45.0 51.0 56.0 61.0 64.0 68.0 Laxmi Puri 40.0 49.0 54.0 59.0 61.0 64.0 CPR Hospital 36.0 40.0 45.0 51.0 56.0 55.0 Bauda Road 38.0 41.0 44.0 47.0 58.0 56.0
Table 12(b): Noise Level in Kolhapur as on 28th October, Evening Session
Location 1800-1900 1900-2000 2000-2100 2100-2200 2200-2300 2300-2400 Tarabai Park 69.0 67.0 59.0 57.0 50.0 46.0 Shivaji Peth 74.0 72.0 80.0 75.0 66.0 75.0 Kalam Baug 67.0 72.0 69.0 76.0 65.0 59.0 Rajaram Puri Road 69.0 73.0 73.0 68.0 65.0 65.0 Mahaduar road 75.0 72.0 80.0 75.0 72.0 60.0 Laxmi Puri 77.0 76.0 74.0 70.0 67.0 61.0 CPR Hospital 73.0 73.0 69.0 67.0 67.0 58.0 Bauda Road 73.0 73.0 80.0 68.0 61.0 59.0
Table 12(c): Noise Level in Kolhapur as on 29th October, Morning Session
Location 0500-0600 0600-0700 0700-0800 0800-0900 0900-1000 1000-1100 Tarabai Park 39.0 52.0 71.0 65.0 61.0 68.0 Shivaji Peth 40.0 52.0 65.0 72.0 66.0 69.0 Kalam Baug 38.0 61.0 69.0 73.0 64.0 63.0 Rajaram Puri Road 40.0 45.0 51.0 62.0 68.0 64.0 Mahaduar road 43.0 56.0 62.0 60.0 66.0 70.0 Laxmi Puri 42.0 47.0 60.0 58.0 64.0 62.0 CPR Hospital 38.0 41.0 48.0 56.0 59.0 63.0 Bauda Road 41.0 44.0 48.0 53.0 61.0 58.0
Table 12(d): Noise Level in Kolhapur as on 29th October, Evening Session
Location 1800-1900 1900-2000 2000-2100 2100-2200 2200-2300 2300-2400 Tarabai Park 67.0 61.0 58.0 57.0 49.0 51.0 Shivaji Peth 74.0 74.0 73.0 70.0 71.0 60.0 Kalam Baug 69.0 69.0 67.0 63.0 62.0 59.0 Rajaram Puri Road 69.0 69.0 72.0 71.0 66.0 64.0 Mahaduar road 75.0 75.0 74.0 72.0 70.0 60.0 Laxmi Puri 75.0 74.0 74.0 71.0 68.0 61.0 CPR Hospital 74.0 73.0 74.0 70.0 68.0 63.0 Bauda Road 71.0 70.0 68.0 66.0 62.0 58.0
Table 12(e): Noise Level in Kolhapur as on 30th October, Evening Session
Location 1800-1900 1900-2000 2000-2100 2100-2200 2200-2300 2300-2400 Tarabai Park 69.0 63.0 61.0 55.0 48.0 49.0 Shivaji Peth 72.0 73.0 72.0 74.0 71.0 65.0 Kalam Baug 69.0 67.0 67.0 65.0 63.0 59.0 Rajaram Puri Road 67.0 70.0 69.0 69.0 64.0 62.0 Mahaduar road 73.0 72.0 72.0 74.0 70.0 65.0 Laxmi Puri 75.0 74.0 73.0 71.0 68.0 61.0 CPR Hospital 73.0 72.0 73.0 72.0 69.0 62.0 Bauda Road 70.0 69.0 69.0 68.0 66.0 55.0
Noise Level Monitoring During Diwali Festival 2008 34

Maharashtra Pollution Control Board
Noise Level Monitoring During Diwali Festival 2008 35
In Kolhapur, a total of 8 locations were monitored from October 28 to 30, between 0500 hrs to 1100 hrs and 1800 hrs to 2400 hrs. It was observed that the minimum mean of sound level was 36.0 dBA and maximum mean was 73.0 dBA during the morning session. During the evening session the minimum mean of sound level was 46.0 dBA and maximum mean was 80.0 dBA

Maharashtra Pollution Control Board
Noise Level Monitoring During Diwali Festival 2008 36
7. Six hourly Tables and Graphs:
Table 13 (a): Noise Level in Mumbai South as on 28th October, Morning Session Location 0500-0600 0600-0700 0700-0800 0800-0900 0900-1000 1000-1100 Avg. Leq
Colaba 59.9 57.0 56.6 61.1 62.3 62.2 59.8 Mantralaya 64.6 60.0 61.5 67.0 58.9 60.8 62.1 Mazgaon 66.1 64.6 69.0 68.3 65.2 63.1 66.0 Girgaon 54.6 60.0 61.5 67.0 58.9 60.8 60.5 Worli 71.9 70.7 68.2 66.3 62.7 61.2 66.8 Prabhadevi 55.0 67.0 62.2 65.0 66.6 62.0 63.0 Mahim 47.8 60.0 69.6 82.8 77.6 60.2 66.3 Parel 60.2 57.2 59.8 67.2 64.0 70.0 63.1 Byculla 73.3 79.0 79.2 81.5 85.6 75.5 79.0 Dadar 50.3 58.4 63.4 60.1 65.3 67.5 60.8 Sion 69.7 67.6 71.8 72.4 75.0 78.2 72.5 Hindu Colony 61.3 66.0 66.2 66.2 61.1 59.8 63.4 Matunga 55.4 55.8 70.0 71.0 78.9 79.3 68.4 Kamathipura 68.0 63.6 68.5 64.7 69.5 67.6 67.0 Malabar Hills 55.6 62.2 67.8 64.6 72.6 67.6 65.1

Maharashtra Pollution Control Board
Noise Level Monitoring During Diwali Festival 2008 37
Table 13 (b): Noise Level in Mumbai South as on 28th October, Evening Session
Location 1800-1900 1900-2000 2000-2100 2100-2200 2200-2300 2300-2400 Avg. Leq
Colaba 77.2 81.1 97.0 104.2 99.0 98.9 92.9 Mantralaya 67.3 76.0 79.7 81.6 87.5 84.9 79.5 Mazgaon 71.6 84.0 84.8 83.2 80.2 83.0 81.1 Girgaon 89.1 95.6 91.2 89.6 88.7 94.7 91.5 Worli 69.5 74.9 84.6 84.4 89.2 86.2 81.5 Prabhadevi 68.9 85.0 92.1 92.8 90.4 82.5 85.3 Mahim 76.0 91.8 102.2 98.6 88.2 73.6 88.4 Parel 64.9 72.9 84.5 91.6 92.2 88.4 82.4 Byculla 71.5 71.1 96.5 101.4 76.4 91.5 84.8 Dadar 83.6 76.6 79.8 92.3 91.7 96.7 86.8 Sion 62.5 71.8 68.2 92.7 70.3 76.6 73.7 Hindu Colony 66.2 67.9 68.5 94.3 66.6 65.5 71.5 Matunga 74.7 77.9 84.0 94.2 88.7 82.2 83.6 Kamathipura 71.7 75.7 83.0 79.5 85.7 82.8 79.7 Malabar Hills 68.5 74.1 88.4 93.3 91.8 87.6 83.9
Maharashtra Pollution Control Board
Noise Level Monitoring During Diwali Festival 2008 38
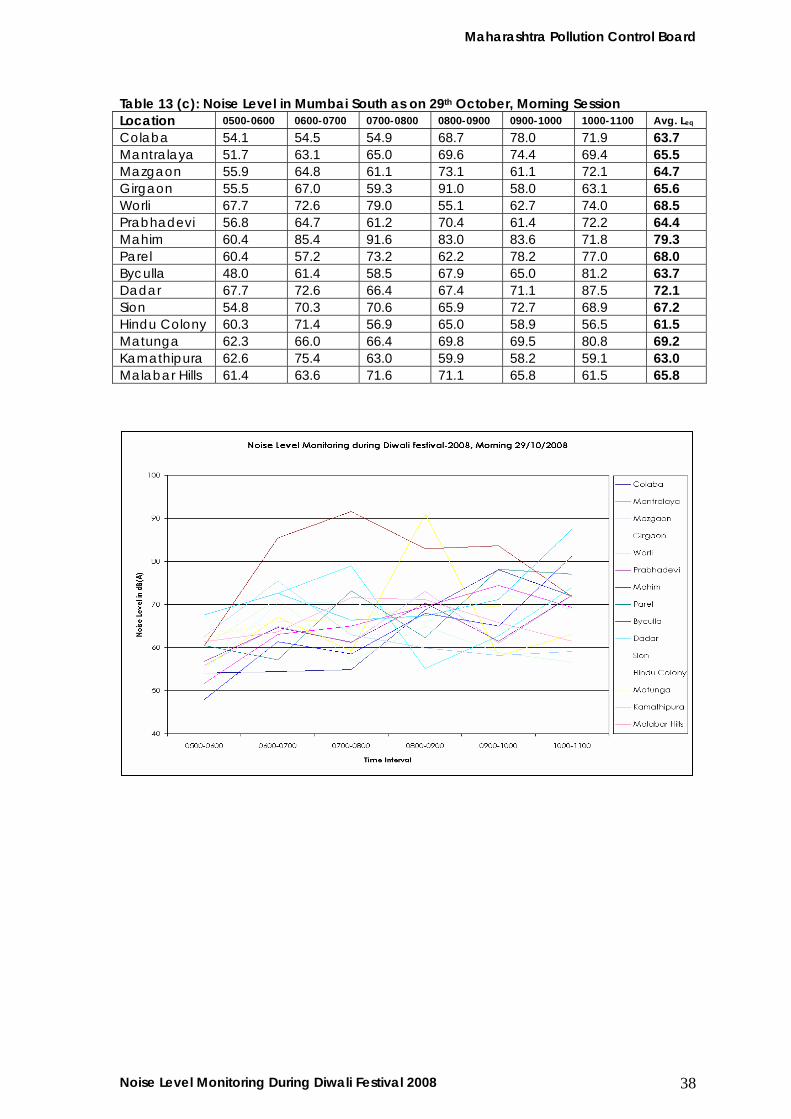
Table 13 (c): Noise Level in Mumbai South as on 29th October, Morning Session Location 0500-0600 0600-0700 0700-0800 0800-0900 0900-1000 1000-1100 Avg. Leq
Colaba 54.1 54.5 54.9 68.7 78.0 71.9 63.7 Mantralaya 51.7 63.1 65.0 69.6 74.4 69.4 65.5 Mazgaon 55.9 64.8 61.1 73.1 61.1 72.1 64.7 Girgaon 55.5 67.0 59.3 91.0 58.0 63.1 65.6 Worli 67.7 72.6 79.0 55.1 62.7 74.0 68.5 Prabhadevi 56.8 64.7 61.2 70.4 61.4 72.2 64.4 Mahim 60.4 85.4 91.6 83.0 83.6 71.8 79.3 Parel 60.4 57.2 73.2 62.2 78.2 77.0 68.0 Byculla 48.0 61.4 58.5 67.9 65.0 81.2 63.7 Dadar 67.7 72.6 66.4 67.4 71.1 87.5 72.1 Sion 54.8 70.3 70.6 65.9 72.7 68.9 67.2 Hindu Colony 60.3 71.4 56.9 65.0 58.9 56.5 61.5 Matunga 62.3 66.0 66.4 69.8 69.5 80.8 69.2 Kamathipura 62.6 75.4 63.0 59.9 58.2 59.1 63.0 Malabar Hills 61.4 63.6 71.6 71.1 65.8 61.5 65.8

Maharashtra Pollution Control Board
Noise Level Monitoring During Diwali Festival 2008 39
Table 13 (d): Noise Level in Mumbai South as on 29th October, Evening Session Location 1800-1900 1900-2000 2000-2100 2100-2200 2200-2300 2300-2400 Avg. Leq
Colaba 82.0 81.0 84.6 92.0 93.4 83.3 86.0 Mantralaya 62.1 64.0 66.2 68.9 73.5 65.0 66.6 Mazgaon 75.5 85.0 88.2 89.0 84.0 84.7 84.4 Girgaon 70.1 77.3 79.7 80.6 92.5 82.6 80.5 Worli 72.4 87.3 85.9 84.2 71.7 71.9 78.9 Prabhadevi 64.9 75.5 99.7 77.0 77.0 83.5 79.6 Mahim 72.2 91.0 89.4 95.2 75.8 73.6 82.9 Parel 70.3 76.8 90.8 97.9 100.2 83.2 86.5 Byculla 79.8 100.5 88.9 89.0 90.4 84.7 88.9 Dadar 71.5 83.1 90.8 95.4 90.4 73.7 84.1 Sion 76.5 77.6 76.5 77.7 77.7 78.5 77.4 Hindu Colony 52.3 78.4 78.5 75.2 76.4 73.7 72.4 Matunga 73.9 74.1 70.7 84.3 83.1 79.4 77.6 Kamathipura 75.3 75.8 78.8 84.0 91.7 82.5 81.4 Malabar Hills 71.9 72.5 73.7 85.4 84.1 79.8 77.9

Maharashtra Pollution Control Board
Noise Level Monitoring During Diwali Festival 2008 40
Table 13 (e): Noise Level in Mumbai South as on 30th October, Evening Session Location 1800-1900 1900-2000 2000-2100 2100-2200 2200-2300 2300-2400 Avg. Leq
Colaba 79.4 79.8 96.8 87.8 92.6 76.6 85.5 Mantralaya 61.3 83.6 83.2 79.1 84.3 87.1 79.8 Mazgaon 71.0 71.4 88.8 86.7 84.0 78.3 80.0 Girgaon 65.6 73.6 79.5 73.6 78.4 77.4 74.7 Worli 77.1 81.6 82.7 91.7 82.0 71.5 81.1 Prabhadevi 90.4 80.5 97.2 96.6 99.1 95.7 93.2 Mahim 72.2 93.0 95.8 93.4 97.2 82.8 89.1 Parel 67.8 86.6 82.9 98.6 97.1 90.7 87.3 Byculla 69.3 78.5 85.5 85.6 89.1 98.3 84.4 Dadar 71.2 79.0 85.0 94.9 94.9 93.9 86.5 Sion 75.8 77.5 77.3 78.1 79.3 75.2 77.2 Hindu Colony 65.9 70.6 74.9 79.5 75.9 74.1 73.5 Matunga 87.2 90.8 94.7 95.9 85.0 88.3 90.3 Kamathipura 74.1 71.4 74.6 73.5 74.5 75.5 74.0 Malabar Hills 76.6 83.5 75.4 86.7 70.2 75.1 77.9

Maharashtra Pollution Control Board
Noise Level Monitoring During Diwali Festival 2008 41
Table 14 (a): Noise Level in Mumbai Eastern Suburb as on 28th October, Morning Session Location 0500-0600 0600-0700 0700-0800 0800-0900 0900-1000 1000-1100 Avg. Leq
Chembur (E) 69.2 69.4 68.4 66.6 69.4 69.2 68.6 Trombay 54.2 53.0 48.4 60.0 60.6 47.8 55.2 Kurla 64.1 60.6 62.5 64.4 60.0 47.8 62.3 Ghatkopar East 56.6 61.4 63.8 60.8 61.2 67.4 60.8
Ghatkopar West 66.5 67.3 82.0 74.0 67.9 61.0 71.5
Mulund East 62.0 64.6 75.7 73.9 75.9 76.9 70.4 Mulund West 73.8 75.2 74.1 74.3 77.3 82.2 74.9 Sakinaka 67.4 68.4 65.7 69.2 67.6 60.8 67.7 Powai 64.1 76.1 71.6 71.9 72.5 79.3 71.2 Wadala 74.0 81.4 81.0 76.6 78.2 71.6 78.2 Dharavi 65.0 60.0 70.0 75.0 72.0 75.0 68.4 Sewree 64.2 62.3 64.2 70.6 66.2 64.0 65.5 Kalina 62.1 66.1 71.6 70.8 65.9 66.8 67.3 Vikhroli (W) 76.4 76.8 80.4 86.0 84.6 83.8 80.8 Bhandup (W) 59.8 56.0 69.4 73.8 76.6 85.4 67.1

Maharashtra Pollution Control Board
Noise Level Monitoring During Diwali Festival 2008 42
Table 14 (b): Noise Level in Mumbai Eastern Suburb as on 28th October, Evening Session Location 1800-1900 1900-2000 2000-2100 2100-2200 2200-2300 2300-2400 Avg. Leq
Chembur (E) 69.0 71.2 76.2 84.2 80.6 77.0 76.4 Trombay 62.6 72.2 72.8 87.0 86.0 87.8 78.1 Kurla 73.2 72.3 69.8 75.5 65.8 66.8 70.6 Ghatkopar East 70.1 83.3 76.9 86.3 80.5 75.2 78.7
Ghatkopar West 80.1 74.8 88.2 84.7 75.6 71.1 79.1
Mulund East 67.8 77.2 75.7 79.1 78.2 80.0 76.3 Mulund West 77.5 75.9 74.2 71.3 63.8 71.8 72.4 Sakinaka 75.2 83.2 98.5 81.8 83.4 65.2 81.2 Powai 67.8 68.9 77.4 72.3 75.7 66.4 71.4 Wadala 69.8 88.2 83.4 82.2 75.6 84.8 80.7 Dharavi 76.8 73.4 72.5 73.8 65.6 64.7 71.1 Sewree 79.0 75.8 86.2 83.9 79.0 78.7 80.4 Kalina 65.8 75.8 98.2 92.2 86.2 86.0 84.0 Vikhroli (W) 80.5 81.5 75.9 82.7 84.5 79.7 80.8 Bhandup (W) 99.2 77.0 83.4 104.8 87.8 90.2 90.4
Maharashtra Pollution Control Board
Noise Level Monitoring During Diwali Festival 2008 43
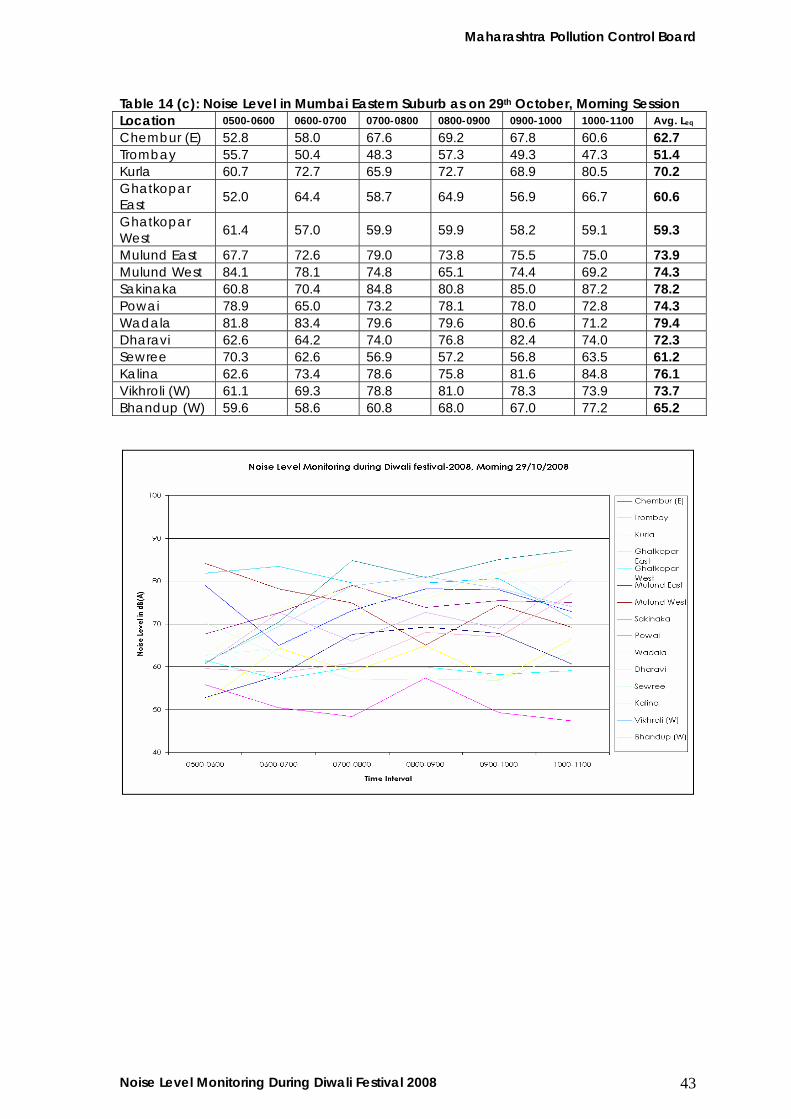
Table 14 (c): Noise Level in Mumbai Eastern Suburb as on 29th October, Morning Session Location 0500-0600 0600-0700 0700-0800 0800-0900 0900-1000 1000-1100 Avg. Leq
Chembur (E) 52.8 58.0 67.6 69.2 67.8 60.6 62.7 Trombay 55.7 50.4 48.3 57.3 49.3 47.3 51.4 Kurla 60.7 72.7 65.9 72.7 68.9 80.5 70.2 Ghatkopar East 52.0 64.4 58.7 64.9 56.9 66.7 60.6
Ghatkopar West 61.4 57.0 59.9 59.9 58.2 59.1 59.3
Mulund East 67.7 72.6 79.0 73.8 75.5 75.0 73.9 Mulund West 84.1 78.1 74.8 65.1 74.4 69.2 74.3 Sakinaka 60.8 70.4 84.8 80.8 85.0 87.2 78.2 Powai 78.9 65.0 73.2 78.1 78.0 72.8 74.3 Wadala 81.8 83.4 79.6 79.6 80.6 71.2 79.4 Dharavi 62.6 64.2 74.0 76.8 82.4 74.0 72.3 Sewree 70.3 62.6 56.9 57.2 56.8 63.5 61.2 Kalina 62.6 73.4 78.6 75.8 81.6 84.8 76.1 Vikhroli (W) 61.1 69.3 78.8 81.0 78.3 73.9 73.7 Bhandup (W) 59.6 58.6 60.8 68.0 67.0 77.2 65.2

Maharashtra Pollution Control Board
Noise Level Monitoring During Diwali Festival 2008 44
Table 14 (d): Noise Level in Mumbai Eastern Suburb as on 29th October, Evening Session Location 1800-1900 1900-2000 2000-2100 2100-2200 2200-2300 2300-2400 Avg. Leq
Chembur (E) 73.0 73.4 72.2 71.2 67.0 74.8 71.9 Trombay 60.1 80.8 66.9 63.2 83.1 86.1 73.4 Kurla 75.8 78.3 73.0 75.0 71.7 78.5 75.4 Ghatkopar East 76.5 75.1 60.7 75.5 77.1 80.6 74.2
Ghatkopar West 79.5 69.0 75.6 95.7 65.4 71.1 76.1
Mulund East 71.7 77.5 81.1 88.1 78.7 90.1 81.2 Mulund West 72.3 74.1 85.1 79.1 79.3 76.3 77.7 Sakinaka 76.4 87.4 80.0 76.0 76.4 70.6 77.8 Powai 69.3 69.5 69.0 81.4 82.0 72.8 74.0 Wadala 73.8 71.4 82.4 81.8 76.8 69.2 75.9 Dharavi 83.8 91.1 94.2 94.8 94.9 78.8 89.6 Sewree 70.9 80.3 80.0 78.1 68.2 67.8 74.2 Kalina 75.2 80.2 90.6 88.6 91.2 75.2 83.5 Vikhroli (W) 82.2 83.0 82.0 85.0 87.8 82.6 83.8 Bhandup (W) 99.6 95.0 97.6 97.6 92.6 94.0 96.1

Maharashtra Pollution Control Board
Noise Level Monitoring During Diwali Festival 2008 45
Table 14 (e): Noise Level in Mumbai Eastern Suburb as on 30th October, Evening Session Location 1800-1900 1900-2000 2000-2100 2100-2200 2200-2300 2300-2400 Avg. Leq
Chembur (E) 68.0 70.0 79.0 72.8 77.2 73.6 73.4 Trombay 57.2 66.4 64.8 73.5 73.8 64.3 66.7 Kurla 79.0 79.0 72.4 69.9 83.0 78.2 76.9 Ghatkopar East 79.8 70.9 72.4 73.9 69.2 76.0 73.7
Ghatkopar West 75.4 62.5 70.0 82.9 85.4 67.9 74.0
Mulund East 82.1 75.3 76.1 79.4 80.4 73.8 77.9 Mulund West 77.5 77.8 85.0 81.1 72.2 69.0 77.1 Sakinaka 76.2 76.4 86.0 68.8 66.8 72.2 74.4 Powai 71.3 68.5 66.7 65.6 67.4 65.2 67.5 Wadala 74.2 78.4 77.6 81.2 81.8 72.8 77.7 Dharavi 76.1 90.5 94.3 102.6 86.3 97.4 91.2 Sewree 69.1 73.4 77.0 80.5 65.0 70.2 72.5 Kalina 74.6 89.4 84.8 83.4 87.6 76.8 82.8 Vikhroli (W) 78.1 75.9 76.3 72.4 84.5 86.0 78.9 Bhandup (W) 92.0 104.2 102.8 106.8 105.0 93.0 100.6

Maharashtra Pollution Control Board
Noise Level Monitoring During Diwali Festival 2008 46
Table 15 (a): Noise Level in Mumbai Western Suburb as on 28th October, Morning Session Location 0500-0600 0600-0700 0700-0800 0800-0900 0900-1000 1000-1100 Avg. Leq
Sahar 85.0 73.1 58.4 83.6 85.4 86.3 77.1 Santacruz (E) 61.8 60.7 58.9 63.0 67.9 67.6 62.5 Vile Parle 63.2 69.6 71.8 76.2 73.4 75.0 70.8 Bandra 61.6 61.6 59.8 68.6 71.6 70.0 64.6 Goregaon 53.3 71.8 64.0 61.3 56.6 53.8 61.4 Jogeshwari 62.0 74.8 67.2 70.0 71.4 66.2 69.1 Versova 65.0 66.3 65.1 61.3 60.6 58.1 63.7 Marve 76.0 65.0 78.0 80.0 81.0 80.0 76.0 Borivali East 72.7 58.2 64.0 69.0 72.0 78.5 67.2 Borivali West 57.0 83.0 75.5 64.2 73.5 61.2 70.6 Dindoshi 52.6 57.0 63.6 59.3 69.6 68.0 60.4 Kandivli (E) 67.0 74.0 77.0 77.0 75.0 78.0 74.0 Dahisar (E) 71.8 64.3 67.5 61.4 58.7 69.4 64.7 Juhu 48.0 55.0 61.0 65.0 70.0 56.0 59.8 Malad (W) 76.0 78.0 78.0 71.0 73.0 72.0 75.2

Maharashtra Pollution Control Board
Noise Level Monitoring During Diwali Festival 2008 47
Table 15 (b): Noise Level in Mumbai Western Suburb as on 28th October, Evening Session Location 1800-1900 1900-2000 2000-2100 2100-2200 2200-2300 2300-2400 Avg. Leq
Sahar 80.6 88.0 100.0 98.0 99.6 82.4 91.4 Santacruz (E) 72.1 80.3 74.4 75.8 72.6 69.3 74.1 Vile Parle 74.6 75.0 78.8 94.2 87.6 86.4 82.8 Bandra 69.6 70.8 70.4 73.4 71.6 56.6 68.7 Goregaon 60.8 85.5 81.2 90.4 81.8 86.3 81.0 Jogeshwari 90.0 99.8 90.2 96.4 97.6 100.4 95.7 Versova 67.4 92.6 87.8 92.4 97.4 92.4 88.3 Marve 78.0 76.2 79.6 84.8 84.8 80.2 80.6 Borivali East 81.1 89.9 96.5 87.7 85.8 86.3 87.9 Borivali West 57.0 83.0 75.5 64.2 73.5 61.2 69.1 Dindoshi 78.2 74.4 90.4 93.0 106.2 103.4 90.9 Kandivli (E) 69.0 80.0 86.7 95.4 90.3 95.2 86.1 Dahisar (E) 83.4 87.8 103.4 106.0 111.0 107.8 99.9 Juhu 73.0 73.8 67.6 74.8 79.8 63.4 72.1 Malad (W) 73.1 78.0 75.3 76.0 77.7 66.8 74.5
Maharashtra Pollution Control Board
Noise Level Monitoring During Diwali Festival 2008 48
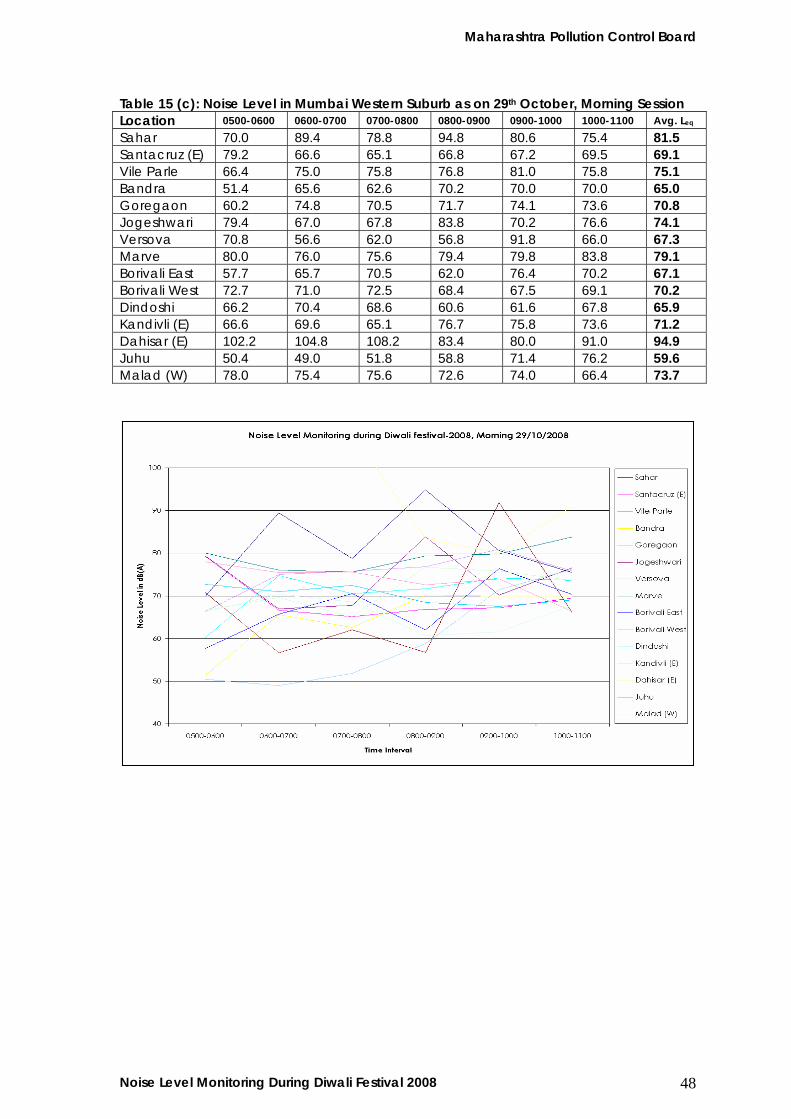
Table 15 (c): Noise Level in Mumbai Western Suburb as on 29th October, Morning Session Location 0500-0600 0600-0700 0700-0800 0800-0900 0900-1000 1000-1100 Avg. Leq
Sahar 70.0 89.4 78.8 94.8 80.6 75.4 81.5 Santacruz (E) 79.2 66.6 65.1 66.8 67.2 69.5 69.1 Vile Parle 66.4 75.0 75.8 76.8 81.0 75.8 75.1 Bandra 51.4 65.6 62.6 70.2 70.0 70.0 65.0 Goregaon 60.2 74.8 70.5 71.7 74.1 73.6 70.8 Jogeshwari 79.4 67.0 67.8 83.8 70.2 76.6 74.1 Versova 70.8 56.6 62.0 56.8 91.8 66.0 67.3 Marve 80.0 76.0 75.6 79.4 79.8 83.8 79.1 Borivali East 57.7 65.7 70.5 62.0 76.4 70.2 67.1 Borivali West 72.7 71.0 72.5 68.4 67.5 69.1 70.2 Dindoshi 66.2 70.4 68.6 60.6 61.6 67.8 65.9 Kandivli (E) 66.6 69.6 65.1 76.7 75.8 73.6 71.2 Dahisar (E) 102.2 104.8 108.2 83.4 80.0 91.0 94.9 Juhu 50.4 49.0 51.8 58.8 71.4 76.2 59.6 Malad (W) 78.0 75.4 75.6 72.6 74.0 66.4 73.7
Maharashtra Pollution Control Board
Noise Level Monitoring During Diwali Festival 2008 49
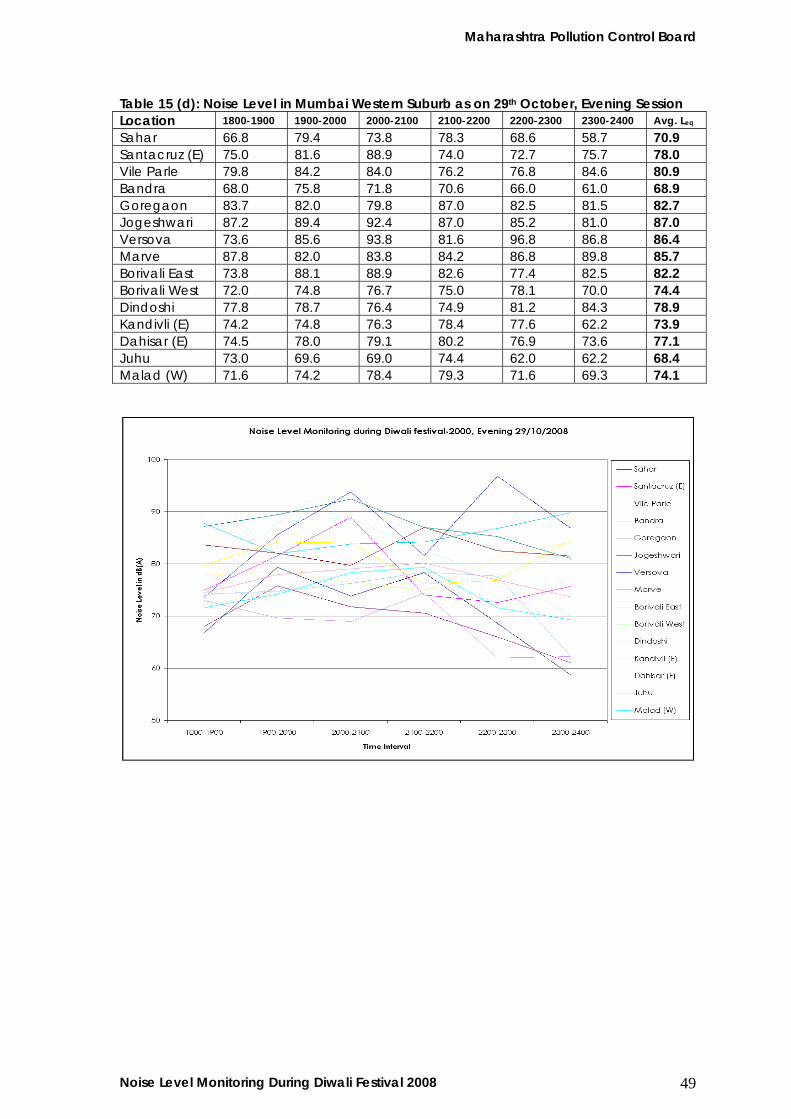
Table 15 (d): Noise Level in Mumbai Western Suburb as on 29th October, Evening Session Location 1800-1900 1900-2000 2000-2100 2100-2200 2200-2300 2300-2400 Avg. Leq
Sahar 66.8 79.4 73.8 78.3 68.6 58.7 70.9 Santacruz (E) 75.0 81.6 88.9 74.0 72.7 75.7 78.0 Vile Parle 79.8 84.2 84.0 76.2 76.8 84.6 80.9 Bandra 68.0 75.8 71.8 70.6 66.0 61.0 68.9 Goregaon 83.7 82.0 79.8 87.0 82.5 81.5 82.7 Jogeshwari 87.2 89.4 92.4 87.0 85.2 81.0 87.0 Versova 73.6 85.6 93.8 81.6 96.8 86.8 86.4 Marve 87.8 82.0 83.8 84.2 86.8 89.8 85.7 Borivali East 73.8 88.1 88.9 82.6 77.4 82.5 82.2 Borivali West 72.0 74.8 76.7 75.0 78.1 70.0 74.4 Dindoshi 77.8 78.7 76.4 74.9 81.2 84.3 78.9 Kandivli (E) 74.2 74.8 76.3 78.4 77.6 62.2 73.9 Dahisar (E) 74.5 78.0 79.1 80.2 76.9 73.6 77.1 Juhu 73.0 69.6 69.0 74.4 62.0 62.2 68.4 Malad (W) 71.6 74.2 78.4 79.3 71.6 69.3 74.1

Maharashtra Pollution Control Board
Noise Level Monitoring During Diwali Festival 2008 50
Table 15 (e): Noise Level in Mumbai Western Suburb as on 30th October, Evening Session Location 1800-1900 1900-2000 2000-2100 2100-2200 2200-2300 2300-2400 Avg. Leq
Sahar 65.1 80.5 80.5 76.5 68.4 70.6 73.6 Santacruz (E) 68.5 73.9 76.6 91.1 87.7 77.2 79.2 Vile Parle 76.6 75.4 76.4 80.8 83.8 81.4 79.1 Bandra 73.0 73.8 74.6 71.0 76.0 60.0 71.4 Goregaon 76.9 79.1 81.4 74.5 70.6 62.3 74.1 Jogeshwari 83.4 83.4 95.8 102.4 102.4 95.4 93.8 Versova 64.6 85.4 93.6 86.8 91.2 97.8 86.6 Marve 81.4 89.6 81.0 90.4 83.4 81.2 84.5 Borivali East 78.2 78.4 91.1 79.4 81.1 77.1 80.9 Borivali West 72.8 73.9 60.3 69.2 84.3 86.2 74.5 Dindoshi 69.6 82.8 95.6 91.8 91.6 86.4 86.3 Kandivli (E) 66.3 73.7 84.4 76.2 72.5 77.8 75.2 Dahisar (E) 65.4 63.8 70.8 66.6 90.2 82.0 73.1 Juhu 69.8 68.2 69.6 69.8 62.4 63.8 67.3 Malad (W) 68.7 71.9 70.8 70.2 71.4 72.5 70.9

Maharashtra Pollution Control Board
Noise Level Monitoring During Diwali Festival 2008 51
Table 16 (a): Noise Level in Navi Mumbai as on 28th October, Morning Session Location 0500-0600 0600-0700 0700-0800 0800-0900 0900-1000 1000-1100 Avg. Leq
CBD 62.4 62.1 64.8 63.4 60.8 59.8 62.7 Nerul Sector 11 60.4 74.0 69.6 64.4 74.2 74.8 68.5 Vashi Sec. 1 61.2 59.8 70.8 63.4 70.8 70.6 65.2 Sector 9 61.6 60.8 56.8 62.0 64.6 66.4 61.2 Sector 15 62.8 82.4 77.0 80.8 81.8 78.6 77.0 Kopar Khairne Sec 10 57.6 60.6 62.3 80.4 75.1 67.4
67.2
Airoli 59.8 58.0 66.4 64.0 65.0 71.6 62.6 Rabale 61.0 85.8 71.6 70.4 81.4 94.4 74.0 Ghansoli 51.0 65.4 69.2 74.6 72.4 74.4 66.5 Kopar Khairne 53.3 56.0 63.4 70.4 71.0 74.8 62.8
Table 16 (b): Noise Level in Navi Mumbai as on 28th October, Evening Session Location 1800-1900 1900-2000 2000-2100 2100-2200 2200-2300 2300-2400 Avg. Leq
CBD 79.4 76.5 70.5 68.8 65.6 64.7 70.9 Nerul Sector 11 68.4 77.4 81.2 76.8 89.2 75.2 78.0 Vashi Sec. 1 60.1 81.3 83.9 75.0 66.8 64.9 72.0 Sector 9 71.6 70.3 81.4 82.4 81.4 89.9 79.5 Sector 15 74.7 77.2 80.5 79.5 85.4 85.8 80.5 Kopar Khairne Sec 10 83.6 79.2 87.3 89.8 81.6 77.8 83.2 Airoli 79.8 80.0 87.6 99.6 65.4 68.0 80.1 Rabale 93.2 81.6 95.6 108.2 103.0 85.6 94.5 Ghansoli 75.6 72.3 83.7 89.8 86.5 84.3 82.0 Kopar Khairne 70.3 85.1 88.2 90.3 83.3 69.0 81.0

Maharashtra Pollution Control Board
Noise Level Monitoring During Diwali Festival 2008 52
Table 16 (c): Noise Level in Navi Mumbai as on 29th October, Morning Session Location 0500-0600 0600-0700 0700-0800 0800-0900 0900-1000 1000-1100 Avg. Leq
CBD 70.2 68.7 64.1 71.7 71.2 74.5 70.1 Nerul Sector 11 66.0 64.4 58.2 68.6 73.2 73.6 67.3 Vashi Sec. 1 56.9 60.6 60.7 55.1 62.7 74.0 61.7 Sector 9 55.5 67.7 66.4 67.4 71.1 87.5 69.3 Sector 15 61.6 62.7 76.4 75.7 85.0 88.5 75.0 Kopar Khairne Sec 10 55.4 67.2 78.7 83.4 87.8 89.1 76.9 Airoli 72.2 67.9 78.2 63.2 63.9 73.6 69.8 Rabale 62.6 75.4 63.0 73.2 98.2 83.0 75.9 Ghansoli 54.8 70.3 70.6 74.3 69.9 74.3 69.1 Kopar Khairne 68.2 69.7 68.7 69.5 71.3 71.9 69.9
Maharashtra Pollution Control Board
Noise Level Monitoring During Diwali Festival 2008 53
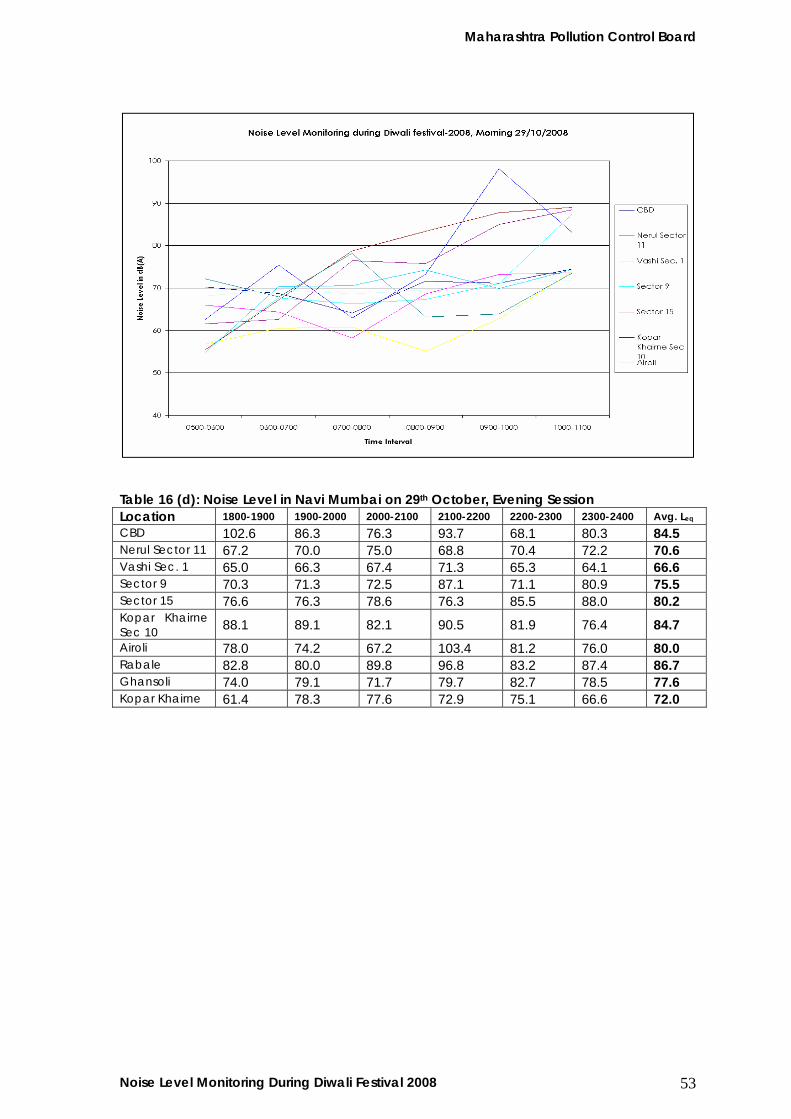
Table 16 (d): Noise Level in Navi Mumbai on 29th October, Evening Session Location 1800-1900 1900-2000 2000-2100 2100-2200 2200-2300 2300-2400 Avg. Leq
CBD 102.6 86.3 76.3 93.7 68.1 80.3 84.5 Nerul Sector 11 67.2 70.0 75.0 68.8 70.4 72.2 70.6 Vashi Sec. 1 65.0 66.3 67.4 71.3 65.3 64.1 66.6 Sector 9 70.3 71.3 72.5 87.1 71.1 80.9 75.5 Sector 15 76.6 76.3 78.6 76.3 85.5 88.0 80.2 Kopar Khairne Sec 10 88.1 89.1 82.1 90.5 81.9 76.4 84.7 Airoli 78.0 74.2 67.2 103.4 81.2 76.0 80.0 Rabale 82.8 80.0 89.8 96.8 83.2 87.4 86.7 Ghansoli 74.0 79.1 71.7 79.7 82.7 78.5 77.6 Kopar Khairne 61.4 78.3 77.6 72.9 75.1 66.6 72.0

Maharashtra Pollution Control Board
Noise Level Monitoring During Diwali Festival 2008 54
Table 16 (e): Noise Level in Navi Mumbai as on 30th October, Evening Session Location 1800-1900 1900-2000 2000-2100 2100-2200 2200-2300 2300-2400 Avg. Leq
CBD 84.8 90.3 81.4 81.5 71.1 75.6 80.8 Nerul Sector 11 67.6 77.4 80.2 75.8 75.6 67.4 74.0 Vashi Sec. 1 63.9 69.0 67.6 71.9 69.7 65.7 68.0 Sector 9 77.5 79.3 78.9 77.7 77.1 65.3 76.0 Sector 15 76.6 76.3 78.6 76.3 85.5 88.0 80.2 Kopar Khairne Sec 10 97.0 112.4 95.2 83.9 87.8 79.3 92.6 Airoli 76.0 66.4 73.4 86.1 75.1 64.8 73.6 Rabale 81.6 77.2 80.8 89.4 84.6 88.6 83.7 Ghansoli 82.5 78.8 87.2 95.3 83.8 78.0 84.2 Kopar Khairne 64.0 72.1 94.6 78.8 74.2 66.8 75.1

Maharashtra Pollution Control Board
Noise Level Monitoring During Diwali Festival 2008 55
Table 17 (a): Noise Level in Thane as on 28th October, Morning Session Location 0500-0600 0600-0700 0700-0800 0800-0900 0900-1000 1000-1100 Avg. Leq
Shiv Mandir 63.1 63.7 76.7 73.3 78.1 79.0 71.0 Tembhi Naka 70.0 71.2 74.0 75.8 73.4 77.6 72.9 Gokhle Road 59.2 61.8 73.2 78.2 74.6 69.6 69.4 Pokharan 55.8 68.2 73.8 68.0 71.0 87.0 67.4 Wagle Estate 58.1 69.6 71.1 71.8 66.7 68.2 67.5

Maharashtra Pollution Control Board
Noise Level Monitoring During Diwali Festival 2008 56
Table 17 (b): Noise Level in Thane as on 28th October, Evening Session Location 1800-1900 1900-2000 2000-2100 2100-2200 2200-2300 2300-2400 Avg. Leq
Shiv Mandir 77.4 79.6 89.5 90.8 85.8 89.4 85.4 Tembhi Naka 74.0 80.0 80.9 92.8 78.5 86.3 82.1 Gokhle Road 88.8 86.6 100.6 80.9 87.8 73.6 86.4 Pokharan 74.0 80.8 99.4 85.8 86.2 90.2 86.1 Wagle Estate 80.1 75.5 87.6 77.5 83.2 77.2 80.2
Table 17 (c): Noise Level in Thane as on 29th October, Morning Session Location 0500-0600 0600-0700 0700-0800 0800-0900 0900-1000 1000-1100 Avg. Leq
Shiv Mandir 57.5 74.3 84.0 86.6 77.8 79.5 76.6 Tembhi Naka 81.7 67.1 79.7 77.2 76.8 78.6 76.8 Gokhle Road 45.6 57.9 68.4 72.5 75.6 68.7 64.8 Pokharan 68.4 76.6 73.6 87.2 79.8 81.2 77.8 Wagle Estate 53.4 61.0 64.3 87.1 75.4 75.5 69.4

Maharashtra Pollution Control Board
Noise Level Monitoring During Diwali Festival 2008 57
Table 17 (d): Noise Level in Thane on 29th October, Evening Session Location 1800-1900 1900-2000 2000-2100 2100-2200 2200-2300 2300-2400 Avg. Leq
Shiv Mandir 80.1 74.8 71.8 84.2 71.7 71.9 75.7 Tembhi Naka 78.9 78.3 77.7 73.4 70.4 86.7 77.6 Gokhle Road 72.7 76.5 77.3 78.4 75.4 76.8 76.2 Pokharan 84.0 94.4 94.4 88.8 92.0 98.0 91.9 Wagle Estate 72.2 76.6 76.5 96.1 79.9 82.8 80.7

Maharashtra Pollution Control Board
Table 17 (e): Noise Level in Thane as on 30th October, Evening Session Location 1800-1900 1900-2000 2000-2100 2100-2200 2200-2300 2300-2400 Avg. Leq
Shiv Mandir 69.1 71.4 75.8 68.5 102.6 97.2 80.7 Tembhi Naka 72.6 75.1 75.7 78.5 80.5 80.4 77.1 Gokhle Road 74.8 76.5 76.1 76.8 75.4 74.7 75.7 Pokharan 81.0 85.0 96.2 87.8 84.2 89.8 87.3 Wagle Estate 78.2 71.3 82.1 83.4 72.5 68.7 76.0
Table 18 (a): Noise Level in Pune as on 28th October, Morning Session Location 0500-0600 0600-0700 0700-0800 0800-0900 0900-1000 1000-1100 Avg. Leq
Shivaji Nagar 40.0 47.0 58.0 64.0 66.0 68.0 57.2 Karve Road 43.0 51.0 56.0 61.0 64.0 69.0 57.3 Swar Gate 41.0 48.0 53.0 59.0 66.0 70.0 56.2 Satara Road 46.0 54.0 58.0 60.0 65.0 69.0 58.7 Shaniwar Peth 42.0 49.0 56.0 63.0 69.0 73.0 58.7
Yerawada 45.0 52.0 63.0 60.0 68.0 72.0 60.0 Khadaki 43.0 56.0 65.0 62.0 61.0 67.0 59.0 Kothrud 41.0 52.0 58.0 63.0 65.0 68.0 57.8 Mahatma Phule Madai 49.0 59.0 64.0 68.0 63.0 70.0 62.2
Laxmi Road 42.0 47.0 51.0 55.0 65.0 68.0 54.7 M G Road 39.0 45.0 52.0 56.0 64.0 66.0 53.7 Sarus Baug 38.0 46.0 57.0 61.0 66.0 64.0 55.3 Parvati 40.0 44.0 58.0 62.0 65.0 68.0 56.2 Hadapsar 43.0 50.0 54.0 65.0 63.0 67.0 57.0 Koregaon Park 42.0 48.0 54.0 63.0 60.0 65.0 55.3
Noise Level Monitoring During Diwali Festival 2008 58

Maharashtra Pollution Control Board
Noise Level Monitoring During Diwali Festival 2008 59
Table 18 (b): Noise Level in Pune as on 28th October, Evening Session Location 1800-1900 1900-2000 2000-2100 2100-2200 2200-2300 2300-2400 Avg. Leq
Shivaji Nagar 75.0 77.0 86.0 79.0 77.0 58.0 75.3 Karve Road 79.0 80.0 82.0 80.0 81.0 51.0 75.5 Swar Gate 72.0 89.0 75.0 85.0 87.0 71.0 79.8 Satara Road 78.0 80.0 84.0 81.0 78.0 76.0 79.5 Shaniwar Peth 70.0 87.0 77.0 65.0 66.0 61.0 71.0
Yerawada 76.0 87.0 83.0 73.0 69.0 60.0 74.7 Khadaki 77.0 73.0 80.0 91.0 79.0 62.0 77.0 Kothrud 79.0 80.0 84.0 78.0 80.0 76.0 79.5 Mahatma Phule Madai 88.0 84.0 84.0 74.0 66.0 58.0 75.7
Laxmi Road 67.0 78.0 74.0 72.0 64.0 59.0 69.0 M G Road 78.0 81.0 76.0 98.0 67.0 62.0 77.0 Sarus Baug 75.0 79.0 82.0 77.0 67.0 59.0 73.2 Parvati 72.0 83.0 81.0 86.0 73.0 63.0 76.3 Hadapsar 73.0 81.0 83.0 73.0 74.0 61.0 74.2 Koregaon Park 73.0 76.0 87.0 74.0 55.0 56.0 70.2

Maharashtra Pollution Control Board
Noise Level Monitoring During Diwali Festival 2008 60
Table 18 (c): Noise Level in Pune as on 29th October, Morning Session Location 0500-0600 0600-0700 0700-0800 0800-0900 0900-1000 1000-1100 Avg. Leq
Shivaji Nagar 38.0 40.0 46.0 58.0 62.0 60.0 50.7 Karve Road 40.0 47.0 51.0 57.0 60.0 65.0 53.3 Swar Gate 39.0 46.0 50.0 55.0 64.0 61.0 52.5 Satara Road 43.0 49.0 54.0 65.0 58.0 63.0 55.3 Shaniwar Peth 41.0 46.0 51.0 59.0 64.0 68.0 54.8
Yerawada 43.0 50.0 68.0 70.0 62.0 66.0 59.8 Khadaki 40.0 51.0 66.0 69.0 64.0 66.0 59.3 Kothrud 42.0 55.0 61.0 67.0 68.0 64.0 59.5 Mahatma Phule Madai 44.0 52.0 58.0 67.0 72.0 65.0 59.7
Laxmi Road 40.0 45.0 52.0 60.0 64.0 68.0 54.8 M G Road 41.0 49.0 54.0 67.0 62.0 67.0 56.7 Sarus Baug 40.0 48.0 52.0 61.0 64.0 68.0 55.5 Parvati 37.0 49.0 54.0 63.0 70.0 66.0 56.5 Hadapsar 41.0 47.0 55.0 68.0 59.0 70.0 56.7 Koregaon Park 38.0 44.0 49.0 54.0 61.0 68.0 52.3

Maharashtra Pollution Control Board
Table 18 (d): Noise Level in Pune on 29th October, Evening Session Location 1800-1900 1900-2000 2000-2100 2100-2200 2200-2300 2300-2400 Avg. Leq
Shivaji Nagar 68.0 65.0 65.0 65.0 61.0 51.0 62.5 Karve Road 75.0 77.0 71.0 73.0 66.0 61.0 70.5 Swar Gate 64.0 67.0 68.0 68.0 60.0 58.0 64.2 Satara Road 74.0 75.0 72.0 67.0 68.0 59.0 69.2 Shaniwar Peth 67.0 74.0 72.0 75.0 68.0 52.0 68.0
Yerawada 67.0 64.0 68.0 66.0 60.0 59.0 64.0 Khadaki 66.0 64.0 64.0 66.0 60.0 54.0 62.3 Kothrud 75.0 72.0 67.0 71.0 62.0 57.0 67.3 Mahatma Phule Madai 69.0 75.0 70.0 68.0 63.0 57.0 67.0
Laxmi Road 72.0 71.0 75.0 65.0 57.0 57.0 66.2 M G Road 74.0 74.0 75.0 73.0 57.0 42.0 65.8 Sarus Baug 67.0 69.0 62.0 64.0 63.0 54.0 63.2 Parvati 66.0 64.0 66.0 63.0 64.0 57.0 63.3 Hadapsar 75.0 77.0 76.0 74.0 71.0 60.0 72.2 Koregaon Park 62.0 61.0 65.0 67.0 60.0 55.0 61.7
Noise Level Monitoring During Diwali Festival 2008 61

Maharashtra Pollution Control Board
Noise Level Monitoring During Diwali Festival 2008 62
Table 18 (e): Noise Level in Pune as on 30th October, Evening Session Location 1800-1900 1900-2000 2000-2100 2100-2200 2200-2300 2300-2400 Avg. Leq
Shivaji Nagar 69.0 70.0 64.0 67.0 68.0 63.0 66.8 Karve Road 76.0 74.0 72.0 66.0 68.0 63.0 69.8 Swar Gate 64.0 64.0 62.0 67.0 62.0 58.0 62.8 Satara Road 73.0 75.0 72.0 65.0 63.0 59.0 67.8 Shaniwar Peth 59.0 68.0 72.0 74.0 63.0 52.0 64.7
Yerawada 66.0 63.0 75.0 65.0 60.0 52.0 63.5 Khadaki 68.0 65.0 66.0 68.0 59.0 53.0 63.2 Kothrud 70.0 74.0 68.0 70.0 66.0 61.0 68.2 Mahatma Phule Madai 65.0 64.0 67.0 62.0 56.0 48.0 60.3
Laxmi Road 62.0 69.0 64.0 70.0 59.0 50.0 62.3 M G Road 76.0 74.0 76.0 76.0 54.0 43.0 66.5 Sarus Baug 64.0 66.0 61.0 69.0 57.0 55.0 62.0 Parvati 63.0 68.0 61.0 69.0 56.0 56.0 62.2 Hadapsar 60.0 65.0 60.0 68.0 58.0 55.0 61.0 Koregaon Park 73.0 77.0 74.0 72.0 70.0 53.0 69.8

Maharashtra Pollution Control Board
Noise Level Monitoring During Diwali Festival 2008 63
Table 19 (a): Noise Level in Nashik as on 28th October, Morning Session Location 0500-0600 0600-0700 0700-0800 0800-0900 0900-1000 1000-1100 Avg. Leq
CBS 54.2 60.2 59.8 57.6 66.8 69.8 61.4 Panchavati 58.7 71.2 75.0 74.6 74.2 68.3 70.3 Dahipool 68.5 75.3 69.1 76.0 70.7 69.9 71.6 CIDCO 58.6 56.3 63.9 65.2 67.2 70.4 63.6 Bytco Point 55.4 56.8 64.6 66.2 65.3 66.7 62.5

Maharashtra Pollution Control Board
Noise Level Monitoring During Diwali Festival 2008 64
Table 19 (b): Noise Level in Nashik as on 28th October, Evening Session Location 1800-1900 1900-2000 2000-2100 2100-2200 2200-2300 2300-2400 Avg. Leq
CBS 61.9 70.7 70.2 72.7 70.7 68.2 69.1 Panchavati 66.1 70.2 72.8 77.0 72.8 66.9 71.0 Dahipool 72.2 75.2 76.6 85.9 67.1 70.9 74.7 CIDCO 61.6 71.8 84.3 75.0 70.2 68.7 71.9 Bytco Point 67.7 71.4 73.5 81.4 74.9 74.6 73.9
Table 19 (c): Noise Level in Nashik as on 29th October, Morning Session Location 0500-0600 0600-0700 0700-0800 0800-0900 0900-1000 1000-1100 Avg. Leq
CBS 57.2 60.1 67.2 58.5 60.4 57.7 60.2 Panchavati 61.5 71.5 72.8 75.0 74.0 75.7 71.8 Dahipool 76.8 79.3 81.5 82.7 71.2 71.7 77.2 CIDCO 54.7 75.9 70.2 57.9 56.7 58.5 62.3 Bytco Point 61.5 66.7 64.2 56.9 55.0 59.0 60.6

Maharashtra Pollution Control Board
Noise Level Monitoring During Diwali Festival 2008 65
Table 19 (d): Noise Level in Nashik on 29th October, Evening Session Location 1800-1900 1900-2000 2000-2100 2100-2200 2200-2300 2300-2400 Avg. Leq
CBS 58.1 70.1 69.7 75.0 70.2 67.7 68.5 Panchavati 70.2 73.2 77.0 70.5 60.6 60.1 68.6 Dahipool 75.8 78.8 74.2 75.6 71.7 68.5 74.1 CIDCO 56.7 68.6 60.1 72.9 70.2 68.2 66.1 Bytco Point 56.2 57.1 62.3 57.4 57.5 57.2 58.0

Maharashtra Pollution Control Board
Noise Level Monitoring During Diwali Festival 2008 66
Table 19 (e): Noise Level in Nashik as on 30th October, Evening Session Location 1800-1900 1900-2000 2000-2100 2100-2200 2200-2300 2300-2400 Avg. Leq
CBS 59.2 68.4 68.2 70.5 67.2 64.6 66.4 Panchavati 68.3 71.9 69.7 66.5 64.9 62.5 67.3 Dahipool 72.7 73.9 73.1 71.7 66.8 64.3 70.4 CIDCO 62.2 68.4 78.0 77.3 67.0 64.2 69.5 Bytco Point 58.0 62.4 65.2 61.4 58.0 56.2 60.2
Table 20 (a): Noise Level in Aurangabad as on 28th October, Morning Session Location 0500-0600 0600-0700 0700-0800 0800-0900 0900-1000 1000-1100 Avg. Leq
Gulmandi 67.8 63.0 71.0 62.0 60.4 54.4 63.1 City Chowk 53.4 82.6 70.0 58.6 61.7 49.6 62.7 Kranti Chowk 62.5 70.8 75.7 72.4 73.8 54.6 68.3 Cidco Residential
60.0 78.6 73.3 81.6 58.2 50.1 68.7
Usmanpura 52.2 72.0 66.3 65.8 62.5 60.3 63.2

Maharashtra Pollution Control Board
Noise Level Monitoring During Diwali Festival 2008 67
Table 20 (b): Noise Level in Aurangabad as on 28th October, Evening Session Location 1800-1900 1900-2000 2000-2100 2100-2200 2200-2300 2300-2400 Avg. Leq
Gulmandi 72.3 70.7 85.3 84.1 79.3 72.1 77.3 City Chowk 72.6 73.0 64.1 66.2 70.9 64.9 68.6 Kranti Chowk 73.7 77.6 81.1 78.6 73.8 71.0 76.0 Cidco Residential 72.9 69.7 82.1 83.6 74.2 72.2 75.8
Usmanpura 70.7 69.0 79.0 80.6 76.1 64.0 73.2

Maharashtra Pollution Control Board
Noise Level Monitoring During Diwali Festival 2008 68
Table 20 (c): Noise Level in Aurangabad as on 29th October, Morning Session Location 0500-0600 0600-0700 0700-0800 0800-0900 0900-1000 1000-1100 Avg. Leq
Gulmandi 62.1 59.3 68.7 60.5 57.3 55.4 60.6 City Chowk 50.6 71.4 72.3 64.2 54.1 52.2 60.8 Kranti Chowk 56.4 64.7 70.2 69.5 65.1 50.2 62.7 Cidco Residential
54.2 60.5 65.8 69.1 59.4 52.3 60.2
Usmanpura 58.2 66.4 71.3 62.4 56.2 55.3 61.6
Table 20 (d): Noise Level in Aurangabad on 29th October, Evening Session Location 1800-1900 1900-2000 2000-2100 2100-2200 2200-2300 2300-2400 Avg. Leq
Gulmandi 60.5 71.2 69.8 70.4 56.2 54.1 63.7 City Chowk 58.4 65.4 69.4 70.6 61.7 57.1 63.8 Kranti Chowk 65.2 66.9 72.4 62.7 59.2 51.4 63.0 Cidco Residential
54.2 68.4 72.9 66.7 59.1 52.6 62.3
Usmanpura 64.8 67.4 71.9 61.7 55.3 51.4 62.1

Maharashtra Pollution Control Board
Noise Level Monitoring During Diwali Festival 2008 69
Table 20 (e): Noise Level in Aurangabad as on 30th October, Evening Session Location 1800-1900 1900-2000 2000-2100 2100-2200 2200-2300 2300-2400 Avg. Leq
Gulmandi 73.9 75.8 73.3 74.8 75.6 74.3 74.6 City Chowk 73.0 74.4 69.7 70.6 72.4 69.4 71.6 Kranti Chowk 75.6 75.8 73.3 74.8 75.6 74.3 74.9 Cidco Residential
74.4 68.3 74.1 71.3 73.0 65.0 71.0
Usmanpura 73.2 71.6 70.1 71.8 68.3 70.2 70.9

Maharashtra Pollution Control Board
Noise Level Monitoring During Diwali Festival 2008 70
Table 21 (a): Noise Level in Nagpur as on 28th October, Morning Session Location 0500-0600 0600-0700 0700-0800 0800-0900 0900-1000 1000-1100 Avg. Leq
Ajani Chowk 43.0 45.5 50.6 65.3 65.6 67.4 56.3 Civil Lines 59.9 56.4 57.7 53.3 57.7 60.5 57.6 Dharam Peth 47.8 54.0 57.7 59.7 64.5 68.1 58.6 Itwari 62.2 64.7 68.3 67.5 69.5 72.7 67.5 Civil Hospital 49.8 50.4 53.0 60.6 69.9 75.9 59.9 Deshpande Layout 55.5 54.9 61.8 66.2 66.2 66.1 61.8 Shankar Nagar 56.7 56.9 59.3 60.3 60.9 63.2 59.5 Mahal 46.5 47.2 53.0 52.2 52.3 51.7 50.5 Sadar 64.5 65.1 63.1 63.2 62.4 65.5 63.9 Kalamna 61.0 62.4 68.8 66.3 65.2 65.2 64.8
Table 21 (b): Noise Level in Nagpur as on 28th October, Evening Session Location 1800-1900 1900-2000 2000-2100 2100-2200 2200-2300 2300-2400 Avg. Leq
Ajani Chowk 63.1 68.9 70.0 65.8 59.6 67.6 65.8 Civil Lines 65.3 64.9 67.9 67.1 66.9 54.8 64.5 Dharam Peth 65.4 68.1 74.2 71.7 66.9 64.7 68.5
Itwari 69.8 71.7 76.6 77.8 72.7 72.7 73.5 Civil Hospital 70.4 73.6 76.2 62.2 75.6 67.8 71.0 Deshpande Layout 67.3 68.4 71.0 74.7 75.8 76.0 72.2
Shankar Nagar 63.2 65.8 72.1 70.2 68.0 62.6 67.0
Mahal 68.1 75.6 76.4 72.7 70.1 55.3 69.7 Sadar 71.5 67.5 71.3 76.2 79.9 66.4 72.1 Kalamna 67.1 69.8 72.7 73.0 70.2 67.0 70.0

Maharashtra Pollution Control Board
Noise Level Monitoring During Diwali Festival 2008 71
Table 21 (c): Noise Level in Nagpur as on 29th October, Morning Session Location 0500-0600 0600-0700 0700-0800 0800-0900 0900-1000 1000-1100 Avg. Leq
Ajani Chowk 47.9 54.8 63.8 69.3 66.6 69.6 62.0 Civil Lines 50.5 56.0 66.2 59.6 64.3 65.7 60.4 Dharam Peth 56.2 56.6 54.4 56.0 63.8 70.2 59.5 Itwari 60.9 59.0 66.0 63.9 67.3 64.4 63.6 Civil Hospital 54.0 68.4 57.3 66.6 67.5 70.8 65.8 Deshpande Layout 60.4 60.3 64.6 66.3 68.1 69.7 64.9 Shankar Nagar 53.7 54.5 60.9 61.6 62.0 63.3 59.3 Mahal 55.0 48.2 53.6 54.5 50.7 53.0 50.5 Sadar 57.0 65.7 72.6 64.4 63.2 64.0 64.5 Kalamna 42.8 65.3 65.7 63.4 64.3 75.9 62.9

Maharashtra Pollution Control Board
Noise Level Monitoring During Diwali Festival 2008 72
Table 21 (d): Noise Level in Nagpur on 29th October, Evening Session Location 1800-1900 1900-2000 2000-2100 2100-2200 2200-2300 2300-2400 Avg. Leq
Ajani Chowk 73.9 68.3 67.6 67.4 64.5 63.6 67.5 Civil Lines 67.4 66.9 68.4 64.5 60.5 59.7 64.6 Dharam Peth 68.9 68.6 68.2 68.1 57.3 53.1 64.0
Itwari 71.5 68.8 70.8 69.8 68.2 64.3 68.9 Civil Hospital 70.6 66.0 76.0 74.4 76.1 67.0 71.7 Deshpande Layout 62.3 68.8 67.4 67.7 65.2 64.2 65.9
Shankar Nagar 65.6 64.8 63.4 61.6 59.5 58.9 62.3
Mahal 70.8 73.4 71.5 67.8 66.7 64.6 69.1 Sadar 68.0 68.0 66.5 65.9 62.6 53.0 64.0 Kalamna 66.5 66.2 67.8 67.6 65.6 63.0 66.1

Maharashtra Pollution Control Board
Noise Level Monitoring During Diwali Festival 2008 73
Table 21 (e): Noise Level in Nagpur as on 30th October, Evening Session Location 1800-1900 1900-2000 2000-2100 2100-2200 2200-2300 2300-2400 Avg. Leq
Ajani Chowk 69.4 69.2 67.8 66.0 67.4 64.5 67.4 Civil Lines 69.4 65.8 65.6 66.1 62.6 60.1 64.9 Dharam Peth 69.8 68.6 71.6 82.9 67.5 67.9 71.4
Itwari 69.7 69.8 69.7 69.8 69.7 67.7 69.4 Civil Hospital 74.8 75.3 75.4 77.3 71.5 69.5 73.9 Deshpande Layout 67.9 67.3 68.7 69.5 67.6 64.9 67.6
Shankar Nagar 63.9 62.5 62.5 62.2 61.4 59.8 62.0
Mahal 69.6 69.3 73.5 70.0 69.0 65.8 69.5 Sadar 68.1 67.5 66.6 62.5 59.8 56.0 63.4 Kalamna 67.5 68.5 66.6 68.9 70.1 66.7 68.0
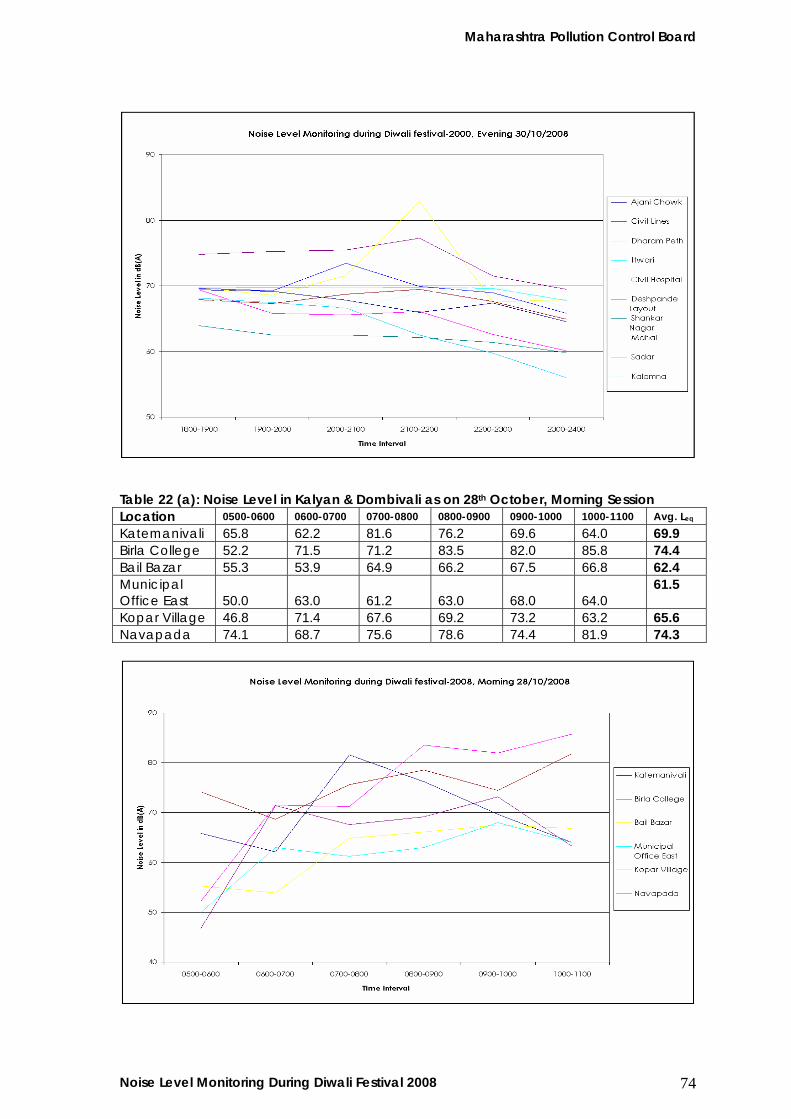
Maharashtra Pollution Control Board
Noise Level Monitoring During Diwali Festival 2008 74
Table 22 (a): Noise Level in Kalyan & Dombivali as on 28th October, Morning Session Location 0500-0600 0600-0700 0700-0800 0800-0900 0900-1000 1000-1100 Avg. Leq
Katemanivali 65.8 62.2 81.6 76.2 69.6 64.0 69.9 Birla College 52.2 71.5 71.2 83.5 82.0 85.8 74.4 Bail Bazar 55.3 53.9 64.9 66.2 67.5 66.8 62.4 Municipal Office East 50.0 63.0 61.2 63.0 68.0 64.0
61.5
Kopar Village 46.8 71.4 67.6 69.2 73.2 63.2 65.6 Navapada 74.1 68.7 75.6 78.6 74.4 81.9 74.3

Maharashtra Pollution Control Board
Noise Level Monitoring During Diwali Festival 2008 75
Table 22 (b): Noise Level in Kalyan & Dombivali as on 28th October, Evening Session Location 1800-1900 1900-2000 2000-2100 2100-2200 2200-2300 2300-2400 Avg. Leq
Katemanivali 71.1 92.1 101.8 94.8 86.3 83.5 88.3 Birla College 79.2 81.8 88.2 98.2 92.6 90.2 88.4 Bail Bazar 75.0 72.8 77.9 80.4 75.7 75.9 76.3 Municipal Office East 72.5 76.8 84.8 88.9 98.1 78.3 83.2
Kopar Village 70.5 73.7 79.5 80.4 74.2 69.4 74.6 Navapada 72.2 76.9 80.4 81.7 79.5 72.6 77.2
Table 22 (c): Noise Level in Kalyan & Dombivali as on 29th October, Morning Session Location 0500-0600 0600-0700 0700-0800 0800-0900 0900-1000 1000-1100 Avg. Leq
Katemanivali 62.5 75.1 69.0 66.5 76.0 82.9 72.0 Birla College 59.9 59.0 72.5 61.5 64.4 76.9 65.7 Bail Bazar 56.6 59.2 64.8 71.5 78.5 79.9 68.4 Municipal Office East 56.9 65.5 57.5 76.7 78.5 77.7 68.8
Kopar Village 68.4 71.7 68.5 70.5 74.5 71.9 70.9 Navapada 67.0 68.9 72.2 70.4 74.8 73.5 71.1

Maharashtra Pollution Control Board
Noise Level Monitoring During Diwali Festival 2008 76
Table 22 (d): Noise Level in Kalyan & Dombivali on 29th October, Evening Session Location 1800-1900 1900-2000 2000-2100 2100-2200 2200-2300 2300-2400 Avg. Leq
Katemanivali 73.4 95.5 93.8 85.6 80.7 78.3 84.6 Birla College 70.6 82.4 80.0 85.2 79.0 63.8 76.8 Bail Bazar 75.6 73.8 78.7 69.4 73.5 70.0 73.5 Municipal Office East 70.4 78.0 76.1 70.5 69.1 84.4 74.8
Kopar Village 66.8 65.8 70.6 68.2 70.8 67.9 68.3 Navapada 88.9 81.1 74.5 79.5 88.5 86.4 83.2

Maharashtra Pollution Control Board
Table 22 (e): Noise Level in Kalyan & Dombivali as on 30th October, Evening Session Location 1800-1900 1900-2000 2000-2100 2100-2200 2200-2300 2300-2400 Avg. Leq
Katemanivali 70.9 84.1 94.7 91.7 94.4 89.1 87.5 Birla College 60.0 79.6 80.0 92.2 90.6 78.6 80.2 Bail Bazar 77.4 71.7 72.2 74.1 73.0 73.1 73.6 Municipal Office East 77.3 70.0 80.8 74.4 82.2 73.8 76.4
Kopar Village 68.4 70.2 80.9 92.6 79.6 71.3 77.2 Navapada 80.4 81.5 82.4 80.8 86.1 81.7 82.1
Table 23 (a): Noise Level in Ambernath & Ulhasnagar as on 28th October, Morning Session Location 0500-0600 0600-0700 0700-0800 0800-0900 0900-1000 1000-1100 Avg. Leq
Kansai Section 60.8 71.6 76.2 79.4 83.6 70.0 74.3 Near Railway Station 59.0 60.4 73.8 60.4 72.6 65.8 65.2 Sai Section 57.6 54.0 68.6 73.6 82.8 69.6 67.3 Shivaji Chawnk No.3 77.0 71.0 71.0 84.4 82.2 85.4 78.5 Camp No. 5 Bus Stop 64.0 73.6 73.0 76.6 75.2 82.0 74.1 Camp No. 1 Gol Maidan 64.0 60.8 74.6 73.4 77.6 80.0 71.7
Noise Level Monitoring During Diwali Festival 2008 77

Maharashtra Pollution Control Board
Noise Level Monitoring During Diwali Festival 2008 78
Table 23 (b): Noise Level in Ambernath & Ulhasnagar as on 28th October, Evening Session Location 1800-1900 1900-2000 2000-2100 2100-2200 2200-2300 2300-2400 Avg. Leq
Kansai Section 74.4 70.7 77.3 87.6 79.5 100.9 81.7 Near Railway Station 75.4 78.6 71.2 66.0 67.2 68.6 71.2 Sai Section 74.0 70.4 84.4 91.6 80.2 82.2 80.5 Shivaji Chawnk No.3 77.4 79.2 76.4 78.6 84.6 81.4 79.6 Camp No. 5 Bus Stop 82.8 83.4 88.8 86.4 81.8 84.4 84.6 Camp No. 1 Gol Maidan 77.0 80.8 75.4 82.6 80.4 83.6 80.0

Maharashtra Pollution Control Board
Noise Level Monitoring During Diwali Festival 2008 79
Table 23 (c): Noise Level in Ambernath & Ulhasnagar as on 29th October, Morning Session Location 0500-0600 0600-0700 0700-0800 0800-0900 0900-1000 1000-1100 Avg. Leq
Kansai Section 53.6 63.2 63.2 64.5 69.2 66.8 63.4 Near Railway Station 57.2 56.0 63.4 62.6 62.6 62.8 60.8 Sai Section 58.0 66.6 69.4 68.8 70.0 76.2 68.2 Shivaji Chawnk No.3 61.8 75.6 69.6 68.8 68.4 72.4 69.4 Camp No. 5 Bus Stop 63.2 66.6 69.4 73.0 76.4 76.8 70.9 Camp No. 1 Gol Maidan 65.6 68.0 70.4 77.8 79.0 82.2 73.8
Table 23 (d): Noise Level in Ambernath & Ulhasnagar on 29th October, Evening Session Location 1800-1900 1900-2000 2000-2100 2100-2200 2200-2300 2300-2400 Avg. Leq
Kansai Section 61.4 67.0 71.2 67.4 77.2 69.8 69.0 Near Railway Station 63.1 73.3 80.4 73.1 78.1 64.7 72.1 Sai Section 60.6 65.4 74.2 86.4 87.2 67.4 73.5 Shivaji Chawnk No.3 73.3 78.1 64.7 63.1 80.4 73.1 72.1 Camp No. 5 Bus Stop 67.0 77.2 69.8 61.4 71.2 67.4 69.0 Camp No. 1 Gol Maidan 65.4 87.2 67.4 60.6 74.2 86.4 73.5

Maharashtra Pollution Control Board
Noise Level Monitoring During Diwali Festival 2008 80
Table 23 (e): Noise Level in Ambernath & Ulhasnagar as on 30th October, Evening Session Location 1800-1900 1900-2000 2000-2100 2100-2200 2200-2300 2300-2400 Avg. Leq
Kansai Section 59.2 67.0 71.2 88.0 90.0 75.0 75.1 Near Railway Station 57.4 73.4 65.6 80.0 72.4 63.6 68.7 Sai Section 66.4 72.8 80.4 91.0 80.6 72.8 77.3 Shivaji Chawnk No.3 82.0 77.8 79.4 78.6 80.4 80.2 79.7 Camp No. 5 Bus Stop 76.4 74.8 81.5 78.1 79.6 81.1 78.6 Camp No. 1 Gol Maidan 83.4 84.4 93.2 84.8 84.4 85.2 85.9

Maharashtra Pollution Control Board
Noise Level Monitoring During Diwali Festival 2008 81
Table 24 (a): Noise Level in Kolhapur as on 28th October, Morning Session Location 0500-0600 0600-0700 0700-0800 0800-0900 0900-1000 1000-1100 Avg. Leq
Tarabai Park 40.0 60.0 65.0 68.0 70.0 66.0 61.5 Shivaji Peth 42.0 56.0 61.0 67.0 72.0 70.0 61.3 Kalam Baug 41.0 56.0 62.0 65.0 60.0 68.0 58.7 Rajaram Puri Road 39.0 49.0 54.0 61.0 65.0 71.0 56.5
Mahaduar road 45.0 51.0 56.0 61.0 64.0 68.0 57.5
Laxmi Puri 40.0 49.0 54.0 59.0 61.0 64.0 54.5 CPR Hospital 36.0 40.0 45.0 51.0 56.0 55.0 47.2
Table 24 (b): Noise Level in Kolhapur as on 28th October, Evening Session Location 1800-1900 1900-2000 2000-2100 2100-2200 2200-2300 2300-2400 Avg. Leq
Tarabai Park 69.0 67.0 59.0 57.0 50.0 46.0 58.0 Shivaji Peth 74.0 72.0 80.0 75.0 66.0 75.0 73.7 Kalam Baug 67.0 72.0 69.0 76.0 65.0 59.0 68.0 Rajaram Puri Road 69.0 73.0 73.0 68.0 65.0 65.0 68.8
Mahaduar road 75.0 72.0 80.0 75.0 72.0 60.0 72.3
Laxmi Puri 77.0 76.0 74.0 70.0 67.0 61.0 70.8 CPR Hospital 73.0 73.0 69.0 67.0 67.0 58.0 67.8 Bauda Road 73.0 73.0 80.0 68.0 61.0 59.0 69.0
Bauda Road 38.0 41.0 44.0 47.0 58.0 56.0 47.3

Maharashtra Pollution Control Board
Noise Level Monitoring During Diwali Festival 2008 82
Table 24 (c): Noise Level in Kolhapur as on 29th October, Morning Session Location 0500-0600 0600-0700 0700-0800 0800-0900 0900-1000 1000-1100 Avg. Leq
Tarabai Park 39.0 52.0 71.0 65.0 61.0 68.0 59.3 Shivaji Peth 40.0 52.0 65.0 72.0 66.0 69.0 60.7 Kalam Baug 38.0 61.0 69.0 73.0 64.0 63.0 61.3 Rajaram Puri Road 40.0 45.0 51.0 62.0 68.0 64.0 55.0
Mahaduar road 43.0 56.0 62.0 60.0 66.0 70.0 59.5
Laxmi Puri 42.0 47.0 60.0 58.0 64.0 62.0 55.5 CPR Hospital 38.0 41.0 48.0 56.0 59.0 63.0 50.8
Bauda Road 41.0 44.0 48.0 53.0 61.0 58.0 50.8

Maharashtra Pollution Control Board
Noise Level Monitoring During Diwali Festival 2008 83
Table 24 (d): Noise Level in Kolhapur on 29th October, Evening Session Location 1800-1900 1900-2000 2000-2100 2100-2200 2200-2300 2300-2400 Avg. Leq
Tarabai Park 67.0 61.0 58.0 57.0 49.0 51.0 57.2 Shivaji Peth 74.0 74.0 73.0 70.0 71.0 60.0 70.3 Kalam Baug 69.0 69.0 67.0 63.0 62.0 59.0 64.8 Rajaram Puri Road 69.0 69.0 72.0 71.0 66.0 64.0 68.5
Mahaduar road 75.0 75.0 74.0 72.0 70.0 60.0 71.0
Laxmi Puri 75.0 74.0 74.0 71.0 68.0 61.0 70.5 CPR Hospital 74.0 73.0 74.0 70.0 68.0 63.0 70.3 Bauda Road 71.0 70.0 68.0 66.0 62.0 58.0 65.8

Maharashtra Pollution Control Board
Noise Level Monitoring During Diwali Festival 2008 84
Table 24 (e): Noise Level in Kolhapur as on 30th October, Evening Session Location 1800-1900 1900-2000 2000-2100 2100-2200 2200-2300 2300-2400 Avg. Leq
Tarabai Park 69.0 63.0 61.0 55.0 48.0 49.0 57.5 Shivaji Peth 72.0 73.0 72.0 74.0 71.0 65.0 71.2 Kalam Baug 69.0 67.0 67.0 65.0 63.0 59.0 65.0 Rajaram Puri Road 67.0 70.0 69.0 69.0 64.0 62.0 66.8
Mahaduar road 73.0 72.0 72.0 74.0 70.0 65.0 71.0
Laxmi Puri 75.0 74.0 73.0 71.0 68.0 61.0 70.3 CPR Hospital 73.0 72.0 73.0 72.0 69.0 62.0 70.2 Bauda Road 70.0 69.0 69.0 68.0 66.0 55.0 66.2

Maharashtra Pollution Control Board
Noise Level Monitoring During Diwali Festival 2008 85

Maharashtra Pollution Control Board
Noise Level Monitoring During Diwali Festival 2008 86
morning session. In Nagpur, 10 locations were monitored and the sound level during monitoring
in 2008 were ranging between 43.0 dBA to 72.6 dBA during morning session. In Kalyan region (including Dombivali, Ulhasnagar and Ambernath), 12
locations were monitored and the sound level during monitoring in 2008 were ranging between 46.8 dBA to 85.8 dBA during morning session.
In Kolhapur, 8 locations were monitored and the sound level during monitoring in 2008 were ranging between 36.0 dBA to 73.0dBA during morning session.
The detailed comparison of Noise level results during Day 1 (6 hourly Leq) of evening session to last year’s results are as follows:
City Location Results in 2007 Results in 2008 Mumbai South Colaba 86.4 92.9 Mantralaya 78.6 79.5 Mazgaon 94.8 81.1 Girgaon 95.6 91.5 Worli 79.3 81.5 Prabhadevi 86.5 85.3 Mahim 73.8 88.4 Parel 86.4 82.4 Byculla 79.3 84.8 Dadar 88.1 86.8 Sion 78.6 73.7 Hindu Colony 74.8 71.5 Matunga 69.7 83.6 Kamathipura 78.4 79.7 Malabar Hills 88.7 83.9
8. Conclusion: It is observed from the results that the noise levels were exceeding the permissible limit during the Diwali Festival from October 28 to 30, 2008 in all the cities. In spite of legal standards in place and efforts of the regulatory agencies, the noise levels could not be controlled under the permissible limit. The detailed comparison of noise level in various cities in Maharashtra are as follows: The Morning Session Noise level range is given as under: In Mumbai, 45 locations were monitored and the sound level during
monitoring in 2008 were ranging between 47.8 dBA to 108.2 dBA during morning session.
In Navi Mumbai, 10 locations were monitored and the sound level during monitoring in 2008 were ranging between 51.0 dBA to 98.2 dBA duringmorning session.
In Thane, 5 locations were monitored and the sound level during monitoring in 2008 were ranging between 45.6 dBA to 87.2 dBA during morning session.
In Pune, 15 locations were monitored and the sound level during monitoring in 2008 were ranging between 37.0 dBA to 73.0 dBA during morning session.
In Nashik, 5 locations were monitored and the sound level during monitoring in 2008 were ranging between 54.2 dBA to 82.7 dBA during morning session.
In Aurangabad, 5 locations were monitored and the sound level duringmonitoring in 2008 were ranging between 50.1 dBA to 82.6 dBA during

Maharashtra Pollution Control Board
Noise Level Monitoring During Diwali Festival 2008 87
City Location Results in 2007 Results in 2008 Mumbai Eastern Suburbs Chembur (E) 74.5 76.4 Trombay 74.2 78.1 Kurla 76.5 70.6 Ghatkopar East 73.2 78.7 Ghatkopar West 72.4 79.1 Mulund East 80.8 76.3 Mulund West 75.8 72.4 Sakinaka 73.5 81.2 Powai 63.2 71.4 Wadala 79.2 80.7 Dharavi 72.8 71.1 Sewree 82.4 80.4 Kalina 80.5 84.0 Vikhroli (W) 72.9 80.8 Bhandup (W) 79.6 90.4 Mumbai Western Suburbs Sahar 81.1 91.4 Santacruz (E) 79.5 74.1 Vile Parle 84.2 82.8 Bandra 87.2 68.7 Goregaon 81.7 81.0 Jogeshwari 83.6 95.7 Versova 79.8 88.3 Marve 73.2 80.6 Borivali East 76.2 87.9 Borivali West 70.2 69.1 Dindoshi 80.3 90.9 Kandivli (E) 79.6 86.1 Dahisar (E) 75.5 99.9 Juhu 69.8 72.1 Malad (W) 76.8 74.5 Navi Mumbai CBD 75.4 70.9 Nerul Sector 11 72.1 78.0 Vashi Sec. 1 70.3 72.0 Sector 9 82.5 79.5 Sector 15 82.5 80.5 Kopar Khairne Sec 10 76.4 83.2 Airoli 76.2 80.1 Rabale 78.6 94.5 Ghansoli 76.3 82.0 Kopar Khairne 72.5 81.0 Thane Shiv Mandir 76.1 85.4 Tembhi Naka 85.3 82.1 Gokhle Road 91.6 86.4 Pokharan 96.1 86.1 Wagle Estate 86.7 80.2

Maharashtra Pollution Control Board
City Location Results in 2007 Results in 2008 Pune Shivaji Nagar 78.9 75.3 Karve Road 82.0 75.5 Swar Gate 81.3 79.8 Balaji Nagar 78.6 79.5 Shaniwar Peth 80.9 71.0 Yerawada 78.1 74.7 Khadaki 79.7 77.0 Kothrud 80.0 79.5 Mahatma Phule
Madan 80.3 75.7
Shagun Chowk 73.7 69.0 M G Road 81.1 77.0 Sarus Baug 79.3 73.2 Parvati 79.9 76.3 Hadapsar 83.0 74.2 Koregaon Park 81.0 70.2 Nashik CBS 74.6 69.1 Panchavati 72.2 71.0 Dahipool 79.1 74.7 CIDCO 72.8 71.9 Bytco Point 73.6 73.9 Aurangabad Gulmandi 89.0 77.3 City Chowk 84.0 68.6 Kranti Chowk 79.0 76.0 Cidco Residential 73.0 75.8 Usmanpura 82.0 73.2 Nagpur Ajani Chowk 64.1 65.8 Civil Lines 71.7 64.5 Dharam Peth 82.2 68.5 Itwari 82.3 73.5 Civil Hospital 66.0 71.0 Deshpande Layout 82.1 72.2 Shankar Nagar 76.2 67.0 Mahal 80.1 69.7 Sadar 81.2 72.1 Kalamna 75.2 70.0 Kalyan Katemanivali 73.7 88.3 Birla College 82.5 88.4 Bail Bazar 83.5 76.3 Dombivali Municipal Office East 76.1 83.2 Kopar Village 74.2 74.6 Navapada `71.2 77.2
Noise Level Monitoring During Diwali Festival 2008 88

Maharashtra Pollution Control Board
City Location Results in 2007 Results in 2008 Ambernath Kansai Section 75.0 71.2 Near Railway Station 73.7 81.7 Sai Section 70.7 80.5 Ulhasnagar Shivaji Chawnk No.3 77.3 79.6 Camp No. 5 Bus Stop 85.4 84.6 Camp No. 1 Gol
Maidan 70.5 80.0
Kolhapur Tarabai Park 72.7 58.0 Shivaji Peth 75.6 73.7 Kalam Baug 74.1 68.0 Rajaram Puri Road 76.8 68.8 Mahaduar road 77.7 72.3 Laxmi Puri 77.7 70.8 CPR Hospital 70.9 67.8 Bauda Road 77.0 69.0
The detailed comparison of Noise level results during Day 2 (6 hourly Leq) of evening session to last year’s results are as follows:
City Location Results in 2007 Results in 2008 Mumbai South Colaba 83.3 86.0 Mantralaya 68.8 66.6 Mazgaon 74.1 84.4 Girgaon 75.6 80.5 Worli 82.6 78.9 Prabhadevi 76.0 79.6 Mahim 88.3 82.9 Parel 73.5 86.5 Byculla 77.3 88.9 Dadar 87.7 84.1 Sion 68.2 77.4 Hindu Colony 67.0 72.4 Matunga 75.2 77.6 Kamathipura 82.7 81.4 Malabar Hills 82.6 77.9 Mumbai Eastern Suburbs Chembur (E) 76.7 71.9 Trombay 69.4 73.4 Kurla 74.0 75.4 Ghatkopar East 66.7 74.2 Ghatkopar West 65.5 76.1 Mulund East 76.8 81.2 Mulund West 76.4 77.7 Sakinaka 75.2 77.8 Powai 68.2 74.0 Wadala 63.5 75.9 Dharavi 82.7 89.6 Sewree 70.8 74.2 Kalina 79.6 83.5 Vikhroli (W) 75.7 83.8 Bhandup (W) 80.1 96.1
Noise Level Monitoring During Diwali Festival 2008 89

Maharashtra Pollution Control Board
City Location Results in 2007 Results in 2008 Mumbai Western Suburbs Sahar 76.6 70.9 Santacruz (E) 77.7 78.0 Vile Parle 78.4 80.9 Bandra 67.9 68.9 Goregaon 77.0 82.7 Jogeshwari 83.2 87.0 Versova 82.6 86.4 Marve 78.6 85.7 Borivali East 85.0 82.2 Borivali West 77.9 74.4 Dindoshi 76.2 78.9 Kandivli (E) 72.4 73.9 Dahisar (E) 75.7 77.1 Juhu 77.0 68.4 Malad (W) 75.6 74.1 Navi Mumbai CBD 73.4 84.5 Nerul Sector 11 61.8 70.6 Vashi Sec. 1 60.8 66.6 Sector 9 74.3 75.5 Sector 15 77.9 80.2 Kopar Khairne Sec 10 81.3 84.7 Airoli 78.7 80.0 Rabale 73.2 86.7 Ghansoli 78.7 77.6 Kopar Khairne 80.1 72.0 Thane Shiv Mandir 72.4 75.7 Tembhi Naka 89.1 77.6 Gokhle Road 82.1 76.2 Pokharan 90.3 91.9 Wagle Estate 83.1 80.7 Pune Shivaji Nagar 69.5 62.5 Karve Road 75.0 70.5 Swar Gate 79.0 64.2 Balaji Nagar 65.7 69.2 Shaniwar Peth 67.0 68.0 Yerawada 76.2 64.0 Khadaki 74.4 62.3 Kothrud 76.6 67.3 Mahatma Phule
Madan 75.7 67.0
Shagun Chowk 68.7 66.2 M G Road 75.2 65.8 Sarus Baug 76.2 63.2 Parvati 71.3 63.3 Hadapsar 76.9 72.2 Koregaon Park 61.7
Noise Level Monitoring During Diwali Festival 2008 90

Maharashtra Pollution Control Board
City Location Results in 2007 Results in 2008 Nashik CBS 77.3 68.5 Panchavati 75.6 68.6 Dahipool 73.9 74.1 CIDCO 75.8 66.1 Bytco Point 64.7 58.0 Aurangabad Gulmandi 71.0 63.7 City Chowk 72.0 63.8 Kranti Chowk 74.0 63.0 Cidco Residential 69.0 62.3 Usmanpura 68.0 62.1 Nagpur Ajani Chowk 64.2 67.5 Civil Lines 59.3 64.6 Dharam Peth 70.8 64.0 Itwari 82.7 68.9 Civil Hospital 66.0 71.7 Deshpande Layout 66.5 65.9 Shankar Nagar 74.2 62.3 Mahal 78.5 69.1 Sadar 78.0 64.0 Kalamna 65.8 66.1 Kalyan Katemanivali 82.9 84.6 Birla College 74.7 76.8 Bail Bazar 79.3 73.5 Dombivali Municipal Office East 70.5 74.8 Kopar Village 70.2 68.3 Navapada 76.7 83.2 Ambernath Kansai Section 79.6 72.1 Near Railway Station 78.4 69.0 Sai Section 85.7 73.5 Ulhasnagar Shivaji Chawnk No.3 77.5 72.1 Camp No. 5 Bus Stop 70.3 69.0 Camp No. 1 Gol
Maidan 68.5 73.5
Kolhapur Tarabai Park 69.4 57.2 Shivaji Peth 73.5 70.3 Kalam Baug 75.5 64.8 Rajaram Puri Road 68.5 68.5 Mahaduar road 73.1 71.0 Laxmi Puri 73.7 70.5 CPR Hospital 74.8 70.3 Bauda Road 77.8 65.8
Noise Level Monitoring During Diwali Festival 2008 91

Maharashtra Pollution Control Board
The detailed comparison of Noise level results during Day 3 (6 hourly Leq) of evening session to last year’s results are as follows:
City Location Results in 2007 Results in 2008 Mumbai South Colaba 83.9 85.5 Mantralaya 88.8 79.8 Mazgaon 88.2 80.0 Girgaon 80.2 74.7 Worli 72.8 81.1 Prabhadevi 82.8 93.2 Mahim 72.6 89.1 Parel 85.3 87.3 Byculla 76.6 84.4 Dadar 95.2 86.5 Sion 78.6 77.2 Hindu Colony 78.1 73.5 Matunga 79.4 90.3 Kamathipura 92.2 74.0 Malabar Hills 85.9 77.9 Mumbai Eastern Suburbs Chembur (E) 69.6 73.4 Trombay 62.2 66.7 Kurla 73.6 76.9 Ghatkopar East 78.4 73.7 Ghatkopar West 64.4 74.0 Mulund East 72.6 77.9 Mulund West 82.8 77.1 Sakinaka 81.2 74.4 Powai 74.5 67.5 Wadala 79.6 77.7 Dharavi 8.9 91.2 Sewree 74.7 72.5 Kalina 83.4 82.8 Vikhroli (W) 85.7 78.9 Bhandup (W) 81.2 100.6 Mumbai Western Suburbs Sahar 74.5 73.6 Santacruz (E) 79.3 79.2 Vile Parle 80.5 79.1 Bandra 63.4 71.4 Goregaon 75.2 74.1 Jogeshwari 86.9 93.8 Versova 81.1 86.6 Marve 79.2 84.5 Borivali East 81.3 80.9 Borivali West 80.0 74.5 Dindoshi 74.8 86.3 Kandivli (E) 76.0 75.2 Dahisar (E) 79.0 73.1 Juhu 76.1 67.3 Malad (W) 75.4 70.9
Noise Level Monitoring During Diwali Festival 2008 92

Maharashtra Pollution Control Board
City Location Results in 2007 Results in 2008 Navi Mumbai CBD 78.3 80.8 Nerul Sector 11 82.9 74.0 Vashi Sec. 1 84. 68.0 Sector 9 80.9 76.0 Sector 15 70.3 80.2 Kopar Khairne Sec 10 86.9 92.6 Airoli 84.3 73.6 Rabale 84.8 83.7 Ghansoli 86.1 84.2 Kopar Khairne 80.7 75.1 Thane Shiv Mandir 84.6 80.7 Tembhi Naka 70.1 77.1 Gokhle Road 67.9 75.7 Pokharan 91.3 87.3 Wagle Estate 72.3 76.0 Pune Shivaji Nagar 75.4 66.8 Karve Road 78.2 69.8 Swar Gate 79.9 62.8 Balaji Nagar 72.6 67.8 Shaniwar Peth 72.5 64.7 Yerawada 76.1 63.5 Khadaki 73.6 63.2 Kothrud 79.2 68.2 Mahatma Phule
Madan 78.8 60.3
Shagun Chowk 74.3 62.3 M G Road 76.0 66.5 Sarus Baug 71.2 62.0 Parvati 76.8 62.2 Hadapsar 76.0 61.0 Koregaon Park 72.4 69.8 Nashik CBS 73.7 66.4 Panchavati 74.1 67.3 Dahipool 74.4 70.4 CIDCO 76.2 69.5 Bytco Point 63.9 60.2 Aurangabad Gulmandi 71.3 74.6 City Chowk 70.4 71.6 Kranti Chowk 72.8 74.9 Cidco Residential 70.6 71.0 Usmanpura 70.4 70.9
Noise Level Monitoring During Diwali Festival 2008 93

Maharashtra Pollution Control Board
City Location Results in 2007 Results in 2008 Nagpur Ajani Chowk 66.4 67.4 Civil Lines 72.0 64.9 Dharam Peth 74.2 71.4 Itwari 81.4 69.4 Civil Hospital 67.7 73.9 Deshpande Layout 69.5 67.6 Shankar Nagar 75.3 62.0 Mahal 83.1 69.5 Sadar 78.1 63.4 Kalamna 66.9 68.0 Kalyan Katemanivali 78.3 87.5 Birla College 78.3 80.2 Bail Bazar 74.9 73.6 Dombivali Municipal Office East 75.3 76.4 Kopar Village 80.1 77.2 Navapada 85.2 82.1 Ambernath Kansai Section 73.5 68.7 Near Railway Station 76.5 75.1 Sai Section 76.4 77.3 Ulhasnagar Shivaji Chawnk No.3 78.9 79.7 Camp No. 5 Bus Stop 79.8 78.6 Camp No. 1 Gol
Maidan 67.8 85.9
Kolhapur Tarabai Park 72.0 57.5 Shivaji Peth 71.8 71.2 Kalam Baug 75.8 65.0 Rajaram Puri Road 73.6 66.8 Mahaduar road 75.6 71.0 Laxmi Puri 75.4 70.3 CPR Hospital 74.8 70.2 Bauda Road 75.7 66.2
It is observed that, there is significant change in noise levels in all the cities. There was a reduction of noise this year in all the cities.as compared to the previous years but in some places in Navi Mumbai there was a significant increase in the Noise level during the DIwali festival.. Increasing awareness amongst masses and enforcement has resulted in reduction of noise levels this season.
Noise Level Monitoring During Diwali Festival 2008 94

Maharashtra Pollution Control Board
9. Glimpse of the event
Roshani Salunkhe and Shalaka Tendulkar at Mulund East Location
Ganesh Kalambe and Farhanaz Mirza
Noise Level Monitoring During Diwali Festival 2008 95

Maharashtra Pollution Control Board
Yogesh Dhekale at Ghatkopar East Location
Bhupendra Shinde at Vartak Nagar Location
Noise Level Monitoring During Diwali Festival 2008 96

Maharashtra Pollution Control Board
Noise Level Monitoring During Diwali Festival 2008 97
Manoj Salvi at Tembhi naka Location
Yogesh Surve at Rabale Location

Maharashtra Pollution Control Board
Noise Level Monitoring During Diwali Festival 2008 98
Sandip Karande at Ghansoli Location
Prashant Narsale and Sanjay Gupta at Balaji Towers Kopar Khairne
Maharashtra Pollution Control Board
Noise Level Monitoring During Diwali Festival 2008 99
Arvind Kadam at Sector 15-16 market, Vashi
Jaywant Patil at Nerul Bus Depot

Maharashtra Pollution Control Board
Noise Level Monitoring During Diwali Festival 2008 100
Parvez Shaikh and Suneet Kamble outside Ambernath railway station
Sagar Asapur at Sai Section

Maharashtra Pollution Control Board
Noise Level Monitoring During Diwali Festival 2008 101
Nilesh Korbal and Nelson Periera at Kansai Section
Girish Sonar and Nilesh Sawant at Camp no. 5 Bus Stop

Maharashtra Pollution Control Board
Noise Level Monitoring During Diwali Festival 2008 102
Rahul Upadhyay at Paanch Rasta Mulund West.
Swapnil Kamble and Sanjay Bhattacharya at Ulhasnagar location