Embed Size (px)
Citation preview

A Demographic Social and Economic Profile, Grant County, Washington
1
A Demographic Social & Economic Profile
Grant County, Washington
By: Isaac Swanson | Planning 301-88
A Demographic Social and Economic Profile, Grant County, Washington
2
TABLE OF CONTENTS
TABLE OF TABLES……………………………………………………………………………………………………………………………….……4
TABLE OF FIGURES………………………………………………………………………………………………………………….……………….5
1.0 INTRODUCTION TO GRANT COUNTY ............................................................................................... 6 1.1 Purpose………………………………………………………………………………………………………………………………………6
1.2 Location………………………………………………………………………………………………………………………………………7
2.0 GRANT COUNTY POPULATION CHANGE 1990-2010 AND 2010-2013……………….……..……………..… 8
2.1 Population Change 1990-2010 .......................................................................................................... 8
2.2 Population Change in 2013………………………………………………………………………………………………………… 9
2.3 Analysis of Growth for Grant County. ............................................................................................. 10
3.0 GRANT COUNTY POPULATION PYRAMID. ..................................................................................... 11 3.1 Population 2000. ............................................................................................................................. 11
3.2 Population 2010 .............................................................................................................................. 12
4.0 GRANT COUNTY RACE AND ETHNICITY PROFILES, 2010……………………………………………………..……. 13
4.1 Grant County Ethnicity: Hispanic or Latino Population…………………………………………………………….. 14
4.2 Grant County Race and Ethnicity, 2010………………………………………………………………………………….….16
5.0 HOUSEHOLD AND HOUSING DATA 2010. ...................................................................................... 18 5.1.0 Household and Housing Data 2010 ................................................................................................ 18
5.1.1 Households by Type………………………………………………………………………………………………………………… 19
5.2.0 Housing Occupancy. ........................................................................................................................ 21
5.2.1 Total Housing Units, Occupied and Unoccupied………………………………………………………………………..23
5.3.0 Housing Tenure. .............................................................................................................................. 24
5.3.1 Cost of Rent………………………………………………………………………………………………………………………………25
5.3.2 Total Housing Units Owned/Rented……………………………………………………………………………………..…..26
5.4 Value of Homes…………………………………………………………………………………………………………………………28
5.5 Age of Homes……………………………………………………………………………………………………………………………29
5.6 Number of Persons per Dwelling Unit……………………………………………………………………………………….31
6.0 GRANT COUNTY 5-YEAR ACS EDUCATION DATA 2009-2013. ....................................................... 32 6.1.0 Education Attainment .................................................................................................................. 32
6.1.1 Education: High School Diploma or Less ...................................................................................... 34
6.1.2 Education: Associates Degree or Less .......................................................................................... 35
6.1.3 Education: University Graduates .................................................................................................. 35
6.1.4 Education Total Population of Graduates .................................................................................... 35
6.2.0 Education Enrollment Overview…………………………………………………………………….………………………. 36
6.2.1 Education Enrollment K-12……………………………………………………………………………………………………… 37
6.2.2 Higher Education Enrollment……………………………………………………………………………………………………38
A Demographic Social and Economic Profile, Grant County, Washington
3
7.0 EMPLOYMENT, INCOME AND OCCUPATION BY INDUSTRY IN GRANT COUNTY.......................... 39 7.1 Employment for Grant County ....................................................................................................... 39
7.2 Household Income for Grant County .............................................................................................. 40
7.3 Median Income for Individual Workers .......................................................................................... 42
7.4 Industry by Occupation ................................................................................................................... 43
8.0 GRANT COUNTY CENSUS OF TRANSPORT…………………………………………….………………………………….47
8.1 Number of Vehicles per Household…………………………………………………………………………………………. 47
8.2 Mode of Transportation for Commuting…………………………………………………………………………………. 48
References .................................................................................................................................................. 50
A Demographic Social and Economic Profile, Grant County, Washington
4
TABLES OF TABLES
Table Page
Table of Figures 5
Table 1 Grant County and State of Washington Population 1990-2010. 8
Table 2 Grant County and State of Washington Population 2010-2013. 9
Table 3 Race In Grant County 2010 13
Table 4 Ethnicity for Grant County 2010 15
Table 5 Race and Ethnicity: Grant County 2010 16
Table 6 Number of Households in Grant County 18
Table 7 Households by Type, 2010 20
Table 8 Housing Occupancy 2010 21
Table 9 Housing Units Occupied/Unoccupied 23
Table 10 Housing Tenure 2010 24
Table 11 Cost of Monthly Rent 25
Table 12 Housing Units Owned/Rented 27
Table 13 Home Value 28
Table 14 Decennial Housing Units Constructed 30
Table 15 Number of Persons per Dwelling 31
Table 16 Education Attainment 33
Table 17 Education Enrollment 37
Table 18 Employment Status 39
Table 19 Household Income 41
Table 20 Industry by Occupation 44
Table 21 Number of Vehicles per Household 47
Table 22 Mode of Transportation by Commuters in Grant County 49

A Demographic Social and Economic Profile, Grant County, Washington
5
TABLE OF FIGURES
Figure Page
Figure 1 Washington State with Highlighted Grant County 6
Figure 2 Grant County Population 1990-2013. 9
Figure 3 Grant County and Washington State Population Percentage. 10
Figure 4 Population Pyramid 2000 11
Figure 5 Population Pyramid 2010 12
Figure 6 Race in Grant County 2010 14
Figure 7 Hispanic Population, 2010 15
Figure 8 Ethnicity 2010 17
Figure 9 Family and Nonfamily Households, 2010. 19
Figure 10 Households by Type, 2010. 20
Figure 11 Housing Occupancy, 2010 22
Figure 12 Vacant Housing Units, 2010 22
Figure 13 Occupied/Unoccupied Housing Units 23
Figure 14 Percentage Housing Tenure for Grant County, 2010. 24
Figure 15 Monthly Rent Cost 26
Figure 16 Housing Units Owned/Rented 27
Figure 17 House Value 29
Figure 18 Housing Unit Constructed 30
Figure 19 Education Attainment Grant County 36
Figure 20 Population Education 34
Figure 21 Education Enrollment 38
Figure 22 Employment Status Percentage 40
Figure 23 Estimated Income and Benefits for 2013 42
Figure 24 Estimated Industry by Occupation for 2013 45
Figure 25 Top Five Industries Estimated for Grant County in 2013 46
Figure 26 Number of Vehicles per Residence 48
Figure 27 Mode of Commuter Transportation 49
A Demographic Social and Economic Profile, Grant County, Washington
6
1.0 INTRODUCTION TO GRANT COUNTY
1.1 Purpose
The purpose of this report is to create a demographic social and economic profile of Grant
County using 2010 decennial Census data and 2013 American Community Survey Census Data
(ACS).
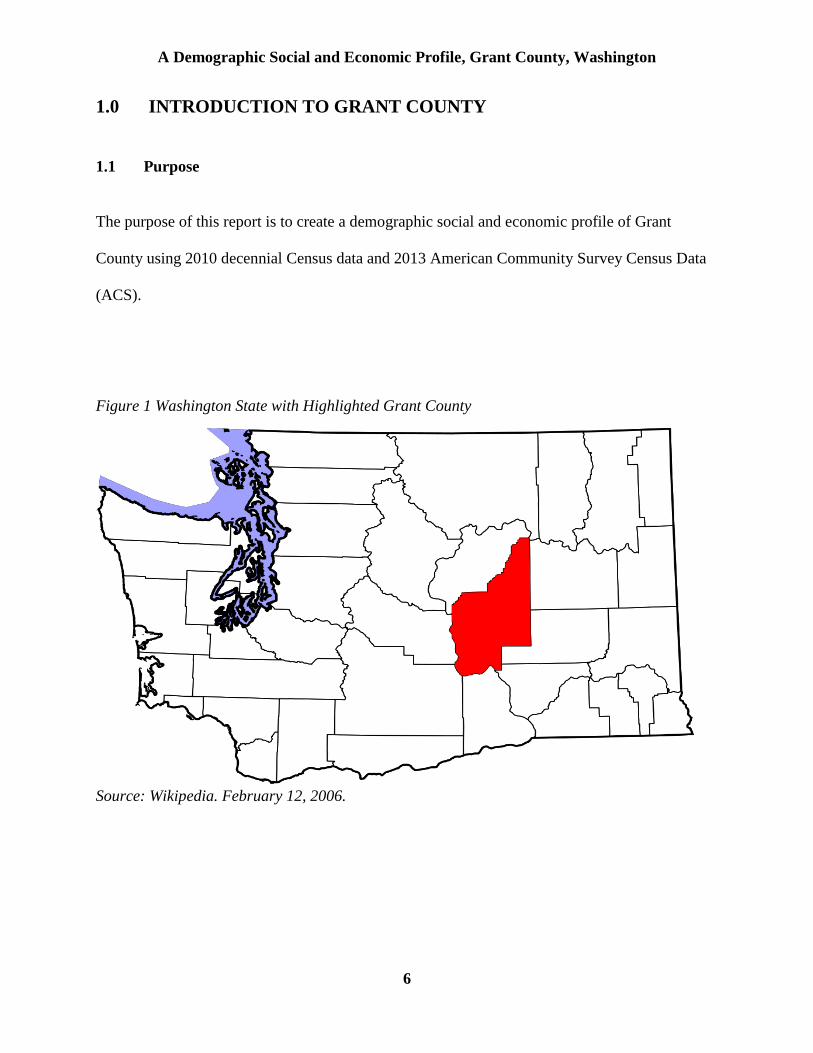
Figure 1 Washington State with Highlighted Grant County
Source: Wikipedia. February 12, 2006.

A Demographic Social and Economic Profile, Grant County, Washington
7
1.2 Location
Grant County is located in the middle of the State of Washington towards the eastern side of the
state. It covers approximately 2,679.5 square miles and has a density of approximately 33 people
per square mile. It has a large Hispanic population along with several other counties in the region
(Source: U.S. Census Bureau: State and County: QuickFacts). The county seat is the city of
Ephrata, Washington. The largest city in Grant County is Moses Lake. The county was originally
a part of Douglas County and was formed into its own entity on February 24, 1909. Grant County
is named after the 18th President of the United States, Ulysses S. Grant.

A Demographic Social and Economic Profile, Grant County, Washington
8
2.0 GRANT COUNTY POPULATION CHANGE 1990-2010
AND 2010-2013.
The focus of this section is to describe population data within Grant County. There are dramatic
changes in population in Grant County showing rapid growth in the last three decades. This
section of the report covers the changes in population between 1990 and 2013.
2.1 Population Change 1990-2010
In the year 1990 Grant County had a population of 54,758, increasing to 74,698 by the year 2000
(36.4%). By 2010 Grant County increased its population to 89,120 people (19.3%) (See Table 1,
Figure 2).
Table 1 Grant Count and State of Washington Population Table 1990-2010.
1990
Population
2000
Population
Real
Change
%
Change
2010
Population
Real
Change
%
Change
Grant
County 54,758 74,698 19,940 36.4% 89,120 14,422 19.3%
Washington
State 4,866,692 5,894,121 1,027,429 21.1% 6,724,540 830,419 14.1%
Source: U.S. Census Bureau | American FactFinder

A Demographic Social and Economic Profile, Grant County, Washington
9
Figure 2 Grant County Population 1990-2013.
Source: U.S. Census Bureau | American FactFinder
2.2 Population Change 2010 to 2013
The Grant County population reached 90,202 in 2013, a 1.2% increase from 2010 (See Table 2).
Table 2 Grant Count and State of Washington Population Table 2010-2013.
Source: U.S. Census Bureau | American FactFinder
54,758
74,698
89,12090,202
0
10,000
20,000
30,000
40,000
50,000
60,000
70,000
80,000
90,000
100,000
1990 2000 2010 2013
Po
pu
lati
on
Decennial Year
Grant County Population Change
2013 POPULATION TABLE 2013 POPULATION REAL
CHANGE
PERCENT
CHANGE
Grant County 90,202 1,082 1.2%
Washington State 6,819,579 95,039 1.4%
A Demographic Social and Economic Profile, Grant County, Washington
10
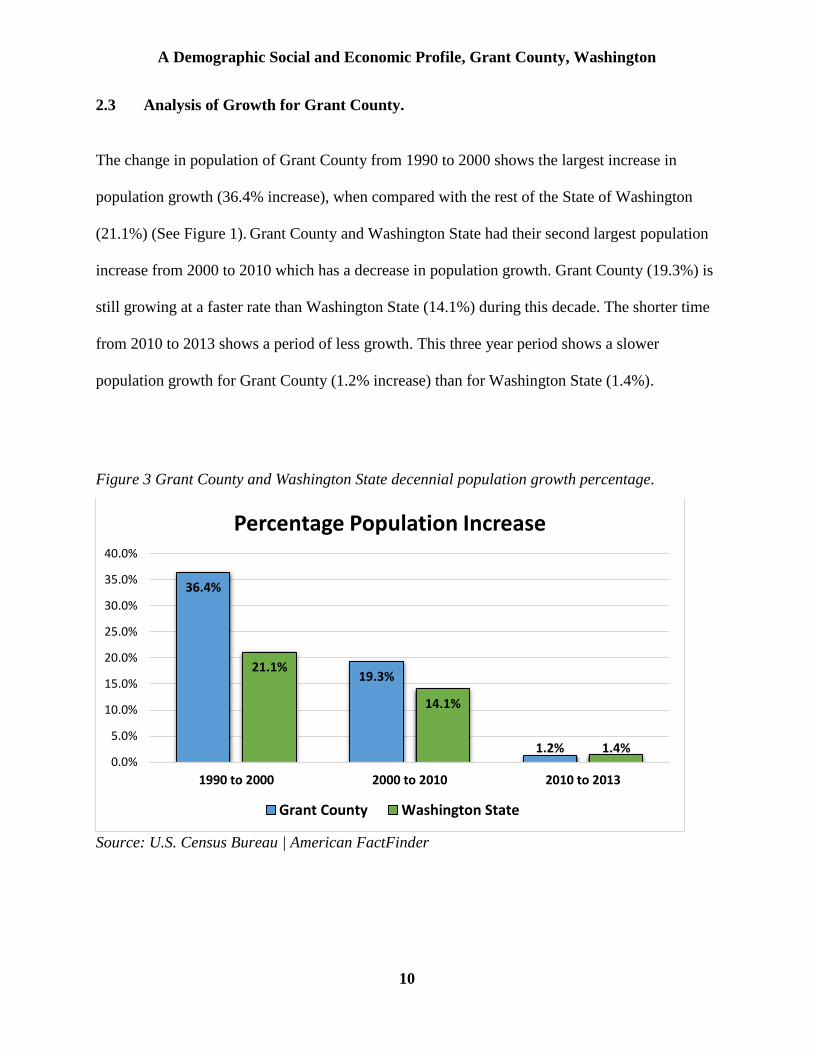
2.3 Analysis of Growth for Grant County.
The change in population of Grant County from 1990 to 2000 shows the largest increase in
population growth (36.4% increase), when compared with the rest of the State of Washington
(21.1%) (See Figure 1). Grant County and Washington State had their second largest population
increase from 2000 to 2010 which has a decrease in population growth. Grant County (19.3%) is
still growing at a faster rate than Washington State (14.1%) during this decade. The shorter time
from 2010 to 2013 shows a period of less growth. This three year period shows a slower
population growth for Grant County (1.2% increase) than for Washington State (1.4%).
Source: U.S. Census Bureau | American FactFinder
36.4%
19.3%
1.2%
21.1%
14.1%
1.4%0.0%
5.0%
10.0%
15.0%
20.0%
25.0%
30.0%
35.0%
40.0%
1990 to 2000 2000 to 2010 2010 to 2013
Percentage Population Increase
Grant County Washington State
Figure 3 Grant County and Washington State decennial population growth percentage.

A Demographic Social and Economic Profile, Grant County, Washington
11
3.0 GRANT COUNTY POPULATION PYRAMID.
This section of the report reviews the population demographics of Grant County by 5 year age
cohorts for the years 2000 and 2010.
3.1 Population 2000.
In the year 2000 the total population of Grant County was 74,648 with 38,177 males and 36,521
females (See Figure 2). The largest population cohorts are of children and youth up until the age
of 20 (35.3%). Then there is a drop in population for the 20 to 35 cohorts reflecting younger
people leaving the county for work or school elsewhere. The work force from ages 35 to 55 is
the second largest cohort grouping (33.6%). There is more population in the younger workforce
cohorts than the older workforce cohorts. The population decreases over the age of 65.
Figure 4 Population Pyramid 2000
Source: U.S. Census Bureau, Census 2000 Summary File 1
-4000 -3000 -2000 -1000 0 1000 2000 3000 4000
Under 5 years
10 to 14 years
20 to 24 years
30 to 34 years
40 to 44 years
50 to 54 years
60 to 64 years
70 to 74 years
80 to 84 years
90 years and over
POPULATION
AG
E IN
INC
REM
ENTS
OF
5 Y
EAR
S
Grant County, WA 2000 Population
Male Female

A Demographic Social and Economic Profile, Grant County, Washington
12
3.2 Population 2010
With a decade of growth in Grant County there was an increase of population in since 2000,
highlighted by an increased number of children and youth cohorts to the age of 20, which still is
the largest population category (See Figure 3). Unlike the year 2000 there was a slight decrease
in population between the ages of 20 and 35 in 2010. More young people seem to be moving to
or staying in Grant County for work. The bulk of the work force has aged, but there in an
increase in younger work force population. The older population cohorts have increased from the
previous decade.
Figure 5 Population Pyramid 2010
Source: U.S. Census Bureau, Census 2010 Summary File 1
-5,000 -4,000 -3,000 -2,000 -1,000 0 1,000 2,000 3,000 4,000 5,000
Under 5 years
10 to 14 years
20 to 24 years
30 to 34 years
40 to 44 years
50 to 54 years
60 to 64 years
70 to 74 years
80 to 84 years
POPULATION
AG
E IN
INC
REM
ENTS
OF
5 Y
EAR
S
Grant County, WA 2010 Population
Male Female

A Demographic Social and Economic Profile, Grant County, Washington
13
4.0 Grant County Race and Ethnicity Profiles, 2010
Race is defined by the Census Bureau under five major categories plus Some Other Race and
Two or More Races. (See Table 3, Figure 4). The largest category for Race in the 2010 Census
data was White (72.8%). The second largest population identified as being Some Other Race
(20.4%). The third largest population in Grant County identified as being Mixed Race (3.5%).
The next largest populations were American Indian and Alaska Natives (1.2%) and Black or
African Americans (1.1%). The smallest racial categories in the county were Asians (0.9%) and
Native Hawaiian and Other Pacific Islander (0.1%).
Table 3 Race In Grant County 2010
RACE IN GRANT COUNTY 2010 POPULATION PERCENT
White 64,906 72.8%
Black or African American 990 1.1%
American Indian and Alaska Native 1,088 1.2%
Asian 810 0.9%
Native Hawaiian and Other Pacific Islander 71 0.1%
Some Other Race 18,154 20.4%
Two or More Races 3,101 3.5%
Total population 89,120 100.0%
Source: U.S. Census Bureau, 2010 Census.

A Demographic Social and Economic Profile, Grant County, Washington
14
Figure 6 Race in Grant County 2010
Source: U.S. Census Bureau, 2010 Census.
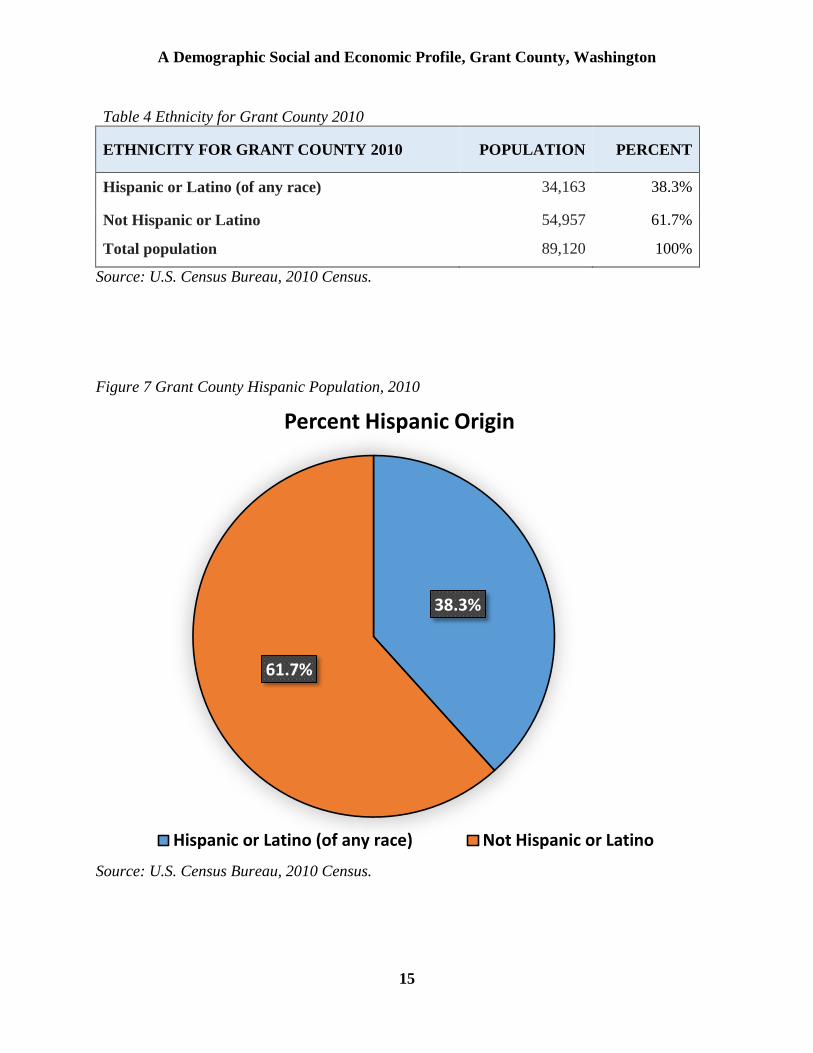
4.1 Grant County Ethnicity: Hispanic or Latino Population
Ethnicity, as defined by the Census Bureau as being under two categories: Hispanic or Latino
and Non-Hispanic or Latino. A total of 89,210 people resided in Grant County in 2010 with
34,163 people (38.3%) that identify as Hispanic of Latino (See Table 4, Figure 5). There were
54,957 individuals (61.7%) in Grant County that were not Hispanic or Latino. This shows that
there is a large Hispanic presence in the county.
72.8%1.1%
1.2%
0.9%
0.1%20.4%
3.5%
Percent Population
White
Black or African American
American Indian and AlaskaNative
Asian
Native Hawaiian and OtherPacific Islander
Some Other Race
Two or More Races
A Demographic Social and Economic Profile, Grant County, Washington
15
Table 4 Ethnicity for Grant County 2010
ETHNICITY FOR GRANT COUNTY 2010 POPULATION PERCENT
Hispanic or Latino (of any race) 34,163 38.3%
Not Hispanic or Latino 54,957 61.7%
Total population 89,120 100%
Source: U.S. Census Bureau, 2010 Census.
Figure 7 Grant County Hispanic Population, 2010
Source: U.S. Census Bureau, 2010 Census.
38.3%
61.7%
Percent Hispanic Origin
Hispanic or Latino (of any race) Not Hispanic or Latino
A Demographic Social and Economic Profile, Grant County, Washington
16
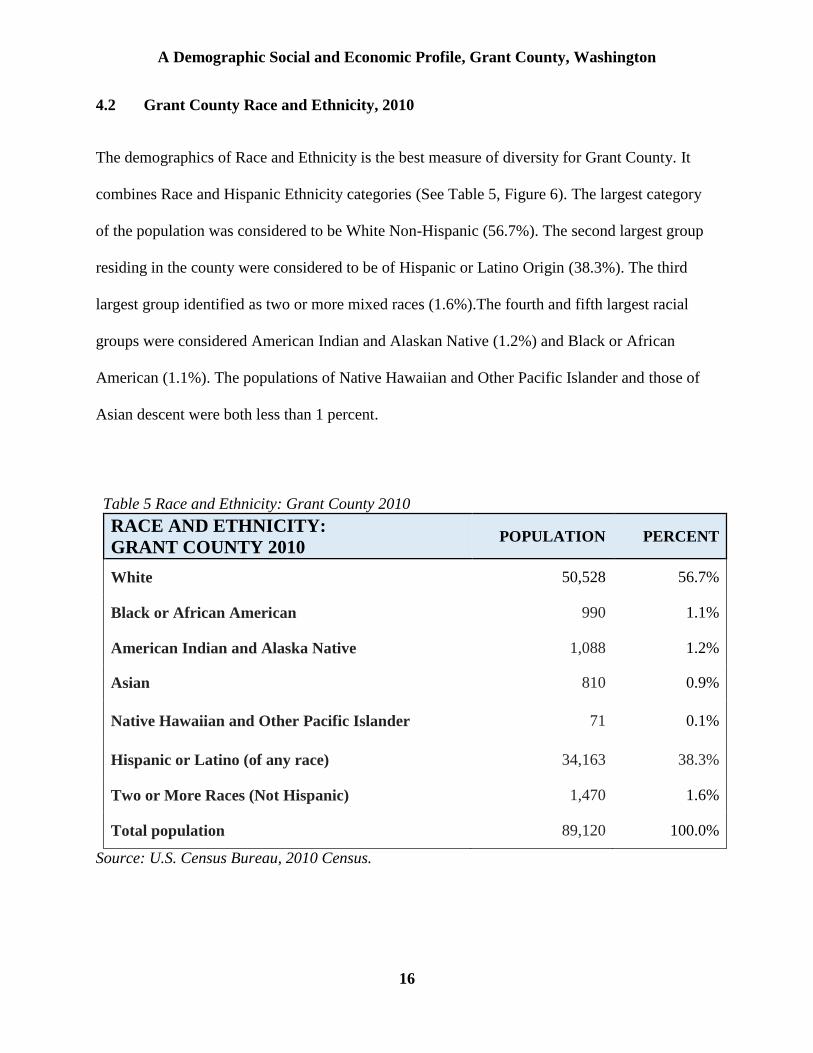
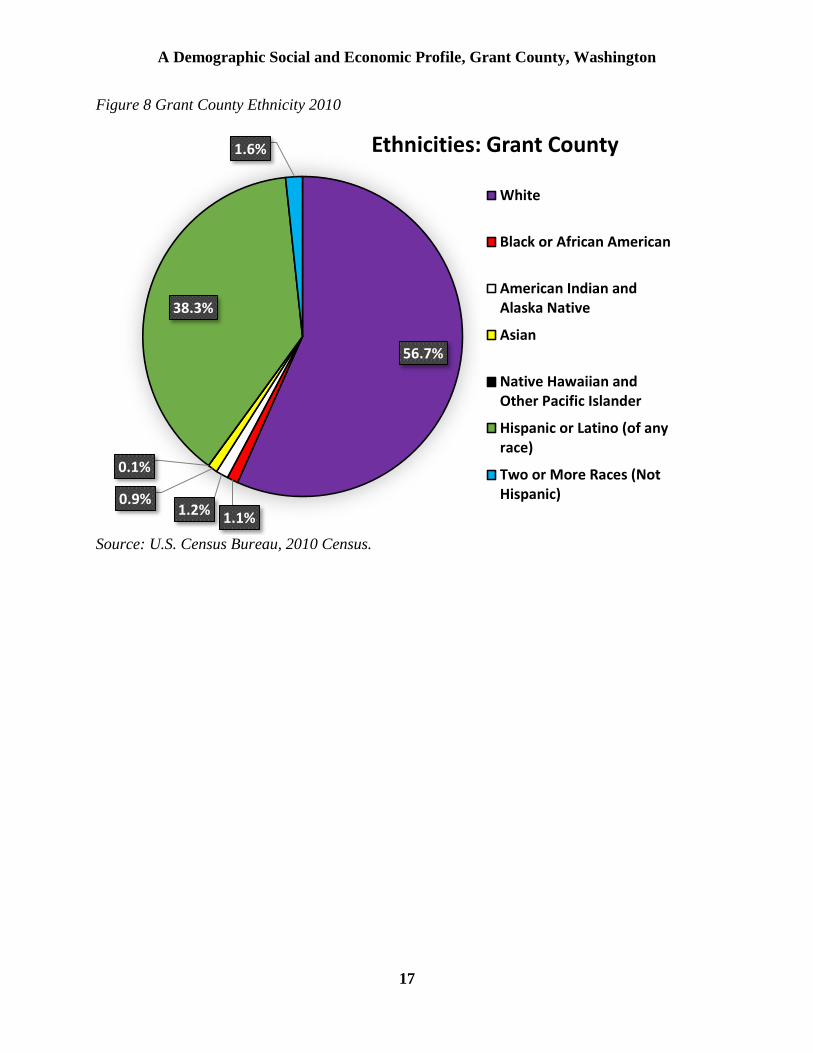
4.2 Grant County Race and Ethnicity, 2010
The demographics of Race and Ethnicity is the best measure of diversity for Grant County. It
combines Race and Hispanic Ethnicity categories (See Table 5, Figure 6). The largest category
of the population was considered to be White Non-Hispanic (56.7%). The second largest group
residing in the county were considered to be of Hispanic or Latino Origin (38.3%). The third
largest group identified as two or more mixed races (1.6%).The fourth and fifth largest racial
groups were considered American Indian and Alaskan Native (1.2%) and Black or African
American (1.1%). The populations of Native Hawaiian and Other Pacific Islander and those of
Asian descent were both less than 1 percent.
Table 5 Race and Ethnicity: Grant County 2010
RACE AND ETHNICITY:
GRANT COUNTY 2010 POPULATION PERCENT
White 50,528 56.7%
Black or African American 990 1.1%
American Indian and Alaska Native 1,088 1.2%
Asian 810 0.9%
Native Hawaiian and Other Pacific Islander 71 0.1%
Hispanic or Latino (of any race) 34,163 38.3%
Two or More Races (Not Hispanic) 1,470 1.6%
Total population 89,120 100.0%
Source: U.S. Census Bureau, 2010 Census.
A Demographic Social and Economic Profile, Grant County, Washington
17
Figure 8 Grant County Ethnicity 2010
Source: U.S. Census Bureau, 2010 Census.
56.7%
1.1%1.2%
0.9%
0.1%
38.3%
1.6% Ethnicities: Grant County
White
Black or African American
American Indian andAlaska Native
Asian
Native Hawaiian andOther Pacific Islander
Hispanic or Latino (of anyrace)
Two or More Races (NotHispanic)

A Demographic Social and Economic Profile, Grant County, Washington
18
5.0 HOUSEHOLD AND HOUSING DATA.
The household data for Grant County is divided into sub categories to better present the data by
type of family. The next subsection is Housing Occupancy which describes the total number of
housing unit types as well as what housing units are occupied or vacant. The third subcategory is
Housing Tenure which describes housing that are rented or owned as well as the cost of rent. The
remainder of the subsections describe the Value of Homes, the Number of Homes, the Age of the
Houses, and the Number of People per Housing Unit.
5.1.0 Family and Non-Family Households 2010
According to the U.S. Census there were 30,041 total households in Grant County for 2010.
21,800 of these were family households (72.6%) with parents and children (See Table 6, Figure
7). 8,241 households were nonfamily households (27.4%) and contained single or non-family
residents.
Table 6 Number of Households in Grant County
HOUSEHOLDS IN GRANT COUNTY NUMBER PERCENT
Family households 21,800 72.6
Nonfamily households 8,241 27.4
Total households 30,041 100
Source: U.S. Census Bureau, 2010 Census: American FactFinder.

A Demographic Social and Economic Profile, Grant County, Washington
19
Figure 9 Grant County Family and Nonfamily Households, 2010.
Source: U.S. Census Bureau, 2010 Census: American FactFinder.
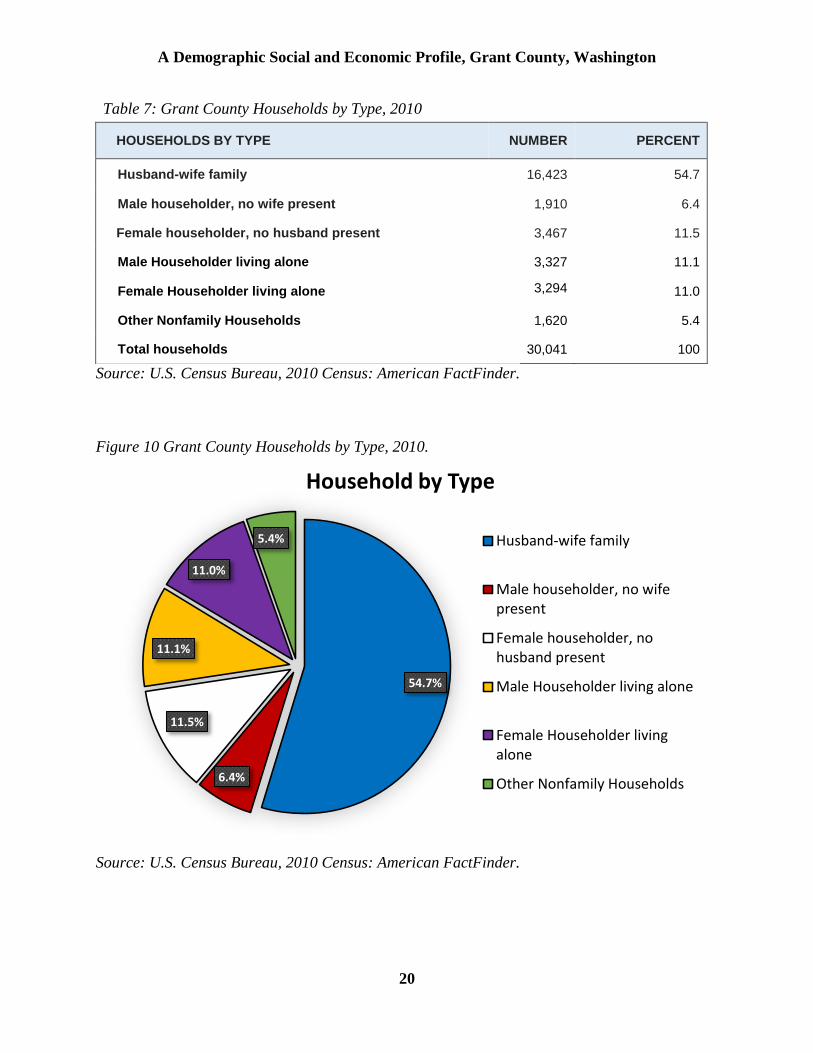
5.1.1 Households by Type
The largest category of households were husband-wife families (54.7%) (See Table 7, Figure 8).
Families with a male householder with no wife present (6.4%) were less than family households
that had a female householder with no husband was present (11.5%). There were more male
householders lived alone (11.1%) than female householders that lived alone (11.0%). Nonfamily
Households are 5.4% are made up of non-married couples as well as individuals living with
friends or roommates.
72.6%
27.4%
Family and Nonfamily Households
Family households
Nonfamily households
A Demographic Social and Economic Profile, Grant County, Washington
20
Table 7: Grant County Households by Type, 2010
HOUSEHOLDS BY TYPE NUMBER PERCENT
Husband-wife family 16,423 54.7
Male householder, no wife present 1,910 6.4
Female householder, no husband present 3,467 11.5
Male Householder living alone 3,327 11.1
Female Householder living alone 3,294 11.0
Other Nonfamily Households 1,620 5.4
Total households 30,041 100
Source: U.S. Census Bureau, 2010 Census: American FactFinder.
Figure 10 Grant County Households by Type, 2010.
Source: U.S. Census Bureau, 2010 Census: American FactFinder.
54.7%
6.4%
11.5%
11.1%
11.0%
5.4%
Household by Type
Husband-wife family
Male householder, no wifepresent
Female householder, nohusband present
Male Householder living alone
Female Householder livingalone
Other Nonfamily Households

A Demographic Social and Economic Profile, Grant County, Washington
21
5.2.0 Housing Occupancy:
In 2010, Grant County had 85.6% occupied and 14.4% vacant housing units (See Table 8,
Figures 9 and 10). Of the vacant housing units 2.7% were available for rent and only 0.1% were
not occupied. There was 1.1% of housing units that were available for sale and 0.1% of these
houses were sold but were not occupied. There were 7.7% of the housing units that were for
seasonal or occasional use.
Table 8 Grant County Housing Occupancy 2010
HOUSING OCCUPANCY NUMBER PERCENT
Total housing units 35,083 100
Occupied housing units 30,041 85.6
Vacant housing units 5,042 14.4
For rent 948 18.8
Rented, not occupied 28 0.6
For sale only 401 8.0
Sold, not occupied 52 13.0
For seasonal, recreational, or occasional use 2,688 53.3
All other vacants 925 18.3
Homeowner vacancy rate ( X ) 2.1
Rental vacancy rate ( X ) 7.8
Source: U.S. Census Bureau, 2010 Census: American FactFinder.

A Demographic Social and Economic Profile, Grant County, Washington
22
Figure 11 Grant County Housing Occupancy, 2010
Source: U.S. Census Bureau, 2010 Census: American FactFinder.
Figure 12 Grant County Vacant Housing Units, 2010
Source: U.S. Census Bureau, 2010 Census: American FactFinder.
85.6%
14.4%
Housing Occupancy
Occupied housing units
Vacant housing units
18.8% 0.6%
8.0%
1.0%53.3%
18.3%
Vacant Housing Units
For rent
Rented, not occupied
For sale only
Sold, not occupied
For seasonal, recreational,or occasional use
All other vacants

A Demographic Social and Economic Profile, Grant County, Washington
23
5.2.1 Total Housing Units, Occupied and Unoccupied.
For Grant County 30,041 (85.6%) of housing units were occupied in 2013, 2.5% were
unoccupied. 7.4% of rental units are vacant (See Table 9, Figure 11).
Table 9 Grant County Housing Units Occupied/Unoccupied
HOUSING OCCUPANCY ESTIMATE MARGIN OF
ERROR PERCENT
MARGIN OF ERROR %
Total housing units 35,044 +/-72 100.0% (X)
Vacant housing units 5,032 +/-395 14.4% +/-1.1%
Occupied housing units 30,012 +/-401 85.6% +/-1.1%
Home vacancy rate 2.5 +/-1.1 (X) (X)
Rental vacancy rate 7.4 +/-2.0 (X) (X)
Source: U.S. Census Bureau, 2009-2013 5-Year American Community Survey DP04.
Figure 13 Occupied/Unoccupied Housing Units
Source: U.S. Census Bureau, 2009-2013 5-Year American Community Survey DP04.
85.6%
14.4%
PercentageOccupied/Unoccupied
Housing Units
Occupied housingunits
Vacant housing units
A Demographic Social and Economic Profile, Grant County, Washington
24
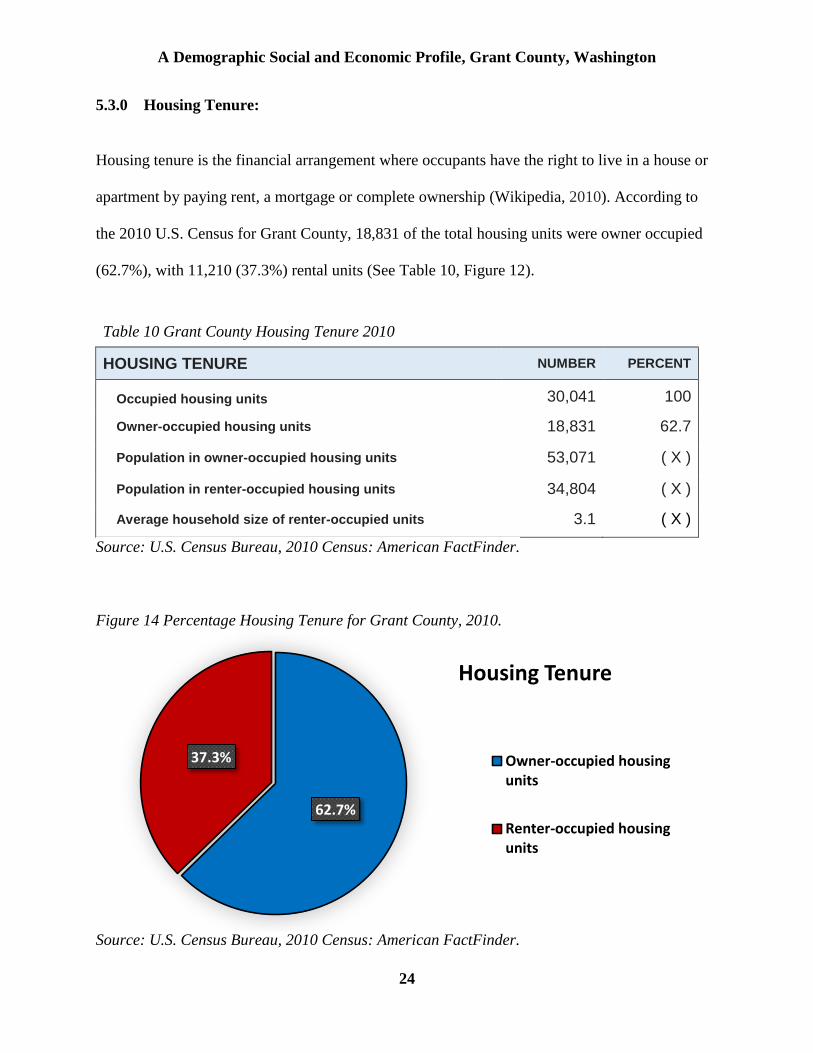
5.3.0 Housing Tenure:
Housing tenure is the financial arrangement where occupants have the right to live in a house or
apartment by paying rent, a mortgage or complete ownership (Wikipedia, 2010). According to
the 2010 U.S. Census for Grant County, 18,831 of the total housing units were owner occupied
(62.7%), with 11,210 (37.3%) rental units (See Table 10, Figure 12).
Table 10 Grant County Housing Tenure 2010
HOUSING TENURE NUMBER PERCENT
Occupied housing units 30,041 100
Owner-occupied housing units 18,831 62.7
Population in owner-occupied housing units 53,071 ( X )
Population in renter-occupied housing units 34,804 ( X )
Average household size of renter-occupied units 3.1 ( X )
Source: U.S. Census Bureau, 2010 Census: American FactFinder.
Figure 14 Percentage Housing Tenure for Grant County, 2010.
Source: U.S. Census Bureau, 2010 Census: American FactFinder.
62.7%
37.3%
Housing Tenure
Owner-occupied housingunits
Renter-occupied housingunits

A Demographic Social and Economic Profile, Grant County, Washington
25
5.3.1 Cost of Rent
In Grant County there are an estimated 10,751 occupied units that pay rent per month with a
median cost of $625 (See Table 11, Figure 13). The largest number of rental units (39.5%) cost
between $500 and $749 per month while the second largest number of rentals (23.9%) cost
between $750 and $999 monthly. The third largest number of rental units (14.6%) cost between
$300 and $499 per month followed closely by a number of rental units (11.4%) that cost between
$1,000 and $1,499 per month. There are 7.3% of rental units that cost less than $300 a month and
3.3% of rental units that cost $1,500 or more monthly.
Table 11 Grant County Cost of Monthly Rent
GROSS MONTHLY RENT ESTIMATE MARGIN OF
ERROR PERCENT
MARGIN OF ERROR %
Less than $200 291 +/-113 2.70% +/-1.0
$200 to $299 494 +/-134 4.60% +/-1.3
$300 to $499 1,575 +/-242 14.60% +/-2.2
$500 to $749 4,248 +/-408 39.50% +/-3.2
$750 to $999 2,566 +/-334 23.90% +/-3.0
$1,000 to $1,499 1,221 +/-261 11.40% +/-2.2
$1,500 or more 356 +/-200 3.30% +/-1.9
Occupied units paying rent 10,751 +/-543 10,751 (X)
Median (dollars) 672 +/-25 (X) (X)
No rent paid 1,105 +/-220 (X) (X)
Source: U.S. Census Bureau, 2009-2013 5-Year American Community Survey DP04.

A Demographic Social and Economic Profile, Grant County, Washington
26
Figure 15 Grant County Monthly Rent Cost
Source: U.S. Census Bureau, 2009-2013 5-Year American Community Survey DP04.
5.3.2 Total Housing Units Owned/Rented
In 2013, the majority (62.7%) of occupied housing units in Grant County were owner occupied,
while the remainder (37.3%) of the housing units were occupied by renting tenants (See Table
12, Figure 14). Of the 18,831 owner occupied homes, 12,152 (40.5%) were owned with a
mortgage and 6,679 (22.2%) were owned out right.
291 494
1,575
4,248
2,566
1,221
356
1,105
0
500
1000
1500
2000
2500
3000
3500
4000
4500
LESS THAN $200
$200 TO $299
$300 TO $499
$500 TO $749
$750 TO $999
$1,000 TO $1,499
$1,500 OR MORE
NO RENT PAID
Nu
mb
er
of
Re
nta
l Un
its
Cost of Rent
Monthly Rent

A Demographic Social and Economic Profile, Grant County, Washington
27
Table 12 Grant County Housing Units Owned/Rented
HOMES OWNED/RENTED ESTIMATE MARGIN
OF ERROR PERCENT
MARGIN OF ERROR
%
Occupied housing units 30,012 +/-401 100.0% (X)
Renter-occupied 11,856 +/-540 39.5% +/-1.7%
Owner-occupied 18,156 +/-541 60.5% +/-1.7%
Owned with a mortgage 12,152 (X) 40.5% (X)
Owned free and clear 6,679 (X) 22.2% (X)
Average household size of owner-occupied unit
2.87 +/-0.06 (X) (X)
Average household size of renter-occupied unit
3.11 +/-0.10 (X) (X)
Source: U.S. Census Bureau, 2009-2013 5-Year American Community Survey DP04 and U.S.
Census Bureau, 2010 Census QT-H1.
Figure 16 Housing Units Owned/Rented
Source: U.S. Census Bureau, 2009-2013 5-Year American Community Survey DP04 and U.S.
Census Bureau, 2010 Census QT-H1.
38.6%
39.6%
21.8%
Housing UnitsOwned and Rented
Renter-occupied
Owned with a mortgage
Owned free and clear
A Demographic Social and Economic Profile, Grant County, Washington
28
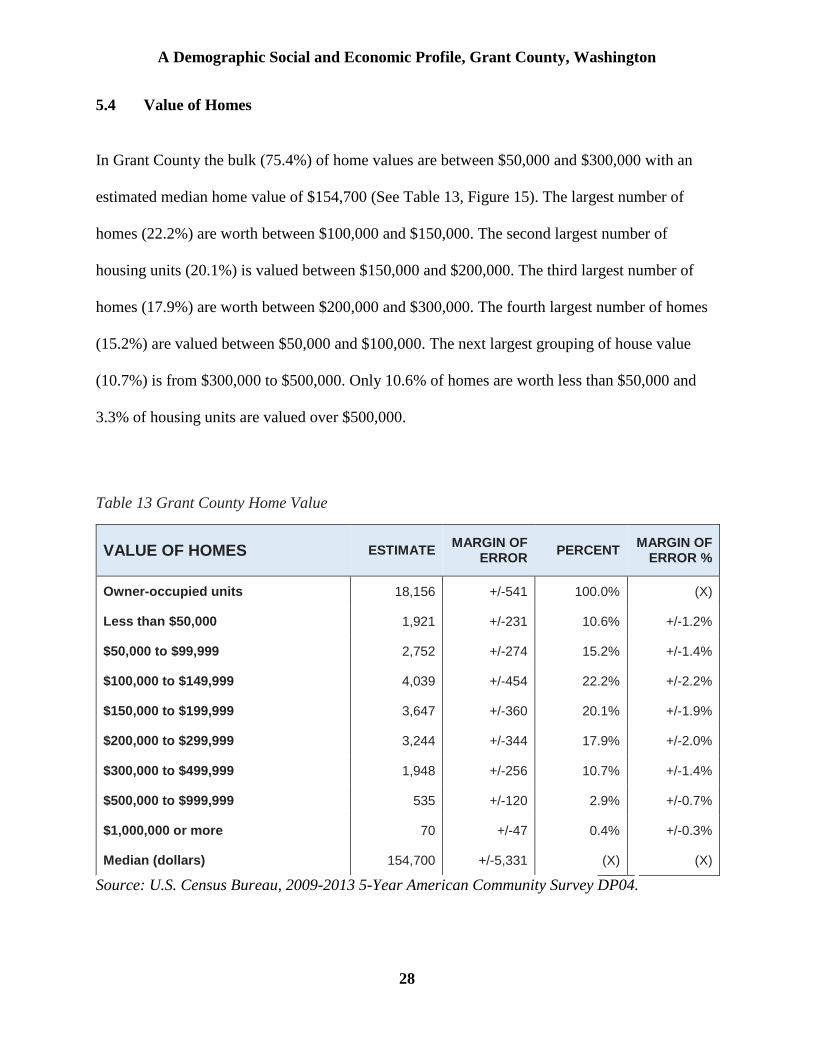
5.4 Value of Homes
In Grant County the bulk (75.4%) of home values are between $50,000 and $300,000 with an
estimated median home value of $154,700 (See Table 13, Figure 15). The largest number of
homes (22.2%) are worth between $100,000 and $150,000. The second largest number of
housing units (20.1%) is valued between $150,000 and $200,000. The third largest number of
homes (17.9%) are worth between $200,000 and $300,000. The fourth largest number of homes
(15.2%) are valued between $50,000 and $100,000. The next largest grouping of house value
(10.7%) is from $300,000 to $500,000. Only 10.6% of homes are worth less than $50,000 and
3.3% of housing units are valued over $500,000.
Table 13 Grant County Home Value
VALUE OF HOMES ESTIMATE MARGIN OF
ERROR PERCENT
MARGIN OF ERROR %
Owner-occupied units 18,156 +/-541 100.0% (X)
Less than $50,000 1,921 +/-231 10.6% +/-1.2%
$50,000 to $99,999 2,752 +/-274 15.2% +/-1.4%
$100,000 to $149,999 4,039 +/-454 22.2% +/-2.2%
$150,000 to $199,999 3,647 +/-360 20.1% +/-1.9%
$200,000 to $299,999 3,244 +/-344 17.9% +/-2.0%
$300,000 to $499,999 1,948 +/-256 10.7% +/-1.4%
$500,000 to $999,999 535 +/-120 2.9% +/-0.7%
$1,000,000 or more 70 +/-47 0.4% +/-0.3%
Median (dollars) 154,700 +/-5,331 (X) (X)
Source: U.S. Census Bureau, 2009-2013 5-Year American Community Survey DP04.

A Demographic Social and Economic Profile, Grant County, Washington
29
Figure 17 Grant County House Value
Source: U.S. Census Bureau, 2009-2013 5-Year American Community Survey DP04.
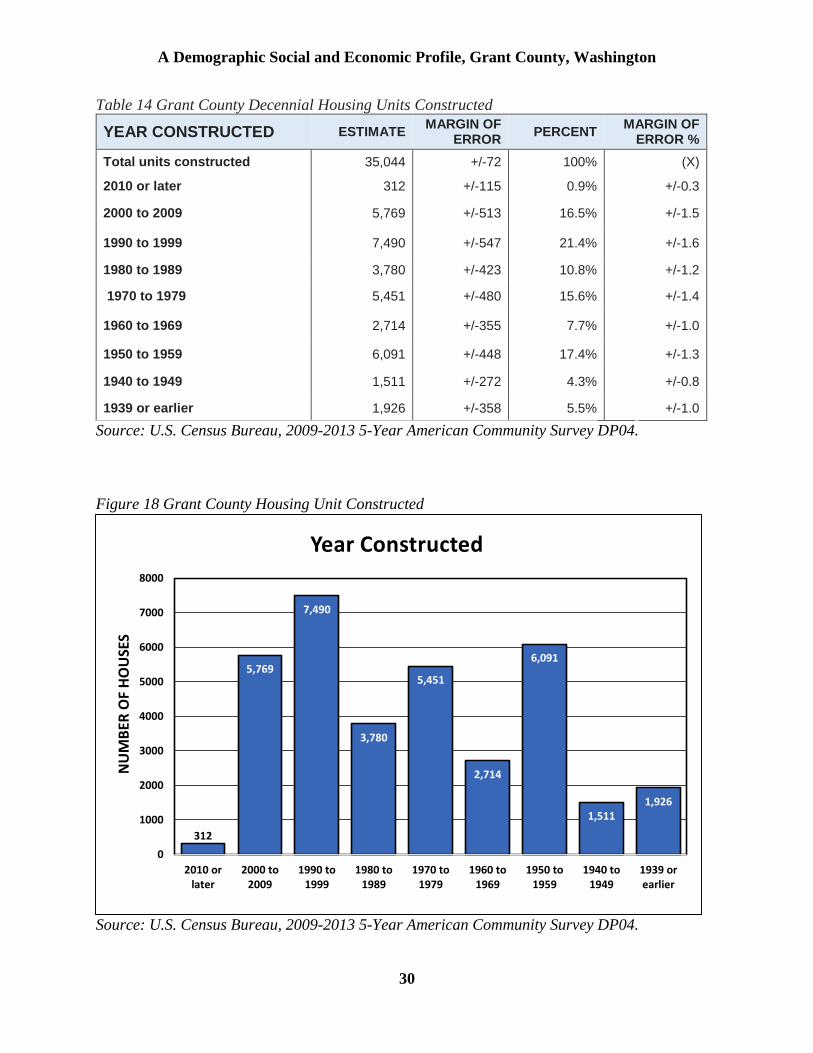
5.5 Age of Homes
In Grant County, the majority (90.3%) of housing construction occurred in the decades following
1950 (See Table 14, Figure 16). The largest number of houses (21.4%) were built between the
years 1990 and 1999. The decade with the second largest number of homes (17.4%) were
constructed between 1950 and 1959. The decade with the third largest number (16.5%) of houses
constructed occurred between 2000 and 2009. The next largest number (15.6%) of houses
constructed were built between the years 1970 and 1979. 1960 through 1969 showed a smaller
number (7.7%) of homes constructed. 9.8% of houses were constructed before the 1950’s and
less than 1% of homes were built after 2010.
0
500
1,000
1,500
2,000
2,500
3,000
3,500
4,000
4,500
Nu
mb
er o
f H
ou
sin
g U
nit
s
House Values
Less than $50,000 $50,000 to $99,999 $100,000 to $149,999 $150,000 to $199,999
$200,000 to $299,999 $300,000 to $499,999 $500,000 to $999,999 $1,000,000 or more
A Demographic Social and Economic Profile, Grant County, Washington
30
Table 14 Grant County Decennial Housing Units Constructed
YEAR CONSTRUCTED ESTIMATE MARGIN OF
ERROR PERCENT
MARGIN OF ERROR %
Total units constructed 35,044 +/-72 100% (X)
2010 or later 312 +/-115 0.9% +/-0.3
2000 to 2009 5,769 +/-513 16.5% +/-1.5
1990 to 1999 7,490 +/-547 21.4% +/-1.6
1980 to 1989 3,780 +/-423 10.8% +/-1.2
1970 to 1979 5,451 +/-480 15.6% +/-1.4
1960 to 1969 2,714 +/-355 7.7% +/-1.0
1950 to 1959 6,091 +/-448 17.4% +/-1.3
1940 to 1949 1,511 +/-272 4.3% +/-0.8
1939 or earlier 1,926 +/-358 5.5% +/-1.0
Source: U.S. Census Bureau, 2009-2013 5-Year American Community Survey DP04.
Figure 18 Grant County Housing Unit Constructed
Source: U.S. Census Bureau, 2009-2013 5-Year American Community Survey DP04.
312
5,769
7,490
3,780
5,451
2,714
6,091
1,5111,926
0
1000
2000
3000
4000
5000
6000
7000
8000
2010 orlater
2000 to2009
1990 to1999
1980 to1989
1970 to1979
1960 to1969
1950 to1959
1940 to1949
1939 orearlier
NU
MB
ER O
F H
OU
SES
Year Constructed

A Demographic Social and Economic Profile, Grant County, Washington
31
5.6 Number of Persons per Dwelling Unit
In Grant County there is an average of 2.99 people per housing unit (See Table 15). The
estimated average of persons living in an owned unit is slightly less than estimated average of
persons living in a rented unit.
Table 15 Grant County Number of Persons per Dwelling
PERSONS PER DWELLING ESTIMATE MARGIN OF
ERROR PERCENT
MARGIN OF ERROR %
Average Persons per Owned Unit 2.87 +/-0.06 (X) (X)
Average Persons per Rental Unit 3.11 +/-0.10 (X) (X)
Average Person per Unit 2.99 +/-0.08 (X) (X)
Source: U.S. Census Bureau, 2009-2013 5-Year American Community Survey DP04.

A Demographic Social and Economic Profile, Grant County, Washington
32
6.0 GRANT COUNTY 5-YEAR ACS EDUCATION DATA 2009-2013.
The focus of this section is to review the education data from the 2009-2013 5-Year American
Community Survey (ACS) for Grant County, Washington. All of the ACS data are estimates
based off of the change from 2009 to 2013, which are shown in the tables as a margin of error.
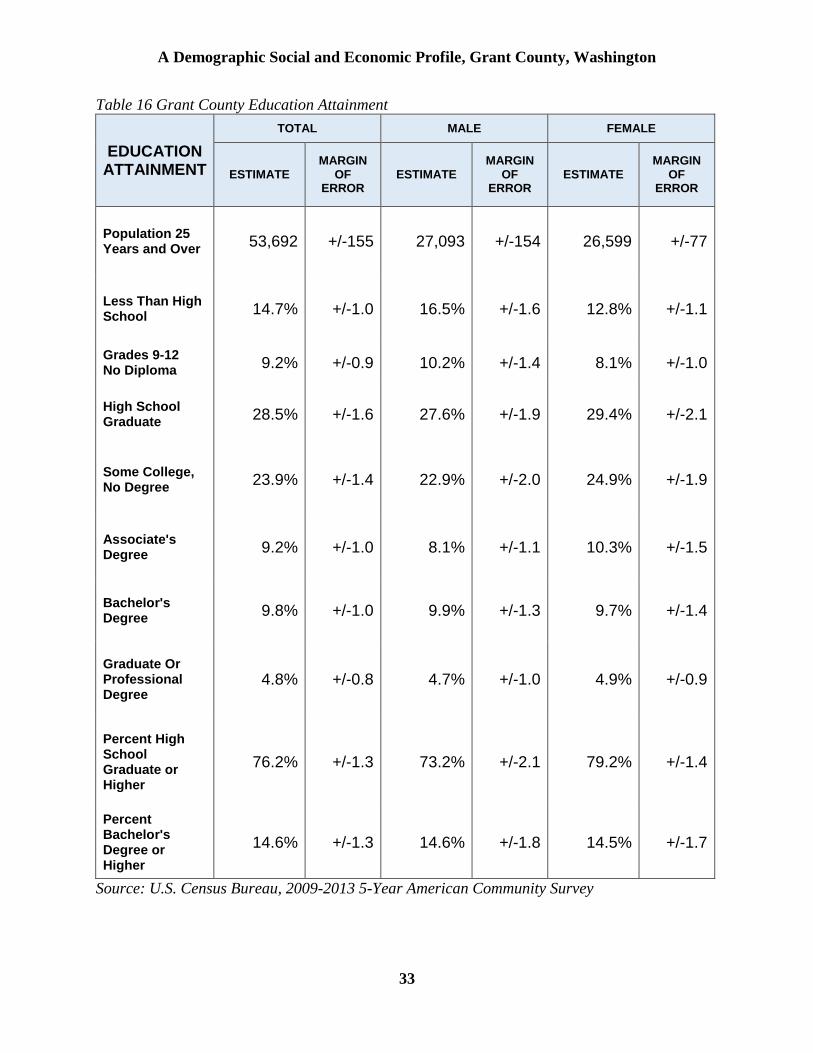
6.1.0 Education Attainment
The education attainment for Grant County, Washington shows that 76.2% of residents have a
minimum of a high school diploma (See Table 16, Figure 17). Of the estimated 53,692 educated
individuals over the age of 25, there are 27,093 educated males (50.4%) and 26,599 educated
females (49.6%). The majority of the educated population (50.5%) has either a high school
diploma or has had some college education without receiving a degree. Of the educated
population (23.9%) that has not graduated from high school, 9.2% have had some high school
education and 14.7% received less than a high school education. Only 14.6% of Grant County’s
educated residents have received a Bachelor’s Degree or higher while 9.2% have received an
Associate’s Degree.
A Demographic Social and Economic Profile, Grant County, Washington
33
Table 16 Grant County Education Attainment
EDUCATION ATTAINMENT
TOTAL MALE FEMALE
ESTIMATE MARGIN
OF ERROR
ESTIMATE MARGIN
OF ERROR
ESTIMATE MARGIN
OF ERROR
Population 25 Years and Over
53,692 +/-155 27,093 +/-154 26,599 +/-77
Less Than High School
14.7% +/-1.0 16.5% +/-1.6 12.8% +/-1.1
Grades 9-12 No Diploma
9.2% +/-0.9 10.2% +/-1.4 8.1% +/-1.0
High School Graduate
28.5% +/-1.6 27.6% +/-1.9 29.4% +/-2.1
Some College, No Degree
23.9% +/-1.4 22.9% +/-2.0 24.9% +/-1.9
Associate's Degree
9.2% +/-1.0 8.1% +/-1.1 10.3% +/-1.5
Bachelor's Degree
9.8% +/-1.0 9.9% +/-1.3 9.7% +/-1.4
Graduate Or Professional Degree
4.8% +/-0.8 4.7% +/-1.0 4.9% +/-0.9
Percent High School Graduate or Higher
76.2% +/-1.3 73.2% +/-2.1 79.2% +/-1.4
Percent Bachelor's Degree or Higher
14.6% +/-1.3 14.6% +/-1.8 14.5% +/-1.7
Source: U.S. Census Bureau, 2009-2013 5-Year American Community Survey
A Demographic Social and Economic Profile, Grant County, Washington
34
Figure 19 Education Attainment Grant County
Source: U.S. Census Bureau, 2009-2013 5-Year American Community Survey
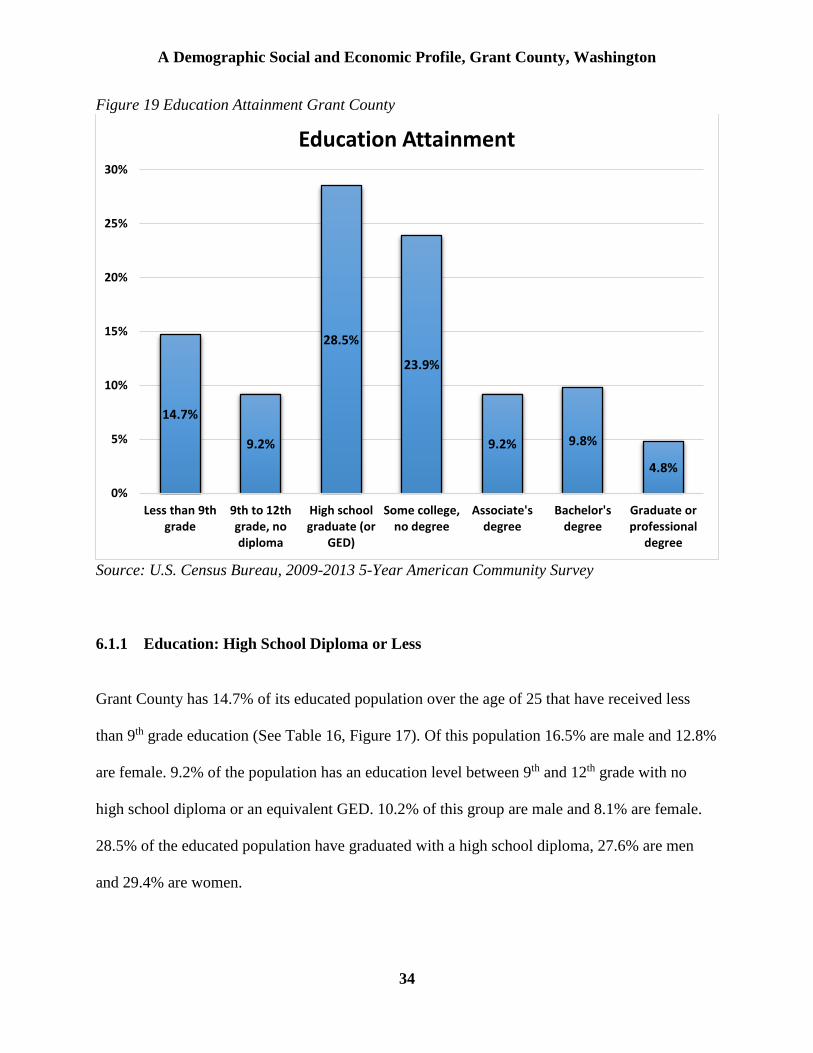
6.1.1 Education: High School Diploma or Less
Grant County has 14.7% of its educated population over the age of 25 that have received less
than 9th grade education (See Table 16, Figure 17). Of this population 16.5% are male and 12.8%
are female. 9.2% of the population has an education level between 9th and 12th grade with no
high school diploma or an equivalent GED. 10.2% of this group are male and 8.1% are female.
28.5% of the educated population have graduated with a high school diploma, 27.6% are men
and 29.4% are women.
14.7%
9.2%
28.5%
23.9%
9.2% 9.8%
4.8%
0%
5%
10%
15%
20%
25%
30%
Less than 9thgrade
9th to 12thgrade, nodiploma
High schoolgraduate (or
GED)
Some college,no degree
Associate'sdegree
Bachelor'sdegree
Graduate orprofessional
degree
Education Attainment
A Demographic Social and Economic Profile, Grant County, Washington
35
6.1.2 Education: Associates Degree or Less
Of the educated population in Grant County that are over the age of 25, 23.9% have had some
college education but have not obtained a degree, 22.9% are men and 24.9% are women (See
Table 16, Figure 17). 9.2% of the educated population have obtained an Associate’s Degree,
8.1% are male and 10.3% are female.
6.1.3 Education: University Graduates
There are 9.8% of Grant County’s educated population over the age of 25 that have obtained a
Bachelor’s Degree, 9.9% are male and 9.7% are female (Table 16, Figure 17). Only 4.8% of the
entire county population has obtained a Master’s Degree or higher, 4.7% are men and 4.9% are
women.
6.1.4 Education Total Population of Graduates
Of the graduate population in Grant County, age 25 and older, 76.4% have received a high
school diploma or higher, 72.3% are male and 79.2% are female (See Table 16, Figure 18).
14.6% of Grant County’s educated population that is over the age of 25 has received a
Bachelor’s Degree or higher, 14.6% are male and 14.5 % are female.

A Demographic Social and Economic Profile, Grant County, Washington
36
Figure 20 Grant County Population Education
Source: U.S. Census Bureau, 2009-2013 5-Year American Community Survey
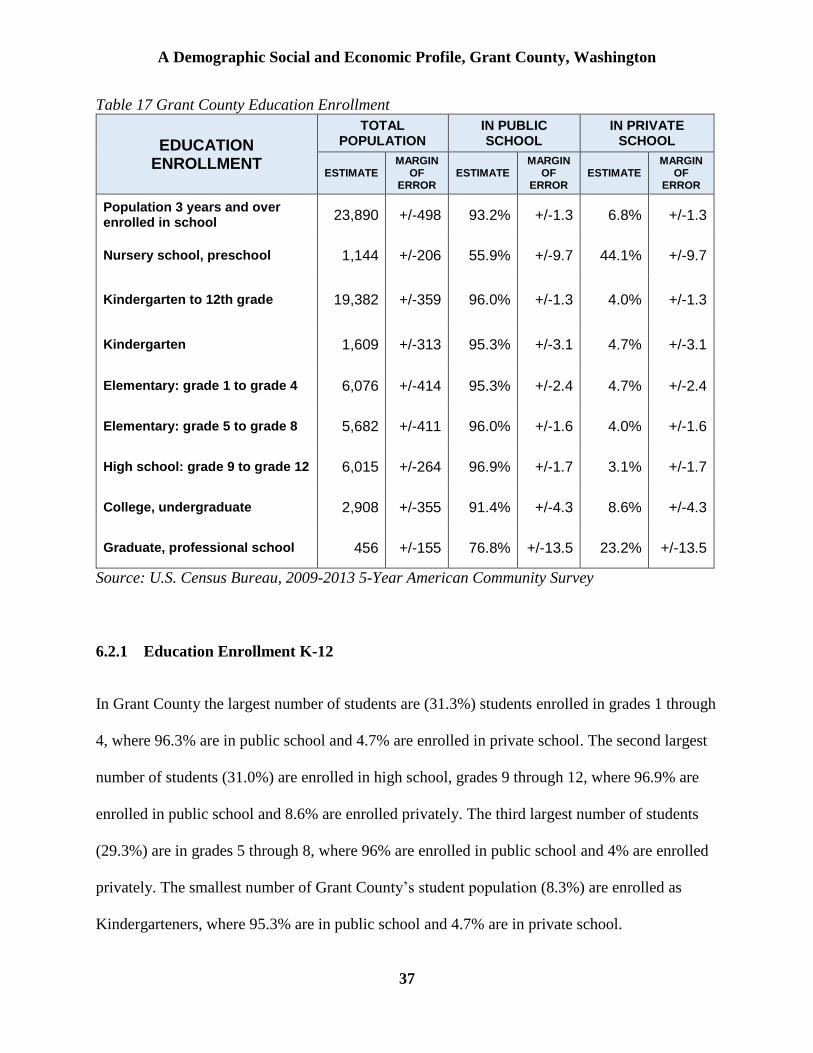
6.2.0 Education Enrollment Overview
There is an estimation of 23,890 students enrolled in school in Grant County, Washington, where
93.2% of students attend public school and 6.8% of are enrolled in privately (See Table 17,
Figure 19). The bulk of the student population (81.1%) are enrolled in Kindergarten through 12th
grades. The second largest student population in the county (14.1%) are enrolled in college. The
smallest student population (4.8%) are in nursery school, preschool, or daycare.
9.2%
76.2%
14.6%
Education of Population Over Age 25
Percent that did notcomplete high school
Percent high schoolgraduate or higher
Percent bachelor'sdegree or higher
A Demographic Social and Economic Profile, Grant County, Washington
37
Table 17 Grant County Education Enrollment
EDUCATION ENROLLMENT
TOTAL POPULATION
IN PUBLIC SCHOOL
IN PRIVATE SCHOOL
ESTIMATE MARGIN
OF ERROR
ESTIMATE MARGIN
OF ERROR
ESTIMATE MARGIN
OF ERROR
Population 3 years and over enrolled in school
23,890 +/-498 93.2% +/-1.3 6.8% +/-1.3
Nursery school, preschool 1,144 +/-206 55.9% +/-9.7 44.1% +/-9.7
Kindergarten to 12th grade 19,382 +/-359 96.0% +/-1.3 4.0% +/-1.3
Kindergarten 1,609 +/-313 95.3% +/-3.1 4.7% +/-3.1
Elementary: grade 1 to grade 4 6,076 +/-414 95.3% +/-2.4 4.7% +/-2.4
Elementary: grade 5 to grade 8 5,682 +/-411 96.0% +/-1.6 4.0% +/-1.6
High school: grade 9 to grade 12 6,015 +/-264 96.9% +/-1.7 3.1% +/-1.7
College, undergraduate 2,908 +/-355 91.4% +/-4.3 8.6% +/-4.3
Graduate, professional school 456 +/-155 76.8% +/-13.5 23.2% +/-13.5
Source: U.S. Census Bureau, 2009-2013 5-Year American Community Survey
6.2.1 Education Enrollment K-12
In Grant County the largest number of students are (31.3%) students enrolled in grades 1 through
4, where 96.3% are in public school and 4.7% are enrolled in private school. The second largest
number of students (31.0%) are enrolled in high school, grades 9 through 12, where 96.9% are
enrolled in public school and 8.6% are enrolled privately. The third largest number of students
(29.3%) are in grades 5 through 8, where 96% are enrolled in public school and 4% are enrolled
privately. The smallest number of Grant County’s student population (8.3%) are enrolled as
Kindergarteners, where 95.3% are in public school and 4.7% are in private school.

A Demographic Social and Economic Profile, Grant County, Washington
38
6.2.2 Higher Education Enrollment
In Grant County there is a relatively small number of students enrolled in college. There are
2,908 (12.2%) undergraduate students enrolled in college, where 91.4% go to a public college or
university while 8.6% attend a private institution. Of the 456 (1.9%) graduate and professional
students enrolled in Grant County, 76.8% attended a public institution and 23.2% are enrolled
privately.
Figure 21 Grant County Percentage Student Enrollment
Source: U.S. Census Bureau, 2009-2013 5-Year American Community Survey
4.8%
6.7%
25.4%
23.8%25.2%
12.2%
1.9%
Enrolled Student Population
Nursery school, preschool
Kindergarten
Elementary: grade 1 tograde 4
Elementary: grade 5 tograde 8
High school: grade 9 tograde 12
College, undergraduate
Graduate, professionalschool

A Demographic Social and Economic Profile, Grant County, Washington
39
7.0 EMPLOYMENT, INCOME AND OCCUPATION BY INDUSTRY
The focus of this section is to review the Workforce and Income data for Grant County,
Washington. There were several different data sets representing work classifications available
from the U.S. Census Bureau. All of the 2009 to 2013 ACS data are estimates with a margin of
error listed in this report.
7.1 Employment for Grant County
In Grant County, Washington the majority of residents 16 years and older (72.8%) were
considered to be in the eligible work force (See Table 18, Figure 20). Of the eligible workers
there where 36,639 individuals (55.8%) that were employed and 5,221 individuals (8.0%) that
were unemployed but were able to work. A large number of individuals (36.1%) were considered
eligible working age but were not in the labor force.
Table 18 Grant County Employment Status
EMPLOYMENT STATUS ESTIMATE MARGIN
OF ERROR PERCENT
MARGIN OF ERROR %
Population 16 Years and Over 65,647 +/-244 100% (X)
In Labor Force 41,928 +/-849 63.9% +/-1.3
Civilian Labor Force 41,860 +/-847 63.8% +/-1.3
Employed 36,639 +/-963 55.8% +/-1.5
Unemployed 5,221 +/-586 8.0% +/-0.9
Armed Forces 68 +/-66 0.1% +/-0.1
Not in Labor Force 23,719 +/-900 36.1% +/-1.3
Source: U.S. Census Bureau, 2009-2013 5-Year American Community Survey, DP03.

A Demographic Social and Economic Profile, Grant County, Washington
40
Figure 22 Grant County Employment Status Percentage
Source: U.S. Census Bureau, 2009-2013 5-Year American Community Survey, DP03.
7.2 Household Income for Grant County
There were 30,012 households reported in the 2013 ACS data for Grant County. 2,246 of these
households made less than $10,000 annually (See Table 19, Figure 21). 1,431 households had an
annual income between $10,000 and 14,999. 4,263 households had an annual income between
$15,000 and $24,999. 3,870 households had a recorded annual income between $25,000 and
$34,999. 4,277 households had an annual income between $35,000 and $49,999. 6,397
households had a recorded annual income between $50,000 and $74,999. 3,409 households had
an annual income between $75,000 and $99,999. 2,884 households had an annual income
55.8%
8.0%
0.1%
36.1%
Employment Status
Employed
Unemployed
Armed Forces
Not in labor force

A Demographic Social and Economic Profile, Grant County, Washington
41
between $100,000 and $149,999. 713 households had a recorded annual income between
$150,000 and $199,999. 522 households had an annual income of $200,000 or more. The median
household income for Grant County was estimated to be $45,949. The average income per
household in the county was estimated to be $56,655.
Table 19 Grant County Household Income
INCOME AND BENEFITS (In 2013 Inflation Adjusted Dollars)
ESTIMATE MARGIN
OF ERROR
PERCENT MARGIN OF ERROR %
Total households 30,012 +/-401 100% (X)
Less than $10,000 2,246 +/-323 7.5% +/-1.1
$10,000 to $14,999 1,431 +/-272 4.8% +/-0.9
$15,000 to $24,999 4,263 +/-460 14.2% +/-1.5
$25,000 to $34,999 3,870 +/-456 12.9% +/-1.5
$35,000 to $49,999 4,277 +/-419 14.3% +/-1.4
$50,000 to $74,999 6,397 +/-546 21.3% +/-1.8
$75,000 to $99,999 3,409 +/-412 11.4% +/-1.3
$100,000 to $149,999 2,884 +/-378 9.6% +/-1.2
$150,000 to $199,999 713 +/-195 2.4% +/-0.6
$200,000 or more 522 +/-148 1.7% +/-0.5
Median household income (dollars) 45,949 +/-2,520 (X) (X)
Mean household income (dollars) 56,655 +/-1,869 (X) (X)
Source: U.S. Census Bureau, 2009-2013 5-Year American Community Survey, DP03.

A Demographic Social and Economic Profile, Grant County, Washington
42
7.3 Median Income for Individual Workers
The estimated median earnings for all workers in Grant County was $45,949, while the average
household income was estimated at the higher amount of $56,655 (See Table 19, Figure 21).
Annual income for male workers was higher than that of their female counterparts, where
$41,100 was the estimated median of male and $30,096 was the estimated median of female full
time workers. In Grant County women make $11,000 less annually than men (Source: U.S.
Census Bureau, 2009-2013 5-Year American Community Survey, DP03).
Figure 23 Grant County Estimated Income and Benefits for 2013
Source: U.S. Census Bureau, 2009-2013 5-Year American Community Survey, DP03.
2,246
1,431
4,263
3,870
4,277
6,397
3,409
2,884
713 522
Less than$10,000
$10,000to
$14,999
$15,000to
$24,999
$25,000to
$34,999
$35,000to
$49,999
$50,000to
$74,999
$75,000to
$99,999
$100,000to
$149,999
$150,000to
$199,999
$200,000or more
Nu
mb
er
of
Ind
iviu
als
Annual Income
Estimated Income and Benefits 2013
A Demographic Social and Economic Profile, Grant County, Washington
43
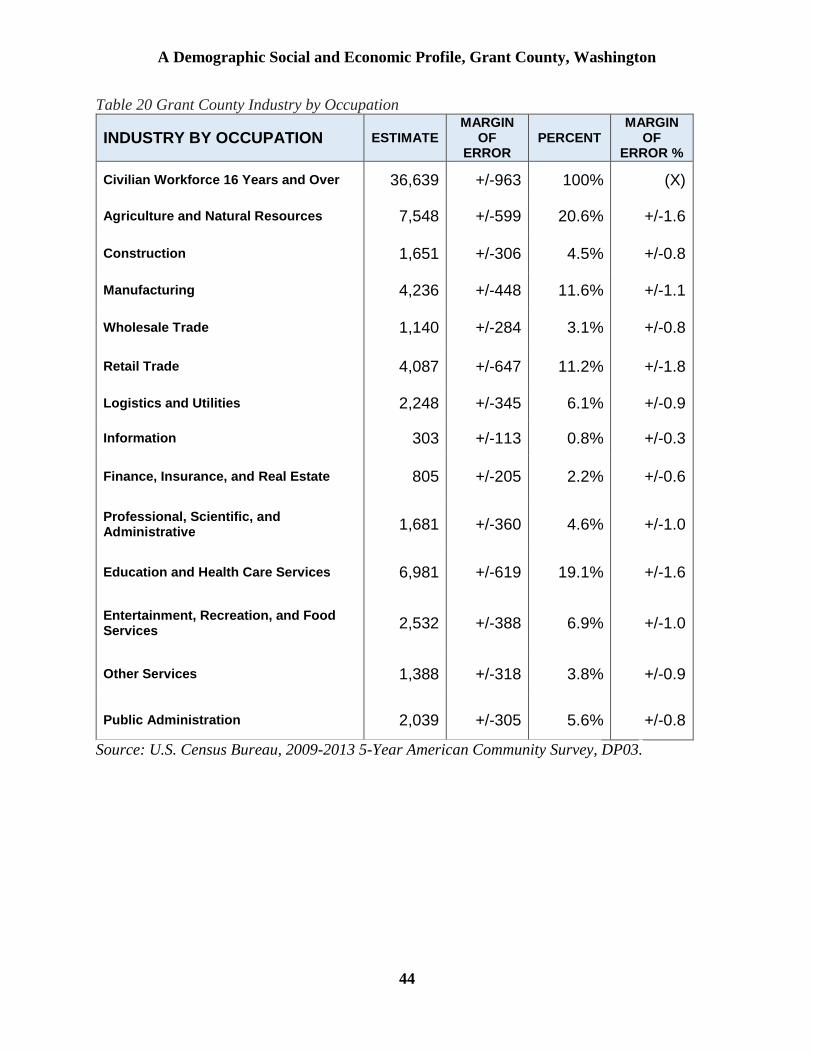
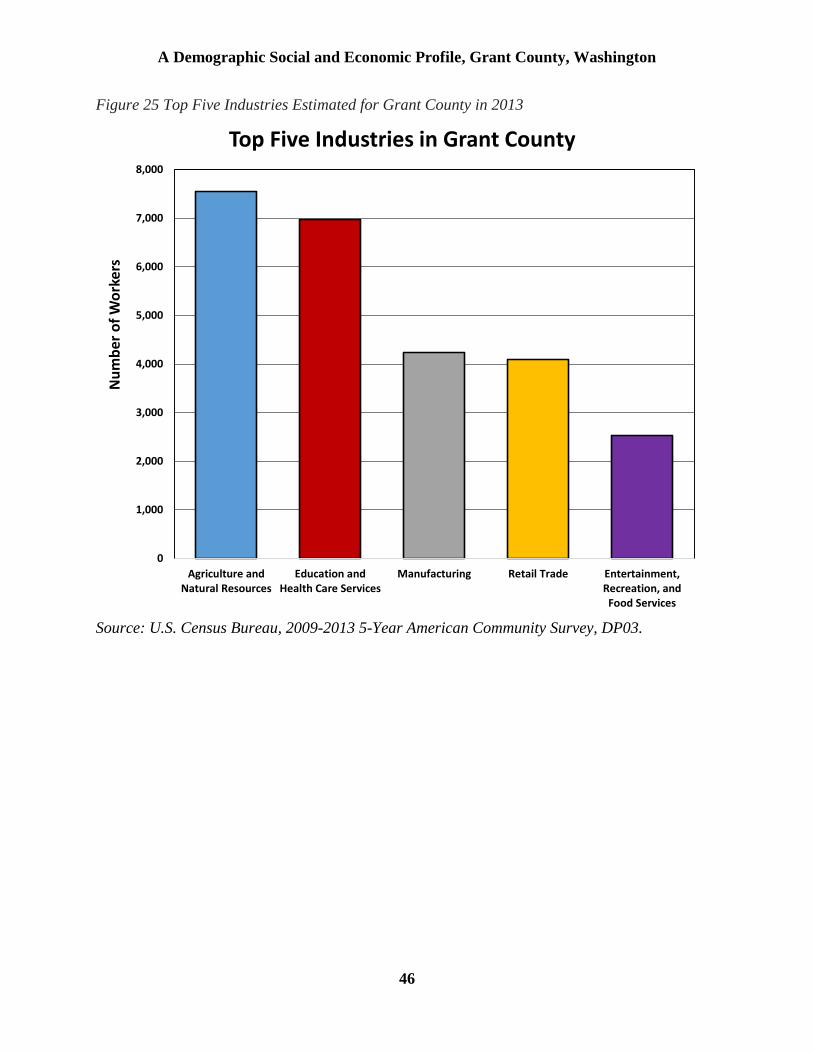
7.4 Industry by Occupation
Grant County is largely production, education, and health based (See Table 20, Figures 22 and
23). The largest industry (20.6%) was in Agriculture and Natural Resources: farming, forestry,
hunting, and mining. The second largest industry in the region (19.1%) pertained to Health and
Education Services. The third largest industry (11.6%) was in manufacturing. The next largest
industry (11.2%) was in Retail Trade. Entertainment, Recreation, and Food Services was the fifth
largest (6.9%) occupational industry (Table 20, Figure 23). Logistics (6.1%) (Shipping and
Receiving), Public Administration (5.6%), Professional Administration and Science (4.6%), and
Construction (4.5%) all are moderate sized industries by occupation for Grant County. The
smallest industries by occupation were Other Services (3.8%), Wholesale Trade (3.1%), Finance
and Real Estate (2.2%), and Information (0.8%).
A Demographic Social and Economic Profile, Grant County, Washington
44
Table 20 Grant County Industry by Occupation
INDUSTRY BY OCCUPATION ESTIMATE MARGIN
OF ERROR
PERCENT MARGIN
OF ERROR %
Civilian Workforce 16 Years and Over 36,639 +/-963 100% (X)
Agriculture and Natural Resources 7,548 +/-599 20.6% +/-1.6
Construction 1,651 +/-306 4.5% +/-0.8
Manufacturing 4,236 +/-448 11.6% +/-1.1
Wholesale Trade 1,140 +/-284 3.1% +/-0.8
Retail Trade 4,087 +/-647 11.2% +/-1.8
Logistics and Utilities 2,248 +/-345 6.1% +/-0.9
Information 303 +/-113 0.8% +/-0.3
Finance, Insurance, and Real Estate 805 +/-205 2.2% +/-0.6
Professional, Scientific, and Administrative
1,681 +/-360 4.6% +/-1.0
Education and Health Care Services 6,981 +/-619 19.1% +/-1.6
Entertainment, Recreation, and Food Services
2,532 +/-388 6.9% +/-1.0
Other Services 1,388 +/-318 3.8% +/-0.9
Public Administration 2,039 +/-305 5.6% +/-0.8
Source: U.S. Census Bureau, 2009-2013 5-Year American Community Survey, DP03.

A Demographic Social and Economic Profile, Grant County, Washington
45
Figure 24 Grant County Estimated Industry by Occupation for 2013
Source: U.S. Census Bureau, 2009-2013 5-Year American Community Survey, DP03.
20.6%
4.5%
11.6%
3.1%
11.2%6.1%
0.8%
2.2%
4.6%
19.1%
6.9%
3.8%5.6%
INDUSTRY BY OCCUPATION
Agriculture and Natural Resources Construction
Manufacturing Wholesale Trade
Retail Trade Logistics and Utilities
Information Finance, Insurance, and Real Estate
Professional, Scientific, and Administrative Education and Health Care Services
Entertainment, Recreation, and Food Services Other services
Public administration
A Demographic Social and Economic Profile, Grant County, Washington
46
Figure 25 Top Five Industries Estimated for Grant County in 2013
Source: U.S. Census Bureau, 2009-2013 5-Year American Community Survey, DP03.
0
1,000
2,000
3,000
4,000
5,000
6,000
7,000
8,000
Agriculture andNatural Resources
Education andHealth Care Services
Manufacturing Retail Trade Entertainment,Recreation, andFood Services
Nu
mb
er o
f W
ork
ers
Top Five Industries in Grant County
A Demographic Social and Economic Profile, Grant County, Washington
47
8.0 GRANT COUNTY CENSUS OF TRANSPORT
The focus of this section is to review the Census of Transport for Grant County, Washington,
using data from the 2009-2013 5-Year American Community Survey (ACS) and data from the
2010 U.S. Census. All of the ACS data are estimates based off of estimated change from 2009 to
2013, creating a margin of error.
8.1 Number of Vehicles per Household
In Grant County the majority of households had access to at least one vehicle (See Table 21,
Figure 24). The greatest number of households (36.2%) have 2 vehicles available for
transportation. The second largest number of households (31.0%) have 3 or more vehicles
available for transportation. The third largest number of households has 1 vehicle (26.8%)
available for transportation. The smallest number of households (6.0%) are estimated to have no
working vehicles.
Table 21 Grant County Number of Vehicles per Household
VEHICLES PER HOUSEHOLD Estimate Margin of
Error Percent
Margin of Error %
Occupied housing units 30,012 +/-401 100% (X)
No vehicles available 1,790 +/-285 6.0% +/-0.9
1 vehicle available 8,053 +/-512 26.8% +/-1.7
2 vehicles available 10,874 +/-626 36.2% +/-2.1
3 or more vehicles 9,295 +/-568 31.0% +/-1.8
Source: U.S. Census Bureau, 2009-2013 5-Year American Community Survey DP04.

A Demographic Social and Economic Profile, Grant County, Washington
48
Figure 26 Grant County Number of Vehicles per Residence
Source: Table 21 Grant County Number of Vehicles per Household
8.2 Mode of Transportation for Commuting
The main mode of commuter transportation in Grant County is driving a personal vehicle to and
from work with an estimated 26,922 people (74.5%) commuted by car, truck, or van (See Table
22, Figure 25). There are a few carpoolers (11.8%) but the majority of drivers, drive solo. The
third largest number of residents (6.4%) do not commute to work, but work from home. The next
largest commuter population (3.5%) commutes by walking to and from work. The second
smallest commuter group (2.7%) commutes between home and work by taxi, bicycle, or
motorcycle. The smallest population in the county (1.1%) commutes to and from work by public
transportation.
6.0%
26.8%
36.2%
31.0%
Number of Vehiclesper Residence
No vehicles available
1 vehicle available
2 vehicles available
3 or more vehicles available

A Demographic Social and Economic Profile, Grant County, Washington
49
Table 22 Mode of Transportation of Commuters in Grant County
MODE OF TRANSPORTATION ESTIMATE MARGIN OF
ERROR
Total 36,135 +/-975
Car, truck, or van - drove alone 26,922 +/-959
Car, truck, or van - carpooled 4,267 +/-554
Public transportation (excluding taxicab) 385 +/-129
Walked 1,274 +/-367
Taxicab, motorcycle, bicycle, or other means 985 +/-270
Worked at home 2,302 +/-395
Source: U.S. Census Bureau, 2009-2013 5-Year American Community Survey B08101.
Figure 27 Grant County Mode of Commuter Transportation
Source: U.S. Census Bureau, 2009-2013 5-Year American Community Survey B08101.
74.5%
11.8%
1.1%
3.5%
2.7%
6.4%
Mode of CommuterTransportation
Personal Vehicle - drovealone
Personal Vehicle - carpooled
Public transportation
Walked
Taxicab, motorcycle, bicycle,or other means
Worked at home

A Demographic Social and Economic Profile, Grant County, Washington
50
References:
Source: U.S. Census Bureau, 2009-2013 5-Year American Community Survey. DP04
http://factfinder.census.gov/faces/tableservices/jsf/pages/productview.xhtml?src=CF.
web. February, 2015.
Source: U.S. Census Bureau, 2009-2013 5-Year American Community Survey. B08101.
http://factfinder.census.gov/faces/tableservices/jsf/pages/productview.xhtml?pid=ACS_1
3_5YR_B08101&prodType=table. web. February, 2015.
Source: U.S. Census Bureau, 2009-2013 5-Year American Community Survey. QT-P11.
http://factfinder.census.gov/faces/tableservices/jsf/pages/productview.xhtml?src=CF.
web. February, 2015.
Source: U.S. Census Bureau, 2009-2013 5-Year American Community Survey. DP03.
http://factfinder.census.gov/faces/tableservices/jsf/pages/productview.xhtml?src=bkmk
web. February, 2015.
Source: U.S. Census Bureau, 2009-2013 5-Year American Community Survey.
http://factfinder.census.gov/faces/tableservices/jsf/pages/productview.xhtml?src=CF.
web. February, 2015.
Source: U.S. Census Bureau | American FactFinder.
http://factfinder.census.gov/faces/tableservices/jsf/pages/productview.xhtml?src=CF.
web. February, 2015.
Source: U.S. Census Bureau | ACS.
https://www.census.gov/acs/www/Downloads/QbyQfact/value.pdf
web. February, 2015.
Source: Wikipedia. January 2010.
http://en.wikipedia.org/wiki/Housing_tenure
web. February, 2015.
Source: Wikipedia. February 12, 2006.
http://commons.wikimedia.org/wiki/File:Map_of_Washington_highlighting_Grant_Count
y.svg#mediaviewer/File:Map_of_Washington_highlighting_Grant_County.svg. Retrieved
02 16, 2015


![County: San Juan County Grant No: SEANWS-2017-SJCoPW … · PROGRESS REPORT: [ ] FINAL REPORT [ X ] PERIOD COVERED: July 1, 2018 – September 30, 2018 DATE SUBMITTED: October 8,](https://img.dokumen.tips/doc/110x75/5f89131f6c8b8471a4607521/county-san-juan-county-grant-no-seanws-2017-sjcopw-progress-report-final.jpg)