Embed Size (px)
Citation preview

2004 OUTDOOR RECREATIONPARTICIPATION SURVEY
OF MINNESOTANS
REPORT ON FINDINGS
2004 Minnesota Outdoor Recreation Participation Survey2
2004 OUTDOOR RECREATION PARTICIPATIONSURVEY OF MINNESOTANS
REPORT ON FINDINGS
The 2004 Outdoor Recreation Participation Survey of Minnesotans was fundedby the Legislative Commission on Minnesota Resources with an allocation of
Land and Water Conservation Funds
Report prepared by:
Tim KellyOffice of Management and Budget ServicesMinnesota Department of Natural Resources
January 2005
An electronic copy of this report can be found on the MN DNR’s website: www.dnr.state.mn.us;

3Minnesota Department of Natural Resources
CONTENTS
Topic
Summary . . . . . . . . . . . . . . . . . . . . . . . . . . . . . . . . . . . . . . . . . . . . . . . . . . .
Introduction . . . . . . . . . . . . . . . . . . . . . . . . . . . . . . . . . . . . . . . . . . . . . . . . .
Methodology . . . . . . . . . . . . . . . . . . . . . . . . . . . . . . . . . . . . . . . . . . . . . . . .
Survey resultsImportance of outdoor recreation in people’s lives . . . . . . . . . . . . . . . . . .Reasons people recreate outdoors . . . . . . . . . . . . . . . . . . . . . . . . . . . . . . .Barriers to recreation participation . . . . . . . . . . . . . . . . . . . . . . . . . . . . . . .Recreation participation and use by activity . . . . . . . . . . . . . . . . . . . . . . .
Demographic patterns of recreation use . . . . . . . . . . . . . . . . . . . . . . . . . .Population density of residence (urban to rural continuum) . . . . . . . . .Region in Minnesota . . . . . . . . . . . . . . . . . . . . . . . . . . . . . . . . . . . . . .Age Class . . . . . . . . . . . . . . . . . . . . . . . . . . . . . . . . . . . . . . . . . . . . . .Gender . . . . . . . . . . . . . . . . . . . . . . . . . . . . . . . . . . . . . . . . . . . . . . . .Race/ethnicity . . . . . . . . . . . . . . . . . . . . . . . . . . . . . . . . . . . . . . . . . . .
Educational attainment . . . . . . . . . . . . . . . . . . . . . . . . . . . . . . . . . . . . .Household income . . . . . . . . . . . . . . . . . . . . . . . . . . . . . . . . . . . . . . .Household size . . . . . . . . . . . . . . . . . . . . . . . . . . . . . . . . . . . . . . . . . .Summary of recreation use trends from demographic characteristics
and trends . . . . . . . . . . . . . . . . . . . . . . . . . . . . . . . . . . . . . . . . .Demographic clusters of activities . . . . . . . . . . . . . . . . . . . . . . . . . . . .
Geographic patterns of recreation useDistance from home and within Minnesota . . . . . . . . . . . . . . . . . . . . . .Regional origin-destination recreation use patterns . . . . . . . . . . . . . . . .
Participation changes over last five years . . . . . . . . . . . . . . . . . . . . . . . . . .
References . . . . . . . . . . . . . . . . . . . . . . . . . . . . . . . . . . . . . . . . . . . . . . . . . . .
Appendix A: Regional Tables (6 pages) . . . . . . . . . . . . . . . . . . . . . . . . . . . .Appendix B: Individual Activity Tables (50 pages) . . . . . . . . . . . . . . . . . . . .
Page
4
11
13
16172126
303134343941
414646
5253
586265
71
7278

2004 Minnesota Outdoor Recreation Participation Survey4
SUMMARY
INTRODUCTION
The most recent State Comprehensive Outdoor Recreation Plan identified the need to betterunderstand the changing nature of outdoor recreation in Minnesota. To meet this need, threeefforts are underway, and one is planned for future funding. The first effort—which is the topic ofthis document—is the collection of primary information on the outdoor recreation patterns of adultMinnesotans. The second effort is an analysis of existing information sources to delineate recenttrends in recreation participation (e.g., trends in fishing licenses, watercraft registrations, and parkattendance). The third effort is to determine—from providers—the recreation facility needs ofcities, counties and school districts in the state. The fourth effort—which is planned for futurefunding—is to determine the recreation facility and program needs of the general Minnesotapopulation directly from that population.
To collect data from adult Minnesotans on their outdoor recreation participation, a mail survey wasconducted in March 2004, near the close of the winter recreation season. The mail-survey sampleof 4400 Minnesotans was allocated to five regions,with 1200 allocated to the Twin Cities metropolitanarea and 800 to each of the four non-metropolitanregions. This regional stratification is intended toproduce region-specific results. The mail surveyachieved nearly a 60 percent overall return rate afterthree mailings. Because the response rate was nothigher (not above 70 percent), a non-respondenttelephone survey was conducted to evaluatenonresponse bias.
The results of the nonresponse bias survey, along withstatistics on demographic characteristics important tooutdoor recreation participation, were used to adjust—through sample weighting—the mail survey responses.Sample weighting creates a better representation of theoutdoor recreation patterns of adult Minnesotans. Thedemographic characteristics used for sample weightingare age, gender, and region of the state.
SURVEY RESULTS
Importance of outdoor recreation in people’s lives
Outdoor recreation is an important component of the lives of most Minnesotans. Nearly 60 percent(57%) indicate that outdoor recreation is “very important” to their life, while another 25 percent
NorthwestNortheast
South
Central
Metro (7 county)
Survey Regions

5Minnesota Department of Natural Resources
indicate it is “moderately important”. The remainder—comprising nearly one in five Minnesotaadults (18%)—believe outdoor recreation is of little importance.
Reasons people recreate outdoors
Outdoor recreators have numerous reasons (or motivations) for going outdoors. Foremost amongthem is, simply, to enjoy nature. Next in the ranking is exercise and feeling healthier, whichreflects a traditional association between recreation and a healthy lifestyle. Outdoor recreation isfrequently a means to build bonds with family and friends, and the social affiliation aspects ofrecreation are ranked highly. Recreation is also commonly used as a means to escape thepressures of modern life, to experience some silence and quiet. Other reasons (such as learningand exploring) are important to sizable groups of Minnesotans. The lowest ranked reason was tomeet new people.
Barriers to recreation participation
Just as people have reasons for recreating outdoor, they have reasons for not recreating outdoors.These latter reasons are known as barriers. For Minnesota adults, the leading barrier is time.People simply do not have enough time to participate more This is closely followed by outdoorpests, a common concern in “Minnesota—land of 10,000 lakes”, otherwise known as the land ofpoor drainage, which is prime habitat for outdoor pests. The next most frequently indicatedbarrier—much less prevalent than the leading two—is cost and effort. To participate in recreationcosts money and requires bearing at least the cost and effort of travel. This is followed by thebarrier of not having a companion to recreate with. As noted above, one of the leading reasonspeople recreate outdoors is to be with family and friends. Lack of a companion is a definitedeterrent to participation, and is one of the leading barriers for people in single-person households.The only other potential barrier indicated by at least one-quarter of adults is crowding in outdoorrecreation areas, which is indicated by 26 percent of adults. It is noteworthy that the “lack ofinterests in outdoor recreation” barrier was indicated by few Minnesota adults (12%).
Recreation participation and use by activity
The leading activity for Minnesota adults—in terms of the number that participate annually—iswalking/hiking outdoors for exercise or pleasure (54% of adults participate annually). This isfollowed by recreational boating, which can be presented in a variety of ways, depending onwhether fishing is included and whether motorized and non-motorized boating are combined.Swimming is next, and is lead by swimming in a lake or stream. Fishing is participated in annuallyby 30 percent of Minnesota adults and hunting by 16 percent, two figures that correspond wellwith current license sales.
Winter activities, as a rule, have lower participation rates than summer activities. Minnesotansmay have a hearty wintertime outdoor image of themselves, but they tend to stay indoors when thecold days and long nights set in.
2004 Minnesota Outdoor Recreation Participation Survey6
A second way to view the magnitude of an activity is the amount of time people spend in theactivity. In terms of hours of activity participation, walking/hiking is the leading activity amongMinnesota adults. This is followed by boating, nature observation, fishing, swimming and hunting,all water-based and wildlife-related activities that Minnesotans have a well-deserved reputation forbeing highly engaged in.
Demographic patterns of recreation use
Recreation participation and use—either by activity or in an overall sense—varies by age, gender,population density, and other population groupings. In this section, recreation patterns areexamined by the following standard demographic breakdowns: population density of residence(urban to rural continuum), region in Minnesota, age class, gender, race/ethnicity, educationalattainment, household income, and household size.
For each demographic breakdown, overall involvement in outdoor recreation is described first(“overall involvement” is total annual recreation hours per capita in the demographic breakdown).Next, the long-term trend in the demographic characteristic is presented, and the implications of thetrend for overall recreation involvement are discussed. Finally, each activity is classified accordingto its association with the demographic characteristic, and the implications of the long-term trendfor activities are discussed (refer to the main body of this report for detailed information on theseactivity associations).
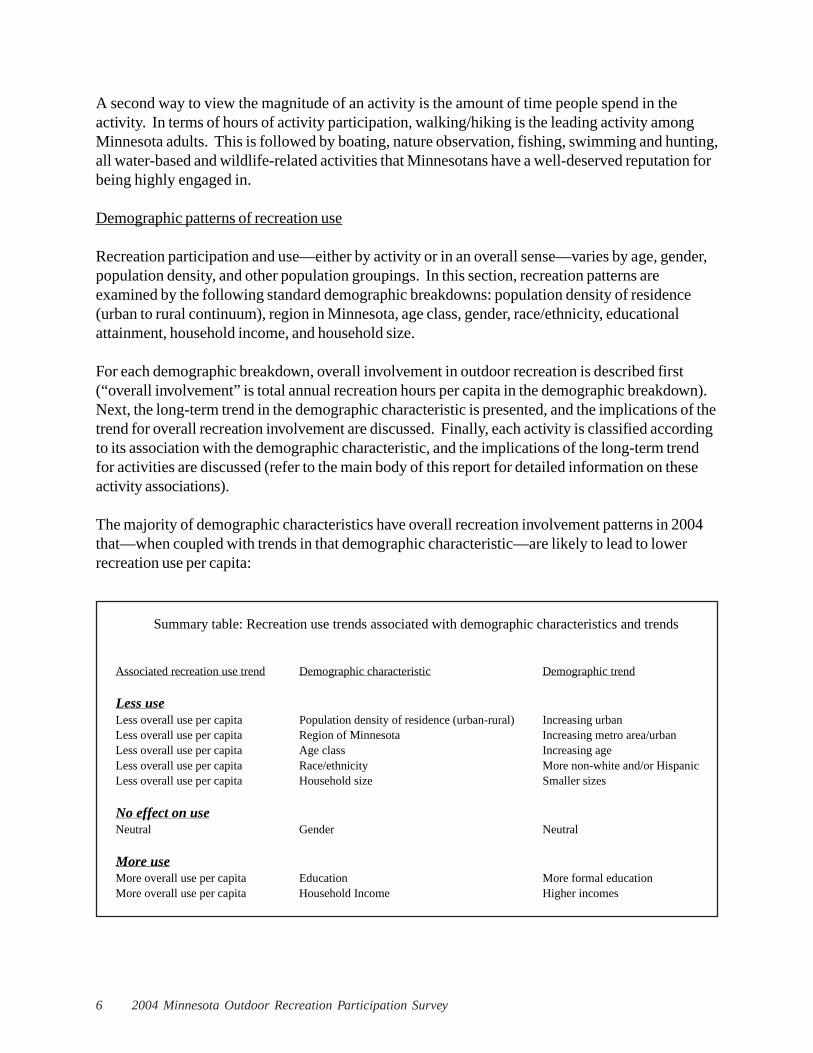
The majority of demographic characteristics have overall recreation involvement patterns in 2004that—when coupled with trends in that demographic characteristic—are likely to lead to lowerrecreation use per capita:
Associated recreation use trend Demographic characteristic Demographic trend
Less useLess overall use per capita Population density of residence (urban-rural) Increasing urbanLess overall use per capita Region of Minnesota Increasing metro area/urbanLess overall use per capita Age class Increasing ageLess overall use per capita Race/ethnicity More non-white and/or HispanicLess overall use per capita Household size Smaller sizes
No effect on useNeutral Gender Neutral
More useMore overall use per capita Education More formal educationMore overall use per capita Household Income Higher incomes
Summary table: Recreation use trends associated with demographic characteristics and trends

7Minnesota Department of Natural Resources
● Population density of residence (urban to rural continuum): Minnesotans who live in more ruralsettings (lower population density) recreate more outdoors than their urban counterparts, who live ahigher densities. The trend in Minnesota (as elsewhere in the nation) is to an increasing urbanpopulation. Over the last 100 years, almost all new additions to the Minnesota population havebeen urban additions. A continuation of this trend—coupled with the pattern of recreation use bypopulation density—would push per-capita recreation use down in the state.
● Region in Minnesota: Most of the discussion of region is redundant with the precedingpopulation density discussion. Minnesotans who live in the high-density Metro area recreate lessoutdoors than those in lower-density rural regions. The regional population trend in Minnesotashows most of the increase over many decades occurring in the metro area, and more recentlyoccurring in the Central Region to the north and west of the Metro Region. Three regions (South,Northeast and Northwest) have shown little growth over the last 40 years. A continuation of thistrend—coupled with the pattern of recreation use by region—would push per-capita recreation usedown in the state.
● Age Class: Older adults (especially those aged 65+) recreate substantially less overall thanyounger adults. The age trend in the state is to an older population over the last 30 years. Acontinuation of this trend—coupled with the pattern of recreation use by age class—would pushper-capita recreation use down in the state.
In 2004, recreation hours per capita increased successively from age class 65+ to each younger ageclass, excepting the youngest adult class (age 20 to 34), which was lower than the next highestclass (age 35 to 44). In contrast, in the past (mid 1980s), the per-capita hour increase continuedinto the youngest class. Whether this pattern change is real cannot be firmly established fromavailable information, but there are pieces of information that lend credence to the idea that youngadults are not as involved in recreation as they used to be. For wildlife-associated recreation(fishing, hunting and wildlife watching) national surveys from 1991 to 2001 have shown that theparticipation decreases of youngest adults were quite rapid compared with older adults. Theparticipation decreases from 1991 to 2001 were steep enough to shift the participation peak out ofthe youngest age classes to high age classes, producing a similar age-class pattern change as mayhave occurred in Minnesota for overall outdoor recreation involvement. If nothing else, theseparallel changes fuel speculation, and raise seminal questions about the changing nature ofrecreation involvement by age class in the state.
● Gender: Men recreate more overall than women. Since the population trend is not toward agreater portion of one gender compared with the other, the trend produces no change in per-capitarecreation use.
● Race/ethnicity: White, non-Hispanic Minnesotans recreate more overall than non-white and/orHispanic Minnesotans. The grouping of “non-white and/or Hispanic” cannot be broken down anyfurther in this study due to sample size limitations. Outdoor recreation—as a general rule—is a“middle America” pursuit and any demographic grouping near the margins of “middle America”will exhibit less overall involvement in recreation. This tends to be true for race, ethnicity,education, and income.

2004 Minnesota Outdoor Recreation Participation Survey8
The trend in Minnesota (as elsewhere in the nation) is to greater racial and ethnic diversity in thepopulation. A continuation of this trend—coupled with the pattern of recreation use by race/ethnicity—would push per-capita recreation use down in the state.
● Educational attainment: Lower education attainment is associated with less overall involvementin outdoor recreation. The trend in Minnesota (as elsewhere in the nation) is to higher educationalattainment in the population. A continuation of this trend—coupled with the pattern of recreationuse by educational attainment—would push per-capita recreation use up in the state.
● Household income: Lower household income is associated with less overall involvement inoutdoor recreation. The trend in Minnesota is to higher household incomes. A continuation ofthis trend—coupled with the pattern of recreation use by income class—would push per-capitarecreation use up in the state.
● Household size: Minnesotans in small households—especially one-person households—recreateless overall. Recreation is a social activity, and not having a companion to recreate with is a majorbarrier for people living alone. The trend in Minnesota is to more single-person households, andsmaller households in general. A continuation of this trend—coupled with the pattern ofrecreation use by household size—would push per-capita recreation use down in the state.
Demographic clusters of activities
Certain activities share similar demographic profiles. To examine which activities have similardemographic profiles, all 32 activities were entered into hierarchical cluster analysis. Four activityclusters resulted: (1) hunting and motorized trail activities, (2) passive recreation and learning-related activities, (3) active recreation activities, and (4) boating/fishing/camping/golfing activities,for lack of a better descriptor .
The “hunting and motorized trail activities” cluster contains 10 percent of all recreation byMinnesota adults, and has the following distinctive demographics: more rural, more male, lessformal education, more middle income, and larger households. To illustrate some of thesedistinctive demographics, rural men invest 21 percent of their total recreation time on activities inthis cluster, while urban women invest 1 percent. The activities in this cluster are big-game andsmall-game hunting, snowmobiling, and ATV driving.
The “passive recreation and learning-related activities” cluster contains 40 percent of all recreationby Minnesota adults, and has the following distinctive demographics: older, more female, andsmaller households. To illustrate some of these distinctive demographics, older women (aged 65+)invest 77 percent of their total recreation time on activities in this cluster, while younger men (aged20 to 35) invest 23 percent. The activities in this cluster include walking/hiking, natureobservation, and visiting nature centers, historic/archaeological sites and outdoor zoos.
The “active recreation activities” cluster contains 26 percent of all recreation by Minnesota adults,and has the following distinctive demographics: younger, more urban, and more formal education.To illustrate some of these distinctive demographics, younger urban dwellers (aged 20 to 45 in

9Minnesota Department of Natural Resources
highest population density class) invest 40 percent of their total recreation time on activities in thiscluster, while older rural dwellers (aged 55+ in lowest population density class) invest 11 percent.The activities in this cluster include swimming, biking, running/jogging, outdoor field/court sports,tent camping, inline skating, non-motorized boating, and downhill skiing/snowboarding.
The “boating/fishing/camping/golfing activities” cluster contains 24 percent of all recreation byMinnesota adults, and has the following distinctive demographics: less urban and more male. Toillustrate some of these distinctive demographics, rural men (lowest population density class) invest30 percent of their total recreation time on activities in this cluster, while urban women (highestpopulation density class) invest 11 percent. The activities in this cluster are motor boating, fishing,camper-vehicle camping, and golfing.
Geographic patterns of recreation use
Most of Minnesotan’s outdoor recreation occurs near home and within the state. Just under 70percent (67%) of all recreation use (hours) is within a half-hour drive of home, and nearly 90percent (89%) occurs in Minnesota. The relatively local (near-home) nature of outdoor recreationmeans that local Minnesota providers bear a large responsibility for providing facilities and servicesfor the Minnesota population.
Certain activities are more locally-based than others. Activities such as ice skating, running/jogging and inline skating have over 90 percent of their recreation time within a half-hour of home.At the other extreme, are the activities for which Minnesotans (and other Midwest residents) travelaway from home. These activities form the backbone of Minnesota’s outdoor recreation tourismindustry, much of which is water-based (e.g., boating, fishing, swimming) or otherwise water-related (e.g., camping).
It is important to note that certain activities are large in both the near-home and away-from-homemarkets. Water-based activities (fishing, boating, swimming) are prime examples, as is walking/hiking, nature observation/photography and hunting. Providing opportunities for such activitiestends to be the responsibility of many levels of government and the private sector.
The predominately near-home nature of recreation use is evident in origin-destination relationships.Most of the recreation use that originates in a region occurs in the same region. For the twonorthern regions, over 80 percent occurs within the region where it originates. The Southern andCentral region have between 70 and 80 percent of use occurring within the origin region, while theMetro Region is the lowest at 65 percent. The Metro, Southern and Central Region have inter-regional flows directed primarily to the two northern regions and out of state. The two northernregions have inter-regional flows directed primarily between themselves and out of state.
Because of these origin-destination patterns, the two northern regions import a large portion of theirMinnesota-originated recreation use. The flow of recreation use between Minnesota regions isaccompanied by the flow of recreation-related spending, which creates economic impacts (e.g.,income, jobs) in the regions where the recreation takes place. In Minnesota, there is a generalsouth-to-north flow of recreation use and spending, driven primarily by the flow from the Metro
2004 Minnesota Outdoor Recreation Participation Survey10
Region to the two northern regions. Additionally, Minnesota regions receive recreation use andassociated spending from non-Minnesotans. The large majority of non-resident use and spendingoccurs in the two northern regions, which provide attractive lake-forest recreation settings for non-residents and Minnesotans alike.
Participation changes over last five years
To gauge outdoor recreation participation changes, the survey asked Minnesota adults twoquestions. One question concerned changes in overall recreation involvement, and the otherconcerned new activities taken up. Both questions were asked over the last five years, the timeinterval between planned survey repetitions. A “new activity” is any activity the respondentreported as “new”, and could be a very specific activity (e.g., wild turkey hunting) or a broadactivity (e.g., hunting). The description of the new activity was hand written by the respondent,and was classified as part of the survey analysis.
In terms of overall recreation involvement, the largest group of Minnesotans (46%) report that theirnumber of recreation days has stayed about the same over the last five years . More reportincreases than decreases in recreation days over the five-year period. It should be empathized thatthese participation changes are “reported” ( or “perceived”) changes, and may or may not haveactually occurred.
In terms of new activities, less than one-third of Minnesota adults (28%) reported taking up a newactivity in the last five years, meaning that the large majority did not take up anything new. MostMinnesotans, it appears, do not regularly adopt new outdoor activities.
A person’s likelihood of taking up a new activity and of reporting an increase in recreation over thelast five years are related to their overall involvement in recreation. In other words, those who arecurrently more involved in recreation are the most likely to have taken up new activities and tohave increased their involvement.
The most common type of new activity taken up around the state is recreational boating, whichaccounts for about 10 percent of all new activities reported. Boating is followed by biking,camping, off-road driving (mainly ATV), and fishing. It is important to note here that the “newactivity” reported could represent a new participant in that activity or an existing participant whotook up a different form of the activity (the survey results cannot separate a new participant from anexisting participant). For example, some of the new boating participants are totally new torecreational boating, while others were existing boaters who took up a different type of boating(e.g., an existing motorboater who takes up kayaking).

11Minnesota Department of Natural Resources
INTRODUCTION
The most recent State Comprehensive Outdoor Recreation Plan identified theneed to better understand the changing nature of outdoor recreation in Minnesota(Reference 1). To meet this need, three efforts are underway, and one is plannedfor future funding. The first effort—which is the topic of this document—is thecollection of primary information on the outdoor recreation patterns of adultMinnesotans. Data collection for this effort commenced in March 2004. Topermit trend analysis, such data collection will be repeated using a consistentmethodology every five years. Short-term recreation forecasts will be one productof the effort.
The second effort is an analysis of existing information sources to delineate recenttrends in recreation participation (e.g., trends in fishing licenses, watercraftregistrations, and park attendance). One report—on wildlife-related recreation(fishing, hunting, wildlife observation) and recreational boating—has beencompleted (Reference 2), and a few others are planned. This effort assemblesinformation that assists with short-term recreation forecasting.
The third effort is to determine—from providers—the recreation facility needs ofcities, counties and school districts in the state. Similar to the first effort, this effortwill establish a cost-effective methodology that can be replicated every 5 years, sotrends can be established, and short-term forecasts made.
The fourth effort is to determine the recreation facility and program needs of thegeneral Minnesota population directly from that population. This will be acompanion to the third effort. Work on this effort will commence once funding iscertain.
Funding for all of these efforts is from the Land and Water Conservation Fund, asallocated by the Legislative Commission on Minnesota Resources.
The scoping and planning of these four efforts was done by a work team, whichcontinues to meet on an ad hoc basis as the efforts progress:
Current members:Dorian Grilley, Parks & Trails Council of MinnesotaTim Kelly, MN DNREmmett Mullin, MN DNR
2004 Minnesota Outdoor Recreation Participation Survey12
Jon Nauman, Three Rivers Park DistrictWayne Sames, MN DNRRon Sushak, MN DNRJonathan Vlaming, Metropolitan Council
Past members:John Schneider, Metropolitan State UniversityColleen Tollefson, Office of Tourism
This report on the findings of the 2004 participation survey will focus primarilyon the current status of outdoor recreation. The information in the report willform one basis for a subsequent report in 2005 on short-term forecasts of outdoorrecreation in Minnesota.
After a brief discussion of methodology, the findings on the current status ofrecreation will be organized as follows:
Global topics:Importance of outdoor recreation in people’s livesReasons for recreating outdoorsBarriers to recreating outdoors
Particular topics:Participation in outdoor recreation by activityDemographic patterns of outdoor recreation involvement by:
Population density of residence (urban to rural continuum)Region in MinnesotaAge classGenderRace/ethnicityEducational attainmentHousehold incomeHousehold size
Clusters of activities that share similar demographic patternsGeographic patterns of recreation use (use and activity patterns relative to
distance from home and location in Minnesota)Participation changes over last five years (new activities taken up and
perceived trends in personal recreational involvement)

13Minnesota Department of Natural Resources
METHODOLOGY
A detailed methodological report is available for this survey (Reference 3). Abrief summary is provided below.
To collect data from adult Minnesotans on their outdoor recreation participation, amail survey was conducted beginning in March 2004, near the close of the winterrecreation season. The mail-survey sample of 4400 Minnesotans was allocated tofive regions, with 1200 allocated to theTwin Cities metropolitan area (seven-county region) and 800 to each of thefour non-metropolitan regions (Figure1). This regional stratification isintended to produce region-specificresults. Sampling within each regionwas proportional to the population ofregional zip codes. The regions are thefour DNR regions, with the CentralDNR region broken into the sevencounty Twin Cities metropolitan andthe balance of the Central Region. TheTwin Cities metropolitan area containshalf of the Minnesota population and iscovered by the regional governmentalagency (Metropolitan Council) that hasoutdoor recreation functions.
The mail survey achieved nearly a 60 percent overall return rate after threemailings. The return rate varied from a low of 52 percent in the Twin Cities metroarea to a high of 61 percent in the Northwest and Central regions of the state. Thereturn rates are near expectations for an effort such as this.
Because the response rate was not higher (not above 70 percent), a non-respondent telephone survey was conducted to evaluate nonresponse bias. Thetelephone survey was conducted by the Minnesota Center for Survey Research(MCSR) at the University of Minnesota during May and June of 2004. Thetelephone survey was stratified by the same regions as the mail survey. Overall,500 interviews were completed, with approximately 140 completions in the Twin
NorthwestNortheast
South
Central
Metro (7 county)
Survey Regions
Figure 1

2004 Minnesota Outdoor Recreation Participation Survey14
Cities metropolitan area (seven-county region) and 90 in each of the four non-metropolitan regions.
As expected, people who did not respond to the mail survey participated less inoutdoor recreation than those that did. This finding is used to reduce non-respondent bias in the final results.
As noted immediately above, the mail survey returns are biased towardsMinnesotans who participate more in outdoor recreation. In addition, the surveyreturns are not proportional to the demographics of the state. For example, theregions of the state were not sampled proportional to population (by design), andthe survey returns are more male than the Minnesota population (for otherreasons, and not by design). To reduce these forms of bias, the survey returns aredifferentially weighted by known demographic statistics and by involvement inoutdoor recreation as obtained from the mail and non-respondent telephonesurveys. This weighting ensures that the results are more representative of theoutdoor recreation patterns in the Minnesota population.
The demographic characteristics used for sample weighting are age and gender—two characteristics that have a large influence on overall recreation involvementand specific recreation activities—and region of the state (demographics are fromthe 2000 U.S. Census—Reference 4). Sample weighting occurs by five ageclasses (20 to 34 years old, 34 to 44, 45 to 54, 55 to 64, and 65 years and older),by gender (male and female), and by region (the five regions on Figure 1).
After sample weighting, the Minnesota population is relatively well described interms of standard demographic breakdowns, but there are shortcomings. Becausethe sample was “fit” through sample weighting to region, age, and gender, thesedemographic groupings are the same as the Minnesota population. For those thatwere not fit in such a fashion, the weighted sample represents residentialpopulation density (urban/rural) rather well; it is under-representative of non-whiteand/or Hispanic individuals; it is under-representative of lower incomeMinnesotans, but the median income is represented well; it is under-representativeof lower formal education groups, and is over-representative of higher educationgroups; and it is roughly representative of household size.
The population groupings that are under-represented tend to have lowerinvolvement in outdoor recreation than the other groupings. Thus, interest in the

15Minnesota Department of Natural Resources
topic of the survey is one probable reason for the under-representation.Additional probable reasons are literacy and language. The survey is a writtenpiece that is written in English and may not easy/possible to read for allMinnesotans.
Overall, the bulk of the Minnesota population is represented well in the survey,but there are definite problems that would likely require different (and probablymore costly) data-collection techniques that this technique to overcome. Sincemost of the under-represented population groupings have lower outdoorrecreation involvement, the survey will over-represent Minnesotan’s recreation.Rough estimates place the over-representation near 5 percent for total outdoorrecreation involvement (total annual recreation hours or days).
The recall period in the survey for activity participation and days was one year, alength that is known to produce a high bias to the number of participants and theirdays of participation (Reference 5). This recall effect is of major concern whenstand-alone quantities are produced from the annual-recall survey (e.g., number ofanglers, or number of fishing days). It is much less of a concern when surveyestimates are compared to each other (e.g., number of anglers compared tonumber of hunters), because the recall effect is relatively uniform and tends tocancel out. To deal with the high-bias in the annual recall, the participant andactivity day estimates were roughly corrected using a bulk-adjustment factor.Performing this adjustment, although admittedly crude, is judged superior topublishing unrealistically high estimates. The adjustment produces more accurateresults for known fishing and hunting and hunting quantities, and is generallybelieved to produce more credible results across all activities (see the detailedmethodological document—Reference 3—for more discussion of this topic).
2004 Minnesota Outdoor Recreation Participation Survey16
How important a part of your life is outdoor recreation?
Very important57%
Moderately important
25%
Slightly important
10%
Not important at all (or did not recreate last
year)8%
Comparison of importance of outdoor recreation in people's lives with amount of their recreation
0%
10%
20%
30%
40%
50%
60%
70%
80%
90%
100%
Less than oncea month (0 to
10 days)
Once a monthto once a week(11 to 50 days)
Once to twice aweek (51 to100 days)
More thantwice a week(101+ days)
Amount of annual recreation
Per
cent
of a
dults Very important
Moderately important
Slightly important
Not important at all (or didnot recreate last year)
Importance
SURVEY RESULTS
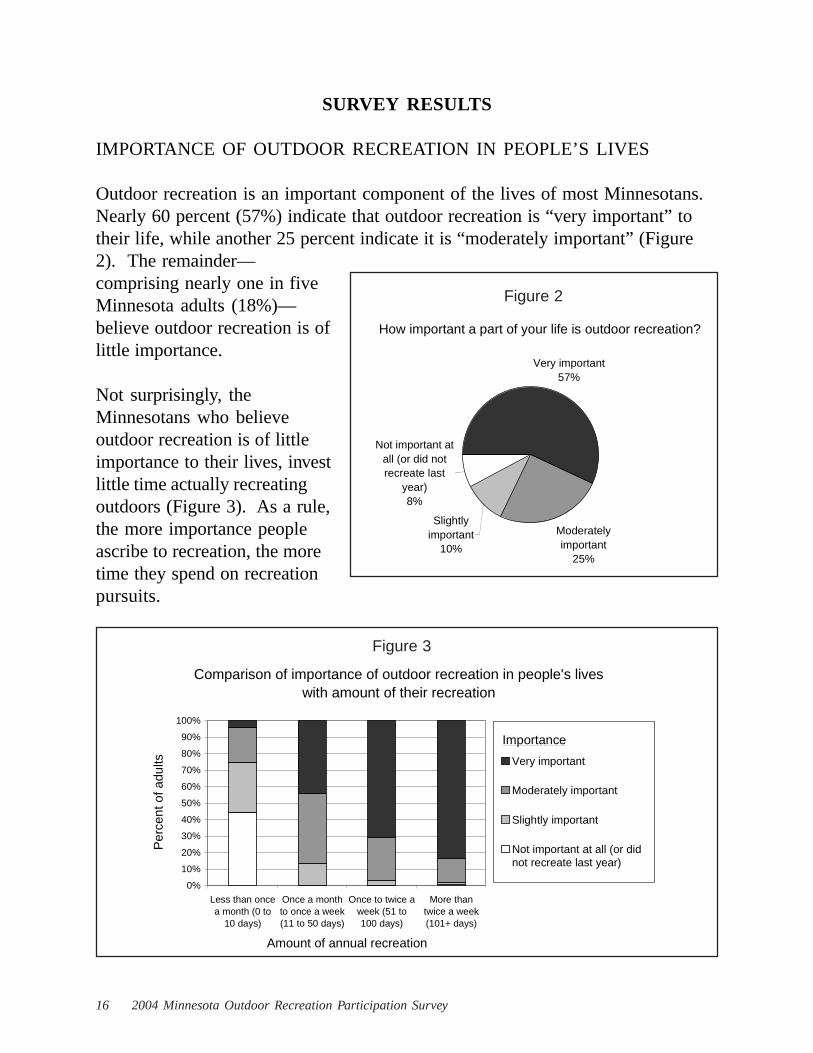
IMPORTANCE OF OUTDOOR RECREATION IN PEOPLE’S LIVES
Outdoor recreation is an important component of the lives of most Minnesotans.Nearly 60 percent (57%) indicate that outdoor recreation is “very important” totheir life, while another 25 percent indicate it is “moderately important” (Figure2). The remainder—comprising nearly one in fiveMinnesota adults (18%)—believe outdoor recreation is oflittle importance.
Not surprisingly, theMinnesotans who believeoutdoor recreation is of littleimportance to their lives, investlittle time actually recreatingoutdoors (Figure 3). As a rule,the more importance peopleascribe to recreation, the moretime they spend on recreationpursuits.
Figure 2
Figure 3
17Minnesota Department of Natural Resources
REASONS PEOPLE RECREATE OUTDOORS
Outdoor recreators have numerous reasons (or motivations) for going outdoors.Foremost among them is, simply, to enjoy nature (Table 1). Next in the rankingis exercise and feeling healthier, which reflects a traditional association betweenrecreation and a healthy lifestyle. Outdoor recreation is frequently a means tobuild bonds with family and friends, and the social affiliation aspects of recreationare ranked highly. Recreation is also commonly used as a means to escape thepressures of modern life, to experience some silence and quiet. Other reasons(such as learning and exploring) are evident in Table 1 and they are important tomany Minnesotans. The lowest ranked reason was to meet new people.
The ordering of reasons from most to least frequent is widely shared. Mostpopulation subgroups rank the reasons close to way the overall population rankedthe reasons, which is evident in the high correlations between the overallpopulation rankings the rankings within subgroups of the population (Table 2).Most of the subgroups have correlation coefficients above 0.9. Only three of thesubgroups have lower correlation coefficients and these are examined individuallybelow.
The first of these low-correlation subgroups is comprised of people who recreatevery little. The primary way they differ from the overall population is the farlower frequency they indicate for many of the reasons (Table 3). This is especiallytrue of such reasons as exercise and feeling healthier; catch/harvest game or fish;learn and explore; and experience adventure and risks.
The second group is people aged 65 and over. The primary ways they differfrom the overall population are in less frequent indication of certain reasons,especially: spend leisure time with family (family formation years may be in thepast); escaping personal, social and physical pressures (life may be less hectic);and experience adventure and risks (may be beyond the risk-taking/adventureyears).
The third low-correlation group is non-white and/or Hispanic people. They differfrom the overall population primarily in the less frequent indication of threereasons (enjoy smells and sounds of nature; get/keep physically fit; and catch/harvest game or fish) and the more frequent indication of one reason (feel moreself-confident). For all the other reasons, they are close to the overall population.

2004 Minnesota Outdoor Recreation Participation Survey18
Cat
egor
yR
easo
nPe
rcen
t of
adul
ts
indi
catin
g re
ason
Cat
egor
yR
easo
nP
erce
nt o
f ad
ults
in
dica
ting
reas
on
Enj
oy n
atur
eE
xper
ienc
e ad
vent
ure
and
risk
sE
njoy
nat
ural
sce
nery
71%
Exp
erie
nce
a se
nse
of a
dven
ture
36%
Enj
oy s
mel
ls a
nd s
ound
s of
nat
ure
63%
Tak
e so
me
risk
s18
%
Exe
rcis
e an
d fe
el h
ealt
hier
Ach
ieve
and
be
stim
ulat
edG
et/k
eep
phys
ical
ly f
it59
%Fe
el e
xhil
arat
ed30
%Fe
el h
ealth
ier
55%
Impr
ove/
reta
in m
y ou
tdoo
r sk
ills
26%
Feel
mor
e se
lf-c
onfi
dent
14%
Be
wit
h fa
mily
and
fri
ends
Spen
d le
isur
e ti
me
wit
h fa
mily
57%
Res
t ph
ysic
ally
Be
wit
h m
embe
rs o
f m
y gr
oup
23%
Res
t phy
sica
lly
26%
Esc
ape
pers
onal
, soc
ial a
nd p
hysi
cal p
ress
ures
Use
equ
ipm
ent
Res
t men
tally
57%
Get
a c
hanc
e to
use
or
test
my
equi
pmen
t26
%G
et a
way
fro
m li
fe’s
usu
al d
eman
ds54
%G
et a
way
fro
m c
row
ds45
%T
each
oth
ers
Exp
erie
nce
sile
nce
and
quie
t40
%H
elp
fam
ily,
fri
ends
or
othe
rs d
evel
op
thei
r ou
tdoo
r sk
ills
25%
Exp
erie
nce
solit
ude
38%
Be
intr
ospe
ctiv
eC
atch
/har
vest
gam
e or
fish
Exp
erie
nce
spir
itual
ren
ewal
20%
Cat
ch o
r ha
rves
t som
e ga
me
or f
ish
42%
Be
crea
tive
Lea
rn a
nd e
xplo
reD
o so
met
hing
cre
ativ
e19
%E
xplo
re a
nd d
isco
ver
new
thin
gs39
%E
njoy
dif
fere
nt e
xper
ienc
es f
rom
hom
e35
%M
eet
new
peo
ple
Lea
rn m
ore
abou
t nat
ure
29%
Inte
ract
wit
h ne
w a
nd v
arie
d pe
ople
16%
Exp
erie
nce
a se
nse
of h
isto
ry18
%
Exp
erie
nce
nost
algi
aB
ring
bac
k pl
easa
nt m
emor
ies
37%
Wha
t are
you
r m
ost i
mpo
rtan
t rea
sons
for
par
tici
pati
ng in
out
door
rec
reat
ion?
Tabl
e 1

19Minnesota Department of Natural Resources
Tabl
e 2
Cor
rela
tion
Cor
rela
tion
Pop
ulat
ion
grou
ping
coef
fici
ent
Pop
ulat
ion
grou
ping
coef
fici
ent
Rec
reat
ion
days
in la
st 1
2 m
onth
sR
ace/
ethn
icit
yL
ess
than
onc
e a
mon
th (
1 to
10
days
)0.
89N
on-w
hite
and
/or
His
pani
c*0.
88O
nce
a m
onth
to o
nce
a w
eek
(11
to 5
0 da
ys)
0.98
Whi
te, n
on-H
ispa
nic
1.00
Onc
e to
twic
e a
wee
k (5
1 to
100
day
s)0.
99M
ore
than
twic
e a
wee
k (1
01+
days
)0.
98E
duca
tion
Hig
h sc
hool
gra
duat
e, o
r so
me
high
sch
ool
0.95
Pop
ulat
ion
dens
ity
of r
esid
ence
V
ocat
iona
l/tec
hnic
al s
choo
l, as
soci
ate
degr
ee,
or s
ome
colle
ge0.
98
(bas
ed o
n 5-
digi
t zip
cod
es in
200
0)G
radu
ated
fro
m c
olle
ge0.
97
Low
(10
0 pe
ople
per
squ
are
mile
or
less
)0.
98So
me
post
grad
uate
stu
dy, i
nclu
ding
po
stgr
adua
te d
egre
es0.
97
Med
ium
(10
1 to
100
0)0.
99H
i gh
(mor
e th
an 1
000)
0.99
Hou
seho
ld in
com
eun
der
$30,
000
0.96
Reg
ion
of M
inne
sota
$30,
000
to $
39,9
990.
97N
orth
wes
t0.
97$4
0,00
0 to
$49
,999
0.98
Nor
thea
st0.
99$5
0,00
0 to
$74
,999
0.98
Sout
h0.
98$7
5,00
0 to
$99
,999
0.97
Cen
tral
0.98
$100
,000
or
mor
e0.
96M
etro
(se
ven
coun
t y)
0.99
Hou
seho
ld s
ize
Age
1 pe
rson
0.94
20-3
40.
962
peop
le0.
9935
-44
0.99
3 pe
ople
0.98
45-5
40.
994
peop
le0.
9455
-64
0.97
5+ p
eopl
e0.
9565
+0.
90
Gen
der
* Fe
wer
than
100
res
pond
ents
in th
is b
reak
dow
n.
Mal
e0.
96Fe
mal
e0.
97
How
wid
ely
shar
ed a
re th
e ra
nkin
gs o
f th
e re
ason
s fo
r ou
tdoo
r re
crea
tion?
(cor
rela
tions
are
bet
wee
n th
e ra
nkin
g of
rea
sons
by
each
pop
ulat
ion
grou
ping
and
the
over
all p
opul
atio
n)

2004 Minnesota Outdoor Recreation Participation Survey20
Tabl
e 3
Wha
t are
you
r m
ost i
mpo
rtan
t rea
sons
for
par
tici
pati
ng in
out
door
rec
reat
ion?
(Not
e: e
ntri
es in
bol
d di
ffer
fro
m "
all a
dult
s" b
y at
leas
t +/-
10%
)
Cat
egor
yR
easo
n
Recreated less than once a month (1 to 10 days) in last 12 months
Age 65+
Non-white and/or Hispanic
All adults
Enj
oy n
atur
e Enj
oy n
atur
al s
cene
ry61
%72
%67
%71
%E
njoy
sm
ells
and
sou
nds
of n
atur
e50
%59
%50
%63
%
Exe
rcis
e an
d fe
el h
ealt
hier
Get
/kee
p ph
ysic
ally
fit
29%
56%
46%
59%
Fee
l hea
lthie
r30
%57
%55
%55
%
Be
wit
h fa
mily
and
frie
nds
Spe
nd le
isur
e ti
me
with
fam
ily
48%
40%
52%
57%
Be
wit
h m
embe
rs o
f m
y gr
oup
21%
24%
27%
23%
Esc
ape
pers
onal
, soc
ial a
nd p
hysi
cal p
ress
ures
Res
t men
tall
y44
%39
%58
%57
%G
et a
way
fro
m li
fe’s
usu
al d
eman
ds36
%35
%54
%54
%G
et a
way
fro
m c
row
ds28
%26
%36
%45
%
Exp
erie
nce
sile
nce
and
quie
t27
%37
%40
%40
%E
xper
ienc
e so
litu
de24
%34
%38
%38
%
Cat
ch/h
arve
st g
ame
or f
ish
Cat
ch o
r ha
rves
t som
e ga
me
or f
ish
18%
32%
23%
42%
Lea
rn a
nd e
xplo
reE
xplo
re a
nd d
isco
ver
new
thin
gs14
%28
%31
%39
%E
njoy
dif
fere
nt e
xper
ienc
es f
rom
hom
e25
%34
%43
%35
%L
earn
mor
e ab
out n
atur
e16
%31
%26
%29
%E
xper
ienc
e a
sens
e of
his
tory
13%
16%
11%
18%
Exp
erie
nce
nost
algi
aB
ring
bac
k pl
easa
nt m
emor
ies
29%
41%
44%
37%
---
----
---
Per
cent
indi
cati
ng r
easo
n --
----
----
Cat
egor
yR
easo
n
Recreated less than once a month (1 to 10 days) in last 12 months
Age 65+
Non-white and/or Hispanic
All adults
Exp
erie
nce
adve
ntur
e an
d ri
sks
Exp
erie
nce
a se
nse
of a
dven
ture
12%
17%
28%
36%
Tak
e so
me
risk
s5%
5%20
%18
%
Ach
ieve
and
be
stim
ulat
edF
eel e
xhila
rate
d22
%25
%20
%30
%Im
prov
e/re
tain
my
outd
oor
skill
s7%
21%
19%
26%
Fee
l mor
e se
lf-c
onfi
dent
9%10
%29
%14
%
Res
t ph
ysic
ally Res
t phy
sica
lly
26%
23%
35%
26%
Use
equ
ipm
ent
Get
a c
hanc
e to
use
or
test
my
equi
pmen
t16
%11
%22
%26
%
Tea
ch o
ther
s Hel
p fa
mily
, fri
ends
or
othe
rs d
evel
op
thei
r ou
tdoo
r sk
ills
8%14
%23
%25
%
Be
intr
ospe
ctiv
eE
xper
ienc
e sp
irit
ual r
enew
al13
%21
%23
%20
%
Be
crea
tive
Do
som
ethi
ng c
reat
ive
4%12
%24
%19
%
Mee
t ne
w p
eopl
eIn
tera
ct w
ith
new
and
var
ied
peop
le9%
19%
25%
16%
---
----
---
Per
cent
indi
cati
ng r
easo
n --
----
----
21Minnesota Department of Natural Resources
BARRIERS TO RECREATION PARTICIPATION
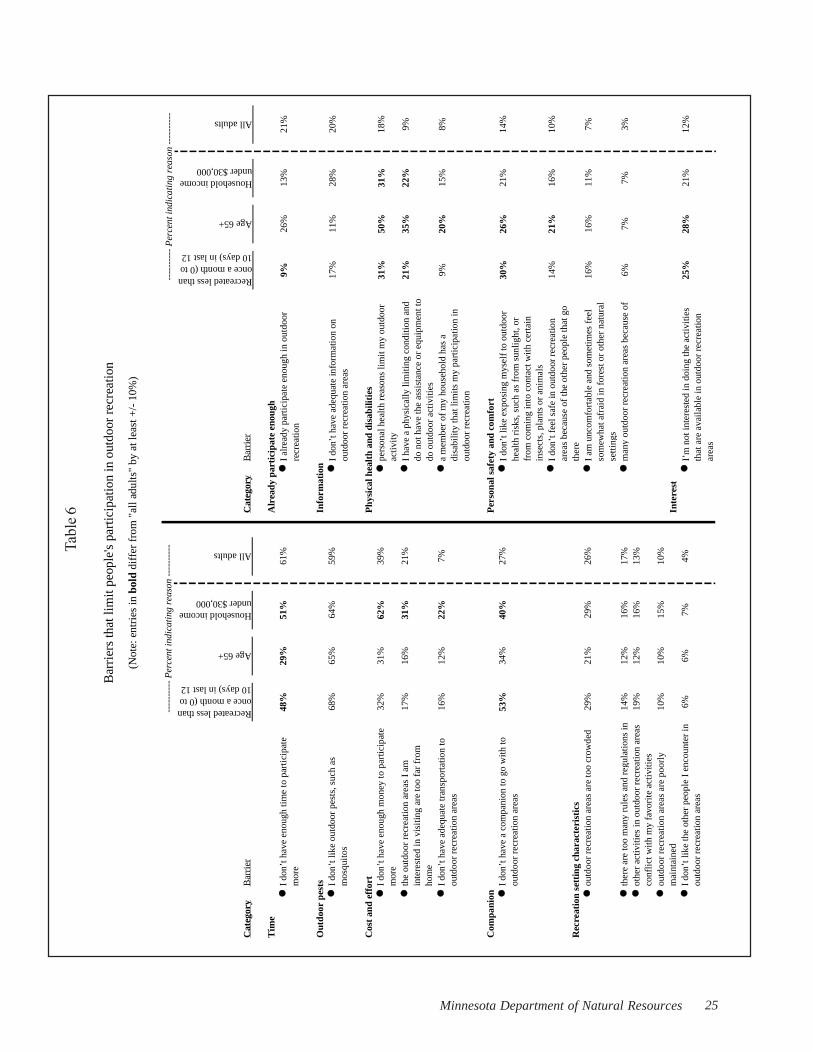
Just as people have reasons for recreating outdoor, they have reasons for notrecreating outdoors. These latter reasons are known as barriers. In the survey,Minnesota adults were presented with 21 potential barriers and asked if eachbarrier limited their outdoor recreation. A potential barrier was deemed an actualbarrier when a person “strongly agreed” or “moderately agreed” that the potentialbarrier was a reason they did not participate more in outdoor recreation.
The leading barrier is time (Table 4). People simply do not have enough time toparticipate more This is closely followed by outdoor pests, a common concern in“Minnesota—land of 10,000 lakes”, otherwise known as the land of poordrainage, which is prime habitat for outdoor pests. The next most frequentlyindicated barrier—much less prevalent than the leading two—is cost and effort.To participate in recreation costs money and requires bearing at least the cost andeffort of travel. This is followed by the barrier of not having a companion torecreate with. As noted in the previous section, one of the leading reasons peoplerecreate outdoors is to be with family and friends. Lack of a companion is adefinite deterrent to participation, and is one of the leading barriers for people insingle-person households. The only other potential barrier indicated by at leastone-quarter of adults is crowding in outdoor recreation areas, which is indicatedby 26 percent of adults. It is noteworthy that the “lack of interests in outdoorrecreation” barrier was indicated by few Minnesota adults (12%).
The ordering of barriers from most to least prevalent is widely shared. Mostpopulation subgroups rank the barriers close to way the overall population rankedthe barriers, which is evident in the high correlations between the overallpopulation rankings the rankings within subgroups of the population (Table 5).Most of the subgroups have correlation coefficients above 0.9. Only three of thesubgroups have lower correlation coefficients and these are examined individuallybelow.
The first of these low-correlation subgroups is comprised of people who recreatevery little (Table 6). One barrier (lack of a companion to recreate with) is muchlarger for this subgroup than for the population as whole. Barriers that are alsolarger concern: physical health and disabilities, personal safety and comfort, andlack of interest in recreating outdoor. Barriers that are less prevalent for this
2004 Minnesota Outdoor Recreation Participation Survey22
subgroup include lack of time, and already participating enough in outdoorrecreation.
The second group is people aged 65 and over. Barriers that are much moreprevalent for this subgroup include physical health and disabilities, personal safetyand comfort, and lack of interest in recreating outdoors. One barrier that is far lessprevalent for this subgroup is lack of time, the leading barrier for other adults.
The third low-correlation group is people with household incomes less than$30,000 per year. Barriers that are much more prevalent of this subgroup focuson the cost and effort of recreating outdoors. Barriers that are also larger concern:lack of a companion, and physical health and disabilities. A barriers that issomewhat less prevalent for this subgroup is lack of time to recreate more.

23Minnesota Department of Natural Resources
Cat
egor
yB
arri
erPe
rcen
t of
adul
ts
indi
catin
g ba
rrie
rC
ateg
ory
Bar
rier
Perc
ent o
f ad
ults
in
dica
ting
barr
ier
Tim
eA
lrea
dy p
arti
cipa
te e
noug
h●
I do
n’t h
ave
enou
gh ti
me
to p
artic
ipat
e m
ore
61%
●I
alre
ady
part
icip
ate
enou
gh in
out
door
re
crea
tion
21%
Out
door
pes
tsIn
form
atio
n●
I do
n’t l
ike
outd
oor
pest
s, s
uch
as
mos
quito
s59
%●
I do
n’t h
ave
adeq
uate
info
rmat
ion
on
outd
oor
recr
eatio
n ar
eas
20%
Cos
t and
eff
ort
Phy
sica
l hea
lth
and
disa
bilit
ies
●I
don’
t hav
e en
ough
mon
ey to
par
ticip
ate
mor
e39
%●
pers
onal
hea
lth r
easo
ns li
mit
my
outd
oor
acti
vity
18%
●th
e ou
tdoo
r re
crea
tion
area
s I
am
inte
rest
ed in
vis
itin
g ar
e to
o fa
r fr
om
hom
e
21%
●I
have
a p
hysi
cally
lim
itin
g co
nditi
on a
nd
do n
ot h
ave
the
assi
stan
ce o
r eq
uipm
ent t
o do
out
door
act
iviti
es
9%
●I
don’
t hav
e ad
equa
te tr
ansp
orta
tion
to
outd
oor
recr
eatio
n ar
eas
7%●
a m
embe
r of
my
hous
ehol
d ha
s a
disa
bilit
y th
at li
mits
my
part
icip
atio
n in
ou
tdoo
r re
crea
tion
8%
Com
pani
onP
erso
nal s
afet
y an
d co
mfo
rt●
I do
n’t h
ave
a co
mpa
nion
to g
o w
ith
to
outd
oor
recr
eatio
n ar
eas
27%
●I
don’
t lik
e ex
posi
ng m
ysel
f to
out
door
he
alth
ris
ks, s
uch
as f
rom
sun
light
, or
from
com
ing
into
con
tact
with
cer
tain
in
sect
s, p
lant
s or
ani
mal
s
14%
Rec
reat
ion
sett
ing
char
acte
rist
ics
●I
don’
t fee
l saf
e in
out
door
rec
reat
ion
area
s be
caus
e of
the
othe
r pe
ople
that
go
ther
e
10%
●ou
tdoo
r re
crea
tion
area
s ar
e to
o cr
owde
d26
%●
I am
unc
omfo
rtab
le a
nd s
omet
imes
fee
l so
mew
hat a
frai
d in
for
est o
r ot
her
natu
ral
setti
ngs
7%
●th
ere
are
too
man
y ru
les
and
regu
latio
ns in
ou
tdoo
r re
crea
tion
area
s17
%●
I fe
el u
nwel
com
e or
unc
omfo
rtab
le a
t m
any
outd
oor
recr
eatio
n ar
eas
beca
use
of
who
I a
m
3%
●ot
her
acti
viti
es in
out
door
rec
reat
ion
area
s co
nflic
t wit
h m
y fa
vori
te a
ctiv
ities
13%
●ou
tdoo
r re
crea
tion
area
s ar
e po
orly
m
aint
aine
d10
%In
tere
st●
I do
n’t l
ike
the
othe
r pe
ople
I e
ncou
nter
in
outd
oor
recr
eatio
n ar
eas
4%●
I’m
not
inte
rest
ed in
doi
ng th
e ac
tivit
ies
that
are
ava
ilab
le in
out
door
rec
reat
ion
area
s
12%
Bar
rier
s th
at li
mit
peo
ple'
s pa
rtic
ipat
ion
in o
utdo
or r
ecre
atio
n(p
erce
nt o
f ad
ults
that
"st
rong
ly"
or "
mod
erat
ely"
agr
ee th
at b
arri
er li
mits
thei
r ou
tdoo
r re
crea
tion)
Tabl
e 4

2004 Minnesota Outdoor Recreation Participation Survey24
Tabl
e 5
Cor
rela
tion
Cor
rela
tion
Pop
ulat
ion
grou
ping
coef
fici
ent
Pop
ulat
ion
grou
ping
coef
fici
ent
Rec
reat
ion
days
in la
st 1
2 m
onth
sR
ace/
ethn
icit
yL
ess
than
onc
e a
mon
th (
0 to
10
days
)0.
83N
on-w
hite
and
/or
His
pani
c*0.
92O
nce
a m
onth
to o
nce
a w
eek
(11
to 5
0 da
ys)
0.99
Whi
te, n
on-H
ispa
nic
1.00
Onc
e to
twic
e a
wee
k (5
1 to
100
day
s)0.
99M
ore
than
twic
e a
wee
k (1
01+
days
)0.
97E
duca
tion
Hig
h sc
hool
gra
duat
e, o
r so
me
high
sch
ool
0.96
Pop
ulat
ion
dens
ity
of r
esid
ence
V
ocat
iona
l/tec
hnic
al s
choo
l, as
soci
ate
degr
ee,
or s
ome
colle
ge0.
99
(bas
ed o
n 5-
digi
t zip
cod
es in
200
0)G
radu
ated
fro
m c
olle
ge0.
99
Low
(10
0 pe
ople
per
squ
are
mile
or
less
)0.
99So
me
post
grad
uate
stu
dy, i
nclu
ding
po
stgr
adua
te d
egre
es0.
97
Med
ium
(10
1 to
100
0)0.
99H
i gh
(mor
e th
an 1
000)
0.99
Hou
seho
ld in
com
eun
der
$30,
000
0.90
Reg
ion
of M
inne
sota
$30,
000
to $
39,9
990.
95N
orth
wes
t0.
98$4
0,00
0 to
$49
,999
0.99
Nor
thea
st0.
97$5
0,00
0 to
$74
,999
0.99
Sout
h0.
98$7
5,00
0 to
$99
,999
0.96
Cen
tral
0.99
$100
,000
or
mor
e0.
94M
etro
(se
ven
coun
ty)
0.99
Hou
seho
ld s
ize
Age
1 pe
rson
0.92
20-3
40.
972
peop
le0.
9835
-44
0.98
3 pe
ople
0.99
45-5
40.
994
peop
le0.
9855
-64
0.94
5+ p
eopl
e0.
9565
+0.
62
Gen
der
* Fe
wer
than
100
res
pond
ents
in th
is b
reak
dow
n.
Mal
e0.
98Fe
mal
e0.
98
How
wid
ely
shar
ed a
re th
e ra
nkin
gs o
f th
e ba
rrie
rs th
at li
mit
out
door
rec
reat
ion?
(cor
rela
tions
are
bet
wee
n th
e ra
nkin
g of
rea
sons
by
each
pop
ulat
ion
grou
ping
and
the
over
all p
opul
atio
n)
25Minnesota Department of Natural Resources
Bar
rier
s th
at li
mit
peo
ple'
s pa
rtic
ipat
ion
in o
utdo
or r
ecre
atio
n
(Not
e: e
ntri
es in
bol
d di
ffer
fro
m "
all a
dults
" by
at l
east
+/-
10%
)
Tabl
e 6
Cat
egor
yB
arri
er
Recreated less than once a month (0 to 10 days) in last 12
Age 65+
Household income under $30,000
All adults
Cat
egor
yB
arri
er
Tim
eA
lrea
dy p
arti
cipa
te e
noug
h●
I do
n’t h
ave
enou
gh ti
me
to p
arti
cipa
te
mor
e48
%29
%51
%61
%●
I al
read
y pa
rtic
ipat
e en
ough
in o
utdo
or
recr
eatio
n
Out
door
pes
tsIn
form
atio
n●
I do
n’t l
ike
outd
oor
pest
s, s
uch
as
mos
quit
os68
%65
%64
%59
%●
I do
n’t h
ave
adeq
uate
info
rmat
ion
on
outd
oor
recr
eatio
n ar
eas
Cos
t an
d ef
fort
Phy
sica
l hea
lth
and
disa
bilit
ies
●I
don’
t hav
e en
ough
mon
ey to
par
ticip
ate
mor
e32
%31
%62
%39
%●
pers
onal
hea
lth
reas
ons
limit
my
outd
oor
acti
vit y
●th
e ou
tdoo
r re
crea
tion
are
as I
am
in
tere
sted
in v
isit
ing
are
too
far
from
ho
me
17%
16%
31%
21%
●I
have
a p
hysi
cally
lim
itin
g co
ndit
ion
and
do n
ot h
ave
the
assi
stan
ce o
r e q
uipm
ent t
o do
out
door
act
iviti
es●
I do
n’t h
ave
adeq
uate
tran
spor
tatio
n to
ou
tdoo
r re
crea
tion
are
as16
%12
%22
%7%
●a
mem
ber
of m
y ho
useh
old
has
a di
sabi
lity
that
lim
its
my
part
icip
atio
n in
ou
tdoo
r re
crea
tion
Com
pani
onP
erso
nal s
afet
y an
d co
mfo
rt●
I do
n’t h
ave
a co
mpa
nion
to g
o w
ith to
ou
tdoo
r re
crea
tion
are
as53
%34
%40
%27
%●
I do
n’t l
ike
expo
sing
mys
elf
to o
utdo
or
heal
th r
isks
, suc
h as
fro
m s
unlig
ht, o
r fr
om c
omin
g in
to c
onta
ct w
ith
cert
ain
inse
cts,
pla
nts
or a
nim
als
Rec
reat
ion
sett
ing
char
acte
rist
ics
●I
don’
t fee
l saf
e in
out
door
rec
reat
ion
area
s be
caus
e of
the
othe
r pe
ople
that
go
ther
e●
outd
oor
recr
eati
on a
reas
are
too
crow
ded
29%
21%
29%
26%
●I
am u
ncom
fort
able
and
som
etim
es f
eel
som
ewha
t afr
aid
in f
ores
t or
othe
r na
tura
l se
ttin
gs●
ther
e ar
e to
o m
any
rule
s an
d re
gula
tion
s in
14
%12
%16
%17
%●
man
y ou
tdoo
r re
crea
tion
are
as b
ecau
se o
f ●
othe
r ac
tivit
ies
in o
utdo
or r
ecre
atio
n ar
eas
conf
lict
wit
h m
y fa
vori
te a
ctiv
ities
19%
12%
16%
13%
●ou
tdoo
r re
crea
tion
are
as a
re p
oorl
y m
aint
aine
d10
%10
%15
%10
%In
tere
st●
I do
n’t l
ike
the
othe
r pe
ople
I e
ncou
nter
in
outd
oor
recr
eati
on a
reas
6%6%
7%4%
●I’
m n
ot in
tere
sted
in d
oing
the
acti
vitie
s th
at a
re a
vail
able
in o
utdo
or r
ecre
atio
n ar
eas
---
----
---
Per
cent
indi
cati
ng r
easo
n --
----
----
Recreated less than once a month (0 to 10 days) in last 12
Age 65+
Household income under $30,000
All adults
9%26
%13
%21
%
17%
11%
28%
20%
31%
50%
31%
18%
21%
35%
22%
9%
9%20
%15
%8%
30%
26%
21%
14%
14%
21%
16%
10%
16%
16%
11%
7%
6%7%
7%3%
25%
28%
21%
12%
---
----
---
Per
cent
indi
catin
g re
ason
---
----
---

2004 Minnesota Outdoor Recreation Participation Survey26
RECREATION PARTICIPATION AND USE BY ACTIVITY
The leading activity for Minnesota adults—in terms of the number that participateannually—is walking/hiking outdoors for exercise or pleasure (54% of adultsparticipate annually) (see Table 7). This is followed by recreational boating,which can be presented in a variety of ways, depending on whether fishing isincluded and whether motorized and non-motorized boating are combined.Swimming is next, and is lead by swimming in a lake or stream.
A large number of activities are presented in Table 7, which is ordered by thenumber of adults who participate annually. Fishing is participated in annually by30 percent of Minnesota adults and hunting by 16 percent, two figures thatcorrespond well with current license sales.
As shown in Table 7, activities can be combined into aggregates (e.g., swimming,camping, or nature observation). They can also be examined for overlaps. Forinstance, the adults who participate in certain activities are far more likely toparticipate in other activities. An example is ATV riding. ATV riders are far morelikely to be hunters than people who do not ride ATVs. A complete set of activityoverlaps is too large to present here, but they are available upon request.
Winter activities, as a rule, have lower participation rates than summer activities.Minnesotans may have a hearty wintertime outdoor image of themselves, but theytend to stay indoors when the cold days and long nights set in.
A second way to view the magnitude of an activity is the amount of time peoplespend in the activity (Table 8—has same activity order as Table 7). Peopleparticipate in an activity a number of days (occasions) each year, and eachoccasion has a typical length in terms of hours. Some activity occasions (e.g.,walking/hiking) tend to be short compared with others (e.g., boating), so boatingis a much larger percent of hours than days, and the reverse is true for walking/hiking. For comparing people’s involvement between activities or betweengroups of activities, hours is generally a better measure than occasions, since theformer is a direct measure of time committed by the individual.
In terms of hours of activity participation, walking/hiking is the leading activityamong Minnesota adults. This is followed by boating, nature observation,

27Minnesota Department of Natural Resources
fishing, swimming and hunting, all water-based and wildlife-related activities thatMinnesotans have a well-deserved reputation for being highly engaged in.
The survey collected detailed information on each individual and the activities he/she participated in. For each activity, tables of this information are provide inAppendix B. The tables display (for all the activities in Table 7 and 8) theparticipation rates, overall use and breakdowns of activities by demographiccharacteristics (including survey region in Minnesota) and geographic patterns ofuse. The tables also contain the (i) profile of the Minnesota population, so activityparticipants can be compared to the general population as represented in thesurvey results; and (ii) a profile of “avid” participants, which can be comparedwith all participants to see if that subset of participants (about half of participants)who account for a large portion of any activity use (usually around 80% or more)are different demographically than the typical activity participant.
Activity participation and use are presented in Appendix A for each of the fivesurvey regions (Figure 4). Many of the activity differences between the regionsare due to the urban or rural characterof the regions, and the associationsbetween activities and the urban-ruralcontinuum. For example, hunting isan activity that has higher participationin rural (low population density)locations than in urban locations, soparticipation rates are much higher forthe non-Metro regions of Minnesota.The reverse is true for urban-associatedactivities such as inline skating. Thenext section examines outdoorrecreation patterns by demographiccharacteristics, including the urban-rural continuum or population densityof residential locations. Activities areclassified according to their degree ofassociation with residential populationdensity.
NorthwestNortheast
South
Central
Metro (7 county)
Survey Regions
Figure 4

2004 Minnesota Outdoor Recreation Participation Survey28
Activity
Number of participants
(000's)Percent of population
Walking/hiking (walking of hiking outdoors for exercise or pleasure) 1,896 54%Boating of all types, including fishing from a boat 1,493 43%
Boating of all types, excluding fishing from a boat 1,237 36%
Motor boating of all types, including fishing from a boat 1,365 39%
Motor boating of all types, excluding fishing from a boat 1,050 30%
Non-motorized boating of all types, excluding fishing 522 15%
Canoeing/kayaking, excluding fishing 485 14%
Swimming or wading (all places) 1,423 41%Swimming or wading in a lake or stream 1,279 37%
Swimming or wading in an outdoor pool or water park 750 22%
Driving for pleasure on scenic roads or in a park 1,300 37%Picnicking 1,245 36%
Fishing of all types 1,054 30%Fishing from a boat 929 27%
Fishing from shore or dock 704 20%
Biking (bicycling outdoors of all types, including mountain biking) 1,011 29%Biking on dirt trails 423 12%
Visiting outdoor zoos 957 27%
Camping of all types 899 26%Camping using a camping vehicle (e.g., pop-up/hard-sided trailer) 450 13%
Camping using a tent 613 18%
Camping using a tent for backpacking or canoe-in/boat-in camping 340 10%
Visiting nature centers 884 25%
Nature observation of all types (viewing, identifying, photographing) 844 24%Viewing, identifying or photographing birds and other wildlife 712 20%
Viewing, identifying or photographing wildflowers, trees, natural vegetation 629 18%
Golfing 820 24%Outdoor field sports (e.g., soccer, softball/baseball, football) 737 21%Visiting historic or archaeological sites 721 21%
Sledding and snow tubing 642 18%Outdoor court sports (e.g., volleyball, basketball, tennis, horseshoes) 612 18%Hunting of all types 556 16%
Hunting big game (e.g., deer, bear, moose) 470 13%
Hunting waterfowl, upland game birds, and other small game 369 11%
Running or jogging 497 14%Ice skating/hockey outdoors 402 12%Inline skating, rollerblading, roller skating, roller skiing 394 11%Offroad ATV driving 357 10%Snowmobiling 342 10%
Downhill skiing/snowboarding 313 9%Gather mushrooms, berries, or other wild foods 302 9%Cross country skiing 227 7%Horseback riding 157 5%Snowshoeing 146 4%
Annual outdoor recreation participation by Minnesotans in Minnesota and elsewhere, 2004
(population 20 years old and older)
Table 7

29Minnesota Department of Natural Resources
Activity
Number of days; total = 360,134
(000's)Percent of
days
Number of hours; total hours = 760,
743 (000's)Percent of
hours
Walking/hiking (walking of hiking outdoors for exercise or pleasure) 105,994 29.4% 129,655 17.0%Boating of all types, including fishing from a boat 29,617 8.2% 107,859 14.2%
Boating of all types, excluding fishing from a boat 17,613 4.9% 58,100 7.6%
Motor boating of all types, including fishing from a boat 27,111 7.5% 98,836 13.0%
Motor boating of all types, excluding fishing from a boat 15,108 4.2% 49,076 6.5%
Non-motorized boating of all types, excluding fishing 2,505 0.7% 9,024 1.2%
Canoeing/kayaking, excluding fishing 2,123 0.6% 7,903 1.0%
Swimming or wading (all places) 21,927 6.1% 53,476 7.0%Swimming or wading in a lake or stream 14,807 4.1% 36,657 4.8%
Swimming or wading in an outdoor pool or water park 7,120 2.0% 16,819 2.2%
Driving for pleasure on scenic roads or in a park 15,511 4.3% 33,473 4.4%Picnicking 11,627 3.2% 35,914 4.7%
Fishing of all types 18,391 5.1% 76,240 10.0%Fishing from a boat 12,003 3.3% 49,759 6.5%
Fishing from shore or dock 6,388 1.8% 26,480 3.5%
Biking (bicycling outdoors of all types, including mountain biking) 22,436 6.2% 31,890 4.2%Biking on dirt trails 2,892 0.8% 4,110 0.5%
Visiting outdoor zoos 2,252 0.6% 5,823 0.8%
Camping of all types 8,515 2.4% 34,060 4.5%Camping using a camping vehicle (e.g., pop-up/hard-sided trailer) 5,469 1.5% 21,877 2.9%
Camping using a tent 3,046 0.8% 12,183 1.6%
Camping using a tent for backpacking or canoe-in/boat-in camping 1,043 0.3% 4,172 0.5%
Visiting nature centers 3,265 0.9% 8,440 1.1%
Nature observation of all types (viewing, identifying, photographing) 46,268 12.8% 77,256 10.2%Viewing, identifying or photographing birds and other wildlife 27,654 7.7% 41,267 5.4%
Viewing, identifying or photographing wildflowers, trees, natural vegetation 18,614 5.2% 35,989 4.7%
Golfing 11,163 3.1% 37,063 4.9%Outdoor field sports (e.g., soccer, softball/baseball, football) 11,187 3.1% 21,185 2.8%Visiting historic or archaeological sites 2,398 0.7% 6,199 0.8%
Sledding and snow tubing 2,985 0.8% 4,999 0.7%Outdoor court sports (e.g., volleyball, basketball, tennis, horseshoes) 5,916 1.6% 11,670 1.5%Hunting of all types 8,060 2.2% 48,188 6.3%
Hunting big game (e.g., deer, bear, moose) 4,025 1.1% 27,175 3.6%
Hunting waterfowl, upland game birds, and other small game 4,035 1.1% 21,013 2.8%
Running or jogging 21,457 6.0% 24,331 3.2%Ice skating/hockey outdoors 2,459 0.7% 4,919 0.6%Inline skating, rollerblading, roller skating, roller skiing 4,733 1.3% 11,384 1.5%Offroad ATV driving 6,520 1.8% 15,262 2.0%Snowmobiling 2,918 0.8% 10,260 1.3%
Downhill skiing/snowboarding 1,514 0.4% 8,657 1.1%Gather mushrooms, berries, or other wild foods 1,623 0.5% 5,090 0.7%Cross country skiing 1,486 0.4% 3,669 0.5%Horseback riding 1,382 0.4% 2,567 0.3%Snowshoeing 535 0.1% 974 0.1%
Annual outdoor recreation use by Minnesotans in Minnesota and elsewhere, 2004
(population 20 years old and older)
Table 8

2004 Minnesota Outdoor Recreation Participation Survey30
DEMOGRAPHIC PATTERNS OF RECREATION USE
Recreation participation and use—either by activity or in an overall sense—variesby age, gender, population density, and other population groupings. In thissection, recreation patterns are examined by the following standard demographicbreakdowns:
Population density of residence (urban to rural continuum)Region in MinnesotaAge classGenderRace/ethnicityEducational attainmentHousehold incomeHousehold size
For each demographic breakdown, overall involvement in outdoor recreation isdescribed first. “Overall involvement” is total annual recreation hours per capita inthe demographic breakdown, indexed to 100 for the average Minnesota adult.Next, the long-term trend in the demographic characteristic is presented (Reference4), and the implications of the trend for overall recreation involvement arediscussed. Finally, each activity is classified according to its association with thedemographic characteristic, and the implications of the long-term trend foractivities is discussed.
The methods used to measure the degree of association between an activity and ademographic characteristic is as follows:
The distribution of participants across a demographic characteristic for eachactivity is compared to the average distribution across all activities. Themean difference from the average profile is totaled for each activity(direction of difference is ignored), and then normalized to an index of 100for the typical difference from the average profile. The degree of activityassociation with a demographic characteristic is classified according to thefollowing index values: an index greater than 150 is considered "strong",while an index from 101 to 150 is "moderate", an index from 51 to 100 is"slight", and an index of 50 or less is considered "very little association".
The activity table for “Region in Minnesota” is not presented, because it isredundant with “Population density of residence (urban to rural

31Minnesota Department of Natural Resources
continuum)”. People in the Metro Region live predominately at highdensity, while people in the Northwest and Northeast Region livepredominately at low density, and people in the Central and SouthernRegion live at densities between those of the two northern regions and theMetro Region. The correlation across all activities between the size of theindex value for population density and region of residence is 0.92.
The discussions of long-term demographic trends, overall recreation involvement,and activity-specific involvement are intended to be general assessments ofrecreation’s relationship to changes taking place in the larger society. Thesediscussions are important for understanding the forces that have shaped, and willcontinue to shape, the direction of outdoor recreation in Minnesota.
These relationships are also likely to be important for those interested in assessingthe activity demands of communities that are, say, aging or urbanizing; or forthose who want to provide facilities for a range of activities that, for example,serve broader parts of the populations as compared with narrower subgroupswithin the population.
A final section examines the commonalities and differences among activitiesaccording to these demographic breakdowns. Activities are grouped into clustersthat share similar demographics.
Population density of residence (urban to rural continuum)
Minnesotans who live in more rural settings (lower population density) recreatemore outdoors than their urban counterparts, who live a higher densities (Figure5). The trend in Minnesota (as elsewhere in the nation) is to an increasing urbanpopulation (Figure 6). Over the last 100 years, almost all new additions to theMinnesota population have been urban additions. A continuation of this trend—coupled with the pattern of recreation use by population density—would pushper-capita recreation use down in the state.
Activities that have strong associations with lower-density (rural) residentiallocations would—all other things constant, including the popularity of anactivity—experience little growth compared to activities with strong urbanassociations (Table 9). In actuality, “all other things”, of course, are not alwaysconstant. For example, ATV riding is strongly rural, but its popularity is

2004 Minnesota Outdoor Recreation Participation Survey32
Index of outdoor recreation use (hours) by population density of residence
(population density based on 5-digit zip codes in 2000)
88
105114
0
20
40
60
80
100
120
140
Low (100 people per squaremile or less)
Medium (101 to 1000) High (more than 1000)
Per
cap
ita in
dex
(100
=av
erag
e)
Urban and rural population trends in Minnesota
0
1,000,000
2,000,000
3,000,000
4,000,000
5,000,000
6,000,000
1900
1910
1920
1930
1940
1950
1960
1970
1980
1990
2000
Num
ber
of p
eopl
e
Urban populationRural population
Figure 5
Figure 6

33Minnesota Department of Natural Resources
ActivityLow (100 people per
sq. mile or less)Medium (101 to
1000)High (more than
1000)Deviation index**
Strongly associated lower density (more rural)Snowmobiling 58% 39% -55% 282Offroad ATV driving 68% 21% -50% 255Hunting big game (e.g., deer, bear, moose) 68% 13% -45% 229Hunting of all types 57% 13% -39% 201Hunting waterfowl, upland game birds, and other small game 54% 11% -36% 186Camping using a camping vehicle (e.g., pop-up/hard-sided trailer) 38% 25% -36% 185
Strongly associated higher density (more urban)Cross country skiing -35% -45% 46% 237Inline skating, rollerblading, roller skating, roller skiing -53% -18% 40% 205Ice skating/hockey outdoors -57% 2% 30% 161
Moderately associated lower densityGather mushrooms, berries, or other wild foods 50% -15% -18% 139Fishing from shore or dock 34% 1% -20% 101
Moderately associated higher densityRunning or jogging -33% -9% 24% 121Downhill skiing/snowboarding -36% -4% 22% 114Camping using a tent for backpacking or canoe-in/boat-in camping 8% -34% 16% 107
Slightly associated lower densityFishing from a boat 20% 12% -19% 95Fishing of all types 22% 8% -16% 84Horseback riding 23% 6% -16% 83
Slightly associated higher densityVisiting outdoor zoos -28% -5% 18% 95Non-motorized boating of all types, excluding fishing -20% -10% 17% 88Canoeing/kayaking, excluding fishing -19% -11% 17% 86Camping using a tent -3% -25% 17% 86Swimming or wading in an outdoor pool or water park -27% 1% 14% 75Golfing -27% 22% 1% 74Visiting nature centers -16% -8% 14% 69Visiting historic or archaeological sites -3% -19% 13% 67Biking on dirt trails -23% 12% 5% 63Viewing, identifying or photographing wildflowers, trees, natural vegetation -10% -10% 12% 61Biking (bicycling outdoors of all types, including mountain biking) -17% -3% 11% 57
Activity associations with: Population density of residence
------ Percent deviation from average activity profile* ------
Very little associationNature observation of all types (viewing, identifying, photographing) 0% 0% 0% 1Boating of all types, excluding fishing from a boat 0% 1% -1% 5Picnicking 2% -1% -1% 5Walking/hiking (walking of hiking outdoors for exercise or pleasure) -4% -1% 3% 14Swimming or wading in a lake or stream -1% 5% -2% 16Swimming or wading (all places) -6% 5% 1% 18Sledding and snow tubing -6% -1% 4% 20Boating of all types, including fishing from a boat 4% 4% -5% 23Viewing, identifying or photographing birds and other wildlife 8% -8% 0% 24Driving for pleasure on scenic roads or in a park 4% -8% 3% 25Outdoor field sports (e.g., soccer, softball/baseball, football) -9% 7% 1% 26Motor boating of all types, excluding fishing from a boat 3% 7% -6% 29Outdoor court sports (e.g., volleyball, basketball, tennis, horseshoes) -11% 10% 0% 30Camping of all types 12% -4% -4% 33Motor boating of all types, including fishing from a boat 7% 7% -8% 43Snowshoeing -4% 14% -6% 43
* Average distribution of participants across all activities for this demographic characteristic, totaling 100%, is =
25.3% 28.2% 46.5%
** Index measures the size of the deviation from the average activity profile; an index of 100 is the typical size of deviation across activities. An index greater than 150 is considered "strong", while from 101 to 150 is "moderate", from 51 to 100 is "slight", and 50 or less is considered "very little association".
Table 9

2004 Minnesota Outdoor Recreation Participation Survey34
burgeoning, and it is growing rapidly in Minnesota. However, if the popularityof ATV riding plateaus, further increases would be difficult to achieve, assumingthe activity maintains a strongly rural base that continues its long-term trend.
It is important to note that many activities have little association, or only a slightassociation, with this demographic characteristic and, thus, are not influencedmaterially by this urban-rural trend.
Region in Minnesota
Most of the discussion of region is redundant with the preceding populationdensity discussion, as noted in the introduction to this section. Minnesotans wholive in the high-density Metro area recreate less outdoors than those in lower-density rural regions (Figure 7). The regional population trend in Minnesotashows most of the increase over many decades occurring in the metro area, andmore recently occurring in the Central Region to the north and west of the MetroRegion (Figure 8). Three regions (South, Northeast and Northwest) have shownlittle growth over the last 40 years. A continuation of this trend—coupled withthe pattern of recreation use by region—would push per-capita recreation usedown in the state.
As discussed in the introduction to this section, the activity table for “Region inMinnesota” is not presented, because it is redundant with “Population density ofresidence (urban to rural continuum)”.
Age Class
Older adults recreate less overall than younger adults (Figure 9). Recreation hoursper capita increase successively from age class 65+ to each younger age class,excepting the youngest adult class (age 20 to 34), which is lower than the nexthighest class (age 35 to 44). In the past (mid 1980s), the per-capita hour increasecontinued into the youngest class (Reference 6). Whether this pattern change isreal cannot be firmly established from available information, but there are piecesof information that lend credence to the idea that young adults are not as involvedin recreation as they used to be. For wildlife-associated recreation (fishing,hunting and wildlife watching) national surveys from 1991 to 2001 have shownthat the participation decreases of youngest adults were quite rapid compared with
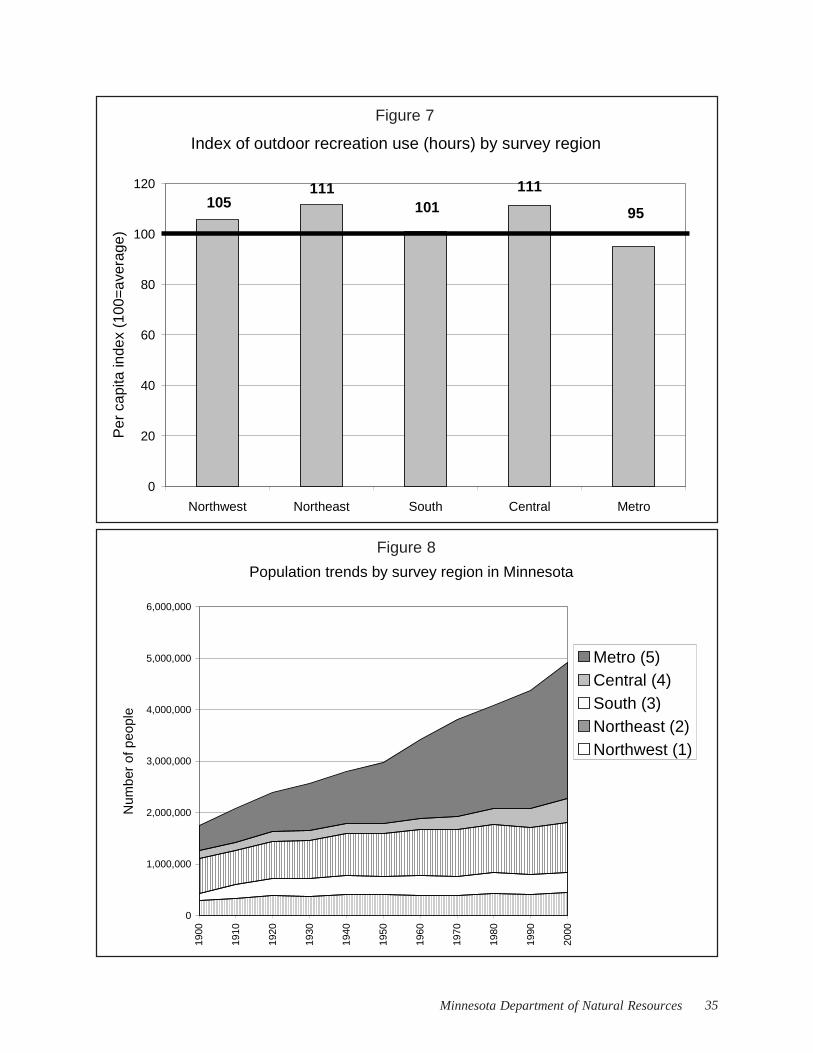
35Minnesota Department of Natural Resources
Index of outdoor recreation use (hours) by survey region
95
111101
111105
0
20
40
60
80
100
120
Northwest Northeast South Central Metro
Per
cap
ita in
dex
(100
=av
erag
e)
Population trends by survey region in Minnesota
0
1,000,000
2,000,000
3,000,000
4,000,000
5,000,000
6,000,000
1900
1910
1920
1930
1940
1950
1960
1970
1980
1990
2000
Num
ber
of p
eopl
e
Metro (5)Central (4)South (3)Northeast (2)Northwest (1)
Figure 7
Figure 8

2004 Minnesota Outdoor Recreation Participation Survey36
Index of outdoor recreation use (hours) by age class
53
89
110121
108
0
20
40
60
80
100
120
140
20-34 35-44 45-54 55-64 65+
Per
cap
ita in
dex
(100
=av
erag
e)
Trends in Minnesota median age
35.432.4
29.226.828.630.629.5
27.225.3
23.722
0
10
20
30
40
50
1900
1910
1920
1930
1940
1950
1960
1970
1980
1990
2000
Med
ian
age
in y
ears
Figure 9
Figure 10

37Minnesota Department of Natural Resources
older adults (Reference 2). The participation decreases from 1991 to 2001 weresteep enough to shift the participation peak out of the youngest age classes to highage classes, producing a similar age-class pattern change as may have occurred inMinnesota for overall outdoor recreation involvement. If nothing else, theseparallel changes fuel speculation, and raise seminal questions about the changingnature of recreation involvement by age class in the state.
The age trend in the state is to an older population over the last 30 years (Figure10). A continuation of this trend—coupled with the pattern of recreation use byage class—would push per-capita recreation use down in the state.
The activities that have moderate-to-strong associations with younger ages tend tobe more physically demanding, such as ice skating/hockey outdoors, inlineskating, and running/jogging (Table 10). The activities most associated with olderage classes tend to be less physically demanding, more passive, and morelearning-related (note that their are no activities “strongly” associated with olderages).
As with the other demographic characteristics, a large number of activities havelittle association, or only a slight association, with age class and, thus, are notinfluenced materially by the aging of the population.

2004 Minnesota Outdoor Recreation Participation Survey38
Activity 20 to 34 35 to 44 45 to 54 55 to 64 65+Deviation index**
Strongly associated with younger agesIce skating/hockey outdoors 26% 28% -34% -74% -93% 214Sledding and snow tubing 23% 21% -26% -60% -82% 175Inline skating, rollerblading, roller skating, roller skiing 34% 4% -24% -46% -99% 167Downhill skiing/snowboarding 24% 14% -18% -66% -76% 157
Strongly associated with middle agesSnowshoeing -27% -13% 62% 26% -8% 174
Moderately associated with younger agesCamping using a tent 30% 3% -22% -36% -85% 144Running or jogging 31% -7% -21% -36% -43% 139Outdoor court sports (e.g., volleyball, basketball, tennis, horseshoes) 31% -5% -15% -47% -55% 136Offroad ATV driving 24% -17% -4% -15% -32% 105
Moderately associated with older agesViewing, identifying or photographing birds and other wildlife -24% -7% 14% 47% 79% 131Nature observation of all types (viewing, identifying, photographing) -22% -8% 14% 44% 80% 127Viewing, identifying or photographing wildflowers, trees, natural vegetation -22% -7% 13% 45% 77% 125Driving for pleasure on scenic roads or in a park -15% -16% 9% 47% 88% 124Gather mushrooms, berries, or other wild foods -20% -4% -5% 36% 126% 118Visiting nature centers -16% -13% 4% 46% 94% 115Visiting historic or archaeological sites -22% -3% 7% 52% 69% 112Walking/hiking (walking of hiking outdoors for exercise or pleasure) -12% -13% 1% 46% 82% 101
Moderately associated with middle agesCross country skiing -30% 12% 34% 12% -3% 136Horseback riding -8% 10% 28% -36% -56% 105
Slightly associated with younger agesCamping using a tent for backpacking or canoe-in/boat-in camping 16% 6% -5% -28% -81% 92Outdoor field sports (e.g., soccer, softball/baseball, football) 11% 8% -9% -35% -34% 78Snowmobiling -1% 22% -4% -14% -79% 77Biking on dirt trails 7% 11% -3% -34% -51% 74Canoeing/kayaking, excluding fishing 9% 0% 6% -29% -43% 56Swimming or wading in an outdoor pool or water park 8% 6% -14% -18% -6% 55Biking (bicycling outdoors of all types, including mountain biking) -6% 8% 10% -5% -33% 53
Slightly associated with older agesPicnicking -14% -3% 0% 29% 69% 73Fishing from a boat -8% -9% 4% 19% 61% 69Fishing from shore or dock -8% -7% 0% 39% 33% 59Fishing of all types -7% -7% 0% 26% 51% 58Camping using a camping vehicle (e.g., pop-up/hard-sided trailer) -9% -4% 11% 9% 25% 52
Activity associations with: Age class
----------- Percent deviation from average activity profile* -----------
Very little associationSwimming or wading in a lake or stream 4% -4% 0% -6% -1% 19Swimming or wading (all places) 3% -5% 3% -1% 3% 21Boating of all types, excluding fishing from a boat -6% 1% 4% 12% 2% 26Hunting of all types -4% -3% 2% 17% 10% 28Golfing 3% -9% 4% 5% 10% 34Hunting waterfowl, upland game birds, and other small game -7% 1% 5% 22% -2% 34Motor boating of all types, excluding fishing from a boat -4% -6% 7% 17% 5% 37Boating of all types, including fishing from a boat -7% -2% 0% 16% 37% 40Hunting big game (e.g., deer, bear, moose) -8% 4% 5% 18% -10% 43Visiting outdoor zoos -1% -2% -14% 31% 24% 45Camping of all types 11% 0% -6% -17% -31% 50Motor boating of all types, including fishing from a boat -5% -8% 1% 21% 42% 50Non-motorized boating of all types, excluding fishing 6% 4% 4% -25% -41% 50
* Average distribution of participants across all activities for this demographic characteristic, totaling 100%, is =
37% 30% 20% 8% 5%
** Index measures the size of the deviation from the average activity profile; an index of 100 is the typical size of deviation across activities. An index greater than 150 is considered "strong", while from 101 to 150 is "moderate", from 51 to 100 is "slight", and 50 or less is considered "very little association".
Table 10

39Minnesota Department of Natural Resources
Gender
Men recreate more overall than women (Figure 11). Since the population trend isnot toward a greater portion of one gender compared with the other, the trendproduces no change in per-capita recreation use.
Certain activities that are strongly male (hunting, snowmobiling, ATV riding) alsowere strongly rural, which shows how combinations of demographic groupingsthat define the character of certain activities (Table 11). An examination of clustersof activities that share similar demographics is the topic at the end of this section.
As with the other demographic characteristics, a large number of activities havelittle association, or only a slight association, with gender.
Index of outdoor recreation use (hours) by gender
88
112
0
20
40
60
80
100
120
140
Male Female
Per
cap
ita in
dex
(100
=av
erag
e)
Figure 11
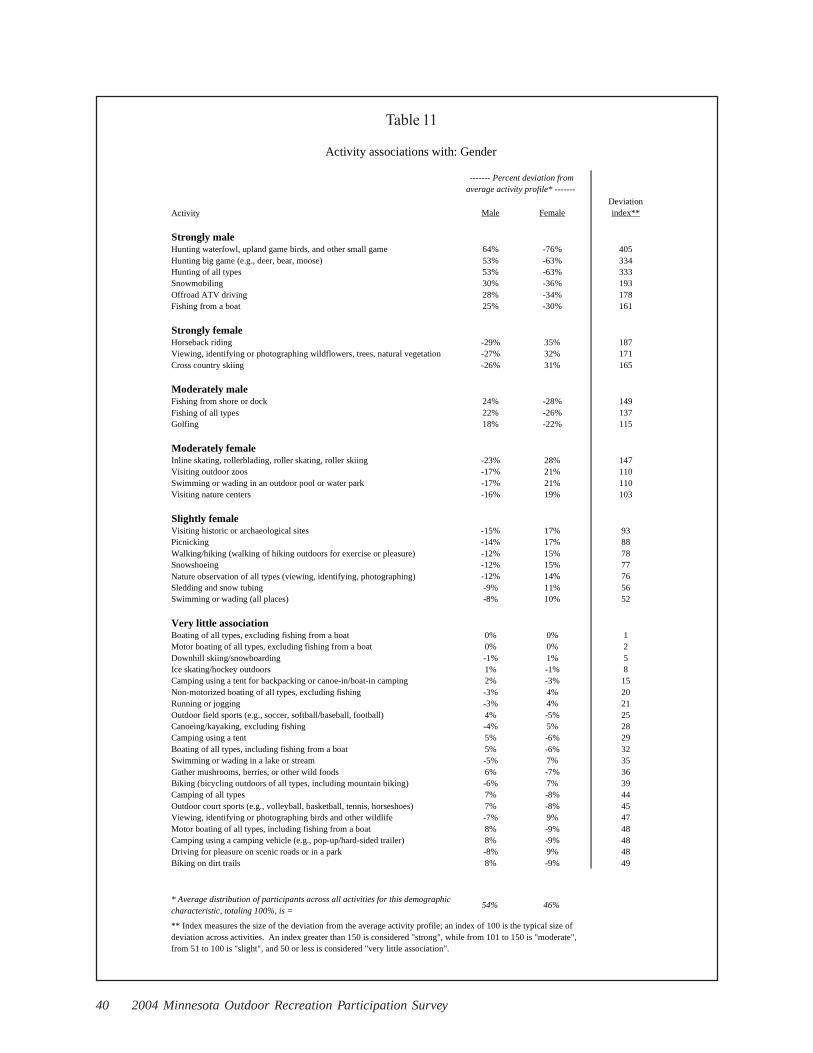
2004 Minnesota Outdoor Recreation Participation Survey40
Activity Male FemaleDeviation index**
Strongly maleHunting waterfowl, upland game birds, and other small game 64% -76% 405Hunting big game (e.g., deer, bear, moose) 53% -63% 334Hunting of all types 53% -63% 333Snowmobiling 30% -36% 193Offroad ATV driving 28% -34% 178Fishing from a boat 25% -30% 161
Strongly femaleHorseback riding -29% 35% 187Viewing, identifying or photographing wildflowers, trees, natural vegetation -27% 32% 171Cross country skiing -26% 31% 165
Moderately maleFishing from shore or dock 24% -28% 149Fishing of all types 22% -26% 137Golfing 18% -22% 115
Moderately femaleInline skating, rollerblading, roller skating, roller skiing -23% 28% 147Visiting outdoor zoos -17% 21% 110Swimming or wading in an outdoor pool or water park -17% 21% 110Visiting nature centers -16% 19% 103
Slightly femaleVisiting historic or archaeological sites -15% 17% 93Picnicking -14% 17% 88Walking/hiking (walking of hiking outdoors for exercise or pleasure) -12% 15% 78Snowshoeing -12% 15% 77Nature observation of all types (viewing, identifying, photographing) -12% 14% 76Sledding and snow tubing -9% 11% 56Swimming or wading (all places) -8% 10% 52
Very little associationBoating of all types, excluding fishing from a boat 0% 0% 1Motor boating of all types, excluding fishing from a boat 0% 0% 2Downhill skiing/snowboarding -1% 1% 5Ice skating/hockey outdoors 1% -1% 8Camping using a tent for backpacking or canoe-in/boat-in camping 2% -3% 15Non-motorized boating of all types, excluding fishing -3% 4% 20Running or jogging -3% 4% 21Outdoor field sports (e.g., soccer, softball/baseball, football) 4% -5% 25Canoeing/kayaking, excluding fishing -4% 5% 28Camping using a tent 5% -6% 29Boating of all types, including fishing from a boat 5% -6% 32Swimming or wading in a lake or stream -5% 7% 35Gather mushrooms, berries, or other wild foods 6% -7% 36Biking (bicycling outdoors of all types, including mountain biking) -6% 7% 39Camping of all types 7% -8% 44Outdoor court sports (e.g., volleyball, basketball, tennis, horseshoes) 7% -8% 45Viewing, identifying or photographing birds and other wildlife -7% 9% 47Motor boating of all types, including fishing from a boat 8% -9% 48Camping using a camping vehicle (e.g., pop-up/hard-sided trailer) 8% -9% 48Driving for pleasure on scenic roads or in a park -8% 9% 48Biking on dirt trails 8% -9% 49
* Average distribution of participants across all activities for this demographic characteristic, totaling 100%, is =
54% 46%
** Index measures the size of the deviation from the average activity profile; an index of 100 is the typical size of deviation across activities. An index greater than 150 is considered "strong", while from 101 to 150 is "moderate", from 51 to 100 is "slight", and 50 or less is considered "very little association".
Activity associations with: Gender
------- Percent deviation from average activity profile* -------
Table 11

41Minnesota Department of Natural Resources
Race/ethnicity
White, non-Hispanic Minnesotans recreate more overall than non-white and/orHispanic Minnesotans (Figure 12). The grouping of “non-white and/or Hispanic”cannot be broken down any further in this study due to sample size limitations.The lower recreation involvement of non-whites and/or Hispanics is consistentwith national findings for wildlife-related outdoor recreation (fishing, hunting,and wildlife watching—Reference 7). Outdoor recreation—as a general rule—is a“middle America” pursuit and any demographic grouping near the margins of“middle America” will exhibit less overall involvement in recreation. This tendsto be true for race, ethnicity, education, and income.
The trend in Minnesota (as elsewhere in the nation) is to greater racial and ethnicdiversity in the population (Figure 13). A continuation of this trend—coupledwith the pattern of recreation use by race/ethnicity—would push per-capitarecreation use down in the state.
Certain activities are more associated with whites/non-Hispanics (e.g., cross-country skiing and hunting), while others are more associated with non-whitesand/or Hispanics (e.g., nature observation and outdoor court sports) (see Table12). Most activities, however, have little association, or only a slight association,with this demographic characteristic
Educational attainment
Lower education attainment is associated with less overall involvement in outdoorrecreation (Figure 14). Part of this difference is due to older Minnesotans, whorecreate less overall than younger Minnesotans, having historically lowereducational attainment. Even with the elimination of people 65+, however, thepattern of less recreation involvement with less formal education remains.
The trend in Minnesota (as elsewhere in the nation) is to higher educationalattainment in the population (Figure 15—data for the nation; a shorter time seriesfor Minnesota exhibits the same trend: see Reference 8). A continuation of thistrend—coupled with the pattern of recreation use by educational attainment—would push per-capita recreation use up in the state.
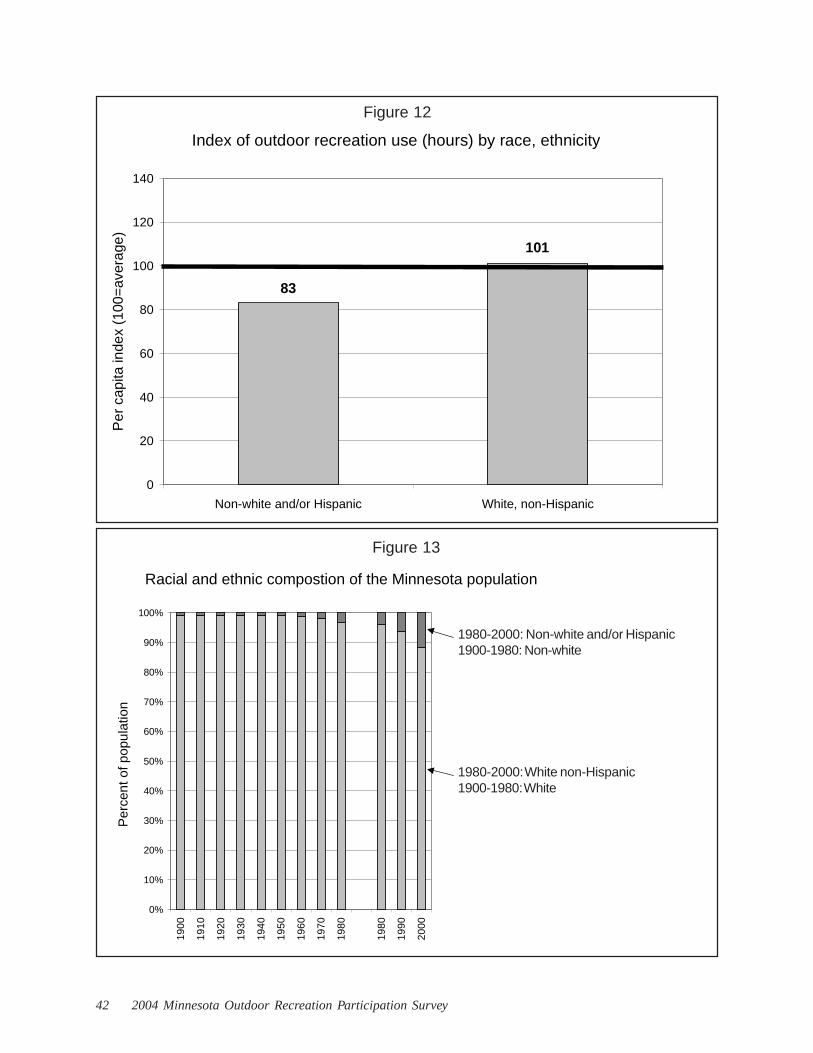
2004 Minnesota Outdoor Recreation Participation Survey42
Index of outdoor recreation use (hours) by race, ethnicity
101
83
0
20
40
60
80
100
120
140
Non-white and/or Hispanic White, non-Hispanic
Per
cap
ita in
dex
(100
=av
erag
e)
Racial and ethnic compostion of the Minnesota population
0%
10%
20%
30%
40%
50%
60%
70%
80%
90%
100%
1900
1910
1920
1930
1940
1950
1960
1970
1980
1980
1990
2000
Per
cent
of p
opul
atio
nFigure 12
Figure 13
1980-2000: Non-white and/or Hispanic1900-1980: Non-white
1980-2000: White non-Hispanic1900-1980: White
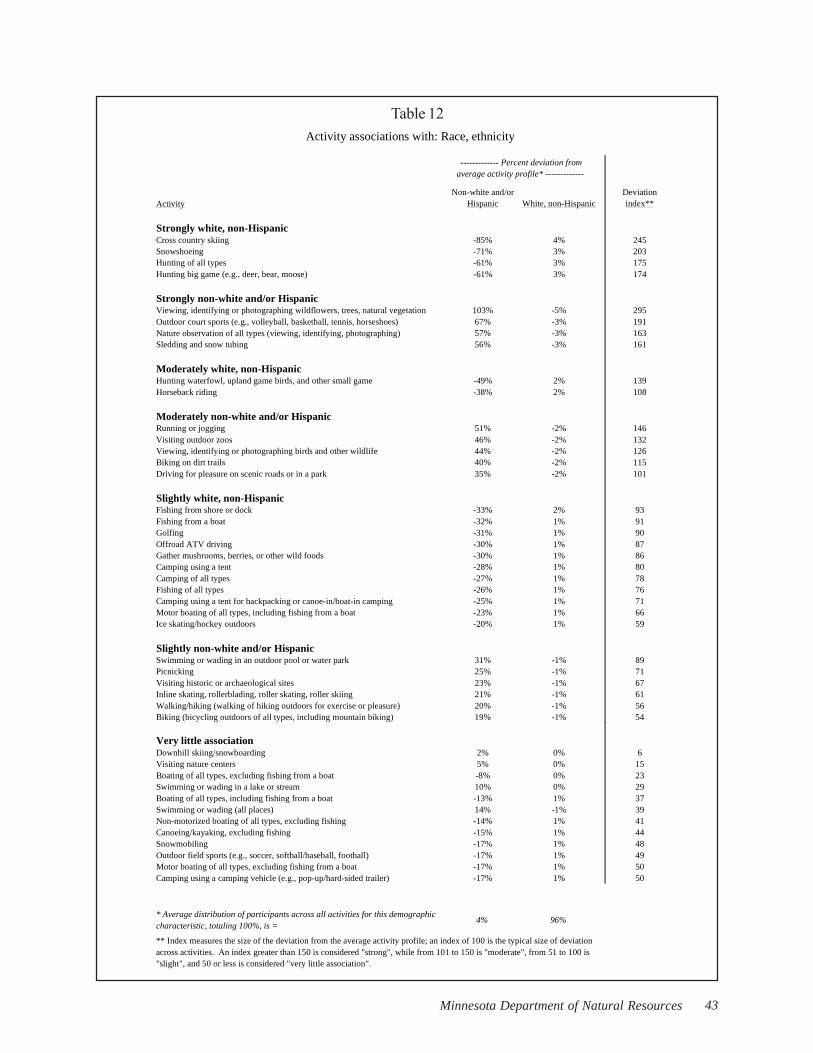
43Minnesota Department of Natural Resources
ActivityNon-white and/or
Hispanic White, non-HispanicDeviation index**
Strongly white, non-HispanicCross country skiing -85% 4% 245Snowshoeing -71% 3% 203Hunting of all types -61% 3% 175Hunting big game (e.g., deer, bear, moose) -61% 3% 174
Strongly non-white and/or HispanicViewing, identifying or photographing wildflowers, trees, natural vegetation 103% -5% 295Outdoor court sports (e.g., volleyball, basketball, tennis, horseshoes) 67% -3% 191Nature observation of all types (viewing, identifying, photographing) 57% -3% 163Sledding and snow tubing 56% -3% 161
Moderately white, non-HispanicHunting waterfowl, upland game birds, and other small game -49% 2% 139Horseback riding -38% 2% 108
Moderately non-white and/or HispanicRunning or jogging 51% -2% 146Visiting outdoor zoos 46% -2% 132Viewing, identifying or photographing birds and other wildlife 44% -2% 126Biking on dirt trails 40% -2% 115Driving for pleasure on scenic roads or in a park 35% -2% 101
Slightly white, non-HispanicFishing from shore or dock -33% 2% 93Fishing from a boat -32% 1% 91Golfing -31% 1% 90Offroad ATV driving -30% 1% 87Gather mushrooms, berries, or other wild foods -30% 1% 86Camping using a tent -28% 1% 80Camping of all types -27% 1% 78Fishing of all types -26% 1% 76Camping using a tent for backpacking or canoe-in/boat-in camping -25% 1% 71Motor boating of all types, including fishing from a boat -23% 1% 66Ice skating/hockey outdoors -20% 1% 59
Slightly non-white and/or HispanicSwimming or wading in an outdoor pool or water park 31% -1% 89Picnicking 25% -1% 71Visiting historic or archaeological sites 23% -1% 67Inline skating, rollerblading, roller skating, roller skiing 21% -1% 61Walking/hiking (walking of hiking outdoors for exercise or pleasure) 20% -1% 56Biking (bicycling outdoors of all types, including mountain biking) 19% -1% 54
Activity associations with: Race, ethnicity
------------- Percent deviation from average activity profile* -------------
Very little associationDownhill skiing/snowboarding 2% 0% 6Visiting nature centers 5% 0% 15Boating of all types, excluding fishing from a boat -8% 0% 23Swimming or wading in a lake or stream 10% 0% 29Boating of all types, including fishing from a boat -13% 1% 37Swimming or wading (all places) 14% -1% 39Non-motorized boating of all types, excluding fishing -14% 1% 41Canoeing/kayaking, excluding fishing -15% 1% 44Snowmobiling -17% 1% 48Outdoor field sports (e.g., soccer, softball/baseball, football) -17% 1% 49Motor boating of all types, excluding fishing from a boat -17% 1% 50Camping using a camping vehicle (e.g., pop-up/hard-sided trailer) -17% 1% 50
* Average distribution of participants across all activities for this demographic characteristic, totaling 100%, is =
4% 96%
** Index measures the size of the deviation from the average activity profile; an index of 100 is the typical size of deviation across activities. An index greater than 150 is considered "strong", while from 101 to 150 is "moderate", from 51 to 100 is "slight", and 50 or less is considered "very little association".
Table 12

2004 Minnesota Outdoor Recreation Participation Survey44
Certain activities are strongly associated with more formal education (e.g., snowskiing and running/jogging), while others are strongly associated with less formaleducation (e.g., ATV riding, hunting, snowmobiling) (see Table 13). Mostactivities, however, have little association, or only a slight association, with thisdemographic characteristic
Index of outdoor recreation use (hours) by formal education
105100112
72
0
20
40
60
80
100
120
140
High school graduate, orsome high school
Vocational/technicalschool, associate
degree, or some college
Graduated from college Some postgraduatestudy, including
postgraduate degrees
Per
cap
ita in
dex
(100
=ave
rage
)
Education attainment trends in U.S.(people 25 years or older)
0%
10%
20%
30%
40%
50%
60%
70%
80%
90%
100%
1940 1950 1959 1970 1980 1990 2000
Per
cent
of p
opul
atio
n
Completed 4 Years ofCollege or more
Completed at least 4 yearsof High School
Completed fewer than 4years of High School
Figure 14
Figure 15

45Minnesota Department of Natural Resources
Table 13
Activity
High school graduate, or some
high school
Vocational/technical school, associate degree, or some
collegeGraduated from
college
Some postgraduate study, including
postgraduate degrees
Deviation index**
Strongly more formal educationCross country skiing -69% -56% 25% 93% 304Downhill skiing/snowboarding -45% -36% 38% 35% 194Running or jogging -86% -14% 26% 35% 161
Strongly less formal educationOffroad ATV driving 85% 34% -29% -62% 238Hunting big game (e.g., deer, bear, moose) 92% 23% -29% -49% 204Hunting of all types 82% 24% -27% -47% 194Snowmobiling 44% 34% -19% -52% 186Hunting waterfowl, upland game birds, and other small game 67% 25% -19% -50% 181
Moderately more formal educationNon-motorized boating of all types, excluding fishing -62% -17% 7% 48% 142Canoeing/kayaking, excluding fishing -59% -16% 8% 46% 138Snowshoeing -63% -2% -15% 50% 128Ice skating/hockey outdoors -57% -12% 20% 25% 119
Moderately less formal educationCamping using a camping vehicle (e.g., pop-up/hard-sided trailer) 83% 12% -13% -45% 150Fishing from a boat 42% 20% -12% -38% 131Fishing from shore or dock 55% 13% -19% -26% 118Fishing of all types 44% 13% -13% -27% 106
Moderate association--no apparent patternHorseback riding -31% 24% -37% 20% 143
Slightly more formal educationViewing, identifying or photographing wildflowers, trees, natural vegetation -31% -3% -8% 28% 71Biking on dirt trails -46% 3% 6% 11% 58Biking (bicycling outdoors of all types, including mountain biking) -25% -6% 15% 6% 56
Slightly "more middle" formal educationCamping using a tent for backpacking or canoe-in/boat-in camping -30% -1% 31% -19% 87Inline skating, rollerblading, roller skating, roller skiing -26% -3% 27% -13% 76Camping using a tent 6% -9% 22% -14% 68Outdoor court sports (e.g., volleyball, basketball, tennis, horseshoes) -14% -4% 23% -11% 63
Slightly less formal educationGather mushrooms, berries, or other wild foods 38% 4% -30% 9% 85Motor boating of all types, including fishing from a boat 31% 11% -1% -31% 81Camping of all types 37% -1% 11% -29% 77Motor boating of all types, excluding fishing from a boat 15% 12% 2% -27% 68Boating of all types, including fishing from a boat 21% 7% -4% -17% 54
Activity associations with: Formal education
--------------------- Percent deviation from average activity profile* ---------------------
Very little associationWalking/hiking (walking of hiking outdoors for exercise or pleasure) 15% -1% 0% -6% 19Swimming or wading (all places) 9% 2% 1% -8% 21Boating of all types, excluding fishing from a boat 1% 5% -1% -8% 22Picnicking 22% 1% -4% -8% 31Viewing, identifying or photographing birds and other wildlife 5% 0% -11% 10% 31Swimming or wading in a lake or stream 0% 6% 4% -13% 32Swimming or wading in an outdoor pool or water park 0% -8% 8% 4% 32Nature observation of all types (viewing, identifying, photographing) -4% 0% -10% 13% 34Visiting historic or archaeological sites -5% -2% -7% 13% 34Visiting outdoor zoos -4% -9% 8% 6% 39Outdoor field sports (e.g., soccer, softball/baseball, football) 0% -1% 15% -15% 41Driving for pleasure on scenic roads or in a park 19% 5% -6% -10% 42Golfing 5% -9% 14% -4% 45Visiting nature centers 3% 0% -17% 17% 48Sledding and snow tubing -40% 1% 7% 10% 50
* Average distribution of participants across all activities for this demographic characteristic, totaling 100%, is =
12% 37% 27% 24%
** Index measures the size of the deviation from the average activity profile; an index of 100 is the typical size of deviation across activities. An index greater than 150 is considered "strong", while from 101 to 150 is "moderate", from 51 to 100 is "slight", and 50 or less is considered "very little association".
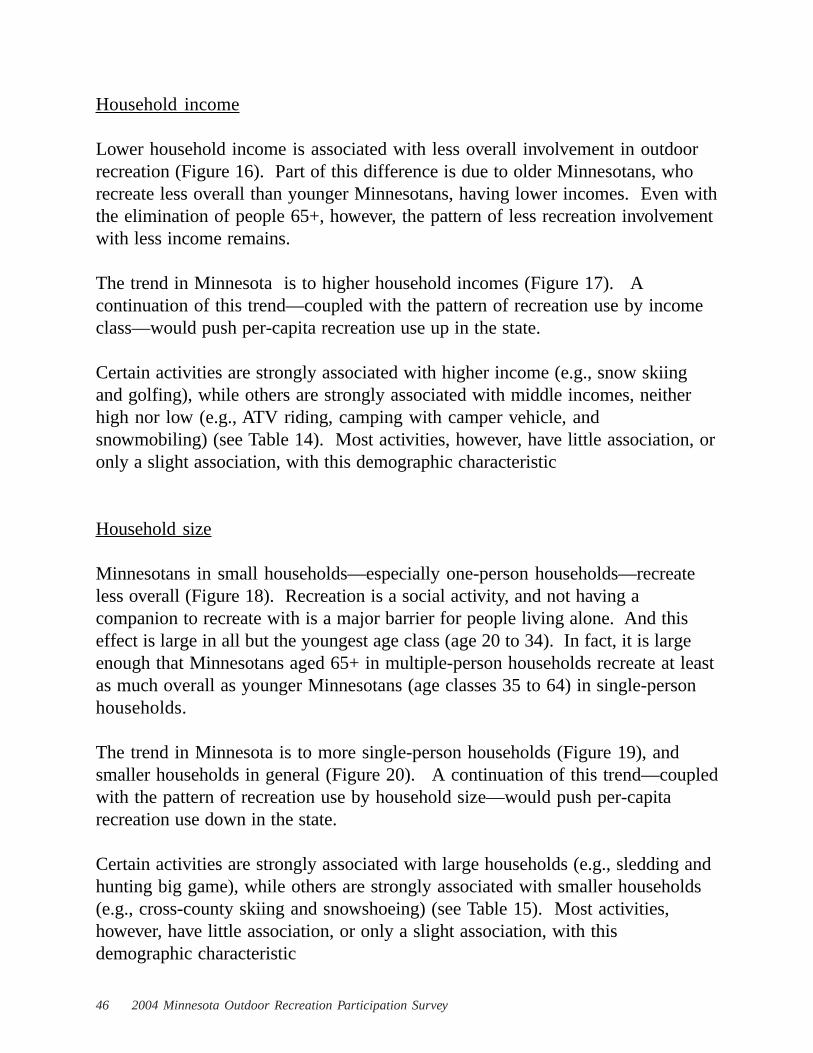
2004 Minnesota Outdoor Recreation Participation Survey46
Household income
Lower household income is associated with less overall involvement in outdoorrecreation (Figure 16). Part of this difference is due to older Minnesotans, whorecreate less overall than younger Minnesotans, having lower incomes. Even withthe elimination of people 65+, however, the pattern of less recreation involvementwith less income remains.
The trend in Minnesota is to higher household incomes (Figure 17). Acontinuation of this trend—coupled with the pattern of recreation use by incomeclass—would push per-capita recreation use up in the state.
Certain activities are strongly associated with higher income (e.g., snow skiingand golfing), while others are strongly associated with middle incomes, neitherhigh nor low (e.g., ATV riding, camping with camper vehicle, andsnowmobiling) (see Table 14). Most activities, however, have little association, oronly a slight association, with this demographic characteristic
Household size
Minnesotans in small households—especially one-person households—recreateless overall (Figure 18). Recreation is a social activity, and not having acompanion to recreate with is a major barrier for people living alone. And thiseffect is large in all but the youngest age class (age 20 to 34). In fact, it is largeenough that Minnesotans aged 65+ in multiple-person households recreate at leastas much overall as younger Minnesotans (age classes 35 to 64) in single-personhouseholds.
The trend in Minnesota is to more single-person households (Figure 19), andsmaller households in general (Figure 20). A continuation of this trend—coupledwith the pattern of recreation use by household size—would push per-capitarecreation use down in the state.
Certain activities are strongly associated with large households (e.g., sledding andhunting big game), while others are strongly associated with smaller households(e.g., cross-county skiing and snowshoeing) (see Table 15). Most activities,however, have little association, or only a slight association, with thisdemographic characteristic

47Minnesota Department of Natural Resources
Index of outdoor recreation use (hours) by annual household income
126
10810610792
71
0
20
40
60
80
100
120
140
under $30,000 $30,000 to$39,999
$40,000 to$49,999
$50,000 to$74,999
$75,000 to$99,999
$100,000 ormore
Per
cap
ita in
dex
(100
=av
erag
e)
Median annual household income trend in Minnesota(adjusted to 2000 dollars using the CPI-U)
$0
$10,000
$20,000
$30,000
$40,000
$50,000
$60,000
1969 1979 1989 1999
Figure 16
Figure 17

2004 Minnesota Outdoor Recreation Participation Survey48
Activityunder
$30,000$30,000 to
$39,999$40,000 to
$49,999$50,000 to
$74,999$75,000 to
$99,999$100,000 or
moreDeviation index**
Strongly higher incomeCross country skiing -26% -40% -34% 13% -26% 64% 230Downhill skiing/snowboarding 5% -16% -41% -20% 8% 56% 182Golfing -34% -19% -10% -10% 33% 33% 156
Strongly more middle incomeOffroad ATV driving -32% -13% 51% 24% -28% -19% 191Camping using a camping vehicle (e.g., pop-up/hard-sided trailer) 19% 12% -23% 30% -18% -35% 175Snowmobiling -43% 14% -2% 28% 19% -31% 173
Moderately higher incomeIce skating/hockey outdoors -47% -3% -2% -6% -3% 46% 130Hunting waterfowl, upland game birds, and other small game -24% -50% 4% 21% 15% 3% 128
Moderately lower incomeGather mushrooms, berries, or other wild foods 48% 18% -27% 2% 8% -35% 147Snowshoeing 37% -8% -15% -13% 21% -7% 112
Slightly higher incomeRunning or jogging -29% -21% 6% 1% -4% 29% 98Biking on dirt trails 3% -26% -5% -8% -6% 33% 96Horseback riding 4% -28% 4% -12% 0% 28% 94Non-motorized boating of all types, excluding fishing -14% 3% -27% 5% 11% 11% 76Canoeing/kayaking, excluding fishing -15% 6% -23% 2% 13% 10% 73
Slightly more middle incomeInline skating, rollerblading, roller skating, roller skiing -19% 2% 45% -14% 5% 0% 96Hunting of all types -2% -33% 3% 21% -4% -8% 88Hunting big game (e.g., deer, bear, moose) 1% -36% -4% 20% 1% -7% 84Boating of all types, excluding fishing from a boat -21% 20% -4% -6% 10% 7% 71Motor boating of all types, excluding fishing from a boat -29% 21% -1% -1% 7% 6% 64Viewing, identifying or photographing wildflowers, trees, natural vegetation 3% 26% 8% -8% -4% -8% 62Sledding and snow tubing -18% -3% 11% 1% 18% -8% 61
Slightly lower incomeVisiting historic or archaeological sites 15% 26% 15% -8% -22% -8% 97Camping of all types 7% 16% -4% 12% 1% -29% 89Picnicking 34% 9% 4% -8% -11% -13% 87Driving for pleasure on scenic roads or in a park 30% 18% -2% -8% -3% -16% 87Outdoor court sports (e.g., volleyball, basketball, tennis, horseshoes) 11% 7% 14% -7% 12% -19% 81Visiting outdoor zoos 29% 14% -6% -5% -7% -13% 80Camping using a tent 8% 18% -1% 5% 6% -27% 77Walking/hiking (walking of hiking outdoors for exercise or pleasure) 23% 14% 3% -10% 1% -12% 74Visiting nature centers 8% 17% 15% -8% -7% -8% 70Camping using a tent for backpacking or canoe-in/boat-in camping 22% 3% -6% 0% 11% -20% 69Viewing, identifying or photographing birds and other wildlife 12% 20% 2% -5% -3% -12% 60Nature observation of all types (viewing, identifying, photographing) 14% 16% 2% -8% 1% -9% 58
Slight association--no apparent patternOutdoor field sports (e.g., soccer, softball/baseball, football) 5% 2% 8% -7% -14% 10% 56
Activity associations with: Household income
--------------------- Percent deviation from average activity profile* ---------------------
Very little associationBoating of all types, including fishing from a boat -6% 14% 1% -5% 5% -1% 35Swimming or wading (all places) 6% 16% -1% -3% -4% -6% 39Swimming or wading in an outdoor pool or water park 2% 1% 10% 3% -22% 4% 44Swimming or wading in a lake or stream 6% 20% -11% 0% 1% -9% 46Fishing from a boat -6% -7% 7% 4% 8% -8% 46Fishing of all types 7% -9% 6% 3% 6% -12% 48Motor boating of all types, including fishing from a boat -10% 16% 5% -4% 7% -4% 48Biking (bicycling outdoors of all types, including mountain biking) -10% -9% -5% -1% -1% 18% 49Fishing from shore or dock 8% 2% 1% 4% 6% -18% 50
* Average distribution of participants across all activities for this demographic characteristic, totaling 100%, is =
14% 11% 13% 28% 14% 20%
** Index measures the size of the deviation from the average activity profile; an index of 100 is the typical size of deviation across activities. An index greater than 150 is considered "strong", while from 101 to 150 is "moderate", from 51 to 100 is "slight", and 50 or less is considered "very little association".
Table 14
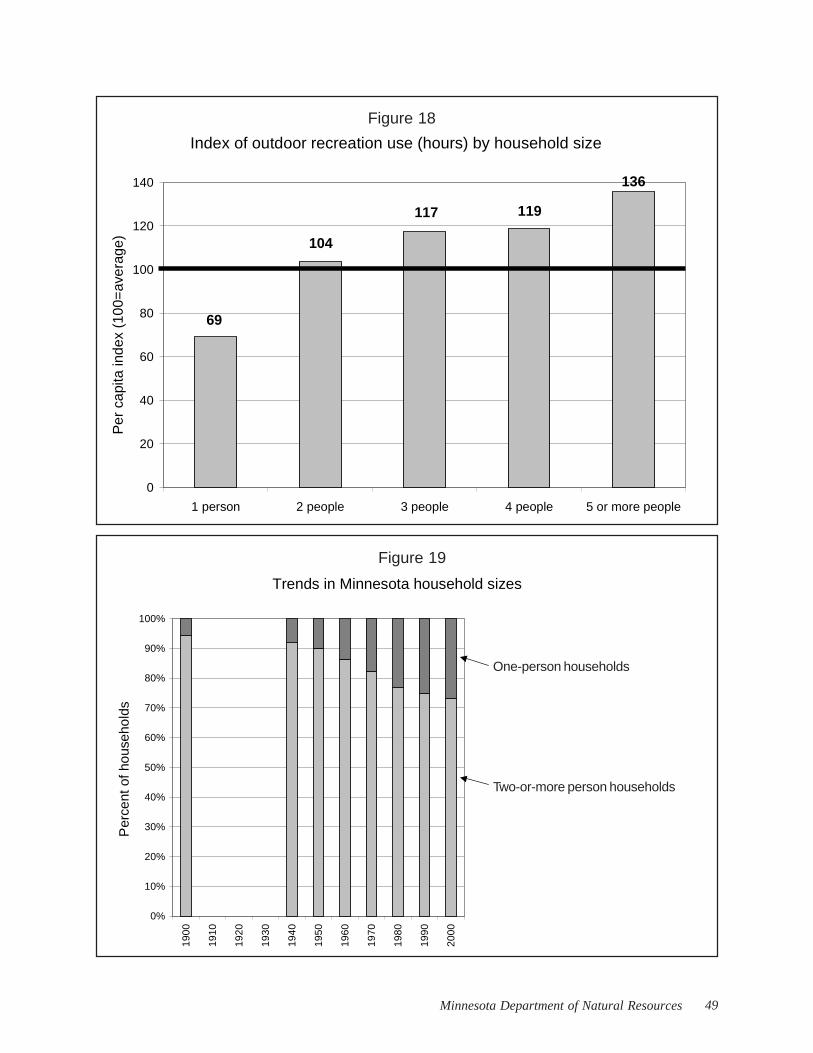
49Minnesota Department of Natural Resources
Index of outdoor recreation use (hours) by household size
136
119117
104
69
0
20
40
60
80
100
120
140
1 person 2 people 3 people 4 people 5 or more people
Per
cap
ita in
dex
(100
=av
erag
e)
Trends in Minnesota household sizes
0%
10%
20%
30%
40%
50%
60%
70%
80%
90%
100%
1900
1910
1920
1930
1940
1950
1960
1970
1980
1990
2000
Per
cent
of h
ouse
hold
sFigure 18
Figure 19
One-person households
Two-or-more person households

2004 Minnesota Outdoor Recreation Participation Survey50
Trends in Minnesota household sizes
2.62.72.8
3.33.43.53.8
4.24.5
5.05.2
0
1
2
3
4
5
619
00
1910
1920
1930
1940
1950
1960
1970
1980
1990
2000
Ave
rage
hou
seho
ld s
ize
Figure 20
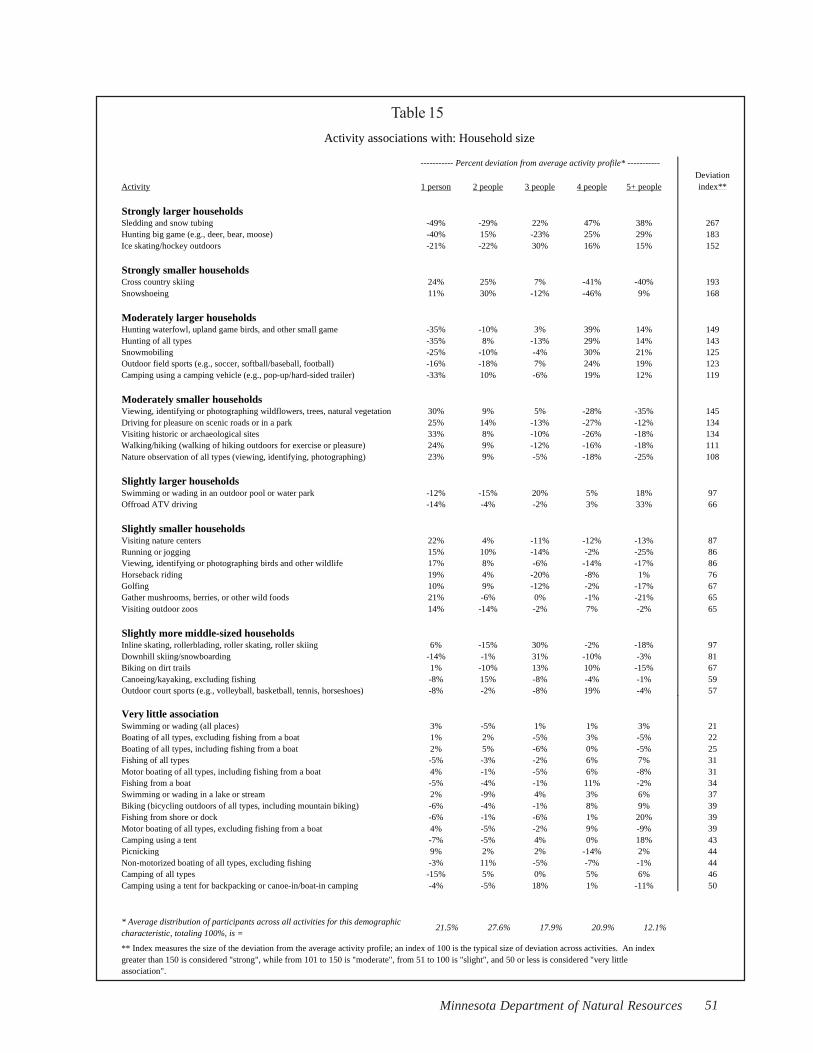
51Minnesota Department of Natural Resources
Table 15
Activity 1 person 2 people 3 people 4 people 5+ peopleDeviation index**
Strongly larger householdsSledding and snow tubing -49% -29% 22% 47% 38% 267Hunting big game (e.g., deer, bear, moose) -40% 15% -23% 25% 29% 183Ice skating/hockey outdoors -21% -22% 30% 16% 15% 152
Strongly smaller householdsCross country skiing 24% 25% 7% -41% -40% 193Snowshoeing 11% 30% -12% -46% 9% 168
Moderately larger householdsHunting waterfowl, upland game birds, and other small game -35% -10% 3% 39% 14% 149Hunting of all types -35% 8% -13% 29% 14% 143Snowmobiling -25% -10% -4% 30% 21% 125Outdoor field sports (e.g., soccer, softball/baseball, football) -16% -18% 7% 24% 19% 123Camping using a camping vehicle (e.g., pop-up/hard-sided trailer) -33% 10% -6% 19% 12% 119
Moderately smaller householdsViewing, identifying or photographing wildflowers, trees, natural vegetation 30% 9% 5% -28% -35% 145Driving for pleasure on scenic roads or in a park 25% 14% -13% -27% -12% 134Visiting historic or archaeological sites 33% 8% -10% -26% -18% 134Walking/hiking (walking of hiking outdoors for exercise or pleasure) 24% 9% -12% -16% -18% 111Nature observation of all types (viewing, identifying, photographing) 23% 9% -5% -18% -25% 108
Slightly larger householdsSwimming or wading in an outdoor pool or water park -12% -15% 20% 5% 18% 97Offroad ATV driving -14% -4% -2% 3% 33% 66
Slightly smaller householdsVisiting nature centers 22% 4% -11% -12% -13% 87Running or jogging 15% 10% -14% -2% -25% 86Viewing, identifying or photographing birds and other wildlife 17% 8% -6% -14% -17% 86Horseback riding 19% 4% -20% -8% 1% 76Golfing 10% 9% -12% -2% -17% 67Gather mushrooms, berries, or other wild foods 21% -6% 0% -1% -21% 65Visiting outdoor zoos 14% -14% -2% 7% -2% 65
Slightly more middle-sized householdsInline skating, rollerblading, roller skating, roller skiing 6% -15% 30% -2% -18% 97Downhill skiing/snowboarding -14% -1% 31% -10% -3% 81Biking on dirt trails 1% -10% 13% 10% -15% 67Canoeing/kayaking, excluding fishing -8% 15% -8% -4% -1% 59Outdoor court sports (e.g., volleyball, basketball, tennis, horseshoes) -8% -2% -8% 19% -4% 57
Activity associations with: Household size
----------- Percent deviation from average activity profile* -----------
Very little associationSwimming or wading (all places) 3% -5% 1% 1% 3% 21Boating of all types, excluding fishing from a boat 1% 2% -5% 3% -5% 22Boating of all types, including fishing from a boat 2% 5% -6% 0% -5% 25Fishing of all types -5% -3% -2% 6% 7% 31Motor boating of all types, including fishing from a boat 4% -1% -5% 6% -8% 31Fishing from a boat -5% -4% -1% 11% -2% 34Swimming or wading in a lake or stream 2% -9% 4% 3% 6% 37Biking (bicycling outdoors of all types, including mountain biking) -6% -4% -1% 8% 9% 39Fishing from shore or dock -6% -1% -6% 1% 20% 39Motor boating of all types, excluding fishing from a boat 4% -5% -2% 9% -9% 39Camping using a tent -7% -5% 4% 0% 18% 43Picnicking 9% 2% 2% -14% 2% 44Non-motorized boating of all types, excluding fishing -3% 11% -5% -7% -1% 44Camping of all types -15% 5% 0% 5% 6% 46Camping using a tent for backpacking or canoe-in/boat-in camping -4% -5% 18% 1% -11% 50
* Average distribution of participants across all activities for this demographic characteristic, totaling 100%, is =
21.5% 27.6% 17.9% 20.9% 12.1%
** Index measures the size of the deviation from the average activity profile; an index of 100 is the typical size of deviation across activities. An index greater than 150 is considered "strong", while from 101 to 150 is "moderate", from 51 to 100 is "slight", and 50 or less is considered "very little association".
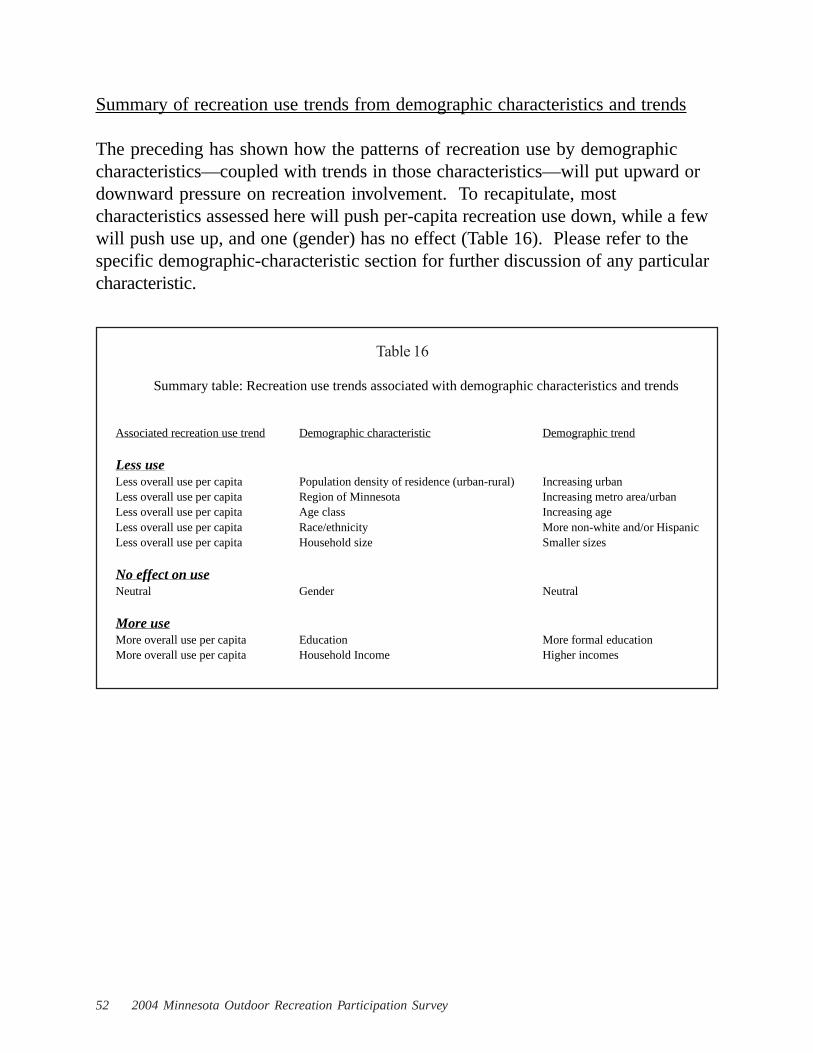
2004 Minnesota Outdoor Recreation Participation Survey52
Summary of recreation use trends from demographic characteristics and trends
The preceding has shown how the patterns of recreation use by demographiccharacteristics—coupled with trends in those characteristics—will put upward ordownward pressure on recreation involvement. To recapitulate, mostcharacteristics assessed here will push per-capita recreation use down, while a fewwill push use up, and one (gender) has no effect (Table 16). Please refer to thespecific demographic-characteristic section for further discussion of any particularcharacteristic.
Associated recreation use trend Demographic characteristic Demographic trend
Less useLess overall use per capita Population density of residence (urban-rural) Increasing urbanLess overall use per capita Region of Minnesota Increasing metro area/urbanLess overall use per capita Age class Increasing ageLess overall use per capita Race/ethnicity More non-white and/or HispanicLess overall use per capita Household size Smaller sizes
No effect on useNeutral Gender Neutral
More useMore overall use per capita Education More formal educationMore overall use per capita Household Income Higher incomes
Summary table: Recreation use trends associated with demographic characteristics and trends
Table 16

53Minnesota Department of Natural Resources
Demographic clusters of activities
In the preceding sections, it is evident that certain activities have commondemographic profiles. For example, ATV riding and hunting usually show up assimilar with respect to demographic characteristics. Other activities share similardemographic profiles, too.
To examine which activities have similar demographic profiles, all 32 activitieswere entered into hierarchical cluster analysis. The 32 activities excludecombination activities (e.g., tent camping and camper-vehicle camping were partof the analysis, but not their combination “camping of all types”).
The demographic characteristics entered into the analysis are all of the preceding,excluding region of residence: population density of residence (urban to ruralcontinuum), age class, gender, race/ethnicity, educational attainment, householdincome, and household size. Region of residence was excluded because it largelymeasured the same characteristic as population density of residence. To ensurethat every characteristic was treated equally in the analysis, all variables werestandardized prior to analysis.
Cluster analysis proceeds from an initial start of 32 clusters (one for each activity),then to the stage of 31 clusters (nearest two clusters merged), then to the stage of30 (nearest two clusters merged again) and proceeds on to the stage of one singlecluster containing all activities. At each stage of the clustering, a similaritycoefficient measures how alike the two clusters that merged at the stage are.Examining the changes in the similar coefficient across stages helps with theselection of the number of clusters.
The number of activity clusters selected was six. Six is the smallest number ofclusters before further clustering becomes noticeably and progressively moredissimilar (Table 17). At six clusters, however, there are four main clusters, eachwith four or more activities, and two secondary clusters, comprised of the threesmallest activities. One secondary cluster contained two activities (horsebackriding and snowshoeing), and the other contained the single activity cross-countryskiing. Since these three smallest activities (which together account for less than1% of all activity time) had associated small sample sizes in the survey, at leastpart of their demographic profiles may be a product of sampling variation. Forthis reason, and to simplify the presentation, the two secondary clusters were“placed” into one of the four main clusters where they fit “best”.

2004 Minnesota Outdoor Recreation Participation Survey54
The decision on “best” fit was made inthe following way: the cluster ofhorseback riding/snowshoeing mergedwith one of the four main clusters at asubsequent stage, so it was placed inthat cluster (“active recreation activities”cluster); the other secondary clustercomprised of cross-country skiing nevermerged with another cluster until thefinal one-cluster stage, and it was“placed” based on judgement (placedinto “active recreation activities”cluster).
The four activity clusters are: (1)hunting and motorized trail activities,(2) passive recreation and learning-related activities, (3) active recreationactivities, and (4) boating/fishing/camping/golfing activities, for lack of abetter descriptor (Tables 18 to 21).
The “hunting and motorized trail activities” cluster contains 10 percent of allrecreation by Minnesota adults, and has the following distinctive demographics:more rural, more male, less formal education, more middle income, and largerhouseholds (Table 18). To illustrate some of these distinctive demographics, ruralmen invest 21 percent of their total recreation time on activities in this cluster,while urban women invest 1 percent (here “rural” is lowest and “urban” is highestpopulation-density class). The activities in this cluster are big-game and small-game hunting, snowmobiling, and ATV driving.
The “passive recreation and learning-related activities” cluster contains 40 percentof all recreation by Minnesota adults, and has the following distinctivedemographics: older, more female, and smaller households (Table 19). Toillustrate some of these distinctive demographics, older women (aged 65+) invest77 percent of their total recreation time on activities in this cluster, while youngermen (aged 20 to 35) invest 23 percent. The activities in this cluster includewalking/hiking, nature observation, and visiting nature centers, historic/archaeological sites and outdoor zoos.
Number of activity clusters
Change in similarity coefficient when this
number of clusters formed15 0.0114 0.0313 0.3412 0.0811 0.0210 0.249 0.098 0.057 0.026 0.035 0.274 1.143 0.722 1.291 1.25
Selection of number of activity clusters(32 activities entered into analysis)
Table 17

55Minnesota Department of Natural Resources
The “active recreation activities” cluster contains 26 percent of all recreation byMinnesota adults, and has the following distinctive demographics: younger, moreurban, and more formal education (Table 20). To illustrate some of thesedistinctive demographics, younger urban dwellers (aged 20 to 45 in highestpopulation density class) invest 40 percent of their total recreation time onactivities in this cluster, while older rural dwellers (aged 55+ in lowest populationdensity class) invest 11 percent. The activities in this cluster include swimming,
#2: Passive Recreation and Learning-Related Activities(40% of total recreation hours)
Activities: Walking/hiking (walking of hiking outdoors for exercise or pleasure)Viewing, identifying or photographing birds and other wildlifeViewing, identifying or photographing wildflowers, trees or other natural vegetationPicnickingDriving for pleasure on scenic roads or in a parkVisiting nature centersVisiting historic or archaeological sitesVisiting outdoor zoosGather mushrooms, berries, or other wild foods
Distinctive demographic characteristics:OlderMore femaleSmaller households
Table 19
Table 18
#1: Hunting and Motorized Trail Activities(10% of total recreation hours)
Activities: Hunting big game (e.g., deer, bear, moose)Hunting waterfowl, upland game birds, and other small gameOffroad ATV drivingSnowmobiling
Distinctive demographic characteristics:More low density (rural)More maleLess formal educationMore middle incomeLarger households

2004 Minnesota Outdoor Recreation Participation Survey56
biking, running/jogging, outdoor field/court sports, tent camping, inline skating,non-motorized boating, and downhill skiing/snowboarding.
The “boating/fishing/camping/golfing activities” cluster contains 24 percent of allrecreation by Minnesota adults, and has the following distinctive demographics:less urban and more male (Table 21). To illustrate some of these distinctivedemographics, rural men (lowest population density class) invest 30 percent oftheir total recreation time on activities in this cluster, while urban women (highestpopulation density class) invest 11 percent. The activities in this cluster are motorboating, fishing, camper-vehicle camping, and golfing.
#3: Active Recreation Activities(26% of total recreation hours)
Activities: Swimming or wading in a lake or streamSwimming or wading in an outdoor pool or water parkBiking (bicycling outdoors of all types, including mountain biking)Running or joggingOutdoor field sports (e.g., soccer, softball/baseball, football)Outdoor court sports (e.g., volleyball, basketball, tennis, horseshoes)Camping using a tentInline skating, rollerblading, roller skating, roller skiingNon-motorized boating of all types (mainly canoeing)Downhill skiing/snowboardingSledding and snow tubingIce skating/hockey outdoorsCross country skiing**Horseback riding**Snowshoeing**
** Placed in this cluster: except for cross-county skiing, the activities joined this cluster at subsequent clustering stages.
Distinctive demographic characteristics:More high density (urban)YoungerMore formal education
Table 20

57Minnesota Department of Natural Resources
#4: Boating/Fishing/Camping/Golfing(24% of total recreation hours)
Activities: Motor boating of all types, including fishing from a boatFishingCamping using a camping vehicle (e.g., pop-up/hard-sided trailer, 3rd wheel, motorhome)Golfing
Distinctive demographic characteristics:Less high density (less urban)More male
Table 21
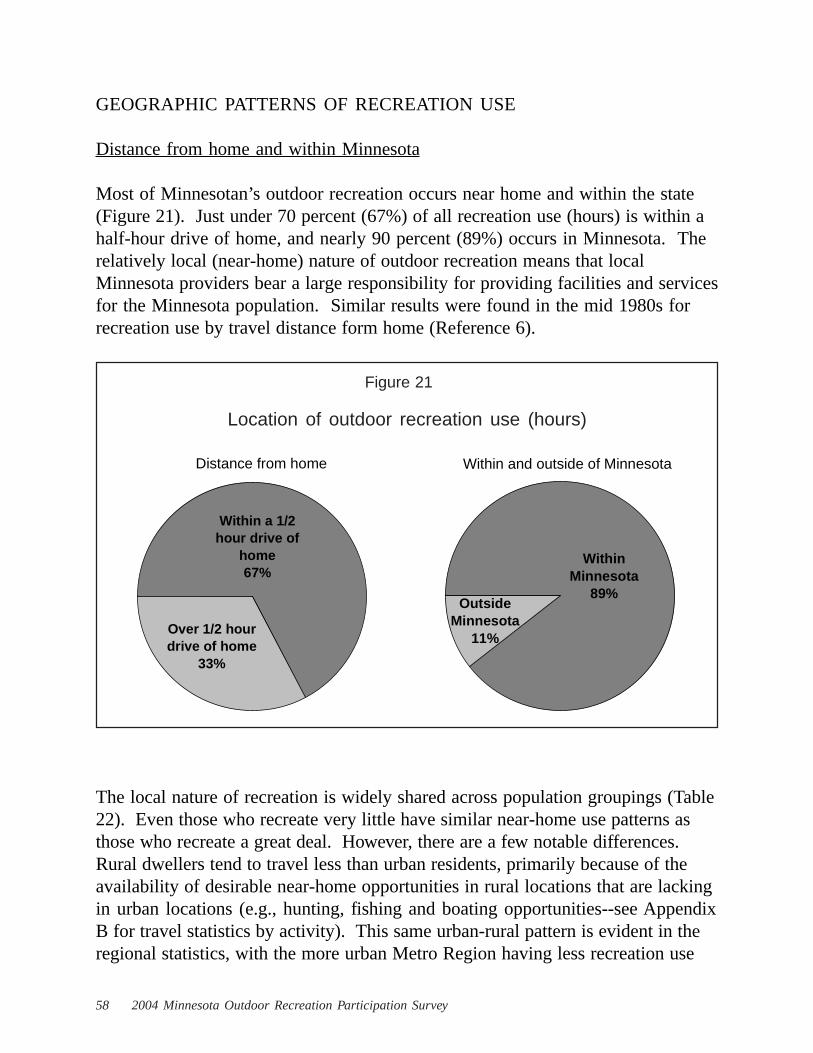
2004 Minnesota Outdoor Recreation Participation Survey58
GEOGRAPHIC PATTERNS OF RECREATION USE
Distance from home and within Minnesota
Most of Minnesotan’s outdoor recreation occurs near home and within the state(Figure 21). Just under 70 percent (67%) of all recreation use (hours) is within ahalf-hour drive of home, and nearly 90 percent (89%) occurs in Minnesota. Therelatively local (near-home) nature of outdoor recreation means that localMinnesota providers bear a large responsibility for providing facilities and servicesfor the Minnesota population. Similar results were found in the mid 1980s forrecreation use by travel distance form home (Reference 6).
The local nature of recreation is widely shared across population groupings (Table22). Even those who recreate very little have similar near-home use patterns asthose who recreate a great deal. However, there are a few notable differences.Rural dwellers tend to travel less than urban residents, primarily because of theavailability of desirable near-home opportunities in rural locations that are lackingin urban locations (e.g., hunting, fishing and boating opportunities--see AppendixB for travel statistics by activity). This same urban-rural pattern is evident in theregional statistics, with the more urban Metro Region having less recreation use
Distance from home
Over 1/2 hour drive of home
33%
Within a 1/2 hour drive of
home67%
Location of outdoor recreation use (hours)
Within and outside of Minnesota
Within Minnesota
89%Outside
Minnesota11%
Figure 21

59Minnesota Department of Natural Resources
Loc
atio
n of
out
door
rec
reat
ion
use
(hou
rs)
by d
ista
nce
from
hom
e an
d oc
curr
ence
in M
inne
sota
Pop
ulat
ion
grou
ping
Perc
ent w
ithi
n 1/
2 ho
ur d
rive
of
hom
ePe
rcen
t with
in
Min
neso
ta
OV
ER
AL
L67
%89
%
Rec
reat
ion
days
in la
st 1
2 m
onth
sL
ess
than
onc
e a
mon
th (
1 to
10
days
)72
%89
%O
nce
a m
onth
to o
nce
a w
eek
(11
to 5
0 da
ys)
64%
87%
Onc
e to
twic
e a
wee
k (5
1 to
100
day
s)65
%88
%
Mor
e th
an tw
ice
a w
eek
(101
+ da
ys)
69%
90%
Pop
ulat
ion
dens
ity
of r
esid
ence
(b
ased
on
5-di
git z
ip c
odes
in 2
000)
Low
(10
0 pe
ople
per
squ
are
mil
e or
less
)72
%92
%M
ediu
m (
101
to 1
000)
65%
89%
Hig
h (m
ore
than
100
0)65
%88
%
Reg
ion
of M
inne
sota
Nor
thw
est
73%
93%
Nor
thea
st72
%91
%So
uth
71%
89%
Cen
tral
65%
92%
Met
ro (
seve
n co
unty
)64
%88
%
Age
20-3
465
%92
%35
-44
71%
89%
45-5
467
%89
%55
-64
65%
87%
65+
66%
86%
Gen
der M
ale
63%
89%
Fem
ale
73%
90%
Pop
ulat
ion
grou
ping
Perc
ent w
ithi
n 1/
2 ho
ur d
rive
of
hom
ePe
rcen
t wit
hin
Min
neso
ta
Rac
e/et
hnic
ity
Non
-whi
te a
nd/o
r H
ispa
nic*
80%
95%
Whi
te, n
on-H
ispa
nic
66%
89%
Edu
cati
onH
igh
scho
ol g
radu
ate,
or
som
e hi
gh s
choo
l66
%92
%V
ocat
iona
l/tec
hnic
al s
choo
l, as
soci
ate
degr
ee,
or s
ome
colle
ge66
%90
%
Gra
duat
ed f
rom
col
lege
68%
87%
Som
e po
stgr
adua
te s
tudy
, inc
ludi
ng
post
grad
uate
deg
rees
70%
88%
Hou
seho
ld in
com
eun
der
$30,
000
69%
90%
$30,
000
to $
39,9
9973
%91
%$4
0,00
0 to
$49
,999
68%
92%
$50,
000
to $
74,9
9968
%91
%$7
5,00
0 to
$99
,999
62%
88%
$100
,000
or
mor
e65
%88
%
Hou
seho
ld s
ize
1 pe
rson
67%
90%
2 pe
ople
65%
86%
3 pe
ople
72%
91%
4 pe
ople
64%
90%
5+ p
eopl
e72
%92
%
* Fe
wer
than
100
res
pond
ents
in th
is b
reak
dow
n.
Tabl
e 22

2004 Minnesota Outdoor Recreation Participation Survey60
near home. In addition, men tend to travel further than women, and white/non-Hispanics more than non-white and/or Hispanics.
Certain activities are more locally-based than others (Table 23). Activities such asice skating, running/jogging and inline skating have over 90 percent of theirrecreation time within a half-hour of home. At the other extreme, are the activitiesfor which Minnesotans (and other Midwest residents) travel away from home.
Table 23
Travel group Activity
Percent of activity time within 1/2 hour
drive of home
Percent of activity time within Minnesota
NEAR HOME (more than 80% within 1/2 hour of home)Ice skating/hockey outdoors 94% 99%Running or jogging 93% 96%Sledding and snow tubing 93% 98%Inline skating, rollerblading, roller skating, roller skiing 91% 97%Outdoor court sports (e.g., volleyball, basketball, tennis, horseshoes) 88% 96%
Horseback riding 86% 89%Biking (bicycling outdoors of all types, including mountain biking) 86% 94%Walking/hiking (walking of hiking outdoors for exercise or pleasure) 82% 92%Outdoor field sports (e.g., soccer, softball/baseball, football) 82% 95%Viewing, identifying or photographing birds and other wildlife 81% 91%
Swimming or wading in an outdoor pool or water park 81% 84%
TYPICAL (60% to 80% within 1/2 hour of home)Viewing, identifying or photographing wildflowers, trees or other natural vegetation 78% 90%Cross country skiing 76% 87%Golfing 74% 87%Gather mushrooms, berries, or other wild foods 73% 92%Picnicking 69% 89%
Visiting nature centers 69% 89%Visiting outdoor zoos 68% 91%Offroad ATV driving 64% 94%Snowmobiling 64% 86%Snowshoeing 61% 81%
AWAY FROM HOME (less than 60% within 1/2 hour of home )Camping using a tent 22% 82%Camping using a camping vehicle (e.g., pop-up/hard-sided trailer, 3rd wheel, motorhome) 25% 79%Visiting historic or archaeological sites 35% 64%Nonmotorized boating (excluding fishing) 40% 86%Downhill skiing/snowboarding 43% 71%
Motorboating (excluding fishing) 50% 91%Fishing 51% 88%Hunting waterfowl, upland game birds, and other small game 52% 90%Hunting big game (e.g., deer, bear, moose) 53% 91%Driving for pleasure on scenic roads or in a park 53% 85%
Swimming or wading in a lake or stream 56% 85%
Location of outdoor recreation use (hours) from home and within Minnesota by activity

61Minnesota Department of Natural Resources
Table 24
Table 25
These activities form the backbone of Minnesota’s outdoor recreation tourismindustry, much of which is water-based (e.g., boating, fishing, swimming) orotherwise water-related (e.g.,camping).
Viewed from a differentperspective, overall near-home recreation is comprisedof a few key activities (Table24). Five activities, led bywalking/hiking, account forover half (53%) of near-home recreation time, and tenactivities make up nearly 80percent (78%) of near-homeuse. Opportunities for thesenear-home activities areprovided by the privatesector and more-local levelsof government (e.g., city,county). A full activitylisting—for the state and forregions—is given inAppendix A.
Similarly, overall away-from-home recreation isconcentrated in a fewactivities, led by fishing(Table 25). The top fiveactivities comprise 56 percentof all away-from-home useand the top ten account for85 percent. Opportunitiesfor these away-from-homeactivities are provided by theprivate sector and broaderlevels of government (e.g.,state, federal). These
Activity
Percent of total recreation use
within 1/2 hour drive of home
Cumulative percent
● Walking/hiking (walking of hiking outdoors for exercise or pleasure)
21% 21%
● Nature observation/photography 12% 33%● Fishing 8% 40%● Swimming (all types) 7% 47%● Boating (all types, excluding
fishing)6% 53%
● Golfing 5% 58%● Biking (bicycling outdoors of all
types, including mountain biking)5% 63%
● Hunting (all types) 5% 68%● Picnicking 5% 73%● Running or jogging 4% 78%
Top 10 activities that comprise recreation use (hours) within 1/2 hour drive of home
Activity
Percent of total recreation use over 1/2 hour drive of home
Cumulative percent
● Fishing 15% 15%● Boating (all types, excluding
fishing)12% 27%
● Camping (all types) 10% 37%● Walking/hiking (walking of hiking
outdoors for exercise or pleasure)10% 47%
● Hunting (all types) 9% 56%
● Swimming (all types) 8% 64%● Driving for pleasure on scenic roads
or in a park6% 70%
● Nature observation/photography 6% 76%● Picnicking 4% 81%● Golfing 4% 85%
Top 10 activities that comprise recreation use (hours) over 1/2 hour drive of home

2004 Minnesota Outdoor Recreation Participation Survey62
activities—as noted above—form the backbone of Minnesota’s outdoor recreationtourism industry, much of which is natural-resource related, especially water-related. A full activity listing—for the state and for regions—is given inAppendix A.
It is important to note that certain activities are large in both the near-home andaway-from-home markets (Table 24 and 25). Water-based activities (fishing,boating, swimming) are prime examples, as is walking/hiking, nature observation/photography and hunting. Providing opportunities for such activities tends to bethe responsibility of many levels of government and the private sector.
Regional origin-destination recreation use patterns
The current survey provides a partial update of the regional flows of recreation useby Minnesotans. When coupled with geographically explicit origin-destinationpatterns from a previous study (Reference 9), estimates of current regionalrecreation use flows can be derived. Estimates are derived as follows : (1) currentnear-home recreation use (hours) from origin regions is allocated to destinationregions based on near-home origin-destination proportions from the previousstudy; (2) current away-from-home recreation use (hours) from origin regions isallocated to destination regions based on away-from-home origin-destinationproportions from the previous study; (3) current out-of-state recreation use (hours)from origin regions is derived directly from the current study; and (4) theassumption is made in 1, 2, and 3 above that all the out-of-state use is part of theaway-from-home use. In the preceding, “near-home” is within a half-hour driveof home, and “away-from-home” is over an half hour drive of home.
The predominately near-home nature of recreation use is evident in origin-destination relationships. Most of the recreation use that originates in a regionoccurs in the same region (Table 26—part A). For the two northern regions, over80 percent occurs within the region where it originates. The Southern and Centralregion have between 70 and 80 percent of use occurring within the origin region,while the Metro Region is the lowest at 65 percent. The Metro, Southern andCentral Region have inter-regional flows directed primarily to the two northernregions and out of state. The two northern regions have inter-regional flowsdirected primarily between themselves and out of state.
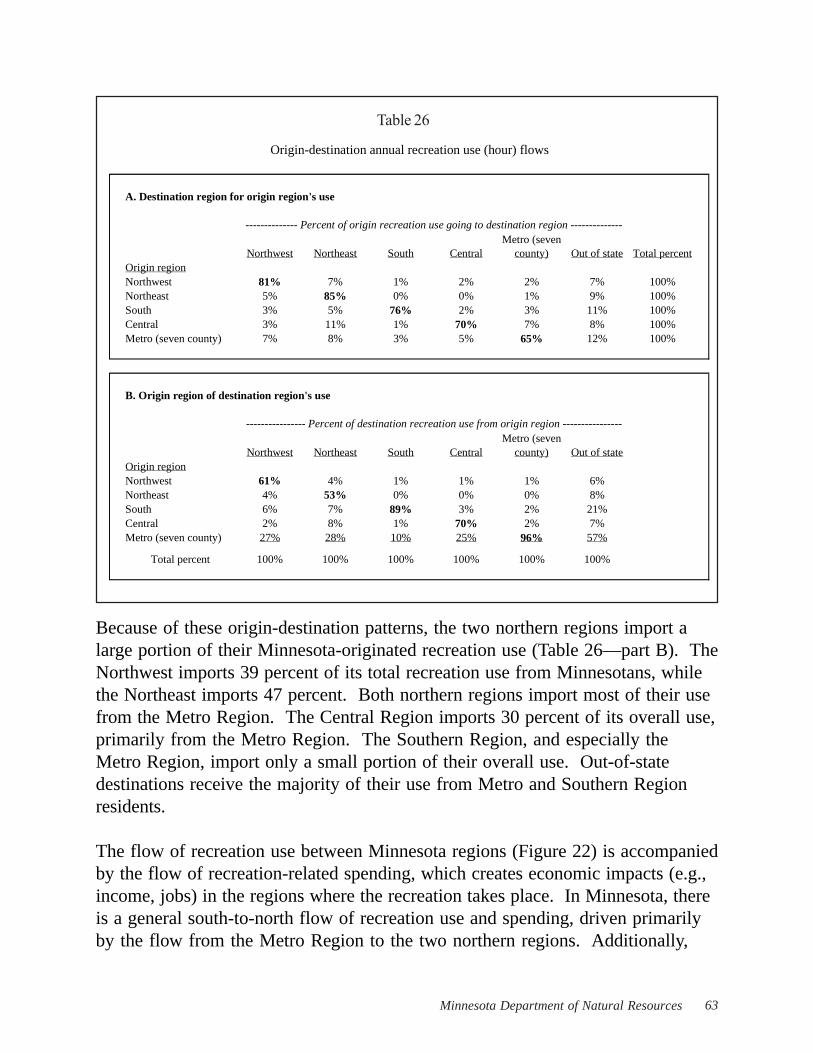
63Minnesota Department of Natural Resources
A. Destination region for origin region's use
Northwest Northeast South CentralMetro (seven
county) Out of state Total percentOrigin regionNorthwest 81% 7% 1% 2% 2% 7% 100%Northeast 5% 85% 0% 0% 1% 9% 100%South 3% 5% 76% 2% 3% 11% 100%Central 3% 11% 1% 70% 7% 8% 100%Metro (seven county) 7% 8% 3% 5% 65% 12% 100%
B. Origin region of destination region's use
Northwest Northeast South CentralMetro (seven
county) Out of stateOrigin regionNorthwest 61% 4% 1% 1% 1% 6%Northeast 4% 53% 0% 0% 0% 8%South 6% 7% 89% 3% 2% 21%Central 2% 8% 1% 70% 2% 7%Metro (seven county) 27% 28% 10% 25% 96% 57%
Total percent 100% 100% 100% 100% 100% 100%
-------------- Percent of origin recreation use going to destination region --------------
---------------- Percent of destination recreation use from origin region ----------------
Origin-destination annual recreation use (hour) flows
Because of these origin-destination patterns, the two northern regions import alarge portion of their Minnesota-originated recreation use (Table 26—part B). TheNorthwest imports 39 percent of its total recreation use from Minnesotans, whilethe Northeast imports 47 percent. Both northern regions import most of their usefrom the Metro Region. The Central Region imports 30 percent of its overall use,primarily from the Metro Region. The Southern Region, and especially theMetro Region, import only a small portion of their overall use. Out-of-statedestinations receive the majority of their use from Metro and Southern Regionresidents.
The flow of recreation use between Minnesota regions (Figure 22) is accompaniedby the flow of recreation-related spending, which creates economic impacts (e.g.,income, jobs) in the regions where the recreation takes place. In Minnesota, thereis a general south-to-north flow of recreation use and spending, driven primarilyby the flow from the Metro Region to the two northern regions. Additionally,
Table 26

2004 Minnesota Outdoor Recreation Participation Survey64
Regional net gains and losses of annual outdoorrecreation use (hours) due to travel for recreation
by Minnesotans within Minnesota(excludes out-of-state recreation use)
NorthwestNortheast
Central
South
Metro
+29+49
-5
+6
-79
Hours in millions
Figure 22Minnesota regions receiverecreation use and associatedspending from non-Minnesotans. The largemajority of non-resident useand spending occurs in thetwo northern regions(Reference 6), whichprovide attractive lake-forestrecreation settings for non-residents and Minnesotansalike.

65Minnesota Department of Natural Resources
Response Percent
Increased 31%Stayed about the same 46%Decreased 15%
Don't know / didn't recreate in last 12 months
7%
Total percent 100%
Over the last 5 years, would you say the overall number of days you participated in outdoor
recreation has increased, stayed about the same, or decreased?
PARTICIPATION CHANGES OVER LAST FIVE YEARS
To gauge outdoor recreation participation changes, the survey asked Minnesotaadults two questions. One question concerned changes in overall recreationinvolvement, and the other concerning new activities taken up. Both questionswere asked over the last five years, the time interval between planned surveyrepetitions. A “new activity” is any activity the respondent reported as “new”, andcould be a very specific activity (e.g., wild turkey hunting) or a broad activity(e.g., hunting). The description of the new activity was hand written by therespondent, and was classified as part of the survey analysis. Classification of newactivities attempted to follow—as much as possible—the individual activity listingin the survey. Some new activities, of course, were not part of the survey listing(e.g., SCUBA diving, and dog training).
In terms of overall recreation involvement, the largest group of Minnesotans(46%) report that their number of recreation days has stayed about the same overthe last five years (Table 27). Morereport increases than decreases inrecreation days over the five-yearperiod. It should be empathized thatthese participation changes are“reported” ( or “perceived”) changes,and may or may not have actuallyoccurred.
In terms of new activities, less thanone-third of Minnesota adults (28%)reported taking up a new activity inthe last five years, meaning that thelarge majority did not take upanything new. Most Minnesotans, itappears, do not regularly adopt newoutdoor activities.
A person’s likelihood of taking up a new activity and of reporting an increase inrecreation over the last five years are related to their overall involvement inrecreation (Table 28). The population groupings with higher per-capita indexes ofrecreation involvement in 2004 (based on annual hours of use, indexed to 100 forthe typical adult) also have higher rates of reporting new activity adoption and of
Table 27
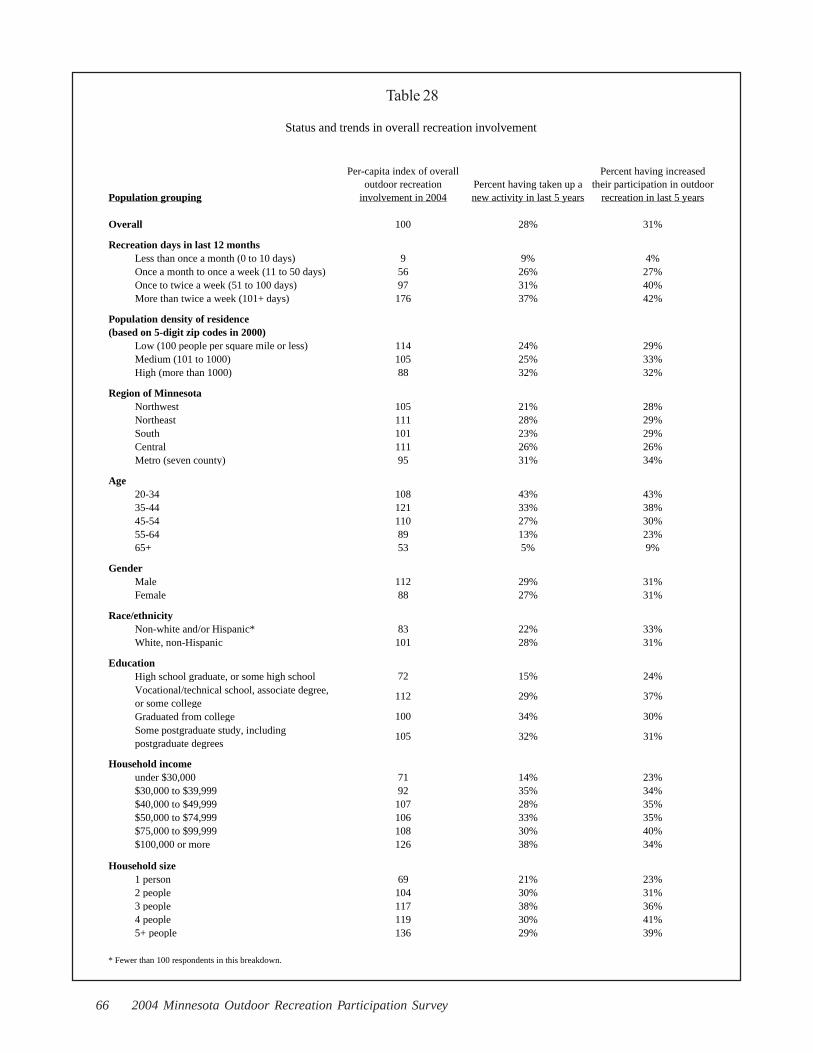
2004 Minnesota Outdoor Recreation Participation Survey66
Table 28
Household size1 person 69 21% 23%2 people 104 30% 31%3 people 117 38% 36%4 people 119 30% 41%5+ people 136 29% 39%
* Fewer than 100 respondents in this breakdown.
Population grouping
Per-capita index of overall outdoor recreation
involvement in 2004Percent having taken up a new activity in last 5 years
Percent having increased their participation in outdoor
recreation in last 5 years
Overall 100 28% 31%
Recreation days in last 12 monthsLess than once a month (0 to 10 days) 9 9% 4%Once a month to once a week (11 to 50 days) 56 26% 27%Once to twice a week (51 to 100 days) 97 31% 40%More than twice a week (101+ days) 176 37% 42%
Population density of residence (based on 5-digit zip codes in 2000)
Low (100 people per square mile or less) 114 24% 29%Medium (101 to 1000) 105 25% 33%High (more than 1000) 88 32% 32%
Region of MinnesotaNorthwest 105 21% 28%Northeast 111 28% 29%South 101 23% 29%Central 111 26% 26%Metro (seven county) 95 31% 34%
Age20-34 108 43% 43%35-44 121 33% 38%45-54 110 27% 30%55-64 89 13% 23%65+ 53 5% 9%
GenderMale 112 29% 31%Female 88 27% 31%
Race/ethnicityNon-white and/or Hispanic* 83 22% 33%White, non-Hispanic 101 28% 31%
EducationHigh school graduate, or some high school 72 15% 24%Vocational/technical school, associate degree, or some college
112 29% 37%
Graduated from college 100 34% 30%Some postgraduate study, including postgraduate degrees
105 32% 31%
Household incomeunder $30,000 71 14% 23%$30,000 to $39,999 92 35% 34%$40,000 to $49,999 107 28% 35%$50,000 to $74,999 106 33% 35%$75,000 to $99,999 108 30% 40%$100,000 or more 126 38% 34%
Status and trends in overall recreation involvement

67Minnesota Department of Natural Resources
reporting increases in days ofrecreation. In other words,those who are currently moreinvolved in recreation are themost likely to have taken upnew activities and to haveincreased their involvement.These relationships are notexact, however, as shown,for example, for populationdensity in the Table 28. Therelationships are of modeststrength: the correlationcoefficient—across thepopulation groupings inTable 28—is 0.70 betweenper-capita index of recreationinvolvement and newactivity adoption, and 0.79between per-capita index andincreases in days ofrecreation.
The most common type ofnew activity taken up aroundthe state is recreationalboating, which accounts forabout 10 percent of all newactivities reported (Table 29).Boating is followed bybiking, camping, off-roaddriving (mainly ATV), andfishing. It is important tonote here that the “newactivity” reported couldrepresent a new participant inthat activity or an existingparticipant who took up adifferent form of the activity
New activityPercent of all new activities statewide
● Boating (other than fishing) 9.9%● Biking (bicycling outdoors of all types, including
mountain biking)8.1%
● Camping 7.5%● Offroad driving (mainly ATV) 7.4%● Fishing 7.3%
● Walking/Hiking (walking or hiking outdoors for exercise or pleasure)
6.3%
● Hunting 6.0%● Cross country skiing 5.7%● Downhill skiing/snowboarding 5.0%● Golfing 4.8%
● Snowshoeing 4.5%● Inline skating, rollerblading, roller skating, roller skiing 4.4%● Snowmobiling 4.0%● Ice skating/hockey outdoors 2.5%● Outdoor field sports (e.g., soccer, softball/baseball,
football)2.4%
● Outdoor court sports (e.g., volleyball, basketball, tennis, horseshoes)
2.2%
● Running or jogging 1.7%● Viewing, identifying, or photographing wildlife,
vegetation and landscapes1.6%
● Gathering/collecting wild products (wild foods, antler shed, rocks)
1.4%
● Driving for pleasure on scenic roads or in a park 1.3%
● Sledding and snow tubing 1.3%● SCUBA diving/snorkeling 0.8%● Shooting sports (trap, skeet etc.) 0.7%● Gardening 0.7%● Horseback riding 0.7%
● Visiting outdoor attractions (nature centers, zoos, historic or archaeological sites)
0.6%
● Trapping wildlife 0.3%● Swimming 0.2%● Dog training (e.g., hunting dog) 0.2%● Metal detector use 0.1%
● Rock climbing 0.1%● Racing motorized vehicles 0.1%● Archery 0.0%● Orienteering/geo-caching 0.0%● Outdoor meditation 0.0%
● Airplane flying 0.0%● Picnicking 0.0%
Total percent 100.0%
New activities taken up in last 5 years(table ordered from high to low percent)
Table 29

2004 Minnesota Outdoor Recreation Participation Survey68
(the survey results cannot separate a new participant from an existing participant).For example, some of the new boating participants are totally new to recreationalboating, while others were existing boaters who took up a different type ofboating (e.g., an existing motorboater who takes up kayaking). Another goodexample is hunting. Some of the new hunting participants are totally new tohunting, while other were existing hunters who took up a different type ofhunting (e.g., an existing waterfowl hunter who takes up deer hunting).
Of all the new activities reported, 97 percent were included in the individualactivity listing in the survey. The remaining 3 percent were not included in thesurvey, and none of these was over 1 percent of new activities. Of this 3 percent,SCUBA diving/snorkeling was the leading activity, and it was followed byshooting sports (trap, skeet), gardening, trapping wildlife, dog training, metaldetector use, rock climbing, racing motorized vehicles, archery, orienteering/geo-caching, outdoor meditation, and airplane flying.
The new activities taken up by each region’s residents have a fair amount incommon with the statewide new activities in Table 29. Of the top 10 newactivities statewide, 8 are represented in the top 10 in the Northwest Region, 7 inthe Northeast Region, 8 in the Southern Region, 8 in the Central Region, and 9in the Metro Region. The minimum correlation coefficient between the statewidenew-activity percents (Table 29) and any regional percents is 0.75 and themaximum is 0.95. Some of the regional differences are due to activityconnections to urban or rural living. For example, the residents in less urbanregions report a higher portion of rural-associated activities (e.g., off-roaddriving, hunting, snowmobiling) than the more urban Metro Region (seeAppendix A for new activities by region).
Certain of the leading new activities are large existing activities (e.g., boating),while others are much smaller (e.g., off-road driving). The latter types ofactivities—compared with the former types—have an accelerating number ofparticipants, who are either totally new to the activity or are new to onedistinctive form of the activity (e.g., turkey hunting within hunting).
Such accelerating activities can be identified by comparing the rate of newactivity reporting with existing activity participation. The activity with the largestgap between new activity adoption and existing activity participation is offroaddriving (mainly ATV), an activity that is well recognized to be growing rapidly inMinnesota (Table 30). The next largest gaps come from a number of snow-related

69Minnesota Department of Natural Resources
Table 30
activities (skiing, snowshoeing). The snow conditions in a series of winterspreceding the survey-recall winter were poor, and pent-up demand may havehelped to position these activities in Table 30. The other two activities withsizable gaps are boating and hunting, both of which may be due to movement
Actual percent of Expected percent ofNew activities* all new activities* all new activities* Actual - Expected
Actual>Expected (over 3%)● Offroad driving (mainly ATV) 8% 2% 5.7%● Cross country skiing 6% 1% 4.7%● Snowshoeing 5% 1% 3.8%● Boating (other than fishing) 10% 7% 3.7%● Downhill skiing/snowboarding 5% 2% 3.5%● Hunting 6% 3% 3.3%
Actual near Expected (+/- 3%)● Biking (bicycling outdoors of all types, including
mountain biking)8% 5% 3.0%
● Camping 8% 5% 3.0%● Inline skating, rollerblading, roller skating, roller skiing 5% 2% 2.5%● Snowmobiling 4% 2% 2.4%● Fishing 7% 6% 1.9%● Golfing 5% 4% 0.6%● Ice skating/hockey outdoors 3% 2% 0.5%● Horseback riding 1% 1% -0.1%● Gathering/collecting wild products (wild foods, antler
shed, rocks)1% 2% -0.1%
● Running or jogging 2% 3% -0.8%● Outdoor court sports (e.g., volleyball, basketball, tennis,
horseshoes)2% 3% -1.0%
● Outdoor field sports (e.g., soccer, softball/baseball, football)
2% 4% -1.5%
● Sledding and snow tubing 1% 3% -2.1%● Viewing, identifying, or photographing wildlife,
vegetation and landscapes2% 4% -2.8%
Actual<Expected (less than -3%)● Walking/Hiking (walking or hiking outdoors for exercise
or pleasure)6% 10% -3.6%
● Driving for pleasure on scenic roads or in a park 1% 7% -5.6%● Picnicking 0% 7% -6.6%● Visiting outdoor attractions (nature centers, zoos, historic
or archaeological sites)1% 8% -7.0%
● Swimming 0% 8% -7.3%
Total percent 100% 100% 0%
* Table excludes "new activities" without expected values; excludes some 3% of "new activities".
New activities* (with "expected" values) taken up in last 5 years
(Note: "Expected" is the percent that would occur if new activity participants were distributed in the same relative patterns as existing activity participants)

2004 Minnesota Outdoor Recreation Participation Survey70
within the activity or into the activity. At the other extreme, certain activities havelower rates of new activity reporting than would be expected from existingactivity participation rates: swimming, visiting outdoor attractions, picnicking,driving for pleasure, and walking/hiking. The bulk of activities are in themiddle, with new activity reporting rates that are near expectations from existingparticipation rates.
When this survey is redone in five years, it will be interesting to compare updatedresults for Table 30 with measured activity trends, to see how useful Table 30 isto assessing recent changes. In some instances it may prove useful (e.g., offroad/ATV driving), but in others it may not, and the overall utility may be mixed ordifficult to interpret.

71Minnesota Department of Natural Resources
REFERENCES
1. Minnesota Department of Natural Resources. 2002. Minnesota’s 2003-2008State Comprehensive Outdoor Recreation Plan. Minnesota Department ofNatural Resources, Office of Management and Budget Services.
2. Kelly, Tim. 2004. Outdoor recreation participation trends in wildlife-relatedactivities (fishing, hunting, wildlife observation) and recreational boating.A background report for Minnesota State Comprehensive OutdoorRecreation Planning. Minnesota Department of Natural Resources, Officeof Management and Budget Services.
3. Kelly, Tim. 2004. 2004 Outdoor Recreation Participation Survey ofMinnesotans: Methodology. Minnesota Department of Natural Resources,Office of Management and Budget Services.
4. U. S. Department of Commerce, U. S. Census Bureau. (i) Minnesota decennialcensus population counts for 1900 to 2000; and (ii) 2002. DemographicTrends in the 20th Century.
5. U.S. Department of Interior, Fish and Wildlife Service (USFWS). 1989.Investigation of Possible Recall/Reference Bias in National Surveys ofFishing, Hunting and Wildlife-Associated Recreation. Investigationconducted for USFWS by Westat, Inc. of Rockville, Maryland.
6. Minnesota Department of Natural Resources. 1989. Minnesota’s 1990-1994State Comprehensive Outdoor Recreation Plan. Minnesota Departments ofNatural Resources and Trade and Development.
7. U. S. Department of the Interior, Fish and Wildlife Service and U. S.Department of Commerce, U. S. Census Bureau. 2001 National Survey ofFishing, Hunting, and Wildlife-Associated Recreation.
8. Minnesota Department of Administration, State Demographic Center. 2003.Educational Attainment in Minnesota.
9. Minnesota Department of Natural Resources (MN DNR). 1985-86 OutdoorRecreation Participation and Expenditure Survey of Minnesotans. Surveyconducted for the MN DNR by the Minnesota Center for Survey Research,University of Minnesota.

2004 Minnesota Outdoor Recreation Participation Survey72
Regional tables
Annual outdoor recreation participation by Minnesotans in Minnesotaand elsewhere, 2004
Annual outdoor recreation use by Minnesotans in Minnesota andelsewhere, 2004
Near-home annual outdoor recreation use by Minnesotans, 2004
Away-from-home annual outdoor recreation use by Minnesotans, 2004
New activities taken up in last five years
Page
73
74
75
76
77
APPENDIX A: REGIONAL TABLES
CONTENTS
NorthwestNortheast
South
Central
Metro (7 county)
Survey Regions

73Minnesota Department of Natural Resources
Horseback riding 5% 3% 4% 5% 6% 4%Snowshoeing 4% 2% 8% 3% 3% 5%
Activity Stat
ewid
e
Nor
thw
est R
egio
n
Nor
thea
st R
egio
n
Sout
hern
Reg
ion
Cen
tral
Reg
ion
Met
ro R
egio
n
Walking/hiking (walking of hiking outdoors for exercise or pleasure) 54% 48% 49% 51% 56% 58%Boating of all types, including fishing from a boat 43% 43% 42% 40% 45% 44%
Boating of all types, excluding fishing from a boat 36% 36% 34% 32% 35% 37%
Motor boating of all types, including fishing from a boat 39% 41% 39% 35% 43% 40%
Motor boating of all types, excluding fishing from a boat 30% 31% 30% 26% 31% 31%
Non-motorized boating of all types, excluding fishing 15% 12% 12% 14% 12% 17%
Canoeing/kayaking, excluding fishing 14% 11% 12% 13% 11% 16%
Swimming or wading (all places) 41% 37% 38% 38% 41% 43%Swimming or wading in a lake or stream 37% 37% 37% 33% 38% 38%
Swimming or wading in an outdoor pool or water park 22% 12% 12% 20% 21% 25%
Driving for pleasure on scenic roads or in a park 37% 40% 37% 35% 38% 38%Picnicking 36% 34% 36% 35% 33% 37%
Fishing of all types 30% 35% 34% 30% 36% 28%Fishing from a boat 27% 30% 31% 25% 33% 25%
Fishing from shore or dock 20% 25% 25% 21% 24% 18%
Biking (bicycling outdoors of all types, including mountain biking) 29% 19% 20% 26% 28% 33%Biking on dirt trails 12% 6% 10% 9% 11% 15%
Visiting outdoor zoos 27% 14% 19% 25% 25% 33%
Camping of all types 26% 30% 32% 22% 28% 25%Camping using a camping vehicle (e.g., pop-up/hard-sided trailer) 13% 19% 18% 13% 18% 10%
Camping using a tent 18% 17% 20% 13% 16% 19%
Camping using a tent for backpacking or canoe-in/boat-in camping 10% 10% 11% 7% 6% 11%
Visiting nature centers 25% 19% 21% 25% 19% 28%
Nature observation of all types (viewing, identifying, photographing) 24% 20% 24% 23% 26% 25%Viewing, identifying or photographing birds and other wildlife 20% 17% 20% 20% 21% 21%
Viewing, identifying or photographing wildflowers, trees, natural vegetation 18% 13% 17% 15% 21% 20%
Golfing 24% 19% 17% 21% 26% 26%Outdoor field sports (e.g., soccer, softball/baseball, football) 21% 21% 20% 19% 22% 22%Visiting historic or archaeological sites 21% 17% 19% 18% 19% 23%
Sledding and snow tubing 18% 15% 16% 16% 19% 20%Outdoor court sports (e.g., volleyball, basketball, tennis, horseshoes) 18% 15% 13% 16% 20% 19%Hunting of all types 16% 23% 23% 14% 26% 13%
Hunting big game (e.g., deer, bear, moose) 13% 21% 20% 12% 23% 10%
Hunting waterfowl, upland game birds, and other small game 11% 14% 17% 9% 14% 9%
Running or jogging 14% 6% 9% 13% 8% 18%Ice skating/hockey outdoors 12% 5% 8% 4% 8% 17%Inline skating, rollerblading, roller skating, roller skiing 11% 6% 5% 6% 8% 16%Offroad ATV driving 10% 17% 19% 9% 18% 7%Snowmobiling 10% 16% 18% 10% 16% 6%
Downhill skiing/snowboarding 9% 3% 5% 9% 8% 11%Gather mushrooms, berries, or other wild foods 9% 11% 19% 7% 7% 7%Cross country skiing 7% 4% 6% 4% 4% 9%
Annual outdoor recreation participation by Minnesotans in Minnesota and elsewhere, 2004(population 20 years old and older)
-------------- Percent of population participating --------------

2004 Minnesota Outdoor Recreation Participation Survey74
Activity Stat
ewid
e (t
otal
hou
rs
=760
, 743
)
Nor
thw
est R
egio
n (t
otal
hou
rs=7
1,95
8)
Nor
thea
st R
egio
n (t
otal
hou
rs=7
2,56
6)
Sout
hern
Reg
ion
(tot
al h
ours
=152
,078
)
Cen
tral
Reg
ion
(tot
al
hour
s=77
,187
)
Met
ro R
egio
n (t
otal
ho
urs=
386,
954)
Walking/hiking (walking of hiking outdoors for exercise or pleasure) 17.0% 14.8% 14.2% 17.8% 16.4% 17.8%Boating of all types, including fishing from a boat 14.2% 16.2% 15.1% 11.2% 15.0% 14.6%
Boating of all types, excluding fishing from a boat 7.6% 7.9% 7.4% 6.2% 7.5% 8.2%
Motor boating of all types, including fishing from a boat 13.0% 14.9% 13.9% 10.4% 13.8% 13.3%
Motor boating of all types, excluding fishing from a boat 6.5% 6.6% 6.2% 5.4% 6.4% 6.9%
Non-motorized boating of all types, excluding fishing 1.2% 1.3% 1.2% 0.8% 1.1% 1.3%
Canoeing/kayaking, excluding fishing 1.0% 1.2% 1.0% 0.8% 1.0% 1.1%
Swimming or wading (all places) 7.0% 6.5% 5.0% 6.2% 7.0% 7.8%Swimming or wading in a lake or stream 4.8% 5.6% 4.4% 3.7% 4.4% 5.3%
Swimming or wading in an outdoor pool or water park 2.2% 1.0% 0.6% 2.4% 2.6% 2.6%
Driving for pleasure on scenic roads or in a park 4.4% 5.1% 4.4% 4.6% 3.9% 4.3%Picnicking 4.7% 4.7% 5.4% 5.1% 4.6% 4.5%
Fishing of all types 10.0% 14.3% 11.7% 8.3% 11.4% 9.3%Fishing from a boat 6.5% 8.2% 7.7% 5.0% 7.4% 6.4%
Fishing from shore or dock 3.5% 6.0% 4.0% 3.3% 4.0% 2.9%
Biking (bicycling outdoors of all types, including mountain biking) 4.2% 2.4% 3.0% 4.1% 4.0% 4.8%Biking on dirt trails 0.5% 0.3% 0.5% 0.3% 0.4% 0.7%
Visiting outdoor zoos 0.8% 0.3% 0.4% 0.6% 0.4% 1.1%
Camping of all types 4.5% 5.6% 5.0% 4.4% 5.0% 4.1%Camping using a camping vehicle (e.g., pop-up/hard-sided trailer) 2.9% 4.1% 3.5% 3.4% 3.9% 2.1%
Camping using a tent 1.6% 1.5% 1.6% 0.9% 1.1% 2.0%
Camping using a tent for backpacking or canoe-in/boat-in camping 0.5% 0.6% 0.6% 0.4% 0.2% 0.7%
Visiting nature centers 1.1% 0.7% 0.6% 0.9% 0.5% 1.5%
Nature observation of all types (viewing, identifying, photographing) 10.2% 7.8% 13.8% 14.1% 9.3% 8.6%Viewing, identifying or photographing birds and other wildlife 5.4% 4.3% 7.8% 7.7% 5.2% 4.3%
Viewing, identifying or photographing wildflowers, trees, natural vegetation 4.7% 3.5% 6.0% 6.3% 4.0% 4.2%
Golfing 4.9% 4.6% 3.5% 4.3% 4.3% 5.5%Outdoor field sports (e.g., soccer, softball/baseball, football) 2.8% 2.3% 2.0% 2.7% 2.7% 3.1%Visiting historic or archaeological sites 0.8% 0.6% 1.1% 0.8% 0.6% 0.9%
Sledding and snow tubing 0.7% 0.5% 0.5% 0.5% 0.9% 0.7%Outdoor court sports (e.g., volleyball, basketball, tennis, horseshoes) 1.5% 1.3% 1.1% 1.6% 1.9% 1.6%Hunting of all types 6.3% 9.2% 9.4% 6.3% 8.5% 4.8%
Hunting big game (e.g., deer, bear, moose) 3.6% 5.5% 5.2% 2.9% 5.3% 2.8%
Hunting waterfowl, upland game birds, and other small game 2.8% 3.7% 4.3% 3.4% 3.1% 2.0%
Running or jogging 3.2% 0.9% 1.6% 3.4% 1.3% 4.2%Ice skating/hockey outdoors 0.6% 0.5% 0.5% 0.1% 0.6% 0.9%Inline skating, rollerblading, roller skating, roller skiing 1.5% 0.5% 0.4% 0.7% 0.9% 2.3%Offroad ATV driving 2.0% 4.5% 3.2% 2.6% 3.9% 0.7%Snowmobiling 1.3% 2.8% 3.2% 1.4% 1.5% 0.7%
Downhill skiing/snowboarding 1.1% 0.6% 0.6% 1.7% 0.9% 1.2%
---------- Percent of annual recreation hours (000's) ----------
Annual outdoor recreation use by Minnesotans in Minnesota and elsewhere, 2004
(population 20 years old and older)
Gather mushrooms, berries, or other wild foods 0.7% 0.9% 1.0% 0.9% 0.4% 0.5%Cross country skiing 0.5% 0.3% 0.5% 0.2% 0.2% 0.7%Horseback riding 0.3% 0.3% 0.2% 0.4% 1.3% 0.2%Snowshoeing 0.1% 0.0% 0.2% 0.1% 0.1% 0.1%

75Minnesota Department of Natural Resources
Activity Stat
ewid
e (t
otal
hou
rs
=511
,117
)
Nor
thw
est R
egio
n (t
otal
hou
rs=5
2,78
0)
Nor
thea
st R
egio
n (t
otal
hou
rs=5
2,26
3)
Sout
hern
Reg
ion
(tot
al h
ours
=107
,810
)
Cen
tral
Reg
ion
(tot
al
hour
s=50
,208
)
Met
ro R
egio
n (t
otal
ho
urs=
248,
057)
Walking/hiking (walking of hiking outdoors for exercise or pleasure) 20.7% 16.4% 15.3% 21.3% 20.0% 22.6%Boating of all types, including fishing from a boat 10.5% 16.4% 14.0% 8.1% 11.7% 9.1%
Boating of all types, excluding fishing from a boat 5.5% 8.0% 6.9% 4.5% 6.4% 5.0%
Motor boating of all types, including fishing from a boat 9.8% 15.3% 12.9% 7.7% 10.7% 8.5%
Motor boating of all types, excluding fishing from a boat 4.8% 6.8% 5.8% 4.2% 5.5% 4.3%
Non-motorized boating of all types, excluding fishing 0.7% 1.1% 1.2% 0.4% 1.0% 0.6%
Canoeing/kayaking, excluding fishing 0.6% 1.1% 0.9% 0.4% 0.9% 0.4%
Swimming or wading (all places) 6.7% 6.7% 4.9% 5.5% 7.1% 7.5%Swimming or wading in a lake or stream 4.0% 5.6% 4.4% 2.9% 3.9% 4.2%
Swimming or wading in an outdoor pool or water park 2.7% 1.1% 0.5% 2.6% 3.2% 3.4%
Driving for pleasure on scenic roads or in a park 3.5% 4.3% 3.3% 3.4% 3.2% 3.4%Picnicking 4.9% 4.4% 5.7% 5.5% 4.8% 4.6%
Fishing of all types 7.6% 14.7% 10.8% 5.9% 8.1% 6.0%Fishing from a boat 4.9% 8.4% 7.1% 3.6% 5.2% 4.1%
Fishing from shore or dock 2.6% 6.2% 3.7% 2.3% 2.8% 1.9%
Biking (bicycling outdoors of all types, including mountain biking) 5.4% 2.8% 3.8% 5.2% 5.5% 6.3%Biking on dirt trails 0.7% 0.3% 0.6% 0.4% 0.5% 0.9%
Visiting outdoor zoos 0.8% 0.2% 0.3% 0.4% 0.3% 1.3%
Camping of all types 1.6% 3.1% 2.1% 1.6% 2.1% 1.1%Camping using a camping vehicle (e.g., pop-up/hard-sided trailer) 1.1% 2.2% 1.4% 1.2% 1.8% 0.6%
Camping using a tent 0.5% 0.9% 0.6% 0.4% 0.3% 0.5%
Camping using a tent for backpacking or canoe-in/boat-in camping 0.2% 0.4% 0.3% 0.2% 0.1% 0.2%
Visiting nature centers 1.1% 0.5% 0.4% 0.7% 0.3% 1.8%
Nature observation of all types (viewing, identifying, photographing) 12.1% 8.6% 16.4% 16.2% 11.0% 10.3%Viewing, identifying or photographing birds and other wildlife 6.6% 4.7% 9.5% 9.2% 6.4% 5.3%
Viewing, identifying or photographing wildflowers, trees, natural vegetation 5.5% 3.9% 6.9% 7.0% 4.6% 5.0%
Golfing 5.4% 4.8% 3.7% 5.1% 5.0% 6.1%Outdoor field sports (e.g., soccer, softball/baseball, football) 3.4% 2.6% 2.3% 2.6% 3.2% 4.2%Visiting historic or archaeological sites 0.4% 0.3% 0.8% 0.3% 0.2% 0.5%
Sledding and snow tubing 0.9% 0.5% 0.7% 0.6% 1.2% 1.1%Outdoor court sports (e.g., volleyball, basketball, tennis, horseshoes) 2.0% 1.6% 1.2% 2.1% 2.3% 2.1%Hunting of all types 5.0% 9.2% 9.2% 6.0% 6.9% 2.3%
Hunting big game (e.g., deer, bear, moose) 2.8% 5.4% 5.2% 2.8% 4.4% 1.5%
Hunting waterfowl, upland game birds, and other small game 2.1% 3.8% 4.0% 3.2% 2.5% 0.9%
Running or jogging 4.4% 1.1% 1.9% 4.5% 1.8% 6.2%Ice skating/hockey outdoors 0.9% 0.6% 0.7% 0.2% 0.7% 1.4%Inline skating, rollerblading, roller skating, roller skiing 2.0% 0.6% 0.5% 0.8% 1.2% 3.3%Offroad ATV driving 1.9% 4.3% 3.3% 2.7% 4.3% 0.3%Snowmobiling 1.3% 2.9% 3.3% 1.4% 1.4% 0.5%
Downhill skiing/snowboarding 0.7% 0.2% 0.4% 1.4% 0.5% 0.7%
Near-home annual outdoor recreation use by Minnesotans, 2004
("near home" is within a half-hour drive of home; population 20 years old and older)
-------- Percent of near-home recreation hours (000's) --------
Gather mushrooms, berries, or other wild foods 0.7% 1.0% 1.0% 1.1% 0.4% 0.5%Cross country skiing 0.5% 0.4% 0.6% 0.2% 0.2% 0.8%Horseback riding 0.4% 0.4% 0.2% 0.6% 1.8% 0.2%Snowshoeing 0.1% 0.0% 0.3% 0.1% 0.1% 0.1%
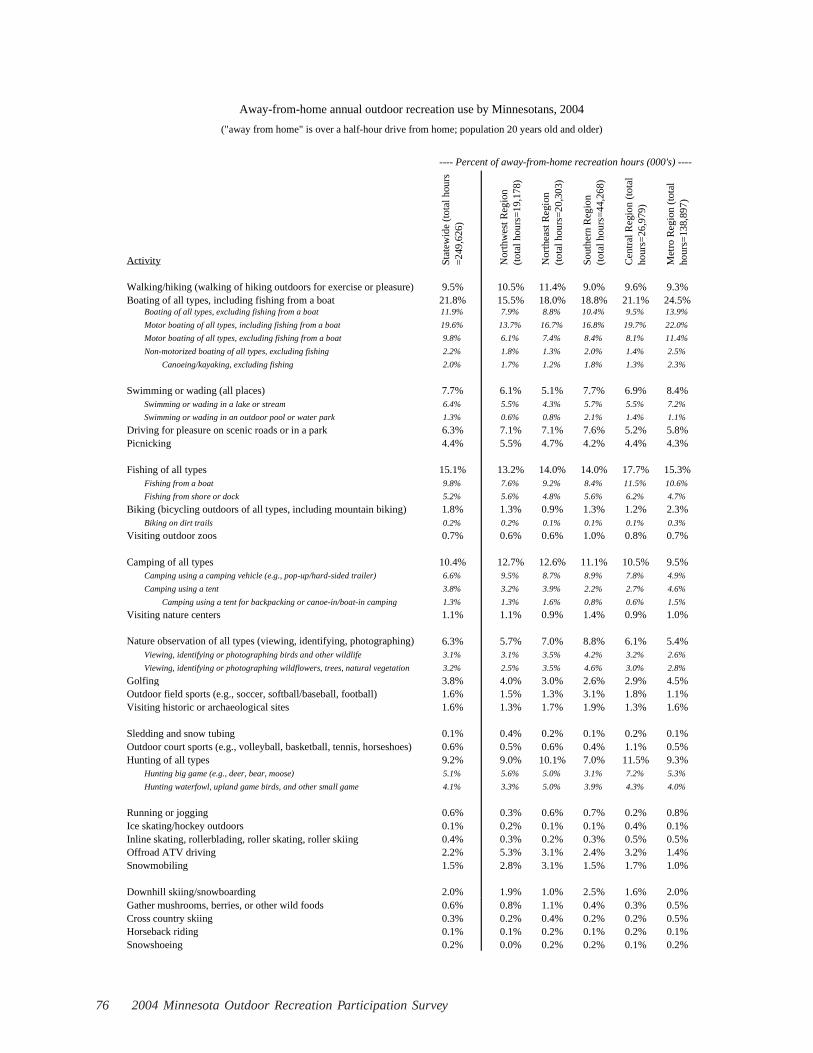
2004 Minnesota Outdoor Recreation Participation Survey76
Activity Stat
ewid
e (t
otal
hou
rs
=249
,626
)
Nor
thw
est R
egio
n (t
otal
hou
rs=1
9,17
8)
Nor
thea
st R
egio
n (t
otal
hou
rs=2
0,30
3)
Sout
hern
Reg
ion
(tot
al h
ours
=44,
268)
Cen
tral
Reg
ion
(tot
al
hour
s=26
,979
)
Met
ro R
egio
n (t
otal
ho
urs=
138,
897)
Walking/hiking (walking of hiking outdoors for exercise or pleasure) 9.5% 10.5% 11.4% 9.0% 9.6% 9.3%Boating of all types, including fishing from a boat 21.8% 15.5% 18.0% 18.8% 21.1% 24.5%
Boating of all types, excluding fishing from a boat 11.9% 7.9% 8.8% 10.4% 9.5% 13.9%
Motor boating of all types, including fishing from a boat 19.6% 13.7% 16.7% 16.8% 19.7% 22.0%
Motor boating of all types, excluding fishing from a boat 9.8% 6.1% 7.4% 8.4% 8.1% 11.4%
Non-motorized boating of all types, excluding fishing 2.2% 1.8% 1.3% 2.0% 1.4% 2.5%
Canoeing/kayaking, excluding fishing 2.0% 1.7% 1.2% 1.8% 1.3% 2.3%
Swimming or wading (all places) 7.7% 6.1% 5.1% 7.7% 6.9% 8.4%Swimming or wading in a lake or stream 6.4% 5.5% 4.3% 5.7% 5.5% 7.2%
Swimming or wading in an outdoor pool or water park 1.3% 0.6% 0.8% 2.1% 1.4% 1.1%
Driving for pleasure on scenic roads or in a park 6.3% 7.1% 7.1% 7.6% 5.2% 5.8%Picnicking 4.4% 5.5% 4.7% 4.2% 4.4% 4.3%
Fishing of all types 15.1% 13.2% 14.0% 14.0% 17.7% 15.3%Fishing from a boat 9.8% 7.6% 9.2% 8.4% 11.5% 10.6%
Fishing from shore or dock 5.2% 5.6% 4.8% 5.6% 6.2% 4.7%
Biking (bicycling outdoors of all types, including mountain biking) 1.8% 1.3% 0.9% 1.3% 1.2% 2.3%Biking on dirt trails 0.2% 0.2% 0.1% 0.1% 0.1% 0.3%
Visiting outdoor zoos 0.7% 0.6% 0.6% 1.0% 0.8% 0.7%
Camping of all types 10.4% 12.7% 12.6% 11.1% 10.5% 9.5%Camping using a camping vehicle (e.g., pop-up/hard-sided trailer) 6.6% 9.5% 8.7% 8.9% 7.8% 4.9%
Camping using a tent 3.8% 3.2% 3.9% 2.2% 2.7% 4.6%
Camping using a tent for backpacking or canoe-in/boat-in camping 1.3% 1.3% 1.6% 0.8% 0.6% 1.5%
Visiting nature centers 1.1% 1.1% 0.9% 1.4% 0.9% 1.0%
Nature observation of all types (viewing, identifying, photographing) 6.3% 5.7% 7.0% 8.8% 6.1% 5.4%Viewing, identifying or photographing birds and other wildlife 3.1% 3.1% 3.5% 4.2% 3.2% 2.6%
Viewing, identifying or photographing wildflowers, trees, natural vegetation 3.2% 2.5% 3.5% 4.6% 3.0% 2.8%
Golfing 3.8% 4.0% 3.0% 2.6% 2.9% 4.5%Outdoor field sports (e.g., soccer, softball/baseball, football) 1.6% 1.5% 1.3% 3.1% 1.8% 1.1%Visiting historic or archaeological sites 1.6% 1.3% 1.7% 1.9% 1.3% 1.6%
Sledding and snow tubing 0.1% 0.4% 0.2% 0.1% 0.2% 0.1%Outdoor court sports (e.g., volleyball, basketball, tennis, horseshoes) 0.6% 0.5% 0.6% 0.4% 1.1% 0.5%Hunting of all types 9.2% 9.0% 10.1% 7.0% 11.5% 9.3%
Hunting big game (e.g., deer, bear, moose) 5.1% 5.6% 5.0% 3.1% 7.2% 5.3%
Hunting waterfowl, upland game birds, and other small game 4.1% 3.3% 5.0% 3.9% 4.3% 4.0%
Running or jogging 0.6% 0.3% 0.6% 0.7% 0.2% 0.8%Ice skating/hockey outdoors 0.1% 0.2% 0.1% 0.1% 0.4% 0.1%Inline skating, rollerblading, roller skating, roller skiing 0.4% 0.3% 0.2% 0.3% 0.5% 0.5%Offroad ATV driving 2.2% 5.3% 3.1% 2.4% 3.2% 1.4%Snowmobiling 1.5% 2.8% 3.1% 1.5% 1.7% 1.0%
Downhill skiing/snowboarding 2.0% 1.9% 1.0% 2.5% 1.6% 2.0%
Away-from-home annual outdoor recreation use by Minnesotans, 2004
("away from home" is over a half-hour drive from home; population 20 years old and older)
---- Percent of away-from-home recreation hours (000's) ----
Gather mushrooms, berries, or other wild foods 0.6% 0.8% 1.1% 0.4% 0.3% 0.5%Cross country skiing 0.3% 0.2% 0.4% 0.2% 0.2% 0.5%Horseback riding 0.1% 0.1% 0.2% 0.1% 0.2% 0.1%Snowshoeing 0.2% 0.0% 0.2% 0.2% 0.1% 0.2%

77Minnesota Department of Natural Resources
Northwest Northeast Southern Central MetroNew activity Statewide Region Region Region Region Region
● Boating (other than fishing) 9.9% 12.7% 15.8% 5.5% 5.9% 10.7%● Biking (bicycling outdoors of all types, including
mountain biking)8.1% 2.2% 2.5% 8.5% 9.1% 9.2%
● Camping 7.5% 8.1% 6.7% 4.6% 5.9% 8.7%● Offroad driving (mainly ATV) 7.4% 8.3% 13.3% 11.1% 13.1% 4.6%● Fishing 7.3% 9.4% 5.6% 3.9% 6.4% 8.3%
● Walking/Hiking (walking or hiking outdoors for exercise or pleasure)
6.3% 3.7% 5.6% 4.8% 3.9% 7.4%
● Hunting 6.0% 12.3% 4.4% 8.3% 8.1% 4.7%● Cross country skiing 5.7% 7.5% 2.4% 0.9% 3.9% 7.6%● Downhill skiing/snowboarding 5.0% 0.0% 5.0% 4.5% 2.1% 6.0%● Golfing 4.8% 1.2% 2.2% 6.8% 2.8% 5.3%
● Snowshoeing 4.5% 1.2% 6.0% 5.5% 3.7% 4.4%● Inline skating, rollerblading, roller skating, roller skiing 4.4% 1.7% 2.1% 3.8% 6.5% 4.9%● Snowmobiling 4.0% 10.0% 10.7% 7.8% 5.6% 1.3%● Ice skating/hockey outdoors 2.5% 0.6% 2.1% 0.0% 3.6% 3.3%● Outdoor field sports (e.g., soccer, softball/baseball,
football)2.4% 4.7% 2.1% 3.8% 3.5% 1.6%
● Outdoor court sports (e.g., volleyball, basketball, tennis, horseshoes)
2.2% 0.6% 0.5% 0.0% 1.5% 3.3%
● Running or jogging 1.7% 0.4% 0.0% 3.3% 1.1% 1.7%● Viewing, identifying, or photographing wildlife,
vegetation and landscapes1.6% 1.9% 1.6% 3.8% 3.3% 0.8%
● Gathering/collecting wild products (wild foods, antler shed, rocks)
1.4% 1.5% 2.6% 2.5% 0.0% 1.2%
● Driving for pleasure on scenic roads or in a park 1.3% 2.2% 0.3% 2.1% 0.9% 1.2%
● Sledding and snow tubing 1.3% 0.0% 0.0% 0.0% 0.0% 2.1%● SCUBA diving/snorkeling 0.8% 1.2% 0.0% 0.0% 0.0% 1.2%● Shooting sports (trap, skeet etc.) 0.7% 1.2% 3.0% 1.0% 2.8% 0.0%● Gardening 0.7% 1.2% 1.1% 2.7% 1.4% 0.0%● Horseback riding 0.7% 1.7% 0.0% 0.6% 2.1% 0.5%
● Visiting outdoor attractions (nature centers, zoos, historic or archaeological sites)
0.6% 0.0% 0.3% 2.5% 1.5% 0.0%
● Trapping wildlife 0.3% 0.0% 2.5% 0.5% 0.0% 0.0%● Swimming 0.2% 0.9% 0.0% 0.9% 0.2% 0.0%● Dog training (e.g., hunting dog) 0.2% 1.7% 0.0% 0.4% 0.0% 0.0%● Metal detector use 0.1% 1.4% 0.4% 0.0% 0.0% 0.0%
● Rock climbing 0.1% 0.0% 0.0% 0.0% 0.0% 0.2%● Racing motorized vehicles 0.1% 0.0% 0.5% 0.0% 0.6% 0.0%● Archery 0.0% 0.4% 0.0% 0.0% 0.2% 0.0%● Orienteering/geo-caching 0.0% 0.0% 0.3% 0.0% 0.0% 0.0%● Outdoor meditation 0.0% 0.0% 0.3% 0.0% 0.0% 0.0%
● Airplane flying 0.0% 0.0% 0.0% 0.0% 0.2% 0.0%● Picnicking 0.0% 0.0% 0.0% 0.0% 0.0% 0.0%
Total percent 100.0% 100.0% 100.0% 100.0% 100.0% 100.0%
---------------------------- Percent of all new activities ----------------------------
New activities taken up in last 5 years(table ordered from high to low on statewide percent)

2004 Minnesota Outdoor Recreation Participation Survey78
APPENDIX B: INDIVIDUAL ACTIVITY TABLES
CONTENTS
Topic
GUIDE TO ACTIVITY TABLES
ACTIVITY TABLES:
Walking/hiking (walking of hiking outdoors for exercise or pleasure)Boating of all types, including fishing from a boat
Boating of all types, excluding fishing from a boatMotor boating of all types, including fishing from a boatMotor boating of all types, excluding fishing from a boatNon-motorized boating of all types, excluding fishing
Canoeing/kayaking, excluding fishing
Swimming or wading (all places)Swimming or wading in a lake or streamSwimming or wading in an outdoor pool or water park
Driving for pleasure on scenic roads or in a parkPicnicking
Fishing of all typesFishing from a boatFishing from shore or dock
Biking (bicycling outdoors of all types, including mountain biking)Biking on dirt trails
Visiting outdoor zoos
Camping of all typesCamping using a camping vehicle (e.g., pop-up/hard-sided trailer)Camping using a tent
Camping using a tent for backpacking or canoe-in/boat-incamping
Visiting nature centers
Page
80
84858687888990
9192939495
96979899
100101
102103104105
106

79Minnesota Department of Natural Resources
ACTIVITY TABLES (CONTINUED):
Nature observation of all types (viewing, identifying, photographing)Viewing, identifying or photographing birds and other wildlifeViewing, identifying or photographing wildflowers, trees, natural
vegetationGolfingOutdoor field sports (e.g., soccer, softball/baseball, football)Visiting historic or archaeological sites
Sledding and snow tubingOutdoor court sports (e.g., volleyball, basketball, tennis, horseshoes)Hunting of all types
Hunting big game (e.g., deer, bear, moose)Hunting waterfowl, upland game birds, and other small game
Running or joggingIce skating/hockey outdoorsInline skating, rollerblading, roller skating, roller skiingOffroad ATV drivingSnowmobiling
Downhill skiing/snowboardingGather mushrooms, berries, or other wild foodsCross country skiingHorseback ridingSnowshoeing
Page
107108109
110111112
113114115116117
118119120121122
123124125126127

2004 Minnesota Outdoor Recreation Participation Survey80
GUIDE TO ACTIVITY TABLES
The tables that follow contain detailed information on each outdoor recreationactivity. For a complete description of how these data were collected andprocessed, refer to the methodological report that accompanies the survey(Reference 3).
All activity tables follow the same format:
● A summary box at the top of each table presents the number of adultparticipants, days of participation, and the mean and median days ofparticipation per participant.
● The rows contain the standard demographic breakdowns. For eachdemographic breakdown, the “MN Population” is given. This (as is noted)is the population “as represented by the survey”, and not all of theseMinnesota population statistics are exact matches with U.S. Census data.The ones that are exact matches are “total”, “region in MN”, “age”, and“gender”, all of which were the demographic statistics used to weight (orfit) the survey sample to the Minnesota population. For those demographicbreakdowns that were not fit in such a fashion (see Table on next page) , theweighted sample represents residential population density (urban/rural)rather well; it is under-representative of non-white and/or Hispanicindividuals; it is under-representative of lower income Minnesotans, but themedian income is represented well; it is under-representative of lowerformal education groups, and is over-representative of higher educationgroups; and it is roughly representative of household size. This lastdemographic category has the major differences between household sizes 1person and 2 people, something the survey instrument itself may accountfor. In the survey, respondents are asked their household size, includingthemselves, but they commonly forget to include themselves, which leads tomore 1 person households, and fewer 2 person households.
The population groupings that are under-represented tend to have lowerinvolvement in outdoor recreation than the other groupings. Thus, interestin the topic of the survey is one probable reason for the under-representation. Additional probable reasons are literacy and language. Thesurvey is a written piece that is written in English and may not easy/possible to read for all Minnesotans.

81Minnesota Department of Natural Resources
Not fit -- results after region, age, gender, and non-respondent sample weighting:
A B C
Recreation survey, 2004 MN Population, 2000 Difference
Population grouping (percent) (percent) (A - B)
Population density of residence (based on 5-digit zip codes in 2000)Low (100 or less) 27% 30% -2%Medium (101 to 1000) 27% 26% 2%High (>1000) 45% 45% 1%
Race/ethnicity (population age 18+)Non-white and/or Hispanic 6.3% 9.7% -3.4%White, non-Hispanic 94% 90% 3%
Household incomeunder $30,000 22% 30% -7%$30,000 to $39,999 13% 12% 1%$40,000 to $49,999 13% 11% 2%$50,000 to $74,999 24% 22% 2%$75,000 to $99,999 13% 12% 1%$100,000 or more 15% 13% 2%
Education (population age 25+)Some high school 4% 12% -8%High school graduate 16% 29% -13%Vocational/technical school, associate degree, or some college
37% 32% 6%
Graduated from college 22% 19% 3%Some postgraduate study, including postgraduate degrees
20% 8% 11%
Household size1 person 32% 27% 5%2 people 28% 34% -6%3 people 14% 15% -1%4 people 16% 14% 2%5+ people 9% 10% -1%
Representation of Minnesota adult population in recreation survey

2004 Minnesota Outdoor Recreation Participation Survey82
● The columns contain—in addition to the MN adult population statistics, asrepresented by the survey—three sets of information. The first set is onactivity participation, and includes percent of population participatingannual, percent of participants (can be compared with column 2—percentof MN population—to see disparities in participants vis a vis the MNpopulation), and percent of activity days.
The second set of columns is for avid participants. An avid participantparticipates more than the median number of days per year and, thus, is lessthan half of all participants. Avids are the core use group of each activity,usually accounting for at least three-fourths of all activity days. Data foravid participants includes percent of population who are avids, and percentof avid participants.
The third set of columns contains activity-day statistics, and includes thepercent of days from avid participants, the percent of days within a one-halfhour drive of home, and percent of days within Minnesota.
Some of the activity tables are for combined activities, some are for subdividedactivities, and some are for sub-activities. Sub-activities had only partialinformation collected in the survey, with remaining information estimated fromthe larger activity that contains the sub-activity.
The combined activities are as follows: boating of all types, motorboating of alltypes, non-motorized boating of all types, swimming or wading (all places),camping of all types, nature observation of all types, and hunting of all types.
Sub-activities with only partial information (that is, with only annual days ofparticipation anywhere, which automatically identifies participants, too) are asfollows: fishing from a boat, biking on dirt trails, and camping using a tent forbackpacking or canoe-in/boat-in camping. For these sub-activities, the remainingtwo data items (percent of days within a half-hour drive of home, and percent ofdays within Minnesota) were estimated from data for the larger activity thatcontains the sub-activity. These two data items for the larger activity were applieduniformly across all demographic breakdowns for a sub-activity.
Just one subdivided activity was derived. It is “fishing from shore or dock”,created by subtracting “fishing from a boat” from “fishing of all types.” For“fishing from shore or dock”, two data items (percent of days within a half-hour
83Minnesota Department of Natural Resources
drive of home, and percent of days within Minnesota) were estimated from datafor “fishing of all types.” These two data items for “fishing of all types” wereapplied uniformly across all demographic breakdowns for “fishing from shore ordock.”
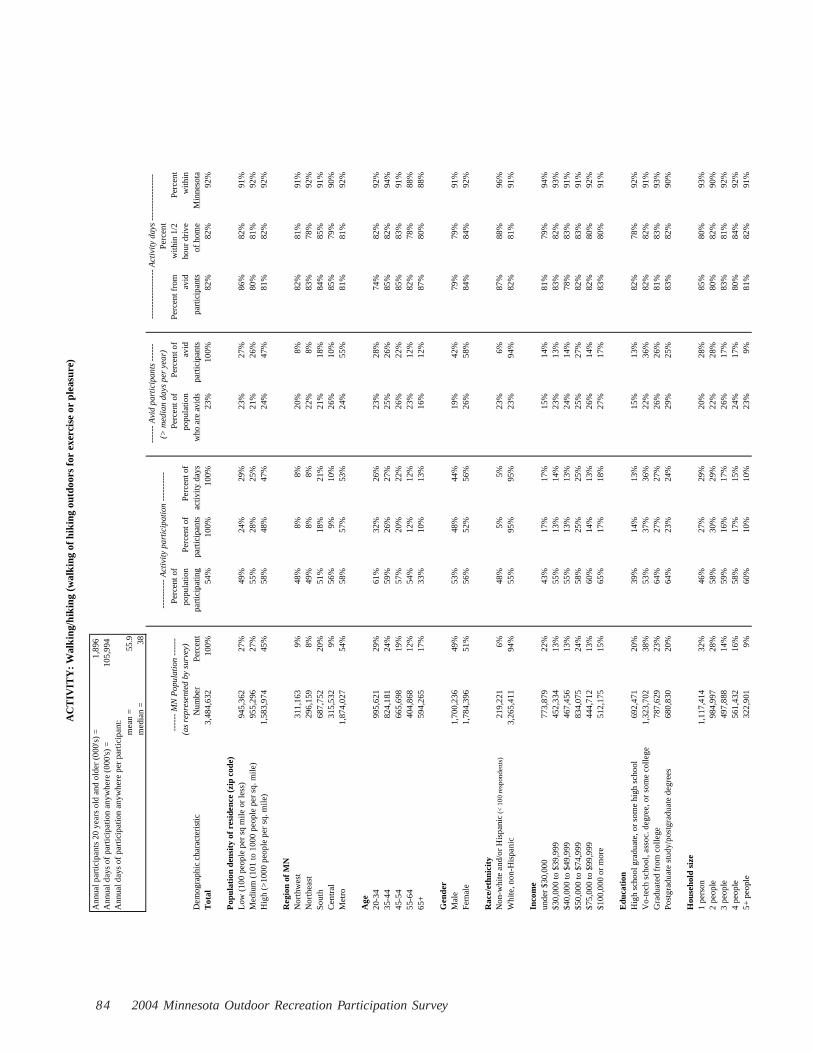
2004 Minnesota Outdoor Recreation Participation Survey84
Ann
ual p
artic
ipan
ts 2
0 ye
ars
old
and
olde
r (0
00's
) =
1,89
6
A
nnua
l day
s of
par
ticip
atio
n an
ywhe
re (
000'
s) =
105,
994
A
nnua
l day
s of
par
ticip
atio
n an
ywhe
re p
er p
artic
ipan
t:m
ean
=55
.9m
edia
n =
38
Perc
ent
Perc
ent o
fPe
rcen
t of
Perc
ent o
fPe
rcen
t fro
mw
ithin
1/2
Perc
ent
popu
latio
nPe
rcen
t of
Perc
ent o
fpo
pula
tion
avid
avid
hour
dri
vew
ithin
Dem
ogra
phic
cha
ract
eris
ticN
umbe
rPe
rcen
tpa
rtic
ipat
ing
part
icip
ants
activ
ity d
ays
who
are
avi
dspa
rtic
ipan
tspa
rtic
ipan
tsof
hom
eM
inne
sota
Tot
al3,
484,
632
100%
54%
100%
100%
23%
100%
82%
82%
92%
Pop
ulat
ion
dens
ity
of r
esid
ence
(zi
p co
de)
Low
(10
0 pe
ople
per
sq
mile
or
less
)94
5,36
2
27%
49%
24%
29%
23%
27%
86%
82%
91%
Med
ium
(10
1 to
100
0 pe
ople
per
sq.
mile
)95
5,29
6
27%
55%
28%
25%
21%
26%
80%
81%
92%
Hig
h (>
1000
peo
ple
per
sq. m
ile)
1,58
3,97
4
45
%58
%48
%47
%24
%47
%81
%82
%92
%
Reg
ion
of M
NN
orth
wes
t31
1,16
3
9%48
%8%
8%20
%8%
82%
81%
91%
Nor
thea
st29
6,15
9
8%49
%8%
8%22
%8%
83%
78%
92%
Sout
h68
7,75
2
20%
51%
18%
21%
21%
18%
84%
85%
91%
Cen
tral
315,
532
9%
56%
9%10
%26
%10
%85
%79
%90
%M
etro
1,87
4,02
7
54
%58
%57
%53
%24
%55
%81
%81
%92
%
Age
20-3
499
5,62
1
29%
61%
32%
26%
23%
28%
74%
82%
92%
35-4
482
4,18
1
24%
59%
26%
27%
25%
26%
85%
82%
94%
45-5
466
5,69
8
19%
57%
20%
22%
26%
22%
85%
83%
91%
55-6
440
4,86
8
12%
54%
12%
12%
23%
12%
82%
78%
88%
65+
594,
265
17
%33
%10
%13
%16
%12
%87
%80
%88
%
Gen
der
Mal
e1,
700,
236
49%
53%
48%
44%
19%
42%
79%
79%
91%
Fem
ale
1,78
4,39
6
51
%56
%52
%56
%26
%58
%84
%84
%92
%
Rac
e/et
hnic
ity
Non
-whi
te a
nd/o
r H
ispa
nic
(< 1
00 r
espo
nden
ts)
219,
221
6%
48%
5%5%
23%
6%87
%88
%96
%W
hite
, non
-His
pani
c3,
265,
411
94%
55%
95%
95%
23%
94%
82%
81%
91%
Inco
me
unde
r $3
0,00
077
3,87
9
22%
43%
17%
17%
15%
14%
81%
79%
94%
$30,
000
to $
39,9
9945
2,33
4
13%
55%
13%
14%
23%
13%
83%
82%
93%
$40,
000
to $
49,9
9946
7,45
6
13%
55%
13%
13%
24%
14%
78%
83%
91%
$50,
000
to $
74,9
9983
4,07
5
24%
58%
25%
25%
25%
27%
82%
83%
91%
$75,
000
to $
99,9
9944
4,71
2
13%
60%
14%
13%
26%
14%
82%
80%
92%
$100
,000
or
mor
e51
2,17
5
15%
65%
17%
18%
27%
17%
83%
80%
91%
Edu
cati
onH
igh
scho
ol g
radu
ate,
or
som
e hi
gh s
choo
l69
2,47
1
20%
39%
14%
13%
15%
13%
82%
78%
92%
Vo-
tech
sch
ool,
asso
c. d
egre
e, o
r so
me
colle
ge1,
323,
702
38%
53%
37%
36%
22%
36%
82%
82%
91%
Gra
duat
ed f
rom
col
lege
787,
629
23
%64
%27
%27
%26
%26
%81
%83
%93
%Po
stgr
adua
te s
tudy
/pos
tgra
duat
e de
gree
s68
0,83
0
20%
64%
23%
24%
29%
25%
83%
82%
90%
Hou
seho
ld s
ize
1 pe
rson
1,11
7,41
4
32
%46
%27
%29
%20
%28
%85
%80
%93
%2
peop
le98
4,99
7
28%
58%
30%
29%
22%
28%
80%
82%
90%
3 pe
ople
497,
888
14
%59
%16
%17
%26
%17
%83
%81
%92
%4
peop
le56
1,43
2
16%
58%
17%
15%
24%
17%
80%
84%
92%
5+ p
eopl
e32
2,90
1
9%60
%10
%10
%23
%9%
81%
82%
91%
---
----
----
----
-- A
ctiv
ity
days
---
----
----
----
-
AC
TIV
ITY
: W
alki
ng/h
ikin
g (w
alki
ng o
f hik
ing
outd
oors
for
exe
rcis
e or
ple
asur
e)
---
---
MN
Pop
ulat
ion
----
--(a
s re
pres
ente
d by
sur
vey)
---
----
---
Act
ivit
y pa
rtic
ipat
ion
----
----
-- -
----
- A
vid
part
icip
ants
---
---
(> m
edia
n da
ys p
er y
ear)

85Minnesota Department of Natural Resources
Ann
ual p
artic
ipan
ts 2
0 ye
ars
old
and
olde
r (0
00's
) =
1,49
3
A
nnua
l day
s of
par
ticip
atio
n an
ywhe
re (
000'
s) =
29,6
17
Ann
ual d
ays
of p
artic
ipat
ion
anyw
here
per
par
ticip
ant:
mea
n =
19.8
med
ian
=9
Perc
ent
Perc
ent o
fPe
rcen
t of
Perc
ent o
fPe
rcen
t fro
mw
ithin
1/2
Perc
ent
popu
latio
nPe
rcen
t of
Perc
ent o
fpo
pula
tion
avid
avid
hour
dri
vew
ithin
Dem
ogra
phic
cha
ract
eris
ticN
umbe
rPe
rcen
tpa
rtic
ipat
ing
part
icip
ants
activ
ity d
ays
who
are
avi
dspa
rtic
ipan
tspa
rtic
ipan
tsof
hom
eM
inne
sota
Tot
al3,
484,
632
100%
43%
100%
100%
21%
100%
90%
50%
89%
Pop
ulat
ion
dens
ity
of r
esid
ence
(zi
p co
de)
Low
(10
0 pe
ople
per
sq
mile
or
less
)94
5,36
2
27%
41%
26%
30%
24%
31%
92%
57%
90%
Med
ium
(10
1 to
100
0 pe
ople
per
sq.
mile
)95
5,29
6
27%
46%
29%
35%
25%
33%
92%
53%
91%
Hig
h (>
1000
peo
ple
per
sq. m
ile)
1,58
3,97
4
45
%42
%44
%36
%17
%37
%86
%40
%87
%
Reg
ion
of M
NN
orth
wes
t31
1,16
3
9%43
%9%
11%
25%
11%
93%
63%
93%
Nor
thea
st29
6,15
9
8%42
%8%
10%
24%
10%
93%
60%
90%
Sout
h68
7,75
2
20%
40%
18%
16%
20%
19%
88%
52%
86%
Cen
tral
315,
532
9%
45%
10%
11%
25%
11%
91%
54%
93%
Met
ro1,
874,
027
54%
44%
55%
53%
19%
49%
89%
44%
89%
Age
20-3
499
5,62
1
29%
51%
34%
36%
25%
34%
90%
47%
91%
35-4
482
4,18
1
24%
52%
29%
28%
24%
28%
89%
56%
88%
45-5
466
5,69
8
19%
44%
20%
18%
23%
21%
90%
47%
88%
55-6
440
4,86
8
12%
34%
9%10
%18
%10
%92
%47
%89
%65
+59
4,26
5
17%
20%
8%8%
9%7%
89%
52%
91%
Gen
der
Mal
e1,
700,
236
49%
50%
57%
66%
28%
66%
92%
49%
90%
Fem
ale
1,78
4,39
6
51
%36
%43
%34
%14
%34
%86
%52
%88
%
Rac
e/et
hnic
ity
Non
-whi
te a
nd/o
r H
ispa
nic
(< 1
00 r
espo
nden
ts)
219,
221
6%
27%
4%4%
10%
3%90
%52
%89
%W
hite
, non
-His
pani
c3,
265,
411
94%
44%
96%
96%
22%
97%
90%
50%
90%
Inco
me
unde
r $3
0,00
077
3,87
9
22%
26%
13%
9%11
%12
%86
%56
%86
%$3
0,00
0 to
$39
,999
452,
334
13
%44
%13
%10
%16
%10
%84
%53
%91
%$4
0,00
0 to
$49
,999
467,
456
13
%43
%13
%17
%20
%13
%92
%49
%93
%$5
0,00
0 to
$74
,999
834,
075
24
%49
%27
%23
%25
%28
%88
%50
%91
%$7
5,00
0 to
$99
,999
444,
712
13
%50
%15
%20
%30
%18
%94
%46
%91
%$1
00,0
00 o
r m
ore
512,
175
15
%58
%20
%21
%29
%20
%90
%54
%88
%
Edu
cati
onH
igh
scho
ol g
radu
ate,
or
som
e hi
gh s
choo
l69
2,47
1
20%
32%
15%
16%
17%
15%
92%
53%
92%
Vo-
tech
sch
ool,
asso
c. d
egre
e, o
r so
me
colle
ge1,
323,
702
38%
45%
40%
50%
25%
46%
93%
49%
89%
Gra
duat
ed f
rom
col
lege
787,
629
23
%48
%26
%19
%19
%21
%83
%49
%88
%Po
stgr
adua
te s
tudy
/pos
tgra
duat
e de
gree
s68
0,83
0
20%
44%
20%
15%
19%
18%
87%
48%
89%
Hou
seho
ld s
ize
1 pe
rson
1,11
7,41
4
32
%30
%22
%19
%10
%16
%85
%44
%89
%2
peop
le98
4,99
7
28%
44%
29%
33%
22%
30%
92%
50%
89%
3 pe
ople
497,
888
14
%50
%17
%17
%27
%19
%91
%56
%92
%4
peop
le56
1,43
2
16%
55%
21%
22%
32%
25%
91%
48%
88%
5+ p
eopl
e32
2,90
1
9%54
%11
%10
%25
%11
%88
%54
%90
%
---
---
MN
Pop
ulat
ion
----
--(a
s re
pres
ente
d by
sur
vey)
AC
TIV
ITY
: B
oati
ng o
f al
l typ
es, i
nclu
ding
fis
hing
fro
m a
boa
t
---
---
Avi
d pa
rtic
ipan
ts -
----
- -
----
----
----
----
Act
ivit
y da
ys -
----
----
----
---
---
----
---
Act
ivit
y pa
rtic
ipat
ion
----
----
--(>
med
ian
days
per
yea
r)
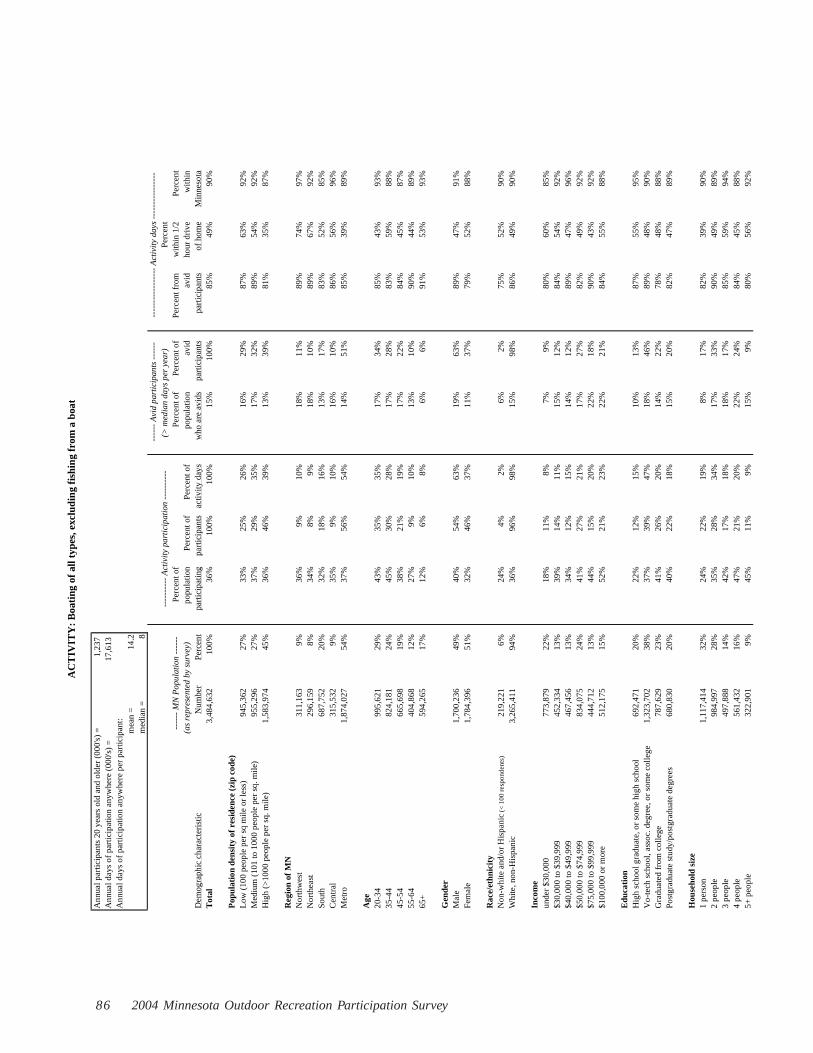
2004 Minnesota Outdoor Recreation Participation Survey86
Ann
ual p
artic
ipan
ts 2
0 ye
ars
old
and
olde
r (0
00's
) =
1,23
7
A
nnua
l day
s of
par
ticip
atio
n an
ywhe
re (
000'
s) =
17,6
13
Ann
ual d
ays
of p
artic
ipat
ion
anyw
here
per
par
ticip
ant:
mea
n =
14.2
med
ian
=8
Perc
ent
Perc
ent o
fPe
rcen
t of
Perc
ent o
fPe
rcen
t fro
mw
ithin
1/2
Perc
ent
popu
latio
nPe
rcen
t of
Perc
ent o
fpo
pula
tion
avid
avid
hour
dri
vew
ithin
Dem
ogra
phic
cha
ract
eris
ticN
umbe
rPe
rcen
tpa
rtic
ipat
ing
part
icip
ants
activ
ity d
ays
who
are
avi
dspa
rtic
ipan
tspa
rtic
ipan
tsof
hom
eM
inne
sota
Tot
al3,
484,
632
100%
36%
100%
100%
15%
100%
85%
49%
90%
Pop
ulat
ion
dens
ity
of r
esid
ence
(zi
p co
de)
Low
(10
0 pe
ople
per
sq
mile
or
less
)94
5,36
2
27%
33%
25%
26%
16%
29%
87%
63%
92%
Med
ium
(10
1 to
100
0 pe
ople
per
sq.
mile
)95
5,29
6
27%
37%
29%
35%
17%
32%
89%
54%
92%
Hig
h (>
1000
peo
ple
per
sq. m
ile)
1,58
3,97
4
45
%36
%46
%39
%13
%39
%81
%35
%87
%
Reg
ion
of M
NN
orth
wes
t31
1,16
3
9%36
%9%
10%
18%
11%
89%
74%
97%
Nor
thea
st29
6,15
9
8%34
%8%
9%18
%10
%89
%67
%92
%So
uth
687,
752
20
%32
%18
%16
%13
%17
%83
%52
%85
%C
entr
al31
5,53
2
9%35
%9%
10%
16%
10%
86%
56%
96%
Met
ro1,
874,
027
54%
37%
56%
54%
14%
51%
85%
39%
89%
Age
20-3
499
5,62
1
29%
43%
35%
35%
17%
34%
85%
43%
93%
35-4
482
4,18
1
24%
45%
30%
28%
17%
28%
83%
59%
88%
45-5
466
5,69
8
19%
38%
21%
19%
17%
22%
84%
45%
87%
55-6
440
4,86
8
12%
27%
9%10
%13
%10
%90
%44
%89
%65
+59
4,26
5
17%
12%
6%8%
6%6%
91%
53%
93%
Gen
der
Mal
e1,
700,
236
49%
40%
54%
63%
19%
63%
89%
47%
91%
Fem
ale
1,78
4,39
6
51
%32
%46
%37
%11
%37
%79
%52
%88
%
Rac
e/et
hnic
ity
Non
-whi
te a
nd/o
r H
ispa
nic
(< 1
00 r
espo
nden
ts)
219,
221
6%
24%
4%2%
6%2%
75%
52%
90%
Whi
te, n
on-H
ispa
nic
3,26
5,41
1
94
%36
%96
%98
%15
%98
%86
%49
%90
%
Inco
me
unde
r $3
0,00
077
3,87
9
22%
18%
11%
8%7%
9%80
%60
%85
%$3
0,00
0 to
$39
,999
452,
334
13
%39
%14
%11
%15
%12
%84
%54
%92
%$4
0,00
0 to
$49
,999
467,
456
13
%34
%12
%15
%14
%12
%89
%47
%96
%$5
0,00
0 to
$74
,999
834,
075
24
%41
%27
%21
%17
%27
%82
%49
%92
%$7
5,00
0 to
$99
,999
444,
712
13
%44
%15
%20
%22
%18
%90
%43
%92
%$1
00,0
00 o
r m
ore
512,
175
15
%52
%21
%23
%22
%21
%84
%55
%88
%
Edu
cati
onH
igh
scho
ol g
radu
ate,
or
som
e hi
gh s
choo
l69
2,47
1
20%
22%
12%
15%
10%
13%
87%
55%
95%
Vo-
tech
sch
ool,
asso
c. d
egre
e, o
r so
me
colle
ge1,
323,
702
38%
37%
39%
47%
18%
46%
89%
48%
90%
Gra
duat
ed f
rom
col
lege
787,
629
23
%41
%26
%20
%14
%22
%78
%48
%88
%Po
stgr
adua
te s
tudy
/pos
tgra
duat
e de
gree
s68
0,83
0
20%
40%
22%
18%
15%
20%
82%
47%
89%
Hou
seho
ld s
ize
1 pe
rson
1,11
7,41
4
32
%24
%22
%19
%8%
17%
82%
39%
90%
2 pe
ople
984,
997
28
%35
%28
%34
%17
%33
%90
%49
%89
%3
peop
le49
7,88
8
14%
42%
17%
18%
18%
17%
85%
59%
94%
4 pe
ople
561,
432
16
%47
%21
%20
%22
%24
%84
%45
%88
%5+
peo
ple
322,
901
9%
45%
11%
9%15
%9%
80%
56%
92%
---
---
MN
Pop
ulat
ion
----
--(a
s re
pres
ente
d by
sur
vey)
AC
TIV
ITY
: B
oati
ng o
f al
l typ
es, e
xclu
ding
fis
hing
fro
m a
boa
t
---
---
Avi
d pa
rtic
ipan
ts -
----
- -
----
----
----
----
Act
ivit
y da
ys -
----
----
----
---
---
----
---
Act
ivit
y pa
rtic
ipat
ion
----
----
--(>
med
ian
days
per
yea
r)

87Minnesota Department of Natural Resources
Ann
ual p
artic
ipan
ts 2
0 ye
ars
old
and
olde
r (0
00's
) =
1,36
5
A
nnua
l day
s of
par
ticip
atio
n an
ywhe
re (
000'
s) =
27,1
11
Ann
ual d
ays
of p
artic
ipat
ion
anyw
here
per
par
ticip
ant:
mea
n =
19.9
med
ian
=9
Perc
ent
Perc
ent o
fPe
rcen
t of
Perc
ent o
fPe
rcen
t fro
mw
ithin
1/2
Perc
ent
popu
latio
nPe
rcen
t of
Perc
ent o
fpo
pula
tion
avid
avid
hour
dri
vew
ithin
Dem
ogra
phic
cha
ract
eris
ticN
umbe
rPe
rcen
tpa
rtic
ipat
ing
part
icip
ants
activ
ity d
ays
who
are
avi
dspa
rtic
ipan
tspa
rtic
ipan
tsof
hom
eM
inne
sota
Tot
al3,
484,
632
100%
39%
100%
100%
19%
100%
90%
51%
90%
Pop
ulat
ion
dens
ity
of r
esid
ence
(zi
p co
de)
Low
(10
0 pe
ople
per
sq
mile
or
less
)94
5,36
2
27%
39%
27%
31%
22%
32%
92%
57%
90%
Med
ium
(10
1 to
100
0 pe
ople
per
sq.
mile
)95
5,29
6
27%
43%
30%
36%
23%
34%
92%
53%
91%
Hig
h (>
1000
peo
ple
per
sq. m
ile)
1,58
3,97
4
45
%37
%43
%34
%14
%34
%85
%41
%89
%
Reg
ion
of M
NN
orth
wes
t31
1,16
3
9%41
%9%
11%
23%
11%
92%
63%
93%
Nor
thea
st29
6,15
9
8%39
%9%
10%
22%
10%
92%
59%
90%
Sout
h68
7,75
2
20%
35%
18%
16%
18%
19%
89%
53%
86%
Cen
tral
315,
532
9%
43%
10%
11%
24%
12%
91%
53%
92%
Met
ro1,
874,
027
54%
40%
54%
52%
17%
48%
89%
45%
90%
Age
20-3
499
5,62
1
29%
48%
35%
36%
23%
35%
89%
48%
91%
35-4
482
4,18
1
24%
45%
27%
28%
21%
26%
90%
57%
90%
45-5
466
5,69
8
19%
41%
20%
18%
21%
22%
91%
47%
87%
55-6
440
4,86
8
12%
32%
10%
10%
16%
10%
91%
47%
89%
65+
594,
265
17
%19
%8%
9%8%
7%89
%52
%91
%
Gen
der
Mal
e1,
700,
236
49%
47%
58%
67%
26%
69%
92%
49%
90%
Fem
ale
1,78
4,39
6
51
%32
%42
%33
%12
%31
%86
%53
%89
%
Rac
e/et
hnic
ity
Non
-whi
te a
nd/o
r H
ispa
nic
(< 1
00 r
espo
nden
ts)
219,
221
6%
22%
3%4%
9%3%
91%
53%
90%
Whi
te, n
on-H
ispa
nic
3,26
5,41
1
94
%40
%97
%96
%19
%97
%90
%51
%90
%
Inco
me
unde
r $3
0,00
077
3,87
9
22%
23%
12%
9%8%
10%
82%
56%
88%
$30,
000
to $
39,9
9945
2,33
4
13%
41%
13%
10%
15%
10%
86%
54%
90%
$40,
000
to $
49,9
9946
7,45
6
13%
41%
14%
18%
19%
13%
92%
50%
93%
$50,
000
to $
74,9
9983
4,07
5
24%
45%
27%
23%
23%
28%
88%
51%
91%
$75,
000
to $
99,9
9944
4,71
2
13%
46%
15%
19%
27%
18%
93%
47%
90%
$100
,000
or
mor
e51
2,17
5
15%
51%
19%
20%
26%
20%
91%
54%
89%
Edu
cati
onH
igh
scho
ol g
radu
ate,
or
som
e hi
gh s
choo
l69
2,47
1
20%
32%
16%
17%
16%
16%
90%
54%
92%
Vo-
tech
sch
ool,
asso
c. d
egre
e, o
r so
me
colle
ge1,
323,
702
38%
43%
41%
51%
24%
49%
93%
50%
89%
Gra
duat
ed f
rom
col
lege
787,
629
23
%46
%26
%19
%18
%21
%83
%51
%88
%Po
stgr
adua
te s
tudy
/pos
tgra
duat
e de
gree
s68
0,83
0
20%
34%
17%
13%
13%
14%
85%
50%
91%
Hou
seho
ld s
ize
1 pe
rson
1,11
7,41
4
32
%28
%22
%18
%9%
15%
84%
44%
90%
2 pe
ople
984,
997
28
%38
%27
%33
%19
%29
%92
%52
%89
%3
peop
le49
7,88
8
14%
46%
17%
16%
24%
18%
90%
57%
93%
4 pe
ople
561,
432
16
%53
%22
%22
%31
%27
%92
%49
%88
%5+
peo
ple
322,
901
9%
48%
11%
10%
22%
11%
89%
55%
91%
---
---
MN
Pop
ulat
ion
----
--(a
s re
pres
ente
d by
sur
vey)
AC
TIV
ITY
: Mot
or b
oati
ng o
f al
l typ
es, i
nclu
ding
fis
hing
fro
m a
boa
t
---
---
Avi
d pa
rtic
ipan
ts -
----
- -
----
----
----
----
Act
ivit
y da
ys -
----
----
----
---
---
----
---
Act
ivit
y pa
rtic
ipat
ion
----
----
--(>
med
ian
days
per
yea
r)

2004 Minnesota Outdoor Recreation Participation Survey88
Ann
ual p
artic
ipan
ts 2
0 ye
ars
old
and
olde
r (0
00's
) =
1,05
0
A
nnua
l day
s of
par
ticip
atio
n an
ywhe
re (
000'
s) =
15,1
08
Ann
ual d
ays
of p
artic
ipat
ion
anyw
here
per
par
ticip
ant:
mea
n =
14.4
med
ian
=7.
5
Perc
ent
Perc
ent o
fPe
rcen
t of
Perc
ent o
fPe
rcen
t fro
mw
ithin
1/2
Perc
ent
popu
latio
nPe
rcen
t of
Perc
ent o
fpo
pula
tion
avid
avid
hour
dri
vew
ithin
Dem
ogra
phic
cha
ract
eris
ticN
umbe
rPe
rcen
tpa
rtic
ipat
ing
part
icip
ants
activ
ity d
ays
who
are
avi
dspa
rtic
ipan
tspa
rtic
ipan
tsof
hom
eM
inne
sota
Tot
al3,
484,
632
100%
30%
100%
100%
12%
100%
85%
50%
91%
Pop
ulat
ion
dens
ity
of r
esid
ence
(zi
p co
de)
Low
(10
0 pe
ople
per
sq
mile
or
less
)94
5,36
2
27%
29%
26%
27%
14%
32%
87%
64%
92%
Med
ium
(10
1 to
100
0 pe
ople
per
sq.
mile
)95
5,29
6
27%
33%
30%
37%
15%
34%
90%
55%
92%
Hig
h (>
1000
peo
ple
per
sq. m
ile)
1,58
3,97
4
45
%29
%44
%36
%9%
34%
78%
35%
88%
Reg
ion
of M
NN
orth
wes
t31
1,16
3
9%31
%9%
10%
16%
12%
88%
75%
97%
Nor
thea
st29
6,15
9
8%30
%9%
9%15
%10
%87
%67
%91
%So
uth
687,
752
20
%26
%17
%17
%11
%18
%86
%55
%84
%C
entr
al31
5,53
2
9%31
%9%
10%
15%
11%
86%
56%
96%
Met
ro1,
874,
027
54%
31%
56%
54%
11%
48%
84%
40%
91%
Age
20-3
499
5,62
1
29%
37%
35%
35%
14%
33%
84%
46%
93%
35-4
482
4,18
1
24%
35%
28%
27%
13%
26%
84%
62%
90%
45-5
466
5,69
8
19%
33%
21%
19%
14%
23%
84%
44%
86%
55-6
440
4,86
8
12%
24%
9%10
%12
%11
%89
%44
%89
%65
+59
4,26
5
17%
11%
6%9%
5%7%
90%
52%
93%
Gen
der
Mal
e1,
700,
236
49%
34%
55%
64%
16%
64%
89%
48%
92%
Fem
ale
1,78
4,39
6
51
%27
%45
%36
%9%
36%
79%
55%
88%
Rac
e/et
hnic
ity
Non
-whi
te a
nd/o
r H
ispa
nic
(< 1
00 r
espo
nden
ts)
219,
221
6%
18%
4%3%
6%3%
77%
56%
92%
Whi
te, n
on-H
ispa
nic
3,26
5,41
1
94
%31
%96
%97
%13
%97
%85
%50
%91
%
Inco
me
unde
r $3
0,00
077
3,87
9
22%
14%
10%
8%4%
7%75
%62
%88
%$3
0,00
0 to
$39
,999
452,
334
13
%33
%14
%12
%13
%13
%85
%56
%92
%$4
0,00
0 to
$49
,999
467,
456
13
%30
%13
%17
%12
%13
%89
%49
%96
%$5
0,00
0 to
$74
,999
834,
075
24
%36
%28
%21
%13
%26
%80
%52
%93
%$7
5,00
0 to
$99
,999
444,
712
13
%36
%15
%20
%18
%19
%91
%44
%91
%$1
00,0
00 o
r m
ore
512,
175
15
%44
%21
%23
%18
%21
%84
%56
%89
%
Edu
cati
onH
igh
scho
ol g
radu
ate,
or
som
e hi
gh s
choo
l69
2,47
1
20%
22%
14%
17%
9%15
%87
%56
%95
%V
o-te
ch s
choo
l, as
soc.
deg
ree,
or
som
e co
llege
1,32
3,70
2
38
%33
%41
%49
%17
%51
%89
%49
%90
%G
radu
ated
fro
m c
olle
ge78
7,62
9
23%
36%
27%
19%
11%
20%
76%
50%
88%
Post
grad
uate
stu
dy/p
ostg
radu
ate
degr
ees
680,
830
20
%27
%18
%15
%9%
15%
80%
50%
93%
Hou
seho
ld s
ize
1 pe
rson
1,11
7,41
4
32
%21
%22
%19
%7%
17%
81%
38%
91%
2 pe
ople
984,
997
28
%28
%26
%35
%14
%32
%90
%52
%90
%3
peop
le49
7,88
8
14%
37%
17%
17%
14%
16%
82%
60%
95%
4 pe
ople
561,
432
16
%42
%23
%21
%18
%25
%83
%47
%88
%5+
peo
ple
322,
901
9%
36%
11%
9%13
%10
%83
%59
%93
%
---
---
MN
Pop
ulat
ion
----
--(a
s re
pres
ente
d by
sur
vey)
AC
TIV
ITY
: M
otor
boa
ting
of
all t
ypes
, exc
ludi
ng f
ishi
ng f
rom
a b
oat
---
---
Avi
d pa
rtic
ipan
ts -
----
- -
----
----
----
----
Act
ivit
y da
ys -
----
----
----
---
---
----
---
Act
ivit
y pa
rtic
ipat
ion
----
----
--(>
med
ian
days
per
yea
r)
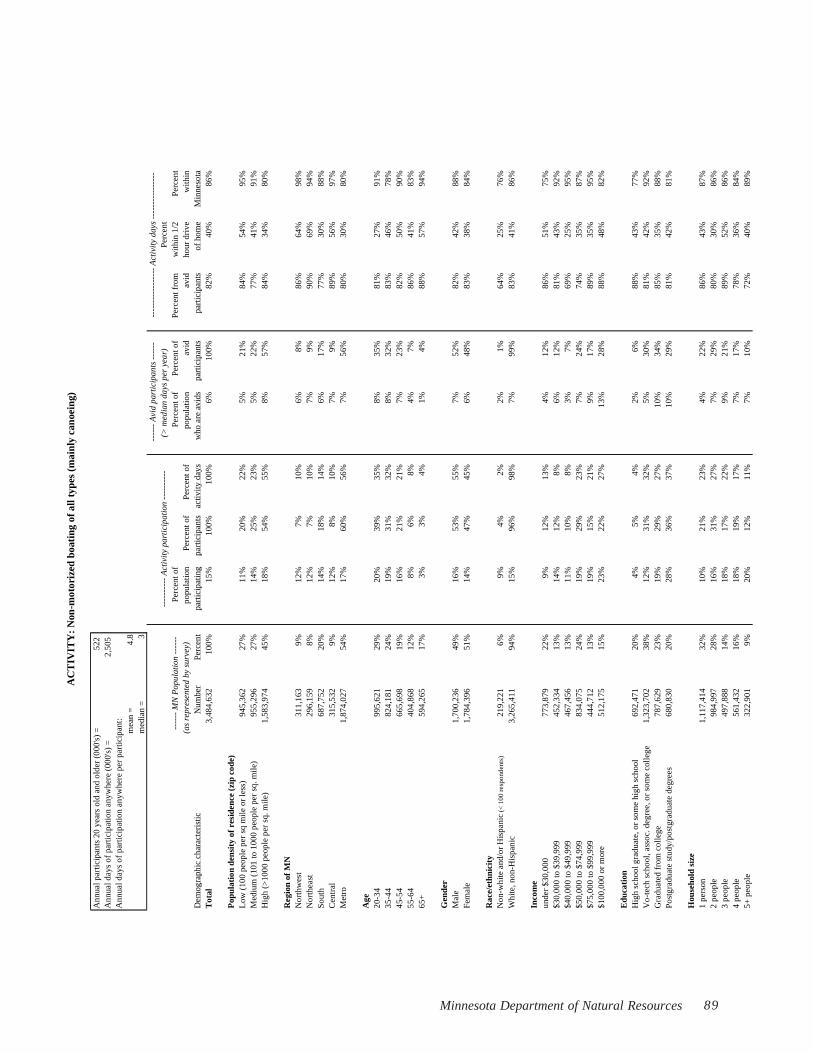
89Minnesota Department of Natural Resources
Ann
ual p
artic
ipan
ts 2
0 ye
ars
old
and
olde
r (0
00's
) =
522
A
nnua
l day
s of
par
ticip
atio
n an
ywhe
re (
000'
s) =
2,50
5
A
nnua
l day
s of
par
ticip
atio
n an
ywhe
re p
er p
artic
ipan
t:m
ean
=4.
8m
edia
n =
3
Perc
ent
Perc
ent o
fPe
rcen
t of
Perc
ent o
fPe
rcen
t fro
mw
ithin
1/2
Perc
ent
popu
latio
nPe
rcen
t of
Perc
ent o
fpo
pula
tion
avid
avid
hour
dri
vew
ithin
Dem
ogra
phic
cha
ract
eris
ticN
umbe
rPe
rcen
tpa
rtic
ipat
ing
part
icip
ants
activ
ity d
ays
who
are
avi
dspa
rtic
ipan
tspa
rtic
ipan
tsof
hom
eM
inne
sota
Tot
al3,
484,
632
100%
15%
100%
100%
6%10
0%82
%40
%86
%
Pop
ulat
ion
dens
ity
of r
esid
ence
(zi
p co
de)
Low
(10
0 pe
ople
per
sq
mile
or
less
)94
5,36
2
27%
11%
20%
22%
5%21
%84
%54
%95
%M
ediu
m (
101
to 1
000
peop
le p
er s
q. m
ile)
955,
296
27
%14
%25
%23
%5%
22%
77%
41%
91%
Hig
h (>
1000
peo
ple
per
sq. m
ile)
1,58
3,97
4
45
%18
%54
%55
%8%
57%
84%
34%
80%
Reg
ion
of M
NN
orth
wes
t31
1,16
3
9%12
%7%
10%
6%8%
86%
64%
98%
Nor
thea
st29
6,15
9
8%12
%7%
10%
7%9%
90%
69%
94%
Sout
h68
7,75
2
20%
14%
18%
14%
6%17
%77
%30
%88
%C
entr
al31
5,53
2
9%12
%8%
10%
7%9%
89%
56%
97%
Met
ro1,
874,
027
54%
17%
60%
56%
7%56
%80
%30
%80
%
Age
20-3
499
5,62
1
29%
20%
39%
35%
8%35
%81
%27
%91
%35
-44
824,
181
24
%19
%31
%32
%8%
32%
83%
46%
78%
45-5
466
5,69
8
19%
16%
21%
21%
7%23
%82
%50
%90
%55
-64
404,
868
12
%8%
6%8%
4%7%
86%
41%
83%
65+
594,
265
17
%3%
3%4%
1%4%
88%
57%
94%
Gen
der
Mal
e1,
700,
236
49%
16%
53%
55%
7%52
%82
%42
%88
%Fe
mal
e1,
784,
396
51%
14%
47%
45%
6%48
%83
%38
%84
%
Rac
e/et
hnic
ity
Non
-whi
te a
nd/o
r H
ispa
nic
(< 1
00 r
espo
nden
ts)
219,
221
6%
9%4%
2%2%
1%64
%25
%76
%W
hite
, non
-His
pani
c3,
265,
411
94%
15%
96%
98%
7%99
%83
%41
%86
%
Inco
me
unde
r $3
0,00
077
3,87
9
22%
9%12
%13
%4%
12%
86%
51%
75%
$30,
000
to $
39,9
9945
2,33
4
13%
14%
12%
8%6%
12%
81%
43%
92%
$40,
000
to $
49,9
9946
7,45
6
13%
11%
10%
8%3%
7%69
%25
%95
%$5
0,00
0 to
$74
,999
834,
075
24
%19
%29
%23
%7%
24%
74%
35%
87%
$75,
000
to $
99,9
9944
4,71
2
13%
19%
15%
21%
9%17
%89
%35
%95
%$1
00,0
00 o
r m
ore
512,
175
15
%23
%22
%27
%13
%28
%88
%48
%82
%
Edu
cati
onH
igh
scho
ol g
radu
ate,
or
som
e hi
gh s
choo
l69
2,47
1
20%
4%5%
4%2%
6%88
%43
%77
%V
o-te
ch s
choo
l, as
soc.
deg
ree,
or
som
e co
llege
1,32
3,70
2
38
%12
%31
%32
%5%
30%
81%
42%
92%
Gra
duat
ed f
rom
col
lege
787,
629
23
%19
%29
%27
%10
%34
%85
%35
%88
%Po
stgr
adua
te s
tudy
/pos
tgra
duat
e de
gree
s68
0,83
0
20%
28%
36%
37%
10%
29%
81%
42%
81%
Hou
seho
ld s
ize
1 pe
rson
1,11
7,41
4
32
%10
%21
%23
%4%
22%
86%
43%
87%
2 pe
ople
984,
997
28
%16
%31
%27
%7%
29%
80%
30%
86%
3 pe
ople
497,
888
14
%18
%17
%22
%9%
21%
89%
52%
86%
4 pe
ople
561,
432
16
%18
%19
%17
%7%
17%
78%
36%
84%
5+ p
eopl
e32
2,90
1
9%20
%12
%11
%7%
10%
72%
40%
89%
---
---
MN
Pop
ulat
ion
----
--(a
s re
pres
ente
d by
sur
vey)
AC
TIV
ITY
: N
on-m
otor
ized
boa
ting
of a
ll ty
pes
(mai
nly
cano
eing
)
---
---
Avi
d pa
rtic
ipan
ts -
----
- -
----
----
----
----
Act
ivit
y da
ys -
----
----
----
---
---
----
---
Act
ivit
y pa
rtic
ipat
ion
----
----
--(>
med
ian
days
per
yea
r)
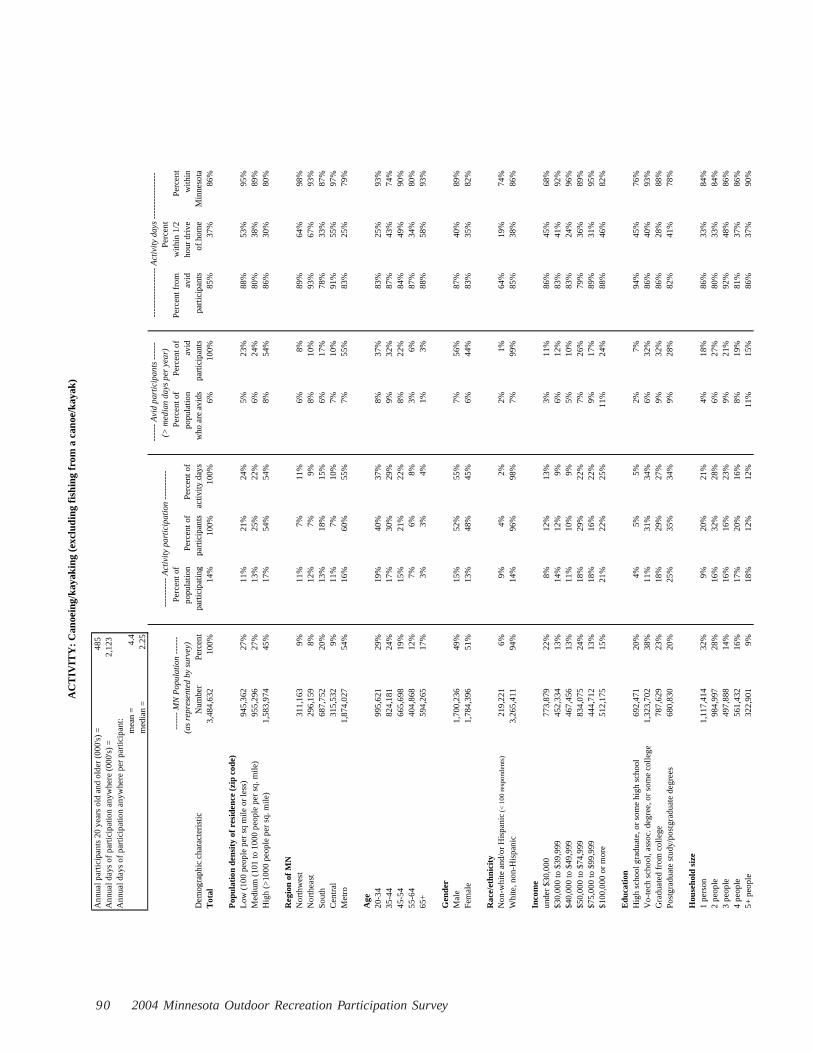
2004 Minnesota Outdoor Recreation Participation Survey90
Ann
ual p
artic
ipan
ts 2
0 ye
ars
old
and
olde
r (0
00's
) =
485
A
nnua
l day
s of
par
ticip
atio
n an
ywhe
re (
000'
s) =
2,12
3
A
nnua
l day
s of
par
ticip
atio
n an
ywhe
re p
er p
artic
ipan
t:m
ean
=4.
4m
edia
n =
2.25
Perc
ent
Perc
ent o
fPe
rcen
t of
Perc
ent o
fPe
rcen
t fro
mw
ithin
1/2
Perc
ent
popu
latio
nPe
rcen
t of
Perc
ent o
fpo
pula
tion
avid
avid
hour
dri
vew
ithin
Dem
ogra
phic
cha
ract
eris
ticN
umbe
rPe
rcen
tpa
rtic
ipat
ing
part
icip
ants
activ
ity d
ays
who
are
avi
dspa
rtic
ipan
tspa
rtic
ipan
tsof
hom
eM
inne
sota
Tot
al3,
484,
632
100%
14%
100%
100%
6%10
0%85
%37
%86
%
Pop
ulat
ion
dens
ity
of r
esid
ence
(zi
p co
de)
Low
(10
0 pe
ople
per
sq
mile
or
less
)94
5,36
2
27%
11%
21%
24%
5%23
%88
%53
%95
%M
ediu
m (
101
to 1
000
peop
le p
er s
q. m
ile)
955,
296
27
%13
%25
%22
%6%
24%
80%
38%
89%
Hig
h (>
1000
peo
ple
per
sq. m
ile)
1,58
3,97
4
45
%17
%54
%54
%8%
54%
86%
30%
80%
Reg
ion
of M
NN
orth
wes
t31
1,16
3
9%11
%7%
11%
6%8%
89%
64%
98%
Nor
thea
st29
6,15
9
8%12
%7%
9%8%
10%
93%
67%
93%
Sout
h68
7,75
2
20%
13%
18%
15%
6%17
%78
%33
%87
%C
entr
al31
5,53
2
9%11
%7%
10%
7%10
%91
%55
%97
%M
etro
1,87
4,02
7
54
%16
%60
%55
%7%
55%
83%
25%
79%
Age
20-3
499
5,62
1
29%
19%
40%
37%
8%37
%83
%25
%93
%35
-44
824,
181
24
%17
%30
%29
%9%
32%
87%
43%
74%
45-5
466
5,69
8
19%
15%
21%
22%
8%22
%84
%49
%90
%55
-64
404,
868
12
%7%
6%8%
3%6%
87%
34%
80%
65+
594,
265
17
%3%
3%4%
1%3%
88%
58%
93%
Gen
der
Mal
e1,
700,
236
49%
15%
52%
55%
7%56
%87
%40
%89
%Fe
mal
e1,
784,
396
51%
13%
48%
45%
6%44
%83
%35
%82
%
Rac
e/et
hnic
ity
Non
-whi
te a
nd/o
r H
ispa
nic
(< 1
00 r
espo
nden
ts)
219,
221
6%
9%4%
2%2%
1%64
%19
%74
%W
hite
, non
-His
pani
c3,
265,
411
94%
14%
96%
98%
7%99
%85
%38
%86
%
Inco
me
unde
r $3
0,00
077
3,87
9
22%
8%12
%13
%3%
11%
86%
45%
68%
$30,
000
to $
39,9
9945
2,33
4
13%
14%
12%
9%6%
12%
83%
41%
92%
$40,
000
to $
49,9
9946
7,45
6
13%
11%
10%
9%5%
10%
83%
24%
96%
$50,
000
to $
74,9
9983
4,07
5
24%
18%
29%
22%
7%26
%79
%36
%89
%$7
5,00
0 to
$99
,999
444,
712
13
%18
%16
%22
%9%
17%
89%
31%
95%
$100
,000
or
mor
e51
2,17
5
15%
21%
22%
25%
11%
24%
88%
46%
82%
Edu
cati
onH
igh
scho
ol g
radu
ate,
or
som
e hi
gh s
choo
l69
2,47
1
20%
4%5%
5%2%
7%94
%45
%76
%V
o-te
ch s
choo
l, as
soc.
deg
ree,
or
som
e co
llege
1,32
3,70
2
38
%11
%31
%34
%6%
32%
86%
40%
93%
Gra
duat
ed f
rom
col
lege
787,
629
23
%18
%29
%27
%9%
32%
86%
28%
88%
Post
grad
uate
stu
dy/p
ostg
radu
ate
degr
ees
680,
830
20
%25
%35
%34
%9%
28%
82%
41%
78%
Hou
seho
ld s
ize
1 pe
rson
1,11
7,41
4
32
%9%
20%
21%
4%18
%86
%33
%84
%2
peop
le98
4,99
7
28%
16%
32%
28%
6%27
%80
%33
%84
%3
peop
le49
7,88
8
14%
16%
16%
23%
9%21
%92
%48
%86
%4
peop
le56
1,43
2
16%
17%
20%
16%
8%19
%81
%37
%86
%5+
peo
ple
322,
901
9%
18%
12%
12%
11%
15%
86%
37%
90%
---
---
MN
Pop
ulat
ion
----
--(a
s re
pres
ente
d by
sur
vey)
AC
TIV
ITY
: C
anoe
ing/
kaya
king
(ex
clud
ing
fish
ing
from
a c
anoe
/kay
ak)
---
---
Avi
d pa
rtic
ipan
ts -
----
- -
----
----
----
----
Act
ivit
y da
ys -
----
----
----
---
---
----
---
Act
ivit
y pa
rtic
ipat
ion
----
----
--(>
med
ian
days
per
yea
r)

91Minnesota Department of Natural Resources
Ann
ual p
artic
ipan
ts 2
0 ye
ars
old
and
olde
r (0
00's
) =
1,42
3
A
nnua
l day
s of
par
ticip
atio
n an
ywhe
re (
000'
s) =
21,9
27
Ann
ual d
ays
of p
artic
ipat
ion
anyw
here
per
par
ticip
ant:
mea
n =
15.4
med
ian
=9
Perc
ent
Perc
ent o
fPe
rcen
t of
Perc
ent o
fPe
rcen
t fro
mw
ithin
1/2
Perc
ent
popu
latio
nPe
rcen
t of
Perc
ent o
fpo
pula
tion
avid
avid
hour
dri
vew
ithin
Dem
ogra
phic
cha
ract
eris
ticN
umbe
rPe
rcen
tpa
rtic
ipat
ing
part
icip
ants
activ
ity d
ays
who
are
avi
dspa
rtic
ipan
tspa
rtic
ipan
tsof
hom
eM
inne
sota
Tot
al3,
484,
632
100%
41%
100%
100%
20%
100%
85%
64%
85%
Pop
ulat
ion
dens
ity
of r
esid
ence
(zi
p co
de)
Low
(10
0 pe
ople
per
sq
mile
or
less
)94
5,36
2
27%
36%
24%
24%
17%
23%
83%
71%
90%
Med
ium
(10
1 to
100
0 pe
ople
per
sq.
mile
)95
5,29
6
27%
44%
30%
30%
21%
29%
86%
63%
87%
Hig
h (>
1000
peo
ple
per
sq. m
ile)
1,58
3,97
4
45
%42
%47
%46
%21
%48
%87
%62
%82
%
Reg
ion
of M
NN
orth
wes
t31
1,16
3
9%37
%8%
9%19
%8%
85%
75%
95%
Nor
thea
st29
6,15
9
8%38
%8%
7%16
%7%
80%
71%
90%
Sout
h68
7,75
2
20%
38%
18%
18%
19%
18%
84%
64%
82%
Cen
tral
315,
532
9%
41%
9%10
%22
%10
%89
%66
%95
%M
etro
1,87
4,02
7
54
%43
%56
%57
%21
%57
%86
%62
%82
%
Age
20-3
499
5,62
1
29%
54%
38%
39%
29%
41%
87%
62%
90%
35-4
482
4,18
1
24%
48%
28%
33%
25%
30%
88%
68%
80%
45-5
466
5,69
8
19%
44%
21%
17%
19%
18%
81%
60%
88%
55-6
440
4,86
8
12%
27%
8%7%
12%
7%80
%65
%78
%65
+59
4,26
5
17%
14%
6%5%
5%4%
75%
70%
82%
Gen
der
Mal
e1,
700,
236
49%
42%
50%
44%
19%
45%
82%
64%
86%
Fem
ale
1,78
4,39
6
51
%40
%50
%56
%22
%55
%89
%65
%84
%
Rac
e/et
hnic
ity
Non
-whi
te a
nd/o
r H
ispa
nic
(< 1
00 r
espo
nden
ts)
219,
221
6%
34%
5%5%
22%
7%94
%79
%91
%W
hite
, non
-His
pani
c3,
265,
411
94%
41%
95%
95%
20%
93%
85%
64%
85%
Inco
me
unde
r $3
0,00
077
3,87
9
22%
28%
15%
17%
14%
15%
90%
70%
80%
$30,
000
to $
39,9
9945
2,33
4
13%
43%
13%
13%
18%
11%
83%
68%
81%
$40,
000
to $
49,9
9946
7,45
6
13%
40%
13%
13%
19%
12%
86%
69%
95%
$50,
000
to $
74,9
9983
4,07
5
24%
48%
27%
25%
23%
27%
83%
67%
88%
$75,
000
to $
99,9
9944
4,71
2
13%
43%
13%
12%
22%
14%
86%
52%
84%
$100
,000
or
mor
e51
2,17
5
15%
53%
19%
19%
31%
22%
86%
64%
85%
Edu
cati
onH
igh
scho
ol g
radu
ate,
or
som
e hi
gh s
choo
l69
2,47
1
20%
28%
13%
10%
11%
11%
81%
71%
91%
Vo-
tech
sch
ool,
asso
c. d
egre
e, o
r so
me
colle
ge1,
323,
702
38%
41%
38%
42%
20%
38%
87%
64%
89%
Gra
duat
ed f
rom
col
lege
787,
629
23
%49
%27
%25
%24
%27
%84
%67
%86
%Po
stgr
adua
te s
tudy
/pos
tgra
duat
e de
gree
s68
0,83
0
20%
46%
22%
23%
25%
24%
87%
60%
74%
Hou
seho
ld s
ize
1 pe
rson
1,11
7,41
4
32
%29
%22
%20
%12
%18
%80
%60
%90
%2
peop
le98
4,99
7
28%
38%
26%
27%
19%
27%
86%
59%
78%
3 pe
ople
497,
888
14
%51
%18
%18
%26
%18
%86
%73
%92
%4
peop
le56
1,43
2
16%
53%
21%
23%
30%
24%
90%
63%
82%
5+ p
eopl
e32
2,90
1
9%56
%12
%12
%26
%12
%85
%76
%89
%
---
---
MN
Pop
ulat
ion
----
--(a
s re
pres
ente
d by
sur
vey)
AC
TIV
ITY
: Sw
imm
ing
or w
adin
g (a
ll pl
aces
) ---
---
Avi
d pa
rtic
ipan
ts -
----
- -
----
----
----
----
Act
ivit
y da
ys -
----
----
----
---
---
----
---
Act
ivit
y pa
rtic
ipat
ion
----
----
--(>
med
ian
days
per
yea
r)

2004 Minnesota Outdoor Recreation Participation Survey92
Ann
ual p
artic
ipan
ts 2
0 ye
ars
old
and
olde
r (0
00's
) =
1,27
9
A
nnua
l day
s of
par
ticip
atio
n an
ywhe
re (
000'
s) =
14,8
07
Ann
ual d
ays
of p
artic
ipat
ion
anyw
here
per
par
ticip
ant:
mea
n =
11.6
med
ian
=7.
5
Perc
ent
Perc
ent o
fPe
rcen
t of
Perc
ent o
fPe
rcen
t fro
mw
ithin
1/2
Perc
ent
popu
latio
nPe
rcen
t of
Perc
ent o
fpo
pula
tion
avid
avid
hour
dri
vew
ithin
Dem
ogra
phic
cha
ract
eris
ticN
umbe
rPe
rcen
tpa
rtic
ipat
ing
part
icip
ants
activ
ity d
ays
who
are
avi
dspa
rtic
ipan
tspa
rtic
ipan
tsof
hom
eM
inne
sota
Tot
al3,
484,
632
100%
37%
100%
100%
14%
100%
77%
56%
85%
Pop
ulat
ion
dens
ity
of r
esid
ence
(zi
p co
de)
Low
(10
0 pe
ople
per
sq
mile
or
less
)94
5,36
2
27%
34%
25%
25%
13%
26%
76%
68%
90%
Med
ium
(10
1 to
100
0 pe
ople
per
sq.
mile
)95
5,29
6
27%
39%
30%
33%
17%
33%
82%
57%
87%
Hig
h (>
1000
peo
ple
per
sq. m
ile)
1,58
3,97
4
45
%37
%45
%43
%13
%41
%75
%49
%82
%
Reg
ion
of M
NN
orth
wes
t31
1,16
3
9%37
%9%
11%
18%
12%
85%
74%
96%
Nor
thea
st29
6,15
9
8%37
%9%
9%14
%8%
75%
73%
92%
Sout
h68
7,75
2
20%
33%
18%
16%
12%
16%
73%
56%
80%
Cen
tral
315,
532
9%
38%
9%9%
16%
11%
79%
56%
96%
Met
ro1,
874,
027
54%
38%
55%
56%
14%
53%
77%
51%
82%
Age
20-3
499
5,62
1
29%
49%
38%
40%
21%
43%
80%
56%
91%
35-4
482
4,18
1
24%
44%
29%
32%
16%
27%
78%
59%
78%
45-5
466
5,69
8
19%
38%
20%
18%
14%
20%
75%
51%
86%
55-6
440
4,86
8
12%
23%
7%6%
8%6%
68%
61%
85%
65+
594,
265
17
%12
%5%
4%3%
4%61
%61
%90
%
Gen
der
Mal
e1,
700,
236
49%
39%
51%
47%
14%
50%
76%
57%
87%
Fem
ale
1,78
4,39
6
51
%35
%49
%53
%14
%50
%78
%56
%84
%
Rac
e/et
hnic
ity
Non
-whi
te a
nd/o
r H
ispa
nic
(< 1
00 r
espo
nden
ts)
219,
221
6%
30%
5%5%
14%
6%80
%76
%90
%W
hite
, non
-His
pani
c3,
265,
411
94%
37%
95%
95%
14%
94%
77%
55%
85%
Inco
me
unde
r $3
0,00
077
3,87
9
22%
25%
15%
19%
12%
18%
86%
61%
75%
$30,
000
to $
39,9
9945
2,33
4
13%
40%
14%
13%
11%
10%
70%
59%
89%
$40,
000
to $
49,9
9946
7,45
6
13%
32%
12%
10%
11%
10%
73%
61%
98%
$50,
000
to $
74,9
9983
4,07
5
24%
44%
28%
23%
16%
26%
70%
61%
90%
$75,
000
to $
99,9
9944
4,71
2
13%
41%
14%
15%
16%
14%
79%
46%
88%
$100
,000
or
mor
e51
2,17
5
15%
46%
18%
20%
22%
22%
81%
59%
84%
Edu
cati
onH
igh
scho
ol g
radu
ate,
or
som
e hi
gh s
choo
l69
2,47
1
20%
23%
12%
11%
9%13
%80
%67
%92
%V
o-te
ch s
choo
l, as
soc.
deg
ree,
or
som
e co
llege
1,32
3,70
2
38
%38
%39
%42
%15
%39
%79
%55
%89
%G
radu
ated
fro
m c
olle
ge78
7,62
9
23%
45%
28%
24%
17%
26%
73%
60%
86%
Post
grad
uate
stu
dy/p
ostg
radu
ate
degr
ees
680,
830
20
%40
%21
%23
%16
%22
%78
%49
%75
%
Hou
seho
ld s
ize
1 pe
rson
1,11
7,41
4
32
%26
%22
%21
%8%
17%
70%
51%
92%
2 pe
ople
984,
997
28
%32
%25
%28
%13
%26
%79
%53
%77
%3
peop
le49
7,88
8
14%
47%
19%
18%
18%
18%
77%
65%
92%
4 pe
ople
561,
432
16
%48
%21
%22
%22
%25
%80
%53
%85
%5+
peo
ple
322,
901
9%
52%
13%
11%
21%
13%
80%
69%
86%
---
---
MN
Pop
ulat
ion
----
--(a
s re
pres
ente
d by
sur
vey)
AC
TIV
ITY
: Sw
imm
ing
or w
adin
g in
a la
ke o
r st
ream
---
---
Avi
d pa
rtic
ipan
ts -
----
- -
----
----
----
----
Act
ivit
y da
ys -
----
----
----
---
---
----
---
Act
ivit
y pa
rtic
ipat
ion
----
----
--(>
med
ian
days
per
yea
r)

93Minnesota Department of Natural Resources
Ann
ual p
artic
ipan
ts 2
0 ye
ars
old
and
olde
r (0
00's
) =
750
A
nnua
l day
s of
par
ticip
atio
n an
ywhe
re (
000'
s) =
7,12
0
A
nnua
l day
s of
par
ticip
atio
n an
ywhe
re p
er p
artic
ipan
t:m
ean
=9.
5m
edia
n =
4
Perc
ent
Perc
ent o
fPe
rcen
t of
Perc
ent o
fPe
rcen
t fro
mw
ithin
1/2
Perc
ent
popu
latio
nPe
rcen
t of
Perc
ent o
fpo
pula
tion
avid
avid
hour
dri
vew
ithin
Dem
ogra
phic
cha
ract
eris
ticN
umbe
rPe
rcen
tpa
rtic
ipat
ing
part
icip
ants
activ
ity d
ays
who
are
avi
dspa
rtic
ipan
tspa
rtic
ipan
tsof
hom
eM
inne
sota
Tot
al3,
484,
632
100%
22%
100%
100%
11%
100%
87%
81%
84%
Pop
ulat
ion
dens
ity
of r
esid
ence
(zi
p co
de)
Low
(10
0 pe
ople
per
sq
mile
or
less
)94
5,36
2
27%
15%
19%
22%
7%19
%91
%78
%89
%M
ediu
m (
101
to 1
000
peop
le p
er s
q. m
ile)
955,
296
27
%22
%29
%25
%10
%27
%84
%79
%86
%H
igh
(>10
00 p
eopl
e pe
r sq
. mile
)1,
583,
974
45%
25%
53%
53%
13%
54%
88%
84%
81%
Reg
ion
of M
NN
orth
wes
t31
1,16
3
9%12
%5%
4%6%
5%88
%84
%87
%N
orth
east
296,
159
8%
12%
5%3%
5%4%
74%
62%
78%
Sout
h68
7,75
2
20%
20%
18%
22%
11%
20%
90%
75%
85%
Cen
tral
315,
532
9%
21%
9%12
%12
%10
%91
%81
%93
%M
etro
1,87
4,02
7
54
%25
%63
%59
%12
%62
%86
%84
%82
%
Age
20-3
499
5,62
1
29%
30%
40%
35%
14%
37%
85%
78%
87%
35-4
482
4,18
1
24%
28%
32%
36%
14%
32%
88%
86%
83%
45-5
466
5,69
8
19%
19%
17%
15%
9%16
%88
%81
%93
%55
-64
404,
868
12
%12
%6%
7%7%
8%92
%71
%68
%65
+59
4,26
5
17%
7%5%
6%4%
6%93
%83
%71
%
Gen
der
Mal
e1,
700,
236
49%
20%
45%
38%
9%40
%83
%80
%84
%Fe
mal
e1,
784,
396
51%
23%
55%
62%
12%
60%
90%
82%
85%
Rac
e/et
hnic
ity
Non
-whi
te a
nd/o
r H
ispa
nic
(< 1
00 r
espo
nden
ts)
219,
221
6%
21%
6%5%
12%
7%89
%85
%92
%W
hite
, non
-His
pani
c3,
265,
411
94%
22%
94%
95%
10%
93%
87%
81%
84%
Inco
me
unde
r $3
0,00
077
3,87
9
22%
14%
14%
14%
6%12
%85
%95
%95
%$3
0,00
0 to
$39
,999
452,
334
13
%20
%12
%14
%10
%12
%92
%86
%67
%$4
0,00
0 to
$49
,999
467,
456
13
%24
%14
%17
%13
%16
%92
%80
%91
%$5
0,00
0 to
$74
,999
834,
075
24
%27
%29
%30
%12
%26
%87
%77
%85
%$7
5,00
0 to
$99
,999
444,
712
13
%19
%11
%8%
9%11
%80
%73
%71
%$1
00,0
00 o
r m
ore
512,
175
15
%31
%20
%17
%17
%23
%85
%75
%86
%
Edu
cati
onH
igh
scho
ol g
radu
ate,
or
som
e hi
gh s
choo
l69
2,47
1
20%
13%
12%
8%4%
8%77
%86
%88
%V
o-te
ch s
choo
l, as
soc.
deg
ree,
or
som
e co
llege
1,32
3,70
2
38
%19
%34
%41
%10
%36
%89
%82
%90
%G
radu
ated
fro
m c
olle
ge78
7,62
9
23%
27%
29%
27%
14%
30%
87%
80%
86%
Post
grad
uate
stu
dy/p
ostg
radu
ate
degr
ees
680,
830
20
%28
%25
%25
%15
%27
%88
%80
%72
%
Hou
seho
ld s
ize
1 pe
rson
1,11
7,41
4
32
%13
%19
%19
%6%
17%
86%
82%
88%
2 pe
ople
984,
997
28
%18
%24
%24
%11
%29
%90
%72
%79
%3
peop
le49
7,88
8
14%
32%
21%
17%
15%
20%
84%
90%
92%
4 pe
ople
561,
432
16
%29
%22
%25
%14
%21
%88
%80
%76
%5+
peo
ple
322,
901
9%
34%
14%
16%
14%
12%
88%
86%
92%
---
---
MN
Pop
ulat
ion
----
--(a
s re
pres
ente
d by
sur
vey)
AC
TIV
ITY
: Sw
imm
ing
or w
adin
g in
an
outd
oor
pool
or
wat
er p
ark
---
---
Avi
d pa
rtic
ipan
ts -
----
- -
----
----
----
----
Act
ivit
y da
ys -
----
----
----
---
---
----
---
Act
ivit
y pa
rtic
ipat
ion
----
----
--(>
med
ian
days
per
yea
r)
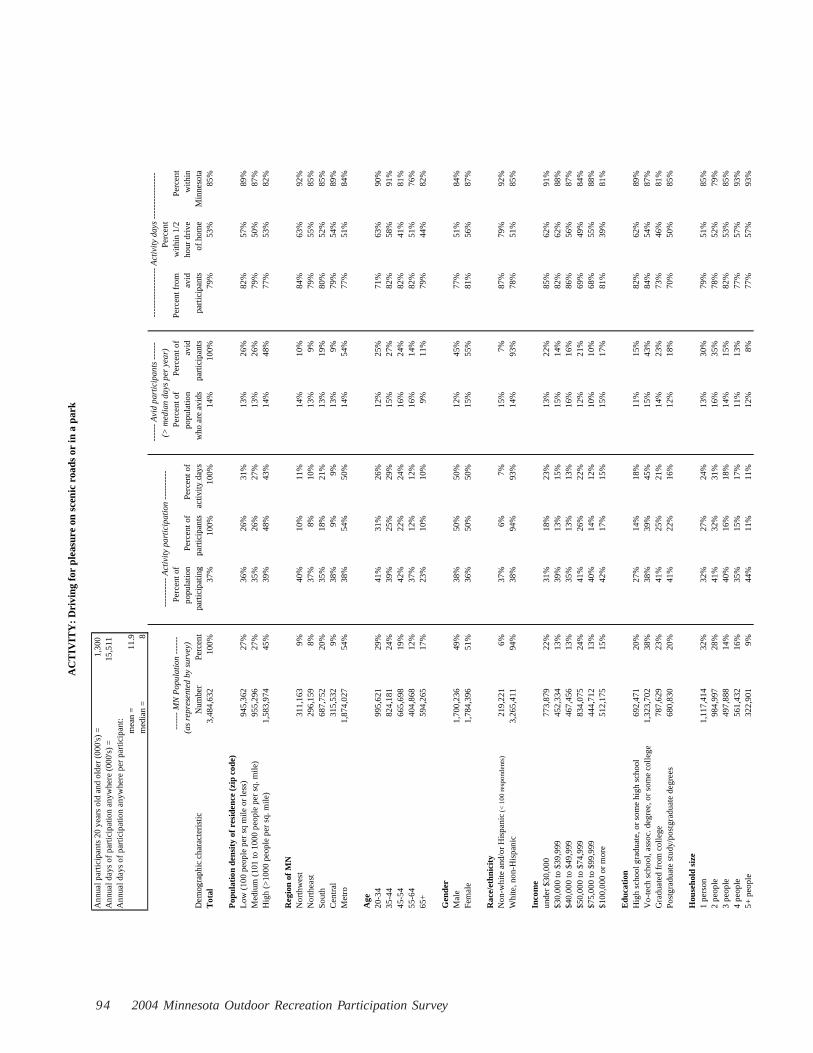
2004 Minnesota Outdoor Recreation Participation Survey94
Ann
ual p
artic
ipan
ts 2
0 ye
ars
old
and
olde
r (0
00's
) =
1,30
0
A
nnua
l day
s of
par
ticip
atio
n an
ywhe
re (
000'
s) =
15,5
11
Ann
ual d
ays
of p
artic
ipat
ion
anyw
here
per
par
ticip
ant:
mea
n =
11.9
med
ian
=8
Perc
ent
Perc
ent o
fPe
rcen
t of
Perc
ent o
fPe
rcen
t fro
mw
ithin
1/2
Perc
ent
popu
latio
nPe
rcen
t of
Perc
ent o
fpo
pula
tion
avid
avid
hour
dri
vew
ithin
Dem
ogra
phic
cha
ract
eris
ticN
umbe
rPe
rcen
tpa
rtic
ipat
ing
part
icip
ants
activ
ity d
ays
who
are
avi
dspa
rtic
ipan
tspa
rtic
ipan
tsof
hom
eM
inne
sota
Tot
al3,
484,
632
100%
37%
100%
100%
14%
100%
79%
53%
85%
Pop
ulat
ion
dens
ity
of r
esid
ence
(zi
p co
de)
Low
(10
0 pe
ople
per
sq
mile
or
less
)94
5,36
2
27%
36%
26%
31%
13%
26%
82%
57%
89%
Med
ium
(10
1 to
100
0 pe
ople
per
sq.
mile
)95
5,29
6
27%
35%
26%
27%
13%
26%
79%
50%
87%
Hig
h (>
1000
peo
ple
per
sq. m
ile)
1,58
3,97
4
45
%39
%48
%43
%14
%48
%77
%53
%82
%
Reg
ion
of M
NN
orth
wes
t31
1,16
3
9%40
%10
%11
%14
%10
%84
%63
%92
%N
orth
east
296,
159
8%
37%
8%10
%13
%9%
79%
55%
85%
Sout
h68
7,75
2
20%
35%
18%
21%
13%
19%
80%
52%
85%
Cen
tral
315,
532
9%
38%
9%9%
13%
9%79
%54
%89
%M
etro
1,87
4,02
7
54
%38
%54
%50
%14
%54
%77
%51
%84
%
Age
20-3
499
5,62
1
29%
41%
31%
26%
12%
25%
71%
63%
90%
35-4
482
4,18
1
24%
39%
25%
29%
15%
27%
82%
58%
91%
45-5
466
5,69
8
19%
42%
22%
24%
16%
24%
82%
41%
81%
55-6
440
4,86
8
12%
37%
12%
12%
16%
14%
82%
51%
76%
65+
594,
265
17
%23
%10
%10
%9%
11%
79%
44%
82%
Gen
der
Mal
e1,
700,
236
49%
38%
50%
50%
12%
45%
77%
51%
84%
Fem
ale
1,78
4,39
6
51
%36
%50
%50
%15
%55
%81
%56
%87
%
Rac
e/et
hnic
ity
Non
-whi
te a
nd/o
r H
ispa
nic
(< 1
00 r
espo
nden
ts)
219,
221
6%
37%
6%7%
15%
7%87
%79
%92
%W
hite
, non
-His
pani
c3,
265,
411
94%
38%
94%
93%
14%
93%
78%
51%
85%
Inco
me
unde
r $3
0,00
077
3,87
9
22%
31%
18%
23%
13%
22%
85%
62%
91%
$30,
000
to $
39,9
9945
2,33
4
13%
39%
13%
15%
15%
14%
82%
62%
88%
$40,
000
to $
49,9
9946
7,45
6
13%
35%
13%
13%
16%
16%
86%
56%
87%
$50,
000
to $
74,9
9983
4,07
5
24%
41%
26%
22%
12%
21%
69%
49%
84%
$75,
000
to $
99,9
9944
4,71
2
13%
40%
14%
12%
10%
10%
68%
55%
88%
$100
,000
or
mor
e51
2,17
5
15%
42%
17%
15%
15%
17%
81%
39%
81%
Edu
cati
onH
igh
scho
ol g
radu
ate,
or
som
e hi
gh s
choo
l69
2,47
1
20%
27%
14%
18%
11%
15%
82%
62%
89%
Vo-
tech
sch
ool,
asso
c. d
egre
e, o
r so
me
colle
ge1,
323,
702
38%
38%
39%
45%
15%
43%
84%
54%
87%
Gra
duat
ed f
rom
col
lege
787,
629
23
%41
%25
%21
%14
%23
%73
%46
%81
%Po
stgr
adua
te s
tudy
/pos
tgra
duat
e de
gree
s68
0,83
0
20%
41%
22%
16%
12%
18%
70%
50%
85%
Hou
seho
ld s
ize
1 pe
rson
1,11
7,41
4
32
%32
%27
%24
%13
%30
%79
%51
%85
%2
peop
le98
4,99
7
28%
41%
32%
31%
16%
35%
78%
52%
79%
3 pe
ople
497,
888
14
%40
%16
%18
%14
%15
%82
%53
%85
%4
peop
le56
1,43
2
16%
35%
15%
17%
11%
13%
77%
57%
93%
5+ p
eopl
e32
2,90
1
9%44
%11
%11
%12
%8%
77%
57%
93%
---
---
MN
Pop
ulat
ion
----
--(a
s re
pres
ente
d by
sur
vey)
AC
TIV
ITY
: D
rivi
ng f
or p
leas
ure
on s
ceni
c ro
ads
or in
a p
ark
---
---
Avi
d pa
rtic
ipan
ts -
----
- -
----
----
----
----
Act
ivit
y da
ys -
----
----
----
---
---
----
---
Act
ivit
y pa
rtic
ipat
ion
----
----
--(>
med
ian
days
per
yea
r)
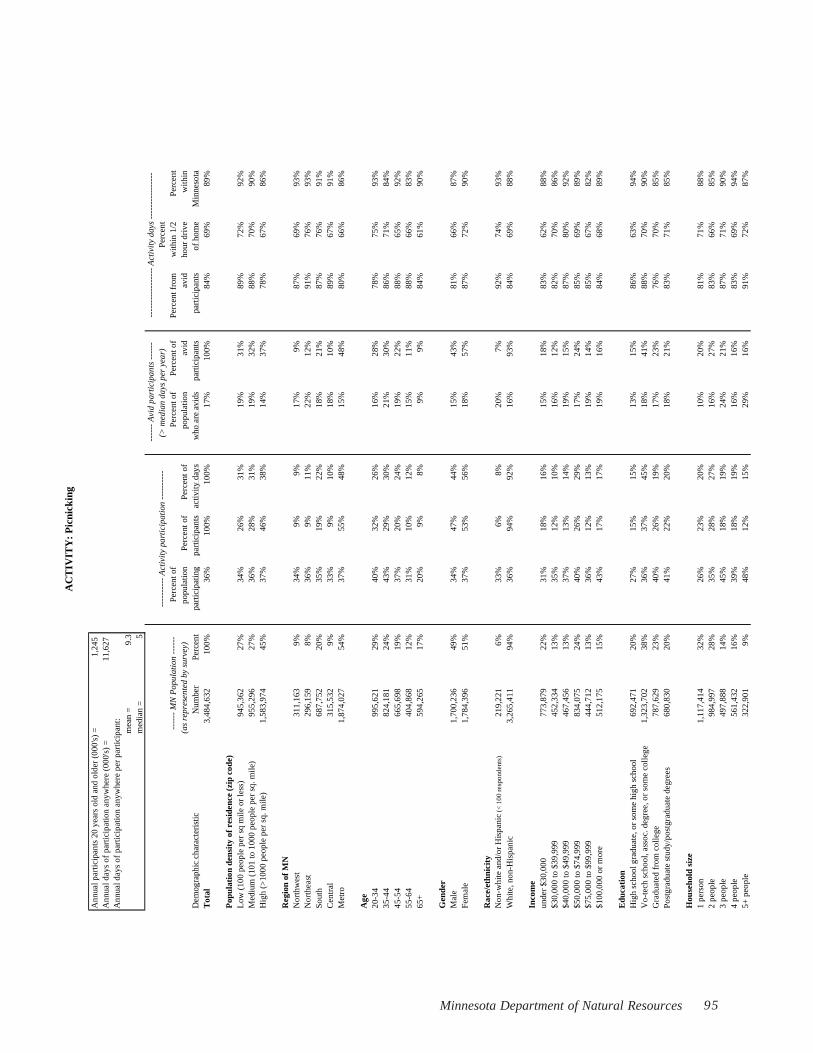
95Minnesota Department of Natural Resources
Ann
ual p
artic
ipan
ts 2
0 ye
ars
old
and
olde
r (0
00's
) =
1,24
5
A
nnua
l day
s of
par
ticip
atio
n an
ywhe
re (
000'
s) =
11,6
27
Ann
ual d
ays
of p
artic
ipat
ion
anyw
here
per
par
ticip
ant:
mea
n =
9.3
med
ian
=5
Perc
ent
Perc
ent o
fPe
rcen
t of
Perc
ent o
fPe
rcen
t fro
mw
ithin
1/2
Perc
ent
popu
latio
nPe
rcen
t of
Perc
ent o
fpo
pula
tion
avid
avid
hour
dri
vew
ithin
Dem
ogra
phic
cha
ract
eris
ticN
umbe
rPe
rcen
tpa
rtic
ipat
ing
part
icip
ants
activ
ity d
ays
who
are
avi
dspa
rtic
ipan
tspa
rtic
ipan
tsof
hom
eM
inne
sota
Tot
al3,
484,
632
100%
36%
100%
100%
17%
100%
84%
69%
89%
Pop
ulat
ion
dens
ity
of r
esid
ence
(zi
p co
de)
Low
(10
0 pe
ople
per
sq
mile
or
less
)94
5,36
2
27%
34%
26%
31%
19%
31%
89%
72%
92%
Med
ium
(10
1 to
100
0 pe
ople
per
sq.
mile
)95
5,29
6
27%
36%
28%
31%
19%
32%
88%
70%
90%
Hig
h (>
1000
peo
ple
per
sq. m
ile)
1,58
3,97
4
45
%37
%46
%38
%14
%37
%78
%67
%86
%
Reg
ion
of M
NN
orth
wes
t31
1,16
3
9%34
%9%
9%17
%9%
87%
69%
93%
Nor
thea
st29
6,15
9
8%36
%9%
11%
22%
12%
91%
76%
93%
Sout
h68
7,75
2
20%
35%
19%
22%
18%
21%
87%
76%
91%
Cen
tral
315,
532
9%
33%
9%10
%18
%10
%89
%67
%91
%M
etro
1,87
4,02
7
54
%37
%55
%48
%15
%48
%80
%66
%86
%
Age
20-3
499
5,62
1
29%
40%
32%
26%
16%
28%
78%
75%
93%
35-4
482
4,18
1
24%
43%
29%
30%
21%
30%
86%
71%
84%
45-5
466
5,69
8
19%
37%
20%
24%
19%
22%
88%
65%
92%
55-6
440
4,86
8
12%
31%
10%
12%
15%
11%
88%
66%
83%
65+
594,
265
17
%20
%9%
8%9%
9%84
%61
%90
%
Gen
der
Mal
e1,
700,
236
49%
34%
47%
44%
15%
43%
81%
66%
87%
Fem
ale
1,78
4,39
6
51
%37
%53
%56
%18
%57
%87
%72
%90
%
Rac
e/et
hnic
ity
Non
-whi
te a
nd/o
r H
ispa
nic
(< 1
00 r
espo
nden
ts)
219,
221
6%
33%
6%8%
20%
7%92
%74
%93
%W
hite
, non
-His
pani
c3,
265,
411
94%
36%
94%
92%
16%
93%
84%
69%
88%
Inco
me
unde
r $3
0,00
077
3,87
9
22%
31%
18%
16%
15%
18%
83%
62%
88%
$30,
000
to $
39,9
9945
2,33
4
13%
35%
12%
10%
16%
12%
82%
70%
86%
$40,
000
to $
49,9
9946
7,45
6
13%
37%
13%
14%
19%
15%
87%
80%
92%
$50,
000
to $
74,9
9983
4,07
5
24%
40%
26%
29%
17%
24%
85%
69%
89%
$75,
000
to $
99,9
9944
4,71
2
13%
36%
12%
13%
19%
14%
85%
67%
82%
$100
,000
or
mor
e51
2,17
5
15%
43%
17%
17%
19%
16%
84%
68%
89%
Edu
cati
onH
igh
scho
ol g
radu
ate,
or
som
e hi
gh s
choo
l69
2,47
1
20%
27%
15%
15%
13%
15%
86%
63%
94%
Vo-
tech
sch
ool,
asso
c. d
egre
e, o
r so
me
colle
ge1,
323,
702
38%
36%
37%
45%
18%
41%
88%
70%
90%
Gra
duat
ed f
rom
col
lege
787,
629
23
%40
%26
%19
%17
%23
%76
%70
%85
%Po
stgr
adua
te s
tudy
/pos
tgra
duat
e de
gree
s68
0,83
0
20%
41%
22%
20%
18%
21%
83%
71%
85%
Hou
seho
ld s
ize
1 pe
rson
1,11
7,41
4
32
%26
%23
%20
%10
%20
%81
%71
%88
%2
peop
le98
4,99
7
28%
35%
28%
27%
16%
27%
83%
66%
85%
3 pe
ople
497,
888
14
%45
%18
%19
%24
%21
%87
%71
%90
%4
peop
le56
1,43
2
16%
39%
18%
19%
16%
16%
83%
69%
94%
5+ p
eopl
e32
2,90
1
9%48
%12
%15
%29
%16
%91
%72
%87
%
---
---
MN
Pop
ulat
ion
----
--(a
s re
pres
ente
d by
sur
vey)
AC
TIV
ITY
: P
icni
ckin
g
---
---
Avi
d pa
rtic
ipan
ts -
----
- -
----
----
----
----
Act
ivit
y da
ys -
----
----
----
---
---
----
---
Act
ivit
y pa
rtic
ipat
ion
----
----
--(>
med
ian
days
per
yea
r)

2004 Minnesota Outdoor Recreation Participation Survey96
Ann
ual p
artic
ipan
ts 2
0 ye
ars
old
and
olde
r (0
00's
) =
1,05
4
A
nnua
l day
s of
par
ticip
atio
n an
ywhe
re (
000'
s) =
18,3
91
Ann
ual d
ays
of p
artic
ipat
ion
anyw
here
per
par
ticip
ant:
mea
n =
17.5
med
ian
=9
Perc
ent
Perc
ent o
fPe
rcen
t of
Perc
ent o
fPe
rcen
t fro
mw
ithin
1/2
Perc
ent
popu
latio
nPe
rcen
t of
Perc
ent o
fpo
pula
tion
avid
avid
hour
dri
vew
ithin
Dem
ogra
phic
cha
ract
eris
ticN
umbe
rPe
rcen
tpa
rtic
ipat
ing
part
icip
ants
activ
ity d
ays
who
are
avi
dspa
rtic
ipan
tspa
rtic
ipan
tsof
hom
eM
inne
sota
Tot
al3,
484,
632
100%
30%
100%
100%
15%
100%
88%
51%
88%
Pop
ulat
ion
dens
ity
of r
esid
ence
(zi
p co
de)
Low
(10
0 pe
ople
per
sq
mile
or
less
)94
5,36
2
27%
34%
31%
38%
19%
35%
91%
63%
92%
Med
ium
(10
1 to
100
0 pe
ople
per
sq.
mile
)95
5,29
6
27%
33%
30%
32%
18%
32%
89%
49%
89%
Hig
h (>
1000
peo
ple
per
sq. m
ile)
1,58
3,97
4
45
%26
%39
%30
%11
%33
%82
%37
%83
%
Reg
ion
of M
NN
orth
wes
t31
1,16
3
9%35
%10
%13
%19
%12
%92
%75
%95
%N
orth
east
296,
159
8%
34%
10%
11%
18%
10%
88%
66%
92%
Sout
h68
7,75
2
20%
30%
19%
16%
15%
19%
86%
51%
83%
Cen
tral
315,
532
9%
36%
11%
12%
19%
12%
87%
46%
95%
Met
ro1,
874,
027
54%
28%
50%
47%
13%
47%
86%
41%
86%
Age
20-3
499
5,62
1
29%
36%
34%
35%
19%
36%
88%
48%
91%
35-4
482
4,18
1
24%
35%
28%
29%
18%
28%
89%
54%
87%
45-5
466
5,69
8
19%
31%
20%
18%
15%
19%
85%
50%
85%
55-6
440
4,86
8
12%
26%
10%
10%
14%
11%
88%
48%
90%
65+
594,
265
17
%15
%8%
8%6%
7%83
%54
%90
%
Gen
der
Mal
e1,
700,
236
49%
41%
66%
70%
21%
69%
88%
49%
90%
Fem
ale
1,78
4,39
6
51
%20
%34
%30
%9%
31%
87%
55%
85%
Rac
e/et
hnic
ity
Non
-whi
te a
nd/o
r H
ispa
nic
(< 1
00 r
espo
nden
ts)
219,
221
6%
16%
3%5%
10%
4%97
%62
%95
%W
hite
, non
-His
pani
c3,
265,
411
94%
31%
97%
95%
15%
96%
87%
50%
88%
Inco
me
unde
r $3
0,00
077
3,87
9
22%
21%
15%
13%
8%12
%83
%60
%96
%$3
0,00
0 to
$39
,999
452,
334
13
%25
%10
%10
%12
%10
%88
%57
%86
%$4
0,00
0 to
$49
,999
467,
456
13
%32
%14
%20
%18
%16
%92
%55
%92
%$5
0,00
0 to
$74
,999
834,
075
24
%37
%29
%25
%17
%27
%85
%56
%93
%$7
5,00
0 to
$99
,999
444,
712
13
%35
%15
%18
%23
%19
%92
%50
%82
%$1
00,0
00 o
r m
ore
512,
175
15
%36
%17
%15
%17
%16
%84
%31
%82
%
Edu
cati
onH
igh
scho
ol g
radu
ate,
or
som
e hi
gh s
choo
l69
2,47
1
20%
27%
17%
20%
14%
18%
89%
57%
95%
Vo-
tech
sch
ool,
asso
c. d
egre
e, o
r so
me
colle
ge1,
323,
702
38%
34%
42%
52%
20%
49%
91%
49%
89%
Gra
duat
ed f
rom
col
lege
787,
629
23
%31
%23
%18
%13
%20
%82
%51
%79
%Po
stgr
adua
te s
tudy
/pos
tgra
duat
e de
gree
s68
0,83
0
20%
27%
18%
10%
9%12
%79
%47
%91
%
Hou
seho
ld s
ize
1 pe
rson
1,11
7,41
4
32
%20
%21
%17
%8%
17%
83%
45%
88%
2 pe
ople
984,
997
28
%28
%27
%32
%16
%31
%91
%51
%87
%3
peop
le49
7,88
8
14%
37%
18%
15%
18%
18%
86%
64%
91%
4 pe
ople
561,
432
16
%41
%22
%23
%22
%24
%87
%42
%88
%5+
peo
ple
322,
901
9%
43%
13%
12%
19%
11%
87%
56%
90%
---
---
MN
Pop
ulat
ion
----
--(a
s re
pres
ente
d by
sur
vey)
AC
TIV
ITY
: F
ishi
ng o
f al
l typ
es
---
---
Avi
d pa
rtic
ipan
ts -
----
- -
----
----
----
----
Act
ivit
y da
ys -
----
----
----
---
---
----
---
Act
ivit
y pa
rtic
ipat
ion
----
----
--(>
med
ian
days
per
yea
r)
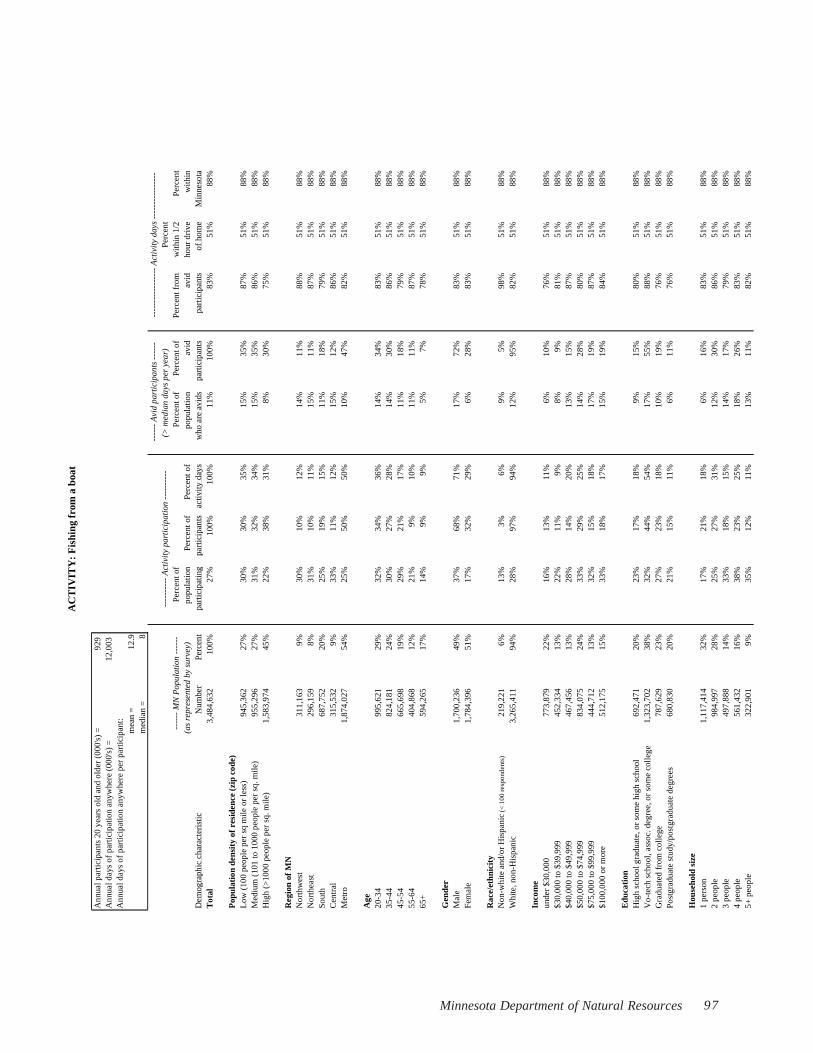
97Minnesota Department of Natural Resources
Ann
ual p
artic
ipan
ts 2
0 ye
ars
old
and
olde
r (0
00's
) =
929
A
nnua
l day
s of
par
ticip
atio
n an
ywhe
re (
000'
s) =
12,0
03
Ann
ual d
ays
of p
artic
ipat
ion
anyw
here
per
par
ticip
ant:
mea
n =
12.9
med
ian
=8
Perc
ent
Perc
ent o
fPe
rcen
t of
Perc
ent o
fPe
rcen
t fro
mw
ithin
1/2
Perc
ent
popu
latio
nPe
rcen
t of
Perc
ent o
fpo
pula
tion
avid
avid
hour
dri
vew
ithin
Dem
ogra
phic
cha
ract
eris
ticN
umbe
rPe
rcen
tpa
rtic
ipat
ing
part
icip
ants
activ
ity d
ays
who
are
avi
dspa
rtic
ipan
tspa
rtic
ipan
tsof
hom
eM
inne
sota
Tot
al3,
484,
632
100%
27%
100%
100%
11%
100%
83%
51%
88%
Pop
ulat
ion
dens
ity
of r
esid
ence
(zi
p co
de)
Low
(10
0 pe
ople
per
sq
mile
or
less
)94
5,36
2
27%
30%
30%
35%
15%
35%
87%
51%
88%
Med
ium
(10
1 to
100
0 pe
ople
per
sq.
mile
)95
5,29
6
27%
31%
32%
34%
15%
35%
86%
51%
88%
Hig
h (>
1000
peo
ple
per
sq. m
ile)
1,58
3,97
4
45
%22
%38
%31
%8%
30%
75%
51%
88%
Reg
ion
of M
NN
orth
wes
t31
1,16
3
9%30
%10
%12
%14
%11
%88
%51
%88
%N
orth
east
296,
159
8%
31%
10%
11%
15%
11%
87%
51%
88%
Sout
h68
7,75
2
20%
25%
19%
15%
11%
18%
79%
51%
88%
Cen
tral
315,
532
9%
33%
11%
12%
15%
12%
86%
51%
88%
Met
ro1,
874,
027
54%
25%
50%
50%
10%
47%
82%
51%
88%
Age
20-3
499
5,62
1
29%
32%
34%
36%
14%
34%
83%
51%
88%
35-4
482
4,18
1
24%
30%
27%
28%
14%
30%
86%
51%
88%
45-5
466
5,69
8
19%
29%
21%
17%
11%
18%
79%
51%
88%
55-6
440
4,86
8
12%
21%
9%10
%11
%11
%87
%51
%88
%65
+59
4,26
5
17%
14%
9%9%
5%7%
78%
51%
88%
Gen
der
Mal
e1,
700,
236
49%
37%
68%
71%
17%
72%
83%
51%
88%
Fem
ale
1,78
4,39
6
51
%17
%32
%29
%6%
28%
83%
51%
88%
Rac
e/et
hnic
ity
Non
-whi
te a
nd/o
r H
ispa
nic
(< 1
00 r
espo
nden
ts)
219,
221
6%
13%
3%6%
9%5%
98%
51%
88%
Whi
te, n
on-H
ispa
nic
3,26
5,41
1
94
%28
%97
%94
%12
%95
%82
%51
%88
%
Inco
me
unde
r $3
0,00
077
3,87
9
22%
16%
13%
11%
6%10
%76
%51
%88
%$3
0,00
0 to
$39
,999
452,
334
13
%22
%11
%9%
8%9%
81%
51%
88%
$40,
000
to $
49,9
9946
7,45
6
13%
28%
14%
20%
13%
15%
87%
51%
88%
$50,
000
to $
74,9
9983
4,07
5
24%
33%
29%
25%
14%
28%
80%
51%
88%
$75,
000
to $
99,9
9944
4,71
2
13%
32%
15%
18%
17%
19%
87%
51%
88%
$100
,000
or
mor
e51
2,17
5
15%
33%
18%
17%
15%
19%
84%
51%
88%
Edu
cati
onH
igh
scho
ol g
radu
ate,
or
som
e hi
gh s
choo
l69
2,47
1
20%
23%
17%
18%
9%15
%80
%51
%88
%V
o-te
ch s
choo
l, as
soc.
deg
ree,
or
som
e co
llege
1,32
3,70
2
38
%32
%44
%54
%17
%55
%88
%51
%88
%G
radu
ated
fro
m c
olle
ge78
7,62
9
23%
27%
23%
18%
10%
19%
76%
51%
88%
Post
grad
uate
stu
dy/p
ostg
radu
ate
degr
ees
680,
830
20
%21
%15
%11
%6%
11%
76%
51%
88%
Hou
seho
ld s
ize
1 pe
rson
1,11
7,41
4
32
%17
%21
%18
%6%
16%
83%
51%
88%
2 pe
ople
984,
997
28
%25
%27
%31
%12
%30
%86
%51
%88
%3
peop
le49
7,88
8
14%
33%
18%
15%
14%
17%
79%
51%
88%
4 pe
ople
561,
432
16
%38
%23
%25
%18
%26
%83
%51
%88
%5+
peo
ple
322,
901
9%
35%
12%
11%
13%
11%
82%
51%
88%
---
---
MN
Pop
ulat
ion
----
--(a
s re
pres
ente
d by
sur
vey)
AC
TIV
ITY
: F
ishi
ng f
rom
a b
oat
---
---
Avi
d pa
rtic
ipan
ts -
----
- -
----
----
----
----
Act
ivit
y da
ys -
----
----
----
---
---
----
---
Act
ivit
y pa
rtic
ipat
ion
----
----
--(>
med
ian
days
per
yea
r)

2004 Minnesota Outdoor Recreation Participation Survey98
Ann
ual p
artic
ipan
ts 2
0 ye
ars
old
and
olde
r (0
00's
) =
704
A
nnua
l day
s of
par
ticip
atio
n an
ywhe
re (
000'
s) =
6,38
8
A
nnua
l day
s of
par
ticip
atio
n an
ywhe
re p
er p
artic
ipan
t:m
ean
=9.
1m
edia
n =
4
Perc
ent
Perc
ent o
fPe
rcen
t of
Perc
ent o
fPe
rcen
t fro
mw
ithin
1/2
Perc
ent
popu
latio
nPe
rcen
t of
Perc
ent o
fpo
pula
tion
avid
avid
hour
dri
vew
ithin
Dem
ogra
phic
cha
ract
eris
ticN
umbe
rPe
rcen
tpa
rtic
ipat
ing
part
icip
ants
activ
ity d
ays
who
are
avi
dspa
rtic
ipan
tspa
rtic
ipan
tsof
hom
eM
inne
sota
Tot
al3,
484,
632
100%
20%
100%
100%
10%
100%
89%
51%
88%
Pop
ulat
ion
dens
ity
of r
esid
ence
(zi
p co
de)
Low
(10
0 pe
ople
per
sq
mile
or
less
)94
5,36
2
27%
25%
34%
45%
14%
38%
92%
51%
88%
Med
ium
(10
1 to
100
0 pe
ople
per
sq.
mile
)95
5,29
6
27%
21%
29%
27%
12%
32%
90%
51%
88%
Hig
h (>
1000
peo
ple
per
sq. m
ile)
1,58
3,97
4
45
%17
%37
%27
%7%
30%
82%
51%
88%
Reg
ion
of M
NN
orth
wes
t31
1,16
3
9%25
%11
%16
%15
%14
%94
%51
%88
%N
orth
east
296,
159
8%
25%
11%
11%
12%
10%
88%
51%
88%
Sout
h68
7,75
2
20%
21%
21%
19%
11%
21%
89%
51%
88%
Cen
tral
315,
532
9%
24%
11%
12%
14%
12%
91%
51%
88%
Met
ro1,
874,
027
54%
18%
47%
42%
8%44
%87
%51
%88
%
Age
20-3
499
5,62
1
29%
24%
34%
33%
12%
34%
87%
51%
88%
35-4
482
4,18
1
24%
23%
28%
30%
11%
27%
90%
51%
88%
45-5
466
5,69
8
19%
21%
20%
18%
10%
19%
88%
51%
88%
55-6
440
4,86
8
12%
19%
11%
11%
11%
13%
91%
51%
88%
65+
594,
265
17
%9%
7%7%
5%8%
90%
51%
88%
Gen
der
Mal
e1,
700,
236
49%
28%
67%
68%
15%
74%
90%
51%
88%
Fem
ale
1,78
4,39
6
51
%13
%33
%32
%5%
26%
87%
51%
88%
Rac
e/et
hnic
ity
Non
-whi
te a
nd/o
r H
ispa
nic
(< 1
00 r
espo
nden
ts)
219,
221
6%
10%
3%5%
7%4%
97%
51%
88%
Whi
te, n
on-H
ispa
nic
3,26
5,41
1
94
%21
%97
%95
%11
%96
%89
%51
%88
%
Inco
me
unde
r $3
0,00
077
3,87
9
22%
14%
15%
17%
6%14
%91
%51
%88
%$3
0,00
0 to
$39
,999
452,
334
13
%18
%12
%12
%9%
12%
89%
51%
88%
$40,
000
to $
49,9
9946
7,45
6
13%
20%
13%
20%
13%
17%
95%
51%
88%
$50,
000
to $
74,9
9983
4,07
5
24%
25%
29%
24%
11%
27%
85%
51%
88%
$75,
000
to $
99,9
9944
4,71
2
13%
23%
15%
17%
15%
18%
92%
51%
88%
$100
,000
or
mor
e51
2,17
5
15%
23%
16%
10%
9%13
%76
%51
%88
%
Edu
cati
onH
igh
scho
ol g
radu
ate,
or
som
e hi
gh s
choo
l69
2,47
1
20%
19%
19%
24%
12%
22%
93%
51%
88%
Vo-
tech
sch
ool,
asso
c. d
egre
e, o
r so
me
colle
ge1,
323,
702
38%
22%
42%
50%
13%
48%
92%
51%
88%
Gra
duat
ed f
rom
col
lege
787,
629
23
%19
%22
%17
%9%
20%
84%
51%
88%
Post
grad
uate
stu
dy/p
ostg
radu
ate
degr
ees
680,
830
20
%19
%18
%10
%5%
10%
72%
51%
88%
Hou
seho
ld s
ize
1 pe
rson
1,11
7,41
4
32
%13
%20
%15
%6%
18%
85%
51%
88%
2 pe
ople
984,
997
28
%19
%27
%35
%12
%33
%92
%51
%88
%3
peop
le49
7,88
8
14%
24%
17%
16%
10%
14%
86%
51%
88%
4 pe
ople
561,
432
16
%26
%21
%20
%14
%22
%89
%51
%88
%5+
peo
ple
322,
901
9%
32%
15%
14%
15%
14%
89%
51%
88%
---
---
MN
Pop
ulat
ion
----
--(a
s re
pres
ente
d by
sur
vey)
AC
TIV
ITY
: F
ishi
ng f
rom
sho
re
---
---
Avi
d pa
rtic
ipan
ts -
----
- -
----
----
----
----
Act
ivit
y da
ys -
----
----
----
---
---
----
---
Act
ivit
y pa
rtic
ipat
ion
----
----
--(>
med
ian
days
per
yea
r)
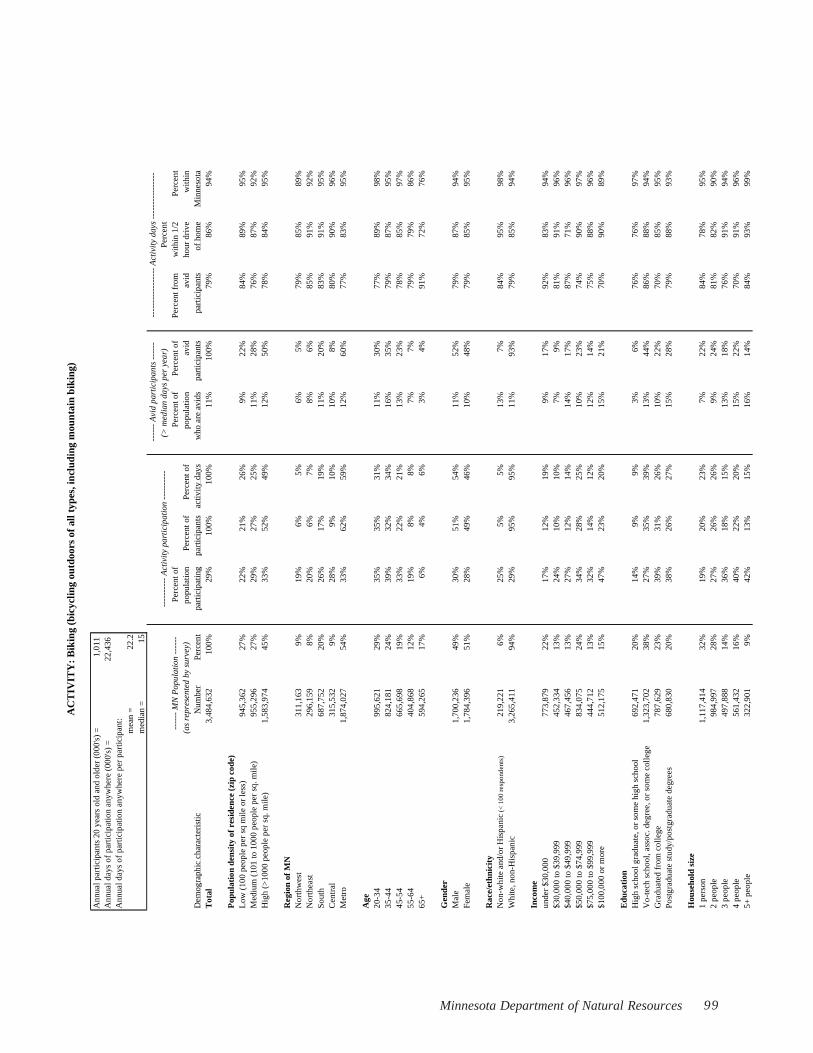
99Minnesota Department of Natural Resources
Ann
ual p
artic
ipan
ts 2
0 ye
ars
old
and
olde
r (0
00's
) =
1,01
1
A
nnua
l day
s of
par
ticip
atio
n an
ywhe
re (
000'
s) =
22,4
36
Ann
ual d
ays
of p
artic
ipat
ion
anyw
here
per
par
ticip
ant:
mea
n =
22.2
med
ian
=15
Perc
ent
Perc
ent o
fPe
rcen
t of
Perc
ent o
fPe
rcen
t fro
mw
ithin
1/2
Perc
ent
popu
latio
nPe
rcen
t of
Perc
ent o
fpo
pula
tion
avid
avid
hour
dri
vew
ithin
Dem
ogra
phic
cha
ract
eris
ticN
umbe
rPe
rcen
tpa
rtic
ipat
ing
part
icip
ants
activ
ity d
ays
who
are
avi
dspa
rtic
ipan
tspa
rtic
ipan
tsof
hom
eM
inne
sota
Tot
al3,
484,
632
100%
29%
100%
100%
11%
100%
79%
86%
94%
Pop
ulat
ion
dens
ity
of r
esid
ence
(zi
p co
de)
Low
(10
0 pe
ople
per
sq
mile
or
less
)94
5,36
2
27%
22%
21%
26%
9%22
%84
%89
%95
%M
ediu
m (
101
to 1
000
peop
le p
er s
q. m
ile)
955,
296
27
%29
%27
%25
%11
%28
%76
%87
%92
%H
igh
(>10
00 p
eopl
e pe
r sq
. mile
)1,
583,
974
45%
33%
52%
49%
12%
50%
78%
84%
95%
Reg
ion
of M
NN
orth
wes
t31
1,16
3
9%19
%6%
5%6%
5%79
%85
%89
%N
orth
east
296,
159
8%
20%
6%7%
8%6%
85%
91%
92%
Sout
h68
7,75
2
20%
26%
17%
19%
11%
20%
83%
91%
95%
Cen
tral
315,
532
9%
28%
9%10
%10
%8%
80%
90%
96%
Met
ro1,
874,
027
54%
33%
62%
59%
12%
60%
77%
83%
95%
Age
20-3
499
5,62
1
29%
35%
35%
31%
11%
30%
77%
89%
98%
35-4
482
4,18
1
24%
39%
32%
34%
16%
35%
79%
87%
95%
45-5
466
5,69
8
19%
33%
22%
21%
13%
23%
78%
85%
97%
55-6
440
4,86
8
12%
19%
8%8%
7%7%
79%
79%
86%
65+
594,
265
17
%6%
4%6%
3%4%
91%
72%
76%
Gen
der
Mal
e1,
700,
236
49%
30%
51%
54%
11%
52%
79%
87%
94%
Fem
ale
1,78
4,39
6
51
%28
%49
%46
%10
%48
%79
%85
%95
%
Rac
e/et
hnic
ity
Non
-whi
te a
nd/o
r H
ispa
nic
(< 1
00 r
espo
nden
ts)
219,
221
6%
25%
5%5%
13%
7%84
%95
%98
%W
hite
, non
-His
pani
c3,
265,
411
94%
29%
95%
95%
11%
93%
79%
85%
94%
Inco
me
unde
r $3
0,00
077
3,87
9
22%
17%
12%
19%
9%17
%92
%83
%94
%$3
0,00
0 to
$39
,999
452,
334
13
%24
%10
%10
%7%
9%81
%91
%96
%$4
0,00
0 to
$49
,999
467,
456
13
%27
%12
%14
%14
%17
%87
%71
%96
%$5
0,00
0 to
$74
,999
834,
075
24
%34
%28
%25
%10
%23
%74
%90
%97
%$7
5,00
0 to
$99
,999
444,
712
13
%32
%14
%12
%12
%14
%75
%88
%96
%$1
00,0
00 o
r m
ore
512,
175
15
%47
%23
%20
%15
%21
%70
%90
%89
%
Edu
cati
onH
igh
scho
ol g
radu
ate,
or
som
e hi
gh s
choo
l69
2,47
1
20%
14%
9%9%
3%6%
76%
76%
97%
Vo-
tech
sch
ool,
asso
c. d
egre
e, o
r so
me
colle
ge1,
323,
702
38%
27%
35%
39%
13%
44%
86%
88%
94%
Gra
duat
ed f
rom
col
lege
787,
629
23
%39
%31
%26
%10
%22
%70
%85
%95
%Po
stgr
adua
te s
tudy
/pos
tgra
duat
e de
gree
s68
0,83
0
20%
38%
26%
27%
15%
28%
79%
88%
93%
Hou
seho
ld s
ize
1 pe
rson
1,11
7,41
4
32
%19
%20
%23
%7%
22%
84%
78%
95%
2 pe
ople
984,
997
28
%27
%26
%26
%9%
24%
81%
82%
90%
3 pe
ople
497,
888
14
%36
%18
%15
%13
%18
%76
%91
%94
%4
peop
le56
1,43
2
16%
40%
22%
20%
15%
22%
70%
91%
96%
5+ p
eopl
e32
2,90
1
9%42
%13
%15
%16
%14
%84
%93
%99
%
---
---
MN
Pop
ulat
ion
----
--(a
s re
pres
ente
d by
sur
vey)
AC
TIV
ITY
: B
ikin
g (b
icyc
ling
outd
oors
of
all t
ypes
, inc
ludi
ng m
ount
ain
biki
ng)
---
---
Avi
d pa
rtic
ipan
ts -
----
- -
----
----
----
----
Act
ivit
y da
ys -
----
----
----
---
---
----
---
Act
ivit
y pa
rtic
ipat
ion
----
----
--(>
med
ian
days
per
yea
r)

2004 Minnesota Outdoor Recreation Participation Survey100
Ann
ual p
artic
ipan
ts 2
0 ye
ars
old
and
olde
r (0
00's
) =
423
A
nnua
l day
s of
par
ticip
atio
n an
ywhe
re (
000'
s) =
2,89
2
A
nnua
l day
s of
par
ticip
atio
n an
ywhe
re p
er p
artic
ipan
t:m
ean
=6.
8m
edia
n =
2
Perc
ent
Perc
ent o
fPe
rcen
t of
Perc
ent o
fPe
rcen
t fro
mw
ithin
1/2
Perc
ent
popu
latio
nPe
rcen
t of
Perc
ent o
fpo
pula
tion
avid
avid
hour
dri
vew
ithin
Dem
ogra
phic
cha
ract
eris
ticN
umbe
rPe
rcen
tpa
rtic
ipat
ing
part
icip
ants
activ
ity d
ays
who
are
avi
dspa
rtic
ipan
tspa
rtic
ipan
tsof
hom
eM
inne
sota
Tot
al3,
484,
632
100%
12%
100%
100%
6%10
0%92
%86
%94
%
Pop
ulat
ion
dens
ity
of r
esid
ence
(zi
p co
de)
Low
(10
0 pe
ople
per
sq
mile
or
less
)94
5,36
2
27%
9%20
%19
%4%
18%
93%
86%
94%
Med
ium
(10
1 to
100
0 pe
ople
per
sq.
mile
)95
5,29
6
27%
14%
32%
44%
9%38
%95
%86
%94
%H
igh
(>10
00 p
eopl
e pe
r sq
. mile
)1,
583,
974
45%
13%
49%
38%
6%44
%89
%86
%94
%
Reg
ion
of M
NN
orth
wes
t31
1,16
3
9%6%
4%5%
4%5%
94%
86%
94%
Nor
thea
st29
6,15
9
8%10
%7%
8%4%
6%94
%86
%94
%So
uth
687,
752
20
%9%
15%
12%
4%14
%91
%86
%94
%C
entr
al31
5,53
2
9%11
%9%
7%6%
9%91
%86
%94
%M
etro
1,87
4,02
7
54
%15
%65
%68
%8%
65%
93%
86%
94%
Age
20-3
499
5,62
1
29%
17%
40%
52%
9%43
%95
%86
%94
%35
-44
824,
181
24
%17
%33
%30
%9%
36%
92%
86%
94%
45-5
466
5,69
8
19%
12%
19%
14%
5%17
%87
%86
%94
%55
-64
404,
868
12
%5%
5%2%
1%2%
64%
86%
94%
65+
594,
265
17
%2%
3%2%
1%2%
91%
86%
94%
Gen
der
Mal
e1,
700,
236
49%
15%
59%
71%
9%69
%95
%86
%94
%Fe
mal
e1,
784,
396
51%
10%
41%
29%
4%31
%86
%86
%94
%
Rac
e/et
hnic
ity
Non
-whi
te a
nd/o
r H
ispa
nic
(< 1
00 r
espo
nden
ts)
219,
221
6%
12%
6%4%
9%8%
97%
86%
94%
Whi
te, n
on-H
ispa
nic
3,26
5,41
1
94
%12
%94
%96
%6%
92%
92%
86%
94%
Inco
me
unde
r $3
0,00
077
3,87
9
22%
8%14
%27
%4%
13%
96%
86%
94%
$30,
000
to $
39,9
9945
2,33
4
13%
8%8%
4%2%
5%83
%86
%94
%$4
0,00
0 to
$49
,999
467,
456
13
%12
%12
%9%
6%13
%88
%86
%94
%$5
0,00
0 to
$74
,999
834,
075
24
%14
%26
%28
%8%
31%
95%
86%
94%
$75,
000
to $
99,9
9944
4,71
2
13%
13%
13%
16%
9%17
%96
%86
%94
%$1
00,0
00 o
r m
ore
512,
175
15
%23
%26
%16
%10
%22
%84
%86
%94
%
Edu
cati
onH
igh
scho
ol g
radu
ate,
or
som
e hi
gh s
choo
l69
2,47
1
20%
4%7%
4%2%
5%83
%86
%94
%V
o-te
ch s
choo
l, as
soc.
deg
ree,
or
som
e co
llege
1,32
3,70
2
38
%12
%38
%42
%7%
42%
95%
86%
94%
Gra
duat
ed f
rom
col
lege
787,
629
23
%15
%28
%34
%9%
33%
95%
86%
94%
Post
grad
uate
stu
dy/p
ostg
radu
ate
degr
ees
680,
830
20
%17
%27
%20
%6%
20%
85%
86%
94%
Hou
seho
ld s
ize
1 pe
rson
1,11
7,41
4
32
%8%
22%
17%
4%21
%92
%86
%94
%2
peop
le98
4,99
7
28%
11%
25%
38%
5%23
%95
%86
%94
%3
peop
le49
7,88
8
14%
17%
20%
17%
8%19
%88
%86
%94
%4
peop
le56
1,43
2
16%
17%
23%
22%
11%
28%
92%
86%
94%
5+ p
eopl
e32
2,90
1
9%14
%10
%7%
7%10
%92
%86
%94
%
---
---
MN
Pop
ulat
ion
----
--(a
s re
pres
ente
d by
sur
vey)
AC
TIV
ITY
: B
ikin
g on
dir
t tr
ails
(a
port
ion
of a
ll bi
king
)
---
---
Avi
d pa
rtic
ipan
ts -
----
- -
----
----
----
----
Act
ivit
y da
ys -
----
----
----
---
---
----
---
Act
ivit
y pa
rtic
ipat
ion
----
----
--(>
med
ian
days
per
yea
r)

101Minnesota Department of Natural Resources
Ann
ual p
artic
ipan
ts 2
0 ye
ars
old
and
olde
r (0
00's
) =
957
A
nnua
l day
s of
par
ticip
atio
n an
ywhe
re (
000'
s) =
2,25
2
A
nnua
l day
s of
par
ticip
atio
n an
ywhe
re p
er p
artic
ipan
t:m
ean
=2.
4m
edia
n =
2
Perc
ent
Perc
ent o
fPe
rcen
t of
Perc
ent o
fPe
rcen
t fro
mw
ithin
1/2
Perc
ent
popu
latio
nPe
rcen
t of
Perc
ent o
fpo
pula
tion
avid
avid
hour
dri
vew
ithin
Dem
ogra
phic
cha
ract
eris
ticN
umbe
rPe
rcen
tpa
rtic
ipat
ing
part
icip
ants
activ
ity d
ays
who
are
avi
dspa
rtic
ipan
tspa
rtic
ipan
tsof
hom
eM
inne
sota
Tot
al3,
484,
632
100%
27%
100%
100%
10%
100%
71%
68%
91%
Pop
ulat
ion
dens
ity
of r
esid
ence
(zi
p co
de)
Low
(10
0 pe
ople
per
sq
mile
or
less
)94
5,36
2
27%
18%
18%
14%
4%11
%55
%43
%85
%M
ediu
m (
101
to 1
000
peop
le p
er s
q. m
ile)
955,
296
27
%27
%27
%29
%10
%28
%73
%68
%92
%H
igh
(>10
00 p
eopl
e pe
r sq
. mile
)1,
583,
974
45%
33%
55%
57%
14%
61%
74%
75%
92%
Reg
ion
of M
NN
orth
wes
t31
1,16
3
9%14
%5%
4%3%
3%58
%46
%71
%N
orth
east
296,
159
8%
19%
6%4%
5%4%
58%
52%
89%
Sout
h68
7,75
2
20%
25%
18%
16%
7%13
%62
%50
%85
%C
entr
al31
5,53
2
9%25
%8%
6%6%
5%51
%41
%92
%M
etro
1,87
4,02
7
54
%33
%64
%70
%14
%74
%76
%77
%94
%
Age
20-3
499
5,62
1
29%
35%
37%
37%
14%
40%
73%
66%
90%
35-4
482
4,18
1
24%
33%
29%
25%
12%
28%
66%
71%
93%
45-5
466
5,69
8
19%
24%
17%
21%
8%16
%75
%68
%91
%55
-64
404,
868
12
%24
%10
%8%
7%8%
58%
63%
91%
65+
594,
265
17
%11
%7%
8%5%
7%79
%76
%93
%
Gen
der
Mal
e1,
700,
236
49%
25%
45%
42%
9%45
%70
%69
%90
%Fe
mal
e1,
784,
396
51%
30%
55%
58%
11%
55%
72%
68%
92%
Rac
e/et
hnic
ity
Non
-whi
te a
nd/o
r H
ispa
nic
(< 1
00 r
espo
nden
ts)
219,
221
6%
29%
6%7%
13%
8%76
%74
%93
%W
hite
, non
-His
pani
c3,
265,
411
94%
28%
94%
93%
10%
92%
71%
68%
91%
Inco
me
unde
r $3
0,00
077
3,87
9
22%
23%
18%
15%
8%16
%65
%69
%91
%$3
0,00
0 to
$39
,999
452,
334
13
%28
%13
%15
%11
%13
%73
%74
%91
%$4
0,00
0 to
$49
,999
467,
456
13
%25
%12
%11
%10
%12
%65
%79
%94
%$5
0,00
0 to
$74
,999
834,
075
24
%31
%27
%27
%11
%25
%69
%66
%91
%$7
5,00
0 to
$99
,999
444,
712
13
%28
%13
%16
%11
%14
%76
%71
%90
%$1
00,0
00 o
r m
ore
512,
175
15
%32
%17
%17
%13
%19
%72
%54
%92
%
Edu
cati
onH
igh
scho
ol g
radu
ate,
or
som
e hi
gh s
choo
l69
2,47
1
20%
16%
12%
8%3%
6%48
%59
%86
%V
o-te
ch s
choo
l, as
soc.
deg
ree,
or
som
e co
llege
1,32
3,70
2
38
%25
%34
%38
%9%
34%
73%
71%
92%
Gra
duat
ed f
rom
col
lege
787,
629
23
%35
%29
%28
%14
%32
%71
%71
%87
%Po
stgr
adua
te s
tudy
/pos
tgra
duat
e de
gree
s68
0,83
0
20%
36%
26%
26%
14%
28%
75%
65%
96%
Hou
seho
ld s
ize
1 pe
rson
1,11
7,41
4
32
%21
%25
%30
%8%
24%
76%
73%
92%
2 pe
ople
984,
997
28
%23
%24
%21
%8%
22%
64%
67%
86%
3 pe
ople
497,
888
14
%34
%18
%16
%12
%17
%66
%70
%93
%4
peop
le56
1,43
2
16%
37%
22%
23%
15%
24%
75%
63%
94%
5+ p
eopl
e32
2,90
1
9%36
%12
%11
%14
%13
%71
%66
%92
%
---
---
MN
Pop
ulat
ion
----
--(a
s re
pres
ente
d by
sur
vey)
AC
TIV
ITY
: Vis
itin
g ou
tdoo
r zo
os
---
---
Avi
d pa
rtic
ipan
ts -
----
- -
----
----
----
----
Act
ivit
y da
ys -
----
----
----
---
---
----
---
Act
ivit
y pa
rtic
ipat
ion
----
----
--(>
med
ian
days
per
yea
r)

2004 Minnesota Outdoor Recreation Participation Survey102
Ann
ual p
artic
ipan
ts 2
0 ye
ars
old
and
olde
r (0
00's
) =
899
A
nnua
l day
s of
par
ticip
atio
n an
ywhe
re (
000'
s) =
8,51
5
A
nnua
l day
s of
par
ticip
atio
n an
ywhe
re p
er p
artic
ipan
t:m
ean
=9.
5m
edia
n =
5
Perc
ent
Perc
ent o
fPe
rcen
t of
Perc
ent o
fPe
rcen
t fro
mw
ithin
1/2
Perc
ent
popu
latio
nPe
rcen
t of
Perc
ent o
fpo
pula
tion
avid
avid
hour
dri
vew
ithin
Dem
ogra
phic
cha
ract
eris
ticN
umbe
rPe
rcen
tpa
rtic
ipat
ing
part
icip
ants
activ
ity d
ays
who
are
avi
dspa
rtic
ipan
tspa
rtic
ipan
tsof
hom
eM
inne
sota
Tot
al3,
484,
632
100%
26%
100%
100%
12%
100%
86%
24%
80%
Pop
ulat
ion
dens
ity
of r
esid
ence
(zi
p co
de)
Low
(10
0 pe
ople
per
sq
mile
or
less
)94
5,36
2
27%
27%
28%
34%
14%
32%
90%
30%
81%
Med
ium
(10
1 to
100
0 pe
ople
per
sq.
mile
)95
5,29
6
27%
25%
27%
31%
14%
32%
90%
26%
82%
Hig
h (>
1000
peo
ple
per
sq. m
ile)
1,58
3,97
4
45
%25
%45
%34
%9%
36%
78%
16%
77%
Reg
ion
of M
NN
orth
wes
t31
1,16
3
9%30
%10
%12
%15
%11
%89
%40
%86
%N
orth
east
296,
159
8%
32%
11%
11%
14%
10%
85%
30%
79%
Sout
h68
7,75
2
20%
22%
17%
19%
12%
20%
90%
26%
77%
Cen
tral
315,
532
9%
28%
10%
11%
16%
13%
91%
27%
90%
Met
ro1,
874,
027
54%
25%
52%
46%
10%
46%
82%
17%
77%
Age
20-3
499
5,62
1
29%
37%
41%
32%
15%
35%
79%
23%
86%
35-4
482
4,18
1
24%
32%
30%
24%
15%
30%
83%
23%
80%
45-5
466
5,69
8
19%
25%
19%
22%
14%
22%
88%
30%
74%
55-6
440
4,86
8
12%
15%
7%13
%8%
8%93
%17
%77
%65
+59
4,26
5
17%
6%4%
10%
4%5%
96%
23%
75%
Gen
der
Mal
e1,
700,
236
49%
31%
58%
65%
15%
59%
87%
23%
80%
Fem
ale
1,78
4,39
6
51
%21
%42
%35
%10
%41
%83
%25
%79
%
Rac
e/et
hnic
ity
Non
-whi
te a
nd/o
r H
ispa
nic
(< 1
00 r
espo
nden
ts)
219,
221
6%
14%
3%3%
8%4%
84%
27%
73%
Whi
te, n
on-H
ispa
nic
3,26
5,41
1
94
%27
%97
%97
%12
%96
%86
%24
%80
%
Inco
me
unde
r $3
0,00
077
3,87
9
22%
18%
15%
17%
9%15
%88
%33
%66
%$3
0,00
0 to
$39
,999
452,
334
13
%27
%13
%12
%12
%13
%84
%37
%90
%$4
0,00
0 to
$49
,999
467,
456
13
%25
%12
%16
%11
%12
%88
%25
%80
%$5
0,00
0 to
$74
,999
834,
075
24
%35
%31
%27
%17
%33
%83
%25
%81
%$7
5,00
0 to
$99
,999
444,
712
13
%29
%14
%14
%14
%15
%86
%16
%87
%$1
00,0
00 o
r m
ore
512,
175
15
%25
%14
%13
%10
%12
%80
%11
%75
%
Edu
cati
onH
igh
scho
ol g
radu
ate,
or
som
e hi
gh s
choo
l69
2,47
1
20%
22%
16%
22%
12%
20%
91%
35%
84%
Vo-
tech
sch
ool,
asso
c. d
egre
e, o
r so
me
colle
ge1,
323,
702
38%
25%
37%
43%
13%
40%
89%
26%
83%
Gra
duat
ed f
rom
col
lege
787,
629
23
%34
%30
%21
%12
%23
%74
%14
%68
%Po
stgr
adua
te s
tudy
/pos
tgra
duat
e de
gree
s68
0,83
0
20%
23%
17%
13%
10%
17%
81%
13%
80%
Hou
seho
ld s
ize
1 pe
rson
1,11
7,41
4
32
%15
%18
%18
%6%
17%
85%
27%
77%
2 pe
ople
984,
997
28
%26
%29
%36
%13
%31
%89
%20
%68
%3
peop
le49
7,88
8
14%
32%
18%
13%
12%
15%
78%
36%
91%
4 pe
ople
561,
432
16
%35
%22
%23
%18
%25
%88
%19
%91
%5+
peo
ple
322,
901
9%
36%
13%
9%17
%13
%79
%26
%88
%
---
---
MN
Pop
ulat
ion
----
--(a
s re
pres
ente
d by
sur
vey)
AC
TIV
ITY
: C
ampi
ng o
f al
l typ
es
---
---
Avi
d pa
rtic
ipan
ts -
----
- -
----
----
----
----
Act
ivit
y da
ys -
----
----
----
---
---
----
---
Act
ivit
y pa
rtic
ipat
ion
----
----
--(>
med
ian
days
per
yea
r)
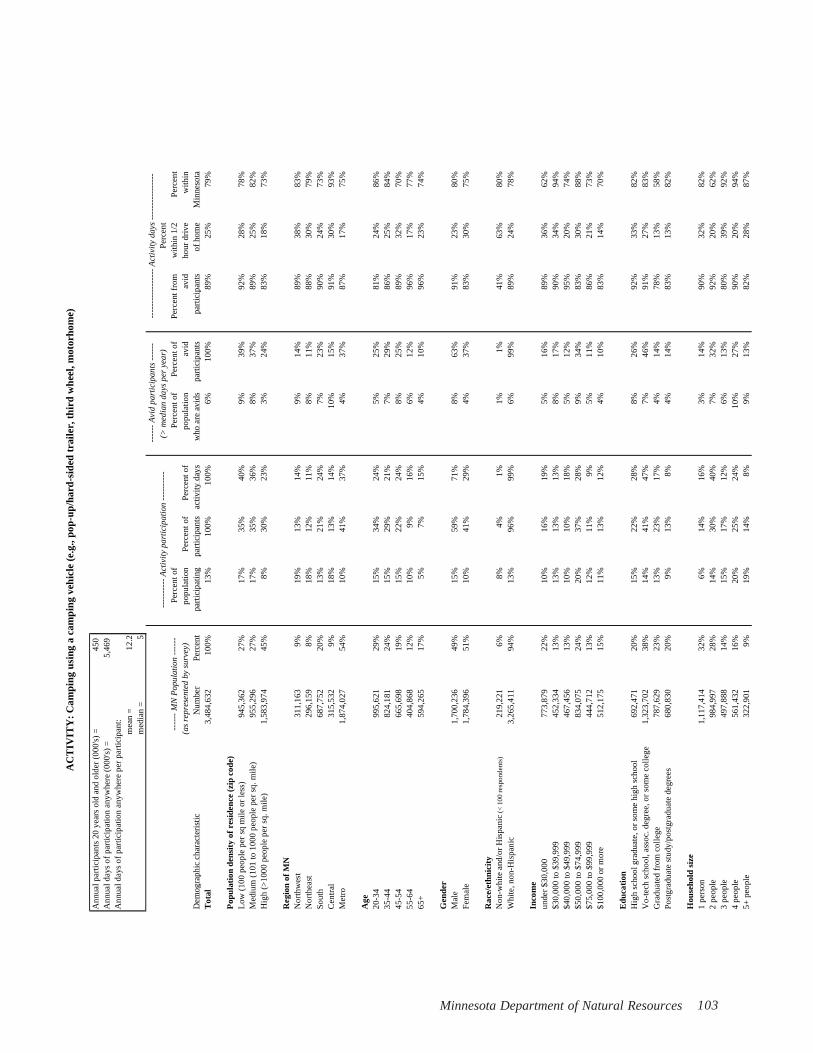
103Minnesota Department of Natural Resources
Ann
ual p
artic
ipan
ts 2
0 ye
ars
old
and
olde
r (0
00's
) =
450
A
nnua
l day
s of
par
ticip
atio
n an
ywhe
re (
000'
s) =
5,46
9
A
nnua
l day
s of
par
ticip
atio
n an
ywhe
re p
er p
artic
ipan
t:m
ean
=12
.2m
edia
n =
5
Perc
ent
Perc
ent o
fPe
rcen
t of
Perc
ent o
fPe
rcen
t fro
mw
ithin
1/2
Perc
ent
popu
latio
nPe
rcen
t of
Perc
ent o
fpo
pula
tion
avid
avid
hour
dri
vew
ithin
Dem
ogra
phic
cha
ract
eris
ticN
umbe
rPe
rcen
tpa
rtic
ipat
ing
part
icip
ants
activ
ity d
ays
who
are
avi
dspa
rtic
ipan
tspa
rtic
ipan
tsof
hom
eM
inne
sota
Tot
al3,
484,
632
100%
13%
100%
100%
6%10
0%89
%25
%79
%
Pop
ulat
ion
dens
ity
of r
esid
ence
(zi
p co
de)
Low
(10
0 pe
ople
per
sq
mile
or
less
)94
5,36
2
27%
17%
35%
40%
9%39
%92
%28
%78
%M
ediu
m (
101
to 1
000
peop
le p
er s
q. m
ile)
955,
296
27
%17
%35
%36
%8%
37%
89%
25%
82%
Hig
h (>
1000
peo
ple
per
sq. m
ile)
1,58
3,97
4
45
%8%
30%
23%
3%24
%83
%18
%73
%
Reg
ion
of M
NN
orth
wes
t31
1,16
3
9%19
%13
%14
%9%
14%
89%
38%
83%
Nor
thea
st29
6,15
9
8%18
%12
%11
%8%
11%
88%
30%
79%
Sout
h68
7,75
2
20%
13%
21%
24%
7%23
%90
%24
%73
%C
entr
al31
5,53
2
9%18
%13
%14
%10
%15
%91
%30
%93
%M
etro
1,87
4,02
7
54
%10
%41
%37
%4%
37%
87%
17%
75%
Age
20-3
499
5,62
1
29%
15%
34%
24%
5%25
%81
%24
%86
%35
-44
824,
181
24
%15
%29
%21
%7%
29%
86%
25%
84%
45-5
466
5,69
8
19%
15%
22%
24%
8%25
%89
%32
%70
%55
-64
404,
868
12
%10
%9%
16%
6%12
%96
%17
%77
%65
+59
4,26
5
17%
5%7%
15%
4%10
%96
%23
%74
%
Gen
der
Mal
e1,
700,
236
49%
15%
59%
71%
8%63
%91
%23
%80
%Fe
mal
e1,
784,
396
51%
10%
41%
29%
4%37
%83
%30
%75
%
Rac
e/et
hnic
ity
Non
-whi
te a
nd/o
r H
ispa
nic
(< 1
00 r
espo
nden
ts)
219,
221
6%
8%4%
1%1%
1%41
%63
%80
%W
hite
, non
-His
pani
c3,
265,
411
94%
13%
96%
99%
6%99
%89
%24
%78
%
Inco
me
unde
r $3
0,00
077
3,87
9
22%
10%
16%
19%
5%16
%89
%36
%62
%$3
0,00
0 to
$39
,999
452,
334
13
%13
%13
%13
%8%
17%
90%
34%
94%
$40,
000
to $
49,9
9946
7,45
6
13%
10%
10%
18%
5%12
%95
%20
%74
%$5
0,00
0 to
$74
,999
834,
075
24
%20
%37
%28
%9%
34%
83%
30%
88%
$75,
000
to $
99,9
9944
4,71
2
13%
12%
11%
9%5%
11%
86%
21%
73%
$100
,000
or
mor
e51
2,17
5
15%
11%
13%
12%
4%10
%83
%14
%70
%
Edu
cati
onH
igh
scho
ol g
radu
ate,
or
som
e hi
gh s
choo
l69
2,47
1
20%
15%
22%
28%
8%26
%92
%33
%82
%V
o-te
ch s
choo
l, as
soc.
deg
ree,
or
som
e co
llege
1,32
3,70
2
38
%14
%41
%47
%7%
46%
91%
27%
83%
Gra
duat
ed f
rom
col
lege
787,
629
23
%13
%23
%17
%4%
14%
78%
13%
58%
Post
grad
uate
stu
dy/p
ostg
radu
ate
degr
ees
680,
830
20
%9%
13%
8%4%
14%
83%
13%
82%
Hou
seho
ld s
ize
1 pe
rson
1,11
7,41
4
32
%6%
14%
16%
3%14
%90
%32
%82
%2
peop
le98
4,99
7
28%
14%
30%
40%
7%32
%92
%20
%62
%3
peop
le49
7,88
8
14%
15%
17%
12%
6%13
%80
%39
%92
%4
peop
le56
1,43
2
16%
20%
25%
24%
10%
27%
90%
20%
94%
5+ p
eopl
e32
2,90
1
9%19
%14
%8%
9%13
%82
%28
%87
%
---
---
MN
Pop
ulat
ion
----
--(a
s re
pres
ente
d by
sur
vey)
AC
TIV
ITY
: Cam
ping
usi
ng a
cam
ping
veh
icle
(e.g
., po
p-up
/har
d-si
ded
trai
ler,
thi
rd w
heel
, mot
orho
me)
---
---
Avi
d pa
rtic
ipan
ts -
----
- -
----
----
----
----
Act
ivit
y da
ys -
----
----
----
---
---
----
---
Act
ivit
y pa
rtic
ipat
ion
----
----
--(>
med
ian
days
per
yea
r)

2004 Minnesota Outdoor Recreation Participation Survey104
Ann
ual p
artic
ipan
ts 2
0 ye
ars
old
and
olde
r (0
00's
) =
613
A
nnua
l day
s of
par
ticip
atio
n an
ywhe
re (
000'
s) =
3,04
6
A
nnua
l day
s of
par
ticip
atio
n an
ywhe
re p
er p
artic
ipan
t:m
ean
=5.
0m
edia
n =
3
Perc
ent
Perc
ent o
fPe
rcen
t of
Perc
ent o
fPe
rcen
t fro
mw
ithin
1/2
Perc
ent
popu
latio
nPe
rcen
t of
Perc
ent o
fpo
pula
tion
avid
avid
hour
dri
vew
ithin
Dem
ogra
phic
cha
ract
eris
ticN
umbe
rPe
rcen
tpa
rtic
ipat
ing
part
icip
ants
activ
ity d
ays
who
are
avi
dspa
rtic
ipan
tspa
rtic
ipan
tsof
hom
eM
inne
sota
Tot
al3,
484,
632
100%
18%
100%
100%
8%10
0%79
%22
%82
%
Pop
ulat
ion
dens
ity
of r
esid
ence
(zi
p co
de)
Low
(10
0 pe
ople
per
sq
mile
or
less
)94
5,36
2
27%
16%
25%
23%
8%26
%79
%34
%88
%M
ediu
m (
101
to 1
000
peop
le p
er s
q. m
ile)
955,
296
27
%13
%21
%22
%7%
25%
84%
28%
80%
Hig
h (>
1000
peo
ple
per
sq. m
ile)
1,58
3,97
4
45
%21
%54
%54
%9%
50%
77%
14%
79%
Reg
ion
of M
NN
orth
wes
t31
1,16
3
9%17
%9%
9%10
%11
%85
%43
%92
%N
orth
east
296,
159
8%
20%
10%
9%9%
9%80
%30
%78
%So
uth
687,
752
20
%13
%15
%12
%5%
13%
73%
33%
88%
Cen
tral
315,
532
9%
16%
8%7%
8%9%
79%
17%
82%
Met
ro1,
874,
027
54%
19%
59%
63%
9%58
%79
%16
%79
%
Age
20-3
499
5,62
1
29%
29%
48%
46%
12%
43%
77%
22%
86%
35-4
482
4,18
1
24%
23%
31%
28%
10%
31%
78%
21%
74%
45-5
466
5,69
8
19%
14%
16%
19%
8%19
%86
%25
%84
%55
-64
404,
868
12
%8%
5%7%
4%6%
83%
18%
78%
65+
594,
265
17
%1%
1%1%
1%1%
84%
20%
91%
Gen
der
Mal
e1,
700,
236
49%
20%
57%
55%
10%
60%
79%
24%
81%
Fem
ale
1,78
4,39
6
51
%15
%43
%45
%6%
40%
79%
19%
83%
Rac
e/et
hnic
ity
Non
-whi
te a
nd/o
r H
ispa
nic
(< 1
00 r
espo
nden
ts)
219,
221
6%
9%3%
5%7%
5%97
%9%
70%
Whi
te, n
on-H
ispa
nic
3,26
5,41
1
94
%18
%97
%95
%8%
95%
78%
22%
82%
Inco
me
unde
r $3
0,00
077
3,87
9
22%
13%
15%
14%
6%15
%82
%26
%73
%$3
0,00
0 to
$39
,999
452,
334
13
%19
%14
%11
%5%
8%67
%43
%82
%$4
0,00
0 to
$49
,999
467,
456
13
%18
%13
%13
%8%
14%
78%
36%
92%
$50,
000
to $
74,9
9983
4,07
5
24%
23%
30%
26%
10%
27%
74%
16%
68%
$75,
000
to $
99,9
9944
4,71
2
13%
21%
15%
22%
13%
20%
92%
13%
96%
$100
,000
or
mor
e51
2,17
5
15%
18%
14%
13%
9%16
%79
%8%
82%
Edu
cati
onH
igh
scho
ol g
radu
ate,
or
som
e hi
gh s
choo
l69
2,47
1
20%
12%
13%
13%
5%12
%78
%44
%90
%V
o-te
ch s
choo
l, as
soc.
deg
ree,
or
som
e co
llege
1,32
3,70
2
38
%16
%34
%38
%7%
35%
82%
24%
83%
Gra
duat
ed f
rom
col
lege
787,
629
23
%25
%32
%28
%10
%29
%71
%15
%78
%Po
stgr
adua
te s
tudy
/pos
tgra
duat
e de
gree
s68
0,83
0
20%
19%
21%
21%
10%
25%
85%
13%
79%
Hou
seho
ld s
ize
1 pe
rson
1,11
7,41
4
32
%11
%20
%23
%4%
17%
77%
21%
71%
2 pe
ople
984,
997
28
%16
%26
%29
%9%
33%
86%
20%
82%
3 pe
ople
497,
888
14
%23
%19
%14
%8%
15%
70%
30%
88%
4 pe
ople
561,
432
16
%22
%21
%22
%11
%22
%82
%18
%85
%5+
peo
ple
322,
901
9%
28%
14%
11%
11%
12%
69%
25%
89%
---
---
MN
Pop
ulat
ion
----
--(a
s re
pres
ente
d by
sur
vey)
AC
TIV
ITY
: C
ampi
ng u
sing
a t
ent
---
---
Avi
d pa
rtic
ipan
ts -
----
- -
----
----
----
----
Act
ivit
y da
ys -
----
----
----
---
---
----
---
Act
ivit
y pa
rtic
ipat
ion
----
----
--(>
med
ian
days
per
yea
r)

105Minnesota Department of Natural Resources
Ann
ual p
artic
ipan
ts 2
0 ye
ars
old
and
olde
r (0
00's
) =
340
A
nnua
l day
s of
par
ticip
atio
n an
ywhe
re (
000'
s) =
1,04
3
A
nnua
l day
s of
par
ticip
atio
n an
ywhe
re p
er p
artic
ipan
t:m
ean
=3.
1m
edia
n =
2
Perc
ent
Perc
ent o
fPe
rcen
t of
Perc
ent o
fPe
rcen
t fro
mw
ithin
1/2
Perc
ent
popu
latio
nPe
rcen
t of
Perc
ent o
fpo
pula
tion
avid
avid
hour
dri
vew
ithin
Dem
ogra
phic
cha
ract
eris
ticN
umbe
rPe
rcen
tpa
rtic
ipat
ing
part
icip
ants
activ
ity d
ays
who
are
avi
dspa
rtic
ipan
tspa
rtic
ipan
tsof
hom
eM
inne
sota
Tot
al3,
484,
632
100%
10%
100%
100%
5%10
0%86
%22
%82
%
Pop
ulat
ion
dens
ity
of r
esid
ence
(zi
p co
de)
Low
(10
0 pe
ople
per
sq
mile
or
less
)94
5,36
2
27%
10%
27%
26%
4%25
%84
%22
%82
%M
ediu
m (
101
to 1
000
peop
le p
er s
q. m
ile)
955,
296
27
%7%
18%
18%
3%19
%85
%22
%82
%H
igh
(>10
00 p
eopl
e pe
r sq
. mile
)1,
583,
974
45%
12%
54%
56%
6%57
%87
%22
%82
%
Reg
ion
of M
NN
orth
wes
t31
1,16
3
9%10
%9%
11%
5%9%
86%
22%
82%
Nor
thea
st29
6,15
9
8%11
%10
%11
%6%
11%
91%
22%
82%
Sout
h68
7,75
2
20%
7%14
%13
%3%
12%
83%
22%
82%
Cen
tral
315,
532
9%
6%6%
4%3%
6%85
%22
%82
%M
etro
1,87
4,02
7
54
%11
%61
%61
%6%
63%
86%
22%
82%
Age
20-3
499
5,62
1
29%
15%
43%
50%
8%48
%90
%22
%82
%35
-44
824,
181
24
%13
%31
%23
%5%
24%
75%
22%
82%
45-5
466
5,69
8
19%
10%
19%
20%
5%22
%89
%22
%82
%55
-64
404,
868
12
%5%
6%6%
2%6%
85%
22%
82%
65+
594,
265
17
%1%
1%1%
0%1%
73%
22%
82%
Gen
der
Mal
e1,
700,
236
49%
11%
56%
51%
6%57
%85
%22
%82
%Fe
mal
e1,
784,
396
51%
8%44
%49
%4%
43%
87%
22%
82%
Rac
e/et
hnic
ity
Non
-whi
te a
nd/o
r H
ispa
nic
(< 1
00 r
espo
nden
ts)
219,
221
6%
5%3%
2%2%
3%60
%22
%82
%W
hite
, non
-His
pani
c3,
265,
411
94%
10%
97%
98%
5%97
%86
%22
%82
%
Inco
me
unde
r $3
0,00
077
3,87
9
22%
8%17
%18
%4%
16%
86%
22%
82%
$30,
000
to $
39,9
9945
2,33
4
13%
9%12
%13
%4%
9%85
%22
%82
%$4
0,00
0 to
$49
,999
467,
456
13
%9%
12%
12%
6%17
%92
%22
%82
%$5
0,00
0 to
$74
,999
834,
075
24
%12
%28
%18
%5%
23%
73%
22%
82%
$75,
000
to $
99,9
9944
4,71
2
13%
12%
15%
24%
8%20
%95
%22
%82
%$1
00,0
00 o
r m
ore
512,
175
15
%11
%16
%15
%5%
14%
83%
22%
82%
Edu
cati
onH
igh
scho
ol g
radu
ate,
or
som
e hi
gh s
choo
l69
2,47
1
20%
4%8%
8%2%
9%84
%22
%82
%V
o-te
ch s
choo
l, as
soc.
deg
ree,
or
som
e co
llege
1,32
3,70
2
38
%10
%37
%36
%5%
38%
86%
22%
82%
Gra
duat
ed f
rom
col
lege
787,
629
23
%15
%35
%36
%7%
33%
85%
22%
82%
Post
grad
uate
stu
dy/p
ostg
radu
ate
degr
ees
680,
830
20
%10
%20
%20
%5%
21%
87%
22%
82%
Hou
seho
ld s
ize
1 pe
rson
1,11
7,41
4
32
%6%
21%
24%
3%20
%87
%22
%82
%2
peop
le98
4,99
7
28%
9%26
%36
%5%
32%
90%
22%
82%
3 pe
ople
497,
888
14
%14
%21
%16
%8%
23%
86%
22%
82%
4 pe
ople
561,
432
16
%13
%21
%17
%5%
17%
80%
22%
82%
5+ p
eopl
e32
2,90
1
9%12
%11
%7%
4%7%
75%
22%
82%
---
---
MN
Pop
ulat
ion
----
--(a
s re
pres
ente
d by
sur
vey)
AC
TIV
ITY
: C
ampi
ng u
sing
a t
ent
that
was
par
t of
bac
kpac
king
or
occu
rred
at a
can
oe-i
n/bo
at-i
n ca
mps
ite
---
---
Avi
d pa
rtic
ipan
ts -
----
- -
----
----
----
----
Act
ivit
y da
ys -
----
----
----
---
---
----
---
Act
ivit
y pa
rtic
ipat
ion
----
----
--(>
med
ian
days
per
yea
r)
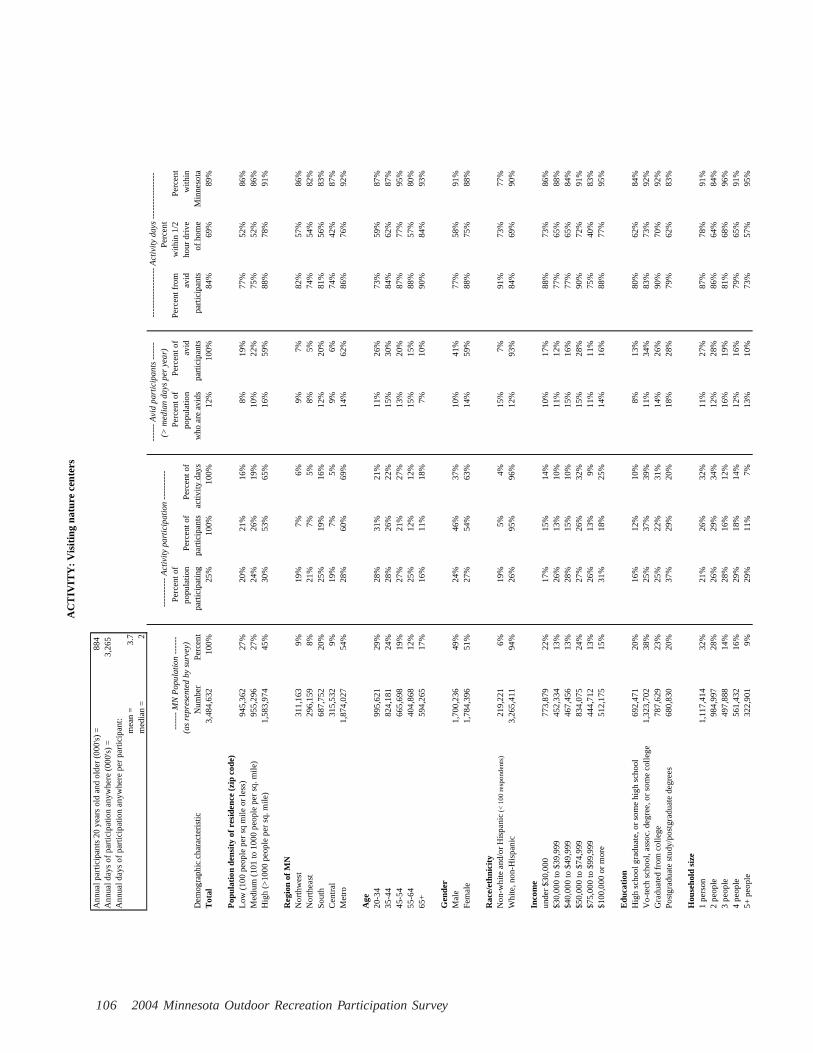
2004 Minnesota Outdoor Recreation Participation Survey106
Ann
ual p
artic
ipan
ts 2
0 ye
ars
old
and
olde
r (0
00's
) =
884
A
nnua
l day
s of
par
ticip
atio
n an
ywhe
re (
000'
s) =
3,26
5
A
nnua
l day
s of
par
ticip
atio
n an
ywhe
re p
er p
artic
ipan
t:m
ean
=3.
7m
edia
n =
2
Perc
ent
Perc
ent o
fPe
rcen
t of
Perc
ent o
fPe
rcen
t fro
mw
ithin
1/2
Perc
ent
popu
latio
nPe
rcen
t of
Perc
ent o
fpo
pula
tion
avid
avid
hour
dri
vew
ithin
Dem
ogra
phic
cha
ract
eris
ticN
umbe
rPe
rcen
tpa
rtic
ipat
ing
part
icip
ants
activ
ity d
ays
who
are
avi
dspa
rtic
ipan
tspa
rtic
ipan
tsof
hom
eM
inne
sota
Tot
al3,
484,
632
100%
25%
100%
100%
12%
100%
84%
69%
89%
Pop
ulat
ion
dens
ity
of r
esid
ence
(zi
p co
de)
Low
(10
0 pe
ople
per
sq
mile
or
less
)94
5,36
2
27%
20%
21%
16%
8%19
%77
%52
%86
%M
ediu
m (
101
to 1
000
peop
le p
er s
q. m
ile)
955,
296
27
%24
%26
%19
%10
%22
%75
%52
%86
%H
igh
(>10
00 p
eopl
e pe
r sq
. mile
)1,
583,
974
45%
30%
53%
65%
16%
59%
88%
78%
91%
Reg
ion
of M
NN
orth
wes
t31
1,16
3
9%19
%7%
6%9%
7%82
%57
%86
%N
orth
east
296,
159
8%
21%
7%5%
8%5%
74%
54%
82%
Sout
h68
7,75
2
20%
25%
19%
16%
12%
20%
81%
56%
83%
Cen
tral
315,
532
9%
19%
7%5%
9%6%
74%
42%
87%
Met
ro1,
874,
027
54%
28%
60%
69%
14%
62%
86%
76%
92%
Age
20-3
499
5,62
1
29%
28%
31%
21%
11%
26%
73%
59%
87%
35-4
482
4,18
1
24%
28%
26%
22%
15%
30%
84%
62%
87%
45-5
466
5,69
8
19%
27%
21%
27%
13%
20%
87%
77%
95%
55-6
440
4,86
8
12%
25%
12%
12%
15%
15%
88%
57%
80%
65+
594,
265
17
%16
%11
%18
%7%
10%
90%
84%
93%
Gen
der
Mal
e1,
700,
236
49%
24%
46%
37%
10%
41%
77%
58%
91%
Fem
ale
1,78
4,39
6
51
%27
%54
%63
%14
%59
%88
%75
%88
%
Rac
e/et
hnic
ity
Non
-whi
te a
nd/o
r H
ispa
nic
(< 1
00 r
espo
nden
ts)
219,
221
6%
19%
5%4%
15%
7%91
%73
%77
%W
hite
, non
-His
pani
c3,
265,
411
94%
26%
95%
96%
12%
93%
84%
69%
90%
Inco
me
unde
r $3
0,00
077
3,87
9
22%
17%
15%
14%
10%
17%
88%
73%
86%
$30,
000
to $
39,9
9945
2,33
4
13%
26%
13%
10%
11%
12%
77%
65%
88%
$40,
000
to $
49,9
9946
7,45
6
13%
28%
15%
10%
15%
16%
77%
65%
84%
$50,
000
to $
74,9
9983
4,07
5
24%
27%
26%
32%
15%
28%
90%
72%
91%
$75,
000
to $
99,9
9944
4,71
2
13%
26%
13%
9%11
%11
%75
%40
%83
%$1
00,0
00 o
r m
ore
512,
175
15
%31
%18
%25
%14
%16
%88
%77
%95
%
Edu
cati
onH
igh
scho
ol g
radu
ate,
or
som
e hi
gh s
choo
l69
2,47
1
20%
16%
12%
10%
8%13
%80
%62
%84
%V
o-te
ch s
choo
l, as
soc.
deg
ree,
or
som
e co
llege
1,32
3,70
2
38
%25
%37
%39
%11
%34
%83
%73
%92
%G
radu
ated
fro
m c
olle
ge78
7,62
9
23%
25%
22%
31%
14%
26%
90%
70%
92%
Post
grad
uate
stu
dy/p
ostg
radu
ate
degr
ees
680,
830
20
%37
%29
%20
%18
%28
%79
%62
%83
%
Hou
seho
ld s
ize
1 pe
rson
1,11
7,41
4
32
%21
%26
%32
%11
%27
%87
%78
%91
%2
peop
le98
4,99
7
28%
26%
29%
34%
12%
28%
86%
64%
84%
3 pe
ople
497,
888
14
%28
%16
%12
%16
%19
%81
%68
%96
%4
peop
le56
1,43
2
16%
29%
18%
14%
12%
16%
79%
65%
91%
5+ p
eopl
e32
2,90
1
9%29
%11
%7%
13%
10%
73%
57%
95%
---
---
MN
Pop
ulat
ion
----
--(a
s re
pres
ente
d by
sur
vey)
AC
TIV
ITY
: V
isit
ing
natu
re c
ente
rs
---
---
Avi
d pa
rtic
ipan
ts -
----
- -
----
----
----
----
Act
ivit
y da
ys -
----
----
----
---
---
----
---
Act
ivit
y pa
rtic
ipat
ion
----
----
--(>
med
ian
days
per
yea
r)

107Minnesota Department of Natural Resources
Ann
ual p
artic
ipan
ts 2
0 ye
ars
old
and
olde
r (0
00's
) =
844
A
nnua
l day
s of
par
ticip
atio
n an
ywhe
re (
000'
s) =
46,2
68
Ann
ual d
ays
of p
artic
ipat
ion
anyw
here
per
par
ticip
ant:
mea
n =
54.8
med
ian
=15
Perc
ent
Perc
ent o
fPe
rcen
t of
Perc
ent o
fPe
rcen
t fro
mw
ithin
1/2
Perc
ent
popu
latio
nPe
rcen
t of
Perc
ent o
fpo
pula
tion
avid
avid
hour
dri
vew
ithin
Dem
ogra
phic
cha
ract
eris
ticN
umbe
rPe
rcen
tpa
rtic
ipat
ing
part
icip
ants
activ
ity d
ays
who
are
avi
dspa
rtic
ipan
tspa
rtic
ipan
tsof
hom
eM
inne
sota
Tot
al3,
484,
632
100%
24%
100%
100%
11%
100%
93%
80%
91%
Pop
ulat
ion
dens
ity
of r
esid
ence
(zi
p co
de)
Low
(10
0 pe
ople
per
sq
mile
or
less
)94
5,36
2
27%
23%
25%
42%
14%
34%
97%
83%
93%
Med
ium
(10
1 to
100
0 pe
ople
per
sq.
mile
)95
5,29
6
27%
25%
28%
23%
10%
26%
92%
80%
87%
Hig
h (>
1000
peo
ple
per
sq. m
ile)
1,58
3,97
4
45
%25
%47
%35
%10
%40
%89
%76
%91
%
Reg
ion
of M
NN
orth
wes
t31
1,16
3
9%20
%8%
7%10
%8%
93%
81%
92%
Nor
thea
st29
6,15
9
8%24
%8%
13%
13%
10%
97%
86%
93%
Sout
h68
7,75
2
20%
23%
18%
28%
11%
20%
96%
82%
90%
Cen
tral
315,
532
9%
26%
10%
9%15
%12
%94
%77
%92
%M
etro
1,87
4,02
7
54
%25
%56
%43
%10
%49
%90
%77
%91
%
Age
20-3
499
5,62
1
29%
24%
29%
12%
6%16
%76
%64
%92
%35
-44
824,
181
24
%28
%27
%26
%11
%24
%92
%83
%89
%45
-54
665,
698
19
%29
%23
%31
%17
%30
%96
%83
%94
%55
-64
404,
868
12
%24
%11
%17
%14
%15
%97
%83
%91
%65
+59
4,26
5
17%
14%
10%
14%
10%
15%
97%
78%
87%
Gen
der
Mal
e1,
700,
236
49%
24%
48%
43%
10%
45%
93%
75%
91%
Fem
ale
1,78
4,39
6
51
%25
%52
%57
%12
%55
%93
%84
%91
%
Rac
e/et
hnic
ity
Non
-whi
te a
nd/o
r H
ispa
nic
(< 1
00 r
espo
nden
ts)
219,
221
6%
28%
7%8%
12%
6%96
%97
%99
%W
hite
, non
-His
pani
c3,
265,
411
94%
24%
93%
92%
11%
94%
93%
78%
90%
Inco
me
unde
r $3
0,00
077
3,87
9
22%
18%
16%
19%
9%18
%95
%81
%93
%$3
0,00
0 to
$39
,999
452,
334
13
%25
%13
%18
%11
%14
%96
%86
%94
%$4
0,00
0 to
$49
,999
467,
456
13
%24
%13
%11
%11
%14
%91
%80
%90
%$5
0,00
0 to
$74
,999
834,
075
24
%26
%26
%23
%11
%25
%92
%79
%92
%$7
5,00
0 to
$99
,999
444,
712
13
%27
%14
%10
%12
%15
%89
%64
%86
%$1
00,0
00 o
r m
ore
512,
175
15
%30
%18
%18
%11
%15
%92
%81
%92
%
Edu
cati
onH
igh
scho
ol g
radu
ate,
or
som
e hi
gh s
choo
l69
2,47
1
20%
14%
12%
11%
6%11
%93
%80
%89
%V
o-te
ch s
choo
l, as
soc.
deg
ree,
or
som
e co
llege
1,32
3,70
2
38
%24
%37
%40
%12
%42
%94
%81
%92
%G
radu
ated
fro
m c
olle
ge78
7,62
9
23%
25%
24%
20%
9%18
%90
%79
%90
%Po
stgr
adua
te s
tudy
/pos
tgra
duat
e de
gree
s68
0,83
0
20%
34%
28%
28%
16%
29%
94%
80%
91%
Hou
seho
ld s
ize
1 pe
rson
1,11
7,41
4
32
%20
%27
%25
%10
%29
%94
%80
%93
%2
peop
le98
4,99
7
28%
26%
30%
30%
12%
30%
93%
77%
88%
3 pe
ople
497,
888
14
%29
%17
%19
%13
%17
%93
%83
%93
%4
peop
le56
1,43
2
16%
26%
17%
13%
10%
14%
89%
79%
90%
5+ p
eopl
e32
2,90
1
9%24
%9%
14%
12%
10%
96%
83%
92%
---
---
MN
Pop
ulat
ion
----
--(a
s re
pres
ente
d by
sur
vey)
AC
TIV
ITY
: N
atur
e ob
serv
atio
n of
all
type
s (v
iew
ing,
iden
tify
ing,
pho
togr
aphi
ng)
---
---
Avi
d pa
rtic
ipan
ts -
----
- -
----
----
----
----
Act
ivit
y da
ys -
----
----
----
---
---
----
---
Act
ivit
y pa
rtic
ipat
ion
----
----
--(>
med
ian
days
per
yea
r)

2004 Minnesota Outdoor Recreation Participation Survey108
Ann
ual p
artic
ipan
ts 2
0 ye
ars
old
and
olde
r (0
00's
) =
712
A
nnua
l day
s of
par
ticip
atio
n an
ywhe
re (
000'
s) =
27,6
54
Ann
ual d
ays
of p
artic
ipat
ion
anyw
here
per
par
ticip
ant:
mea
n =
38.8
med
ian
=11
Perc
ent
Perc
ent o
fPe
rcen
t of
Perc
ent o
fPe
rcen
t fro
mw
ithin
1/2
Perc
ent
popu
latio
nPe
rcen
t of
Perc
ent o
fpo
pula
tion
avid
avid
hour
dri
vew
ithin
Dem
ogra
phic
cha
ract
eris
ticN
umbe
rPe
rcen
tpa
rtic
ipat
ing
part
icip
ants
activ
ity d
ays
who
are
avi
dspa
rtic
ipan
tspa
rtic
ipan
tsof
hom
eM
inne
sota
Tot
al3,
484,
632
100%
20%
100%
100%
10%
100%
93%
81%
91%
Pop
ulat
ion
dens
ity
of r
esid
ence
(zi
p co
de)
Low
(10
0 pe
ople
per
sq
mile
or
less
)94
5,36
2
27%
21%
27%
43%
13%
37%
97%
84%
92%
Med
ium
(10
1 to
100
0 pe
ople
per
sq.
mile
)95
5,29
6
27%
19%
26%
24%
9%26
%93
%83
%90
%H
igh
(>10
00 p
eopl
e pe
r sq
. mile
)1,
583,
974
45%
21%
47%
33%
8%37
%88
%78
%92
%
Reg
ion
of M
NN
orth
wes
t31
1,16
3
9%17
%7%
7%8%
8%93
%81
%94
%N
orth
east
296,
159
8%
20%
8%14
%12
%11
%97
%88
%94
%So
uth
687,
752
20
%20
%19
%29
%11
%22
%96
%84
%89
%C
entr
al31
5,53
2
9%21
%10
%10
%14
%13
%95
%79
%91
%M
etro
1,87
4,02
7
54
%21
%56
%41
%8%
46%
88%
78%
92%
Age
20-3
499
5,62
1
29%
20%
28%
11%
6%18
%80
%68
%93
%35
-44
824,
181
24
%24
%28
%23
%10
%24
%90
%82
%90
%45
-54
665,
698
19
%24
%23
%31
%14
%28
%96
%85
%93
%55
-64
404,
868
12
%20
%12
%18
%13
%15
%97
%83
%94
%65
+59
4,26
5
17%
12%
10%
16%
9%15
%97
%82
%87
%
Gen
der
Mal
e1,
700,
236
49%
21%
50%
46%
10%
51%
93%
76%
92%
Fem
ale
1,78
4,39
6
51
%20
%50
%54
%9%
49%
92%
86%
91%
Rac
e/et
hnic
ity
Non
-whi
te a
nd/o
r H
ispa
nic
(< 1
00 r
espo
nden
ts)
219,
221
6%
22%
6%8%
9%6%
96%
97%
99%
Whi
te, n
on-H
ispa
nic
3,26
5,41
1
94
%21
%94
%92
%10
%94
%93
%80
%91
%
Inco
me
unde
r $3
0,00
077
3,87
9
22%
15%
15%
20%
9%21
%97
%83
%94
%$3
0,00
0 to
$39
,999
452,
334
13
%22
%14
%17
%10
%13
%96
%88
%95
%$4
0,00
0 to
$49
,999
467,
456
13
%20
%13
%11
%9%
13%
89%
82%
93%
$50,
000
to $
74,9
9983
4,07
5
24%
23%
27%
24%
10%
26%
91%
78%
93%
$75,
000
to $
99,9
9944
4,71
2
13%
22%
13%
8%10
%13
%85
%64
%83
%$1
00,0
00 o
r m
ore
512,
175
15
%24
%17
%20
%9%
14%
92%
84%
94%
Edu
cati
onH
igh
scho
ol g
radu
ate,
or
som
e hi
gh s
choo
l69
2,47
1
20%
13%
13%
14%
6%13
%94
%80
%90
%V
o-te
ch s
choo
l, as
soc.
deg
ree,
or
som
e co
llege
1,32
3,70
2
38
%20
%37
%41
%11
%44
%95
%84
%91
%G
radu
ated
fro
m c
olle
ge78
7,62
9
23%
21%
24%
20%
8%19
%91
%81
%92
%Po
stgr
adua
te s
tudy
/pos
tgra
duat
e de
gree
s68
0,83
0
20%
28%
27%
24%
12%
24%
91%
79%
92%
Hou
seho
ld s
ize
1 pe
rson
1,11
7,41
4
32
%16
%25
%22
%8%
26%
92%
81%
93%
2 pe
ople
984,
997
28
%21
%30
%33
%11
%32
%94
%80
%90
%3
peop
le49
7,88
8
14%
24%
17%
19%
12%
17%
93%
85%
94%
4 pe
ople
561,
432
16
%23
%18
%14
%8%
13%
88%
81%
88%
5+ p
eopl
e32
2,90
1
9%23
%10
%13
%12
%12
%95
%83
%93
%
---
---
MN
Pop
ulat
ion
----
--(a
s re
pres
ente
d by
sur
vey)
AC
TIV
ITY
: V
iew
ing,
iden
tify
ing
or p
hoto
grap
hing
bir
ds a
nd o
ther
wild
life
---
---
Avi
d pa
rtic
ipan
ts -
----
- -
----
----
----
----
Act
ivit
y da
ys -
----
----
----
---
---
----
---
Act
ivit
y pa
rtic
ipat
ion
----
----
--(>
med
ian
days
per
yea
r)
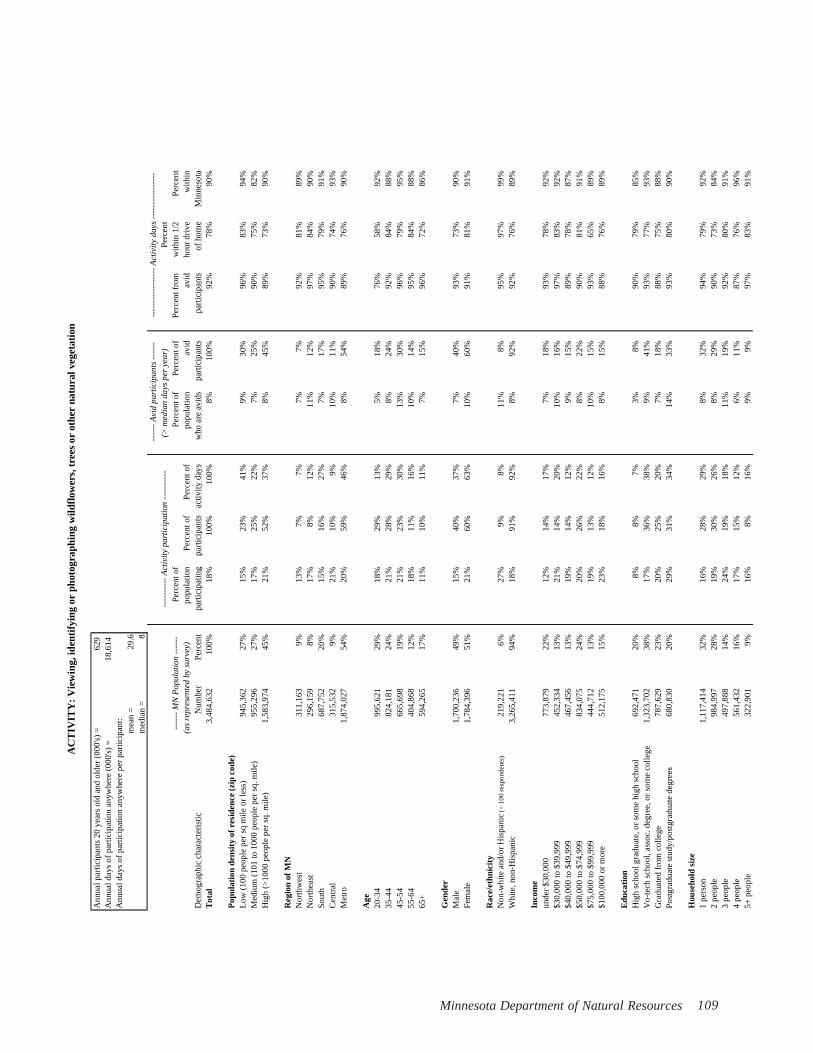
109Minnesota Department of Natural Resources
Ann
ual p
artic
ipan
ts 2
0 ye
ars
old
and
olde
r (0
00's
) =
629
A
nnua
l day
s of
par
ticip
atio
n an
ywhe
re (
000'
s) =
18,6
14
Ann
ual d
ays
of p
artic
ipat
ion
anyw
here
per
par
ticip
ant:
mea
n =
29.6
med
ian
=8
Perc
ent
Perc
ent o
fPe
rcen
t of
Perc
ent o
fPe
rcen
t fro
mw
ithin
1/2
Perc
ent
popu
latio
nPe
rcen
t of
Perc
ent o
fpo
pula
tion
avid
avid
hour
dri
vew
ithin
Dem
ogra
phic
cha
ract
eris
ticN
umbe
rPe
rcen
tpa
rtic
ipat
ing
part
icip
ants
activ
ity d
ays
who
are
avi
dspa
rtic
ipan
tspa
rtic
ipan
tsof
hom
eM
inne
sota
Tot
al3,
484,
632
100%
18%
100%
100%
8%10
0%92
%78
%90
%
Pop
ulat
ion
dens
ity
of r
esid
ence
(zi
p co
de)
Low
(10
0 pe
ople
per
sq
mile
or
less
)94
5,36
2
27%
15%
23%
41%
9%30
%96
%83
%94
%M
ediu
m (
101
to 1
000
peop
le p
er s
q. m
ile)
955,
296
27
%17
%25
%22
%7%
25%
90%
75%
82%
Hig
h (>
1000
peo
ple
per
sq. m
ile)
1,58
3,97
4
45
%21
%52
%37
%8%
45%
89%
73%
90%
Reg
ion
of M
NN
orth
wes
t31
1,16
3
9%13
%7%
7%7%
7%92
%81
%89
%N
orth
east
296,
159
8%
17%
8%12
%11
%12
%97
%84
%90
%So
uth
687,
752
20
%15
%16
%27
%7%
17%
95%
79%
91%
Cen
tral
315,
532
9%
21%
10%
9%10
%11
%90
%74
%93
%M
etro
1,87
4,02
7
54
%20
%59
%46
%8%
54%
89%
76%
90%
Age
20-3
499
5,62
1
29%
18%
29%
13%
5%18
%76
%58
%92
%35
-44
824,
181
24
%21
%28
%29
%8%
24%
92%
84%
88%
45-5
466
5,69
8
19%
21%
23%
30%
13%
30%
96%
79%
95%
55-6
440
4,86
8
12%
18%
11%
16%
10%
14%
95%
84%
88%
65+
594,
265
17
%11
%10
%11
%7%
15%
96%
72%
86%
Gen
der
Mal
e1,
700,
236
49%
15%
40%
37%
7%40
%93
%73
%90
%Fe
mal
e1,
784,
396
51%
21%
60%
63%
10%
60%
91%
81%
91%
Rac
e/et
hnic
ity
Non
-whi
te a
nd/o
r H
ispa
nic
(< 1
00 r
espo
nden
ts)
219,
221
6%
27%
9%8%
11%
8%95
%97
%99
%W
hite
, non
-His
pani
c3,
265,
411
94%
18%
91%
92%
8%92
%92
%76
%89
%
Inco
me
unde
r $3
0,00
077
3,87
9
22%
12%
14%
17%
7%18
%93
%78
%92
%$3
0,00
0 to
$39
,999
452,
334
13
%21
%14
%20
%10
%16
%97
%83
%92
%$4
0,00
0 to
$49
,999
467,
456
13
%19
%14
%12
%9%
15%
89%
78%
87%
$50,
000
to $
74,9
9983
4,07
5
24%
20%
26%
22%
8%22
%90
%81
%91
%$7
5,00
0 to
$99
,999
444,
712
13
%19
%13
%12
%10
%15
%93
%65
%89
%$1
00,0
00 o
r m
ore
512,
175
15
%23
%18
%16
%8%
15%
88%
76%
89%
Edu
cati
onH
igh
scho
ol g
radu
ate,
or
som
e hi
gh s
choo
l69
2,47
1
20%
8%8%
7%3%
8%90
%79
%85
%V
o-te
ch s
choo
l, as
soc.
deg
ree,
or
som
e co
llege
1,32
3,70
2
38
%17
%36
%38
%9%
41%
93%
77%
93%
Gra
duat
ed f
rom
col
lege
787,
629
23
%20
%25
%20
%7%
18%
88%
75%
88%
Post
grad
uate
stu
dy/p
ostg
radu
ate
degr
ees
680,
830
20
%29
%31
%34
%14
%33
%93
%80
%90
%
Hou
seho
ld s
ize
1 pe
rson
1,11
7,41
4
32
%16
%28
%29
%8%
32%
94%
79%
92%
2 pe
ople
984,
997
28
%19
%30
%26
%8%
29%
90%
73%
84%
3 pe
ople
497,
888
14
%24
%19
%18
%11
%19
%92
%80
%91
%4
peop
le56
1,43
2
16%
17%
15%
12%
6%11
%87
%76
%96
%5+
peo
ple
322,
901
9%
16%
8%16
%9%
9%97
%83
%91
%
---
---
MN
Pop
ulat
ion
----
--(a
s re
pres
ente
d by
sur
vey)
AC
TIV
ITY
: V
iew
ing,
iden
tify
ing
or p
hoto
grap
hing
wild
flow
ers,
tre
es o
r ot
her
natu
ral v
eget
atio
n
---
---
Avi
d pa
rtic
ipan
ts -
----
- -
----
----
----
----
Act
ivit
y da
ys -
----
----
----
---
---
----
---
Act
ivit
y pa
rtic
ipat
ion
----
----
--(>
med
ian
days
per
yea
r)

2004 Minnesota Outdoor Recreation Participation Survey110
Ann
ual p
artic
ipan
ts 2
0 ye
ars
old
and
olde
r (0
00's
) =
820
A
nnua
l day
s of
par
ticip
atio
n an
ywhe
re (
000'
s) =
11,1
63
Ann
ual d
ays
of p
artic
ipat
ion
anyw
here
per
par
ticip
ant:
mea
n =
13.6
med
ian
=8
Perc
ent
Perc
ent o
fPe
rcen
t of
Perc
ent o
fPe
rcen
t fro
mw
ithin
1/2
Perc
ent
popu
latio
nPe
rcen
t of
Perc
ent o
fpo
pula
tion
avid
avid
hour
dri
vew
ithin
Dem
ogra
phic
cha
ract
eris
ticN
umbe
rPe
rcen
tpa
rtic
ipat
ing
part
icip
ants
activ
ity d
ays
who
are
avi
dspa
rtic
ipan
tspa
rtic
ipan
tsof
hom
eM
inne
sota
Tot
al3,
484,
632
100%
24%
100%
100%
10%
100%
83%
74%
87%
Pop
ulat
ion
dens
ity
of r
esid
ence
(zi
p co
de)
Low
(10
0 pe
ople
per
sq
mile
or
less
)94
5,36
2
27%
16%
19%
22%
7%19
%88
%78
%88
%M
ediu
m (
101
to 1
000
peop
le p
er s
q. m
ile)
955,
296
27
%29
%34
%38
%12
%35
%84
%79
%91
%H
igh
(>10
00 p
eopl
e pe
r sq
. mile
)1,
583,
974
45%
25%
47%
40%
10%
46%
79%
68%
83%
Reg
ion
of M
NN
orth
wes
t31
1,16
3
9%19
%7%
9%8%
8%89
%77
%85
%N
orth
east
296,
159
8%
17%
6%7%
6%5%
89%
76%
87%
Sout
h68
7,75
2
20%
21%
17%
18%
9%19
%85
%83
%92
%C
entr
al31
5,53
2
9%26
%10
%9%
9%8%
79%
76%
91%
Met
ro1,
874,
027
54%
26%
60%
57%
11%
59%
81%
71%
86%
Age
20-3
499
5,62
1
29%
31%
38%
28%
11%
33%
75%
74%
88%
35-4
482
4,18
1
24%
27%
27%
26%
10%
24%
84%
76%
89%
45-5
466
5,69
8
19%
25%
21%
22%
10%
21%
80%
76%
92%
55-6
440
4,86
8
12%
17%
8%11
%9%
11%
90%
73%
88%
65+
594,
265
17
%9%
6%13
%6%
11%
96%
70%
74%
Gen
der
Mal
e1,
700,
236
49%
31%
64%
66%
14%
70%
84%
71%
85%
Fem
ale
1,78
4,39
6
51
%16
%36
%34
%6%
30%
80%
81%
92%
Rac
e/et
hnic
ity
Non
-whi
te a
nd/o
r H
ispa
nic
(< 1
00 r
espo
nden
ts)
219,
221
6%
12%
3%4%
4%3%
85%
79%
98%
Whi
te, n
on-H
ispa
nic
3,26
5,41
1
94
%24
%97
%96
%10
%97
%83
%74
%87
%
Inco
me
unde
r $3
0,00
077
3,87
9
22%
10%
9%7%
3%6%
78%
72%
93%
$30,
000
to $
39,9
9945
2,33
4
13%
17%
9%8%
6%8%
76%
74%
94%
$40,
000
to $
49,9
9946
7,45
6
13%
21%
12%
13%
10%
13%
86%
74%
86%
$50,
000
to $
74,9
9983
4,07
5
24%
26%
25%
20%
9%22
%80
%74
%86
%$7
5,00
0 to
$99
,999
444,
712
13
%35
%18
%19
%15
%20
%84
%78
%88
%$1
00,0
00 o
r m
ore
512,
175
15
%43
%26
%32
%21
%31
%86
%74
%85
%
Edu
cati
onH
igh
scho
ol g
radu
ate,
or
som
e hi
gh s
choo
l69
2,47
1
20%
15%
13%
15%
7%15
%86
%73
%91
%V
o-te
ch s
choo
l, as
soc.
deg
ree,
or
som
e co
llege
1,32
3,70
2
38
%21
%34
%35
%8%
33%
84%
77%
88%
Gra
duat
ed f
rom
col
lege
787,
629
23
%31
%30
%29
%14
%33
%83
%71
%85
%Po
stgr
adua
te s
tudy
/pos
tgra
duat
e de
gree
s68
0,83
0
20%
28%
23%
21%
10%
20%
78%
77%
87%
Hou
seho
ld s
ize
1 pe
rson
1,11
7,41
4
32
%18
%24
%22
%7%
22%
84%
76%
86%
2 pe
ople
984,
997
28
%25
%30
%36
%11
%32
%85
%71
%86
%3
peop
le49
7,88
8
14%
26%
16%
16%
11%
16%
83%
77%
91%
4 pe
ople
561,
432
16
%29
%20
%20
%14
%24
%83
%75
%88
%5+
peo
ple
322,
901
9%
26%
10%
6%6%
6%61
%78
%89
%
---
---
MN
Pop
ulat
ion
----
--(a
s re
pres
ente
d by
sur
vey)
AC
TIV
ITY
: G
olfi
ng
---
---
Avi
d pa
rtic
ipan
ts -
----
- -
----
----
----
----
Act
ivit
y da
ys -
----
----
----
---
---
----
---
Act
ivit
y pa
rtic
ipat
ion
----
----
--(>
med
ian
days
per
yea
r)

111Minnesota Department of Natural Resources
Ann
ual p
artic
ipan
ts 2
0 ye
ars
old
and
olde
r (0
00's
) =
737
A
nnua
l day
s of
par
ticip
atio
n an
ywhe
re (
000'
s) =
11,1
87
Ann
ual d
ays
of p
artic
ipat
ion
anyw
here
per
par
ticip
ant:
mea
n =
15.2
med
ian
=9
Perc
ent
Perc
ent o
fPe
rcen
t of
Perc
ent o
fPe
rcen
t fro
mw
ithin
1/2
Perc
ent
popu
latio
nPe
rcen
t of
Perc
ent o
fpo
pula
tion
avid
avid
hour
dri
vew
ithin
Dem
ogra
phic
cha
ract
eris
ticN
umbe
rPe
rcen
tpa
rtic
ipat
ing
part
icip
ants
activ
ity d
ays
who
are
avi
dspa
rtic
ipan
tspa
rtic
ipan
tsof
hom
eM
inne
sota
Tot
al3,
484,
632
100%
21%
100%
100%
10%
100%
85%
82%
95%
Pop
ulat
ion
dens
ity
of r
esid
ence
(zi
p co
de)
Low
(10
0 pe
ople
per
sq
mile
or
less
)94
5,36
2
27%
18%
23%
23%
9%25
%87
%80
%98
%M
ediu
m (
101
to 1
000
peop
le p
er s
q. m
ile)
955,
296
27
%23
%30
%28
%11
%30
%83
%73
%94
%H
igh
(>10
00 p
eopl
e pe
r sq
. mile
)1,
583,
974
45%
22%
47%
49%
10%
45%
85%
87%
94%
Reg
ion
of M
NN
orth
wes
t31
1,16
3
9%21
%9%
8%9%
8%83
%83
%94
%N
orth
east
296,
159
8%
20%
8%7%
9%7%
83%
82%
98%
Sout
h68
7,75
2
20%
19%
18%
19%
10%
19%
86%
67%
98%
Cen
tral
315,
532
9%
22%
10%
10%
13%
12%
89%
77%
94%
Met
ro1,
874,
027
54%
22%
56%
56%
10%
55%
84%
87%
94%
Age
20-3
499
5,62
1
29%
30%
41%
44%
16%
44%
86%
81%
98%
35-4
482
4,18
1
24%
28%
32%
35%
15%
35%
88%
83%
92%
45-5
466
5,69
8
19%
20%
18%
15%
8%16
%79
%83
%98
%55
-64
404,
868
12
%9%
5%4%
2%3%
79%
88%
92%
65+
594,
265
17
%5%
4%2%
1%2%
71%
63%
90%
Gen
der
Mal
e1,
700,
236
49%
24%
57%
58%
12%
56%
84%
83%
96%
Fem
ale
1,78
4,39
6
51
%18
%43
%42
%9%
44%
86%
80%
94%
Rac
e/et
hnic
ity
Non
-whi
te a
nd/o
r H
ispa
nic
(< 1
00 r
espo
nden
ts)
219,
221
6%
13%
4%3%
4%2%
80%
81%
98%
Whi
te, n
on-H
ispa
nic
3,26
5,41
1
94
%22
%96
%97
%11
%98
%85
%82
%95
%
Inco
me
unde
r $3
0,00
077
3,87
9
22%
14%
14%
15%
7%14
%89
%68
%89
%$3
0,00
0 to
$39
,999
452,
334
13
%19
%12
%10
%9%
11%
83%
80%
96%
$40,
000
to $
49,9
9946
7,45
6
13%
23%
14%
14%
11%
14%
85%
81%
100%
$50,
000
to $
74,9
9983
4,07
5
24%
24%
26%
24%
11%
25%
80%
83%
98%
$75,
000
to $
99,9
9944
4,71
2
13%
20%
12%
18%
13%
16%
92%
84%
99%
$100
,000
or
mor
e51
2,17
5
15%
32%
22%
19%
14%
20%
85%
88%
90%
Edu
cati
onH
igh
scho
ol g
radu
ate,
or
som
e hi
gh s
choo
l69
2,47
1
20%
13%
12%
8%4%
8%71
%88
%99
%V
o-te
ch s
choo
l, as
soc.
deg
ree,
or
som
e co
llege
1,32
3,70
2
38
%21
%37
%42
%10
%39
%88
%82
%97
%G
radu
ated
fro
m c
olle
ge78
7,62
9
23%
29%
31%
29%
15%
34%
85%
79%
95%
Post
grad
uate
stu
dy/p
ostg
radu
ate
degr
ees
680,
830
20
%22
%21
%21
%10
%19
%84
%82
%90
%
Hou
seho
ld s
ize
1 pe
rson
1,11
7,41
4
32
%12
%18
%12
%5%
15%
78%
81%
97%
2 pe
ople
984,
997
28
%17
%23
%17
%6%
17%
77%
72%
87%
3 pe
ople
497,
888
14
%28
%19
%20
%16
%23
%87
%84
%96
%4
peop
le56
1,43
2
16%
34%
26%
30%
18%
28%
88%
87%
97%
5+ p
eopl
e32
2,90
1
9%33
%14
%20
%19
%17
%89
%80
%98
%
---
---
MN
Pop
ulat
ion
----
--(a
s re
pres
ente
d by
sur
vey)
AC
TIV
ITY
: O
utdo
or f
ield
spo
rts
(e.g
., so
ccer
, sof
tbal
l/bas
ebal
l, fo
otba
ll)
---
---
Avi
d pa
rtic
ipan
ts -
----
- -
----
----
----
----
Act
ivit
y da
ys -
----
----
----
---
---
----
---
Act
ivit
y pa
rtic
ipat
ion
----
----
--(>
med
ian
days
per
yea
r)

2004 Minnesota Outdoor Recreation Participation Survey112
Ann
ual p
artic
ipan
ts 2
0 ye
ars
old
and
olde
r (0
00's
) =
721
A
nnua
l day
s of
par
ticip
atio
n an
ywhe
re (
000'
s) =
2,39
8
A
nnua
l day
s of
par
ticip
atio
n an
ywhe
re p
er p
artic
ipan
t:m
ean
=3.
3m
edia
n =
2
Perc
ent
Perc
ent o
fPe
rcen
t of
Perc
ent o
fPe
rcen
t fro
mw
ithin
1/2
Perc
ent
popu
latio
nPe
rcen
t of
Perc
ent o
fpo
pula
tion
avid
avid
hour
dri
vew
ithin
Dem
ogra
phic
cha
ract
eris
ticN
umbe
rPe
rcen
tpa
rtic
ipat
ing
part
icip
ants
activ
ity d
ays
who
are
avi
dspa
rtic
ipan
tspa
rtic
ipan
tsof
hom
eM
inne
sota
Tot
al3,
484,
632
100%
21%
100%
100%
8%10
0%74
%35
%64
%
Pop
ulat
ion
dens
ity
of r
esid
ence
(zi
p co
de)
Low
(10
0 pe
ople
per
sq
mile
or
less
)94
5,36
2
27%
19%
25%
27%
8%27
%79
%46
%78
%M
ediu
m (
101
to 1
000
peop
le p
er s
q. m
ile)
955,
296
27
%17
%23
%26
%8%
29%
79%
27%
62%
Hig
h (>
1000
peo
ple
per
sq. m
ile)
1,58
3,97
4
45
%24
%53
%46
%8%
44%
68%
34%
58%
Reg
ion
of M
NN
orth
wes
t31
1,16
3
9%17
%7%
6%9%
10%
78%
37%
74%
Nor
thea
st29
6,15
9
8%19
%8%
12%
6%7%
82%
54%
75%
Sout
h68
7,75
2
20%
18%
17%
20%
7%19
%79
%30
%60
%C
entr
al31
5,53
2
9%19
%8%
7%6%
8%65
%20
%65
%M
etro
1,87
4,02
7
54
%23
%59
%55
%8%
57%
71%
35%
62%
Age
20-3
499
5,62
1
29%
21%
29%
19%
5%19
%58
%37
%73
%35
-44
824,
181
24
%25
%29
%28
%9%
27%
72%
46%
75%
45-5
466
5,69
8
19%
23%
21%
25%
11%
26%
79%
33%
60%
55-6
440
4,86
8
12%
21%
12%
15%
11%
16%
81%
28%
50%
65+
594,
265
17
%12
%9%
12%
5%11
%83
%23
%52
%
Gen
der
Mal
e1,
700,
236
49%
20%
46%
46%
7%47
%74
%38
%71
%Fe
mal
e1,
784,
396
51%
22%
54%
54%
8%53
%74
%33
%58
%
Rac
e/et
hnic
ity
Non
-whi
te a
nd/o
r H
ispa
nic
(< 1
00 r
espo
nden
ts)
219,
221
6%
19%
5%5%
7%5%
67%
48%
73%
Whi
te, n
on-H
ispa
nic
3,26
5,41
1
94
%21
%95
%95
%8%
95%
74%
35%
64%
Inco
me
unde
r $3
0,00
077
3,87
9
22%
15%
16%
20%
7%20
%82
%49
%65
%$3
0,00
0 to
$39
,999
452,
334
13
%23
%14
%17
%7%
12%
77%
48%
73%
$40,
000
to $
49,9
9946
7,45
6
13%
24%
15%
14%
8%13
%70
%36
%64
%$5
0,00
0 to
$74
,999
834,
075
24
%23
%26
%25
%8%
25%
70%
22%
66%
$75,
000
to $
99,9
9944
4,71
2
13%
18%
11%
9%8%
13%
68%
19%
56%
$100
,000
or
mor
e51
2,17
5
15%
26%
18%
15%
10%
18%
70%
29%
56%
Edu
cati
onH
igh
scho
ol g
radu
ate,
or
som
e hi
gh s
choo
l69
2,47
1
20%
12%
11%
10%
5%12
%74
%41
%74
%V
o-te
ch s
choo
l, as
soc.
deg
ree,
or
som
e co
llege
1,32
3,70
2
38
%20
%36
%40
%8%
38%
75%
44%
71%
Gra
duat
ed f
rom
col
lege
787,
629
23
%23
%25
%22
%9%
27%
73%
21%
54%
Post
grad
uate
stu
dy/p
ostg
radu
ate
degr
ees
680,
830
20
%29
%28
%28
%9%
23%
73%
32%
59%
Hou
seho
ld s
ize
1 pe
rson
1,11
7,41
4
32
%19
%29
%32
%7%
29%
77%
33%
60%
2 pe
ople
984,
997
28
%22
%30
%30
%9%
32%
74%
23%
49%
3 pe
ople
497,
888
14
%23
%16
%16
%9%
16%
76%
61%
83%
4 pe
ople
561,
432
16
%20
%16
%12
%6%
13%
63%
35%
80%
5+ p
eopl
e32
2,90
1
9%22
%10
%9%
9%10
%74
%38
%76
%
---
---
MN
Pop
ulat
ion
----
--(a
s re
pres
ente
d by
sur
vey)AC
TIV
ITY
: V
isit
ing
hist
oric
or
arch
aeol
ogic
al s
ites
---
---
Avi
d pa
rtic
ipan
ts -
----
- -
----
----
----
----
Act
ivit
y da
ys -
----
----
----
---
---
----
---
Act
ivit
y pa
rtic
ipat
ion
----
----
--(>
med
ian
days
per
yea
r)

113Minnesota Department of Natural Resources
Ann
ual p
artic
ipan
ts 2
0 ye
ars
old
and
olde
r (0
00's
) =
642
A
nnua
l day
s of
par
ticip
atio
n an
ywhe
re (
000'
s) =
2,98
5
A
nnua
l day
s of
par
ticip
atio
n an
ywhe
re p
er p
artic
ipan
t:m
ean
=4.
6m
edia
n =
3
Perc
ent
Perc
ent o
fPe
rcen
t of
Perc
ent o
fPe
rcen
t fro
mw
ithin
1/2
Perc
ent
popu
latio
nPe
rcen
t of
Perc
ent o
fpo
pula
tion
avid
avid
hour
dri
vew
ithin
Dem
ogra
phic
cha
ract
eris
ticN
umbe
rPe
rcen
tpa
rtic
ipat
ing
part
icip
ants
activ
ity d
ays
who
are
avi
dspa
rtic
ipan
tspa
rtic
ipan
tsof
hom
eM
inne
sota
Tot
al3,
484,
632
100%
18%
100%
100%
8%10
0%80
%93
%98
%
Pop
ulat
ion
dens
ity
of r
esid
ence
(zi
p co
de)
Low
(10
0 pe
ople
per
sq
mile
or
less
)94
5,36
2
27%
16%
24%
29%
8%27
%86
%91
%10
0%M
ediu
m (
101
to 1
000
peop
le p
er s
q. m
ile)
955,
296
27
%19
%28
%24
%8%
27%
73%
95%
98%
Hig
h (>
1000
peo
ple
per
sq. m
ile)
1,58
3,97
4
45
%20
%48
%47
%8%
47%
80%
93%
98%
Reg
ion
of M
NN
orth
wes
t31
1,16
3
9%15
%7%
7%6%
6%78
%81
%99
%N
orth
east
296,
159
8%
16%
7%8%
8%8%
82%
91%
99%
Sout
h68
7,75
2
20%
16%
17%
14%
6%16
%76
%96
%97
%C
entr
al31
5,53
2
9%19
%9%
14%
8%9%
84%
91%
100%
Met
ro1,
874,
027
54%
20%
59%
57%
9%60
%80
%94
%98
%
Age
20-3
499
5,62
1
29%
29%
45%
40%
11%
38%
76%
89%
99%
35-4
482
4,18
1
24%
28%
36%
44%
15%
46%
87%
95%
98%
45-5
466
5,69
8
19%
14%
15%
14%
6%15
%75
%95
%98
%55
-64
404,
868
12
%5%
3%2%
1%1%
33%
91%
90%
65+
594,
265
17
%1%
1%0%
0%0%
0%98
%10
0%
Gen
der
Mal
e1,
700,
236
49%
19%
50%
42%
7%44
%74
%90
%98
%Fe
mal
e1,
784,
396
51%
18%
50%
58%
9%56
%84
%94
%99
%
Rac
e/et
hnic
ity
Non
-whi
te a
nd/o
r H
ispa
nic
(< 1
00 r
espo
nden
ts)
219,
221
6%
21%
7%10
%12
%9%
87%
92%
100%
Whi
te, n
on-H
ispa
nic
3,26
5,41
1
94
%18
%93
%90
%8%
91%
79%
93%
98%
Inco
me
unde
r $3
0,00
077
3,87
9
22%
10%
11%
17%
4%10
%83
%91
%10
0%$3
0,00
0 to
$39
,999
452,
334
13
%16
%11
%11
%8%
12%
86%
98%
100%
$40,
000
to $
49,9
9946
7,45
6
13%
20%
14%
18%
9%15
%86
%99
%98
%$5
0,00
0 to
$74
,999
834,
075
24
%23
%29
%25
%10
%30
%75
%93
%10
0%$7
5,00
0 to
$99
,999
444,
712
13
%24
%16
%13
%9%
15%
73%
85%
97%
$100
,000
or
mor
e51
2,17
5
15%
24%
18%
16%
10%
18%
78%
89%
95%
Edu
cati
onH
igh
scho
ol g
radu
ate,
or
som
e hi
gh s
choo
l69
2,47
1
20%
7%7%
10%
4%10
%90
%85
%99
%V
o-te
ch s
choo
l, as
soc.
deg
ree,
or
som
e co
llege
1,32
3,70
2
38
%18
%37
%40
%9%
42%
82%
92%
99%
Gra
duat
ed f
rom
col
lege
787,
629
23
%23
%29
%22
%8%
22%
71%
94%
98%
Post
grad
uate
stu
dy/p
ostg
radu
ate
degr
ees
680,
830
20
%25
%27
%28
%10
%26
%80
%95
%97
%
Hou
seho
ld s
ize
1 pe
rson
1,11
7,41
4
32
%6%
11%
7%1%
5%60
%97
%95
%2
peop
le98
4,99
7
28%
13%
20%
19%
4%13
%77
%93
%99
%3
peop
le49
7,88
8
14%
28%
22%
20%
14%
25%
79%
91%
97%
4 pe
ople
561,
432
16
%35
%31
%32
%19
%38
%83
%89
%99
%5+
peo
ple
322,
901
9%
34%
17%
22%
17%
20%
86%
98%
100%
---
---
MN
Pop
ulat
ion
----
--(a
s re
pres
ente
d by
sur
vey)
AC
TIV
ITY
: Sl
eddi
ng a
nd s
now
tub
ing
---
---
Avi
d pa
rtic
ipan
ts -
----
- -
----
----
----
----
Act
ivit
y da
ys -
----
----
----
---
---
----
---
Act
ivit
y pa
rtic
ipat
ion
----
----
--(>
med
ian
days
per
yea
r)

2004 Minnesota Outdoor Recreation Participation Survey114
Ann
ual p
artic
ipan
ts 2
0 ye
ars
old
and
olde
r (0
00's
) =
612
A
nnua
l day
s of
par
ticip
atio
n an
ywhe
re (
000'
s) =
5,91
6
A
nnua
l day
s of
par
ticip
atio
n an
ywhe
re p
er p
artic
ipan
t:m
ean
=9.
7m
edia
n =
8
Perc
ent
Perc
ent o
fPe
rcen
t of
Perc
ent o
fPe
rcen
t fro
mw
ithin
1/2
Perc
ent
popu
latio
nPe
rcen
t of
Perc
ent o
fpo
pula
tion
avid
avid
hour
dri
vew
ithin
Dem
ogra
phic
cha
ract
eris
ticN
umbe
rPe
rcen
tpa
rtic
ipat
ing
part
icip
ants
activ
ity d
ays
who
are
avi
dspa
rtic
ipan
tspa
rtic
ipan
tsof
hom
eM
inne
sota
Tot
al3,
484,
632
100%
18%
100%
100%
6%10
0%72
%88
%96
%
Pop
ulat
ion
dens
ity
of r
esid
ence
(zi
p co
de)
Low
(10
0 pe
ople
per
sq
mile
or
less
)94
5,36
2
27%
15%
23%
29%
5%22
%78
%90
%98
%M
ediu
m (
101
to 1
000
peop
le p
er s
q. m
ile)
955,
296
27
%20
%31
%26
%6%
26%
60%
83%
94%
Hig
h (>
1000
peo
ple
per
sq. m
ile)
1,58
3,97
4
45
%18
%46
%45
%7%
51%
75%
89%
95%
Reg
ion
of M
NN
orth
wes
t31
1,16
3
9%15
%8%
8%5%
7%73
%89
%98
%N
orth
east
296,
159
8%
13%
6%7%
4%5%
71%
84%
91%
Sout
h68
7,75
2
20%
16%
18%
21%
5%16
%68
%94
%99
%C
entr
al31
5,53
2
9%20
%11
%13
%8%
12%
78%
80%
98%
Met
ro1,
874,
027
54%
19%
57%
52%
6%59
%72
%88
%94
%
Age
20-3
499
5,62
1
29%
30%
48%
53%
11%
53%
76%
90%
98%
35-4
482
4,18
1
24%
21%
28%
25%
6%26
%66
%84
%92
%45
-54
665,
698
19
%16
%17
%17
%5%
16%
70%
88%
98%
55-6
440
4,86
8
12%
6%4%
4%2%
3%65
%88
%89
%65
+59
4,26
5
17%
3%2%
2%0%
1%61
%78
%78
%
Gen
der
Mal
e1,
700,
236
49%
21%
58%
53%
6%53
%68
%90
%95
%Fe
mal
e1,
784,
396
51%
14%
42%
47%
5%47
%76
%86
%97
%
Rac
e/et
hnic
ity
Non
-whi
te a
nd/o
r H
ispa
nic
(< 1
00 r
espo
nden
ts)
219,
221
6%
21%
7%6%
7%8%
62%
79%
98%
Whi
te, n
on-H
ispa
nic
3,26
5,41
1
94
%17
%93
%94
%6%
92%
72%
89%
95%
Inco
me
unde
r $3
0,00
077
3,87
9
22%
13%
15%
17%
6%21
%79
%85
%99
%$3
0,00
0 to
$39
,999
452,
334
13
%17
%12
%12
%5%
11%
69%
96%
99%
$40,
000
to $
49,9
9946
7,45
6
13%
20%
15%
15%
6%14
%72
%89
%92
%$5
0,00
0 to
$74
,999
834,
075
24
%20
%26
%19
%4%
16%
53%
85%
97%
$75,
000
to $
99,9
9944
4,71
2
13%
22%
16%
20%
8%18
%82
%85
%93
%$1
00,0
00 o
r m
ore
512,
175
15
%20
%16
%17
%8%
20%
75%
89%
94%
Edu
cati
onH
igh
scho
ol g
radu
ate,
or
som
e hi
gh s
choo
l69
2,47
1
20%
9%10
%11
%4%
14%
82%
90%
95%
Vo-
tech
sch
ool,
asso
c. d
egre
e, o
r so
me
colle
ge1,
323,
702
38%
17%
35%
43%
7%44
%78
%85
%97
%G
radu
ated
fro
m c
olle
ge78
7,62
9
23%
25%
33%
28%
7%27
%64
%89
%95
%Po
stgr
adua
te s
tudy
/pos
tgra
duat
e de
gree
s68
0,83
0
20%
19%
22%
18%
4%15
%62
%92
%93
%
Hou
seho
ld s
ize
1 pe
rson
1,11
7,41
4
32
%11
%20
%13
%3%
14%
53%
86%
88%
2 pe
ople
984,
997
28
%17
%27
%28
%6%
28%
71%
93%
97%
3 pe
ople
497,
888
14
%20
%17
%13
%6%
15%
62%
78%
96%
4 pe
ople
561,
432
16
%27
%25
%26
%10
%29
%78
%83
%95
%5+
peo
ple
322,
901
9%
22%
12%
21%
8%13
%83
%95
%99
%
---
---
MN
Pop
ulat
ion
----
--(a
s re
pres
ente
d by
sur
vey)
AC
TIV
ITY
: O
utdo
or c
ourt
spo
rts
(e.g
., vo
lleyb
all,
bask
etba
ll, te
nnis
, hor
sesh
oes)
---
---
Avi
d pa
rtic
ipan
ts -
----
- -
----
----
----
----
Act
ivit
y da
ys -
----
----
----
---
---
----
---
Act
ivit
y pa
rtic
ipat
ion
----
----
--(>
med
ian
days
per
yea
r)

115Minnesota Department of Natural Resources
Ann
ual p
artic
ipan
ts 2
0 ye
ars
old
and
olde
r (0
00's
) =
556
A
nnua
l day
s of
par
ticip
atio
n an
ywhe
re (
000'
s) =
8,06
0
A
nnua
l day
s of
par
ticip
atio
n an
ywhe
re p
er p
artic
ipan
t:m
ean
=14
.5m
edia
n =
9
Perc
ent
Perc
ent o
fPe
rcen
t of
Perc
ent o
fPe
rcen
t fro
mw
ithin
1/2
Perc
ent
popu
latio
nPe
rcen
t of
Perc
ent o
fpo
pula
tion
avid
avid
hour
dri
vew
ithin
Dem
ogra
phic
cha
ract
eris
ticN
umbe
rPe
rcen
tpa
rtic
ipat
ing
part
icip
ants
activ
ity d
ays
who
are
avi
dspa
rtic
ipan
tspa
rtic
ipan
tsof
hom
eM
inne
sota
Tot
al3,
484,
632
100%
16%
100%
100%
8%10
0%85
%52
%90
%
Pop
ulat
ion
dens
ity
of r
esid
ence
(zi
p co
de)
Low
(10
0 pe
ople
per
sq
mile
or
less
)94
5,36
2
27%
23%
40%
45%
14%
47%
89%
72%
93%
Med
ium
(10
1 to
100
0 pe
ople
per
sq.
mile
)95
5,29
6
27%
18%
32%
36%
9%32
%85
%46
%90
%H
igh
(>10
00 p
eopl
e pe
r sq
. mile
)1,
583,
974
45%
10%
28%
19%
4%21
%76
%17
%84
%
Reg
ion
of M
NN
orth
wes
t31
1,16
3
9%23
%13
%14
%14
%16
%91
%74
%94
%N
orth
east
296,
159
8%
23%
12%
14%
15%
16%
92%
70%
96%
Sout
h68
7,75
2
20%
14%
18%
20%
7%18
%88
%67
%91
%C
entr
al31
5,53
2
9%26
%15
%13
%11
%12
%78
%53
%89
%M
etro
1,87
4,02
7
54
%13
%42
%38
%5%
37%
82%
31%
87%
Age
20-3
499
5,62
1
29%
20%
35%
39%
9%34
%88
%52
%92
%35
-44
824,
181
24
%19
%29
%26
%9%
28%
83%
56%
91%
45-5
466
5,69
8
19%
17%
20%
21%
9%23
%86
%54
%86
%55
-64
404,
868
12
%13
%9%
9%7%
11%
87%
48%
92%
65+
594,
265
17
%6%
6%5%
2%4%
75%
39%
85%
Gen
der
Mal
e1,
700,
236
49%
27%
83%
90%
14%
88%
87%
51%
90%
Fem
ale
1,78
4,39
6
51
%5%
17%
10%
2%12
%75
%67
%95
%
Rac
e/et
hnic
ity
Non
-whi
te a
nd/o
r H
ispa
nic
(< 1
00 r
espo
nden
ts)
219,
221
6%
5%2%
1%3%
2%87
%47
%99
%W
hite
, non
-His
pani
c3,
265,
411
94%
17%
98%
99%
8%98
%86
%53
%90
%
Inco
me
unde
r $3
0,00
077
3,87
9
22%
10%
13%
10%
5%14
%82
%50
%94
%$3
0,00
0 to
$39
,999
452,
334
13
%9%
8%6%
4%6%
85%
69%
94%
$40,
000
to $
49,9
9946
7,45
6
13%
16%
13%
16%
8%12
%89
%64
%95
%$5
0,00
0 to
$74
,999
834,
075
24
%23
%34
%37
%12
%35
%88
%59
%92
%$7
5,00
0 to
$99
,999
444,
712
13
%17
%13
%14
%10
%16
%89
%50
%81
%$1
00,0
00 o
r m
ore
512,
175
15
%20
%18
%17
%9%
16%
79%
26%
87%
Edu
cati
onH
igh
scho
ol g
radu
ate,
or
som
e hi
gh s
choo
l69
2,47
1
20%
18%
22%
22%
10%
26%
88%
62%
94%
Vo-
tech
sch
ool,
asso
c. d
egre
e, o
r so
me
colle
ge1,
323,
702
38%
19%
46%
53%
10%
47%
87%
54%
91%
Gra
duat
ed f
rom
col
lege
787,
629
23
%14
%20
%16
%5%
16%
80%
41%
80%
Post
grad
uate
stu
dy/p
ostg
radu
ate
degr
ees
680,
830
20
%10
%13
%9%
5%11
%79
%42
%93
%
Hou
seho
ld s
ize
1 pe
rson
1,11
7,41
4
32
%7%
14%
16%
4%15
%89
%50
%93
%2
peop
le98
4,99
7
28%
17%
30%
27%
7%27
%84
%53
%91
%3
peop
le49
7,88
8
14%
17%
16%
15%
9%17
%85
%61
%81
%4
peop
le56
1,43
2
16%
26%
27%
23%
11%
24%
80%
46%
92%
5+ p
eopl
e32
2,90
1
9%24
%14
%20
%15
%17
%92
%55
%92
%
---
---
MN
Pop
ulat
ion
----
--(a
s re
pres
ente
d by
sur
vey)
AC
TIV
ITY
: H
unti
ng o
f al
l typ
es
---
---
Avi
d pa
rtic
ipan
ts -
----
- -
----
----
----
----
Act
ivit
y da
ys -
----
----
----
---
---
----
---
Act
ivit
y pa
rtic
ipat
ion
----
----
--(>
med
ian
days
per
yea
r)

2004 Minnesota Outdoor Recreation Participation Survey116
Ann
ual p
artic
ipan
ts 2
0 ye
ars
old
and
olde
r (0
00's
) =
470
A
nnua
l day
s of
par
ticip
atio
n an
ywhe
re (
000'
s) =
4,02
5
A
nnua
l day
s of
par
ticip
atio
n an
ywhe
re p
er p
artic
ipan
t:m
ean
=8.
6m
edia
n =
5
Perc
ent
Perc
ent o
fPe
rcen
t of
Perc
ent o
fPe
rcen
t fro
mw
ithin
1/2
Perc
ent
popu
latio
nPe
rcen
t of
Perc
ent o
fpo
pula
tion
avid
avid
hour
dri
vew
ithin
Dem
ogra
phic
cha
ract
eris
ticN
umbe
rPe
rcen
tpa
rtic
ipat
ing
part
icip
ants
activ
ity d
ays
who
are
avi
dspa
rtic
ipan
tspa
rtic
ipan
tsof
hom
eM
inne
sota
Tot
al3,
484,
632
100%
13%
100%
100%
6%10
0%81
%53
%91
%
Pop
ulat
ion
dens
ity
of r
esid
ence
(zi
p co
de)
Low
(10
0 pe
ople
per
sq
mile
or
less
)94
5,36
2
27%
21%
43%
42%
12%
51%
84%
73%
94%
Med
ium
(10
1 to
100
0 pe
ople
per
sq.
mile
)95
5,29
6
27%
16%
32%
43%
8%34
%87
%45
%91
%H
igh
(>10
00 p
eopl
e pe
r sq
. mile
)1,
583,
974
45%
8%26
%15
%2%
15%
58%
20%
83%
Reg
ion
of M
NN
orth
wes
t31
1,16
3
9%21
%14
%14
%12
%17
%87
%72
%92
%N
orth
east
296,
159
8%
20%
13%
14%
13%
18%
90%
73%
96%
Sout
h68
7,75
2
20%
12%
18%
16%
4%14
%77
%69
%92
%C
entr
al31
5,53
2
9%23
%15
%15
%10
%15
%79
%53
%93
%M
etro
1,87
4,02
7
54
%10
%40
%40
%4%
35%
80%
33%
87%
Age
20-3
499
5,62
1
29%
16%
34%
41%
7%34
%86
%52
%93
%35
-44
824,
181
24
%17
%31
%27
%8%
29%
77%
59%
93%
45-5
466
5,69
8
19%
15%
21%
19%
7%22
%79
%52
%83
%55
-64
404,
868
12
%11
%9%
9%6%
11%
83%
46%
93%
65+
594,
265
17
%4%
5%4%
2%4%
72%
43%
93%
Gen
der
Mal
e1,
700,
236
49%
23%
83%
89%
11%
88%
84%
52%
90%
Fem
ale
1,78
4,39
6
51
%4%
17%
11%
1%12
%62
%62
%97
%
Rac
e/et
hnic
ity
Non
-whi
te a
nd/o
r H
ispa
nic
(< 1
00 r
espo
nden
ts)
219,
221
6%
4%2%
2%3%
3%94
%48
%98
%W
hite
, non
-His
pani
c3,
265,
411
94%
14%
98%
98%
6%97
%81
%53
%91
%
Inco
me
unde
r $3
0,00
077
3,87
9
22%
9%14
%11
%4%
12%
70%
46%
98%
$30,
000
to $
39,9
9945
2,33
4
13%
8%7%
5%3%
6%76
%68
%93
%$4
0,00
0 to
$49
,999
467,
456
13
%13
%12
%17
%7%
16%
89%
65%
96%
$50,
000
to $
74,9
9983
4,07
5
24%
19%
34%
40%
9%33
%84
%59
%92
%$7
5,00
0 to
$99
,999
444,
712
13
%15
%14
%13
%7%
15%
82%
49%
80%
$100
,000
or
mor
e51
2,17
5
15%
17%
18%
15%
7%18
%74
%31
%89
%
Edu
cati
onH
igh
scho
ol g
radu
ate,
or
som
e hi
gh s
choo
l69
2,47
1
20%
16%
23%
24%
8%24
%80
%61
%94
%V
o-te
ch s
choo
l, as
soc.
deg
ree,
or
som
e co
llege
1,32
3,70
2
38
%16
%45
%53
%9%
53%
87%
55%
91%
Gra
duat
ed f
rom
col
lege
787,
629
23
%11
%19
%15
%3%
12%
72%
45%
83%
Post
grad
uate
stu
dy/p
ostg
radu
ate
degr
ees
680,
830
20
%9%
13%
9%3%
10%
69%
36%
95%
Hou
seho
ld s
ize
1 pe
rson
1,11
7,41
4
32
%5%
13%
13%
3%14
%85
%56
%93
%2
peop
le98
4,99
7
28%
15%
32%
30%
6%28
%78
%52
%90
%3
peop
le49
7,88
8
14%
13%
14%
13%
7%16
%81
%68
%84
%4
peop
le56
1,43
2
16%
22%
26%
22%
10%
25%
77%
46%
91%
5+ p
eopl
e32
2,90
1
9%23
%16
%22
%12
%18
%89
%52
%95
%
---
---
MN
Pop
ulat
ion
----
--(a
s re
pres
ente
d by
sur
vey)
AC
TIV
ITY
: H
unti
ng b
ig g
ame
(e.g
., de
er, b
ear,
moo
se)
---
---
Avi
d pa
rtic
ipan
ts -
----
- -
----
----
----
----
Act
ivit
y da
ys -
----
----
----
---
---
----
---
Act
ivit
y pa
rtic
ipat
ion
----
----
--(>
med
ian
days
per
yea
r)

117Minnesota Department of Natural Resources
Ann
ual p
artic
ipan
ts 2
0 ye
ars
old
and
olde
r (0
00's
) =
369
A
nnua
l day
s of
par
ticip
atio
n an
ywhe
re (
000'
s) =
4,03
5
A
nnua
l day
s of
par
ticip
atio
n an
ywhe
re p
er p
artic
ipan
t:m
ean
=10
.9m
edia
n =
8
Perc
ent
Perc
ent o
fPe
rcen
t of
Perc
ent o
fPe
rcen
t fro
mw
ithin
1/2
Perc
ent
popu
latio
nPe
rcen
t of
Perc
ent o
fpo
pula
tion
avid
avid
hour
dri
vew
ithin
Dem
ogra
phic
cha
ract
eris
ticN
umbe
rPe
rcen
tpa
rtic
ipat
ing
part
icip
ants
activ
ity d
ays
who
are
avi
dspa
rtic
ipan
tspa
rtic
ipan
tsof
hom
eM
inne
sota
Tot
al3,
484,
632
100%
11%
100%
100%
4%10
0%76
%52
%90
%
Pop
ulat
ion
dens
ity
of r
esid
ence
(zi
p co
de)
Low
(10
0 pe
ople
per
sq
mile
or
less
)94
5,36
2
27%
15%
39%
48%
8%49
%83
%70
%93
%M
ediu
m (
101
to 1
000
peop
le p
er s
q. m
ile)
955,
296
27
%12
%31
%30
%4%
28%
72%
48%
88%
Hig
h (>
1000
peo
ple
per
sq. m
ile)
1,58
3,97
4
45
%7%
30%
22%
2%23
%69
%16
%84
%
Reg
ion
of M
NN
orth
wes
t31
1,16
3
9%14
%12
%13
%7%
15%
80%
76%
96%
Nor
thea
st29
6,15
9
8%17
%14
%15
%7%
14%
76%
67%
96%
Sout
h68
7,75
2
20%
9%16
%24
%5%
24%
89%
66%
90%
Cen
tral
315,
532
9%
14%
12%
11%
6%12
%74
%52
%85
%M
etro
1,87
4,02
7
54
%9%
45%
37%
3%34
%68
%28
%86
%
Age
20-3
499
5,62
1
29%
13%
34%
37%
6%37
%80
%52
%92
%35
-44
824,
181
24
%13
%30
%26
%5%
27%
71%
53%
89%
45-5
466
5,69
8
19%
11%
21%
23%
5%23
%78
%55
%89
%55
-64
404,
868
12
%9%
10%
9%3%
8%71
%49
%91
%65
+59
4,26
5
17%
3%5%
6%1%
5%78
%36
%80
%
Gen
der
Mal
e1,
700,
236
49%
19%
89%
90%
8%90
%76
%49
%89
%Fe
mal
e1,
784,
396
51%
2%11
%10
%1%
10%
76%
72%
92%
Rac
e/et
hnic
ity
Non
-whi
te a
nd/o
r H
ispa
nic
(< 1
00 r
espo
nden
ts)
219,
221
6%
4%2%
1%1%
1%45
%44
%10
0%W
hite
, non
-His
pani
c3,
265,
411
94%
11%
98%
99%
5%99
%77
%52
%90
%
Inco
me
unde
r $3
0,00
077
3,87
9
22%
5%10
%10
%2%
11%
68%
55%
90%
$30,
000
to $
39,9
9945
2,33
4
13%
5%6%
6%2%
6%77
%71
%95
%$4
0,00
0 to
$49
,999
467,
456
13
%11
%14
%16
%5%
16%
84%
62%
95%
$50,
000
to $
74,9
9983
4,07
5
24%
15%
34%
34%
6%35
%78
%58
%92
%$7
5,00
0 to
$99
,999
444,
712
13
%14
%16
%15
%6%
16%
74%
51%
82%
$100
,000
or
mor
e51
2,17
5
15%
15%
20%
19%
5%16
%74
%23
%86
%
Edu
cati
onH
igh
scho
ol g
radu
ate,
or
som
e hi
gh s
choo
l69
2,47
1
20%
11%
20%
21%
5%25
%79
%63
%93
%V
o-te
ch s
choo
l, as
soc.
deg
ree,
or
som
e co
llege
1,32
3,70
2
38
%13
%46
%53
%6%
50%
80%
52%
92%
Gra
duat
ed f
rom
col
lege
787,
629
23
%10
%22
%16
%3%
15%
63%
38%
78%
Post
grad
uate
stu
dy/p
ostg
radu
ate
degr
ees
680,
830
20
%7%
12%
10%
2%9%
70%
48%
91%
Hou
seho
ld s
ize
1 pe
rson
1,11
7,41
4
32
%5%
14%
18%
2%15
%79
%46
%93
%2
peop
le98
4,99
7
28%
9%25
%24
%4%
24%
77%
56%
92%
3 pe
ople
497,
888
14
%13
%18
%16
%4%
14%
64%
56%
78%
4 pe
ople
561,
432
16
%19
%29
%24
%7%
27%
75%
45%
93%
5+ p
eopl
e32
2,90
1
9%16
%14
%18
%9%
19%
85%
58%
88%
---
---
MN
Pop
ulat
ion
----
--(a
s re
pres
ente
d by
sur
vey)
AC
TIV
ITY
: H
unti
ng w
ater
fow
l, up
land
gam
e bi
rds,
and
oth
er s
mal
l gam
e
---
---
Avi
d pa
rtic
ipan
ts -
----
- -
----
----
----
----
Act
ivit
y da
ys -
----
----
----
---
---
----
---
Act
ivit
y pa
rtic
ipat
ion
----
----
--(>
med
ian
days
per
yea
r)

2004 Minnesota Outdoor Recreation Participation Survey118
Ann
ual p
artic
ipan
ts 2
0 ye
ars
old
and
olde
r (0
00's
) =
497
A
nnua
l day
s of
par
ticip
atio
n an
ywhe
re (
000'
s) =
21,4
57
Ann
ual d
ays
of p
artic
ipat
ion
anyw
here
per
par
ticip
ant:
mea
n =
43.2
med
ian
=19
Perc
ent
Perc
ent o
fPe
rcen
t of
Perc
ent o
fPe
rcen
t fro
mw
ithin
1/2
Perc
ent
popu
latio
nPe
rcen
t of
Perc
ent o
fpo
pula
tion
avid
avid
hour
dri
vew
ithin
Dem
ogra
phic
cha
ract
eris
ticN
umbe
rPe
rcen
tpa
rtic
ipat
ing
part
icip
ants
activ
ity d
ays
who
are
avi
dspa
rtic
ipan
tspa
rtic
ipan
tsof
hom
eM
inne
sota
Tot
al3,
484,
632
100%
14%
100%
100%
7%10
0%89
%93
%96
%
Pop
ulat
ion
dens
ity
of r
esid
ence
(zi
p co
de)
Low
(10
0 pe
ople
per
sq
mile
or
less
)94
5,36
2
27%
9%17
%18
%4%
17%
91%
92%
96%
Med
ium
(10
1 to
100
0 pe
ople
per
sq.
mile
)95
5,29
6
27%
13%
26%
24%
7%27
%89
%92
%93
%H
igh
(>10
00 p
eopl
e pe
r sq
. mile
)1,
583,
974
45%
18%
57%
57%
9%56
%89
%94
%97
%
Reg
ion
of M
NN
orth
wes
t31
1,16
3
9%6%
4%3%
3%4%
88%
92%
92%
Nor
thea
st29
6,15
9
8%9%
6%5%
4%5%
85%
89%
97%
Sout
h68
7,75
2
20%
13%
18%
21%
8%22
%93
%94
%96
%C
entr
al31
5,53
2
9%8%
5%4%
4%5%
82%
93%
95%
Met
ro1,
874,
027
54%
18%
67%
67%
8%64
%89
%94
%96
%
Age
20-3
499
5,62
1
29%
24%
48%
39%
11%
43%
87%
95%
94%
35-4
482
4,18
1
24%
16%
28%
26%
8%29
%90
%95
%96
%45
-54
665,
698
19
%12
%16
%22
%7%
18%
91%
93%
98%
55-6
440
4,86
8
12%
6%5%
7%3%
6%91
%91
%95
%65
+59
4,26
5
17%
3%3%
6%2%
4%95
%80
%97
%
Gen
der
Mal
e1,
700,
236
49%
15%
53%
49%
7%51
%89
%91
%93
%Fe
mal
e1,
784,
396
51%
13%
47%
51%
7%49
%90
%95
%98
%
Rac
e/et
hnic
ity
Non
-whi
te a
nd/o
r H
ispa
nic
(< 1
00 r
espo
nden
ts)
219,
221
6%
16%
7%4%
7%6%
80%
99%
98%
Whi
te, n
on-H
ispa
nic
3,26
5,41
1
94
%14
%93
%96
%7%
94%
89%
93%
95%
Inco
me
unde
r $3
0,00
077
3,87
9
22%
7%10
%15
%5%
15%
96%
94%
100%
$30,
000
to $
39,9
9945
2,33
4
13%
10%
9%11
%4%
7%91
%97
%98
%$4
0,00
0 to
$49
,999
467,
456
13
%15
%14
%6%
4%7%
61%
93%
97%
$50,
000
to $
74,9
9983
4,07
5
24%
17%
29%
28%
9%31
%89
%95
%95
%$7
5,00
0 to
$99
,999
444,
712
13
%15
%13
%12
%7%
13%
88%
91%
94%
$100
,000
or
mor
e51
2,17
5
15%
25%
26%
28%
13%
27%
90%
89%
93%
Edu
cati
onH
igh
scho
ol g
radu
ate,
or
som
e hi
gh s
choo
l69
2,47
1
20%
1%2%
2%1%
2%88
%85
%90
%V
o-te
ch s
choo
l, as
soc.
deg
ree,
or
som
e co
llege
1,32
3,70
2
38
%12
%32
%25
%4%
22%
83%
93%
98%
Gra
duat
ed f
rom
col
lege
787,
629
23
%21
%34
%35
%12
%40
%93
%95
%94
%Po
stgr
adua
te s
tudy
/pos
tgra
duat
e de
gree
s68
0,83
0
20%
24%
33%
39%
13%
36%
90%
92%
95%
Hou
seho
ld s
ize
1 pe
rson
1,11
7,41
4
32
%11
%25
%27
%6%
27%
91%
96%
98%
2 pe
ople
984,
997
28
%15
%30
%33
%7%
28%
89%
93%
96%
3 pe
ople
497,
888
14
%15
%15
%14
%6%
12%
86%
93%
95%
4 pe
ople
561,
432
16
%18
%20
%17
%9%
21%
88%
89%
91%
5+ p
eopl
e32
2,90
1
9%14
%9%
9%9%
12%
95%
95%
97%
---
---
MN
Pop
ulat
ion
----
--(a
s re
pres
ente
d by
sur
vey)
AC
TIV
ITY
: R
unni
ng o
r jo
ggin
g
---
---
Avi
d pa
rtic
ipan
ts -
----
- -
----
----
----
----
Act
ivit
y da
ys -
----
----
----
---
---
----
---
Act
ivit
y pa
rtic
ipat
ion
----
----
--(>
med
ian
days
per
yea
r)

119Minnesota Department of Natural Resources
Ann
ual p
artic
ipan
ts 2
0 ye
ars
old
and
olde
r (0
00's
) =
402
A
nnua
l day
s of
par
ticip
atio
n an
ywhe
re (
000'
s) =
2,45
9
A
nnua
l day
s of
par
ticip
atio
n an
ywhe
re p
er p
artic
ipan
t:m
ean
=6.
1m
edia
n =
4
Perc
ent
Perc
ent o
fPe
rcen
t of
Perc
ent o
fPe
rcen
t fro
mw
ithin
1/2
Perc
ent
popu
latio
nPe
rcen
t of
Perc
ent o
fpo
pula
tion
avid
avid
hour
dri
vew
ithin
Dem
ogra
phic
cha
ract
eris
ticN
umbe
rPe
rcen
tpa
rtic
ipat
ing
part
icip
ants
activ
ity d
ays
who
are
avi
dspa
rtic
ipan
tspa
rtic
ipan
tsof
hom
eM
inne
sota
Tot
al3,
484,
632
100%
12%
100%
100%
4%10
0%77
%94
%99
%
Pop
ulat
ion
dens
ity
of r
esid
ence
(zi
p co
de)
Low
(10
0 pe
ople
per
sq
mile
or
less
)94
5,36
2
27%
5%11
%12
%1%
8%76
%91
%99
%M
ediu
m (
101
to 1
000
peop
le p
er s
q. m
ile)
955,
296
27
%12
%29
%32
%4%
25%
77%
91%
98%
Hig
h (>
1000
peo
ple
per
sq. m
ile)
1,58
3,97
4
45
%15
%60
%56
%6%
67%
77%
96%
99%
Reg
ion
of M
NN
orth
wes
t31
1,16
3
9%5%
4%8%
2%4%
88%
89%
98%
Nor
thea
st29
6,15
9
8%8%
6%7%
3%6%
84%
96%
92%
Sout
h68
7,75
2
20%
4%6%
4%1%
6%70
%79
%10
0%C
entr
al31
5,53
2
9%8%
7%9%
4%8%
85%
78%
99%
Met
ro1,
874,
027
54%
17%
77%
72%
6%76
%74
%97
%99
%
Age
20-3
499
5,62
1
29%
19%
46%
46%
6%45
%76
%96
%10
0%35
-44
824,
181
24
%18
%38
%42
%8%
46%
81%
91%
97%
45-5
466
5,69
8
19%
8%13
%10
%2%
8%62
%94
%99
%55
-64
404,
868
12
%2%
2%3%
1%2%
80%
98%
100%
65+
594,
265
17
%0%
0%0%
0%0%
0%94
%99
%
Gen
der
Mal
e1,
700,
236
49%
13%
55%
49%
4%49
%73
%93
%98
%Fe
mal
e1,
784,
396
51%
10%
45%
51%
4%51
%81
%95
%99
%
Rac
e/et
hnic
ity
Non
-whi
te a
nd/o
r H
ispa
nic
(< 1
00 r
espo
nden
ts)
219,
221
6%
7%4%
6%4%
5%87
%70
%10
0%W
hite
, non
-His
pani
c3,
265,
411
94%
12%
96%
94%
4%95
%77
%95
%99
%
Inco
me
unde
r $3
0,00
077
3,87
9
22%
4%7%
9%2%
11%
86%
81%
100%
$30,
000
to $
39,9
9945
2,33
4
13%
10%
11%
6%2%
5%51
%97
%10
0%$4
0,00
0 to
$49
,999
467,
456
13
%11
%13
%18
%5%
15%
82%
97%
100%
$50,
000
to $
74,9
9983
4,07
5
24%
13%
26%
26%
4%25
%76
%91
%97
%$7
5,00
0 to
$99
,999
444,
712
13
%12
%14
%15
%6%
17%
83%
99%
99%
$100
,000
or
mor
e51
2,17
5
15%
23%
29%
27%
8%28
%77
%95
%98
%
Edu
cati
onH
igh
scho
ol g
radu
ate,
or
som
e hi
gh s
choo
l69
2,47
1
20%
3%5%
6%1%
5%78
%61
%10
0%V
o-te
ch s
choo
l, as
soc.
deg
ree,
or
som
e co
llege
1,32
3,70
2
38
%10
%32
%45
%4%
40%
87%
97%
98%
Gra
duat
ed f
rom
col
lege
787,
629
23
%16
%32
%26
%6%
33%
75%
93%
100%
Post
grad
uate
stu
dy/p
ostg
radu
ate
degr
ees
680,
830
20
%18
%30
%23
%4%
21%
59%
96%
98%
Hou
seho
ld s
ize
1 pe
rson
1,11
7,41
4
32
%6%
17%
11%
1%11
%60
%95
%10
0%2
peop
le98
4,99
7
28%
9%22
%17
%3%
18%
68%
93%
100%
3 pe
ople
497,
888
14
%19
%23
%33
%9%
31%
87%
92%
99%
4 pe
ople
561,
432
16
%17
%24
%29
%8%
31%
82%
96%
97%
5+ p
eopl
e32
2,90
1
9%18
%14
%10
%4%
10%
62%
93%
99%
---
---
MN
Pop
ulat
ion
----
--(a
s re
pres
ente
d by
sur
vey)
AC
TIV
ITY
: Ic
e sk
atin
g/ho
ckey
out
door
s
---
---
Avi
d pa
rtic
ipan
ts -
----
- -
----
----
----
----
Act
ivit
y da
ys -
----
----
----
---
---
----
---
Act
ivit
y pa
rtic
ipat
ion
----
----
--(>
med
ian
days
per
yea
r)
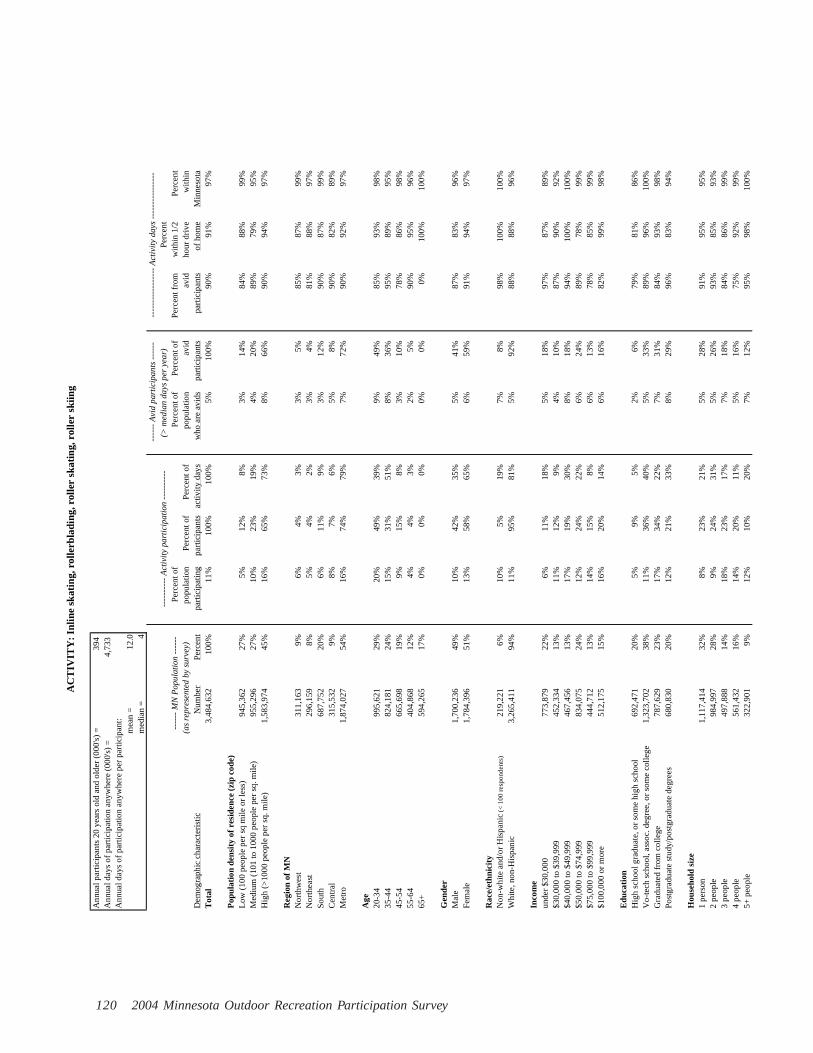
2004 Minnesota Outdoor Recreation Participation Survey120
Ann
ual p
artic
ipan
ts 2
0 ye
ars
old
and
olde
r (0
00's
) =
394
A
nnua
l day
s of
par
ticip
atio
n an
ywhe
re (
000'
s) =
4,73
3
A
nnua
l day
s of
par
ticip
atio
n an
ywhe
re p
er p
artic
ipan
t:m
ean
=12
.0m
edia
n =
4
Perc
ent
Perc
ent o
fPe
rcen
t of
Perc
ent o
fPe
rcen
t fro
mw
ithin
1/2
Perc
ent
popu
latio
nPe
rcen
t of
Perc
ent o
fpo
pula
tion
avid
avid
hour
dri
vew
ithin
Dem
ogra
phic
cha
ract
eris
ticN
umbe
rPe
rcen
tpa
rtic
ipat
ing
part
icip
ants
activ
ity d
ays
who
are
avi
dspa
rtic
ipan
tspa
rtic
ipan
tsof
hom
eM
inne
sota
Tot
al3,
484,
632
100%
11%
100%
100%
5%10
0%90
%91
%97
%
Pop
ulat
ion
dens
ity
of r
esid
ence
(zi
p co
de)
Low
(10
0 pe
ople
per
sq
mile
or
less
)94
5,36
2
27%
5%12
%8%
3%14
%84
%88
%99
%M
ediu
m (
101
to 1
000
peop
le p
er s
q. m
ile)
955,
296
27
%10
%23
%19
%4%
20%
89%
79%
95%
Hig
h (>
1000
peo
ple
per
sq. m
ile)
1,58
3,97
4
45
%16
%65
%73
%8%
66%
90%
94%
97%
Reg
ion
of M
NN
orth
wes
t31
1,16
3
9%6%
4%3%
3%5%
85%
87%
99%
Nor
thea
st29
6,15
9
8%5%
4%2%
3%4%
81%
88%
97%
Sout
h68
7,75
2
20%
6%11
%9%
3%12
%90
%87
%99
%C
entr
al31
5,53
2
9%8%
7%6%
5%8%
90%
82%
89%
Met
ro1,
874,
027
54%
16%
74%
79%
7%72
%90
%92
%97
%
Age
20-3
499
5,62
1
29%
20%
49%
39%
9%49
%85
%93
%98
%35
-44
824,
181
24
%15
%31
%51
%8%
36%
95%
89%
95%
45-5
466
5,69
8
19%
9%15
%8%
3%10
%78
%86
%98
%55
-64
404,
868
12
%4%
4%3%
2%5%
90%
95%
96%
65+
594,
265
17
%0%
0%0%
0%0%
0%10
0%10
0%
Gen
der
Mal
e1,
700,
236
49%
10%
42%
35%
5%41
%87
%83
%96
%Fe
mal
e1,
784,
396
51%
13%
58%
65%
6%59
%91
%94
%97
%
Rac
e/et
hnic
ity
Non
-whi
te a
nd/o
r H
ispa
nic
(< 1
00 r
espo
nden
ts)
219,
221
6%
10%
5%19
%7%
8%98
%10
0%10
0%W
hite
, non
-His
pani
c3,
265,
411
94%
11%
95%
81%
5%92
%88
%88
%96
%
Inco
me
unde
r $3
0,00
077
3,87
9
22%
6%11
%18
%5%
18%
97%
87%
89%
$30,
000
to $
39,9
9945
2,33
4
13%
11%
12%
9%4%
10%
87%
90%
92%
$40,
000
to $
49,9
9946
7,45
6
13%
17%
19%
30%
8%18
%94
%10
0%10
0%$5
0,00
0 to
$74
,999
834,
075
24
%12
%24
%22
%6%
24%
89%
78%
99%
$75,
000
to $
99,9
9944
4,71
2
13%
14%
15%
8%6%
13%
78%
85%
99%
$100
,000
or
mor
e51
2,17
5
15%
16%
20%
14%
6%16
%82
%99
%98
%
Edu
cati
onH
igh
scho
ol g
radu
ate,
or
som
e hi
gh s
choo
l69
2,47
1
20%
5%9%
5%2%
6%79
%81
%86
%V
o-te
ch s
choo
l, as
soc.
deg
ree,
or
som
e co
llege
1,32
3,70
2
38
%11
%36
%40
%5%
33%
89%
96%
100%
Gra
duat
ed f
rom
col
lege
787,
629
23
%17
%34
%22
%7%
31%
84%
93%
98%
Post
grad
uate
stu
dy/p
ostg
radu
ate
degr
ees
680,
830
20
%12
%21
%33
%8%
29%
96%
83%
94%
Hou
seho
ld s
ize
1 pe
rson
1,11
7,41
4
32
%8%
23%
21%
5%28
%91
%95
%95
%2
peop
le98
4,99
7
28%
9%24
%31
%5%
26%
93%
85%
93%
3 pe
ople
497,
888
14
%18
%23
%17
%7%
18%
84%
86%
99%
4 pe
ople
561,
432
16
%14
%20
%11
%5%
16%
75%
92%
99%
5+ p
eopl
e32
2,90
1
9%12
%10
%20
%7%
12%
95%
98%
100%
---
---
MN
Pop
ulat
ion
----
--(a
s re
pres
ente
d by
sur
vey)
AC
TIV
ITY
: Inl
ine
skat
ing,
rol
lerb
ladi
ng, r
olle
r sk
atin
g, r
olle
r sk
iing
---
---
Avi
d pa
rtic
ipan
ts -
----
- -
----
----
----
----
Act
ivit
y da
ys -
----
----
----
---
---
----
---
Act
ivit
y pa
rtic
ipat
ion
----
----
--(>
med
ian
days
per
yea
r)

121Minnesota Department of Natural Resources
Ann
ual p
artic
ipan
ts 2
0 ye
ars
old
and
olde
r (0
00's
) =
357
A
nnua
l day
s of
par
ticip
atio
n an
ywhe
re (
000'
s) =
6,52
0
A
nnua
l day
s of
par
ticip
atio
n an
ywhe
re p
er p
artic
ipan
t:m
ean
=18
.2m
edia
n =
8
Perc
ent
Perc
ent o
fPe
rcen
t of
Perc
ent o
fPe
rcen
t fro
mw
ithin
1/2
Perc
ent
popu
latio
nPe
rcen
t of
Perc
ent o
fpo
pula
tion
avid
avid
hour
dri
vew
ithin
Dem
ogra
phic
cha
ract
eris
ticN
umbe
rPe
rcen
tpa
rtic
ipat
ing
part
icip
ants
activ
ity d
ays
who
are
avi
dspa
rtic
ipan
tspa
rtic
ipan
tsof
hom
eM
inne
sota
Tot
al3,
484,
632
100%
10%
100%
100%
5%10
0%88
%64
%94
%
Pop
ulat
ion
dens
ity
of r
esid
ence
(zi
p co
de)
Low
(10
0 pe
ople
per
sq
mile
or
less
)94
5,36
2
27%
16%
43%
57%
9%52
%93
%76
%97
%M
ediu
m (
101
to 1
000
peop
le p
er s
q. m
ile)
955,
296
27
%13
%34
%32
%6%
34%
88%
60%
91%
Hig
h (>
1000
peo
ple
per
sq. m
ile)
1,58
3,97
4
45
%5%
23%
11%
1%14
%68
%18
%89
%
Reg
ion
of M
NN
orth
wes
t31
1,16
3
9%17
%15
%21
%10
%20
%94
%69
%98
%N
orth
east
296,
159
8%
19%
16%
15%
9%18
%88
%73
%95
%So
uth
687,
752
20
%9%
17%
26%
4%18
%92
%73
%94
%C
entr
al31
5,53
2
9%18
%16
%20
%9%
17%
90%
71%
95%
Met
ro1,
874,
027
54%
7%37
%18
%2%
26%
74%
30%
90%
Age
20-3
499
5,62
1
29%
16%
46%
41%
7%44
%88
%59
%98
%35
-44
824,
181
24
%11
%25
%25
%4%
23%
86%
75%
93%
45-5
466
5,69
8
19%
10%
19%
20%
5%22
%90
%62
%89
%55
-64
404,
868
12
%6%
7%8%
3%7%
90%
62%
89%
65+
594,
265
17
%2%
4%6%
1%4%
94%
72%
97%
Gen
der
Mal
e1,
700,
236
49%
15%
70%
75%
7%80
%90
%63
%93
%Fe
mal
e1,
784,
396
51%
6%30
%25
%2%
20%
83%
69%
98%
Rac
e/et
hnic
ity
Non
-whi
te a
nd/o
r H
ispa
nic
(< 1
00 r
espo
nden
ts)
219,
221
6%
5%3%
2%1%
1%85
%89
%98
%W
hite
, non
-His
pani
c3,
265,
411
94%
11%
97%
98%
5%99
%88
%64
%94
%
Inco
me
unde
r $3
0,00
077
3,87
9
22%
5%9%
17%
3%12
%95
%62
%95
%$3
0,00
0 to
$39
,999
452,
334
13
%8%
10%
8%2%
7%83
%71
%98
%$4
0,00
0 to
$49
,999
467,
456
13
%16
%20
%20
%5%
14%
85%
65%
96%
$50,
000
to $
74,9
9983
4,07
5
24%
16%
35%
34%
7%38
%89
%72
%91
%$7
5,00
0 to
$99
,999
444,
712
13
%8%
10%
8%4%
11%
85%
52%
96%
$100
,000
or
mor
e51
2,17
5
15%
12%
16%
14%
6%18
%91
%50
%98
%
Edu
cati
onH
igh
scho
ol g
radu
ate,
or
som
e hi
gh s
choo
l69
2,47
1
20%
12%
22%
25%
6%27
%91
%75
%92
%V
o-te
ch s
choo
l, as
soc.
deg
ree,
or
som
e co
llege
1,32
3,70
2
38
%14
%50
%60
%7%
54%
91%
62%
95%
Gra
duat
ed f
rom
col
lege
787,
629
23
%9%
19%
10%
2%10
%74
%64
%95
%Po
stgr
adua
te s
tudy
/pos
tgra
duat
e de
gree
s68
0,83
0
20%
5%9%
5%2%
9%77
%36
%96
%
Hou
seho
ld s
ize
1 pe
rson
1,11
7,41
4
32
%6%
19%
14%
2%15
%84
%53
%92
%2
peop
le98
4,99
7
28%
10%
27%
24%
4%27
%87
%62
%95
%3
peop
le49
7,88
8
14%
12%
17%
17%
5%16
%87
%67
%96
%4
peop
le56
1,43
2
16%
13%
21%
26%
7%25
%90
%62
%98
%5+
peo
ple
322,
901
9%
18%
16%
20%
8%17
%93
%78
%91
%
---
---
MN
Pop
ulat
ion
----
--(a
s re
pres
ente
d by
sur
vey)
AC
TIV
ITY
: Off
road
AT
V d
rivi
ng
---
---
Avi
d pa
rtic
ipan
ts -
----
- -
----
----
----
----
Act
ivit
y da
ys -
----
----
----
---
---
----
---
Act
ivit
y pa
rtic
ipat
ion
----
----
--(>
med
ian
days
per
yea
r)
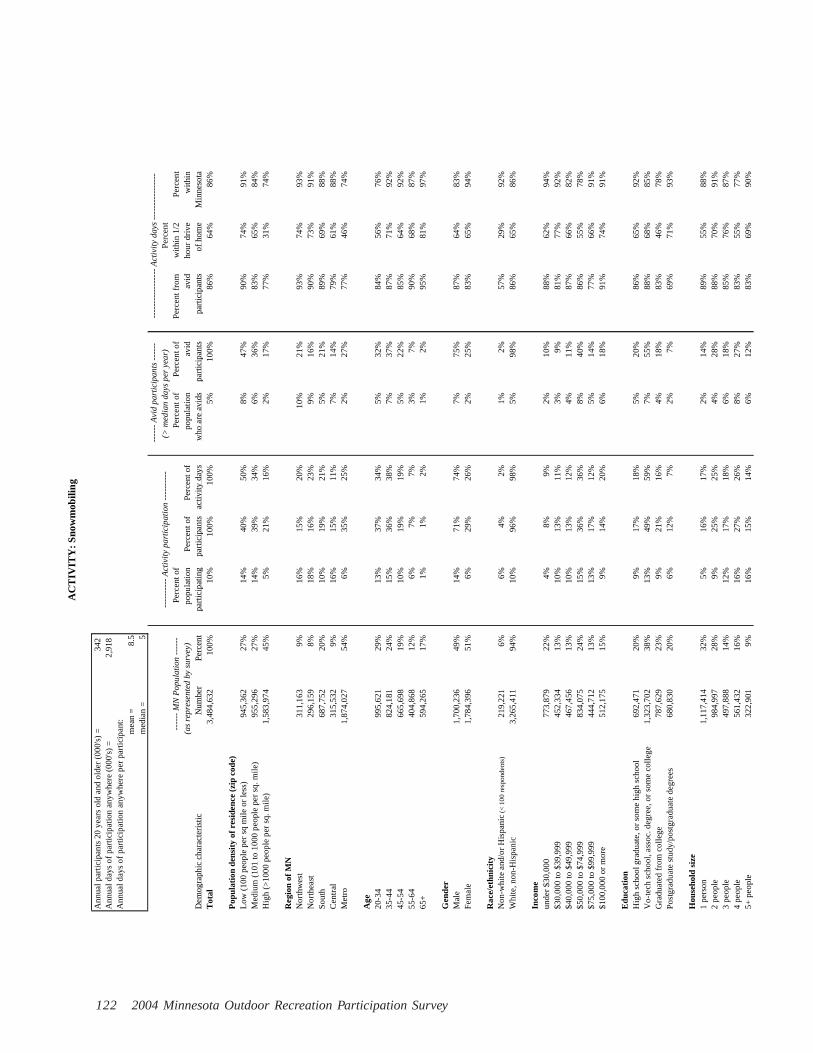
2004 Minnesota Outdoor Recreation Participation Survey122
Ann
ual p
artic
ipan
ts 2
0 ye
ars
old
and
olde
r (0
00's
) =
342
A
nnua
l day
s of
par
ticip
atio
n an
ywhe
re (
000'
s) =
2,91
8
A
nnua
l day
s of
par
ticip
atio
n an
ywhe
re p
er p
artic
ipan
t:m
ean
=8.
5m
edia
n =
5
Perc
ent
Perc
ent o
fPe
rcen
t of
Perc
ent o
fPe
rcen
t fro
mw
ithin
1/2
Perc
ent
popu
latio
nPe
rcen
t of
Perc
ent o
fpo
pula
tion
avid
avid
hour
dri
vew
ithin
Dem
ogra
phic
cha
ract
eris
ticN
umbe
rPe
rcen
tpa
rtic
ipat
ing
part
icip
ants
activ
ity d
ays
who
are
avi
dspa
rtic
ipan
tspa
rtic
ipan
tsof
hom
eM
inne
sota
Tot
al3,
484,
632
100%
10%
100%
100%
5%10
0%86
%64
%86
%
Pop
ulat
ion
dens
ity
of r
esid
ence
(zi
p co
de)
Low
(10
0 pe
ople
per
sq
mile
or
less
)94
5,36
2
27%
14%
40%
50%
8%47
%90
%74
%91
%M
ediu
m (
101
to 1
000
peop
le p
er s
q. m
ile)
955,
296
27
%14
%39
%34
%6%
36%
83%
65%
84%
Hig
h (>
1000
peo
ple
per
sq. m
ile)
1,58
3,97
4
45
%5%
21%
16%
2%17
%77
%31
%74
%
Reg
ion
of M
NN
orth
wes
t31
1,16
3
9%16
%15
%20
%10
%21
%93
%74
%93
%N
orth
east
296,
159
8%
18%
16%
23%
9%16
%90
%73
%91
%So
uth
687,
752
20
%10
%19
%21
%5%
21%
89%
69%
88%
Cen
tral
315,
532
9%
16%
15%
11%
7%14
%79
%61
%88
%M
etro
1,87
4,02
7
54
%6%
35%
25%
2%27
%77
%46
%74
%
Age
20-3
499
5,62
1
29%
13%
37%
34%
5%32
%84
%56
%76
%35
-44
824,
181
24
%15
%36
%38
%7%
37%
87%
71%
92%
45-5
466
5,69
8
19%
10%
19%
19%
5%22
%85
%64
%92
%55
-64
404,
868
12
%6%
7%7%
3%7%
90%
68%
87%
65+
594,
265
17
%1%
1%2%
1%2%
95%
81%
97%
Gen
der
Mal
e1,
700,
236
49%
14%
71%
74%
7%75
%87
%64
%83
%Fe
mal
e1,
784,
396
51%
6%29
%26
%2%
25%
83%
65%
94%
Rac
e/et
hnic
ity
Non
-whi
te a
nd/o
r H
ispa
nic
(< 1
00 r
espo
nden
ts)
219,
221
6%
6%4%
2%1%
2%57
%29
%92
%W
hite
, non
-His
pani
c3,
265,
411
94%
10%
96%
98%
5%98
%86
%65
%86
%
Inco
me
unde
r $3
0,00
077
3,87
9
22%
4%8%
9%2%
10%
88%
62%
94%
$30,
000
to $
39,9
9945
2,33
4
13%
10%
13%
11%
3%9%
81%
77%
92%
$40,
000
to $
49,9
9946
7,45
6
13%
10%
13%
12%
4%11
%87
%66
%82
%$5
0,00
0 to
$74
,999
834,
075
24
%15
%36
%36
%8%
40%
86%
55%
78%
$75,
000
to $
99,9
9944
4,71
2
13%
13%
17%
12%
5%14
%77
%66
%91
%$1
00,0
00 o
r m
ore
512,
175
15
%9%
14%
20%
6%18
%91
%74
%91
%
Edu
cati
onH
igh
scho
ol g
radu
ate,
or
som
e hi
gh s
choo
l69
2,47
1
20%
9%17
%18
%5%
20%
86%
65%
92%
Vo-
tech
sch
ool,
asso
c. d
egre
e, o
r so
me
colle
ge1,
323,
702
38%
13%
49%
59%
7%55
%88
%68
%85
%G
radu
ated
fro
m c
olle
ge78
7,62
9
23%
9%21
%16
%4%
18%
83%
46%
78%
Post
grad
uate
stu
dy/p
ostg
radu
ate
degr
ees
680,
830
20
%6%
12%
7%2%
7%69
%71
%93
%
Hou
seho
ld s
ize
1 pe
rson
1,11
7,41
4
32
%5%
16%
17%
2%14
%89
%55
%88
%2
peop
le98
4,99
7
28%
9%25
%25
%4%
28%
88%
70%
91%
3 pe
ople
497,
888
14
%12
%17
%18
%6%
18%
85%
76%
87%
4 pe
ople
561,
432
16
%16
%27
%26
%8%
27%
83%
55%
77%
5+ p
eopl
e32
2,90
1
9%16
%15
%14
%6%
12%
83%
69%
90%
---
---
MN
Pop
ulat
ion
----
--(a
s re
pres
ente
d by
sur
vey)
AC
TIV
ITY
: Sno
wm
obili
ng
---
---
Avi
d pa
rtic
ipan
ts -
----
- -
----
----
----
----
Act
ivit
y da
ys -
----
----
----
---
---
----
---
Act
ivit
y pa
rtic
ipat
ion
----
----
--(>
med
ian
days
per
yea
r)
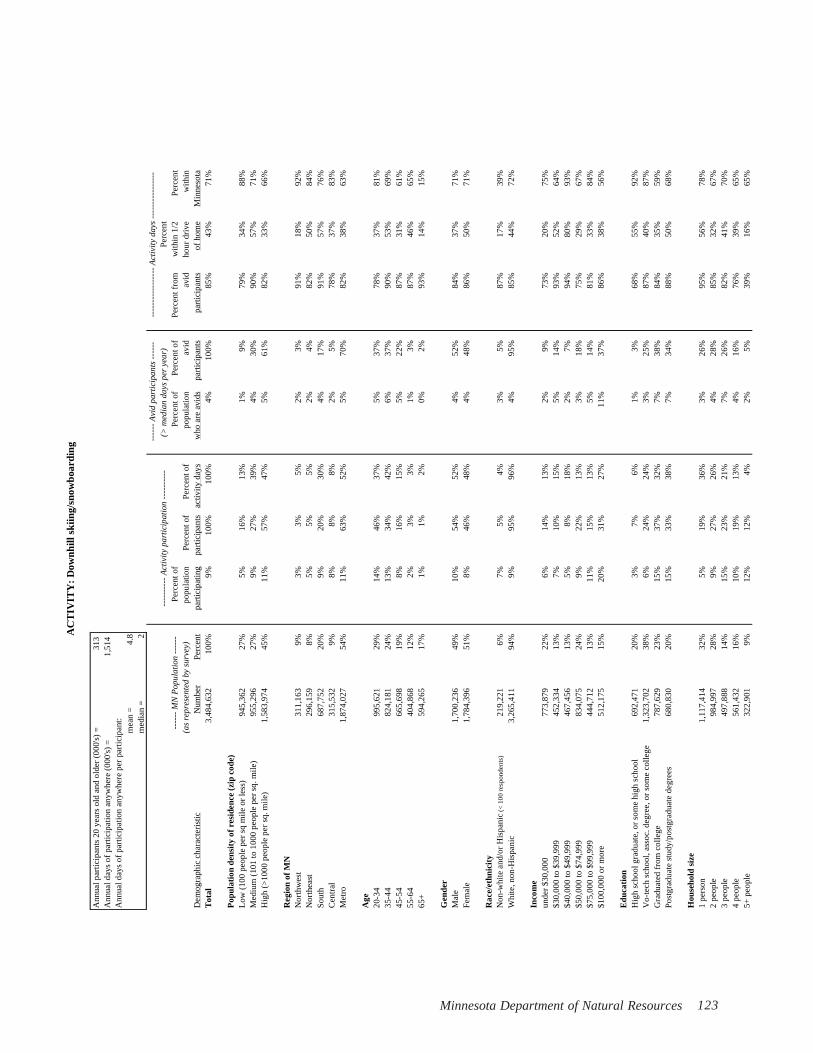
123Minnesota Department of Natural Resources
Ann
ual p
artic
ipan
ts 2
0 ye
ars
old
and
olde
r (0
00's
) =
313
A
nnua
l day
s of
par
ticip
atio
n an
ywhe
re (
000'
s) =
1,51
4
A
nnua
l day
s of
par
ticip
atio
n an
ywhe
re p
er p
artic
ipan
t:m
ean
=4.
8m
edia
n =
2
Perc
ent
Perc
ent o
fPe
rcen
t of
Perc
ent o
fPe
rcen
t fro
mw
ithin
1/2
Perc
ent
popu
latio
nPe
rcen
t of
Perc
ent o
fpo
pula
tion
avid
avid
hour
dri
vew
ithin
Dem
ogra
phic
cha
ract
eris
ticN
umbe
rPe
rcen
tpa
rtic
ipat
ing
part
icip
ants
activ
ity d
ays
who
are
avi
dspa
rtic
ipan
tspa
rtic
ipan
tsof
hom
eM
inne
sota
Tot
al3,
484,
632
100%
9%10
0%10
0%4%
100%
85%
43%
71%
Pop
ulat
ion
dens
ity
of r
esid
ence
(zi
p co
de)
Low
(10
0 pe
ople
per
sq
mile
or
less
)94
5,36
2
27%
5%16
%13
%1%
9%79
%34
%88
%M
ediu
m (
101
to 1
000
peop
le p
er s
q. m
ile)
955,
296
27
%9%
27%
39%
4%30
%90
%57
%71
%H
igh
(>10
00 p
eopl
e pe
r sq
. mile
)1,
583,
974
45%
11%
57%
47%
5%61
%82
%33
%66
%
Reg
ion
of M
NN
orth
wes
t31
1,16
3
9%3%
3%5%
2%3%
91%
18%
92%
Nor
thea
st29
6,15
9
8%5%
5%5%
2%4%
82%
50%
84%
Sout
h68
7,75
2
20%
9%20
%30
%4%
17%
91%
57%
76%
Cen
tral
315,
532
9%
8%8%
8%2%
5%78
%37
%83
%M
etro
1,87
4,02
7
54
%11
%63
%52
%5%
70%
82%
38%
63%
Age
20-3
499
5,62
1
29%
14%
46%
37%
5%37
%78
%37
%81
%35
-44
824,
181
24
%13
%34
%42
%6%
37%
90%
53%
69%
45-5
466
5,69
8
19%
8%16
%15
%5%
22%
87%
31%
61%
55-6
440
4,86
8
12%
2%3%
3%1%
3%87
%46
%65
%65
+59
4,26
5
17%
1%1%
2%0%
2%93
%14
%15
%
Gen
der
Mal
e1,
700,
236
49%
10%
54%
52%
4%52
%84
%37
%71
%Fe
mal
e1,
784,
396
51%
8%46
%48
%4%
48%
86%
50%
71%
Rac
e/et
hnic
ity
Non
-whi
te a
nd/o
r H
ispa
nic
(< 1
00 r
espo
nden
ts)
219,
221
6%
7%5%
4%3%
5%87
%17
%39
%W
hite
, non
-His
pani
c3,
265,
411
94%
9%95
%96
%4%
95%
85%
44%
72%
Inco
me
unde
r $3
0,00
077
3,87
9
22%
6%14
%13
%2%
9%73
%20
%75
%$3
0,00
0 to
$39
,999
452,
334
13
%7%
10%
15%
5%14
%93
%52
%64
%$4
0,00
0 to
$49
,999
467,
456
13
%5%
8%18
%2%
7%94
%80
%93
%$5
0,00
0 to
$74
,999
834,
075
24
%9%
22%
13%
3%18
%75
%29
%67
%$7
5,00
0 to
$99
,999
444,
712
13
%11
%15
%13
%5%
14%
81%
33%
84%
$100
,000
or
mor
e51
2,17
5
15%
20%
31%
27%
11%
37%
86%
38%
56%
Edu
cati
onH
igh
scho
ol g
radu
ate,
or
som
e hi
gh s
choo
l69
2,47
1
20%
3%7%
6%1%
3%68
%55
%92
%V
o-te
ch s
choo
l, as
soc.
deg
ree,
or
som
e co
llege
1,32
3,70
2
38
%6%
24%
24%
3%25
%87
%40
%87
%G
radu
ated
fro
m c
olle
ge78
7,62
9
23%
15%
37%
32%
7%38
%84
%35
%59
%Po
stgr
adua
te s
tudy
/pos
tgra
duat
e de
gree
s68
0,83
0
20%
15%
33%
38%
7%34
%88
%50
%68
%
Hou
seho
ld s
ize
1 pe
rson
1,11
7,41
4
32
%5%
19%
36%
3%26
%95
%56
%78
%2
peop
le98
4,99
7
28%
9%27
%26
%4%
28%
85%
32%
67%
3 pe
ople
497,
888
14
%15
%23
%21
%7%
26%
82%
41%
70%
4 pe
ople
561,
432
16
%10
%19
%13
%4%
16%
76%
39%
65%
5+ p
eopl
e32
2,90
1
9%12
%12
%4%
2%5%
39%
16%
65%
---
---
MN
Pop
ulat
ion
----
--(a
s re
pres
ente
d by
sur
vey)
AC
TIV
ITY
: D
ownh
ill s
kiin
g/sn
owbo
ardi
ng
---
---
Avi
d pa
rtic
ipan
ts -
----
- -
----
----
----
----
Act
ivit
y da
ys -
----
----
----
---
---
----
---
Act
ivit
y pa
rtic
ipat
ion
----
----
--(>
med
ian
days
per
yea
r)

2004 Minnesota Outdoor Recreation Participation Survey124
Ann
ual p
artic
ipan
ts 2
0 ye
ars
old
and
olde
r (0
00's
) =
302
A
nnua
l day
s of
par
ticip
atio
n an
ywhe
re (
000'
s) =
1,62
3
A
nnua
l day
s of
par
ticip
atio
n an
ywhe
re p
er p
artic
ipan
t:m
ean
=5.
4m
edia
n =
2
Perc
ent
Perc
ent o
fPe
rcen
t of
Perc
ent o
fPe
rcen
t fro
mw
ithin
1/2
Perc
ent
popu
latio
nPe
rcen
t of
Perc
ent o
fpo
pula
tion
avid
avid
hour
dri
vew
ithin
Dem
ogra
phic
cha
ract
eris
ticN
umbe
rPe
rcen
tpa
rtic
ipat
ing
part
icip
ants
activ
ity d
ays
who
are
avi
dspa
rtic
ipan
tspa
rtic
ipan
tsof
hom
eM
inne
sota
Tot
al3,
484,
632
100%
9%10
0%10
0%4%
100%
86%
73%
92%
Pop
ulat
ion
dens
ity
of r
esid
ence
(zi
p co
de)
Low
(10
0 pe
ople
per
sq
mile
or
less
)94
5,36
2
27%
12%
38%
40%
7%48
%90
%77
%96
%M
ediu
m (
101
to 1
000
peop
le p
er s
q. m
ile)
955,
296
27
%8%
24%
35%
3%22
%90
%78
%89
%H
igh
(>10
00 p
eopl
e pe
r sq
. mile
)1,
583,
974
45%
7%38
%26
%3%
30%
75%
58%
89%
Reg
ion
of M
NN
orth
wes
t31
1,16
3
9%11
%11
%13
%7%
15%
92%
77%
97%
Nor
thea
st29
6,15
9
8%19
%19
%15
%7%
15%
79%
70%
93%
Sout
h68
7,75
2
20%
7%17
%28
%5%
25%
96%
87%
98%
Cen
tral
315,
532
9%
7%7%
5%3%
7%82
%74
%95
%M
etro
1,87
4,02
7
54
%7%
46%
39%
3%37
%81
%62
%85
%
Age
20-3
499
5,62
1
29%
9%29
%35
%3%
23%
87%
79%
90%
35-4
482
4,18
1
24%
10%
28%
24%
5%32
%86
%69
%91
%45
-54
665,
698
19
%9%
19%
14%
4%19
%78
%75
%93
%55
-64
404,
868
12
%8%
11%
12%
4%12
%89
%78
%91
%65
+59
4,26
5
17%
7%12
%15
%3%
14%
89%
58%
99%
Gen
der
Mal
e1,
700,
236
49%
10%
57%
51%
5%56
%84
%67
%90
%Fe
mal
e1,
784,
396
51%
7%43
%49
%3%
44%
88%
79%
95%
Rac
e/et
hnic
ity
Non
-whi
te a
nd/o
r H
ispa
nic
(< 1
00 r
espo
nden
ts)
219,
221
6%
4%3%
3%3%
4%79
%88
%96
%W
hite
, non
-His
pani
c3,
265,
411
94%
9%97
%97
%4%
96%
86%
72%
92%
Inco
me
unde
r $3
0,00
077
3,87
9
22%
8%20
%34
%5%
28%
94%
71%
86%
$30,
000
to $
39,9
9945
2,33
4
13%
9%14
%19
%4%
12%
90%
87%
98%
$40,
000
to $
49,9
9946
7,45
6
13%
6%9%
6%3%
9%78
%69
%95
%$5
0,00
0 to
$74
,999
834,
075
24
%11
%29
%23
%4%
26%
83%
84%
96%
$75,
000
to $
99,9
9944
4,71
2
13%
10%
15%
7%3%
10%
64%
56%
89%
$100
,000
or
mor
e51
2,17
5
15%
8%13
%11
%4%
14%
82%
51%
93%
Edu
cati
onH
igh
scho
ol g
radu
ate,
or
som
e hi
gh s
choo
l69
2,47
1
20%
7%17
%25
%4%
21%
92%
86%
97%
Vo-
tech
sch
ool,
asso
c. d
egre
e, o
r so
me
colle
ge1,
323,
702
38%
9%38
%38
%4%
36%
85%
67%
90%
Gra
duat
ed f
rom
col
lege
787,
629
23
%7%
19%
9%2%
10%
63%
54%
87%
Post
grad
uate
stu
dy/p
ostg
radu
ate
degr
ees
680,
830
20
%12
%26
%28
%7%
33%
90%
75%
91%
Hou
seho
ld s
ize
1 pe
rson
1,11
7,41
4
32
%7%
26%
23%
2%19
%81
%79
%95
%2
peop
le98
4,99
7
28%
8%26
%32
%4%
30%
90%
68%
83%
3 pe
ople
497,
888
14
%11
%18
%22
%5%
18%
88%
80%
98%
4 pe
ople
561,
432
16
%11
%21
%17
%6%
26%
88%
63%
96%
5+ p
eopl
e32
2,90
1
9%9%
10%
7%3%
7%74
%75
%95
%
---
---
MN
Pop
ulat
ion
----
--(a
s re
pres
ente
d by
sur
vey)
AC
TIV
ITY
: G
athe
r m
ushr
oom
s, b
erri
es, o
r ot
her
wild
foo
ds
---
---
Avi
d pa
rtic
ipan
ts -
----
- -
----
----
----
----
Act
ivit
y da
ys -
----
----
----
---
---
----
---
Act
ivit
y pa
rtic
ipat
ion
----
----
--(>
med
ian
days
per
yea
r)
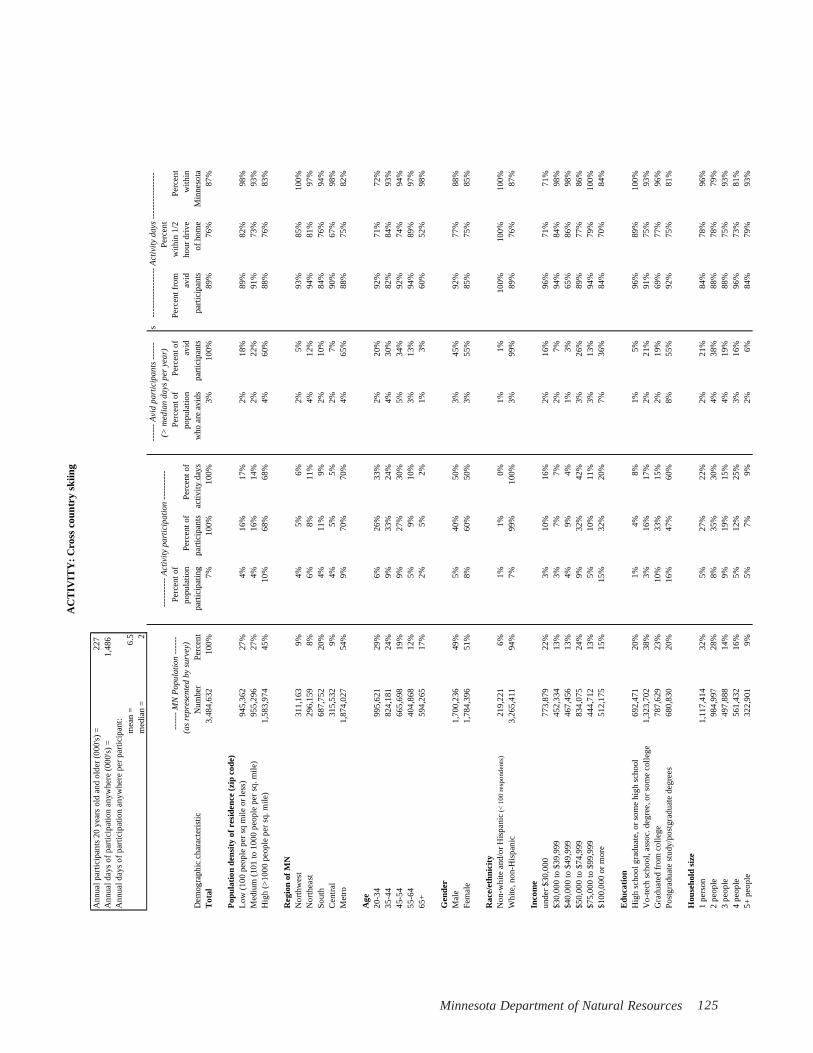
125Minnesota Department of Natural Resources
Ann
ual p
artic
ipan
ts 2
0 ye
ars
old
and
olde
r (0
00's
) =
227
A
nnua
l day
s of
par
ticip
atio
n an
ywhe
re (
000'
s) =
1,48
6
A
nnua
l day
s of
par
ticip
atio
n an
ywhe
re p
er p
artic
ipan
t:m
ean
=6.
5m
edia
n =
2s
Perc
ent
Perc
ent o
fPe
rcen
t of
Perc
ent o
fPe
rcen
t fro
mw
ithin
1/2
Perc
ent
popu
latio
nPe
rcen
t of
Perc
ent o
fpo
pula
tion
avid
avid
hour
dri
vew
ithin
Dem
ogra
phic
cha
ract
eris
ticN
umbe
rPe
rcen
tpa
rtic
ipat
ing
part
icip
ants
activ
ity d
ays
who
are
avi
dspa
rtic
ipan
tspa
rtic
ipan
tsof
hom
eM
inne
sota
Tot
al3,
484,
632
100%
7%10
0%10
0%3%
100%
89%
76%
87%
Pop
ulat
ion
dens
ity
of r
esid
ence
(zi
p co
de)
Low
(10
0 pe
ople
per
sq
mile
or
less
)94
5,36
2
27%
4%16
%17
%2%
18%
89%
82%
98%
Med
ium
(10
1 to
100
0 pe
ople
per
sq.
mile
)95
5,29
6
27%
4%16
%14
%2%
22%
91%
73%
93%
Hig
h (>
1000
peo
ple
per
sq. m
ile)
1,58
3,97
4
45
%10
%68
%68
%4%
60%
88%
76%
83%
Reg
ion
of M
NN
orth
wes
t31
1,16
3
9%4%
5%6%
2%5%
93%
85%
100%
Nor
thea
st29
6,15
9
8%6%
8%11
%4%
12%
94%
81%
97%
Sout
h68
7,75
2
20%
4%11
%9%
2%10
%84
%76
%94
%C
entr
al31
5,53
2
9%4%
5%5%
2%7%
90%
67%
98%
Met
ro1,
874,
027
54%
9%70
%70
%4%
65%
88%
75%
82%
Age
20-3
499
5,62
1
29%
6%26
%33
%2%
20%
92%
71%
72%
35-4
482
4,18
1
24%
9%33
%24
%4%
30%
82%
84%
93%
45-5
466
5,69
8
19%
9%27
%30
%5%
34%
92%
74%
94%
55-6
440
4,86
8
12%
5%9%
10%
3%13
%94
%89
%97
%65
+59
4,26
5
17%
2%5%
2%1%
3%60
%52
%98
%
Gen
der
Mal
e1,
700,
236
49%
5%40
%50
%3%
45%
92%
77%
88%
Fem
ale
1,78
4,39
6
51
%8%
60%
50%
3%55
%85
%75
%85
%
Rac
e/et
hnic
ity
Non
-whi
te a
nd/o
r H
ispa
nic
(< 1
00 r
espo
nden
ts)
219,
221
6%
1%1%
0%1%
1%10
0%10
0%10
0%W
hite
, non
-His
pani
c3,
265,
411
94%
7%99
%10
0%3%
99%
89%
76%
87%
Inco
me
unde
r $3
0,00
077
3,87
9
22%
3%10
%16
%2%
16%
96%
71%
71%
$30,
000
to $
39,9
9945
2,33
4
13%
3%7%
7%2%
7%94
%84
%98
%$4
0,00
0 to
$49
,999
467,
456
13
%4%
9%4%
1%3%
65%
86%
98%
$50,
000
to $
74,9
9983
4,07
5
24%
9%32
%42
%3%
26%
89%
77%
86%
$75,
000
to $
99,9
9944
4,71
2
13%
5%10
%11
%3%
13%
94%
79%
100%
$100
,000
or
mor
e51
2,17
5
15%
15%
32%
20%
7%36
%84
%70
%84
%
Edu
cati
onH
igh
scho
ol g
radu
ate,
or
som
e hi
gh s
choo
l69
2,47
1
20%
1%4%
8%1%
5%96
%89
%10
0%V
o-te
ch s
choo
l, as
soc.
deg
ree,
or
som
e co
llege
1,32
3,70
2
38
%3%
16%
17%
2%21
%91
%75
%93
%G
radu
ated
fro
m c
olle
ge78
7,62
9
23%
10%
33%
15%
2%19
%69
%77
%96
%Po
stgr
adua
te s
tudy
/pos
tgra
duat
e de
gree
s68
0,83
0
20%
16%
47%
60%
8%55
%92
%75
%81
%
Hou
seho
ld s
ize
1 pe
rson
1,11
7,41
4
32
%5%
27%
22%
2%21
%84
%78
%96
%2
peop
le98
4,99
7
28%
8%35
%30
%4%
38%
88%
78%
79%
3 pe
ople
497,
888
14
%9%
19%
15%
4%19
%88
%75
%93
%4
peop
le56
1,43
2
16%
5%12
%25
%3%
16%
96%
73%
81%
5+ p
eopl
e32
2,90
1
9%5%
7%9%
2%6%
84%
79%
93%
---
---
MN
Pop
ulat
ion
----
--(a
s re
pres
ente
d by
sur
vey)
AC
TIV
ITY
: C
ross
cou
ntry
ski
ing
---
---
Avi
d pa
rtic
ipan
ts -
----
- -
----
----
----
----
Act
ivit
y da
ys -
----
----
----
---
---
----
---
Act
ivit
y pa
rtic
ipat
ion
----
----
--(>
med
ian
days
per
yea
r)

2004 Minnesota Outdoor Recreation Participation Survey126
Ann
ual p
artic
ipan
ts 2
0 ye
ars
old
and
olde
r (0
00's
) =
157
A
nnua
l day
s of
par
ticip
atio
n an
ywhe
re (
000'
s) =
1,38
2
A
nnua
l day
s of
par
ticip
atio
n an
ywhe
re p
er p
artic
ipan
t:m
ean
=8.
8m
edia
n =
1
Perc
ent
Perc
ent o
fPe
rcen
t of
Perc
ent o
fPe
rcen
t fro
mw
ithin
1/2
Perc
ent
popu
latio
nPe
rcen
t of
Perc
ent o
fpo
pula
tion
avid
avid
hour
dri
vew
ithin
Dem
ogra
phic
cha
ract
eris
ticN
umbe
rPe
rcen
tpa
rtic
ipat
ing
part
icip
ants
activ
ity d
ays
who
are
avi
dspa
rtic
ipan
tspa
rtic
ipan
tsof
hom
eM
inne
sota
Tot
al3,
484,
632
100%
5%10
0%10
0%2%
100%
96%
86%
89%
Pop
ulat
ion
dens
ity
of r
esid
ence
(zi
p co
de)
Low
(10
0 pe
ople
per
sq
mile
or
less
)94
5,36
2
27%
5%31
%51
%4%
50%
99%
90%
90%
Med
ium
(10
1 to
100
0 pe
ople
per
sq.
mile
)95
5,29
6
27%
5%30
%41
%2%
25%
96%
91%
95%
Hig
h (>
1000
peo
ple
per
sq. m
ile)
1,58
3,97
4
45
%4%
39%
8%1%
25%
71%
37%
59%
Reg
ion
of M
NN
orth
wes
t31
1,16
3
9%3%
6%8%
3%12
%99
%95
%97
%N
orth
east
296,
159
8%
4%8%
5%3%
13%
98%
78%
85%
Sout
h68
7,75
2
20%
5%21
%26
%2%
17%
96%
92%
95%
Cen
tral
315,
532
9%
6%12
%38
%4%
16%
99%
94%
90%
Met
ro1,
874,
027
54%
4%53
%23
%2%
43%
88%
67%
79%
Age
20-3
499
5,62
1
29%
5%34
%37
%2%
24%
95%
92%
86%
35-4
482
4,18
1
24%
6%33
%40
%4%
43%
97%
89%
95%
45-5
466
5,69
8
19%
6%26
%12
%2%
20%
88%
86%
95%
55-6
440
4,86
8
12%
2%5%
9%2%
9%99
%74
%81
%65
+59
4,26
5
17%
1%2%
2%1%
4%98
%0%
35%
Gen
der
Mal
e1,
700,
236
49%
4%38
%33
%2%
40%
95%
86%
93%
Fem
ale
1,78
4,39
6
51
%5%
62%
67%
3%60
%96
%87
%87
%
Rac
e/et
hnic
ity
Non
-whi
te a
nd/o
r H
ispa
nic
(< 1
00 r
espo
nden
ts)
219,
221
6%
2%3%
0%0%
0%0%
0%28
%W
hite
, non
-His
pani
c3,
265,
411
94%
5%97
%10
0%2%
100%
96%
87%
89%
Inco
me
unde
r $3
0,00
077
3,87
9
22%
3%14
%11
%2%
20%
96%
66%
71%
$30,
000
to $
39,9
9945
2,33
4
13%
3%8%
5%1%
3%88
%80
%83
%$4
0,00
0 to
$49
,999
467,
456
13
%5%
13%
28%
3%19
%99
%90
%88
%$5
0,00
0 to
$74
,999
834,
075
24
%5%
25%
28%
3%33
%97
%88
%93
%$7
5,00
0 to
$99
,999
444,
712
13
%5%
14%
7%2%
9%88
%83
%92
%$1
00,0
00 o
r m
ore
512,
175
15
%8%
25%
21%
2%16
%93
%95
%96
%
Edu
cati
onH
igh
scho
ol g
radu
ate,
or
som
e hi
gh s
choo
l69
2,47
1
20%
2%8%
13%
1%11
%98
%99
%98
%V
o-te
ch s
choo
l, as
soc.
deg
ree,
or
som
e co
llege
1,32
3,70
2
38
%6%
46%
56%
3%50
%97
%85
%86
%G
radu
ated
fro
m c
olle
ge78
7,62
9
23%
3%17
%10
%2%
21%
94%
74%
96%
Post
grad
uate
stu
dy/p
ostg
radu
ate
degr
ees
680,
830
20
%7%
29%
21%
2%18
%92
%86
%89
%
Hou
seho
ld s
ize
1 pe
rson
1,11
7,41
4
32
%4%
26%
43%
2%33
%98
%86
%93
%2
peop
le98
4,99
7
28%
5%29
%10
%1%
19%
84%
64%
69%
3 pe
ople
497,
888
14
%4%
14%
25%
3%23
%99
%96
%98
%4
peop
le56
1,43
2
16%
5%19
%6%
2%11
%81
%73
%86
%5+
peo
ple
322,
901
9%
6%12
%16
%4%
15%
97%
92%
80%
---
---
MN
Pop
ulat
ion
----
--(a
s re
pres
ente
d by
sur
vey)
AC
TIV
ITY
: H
orse
back
rid
ing
---
---
Avi
d pa
rtic
ipan
ts -
----
- -
----
----
----
----
Act
ivit
y da
ys -
----
----
----
---
---
----
---
Act
ivit
y pa
rtic
ipat
ion
----
----
--(>
med
ian
days
per
yea
r)

127Minnesota Department of Natural Resources
Ann
ual p
artic
ipan
ts 2
0 ye
ars
old
and
olde
r (0
00's
) =
146
A
nnua
l day
s of
par
ticip
atio
n an
ywhe
re (
000'
s) =
535
A
nnua
l day
s of
par
ticip
atio
n an
ywhe
re p
er p
artic
ipan
t:m
ean
=3.
7m
edia
n =
2
Perc
ent
Perc
ent o
fPe
rcen
t of
Perc
ent o
fPe
rcen
t fro
mw
ithin
1/2
Perc
ent
popu
latio
nPe
rcen
t of
Perc
ent o
fpo
pula
tion
avid
avid
hour
dri
vew
ithin
Dem
ogra
phic
cha
ract
eris
ticN
umbe
rPe
rcen
tpa
rtic
ipat
ing
part
icip
ants
activ
ity d
ays
who
are
avi
dspa
rtic
ipan
tspa
rtic
ipan
tsof
hom
eM
inne
sota
Tot
al3,
484,
632
100%
4%10
0%10
0%2%
100%
79%
61%
81%
Pop
ulat
ion
dens
ity
of r
esid
ence
(zi
p co
de)
Low
(10
0 pe
ople
per
sq
mile
or
less
)94
5,36
2
27%
4%24
%29
%2%
30%
86%
79%
96%
Med
ium
(10
1 to
100
0 pe
ople
per
sq.
mile
)95
5,29
6
27%
5%32
%25
%2%
30%
72%
62%
71%
Hig
h (>
1000
peo
ple
per
sq. m
ile)
1,58
3,97
4
45
%4%
44%
45%
1%40
%77
%50
%76
%
Reg
ion
of M
NN
orth
wes
t31
1,16
3
9%2%
5%3%
1%4%
76%
77%
100%
Nor
thea
st29
6,15
9
8%8%
15%
18%
3%18
%82
%81
%92
%So
uth
687,
752
20
%3%
14%
18%
2%20
%89
%57
%69
%C
entr
al31
5,53
2
9%3%
7%6%
1%8%
81%
54%
99%
Met
ro1,
874,
027
54%
5%59
%55
%2%
50%
74%
56%
78%
Age
20-3
499
5,62
1
29%
4%27
%20
%1%
17%
64%
63%
84%
35-4
482
4,18
1
24%
5%26
%30
%3%
38%
87%
40%
64%
45-5
466
5,69
8
19%
7%32
%31
%2%
20%
73%
73%
95%
55-6
440
4,86
8
12%
4%10
%10
%2%
16%
86%
72%
77%
65+
594,
265
17
%1%
5%9%
1%9%
96%
79%
87%
Gen
der
Mal
e1,
700,
236
49%
4%48
%46
%2%
48%
78%
72%
88%
Fem
ale
1,78
4,39
6
51
%4%
52%
54%
2%52
%79
%52
%75
%
Rac
e/et
hnic
ity
Non
-whi
te a
nd/o
r H
ispa
nic
(< 1
00 r
espo
nden
ts)
219,
221
6%
1%1%
2%1%
2%91
%69
%10
0%W
hite
, non
-His
pani
c3,
265,
411
94%
4%99
%98
%2%
98%
79%
61%
80%
Inco
me
unde
r $3
0,00
077
3,87
9
22%
4%19
%21
%2%
22%
81%
53%
56%
$30,
000
to $
39,9
9945
2,33
4
13%
3%11
%15
%2%
19%
95%
65%
100%
$40,
000
to $
49,9
9946
7,45
6
13%
4%11
%9%
1%8%
70%
31%
38%
$50,
000
to $
74,9
9983
4,07
5
24%
4%25
%28
%1%
20%
79%
84%
97%
$75,
000
to $
99,9
9944
4,71
2
13%
6%17
%13
%2%
12%
66%
60%
89%
$100
,000
or
mor
e51
2,17
5
15%
5%18
%14
%2%
20%
70%
38%
85%
Edu
cati
onH
igh
scho
ol g
radu
ate,
or
som
e hi
gh s
choo
l69
2,47
1
20%
1%4%
13%
1%8%
97%
76%
99%
Vo-
tech
sch
ool,
asso
c. d
egre
e, o
r so
me
colle
ge1,
323,
702
38%
4%36
%28
%2%
34%
72%
68%
95%
Gra
duat
ed f
rom
col
lege
787,
629
23
%4%
23%
14%
1%16
%58
%69
%81
%Po
stgr
adua
te s
tudy
/pos
tgra
duat
e de
gree
s68
0,83
0
20%
8%37
%45
%4%
42%
84%
51%
67%
Hou
seho
ld s
ize
1 pe
rson
1,11
7,41
4
32
%3%
24%
32%
1%26
%86
%55
%74
%2
peop
le98
4,99
7
28%
5%36
%43
%3%
44%
83%
61%
81%
3 pe
ople
497,
888
14
%5%
16%
11%
1%11
%63
%89
%95
%4
peop
le56
1,43
2
16%
3%11
%8%
1%9%
65%
55%
88%
5+ p
eopl
e32
2,90
1
9%6%
13%
7%2%
11%
56%
61%
85%
---
---
MN
Pop
ulat
ion
----
--(a
s re
pres
ente
d by
sur
vey)
AC
TIV
ITY
: Sn
owsh
oein
g
---
---
Avi
d pa
rtic
ipan
ts -
----
- -
----
----
----
----
Act
ivit
y da
ys -
----
----
----
---
---
----
---
Act
ivit
y pa
rtic
ipat
ion
----
----
--(>
med
ian
days
per
yea
r)