Embed Size (px)
Citation preview

August 2003 • NREL/SR-560-34715
N. Miller GE Power Systems Schenectady, New York Z. Ye GE Global Research Center Niskayuna, New York
Report on Distributed Generation Penetration Study
National Renewable Energy Laboratory 1617 Cole Boulevard Golden, Colorado 80401-3393 NREL is a U.S. Department of Energy Laboratory Operated by Midwest Research Institute • Battelle • Bechtel
Contract No. DE-AC36-99-GO10337

August 2003 • NREL/SR-560-34715
Report on Distributed Generation Penetration Study
N. Miller GE Power Systems Schenectady, New York Z. Ye GE Global Research Center Niskayuna, New York
NREL Technical Monitor: B. Kroposki Prepared under Subcontract No. NAD-1-30605-01
National Renewable Energy Laboratory 1617 Cole Boulevard Golden, Colorado 80401-3393 NREL is a U.S. Department of Energy Laboratory Operated by Midwest Research Institute • Battelle • Bechtel
Contract No. DE-AC36-99-GO10337

NOTICE This report was prepared as an account of work sponsored by an agency of the United States government. Neither the United States government nor any agency thereof, nor any of their employees, makes any warranty, express or implied, or assumes any legal liability or responsibility for the accuracy, completeness, or usefulness of any information, apparatus, product, or process disclosed, or represents that its use would not infringe privately owned rights. Reference herein to any specific commercial product, process, or service by trade name, trademark, manufacturer, or otherwise does not necessarily constitute or imply its endorsement, recommendation, or favoring by the United States government or any agency thereof. The views and opinions of authors expressed herein do not necessarily state or reflect those of the United States government or any agency thereof.
Available electronically at http://www.osti.gov/bridge
Available for a processing fee to U.S. Department of Energy and its contractors, in paper, from:
U.S. Department of Energy Office of Scientific and Technical Information P.O. Box 62 Oak Ridge, TN 37831-0062 phone: 865.576.8401 fax: 865.576.5728 email: [email protected]
Available for sale to the public, in paper, from:
U.S. Department of Commerce National Technical Information Service 5285 Port Royal Road Springfield, VA 22161 phone: 800.553.6847 fax: 703.605.6900 email: [email protected] online ordering: http://www.ntis.gov/ordering.htm
Printed on paper containing at least 50% wastepaper, including 20% postconsumer waste

iii
List of Acronyms DER distributed energy resource(s) DG distributed generation DR distributed resource(s) EPS electric power system FERC Federal Energy Regulatory Commission IEEE Institute of Electrical and Electronics Engineers NOPR Notice of Proposed Rulemaking PCC point of common coupling, point of common connection PSLF Positive Sequence Load Flow UI universal interconnect WECC Western Energy Coordinating Council WSCC Western Systems Coordinating Council

iv
Executive Summary In the future, power distribution systems now controlled by large power generators will be enhanced with more distributed energy resource (DER) architectures in which the demarcations between providers and users of power are less restrictive. Industry is concerned about how existing electric power systems (EPSs) can accommodate these changes because they will affect the economics and performance of power delivery. One key area of concern is the technical details of interconnecting distributed generation (DG) with the EPS. This report documents part of a multiyear research program dedicated to the development of requirements to support the definition, design, and demonstration of a DG-EPS interconnection interface concept. The interconnection must allow DG sources to be interconnected with the EPS in a manner that provides value to the end user without compromising reliability or performance. The report focuses on the dynamic behavior of power systems when a significant portion of the total energy resource is DG. The work documented here results from the second year of study and builds extensively on the first-year results [1]. In the first-year effort, a virtual test bed was developed to explore how distributed generators interact with the EPS and with one another under a range of realistic conditions. That effort examined response to events such as short circuits on power lines, line switching operations, and load fluctuations. The effects on systems from local distribution feeders to entire multi-gigawatt interconnected power systems were considered. Those explorations focused on a long-term vision of the future in which the majority of DER relies on power electronic inverters for connection to the power system. That work showed that as the penetration of DG increases, the performance requirements for the DG become broader. The ability to achieve the desired performance with an autonomous local interconnect becomes limited, and penalties for undesirable behavior, such as over-aggressive DG tripping, become greater. The effort reported here is focused on a nearer-term reality in which the majority of new DG is of a more conventional type that relies on rotating synchronous generators for energy conversion. The characteristics of synchronous machines (termed “rotating DG” in this work for simplicity) are substantially different from those of inverter-based DG and have the potential to substantially affect system performance. Actual data and projections of new DG deployments of a US utility are included to provide context to the technical examination. The study further examines the concepts of microgrids and focuses on a near-term reality of single-owner systems (termed “facility microgrids” in this work). A discussion and update of the latest regulatory and standards trends are provided in the report. The results of explorations reported here reinforce the preliminary findings of the first-year effort. Of particular interest is the reinforcement of the observations that a high penetration of DER does have the potential to significantly affect bulk power system performance and that penalties for undesirable behavior, such as overaggressive DG tripping, become greater. The study further reinforced the concept that the behavior of microgrids can be made beneficial to both the microgrid and the host bulk power system. The report identifies areas for further investigation.

v
The results show that the development of a universal interconnect should follow a natural progression of functionality, as proposed. Ultimately, higher levels of functionality benefit both system reliability and the economics of DG. The functionality of the universal interconnect must meet the basic requirements imposed by the various interconnection standards, most notably IEEE 1547, while providing a foundation on which higher levels of functionality can be built.

vi

vii
Table of Contents Table of Figures ....................................................................................................................................... viii Table of Tables ........................................................................................................................................... ix 1. Introduction......................................................................................................................................... 1
1.1 Background Discussion .....................................................................................................1 1.2 Regulatory Perspectives.....................................................................................................1 1.3 Economic and Equipment Perspectives .............................................................................3 1.4 Overview of Technical Approach......................................................................................4
2. Penetration and Market Trends......................................................................................................... 6
2.1 Discussion ..........................................................................................................................6 2.2 Case Study .........................................................................................................................6
3. Dynamics of Bulk Power Systems With High DG Penetration .................................................... 10
3.1 Control and Protection of Rotating DG ...........................................................................10 3.2 System Modeling .............................................................................................................12 3.3 WECC Results .................................................................................................................20
4. Microgrids ......................................................................................................................................... 33
4.1 Introduction......................................................................................................................33 4.2 Facility Microgrid Model.................................................................................................34 4.3 Microgrid Dynamics ........................................................................................................36
5 Summary ........................................................................................................................................... 45
5.1 Study Results Summary...................................................................................................45 5.2 Implications for Universal Interconnect ..........................................................................47 5.3 Implications for Standards ...............................................................................................47 5.4 Further Research Needs ...................................................................................................47
6 References ........................................................................................................................................ 49 Appendix A. WECC System Information (Trip Malin to Round Mountain Line Circuit #2) 1............. 50 Appendix B. WECC System Information (Trip Malin to Round Mountain Line Circuit #2) 2............. 58 Appendix C. WECC System Information (Trip 3 Palo Verte Generators) 1 ......................................... 65 Appendix D. WECC System Information (Trip 3 Palo Verte Generators) 2 ......................................... 73 Appendix E. WECC System Information (Trip 3 Palo Verte Generators) 3 ......................................... 81 Appendix F. WECC System Information (Trip 3 Palo Verte Generators) 4 ......................................... 89

viii
Table of Figures Figure 2.1. Declining contract resources (studied utility) ......................................................... 6 Figure 2.2. Pareto of known scheduled DG additions (studied utility)..................................... 7 Figure 2.3. Units less than 2 MW – Pareto of known scheduled DG additions
(studied utility)........................................................................................................ 8 Figure 2.4. Units more than 2 MW and less than 20 MW – FERC Level 2 Pareto of
known scheduled DG additions (studied utility) .................................................... 9 Figure 3.1. Generic rotating synchronous distributed generator model .................................. 14 Figure 3.2. Generic rotating synchronous DG exciter model.................................................. 15 Figure 3.3. Generic rotating synchronous DG governor model .............................................. 16 Figure 3.4. Positive sequence DG inverter-based model with anti-islanding paths................ 17 Figure 3.5. Major transmission in WECC............................................................................... 18 Figure 3.6. Power flows around the California-Oregon border (Malin station) in WECC..... 19 Figure 3.7. Major transmission fault in WECC – comparison with basic controls................. 22 Figure 3.8. Major transmission fault in WECC – comparison of various rotating DG
controls.................................................................................................................. 24 Figure 3.9. Major generation loss event in WECC – comparison with basic controls ........... 26 Figure 3.10. Major generation loss event in WECC – comparison of various rotating DG
controls.................................................................................................................. 28 Figure 3.11. Major generation loss event in WECC – effect of under frequency tripping ....... 30 Figure 3.12. Major generation loss event in WECC – effect of active anti-islanding .............. 32 Figure 4.1. One-line of facility – active and reactive power flows ......................................... 35 Figure 4.2. One-line of facility – resistance and reactance of network elements.................... 36 Figure 4.3. Microgrid load bus voltage – following grid disturbance..................................... 38 Figure 4.4. Active power into microgrid – following grid disturbance .................................. 38 Figure 4.5. Microgrid load motor speeds – following grid disturbance.................................. 39 Figure 4.6. Microgrid load currents – following grid disturbance .......................................... 39 Figure 4.7. Microgrid load voltages – following grid disturbance and trip to island.............. 41 Figure 4.8. Microgrid main bus voltages – grid disturbance and trip to island....................... 41 Figure 4.9. Microgrid DG reactive power outputs – grid disturbance and trip to island ........ 42 Figure 4.10. Microgrid DG active power outputs – grid disturbance and trip to island ........... 42 Figure 4.11. Microgrid DG currents – grid disturbance and trip to island................................ 43

ix
Table of Tables Table 3.1. Generator Model Parameters .................................................................................15 Table 3.2. Exciter Model Parameters......................................................................................16 Table 3.3. Governor Model Parameters ..................................................................................17

x

1
1 Introduction 1.1 Background Discussion Traditional nonutility-generated power sources, such as emergency and standby power systems, have minimal interaction with the electric power system (EPS). As distributed generation (DG) hardware becomes more reliable and economically feasible, there is an increasing trend to interconnect those DG units with existing utilities to meet various energy needs and offer more service possibilities to customers and the host EPS. Among these possibilities are:
• Standby/backup power to improve the availability and reliability of electric power • Peak load shaving • Combined heat and power • Sales of power back to utilities or other users • Renewable energy • Power quality, such as reactive power compensation and voltage support • Dynamic stability support.
This trend is fueled and accelerated by utility deregulation. Safe and reliable operation of the power system will increasingly be influenced by distributed energy resources (DER). Penetration is a measure of the amount of DER compared with the total generation resource on a power system. In the broadest sense, this applies to the entire interconnected grid. However, the concept of local penetration is valuable, as well. A few megawatts of generation can represent a substantial penetration on a small system or the local portion of a large system. Further, penetration is not a static measure. A relatively small amount of installed DG might represent a high level of penetration when the system is at light load. A broad vision of DER includes widespread deployment of a range of new technologies. In that long-term view, the majority of attractive emerging DER technologies relies on power electronic inverters for connection to the power system. These technologies include fuel cells, photovoltaics, and microturbines. The first year of effort examining penetration focused on those technologies. In the nearer term, the reality is that most (on a total kilowatt basis) of the DER being built and planned are more conventional, synchronous machine-based generation. The investigation reported here focused mainly on this nearer-term reality but with the same objectives of identifying system performance issues, quantifying functional requirements for the successful interconnection of DG, maximizing benefits and minimizing risks, and adding to the growing body of engineering knowledge required for the successful evolution of power systems. 1.2 Regulatory Perspectives The current thrust of distributed resource-related regulatory initiatives is on the removal of obstacles to the interconnection of distributed resources (DR) and the promotion of DR as a player in the energy market.

2
In the past, the Area EPS operator has been the sole arbiter deciding the requirements for an acceptable interconnection of DR to the Area EPS. These requirements have often become a contentious issue, with DR proponents claiming obstructionism on the part of Area EPS operators. In some cases, the requirements are justified and necessary when judged from the traditionally conservative engineering standpoint characteristically applied to utility power systems. In other cases, the Area EPS is taking a risk-averse posture by concentrating on the negative aspects of the DR interconnection and the potential risks and liabilities to which they might expose the Area EPS. And, in still other cases, the requirements do present the clear impression of intentional obstructionism. 1.2.1 Standardized Interconnection Technical Requirements In general, regulatory bodies and standards groups are attempting to settle the contention by establishing uniform interconnection requirements for DR. This process began with the Institute of Electrical and Electronics Engineers (IEEE) Standard 929, which focused on small photovoltaic DR. Several states followed, and the scopes of their interconnection requirements were expanded to a wider range of DR. To a great extent, the technical provisions of IEEE 929 influenced state standards. For the DR manufacturer, the need to design DR and interconnect hardware to meet the disparate interconnection requirements of each of the states is itself an impediment. In 1998, IEEE initiated development of a new standard, 1547, to develop uniform interconnect requirements for all types of DR rated 10 MW and less. When this report was written, IEEE 1547 had been successfully balloted and was on its way to publication. It is anticipated that most states will adopt and codify this standard with minimum modification. The development of 1547, and its future application, is complicated by the large variations in distribution system configurations and situations into which DR may be connected and the widely differing performance characteristics of DR technologies. To achieve a consensus, and because of the virtual impossibility of considering every possible system situation, 1547 sets a minimum standard to which additional requirements may need to be added. The scope of 1547 is limited to requirements that can be met at the point of common coupling (PCC) between the DR owner’s facility (Local EPS) and the Area EPS. Effects on the Area EPS are not fully addressed. Also, the standard does not impose any limitation or additional requirements on the basis of DR penetration. Inherent to the development of 1547 was the assumption of a relatively low DR penetration in the Area EPS. There is an inherent compromise between DR interconnection requirements for the avoidance of islanding and the security of the EPS when there is significant penetration on the particular distribution circuit or on the larger interconnected grid [2]. Because the provisions of 1547 were drafted in the context of today’s low DR penetration, the balance between the conflicting goals was heavily weighted toward avoiding islanding. Thus, 1547 requires sensitive DR trip points, which also could be reached in events in which the grid security is compromised. With low DR penetration, the loss of DR capacity is inconsequential, and tripping is only a nuisance for the DR operator. With higher penetration, loss of DR could aggravate the system event, potentially precipitating a major system disruption. These issues are explored in this

3
report, and it is evident that future interconnection requirements will need to consider the system effects of higher DR penetration. 1.2.2 Nontechnical Interconnection Issues In addition to the technical requirements, interconnection also requires resolution of many commercial issues. These issues include matters of impact study requirements, allocation of costs for interconnection and system reinforcement, insurance, and rates. These issues have been addressed by state regulators in some states, where the important “who pays who what” issues have been determined in regulatory rulings and policy. In an effort to promote DR as a grid energy resource, thus promoting power market competition and liquidity, the Federal Energy Regulatory Commission (FERC) has recently stepped into the picture. Although it had previously been assumed that federal jurisdiction did not extend to local power distribution systems, FERC has now claimed jurisdiction regarding the interconnection of those DR intending to participate in the power market. A working group of stakeholder representatives has recently hashed out a consensus document that will be used by FERC to develop a Notice of Proposed Rulemaking (NOPR). A key feature of the FERC-sponsored document is the establishment of processes for approval of DR interconnection when the DR meets certain screening criteria. A “super-expedited process” is available for DR rated 2 MW or less; it establishes very prompt turnaround times and minimal application costs if the DR qualifies under a series of criteria related to penetration. For DR larger than 2 MW but no more than 20 MW, as well as for smaller DR failing to meet the screening criteria for the “super-expedited process,” an “expedited process” is specified. Although the details of the final NOPR will be determined by FERC, it is clear that processes that will tend to accelerate DR penetration, provided the necessary economic drivers are present, will be established. 1.2.3 Grid Performance Requirements In European countries, such as Denmark, in which the penetration of DR is already significant, grid-wide performance issues have arisen. In response, special grid performance requirements, or “grid codes,” have been established. These codes ensure that the performance of all generation resources is consistent with the needs of the system during critical events. At this time, such performance requirements have not been adopted in the United States. This has been the case because of the small DR penetration to date and the lack of recognition that small generating units, in large numbers, can significantly affect very large grid systems. It is evident from the results presented in this report that grid performance issues will eventually need to be addressed if DR are to reach penetrations at which they are a significant contributor to the nation’s energy portfolio. 1.3 Economic and Equipment Perspectives As noted in the background discussion, there are predictions that DG will become a significant factor in meeting total generation requirements for entire power systems.

4
The long-term vision of high penetration of novel and green DG sources and storage, with deployment that is highly dispersed and high tech—using many inverter-based technologies— needs to be balanced against the near-term realities. The fact is, on a kilowatt basis, most DG deployed today is rotating- and fossil-based. The economics of the US energy market and the natural risk aversion of private enterprise tend to favor mature and evolutionary technologies, not revolutionary technologies. The initial capital cost (e.g., dollars per kilowatt installed), reliability, and thermal efficiency of mature technologies—especially diesel and gas reciprocating engines and small gas turbines—are such that most new nonutility generation are of this type. On the renewables front, two technologies dominate: wind and mini/microhydro. In some parts of the country, especially the Northwest, microhydro (roughly less that 1 MW) continues to enjoy steady growth. The big news, especially in the past year, is the explosive growth of wind generation. However, it is important to note that the vast majority of new wind generation (on a megawatt basis) is being added as wind farms, not as DG. The wind turbine-generators in a wind farm are distributed within the farm, but the total output of the farm normally connects to the bulk power system at a single substation, in a fashion similar to other central-station generation. To be sure, there are interesting interconnection and operational questions related to the widespread and growing penetration of wind generation, but they are not DG interconnection issues. 1.4 Overview of Technical Approach The overall technical approach used in this study relies on illustrative simulations of power systems with significant penetrations of DG. These simulations are performed on one of the utility industry’s standard simulation packages, Positive Sequence Load Flow (PSLF) [7], used by bulk system planning engineers around the world. Details of the program and simulations are presented in the appropriate sections. Philosophically, the study and supporting simulations were designed to explore the boundaries of possible system behavior under a wide range of assumptions or possibilities regarding DG behavior and characteristics. Generally, the search for bounding behaviors drove the simulations toward extreme cases in the search for understanding. This approach does not reflect a belief that these particular extremes (e.g., 100% of all DG added has frequency control) are realistic but rather is a means of identifying which characteristics are most important. As noted above, the primary focus of this year’s efforts has been to examine a nearer-term reality, which is dominated by the addition of rotating, conventional technology DG. Many cases without DG and with inverter-based DG are provided for comparison and reference. In bulk power systems, events on the major transmission corridors or those involving major generating facilities will be felt electrically over the entire system. For example, events of the past few years in the western United States have made the general public aware that disturbances in the Pacific Northwest can affect the desert Southwest (and vice versa). Widespread deployment of DG is clearly further in the future than localized high concentrations. The widespread deployment of DG raises questions about the effect on dynamic performance of the bulk power system.

5
As a recap, the Year 1 study accomplished the following:
• Examined dynamic behavior of DG on distribution systems in which the DG was highly integrated with diverse residential/commercial loads
• Examined bulk power system behavior, with special concentration on inverter-based technologies
• Examined the tension between safety-related controls (especially anti-islanding) and bulk system behavior, illustrating some conflicts among local imperatives, equipment imperatives, and globally desirable (good citizen) behavior
• Identified some aspects for concern, especially with respect to the sensitivity of tripping for big events. These sensitivities increased the risk of cascading failures and widespread collapse, contrary to the view of DG as an asset for system reliability.
This second year’s effort built on the first and focused on:
• Closely examining rotating, conventional technology DG issues; testing ground for better/wider use of DG
• Searching for additional understanding to make this near-term reality mesh successfully with the long-term vision
• Examining the near-term projections and planning reality facing an operating US utility
• Examining frequency and frequency regulation effects (which were only partially addressed last year)
• Looking for additional drivers for universal interconnect (UI) functionality
• Looking for additional drivers and guidance for standards development (e.g., application of 1547) and input for other new standards.

6
2 Penetration and Market Trends 2.1 Discussion Major factors influencing the acceptance and deployment of DG in the United States are the business realities and market forces now acting on traditional utilities. With changes in regulation and unbundling of services, electric service providers are faced with the challenge of balancing their obligation to serve load with the need to manage risk. These basic requirements are in contrast with the need to keep customer rates down and maximize shareholder value. This section provides a brief examination of the planning reality facing one US utility and examines how DG influences and fits within that reality. 2.2 Case Study Bilateral power purchase agreements provide the backbone of power supply for electric service providers. The utility, used as the subject in this case study, currently meets the majority of its power supply in this fashion. Most bilateral agreements have fixed durations and need to be periodically renegotiated or allowed to expire. This is an ongoing process and one to which DG has the potential to add a significant variation. Figure 2-1 shows existing bilateral contracts through 2040. The overall downward trend shows the expiration of present contracts. This general trend applies to most utilities, though details will vary considerably.
Declining Contract Resources
0
500
1000
1500
2000
2500
3000
2002
2004
2006
2008
2010
2012
2014
2016
2018
2020
2022
2024
2026
2028
2030
2032
2034
2036
MW
Figure 2.1. Declining contract resources (studied utility)

7
This trend raises a major strategic question for the utility. Should it:
• Renew central station bilaterals • Rely on the spot market or other market mechanisms • Rely on DG?
These choices are not mutually exclusive, and the emergence of DG presents an additional class of options. The near-term trends in Figure 2.1 are important. The studied utility has about 20% of its bilateral contracts, totaling roughly 500 MW, expiring over the 5-year, near-term horizon. To gain insight into the role of DG in meeting this 500-MW obligation, it is valuable to look at what the utility can see in the near future for “DG” additions. The studied utility tracks planned additions of DG. Figure 2-2 shows a Pareto chart of the 34 “DG” projects on the radar of the studied utility. The total planned capacity addition is about 300 MW. The timing of the “DG” additions for this sample is over the next few years. This is a key point: these “DG” capacity additions are on the same order of magnitude as the loss in bilaterals. “DG” by this measure is a major factor in the business strategy of this utility. Look more closely at the figure.
DG Additions (Known)
0 10000 20000 30000 40000 50000 60000 70000 80000 90000
1 3 5 7 9 11
13
15
17
19
21
23
25
27
29
31
33
Site Number
kW R
atin
g
Figure 2.2. Pareto of known scheduled DG additions (studied utility)
The first four units are larger than the maximum DG rating addressed in the FERC NOPR. They are regarded by the subject utility as “DG” but will be interconnected by central-station interconnection rules—hence, the quotation marks. These additions are very important from a business perspective, and they are important from an infrastructure perspective. But they are not important with respect to the UI.

8
Together, these first four units are 206 MW, or 69% of the total. That puts the significance of the added DG into a different light. Truly distributed generation will constitute a much smaller percentage of additions. Figure 2-3 examines the DG additions more closely. This figure shows all of the known DG additions of rating below the proposed FERC 2-MW break point. These dozen projects add up to 4.2 MW, or 1.4% of the known additions. The stress on “known” is important. Very small generation is more likely to slip under the information-gathering radar of the host utility even if interconnection requirements are in place. It is difficult to know how accurate such information is. However, even if these represent only a fraction of the total DG to come on line in the near future, the contributed power will be small from a bulk system perspective, though not necessarily from the perspective of the local power system.
DG additions (known) < 2 MW
0
500
1000
1500
2000
2500
Hydro / S
ynch
ronou
s
Hydro / I
nduc
tion
Hydro / I
nduc
tion
Hydro / I
nduc
tion
Gas - s
ynch
ronous
Wind / I
nduc
tion
Hydro / I
nduc
tion
Hydro / I
nduc
tion
Hydro / I
nduc
tion
Hydro / I
nduc
tion
Hydro / I
nduc
tion
Wind / I
nduc
tion
kW R
atin
g
Figure 2.3. Units less than 2 MW – Pareto of known scheduled DG additions (studied utility)
Figure 2-4 examines DG additions in the FERC range of 2–20 MW. The 15 units here total 89 MW, or 30% of the total on the sample utility radar. These units are big enough to make a significant difference in system dynamics and yet small enough to possibly escape closer scrutiny, especially with respect to system performance. Proposed FERC rules and most utility rules do require complete system interconnection studies and protection for equipment in this size range. Notice that all of the generation in the 2–20 MW range is rotating machines, with a mixture of fossil and hydro prime movers.
9
DG additions (known) 2< P < 20 MW
0
2000
4000
6000
8000
10000
12000
14000
Hydro / S
ynch
ronous
Synch
ronous
Nat Gas
/ Syn
chron
ous
CT / Syn
chrono
us
Garbage bu
rner
Hydro
Hydro / S
ynch
ronous
Synch
ronous
Nat Gas
/ Syn
chron
ous
Steam / S
ynch
ronous
Nat Gas /
Synch
ronous
Diesel /
Synch
ronou
sDiese
l
Hydro / I
nducti
on
Steam / S
ynch
ronous
kW R
atin
g
Figure 2.4. Units more than 2 MW and less than 20 MW – FERC Level 2 Pareto of known scheduled
DG additions (studied utility) Some observations can be drawn from this sample data:
• A relatively small number of large customer-owned generation dominates the known nonutility generation additions.
• The total power from these sources is large enough to have a substantial effect on the business of the host utility and is likely to influence system performance as well (see next section).
• A significant amount of new generation is in the 2–20 MW range. DG is here and happening now for this utility.
• It is possible that the small DG (less than 2 MW) is either not happening or not visible to the host utility. It is not clear from this data how much concern about these sources is necessary from a bulk system perspective.
The real data from this example provided some of the guidance for the system analysis presented in the next two sections for this year’s work.

10
3 Dynamics of Bulk Power Systems With High DG Penetration 3.1 Control and Protection of Rotating DG Rotating, synchronous DG has inherent performance characteristics that are generally complementary to the operation of power systems. Synchronous machines provide virtually all power generation in all power systems, and a century of application practice and equipment has grown to meet the requirements they impose on the system. Although the basic dynamic behavior of synchronous generators is inherent, there is latitude to modify or adopt protection and control practices without incurring substantial capital costs or requiring fundamental changes in hardware. The control and protection of individual distributed generators naturally tend toward the interest of the buyer. The behavior of these individual distributed generators may or may not be beneficial to the performance of the bulk system. The DG owner may not be rewarded economically for providing system benefits. The introduction of DG presents some challenges to the power system because the connection of DG, when it is imbedded in the distribution system with customer load, complicates operation and protection of the distribution system. Many aspects of these complications were examined in the first-year study [1]. This section investigates implications of the controls that are commonly provided with DG with respect to the interests of the bulk power system. The investigation is aimed at identifying potential benefits and risks to the bulk power system arising from these practices. The following subsections present a brief explanation of typical unit controls that might be provided with rotating DG. 3.1.1 Excitation Every synchronous machine maintains the magnetic field required for synchronism by means of another externally powered magnetic field. In very simple permanent magnet machines (which are typically very small), this field is fixed. For all other synchronous machines, the field is maintained by means of an excitation system—an exciter, for short. The exciter delivers direct current to the machine field (on the rotor of the machine). The excitation can normally be adjusted or controlled, and the differences in this control can be substantial—or more importantly, have substantial effects on the behavior of the power system. Manual Control Manual control requires that a human operator adjust a setting to raise or lower the reactive power output (and normally the resultant steady-state voltage) of the machine. Human control can be important for slow variations in system condition, e.g., daily or seasonal variations. It is largely irrelevant for faster phenomena such as system upsets. For the purpose of this report, manual control is equivalent to no excitation control at all. Manual control is often found on synchronous generators, sometimes including rather large ones.
11
Constant Power Factor Automatic controls can be used to hold a constant power factor (i.e., a fixed ratio of active to reactive power). Such control is quite common. Owners of generation will often set the power factor control to hold unity power factor—that is, to produce only active power (kilowatts), leaving all voltage regulation and support functions to other sources, often the host grid. This operating philosophy often makes good economic sense to the DG owner. Unity power factor normally represents the minimum loss operating point for the machine. The DG owner may not be rewarded for providing reactive power or voltage support and is therefore unmotivated to incur costs to do so. (Or conversely, the owner may not be “punished” for failure to do so.) Voltage Control Voltage control results when machine excitation is adjusted in a closed-loop automatic fashion in response to deviations in measured voltage (e.g., at the terminals of the machine) from a voltage reference. Such control is standard practice for large, central-station generation and is a component of bulk power system operation and security. Voltage control on DG has the potential to complicate voltage and reactive power management on distribution systems [1]. On the other hand, there are examples of how voltage regulation has the potential to improve system performance. Voltage regulation is a requirement for isolated operation but is contrary to anti-islanding. (This was investigated at some length in the first year.) 3.1.2 Governor The active power output of a synchronous generator is controlled by the energy source—the prime mover, which is normally either a turbine (hydro, steam, or gas) or an engine (diesel or gas). Control of the active power output is by a governor and can sometimes be adjusted. Again, the differences in this control can be substantial—or more importantly, can have substantial effects on the behavior of the power system. Constant Power Control The power output of a distributed generator can be held constant within the constraints of the prime mover. This type of control is used for base load generation and is preferred for grid-connected DG to minimize the potential for sustained islanding. This arrangement can sometimes have the benefit of allowing steady operation at an optimum performance level for the energy source. For some devices, cleaner and more efficient operation may result from constant power operation. For grid-parallel operation, there is no requirement that the energy source actively respond to system disturbances. Thermal Load Following Power generation that is an integrated part of a large energy system will often “follow” the load. For example, steam or other heat needed for processes or space heating will dictate the overall energy production. The electric power produced in the process of meeting this primary need is therefore not controlled for the benefit of the EPS. This practice is relatively common in industrial applications and could be significant in combined heat and power and combined cooling, heating, and power applications as well.

12
In a sense, many types of microhydro fall functionally into this category. Hydro that relies solely on flow (i.e., run of river, with no controllable water storage) must produce power in relationship to the available flow or uneconomically spill water without generating power. Frequency control The balance between load and power production dictates the frequency of the power system. In large interconnected power systems, a significant fraction of the central-station generation participates in frequency regulation—increasing power output when the frequency drops and reducing output when the frequency rises. The first line of frequency control is the local machine governor, which provides the spinning reserve for the system. For DG, this type of control will be required for islanded operation but will not normally be applied to grid-connected devices. Frequency control will (generally) direct the DG to increase power output in response to frequency depressions. 3.1.3 Anti-Islanding Implementations The options for active detection of islanding are somewhat more limited for conventional rotating DG than they are for inverter-based devices. Active anti-islanding must act through existing controls, i.e., the exciter or the prime mover controls. In one arrangement under consideration by a conventional rotating-DG manufacturer, the fuel flow to the engine is increased in response to a measured increase in system frequency. Active anti-islanding schemes of this type are designed to destabilize a local islanded power system. A reasonable simplification for these systems from a system perspective is a governor function with a negative gain—i.e., one that raises output with increased frequency and vice versa. The bulk system implications of this type of control are considered below. 3.2 System Modeling Simulations of bulk power system dynamic behavior depend on both software with appropriate models and data specific to the particulars of the system under study to support those models. This section describes the modeling used for investigation of bulk power system effects of high levels of DG penetration. 3.2.1 PSLF Description GE PSLF is a large-scale power systems analysis software program designed to provide comprehensive and accurate load flow, dynamic simulation, and short circuit analysis. It is a commercial software product developed, supported, used, and distributed by GE Power Systems Energy Consulting. PSLF is a positive sequence, fundamental frequency phasor analysis tool. This tool can handle large-scale power system problems. System models with thousands of generators and tens of thousands of buses, loads, and circuit elements are commonly used. It is one of the industry standards for this type of analysis and is widely accepted by electric power businesses. The tool is suitable for investigating a wide range of fundamental power system issues, such as:

13
• Voltage profile • Short circuit current levels • Active and reactive power flows • Thermal (current) loading on circuit elements • Transient stability (maintenance of synchronism) • Dynamic stability (damping of electromechanical oscillations between generators) • Voltage stability and collapse • Reactive power control and management • Frequency control • Power interchange control.
These issues are constantly under consideration by electric utilities. The introduction of DG to the power system has the potential to affect all these issues, and so PSLF (as well as other similar tools) are well suited for investigation of possible effects. A detailed description of the PSLF program is provided in [7]. For PSLF power system simulations that include DG, the DG is represented at various levels of detail. As noted above, from a power system performance perspective, there are two general classes of DG:
• Rotating machinery, including synchronous generators and induction generators. Synchronous generators include reciprocating engines (diesel and gas), minihydro, small gas turbines, and many wind systems. Induction generators are used for some wind and microhydro systems.
• Inverter-based DG, which includes most emerging technologies such as fuel cells, microturbines, photovoltaics, and some wind systems.
Modeling electrical components of synchronous and induction generation for fundamental frequency is a well-established art. PSLF includes a full suite of industry-accepted models for synchronous generators, induction machines, excitation systems, turbines, engines, speed governors, and protective relays. These models, with appropriately selected parameters, are well suited to modeling rotating machinery. Further, the fundamental frequency behavior of power systems, which include a wide variety of synchronous generation, is well understood [4]. Modeling of inverter-based systems for fundamental frequency dynamic performance builds on a reasonably established experience base, which includes modeling power electronics in power systems. 3.2.1.1 PSLF EPS Models The modeling of the EPS network in PSLF is through algebraic device models that are compatible with phasor analysis. As such, all network elements such as transmission and distribution lines, cables, transformers, capacitors, and inductors are modeled by their fundamental frequency (i.e., 60 Hz) positive sequence impedances. Series elements, including all lines and cables, will normally include a resistive and inductive impedance. The capacitive
14
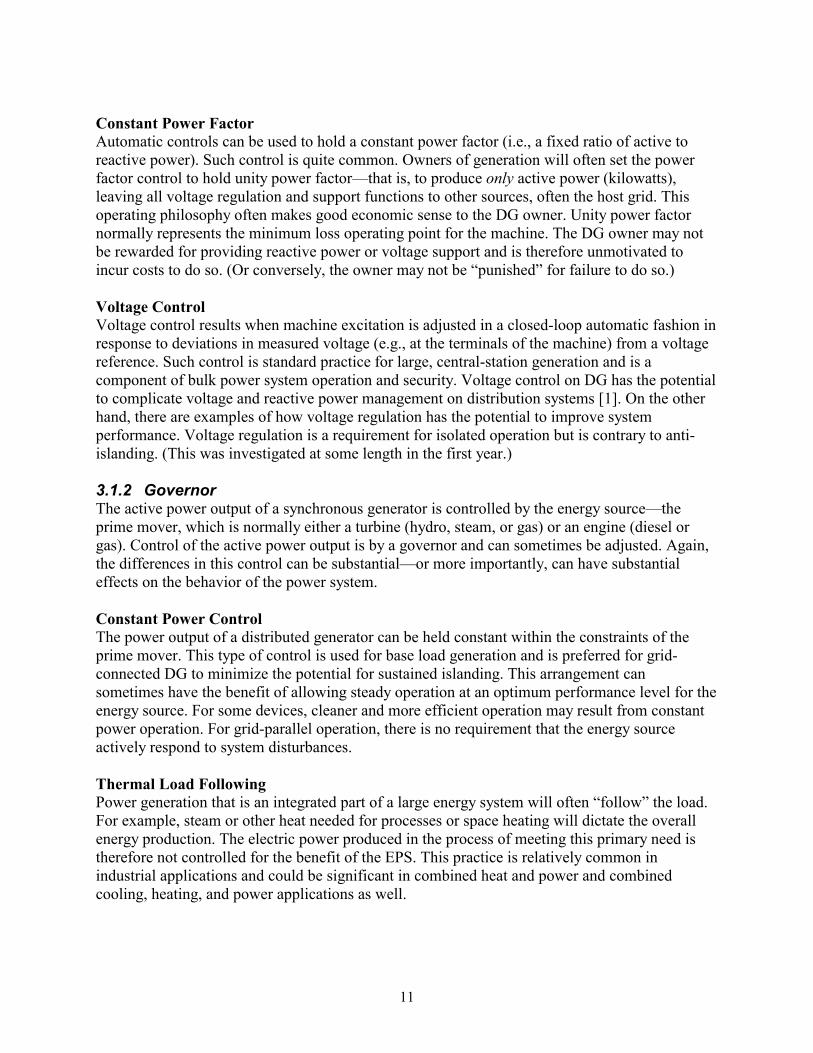
charging of cables and long lines is included using the standard p-equivalent model. Transformer models always include leakage reactance and a nominal turns ratio. Additional detail for transformers can include winding resistance, multiple windings, no-load magnetizing reactance (to ground), and load tap changers. Shunt devices such as switched capacitors may include voltage-sensitive switching controls. 3.2.1.2 PSLF Load Models In the examination of potential DG effects and dynamic performance on power systems, representation of load dynamics is critical. The dynamic behavior of the motors, which make up a major share of the total load served on normal power systems, is critical. Representation of loads as simple shunt resistances and reactances is incorrect and can be misleading when seeking to understand potential dynamic behavior of power systems with DG. 3.2.2 Rotating DG – Generator The generator used in this report is represented by a typical uniform inductance ratio rotor model (WSCC Type F mode) in which shaft speed effects are neglected. Figure 3.1 shows the generator model. For the investigations in this report, a representative set of parameters for the model was used. These are listed in Table 3.1. All DG modeled in the WECC system simulations were assumed to have these parameters, with only the size (megavolt-ampere rating) being adjusted for each of the thousands of sites. Of course, in practice, there is a range of parameters for machines. Nevertheless, this approach gives good insight into overall system effects of widespread DG penetration. This investigation only considered synchronous generation; it did not consider induction generation, for which voltage control is not an option. Some governor control is possible. As we noted above, induction-type rotating generation tends to be limited to very small sources.
do''s T1
id
Efd do's T1
d''Ld'Ld'LLd
−−
L’d - L”dd''Ld'Ld"LLd
−−
E’q
Se
SeE”q
)ag(LdLq.1Se
:ex c epts im ilarAx isQ
)ag(f s at.1Se
ϕ+=
−
ϕ+=
d"ϕ
Figure 3.1. Generic rotating synchronous distributed generator model

15
Table 3.1. Generator Model Parameters
T’do D-axis transient rotor time constant, s 5.560 T’’do D-axis sub-transient rotor time constant, s 0.038 T’qo Q-axis transient rotor time constant, s 0.840 T’’qo Q-axis sub-transient rotor time constant, s 0.055
H Inertia constant, s 4.555 D Damping factor, pu 0.000 Ld D-axis synchronous reactance, pu 1.921 Lq Q-axis synchronous reactance, pu 1.885 L’d D-axis transient reactance, pu 0.266 L’q Q-axis transient reactance, pu 0.422 L’’d D-axis sub-transient reactance, pu 0.176 L’’q Q-axis sub-transient reactance, pu 0.182 L1 Stator leakage reactance, pu 0.170
Se (1.0) Saturation factor at 1 pu flux 0.124 Se (1.2) Saturation factor at 1.2 pu flux 0.550
Ra Stator resistance, pu 0.0038 Rcomm Compounding resistance for voltage control, pu 0.000 Xcomm Compounding resistance for voltage control, pu 0.000
3.2.3 Rotating DG – Excitation Exciters come in a variety of forms and models. As with the machine models, a single exciter model was used for all DG in the simulations. The exciter used was an IEEE-type ST1 excitation system, which is a modern bus-fed exciter with a high-speed voltage regulator. It is representative of an exciter that might be found on a small rotating distributed generator. Figure 3.2 shows the exciter model. The parameters used for the study are listed in Table 3.2.
Ilr
Klr
Efd
Ladlfd
S0
VcompS1
++
+
+
--
Vref
Vamin
+
VamaxVimax
Vimin
sTb1sTc1
++
1sTb11sTc1
++
S4 S2
S3
+
VtVrmax - Kc Ifd
Xe
-
0
sTa1Ka
+sTr11
+
VtVrmin - KcIfd
sTf1sKf+
Vsig
Figure 3.2. Generic rotating synchronous DG exciter model
16
Table 3.2. Exciter Model Parameters
Tr Filter time constant, s 0.025
Vimax Maximum error, pu 7.000 Vimin Minimum error, pu -7.000
Tc Lead time constant, s 1.000 Tb Lag time constant, s 10.000 Ka Gain, pu 210.000 Ta Time constant, s 0.020
Vrmax Maximum controller output, pu 6.430 Vrmin Minimum controller output, pu -6.000
Kc Excitation system regulation factor, pu 0.038 Kf Rate feedback gain 0.000 Tf Rate feedback time constant, s 0.000
Tc1 Lead time constant, s 0.000 Tb1 Lag time constant, s 0.000
Vamax Maximum control element output, pu 99.000 Vamin Minimum control element output, pu -99.000
Xe Excitation transformer effective reactance, pu 0.000 Ilr Maximum field current, pu 99.000 Klr Gain on field current limit 0.000
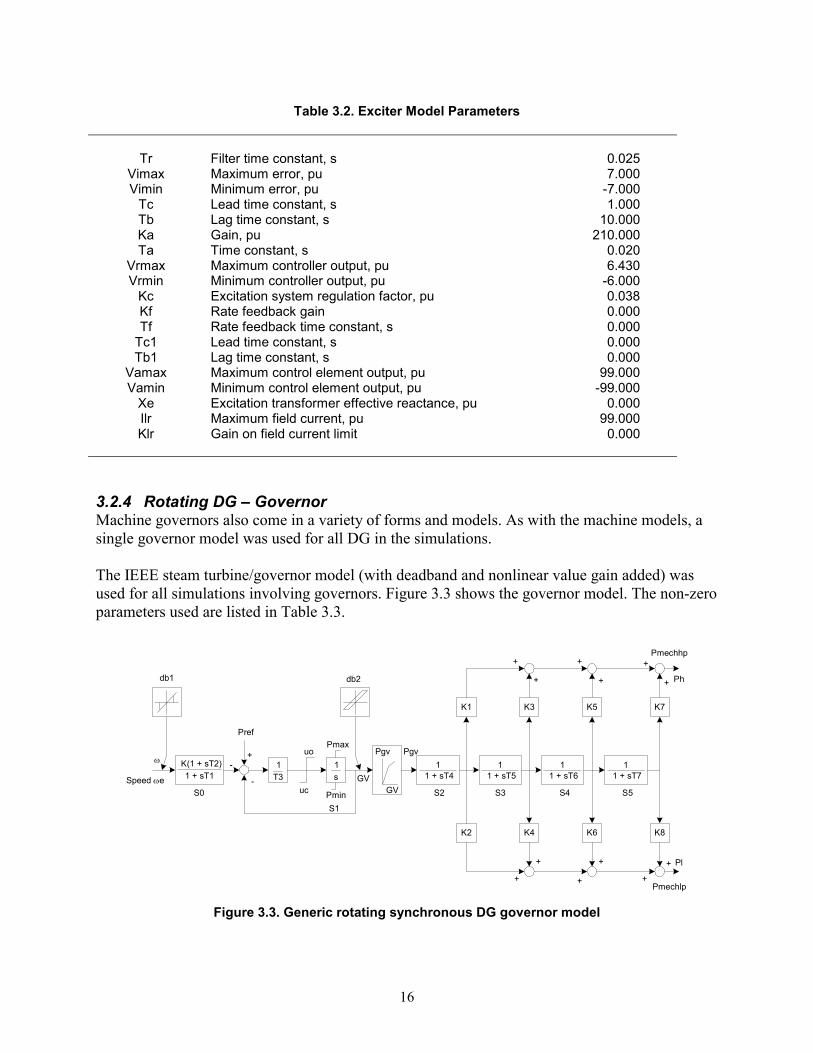
3.2.4 Rotating DG – Governor Machine governors also come in a variety of forms and models. As with the machine models, a single governor model was used for all DG in the simulations. The IEEE steam turbine/governor model (with deadband and nonlinear value gain added) was used for all simulations involving governors. Figure 3.3 shows the governor model. The non-zero parameters used are listed in Table 3.3.
K(1 + sT2)1 + sT1
11 + sT4
11 + sT5
11 + sT6
11 + sT7
K1
K2
K3
K4
K5
K6
K7
K8
1s
1T3
Pmin
PmaxPref
db1 db2
uo
ucGV
Pgv
GV
Pgv
S2 S3 S4 S5
Pmechhp
Pmechlp
Ph
Pl+
+
+
+
+
+
+
+
+
+
+
+
+
-
-
S1
S0Speed ωe
ω
Figure 3.3. Generic rotating synchronous DG governor model

17
Table 3.3. Governor Model Parameters
K Governor gain (reciprocal of droop), pu 20.000 T1 Governor lag time constant, s 0.150 T2 Governor lead time constant, s 0.000 T3 Valve positioner time constant, s 0.100 Uo Maximum valve opening velocity, pu/s 0.100 Uc Maximum valve closing velocity, pu/s -0.200
Pmax Maximum valve opening, pu of mwcap 1.000 Pmin Minimum valve opening, pu of mwcap 0.000 T4 Inlet piping/steam bowl time constant, s 0.300 K1 Fraction of hp shaft power after first boiler pass 0.237 K2 Fraction of lp shaft power after first boiler pass 0.000 T5 Time constant of second boiler pass, s 10.000 K3 Fraction of hp shaft power after second boiler pass 0.763 K4 Fraction of lp shaft power after second boiler pass 0.000
3.2.5 Inverter DG Figure 3.4 shows an inverter-based DG structure with the anti-islanding schemes highlighted (in red). This structure is discussed in depth in references [1] and [3]. The anti-islanding schemes work through two paths of the inverter control. The first path primarily affects the power output, via the current magnitude control, in response to voltage deviations. The second path primarily affects the synchronization of the DG, through the angle, in response to frequency deviations. These two schemes were applied together for the cases presented in this section.
PVsT+11
VsT+11
PVKIQmax
-IQmax
%Imax
0
%
cos(x)
tan-1(IQ/IP)
sT+11
Im
θ V
θ I
+-+
-
Vorder
Porder
V
Ipdes
Iqdes
PV
pf
sT+1K
Pref
∆ f+-
Pmax
0Vmax
Vmin
2pdes
2maxmaxQ II=I
DG Control ModelDG Inverter Model
+
+
VI
VI
sT+1sK
V
++
FI
FI
sT+1sK
∆ f Figure 3.4. Positive sequence DG inverter-based model with anti-islanding paths

18
3.2.6 Western Energy Coordinating Council A model of the entire Western Energy Coordinating Council (WECC), formerly the Western Systems Coordinating Council (WSCC), bulk power system was used for this investigation. A transmission map of WECC is shown in Figure 3.5. WECC includes the entire western half of the United States (from east of the Rocky Mountains to the Pacific Ocean); all of Alberta and British Columbia, Canada; and a portion of northern Baja, Mexico. The model was obtained from Puget Sound Energy and includes 12,082 buses and 2,291 generators. The condition represented in this data set is for heavy winter load conditions for the year 2001. This full system model is used to examine bulk power system effects that may result from widespread deployment of DG and the effect of variations in DG characteristics. The specific focus of the investigations was on system dynamics following disturbances under high-stress conditions.
Malin Station
Palo Verde NPS
Path 15
Figure 3.5. Major transmission in WECC

19
Static load flow analysis of this system provides boundary conditions to examine the dynamics resulting from system disturbances. Figure 3.6 shows the voltages, active power, and reactive power flows around a representative key 500-kV substation in the Pacific Northwest: the Malin substation. Flows are given in megawatts (above the line) and megavolt-amperes reactive (below the line). This figure is included to provide a sense of the scale of bulk power exchange in a large interconnected system such as the WECC. Flows south from Malin to Round Mountain (across the California-Oregon Interface) total more than 2,000 MW.
Figure 3.6. Power flows around the California-Oregon border (Malin station) in WECC

20
3.3 WECC Results As initially noted, in bulk power systems, events on the major transmission corridors or those involving major generating facilities will be felt electrically over the entire system. For example, events of the past few years in the western United States have made the general public aware that disturbances in the Pacific Northwest can affect the desert Southwest (and vice versa). It is that fundamental observation that drives the need to investigate the aggregate effect of a significant penetration of DG on the behavior of the power system. Many questions immediately present themselves:
• How many distributed generators constitute “significant” penetration? • Will the dynamic behavior of DG benefit or hurt system performance? • What aspects of the dynamic behavior of DG cause these effects?
The first year’s investigation showed significant effects at between 10% and 20% penetration for the WECC system and condition examined (summer peak load). Therefore, a 20% penetration level has been retained for this investigation, which is focused on providing insight into the other two questions with rotating DG. 3.3.1 Line (Voltage/Angular Stability) Events The dynamic response of this system to large events involves the entire power grid. To illustrate this point, a simulation of a severe (bolted three-phase) fault at the Malin 500-kV substation near the California-Oregon border, cleared by opening Circuit #2 of the 500-kV line south to the Round Mountain 500-kV station, was run. Time traces for some key system variables are shown in Figure 3.7. These are:
• Palo Verde frequency: Arizona • Malin frequency and voltage: California-Oregon Border • Midway voltage: Central California • Malin-Round Mountain (Circuit #1) power: California-Oregon Interface • Gates-Midway (Circuit #1) power: Central California (Path 15) Interface.
There are four color traces on each of the six sets of axes. These represent four sets of DG assumptions, subject to the same fault:
• The black trace is for no DG. • The red trace is for inverter-based DG with no controls. • The green trace is for inverter-based DG with full controls (per Figure 3.4). • The blue trace is for conventional rotating DG with no controls.
In these time traces, one can see that a disturbance (the fault) occurs at 0.5 seconds and is removed by protective relay action about 70 ms later. As shown in the lower left traces of Figure 3.7, the Malin-Round Mountain circuit is initially carrying about 1,000 MW. When the parallel circuit (#2) trips, much of the power flow on the

21
remaining circuit swings to near 2,000 MW and then settles to around 1,800 MW. Figure 3.7 shows the voltage and frequency swings on a few 500-kV buses of interest. A more complete set of traces is included in the appendices for each of the simulation result figures presented in this section. The traces in the appendices include a wide range of system and machine variables from around the WECC. Several important observations can be made from this case:
1. First and most importantly, large events on the bulk power system affect every generator and load in the entire power system. All 2,000-plus central-station generating stations in the WECC are affected by the fault on the California-Oregon border, and they all participate in varying degrees in the resulting dynamics. It is clear from this case that every distributed generator that might be deployed in this system will also participate in the dynamics of these events.
2. Second, the action of DG with controls can significantly alter the system dynamics. This is shown clearly in the green trace.
3. Third, the inherent (i.e., uncontrolled) response of DG has relatively little effect on the system dynamics for this event.
The set of cases presented in Figure 3.7 provides some context for further investigation of the effect of controls that might be found on conventional rotating DG.

22
Figure 3.7. Major transmission fault in WECC – comparison with basic controls

23
The same fault event is reported again in the traces of Figure 3.8. In this case, the traces correspond to the following sets of modeling:
• The black trace is for no DG.
• The red trace is for conventional rotating DG with no controls acting on the prime mover or rotor field current within the timeframe of the simulation.
• The green trace is for conventional rotating DG with exciter/voltage regulation control (per Figure 3.2).
• The blue trace is for conventional rotating DG with governor/frequency regulation control (per Figure 3.3).
These control assumptions are intended to provide performance representative of the control philosophies outlined in Section 3.1 for the time frame of these simulations. In particular, the red trace corresponds to DG with fixed field or power factor controls and fixed power outputs. Several observations can be made from this set of cases:
• First, the excitation/voltage control has considerably more effect on the system response than the governor response. This is expected because this type of event creates much larger voltage disruptions than frequency disruptions. Thus, controllers that respond to the larger signal will have more effect.
• The first swing response of the system is somewhat better with the rotating DG, especially those with voltage regulation. This is most apparent in the Palo Verde frequency swing (which peaks at about 1.5 s) but can also be seen in other system variables.
• The effect on the system damping (i.e., the oscillatory response) is moderate. The shape of the swing curves (and therefore, the mode shapes) is noticeably different, though none of the cases shows much difference in the settling time (i.e., how long it takes for the oscillations to die out). This suggests that the rotating DG is relatively benign with respect to damping effect. However, because the mode shapes are changed, it is possible that the true effect on damping may be obscured from easy identification in a few seconds of simulation.

24
Figure 3.8. Major transmission fault in WECC – comparison of various rotating DG controls

25
3.3.2 Frequency/Capacity Events The following cases show the response of the WECC following an unusually severe event. In this case, a very large power station with multiple units—the Palo Verde NPS, generating more than 3,000 MW—is assumed to be tripped off line by some common-mode disturbance. (It should be noted that this disturbance is more severe than standard “N-1” planning criteria. WECC criteria dictate that the power system should survive this disturbance, but limited customer interruptions are allowable for events of this severity.) The same system variables are reported again in the traces of Figure 3.9. In this case, the traces correspond to the following sets of modeling:
• The black trace is for no DG. • The red trace is for inverter-based DG with no controls. • The green trace is for inverter-based DG with full controls (per Figure 3.4). • The blue trace is for conventional rotating DG without prime mover or excitation
controls. In this case, loss of a major generating station causes a severe decay in system frequency. The frequency drops fastest at the Palo Verde station but is felt a thousand miles away at Malin within the first second. A couple of observations can be made from this set of cases: • First, the action of inverter controls dramatically alters the system dynamics. The green
trace shows a faster frequency drop followed by a somewhat better voltage and frequency recovery. (The underlying cause of this response will be discussed more with the next set of cases).
• Second, the behavior of the system with the uncontrolled rotating DG is slightly better.

26
Figure 3.9. Major generation loss event in WECC – comparison with basic controls
27
The same fault event is reported again in the traces of Figure 3.10. In this case, the traces correspond to the following sets of modeling:
• The black trace is for no DG.
• The red trace is for conventional rotating DG without prime mover or exciter controls.
• The green trace is for conventional rotating DG with exciter/voltage regulation control (per Figure 3.2).
• The blue trace is for conventional rotating DG with governor/frequency regulation control (per Figure 3.3).
Two important observations can be made from this set of cases:
• First, and most surprisingly, the excitation/voltage control (green trace) has a strong and adverse effect on the system response. The system frequency excursion is made substantially worse, with frequencies dropping below 59.7 Hz—commonly the first level of under frequency load shedding. Closer inspection of the system dynamics reveals the reason for this response. Following this large system disturbance, both voltages and frequencies drop. The drop in voltage near the customer loads results in a temporary reduction in their power consumption. This is a beneficial effect, sometimes termed “load relief,” resulting from the load-voltage sensitivity. In this system, the widespread deployment of DG is modeled as occurring at the loads. When the excitation systems are equipped with voltage regulators, they work to hold up the load voltages, reducing the load relief and aggravating the frequency decline. For this class of event, the presence of voltage regulation without a complementary frequency regulation function is much worse than with no DG control at all.
• As might be expected, the presence of governor/frequency regulation (blue trace) helps the system response, improving the frequency recovery and reducing the amplitude of the voltage swings.

28
Figure 3.10. Major generation loss event in WECC – comparison of various rotating DG controls

29
3.3.3 Under Frequency Trip Sensitivity Interconnection standards for DG, including 1547 and most state DG interconnection standards, have requirements for under voltage and under frequency tripping of DG. These requirements are directed at ensuring that DG rapidly disconnects in response to problems on the distribution system. However, because large-scale disturbances can cause widespread voltage and frequency excursions, this requirement raises some concerns about its potential effect on bulk system dynamics. Most of the new standards and guidelines dictate that DG disconnect when frequencies drop more than 0.7 Hz. It is important to note that these documents specify the minimum frequency to trip. The DG may trip at higher frequencies than this. In fact, to achieve very rapid islanding detection to coordinate with circuit reclosing delays, a DG installer may have strong incentives to set the under frequency trip point as sensitive (high) as possible. Figure 3.11 presents a case in which aggressive under frequency tripping of the DG is applied.
• The black trace is for no DG. • The red trace is for conventional rotating DG with no controls. • The green trace shows behavior with under frequency DG tripping.
The disturbance for these cases is the same very severe event shown in the previous case: tripping of a large multiunit power plant. In each case, there is 20% DG penetration, as described above. The under frequency trip level (based on machine speed as would normally be the case, rather than transduced from voltage signals) is set at 59.8 Hz, which is the maximum under frequency trip point specified in IEEE 1547 for large (more than 30 kW) DG. Figure 3.11 shows the cumulative behavior of the DG driving the system into widespread disruption. During the initial stages of the disturbance, the frequency in the vicinity of Palo Verde drops fastest. Within the first few hundred milliseconds following the disturbance, the frequency drops more quickly as DG starts to trip on low frequency. The subsequent widespread power shortage, because of the DG tripping, causes a cascading failure. Over the course of the next few seconds, several thousand more megawatts of DG trip. The details are relatively unimportant because the system is beyond the point of no return a fraction of a second following the fault clearing. The results are somewhat alarming. The widespread frequency depression because of the fault causes many distributed generators throughout the system to trip, which leads to a cascading failure of the entire network. The lower right traces show the power flow on one circuit of Path 15 in central California. The power on that circuit rises quickly as power flows from the north to help make up the deficiency caused by the generator tripping. Widespread tripping of generation halts this balance as the system voltage collapses. The entire system is in full-blown irreversible collapse by 1.5 s. In the last stages of a system breakup like this, the voltage collapses, driving the load power down. The frequency rises uncontrollably. Past experience in WECC is that the system breaks up into isolated electrical service areas, some of which would be viable and maintain service. Others would be unstable and black out.

30
Figure 3.11. Major generation loss event in WECC – effect of under frequency tripping

31
3.3.4 Active Anti-Islanding Effects The potential effect of active anti-islanding, as discussed in Section 3.1.3, was tested on the same fault event. The same variables are again presented in the traces of Figure 3.12. In this case, the traces correspond to the following sets of modeling:
• The black trace is for no DG.
• The red trace is for conventional rotating DG with no controls.
• The green trace is for conventional rotating DG with governor/frequency regulation control (per Figure 3.3).
• The blue trace is for conventional rotating DG with a governor with negative frequency regulation gain as an approximation to governor-based active anti-islanding (per discussion in Section 3.1.3 and Figure 3.3).
The principal observation from this case is that the active anti-islanding, while relatively benign, does aggravate the frequency depression and impede recovery. Sustained negative response to frequency deviations is not beneficial, and schemes should avoid this simplistic approach.

32
Figure 3.12. Major generation loss event in WECC – effect of active anti-islanding

33
4 Microgrids 4.1 Introduction One class of dynamic effect of immediate concern is the potential for DG to alter the local dynamics of a specific subsystem or distribution feeder. This becomes a concern when there is a significant penetration of DG relative to the total load power on that feeder. Such localized concentrations are likely to occur even before DG becomes more commonplace. Thus, there is some urgency for the power industry to understand the possible effects of locally high concentrations of DG. One business and technical structure that shows promise as a means of taking full advantage of DG is the microgrid. Microgrids are receiving considerable interest from the power community [8]. “Microgrid” is a loosely defined term that describes a small power system, generally with multiple generators and loads. Concepts for microgrids fall into two general categories:
• Systems that are intended to always operate isolated from a large utility grid • Systems that are normally connected to a larger grid.
Conceptually, the isolated microgrid is like a scaled-down version of a large-scale utility grid. Many of the technical requirements are the same. To supply reliable, quality power, the microgrid must have mechanisms to regulate voltage and frequency in response to changes in customer loads and disturbances. The penetration of DG in an isolated microgrid is, by definition, 100%—all power comes from DG. For the grid-connected microgrid, the distinction is more subtle. The basic concept is that a well-defined subset or subsystem contains loads and local DG. The penetration of DG for this subsystem could approach or even exceed 100%. The microgrid would be designed and operated such that it presents the appearance of a single predictable and orderly load or generator to the grid at the point of interconnection. This arrangement provides potential advantages for all stakeholders:
• DG owners may be able to rate and operate their generation more economically by being able to export (and import) power to the microgrid.
• The microgrid takes advantage of load diversity to reduce the total installed DG capacity required.
• Load customers may be able to have continued service (possibly at a reduced level) when connection to the host utility is lost.
• The host utility may be able to depend on the microgrid to serve load customers in such a fashion that substation and bulk power infrastructure need not be rated (or expanded) to meet the entire load, as if the DG were not present. (This last point is a major, legitimate obstacle to DG.)
• The microgrid could be controlled in such a fashion as to be an active asset to bulk system reliability (for example, by providing spinning reserve or black start services).

34
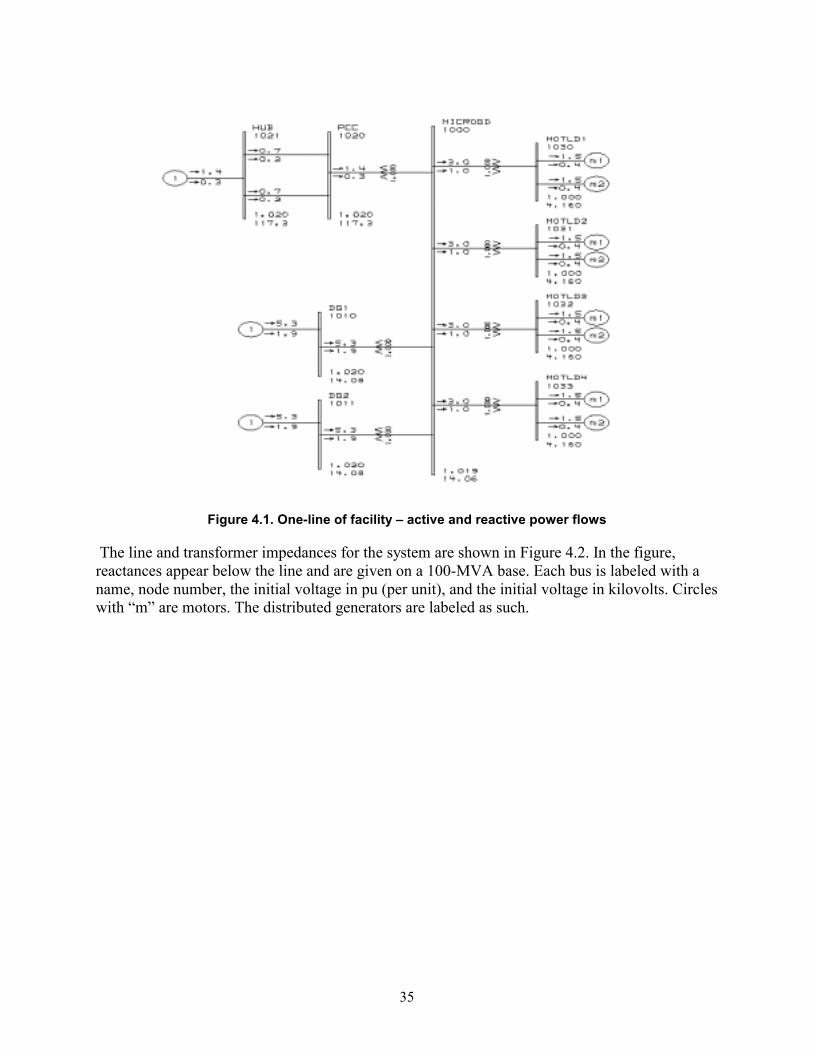
To realize these potential benefits, the distributed generators in the microgrid must have, at the least, additional controls. Further, most of these potential benefits require some level of coordination and communication. These controls, which are basically aimed at allowing viable standalone operation and intentional islands, are largely incompatible with present industry trends and the requirements of current interconnection standards. The business and regulatory environments presently do not favor multiparty microgrids—those in which power and services are exchanged between third parties over regulated power distribution infrastructure. The result of this environment is that individual entities, such as industrial or institutional facilities, represent the first generation of microgrids. The entities that turn to DG for their power needs are the “first adapters” from which industry understanding and best practices can evolve for microgrids. The explorations of microgrids for this year’s effort are focused on these single business entity microgrids. For clarity, we have termed this more narrowly defined structure a “facility microgrid.” 4.2 Facility Microgrid Model A relatively simple facility with a variety of loads and DG was used for investigation of facility microgrid dynamic behaviors. A one-line of the system—showing the loads, DG, and power flow for the base condition—is shown in Figure 4.1. It includes most basic distribution system components expected to be important for investigation of fundamental frequency performance issues. The facility has a main 13.8-kV service bus, with multiple laterals serving individual blocks of load. The loads are a variety of motors with different dynamic characteristics. The facility connects to a host utility at a point of common connection (PCC) at 115 kV. The 115-kV system is greatly simplified, with two equivalent lines leading to an equivalent hub node. Two individual 6-MVA distributed generators are connected to the main facility bus through individual transformers. The model, although simple, is suitable for examination of equipment interactions and response to power system stimulus. It has been designed to also be suitable for investigation of the performance of microgrid applications.
35
Figure 4.1. One-line of facility – active and reactive power flows
The line and transformer impedances for the system are shown in Figure 4.2. In the figure, reactances appear below the line and are given on a 100-MVA base. Each bus is labeled with a name, node number, the initial voltage in pu (per unit), and the initial voltage in kilovolts. Circles with “m” are motors. The distributed generators are labeled as such.

36
Figure 4.2. One-line of facility – resistance and reactance of network elements
4.3 Microgrid Dynamics 4.3.1 Host/Macro Grid Events The facility microgrid will normally be connected to the host utility (macro grid, or Area EPS). Depending on design and operation philosophy, as well as on the contractual arrangement with the host utility, the facility microgrid is most likely to rely on the host grid for a portion of its power, with the balance being generated by the DG imbedded in the microgrid. This is the case for the study system. The initial condition for disturbances studied here is with some power imported, as shown in Figure 4.1. In this case, about 10% (1.4 MW) of the facility power is imported. When there are disturbances on the macrogrid, the microgrid will respond. Large remote disturbances of the type examined in Section 3 will affect the microgrid. However, disturbances that are electrically nearby have a much higher likelihood of disrupting operation. Figures 4.3, 4.4, 4.5, and 4.6 show the response of the facility microgrid to a fault on the host system. The event simulated is a fault at the midpoint of one of the two 115-kV lines from point of interconnection to the system equivalent hub. The fault is cleared by removal of the faulted line, which leaves the connection of the microgrid to the host system weaker. Each of the four figures shows a different system variable for this event. In each figure, there are five traces showing different DG technologies and controls. For each figure:
• The dark blue trace is for no DG.
• The pink trace is for inverter DG with full controls (voltage and frequency regulation).

37
• The red trace is for rotating DG with full controls (conventional voltage regulator/excitation and frequency regulation/governor).
• The light blue trace is for inverter DG without controls (passive).
• The purple trace is for rotating DG without controls (passive). Figure 4.3 shows the voltage at the motor loads within the facility. Figure 4.4 shows the active power exchange between the facility microgrid and the host macrogrid. Figure 4.5 shows the speed of some of the motors in the facility, and Figure 4.6 shows the current drawn by the loads. A number of observations can be made from these cases:
• The most important observation is that the behavior of the system is significantly different for each set of assumptions. The cases with no DG and passive inverter-based DG fail to recover from the fault—that is, the load in the facility is disrupted, and the facility would likely trip some or all of its load and the DG. The collapse of the motor speed is graphic evidence of the failed recovery. The motors have stalled and, in the process, have collapsed the voltage. As a result of the collapsed voltage, the motors cannot restart, so the voltage cannot recover.
• This failed recovery is not only disruptive to the microgrid load, but it is also disruptive to the host grid. This is evident in the high currents drawn after the load stalls. This could cause false trips of protective relaying and possibly result in outage of other customers on the host grid. The addition of control for both types of DG allows a successful recovery, and all parties benefit.
• The presence of DG in the microgrid can be beneficial to both the microgrid (DG owner) and the grid. (The no-DG case failed.)
• The failure of the passive (i.e., no-control) inverter DG shows that lack of control does have a penalty when compared with the WECC cases (e.g., compare black and red traces in Figure 3.8) in which the no-control case was relatively benign.
• The passive rotating-based DG was more benign. This may be because of the inherent mechanical (and magnetic) inertia of the machine, which may make recovery naturally friendlier. Conversely, the best performance results from the inverter-based DG with a full set of controls. (“Best performance” is based on fastest recovery to normal voltage and speed). This is not surprising. The inverter-based technologies are more controllable and are more dependent on good control—these are different faces of the same nature of the equipment.

38
Micro Grid Study Case F1Bolted 3ph Fault at 50% of PCC-HUB 115kV Line CKT1
Clear Fault after 16 cycles by tripping PCC-HUB Line CKT1
0
0.2
0.4
0.6
0.8
1
1.2
1 2 3 4 5 6 7 8 9 10
Time (s)
MO
TLD
3-m
1 V
pu No DG
INV DG
ROT DGINV DG Passive
ROT DG Passive
Figure 4.3. Microgrid load bus voltage – following grid disturbance
Micro Grid Study Case F1Bolted 3ph Fault at 50% of PCC-HUB 115kV Line CKT1
Clear Fault after 16 cycles by tripping PCC-HUB Line CKT1
-20
-15
-10
-5
0
5
10
15
1 2 3 4 5 6 7 8 9 10
Time (s)
Pow
er in
to M
icro
Grid
MW
No DG
INV DG
ROT DGINV DG Passive
ROT DG Passive
Figure 4.4. Active power into microgrid – following grid disturbance

39
Micro Grid Study Case F1Bolted 3ph Fault at 50% of PCC-HUB 115kV Line CKT1
Clear Fault after 16 cycles by tripping PCC-HUB Line CKT1
0.6
0.7
0.8
0.9
1
1.1
1 2 3 4 5
Time (s)
MO
TLD
#-m
1 S
peed
pu
No DGINV DGROT DG
INV DG PassiveROT DG Passive
Figure 4.5. Microgrid load motor speeds – following grid disturbance
Micro Grid Study Case F1Bolted 3ph Fault at 50% of PCC-HUB 115kV Line CKT1
Clear Fault after 16 cycles by tripping PCC-HUB Line CKT1
1
1.5
2
2.5
3
3.5
4
4.5
5
1 2 3 4 5
Time (s)
MO
TLD
3-m
1 It
pu No DGINV DG
ROT DGINV DG Passive
ROT DG Passive
Figure 4.6. Microgrid load currents – following grid disturbance
40
4.3.2 Island EventsOne of the most attractive aspects of a facility microgrid is the potential for the facility to separate, or island, from the grid. In the simplest sense, this provides a higher level of reliability for the facility than can be obtained from reliance on the grid alone. This extra reliability is often the primary motive for considering individual applications of DG, and it easily expands to the microgrid. The benefits to the microgrid are fairly obvious; however, this capability also can be beneficial to the host grid. Consider the results presented in Section 3. The single largest concern identified was risk from DG tripping but leaving its associated load connected. Alternatively, the successful islanding of an entire microgrid from the host utility in response to large system disturbances would reduce the stress on the grid. For local disturbances, the action of a single microgrid might be enough to produce significant benefits. On the larger scale of an entire system, high penetrations of DG incorporated into microgrids with such an islanding operating philosophy could have substantial system-wide benefits. The ability of a grid-connected microgrid to survive loss of connection to the host utility depends on a number of factors. The microgrid must have sufficient dynamic regulating capability to be able to tolerate the change in both active and reactive power flow that will result from loss of the utility tie. This means that at least some of the DG must have both voltage and frequency regulation functions. Figures 4.7, 4.8, 4.9, and 4.10 show the response of the facility microgrid to faults at the PCC that result in trip of the microgrid from the host system. The events simulated are faults at the terminal 115-kV PCC cleared by removal of the microgrid main transformer. In one pair of cases, the fault is bolted (i.e., has no fault impedance) and is therefore more severe than the second pair of cases, in which some fault impedance is assumed. Each of the five figures shows a different system variable for this pair of events. In each figure, there are four traces. For each figure:
• The dark blue trace if for inverter DG for a bolted three-phase fault. • The pink trace is for rotating DG for a bolted three-phase fault. • The red trace is for inverter DG for an impedance fault. • The light blue trace is for rotating DG for an impedance fault.
As noted above, voltage and frequency regulation are a prerequisite for islanded operation. Thus, only cases with full control are considered. The two fault events are intended to illustrate that having these controls is a necessary condition; it may not be sufficient to ensure successful islanding. The dynamics of tripping from grid connection to islanded operation can be very important. Figure 4.7 shows the voltage at the motor loads within the facility.
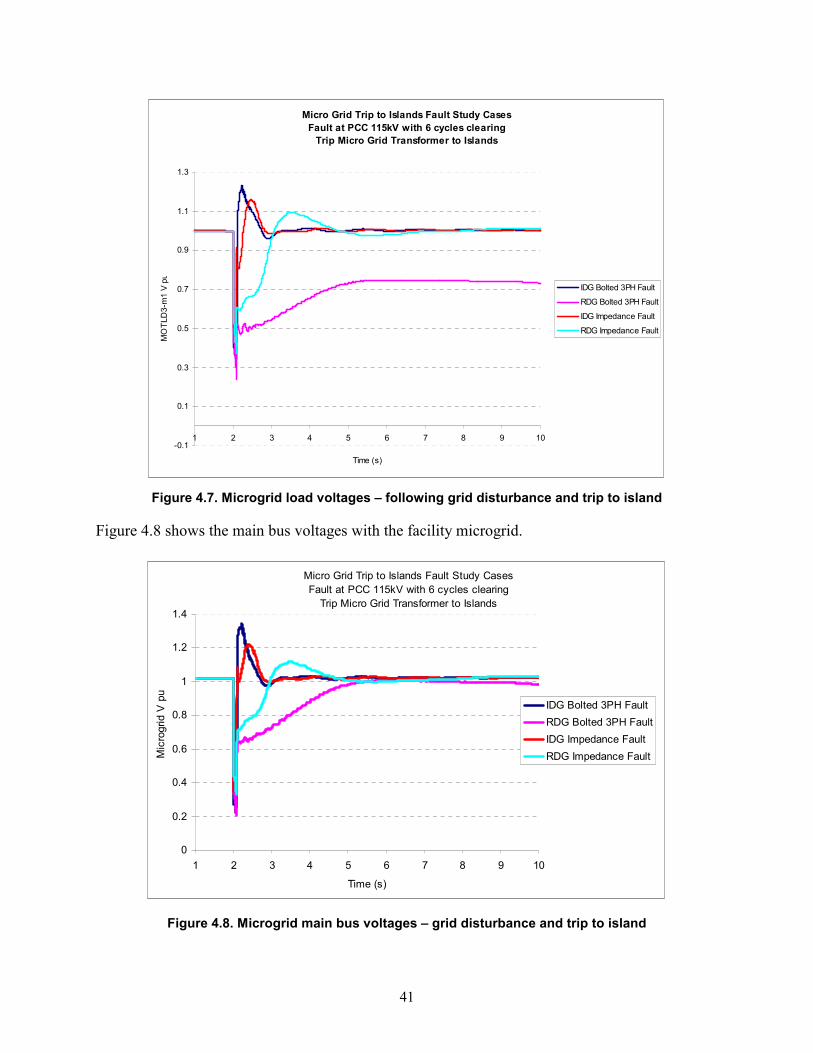
41
Micro Grid Trip to Islands Fault Study CasesFault at PCC 115kV with 6 cycles clearing
Trip Micro Grid Transformer to Islands
-0.1
0.1
0.3
0.5
0.7
0.9
1.1
1.3
1 2 3 4 5 6 7 8 9 10
Time (s)
MO
TLD
3-m
1 V
pu
IDG Bolted 3PH Fault
RDG Bolted 3PH Fault
IDG Impedance Fault
RDG Impedance Fault
Figure 4.7. Microgrid load voltages – following grid disturbance and trip to island
Figure 4.8 shows the main bus voltages with the facility microgrid.
Figure 4.8. Microgrid main bus voltages – grid disturbance and trip to island
Micro Grid Trip to Islands Fault Study CasesFault at PCC 115kV with 6 cycles clearing
Trip Micro Grid Transformer to Islands
0
0.2
0.4
0.6
0.8
1
1.2
1.4
1 2 3 4 5 6 7 8 9 10
Time (s)
Mic
rogr
id V
pu
IDG Bolted 3PH FaultRDG Bolted 3PH FaultIDG Impedance FaultRDG Impedance Fault

42
Figure 4.9 shows the reactive power output of one of the distributed generators in the facility.
Micro Grid Trip to Islands Fault Study CasesFault at PCC 115kV with 6 cycles clearing
Trip Micro Grid Transformer to Is lands
-1
1
3
5
7
9
11
13
1 2 3 4 5 6 7 8 9 10
Time (s)
Q M
VAR
IDG Bolted 3PH FaultRDG Bolted 3PH Fault
IDG Impedance FaultRDG Impedance Fault
Figure 4.9. Microgrid DG reactive power outputs – grid disturbance and trip to island
Figure 4.10 shows the active power output of one of the distributed generators in the facility.
Micro Grid Trip to Islands Fault Study CasesFault at PCC 115kV with 6 cycles clearing
Trip Micro Grid Transformer to Islands
0
2
4
6
8
10
12
14
1 2 3 4 5 6 7 8 9 10
Time (s)
P pu
IDG Bolted 3PH Fault
RDG Bolted 3PH Fault
IDG Impedance Fault
RDG Impedance Fault
Figure 4.10. Microgrid DG active power outputs – grid disturbance and trip to island

43
Figure 4.11 shows the currents delivered by one of the distributed generators in the facility.
Micro Grid Trip to Islands Fault Study CasesFault at PCC 115kV with 6 cycles clearing
Trip Micro Grid Transformer to Islands
0
0.5
1
1.5
2
2.5
3
3.5
4
1 2 3 4 5 6 7 8 9 10Time (s)
I pu
IDG Bolted 3PH FaultRDG Bolted 3PH Fault
IDG Impedance Fault
RDG Impedance Fault
Figure 4.11. Microgrid DG currents – grid disturbance and trip to island
Two observations can be made from these cases:
• First, and most important, is that for this particular microgrid, not all of the load within the facility can be served when the microgrid trips to islanded operation. In all of these cases, roughly half of the load in the facility is tripped. This non-essential load is disconnected to allow for continued secure operation of the remaining critical load. The ability to differentiate between critical and non-critical loads is a major reliability consideration and potential advantage in a facility microgrid. In these cases, the facility microgrid control disconnects the non-essential load at the same time that the transformer circuit breaker opens, creating the island. The transient swings of the system variables reflect the dynamics of the loads responding to the fault and their interaction with the DG controls.
• Second, the microgrid fails to tolerate the dynamics associated with the trip to an island for one case: that with the very severe fault and the rotating DG. In this case, the motor recovery fails in a fashion similar to that in failed recovery cases discussed above for host grid faults. In these cases, the faster response of the inverter-based DG with very aggressive controls allows for a better recovery.
This particular comparison is illustrative mainly in the sense that it is clear that different responses will have a major effect on the success (and therefore viability) of the island. One might be tempted to conclude from this example that inverter-based DG is superior for islanded operation. However, other experience shows that inverter-based DG is generally more

44
sensitive to voltage dips that result from faults and more likely to trip in response to such stimulus. Rather, several necessary conditions are shown:
• The load in the island must not exceed the capability of the DG in the islanded microgrid.
• Having enough capability is not sufficient alone. The DG must have the necessary dynamic response to survive the disturbances that cause the trip to island.
• The DG must not trip in response to the initiating disturbance.

45
5 Summary 5.1 Study Results Summary In the long term, the majority of DER technologies will rely on power electronic inverters for connection to the power system. These technologies include fuel cells, photovoltaics, and microturbines. In the nearer term, the reality is that most (on a total kilowatt basis) of the DER being built and planned is more conventional, synchronous machine-based generation. The investigation reported here focused on this nearer-term reality but with the same objectives:
• To identify system performance issues • To quantify functional requirements for the successful interconnection of DG • To maximize benefits and minimize risks • To add to the growing body of engineering understanding required for the successful
evolution of power systems to that long-term view. Examination of some of the resource planning choices facing an operating US utility helped provide perspective on near-term reality of DG for domestic utilities. Key observations for that particular system were:
• Near-term expiration of bilateral power contracts from central-station generation presents an opportunity to alter the generation mix.
• Actual and planned additions of third-party generation, including substantial amounts of DG, have a total capacity on the same order as the expiring bilateral contracts.
• Small DG (less than 2 MW) represents a small fraction (less than 2%) of the known planned additions.
• Essentially all the DG additions are conventional rotating synchronous generation, both thermal and minihydro.
5.1.1 Observations on Bulk System Dynamics This year’s incremental investigations of the effect of DG on power systems include some findings that reinforce conclusions from the first year’s effort and some that provide new insights. The aspects that were reinforced are:
• Widespread penetration of DG at the load appears to be benign with respect to system response to bulk system disturbances.
• Aggressive tripping of DG in response to under frequency (as well as under voltage from earlier work) appears to present a substantial hazard to the bulk system and was shown to bring down the entire US western system in one extreme case. In general, tripping of DG should be designed to take the local load with it. Simultaneous tripping of DG in a system dependent on the DG output can result in widespread and severe voltage problems. Presently, P1547 is biased in favor of fast tripping to rapidly detect and eliminate inadvertent islands. There may be a need for further consideration of the fine balance

46
between island avoidance and making the system vulnerable to voltage collapse. Avoiding overly aggressive DG tripping should be a design objective.
The new insights are:
• Voltage control by DG without frequency control may be undesirable from a bulk system perspective. This was a somewhat surprising result. This behavior is due to the fact that voltage regulation has the potential to partially negate the beneficial effect of load relief because of voltage depressions following system upsets. This behavior may warrant closer inspection.
• Anti-islanding schemes based on decreasing DG power output in response to declining frequency (i.e., negative droop) have some adverse effect on recovery of the bulk system from large disturbances. This is a somewhat different conclusion from earlier work in which active anti-islanding systems appeared to have little effect on system response.
• The industry trajectory on DG is mostly toward rotating DG with controls that are focused on the needs of the local EPS. These controls, with the exception of aggressive tripping, are largely benign for the system.
5.1.2 Observations on Local and Microgrid Dynamics This year’s incremental investigation of microgrids includes findings that reinforce conclusions from the first year’s effort and provide new insights. The presence of DR on the power system has the potential to affect local system dynamics. Several cases were presented in this section to illustrate these effects. The cases cannot be considered comprehensive enough to allow definitive conclusions to be drawn; however, several observations can be made. The aspects that were reinforced are:
• Microgrid supervisory control was shown to provide satisfactory performance in terms of managing power exchange with the host utility.
• Microgrids appear to be viable, within limits, when DG is provided with fast, autonomous voltage and frequency controls.
The new insights are:
• Local facility microgrids, with suitable controls, can beneficially affect the performance of the host power system and the microgrid.
• Microgrids with suitable DG controls can have a substantial effect on the security of the load served within that microgrid. They present the opportunity for higher power quality and differentiation of service for premium power. Higher security, when connection to the host utility is maintained, has important implications from an (national) infrastructure security perspective.

47
• Disconnection of microgrids from the host power system appears to have the potential to be beneficial for the host system. This aspect warrants further investigation.
5.2 Implications for Universal Interconnect The economic and dynamic investigations of this year’s study provide insights for additional functions for the UI that would allow reliable DG islanding detection by means other than sensitive under/over frequency and voltage trip points and schemes that can interact undesirably with bulk system dynamics when the DG is not islanded. 5.3 Implications for Standards DG is envisioned to play a large role in the nation’s power system. Therefore, there is a growing need for DG interconnection requirements to address the effect of DG on large-scale grid behavior. As DG becomes a vital resource, there must be means to ensure its continued connection and participation in support of the grid when the grid most needs that support. This may require revisiting the frequency and voltage tripping points specified in IEEE 1547. This work suggests that standards will be required for the PCC interface of microgrids. 5.4 Further Research Needs The issues of bulk and local system dynamics with high penetrations of DG will continue to require investigation. As practice and technology evolve, power system planners will need better understanding and access to analytical tools. At the conclusion of this year’s work, several areas would benefit from further investigation:
• Feedback active anti-islanding system It is clear that the performance of DG can have a decisive role in the security of the bulk power system when DG provides a significant portion of the system resources. This year’s work has shown some negative consequences of active anti-islanding schemes on grid performance. Further parametric evaluation is needed of these schemes, including the frequency shift and voltage shift schemes used in inverter-based DG, to fully understand the potential large-scale system effects.
• Light load conditions All of the bulk system stability investigations performed to date have focused on high-stress conditions associated with high loads. However, many systems experience the most limiting stability problems under light load and high power transfer conditions. For example, this is the case in New England. Under light load conditions, it is possible that the effective penetration of DG could be substantially higher. This condition would occur if DG continues to generate at light load while central station generation is decommitted. This is fertile ground for further investigation and development of bulk system-friendly control and protection philosophies for DG.
• Decentralized, semi-autonomous control for microgrids The facility microgrid examinations presented in this report highlight the potential for microgrids to provide valuable performance benefits to both the microgrid and the bulk

48
power system. Topologically, the facility microgrid presented is simple and realistic for the present and near-term future. As physical area and complexity of the facilities increase, additional functionality will be required to get the maximum performance and reliability from microgrids. With multiple distributed generators at separate locations, serving both electrical and other energy loads throughout a microgrid, further layers of control beyond those demonstrated here would be required.
• System-wide benefits and control philosophy for multiple microgrids The potential future use of widespread microgrids as a vehicle to facilitate the economic deployment of DG raises further issues about the effect and potential benefits of many microgrids on the bulk power system. The investigation this year made very preliminary steps in that direction. Microgrid controllers may provide the means to economically elicit behavior that is beneficial (and rewardable) from highly distributed generation. Of particular interest are structures that would contribute to power infrastructure security. Control and architecture concepts need to be explored to identify and realize these benefits.
49
6 References [1] GE Corporate Research and Development. “DG Power Quality, Protection and Reliability
Case Studies Report.” Sept. 2001.
[2] Walling, R.A.; Miller, N.W. “Distributed Generation Islanding – Implications on Power System Dynamic Performance.” Proceedings of the IEEE/PES Summer Power Meeting, Chicago, July 2002.
[3] GE Corporate Research and Development. “Models and Virtual Test Bed Report.” June 2001.
[4] Kundar, P. “Power System Stability and Control.” McGraw-Hill Inc., 1994.
[5] IEEE P1547 Draft Standard for Interconnecting Distributed Resources With Electric Power Systems.
[6] Alderfer, R.B.; Eldridge, M.M.; Starrs, T. J. "Making Connections: Case Studies of Interconnection Barriers and Their Impacts on Distributed Power Projects." NREL/SR-200-28053. Golden, Colorado: National Renewable Energy Laboratory. May 2000.
[7] PSLF Users’ Guide. V13, GE Power Systems Energy Consulting. December 2002.
[8] California Energy Commission. Workshop on Microgrids. Proceedings, July 2002.

50
Appendix A. WECC System Information (Trip Malin to Round Mountain Line Circuit #2) 1
Black: No DG Red: Inverter-type DG with no control Green: Inverter-type DG with full control Blue: Rotating-type DG with no control

51
59.90
59.95
60.00
60.05
60.10
0.0 2.5 5.0 7.5 10.0
FCNGNSCC frequency, Hz
Time (seconds)
59.90
59.95
60.00
60.05
60.10CHIEF J5 frequency, Hz
59.90
59.95
60.00
60.05
60.10PALOVRDE frequency, Hz
59.90
59.95
60.00
60.05
60.10
0.0 2.5 5.0 7.5 10.0
DEVERS frequency, Hz
Time (seconds)
59.90
59.95
60.00
60.05
60.10ING500 frequency, Hz
59.90
59.95
60.00
60.05
60.10CUSTER W frequency, Hz
WECC System Information (Trip MALIN to ROUND MT Line CK#2) Black:No DG; Red:Inv DG w/o Control;
Green:Inv DG w/ Full Control; Blue:Rot DG w/o Control
10-DEC-2002 10:34:31 C:\WeiWork\projects\DG\NREL\P3sys\chan\nodgbr62. Page 1

52
59.90
59.95
60.00
60.05
60.10
0.0 2.5 5.0 7.5 10.0
COLSTRP frequency, Hz
Time (seconds)
59.90
59.95
60.00
60.05
60.10BROADV&1 frequency, Hz
59.90
59.95
60.00
60.05
60.10MALIN frequency, Hz
59.90
59.95
60.00
60.05
60.10
0.0 2.5 5.0 7.5 10.0
ROUND MT frequency, Hz
Time (seconds)
59.90
59.95
60.00
60.05
60.10SUMMER L frequency, Hz
59.90
59.95
60.00
60.05
60.10GATES frequency, Hz
WECC System Information (Trip MALIN to ROUND MT Line CK#2) Black:No DG; Red:Inv DG w/o Control;
Green:Inv DG w/ Full Control; Blue:Rot DG w/o Control
10-DEC-2002 10:53:27 C:\WeiWork\projects\DG\NREL\P3sys\chan\nodgbr62. Page 2

53
59.90
59.95
60.00
60.05
60.10
0.0 2.5 5.0 7.5 10.0
MIDWAY frequency, Hz
Time (seconds)
59.90
59.95
60.00
60.05
60.10LOSBANOS frequency, Hz
59.90
59.95
60.00
60.05
60.10SANTIAGO frequency, Hz
59.90
59.95
60.00
60.05
60.10
0.0 2.5 5.0 7.5 10.0
SANTIAGO frequency, Hz
Time (seconds)
59.90
59.95
60.00
60.05
60.10BOISEBCH frequency, Hz
59.90
59.95
60.00
60.05
60.10WESTWING frequency, Hz
WECC System Information (Trip MALIN to ROUND MT Line CK#2) Black:No DG; Red:Inv DG w/o Control;
Green:Inv DG w/ Full Control; Blue:Rot DG w/o Control
10-DEC-2002 10:34:31 C:\WeiWork\projects\DG\NREL\P3sys\chan\nodgbr62. Page 3

54
0.90
0.95
1.00
1.05
1.10
0.0 2.5 5.0 7.5 10.0
BRIDGER1 voltage, pu
Time (seconds)
0.90
0.95
1.00
1.05
1.10COLSTP 4 voltage, pu
0.90
0.95
1.00
1.05
1.10PALOVRDE voltage, pu
0.90
0.95
1.00
1.05
1.10
0.0 2.5 5.0 7.5 10.0
DEVERS voltage, pu
Time (seconds)
0.90
0.95
1.00
1.05
1.10ING500 voltage, pu
0.90
0.95
1.00
1.05
1.10CUSTER W voltage, pu
WECC System Information (Trip MALIN to ROUND MT Line CK#2) Black:No DG; Red:Inv DG w/o Control;
Green:Inv DG w/ Full Control; Blue:Rot DG w/o Control
10-DEC-2002 10:34:31 C:\WeiWork\projects\DG\NREL\P3sys\chan\nodgbr62. Page 4

55
0.90
0.95
1.00
1.05
1.10
0.0 2.5 5.0 7.5 10.0
COLSTRP voltage, pu
Time (seconds)
0.90
0.95
1.00
1.05
1.10BROADV&1 voltage, pu
0.90
0.95
1.00
1.05
1.10MALIN voltage, pu
0.90
0.95
1.00
1.05
1.10
0.0 2.5 5.0 7.5 10.0
ROUND MT voltage, pu
Time (seconds)
0.90
0.95
1.00
1.05
1.10SUMMER L voltage, pu
0.90
0.95
1.00
1.05
1.10GATES voltage, pu
WECC System Information (Trip MALIN to ROUND MT Line CK#2) Black:No DG; Red:Inv DG w/o Control;
Green:Inv DG w/ Full Control; Blue:Rot DG w/o Control
10-DEC-2002 10:34:31 C:\WeiWork\projects\DG\NREL\P3sys\chan\nodgbr62. Page 5
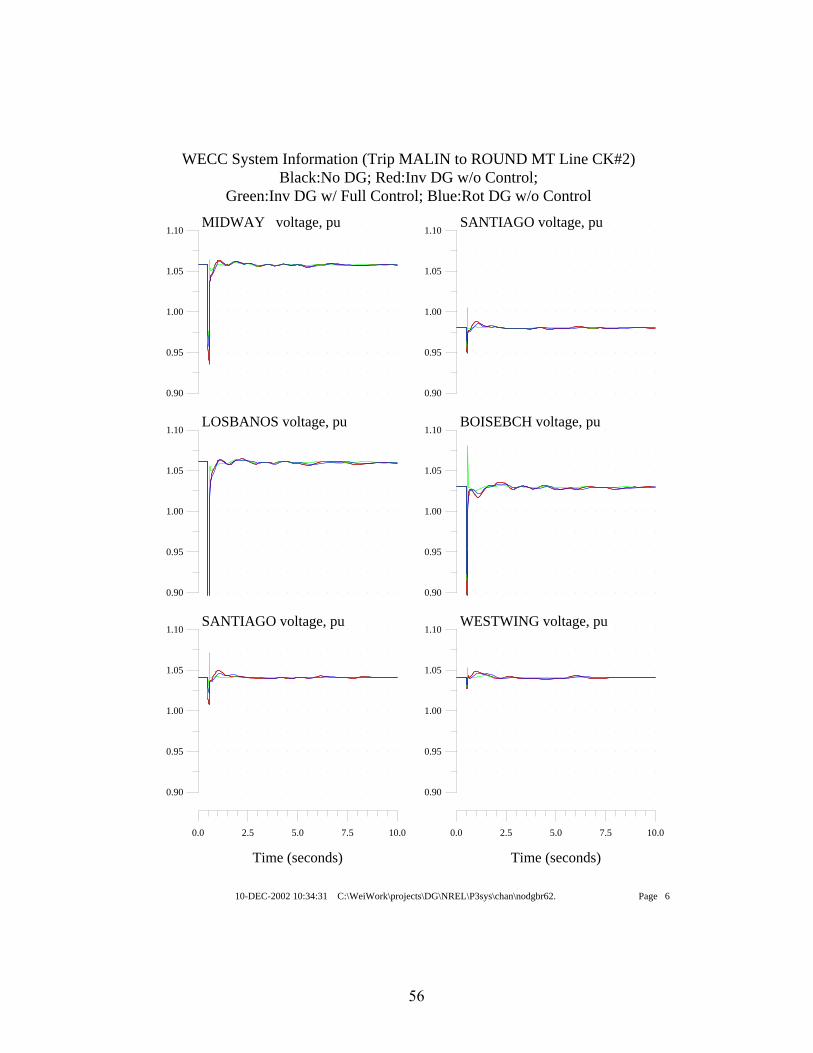
56
0.90
0.95
1.00
1.05
1.10
0.0 2.5 5.0 7.5 10.0
MIDWAY voltage, pu
Time (seconds)
0.90
0.95
1.00
1.05
1.10LOSBANOS voltage, pu
0.90
0.95
1.00
1.05
1.10SANTIAGO voltage, pu
0.90
0.95
1.00
1.05
1.10
0.0 2.5 5.0 7.5 10.0
SANTIAGO voltage, pu
Time (seconds)
0.90
0.95
1.00
1.05
1.10BOISEBCH voltage, pu
0.90
0.95
1.00
1.05
1.10WESTWING voltage, pu
WECC System Information (Trip MALIN to ROUND MT Line CK#2) Black:No DG; Red:Inv DG w/o Control;
Green:Inv DG w/ Full Control; Blue:Rot DG w/o Control
10-DEC-2002 10:34:31 C:\WeiWork\projects\DG\NREL\P3sys\chan\nodgbr62. Page 6

57
0
10
20
30
40
0.0 2.5 5.0 7.5 10.0
MALIN - ROUND MT #1 ibr, A
Time (seconds)
3
4
5
6
7
8GATES - MIDWAY ibr, A
0
400
800
1200
1600
2000MALIN - ROUND MT #1 P, MW
300
400
500
600
700
800
0.0 2.5 5.0 7.5 10.0
GATES - MIDWAY P, MW
Time (seconds)
1.30
1.35
1.40
1.45
1.50SANT230 - SANT66 #1 ibr, A
120
125
130
135
140SANT230 - SANT66 #1 P, MW
WECC System Information (Trip MALIN to ROUND MT Line CK#2) Black:No DG; Red:Inv DG w/o Control;
Green:Inv DG w/ Full Control; Blue:Rot DG w/o Control
10-DEC-2002 10:34:31 C:\WeiWork\projects\DG\NREL\P3sys\chan\nodgbr62. Page 7

58
Appendix B. WECC System Information (Trip Malin to Round Mountain Line Circuit #2) 2 Black: No DG Red: Rotating-type DG with no control Green: Rotating-type DG with exciter control Blue: Rotating-type DG with governor control

59
59.90
59.95
60.00
60.05
60.10
0.0 2.5 5.0 7.5 10.0
FCNGNSCC frequency, Hz
Time (seconds)
59.90
59.95
60.00
60.05
60.10CHIEF J5 frequency, Hz
59.90
59.95
60.00
60.05
60.10PALOVRDE frequency, Hz
59.90
59.95
60.00
60.05
60.10
0.0 2.5 5.0 7.5 10.0
DEVERS frequency, Hz
Time (seconds)
59.90
59.95
60.00
60.05
60.10ING500 frequency, Hz
59.90
59.95
60.00
60.05
60.10CUSTER W frequency, Hz
WECC System Information (Trip MALIN to ROUND MT Line CK#2) Black:No DG; Red:Rot DG w/o Control;
Green:Rot DG w/ Exciter; Blue:Rot DG w/ Governor
10-DEC-2002 11:24:19 C:\WeiWork\projects\DG\NREL\P3sys\chan\nodgbr62. Page 1

60
59.90
59.95
60.00
60.05
60.10
0.0 2.5 5.0 7.5 10.0
COLSTRP frequency, Hz
Time (seconds)
59.90
59.95
60.00
60.05
60.10BROADV&1 frequency, Hz
59.90
59.95
60.00
60.05
60.10MALIN frequency, Hz
59.90
59.95
60.00
60.05
60.10
0.0 2.5 5.0 7.5 10.0
ROUND MT frequency, Hz
Time (seconds)
59.90
59.95
60.00
60.05
60.10SUMMER L frequency, Hz
59.90
59.95
60.00
60.05
60.10GATES frequency, Hz
WECC System Information (Trip MALIN to ROUND MT Line CK#2) Black:No DG; Red:Rot DG w/o Control;
Green:Rot DG w/ Exciter; Blue:Rot DG w/ Governor
10-DEC-2002 11:24:19 C:\WeiWork\projects\DG\NREL\P3sys\chan\nodgbr62. Page 2
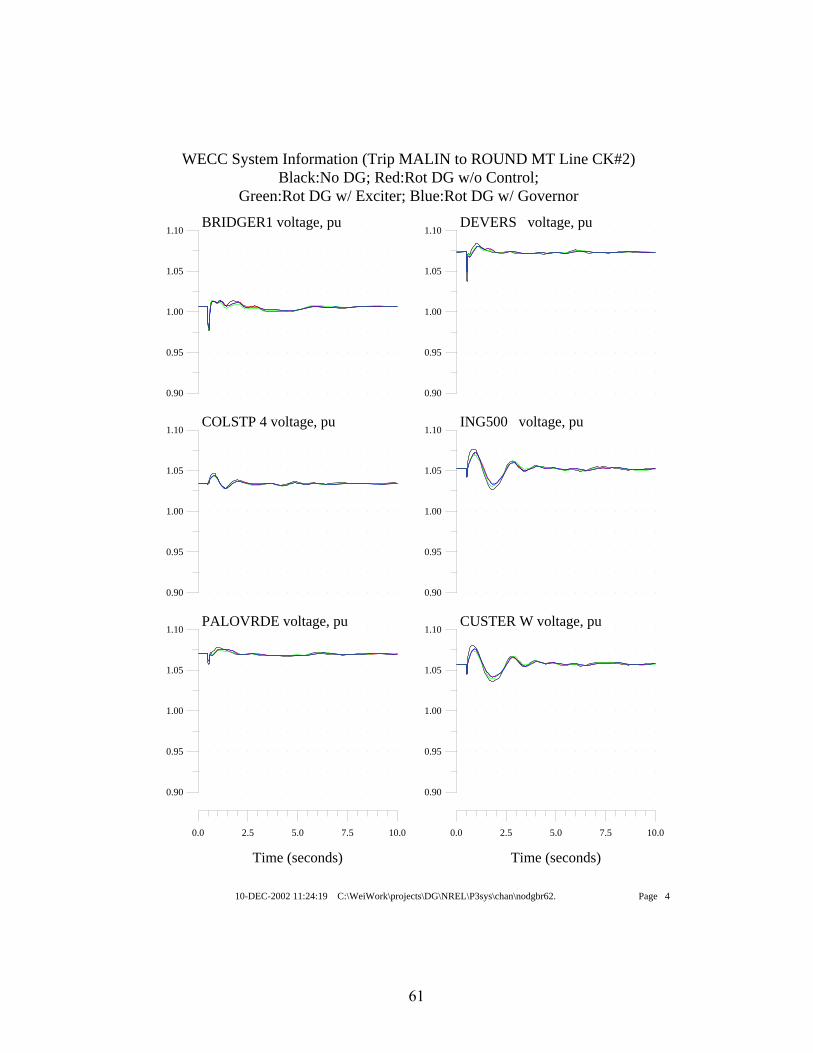
61
0.90
0.95
1.00
1.05
1.10
0.0 2.5 5.0 7.5 10.0
BRIDGER1 voltage, pu
Time (seconds)
0.90
0.95
1.00
1.05
1.10COLSTP 4 voltage, pu
0.90
0.95
1.00
1.05
1.10PALOVRDE voltage, pu
0.90
0.95
1.00
1.05
1.10
0.0 2.5 5.0 7.5 10.0
DEVERS voltage, pu
Time (seconds)
0.90
0.95
1.00
1.05
1.10ING500 voltage, pu
0.90
0.95
1.00
1.05
1.10CUSTER W voltage, pu
WECC System Information (Trip MALIN to ROUND MT Line CK#2) Black:No DG; Red:Rot DG w/o Control;
Green:Rot DG w/ Exciter; Blue:Rot DG w/ Governor
10-DEC-2002 11:24:19 C:\WeiWork\projects\DG\NREL\P3sys\chan\nodgbr62. Page 4

62
0.90
0.95
1.00
1.05
1.10
0.0 2.5 5.0 7.5 10.0
COLSTRP voltage, pu
Time (seconds)
0.90
0.95
1.00
1.05
1.10BROADV&1 voltage, pu
0.90
0.95
1.00
1.05
1.10MALIN voltage, pu
0.90
0.95
1.00
1.05
1.10
0.0 2.5 5.0 7.5 10.0
ROUND MT voltage, pu
Time (seconds)
0.90
0.95
1.00
1.05
1.10SUMMER L voltage, pu
0.90
0.95
1.00
1.05
1.10GATES voltage, pu
WECC System Information (Trip MALIN to ROUND MT Line CK#2) Black:No DG; Red:Rot DG w/o Control;
Green:Rot DG w/ Exciter; Blue:Rot DG w/ Governor
10-DEC-2002 11:24:19 C:\WeiWork\projects\DG\NREL\P3sys\chan\nodgbr62. Page 5

63
0.90
0.95
1.00
1.05
1.10
0.0 2.5 5.0 7.5 10.0
MIDWAY voltage, pu
Time (seconds)
0.90
0.95
1.00
1.05
1.10LOSBANOS voltage, pu
0.90
0.95
1.00
1.05
1.10SANTIAGO voltage, pu
0.90
0.95
1.00
1.05
1.10
0.0 2.5 5.0 7.5 10.0
SANTIAGO voltage, pu
Time (seconds)
0.90
0.95
1.00
1.05
1.10BOISEBCH voltage, pu
0.90
0.95
1.00
1.05
1.10WESTWING voltage, pu
WECC System Information (Trip MALIN to ROUND MT Line CK#2) Black:No DG; Red:Rot DG w/o Control;
Green:Rot DG w/ Exciter; Blue:Rot DG w/ Governor
10-DEC-2002 11:24:19 C:\WeiWork\projects\DG\NREL\P3sys\chan\nodgbr62. Page 6
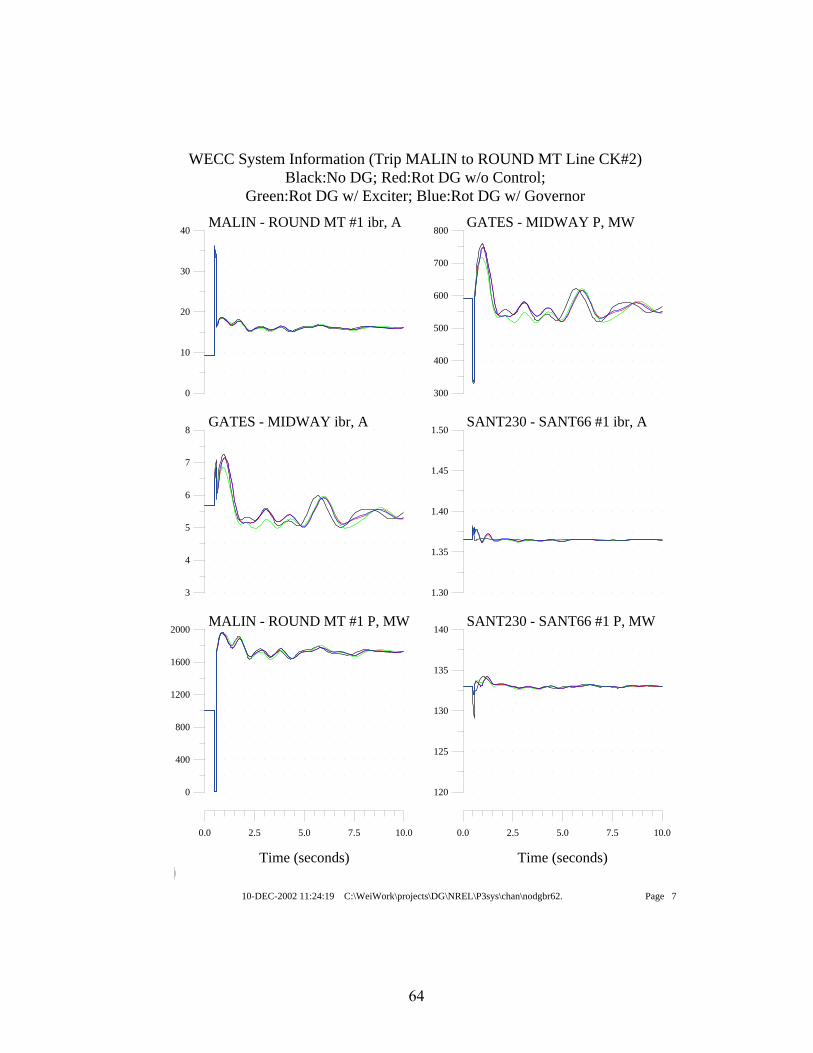
64
0
10
20
30
40
0.0 2.5 5.0 7.5 10.0
MALIN - ROUND MT #1 ibr, A
Time (seconds)
3
4
5
6
7
8GATES - MIDWAY ibr, A
0
400
800
1200
1600
2000MALIN - ROUND MT #1 P, MW
300
400
500
600
700
800
0.0 2.5 5.0 7.5 10.0
GATES - MIDWAY P, MW
Time (seconds)
1.30
1.35
1.40
1.45
1.50SANT230 - SANT66 #1 ibr, A
120
125
130
135
140SANT230 - SANT66 #1 P, MW
WECC System Information (Trip MALIN to ROUND MT Line CK#2) Black:No DG; Red:Rot DG w/o Control;
Green:Rot DG w/ Exciter; Blue:Rot DG w/ Governor
10-DEC-2002 11:24:19 C:\WeiWork\projects\DG\NREL\P3sys\chan\nodgbr62. Page 7

65
Appendix C. WECC System Information (Trip 3 Palo Verte Generators) 1 Black: No DG Red: Inverter-type DG with no control Green: Inverter-type DG with full control Blue: Rotating-type DG with no control

66
59.6
59.7
59.8
59.9
60.0
60.1
0.0 2.5 5.0 7.5 10.0
FCNGNSCC frequency, Hz
Time (seconds)
59.6
59.7
59.8
59.9
60.0
60.1CHIEF J5 frequency, Hz
59.6
59.7
59.8
59.9
60.0
60.1PALOVRDE frequency, Hz
59.6
59.7
59.8
59.9
60.0
60.1
0.0 2.5 5.0 7.5 10.0
DEVERS frequency, Hz
Time (seconds)
59.6
59.7
59.8
59.9
60.0
60.1ING500 frequency, Hz
59.6
59.7
59.8
59.9
60.0
60.1CUSTER W frequency, Hz
WECC System Information (Trip 3 Palo Verte generators) Black:No DG; Red:Inv DG w/o Control;
Green:Inv DG w/ Full Control; Blue:Rot DG w/o Control
10-DEC-2002 13:37:58 C:\WeiWork\projects\DG\NREL\P3sys\chan\nodg63.ch Page 1

67
59.6
59.7
59.8
59.9
60.0
60.1
0.0 2.5 5.0 7.5 10.0
COLSTRP frequency, Hz
Time (seconds)
59.6
59.7
59.8
59.9
60.0
60.1BROADV&1 frequency, Hz
59.6
59.7
59.8
59.9
60.0
60.1MALIN frequency, Hz
59.6
59.7
59.8
59.9
60.0
60.1
0.0 2.5 5.0 7.5 10.0
ROUND MT frequency, Hz
Time (seconds)
59.6
59.7
59.8
59.9
60.0
60.1SUMMER L frequency, Hz
59.6
59.7
59.8
59.9
60.0
60.1GATES frequency, Hz
WECC System Information (Trip 3 Palo Verte generators) Black:No DG; Red:Inv DG w/o Control;
Green:Inv DG w/ Full Control; Blue:Rot DG w/o Control
10-DEC-2002 13:37:58 C:\WeiWork\projects\DG\NREL\P3sys\chan\nodg63.ch Page 2
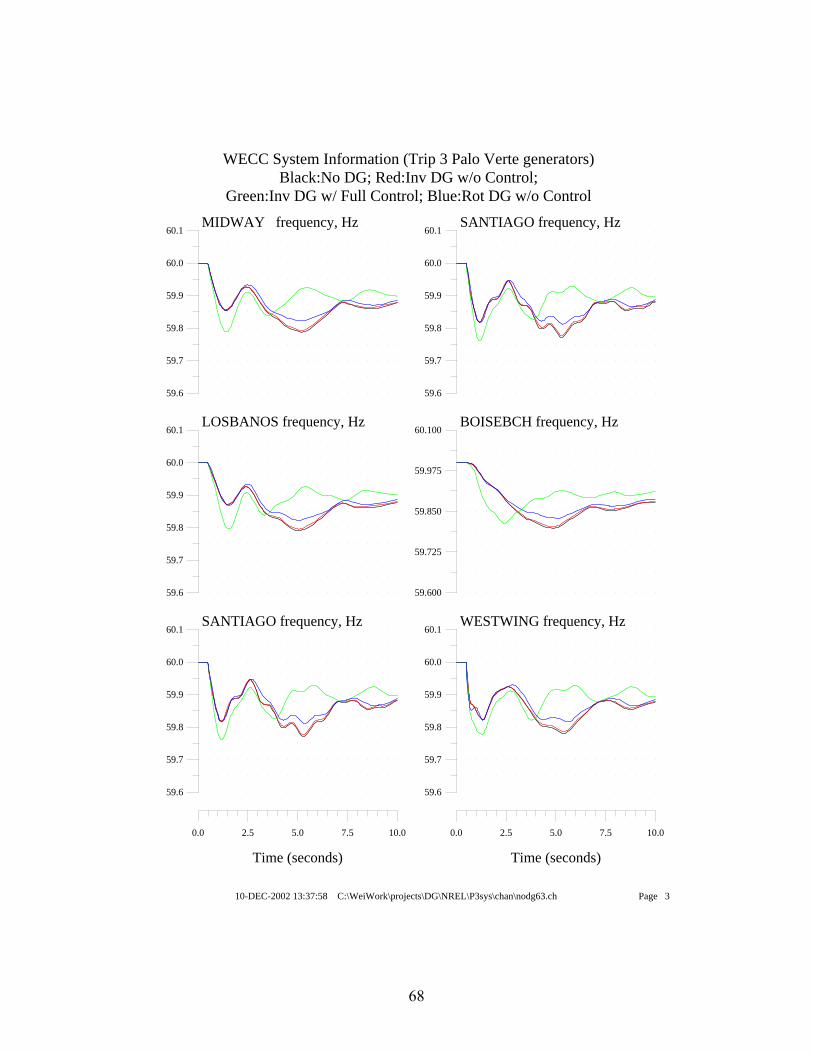
68
59.6
59.7
59.8
59.9
60.0
60.1
0.0 2.5 5.0 7.5 10.0
MIDWAY frequency, Hz
Time (seconds)
59.6
59.7
59.8
59.9
60.0
60.1LOSBANOS frequency, Hz
59.6
59.7
59.8
59.9
60.0
60.1SANTIAGO frequency, Hz
59.6
59.7
59.8
59.9
60.0
60.1
0.0 2.5 5.0 7.5 10.0
SANTIAGO frequency, Hz
Time (seconds)
59.600
59.725
59.850
59.975
60.100BOISEBCH frequency, Hz
59.6
59.7
59.8
59.9
60.0
60.1WESTWING frequency, Hz
WECC System Information (Trip 3 Palo Verte generators) Black:No DG; Red:Inv DG w/o Control;
Green:Inv DG w/ Full Control; Blue:Rot DG w/o Control
10-DEC-2002 13:37:58 C:\WeiWork\projects\DG\NREL\P3sys\chan\nodg63.ch Page 3

69
0.90
0.95
1.00
1.05
1.10
0.0 2.5 5.0 7.5 10.0
BRIDGER1 voltage, pu
Time (seconds)
0.90
0.95
1.00
1.05
1.10COLSTP 4 voltage, pu
0.90
0.95
1.00
1.05
1.10PALOVRDE voltage, pu
0.90
0.95
1.00
1.05
1.10
0.0 2.5 5.0 7.5 10.0
DEVERS voltage, pu
Time (seconds)
0.90
0.95
1.00
1.05
1.10ING500 voltage, pu
0.90
0.95
1.00
1.05
1.10CUSTER W voltage, pu
WECC System Information (Trip 3 Palo Verte generators) Black:No DG; Red:Inv DG w/o Control;
Green:Inv DG w/ Full Control; Blue:Rot DG w/o Control
10-DEC-2002 13:37:58 C:\WeiWork\projects\DG\NREL\P3sys\chan\nodg63.ch Page 4

70
0.90
0.95
1.00
1.05
1.10
0.0 2.5 5.0 7.5 10.0
COLSTRP voltage, pu
Time (seconds)
0.90
0.95
1.00
1.05
1.10BROADV&1 voltage, pu
0.90
0.95
1.00
1.05
1.10MALIN voltage, pu
0.90
0.95
1.00
1.05
1.10
0.0 2.5 5.0 7.5 10.0
ROUND MT voltage, pu
Time (seconds)
0.90
0.95
1.00
1.05
1.10SUMMER L voltage, pu
0.90
0.95
1.00
1.05
1.10GATES voltage, pu
WECC System Information (Trip 3 Palo Verte generators) Black:No DG; Red:Inv DG w/o Control;
Green:Inv DG w/ Full Control; Blue:Rot DG w/o Control
10-DEC-2002 13:37:58 C:\WeiWork\projects\DG\NREL\P3sys\chan\nodg63.ch Page 5

71
0.90
0.95
1.00
1.05
1.10
0.0 2.5 5.0 7.5 10.0
MIDWAY voltage, pu
Time (seconds)
0.90
0.95
1.00
1.05
1.10LOSBANOS voltage, pu
0.90
0.95
1.00
1.05
1.10SANTIAGO voltage, pu
0.90
0.95
1.00
1.05
1.10
0.0 2.5 5.0 7.5 10.0
SANTIAGO voltage, pu
Time (seconds)
0.90
0.95
1.00
1.05
1.10BOISEBCH voltage, pu
0.90
0.95
1.00
1.05
1.10WESTWING voltage, pu
WECC System Information (Trip 3 Palo Verte generators) Black:No DG; Red:Inv DG w/o Control;
Green:Inv DG w/ Full Control; Blue:Rot DG w/o Control
10-DEC-2002 13:37:58 C:\WeiWork\projects\DG\NREL\P3sys\chan\nodg63.ch Page 6

72
5
10
15
20
0.0 2.5 5.0 7.5 10.0
MALIN - ROUND MT #1 ibr, A
Time (seconds)
5
10
15
20GATES - MIDWAY ibr, A
800
1000
1200
1400
1600
1800MALIN - ROUND MT #1 P, MW
500
1000
1500
2000
0.0 2.5 5.0 7.5 10.0
GATES - MIDWAY P, MW
Time (seconds)
1.30
1.32
1.34
1.36
1.38
1.40SANT230 - SANT66 #1 ibr, A
125
127
129
131
133
135SANT230 - SANT66 #1 P, MW
WECC System Information (Trip 3 Palo Verte generators) Black:No DG; Red:Inv DG w/o Control;
Green:Inv DG w/ Full Control; Blue:Rot DG w/o Control
10-DEC-2002 13:37:58 C:\WeiWork\projects\DG\NREL\P3sys\chan\nodg63.ch Page 7

73
Appendix D. WECC System Information (Trip 3 Palo Verte Generators) 2 Black: No DG Red: Rotating-type DG with no control Green: Rotating-type DG with exciter control Blue: Rotating-type DG with governor control

74
59.6
59.7
59.8
59.9
60.0
60.1
0.0 2.5 5.0 7.5 10.0
FCNGNSCC frequency, Hz
Time (seconds)
59.6
59.7
59.8
59.9
60.0
60.1CHIEF J5 frequency, Hz
59.6
59.7
59.8
59.9
60.0
60.1PALOVRDE frequency, Hz
59.6
59.7
59.8
59.9
60.0
60.1
0.0 2.5 5.0 7.5 10.0
DEVERS frequency, Hz
Time (seconds)
59.6
59.7
59.8
59.9
60.0
60.1ING500 frequency, Hz
59.6
59.7
59.8
59.9
60.0
60.1CUSTER W frequency, Hz
WECC System Information (Trip 3 Palo Verte generators) Black:No DG; Red:Rot DG w/o Control;
Green:Rot DG w/ Exciter; Blue:Rot DG w/ Governor
10-DEC-2002 13:48:44 C:\WeiWork\projects\DG\NREL\P3sys\chan\nodg63.ch Page 1

75
59.6
59.7
59.8
59.9
60.0
60.1
0.0 2.5 5.0 7.5 10.0
COLSTRP frequency, Hz
Time (seconds)
59.6
59.7
59.8
59.9
60.0
60.1BROADV&1 frequency, Hz
59.6
59.7
59.8
59.9
60.0
60.1MALIN frequency, Hz
59.6
59.7
59.8
59.9
60.0
60.1
0.0 2.5 5.0 7.5 10.0
ROUND MT frequency, Hz
Time (seconds)
59.6
59.7
59.8
59.9
60.0
60.1SUMMER L frequency, Hz
59.6
59.7
59.8
59.9
60.0
60.1GATES frequency, Hz
WECC System Information (Trip 3 Palo Verte generators) Black:No DG; Red:Rot DG w/o Control;
Green:Rot DG w/ Exciter; Blue:Rot DG w/ Governor
10-DEC-2002 13:48:44 C:\WeiWork\projects\DG\NREL\P3sys\chan\nodg63.ch Page 2

76
59.6
59.7
59.8
59.9
60.0
60.1
0.0 2.5 5.0 7.5 10.0
MIDWAY frequency, Hz
Time (seconds)
59.6
59.7
59.8
59.9
60.0
60.1LOSBANOS frequency, Hz
59.6
59.7
59.8
59.9
60.0
60.1SANTIAGO frequency, Hz
59.6
59.7
59.8
59.9
60.0
60.1
0.0 2.5 5.0 7.5 10.0
SANTIAGO frequency, Hz
Time (seconds)
59.600
59.725
59.850
59.975
60.100BOISEBCH frequency, Hz
59.6
59.7
59.8
59.9
60.0
60.1WESTWING frequency, Hz
WECC System Information (Trip 3 Palo Verte generators) Black:No DG; Red:Rot DG w/o Control;
Green:Rot DG w/ Exciter; Blue:Rot DG w/ Governor
10-DEC-2002 13:48:44 C:\WeiWork\projects\DG\NREL\P3sys\chan\nodg63.ch Page 3

77
0.90
0.95
1.00
1.05
1.10
0.0 2.5 5.0 7.5 10.0
BRIDGER1 voltage, pu
Time (seconds)
0.90
0.95
1.00
1.05
1.10COLSTP 4 voltage, pu
0.90
0.95
1.00
1.05
1.10PALOVRDE voltage, pu
0.90
0.95
1.00
1.05
1.10
0.0 2.5 5.0 7.5 10.0
DEVERS voltage, pu
Time (seconds)
0.90
0.95
1.00
1.05
1.10ING500 voltage, pu
0.90
0.95
1.00
1.05
1.10CUSTER W voltage, pu
WECC System Information (Trip 3 Palo Verte generators) Black:No DG; Red:Rot DG w/o Control;
Green:Rot DG w/ Exciter; Blue:Rot DG w/ Governor
10-DEC-2002 13:48:44 C:\WeiWork\projects\DG\NREL\P3sys\chan\nodg63.ch Page 4

78
0.90
0.95
1.00
1.05
1.10
0.0 2.5 5.0 7.5 10.0
COLSTRP voltage, pu
Time (seconds)
0.90
0.95
1.00
1.05
1.10BROADV&1 voltage, pu
0.90
0.95
1.00
1.05
1.10MALIN voltage, pu
0.90
0.95
1.00
1.05
1.10
0.0 2.5 5.0 7.5 10.0
ROUND MT voltage, pu
Time (seconds)
0.90
0.95
1.00
1.05
1.10SUMMER L voltage, pu
0.90
0.95
1.00
1.05
1.10GATES voltage, pu
WECC System Information (Trip 3 Palo Verte generators) Black:No DG; Red:Rot DG w/o Control;
Green:Rot DG w/ Exciter; Blue:Rot DG w/ Governor
10-DEC-2002 13:48:44 C:\WeiWork\projects\DG\NREL\P3sys\chan\nodg63.ch Page 5

79
0.90
0.95
1.00
1.05
1.10
0.0 2.5 5.0 7.5 10.0
MIDWAY voltage, pu
Time (seconds)
0.90
0.95
1.00
1.05
1.10LOSBANOS voltage, pu
0.90
0.95
1.00
1.05
1.10SANTIAGO voltage, pu
0.90
0.95
1.00
1.05
1.10
0.0 2.5 5.0 7.5 10.0
SANTIAGO voltage, pu
Time (seconds)
0.90
0.95
1.00
1.05
1.10BOISEBCH voltage, pu
0.90
0.95
1.00
1.05
1.10WESTWING voltage, pu
WECC System Information (Trip 3 Palo Verte generators) Black:No DG; Red:Rot DG w/o Control;
Green:Rot DG w/ Exciter; Blue:Rot DG w/ Governor
10-DEC-2002 13:48:44 C:\WeiWork\projects\DG\NREL\P3sys\chan\nodg63.ch Page 6
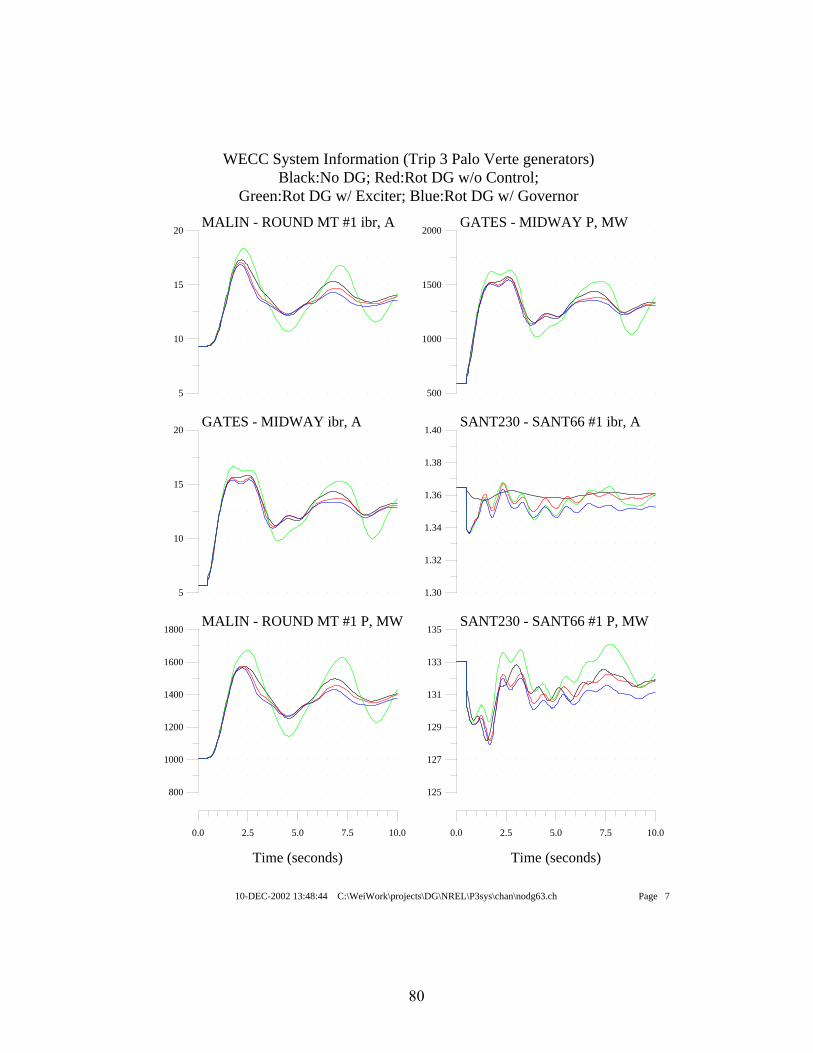
80
5
10
15
20
0.0 2.5 5.0 7.5 10.0
MALIN - ROUND MT #1 ibr, A
Time (seconds)
5
10
15
20GATES - MIDWAY ibr, A
800
1000
1200
1400
1600
1800MALIN - ROUND MT #1 P, MW
500
1000
1500
2000
0.0 2.5 5.0 7.5 10.0
GATES - MIDWAY P, MW
Time (seconds)
1.30
1.32
1.34
1.36
1.38
1.40SANT230 - SANT66 #1 ibr, A
125
127
129
131
133
135SANT230 - SANT66 #1 P, MW
WECC System Information (Trip 3 Palo Verte generators) Black:No DG; Red:Rot DG w/o Control;
Green:Rot DG w/ Exciter; Blue:Rot DG w/ Governor
10-DEC-2002 13:48:44 C:\WeiWork\projects\DG\NREL\P3sys\chan\nodg63.ch Page 7

81
Appendix E. WECC System Information (Trip 3 Palo Verte Generators) 3 Black: No DG Red: Rotating-type DG with no control Green: Rotating-type DG with under frequency tripping

82
59.6
59.7
59.8
59.9
60.0
60.1
0.00 0.75 1.50 2.25 3.00
FCNGNSCC frequency, Hz
Time (seconds)
59.6
59.7
59.8
59.9
60.0
60.1CHIEF J5 frequency, Hz
59.6
59.7
59.8
59.9
60.0
60.1PALOVRDE frequency, Hz
59.6
59.7
59.8
59.9
60.0
60.1
0.00 0.75 1.50 2.25 3.00
DEVERS frequency, Hz
Time (seconds)
59.6
59.7
59.8
59.9
60.0
60.1ING500 frequency, Hz
59.6
59.7
59.8
59.9
60.0
60.1CUSTER W frequency, Hz
WECC System Information (Trip 3 Palo Verte generators) Black:No DG; Red:Rot DG w/o Control; Green:Rot DG w/ Underfrequency Tripping
10-DEC-2002 14:18:36 C:\WeiWork\projects\DG\NREL\P3sys\chan\nodg63.ch Page 1
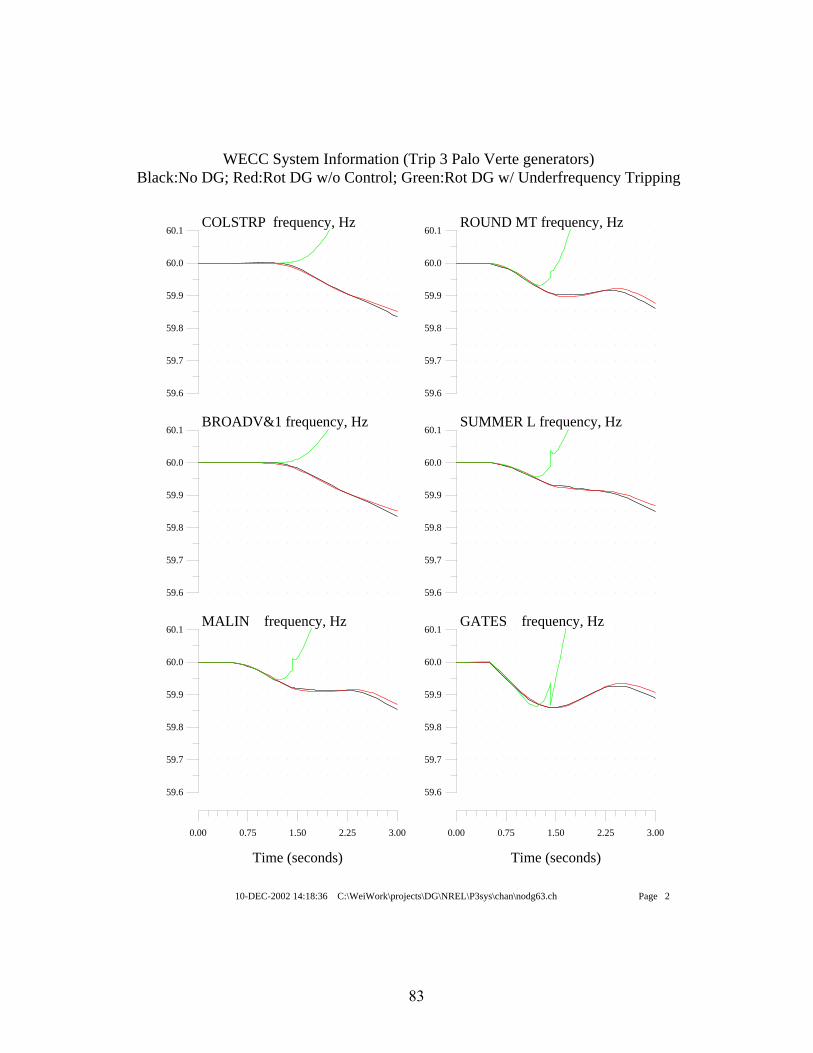
83
59.6
59.7
59.8
59.9
60.0
60.1
0.00 0.75 1.50 2.25 3.00
COLSTRP frequency, Hz
Time (seconds)
59.6
59.7
59.8
59.9
60.0
60.1BROADV&1 frequency, Hz
59.6
59.7
59.8
59.9
60.0
60.1MALIN frequency, Hz
59.6
59.7
59.8
59.9
60.0
60.1
0.00 0.75 1.50 2.25 3.00
ROUND MT frequency, Hz
Time (seconds)
59.6
59.7
59.8
59.9
60.0
60.1SUMMER L frequency, Hz
59.6
59.7
59.8
59.9
60.0
60.1GATES frequency, Hz
WECC System Information (Trip 3 Palo Verte generators) Black:No DG; Red:Rot DG w/o Control; Green:Rot DG w/ Underfrequency Tripping
10-DEC-2002 14:18:36 C:\WeiWork\projects\DG\NREL\P3sys\chan\nodg63.ch Page 2

84
59.6
59.7
59.8
59.9
60.0
60.1
0.00 0.75 1.50 2.25 3.00
MIDWAY frequency, Hz
Time (seconds)
59.6
59.7
59.8
59.9
60.0
60.1LOSBANOS frequency, Hz
59.6
59.7
59.8
59.9
60.0
60.1SANTIAGO frequency, Hz
59.6
59.7
59.8
59.9
60.0
60.1
0.00 0.75 1.50 2.25 3.00
SANTIAGO frequency, Hz
Time (seconds)
59.6
59.7
59.8
59.9
60.0
60.1BOISEBCH frequency, Hz
59.6
59.7
59.8
59.9
60.0
60.1WESTWING frequency, Hz
WECC System Information (Trip 3 Palo Verte generators) Black:No DG; Red:Rot DG w/o Control; Green:Rot DG w/ Underfrequency Tripping
10-DEC-2002 14:18:36 C:\WeiWork\projects\DG\NREL\P3sys\chan\nodg63.ch Page 3

85
0.2
0.4
0.6
0.8
1.0
1.2
0.00 0.75 1.50 2.25 3.00
BRIDGER1 voltage, pu
Time (seconds)
0.2
0.4
0.6
0.8
1.0
1.2COLSTP 4 voltage, pu
0.2
0.4
0.6
0.8
1.0
1.2PALOVRDE voltage, pu
0.2
0.4
0.6
0.8
1.0
1.2
0.00 0.75 1.50 2.25 3.00
DEVERS voltage, pu
Time (seconds)
0.2
0.4
0.6
0.8
1.0
1.2ING500 voltage, pu
0.2
0.4
0.6
0.8
1.0
1.2CUSTER W voltage, pu
WECC System Information (Trip 3 Palo Verte generators) Black:No DG; Red:Rot DG w/o Control; Green:Rot DG w/ Underfrequency Tripping
10-DEC-2002 14:18:36 C:\WeiWork\projects\DG\NREL\P3sys\chan\nodg63.ch Page 4

86
0.2
0.4
0.6
0.8
1.0
1.2
0.00 0.75 1.50 2.25 3.00
COLSTRP voltage, pu
Time (seconds)
0.2
0.4
0.6
0.8
1.0
1.2BROADV&1 voltage, pu
0.2
0.4
0.6
0.8
1.0
1.2MALIN voltage, pu
0.2
0.4
0.6
0.8
1.0
1.2
0.00 0.75 1.50 2.25 3.00
ROUND MT voltage, pu
Time (seconds)
0.2
0.4
0.6
0.8
1.0
1.2SUMMER L voltage, pu
0.2
0.4
0.6
0.8
1.0
1.2GATES voltage, pu
WECC System Information (Trip 3 Palo Verte generators) Black:No DG; Red:Rot DG w/o Control; Green:Rot DG w/ Underfrequency Tripping
10-DEC-2002 14:18:36 C:\WeiWork\projects\DG\NREL\P3sys\chan\nodg63.ch Page 5

87
0.2
0.4
0.6
0.8
1.0
1.2
0.00 0.75 1.50 2.25 3.00
MIDWAY voltage, pu
Time (seconds)
0.2
0.4
0.6
0.8
1.0
1.2LOSBANOS voltage, pu
0.2
0.4
0.6
0.8
1.0
1.2SANTIAGO voltage, pu
0.2
0.4
0.6
0.8
1.0
1.2
0.00 0.75 1.50 2.25 3.00
SANTIAGO voltage, pu
Time (seconds)
0.2
0.4
0.6
0.8
1.0
1.2BOISEBCH voltage, pu
0.2
0.4
0.6
0.8
1.0
1.2WESTWING voltage, pu
WECC System Information (Trip 3 Palo Verte generators) Black:No DG; Red:Rot DG w/o Control; Green:Rot DG w/ Underfrequency Tripping
10-DEC-2002 14:18:36 C:\WeiWork\projects\DG\NREL\P3sys\chan\nodg63.ch Page 6

88
0
5
10
15
20
0.00 0.75 1.50 2.25 3.00
MALIN - ROUND MT #1 ibr, A
Time (seconds)
5
10
15
20
25GATES - MIDWAY ibr, A
-600
-200
200
600
1000
1400
1800MALIN - ROUND MT #1 P, MW
-600
-200
200
600
1000
1400
1800
0.00 0.75 1.50 2.25 3.00
GATES - MIDWAY P, MW
Time (seconds)
1.0
1.2
1.4
1.6
1.8
2.0SANT230 - SANT66 #1 ibr, A
0
50
100
150
200SANT230 - SANT66 #1 P, MW
WECC System Information (Trip 3 Palo Verte generators) Black:No DG; Red:Rot DG w/o Control; Green:Rot DG w/ Underfrequency Tripping
10-DEC-2002 14:18:36 C:\WeiWork\projects\DG\NREL\P3sys\chan\nodg63.ch Page 7

89
Appendix F. WECC System Information (Trip 3 Palo Verte Generators) 4 Black: No DG Red: Rotating-type DG with no control Green: Rotating-type DG with governor control Blue: Rotating-type DG with governor anti-islanding control
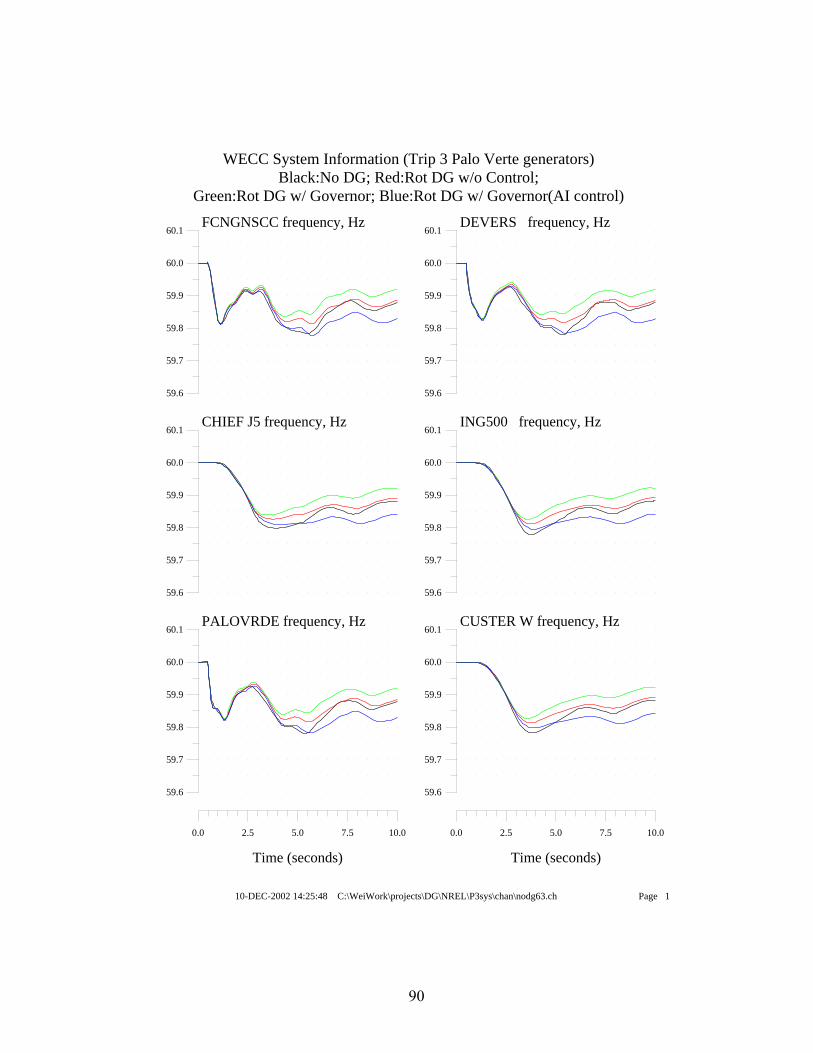
90
59.6
59.7
59.8
59.9
60.0
60.1
0.0 2.5 5.0 7.5 10.0
FCNGNSCC frequency, Hz
Time (seconds)
59.6
59.7
59.8
59.9
60.0
60.1CHIEF J5 frequency, Hz
59.6
59.7
59.8
59.9
60.0
60.1PALOVRDE frequency, Hz
59.6
59.7
59.8
59.9
60.0
60.1
0.0 2.5 5.0 7.5 10.0
DEVERS frequency, Hz
Time (seconds)
59.6
59.7
59.8
59.9
60.0
60.1ING500 frequency, Hz
59.6
59.7
59.8
59.9
60.0
60.1CUSTER W frequency, Hz
WECC System Information (Trip 3 Palo Verte generators) Black:No DG; Red:Rot DG w/o Control;
Green:Rot DG w/ Governor; Blue:Rot DG w/ Governor(AI control)
10-DEC-2002 14:25:48 C:\WeiWork\projects\DG\NREL\P3sys\chan\nodg63.ch Page 1

91
59.6
59.7
59.8
59.9
60.0
60.1
0.0 2.5 5.0 7.5 10.0
COLSTRP frequency, Hz
Time (seconds)
59.6
59.7
59.8
59.9
60.0
60.1BROADV&1 frequency, Hz
59.6
59.7
59.8
59.9
60.0
60.1MALIN frequency, Hz
59.6
59.7
59.8
59.9
60.0
60.1
0.0 2.5 5.0 7.5 10.0
ROUND MT frequency, Hz
Time (seconds)
59.6
59.7
59.8
59.9
60.0
60.1SUMMER L frequency, Hz
59.6
59.7
59.8
59.9
60.0
60.1GATES frequency, Hz
WECC System Information (Trip 3 Palo Verte generators) Black:No DG; Red:Rot DG w/o Control;
Green:Rot DG w/ Governor; Blue:Rot DG w/ Governor(AI control)
10-DEC-2002 14:25:48 C:\WeiWork\projects\DG\NREL\P3sys\chan\nodg63.ch Page 2

92
59.6
59.7
59.8
59.9
60.0
60.1
0.0 2.5 5.0 7.5 10.0
MIDWAY frequency, Hz
Time (seconds)
59.6
59.7
59.8
59.9
60.0
60.1LOSBANOS frequency, Hz
59.6
59.7
59.8
59.9
60.0
60.1SANTIAGO frequency, Hz
59.6
59.7
59.8
59.9
60.0
60.1
0.0 2.5 5.0 7.5 10.0
SANTIAGO frequency, Hz
Time (seconds)
59.600
59.725
59.850
59.975
60.100BOISEBCH frequency, Hz
59.6
59.7
59.8
59.9
60.0
60.1WESTWING frequency, Hz
WECC System Information (Trip 3 Palo Verte generators) Black:No DG; Red:Rot DG w/o Control;
Green:Rot DG w/ Governor; Blue:Rot DG w/ Governor(AI control)
10-DEC-2002 14:25:48 C:\WeiWork\projects\DG\NREL\P3sys\chan\nodg63.ch Page 3

93
0.90
0.95
1.00
1.05
1.10
0.0 2.5 5.0 7.5 10.0
BRIDGER1 voltage, pu
Time (seconds)
0.90
0.95
1.00
1.05
1.10COLSTP 4 voltage, pu
0.90
0.95
1.00
1.05
1.10PALOVRDE voltage, pu
0.90
0.95
1.00
1.05
1.10
0.0 2.5 5.0 7.5 10.0
DEVERS voltage, pu
Time (seconds)
0.90
0.95
1.00
1.05
1.10ING500 voltage, pu
0.90
0.95
1.00
1.05
1.10CUSTER W voltage, pu
WECC System Information (Trip 3 Palo Verte generators) Black:No DG; Red:Rot DG w/o Control;
Green:Rot DG w/ Governor; Blue:Rot DG w/ Governor(AI control)
10-DEC-2002 14:25:48 C:\WeiWork\projects\DG\NREL\P3sys\chan\nodg63.ch Page 4

94
0.90
0.95
1.00
1.05
1.10
0.0 2.5 5.0 7.5 10.0
COLSTRP voltage, pu
Time (seconds)
0.90
0.95
1.00
1.05
1.10BROADV&1 voltage, pu
0.90
0.95
1.00
1.05
1.10MALIN voltage, pu
0.90
0.95
1.00
1.05
1.10
0.0 2.5 5.0 7.5 10.0
ROUND MT voltage, pu
Time (seconds)
0.90
0.95
1.00
1.05
1.10SUMMER L voltage, pu
0.90
0.95
1.00
1.05
1.10GATES voltage, pu
WECC System Information (Trip 3 Palo Verte generators) Black:No DG; Red:Rot DG w/o Control;
Green:Rot DG w/ Governor; Blue:Rot DG w/ Governor(AI control)
10-DEC-2002 14:25:48 C:\WeiWork\projects\DG\NREL\P3sys\chan\nodg63.ch Page 5

95
0.90
0.95
1.00
1.05
1.10
0.0 2.5 5.0 7.5 10.0
MIDWAY voltage, pu
Time (seconds)
0.90
0.95
1.00
1.05
1.10LOSBANOS voltage, pu
0.90
0.95
1.00
1.05
1.10SANTIAGO voltage, pu
0.90
0.95
1.00
1.05
1.10
0.0 2.5 5.0 7.5 10.0
SANTIAGO voltage, pu
Time (seconds)
0.90
0.95
1.00
1.05
1.10BOISEBCH voltage, pu
0.90
0.95
1.00
1.05
1.10WESTWING voltage, pu
WECC System Information (Trip 3 Palo Verte generators) Black:No DG; Red:Rot DG w/o Control;
Green:Rot DG w/ Governor; Blue:Rot DG w/ Governor(AI control)
10-DEC-2002 14:25:48 C:\WeiWork\projects\DG\NREL\P3sys\chan\nodg63.ch Page 6

96
5
10
15
20
0.0 2.5 5.0 7.5 10.0
MALIN - ROUND MT #1 ibr, A
Time (seconds)
5
10
15
20GATES - MIDWAY ibr, A
800
1000
1200
1400
1600
1800MALIN - ROUND MT #1 P, MW
500
1000
1500
2000
0.0 2.5 5.0 7.5 10.0
GATES - MIDWAY P, MW
Time (seconds)
1.30
1.32
1.34
1.36
1.38
1.40SANT230 - SANT66 #1 ibr, A
125
127
129
131
133
135SANT230 - SANT66 #1 P, MW
WECC System Information (Trip 3 Palo Verte generators) Black:No DG; Red:Rot DG w/o Control;
Green:Rot DG w/ Governor; Blue:Rot DG w/ Governor(AI control)
10-DEC-2002 14:25:48 C:\WeiWork\projects\DG\NREL\P3sys\chan\nodg63.ch Page 7

REPORT DOCUMENTATION PAGE
Form Approved OMB NO. 0704-0188
Public reporting burden for this collection of information is estimated to average 1 hour per response, including the time for reviewing instructions, searching existing data sources, gathering and maintaining the data needed, and completing and reviewing the collection of information. Send comments regarding this burden estimate or any other aspect of this collection of information, including suggestions for reducing this burden, to Washington Headquarters Services, Directorate for Information Operations and Reports, 1215 Jefferson Davis Highway, Suite 1204, Arlington, VA 22202-4302, and to the Office of Management and Budget, Paperwork Reduction Project (0704-0188), Washington, DC 20503. 1. AGENCY USE ONLY (Leave blank)
2. REPORT DATE
August 2003
3. REPORT TYPE AND DATES COVERED
Subcontract
4. TITLE AND SUBTITLE Report on Distributed Generation Penetration Study
6. AUTHOR(S) N. Miller and Z. Ye
5. FUNDING NUMBERS
DP03.1001 NAD-1-30605-01
7. PERFORMING ORGANIZATION NAME(S) AND ADDRESS(ES)
GE Global Research Center One Research Circle Niskayuna, NY 12309
8. PERFORMING ORGANIZATION
REPORT NUMBER
9. SPONSORING/MONITORING AGENCY NAME(S) AND ADDRESS(ES)
National Renewable Energy Laboratory 1617 Cole Blvd. Golden, CO 80401-3393
10. SPONSORING/MONITORING
AGENCY REPORT NUMBER NREL/SR-560-34715
11. SUPPLEMENTARY NOTES
NREL Technical Monitor: Ben Kroposki 12a. DISTRIBUTION/AVAILABILITY STATEMENT
National Technical Information Service U.S. Department of Commerce 5285 Port Royal Road
Springfield, VA 22161
12b. DISTRIBUTION CODE
13. ABSTRACT (Maximum 200 words) This report documents part of a multiyear research program dedicated to the development of requirements to support the definition, design, and demonstration of a distributed generation-electric power system interconnection interface concept. The report focuses on the dynamic behavior of power systems when a significant portion of the total energy resource is distributed generation. It also focuses on the near-term reality that the majority of new DG relies on rotating synchronous generators for energy conversion.
15. NUMBER OF PAGES
14. SUBJECT TERMS
interconnection; penetration; distributed generation; DG; microgrids; synchronous generators; distributed energy resources; DER; distributed power; Distribution and Interconnection R&D; National Renewable Energy Laboratory; NREL
16. PRICE CODE
17. SECURITY CLASSIFICATION
OF REPORT Unclassified
18. SECURITY CLASSIFICATION
OF THIS PAGE Unclassified
19. SECURITY CLASSIFICATION
OF ABSTRACT Unclassified
20. LIMITATION OF ABSTRACT
UL
NSN 7540-01-280-5500 Standard Form 298 (Rev. 2-89) Prescribed by ANSI Std. Z39-18 298-102