Embed Size (px)
Citation preview

C A R I B B E A N E X A M I N A T I O N S C O U N C I L
REPORT ON CANDIDATES’ WORK IN THE
CARIBBEAN SECONDARY EDUCATION CERTIFICATE® EXAMINATION
MAY/JUNE 2013
GEOGRAPHY
GENERAL PROFICIENCY EXAMINATION
Copyright © 2013 Caribbean Examinations Council
St Michael, Barbados
All rights reserved.

2
GENERAL COMMENTS
This year 12,571 candidates sat the CSEC Geography. Approximately 68 per cent of these candidates
obtained acceptable grades of Grades I – III. This figure is consistent with that of 2012.
Candidates’ responses continue to show that there is a lack of understanding of basic geographical concepts
and terms. This was particularly evident in the interpretation of the questions. Candidates misinterpreted
terms such as temperature range, characteristics of soil, and land use pattern.
Some other areas of concern include the following:
Maps and diagrams were often poorly drawn, untidy and inaccurate. Conventions for drawing maps and
diagrams, even such basic conventions as giving a title, were often ignored.
Poor written language skills.
Lack of appropriate elaboration in describing items and giving reasons when explaining measures and
processes.
Failure to provide specific examples when requested by the questions.
In Papers 031 (School-Based Assessment) and 032 (Alternative to School-Based Assessment) many
candidates displayed an inability to conduct geographical field research and in Paper 031, in particular, to
write independent reports on that research. The use of computer graphics in Paper 031 seems to be having a
negative impact on the ability of candidates to draw graphs and pie charts.
Unfortunately, many candidates earned Grade VI, a grade which indicates a very limited knowledge and
understanding of the content and concepts tested. This suggests that these candidates were not adequately
prepared to write this examination.
DETAILED COMMENTS
Paper 01
This paper consists sixty multiple choice questions. Performance was generally satisfactory. The mean was
58 per cent compared to 60 per cent in 2012.
Paper 02 – Structured Response
This paper comprised ten structured response questions, the first of which was compulsory and tested map
reading skills. The other nine questions tested Natural Human and Human Environment systems.
Candidates were required to answer one of the three questions based on each system. The mean for this
paper was approximately 49 per cent, a similar figure to that in 2012.
Section A: Map-reading (Compulsory)
Question 1
This question was not well done as approximately 70 per cent of candidates earned between 0 and 10 marks,
out of a possible 28. The mean was 8.89 or 32 per cent.
Part (a), which tested candidates’ ability to give a six-figure grid reference for a location was not well done.
Over 80 per cent of candidates were able to give the correct grid square for the feature but fewer than half of
those were able to calculate the correct fractions to give the six-figure reference.

3
In Part (b) (i), candidates were asked to give the ratio scale of the map as a statement by saying how many
metres were represented by one centimetre on the map. About 20 per cent gave the correct answer.
Candidates gave answers which suggested that they had no concept of distances. Common answers were
one centimetre represented 25,000 metres and 2,500 metres instead of 250 metres.
Part (b) (ii) was fairly well done despite the lack of a concept of distance seen in (b) (i). About 70 per cent
got the correct answer using the line scale.
Part (c) (i), which tested the ability to identify grid bearing was also well done as over 80 per cent gave the
correct bearing.
Part (c) (ii) tested the ability to give a compass direction. The answer was west, but only about 50 per cent
gave that answer.
Part (d) provided a grid on which candidates were required to plot various features taken from the map
extract. Although the question said the grid was at half the scale, the grid provided was at the same scale as
the map. This error did not pose any problem to the candidates. However, many candidates lost marks
because they failed to label or provide a key for the beach and airport. Symbols must be labelled or
explained in a key. Candidates were asked to give the scale as a representative fraction and despite the grid
being obviously at the same scale, because the question said it was at half the scale. The scale of the map
and half the scale were both accepted as answers. Many candidates gave incorrect answers such as 1:12,500.
The concept of scale, the representative fraction in particular, was clearly not understood.
Part (e) required candidates to describe four characteristics of the land use pattern. They were able to
identify the types of land use but most failed to describe the pattern. Candidates were expected to say
specifically where the types of land use were found with reference to the position on the map. For example,
forests could have been described as being found largely in the northern and central areas on steep slopes.
Just saying on steep slopes would not be enough and was not considered an adequate response. Many,
instead of describing the spatial distribution of the types of land use, gave descriptions of settlement patterns
and drainage patterns, clearly misunderstanding the term, land use pattern.
For Part (f), candidates were asked to give reasons to explain the distribution of cultivation and plantations,
using evidence from the map. Many were able to identify some factors influencing the distribution but
failed to give adequate explanations for role of the factor. An unacceptable number of candidates had the
misconception that estates were located close to the coast to obtain seawater for irrigation.
Section B: Natural Systems
Question 2
This was the most popular question in this section. It was attempted by more than 50 per cent of the
candidates and about half of them gave satisfactory answers. It tested the candidates’ ability to draw a
diagram showing intrusive and extrusive volcanic features and their knowledge of plate boundaries and of
the processes leading to the formation of volcanoes and fold mountains. The mean of 11 or 45 per cent was
the highest in this section.
Part (a) which required candidates to draw a diagram illustrating features of a volcano was not well done.
Many candidates scored only one mark of the possible four. Intrusive features were placed on the surface
(without any explanation claiming exposure by erosion) and many when drawn underground, indicated no
apparent source of magma. Candidates confused sills and dykes and showed them as small as magma
chambers feeding a volcano. Lava plateaus were often depicted with a dome shape fed by a pipe.
Candidates need to pay more attention to diagrams when studying topics in the Natural Systems.
Part (b) required the candidates to name two types of plate boundaries and describe what happens at one of
them. This was the part of the question that was answered best. Some candidates however did not earn full
marks as they failed to give an appropriate example.

4
In the answers to part (c), many candidates were able to explain the formation of volcanoes better than that
of fold mountains. Some candidates did not know that fold mountains were formed by compression of the
sediments on the edge of converging plates.
Question 3
This question tested candidates’ understanding of the water cycle, their knowledge of drainage patterns and
their ability to explain the formation of surface and underground features in limestone areas. More than 60
per cent of the candidates earned less than 14 out of a possible 24. The mean was 9.47 or 40 per cent.
Part (a) was very well done but some candidates did not earn any marks because they listed the processes but
did not indicate which of the letters in the diagram applied to each one.
In Part (b), candidates were able to name two drainage patterns but did not describe them adequately, even
with the aid of diagrams. Some wrongly stated that tributaries take water away from the river and placed
arrows in their diagrams to show the flow away from the main rivers. The syllabus requires candidates to be
able to describe trellis, radial and dendritic patterns and they should be able to draw appropriate diagrams.
In Part (c), the majority of the candidates knew of the features created in limestone but many were not clear
as to whether they were surface features or underground features. Many did not detail the processes
explaining the formation of the features.
Question 4
The mean of this question 5.6, or 23 per cent, the lowest in the whole paper. It tested the candidates’ ability
to read and interpret a climate graph, explain the process leading to relief rain, describe any two
characteristics of soil and explain how climate and vegetation influence the formation of soils. All of these
topics proved to be difficult for the candidates.
For Part (a) a climate graph was provided and most candidates scored 2 out of the 4 marks available. While
candidates read the values of temperature and rainfall correctly, the majority did not recognize the
relationship between temperature and rainfall. Many did not understand what was meant by the “range of
average temperature”.
Candidates were asked to define the terms weather and climate in Part (b) (i). Surprisingly, most were
unable to do so. In Part (b) (ii), they were asked to explain what happens when warm, moist air is forced to
rise over a mountain. Few were able to recognize the process leading to relief rain and to explain what
happens in any great detail.
In Part (c) (i), candidates were able to identify characteristics of soil but could not develop the description.
Many gave examples of types of soil as characteristics.
The majority did not understand the requirements of Part (c) (ii). Some knew the characteristics of the
specific climatic types and vegetation types but were unable to relate them to soil formation. Some
recognized weathering material but did not link it to soil formation. Candidates were asked to explain the
influence on the formation of soil in either equatorial or tropical continental areas but some failed to say
which area they chose and so lost marks.

5
Section C: Human Systems
Question 5
Many candidates who answered this question gave satisfactory responses. It tested candidate's
understanding of population distribution and their ability to define key terms and understand the factors
affecting population change, using case studies (examples) of populations inside and outside of the region.
The mean was 10.35 or 41 per cent, the lowest in this section.
Answers to Part (a) were barely satisfactory. Not many candidates were able to accurately draw and label a
sketch map of a named Caribbean territory and to correctly indicate where dense or sparse settlements are
located within that territory. Some candidates used the map of Nevis provided for Question 1. Although
Nevis is not a country, they were not penalized nor were those who drew one island of other multi-island
countries. Candidates can learn to sketch maps by using geometric shapes to form a frame which they can
then enhance.
Part (b) (i) was not generally well done. Candidates were unable to give complete definitions of the terms:
‘birth rate’ and ‘infant mortality rate’. Most candidates gave better responses for birth rate. Candidates were
expected to state that birth rate is the number of babies born per 1-000 persons per year in a nation or
country. Infant mortality rate is the number of babies under one year old who die per 1-000 live births per
annum for a nation or country.
Part (b) (ii) was also not well done. Many candidates were aware of the impact of migration on population
increase; however, they did not develop the concepts of net migration and natural increase. Candidates were
expected to briefly outline that natural increase occurs when birth rate exceeds death rate or total number
of births per annum outstrips total number of deaths per annum and net migration occurs when immigration
exceeds emigration or total number of persons entering a country outstrips the total number of persons
exiting a country.
Part (c) (i) was fairly well done by many candidates as they were able to use appropriate examples and to
fully explain how population distribution is affected by the availability of services. The candidates who
selected relief did not score well as they did not indicate that flat or gently sloping areas attract settlement
due to the ease of construction, developing infrastructure or suitability for agriculture, or to give reasons
why it is difficult to settle on hilly, steep or mountainous areas. Some candidates did not follow instructions
and wasted time giving responses to both relief and services instead of just one of the two.
Part (c) (ii) posed a great challenge for many candidates because they needed to know about growth rates in
More Economically Developed Countries (MEDCs) and one Caribbean country and how growth rates were
affected by fertility rates and migration. Many of them were quite familiar with migration but dealt poorly
with the relationship between fertility rate and population growth. Also they were unable to correctly use
examples of a developed country listed in the syllabus. Several candidates used a Caribbean country that
has a greater level of development than the rest of the region such as Barbados, Trinidad and Tobago,
Bahamas, Turks and Caicos rather than using a MEDC outside of the region. Far too many candidates cited
China as a MEDC.
Many of the candidates were not familiar with the relative fertility rates of the MEDC and the Caribbean
country that they selected for comparison. As a result, they were unable to link fertility rates to the
population growth rates. Only a small number of the candidates were able to adequately demonstrate how
fertility rates contributed to higher or lower growth rates. This may suggest that more attention needs to be
paid to the effective teaching of this topic. In fact, some of the weaker candidates misinterpreted fertility
rates as the ability of rich soils to produce high yields and hence higher population growth. Too many
candidates incorrectly proposed that the size of countries impacted on population growth rate. They stated,
for example, that the United States of America being larger than Trinidad and Tobago, must therefore have a
higher population growth rate.
Candidates were expected to identify trends or patterns in fertility rates then explain some factors
influencing these rates namely religion, career choices, culture and the role of females of child bearing age.

6
The migration section of this question was fairly well answered although most candidates needed to organize
and structure their responses more clearly. Many of them had a fairly good understanding of how push -
pull factors led to and impacted on population growth in the two countries. Many were able to recognize
that emigration from the Caribbean is relatively high and tended to slow the population growth of
Caribbean countries, while MEDCs, such as Canada and the United Kingdom, which received large
numbers of young immigrants with higher fertility rates have increasing population.
Weaker candidates, however, interpreted ‘migration’ to mean rural to urban migration and explained the
effects of temporary movements associated with tourism.
Question 6
This question tested candidates’ skill in reading and comparing pie-charts and their knowledge and
understanding of the types and benefits of different economic activities in the Caribbean. The mean was
10.55 or 44 per cent.
In part (a) candidates were asked to read and compare two pie-charts. It was generally well done.
Part (b) required candidates to give a definition of ‘secondary economic activity’, an example of a secondary
economic activity and the main features of three types of tourism. It was well done but weak candidates
confused ‘secondary economic activity’ with ‘secondary level of education’. Candidates lost marks for
failing to give an example of secondary economic activity because they simply said manufacturing rather
than giving an example of a manufacturing or construction activity. In giving the main feature of the types
of tourism, some candidates did not link the types with attracting visitors. Answers on ecotourism and
sports tourism were not as good as those on heritage tourism.
Part (c) proved difficult for half of those who attempted this question. They were asked to explain three
benefits of primary activities to the Caribbean with reference to specific examples. Some named tourism as
a primary economic activity. Some listed three benefits, but gave no specific examples and no explanation
of the benefits to the Caribbean. By contrast, a few candidates earned full marks showing a specific benefit
linked to a specific primary activity and gave a satisfactory explanation of the benefit.
Candidates need to pay attention to the instructions of the question and the marks allocated. They should
note that the instruction words have specific meanings. ‘Explain’ does not mean ‘list’. It requires an
expansion of the point. For instance, earning foreign exchange helps to pay for imports and provides funds
for development.
Question 7
Candidates were required to construct a pie-chart, given three percentage values; state benefits of
agriculture, outline two problems faced by peasant farmers in the Caribbean and to give reasons for the
decline of the importance of agriculture in a named Caribbean country and also compare wheat farming and
commercial arable farming in a named Caribbean country using the two headings given. This was the least
popular question in this section. The mean was 12.21 or 51 per cent.
In Part (a), the pie-chart was fairly well done. Some responses lacked a title. Some candidates shaded the
three sectors. That should not be done in an examination unless the question asked for it.
In part (b) (i), most candidates had difficulty stating four benefits of agriculture. In Part (b) (ii), even the
weakest candidates were able to identify the problems faced by peasant (small) farmers but they had
difficulty earning full marks as they did not outline the problems adequately.
Part (c) (i) was answered poorly as candidates wrote about the importance and the decline in agriculture
rather than the declining importance of agriculture.

7
Part (c) (ii) was fairly well done but many candidates failed to earn full marks because they did not develop
their points fully in making the comparison. Both parts of (c) saw several candidates naming countries
outside of the Caribbean, but most identified a Caribbean country.
Section D: Human – Environment System
This section had responses which earned the highest average marks. Most candidates had their best answer
in this section.
Question 8
This was the most popular question, with a mean of 13.44 or 56 per cent. It tested the candidates’ skill in
extracting information from a table and their knowledge of the effects of one of the natural hazards and the
nature of a natural hazard. They also had to explain ways an individual should prepare for a chosen natural
hazard and measures used by a national disaster organization in a named Caribbean country in response to
hazards. The answers were good and in most cases, it was the best answer in the candidate’s entire script,
but there were some weak areas.
Most of the candidates got Part (a) (i) wrong as they did not check the list to realize that the year 1933 was
listed twice. Candidates should be cautious of this type of problem in using tables.
In Part (b), many candidates in defining a natural hazard did not include the element of threat.
Part (c) was the best answered part of this question. Nearly all the candidates described the effects of the
chosen hazard and the specific causes. A few candidates did not get full marks because they did not develop
their answer by giving the specific cause of the effect.
Part (d) (i) was also well done. Most candidates gave the reasons for the specific acts of preparing for the
chosen hazard and earned full marks.
In Part (d) (ii), about half the candidates did not identify a national disaster organization in a named
Caribbean country and/or give reasons for two measures these organizations use in response to hazards.
Question 9
This was the second least popular questions in this section. It tested the candidates’ ability to use data in a
table, knowledge of the definition of the term ‘greenhouse effect’ and of the causes of coral reef destruction
and deforestation and their ability to explain the contribution of global warming to the tourism industry and
of the impact of the destruction of coral reefs on that industry. Despite some sections which candidates did
not answer adequately, the question had the highest average mean, 14.37 or 60 per cent, in the examination.
Part (a) (i) to (iv) tested the candidates’ interpretation of a table showing global average temperature change
over six periods. Candidates performed reasonably well on this task but most failed to interpret the word
‘trend’.
Responses to Part (b) (i) were less than satisfactory. The term, ‘greenhouse effect’ was not fully understood
by candidates which was perhaps reflected in the variety of inappropriate answers. Some candidates
confused ‘greenhouse effect’ with ‘global warming’. More than 50 per cent of the candidates who did this
question failed to score a mark for Part (b) (i).
Part (b) (ii) tested candidates’ grasp of the causes of deforestation and was well done. About 90 per cent of
the responses earned full marks for this question.
Part (b) (iii) was answered appropriately by some candidates did not recognize that they had to do more than
just list two causes of coral reef destruction but they gave a brief description of the causes.
8
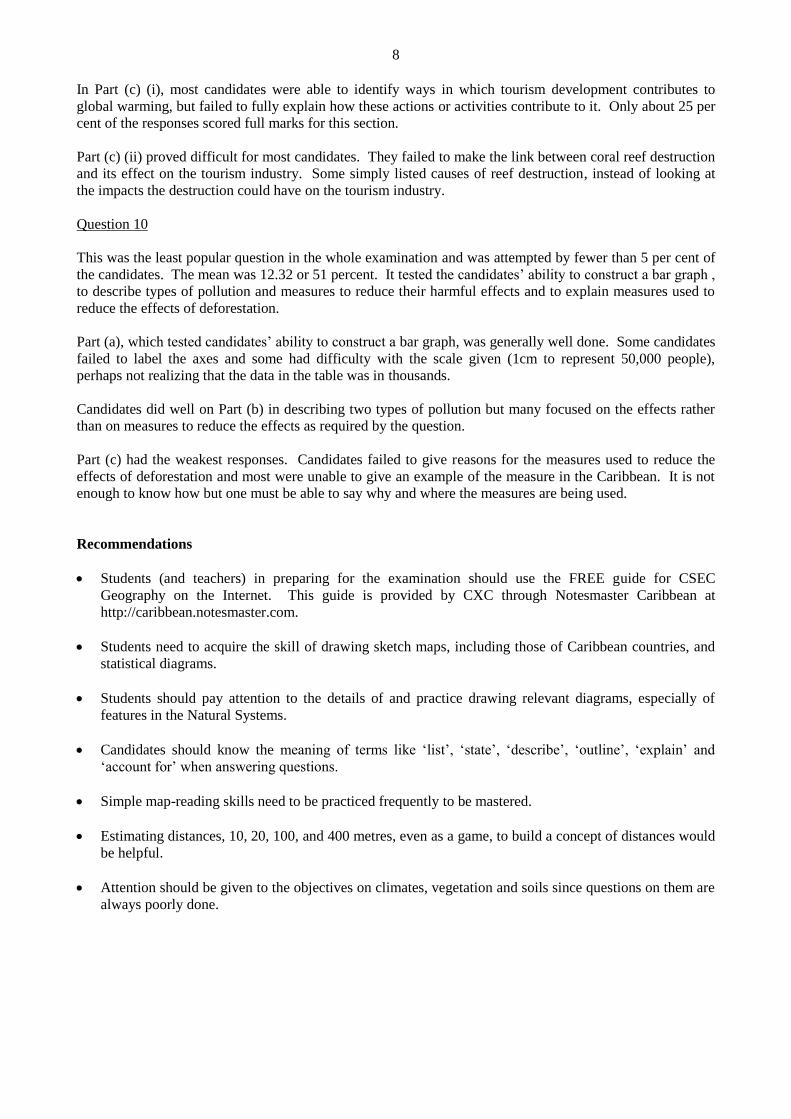
In Part (c) (i), most candidates were able to identify ways in which tourism development contributes to
global warming, but failed to fully explain how these actions or activities contribute to it. Only about 25 per
cent of the responses scored full marks for this section.
Part (c) (ii) proved difficult for most candidates. They failed to make the link between coral reef destruction
and its effect on the tourism industry. Some simply listed causes of reef destruction, instead of looking at
the impacts the destruction could have on the tourism industry.
Question 10
This was the least popular question in the whole examination and was attempted by fewer than 5 per cent of
the candidates. The mean was 12.32 or 51 percent. It tested the candidates’ ability to construct a bar graph ,
to describe types of pollution and measures to reduce their harmful effects and to explain measures used to
reduce the effects of deforestation.
Part (a), which tested candidates’ ability to construct a bar graph, was generally well done. Some candidates
failed to label the axes and some had difficulty with the scale given (1cm to represent 50,000 people),
perhaps not realizing that the data in the table was in thousands.
Candidates did well on Part (b) in describing two types of pollution but many focused on the effects rather
than on measures to reduce the effects as required by the question.
Part (c) had the weakest responses. Candidates failed to give reasons for the measures used to reduce the
effects of deforestation and most were unable to give an example of the measure in the Caribbean. It is not
enough to know how but one must be able to say why and where the measures are being used.
Recommendations
Students (and teachers) in preparing for the examination should use the FREE guide for CSEC
Geography on the Internet. This guide is provided by CXC through Notesmaster Caribbean at
http://caribbean.notesmaster.com.
Students need to acquire the skill of drawing sketch maps, including those of Caribbean countries, and
statistical diagrams.
Students should pay attention to the details of and practice drawing relevant diagrams, especially of
features in the Natural Systems.
Candidates should know the meaning of terms like ‘list’, ‘state’, ‘describe’, ‘outline’, ‘explain’ and
‘account for’ when answering questions.
Simple map-reading skills need to be practiced frequently to be mastered.
Estimating distances, 10, 20, 100, and 400 metres, even as a game, to build a concept of distances would
be helpful.
Attention should be given to the objectives on climates, vegetation and soils since questions on them are
always poorly done.

9
Paper 03/1 – School-Based Assessment
GENERAL COMMENTS
There is need for greater guidance for students in selecting topics for study.
Plagiarism in reports is a problem which ought to be addressed by teachers, as stated in the syllabus. Some
teachers appear to condone plagiarism by grading reports that include plagiarized material without applying
a penalty and then leaving it to the decision of the moderation team to detect and penalize. When these
cases reach to the CXC moderators the consequences for the candidates are more drastic.
Comments on the body of the Field Report
Strategy Sheet
More attention has to be given to the strategy to ensure the study is appropriate and manageable.
Table of Contents
The majority of candidates were able to produce a satisfactory Table of Contents. However, the
recommended format was not followed by many. This format is:
Aim
Location Maps
Methodology
Presentation and Analysis of Data
Conclusion
Bibliography
Appendix
Aim of Study
The aims presented by candidates needed to be more specific and measurable. In a lot of cases, aims were
either too general or were not geographical in focus. For example, a study “to determine the types of
pollution in Country A” is beyond the scope of a CSEC study. Several candidates did projects on topics that
were not in the syllabus. The study area was not included in the aims of some studies. The exact area and
the territory must be clearly stated.
A good example of an aim is To examine and account for the distribution of litter in the streets of Town
/suburb (named) in country (named) on Saturday (date). A vague, non-geographical aim is ‘To investigate
biodiversity in (named territory)’. Candidates are encouraged to use verbs such as assess, examine,
evaluate, measure, analyse and discuss in their aims or to pose a question to test an idea. This will help
focus the work in the field. To ensure that the topic is geographical, apart from being on the CSEC syllabus,
the spatial distribution of features or characteristics should be included in the aim.
Location of Study
Most candidates failed to score full marks on this aspect. Maps were untidy and lacked information.
Candidates are required to provide a map of the territory on which the position of the study area is shown
and a site map of the study area. The study area must be clearly highlighted on the territory map.
All maps should be drawn neatly. A title, scale, north arrow, key, and border should be provided. Labels
should be printed (and not in cursive script).
Site maps need to have the specific features studied clearly labeled and highlighted. Details of the
immediate environment, such as roads, physical features and buildings should be shown.

10
Where maps are photocopied or computer generated they must be altered to suit the purpose. Unnecessary
details should be removed and labels, including the name of water bodies, added.
Methodology
There was an over-reliance on questionnaires and these were often used even when they were not
appropriate to the aim of the study. As such, many studies, such as those done on pollution, tended to be
based on respondents’ perceptions rather than quantitative measurements. Teacher input into the strategy is
necessary so as to prevent this. Methods must suit topics.
Many candidates did not indicate the time period during which the study was done. Topics chosen should
permit the collection of primary data in the field and the specific times of data collection should be recorded.
In other words, where and when the study was conducted must be clearly stated, for example, 5 January
2013, between the hours of 10:00 a.m. and 3:00 p.m. at Site X, Parish/Town, Country C.
Where questionnaires are used as the main instrument for data collection, candidates should give the
sampling details, such as the population size, the sampling method and size of the sample. A copy of the
questionnaire should be included in the appendix.
Presentation of Data
Some studies had data that did not support the aim. Work in the field must be guided by the aim. The data
should be presented using different illustrations and integrated into the discussion, and the illustrations must
be appropriate. Some candidates used a pie chart to show an item with a 100 per cent value, which was
clearly inappropriate. Although tables, bar charts, line graphs and pie charts should all be used, candidates
should select the method of presentation which is most appropriate. Some candidates used illustrations from
secondary sources, for example pictures and diagrams from textbooks or the Internet. These are only
acceptable if used for comparison with pictures or sketches made at the site during the field work for the
study.
There were some other weaknesses which were also noted last year. These included:
failure to give illustrations a title and figure number
improperly labelled axes on graphs
unlabelled photographs and photographs with no arrows pointing to features being highlighted
use of more than one type of diagram to represent the same data
unclear and untidy diagrams
In some cases, all or most of the candidates from the same school presented identical illustrations.
Candidates need to be reminded that no credit is given to illustrations copied from secondary sources.
Quality of Data
Many candidates failed to obtain full marks for this area because their data were either inappropriate or
irrelevant to the aims or lacked evidence of field work. Too often, the data were not sufficient to achieve the
aim of the study.
Analysis and Discussion
Generally, candidates did not do well in this section as they failed to refer to the data and illustrations
appropriately, to analyse the data in relation to the aim and to present their findings in a properly sequenced
and logical manner. Candidates must be encouraged to account for and explain patterns and trends in their
field data and clearly relate these to the aim of the study. Candidates who rely only on secondary data can
earn no more than two marks in this section.

11
Conclusion
For most studies, the conclusions were too simplistic. Candidates had some difficulty in summarizing their
findings and others attempted to introduce new information not mentioned in the analysis and discussion.
Candidates often engaged in discussion that should have been placed in the section for presentation and
analysis of data. Candidates need to be aware that in the conclusion they have to give a concise summary of
their findings and state whether or not the aim was achieved.
Communication of Information
Candidates must be encouraged to review and thoroughly edit their projects before submission in order to
reduce the incidence of spelling, grammatical and punctuation errors. They must be strongly encouraged to
make better use of appropriate geographical terms and to ensure the report is within the word limit.
Bibliography
Many candidates failed to adhere to the format in compiling the bibliography as outlined in the Geography
syllabus. Many of them did not present their sources in alphabetical order and used the first name of the
author rather than the surname when listing sources. Further, some candidates did not include sources
referred to in the study.
Candidates should use at least three references.
Paper 032 (Alternative to SBA)
GENERAL COMMENTS
This paper is a substitute for the field study report and is usually done by students who are not attending an
educational institution where they will have the benefit of a computer teacher to provide the required
guidance to complete the school-based assessment. It is designed to test the same skills demonstrated for the
work in the field. It tests a candidate’s knowledge of field research techniques, methods of presenting
information and data, and ability to summarize and analyse data obtained in the field. It is clear that the
majority of the candidates were not adequately conversant with these techniques and methods. The mean on
the paper was 13.76 or 34 per cent. This was consistent with the performance in 2012.
Question 1
This question required the completion of a site map and a location map from a topographical map with a
scale of 1:25,000. The site map was at the same scale as the map while the location map was a thumbnail
size. Most candidates had difficulty in plotting the features on both maps.
Question 2
Candidates performed poorly on this question which tested the ability to frame a research question or
hypothesis. A suitable response for the scenario given might have been: Are most of the tourists coming
from other areas in the Caribbean and mainly interested in rainforest, reefs and ruins and not the beaches?
In other words, the suggestion given in the question could have been rephrased as a question to guide the
research.
Question 3
Part (a) required candidates to identify six variables on which to collect data. Many candidates were not
familiar with the term ‘variables’ so responses were poor. Most candidates listed methods of collecting data
rather than the data they would collect (such as the origin of the tourist, the four main reasons for visiting,
age and gender).
12
In Part (b) most candidates who knew the term ‘variable’ were able to identify an appropriate time to
conduct the research but most did not mention sampling techniques.
Part (c) required candidates to identify one problem (excluding weather, illness and injury) they might
encounter in conducting the research and state how they would overcome that problem. This was not done
well. Trivial reasons, such as a school event were advanced. The better answers anticipated the
unwillingness of tourists to be interviewed by a strange person.
Question 4
Part (a) required the construction of a line graph showing temperatures in Nevis and given in a table. It was
well done. In a few cases, the graphs were untidy.
Part (b) asked candidates to show how two features of the temperature in the table might make the climate
suitable for agriculture. This was a difficult exercise for most candidates. Candidates needed to examine the
values and note that there were no freezing temperatures, and that temperatures were suitable for plant
growth throughout the year.
Question 5
Part (a) required the candidate to name the instrument used to collect rainfall data. Surprisingly, the
majority of the candidates did not give the correct answer.
Part (b) was fairly well done. It asked for a bar graph to show rainfall data given in a table.
Part (c) asked for six possible reasons for the above average rainfall at the station in eastern Nevis for the
month shown in the table. Candidates had great difficulty doing this. They needed to recognize the
difference between weather and climate data, the difference between the average data for the whole island
and the record for one station, the importance of the position of the site on the eastern side of the island, the
vagaries of weather and of the risk of error in the measurement and recording of rainfall or in placement of
the rain gauge.
Question 6
The knowledge of the elements of a book that are to be given in a bibliography was tested by this question.
Most candidates did well on this question. However, some had absolutely no idea that the missing element
was the city of publication and suggested the size of the book or the number of pages.
Generally, candidates need more instruction on the requirement for Paper 032 if they are to improve their
performance. Candidates need to know how to conduct fieldwork and prepare a report in order to achieve
higher scores on this paper.