Embed Size (px)
Citation preview

Report of Water Quality Monitoring for Bacteria Indicators in the Lower San Lorenzo River Watershed, 2014 and 2016
Prepared for the San Lorenzo River Alliance, Water Quality Working Group, with participants from:
City of Santa Cruz Public Works Department City of Santa Cruz Water Department
County of Santa Cruz Department of Public Works County of Santa Cruz Department of Environmental Health Services
Central Coast Regional Water Quality Control Board Coastal Watershed Council
Surfrider Foundation
Prepared by: Armand Ruby, Technical Director, Coastal Watershed Council
Alev Bilginsoy, River Scientist, Coastal Watershed Council
December 29, 2017

INTRODUCTION
The Water Quality Working Group of the San Lorenzo River Alliance (SLRA) was first assembled in 2013 to help address water quality issues in the San Lorenzo River and its tributaries. Working Group participants include personnel with water quality expertise from:
City of Santa Cruz Public Works and Water Departments,
County of Santa Cruz Environmental Health Services and Public Works,
Central Coast Regional Water Quality Control Board, and
Nonprofit organizations Surfrider Foundation and Coastal Watershed Council.
The Working Group has taken a collaborative approach to improving water quality in the San Lorenzo River watershed. The initial focus of the Working Group’s activity has been to address impairment of river water quality by fecal indicator bacteria. The reasons for this focus are:
1. The SLRA wishes to improve the general quality and beneficial uses in the San Lorenzo River, and
2. The SLRA seeks to participate with other stakeholders and help municipalities in response to the impairment of beneficial uses of the river, as described in the San Lorenzo River Watershed Pathogen Total Maximum Daily Load (TMDL) regulation (Central Coast Water Board Resolution R3-2009-0023).
The TMDL Problem Statement characterizes the impairment as follows:
“The beneficial use of water contact recreation is not protected in the impaired reaches of the San Lorenzo River Estuary (also known as San Lorenzo River Lagoon), San Lorenzo River, Branciforte Creek, Camp Evers Creek, Carbonera Creek, and Lompico Creek because fecal coliform concentrations exceed existing Basin Plan numeric water quality objectives protecting this beneficial use. All reaches in these water bodies are impaired with the exception of Carbonera Creek, where the impairment extends from the mouth of Carbonera Creek upstream to its intersection with Bethany Road.”
Focusing on the water contact recreation beneficial use cited in the TMDL, the guiding questions developed by the Working Group in its efforts to address the bacteria contamination issues are:
What is the level of human bacterial contamination in the surface waters of the lower San Lorenzo River watershed?
What are the key sources of human and other anthropogenic bacterial contamination in the lower San Lorenzo River?
What BMPs are best suited to control high-priority bacteria sources in the urban area?
APPROACH
Beginning in 2014, the Working Group has been implementing the following steps to address the impairment of the San Lorenzo River and its key tributaries (collectively, the “receiving waters”):
1. Monitor and assess receiving water conditions to characterize the bacteria impairment.
2. Determine the extent to which urban runoff may cause or significantly contribute to the receiving water impairment, and the relative contribution of human sources to the overall in-stream bacteria load.
3. Identify and prioritize the sources of bacteria from runoff within the urbanized watershed, including an assessment of controllability, under both wet and dry weather conditions.
4. Identify existing and new BMPs applicable to the identified high-priority bacteria sources, and prioritize BMPs for implementation, to help further control high-priority sources of bacteria from runoff within the urbanized watershed.
5. Implement selected BMPs to address high-priority bacteria sources in the lower San Lorenzo River watershed.

Water Quality Monitoring in the Lower San Lorenzo River Watershed, 2014 and 2016 Page 2
Progress to date in implementing the above-listed steps is described below. Likely next steps may include assessment of the effectiveness of implemented BMPs (by methods to be determined), including progress towards achieving TMDL requirements, and evaluation of the need for improvements in BMP implementation and/or introduction of additional BMPs to further improve receiving water quality and address TMDL requirements. WATER QUALITY MONITORING; RECEIVING WATER ASSESSMENT The Working Group designed a water quality monitoring program to implement steps 1 and 2 in the approach outlined above, and to address the first management question:
• What is the level of human bacterial contamination in the surface waters of the lower San Lorenzo River watershed?
Monitoring was performed initially in 2014 to characterize bacteria-related water quality conditions in the lower San Lorenzo River watershed, and identify the extent of human contributions to in-stream bacteria levels. The monitoring program was implemented at six receiving water locations throughout the lower San Lorenzo River watershed, during the period of peak recreational water contact, May through October 2014. Monitoring sites are listed in Table 1 and shown in Figure 1. In 2016 the Working Group replicated the 2014 bacterial monitoring study, with monitoring performed at the same locations and again during the May-October peak recreational period. The 2015-16 wet season produced near-normal precipitation, whereas the 2014 monitoring was performed during a period of extended drought conditions. An additional sub-question was therefore added to the management question listed above:
o How do levels of human bacterial contamination in drought conditions (2014) compare to levels in a near normal precipitation year (2016) in the surface waters of the lower San Lorenzo River watershed?
Table 1. SLRA Monitoring Sites
Site Name Site ID Description
San Lorenzo River at Sycamore Grove 304-SANLO-31 San Lorenzo River at Sycamore Grove
San Lorenzo River at Tait St. 304-SANLO-30 San Lorenzo River upstream from main urban area inputs, near City water intake at Tait Street
Branciforte u/s of Carbonera 304-BRANC-26 Branciforte Creek upstream from confluence with Carbonera Creek
Carbonera u/s of Branciforte 304-CARBO-21 Carbonera Creek upstream from confluence with Branciforte Creek
Branciforte u/s of San Lorenzo River 304-BRANC-21 Branciforte Creek upstream from confluence with San Lorenzo River, at start of concrete channel
San Lorenzo River at Trestle 304-SANLO-22 San Lorenzo River at lagoon, beneath Trestle Bridge.

Water Quality Monitoring in the Lower San Lorenzo River Watershed, 2014 and 2016 Page 3
Figure 1. SLRA Monitoring Sites, Lower San Lorenzo River Watershedi Notes re: abbreviations used in figures/tables: “u/s” = upstream; “SLR” = San Lorenzo River; “B’forte” = Branciforte Creek.

Water Quality Monitoring in the Lower San Lorenzo River Watershed, 2014 and 2016 Page 4
To distinguish between human bacterial contamination and non-human contamination, the Working Group utilized a multiple-lines-of-evidence approach, cross-referencing observed levels of the ubiquitous fecal indicator bacteria with the measurement of other, specific chemical and biological constituents that can be used as markers for human contamination. Analytical Constituents The multiple-lines-of-evidence approach included measurement of the standard fecal bacteria indicators, plus a diverse range of possible biological and chemical human markers. All analyses were performed at analytical laboratories with ELAP (Environmental Laboratory Accreditation Program) and/or NELAC (National Environmental Laboratory Accreditation) certification. Water samples were analyzed for the following constituents:
• Fecal sterols and stanols • Caffeine • Human Bacteroides (HF183 marker) • Fecal indicator bacteria (FIB), including E. coli, Total coliform, and Enterococcus • Standard field parameters (dissolved oxygen, temperature, conductivity, pH)
Fecal sterols, stanols and caffeine are considered to be chemical tracers that can be used to help identify potential contributions from human sources (c.f., Standley et al., 2000). The use of chemical source tracking methods represents an important additional line of evidence among the several lines of evidence previously applied in the investigation of bacteria sources in the San Lorenzo River watershed. The fecal sterol cholesterol is ubiquitous in the digestive tracts of animals and in the environment. Cholesterol is mostly metabolized in the human gut to the fecal stanol coprostanol. By contrast, in the environment cholesterol normally reduces to cholestanol. Coprostanol is therefore often used alone or in ratio to other fecal sterols/stanols to identify human fecal sources (c.f., Ahmed et al., 2011). For both the 20141 and 2016 samples, fecal sterols and stanols analyses were performed at Physis Environmental Laboratories in Anaheim, CA, via high resolution gas chromatography coupled with mass spectrometry (GC/MS) in a modified version of the USEPA 625 GC/MS method. Caffeine is widely consumed in modern cultures, and while caffeine is readily metabolized by the human body, up to 10% of the consumed caffeine may be excreted, mostly via the urine (Ferreira, 2005). Caffeine has been shown to be a reliable indicator of human contamination in surface waters, and detection of caffeine can be interpreted as representative of the presence of human sewage (c.f., Ferreira, 2005). Caffeine analysis was performed for both the 2014 and 2016 samples using the caffeine ELISA test at the City of Santa Cruz Environmental Laboratory. Bacteroides are anaerobic bacteria prevalent in the gastrointestinal tracts of mammals; species that are specific to the human gut may be used as indicators of human sewage contamination in environmental samples (Sauer et al., 2011). Different analytical laboratories and methods were used for the 2014 vs. 2016 samples:
• For the 2014 samples, bacteroides analysis was conducted using quantitative polymerase chain reaction (qPCR) testing for human-specific bacteroides at the County of Santa Cruz Environmental Health Services laboratory, using the HF183 marker and an Applied BioSystem StepOne Real Time PCR Analyzer. Testing was accomplished by filtering 100 ml of stream water through a 0.4uM polycarbonate filter and processing using a GeneRite DNA-EZ ST2 Kit, S0205-50. The purified DNA extract was then run through the DNA Analyzer and compared to standards made up from a DNA sequence outlined in the HF183 procedure and purchased from Integrated DNA Technologies.
1 During the first two monitoring events of 2014 (May-June samples), fecal sterols and stanols were analyzed by Axys Analytical Services of Sydney, British Columbia, using their own GC/MS method (Axys Method MLA-068 Rev 3)

Water Quality Monitoring in the Lower San Lorenzo River Watershed, 2014 and 2016 Page 5
• For the 2016 samples, bacteroides analysis was conducted by the City of Santa Cruz Environmental Laboratory, using a technologically-sophisticated digital droplet PCR (ddPCR) analytical method. Initial processing for human bacteroides analysis, which includes sample water filtering, freezing the filters, and extracting DNA, was performed monthly by a trained volunteer from the local Surfrider chapter, and County Environmental Health staff at the County Environmental Health Lab. Two 1000 mL samples were collected at each site, and the full 1000 mL was filtered and processed for each sample. The results from each sample pair were averaged for presentation and analysis. The ddPCR technique is a relatively new PCR method that is touted for higher precision and similar sensitivity and specificity of the HF183 marker when compared to the qPCR method utilized in 2014.
Fecal indicator bacteria analysis was performed by the Santa Cruz County Environmental Health laboratory, for both the 2014 and 2016 samples. Routine field measurements were made in the field at the time of sample collection. Summer 2014 Study Results Samples were collected monthly as grab samples by Coastal Watershed Council (CWC) staff and volunteers from six sites located at strategic points within the lower San Lorenzo River watershed (see list of sites in Table 1 and Figure 1). Samples were collected using clean sample handling techniques, according to protocols specified in CWC’s creek sampling Quality Assurance Project Plan (QAPP). The following summarizes the results of the 2014 monitoring (Ruby, 2015):
• For the fecal sterols and stanols analyses, very few samples indicated the presence of human contributions to the in-stream chemistry, while most samples exhibited indications of avian (bird) contributions.
• For caffeine, all 36 river and creek samples were reported as below the analytical detection level (commonly referred to as “non-detect”). By contrast, the City of Santa Cruz has detected caffeine in samples from certain problem sites in the storm drain system, where there is presumed to be cross-contamination from sewage sources (Steve Wolfram, pers. comm.).
• Human Bacteroides were only detected at quantifiable levels in three of the 36 samples; two of those were at the Carbonera Creek site (upstream of the confluence with Branciforte Creek).
• FIB levels were highly variable from site to site and month to month; highest results were most often obtained at the Branciforte Creek site upstream of the confluence with the San Lorenzo River, and at the Carbonera Creek site (upstream of the confluence with Branciforte Creek). A minority of the samples exceeded the USEPA Freshwater Recreational Water Quality Criteria (USEPA, 2012) statistical threshold values for E.coli (410 cfu/100mL) and Enterococcus (130 cfu/100mL).
• The Bacteroides results don’t correlate well statistically with either the concurrent FIB results or the chemical tracer results.
Summer 2016 Study - Overview The Water Quality Working Group replicated the 2014 study with an identical, multiple-lines-of-evidence strategy in 2016, repeating the sites and analytical constituents monitored in 2014, and again monitoring monthly, from May to October. Samples were again collected by Coastal Watershed Council (CWC) staff and volunteers from six sites located at strategic points within the lower San Lorenzo River watershed (Table 1 and Figure 1). Samples were collected using clean sample handling techniques, according to protocols specified in CWC’s creek sampling Quality Assurance Project Plan (QAPP). Monitoring was conducted monthly on the following dates, scheduled to coincide with outgoing tidal conditions (beginning at the upstream sites and working downstream):

Water Quality Monitoring in the Lower San Lorenzo River Watershed, 2014 and 2016 Page 6
Monday, May 16, 8 AM start Monday, June 13, 9:30 AM start Wednesday, July 13, 8 AM start Thursday, August 11, 7 AM start Monday, September 12. 9:30 AM start Monday, October 10, 8:30 AM start
Samples were iced and delivered to the analytical laboratories on the day of sample collection. Analysis of fecal sterols and stanols was performed by Physis Environmental Laboratories and jointly funded by the City of Santa Cruz Public Works Department and County of Santa Cruz. Caffeine testing was performed by the City of Santa Cruz Environmental Laboratory. Fecal indicator bacteria analysis was performed by Santa Cruz County Environmental Health laboratory. Initial processing for human bacteroides analysis, which includes sample water filtering, freezing the filters, and extracting DNA, was performed monthly by the Surfrider and County Environmental Health staff at the County Environmental Health Lab. The extracted DNA samples were analyzed for the human-associated HF183Taqman marker by the City of Santa Cruz Environmental Laboratory, using a digital droplet PCR (ddPCR) analytical method. 2016 Results and Discussion The 2016 study findings are outlined below. Results from chemical and biological analyses indicate a likely preponderance of bird inputs, similar to the 2014 study, but with a greater degree of human input in the San Lorenzo River when compared to the 2014 study results. See Appendix A, Tables 1 and 2 for the specific chemical tracer data and FIB data, respectively. Fecal Sterols and Stanols Coprostanol, commonly identified with human fecal sources, was detected by the analytical laboratory regularly in samples from May, September and October (see Figure 2). Notably, coprostanol levels in samples from June through August were below the limit of analytical detection.
Figure 2: Monthly Coprostanol Concentrations at Six Sites, 2016 monitoring

Water Quality Monitoring in the Lower San Lorenzo River Watershed, 2014 and 2016 Page 7
Three chemical tracer ratios were used to evaluate fecal sterols and stanols (per Ahmed et al., 2011); two ratios are designed to indicate the presence of human fecal contamination, and one is designed to indicate the presence of avian fecal contamination. In May, due principally to high coprostanol levels, the Branciforte u/s of Carbonera site sample exceeded both human fecal indicator ratio limits at a level >0.5, indicating the presence of anthropogenic contamination (Tables 2, 3). In September, samples collected from Branciforte u/s of Carbonera, Carbonera u/s of Branciforte and Branciforte u/s of San Lorenzo River sites all exceeded the human fecal indicator Ratio #1 threshold at a level >0.5. In September, a sample from Branciforte u/s of Carbonera also exceeded the human fecal indicator Ratio #4 threshold at a level >0.5 (Tables 2, 3).
Table 2: Human Fecal Indicator Ratio #1 (Ahmed et al., 2011), 2016 Data
Coprostanol : Cholestanol Ratios by Sample Collection Date
Site 5/16/16 6/13/16 7/13/16 8/11/16 9/12/16 10/10/16
SLR @ Sycamore Grove 0.24 0.25 0.32 0.26 0.14 0.26 SLR @ Tait St. 0.19 0.23 0.16 0.23 0.12 0.35 B40 u/s of Carbonera 1.47 0.22 0.18 0.26 1.46 0.40 Carbonera u/s of B40 0.40 0.34 0.29 0.26 0.53 0.37 B40 u/s of SLR 0.37 0.15 0.05 0.05 0.55 0.38 SLR @ Trestle 0.15 0.10 0.11 0.07 0.21 0.09
Monthly averages: 0.47 0.21 0.19 0.19 0.50 0.31 Shading Indicates: Human Fecal Indicator: ratio>0.5 [Ratio 1 from Ahmed et al. 2011, Table 21.2]
Table 3: Human Fecal Indicator Ratio #4 (Ahmed et al., 2011), 2016 Data
Coprostanol: (Cholestanol + Coprostanol) Ratios by Sample
Collection Date Site 5/16/16 6/13/16 7/13/16 8/11/16 9/12/16 10/10/16
SLR @ Sycamore Grove 0.19 0.20 0.24 0.20 0.12 0.21 SLR @ Tait St. 0.16 0.19 0.14 0.19 0.11 0.26 B40 u/s of Carbonera 0.60 0.18 0.16 0.20 0.59 0.29 Carbonera u/s of B40 0.29 0.25 0.22 0.20 0.35 0.27 B40 u/s of SLR 0.27 0.13 0.05 0.05 0.36 0.28 SLR @ Trestle 0.13 0.09 0.10 0.07 0.18 0.08
Monthly averages: 0.27 0.17 0.15 0.15 0.28 0.23 Shading Indicates: Human Fecal Indicator: ratio>0.5 [Ratio 4 from Ahmed et al. 2011, Table 21.2]
While various sites exceeded the avian indicator ratio (Ratio #10) at the threshold level of >67% during the study period, the San Lorenzo River at Trestle site measured >67% for all six events, indicating a consistent avian fecal contribution at that site. Averaging avian fecal indicators over the

Water Quality Monitoring in the Lower San Lorenzo River Watershed, 2014 and 2016 Page 8
six-month study period, San Lorenzo at Tait St, Branciforte u/s of San Lorenzo River and San Lorenzo River at Trestle sites all exhibited a high avian fecal contribution (Table 4).
Table 4: Avian Fecal Indicator Ratio #10 (Ahmed et al. 2011), 2016 Data
Cholestanol:(Cholestanol+Coprostanol+Epicoprostanol) Ratios by
Sample Date
Site 5/16/16 6/13/16 7/13/16 8/11/16 9/12/16 10/10/16
SLR @ Sycamore Grove 72% 67% 61% 66% 70% 66% SLR @ Tait St. 73% 68% 76% 69% 80% 59% B40 u/s of Carbonera 36% 69% 73% 66% 36% 56% Carbonera u/s of B40 59% 60% 63% 66% 61% 57% B40 u/s of SLR 65% 77% 84% 91% 62% 66% SLR @ Trestle 77% 84% 82% 87% 80% 87%
Monthly Averages: 64% 71% 73% 74% 65% 65% Shading Indicates: Avian Fecal Indicator: ratio > 67% [Ratio 10 from Ahmed et al. 2011, Table 21.2]
Summarizing the 2016 fecal sterol/stanol analysis using the ratios from Ahmed et al., 2011, the following results were obtained (where “hits” are those samples that exceeded the respective ratio):
• Ratio #1 (human fecal indicator): 4/36 hits • Ratio #4 (human fecal indicator): 2/36 hits • Ratio #10 (avian fecal indicator): 18/36 hits
Caffeine As in 2014, caffeine was not detected by the City of Santa Cruz Environmental laboratory at any of the six sites over the six months of monitoring at the analytical reporting limit of 0.175 µg/L (see Appendix A, Table A.1). Detections of caffeine associated with high levels of fecal indicator bacteria often suggest the presence of domestic sewage. Bacteroides During the 2016 study, two 1000 mL samples were collected and analyzed from each site each month. The full samples were filtered and processed, and the extracted DNA was analyzed for the HF183 gene marker using the ddPCR method. Fifty-eight of the total 72 samples collected were positive for the human DNA marker HF183. The results of the HF183 analyses were averaged for each sample pair. The results of the averages of each sample pair are shown in Table 5. The USEPA’s most recently published, updated recreational water quality criteria for enterococci are designed to establish the permissible levels of contamination for freshwater exposure, so as to limit the risk of gastrointestinal illness to less than 30 illnesses per 1000 swimmers (USEPA, 2012). In an assessment of the risk of gastrointestinal illness in contaminated recreational waters, a benchmark level of 4200 copies of HF183 per 100 mL was estimated to correspond to the 30 illnesses/1000 swimmers health risk level (Boehm et al., 2015). All of the 2016 results in the lower San Lorenzo River watershed (Table 5) were more than an order of magnitude below this benchmark. However, efforts by other researchers to develop a “Human Fecal Score” for interpretation of such data have been complicated by the relatively rapid rates of decay of the HF183 genetic material in

Water Quality Monitoring in the Lower San Lorenzo River Watershed, 2014 and 2016 Page 9
natural waters (Cao et al., 2017a). It is unknown how the results of the current study’s bacteroides monitoring may have been affected by such environmental decay. Table 5: Human Bacteroides Concentrations as Copies of HF183 Gene Marker, 2016
HF183 Copies per 100 mL*, by Sample Collection Date
Site 5/16/16 6/13/16 7/13/16 8/11/16 9/12/16 10/10/16
SLR @ Sycamore Grove 230 188 146 63 ND 22
SLR @ Tait St. 306 146 113 96 43 ND
B40 u/s of Carbonera 250 128 50 20 151 ND
Carbonera u/s of B40 190 132 42 93 ND 45
B40 u/s of SLR 184 178 114 66 50 77
SLR @ Trestle 80 183 147 58 ND 94 Monthly GeoMean: 191 157 91 59 8 18
ND = constituent not detected above analytical reporting limit * Results shown are the average concentrations from two 1000 mL samples collected and analyzed per site each month
Notably, the relative concentrations of gene copies declined from the start of the monitoring period in May through September (Figure 3). The monthly geometric mean for May was 191 gene copies per 100 mL, dropping to 8 copies per 100 mL in September; the human bacteroides marker was not detected at three of six sites in that month (Table 5). The monthly geometric mean did rise slightly in October to 18 copies averaged across all sites.
Figure 3: HF183 Gene Copies per 100 mL, 2016 Monitoring (results are averages of two samples per site per month)

Water Quality Monitoring in the Lower San Lorenzo River Watershed, 2014 and 2016 Page 10
The higher percentage of positive detects for HF183 in 2016 (31 of 36 samples) compared to 2014 (only 3 of 36 samples) may be attributable to both the higher sample volume filtered (1000mL in 2016 vs. 100 mL in 2014), as well use of the improved ddPCR technique. Yet detection of HF183 does not necessarily indicate unhealthy levels of human contamination. While the precision of ddPCR provides improved sensitivity for detecting and quantifying human DNA, the concentrations measured in lower San Lorenzo River watershed samples in 2016 were well below the numbers of gene copies associated with human illnesses at the benchmark level described above (4200 copies per 100 mL). The highest concentrations of HF183 were measured at San Lorenzo River at Tait Street site, at 306 copies (Table 5). Average levels of the HF183 marker found in the 2016 study were compatible with average dry weather levels reported in a study of southern California surface waters (Cao et al., 2017b). However, the southern California study reported some HF183 results at much higher levels, in several cases with individual sample concentrations ranging up above 5000 copies per 100 mL, and in a few instances exceeding one million copies per 100 mL. Fecal indicator bacteria Fecal indicator bacteria levels were variable from site to site and month to month, as shown in Appendix A, Table A.2, and Figure 3 below. The highest geometric mean concentrations for total coliform and Enterococcus occurred in September, while highest geometric mean concentrations for E. coli occurred in May. The high geometric mean for total coliform in September was significantly influenced by high levels at the Branciforte Creek site upstream of Carbonera Creek and the San Lorenzo River site at the trestle bridge.
Figure 4: Monthly Geometric Mean Concentrations for FIB Constituents at Six Sites, 2016 During the 2016 study period, the highest FIB results occurred most often in Branciforte Creek upstream of SLR, Carbonera Creek upstream of Branciforte, and San Lorenzo River at the trestle

Water Quality Monitoring in the Lower San Lorenzo River Watershed, 2014 and 2016 Page 11
bridge (Table 6). In 2014, the highest FIB results typically occurred at Branciforte Creek upstream of SLR and Carbonera Creek upstream of Branciforte. Table 6: Highest Monthly and 6 Month Levels, Fecal Indicator Bacteria Results
Highest Monthly FIB Levels
Sample Date Total coliform E. coli Enterococcus 5/16/16 Branciforte u/s of
SLR Branciforte u/s of
SLR Branciforte u/s of
Carbonera
6/13/16 San Lorenzo River @ Trestle
San Lorenzo River @ Trestle
Branciforte u/s of Carbonera
7/13/16 San Lorenzo River @ Trestle
Carbonera u/s of Branciforte
Branciforte u/s of Carbonera
8/11/16 Branciforte u/s of SLR
Carbonera u/s of Branciforte
Carbonera u/s of Branciforte
9/12/16 San Lorenzo River @ Trestle
Carbonera u/s of Branciforte
Carbonera u/s of Branciforte
10/10/16 San Lorenzo River @ Trestle
San Lorenzo River @ Trestle
Carbonera u/s of Branciforte
Highest 6-Month FIB Levels Highest 6-Month Geometric Mean:
San Lorenzo River @ Trestle
Carbonera u/s of Branciforte
Carbonera u/s of Branciforte
Highest 6-Mo. Maximum: San Lorenzo River @ Trestle
Carbonera u/s of Branciforte
Carbonera u/s of Branciforte
2016 Summary and Conclusions The following summarizes the 2016 findings:
• For the fecal sterols and stanols analyses, a small number of samples indicate the presence of human contributions to the in-stream chemistry. Indications of human contribution increased slightly from 2014 to 2016 results. Most samples continue to exhibit indications of avian (bird) contributions.
• For caffeine, all 36 river and creek samples were reported as below the analytical detection level (i.e., “non-detect”), as was the case also in 2014.
• Human bacteroides were detected at low levels in the majority of 2016 samples, indicating some level of human contamination. The measured concentrations were well below levels estimated to be associated with significant levels of human risk of illness.
• FIB levels were highly variable from site to site and month to month; highest results were most often obtained at the Branciforte Creek site upstream of SLR, Carbonera Creek site upstream of Branciforte Creek, and at the San Lorenzo River at the Trestle Bridge. A small minority of the samples exceeded the USEPA Freshwater Recreational Water Quality Criteria (USEPA, 2012) statistical threshold values for E.coli (410 cfu/100mL) and Enterococcus (130 cfu/100mL).
• When tested for statistical correlation, the concurrent results for coprostanol, FIB (E. coli or Enterococcus) and human bacteroides (HF183 copies) do not correlate well (correlation coefficients range from 0.07 to 0.21); only E.coli and Enterococcus are well correlated (correlation coefficient = 0.88).

Water Quality Monitoring in the Lower San Lorenzo River Watershed, 2014 and 2016 Page 12
Comparisons of 2014 vs. 2016 Results In 2016 the Working Group replicated the 2014 bacterial monitoring study, with monitoring performed at the same locations and again during the May-October peak recreational period. The 2015-16 wet season produced near-normal precipitation, whereas the 2014 monitoring was performed during a period of extended drought conditions. An additional sub-question was therefore added to the management question listed above:
o How do levels of human bacterial contamination in drought conditions (2014) compare to levels in a near normal precipitation year (2016) in the surface waters of the lower San Lorenzo River watershed?
The results for the 2014 vs. 2016 comparisons were mixed, as shown in Table 7. Table 7. Comparisons of Key Metrics from 2014 and 2016 SLR Receiving Waters Monitoring
Parameter Metric
2014 Monitoring
Study
2016 Monitoring
Study Water Year Rainfall Annual rainfall, inches (a) 15.01 25.4 E. coli (MPN/100mL) Mean concentration (b) 1075 273 E. coli WQC Exceedances # Results > USEPA WQC (b) 10/36 7/36 Enterococcus (MPN/100mL) Mean concentration (b) 699 75 Entero. WQC Exceedances # Results > USEPA WQC(b) 13/36 5/36 Total coliform (MPN/100mL) Mean concentration (b) 6475 5689 Bacteroides/HF183 # Detects (b) 3/36 31/36 Caffeine # Detects (b) 0/36 0/36 Coprostanol # Detects (b) 26/36 10/36 Fecal sterols/stanols Ahmed Ratio #1 (Human) 2/36 4/36 Fecal sterols/stanols Ahmed Ratio #4 (Human) 0/36 2/36 Fecal sterols/stanols Ahmed Ratio #10 (Avian) 32/36 18/36
(a) For preceding water year beginning Oct. 1 and ending Sept. 30, measured in Santa Cruz, CA (b) For all sites over 6 months; n=36
The following observations are gleaned from the 2014 vs. 2016 comparisons:
• Rainfall in the preceding water year (beginning October 1) was nearly 70% higher in WY 2016 compared to WY 2014.
• Average FIB results were higher for all three FIB analytes in 2014, with E. coli averaging nearly four times higher and Enterococcus averaging over nine times more than 2016 levels.
• Human bacteroides (HF183 marker) were detected much more frequently in the 2016 samples vs. 2014 samples; however, this difference may be largely attributable to improvements in the analytical methods.
• Caffeine was never detected in any sample in either year. • Coprostanol, a key indicator of potential contamination from the human metabolic system,
was detected far more frequently in the 2014 samples compared to the 2016 samples. • The two fecal sterol/stanol ratios used to identify human contamination were positive slightly
more frequently in 2016 compared to 2014 (two additional hits each). • The fecal sterol/stanol ratio used to identify avian contamination was positive less frequently
in 2016 (18 hits) compared to 2014 (32 hits).
Water Quality Monitoring in the Lower San Lorenzo River Watershed, 2014 and 2016 Page 13
The results of these comparisons do not present a clear picture of whether levels of human bacterial contamination were higher in receiving water samples in the drought monitoring year (2014) or the near-normal-precipitation monitoring year (2016). The FIB constituents were substantially higher on average in the drought year (2014) than in the near-normal rainfall year (2016), but the evidence for human bacterial contamination was mixed. Coprostanol, characteristic metabolite of cholesterol in the human gut, was much more commonly detected in 2104 than 2016, while human bacteroides (HF183 marker) were much more commonly detected in 2016. Hits on the two human fecal sterol/stanol ratios were about the same in both years, but there were substantially more hits on the avian ratio in 2014. The difference in frequency of bacteroides detection between the 2014 and 2016 samples may be largely related to the different PCR techniques used in 2014 (qPCR) vs. 2016 (ddPCR). Filtration of 10 times the sample volume (1000 mL in 2016 vs. 100 mL in 2014) could hypothetically result in a factor of 10 improvement (lowering) of the analytical detection limit. It is also clear from the literature (c.f., Cao et al., 2015) that ddPCR represents a substantial improvement over qPCR analytically. In a comparative study (Taylor et al., 2017) the researchers report:
“ddPCR) and qPCR platforms were directly compared for gene expression analysis using low amounts of purified, synthetic DNA in well characterized samples under identical reaction conditions. We conclude that for sample/target combinations with low levels of nucleic acids (Cq ≥ 29) and/or variable amounts of chemical and protein contaminants, ddPCR technology will produce more precise, reproducible and statistically significant results required for publication quality data.”
Conclusions: Human Bacterial Contamination in Surface Waters of the Lower San Lorenzo River Watershed Focusing on the water contact recreation beneficial use cited in the TMDL, the 2014 and 2016 receiving water quality monitoring was designed to address the initial, guiding question developed by the Working Group, and a sub-question related to the differences in conditions presented by the two monitoring years:
• What is the level of human bacterial contamination in the surface waters of the lower San Lorenzo River watershed?
o How do levels of human bacterial contamination in drought conditions (2014) compare to levels in a near normal precipitation year (2016) in the surface waters of the lower San Lorenzo River watershed?
The monitoring phase of the Working Group’s efforts involved implementation of the first two steps in the Working Group’s adaptive management approach:
1. Monitor and assess receiving water conditions to characterize the bacteria impairment. 2. Determine the extent to which urban runoff may cause or significantly contribute to the
receiving water impairment, and the relative contribution of human sources to the overall in-stream bacteria load.
The results of the water quality monitoring in 2014 and 2016 support the tentative conclusion that there is persistent contamination of the surface waters of the lower San Lorenzo River watershed from human sources, at relatively low levels, during the peak recreational period (May-October). The multiple lines of evidence employed by the Working Group to investigate this question produced the following results:
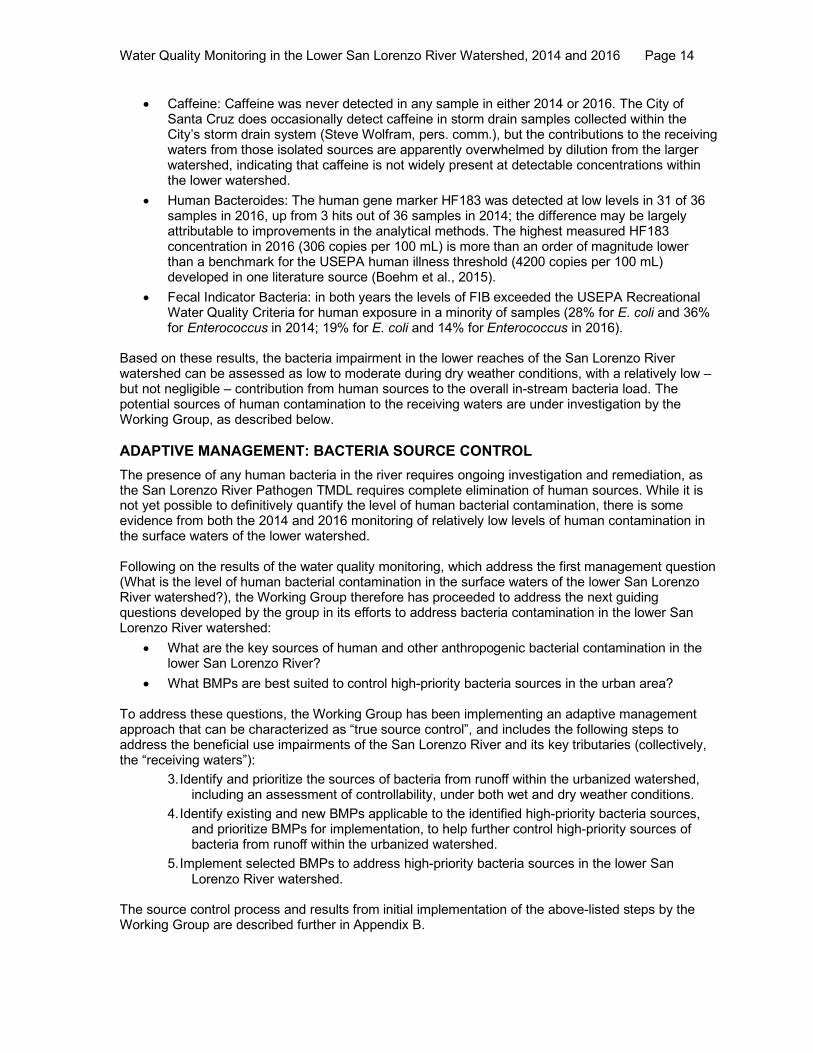
• Fecal Sterols/Stanols: The human metabolic indicator coprostanol was frequently detected (26/36 samples) in 2014 but much less frequently detected in 2016 (10/36 samples). Hits on the two human indicator ratios (from Ahmed et al., 2011) were low in both years (2 and 0 hits out of 36 samples in 2014, and 2 and 4 hits out of 36 samples in 2016). The avian indicator ratio had 32 hits on 36 samples in 2014, but only 18 hits on 36 samples in 2016.
Water Quality Monitoring in the Lower San Lorenzo River Watershed, 2014 and 2016 Page 14
• Caffeine: Caffeine was never detected in any sample in either 2014 or 2016. The City of Santa Cruz does occasionally detect caffeine in storm drain samples collected within the City’s storm drain system (Steve Wolfram, pers. comm.), but the contributions to the receiving waters from those isolated sources are apparently overwhelmed by dilution from the larger watershed, indicating that caffeine is not widely present at detectable concentrations within the lower watershed.
• Human Bacteroides: The human gene marker HF183 was detected at low levels in 31 of 36 samples in 2016, up from 3 hits out of 36 samples in 2014; the difference may be largely attributable to improvements in the analytical methods. The highest measured HF183 concentration in 2016 (306 copies per 100 mL) is more than an order of magnitude lower than a benchmark for the USEPA human illness threshold (4200 copies per 100 mL) developed in one literature source (Boehm et al., 2015).
• Fecal Indicator Bacteria: in both years the levels of FIB exceeded the USEPA Recreational Water Quality Criteria for human exposure in a minority of samples (28% for E. coli and 36% for Enterococcus in 2014; 19% for E. coli and 14% for Enterococcus in 2016).
Based on these results, the bacteria impairment in the lower reaches of the San Lorenzo River watershed can be assessed as low to moderate during dry weather conditions, with a relatively low – but not negligible – contribution from human sources to the overall in-stream bacteria load. The potential sources of human contamination to the receiving waters are under investigation by the Working Group, as described below. ADAPTIVE MANAGEMENT: BACTERIA SOURCE CONTROL The presence of any human bacteria in the river requires ongoing investigation and remediation, as the San Lorenzo River Pathogen TMDL requires complete elimination of human sources. While it is not yet possible to definitively quantify the level of human bacterial contamination, there is some evidence from both the 2014 and 2016 monitoring of relatively low levels of human contamination in the surface waters of the lower watershed. Following on the results of the water quality monitoring, which address the first management question (What is the level of human bacterial contamination in the surface waters of the lower San Lorenzo River watershed?), the Working Group therefore has proceeded to address the next guiding questions developed by the group in its efforts to address bacteria contamination in the lower San Lorenzo River watershed:
• What are the key sources of human and other anthropogenic bacterial contamination in the lower San Lorenzo River?
• What BMPs are best suited to control high-priority bacteria sources in the urban area? To address these questions, the Working Group has been implementing an adaptive management approach that can be characterized as “true source control”, and includes the following steps to address the beneficial use impairments of the San Lorenzo River and its key tributaries (collectively, the “receiving waters”):
3. Identify and prioritize the sources of bacteria from runoff within the urbanized watershed, including an assessment of controllability, under both wet and dry weather conditions.
4. Identify existing and new BMPs applicable to the identified high-priority bacteria sources, and prioritize BMPs for implementation, to help further control high-priority sources of bacteria from runoff within the urbanized watershed.
5. Implement selected BMPs to address high-priority bacteria sources in the lower San Lorenzo River watershed.
The source control process and results from initial implementation of the above-listed steps by the Working Group are described further in Appendix B.

Water Quality Monitoring in the Lower San Lorenzo River Watershed, 2014 and 2016 Page 15
REFERENCES Ahmed, Warish, Marek Kirs, and Brent Gilpin. 2011. Source Tracking in Australia and New Zealand:
Case Studies. Ch. 21 In: C. Hagedorn et al. (eds.), Microbial Source Tracking: Methods, Applications, and Case Studies, DOI 10.1007/978-1-4419-9386-1_21
Boehm, A.B., Soller, J.A., and O.C. Shanks. 2015. Human-Associated Fecal Quantitative Polymerase Chain Reaction Measurements and Simulated Risk of Gastrointestinal Illness in Recreational Waters Contaminated with Raw Sewage. Environ. Sci. Technol. Lett. 2015, 2, 270−275
Cao, Y., M.R. Raith, and J.F. Griffith. 2015. Droplet digital PCR for simultaneous quantification of general and human-associated fecal indicators for water quality assessment. Water Research 70 (2015) 337-349.
Cao, Y.; Andersen, G.L.; Boehm, A.A.; Holden, P.A.; Jay, J.A.; Griffith, J.F. 2017a. Determination of DNA-Based Fecal Marker Aging Characteristics for Use in Quantitative Microbial Source Tracking; Technical Report 978; Southern California Coastal Water Research Project Authority: Costa Mesa, CA, USA, 2017.
Cao, Y.; Raith, M.R.; Smith P.D.; Griffith, J.F., Weisberg, S.B. 2017b. Regional Assessment of Human Fecal Contamination in Southern California Coastal Drainages. Int. J. Environ. Res. Public Health 2017, 14, 874. doi:10.3390/ijerph14080874
Central Coast Regional Water Quality Control Board. 2017. Water Quality Control Plan for the Central Coastal Basin, September 2017 Edition. Regional Water Quality Control Board, Central Coast Region; State Water Resources Control Board; California Environmental Protection Agency. Available at: https://www.waterboards.ca.gov/centralcoast/publications_forms/publications/basin_plan/docs2017/2017_basin_plan_r3_complete.pdf
Ferreira, Aldo Pacheco. 2005. Cafeína como indicador ambiental prospectivo para avaliar ecossistemas aquáticos urbanos (Caffeine as an environmental indicator for assessing urban aquatic ecosystems). Cad. Saúde Pública vol.21 no.6 Rio de Janeiro Nov./Dec. 2005.On-line version ISSN 1678-4464:http://dx.doi.org/10.1590/S0102-311X2005000600038
MPSL Field Sampling Team. 2014. Collections of Water and Bed Sediment Samples with Associated Field Measurements and Physical Habitat in California. SOP Procedure Number: 1.1 March. Available at: http://www.waterboards.ca.gov/water_issues/programs/swamp/docs/collect_bed_sediment_update.pdf
Ruby, Armand. 2015. Technical Memo: Water Quality Monitoring in the San Lorenzo River Watershed. Available at: https://coastal-watershed.org/wp-content/uploads/2016/05/San-Lorenzo-River-Alliance-Tech-Memo-June-3-2015.pdf
Ruby, Armand. 2016. Source Prioritization Process for Bacteria in the San Lorenzo River Watershed. Prepared for the San Lorenzo River Alliance, Water Quality Working Group. Draft.
Sauer, E.P., J.L. Vandewalle, M.J. Bootsma, and S.L. McLellan. 2011. Detection of the human specific Bacteroides genetic marker provides evidence of widespread sewage contamination of stormwater in the urban environment. Water Res. 2011 Aug;45(14):4081-91. doi: 10.1016/j.watres.2011.04.049. Epub 2011 May 10.
Standley, L.G., L. A. Kaplan, and D. Smith. 2000. Molecular Tracers of Organic Matter Sources to Surface Water Resources. Environ. Sci. Technol. 34: 3124–3130.
Surface Water Ambient Monitoring Program (SWAMP), 2008. Quality Assurance Program Plan Version 1.0. Originated by the Surface Water Ambient Monitoring Program Quality Assurance Team Quality Assurance Research Group, Moss Landing Marine Laboratories, San Jose State University Research Foundation. September 1. Available at: http://www.waterboards.ca.gov/water_issues/programs/swamp/docs/qapp /qaprp082209.pdf

Water Quality Monitoring in the Lower San Lorenzo River Watershed, 2014 and 2016 Page 16
Taylor, S.C, Laperriere, G. and H. Germain. 2017. Droplet Digital PCR versus qPCR for gene expression analysis with low abundant targets: from variable nonsense to publication quality data. Scientific Reports 7, Article number: 2409 (2017). doi:10.1038/s41598-017-02217-x
Updated SWAMP QA/QC parameters (measurement quality objectives) and sample handling protocols can be found at the following links:
• Conventional Parameters in Fresh and Marine Water: http://www.waterboards.ca.gov/water_issues/programs/swamp/docs/mqo/1_conv_water.pdf
• Field Measurements in Fresh and Marine Water: http://www.waterboards.ca.gov /water_issues/programs/swamp/docs/mqo/fld_msmt_water.pdf
• Indicator Bacteria in Fresh Water (revised 08/03/15): http://www.waterboards .ca.gov/water_issues/programs/swamp/docs/mqo/ind_bact_water.pdf
• Inorganic Analytes in Fresh and Marine Water: http://www.waterboards.ca.gov /water_issues/programs/swamp/docs/mqo/2_inorg_water.pdf
• Nutrients in Fresh and Marine Water: http://www.waterboards.ca.gov/water_ issues/programs/swamp/docs/mqo/3_nut_water.pdf
• Solid Parameters in Fresh and Marine Water: http://www.waterboards.ca.gov /water_issues/programs/swamp/docs/mqo/5_solid_water.pdf
USEPA. 2012. Recreational Water Quality Criteria. OFFICE OF WATER 820-F-12-058. See: https://www.epa.gov/wqc/2012-recreational-water-quality-criteria-documents
USEPA. 40 CFR Part 136: Guidelines Establishing Test Procedures for the Analysis of Pollutants. See July 1, 2015 Federal Register notice: https://www.gpo.gov/fdsys/pkg/CFR-2015-title40-vol23/xml/CFR-2015-title40-vol23-part136.xml ; subject to updating.
Wolfram, Steve. Personal communication, 2014-2017, regarding City of Santa Cruz storm drain system monitoring for caffeine.

APPENDIX A. 2016 MONITORING RESULTS Table A.1: Chemical Tracer Analytical Results, 2016 Monitoring
Constituent/Site ID 5/16/2016 6/13/2016 7/13/2016 8/11/2016 9/12/2016 10/10/2016
Cholestanol Mean Min. Max.
SLR @ Sycamore Grove 32.0 20.3 15.8 19.6 35.8 19.1 23.8 15.8 35.8
SLR @ Tait St. 27.0 21.7 31.0 21.8 41.1 14.4 26.2 14.4 41.1
B40 u/s of Carbonera 17.6 22.4 27.2 19.6 17.0 12.5 19.4 12.5 27.2
Carbonera u/s of B40 17.3 14.8 17.3 19.4 42.9 13.5 20.9 13.5 42.9
B40 u/s of SLR 31.3 33.4 97.7 100.9 95.0 37.7 66.0 31.3 100.9
SLR @ Trestle 32.9 51.0 45.3 67.3 148.2 75.4 70.0 32.9 148.2
Monthly averages: 26.4 27.3 39.1 41.4 63.3 28.8
CholesterolSLR @ Sycamore Grove 629.2 438.6 305.4 442.7 692.2 323.7 472.0 305.4 692.2
SLR @ Tait St. 452.9 424.4 449.4 460.5 710.6 271.4 461.5 271.4 710.6
B40 u/s of Carbonera 492.1 576.9 545.1 405.1 463.5 371.3 475.7 371.3 576.9
Carbonera u/s of B40 348.6 347.9 320.4 444.0 793.2 435.8 448.3 320.4 793.2
B40 u/s of SLR 992.0 958.8 1,257.4 1,252.7 1,328.8 2,191.4 1,330.2 958.8 2,191.4
SLR @ Trestle 603.3 856.7 1,115.1 1,072.8 2,070.7 1,865.4 1,264.0 603.3 2,070.7
Monthly averages: 586.4 600.6 665.5 679.6 1,009.8 909.8
CoprostanolSLR @ Sycamore Grove 7.6 ND ND ND ND ND 5.4 5.0 7.6
SLR @ Tait St. ND ND ND ND ND ND 5.0 5.0 5.0
B40 u/s of Carbonera 25.9 ND ND ND 24.9 ND 11.8 5.0 25.9
Carbonera u/s of B40 6.9 ND ND ND 22.6 ND 8.3 5.0 22.6
B40 u/s of SLR 11.7 ND ND ND 52.4 14.5 15.6 5.0 52.4
SLR @ Trestle ND ND ND ND 31.7 6.6 9.7 5.0 31.7
Monthly averages: 10.4 5.0 5.0 5.0 23.6 6.9
EpicoprostanolSLR @ Sycamore Grove ND ND ND ND 10.2 ND 5.9 5.0 10.2
SLR @ Tait St. ND ND ND ND ND ND 5.0 5.0 5.0
B40 u/s of Carbonera ND ND ND ND ND ND 5.0 5.0 5.0
Carbonera u/s of B40 ND ND ND ND ND ND 5.0 5.0 5.0
B40 u/s of SLR ND ND 13.7 ND ND ND 6.5 5.0 13.7
SLR @ Trestle ND ND ND ND ND ND 5.0 5.0 5.0
Monthly averages: 5.0 5.0 6.5 5.0 5.9 5.0
SitosterolSLR @ Sycamore Grove 464.3 165.0 120.1 232.7 355.4 180.9 253.1 120.1 464.3
SLR @ Tait St. 246.7 177.9 248.4 183.9 323.4 109.4 215.0 109.4 323.4
B40 u/s of Carbonera 370.4 362.1 338.3 252.6 254.6 289.2 311.2 252.6 370.4
Carbonera u/s of B40 260.4 190.9 143.3 608.2 1,235.7 447.7 481.0 143.3 1,235.7
B40 u/s of SLR 514.3 460.4 332.9 666.0 518.2 494.6 497.7 332.9 666.0
SLR @ Trestle 151.4 168.7 349.8 190.9 779.1 518.8 359.8 151.4 779.1
Monthly averages: 334.6 254.2 255.5 355.7 577.7 340.1
StigmasterolSLR @ Sycamore Grove 79.9 ND ND 55.8 371.6 38.2 92.6 5.0 371.6
SLR @ Tait St. 63.1 21.0 ND 92.9 335.8 33.5 91.9 5.0 335.8
B40 u/s of Carbonera 102.9 61.5 363.2 ND 257.8 50.5 140.2 5.0 363.2
Carbonera u/s of B40 65.3 ND ND ND 1,373.1 85.5 256.5 5.0 1,373.1
B40 u/s of SLR 124.4 88.8 204.5 876.2 651.5 202.3 358.0 88.8 876.2
SLR @ Trestle ND 51.7 363.4 210.2 784.8 401.5 302.8 5.0 784.8
Monthly averages: 73.4 38.8 157.7 207.5 629.1 135.3
CaffeineSLR @ Sycamore Grove ND ND ND ND ND ND ND ND ND
SLR @ Tait St. ND ND ND ND ND ND ND ND ND
B40 u/s of Carbonera ND ND ND ND ND ND ND ND ND
Carbonera u/s of B40 ND ND ND ND ND ND ND ND ND
B40 u/s of SLR ND ND ND ND ND ND ND ND ND
SLR @ Trestle ND ND ND ND ND ND ND ND ND Notes: NA = not analyzed, ND = not detected
For results reported by lab as ND, values substituted with 1/2 RL for calculation of statistics
Measured Concentrations (ng/L) by Sample Collection Date Descriptive Statistics (NDs est. as 1/2 RL)

Table A.2: Fecal Indicator Bacteria Analytical Results, 2016 Monitoring

APPENDIX B: ADAPTIVE MANAGEMENT, BACTERIA SOURCE CONTROL
Following up on the receiving water quality assessment phase, the SLRA Water Quality Working Group has proceeded to address the next guiding questions developed by the group in its efforts to address bacteria contamination in the lower San Lorenzo River watershed:
• What are the key sources of human and other anthropogenic bacterial contamination in the lower San Lorenzo River?
• What BMPs are best suited to control high-priority bacteria sources in the urban area? To address these questions, the Working Group has been implementing an adaptive management approach that can be characterized as “true source control”, and includes the following steps to address the beneficial use impairments of the San Lorenzo River and its key tributaries (collectively, the “receiving waters”):
3. Identify and prioritize the sources of bacteria from runoff within the urbanized watershed, including an assessment of controllability, under both wet and dry weather conditions.
4. Identify existing and new BMPs applicable to the identified high-priority bacteria sources, and prioritize BMPs for implementation, to help further control high-priority sources of bacteria from runoff within the urbanized watershed.
5. Implement selected BMPs to address high-priority bacteria sources in the lower San Lorenzo River watershed.
The source control process and results from initial implementation of the above-listed steps by the Working Group are described below. BACTERIA SOURCE IDENTIFICATION AND PRIORITIZATION
The Bacteria Source Prioritization process developed by the San Lorenzo River Alliance Water Quality Working Group is being used to identify, characterize, and prioritize bacteria sources in the study area of the lower reaches of the San Lorenzo River and its major tributaries (Ruby, 2016). Bacteria Source Identification and Prioritization addresses the following guiding question as developed by the Working Group:
• What are the key sources of human and other anthropogenic bacterial contamination in the lower San Lorenzo River?
- and involves implementation of the following step from the adaptive management process:
3. Identify and prioritize the sources of bacteria from runoff within the urbanized watershed, including an assessment of controllability, under both wet and dry weather conditions.
The Working Group recognized that bacteria sources should be identified by their relationship to human activity and by extension, controllability, particularly with respect to TMDL compliance for controllable bacteria sources. The Working Group established the following broad categories of bacteria sources:
• Human origin (i.e., from the human body) • Anthropogenic, non-human origin (resulting from or caused by human activities, but not from
the human body), and • Non-anthropogenic origin (independent of human activity)
In 2015, conceptual modeling was used to illustrate the various sources and transport pathways associated with each of the three categories of sources listed above, within the lower San Lorenzo River watershed (Figures B.1-B.3). From these models, the Working Group produced lists of possible bacteria sources. Only sources with a potential pathway into a municipal separate storm sewer system (MS4) or receiving water (creek, river, lagoon, ocean) were allowed on the list.

The potential sources were further aggregated according to common characteristics, and grouped accordingly into a draft list of sources (Table B.1). The list is organized first by major sources type (human, anthropogenic non-human, non-anthropogenic) and then by subcategory. In evaluating transport pathways, the Working Group considered the possible impact of hydrologic conditions on bacterial deposition and mobilization into surface waters. Upon evaluation, most of the identified sources were considered to be available for transport to MS4s or receiving waters during both wet and dry weather. However, because the magnitude, frequency and means of transport to receiving waters could vary substantially for a given source in dry vs. wet weather, the Working Group agreed to perform the source prioritization scoring separately for wet vs. dry weather conditions. Prioritization Factors
The Working Group agreed to use the following factors in bacteria source prioritization for the San Lorenzo River watershed:
• Human Health Risk: the degree to which humans could experience negative health effects from exposure during water contact recreation, if/when the source is present in the receiving waters (i.e., health risk here refers to potential effects that may accrue upon contact with the bacteria produced by the source, not whether the bacteria derive from a human source)
• Magnitude: the relative amount of contaminated material likely to be contributed to receiving waters on an episodic basis from this source (magnitude here refers to the relative amount of bacteria available from a particular source during either dry or wet conditions, watershed-wide, when the source is present and discharging; the Frequency factor addresses how often a source may discharge)
• Frequency: how often within the course of the wet or dry season this source is likely to occur (assumes wet weather sources dominate during wet season)
• Transport Feasibility: how likely it is that the source will be transported to listed receiving waters when the source is present in the watershed; this factor includes consideration of both the proximity of the source to the receiving waters, as well as the characteristics of the transport pathway (for example, whether transport occurs via a storm drain or overland flow)
• Controllability: how likely it is that the source can be controlled through reasonable municipal agency and/or stakeholder efforts; this factor will be used separately, for the control identification phase, following completion of the source prioritization process
Scoring Sources
All sources were scored based on the above-listed factors, with respect to transport to the principal receiving waters in the lower San Lorenzo River watershed (defined as San Lorenzo River below Sycamore Grove, Branciforte Creek below Isbel Drive, and Carbonera Creek below Carbonera Estates), as follows:
• Each factor is assigned a score from 1 to 5; i.e., within the possible range, 1 is lowest/least, 5 is highest/most.
• Sources that are not found within a given watershed are given zero scores for all factors. • Sources with no apparent transport mechanism from source to MS4 or receiving waters also
are given zero scores for all factors. In scoring, the Working Group considered locations of key features, such as areas served by sanitary sewer, areas served by septic systems, landfills, homeless encampments, commercial and residential land uses. Within the scoring spreadsheet table, there was also the option to check a box if the source is from “upstream only”, meaning above the limits of the study area as defined by the Working Group (above Sycamore Grove, Isbel Dr., Carbonera Estates for the listed receiving waters). While proceeding through the scoring, attention was paid to wet conditions relative to dry conditions, to consider comparative scores for sources within a given source category, and to continue the relative scoring for the sources within various source categories. The scoring is done separately for

wet weather transport (assumed to dominate loadings during the wet season) and dry weather transport (assumed to be the sole means of transport during the dry season). Source Prioritization
The prioritization process involves summing the scores for the Human Health Risk, Magnitude, Frequency, and Transport Feasibility factors, drawing on available information about the watershed and its potential bacteria sources, to the extent possible. Where watershed-specific information is lacking, the Working Group made use of available information from the literature, and when necessary, best professional judgment. See Tables B.2 and B.3 for preliminary lists of the prioritized bacteria sources in the lower San Lorenzo River watershed, for wet and dry weather, respectively.
ADDRESSING SOURCES WITH BEST MANAGEMENT PRACTICES
In Spring 2016, the Working Group began using the prioritized bacteria source lists as a framework for identifying and prioritizing best management practices (BMPs), beginning with BMPs that are included in existing City and County programs. The Working Group reviewed the City of Santa Cruz and Santa Cruz County Stormwater Program Effectiveness Assessment and Improvement Plan (PEAIP) and Wasteload Allocation Attainment Plan (WAAP) documents, identifying proposed and implemented best management practices that address the bacteria sources in question. The Working Group assessed existing BMPs to determine gaps in BMP implementation and accordingly proposed new BMPs. Following extensive review of BMPs, including those implemented by the City and County, nonprofit partners and community groups, the Working Group created an inventory of BMPs that address the prioritized bacteria sources.
To begin BMP implementation, the Working Group identified three sources from the prioritized source lists as the initial focus for BMP identification and source control efforts. The following sources were selected based on the relative magnitude of bacteria input, as reflected in the prioritization scoring, as well as the expected controllability of the sources through public education and outreach BMPs:
• Leaking sewer laterals: Spills, leakage or infiltration, of polluted water and human waste from sewer laterals into surface water or ground waters.
• Pet waste: Waste from dogs and cats in public and private spaces that gets swept into the storm drain or San Lorenzo River from rainfall or human-caused flows.
• Incidental flows: Dry weather flows from washing your car or watering your lawn, that are unrelated to any rain event and cause the propagation of bacteria-laden biofilm in the storm drain system.
Starting in February 2017, the City of Santa Cruz and the Coastal Watershed Council have worked together to make policy changes and increase public awareness regarding the three sources. The City of Santa Cruz Public Works Department will propose two significant changes to the Sanitary Sewer Ordinance for residents within city limits in the coming months. Many homes in Santa Cruz have clay sewer laterals or pipes that connect the household plumbing system to the City’s sewer mains. Over time, these pipes can crack or split allowing for bacteria-laden sewage to seep into the ground and mobilize to local creeks and the San Lorenzo River. The following changes aim to reduce the frequency of spills and leaks that pollute the environment.
1. Any owner/occupant of a property with a sewer spill is responsible for stopping the spill immediately and will be subject to fines and penalties if inspections and repairs are not made in a timely manner.
2. Prior to the sale of property, the property owner must have the sewer lateral inspected by an authorized inspector, and then make any needed repairs and submit an inspection form to verify compliance.
CWC has been working to support these proposed changes through public education and outreach. In May 2017 the City of Santa Cruz and the Coastal Watershed Council launched a joint public information campaign to support the proposed sewer lateral ordinance and teach the community about sewer laterals. The campaign also includes outreach and education on the impact of pet waste and incidental flows on receiving waters. The public information campaign employs gained media attention, radio PSAs, social media, an informational blog, youth education and outreach at public-facing events to share information about the three bacteria sources. Additionally, the City of Santa Cruz and CWC are currently developing a pet waste volunteer program to supplement the public information campaign. The program will engage volunteers in removing pet waste and educating dog owners about pet waste in neighborhoods with storm drains emptying to the San Lorenzo River. While the initial efforts of the public information campaign are focused on the San Lorenzo River within the City of Santa Cruz, there is potential to expand outreach efforts to the upper San Lorenzo River watershed. The Water Quality Working Group is optimistic that the focused BMP strategy will be effective at reducing bacteria levels and supporting a healthier San Lorenzo River for the Santa Cruz community.

Abbreviations Used in Conceptual Model Diagrams:
D = Dry weather flow/source GW = Groundwater transport IC = Illicit connection to storm drainage system MS4 = Municipal separate storm sewer system SSO = Sanitary sewer overflow

Figure B.1: Conceptual Model of Human Bacteria Sources, Lower San Lorenzo River Watershed (Urban Area)

HUMAN (WET/ DRY) D
MS4 Biofilm Re-growth
San
Lorenzo River
Leaky / Failing Septic Systems
GW D
Leaky Sewer Pipes (Exfiltration)
GW
D
GW
D
GW D
IC’s SSO’s
D
D
D
Bathers
D
Homeless Camps
D
Dumpsters Trash Cans
Port-a-Potties
D (wash water)
Pools Hot Tubs
Gray Water
D
RVs (mobile) Garbage Trucks
Septage Trucks
D
D (illegal)
Lagoon/ Beach
Sediment Re-Suspension;
In-Stream Regrowth
Ocean
Upstream Sources

Figure B.2: Conceptual Model of Anthropogenic, Non-Human Bacteria Sources, Lower San Lorenzo River Watershed (Urban Area)

ANTHROPOGENIC NON-HUMAN (WET / DRY)
Biofilm Re-Growth MS4
San Lorenzo River
Lagoon/ Beach
Sediment Re-Suspension;
In-Stream Regrowth
Solid/ Liquid Waste Dumpsters Trash Cans Grease Bins Green Waste (blowers, illegal dumping) Compost Garbage Trucks [+ Wash Water for above]
Litter
Vectors
Commercial/ Industrial Food Processing Outdoor Dining/ Fast Food
(D)
D (GW)
D (irrig.)
D (wind) D
D
D
(D)
Domestic Animals Pets Livestock
Agriculture Livestock Manure Re-Use Irrigation Tailwater Soil; Plant Decomposition
Landscaping
Green Waste Soil Manure/ Compost
Secondary Wildlife Generation
D (irrig., direct dump.)
D (irrig.)
D
D
Upstream Sources
Ocean
D
D
D
D
D

Figure B.3: Conceptual Model of Non-Anthropogenic Bacteria Sources, Lower San Lorenzo River Watershed (Urban Area)

NON-ANTHROPOGENIC WET/ DRY
MS4 Biofilm Re-growth
San Lorenzo River
Algae Plants Soil
Streambank Erosion
D
D
Wildlife
Plants
Soil
Sediment Re-Suspension;
In-Stream Regrowth
Windblown Erosion
Lagoon/ Beach
D (springs)
D
D (springs)
Ocean Kelp/Wildlife
Upstream Sources

Table B.1 LIST OF PRIORITIZED BACTERIA SOURCES BY CATEGORY
HUMAN WASTE
Leaky Failing Septic Systems Leaky Sewer Pipes (Exfiltration) Sanitary sewer overflows (SSOs) Illegal Connections Homeless Encampments Bathers Dumpsters Trash cans Porta-Potties Pools Hot Tubs Gray Water Discharges RVs (mobile) Garbage trucks Septage trucks Ocean Inflow MS4s Infrastructure - Biofilm/Regrowth ANTHROPOGENIC NON-HUMAN
Solid/Liquid Waste Dumpsters Trash Cans Grease Bins Green Waste Compost Garbage Trucks Washwater from above sources Litter Vectors Commercial/Industrial Food Processing Outdoor Dining/Fast Food Domestic Animals Pets Livestock Agriculture Livestock Manure/Manure Re-use Irrigation Tailwater Soil and Decaying Plant Matter Landscaping Green Waste Soil Manure/Compost Secondary Wildlife Rodents, Raccoons, Rabbits, etc. Birds (Gulls, Pigeons, etc.) Ocean Inflow MS4s Infrastructure - Biofilm/regrowth NON-ANTHROPOGENIC
Soil - Streambank Erosion Soil - Windblown Erosion Wildlife (Birds and Others) Plants Ocean Inflow Wrackline (Birds, Flies, Dogs and Plants) MS4s Infrastructure - Biofilm/regrowth

Table B.2: Preliminary Top 20 Prioritized List of Wet Weather Bacteria Sources, Lower San Lorenzo River Watershed (Urban Area)
Upstream Sources Only**
A) Human Health Risk
B) Magnitude
C) Frequency
D) Transport Feasibility
E) Controll-
ability
Summmed Scores
(A+B+C+D)
Multiplied Scores
(A*B*C*D)
1 Birds (Gulls, Pigeons, etc.) 2 5 5 5 1 17 250
2 Leaky Failing Septic Systems Y 5 3 2 4 4 14 120
3 Terrestrial Vectors (Mammals, Insects) 2 3 4 5 1 14 120
4 Homeless Deposition (Y?) 5 3 2 3 2 13 90
5 Pets 2 2 5 4 2 13 80
6 Manure/Manure Re-use Y 2 4 2 4 3 12 64
7 Sanitary sewer overflows (SSOs) 5 5 0.5 5 4 15.5 62.5
8 Broken Sewer Pipes / Failures 5 4 1 3 4 13 60
9 MS4s Infrastructure - Biofilm/regrowth 2 2 3 5 3 12 60
10 Leaky Sewer Pipes (Exfiltration) 5 1 5 2 3 13 50
11 Illegal Connections/Illicit Discharges 5 4 0.5 5 2 14.5 50
12 Dumpsters (Human waste) 4 2 2 3 5 11 48
13 Livestock (Agricultural) Y 2 3 2 4 3 11 48
14 RVs (mobile) 5 3 1 3 3 12 45
15 Dumpsters (Non-human waste) 2 3 2 3 5 10 36
16 Livestock (Domestic; mostly chickens) 2 3 2 3 2 10 36
17 Septage trucks 5 4 0.5 3 3 12.5 30
18 Porta-Potties 5 3 1 2 4 11 30
19 Food Processing 1 5 1 5 4 12 25
20 Grease Bins 1 4 2 3 4 10 24
* Scores for each factor range from 1 to 5, where 1 is lowest/least, 5 is highest/most, as follows:
Human Health Risk: degree to which humans could experience negative health effects from exposure if the source is present in the receiving waters
Magnitude: amount of contaminated material likely to be contributed to receiving waters on an episodic basis from this source
Frequency: how often within the course of the wet season this source is likely to occur (assumes wet weather sources dominate during wet season)
Transport Feasibility: how likely it is that the source will be transported to listed receiving waters when the source is present in the watershed
Controllability: how likely is it that the source can be controlled through reasonable municipal agency and/or stakeholder efforts
[All sources are scored WRT transport to receiving waters: lower San Lorenzo River, Branciforte Creek, and/or Carbonera Creek]
** "Y" if source is from upstream only (above Sycamore Grove, Isbel Dr., Carbonera Estates for the listed receiving waters)
Ranking is based on Multiplied Scores (excluding Controlability factor)
Bolded sources include direct contribution of human waste
WET WEATHER SOURCES
SOURCE PRIORITIZATION RANKING FACTORS*
Rank

Table B.3: Preliminary Top 20 Prioritized List of Dry Weather Bacteria Sources, Lower San Lorenzo River Watershed (Urban Area)
Upstream Sources Only**
A) Human Health Risk
B) Magnitude
C) Frequency
D) Transport Feasibility
E) Controll-
ability
Summmed Scores
(A+B+C+D)
Multiplied Scores
(A*B*C*D)
1 Birds (Gulls, Pigeons, etc.) 2 4 4 4 1 14 1282 MS4s Infrastructure - Biofilm/regrowth 2 2 4 4 3 12 643 RVs (mobile) 5 3 2 2 3 12 604 Leaky Sewer Pipes (Exfiltration) 5 1 5 2 3 13 505 Illegal Connections/Illicit Discharges 5 4 0.5 5 3 14.5 506 Broken Sewer Pipes / Failures 5 4 1 2 4 12 407 Sanitary sewer overflows (SSOs) 5 4 1 2 4 12 408 Pets 2 2 5 2 2 11 409 Bathers Y 3 1 2 5 1 11 3010 Septage trucks 5 4 1 1 4 11 2011 Homeless Deposition 5 2 1 2 2 10 2012 Food Processing 1 5 1 4 4 11 2013 Manure/Manure Re-use Y 2 4 2 1 3 9 1614 Terrestrial Vectors (Mammals, Insects) 2 2 2 2 1 8 1615 Porta-Potties 5 3 1 1 4 10 1516 Dumpsters (Non-human waste) 2 3 2 1 5 8 1217 Livestock (Domestic; mostly chickens) 2 3 2 1 2 8 1218 Livestock (Agricultural) Y 2 3 2 1 3 8 1219 Leaky Failing Septic Systems Y 5 1 1 2 4 9 1020 Dumpsters (Human waste) 4 2 1 1 5 8 8
* Scores for each factor range from 1 to 5, where 1 is lowest/least, 5 is highest/most, as follows: Human Health Risk: degree to which humans could experience negative health effects from exposure if the source is present in the receiving watersMagnitude: amount of contaminated material likely to be contributed to receiving waters on an episodic basis from this sourceFrequency: how often within the course of the dry season this source is likely to occurTransport Feasibility: how likely it is that the source will be transported to listed receiving waters when the source is present in the watershedControllability: how likely is it that the source can be controlled through reasonable municipal agency and/or stakeholder efforts[For dry weather, source must have a means of transport to receiving waters: lower San Lorenzo River, Branciforte Creek, and/or Carbonera Creek]** "Y" if source is from upstream only (above Sycamore Grove, Isbel Dr., Carbonera Estates for the listed receiving waters)Ranking is based on Multiplied Scores (excluding Controlability factor)Bolded sources include direct contribution of human waste
DRY WEATHER SOURCES
SOURCE PRIORITIZATION RANKING FACTORS*
Rank