Embed Size (px)
Citation preview

March 2011
United StatesDepartment ofAgriculture
Report of the
Submitted to theSecretary of Agriculture
Dairy IndustryAdvisory Committee

1
Recommendations for Public Policy to Improve Dairy Farm Profitability and Reduce Milk Price Volatility
Foreword
The U.S. Department of Agriculture (USDA) established the Dairy Industry Advisory Committee
(Committee) in August 2009, under the rules of the Federal Advisory Committee Act (FACA). Secretary
Tom Vilsack appointed 17 members to serve on the Committee on January 6, 2010. The Committee
Charter is “to review the issues of: 1) farm milk price volatility and 2) dairy farmer profitability. The
Committee will provide suggestions and ideas to the Secretary on how USDA can best address these
issues to meet the dairy industry’s needs.” The Committee Charter further explains, “The exchange of
views and information between industry representatives and USDA should result in improved
understanding of the impact of USDA programs on the dairy industry and contribute to those programs’
effective and efficient administration”.
The Committee Bylaws state that “Members will be selected from a cross section of the dairy
industry representing producers and producer organizations, processors and processor organizations,
handlers, academia, retailers, consumers, and State agencies involved in organic and non-organic dairy at
the local, regional, national, and international levels.” Individuals serving on the Committee are as
follows1:
1 All members, except Dr. Novakovic, are considered under FACA to be serving as Representative Members and are appointed to obtain the perspectives of public sector stakeholders. Dr. Novakovic serves as a Special Government Employee under appointment by Secretary Vilsack.

2
Members Affiliation
Paul Bourbeau Paboco Farms, Inc., Vermont
Jay Bryant Maryland and Virginia Milk Producers Cooperative
Association, Virginia
Erick Coolidge Le-Ma-Ra Farm, Pennsylvania
Timothy den Dulk Den Dulk Dairy Farm, LLC, Michigan
Debora Erb Springvale Farms & Landaff Creamery, LLC, New Hampshire
James Goodman Northwood Farm, Wisconsin
James Krahn Oregon Dairy Farmers Association, Oregon
Edward Maltby Northeast Organic Dairy Producers Alliance, Massachusetts
Andrew Novakovic Cornell University, New York
Randy Romanski (replacing Rodney
Nilsestuen, dec. July 2010)
Department of Agriculture, Trade and Consumer Protection,
Wisconsin (formerly)
Robert Schupper Ahold USA Retail, Pennsylvania
Manuel (Ray) Souza Mel-Delin Dairy, California
Patricia Stroup Nestle USA, California
Sue Taylor Leprino Foods Company, Inc., Colorado
Edward Welch Associated Milk Producers Inc., Minnesota
James (Ricky) Williams Williams Dairy & Williams Dairy Trucking, Inc., Georgia
Robert Wills Cedar Grove Cheese Inc., Wisconsin

3
Executive Summary
The Federal Government has a number of programs to intervene when dairy prices fall to low
levels. For example, the Dairy Product Price Support Program (DPPSP) is designed to prevent wholesale
and farm prices from falling below a certain level. The Milk Income Loss Contract (MILC) Program is
designed similarly to the countercyclical payments used for agricultural crops and provides a cash income
supplement to partially offset the impact of low milk prices.
During 2009, MILC income supplements were triggered from February through November 2009.
Just short of $1 billion was spent on MILC in the 2 fiscal years (FYs) from October 2008 to
September 2010. The Agricultural Appropriations bill for FY 2010 provided an additional $290 million
as direct payments to farmers through the Dairy Economic Loss Assistance Payment (DELAP) Program.
These direct payments to farmers were by far the most significant and costly of the existing program
activities in the last 2 years.
Surplus butter and nonfat dry milk (NDM) were sold to the Government, at supported price
levels, under the DPPSP as well. The magnitude of DPPSP sales was quite small. In FY 2009,
Government purchases as a percentage of all commercial disappearance was 0.03 percent on a milkfat
basis and 1.7 percent for nonfat solids. The FY 2010 special Agricultural Appropriation also provided
$60 million for the purchase of cheese to be used in domestic food assistance programs. Of this total, $43
million was spent in FY 2010. In that year, the purchases enabled by the special appropriation amounted
to about 0.3 percent of total cheese production. For FY 2009, $230 million was spent to acquire surplus
dairy products under the DPPSP. These Government purchases and expenditures were not large enough
to mitigate the drop in commercial sales.
In addition to these core dairy programs, the Government made $108.6 million in direct loans to
dairy farmers through the Farm Loan Program (FLP), loan guarantees, concessions, and options for
restructuring, rescheduling, or deferring payments on existing FLP loans. The Dairy Export Incentive
Program (DEIP) was activated after several years of dormancy. Existing programs were implemented
and even augmented in 2009 and 2010 but those efforts did not prevent 2009 from being the worst year
for dairy farm profitability in decades.
The Committee makes 23 recommendations that are listed in the table at the end of the summary.
The order in which the recommendations are presented is not intended to connote importance or priority.
They are grouped thematically. The first set of recommendations relate to existing programs. These are
recommendations that do not require Congressional action.

4
The Committee finds that existing Federal programs and legislation had a limited impact on
mitigating the massive impact of recent market events. Some laws provide no flexibility to the Secretary,
while others allow some or even considerable discretion. When a proposed action has or is likely to have
an impact on Government expenditures, even programs that offer discretion to the Secretary cannot be
used without approval of the OMB. Meanwhile, Federal Milk Marketing Orders (FMMOs) are designed
for longer-term regulation of markets and are not readily amenable to mitigating shorter-term price
events.
Considering existing programs alone, if the Secretary can identify funding sources, he can use the
DPPSP and one or more food assistance programs to stimulate demand and lift prices. In this report, the
Committee suggests guidelines for using these programs (cf. recommendation 5).
Allocating part of the U.S. Government’s budget to dairy programs necessarily involves tradeoffs
with other programs. The Committee suggests that using objective measures of sector hardship can
reduce political pressures in the allocation process. The Committee recommends that the Secretary
implement trigger levels based on the difference between average milk prices and a new measure of feed
costs (cf. recommendation 1). The Secretary can then objectively determine when dairy farmers face
extreme hardship by examining whether the difference between revenues and costs falls below specific
trigger levels. Extreme hardship would justify shifting Governmental resources from other uses. Within
this framework, the first trigger would indicate use of a food assistance program to increase demand for
dairy products. At the second trigger, the DPPSP purchase prices may be raised. The Committee
recommends applying these responses cautiously.
The Committee also recommends that the Secretary review existing program administration to
examine its impact on exacerbating price volatility or delaying the Government’s response to dairy
farmers’ economic distress (cf. recommendation 2). For example, there are some delays in using the
DPPSP because of extra grading and other requirements and slower payment than is typical with
commercial accounts. Comments made to the Committee indicated that, despite significant
improvements in the Order amendment process, the FMMO program is difficult to change and could still
be improved. Moreover, the FMMO milk pricing formulas may be transferring volatility in narrow
subsectors of the dairy market into wider milk prices. Changes can be made to FMMOs without new
legislation.
USDA also is authorized to offer certain programs to help dairy farmers manage price, margin,
and/or income risk and to facilitate obtaining operating loans, especially for farmers whose circumstances
5
make it difficult to get conventional, commercial loans. The Committee offers one recommendation for
each type of program (cf. recommendations 4 and 5).
The Committee has also reviewed and considered alternative actions that would require new
legislation or regulation. In so doing, it was guided by the charge from the Secretary to focus attention on
dairy farm profitability and milk price volatility (cf. recommendations 6-9). Thus, the second set of
recommendations relates to actions that primarily address issues of milk price protection, stabilization, or
regulation. In a sense, they approach the problems of milk price volatility from the perspective of can this
be prevented or reduced. The third set take the perspective that, if price volatility cannot be avoided,
what can be done to reduce its impacts on the industry (cf. recommendations 10-12). This section is
referred to as income protection or stabilization. The fourth and last section combines a variety of
recommendations that seek to improve dairy farm profitability or enhance the development of dairy
markets, using strategies different from price or income stabilization (cf. recommendations 13-23).
It should also be noted that, while there was widespread DIAC support for most of these
recommendations, some recommendations were harder to reconcile across the entire group. Indications
of support among DIAC members are listed with each recommendation as a vote tally.
This report has three main sections. In the first, the justification for existing and new dairy policy
is reviewed, with an emphasis on the Committee’s charge to focus on dairy farm profitability and milk
price volatility. In the second section, existing programs, laws, and authorities are discussed. Lastly,
proposals and recommendations for modifications to existing programs or the creation of new programs
are reviewed and discussed.

6
NUMBER RECOMMENDATION PAGEEXISTING PROGRAMS AND AUTHORITIES
1
DEVELOP A SYSTEM THAT PROVIDES AN ACCURATE ASSESSMENT OF DAIRY FARM PROFITABILITY IN THE DAIRY INDUSTRY. USDA should develop a data gathering and reporting system that expresses farm profitability in the dairy industry using an index to provide an impartial overview of the general level of profitability at the farm level based on the milk price-feed cost margin.
12 in favor, 5 opposed, 0 abstaining
19
2
REVIEW FEDERAL MILK MARKETING ORDERS (FMMOs). The Secretary should appoint a committee to review implications of FMMOs, including, but not limited to, end-product pricing’s impact on milk price volatility and impact of classified pricing and pooling on processing investment, competition and dairy product innovation.
17 in favor, 0 opposed, 0 abstaining
31
3
SIMPLIFY AND IMPROVE RISK MANAGEMENT PRODUCTS FOR DAIRY FARMERS. Continue to simplify and improve Livestock Gross Margin (LGM)-Dairy and overhaul Adjusted Gross Revenue-Lite (AGR-Lite) in order to make them more accessible and easier for dairy farmers to use and adapt Livestock Risk Protection for use by dairy farmers. Expand risk management education.
17 in favor, 0 opposed, 0 abstaining
35
4
USE OF USDA Farm Loan Programs (FLPs). The Secretary should work with the Farm Service Agency (FSA) in Washington and all State FSA Executive Directors and State Committee members, particularly those in States with significant numbers of dairy operations, to promote efficient and effective use of the FLP for dairy farmers. We especially encourage the use of the Guaranteed Loan Program with existing commercial lenders. Apparently, some States leverage FLPs more effectively than others. We recommend that the Federal FSA examine any disparities and develop strategies to share best practices across regions.
17 in favor, 0 opposed, 0 abstaining
45
5
EMERGENCY INTERVENTIONS. The Secretary should develop a system of triggers and actions to guide his choices for special and emergency interventions, using existing programs.
17 in favor, 0 opposed, 0 abstaining
50
PRICE PROTECTION, STABILIZATION AND REGULATION
6
BEST USE OF FUNDS: Explore elimination of the Dairy Product Price Support Program (DPPSP) and the Dairy Export Incentive Program (DEIP) and use budget savings to enhance the safety net for producers.
16 in favor, 0 opposed, 1 abstaining
52
7
STRONGLY CONSIDER THE ELIMINATION OF END PRODUCT PRICING. Explore alternative measures to the current end product pricing system, such as competitive pricing and mandatory price reporting.
17 in favor, 0 opposed, 0 abstaining
53
7
NUMBER RECOMMENDATION PAGE
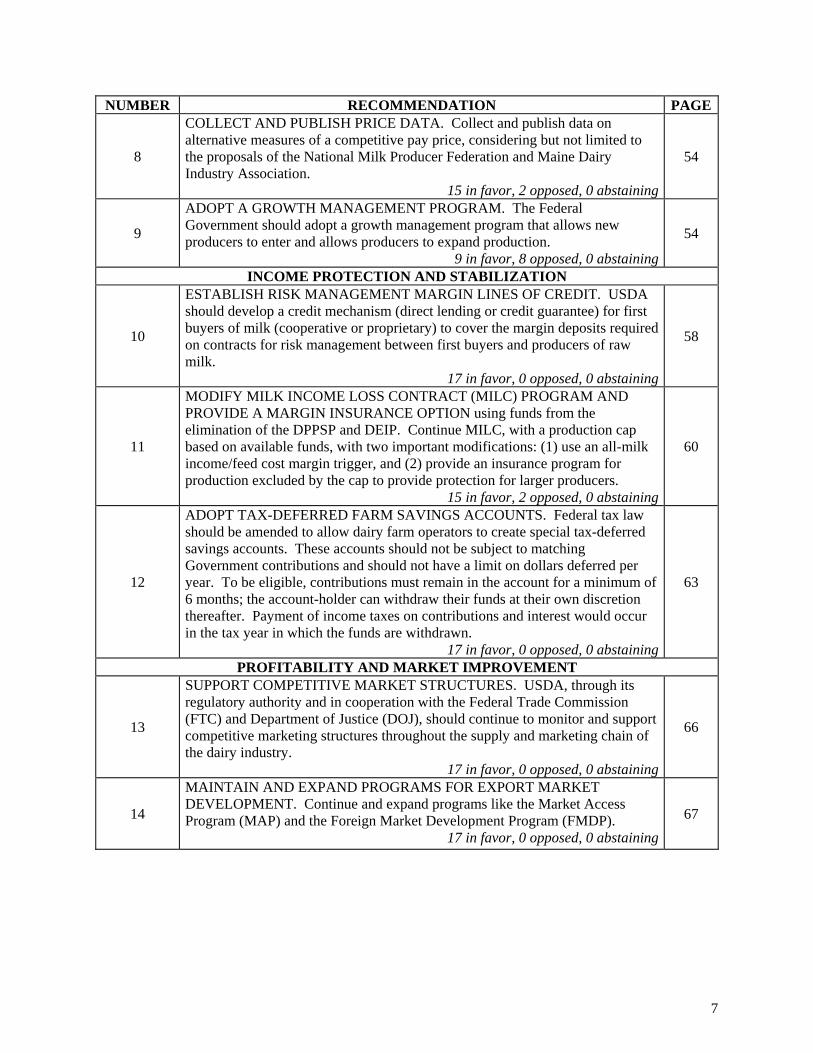
8
COLLECT AND PUBLISH PRICE DATA. Collect and publish data on alternative measures of a competitive pay price, considering but not limited to the proposals of the National Milk Producer Federation and Maine Dairy Industry Association.
15 in favor, 2 opposed, 0 abstaining
54
9
ADOPT A GROWTH MANAGEMENT PROGRAM. The Federal Government should adopt a growth management program that allows new producers to enter and allows producers to expand production.
9 in favor, 8 opposed, 0 abstaining
54
INCOME PROTECTION AND STABILIZATION
10
ESTABLISH RISK MANAGEMENT MARGIN LINES OF CREDIT. USDA should develop a credit mechanism (direct lending or credit guarantee) for first buyers of milk (cooperative or proprietary) to cover the margin deposits required on contracts for risk management between first buyers and producers of raw milk.
17 in favor, 0 opposed, 0 abstaining
58
11
MODIFY MILK INCOME LOSS CONTRACT (MILC) PROGRAM AND PROVIDE A MARGIN INSURANCE OPTION using funds from the elimination of the DPPSP and DEIP. Continue MILC, with a production cap based on available funds, with two important modifications: (1) use an all-milk income/feed cost margin trigger, and (2) provide an insurance program for production excluded by the cap to provide protection for larger producers.
15 in favor, 2 opposed, 0 abstaining
60
12
ADOPT TAX-DEFERRED FARM SAVINGS ACCOUNTS. Federal tax law should be amended to allow dairy farm operators to create special tax-deferred savings accounts. These accounts should not be subject to matching Government contributions and should not have a limit on dollars deferred per year. To be eligible, contributions must remain in the account for a minimum of 6 months; the account-holder can withdraw their funds at their own discretion thereafter. Payment of income taxes on contributions and interest would occur in the tax year in which the funds are withdrawn.
17 in favor, 0 opposed, 0 abstaining
63
PROFITABILITY AND MARKET IMPROVEMENT
13
SUPPORT COMPETITIVE MARKET STRUCTURES. USDA, through its regulatory authority and in cooperation with the Federal Trade Commission (FTC) and Department of Justice (DOJ), should continue to monitor and support competitive marketing structures throughout the supply and marketing chain of the dairy industry.
17 in favor, 0 opposed, 0 abstaining
66
14
MAINTAIN AND EXPAND PROGRAMS FOR EXPORT MARKET DEVELOPMENT. Continue and expand programs like the Market Access Program (MAP) and the Foreign Market Development Program (FMDP).
17 in favor, 0 opposed, 0 abstaining
67

8
NUMBER RECOMMENDATION PAGE
15
SUPPORT REDUCTION OF SOMATIC CELL COUNT STANDARD. Recommend that the Secretary support the adoption of a maximum somatic cell count of Grade A milk in the amount of 400,000 cells per milliliter at the farm level at the Interstate Milk Shippers Conference. The implementation should occur over a period of time not to exceed 48 months.
17 in favor, 0 opposed, 0 abstaining
70
16
ENHANCED FLUID MILK SOLIDS STANDARDS. Encourage the Secretary to explore the impacts of California-type fortification standards for U.S. beverage milk.
17 in favor, 0 opposed, 0 abstaining
72
17
RESTRICT USE OF DAIRY DESCRIPTORS ON PRODUCT LABELS. Recommend that USDA support restriction of dairy descriptors, including terms such as milk, cheese, yogurt, butter, for use on products made from milk.
17 in favor, 0 opposed, 0 abstaining
75
18
SUPPORT FOR VALUE-ADDED DAIRY. The Secretary should support programs that enhance value-added market development for dairy farms and dairy products. Opportunities include, but are not limited to, the development of educational training programs and technical assistance for farms, inspectors, and regulatory personnel to accommodate unique value-added dairy farm operations. A study should be made to examine the impact of user fees on value-added dairy product operations.
15 in favor, 0 opposed, 2 abstaining
77
19
PROVIDE INCENTIVE PAYMENTS FOR ENVIRONMENTAL PRACTICES. The Secretary should increase the amount of money available for incentive payments to dairy farmers for environmental practices that address social, economic, and environmental benefits to dairy farm communities.
16 in favor, 1 opposed, 0 abstaining
78
20
CONTINUE THE ENVIRONMENTAL QUALITY INCENTIVES PROGRAM (EQIP) AND GRANT PROGRAMS. Continue EQIP and give dairy farmers preference in grant programs for implementation of energy audits, infrastructure development for value-added processing and distribution facilities, construction of facilities to meet food safety regulations and farmland protection, and to allow beginning farmer loans for farm transfers between generations.
15 in favor, 1 opposed, 1 abstaining
80
21 PHASE OUT ETHANOL SUBSIDIES. Support the rapid phase out of the blender’s credit and tariff on imported ethanol.
16 in favor, 1 opposed, 0 abstaining82
22 DAIRY HERD HEALTH. Create a program to rapidly eradicate bovine tuberculosis (TB) and Johne's from the U.S. dairy herd.
17 in favor, 0 opposed, 0 abstaining84
23
DAIRY LABOR. The Secretary should use his influence with other agencies and Congress to provide a legal means for dairy farms to employ year-around long-term immigrant labor. Provide assurance that existing farm laborers have the opportunity to obtain permanent resident status.
13 in favor, 1 opposed, 3 abstaining
87

9
Approving:
Signature on File ____________________________________ Paul Bourbeau
Signature on File ____________________________________ Andrew Novakovic
Signature on File ____________________________________ Jay Bryant
Signature on File ____________________________________ Randy Romanski
Signature on File ____________________________________ Erick Coolidge
Signature on File ____________________________________ Robert Schupper
Signature on File ____________________________________ Timothy den Dulk
Signature on File ____________________________________ Manuel Souza
Signature on File ____________________________________ Debora Erb
Signature on File ____________________________________ Patricia Stroup
Signature on File ____________________________________ James Goodman
Signature on File ____________________________________ Sue Taylor
Signature on File ____________________________________ James Krahn
Signature on File ____________________________________ Edward Welch
Signature on File ____________________________________ Edward Maltby
Signature on File ____________________________________ James Williams
Dissenting:
Signature on File
____________________________________
Robert Wills
10
Table of Contents
Foreword ......................................................................................................................................................... 1
Executive Summary ........................................................................................................................................ 3
Approving: ...................................................................................................................................................... 9
Dissenting: ...................................................................................................................................................... 9
Table of Contents ............................................................................................................................................ 10
Introduction ..................................................................................................................................................... 13
Milk Price Volatility ....................................................................................................................................... 13
Causes of Price Volatility in the Dairy Sector ........................................................................................ 14
Dairy Farm Profitability .................................................................................................................................. 17
Measures of Profitability ......................................................................................................................... 19
The Status of Dairy Farm Profitability .................................................................................................... 22
Current Legislative and Regulatory Authorities ............................................................................................. 24
The Office of Management and Budget (OMB) ..................................................................................... 25
Comments on Possible Unintended Consequences ................................................................................. 26
The Dairy Product Price Support Program (DPPSP) ...................................................................................... 26
Milk Income Loss Contract (MILC) Program ................................................................................................ 28
Federal Milk Marketing Orders (FMMOs) ..................................................................................................... 31
Dairy Export Incentive Program (DEIP) ........................................................................................................ 34
Risk Management Programs ........................................................................................................................... 35
Livestock Gross Margin (LGM)-Dairy ................................................................................................... 36
Adjusted Gross Revenue Lite (AGR Lite) .............................................................................................. 37
Use and Participation in LGM-Dairy and AGR-Lite .............................................................................. 37
Commodity Credit Corporation (CCC) Charter Act, Section 5 ...................................................................... 38
Domestic Food Assistance Programs .............................................................................................................. 40
International Food Assistance Programs ......................................................................................................... 42

11
Section 32, Public Law 74-320 ....................................................................................................................... 44
Farm Loan Programs (FLPs)........................................................................................................................... 45
Wisconsin FSA FLP Example ................................................................................................................ 46
Market News, Research, and Promotion Programs ........................................................................................ 49
Recommendation for the Use of Existing Programs in Times of Severe Economic Distress......................... 50
Concluding Comments About Existing Programs .......................................................................................... 51
New Programs, Legislation, and Regulation .................................................................................................. 52
Programs to Stabilize and Regulate Milk Prices ..................................................................................... 52
Dairy Product Price Support Program (DPPSP) and Dairy Export Incentive Program (DEIP) ........ 52
Federal Milk Marketing Orders (FMMOs) ........................................................................................ 53
Growth Management ......................................................................................................................... 54
Programs to Protect and Stabilize Farm Incomes ................................................................................... 58
Price and Income Risk Management ................................................................................................. 58
Modified MILC and Margin Insurance .............................................................................................. 60
Farm Savings Accounts ..................................................................................................................... 63
Programs to Improve Profitability and Dairy Markets .......................................................................... 66
Export Markets .................................................................................................................................. 67
Farm Milk Quality ............................................................................................................................. 70
Enhanced Fluid Milk Solids Standards .............................................................................................. 72
What are the regional disparities? ................................................................................................... 74
Dairy Management Practices and Production Costs – Value-Added Dairy Operations .................... 77
Dairy Management Practices and Production Costs – Environmental Practices ............................... 78
Promoting Dairy Farm Development – EQIP and Other Grants ....................................................... 80
Dairy Management Practices and Production Costs – Corn Based Ethanol Subsidies ...................... 82
Dairy Herd Health Programs ............................................................................................................. 84
Johne’s Disease ............................................................................................................................... 86
Dairy Labor ........................................................................................................................................ 87
Summary and Conclusions ............................................................................................................................. 90
12
Appendix A - Farm Financial Performance Measures .................................................................................... 92
Liquidity .................................................................................................................................................. 92
Solvency .................................................................................................................................................. 92
Profitability ............................................................................................................................................. 92
Repayment Capacity ............................................................................................................................... 93
Financial Efficiency ................................................................................................................................ 93
Appendix B – Summary Information About Existing Dairy Programs .......................................................... 94
13
Introduction
With the ink barely dry on the 2008 Food Conservation and Energy Act (FCEA or 2008 Farm
Bill), the U.S. economy descended into the worst recession since the Great Depression of the 1930s. The
dairy industry suffered a combination of recession-driven demand effects and more sector-specific supply
effects. Dairy exports, which had been a primary contributor to dairy farm prosperity in 2007 and 2008,
collapsed as global demand declined. Domestic demand, especially in foodservice, also shrank as
consumers trimmed household budgets. On the supply side, feed costs, the single largest expense of milk
production, hit record highs. This created the worst margin squeeze since the early 1970s and pushed
most dairy farm businesses into the red, eliminating years of growth in dairy farm balance sheets.
Although net income for dairy farmers improved in 2010, weakened balance sheets leave farmers
vulnerable to any near-term negative margins.
This report reviews current and possible new Federal laws and programs intended to assist dairy
farmers, and discusses their potential application and impacts in various market environments. Milk and
dairy product markets begin with industries that provide products and services to dairy farmers and end
with consumers of traditional dairy products and other products containing significant dairy ingredients.
This report will attempt to highlight significant implications and considerations along the entirety of the
supply chain, but its orientation is defined by the Secretary’s charge to focus on the twin issues of milk
price volatility and dairy farm profitability.
Milk Price Volatility
A Working Definition of Price Volatility
Since the collapse of prices in 2009, it is common to hear milk prices described as “volatile”. The
image this connotes is negative, but beyond that it is not a well-defined concept. Prices can be considered
to have three fundamental dynamic characteristics: certainty, stability, and adequacy.
Certainty means that a future price is predictable. The more confident a prediction is, in amount
and distance, the greater the price certainty. Certainty can be measured by the difference between the
future price one expects at a future time and the actual price that is realized.
Stability refers to how much price changes over time. This involves the frequency and size of
change. A price that never changes is stable and predictable, but otherwise the two concepts are
independent. For example, a highly seasonal price pattern might be quite predictable while still being
“unstable”. Stability can be measured statistically in several ways, involving either amplitude or
frequency. Adequacy is a more subjective assessment, but it concerns whether a price returns positive net
revenue to the seller.

14
With this in mind, the Committee used the following description of volatility to consider and
evaluate policy solutions to the problem of volatility:
Prices that are volatile over time are unpredictable, unstable, and at least occasionally, inadequate.
This, of course, does not preclude the possibility of prices being very advantageous to a seller at other
times.
Causes of Price Volatility in the Dairy Sector
Before the Agricultural Act of 1949 established the Dairy Price Support Program (DPSP), farm
milk prices exhibited a high degree of instability. The relative spread from high to low was generally as
great as or greater than the dispersion in milk prices known today. The frequency was quite different as
the earlier fluctuations were entirely seasonal, whereas today one or more cyclical components
overwhelm a seasonal component. This instability had its effects, but these fluctuations were primarily
seasonal and generally predictable.
From 1950 to 1989, milk price variability was considerably dampened compared to the first half
of the 20th century. During the 1970s, the primary price mover was inflation, which affected the entire
U.S. economy. To offset surpluses generated by aggressive support price policies of the late 1970s, from
1981 to 1990, dairy markets were affected by a variety of significant Government programs, including
large product purchases and two new, temporary supply management programs. Beginning in 1983, the
support price for milk used in manufacturing was gradually reduced from over $13.00 per cwt to under
$10.00, where it has more or less remained. Government purchases have been infrequent at this low level
of support. While there clearly were price issues in the 1970s and 1980s, volatility, as defined in this
report, would probably not be the word used to describe them.
Since 1990, the farm milk price has become highly variable and unpredictable. The causes of this
increased volatility are debatable, but likely involve policy or regulatory issues and economic factors. As
a policy matter, the reduction of the Federal support price for milk during the 1980s may have revealed an
underlying susceptibility to volatility.
Price volatility in the last decade also corresponds to significant changes in administration of
Federal dairy programs. The base price for FMMO formulas was changed from a competitive pay price
survey of prices paid to a subset of dairy farmers producing unregulated milk (the Minnesota-Wisconsin
[M-W] price and then the so-called Basic Formula Price [BFP]) to class prices derived from the wholesale
prices of four dairy commodities (product price formulas or end product pricing). This change had the
effect of directly tying farm price volatility to the volatility of wholesale prices for dairy commodities,
15
which had always been more volatile than the previous competitive pay price series for milk. The switch
to a product formula price occurred in 2000.
Another significant policy event that seems to have changed dairy markets was the conclusion of
the Uruguay Round negotiations under the General Agreement on Tariffs and Trade, now referred to as
the World Trade Organization (WTO). In the U.S., the Uruguay Round Agreements Act was passed
in 1994. Under the Agreement on Agriculture (AoA), the U.S. and other developed countries agreed to
provide access to its dairy markets by foreign competitors equal to about 5 percent of total U.S. sales with
relatively low levels of tariff protection (this roughly doubled U.S. imports from about 2.5 percent to
5 percent of sales). Above this level, the U.S. replaced its strict import quota system with a tariff-based
system that generally provides a high degree of protection for most dairy commodities but greater access
to value added products, such as European-style cheeses. In exchange for increasing access to foreign
marketers, the U.S. dairy industry gained greater access to foreign markets. Increased trade subjected
U.S. dairy markets to the effects of changes in world supply and demand conditions, including weather,
political shocks, and foreign food safety issues. This increased trade opportunity may also have
contributed to increased price instability.
The somewhat unusual position of the U.S. among world dairy product traders may be a
compounding factor. The U.S. is among the largest producers of milk and milk products in the world. Its
cost structure puts it in the rather unusual position of being either a potential net importer or net exporter.
U.S. buyers tend to import high-value cheeses and other specialized products and sell low-value
commodities, especially dry powders. As such, the U.S. has tended to be a net importer on a dollar value
basis since the WTO, but on a milk equivalent basis it has often been a net exporter. This has been
increasingly true in the last several years. Periods of net export have been the result of a combination of
factors, including strong world demand, weak supplies by more consistent exporters, and favorable
exchange rates. While the U.S. is hardly unique in being susceptible to swings in world markets, its
vacillation between being a net importer or net exporter is unusual and perhaps puts it in a more volatile
position.
Another policy element that may contribute to persistence in dairy farming and milk production,
despite economic stress on farms, is the pooling of returns under FMMOs and State milk marketing
orders. Marketwide pools, which have been the norm for milk pricing for the last century or so, represent
a system of average pricing whereby processors pay a much different price for milk than the individual
price that farmers receive. This is because processors pay minimum regulated classified prices based on
their product sector, whereas dairy farmers receive a weighted average of the various classified prices,
regardless of the products that are made from their own milk. While useful in ensuring that farmers do

16
not destructively compete2 with one another for the highest valued market, pooling mutes price signals
that would otherwise discourage production from individual producers or suppliers facing a down market
or subsector.
Although not a matter of public policy per se, a related element is that the vast majority of the
milk marketed in the U.S. is marketed via cooperatives, and the cooperative business model has long been
to accept responsibility to market whatever volume of milk a producer chooses or is able to produce.3 In
periods of stress, when markets are long, there is essentially no marketing risk for a producer, in the sense
that every pound of milk produced will be purchased. Cooperatives cannot simultaneously agree to
market every pound of milk and guarantee a favorable price. Prices must be able to adjust to clear the
market. Pooling, combined with the essentially unlimited cooperative guarantee to purchase all milk
produced, is likely to exacerbate price volatility because those practices tend to delay production
adjustments when prices are low. When the DPSP was more aggressively used, it essentially guaranteed
a Government outlet for surplus dairy commodities and many cooperatives invested in producing these
sorts of products, especially nonfat dry milk (NDM) and butter (which also happen to be highly tradable
products in world markets). This also helps to explain the relatively open-ended purchasing agreements
cooperatives have had with their members. This marketing and pricing system has been in place for about
a century; so modern price volatility cannot be blamed on pooling and market security, but those two
elements likely confound the ability of the marketplace to react to volatility caused by other factors.
In terms of the internal economics of the sector, dairy analysts have described dairy markets as
having low price elasticities of supply and demand for farm level milk, and inelastic price elasticity of
demand for many dairy products throughout the market chain. While analysts debate the degree of
elasticity, most agree that short-term elasticities are small. As such, small relative changes in quantities
are associated with relatively large changes in price. This has always been true for dairy markets, and
some have argued that it is less true today.
2 “Destructive” competition is a term used historically to describe competition between dairy farmers for high priced markets or buyers that results in lower average prices for all farmers. Competition between buyers and sellers can be difficult, but it is generally considered to be “constructive” provided the competitive conditions are fair and balanced.
3 Of course there are exceptions to this general rule. A few cooperatives have long operated a “closed membership”, to control growth by restricting entry. In recent years, it has become more common for cooperatives to institute short or longer-term restrictions on individual farm growth, especially when the cooperative is processing its member's milk directly.

17
Whatever its precise magnitude, supply and demand inelasticity in dairy markets means that the
reduction in price support exposes the industry to this kind of volatility more now than when the DPSP
was more important in establishing and constraining market prices. Product formula pricing may further
aggravate the volatility enhancing aspects of product supply and demand inelasticities. Because
wholesale dairy prices have always tended to be more volatile, product formula pricing tends to transmit
this wholesale volatility very quickly and completely. Volatile farm prices directly impact dairy farm
revenue, but this form of pricing tends to keep processor margins, and hence net revenue, less volatile.
Manufacturers have less margin risk as long as they produce those specific commodities or a product
whose price is highly correlated with one of them. The number of product classes, combined with
pooling, may also have an effect on milk price volatility. Demand factors can result in the wholesale
value of one product class rising dramatically, while another product class price rises more slowly or even
falls. The relative margin assurance under product formula pricing reduces the buyer’s incentives to
move farm milk from lower valued to higher valued uses and pooling tends to dilute the seller’s
incentives. The exact magnitude and importance of these possible effects is not known, but the
Committee believes these are issues that warrant more in depth analysis.
One reason for the low degree of milk supply elasticity is that dairy farming is a production
activity that is characterized by a high degree of asset fixity. An operating farm will endure a great deal
of short term stress (negative cash flow) as long as the operator believes that the farm will be profitable in
the long term and sufficient credit or reserves exist to get through the negative period. Moreover, the
generally high degree of fixed costs and the fact that cows are not machines that can be simply turned off
means that it generally makes sense in the short term to produce at full capacity. Thus, in periods of low
or negative margins, farmers will continue to produce until they decide to discontinue their business or
their access to credit is eliminated.
Dairy Farm Profitability
In addition to swings in milk price, dairy farmers have experienced significant changes in prices
of feed and other production inputs. Feed is the single largest milk production cost component
(40-50 percent). Thus, dairy farmers are especially sensitive to the prices of purchased feeds or to the
prices of inputs used in homegrown feed production. Key feedstuffs include corn, soybean meal, and
alfalfa hay. Other important production inputs are energy and labor and—for those who grow their own
feed—fuel, fertilizer and seed.
From Fall 2006 through Summer 2008, the price of corn increased from about $2.00 to about
$5.50 per bushel. The increase in soybean prices was equally dramatic. Among the causes of feed price

18
increases was expanded bio-fuel production which created a large and new demand for corn and
contributed to the price increase for soybeans and other crops. Weather and international grain demand
also contributed to high feed costs.
Milk prices were
moving to a cyclical low in
2006 even as feed prices were
beginning to increase. As a
result of the high feed costs that
in turn led to decreased milk
supply, the price of milk rose
from a low of $11.70 per cwt in
July 2006 to a high of $21.90 in
November 2007—the all time
record high for the nominal
price of milk. By the end of
2008 and through 2009, farm profitability began to decline dramatically. Although corn prices and other
input costs softened from their highs, milk prices fell even more. The problem in 2009 was not just the
low price of milk, which was no lower than the levels of the previous two cycles; it was extremely low to
negative margins. In many months, the milk check barely covered the cost of feed. This is illustrated in
the accompanying chart.4
Clearly, the low point in milk margin over feed costs ($/cwt) during 2009 is far lower than the
previous troughs in 2006 and 2002, although milk prices were approximately the same in the 3 years. The
distinction between prices and margins is important. Prices influence margins and financial outcomes,
but output price alone does not determine farmers’ well-being. Most dairy and other agricultural support
programs are based on or triggered by an output price, such as milk price. The usefulness of that simple
approach has been seriously challenged by the events of the last 2 years and is a concern looking forward.
4 This chart uses a margin methodology developed by the National Milk Producers Federation (NMPF), in its Foundation for the Future proposal, combined with USDA price data. There are several ways to measure margins or other indicators of the relationship between the price of milk and the prices or costs of feed, or farm returns, more generally. The methodology proposed by NMPF is reasonable; however, in using it in this paper, the Committee does not imply a formal endorsement of their methodology.
19
The experience of 2009 has sensitized industry members and analysts that a milk price that looks
good, or even high, by purely historical comparisons can easily be inadequate when input prices are high.
This has caused much attention to be focused on alternative measures of profitability in dairy farming.
The need for this is accentuated by a general feeling that grain prices have likely shifted to a new average
level and that recent “highs” may prove to represent a new “normal”.
Measures of Profitability
Recommendation 1:
DEVELOP A SYSTEM THAT PROVIDES AN ACCURATE ASSESSMENT OF DAIRY
FARM PROFITABILITY. A data gathering and reporting system should be developed that
expresses farm profitability in the dairy industry using an index to provide an impartial
overview of the general level of profitability at the farm level based on the milk price-feed
cost margin.
There is no single best way to describe or measure dairy farm profitability. Various concepts are
used, and each can lead to rather different perspectives on “profitability” of dairy farmers.
Two observations reveal a basic conundrum about the apparently simple concept of profitability.
In 1975, USDA estimates that 443,610 “operations” reported having milk cows and total milk production
that year was 115,398 million pounds. In 2009, USDA estimates that there were 65,000 operations
having dairy cows and annual production was 189,320 million pounds. Thus, the number of operations
declined 85 percent while production increased 64 percent.
It is tempting to use the data on number of dairy operations as evidence that there must be a long-
term problem with dairy farm profitability. Even from year to year, it is common to describe poor
profitability across the sector as the cause for dairy farms going out of business. On the other hand, if one
looks at the growth in milk production, it is just as logical to say that dairy farming must have been
profitable to support that level of growth over so many years.
Data on farm numbers and prices are simple facts about the U.S. dairy sector. Interpreting these
facts and translating their meaning for questions like “are dairy farms profitable” or “is dairy farm
profitability a long term problem” is less straightforward. Perhaps the simplest conclusion that can be
made from these data is the following: Farm milk prices have not kept pace with consumer price
20
inflation5, but apparently the lower rate of increase in farm milk prices has been adequate to support an
impressive long-term increase in milk production. However, it is equally clear that many farm operators
have found the increase in price to be “inadequate”. The decline in numbers of farm operations that milk
cows is testimony that these farmers have found better places to invest their equity, labor, and
management skills, and/or that farmers reached normal retirement decisions and those farms were
consolidated rather than passed on to a new generation. By the same token, the increase in milk
production means that there is a group of farmers who have found profits to be sufficient to justify
continuing and even expanding.
If nothing else, this simple exercise reveals the difficulty in using averages to explain complex
economic factors and outcomes related to dairy farming. Factors of a more social nature, or related to
personal values, are part of this complexity as well.
Whether looking at an average or results for a specific farm, another question is how one ought to
measure profitability. Operators use different criteria to measure profit depending on their goals, size,
business structure, location, etc. High prices do not ensure high farm level profitability, and prices that
are more modest do not condemn farms to a lack of profitability. It is the relationship between cash
revenue and cash costs that keeps farms in business in the short term (liquidity), and measures such as the
return on equity (ROE) or net farm income (NFI) that define the long-term profitability of the farm
operation. There are many different production practices and, as with many small businesses, plenty of
entrepreneurial initiative and innovation that make a single standard for farm profitability difficult to
define. Some farms may be unprofitable in the long term, even though they have positive cash flow from
most years to the next. Other farm families may be eligible for public assistance for health insurance and
food stamps, but still see dairy farming as the best place to invest their equity and labor. Commercial
lenders typically have their own preferred measures and benchmarks when assessing the profitability and
5 The U.S. average price paid for all milk went from $8.78 per cwt in 1975 to $12.83 per cwt in 2009. Given the instability of prices in both periods, as opposed to the steady trend in milk production and the number of farms, a better indication of trend is to consider the average prices in the early 1970s vs. the late 2000s. These values are approximately $8 per cwt. and $15, respectively. This is an increase of 88 percent. Over those same time periods, the Consumer Price Index for all goods increased from about 50 to 196, according to the Bureau of Labor Statistics. If the average farm price had increased by the same percentage, it would have been over $31 per cwt in the 21st Century. The “nominal” price of milk increased 88 percent but the “real” price decreased over 50 percent.

21
repayment capacity of a farm borrower. The USDA and other Federal agencies may choose different
criteria (for example, USDA Rural Development uses tangible net-worth).
In response to the economic crisis experienced by much of the agricultural sector in the early
1980s, the American Bankers Association decided that there was a need to standardize how farm financial
performance is measured. This ultimately led to the creation of an independent organization called the
Farm Financial Standards Council (FFSC). The FFSC is a voluntary, not for profit organization that
seeks “to create and promote uniformity and integrity in financial reporting and analysis for agricultural
producers”. It currently endorses 21 specific measures of financial performance. Different groups of
measures are deemed to be alternative and useful indications of liquidity, solvency, profitability,
repayment capacity, and financial efficiency. A description of each is provided in Appendix A.
The Committee discussed numerous aspects of these questions and issues as it considered the
concept of dairy farm profitability, the status of dairy farm profitability currently, and alternative ways to
assist farmers in improving profitability. While we recognized that it is very appealing to have one “best”
measure that could be used to gauge farm profitability over time or to guide public policy actions, in the
end we concluded that no single measure is “best” for all purposes. Some measures are appealing
because they can be calculated or estimated without a lot of variables or data. They are simple. Other
measures are more appealing conceptually, but they are complex and difficult to calculate.
Recognizing that there are appropriate times and applications for different measures, we conclude
that a margin measure, such as the average, per cwt net return from the sale of milk less the cost of
purchasing feed to produce 100 pounds of milk – the milk margin over feed costs – is a simple but useful
measure of short term financial performance of dairy farm businesses.6 The milk margin over feed cost
does not account for other production cost components, such as labor, energy, depreciation, capital,
6 USDA has reported a ratio of the all milk price to an index of feed prices for decades. The milk-feed price ratio is the pounds of 16 percent protein mixed dairy feed equal in value to 1 pound of whole milk. The higher the ratio, the more feed a dairy producer could buy with proceeds from the sale of a pound of milk. Reported monthly by USDA, feed prices used in the ratio are based on current U.S. prices received for corn, soybeans, and alfalfa hay. The milk: feed price ratio has been a familiar and easy tool for indicating net returns to dairying: however some recent research has highlighted that in times of great volatility this measurement is not accurate (Understanding the milk-to-feed price ratio as a proxy for dairy farm profitability: CA Wolf October 2010, Journal of Dairy Science.). While conceptually related, a composite index of prices of feed is not the same as the average cost of the same feeds used to produce 100 pounds of milk. The first is simply a ratio of prices; the second results in a margin per cwt of milk produced.

22
veterinary services, and nutritional supplements. These costs vary greatly across individual operations,
either by region or the structure of the farm business. These other costs are probably not as volatile as
feed costs; hence, the milk margin over feed cost remains a fairly reasonable short-term indicator of farm
financial performance. However, individual producers will need to take into account their own
circumstances when evaluating how well this simple national measure represents their financial status.
Later in the report, we recommend the use of milk margin over feed costs for policy purposes, but
it should be understood that we do not think it is the “best” measure of profitability. As a type of cash
flow measure, it falls in the financial category FFSC describes as a measure of liquidity. Alternatively,
NFI is an appealing measurement of profitability and can be especially useful in comparing the
profitability of different dairy farms. ROE, another measure of profitability endorsed by FFSC, is a
helpful measurement when comparing profitability in dairy to other agricultural or even non-agricultural
businesses.
The Status of Dairy Farm Profitability
The impact on business equity and liquidity for farmers in 2009 was at an unprecedented level
that will need many months, if not years, of higher net returns to remedy. Those dairy farms that are
under most pressure are farms that:
must purchase feed have highly leveraged assets rely heavily on cash flow from the farm business for household income.
Economists at the USDA, Economic Research Service (ERS) estimate returns and costs of
production on dairy farms across the U.S. 7 Their reports estimate total returns to the dairy operation,
including milk sales, sales of cull cows and calves, and income from other sources that pertain to the dairy
operation or can be allocated in part to the dairy enterprise. Operating costs included cash expenses for
variable and fixed inputs in the dairy operation. Costs for hired labor, family labor, depreciation, taxes
and insurance and general farm overhead are estimated and allocated to the dairy enterprise. From these
basic data and estimates, it is possible to calculate measures such as NFI. The accompanying chart
illustrates net returns over total cost or operating costs. The patterns of both measures are very similar;
however, there is a significant distance between the two. This illustrates that non-cash average costs are
significant but much less variable than cash costs and income. 7 USDA ERS: Commodity Costs and Returns Data, Dairy. http://www.ers.usda.gov/data/costsandreturns/testpick.htm#milkproduction

23
The dairy industry is very diverse in production practices, location, capital investment, overhead
costs, and
expectations.
Estimated
averages
certainly do not
describe every
farm situation,
some of which
are much worse,
some much
better, and many
of which follow
a somewhat
different pattern
over time.
Nevertheless, these estimates bear witness to the severe economic challenge experienced across the dairy
sector in 2009. Perhaps even more importantly for long-term policy, the chart also indicates that dairy
farms experience a considerable amount of margin volatility.
-10
-8
-6
-4
-2
0
2
4
6
8
10
2000 2001 2002 2003 2004 2005 2006 2007 2008 2009
$/cw
t
US Dairy Returns Over Costs, Operating vs Total Costs
Dairy Returns less Total Costs Dairy Returns less Operating Costs
24
Current Legislative and Regulatory Authorities8
Dairy programs are legal authorizations or mandates specified by Congress and implemented as
regulations by the USDA or another executive agency of the Federal Government. Some of these
programs exist under permanent law while others are temporary. Temporary programs may exist for
many years, but periodically Congress needs to reaffirm them. The so-called Farm Bill is “omnibus”
legislation that mostly codifies changes to laws and programs that exist in other statutes. Therefore, it is
usually a bill of amendments to existing law. Underlying laws, such as the Agricultural Adjustment Act
of 1933, the Agricultural Marketing Agreement Act of 1937 (AMAA of 1937), and the Agricultural Act
of 1949, contain the original authorizations for basic dairy programs. This chapter of the report focuses
on existing laws and programs and attempts to suggest how the existing programs might best be used in
those cases where the Secretary has some discretion and flexibility. It is also an objective to better inform
the dairy community about existing laws and the opportunities and limits that the Secretary faces in
working within existing statutes and regulations.
Congress has latitude in how strongly it directs an action of the Executive Branch. In many
cases, a law authorizes USDA or another agency to do something, but it does not require or even enable
that action. For example, under the old parity-based DPSP, USDA could announce a support price for
milk that was no less than 75 percent of the parity price but no more than 90 percent. Thus, USDA was
authorized to choose within a range. Sometimes USDA is permitted to do nothing at all. For example,
USDA is not required to implement a FMMO simply at the request of farmers or another market
participant. The Secretary has the authority to deny a request for a new Order or even suspend or
discontinue an existing Order. Lastly, Congress may give the Secretary authority to act, but not provide
necessary funding, so as a result, the policy is not implemented.
Current programs have direct effects on milk prices, dairy product sales, farm incomes, and other
direct aspects of dairy profitability and volatility. Many programs exist outside of USDA authority that
affect dairy markets, including tax policy, public borrowing, transportation, energy, environment, labor
policy, and food regulations. The primary focus in this report will be on dairy-specific programs that
could reasonably impact farm level dairy markets. Where a recommendation is made for an action not
under the direct purview of the Secretary, the Committee encourages the Secretary to exert influence and
resources at his disposal to encourage the appropriate agency or agencies to adopt the recommended
8 A tabular summary of the objectives and legislative authorities for major dairy programs is provided in Appendix B.

25
action. Where there are specific recommendations related to the operation of an existing program (as
opposed to creating new legislation to modify an existing program), that recommendation is made at the
beginning of each program section. A concluding recommendation is offered that spans several
programs.
The Committee offers its recommendations with awareness that the President’s Office of
Management and Budget (OMB) may constrain executive discretion and, therefore, policy
implementations. The Committee also acknowledges the risk of undesired and/or unanticipated
consequences of any policy choice. Individually and collectively, members of the Committee considered
the consequences of each recommendation along the dairy supply chain.
The Office of Management and Budget (OMB)
The Secretary may only initiate and operate programs 1) which he is authorized to administer and
2) which have a well-defined mandatory or discretionary source of funding. If a program is mandatory,
Congress provides authority to spend whatever money is required to achieve the purposes of that act. If
the program is discretionary, Congress may or may not provide funding to support the program. When
funding is limited, which is often, the OMB plays a crucial role in determining which programs may be
implemented.
OMB implements and enforces Presidential policy Government-wide through “budget
development and execution, agency management, coordination and review of all significant Federal
regulations by executive agencies, review, and clearance of all agency communications with Congress,
and executive orders and Presidential memoranda”.9
OMB has significant influence on the spending ability of any Federal agency, including USDA.
When Congress provides a clear mandate and sufficient funding to conduct a program, OMB’s primary
concern is the efficient execution of the required program. However, when an authorized program is
unfunded or underfunded, USDA must work with OMB to determine where funding might be available or
even whether any such funding can be found. Inasmuch as OMB reports to the President, OMB’s
priorities, both programmatically and from the standpoint of financial stewardship, are driven by the
President’s overarching priorities. In periods when budgets are tight, OMB toes a strict line on
discretionary spending. Even when budgets are not unusually stressed, OMB will and must evaluate
tradeoffs when an Executive agency, like USDA, makes a request.
9 http://www.whitehouse.gov/omb/organization_mission/

26
Comments on Possible Unintended Consequences
One of the challenges in any public policy is that few choices make everyone better off. Policies
involve tradeoffs. In the dairy sector, tradeoffs exist among producers and among dairy processors,
retailers, consumers, taxpayers, and alternate agricultural and food sectors. We recognize that policies
that are good for some dairy farmers may not be good for all dairy farmers. This is evident in the ongoing
public debates related to varying farm size, business models, and regions of the U.S.
While we have not been charged to address business or individual issues that derive primarily
beyond the farm sector, we cannot look at farm level policy solutions without considering their possible
downstream effects over time.
We also recognize that the Secretary has a responsibility to balance and represent a public interest
in the administration of USDA programs and acknowledge that this is a difficult task. The purpose of the
policies discussed here is to counter extreme market conditions, not to eliminate fundamental market
functions.
The Dairy Product Price Support Program (DPPSP)
Recommendation Note:
At the conclusion of the chapter on existing laws and programs, we offer a recommendation
that relates to the Secretary’s use of the DPPSP. We also make a recommendation
concerning legislative changes that impact the DPPSP.
The DPSP was authorized under the Agricultural Act of 1949 and has been reauthorized by
subsequent Farm Bills. The Agricultural Act of 1949 gave the Secretary discretion to establish a support
price that would cover 75-90 percent of “parity” (a measure of farmers’ purchasing power in comparison
to a base period in the early 20th century). Since 1981, Congress has suspended the requirement that the
Secretary establish support prices according to a parity price benchmark.
FCEA also altered the purchase price targets, replacing a “support price” for milk with “purchase
prices” for commodity cheddar cheese, butter, and NDM. This altered program was titled the DPPSP.
Purchase prices, specified in law by FCEA or announced by USDA prior to 2008, did not change
significantly and are listed in the following table.

27
Price Before FCEA After FCEA Support Price for Milk Used in Manufacturing, average fat test (per cwt)
$9.90 not specified
Purchase Price for Cheddar Cheese, blocks (per pound) $1.1314 $1.13 Purchase Price for Cheddar Cheese, barrels (per pound) $1.1014 $1.10 Purchase Price for Butter (per pound) $1.05 $1.05 Purchase Price for NDM (per pound) $0.80 $0.80
Dairy product manufacturers initiate the process of moving surplus product off the market to
Government storage. USDA is obliged to buy any and all quantities of eligible product offered at the
announced purchase prices. Typically, any such product so acquired will either be sold back into
commercial markets at the statutory sellback price or will be made available for use in an international
food assistance program (for example, under Sec. 416(b) or one of the domestic programs, such as The
Emergency Food Assistance Program (TEFAP) or School Lunch).
To the extent that manufacturers take advantage of this guaranteed price, wholesale market prices
should not fall below the Government offer price, or at least not by very much. In practice, sellers show
some reluctance to sell cheese and butter to the Government. USDA issues standards for product
purchases that do not match the standards required by commercial buyers and payment terms are outside
of industry norms. Many manufacturers refer to a “cost of selling” to the Federal Government, with
estimates of that cost in the neighborhood of 3-5 cents per pound of product. In January 2009, wholesale
cheddar cheese prices were 6 to 7 cents per pound less than the USDA purchase price for 3 weeks without
generating sales to the Commodity Credit Corporation (CCC). As an approximation, a 1-cent per pound
change in the price of cheese equates to a change of about 10 cents per cwt of milk. USDA has reasons
for each of these rules and requirements. Nevertheless, the Committee believes that USDA should
carefully examine its requirements in an effort to make program changes that minimize reluctance to
participate.
The USDA purchase prices assure manufacturers of listed commodities that they will have a
market for those products at those prices. Also, market prices of these products are the foundation for
class prices in FMMOs,10 so the effect of Government purchases is widespread. Some analysts suggest
10 The California Stabilization and Marketing Plan for Market Milk does not use the same classification and pricing scheme as FMMO, but they are similar. California, which represents over one-fourth of U.S. milk production, also has regulated minimum class prices that are determined by wholesale product price formulas.

28
that dairy price supports have resulted in too many resources being directed toward production of the
targeted commodities compared to other products that might have better or broader commercial market
opportunities. If this causes a distortion that leads to inefficient allocation of resources in dairy markets,
returns to farmers will eventually be reduced.
Although Congress specified a support price for milk that “shall be” fixed at a given level from
1981 to 2008, the FCEA mandated commodity purchase prices for cheese, butter, and non-fat dry milk
specifying that the purchase prices “shall be no less than” proscribed levels specified in the statute. While
this language gives the Secretary the authority to raise one or more of the three commodity purchase
prices, the Secretary's ability to do so is subject to the approval of the OMB.
USDA used this discretionary authority to increase the purchase prices for cheddar cheese and
NDM in August, September, and October 2009. Compared to the purchase prices listed in the previous
table, the Secretary increased the purchase price of cheddar cheese by 18 cents per pound (16 percent) and
NDM by 12 cents per pound (15 percent). This action resulted in little dairy support program purchases
of NDM or cheese by the CCC, as product prices increased over the same period. In November 2009,
purchase prices for cheddar cheese and NDM under the DPPSP reverted to the levels specified in the
FCEA. The Secretary’s authority to make changes in the DPPSP support prices is limited by available
funding as detailed in the previous discussion regarding the OMB.
Milk Income Loss Contract (MILC) Program
Recommendation Note:
In the chapter on alternative laws and programs, we offer a recommendation concerning
legislative changes that impact the MILC.
The MILC program provides a form of countercyclical income support that draws some elements
from the structure of the (discontinued) Northeast Dairy Compact and the ongoing countercyclical price
(CCP) subsidies established for program crops (food and feed grains, etc.) in the Farm Security Act
of 2002.

29
The Northeast Dairy Compact was a Congressionally sanctioned agreement between the 6 New
England states to coordinate a minimum price for Class I milk marketed in their jurisdiction. When
Congressional approval for this multi-State Compact expired, the calculation methodology was adapted to
a countercyclical income subsidy that would apply to all dairy farmers in the contiguous U.S. As such,
there are three key variables that determine payments to farmers: the price trigger, the payment rate, and
the marketings payment limit.
Following the methodology of the Northeast Dairy Compact, the Northeast FMMO, Boston city
zone Class I price serves as the price trigger. When the actual Boston Class I price falls below $16.94 per
cwt, the MILC program becomes active. In the FCEA, Congress modified the trigger price to include an
automatic adjustment for changes in the prices farmers pay for certain feeds used in a dairy ration.
USDA’s National Agricultural Statistics Service (NASS) calculates the national dairy ration cost each
month. When the monthly ration cost exceeds $7.35 per cwt, the trigger price is increased by 45 percent
of the difference between the ration-cost trigger and the estimated actual U.S. average cost. For example,
if the dairy ration cost is estimated to be 10 percent above $7.35 per cwt, the milk payment trigger rises
4.5 percent (or $16.94 times 1.045 = $17.70). The FCEA increases the automatic feed adjustment trigger
cost from $7.35 to $9.50 per cwt beginning on September 1, 2012.
A payment rate was originally set at 45 percent of the difference between the announced monthly
price and the trigger, approximately the same percentage as the Class I utilization in the Northeast
FMMO. The FCEA reduces the MILC payment rate from 45 to 34 percent of the difference between the
announced monthly price and the trigger price beginning on September 1, 2012. There have been other
periods when the payment rate has varied. These changes are made by Congress as a way to achieve
budget targets, not because of conceptual or philosophical changes about the MILC program.
Lastly, the MILC program limits on how much an individual farm operator can receive. The
concept of a payment limit is derived from countercyclical payment programs for other agricultural crops
and was not used in the old Compact. For major program crops, the CCP and other subsidies are
generally limited by a maximum dollar amount. In the case of the MILC program, the payment is limited
by the number of pounds of milk on which a subsidy payment can be received. Like the dollar limit, the
quantitative limit has two objectives. First, it limits Government exposure to budget costs. Second, it
targets limited budget dollars to provide greater assistance to smaller scale farmers, which Congress has
generally favored in the form of payment limitations and income eligibility rules for other agricultural
programs.
Through September 2012, dairy producers are eligible to receive payments on up to 2.985 million
pounds per FY. At the national average production per cow, this equates to a farm size of about 150

30
cows. Producers whose marketings exceed the cap can choose the month for which they want to start
receiving payments. Marketings prior to that month do not count toward the limit even if the MILC
program is active. From that month, they receive payments for all months in which the program is active
until they reach their limit. The calculation starts over at the beginning of a new FY. This means that
smaller farmers will receive a greater proportional benefit relative to their gross income than will a very
large farm.
Many large-scale producers for which the eligible volume represents a very small portion of their
total production or gross income have criticized the program as being unfair to them. Also, many
producers and analysts believe that the price of milk remains at lower levels for longer periods when
MILC payments are triggered. The economic logic for this begins with the recognition that low prices are
the result of excess supply. Normally, low prices tend to stimulate consumption and discourage
production, thereby bringing supply and demand back into balance. When producers receive a Federal
price supplement, the self-correcting mechanism of the market is necessarily thwarted. This tends to
lessen the supply response and put more burdens on the demand side to correct the imbalance. This leads
to questions about the extent to which retail prices reflect lower farm and wholesale prices, or how long it
takes to reflect a decline. If the demand side is slow to respond, or does not feel the full effect of the price
declines farther upstream, and the supply side is protected from low prices by a price subsidy, then it is
consistent that low prices would persist for a longer period. The extent to which this occurs is debated.
Regardless, payments and their volume limitations are the basis for both political support and criticism of
the MILC program.
The MILC program is administered by the USDA’s FSA and is a mandatory program over which
USDA has no discretionary authority. USDA does promulgate rules to interpret and enforce the program
as authorized by Congress. These rules define requirements for eligibility and compliance, but they do
not alter the fundamental parameters specified in legislation.

31
Federal Milk Marketing Orders (FMMOs)
Recommendation 2:
REVIEW FEDERAL MILK MARKETING ORDERS (FMMOs). The Secretary should
appoint a committee to review implications of FMMOs, including, but not limited to,
end-product pricing’s impact on milk price volatility and impact of classified pricing and
pooling on processing investment, competition and dairy product innovation.
Recommendation Note:
Recommendation 7 pertains to a specific provision of FMMOs.
The Committee feels that FMMOs in general and specific provisions of current orders warrant
careful review, but that we do not have sufficient time or resources to fully evaluate this system and make
more specific recommendations.
FMMOs are the oldest U.S. dairy industry specific program. Milk marketing cooperatives used
classified pricing and pooling over 30 years before passage of enabling Federal and State legislation,
beginning in the 1930s. Over time, most State laws gave way to the Federal law due to States’ inability to
price or regulate milk in interstate trade. However, several States continue to have some form of milk
price regulation, including California, New York, Pennsylvania, Virginia, Maine, Montana, Nevada, and
North Dakota.
Fluid (beverage) milk processors are automatically subject to the requirements of a FMMO.
Manufacturers of other dairy products are not automatically regulated. Instead, in order to share in Class
I (beverage) milk price premiums, manufacturers of other products are required to demonstrate their
capacity to supply milk to the fluid milk market. The specific performance or pool qualification
requirements vary across orders, ranging from quite easy to very difficult. A manufacturer who does not
or cannot meet these performance requirements generally finds that it must compete for milk on the basis
of the blended price that farmers receive while regulated competitors have costs based on the minimum
class price. USDA should be vigilant to assure that criteria for participation are justified and do not
confer unintended advantages or penalties to different firms.
Marketing orders are complex regulatory instruments. Many comprehensive descriptions are
available to interested readers. Rather than focusing on the mechanics of the orders, the Committee
wishes to highlight several aspects of market order operation that are related to its charge.

32
The AMAA of 1937 authorizes, but does not mandate FMMOs. FMMO’s are initiated and
amended through producer requests followed by formal hearings, briefings, recommended decisions,
public comments, a farmer vote, and, ultimately, final Orders by USDA. Changes in FMMOs are
approved by an affirmative vote of two-thirds of the eligible dairy farmers.11 Farmers may only vote for
or against the entire order, they cannot vote on specific provisions of a FMMO. If a vote fails, the order
ceases to exist. The logic behind the all or nothing vote hinges on two aspects of the law. First, the
AMAA requires the Secretary to craft FMMOs that are “in the public interest”, meaning the Secretary has
to balance the objectives and concerns of farmers with those of the rest of the supply chain down to
consumers. Second, only farmers whose price are or would be affected by an FMMO are allowed to vote
on its provisions. If they could choose only those favorable to them, the Secretary could not ensure that
the public interest was balanced. Today, FMMOs cover about two-thirds of the U.S. milk supply. Most
of the rest of the nation’s milk supply is regulated under a State plan, which is generally similar in
operation to a FMMO.12
The Committee agrees that FMMOs play a valuable role in oversight of compliance issues such
as accuracy of weights, milk component testing, contract enforcement, auditing, and in data gathering and
publication of statistics vital to market transparency.
The current structure of the FMMO system uses “product formula” or “end product” pricing
based on NASS dairy commodity survey prices to determine minimum classified prices for milk. Under
end-product pricing formulas, Chicago Mercantile Exchange (CME) spot prices for cheese and butter
have a large influence on milk prices, even though they are not used directly in the formulas. Processors
typically use CME prices as a reference for basic price discovery and to reduce their margin risk. Many
cheese makers establish selling prices tied directly to the CME spot price in a given week. Thus, the
prices paid to marketers of milk by plants and reported to NASS tend to be highly correlated with CME
prices. The spot (CME) commodity markets trade very little product relative to the total volumes
manufactured and sometimes exhibit large and unexpected swings in price. An aggravated price
movement in a specific dairy commodity on the CME will likely be transmitted to farmers as increased
farm milk price volatility. There is a concern in the dairy community that the CME markets are subject to
11 Eligible farmers are generally those whose milk would be priced under the provisions of the proposed FMMO.
12 California represents about 22 percent of U.S. marketings. The amount of State regulated milk in the next 2 largest States, Pennsylvania and New York, represents less the 2 percent of U.S. marketings.
33
manipulation by a small group of traders, although the CME and the Commodity Futures Trading
Commission, which has Federal oversight responsibility, do not find evidence of frequent or routine
illegal manipulation of those market mechanisms. The structure of spot cash markets themselves lend to
volatility as they serve only as a market of marginal production and may not be representative of the value
of all product.
Some other fundamental aspects of classified pricing and pooling may hamper dairy farmers’
ability to innovate and create unintended incentives for farmers and processors. Milk prices paid by
processors of commodities referenced in classified prices tie relatively closely to their finished product
prices. Manufacturers of other dairy products face additional risk as their prices and costs deviate from
those of the referenced commodities. The reduced margin uncertainty for manufacturers of the basic
commodities makes those commodities relatively low-risk investments. This distortion may discourage
dairy product innovation, reduce market efficiency, and thereby, lower money available for farmers.
Similarly, improvements in dairy processing technology and changes in consumer preferences
may render some of the original justifications for classified pricing and/or pooling obsolete. In the mid-
20th Century, the percentage of FMMO milk used to make fluid milk products was in the range of
60-65 percent. In the 21st Century, Class I utilization has been in the neighborhood of 40 percent.
Developments in milk transportation and storability, long-term declines in per capita beverage milk
consumption and increases in cheese consumption, establishment of extremely large farmer-owned
cooperatives, development of protein filtration technology, the increasing use of dairy products for
ingredient usage in other foods, the emerging product preferences of both domestic and global dairy
consumers, and a host of other factors necessitate a strategic look at the future role of FMMOs, especially
in its role in price setting and pooling.
While FMMOs have many functions in the dairy industry, the underlying structure and the
rulemaking required, means that the FMMO system is not a viable vehicle for USDA to assist dairy
farmers during periods of stress. At best, FMMOs provide long term, consistent regulation of price, not
short-term price stabilization. However, the Committee recommends further work by USDA, this
Committee, or some other commission focused on analyzing the operations of the FMMO program,
including end-product pricing’s impact on milk price volatility and impact of classified end-product
pricing and pooling on processing investment, dairy product innovation, and competition.

34
Dairy Export Incentive Program (DEIP)
Recommendation Note:
The Committee has no specific recommendations concerning the current operation of the
DEIP. However, given its limited value in the current global dairy trade climate, we suggest
using DEIP funds more effectively for other programs in Recommendation 12. In the
chapter on alternative actions, we do make broader recommendations related to dairy
export programs and activities.
DEIP helps exporters of U.S. dairy products make sales to foreign buyers when U.S. prices
exceed prevailing world prices for targeted dairy products and destinations. As part of its WTO
commitments resulting from the Uruguay Round Agreement on Agriculture, annual export subsidy
ceilings are set for each commodity. These define maximum quantities and maximum budgetary
expenditures, which are charged against the U.S.’ constrained subsidies under the WTO agreement.
Private companies, not the U.S. Government, make all sales under the DEIP.
USDA issues two types of bonus invitations: those inviting exporters to compete for a bonus and
those inviting exporters to apply for an announced bonus. When USDA issues an invitation for offers,
agricultural exporters negotiate a sales contract with prospective buyers in eligible countries. The sale
may be contingent on USDA’s approval of a bonus. Each prospective exporter submits requests to
USDA suggesting a bonus that would allow sales to take place at the agreed price. USDA chooses which
bonuses to award.
Under an announced bonus, requests meeting all program requirements are accepted in the order
submitted. USDA has the right to reject any or all bids.
Once USDA accepts a bonus request, the exporter and USDA’s CCC enter into an agreement.
The bonus is paid to the U.S. exporter in cash. The CCC determines the bonus payment by multiplying
the bonus specified in the agreement by the net quantity of the commodity exported. Once an exporter
furnishes USDA with evidence that the specified commodity has been exported to the target destination
under the terms of the agreement, the exporter receives the bonus.
To be consistent with WTO agreements, USDA has limited the use of DEIP to instances when 1)
U.S. prices are above prices in international markets and 2) the claim that we are countervailing other
countries’ subsidies is plausible. In recent years, U.S. and “world” dairy commodity prices have been
closely aligned or the U.S. price has been below prices in competing countries; hence, the economic and
legal justification for an export subsidy has been weak. Moreover, the European Union (EU) has reduced
its dairy export subsidies as part of its agricultural policy, diminishing arguments that the U.S. is

35
offsetting other countries’ subsidies. The EU did resume export subsidies following price-supporting
actions it took during 2009, but the EU maintains its longer-term commitment to dismantling dairy
industry support programs.
In addition to DEIP, other Foreign Agricultural Service (FAS) programs are intended to enable or
assist U.S. agricultural and food exports. These range from export promotion activities (such as trade
shows, tours, and visits) to programs that facilitate commercial transactions. Many agricultural
businesses use export credit guarantees for commercial financing of U.S. agricultural exports.
Use of DEIP or other export assistance as a countercyclical measure to reduce dairy price
volatility is limited by the requirements that U.S. prices be above world prices and/or the existence of
evidence that other countries are providing export subsidies. However, it is sensible to exhaust all
possible DEIP options before taking more extreme measures, such as raising support prices. We believe
this is well understood within USDA.
Risk Management Programs
Recommendation 3:
SIMPLIFY AND IMPROVE RISK MANAGEMENT PRODUCTS FOR DAIRY FARMERS.
Continue to simplify and improve Livestock Gross Margin (LGM)-Dairy and overhaul
Adjusted Gross Revenue-Lite (AGR-Lite) in order to make them more accessible and easier
for dairy farmers to use and adapt Livestock Risk Protection for use by dairy farmers.
Expand risk management education.
Dairy farmers may use public or private programs to manage risk. Farmers, without Government
assistance, can hedge milk or input prices using futures and options contracts on traded exchanges. In
addition, depending on location, some farmers can forward contract milk with dairy cooperatives and
other buyers.13 Farmers also can forward contract some inputs, mainly feed, with suppliers.
13 Until recently, only dairy cooperatives were able to offer price forward contracts to their member suppliers; because cooperatives, generally, are not required to pay minimum blend prices each month. Non-cooperative buyers are generally required to pay at least the minimum blend price to their cooperative or independent farmer suppliers. Federal orders were amended to allow any manufacturing buyer to offer price forward contracts and make payment on the basis of those negotiated agreements regardless of the specific minimum blend price in the month of delivery. In California, price forward contracting, for all practical purposes, continues to be restricted to cooperatives and their members.

36
There are some concerns that limit the use of risk management tools. Futures contracts may be
“lumpy”, offered in unit sizes that are not easy for small producers to use on their own. Also, some
hedging tools require “margin”, a posting of earnest money to cover the financial exposure of hedged
positions. These margin requirements are designed to make sure that those with positions in the futures
market can perform (settle up) under their contract terms. Margin requirements can tie up a significant
amount of cash in a dairy operation.
USDA’s Risk Management Agency (RMA) offers two risk management tools. One is designed
specifically for dairy farmers and is called LGM-Dairy. Another is a program available for any type of
farm called AGR-Lite.
Livestock Gross Margin (LGM)-Dairy
LGM-Dairy, introduced in 2007, is a bundled hedging tool that provides protection to dairy
producers for the difference between milk prices and feed costs. Rather than having to hedge milk prices
and feed prices separately, LGM-Dairy establishes a floor on gross margins (milk price minus feed costs)
and pays an indemnity if the margin falls below the established floor. The farmer chooses how much of
his or her milk to cover and the months of the coverage. Premiums are based on expected milk revenue
and expected feed costs that are calculated using futures market prices on Class III milk, corn, and
soybean meal at the time the insurance is purchased. While any given farmer’s milk revenue or feed costs
will not equal the futures prices on the CME, his or her margin changes are expected to correlate closely
enough to CME price movements to make the tool useful for reducing risk.
Unlike futures contracts, LGM-Dairy does not require a minimum amount of milk. Producers
may sign up for this program monthly and may choose to cover up to 10 months of production at a time.
Farmers may not purchase insurance for margins on more than 24 million pounds of milk over that
period.
RMA announced changes on October 26, 2010, designed to make LGM-Dairy more user-
friendly.14 For policies sold after December 17, 2010, premiums are due at the end of the coverage period
rather than at the beginning. This allows the premium to be deducted from the indemnity. Higher
deductible levels are also now offered. The maximum deductible level increased from $1.50 to $2.00 per
cwt. With this change, producers are better able to cover a minimum gross margin, which is comparative
14USDA - RMA. “Improvements to the Livestock Gross Margin for Dairy Cattle Insurance Plan.” October 26, 2010. RMA Program Announcement.

37
to catastrophic coverage. Allowable feed ranges have also been changed to better customize feed rations
for an individual producer. Importantly, a subsidy has also been added for producers purchasing multiple
months of LGM-Dairy insurance. The level of the subsidy is based upon deductible level selected,
ranging from 18 percent for a $0 deductible to 50 percent for a $2 deductible15. Although these changes
have only been in place a short time, initial indications are that farmers have responded very positively.
Participation in the program has jumped considerably. The success of these changes should continue to
be monitored in the coming months.
Adjusted Gross Revenue Lite (AGR Lite)
In 1998, RMA developed a new insurance product intended for all farmers and based on adjusted
gross income (AGI) as reported on Schedule F (Profit or Loss from Farming, IRS Form 1040) of the farm
business’ tax form. The program combines protection from production losses related to natural causes
with output price declines or input price increases related to market fluctuations. That product became
quite complex and was difficult to use, so AGR-Lite was developed in 2002 to provide a simpler tool that
would have the same goal.
Any farmer can use AGR-Lite and the revenue protection applies to the whole farm, not one
product. Premiums are lower for farmers who sell more products because their expected total margin risk
is reduced by that diversity.
Participation rules are not conducive to dairy production. No more than 35 percent of farm
income can come from animals or animal products. Milk marketings are limited to 1.6 million pounds
annually. The program only calculates costs of feed that is purchased, not feed that is grown. Total farm
liability cannot exceed $1 million and gross income must be below $2,051,282.
Farmers select the coverage percentage of their total AGI and the percentage of the difference
that they can receive if their actual AGI is less than the selected income coverage level. The maximum
income coverage is based on each producer’s average AGI over the previous 5 years.
Use and Participation in LGM-Dairy and AGR-Lite
Although they are similar, the LGM-Dairy and AGR-Lite approaches to income protection differ
beyond the fact that one is tailored to dairy and the other is designed for small, diversified farming
operations. LGM-Dairy works on the basis of a price spread, the difference between the price of milk and
15 RMA Fact Sheet “Livestock Gross Margin Insurance - - Dairy Cattle” November 2010, http://www.rma.usda.gov/pubs/rme/lgmdairy.pdf

38
the cost of feed expressed relative to an amount of milk produced. The resulting margin is expressed in
$/cwt. AGR-Lite is based on the concept of income less production expenses, where both vary with the
amount of milk produced (and other agricultural sales) and the amount of feed (and other production
inputs) purchased. The result is NFI in total dollars.
This Committee recommends an examination and overhaul of these programs to make them
easier for dairy farmers to use. Current feedback from the farm community is that these programs are
much too complicated and involve too much paperwork and that the cost of the program is not justified by
its likely benefit.
USDA has recently implemented several changes to LGM-Dairy. We believe these are important
and useful. We encourage USDA to monitor the impact of these changes on usage by dairy farmers and
continue to adjust the program accordingly.
RMA has sponsored a number of educational programs for dairy farmers. Cooperative Extension
in many States, State agencies, cooperatives, and private industry have also repeatedly developed
educational programs related to hedging, covering specific tools like LGM-Dairy or price risk
management more broadly. Despite these considerable efforts, dairy farmers have yet to embrace these
tools. Some of the reason for this is due to limitations in the tools and some is due to general lack of
familiarity with risk management. We believe that there remains a need for broad and general education
on price and income risk management strategies and tactics for dairy farm businesses. Volatility in the
dairy industry is still a relatively new experience (less than 20 years) for many farmers, and the range of
strategies and tools available is even more recent, with some tools still unknown or being developed. It is
understandable that farmers are unsure of whether or how to manage their own risk. USDA risk
management programs could provide a valuable tool to dairy farmers simply by providing or facilitating
that education, regardless of the actual risk management tools used.
Commodity Credit Corporation (CCC) Charter Act, Section 5
CCC was created in 1933 to handle commercial transactions that involve agricultural
commodities. It is the business vehicle through which various programs stabilize, support, and protect
farm income and prices. CCC also facilitates the movement of surplus or other agricultural commodities
to various Government and non-Governmental outlets.
The CCC Charter Act of 1948 establishes the general purpose of the CCC and its operating rules
and authorities. Section 5 of the Act, excerpted below, grants authorities to acquire and disburse
agricultural commodities.

39
SEC. 5. [15 U.S.C. 714]
SPECIFIC POWERS. —In the fulfillment of its purposes and in carrying out its annual budget programs submitted to and approved by the Congress pursuant to Chapter 91 of Title 31, the Corporation is authorized to use its general powers only to —
(a) Support the prices of agricultural commodities (other than tobacco) through loans, purchases, payments, and other operations.
(b) Make available materials and facilities required in connection with the production and marketing of agricultural commodities (other than tobacco).
(c) Procure agricultural commodities (other than tobacco) for sale to other Government agencies, foreign Governments, and domestic, foreign, or international relief or rehabilitation agencies, and to meet domestic requirements.
(d) Remove and dispose of or aid in the removal or disposition of surplus agricultural commodities (other than tobacco).
(e) Increase the domestic consumption of agricultural commodities (other than tobacco) by expanding or aiding in the expansion of domestic markets or by developing or aiding in the development of new and additional markets, marketing facilities, and uses for such commodities.
(f) Export or cause to be exported, or aid in the development of foreign markets for, agricultural commodities (other than tobacco) (including fish and fish products, without regard to whether such fish are harvested in aquacultural operations).
(g) Carry out conservation or environmental programs authorized by law.
Carry out such other operations as the Congress may specifically authorize or provide for.
In the Corporation’s purchasing and selling operations with respect to agricultural commodities (other than tobacco) (except sales to other Government agencies), and in the warehousing, transporting, processing, or handling of agricultural commodities (other than tobacco), the Corporation shall, to the maximum extent practicable consistent with the fulfillment of the Corporations purposes and the effective and efficient conduct of its business, utilize the usual and customary channels, facilities, and arrangements of trade and commerce (including, at the option of the Corporation, the use of private sector entities).
This Section of the legislation defines a number of things that the CCC may do; however, this
permission is different from what is actually possible or required. These general authorities enable the
Secretary to implement the procurement and sale of dairy products under the DPPSP and various other
programs related to domestic and international food assistance.16
16 The CCC is managed by a Board of Directors, subject to the general supervision and direction of the Secretary, who is an ex-officio director and chairperson of the Board.

40
If no specific program requires the Secretary to procure and/or distribute dairy or other
commodities, he could use the provisions of this Charter to do so if and only if there is a source of funds
authorized by the OMB. Many of the programs that use the CCC as a procurement conduit are described
in the next two sections.
Domestic Food Assistance Programs
Recommendation Note:
At the conclusion of the chapter on existing laws and programs, we offer a recommendation
that relates to the Secretary’s use of domestic food assistance programs.
The majority of the USDA budget, about two-thirds, is devoted to food and nutrition programs.
These programs are generally administered through the Food and Nutrition Service and include the
following:17
1. Supplemental Nutrition Assistance Program (SNAP, formerly Food Stamps)
2. Special Supplemental Nutrition Program for Women, Infants, and Children (WIC)
3. School Meals
a. National School Lunch
b. Fresh Fruit and Vegetable Program
c. School Breakfast Program
d. Special Milk Program
e. Team Nutrition
4. Summer Food Service Program
5. Child and Adult Care Food Program
6. Food Assistance for Disaster Relief
7. Food Distribution
a. Schools/Child Nutrition Commodity Program
b. Food Distribution Program on Indian Reservations
c. Nutrition Services Incentive Program
17 For more information: (http://www.fns.usda.gov/fns/)

41
d. The Commodity Supplemental Food Program
e. TEFAP
Only the Special Milk Program is exclusive to dairy products, but many of these programs have
played a significant role in increasing the availability and use of dairy products among children and the
needy. The Special Milk Program provides cash subsidies to schools for milk served to children not
covered under the School Lunch and similar programs.
The overwhelming majority of public schools, and many private ones, participate in the National
School Lunch Program, while a significant and growing number also offer the School Breakfast Program.
Milk is the only product required to be offered with each school meal, and school milk accounts for
approximately 6 percent of all fluid milk consumption in the U.S.
USDA provides grants to States, which in turn deliver WIC program benefits to pregnant and
lactating women, infants, and young children. Historically, WIC has had a strong emphasis on providing
milk and other nutritious dairy products to these people.
TEFAP was originally started during the early 1980s when surpluses under the DPSP became
burdensome. The success of the Temporary Emergency Food Assistance Program led to the creation of
The Emergency Food Assistance Program. Today, TEFAP is the primary vehicle for distributing
commodity foods to States that, in turn, distribute food to food banks and similar local food distribution
agencies.
Each of these programs can be a vehicle for the use and distribution of dairy foods. However,
several factors limit their effectiveness as a short-term response to a dairy surplus. First, these programs
are budgeted. Increased dairy purchases would displace purchases of other food products. USDA may
shift funding among various commodities, but many non-dairy foods have legitimate claims on available
funds.
Second, these programs require planning, implementation, and execution. Programs that
coordinate with State-run activities are subject to the timing, planning, and discretion of the receiving
State or school district. Programs in which USDA works directly with an agency typically involve a
spending and utilization plan of that agency. Schools, in particular, plan their budgets and menus early in
their fiscal cycles. Once in place, these plans are not often changed.
Third, the amount of dairy products that can be used and provided to these programs on a timely
basis is limited. For example, storage space and refrigerator capacity to minimize spoilage are limited. In
addition, because dairy processors must continue to service existing customers or risk losing their
customer base, they cannot divert unlimited quantities to food assistance outlets on a sporadic basis.

42
Finally, increased use of dairy products in food assistance programs may substitute for
commercial sales if recipients substitute the additional dairy products that they receive for dairy products
that they would normally purchase through commercial channels. If this occurs, total utilization of dairy
products does not increase and dairy producers do not benefit.
Congress can create funding and programs to respond to something like the dairy crisis of 2009,
but, once funding for food and nutrition programs are established, the Secretary cannot easily alter the
plan or find additional funding to support one specific agricultural or food sector.
International Food Assistance Programs
Several programs provide food to needy people in low-income countries on an ongoing basis or
to provide emergency assistance in times of natural or other specific disaster. These include:
A. Food for Peace
B. McGovern-Dole
C. Food for Progress
D. Section 416(b)
Food for Peace (FPA, often called Public Law 480) was authorized under the Agricultural Trade
Development and Assistance Act of 1954. At first considered a temporary response to mitigate
agricultural surpluses, this program has evolved to become a pillar of U.S. food assistance and is
considered a core program by advocates for low-income countries. The FPA has three titles, each with a
specific objective and providing assistance to countries at a particular level of economic development.
Title I is administered by USDA. Titles II and III are administered by the U.S. Agency for International
Development (USAID). USAID is an independent Federal agency that operates under the supervision of
the Secretary of State. FPA, Title I–Trade and Development Assistance, provides for Government-to-
Government sales of U.S. agricultural commodities to developing countries.18 Agreements under the Title
I credit program may provide for repayment terms of up to 30 years with a grace period of up to 5 years.
Title I also allows for grant programs, which have outnumbered loans in recent years. Depending on the
agreement, commodities provided under the program may be sold in the recipient country and the
proceeds used to support agricultural, economic or infrastructure development projects there.
18 For more information: (http://www.fas.usda.gov/excredits/FoodAid/pl480/pl480.asp )
43
Since FY 2006, new funding has not been requested because demand for food assistance using
credit financing has fallen, or grant programs have been a more appropriate tool.
FPA, Title II–Emergency and Private Assistance, provides for the donation of U.S. agricultural
commodities to meet emergency and non-emergency food needs in other countries.
FPA, Title III–Food for Development, provides for Government-to-Government grants to support
long-term growth in the least developed countries. Donated commodities are sold in the recipient
country, and the revenue generated is used to support economic development programs. In recent years,
this title has been inactive.
Although the Secretary is responsible for Title I uses of agricultural commodities, funding is
needed in order to use that authority. In recent years, advocates for international food assistance have
urged Congress to provide direct cash subsidies that would allow foreign Governments or approved
agencies in foreign countries to buy food wherever they can find it most cheaply. While this approach
enables the most total food assistance per dollar spent, it may not provide much support for U.S.
agriculture.
The McGovern-Dole International Food for Education and Child Nutrition Program helps
promote education, child development, and food security for some of the world’s poorest children. It
provides for donations of U.S. agricultural products, as well as financial and technical assistance, for
school feeding and maternal and child nutrition projects in low-income countries. The USDA FAS
administers this program, authorized by the Farm Security and Rural Investment Act of 2002.
Commodities are donated through agreements with private organizations, cooperatives,
intergovernmental organizations, and foreign Governments. Commodities may be donated for direct
feeding or, in limited situations, for local sale to generate proceeds to support school feeding and nutrition
projects.
Under the Food for Progress Act of 1985, agricultural commodities are provided to developing
countries and emerging democracies that are committed to introducing and expanding free enterprise in
the agricultural sector. Commodities are currently donated to foreign Governments, private voluntary
organizations, nonprofit organizations, cooperatives, or intergovernmental organizations.
The implementing organizations request commodities and USDA buys those commodities from
the U.S. market. USDA donates the commodities to the implementing organizations and pays for the
freight to move the commodity to the recipient country.

44
Section 416(b) of the Agricultural Act of 1949, as amended, provides for overseas donations of
surplus commodities acquired by the CCC. Donations are not permitted to reduce the amounts of
commodities that are traditionally donated to U.S. domestic feeding programs or agencies or disrupt
normal commercial sales.
Availability of commodities under Section 416(b) depends on CCC inventories and acquisitions.
Programming varies from year to year. The commodities are made available for donation through
agreements with foreign Governments, private voluntary organizations (PVOs), cooperatives, and
intergovernmental organizations. Depending on the agreement, the commodities donated under Section
416(b) may be sold in the recipient country and the proceeds used to support agricultural, economic, or
infrastructure development programs.
The Section 416(b) program is currently not active, as there are no CCC-owned commodities
available at this time.
The assortment of foreign food export programs provides opportunities for the U.S. Government
to increase use of dairy products. However, that authority is tempered by budgetary constraints and by
concerns that the dispositions not be disruptive to recipient country economies or of world trade in dairy
products.
Section 32, Public Law 74-320
In 1935, as part of its response to the hardship for agriculture during the Great Depression,
Congress created a permanent authority to give USDA money from U.S. customs receipts (tariffs) to
support farmers whose products were not otherwise covered or protected by more specific commodity
policy. The Secretary has discretion in how to use Section 32 funds. The following is from a
Congressional Research Service report written in 2006:
Section 32 of the act of August 24, 1935, authorizes a permanent appropriation equal to 30 percent of annual U.S. customs receipts (Public Law 74-320 as amended; 7 U.S.C. 612c). This money was first available to assist Depression-era producers of non-price-supported commodities. Section 32 funds, along with up to $500 million in any unobligated prior year funds, are to be used for (1) encouraging the export of farm products through producer payments or other means; (2) encouraging the domestic consumption of farm products by diverting surpluses from normal channels or increasing their use by low income groups; and (3) reestablishing farmers’ purchasing power. The Secretary has considerable discretion in deciding how to achieve these broad objectives. .....Today [viz. 2006], most of this appropriation (now approximately $6.5 billion yearly) is transferred to USDA’s account that funds child nutrition programs. Other Section 32 funds are used by USDA to purchase meats, poultry, fruits, vegetables, and fish, which are diverted mainly to school lunch and other domestic food programs. Several times in

45
recent years, the Secretary also has drawn substantial amounts from Section 32 to pay for special farm disaster relief. This has added to the debate over how much flexibility the Secretary should have over use of the reserve, and whether the disaster aid has or could come at the expense of the other Section 32 activities.
Excerpted from: Farm and Food Support Under USDA’s Section 32 Program,
by Geoffrey S. Becker; Specialist in Agricultural Policy; Resources, Science, and Industry Division; Congressional Resource Service; RS20235; 28 November 2006.
Because the DPSP was defined to broadly assist the dairy sector, Section 32 funds could not be
used to purchase or distribute dairy products. With the evolution of the DPSP into the DPPSP in 2008, an
argument could be made that Government support has now been legally limited to commodity packaged
butter, NDM, and cheddar cheese. Under this interpretation, Section 32 funds could support other dairy
products, such as mozzarella cheese, fluid milk, or whey protein concentrate.
Section 32 does not create a program; it creates a source of funds. Thus, this money could be
used in conjunction with existing programs that are designed for domestic food assistance, international
exports, or food aid. The legislative language “reestablishing farmer’s purchasing power” suggests an
even broader authority to, for example, compensate producers for losses caused by low prices. However,
it is unclear whether Section 32 funds could legally be used to benefit the dairy sector since, even with the
change in the DPSP, other programs, such as the MILC program, are specifically designed for dairy.
Moreover, USDA in fact uses other authorities to purchase dairy products for the same uses as Section 32
commodities.
Farm Loan Programs (FLPs)
Recommendation 4:
USE OF USDA FARM LOAN PROGRAMS (FLPs). The Secretary should work with the
FSA in Washington and all State FSA Executive Directors and State Committee members,
particularly those in States with significant numbers of dairy operations, to promote efficient
and effective use of FLPs for dairy farmers. We especially encourage the use of the
Guaranteed Loan Program with existing commercial lenders.
Apparently, some States leverage the FLPs more effectively than others. We recommend
that the Federal FSA examine any disparities and develop strategies to share best practices
across regions.
USDA’s FLP operates under the authority of the Consolidated Farm and Rural Development Act
(7 U.S.C. 1936) and is administered by USDA’s FSA. FSA makes direct and guaranteed farm ownership
and operating loans to qualified and eligible farmers and ranchers who cannot otherwise obtain

46
commercial credit from a bank, Farm Credit System institution, or other lender. It also issues emergency
loans in situations where farmers have been adversely impacted by severe weather conditions. FSA loans
can be used to purchase land, livestock, equipment, feed, seed, and supplies. Loans can also be used to
construct buildings or make farm improvements. FSA employs farm loan officers who originate and
service direct farm ownership and operating loans. FSA works with banks and Farm Credit System
institutions, providing guarantees on loans originated and serviced by those commercial lenders.
In FY 2010, $6.115 billion was appropriated for the FLP. As of September 3, 2010, the FLP had
33,541 loans in its national portfolio for a total of $4.913 billion. The maximum principal amount per
borrower in direct loans is $300,000. The maximum total principal amount for direct loans plus loan
guarantees is $1,119,000. This amount is adjusted annually based on inflation.
The top five States in FY 2010 in terms of number of new loan applications are listed below.
New direct and guarantee loan volumes for the first eleven months of the FY are in parenthesis.
1. Wisconsin ($419 million) 2. Minnesota ($309 million) 3. Iowa ($286 million) 4. Texas ($220 million) 5. Nebraska ($235 million)
Wisconsin FSA FLP Example
As Wisconsin is the largest customer of the FLP, with by far the majority of its loans procured by
dairy producers, we provide here a closer look at Wisconsin’s successful use of the FLP.
The Wisconsin FSA FLP portfolio crossed the $1 billion threshold in early 2010. As of
August 31, 2010, it held 4,956 loans for a total of $1.24 billion. Of these, 62 percent were direct loans
and 38 percent were loan guarantees. Approximately 90 percent of FLP borrowers in Wisconsin are dairy
producers.
The FSA FLP has, for many years, been an important source of credit for Wisconsin dairy
producers. Wisconsin FSA FLP has historically been one of the top three among all States in both the
number and the dollar volume of loans. FSA FLP has loan program managers assigned to cover every
county in the State. They do an excellent job of outreach to farmers. They partner with many other
entities that can help them more effectively serve farmers including the Wisconsin Department of
Agriculture, Trade and Consumer Protection, Wisconsin Technical College System, University of
Wisconsin School for Beginning Dairy and Livestock Farmers, and others. FSA has developed strong
working relationships with commercial agricultural lenders to broaden the scope of its loan guarantee and
interest assistance programs. In short, there are few agricultural borrowers or lenders in Wisconsin that
are not aware of the FSA FLP.

47
As commercial agricultural credit became more difficult to obtain in 2009, the importance of the
Wisconsin FSA FLP became even more pronounced. Lenders pointed many borrowers towards the FLP,
and FLP loan volume in the State increased dramatically.
There are some key reasons that the FSA FLP works well in Wisconsin:
Wisconsin FLP has a high level of participation in the Preferred Lender Program (PLP), which
allows experienced agricultural lenders to quickly obtain USDA Loan Guarantees with a minimal amount
of paperwork. Subsequent review by State FSA FLP staff allows the private lender to conduct their
business with minimal disruption of their normal operating procedures. FSA FLP monitors the aggregate
performance of each lender rather than each individual loan application. Lenders with strong records of
success maintain PLP status; those with higher losses are more closely scrutinized. (Many States have
struggled to implement these loan guarantee processes.)
Wisconsin FSA FLP views itself as a partner with private agricultural lenders, and the lenders
look at FSA FLP in that way as well. In many cases, the private lender has part of the financing package
and FSA has part of the financing package. It is not an “either or” situation.
Wisconsin FSA FLP contracts out to the private sector for many services such as real estate and
chattel appraisals that assist their loan officers, which allows them to focus on the duties that only they
can do. In the past, FSA FLP loan officers would have done these tasks. By contracting out for these
services, FSA FLP has freed up its loan officers to serve new loan applicants and service their existing
loan portfolios. This has allowed Wisconsin FSA FLP to be a national leader in loan-making, while
keeping delinquencies and losses among the lowest in the nation. Wisconsin FSA FLP has centralized its
loan liquidation process in the State office, which also frees up field loan staff to make and service more
loans.
Despite maintaining a large loan portfolio with borrowers who were unable to obtain commercial
credit, Wisconsin FSA FLP has experienced relatively low delinquency rates. In FY 2010, approximately
1.93 percent of the direct loan portfolio and 0.88 percent of the guaranteed loan portfolio was delinquent.
By commercial lending standards, these delinquency rates are relatively low, particularly considering the
poor economic conditions in the dairy industry during the period.
On a national level, the Secretary issued a letter at the height of the 2009 dairy crisis to all of
FSA’s dairy producer-borrowers informing them of the loan servicing options available to alleviate
financial stress. These options included lifting milk check assignments to allow money to flow through
for family living and operating expenses, deferring principal and interest payments, lowering payments

48
through rescheduling or re-amortizing of debt, and other options. Many FLP borrowers contacted their
loan managers to take advantage of the relief that was available.
All State FLPs could extend the scope of their Guaranteed Loan Programs by building effective
PLPs. PLPs make it much easier for commercial lenders to use FLP Guarantees. PLPs make more
efficient use of State FLP staff time by minimizing the loan processing involved in each guarantee.
Additionally, the definition of a “family farm” for purposes of extending credit under the FLP should be
interpreted consistently in all States. Approximately 95 percent of the dairy operations in the U.S. milk
fewer than 500 cows. Most of those would meet the FLP definition of a family farm and would find the
FLP to be a very beneficial source of credit during times when access to commercial credit is limited.
Dairy industry stakeholders across the country should take the initiative to learn more about the
Federal loan programs available to producers and other agriculture-related businesses in their States. In
addition to the FSA FLP, other Federal agencies such as USDA Rural Development and the Small
Business Administration have loan programs that may be helpful to dairy producers.
When it works well, the FLP can be critically important to our nation’s dairy producers,
especially when economic conditions make commercial credit difficult to obtain. The remarkably low
default rate experienced in the FLP shows that funds invested in the program will be used wisely and will
recirculate to provide help to even more farmers. We appreciate the Secretary’s and Congress’ work in
providing additional funds for the FLP during the 2009 dairy crisis. We encourage the Secretary to also
provide adequate staffing for the FLP. State FSA Executive Directors should be given the discretionary
authority to temporarily re-assign county-level staff from commodity programs to the FLP during times
of high loan demand. FSA Executive Directors should also be given the ability to temporarily hire
assistance, such as experienced, retired commercial agricultural lenders to provide support to FLP staff
during periods of strong demand. To achieve maximum efficiency of FSA staff, USDA could encourage
State FSA offices to consider contracting out to the private sector for items like real estate and chattel
appraisals.

49
Market News, Research, and Promotion Programs
Recommendation Note:
In the section on alternative price protection programs, we offer additional
recommendations that relate to the creation of new public information related to dairy
markets and dairy sector performance.
Numerous Federal programs support dairy market development, day-to-day dairy business
decisions, and the ability of dairy businesses to plan. They do so by providing information on milk and
dairy product prices, market conditions, and market outlook. Such programs include the Agricultural
Marketing Service (AMS) Dairy Market News; various data serials published by NASS, ERS, and FAS;
special analytical reports by ERS; and the USDA World Agriculture Supply Demand Estimates
(WASDE). USDA also operates programs for market and business development, and AMS participates
in the oversight of the National Dairy Promotion and Research Board.
These programs typically provide valuable information for buyers and sellers in dairy markets.
While valuable for both long-term profitability of the dairy industry and beneficial to ensure the smooth
functioning of markets and as a resource for sound business decisions, the programs are not constructed
or intended for direct short-term assistance.
There has been considerable discussion in recent months and years about two dimensions of
market reports – mandatory reporting and electronic submission of data.
Although individual plant pay price reporting is required under FMMOs, these data are collected
for purposes of enforcing price regulation, not to provide general market reports of prices. Most surveys
of prices by NASS, AMS, ERS, or other agencies are conducted on a voluntary basis. Some surveys use
formal statistical survey techniques and some are very informal. Mandatory price reporting seeks to
compel dairy businesses to report their price transactions so that the reliability of the marketwide results is
ensured. In a sense, this becomes a census rather than a statistical sample. The confidentiality of
individual business records is protected.
Electronic reporting of data is a tactical issue, but it is encouraged to facilitate the collection,
dissemination, and use of market price data.
Congress passed two laws related to mandatory price reporting. One was imbedded in the
2008 Farm Bill. Last September, the Mandatory Price Reporting Act of 2010 was passed which extends
and expands the price reporting requirements under the previous legislation. It includes mandatory
weekly electronic reporting for dairy products. As a result, USDA’s Dairy Product Mandatory Reporting

50
Program: (1) requires persons engaged in manufacturing dairy products to report certain information
including the price, quantity, and moisture content where applicable, of dairy products sold by the
manufacturer; and (2) requires persons storing dairy products to report information on the quantity of
dairy products stored. NASS collects such information for the program. AMS has implemented a plan to
verify the price information submitted by dairy product manufacturing plants to NASS. Any
manufacturer that processes and markets less than 1 million pounds of dairy products per year is exempt
from the price reporting requirements.
Recommendation for the Use of Existing Programs in Times of Severe Economic Distress
Recommendation 5:
EMERGENCY INTERVENTIONS. The Secretary should develop a system of triggers and
actions to guide his choices for special and emergency interventions, using existing
programs.
Barring legislative changes, the programs which permit the Secretary some flexibility in their
application as emergency measures in times of critically low farm margins are the DPPSP and one or
more food assistance programs. If the Secretary can identify sources of funding, he could stimulate or
supplement commercial demand and thereby lift prices via either of these approaches. We recommend
establishing trigger points based on a new margin measurement (cf. recommendation 1). We do not
recommend specific trigger points, but we do encourage USDA to establish and announce these action
levels so that the industry can be prepared.
We strongly suggest using food assistance programs first and resorting to increasing DPPSP
purchase price levels only under severe stress, as the Secretary did in 2009. Movements of the DPPSP
purchase prices can disrupt commodity financial markets, as well as U.S. export markets, and thereby
impact the financial positions of farmers and others who have chosen to mitigate risk through those
markets. Unpredictable changes in Government purchase prices would tend to undermine or add risk to a
buyer or seller’s ability to hedge their future prices.
When dairy farm margins decrease to the first trigger level, the Committee recommends that the
Secretary guide food assistance purchases toward additional dairy products. This would temporarily
create new demand for dairy products, which would exert upward pressure on dairy product prices and,
therefore, farm level milk prices. The Secretary should ensure that Government purchased dairy foods
donations do not significantly displace commercial sales. Therefore, dairy foods should be provided to
people who would not otherwise purchase them or would purchase a lesser amount.
51
If dairy farm margin levels decrease to the second trigger level, the Secretary would have
justification to increase the purchase prices under the DPPSP to levels that provide more revenue for dairy
farmers.
Although the triggers provide a justification and a guide, the Secretary should maintain discretion
as to whether to implement these measures. He should determine that market conditions are a result of
extraordinary shocks rather than predictable cyclical price swings. Note that this recommendation is
made in the context of existing programs, one of which is the MILC program. The feed cost adjusted
MILC payment may or may not trigger in the same months as the new margin trigger. This would be one
of the elements for which the Secretary would need to account in determining the need for an
extraordinary response.
USDA should also develop standards that assure that the measures do not significantly or
unavoidably harm export markets or commercial channels. When the margin measurement methodology
has been determined, appropriate margin trigger level(s) identified, and any corresponding DPPSP price
level increases that might occur at those trigger levels set, USDA should publish those details. That way,
potential future Government interventions, such as increases in the DPPSP, can be considered and
included in dairy farmers’ personal milk marketing and business decisions. Uncertainty related to
Government intervention may tend to discourage farmers from protecting their own margin risk because
of varying expectations about timing or impacts of Government interventions.
The Secretary should apply these approaches judiciously and rarely. If these approaches are used
too frequently, they lose their effectiveness. We encourage the Secretary to work with OMB in
developing the rationale for emergency interventions before such actions become necessary, based on
market conditions. We do not intend to indicate that this Committee unequivocally supports continuation
of the DPPSP. Rather, we intend to provide a framework around which the Secretary’s existing authority
should be applied.
Concluding Comments About Existing Programs
Numerous programs can be used to benefit dairy farmers and the dairy sector in times of stress.
This includes programs to directly support prices or farm incomes and programs that more indirectly
affect the demand for dairy products and thereby strengthen markets and prices.
In theory, all of these programs could be extremely helpful in times of economic stress, but in
practice, most are not well suited to unanticipated stress and quick responses to emergency conditions. In
many cases, the Secretary has no authority to change a program or operate it outside of a very narrow
range of legislatively defined parameters. In some cases, the law grants the Secretary some discretion in

52
defining a program’s parameters, but when the Secretary’s decisions have an impact on Government
expenditures, he or she must get approval from the President’s OMB. Obtaining permission to use
discretionary authority for agricultural programs in general and dairy in particular can prove difficult.
New Programs, Legislation, and Regulation
Programs to Stabilize and Regulate Milk Prices
Dairy Product Price Support Program (DPPSP) and Dairy Export Incentive Program (DEIP)
Recommendation 6:
BEST USE OF FUNDS: Explore elimination of the Dairy Product Price Support Program
(DPPSP) and the Dairy Export Incentive Program (DEIP) and use budget savings to
enhance the safety net for producers.
DPPSP and DEIP were discussed in detail in the previous section on current authorities. The
consensus of the Committee is that there are circumstances when the Secretary should seriously consider
using the tools at his disposal, but that the industry would be better served with some new tools. While
these programs have some merit and should be used until alternatives are in place, the Committee
believes that their effectiveness has become limited and that budgetary resources could be better used for
other programs.
The members’ perspectives on each of these programs are not unanimous but there is a
widespread belief that both programs have problems. This does not mean that any alternative is better,
but there is general agreement that these programs are not necessarily the best use of funds that might be
available to improve dairy farm profitability and milk price volatility.
In recommendation 14, we express our strong endorsement of programs to help develop U.S.
export markets. To some extent, DEIP can play that role; however, the implementation of the program
has generally fallen short of the goals its supporters desired. In the current global dairy economic climate,
the ability to use DEIP within WTO parameters is severely limited, as discussed in the introductory
section. There are also arguments from a marketing perspective against an ongoing policy of export
subsidies as well. We believe DEIP is not the best use of scarce Federal resources, even though we do
support Federal involvement in export market development.
Earlier in the report we described the evolution and current status of the DPPSP. Again, opinions
on the merits of this program are diverse. They range from a belief that the program could play a helpful
and positive role in protecting farm prices to a belief that the program is ultimately more disruptive than
helpful - that it creates perverse incentives in the investment of processing facilities and the amounts of

53
alternative products produced, even when the program is inactive. It is also recognized that dependence
on the assurances of the DPPSP varies regionally. Regions that have invested heavily in so-called butter-
powder plants are more concerned about their market and investment risks if the DPPSP is terminated.
Alternative, safety net type programs will be more fully discussed in the section on price
stabilization programs. Recommendation 11 concerns a particular approach and specifically refers to
replacing DPPSP and DEIP. Our more general recommendation here is to suggest that if Congress can
come up with a better safety net program for dairy farmers, we would support ending the DPPSP and
DEIP to provide funding for an alternative program that better protected dairy profitability.
Federal Milk Marketing Orders (FMMOs)
FMMOs, as they currently exist, were discussed in an earlier section of this report. We have
recommended (recommendation 2) that “The Secretary should appoint a committee to review
implications of FMMOs, including, but not limited to, end-product pricing’s impact on milk price
volatility and impact of classified pricing and pooling on processing investment, competition and dairy
product innovation.”
Congress authorized the creation of a Congressional “commission” to review FMMOs in the
2008 Farm Bill. Although it was subsequently decided to not pursue this commission, our experience
leads us to better appreciate the need for a focused effort, involving people who are deeply familiar with
the intricacies of this complex regulation.
Comments received by the Committee and our own personal experiences suggest that there are
advantages and disadvantages to classified pricing and pooling, which are the fundamental tools of
FMMOs. Similarly, there are positives and negatives in the specific implementation of these tools that
currently exist in FMMOs. For example, classified pricing may be a helpful way to establish prices for
milk, but setting class prices by a formula tied to wholesale prices of basic dairy commodities might not
be the best approach.
Recommendation 7:
STRONGLY CONSIDER THE ELIMINATION OF END PRODUCT PRICING. Explore
alternative measures to the current end product pricing system, such as competitive pricing
and mandatory price reporting.
This recommendation goes beyond recommendation 2, which calls for a broad review, by more
firmly stating our skepticism of the merits of the current use of wholesale prices of four dairy
commodities to establish the minimum prices paid for milk under FMMOs. Testimony spoke to the need
for a new system of price discovery in FMMOs or even more generally. Determining the best alternative

54
approach to end-product classified pricing is not feasible within the Committee’s timeframe. However,
for the reasons outlined in the introductory section on FMMOs, we believe eliminating end-product
pricing has merit and deserves particular review and attention. The objective should be to simplify dairy
price regulation and use a system in which all participants would have a high degree of trust and
confidence.
Recommendation 8:
COLLECT AND PUBLISH PRICE DATA. USDA should collect and publish data on
alternative measures of a competitive pay price, considering but not limited to the proposals
of the National Milk Producers Federation and Maine Dairy Industry Association.
We have previously discussed ongoing and new efforts at price and market news reporting. A
new system of weekly, electronic reporting will be implemented in the coming months. We applaud this
effort and encourage USDA and industry members to use it and evaluate its usefulness over the coming
year.
Beyond the current plan to survey dairy product prices, we encourage USDA to collect and report
data on actual milk prices paid by dairy processors. Such information would assist members of the dairy
industry in better understanding the possible consequences of using a competitive pay price approach in
FMMOs instead of the current product formula pricing method.
Growth Management
Recommendation 9:
ADOPT A GROWTH MANAGEMENT PROGRAM. The Federal Government should adopt
a growth management program that allows new producers to enter and allows producers to
expand production.
Proposals have been made in the last year to authorize a new Federal program that would create
new and targeted incentives to control production growth in periods of economic distress on dairy farms.
The Committee is not prepared to endorse a specific plan; however, we agree that a primary challenge in
taming milk price volatility is to better coordinate milk marketings with milk usage over time. We do not
agree on whether this should be a public or a private endeavor.
In evaluating specific proposals and considering the concept in general, we recognize advantages
and disadvantages to a new Government program of this type. While a simple majority of the Committee
supports a new Federal program, as a group we recognize that there are different perspectives on the
merits of such a plan. Indeed, the members of the Committee reflect the diversity of perspective and

55
opinion within the industry. In the remainder of this section, we will briefly highlight aspects of these
programs that are appealing to us but also discuss cautions about this approach.
Merits of Growth Management Plans
The most compelling justification for a Federal program to help the dairy industry better align
milk production growth with growth in demand is that experience has amply demonstrated that, in the
short run, milk prices can rise or fall dramatically when supply and demand are not aligned. Hence, if we
could anticipate periods of excess supply, we might avoid or minimize the resulting drop in prices.
Other countries and regions have had Government-regulated production controls. At their most
extreme, such programs include very sophisticated and elaborate programs that establish marketing
quotas on each farm, require quota to market milk, and include stiff and prohibitive penalties for bringing
more milk to market. History has shown that a range of programs of this type may be effective in
stabilizing milk prices to farmers and/or either preventing milk prices from falling precipitously or
bringing them back up if they do.
The limited U.S. experience with short-term programs of this type and the international
experience with longer-term programs provide lessons that have impacted current policy discussions. A
reflection of this is that proponents of a new, U.S. version of this type of program prefer to refer to it as
“growth” management, rather than the historically common label of “supply” management. This change
in name reflects meaningful intentions about what kind of intervention is sought.
Even with the promise of significantly higher prices, few U.S. dairy farmers desire a heavy-
handed public program involving quotas and strict controls on how much milk they market. By the same
token, short-term programs like the old Milk Diversion Program or its successor the Dairy Termination
Program (buyout), while effective when they were actively engaged, failed to have permanent or long-
term benefits. Thus, a new growth management program is sought that would operate as a safety net
during times of economic distress. It would have longevity in the sense that it would be available as an
ongoing tool, but it would only be activated when economic conditions warranted intervention to protect
farmers from disastrously low prices. The disincentives created by this program would be real and potent,
but they would not be in place to prevent long term growth or to create new upfront costs for new entrants
or when farms change hands.
Industry advocacy groups have put forth several growth management plans in recent months.
Although there are important differences in the leading proposals, they all strive to tame milk price
volatility in general and avoid or mitigate especially low milk prices. In this sense, they are intended to
be a safety net. At the same time, all proponents have made it clear that their intention is not to stifle or

56
discourage long-term investment in the dairy sector. For example, they wish to avoid the accumulation of
value that occurs within strict quota systems, where the right to sell milk may take on very high values.
The new plans allow for natural, long-term production growth, in line with the underlying growth in
domestic and world demand. They try to provide for the natural exit of existing producers and enable
new producers to enter the industry. A healthy exit and entrance is considered necessary to maintain a
viable dairy structure. These plans aim to have little impact on import and export activity; be national and
mandatory; and reduce the cost of Government dairy programs in general.
Analyses presented to the Committee suggest that a growth management plan could be effective
in reducing milk price volatility and do so at a Government cost that is less, perhaps much less, than the
cost of current programs. Dr. Scott Brown of the Food and Agricultural Policy Research Institute at the
University of Missouri and Drs. Charles Nicholson and Mark Stephenson (of the California Polytechnic
State University-San Luis Obispo and the University of Wisconsin, respectively) presented analyses of
these plans to the Committee. They analyzed the National Milk Producers Federation “Foundation for the
Future” plan as a collective package, including the replacement of price supports and the MILC program
with margin insurance in combination with the Dairy Market Stabilization Plan. The Costa/Sanders Plan,
named after its Congressional sponsors in the 111th Congress, adds a growth management program to
existing programs, including the DPPSP and the MILC program and was also analyzed. As currently
constructed, these programs would not have a significant effect on longer-term dairy farm returns, as
measured by net farm operating income. Also introduced in the 111th Congress, the Specter/Casey Bill,
carrying the name of its senatorial sponsors, featured a growth management component. Intrinsic to this
plan is changing the way class prices are determined in FMMOs. The Specter/Casey Bill would set the
manufacturing class prices equal to a national average (full or total) cost of producing milk. In the event
that this could lead to excess production, the Bill permits growth management in two phases. In the first
phase, the Secretary determines if there would be overproduction of milk and could reduce the value of
milk on up to 5 percent of every producer’s production. Under the second phase provision, if the
Secretary feels too much milk is going to be produced, an additional penalty can be placed on any
producer who produces more milk than the previous year.
Concerns About a Mandatory, National Growth Management Plan
Although there is general agreement that it is essential to align milk marketings with commercial
market needs, how this is accomplished is something about which this Committee and industry members
more generally debate. For some, a Federally mandated effort to intervene in the individual production
decisions of a farm business is categorically unappealing or unacceptable.

57
Other critics have concerns that a Federal program would be very difficult to run efficiently and
effectively. In this case, the concern is not categorical or based on principle; rather it is practical. Part of
this concern is about the ability of USDA to monitor and enforce individual farm marketings. Other
concerns are around the ability of any specific formula, trigger, or advisory committee to accurately
predict the timing of intervention and the ensuing negative consequences of wrong timing or magnitude.
A poorly timed program could exacerbate volatility, especially when markets are changing rapidly.
Where proponents see the flexibility to allow new producer entry and growth by existing producers,
opponents see this as evidence of the difficulty in effectively mitigating growth that results in excess
supply.
Other concerns relate to potential disruptions in commercial markets, either domestically or
abroad. A fundamental characteristic of any growth management plan is that it would activate or bite
more deeply when milk prices are low or heading down. It may be these moments when the U.S. would
enjoy significant export opportunities. Thus, it is possible that we would diminish our opportunity to
grow new markets in foreign countries.
The possibility for disruptions in domestic markets also exists. The 1984-85 MDP was intended
to be a national program. It provided the same incentives to reduce marketings everywhere in the U.S.,
and it had no constraints on who could partake in the program. As it turned out, participation in the
Southeast was high because those producers, with their production system, found it easier to make
temporary and limited cutbacks in production than was true in the Upper Midwest and the Northeast.
This resulted in a greater reduction in Southeastern milk marketings, a region that is chronically short of
milk. Southeastern cooperatives incurred considerable additional expense to bring northern milk to the
South so that they could fill out their contractual obligations to Southern processors.
Within the Committee there was general agreement that a program should be national in scope,
but different members raised different concerns about cutting marketings on a regional or product sector
basis. Their concern is that the kind of regional effect that occurred in the 1980s programs could happen
with a new program. In addition to the regional effect, some members expressed concern that developing
and high value markets could face an artificial shortage under a growth management plan. In their
opinion, shorting such a market channel would not make sense in either the long or short term, regardless
of any “average” benefit.
Thus, these combined concerns are sufficient to cause a significant minority of members to
withhold their support for a Federal growth management plan.
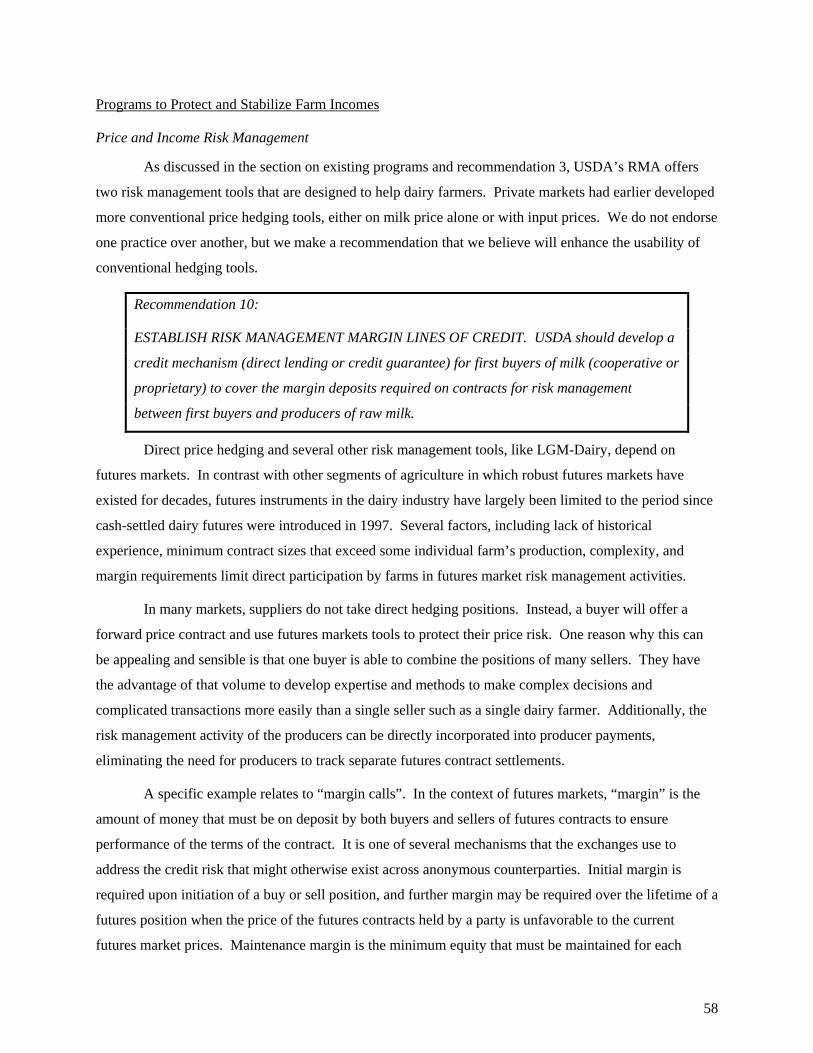
58
Programs to Protect and Stabilize Farm Incomes
Price and Income Risk Management
As discussed in the section on existing programs and recommendation 3, USDA’s RMA offers
two risk management tools that are designed to help dairy farmers. Private markets had earlier developed
more conventional price hedging tools, either on milk price alone or with input prices. We do not endorse
one practice over another, but we make a recommendation that we believe will enhance the usability of
conventional hedging tools.
Recommendation 10:
ESTABLISH RISK MANAGEMENT MARGIN LINES OF CREDIT. USDA should develop a
credit mechanism (direct lending or credit guarantee) for first buyers of milk (cooperative or
proprietary) to cover the margin deposits required on contracts for risk management
between first buyers and producers of raw milk.
Direct price hedging and several other risk management tools, like LGM-Dairy, depend on
futures markets. In contrast with other segments of agriculture in which robust futures markets have
existed for decades, futures instruments in the dairy industry have largely been limited to the period since
cash-settled dairy futures were introduced in 1997. Several factors, including lack of historical
experience, minimum contract sizes that exceed some individual farm’s production, complexity, and
margin requirements limit direct participation by farms in futures market risk management activities.
In many markets, suppliers do not take direct hedging positions. Instead, a buyer will offer a
forward price contract and use futures markets tools to protect their price risk. One reason why this can
be appealing and sensible is that one buyer is able to combine the positions of many sellers. They have
the advantage of that volume to develop expertise and methods to make complex decisions and
complicated transactions more easily than a single seller such as a single dairy farmer. Additionally, the
risk management activity of the producers can be directly incorporated into producer payments,
eliminating the need for producers to track separate futures contract settlements.
A specific example relates to “margin calls”. In the context of futures markets, “margin” is the
amount of money that must be on deposit by both buyers and sellers of futures contracts to ensure
performance of the terms of the contract. It is one of several mechanisms that the exchanges use to
address the credit risk that might otherwise exist across anonymous counterparties. Initial margin is
required upon initiation of a buy or sell position, and further margin may be required over the lifetime of a
futures position when the price of the futures contracts held by a party is unfavorable to the current
futures market prices. Maintenance margin is the minimum equity that must be maintained for each

59
contract in a customer’s account subsequent to the deposit of the initial margin. Minimum initial and
maintenance margins are set by the exchange for each market but individual brokerage firms may require
margin deposits at higher levels than the exchange minimums.19
A party’s margin account is adjusted daily based upon the difference in the value of the futures
contracts being held and the daily settlement price, a process that is referred to as “mark to market.” For
example, if a dairy farmer sold a Class III milk future contract for $15 per cwt and the daily settlement
price for that contract is $18, she would have been required to wire transfer some portion of the $3
difference to her broker in order to maintain the minimum maintenance margin account. If, in contrast,
the daily settlement price for that contract is $12 per cwt, she would have been credited the difference in
her margin account. The requests from the brokerage firm to a customer to bring margin deposits up to a
required minimum level are referred to as margin calls.
Margin calls are obstacles to direct dairy producer hedging because of the logistical challenge of
having to monitor their positions daily and arrange for a transfer of funds to their broker daily when they
have sold futures at a price below the current price in an upwardly moving market. The logistical and
emotional stress of responding to margin calls is sufficient to keep many producers from managing their
milk price risk directly. Additionally, margin requirements can involve a substantial amount of money,
day to day. The financing of margin deposits can be a considerable expense and a deterrent to using the
hedging tool, even when it ultimately works to the seller’s advantage.
Programs offered by milk buyers, both cooperative and proprietary, that overcome the obstacles
to risk management are essential to increasing the usefulness of risk management tools for producers.
Such programs have been available for many decades to grain and oilseed producers in the form of cash
forward contracts offered by country elevators. However, the ability for many entities to offer dairy
producers these programs that facilitate producer risk management could be constrained by margin call
encroachment on credit capacities. Even having only half of their producers manage price or margin risk
on half of their milk could generate millions of dollars in potential margin calls per day for some
cooperatives. This working capital may be out of reach for some, even though the margin costs are not
true operating costs of the cooperative or proprietary buyer of milk. Rather, the margin account value
(plus or minus) is reflected in the milk price paid to the producers who contracted for the forward price or
19 Plourd, Phil. From Price Taker to Price Maker. Coffee, Sugar & Cocoa Exchange, 1997. Pp. 115-122.

60
margin. As a result, the risk associated with default on the debt associated with the margin calls is
minimal.
In such circumstances, facilitating financial tools can have a powerful effect on the ability of a
company to develop and use risk management tools. It is in this vein that the Committee recommends
that USDA, through its existing credit programs, develop new financial products that would make it
easier to finance margin calls and thereby enhance the usability of hedging tools.
The Committee recommends that USDA establish a credit mechanism to facilitate risk
management margin lines of credit to first buyers (cooperative or proprietary) of milk. These lines of
credit should be available through the direct lending or credit guarantee program. Funds that could be
borrowed against the line of credit would be restricted to funds required to cover margin calls associated
with bona fide risk management activity documented by contracts between the first buyers and producers
of raw milk.
This recommendation should not be taken as an endorsement of simple price hedging as a risk
management tool above all others. This recommendation is intended to improve the usefulness of an
existing tool. It does not preclude the development or improvement of other tools that might be used
instead of or in addition to price hedging.
Modified MILC and Margin Insurance
Recommendation 11:
MODIFY MILK INCOME LOSS CONTRACT (MILC) PROGRAM AND PROVIDE A
MARGIN INSURANCE OPTION using funds from the elimination of the DPPSP and DEIP.
Continue MILC, with a production cap based on available funds, with two important
modifications: (1) use an all-milk income/feed cost margin trigger, and (2) provide an
insurance program for production excluded by the cap to provide protection for larger
producers.
Rapid input price inflation following World War II led to low net returns to dairy farmers even as
milk prices were increasing. The adoption of the DPSP as part of permanent law in the Agricultural Act
of 1949 was a strong Congressional endorsement of the merits of some kind of “safety net” protection for
dairy farmers against extreme economic distress. As discussed elsewhere, the current DPPSP is no longer
structured to provide much help to dairy farmers and the primary safety net tool has become the MILC
program. The Committee believes that some kind of Federal safety net continues to be warranted. As is
true of the industry at large, different members have different preferences for specific forms or types of
safety net programs. For some, the growth management concept is more appealing or believed to be more

61
effective. Some favor a safety net only under economic conditions that are extreme and largely
unpredictable, such as occurred in 2009, but perhaps not in the case of the cyclical downturns in 2002-03
and 2006. Some are ready to trade all existing safety net programs for new programs based on an
insurance-type program calibrated around milk margins over feed costs. To the extent there is a debate, it
should be noted that the debate is not about the concept of a safety net, but rather on what form is most
effective or fair.
In considering existing programs, in particular the MILC program, and new proposals, such as the
NMPF Dairy Producer Margin Protection Program (DPMPP), many members of the Committee were
intrigued by the possibility of combining these two approaches. Ultimately the recommendation that
mustered the greatest support in the Committee was to retain the basic framework of the MILC program
but amend the trigger and add on a margin insurance type program for milk marketed in excess of the
payment cap.
Every farmer would prefer that the monthly market price of milk be at a level that results in a fair
and adequate net return. This has not been the reality of milk markets for many years. In the absence of
that condition, the MILC program has significantly helped a lot of farmers during challenging times.
Although the payment limitation constrains benefits for larger farms, 76 percent of herds nationally have
fewer than 100 cows; another 13 percent have between 100 and 200 milking cows.20 Thus, some 80
percent of all U.S. farms are eligible to receive the full countercyclical payment on all their milk sales.21
Farm sizes are not distributed the same across all States, but producers in every State have received
benefits from the MILC program,. Farmers in Wisconsin received an average of $13,300 per herd; in
New York the average is $13,400; in California it is $47,000; and in Georgia the average dairy farm
received $26,470.22
In the discussion of dairy farm profitability and in conjunction with recommendation 1, we have
previously stated the merits of using the simple milk margin over feed cost measure instead of focusing
on the price of milk alone. We have also recognized that this financial measurement is not without some
limitations. Nevertheless, it is our conclusion that it makes sense to use one measure as the action signal
for any safety net program. Hence, we recommend that a milk margin over feed cost trigger replace the
20 http://www.nass.usda.gov/QuickStats/Create_Federal_All.jsp
21 The cap becomes operable at ranges of 130-180 cows depending on production levels.
22 Calculated from USDA data on MILC payments by State and number of farms by State.
62
feed cost adjusted Boston Class I price trigger that is currently used for MILC payments. There should be
some examination of which feed prices to use and how to most quickly distribute funds to farmers.
While we believe modifications to the existing MILC program or its implementation would
improve it, we recognize that this does not address the concerns of the largest dairy farmers for whom the
MILC program provides little assistance and may even make their situation worse by prolonging periods
of low milk prices. To address this concern, we recommend a supplemental margin protection plan that
would offer all producers the opportunity to protect their margin on volumes of milk marketed in excess
of the MILC payment cap. The nature of this plan and how it would work is based on the modified MILC
plan. The same payment trigger would apply. If the actual national average margin in a month fell below
the specified payment trigger, the MILC program would automatically activate. The margin insurance
supplement would allow dairy farmers who want to receive coverage on larger volumes of milk to obtain
that coverage by paying a modest premium. Similarly, the program could offer higher margin protection
levels for any farmer, large or small, by setting a higher payment trigger for a premium charge.
This supplemental “buy-up” insurance tier would include a Federal subsidy for buying additional
margin coverage protection. The subsidy amount would be based upon a sliding scale. As higher
coverage levels are elected, producers will get a lower subsidy on the cost of the margin protection.
Countercyclical payment programs, of any type, must contend with the desire to protect dairy
farmers from severe market events versus the desirability of allowing markets to work and send
appropriate price signals when supply is abundant relative to demand. This is a difficult balancing act,
and there will be different perspectives on when that balance is disturbed too much in one direction or the
other. It is also a concern that a Federal program of countercyclical payments will undermine the
incentive to use private risk management tools.23
The Committee does not have a specific recommendation for the magnitude of the MILC margin
trigger or the parameters of a supplemental margin protection program. We assume that the types of
23 In its 2009 publication Managing Risk in Agriculture: A Holistic Approach, the Organization for Economic Co-operation and Development authors review the nature of risk in agriculture and public and private mechanisms to reduce or manage risk. In considering Government price supporting programs, such as a CCP, they state, “If a measure reduces risk, there will be a risk related response with impacts on production and on the use of other risk management strategies. Interaction among policy measures has been shown to be very significant. In particular there is scope for crowding out market measures that cover the same type of risk as Government programs: deficiency payments or price stabilization schemes tend to crowd out price hedging through futures and options.
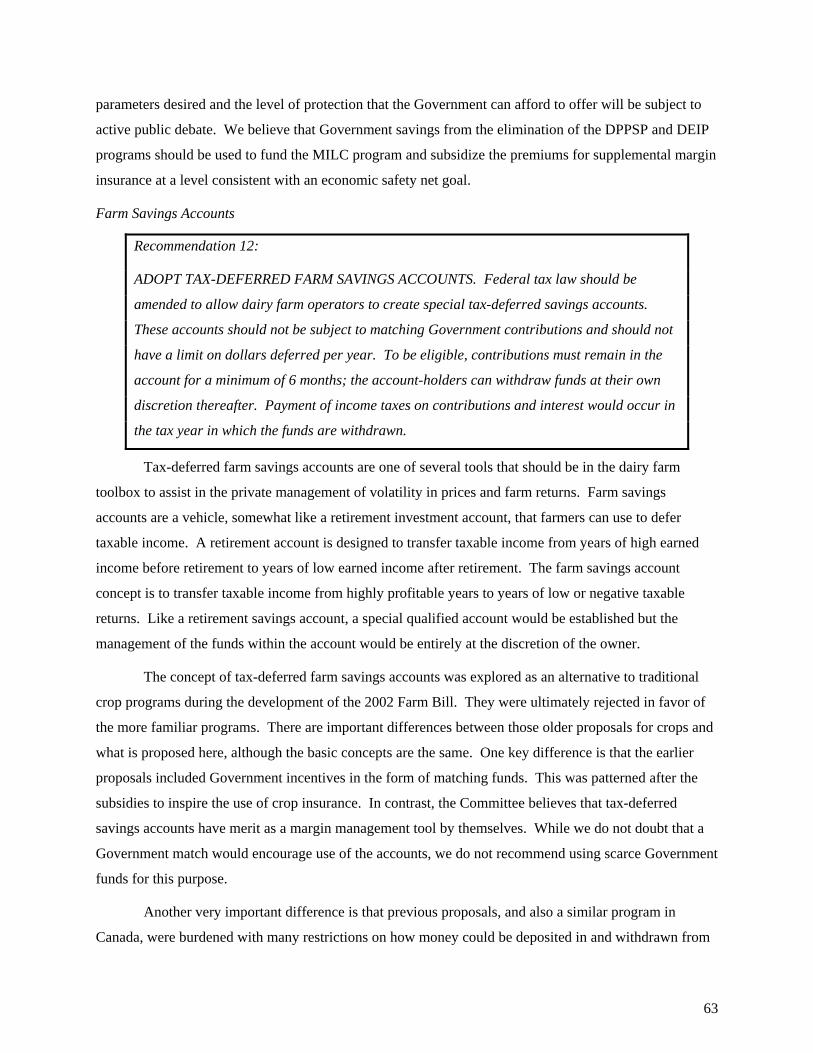
63
parameters desired and the level of protection that the Government can afford to offer will be subject to
active public debate. We believe that Government savings from the elimination of the DPPSP and DEIP
programs should be used to fund the MILC program and subsidize the premiums for supplemental margin
insurance at a level consistent with an economic safety net goal.
Farm Savings Accounts
Recommendation 12:
ADOPT TAX-DEFERRED FARM SAVINGS ACCOUNTS. Federal tax law should be
amended to allow dairy farm operators to create special tax-deferred savings accounts.
These accounts should not be subject to matching Government contributions and should not
have a limit on dollars deferred per year. To be eligible, contributions must remain in the
account for a minimum of 6 months; the account-holders can withdraw funds at their own
discretion thereafter. Payment of income taxes on contributions and interest would occur in
the tax year in which the funds are withdrawn.
Tax-deferred farm savings accounts are one of several tools that should be in the dairy farm
toolbox to assist in the private management of volatility in prices and farm returns. Farm savings
accounts are a vehicle, somewhat like a retirement investment account, that farmers can use to defer
taxable income. A retirement account is designed to transfer taxable income from years of high earned
income before retirement to years of low earned income after retirement. The farm savings account
concept is to transfer taxable income from highly profitable years to years of low or negative taxable
returns. Like a retirement savings account, a special qualified account would be established but the
management of the funds within the account would be entirely at the discretion of the owner.
The concept of tax-deferred farm savings accounts was explored as an alternative to traditional
crop programs during the development of the 2002 Farm Bill. They were ultimately rejected in favor of
the more familiar programs. There are important differences between those older proposals for crops and
what is proposed here, although the basic concepts are the same. One key difference is that the earlier
proposals included Government incentives in the form of matching funds. This was patterned after the
subsidies to inspire the use of crop insurance. In contrast, the Committee believes that tax-deferred
savings accounts have merit as a margin management tool by themselves. While we do not doubt that a
Government match would encourage use of the accounts, we do not recommend using scarce Government
funds for this purpose.
Another very important difference is that previous proposals, and also a similar program in
Canada, were burdened with many restrictions on how money could be deposited in and withdrawn from
64
a savings account. In contrast, this Committee recommends that the only limitations would be that
deposits could only be made on amounts of taxable income reported on Schedule F of the IRS Form 1040.
So, farmers have to have taxable farm income to save. They cannot create a farm “loss” by depositing
more money in a farm savings account than the farm earned in taxable net income. Likewise,
withdrawals would be reported as farm earnings on Schedule F in the year the funds are withdrawn. We
recommend that a period of 6 months must lapse before a deposit can be withdrawn.
In transferring taxable farm income across years, this program is intended to mitigate cash flow
volatility, both for the individual participant and for the industry as a whole. Analysis presented to the
Committee by Nicholson and Stephenson determined that the impact of a version of Farm Savings
Accounts on milk price volatility is “comparable to the reduction observed for other proposed programs
such as Costa Sanders, Marginal Milk Pricing, or Foundation for the Future”.24
A farm savings account helps producers manage income risk, but it does not shield them from or
eliminate risk. It only works if a producer is able to operate at a level where average returns over many
years are adequate, and it only makes sense if specific returns in any given year are highly variable
relative to that adequate average return. If these conditions are true, then any farm, regardless of size or
location, could take advantage of a farm savings account.
The Committee recognizes that a farm savings account would generally not be used in the current
environment. It works best in moving taxable income from a high margin year to a low margin year. The
dairy cycle will eventually move farm incomes up to levels in which building a cash reserve is feasible.
That was not the situation in 2010. Whether 2011 will be a year of substantial recovery and restoration
remains to be seen. However, we would strongly suggest that now is precisely the right time to begin to
develop this program so that it can be available in the next up phase of the dairy cycle.
In addition to assisting producers through periods of financial stress by creating a cash reserve,
farm savings accounts may well have the benefit of reducing capital costs on farms. Most farmers are
highly motivated to avoid income taxes. They do so in two basic ways. In years of relatively high
profitability, they take advantage of farm cash accounting and purchase consumable inputs, like feed and
fertilizer, and investment inputs, like equipment or cattle, to report as expenses in higher income years,
assuming that this will balance out in the coming year, when they actually will begin using the inputs.
24 Nicholson, Charles and Mark Stephenson; Initial Analysis of the Impacts of a Farm Savings Account Program on Price Volatility, Preliminary Analysis, September 17, 2010.

65
This is not an effective strategy unless the second year has significantly lower returns than the first year,
especially for investment inputs. A farm savings account does not require a profitable year to be followed
by an unprofitable year.
The second common farm business strategy is to borrow operating capital in years of low net
returns. This replaces operating cash with borrowed cash to maintain necessary cash flow balance. The
alternative of balancing cash flow in a low year by drawing on cash reserves saves the cost of borrowing.
Credit costs can also be an issue in the profitable year. If a farmer buys an investment input to declare as
a cash expense in the high year, the farmer is generally still left with some portion of capital being
financed. Thus, farmers incur an ongoing intermediate or long-term interest expense in the good year and
a short-term interest expense in the bad year. The farm savings account, once it is established, would earn
farmers an interest return. This is a sharp contrast to the cost of credit incurred with current tax
management practices.
One particular form of this strategy that bears noting is the level of investment in farm expansion
and other production enhancing capital projects that are made with the objective of avoiding tax liabilities
under current tax law. If farm savings accounts reduced or eliminated current incentives to reduce tax-
avoidance driven farm expansion it may reduce the production surge that often contributes to a deeper
down cycle after profitable years.
The Committee recommends amending Federal tax laws to provide for farm savings accounts that
contain the following provisions:
1) No limits on the dollars deferred per year, except that the deposit may not exceed the taxable farm
income on Schedule F, excluding the deposit.
2) No Government match on farm deposits.
3) Deposited money must remain in the account a minimum of 6 months but otherwise withdrawal
amounts and timing is allowed at the account-holder’s discretion thereafter.
4) Withdrawals from the account are taxable as Schedule F income whether they derive from the
original principal or from earnings on the account.
The rules proposed above would provide a tool that benefits dairy producers through the
development of a tax deferral mechanism that could result in reserve capital to address margin downturns
or negative cash flow. Because dairy farmers already largely reduce their tax liability through forward
purchases or expansion, this proposal should have minimal impact on tax collections.

66
Programs to Improve Profitability and Dairy Markets
Recommendation 13:
SUPPORT COMPETITIVE MARKET STRUCTURES: USDA, through its regulatory
authority and in cooperation with the Federal Trade Commission (FTC) and Department of
Justice (DOJ), should continue to monitor and support competitive marketing structures
throughout the supply and marketing chain of the dairy industry.
Market power conveys the opportunity to control supply and raise price. Traditional industrial
organization theory suggests that market concentration leads to market power, although this does not
necessarily mean that market power is abused. Collusion is a specifically restricted activity because it
creates and exists to abuse market power. Even marketing actions that are often thought of as acceptable,
even commendable, can create an opportunity to abuse the market power they confer. An example of this
would be highly effective product or brand differentiation.
One or a few firms increasingly dominate dairy markets, and concentration has been increasing at
all levels of the market chain. Many farmers have fewer potential buyers for their milk, and in some areas
only one is common.25 Some processors of dairy products have significant market share in their product
categories. A sizeable national market share may also mean a dominating regional or local share. A few
firms also increasingly dominate distribution and retail channels and almost half (46 percent) of the retail
sector is comprised of five companies26. By the same token, processors themselves can also face few
potential suppliers of milk. DOJ is studying issues of market power in food markets. Dairy is one of the
markets receiving close attention.
A variety of concerns have been raised in public testimony and comments made to the
Committee. These include:
A declining farm share of the retail expenditures on dairy products;
The short term relationship between price changes at the retail or wholesale levels and the farm price
of milk;
25 Senate hearing, 2003 (October 30). Monopsony issues in agriculture: buying power of processors in our nation’s agricultural markets hearing before the committee on the judiciary U.S. Senate One Hundred Eighth Congress First Session. Serial No. J–108–51
26 Progressive Grocer’s Super 50 (5/1/04)
67
The health or fairness of competition in wholesale level markets;
The implications of the competitive structure of the industry for dairy farm prices and marketing
options; and
The importance of the CME as a primary de facto price discovery tool for the dairy sector and its
appropriateness for that purpose.
A number of studies have been done on various aspects of these questions. Regulatory agencies
such as the Commodity Futures Trading Commission and the DOJ Antitrust Division, have formally and
informally explored these general questions and specific activities. Research is ongoing but to date the
various studies have not provided either a solution or a firm conclusion to resolve these concerns.
Regulatory and legal efforts have resulted in some specific mitigating actions, but no evidence of
widespread market failure has been determined or revealed.
The Committee recommends that the Secretary continue to monitor and support competitive
market structures throughout the dairy value chain and consider potential impacts on healthy competition
when developing and implementing regulatory programs.
Export Markets
Recommendation 14:
MAINTAIN AND EXPAND PROGRAMS FOR EXPORT MARKET DEVELOPMENT.
Programs like the Market Access Program (MAP) and the Foreign Market Development
Program (FMDP) should be continued and expanded.
Ample evidence has been presented to the Committee that the U.S. is uniquely positioned to take
advantage of export opportunities. The transition to becoming a consistent supplier of value-added dairy
products should provide more consistent and resilient export volumes, thereby reducing the incremental
price volatility currently contributed by our volatile export volumes. The Committee recommends that
USDA maintain and even expand its trade export development capacity to take advantage of new export
opportunities for dairy products and increase exports of value-added dairy products.
Several USDA programs, including the MAP and the FMDP administered by the FAS fund
activities that introduce U.S.-produced dairy products to key export markets and are important
components of the budgets of organizations like the U.S. Dairy Export Council.

68
Recently, the National Commission on Fiscal Responsibility and Reform released its findings27
on areas reconciling the budget deficit through policy and fiscal reform. Spending suggestions covered a
range of Federal Agencies and programs. Changes to agricultural programs included spending reductions
for MAP. This recommendation is in direct conflict with the Administration’s goal of doubling exports
by 2015. Programs like MAP implement the Administration’s goal by facilitating export enhancement.
MAP is a sound investment in U.S. agriculture’s global competitiveness and results in increased U.S.
exports. Considering new export goals and the benefit to the U.S. dairy industry, MAP funding should be
maintained.
The export market has been especially important to the recent U.S. dairy industry price recovery.
During the first nine months of 2010, U.S. exports were equivalent to 43 percent of the total NDM/skim
milk powder produced, 65 percent of the whey proteins, 65 percent of the lactose, 4 percent of the cheese,
and 8 percent of the butter produced in the U.S.
A review of the price relationship between the domestic and international markets and trade data
substantiates the interplay between U.S. and international dairy prices. Prior to the implementation of the
WTO reforms in the mid-1990s, U.S. exports were minimal. The implementation of the WTO AoA,
combined with ongoing reforms to the EU Common Agricultural Policy, resulted in reduced export
subsidies from the EU. Increased animal protein demand in developing countries and the convergence of
U.S. and international prices over the last decade has resulted in increasing U.S. exports and an improved
balance of dairy trade. In fact, international prices have exceeded U.S. prices for long periods since 2005.
WTO negotiations to further liberalize trade may have important consequences for the dairy
sector. The impact of WTO tariff commitments and the funds required to pay damages if the U.S. were to
increase its tariff barriers beyond agreed levels makes isolation of the domestic market unlikely and
untenable. Additionally, a protectionist approach that isolates the U.S. markets and significantly raises
prices would reduce or eliminate the greatest growth opportunities for the U.S. dairy industry.
Global demand for dairy products is increasingly driven by income growth and changing diets in
developing countries. That has opened up new opportunities for dairy product exports and also increased
the correlation between farm-gate prices in different countries. We live in a market economy and
96 percent of the world’s population lives, purchases, and consumes products outside of the U.S. During
27 The National Commission on Fiscal Responsibility, “The Moment of Truth”, December 2010. White House Release.
69
the Committee discussions it was stressed that as the dairy industry has become increasingly globalized
and complex, there is higher volatility in output and input prices, and new sources of demand growth
(exports, functional nutrients, pharmaceutical products) are emerging.
The Committee recognizes it must use caution when using existing econometric models to predict
world demand. Because export demand is so new to the U.S., existing models may over simplify and
underestimate the situation, making predicting demand and supply challenging. However, in general
terms, the potential for an expanding market for international trade is based on the projection that the
number of middle-class consumers in emerging markets is projected to triple by 2030, reaching one
billion in that year. These consumers will demand more animal proteins for their diets, including dairy
products. For example: China has 20 percent of the world’s population and growing per capita income.
Its dairy product consumption is expected to increase by about 10 percent annually in the coming years.
Dairy product consumption is also expected to grow by 4 to 9 percent annually in Southeast Asia,
depending upon the country. Mexico, Algeria, and Saudi Arabia have recorded increases in dairy product
consumption and are open to dairy imports. Mexico, in particular, will continue to represent a growing
market for U.S. dairy exports. The opportunity for sales to these countries exists now as they start to
invest in their own dairy infrastructure. The U.S. dairy industry needs to be proactive in competing for
these markets with product they want. The world market can become a dependable growth sector for U.S.
dairy whether supply is in surplus or deficit. The U.S. can be a player in the world market if it reacts to
world trends rather than expecting the world market to be tailored to U.S. current manufacturing capacity.
The Committee believes that expanding existing market access and opening new markets under
future trade agreements could significantly boost U.S. agricultural export sales. However, we also believe
that the industry’s current role is largely as a residual supplier of bulk commodities, and this is leading to
increased volatility in the U.S. market. The U.S. needs to be proactive in marketing more profitable
value-added products as well as bulk commodities on the world market.

70
Farm Milk Quality
Recommendation 15:
LOWER SOMATIC CELL COUNT LIMIT FOR GRADE A MILK. We recommend that the
Secretary support the adoption of a maximum somatic cell count for Grade A milk in the
amount of 400,000 cells per milliliter at the farm level at the Interstate Milk Shippers
Conference. The implementation should occur over a period of time not to exceed 48
months.
The quantity of somatic cells in milk is one of the primary indicators of milk quality. Elevated
somatic cell counts (SCC) are indicative of mastitis, or the inflammation of the udder, which may or may
not be accompanied by clinical signs of inflammation.28 Annual losses in net milk income per cow for
subclinical mastitis are estimated at $200 per year. For every clinical case of mastitis in a herd, there are
likely 15-40 cases of subclinical mastitis and these cases may be responsible for up to 70 percent of
production losses associated with mastitis, as shown in the following table. 29 The typical production
losses associated with different levels of SCC in the milk are illustrated in the accompanying table. Every
dollar invested in a mastitis control program will return $15 to $20 in production, premiums, and reduced
death and culling.30
28 Clinical mastitis is those infections that are typically accompanied by the observable signs of inflammation: redness, swelling, heat and pain, and abnormal milk. Subclinical mastitis is infections that result in high somatic cell counts, but the udder and the milk appear normal.
29 Dr. Linda Tikofsky: Quality Milk Production Services, Cornell University
30 ibid.
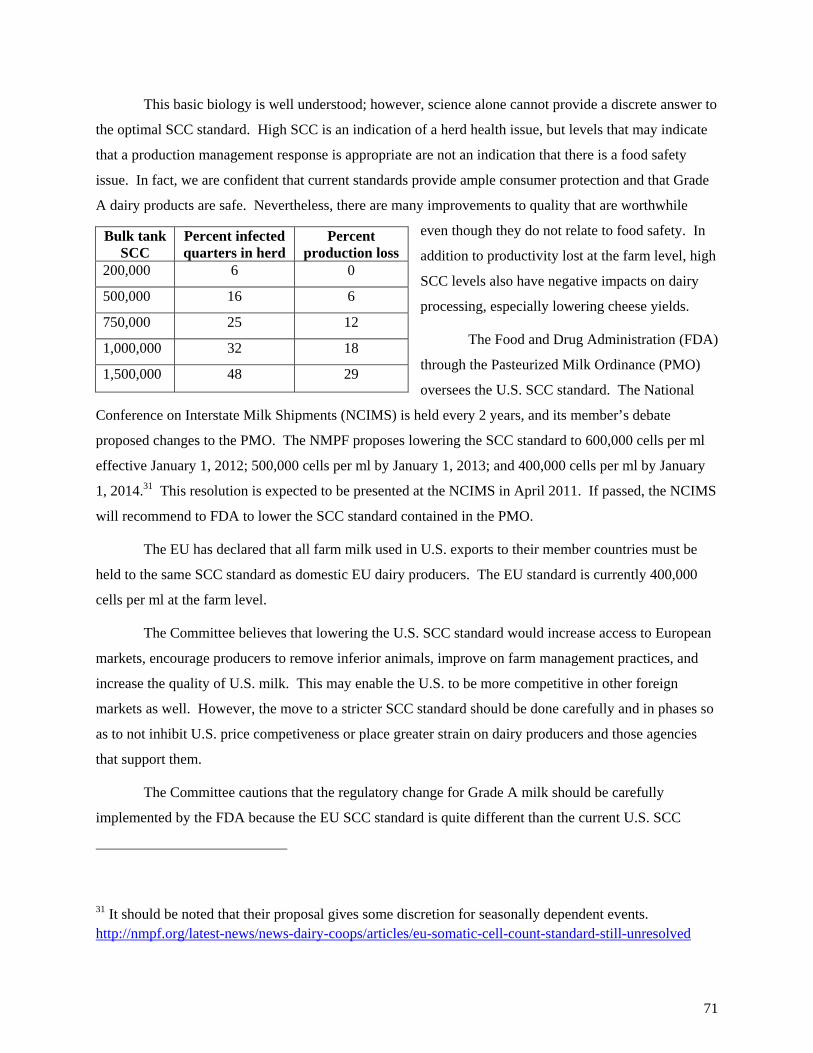
71
This basic biology is well understood; however, science alone cannot provide a discrete answer to
the optimal SCC standard. High SCC is an indication of a herd health issue, but levels that may indicate
that a production management response is appropriate are not an indication that there is a food safety
issue. In fact, we are confident that current standards provide ample consumer protection and that Grade
A dairy products are safe. Nevertheless, there are many improvements to quality that are worthwhile
even though they do not relate to food safety. In
addition to productivity lost at the farm level, high
SCC levels also have negative impacts on dairy
processing, especially lowering cheese yields.
The Food and Drug Administration (FDA)
through the Pasteurized Milk Ordinance (PMO)
oversees the U.S. SCC standard. The National
Conference on Interstate Milk Shipments (NCIMS) is held every 2 years, and its member’s debate
proposed changes to the PMO. The NMPF proposes lowering the SCC standard to 600,000 cells per ml
effective January 1, 2012; 500,000 cells per ml by January 1, 2013; and 400,000 cells per ml by January
1, 2014.31 This resolution is expected to be presented at the NCIMS in April 2011. If passed, the NCIMS
will recommend to FDA to lower the SCC standard contained in the PMO.
The EU has declared that all farm milk used in U.S. exports to their member countries must be
held to the same SCC standard as domestic EU dairy producers. The EU standard is currently 400,000
cells per ml at the farm level.
The Committee believes that lowering the U.S. SCC standard would increase access to European
markets, encourage producers to remove inferior animals, improve on farm management practices, and
increase the quality of U.S. milk. This may enable the U.S. to be more competitive in other foreign
markets as well. However, the move to a stricter SCC standard should be done carefully and in phases so
as to not inhibit U.S. price competiveness or place greater strain on dairy producers and those agencies
that support them.
The Committee cautions that the regulatory change for Grade A milk should be carefully
implemented by the FDA because the EU SCC standard is quite different than the current U.S. SCC
31 It should be noted that their proposal gives some discretion for seasonally dependent events. http://nmpf.org/latest-news/news-dairy-coops/articles/eu-somatic-cell-count-standard-still-unresolved
Bulk tank SCC
Percent infected quarters in herd
Percent production loss
200,000 6 0
500,000 16 6
750,000 25 12
1,000,000 32 18
1,500,000 48 29

72
standard. If U.S. standards are changed to mirror the EU standards, the U.S. should use similar testing
mechanisms so unnecessary burdens are not placed on U.S. producers or regulatory agencies. The shift of
focus to farm level SCC counts is a dramatic change from using the commingled silo or tanker for testing
for regulatory purposes. Also, the current U.S. method of SCC sampling for purposes of regulation is 1–
point-in-time versus the EU’s 3-month rolling geometric mean.
The U.S. dairy industry should be able to adapt if the regulations are implemented carefully.
Dairy producers have already demonstrated their ability to adapt in response to stricter SCC standards
when the regulated SCC standard was reduced from 1,500,000 cells per ml to 1,000,000 cells per ml in
the 1970s and from 1,000,000 cells per ml to the current 750,000 cells per ml around 1990.
Enhanced Fluid Milk Solids Standards
Recommendation 16:
ENHANCED FLUID MILK SOLIDS STANDARDS: The Secretary should explore the
impacts of California-type fortification standards for U.S. beverage milk.
Milk contains water, nonfat solids, and butterfat. The nonfat milk solids are composed of
proteins, lactose, and minerals. The percentage content of any cow’s milk varies by breed of cow, season,
diet, and region. Nationally, the average annual composition of milk is 8.72 percent nonfat solids and
3.67 percent butterfat, with the remainder being water.
The FDA establishes minimum standards for fluid milk products. The minimum standard for
nonfat solids for the majority of the country is 8.25 percent for fluid milk at the retail level. Since 1962
fluid milk marketed in California has to meet different standards. The current standard is 8.7 percent for
whole milk, 10 percent for reduced fat (2 percent fat) milk, 11 percent for low fat (1 percent fat) milk and
9 percent nonfat solids in skim milk. There are several fortified fluid milk products commercially
available in other States. These products have been developed by companies who are using conventional
market mechanisms to differentiate products and segment consumer preferences. They come in a wide
variety of forms and may involve fortification techniques and ingredients quite different from the
standardized California products, including non-dairy ingredients.

73
Over the last 20 years there have been numerous studies of the effects of applying California fluid
milk standards across the U.S.32 At the request of the U.S. Congressional Dairy Farm Caucus, the
University of Missouri’s Food and Agricultural Policy Research Institute wrote a report to consider the
potential effects of mandating California fluid milk standards on a national level (FAPRI study).
The FAPRI study indicated that fortifying the nation’s milk to California standards would use an
additional 350 million pounds of nonfat solids per year. That would quickly increase NDM prices and
increase average farm milk prices by 27 cents per cwt during the first year. Those price increases would
then slip to 17 cents in the second year and narrow to 9 cents by the seventh year in response to dynamic
adjustments in quantities supplied and demanded. The FAPRI study estimated that the cost of the
additional milk solids alone would increase the retail price of a gallon of milk by about 17 cents. The
FAPRI study did not have a current estimate of other processing costs that might increase because of
fortification.
Although the FAPRI study mirrors previous studies, it notes, “The market situation is very
different today than when those studies were conducted.” One key difference is that the U.S. dairy sector
has now become a major exporter of skim milk solids. Past studies were done when there were large
Government stocks of NDM, and adding more solids to milk was thought to be a way to reduce that
surplus. The FAPRI study suggested that an effect of fortification now could be to reduce exports, as
fewer nonfat solids would be available unless and until milk production responded to increased demand.
The Committee supports further investigation of areas that FAPRI did not cover or where additional
confirmation of the possible benefits would be useful. Some of these questions could be:
How will consumers respond?
Under the assumptions of their study, FAPRI estimates that retail milk prices will likely rise
initially with enhanced fluid standards, but the farm and retail price structure lowers again over time. The
FAPRI study lacked firm evidence or data on the costs of processing that might be involved in
fortification. California provides a producer subsidized allowance to processors to assist then in the cost
32 Salathe and Price. http://ageconsearch.umn.edu/bitstream/29633/1/24020197.pdf; Outlaw, et al. http://cpdmp.cornell.edu/CPDMP/Pages/Publications/Pubs/P13.pdf; Boynton, R.D. "Effects of Milk Solids Content on Consumption of Milk.", Journal of Dairy Science, Vol. 69, No. 5, May 1986, pp. 1454-1461.

74
of the added ingredients, and such a system could be used in a U.S. model. To the extent that there would
be processing and ingredient cost increases, it is also not clear what the impact of that would be on retail
prices. Thus, there are several limitations to assessing the effect on retail sales.
Advocates of fortified fluid products argue that they are better because lower fat products retain
more of the “mouth feel” of the whole milk product. They contend that U.S. consumers would prefer
fortified products and that milk sales would increase. Critics raise concerns that the different taste and
mouth feel of fortified milks might alienate milk drinkers accustomed to unfortified milks.
The Committee recommends more study of the impact on consumer purchases.
What is the availability of nonfat solids and how will this impact trade?
There has not been a significant volume of excess solids in recent years (sales to CCC in 2009
equaled 232 million pounds of skim solids or about 1 percent of total domestic skim solids marketed). A
major factor has been the good export opportunities for skim solids in various product forms. There is
potential for encouraging further imports of skim milk solids if U.S. solids are not readily available and
prices are competitive. The change in standards would be more difficult for organic fluid milk producers
and bottlers (and other specialized types of milk); because organic and other specialty NDM is not
produced in large quantities at present.
What are the regional disparities?
FAPRI researchers provided supplemental estimates to their original report which indicate that
price benefits to dairy farmers would differ by region, with farmers in heavy NDM producing States, such
as California, benefitting while dairymen in large cheese-producing States, such as Wisconsin and
Minnesota, actually seeing milk price decreases over time. Increased milk production and potentially
reduced consumption would drive cheese and butter prices lower, according to the analysis.
As mentioned in the discussion of the DPPSP, one concern is that regions that have invested
heavily in so-called butter-powder plants, either for balancing market supply and demand or as part of a
product marketing strategy, have greater market and investment risk if the DPPSP is terminated. From
the perspective of manufacturers in this position, fortification as an alternative use for skim milk solids
likely would be a welcome development.
The Secretary should consider the potential impact on producer prices from all perspectives.
How will this impact fluid processors?
The FAPRI study of fluid milk fortification was not able to consider the potential additional cost
of equipment that may be required to fortify milk and associated operating expenses. Some processors

75
would have additional capital costs for storage tanks and blending or other equipment. Those
manufacturers already set up to handle the increased storage may well have a competitive advantage
while others experience conversion costs. In the opinion of Committee members, the majority of smaller
scale processors would use NDM for fortification. Because NDM oxidizes over time, some modification
of storage conditions for dry materials might be required. This could leave smaller plants more
vulnerable to procurement factors.
The FAPRI study also did not estimate the potential cost offsetting of a “fortification allowance”
such as is used in the California system.
Given recommendation 13 to maintain competitive market structures, we would also want to see
analysis of the potential impact on bottler consolidation because of these higher costs. California’s
regulation anticipated this problem and attempted to mitigate it by providing a “fortification allowance”
under which an estimated, standardized additional processing cost is deducted from the processor’s price
obligation.
Our recommendation to explore the impacts of enhanced solids standards for U.S. beverage milk
recognizes the differences of opinion within the dairy industry and the lack of conclusive evidence in
existing studies. In light of this, the Committee believes that it is appropriate to encourage additional
comprehensive analyses of this concept.
Dairy Product Labeling
Recommendation 17:
RESTRICT USE OF DAIRY DESCRIPTORS ON PRODUCT LABELS. We recommend that
USDA support restriction of dairy descriptors, including terms such as milk, cheese, yogurt,
butter, for use on products made from milk.
Product innovation has occurred throughout the food sector. Many dairy products are no longer
limited to strictly defined standards of identities, and many new novel products have been introduced. At
the same time, some non-dairy products have associated themselves by connotation or direct reference
with the positive image of dairy products. This has the potential to lead to consumer confusion about the
composition of such products. Dairy products have beneficial combinations of nutrients not found in
other products. Some research indicates that certain nutrients, minerals, or vitamins in milk are better
absorbed and utilized in the body than seemingly similar ingredients obtained from non-dairy sources and
added to milk (e.g., calcium from milk vs. calcium carbonate or calcium citrate). Advertising and food
container labels should be accurate and truthful so consumers are properly informed of product contents
and are not misled. Making informed food choices would improve nutrition and increase overall health.

76
The Committee is concerned that misleading food product names or labels are having a
detrimental impact on dairy product sales. Some products are currently being marketed that mimic
traditional dairy products and are labeled using milk or dairy terms.33 For example, there are a number of
beverage products that use the word “milk” in their brand name or product name, yet these products do
not meet the standard of identity for milk. Sometimes these products are positioned in stores to directly
compete with conventional fluid milk or other dairy products. The Committee supports healthy
competition and consumer choice, but consumers must have access to accurate information and not be
misinformed or confused when making their choices.
Many members of the Committee believe that milk and dairy products utilizing added protein or
calcium in their production should use natural milk ingredients in the fortification process. There is also a
concern that some ingredients may be used in certain dairy foods that are safe but are not used for their
originally intended purpose or in proper amounts. The formulation of dairy products involves some
complexities in definition and regulation. Products for which FDA has established a Standard of Identity
are subject to stringent restrictions on their formulation, including allowed ingredients and make
procedures. Non-standardized products are subject to the restrictions faced by any food product,
including the use of ingredients or procedures that are determined to be safe or are Generally Recognized
as Safe (GRAS). Because of these differences in degree of regulation, a requirement to use natural milk
or GRAS ingredients can only be applied to standardized dairy products with a FDA Standard of Identity.
Accurate dairy product descriptions and formulations that comply with legal FDA definitions and
production practices can only make it easier for the consumer to purchase products that are not
misrepresented.
Our recommendation is not intended to stymie innovation or prevent dairy product manufacturers
from using ingredients that are and have been customarily added to dairy products, such as flavorings,
seasonings, vitamins, and similar functional ingredients. These inclusions are common for dairy products
and add to the dairy product experience. Our concerns lie in subtle or blatant portrayals of non-dairy
foods or ingredients as being the same as milk and dairy products.
The Committee recommends that the Secretary support restrictions on dairy descriptors that will
help preserve the integrity of milk’s nutritious and wholesome image. Eliminating confusion over
product identity and content will likely favor and protect demand for milk and dairy products. Truthful
33 The Committee’s concern extends to subtle misspellings that may suggest milk content or equivalence, e.g. Kreme or Cheez.

77
and accurate food labels can also contribute to improving consumer health and help them to make
accurate and educated choices.
Dairy Management Practices and Production Costs – Value-Added Dairy Operations
Recommendation 18:
SUPPORT FOR VALUE-ADDED DAIRY. We recommend that the Secretary support
programs that enhance value-added market development for dairy farms and dairy products.
Opportunities should be explored including, but not limited to, the development of
educational training programs and technical assistance for farmers, inspectors, and
regulatory personnel to accommodate unique value-added dairy farm operations. A study
should be made to examine the impact of user fees on value-added dairy product operations.
Opportunities exist for dairy farms to increase their profitability and sustainability by the
marketing of value-added dairy products. Indeed, in the last 5 years, the number of farms in the U.S. has
grown 4 percent and the operators of those farms have become more diverse, according to results of the
2007 Census of Agriculture. The latest census figures show a continuation in the trend towards more very
small and very large farms and fewer mid-sized operations. Many of these smaller farmers are either
beginning farmers34 and/or second career farmers.
Local and regional food systems are the fastest growing areas in agriculture.35 The value-added
marketing of dairy products by small to medium sized operations to take advantage of this developing
trend can either be achieved within a wholesale market (for example organic certification) or by direct
marketing using on-farm processing or joint ventures for manufacturing and marketing of dairy products.
The changing face of agriculture is attracting entrepreneurs who see the value in directly
marketing dairy products, and they are bringing new expertise to the industry and new approaches to
dairy farming that appeal to many consumers.
At the same time, some dairies are struggling to remain in business. The loss of small to mid-size
conventional dairy operations is well documented. An opportunity to capitalize on location advantages
34 USDA’s definition of a farm encompasses a large number of different farming operations, and the beginning farmer definition is, likewise, broad. USDA’s current definition of a beginning farm is one operated by a farmer who has operated a farm or ranch for 10 years or less.
35 Agriculture Secretary Vilsack Launches Showcase on 'Know Your Farmer, Know Your Food' Website Online Resource will Expand National Dialogue About Economic Opportunity for Producers -8/30/2010

78
and leverage involvement in their local community by marketing value-added dairy products may allow
vulnerable farm businesses to continue. In many communities, this is seen as also having associated
benefits to the preservation of the economic and social infrastructure of the rural community.
Direct marketing of fluid and manufactured dairy products involves new and considerable costs
for a farm-based business. The high capital cost of manufacturing equipment, challenges to establishing a
customer base and, in some circumstances, regulation can inhibit the growth of on farm value-added
enterprises and provide high barriers to innovation and profitability for dairy farms that want to maximize
their location or product by selling direct to the consumers. Adding disproportionate expenses to farms
and food producers that already depend on slim margins will reduce opportunity and create barriers to
entry for producers of all scales. The Committee cautions against excessive regulations, but recognizes
that defining what is excessive is tricky and ultimately must be left to legislative and regulatory
mechanisms.
Establishment and enforcement of basic standards, especially in areas of greatest known risk, is
an important responsibility of Government. All dairy manufacturing is regulated in some form by
municipality, county, State, and/or Federal regulations that are continually evolving to meet new areas of
risk. Federal, State, and local agencies need to work together in a consistent fashion to tailor enforcement
that is appropriate and effective in light of local and regional realities, reinforcing a multi-stakeholder
process of continuous improvement. The Committee recommends that the Secretary actively support the
development of educational training programs and technical assistance for farms, inspectors, and
regulatory personnel to accommodate and nurture unique, value-added dairy farm operations.
Dairy Management Practices and Production Costs – Environmental Practices
Recommendation 19:
PROVIDE INCENTIVE PAYMENTS FOR ENVIRONMENTAL PRACTICES. The Secretary
should increase the amount of money available for incentive payments to dairy farmers for
environmental practices that address social, economic, and environmental benefits to dairy
farm communities.
For the dairy industry, sustainability is not new. Innovation and efficiencies in milk production,
processing, packaging and transportation have all contributed to its ability to do more with less, to be
profitable and to provide wholesome dairy products to feed a growing population. Environmental
practices, from recycling water and manure to crop technologies that improve the soil and prevent
erosion, have all contributed to dairy’s dramatic increase in productivity. And, “in an era of dwindling
natural resources and a growing population that cares deeply about the health and environmental impact
79
of the products they buy, the dairy industry is committed to doing more with less.”36 In order to do more
with less, existing resources will need to be managed more effectively, with new technologies created,
developed, and adopted. Society will need to commit more of its resources to this process as well,
leveraging the contributions of dairy.
Dairy has taken a leadership position in determining its carbon foot print and partnered with
USDA in many environmental areas. Anaerobic digesters can reduce greenhouse gas emissions, as can
feed inputs. Other examples include initiatives around practices like nutrient management, with
protection of both surface and ground water. The Committee believes that industry itself should not be
expected to bear all the costs associated with environmental practices that are required for social benefits,
just as they are not directly compensated for social benefits that they provide. The dairy industry provides
a number of indirect benefits that are hard to measure, including jobs, leadership in communities,
environmental impact reduction, improved wildlife habitat, the aesthetic value of a working landscape,
and contributions to social values.
The Committee encourages the Secretary to recognize the impact of dairy farmers as stewards of
environmentally stable rural land, job creators, and economic drivers of rural economies. The Secretary
should increase the amount of Federal environmental funds, especially those funds not traditionally
targeted for dairy operations, which can directly assist dairy farms with environmental challenges. The
Committee recommends that the Secretary give preference to dairy farms in different policy and program
venues to address environmental challenges that directly affect farm profitability and also address the
social and economic effects of dairy farms on rural communities, while providing a national supply of
milk.
36 Jerry Kozak, CEO NMPF, U. S. Sustainability Commitment Progress Report

80
Promoting Dairy Farm Development – EQIP and Other Grants
Recommendation 20:
CONTINUE THE ENVIRONMENTAL QUALITY INCENTIVES PROGRAM (EQIP) AND
GRANT PROGRAMS. EQIP should be continued, and dairy farmers should be given
preference in grant programs for implementation of energy audits, infrastructure
development for value-added processing and distribution facilities, construction of facilities
to meet food safety regulations and farmland protection, and to allow beginning farmer
loans for farm transfers between generations.
With increasing State, county, and Federal conservation regulation and enforcement, the costs of
meeting these regulations and the time dealing with regulators who lack experience with farm operations
will increase. EQIP is one program that can assist the individual dairy farmer in meeting increasing
regulation. EQIP was approved in 1996 by amending the Food Security Act of 1985 (1985 Farm Bill),
reauthorized in the Farm Security and Rural Investment Act of 2002 and again reauthorized in FCEA.
EQIP offers financial and technical help to assist eligible producers install or implement conservation
practices on eligible agricultural land. The five EQIP national priorities are very applicable to the
environmental challenges that the dairy industry experiences.37 EQIP offers contracts that provide
financial assistance to help develop conservation plans and implement conservation practices. EQIP may
provide payments up to 75 percent of the estimated incurred costs and loss of income of certain
conservation practices and conservation activity plans.
The USDA Rural Development Agency’s Rural Energy for America Program Grants/Energy
Audit and Renewable Energy Development Assist (REAP/EA/REDA) provides grant money for energy
audits and renewable energy development to organizations that help agricultural producers and rural small
37 Reductions of nonpoint source pollution, such as nutrients, sediment, pesticides, or excess salinity in impaired watersheds consistent with Total Daily Maximum Loads (TMDLs), where available; the reduction of surface and groundwater contamination; and reduction of contamination from agricultural point sources, such as concentrated animal feeding operations (CAFOs); conservation of ground and surface water resources; reduction of emissions, such as particulate matter, nitrogen oxides (NOX), volatile organic compounds, and ozone precursors and depleters that contribute to air quality impairment violations of National Ambient Air Quality Standards; reduction in soil erosion and sedimentation from unacceptable levels on agricultural land and promotion of at-risk species habitat conservation.

81
businesses reduce energy costs and consumption. USDA should continue to use programs like REAP to
promote the use of manure digesters to create renewable energy generation in rural America.
As the number of dairy farms in any one area decrease there is a corresponding decrease in the
economic viability and profitability for service providers. As these service providers disappear, there is
an increased overhead for maintenance, repair and other input service costs, plus the availability of
production advisors. In order to re-establish that infrastructure to meet the changing needs of farmers the
USDA Rural Development Value-Added Producer Grants can be used for both capital and planning
activities and for working capital to market value-added agricultural products and for farm-based
renewable energy. Eligible applicants are independent producers, farmer and rancher cooperatives,
agricultural producer groups, and majority-controlled producer-based business ventures.
In a previous section, the merits of FSA loan programs have been addressed. These programs can
have a profound effect on the development of dairy farming systems, of many types and varieties.
The consolidation of dairy processors, distribution, warehousing, and retailers has created an
opportunity for entrepreneurs, including dairy farmers, to diversify and bring unique or innovative dairy
products to the market. Programs that provide grant money and technical assistance to assist the
establishment of valued-added dairy processing benefit the individual farmer or group of farmers and also
expand choices for consumers.
The Committee recognizes that this recommendation is intended to impact the 2012 Farm Bill
and will be subject to tight budgetary constraints, congressional budget rules, budget reconciliation, and a
looming Federal budget deficit. The intent of this recommendation is to provide ongoing support to dairy
operations to face the challenges and demands of dairy farming in the 21st century. The Committee
recommends that EQIP and other environmental programs be funded in the 2012 Farm Bill at levels that
will maximize the adoption of sound environmental practices at an affordable cost. The Secretary should
support the funding and implementation of these and other programs that will provide cost share or full
cost grants to enable dairy farmers to increase innovation in marketing of dairy products; improve dairy
farm production methods; enable dairy farmers to make capital investments in their operations in
anticipation of regulatory changes; and provide ongoing support to dairy farm operations.
82
Dairy Management Practices and Production Costs – Corn Based Ethanol Subsidies
Recommendation 21:
PHASE OUT ETHANOL SUBSIDIES. We support the rapid phase out of the blender’s
credit and tariff on imported ethanol.
The Volumetric Ethanol Excise Tax Credit (VEETC), also known as the “blender’s credit”, is the
primary Federal tax incentive to produce ethanol. The tax credit, which was created by the American
Jobs Creation Act of 2004, provides a Federal tax credit on each gallon of ethanol blended with gasoline.
Ethanol blenders receive a 45 cent per gallon tax credit through 2015 and a 10 cent gallon tax credit on
the first 15 million gallons of ethanol made by companies that produce less than 60 million gallons per
year. The tax credit is applied to all ethanol blended in the U.S., and a registered blender is the only
individual in the supply chain that is eligible for this credit. This credit is now refundable quarterly, and
all funds are paid out of the General Fund of the Federal budget.
The use of ethanol is not optional. The Energy Independence and Security Act of 2007 mandated
that nine billion gallons of renewable fuels be used in 2008 and 36 billion gallons of renewable fuels must
be used annually by 2022. Of the total, 21 billion gallons must come from advanced biofuels and from
sources such as cellulose (i.e., corn stalks, wood chips, switchgrass, etc.) and sugarcane. The Act requires
12.6 billion gallons of conventional ethanol (or about 4.5 billion bushels of corn) be used in 2011 and
15 billion gallons (5.4 billion bushels) by 2015.
In December 2010, Congress renewed the credit and tariff for 1 year. That extension was
opposed by many environmentalists and by other corn users, including livestock producers. Opponents
argue that because there are Federal mandates in place for minimum use of ethanol, the subsidy does not
increase the volume of ethanol sold. Moreover, they argue that the dramatic increases in the prices of
corn and soybean meal are a direct result of current ethanol policy. As a result, demand adjustments to
price increases tend to be limited to the livestock sector.38 Ethanol mandates, demand subsidies, and
import barriers impact the ability of world feed markets to cope with unexpected supply disruptions.
Especially when gasoline prices are high relative to ethanol, most of the adjustment must take place in the
livestock industry rather than in the ethanol industry.
38 Impact on Ethanol, Corn, and Livestock from Imminent U.S. Ethanol Policy Decisions by Bruce A. Babcock, Center for Agricultural and Rural Development or Iowa State University.

83
Although farmers have some ability to adjust their purchases of inputs in response to the margin
squeeze generated by higher feed prices, their response is limited by the implications for production and
the health of their herds. Moreover, although there are a variety of feedstuffs available to farmers, there
are a finite amount of feed inputs possible in a balanced ration. Moreover, many of these alternative feeds
have prices correlated with the basic feed inputs of corn or soybeans.
The renewal of the blender’s credit and tariff for ethanol together with the renewable fuels
mandate follows a policy that created a new use for a large share of the corn crop. In recent years, the
share of corn production used for ethanol has ranged from about one-fourth to over one-third. Corn
production has increased dramatically in recent years, but, by and large, the surge in demand has absorbed
all the increase, and market prices remain high. This increased use of corn and the subsequent increase in
price for all feed inputs has an undeniable effect on dairy profitability. Although the availability of dry
distillers grains (DDGs), a byproduct of ethanol production, provides an alternative feedstuff, the high fat
composition of DDGs limits the amount that can be used in a dairy ration. A continuation of the decrease
in the milk price-feed cost margin for dairy farmers, despite higher milk prices, will result in a major
devaluation of all dairy-related assets including cows, equipment and facilities, aggravating the precarious
economic situation in which all dairy farmers found themselves in 2009 and 2010.
High feed costs have contributed to the economic volatility and unprofitability that has beset
dairy farmers since 2008. Increased grain costs affect the ability of U.S. dairy farmers to compete on the
world market, which has many low cost production competitors who rely less on purchased grain.
Moreover, in the long-term higher corn prices will have to be reflected in higher consumer prices for meat
and dairy products.
Proponents of the credit and tariff believe that they are an important aspect of promoting biofuels
development, which they see as a key component of promoting energy independence for the U.S.
Proponents argue that more emphasis on homegrown biofuels will limit the reliance on fuel sources from
other parts of the world and boost economic opportunities for rural America. Some also argue that usage
of corn will fall as new technologies are developed and implemented to produce ethanol from wood or
other non-food biomass fibers.
While the Committee recognizes the attractiveness of increased energy from U.S. sources and the
benefits of ethanol production to corn growers and their rural communities, it also recognizes its negative
impact on dairy and livestock producers and their communities. We recommend that the Secretary

84
support phasing out the blender’s credit and tariff on imported ethanol and allow market forces to
determine the desirability of using corn for ethanol and/or imported ethanol. 39
Dairy Herd Health Programs
Recommendation 22:
DAIRY HERD HEALTH: Adequately fund and implement programs to rapidly eradicate
bovine tuberculosis (TB) and Johne’s from the U.S. dairy herd.
Programs to promote the eradication and control of bovine TB and Johne’s disease need to be
adequately funded, regularly updated, and supported by ongoing research. Education and outreach with
continued producer involvement is vital to controlling both these diseases, which directly affect the health
of dairy cows and the profitability of dairy farmers. Adequately funded testing and long-term research is
needed to assist in disease control and to highlight areas of opportunity in the programs to regulate,
monitor, and control these diseases. Investment in programs that can monitor and eradicate bovine TB
and Johne’s disease will create a healthier livestock industry and more profitable dairy farms.
Bovine Tuberculosis40
39 Keep in mind that this recommendation does not address the Renewable Fuel Standard requirement and its significant impact on requiring the use of ethanol blends in gasoline. As long as there is an effective RFS, the use of corn for ethanol will not be purely market driven.
40 Bovine TB is a chronic bacterial disease of cattle that occasionally affects other species of mammals. This disease is a significant zoonosis that can spread to humans, typically by the inhalation of aerosols or the ingestion of unpasteurized milk.
In developed countries, eradication programs have reduced or eliminated tuberculosis in cattle, and human disease is now rare; however, reservoirs in wildlife can make complete eradication difficult. Tuberculosis is usually a chronic debilitating disease in cattle, but it can occasionally be acute and rapidly progressive.
Bovine tuberculosis can be controlled by test-and-slaughter or test-and-segregation methods. Affected herds are re-tested periodically to eliminate cattle that may shed the organism; the tuberculin test is generally used. Infected herds are usually quarantined, and animals that have been in contact with reactors are traced. Only test-and-slaughter techniques are guaranteed to eradicate tuberculosis from domesticated animals. Once eradication is nearly complete, slaughter surveillance, with tracing of infected animals, may be a more efficient use of resources. Sanitation and disinfection may reduce the spread of the agent within the herd. Once the most prevalent infectious disease of cattle and swine in the U.S., bovine TB caused more losses among U.S. farm animals in the early part of this century than all other infectious diseases combined.

85
Since 1917 the prevalence rate of tuberculosis in U.S. cattle herds dropped from 5 percent to less
than 0.001 percent.41 In developed countries, eradication programs have reduced or eliminated
tuberculosis in cattle, and human disease is now rare; however, reservoirs in wildlife can make complete
eradication difficult.
In 1917, under pressure from medical, veterinary, and animal industry lobbies, Congress passed a
$1 million appropriations bill initiating the State-Federal Cooperative Bovine Tuberculosis Eradication
Program which is administrated by USDA’s Animal and Plant Health Inspection Service (APHIS), State
animal health agencies, and U.S. livestock producers. APHIS has established minimum standards for the
maintenance of tuberculosis-free accredited herds of cattle, captive cervids, bison, and goats. These
minimum standards do not preclude the adoption of more stringent standards by any State, status zone
within a State, or region containing multiple States.
The TB eradication program has successfully reduced the incidence of the disease in U.S. cattle,
but there continues to be a low incidence of TB as evidenced by newly identified infected herds over the
past several years. In order to have a more concerted effort to achieve the end goal of complete
eradication of bovine TB from the U.S. cattle herd, with no recursions, it has become evident that
USDA’s program needs to be updated, and the current testing methodologies and surveillance tools
improved.
The USDA issued a concept paper in December 2009, A New Approach for Managing Bovine
Tuberculosis: Veterinary Services’ Proposed Action Plan, to improve the control and eradication of TB.
The National Milk Producers Federation provided comments42 on that paper on behalf of dairy farmers
and they can be summarized under the following points:
Mitigate Disease Introduction: Efforts to fully eradicate TB in the U.S. are compounded by
several known or suspected routes of exposure which require further regulatory enhancements to
minimize these risks including Mexican imported feeder cattle, Mexican imported event cattle, Canadian
imported cattle, wildlife reservoirs and employee transmission.
Enhance Diagnostics and Surveillance & Traceability: Diagnostic, surveillance and
traceability capabilities have not kept pace with the changing needs of the TB eradication program.
41 USDA APHIS: A New Approach for Managing Bovine Tuberculosis: Veterinary Services’ Proposed Action Plan
42 http://www.nmpf.org/files/file/NMPF-TB-comments-12-04-09.pdf

86
Current diagnostics are no longer adequate for the low‐level incidence of TB the U.S. now has. The
success of both the TB and brucellosis eradication programs has led to a decline in the use of permanent
identification for breeding cattle.
Manage TB Affected Animals & Herds: Enhancement of the management tools available
for producers who have a TB‐infected animal identified to their premises is required to advance the TB
eradication program.
Modernize Regulatory Framework: An effective TB eradication program requires
modernizing the regulatory framework.
Johne’s Disease
The National Animal Health Monitoring Systems (NAHMS) study, Dairy 200743, showed that
68.1 percent of U.S. dairy operations are infected with the bacterium that causes Johne’s disease. Dairy
2007 also suggests that at least 1 out of every 4 U.S. dairy operations may have a relatively high
percentage of Johne’s-infected cows in their herds. Lost productivity due to Johne’s disease is estimated
to cost the U.S. dairy industry $200 million to $250 million annually.
Johne’s disease is a difficult problem for livestock owners because clinical symptoms of the
disease may not occur until 2 to 5 years after infection has taken place. After infection, but before clinical
symptoms are apparent, the infected animal is likely to be contagious. There is currently no treatment for
Johne’s disease. General recommendations are to cull infected animals. There is no preventive vaccine
available to combat infection. The vaccine that is currently available simply minimizes clinical signs and
shedding of the organism. It does not prevent new infections.
The Uniform Program Standards for the Voluntary Bovine Johne’s Disease Control Program
(VBJDCP) has been developed by the National Johne’s Disease Working Group, the Johne’s Disease
Committee of the U.S. Animal Health Association, State Veterinarians, industry representatives, and
APHIS Veterinary Services (VS) to provide national standards for the control of Johne’s Disease. This is
a voluntary program and the only Federal regulation related to Johne’s Disease is that cattle, sheep, goats,
and other domestic animals that are positive to an official test for Johne’s Disease may generally be
moved across State lines only to a recognized slaughtering establishment or to an approved livestock
43 NAHMS Study: Johne's Disease on U.S. Dairies, 1991-2007

87
facility for sale to such an establishment.44 The VBDCP consists of three basic elements: 1) Education–to
inform producers about the cost of Johne’s Disease and to provide information about management
strategies to prevent, control, and eliminate the disease; 2) Management—to work with producers to
establish good management strategies on their farms; and 3) Herd testing and classification—to
demonstrate the level of risk of Johne’s Disease on the farm.
The Committee agrees that programs to promote the eradication and control of Johne’s disease
and bovine TB need to be adequately funded, regularly updated, and supported by ongoing research.
Education and outreach, with ongoing producer involvement, is vital to controlling both these diseases,
which directly affect the health of dairy cows and the profitability of dairy farmers. Investment in
programs that can monitor and eradicate bovine TB and Johne’s disease will create a healthier livestock
industry and more profitable dairy farms.
Dairy Labor
Recommendation 23:
DAIRY LABOR: The Secretary should use his influence with other agencies and Congress
to provide a legal means for dairy farms to employ year-around long-term immigrant labor.
Provide assurance that existing farm laborers have the opportunity to obtain permanent
resident status.
Immigrant labor plays a very important role in contributing to the success of America’s dairy
industry; a large percentage of the hired workers on dairy farms are immigrants. This is true for a great
number of dairy farmers across this country, large and small. Dairy farming, particularly the care and
milking of cows, is labor intensive. As production methods have become more sophisticated, sourcing
qualified and committed farm labor has become an increasing challenge.
A 2009 report by researchers at Texas A&M University provides new information about the
nature of hired labor on dairy farms.45 The following discussion relies heavily on this report for
descriptive information.
44 Title 9, Code of Federal Regulations (9 CFR), part 80
45 “Dairy Farms employed an estimated 138,000 full-time equivalent workers in 2008: 41 percent, or 57,000 of those were estimated of foreign origin, primarily from Mexico.” (The Economic Impacts of Immigration on U.S. Dairy Farms, June 2009, National Milk Producers Federation (NMPF) and Texas A&M.)

88
A growing source of farm labor has come from immigrants, whether under Government plans or
from those immigrants who are otherwise able to work legally in the U.S.46 Despite compliance with
Form I-9 protocol, the employment of many of these employees remains under a cloud. Uncertainty
about immigration reform has been an issue with many dairies that have previously used qualified and
motivated immigrant labor.47
In the Texas A&M study, dairies reported that the average number of hired workers per dairy
farm rose from 5.0 in 2006 to 5.6 in 2008, with most of the growth in full-time employees. In 2008, four
workers per farm were reported to be full-time. Approximately 47 percent of all farms surveyed reported
the use of immigrant labor.
Respondents to the 2008 Texas A&M AgriLife Research survey reported that they paid their
workers $506 in average weekly wages, while most also reported providing at least one non-wage benefit
to employees, such as paid vacation, housing, and/or insurance. Those non-wage benefits brought
average dairy workers salaries in 2008 to $31,521, significantly higher than salaries in the landscaping,
ranching, and fast food sectors, which employ similar proportions of immigrant workers. Texas AgriLife
Research estimated that if Federal labor and immigrant policies were to result in the loss of just half of the
57,000 foreign-born dairy workers, an additional 66,000 workers would also be lost, due to the closure of
some dairy farms, and the resulting multiplier effect of fewer jobs in grain and fertilizer production and
sales, veterinary services, milk hauling, and related agricultural service jobs. This would produce an
economic loss of $11 billion.
There are many issues and tensions linked to immigration policy. The Committee does not seek
to address all those issues. Rather, in the midst of major immigration reform, the special relationship of
dairy and immigrant labor should be considered. Specifically, dairy producers need a program that
provides dairy farm employment opportunities for foreign guest workers in sufficient quantities for year
round employment and eliminates questions regarding the legal status of these employees or the
employer. Current guest worker programs, as well as provisions for seasonal agricultural labor, do not
work for dairy operations. Dairy farming is a year-round enterprise, with workers’ primary roles in
46 Farm Labor Shortages and Immigration Policy - Linda Levine, Specialist in Labor Economics, Congressional Research Office, November 9, 2009
47 “Vermont dairy farms count on illegal immigrants” By Wilson Ring, AP Staff Writer, May 13, 2009, http://www.immigrationworksusa.org/uploaded/file/051309Vermontdairyfarmscountonillegalimmigrants.pdf

89
working with cows and calves. Consistent and expert animal care only comes from hands-on experience
over time, a time period longer than just a few months.
In the opinion of most Committee members, the issues surrounding immigrant labor for dairy
farmers needs to be resolved in order to maintain a continued supply of fresh milk in the U.S. within the
current economic and labor conditions. Large numbers of dairy farms in most, if not every, State are
dependent on immigrant labor. Enforcement only, without a workable program for agriculture, will
severely impact the dairy industry. The Committee shares the concerns of all Americans about protecting
the U.S., and it is not willing to sacrifice security. However, failing to provide for orderly flows of
greatly needed workers will create enormous economic consequences for our industry and do very little to
enhance our border protection. A dairy worker visa program (or modification of the current H-2A visa
program) that allows for terms up to 3 years for dairy workers with the ability to renew those visas is
needed. The program should also be respectful of those who take the opportunity to work in this country
and allow for the opportunity for permanent residency or citizenship if desired.
The Committee recognizes that the Secretary does not have any authority over immigration, but,
in his role as a member of the Cabinet and his relations with Congress, he should urge those who do have
jurisdiction to meet this need of the dairy industry.

90
Summary and Conclusions
Dairy farm operations have an impact on their rural communities far beyond providing high
quality, nutritious products. Dairy farms are job creators and tend to be strong investors in their local
community both with vendor purchases and long-term social commitment. The multiplier effect on the
economy, reduction of the tax burden on local economies, the maintenance of open space, and many other
positive secondary effects of dairy farming are important contributions made by a vibrant and healthy
dairy sector. The Secretary has encouraged the Committee to be aware of the needs of all dairy farmers,
of all structures and business models, and in all locations. Dairy farmers themselves would be the first to
also add that a healthy and vibrant dairy foods processing and marketing sector is essential to their own
prosperity and also add a variety of economic and social benefits where they exist.
Many studies have shown the impact of dairy farms on local economies. One common theme in
all of them is the multiplier effect of the dairy industry.48 Dairy farming is a capital-intensive industry
with many direct, indirect, and induced effects. Dairy farms and milk processors directly affect the
economy by employing farmers, milkers, truck drivers, and workers at processing plants. The dairy
industry also indirectly affects local economies through the purchases of inputs and services required to
keep the industry operating. By creating and maintaining employment, the spending of salaries and
wages by workers employed in the dairy industry helps support the economy.
Beyond their direct economic effects, dairy farms have other community benefits. They are often
regarded as stewards to the countryside who provide conservation and land preservation benefits for all.
The disappearance of working farms and the subsequent dilapidation of the land and buildings have a
significant negative effect on the rural economy and community and may add costs to the State or local
Government for the maintenance of land. Beyond its historical role in land stewardship, many new
methods are becoming technically and economically available to provide new environmental benefits,
including the possibility of harnessing methane from animal wastes to generate energy as well as manage
environmental risks related to manure handling.
It is also increasingly imperative to world food security that the U.S. protects and preserves its
working farmland. In return, farms will continue to benefit from producing products for the U.S. and
48 The Community Value of a Dairy Farm: September 8, 2009 N. Alan Bair, Director of Dairy Industry Relations, The Pennsylvania State University
91
international marketplaces. Farms of all sizes and business models are welcome and have a place in
ensuring a strong, diverse dairy industry.
A myriad of complex issues face dairy farmers as they prepare their businesses to compete in a
growing global economy. Relatively new business challenges such as increased feed prices, more volatile
milk prices, changing consumer diets, a global economy, and new production and processing technologies
have challenged the industry to develop new, adaptive strategies.
The Committee presents analyses of many of these issues and highlights their importance. It
offers a number of recommendations for how USDA, and others, can assist in that development and
provide tools for dairy farmers to help their farm businesses survive and thrive in the coming years. We
encourage USDA and the industry to continue its dialogue and implement those strategies that provide a
long-term, fundamentally sound dairy business climate.

92
Appendix A - Farm Financial Performance Measures
In January 1989 a “Farm Financial Standards Task Force” was created with the mandate to
develop and publish standardized Financial Guidelines for Agricultural Producers. The Farm Financial
Standards Task Force was incorporated in March 1993, as a “Nebraska non-profit corporation” and on
November 12, 1994, the corporate name was changed to Farm Financial Standards Council to reflect
more appropriately a permanent organization.
The FFSC accepts as one of its core missions to: “present standardized definitions and methods
for calculating financial measures which may be used in the measurement of financial position and
financial performance of agricultural producers”. Currently, 21 measures are endorsed by the FFSC.
Farm Financial Standards Council
http://www.ffsc.org/index.htm
Liquidity
Current Ratio: (total current farm assets) / (total current farm liabilities). This measure reflects the extent to which current farm assets, if sold tomorrow, would pay off current farm liabilities.
Working Capital: (total current farm assets) – (total current farm liabilities). This measure represents the short-term operating capital available from within the business.
Working Capital to Gross Income: Measures operating capital available against the size of the business.
Solvency
Debt-to-Asset Ratio: (total farm liabilities) / (total farm assets). This represents the bank’s share of your business. A higher ratio is an indicator of greater financial risk and lower borrowing capacity.
Equity-to-Asset Ratio: (farm net worth) / total farm assets). This measure of solvency compares farm equity to total farm assets.
Debt-to-Equity Ratio: (total farm liabilities) / farm net worth. This measure compares the bank’s ownership to your ownership of the business.
Profitability
Rate of Return on Assets: [(NFI) + (farm interest) – (value of operator labor and management)] / (average value of farm assets). This measure represents the average “interest” rate being earned on all investments in the business (your investment and that of your creditors).
Rate of ROE: [(NFI) – (value of operator labor and management)] / (average farm net worth). This measure represents the “interest” rate being earned by your investment in the farm. This return can be compared to the return on your investments if equity were invested somewhere else, outside the business.
Operating Profit Margin: (return on farm assets) / (value of farm production), where return on farm assets equals (NFI from operation) + (farm interest expense) – opportunity return to labor and management). This measure of profitability shows the operating efficiency of the business. Low expenses relative to the value of farm production result in a healthy operating profit margin.
NFI: (gross cash farm revenue) – (total cash farm expense) + (inventory changes) + (depreciation and other capital adjustments, including gains/losses from the sale of capital assets). This measure represents profitability or the farm’s return to labor, management, and equity.

93
EBITDA: Earnings before interest, taxes, depreciation, and amortization—measurement shows the earnings of the business that are available for debt repayment.
Repayment Capacity
Term Debt Coverage Ratio: [(net farm operating income) + (net nonfarm income) + (depreciation) + (scheduled interest on term debt and capital leases) – (family living and taxes paid)] / (scheduled principal and interest payments on term debt and capital leases). This measure of repayment capacity tells whether the business produced enough cash to cover all intermediate and long-term debt payments.
Capital Replacement Margin: the value of (NFI) + (net nonfarm income) + (depreciation – (family living expenses, taxes paid, scheduled payments on term debt). This measure describes the amount of money left over after all operating expenses, taxes, family living cost, and scheduled debt payments have been made.
Capital Debt Repayment Capacity: Measurement of all sources of income that could be used to pay debt (both farm and non-farm sources of income).
Replacement Margin: Enables borrowers and lenders to evaluate the ability of the operation to generate funds necessary to repay debts with maturity dates longer than 1 year and to replace assets.
Replacement Margin Coverage Ratio: To show if enough income was generated to cover term debt payments and the cash contribution for new equipment.
Financial Efficiency
Asset Turnover Rate: the (gross farm revenue) / (average farm assets). This measures the efficiency of using capital. A high level of production in proportion to the level of capital investment yields a high (or efficient) asset turnover rate.
Operating Expense Ratio: the value of [(total farm operating expenses) – (depreciation) – (farm interest)] / (gross farm revenue). This measure reflects the proportion of farm revenues used to pay operating expenses, not including principal or interest.
Interest Expense Ratio: (farm interest) / (gross farm revenue). This measure of financial efficiency shows how much of gross farm revenue is used to pay for borrowed capital.
Depreciation Expense Ratio: (depreciation and other capital adjustments) / (gross farm revenue). This measure indicates what proportion of farm revenue is needed to maintain the capital used by your business.
NFI from Operations Ratio: (NFI from operations) / (gross farm revenue). This measure of financial efficiency compares profit to gross farm revenue. It shows how much is left after all farm expenses, except for the return to unpaid operator and family labor, management and capital, are paid.

94
Appendix B – Summary Information About Existing Dairy Programs
Summary of Dairy Product Price Support Program (DPPSP)
Objectives: Price Support - prevent farm price of milk from falling below a target level by purchasing dairy
commodities specified by Congress at specified minimum prices. The underlying objective is variously described as to create greater price stability or to enhance farm prices and income.
Minimize impact on commercial sales when disposing of Government stocks.
Methods: USDA/CCC offers to purchase butter, cheese, and NDM, according to established specifications,
at the announced purchase prices. If this price is appealing to manufacturers of those commodities, compared to prevailing or
expected market prices, the manufacturer initiates a “response” to USDA’s “invitation. CCC takes ownership of the product and is expected to dispose of the product in a manner that
recognizes its value as a food product but which does not undermine the commercial market for similar products. This may include domestic and international food assistance, use in Government programs and facilities, use in animal feeds, and the like.
If a product is offered for sale in commercial channels, its price must equal or exceed the established Sellback Price. Sellback Prices are currently 110 percent of purchase prices.
Legal Authority: Agricultural Act of 1949 (as amended)
Administering Agency: U.S. Department of Agriculture - Farm Service Agency
Commodity Operations - Commodity Credit Corporation

95
Summary of the Milk Income Loss Contract (MILC) Program
Objectives: Income Support - augment dairy farmer income when milk prices are low
Methods: Provide a countercyclical payment to qualified dairy farmers when the Class I price announced for
the Boston city zone of the Northeast FMMO falls below a legislatively specified value. In addition to setting the benchmark or target price, the law also specifies a percentage of the
difference between the target price and the announced price. The payment rate is based on that percentage.
Total payments are limited to a specified amount of milk marketings (pounds of milk sold) per farm. In each FY, qualified dairy farmers must elect the month in which they are first eligible to begin
receiving a monthly MILC supplement. Payments are made in each consecutive month in which a payment is due until the annual limit on marketings is reached.
Legal Authority: Food, Conservation and Energy Act of 2008 (FCEA or 2008 Farm Bill). The MILC was first authorized under the Farm Security Act of 2002 (2002 Farm Bill). But, its legislative origin traces to emergency market transition assistance authorized under the Agriculture, Rural Development, Food and Drug Administration, and Related Agencies Appropriations Act, 2000 (H.R.1906).
Administering Agency: U.S. Department of Agriculture - Farm Service Agency
Farm Programs - Price Support Division

96
Summary of Federal Milk Marketing Orders (FMMO)
Objectives: Orderly marketing (not specifically defined) Adequate supplies of milk for fluid purposes
Methods: Classification of producer milk according to the end-product in which it is used and minimum
pricing of milk according to class Pooling the values paid by processors for each class of milk to return a common “pool” price to all
producers, regardless of the actual destination of their milk. Auditing to ensure and enforce compliance by regulated handlers.
Legal Authority: Agricultural Marketing Agreement Act of 1937 (as amended)
Administering Agency: U.S. Department of Agriculture - Agricultural Marketing Service Dairy Programs

97
Summary of the Dairy Export Incentive Program (DEIP)
Objectives: Increase sales of U.S. dairy products in foreign markets, particularly to offset export subsidies from
other countries Encourage dairy product marketers to export
Methods: Provide cash subsidies to dairy product exporters by supplementing privately negotiated export
prices.
Legal Authority: Created under the Dairy Production Stabilization Act of 1983 and initiated in May 1985.
Reauthorized under the Agriculture, Conservation, and Trade Act of 1990, the Uruguay Round Agreements Act of 1995, and the Federal Agriculture Improvement and Reform Act of 1996.
Administering Agency: U.S. Department of Agriculture - Foreign Agricultural Service