Embed Size (px)
Citation preview
I -
UNIVERSITY OF MICHIGAN
OFFICIAL PUBLICATION
Report of
The Office ofRegistration and Records
1961-1962
Reprinted from the President's Report for
1961-1962. The University' of Michigan
(j
/
ANN ARBOR, MICHIGANPUBLISHED BY THE UNIVERSITY
FOREWORD
The statistical summary of the student population ofThe University of Michigan for the year 1961-62 is presented here in the form of tables and figures. Enrollment information, honor-point averages, degrees granted, and other interesting data are summarized. Additionaldetailed information is available in the statistical Service of the Office of Registration and Records.
The other services given by this office are in theareas of orientation, registration, recording, SelectiveService certification and counseling, and the furnishingof diplomas anci"transcripts. Comments and suggestionsfor the improvement of these services and this reportare most welcome.
Office of Registration and Records
Edward G. Groesbeck, Director
CONTENTS
TABLES
OFFICE OF REGISTRATION AND RECORDS: ENROLLMENT .. 7
I. Enrollment Summary of the University for StudentsRegistered in Residence Credit Programs, Credit Extension Courses, and Extramural Certificate Programs-1961-62 " . . . . . . . . . . . . . . . . . . 8
IT. Student Credit Registrations by 1961-62 Regular Sessionand Annual Summary, Student Group, and Sex 9
ITI. Student Credit Registrations by Period of Enrollment,Student Group, and Sex,-1961-62 10
IV. Enrollment in Credit and Professional Programs from1841-42 through 1961-62 ~ 12
CHARACTERISTICS OF THE STUDENT POPULATION 14
V. Class Distribution of Students in Residence Credit Programs by Period of Enrollment and Student Group, 1961-62 15
VI. Class Distribution-1961 Fall Semester . . . .. . . . . .. 19
VII. 1961 Fall Enrollment by Marital Status, Class Level,Student Group, and Sex, Close of the Fifth Week ofClasses 22
VIIT. College of Literature, Science, and the Arts Concentra-tio~ Count, First Semester, 1961-62 ..... '. . . . . . .. 24
ACADEMIC ACHIEVEMENT
IX. Academic Success of Undergraduate Students, Fall,1961
X. Academic Success of Undergraduate Students, Spring,1962
26
27
27
XI. Honor-Point Averages Earned by Fall, 1961, FreshmenDuring First Semester 28
3

XII. Honor-Point Averages Earned by Fall, 1961, FreshmenDuring Second Semester 28
XIII. Comparison of Students Honored at the 1962 HonorsConvocation with the 1961 Fall Semester Eligible Un-dergraduate Enrollment 29,
XIV. Students Honored at the 1962 Honors Convocation-byCitation 30
XV. Transcripts and Grade Reports to Students, Deans, andDepartments . . . . . . . . . . . . . . . . . . . . . . . . . . . .. 30
XVI. Undergraduate Grade-Point Averages by PercentileRanking, Class and Unit, 1961-62 ......•........ 32
DEGREES AND AWARDS 33
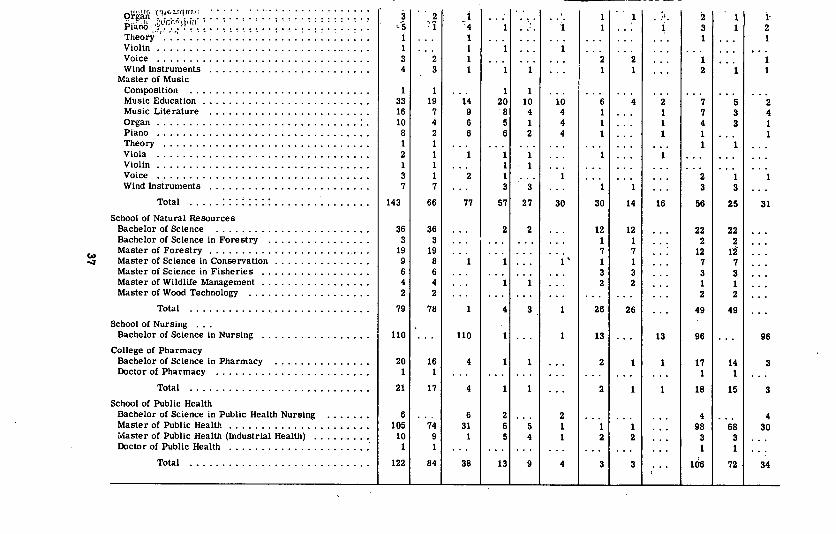
XVII. Summary of Degrees, Certificates, and CommissionsConferred July 1, 1961 Through June 30, 1962 . . . . . .. 34
XVIII. Number of Degrees by Degree Level, 1950-51 Through1961-62 40
XIX. Degrees in Course Conferred by the University of Mich-igan 1845 to 1962 41
XX. Number of Graduates by Field, Degree Level, and Unit,1961-62 42
XXI. Number of Graduates by Field in the College of Literature, Science, and the Arts from July 1, 1961, ThroughJune 30, 1962 . . . . . . . . . . . . . . . . . . . . . .. 46
GEOGRAPHICAL ORIGIN OF STUDENTS 48
XXII. Distribution. of Students by Selected Geographical Re-gions, 1961-62 48
XXIII. Regional Distribution of Students, 1961-62: ResidenceStudents in Credit Programs and Extramural Students inCredit and Professional Programs 50
XXIV. 1961-62 Geographical Distribution of Students by Statesand Countries: Residence Students in Credit Programsand Extramural Students in Credit and ProfessionalPrograms 51
XXV. 1961-62 Geographical Distribution of Students by Counties in Michigan: Residence Students in Credit Programs and Extramural Students in Credit and Profes-sional Programs .... . . . . . . . . . . . . . . . . .. 58
4
XXVI. Michigan Population, High School Data, and UniversityEnrollment by County . . . . . . . . . . . . . . . . . . . . . ., 62
XXVII. Michigan Counties Ranked by University of MichiganStudents, Population, High School Enrollees, and HighSchool Graduates , .. ' 63
XXVIII. Students Registered in Certificate Courses in the Falland Spring of 1961-62, Distributed by Michigan Counties,Other States, and Foreign Countries 64
XXIX. Persistence of Fall, 1961, Freshmen. . . . . . . . . . . .. 67
XXX. Number and Percentage of the University of MichiganResidence Credit Students who Registered Both Spring,1961, and Fall, 1961 68
XXXI. The University of Michigan Spring, 1961 ResidenceCredit Students Returning to the University, Fall, 1961,by Unit of Registration 69
XXXlI. Number and Percentage of Residence Credit Studentswho Registered Both Summer, 1961, and Fall, 1961 ... 70
XXXIII. Summer, 1961, Residence Credit Students Returning tothe University, Fall, 1961, by Unit of Registration .. .. 71
XXXIV. Number and Percentage of Residence Credit Studentswho Registered Both Spring, 1961, and Summer, 1961 .. 72
XXXV. Spring, 1961, Residence Credit Students Returning to theUniversity, Summer, 1961, by Unit of Registration .. ", 73
XXXVI. Freshmen Registrants Without Previous College Ex-perience, 1945-46 to 1961-62 74
RETURNING STUDENTS, FRESHMEN, AND TRANSFERSTUDENTS . 67
XXXVII. Freshman Registrations by Residence, Sex, College, andAdmission Period, 1961-62 76
XXXVIII. Transfer Students Who Registered Fall, 1961, Close ofFifth Week of Classes . . . . . . . . . . . . . . . . . . . . . .. 78
XXXIX. Transfer Students Who Registered Spring, 1962, Closeof Fifth Week of C~asses ... . . . . . . . . . . . . . . . . .. 79
5
FIGURES
1. Student Credit Registration by Period of Enrollment,1961-62 11
2. Enrollment in Credit and Professional Programs, 1841-42 through 1961-62 13
3. Percentage of Class Distribution, 1961-62 . 18
4. Fall Enrollment by Marital Status, 1961-62 21
5. Students Honored at the 1962 Honors Convocation. . . .. 31
6. Degrees Granted ;-.. 33
7. Regional Distribution of Residence and Extramural Students in Credit and Postgraduate Professional Pro-grams, 1961-62 49
8. 1961-62 Enrollment by States 56
9. 1961-62 Enrollment by Counties .. . . . . . . . . . . . . .. 57
10. Freshman Registrants Without Previous College Exper-ience, 1945-46 to 1961-62 75
6

THE OFFICE OF REGISTRATION AND RECORDS
ENROLLMENT
For the ninth consecutive year the residence credit enrollment hasexceeded the previous fall or spring semester. In the fall of 1961,25,689 students were enrolled for residence credit in degree programs,resulting in a 51 per cent increase in fall enrollment since 1952. Anadditional 4,117 were enrolled in credit courses at University centers.The total enrollment for the year was 39,467. This was 10,477 studentsmore than in 1952-53.
The tables and figures that follow describe in detail the enrollmentby period and unit at the University. Prescribed procedures were followed in accounting the number of students registered at the University.The year includes the 1961 Summer session, the 1961-1962 first semester, and the 1961-1962 second semester. Only those students whoremained beyond the total refund in any period are included. Postgraduate registrations are considered to be short-course enrollmentsif less than four weeks in the summer or less than eight" weeks duringthe regular semesters. Any apparent numerical discrepancies in totalare the result of students who are enrolled in two or more units andcounted but once in the net total.
Extramural students in certificate programs in Group III arecounted in the summary only. All other groups mentioned in the summary are included in the tables on geographical distribution of studentssince they constitute a service of instruction to the people of the state,the nation, and other areas.
7

TABLE I
2653
11,466
11,387
Men Women
22,105
Total
33,492
468 442817 764
34,7772~,311
6,143 2,793 3,350787 422 365
820 786 34
7,699 3,970 3,729
41,516 26,735 14,781
8
A. Class ........................... 3,001 2,233 768B. Correspondence ................... 722 374 348
Net total certificate programs ............ 3,723 2,607 1,116
Students enrolled in University instructionalprograms* ......................... . . 45,239 29,342 15,897
Net Total
Net Total
I. Students in residence credit programs:
A. Degree and postgraduate professionalprograms .
B. Shorter postgraduate programs1. Dentistry .2. Medicine .
Enrollment Summary(1961-1962)
Student Group
IT. Students in extramural credit and professionalprogrflms:
A. Ektension1. Class .2. Correspondence .
B. Postgraduate professional medicine .
Net total credit and professional programs*
ill. Students in extramural certificate programs:
Extension
*Students registered in more than one credit program have' been counted onlyonce.
In the summary, enrollments have been divided into groups as follows:
I-A Students in University degree or postgraduate professional resi-dence credit-level programs 33,492
I-B Students in University postgraduate professional programs offewer than four weeks in the summer session or fewer than eightweeks during either semester. . . . . . . . . . . . . . . . . . . . . . . .. 1,285
II-A 1 Students in University Extension credit courses offered in the following areas: Ann Arbor, Battle Creek, Detroit, Dearborn, Escanaba, Flint, Grand Rapids, Port Huron, Saginaw, and Traverse City.Classes were also held in forty-six other Michigan communities. 6,143
IT-A 2 Students in University Extension credit courses ,offered throughcorrespondence ',' . . . . . . . . . . . . . . . . . 787
IT-B Students in extramural postgraduate programs in medicine, offeredat twenty-two centers in the state . 820
III-A Students in University Extension certificate classes, designed toassist the mature individual who is seeking continued study alonglines not covered in regular University courses. . . . . . . . . . . .. 3,001
ill-B Students in University Extension certificate courses offeredthrough correspondence , . . . . . . . . . . . . 722
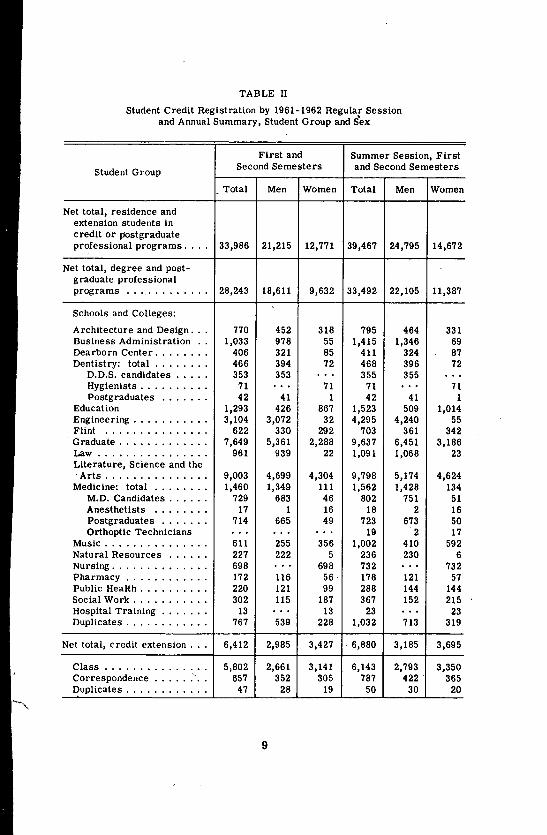
TABLE II
Student Credit Registration by 1961-1962 Regular Sessionand Annual Summary, Student Group and S'ex
First and Summer Session, First
Student GroupSecond Semesters and Second Semesters
Total Men Women Total Men Women
Net total, residence andextension students incredit or postgraduateprofessional programs .... 33,986 21,215 12,771 39,467 24,795 14,672
Net total, degree and post-graduate professionalprograms .... - ........ 28,243 18,611 9,632 33,492 22,105 11,387
Schools and Colleges:
Architecture and Design ... 770 452 318 795 464 331Business Administration .. 1,033 978 55 1,415 1,346 69Dearborn Center ••...••• 406 321 85 411 324 87Dentistry: total ........ 466 394 72 468 396 72
D.D.S. candidates .••.. 353 353 ... 355 355 . ..Hygienists .•......•. 71 ... 71 71 ... 71Postgraduates ....... 42 41 1 42 41 1
Education 1,293 426 867 1,523 509 1,014Engineering ..•.•....•. 3,104 3,072 32 4,295 4,240 55Flint ............... 622 330 292 703 361 342Graduate .........•... 7,649 5,361 2,288 9,637 6,451 3,186Law ...•......•..... 961 939 22 1,091 1,068 23Literature, Science and the
Arts •......••..•.•. 9,003 4,699 4,304 9,798 5,174 4,624Medicine: total ........ 1,460 1,349 111 1,562 1,428 134
M.D. Candidates ..•... 729 683 46 802 751 51Anesthetists ........ 17 1 16 18 2 16Postgraduates ....... 714 665 49 723 673 50Orthoptic Technicians .. . .. . ... 19 2 17
Music ..•....•.•..... 611 255 356 1,002 410 592Natural Resources ...... 227 222 5 236 230 6Nursing ........•...•. 698 .. . 698 732 ... 732Pharmacy ....•....... 172 116 56 178 121 57Public Health .......... 220 121 99 288 144 144Social Work ........... 302 115 187 367 152 215Hospital Training ......• 13 ... 13 23 . .. 23Duplicates .....•....•. 767 539 228 1,032 713 319
Net total, credit extension ... 6,412 2,985 3,427 6,880 3,185 3,695
Class .•...........•. 5,802 2,661 3,141 6,143 2,793 3,350Correspondence .•....".. 657 352 305 787 422 365Duplicates ....••. , •... 47 28 19 50 30 20
9

TABLE ill
Student Credit Registrations By Period of Enrollment,Student Group, and Sex (1961-1962)
1961 Summer Session First Semester Second SemesterStudent Group
Total Men Women Total Men Women Total Men
Net total, residence and exten-siori students in credit orpostgraduate professionalprograms ............ 12,547 8,187 4,360 29,562 18,846 10,716 28,019 17,856
Net total, degree and post-graduate professional pro-
7,763grams ............... 11,588 3,825 25,689 17,026 8,663 24,590 16,252
Schools and Colleges:
Architecture and Design 99 47 52 718 416 302 676 39jlBusiness Administration 548 527 21 853 808 45 855 816Dearborn Center ........ 184 175 9 331 265 66 363 290Dentistry: total ........ 28 27 1 454 382 72 432 361
D.D.S. candidates 26 26 346 346 334 334Hygienists .......... 1 71 71 70Postgraduates ........ 1 1 37 36 1 28 27
Education ............. 413 137 276 1,070 352 718 1,083 343Engineering ........... 1,698 1,664 34 2,938 2,906 32 2,549 2,524Flint ................ 239 114 125 514 282 232 496 265Graduate ............. 4,329 2,736 1,593 6,258 4,497 1,761 6,358 4,550Law ................ 315 310 5 957 935 22 881 862Literature, Science, and the 1,609 865 744 8,268 4,237 4.031 7,786 4,027
Arts ..............Medicine: total ......... 845 778 67 1,339 1,256 83 1,269 1,171
M.D. Candidates ....... 432 408 24 724 678 46 708 664Anesthetists ......... 8 1 7 17 1 16 9 1Postgraduates ........ 386 . 367 19 598 577 21 552 506Orthoptic Technicians .. '. 19 2 17
Music ............... 533 212 321 556 238 318 515 211Natural Resources ....... 70 69 1 200 196 4 197 192Nursing .............. 454 454 674 674 629Pharmacy ............ 33 25 8 157 105 52 137 95Publlc Health
,86 36 50 204 112 92 194 113..........
Social Work ........... 117 59 58 242 92 150 232 93Hospital Training ....... 10 10 13 13 13Dupllcates ............ 22 18 4 57 53 4 75 59
Net total, credit extension ... 1,018 455 563 4,117 1,949 2,168 3,626 1,708
Class ............... 453 170 283 3,577 1,668 1,909 3,221 1,487Corre.spondence ....... '. 566 286 280 561 291 270 427 233Dupllcates ............ 1 1 21 10 11 22 12
10

BY
1961-62
IIIII!!IIIIIIIIIIIIII
4,000
8,000
PERIOD OF ENROLLMENT
STUDENT CREDIT REGISTRATIONS
16,000
12,000
20,000
24,000
28,000
summersession
firstsemester
secondsemesteJ:
FIGURE 1
11

12
TABLE IV
Enrollment in Credit and Professional Programs from 1841-42 Through 1961-62
'Includes students in the regular session and summer session and those taking classand correspondence extension courses for which credit may be given. Students in noncredit courses are not included. Students in postgraduate programs are included after1944-45. '
tNot including 2,258. Section B., S.A.T.C.
Total'3,7923,9574,1364,5714,7465,0105,2235,3835,3815,5825,8056,2586,8577.2147;5176,7347,288t9,401
10,62311,12011,45012,29112,31212,69013,25713,59313,76915,15415,50014,82613,25712,30113,69116,04018,04318,85119,59119,59618,89917,16716,27117,70818,71825,54930,27832,30732,77033,15631,33928,62328,99030,20130,57033,72335,91937,46238,78638,79339,08141,516
Year
1902-03 .1903-04 .1904-05 .1905-06 .1906-07 .1907-08 .1908-09 .1909-10 .1910-11 .1911-12 . : .1912-13 ,..1913-14 .1914-15 .1915-16 .1916-17 .1917-18 .1918-19 .1919-20 .1920-21 .1921-22 .1922-23 .1923-24 .1924-25 .1925-26 .1926-27 .1927-28 .1928-29 .......•......-.1929-30 .1930-31 .1931-32 .1932-33 .1933-34 .1934-35 .1935-36 .1936-37 .1937-38 .1938-39 .1939-40 .1940-41 ....•..........1941-42 .1942-43 .1943-44 .1944-45 .. ' .1945-46 .1946-47 .1947-48 .1948-49 .1949-50 .1950-51 .1951-52 .1952-53 .1953-54 .1954-55 .1955-56 .1956-57 .1957-58 .. ; .1958-59 .1959-60 .1960-61 .1961-62 .
Total'Year
1841-42 . . . . . . . . . . . . . . . 71842-43 . . . . . . . . . . . . . . . 251843-44 . . . . . . . . . . . . . . . 531844-45 . . . . . . . . . . . . . . . 531845-46 . . . . . . . . . . . . . . . 701846-47 • . . . . . . . . . . . . . . 671847-48. . . . . . . . . . . . . . . 891848-49 . . . . . . . . . . . . • . . 771849-50 .........• ~ . . . . 721850-51 . . • . . . . . . . . • • . . 1591851-52 . . . . . . . . . . . . . . . 2161852-53 . • • . . . . . . . . . . . . 2221853- 54 . • . . . . . . . . . . . . . 2441854-55 . . • . . . . . . . • • . . . 2881855- 56 . . • . . . . . . . . . . . . 3901856-57 . . . . . . . • • . . . . . . 4801857-58 . . . . • . . • . . . . . . . 4491858- 59 ... '. . . . . . . . . . • • 4301859-60 . . . . . • . . . . . . . . . 5191860-61 . . . . . . . . . . . . . . . 6741861-62 . . . . . . . . . . . . . . . 6151862- 63 . . . . . . . . . . . . . . . 6521863- 64 . . . . . . . . . . • . . . . 8561864-65 . . . . . . . . . . . . . . . 9531865-66 . . . . . . . . . . . . . . . 1,2051866-67 . . . . . . . . . . . . . . . 1,2551867 - 68 . . . . . . . . . . . . . . . 1;27 31868-69 . . . . . . . . . . . . . . . 1,1141869-70 . . . . . . . . . . . . . • . 1,1121870-71 . . . . . . . • . . . . . . . 1;1101871-72 '. . . 1,2071872-73 . . . . . . . . . . . . . . . 1,1631873-74 ; . . . . . . . 1,1051874-75 . . . . . . . . . . . . . . . 1,1911875-76 . . . . . . . . . . . . . . . 1,1291876-77 . . . . . . . . . . . . . . . 1,1111877-78 . . . . . . . . . . . . . . . 1,2301878-79 . . . . . . . . . . . . . . . 1,3721879-80 . . . . . . . . . . . . . . . 1,4271880-81 . . . . . . • • . • • . . . . 1,5341881-82 . . . . . . • . . . . . . .. 1,5341882-83 . . . . . . . . . . . . . . . 1,4401883-84 . . . . . . . . . . . . . . . 1,3371884-85 . • . . . . . • . . . . • .. 1,2951885-86 ....•.•• : . . . . . . 1,4011886-87 . . . . . . . . . . . . . . . 1,5721887-88 . • • . • . . . • . . . . . . 1,6671888- 89 . . . . . . • . • . . . . . . 1,8821889-90 . . • • • . . . . . . . . . . 2,1531890-91 . . . . . • . . . . . . . . • 2,4201891-92 . . . . . . . . • • . . . . . 2,6921892-93 ............•. , 2,7781893-94 ' 2,6591894-95 . . . . . . . . . . . . . .. 2,8641895-96 . . . . . . . . . . . . . . . 3,0141896-97 . . . . . . . . . . . . . . . 2,9751897-98 . . . . . . . . . . . . . . . 3,2231898-99 . . . . . . . . . . . . . . . 3,1921899-1900 3,4411900-1901 3,7121901-02 , . . . . . .. 3,709
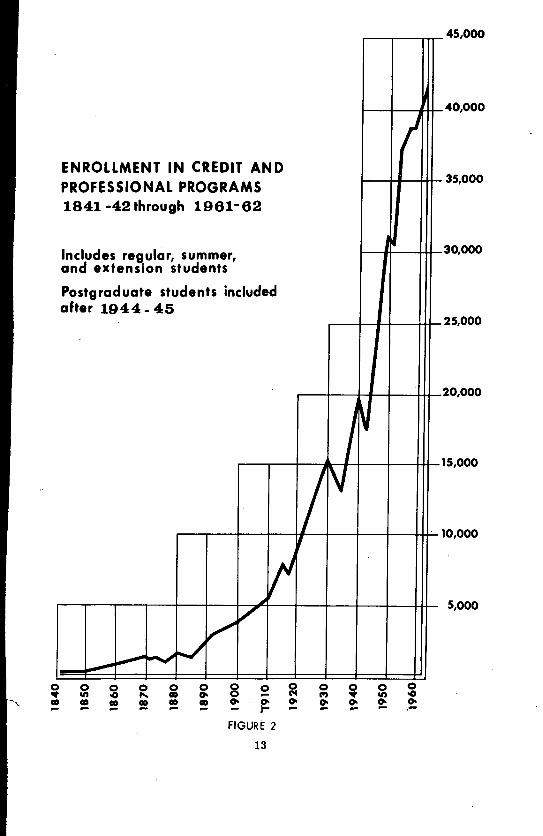
ENROLLMENT IN CREDIT ANDPROFESSIONAL PROGRAMS1841 -42 through 1961-62
Includes regular, summer,and extension students
Postg rad uate students includedafter 1944 - 45
,.----r-"""'TT'1r- 45,000
1---+--;----..I4+_ 40,000
I-----+..I---I-I-l- 35,000
1--~---l+1-30,000
.--~---4I-l---++l'-25,000
,.---4--+-1-+---J.++.-20,000
5,000
0 0 0 0 0 0 0 0 0 0 0 0 0• 11'1 00 " CD 0- 0 - N CO') • 11'1 00CD CD CD !! CD CD 0-
~0- 0- 0- 0- 0-- - - - - - - - - - .-
FIGURE 2
13

CHARACTERISTICS OF THE STUDENT POPULATION
Great interest has been exhibited in the characteristics of the student population. This was evident from the number of inquiries aboutthe 1961-1962 student groups. The following tables and figures answermany of these inquiries by showing the enrollment by class level andmarital status. Enrollment by fields of specialization is presented forthe College of Literature, Science, and the Arts.
The number of married graduate/graduate-professional male students surpasses the number of single graduate students by a wide margin. Again this year the total number of married students is above theprevious year. One out of four students who attend the University ismarried.
The graduate/graduate-professional enrollments continue to account for more than 41 per cent of the total enrollment during theacademic year and nearly 54 per cent during the summer session.
14

/
TABLE V
...(/1
Class Distribution of Students in Residence Credit Programs by Period of Enrollment and Student Group (1961-62)
1961 Summer Session 1961 Summer Sessiont First Semestert Second Semester§First and Second Semesters·
~ (ij E (ij '" (ij~ (ijUniversity " '" " ~ " "" 0 " 0 " 0 " 0Unit '" , .- '" , .- '" , .- '" , .-
'" ~ '" "' '" j!J '" "' '" '" '" "' '" j!J '" "'... ~"' ... ~"' ...~ ~ "' ... ~ "'bll '" '" bll '" '" '" bll "'~ bll '" '" '"~ ... " ,,- ... " ,,- ... " " 0 (ij
... " ,,-'" '" '" 0 3 '" '" '" 0 '" '" '" ... '" '" '" 0~ '" '" '" ... '" '" '" ... ~ '" '" ePo.
~ '" '" '" ...{:. " ... ... Po. {:. " ... ... Po. 0 "...
"... ... Po.
::> (,:J (,:J ::> (,:J (,:J f-< ::> (,:J (,:J ::> (,:J (,:J
Enrollment in residencecredit programs ...... Total 33,492 19,510 10,374 3,608 11,588 5,347 4,855 1,386 25,689 15,703 6,899 3,087 24,590 14,918 6,754 2,918
Men · . 22,105 11,915 7,047 3,143 7,763 3,437 3,097 1,229 17,026 9,215 5,052 2,759 16,252 8,741 4,918 2,593Women. 11,387 7,595 3,327 465 3,825 1,910 1,758 157 8,663 6,488 1,847 328 8,338 6,177 1,836 325
Unde rgraduate, graduate,and graduate-professionalpercentage of totalenrollments ......... 100.0 58.3 30.9 10.8 100.0 46.1 41.9 12.0 100.0 61.1 26.9 12.0 100.0 60.7 27.5 11.8
.Schools and Colleges:Architecture and Design Total 795 795 .. . .. . 99 99 . , . . .. 718 718 . .. .. . 676 676 . .. ., .
Men · . 464 464 .. . .. . 47 47 . , . .. . 416 416 . .. " . 398 398 ... ., .Women. 331 331 .. . .. . 52 52 .. . .. . 302 302 ... " . 278 278 .. . ., .
Business Administration Total 1,415 791 624 .. . 548 375 173 . .. 853 369 484 ... 855 410 445 ...Men 1,346 741 605 .. . 527 362 165 .. . 808 335 473 .. . 816 375 441 ., .Women. 69 50 19 . , . 21 13 8 .. . 45 34 11 .. . 39 35 4 ., .
Dearborn ., .. ,....... Total 411 411 .. . .. . 184 184 . , . " . 331 331 . .. . .. 363 363 ... ., .Men · . 324 324 . , . .. . 175 175 .. . " . 265 ·265 .. . . .. 290 290 ... ., .Women. 87 87 . , . .. . 9 9 . , . ... 66 66 . .. ... 73 73 . .. . ..
Dentistry ........... Total 468 71 . , . 397 28 1 . .. 27 454 71 .. . 383 432 70 ... 362M~n " 396 .. . . , . 396 27 .. . ., . 27 382 .. . .. . 382 361 . .. ... 361Women. 72 71 .. . 1 1 1 ., . ... 72 71 " . 1 71 70 ... 1

TABLE V (Cont.)
Class Distribution of Students in Residence Credit Programs by Period of Enrollment and Student Group (1961-62)
1961 Summer Session 1961 First Semestert Second Semester§First and Second Semesters· Summer Sessiont
University$ ~ ~ ~ ~ ~ $ ~oS " " "
oS
"Unit .g 0 " 0 " 0 " 0, .~ "0 , .~ "0 , .~ "0 , .~
oS <II <II Ul oS $ <II Ul oS~
<II Ul oS
~<II Ul...
""_ Ul
'" _Ul '" _Ul '"_ Ul
bJl oS <II bJl oS ~~ bJl ~~bJl oS <II
~ '" ",,~
'" .g - '" " '" ",,~
<II "0 "0 0~ <II "0 0 <II "0 "0 0 ' ~ <II "0 "0 0
0 "0 oS oS ... "0 oS oS '" 5 "0 oS£!~ "0 oS oS '"
" '"",p.,
~ " '"",p.,
{? " '" ~ " ... ",p.,f-< ~ Cl Cl ~ Cl Cl ~ Cl Cl ~ Cl Cl
Schools and Colleges:
Education .......... . Total · . 1,523 1,523 ' 413 413 1,070 1,070 1,083 1,083Men ... 509 509 137 137 352 352 343 343Women 1,014 1,014 276 276 718 718 740 740
.... Engineering Total 4,295 4,295 1,698 1,698 . 2,938 2,938 2,549 2,549Q> ........ . · .Men , .. 4,240 4,240 1,664 1,664 2,906 2,906 2,524 2,524Women 55 55 34 34 32 32 25 25
Flint ........... . Total · . 703 703 239 239 514 514 496 496Men ... 361 361 114 114 282 282 265 265Women 342 342 125 125 232 232 231 231
Graduate .......... . Total · . 9,637 9,637 4,329 4,329 6,258 6,258 6,358 6,358Men ... 6.451 6,451 2,736 2,736 4,497 4,497 4,550 4,550Women 3,186 3,186 1,593 1,593 1,761 1,761 1,808 1,808
Law ............. . Total · . 1,091 1,091 315 315 957 957 881 881Men ... 1,068 1,068 310 310 935 935 862 862Women 23 23 5 5 22 22 19 19
Literature, SCience, andthe Arts .......... . Total · . 9,798 9,798 1,609 1,609 8,268 8,268 7,786 7,786
Men ... 5,174 5,174 865 865 4,237 4,237 4,027 4,027Women 4,624 4,624 744 744 4,031 4,031 3,759 3,759
Medicine .......... . ,Total " . 1,562 .1~o t1,543 845 19 826 1,339 1,3~9 1269 I" ... 1,269,
.......... . ~~e~ : '.' ,1,4,28' ;1,426. 778' 2 F6 1,256 0' 1,256 '1:17i'; I· .: il ,P1,.. 'j-, !~. :.l, 67"' . '.~.
i:,:~IWomen I '134 '17 i 117 17 50 ! 83 : . :-:..: I 83 I 9il' !. :' 98
,I I ...... t - ~ .. ' 11 I
1;092 664' 3381 f:r~ ! 533I
,.'1"1 I I.: •• 1
. ,Music '.I~tiil .... 288i 245 556 . 423' 133 . ,515j ~~3: 122 \ .',•••••••••••• oi
M!in .....1 410 254: i56 1 ,.·:t! '212 96' 1i6 ... 2'38 i79i 59' ~'~":i , 211i 160: 51Women. 592 410 182' . 32'1 192 129 318 244 74 304 233 71
Natural Resources ..... Total · . 236 182 54 70 58 12 200 154 46 197 157 40Men ... 230 180 50 69 58 11 196 152 44 192 155 37Women 6 2 4 1 1 4 2 2 5 2 3
Nursing ............ Women 732 732 454 454 674 674 629 629
Pharmacy .......... Total · . 178 170 8 33 30 3 137 150 7 137 130 7Men ... 121 113 8 25 22 3 105 98 7 95 88 7Women 57 57 8 8 52 52 42 42
Public Health ........ Total · . 288 60 228 86 23 63 204 33 171 194 34 160Men ... 144 5 139 36 2 34 112 112 113 3 110Women 144 55 89 50 21 29 92 33 59 81 31 50
Social Work ......... Total · . 367 367 117 117 242 242 232 232Men ... 152 152 59 59 92 92 93 93Women 215 215 58 58 150 150 139 139
Hospital Training Total · . 2:t 23 10 10 13 13 13 .", 13Men ... . ..Women 23 23 10 10 13 13 13 13...
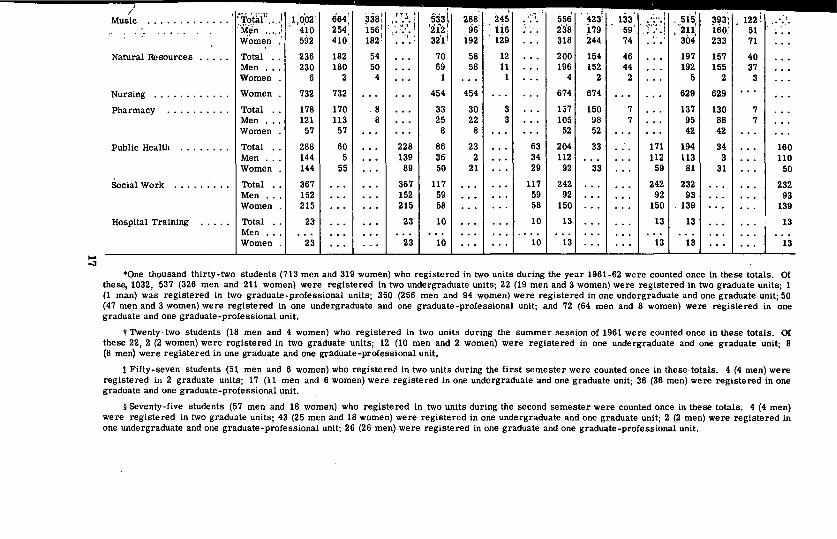
-oJ
.One thousand thirty-two students (713 men and 319 women) who registered in two units during the year 1961-62 were counted once in these totals. Ofthese, 1032, 537 (326 men and 211 women) were registered in two undergraduate units; 22 (19 men and 3 women) were registered in two graduate units; 1(1 man) was registered in two graduate-professional units; 350 (256 men and 94 women) were registered in one undergraduate and one graduate unit; 50(47 men and 3 women) were registered in one undergraduate and one graduate-professional unit; and 72 (64 men and 8 women) were registered in onegraduate and one graduate-professional unit.
t Twenty-two students (18 men and 4 women) who registered in two units during the summer session of 1961 were counted once in these totals. Ofthese 22, 2 (2 women) were registered in two graduate units; 12 (10 men and 2 women) were registered in one undergraduate and one graduate unit; 8(8 men) were registered in one graduate and one graduate-professional unit.
t Fifty-seven students (51 men and 6 women) who registered in two units during the first semester were counted once in these· totals. 4 (4 men) wereregistered in 2 graduate units; 17 (11 men and 6 women) were registered in one undergraduate and one graduate unit; 36 (36 men) were registered in onegraduate and one graduate-professional unit.
§ Seventy-five students (57 men and 18 women) who registered in two units during the second semester were counted once in these totals. 4 (4 men)were registered in two graduate units; 43 (25 men and 18 women) were registered in one undergraduate and one graduate unit; 2 (2 men) were registered inone undergraduate and one graduate-professional unit; 26 (26 men) were registered in one graduate and one graduate-professional unit.

60
SO
... 40cQ)u...
30Q)0-
20
10
PERCENTAGE
OF
CLASS DISTRIBUTION
1961·62
annual summer fall spring
undergraduate ~'::::!I!::I:::':1 graduate
FIGURE 3
18
graduate.professional

-'
TABLE VI
Class Distribution - 1961 Fall Semester"
Undergraduate Total
Total Total GraduateUniversity Unit
Students Fresh- Sopho- Graduate Profes-Total Junior Senior Special sionalman more
Enrollment in residence credit programs ..... Total 25,475 t 15,622 3,665 3,912 3,932 3,417 696 6,874 3,029Men 16,847 9,151 2,042 2,326 2,310 2,022 451 5,035 2,710Women 8,628 6,471 1,623 1,586 1,622 1,395 245 1,839 319
Undergraduate, graduate, and graduate-professional percentage of total enrollments .. 100.0 61.3 14.4 15.4 15.4 13.4 2.7 26.9 11.8
Class percentage of total undergraduateenrollments ....................... 100.0 23.5 25.0 25.2 21.9 4.4
Schools and Colleges
Architecture and Design .............. Total 718 718 141 213 221 139 4 . .. . ..Men 416 416 80 115 143 74 4 .. . ...Women 302 302 61 98 78 65 ., . .. . . ..
Business Administration .............. Total 852 368 .. . . .. 179 165 24 484 . ..Men 807 334 .. . ., . 164 150 20 473 . ..Women 45 34 .. . ., . 15 15 4 11 . ..
Dearborn ........................ Total 328 328 .. . ., . 115 149 64 .. . . ..Men 263 263 ... 86 126 51 . .. . ..Women 65 65 .. . ., . 29 23 13 . .. . ..
Dentistry ........................ Total 453 71 18 11 19 23 ., . . .. 382Men 381 ., . .. . .. . ., . . , . ., . . .. 381Women 72 71 18 11 19 23 ., . . .. 1
Education ........................ Total 1,062 1,062 97 87 380 397 101 .. . . ..Men 349 349 69 55 81 103 41 .. . ...Women 713 713 28 32 299 294 60 .. . ...
Engineering ...................... Total 2,939 2,939 657 873 687 633 89 ... . ..Men 2,907 2,907 649 866 681 623 88 ... . ..Women 32 32 8 7 6 10 1 .. . ...
Flint ........................... Total 514 514 .. . ., . 296 167 51 . .. . ..Men 282 282 .. . ., . 160 97 25 .. . . ..Women 232 232 .. . ., . 136 70 26 . .. . ..
Graduate ........................ Total 6,210 . , . . .. .. . . .. . , . ., . 6,210 . ..Men 4,457 ... .. . . , . . , . .. . ., . 4,457 ...Women 1,753 .. . .. . . , . ., . ., . ., . 1,753 . ..

No
TABLE VI (Cont.)
Class Distribution - 1961 Fall Semester*
Undergraduate Total
University UnitTotal Total Graduate
StudentsTotal
Fresh- Sopho- Junior Senior Special Graduate Profes-man more sional
Schools and Colleges (Cont.)Law ............................ Total 955 .. . . .. .. . .. . . .. . .. . .. 955
Men 933 .. . .. . .. . ... .. . .. . . .. 933Women 22 .. . ' ... .. . .. . .. . ... ... 22
Literature, Science, and the Arts ......... Total 8,188 8,188 2,299 2,366 1,750 1,456 317 ... . ..Men 4,171 4,171 1,129 1,203 906 741 192 ... ...Women 4,017 4,017 1,170 1,163 844 715 125 " . . ..
Medicine ........................ Total 1,265 .. . .. . . .. . .. .. . . .. . .. 1,265Men 1,192 ... . .. .. . .. . . .. .. . . .. 1,192Women 73 .. . .. . .. . ... .. . .. . ... 73
Music ••••••••••••••••• 0.' ••••••• Total 554 423 145 85 93 84 16 131 ...Men 237 179 70 31 32 35 11 58 ...Women 317 244 75 54 61 49 5 73 ...
Natural Resources .................. Total 199 154 22 28 45 50 9 45 ...Men 195 152 22 27 44 50 9 43 ...Women 4 2 ... 1 1 .. . . .. 2 . ..
Nursing . . '....................... Women 674 674 248 204 113 109 . ~ . .. . . ..Pharmacy ........................ Total 157 150 36 39 26 36 13 7 . ..
Men 105 98 23 29 13 23 10 7 ...Women 52 52 13 10 13 13 3 ... ...
Public Health ..................... Total 204 33 2 6 8 9 8 . .. 171Men 112 .. . .. . .. . .. . .. . ... . .. 112Women 92 33 2 6 8 9 8 ... 59
Social Work ...................... Total 243 .. . . .. .. . . .. .. . . .. . .. 243Men 92 .. . .. . .. . .. . . .. ... ... 92Women 151 .. . .. . .. . . , . .. . ... . .. 151
Hospital Training ................... Women 13 .. . .. . .. . .. . .. . . .. . .. 13
*Through the fifth week of classes, October 20, 1961.t53 students (52 men and 1 woman), registered in two units, are counted only once in this total. Of these 53, 36 (36 men) are simultaneously regis
tered in a graduate professional and a graduate unit, 14 (13 men and 1 woman) are Simultaneously registered in a graduate and an undergraduate unitand 3 (3 men) are simultaneously registered in two graduate units.

17,000
15,000
FALL ENROLLMENTBY
MARITAL STATUS
13,000
11,000
9,000
7,000
5,000
3,000
1,000
graduate. undergraduate
,;1 ;~'. t
'"i; tota I mimmm
~.
married single
•FIGI,JRE 4
21
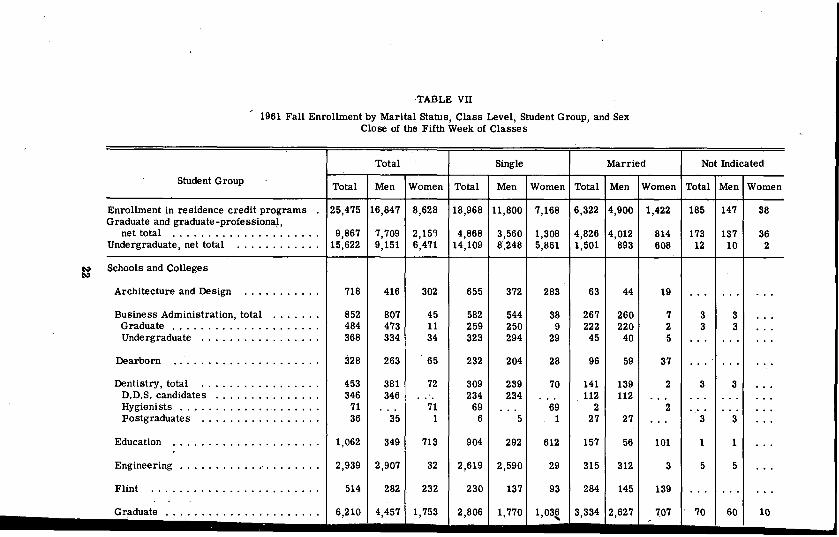
·TABLE vn/
1961 Fall Enrollment by Marital Status, Class Level, Student Group, and SexClose of the Fifth Week of Classes -
Total Single Married Not Indicated
Student Group Total Men Women Total Men Women Total Men Women Total Men Women
Enrollment in residence credit programs 25,475 16,847 8,628 18,968 11,800 7,168 6,322 4,900 1,422 185 147 38Graduate and graduate-professiona~,
net total ..................... 9,867 7,709 2,15'3 4,868 3,560 1,308 4,826 4,012 814 173 137 36Undergraduate, net total ............ 15,622 9,151 6,471 14,109 8,248 5,861 1,501 893 608 12 10 2
N Schools and CollegesN
Architecture and Design ........... 718 416 302 655 372 283 63 44 19 .. . .. . " .Business Administration, total ....... 852 807 45 582 544 38 267 260 7 3 3 . ..
Graduate ..................... 484 473 11 259 250 9 222 220 2 3 3 . ..Undergraduate ................. 368 334 34 323 294 29 45 40 5 .. . .. . . ..
Dearborn ..................... 328 263 65 232 204 28 96 59 37 . .. . .. . ..Dentistry, total ................. 453 381 72 309 239 70 141 139 2 3 3 " .
D.D.S. candidates ............... 346 346 . .. 234 234 .. . 112 112 " . .. . .. . . ..Hygienists •••••••••••• 0 •••••••• 71 " . 71 69 .. . 69 2 2 .. . . .. " .Postgraduates ................. 36 35 1 6 5 1 27 27 " . 3 3 " .
Education ..................... 1,062 349 713 904 292 612 157 56 101 1 1 . ..Engineering ••••••••••• 0" •••••••• 2,939 2,907 32 2,619 2,590 29 315 312 3 5 5 . ..
Flint ........................ 514 282 232 230 137 93 284 145 139 .. . .. . " .Gr.aduate ...................... 6,210 4,457 1,753 2,806 1,770 1,03~ 3,334 2,627 707 70 60 10-
!« ' , "'
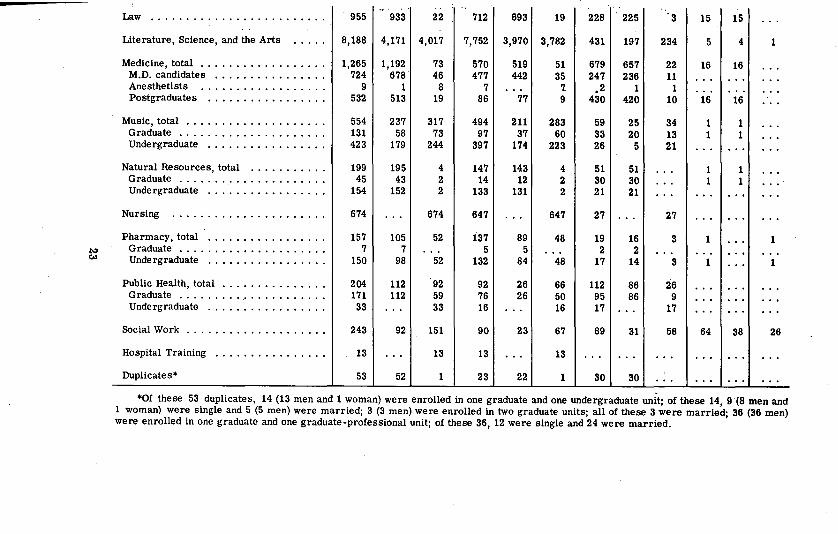
Law ............... ".......... 955 933 22 712 693 19 228 225 3 15 15 . ..Literature, Science, and the Arts ..... 8,188 4,171 4,017 7,752 3,970 3,782 431 197 234 5 4 1
Medicine, total .................. 1,265 1,192 73 570 519 51 679 657 22 16 16 . ..M.D. candidates ................ 724 678 46 477 442 35 247 236 11 .. . ., . . ..Anesthetists ................. . 9 1 8 7 " . 7. .2 1 1 .. . ., . . ..Postgraduates ................. 532 513 19 86 77 9 430 420 10 16 16 . ..
Music, total .................... 554 237 317 494 211 283 59 25 34 1 1 . ..Graduate ..................... 131 58 73 97 37 60 33 20 13 1 1 . ..Undergraduate ................. 423 179 244 397 174 223 26 5 21 .. . ., . . ..
Natural Resources, total ........... 199 195 4 147 143 4 51 51 . .. 1 1 . ..Graduate ..................... 45 43 2 14 12 2 30 30 . .. 1 1 . ..Undergraduate ................. 154 152 2 133 131 2 21 21 .. . .. . ., . . ..
Nursing ..................... . 674 .. . 674 647 " . 647 27 .. . 27 .. . ., . . ..Pharmacy, total ................. 157 105 52 i37 89 48 19 16 3 1 • °0
"1
Graduate . . ~ . . . . . . .. . . . . . . . . . . 7 7 ... 5 5 .. . 2 2 .. . " . ., . . ..Undergraduate ................. 150 98 52 132 84 48 17 14 3 1 . .. 1
Public Health, total ............... 204 112 92 92 26 66 112 86 26 .. . ., . . ..Graduate ..................... 171 112 59 76 26 50 95 86 9 .. . ., . . ..Undergraduate ................ . 33 .. . 33 16 ... 16 17 .. . 17 .. . ., . . ..
Social Work .................... 243 92 151 90 23 67 89 31 58 64 38 26
Hospital Training ............... . 13 .. . 13 13 .. . 13 .. . .. . ... .. . ... . ..Duplicates* 53 52 1 23 22 1 30 30 ... " . .. . ...
*Of these 53 duplicates, 14 (13 men and 1 woman) were enrolled in one graduate and one undergraduate unit; of these 14, 9(8 men and1 woman) were single and 5 (5 men) were married; 3 (3 men) were enrolled in two graduate units; all of these 3 were married; 36 (36 men)were enrolled in one graduate and one graduate-professional unit; of these 36, 12 were single and 24 were married.

TABLE VIII
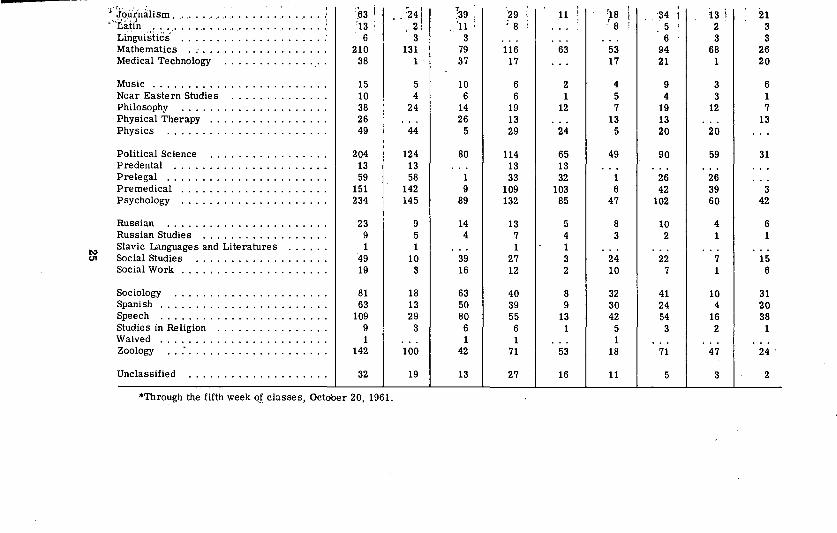
College ,of Literature, Science, and the Arts, Concentration CountFirst Semester, 1961-62-
Grand Total Junior seniorField of Concentration Total Men Women Total Men Women Total Men Women
Totill ... . ... . · . · . ... . · . · . 3,206 1,647 1,559 1,750 906 844 1,456 741 715
American Culture · . .. . .. . · . · . • 0"'14 2 12 8 1 7 6 1 5
Anthropology · . ... . · . ..... . · . 40 23 17 21 9 12 19 14 ' 5Anthropology and Zoology ..... · . · . 7 3 4 4 2 2 3 1 2Astronomy ... . .. . · . .·0 •••• · . 9 6 3 5 3 2 4 3 1Biology · . · . ..... . · . ..... · . 54 17 37 29 10 19 25 7 18
Biophysics · . · . · . .. . · . .. . 7 7 . .. 3 3 . .. 4 4 . ..l\:I". Botany ..... . · . · . · . .. . · . · . 9 6 3 5 2 3 4 4 . .
Botany and Bacteriology ..... . · . ... 8 4 4 6 4 2 2 . .. 2Cellular Biology '" . ..... . · . '. · . · . 4 2 2 3 2 1 1 ... 1Chemistry .0.• .... . · . . . ., .. · . 141 105 36 75 59 16 66 46 20
Chinese · . · . · . · . · . ... . ... . · . · . 1 1 . .. . .. . . 1 1 ...Classical Studies · . .. . ... . · . · . 4 1 3 3 .. . 3 1 1 " .Economics · . · . · . · . · . . . · . · . · . 196 171 25 129 113 16 67 58 9English · . · . · . · . ... . ... · . · . 569 164 405 281 81 200 288 '$3 205Far Eastern Languages and Literatures 2 2 .. 1 1 . .. 1 1 . ..Far Eastern Studies · . · . · . · . 8 3 5 5 2 3 3 1 2French · . · . .. . · . 79 8 71 48 4 44 31 4 27Geography .. . · . 13 7 6 6 3 3 7 4 3Geology · . · . · . · . · . · . 17 16 1 _3 3, . . 14 13 1German · . · . · . · . . .. · . · . 38 16 22 21 9 12 17 7 10
Germanic Languages and Literatures · . 1 1 . . . . . . . .. 1 1 . ..History
,285 146 139 137 67 70 148 79 69. . . . .'. · . · . · . . . . .. · .
Hi~t,o,fY, of Art ...,., ................ 30 5.~. i
25 12 2 10 18 3 151": I ,
It~,l~IP'~II::nuliJ' . " .... " " ......... " .. i i .. 1 . i 1 ... . 1 . -rJ'·· i.N 1;0 I'!
,Ii" . '1'" I l' '; i .. :.{,
Japanese ....................... I 2 ' , I I .. I I
-,'!" ',I, ,,;.
.63 I '24 ! ?39 '29 11 !18 ~4 '13 i 21:.~,~~~na]iSm . " (" " " " " " " " " .... ," . Ir.atin ..: :.'/ · . .. · . '13 2' '11 : ; 8 .r 8 5 2 3.. ,'(' · ',',' ,. " " ..Linguistics · . · . · . · . · . · . · . · . 6 3 3 6 3 3Mathematics · . · . .. . .. . · . · . . ... 210 131 79 116 63 53 94 68 26Medical Technology · . .. . .. . · . · . · . 38 1 37 17 17 21 1 20
M~sic .. · . ..... . · . · . . . . .. · . 15 5 10 6 2 4 9 3 6Near Eastern Studies · . · . · . · . 10 4 6 6 1 5 4 3 1Philosophy · . · . · . · . · . · . · . .. . 38 24 14 19 12 7 19 12 7
. Physical Therapy · . · . ... . · . · . .. . 26 26 13 13 13 13Physics · . · . . .. · . · . · . · . · . .. . 49 44 5 29 24 5 20 20
Political Science . . · . .. . · . · . · . 204 124 80 114 65 49 90 59 31Predental · . ... . · . · . . .. 13 13 13 13Prelegal · . · . · . · . ... · . .. . · . · . 59 58 1 33 32 1 26 26Premedical · . · . .. . .. . · . .. . · . .. . 151 142 9 109 103 6 42 39 3Psychology ... · . . .. .. . .. . · . · . 234 145 89 132 85 47 102 60 42
Russian · . · . .. . · . · . ... . · . · . .. . 23 9 14 13 5 8 10 4 6Russian Studies · . · . · . .... · . · . · . 9 5 4 7 4 3 2 1 1Slavic Languages and Literatures · . · . 1 1 1 1
~
Social Studies 49 10 39 27 3 24 22 7 15U1 · . .... . · . . . · .Social Work · . · . · . .. . · . · . . ... 19 3 16 12 2 10 7 1 6
Sociology · . · . · . ... . · . · . · . 81 18 63 40 8 32 41 10 31Spanish · . · . · . · . · . · . · . · . · . 63 13 50 39 9 30 24 4 20Speech ... · . · . .. . · . . .. · . · . · . 109 29 80 55 13 42 54 16 38Studies in Religion · . · . .... . · . 9 3 6 6 1 5 3 2 1Waived .. . · . · . · . · . .... 1 1 1 1Zoology ... . · . · . · . . .. · . · . ., . 142 100 42 71 53 18 71 47 24
Unclassified ... · . · . · . · . · . · . · . 32 19 13 27 16 11 5 3 2
*Through the fifth week oj classes, October 20, 1961.

ACADEMIC ACHIEVEMENT
The academic achievement of undergraduate students for the year1961-1962 is given in the following tables. These tables indicate theacademic average of selected groups during the fall and spring semesters. Although there is a slight drop from the preceeding year, theaverages generally remain above those recorded in past years. Thewomen, as usual, achieved higher averages than the men.
It should be emphasized that only undergraduate students are included. The grades for students in the School of Dentistry, the graduate School, the Law School, the Medical School, and the School of SocialWork and the graduate students in the School of Business Administration, the School of Music, the School of Natural Resources, the Collegeof Pharmacy, and the School of Public Health have been eXCluded, aswell as those for the students in the Flint College. Freshmen are defined as students who entered the University in the fall of 1961 or in thespring of 1962 with less than one semester of college experience.
The thirty-ninth Honors Convocation, held on May 11, 1962, recognized the achievement of 917 undergraduate students who attained agrade-point average of 3.5 for the preceeding two semesters or freshmen who had earned this average for their first semester. Nearly 10
.per cent of the seniors were honored.
26
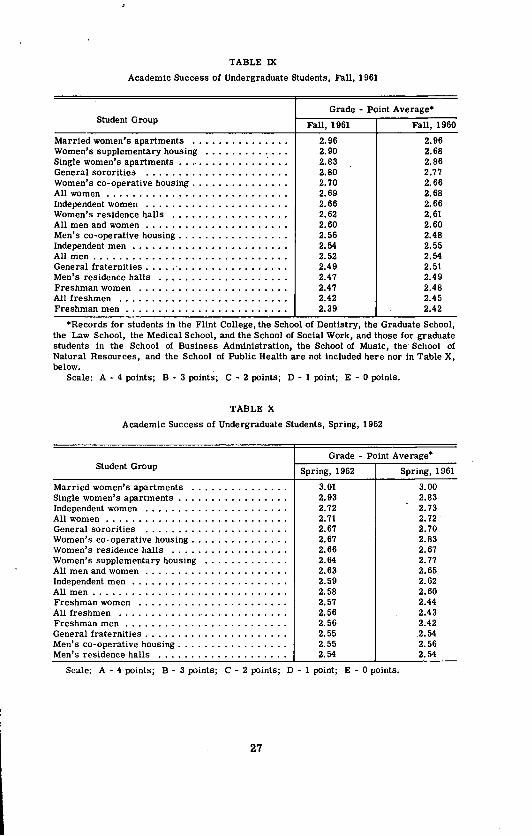
TABLE IX
Academic Success of Undergraduate Students, Fall, 1961
Grade - Point Average.Student Group
Married women's apartments ............•..Women's supplementary housing ...•...•...•.Single women's apartments ...' .•..•.........General sororities .........•....•..•.••.Women's co-operative housing ...•...•....•..All women .......•.•..........•.•..•.•Independent women •..•.•.•.......••......Women's residence halls .•.•..••...••.••.•All men and women ..•..•...••••..••.•..•Men's co-operative housing .....•...........Independent men .•.....•...•.•...•.•..•.All men ............•.•.......•..•..•.General fraternities ..... '....••..••.••.••.Men's residence halls ..............•..•..Freshman women .•..•........••..•..•..All freshmen ...••..•...•...••••••..•.•Freshman men ........•..•.......•....•
Fall, 1961
2.962.902.832.802.702.692.662.622.602.562.542.522.492.472.472.422.39
Fall, 1960
2.962.682.862.772.662.682.662.612.602.482.552.542.512.492.482.452.42
·Records for students in the Flint College, the School of Dentistry, the Graduate School,the Law School, the Medical School, and the School of Social Work, and those for graduatestudents in the School of Business Administration, the School of Music, the School ofNatural Resources, and the School of Public Health are not included here nor in Table X,below.
Scale: A - 4 points; B-3 points; C - 2 points; D - 1 point; E - 0 points.
TABLE X
Academic Success of Undergraduate Students, Spring, 1962
Student GroupGrade - Point Average·
Spring, 1962 Spring, 1961
Married women's apartments ...•...........Single women's apartments .......•..••.....Independent women ......•...............All women ................•.....•.. '...General sororities ......•...............Women's co-operative housing .Women's residence halls .....•...•........Women's supplementary housing .All men and women .Independent men' .All men ........................•.....Freshman women .................•..•..All freshmen ....................•..•..Freshman men .General fraternities .Men's co-operative housing .Men's residence halls .
3.012.932.722.712.672.672.662.642.632.592.582.572.562.562.552.552.54
3.002.832.732.722.702.832.672.772.652.622.602.442.432.422.542.562.54
Scale: A - 4 points; B-3 points; C - 2 points; D - 1 point; E - 0 points.
27

TABLE XI
Honor Point Averages Earned by Fall, 1961, FreshmenDuring Their First Semester
FreshmenFreshmen
Total HonorUniversity Unit Registered
WhoHours Point
ReceivedFall, 1961Grades Completed Average*
Total .................. 3,215 3,155 46,775 2.42
Architecture and Design ...... 119 116 1,715 2.40Dental Hygiene ............ 12 12 132 2.52Education ................ 80 79 905 2.64Engineering .............. 58'1 581 8,834 2.29Literature, Science, and the Arts 2,024 1,984 29,225 2.50Music .................. 113 109 1,647 2.67Natural Resources .......... 17 17 239 1. 91Nursing ................. 231 228 3,395 ~.19
Pharmacy ............... 32 29 428 2.07
*Scale: A - 4 points; B-3 points; C - 2 points; D - 1 point; E - 0 points;incomplete disregarded.
TABLE XII
Honor Point Averages Earned by Fall, 1961, FreshmenDuring Their Second Semester
Fall, 1961 FreshmenTotal Honor
University UnitFreshmen Who
Hours PointRegistered ReceivedSpring, 1962 Grades Completed Average*
Total ............... · . 3,028 2,997 45,007 2.48
Architecture and Design ... · . 112 108 1,614 2.40Dental Hygiene ......... · . 12 12 237 2.29Education ............ · . 77 76 1,016 2.07Engineering ........... · . 511 507 7,607 2.42Literature, Science, and the Arts 1,966 1,951 29,239 2.53Music ................. 102 99 1,532 2.67Natural Resources ......... 14 13 167 2.02Nursing .. .............. 207 205 3,216 2.31Pharmacy .............. 27 26 379 2.22
*Scale: A - 4 points; B-3 points; C - 2 points; D - 1 pomt; E - °pomts;incomplete disregarded.
128

TABLE xmComparison of Students Honored at the 1962 Honors Convocationwith the 1961 Fall Semester Eligible Undergraduate Enrollment
Total Freshmen Sophomores Juniors Seniors
University EligibleTotal
EligibleTotal Eligible
TotalEligible
Total EligibleTotal
Unit StudentStudents Per Student
Students Per StudentStudents Per Student
Students Per StudentStudents Per
Enroll-Honored Cent Enroll-
Honored Cent Enroll-Honored Cent Enroll-
Honored Cent Enroll-Honored Cent
ment ment ment ment ment
Total 14,926· 917 6.14 3,665 222 6.06 3,912 195 4.98 3,932 170 4.32 3,417 330 9.66
Architecture and Design 714 14 1.96 141 2 1.42 213 3 1.41 221 .. . ... 139 9 6.47Business Administration. 344 13 3.78 .. . ... .. . .. . .. . . .. 179 3 1.68 165 10 6.06Dearborn ......... . 264 19 7.20 .. . .. . .. . " . ... . .. 115 1 0.87 149 18 12.08Dental Hygiene ....... 71 2 2.82 18 .. . .. . 11 ... . .. 19 1 5.26 23 1 4.35Educatlon .......... 961 34 3.54 97 1 1.03 87 .. . . .. 380 7 1.84 397 26 6.55Engineering ......... 2,850 176 6.18 657 30 4.57 873 38 4.35 687 43 6.26 633 65 10.27"Flint ............ . 463 6 1.30 .. . .. . .. . .. . .. . . .. 296 .. . ... 167 6 3.59Lite rature, Science, and
the Arts .......... 7,871 591 7.51 2,299 174 7.57 2,366 143 6.04 1,750 102 5.83 1,456 172 11.81Music ............. 407 33 8.11 145 8 5.52 85 5 5.88 93 6 6.45 84 14 16.67Natural Resources ... . 145 2 1.38 22 .. . ... 28 1 3.57 45 .. . . .. 50 1 2.00Nursing ........... 674 24 3.56 248 6 2.42. 204 5 2.45- 113 6 5.31 109 7 6.42Pharmacy ......... . 137 3 2.19 36 1 2.78 39 .. . ..... 26 1 3.85 36 1 2.78Public Health ....... . 25 .. . .. . 2 .. . ... 6 .. . .. . 8 .. . . .. 9 .. . ...
·Six hundred ninety-six nonclassified students were not considered.

TABLE XIV
Students Honored at the 1962 Honors Convocation, (By citation)
Honors Conferred Total Men Women
James B. Angell Scholars (students with anall-A record for two ·consecutive semesters 70 45 25
Class Honors (students with an average of 3.5or better for the past two semesters) ...... 917 544 373
Total Men Women
Seniors ..... 330 193 137Juniors ..... 170 108 62Sophomores .. 195 118 77Freshmen ... 222 125 97
Total citations ... . .... . . . ...... 987 589 398Duplicates ....... . ........ ..... . 67 43 24Nonduplicates ...... ....... . . ..... 3 2 1
Total students honored ........ ..... . 917 544 373
TABLE XV
Transcripts and Grade Reports to Students, Deans, and Departments*
Individual Requests Grade Reportsfor Transcripts to Students,Year Deans, andAmountNumber Received Departments
1950-51 ............... 30,458 $ 5,370.50 93,4381951-'52 .............. 30,932 5,507.50 105,4161952-53 · . ............ 29,847 4,900.00 102,4291953-54 ............ 31,781 5,117.00 93,4581954-55 · . ... . ... . .... 34,314 5,730.00 94,0231955-56 · . ....... . .... 39,428 11,015.00 107,2831956-57 .......... ... . 41,375 18,920.00 118,1051957-58 .......... .... . 50,563 23,511.00 147,7811958-59 ......... . ..... 56,246 26,426.00 141,8611959-60 ......... . ..... 56,502 28,349.00 156,7051960-61 .......... .... . 58,278 31,079.00 146,3991961-62 ............... 68,693 34,575.00 145,072
*The constant increase in the number of individual. requests for transcripts isshown above. In 1955 the transcript fee was increasect'"to $1. 00; this accounts forthe unusual increase in the "Amount Received" column. Transcripts were used asgrade reports to the students and to their deans and departments. These reportswere printed en masse at the end of each semester and summer session. In addition, copies of transcripts of graduates of Michigan high schools and junior collegesare sent to the schools when the students receive their first degree from theUniversity.
30

senior9.66%
Junior
4.32%
sophomore4.98%
freshman6.06%
STUDENTS HONORED
AT THE
1962 HONORS CONVOCATION
o 60 120
FIGURE 5
180 240 300
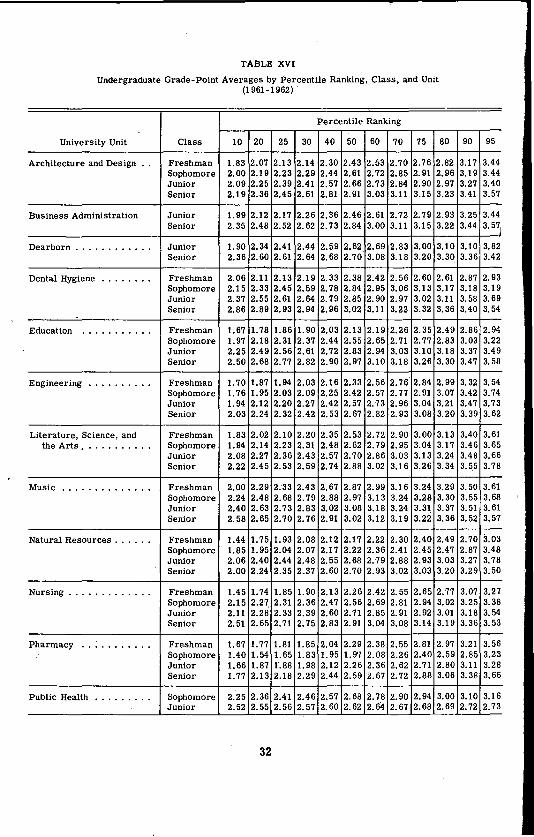
TABLE XVI
Undergraduate Grade-Point Averages by Percentile Ranking, Class, and Unit(1961-1962 )
Percentile Ranking
University Unit Class 10 20 25 30 40 50 60 70 75 80 90 95
Architecture and Design .. Freshman 1.83 2.07 2.13 2.14 2.30 2.43 2.53 2.70 2.76 2.82 3.17 3.44Sophomore 2.00 2.19 2.23 2.29 2.44 2.61 2.72 2.85 2.91 2.96 3.19 3.44Junior 2.09 2.25 2.39 2.41 2.57 2.66 2.73 2.84 2.90 2.97 3.27 3.40Senior 2.19 2.36 2.45 2.61 2.81 2.91 3.03 3.11 3.15 3.23 3.41 3.57
Business Administration Junior 1.99 2.12 2.17 2.26 2.36 2.46 2.61 2.72 2.79 2.93 3.25 3.44Senior 2.35 2.48 2.52 2.62 2.73 2.84 3.00 3.11 3.15 3.22 3.44 3.57
1
Dearborn ............ Junior 1.90 2.34 2.41 2.44 2.59 2.62 2.69 2.83 3.00 3.10 3.10 3.82Senior 2.36 2.60 2.61 2.64 2.68 2.70' 3.08 3.18 3.20 3.30 3.36 3.42
Dental Hygiene ........ Freshman 2.06 2.11 2.13 2.19 2.33 2.38 2.42 2.56 2.60 2.61 2.87 2.93Sophomore 2.15 2.33 2.45 2.59 2.78 2.84 2.95 3.06 3.13 3.17 3.18 3.19Junior 2.37 2.55 2.61 2.64 2.79 2.85 2.90 2.97 3.02 3.11 3.58 3.69Senior 2.86 2.89 2.93 2.94 2.96 3.02 3.11 3.22 3.32 3.36 3.40 3.54
Education ........... Freshman 1.67 1.78 1.86 1. 90 2.03 2.13 2.19 2.26 2.35 2.49 2.86 2.94Sophomore 1.97 2.18 2.31 2.37 2.44 2.55 2.65 2.71 2.77 2.83 3.03 3.22Junior 2.25 2.49 2.56 2.61 2.72 2.83 2.94 3.03 3.10 3.18 3.37 3.49Senior 2.50 2.68 2.77 2.82 2.90 2.97 3.10 3.18 3.26 3.30 3.47 3.58
Engineering .......... Freshman 1.70 1.87 1.94 2.03 2.16 2.33 2.56 2.76 2.84 2.99 3.32 3.54Sophomore 1.76 1.95 2.03 2.09 2.25 2.42 2.57 2.77 2.91 3.07 3.42 3.74Junior 1.94 2.12 2.20 2.27 2.42 2.57 2.73 2.96 3.04 3.21 3.47 3.73Senior 2.03 2.24 2.32 2.42 2.53 2.67 2.82 2.93 3.08 3.20 3.39 3.62
Literature, Science, and Freshman 1.83 2.02 2.10 2.20 2.35 2.53 2.72 2.90 3.00 3.13 3.40 3.61the Arts .•.......•• Sophomore 1.94 2.14 2.23 2.31 2.48 2.62 2.79 2.95 3.04 3.17 3.46 3.65
Junior 2.08 2.27 2.36 2.43 2.57 2.70 2.86 3.03 3.13 3.24 3.48 3.66Senior 2.22 2.45 2.53 2.59 2.74 2.88 3.02 3.16 3.26 3.34 3.55 3.78
Music .............. Freshman 2.00 2.29 2.33 2.43 2.67 2.87 2.99 3.16 3.24 3.29 3.50 3.61Sophomore 2.24 2.48 2.68 2.79 2.88 2.97 3.13 3.24 3.28 3.30 3.55 3.68Junior 2.40 2.63 2.73 2.83 3.02 3.08 3.18 3.24 3.31 3.37 3.51 3.61Senior 2.58 2.65 2.70 2.76 2.91 3.02 3.12 3.19 3.22 3.36 3.52 3.57
Natural Resources ...... Freshman 1.44 1.75 1. 93 2.08 2.12 2.17 2.22 2.30 2.40 2.49 2.70 3.03Sophomore 1.85 '1.95 2.04 2.07 2.17 2.22 2.36 2.41 2.45 2.47 2.87 3.48Junior 2.06 2.40 2.44 2.48 2.55 2.68 2.79 2.88 2.93 3.03 3.27 3.78Senior 2.00 2.24 2.35 2.37 2.60 2.70 2.93 3.02 3.03 3.20 3.29 3.50
Nursing ...•......... Freshman 1.45 1.74 1.85 1.90 2.13 2.26 2:42 2.55 2.65 2.77 3.07 3.27Sophomore 2.15 2.27 2.31 2.36 2.47 2.56 2.69 2.81 2.94 3.02 3.25 3.38Junior 2.11 2.28 2.33 2.39 2.60 2.71 2.85 2.91 2.92 3.01 3.18 3.54Senior 2.51 2.65 2.71 2.75 2.83 2.91 3.04 3.08 3.14 3.19 3.36 3.53
Pharmacy ........... Freshman 1.67 1.77 1.81 1.85 2.04 2.29 2.38 2.55 2.81 2.97 3.21 3.56Sophomore 1.40 1.54 1.65 1.83 1. 95 1. 9'7 2.08 2.26 2.40 2.59 2.85 3.23Junior 1.66 1.87 1'.88 1.98 2.12 2.26 2.36 2.62 2.71 2.80 3.11 3.28Senior 1. 77 2.13 2.18 2.29 2.44 2.59 2.67 2.72 2.88 3.06 3.38 3.66
Public Health ......... Sophomore 2.25 2.36 2.41 2.46 2.57 2.68 2.78 2.90 2.94 3.00 3.10 3.16Junior 2.52 2.55 2.56 2.57 2.60 2.62 2.64 2.67 2.68 2.69 2.72 2.73
32

DEGREES AND AWARDS
A total of 6,342 degrees was granted by the University during theyear. This figure represents 96 different degrees in 162 fields ofspecialization. Of all the degrees granted, 50.3 per cent were bachelor's degrees, 32.7 per cent were master's degrees, 5.8 per cent weredoctorates, and 11.2 per cent were graduate-professional degrees. Thetotal number of students who received degrees is 19 per cent of thetotal enrollment in degree programs. The number of graduate degreesgranted is 24 per cent of the total graduate enrollment.
1911- i2
1980 -II
1959-90
1151-51
1157-5'
1955-51
1954 -55
1953-54
1952- 53
1951-52
-.r -..r -.r -.r -.r -.r -.r -.r~ -..or "'i ~.... 6342
~ -..:r -.r -..:r -..q -.r -.r -..:J -.r~~ """T .. 6286
-..:y~ -..q~~~ ...-r~ ...-r~ -..q ~.,. 6239
-.r -..q~~ -..q -..q -..:y -..q~ -..q -..q .....-r'" 6242
-.r~ -.r ....-r --...r -..:r~ -..q -.r -..q ...-r ~ 5813
-..q -...q -...q -..q -...q AIII'l .....-r -...q -..q -..:r -.:J 5516
...-r --...r ....-r ....-r ....-r -..q -..q ....-r -..:r -..q 5030
AIII'l -..q -...q~ ....-r -...q -..q -..q -..:r 4535
...-r~ -.r -..:r -..:r~ -.r -.:r -..::I 4589
~ -..:r --r --r ...-r -.r -..:r --r --r" 4 8 2 5
-.r -..:r -..:r -..r -..r -.r -.r -.r -.r -.r .. 5325
(,(, DEGREES GRANTED
FIGURE 6
33
-.r=500
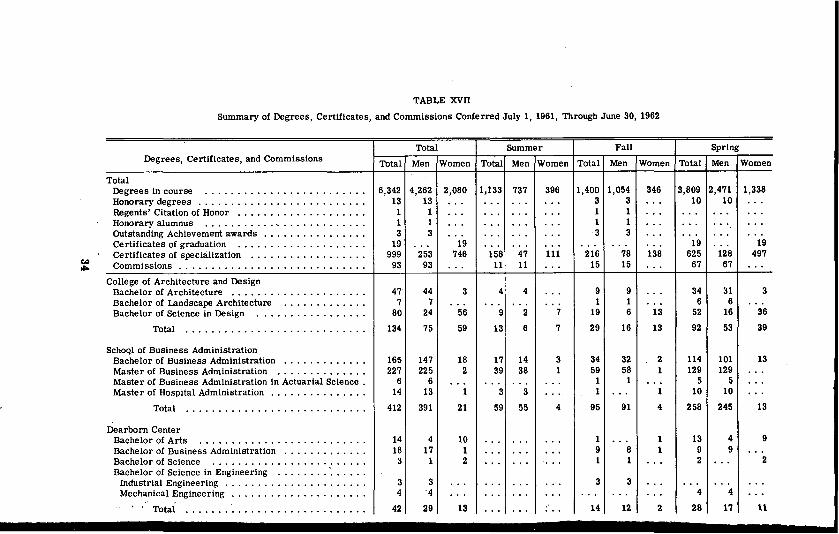
TABLE XVII
Summary of Degrees, Certlflcates, and Commissions Conferred July 1, 1961, Through June 30, 1962
Total Summer Fall SpringDegrees, Certificates, and Commissions Total Men Women Total Men Women Total Men Women Total Men Women
TotalDegrees in course ......................... 6,342 4,262 2,080 1,133 737 396 1,400 1,054 346 3,809 2,471 1,338Honorary degrees .......................... 13 13 3 3 10 10Regents' Citation of Honor .................... 1 1 1 1Honorary alumnus ........... '.............. 1 1 1 1Outstanding Achievement awards ................ 3 3 3 3Certificates of graduation .................... 19 19 19 19Certificates of specialization .................. 999 253 746 158 47 111 216 78 138 625 128 497
c.:l Commissions 93 93 11 11 15 15 67 67".. .............................College of Architecture and Design
Bachelor of Architecture ..................... 47 44 3 4 4 9 9 34 31 3Bachelor of Landscape Architecture ............. 7 7 1 1 6 6Bachelor of Science in Design ................ 80 24 56 9 2 7 19 6 13 52 16 36
Total ............................ 134 75 59 13 6 7 29 16 13 92 53 39
SchoQl of Business AdministrationBachelor of Business Administration ............. 165 147 18 17 14 3 34 32 2 114 101 13Master of Business Administration .............. 227 225 2 39 38 1 59 58 1 129 129Master of Business Administration in Actuarial Science. 6 6 1 1 5 5Master of Hospital Administration ............... 14 13 1 3 3 1 10 10
Total ............................ 412 391 21 59 55 4 95 91 4 258 245 13
Dearborn CenterBachelor of Arts .......................... 14 4 10 1 13 4 9Bachelor of Business Administration ............. 18 17 1 9 8 9 9Bachelor of Science ........................ 3 1 2 1 1 2 2Bachelor of Science in Engineering ..............
Industrial Engineering ...................... 3 3 3 3Mechanical Engineering ..................... 4 -4 4 4
Total ............................ 42 29 13 14 12 2 28 17 11
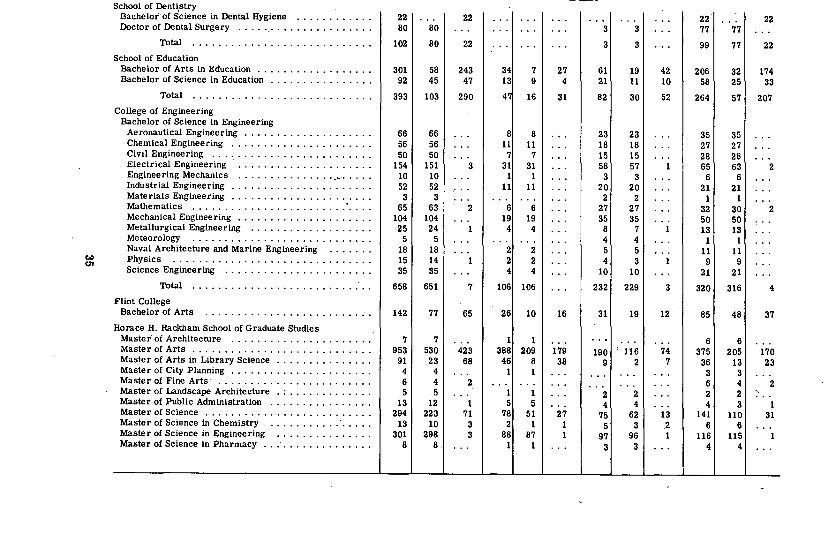
School of Denti.stryBachelor'ofScience in Dental Hygiene ............ 22 22 22 22Doctor of Dental Surgery .... "0"··············· 80 80 3 3 77 77
Total ............................ 102 80 22 3 3 99 77 22School of Education
Bachelor of Arts in Education .................. 301 58 243 34 7 27 61 19 42 206 32 174Bachelor of Science in Education ................ 92 45 47 13 9 4 21 11 10 58 25 33
Total ............................ 393 103 290 4 16 31 82 30 52 264 57 207College of Engineering
Bachelor of Science in EngineeringAeronautical Engineering .................... 66 66 8 8 23 23 35 35Chemical Engineering ...................... 56 56 11 11 18 18 27 27Civil Engineering ......................... 50 50 7 7 15 15 28 28Electrical Engineering ..................... 154 151 3 31 31 58 57 65 63 2Engineering Mechanics ............... .,.-..... 10 10 1 1 3 3 6 6Industrial Engineering ...................... 52 52 11 11 20 20 21 21Materials Engineering ...................... 3 3 2 2 1 1Mathematics ............................ 65 63 2 6 6 27 27 32 30 2Mechanical Engineering ..................... 104 104 19 19 35 35 50 50Metallurgical Engineering ................... 25 24 4 4 8 7 13 13Meteorology ............................ 5 5 4 4 1 1Naval Architecture and Marine Engineering ....... 18 18 2 2 5 5 11 11
W Physics ............................... 15 14 2 2 4 3 9 9c.nScience Engineering ....................... 35 35 4 4 10 10 21 21
Total ............................ 658 651 7 106 106 232 229 3 320 316 4Flint College
Bachelor of Arts .......................... 142 77 65 26 10 16 31 19 12 85 48 37Horace H. Rackham School of Graduate Studies
Master' of Architecture ...................... 7 7 1 1 6 6Master of Arts ............................ 953 530 423 388 209 179 190 I 116 74 375 205 170Master of Arts in Library Science ............... 91 23 68 46 8 38 9 2 7 36 13 23Master of City Planning ...................... 4 4 1 1 3 3Master of Fine Arts' ........................ 6 4 2 6 4 2Master of Landscape Architecture ............... 5 5 1 1 2 2 2 2Master of Public Administration ................ 13 12 1 5 5 4 4 4 3 1Master of Science .......................... 294 223 71 78 51 27 75 62 13 141 110 31Master of Science in Chemistry ................ 13 10 3 2 1 1 5 3 2 6 6Master of Science in Engineering ............... 301 298 3 88 87 1 97 96 1 116 115Master of Science in Pharmacy ................. 8 8 1 1 3 3 4 4

TABLE XVII (COllt.)
Summary of Degrees, Certificates, and Commissions Conferred July I, 1961, Through June 30, 1962
Total Summer Fall SpringDegrees, Certificates, and Commissions Tot;ll Men Women Total Men Women Total Men Women Total Men Iwomen
Aeronautical and Astronautical Engineer .......... 4 4 2 2 2 2Civil Engineer ............................ 1 1 1Electrical Engineer ........................ 2 2 1Industrial Engineer ......................... 1 1 1Instrumentation Engineer ..................... 1 1Mechanical Engineer ........................ 1 1 1 1Specialist in Education ...................... 8 6 2 2 1 5 5Doctor of Education ........................ 9 9 4 4 5 5'Doctor of Musical Arts ...................... 5 5 5 5Doctor of Philosophy ........................ 344 307 37 174 155 19 170 152 18
W Doctor of Science .......................... 2 2 1 1 1 1CD
Total 2,073 1,463 610 616 369 247 575 458 117 882 636 246............................Law School
Bachelor of Laws .......................... 218 215 3 40 40 29 28 149 117 2Juris Doctor ............................. 37 36 1 7 7 2 2 28 27 1Master of Comparative Law ................... 3 3 1 1 2 2Master of Laws ........................... 8 6 2 1 2 1 5 5Doctor of the Science of Law .................. 3 3 2 2 1 1
Total ............................ 269 263 6 49 48 35 33 2 185 182 • 3
College of Literature, Science, and the Arts .........Bachelor of Arts ........................... 1,133 533 600 101 61 40 190 95 95 842 377 465Bachelor of Science ........................ 230 135 95 24 18 6 27 18 9 179 99 80Bachelor of Science in Chemistry ............... 36 28 8 6 4 2 3 3 27 21 6
Total ............... ............ . 1,399 696 703 131 83 48 220 116 104 1,048 497 551
Medical SchoolDoctor of Medicine ......................... 169 161 8 169 161 8
School of MusicBachelor of MusicComposi~iC?'1 . '......... , ...... : , , : ... , . , . , . : . : , 2 1 1 2 1 1Music Education ........................... 36 13 23 7 3 4 11 5 6 18 5 13·,'.\,1'-11 ••• , •• , - ••.. ,>'" -., -. ' ••• - ••
Ii . ..it 6 i 3 2Music Literature ......................... 1 3 2
1 120 108 45 16 2
1 11 113 3
57 27
lIn 1h: t·'j(.. Lrqr11~1l ,-.
~~!:B ,tl.:r.:~~!,!~~rt: ~ . ~ .. :... ~ ~. . ~ ~ ~ : ~: : :Theory" .. ', ... , .. ,.... . . . .
Violin .VoiceWind Instruments
Master of MusicCompositionMusic EducationMusic Lite ratureOrganPianoTheoryViolaViolinVoiceWind Instruments
Total '
School of Natural ResourcesBachelor of ScienceBachelor of Science in ForestryMaster of Forestry ..Master of Science in ConservationMaster of Science in FisheriesMaster of Wildlife ManagementMaster of Wood Technology
Total '.' •.
School of NursingBachelor of Science in Nursing ..
College of PharmacyBachelor of Science in PharmacyDoctor of Pharmacy
Total
School of Public HealthBachelor of Science in Public Health NursingMasle r of Public Health .•Master of Public Health (Industrial Health) .Doctor of Public Health .
Total
3"5i134
1331610812137
143
363
199642
79
110
201
21
6105
101
122
2:1
23
119
74211117
66
363
198642
78
161
17
7491
84
i41111
14966
2
77
110
4
4
631
1
38
2
4
265
13
2
3
54
9
10444
30
1 \
211
4
21
6111
1
30
1217132
26
13
2
2
12
3
1
21
4
14
1217132
26
12
3
2111
16
13
231
12
77411
23
56
222
127312
49
96
171
18
498
31
100
533
1
13
25
222
127312
49
141
15
6831
72
l'21
2411
31
96
3
3
430
34

TABLE xvn (Cont.)
Summary of Degrees, Certificates, and Commissions Conferred July I, 1961, Through June 30, 1962
Degrees, Certificates, and CommissionsTotal Summer Fall Spring
Total Men Women Total Men Women Total Men Women Total Men Women
School of Social WorkMaster of Social Work ....................... 74 29 45 10 4 6 10 3 7 54 22 32
Honorary DegreesDoctor of Aeronautical Science ................. 1 1Doctor of Humane Lette rs .................... 1 1Doctor of Humanities ....................... 1 1 1 1Doctor of Laws ........................... 5 5 4 4Doctor of Letters •••••• 0 •••••••••••••••••••• 1 1 1 1Doctor of Science .......................... 3 3 3 3Doctor of Science In Business Administration ....... 1 1 1 1
(,.)Total 13 13 3 3 10 10co ............................
Regents' Citation of Honor ..................... 1 1 1 1
Honorary Alumnus .......................... 1
Outstanding Achievement Awards ................ 3 3 3- 3
Certificates of GraduationCertificate In Anesthesia ..................... 8 8 8 8Ce rtlflcate in Dental Hygiene .................. 11 11 11 11
Total ............................ 19 19 19 19
Certificates of SpeciallzatlonCertificate In Journalism ..................... 14 4 10 1 1 2 2 11 2 9Certificate in Medical Technology ............... 22 22 2 2 20 20Certificate In Physical Therapy ................. 12 12 12 12Teachers' Certificates
State Elementary Provisional CertificateDearborn Cente r ........................ 8 1 7 2 2 6 1 5School of Education ....................... 249 10 239 29 3 26 48 3 45 172 4 168Flint College ........................... 59 12 47 22 6 16 11 3 8 26 3 23Horace H. Rackham School of Graduate Studies .... 12 2 10 3 1 2 3 3 6 1 5School of Natural Resources ................. 1 1 1 1
S!ate secondary Provisional CertificateCollege of Architecture and Design ............ 27 ? 25 3 3 4 4 20 2 18

Dearborn Center ".,....... .................. 8 2 6 1 1 7 2 5School of Education .......... '., ............ 183 110 73 27 16 11 58 37 21 98 57 41Flint College ........................... 26 17 9 2 1 1 7 5 2 17 1..1 6Horace H. Rackham School of Graduate Studies .... 45 22 23 16 9 7 9 5 4 20 8 ,12College of Literature, Science, and the Arts 279 48 231 22 3 19 57 16 41 200 29 171School of Music •••••••••• 0-0 ••••••••••••• 46 18 28 '0 4 '6 16 7 9 20 7 13School of Natural Resources ................. 1 1 1 1School of Public Health .................... 1 1
State Community College Permanent CertificateHorace H. Rackham School of Graduate Studies .... 5 3 2 5 3 2School of Public Health .................... 1 1 1 1
Total ............................ 999 253 746 158 47 111 216 78 138 625 128 497Commissions
Naval Reserve Officers' Traini~ CorpsUnited States Marine Corps .................. 2 2 2 2United States Marine Corps Reserve ............ 3 3 2 2 1 1United States Naval Reserve ................... 5 5 ,3 3 2 2United States Naval Reserve Civil Engineer Corps ... 1 1 1 1United States Naval Reserve Supply Corps ........ 3 3 . .. 3 3United States Navy ........................ 19 19 3 3 2 2 14 14United States Navy Supply Corps ............... 6 6 2 2 4 4
Reserve Officers' Training Corps
W United States Air Force Reserve ............... 18 18 3 3 3 3 12 12CQ United States Army
Adjutant General's Corps ................... 3 3 3 3Armor ..............•............•... 3 3 3 3Army Intelligence ........................ 2 2 2 2Army security ••••••••••••••••••••••• 0· •• 2 2 2 2Artillery .............................. 5 5 1 1 3 3Corps of Engineers ....................... 1 1 1 1Infantry .............................. 4 4 1 1 2 2Medical Service Corps .................... 4 4 4 4Ordnance Corps ......................... 8 8 3 3 5 5Quartermaster Corps ..................... 3 3 3 3Transportation Corps ..................... 1 1 1 1
Total ............................ 93 93 11 11 15 15 67 67

TABLE XVIll
Number of Degrees by Degree Level, 1950-51 through 1961-62
Degree Level
Graduate-Year Total Bachelor Master Professional Doctorate
1950-51 ... 6,399 3,346 2,172 666 215
1951-52 ... 5,325 2,562 2,003 522 238
1952-53 ... 4,825 2,253 1,803 504 265
1953-54 ... 4,589 1,989 1,827 470 303
1954-55 ... 4,535 1,971 1,794 491 279
1955-56 ... 5,030 2,440 1,817 499 274
1956-57 ... 5,516 2,708 1,999 532 277
1957-58 ... 5,813 2,786 2,024 742 261
1958-59 ... 6,242 3,078 2,083 772 309
1959-60 ., . 6,239 3,150 2,118 680 291
1960-61 ... 6,286 3,040 2,164 727 355
1961-62 ... 6,342 3,191 2,075 712 364
40

TABLE XIX
Degrees in Course Conferred by The University of Michigan, 1845 to 1962
Cumulative Cumulative Cumulative CumulativeYear Total Total Year Total Total Year Total Total Year Total Total
1845 ... 11 11 1875 ... 372 4,715 1905 .. " 830 22,075 1934-35 ... 2,322 72,9031846 .. . 17 28 1876 ... 416 5,131 1906 '" . 883 22,958 1935-36 ... 2,472 75,3751847 .. . 12 40 1877 ... 365 5,496 1907 '" . 893 23,851 1936~37 ... 2,823 78,1981848 .. . 16 56 1878 ... 380 5,876 1908 '" . 958 24,809 1937-38 ... 2,943 81,1411849 .. . 25 81 1879 ... 434 6,310 1909 '" . 993 25,802 1938-39 ... 3,178 84,3191850 .. . 17 98 1880 ... 415 6,725 1910 '" . 1,032 26,834 1939-40 ... 3,372 87,6911851 ... 18 116 1881 ... 436 7,161 1911 '" . 1,096 27,930 1940-41 ... 3,386 91,0771852 ... 42 158 1882 ... 436 7,597 1912 '" . 1,133 29,063 1941-42 ... 3,144 94,2211853 ... 48 206 1883 ... 450 8,047 1913 '" . 1,136 30,199 1942-43 ... 2,652 96,8731854 ... 79 285 1884 ... 404 8,451 1914 '" . 1,246 31,445 1943-44 ... 2,146 99,0191855 .. . 40 325 1885 ... 363 8,814 1915* .... 1,031 32,476 1944-45 ... 1,945 100,9641856 .. . 54 379 1886 ... 369 9,183 1915c 16t.. 1,207 33,683 1945-46 ... 2,761 103,7251857 .. . 70 449 1887 ... 413 9,596 1916-17 .. 1,468 35,151 1946-47 ... 4,559 108,2841858 .. . 87 536 1888 ... 422 10,018 1917-18 .. 1,148 36,299 1947-48 ... 5,801 114,0851859 .. . 78 614 1889 ... 441 10,459 1918-19 .. 833 37,132 1948-49 ... 6,158 120,2431860 .. . 109 723 1890 •.• 556 11,015 1919-20 .. 1,326 38,458 1949-50 ... 7,055 127,2981861 .. . 166 889 1891 ... 635 11,650 1920-21 .. 1,526 39,984 1950-51 ... 6,'399 133,6971862 .. . 153 1,042 1892 ... 702 12,352 1921-22 .. 1,823 41,807 1951-52 ... 5,325 139,0221863· 129 1,171 1893 ... 743 13,095 1922-23 .. 2,093 43,900 1952-53 ... 4,825 143,8471864 ... 165 1,336 1894 ... 703 13,798 1923-24 .. 2,220 46,120 1953-54 . , . 4,589 148,4361865 ... 217 1,553 1895 ... 714 14,512 1924-25 .. 2,114 48,234 1954-55 ... 4,535 152,9711866' ... 251 1,804 1896 •.. 765 15,277 1925-26 .. 2,143 50,377 1955-56 ... 5,030 158,0011867 .. . 285 2,089 1897 ... 498 15,775 1926-27 .. 2,279 52,656 . 1956-57 ... 5,516 163,5171868 ... 306 2,395 1898 ... 703 16,478 1927-28 .. 2,447 55,103 1957-58 ... 5,813 169,3301869 ... 317 2,712 1899 ... 719 17,197 1928-29 .. 2,469 57,572 1958-59 ... 6,242 175,5721970 ... 338. 3,050 1900 ... 766 17,963 1929-30 .. 2,633 60,205 1959-60 ... 6,239 181,8111871 ... 304 3,354 1901 ... 764 18,727 1930-31 .. 2,673 62,878 1960-61 ..• 6,286 188,0971872 ... 341 3,695 1902 ... 823 19,550 1931-32 .. 2,758 65,636 1961-62 ... 6,342 194,4391873 ... 331 4,026 1903 ... 858 20,408 1932-33 .. 2,597 68,2331874 ... 317 4,343 1904 ... 837 21,245 1933-34 .. 2,348 70,581
*January to Junet July 1, 1915, to June 30, 1916

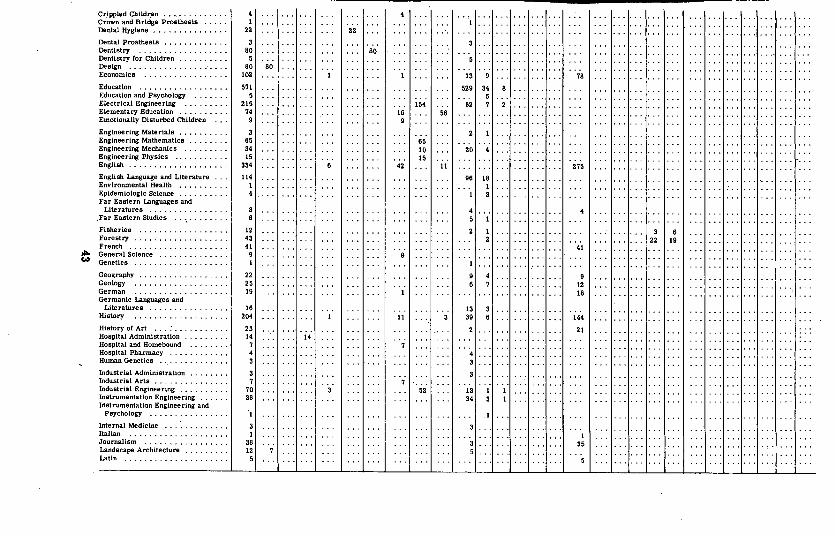
TABLE XX
Number of Graduates by Field, Degree Level, and Unit, 1961-62
Arch.and
Des. Bus.AdDear-born Del;lUBtry Educ. Eng. Flint Rackham Law
L.• S••and A. Med. Musle Nat. Res. Nurs. .Pharm.
Soc.Pub. Health Work
~.. -d~
~~~ ~ ~ $ ~ $ ~ 'Cl~ ~ ~ ~ $ ~
~,g ° oil ,g ,g ,g~ f ,l; ,g
~ " ,g ,g s .s ~,g .,g f ,g
~
~- ~ ~- S.1! .sll J .1! ~ ~ .s~ ~ ~ .s ~ .s.!l .1! .1! ~ .1! .1! .s
~ ~ ~~
u c
~ B Bu."
~ " ~ ~u B "8~ ~ " " " 8:ll :2 :2 ~ " 8 :2:s c'5 III :s III III III III III :s
22 80 393 658 142 1.695 360 18 255 11 1,399 169 61 82 39 40 110 20 115 74
2966
181
77 20
794
27 24
29
22 1758
17 24 604
50 50
137
81
n
ToW~ ~ ~,g ,g
~,g
.1! .1! ~ .1!~ ~ " ~:s III
6.342 134 165 247 42
1
3666
28
626
154 4727
1413
66
56
31
122
452 165 233 16
Total .
Field of Specialization
Acoustically Handicapped .Ae ronautlcal and Astronautical
Englnee rin~ . . . .•.....'Aeronautical EngineerIng .!Aeronautics and Astronautics .
.. ;AmeJ;l.can Culture .
N 'Anatomy .,Anthropology .IAnthropology and Zoology .Architecture .Art .
Astronomy .BacterIology .Biological Chemistry .Biological Science .Biology .
Biophysics .Biostatistics .Botany .Botany and Bacteriology .Business Administration .
Business Subjects .Chemical and Metallurgical
Engineering . . . . . . . . 39Chemical Engineering 56Chemistry . . . . . . . . . . . . . . 105City Planning . . . . . . 4
CivU Engineering 104Classical Studies 1Classical Studies: Greek and Latin. 1Classical Studies: Latin 13Communication Sciences 7
Comparative' Literatu'~ 10Conservation 18
Crippled Childr.en .............. 4Crown and Bridge Prosthesls ..... 1Dental Hygiene ............... 22 22
Dental Prosthesis ............. 3Dentistry .................. 80 80Dentistry (or Children .......... 5Design ..................... 80 80Economics ................. 102 13 9 78
Education . . . . . . .. . . . . . . . . . . 571 529 34Education and Psychology ....... 5 5Electrical Engineering ......... 215 154 52 7Elementary Education .......... 74 16 58Emotionally Disturbed Chlldren ... 9 9
Engineering Materials .......... 3Engineering Mathematics ........ 65 65Engineering Mechanics . . . . . .. . . 34 10 20Englneering Physics .. . . . . . . . .. 15 15English .. . . . . . . . . . . . . . . . . . . 334 42 11 275
English Language and Literature ... 114 96 18Environmental Health .......... 1 1Epidemiologic Science .......... 4 3Far Eastern Languages and
Literatures ................,Far Eastern Studies ...........Fisheries . . . . . . . . . . . . .. . . . . 12 3 6Forestry · . . .. . . . . . . . . . . . . . . 43 22 19French .................... 41 41
"., General Science .............. 9W Genetics '" ................ 1
Geography .................. 22 9Geology ................... 25 12German · .................. 19 18Germanic Languages and
Literatures ................ 16 13History · .................. 204 11 39 144
History of Art ............... 23 21Hospital Administration .. . . . . . . . 14 14Hospitai and Homebound ........ 7Hospital Pharmacy ............ 4Human Genetics .............. 3
Industrial Administration ........ 3Industrial Arts ............... 7Industrial Engineering . .. . . . . . . . 70 52 13Instrumentation Engineering ...... 38 34IrtstrumentatiQn Engineering and
Psychology . . . . .. . . . . . . . . . . 1
Internal Medicine ............. 3ItaHan . . . . . . . . . . . . . . . . . . . . 1 1Journalism ................. 38 35Landscape Architecture ......... 12LaUn . . . . . . . . . . . . . . . . . . . . . 5
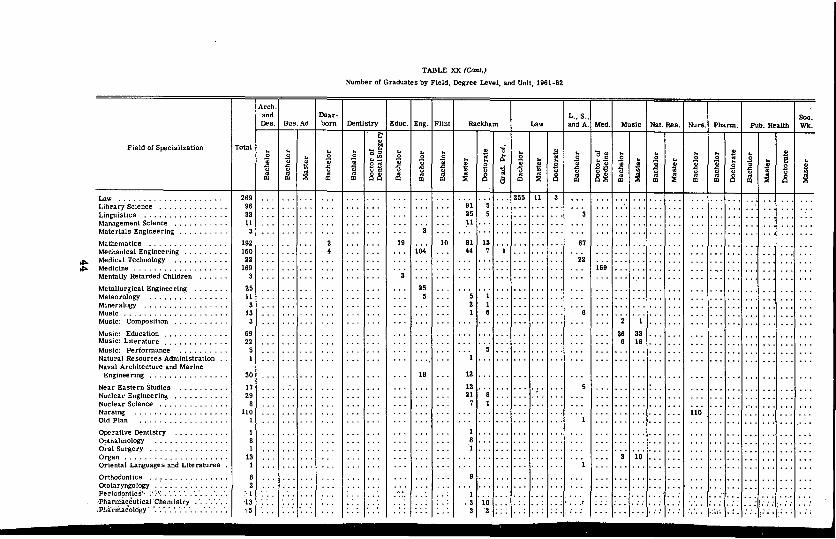
TABLE XX (Cont.)
Number of Graduates by Field, Degree Level, and Unit, 1961-62
Arch.and Dear-Des. Bus. Ad born Dentistry Educ. Eng. FUnt Rackham Law
L., S., Soc.and A. Med. Music Nat. Res. Nun. Pharm. Pub. Health Wk.
Field of Specialization Total
22
87
LawLibrary ScienceLinguisticsManagement ScienceMaterials Engineering
MathematicsMechanical Engineering" ..Medical TechnologyMedicine ..Mentally Retarded Children
Metallurgical EngineeringMeteorologyMineralogyMusicMusic: Composition
Music: EducatlonMusic: Literature ..Music: PerformanceNatural Resources AdministrationNaval Architecture and Marine
Engineering '.
Near Eastern StudiesNuclear Engineering ..Nuclear Science ..NursingOld Plan
Operative DentistryOpthalmologyOral SurgeryOrgan" " " " " , , , " " ..Oriental Languages and Literatures
Orthodontics ,Otolaryngology .Periodontics':.. I,' :,l; , " " " " ,
"'Pnarrrraceutical 'Chemistry,Ph"ifiiiiacolo"gy' '. " ". ". ". ". ", ",
269963311
3
192160
22169
3
25113
133
6922
51
30
17298
1101
181
131
82
',1"13,5
19104
255
18
10
9125II
81 1344 7
12
1221
7
1,3 10
3 '2
255 11
"";; .r"" :: :
189
2
388
33 ...18 •.
10
110
" :~l'"

Phaimacy';j~··., . 25 ,,' 4 " ; ::! "" " " " "
"" " " '20 I' "'I " " " " "
Philosopny'lllr:.'.l.t }"..\U!.} '..... 40 20 18 ""
" " " : " ".:.:j.: "
" "Physical Education " 34 34Physical Science 3 1Physical Therapy " 13 13
Physics " " " 75 ,35 18 18Physiology 2 :iPiano 13PoUtical Science " " "
, 118 23 83Predental " 4 4
Prelegal " 26 26Premedical 44 44Psychology 136 19 24 91Psychology and Sociology 1Public Administration 13 13
Public Health 122 115Romance Languages and Literatures. 1Romance Languages and Literatures:
French 11Romance Languages and Literatures:
Spanish 13 10Russian 7
"Russian Languages and Literatures 3Russian Studies 6Science Engineering 35 35Science Cor Teachers 21 21Science Studies 28 28
~ Slavic Languages and Literatures 1 1C1I Social Psychology 11 11
Social Science " 16 16Social Studies 177 147 7 22Social Work 63 9 74
Social Work and Social Psychology 1Social Work and Sociology 2Sociology 65 16 43Spanish " " 27 26Speech " " 101 32 ,6 53
Speech Correction " " 3Studies in Religion " 2Surgery
" 4Theory
" " 2 1Viola " " 2
Violin 2Voice 6WlldUfe Management
" " 6WInd Instruments " 11Wood Technology 11
Zoology" 110 28 17 65
Unclassified " 16 16
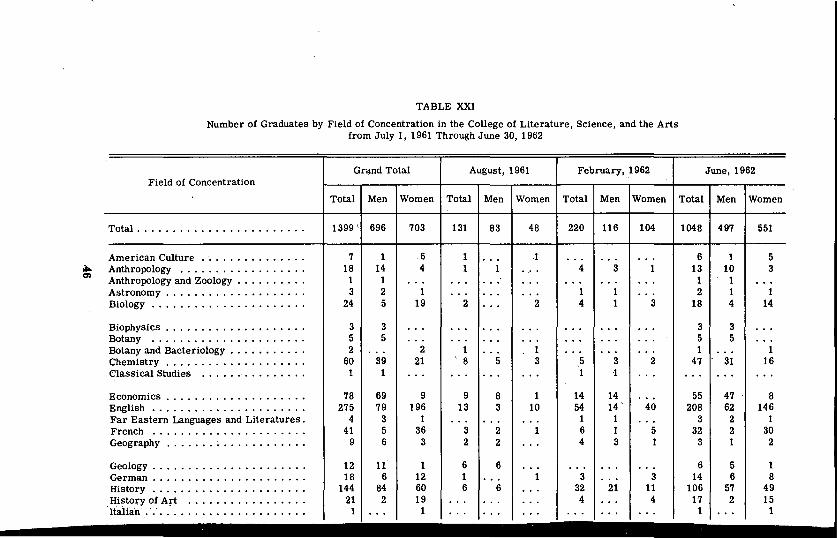
TABLE XXI
Number of Graduates by Field of Concentration in the College of Literature, Science, and the Artsfrom July 1, 1961 Through June 30, 1962
Grand Total August, 1961 February, 1962 June, 1962Field of Concentration
Total Men Women Total Men Women Total Men Women Total Men Women
Total ............... ......... 1399 ' 696 703 131 83 48 220 116 104 1048 497 551
American Culture ............... 7 1 6 1 " . 1 . .. .. . . .. 6 1 5.:.. Anthropology ..... . ......... . .. 18 14 4 1 1 . . 4 3 1 13 10 3(l)
Anthropology and Zoology 1 1 1 1.......... .. . . .. " . .. . .. . .. . . .. . ..Astronomy ........ . ........... 3 2 1 .. . " . . .. 1 1 . .. 2 1 1Biology ................... . .. 24 5 19 2 " . 2 4 1 3 18 4 14
Biophysics ................... 3 3 . .. .. . " . .. . .. . . .. . .. 3 3 . ..Botany ............... . ...... 5 5 .. . .. . " . .. . .. . .. . . .. 5 5 . ..Botany and Bacteriology .......... 2 .. . 2 1 " . 1 . .. .. . . .. 1 . .. 1Chemistry 60 39 21
,8 5 3 5 3 2 47 31 16....................
Classical Studies ••••• 0· ••••••••• 1 1 . .. . .. " . . .. 1 1 . .. ... .. . . ..Economics .................... 78 69 9 9 8 1 14 14 . .. 55 47 8English ...................... 275 79 196 13 3 10 54 14' 40 208 62 146Far Eastern Languages and Literatures. 4 3 1 .. . " . .. . 1 1 . .. 3 2 1French ...................... 41 5 36 3 2 1 6 1 5 32 2 30Geography ........... . ........ 9 6 3 2 2 . .. 4 3 1 3 1 2
Geology ...................... 12 11 1 6 6 .. . .. . .. . . .. 6 5 1German ...................... 18 6 12 1 " . 1 3 . .. 3 14 6 8History ...................... 144 84 60 6 6 . .. 32 21 11 106 57 49History of Art ................. 21 2 19 .. . " . .. . 4 . .. 4 17 2 15
'ItaHan' .... : ................... 1 .. . 1 .. . " . .. . .. . .. . . .. 1 . .. 1
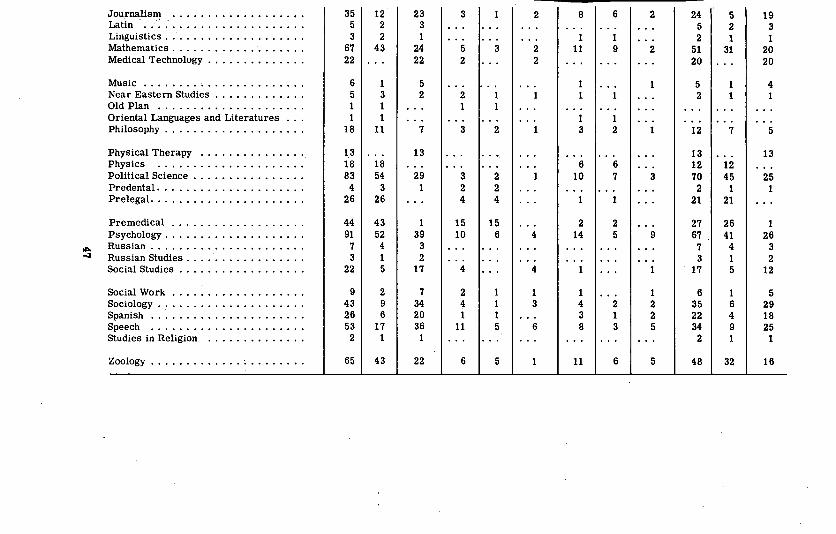
Journalism .................•.Latin> >.• : ••.••••..•••••••••••Linguistics . . . . . . . . . . . . . . . . . . . .Mathematics .Medical Technology .
Music .Near Eastern Studies .Old Plan .Oriental Languages and Literatures .Philosophy . . . . . . . . . . . . . . . . . . . .
Physical Therapy .Physics .Political Science .Predental .Prelegal .
Premedical .. , .Psychology .Russian .Russian Studies .Social Studies .
Social Work .Sociology .Spanish .Speech .Studies in Religion .
Zoology .
3553
6722
6511
18
131883
426
449173
22
9432653
2
65
1222
43
1311
11
1854
326
4352415
296
171
43
2331
2422
52
7
13
291
139
32
17
73420361
22
3
52
21
3
324
1510
4
241
11
6
3
2
224
156
1115
5
2
22
4
4
13
6
8
111
11
13
610
214
1
1438
11
6
19
12
67
1
25
213
6
2
2
3
9
1
1225
5
2452
5120
52
12
131270
221
276773
17
6352234
2
48
521
31
7
1245
121
2641
415
16491
32
1931
2020
41
5
13
251
126
32
12
52918251
16

GEOGRAPHICAL ORIGIN OF STUDENTS
The University of Michigan again served students from everyMichigan county. Numerically, eight counties supplied the bulk of thestudents; when considered as a ratio of the population, the representation was nearly equal throughout the state.
Every state, the District of Columbia, the Canal Zone, Puerto Rico, \the Virgin Isiands, and ninety-nine foreign nations were represented inthe student body.
Geographical distributions were made according to the home address given by the student at the time of his· registration. Table XXII,below, and Figure 7, following, indicate these distributions.
TABLE XXII
Distribution of Students by Selected Geographical Regions1961-1962
Residence and Extramural Students in Creditand Postgraduate Professional Programs
Total ..•...•........•.•.........•..
Michigan •..... • . . . . . . • . .' _. . . • . • . . . . . .
Other states .• : -.•.•.•..
Far East and South East Asia ..........•..
Latin America and Caribbean Islands .....•..
Canada .•....•.•.••..•......•....•.
Near East and North Africa .....•......•.
Europe ....••.....•.......•..•.•••••
United Arab Republic ....•..••.....•....
Africa, other than North Africa ......••....
United States Territories .
Australia, New Zealand, and Oceania ....••..
48
Students
41,516
29,101
10,251
742
443
376
232
180
62
63
54
12
Per Cent
100.00
70.10
24.70
1.79
1.07
.90
.55
.43
.15
.15
.13
.03
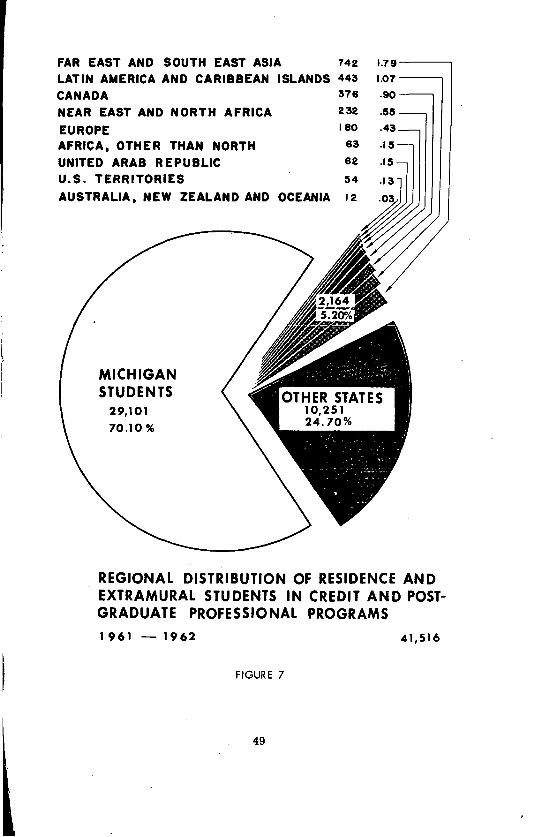
FAR EAST AND SOUTH EAST ASIA 742 1.79-----,
LATIN AMERICA AND CARIBBEAN ISLANDS 443 1.07-----,
CANADA 376 .90
NEAR EAST AND NORTH AFRICA 232 .SS
EUROPE 180 .43
AFRICA. OTHER THAN NORTH 63 .IS
UNITED ARAB REPUBL~
U.S. TERRITORIES
AUSTRALIA. NEW ZEALAND AND OCEANIA
MICHIGANSTUDENTS
29,101
70.10 %
REGIONAL DISTRIBUTION OF RESIDENCE ANDEXTRAMURAL STUDENTS IN CREDIT AND POSTGRADUATE PROFESSIONAL PROGRAMS
1961 - 1962
FIGURE 7
49
41,516

TABLE XXlll
Regional Distribution of Students, 1961-1962Residence Students in Credit Programs and Extramural Students in Credit and Professional Programs
eno
United States
All Michigan Other States T ~rritories ForeignStudent Group Areas Per Per Per Per
Students Cent Students Cent Students Cent Students Cent
... Architecture and Design· ...................• 718 507 70.61 190 26.46 6 .84 15 2.09.2i Business Administration ....•............... 853 594 69.64 202 23.68 2 .23 55 6.45en Dearborn Center 331 322 97.28 7 2.12 .00 2 .60., ......................... ...] ~~:~~t~~~ : : : : : : : : : : : : : : : :: : : : : : : : : : : : : :
454 402 88.55 45 9.91 ... .00 7 1.541,070 792 74.02 250 23.37 1 .09 27 2.52-Engineering 2,938 1,890 64.33 730 24.85 3 .10 315 10.72en .................... '........... Flint 514 511 99.42 .00 .00 3 .58
~................................. ... ...
.SGraduate .............................. 6,258 4,053 64.77 1,600 25.57 9 .14 596 9.52Law ................................. 957 416 43.47 511 53.40 . .. .00 30 3.13
C Literature, Science, and the Arts .............. 8,268 5,511 66.66 2,460 29.75 14 .17 283 3.42.,.5 Medicine .............................. 1,339 1,012 75.58 284 21.21 4 .30 39 2.91
'0 Music ................................ 556 313 56.29 232 41.73 . .. .00 11 1.98... Natural Resources . ...................... 200 82 41.00 105 52.50 ... .00 13 6.50ctil Nursing ............................... 674 480 71.21 192 28.49 . .. .00 2 .30., Pharmacy ............................. 157 119 75.80 32 20.38 ... .00 6 3.82"c Public Health ........................... 204 68 33.33 104 50.98 3 1.47 29 14.22.,
'<l Social Work ............................ 242 167 69.01 61 25.21 ... .00 14 5.78'fii., Hospital Training ......................... 13 2 15.39 10 76.92 . .. .00 1 7.690:: Duplicates ............................. 57 35 61.40 18 31.58 . .. .00 4 7.02
Net total, first semester ...................... 25,689 17,206 66.98 6,997 27.24 42 .16 1,444 5.62
Net total, second semester .................... 24,590 16,470 66.98 6,680 27.17 43 .17 1,397 5.68
Net total, first and second semester .............. 28,243 19,169 67.87 7,307 25.87 47 .17 1,720 6.09
1961 summer session ....................... 11,588 7,134 61.56 3,721 32.11 17 .15 '716 6.18
Credit extension ........................... 6,880 6,661 96.82 183 2.66 1 .01 35 .51
Extramural med. and short post-grad. med., dental,or hospital training ....................... 2,070 1,546 74.69 458 22.12 0.' • ., . 66 3.19
Net total ............................. 41,516 29,101 70.10 10,251 24.69 54 .13 2,110 5.08
------....-- .~7__.... •

s -TABLE XXIV
Geographical D1strlbullon of Students by State~ and CountriesResidence Students In Credit Programs and Extramural Students In Credit and Professional Programs
(1961-1962)
t1I....
Residence Enrollment In First Semester1::
" " ,8..;.!!!' ~
",,,.si00 " "'2;'" '" ",- '" .2 ; ~~ 00.2Cl .!:: 00 " 00
.~ " '" .~«00 00 .", -00
'" " " " -" '" " "g Q.I C "00
" .S .!l " " 2 00'" '" .9 "''''Geographical Location '" e " " .c .s '" 00 .~~ " 00 )1)1 .. "gC;'" U:5 0
'" ;; '" " -;<.st: -"" " .~00 ;::
~ " --~ ~~ '" '" "'Po.~
-< "''' ~ '" f-< '" e 1<" ;., " " ;-< ;.,'" 0 -e e ~-g ~ ~.. ~ 800 .9 ~ '" " ill ~ "'''' ~~ "'''' r.l
'" 00 " .!:: '" .s -;< bll '" ~ '5" "'"0
~ '" .~ '" .S e '5'" e"oo ~:t::f:ii " .c .~ .S " "'.c " " " ~ ~ f-<- f-<C f-<g '" ;:f!~'iii " " " :5 " ,,- '6 'iii
~00 " "" .00 0 .... " _il ~
" '" " bll '" ~ 2" " " '" -§ 00 -" -" -" '" '" 1< 0 "" " '" <l> " C r;: " .~ " '" " .c 0 0 "'.~ "'''' "'<l>~ " "'''''-< "l Cl Cl r.l r.l " ..:I ..:I", )1 ::0 Z Z Po. Po. '" ill Zf<. Z'" Z'" U r.lPo. 0 ZUPo.
,Total 718 853 331 454 1,070 2,938 514 6,258 957 8,268 1,339 556 200 674 157 204 242 13 25,689 24,590 28,243 11,588 6,880 2,070 41,516
United StatesAlabama .................. .. . 3 ••• .. . 1 1 .•. 12 4 5 2 2 .•• .. . ... 2 1 .•• 33 31 34 73 . .. 5 107Alaska ................... .. . .. . .. . .. . .. . .. . . , . 2 ••• 1 . .. ... .. . .. . .. . .. . .. . .. . 3 2 3 2 1 . .. 6Arizona . ................. .. . 1 .•• .. . 2 1 ... 9 ••• 3 3 ••• 1 2 . .. .. . .. . .. . 22 22 25 18 " . 4 36Arkansas ................ . .. . 1 ••. . .. . .. 1 ... 5 ..• .. . 3 .•• 1. . : 2 •.• . .. 13 10 13 15 . .. 1 22California ................ 2 2 ... 9 3 23 ... 88 7 20 16 7 4 2 1 7 3 1 192 186 206 188 8 9 362Colorado ................ . 1 3 .•. 2 4 2 ... 18 6 10 1 2 ... . .. ... 2 1 .•. 52 54 59 35 1 7 88Connecticut ............... 5 7 ..• 2 3 22 .•. 32 13 55 5 2 4 3 1 .•• . .. 1 154 142 163 74 2 4 216Delaware ................. 1 1 •.. .. . . .. 1 ... 11 ••. 5 2 1 .•. . .. .. . .. . .. . .. . 21 17 21 14 . .. 4 33District of Columbia ........ . 1 3 .•. . .. 2 11 ... 19 2 25 2 ••. ... .. . .. . 1 ••• 1 67 61 67 53 1 6 110Florida ................. . .. . 4 ••• 3 2 17 ..• 29 4 38 3 5 ..• ... 1 3 ..• . .. 108 101 115 86 1 3 180Georgia .................. .. . .. . .. . .. . .. . .. . .. . 11 1 10 2 3 .•• ... .. . 1 1 ••. 29 25 30 26 1 12 62Hawaii ................... 1 .•. .. . .. . 1 13 .•. 13 5 10 4 '.' . . .. .. . .. . 2 .•• 1 50 47 51 19 1 1 60Idaho .................... .. . 2 •.• . .. .. . .. .' ., . 12 1 1 . .. " . 1 ..• ... 2 1 •.• 20 21 22 6 . .. 1 24illinois ................... 27 37 1 3 54 91 ••. 129 68 593 21 19 15 30 2 9 6 .•• 1,104 1,072 1,143 289 26 35 1,358Indiana .................. 20 18 .•. . .. 8 20 ... 49 33 105 4 7 1 19 •.. 2 3 1 290 275 301 146 7 19 417Iowa .................... 3 2 .•. .. . 1 8 ... 30 11 19 2 8 ... . .. 1 1 3 •.. 88 83 92 57 2 5 134Kansas .................. .. . .. . .. . .. . 1 2 ••. 30 7 7 . .. 2 1 3 .•• 1 ••• 1 55 54 58 46 . .. 3 87Kentucky ................. 2 6 .•• 1 2 6 ••. 14 5 15 3 •.. 1 2 ••• 3 2 .•• 62 67 69 35 1 16 108Louisiana ................. • 0.0 .. . ... .. . . .. 1 •.• 8 1 3 1 5 ••• ... " . .. . .. ... . 19 17 20 26 . .. 3 43Maine ................... 1 2 .•• .. . 1 2 .•• 8 1 3 .. . . .. .. . . .. . .. . .. .. . .. . 18 17 21 11 3 3 32Maryland •• , 0' ••••••••••••• 2 4 ••• .. . 1 9 .•• 31 3 45 3 6 3 5 1.., . . .. .. . 113 104 116 112 4 10 - 219Massachusetts ............. 7 10 •.. 1 7 29 ... 61 22 56 5 6 8 3 1 3 2 1 222 208 228 94 5 5 289Michigan ................. 507 594 322 402 792 1,890 511 4,053 416 5,511 1,012 313 82 480 119 68 187 2 17,206 18,470 19,169 7,134 8,661 1,546 29,101Minnesota ................ .. . 2 ••• " . 5 2 ••• 36 8 17 4 4 •.• . .. .. . 1 2 ••• 81 77 84 59 1 7 134
'Mississippi .............. . .. . 1 .•• .. . 1 .. . ., . 6 .•• 2 2 2 1 ••• .. . 1 ••• .. . 16 17 19 20 ... 1 35
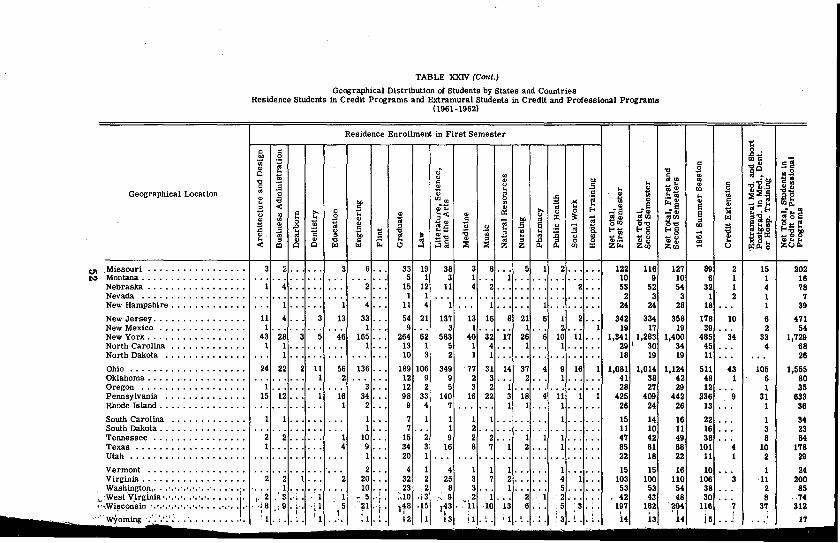
TABLE XXW (Coni.)
Geographical Distribution of Students by States and CountriesResidence Students in Credit Programs and Extramural Students in Credit and Professional Programs
(1961-1962)
Residence Enrollment in First Semester1::
" "0"'.;
~ ,2 m" .s~., .. § .,,'"'" ..'"
." :;0. .,.!a0 <;; u ., :;., .,." '" , .,
.,;-g~ ~=:9 " u .. -" '" "" .2loS .. ..~ .,'" m
~ ~::o~.".2lGeographical Location 8 u " '" '" ~1;j .. .a 0
'" CIJ..230 <;; '" ".. ."
~., :: ... r..'" '" "E~l:
mt..a < '" oS .. ..'" ...:-~ A 8 '"
" >. " "' .. Il:: >. '" 0 fo< ...:-8 8 10 c;"~ E1u ., .. .. .2 .. '" ;< '" u :t: ~ .5'" oSm.g~ r.l gog ci.'"
.,0 !i '" .. .s ;;; bll oS
i '5." " ~::~:: '" .. '" " -'" .s 8 om m~
.. .,.s of "
oS", .;l .;l .. .lO .5 fo<<;; fo<S fo<S'" u ]I 'g ..- ., .. eJZ~~'., oS -a " ..
~2." ." .,
~ ..~ ~
u ., - '"_ ill!'
'" .. '" " -.. -u -u '"" '" ." " r;: " 0 0 "'- "'''' "'''' .. 100" "' ....< Q:l 0 0 r.l r.l Cl :3:; ::0 ::0 z Z Po m :t: zr.. Zm Zm ~ U ~Poo zUPo
C1l ,Missouri ••••••••••• 0 ••• • 2 ... .. . 3 6 ... 33 19 38 3 8 ... 5 1 2. ..... 122 116 127 89 2 15 202N Montana ......•...••..•... ... .. . . .. .. . 5 1 3 1 ... 1 ..• ... .. . . .. .. . 10 9 10 6 1 1 16
Nebraska .. . ............. . 4 .•• ... 2 •.. 15 12 11 4 2 ... . .. .. . .. . 2 ..• 53 52 54 32 1 4 78Nevada ................. . ... .. ... . .. . 1 1 .. . . .. . .. .. . .. . . .. . .. .. . 2 3 3 1 2 1 7New Hampshire .....••..•.•• 1 ... ... 1 4 ••. 11 4 1 1 ... .. . 1 ... . .. . .. 24 24 28 18 1 39
New Jersey. ............ .. . 11 4 ... 3 13 33 ... 54 21 137 13 16 8 21 6 1 2 ..• 342 334 358 178 10 6 471New Mexico ........... . .. . 1 ... . .. ... 1 ... 9 ... 3 1 .•. . .. 1. .. 2 ..• 1 19 17 19 39 2 54New York. ........ . '" . .. . 43 28 3 5 46 165 . .. 264 62 583 40 32 17 26 6 10 11 .•• 1,341 1,283 1,400 485 34 33 1,729North Carolina ............. 1 1 ... . .. 1 .•. 13 1 5 1 4 ... 1 ... 1. . .... 29 ' 30 34 45 4 68North Dakota ............. . 1 .•. ... 10 3 2 1 1 ... . .. .. . .. . .. . .. . 18 19 19 11 28
Ohio .. . ................. 24 22 2 11 56 136 . .. 189 106 349 77 31 14 37 4 9 16 1 1,081 1,014 1,124 511 43 105 1,555Oklahoma ... .. .-........... ... .. . .. . 1 2 12 9 9 2 3 ... 2 ..• 1 ... . .. 41 38 42 48 1 6 80Oregon ............... . 1 .. . ... ... 3 ..• 12 2 5 3 2 1 .•• . .. .. ... ... . 28 27 29 12 1 35Pennsylvania .............. 15 12 ... 1 16 34 ... 98 33 140 16 22 3 18 4 11 1 1 425 409 442 236 9 31 633Rhode Island . . . . . . • • • • . . . . . ... .. . .. . . .. 1 2 .•• 9 4 7 1 1 .•• 1 •.• ... 28 24 28 13 1 36
South Carolina . . .......... . 1 ... ... 1 ... 7 1 1 1 1 . . . .. . . .. 1 ..• . .. 15 14 16 22 1 34South Dakota . . . • . . • • . . . . • • • ... .. . ... .. . 1 ... 7 ... 1 2 .•• . .. .. . . .. 11 10 11 16 3 23Tennessee ............... . 2 2 ••• ... 1 10 •.. 15 2 9 2 2 ... 1 1 1 ... . .. 47 42 49 38 8 84Texas •••••• 0 ........ .... . 1 ..• ... .. . 4 9 ... 34 3 16 8 7 1 2 ..• 1 ... . .. 85 81 88 101 4 10 178Utah ................... . ... . .. . .. .. . 1 ..• 20 1 .. . ... ... .. . ... . .. .. . . .. 22 18 22 11 1 2 29
Vermont ................ . .. . .. . .. . .. . ... 2 ... 4 1 4 1 .•• ... 1 ... . .. 15 15 16 10 1 24Virginia . ................. 2 1 .•• 2 20 ... 32 2 25 2 .•. ... 4 1 .•• 103 100 110 106 11 200
.' Wash~gt0!1I'·'·'·'·'·'·'·'·'·'·'·', .• 'i. 1 . 10 . 23 2 8 3 ... 1 ... . .. 5 ... . .. 53 53 54 38 2 85
;:,,~~::o~~~~~~::::::::::::::·:::.::: :1:. \" 2 ,: 3. 1 1 ~,5 .' ;110 ,,3 ,<9 2 1 ... 2 1 2 .•. . .. 42 43 48 30 8 ·74•• J 8 .1 9 . i 1 ' ~ 5 21. ;48 .15 143 . 'li ·10 13 6 ..• : 5 ,3 197 182 '204 l}6 7 3~ 312
.'.........!.,
11 . .1. !1. " I13 ~ 1 . ~ . : 3. ( • i ,
b 'Ii5 .. .I i"Wyoming ,·.\·'i: l <: :1.l .. 12 11 I 1 , ~ • 14 14 17~ :..:..;'" ... ••• J
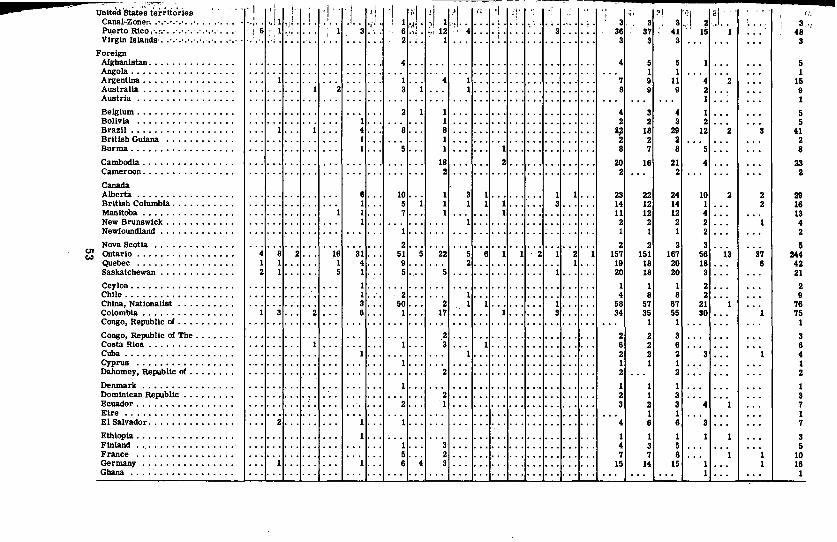
a 2 , --~-_.'-
_.Unlt.1d 'stS.t~~ territories I ,I i :1 .1.
·1 ~I ~I :I-./ 'I l "' :'1 'I :;1 f,'.,
..11 'j) l I 3,~ ,Canal·,Zoner•.....•.. 0'.·.· .... '.. "1" oj 1 ',.1; 1 :"
: .0, 3 3 2 ",.'. '0 3",Pu:erto Rico ".r... ·.·.·.·.-.·.·.·.'.·. , 6 " 1 1 3 : 6 .... ~ :H 12 4 3 36 37 41 15 1 48,
"Virgin Islands· .. '.' 0·.""'.'.', .... " ., 2 1 0' 3 3 3 3Foreign
Afghanistan . 4 00 4 5 5 5Angola , 1 1 1Argentina . 1 1 4 1 7 9 11 4 2 15Australia 1 2 3 1 1 8 9 9 2 9Austria 1 1Belgium 2 1 4 3 4 1 5Bolivia 1 1 2 2 3 2 5Brazil 1 4 8 8 22 18 29 12 2 3 41British Guiana 1 1 2 2 2 2Burma . 1 5 I 1 8 7 8 5 8
Cambodia • 18 2 20 18 21 4 23Cameroon. 2 2 2 2
CanadaAlberta 8. 10 3 1 1 1 23 22 24 10 2 2 29British Columbia . 1 5 1 1 1 1 3 14 12 14 1 2 16Manitoba 1 7 1 11 12 12 4 13New Brunswick 1 1 2 2 2 2 4Newfoundland 1 1 1 1 2 2
Nova Scotia .. 2 2 2 2 3 5C)1 Ontario 4 8 2 18 31 51 5 22 6 2 2 1 157 151 167 56 13 37 244c.o
Quebec 1 1 1 4 9 20 1 19 16 20 16 6 42Saskatchewan 2 1 5 1 5 1 20 18 20 3 21
Ceylon, 1 1 1 1 2 2Chile .. 1 2 1 4 8 8 2 9China, Nationalist 3 500 2 1 1 1 58 57 67 21 76Colombia 3 2 6 1 17 1 3 34 35 55 30 75Congo, Republic of ',' 1 1 1
Congo, Republic of The 2 2 2 3 3Costa Rica 1 3 1 6 2 6 6Cuba 1 1 2 2 2 3 4Cyprus ..... .. o, 1 1 1 1 1Dahomey, Republic of 2 2 2 2
Denmark 1 ... 1 1 1 1Dominican Republic , 2 2 1 3 3Ecuador. 2 1 3 2 3 4 7Eire 1 1 1El Salvador. 2 1 1 4 8 6 3 7
Ethiopia . 1 1 1 1 1 3Fln1aod ',' 1 3 4 3 5 5France 5 2 7 7 8 10Germany 1 1 6 4 3 15 14 15 16Ghana 1
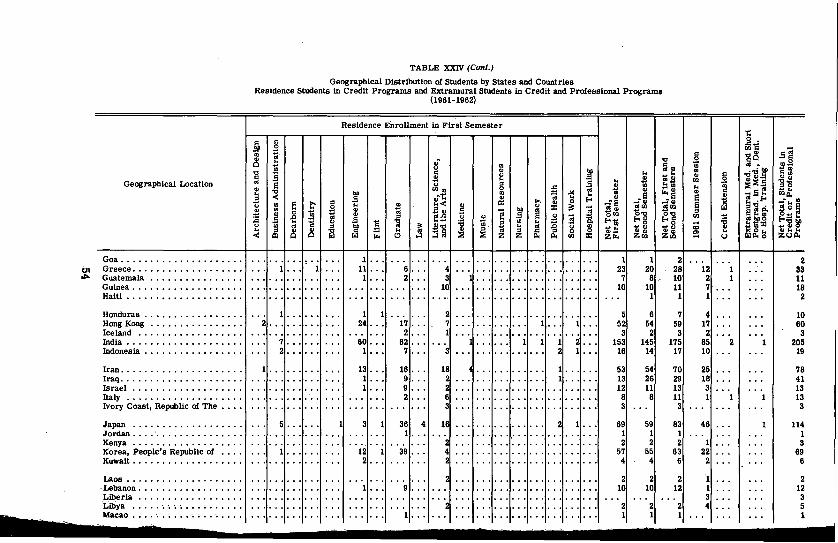
TABLE XXIV (Cont.)
Geographical Distribution of Students by States and CountriesResidence Students In Credit Programs and Extramural Students In Credit and Professional Programs
(1961-1962)
Residence Enrollment In First Semester~
'" '" ,g..;.!!l' ° "'''' .s~.. 1;l '" ","
~ .. .." '" .2 :a': .. .210 .. :a .. .." ..
~..
.,;-g~~ ..
1:1 :s '" ".. ~ .. .. '" "' ..
~ ..~
.... .2 .. ..Geographical Location '" S " " .s .. .. ~ '" ;;l:ll~ "g'O.. 0 .<: ~ r;:~
.. .."' .. f .. '" ~ .... '" .. cart:.. ;tl ~ A
.. .. -.s .. "'Po..a < .s &! '" '" 0 !-o ..~ .. S
~ ~ .F-t3~~e t' '" .. < .. _os S" .. 0 ..
~ .~ " = ~ "'''' :I'" r.l ~'h.. .. ..~Jj f .~ ~ ~ :I" 'is,,, ".. 0 s 1;l .. 0'" 0'" 0;tl;tl .s of .s i ,a ~ ~ ; !-os !-os '" ;tl
f~~.<: 1: " 1: .. ~"
.. .. '" !-o"l;; - II ~ll ~" .. '" " ~ j ~§..
'i .. '" .g " ..~" ~" <D.. " ~ ~ '" :::l .. " " " .<: 0 0 ~ .."" " .. .. a&~ " ....:ll :ll ,,-
~< ll:l r.l r.l r.. t:l z z Po. Po. '" = zr.. z", z", U zuPo.
Goa. : 1 1 1 2 2CJ1 Greece. 1 11 6 4 23 20 28 12 33~ Guatemala 1 2. 3 7 8 10 2 11
Guinea. 10 10 10 11 7 18Haiti 1 1 1 2
Honduras 1 1 1 2 5 6 7 4 10Hong Kong 2 24 17 7 1 1 52 54 59 17 60Iceland 2 1 3 2 3 2 3india 7 60 82. 1 2 153 145 175 85 2 205indonesia 2 1 7 3 2 1 16 14 17 10 19
Iran. 1 13 16 18 4 1 53 54 70 25 78Iraq. 1 9 1 13 26 29 18 41Iarael 1 9 2 12 11 13 3 13Italy 2. 6 8 8 11 1 13Ivory Coast, Republic of The 3 3 3 3
Japan 5 36 4 16 2 1 69 59 83 46 114Jordan , 1
~1 1 1 1
Kenya .............. 2 2 2 1 3Korea, People's Republic of 1 12 1 39 57 55 63 22 69Kuwait 2 2 4 4 6 2 6
Laos 2 2 2 2 1 2·Lebanon. 1 9 10 10 12 1 12Liberia
'23 3
:Llbya '. '. , ,'" " 2 2 2 4 5- Macao , 1 .,. 1 1 1 ,I
7 ..
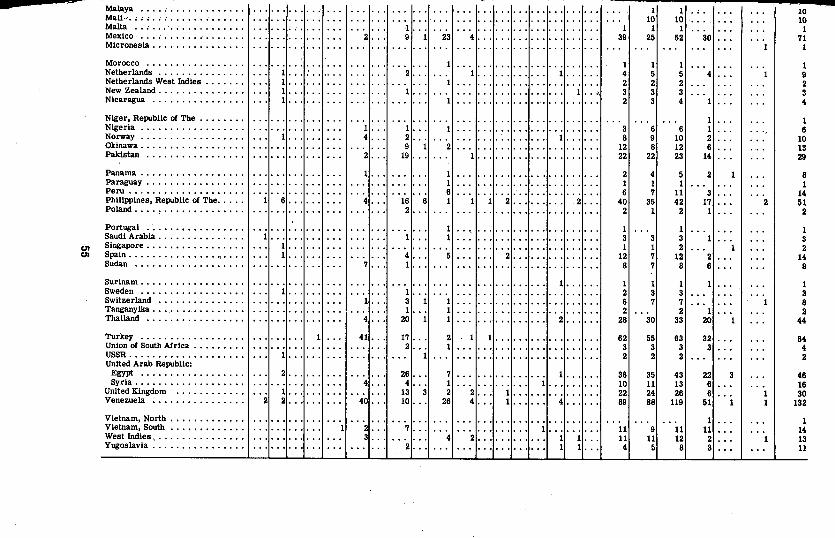
• -~__ --o--_~ aMalaya , 1 1 10Mall¥, , : , , : 10 10 10Malta ; "
, I 1 1 1 1Mexico , ; 2 9 1 23 4 39 25 52 30 71Micronesia , , 1
Morocco 1 1 I INetherlands I : .. 2 I 1 4 5 5 4 9Netherlands West indies 1 2 2 2 2New Zealand, 1 1 1 3 3 3 3Nicaragua 1 " 2 3 4 4
Niger, Republic of The 1 1Nigeria 1 1 3 6 6 1 6Norway 1 4 2 1 8 9 10 2 10Okinawa, 9 1 2 12 8 12 6 13Pakistan 2 19 1 22 22 23 14 29
Panama 1 1 2 4 5 2 8Paraguay 1 1 1 1 1Peru . ... ...... 6 6 7 11 3 14Philippines, Republic of The, 6 4 16 6 1 2 2 40 35 42 17 2 51Poland , 2 ,., 2 1 2 1 2
Portugal 1 1 1Saudi Arabia , 1 1 3 3 3 3
C1l Singapore 1 1 1 2 2C1l Spain, ". 1 4 2 • 12 7 12 2 14
Sudan 7 1 8 7 8 6 8
Surinam. 1 1 1 1 1Sweden 1 1 2 3 3 3Switzerland 1 3 1 6 7 7 8Tanganyika . .... 1 2 2 1 2Thailand 4 20 1 2. 28 30 33 20 44
Turkey 41 17 2 1 62 55 63 32 64Union of South Africa 2 1 3 3 3 3 4USSR. .......... 1 1 2 2 2 2United Arab Republic:
Egypt 2, 26 7 1 36 35 43 22 46Syria, 4 4 1 1 10 11 13 6 16
United Kingdom 1 13 3 2 2 1 22 24 26 6 30Venezuela 2 2, 40 10 26 4 1 4 89 88 119 51 132
Vietnam, Nortb 1 1Vietnam, South 2 7 1 11 9 11 11 14West indies, 3 4 2 1 1 11 11 12 2 13Yugoslavia 2, 1 1 4 5 8 3 11

1961-62 ENROLLMENT BY STATES
C~:'=-:::JO-99
,m,===,::rf::=:=:{::i=:=:{ 100 - 499
•••600 OR MORE
Total U.S. Enrollment39,352ALASKA 6 HAWAII 60INCLUDES STUDENTSIN GROUPS I AND ]XOF THE SUMMARV
ARIZ36
Nev?
" J"""" '-W<48" /7"-,-,-,-",-,_,
ee / '.\~_f:T-~~]~-_~;!.--lIE"'. "". 24 ! WYO 23
--r -----.-l 17 I:. ...... r"'"''~~~'''-'''" r------------1----1 78
" UTAH! COL ; : ..:' 29: 88 i KAN
; / __ _._..).. 87
f .....IIII
....... I
" '........... I
·....·_·-._.l_r·-·-·
FIGURE 8
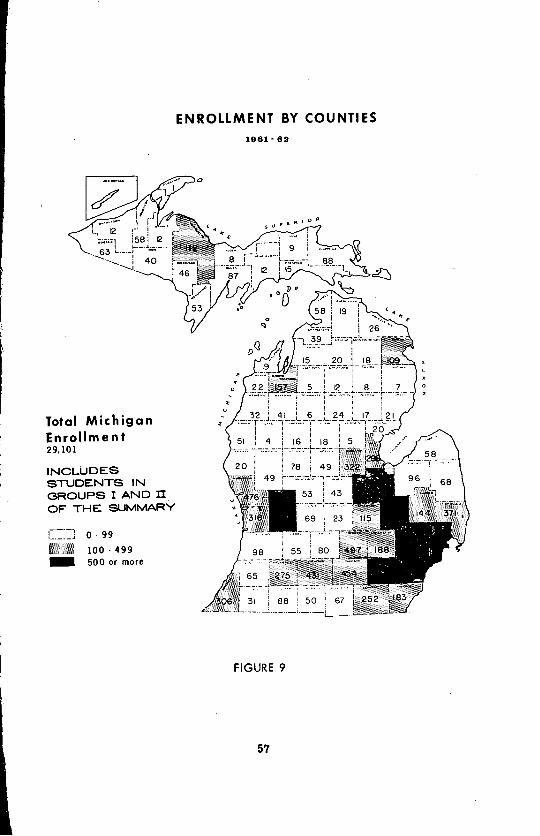
Total MichiganEnrollment29.101
INCLUDESSTUDENTS INGROUPS I AND nOF THE SUMMARY
C~=~=J O· 99100 . 499
_ 500 or more
ENROLLMENT BY COUNTIES1961-62
o
. .. .....:. ..__ .._l._.._j
\.- ..--
FIGURE 9
57

TABLE XXV
1961-62 Geographical Distribution of Students by Counties in MichiganResidence Students in Credit Programs and Extramural Students in Credit and Professional Programs
Residence Enrollment in First Semester
Geographical Location
Total, Michigan . 507 594 322 402 792 1.890 511 4.053 416 5.511 1.012 313 82 480 119 68 167 17.206 16,470 19.169 7.134 6.661 1,546 29.101
CTICO
Counties:Alcona .Alger .Allegan .Alpena ..Antrim .
Arenac .Baraga .Barry .Bay .Benzie '.' .
Berrien .Branch .Calhoun .Cass .Charlevoix .
Cheboygan ..Chippewa .Clare .Cllnton ..Crawford .
Delta .Dickinson .Eaton '" ., .Emmet .Genesee .
Gladwin .
g~~~l~'r~~~r'~' :':.: :': : : :.: : : : :Gratiot .
Ie .
222 21 1
20 21
11112
63
11
2 51 1
23 28
113
1023
2
403
2745
1213
62
113
71 447
676
11
12
144
'3
227
1
145
2421
12
11 1
5 11 14 41 1
380 11
1 48 24 '15 2
12
27168
62
2069
8
10814856
10
712
34
20131513
192
1243
·-619
531
11191
54
1621
I382
47 14
145 14 17 ._4
16
711
2341
13
1.
5 ...
5 •..
35
714210
157
4218416
22338
2082022
133810122
45276025
1,284
239813056
26
67409
137
4216213
21536
1932121
123911112
42245425
1,280
23972
~~
36
754310
158
44199
16
23441
2232224
134311142
48276330
1,551
24187
.~:
41
24162
255
664
741060116
415643
147
1711
552
19
22
.~?
1344
3
4
1134
4
135
10156
310263
19181
730
17
26'41
72 85 98
19 1092 15
1 202 12
5543 298
1 22
38 3063 50
99 43131
8 39
2 1930 88
3 182 234 12
17 8716 46
4 8024 5849 2,398
1 512 6334 157
:~

-,~.~~--~-~---------_..-_--_.Houghton_,.: 2 1 1 2 6 1 12 2 1 26 27 29 12 8 13 56Huron· . ..... 2 8 6 3 6 1 2 1 31 24 31 21 7 10 56Ingham 14 4 18 14 26 34 14 98 37 3 1 5 2 4 2 278 251 287 83 44 134 497Ionia 1 1 1 3 10 5 1 11 2 1 1 37 38 39 18 22 1 69IOBea 1 1 4 1
"5 2 1 1 16 18 16 5 3 21
Iron 1 3 1 5 2 1 10 1 2 1 2 1 30 28 31 4 2 5 40Isabella 7 3 2 9 2 1 24 25 29 16 2 9 49Jackson 8 13 5 13 21 29 40 6 94 19 7 7 3 14 279 258 308 138 31 60 454Kalamazoo 3 4 1 8 6 33 38 9 57 16 3 1 8 I 1 187 192 207 64 12 34 275Kalkaska 1 4 5Kent 29 30 15 25 29 121 229 12 166 35 12 1 25 I 28 1 754 742 880 345 619 54 1,639Keweenaw I I 1 1 ILake 3 3 3 3 1 4Lapeer 1 2 2 6 16 15 3 17 6 1 3 1 73 68 83 30 52 7 144Leelanau 1 2 2 1 3 1 10 9 11 3 5 1 19Lenawee 6 4 I 3 10 22 32 5 47 7 6 1 8 4 I 3 160 160 181 99 10 4 252Livingston 3 5 2 4 14 21 34 4 3 4 3 I 98 96 113 47 48 6 188Luce " '., 1 I 1 3 3 4 1 1 3 9Mackinac 3 '.' 3 3 4 3 4 4 15Macomb 13 17 3 9 13 47 132 9 113 21 5 2 8 7 1 400 370 452 171 360 16 839Manistee 1 , 4 8 1 1 1 16 16 18 6 4 5 32Marquette 2 2 2 I 6 3 9 3 22 5 2 3 59 60 65 26 2 36 112Mason 2' 3 4 3 12 I I 28 28 29 15 16 1 51Mecosta 2 4 I 3 12 1 6 5 2 36 33 38 16 26 6 78Menominee 2 1 3 1 3 5 11 2 1 29 31 31 10 6 12 53MIdland 10 13 2 5 3 26 29 3 64 9 2 1 5 I 173 168 188 69 76 41 322Mfssaukee ; 1 1 1 1 4 6Monroe 3 4 1 3 32 13 4 50 I 4 3 1 119 116 133 68 12 3 183Montcalm I 2 1 5 4 1 11 I 2 28 26 29 6 14 8 53Montmorency 1 1 4 1 " 7 7 7 3 11 18Muskegon 9 10 14 7 21 29 1 43 6 76 20 6 1 8 2 253 244 272 101 105 80 476Newago 1 4 4 3 1 13 1 I 28 27 30 12 13 2 49oakland 67 88 23 37 102 230 16 320 45 660 69 38 4 66 15 4 8 1,992 1,899 2,145 625 986 83 3,321Oceana '. 2 1 2 1 1 5 12 12 13 3 4 1 20Ogemaw 1 I 1 4 1 1 9 8 9 3 2 5 17Ontonagon I 2 I 3 2 1 10 10 11 1 I 12Osceola I 1 2 4 2 1 I 12 12 13 2 3 1 16Oscoda ", 3 3 2 3 2 3 I 8Otsego 3 6 I I 11 9 11 7 3 4 20Ottawa 7 5 2 10 4 37 35 2 36 25 I I 6 2 4 177 171 190 85 91 9 318Presque Isle " 1 I 3 2 8 I 1 17 13 17 6 5 3 26Roscommon I 1 3 1 5 11 11 12 I 6 5 24Saginaw 14 13 8 11 17 46 11 89 8 120 22 6 3 11 2 16 396 361 435 167 168 19 660Saint Clair 6 9 7 4 7 34 6 21 2 63 2 8 4 2 175 163 192 78 117 52 371Baint Joseph 2 3 1 2 9 9 4 27 6 2 4 1 1 1 72 65 73 22 2 8 88Banilac 1 1 2 2 8 3 2 12 2 1 1 1 36 33 37 11 18 7 68Schoolcraft 1 1 2 2 5 2 4 12Shiawassee 2 5 2 8 7 4 I 18 4 2 4 55 50 58 28 41 5 115Tuscola 1 1 1 3 6 3 9 20 4 1 1 1 51 52 56 21 26 6 96Van Buren 5 1 4 1 9 4 16 5 4 1 1 51 49 5~ 19 3 2 65Washtenaw 76 74 6 55 147 246 1,175 99 639 249 65 32 47 17 36 40
i2,986 2,855 3,386 1,721 343 134 4,323
Wayne " 151 224 207 90 252 540 I 1,177 110 1,943 291 80 15 140 36 12 25 5,288 5,060 5,892 1,932 2,244 202 8,746Wexford 1 I 3 2 1 2 10 2 1 23 21 24 4 7 9 41
•

a>o
TABLE XXVI
Michigan Population, High School Data, and University Enrollment by County
Michigan Twelve-Grade High Schools and/orDistricts for the Year 1960- 61*
Number of University of University ofCounties in Population Enrollment Schools and/or Graduates Michigan MichiganMichigan 1960 Census Freshmen StudentsDistricts 1961-62 1961-62
Non- Non- Non-Public public Public public Public public
Total .......... 7,778,220 375,730 60,310 552 184 77,916 14,066 2,394 29,101
Alcona .......... 6,260 324 .. . 1 .. . 86 . .. . .. 7Alger .......... 9,910 666 .. . 4 .. . 142 . .. 2 8Allegan ........ . 57,406 2,954 .. . 9 .. . 611 ... 17 98Alpena ......... 28,757 1,260 520 1 1 263 122 5 109Antrim ......... 10,328 727 . .. 6 •• 0' 166 . .. 2 15
Arenac ......... 9,799 742 . .. 3 .. . 154 . .. 3 20Baraga ........ . 6,959 515 ... 2 . .. 110 . .. 1 12Barry .......... 31,588 1,809 .. . 5 . .. 365 . .. 14 55Bay ........... 105,594 4,695 1,661 2 2 1,038 408 22 298Benzie ......... 7,659 527 . .. 3 .. . 119 . .. 2 22
Berrien ......... 148,813 8,350 348 15 4 1,755 76 40 306Branch ......... 34,843 1,809 115 4 1 395 33 7 50Calhoun ......... 138,378 6,716 618 10 2 1,135 152 42 431Cass ........... 36,610 1,748 .. . 4 . .. 372 ... 1 31Charlevoix ....... 13,216 851 .. . 5 .. . 189 . .. 3 39
Cheboygan ....... 14,218 643 201 4 1 164 . .. 3 19Chippewa ........ 32,487 1,688 381 6 1 372 ... 4 88Clare ........... 11,559 883 .. . 3 ... 202 . .. 5 18Clinton ........ . 37,865 1,867 ... 6 .. . 411 . .. 4 23Crawford ........ 4,917 291 . .. 2 .. . 72 .. . . .. 12
Delta .......... 34,061 1,756 643 8 2 380 162 8 87Dickinson ........ 23,679 1,414 .. . 6 . .. 343 . .. 8 46Eaton " -,' 49,887 3,246 111 . 9 1 702 22 13 80••• 0- ••••••
Eiiimer"' ............. 15;646' '9'64' 179" ; 4" ! 1 233 48 3 , 58Genesee 370,·303' : 18,466, I 1,928 ' 20; 8 3,744;' ! 428 81 i 2,398........ I , I I :

£~', .i I I : l160 : ... ;.'!:;.
,C! I ~':'~:'5Gladwin . • . • . . .'. . ! '. '10,650 . "735 :JC2 ,, ... ·"0·Gogeliic 24,234 1,505
,:5 I 1 361 . 23 9 I 63•••••••• j 104 ,
Grand Traverse ... 33,144 1,772 286 2 2 371 65 12 157Gratiot ........ . 36,936 2,627 ... 6 " . 583 . .. 4 43Hillsdale ....... . 34,605 2,074 ... 8 . .. 492 . .. 13 67
Houghton ....... . 35,579 2,224 ... 7 ... 512 . .. 8 58Huron .......... 33,812 2,363 168 10 1 531 38 9 58lIigham ......... 211,634 10,907 961 12 3 2,417 224 40 497Ionia .......... 42,849 2,309 466 7 4 534 97 6 69losco .......... 16,213 1,300 .. . 4 . .. 259 1 21Iron ........... 17,079 1,122 .. . 5 . .. 254 . .. 8 40Isabella ........ 35,250 1,642 211 5 1 367 52 3 49Jackson ......... 130,948 6,300 . .. 13 2 1,283 . .. 39 454Kalamazoo ...... 169,151 7,441 1,190 10 3 1,469 295 20 275Kalkaska ........ 4,343 303 2 . .. 71 . .. . .. 5
Kent ........... 360,574 14,578 4,989 21 10 2,897 1,172 57 1,639Keweenaw ....... 2,387 .. . ., . .. . .. . .. . . .. . .. 1Lake ........... 5,280 268 ., . 2 . .. 39 .. . . .. 4Lapeer ......... 42,075 2,050 . , . 5 . .. 480 . .. 8 144Leelanau ........ 9,210 389 238 4 3 87 68 1 19,Lenawee ........ 77,301 4,495 968 12 2 957 208 24 252Livingston ...... . 37,899 2,074 .. . 5 ... 462 . .. 17 188Luce ......... . 7,784 516 .. . 1 ... 94 . .. 1 9Mackinac ...... . 10,923 494 . , . 3 ... 93 . .. 1 15Macomb ......... 406,553 18,334 2,194 21 4 3,762 504 68 839
Manistee ........ 18,876 1,124 161 7 1 289 45 7 32Marquette ....... 55,604 2,631 89 8 3 588 24 11 112Mason .......... 21,699 1,365 89 4 1 311 24 2 51Mecosta ......... 21,001 1,320 . , . 5 ... 288 ... 4 78Menominee ....... 24,665 1,449 .. . 5 ... 352 . .. 6 53
Midland ........ 51,154 3,169 . , . 2 . .. 646 . .. 31 322Missaukee ....... 6,683 420 152 3 1 88 36 . .. 6Monroe ......... 100,980 4,921 1,167 9 2 952 339 23 183Montcalm ....... 35,380 2,489 227 9 1 365 56 5 53Montmorency ..... 4,402 323 . , . 2 . .. 84 . .. 1 18
a

TABLE XXVI
Michigan population, High School Data, and University Enrollment by County (Cont.)
Michigan Twelve-Grade High Schools and/orDistricts for the Year 1960-61'"
Number of University of University ofCounties in Population Enrollment Schools and/or Graduates Michigan Michigan
Michigan 1960 Census Districts Freshmen Students1961-62 1961-62
Non- Non- Non-Public public Public public Public public
Muskegon ....... 148,950 7,465 1,436 10 1 1,369 352 30 476Newago ........ . 23,941 1,598 ., . 5 . .. 269 . .. 4 49Oakland ......... 686,893 36,514 3,352 27 13 7,378 807 391 3,321Oceana ........ . 16,413 859 .. . 4 .. . 195 ... 4 20Ogemaw ......... 9,591 607 .. . 2 .. . 138 . .. 2 17
Ontonagon ...... . 10,447 719 .. . 7 .. . 143 ... 2 12Osceola ....... . 13,572 1,069 .. . 5 .. . 259 . .. ... 16Oscoda ........ . 3,388 195 .. . 2 .. . 34 ... 2 8Otsego ......... 7,511 448 128 3 1 102 23 2 20Ottawa .......... 98,362 5,167 1,343 5 1 1,125 313 23 318
Presque Isle .... . 12,855 925 .. . 3 ... 196 . .. 2 26Roscommon ..... . 7,075 505 .. . 2 ... 117 . .. 1 24Saginaw ........ 189,237 9,451 1,865 11 7 1,908 454 50 660Saint Clair ....... 106,396 5,557 648 6 2 1,197 156 - 25 371Saint Joseph ...... 42,190 2,621 224 8 1 527 59 11 88
Sanilac ........ . 32,103 2,066 ... 7 .. . 349 . .. 5 68Schoolcraft ..... . 9,200 541 0·•• 2 .. . 111 . .. 1 12Shiawassee . . . . . . . 53,194 3,023 435 8 3 682 118 10 115Tuscola ......... 41,764 2,89ol .. . 9 . .. 635 . .. 8 96Van Buren ...... . 48,060 3,092 ... 11 . .. 636 . .. 7 65
Washtenaw ....... 172,016 7,125 975 10 4 1,476 214 197 4,323Wayne .•..•...•. 2,650,001 110,135 29,539 33 82 22,798 6,849 887 8,746Wexford .....•... 18,182 1,210 . .. 4 ... 251 . .. 1 41
"'Reported by the Michigan Department of Public Instruction

TABLE XXVII
Michigan Counties Ranked byUniversity of Michigan Students, Population, High School Enrollees, and High School Graduates
3 -
Michigan Counties With Michigan Counties With Michigan Counties WithGreatest Number of Students Michigan Counties Greatest Number of Students Greatest Number of Graduates
in the University During With Largest Enrolled in Public from Public High SchoolsRank 1961-62 Population in 1960 High Schools During 1960-61 During 1960-61
University Population Public PublicCounty County (Preliminary County High School County High SchoolStudents Count) Enrollment Graduates
1 Wayne ........ 8,746 Wayne ....... 2,650,001 Wayne ........ 110,135 Wayne ......... 22,7982 Washtenaw ..•.. . . 4,323 Oakland ...... 686,893 Oakland ....... 36,514 Oakland ........ 7,3783 Oakland ....... 3,321 Macomb ...... 406,553 Genesee ......• 18,466 Macomb ........ 3,7624 Genesee •..••.. 2,398 Genesee ...... 370,303 Macomb ..••... 18,334 Genesee ........ 3,7445 Kent ......... 1,639 Kent ....... . 360,574 Kent ......... 14,578 Kent . ......... 2,8976 Macomb ..•.•.. 839 Ingham ....... 211,634 Ingham . ...... 10,907 Ingham . ....... 2,4177 Saginaw ....•.. 660 Saginaw ...... 189,237 Saginaw ....... 9,451 Saginaw ........ 1,9088 Ingham .•... , .. 497 Washtenaw .... 172,016 Berrien .....•. 8,350 Berrien ..•..... 1,7559 Jackson ....... 454 Kalamazoo .... 169,151 Muskegon •..... 7,465 Washtenaw •...•. 1,476
10 Calhoun ....... 431 Muskegon .••.. 148,950 Kalamazoo .•..• 7,441 Kalamazoo .•..•. 1,469

TABLE xxvmStudents Registered in Certiflcate Courses in the Fall and Spring of 1961-62
Distributed by Michigan Counties, Other States, and Foreign Countries
Extension Center Areas
GeographicalLocation
Total Ann BattleArbor Creek
Semester Semester
Grand PortDearborn Detroit Flint Rapids Huron Saginaw
TraverseCity
Semester
Corre-Upper spondence Parent
Peninsula Study Education
Semester Semester Semester
Firemanship
Training
Year
Grand total
1st 2nd
3,723 77
1st 2nd
374
1st 2nd
122
1st 2nd
298
1st 2nd
204
1st 2nd
185
1st 2nd
41
1st 2nd
153
1st 2nd
61
1st 2nd
52
1st 2nd
722
1st 2nd
303
1961-62
1,131
Michigan countyenrollment,net total: by year 3,657
By semester ... 4,116
77
35 59
374
263 212
122
29 105
296 204
157 214 124 134
185
98 140
40
29 20
153
90 95
61
48 43
36
40 25
675
469 253
303
124 179
1,131
1,131 •
3
101
14 3
7 1
41
Alcona .Alger .Allegan .Alpena .Antrim .
Arenac .Baraga .Barry .Bay .Benzie .
Berrien .Branch .Calhoun .Cass .Charlevoix .
Cheboygan .Chippewa .Clare .Clinton .Crawford .
Delta .Dickinson .Eaton .Emmet .Genesee .......•..•
Gladwin .9.?~'~~!~ .,., .. 0, •• ' " •••
9'\~ra~,C! Trave ree .G.~atfgL··········· .
t·,····
18
596
4
6
.1.2
3
22
424
.'..
2
12
54
......
51
','.",
4
......
10 16
21 23
4
. ~ .
7
10
2
934
e9161
134
6551\7'
3
511
11
21
211
. 1 .I"
28
88.
25
3331
24
3247
28
.....lot
1512
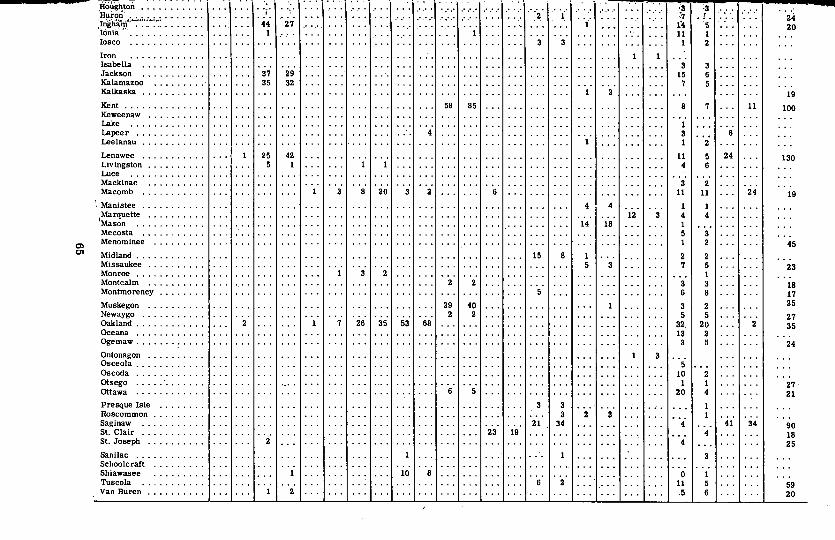
Houghton. , .-•....,.............'.-""!". . . . . a, , .. . ";" .~ . ,',' "2 :3 '3
:a~~~~:~:·:U:L:.~::::: :: :7 . !. : 2444 27 i'4 5 20
1 11 1loseo 3 1 2
IronIsabella 3 3Jackson 37 29 15 6Kalamazoo 35 32 7 5Kalkaska 19Kent 58 85 8 11 100Keweena;wLake 1Lapeer 4 3 6Leelanau 1 2
Lenawee 25 42 11 5 24 130Livingston 5 1 4 6LuceMackinac .. 3 2Macomb 3 8 20 2 6 11 11 24 19Manistee 4 4 1 1
I::~:ett~ . 12 4 414 18 1
Mecosta 5 3
en Menominee 1 2 45CTI Midland 15 8 2 2
Missaukee 3 7 5 23Monroe 2 1Montcalm 2 2 3 3 18Montmorency 6 8 17Muskegon 29 40 3 2 25Newaygo 2 2 5 5 27Oakland 7 26 35 53 68 32 20 35Oceana 13 2Ogemaw. : ; 3 5 24Ontonagon 3Osceola 5Oscoda 10 2otsego 1 1 27ottawa 20 4 21Presque Isle 3 1Roscommon 3 2 3 1Saginaw 21 34 .. " 4 41 34 90St. Clair 23 19 4 18St. Joseph 4 25sanilac ..SchoolcraftShiawasee , , 10 0 1Tuscola 11 5 59Van Buren 2 .5 6 20

TABLE XXVUI (Cont.)
Students Registered In Certificate Courses In the Fall and Spring of 1961-62Distributed by Michigan Counties, Other States, and Foreign Countries
Extension Center Areas
Semester Semester
AnnArbor
Washtenaw 32Wayne 3Wexford .
Other States:Arizona .California .Connecticut .Colorado .Florida .
lllinois .Iowa .Minnesota .Mississippi .Nevada .
New Jersey .New Mexico .New York .North Carolina .North Dakota .
Ohio •.............South Dakota .Tennessee .Texas ..Utah ..
Virginia .Washington .Wisconsin .
Foreign CountriesArgentina .Canada .Germany .India .Indonesia .
Mexico .Scotland .Spain .Switzerland .West Pakistan .
Corre- Fireman-Grand Port Traverse Upper spondence Parent ship
Dearborn Detroit Flint Rapids Huron Saginaw City Peninsula Study Education Training
Semester Semester semester Semester Semester Semester semester Semester Semester Semester Year
1st 2nd 1st 2nd 1st 2nd 1st 2nd 1st 2nd 1st 2nd 1st '2nd 1st 2nd 1st 2nd 1st 2nd 1961-62
1 2 2 3 31 18 1626 92 116 151 50 35 20 87
14 6 1 1 20
" .
21111
7 9
211
1112
-1 1
i' .
'...
2
BattleCreek
55 2, 11
2nd 1st 2nd1st
TotalGeographicalLocation
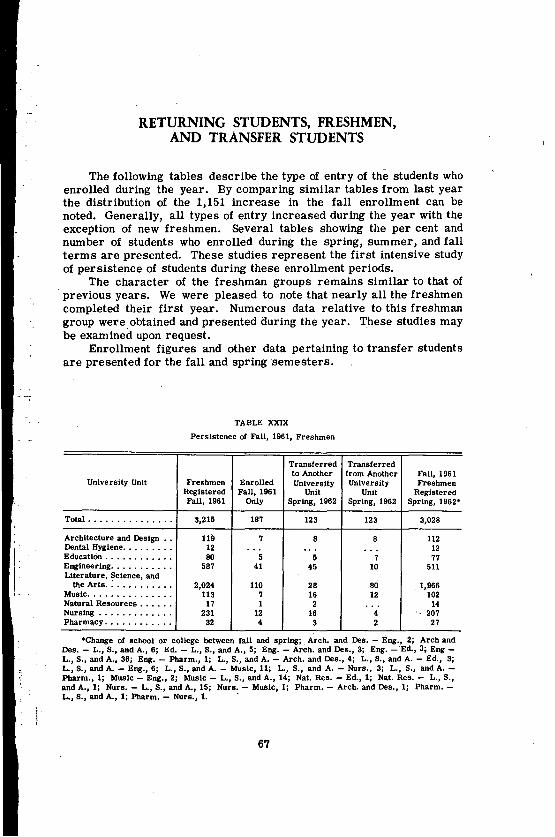
RETURNING STUDENTS, FRESHMEN,AND TRANSFER STUDENTS
The following tables describe the type of entry of the students whoenrolled during the year. By comparing similar tables from last yearthe distribution of the 1,151 increase in the fall enrollment can benoted. Generally, all types of entry increased during the year with theexception of new freshmen. Several tables showing the per cent andnumber of students who enrolled during the spring, summer, and fallterms are presented. These studies represent the first intensive studyof persistence of students during these enrollment periods.
The character of the freshman groups remains similar to that of. previous years. We were pleased to note that nearly all the freshmencompleted their first year. Numerous data relative to this freshmangroup were. obtained and presented during the year. These studies maybe examined upon request.
Enrollment figures and other data pertaining to transfer studentsare presented for the fall and spring semesters.
TABLE XXIX
Persistence of Fall, 1961, Freshmen
Transferred Transferredto Another from Another Fall, 1961
University Unit Freshmen Enrolled University University FreshmenRegistered Fall, 1961 Unit Unit RegisteredFall, 1961 Only Spring, 1962 Spring, 1962 Sprtng, 1962-
Total ............... 3,215 187 123 123 3,028
Architecture and Design .. 119 7 8 8 112Dental Hygiene. . . . . . . . . 12 ... .. . . .. 12Education ............ 80 5 5 7 77Engtneerlng........... 587 41 45 10 511Literature, Science, and
the Arts. : .......... 2,024 110 28 80 1,966Music............... 113 7 16 12 102Natural Resources . ..... 17 1 2 ... 14Nursing ......•...... 231 12 16 4 '. 207Pharma,cy ............ 32 4 3 2 27
-Change of school or college belween fall and sprtng; Arch. and Des. - Eng., 2; Arch andDes. - L., S., and A., 6; Ed. - L., S., and A., 5; Eng. - Arch. and Des., 3; Eng. -Ed., 3; Eng L., S., and A., 38; Eng. - Pharm., 1; L., S., and A. - Arch. and Des., 4; L., S., and A. - Ed., 3;L' I S., and A. - Eng., 6; L' J S., and A. - Music, 11; LO J S., and A. - Nurs., 3j L" So, and A. Pharm., 1; Music - Eng., 2; Music - L., S., and A., 14; Nal. Res. - Ed., 1; Nal. Res. - L., S.,and A., 1; Nurs. - Lo, S., and A' J 15; Nurs. - Music, 1; Pharm. - Arch. and Des., Ij Pharm.-Lo, S., and A., 1; Pharm. - Nurs., 1. .
67

TABLE XXX
Number and Percentage of Residence Credit Studentswho Registered Both Spring, 1961, and Fall, 1961
Returnees to Fall, 1961, from Spring, 1961Final Per Cent
Spring, 1961, To the Univ. To the Same Unit To Other Units Fall, 1961, EnrolledStudent Group Enrollment Enrollment in Same Unit,Per Per Per,
Spring, 1961Number Cent Number Cent Number Cent
Net total 23,580 15,955 67 14,689 62 1,266 5 25,689 57
Architecture and Design ...... 661 506 77 480 73 25 4 718 67Business Administration ...... 850 486 57 449 53 38 4 853 53Dearborn ................ 226 196 87 192 85 4 2 331 58Dentistry, D. D. S. candidates... 347 256 74 246 71 10 3 346 71
Dental Hygiene ........•.. 76 37 49 35 46 2 3 71 49Postgraduate Dentistry.•.... 31 1 3 1 3 · . · . 37 3
Education .•.......•...... 1,050 577 55 534 . 51 46 4 1,070 50Engineering............... 2,728 2,175 80 1,912 70 261 10 2,938 65Flint ................... 460 297 65 275 60 22 5 514 54Graduate.....•.•.......•. 5,938 3,478 59 3,453 58 21 • 6~258 55Law .................... 844 534 63 521 62 15 2 957 54Literature, Science, and the Arts 7,440 5,569 75 4,82~ 65 732 10 8,268 58Medicine, M. D. candidates .... 710 538 76 518 73 19 3 724 72
Anesthesia •.....••••.•.. 8 8 100 8 100 · . · . 17 47Postgraduate Medicine ...... 449 228 51 227 51 8 2 598 38
Music .................. 460 310 67 284 62 27 6 556 51Natural Resources . . . . . . . . . . 175 112 64 106 61 6 3 200 53Nursing ........ '......... 596 427 72 392 66 35 6 674 58Pharmacy ................ 153 115 75 103 67 12 8 157 66Public Health. . . . . . . . . . . . .. 201 49 24 43 21 6 3 204 21Social Work. . . ............ 243 107 44 102 42 5 2 242 42Hospital Training. . . . . . . .... 14 .. . . . .. . . . · . · . 13 . .Enrolled In two units andcounted once in totals . . ...... 80 51 . . 20 . . 28 · . 57 ..
• Less than 1 per cent.

-----_.,-~ a
TABLE XXXI
Spring, 1961, Residence Credit Students Returning Fall, 1961,(By Unit of Registration)
Fall Unit in Which Students Were Enrolled
'" i"~ " '""§ " 'tl :5~0
§ ... 'tl "Spring Unit '" =:il .l:: ; .s~ .l:: " !l ,,' § :aIn Which Students <Ii " '"'tl !l " " " "Were Enrolled ; .s Q ~ " Q ::il "" " ~e " u" Q ~ " ::;j " 0 E Net Total... 'tl -:;; .. en -:;; '" ....a « ..
:J .s ,,' .. :J " ... .. ... Spring'" " ~ ...
'tl " ... " ... ,,' Oi 'tl a: " " ~" :z: 0 :z: Students" '"... b .. " -:;; :J .s " .. !' ..:::: " .& 3 ... =:il " -:;; :5 ... 01 e ".s '" .!l' .s :J :a .!l' ~ ... :3 Returning.c~ ~ " ~
'tl ... '" '" ...~" '" " i!l :J
~ .. ~ " " '" gj :J
~.. in the... til ~ ~ ~
'tl ...~ ::3 " " 0 £ .c g« Po c.l c.l r.. 0 ::il « Po ::il Po Po en Fall
Architecture and Design 480 1 14 7 506en Business Administration 449 1 2 9 21 4 486CO ...Dearborn 1 192 2 196Dentistry, D. D. S. candidates 246 2 256
Dental Hygiene 35 2 37Postgraduate Dentistry 1
Education 1 534 1 30 13 577Engineering 3 31 7 10 1,912 2 101 2 102 2 2,175Flint 1 1 275 12 1 2 297Graduate 1 2 4 \ 1 3,453 4 4 3,478Law 8 1 1 5 521 534Literature, Science, and the Arts 23~ 113 6 28 11 241 19 4 113 64 4,828 81 2 9 2 3 5,569Medicine, M. D. candidates 1 1 518 17 538
Anesthesia 8 8Postgraduate Medicine 8 227 228
Music 1 6 20 284 310Natural Resources 1 5 106 112Nursing 3 2 26 392 4 427Pharmacy ',2 1 1 'I 103 115Public Health 1 5 43 49Social Work 5 102 107Net total fall students 506 609 206 274 46 798 1,938 285 3,774 613 5,020 607 9 246 297 112 401 106 49 106 15,955"
" Excludes 51 double enrollments in spring and 48 double enroUments in fall.
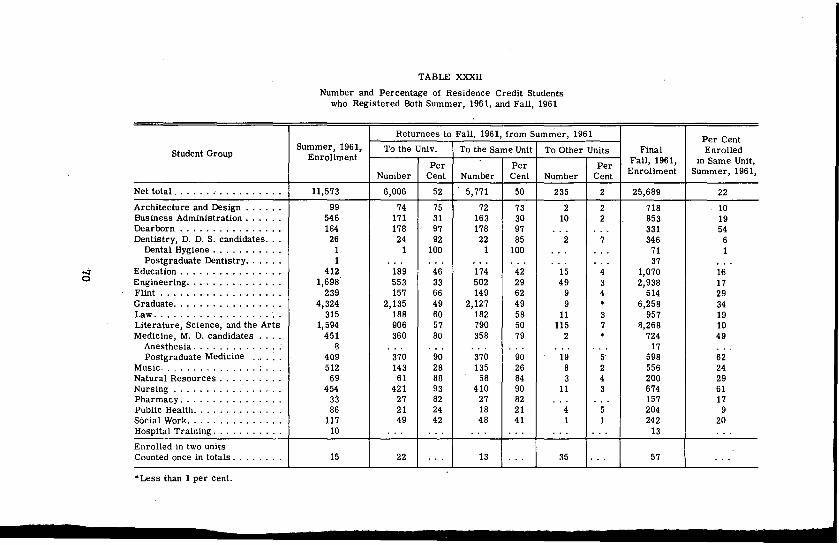
TABLE XXXII
Number and Percentage of Residence Credit Studentswho Registered Both Summer, 1961, and Fall, 1961
Returnees to Fall, 1961, from Summer, 1961Per Cent
Student GroupSummer, 1961, To the Univ. To the Same Unit To Other Units Final Enrolled
Enrollment Fall, 1961, in Same Unit,Per Per PerNumber Cent Number Cent Number Cent Enrollment Summer, 1961,
Net total ................ 11,573 6,006 52 5,771 50 235 2 25,689 22
Architecture and Design ...... 99 74 75 72 73 2 2 718 10Business Administration ...... 546 171 31 163 30 10 2 853 19Dearborn ................ 184 178 97 178 97 .. . " . 331 54Dentistry, D. D. S. candidates... 26 24 92 22 85 2 7 346 6
Dental Hygiene ........... 1 1 100 1 100 .. . " . 71 1Postgraduate Dentistry...... 1 .. . ... . .. .. . . .. " . 37 . ..
Education ................ 412 189 46 174 42 15 4 1,070 16Engineering............... 1,698 553 33 502 29 49 3 2,938 17Flint ................... 239 157 66 149 62 9 4 514 29Graduate................. 4,324 2,135 49 2,127 49 9 • 6,258 34Law .................... 315 188 60 182 58 11 3 957 19Literature, Science, and the Arts 1,594 906 57 790 50 115 7 8,268 10Medicine, M. D. candidates ... . 451 360 80 358 79 2 • 724 49
Anesthesia ............. : 8 .. . " . . .. ... .. . .. . 17 ., .Postgraduate Medicine ...... 409 370 90 370 90 - 19 5 598 62
Music.............. '.: ... 512 143 28 135 26 8 2 556 24Natural Resources .......... 69 61 88 58 84 3 4 200 29Nursing ................. 454 421 93 410 90 11 3 674 61Pharmacy ................ 33 27 82 27 82 .. . ... 157 17Public Health.............. 86 21 24 18 21 4 5 204 9Social Work............... 117 49 42 48 41 1 1 242 20Hospital Training ........... 10 .. . " . . .. .. . . .. " . 13 . ..Enrolled in two unitsCounted once in totals ........ 15 22 .. . 13 .. . 35 . .. 57 . ..• Less than 1 per cent.

&
TABLE XXXIII
Summer, 1961, Residence Credit Students Returning, in Fall, 1961(By Unit of Registration)
Fall Unit in Which Students Were Enrolled
" "bJl ,9~'iii ...
~ .t: ,,' 'u'"'" '" " :a " NetSummer Unit 'tl 'c ~ " '" " "" ,~ ::;; "'" '13 '" " ~ TotalIn Which Students " " "'tl 0 :S" 'tl :a " "'", '" ~ SummerWere Enrolled " 'Q, bJl 'tl '" .. .:.:.a « ." " Gt"t :a '" ~ " Students'" " ,.,'" ,.,
" ';:: ~« " ,.," ~" '" " "" ::r: ,9 " "" 'tl " ::r:
~ " ... "'" '" .. bJl '"" 0 tj. .. ... " -" '(jC) " " " e ,~:c " .0 ,~'" ." - " "'.<: bJl " 'iii .~'iii " <=0 <= " 'Q, 'tl "- 'CO tj 'iii .a " :0" '" " ,5 '" j ~'tl " '" "" " ~ ~O ~'tl " " " ' 0 " '" i .<: "r;: ,- " ::;;::;; ::;; 0« o:l r.:I r.:I c:l ..:l", P. Z P. P. '"Architecture and Design 72 2 74
~ Business Administration 163 2 7 171... Dearborn .............. 178 178Dentistry, D. D. S. candidates 22 24
Dental Hygiene .......... 1Education .............. 174 12 1 189Engineering ............. 6 1 502 33 7 553Flint ................. 149 3 4 157Graduate ............... 2 2,127 1 2 2 2 2.135Law .................. 4 6 182 1 188Literature, Science, and the Arts 2 10 12 15 3 2 31 7 791 14 8 7 2 906Medicine. M. D. candidates ... 2 358. 360
Postgraduate Medicine 19 370 370Music ................. 6 2 135 143Natural Resources ........ 2 1 58 61Nursing ............... 10 410 421Pharmacy .............. 27 27Public Health ............ 4 18 21Social Work ............. 1 48 49
Net total, fall students ....... 75 183 180 34 1. 193 508 152 2,248 197 820 374 371 144 58 411 27 25 53 6,006*
*Excludes 22 double enrollments in Summer and 48 double enrollments in Fall.

TABLE XXXIV
Number and Percentage of Residence Credit Studentswho- Registered both Spring, 1961, and Summer, 1961
Returnees to Summer 1961 from Spring 1961 Final Per Cent
Summer, 1961, EnrolledStudent Group Spring, 1961, To The Univ. To The Same Unit To Other Units Enrollment in Same Unit,
Enrollment Number Per Cent Number Per Cent Number Per Cent Spring, 1961
Net totals ............... 23,580 6,310 27 6,057 26 253 1 11,588 52
Architecture and Design '" . 661 82 12 77 11 5 1 99 78Busine ss Adm inistration '" . 850 183 22 173 20 7 1 548 32Dearborn .............. 226 166 73 161 71 5 2 184 88Dentistry, D.D.S. candidates .. 347 28 8 24 7 4 1 26 92
Dental Hygiene ......... . 76 1 1 1 1 . .. ... 1 100Postgraduate Dentistry '" . 31 1 3 1 3 . .. ... 1 100
Education .............. 1.050 220 21 190 18 32 3 413 46Engineering ............. 2;728 612 22 569 21 41 1 1,698 34Flint ................. 460 154 33 149 32 5 1 239- 62Graduate ............... 5,938 2,360 40 2,335 39 18 * 4,329 54Law .................. 844 186 22 180 21 6 1 315 57Lite ra ture. Science, and the Arts 7,440 935 12 832 11 100 1 1,609 52Medicine. M.D. candidates 710 384 54 359 51 22 3 451 I 80
Anesthesia ............ 8 8 100 8 100 .. . . .. 8 100Postgraduate Medicine '" . 449 221 49 220 49 1 * 386 57
Music ................. 460 172 37 161 35 11 2 533 30Natural Resources ....... . 175 48 27 48 27 . .. ... 70 69Nursing ............... 596 420 70 413 69 7 1 454 91Pharmacy .............. 153 27 18 27 18 .. . . .. 33 82Public Health ............ 201 65 32 64 32 1 * 86 74Social Work •••••• • r•••••• 243 60 25 59 24 1 * 117 50Hospital Training ......... 14 10 71 10 71 . .. . .. 10 100
Enrolled in two unitsCounted once in totals ...... 80 33 .. . 4 .. . 13 . .. 22 ., .
*Less than 1 per cent.
L\' J~"- ,_ ..

a
TABLE XXXV
Spring, 1961 Residence Credit Students Returning in Summer, 1961(By Unit of Registration)
Summer Unit in which, Students Were Enrolled
!J., ...'" <-;;;
'".,
:s -5 '"" " -;;;bll .8 -g >. 'C :s '" Net.;;; -;;; os .t: ; 'C CSpring Unit~ .t: " .,
or c 'u Totalv.i ~os 'ii .,In Which Students
'C .23 " " '" bll Spring~ " '" "Were Enrolled c " p '" Q ::.> .5os S '" <l ... Students
" '" '" " 3 "'" Q en ::E 0 .;... 'C '" -;;; bll -;;; .,"'"Z < ....
.5 ",' os '" os ... ..." >: >. " c ",' .;;; .g a:; >. '" ~
!-<"
., 'C .8 ... '" ...".e ., ... ... lI: os '" -;;; " " '" os -; bll os lI:
'" 0~ ... -;;; '" -;;; 'u -5 ... " 8 " ~:c .5 .c
~ ~ .5 " ~ .~ ... .;;; -;... c " 'C ... 'ii .,~
... ~ c." gj os ., " bll f os j '" '"., ., ... os 'g .,...
~ ~ ~0 'C " ... :3 '" c 0 " ~
..," 0< "l C. f.<l f.<l 0 ::.> < c. ::.> c. C. en lI:
Architecture and Design 77 1 82-.J Business Administration 173 1 3 183Co) Dearborn 161 1 3 166
Dentistry, D. D. S. candidates 24 2 2 28Dental Hygiene 1Postgraduate Dentistry 1
Education 190 28 3 220Engineering 2 569 25 8 612Flint 1 149 1 2 154Graduate 2 2,335 4 2,360Law 4 2 180 186Literature, Science, and the Arts 6 17 41 9 833 1 2 8 935Medicine, M. D. candidates 5 359 17 384
Anesthesia 8Postgraduate Medicine 220 221
Music 2 161 172Natural Resources 48 48Nursing 413 420Pharmacy 27 27Public Health 64 65Social Work 59 60Hospital Training 10 10Net total summer students 78 187 164 24 216 584 155 2,441 193 877 361 240 165 50 421 27 64 60 10 6,310·
• Excludes 33 double e,nrollrnents in spring and 17 double enrollments in summer.
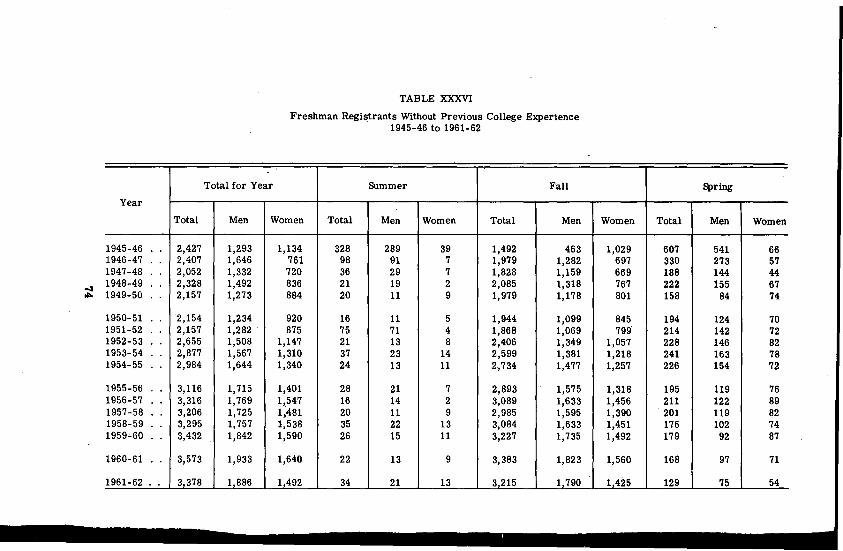
TABLE XXXVI
Freshman Registrants Without Previous College Experience1945-46 to 1961-62
Total for Year Summer Fall Spring
Year
Total Men Women Total Men Women Total Men Women Total Men Women
1945-46 2,427 1,293 1,134 328 289 39 1,492 463 1,029 607 541 661946-47 2,407 1,646 761 98 91 7 1,979 1,282 697 330 273 571947-48 2,052 1,332 720 36 29 7 1,828 1,159 669 188 144 441948-49 2,328 1,492 836 21 19 2 2,085 1,318 767 222 155 671949-50 2,157 1,273 884 20 11 9 1,979 1,178 801 158 84 74
1950-51 2,154 1,234 920 16 11 5 1,944 1,099 845 194 124 701951-52 2,157 1,282 875 75 71 4 1,868 1,069 799 214 142 721952-53 2,655 1,508 1,147 21 13 8 2,406 1,349 1,057 228 146 821953-54 2,877 1,567 1,310 37 23 14 2,599 1,381 1,218 241 163 781954-55 2,984 1,644 1,340 24 13 11 2,734 1,477 1,257 226 154 72
1955-56 3,116 1,715 1,401 28 21 7 2,893 1,575 1,318 195 119 761956-57 3;316 1,769 1,547 16 14 2 3,089 1,633 1,456 211 122 891957-58 3,206 1,725 1,481 20 11 9 2,985 1,595 1,390 201 119 821958-59 3,295 1,757 1,538 35 22 13 3,084 1,633 1,451 176 102 741959~60 3,432 1,842 1,590 26 15 11 3,227 1,735 1,492 179 92 87
1960-61 3,573 1,933 1,640 22 13 9 3,383 1,823 1,560 168 97 71
1961-62 .. 3378 1 886 1492 34 21 13 3215 1 790 1425 129 75 54

1900
1700
1500
1300
1100
900
700
500
FRESHMAN REGISTRANTS
WITHOUT
PREVIOUS COLLEGE
EXPERIENCE
1945-46 to' 1961-62
v .....
~ ....... ill""'"I"l'",m pon V _4
I \ L",,-
,,~ ....10·... -,I \ )1\ J v· 10·, ,
\ II -'~-~~ J
'.'.~ ;W ,11 I~I
\ 'I~, .' ... --...- .'
1947-48 1951-52 1955-56 1959-60
1945 -46 1949-50 1953-54 1951-'58 1961-62
FIGURE 10,
75
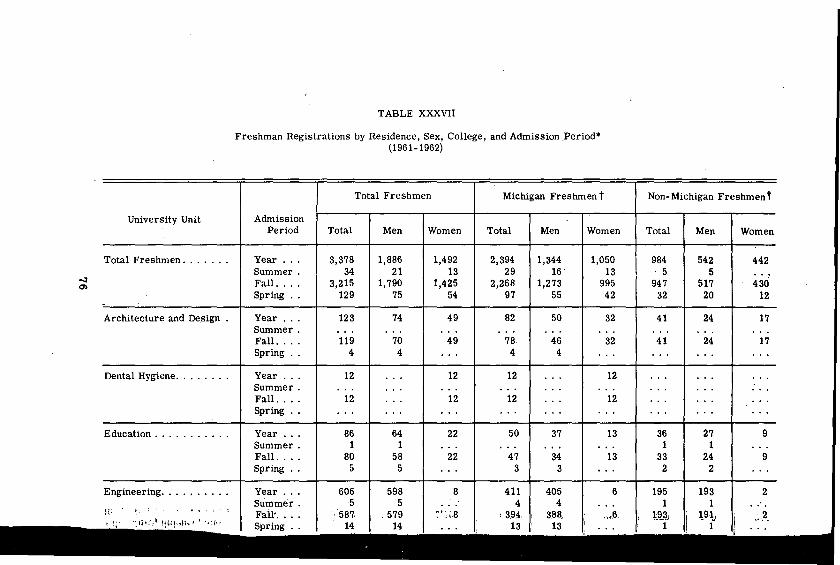
TABLE XXXVII
Freshman Registrations by Residence, Sex, College, and Admission Period·(1961-1962)
Total Freshmen Michigan Freshmen t Non- Michigan Freshmen t
University Unit AdmissionPeriod Total Men Women Total Men Women Total Men Women
Total Freshmen ....... Year ... 3,378 1,886 1,492 2,394 1,344 1,050 984 542 442Summer. 34 21 13 29 16 ' 13 5 5
~ Fall .... 3,215 1,790 1,425 2,268 1,273 995 947 517 430Cl)
Spring .. 129 75 54 97 55 42 32 20 12
Architecture and Design Year ... 123 74 49 82 50 32 41 24 17Summer.Fall .... 119 70 49 78 46 32 41 24 17Spring .. 4 4 4 4
Dental Hygiene........ Year ... 12 12 12 12Summer.Fall .... 12 12 12 12Spring ..
Education ........... Year ... 86 64 22 50 37 13 36 27 9Summer. 1 1 1 1Fall .... 80 58 22 47 34 13 33 24 9Spring .. 5 5 3 3 2 2
Engineering.......... 8 6 195 193 21 1 ...
Hi ! ; :t '; ~,8 ... 6. l!!.3; l~1J .. ,2.1 1
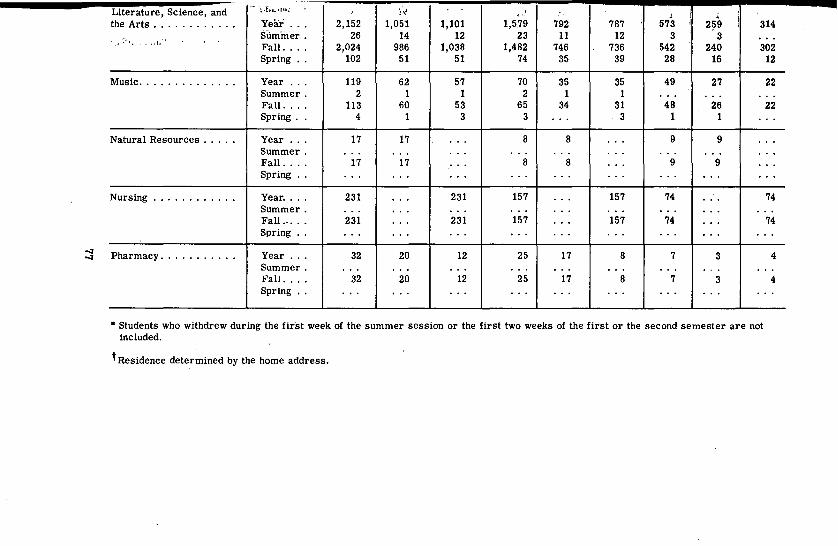
Literature, Science, and- i ,I.... 'III-; ,,</." < '. J I i
the Arts .. , , . . . .. . Year . .. 2,152 1,051 1,101 1,5.79 7.92 , 787 573 I ~?9 I 314
'. Summer. 26 14 12 23 11 12 3 3 ...• ,"\J"
Fall. 2,024 986 1,038 1,482 746 736 542 240 302...Spring 102 51 51 74 35 39 28 16 12
Music .. ... .. . . . . . Year' ... 119 62 57 70 35 35 49 27 22Summer. 2 1 1 2 1 1 .. · . · .Fall. 113 60 53 65 34 31 48 26 22Spring. 4 1 3 3 · . 3 1 1 · .
Natural Resources .. . . Year . . 17 17 · . 8 8 · . 9 9 · .Summer. .. . . . · . · .Fall. · . 17 17 8 8 9 9 · .Spring · . · . · . . . . . · .
Nursing . . . . . . . . . . Year. . . 231 . . 231 157 · . 157 74 . .. 74Summer. · . . . · . . . · . . .. .. . . ..Fall.- ... 231 .. . 231 157 · . 157 74 · . 74Spring · . .. . .. . · . .. · . .. . . .. · . . .
Pharmacy. .. ..... . Year · . 32 20 12 25 17 8 7 3 4Summer. · . . . . .. · . · . . . .. . · .Fall. ... 32 20 12 25 17 8 7 3 4Spring · . · . . . . . · . . . " . · .
• Students who withdrew during the fir'st week of the summer session or the first two weeks of the first or the second semester are notincluded.
t Residence determined by the home address.
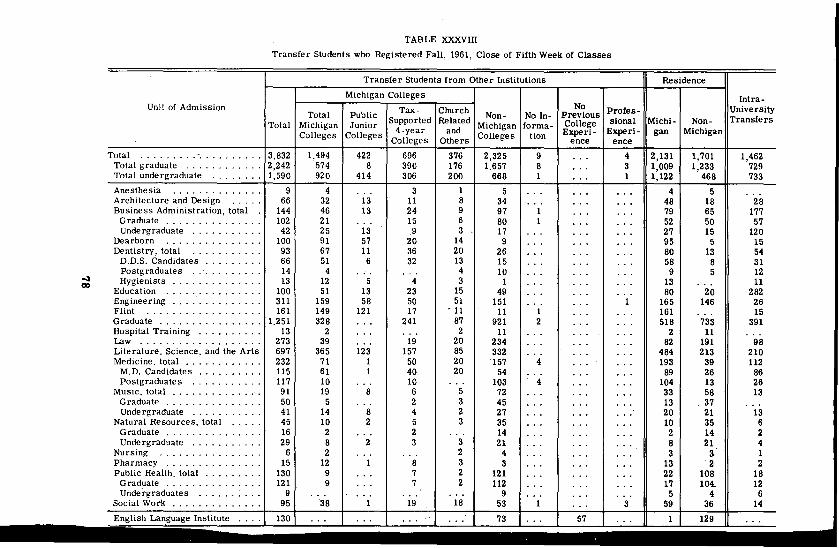
TABLE XXXVIII
Transfer Students who Registered Fall, 1961, Close of Fifth Week of Classes
Transfer Students from Other Institutions Residence
Michigan Colleges Intra-Unit of Admission Tax- Church No Profes- University
Total Public Supported Related Non- No In- Previoussional Michi- Non- Transfers
Total Michigan Junior Michigan forma- CollegeColleges Colleges 4-year and Colleges tion Experi- Experi- gan Michigan
Colleges Others ence ence
Total ................... 3.832 1,494 422 696 376 2,325 9 . .. 4 2,131 1,701 1,462Total graduate ............ 2,242 574 8 390 176 1,657 8 . .. 3 1,009 1,233 729Total undergraduate . . . . . . . . 1,590 920 414 306 200 668 1 ... 1 1,122 468 733
Anesthesia .............. 9 4 .. . 3 1 5 .. . .. . . .. 4 5 . ..Architecture and Design .... . 66 32 13 11 8 34 .. . ... . .. 48 18 28Business Administration, total 144 46 13 24 9 97 1 .. . ... 79 65 177
Graduate ............... 102 21 . .. 15 6 80 1 .. . . .. 52 50 57Undergraduate ........... 42 25 13 9 3 17 .. . .. . . .. 27 15 120
Dearborn .............. . 100 91 57 20 14 9 .. . ... . .. 95 5 15Dentistry, total ••••••••• 0·' 93 67 11 36 20 26 .. . .. . ... 80 13 54
D.D.S. Candidates ......... 66 51 6 32 13 15 .. . .. . . .. 58 8 31Postgraduates ........... 14 4 .. . .. . 4 10 . .. .. . . .. 9 5 12
...:J Hygienists .............. 13 12 5 4 3 1 .. . .. . ... 13 . .. 1100Education ............... 100 51 13 23 15 49 . .. .. . . .. 80 20 282Engineering .............. 311 159 58 50 51 151 . .. . .. 1 165 146 26Flint ................. . 161 149 121 17 '11 11 1 ... .. ' 161 ... 15Graduate ................ 1.251 328 .. . 241 87 921 2 . .. . .. 518 733 391Hospital Training ......... . 13 2 .. . .. . 2 11 ... .. . .. . 2 11 . ..Law .................. . 273 39 ... 19 20 234 .. . .. . . .. 82 191 98Literature. Science. and the Arts 697 365 123 157 85 332 ... .. . . .. 484 213 210Medicine. total ............ 232 71 1 50 20 '157 4 . .. . .. 193 39 112
M.D. Candidates .......... 115 61 1 40 20 54 .. . .. . . .. 89 26 86Postgraduates .......... . 117 10 .. . 10 ... 103 4 .. . . .. 104 13 26
Music. totai ............. . 91 19 8 6 5 72 .. . ... . .. 33 58 13Graduate .............. . 50 5 .. . 2 3 45 .. . .. . . .. 13 37 ., .Unde rgraduate ........... 41 14 8 4 2 27 .. . .. . . .. 20 21 13
Natural Resources. total .... . 45 10 2 5 3 35 ... .. . . .. 10 35 6Graduate .............. . 16 2 .. . 2 ... 14 . .. .. . . .. 2 14 2Unde rgraduate ........... 29 8 2 3 3 21 .. . .. . . .. 8 21 4
Nursing ............... . 6 2 ... .. . 2 4 .. . .. . . .-. 3 :l 1Pharmacy .............. . 15 12 1 8 3 3 ... .. . . .. 13 2 2Public Health. total ........ . 130 9 ... 7 2 121 .. . .. . . .. 22 108 18
Graduate ...... , ........ 121 9 .. . 7 2 112 . .. .. . . .. 17 104- 12Undergraduates ......... . 9 .. . .. . .. . ... 9 .. . . .. . .. 5 4 6
Social Work ...... ' ........ 95 '38 1 19 18 53 1 . .. 3 59 36 14
English Language Institute ... . 130 .. . .. . .. . .. . 73 .. . 57 . .. 1 129 ...-

•TABLE XXXIX
Transfer Students Who Registered Spring, 1962, Close of Fifth Week of Classes
Transfer Students from Other Institutions Residence
Michigan CollegesIntra-
Unit af Admission Tax- Church No UniversityTotal Public Non- Profes-Total Michigan Junior Supported Related Michigan Previous sional Michigan Non- Transfers
4-year and College MichiganColleges Colleges Colleges Others Colleges Experience Experience
Total ................. . 978 524 117 307 100 448 6 764 214 888Total, graduate .......... 491 259 1 202 56 226 6 393 98 383Total, undergraduate ....... 487 265 116 105 44 222 371 116 505
Architecture and Design 13 8 2 5 1 5 9 4 21Business Administration, total .. 44 17 4 9 4 27 29 15 90
Graduate ............... 29 9 6 3 20 19 10 36Undergraduate ........... 15 8 4 3 1 7 10 5 54
Dearborn ............... 64 55 30 14 11 9 60 4 13Dentistry, total ........... 2 2 2 4
D.D.S. Candidates ......... 3Postgraduates ........... 2 2 2 1
-l Hygienists ..............co Education 42 21 3 14 4 21 38 4 133...............Engineering ............. ", 82 33 8 16 9 49 41 41 35Flint .................. 85 72 55 15 2 13 85 8Graduate ................ 380 222 1 174 47 158 306 74 326Law ................... 2 2 1 1Literature, Science, and the Arts 151 58 12 33 13 93 109 42 199Medicine, total ............ 27 2 2 25 26 1 7
M.D. Candidates .......... 1 1 1 1Postgraduates ........... 26 1 1 25 25 1 7
Music, total .............. 12 3 2 9 8 4 22Graduate ............... 7 2 1 5 5 2 1Unde rgraduate ........... 5 1 1 4 3. 2 21
Natural Resources, total 15 1 14 5 10 6Graduate ............... 3 3 1 2Unde rgraduate ........... 12 1 11 4 8 6
Nursing ................ 9 7 4 3 2 8 1 7Pharmacy, total ........... 4 1 3 2 2 7
Graduate ............... 1 1 1Undergraduate ............ 3 1 2 2 1 7
Public Health, total ......... 9 2 2 7 5 4 3Graduate ............... 3 2 2 1 3 2Undergraduate ........... 6 6 2 4 1
Social Work .............. 37 22 17 9 6 32 5 7
English Language Institute .... 52 27 25 52 1
Edward G. Groesbeck, Director