Embed Size (px)
Citation preview

Report of the 2012 Concentrated Inspection Campaign (CIC) on Fire Safety Systems
August 21, 2013
2 | P a g e
Executive Summary The Paris MOU on Port State Control (PMOU) carried out a joint Concentrated Inspection Campaign (CIC) with the Tokyo MOU on Port State Control (TMOU) on fire safety systems between September 1 and November 30, 2012. During the campaign, 27 PMOU and 17 TMOU member states focussed on compliance with SOLAS Chapter II-2 requirements on inspected ships. This report documents the results of the campaign for the PMOU Maritime Authorities. Results for the TMOU Maritime Authorities are documented separately. A total of 4,014 inspections were carried out with the CIC questionnaire involving 3,985 individual ships. The overall CIC detention rate was 4.0% (160 ships were detained). The CIC-topic detention rate was 2.6% (103 ships were detained). 64% of the detentions were CIC-topic related. The overall number of CIC-topic related deficiencies reported per inspection was 0.49.
Considering both the questionnaire and deficiency data, the most positive results were reported for Question 3, which asked are portable extinguishers ready for use in locations as per fire plan. The least favourable results were reported for Question 12, which asked where a fire drill was witnessed was it found to be satisfactory. General cargo / multipurpose ships were inspected 1347 (33.5%) during the campaign which was the highest, followed by bulk carriers 766 (19%), container ships 422 (10.5%), chemical tankers 343 (8.5%) and oil tankers with 308 (7.6%) inspections. Even though dredgers had the highest CIC-topic related detention rate (11.1%), General cargo – multi-purpose ships had the highest number of detained ships 59 (57.2%), then bulk carriers 14 (13.6%). Container ship had the third highest with 9, 4 each for offshore supply and Ro-Ro cargo ships. Younger ships had the lowest detention rate (0.7%) and older ships the highest detention rate (6.6%). The rate increased steadily from ships less than six years old to ships over 35 years old. Ships from 97 flag states were inspected during the CIC, most of the inspections were carried out on the flag states of Panama 445 (11.1%), Liberia with 308 (7.7%), Malta 306 (7.6%) and Antigua and Barbuda 282 (7%) The flag state with the highest detention rate (CIC-topic related) was Dominica (28.6%), followed by the Sierra Leone (21.2%), Togo (18.2%), the Faroe Islands (14.3%), and Belize (10.5%). 64 of the 97 flag states (69%) did not have any detentions. The overall results of ship detentions was consistent with the risk profiling methodology of the new inspection regime (NIR) – HRS ships comprised the largest percentage of ships detained, LRS ships the lowest, and results for SRS ships fell in between. Of the PMOU member states, the Netherlands conducted the most inspections (369), followed by Spain (366) and Italy (336). With respect to CIC-topic related detentions, Ireland detained the highest percentage of ships with a rate of 12.8%, followed by Cyprus at 10.5% and Italy at 8%. Eight member states did not detain any vessels for CIC-related deficiencies. The objective of the CIC was to provide indications as to the industry’s level of compliance with specific aspects of SOLAS Chapter II-2 on Fire Protection, Fire Detection and Fire Extinction arrangements vessels regardless of type. New provisions were introduced in July 2002 and deficiencies related to fire safety account for 14% of total deficiencies with the Paris and Tokyo MOU. The PMOU concludes that the CIC has indeed provided sound evidence supporting that the industry has in general achieved a good level of compliance with the specific provisions of SOLAS Chapter II-2 pertaining to fire safety systems. Despite the fact 64% of the detentions were CIC-topic related, when the overall CIC-topic related detention and deficiency rates are compared to the broader PMOU PSC rates that were published in the 2011 Annual Report on Port State Control, the results are favourable by 21% for detentions and a significant 82% for deficiencies. Key recommendation pertain to the PMOU continuing, during normal PSC inspections, to put emphasis on the Chapter II-2 requirements that had the least favourable results of the CIC namely, fire drills, fire pumps and pipes, firefighting equipment and appliances and fire control Plan.
3 | P a g e
Table of Contents Page
Section 1: Introduction 1.1 Purpose of this Report
1.2 Objective of the CIC 1.3 Scope of the CIC
1.4 General Remarks
……………………………………
…………………………………………………………………………
……………………………………
5
5 5
6
Section 2: Summary Analysis, Conclusions and Recommendations
2.1 Summary Analysis
2.2 Conclusions 2.3 Recommendations
……………………………………
…………………………………………………………………………
6
7 8
Section 3: CIC Questionnaire Results
3.1 Analysis 3.1.1 Response to CIC Questionnaire
3.1.2 Analysis of Answers to Questionnaire
3.1.3 Number of Inspections and Number of Ships in CIC
3.1.4 Specification of CIC-Topic Related Deficiencies
3.1.5 Analysis of CIC-topic Related Deficiencies (ISM-Related Deficiencies)
3.1.6 Number of Ships to Number of Inspections in CIC
3.1.7 Number of Inspected Ships per Risk Profile
3.1.8 Number of Inspected Ships and Detentions per Ship Type
3.1.9 Number of Inspected Ships and Detentions per Flag State
3.1.10 Number of Inspections and Detentions per Recognized Organization
3.1.11 Ship Age Overview
3.2 Results on Former CIC on Same Subject
3.3 Results Other CIC Participants
……………
……………
…………… ……………
…………… ……………
……………
…………… ……………
……………
…………… ……………
……………
……………
8
9
12 13
14 15
17
17 18
19
20 20
21
21
Annex 1: CIC Questionnaire
Annex 1.1 Inspection Form of CIC Annex 1.2 Table - Inspections and Detentions per Flag State Annex 1.3 Table Inspections and Detentions Per Recognized Organization
………………………….. ………………………….. …………………………..
22 23 28

4 | P a g e
Introduction
1.1 Purpose of this Report This report documents the results of the Concentrated Inspection Campaign (CIC) on Fire Safety Systems (SOLAS CH II-2) which was carried out by 27 member Maritime Authorities of the Paris Memoranda of Understanding (MOU) on Port State Control between September 1 and November 30, 2012. The CIC was carried out jointly by the Tokyo MOU on Port State Control which involved 17 additional Maritime Authorities (44 in total). CIC results for the Tokyo MOU are documented in a separate report; however, a summary comparison between the Paris and Tokyo MOU results is provided in Section 3.3 of this report.
1.2 Objective of the CIC The SOLAS Convention specifies minimum standards for the construction, equipment and operation of ships, compatible with their safety. Ch II-2 relates to Construction - Fire Protection, Fire Detection, and Fire Extinction arrangements on board ships and includes detailed fire safety provisions for all ships and specific measures for passenger ships, cargo ships and tankers. Revised SOLAS Ch II-2 provisions came into force on July 1, 2002 and apply to all ships, irrespective of type, constructed before, on or after this date. Existing ships are also expected to comply with the requirements of the Convention and regulations as specified. Principles of the updated provisions include:
• Division of the ship into main and vertical zones by thermal and structural boundaries;
• Separation of accommodation spaces from the remainder of the ship by thermal and structural boundaries;
• Restricted use of combustible materials; • Detection of any fire in the zone of origin; • Containment and extinction of any fire in the space of origin; • Protection of the means of escape or of access for fire-fighting purposes; • Ready availability of fire-extinguishing appliances; and, • Minimization of the possibility of ignition of flammable cargo vapour.
The objective of the CIC was to provide indications as to the industry’s level of compliance with specific aspects of SOLAS Chapter II-2 on Fire Protection, Fire Detection and Fire Extinction arrangements on board ships regardless of type. It was also intended to help raise awareness of fire safety related issues. Deficiencies related to fire safety account for 14% of total deficiencies with the Paris and Tokyo MOU and a CIC on the fire safety systems of all types of ships has never been done.
1.3 Scope of the CIC The CIC targeted 12 aspects of compliance provisions that are considered critical to shipboard fire safety systems. Areas include:
• Compliance with the requirements of the SOLAS convention for fire safety systems; • Ensuring firefighting equipment is readily available and maintained at all times;
and,

5 | P a g e
• Ensuring the master, officers and crew are familiar with FSS equipment and have received training in carrying out their duties.
The CIC was designed to examine specific areas and not intended to detract from the normal coverage of Port State Control Inspections. As such, it was conducted in conjunction with the regular Port State Control targeting and inspection activities.
Member Maritime Authorities were provided with a standardized questionnaire format to record and report their results against the 12 targeted compliance provisions that comprised the CIC. In addition, Port State Control Officers (PSCOs) were required to indicate if the ship was detained as a result of the CIC. The questionnaire required a “Yes” (Satisfactory) or “No” (Unsatisfactory) response to each question. In some cases a “N/A” (Not Applicable) answer was acceptable. For each “No” answer, participants were directed to document the deficiency using the appropriate deficiency code on Form B of the PSC inspection report. For six of the questions, a “No” answer was serious enough that the ship could be considered for detention.
1.4 General Remarks General remarks pertaining to this report include:
For the purpose of this report, a detention is an inspection containing at least one deficiency that is considered a ground for detention.
With the exception of Table 2, the tables contained in the report take into account only those inspections that were conducted with the CIC questionnaire.
Summary, Conclusions and Recommendations 2.1 Summary The following summarizes the results of the CIC:
• 3,985 individual ships and 4,014 inspections were conducted with a CIC questionnaire.
• 160 ships were detained in the CIC. 103 ships or 64% of the detentions were CIC-topic related. The overall detention rate (percentage of detentions per inspection) for the CIC was 4%. The CIC-topic related detention rate was 2.6%.
• Responses to Question3, which asked Are portable extinguishers ready for use in locations as per the fire plan, reported the most favourable results – only 41 unsatisfactory responses were recorded representing 1.0% of resultant inspections.
• The least favourable results were reported for Question 12, which asked if where a fire drill was witnessed was it found to be satisfactory - 213 unsatisfactory responses were recorded representing 13.6% of resultant inspections. An unsatisfactory response to Question 12 was a potentially detainable violation and 78% of the ships which were found to have this deficiency were detained.
• The overall CIC-topic deficiency rate (average number of deficiencies reported per inspection) was 0.49.
• Deficiency 07113 (related to Question 11), which pertains to fire pumps and its pipes, accounted for the most number of reported inspection deficiencies at 13% of the total. Deficiency 08103 (related to Question 7), which pertains to fire alarms, accounted for the least number of reported inspection deficiencies at 1% of the total.
• By ship type, dredgers had the highest CIC-topic related detention rate (11.1%), followed by livestock carrier ships (7.1%), offshore supply ships (5.1%) and general cargo/multipurpose ships (4.4%). A number of ship types had “zero” CIC-topic related detentions.

6 | P a g e
• By ship age, younger ships had the lowest detention rate (0.7%) and older ships the highest detention rate (6.6%). The rate increased steadily from ships less than six years old to ships over 35 years old.
• Ships from 97 flag states were inspected during the CIC. With respect to CIC-topic related detentions, the flag state with the highest percentage of ships detained was Dominica (28.6%), followed by the Sierra Leone (21.2%), Togo (18.2%), the Faroe Islands (14.3%), and Belize (10.5%). 64 of the 97 flag states (69%) did not have any detentions.
• The CIC results for the top three flag states with the worst performance aligns well with what would be expected based on the WGB-list ranking – all three are “Black List”. However, the Faroe Islands, which had the fourth worst performance of the CIC, recently (2011) achieved “White List” status, and Belize is on the “Grey List”.
• By ship risk profile categories, the results of the CIC were consistent with what would be expected in accordance with the risk profiling breakdown. These results help support the validity of the risk profiling methodology of the NIR. For both general detentions and CIC-topic related inspections, ships with a high risk profile (HRS) comprised (by far) the largest percentage of ships detained per inspection, ships with a low risk profile (LRS) comprised the smallest percentage of ships detained per inspection, and ships with a standard risk profile (SRS) fell in between.
• There were a total of 3419 inspections of ships where the certificate was recorded as issued by the RO, and a total of 20 CIC-topic related detentions which had a deficiency linked to one of the three certificates. This equates to a detention rate of 0.6% which is significantly lower than the 2.6% rate of detentions for the CIC-topic related detentions as a whole.
• Of the PMOU members states, the Netherlands conducted the most inspections (369), followed by Spain (366) and Italy (336). The least number of inspections were conducted by Iceland (15) followed by Cyprus (19) and Estonia (25). With respect to CIC-topic related detentions, Ireland detained the highest percentage of ships with a rate of 12.8%, followed by Cyprus at 10.5% and Italy at 8%. Eight member states did not detain any vessels for CIC-related deficiencies.
The analysis also revealed there are inconsistencies between the questionnaire data and the deficiency and detention data. These inconsistencies are common in all CICs. Several reasonable explanations exist however which support the conclusion that the questionnaire and the deficiency data are both correct but just not necessarily associated with each other in all cases. Independently and/or taken together, both results provide valuable information to PMOU Maritime Authorities as to the industry’s level of compliance with specific aspects of SOLAS Chapter II-2 on Fire Protection, Fire Detection and Fire Extinction arrangements onboard ships.
2.2 Conclusions
The objective of the CIC was to provide indications as to the industry’s level of compliance with specific aspects of SOLAS Chapter II-2 on Fire Protection, Fire Detection and Fire Extinction arrangements vessels regardless of type. New provisions were introduced in July 2002. It was also the intent of the CIC to help raise awareness of fire safety related issues. During the campaign, 64% of the detentions were CIC-topic related, which if considered in isolation would lead to a conclusion that the industry has not achieved an acceptable level of compliance with SOLAS Chapter II-2 requirements. However, the PMOU now monitors and publishes two key indicators for measuring the compliance performance of ships that are inspected:
1. Number of deficiencies reported per inspection (deficiency rate); and,
2. Percentage of detentions per inspection (detention rate).

7 | P a g e
With regard to the deficiency rate, the results of the CIC reported an overall rate of 0.49 (CIC-topic related). This result is highly favourable compared to the latest deficiency rate of 2.7 reported for all PMOU PSC Inspections conducted during 20101. With regard to the detention rate, the results of the CIC reported an overall rate of 2.6% (CIC-topic related). This also compares favourably to the latest overall PMOU PSC detention rate of 3.28% reported for 20102. 2.3 Recommendations The follow recommendations are offered for consideration:
1. The PMOU continue, during normal PSC inspections, to put emphasis on the specific areas covered by the CIC that had the least favourable results, namely fire drills, which had the highest negative response during CIC. Also, fire pump and pipes, fire fighting equipment and appliances and fire control plan are additional areas to be emphasized.
CIC Questionnaire Results
3.1 Analysis
1 PMOU 2011 Annual Report 2 PMOU 2011 Annual Report

8 | P a g e
3.1.1 Response to CIC questionnaire Table 1 Response to CIC questionnaire
‘YES’ ‘NO’ N/A Blank % ‘NO’
adjusted (2)
# % (3)
(yes&no) # % (3)
(yes&no) #
% (4) (total
inspected) #
% (4) (total
inspected) Q1 Does the Fire Control
Plan meet the requirements?
3753 93.8% 248 6.2% 0 #VERW! 13 0.3% #DEEL/0!
Q2a Do the fire fighters’ outfits including personal equipment comply with the requirements?
3811 96.5% 137 3.5% 42 1.0% 24 0.6%
#DEEL/0!
Q2b Do the Emergency Escape Breathing Devices (EEBD) comply with the requirements?
3859 98.3% 65 1.7% 78 1.9% 12 0.3%
#DEEL/0!
Q3 Are the portable extinguishers ready for use in locations as per the fire plan?
3939 99.0% 41 1.0% 15 0.4% 19 0.5% 32%
Q4 (1) Does the test of automatic audible alarm sound prior to release of a fixed gas fire-extinguishing medium into spaces in which personnel normally work?
3472 98.4% 57 1.6% 466 11.6% 19 0.5% 31%
Q5a (1) Are the fire protection systems, fire fighting-systems and appliances maintained ready for use?
3729 93.6% 254 6.4% 0 #VERW! 31 0.8% #DEEL/0!

9 | P a g e
‘YES’ ‘NO’ N/A Blank % ‘NO’
adjusted (2)
# % (3)
(yes&no) # % (3)
(yes&no) #
% (4) (total
inspected) #
% (4) (total
inspected) Q5b Is there a maintenance
plan onboard to show that fire protection systems and fire- fighting systems and appliances (as appropriate) have been properly tested and inspected?
3844 96.7% 132 3.3% 0 #VERW! 38 0.9% 34%
Q6 (1) Is the crew familiar with the location and operation of fire-fighting systems and appliances that they may be called upon to use?
3875 97.1% 116 2.9% 0 #VERW! 23 0.6% #DEEL/0!
Q7 Does the test of the sprinkler system trigger an automatic visual and audible alarm for the section?
923 97.4% 25 2.6% 3040 75.7% 26 0.6% 47%
Q8 (1) Does the activation of any detector or manually operated call point initiate a visual and audible fire signal at the control panel on the bridge or control station?
3695 98.0% 74 2.0% 212 5.3% 33 0.8% #DEEL/0!
Q9 Is the lighting in escape routes, including the Low Location Lighting systems where applicable properly maintained?
3490 98.1% 66 1.9% 435 10.8% 23 0.6% 50%

10 | P a g e
‘YES’ ‘NO’ N/A Blank % ‘NO’
adjusted (2)
# % (3)
(yes&no) # % (3)
(yes&no) #
% (4) (total
inspected) #
% (4) (total
inspected) Q10 (1) Is the Emergency Fire
pump, capable of producing at least two jets of water?
3796 98.8% 48 1.2% 141 3.5% 29 0.7% #DEEL/0!
Q11 Are the Isolating valves of the fire main marked, maintained and easily operable?
3506 94.0% 224 6.0% 254 6.3% 30 0.7% 22%
Q12 (1) Where a fire drill was witnessed was it found to be satisfactory?
1349 86.4% 213 13.6% 2435 60.7% 17 0.4% #DEEL/0!
Q13 Was the ship detained as a result of the CIC? 130 3.3% 3869 96.7% 0 #VERW! 15 0.4% #VERW!
1. ‘NO’ means: the ship may be considered for detention. The details of any detention should be appropriately entered on the PSC
report B. 2. “% ‘NO’ adjusted]” = % “[Answer = NO, may be considered for detention]” but the ship has not been detained. 3. "% (yes/no)" are percentages calculated using total yes and no answers only. 4. "% (total inspected)" are percentages of the total number of inspections.

3.1.2. Analysis of answers to questionnaire Table 1 above reveals that during the period of the CIC, a total of 4,014 inspections were carried out using the CIC questionnaire. The number of unsatisfactory responses per question ranges from 25 to 254 representing from 1.0% to 13.6% of positive or negative responses respectively. Responses to Question 3, which asked Are the portable extinguishers ready for use in locations as per the fire plan, reported the most favourable results of all questions – only 41 unsatisfactory responses were recorded representing 1.0% of positive or negative reponses. Question 10, which asked is the emergency fire pump, capable of producing at least two jets of water, reported the next most favourable results with only 48 unsatisfactory responses representing 1.2% of positive or negative responses. The least favourable results were reported for Question 12, which asked where a fire drill was witnessed was it found to be satisfactory – 213 unsatisfactory responses were recorded representing 13.6% of positive or negative responses. An unsatisfactory response to Question 12 was a potentially detainable violation and 78% of the ships which were found to have this deficiency were detained. Question 5a, which asked are the fire protection systems, fire fighting-systems and appliances maintained ready for use, reported the next least favourable results with 254 unsatisfactory responses representing 6.4% of inspections. Responses to Questions 11, which asked if the isolating valves of the fire main were marked, maintained and easily operable, and 1, which asked does the fire control plan meet the requirements, also reported similar results. Question 11 reported 224 unsatisfactory responses (6.0% of inspections) and Question 1 reported 248 unsatisfactory responses (6.2% of inspections). Please note that although the questionnaire data in Table 1 identifies at Question 13 that 130 CIC-topic related inspections resulted in a ship detention, the actual number of vessels that were detained based on the Form B/Notice of Detention for the Master paperwork was 103. This is the figure that is used throughout the rest of the report. Inconsistencies between the questionnaire data and the Form B data are discussed in more detail in Section 3.1.5.
11 | P a g e

3.1.3. Number of inspections and number of ships in CIC Table 2 Number of inspections and number of ships in CIC
Individual ships
inspected with a CIC
questionnaire
Inspections performed with a CIC
questionnaire
Inspections without a CIC questionnaire
Inspections 3985 4014 468
Inspections with detentions 160 160 21
Detentions with CIC-topic related deficiencies
103 103 6
Table 2 reveals that a total of 4,482 inspections were conducted during the CIC, of which the vast majority were performed with the CIC questionnaire (4,014 or 90%). Of the ships that were inspected with a CIC questionnaire, a total of 160 ships were detained of which 103 were related to CIC-topic deficiencies. CIC-topic related deficiencies therefore accounted for 64% of the total ships detained and the detention rate for CIC-topic related deficiencies was 2.6%.
12 | P a g e

3.1.4. Specification of CIC-topic related deficiencies Table 3 Specification of CIC-topic related deficiencies
CIC-topic related deficiencies Inspections Detentions
CIC-topic related
Detentions CIC-topic related with RO responsibility
(# of inspections with this deficiency) One inspection can have multiple deficiencies
(# of inspections with this deficiency recorded as ground for detention)
(# of inspections with this deficiency recorded as ground for detention and RO related)
01309 Fire control plan - all 185 1 1
04102 Emergency fire pump and its pipes 100 18 1
04109 Fire drills 74 34 0
07106 Fire detection and alarm system 214 26 1
07108 Ready availability of fire-fighting equipment
158 33 3
07109 Fixed fire extinguishing installation
184 26 5
07110 Fire-fighting equipment and appliances
216 12 2
07111 Personal equipment for fire safety 138 10 1
07112 Emergency Escape Breathing Device and disposition
72 3 0
07113 Fire pumps and its pipes 256 16 1
07120 Means of escape 119 2 0
13 | P a g e

14 | P a g e
CIC-topic related deficiencies Inspections Detentions
CIC-topic related
Detentions CIC-topic related with RO responsibility
(# of inspections with this deficiency) One inspection can have multiple deficiencies
(# of inspections with this deficiency recorded as ground for detention)
(# of inspections with this deficiency recorded as ground for detention and RO related)
07123 Operation of Fire protection systems 85 11 0
07124 Maintenance of Fire protection systems 143 8 0
08103 Fire alarm 14 1 0
3.1.5. Analysis of CIC-topic related deficiencies (ISM-related deficiencies)
Deficiency 07113 (related to Question Q11), which pertains to fire pumps and its pipes, accounted for the most number of reported inspection deficiencies at 13% of the total. This was closely followed by Deficiency 07110 (related to Question 3), pertaining to fire-fighting equipment and appliances, and Deficiency 07106 (related to Question 8), pertaining to fire detection and alarm systems, each of which accounts for 11% of the total reported inspection deficiencies. Deficiency 08103 (related to Question 7), which pertains to fire alarms, accounted for the least number of reported inspection deficiencies at 1% of the total. Deficiency 07112 (emergency escape breathing device and disposition), Deficiency 04109 (fire drills) and Deficiency 07123) accounted for the next least number of reported inspection deficiencies with each contributing 4% to the total. Note, this analysis reveals there are some inconsistencies between the deficiency results and the questionnaire results which raise some questions. For example, Question 12 according to the questionnaire reported the least favourable results of all questions; yet, the deficiency results indicate that Deficiency 07108, which is the code for non-compliance with Question 12, was only the 12th most used deficiency code. Another more extreme example pertains to Deficiency 07110, which is the code for non-compliance with Question 3. According to the questionnaire, Question 3 reported the most favourable results of all questions; yet, the deficiency results indicate that Deficiency 07110 was the second most used deficiency code. The CIC instructions require that for each unsatisfactory answer in the questionnaire, Inspectors are to provide the detail of any deficiencies on the PSC Form B. The questionnaire also specifically notes for each question, the deficiencies that apply. It is thus reasonable to expect that there should be good correlation between the results of the

questionnaire and the results of the deficiencies in terms of most favourable to least favourable; yet, the correlation is only 0.43. Chart 2 below shows the comparison of the questionnaire and deficiency results for all CIC questions. It reveals that the number of reported deficiencies exceeds the number of “No” responses in the questionnaire almost 2:1. In some cases, the gap is significant.
The inconsistencies that exist between the questionnaire data and the deficiency data are found in every CIC. One explanation may be that in some instances PSCOs are completing the questionnaire but are not doing the extra step for the unsatisfactory answers and filling out the PSC Report Form B. Another explanation may be that given that the CIC is carried out in conjunction with the normal PSC inspections, perhaps in some cases PSCOs are filling out the questionnaire independent of the PSC Report Form B. It could also be a combination of both explanations.
The above explanations support that both the questionnaire and the deficiency data are likely correct but just not necessarily associated with each other in all cases. For this reason, it is the opinion of the PMOU that even though the deficiency and questionnaire data is not necessarily consistent, it does not diminish the validity of the overall results of the CIC. Independently and/or taken together, both results provide valuable information to PMOU Maritime Authorities as to the industry’s level of compliance with specific aspects of SOLAS Chapter II-2 on Fire Protection, Fire Detection and Fire Extinction arrangements on board ships.
15 | P a g e

3.1.6. Number of ships to number of inspections in CIC Table 4 Number of ships to number of inspections in CIC campaign
# of inspections performed per ship # of ships % of total
1 3956 99.3%
2 29 0.7%
Total 3,985 100.0%
Table 4 reveals that the vast majority of the ships inspected for the CIC (99.3%) were only inspected once. Less than 1% of ships were inspected twice. 3.1.7. Number of inspected ships per Ship Risk Profile Table 5 Number of inspected ships per Ship Risk Profile
Ship Risk Profile
# of inspections
# of detentions
detention as % of
inspections
detentions CIC-topic related
detentions CIC-topic related as
% of inspections
High Risk Ship (HRS) 309 31 10.0% 22 7.1%
Standard Risk Ship (SRS)
3005 115 3.8% 75 2.5%
Low Risk Ship (LRS) 441 6 1.4% 3 0.7%
Unknown 259 8 3.1% 3 1.2%
Total 4014 160 4.0% 103 2.6%
The PMOU introduced a new, risk-based inspection regime (NIR) in January 2011. The NIR makes use of company performance and the Voluntary IMO Member State Audit Scheme for identifying the risk profile of ships together with the performance of the flag State and the recognized organization. The past inspection record of the ship as well as the ship’s age and ship type influences the targeting. The CIC results shown in Table 5 above, which identify the number and percentage of ship detentions falling in each of the ship risk profile categories, are consistent with what would be expected in accordance with the risk profiling breakdown. This helps support the validity of the risk profiling methodology of the NIR. For both general detentions and CIC-topic related detentions, ships with a high risk profile (HRS) comprised (by far) the largest percentage of ships detained per inspection, ships with a low risk profile (LRS) comprised the smallest percentage of ships detained per inspection, and ships with a standard risk profile (SRS) fell in between.
16 | P a g e

3.1.8. Number of inspected ships and detentions per ship type Table 6 Number of inspected ships and detentions per ship type
Ship type
# of individual ships
# of inspections
# of detentions
detention as % of inspections
detentions CIC-topic related
detentions CIC-topic
related as % of
inspections
Bulk carrier 765 766 31 4.0% 14 1.8%
Chemical tanker 342 343 4 1.2% 0 0.0%
Combination carrier 8 8 0 0.0% 0 0.0%
Container 420 422 12 2.8% 9 2.1%
Dredger 9 9 1 11.1% 1 11.1%
Gas carrier 85 86 2 2.3% 2 2.3%
General cargo/multipurpose 1329 1347 78 5.8% 59 4.4%
Heavy load 6 6 0 0.0% 0 0.0%
High speed passenger craft 2 2 0 0.0% 0 0.0%
Livestock carrier 14 14 2 14.3% 1 7.1%
MODU & FPSO 5 5 0 0.0% 0 0.0%
NLS tanker 29 31 0 0.0% 0 0.0%
Offshore supply 78 78 5 6.4% 4 5.1%
Oil tanker 307 308 4 1.3% 2 0.6%
Other special activities 164 165 7 4.2% 3 1.8%
Passenger ship 39 39 0 0.0% 0 0.0%
Refrigerated cargo 95 95 4 4.2% 3 3.2%
Ro‐Ro cargo 193 194 8 4.1% 4 2.1%
Ro‐Ro passenger ship 28 28 0 0.0% 0 0.0%
Special purpose ship 29 29 1 3.4% 1 3.4%
Tug 38 39 1 2.6% 0 0.0%
Total 3985 4014 160 4.0% 103 2.6%
Table 6 reports the number of ship inspections and the number and percentage of ships detained during the CIC by ship type. With respect to CIC-topic related detentions, dredgers
17 | P a g e

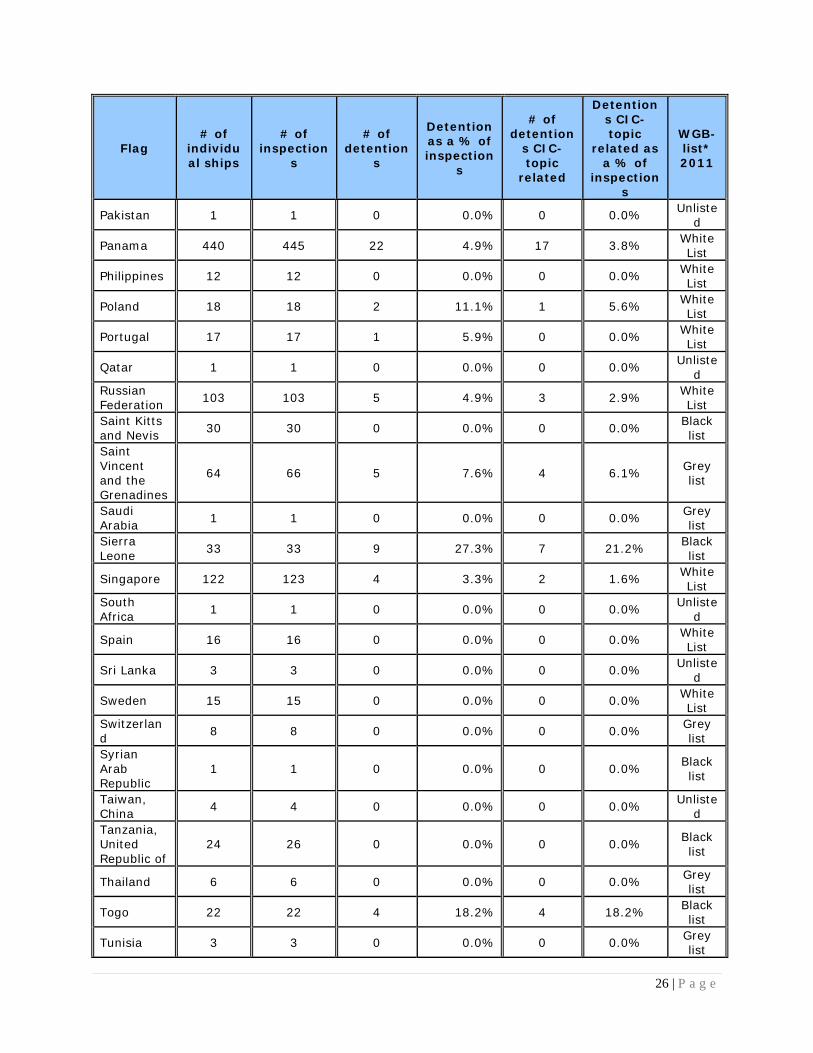
had the highest detention rate (11.1%), followed by livestock carrier ships (7.1%), offshore supply ships (5.1%) and general cargo/multipurpose ships (4.4%). A number of ship types had “zero” CIC-topic related detentions including chemical tankers, combination carriers, heavy load ships, high speed passenger crafts, MODU & FPSO ships, NLS tankers, passenger ships, Ro-Ro cargo ships or tugs. It is important to note that the sample sizes (number of ships inspected) of the ship types that comprise the top two vessel types that were detained were relatively low compared to the other types. There were only nine inspections of dredgers and only 14 livestock carrier inspections. By comparison there were 78 offshore supply ship inspections (third most CIC-topic related vessel detentions) and 1,347 general cargo/multipurpose ship inspections. Although smaller sample sizes do not invalidate the results in anyway, it does however provide less certainty as to how widespread a finding may be within a specific ship type. If available, comparing the data in Table 6 with the total number of ships that comprise the overall convention ship fleet by ship type would help improve this uncertainty and bring more precision to the analysis. If only vessel types with a relatively larger sample size are considered in the analysis, offshore supply ships become the ship type with the highest percentage of detentions followed by general purpose/multipurpose vessels and then refrigerated cargo ships. 3.1.9 Inspections and detentions per Flag State The table in Annex 1.4 presents the number of inspections and number and percentage of ships detained during the CIC by flag state. It also identifies the “White, Grey, Black (WGB) List” ranking for each flag state. Ships from 97 different flag states were inspected during the CIC. With respect to CIC-topic related detentions, the flag state with the highest percentage of ships detained was Dominica (28.6%), followed by the Sierra Leone (21.2%), Togo (18.2%), the Faroe Islands (14.3%), and Belize (10.5%). 64 of the 97 flag states (69%) did not have any detentions. The CIC results for the top three flag states with the highest percentage of CIC-topic related ship detentions aligns well with what would be expected based on the WGB-list ranking – all three are “Black List”. However, the Faroe Islands, which had the fourth worst performance of the CIC, recently (2011) achieved “White List” status, and Belize is on the “Grey List”. The number of Dominica ships inspected was only 7 compared to 33 Sierra Leone, 22 Togo, 14 Faroe Island and 38 Belize ships. This compares, for example, with 139 Cyprus ship inspections of which 3.6% were detained with CIC-topic related deficiencies, and 129 Hong Kong ships of which none were detained. Again, as mentioned previously, smaller sample sizes do not make the results any less valid but rather reduces the certainty as to how widespread a finding may be, in this case, for a particular flag state. If available, including the number of ships that comprise each flags convention fleet in the Annex 1.4 table would help improve this uncertainty and bring more precision to the results.
18 | P a g e

3.1.10 Inspections and detentions per Recognized Organization
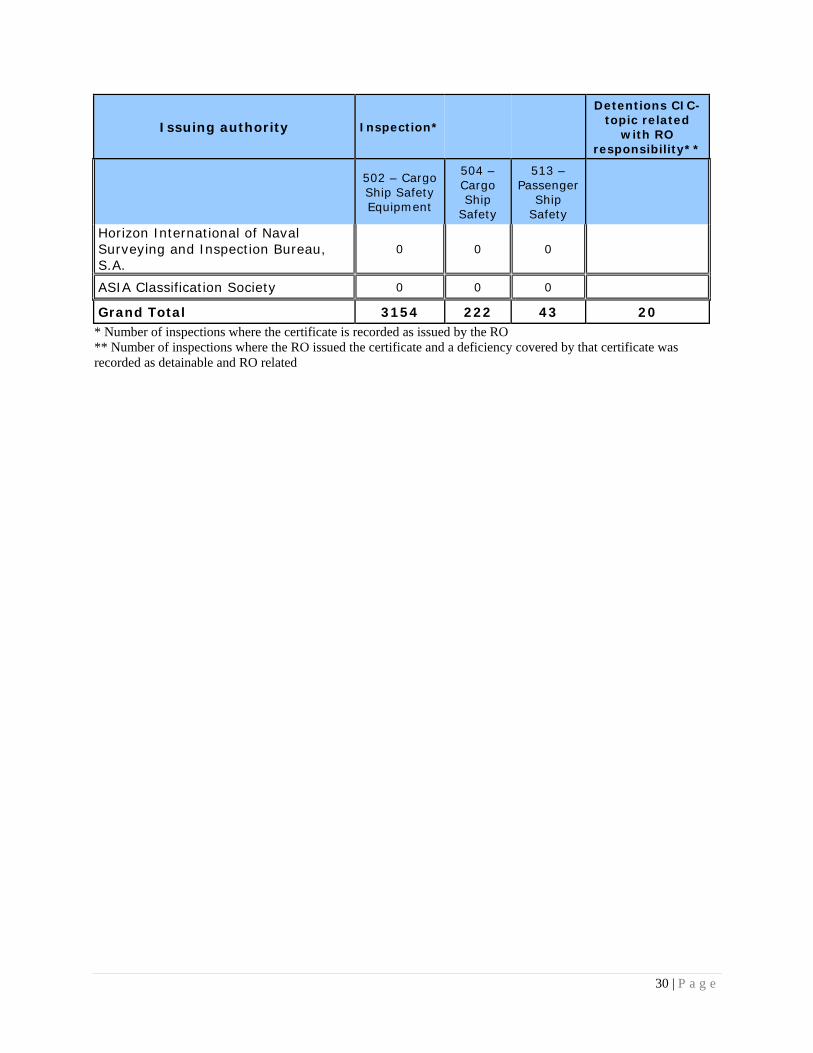
The table in Annex 1.3 presents the number of inspections (by vessel certificate – 502, 504 and 513) and number of CIC-topic related detentions by Recognized Organization (RO). It shows there were a total of 3419 inspections of ships where the certificate was recorded as issued by the RO and a total of 20 CIC-topic related detentions which had a deficiency linked to one of the three certificates. This equates to a detention rate of 0.58%. By comparison, the detention rate for the overall CIC (CIC-topic related deficiencies) was 2.6% which means that ships for which ROs have the delegated authority to perform inspections and certifications on behalf of the member Maritime Authority performed relatively better than the overall results of the CIC. The RO with most inspections (659) and most detentions (6) was Germanischer Lloyd, followed by Bureau Veritas with 463 inspections and 3 detentions and the Russian Maritime Register of Shipping with 431 inspections and 1 detentions. 39 ROs did not have any detentions at all. 3.1.11 Ship age overview Table 7 ship age overview
Ship age # of
individual ships
# of inspections
# of detentions
Detention as a % of
inspections
Detentions CIC-topic related
Detentions CIC-topic
related as a % of inspections
< 6 years 990 990 15 1.5% 7 0.7%
6-11 years 925 932 22 2.4% 13 1.4%
12-17 years 657 664 31 4.7% 18 2.7%
18-23 years 430 431 18 4.2% 12 2.8%
24-29 years 353 357 23 6.4% 17 4.8%
30-35 years 344 353 27 7.6% 17 4.8%
> 35 years 286 287 24 8.4% 19 6.6%
Total 3985 4014 160 4.0% 103 2.6%
Table 7 reports the number of ship inspections and the number and percentage of ships detained during the CIC by ship age. By ship age, the data clearly indicates that the rate of ship detention per inspection increases with ship age. For ships less than six years old, the rate of detention was 0.7% and the rate steadily increases to where ships over 35 years old have a rate of detention of 6.6% per inspection.
19 | P a g e

3.2 Results on former CICs on same subject Not applicable – this is the first CIC for this subject matter. 3.3 Results other CIC participants Table 8 Results other CIC participants
PMOU TMOU
# of inspections with CIC Questionnaire 4,014 6,606
# of detentions 160 217
Detentions as a % of inspections 4.0% 3.3%
Detentions with CIC-topic related deficiencies
103 150
Detentions with CIC-topic related deficiencies as a % of inspections
2.6%
2.3% Detentions with CIC-topic related deficiencies as a % of detentions
64%
69% CIC Question reporting the most favourable results
Q3 Q7
CIC Question reporting the least favourable results
Q12 Q5a and Q11
Ship type reporting the least favourable results*
Cargo/multipurpose ships
Cargo/multipurpose ships
Ship age reporting the most favourable results
< 6 years <11 years
Ship age reporting the least favourable results
>35 years > 30 years
RO ships detention rate for CIC-topic related detentions
0.5% 0.09
# of RO responsibility ship inspections during CIC
3419 7787
Most recent published annual detention rate for broader PSC inspection regime
3.28% 5.46%
* Taking into consideration sample sizes.
20 | P a g e

Table 8 reveals that TMOU member states conducted 39.2% more inspections with CIC questionnaires than PMOU member states during the three months of the campaign. However, detentions as a percentage of inspections were 17.5% higher for the PMOU overall and 11.5% higher for CIC-topic related detentions. Nonetheless, the proportion of detentions with CIC-topic related deficiencies as a percentage of total detentions was higher for TMOU inspections by 5%. Cargo/multipurpose ships were the most problematic ship type for both the TMOU and PMOU and older ships had the highest rate of detention in both cases. There was a slight difference however in the PMOU and TMOU results with respect to inspections of RO responsibility ships. Although only 3419 RO recorded responsibility issuing ship certificates were conducted by PMOU member states, the detention rate for CIC-topic related deficiencies was five times higher than TMOU. . In stark contrast, TMOU member states inspected 7,043 RO recorded responsibility issuing ship certificates (the vast majority of all ships inspected by TMOU member states) and the detention rate for CIC-topic related deficiencies was low at 0.09%. This result is below the PMOU results for the CIC, but also better than the TMOU broader PSC inspection results reported annually. Overall, both the PMOU and TMOU CIC results faired better than their respective broader PSC inspection results, thus both authorities conclude that the CIC has indeed provided sound evidence supporting that the industry has in general achieved a good level of compliance with the specific provisions of the SOLAS Chapter II-2 pertaining to fire safety systems.
21 | P a g e

Annex 1 CIC Questionnaire Annex 1.1 Inspection form of the CIC
22 | P a g e
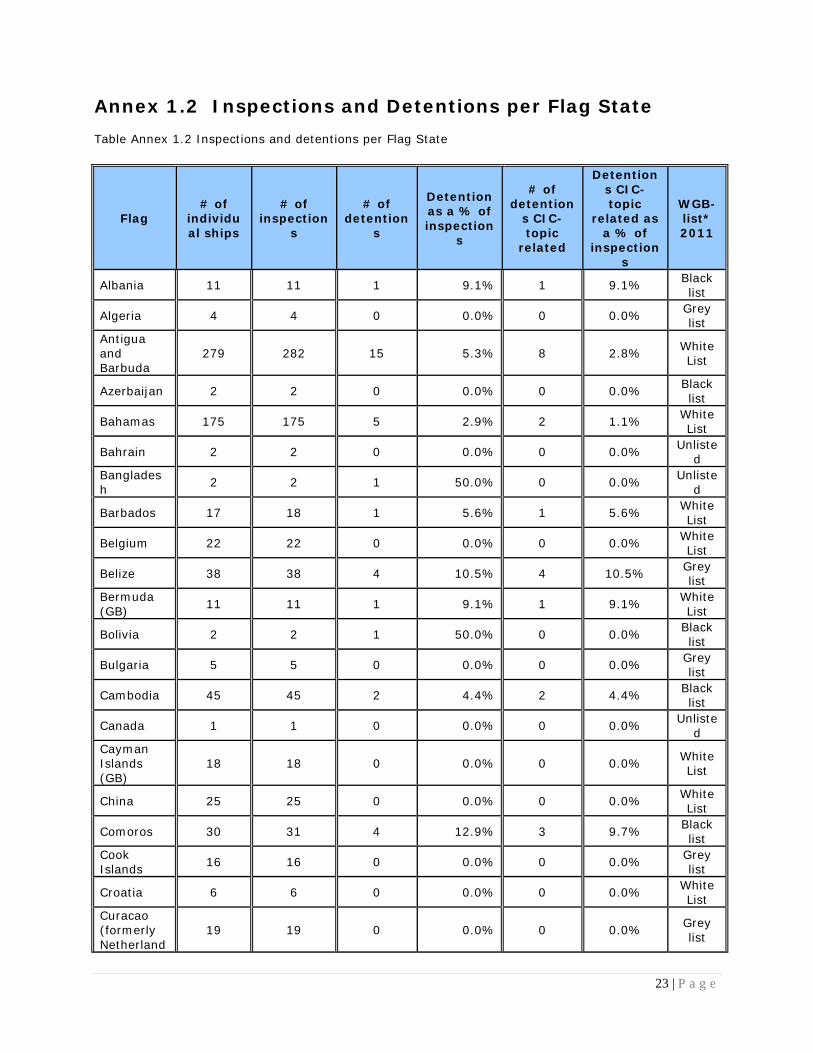
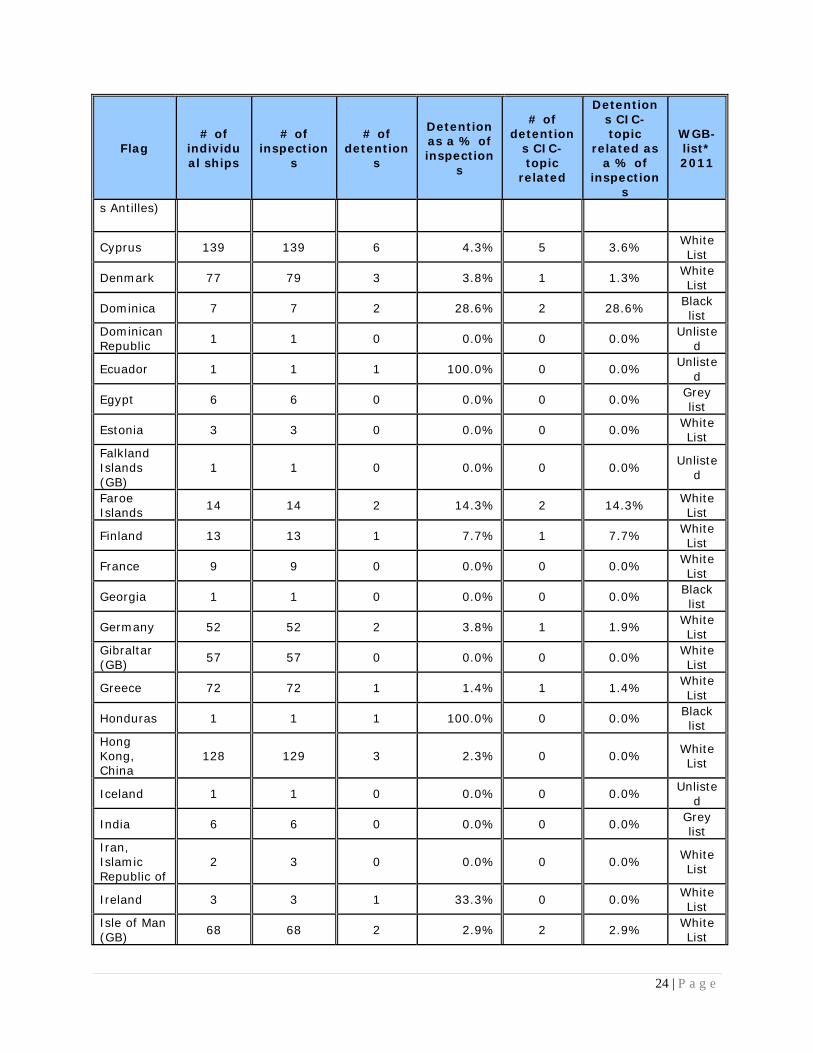
Annex 1.2 Inspections and Detentions per Flag State Table Annex 1.2 Inspections and detentions per Flag State
Flag # of
individual ships
# of inspection
s
# of detention
s
Detention as a % of inspection
s
# of detention
s CIC-topic
related
Detentions CIC-topic
related as a % of
inspections
WGB- list* 2011
Albania 11 11 1 9.1% 1 9.1% Black list
Algeria 4 4 0 0.0% 0 0.0% Grey list
Antigua and Barbuda
279 282 15 5.3% 8 2.8% White List
Azerbaijan 2 2 0 0.0% 0 0.0% Black list
Bahamas 175 175 5 2.9% 2 1.1% White List
Bahrain 2 2 0 0.0% 0 0.0% Unlisted
Bangladesh 2 2 1 50.0% 0 0.0% Unliste
d
Barbados 17 18 1 5.6% 1 5.6% White List
Belgium 22 22 0 0.0% 0 0.0% White List
Belize 38 38 4 10.5% 4 10.5% Grey list
Bermuda (GB) 11 11 1 9.1% 1 9.1% White
List
Bolivia 2 2 1 50.0% 0 0.0% Black list
Bulgaria 5 5 0 0.0% 0 0.0% Grey list
Cambodia 45 45 2 4.4% 2 4.4% Black list
Canada 1 1 0 0.0% 0 0.0% Unlisted
Cayman Islands (GB)
18 18 0 0.0% 0 0.0% White List
China 25 25 0 0.0% 0 0.0% White List
Comoros 30 31 4 12.9% 3 9.7% Black list
Cook Islands 16 16 0 0.0% 0 0.0% Grey
list
Croatia 6 6 0 0.0% 0 0.0% White List
Curacao (formerly Netherland
19 19 0 0.0% 0 0.0% Grey list
23 | P a g e
24 | P a g e
Flag # of
individual ships
# of inspection
s
# of detention
s
Detention as a % of inspection
s
# of detention
s CIC-topic
related
Detentions CIC-topic
related as a % of
inspections
WGB- list* 2011
s Antilles)
Cyprus 139 139 6 4.3% 5 3.6% White List
Denmark 77 79 3 3.8% 1 1.3% White List
Dominica 7 7 2 28.6% 2 28.6% Black list
Dominican Republic 1 1 0 0.0% 0 0.0% Unliste
d
Ecuador 1 1 1 100.0% 0 0.0% Unlisted
Egypt 6 6 0 0.0% 0 0.0% Grey list
Estonia 3 3 0 0.0% 0 0.0% White List
Falkland Islands (GB)
1 1 0 0.0% 0 0.0% Unlisted
Faroe Islands 14 14 2 14.3% 2 14.3% White
List
Finland 13 13 1 7.7% 1 7.7% White List
France 9 9 0 0.0% 0 0.0% White List
Georgia 1 1 0 0.0% 0 0.0% Black list
Germany 52 52 2 3.8% 1 1.9% White List
Gibraltar (GB) 57 57 0 0.0% 0 0.0% White
List
Greece 72 72 1 1.4% 1 1.4% White List
Honduras 1 1 1 100.0% 0 0.0% Black list
Hong Kong, China
128 129 3 2.3% 0 0.0% White List
Iceland 1 1 0 0.0% 0 0.0% Unlisted
India 6 6 0 0.0% 0 0.0% Grey list
Iran, Islamic Republic of
2 3 0 0.0% 0 0.0% White List
Ireland 3 3 1 33.3% 0 0.0% White List
Isle of Man (GB) 68 68 2 2.9% 2 2.9% White
List

25 | P a g e
Flag # of
individual ships
# of inspection
s
# of detention
s
Detention as a % of inspection
s
# of detention
s CIC-topic
related
Detentions CIC-topic
related as a % of
inspections
WGB- list* 2011
Israel 2 2 0 0.0% 0 0.0% Unlisted
Italy 72 73 0 0.0% 0 0.0% White List
Japan 3 3 0 0.0% 0 0.0% White List
Jordan 1 1 0 0.0% 0 0.0% Unlisted
Kazakhstan 7 7 0 0.0% 0 0.0% Grey
list
Kiribati 1 1 0 0.0% 0 0.0% Unlisted
Korea, Democratic People's Republic of
1 1 0 0.0% 0 0.0% Unlisted
Korea, Republic of 11 11 0 0.0% 0 0.0% White
List
Kuwait 1 1 1 100.0% 0 0.0% Unlisted
Latvia 4 4 0 0.0% 0 0.0% White List
Lebanon 3 3 0 0.0% 0 0.0% Black list
Liberia 307 308 5 1.6% 4 1.3% White List
Libyan Arab Jamahiriya
1 1 0 0.0% 0 0.0% Black list
Lithuania 10 10 0 0.0% 0 0.0% White List
Luxembourg 15 15 1 6.7% 1 6.7% White
List
Malaysia 4 4 0 0.0% 0 0.0% Grey list
Malta 305 306 12 3.9% 4 1.3% White List
Marshall Islands 225 225 6 2.7% 4 1.8% White
List
Mauritius 2 2 0 0.0% 0 0.0% Unlisted
Moldova, Republic of 54 54 3 5.6% 2 3.7% Black
list
Morocco 3 3 0 0.0% 0 0.0% Grey list
Netherlands 206 208 8 3.8% 4 1.9% White
List
Norway 86 86 1 1.2% 1 1.2% White List
26 | P a g e
Flag # of
individual ships
# of inspection
s
# of detention
s
Detention as a % of inspection
s
# of detention
s CIC-topic
related
Detentions CIC-topic
related as a % of
inspections
WGB- list* 2011
Pakistan 1 1 0 0.0% 0 0.0% Unlisted
Panama 440 445 22 4.9% 17 3.8% White List
Philippines 12 12 0 0.0% 0 0.0% White List
Poland 18 18 2 11.1% 1 5.6% White List
Portugal 17 17 1 5.9% 0 0.0% White List
Qatar 1 1 0 0.0% 0 0.0% Unlisted
Russian Federation 103 103 5 4.9% 3 2.9% White
List Saint Kitts and Nevis 30 30 0 0.0% 0 0.0% Black
list Saint Vincent and the Grenadines
64 66 5 7.6% 4 6.1% Grey list
Saudi Arabia 1 1 0 0.0% 0 0.0% Grey
list Sierra Leone 33 33 9 27.3% 7 21.2% Black
list
Singapore 122 123 4 3.3% 2 1.6% White List
South Africa 1 1 0 0.0% 0 0.0% Unliste
d
Spain 16 16 0 0.0% 0 0.0% White List
Sri Lanka 3 3 0 0.0% 0 0.0% Unlisted
Sweden 15 15 0 0.0% 0 0.0% White List
Switzerland 8 8 0 0.0% 0 0.0% Grey
list Syrian Arab Republic
1 1 0 0.0% 0 0.0% Black list
Taiwan, China 4 4 0 0.0% 0 0.0% Unliste
d Tanzania, United Republic of
24 26 0 0.0% 0 0.0% Black list
Thailand 6 6 0 0.0% 0 0.0% Grey list
Togo 22 22 4 18.2% 4 18.2% Black list
Tunisia 3 3 0 0.0% 0 0.0% Grey list

27 | P a g e
Flag # of
individual ships
# of inspection
s
# of detention
s
Detention as a % of inspection
s
# of detention
s CIC-topic
related
Detentions CIC-topic
related as a % of
inspections
WGB- list* 2011
Turkey 146 150 7 4.7% 5 3.3% White List
Tuvalu 3 3 1 33.3% 0 0.0% Grey list
Ukraine 22 23 1 4.3% 1 4.3% Black list
United Arab Emirates
1 1 0 0.0% 0 0.0% Unlisted
United Kingdom 117 117 2 1.7% 2 1.7% White
List United States 21 21 0 0.0% 0 0.0% Grey
list
Vanuatu 12 12 0 0.0% 0 0.0% White List
Viet Nam 2 2 0 0.0% 0 0.0% Grey list
Grand Total 3985 4014 160 4.0% 103 2.6%
* The official WGB-list of the Paris MoU is published in the Annual Report. The scope of this table is only the CIC.

Annex 1.3 Inspections and detentions per Recognized Organization
Table Annex 1.3 Inspections and detentions per Recognized Organization
Issuing authority Inspection*
Detentions CIC-topic related
with RO responsibility**
502 – Cargo Ship Safety Equipment
504 – Cargo Ship
Safety
513 – Passenger
Ship Safety
American Bureau of Shipping 274 3 1 1
Bureau Veritas 349 107 7 3
China Classification Society 42 1 0
China Corporation Register of Shipping 4 1 0
Croatian Register of Shipping 6 0 1
Det Norske Veritas 409 11 9 1
Dromon Bureau of Shipping 27 1 0
Germanischer Lloyd 623 29 7 6
Global Marine Bureau Inc. 14 0 0
Hellenic Register of Shipping 1 0 0
Indian Register of Shipping 1 0 0
Inspeccion y Clasificacion Maritima (INCLAMAR) 7 1 0 1
International Naval Surveys Bureau 32 0 0
International Register of Shipping 23 2 0 1
Iranian Classification Society 3 0 0
Isthmus Bureau of Shipping, S.A. 3 2 0 1
Korea Classification Society 2 0 0
Korean Register of Shipping 57 0 0
Lloyd's Register 349 51 7 1
Macosnar Corporation 6 0 0
Maritime Bureau of Shipping 6 0 0
Nippon Kaiji Kyokai 428 3 0 1
Panama Marine Survey and Certification Services Inc. 3 0 0
28 | P a g e

29 | P a g e
Issuing authority Inspection*
Detentions CIC-topic related
with RO responsibility**
502 – Cargo Ship Safety Equipment
504 – Cargo Ship
Safety
513 – Passenger
Ship Safety
Panama Maritime Documentation Services 2 0 0
Panama Register Corporation 3 1 0
Panama Shipping Registrar Inc. 0 0 0
Phoenix Register of Shipping 12 0 0
Polski Rejestr Statkow (Polish Register of Shipping) 16 4 2
Register of Shipping (Albania) 10 0 1 1
Registro Italiano Navale 64 2 5
Russian Maritime Register of Shipping 242 2 1 2
Shipping Register of Ukraine 47 1 2 1
Turkish Lloyd 5 0 0
Universal Shipping Bureau Inc. 4 0 0
Unknown 1 0 0
Other 10 0 0
Bulgarian Register of Shipping 19 0 0
International Ship Classification 1 0 0
Venezuelan Register of Shipping 13 0 0
Maritime Lloyd - Georgia 11 0 0
American Register of Shipping 2 0 0
International Maritime Register 3 0 0
Union Marine Classification Society 1 0 0
Maritime Lloyd 4 0 0
Overseas Marine Certification Services 5 0 0
Global Shipping Bureau Inc 7 0 0
Vietnam Register 2 0 0
Intermaritime Certification Services, ICS Class 1 0 0
Honduras International Surveying and Inspection Bureau 0 0 0
30 | P a g e
Issuing authority Inspection*
Detentions CIC-topic related
with RO responsibility**
502 – Cargo Ship Safety Equipment
504 – Cargo Ship
Safety
513 – Passenger
Ship Safety
Horizon International of Naval Surveying and Inspection Bureau, S.A.
0 0 0
ASIA Classification Society 0 0 0
Grand Total 3154 222 43 20 * Number of inspections where the certificate is recorded as issued by the RO ** Number of inspections where the RO issued the certificate and a deficiency covered by that certificate was recorded as detainable and RO related