Embed Size (px)
Citation preview

KPMG LLPOne Financial Plaza755 Main StreetHartford, CT 06103
Report of Independent Registered Public Accounting Firm
The Board of Directors of MML Bay State Life Insurance Company and Policy Owners ofMML Bay State Variable Life Separate Account I:
Opinion on the Financial Statements
We have audited the accompanying statement of assets and liabilities of MML Bay State Variable Life Separate Account I(comprised of the divisions listed in Appendix A to the opinion) (collectively, “the Separate Account”) as of December 31,2017, the related statements of operations and changes in net assets for each of the years in the two-year period then ended, andthe related notes (collectively, the “financial statements”) and the financial highlights for each of the years in the five-yearperiod then ended. In our opinion, the financial statements and financial highlights present fairly, in all material respects, thefinancial position of the Separate Account as of December 31, 2017, the results of its operations and the changes in its net assetsfor each of the years in the two-year period then ended, and the financial highlights for each of the years in the five-year periodthen ended, in conformity with U.S. generally accepted accounting principles.
Basis for Opinion
These financial statements and financial highlights are the responsibility of the Separate Account’s management. Ourresponsibility is to express an opinion on these financial statements and financial highlights based on our audits. We are a publicaccounting firm registered with the Public Company Accounting Oversight Board (United States) (“PCAOB”) and are requiredto be independent with respect to the Separate Account in accordance with the U.S. federal securities laws and the applicablerules and regulations of the Securities and Exchange Commission and the PCAOB.
We conducted our audits in accordance with the standards of the PCAOB. Those standards require that we plan and perform theaudit to obtain reasonable assurance about whether the financial statements and financial highlights are free of materialmisstatement, whether due to error or fraud. Our audits included performing procedures to assess the risks of materialmisstatement of the financial statements and financial highlights, whether due to error or fraud, and performing procedures thatrespond to those risks. Such procedures included examining, on a test basis, evidence regarding the amounts and disclosures inthe financial statements and financial highlights. Such procedures also included confirmation of securities owned as ofDecember 31, 2017, by correspondence with the underlying mutual funds or their transfer agent. Our audits also includedevaluating the accounting principles used and significant estimates made by management, as well as evaluating the overallpresentation of the financial statements and financial highlights. We believe that our audits provide a reasonable basis for ouropinion.
We have served as the Separate Account’s auditor since 2004.
Hartford, ConnecticutMarch 5, 2018
KPMG LLP is a Delaware limited liability partnership and the U.S. memberfirm of the KPMG network of independent member firms affiliated with
KPMG International Cooperative (“KPMG International”), a Swiss entity.
LA2048 F-1

Appendix AThe MML Bay State Variable Life Separate Account I is composed of the following divisions and the activities of each divisionhave been included within the accompanying statement of assets and liabilities as of December 31, 2017 and the relatedstatements of operations and changes in net assets for each of the years in the two-year period then ended.
Divisions
American Century VP Income & Growth DivisionFidelity® VIP Contrafund® DivisionMML Blend DivisionMML Equity DivisionMML Equity Index DivisionMML Managed Bond DivisionMML Small Cap Equity DivisionMML U.S. Government Money Market DivisionOppenheimer Capital Appreciation DivisionOppenheimer Discovery Mid Cap Growth DivisionOppenheimer Global DivisionOppenheimer Global Strategic Income DivisionT. Rowe Price Mid-Cap Growth Division
F-2

MML Bay State Variable Life Separate Account I
STATEMENT OF ASSETS AND LIABILITIESDecember 31, 2017
AmericanCentury
VP Income& GrowthDivision
Fidelity®VIP
Contrafund®Division
MMLBlend
Division
MMLEquity
Division
MMLEquityIndex
Division
MMLManaged
BondDivision
MMLSmall
Cap EquityDivision
MMLU.S. Government
Money MarketDivision
ASSETSInvestments
Number of shares . . . . . . . . . . . . . . . . . . . . . 1,016,665 777,468 4,153,208 8,681,707 1,751,965 1,218,456 797,131 5,227,786
Identified cost . . . . . . . . . . . . . . . . . . . . . . . . $ 8,050,203 $ 21,397,867 $ 77,775,766 $197,512,774 $ 38,866,127 $ 15,570,374 $ 7,188,422 $ 5,224,737
Value . . . . . . . . . . . . . . . . . . . . . . . . . . . . . . $ 10,888,478 $ 29,497,142 $ 96,886,730 $275,083,372 $ 54,328,433 $ 15,126,839 $ 8,206,762 $ 5,227,786Receivable from MML Bay State Life Insurance
Company . . . . . . . . . . . . . . . . . . . . . . . . . . . - - 55,432 9,829 2 9,869 1 41
Total assets . . . . . . . . . . . . . . . . . . . . . . . . 10,888,478 29,497,142 96,942,162 275,093,201 54,328,435 15,136,708 8,206,763 5,227,827
LIABILITIESPayable to MML Bay State Life Insurance
Company . . . . . . . . . . . . . . . . . . . . . . . . . . . - - - - - - - -
NET ASSETS . . . . . . . . . . . . . . . . . . . . . . . . . $ 10,888,478 $ 29,497,142 $ 96,942,162 $275,093,201 $ 54,328,435 $ 15,136,708 $ 8,206,763 $ 5,227,827
Outstanding unitsPolicy owners . . . . . . . . . . . . . . . . . . . . . . . . 4,512,257 8,462,782 16,433,268 50,380,428 22,721,842 4,374,040 2,182,776 3,244,096
UNIT VALUEVariable Life (Note 3G) $ - $ - $ - $ - $ - $ - $ - $ -Variable Life Plus - - 9.03 9.65 2.25 5.39 - 2.13Variable Life Select 2.41 3.49 4.13 4.11 2.43 2.87 3.76 1.44
See Notes to Financial Statements.
F-3

MML Bay State Variable Life Separate Account I
STATEMENT OF ASSETS AND LIABILITIES (Continued)December 31, 2017
OppenheimerCapital
AppreciationDivision
OppenheimerDiscoveryMid CapGrowthDivision
OppenheimerGlobal
Division
OppenheimerGlobal
StrategicIncomeDivision
T. Rowe PriceMid-CapGrowthDivision
ASSETSInvestments
Number of shares . . . . . . . . . . . . . . . . . . . . . . . . . . . . . . . . . . . . . . . . . . . . . . . . . . . . . . . . . . . 1,146,814 806,733 1,910,998 1,536,527 1,611,359
Identified cost . . . . . . . . . . . . . . . . . . . . . . . . . . . . . . . . . . . . . . . . . . . . . . . . . . . . . . . . . . . . . . $ 52,923,851 $ 45,031,905 $ 66,738,738 $ 8,139,720 $ 39,533,996
Value . . . . . . . . . . . . . . . . . . . . . . . . . . . . . . . . . . . . . . . . . . . . . . . . . . . . . . . . . . . . . . . . . . . . . $ 63,877,523 $ 67,935,003 $ 90,619,516 $ 7,882,385 $ 45,520,880Receivable from MML Bay State Life Insurance Company . . . . . . . . . . . . . . . . . . . . . . . . . . . . . . 3 - 1 - -
Total assets . . . . . . . . . . . . . . . . . . . . . . . . . . . . . . . . . . . . . . . . . . . . . . . . . . . . . . . . . . . . . . 63,877,526 67,935,003 90,619,517 7,882,385 45,520,880
LIABILITIESPayable to MML Bay State Life Insurance Company . . . . . . . . . . . . . . . . . . . . . . . . . . . . . . . . . . . - 2 - - -
NET ASSETS . . . . . . . . . . . . . . . . . . . . . . . . . . . . . . . . . . . . . . . . . . . . . . . . . . . . . . . . . . . . . . . $ 63,877,526 $ 67,935,001 $ 90,619,517 $ 7,882,385 $ 45,520,880
Outstanding unitsPolicy owners . . . . . . . . . . . . . . . . . . . . . . . . . . . . . . . . . . . . . . . . . . . . . . . . . . . . . . . . . . . . . . 10,805,419 14,492,672 14,557,589 2,369,289 9,032,616
UNIT VALUEVariable Life (Note 3G) . . . . . . . . . . . . . . . . . . . . . . . . . . . . . . . . . . . . . . . . . . . . . . . . . . . . . . . $ - $ - $ - $ - $ -Variable Life Plus . . . . . . . . . . . . . . . . . . . . . . . . . . . . . . . . . . . . . . . . . . . . . . . . . . . . . . . . . . . . - - 2.94 - 4.50Variable Life Select . . . . . . . . . . . . . . . . . . . . . . . . . . . . . . . . . . . . . . . . . . . . . . . . . . . . . . . . . . 5.91 4.69 7.90 3.33 5.60
See Notes to Financial Statements.
F-4

MML Bay State Variable Life Separate Account I
STATEMENTS OF OPERATIONS AND CHANGES IN NET ASSETSFor The Year Ended December 31, 2017
AmericanCentury
VP Income& GrowthDivision
Fidelity®VIP
Contrafund®
Division
MMLBlend
Division
MMLEquity
Division
MMLEquityIndex
Division
MMLManaged
BondDivision
MMLSmall
Cap EquityDivision
MMLU.S. Government
Money MarketDivision
Investment IncomeDividends . . . . . . . . . . . . . . . . . . . . . . . . . . . . . . $ 236,684 $ 281,628 $ 1,984,036 $ 4,791,190 $ 595,296 $ 470,083 $ 65,697 $ 19,477Interest Income on Policy loans (Note 3F) . . . . . . - - 16,829 59,297 - 9,352 - 1,301
Total Income . . . . . . . . . . . . . . . . . . . . . . . . . . 236,684 281,628 2,000,865 4,850,487 595,296 479,435 65,697 20,778
ExpensesMortality and expense risk fees . . . . . . . . . . . . . . 54,457 155,868 435,702 1,275,205 260,314 72,712 42,748 27,686
Net investment income (loss) . . . . . . . . . . . . . . 182,227 125,760 1,565,163 3,575,282 334,982 406,723 22,949 (6,908)
Net realized and unrealized gain (loss) oninvestments
Realized gain (loss) on sale of fund shares . . . . . 510,053 964,070 2,477,454 4,024,118 1,438,962 (35,482) 170,593 1,795Realized gain distribution . . . . . . . . . . . . . . . . . . . 226,225 1,499,095 3,721,725 1,803,147 1,347,229 - 296,533 59
Realized gain (loss) . . . . . . . . . . . . . . . . . . . . . . . 736,278 2,463,165 6,199,179 5,827,265 2,786,191 (35,482) 467,126 1,854
Change in net unrealized appreciation/depreciation of investments . . . . . . . . . . . . . . . 892,542 2,839,069 5,144,860 28,221,105 6,404,743 245,896 519,906 (1,844)
Net gain (loss) on investments . . . . . . . . . . . . . 1,628,820 5,302,234 11,344,039 34,048,370 9,190,934 210,414 987,032 10
Net increase (decrease) in net assets resultingfrom operations . . . . . . . . . . . . . . . . . . . . . . . 1,811,047 5,427,994 12,909,202 37,623,652 9,525,916 617,137 1,009,981 (6,898)
Capital transactions:Transfer of net premiums . . . . . . . . . . . . . . . . . 514,858 1,203,247 4,149,493 12,943,355 744,367 952,046 279,342 452,568Transfers due to death benefits . . . . . . . . . . . . . (79,597) (203,653) (1,085,033) (2,126,568) (93,096) (101,385) (58,114) (18,421)Transfers due to withdrawal of funds . . . . . . . . . (376,131) (1,687,870) (4,578,860) (11,743,943) (829,101) (814,033) (311,660) (758,998)Transfers due to policy loans, net of
repayments . . . . . . . . . . . . . . . . . . . . . . . . . . (127,182) (267,442) (708,530) (2,494,630) (147,906) (77,715) (79,009) (54,822)Transfers due to cost of insurance . . . . . . . . . . - - (89,465) (151,415) - (14,298) - (10,756)Transfers due to changes for administrative
costs . . . . . . . . . . . . . . . . . . . . . . . . . . . . . . . (406,033) (1,393,666) (4,686,591) (13,674,083) (1,336,366) (1,071,465) (298,230) (462,089)Transfers between divisions and to/from
Guaranteed Principal Account . . . . . . . . . . . . 182,707 (178,219) (20,584) (1,437,376) (128,111) 642,706 116,099 534,117
Net increase (decrease) in net assets resultingfrom capital transactions . . . . . . . . . . . . . . . . . . (291,378) (2,527,603) (7,019,570) (18,684,660) (1,790,213) (484,144) (351,572) (318,401)
Total increase (decrease) . . . . . . . . . . . . . . . . . 1,519,669 2,900,391 5,889,632 18,938,992 7,735,703 132,993 658,409 (325,299)
NET ASSETS, at beginning of the year . . . . . . . 9,368,809 26,596,751 91,052,530 256,154,209 46,592,732 15,003,715 7,548,354 5,553,126
NET ASSETS, at end of the year . . . . . . . . . . . . $ 10,888,478 $ 29,497,142 $ 96,942,162 $275,093,201 $ 54,328,435 $ 15,136,708 $ 8,206,763 $ 5,227,827
See Notes to Financial Statements.
F-5

MML Bay State Variable Life Separate Account I
STATEMENTS OF OPERATIONS AND CHANGES IN NET ASSETS (Continued)For The Year Ended December 31, 2017
OppenheimerCapital
AppreciationDivision
OppenheimerDiscoveryMid CapGrowthDivision
OppenheimerGlobal
Division
OppenheimerGlobal
StrategicIncomeDivision
T. Rowe PriceMid-CapGrowthDivision
Investment IncomeDividends . . . . . . . . . . . . . . . . . . . . . . . . . . . . . . . . . . . . . . . . . . . . . . . . . . . . . . . . . . . . . . . . . . . $ 142,453 $ 19,312 $ 760,164 $ 179,761 $ -Interest Income on Policy loans (Note 3F) . . . . . . . . . . . . . . . . . . . . . . . . . . . . . . . . . . . . . . . . . . . - - - - -
Total Income . . . . . . . . . . . . . . . . . . . . . . . . . . . . . . . . . . . . . . . . . . . . . . . . . . . . . . . . . . . . . . 142,453 19,312 760,164 179,761 -
ExpensesMortality and expense risk fees . . . . . . . . . . . . . . . . . . . . . . . . . . . . . . . . . . . . . . . . . . . . . . . . . . 330,374 347,434 431,406 43,217 207,120
Net investment income (loss) . . . . . . . . . . . . . . . . . . . . . . . . . . . . . . . . . . . . . . . . . . . . . . . . . . (187,921) (328,122) 328,758 136,544 (207,120)
Net realized and unrealized gain (loss) on investmentsRealized gain (loss) on sale of fund shares . . . . . . . . . . . . . . . . . . . . . . . . . . . . . . . . . . . . . . . . . . 1,507,197 2,417,616 2,590,380 (9,758) 1,521,790Realized gain distribution . . . . . . . . . . . . . . . . . . . . . . . . . . . . . . . . . . . . . . . . . . . . . . . . . . . . . . . 5,423,451 6,343,723 - - 5,246,127
Realized gain (loss) . . . . . . . . . . . . . . . . . . . . . . . . . . . . . . . . . . . . . . . . . . . . . . . . . . . . . . . . . . . 6,930,648 8,761,339 2,590,380 (9,758) 6,767,917
Change in net unrealized appreciation/depreciation of investments . . . . . . . . . . . . . . . . . . . . . . . . 7,031,529 7,099,613 21,973,930 309,005 2,683,173
Net gain (loss) on investments . . . . . . . . . . . . . . . . . . . . . . . . . . . . . . . . . . . . . . . . . . . . . . . . . 13,962,177 15,860,952 24,564,310 299,247 9,451,090
Net increase (decrease) in net assets resulting from operations . . . . . . . . . . . . . . . . . . . . . . . 13,774,256 15,532,830 24,893,068 435,791 9,243,970
Capital transactions:Transfer of net premiums . . . . . . . . . . . . . . . . . . . . . . . . . . . . . . . . . . . . . . . . . . . . . . . . . . . . . . 2,751,994 2,956,705 3,416,724 504,096 1,306,331Transfers due to death benefits . . . . . . . . . . . . . . . . . . . . . . . . . . . . . . . . . . . . . . . . . . . . . . . . . (216,017) (300,823) (542,343) (110,180) (221,776)Transfers due to withdrawal of funds . . . . . . . . . . . . . . . . . . . . . . . . . . . . . . . . . . . . . . . . . . . . . (3,168,711) (3,621,838) (4,521,755) (229,780) (2,430,859)Transfers due to policy loans, net of repayments . . . . . . . . . . . . . . . . . . . . . . . . . . . . . . . . . . . . (416,935) (543,131) (630,924) (59,323) (423,865)Transfers due to cost of insurance . . . . . . . . . . . . . . . . . . . . . . . . . . . . . . . . . . . . . . . . . . . . . . . - - - - -Transfers due to changes for administrative costs . . . . . . . . . . . . . . . . . . . . . . . . . . . . . . . . . . . (2,652,373) (2,774,944) (3,615,429) (488,922) (1,609,818)Transfers between divisions and to/from Guaranteed Principal Account . . . . . . . . . . . . . . . . . . . (227,343) (640,260) (390,732) 1,867 (244,348)
Net increase (decrease) in net assets resulting from capital transactions . . . . . . . . . . . . . . . . . . . (3,929,385) (4,924,291) (6,284,459) (382,242) (3,624,335)
Total increase (decrease) . . . . . . . . . . . . . . . . . . . . . . . . . . . . . . . . . . . . . . . . . . . . . . . . . . . . . . 9,844,871 10,608,539 18,608,609 53,549 5,619,635
NET ASSETS, at beginning of the year . . . . . . . . . . . . . . . . . . . . . . . . . . . . . . . . . . . . . . . . . . . 54,032,655 57,326,462 72,010,908 7,828,836 39,901,245
NET ASSETS, at end of the year . . . . . . . . . . . . . . . . . . . . . . . . . . . . . . . . . . . . . . . . . . . . . . . . $ 63,877,526 $ 67,935,001 $ 90,619,517 $ 7,882,385 $ 45,520,880
See Notes to Financial Statements.
F-6

MML Bay State Variable Life Separate Account I
STATEMENTS OF OPERATIONS AND CHANGES IN NET ASSETSFor The Year Ended December 31, 2016
AmericanCentury
VP Income& GrowthDivision
Fidelity®VIP
Contrafund®Division
MMLBlend
Division
MMLEquity
Division
MMLEquityIndex
Division
MMLManaged
BondDivision
MMLSmall
Cap EquityDivision
MMLU.S. Government
Money MarketDivision
Investment IncomeDividends . . . . . . . . . . . . . . . . . . . . . . . . . . . . . . $ 211,085 $ 209,418 $ 1,918,723 $ 4,218,071 $ 822,436 $ 446,246 $ 73,202 $ 7Interest Income on Policy loans (Note 3F) . . . . . . - - 15,187 55,610 - 9,118 - 1,937
Total Income . . . . . . . . . . . . . . . . . . . . . . . . . . 211,085 209,418 1,933,910 4,273,681 822,436 455,364 73,202 1,944
ExpensesMortality and expense risk fees . . . . . . . . . . . . . . 48,658 142,478 416,402 1,165,239 227,632 78,306 37,539 30,401
Net investment income (loss) . . . . . . . . . . . . . . 162,427 66,940 1,517,508 3,108,442 594,804 377,058 35,663 (28,457)
Net realized and unrealized gain (loss) oninvestments
Realized gain (loss) on sale of fund shares . . . . . 489,026 321,858 2,763,242 1,779,346 1,056,725 72,322 189,387 1,342Realized gain distribution . . . . . . . . . . . . . . . . . . . 165,183 2,071,258 8,566,104 15,422,391 1,036,841 69,539 157,677 -
Realized gain (loss) . . . . . . . . . . . . . . . . . . . . . . . 654,209 2,393,116 11,329,346 17,201,737 2,093,566 141,861 347,064 1,342
Change in net unrealized appreciation/depreciation of investments . . . . . . . . . . . . . . . . 266,696 (616,014) (5,167,027) 7,615,256 1,979,151 (142,754) 751,206 5,300
Net gain (loss) on investments . . . . . . . . . . . . . 920,905 1,777,102 6,162,319 24,816,993 4,072,717 (893) 1,098,270 6,642
Net increase (decrease) in net assets resultingfrom operations . . . . . . . . . . . . . . . . . . . . . . . 1,083,332 1,844,042 7,679,827 27,925,435 4,667,521 376,165 1,133,933 (21,815)
Capital transactions:Transfer of net premiums . . . . . . . . . . . . . . . . . 514,601 1,232,411 4,469,213 13,927,832 778,495 931,383 307,751 456,022Transfers due to death benefits . . . . . . . . . . . . . (13,165) (35,429) (972,519) (1,748,016) (101,489) (55,173) (7,649) (19,124)Transfers due to withdrawal of funds . . . . . . . . . (481,103) (1,341,059) (4,989,590) (11,931,444) (775,424) (925,786) (360,499) (1,646,964)Transfers due to policy loans, net of
repayments . . . . . . . . . . . . . . . . . . . . . . . . . . (83,530) (276,869) (1,179,869) (2,561,188) (114,333) (97,674) (82,696) (101,612)Transfers due to cost of insurance . . . . . . . . . . - - (86,078) (155,696) - (14,269) - (12,917)Transfers due to changes for administrative
costs . . . . . . . . . . . . . . . . . . . . . . . . . . . . . . . (424,736) (1,425,880) (4,911,048) (14,313,819) (1,335,236) (1,182,742) (300,219) (483,874)Transfers between divisions and to/from
Guaranteed Principal Account . . . . . . . . . . . . 35,389 (204,122) (18,669) (1,266,368) 59,570 53,367 (11,490) 1,219,997
Net increase (decrease) in net assets resultingfrom capital transactions . . . . . . . . . . . . . . . . . . (452,544) (2,050,948) (7,688,560) (18,048,699) (1,488,417) (1,290,894) (454,802) (588,472)
Total increase (decrease) . . . . . . . . . . . . . . . . . 630,788 (206,906) (8,733) 9,876,736 3,179,104 (914,729) 679,131 (610,287)
NET ASSETS, at beginning of the year . . . . . . . 8,738,021 26,803,657 91,061,263 246,277,473 43,413,628 15,918,444 6,869,223 6,163,413
NET ASSETS, at end of the year . . . . . . . . . . . . $ 9,368,809 $ 26,596,751 $ 91,052,530 $256,154,209 $ 46,592,732 $ 15,003,715 $ 7,548,354 $ 5,553,126
See Notes to Financial Statements.
F-7

MML Bay State Variable Life Separate Account I
STATEMENTS OF OPERATIONS AND CHANGES IN NET ASSETS (Continued)For The Year Ended December 31, 2016
OppenheimerCapital
AppreciationDivision
OppenheimerDiscoveryMid CapGrowthDivision
OppenheimerGlobal
Division
OppenheimerGlobal
StrategicIncomeDivision
T. Rowe PriceMid-CapGrowthDivision
Investment IncomeDividends . . . . . . . . . . . . . . . . . . . . . . . . . . . . . . . . . . . . . . . . . . . . . . . . . . . . . . . . . . . . . . . . . . . $ 224,114 $ - $ 764,251 $ 395,013 $ -Interest Income on Policy loans (Note 3F) . . . . . . . . . . . . . . . . . . . . . . . . . . . . . . . . . . . . . . . . . . . - - - - -
Total Income . . . . . . . . . . . . . . . . . . . . . . . . . . . . . . . . . . . . . . . . . . . . . . . . . . . . . . . . . . . . . . 224,114 - 764,251 395,013 -
ExpensesMortality and expense risk fees . . . . . . . . . . . . . . . . . . . . . . . . . . . . . . . . . . . . . . . . . . . . . . . . . . 299,461 317,764 376,561 43,506 190,680
Net investment income (loss) . . . . . . . . . . . . . . . . . . . . . . . . . . . . . . . . . . . . . . . . . . . . . . . . . . (75,347) (317,764) 387,690 351,507 (190,680)
Net realized and unrealized gain (loss) on investmentsRealized gain (loss) on sale of fund shares . . . . . . . . . . . . . . . . . . . . . . . . . . . . . . . . . . . . . . . . . . 1,572,492 2,209,185 1,594,701 (58,206) 870,231Realized gain distribution . . . . . . . . . . . . . . . . . . . . . . . . . . . . . . . . . . . . . . . . . . . . . . . . . . . . . . . 5,678,420 4,486,304 4,844,288 - 2,576,199
Realized gain (loss) . . . . . . . . . . . . . . . . . . . . . . . . . . . . . . . . . . . . . . . . . . . . . . . . . . . . . . . . . . . 7,250,912 6,695,489 6,438,989 (58,206) 3,446,430
Change in net unrealized appreciation/ depreciation of investments . . . . . . . . . . . . . . . . . . . . . . . (8,908,853) (5,398,863) (7,411,601) 164,549 (1,075,287)
Net gain (loss) on investments . . . . . . . . . . . . . . . . . . . . . . . . . . . . . . . . . . . . . . . . . . . . . . . . . (1,657,941) 1,296,626 (972,612) 106,343 2,371,143
Net increase (decrease) in net assets resulting from operations . . . . . . . . . . . . . . . . . . . . . . . (1,733,288) 978,862 (584,922) 457,850 2,180,463
Capital transactions:Transfer of net premiums . . . . . . . . . . . . . . . . . . . . . . . . . . . . . . . . . . . . . . . . . . . . . . . . . . . . . . 2,904,065 3,121,224 3,626,217 531,166 1,380,054Transfers due to death benefits . . . . . . . . . . . . . . . . . . . . . . . . . . . . . . . . . . . . . . . . . . . . . . . . . (158,380) (189,161) (289,975) (23,150) (217,279)Transfers due to withdrawal of funds . . . . . . . . . . . . . . . . . . . . . . . . . . . . . . . . . . . . . . . . . . . . . (2,952,727) (2,685,942) (3,832,194) (515,443) (2,166,383)Transfers due to policy loans, net of repayments . . . . . . . . . . . . . . . . . . . . . . . . . . . . . . . . . . . . (729,303) (664,699) (879,983) (46,442) (435,614)Transfers due to cost of insurance . . . . . . . . . . . . . . . . . . . . . . . . . . . . . . . . . . . . . . . . . . . . . . . - - - - -Transfers due to changes for administrative costs . . . . . . . . . . . . . . . . . . . . . . . . . . . . . . . . . . . (2,818,043) (2,922,886) (3,616,806) (536,182) (1,720,967)Transfers between divisions and to/from Guaranteed Principal Account . . . . . . . . . . . . . . . . . . . (245,522) (455,438) (612,893) (37,648) (216,577)
Net increase (decrease) in net assets resulting from capital transactions . . . . . . . . . . . . . . . . . . . (3,999,910) (3,796,902) (5,605,634) (627,699) (3,376,766)
Total increase (decrease) . . . . . . . . . . . . . . . . . . . . . . . . . . . . . . . . . . . . . . . . . . . . . . . . . . . . . . (5,733,198) (2,818,040) (6,190,556) (169,849) (1,196,303)
NET ASSETS, at beginning of the year . . . . . . . . . . . . . . . . . . . . . . . . . . . . . . . . . . . . . . . . . . . 59,765,853 60,144,502 78,201,464 7,998,685 41,097,548
NET ASSETS, at end of the year . . . . . . . . . . . . . . . . . . . . . . . . . . . . . . . . . . . . . . . . . . . . . . . . $ 54,032,655 $ 57,326,462 $ 72,010,908 $ 7,828,836 $ 39,901,245
See Notes to Financial Statements.
F-8

MML Bay State Variable Life Separate Account I
Notes To Financial Statements1. ORGANIZATION
MML Bay State Variable Life Separate Account I (“the Separate Account”) is a separate investment account of MML BayState Life Insurance Company (“MML Bay State”) established on June 9, 1982. The Separate Account is registered as aunit investment trust under the Investment Company Act of 1940 (“the 1940 Act”).
On June 30, 1997, MML Bay State redomesticated from the state of Missouri to the state of Connecticut. MML Bay State isan indirect subsidiary of Massachusetts Mutual Life Insurance Company (“MassMutual”).
MML Bay State maintains the following three segments within the Separate Account: Variable Life, Variable Life Plus,and Variable Life Select.
The assets and liabilities of the Separate Account are clearly identified and distinguished from MML Bay State’s otherassets and liabilities. The Separate Account assets are not chargeable with liabilities arising from any other MML Bay Statebusiness.
2. INVESTMENT OF THE SEPARATE ACCOUNT’S ASSETS
As of December 31, 2017, the Separate Account consists of thirteen divisions that invest in the following mutual funds. Allof the funds may not be available to all of the three segments of the Separate Account:
DivisionsThe division listed in the first column
invests in the fund in this column
American Century VP Income & Growth Division American Century VP Income & Growth Fund 1
Fidelity® VIP Contrafund® Division Fidelity® VIP Contrafund® Portfolio 2
MML Blend Division MML Blend Fund 3
MML Equity Division MML Equity Fund 3
MML Equity Index Division MML Equity Index Fund 4
MML Managed Bond Division MML Managed Bond Fund 3
MML Small Cap Equity Division MML Small Cap Equity Fund 3
MML U.S. Government Money Market Division MML U.S. Government Money Market Fund 3
Oppenheimer Capital Appreciation Division Oppenheimer Capital Appreciation Fund/VA 5
Oppenheimer Discovery Mid Cap Growth Division Oppenheimer Discovery Mid Cap Growth Fund/VA 5
Oppenheimer Global Division Oppenheimer Global Fund/VA 5
Oppenheimer Global Strategic Income Division Oppenheimer Global Strategic Income Fund/VA 5
T. Rowe Price Mid-Cap Growth Division T. Rowe Price Mid-Cap Growth Portfolio 6
In addition to the thirteen divisions, some contract owners may also allocate funds to the Guaranteed Principal Account(“GPA”), which is part of MML Bay State’s general investment account (“General Account”). Because of exemptive andexclusionary provisions in the securities law, interests in the GPA are not registered under the Securities Act of 1933, andthe General Account and the GPA are not registered as an investment company under the 1940 Act.
1 American Century Investment Management, Inc. is the investment adviser to this Fund.2 Fidelity Management & Research Company is the investment adviser to this Portfolio.3 MML Investment Advisers, LLC is the investment adviser to the listed MML II Trust Fund.4 MML Investment Advisers, LLC is the investment adviser to this MML Trust Fund.5 OFI Global Asset Management, Inc. is the investment adviser to the listed Funds.6 T. Rowe Price Associates, Inc. is the investment adviser to this Portfolio.
F-9

Notes To Financial Statements (Continued)
3. SIGNIFICANT ACCOUNTING POLICIES
The following is a summary of significant accounting policies followed by the Separate Account in preparation of thefinancial statements in conformity with generally accepted accounting principles. Separate Account MML Bay StateVariable Life Separate Account I follows the accounting and reporting guidance in FASB Accounting StandardsCodification 946.
A. Investment ValuationInvestments in the investment divisions are valued at the closing net asset value of each of the respective underlyingfunds, which value their investment securities at fair value.
B. Accounting for InvestmentsInvestment transactions are accounted for on a trade-date basis and identified cost is the basis followed in determiningthe cost of investments sold for financial statement purposes. Dividend income and gains from realized gaindistributions are recorded on the ex-distribution date, and are reinvested in the underlying investment divisions.
C. Federal Income TaxesMML Bay State is taxed under federal law as a life insurance company under the provisions of the 1986 InternalRevenue Code, as amended. Under existing federal law, no taxes are payable on net investment income and netrealized capital gains attributable to policies, which depend on the Separate Account’s investment performance.Accordingly, no provision for federal income tax has been made. MML Bay State may, however, make such a chargein the future if an unanticipated change of current law results in a company tax liability attributable to the SeparateAccount.
D. Policy ChargesSee Note 8B for charges associated with the policies.
E. EstimatesThe preparation of financial statements in conformity with U.S. generally accepted accounting principles requiresmanagement to make estimates and assumptions that affect the reported amounts of assets and liabilities and disclosureof contingent assets and liabilities at the date of the financial statements and the reported amounts of revenues andexpenses during the reporting period. Actual results could differ from those estimates.
F. Policy LoansWhen a policy loan is made, the Separate Account transfers the amount of the loan to MML Bay State, therebydecreasing both the investments and the net assets of the Separate Account by an equal amount. The policy owner ischarged interest on the outstanding policy loan amount generally equal to either a fixed interest rate of 5% to 6% peryear or (in all jurisdictions except Arkansas) an adjustable loan rate. The adjustable loan rate is determined each yearfor the following policy year.
As long as a loan is outstanding, a portion of the policy account value equal to the loan is invested in the GPA. Theamount of the loan earns interest at a rate equal to the greater of either a fixed interest rate generally equal to 3% to 4%of the loan or the policy loan rate less the loan interest rate expense charge. The loan interest rate expense chargerepresents the difference (cost) between the loan interest rate charged and the interest credited on loaned amounts. Thisamount does not participate in the Separate Account’s investment performance.
Interest income presented in the Statement of Operations represents interest credited by MML Bay State topolicyholders of the Variable Life product on their outstanding loan balance. This amount is not included in calculationof Investment Income Ratio as it does not impact overall performance of the division.
G. Policy Owner’s Share of Net AssetsThe policy owner’s share of net assets in the Variable Life Segment is expressed in terms of dollars rather than sharesor units of investments. Charges assessed by the Separate Account, for the Variable Life Segment as noted in Note 8B,shown as a reduction in units, or a redemption of units, are a reduction of assets.
F-10

Notes To Financial Statements (Continued)H. Life Reserves
Life reserves are developed by using accepted actuarial methods and are computed using the 1958 CSO or 1980 CSOmortality tables.
4. FAIR VALUE OF FINANCIAL INSTRUMENTS
The Separate Account defines fair value as the price that would be received to sell an asset or paid to transfer a liability inan orderly transaction between market participants at the measurement date. In determining fair value, the SeparateAccount generally uses the market approach as the valuation technique due to the nature of the mutual fund investmentsoffered in the Separate Account. This technique maximizes the use of observable inputs and minimizes the use ofunobservable inputs. Investments in mutual funds are valued at the mutual fund’s closing net asset value per share on theday of valuation.
Valuation Inputs: Various inputs are used to determine the value of the Separate Account’s investments. These inputs aresummarized in the three broad levels listed below:
• Level 1 – quoted prices in active markets for identical securities• Level 2 – observable inputs other than Level 1 quoted prices (including, but not limited to, quoted prices for
similar securities, interest rates, prepayment speeds and credit risk)• Level 3 – unobservable inputs
The net assets of the Separate Account are measured at fair value. All the net assets are categorized as Level 1 as ofDecember 31, 2017. There have been no transfers between levels for the year ended December 31, 2017.
5. RELATED PARTY TRANSACTIONS
A. Sales AgreementsPursuant to separate underwriting agreements with MML Bay State, on its own behalf and on the behalf of the SeparateAccount, MML Investors Services, LLC (“MMLIS”) serves as principal underwriter of the policies sold by itsregistered representatives, and MML Strategic Distributors, LLC (“MSD”) serves as principal underwriter of thepolicies sold by registered representatives of other broker-dealers who have entered into distribution agreements withMSD.
Both MMLIS and MSD are registered with the Securities and Exchange Commission (the “SEC”) as broker-dealersunder the Securities Exchange Act of 1934 and are members of the Financial Industry Regulatory Authority(“FINRA”). Commissions for sales of policies by MMLIS registered representatives are paid on behalf of MMLIS toits registered representatives. Commissions for sales of policies by registered representatives of other broker-dealersare paid on behalf of MSD to those broker-dealers. MMLIS and MSD also receive compensation for their actions asprincipal underwriters of the policies.
The policies are no longer offered for sale to the public. Policy owners may continue, however, to make premiumpayments under existing policies.
B. Receivable from/Payable to MML Bay StateCertain fees such as cost of insurance fees and mortality and expense risk fees are charges paid between the GeneralAccount and the Separate Account.
F-11

Notes To Financial Statements (Continued)
6. PURCHASES AND SALES OF INVESTMENTS
The cost of purchases and proceeds from sales investments for the year ended December 31, 2017 were as follows:
AmericanCentury
VP Income& GrowthDivision
Fidelity®VIP
Contrafund®Division
MMLBlend
Division
MMLEquity
Division
MMLEquityIndex
Division
Cost of purchases . . . . . . . . . . . . . . . . . . . . . . . . . . . . . . . . . . . . . . . . . . . . . . . . . . . . . $ 1,103,765 $ 2,365,249 $ 7,618,582 $ 11,562,221 $ 2,478,041Proceeds from sales . . . . . . . . . . . . . . . . . . . . . . . . . . . . . . . . . . . . . . . . . . . . . . . . . . . (986,691) (3,267,999) (9,407,064) (24,842,952) (2,586,043)
MMLManaged
BondDivision
MMLSmall
Cap EquityDivision
MMLU.S. Government
Money MarketDivision
OppenheimerCapital
AppreciationDivision
OppenheimerDiscoveryMid CapGrowthDivision
Cost of purchases . . . . . . . . . . . . . . . . . . . . . . . . . . . . . . . . . . . . . . . . . . . . . . . . . . . . . $ 2,001,621 $ 689,331 $ 1,483,265 $ 6,762,166 $ 7,717,269Proceeds from sales . . . . . . . . . . . . . . . . . . . . . . . . . . . . . . . . . . . . . . . . . . . . . . . . . . . (2,088,924) (721,423) (1,808,321) (5,456,026) (6,625,955)
OppenheimerGlobal
Division
OppenheimerGlobal
StrategicIncomeDivision
T. Rowe PriceMid-CapGrowthDivision
Cost of purchases . . . . . . . . . . . . . . . . . . . . . . . . . . . . . . . . . . . . . . . . . . . . . . . . . . . . . $ 2,178,820 $ 605,021 $ 6,043,885Proceeds from sales . . . . . . . . . . . . . . . . . . . . . . . . . . . . . . . . . . . . . . . . . . . . . . . . . . . (8,134,526) (850,720) (4,629,217)
7. NET INCREASE (DECREASE) IN OUTSTANDING UNITS
The changes in outstanding units for the two years ended December 31, 2017 were as follows:
2017
AmericanCentury
VP Income& GrowthDivision
Fidelity®VIP
Contrafund®Division
MMLBlend
Division
MMLEquity
Division
MMLEquityIndex
Division
MMLManaged
BondDivision
MMLSmall
Cap EquityDivision
MMLU.S. Government
Money MarketDivision
Units purchased . . . . . . . . . . . . . . . . . . . . . . 242,610 403,936 860,702 2,827,074 365,329 292,358 88,713 320,514Units withdrawn . . . . . . . . . . . . . . . . . . . . . . (501,166) (1,163,218) (2,135,498) (6,204,144) (1,095,917) (675,867) (211,197) (840,949)Units transferred between divisions and
to/from GPA . . . . . . . . . . . . . . . . . . . . . . . . 118,545 (26,995) (46,757) (304,161) (109,008) 260,388 21,672 354,155
Net increase (decrease) . . . . . . . . . . . . . . . . (140,011) (786,277) (1,321,553) (3,681,230) (839,596) (123,121) (100,811) (166,281)
2017 (continued)
OppenheimerCapital
AppreciationDivision
OppenheimerDiscoveryMid CapGrowthDivision
OppenheimerGlobal
Division
OppenheimerGlobal
StrategicIncomeDivision
T. Rowe PriceMid-CapGrowthDivision
Units purchased . . . . . . . . . . . . . . . . . . . . . . 563,330 772,733 670,738 173,053 297,071Units withdrawn . . . . . . . . . . . . . . . . . . . . . . (1,267,095) (1,866,252) (1,729,905) (294,919) (1,015,320)Units transferred between divisions and
to/from GPA . . . . . . . . . . . . . . . . . . . . . . . . (20,023) (78,233) (95,147) 4,043 (75,323)
Net increase (decrease) . . . . . . . . . . . . . . . . (723,789) (1,171,753) (1,154,314) (117,823) (793,573)
F-12

Notes To Financial Statements (Continued)
2016
AmericanCentury
VP Income& GrowthDivision
Fidelity®VIP
Contrafund®Division
MMLBlend
Division
MMLEquity
Division
MMLEquityIndex
Division
MMLManaged
BondDivision
MMLSmallCap
EquityDivision
MMLU.S. Government
Money MarketDivision
Units purchased . . . . . . . . . . . . . . . . . . . . . . . . 299,048 522,164 1,003,068 3,651,053 464,346 288,988 130,428 298,780Units withdrawn . . . . . . . . . . . . . . . . . . . . . . . . (576,951) (1,243,844) (2,415,931) (7,165,416) (1,306,275) (733,753) (297,847) (1,348,935)Units transferred between divisions and
to/from GPA . . . . . . . . . . . . . . . . . . . . . . . . . . 33,029 (41,392) (36,569) (345,155) 9,721 25,524 7,782 674,739
Net increase (decrease) . . . . . . . . . . . . . . . . . . (244,874) (763,072) (1,449,432) (3,859,518) (832,208) (419,242) (159,637) (375,415)
2016 (continued)
OppenheimerCapital
AppreciationDivision
OppenheimerDiscoveryMid CapGrowthDivision
OppenheimerGlobal
Division
OppenheimerGlobal
StrategicIncomeDivision
T. RowePrice
Mid-CapGrowthDivision
Units purchased . . . . . . . . . . . . . . . . . . . . . . . . 669,793 933,019 875,780 198,084 395,127Units withdrawn . . . . . . . . . . . . . . . . . . . . . . . . (1,540,979) (1,903,652) (1,933,030) (411,382) (1,145,157)Units transferred between divisions and
to/from GPA . . . . . . . . . . . . . . . . . . . . . . . . . . (3,038) (91,027) (233,772) 8,141 (128,034)
Net increase (decrease) . . . . . . . . . . . . . . . . . . (874,223) (1,061,660) (1,291,023) (205,156) (878,064)
8. FINANCIAL HIGHLIGHTS
A. A summary of units outstanding, unit values, net assets, investment income ratios, expense ratios (excluding expensesof the underlying funds) and total return ratios for each of the five years in the period ended December 31, 2017follows:
At December 31, For the Years Ended December 31,
Units4Unit Value3
(Lowest to Highest) Net Assets
InvestmentIncomeRatio1
Expense Ratio2
(Lowest to Highest)Total Return3
(Lowest to Highest)
American Century VP Income & Growth Division2017 . . . . . . . . . . . . . . . . . . . . . . . . . . . 4,512,257 $2.41 $ 10,888,478 2.38% 0.55% 19.83%2016 . . . . . . . . . . . . . . . . . . . . . . . . . . . 4,652,268 2.01 9,368,809 2.38 0.55 12.862015 . . . . . . . . . . . . . . . . . . . . . . . . . . . 4,897,142 1.78 8,738,021 2.10 0.55 (6.14)2014 . . . . . . . . . . . . . . . . . . . . . . . . . . . 5,199,333 1.90 9,883,923 2.05 0.55 11.892013 . . . . . . . . . . . . . . . . . . . . . . . . . . . 5,344,231 1.70 9,080,091 2.22 0.55 35.08
Fidelity® VIP Contrafund® Division2017 . . . . . . . . . . . . . . . . . . . . . . . . . . . 8,462,782 3.49 29,497,142 0.99 0.55 21.212016 . . . . . . . . . . . . . . . . . . . . . . . . . . . 9,249,059 2.88 26,596,751 0.81 0.55 7.412015 . . . . . . . . . . . . . . . . . . . . . . . . . . . 10,012,131 2.68 26,803,657 1.01 0.55 0.122014 . . . . . . . . . . . . . . . . . . . . . . . . . . . 11,108,388 2.67 29,703,149 0.95 0.55 11.332013 . . . . . . . . . . . . . . . . . . . . . . . . . . . 11,976,521 2.40 28,765,504 1.08 0.55 30.57
MML Blend Division2017 . . . . . . . . . . . . . . . . . . . . . . . . . . . 16,433,268 4.13 to 9.03 96,942,162 2.12 0.25 to 0.55 14.62 to 14.972016 . . . . . . . . . . . . . . . . . . . . . . . . . . . 17,754,821 3.60 to 7.86 91,052,530 2.14 0.25 to 0.55 8.82 to 9.152015 . . . . . . . . . . . . . . . . . . . . . . . . . . . 19,204,253 3.31 to 7.22 91,061,263 2.14 0.25 to 0.55 (0.47) to (0.17)2014 . . . . . . . . . . . . . . . . . . . . . . . . . . . 20,587,465 3.33 to 7.24 97,857,834 2.07 0.25 to 0.55 10.38 to 10.712013 . . . . . . . . . . . . . . . . . . . . . . . . . . . 21,915,684 3.01 to 6.55 94,297,518 2.04 0.25 to 0.55 19.65 to 20.01
MML Equity Division2017 . . . . . . . . . . . . . . . . . . . . . . . . . . . 50,380,428 4.11 to 9.65 275,093,201 1.82 0.25 to 0.55 15.16 to 15.502016 . . . . . . . . . . . . . . . . . . . . . . . . . . . 54,061,658 3.57 to 8.37 256,154,209 1.75 0.25 to 0.55 11.98 to 12.312015 . . . . . . . . . . . . . . . . . . . . . . . . . . . 57,921,176 3.19 to 7.46 246,277,473 2.09 0.25 to 0.55 (3.96) to (3.67)2014 . . . . . . . . . . . . . . . . . . . . . . . . . . . 61,771,895 3.32 to 7.76 273,001,202 1.56 0.25 to 0.55 10.95 to 11.292013 . . . . . . . . . . . . . . . . . . . . . . . . . . . 65,945,890 2.99 to 6.98 262,841,129 1.89 0.25 to 0.55 32.54 to 32.94
F-13

Notes To Financial Statements (Continued)
8. FINANCIAL HIGHLIGHTS (Continued)
At December 31, For the Years Ended December 31,
Units4Unit Value3
(Lowest to Highest) Net Assets
InvestmentIncomeRatio1
Expense Ratio2
(Lowest to Highest)Total Return3
(Lowest to Highest)
MML Equity Index Division2017 . . . . . . . . . . . . . . . . . . . . . . . . . . . 22,721,842 $2.25 to $2.43 $ 54,328,435 1.19% 0.40% to 0.55% 20.83% to 21.01%2016 . . . . . . . . . . . . . . . . . . . . . . . . . . . 23,561,438 1.86 to 2.01 46,592,732 1.87 0.40 to 0.55 11.01 to 11.172015 . . . . . . . . . . . . . . . . . . . . . . . . . . . 24,393,646 1.67 to 1.81 43,413,628 1.48 0.40 to 0.55 0.61 to 0.762014 . . . . . . . . . . . . . . . . . . . . . . . . . . . 15,281,555 1.66 to 1.80 26,698,318 1.53 0.40 to 0.55 12.73 to 12.902013 . . . . . . . . . . . . . . . . . . . . . . . . . . . 16,229,274 1.47 to 1.60 25,134,359 1.58 0.40 to 0.55 31.30 to 31.49
MML Managed Bond Division2017 . . . . . . . . . . . . . . . . . . . . . . . . . . . 4,374,040 2.87 to 5.39 15,136,708 3.18 0.25 to 0.55 4.12 to 4.432016 . . . . . . . . . . . . . . . . . . . . . . . . . . . 4,497,161 2.76 to 5.17 15,003,715 2.82 0.25 to 0.55 2.19 to 2.492015 . . . . . . . . . . . . . . . . . . . . . . . . . . . 4,916,403 2.70 to 5.05 15,918,444 2.83 0.25 to 0.55 (1.29) to (1.00)2014 . . . . . . . . . . . . . . . . . . . . . . . . . . . 5,113,576 2.74 to 5.11 16,949,410 3.23 0.25 to 0.55 5.87 to 6.192013 . . . . . . . . . . . . . . . . . . . . . . . . . . . 5,609,020 2.58 to 4.82 17,551,853 3.10 0.25 to 0.55 (2.18) to (1.88)
MML Small Cap Equity Division2017 . . . . . . . . . . . . . . . . . . . . . . . . . . . 2,182,776 3.76 8,206,763 0.84 0.55 13.742016 . . . . . . . . . . . . . . . . . . . . . . . . . . . 2,283,587 3.31 7,548,354 1.07 0.55 17.572015 . . . . . . . . . . . . . . . . . . . . . . . . . . . 2,443,224 2.81 6,869,223 0.84 0.55 (6.15)2014 . . . . . . . . . . . . . . . . . . . . . . . . . . . 2,633,670 3.00 7,889,956 0.98 0.55 11.542013 . . . . . . . . . . . . . . . . . . . . . . . . . . . 2,753,894 2.69 7,396,537 1.01 0.55 40.25
MML U.S. Government Money Market Division2017 . . . . . . . . . . . . . . . . . . . . . . . . . . . 3,244,096 1.44 to 2.13 5,227,827 0.36 0.25 to 0.55 (0.19) to 0.112016 . . . . . . . . . . . . . . . . . . . . . . . . . . . 3,410,377 1.44 to 2.13 5,553,126 - 0.25 to 0.55 (0.44) to (0.14)2015 . . . . . . . . . . . . . . . . . . . . . . . . . . . 3,785,792 1.45 to 2.13 6,163,413 0.01 0.25 to 0.55 (0.55) to (0.25)2014 . . . . . . . . . . . . . . . . . . . . . . . . . . . 4,028,279 1.45 to 2.14 6,596,354 - 0.25 to 0.55 (0.55) to (0.25)2013 . . . . . . . . . . . . . . . . . . . . . . . . . . . 4,075,810 1.46 to 2.15 6,740,136 - 0.25 to 0.55 (0.55) to (0.25)
Oppenheimer Capital Appreciation Division2017 . . . . . . . . . . . . . . . . . . . . . . . . . . . 10,805,419 5.91 63,877,526 0.24 0.55 26.142016 . . . . . . . . . . . . . . . . . . . . . . . . . . . 11,529,208 4.69 54,032,655 0.41 0.55 (2.74)2015 . . . . . . . . . . . . . . . . . . . . . . . . . . . 12,403,431 4.82 59,765,853 0.09 0.55 2.982014 . . . . . . . . . . . . . . . . . . . . . . . . . . . 13,212,256 4.68 61,823,595 0.44 0.55 14.782013 . . . . . . . . . . . . . . . . . . . . . . . . . . . 14,105,380 4.08 57,505,996 0.99 0.55 29.03
Oppenheimer Discovery Mid Cap Growth Division2017 . . . . . . . . . . . . . . . . . . . . . . . . . . . 14,492,672 4.69 67,935,001 0.03 0.55 28.092016 . . . . . . . . . . . . . . . . . . . . . . . . . . . 15,664,425 3.66 57,326,462 - 0.55 1.772015 . . . . . . . . . . . . . . . . . . . . . . . . . . . 16,726,085 3.60 60,144,502 - 0.55 6.022014 . . . . . . . . . . . . . . . . . . . . . . . . . . . 18,030,621 3.39 61,153,155 - 0.55 5.202013 . . . . . . . . . . . . . . . . . . . . . . . . . . . 19,332,340 3.22 62,324,662 0.01 0.55 35.24
Oppenheimer Global Division2017 . . . . . . . . . . . . . . . . . . . . . . . . . . . 14,557,589 2.94 to 7.90 90,619,517 0.92 0.40 to 0.55 35.92 to 36.122016 . . . . . . . . . . . . . . . . . . . . . . . . . . . 15,711,903 2.16 to 5.81 72,010,908 1.07 0.40 to 0.55 (0.47) to (0.32)2015 . . . . . . . . . . . . . . . . . . . . . . . . . . . 17,002,926 2.17 to 5.84 78,201,464 1.34 0.40 to 0.55 3.37 to 3.532014 . . . . . . . . . . . . . . . . . . . . . . . . . . . 21,203,327 2.10 to 5.65 98,203,986 1.10 0.40 to 0.55 1.73 to 1.882013 . . . . . . . . . . . . . . . . . . . . . . . . . . . 22,783,726 2.06 to 5.55 103,692,912 1.39 0.40 to 0.55 26.61 to 26.80
Oppenheimer Global Strategic Income Division2017 . . . . . . . . . . . . . . . . . . . . . . . . . . . 2,369,289 3.33 7,882,385 2.28 0.55 5.692016 . . . . . . . . . . . . . . . . . . . . . . . . . . . 2,487,112 3.15 7,828,836 4.98 0.55 5.952015 . . . . . . . . . . . . . . . . . . . . . . . . . . . 2,692,268 2.97 7,998,685 5.86 0.55 (2.80)2014 . . . . . . . . . . . . . . . . . . . . . . . . . . . 2,868,868 3.06 8,768,569 4.24 0.55 2.272013 . . . . . . . . . . . . . . . . . . . . . . . . . . . 3,189,252 2.99 9,531,011 5.02 0.55 (0.68)
F-14

Notes To Financial Statements (Continued)
8. FINANCIAL HIGHLIGHTS (Continued)
At December 31, For the Years Ended December 31,
Units4Unit Value3
(Lowest to Highest) Net Assets
InvestmentIncomeRatio1
Expense Ratio2
(Lowest to Highest)Total Return3
(Lowest to Highest)
T. Rowe Price Mid-Cap Growth Division2017 . . . . . . . . . . . . . . . . . . . . . . . . . . . 9,032,616 $4.50 to $5.60 $ 45,520,880 - 0.40% to 0.55% 24.09% to 24.28%2016 . . . . . . . . . . . . . . . . . . . . . . . . . . . 9,826,189 3.62 to 4.51 39,901,245 - 0.40 to 0.55 5.68 to 5.832015 . . . . . . . . . . . . . . . . . . . . . . . . . . . 10,704,253 3.42 to 4.27 41,097,548 - 0.40 to 0.55 5.98 to 6.142014 . . . . . . . . . . . . . . . . . . . . . . . . . . . 11,503,689 3.22 to 4.03 41,666,694 - 0.40 to 0.55 12.50 to 12.662013 . . . . . . . . . . . . . . . . . . . . . . . . . . . 12,583,747 2.86 to 3.58 40,547,735 - 0.40 to 0.55 35.94 to 36.15
1 The investment income ratios represent the dividends, excluding distributions of capital gains, received by the division from the underlying mutual fund, net of managementfees assessed by the fund manager, divided by the average net assets. These ratios exclude those expenses, such as mortality and expense charges, that are assessedagainst policy owners accounts either through reductions in the unit values or the redemption of units. The recognition of investment income by the division is affected by thetiming of the declaration of dividends by the underlying fund in which the division invests.
2 The expense ratios represent the annualized policy expenses of the Separate Account, consisting primarily of mortality and expense charges, for each period indicated. Theratios include only those expenses that result in a direct reduction in unit values. Charges made directly to policy owner accounts through the redemption of units andexpenses of the underlying fund have been excluded.
3 The total returns are for the periods indicated, including changes in the value of the underlying fund, and the expenses assessed through the reduction in unit values. Theseratios do not include any expenses assessed through the redemption of units. Investment options with a date notation indicate the effective date of that investment option inthe variable account. The total return is calculated for each period indicated or from the effective date through the end of the reporting period. As the total return table ispresented as a range of minimum to maximum values, based on the product grouping representing the minimum and maximum expense ratio amounts, some individualpolicy total returns and unit values are not within the ranges presented.
4 See note 3G with respect to Variable Life
B. The Separate Account assesses “current” charges associated with each policy. These charges are either assessed as adirect reduction in unit values or through the redemption of units for all policies contained within the Separate Account(see note 3G). Charges shown below state charges assessed at a monthly rate unless otherwise specified.
Administrative Charge $2.50 to $6.00 per month
This charge is assessed through the redemption of units.
Mortality and Expense Risk Charge Effective annual rate of 0.25% to 0.55% of thepolicy’s average daily net assets in the SeparateAccount.
This charge is assessed through reduction of unit values.
Mortality Charge $0.01688 to $63.89 per $1,000 of insurance risk
This charge is assessed through the redemption of units.
Additional Mortality Fees $0.0042 to $83.33 per $1,000 of insurance risk
This charge is assessed through the redemption of units. $0.08 to $83.33 per $1,000 of face amount
Loan Interest Rate Expense Charge Effective annual rate of 0.90% to 1.00% of theloan mount
This charge is assessed through the redemption of units.
F-15

Notes To Financial Statements (Continued)
8. FINANCIAL HIGHLIGHTS (Continued)
Rider Charges:
The rider charges do not apply to all segments within the Separate Account. These charges are assessed throughthe redemption of units.
A. Accidental Death Benefit $0.06591 to $1.42 per $1,000 of coverage
B. Death Benefit Guarantee $0.01 per $1,000 of face amount
C. Insurability Protection $0.043 to $0.179 per $1,000 of coverage
D. Children’s Term $5.00 per $1,000 of insurance risk
E. Disability Benefit $0.041 to $0.266 per $1 of monthly deductions
$0.009 to $0.149 per $1 of specified premium
F. Renewal Term $1.53 to $39.37 per $1,000 of insurance risk
G. Waiver of Monthly Charges $0.036 to $0.349 per $1 of monthly deductions
H. Waiver of Premium $0.11 to $3.51 per $1,000 of insurance risk
9. SUBSEQUENT EVENTS
The Separate Account’s management has reviewed events occurring through March 5, 2018, the date the financialstatements were issued, and no subsequent events occurred requiring accrual or disclosure.
F-16

LA2048

MML BAY STATE LIFE INSURANCE COMPANY
STATUTORY FINANCIAL STATEMENTS
As of December 31, 2017 and 2016 and for the years ended December 31, 2017, 2016 and 2015

MML BAY STATE LIFE INSURANCE COMPANY STATUTORY FINANCIAL STATEMENTS
Table of Contents
Page Independent Auditors' Report .................................................................................................... 2 Statutory Statements of Financial Position ................................................................................... 4 Statutory Statements of Operations ............................................................................................. 5 Statutory Statements of Changes in Shareholder's Equity ................................................................ 6 Statutory Statements of Cash Flows ............................................................................................ 7 Notes to Statutory Financial Statements: 1. Nature of operations ................................................................................................. 8 2. Summary of significant accounting policies .................................................................. 8 3. New accounting standards ......................................................................................... 15 4. Fair value of financial instruments ............................................................................... 17 5. Investments a. Bonds .................................................................................................................... 21 b. Mortgage loans ........................................................................................................ 24 c. Net investment income .............................................................................................. 25 d. Net realized capital gains (losses) ............................................................................... 25 6. Federal income taxes ................................................................................................ 26 7. Deferred and uncollected life insurance premium ........................................................... 32 8. Policyholders’ liabilities ............................................................................................ 32 9. Reinsurance ............................................................................................................ 34 10. Withdrawal characteristics ......................................................................................... 36 11. Shareholder's equity ................................................................................................. 38 12. Presentation of the Statutory Statements of Cash Flows ................................................... 38 13. Business risks, commitments and contingencies ............................................................. 38 14. Related party transactions .......................................................................................... 40 15. Subsequent events .................................................................................................... 41 16. Subsidiaries and affiliated companies ........................................................................... 42 17. Impairment listing for loan-backed and structured securities ............................................. 43 18. Structured notes ....................................................................................................... 44

Independent Auditors’ Report
The Board of Directors and Shareholder of MML Bay State Life Insurance Company:
We have audited the accompanying financial statements of MML Bay State Life Insurance Company (the Company), which comprise the statutory statements of financial position as of December 31, 2017 and 2016, and the related statutory statements of operations, changes in shareholder’s equity, and cash flows for the three-year period ended December 31, 2017, and the related notes to the statutory financial statements.
Management’s Responsibility for the Financial Statements
Management is responsible for the preparation and fair presentation of these financial statements in accordance with statutory accounting practices prescribed or permitted by the State of Connecticut Insurance Department. Management is also responsible for the design, implementation, and maintenance of internal control relevant to the preparation and fair presentation of financial statements that are free from material misstatement, whether due to fraud or error.
Auditors’ Responsibility
Our responsibility is to express an opinion on these financial statements based on our audits. We conducted our audits in accordance with auditing standards generally accepted in the United States of America. Those standards require that we plan and perform the audit to obtain reasonable assurance about whether the financial statements are free from material misstatement.
An audit involves performing procedures to obtain audit evidence about the amounts and disclosures in the financial statements. The procedures selected depend on the auditors’ judgment, including the assessment of the risks of material misstatement of the financial statements, whether due to fraud or error. In making those risk assessments, the auditor considers internal control relevant to the entity’s preparation and fair presentation of the financial statements in order to design audit procedures that are appropriate in the circumstances, but not for the purpose of expressing an opinion on the effectiveness of the entity’s internal control. Accordingly, we express no such opinion. An audit also includes evaluating the appropriateness of accounting policies used and the reasonableness of significant accounting estimates made by management, as well as evaluating the overall presentation of the financial statements.
We believe that the audit evidence we have obtained is sufficient and appropriate to provide a basis for our audit opinions.
Basis for Adverse Opinion on U.S. Generally Accepted Accounting Principles
As described in Note 2 to the financial statements, the financial statements are prepared by the Company using statutory accounting practices prescribed or permitted by the State of Connecticut Insurance Department, which is a basis of accounting other than U.S. generally accepted accounting principles. Accordingly, the financial statements are not intended to be presented in accordance with U.S. generally accepted accounting principles.
KPMG LLP is a Delaware limited liability partnership and the U.S. member firm of the KPMG network of independent member firms affiliated with KPMG International Cooperative (“KPMG International”), a Swiss entity.
KPMG LLPOne Financial Plaza755 Main StreetHartford, CT 06103

The effects on the financial statements of the variances between the statutory accounting practices described in Note 2 and U.S. generally accepted accounting principles, although not reasonably determinable, are presumed to be material.
Adverse Opinion on U.S. Generally Accepted Accounting Principles
In our opinion, because of the significance of the variances between statutory accounting practices and U.S. generally accepted accounting principles discussed in the Basis for Adverse Opinion on U.S. Generally Accepted Accounting Principles paragraph, the financial statements referred to above do not present fairly, in accordance with U.S. generally accepted accounting principles, the financial position of the Company as of December 31, 2017 and 2016, or the results of its operations or its cash flows for the three-year period ended December 31, 2017.
Opinion on Statutory Basis of Accounting
In our opinion, the financial statements referred to above present fairly, in all material respects, the financial position of the Company as of December 31, 2017 and 2016, and the results of its operations and its cash flows for the three-year period ended December 31, 2017, in accordance with statutory accounting practices prescribed or permitted by the State of Connecticut Insurance Department described in Note 2.
February 21, 2018

MML BAY STATE LIFE INSURANCE COMPANY STATUTORY STATEMENTS OF FINANCIAL POSITION
See notes to statutory financial statements 4
December 31, 2017 2016
($ In Millions Except for
Par Value)
Assets: Bonds $ 312 $ 310 Mortgage loans 3 4 Policy loans 95 95 Cash, cash equivalents and short-term investments 55 63
Total invested assets 465 472 Investment income due and accrued 5 4 Insurance amounts receivable 21 20 Federal income taxes 3 - Deferred income taxes 2 6
Total assets excluding separate accounts 496 502 Separate account assets 4,465 4,312 Total assets $ 4,961 $ 4,814
Liabilities: Policyholders' reserves $ 141 $ 139 Liabilities for deposit-type contracts 13 12 Contract claims and other benefits 16 18 Transfers due to separate accounts 15 16 Payable to affiliates 1 2 Federal income taxes - 19 Asset valuation reserve 5 5 Other liabilities 10 3
Total liabilities excluding separate accounts 201 214 Separate account liabilities 4,465 4,312
Total liabilities 4,666 4,526
Shareholder's equity: Common stock, $200 par value 50,000 shares authorized 12,501 shares issued and outstanding 2 2 Paid-in and contributed surplus 144 144 Surplus 149 142
Total shareholder's equity 295 288 Total liabilities and shareholder's equity $ 4,961 $ 4,814

MML BAY STATE LIFE INSURANCE COMPANY STATUTORY STATEMENTS OF OPERATIONS
See notes to statutory financial statements 5
Years Ended December 31, 2017 2016 2015 (In Millions)
Revenue: Premium income $ 2 $ (106) $ 24 Net investment income 18 14 13 Reserve adjustments on reinsurance assumed (ceded) (70) 113 (15) Fees and other income 74 132 75
Total revenue 24 153 97
Benefits and expenses: Policyholders' benefits 42 129 97 Change in policyholders' reserves 2 2 5 Net transfers from separate accounts (44) (36) (45) General insurance expenses 8 8 8 Commissions 3 3 3 State taxes, licenses and fees 1 1 1
Total benefits and expenses 12 107 69 Net gain from operations before federal income taxes 12 46 28 Federal income tax (benefit) and expense (3) 26 7
Net income $ 15 $ 20 $ 21

MML BAY STATE LIFE INSURANCE COMPANY STATUTORY STATEMENTS OF CHANGES IN SHAREHOLDER’S EQUITY
See notes to statutory financial statements 6
Years Ended December 31, 2017 2016 2015 (In Millions) Shareholder's equity, beginning of year $ 288 $ 231 $ 212 Increase (decrease) due to: Net income 15 20 21 Change in other net deferred income taxes (10) 12 (1) Change in nonadmitted assets 5 (10) 1 Change in asset valuation reserve - - (1) Other (3) 35 (1) Net increase 7 57 19
Shareholder's equity, end of year $ 295 $ 288 $ 231

MML BAY STATE LIFE INSURANCE COMPANY STATUTORY STATEMENTS OF CASH FLOWS
See notes to statutory financial statements 7
Years Ended December 31, 2017 2016 2015 (In Millions) Cash from operations: Premium collected net of reinsurance $ 2 $ (102) $ 22 Net investment income 17 14 12 Miscellaneous income 20 243 58 Benefit payments (51) (95) (92) Net transfers from separate accounts 36 35 45 Commissions and other expenses (13) (12) (13) Federal and foreign income taxes paid (19) (4) (4) Net cash from operations (8) 79 28 Cash from investments: Proceeds from investments sold, matured or repaid: Bonds 23 48 27 Mortgage loans 1 2 1 Total investment proceeds 24 50 28 Cost of investments acquired: Bonds (26) (135) (105) Mortgage loans - - (2) Total investments acquired (26) (135) (107) Net (increase) decrease in policy loans 1 - (2) Net cash from investing activities (1) (85) (81) Cash from financing and miscellaneous sources: Net deposits (withdrawals) on deposit-type contracts 1 1 3 Other cash provided (used) - 7 - Net cash from financing and miscellaneous sources 1 8 3 Net change in cash, cash equivalents and short-term investments (8) 2 (50) Cash, cash equivalents and short-term investments, beginning of year 63 61 111 Cash, cash equivalents and short-term investments, end of year $ 55 $ 63 $ 61

MML BAY STATE LIFE INSURANCE COMPANY NOTES TO STATUTORY FINANCIAL STATEMENTS
8
1. Nature of operations These statutory financial statements include MML Bay State Life Insurance Company (the Company), a wholly owned stock life insurance subsidiary of C.M. Life Insurance Company (C.M. Life). C.M. Life is a wholly owned stock life insurance subsidiary of Massachusetts Mutual Life Insurance Company (MassMutual). The Company is domiciled in the State of Connecticut. It provides life insurance and annuities to individuals and group life insurance to institutions. MassMutual is a mutual life insurance company domiciled in the Commonwealth of Massachusetts. MassMutual and its subsidiaries provide individual and group life insurance, disability insurance, individual and group annuities and guaranteed interest contracts (GICs) to individual and institutional customers in all 50 states of the United States of America (U.S.), the District of Columbia and Puerto Rico. Products and services are offered primarily through the Company’s MassMutual Financial Advisors (MMFA), Direct to Consumer, Institutional Solutions and Workplace Solutions distribution channels. MMFA is a sales force that includes financial advisors that operate in the U.S. MMFA sells individual life and individual annuities. 2. Summary of significant accounting policies a. Basis of presentation The statutory financial statements have been prepared in conformity with the statutory accounting practices of the National Association of Insurance Commissioners (NAIC) and the accounting practices prescribed or permitted by the State of Connecticut Insurance Department (the Department). Statutory accounting practices are different in some respects from financial statements prepared in accordance with U.S. generally accepted accounting principles (U.S. GAAP). The more significant differences between statutory accounting principles and U.S. GAAP are as follows: (a) bonds are generally carried at amortized cost, whereas U.S. GAAP reports bonds at fair value for bonds available for sale and trading or at amortized cost for bonds held to maturity; (b) changes in the fair value of derivative financial instruments are recorded as changes in shareholder’s equity, whereas U.S. GAAP generally reports these changes as revenue unless deemed an effective hedge; (c) embedded derivatives are recorded as part of the underlying contract, whereas U.S. GAAP would identify and bifurcate certain embedded derivatives from the underlying contract or security and account for them separately at fair value; (d) changes in the balances of deferred income taxes, which provide for book versus tax temporary differences, are subject to limitation and are recorded in shareholder’s equity, whereas U.S. GAAP would generally include the change in deferred taxes in net income; (e) assets are reported at admitted asset value and assets designated as nonadmitted are excluded through a charge against shareholder’s equity, whereas U.S. GAAP recognizes all assets, net of any valuation allowances; (f) statutory policy reserves are based upon prescribed methods, such as the Commissioners’ Reserve Valuation Method, Commissioners’ Annuity Reserve Valuation Method (CARVM) or net level premium method, and prescribed statutory mortality, morbidity and interest assumptions at the time of issuance, whereas U.S. GAAP policy reserves would generally be based upon the net level premium method or the estimated gross margin method with estimates, at time of issuance, of future mortality, morbidity, persistency and interest; (g) liabilities for policyholder reserves, unearned premium, and unpaid claims are presented net of reinsurance ceded, whereas U.S. GAAP would present the liabilities on a direct basis and report an asset for the amounts due from reinsurers for the amounts ceded; (h) an asset valuation reserve (AVR) is reported as a contingency reserve to stabilize shareholder’s equity against fluctuations in credit-related changes in the value of bonds, mortgage loans and certain derivatives, whereas U.S. GAAP does not record this reserve; (i) after-tax realized capital gains (losses) that result from changes in the overall level of interest rates for all types of fixed-income investments and interest-related hedging activities are deferred into the interest maintenance reserve (IMR) and amortized into revenue, whereas U.S. GAAP reports these gains and losses as revenue; (j) changes to the mortgage loan valuation allowance are recognized in net unrealized capital gains (losses), net of tax, in the Statutory Statements of Changes in Shareholder’s Equity, whereas U.S. GAAP reports these changes in net realized capital gains (losses); (k) payments received for universal and variable life insurance products and certain variable and fixed deferred annuities are reported as premium income and corresponding change in reserves, whereas U.S. GAAP would treat these payments as deposits to policyholders’ account balances; (l) certain acquisition costs, such as commissions and other variable costs, directly related to

MML BAY STATE LIFE INSURANCE COMPANY NOTES TO STATUTORY FINANCIAL STATEMENTS, continued
9
successfully acquiring new business are charged to current operations as incurred, whereas U.S. GAAP would generally capitalize these expenses and amortize them based on profit emergence over the expected life of the policies or over the premium payment period; and (m) Statutory Statements of Changes in Shareholder’s Equity includes net income, change in net unrealized capital gains (losses), change in net unrealized foreign exchange capital gains (losses), change in other net deferred income taxes, change in nonadmitted assets, change in asset valuation reserve and prior period adjustments, whereas U.S. GAAP presents net income as retained earnings and net unrealized capital gains (losses), change in net unrealized foreign exchange capital gains (losses), as other comprehensive income. The preparation of financial statements requires management to make estimates and assumptions that impact the reported amounts of assets and liabilities, the disclosure of assets and liabilities as of the date of the statutory financial statements and the reported amounts of revenues and expenses during the reporting periods. The most significant estimates include those used in determining the carrying values of investments including the amount of mortgage loan investment valuation reserves, other-than-temporary impairment(s) (OTTI), the liabilities for policyholders’ reserves, the determination of admissible deferred tax assets (DTAs), the liability for taxes and the liability for litigation or other contingencies. Future events including, but not limited to, changes in the level of mortality, morbidity, interest rates, persistency, asset valuations and defaults could cause results to differ from the estimates used in the statutory financial statements. Although some variability is inherent in these estimates, management believes the amounts presented are appropriate. Certain prior year amounts within these financial statements have been reclassified to conform to the current year presentation. b. Bonds Bonds are generally valued at amortized cost using the constant yield interest method with the exception of NAIC Category 6 bonds, which are in or near default, and certain residential mortgage-backed securities (RMBS) and commercial mortgage-backed securities (CMBS), which are rated by outside modelers, which are carried at the lower of amortized cost or fair value. NAIC ratings are applied to bonds and other securities. Categories 1 and 2 are considered investment grade, while Categories 3 through 6 are considered below investment grade. Bonds are recorded on a trade date basis, except for private placement bonds, which are recorded on the funding date. For loan-backed and structured securities, such as asset-backed securities (ABS), mortgage-backed securities (MBS), including RMBS and CMBS, and structured securities, including collateralized debt obligations (CDOs), amortization or accretion is revalued quarterly based on the current estimated cash flows, using either the prospective or retrospective adjustment methodologies. Certain fixed income securities, with the highest ratings from a rating agency follow the retrospective method of accounting. Under the retrospective method, the recalculated effective yield equates the present value of the actual and anticipated cash flows, including new prepayment assumptions, to the original cost of the investment. Prepayment assumptions are based on borrower constraints and economic incentives such as the original term, age and coupon of the loan as affected by the interest rate environment. The current carrying value is then increased or decreased to the amount that would have resulted had the revised yield been applied since inception, and investment income is correspondingly decreased or increased. All other fixed income securities, such as floating rate bonds and interest only securities, including those that have been impaired, follow the prospective method of accounting. Under the prospective method, the recalculated future effective yield equates the carrying value of the investment to the present value of the anticipated future cash flows. The fair value of bonds is based on quoted market prices when available. If quoted market prices are not available, values provided by other third-party organizations are used. If values provided by other third-party organizations are unavailable, fair value is estimated using internal models by discounting expected future cash flows using observable current market rates applicable to yield, credit quality and maturity of the investment or using quoted market values for comparable investments. Internal inputs used in the determination of fair value include estimated prepayment speeds, default rates, discount rates and collateral values, among others. Structure characteristics and cash flow priority are also considered. Fair values resulting from internal models are those expected to be received in an orderly transaction between willing market participants.
MML BAY STATE LIFE INSURANCE COMPANY NOTES TO STATUTORY FINANCIAL STATEMENTS, continued
10
Refer to Note 2s. "Realized capital gains (losses) including other-than-temporary impairments and unrealized capital gains (losses)" for information on the Company’s policy for determining OTTI. c. Mortgage loans Mortgage loans are valued at the unpaid principal balance of the loan, net of unamortized premium, discount, mortgage origination fees and valuation allowances. d. Policy loans Policy loans are carried at the outstanding loan balance less amounts unsecured by the cash surrender value of the policy. At issuance, policy loans are fully secured by the cash surrender value of the policy. Unsecured amounts can occur when subsequent charges are incurred on the underlying policy without the receipt of additional premium. If the premium is not paid during the contractual grace period, the policy will lapse. As of December 31, 2017 and 2016, there were no unsecured nonadmitted amounts. Policy loans earn interest calculated based upon either a fixed or a variable interest rate. Accrued investment income on policy loans more than 90 days past due is included in the unpaid balance of the policy loan to the extent it does not exceed the cash surrender value of the underlying contract.
e. Cash, cash equivalents and short-term investments
Cash and cash equivalents, which are carried at amortized cost, consist of all highly liquid investments purchased with original maturities of three months or less.
Short-term investments, which are carried at amortized cost, consist of short-term bonds and all highly liquid investments purchased with maturities of greater than three months and less than or equal to 12 months.
The carrying value reported in the Statutory Statements of Financial Position for cash, cash equivalents and short-term investment instruments approximates the fair value.
f. Investment income due and accrued Accrued investment income consists primarily of interest, which is recognized on an accrual basis. g. Insurance amounts receivable Insurance amounts receivable primarily includes reinsurance recoverables and other receivables, including deferred and uncollected premium. h. Federal income taxes Total federal income taxes are based upon the Company’s best estimate of its current and deferred tax assets or liabilities. Current tax expense (benefit) is reported in the Statutory Statements of Operations as federal income tax expense (benefit) if resulting from operations and within net realized capital gains (losses) if resulting from invested asset transactions. Changes in the balances of deferred taxes, which provide for book-to-tax temporary differences, are subject to limitations and are reported within various lines within surplus. Accordingly, the reporting of book-to-tax temporary differences, such as reserves and policy acquisition costs, and of book-to-tax permanent differences, such as tax-exempt interest and tax credits, results in effective tax rates in the Statutory Statements of Operations that differ from the federal statutory tax rate.

MML BAY STATE LIFE INSURANCE COMPANY NOTES TO STATUTORY FINANCIAL STATEMENTS, continued
11
i. Nonadmitted assets Assets designated as nonadmitted by the NAIC primarily include the amount of DTAs (subject to certain limitations) that will not be realized by the end of the third calendar year following the current year end. These assets are designated as nonadmitted and are excluded from Statutory Statements of Financial Position through a charge against surplus. j. Separate accounts Separate accounts and sub-accounts are segregated funds administered and invested by the Company, the performance of which primarily benefits the policyholders/contract holders with an interest in the separate accounts. Group and individual variable annuity, variable life and other insurance policyholders/contract holders select from among the separate accounts and sub-accounts made available by the Company. The separate accounts and sub-accounts are offered as investment options under certain insurance contracts or policies. The returns produced by separate account assets increase or decrease separate account reserves. Separate account assets consist principally of marketable securities reported at fair value. Except for the Company’s seed money, and certain book value separate accounts, separate account assets can only be used to satisfy separate account liabilities and are not available to satisfy the general obligations of the Company. Separate account administrative and investment advisory fees are included in fees and other income. Assets may be transferred from the general investments of the Company to seed the separate accounts. When assets are transferred to separate accounts, they are transferred at fair market value. Gains related to the transfer are deferred to the extent that the Company maintains a proportionate interest in the separate account. The deferred gain is recognized as the Company’s ownership decreases or when the separate account sells the underlying asset during the normal course of business. Losses associated with these transfers are recognized immediately. Separate accounts reflect two categories of risk assumption: nonguaranteed separate accounts for which the policyholder/contract holder assumes the investment risk and guaranteed separate accounts for which the Company contractually guarantees a minimum return, a minimum account value, or both to the policyholder/contract holder. Premium income, benefits and expenses of the separate accounts are included in the Statutory Statements of Operations with the offset recorded in the change in policyholders’ reserves. Investment income, realized capital gains (losses) and unrealized capital gains (losses) on the assets of separate accounts, other than seed money, accrue to policyholders/contract holders and are not recorded in the Statutory Statements of Operations.
k. Policyholders' reserves
Policyholders’ reserves provide for the present value of estimated future obligations in excess of estimated future premium on policies in force.
Reserves for life insurance contracts are developed using accepted actuarial methods computed principally on the net level premium or CARVM bases using the 1958 or 1980 Commissioners’ Standard Ordinary mortality tables with assumed interest rates. Reserves for disability riders associated with life contracts are calculated using morbidity rates from the 1952 Period 2 Intercompany Disability Table, modified to reflect the Company’s experience.
The Company charges a higher premium on certain contracts that cover substandard mortality risk. For these policies, the reserve calculations are based on a substandard mortality rate, which is a multiple of the standard mortality tables.
Reserves for individual payout annuities are developed using accepted actuarial methods computed principally under Commissioners’ Annuity Reserve Valuation Method using applicable interest rates and mortality tables, primarily the 1983 Individual Annuity Mortality and Annuity 2000 tables.
Certain individual variable annuity products issued by the Company offer guaranteed minimum death benefits (GMDBs). The liability for GMDBs is included in policyholders’ reserves and the related change in this liability is included in change in policyholders’ reserves.

MML BAY STATE LIFE INSURANCE COMPANY NOTES TO STATUTORY FINANCIAL STATEMENTS, continued
12
Variable annuity GMDBs provide a death benefit in excess of the contract value if the contract value is less than the guaranteed minimum amount. Some contracts provide that guarantee upon the contract owner’s death and others provide it upon the annuitant’s death. This amount may be based on a return of premium (the premium paid generally adjusted for withdrawals), a roll-up (an accumulation of premium at a specified interest rate adjusted for withdrawals), a reset (the contract value on a specified anniversary date adjusted for subsequent withdrawals, which is allowed to decrease when reset) or a ratchet (the contract value on a specified anniversary date adjusted for subsequent withdrawals, which is never allowed to decrease when reset). For a variable annuity contract, a decline in the stock market causing the contract value to fall below the guaranteed specified amount will increase the net amount at risk, which is the amount of the GMDBs in excess of the contract value.
Reserves for individual variable deferred annuities are developed using accepted actuarial methods computed principally under Commissioners’ Annuity Reserve Valuation Method for variable annuities using applicable interest rates and mortality tables. Individual variable deferred annuities primarily use the 1994 Minimum Guaranteed Death Benefit or Annuity 2000 tables. The liability is evaluated under both a standard scenario and stochastic scenarios. The Company holds the reserve liability valuation at the higher of the standard or stochastic scenario values.
The standard scenario is a prescriptive reserve with minimal company discretion. The primary driver of the standard scenario result is the composition of the in force policies, with the key factor being the extent to which the product guarantees are “in the money.” The value of the reserve guarantees under the standard scenario is driven primarily by equity markets.
For the stochastic scenarios, the Company uses the American Academy of Actuaries’ scenarios. Prudent estimate assumptions are used for mortality, expenses and commissions, investment management fees taxes and policyholder behavior including lapses, partial withdrawals, annuitization and additional premium. These assumptions are consistent with those used for asset adequacy testing and are based on Company experience. Stochastic reserves are driven by the degree that the variable annuity benefits are “in the money” at projected interest rates and equity market levels, expenses, discount rates, net derivative values and policyholder behavior.
Tabular interest, tabular reserves less actual reserves released, and tabular cost for all life and annuity contracts and supplementary contracts involving life contingencies are determined in accordance with NAIC Annual Statement instructions. For tabular interest, variable life uses a formula that applies a weighted average interest rate determined from a seriatim valuation file to the mean average reserves. Variable universal life, group life, annuity and supplemental contracts use a formula that applies a weighted average credited rate to the mean account value. For contracts without an account value a weighted average statutory valuation rate is applied to the mean statutory reserve or accepted actuarial methods using applicable interest rates are applied.
All policyholders’ reserves and accruals are presented net of reinsurance. Management believes that these liabilities and accruals represent management’s best estimate and will be sufficient, in conjunction with future revenues, to meet future anticipated obligations of policies and contracts in force.
l. Liabilities for deposit-type contracts Liabilities for investment-type contracts such as supplementary contracts not involving life contingencies are based on account value or accepted actuarial methods using applicable interest rates. m. Transfers due to separate accounts Transfers due to separate accounts represent a net payable to the Company’s separate accounts. n. Asset valuation reserve The Company maintains an AVR that is a contingency reserve to stabilize shareholder’s equity against credit-related changes in the value of bonds and mortgage loans. The AVR is reported as a liability and the change in AVR, net of tax, is reported in shareholder’s equity.
MML BAY STATE LIFE INSURANCE COMPANY NOTES TO STATUTORY FINANCIAL STATEMENTS, continued
13
o. Interest maintenance reserve The Company maintains an IMR that is used to stabilize net income against fluctuations in interest rates. After-tax realized capital gains (losses), which result from changes in interest rates for all types of fixed-income investments, are deferred into the IMR and amortized into net investment income using the grouped amortization method. In the grouped amortization method, assets are grouped based on years of maturity. IMR is reduced by the amount ceded to reinsurers when entering into in force coinsurance ceding agreements. The IMR is included in other liabilities, or if negative, is recorded as a nonadmitted asset. p. Other liabilities Other liabilities primarily consist of due and accrued separate account transfers, remittances and items not allocated, affiliated payables and accounts payable. q. Reinsurance The Company enters into reinsurance agreements with affiliated and unaffiliated insurers in the normal course of business to limit its insurance risk. Premium income, benefits to policyholders (including unpaid claims) and policyholders’ reserves are reported net of reinsurance. Premium, benefits and reserves related to reinsured business are accounted for on bases consistent with those used in accounting for the original policies issued and the terms of the reinsurance contracts. The Company records a receivable for reinsured benefits paid, but not yet reimbursed by the reinsurer and reduces policyholders’ reserves for the portion of insurance liabilities that are reinsured. Commissions and expense allowances on reinsurance ceded and modified coinsurance (Modco) reserve adjustments on reinsurance ceded are recorded as revenue.
r. Premium and related expense recognition
Life insurance premium revenue is generally recognized annually on the anniversary date of the policy. However, premium for flexible products, primarily variable universal life contracts, is recognized as revenue when received. Annuity premium is recognized as revenue when received.
Premium revenue is adjusted by the related deferred premium adjustment. Deferred premium adjusts for the overstatement created in the calculation of reserves as the reserve computation assumes the entire year’s net premium is collected annually at the beginning of the policy year and does not take into account installment or modal payments. Commissions and other costs related to issuance of new policies and policy maintenance and settlement costs are charged to current operations when incurred. Surrender fee charges on certain life and annuity products are recorded as a reduction of benefits and expenses.
s. Realized capital gains (losses) including other-than-temporary impairments and unrealized capital gains (losses) Realized capital gains (losses), net of taxes, exclude gains (losses) deferred into the IMR and gains (losses) of the separate accounts. Realized capital gains (losses), including OTTI, are recognized in net income and are determined using the specific identification method.

MML BAY STATE LIFE INSURANCE COMPANY NOTES TO STATUTORY FINANCIAL STATEMENTS, continued
14
Bonds - general
The Company employs a systematic methodology to evaluate OTTI by conducting a quarterly analysis of bonds. OTTI is evaluated in a manner consistent with market participant assumptions. The Company considers the following factors, where applicable depending on the type of securities, in the evaluation of whether a decline in value is other than temporary: (a) the likelihood that the Company will be able to collect all amounts due according to the contractual terms of the debt security; (b) the present value of the expected future cash flows of the security; (c) the characteristics, quality and value of the underlying collateral or issuer securing the position; (d) collateral structure; (e) the length of time and extent to which the fair value has been below amortized cost; (f) the financial condition and near-term prospects of the issuer; (g) adverse conditions related to the security or industry; (h) the rating of the security; (i) the Company’s ability and intent to hold the investment for a period of time sufficient to allow for an anticipated recovery to amortized cost; and (j) other qualitative and quantitative factors in determining the existence of OTTI including, but not limited to, unrealized loss trend analysis and significant short-term changes in value.
In addition, if the Company has the intent to sell, or the inability, or lack of intent to retain the investment for a period sufficient to recover the amortized cost basis, an OTTI is recognized as a realized loss equal to the entire difference between the investment’s amortized cost basis and its fair value at the balance sheet date.
When a bond is other-than-temporarily impaired, a new cost basis is established.
Bonds - corporate
For corporate securities, if it is determined that a decline in the fair value of a bond is other than temporary, OTTI is recognized as a realized loss equal to the difference between the investment’s amortized cost basis and, generally, its fair value at the balance sheet date.
Bonds - loan-backed and structured securities
For loan-backed and structured securities, if the present value of cash flows expected to be collected is less than the amortized cost basis of the security, an OTTI is recognized as a realized loss equal to the difference between the investment’s amortized cost basis and the present value of cash flows expected to be collected. The expected cash flows are discounted at the security’s effective interest rate. Internal inputs used in determining the amount of the OTTI on structured securities include collateral performance, prepayment speeds, default rates, and loss severity based on borrower and loan characteristics, as well as deal structure including subordination, over-collateralization and cash flow priority.
ABS and MBS are evaluated for OTTI using scenarios and assumptions based on the specifics of each security including collateral type, loan type, vintage and subordination level in the structure. Cash flow estimates are based on these assumptions and inputs obtained from external industry sources along with internal analysis and actual experience. Where applicable, assumptions include prepayment speeds, default rates and loss severity, weighted average maturity and changes in the underlying collateral values.
The Company has a review process for determining if CDOs are at risk for OTTI. For the senior, mezzanine and junior debt tranches, cash flows are modeled using multiple scenarios based on the current ratings and values of the underlying corporate credit risks and incorporating prepayment and default assumptions that vary according to collateral attributes of each CDO. The prepayment and default assumptions are varied within each model based upon rating (base case), historical expectations (default), rating change improvement (optimistic), rating change downgrade (pessimistic) and fair value (market). The default rates produced by these multiple scenarios are assigned an expectation weight according to current market and economic conditions and fed into a final scenario. OTTI is recorded if this final scenario results in the loss of any principal or interest payments due.
For the most subordinated junior CDO tranches, the present value of the projected cash flows in the final scenario is measured using an effective yield. If the current book value of the security is greater than the present value measured using an effective yield, an OTTI is taken in an amount sufficient to produce its effective yield. Certain CDOs cannot be modeled using all of the scenarios because of limitations on the data needed for all scenarios. The cash flows for these CDOs, including foreign currency denominated CDOs, are projected using a customized scenario management believes is reasonable for the applicable collateral pool.

MML BAY STATE LIFE INSURANCE COMPANY NOTES TO STATUTORY FINANCIAL STATEMENTS, continued
15
For loan-backed and structured securities, any difference between the new amortized cost basis and any increased present value of future cash flows expected to be collected is accreted into net investment income over the expected remaining life of the bond.
Unrealized capital gains (losses) Unrealized capital gains (losses) include changes in the fair value of bonds held at fair value and are recorded as a change in shareholder’s equity net of tax. 3. New accounting standards a. Adoption of new accounting standards
In June 2016, the NAIC adopted substantive revisions to the Statements of Statutory Accounting Principles (SSAP) No. 51R, Life Contracts, to incorporate references to the Valuation Manual (VM) and to facilitate the implementation of principles-based reserving (PBR), which were effective on January 1, 2017. The adoption of PBR only applies to new life insurance policies issued after January 1, 2017, however the Company plans to adopt these revisions to SSAP No. 51 using the 3-year phased in approach by no later than January 1, 2020. The Company currently uses formulas and assumptions to determine reserves as prescribed by state laws and regulations. Under PBR, the Company will be required to hold the higher of (a) the reserve using prescribed factors and (b) the PBR reserve which considers a wide range of future economic conditions, computed using justified company experience factors, such as mortality, policyholder behavior and expenses. The Company is currently assessing the impact of these modifications on the Company’s financial statements.
In August 2016, the NAIC adopted modifications to SSAP No. 51R, Life Contracts, which were effective January 1, 2017. These modifications clarified that annual assumption changes from reserving methods used in PBR would not qualify as a change in valuation basis. Changes in valuation basis are recorded directly to surplus instead of through income. These modifications were made to accommodate PBR which became effective January 1, 2017. These modifications are not expected to have an impact on the Company’s financial statements.
In April 2017, the NAIC adopted modifications to SSAP No. 26R, Bonds, which is effective December 31, 2017. These modifications are part of an ongoing investment classification project. These modifications (a) provide a definition of a security, (b) update the description of bonds included in scope of the guidance, (c) require fair value accounting for certain Securities Valuation Office (SVO) identified investments, such as bond exchange traded funds, unless a systematic value has been elected, and (d) clarify the scope of the standard to specifically include bank loans acquired through organization, participation, syndication or assignment. The adoption of these modifications did not have an impact on the Company’s financial statements in 2017. b. Future adoption of new accounting standards
In January 2017, the NAIC adopted modifications to SSAP No. 86, Derivatives, which will be effective January 1, 2018. The modifications maintain gross reporting of derivative variation margin as a separate unit of account, rather than characterizing as legal settlement with mark-to-market changes recorded in surplus. Regarding exchange traded futures, these modifications further clarify that variation margin and mark-to-market changes should be recorded in the same manner as all other derivative instruments. The Company will record mark-to-market gains and losses from exchange traded futures as unrealized gains or losses instead of realized gains or losses and gross up the derivatives and collateral line items on its financial statements. The modifications will not impact total surplus and the Company anticipates an immaterial impact on its financial statements.

MML BAY STATE LIFE INSURANCE COMPANY NOTES TO STATUTORY FINANCIAL STATEMENTS, continued
16
In April 2017, the NAIC adopted modifications to SSAP No. 69, Statement of Cash Flow: Classification of Certain Cash Receipts and Cash Payments, to adopt ASU No. 2016-15, Classification of Certain Cash Receipts and Cash Payments, in its entirety, which will be effective January 1, 2018 on a retrospective basis. In June 2017, the NAIC adopted additional modifications to SSAP No. 69 to incorporate portions of ASU No. 2016-18, Restricted Cash, which will be effective December 31, 2019 with early adoption permitted. The initial modifications address the classification and disclosure of certain items within the statements of cash flows. Upon adoption, proceeds from the settlement of corporate owned life insurance policies owned by the Company will be classified as investing activities instead of operating activities. Additionally, the Company will apply the nature of distribution approach to SCA equity method investments and the cumulative earnings approach to all other equity method investments in determining whether distributions received from equity method investees are returns on investment, recorded as operating activities, or returns of investment, recorded as investing activities. Effective January 1, 2018, the Company will early adopt on a retrospective basis, the second modification that adds restricted cash, cash equivalents and short-term investments to the existing statutory disclosure requirements in SSAP No.1, Accounting Policies, Risks & Uncertainties and Other Disclosures. Although the adoption of these modifications will require reclassification between investing and operating cash flows, they will not have a material impact on the Company’s financial statements.

MML BAY STATE LIFE INSURANCE COMPANY NOTES TO STATUTORY FINANCIAL STATEMENTS, continued
17
4. Fair value of financial instruments The following presents a summary of the carrying values and fair values of the Company's financial instruments: December 31, 2017 Carrying Fair Value Value Level 1 Level 2 Level 3 (In Millions) Financial assets: Bonds: U. S. government and agencies $ 40 $ 40 $ - $ 40 $ - Industrial and miscellaneous 265 269 - 268 1 Parent, subsidiaries and affiliates 7 7 - 7 - Mortgage loans - residential 3 3 - - 3 Cash, cash equivalents and short-term investments 55 55 (3) 58 - Separate account assets 4,465 4,477 1,044 3,419 14 Financial liabilities: Individual annuity contracts 3 2 - - 2 Supplementary contracts 13 13 - - 13
December 31, 2016 Carrying Fair Value Value Level 1 Level 2 Level 3 (In Millions) Financial assets: Bonds: U. S. government and agencies $ 39 $ 39 $ - $ 39 $ - Industrial and miscellaneous 265 267 - 253 14 Parent, subsidiaries and affiliates 6 6 - 6 - Mortgage loans - residential 4 4 - - 4 Cash, cash equivalents and short-term investments 63 63 (2) 65 - Separate account assets 4,312 4,320 923 3,381 16 Financial liabilities: Individual annuity contracts 3 2 - - 2 Supplementary contracts 11 12 - - 12
Fair value is defined as the price that would be received from selling an asset or paid to transfer a liability in an orderly transaction between market participants at the measurement date. The authoritative guidance for fair value establishes a measurement framework that includes a hierarchy used to classify the inputs used in measuring fair value. The hierarchy prioritizes the inputs to valuation techniques into three levels. Each level reflects a unique description of the inputs that are significant to the fair value measurements. The levels of the fair value hierarchy are as follows:
Level 1 – Observable inputs in the form of quoted prices for identical instruments in active markets.
Level 2 – Observable inputs other than Level 1 prices, such as quoted prices for similar assets or liabilities, quoted prices in markets that are not active or other inputs that are observable or can be derived from observable market data for substantially the full term of the assets or liabilities.

MML BAY STATE LIFE INSURANCE COMPANY NOTES TO STATUTORY FINANCIAL STATEMENTS, continued
18
Level 3 – One or more unobservable inputs that are supported by little or no market activity and are significant to the fair value of the assets or liabilities. Level 3 assets and liabilities include financial instruments whose value is determined using internal models, as well as instruments for which the determination of fair value requires significant management judgment or estimation.
When available, the Company generally uses unadjusted quoted market prices from independent sources to determine the fair value of investments and classifies such items within Level 1 of the fair value hierarchy. If quoted prices are not available, prices are derived from observable market data for similar assets in an active market or obtained directly from brokers for identical assets traded in inactive markets. Investments that are priced using these inputs are classified within Level 2 of the fair value hierarchy. When some of the necessary observable inputs are unavailable, fair value is based upon internally developed models. These models use inputs not directly observable or correlated with observable market data. Typical inputs, which are integrated in the Company’s internal discounted cash flow models and discounted earnings models include, but are not limited to, issuer spreads derived from internal credit ratings and benchmark yields such as London Inter-Bank Offered Rate (LIBOR), cash flow estimates and earnings before interest, taxes, depreciation and amortization estimates. Investments that are priced with such unobservable inputs are classified within Level 3 of the fair value hierarchy.
The Company has established and maintains policies and guidelines that govern its valuation methodologies and their consistent application. These policies and guidelines address the use of inputs, price source hierarchies and provide controls around the valuation processes. These controls include appropriate review and analysis of prices against market activity or indicators for reasonableness, approval of price source changes, price overrides, methodology changes and classification of fair value hierarchy levels. The valuation policies and guidelines are reviewed and updated as appropriate.
Annually, the Company reviews the primary pricing vendor to validate that the inputs used in that vendor’s pricing process are deemed to be market observable as defined above. While the Company was not provided access to proprietary models of the vendor, the reviews have included on-site walk-throughs of the pricing process, methodologies and control procedures for each asset class and level for which prices are provided. The review also included an examination of the underlying inputs and assumptions for a sample of individual securities across asset classes. In addition, the Company and its pricing vendors have an established challenge process in place for all security valuations, which facilitates identification and resolution of prices that fall outside expected ranges. The Company believes that the prices received from the pricing vendors are representative of prices that would be received to sell the assets at the applicable measurement date (exit prices) and are classified appropriately in the hierarchy.
The Company reviews the fair value hierarchy classifications at each reporting period. Overall, reclassifications between levels occur when there are changes in the observability of inputs and market activity used in the valuation of a financial asset or liability. Such reclassifications are reported as transfers between levels at the beginning fair value for the reporting period in which the changes occur. Given the types of assets classified as Level 1, transfers between Level 1 and Level 2 measurement categories are expected to be infrequent.
The fair value of individual annuity and supplementary contracts is determined using one of several methods based on the specific contract type. For short-term contracts, generally less than 30 days, the fair value is assumed to be the book value. For investment-type contracts, the fair value is determined by calculating the present value of future cash flows discounted at current market interest rates, the risk-free rate or a current pricing yield curve based on pricing assumptions using assets of a comparable corporate bond quality. Annuities are valued using cash flow projections from the Company's asset-liability management analysis.

MML BAY STATE LIFE INSURANCE COMPANY NOTES TO STATUTORY FINANCIAL STATEMENTS, continued
19
The following presents the Company's fair value hierarchy for assets and liabilities that are carried at fair value: December 31, 2017 Level 1 Level 2 Level 3 Total (In Millions) Financial assets: Separate account assets $ 1,044 $ 2,312 $ - $ 3,356 $1,109 million of book value separate account assets are not carried at fair value and therefore, are not included in this table. For the year ended December 31, 2017, there were no significant transfers between Level 1 and Level 2. December 31, 2016 Level 1 Level 2 Level 3 Total (In Millions) Financial assets: Bonds Parent, subsidiaries and affiliates - 1 - 1 Separate account assets $ 923 $ 2,302 $ - $ 3,225 $1,087 million of book value separate account assets are not carried at fair value and, therefore, are not included in this table. For the year ended December 31, 2016, there were no significant transfers between Level 1 and Level 2. Valuation Techniques and Inputs The Company determines the fair value of its investments using primarily the market approach or the income approach. The use of quoted prices for identical assets and matrix pricing or other similar techniques are examples of market approaches, while the use of discounted cash flow methodologies is an example of the income approach. The Company attempts to maximize the use of observable inputs and minimize the use of unobservable inputs in selecting whether the market or the income approach is used. A description of the significant valuation techniques and inputs to the determination of estimated fair value for the more significant asset and liability classes measured at fair value on a recurring basis and categorized within Level 2 and Level 3 of the fair value hierarchy is as follows: Separate account assets - These assets primarily include bonds (industrial and miscellaneous; U.S. government and agencies) and derivatives. Their fair values are determined as follows:

MML BAY STATE LIFE INSURANCE COMPANY NOTES TO STATUTORY FINANCIAL STATEMENTS, continued
20
Bonds (Industrial and miscellaneous) - These securities are principally valued using the market or the income approaches. Level 2 valuations are based primarily on quoted prices in markets that are not active, broker quotes, matrix pricing or other similar techniques that use standard market observable inputs such as benchmark yields, spreads versus benchmark yields, new issuances, issuer ratings, duration, and trades of identical or comparable securities. Privately placed securities are valued using discounted cash flow models using standard market observable inputs, and inputs derived from, or corroborated by, market observable data including market yield curve, duration, call provisions, observable prices and spreads for similar publicly traded or privately traded issues that incorporate the credit quality and industry sector of the issuer. This level also includes securities priced by independent pricing services that use observable inputs. Valuations based on matrix pricing or other similar techniques that utilize significant unobservable inputs or inputs that cannot be derived principally from, or corroborated by, observable market data, including adjustments for illiquidity, delta spread adjustments or spreads to reflect industry trends or specific credit−related issues are classified as Level 3. In addition, inputs including quoted prices for identical or similar securities that are less liquid and based on lower levels of trading activity than securities classified in Level 2 are classified as Level 3.
Bonds (U.S. government and agencies) - These securities are principally valued using the market approach. Level 2 valuations are based primarily on quoted prices in markets that are not active, or using matrix pricing or other similar techniques using standard market observable inputs such as the benchmark U.S. Treasury yield curve, the spreads versus the U.S. Treasury yield curve for the identical security and comparable securities that are actively traded. Derivative assets and liabilities - These financial instruments are primarily valued using the market approach. The estimated fair value of derivatives is based primarily on quotations obtained from counterparties and independent sources, such as quoted market values received from brokers. These quotations are compared to internally derived prices and a price challenge is lodged with the counterparties and an independent source when a significant difference cannot be explained by appropriate adjustments to the internal model. When quoted market values are not reliable or available, the value is based upon an internal valuation process using market observable inputs that other market participants would use. Significant inputs to the valuation of derivative financial instruments include overnight index swaps and LIBOR basis curves, interest rate volatility, swap yield curve, currency spot rates, cross currency basis curves and dividend yields. Due to the observability of the significant inputs to these fair value measurements, they are classified as Level 2.
The use of different assumptions or valuation methodologies may have a material impact on the estimated fair value amounts. For the periods presented, there were no significant changes to the Company's valuation techniques.

MML BAY STATE LIFE INSURANCE COMPANY NOTES TO STATUTORY FINANCIAL STATEMENTS, continued
21
5. Investments The Company maintains a diversified investment portfolio. Investment policies limit concentration in any asset class, geographic region, industry group, economic characteristic, investment quality or individual investment. a. Bonds The carrying value and fair value of bonds were as follows: December 31, 2017 Gross Gross Carrying Unrealized Unrealized Fair Value Gains Losses Value (In Millions) U.S. government and agencies $ 40 $ - $ - $ 40 Industrial and miscellaneous 265 6 2 269 Parent, subsidiaries and affiliates 7 - - 7 Total $ 312 $ 6 $ 2 $ 316 December 31, 2016 Gross Gross Carrying Unrealized Unrealized Fair Value Gains Losses Value (In Millions) U.S. government and agencies $ 39 $ - $ - $ 39 Industrial and miscellaneous 265 5 3 267 Parent, subsidiaries and affiliates 6 - - 6 Total $ 310 $ 5 $ 3 $ 312

MML BAY STATE LIFE INSURANCE COMPANY NOTES TO STATUTORY FINANCIAL STATEMENTS, continued
22
The quality of the bond portfolio is determined by the use of SVO ratings and the equivalent rating agency designations, except for RMBS and CMBS that use outside modelers. The following sets forth the NAIC class ratings for the bond portfolio including RMBS and CMBS: December 31, 2017 2016 NAIC Equivalent Rating Carrying % of Carrying % of Class Agency Designation Value Total Value Total ($ In Millions) 1 Aaa/ Aa/ A $ 226 72 % $ 223 73 % 2 Baa 81 26 81 26 3 Ba 2 1 3 1 4 B 3 1 1 - 5 Caa and lower - - 1 - 6 In or near default - - 1 - Total $ 312 100 % $ 310 100 % The following summarizes NAIC ratings for RMBS and CMBS subject to NAIC modeling: December 31, 2017 2016 RMBS CMBS RMBS CMBS NAIC Carrying % of Carrying % of Carrying % of Carrying % of Class Value Total Value Total Value Total Value Total ($ In Millions) 1 $ 3 100 % $ 95 100 % $ 3 100 % $ 42 100 % The following is a summary of the carrying value and fair value of bonds as of December 31, 2017 by contractual maturity. Expected maturities may differ from contractual maturities because issuers may have the right to call or prepay obligations with or without prepayment penalties. Securities with more than one maturity date are included in the table using the final maturity date. Carrying Fair Value Value (In Millions) Due in one year or less $ 2 $ 1 Due after one year through five years 75 75 Due after five years through ten years 90 93 Due after ten years 145 147 Total $ 312 $ 316
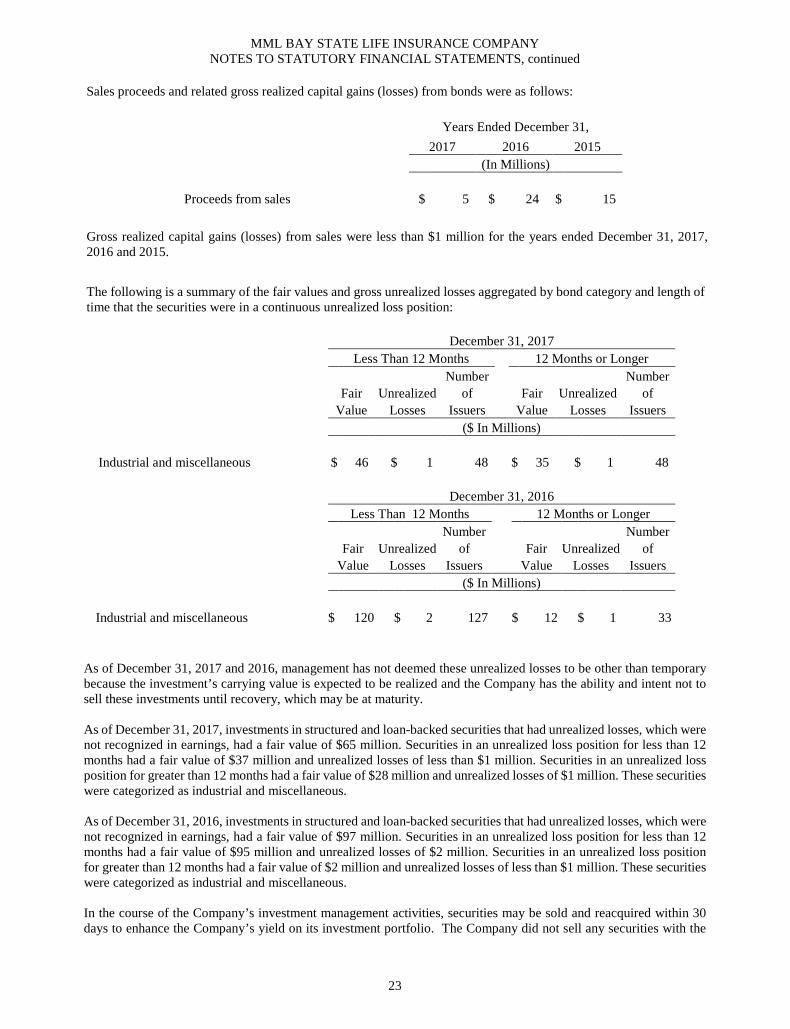
MML BAY STATE LIFE INSURANCE COMPANY NOTES TO STATUTORY FINANCIAL STATEMENTS, continued
23
Sales proceeds and related gross realized capital gains (losses) from bonds were as follows: Years Ended December 31, 2017 2016 2015 (In Millions) Proceeds from sales $ 5 $ 24 $ 15 Gross realized capital gains (losses) from sales were less than $1 million for the years ended December 31, 2017, 2016 and 2015.
The following is a summary of the fair values and gross unrealized losses aggregated by bond category and length of time that the securities were in a continuous unrealized loss position: December 31, 2017 Less Than 12 Months 12 Months or Longer Number Number Fair Unrealized of Fair Unrealized of Value Losses Issuers Value Losses Issuers ($ In Millions) Industrial and miscellaneous $ 46 $ 1 48 $ 35 $ 1 48 December 31, 2016 Less Than 12 Months 12 Months or Longer Number Number Fair Unrealized of Fair Unrealized of Value Losses Issuers Value Losses Issuers ($ In Millions) Industrial and miscellaneous $ 120 $ 2 127 $ 12 $ 1 33 As of December 31, 2017 and 2016, management has not deemed these unrealized losses to be other than temporary because the investment’s carrying value is expected to be realized and the Company has the ability and intent not to sell these investments until recovery, which may be at maturity. As of December 31, 2017, investments in structured and loan-backed securities that had unrealized losses, which were not recognized in earnings, had a fair value of $65 million. Securities in an unrealized loss position for less than 12 months had a fair value of $37 million and unrealized losses of less than $1 million. Securities in an unrealized loss position for greater than 12 months had a fair value of $28 million and unrealized losses of $1 million. These securities were categorized as industrial and miscellaneous. As of December 31, 2016, investments in structured and loan-backed securities that had unrealized losses, which were not recognized in earnings, had a fair value of $97 million. Securities in an unrealized loss position for less than 12 months had a fair value of $95 million and unrealized losses of $2 million. Securities in an unrealized loss position for greater than 12 months had a fair value of $2 million and unrealized losses of less than $1 million. These securities were categorized as industrial and miscellaneous. In the course of the Company’s investment management activities, securities may be sold and reacquired within 30 days to enhance the Company’s yield on its investment portfolio. The Company did not sell any securities with the

MML BAY STATE LIFE INSURANCE COMPANY NOTES TO STATUTORY FINANCIAL STATEMENTS, continued
24
NAIC Designation 3 or below for the years ended December 31, 2017 or 2016, that were reacquired within 30 days of the sale date. The Company had assets on deposit with government authorities or trustees, as required by law, in the amount of $4 million as of December 31, 2017 and 2016. Residential mortgage-backed exposure RMBS are included in the U.S. government and agencies, special revenue, and industrial and miscellaneous bond categories. The Alt-A category includes option adjustable-rate mortgages and the subprime category includes 'scratch and dent' or reperforming pools, high loan-to-value pools and pools where the borrowers have very impaired credit but the average loan-to-value is low, typically 70% or below. In identifying Alt-A and subprime exposure, management used a combination of qualitative and quantitative factors, including FICO scores and loan-to-value ratios. As of December 31, 2017, RMBS had a total carrying value of $3 million and a fair value of $3 million, of which approximately 39%, based on carrying value, was classified as Alt-A. Alt-A and subprime RMBS had a total carrying value of $3 million and a fair value of $3 million. As of December 31, 2016, RMBS had a total carrying value of $3 million and a fair value of $4 million, of which approximately 39%, based on carrying value, was classified as Alt-A. Alt-A and subprime RMBS had a total carrying value of $3 million and a fair value of $4 million. During the year ended December 31, 2017, there were no significant credit downgrades for the securities held by the Company that were backed by residential mortgage pools. Leveraged loan exposure Leveraged loans are loans extended to companies that already have considerable amounts of debt. The Company reports leveraged loans as bonds. These leveraged loans have interest rates higher than typical loans, reflecting the additional risk of default from issuers with high debt-to-equity ratios. As of December 31, 2017, total leveraged loans and leveraged loan CDOs had a carrying value of $39 million and a fair value of $40 million, all of which were domestic leveraged loans and CDOs. As of December 31, 2016, total leveraged loans and leveraged loan CDOs had a carrying value of $44 million and a fair value of $44 million, all of which were domestic leveraged loans and CDOs. Commercial mortgage-backed exposure The Company holds bonds backed by pools of commercial mortgages. The mortgages in these pools have varying risk characteristics related to underlying collateral type, borrower's risk profile and ability to refinance and the return provided to the borrower from the underlying collateral. These investments had a carrying value and fair value of $95 million as of December 31, 2017 and a carrying value and fair value of $83 million as of December 31, 2016. b. Mortgage loans Mortgage loans comprised primarily seasoned pools of homogeneous residential mortgage loans substantially backed by Federal Housing Administration (FHA) and Veterans Administration (VA) guarantees. As of December 31, 2017 and 2016, the Company did not have any direct subprime exposure through the purchases of unsecuritized whole-loan pools. Geographical concentration is considered prior to the purchase of residential mortgage loan pools. The mortgage loan portfolio is diverse with no significant collateral concentrations in any particular geographic region as of December 31, 2017 or 2016. The carrying and fair values of the Company’s residential mortgage loans were $3 million as of December 31, 2017 and $4 million as of December 31, 2016.

MML BAY STATE LIFE INSURANCE COMPANY NOTES TO STATUTORY FINANCIAL STATEMENTS, continued
25
The Company uses an internal rating system as its primary method of monitoring credit quality. The residential mortgage loan portfolio translated into the equivalent rating agency designation of AAA/AA/A and had carrying values of $3 million as of December 31, 2017 and $4 million as of December 31, 2016. Interest rates, including fixed and variable, on the Company's portfolio of mortgage loans were: December 31, 2017 2016 Weighted Weighted Low High Average Low High Average Residential mortgage loans 3.9 % 7.0 % 5.3 % 3.9 % 6.8 % 5.2 % The Company did not purchase any residential mortgage loans during the years ended December 31, 2017 and 2016. The Company did not hold any impaired residential mortgage loans and had no valuation allowances recorded as of December 31, 2017, 2016 or 2015. The Company did not hold any restructured residential mortgage loans or residential mortgage loans with principal or interest past due as of December 31, 2017 or 2016. c. Net investment income Net investment income comprised the following: Years Ended December 31, 2017 2016 2015 (In Millions) Bonds $ 12 $ 9 $ 8 Policy loans 5 5 5 Cash, cash equivalents and short-term investments 1 - - Net investment income $ 18 $ 14 $ 13 d. Net realized capital gains (losses) Net realized capital gains after tax and transfer to the IMR were less than $1 million for the years ended December 31, 2017, 2016 and 2015. The IMR liability balance was less than $1 million as of December 31, 2017 and 2016 and was included in other liabilities on the Statutory Statements of Financial Position. Refer to Note 2o. “Interest maintenance reserve” for information on the Company’s policy for IMR. For the years ended December 31, 2017, 2016 and 2015, the Company recognized less than $1 million for each year, of OTTI on structured and loan-backed securities, primarily due to the present value of expected cash flows being less than the amortized cost. The remaining OTTI amounts were determined using external inputs such as publicly observable fair values and credit ratings. Refer to Note 2s. "Realized capital gains (losses) including other-than-temporary impairments and unrealized capital gains (losses)" for more information on assumptions and inputs used in the Company’s OTTI models.

MML BAY STATE LIFE INSURANCE COMPANY NOTES TO STATUTORY FINANCIAL STATEMENTS, continued
26
Refer to Note 17. "Impairment listing for loan-backed and structured securities" for a CUSIP level list of impaired structured securities where the present value of cash flows expected to be collected is less than the amortized cost basis. 6. Federal income taxes On December 22, 2017, the president signed into law H.R. 1/Public Law 115-97, commonly known as the Tax Cuts and Jobs Act (the Act). The Act contains several key provisions that have significant financial statement effects. These provisions required the remeasurement of deferred tax assets and liabilities, and changed the method for computing deductions for life insurance reserves.
The Act required the remeasurement of deferred taxes, as it reduces the corporate tax rate to 21 percent, effective January 1, 2018. Accordingly, the Company remeasured its net admitted deferred taxes as of the enactment date and recognized a decrease in surplus of $1 million in 2017. Of the $1 million net decrease, $7 million was reflected in the change in other deferred income taxes, offset by an increase of $6 million reflected in change in nonadmitted assets. The Act revised the computation of life insurance tax reserves to be the greater of the net surrender value of a contract and 92.81 percent of statutory reserves. The revised reserve computation is effective for taxable years beginning after December 31, 2017. A transition rule requires life insurers to spread the difference between the prior year end reserves computed on the old basis and those computed on the new basis over eight years as either income or a deduction. The Company has recorded an estimated provision for this change by recognizing a net decrease of less than $1 million in its DTA, offset by a corresponding decrease in its deferred tax liability that will reverse over the eight year transition period. The Company is in the process of modifying its tax reserve systems to incorporate the new method. The Company will update the provisional amount when it completes its system modifications during the measurement period, but no later than December 2018.

MML BAY STATE LIFE INSURANCE COMPANY NOTES TO STATUTORY FINANCIAL STATEMENTS, continued
27
The Company provides for DTAs in accordance with statutory accounting practices, and has met the required threshold to utilize the three-year reversal period and 15% of surplus limitation. The net DTA or deferred tax liability (DTL) recognized in the Company’s assets, liabilities and surplus is as follows: December 31, 2017 Ordinary Capital Total (In Millions) Gross DTAs $ 12 $ - $ 12 Statutory valuation allowance adjustment - - - Adjusted gross DTAs 12 - 12 DTAs nonadmitted (8) - (8) Subtotal net admitted DTA 4 - 4 Total gross DTLs (1) (1) (2) Net admitted DTA(L) $ 3 $ (1) $ 2 December 31, 2016 Ordinary Capital Total (In Millions) Gross DTAs $ 21 $ - $ 21 Statutory valuation allowance adjustment - - - Adjusted gross DTAs 21 - 21 DTAs nonadmitted (14) - (14) Subtotal net admitted DTA 7 - 7 Total gross DTLs - (1) (1) Net admitted DTA(L) $ 7 $ (1) $ 6 Change Ordinary Capital Total (In Millions) Gross DTAs $ (9) $ - $ (9) Statutory valuation allowance adjustment - - - Adjusted gross DTAs (9) - (9) DTAs nonadmitted 6 - 6 Subtotal net admitted DTA (3) - (3) Total gross DTLs (1) - (1) Net admitted DTA(L) $ (4) $ - $ (4)

MML BAY STATE LIFE INSURANCE COMPANY NOTES TO STATUTORY FINANCIAL STATEMENTS, continued
28
December 31, 2017 Ordinary Capital Total (In Millions) Admitted DTA 3 years: Federal income taxes that can be recovered $ - $ - $ - Remaining adjusted gross DTAs expected to be realized within 3 years (lesser of 1 or 2): 1. Adjusted gross DTA to be realized 2 - 2 2. Adjusted gross DTA allowed per limitation threshold 43 - 43 Lesser of lines 1 or 2 2 - 2 Adjusted gross DTAs offset by existing DTLs 2 - 2 Total admitted DTA realized within 3 years $ 4 $ - $ 4 December 31, 2016 Ordinary Capital Total (In Millions) Admitted DTA 3 years: Federal income taxes that can be recovered $ 6 $ - $ 6 Remaining adjusted gross DTAs expected to be realized within 3 years 1. Adjusted gross DTA to be realized - - - 2. Adjusted gross DTA allowed per limitation threshold 36 - 36 Lesser of lines 1 or 2 - - - Adjusted gross DTAs offset by existing DTLs 1 - 1 Total admitted DTA realized within 3 years $ 7 $ - $ 7 Change Ordinary Capital Total (In Millions) Admitted DTA 3 years: Federal income taxes that can be recovered $ (6) $ - $ (6) Remaining adjusted gross DTAs expected to be realized within 3 years 1. Adjusted gross DTA to be realized 2 - 2 2. Adjusted gross DTA allowed per limitation threshold 7 - 7 Lesser of lines 1 or 2 2 - 2 Adjusted gross DTAs offset by existing DTLs 1 - 1 Total admitted DTA realized within 3 years $ (3) $ - $ (3) Effective January 1, 2018, the Act eliminates the ability to carryback net operating losses, therefore the amount of adjusted gross DTA admitted based on recoverable federal taxes is limited only to capital DTAs.

MML BAY STATE LIFE INSURANCE COMPANY NOTES TO STATUTORY FINANCIAL STATEMENTS, continued
29
The Company's total realization threshold limitations are as follows: December 31, 2017 2016 ($ In Millions) Ratio percentage used to determine recovery period and threshold limitation 11,571% 11,734% Amount of adjusted capital and surplus used to determine recovery period and threshold limitation above $ 291 $ 240 The ultimate realization of DTAs depends on the generation of future taxable income during the periods in which the temporary differences are deductible. Management considers the scheduled reversal of DTLs, including the impact of available carryback and carryforward periods, projected taxable income and tax-planning strategies in making this assessment. The impact of tax-planning strategies is as follows:
December 31, 2017 Ordinary Capital Total (Percent) Impact of tax planning strategies: Adjusted gross DTAs (% of total adjusted gross DTAs) - % - % - % Net admitted adjusted gross DTAs (% of total net admitted adjusted gross DTAs) 22 % - % 22 % December 31, 2016 Ordinary Capital Total (Percent) Impact of tax planning strategies: Adjusted gross DTAs (% of total adjusted gross DTAs) - % - % - % Net admitted adjusted gross DTAs (% of total net admitted adjusted gross DTAs) - % - % - % Change Ordinary Capital Total (Percent) Impact of tax planning strategies: Adjusted gross DTAs (% of total adjusted gross DTAs) - % - % - % Net admitted adjusted gross DTAs (% of total net admitted adjusted gross DTAs) 22 % - % 22 % There are no reinsurance strategies included in the Company's tax-planning.

MML BAY STATE LIFE INSURANCE COMPANY NOTES TO STATUTORY FINANCIAL STATEMENTS, continued
30
The provision for current tax expense on earnings is as follows: Years Ended December 31, 2017 2016 2015 (In Millions) Federal income tax expense (benefit) on operating earnings $ (3) $ 26 $ 7 Total federal and foreign income tax expense (benefit) $ (3) $ 26 $ 7 The tax effects of temporary differences that give rise to significant portions of the DTAs and DTLs are as follows: December 31, 2017 2016 Change (In Millions) DTAs: Ordinary Policy acquisition costs $ 4 $ 8 $ (4) Reserve items 1 1 - Other 7 12 (5) Total ordinary DTAs 12 21 (9) Nonadmitted DTAs (8) (14) 6 Admitted ordinary DTAs 4 7 (3) Capital Admitted DTAs $ 4 $ 7 $ (3) DTLs: Capital Investment items 2 1 1 Total capital DTLs 2 1 1 Total DTLs 2 1 1 Net admitted DTA $ 2 $ 6 $ (4) The change in net deferred income taxes comprised the following: Years Ended December 31, 2017 2016 2015 (In Millions) Net DTA(L) $ (10) $ 12 $ (1) Less: Items not recorded in the change in net deferred income taxes: Change in net deferred income taxes $ (10) $ 12 $ (1) The change in net deferred income taxes includes a decrease of $7 million due to the remeasurement of net DTA(L). As of December 31, 2017, the Company had no net operating or capital loss carryforwards to include in deferred income taxes. The Company has no tax credit carryforwards included in deferred taxes.
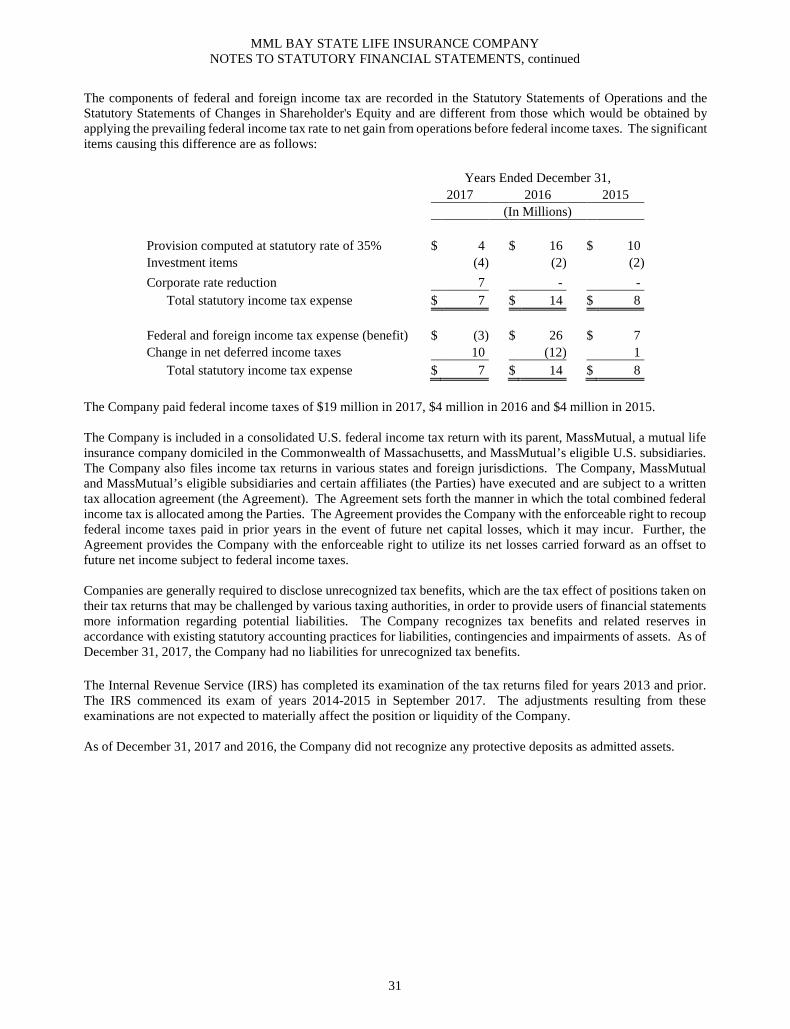
MML BAY STATE LIFE INSURANCE COMPANY NOTES TO STATUTORY FINANCIAL STATEMENTS, continued
31
The components of federal and foreign income tax are recorded in the Statutory Statements of Operations and the Statutory Statements of Changes in Shareholder's Equity and are different from those which would be obtained by applying the prevailing federal income tax rate to net gain from operations before federal income taxes. The significant items causing this difference are as follows: Years Ended December 31, 2017 2016 2015 (In Millions) Provision computed at statutory rate of 35% $ 4 $ 16 $ 10 Investment items (4) (2) (2) Corporate rate reduction 7 - - Total statutory income tax expense $ 7 $ 14 $ 8 Federal and foreign income tax expense (benefit) $ (3) $ 26 $ 7 Change in net deferred income taxes 10 (12) 1 Total statutory income tax expense $ 7 $ 14 $ 8 The Company paid federal income taxes of $19 million in 2017, $4 million in 2016 and $4 million in 2015. The Company is included in a consolidated U.S. federal income tax return with its parent, MassMutual, a mutual life insurance company domiciled in the Commonwealth of Massachusetts, and MassMutual’s eligible U.S. subsidiaries. The Company also files income tax returns in various states and foreign jurisdictions. The Company, MassMutual and MassMutual’s eligible subsidiaries and certain affiliates (the Parties) have executed and are subject to a written tax allocation agreement (the Agreement). The Agreement sets forth the manner in which the total combined federal income tax is allocated among the Parties. The Agreement provides the Company with the enforceable right to recoup federal income taxes paid in prior years in the event of future net capital losses, which it may incur. Further, the Agreement provides the Company with the enforceable right to utilize its net losses carried forward as an offset to future net income subject to federal income taxes. Companies are generally required to disclose unrecognized tax benefits, which are the tax effect of positions taken on their tax returns that may be challenged by various taxing authorities, in order to provide users of financial statements more information regarding potential liabilities. The Company recognizes tax benefits and related reserves in accordance with existing statutory accounting practices for liabilities, contingencies and impairments of assets. As of December 31, 2017, the Company had no liabilities for unrecognized tax benefits. The Internal Revenue Service (IRS) has completed its examination of the tax returns filed for years 2013 and prior. The IRS commenced its exam of years 2014-2015 in September 2017. The adjustments resulting from these examinations are not expected to materially affect the position or liquidity of the Company. As of December 31, 2017 and 2016, the Company did not recognize any protective deposits as admitted assets.

MML BAY STATE LIFE INSURANCE COMPANY NOTES TO STATUTORY FINANCIAL STATEMENTS, continued
32
7. Deferred and uncollected life insurance premium Deferred and uncollected life insurance premium, net of loading and reinsurance, are included in insurance amounts receivable in the Company’s Statutory Statements of Financial Position. The Company had $2.7 million of ordinary renewal as of December 31, 2017 and had $2 million as of December 31, 2016. As of December 31, 2017 and 2016, the Company had less than $1 million of group life, on both a gross and net of loading and reinsurance basis, for deferred and uncollected life insurance premium and annuity considerations. Deferred premium is the portion of the annual premium not earned at the reporting date. Loading on deferred premium is an amount obtained by subtracting the valuation net deferred premium from the gross deferred premium and generally includes allowances for acquisition costs and other expenses. Refer to Note 2k. “Policyholders’ reserves” for information on the Company’s accounting policies regarding gross premium and net premium. Uncollected premium is gross premium net of reinsurance that is due and unpaid as of the reporting date, net of loading. Net premium is the amount used in the calculation of reserves. The change in deferred and uncollected life insurance premium is included in premium income. The change in loading is included as an expense and is not shown as a reduction to premium income. Ordinary new business and ordinary renewal business consist of the basic amount of premium required on the underlying life insurance policies. 8. Policyholders’ liabilities a. Policyholders’ reserves
The Company had life insurance in force of $11,926 million as of December 31, 2017 and $12,236 million as of December 31, 2016. The following summarizes policyholders' reserves, net of reinsurance, and the range of interest rates by type of product:
December 31, 2017 2016 Amount Interest Rates Amount Interest Rates ($ In Millions) Variable life $ 137 3.0% - 5.5% $ 135 3.0% - 5.5% Individual annuities 4 5.0% - 7.3% 4 5.0% - 7.3% Total $ 141 $ 139 b. Liabilities for deposit-type contracts Supplementary contracts not involving life contingencies of $13 million as of December 31, 2017 and $12 million as of December 31, 2016 were included in liabilities for deposit-type contracts. The interest rates on supplementary contracts ranged from 0.3% to 3.0% as of December 31, 2017 and 2016.

MML BAY STATE LIFE INSURANCE COMPANY NOTES TO STATUTORY FINANCIAL STATEMENTS, continued
33
c. Additional liability for annuity contracts Certain variable annuity contracts include additional death benefit features. Election of these benefits is generally only available at contract issue. The following shows the liabilities for GMDBs (in millions): Liability as of January 1, 2016 $ 1 Incurred guarantee benefits - Paid guarantee benefits (1) Liability as of December 31, 2016 1 Incurred guarantee benefits - Paid guarantee benefits - Liability as of December 31, 2017 $ 1 The Company held reserves in accordance with the standard scenario as of December 31, 2017 and 2016. The following summarizes the account values, net amount at risk and weighted average attained age for variable annuity contracts with GMDBs classified as policyholders’ reserves and separate account liabilities. The net amount at risk is defined as the minimum guarantee less the account value calculated on a policy-by-policy basis, but not less than zero.
December 31, 2017 2016 Net Weighted Net Weighted Account Amount Average Account Amount Average Value at Risk Attained Age Value at Risk Attained Age ($ In Millions) GMDB $ 44 $ 6 72 $ 42 $ 7 72 Account values of variable annuity contracts with GMDBs are summarized below: December 31, 2017 2016 (In Millions) Separate account $ 42 $ 40 General account 2 2 Total $ 44 $ 42

MML BAY STATE LIFE INSURANCE COMPANY NOTES TO STATUTORY FINANCIAL STATEMENTS, continued
34
9. Reinsurance The Company enters into reinsurance agreements with affiliated and unaffiliated insurers in the normal course of business in order to mitigate the impact of underwriting mortality and morbidity risks. Such transfers do not relieve the Company of its primary liability to its customers and, as such, failure of reinsurers to honor their obligations could result in credit losses that could arise if a reinsurer defaults. The Company reduces reinsurance default risk by evaluating the financial condition of reinsurers and monitoring for possible concentrations within the Company’s reinsurers and using trust structures, when appropriate. The Company reinsures a portion of its mortality risk in its life business under either a first dollar quota-share arrangement or an in excess of the retention limit arrangement with reinsurers. The amounts reinsured are on a yearly renewable term or Modco basis. The Company’s highest retention limit for new issues of life policies ranges from $15 million to $25 million. Refer to Note 14. "Related party transactions" for information about the Company’s affiliated ceded reinsurance transactions. The Company did not reinsure any policies with a company chartered in a country other than the U.S., excluding U.S. branches of these companies, which was owned in excess of 10% or controlled directly or indirectly by an insured, a beneficiary, a creditor or any other person not primarily engaged in the insurance business. There are no reinsurance agreements in effect under which the reinsurer may unilaterally cancel any reinsurance for reasons other than for nonpayment of premium or other similar credits. The Company has no reinsurance agreements in effect such that the amount of losses paid or accrued through the statement date may result in a payment to the reinsurer of amounts which, in aggregate and allowing for offset of mutual credits from other reinsurance agreements with the same reinsurer, exceed the total direct premium collected under the reinsured policies. If all reinsurance agreements were terminated by either party as of December 31, 2017, the resulting reduction in surplus due to loss of reinsurance reserve credits, net of unearned premium, would be approximately $11 million assuming no return of the assets backing these reserves from the reinsurer to the Company. Reinsurance amounts included in the Statutory Statements of Operations were as follows: Years Ended December 31, 2017 2016 2015 (In Millions)
Direct premium $ 38 $ 34 $ 42 Premium ceded (36) (140) (18)
Total net premium $ 2 $ (106) $ 24 Ceded reinsurance recoveries $ 42 $ 25 $ 26

MML BAY STATE LIFE INSURANCE COMPANY NOTES TO STATUTORY FINANCIAL STATEMENTS, continued
35
Reinsurance amounts included in the Statutory Statements of Financial Position were as follows: December 31, 2017 2016 (In Millions)
Reinsurance reserves ceded $ (22) $ (23) Ceded amounts recoverable 19 12
Effective December 31, 2016, the Company entered into a reinsurance agreement with an authorized third-party to reinsure approximately 100% of certain of the Company’s inforce variable life policies. Under the terms of the agreement, the Company received approximately $56 million of consideration from the reinsurer. The variable life policies are reinsured on a Modco basis. Under the terms of the agreement, the Company will maintain responsibility for servicing the policies. The Company ceded premium of $122 million and recorded a $36 million increase in the Statutory Statements of Changes in Surplus in conjunction with this agreement. As of December 31, 2017, one reinsurer accounted for 48% of the outstanding balance of the unaffiliated reinsurance recoverable and the next largest reinsurer had 21%. Overall, the Company believes that each of these exposures to a single reinsurer does not create an undue concentration of risk and the Company’s business is not substantially dependent upon any single reinsurer.

MML BAY STATE LIFE INSURANCE COMPANY NOTES TO STATUTORY FINANCIAL STATEMENTS, continued
36
10. Withdrawal characteristics a. Annuity actuarial reserves and liabilities for deposit-type contracts The withdrawal characteristics of the Company's annuity actuarial reserves and deposit-type contracts as of December 31, 2017 are illustrated below. Separate Separate General Account w/ Account % of Account Guarantees Nonguaranteed Total Total ($ In Millions) Subject to discretionary withdrawal: With fair value adjustment $ 2 $ - $ - $ 2 5 % At fair value - - 42 42 73 Subtotal $ 2 $ - $ 42 $ 42 78 % Subject to discretionary withdrawal:
At book value without fair value adjustment 13 - - 13 21
Not subject to discretionary withdrawal 1 - - 1 1 Total $ 16 $ - $ 42 $ 58 100 % The following is a summary of total annuity actuarial reserves and liabilities for deposit-type contracts as of December 31, 2017 (in millions): Statutory Statements of Financial Position: Policyholders’ reserves – individual annuities $ 3 Liabilities for deposit-type contracts 13 Subtotal 16 Separate Account Annual Statement: Annuities 42 Total $ 58 b. Separate accounts The Company has guaranteed separate accounts classified as nonindexed to fund a long-term interest guarantee in excess of a year that does not exceed 4% rate of return. The Company has nonguaranteed separate accounts which are variable accounts where the benefit is determined by the performance and/or market value of the investments held in the separate account with incidental risk, notional expense and minimum death benefit guarantees.

MML BAY STATE LIFE INSURANCE COMPANY NOTES TO STATUTORY FINANCIAL STATEMENTS, continued
37
Information regarding the separate accounts of the Company as of and for the year ended December 31, 2017 is as follows: Guaranteed Nonindexed Less Than/ Non Equal to 4% Guaranteed Total (In Millions) Net premium, considerations or deposits for the year ended December 31, 2017 $ - $ 32 $ 32 Reserves at December 31, 2017: For accounts with assets at: Fair value $ - $ 3,336 $ 3,336 Amortized cost/book value 1,117 - 1,117 Subtotal 1,117 3,336 4,453 Non policy liabilities 1 10 11 Total $ 1,118 $ 3,346 $ 4,464 Reserves by withdrawal characteristics: Subject to discretionary withdrawal: At fair value $ - $ 3,336 $ 3,336 At book value without market value adjustment and current surrender charge of less than 5% 1,117 - 1,117 Subtotal 1,117 3,336 4,453 Non policy liabilities 1 10 11 Total $ 1,118 $ 3,346 $ 4,464 The Company does not have any reserves in separate accounts for asset default risk in lieu of AVR. The Company has a general account AVR of $5 million for book value separate accounts. The following is a reconciliation of amounts reported as transfers (from) to separate accounts in the Summary of Operations of the Company’s NAIC Separate Account Annual Statement to the amounts reported as net transfers (from) to separate accounts in change in policyholders’ reserves in the accompanying Statutory Statements of Operations: Years Ended December 31, 2017 2016 2015 (In Millions) From the Separate Account Annual Statement: Transfers to separate accounts $ 32 $ 34 $ 37 Transfers from separate accounts (76) (70) (82) Net transfers from separate accounts $ (44) $ (36) $ (45)

MML BAY STATE LIFE INSURANCE COMPANY NOTES TO STATUTORY FINANCIAL STATEMENTS, continued
38
11. Shareholder's equity MassMutual has authorized the contribution of funds to the Company sufficient to meet the capital requirements of each state in the U.S. in which the Company is licensed to do business. Substantially all of the statutory shareholder’s equity is subject to dividend restrictions. Dividend restrictions, imposed by state regulations, limit the payment of dividends to the shareholder without prior approval from the Department. Under these regulations, $30 million of shareholder’s equity is available for distribution to the shareholder in 2018 without prior regulatory approval. The Company did not pay a dividend to C.M. Life in 2017, 2016 or 2015.
12. Presentation of the Statutory Statements of Cash Flows
The following table presents those transactions that have affected the Company's recognized assets or liabilities but have not resulted in cash receipts or payments during the years ended December 31, 2017, 2016 and 2015. Accordingly, the Company has excluded these non-cash activities from the Statutory Statement of Cash Flows for the years ended December 31, 2017, 2016 and 2015.
Years Ended December 31, 2017 2016 2015 (In Millions) Bond conversions and refinancing $ 2 $ 1 $ 2
13. Business risks, commitments and contingencies
a. Risks and uncertainties
The Company operates in a business environment subject to various risks and uncertainties. The principal risks include insurance and underwriting risks, investment and interest rate risks and credit risk.
Insurance and underwriting risks
The Company prices its products based on estimated benefit payments reflecting assumptions with respect to mortality, longevity, persistency, interest rates and other factors. If actual policy experience emerges that is significantly and adversely different from assumptions used in product pricing, the effect could be material to the profitability of the Company. The Company reinsures certain life insurance policies to mitigate the impact of its underwriting risk.
Investment and interest rate risks
The fair value, cash flows and earnings of investments can be influenced by a variety of factors including changes in interest rates, credit spreads, equity markets, portfolio asset allocation and general economic conditions. The Company employs a rigorous asset/liability management process to help mitigate the economic impacts of various investment risks, in particular interest rate risk. By effectively matching the market sensitivity of assets with the liabilities they support, the impact of interest rate changes is addressed, on an economic basis, as the change in the value of the asset is offset by a corresponding change in the value of the supported liability.
The levels of U.S. interest rates are influenced by U.S. monetary policies and by the relative attractiveness of U.S. markets to investors versus other global markets. As interest rates increase, certain debt securities may experience amortization or prepayment speeds that are slower than those assumed at purchase, impacting the expected maturity of these securities and the ability to reinvest the proceeds at the higher yields. Rising interest rates may also result in a decrease in the fair value of the investment portfolio. As interest rates decline, certain debt securities may experience accelerated amortization and prepayment speeds than what was assumed at purchase. During such periods, the Company is at risk of lower net investment income as it may not be able to reinvest the proceeds at comparable yields. Declining interest rates may also increase the fair value of the investment portfolio.

MML BAY STATE LIFE INSURANCE COMPANY NOTES TO STATUTORY FINANCIAL STATEMENTS, continued
39
Interest rates also have an impact on the Company’s products with guaranteed minimum payouts and on interest credited to account holders. As interest rates decrease, investment spreads may contract as crediting rates approach minimum guarantees, resulting in an increased liability.
In periods of increasing interest rates, policy loans, surrenders and withdrawals may increase as policyholders seek investments with higher perceived returns. This could result in cash outflows requiring the Company to sell invested assets at a time when the prices of those assets are adversely affected by the increase in market interest rates, which could cause the Company to realize investment losses.
Credit and other market risks
The Company manages its investments to limit credit and other market risks by diversifying its portfolio among various security types and industry sectors as well as purchasing credit default swaps to transfer some of the risk.
Stressed conditions, volatility and disruptions in capital markets or financial asset classes can have an adverse effect on the Company, in part because the Company has a large investment portfolio and assets supporting the Company’s insurance liabilities are sensitive to changing market factors. Market factors, including interest rates, credit spread, equity prices, consumer spending, business investment, government spending, the volatility and strength of the capital markets, deflation and inflation, all affect the business and economic environment and, ultimately, the profitability of the Company’s business. Disruptions in one market or asset class can also spread to other markets or asset classes. Upheavals in the financial markets can also affect the Company’s business through their effects on general levels of economic activity, employment and customer behavior.
The CMBS, RMBS and leveraged loan sectors are sensitive to evolving conditions that can impair the cash flows realized by investors and is subject to uncertainty. Management’s judgment regarding OTTI and estimated fair value depends upon the evolving investment sector and economic conditions. It can also be affected by the market liquidity, a lack of which can make it difficult to obtain accurate market prices for RMBS and other investments, including CMBS and leveraged loans. Any deterioration in economic fundamentals, especially related to the housing sector could affect management’s judgment regarding OTTI.
The Company has investments in structured products exposed primarily to the credit risk of corporate bank loans, corporate bonds or credit default swap contracts referencing corporate credit risk. Most of these structured investments are backed by corporate loans and are commonly known as collateralized loan obligations that are classified as CDOs. The portfolios backing these investments are actively managed and diversified by industry and individual issuer concentrations. Due to the complex nature of CDOs and the reduced level of transparency to the underlying collateral pools for many market participants, the recovery in CDO valuations generally lags the overall recovery in the underlying assets. Management believes its scenario analysis approach, based primarily on actual collateral data and forward looking assumptions, does capture the credit and most other risks in each pool. However, in a rapidly changing economic environment, the credit and other risks in each collateral pool will be more volatile and actual credit performance of CDOs may differ from the Company’s assumptions.
The Company continuously monitors its investments and assesses their liquidity and financial viability; however, the existence of the factors described above, as well as other market factors, could negatively impact the market value of the Company's investments. If the Company sells its investments prior to maturity or market recovery, these investments may yield a return that is less than the Company otherwise would have been able to realize.
Asset-based fees calculated as a percentage of the separate account assets are a source of revenue to the Company. Gains and losses in the investment markets may result in corresponding increases and decreases in the Company’s separate account assets and related revenue.
Political Uncertainties
Political events, such as the ongoing volatility with respect to the European Union, may trigger or exacerbate the risk factors described above. Whether those underlying risk factors are driven by politics or not, the Company’s dynamic approach to managing risks enables management to utilize the mitigating actions described above to attempt to reduce the potential impact of each underlying risk factor on the Company.

MML BAY STATE LIFE INSURANCE COMPANY NOTES TO STATUTORY FINANCIAL STATEMENTS, continued
40
b. Guaranty funds The Company is subject to state insurance guaranty fund laws. These laws assess insurance companies amounts to be used to pay benefits to policyholders and policy claimants of insolvent insurance companies. Many states allow these assessments to be credited against future premium taxes. The Company believes such assessments in excess of amounts accrued will not materially impact its financial position, results of operations or liquidity. c. Litigation and regulatory matters In the normal course of business, the Company is involved in disputes, litigation and governmental or regulatory inquiries, administrative proceedings, examinations and investigations, both pending and threatened. These matters, if resolved adversely against the Company or settled, may result in monetary damages, fines and penalties or require changes in the Company’s business practices. The resolution or settlement of these matters is inherently difficult to predict. Based upon the Company’s assessment of these pending matters, the Company does not believe that the amount of any judgment, settlement or other action arising from any pending matter is likely to have a material adverse effect on the statement of financial position. However, an adverse outcome in certain matters could have a material adverse effect on the results of operations for the period in which such matter is resolved, or an accrual is determined to be required, on the financial statement financial position, or on our reputation. The Company evaluates the need for accruals of loss contingencies for each matter. When a liability for a matter is probable and can be estimated, the Company accrues an estimate of the loss and any related insurance recoveries, if any. An accrual is subject to subsequent adjustment as a result of additional information and other developments. The resolution of matters are inherently difficult to predict, especially in the early stages of matter. Even if a loss is probable, due to many complex factors, such as speed of discovery and the timing of court decisions or rulings, a loss or range of loss may not be reasonably estimated until the later stages of the matter. For matters where a loss is material and it is either probable or reasonably possible then it is disclosed. For matters where a loss may be reasonably possible, but not probable, or is probable but not reasonably estimated, no accrual is established, but the matter, if material, is disclosed. The Company is not able to provide a reasonable estimate of the aggregate range of any reasonably possible losses related to these matters. 14. Related party transactions Pursuant to a management agreement, MassMutual, for a fee, furnishes the Company, as required, operating facilities, human resources, computer software development and managerial services. Investment and administrative services are also provided to the Company pursuant to a management services agreement with MassMutual. While management believes that these fees are calculated on a reasonable basis, these fees may not necessarily be indicative of the costs that would have been incurred on a stand-alone basis. The following table summarizes the transactions between the Company and the related parties: Years Ended December 31, 2017 2016 2015 (In Millions) Fee income: Recordkeeping and other services $ 1 $ 1 $ 1 Investment advisory income 2 2 2 Fee expense: Management and service contracts and cost-sharing arrangements 9 9 9 The Company reported less than $1 million as amounts due from affiliates as of December 31, 2017 and 2016. The Company reported $1 million as amounts due to affiliates as of December 31, 2017 and $2 million as of December 31, 2016. Terms generally require settlement of these amounts within 30 to 90 days.

MML BAY STATE LIFE INSURANCE COMPANY NOTES TO STATUTORY FINANCIAL STATEMENTS, continued
41
The Company has a Modco quota-share reinsurance agreement with MassMutual where the Company cedes 100% of the premium on certain bank-owned life insurance policies. In return, MassMutual pays the Company a stipulated expense allowance, death and surrender benefits. The Company retains the assets and related reserves for payment of future benefits on the ceded policies. The Modco adjustment is the mechanism by which MassMutual funds the reserve on the reinsured portion of the risk. It is needed to adjust for the financial effect of the Company holding the reserves on the ceded coverage rather than MassMutual. The Company also has a stop-loss agreement with MassMutual under which the Company cedes claims which, in aggregate, exceed 1.24% of the covered volume for any year, with maximum coverage of $25 million above the aggregate limit. The aggregate limit was $27 million in 2017, $27 million in 2016 and $28 million in 2015, and it was not exceeded in any of the years. The Company has a quota-share reinsurance agreement with MassMutual in which MassMutual assumes specific plans of insurance on a yearly renewable term basis. As of December 31, 2017, the net amounts due from MassMutual for the various reinsurance agreements were $23 million and as of December 31, 2016, the net amounts due from MassMutual were $27 million. These outstanding balances are due and payable with terms ranging from monthly to annually, depending on the agreement in effect. The following summarizes the related party reinsurance transactions between the Company and MassMutual: Years Ended December 31, 2017 2016 2015 (In Millions) Premium expense ceded, related to: Quota-share reinsurance agreements (6) (7) (7) Modco adjustments ceded, included in fees and other expense (14) (9) (15) Expenses allowances on reinsurance ceded, included in fees and other expense, related to: Modco agreements 6 6 6 Policyholders' benefits ceded, related to: Modco agreements 14 8 14 Quota-share reinsurance agreements 3 5 2 Experience refunds (paid) received, related to: Modco agreements (1) - -
15. Subsequent events
Management of the Company has evaluated subsequent events through February 21, 2018, the date the financial statements were available to be issued. No events have occurred subsequent to the date of the Statements of Financial Position and before the date of evaluation that would require disclosure.

MML BAY STATE LIFE INSURANCE COMPANY NOTES TO STATUTORY FINANCIAL STATEMENTS, continued
42
16. Subsidiaries and affiliated companies
A summary of ownership and relationship of MassMutual and its subsidiaries and affiliated companies as of December 31, 2017 is illustrated below. Subsidiaries are wholly owned, except as noted.
Subsidiaries of Massachusetts Mutual Life Insurance Company C.M. Life Insurance Company MML Mezzanine Investor L, LLC Berkshire Way MML Special Situations Investor LLC Timberland Forest Holding LLC WP – SC, LLC – 81% (remaining 19% owned by C.M. Life Insurance Company) MSP – SC, LLC Country Club Office Plaza LLC – 88% (remaining 12% owned by C.M. Life Insurance Company) Insurance Road LLC MM Copper Hill Road LLC Invicta Advisors LLC Jefferies Finance LLC– 50% (remaining 50% owned by Jefferies Group, Inc.) MassMutual Retirement Services, LLC MML Distributors LLC – 99% (remaining 1% owned by MassMutual Holding LLC) MML Investment Advisers, LLC MML Mezzanine Investor, LLC MML Strategic Distributors, LLC The MassMutual Trust Company, FSB MassMutual Asset Finance LLC MassMutual Mortgage Lending LLC MML Private Placement Investment Company I, LLC MML Private Equity Fund Investor LLC MM Private Equity Intercontinental LLC Pioneers Gate LLC MassMutual Holding LLC MassMutual International, LLC MML Management Corporation MML Mezzanine Investor II, LLC MML Mezzanine Investor III, LLC MassMutual External Benefits Group LLC Subsidiaries of C.M. Life Insurance Company MML Bay State Life Insurance Company CML Mezzanine Investor, LLC CML Mezzanine Investor L, LLC CML Mezzanine Investor III, LLC CML Special Situations Investor LLC Subsidiaries of MML Bay State Life Insurance Company (No subsidiaries)

MML BAY STATE LIFE INSURANCE COMPANY NOTES TO STATUTORY FINANCIAL STATEMENTS, continued
43
17. Impairment listing for loan-backed and structured securities The following are the total cumulative adjustments and impairments for loan-backed and structured securities since July 1, 2009:
Period Ended
Amortized Cost before
Cumulative Adjustment
Cumulative Adjustment
Amortized Cost before OTTI
Projected Cash Flow
Recognized OTTI
Amortized Cost after OTTI Fair Value
December 31, 2017 $ - $ - $ - $ - $ - $ - $ - September 30, 2017 - - - - - - - June 30, 2017 342.38 - 342.38 266.85 (75.53) 266.85 2,967.48
March 31, 2017 94,423.73 - 94,423.73 53,149.44 (41,274.29) 53,149.44 89,278.88
December 31, 2016 110,963.64 - 110,963.64 109,147.27 (1,816.37) 109,147.27 104,907.61
September 30, 2016 118,384.00 - 118,384.00 117,539.00 (845.00) 117,539.00 112,771.00
June 30, 2016 76,836.92 - 76,836.92 70,384.74 (6,452.18) 70,384.74 72,517.43
March 31, 2016 - - - - - - - December 31, 2015 - - - - - - - September 30, 2015 79,533.44 - 79,533.44 77,196.59 (2,336.85) 77,196.59 76,960.70
June 30, 2015 - - - - - - - March 31, 2015 - - - - - - - December 31, 2014 7,387.14 - 7,387.14 5,752.25 (1,634.89) 5,752.25 24,010.12
September 30, 2014 - - - - - - - June 30, 2014 - - - - - - -
March 31, 2014 11,681.75 - 11,685.75 11,342.00 (339.75) 11,342.00 13,573.02
December 31, 2013 8,955.12 - 8,955.12 7,966.58 (988.54) 7,966.58 11,477.00
September 30, 2013 5,946.55 - 5,946.55 5,842.35 (104.20) 5,842.35 5,478.02
June 30, 2013 456,120.47 - 456,120.47 445,397.36 (10,723.11) 445,397.36 340,976.95
March 31, 2013 - - - - - - - December 31, 2012 1,242,595.82 - 1,242,595.82 1,144,981.30 (97,614.52) 1,144,981.30 1,195,404.80
September 30, 2012 2,265,155.66 - 2,265,155.66 2,103,073.10 (162,082.56) 2,103,073.10 2,115,758.98
June 30, 2012 1,884,017.51 - 1,884,017.51 1,845,692.12 (38,325.39) 1,845,692.12 1,521,643.03
March 31, 2012 3,900,635.45 - 3,900,635.45 3,788,244.00 (112,391.45) 3,788,244.00 3,066,813.39
December 31, 2011 3,900,657.97 - 3,900,657.97 3,740,566.23 (160,091.74) 3,740,566.23 3,217,415.48
September 30, 2011 2,070,736.56 - 2,070,736.56 2,014,120.98 (56,615.58) 2,014,120.98 1,664,098.87
June 30, 2011 4,933,708.07 - 4,933,708.07 4,626,546.26 (307,161.81) 4,626,546.26 3,860,445.21
March 31, 2011 3,031,095.16 - 3,031,095.16 2,949,182.01 (81,913.15) 2,949,182.01 2,370,633.14
December 31, 2010 2,843,612.77 - 2,843,612.77 2,795,485.61 (48,127.16) 2,795,485.61 2,189,660.73
September 30, 2010 3,666,522.50 - 3,666,522.50 3,544,040.19 (122,482.31) 3,544,040.19 2,935,439.96
June 30,2010 2,331,449.06 - 2,331,449.06 2,200,016.30 (131,432.76) 2,200,016.30 1,658,548.15
March 31, 2010 3,606,733.30 - 3,606,733.30 3,269,443.64 (337,289.66) 3,269,443.64 2,259,716.96
December 31, 2009 4,888,306.08 - 4,888,306.08 4,101,772.99 (786,533.09) 4,101,772.99 2,994,613.30
September 30, 2009 10,338,098.79 207,960.30 10,546,059.09 9,768,287.29 (777,771.80) 9,768,287.29 6,661,983.49
Totals $ 207,960.30 $ (3,286,423.69)
There were no impairments on loan-backed or structured securities for the three months ended December 31, 2017. There were no impairments on loan-backed or structured securities for the three months ended September 30, 2017.

MML BAY STATE LIFE INSURANCE COMPANY NOTES TO STATUTORY FINANCIAL STATEMENTS, continued
44
The following is the impairment listing for loan-backed and structured securities for the three months ended June 30, 2017:
CUSIP
Amortized Cost before
Cumulative Adjustment
Cumulative Adjustment
Amortized Cost before OTTI
Projected Cash Flow
Recognized OTTI
Amortized Cost after OTTI Fair Value
86358RLG0 $ 342.38 $ - $ 342.38 $ 266.85 $ (75.53) $ 266.85 $ 2,967.48
The following is the impairment listing for loan-backed and structured securities for the three months ended March 31, 2017:
CUSIP
Amortized Cost before
Cumulative Adjustment
Cumulative Adjustment
Amortized Cost before OTTI
Projected Cash Flow
Recognized OTTI
Amortized Cost after OTTI Fair Value
22541QJR4 $ 7,034.17 $ - $ 7,034.17 $ 33.78 $ (7,000.39) $ 33.78 $ 4,334.02 86358RA23 87,389.56 - 87,389.56 53,115.66 (34,273.90) 53,115.66 84,944.86
Totals $ 94,423.73 $ - $ 94,423.73 $ 53,149.44 $ (41,274.29) $ 53,149.44 $ 89,278.88
18. Structured Notes A structured note is a direct debt issuance by a corporation, municipality, or government entity, ranking pari-passu with the issuer’s other debt issuance of equal seniority where either: (a) the coupon and/or principal payments are linked, in whole or in part, to prices or payment streams from index or indices, or assets deriving their value from other than the issuer’s credit quality, or (b) the coupon and/or principal payments are leveraged by a formula that is different from either a fixed coupon, or a non-leveraged floating rate coupon linked to an interest rate index, including but not limited to LIBOR or the prime rate. As structured notes are issuer obligations without a trust, they are within the scope of SSAP No. 26R, Bonds. Structured notes are different than the asset backed structured securities, which are accounted for under SSAP No. 43R, Loan-Backed and Structured Securities, as they lack either a trust or assets backing them. The disclosure below allows regulators to assess the volume of activity in structured notes and to determine whether additional accounting or reporting revisions, such as valuation and risk-based capital, are needed. To satisfy this request, the Company is required to separately identify structured notes, on a CUSIP basis and provide information by CUSIP for actual cost, fair value, book/adjusted carrying value, and whether the structured note is a mortgage-referenced security. The following sets forth the actual cost, fair value and carrying value of structured notes as of December 31, 2017:
CUSIP Identification Actual Cost Fair Value
Book / Adjusted Carrying Value
Mortgage-Referenced Security (YES/NO)
391164AF7 $ 526,870 $ 516,376 $ 512,467 NO Total $ 526,870 $ 516,376 $ 512,467 XXX

LA2047