Embed Size (px)
Citation preview
Report No. 5533-MAS
MauritiusAdjustment and GrowthCountry Economic MemorandumApril 11, 1985
Country Programs Department 11Eastern and Southem Africa Region
FOR OFE iCIAL USE ONLY
~~~ ,J-~,,,-
:, * j F 7 2 _ g ~~~~~~~~~~~~~~~~~~~~~~~~~~~~~~~~--t--.0- - - i -
-~ ~ , . .-- - ' - ,- , - ,
- .. --
Document of the World Bank
This document has a restricted distribution and may be used by recipientsonly in the performanceof theirofficial duties. Its contents may not otherwisebe disclosed without World Bank authorization.
Pub
lic D
iscl
osur
e A
utho
rized
Pub
lic D
iscl
osur
e A
utho
rized
Pub
lic D
iscl
osur
e A
utho
rized
Pub
lic D
iscl
osur
e A
utho
rized
Pub
lic D
iscl
osur
e A
utho
rized
Pub
lic D
iscl
osur
e A
utho
rized
Pub
lic D
iscl
osur
e A
utho
rized
Pub
lic D
iscl
osur
e A
utho
rized
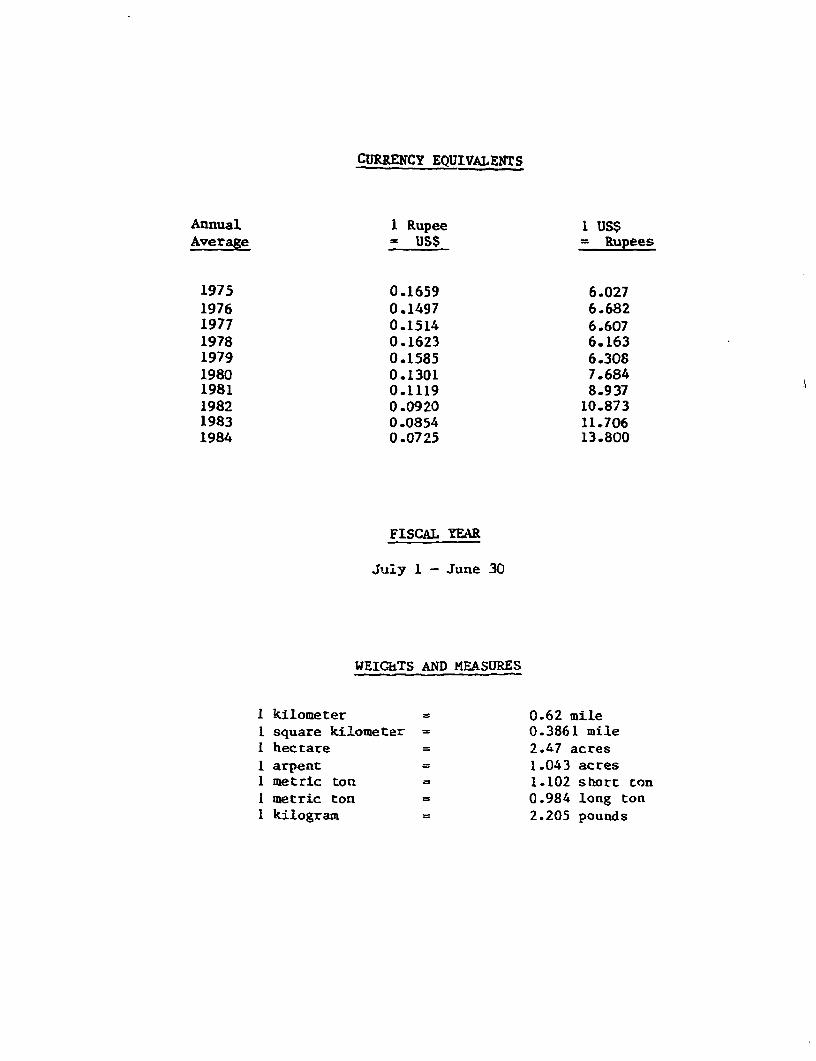
CURRENCY EQUIVALENTS
Annual 1 Rupee 1 US$Average = USS = Rupees
1975 0.1659 6.0271976 0.1497 6.6821977 0.1514 6.6071978 0.1623 6.1631979 0.1585 6.3081980 0.1301 7.6841981 0.1119 8.9371982 0.0920 10.8731983 0.0854 11.7061984 0.0725 13.800
FISCAL YEAR
july 1 - June 30
WEIGhTS AND MEASURES
1 kilometer = 0.62 mileI square kilometer = 0.3861 mileI hectare 2.47 acresI arpent 1.043 acres1 metric ton = 1.102 short ton1 metric ton 0.984 long ton1 kilogram = 2.205 pounds
(i) FOR OFFICIAL USE ONLY
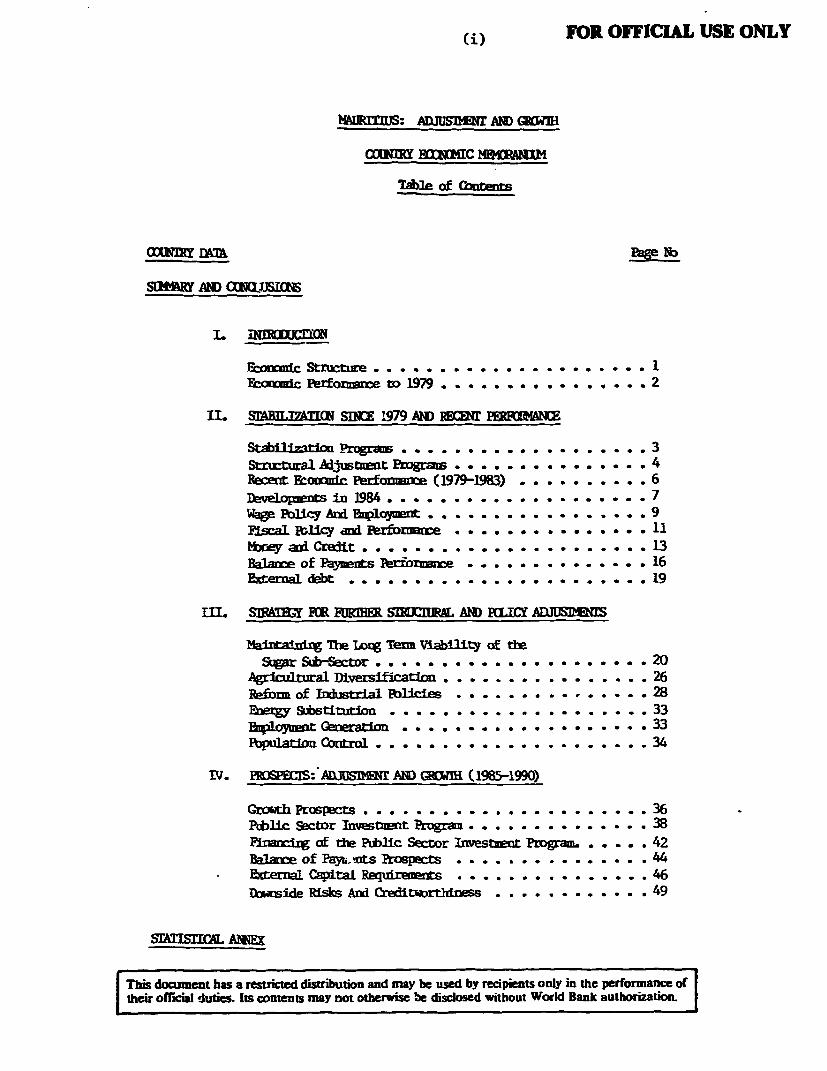
MAIRTUS: AD TUSnfr AM GRa
wmxarmic Muu~
Tdae of Qxitens
axrN DMfge No
SU*M A IXUXUfSlOS
Fcsixc Strnktwe . . . . . . . . . . . . . . . . . . . . . 1iaormdc Pexfonrmame t 1979 . . . .*. . . .. . .. . . . . 2
-I. SnB.IZ SE 1979 AND ES= MOM=
St ai1i~.t1on Prcrw . . . . . . . . . . . ........ 3Structural Adjisnzt Progrm . . . . . . . . ....... 4Reent Ecmic Perfomnae (1979-1983) . . . . . . . . . . 6Deveioaets in 1984 . . . . . . . . . . . . . . . . . . . . 7Wage Poicy Arxl Bloyment . . . . . . . . . . . . . . . .. 9Fiscal PrUcy and PErfiormne . . . . . . . . . . .... . .. . 11Mnq anl Credit . . . . .. . . . . . . . . .* . . . . . .* . 13Bialae of Payments Derfornmme . . . . . . . . . . . . . . 16
125ctrnaldebt. . .. a. .. .. .. . .. .. ...... ................... 19
Ila. SAMEYKNR KUREM sSMUtRL AMD ELa! ADJSE
MIentaJming The Log Tern Viability of theipr SRh-Sector . . . . . . .. a ... .. . . ... . . . O 20
Agricxd.tra:L Diversification .. . .. . 26Refonn of Industrial Eblicies . . . . . . . . . . . 28Energy Ststivjtim, . . . . . . . . . . . .. 33
7macm1t Gnatliou ....... 33Population GCntrol . . . . . . . . . . . .. . . . 34
IV. FRSPE1S: AUJUSMEN! ANDGROM (1985-1990)
Growth Prospects . . . . . . . . . . . ... 36Pcblic Sector Investent Program . . . .. 38Finaring of the Piblic Setor lnvesbxmt PLgram. .. .. . 42Balaxe of PqEytj,ts Prospects . . . . . . . . . .. 44Thcternal Capitad Reqnrxe ts ....... .. . . . . . . 46Dlaside R1s And Creitworthirms . . . . .49
SIATI GNL Ae
This document has a restrited distribution and may be used by recipients only in the performance oftheir offcial duties Its contents may not otherwise be disclosed without World Bank authorization.
(i)
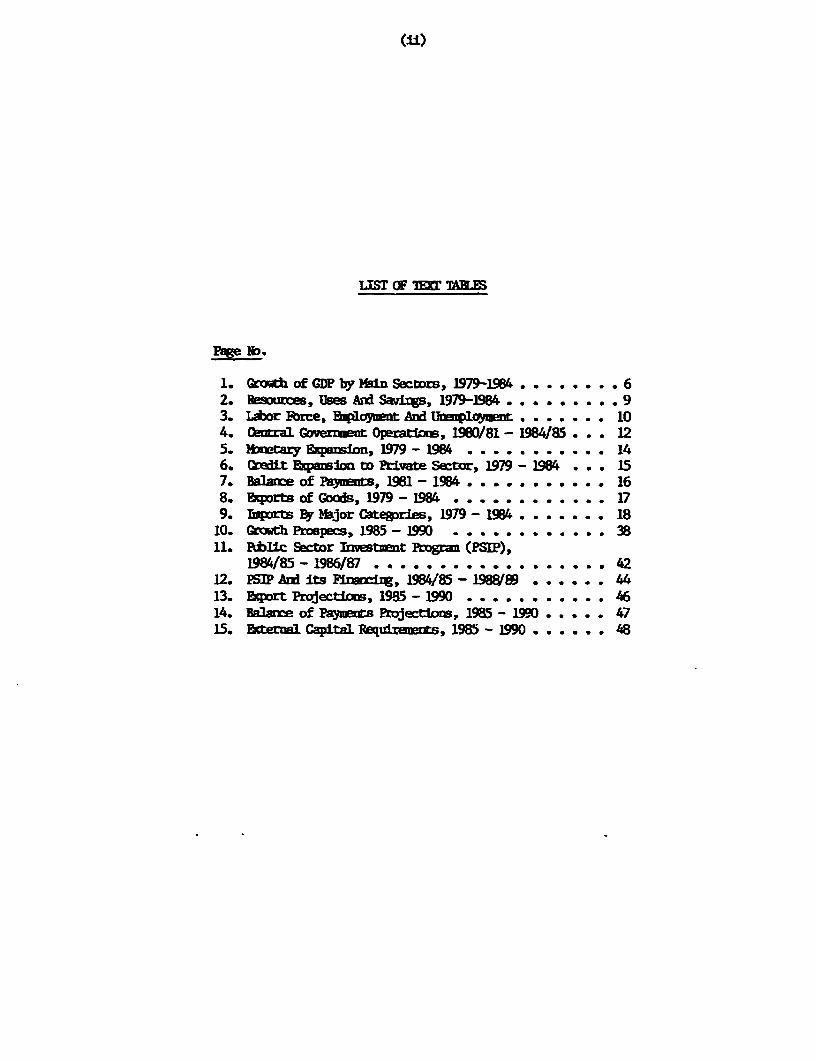
LIST OF M= TANS
1. wh of GDP by Main SCrs, 1979-19B4 6...... 62. Ire, Us6 Ard Savrgs, 1979-1984 9......093. Labor Farce. loyu2nt And Uimz1ouen . . .. ... . 104. OmatraJ Gaverrment Operatkm, 1980/81 - 1984/85. .. 125. Ymtr Eminn L97 - 1984 o........ 146. (oit EpmIion m Private Sector, 1979 - 1984 . . . 157. Balame of Paymews, 1981-194 .. . . ...... 168. iSports of Goods, 1979-18 . . -... . .. 0. 179. 1rport ByMjorCate,ries. 1979 -1984. *.... 18
10. GrowthProspecs, 1985 - 1990 .......... 3811. Pbl±c Sector Invtieznt Progg (PSP),
1984/85 - 1986/87 .0..0 ...... * *.... 4212. PSP An! its Fiz?rg, 1984/85 - 198889 . . . .0 . . 4413. Eqxort ProjectLoks, 1985 -1990 *. . . . . . . . 4614. Ba1 of paymmrs Ppro,ject1, 1985 - 1990 ..... 4715. a 1erid capital RePqxeimts, 1985 - 1990 . . . . . . 48
(ii)
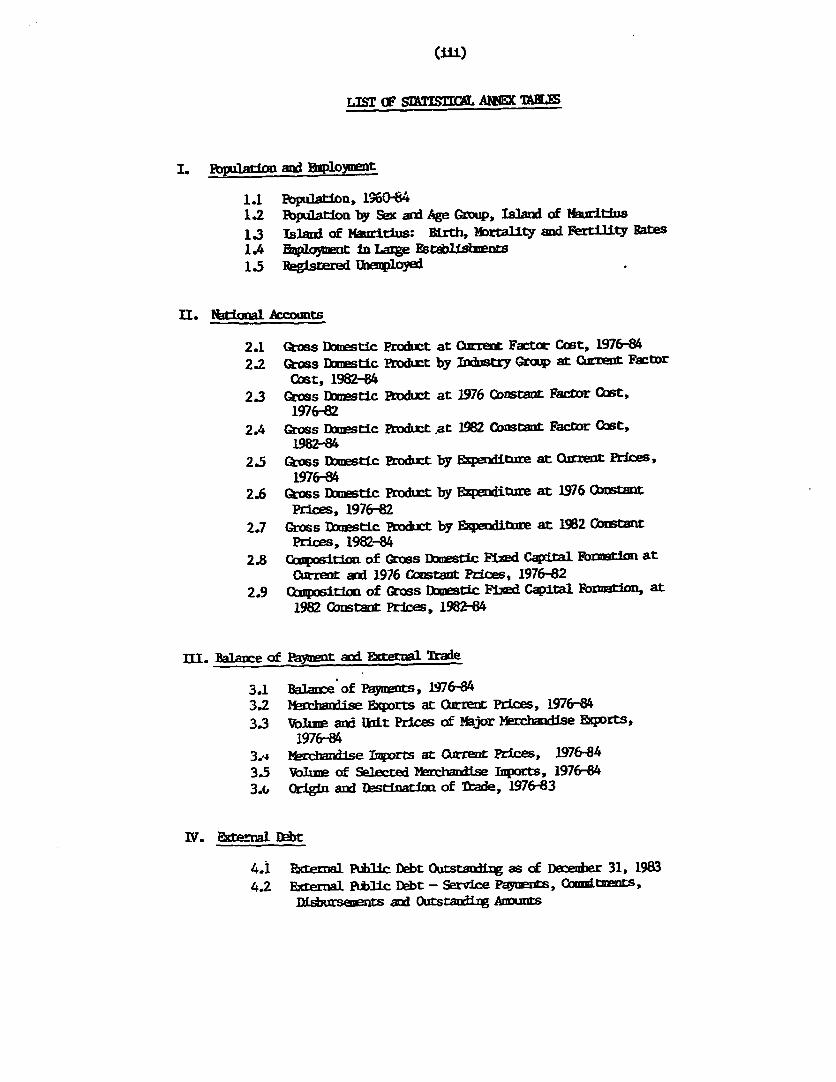
LIS OF S1ATISML AN= MOM
I. Ebplaati and Bnployuft
1.1 1bPUJtioQ. 196O-641.2 Pobpulation by SEx and Age Group, Island of HMritlus1.3 Islad of Mzwitis: lBrth, Mortality and Fertility Rates1.4 eoyDet i Lage Estcbiss1.5 Re&stered U poyed
II. National Accotts
2.1 Gross Domestic prodlut at current Fawtr Cost, 1976-842.2 Gross 1ntic Product by Industry Group at Cwrreat Factor
Cost, 1982-842.3 Gross Dkmestic Product at 1976 Constant FactDr cost,
1976-822.4 Gross Ikmstic Rduct at 1982 Coostant FactOr Cost,
1982-842.5 Gross Jmestic Produc Expyaxiture at Qrert Erices,
1976-842.6 Gross lDomstlc Produrt by Expeiture at 1976 Cottnt
Plres, 1976-822.7 Gross Dkistic Product .by lptditure at 1982 Costant
Prices, 1982-842.8 Gcomasitioa of Gmoss Domestic Fied Cptal Fbnutin at
irrent and 1976 Coxtant PLces, 1976-822.9 Ccaposition. of Gross DoTstsic F1Ed Capital FEnition, at
1982 Ciostat Prices, 1982-84
MI. Balane of Payint and Eternal Trade
3.1 Ba of Payments, 1976843.2 trlhridise Exports at Qirrert Prices, 1976-843.3 Volum and Unit Prices cf Major Mechadise Exports,
1976,843.'. sr dse bports at Qrren Praces, 1976-843.5 ol;re of Selted Merchaniise I1ports, 1976-843.L, OrigLn and Btinatim of frade, 1976-83
1NV7 Exteral DE!bt
4.1 External Public Debt Outstandig as of Deeuber 31, 19834.2 External RPblic Debt - Service Payments, C=W tments,
Disbsnts ad Ourts tanig Anounts

(iv)
V. Public Fliexae
5.1 Budgetary Operatior, 1975/76 - 1984W855.2 Pem.e and Grants, 1980/81 - 1984/855.3 Cnolidated Public Sector Remem Aounts,
1978/80 - 1984/855.4 Econamic Classi.fcation of Bxgetary Expeditues,
1979/80 - 1984/855.5 Rmctlonal Classificaion of Recurrent Expeditur,
1979/80 - 1984/855.6 Public Sector Corolidate Firial Acounts, 1979/80 -
1984/855.7 Finaoial Accounts of Non4innocial. Public Enterprises,
1979/80 - 1984/85
VI. Monetary Statistics
6.1 M,rtary Survey, 1979-846.2 Sunaxy Accounts of the Bark of Mauitius, 1979-846.3 Sumary Accouts of °mwmiia1 Ba*.s, 1979-46.4 Cedit to the Private Sector, 1980-846.5 Priuipal Interest Rates
II. Agrla tatistics
7.1 Area Harvested, Yield and Poduction of Cam and Sugar,1975-83
7.2 Frequency Distributim of Sugar Planters aid LandHoldirgs, 1974-84
7.3 SWr Productiom and Dis l, 1974-847.4 Sr Pmduction by Mill and Regim, 1974-837.5 Producer Prices and Export Tmres for Sugar, 1977T837.6 Sgar Sales Proceeds, 19847.7 Foodcrop Producetion
II. Ocber
8.1 Average Pbnthly Salarles and Wages by Selected Sectors,1980-83
8.2 GDnsumer Price Tnlces, 1976-838.3 Distribution of Iuse]iold Ixra, 1979
(v)
MAURITIUS - ECONCOIC INDICATORS
GROSS DOMESTIC PRODUCT IN 1984 1/
Annual rates of Grovth 2/USS Mln. % 1978-82 1982-84
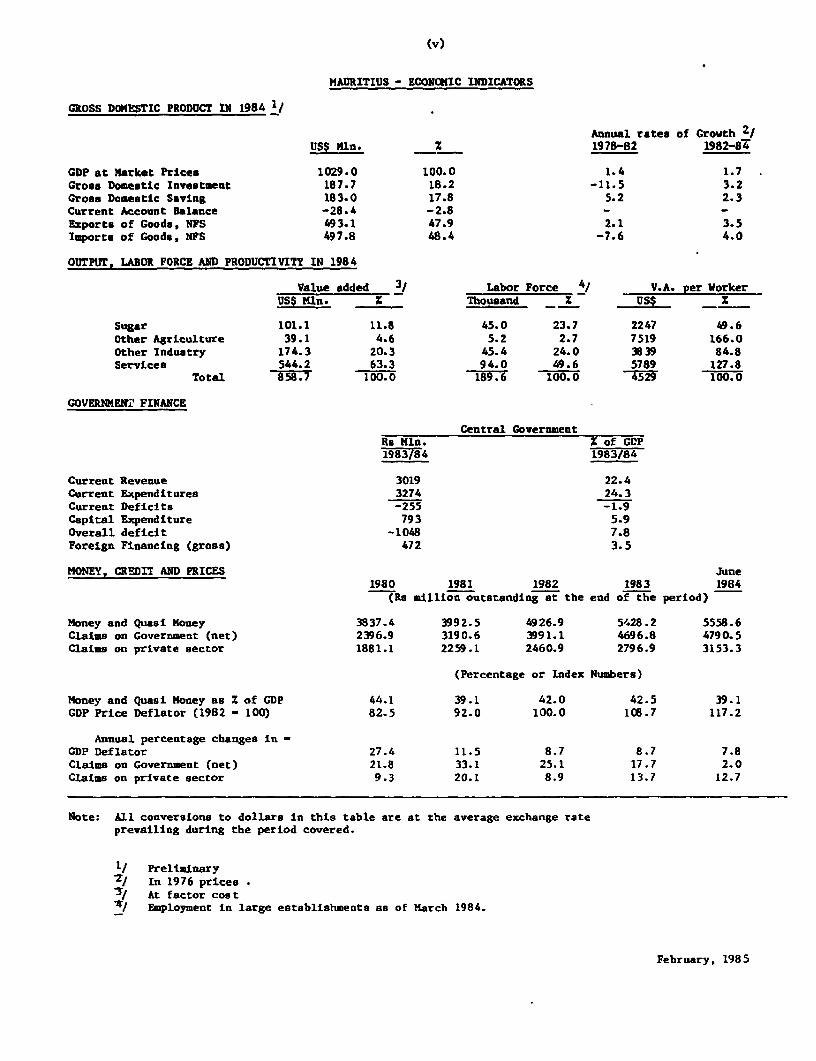
GDP at Market Prices 1029.0 100.0 1.4 1.7Gross Domestic Investment 187.7 18.2 -11.5 3.2Gross Domestic Saving 183.0 17.8 5.2 2.3Current Account Balance -28.4 -2.8Exports of Goods, NFS 493.1 47.9 2.1 3.5Imports of Goods, NFS 497.8 48.4 -7.6 4.0
OUTPUT, LABOR FORCE AND PRODUCTIVITY IN 1984
Value added 3I Labor Force 4/ V.A. per WorkerUS$ Mln. Z Thousand _ US$ Z
Sugar 101.1 11.8 45.0 23.7 2247 49.6Other Agriculture 39.1 4.6 5.2 2.7 7519 166.0Other Industry 174.3 20.3 45.4 24.0 3839 84.8Services 544.2 63.3 94.0 49. 6 5789 127.8
Total 858 7 100.0 189.6 100.0 4529 100.0
GOVERNMEN'i' FINANCE
Central GovernmentRe Mln. Z of GDP1983/84 1983/84
Current Revenue 3019 22.4Current Expenditures 3274 24.3Current Deficits -255 -1.9Capital Expenditure 793 5.9Overall deficit -1048 7.8Foreign Financing (gross) 472 3.5
MONEY, CREDIT AND PRICES June1980 1981 1982 1983 1984
(Re million outstanding at the end of the period)
Money and Quasi Money 3837.4 3992.5 4926.9 5428.2 5558.6Claims on Government (net) 2396.9 3190.6 3991.1 4696.8 4790.5Claims on private sector 1881.1 2259.1 2460.9 2796.9 3153.3
(Percentage or Index Numbers)
Money and Quasi Money as Z of GDP 44.1 39.1 42.0 42.5 39.1GDP Price Deflator (1982 - 100) 82.5 92.0 100.0 10B.7 117.2
Annual percentage changes in -GDP Deflator 27.4 11.5 8.7 8.7 7.8Claims on Government (net) 21.8 33.1 25.1 17.7 2.0Claims on private sector 9.3 20.1 8.9 13.7 12.7
Note: All conversions to dollars in this table are at the average exchange rateprevailing during the period covered.
I/ Preliminary'Z/ In 1976 prices
At factor costt/ Employment in large establishments as of March 1984.
February, 1985

(vi)
MAURITIUS - TRADE, PAYT1NTS AND CAPITAL FLOWS
BALANCE OF PAYMENTS MERCHANDISE EXPORTS (AVERAGE 1980 - 83)
1961 1982 1983 1984 1ICUSS Million)
US$ ol. X
Excports of Coods, UPS 494.7 504.3 508.5 509.5 Sugar 229.8 61.1Imports of Goods, NFS 614.2 536.2 511.3 522.2 Molasses 9.3 2.5Resource Gap -119.5 -31.9 -26.0 -12.7 Tea 6.4 1.7
Clothing. 81.0 21.5Investment Income (net) -45.5 -45.7 -41.0 -41.9 Other products 41.4 11.0Net Transfers 17.3 30.7 19.4 27.4 Re-exports 6.4 2.2Current Account Balance -147.8 -46.9 -24.3 -27.2
Total 376.2 100.0Long-term Capital 7.8 1.5 0.9 5.9Net ItLT borrowing: 36.8 81.0 -21.4 68.8
Disbursements (49.1) (105.7) (31.6) (111.6) EXTERNAL DEST, DECEBUER 31, 1984Amortlzation (12.3) (24.7) (53.0) (42.8) (US$ million)
Other capital (net) 2/ 1.8 -16.5 0.8 -11.3Public Debt, outstanding and 413.2
Change in Reserves 101.4 -19.1 44.0 -36.2 disbursed( (-) - increase)
DEBT SERVICE RATIO FOR 1984Memo item
Use of-SDRe -7.3 - - - Public Debt, incl. guaranteed 17.8 3/Use of IMF credit 64.4 33.0 14.7 -9.8
1BRD/IDA LENDING (December 31, 1984)0SS million)
RATE OF EXCUANCE IBRD IDA
1981 1982 1983 1984 Outstanding & Disbursed 106.74 20.19US3l.08.937 US$1. 010.873 US01.0-11.706 US$1.0-13.801 Undisbursed 78.51 -R10-US$0.1119 R1.OU-S$0.92 RIlO.US$0085 R1 -U-S$O.073 Outstanding including 185.25 20.19
undisbursed
I/ Preliminary_/ Includes short-term private capital, SDR allocation and errors and omissionsi Debt service payments (excludlng IMF repayments) as percentage of estimated export earnings.
February 1985
(vii)T A B L IUA PACE I
NAURITIUS - SOCIAL INDICATORS DNTA SHEETRAURITIUS RMORE u rLI3uPw-rICHTD AVur lsr-
MOST (MOST RECENT ESTIMATE) LbRECENr AlDnLE INCOME HIDOLE I NCORr
Iqeolk 1970To EsTtNATILi AFRICA S. OF SAHARA N. AFRICA A HID EAST
AMA (THUSD A . I S -)TOTAL I.9 1.9 1.9ACRICULTUIJAL 3.0 3.1 1.1
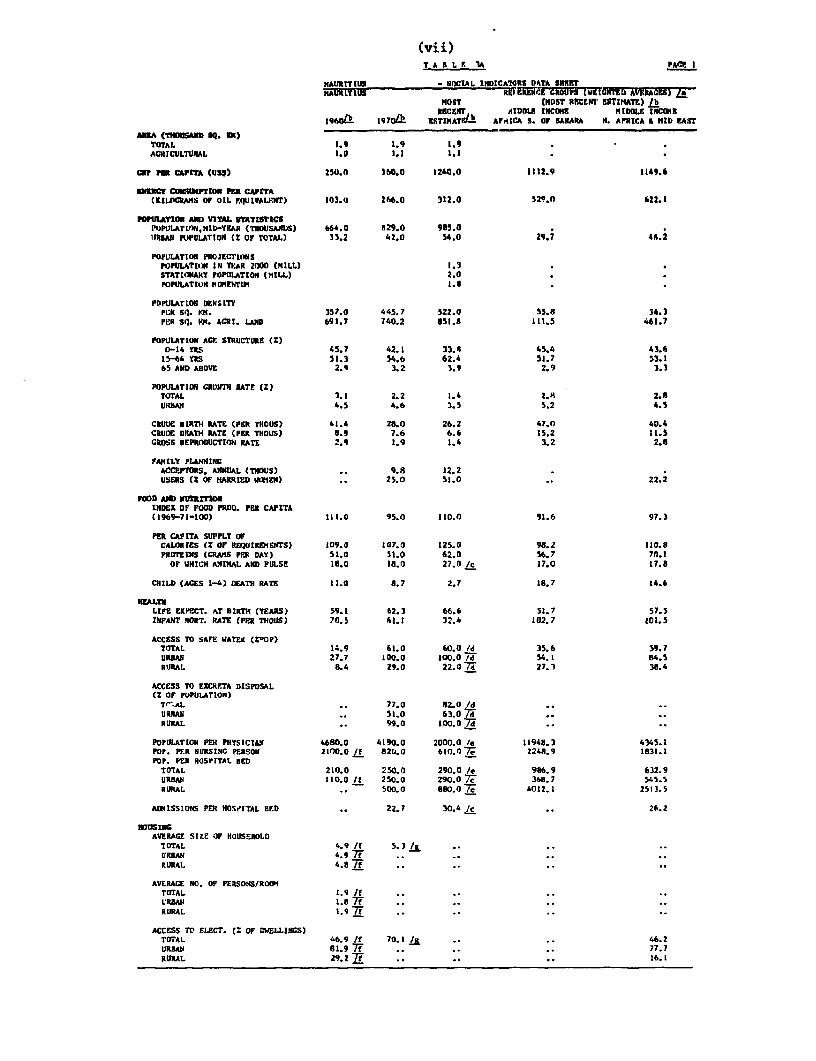
CGNPC CAPITA (US) 250.0 360.0 3240.0 1112.9 1149.6
Ymmc CmNSUMnION PE CAPITACSILOCMMs or OIL rQUIVALSNT) 103.a 266.0 312.0 529.n 622.1
rOPtHATOU AlD VITAL EtTATSTCSPOPlLATION,MHD-YEAR (THOUSANDS) 664.0 329.0 935.0IRSAN POPULATION (Z OF TOTAL) 31.2 42.0 54.0 29.7 4L2
POPULATtON PROJCTI(oNSPOPUIATION IN TEAR 2000 (MILL) .3.STATIONARY POPULATION (MILL) 2.0POPULATION II WFNTLH 1..
POPULATION DENSITYPC3 SQ. nK. 357.0 445.7 522.0 55.8 36.3PER Sq. M. ACRI. LAND 691.7 740.2 653.5 313.5 461.7
POPUlATION Ag: STRUCTUCE (Z)0-14 YRS 45.7 42.1 33.8 45.4 43.6
15-64 YI5 51.3 54.6 62.4 5s.7 53.165 AND ABOVE 2.9 3.2 3.9 2.9 3.3
POPUATION GROUt RATE (z)TOTAL 3.1 2.2 1.4 2.8 2.6URBAN 4.5 4.6 3.5 5.2 6.5
CRUDE BIRTH RATE (PER TubOS) 41.4 26.0 26.2 47,0 40.4CRUDE DEATH RATE (PR TrHOUS) E.9 7.6 6.6 15.2 1L.5CROSS REPRODUCTION RATE 2.9 1.9 1.4 3.2 2.6
FANtLY PLAPINGACCEPTORS. ANNUAL (THOUS) .. 9.8 12.2USERS (z OF HARRIED iZEN) . 25.0 51.0 .. 22.2
FOOD AND NUTRITIONINDEX OF FOOD PROD. PER CAPITA(1969-71-100) 133.0 1s.o 110.0 91.6 97.3
PER CAPITA SUPPLY OFCALORrEs (Z OF REquIRDIENTS) 109.0 107.0 L25.0 96.2 110.8PROTEINS (GRMS PER DAY) 51.0 51.0 62.0 56.7 70.3
or WHICH ANIMAL AND PULSE 1.0 38.0 27.0 7c 17.0 17.8
CHILD (ACES 1-4) DEATH RATF 11.0 6.7 2.7 13.7 14.6
HEALHLIFE EXPECT. AT BtRTH (YEARS) 59.1 62.3 66.6 51.7 57.5INFANr M1ORT. RATE (PER TH0OUS) 70.5 h1.1 32.4 102.7 101.5
ACCESS TO SArE WATER (Z-OP)TOTAL 14.9 61.0 60.0 Id 35.6 39.7URIAN 27.7 100.0 300.0 7d 54.1 84.5RURAL 6.4 29.0 22.077 27.3 38.4
ACCESS TO EXCRFTA DISPOSAL(Z OF POPULATION)
TrYAL .. t7,0 82.0 /dURuN .. 53.0 63.0 7d7RURAL .. 99.0 10o.O 7
POPULATION PER PHYSICIAN 4680.0 4190.0 2000.0 /a 11948.3 4345.1POP. PER NURSING PERSON 2100.0 Jf 820.0 ein.077 2248.9 1831.1POP. PER HOSPITAL BED
TOTAL 210.0 250.0 290.0 /e 9U6.9 632.9URBAJI 110.0 /f 250.0 290.0 7e 365.7 545.5RURAL .. 500.0 860.0 /c 4012.1 2513.5
ADHISSIONS PER NSTIqTAL BED .. 22.7 30.4 /c .. 26.2
AVERAGE SIZE OF HOUSEHOLDTOTAL 4.9 /J 5.3I / .URSAN 4.9 7W.RURAL 4. Jf ..
AVERAGE NO. OF PERSONS/ROOITOTAL 1.9 Jf ..URBA 1.5 77F ..RURAL 1.9 If ..
ACCESS TO ELECT. (: OF DWELLINGS)TOTAL 46.9 if 70.1 JR - .. 46.2URBAN 81.9 7F .. .. .. 77.7RURAL 29.27? .. .. .. 16.1
(viii)
T A E L C 3A PACE 2
NAURITIUS -SOCIAL INDICATORS DAT micrKAURIT US REFERENCE GROUPMS (lEIGNTED AVERAGES) 7j
MOST (HOST RECENT ESTIMATE) lbRECENT MIDDLE INCOME MIDDLE TNcQI
aLbk 1 9 .1 / ESTIMATILb AFRICA S. OF SAHARA N. AFlICA & NID AST
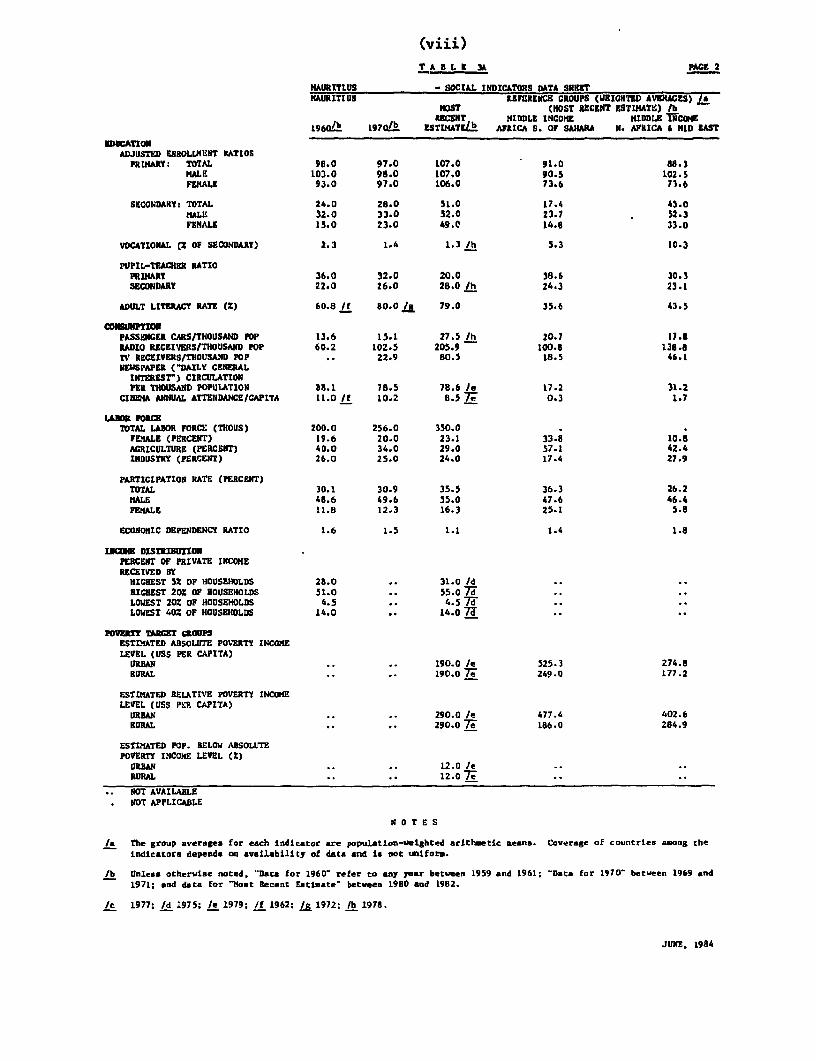
ADJUSTED ENROLLMENT RATIOSPRIMARY: TOTAL 98.0 97.0 107.0 91.0 68.3
MALE 103.0 98.0 107.0 90.5 102.5FEMALE 93.0 97.0 106.0 73.6 73.6
SECONDARYt TOTAL 24.0 28.0 51.0 17.4 43.0MALE 32.0 33.0 52.0 23.7 52.3FEMALE 15.0 23.0 49.0 14.8 33.0
VOCATIONAL Cl OF SECONDARY) 2.3 1.4 1.3 lh 5.3 10.3
PUPIL-TEACHER RATIOPRIMARY 36.0 32.0 20.0 38.S 30.3SECONDARY 2Z.0 26.0 28.0 /h 24.3 23.1
ADULT LITERACY RATE (Z) 60.8 If 80.0 j 79.0 35.6 43.5
CONSUIPTIONPASSENGER CARS/THOUSAND POP 13.6 15.1. 27.5 /h 20.7 17.8RADIO RECEIVERS/TNOUSAND POP 60.2 102.5 205.9 100.6 138.8TV RECEIVERS/THOUSAIND POP .. 22.9 80.5 18.5 46.1NEWSPAPER ("DAILY CENERAL
INTEREST") CIRCULATIONPER THOUSAND POPULiATION 8.1 78.5 78.6 le 17.2 31.2
CINEMIA ANNUAL ATTENDANCE/CAPITA 11.0 /f 10.2 8.5 7e 0.3 1.7
TOTAL LABOR FORCE (TEOUS) 200.0 256.0 350.0FEMALE (PERCENT) 19.6 20.0 23.1 33.8 10.8AGRICULTURE (PERCENT) 40.0 34.0 29.0 57.1 42.4INDUSTRY (PERCENT) 26.0 25.0 24.0 17.4 27.9
PARTICIPATION RATE (PERCENT)TOTAL 30.1 30.9 35.5 36.3 26.2M;ALE 45.6 49.6 55.0 47.6 46.4FEMALE 11.8 12.3 16.3 25.1 5.8
ECONOMIC DEPENDENCY RATIO 1.6 1.5 1.1 1.4 1.8
lUCOlE DISTRIBUTIONPERCENT OF PRIVATE INCOMERECEtVED BY
RICHEST 5% OF HOUSEHOLDS 28.0 .. 31.0 /dHIGHEST 20S OF HOUSEHOLDS 51.0 .. 55.0 7i *.LOWEST 20% OF HOUSEHOLDS 4.5 .. 4.5 7*-LOWEST 402 OF HOUSEHOLDS 14.0 .. 14.0 7..
POVERT TARGET sROUPSESTIMATED ABSOLUTE POVERTY INCOMELEVEL (USS PER CAPITA)
URBAN .. .. 190.0 /e 525.3 274.8RURAL .. .. 190.0 7e 249.0 177.2
ESTIMATED RELATIVE POVERTY INCOMELEVEL (USS PEP. CAPITA)
URBAN .. .. 290.0 /e 477.4 402.6RURAL .. .. 290.0 7e 186.0 284.9
ESTIMATED POP. BELOW ABSOLUTEPOVERTY INCOME LEVEL (2)
URBAN .. .. 12.0 /eRURAL .. .. 12.0o7
NOT AVAILABLENOT APPLICABLE
N O T E S
/a The group averages for each indicator are population-veighted arithmetic means. Coverage of countries among theindicators depends on availability of data and is not uniform.
lb Unless otherwise noted, "Data for 1960- refer to any year between 1959 and 1961; 'Data for 1970- between 1969 and1971; and data for -Most Recent Eattuate- between 1980 and 1982.
/c 1977; /d 1975; le 1979; /f 1962; /R 1972: lh 1978.
JUNE, 1984
(ix)
Seq.., iliha th. St. .. deem lts gape. Oodeersu lGotwer* as8 =mqelssmato psei .1is e id Snds hs seand enbs use ssss Us ie.rsm.stesdesuTbi tes... q Sb twit qt- e.tdssdhse 14pIlie adel seeep. sadd i dilltesS .sepssi elsatie it. is.. Th. dsp. en sersstaIses. at.. mado=eits epstm.tissdliSe. India. BtEads ss.d serseri elsel esge Aul lst.eadd busemns. sal .pi
lIsps see s.s an 155d ftI Sb Se a tde - If s.ee elf Oft t s assnlMMP Go. (ilt rapeN sie ish6 sadins 41hubs s..ftuu , Ifsedits. StSs.?. dooal SI sek:New:e am G55; issnp too lEgs lesse lii Sspresirl' Smadstpsodr Nlidfl SiReu rteP 51,. sed Miaddle Uss' is etss. tesses sosp.,fsi.sea
aElsiise. far lob nla 1nss s.l leE4 sh aesss 95 -shssseasSst spisteegi aness. as eseb lveilss s. s ofI ip sEw.,alpe ln.9 lbh sampese
st Gph 5 r ss isu.li. sesen 1esuse iu h rdlep .. d bsalbii di .du am smIler,. seitse ue'h
*ag I u.us.. dp.10 ol ni sasuels p...aural.p.ssJiloaln,n ieen.-I.55 5 Isi., sq:. P Pa .- ls.sser Itetss -A Ii aulsi. be 5...P it llo,s1.'Stu.arurLs3L - tes,els a esraeissrs11 ldps sea. tISepsrepss eP -- Iafesu I. -rei aP55 sense. Gasepis siVnes pes.1 ci rts setpssts.Ph.55iisissPsui s sIltw 55 .isqiS ss lep GS.
eIsm. 1590, eso usi dss.. he is MIses asg phrpeususe. hetshttesesst lpeetldu Prapielseusp l s.qeuuis
511. s.d uwi disS. ~ ~ ~ .N1 . d ~ Srt -d.d m Wus. tP; I 44.1 sd. sles ts*r isUes
- ~~~ ~e. te t nly s4 us6s1* tIle. ad lies i sait e. rissjj.s5 r..i ss
prs.u m eayer .Me. -F elIses saeslbiliie .4 is..l aibi -l. .. i.. A ttIdMd a kldssr -F 5P ..? esm te sesuede 5ass.esepu.u. soma. lels. asr Iona %s..sess"id lee esuius rplwam.
-taial.lpmein wr CirlsspIial prlsiedaswess aps Ussd ss seow L...~ 5 n 5 .. isp .sua nMee
is. p.1.1`p uS of sews a . sub steir altiustip *d First lutier eisuri. pesnisimi. Radit-len ssr5ed ss-mapeSe-I eurssisalnd
seals seemii Ills eeussy iila birth lanstes 1.111 o55
flfls ps eosa ssuigyleretn ttle . es-psef. lb I.-L5. PerF-1 kerits.ri elsef e." sista0 dssi .9. sirusi. s He. e phIps husie. rsN esisslq.11.lseis .e sum1 is -lendsH -VI sq ap sedie es" uses.. -Imnia k.Issent,.0.wm aArr1bliesport.,plsSSi P. setadas. Rsi sentre Is ite ssslkesd - ,atboos suea
pestlasiar .9 doislite add lsPsllist ireeds ise polsjsSst, Itilass.
is sesetus Ste est-Psu. l e indsPsir 5w sise= wsssse 55 sb sassP pi. 'tn eAPss eLe., it esuls meseed55p.,araSh nis is s. tim s555'P5 sees-.lb.l etc en, aumi s. soue msen e.sss seeod F u. diffftsast 5-1 555 .. lau se
eieaslstoo.heels -. .. * the mo5.5r? p1st lepiaLa" sanh 5 deiseims ppsiwelftdes sseth -. 01, bl. STe1o Is.after IraqIs ssssaleqS EseC..: -91tdIIT111L nrisae.sm spiltlss te t.S .1. s*as seeeg5 u.iee 5t .ass. *as oeetts..r apses.. as.is. o o.sass .slqs sise a rspe Idseale rats, Patehe ola'.K esis. e eeesil ssrqeis.6 01 -1 rod.. ~ 11
.5 pissi. elat laCaCc 159g1s5 iss 5, Shepe,teleIs le she sa. 1.,,i*lsssP 4- .I 5ea.l,qtps. iidsp. .... .s.ap.vs.e.s sgo, ..t5sl si e prlisre pteewles 1 5 pspaaas Go.1Es eII 4: teepiesl - Cs dsIssseS e-.deeie
sai 15 us -1es .dtl . % Mlld ' Isee.-.t,b Pt -e.ePs1. 45stwse-e. .. es s.ie-P.,IE ..sc Gs p rresp -- s...ps ep issiekiet4 :li.ssn ..Ms IS~!~j-su-resr rselssli rreq -Pe Slal-p iN t5ps '*.* -. W.tre..s ee
ssisapea liS, iJ s.es qq se. .`21`.qIeprplep.qttes ass ss aps it.,,
t1ji.l I .. l±kjPffl lseleis5 q- eeePeailhsn ea eeCeCEIsesIsests nslewsCcsep
_______ ______ _______ ______ C hl ipse- 1 -1. 1 ysani isp ses-e lie
Pielius175ss5h low. Ide.rent *" Al .. isedqshrseaisi -sI5iserc eshla5a-..
Psesrmopiush qg;y$r~sl-at.*Ms ss ass edEal tE dssssk sDlreess dse.9 sesltetP- sapsaIssism Isp Ise-o. es-s.7a 115-3. .eie1i ssqp qpseeeIssaS Is Sa ab Vs ssesimt. .5 raise
Pp.. snetes (sf Usi~pi -seaes lisbiles.f tbeal. nd S a Is *llst Lute Istr resos "n meaW. t Us teeardebla esse assa
______ ______ ______ _ Tool_ is es l Ga bla P s a e s ii S d- ra pI M C p its s s ps i s n s e s l 1 s t s Per -r Gd.a S
S.P sepal rapraiaeisa pepist il sa sepepisese 1t55at5 555-Ss.5itl. ___i__ t- __ -w_ p_ -4__ on _____a Q__ __ -94.,apsplqey rn. ans Mamra- (wr ase ssts tennl sag,le, a t. 1. ?:l1L1 sa Ifei esltea inP ppi
peespa.. Ii a.." spinsra ti dha, al a.sp. Ieadq .eseauusda-sel asrseiLr pla.esta - Sean (nines sq eereied isaql - Peleiseg .1 arpIst getS Is cite.~~~~~::.PIaL- f LIMal. aSI.I.- I
asses .t steAd-Usseleg as. a. an Irastalse ar Idea Peshei-Is ens J.. M. --f ... I1- IG Ii-spl na.napsI,as 55 t-t .ilstLetsa'si I'l J.setai Is.. sese. irese
easirl a pses! ia usas Ise) 4m.aseed s sdbroto eniPl '7
Sfla CS7eels.sci SWeees.1sS N5S,t!. neP VSbd-4 do -1-,M Pradood, P.L. Ilojeh..slwkalaq t sita.. s- ssiqes Se aise.rs.gti - ce -
sew efrellios assantles ICte, 11111 asegant lee: Se,Ss.-.-Wea Isssl t*l Isgi ame,iSrsa. Hs-Saaftis sP.l -Os PM seeB .9 Ma alate an Ene. qqpaprs5sea, Issers .ItS u.s
as"i. AMIs - eslaslu ftartess 1. dislss sedap waisred 55 es.. IOU.e1easereasesd.. ti%M is ae lpp a. IM,- IDr P.m..e Ci Iona-do!ta tsti .1 ssepi set.a sitis aSjd sense fawdisess 55.1 fl lotl,fl 5 M-. Les Pa.. SW -V,es IStatee Id-s aP-aerl .afltsaista and t.ul- PsedS3. S asendao, pt.beel.1,t awe mt- I. sls .. tIiloall. -tI - .a esss""tEtlib lpe f.eteed -usls d saflPA 115515d -Plap alMGee Iq laneesf t1. so,aetd SC"SI si see: is.. MN G .- I
dats. 1l.n5 -- sirse bihod,sftt- Itl -seel. adle.-sG Ast I. t.laSsaPer aert sssei 51 -seislas Wsp.eeq str osdesss -a basa. tp. s.e1 pa r e.ia eils,aa titaslbprp.
-seit esi" Se lad ePenweiss. is ;- Lsssse le alnlbls issi.- pi ilasa.I0stieiae-
Pain. seaL. sasen byl Pt. g-s b- pbrelsa-Isie TIM . spal ttm Scn A5 as.a etet dp I.iI ttwas ` SkIp eM ts 'h-ssm do seIpes Mm leleispe.: .teip Elt.- it"K-t..s Ess nd -to .d Pras islta. l an poaed, ieql.. owed. sslels5 b, TAPBi tgp ala0odb.["lG, Mdlb. ,I
Per s-s ef l -.1 eni as a ee se5 ea .1m ; pee peItS" ~ .s -1rrise tdesemW Ilst s.-Itee .eestsa- ssEe si -esibasdpM . i e P .aspelld5 isda b. .. pres.eass1 e.e
5peseS pne,sdlwetAtpPese
qanaas g alMesels siitb he les W,el Pt seqn tes,s
rep Pales enqiesale L pa asses isala -. P5.f1 see a r Pad Sheal esL Le saIIssatLa. pi m~aaIe s
C5ild~ ~ ~ ~ ~ ~~~~~:4 I.. a et se a tsse seldsbppIea I asiitIpaPsrsls a e see ta.ist11 -*Pb5 q .,e-oo. ase -"IT rats, i sPollase is- ewGn55e a slse as ssi.parps ts5 nsiis ensprLit --M."lE -te .Mn dap-n Cp Isp,sablesqe,il P.5 95 . sess a s.beee Pl.aIaw 5SldP. e It
- .- . pool. rallad.l. .. 7--p- La"a.."sUb ajaqs. er sete ass..-I.Iss_gapg.ss-_Ft:% h-. fty b. dooldnaS M b"o5sen1 Pa Isit bl ssske. 4Sse 4esala.5 ssnses- ah-
P-Moamea .ef perLes-e.&- sps tis.S Isi. atm Cd IsIIS det..ad
.qtSoel a idsnta es P Mom-Gqie Irwessea bre telse. ippsqs isIss asas It.e ses --- sain.Pse.e pei tpilel ltes ss
(x)
ABREVIATIONS AND ACRONYMS
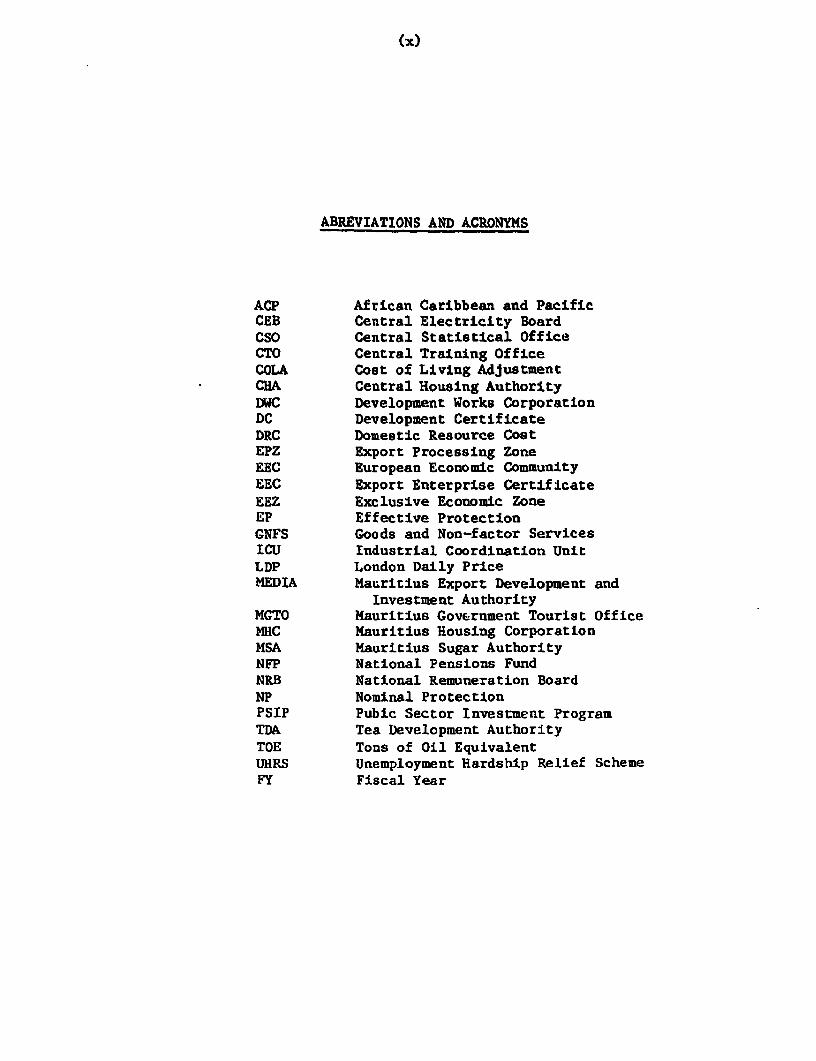
ACP African Caribbean and PacificCEB Central Electricity BoardCSO Central Statistical OfficeCTO Central Training OfficeCOLA Cost of Living AdjustmentCHA Central Housing AuthorityDWC Development Works CorporationDC Development CertificateDRC Domestic Resource CostEPZ Export Processing ZoneEEC European Economic CommunityEEC Export Enterprise CertificateEEZ Exclusive Economic ZoneEP Effective ProtectionGNFS Goods and Non-factor ServicesICU Industrial Coordination UnitLDP London Daily PriceMEDIA Mauritius Export Development and
Investment AuthorityMGTO Mauritius Goveirnment Tourist OfficeMHC Mauritius Housing CorporationMSA Mauritius Sugar AuthorityNFP National Pensions FundNRB National Remuneration BoardNP Nominal ProtectionPSIP Pubic Sector Investment ProgramTDA Tea Development AuthorityTOE Tons of Oil EquivalentUHRS Unemployment Hardship Relief SchemeFY Fiscal Year

txi)
PREFACE
This report is based on the findingsof an economic mission which visited Mauritiusfrom July 23 - August 17, 1984. Tbis mission wascomposed of Ms. F. Aynur Sumer, (Mission Chiefresponsible for the preparation of this CEM),Mr. Hassan Imam (public investment program), Mr.Constantxao Lluch (wage policy and employmentissues), Ns. Pisei Eap (balance of payments andlong term economic projections), Mr. Ben Yates(Consultant on sugar subsector and agriculture),Itr. lan McDougall (Consultant on industry) andMr. Pierre Demangel (Consultant on public finance)
The section on energy is a summaryof the findings of the energy assessmentfollow-up mission which visited Mauritius in1983. The section on population draws on thePopulation Sector Review (4486 - MAS) publishedin grey cover in November 1983.
(xii)
MAURITIUS: ADJUSTMENT AMD GROWTH
COUNTRY ECONOMIC M1EMORANDUM
SUMMARY AND CONCLUSIONS
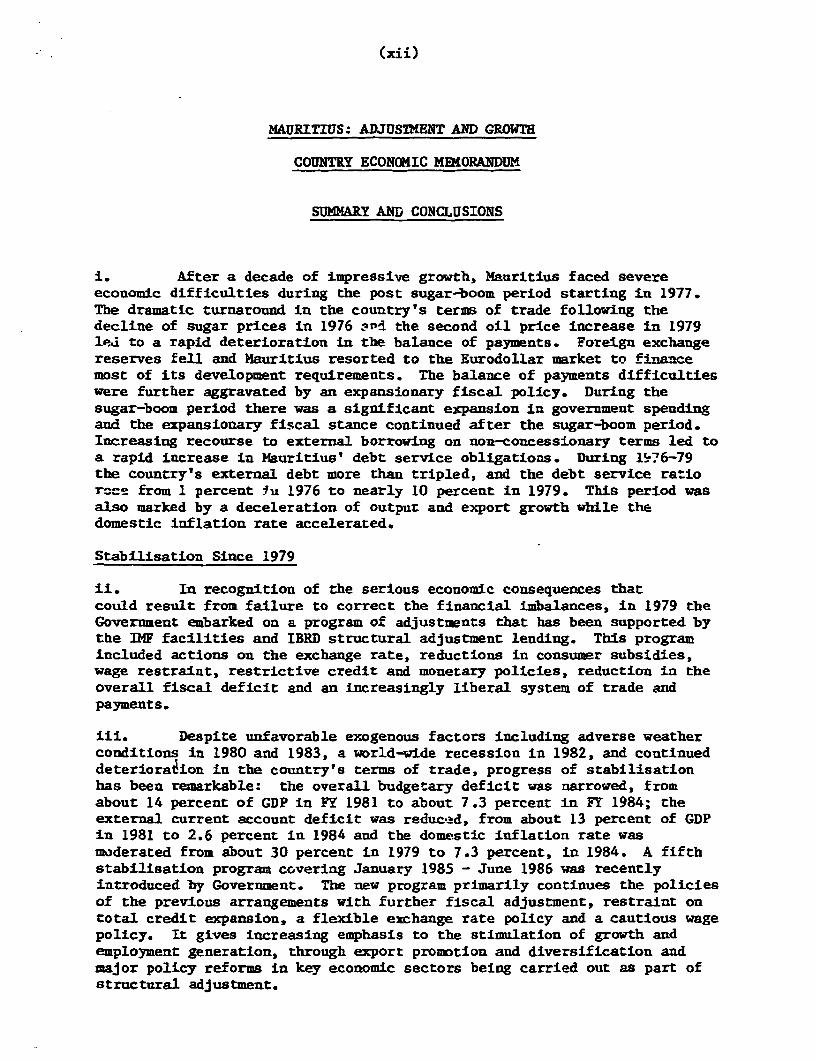
i. After a decade of impressive growth, Mauritius faced severeeconomic difficulties during the post sugar-boom period starting in 1977.The dramatic turnaround in the country's terms of trade following thedecline of sugar prices in 1976 onli the second oil price increase in 1979led to a rapid deterioration in the balance of payments. Foreign exchangereserves fell and Mauritius resorted to the Eurodollar market to financemost of its development requirements. The balance of payments difficultieswere further aggravated by an expansionary fiscal policy. During thesugar-boom period there was a significant expansion in government spendingand the expansionary fiscal stance continued after the sugar-boom period.Increasing recourse to external borrowing on non-concesslonary terms led toa rapid increase in Mauritius' debt service obligations. During 1X76-79the country's external debt more than tripled, and the debt service ratior-e- from 1 percent fu 1976 to nearly 10 percent in 1979. This period wasalso marked by a deceleration of output and export growth while thedomestic inflation rate accelerated.
Stabilisation Since 1979
ii. In recognition of the serious economic consequences thatcould result from failure to correct the financial imbalances, in 1979 theGovernment embarked on a program of adjustments that has been supported bythe IMF facilities and IBRD structural adjustment lending. This programincluded actions on the exchange rate, reductions in consumer subsidies,wage restraint, restrictive credit and monetary policies, reduction in theoverall fiscal deficit and an increasingly liberal system of trade andpayments.
iii. Despite unfavorable exogenous factors including adverse weatherconditions in 1980 and 1983, a world-wide recession in 1982, and continueddeterioration in the country's terms of trade, progress of stabilisationhas been remarkable: the overall budgetary deficit was narrowed, fromabout 14 percent of GDP in FY 1981 to about 7.3 percent in FY 1984; theexternal current account deficit was reduced, from about 13 percent of GDPin 1981 to 2.6 percent in 1984 and the domeistic Inflation rate wasmoderated from about 30 percent in 1979 to 7.3 percent, in 1984. A fifthstabilisation program covering January 1985 - June 1986 was recentlyintroduced by Government. The new program primarily continues the policiesof the previous arrangements with further fiscal adjustment, restraint ontotal credit expansion, a flexible exchange rate policy and a cautious wagepolicy. It gives increasing emphasis to the stimulation of growth andemployment generation, through export promotion and diversification andmajor policy reforms in key economic sectors being carried out as part ofstructural adjustment.
(xiii)
Structural Adjustment
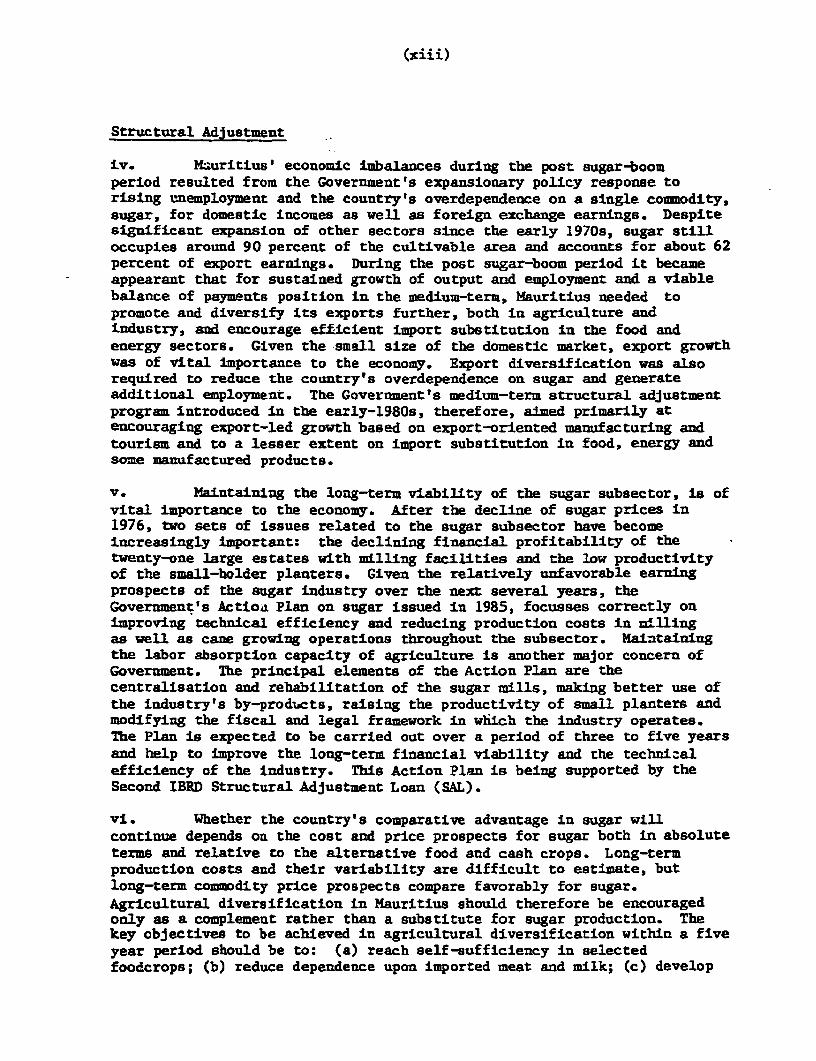
iv. Mauritius' economic imbalances during the post sugar-boomperiod resulted from the Government's expansionary policy response torising unemployment and the country's overdependence on a single commodity,sugar, for domestic incomes as well as foreign exchange earnings. Despitesignificant expansion of other sectors since the early 1970s, sugar stilloccupies around 90 percent of the cultivable area and accounts for about 62percent of export earnings. During the post sugar-boom period it becameappearant that for sustained growth of output and employment and a viablebalance of payments position in the medium-term, Mauritius needed topromote and diversify its exports further, both in agriculture andindustry, and encourage efficient import substitution in the food andenergy sectors. Given the small size of the domestic market, export growthwas of vital importance to the economy. Export diversification was alsorequired to reduce the country's overdependence on sugar and generateadditional employment. The Government's medium-term structural adjustmentprogram introduced in the early-1980s, therefore, aimed primarily atencouraging export-led growth based on export-oriented manufacturing andtourism and to a lesser extent on import substitution in food, energy andsome manufactured products.
v. Maintaining the long-term viability of the sugar subsector, is ofvital importance to the economy. After the decline of sugar prices in1976, two sets of issues related to the sugar subsector have becomeincreasingly important: the declining financial profitability of thetwenty-one large estates with milling facilities and the low productivityof the small-holder planters. Given the relatively unfavorable earningprospects of the sugar industry over the next several years, theGovernment's Actioa Plan on sugar issued in 1985, focusses correctly onimproving technical efficiency and reducing production costs in millingas well as cane growing operations throughout the subsector. Maintainingthe labor absorption capacity of agriculture is another major concern ofGovernment. The principal elements of the Action Plan are thecentralisation and rehabilitation of the sugar mills, making better use ofthe industry's by-products, raising the productivity of small planters andmodifying the fiscal and legal framework in waich the industry operates.The Plan is expected to be carried out over a period of three to five yearsand help to improve the long-term financial viability and the techni:alefficiency of the industry. This Action Plan is being supported by theSecond IBRD Structural Adjustment Loan (SAL).
vi. Whether the country's comparative advantage in sugar willcontinue depends on the cost and price prospects for sugar both in absoluteterms and relative to the alternative food and cash crops. Long-termproduction costs and their variability are difficult to estimate, butlong-term commodity price prospects compare favorably for sugar.Agricultural diversification in Mauritius should therefore be encouragedonly as a complement rather than a substitute for sugar production. Thekey objectives to be achieved in agricultural diversification within a fiveyear period should be to: (a) reach self-sufficiency in selectedfoodcrops; (b) reduce dependence upon imported meat and milk; (c) develop
(xiv)
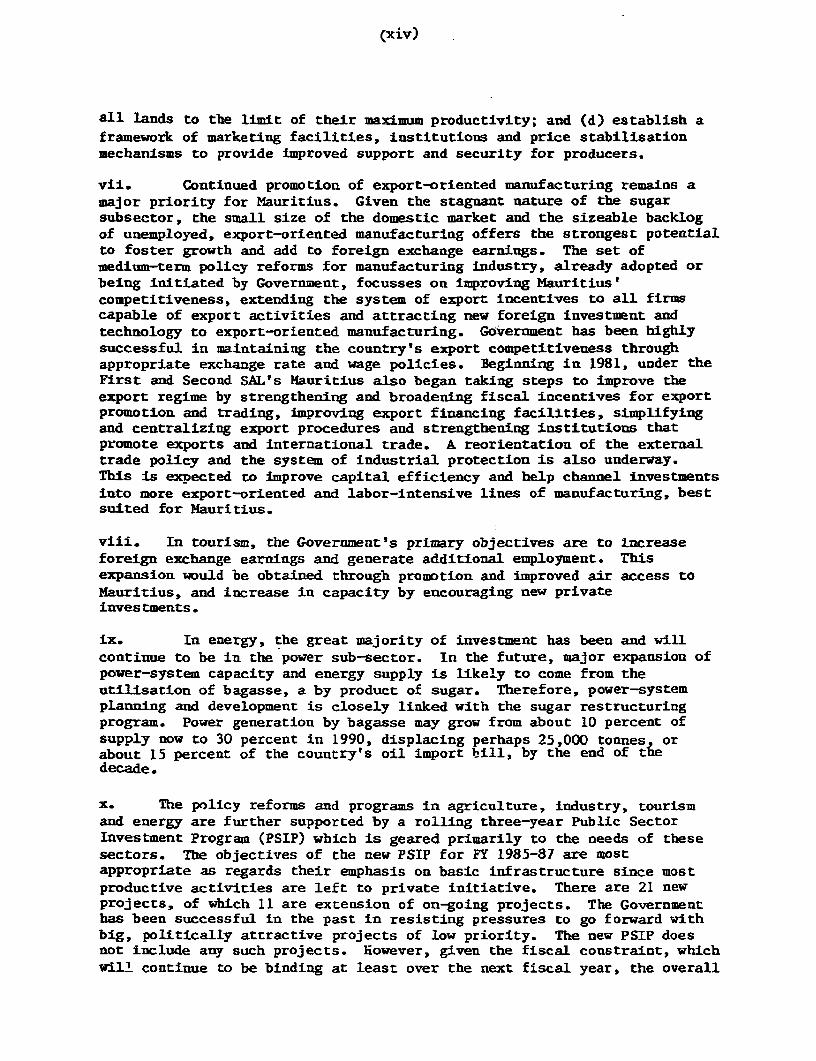
all lands to the limit of their maximum productivity; and (d) establish aframework of marketing facilities, institutions and price stabilisationmechanisms to provide improved support and security for producers.
vii. Continued promotion of export-oriented manufacturing remains amajor priority for Mauritius. Given the stagnant nature of the sugarsubsector, the small size of the domestic market and the sizeable backlogof unemployed, export-oriented manufacturing offers the strongest potentialto foster growth and add to foreign exchange earnings. The set ofmedium-term policy reforms for manufacturing industry, already adopted orbeing initiated by Government, focusses on improving Mauritius'competitiveness, extending the system of export incentives to all firmscapable of export activities and attracting new foreign investment andtechnology to export-oriented manufacturing. Go4ernment has been highlysuccessful in maintaining the country's export competitiveness throughappropriate exchange rate and wage policies. Beginning in 1981, under theFirst and Second SAL's Mauritius also began taking steps to improve theexport regime by strengthening and broadening fiscal incentives for exportpromotion and trading, improving export financing facilities, simplifyingand centralizing export procedures and strengthening institutions thatpromote exports and international trade. A reorientation of the externaltrade policy and the system of industrial protection is also underway.This is expected to improve capital efficiency and help channel investmentsinto more export-oriented and labor-intensive lines of manufacturing, bestsuited for Nauritius.
viii. In tourism, the Government's primary objectives are to Increaseforeign exchange earnings and generate additional employment. Thisexpansion would be obtained through promDtion and improved air access toMauritius, and increase in capacity by encouraging new privateinvestments.
ix. In energy, the great majority of investment has been and willcontinue to be in the power sub-sector. In the future, major expansion ofpower-system capacity and energy supply is likely to come from theutilisation of bagasse, a by product of sugar. Therefore, power-systemplanning and development is closely linked with the sugar restructuringprogram. Power generation by bagasse may grow from about 10 percent ofsupply now to 30 percent in 1990, displacing perhaps 25,000 tonnes orabout 15 percent of the country's oil import bill, by the end of tAedecade.
x. The policy reforms and programs in agriculture, industry, tourismand energy are further supported by a rolling three-year Public SectorInvestment Program (PSIP) which is geared primarily to the needs of thesesectors. The objectives of the new PSIP for FY 1985-87 are mostappropriate as regards their emphasis on basic infrastructure since mostproductive activities are left to private initiative. There are 21 newprojects, of which 11 are extension of on-going projects. The Governmenthas been successful in the past in resisting pressures to go forward withbig, politically attractive projects of low priority. The new PSIP doesnot include any such projects. lowever, given the fiscal constraint, whichwill continue to be binding at least over the next fiscal year, the overall

(xv)
size of the PSIP would need to be reduced somewhat in 1985 and be keptunder review, thereafter. Its implementation will also depend on theavailab'lity of external resources on terms and conditions geared toMauritius' needs.
Recent Economic Performance
xi. The economy showed signs of a strong recovery in 1984 afterdisappointing performance in the preceeding years. This reflectedthe expansion of economic activity abroad as well as the favorable impactof domestic economic policies pursued to stabilize the economy and supportexport-oriented industrialisation and tourism. In 1984 there was rapidgrowth in all productive sectors except sugar where output fell belawnormal production level. Gross domestic product increased by 3.1 percentin 1984 as compared to 0.3 percent in drought-affected 1983.
xii. The strongest recovery in 1984 has been observed in themanufacturing sector, especially in the Export Processing Zone (EPZ) wheregrowth has been estimated at 16 percent in real terms. In mDst of the EPZfirms new purchase orders extend as far as end-1985, and many firms areapproaching their capacity limits. A significant increase in newinvestments was also evident in 1984. This strong upsurge in output andinvestment in export manufacturing is attributable to a number of factors:expansion of export markets as a result of the global economic recovery,the promotional campaign undertaken by Government under its StructuralAdjustment Program, improved investment incentives to the private sectorand the emergence of the -Hong Kong factor: the majority of foreignprivate investments to start new export enterprises, mainly in the knitwearand textile are coming from Hong Kong. Most of these investors havealready established markets in the EEC countries, and others are interestedin establishing themselves in the North American market.
-iii. 1984 also witnessed a healthy recovery in tourist arrivals andcapacity use. The most recent estimates indicate a growth of 10 percent invalue added in tourism in 1984. Government has moved ahead effectivelywith measures to strengthen the promotion of Mauritius as a destination fortourists and to open up new air access points abroad, notably Zurich,Taipei and Jeddah. Consideration is also being given to air access fromSingapore, Dubai and Australia. Interest by private investors inexpanding or opening new hotel capacity also seems strong; 50 rooms haverecently been added to one hotel and 200 rooms will be opening up in newhotels in 1985. The target is to double the existing room capacity by1990.
xiv. The tea sub-sector has also shown remarkable progress, followingreforms in the ownership pattern of Tea Development Authority (TDA)plantations as well as favorable export prices.
xv. On the demand side, there was an upturn in capital formation in1983, which continued in 1984. Gross fixed investments in 1984 areestimated to have increased by about 8 percent in real terms.- Most of theincrease is attributable to higher investment in construction other thanresidential buildings, transport equipment and machinery. Private
(xvi)
investment seems to have risen substantially in 1983 and 1984, particularlyin manufacturing. Investment in construction has also shown, for the firsttime since 1980, an increase of 5.5 percent in 1984. This is due toconstruction in road infrastructure and industrial estates, and to hotelexpansion. Housing construction continues to remain stable, in line withGovernment policy to discourage investments in less productiveinfrastructure.
xvi. After a decline of 1.5 percent in 1982 domestic consumptionincreased by about 1.0 percent in 1983 and nearly 2.5 percent in 1984.Increase in real per capita consumption in 1984 was about 1.0 percent.Government consumption increased by 2.7 percent and it is expected that therestraint on government expenditure will continue in the future. With therecovery of domestic income, which rose faster than consumption, grossdomestic savings increased from 15.4 percent of GDP in 1982 to over 18.0percent in 1984.
Prospects: Adjustment and Growth
xvii. The key objectives of Mauritius's structural adjustment strategywill continue to be valid throughout this decade. This should enable thecountry to achieve a sustainable growth path and provide employment for theunemployed as well as new entrants to the labor force. Since 1979 economicgrowth has slowed down and the employment situation has deteriorated.Therefore, a transition to a more growth-oriented development strategywould be desirable within a viable financial framework. This frameworkshould take into account the heavy debt service obligations falling due forrepayment in 1985 and 1986 particularly. The most recent balance ofpayments estimates place Mauritius' debt service ratio, includingrepayments to the IMF, in the range of 26 percent in 1985. Providedfinancing is made availabe on relatively sof t terms, the debt service ratiois expected to decline thereafter. Beginning in 1986, Yauritius should beable to relax its restrictive economic policies gradually and acceleratethe implementation of the structural adjustment strategy.
xviii. The GDP growth for the medium term (1985-1990) could be around3.5 - 4.0 percent per annum. Growth in industrial output, primarily in theExport Processing Zone, would be the main impetus for GDP growth.Expansion in agriculture would remain constrained by the limited prospectsof the sugar subsector, notwithstanding the recovery from the low ou.pu;level of 1984. The continuous recovery of the economy calls for higherlevels of investment in productive sectors. Therefore the ratio ofinvestment to GDP is projected to increase somewhat to 20.5 percent in 1986and remain at around that level until 1989.
xix. Despite higher rates of growth during 1985-1990 the balance ofpayments situation would remain manageable, provided that the export drivewhich began in the early 1980s as part of the structural adjustmentstrategy continues throughout the projection period. Although the exportgrowth rate in 1984 cannot be sustained over the medium term, a 13 percentannual increase in exports of goods and in non-factor services (e.g.,tourism) in current prices should be feasible for the rest of this decade.The external current account deficit is projected to increase from aboutUS$28 million in 1984 to about US$30 million in 1985 and US$57 million in1990.
(xvii)
Externa. Capital Requirements
xx. These current account deficits, the external debt liabilities andthe minimal external reserve build up required would call for a totalinflow of foreign capital of about US$360 million during the 1985-87period. Taking into account the likelilevel of net direct foreigninvestment and expected disbursements from loans already contracted, thiswould call for about US$335 million in new commitments from theinternational community over the period. Multilateral and bilateral donorscould be expected to provide about US$300-315 million of this amount. Theremaining US$20-35 would have to be financed through borrowings fromcommercial sources. Given Mauritius' need for quick-disbursements, aboutUS$100-115 million should accordingly be in the form of program loans. Thedebt service ratio, excluding IMF repayments, should stabilize at around 15percent. Including IMF repayments the debt service ratio would be higherbut remain manageable at around 17 percent.
xxi. If the response of the aid community does not support theadjustment efforts of the Government, Maurttius may be led to borrow inamounts and on terms which would bring the future debt burden beyond safelimits in the 1990s. This is the risk which has to be faced in the nextfew years and which argues for a close monitoring of the economic situationby all parties involved. During the post-sugar boom period and since then,Mauritius has demonstrated excellent managerial capacity to protect itsinternational credit standing. There has never been a default or paymentsarrears on external debt. Under the SAL and stabilisation programs thegovernment has taken measures that many countries have not been able orwilling to take. Provided that the Government continues to be committed toa continued process of adjustment, Mauritius should remain creditworthy forthe projected amounts of non-project and project borrowing.

MAURITIUS: ADJUSTKENT AND GROWTH
COUNTRY ECONOMIC MEMORANDUM
I - INTRODUCTION
1.1. The last Country Economic Memorandum (CEM) on Mauritius waspublished in January 1983. That CEK and an updating economic note weredistributed to the Second Consultative Group meeting held in June 1983.Since then, a Population Sector Memo has been published in grey cover and anumber of studies commissioned by the Government have been completed.These include two reports prepared by the Sugar Commission of Inquiry andsector reports on Industry.
1.2. This Economic Memorandum reflects the findings of an economicmission which visited Mauritius between July 23 and August 17, 1984. Theobjective of the memorandum is to review Mauritius' economic performancesince the last Consultative Group meeting and discuss the country's growthand employment prospects to the end of this decade. The report covers thefollowing topics: a review of the stabilization efforts since 1979 andrecent economic performance; a review of the structural adjustment policiesalready undertaken and to be followed during the second half of the 1980sand finally, a discussion of the prospects of the Mauritian economy during1985-90 with a change in the emphasis of economic policies from austerityto a more growth-oriented strategy.
Economic Structure
1.3. Mauritius is an island with smaller outer islands situated in theIndian Ocean, densely populated and with an economy dominated by sugarproduction. Despite significant expansion of other sectors since the early1970s, sugar still occupies around 90 percent of the cultivable area andaccounts for about 60 percent of export earnings. The level of economicactivity, is therefore, highly sensitive to fluctuations in sugarproduction and exports. Overdependence on a single commodity also rendersthe economy highly vulnerable to e%ternal shocks and disturbances.
1.4. The main island of Mauritius has a population of 1 million on aland area of about 2,000 km2, just over half of which is cultivable. Theouter islands are dispersed and less developed. Despite the spectaculardrop in fertility during 1965-73, the population growth rate (currently at1.5 percent) has recently been rising and is a matter of concern toGovernment.
1.5. Mauritius enjoys a pleasant tropical climate which makes itattractive for tourists. however, the country is subject to cyclonesbetween late December and March which can cause severe damage. Major

-2-
cyclones occur on average at 12-15 year intervals. The absence of mineralresources and the distance of Mauritius from major markets (about 6thousand miles from Western Europe; 10 thousand miles from the U.S.) affectthe potential for economic development and condition the choice of economicactivities best suited to Mauritius. Furthermore, the country, does notlie on the main sea routes and thus maritime transport costs are higher inMauritius than in countries competing for similar markets.
Economic Performance to 1979
1.6. In the early years following independence (1968) the Mauritianeconomy was characterized by low economic growth, conservative economicmanagement and the emergence of a major unemployment problem. During thatperiod the GDP increased at an average rate of 1.1 percent per year whilethe investment level remained virtually constant at about 16 percent ofGDP. At the beginning of the 1970s Mauritius adopted a pragmaticdevelopment strategy with the twin objectives of growth and socialjustice. With an open and relatively free economy, the Governmentencouraged private initiative to assume an important role in thedevelopment process; itself providing infrastructure, institutional supportand incentives to the private sector. Social justice was to be achievedthrough alleviation of poverty and unemployment. The social objectiveswere pursued through public works programs, minimum wage regulations,public provision of health care and education, food subsidies and selectivecontrol over consumer prices.
1.7. The country's economic performance during most of the 1970s wasremarkably successful. With an open economy and an export-orienteddevelopment strategy the Goverrnment encouraged the production of cashcrops; sugar and tea for export, the development of export mauufacturingindustries and tourism and provided infrastructure for the growing needs ofthe economy. The unprecedented increase in sugar prices in 1973 and 1974helped the economy to grow by more than 10 percent per year between1972-77. During this period, gross domestic savings increasedsubstantially and helped accelerate the growth of manufacturing,construction and service sectors. The rapid growth in production andexports was also accompanied by a rapid increase in employment; in 1977 theunemployment rate was reduced to about half of its peak level at thebeginning of the 1970s. About a decade after independence, the GNP percapita was above $1,000; equivalent to the level of a middle-incomedeveloping country. The adult literacy rate was more than 80 percent andbasic needr of tne vast majority of the population were extensivelycovered.
1.8. During the post sugar-boom period, however, between 1976 and1979, serious economic difficulties emerged. The sharp turnaround inMauritius' international terms of trade following the decline of sugarprices in 1976 and the second price increase in petroleum led to a rapiddeterioration in the balance of payments. Foreign exchange reserves felland the country had to resort to the Eurodollar market to finance some of
its development requirements. The balance of payments difficulties werefurther aggravated by an expansionary fiscal policy. During 1975-1979 anambitious public investment program was initiated that increased capitalspending at an average annual rate of 40 percent while current expendituresgrew over 30 percent per year. Although the growth of government spendingmoderated after the end of the sugar boom, the fiscal deficit continued tomount, reflecting expansionary economic policies that were increasingly outof line with the reduced resource availabilities. Failure to take promptaction to revert to more austere economic policies when sugar pricesdeclined led to excessive budgetary deficits, strong domestic demand,rising domestic inflation and ultimately widening balance of paymentsdeficits.
1.9. Growing current account deficits of the balance of payments werefinanced largely by increasing recourse to external borrowing onnon-concessionary terms. This in turn resulted in a rapid increase inMauritius' debt service obligations. During 1976-79 the country's externaldebt more than tripled and the debt service ratio rose from a modest 1% in1976 to nearly 10% in 1979. This period was also marked by a decelerationof GDP and export growth. The domestic inflation rate rose dramaticallyand the unemployment rate reached a critically high level.
II. STABILIZATION SINCE 1979 AND RECENT PERFORMANCE
2.1. Beginning in 1979, the Government embarked on a stabilisation andstructural adjustment program that could be supported by the IMF facilitiesand World Bank Structural Adjustment lending.
Stabilization Programs
2.2. For short term adjustment focussed primarily on demand-managementpolicies, Mauritius has worked closely with the IMF. Since 1979, fourconsecutive stand-by arrangements covering 1979/80 - 1983/84, have beensuccessfully implemented. Central to these programs has been the adoptionof policies in the areas of the exchange rate, reductions in consumersubsidies, wage restraint, restrictive credit and monetary policies,reduction in the overall fiscal deficit, and the maintenance of a liberalsystem of trade and payments. Despite unfavorable factors including aworld-wide recession in 1982, adverse weather conditions and continueddeterioration in the country's terms of trade, progress under the stand-byarrangements has been good: the overall budgetary deficit has beennarrowed (from about 14 percent of GDP in FY1981 to about 7.3 percent in FY1984), Lhe external current account deficit has been reduced (from over 13percent of GDP In 1981 to an estimated 2.6 percent in 1984), and thedomestic inflation rate has been dampened (from about 27 percent in 1979 to7.3 percent, in 1984).
-4-
2.3 In 1979 and 1981, the Mauritian rupee was devalued by 30 percentand 20 percent, respectively, vis-a-vis the SDR. In February 1983 theGovernment changed the peg of the Mauritian rupee from the SDR to atrade-weighted basket of currencies more representative of Mauritius'external trade pattern. Since then, Mauritius has been pursuing a flexibleexchange rate policy which together with the wage policy has been highlyeffective in maintaining Mauritius' export competitiveness.
2.4. A fifth stand-by arrangement for a period of eighteen monthscovering January 1985-June 1986 in an amount equivalent to SDR 49.1 millionhas recently been approved by the IMF's Board (March 1, 1985). The newprogram primarily continues the policies of the previous stand-byarrangements with further fiscal adjustment, restraint on total creditexpansion, a flexible exchange rate policy and a cautious wage policy. Thenew program also gives increasing emphasis to the stimulation of growth andemployment generation through export promotion and diversification andmajor policy reforms in key economic sectors. In this respect, the newstand-by arrangement and the ongoing structural adjustment efforts aremutually reinforcing.
Structural Adjustment Program
2.5. Mauritius' economic imbalances during the post sugar-boom periodresulted from the Government's expansionary response to rising unemploymentand the country's overdependence on a single commodity. With the dramaticturnaround in the country's terms of trade during 1976-79 it becameapparent that, for sustained growth of output and employment and a viablebalance of payments position in the medium term, Mauritius had to furtherpromote and diversify its exports, both in agriculture and industry andencourage import-substitution of food and energy. Given the small size ofthe domestic market, export growth was of vital importance te the economy.Export diversification was also required to reduce the country'soverdependence on sugar and generate additional employment.
2.6. A Structural Adjustment Program focussing more on supply sidemeasures -was initiated in 1980. Concurrently, policy discussions beganwith the World Bank and the Program was supported by the First StructuralAdjustment Loan (SAL I). Despite shortcomings in implementation, the FirstStructural Adjustment Loan am proved timely and its results positive.Under SAL I, the country's energy planning capacity was strenghtened, themedium term public investment program was reduced and rationalized and aset of policy reforms in agriculture and industry was initiated. Theprogram contributed to the mobilization of a financing package at a timewhen Mauritius' foreign exchange reserves were completely exhausted. Italso helped to develop a dialogue both internally and with theinternational community - on a large number of sector issues whose adequatesolution are critical for the achievement of sustained growth of output andemployment. Also, the discussions on the different components of the FirstStructural Adjustment Loan helped the emergence of a general consensus

among different segments of political opinion in Mauritius on the urgencyand content of the future policy reforms required by the economy. This inturn set the stage for further action on the part of the Government, ascontemplated in the second Structural Adjustment Loan (SAL II).
2.7. The thrust of the Second Structural Adjustment Loan, introducedin late 1983, is basically in four areas: (a) restructuring of the sugarindustry and agricultural diversification (b) further promotion ofexport-oriented industrialization, (c) tourism development and (d)improvement in public resource management.
2.8. A first approach to a restructuring program for the sugarindustry was announced by the Government in July 1984 after the findings ofa Sugar Commission of Inquiry. The program, which Includes a major taxreform and factory rationalisation, aims at (a) maintaining the long termfinancial viability of the large estates, (b) rationalising millingoperations on a national scale and rehabilitating and modernising factoryequipment, (c) raising the productivity of small planters and (d) improvingthe utilisation of the industry's by-products and (e) diversifying theoutput in terms of food production and/or other agricultural activities.On the basis of the restructuration program, an Action Plan for themodernisation and rehabilitation of the industry has, more recently beendrawn up, which details the measures to be taken to achieve theseobjectives.
2.9. In the manufacturing sector continued promotion of export-oriented industries remains a major priority for Mauritius. Given thestagnant nature of the sugar sub-sector, the small size of the domesticmarket and the sizable backlog of unemployed, export-oriented manufacturingoffers the strongest potential to foster growth and add to foreign exchangeearnings. The set of medium term policy reforms for manufacturing industryfocusses on improving Mauritius' competitiveness, extending the system ofexport incentives to all firms capable of export activities and attractingnew foreign investment and technology to export manufacturing.
2.10. In tourism, the primary objectives are to increase foreignexchange earnings and generate additional employment. Infrastructure andhigh air fares constitute the two main constraints to a more rapid growthin tourism. The program for tourism aims at fuller utilization of existingcapacity through tourism promotion and improved air access to Mauritius andexpansion of capacity through encouragement of new private investments.
2.11. Energy policies were not dealt with explicitly in the SecondStructural Adjustment Loan. The Government has recently established anEnergy Planning Division in the Ministry of Energy and InternalCommunications in order to define and program the implementaiton ofeffective and comprehensive energy policies and projects. The greatmajority of energy sector investment in Mauritius has been, and willcontinue to be in the power sub-sector. Future major expansion of powersystem capacity and energy supply is likely to come from the utilisation ofbagasse; hence power system planning and development is now closely linkedwith the sugar restructuring program. Accordingly, displacement of oilwith bagasse as a fuel for power generation is becoming an important importsubstitution program. Power generation from baggasse may grow from about10 percent of supply now to 30 percent in 1990, displacing perhaps 25,000tonnes, or about 15 percent of the country's oil bill by the end of thedecade.
- 6 -
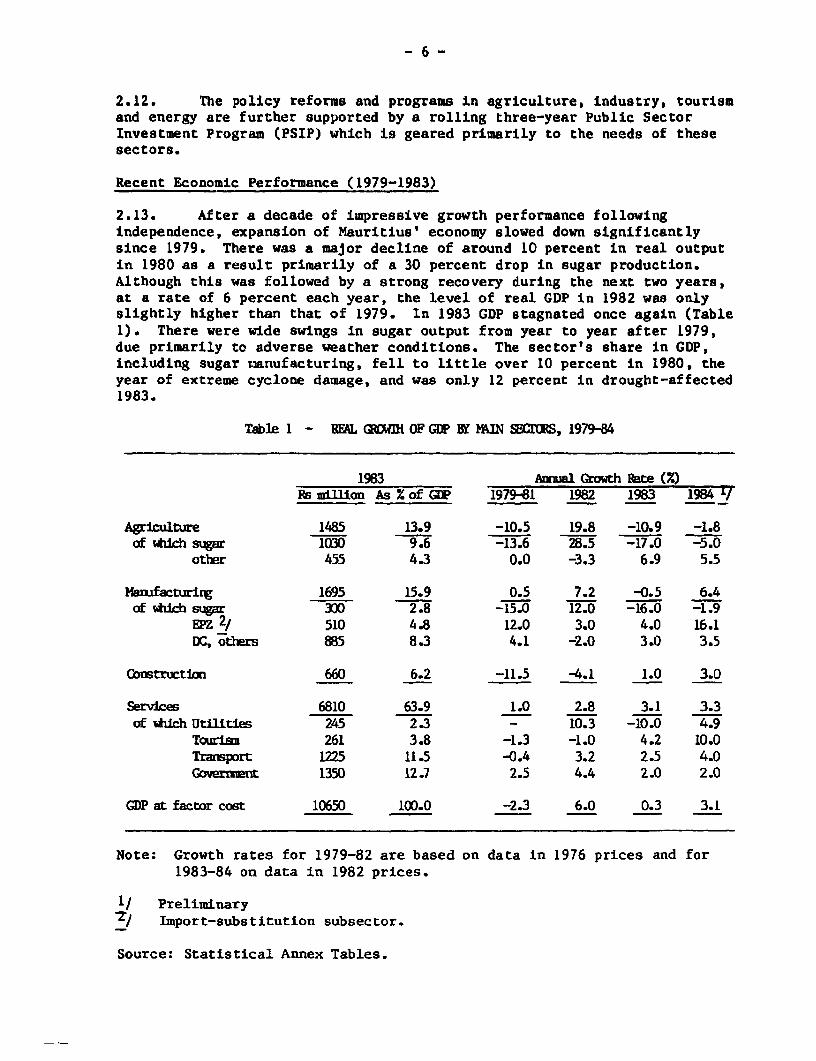
2.12. The policy reforms and programs in agriculture, industry, tourismand energy are further supported by a rolling three-year Public SectorInvestment Program (PSIP) which is geared primarily to the needs of thesesectors.
Recent Economic Performance (1979-1983)
2.13. After a decade of impressive growth performance followingindependence, expansion of Mauritius' economy slowed down significantlysince 1979. There was a major decline of around 10 percent in real outputin 1980 as a result primarily of a 30 percent drop in sugar production.Although this was followed by a strong recovery during the next two years,at a rate of 6 percent each year, the level of real GDP in 1982 was onlyslightly higher than that of 1979. In 1983 GDP stagnated once again (Table1). There were wide swings in sugar output from year to year after 1979,due primarily to adverse weather conditions. The sector's share in GDP,including sugar manufacturing, fell to little over 10 percent in 1980, theyear of extreme cyclone damage, and was only 12 percent in drought-affected1983.
Table 1 - RFI GXXTh OF GDP BY MIN MA2MR5, 1979-84
1983 Annual Gowth Rate (%)Rs million As % of GDP 1979-81 1982 1983 1984 '/
Agriculture 1485 13.9 -10.5 19.8 -10.9 -1.8of which sugar 1030 9.6 -13.6 28.5 -17.0 -5.0
other 455 4.3 0.0 -3.3 6.9 5.5
Marufacturii:g 1695 15.9 0.5 7.2 -0.5 6.4of *idch sugar 300 2.8 -15.0 12.0 -16.0 -1.9
EpZ 2/ 510 4.8 12.0 3.0 4.0 16.1DC, others 885 8.3 4.1 -2.0 3.0 3.5
Costruxtion 660 6.2 -11.5 -4.1 1.0 3.0
Services 6810 63.9 1.0 2.8 3.1 3.3of i*ch Utilities 245 2.3 - 10.3 -10.0 4.9
Tourias 261 3.8 -1.3 -1.0 4.2 10.0Transport 1225 11.5 -0.4 3.2 2.5 4.0Goverrmnt 1350 12.7 2.5 4.4 2.0 2.0
CDP at factor cost 10650 100.0 -2.3 6.0 0.3 3.1
Note: Growth rates for 1979-82 are based on data in 1976 prices and for1983-84 on data in 1982 prices.
1/ Preli-minary2, Import-substitution subsector.
Source: Statistical Annex Tables.
-7-
2.14. During 1979-1983, the setback in non-sugar activity was smaller.Nevertheless the real rate of growth In manufacturing (excluding sugarmanufacturing) averaged only 3 percent per annum as compared to 17 and 10percent per year achieved during 1972-76 and 1976-79, respectively. Fixedinvestment in manufacturing had risen steadily In real terms until 1979,following the establishment of the Export Processing Zone (EPZ) In 1970.It fell each year from 1979 to 1982. The slowdown in industrial growthreflected an actual decline in the import-substitution sub-sector while EPZgrowth also decelerated. Devaluations In 1979 and 1981 helped to restorecompetitiveness in the industrial sector; however, in 1981 Mauritius lostits preferential status for textile exports vis-a-vis the EEC market whentariff preferences were extended to other developing countries.Furthermore, in 1982 the country's major export markets were depressed as aresult of international recession and increased protectionism both in theEEC and the US. It was not until late-1983, that new orders for knitwearand textile products started to come in, as well as applications to opennew Export Processing Industries (see also para. 2.40). After declining by8 percent in 1982, investment in manufacturing recovered in 1983 andreached a level slightly above that of 1981.
2.15. By 1979, tourism had become the third largest foreign exchangeearner after sugar and manufacturing, and a major source of employmentproviding jobs directly and indirectly to about 10 percent of the laborforce. Between 1979-83 there was a serious setback in tourism; neither thenumber of tourist arrivals nor the nights spent regained their 1979 level.The downturn was mainly attributable to the second oil crisis in 1979 whichraised the air fares substantially, the cyclonic conditions and theirafter-effects in 1980, and the economic recession in 1982 in the majortourist generatirng countries.
2.16. Construction declined through 1983 in both real and relativeterms reflecting completion of one major project, the bulk sugar terminal,and the effects of restrictive demand management policies.
Developments in 1984
2.17. The economy shows signs of a modest recovery in 1984, aftervirtual stagnation in 1983. This reflects expansion of economic activityabroad as well as the favorable impact of domestic economic policiespursued to encourage export-led industrialization and tourism. Preliminaryestimates indicate that in 1984 there has been rapid growth in allproductive sectors except sugar.
2.18. The strongest recovery in 1984 has been observed in themanufacturing sector especially in the Export Processing Zone (EPZ). Basedon a firm-level survey carried out in 1984, the rate of growth ofmanufacturing output in the Export Processing Zone firms has been estimatedto be around 16 percent in real terms. Factual evidence indicates that inmost of the LPZ firms new purchase orders extend as far as end-1985 andthat many firms are approaching their capacity limits. A significantincrease in new investments is also evident in 1984. These new investmentsare expected to increase the production capacity in export manufacturing byabout 20 percent by end-1985.
- 8 -
2.19. A strong upsurge in output and investments in the ExportProcessing Zone is attributable to a number of factors: expansion ofeconomic activity abroad, the promotional campaign undertaken by Governmentunder its Structural Adjustment Program, improving investment incentives tothe private sector and the emergence of the Hong Kong syndrome. Themajority of applications to start new export enterprises, mainly inknitwear and textile industries, are coming from Hong Kong. Some of theseinvestors already have established markets in the EEC countries, and othersare interested in establishing themselves in the North American market.Push factors within Hong Kong due to political uncertainties have beenpartly responsible for the recent surge of private capital inflow from HongKong. However, the Government efforts to promote the export-led industryhave also been quite active, especially in the Far East. Severalincentives have attracted new investors, such as the provision of taxholidays, import duty exemptions, infrastructural facilities and evenMauritian nationality. Administrative procedures have also been greatlycentralized and simplified.
2.20. In 1984, there has also been a healthy recovery in touristarrivals and capacity use. From January to June 1984, tourist arrivalsreached 65,300 as compared to 56,700 in the same period of 1983. Touristsfrom Europe, notably France, Germany, Italy, and the United Kingdom,accounteA for more than one-third of total arrivals. The average touriststay has also increased to 11 days as compared to 9 days over the pastdecade Preliminary estimates indicate a growth of 10 percent in valueadded a 1984. The government has moved ahead effectively with measures tostreng..hen the promotion of Mauritius as a destination for tourists and toopen up new air access points abroad, notably Zurich, Taipei and Jeddah.Consideration is also being given to air access from Singapore, Dubai andAustralia. Interest by private investors in expanding or opening new hotelcapacity also seems strong. The target is to double the existing roomcapacity by 1990.
2.21. On the demand side gross capital formation which peaked in 1978fell steadily up to 1983. In real terms, total fixed investment declinedby almost 40 percent during 1978-1982, then rose by some 3 percent in1983 (Table 2). The decline was fairly even]y shared by all economicsectors except energy and water which recovered somewhat in 1982 due toconstruction of a major hydroelectric project. The rise in totalinvestment in 1983 was due mainly to a revival of investments inmanufacturing.
2.22. Upturn in capital formation in 1983 has continued in 1984. Grossfixed investments in 1984 are estimated to have increased by about 8percent in real terms. Most of the increase is attributable to higherinvestment in constri'ztion other than residential buildings, transportequipment and machinery. Private investment seems to have risensubstantially in 1983 and 1984, particularly in manufacturing. Investmentin construction has also shown for the first time since 1980 an increase of5.5 percent in 1984. This is due to construction in road infrastructure,industrial estates and hotel expansion. Housing construction continues toremain stable, in line with Government policy to discourage investments inless productive infrastructure.
- 9 -
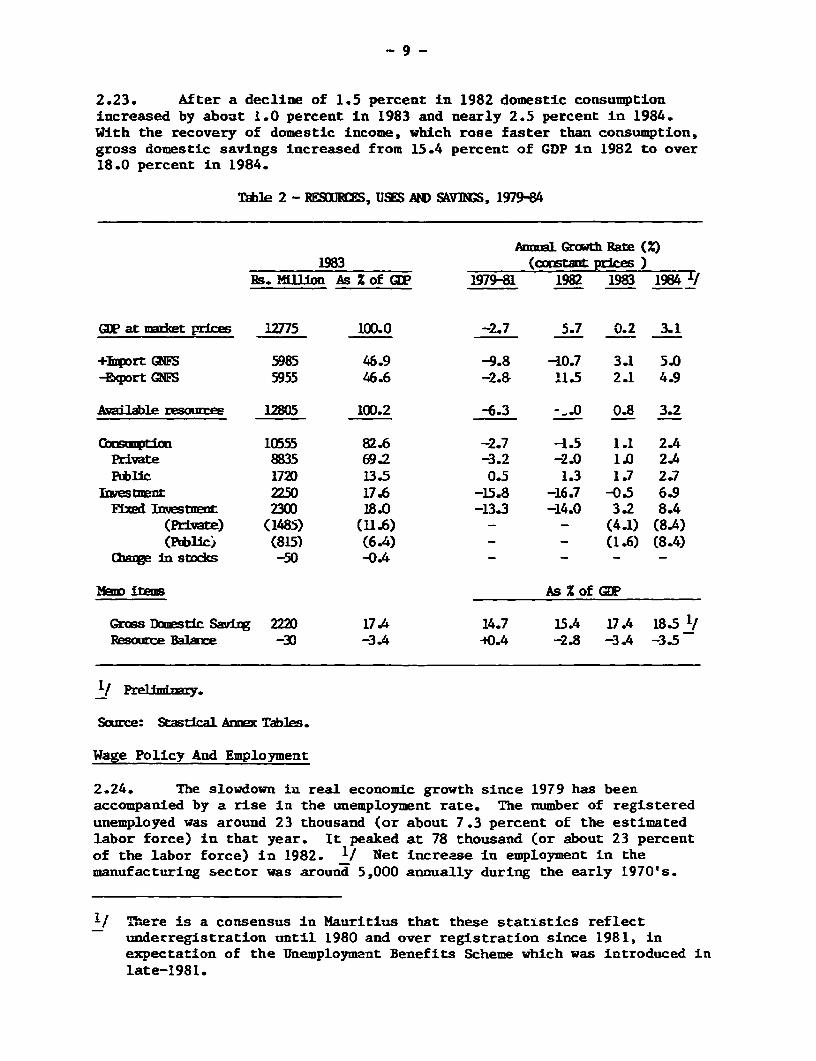
2.23. After a decline of 1.5 percent in 1982 domestic consumptionincreased by about 1.0 percent in 1983 and nearly 2.5 percent in 1984.With the recovery of domestic income, which rose faster than consumption,gross domestic savings increased from 15.4 percent of GDP in 1982 to over18.0 percent in 1984.
Table 2 - WRE9JRE, USES AND SkYI%S, 1979-84
Anmkl Grth Rate (X)1983 (constant prices )
Rs. Million As x of di 1979-81 1982 1983 1984 /
GOP at nmret prices 12775 100.0 -2.7 5.7 0.2 3.1
+bWiurt GNFS 5985 46.9 -9.8 -10.7 3.1 5.0-Export GNQE 5955 46.6 -2.8 11.5 2.1 4.9
Available resounces 12805 100.2 -6.3 - -. 0 0.8 3.2
10555 82.6 -2.7 -1.5 1.1 2.4Private 8835 69.2 -3.2 -2.0 1.0 2.4Fkblic 1720 13.5 0.5 1.3 1.7 2.7
Invest7wnt 2250 17.6 -15.8 -16.7 -0.5 6.9Fx Investment 2300 18.0 -13.3 -14.0 3.2 8.4
(Privat) (1485) (11.6) - - (4.1) (8.4)(Public} (815) (6.4) - - (1.6) (8.4)
CargeIn stocks -50 -0.4 - - - -
items As % of GIP
Gross Dowstic Sarrxg 2220 17.4 14.7 15.4 17.4 18.5 1/Resource Balance -30 -3.4 -0.4 -2.8 -3.4 -3.5
V Prelimidazy.
Source: Stastical Aex Tables.
Wage Policy And Employment
2.24. The slowdown in real economic growth since 1979 has beenaccompanied by a rise in the unemployment rate. The number of registeredunemployed was around 23 thousand (or about 7.3 percent of the estimatedlabor force) in that year. It peaked at 78 thousand (or about 23 percentof the labor force) in 1982. 1/ Net increase in employment in themanufacturing sector was around 5,000 annually during the early 1970's.
1/ There is a consensus in Mauritius that these statistics reflectunderregistration untll 1980 and over registration since 1981, inexpectation of the Unemployment Benefits Scheme which was introduced inlate-1981.

- 10 -
This trend tapered off gradually after 1979 and turned negative in 1982,when industry as a whole had to lay off a significant number of employees.With the recovery in economic activity, however, employment opportunities,particularly in export-manufacturing and tourism, expanded vigorously inthe latter part of 1983 and in 1984. There are indications that betweenSeptember 1983 and June 1984 some 8,200 additional jobs were created in theExport Processing Zone as a result of fuller utilization of existingcapacity. Including additional employment generated in tourism andconstruction it has been estimated that employment growth in 1984 hasslightly exceeded the increase of about 10,000 in the labor force for thefirst time in several years. Despite these improvements, however, thelevel of unemployment at 20 percent, still remains high and is a majorissue in Mauritius.
2.25. Wage policy has b.een an important part of adjustment policiessince 1979. The policy is implemented annually througn a national wageaward (the cost of living adjustment), which is based on the previousyear's inflation rate. The cost of living adjustment is also mandatory inthe private sector and is decided, at the beginning of each fiscal year,after national tripartite negotiations. During 1979-1984 wage awards inboth public and private sectors have been held considerably below cost ofliving increases. From 1979/80 through 1983/84, these awards have amountedto a cumulative increase of 55 percent, compared to 122 percent for theconsumer price index in the same period. The cost of living adjustment for1984/85 equaled about 3 percent, compared to the rise in the cost of livingindex in 1983/84 of 5.6 percent. The Government continues to view wagerestraint as vital to improve the country's export competitiveness.
Table 3: LABOR FORCE, EMPLOYMENT AND UNEMPLOYMENT, 1979-83(In thousands)
1979 1980 1981 1982 1983
Labor Force 313 324 332 339 355Employment 286 289 290 289 294Large Establishments 199 197 195 194 191Informal Sector 1/ 87 92 95 95 103
Unemployment (residual) 27 35 42 50 61
Registered Unemployment 2/ 23 31 57 78 73
Memo Items
Unemployment Rate (percent)Residual Unemployment 8.6 10.8 12.7 14.7 17.2Registered Unemployment 7.3 9.6 17.2 23.0 20.6
/ Estimated by the CSO based on assumptions made about labor/landratios in small scale agriculture and about the number of employeesper license issued to operate a small establishment.
2/ Unemployment registered in the official employment exchanges.
Source: Central Statistical Office.
- 11 -
Fiscal Policy and Performance
2.26. The drop in sugar prices after the sugar-boom, natural calamitieslike cyclones and drought and costly welfare state policies caused thebudget deficit to reach a peak of 14 percent of GDP in 1980/81. Followingthe end of the sugar boom the government did not retrench spending forseveral reasons. Some development projects necessitated outlays overseveral years and many projects had a high job-creation component and weredifficult to cut back at a time when private employment opportunities weredeteriorating. Current expenditure decisions, on the other hand, couldonly be reversed with great political difficulty.
2.27. Since 1979, however, there has been a sharp change in fiscalpolicy, which has become a key element of stabilisation. Despite a setback in 1980 due to severe cyclones, the fiscal adjustment since 1979 hasbeen substantial. The current budget deficit, which peaked at Rs. 554million in 1981/82, was reduced by one half to Rs. 255 million in 1983/84.The overall fiscal deficit at 12.6 percent of GDP continued to be alarmingin 1981/82. Through continuous efforts to postpone or slow down lowpriority capital spending, it was reduced substantially to about 7.3percent of GDP in 1983/84. The 1984/85 budget calls for additional cuts ingovernment spending and aims at reducing the fiscal deficit further toabout 6.0 percent of GDP.
2.28. On the revenue side discretionary tax measures taken since 1979to reduce the fiscal deficit included increases in the rates of importduties, across-the-board surcharges, and the introduction in 1983 of asales tax levied on wholesale trade. New tax measures introduced in1983/84 included a land development tax with a rate of 40 percent on theincreased value of land resulting from conversion of agricultural toresidential use; a tax on seasonal residences and vacation bungalows; and aland transfer tax of 5 percent on the value of land transferred. Thesetaxes were expected to bring about 45 million Rs. in 1983/84 but actuallybrought much less. Import duties were restored on some non-basic fooditems as well as luxury items. Several exemptions from import duties werewithdrawn. A withholding tax of 20 percent of dividends as an advancepayment on the income tax due was also introduced. As a result revenuesincreased by 2 percent in real terms during 1981/82-1983/84 while currentexpenditures were kept constant.
2.29. Current expenditures were restrained with substantial reductionsin budgetary subsidies to rice, wheat flour and to private educationalinstitutions. Retail prices of rice and wheat flour were raised in 1982/83and again in 1983/84 to curtail government spending and promote theproduction of domestically produced food stuffs. Primarily because ofthese measures but also as a result of the continued policy of wagerestraint which, allowed only partial compensation for inflation, thecurrent account deficit dropped to about 1.9 percent of GDP in 1983/84 fromabout 4.0 percent in 1981/82.

- 12 -
Table 4: CENTRAL GOVERNMENT OPERATIONS, FY81-85(Rs million)
1980/81 1981/82 1982/83 1983/84 1984/85(Prov.) (Budget)
Current revenue 2059 2278 2798 3019 3505Current expenditure 2318 2772 3091 3274 3581Current deficit -258 -554 -293 -255 -78
Capital expenditure 1048 902 889 793 912
Overall balance -1307 -1456 -1182 -1048 -988
Financed by:Grants 14 68 23 61 120External Borrowing 638 947 315 472 1435Debt Amortization -152 -234 -572 -791 -648Domestic Borrowing 807 675 1416 1306 81
Overall deficit aspercent of GDP 14.0 12.6 9.5 7.3 5.8
Source: Statistical Annex Tables.
2.30. Capital expenditures were cut sharply in 1981/82 from theirunsustainable high levels during the pre-stabilization period. Furtherreductions in capital spending also materialized in subsequent years due todelays in project execution. There was a modified pattern in deficitfinancing for both 1982/83 and 1983/84 marked by negative net foreignborrowing. This was due to a surge in capital repayments against a reducedlevel of new disbursements. This left the burden of financing on domesticsources in both years. Due to ceilings on total credit to the economy,fewer funds were available for private activity. This situation isexpected to reverse in 1984/85 with net foreign borrowing becoming positiveand domestic financing being substantially reduced.
2.31. The 1984/85 budget continues to reflect the restrictive fiscalobjectives of the ongoing stabilisation efforts. The principal new revenuemeasure introduced in 1984/85 is a 10 percent surcharge on customs andstamp duties, which is expected to yield an additional Rs 120 million (or 7percent of 1983/84 tax revenue). Grants are expected to nearly doublereflecting additional aid from European sources. The budget figures takeno account, however, of benefits that may arise from the June 1, 1984establishment of a Unifed Revenue Board, which will co-ordinate the effortsof the various revenue departments and work with the newly established TaxAppeals Tribunal, set up to expedite the adjudication of tax disputes.
- 13 -
2.32. Another important structural reform introduced by Government in1984/85 is a change in the company tax. The tax, which had been set at 55percent for public companies and 66 percent for private companies, wasformerly calculated on net profits after dividend distributions and henceencouraged the distribution of dividends. In tne 1984/85 budget thededuction for dividend distribution was eliminated, and the tax rate wasreduced to 35 percent for both public and private companies. In addition,the companies that are in nontraditional export sectors (i.e., other thansugar, molasses, and tea) will benefit by a 2 percentage point reduction inthe rate of company taxation for each 10 percent of their turnoverexported, subject to a minimum corporate tax rate of 25 percent. Thesemodifications, which have been introduced as part of the Government'sstructural adjustment strategy, are expected to encourage privateinvestment and promote export-oriented production.
2.33. On the expenditure side, the 1984/85 budget continues therestraint on current expenditures exercised in the previous three years.The wage bill is budgeted to increase by only 5.6 percent compared with 11percent in 1983/84. Total subsidies and transfers will remain virtuallystable, as slight increases in subsidies to local government, educationand pensions are expected to be offset by a further decline (of more than25 percent) in subsidies for rice and wheat flour. Capital expenditure isbudgeted to increase only slightly from the outturn of 1983/84 and toremain at a little over 5 percent of GDP. The Government expects that thework of the recently established Management Audit Bureau, in conjunctionwith spending agencies, will result in a much closer correspondence betweenthe capital budget and the actual outturn, with the former being based uponthe most realistic possible assumptions. The fiscal deficit in FY1984/85was Initially intended to be financed partly by external financing andpartly by domestic bank borrowing. However balance of payments problemsforced the government to raise an additional 500 million Rupees (US$40million) in Eurodollar loans, which should liberate most of the domesticfinancial resources for the private sector.
Money and Credit
2.34. Since 1979 broad money has increased in line with the trend ofnominal GDP around 14 percent per year. In 1981 the deterioration in thebanking system's net foreign assets position contributed to the slow growthin money supply. In 1982 nominal deposit interest rates were raised andinflation declined, bringing an end to negative real interest rates. In1983, the money supply increased more slowly than GDP, in response to thedecline in real deposit rates and also reflecting some reluctance on thepart of banks to bid for deposits in view of ceilings on their lending tothe private sector and their excess liquidity. In 1984 the increase inprivate credit accelerated while a new US$ 40 million Eurocurrency credit,disbursed in September 1984. led to a sharp reduction in net domestic bankclaims on the Government.
- 14 -
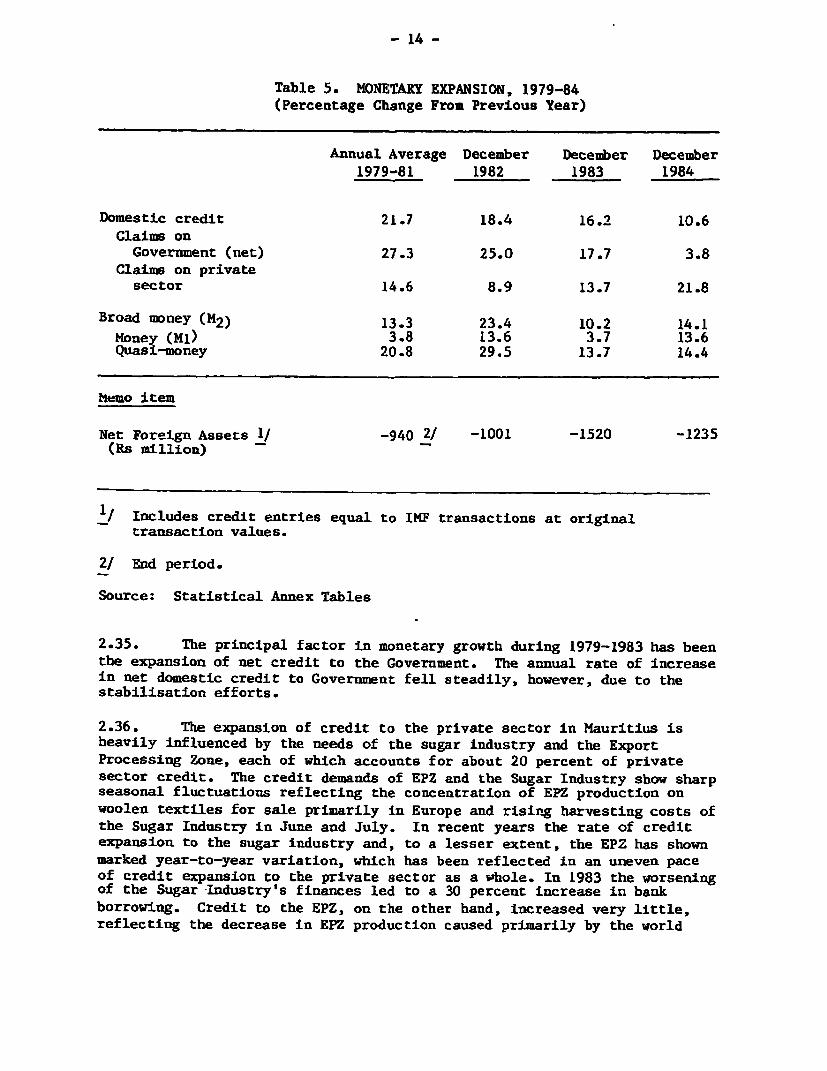
Table 5. MONETARY EXPANSION, 1979-84(Percentage Change From Previous Year)
Annual Average December December December1979-81 1982 1983 1984
Domestic credit 21.7 18.4 16.2 10.6Claims onGovernment (net) 27.3 25.0 17.7 3.8
Claims on privatesector 14.6 8.9 13.7 21.8
Broad mDney (M2) 13.3 23.4 10.2 14.1Money (Ml) 3.8 13.6 3.7 13.6Quasi-money 20.8 29.5 13.7 14.4
Memo item
Net Foreign Assets 1/ -940 2/ -1001 -1520 -1235(Rs million)
,' Includes credit entries equal to IMF transactions at originaltransaction values.
2/ End period.
Source: Statistical Annex Tables
2.35. The principal factor in monetary growth during 1979-1983 has beenthe expansion of net credit to the Government. The annual rate of increasein net domestic credit to Government fell steadily, however, due to thestabilisation efforts.
2.36. The expansion of credit to the private sector in Mauritius isheavily influenced by the needs of the sugar industry and the ExportProcessing Zone, each of which accounts for about 20 percent of privatesector credit. The credit demands of EPZ and the Sugar Industry show sharpseasonal fluctuations reflecting the concentration of EPZ production onwoolen textiles for sale primarily in Europe and rising harvesting costs ofthe Sugar Industry in June and July. In recent years the rate of creditexpansion to the sugar industry and, to a lesser extent, the EPZ has shownmarked year-to-year variation, which has been reflected in an uneven paceof credit expansion to the private sector as a whole. In 1983 the worseningof the Sugar -Industry's finances led to a 30 percent increase in bankborrowing. Credit to the EPZ, on the other hand, increased very little,reflecting the decrease in EPZ production caused primarily by the world
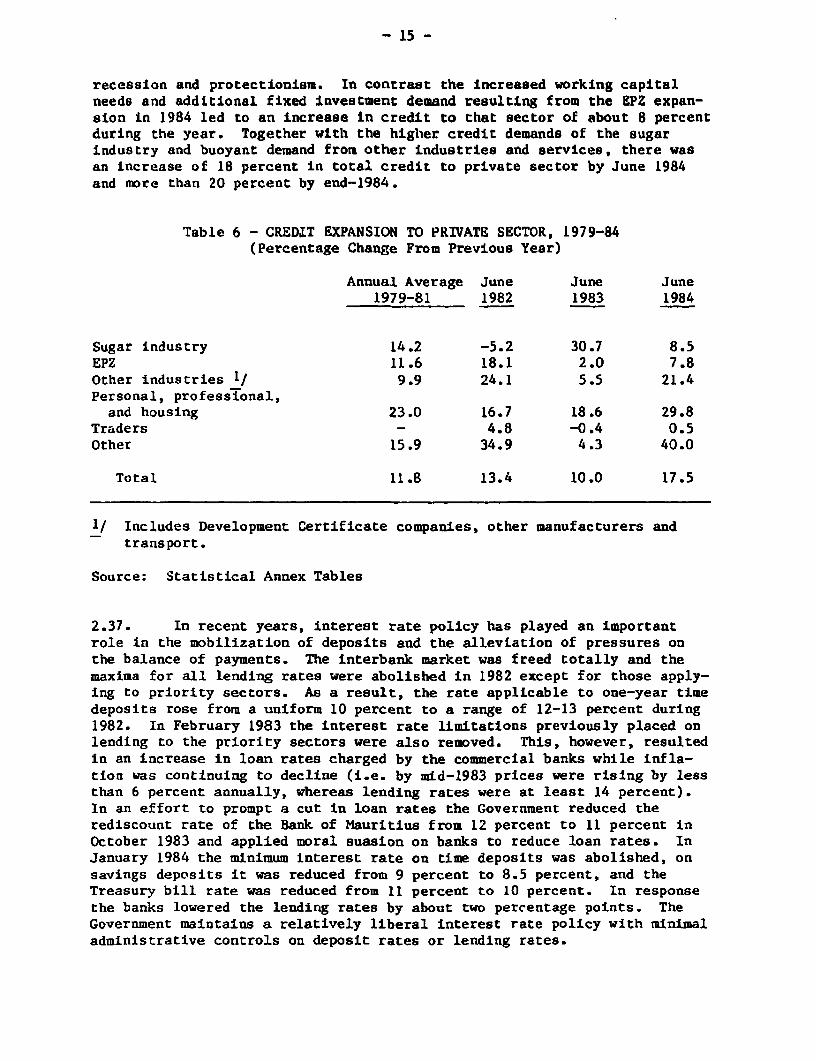
- 15 -
recession and protectionism. In contrast the Increased working capitalneeds and additional fixed investment demand resulting from the EPZ expan-sion in 1984 led to an increase in credit to that sector of about 8 percentduring the year. Together with the higlher credit demands of the sugarindustry and buoyant demand from other industries and services, there wasan increase of 18 percent in total credit to private sector by June 1984and more than 20 percent by end-1984.
Table 6 - CREDIT EXPANSION TO PRIVATE SECTOR, 1979-84(Percentage Change From Previous Year)
Annual Average June June June1979-81 1982 1983 1984
Sugar industry 14.2 -5.2 30.7 8.5EPZ 11.6 18.1 2.0 7.8Other industries 1/ 9.9 24.1 5.5 21.4Personal, professional,and housing 23.0 16.7 18.6 29.8
Traders - 4.8 -0.4 0.5Other 15.9 34.9 4.3 40.0
Total 11.8 13.4 10.0 17.5
1/ Includes Development Certificate companies, other manufacturers andtransport.
Source: Statistical Annex Tables
2.37. In recent years, interest rate policy has played an importantrole in the mobilization of deposits and the alleviation of pressures onthe balance of payments. The interbank market was freed totally and themaxima for all lending rates were abolished in 1982 except for those apply-ing to priority sectors. As a result, the rate applicable to one-year timedeposits rose from a uniform 10 percent to a range of 12-13 percent during1982. In February 1983 the interest rate limitations previously placed onlending to the priority sectors were also removed. This, however, resultedin an increase in loan rates charged by the commercial banks while infla-tion was continuing to decline (i.e. by mid-1983 prices were rising by lessthan 6 percent annually, whereas lending rates were at least 14 percent).In an effort to prompt a cut in loan rates the Government reduced therediscount rate of the Bank of Mauritius from 12 percent to 11 percent inOctober 1983 and applied moral suasion on banks to reduce loan rates. InJanuary 1984 the minimum interest rate on time deposits was abolished, onsavings deposits it was reduced from 9 percent to 8.5 percent, and theTreasury bill rate was reduced from 11 percent to 10 percent. In responsethe banks lowered the lending rates by about two percentage points. TheGovernment maintains a relatively liberal interest rate policy with minimaladministrative controls on deposit rates or lending rates.
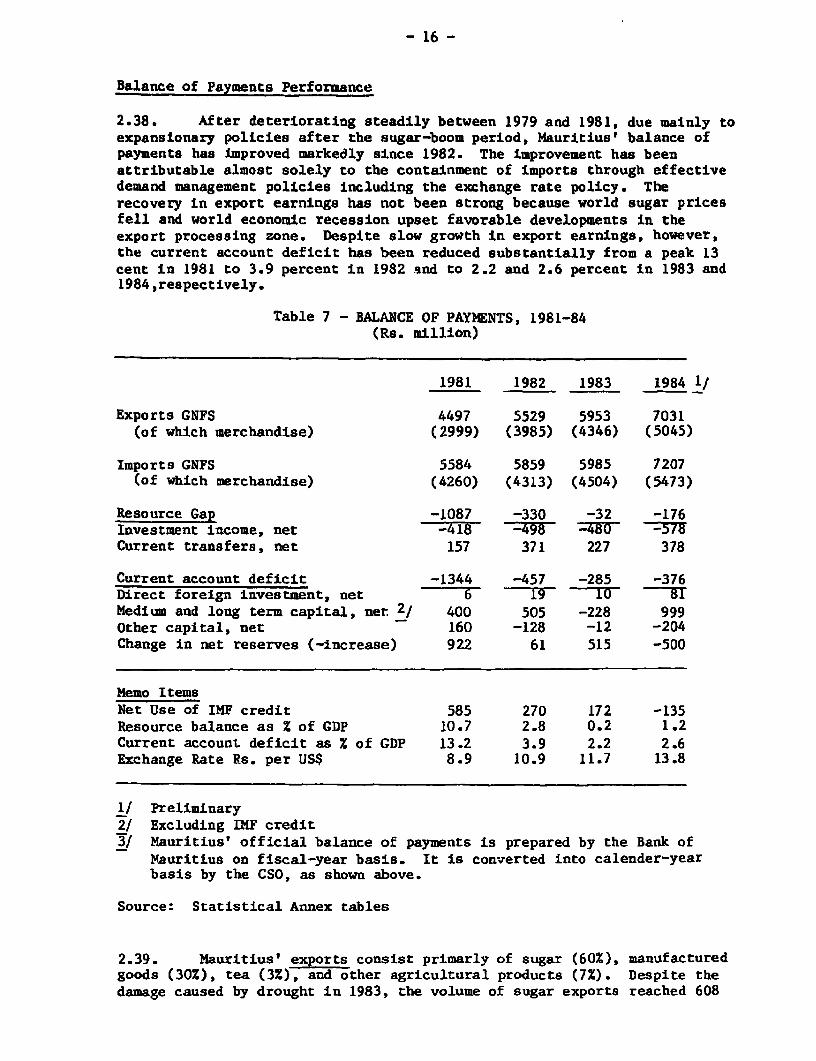
- 16 -
Balance of Payments Performance
2.38. After deteriorating steadily between 1979 and 1981, due mainly toexpansionary policies after the sugar-boom period, Mauritius' balance ofpayments has improved markedly since 1982. The improvement has beenattributable almost solely to the containment of imports through effectivedemand management policies including the exchange rate policy. Therecovery in export earnings has not been strong because world sugar pricesfell and world economic recession upset favorable developments in theexport processing zone. Despite slow growth in export earnings, however,the current account deficit has been reduced substantially from a peak 13cent in 1981 to 3.9 percent in 1982 and to 2.2 and 2.6 percent in 1983 and1984,respectively.
Table 7 - BALANCE OF PAYMENTS, 1981-84(Re. million)
1981 1982 1983 1984 1/
Exports GNFS 4497 5529 5953 7031(of which merchandise) (2999) (3985) (4346) (5045)
Imports GNFS 5584 5859 5985 7207(of which merchandise) (4260) (4313) (4504) (5473)
Resource Gap -1087 -330 -32 -176Investment income, net -418T -498 -4W -578Current transfers, net 157 371 227 378
Current account deficit -1344 -457 -285 -376Direct foreign investment, net 6 19 f1 81Medium and long term capital, net 2/ 400 505 -228 999Other capital, net 160 -128 -12 -204Change in net reserves (-increase) 922 61 515 -500
Memo ItemsNet Use of IMF credit 585 270 172 -135Resource balance as % of GDP 10.7 2.8 0.2 1.2Current account deficit as % of GDP 13.2 3.9 2.2 2.6Exchange Rate Re. per US$ 8.9 10.9 11.7 13.8
1/ Preliminary2/ Excluding IMF credit3/ Mauritius' official balance of payments is prepared by the Bank of
Mauritius on fiscal-year basis. It is converted into calender-yearbasis by the CSO, as shown above.
Source: Statistical Annex tables
2.39. Mauritius' exports consist primarly of sugar (60%), manufacturedgoods (30%), tea (3X), and other agricultural products (7%). Despite thedamage caused by drought in 1983, the volume of sugar exports reached 608
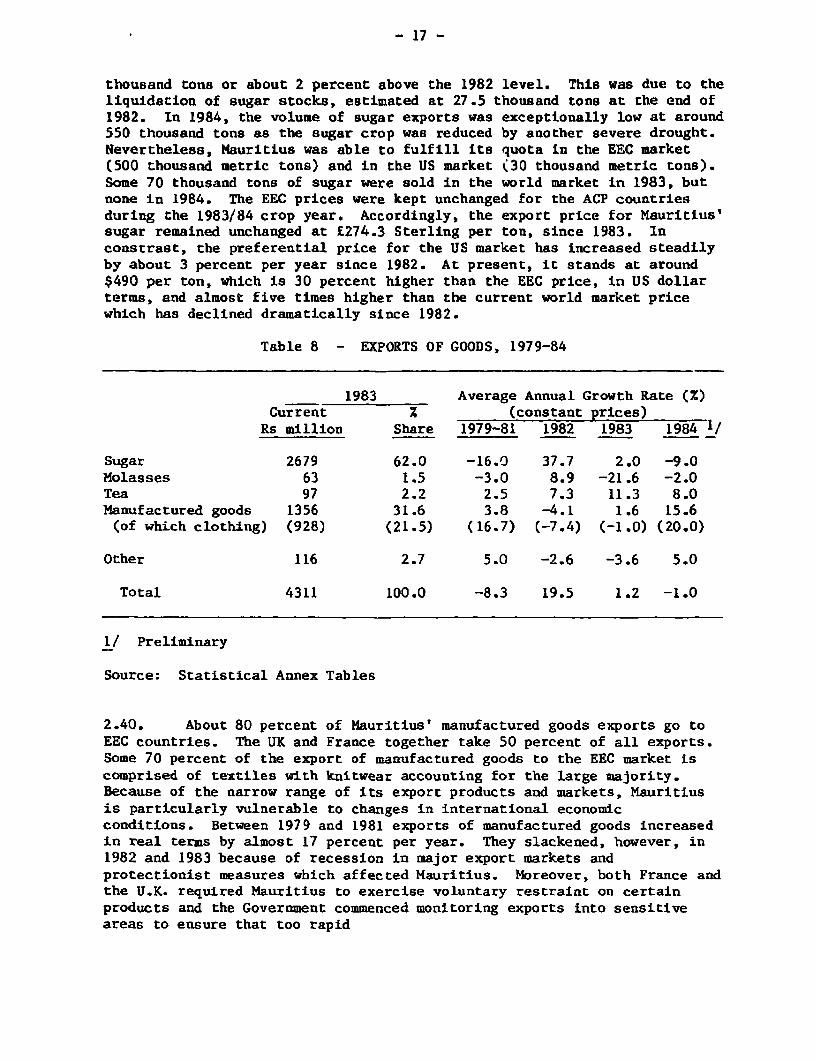
I - 17 -
thousand tons or about 2 percent above the 1982 level. This was due to theliquidation of sugar stocks, estimated at 27.5 thousand tons at the end of1982. In 1984, the volume of sugar exports was exceptionally low at around550 thousand tons as the sugar crop was reduced by another severe drought.Nevertheless, Mauritius was able to fulfill its quota in the EEC market(500 thousand metric tons) and in the US market (30 thousand metric tons).Some 70 thousand tons of sugar were sold in the world market in 1983, butnone in 1984. The EEC prices were kept unchanged for the ACP countriesduring the 1983/84 crop year. Accordingly, the export price for Mauritius'sugar remained unchanged at £274.3 Sterling per ton, since 1983. Inconstrast, the preferential price for the US market has increased steadilyby about 3 percent per year since 1982. At present, it stands at around$490 per ton, which is 30 percent higher than the EEC price, in US dollarterms, and almost five times higher than the current world market pricewhich has declined dramatically since 1982.
Table 8 - EXPORTS OF GOODS, 1979-84
1983 Average Annual Growth Rate (Z)Current % (constant prices)
Rs million Share 1979-81 1982 1983 1984 _/
Sugar 2679 62.0 -16.0 37.7 2.0 -9.0Molasses 63 1.5 -3.0 8.9 -21.6 -2.0Tea 97 2.2 2.5 7.3 11.3 8.0Manufactured goods 1356 31.6 3.8 -4.1 1.6 15.6(of which clothing) (928) (21.5) (16.7) (-7.4) (-1.0) (20.0)
Other 116 2.7 5.0 -2.6 -3.6 5.0
Total 4311 100.0 -8.3 19.5 1.2 -1.0
1/ Preliminary
Source: Statistical Annex Tables
2.40. About 80 percent of Mauritius' manufactured goods exports go toEEC countries. The UK and France together take 50 percent of all exports.Some 70 percent of the export of manufactured goods to the EEC market iscomprised of textiles with knitwear accounting for the large majority.Because of the narrow range of its export products and markets, Mauritiusis particularly vulnerable to changes in international economicconditions. Between 1979 and 1981 exports of manufactured goods increasedin real terms by almost 17 percent per year. They slackened, however, in1982 and 1983 because of recession in major export markets andprotectionist measures which affected Mauritius. Moreover, both France andthe U.K. required Mauritius to exercise voluntary restraint on certainproducts and the Government commenced monitoring exports into sensitiveareas to ensure that too rapid
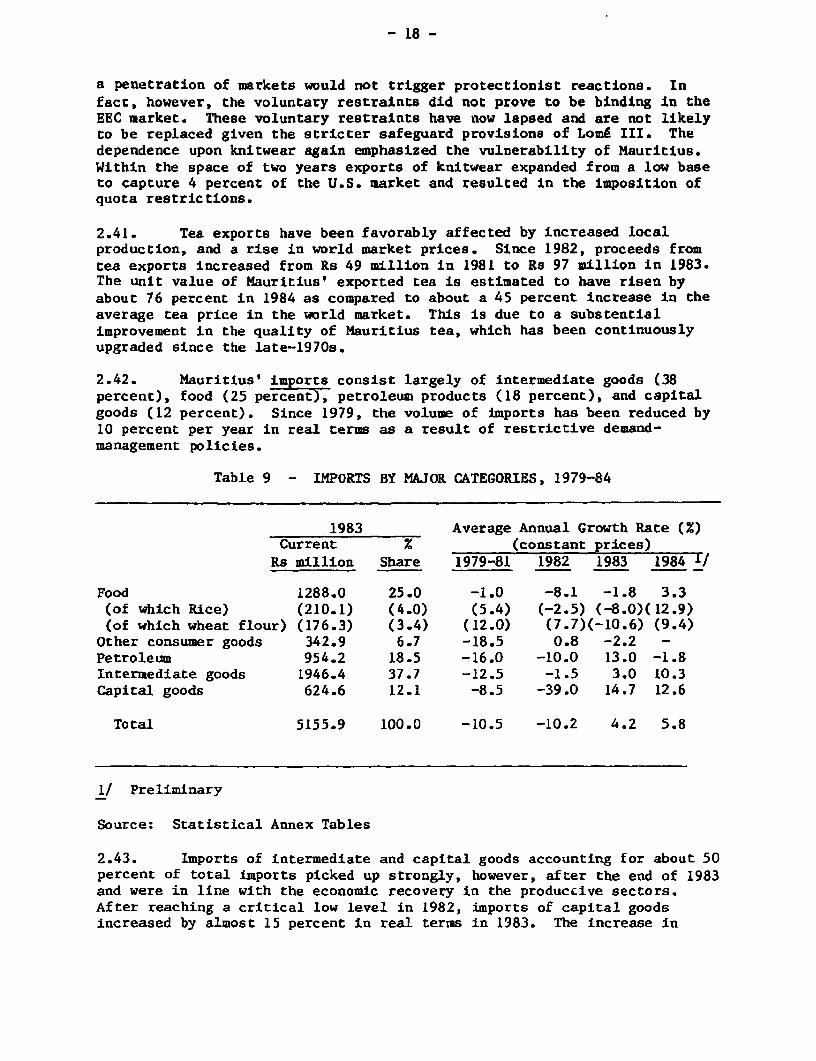
- 18 -
a penetration of markets would not trigger protectionist reactions. Infact, however, the voluntary restraints did not prove to be binding in theEEC market. These voluntary restraints have niow lapsed and are not likelyto be replaced given the stricter safeguard provisions of Lomd III. Thedependence upon knitwear again emphasized the vulnerability of Mauritius.Within the space of two years exports of knitwear expanded from a low baseto capture 4 percent of the U.S. market and resulted in the imposition ofquota restrictions.
2.41. Tea exports have been favorably affected by increased localproduction, and a rise in world market prices. Since 1982, proceeds fromtea exports increased from Rs 49 million in 1981 to Rs 97 million in 1983.The unit value of Mauritius' exported tea is estimated to have risen byabout 76 percent in 1984 as compared to about a 45 percent increase in theaverage tea price in the world market. This is due to a substentialimprovement in the quality of Mauritius tea, which has been continuouslyupgraded since the late-1970s.
2.42. Mauritius' imports consist largely of intermediate goods (38percent), food (25 percent), petroleum products (18 percent), and capitalgoods (12 percent). Since 1979, the volume of imports has been reduced by10 percent per year in real terms as a result of restrictive demand-management policies.
Table 9 - IMPORTS BY MAJOR CATEGORIES, 1979-84
1983 Average Annual Growth Rate (%)Current X (constant prices)
Rs million Share 1979-81 1982 1983 1984 1/
Food 1288.0 25.0 -1.0 -8.1 -1.8 3.3(of which Rice) (210.1) (4.0) (5.4) (-2.5) (-8.0)(12.9)(of which wheat flour) (176.3) (3.4) (12.0) (7.7)(-10.6) (9.4)
Other consumer goods 342.9 6.7 -18.5 0.8 -2.2 -Petroleum 954.2 18.5 -16.0 -10.0 13.0 -1.8Intermediate goods 1946.4 37.7 -12.5 -1.5 3.0 10.3Capital goods 624.6 12.1 -8.5 -39.0 14.7 12.6
Total 5155.9 100.0 -10.5 -10.2 4.2 5.8
1/ Preliminary
Source: Statistical Annex Tables
2.43. Imports of intermediate and capital goods accounting for about 50percent of total imports picked up strongly, however, after the end of 1983and were in line with the economic recovery in the produccive sectors.After reaching a critical low level in 1982, imports of capital goodsincreased by almost 15 percent in real terms in 1983. The increase in
- 19 -
imports of capital and intermediate goods was even more pronounced in 1984,when exports of EPZ products were estimated to have increased in volume by20 percent.
2.44. Food imports were reduced in volume by 8 percent in 1982 andanother 2 percent in 1983 in line with the Government's policy to reduceprice subsidies on imported food items and stimulate the production oflocal food crops. Rice imports declined from 88,000 tons in 1980 to 72,000tons in 1983 when retail prices of rice in Mauritius rose gradually from Rs1.40 per kg in January 1980 to Ps 2.50 in 1983. Similarly, imports ofwheat flour dropped by almost lit percent in volume in 1983 when its retailprice rose from Rs 1.16 per kg in 1980 to Rs 2.40 in 1983. In 1984 importsof food are estimated to have risen by 3 percent while imports of otherconsumer goods remained low reflecting the continued implementation ofpolicies to reduce import demand, particularly on low-priority importitems.
2.45. Imports of petroleum products declined by 10 percent in volume in1982 in response to specific energy conservation measures. In 1983,however, there was a substantial increase in petroleum imports because ofthe need to replenish stocks which were severely depleted at the end of1982. The import bill went up by only 5 percent in current prices, asGovernment succeeded in negotiating a preferential price with Kuwait. In1984, the imports of petroleum products in volume are estimated to havedeclined by nearly 2 percent.
2.46. The current account deficits of the balance of payments since 1979have been financed to a large extent by medium and long term loans frombilateral and multilateral sources; a drawdown in foreign exchangereserves, a significant use of IMF resources, and to a lesser extent bydirect foreign investment. After reaching a critically low level in 1982net direct foreign investment is estimated to have tripled to Rs 80 millionin 1984. Net medium and long term capital inflows were high in 1982 as aresult of a $40 million Euro-dollar loan contracted in that year. In 1983,however, there was a net capital outflow of Rs 228 million due to a rise indebt service payments and to low gross disbursements on previouslycontracted loans. In 1984 disbursements especially from loans for balanceof payments support have increased significantly. These disbursements,however, have not been adequate to offset the heavy debt burden Mauritiushad to face during the second half of 1984. The need for additionalforeign exchange to meet the country's debt service obligations and restoreits foreign exchange reserves resulted in another Eurocurrency borrowing of$40 million, contracted in August 1984. With the new Eurocurrency loan andexpected higher disbursements from other sources in 1984, foreign exchangereserves are estimated to have increased by Rs 500 million, equal to aboutfour weeks' imports.
External Debt
2.47. Mauritius' external debt outstanding includiag undisbursed stoodat $543 million at the end of 1983, of which $332 million was disbursed.Of this amount roughly 68 percent came from bilateral sources and
- 20
multilateral organizations, excluding the IMF. The remaining 32 percentwere suppliers credits and loans from commercial banks. The World BankGroup held one-fourth of Mauritius' total debt outstandlng and disbursed(19 percent for IBRD and 6 ptrcent for IDA) by end-1983. Among bilateraldonors, France continues to be the most important creditor (11 percent)followed by the United Kingdom (6 percent), and the United States (4percent).
2.48. With increased recourse to commercial borrowing since 1977, theoverall terms of external borrowing have hardened. The average terms ofexternal public debt in 1983 were estimated at 17 years maturity with 4years of grace. The average interest rate was around 10 percent. TheGovernment has recently undertaken to limit new borrowing onnon-concessionary loans until mid-1986, with maturities of less than oneyear to US$ 30 million and to contract no new loans with maturities of 1-12years. Mauritius' debt service payments rose from $7 million in 1977 to$84 million in 1983, or about 16 percent of export earnings. Including IMFrepayments, the debt service payments were equal to about 20 percent ofexport earnings in 1983. The debt service ratio, excluding IMF repayments,has been estimated to have increased to nearly 18 percent in 1984.Including IMF repayments, the debt service ratio was 24 percent.
III. STRATEGY FOR FURTHER STRUCTURAL AND POLICY ADJUSTMENTS
3.1. The key objectives of Mauritius' structural adjustment dtrategy,initiated by Government in the early 1980s, will continue to be validthroughout this decade. The structural adjustment strategy aims primarilyat encouraging export-led growth based on export processing industries andtourism and replacing imports of energy and food and some manufacturedproducts. The ultimate objective iB to achieve a sustainable growth pathand provide employment for the unemployed as well as new entrants to thelabor force. The key objectives of Mauritius' structural adjustmentstrategy and further policy reforms required are as follows:
Maintaining the Long-term Viability of the Sugar Subsector:
3.2. Sugar is still the most important subsector of the economy. Itis the primary foreign exchange earner and the largest employer. Itsdirect/indirect contributions to domestic savings and government revenueare also significant. Scope to increase sugar production, however, islimited since there is a constraint on effective demand and the cultivatedarea under sugar is already at its maximum limits. Future growth of outputand employment in Mauritius therefore, will depend increasingly onnon-sugar activities. Nevertheless, the critical importance of the sugarsubsector will continue; it will provide the necessary foreign exchange anddomestic resources for sustained growth of output and investments elsewherein the economy.
- 21 -
3.3. Sector Structure: Despite significant expansion of other sector*since the early 1970s, sugar still occupies around 90 percent of thecultivable area and accounts for about 62 percent of the export earnings.Sugar growers may be classified as owner-planters and tonant-planters, withthe former being sub divided between planters without milLing faciltiesand those wlth mills connected wlth th estaotes; the miller-planters.About 60 percent of the best sugar land is owned and cultivated by twentyone miller-planters. Historical heritage ls an lmportant factor explainingthis concentration. The remaining 40 percent of the land is cultivated byabout 33 thousand small planters (Annex Table 7.2).
3.4. Until the early 1960's most of the Increased production resultedfrom Lncreases in the area harvested, while yields were practicallyconstant. Since then, the area under cane has stayed stabla and theincrease in production has been attributable to Lncreased yields. Ingeneral, the large estates use more capital intensive techniques and betteragricultural practices compared with the smpll planters. As a result,large producers generally obtain much higher yields than small planters.During the period 1976-1980 small planters' ylelds have averaged around 28tons per arpent compared with 37 tons per arpent in miller-planters (1arpent - 1.04 acre). Part of the problem lies in the small and irregularsize of holdings of many of the small planters and the poor land capabilityof the small planters land, generally. Some of the small planters may alsohave full-time jobs elsewhere in the economy. It is clear, however, thatthe gap in yields is disturbing and lmprovements in productivity are calledfor.
3.5. Market And Price Structure: Mauritius exports 95 percent of itssugar production. From 1951 to 1974 Brltain was nearly the sole purchaserof Mauritian sugar, under the Commonwealth Agreement. In 1975 Brltainintegrated its sugar policy with that of the European Economic Communityunder the LomE Convention. According to the Sugar Protk al of the Load6Convention, the EEC agreed to purchase and import 1.3 million metric tonsof white sugar from 46 African, Caribbean and Pacific (ACP)associate-members at guaranteed prices for an indefinite perlod of time.Mauritius' share in the EEC quota is 487.2 thousand metric tons of whitesugar. In terms of shipping weight, this equals about ' 0 thousand tons.Untll 1974 Mauritius also had a small annual quota in the US market underthe Sugar Act. In 1975 the Sugar Act expired and Maurirutjs became free tocompete in the US market for any quantity of sugar at world market prices.Since May 1982, however, exports to the US have again been restricted (30.3and 25.3 thousand metric tons in 1983/84 and 1984/85, respectively) under apreferential prlce system. During the period 1979-83 annual sugarproduction in Mauritius averaged around 620.0 thousand tons, of which about50.0 thousand tons per year were exported to non-quota countries.
3.6. The guaranteed EEC price has remained well above the world marketprice since 1976. Although the price differential narrowed substantiallysince 1983, the EEC price at US cents 17.0 per pounds still compares veryfavorably with the free world market price of about 5 US cents per pound.
- 22 -
The US quota price has been even more favorable, in line with the pricespaid to the US producers. The sugar export proceeds, before export tax,are distributed in Mauritius between planters aud millers on the basis of a74:26 distribution ratio. Export duties are based on the f.o.b. value ofsugar exports. Until the recent changes, the rate of export duty used tovary according to the product size; planters producing 75 tons (or less)were exempt from the export duty and the largest producers were assessed atthe highest nominal rate of 23.6 percent. In 1983 the income transfer toMauritius by the EEC through preferential prices was equal to about $75million (or Rs 800 million). Because of variable and progressive rates ofexport levies the level of producers' prices differ for differentcategories of producers; the smaller planters receiving the highest prices(Annex Table 7.5).
3.7. Market Outlook: Mauritius' sugar quota with the EEC is due for areview in 1985. There is almost no scope however for an expansion sincethe country enjoys the largest single agreed quantity under the LomeConvention and the EEC market is already in sugar - surplus. The totalimport requirements of US are expected to decline substantially from about3.2 million tons to around 2.6 million over the next few years as a resultprimarily of continued expansion of the market share of corn-basedsweeteners. World sugar production and consumption in 1984/85 areestimated at 94 and 96 million tons, respectively. These imply only amodest reduction in large carry-over stocks held by the major producingcountries (about 37 million tons). Pressure to earn foreign exchange mayforce major producers to increase their sales. This in return, would exertfurther downward pressure on the world market prices.
3.8. The EEC prices are adjusted annually under the CommonAgricultural Policy. The EFC prices remained stagnant in real terms since1983 in relation to a basket of EEC currencies. !n relation to the US$,prices have decreased markedly. The EEC prices are expected to decline byabout 3 percent per year in real terms over the period of 1985 - 1990. Inthe US, the market stabilisation price has recently been increased from UScents 21.2 per pound to US cents 21.6 per pound. Prospects up to 1987 aresubject to the provisions of a new US Farm Bill: however no increase inreal terms is expected. The world market handles less than 25 percent oftraded sugar excluding Cuba and Soviet Block. It is a residual market forsugar and displays greater instability than any other commodity. Pricelevels in 1984 were extremely depressed. The London Daily Price (LDP) forraw sugar at the beginning of the quarter was 5.8 c/lb. The pricegradually declined over the period and by the end of November the LDP rawsugar price was 5.2 c/lb. This is below the marginal cost of production ofmost producers.
3.9 Issues And The 'Restructuration" Program: After the dramatic turnaround in Mauritius' terms of trade following the decline of sugar pricesin 1976 and the second oil price increase in 1979, two sets of issuesrelated to the sugar subsector have become increasingly important. First,the declining financial profitability of the sugar industry; the twenty-onelarge estates with milling facilities. Second, the low productivity of thesmall-holder planters.

- 23 -
3.10. Under the First Structural Adjustment Loan (1981) the Governmentappointed a Commission of Inquiry to deal with both sets of issues. Afterthe work of the Commission, in the context of SAL It Government issued apolicy statement outlining its intention for a restructuration of the SugarIndustry. Given the unfavorable earning prospects of the sugar industryover the next several years, the Restructuring Program focusses correctlyon improving technical efficiency and reducing production costs in millingas well as cane growing operations throughout the subsector. Maintainingthe Labor absorption capacity of agriculture is another major concern ofGovernment. The principal elements of the program are the centralisationand rehabilitation of the sugar mills, making better use of the industry'sby-products, raising the productivity of small planters and modifying thefiscal and legal framework in which the industry operates. A detailedAction Plan for the rehabilitation of the sugar industry, based on theseprinciples has recently been prepared by the Sugar Authority. The ActionPlan is expected to be carried out over a period of three to five years andhelp to improve the long-term financial viability and the technicalefficiency of the sugar industry.
(i) Factory Centralisation and Rehabilitation: A majorrecommendation of the Commission of Inquiry on Sugar was therationalisation of its milling operations. This entails,first, the closure of the less efficient units andcentralisation of sugar factories. Next, existing unitsrequire rehabilitation, for during the recent years offinancial difficulties, investment in this sector declined andeven the maintenance and replacement of equipment has beenneglected. Cane supplies to the remaining units need to berationally reallocated in accordance with their crushingcapacities, cane handling facilities, and cane transportationcosts. An expansion of the capacities of the remainingfactories will be necessary, to cater for the increased canesupply. Economies of scale in milling and in operating costssuggest that it will be economical to have a smaller number offactories of relatively high crushing capacities. The presentaverage size of sugar mills in Mauritius of 32,900 tons sugarper year is small compared to the size of new factories beinginstalled in the world today, of up to 100,000 tsy. Thepotential reduction in factory operating costs resulting fromthe closure of five factories has been estimated in the rangeof Rs 55-95 million per year. Accordingly the Action Plan hasidentified five to six mills as likely candidates for closureor merger by 1990. Two of these mills, one In the north ofthe island and one in the center, are scheduled to be closedby mid-1985. The items required for the rationalization,modernization and ex'--nsion of each of the remaining unitshave been identified The entire cost of the program has beententatively estimated at Rs. 650 million in 1984 prices.
- 24 -
(ii) Better Utilisation of By-Products: Bagasse, thefibrous residue of crushed sugar cane, can be used as a formof fuel for thermal power generating plants. At present, mostlarge and medium sized sugar factories in Mauritius supplysome energy to the national grid during crop time. Up to1983, only a small amount of energy had been supplied in thisway, peaking at about 32 GWh, (excluding FUEL and Medine) orless than 10 percent of the country's consumption of energy in1983, of 375 GWh. The potential energy which can be suppliedfrom this source is considerably higher. Assuming that energyrequirements grow by about 5 percent per year, so that thecountry's total energy consumption by 1990 is about 485 GWh,the Action Plan estimates that up to 250 GWh can be suppliedby bagasse-based power stations. This will not only permit asaving of foreign exchange for the country, by reduction infuel imports, but will also increse the revenue of theindustry. This will entail the setting up of two newbagasse-based power stations, with an installed capacity of12.5 KW each, in addition to the existing capacity at FUEL andMedine. The Action Plan anticipates that one of these will bein the north, and the other will be in the south. The totalcost of the project would be about Rs. 330 million. Thiswould include the purchase of power generation, steam saving,and bagasse densifying and handling equipment.
giii) Land Rationalisation: It has been established thatthe sugar industry's financial difficulties stem more fromcane production than from the mill operations. Preliminaryanalysis suggests that one of the main causes of this is thecost of labor, which receives a high level of non-wagebenefits, compared to other sectors in the economy, and isguaranteed year-round employment. At present, regularemployment in field operations in the large sugar estates isabout 33 thousand people. If the current full-year employmentand pay regulations were modified, this would lead toincreased cost effectiveness in the use of labour. Thepotential saving to the sugar industry could be up to 10percent a year. Hcwever, it is evident that to resolve partof the industry's financial problems by displacing largenumbers of workers would not be on its own an acceptablesolution in the national economic context, particularly asregards the present unemployment situation. A possiblesolution to both these problems (i.e. improving the financialviability of the sugar industry and maintaining the laborabsorption capacity of the sugar subsector) may involvemaking the estate lands available for outright sale or tosettling labour on viable family cane plots (5-10 arpents).This would lead to materially wider
- 25 -
participation in cane production and land ownership. Toprevent a decline in sugar production, the settlement of theworkers on cane plots, and the yields of small planters wouldneed to be monitored carefully.
(iv) Raising the Productivity of Small Planters: Small planterscane yields per arpent today in general are 75 percent of theyields on the large estates. A 10 percent increase in theiryields could raise total sugar output by upto 15,000 tons ayear. The "Action Plan" therefore recommends that measures beadopted to realise their potential. A first step towardsachieving this is the identification of the constraints whichhave limited planter productivity so far. These include,first, poor quality land and potential and the absence ofcoordination among the several institutions designed to servesmall holders in areas such as land preparation, creditfinancing, crop insurance etc. The separate policies followedby these institutions can subject a planter to conflictingsituations and at the least, require him to go to a series ofplaces to solve his problems. A second major problem is theshortage of certain services, such as herbicide sprayingfacilities and soil preparation facilities, or inputs, such aherbicides. The Action Plan therefore recommends theestablishment of Planter Service Centers designed toco-ordinate all the requirements of the planters, in terms ofboth inputs and serivices, and make them available at oneplace. Some of the problems faced by small planters, forexample, the availability and cost of soil preparationfacilities, are due to the intrinsic nature of their small andscattered holdings. Incentives will be given to smallplanters to group together for such purposes. At the sametime, the restructuration program will intensify research bythe Mauritius Sugar Industry Research Institute (MSIRI) onproblems peculiar to small planters, and improve the extensionfacilities available to them.
(v) Modifications in the Fiscal and legal Framework: TheGovernment has recently introduced a set ot rax reforms toprovide financial relief to the sugar industry and encouragethe sales of sugar cane land. In export tax, the reform willbe achieved first by raising the exemption ceiling from 75tons of 1,000 tons, and second by changing the structure ofthe tax so that outputs of any given producer, up to eachsuccessive ceiling, will be taxed at the rate applicable tothat ceiling. The financial relief for 1984/85, calculated onthis basis, amounts to about Rs. 100 million. The Governmenthas also decided to reduce taxes on the transfer of sugarcaneland. The Land Transfer Tax, at present levied at the rate of5% of the land value, will be suspended for a period of fiveyears. This will apply to plots up to 25 arpents for any onebuyer and to any number of plots not exceeding 25 arpents eachfor the seller. Similarly the Land Development Tax will besuspended for five years on sales of sugarcane land up to 25

- 26 -
arpents. The overall tax rate will also be reduced. The LandDevelopment Tax will be cnarged, where applicable, on the landtransferred and not on the total size of holdings as appliedup to now. These measures are expected to encourage the saleof marginal sugar lands in large estates, lead to animprovement in their productivity and help to maintain thelabor absoption capacity of the subsector.
(vi) Certain revisions in the legal framework in which largeestates operate have also been introduced through appropriatemodifications in the Companies Act. These are designed toenhance the social accountability of large sugar estatesthrough broadening their ownership and providing for widerdisclosure of their operations and at the seine time providingthem with investment incentives. These provisions include theseparation of milling from planting operations, theregistration of a}l sugar mills under the Companies Act andthe taxation of corporate income based on profits beforedistribution of dividends instead of retained profits, as atpresent. Auditing and accounting requirements will be revisedin order to ensure uniformity across firms and between privateand public companies. Annual reports incorporating relevantinformation will be filed with the Register of Companies,presented to all shareholders, and made available to otherinterested persons.
Agricultural Diversification
3.10. Mauritius has significant comparative advantage in producingsugar. Few commodities other than sugar can be produced in Mauritius at acost less than their border price equivalents. Average economicprofitability of sugarcane, at preferential prices, far exceeds the averageeconomic profitability of alternative food and cash crops, even inrelatively less-fertile lands that are considered marginal for sugar.Whether the country's comparative advantage in sugar will continue dependson the cost and price prospects for sugar, both in absolute terms andrelative to alternative food and cash crops. Long-term production costsand their variability are difficult to estimate, but long-term commodityprice prospects compare favorably for sugar. These lead to the policyconclusion that agricultural diversification in Mauritius should only beencouraged as a complement rather than a substitute for sugar production.
3.11. Government policies on agricultural diversification are based ona White Paper on the subject published in February 1983. The overallthrust of Government policy is to reduce imports of food which from 1980-83averaged about 23 percent of total imports, without putting at risk thepresent level of export earnings from sugar. The key objectives to beachieved within a five-year period are: (a) to reach self-sufficiency inselected foodcrops; (b) to reduce dependence upon imported meat and milk;(c) to develop all lands to the limit of their maximum productivity; and(d) to establish a framework of marketing facilities, institutions andprice stabilisation mechanisms to provide improved support and security forproducers.

- 27 -
3.12. The area of land allocated to fulltime foodcrop production atpresent, is approximately 5 000 arpents. Since sugar remains the crop withbest return per unit of land, tbe foodcrop programme will need to be basedlargely on rotation and interlining with sugar cane.
3.13. Scope to increase food crops through rotation is limited sincerotation land is available only in fields scheduled for -Grande Saison"replanting which takes place in 8-year intervals. The land available forinterlining could, however, ultimately rise to 35,000 to 40,000 arpentswhich is considered to be adequate for foreseeable requirements.Conditions in the country are generally unsuitable for growing rice orwheat--major staples consumed in Mauritius. The country therefore, willhave to continue to rely on imported cereals. However, the import billcould be reduced significantly by encouraging consumers to change theirconsumer preferences from rice to wheat, whose price on the internationalmarket is about half of that of rice, or other staples like maize which canbe produced domestically. To encourage such a shift in consumption patern,the government has been reducing price subsidies on imported food crops.This policy should continue in the future.
3.14. The country's success in achieving self sufficiency in somevegetables (i.e. potatoes and most green vegetables) with even anexportable surplus, is encouraging. Exports of fresh and dried flowers areactively being promoted. The government is also examining measures topromote production of other minor vegetables which can be grown inMauritius.
3.15. Livestock and dairy products offer the greatest potential foragricultural diversification since they don't require arable land. Localproduction of meat and milk represents less than 5 percent of totalconsumption in Mauritius. Cattle breeding is undertaken by both small andlarge breeders, the latter mainly on sugar estates. Since 1976, there hasbeen a consistent decline in the numbers of cattle in the small breederssector, resulting in an overall decline in the cattle population despitesome expansion by the large breeders. It is reported that the two keyconstraints on small breeders have been the unavailability of fodder andunremunerative marketing systems. The Government intends to improve theavailability of fodder: (a) on Crown Lands; and (b) by ensilation ofcane-tops. The latter represents Mauritius' greatest underutilisedagricultural asset, as production of cane tops is estimates at up to twomillion tonnes a year. These may be fed fresh or following ensllation withor without the addition of urea. Ensilation with urea is reported to begiving good results in feeding trials, and Government intends to encouragethis development.
3.16 Deer farming and ranching have recently been introduced toutilize steep or rocky slopes which can not be farmed. Initial indicationshave been favorable with adequate returns to producers. The deer meat isacceptable to most local communities and there are promissing exportmarkets. Government may wish to consider making available more CrownLands, presently under forest, for deer ranching.
3.17. Fisning is another potential area of development. Fish
represents abcat 40 percent of the total animal protein consumed in
- 28 -
Mauritius. The deficit between local production and consumption (about18 kg per capita) is met by imports at a significant foreign exchangecost. The yield potential of the banks fishery has been assessed at about5000 tons per year. Thus some further encouragement of the development ofthis resource seems necessary. Deep sea fishing also requires greaterGovernment attention since export receipts from this source are significantat present, and could be stimulated further.
Reform of Industrial Policies
3.18. The promotion of export-oriented manufacturing is the majorpriority for Mauritius since export manufacturing constitutes the Island'smain hope for sustained growth in domestic income, employment and foreignexchange earnings. The primary objectives in industry, therefore, are:
a) to maintain the competitiveness of Mauritius as a base forexport-oriented manufacturing and
b) to move toward an industrial incentive system thatencourages all manufacturing industries to export.
3.19. Sector Structure: Manufacturing played a relatively small rolein the economy of Mauritius until the 1970's. It provided a fewcommodities for domestic consumption and service facilities for thedominant sugar sector. Most consumer and nearly all intermediate andcapital goods were imported. In a small, low-income country opportunitiesfor reasonably efficient import substitution were limited and theIncentives Ace of 1964 gave only a small stimulus to growth inmanufacturing output. Under these cirerumstances an attempt was made tofollow the successful example of some smaller Asian countries that adoptedvigorous export-led strategies to encourage manufacturing development. TheExport processing Zones Act of 1970 offered an attractive basket ofincentives to domestic and foreign exporters alike. The Government hassince then vigorously promoted export-industries and, at the same timeprovided too generous incentives to industries wlhich compete with imports.
3.20. The two main incentive schemes, at present, affectimport-substituting firms and, export-oriented enterprises: TheDevelopment Certificate (DC) Scheme, introduced in 1964, provides selectedimport-substituting enterprises with significant tax and duty concessions.Over 200 companies have benefitted from the scheme, particularly in foodand beverages, textiles and garments, chemical products, iron and steel,and tourism. In June 1981, import-substitulting firms were also madeeligible for the drawback of duty paid on the import content of any exportsthey might make. In addition to the duty free import of capital goods, DCfirms often sought and obtained exemption from payment of duty on importedmaterial inputs. These two privileges were disallowed in October, 1983.DC firms also often applied for and received tariffs, additional tariffs orthe imposition of import quotas to protect their sales in the domesticmarket. Import-substituting industry employs about 16,000 people(excluding small firms), of which present and former DC industrialenterprises employ some 6,600.
- 29 -
3.21. Under the Export Processing Zone (EPZ) Schemin, Introduced in1971, enterprises setting up factories to sell their eiitire output outsideMauritius are eligible for Export Enterprise Certificates (EEC), by whichthey are granted a company tax holiday on retained earviings for 10 yearswith a possible extension to 20 years, tax-free dividends in any fiveconsecutive years and exemption of duty for imports of machinery andequipment. In 1980 the corporate tax holiday facility was extended but ona declining basis for a further 10 years after the initial ten. Finally,in August 1981 the complementary Export Service Zones Act extended similartax incentives to firms providing servlces. Other benefits offered includefree repatriation of profits, liberal work permits for specialistexpatriate staff, and export financing at preferential rates. Priority wasinitially given by Government to labor-intensive industries, and to thosewhich introduced new technology and marketing skills. Local participationin equity was encouraged. As of 1983, the EPZ companies in operationemployed some 23,000 people; textiles and garments, jewelry, electronics,diamond cutting, watches, toys and plastic goods are the major industriesrepresented.
3.22. In general, export-oriented firms are larger, have grown fasterand specialise in textiles and garments production. On theimport-competing side, production is more diversified and accounts for mostof- the output in food and beverages, chemical and metal and non-metalmineral products. Export processing industries provide 60 percent of alljobs in the manufacturing sector and provide 30 percent of total exportearnings. While value added in the import-competing sector is larger, itsshare is quickly diminishing. During 1976-1983 the export processingindustries grew at about 14 percent per year compared with 5 percent peryear for import-competing firms. The share of the export processingindustries in manufacturing value added, increased from 31 to 41 percentduring the same period.
3.23 Policy Reforms Achieved: Mauritius has been highly successfullin promoting export processing industries and maintaining the country'sexport competitiveness through appropriate exchange rate and wage policiesand a vigorous promotional campaign. Macro-economic policies havegenerally been adjusted to support the country's strategy forexport-oriented industrialisation. Inflation has been kept moderate with aleveling off or decline in prices of some imported commodities and productsespecially since 1979. The annual wage adjustments in the industrialsector have been held considerably below cost-of-living increases. Despitecomprehensive labor legislation designed to protect workers, money wagerates in the export manufacturing sector compare favorably at present withmost of Mauritius competitors. 1/ The Government has been following arelatively liberal interest rate policy and the exchange rate has been keptflexible.
/ Of five countri.es examined - Mauritius, Sri Lanka, Singapore, ThePhilippines and H^ngkong only Sri Lanka has lower wage rates forunskilled and semi-skilled labour.

- 30 -
3.24 Beginning in 1981 under the First and Second StructuralAdjustment Loans, the Government also began taking steps to strengthen theexport regime by strengthening and broadening fiscal incentives for exportpromotion and trading, improving export financing facilities, simplifyingand centralizing export procedures and strengthening institutions thatpromote exports and international trade. Since 1981: (a) double taxationarrangements have been reached with Germany, France and UK to extend thebenefits of the Mauritius' tax-holiday provisions to the German, French andBritish investors on taxes they pay in their home countries; (b) a taxrebate (duty drawback) system was introducted to encourage the growth ofmanufactured exports by non-Export Enterprises; (c) Export Credit Guaranteeand Insurance Schemes were established to provide colateral support to thecommercial banks to stimulate liberal and flexible export credit; (d) anExport Development and Investment Authority (MEDIA) was set up to carry outplanning, executive and advisory roles with regard to investment and ---ortpromotion and to have responsibility for developing and operatingindustrial estates, provided by Government for industrial investors;finally, (e) an Industrial Coordination Unit (ICU) was established toassist potential investors in obtaining clearances and permit, to set uptheir business. Significant progress has been made in most of theseareas.
3.25 Further Reforms Required: In the import-substituting sub-sector,however, performance has been mixed. A recent review has revealed that acomprehersive reform of the existing system of industrial protection wouldbe necessary if the manufacturing sector as a whole is to make moreefficient use of capital, increase foreign exchange earnings and createsubstantially more employment.
3.26 The question of efficiency of the import-substituting sub-sectorhas recently been reviewed by Government through a consultancy reportprepared for the Ministry of Industry. l/ This report assessed theefficiency of the sector and its various sub-sectors by analysing the leveland structure of nominal protection (NP), effective protection (EP) and bycomputing domestic resource cost (DRC) of the manufacturing output. 2/ Theresults suggest that the net effect of the existing system of industrialprotection is highly distortionary as between export-oriented andimport-substituting sectors as well as within import-substitutingestablishments. First, the effective rates of protection forImport-competing industries vary between negative (whlch implies the firmswould do better in a free trade regime) and over 300 percent. In a fewcases international value added is negative. Average effective rates by
1, Mauritius-Industrial Policy Review, Port Louis, Mauritius, August1984.
2/ The nominal protection coefficient (NP) is the ratio of the firm'srevenue in market prices to its revenue in social (border) prices.The effective protection coefficient (EPC) is the ratio of value addedin market prices to value added in social prices. Finally, the (DRC)coefficient represents the ratio of domestic factor costs in socialprices to value added in social prices.
- 31 -
sector range from (- 24) percent in the case of food to (824) percent forelectrical machinery. There is also a considerable dispersion of effectiverates among firms within sectors. Second, it is evident that Mauritius hasgeneral comparative advantage in sectors which use labour in a relativelyintensive manner. The existing system of industrial protection hasdiverted investment into relatively capital intensive sectors with lessscope for employment creation. Third, from a social point of view thelower the level of effective protection the more profitable the investmentis. In other words, the social rate of return as measured by the DRCdecreases as the effective rate of protection increases. And finally,financial returns to investment are greater, the higher the level ofeffective protection. The relative profitability of import-substitutingindustries over export-oriented industries has diverted investments awayfrom export-manufacturing. During 1979-81 four-fifths of total fixedinvestments in manufacturing were absorbed by import-substitutingsub-sector.
3.27. A more efficient and export-oriented pattern of industrialisationwould require that the level of protection for import-substitutingindustries be reduced gradually zis export promotion measures arefurther strengthened. Reorientation of the trade policy and otherindustrial incentives to improve capital efficiency and to allocateinvestment to more export-oriented and labor intensive lines of productionwill both save resources and generate more foreign exchange and employmentper rupee of investment. Furthermore if import-substituting industries areencouraged to become more competitive by international standards and todevelop in line with the country's comparative advantage, they should alsobe able to export an increasing share of their output, either directly orindirectly. All these would necessitate the following policy improvements:
(i) Replacement of Quotas With Tariff Protection: This reformis already well in progress with all quantitative importrestrictions having been lifted as of January 31, 1985. Theremoved quotas have not, however, been replaced with theirtariff equivalent which means that protection to someindustries is being reduced at a faster pace thandesirable. Prompt action would be required to replace thesequotas with tariffs equivalents.
(ii) Tariff Reform: The tariff system in Mauritius is highlycomplex and is subject to frequent changes. It is comprisedof five elements including fiscal, customs and stamp duties,surcharges and exemptions from payment of duty. Frequentchanges in the tariff schedule have been prompted by balanceof payments considerations, fiscal need and a desire toprotect local industry. A rationalised tariff structure tobe implemented over a period of four to five years shouldinclude (a) the consolidation of the fiscal, customs andstamp duty and surcharges into a unified ad-valorem tariff;(b) the implementation of a new and more uniform tariffstructure that would lower the existing effective protection

- 32 -
and narrow the spread of eff.'L.*Lve rates over a period ofseveral years by raising tariffs on goods which havenegative effective protection and lowering them on goodsthdt .;re over protected. A uniform tariff structure wouldbe simpler to administer and would provide much more equaleffective protection.
(lli) Termination of Development Certificate Scheme: TheDevelopment Certificate (DC) Scheme was introduced in theearly 1960s to stimulate the growth of import-competingindustries. The excessive protection granted to DC firmsthrough the DC Scheme is contrary to creating an efficientand low cost industrial sector capable of exportlng. Theconsolidation and re-structuring of the tariff should be themajor policy instrument for the protection and encouragementof domestic industry and the Development Certificate schemeshould be discontinued, although the tax provisions incontracts with current DC holders should be honored.Furthermore (a) corporate tax benefits should be linked andbe made proportionate to output exported; and (b) the dutydrawback system should be improved. The tax system shouldreward the act of exporting regardless of the original typeof certificate (DC or EEC) of the exporting firm. Thecorporate tax reform introduced in the 1984/85 budget is afirst step in this direction. The current drawback systemoffsets only partially the additional costs imposed byprotection (it does not cover secondary inputs and importedmachinery used to produce for export). In addition, longdelays occur before any refund actually takes place. Thedrawback system should be improved by (a) the use of avoucher system that can be used for payment of duties onimported goods; and (b) by the adoption of a uniform tariffrate applied to the f.o.b. value of exports. This systemwould have the advantage of administrative simplicity, andof compensating exports for the evaluation of all imputs(local and imported) that results from the protectivesystem. The adoption of a uniform rebate rate depends,however, on the implementaiton of a more uniform tariffstructure. In the meantime the drawback rate should bemodified to include a rebate on local inputs based on theirstatutory tariffs.
(iv) Removal of Price Controls: Price controls include maximumprice regulation and maximum mark-ups. Reasons for pricecontrols are to maintain low prices for essential food andhousehold items that are important to low income groups andto curtail possible monopoly abuse by importers or localproducers favored by the existing system of industrialprotection. It has been the policy of the Government to
-33-
reduce the number of goods subject to maximum priceregulation. Since the beginning of 1984 controls have beenremoved from about 50 commodities. As of August, 1984 only11 imported and 17 locally produced goods, nearly all ofthem classified as necessities, were still under pricecontrol. By contrast the range of commodities under maximummark-up control has expanded to some 40 items. With theremoval of quotas the arguments in favor of price controlsparticularly for non-essential items would need to be re-examined.
Energy Substitution
3.28. Total energy requirements in Mauritius are met about half bybagasse, 30 percent by imported petroleum products and 20 percent bybiomass (firewood, cane crop and other residues, charcoal) and hydropower.Bagasse is now used very largely in the sugar industry, though it isexpected to make an important contribution to publi: power supply by theend of the decade. Outside the sugar industry, the energy requirements ofthe economy are met about 60 percent by petroleum, about a third by biomassfor household cooking and the remainder by hydropower and coal. From 1985onwards though coal is expected to be a major source of power, being firedjointly with bagasse in steam power generation systems. The first 28,000tonne shipment of coal for power generation arrived in 1984 but was barelyused in that year due to delays In commissioning the power plantconcerned.
3.29. The major thrust of energy policies through 1990 will be toimprove the efficiency of petroleum use and power generation; to convertfacilities using imported fuels - oil and coal - to cheaper locallyproduced fuels, primarily bagasse and sugar crop residues; and to developand implement a least-cost strategy for supplying household cooking fuels.The decline in oil prices in recent years has reduced pressure on foreignexchange resources and, with improving heavy diesel technology, has broughtthe cost of oil-fired diesel engine generation much closer to that ofcoal. Moreover, Mauritius has one of the most efficiently run large heavydiesel power plants in the region. Hence, combined with the aforementionedfactors, oil must be considered along with other options in reviewing theleast-cost power system development for Mauritius. However, the prospectof generating large scale bagasse surpluses through modernising andupgrading sugar mills makes bagasse the most likely source of future largescale power sector energy supply. In the interim, there are a number ofmeasures for reducing the loss of power and energy in transmission anddistribution, as well as rehabilitation of older hydro-power plants, thatpromise cheaper "additions" to power supply. Larger scale bagasse firedpower generation has already been developed by the private sector for saleyear round to the Central Electricity Board (CEB). One sugar factory,F.U.E-L., has already installed a 25MW power station and offers 17MW firmyear round supply to the CEB. After preliminary trials it is likely thatthis plant will be permanently fired simultaneously with coal and bagasse,somewhat reducing the foreign exchange savings anticipated from longperiods of solely bagasse fired operation. In parallel, another sugarfactory has installed a pilot

-34-
bagasse pelletising plant, BAGAPEL, to provide dry pellets to the FUELplant throughout the year. Early trials have not been economicallypromising, though further evaluation of this and other densification andbagasse handling systems is warranted since improved bagasse storage andtransport systems are important to the long term viability of large scalebagasse fired power generation. With well planned and timely investmentsin surplus bagasse production, bagasse handllng systems, bagasse firedpower generation, and possibly the use of deneified bagasse as anindustrial and household fuel, it is conceivable that sustainable localenergy sources could expand from about two thirds at present to over 80% ofprimary energy supply by the early 1990's.
Employment Generation
3.30. Of the total labor force (355 thousand) about 190 thousand areemployed in the formal sector and about 20 percent is unemployed atpresent. The unemployment problem in Mauritius is serious not only becausemore jobs will need to be created than in recent years, but also becausesome sectors that have greatly helped in solving the problem up to now canno longer be expected to do so.
3.31. It is unlikely that agriculture which provides about one-third ofthe wage employment in Mauritius will absorb a significant number of newentrants to the labor force since the sugar subsector, traditionally themajor employer, occupies 90 percent of the country's arable land and cannotexpand further. Moreover, the sugar industry will continue to shed laboras sugar harvesting becomes more mechanized. About 50 percent of the landunder sugar cane is estimated to be suitable for mechanization. Unlessthere is a fundamental change in the distribution of land-holdings and/orwage and employment regulations in agriculture, the sugar industry willcontinue to reduce labor-use. Diversification into other crops would atbest create enough new jobs to offset the negative impact of laborredundancy in the sugar industry.
3.32. The public sector, the second largest emDloyer in Mauritius whichsustains about 30 percent of the labor force employed in the formal sector,should not expand further. The pressures upon the public sector to expandemployment will remain large and difficult to resist. However, policiesshould proceed in the opposite direction since the public sector in generalcannot offer productive employment and further austerity would be needed ingovernment spending.
3.33. Export manufacturing and services are the only promising outletsfor future growth of gainful employment in Mauritius. Within the servicesectors, tourism and trade have the largest potential for new employmentopportunities. However, Mauritius' tourism is seasonal w-~th sharp peaksoccuring in December/January and in July. Moreover, Mauritius caters tothe upper end of the tourist market and the origin of tourists coming tothe country is heavily concentrated in Reunion, Metropolitan France and theRepublic of South Africa. It is only through increased diversification inthe origin of tourists, that Mauritius will be able to sustain the requiredabove-average stimulus for tourism expansion. Growth in transport and
-35-
trade on the other hand, are linked closely and are thus sensitive to thegeneral developments in productive sectors.
3.34. In manufacturlng, some 38 thousand people were employed in largeestablishments in 1983 and about 60 percent of these were In exportmanufacturing. Employment in export manufacturing expanded vigorously In1983 and 1984. The Government's target in Its "medium-growth" scenario forthe period of 1984-1986 is to generate 6000 new employment opportunitiesper year, in export manufacturing. Assuming that the current relationshipbetween the growth of value added and employment generation in exportmanufacturing industry remains constant, this employment target wouldrequire a real growth in value added in export manufacturing of around 8.0percent per year. Although feasible, if judged by historical performance,this rate of growth in export manufacturing will require continuedadjustments in economic policies to maintain the country's exportcompetitiveness, attract new foreign investors and expand the country'straditional export markets. In the longer run, the solution to the risingunemployment problem will depend increasingly on further reductions in thepopulation growth rate.
3.35. Manpower Training: Though the industrial sector presently makesuse mainly of unskilled labor, the course of development of the EPZ and ofother industires Is likely to require increasingly skilled and speciallytrained manpower. In large measure, the success of the EPZ is a positivereflection on the labor force that Mauritius has to offer, namely bilingualworkers with a relatively high level of general education. This prividesthe basis for eventual diversification of industry to more technical fieldswhich require higher technical skills in the workforce. Owners andmanagers of the EPZ have already expressed their need for and support ofsuch skill development, and the Government has responded by passing a lawestablishing a Central Training Office (CTO). The objectives of the CTOwould be fourfold: to monitor the needs for occupational training; toadvise on technical and vocational training; to administer, control andoperate training schemes; and to provide for, assist in and regulateapprenticeship and on-the-job training programs. The need for acoordinated system of training programs to support diversified industrialdevelopment has thereby recognized by both the Government and theindustrial sector, but much remains to be done. The CTO has beenofficially established as an operating body, although it is not yet fullyfunctional. The n..npower information required to guide the coordinationand improvement of skill training programs is not well developed. At thesame time, it would not be desirable to set up a rigid connection betweentraining programs and presumed labor market needs, given the climate ofrapid economic and technical charge, and the uncertainties regarding whatopportunities and problems the future will bring. A close and continuinginteraction between skill training and industrial needs is thus calledfor. Under these circumstances, the role of the CTO is of highestimportance and its operational development a matter for urgent action.
Population Control
3.36. A vigorous family planning program initiated in the late 1960shad succeeded in reducing the annual rate of natural increase from 3.0percent to 1.5 percent. The total fertility rate which fell from 5.9 to
-36-
2.7 was among the most rapid decline to have occured in a population ofsignificant size. It is clear indeed that the family planning program inMauritius has successfully evolved despite the difficulties of management,service delivery, and demand stimulation.
3.37. In spite of the past success of the population program,population policy continues to be a major concern to the Government. Witha continuation of the present rate of population growth, the presure onavailable land and food production would require substantial technologicalchange in agriculture or in the structure of the economy. In addition,population growth continues to generate new entrants into the labor forcethus adding to the already acute problem of unemployment. If fertilitycontinues at the present rate, the population density of the island ofMauritius would grow from 530/km2 in 1984 to 970/km2 in 35 years. However,if a net reproductive rate of one is reached before 1990, as planned by theGovernment, the population density would be less than 800/km 2 in 35 years.If the present level of services for education, health and other socialinfrastructure is to be maintained the added cost to government expenditureover the next 25 years will be 26 percent greater with a continuation ofthe present population growth rate than would be the case if governmentfertility targets are attained. Most recent estimates indicate that theearlier success of the Family Planning Program is continuing and that theGovernmeuaLs objective will most likely be reached before 1990.
3.38. The goveriment recognizes that a more effective populationprogram is vitai given the small size of the country, its limited naturalresources, and the importance of controlled population growth for long runstructural adjustment. Furthermore, Mauritius has a positive set of socialand institutional factors that give considerable reason for optimism forfurther progress in the area of population policy. These factors include aper capita income in the mid range of developing countries, a high level ofeducation and a strong government program of family planning that works ona cooperative basis with non-governmental family planning institutions.However, past success with the family planning program has exploited theeasy gains from this positive set of preconditions and additional gains canonly be achieved with more effort. Future action should be concentrated inthree areas where significant gains appear to be possible: (i) improvedsupervision and management, (ii) enhanced information, education andco3municaton (IEC) and (iii) improved contraceptive method mix.
IV. PROSPECTS: ADJUSTMENT AND GROWTH (1985 - 1990)
4.1. Mauritius has made significant progress since 1979 in reducingits fiscal and financial imbalances. The current account deficit of thebalance of payments at 2.5 percent of GDP is now at its socially tolerableminimum level. Although the budget deficit at 7.3 percent of GDP stillremains high, the effort to curtail government outlays since 1979 has beenremarkable: subsidies of food and education have been continuouslyreduced, current expenditures on housing and public health have beensharply curtailed. In addition, public utility prices have been adjustedperiodically to minimize budgetary transfers to parastatals and prevent

-37-
distortions in resource allocation. Finally, the public investmentprojects with low economic rates of return have continuously beeneliminated from the capital budget. As progress in narrowing fiscal andexternal deficits continues, however, the incremental gains to furtherausterity become less. Despite recovery in 1984, growth remaines sluggishand unemployment high at about 20 percent.
4.2. In 1985 there are large debt service obligations falling due forrepayment. The debt service ratio including IMF repayments is expected topeak at 26 percent in 1985, but decline thereafter. The balance ofpayments constraint therefore, will continue to be binding and will forcecontinued stringency in economic policy.
4.3. Beginning in 1986, however, the emphasis of economic policiesshould switch from austerity to a more growth-oriented developmentstrategy. For more rapid growth during 1986-1990 less restrictivedemand-management policies should allow import demand to expand gradually.Furthermore, the overall investment level will need to be increased, lowpriority investments in infrastructure be discouraged and the growth ofprivate investments in productive sectors be accelerated. The viability ofthis "high growth/low unemployment" scenario will depend largely on asubstantial effort on the part of the Government to pursue successfully itsprogram of structural adjustment, but partly on the international communityproviding adequate financial support during this recovery period.
Growth Prospects
4.4. During 1985-90 Mauritius can sustain higher rates of growth ofGDP provided that the progress achieved to date under the StructuralAdjustment Program continues in the future. Under the IBRD base-casegrowth scenario, GDP is projected to grow by 3.5 percent per year during1985-1986 and by about 4.0 percent towards the end of chis decade. Growthin industrial output, primarily in the Export Processing Zone (EPZ), willbe the main impetus for GDP growth. Growth in agriculture will remainconstrained by the limited prospects of the sugar sub-sectornotwithstanding the recovery from the low output level 4f 1984. Growth inother sectors will be higher than in agriculture, but cannot be expected tomatch that of industry. The unfolding medium-term scenario is, therefore,one of growth impetus being derived primarily from the non-agriculturalsectors. For land-scarce and labour-surplus Mauritius, this is the onlyplausible growth path.
4.5. Sugar production is projected to increase gradually from a lowlevel (575 thousand tons) in 1984 and reach an average yearly level ofaround 650 thousand tons during the projection period. The majorunderlying assumption is that the sugar restructuration program willimprove medium and long term viability of the sugar industry and willincrease the productivity of land-use especially among small holderplanters. In addition, the Government will continue to encourageagricultural diversification through promotion of livestock, fooderops andfisheries. Improvements in the productivity of land-use should increasethe real growth rate in agriculture and stabilize it around 2.7 percentuntil the end of this decade.
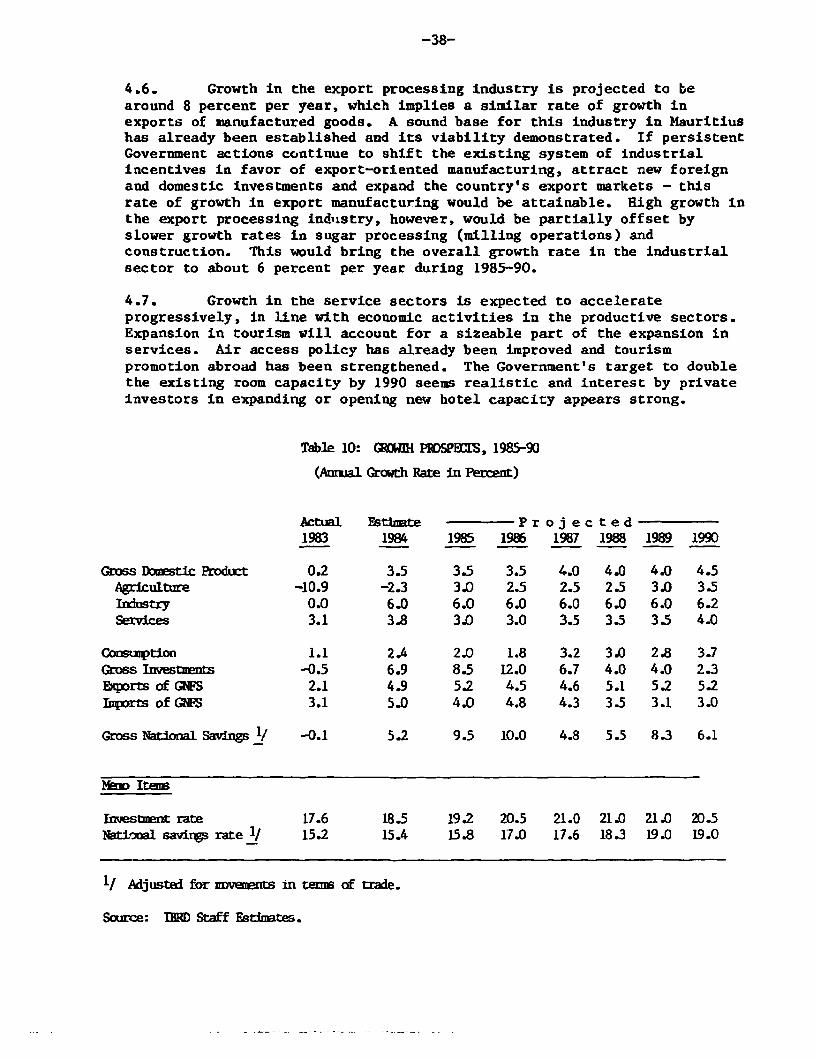
-38-
4.6. Growth in the export processing industry is projected to bearound 8 percent per year, which implies a similar rate of growth inexports of manufactured goods. A sound base for this industry in Mauritiushas already been established and its viability demonstrated. If persistentGovernment actions continue to shift the existing system of industrialincentives in favor of export-oriented manufacturing, attract new foreignand domestic investments and expand the country's export markets - thisrate of growth in export manufacturing would be attainable. High growth inthe export processing indulstry, however, would be partially offset byslower growth rates in sugar processing (milling operations) andconstruction. This would bring the overall growth rate in the industrialsector to about 6 percent per year during 1985-90.
4.7. Growth in the service sectors is expected to accelerateprogressively, in line with economic activities in the productive sectors.Expansion in tourism will account for a sizeable part of the expansion inservices. Air access policy has already been improved and tourismpromotion abroad has been strengthened. The Government's target to doublethe existing room capacity by 1990 seems realistic and interest by privateinvestors in expanding or opening new hotel capacity appears strong.
Table 10: G(XJH PHESPBCrS, 1985-90
(Anual Growth Rate ln Percent)
Actual Est iite P r oj e c t e d1983 1984 1985 1986 1987 1988 1989 1990
Gross Dometic Prodxct 0.2 3.5 3.5 3.5 4.0 4.0 4.0 4.5Agriculture -10.9 -2.3 3.0 2.5 2.5 2.5 3.0 3.5Taxistry 0.0 6.0 6.0 6.0 6.0 6.0 6.0 6.2Services 3.1 3.8 3.0 3.0 3.5 3.5 3.5 4.0
Cosunption 1.1 2.4 2.0 1.8 3.2 3.0 2.8 3.7Gross Investmnts -0.5 6.9 8.5 12.0 6.7 4.0 4.0 2.3Exports of GNFS 2.1 4.9 5.2 4.5 4.6 5.1 5.2 5.2Imports of GNES 3.1 5.0 4.0 4.8 4.3 3.5 3.1 3.0
Gross National Savings 1 -0.1 5.2 9.5 10.0 4.8 5.5 8.3 6.1
MeD Items
Imnestment rate 17.6 18.5 19.2 20.5 21.0 21.0 21.0 20.5NaticAml savings rate 1/ 15.2 15.4 15.8 17.0 17.6 18.3 19.0 19.0
11 Adjusted for meverts in rems of trale.
Source: IBED Staff Estimates.

-39-
4.8. The continuous recovery of the economy calls for higher levels ofinvestment in productive sectors. Therefore, the ratio of investment toGDP is projected to increase somewhat to 20.5 percent in 1986 and remain ataround that level until 1989. An increasing share of these investments areexpected to be financed through national savings. This would requirefurther improvements in the national savings rate which stands at presentaround 15.5 percent.
Public Sector Investment Program (PSIP)
4.9. The new three-year Public Sector Investment Program coveringFY1985-87, was finalized in late-1984. It aims at providing supportiveinfrastructure for the directly productive sectors and essential publicservices. The new PSIP is seen by the Government as an instrument toredress the employment problem only indirectly, through laying the basisfor economic growth. This is a departure from the view taken by previousgovernments which have used expenditures under the Development WorksCorporation (DWC) as a way to simultaneously build physical infrastructureas well as partially alleviate the employment problem. Expenditures underDWC are presently being constrained and the Government correctly sees PSIPas catalyst to private economic activity and seeks to address theemployment problem by stimulating the latter.
4.10. Sector composition of the new PSIP substantially meets theGovernment's stated objectives. Investments for supportive infrastructureconstitute more than 50% of the total. There are 21 new projects of which11 are extension of on-going projects or system improvements of currentworks. For the period as a whole, there will be 7 project completions. Ofthe new projects the Ethanol project requires some caution. Its prospectsare questionable with economic rate of return ranging only between 1% tro4%. The new coal project, on the other hand, seems quite appropriate inthe light of the exhaustion of the country's hydro-potential. and therelative price advantage of coal over imported oil. Various sectoraldetailes are as follows:
i. Agriculture, Co-operatives, and Rural Development. Of the 18projects, seven are new projects (viz., Northern Plains II, MIPipeline, Drip Irrigation, Chaumiere Irrigation, PalmaIrrigation, Agricultural Diversification, Tea Manufacturing);-however, only Palma Irrigation is strictly a new project, delayedstart-up from the previous schedule accounting for the rest. Ofthe above, Drip Irrigation is a pilot project which could lead toa redesign of the Northern Plains II Project involving theadvisability of sub-surface or drip irrigation methods. Therewill be eight project completions during the present three-yearperiod: one in 1984/85 (e.g., cooperatives), two in 1985/86 (TeaManufacturing, Palma Irrigaticn) and five in 1986/87 (e.g.,Northern Plain I, Drip Irrigation, Tea Development, AgriculutralFarms, Fisheries Development).
ii. Industry and Tourism. There are two new projects in thesesectors (Regional Industrial Estates and Vacoas-PhoenixIndustrial Estate) to meet the rising demand for industrial
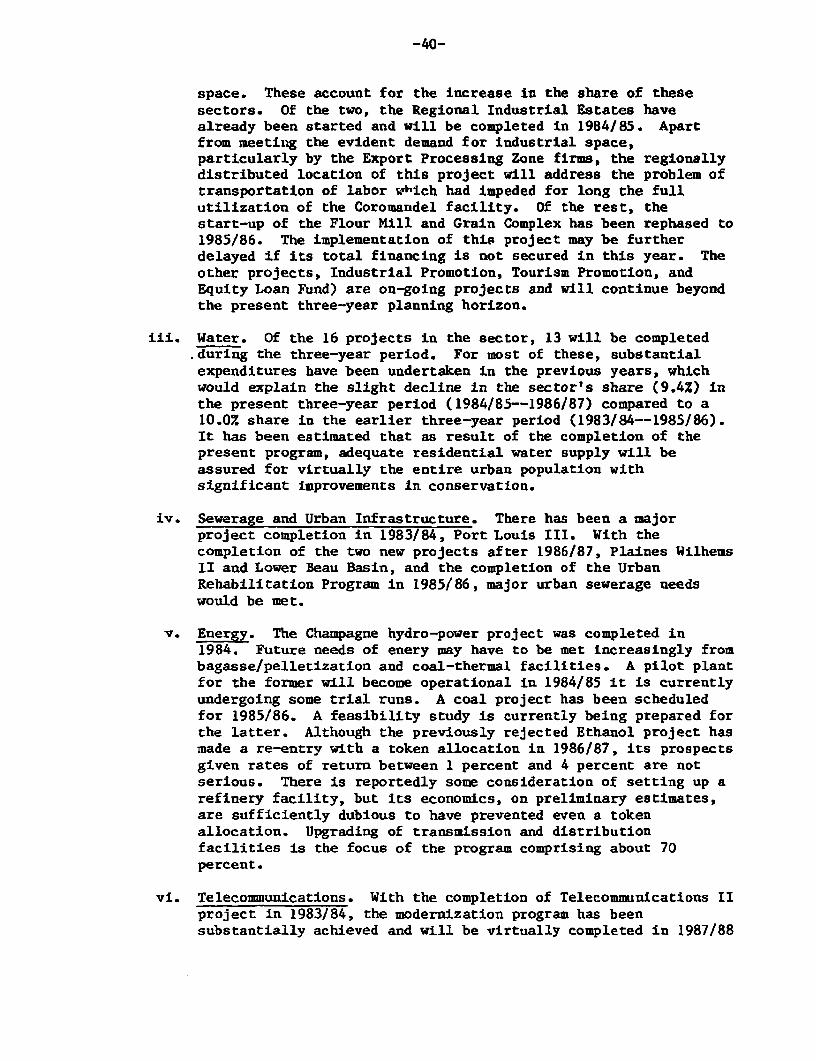
-40-
space. These account for the increase in the share of thesesectors. Of the two, the Regional Industrial Estates havealready been started and will be completed in 1984/85. Apartfrom meetirg the evident demand for industrial space,particularly by the Export Processing Zone firms, the regionallydistributed location of this project will address the problem oftransportation of labor which had impeded for long the fullutilization of the Coromandel facility. Of the rest, thestart-up of the Flour Kill and Grain Complex has been rephased to1985/86. The implementation of this project may be furtherdelayed if its total financing is not secured in this year. Theother projects, Industrial Promotion, Tourism Promotion, andEquity Loan Fund) are on-going projects and will continue beyondthe present three-year planning horizon.
iii. Water. Of the 16 projects in the sector, 13 will be completed.during the three-year period. For most of these, substantialexpenditures have been undertaken in the previous years, whichwould explain the slight decline in the sector's share (9.4Z) inthe present three-year period (1984/85--1986/87) compared to a10.0% share in the earlier three-year period (1983/84--1985/86).It has been estimated that as result of the completion of thepresent program, adequate residential water supply will beassured for virtually the entire urban population withsignificant improvements in conservation.
iv. Sewerage and Urban Infrastructure. There has been a majorproject completion in 1983/84, Port Louis III. With thecompletion of the two new projects after 1986/87, Plaines WilhemsII and Lower Beau Basin, and the completion of the UrbanRehabilitation Program in 1985/86, major urban sewerage needswould be met.
v. Energy. The Champagne hydro-power project was completed in1984. Future needs of enery may have to be met increasingly frombagasse/pelletization and coal-thermal facilities. A pilot plantfor the former will become operational in 1984/85 it is currentlyundergoing some trial runs. A coal project has been scheduledfor 1985/86. A feasibility study is currently being prepared forthe latter. Although the previously rejected Ethanol project hasmade a re-entry with a token allocation in 1986/87, its prospectsgiven rates of return between 1 percent and 4 percent are notserious. There is reportedly some consideration of setting up arefinery facility, but its economics, on preliminary estimates,are sufficiently dubious to have prevented even a tokenallocation. Upgrading of transmission and distributionfacilities is the focus of the program comprising about 70percent.
vi. Telecommunications. With the completion of Telecommunications IIproject in 1983/84, the modernization program has beensubstantially achieved and will be virtually completed in 1987/88

-41-
by the on-going Telecommunication III. The other on-goingproject comprising a series of minor investments will address theneeds for further expansion and modernization.
vii. Roads and Roads Transport. The share of this sector remainsvirtually unaltered in the present PSIP. However, the estimatedexpenditure in 1984/85 is 11 times higher than 1983/84 and isaccounted for by the expected start-up of three major projects,delayed from 1983/84. Of the eight projects in the sector, fourwill be completed within the plan period and the restsubstantially so.
viii. Housing. The decline in this sector's share is largely due to acutback in the loans to Mauritius Housing Cooperation, anddelayed implementation of the Urban Development Project. Thedecline in the share and nominal volume of this sector as well asthose in Education and Health (see below) reflects theGovernment's intention to shift the PSIP's focus away from socialinfrastructure to physical infrastructure.
ix. Education. The relative decline in the sector's share isaccounted for dropping of two out of six projects in the earlierPSIP. This does not, however, entail any deviation from theGovernment's intention to provide free primary and secondaryeducation. The proposed investments involve upgrading of presentfacilities.
x. Health. Except for Nehru Hospital, there are no new projects inthis sector. Current Government facilities provide free hospitalcare and drugs, and the investments aim at improvements in thepresent facilities.
xi. Port Development. Of the four projects, three are on-going. Theonly new project is for a heavy tug and a token provision forfuture improvements in expectation of the findings of the masterplan currently under preparation.
xii. tirport Development. All four of the projects relate to theexisting airport. Of these, three will be completed within theplan period while the fourth, a new terminal building, will spillover into 1986/87. No provision is evident for the secondairport project which has been abandoned.
xiii. Development Works and Other Capital Projects. This residualcategory is a major repository of the Government's currentexpenditures. Of these, the largest sub-category, developmentworks, primarily comprises the wage-bill for underemployedlabor. The Government has shown commendable initiative in tryingto minimize such expenditures: the estimated 1984/85 expendituresunder this sub-category are about 15 percent less than 1983/84.Further effort should be made to redeploy this labor force in thegrowing private sector.
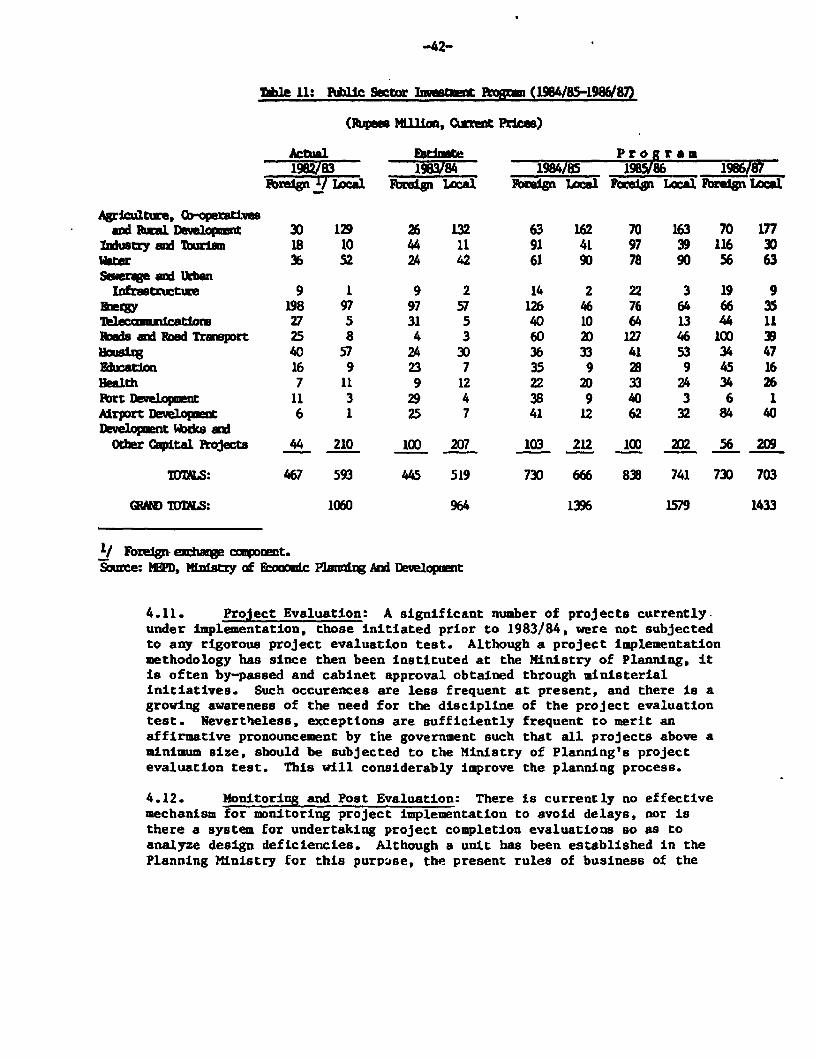
-42-
1dle 11: bUc Seetor kJw nE r (1984/&5-1986/87)
(Ike ,ilin Cxe Pri)
Actual E Programi97r 198_3/84 1984/85 1985/86 1966/87
eJ 1Pbroign Local Forei Local Focip Local -brlg T=a
Agrcedture, 0zperativesand luallDewaopt 30 129 26 132 63 162 70 163 70 177
Industry ad bzrisan 18 10 44 11 91 41 97 39 116 30rhter 36 52 24 42 61 90 78 90 56 63
Serqge ad UrbmnIafrtu:rtuze 9 1 9 2 14 2 22 3 19 9
amrg 198 97 97 57 126 46 76 64 66 35ThlacaummiatS£lm 27 5 31 5 40 10 64 13 44 11Bzeds a oeid Transport 25 8 4 3 60 20 127 46 100 39HWinrg 40 57 24 30 36 33 41 53 34 47fuaatilon 16 9 23 7 35 9 28 9 45 16Health 7 11 9 12 22 20 33 24 34 26EbrtDevelq ment 11 3 29 4 38 9 40 3 6 1Alrport Developun 6 1 25 7 41 12 62 32 84 40Develpmnt W'brs adOher Capital Projects 44 210 100 207 103 212 100 202 56 209
TALS: 467 593 445 519 730 666 838 741 730 703
GI D TALS: 1060 964 1396 1579 1433
/ Foregn ep uzge ucaqonent.Source: HEED, MUinistry of Fcocade Plnuiig And Developmnt
4.11. Project Evaluation: A significant number of projects currently.under implementation, those initiated prior to 1983/84, were not subjectedto any rigorous project evaluation test. Although a project implementationmethodology has since then been instituted at the Ministry of Planning, itis often by-passed and cabinet approval obtained through ministerialinitiatives. Such occurences are less frequent at present, and there is agrowing awareness of the need for the discipline of the project evaluationtest. Nevertheless, exceptions are sufficiently frequent to merit anaffirmative pronouncement by the government such that all projects above aminimum size, should be subjected to the Ministry of Planning's projectevaluation test. This will considerably improve the planning process.
4.12. Monitoring and Post Evaluation: There is currently no effectivemechanism for monitoring project implementation to avoid delays, nor isthere a system for undertaking project completion evaluations so as toanalyze design deficiencies. Although a unit has been established in thePlanning Ministry for this purpuse, the present rules of business of the
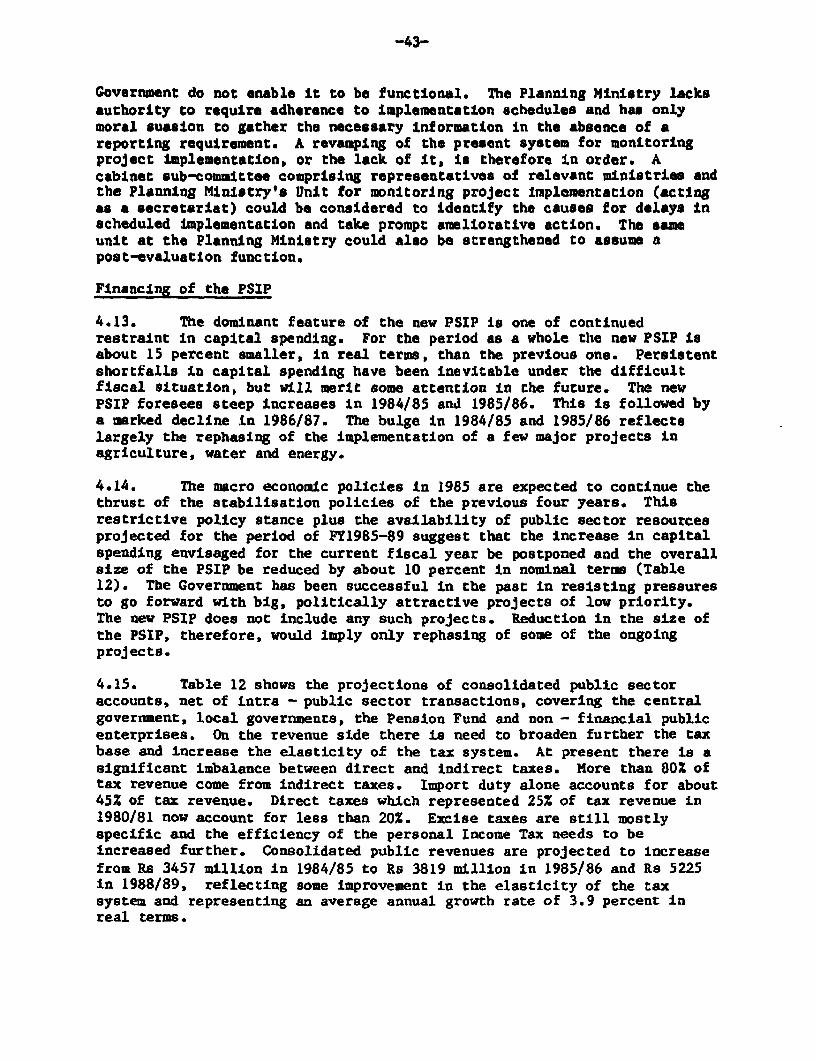
-43-
Government do not enable it to be functional. The Planning Ministry lacksauthority to requlre adherence to iLplementation schedules and has onlymoral suasion to gather the necessary information in the absence of areporting requirement. A revamping of the present system for monitoringproject implementation, or the lack of it, is therefore in order. Acabinet sub-committee comprising representatives of relevant ministries andthe Planning Ministry's Unit for monltorlng project implementation (actingas a ecretariat) could be considered to Identify the causes for delays Inscheduled implementation and take prompt ameliorative action. The sameunit at the Planning Ministry could also be strengthened to assume apost-evaluation function.
Financing of the PSIP
4.13. The dominant feature of the new PSIP is one of continuedrestraint in capital spending. For the period as a whole the now PSIP isabout 15 percent smaller, in real terms, than the previous one. Persistentshortfalls in capital spendlng have been inevitable under the difficultfiscal situation, but will merit some attention in the future. The newPSIP foresees steep increases in 1984/85 and 1985/86. This is followed bya marked decline in 1986/87. The bulge In 1984/85 and 1985/86 reflectslargely the rephaslng of the implementation of a few major projects inagriculture, water and energy.
4.14. The macro economic policies In 1985 are expected to continue thethrust of the stabilisation policies of the previous four years. Thisrestrictive policy stance plus the availability of public sector resourcesprojected for the period of FY1985-89 suggest that the increase in capitalspending envisaged for the current fiscal year be postponed and the overallsize of the PSIP be reduced by about 10 percent in nominal terms (Table12). The Government has been successful in the past in resisting pressuresto go forward with big, politically attractive projects of low priority.The new PSIP does not include any such projects. Reduction in the size ofthe PSIP, therefore, would imply only rephasing of some of the ongoingprojects.
4.15. Table 12 shows the projections of consolidated public sectoraccounts, net of intra - public sector transactions, covering the centralgovernment, local governments, the Pension Fund and non - financial publicenterprises. On the revenue side there is need to broaden further the taxbase and increase the elasticity of the tax system. At present there is asignificant imbalance between direct and indirect taxes. More than 80% oftax revenue come from indirect taxes. Import duty alone accounts for about45% of tax revenue. Dlrect taxes which represented 25% of tax revenue in1980/81 now account for less than 20%. Excise taxes are still mostlyspecific and the efficiency of the personal Income Tax needs to beIncreased further. Consolidated public revenues are projected to Increasefrom Rs 3457 million in 1984/85 to Rs 3819 million in 1985/86 and Rs 5225in 1988/89, reflecting some improvement in the elasticity of the taxsystem and representing an average annual growth rate of 3.9 percent inreal terms.
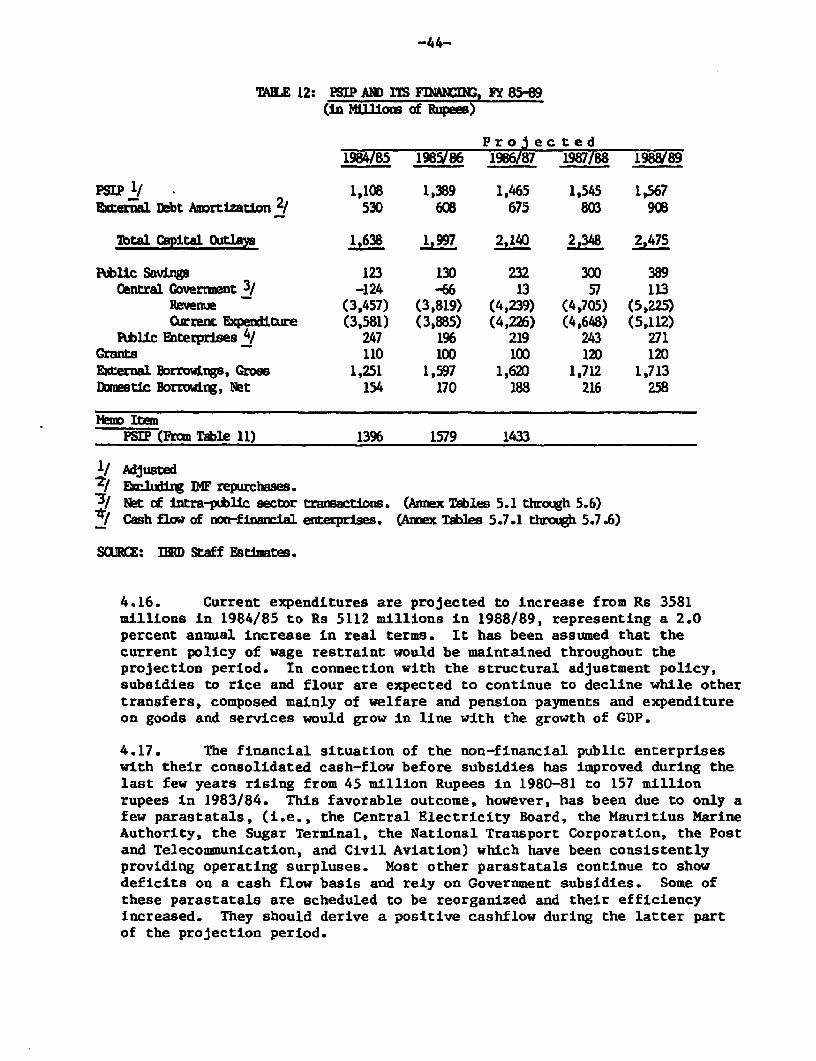
-44-
TAELE 12: PSIP AND ITS FflICCIW, FY 85-89(in Million of RLxe)
Proj ec ted1984/85 1985/86 1986/87 1987/88 1988(89
PSIP 1/ 1,108 1,389 1,465 1,545 1,567Externsl Debt Amortization 2/ 530 608 675 803 908
Tbtal Capital Outlays 1,638 1,997 2,140 2,348 2,475
Public Suavings 123 130 232 300 389Central Governient 3/ -124 -66 13 57 113
Revenue (3,457) (3,819) (4,239) (4,705) (5,Z25)Ozrenc Expenditure (3,581) (3,885) (4,226) (4,648) (5,112)
Publc Ehterprises 41 247 196 219 243 271Grants 110 100 100 120 120External Borrowings, Gross 1,251 1,597 1,620 1,712 1,713Domestic Borrowing, Net 154 170 188 216 258
mew IitnPSIP (Frcu Table 11) 1396 1579 1433
1/AdjustedM! 9rlrdirg IM repurchases.N et of intra-public sector transactions. (Annex TIbles 5.1 tbrough 5.6)
! Cash flow of mox-flnmrrial enterprises. (AI3ex. Tsbles 5.7.1 through 5.7.6)
SOLRC: IBD Staff Estimates.
4.16. Current expenditures are projected to increase from Rs 3581millions in 1984/85 to Rs 5112 millions in 1988/89, representing a 2.0percent annual increase in real terms. It has been assumed that thecurrent policy of wage restraint would be maintained throughout theprojection period. In connection with the structural adjustment policy,subsidies to rice and flour are expected to continue to decline while othertransfers, composed mainly of welfare and pension payments and expenditureon goods and services would grow in line with the growth of GDP.
4.17. The financial situation of the non-financial public enterpriseswith their consolidated cash-flow before subsidies has improved during thelast few years rising from 45 million Rupees in 1980-81 to 157 millionrupees in 1983/84. This favorable outcome, however, has been due to only afew parastatals, (i.e., the Central Electricity Board, the Mauritius MarineAuthority, the Sugar Terminal, the National Transport Corporation, the Postand Telecommunication, and Civil Aviation) which have been consistentlyproviding operating surpluses. Most other parastatals continue to showdeficits on a cash flow basis and rely on Government subsidies. Some ofthese parastatals are scheduled to be reorganized and their efficiencyincreased. They should derive a positive cashflow during the latter partof the projection period.
-45-
4.18. Under these conditionE, public savings generated by both thecentral government and the parastatals would increase gradually and help tofinance a growing share of public investments. Projections for the flow ofexternal funds are consistent with the disbursements expected from theexisting debt pipeline and from new commitments (para. 4.26). Given thenarrowness of Mauritius' revenue base and its prevailing fiscaldifficulties, the project-tied external funds should continue to financepart of the local cost components. Domestic borrowing would grow slowly atan average annual growth rate of around 13 percent, consistent with thepermissible monetary expansion and domestic inflation, in line withinternational price increases.
Balance of Payments Prospects
4.19. Sugar exports in 1985 are estimated to increase by 6 percent overthe 1984 level. This includes the sugar output available for exportsduring 1985 plus the special stock of 25 thousand tons kept under theInternational Sugar Agreement. The EEC quota for Mauritius is expected toremain at 500 thousand with no scope for an expansion since the countryenjoys the largest single agreed quantity under the Lom6 Convention. TheUS quota currently at 30 thousand metric tons, is projected to declinebeginning in 1985 as a result of a shift in the US domestic consumption infavor of sugar-substitutes. More importantly the US quota system isexpected to completely revert to a duty and fee based system by no laterthan 1988. Mauritius' sugar exports are projected to remain around 600thousand tons per year, increasing gradually from the unusually low levelof 1984.
4.20. Manufactured goods exports (mai'ily textiles) are vulnerable tofluctuations in the economic activity abroad and protectionist tendencies.Mauritius is trying to mitigate such adverse effects by trying to sec-urepercentage increases in non-quota markets. The production of garments witha higher design input and higher unit values provides a way aroundprotectionist quota restrictions. In addition Mauritius is seekingvigorously to expand into new markets such as the Middle East andAustralia, and is trying to secure the most preferred position possible inthe EEC market. These efforts together with major policy reforms in theindustrial sector and an active exchange rate policy should helpmanufacturing exports grow by about 8 percent per year during most of theprojection period.
4.21. The restructuring program for the Tea Development Authority (TDA)started successfully in 1983 and positive results have already occurred intea production. A program to uniformize tea grades has also been helpfulin upgrading the quality of Mauritius' tea, thus bringing higher prices onexport markets. In view of its extremely small share in world markets teaexports are projected to increase by 7 percent a year above the historicalgrowth rate during 1985-87 and to level off at 6.0 percent a year towardthe end of the decade. Exports of vegetables, fruits and flowers areexpected to continue their favorable past trends.
4.22. Total export earnings have thus been projected to grow in realterms by nearly 5 percent per year over the 1985-90 period, whereas nominal
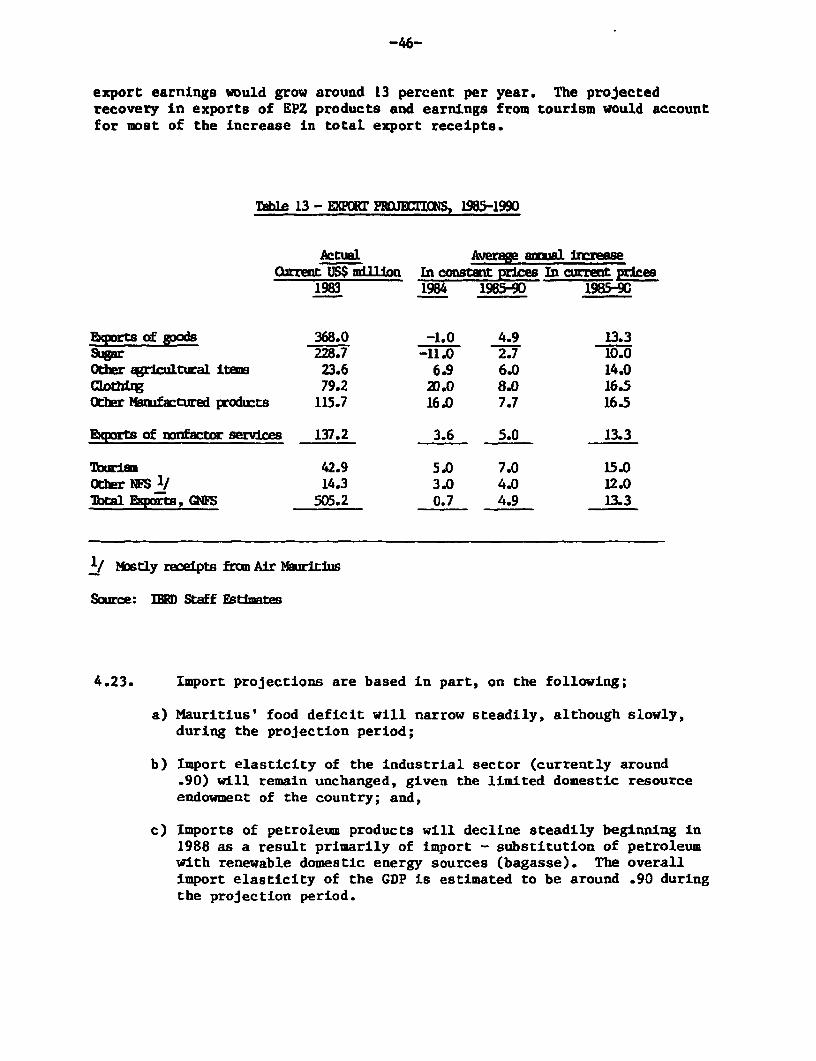
-46-
export earnings would grow around 13 percent per year. The projectedrecovery in exports of EPZ products and earnings from tourism would accountfor most of the increase in total export receipts.
Table 13 - EMMO PMJl'=ICNS, 1985-1990
Actual Average auxul iureaseQrrent US$ million In constant prics In cuwrnt prices
1983 1984 1985-90 1985-9
EKmfns Of grndq 368.0 -1.0 4.9 13.3SLar 228.7 -11.0 2.7 10.0Other aricultural items 23.6 6.9 6.0 14.0Clothing 79.2 20.0 8.0 16.5Othr Mœnfactured irodcts 115.7 16.0 7.7 16.5
Exports of nxfactor servic 137.2 3.6 5.0 13.3
Touriasm 42.9 5.0 7.0 15.0Oter NFS 1/ 14.3 3.0 4.0 12.0btal Ebports, GNFS 505.2 0.7 4.9 13.3
1/ Msty receipts from Air Muritrus
Source: IBD Staff Estimates
4.23. Import projections are based in part, on the following;
a) Mauritius' food deficit will narrow steadily, although slowly,during the projection period;
b) Import elasticity of the industrial sector (currently around.90) will remain unchanged, given the limited domestic resourceendowment of the country; and,
c) Imports of petroleum products will decline steadily beginning in1988 as a result primarily of import - substitution of petroleumwith renewable domestic energy sources (bagasse). The overallimport elasticity of the GDP is estimated to be around .90 duringthe projection period.
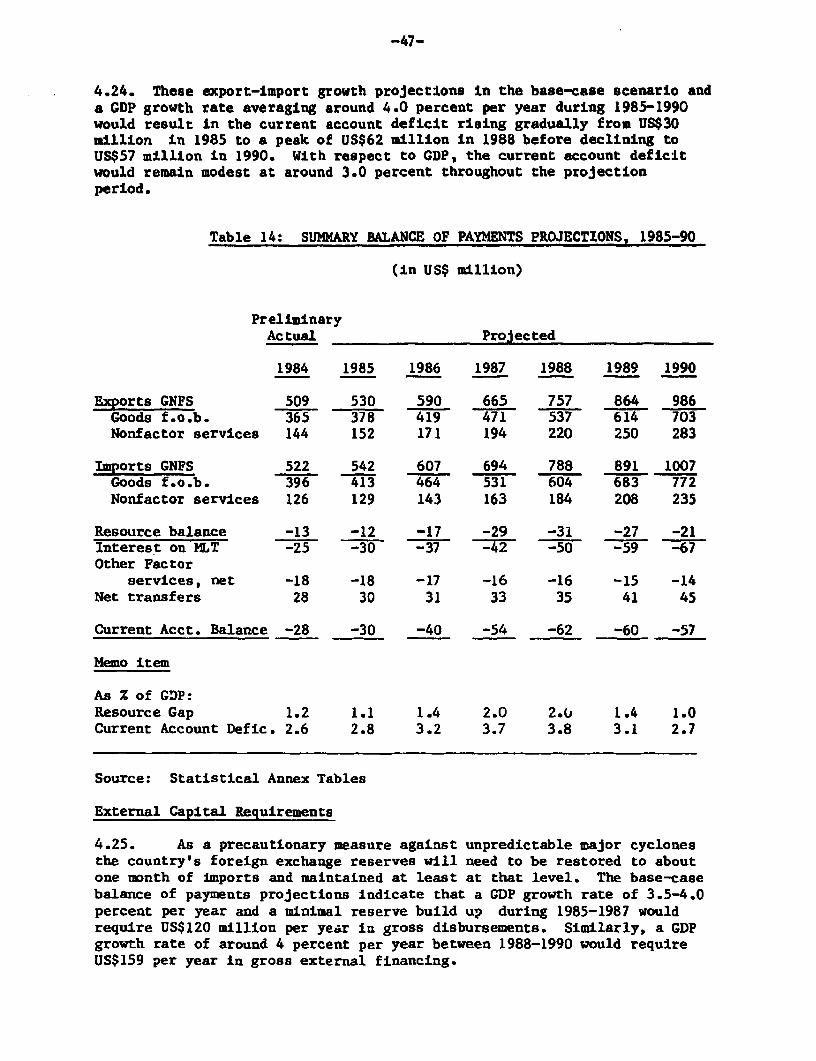
-47-
4.24. These export-import growth projections in the base-case scenarlo anda GDP growth rate averaging around 4.0 percent per year during 1985-1990would result in the current account deficit rising gradually from US$30million in 1985 to a peak of US$62 million in 1988 before declining toUS$57 milllon in 1990. With respect to GDP, the current account deficitwould remain modest at around 3.0 percent throughout the projectionperiod.
Table 14: SUMMARY BALANCE OF PAYMENTS PROJECTIONS, 1985-90
(in US$ million)
PreliminaryActual Projected
1984 1985 1986 1987 1988 1989 1990
Exports GNFS 509 530 590 665 757 864 986Goods f.o.b. 365 378 419 471 537 614 703Nonfactor services 144 152 171 194 220 250 283
Imports GNFS 522 542 607 694 788 891 1007Goods f.o.b. 396 413 464 531 604 683 772Nonfactor services 126 129 143 163 184 208 235
Resource balance -13 -12 -17 -29 -31 -27 -21Interest on MLT -25 -30 -37 -42 -50 -59 -67Other Factor
services, net -18 -18 -17 -16 -16 -15 -14Net transfers 28 30 31 33 35 41 45
Current Acet. Balance -28 -30 -40 -54 -62 -60 -57
Memo item
As Z of GDP:Resource Gap 1.2 1.1 1.4 2.0 2.U 1.4 1.0Current Account Defic. 2.6 2.8 3.2 3.7 3.8 3.1 2.7
Source: Statistical Annex Tables
External Capital Requirements
4.25. As a precautionary measure against unpredictable major cyclonesthe country's foreign exchange reserves will need to be restored to aboutone mDnth of Imports and maintained at least at that level. The base-casebalance of payments projections indicate that a GDP growth rate of 3.5-4.0percent per year and a minimal reserve build up during 1985-1987 wouldrequire US$120 million per year in gross disbursements. Similarly, a GDPgrowth rate of around 4 percent per year between 1988-1990 would requireUS$159 per year in gross external financing.
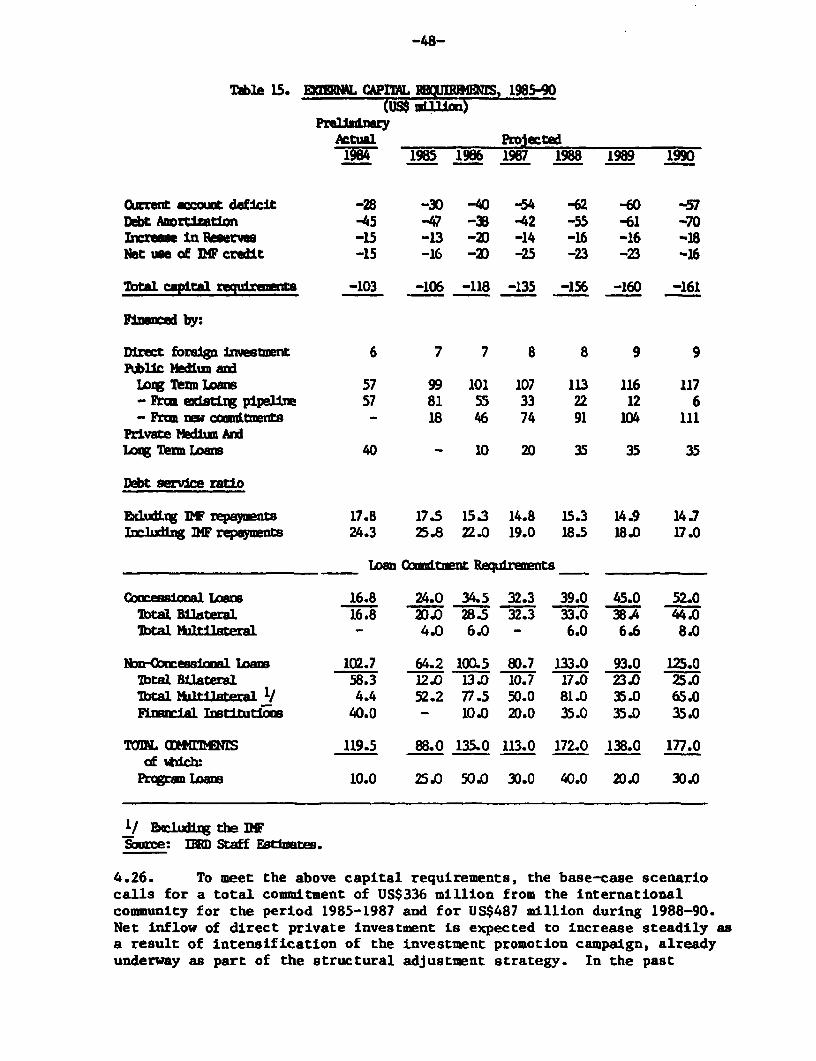
-48-
Tiae 15. EXlUE CAPIh R 1985L(US$ )dlm
Act.lm ProjectedI_ 1985 1986 1987 1988 1989 1990
Cxrmt amount dlecit -28 -30 -40 -54 -62 -60 -57Debt Awrtlzatlon -45 -4 -38 -42 -55 -61 -70Inrebae In Reervn -15 -13 -20 -14 -16 -16 -18Not use of DIF credit -15 -16 -20 -25 -23 -23 -16
Total capital RMEq Ts -103 -106 -118 -135 -156 -160 -161
Finswed by:
Direct forelgp nlesmmnt 6 7 7 8 8 9 9PuLbc NMdiul andLorg TemaLoS 57 99 101 107 113 116 117- Ea eodstiI pipelii 57 81 55 33 22 12 6- Fran now comiitants - 18 46 74 91 104 111
Private Mad1m AndlogTersmLoz 40 - 10 20 35 35 35
Dt servlce ratio
x:udirig repaymnts 17.8 17.5 15.3 14.8 15.3 14.9 14.7l.udixg ID F srepsunt 24.3 25.8 22.0 19.0 18.5 18.0 17.0
_______ Lom Ot Ruftwt_ _ ___
Couz_.einal La"ra 16.8 24.0 34.5 32.3 39.0 45.0 52.02baBi.lateral 16.8 20.0 28.5 32.3 33.0 38.4 44.0Tbtal liltilateral - 4.0 6.0 - 6.0 6.6 8.0
NImncrbessional IaiNS 102.7 64.2 100.5 80.7 133.0 93.0 125.0Tbtal Bilateral 58.3 12.0 13.0 10.7 17.0 23.0 25.0Total iltilateral 1/ 4.4 52.2 77.5 50.0 81.0 35.0 65.0FrIi ialsttutitiu 40.0 - 10.0 20.0 35.0 35.0 35.0
T0RL 0*l'IDS 119.5 88.0 135.0 113.0 172.0 138.0 177.0of hich:PRria Loans 10.0 25.0 50.0 30.0 40.0 20.0 30.0
1/ Thuldiig the hFSazce: ISD Staff Estmte.
4.26. To meet the above capital requirements, the base-case scenariocalls for a total commitment of US$336 million from the internationalcommunity for the period 1985-1987 and for US$487 million during 1988-90.Net inflow of direct private investment is expected to increase steadily asa result of intensification of the investment promotion campaign, alreadyunderway as part of the structural adjustment strategy. In the past

-49-
bilateral and multilateral donors, excluding the IMF, have financed about70 percent of Mauritius' external capital requirements. This share isprojected to increase to about 90 percent during 1985-1987, and about 80percent during 1988-90.
4.27. Since 1979, Mauritlus has made extensive use of Fund resourcesunder consecutive stand-by arrangements. As of December 31, 19B4 Fundholdings of Mauritius rupees subject to repurchases amounted to SDR 157.3million, equivalent to 294 percent of quota. Of this amount SDR 34 millionwas in respect of compensatory financing and buffer stock facilities.Substantial repayents resultlng In negative flows of IMF funds havealready begun in 1984 and will continue in 1985, even after drawings underthe current stand-by arrangement.
4.28. Given Mauritius' need for higher disbursements during 1985-87, itis estimated that a commitment of US$-115 million in the form ofpolicy-based loans would be required from the international community.Increased transfer of quick disbursing resources would help to finance theimport requirements of the high rates of growth projected for exportmanufacturing and tourism; encourage continued policy improvements at bothmacro and sectoral levels and; improve (soften) the external debt profileof Mauritius. Since 1979 the country has been able to adhere to austeritymeasures contained in the various stand-by programs. The First and theSecond Structurl Adjustment Loans have been substantially successful. Theadjustment measures for improved technical and financial efficiency insugar, further promotion of export-oriented manufacturing and tourism andenergy substitution are now well articulated. It is important that theimplementation of these measures be supported by continued policy-basedlending from bilateral and multilateral sources.
4.29. External loans to be contracted for the period 1985-89 have beenprojected at the terms prevailing in 1984. Private medium term loans areprojected at an interest rate of 13.5 percent with 8 years maturity and agrace period of 3 years. Program loans have been projected at harder termsthan project loans with 11 percent interest, 10 years maturity and 3 yearsgrace. Project loans have been assumed to continue to come from Mauritius'traditional bilateral sources, which are varied. These loans would have 17years of maturity including 5 years of grace. Interest rates on theseloans would range between 6 to 8 percent.
Downside Risks and Creditworthiness
4.30 While the growth scenario presented above would lay the basis forMauritius's longer-term development and would somewhat ease the process offurther adjustment which is required, it is predicated not only onGovernment determination to adapt but also on a relatively favorableenvironment. It is clear that Mauritius's economy is extremely fragile,subject to the vagaries of weather, including cyclones and world marketswith respect to export quantities and prices, future private capitalinflows. The scenario is finally also very dependent on continued officialexternal assistance, in significant amounts and on relatively soft terms.

-50-
4.31. Against the background of the successful efforts made by theGovernment over the last few years to bring financial stabilization to theeconomy, and the support that the international community has providedduring these years, it would be realistic to give to Mauritius the chanceto pursue the growth path outlined above. This strategy of export-ledgrowth relies on further adjustment of Government policies to make theeconomy more responsive to private initiative while keeping publicinvestment and expenditure to the minimum necessary to the provision ofeconomic and social infrastructure. Indeed, future patterns and levels ofproduction, investments and imports would be to a large extent dependentupon the contrib'i.on and demands of the private sector.
4.32. If current expectations with respect to foreign and nationalprivate initia-ives do not materialize, it is quite conceivable that futureadjustments may take place in the context of lower levels of production,investment and imports. Alternative scenarios could thus be devised underrevised conditions. It would, however, be difficult to specify andquantify possible shortfalls from the somewhat optimistic situation of thebase-case scenario, which remains quite attainable. It might also beself-defeating at a time when the Government has demonstrated itscommitment and ability to set the stage for further new developments. Pastand current improvements in economic management and in the flexibility ofthe economy should be considered as the warranty that eventual shortfallswould lead to another type of economic equilibrium, though at a lowerlevel.
4.33. It remains that the fragility of the economy also pertains topossible shortfalls in export earnings mainly due to the fluctuations inworld prices and to sugar crop failures on account of adverse weatherconditions. In these cases, the preceding argument of the maintenance ofthe external deficit at a level similar to that projected in the base-casescenario may not hold true. Admittedly, there are few mechanisms which maybe built in the economy to adapt to such eve.nts but the scenario providessome room for further adjustments: In addition to the crop insurancescheme and possible recourse to the IMF, under the Compensatory FinancingFacility or other, the scenario expects some improvement over time in theforeign exchange reserve position of Mauritius. The Government may stillhave to take new stabilization measures which would halt the on-goinggrowth process as the international community would not tailor itsassistance to the country's need in these special circumtances.
4.34. Ultimately, the main issue facing the Government as well ascurrent and potential donors is that of the capacity of Mauritius tosustain the burden of a relatively high debt service. Including IMFrepayments, the debt service ratio is projected to increase from about 24percent in 1984 to abour 26 percent in 1985. According to the proposedscenario it would decli. .e thereafter and reach about 17 percent in 1990.Without the repurchases to the IMF, the debt service ratio would declinesignificantly from 17.5 percent in 1985 and remain below 15 percent untilthe end of the decade.
4.35. A debt service ratio of around 15 percent of export earnings(excluding the IMF repurchases) should be appropriate for Mauritius. Manycountries have a higher debt burden but their economies are often larger,
-51-
more diversified and less dependent on foreign trade, and so have greaterresilience in absorbing exogenous shocks.
4.36. Indeed, it may very well occur that Mauritius's export earningsdo not materialize as expected in the course of this decade. If theresponse of the aid community does not support the adjustment efforts ofthe Government at that time, Mauritius may be led to borrow in amounts andon terms which would bring the future debt burden beyond safe limits in the1990s. This is the risk which has to be faced in the next few years andwhich argues for a close monitoring of the economic situation by allparties involved. During the post-sugar boom period and since then,Mauritius has demonstrated its managerial capacity to protect itsinternational credit standing. There has never been a default or paymentsarrears on external debt. The Government under the SAL and stabilisationprograms have taken measures that many countries have not been able orwilling to take. Provided that the Government continues to be committed toa continued process of adjustment, Mauritius should remain creditworthy forthe projected amounts of non-ploject and project borrowing.
-52-
STATISTICAL ANNEX
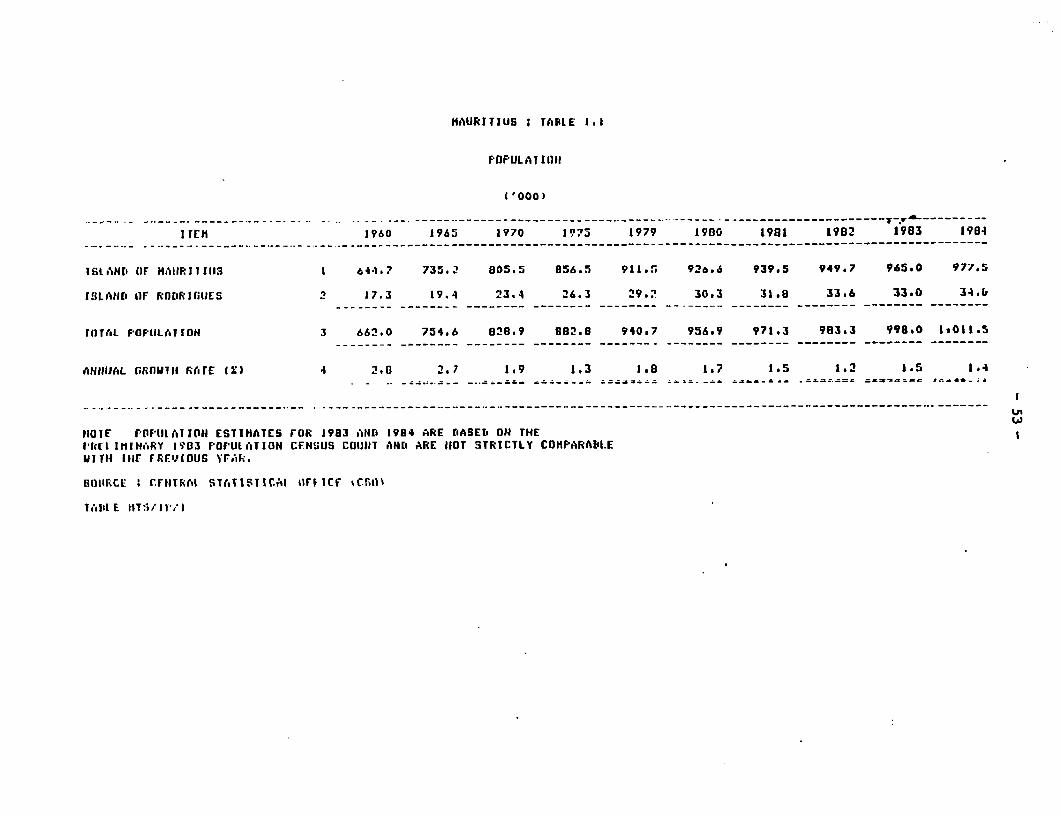
HhiURITIUS : TABLE I.I
PFnUL AT 1111
('000)
ITEM 1960 1965 1970 1973 1979 1980 1981 1982 1983 1964
ISLAND (IF l4aIlIRlillS I 644.7 735.2 905.5 856.5 911.5 926.6 939.5 949.7 965.0 977.5
ISLAti[ air RlrtiflJES 2 17.3 19.4 23. 26.3 29.? 30.3 31.8 33.6 33.0 34.6
FOTuL POfULLATION 3 662.0 754.6 828.9 882.8 940.7 956.9 971.3 983.3 998.0 1,011.5…-- - - - - - - - - -- - - - - - - - - - - - -- …- - - - - - - - - - - - - - - - - -
ANlIIJAL riraUuli RATE (X) I 2.0 2.7 1.9 1.3 1.8 1.7 1.5 1.2 1.5 1.4
110 E POFNILATIOI ESTIHATES FOR 1983 AND 1984 ARE DASEtD ON THE11ff[ I IHINHtY 1903 POF'ULATION CFNiJUS COIJIIT AND ARE IIOT STRICTLY COMPARALBLEWITH 111r fREvioUS vrAk.
SOIIkRCE : CFNITRAt STATISTICAl 8irF ICF %CFlt
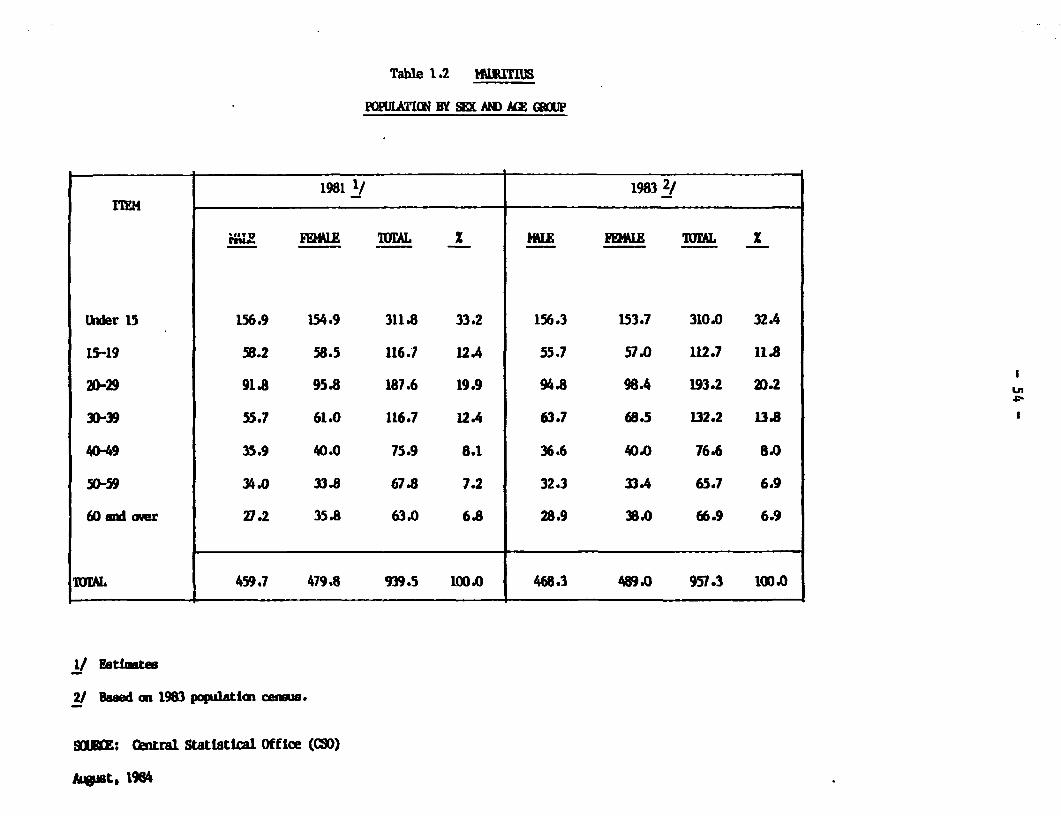
Table 1.2 wMriu
FOPUJION BY SEX AND aM QUAP
1981 l/ 190 2/
FEMD 'IOAL HUE __EK_ TOM_
Unhder 15 156.9 154.9 311.8 33.2 156.3 153.7 310.0 32.4
15-19 58.2 58.5 116.7 12.4 55.7 57.0 112.7 11.8
20-29 91.8 95.8 187.6 19.9 94.8 98.4 193.2 20.2 >
30-39 55.7 61.0 116.7 12.4 63.7 68.5 132.2 13.8
40-49 35.9 40.0 75.9 8.1 36.6 40.0 76.6 8.0
50-59 34.0 33.8 67.8 7.2 32.3 33.4 65.7 6.9
60 and over 27.2 35.8 63.0 6.8 28.9 38.0 66.9 6.9
TNJEAL 459.7 479.8 939.5 100.0 468.3 489.0 957.3 100.0
1/ Iaimi
2/ Based 1 1983 pop.zlataicn as.
SI : itLral StatlatLCal Office ((SD)
h9st, 1984
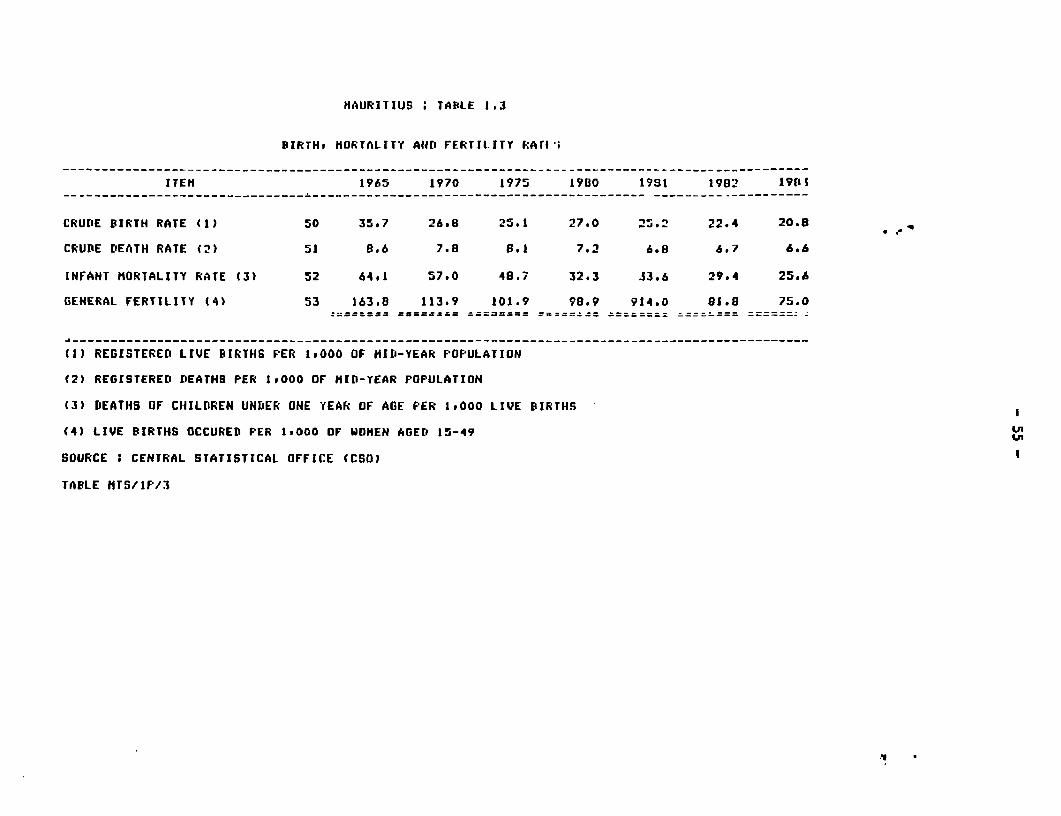
IAURITIUS ; TABLE 1.3
BIRTH, MORTALITY AHD FERTILITY CArIl-
ITEM 1965 1770 1975 1780 1981 1982 19t11
CRUDE BIRTH RATE (1) 50 35.7 26.B 25.1 27.0 25.2 22.4 20.8
CRUDE DEATH RATE (2) 51 8.6 7.8 8.1 7.2 6.8 6.7 6.6
INFANT MORTALITY RATE (3) 52 64.1 57.0 48.7 32.3 43.6 29.4 25.6
GENERAL FERTILITY (4) 53 163.8 113.9 101.9 98.9 914.0 81.0 75.0
(1) REGISTERED LIVE BIRTHS PER 1,000 OF HID-YEAR POPULATION
(2) REGISTERED DEATHS PER 1,000 OF HID-YEAR POPULATION
(3) DEATHS OF CHILDREN UNDER ONE YEAR OF AGE PER 1,000 LIVE BIRTHS
(4) LIVE BIRTHS OCCURED PER 1,000 OF WOMEN AGED 15-49 U'
SOURCE : CENTRAL STATISTICAL OFFICE (CSD)
TABLE HTS/IP/3
?V

MAURITIUS : TABLE 1.4
EMPLOYMENT IN LARGE ESTABLISHMENTS (1)
1980 1981 1982 1983 1984ITEM ---------------------------------------------------------------------------- - - - - - --
MARCH SEPT. MARCH SEPT MARCH SEPT. MAc SEFr. MAWRC
SUGAR (2) 60 47,493 51,146 47,271 50.066 46,457 49,864 46,163 49.132 435022
OTHER AGRICULTURE (3) 61 6,521 6.896 6.185 6.889 6.000 6.P47 6.213 6.756 5,251
MINING 3 QUARRYING 62 145 145 147 147 147 152 160 165 164
MANUFACTURING (4) 63 36,172 36.360 36,899 37.178 38.329 36.884 36.867 38.054 40s991
UTILITIES 64 4P639 4s487 4.430 4,363 4,451 4P403 4t231 4.133 4.084
CONSTRUCTION 65 9.144 7,391 7.257 6.300 5.659 5.619 4.525 4.436 4.258
TRADE. RESTAURANTS I HOTELS 66 9,297 99221 9.122 8.999 9.129 8.996 99044 8.906 8.665
TRANSPORT. STORAGE I CON. 67 8,656 7,901 7.942 7.937 7,542 7.598 7.634 7.724 7.229
FINANCE, INSURANCE ETC. 69 49369 4.459 4v576 4.634 4v669 4.737 4.699 4.615 4.740
GOVERNMENT (5) (6) 69 54.117 54,546 54.551 54.905 559699 55.048 55.076 54.915 55.237
OTHER SERVICES 70 9,595 8.299 9.271 8.271 9.309 9.360 9.312 9.214 8.068
DWC 71 br11B 6.477 6.913 6.355 6,376 6.239 69151 6.224 .9864
ALL SECTORS 72 196.266 197.328 193P454 196,044 193.067 194.747 187.065 193.174 189.576…======== ==== ra=5 ==s ===nfl= =====fc r===S== ===S====
- NOT AVAILABLE
(1) INCLUDES INDUSTRIAL AND COMMERCIAL ESTABLISHMENTS EMPLOYING 10 OR MOREWORKERS AND SUGAR CANE PLANTATIONS WHERE 25 ARPENTS OR MORE ARE HARVESTED.(2) INCLUDES EMPLOYEES IN SUGAR FACTORIES(3) INCLUDES EMPLOYEES IN TEA FACTORIES(4) EXCLUDES EMPLOYEES IN SUGAR AND TEA FACTORIES(5). CENTRAL AND LOCAL GOVERNMENT(6) INCLUDES RELIEF/DEVELOPMENT WORKERS
SOURCE : CENTRAL STATISTICAL OFFICE (CSO)
TABLE MTS/lP/4
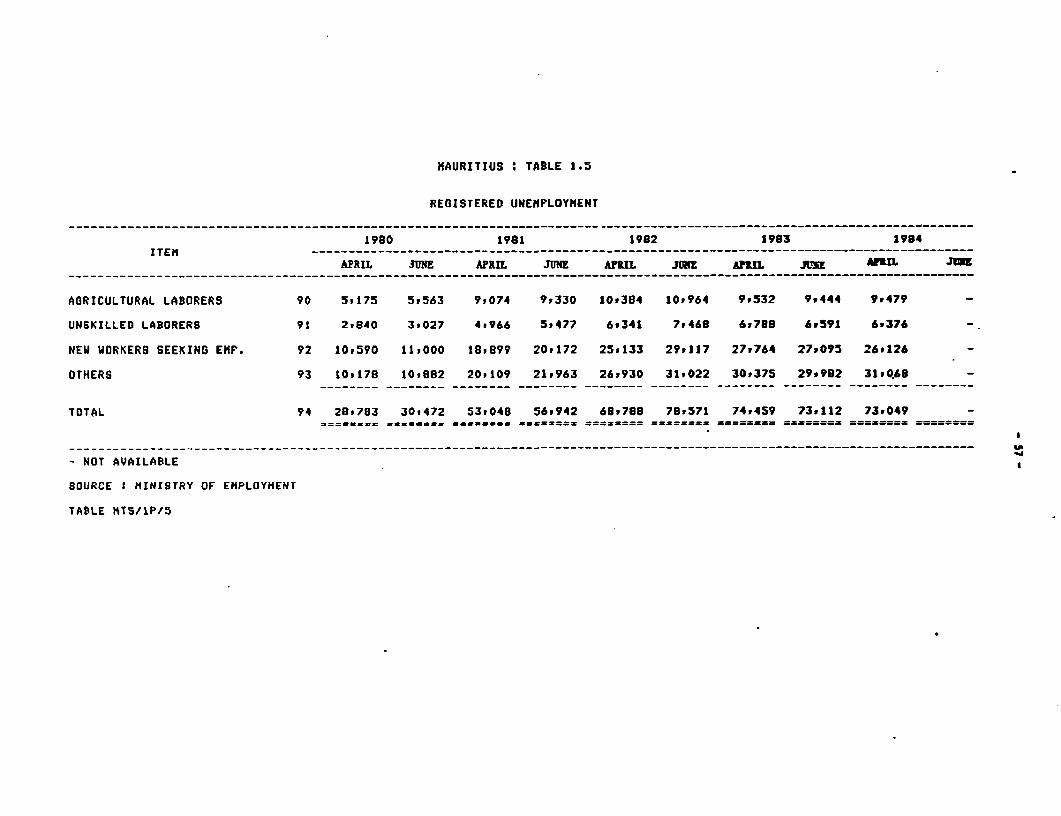
MAURITIUS : TABLE 1.5
REGISTERED UNEMPLOYMENT
1980 1981 1982 1983 1984
APRIL JUNE APRIL JUNE API 31 API JE m JUN
AGRICULTURAL LABORERS 90 5,175 5.563 9,074 9P330 10.384 10,964 9,532 9.444 9.479
UNSKILLED LABORERS 91 2.9840 3.027 4t966 5t477 6,341 7.463 6,738 6.591 6.376
NEW WORKERS SEEKING EMP. 92 10.590 11.000 18.899 20t172 25P133 29,117 27P764 27.095 26.126
OTHERS 93 10.178 10.882 20.109 21.963 26.930 31,022 30.375 29.982 31.0.6-
TOTAL 74 28.783 30.472 53.048 56.942 68.788 79.571 74.459 73.112 73.049==-= ====== *==== == -= =Sn ====s=== ==s====s ==-==a==========
------------------------------------------------------------------------- __--__--------------------------------------_--- -
- NOT AVAILABLE
SOURCE I MINISTRY OF EHPLOYHENT
TABLE MTS/1P/5
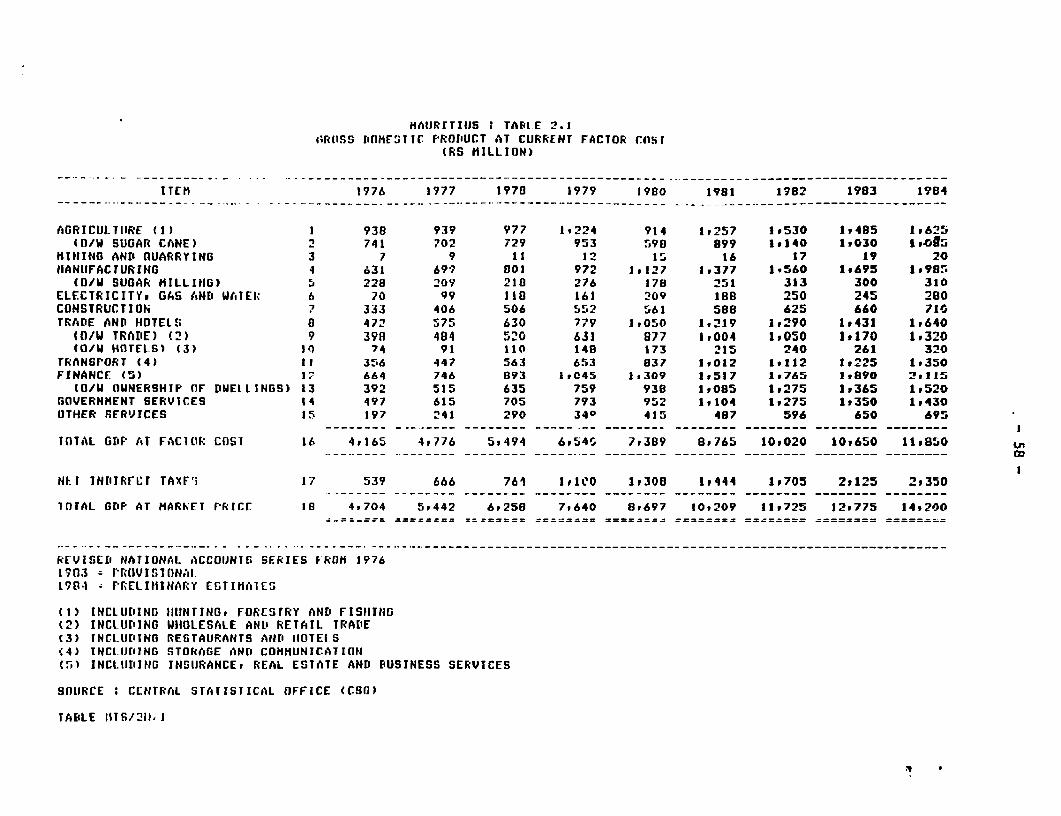
HAURITIIIS : TAIBE 2.1;ROSS IOHESTIrIC fRODUCT AT CURRENT FACTOR CriIS
(RS MILLION)
1TEM 1976 1977 1978 1979 29B0 1981 1982 1983 1954
AGRICULTIIRE (1) 1 938 939 977 19224 914 1,257 1530 1485 1,625(O/W SUGAR CANE) 2 741 702 729 953 598 899 1,140 1.C30 lpog5
MIIIINC AND GUARRYING 3 7 9 11 12 IJ 16 17 19 20IIANUIFACTURING 4 631 69? 501 972 1.127 3.377 1,560 19695 1#985.
(0/U SUGAR MILLING) b 228 209 210 276 178 251 313 300 310ELECTRICITYP GAS AND UAEI; 6 70 99 110 161 209 18B 250 245 280CONSTRUCTION 7 333 406 506 552 561 588 625 660 710TRADE AND HOTELS a 472 S75 630 779 1,05O 1,219 1F290 1431 1,640
(n/U TRADtE) (2) 9 390 484 520 631 877 1,004 1,050 1,170 1,320(Q/U HOTELS) (3) 1( 74 91 110 148 173 215 240 261 320
TRANSPORT (4? 11 356 447 563 653 837 1,012 19112 1f225 1.350FINANCr (5) 1I 664 746 893 I1045 1.309 1,517 1,765 1,890 2,115
(O/U OWNERSHIP OF DWEILINGS) 13 392 515 635 759 936 1,085 1275 1,365 1,520GOVERNMENT SERVICES 14 497 615 705 793 952 1,104 19275 1350 1,430OTHER SERVICES 15 197 241 290 340 415 487 596 650 695
TOTAL GDP AT FAClIR COSI 16 4,165 4,776 5,494 6t545 7.389 8,765 10,020 10,650 11,850.______- -- -- - --- --- --------- . -------- --- --- --- _ ___ _ _____----- -------- -------- 00
NEr INEIIRUIT TAXF'; 17 539 666 761 1.10 1.308 l444 1,705 2.125 2.350
TnFAL GDP AT HARNET FRICE 18 4,704 5.442 6,258 79640 6.697 109209 11,725 12.775 14.200
REVISED NATIONAL ACCOUNTS SERIES FROM 19761703 PRIOVIS1ON:,I.190.1 FRELIHINARY ESTIATlES
(1) INCtIUDING lIINTING, FORESrRY AND FISIIIHG(2) INCLUDING WIIOLESALE ANIi RETAIL TRADE(3) INCLIUIDING RESTAURANTS tIND IIOTEIS(4) INCLUDING STORAGE AND COMMUNICATION(5) INCLII[IING INSURANCE, REAL ESTATE AND BUSINESS SERVICES
SOUlRCE : CENTRAL STAIISTICAL OFFICE (CSO)
TABLE 1I16/21 I
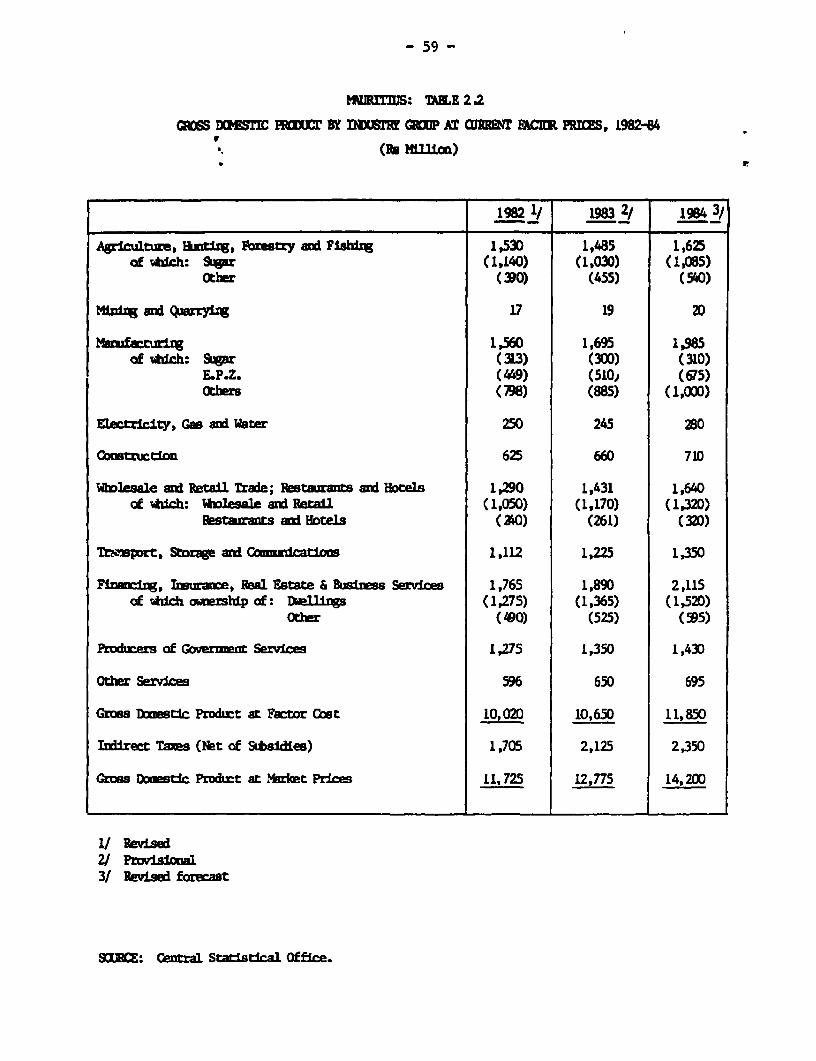
- 59 -
MURJI: TALE 2.2
GMS DMS= F 3Y IBY 11UW MP AT a1RRT ElR PPIcS, 1982-84
r
1982 1 83 2/ 1984 3/
Agricu1C, x, acntizg, Porestry and Flhirg 1,530 1,485 1,625ofa uhch: Sugar (1,140) (1,030) (1,085)
Otbmr (390) (455) (540)
MEDxM aid (mzy±zg 17 19 20
Muf.curir 1,560 1,695 1,985of utbch: Sua (313) (300) (310)
LP.Z. (449) (510, (675)Othns (798) (885) (1,000)
Vlectr1c±cy, Gas and Water 250 245 280
Cocstrtiwon 625 660 710
WlxD2sale ard Retall Trade; Restaaits and Hotels 1 ,290 1,431 1,640of utdch: Wholesale arid Recall (1,050) (1,170) (1,320)
Restawants and Hote]ls (3.0) (261) (3Z0)
Tl'uport, Sorage ard Gzmandcations 1,112 1,225 1,350
Fina1zM, Ismaoe, Rel Estate & &mImess Servi:es 1,765 1,890 2,115of iitch ac.shlp of: Dwelinp (1,275) (1,365) (1,520)
other (490) (525) (595)
Pzoduous of GDverrmentServices 1,275 1,350 1,430
Other Services 596 650 695
Gross tlc Produrt at Faor Cost 10,020 10,650 11,850
Irdirect Taes (Net of Sbskide) 1,705 2,125 2,350
Gross tic Prod.zt at Miret Prlces 11,725 12,775 14,200
1/ Revised2/ Provisional3/ Revisei forast
SIJM: Cental Statistical Office.

MAURITIUS : TABLE 2.3GROSS DOMESTIC PRODUCT AT 1976 CONSTANT FACTOR COST
(RS MILLION)
ITEM 1976 1977 1978 1979 1990 1991 1982…----------------------------------_----_---_---------------_____-----__---____-__--------------
AGRICULTURE (1) 21 938 938 939 977 643 784 939(O/U SUGAR CANE) 22 741 715 723 762 442 569 731
HINING AND QUARRYINO 23 7 7 7 7 7 7 7MANUFACTURING 24 631 666 717 754 701 762 817
(0/W SUGAR MILLING) 25 229 220 222 230 139 167 '87ELECTRICITY, GAS AND MATER 26 70 91 89 97 97 97 107CONSTRUCTION 27 333 381 400 370 307 292 280TRADE AND HOTELS 29 472 533 538 582 558 568 539
(/UW TRADE) (2) 29 398 448 444 471 462 499 468(0/N HOTELS) (3) 30 74 95 94 111 96 106 107
TRANSPORT (4) 31 356 410 431 437 423 434 449FINANCE (5) 32 664 702 734 763 761 794 834
(0/N OWNERSHIP OF DWELLINGS) 33 427 453 478 503 511 536 556GOVERNMENT SERVICES 34 497 522 547 563 569 591 617OTHER SERVICES 35 197 215 231 252 252 265 280
TOTAL GDP AT FACTOR COST 36 49165 4.455 49633 4.802 4.318 49594 4,969
NET INDIRECT TAXES 37 539 620 735 972 780 770 9OO
TOTAL GDP AT MARKET PRICES 38 4.704 5,075 5,368 5.674 5.098 5.364 5,668=sn -s saa== amt=S inasna=s =-ssans- ==nawa =f=nSs=5
REVISED NATIONAL ACCOUNT SERIES FROM 1976
(1) INCLUDING HUNTING, FORESTRY AND FISHING(2) INCLUDING WHOLESALE AND RETAIL TRADE(3) INCLUDING RESTAURANTS AND HOTELS(4) INCLUDING STORAGE AND COMhUNICATION(5) INCLUDING INSURANCE, REAL ESTATE AND BUSINESS SERVICES
SOURCE I CENTRAL STATISTICAL OFFICE (CSO)
TABLE MTS/2N/3
.,
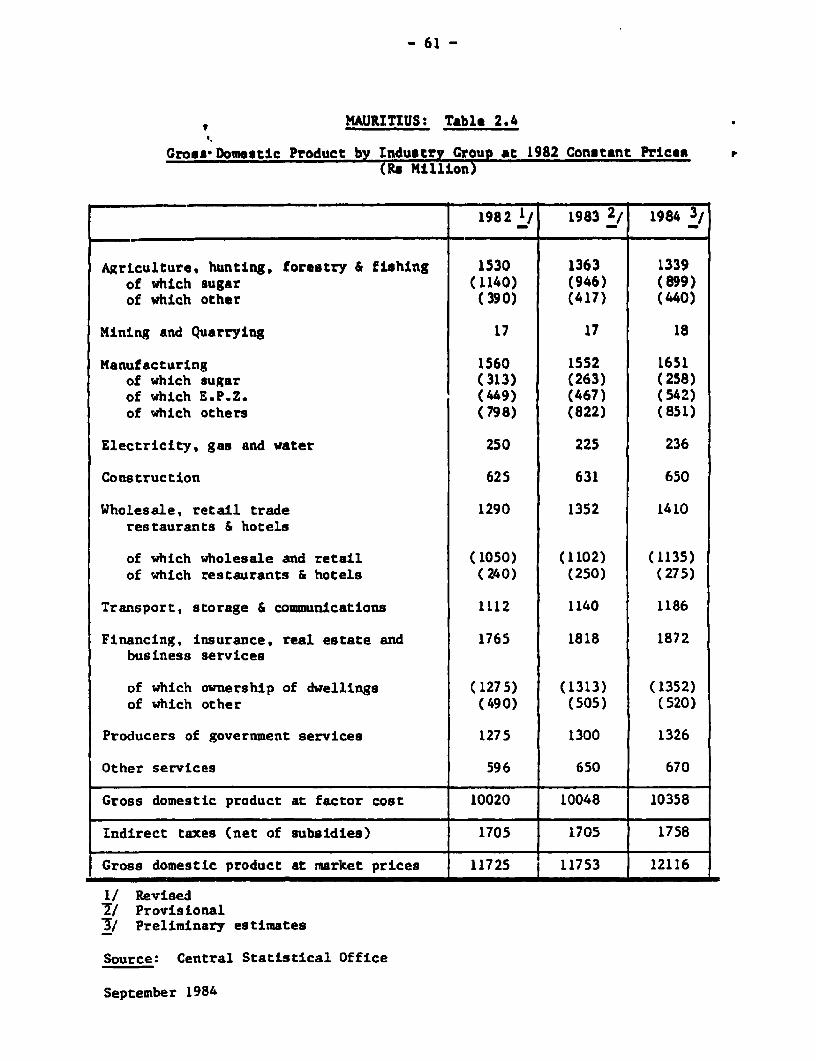
- 61 -
MAURITIUS: Table 2.4
Gross-Domestic Product by Industry Group at 1982 Constant Prices(Rs Million)
1982 I/ 1983 2/ 1984 3/
Agriculture, huntlng, forestry & fishlng 1530 1363 1339of which sugar (1140) (946) (899)of which other (390) (417) (440)
Mining and Quarrying 17 17 18
Manufacturing 1560 1552 1651of which sugar (313) (263) (258)of which E.P.Z. (449) (467) (542)of which others (798) (822) (851)
Electricity, gas and water 250 225 236
Construction 625 631 650
Wholesale, retail trade 1290 1352 1410restaurants & hotels
of which wholesale and retail (1050) (1102) (1135)of which restaurants & hotels ( 240) (250) (275)
Transport, storage & communications 1112 1140 1186
Financing, insurance, real estate and 1765 1818 1872business services
of which ownership of dwellings (1275) (1313) (1352)of which other (490) (505) (520)
Producers of government services 1275 1300 1326
Other services 596 650 670
Gross domestic product at factor cost 10020 10048 10358
Indirect taxes (net of subsidies) 1705 1705 1758
Gross domestic product at market prices 11725 11753 12116
1/ Revised/ Provisional/ Preliminary estimates
Source: Central Statistical Office
September 1984
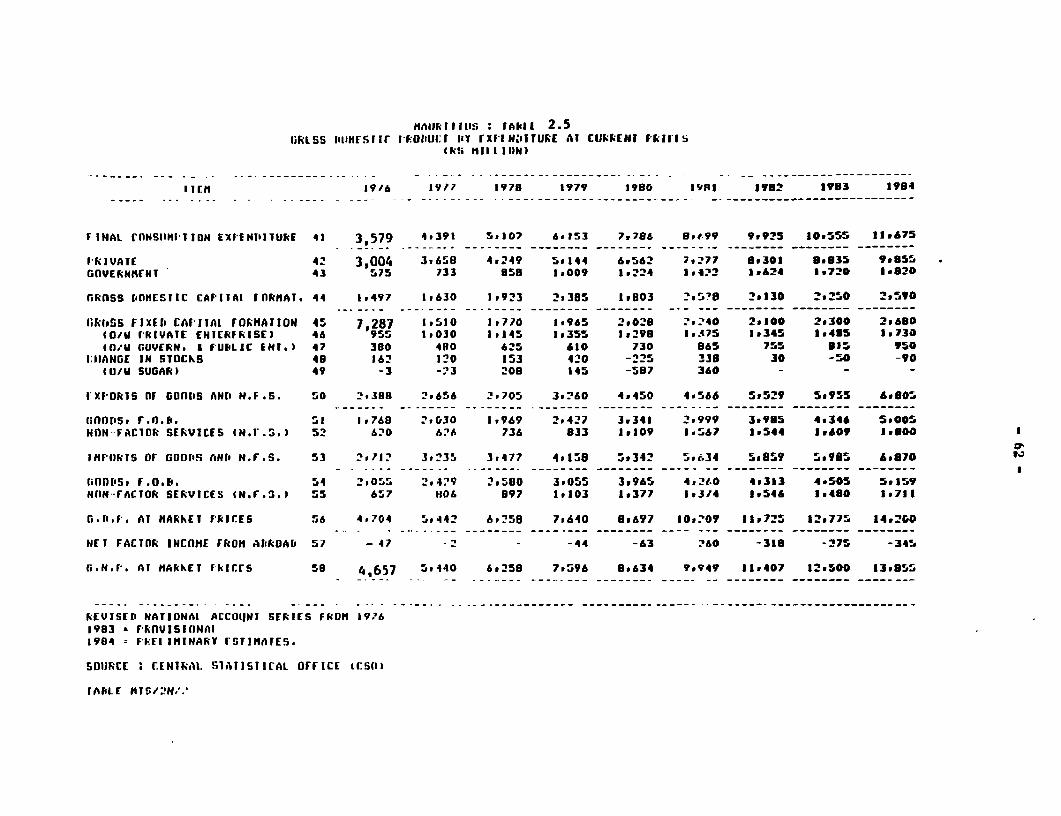
MAhFI&IIIGI : IAIiII 2.5likL55 3iitiHsi ir uFcmuct:fs' rxii XI,INvTURE Al CUIJ1EINT PRIuI s
(RH fI,II I I Il)
l1cM 19/6 19,?7 1978 31979 1990 3993 1932 1983 3984
FINAL rONS11MI'TION EXPEND'ITURE 41 3,579 4 .391 5,307 6.353 7,786 ofB.99 9.925 30.555 11.675
PRIVATE 42 3,004 3,658 4w249 5.144 6.562 7v277 8.301 3.335 9.855GOVERNMENT 43 575 733 9s9 I3.009 1.224 3.422 1.624 1.f720 11.320
r.Ross DOMESTIC CAF'IIAI FORMAT. 44 1#4977 Iv630 1 ,923 2,395 1 t903 2.95790 291130 2. 250 2.05g
liki,ss EJXtf' CAF'ITAt fORMATION 4 S 7,287 1.530 3.v770 3.965 2.028 ?.240 2.100 2.300 2.690CO/W f'RIVATE EN!CERFR5SEI 46 955 1.030 3.145 1.355 2.299 3f..475 1.345 3.435 31730(fl/U GOYERN. I F'UILIC ENF.) 47 380 480 625 6I0 730 965 755 115 950
I:1IANGE IN STOCKS 49 362 320 153 420 -225 336 30 -5-0 -90(UI/U SUGAR) 49 -3 -23 209 145 -507 360 - - -
r'XPokiS nf GOODS AND M. F.S. so 2.39ja 2.656 2 .705 3.260 4.450 4.566 5.529 5.P955 a6.3105
(nnorist F.O.P. :;I 1,768 2,030 1.969 2.427 3.343 2.999 3.995 49346 5.005
HNONFACIOR SERVICES (N.1'.3. 52 620 6216 736 533 1.109 3.567 1.544 1.609 1.800
IMF'IRTS Or GOOF'S AND N.F.S. 53 ?,712 3.2 :35 3.477 4.158 5.342 'F .3 4 5.959 5.935 6.870
1inn1's, F.O.I'. 54 2.0055 2.429 2P,590 3.055 3.965 Als2f0 4.3113 4.505 5.159NIIN-FACTOR SERVICES (N.F.3.) 55 657 3306 997 1.103 1.377 1.514 1.546 3.430 1.7ll,
G.11.P. Al MAREI~E FRICES 56 4.704 5,1442 6.259 7.640 8.697 30.09,o 33.725 12.775 14.200
NE! FAC7DR INCOME FkOM AbkOAI. 57 - 47 .2 - -44 -63 260 -319 -275 -34:0
Gi.N.P. A! MARK~ET PRICES so 4,657 59440 6.259 7.596 8.v634 9.949 31.407 32.500 113.355
REVISED NATIONAI ACCOuNMT SERIES FROM 19.'61983 P ROVISI(3NAI1904 FIEI,F IMINARY r'STIMATE5.
SOURCE ' CENTRAL SlATIlSIICAL OFFICE (CSIII
FABLE nhT;/:'N.'

MAURITIUS : TABLE 2.6GROSS DOMESTIC FRODlIUCT BY EXPENDITURE AT 1976 CONSTANT FRICES
IRS MILLION)
ITEM 1976 1977 1978 1979 1980 1981 1982
FINAL CONSUMFTION EXFENDITURE 61 3.579 3.854 4,069 4.209 4,017 3.980 3.919
PRIVATE 62 3.004 3.250 3.434 3.582 3.386 3.347 3.278GOVERNMENT 63 575 £O4 635 627 631 633 641
GROSS DOMESTIC CAPITAt FORMAT. 64 1.449 2.400 1.609 3.686 978 .1197 997
GROSS FIXED CAFITAL FORMATION 65 1.297 1.370 1.471 I.370 1.120 1.040 894CIIANGE IN STOCKS 68 162 10 138 308 -142 157 103
EXPORTS Of GOODS ANID N.F.3. 70 2,398 2.709 2.700 2,789 2,836 2.630 2.933
GIIo:!St F.O.Ei. 71 1,768 2,071 2.051 2.161 2.168 1.791 2.150NON-FACTOR SERVICES (N.F.S.) 72 620 630 649 521 668 839 783
IMPORTS OF GOO115 AND N.F.S 73 -2.712 -2.968 -3010 -3.010 -2.733 -2,443 -2.181
finnlImSt F.O.E'. 74 2.055 2.228 2.234 2.212 2.028 1.963 1.691NON-FACTOR SERVICES (N.F.S.I 75 657 740 776 798 705 5_0 490
G.D.F. AT MARKET PRICES 76 4.704 5.075 5,368 5s674 5*098 5.36- 5^668
NFT FACTOR INCOME r.A. (1) (2) 77 -47 -2 - -33 -37 -137 -154
G.N.P. AT MARK.ET PRICES 78 4.657 5.073 5.368 5.641 5.061 5t227 5S514
ElVJISEDi NArTINAL ACCOUNT SERIES FROM 19.'6
(1) IIFFpi7EID BY GDF DEFLATOR AT MARNFT PTlrESt') r.at. - FROM m ,ihillAD
SOIURCE : hISSION fSTIMATES
IABLE MTS/2N;'f
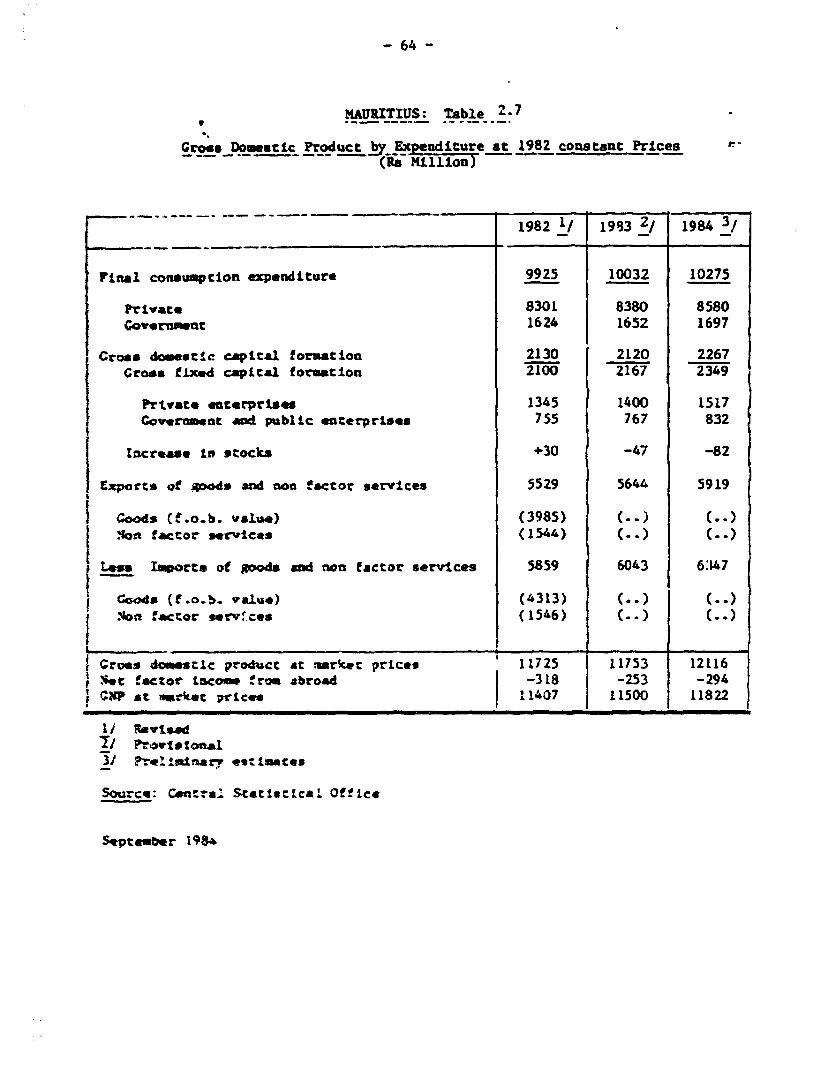
- 64 -
MAURITIUS: Table 2.7
GraCe Dometic Product .y _Ependiture at 1982 constant Prices- _ _ __ _(RS mi_ . -llin_)
. -. - - -- -- 1982 1I 1993 2/ 1984 3/
Final consumption expenditure 9925 10032 10275
Private 8301 8380 8580Govrermnt 1624 1652 1697
Cross domestic capital formation 2130 2120 2267Gross fixed capital formation 2100 2167 2349
Private enterprises 1345 1400 1517Covernment and public enterprises 755 767 832
| Increase in stocks +30 -47 -82
Cxpotrts of moods nd non factor services 5529 5644 5919
Coods (f.o.b. value) (3985) ( .-) ( .)l on factor services (1544) (.v) C..)
I ILain taport.s of soods and non Eactor services 5859 6043 6347
Ca-ds (f.o.b. vsl<u) (4313) (.-) C.)j 'Jo "actor servfces (1546) C.*) C..)
Cross domestic product at :mrket prices 11725 11753 12116t Net factor Laco from abroa -318 -253 -294
GXP At market prices 11407 11500 11822
I/ Reaw1sd1/ ?rovieLcmal&31 Proij-nuary e**ia&ces
Source: Contra- ScatisricaL off lc*
Se-tteber 198k
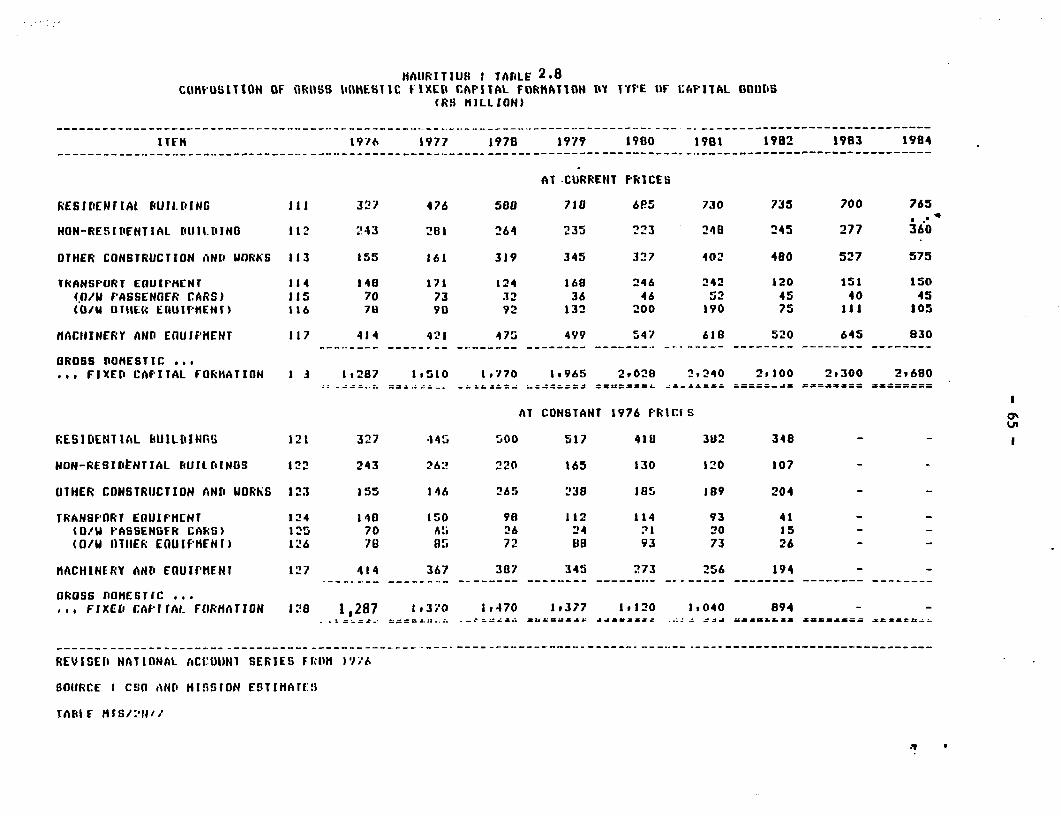
HAIIRITIUS TAnLE 2.8COBF0'6STtON OF ORIRSS 1iOIhEST C FIXEI% CAPITAL FRAYIATI1O BY TYPE IIF C:PITAL GOODS
(RS HlLLION)
IT8N 1976 1977 1979 179 19180 1981 1982 1983 1984
AT CURRENT PRICES
RESIDENTIAL BUIlDING 111 3:!7 476 508 710 6P5 730 735 700 765I**.
NON-RESIDENTIAL BUILDING 112 243 281 264 235 223 240 245 277 360
OTHER CONSTRUCTION ANIB UORKS 113 I55 161 319 345 327 402 480 527 575
TRANSPO(RT EOUipKCNr 114 149 171 124 168 246 242 120 151 150(fl/ f'ASSENfiER CARS) 115 70 73 32 36 46 52 45 40 45(O/U OIIEI; EQUIPIhENI) 116 7u 9C 92 132 200 190 75 111 105
HACIIINERY AND EOUIF'HENT 117 414 421 475 499 547 618 520 645 830
DROSS DOMESTIC ..see FIXED CAPITAL FOR1MATION I 3 1.287 1,510 1,770 1965 2,028 2,240 2P100 2,300 2,680
: _:-D... ..-.. - :.- :: = . ; J Z _ _3_ : * :. _ _:==:=_== _:S:==_=5=_==S=
AT CONSTANT 1976 PRICIS
RESIDENTIAL hUILDINRS 121 327 144 JO0 517 410 302 348 - -
NON-RESIDtNTIAL BUIIlINGS 122 243 262 220 165 130 120 107 -
OTHER CONSTRIJCTION AND WORKS 123 15S 146 265 230 15s 189 204 - -
TRANSFORT EOUIPHCNT 124 140 ISO 98 112 114 93 41 - -
10/U PASSENOFR CARS) 125 70 6!i 26 24 :1 20 15 - -
(0/U OTHER EOUIPFENF) 126 70 H5 72 80 93 73 26 - -
MACHINERY AND EUUIFPHENT 127 414 367 387 345 273 256 194 - _
GROSS DOMEsrIc ...* FIXED CAP'IrAl FOlRMATION 1:!8 1,287 1,370 1,470 1.377 1,120 1,040 894 -_
, . = _ - =- = . _ :. : . L. . = : _: = = .. : 4 _ S .4 : = = a = JS = S= =_
REVISEII NATIONAL ACIUNIINi SERIES FRtI2H l9/6
SOUIRCE I Co .AIND MI5SION ESTIMATES;
TABIE TB/211//
.,
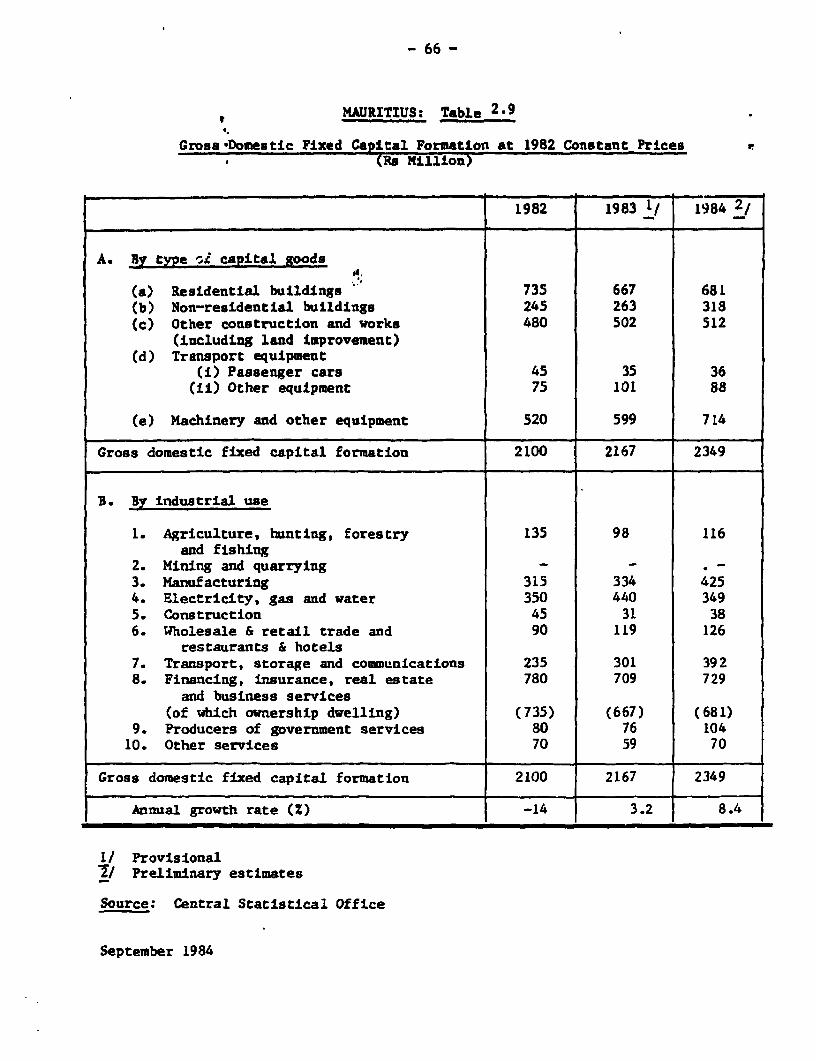
- 66 -
MAURITIUS: Table 2.9
Gross Domestic Fixed Capital Formation at 1982 Constant Prices(Rs Million)
1982 1983 I/ 1984 2/
A. By type si capital goods
(a) Residential buildings 735 667 681(b) Non-residential buildings 245 263 318(c) Other construction and works 480 502 512
(including land improvement)(d) Transport equipment
(i) Passenger cars 45 35 36(ii) Other equipment 75 101 88
Ce) Machinery and other equipment 520 599 714
Gross domestic fixed capital formation 2100 2167 2349
S. By industrial use
1. Agriculture, hunting, forestry 135 98 116and fishing
2. Mining and quarrying _ _3. Manufacturing 315 334 4254. Electricity, gas and water 350 440 3495. Construction 45 31 386. Wholesale & retail trade and 90 119 126
restaurants & hotels7. Transport, storage and communications 235 301 3928. Financing, insurance, real estate 780 709 729
and business services(of whtich ownership dwelling) (735) (667) (681)
9. Producers of government services 80 76 10410. Other services 70 59 70
Gross domestic fixed capital formation 2100 2167 2349
Annual growth rate (%) -14 3.2 8.4
1/ Provisional2/ Preliminary estimates
Source: Central Statistical Office
September 1984
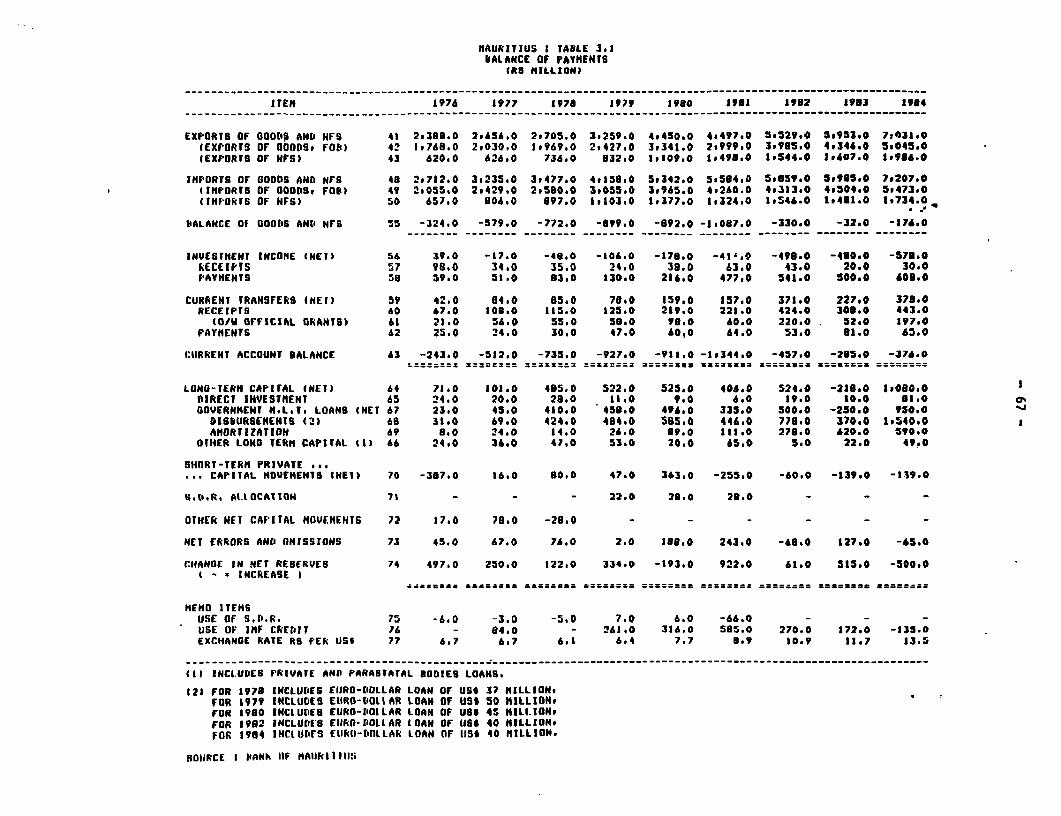
MAURITIUS I TABLE 3.1SAL ANCE OF PAymENTS
(RS MILLION)
ITEM 1976 1977 1978 1979 I980 IYOI 1912 £913 194
EXPORTS OF 000PS AND NFS 41 2P3811.0 2,656.0 2.705.0 3o259.0 4,450.0 4a497.0 5s52990 5,953.0 7t031.0(EXrORTS OF BOODS, FOE') 42 1,768.0 2,030.0 5.969,0 29427.0 30341.0 2,999.0 3,965.0 4w346.0 5,045.0(EXPORTS OF NF5) 41 620.0 626.0 736.0 832.0 1P109.0 1,498.0 1,544.0 1.407-0 1.9116.
IMPORTS OF GOODS AND NFS 48 29712.0 3235.0 3.477,0 4,151.0 5342.0 5.514.0 5,659.0 5t965.0 7,207.0tIMPORTS OF ooas. FOB) 49 2055.0 2,429.0 2S580.0 3,055.0 3,965.0 4.2A0.0 4,311. 4,504.0 5.473o0(IMPORS OF NFSH 50 657.0 006.0 197.0 1.103.0 1.377.0 19324.0 I,S46.0 1.411.0 19734.0
9ALANCE OF GOODS AND NFS 55 -324,0 -579.0 -772,0 -199.0 -192.0 -1.087.0 -130.0 -32.0 -176.0
INVESTMENT INCOME (NEIT 56 39.0 -17.0 -46.0 -106.0 -176.0 -413'0 -498.0 -430.0 -573.0kECEIPTS 57 98.0 34.0 35.0 24.0 39.0 63.0 43.0 20*0 30.0F-AYMENTS 51 59.0 5S.0 63.0 110.0 216.0 477.0 541.0 SOO0O 601.0
CURRENT TRANSFERS (NETF 5 42.0 84.0 85.0 78M 19.0 157.0 371.0 227.0 378.0RECEIPTS 60 a7.0 301.0 115.0 125.0 219.0 221.0 424.0 305.0 443.0
O/tU OFFICIAL GRANTS) 61 21.0 56.0 55.0 59.0 98.0 60.0 220.0 32.0 197.0PAYMENTS 62 25.0 24.0 30.0 47.0 60,0 64.0 5310 81.0 6 5.0
CURRENT ACCOUNT BALANCE 63 -243.0 -512.0 -735.0 -927.0 -933.0 -1v344.0 -457*0 -25S.0 -376.0L=zzz==z =zz==z== ==a===== ======== ma==a==S ===ax=== _======= a=====-== ==U=====w
LONG-TERM CAPITAL (NET) 64 71.0 101.0 435.0 522.0 525.0 406.0 524.0 -21830 l,080.0DIRECT INVESTMENT 65 24.0 20.0 26.0 11.0 9.0 6.0 19.0 10.0 311.0 0GOVERNmENT MoL.T. LOANS (NET 67 23.0 45.0 410.0 459.0 496.0 315.0 500.0 -250.0 950.0
DISBURSEMENTS (21 69 31.0 69.0 424.0 494.0 595*0 446.0 779.0 370.0 1540.0AMORTIZATION 69 6.0 24,0 14.0 26.0 69.0 111.0 278.0 620.0 590.0
OTIIER LONO TERM CAPITAL (11 66 24.0 36.0 47.0 53-0 20.0 65.0 5.0 22.0 49.0
SHORT-TERM PRIVATE ...... CAPITAL MOVEMENTS (NET) 70 -367.0 16.0 90.0 47.0 163.0 -255.0 -60.0 -139*0 -139.0
D.ER. lALOCATtON 71 - - - 22.0 23.0 2E.0 - - -
OTHER NET CAPITAL MOVEMENTS 72 17.0 78.0 -28.0 - - - - - -
NET ERRORS AND OMISSIONS 73 45,0 67.0 76.0 2.0 188.0 243.0 -66.O 127.0 -65.0
C11ANOE IN NET RESERVES 74 497.0 250.0 122.0 314.0 -393.0 922.0 61.0 515.0 -500.0C - * INCREASE I
HEmO ITEMSUSE OF S.D.R. 75 -6,0 -3.0 -3.0 7.0 6.0 -66.0 - - -USE OF IMF CREDIT 76 - 04.0 - 261.0 336.0 55.0 270.0 172.0 -115.0EXCHANGE RATE RS PER US$ 77 6.7 6.7 6.1 6.4 7.7 6.9 30.9 11.7 13.5
I11 INCLUDES PRIVATE AND PARASTATAL OtDIES LOANS.
C21 FOR I973 INCLUDES EIJRO-DOLLAR LOAN OF US$ 37 HILLION.FaR 1979 INCLUDES EtURO-DOalAR LOAN OF US$ 50 HILLION.FOR 3190 INClIDES EURO-IOILAR LOAN OF US$ 45 MILL.ION.FOR I9Y2 INCLUDIES EURO-DOLLAR LOAN OF 116S 40 MILLION.FOR 1964 INCLUDES EURiI-DinLLAR LOAN nF 1S* 40 MIlLLION.
fOIIRCE; IE 1ANh lIF MAURIJII!i
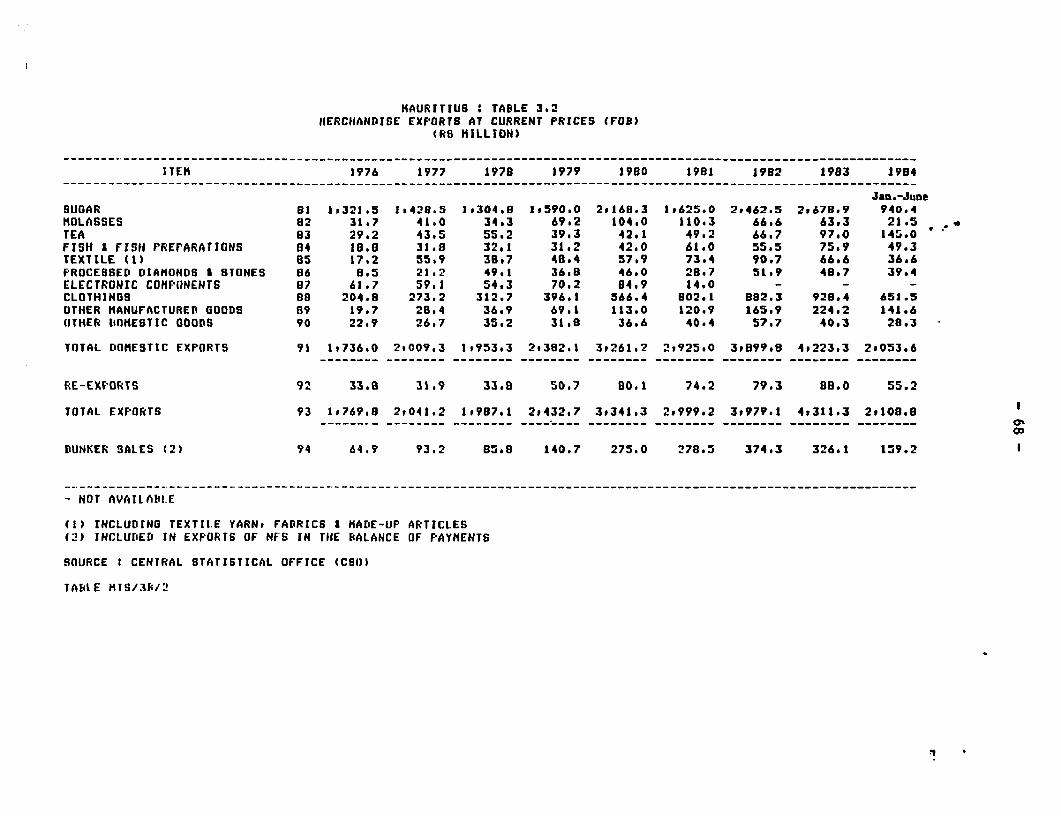
HAURITIUS : TABLE 3.2IIERCHANDISE EXPORTS AT CURRENT PRICES (FOB)
(RS HILLION)
ITEM 1976 1977 1978 1Y79 1980 19H1 1992 1983 1984--------------..-------------- __----_------------------------------___-------__------------------------------------
Jan.-JuneSU8AR 81 1,321.5 1.428.5 1.304.8 1.590.0 2,169.3 1,625.0 2.462.5 2,678.9 940.4MOLASSES 82 31.7 41.0 34.3 69.2 104.0 110.3 66.6 63.3 21.5 .*TEA 83 29.2 43.5 55.2 39.3 42.1 49.2 66.7 97.0 145.0FISH I FISH PREPARATIONS 84 18.8 31.8 32.1 31,2 42.0 61.0 55.5 75.9 49.3TEXTILE (1) 85 17.2 55,9 39.7 48.4 57.9 73.4 90.7 66.6 36.6PROCESSED DIAMONDS I STONES 86 9.5 21.2 49.1 36.8 46.0 28.7 51.9 48.7 39.4ELECTRONIC COMPONENTS 87 61.7 59.1 54.3 70.2 84.9 14.0 - - -CLOTHINGS ea 204.8 273.2 312.7 396.1 566.4 802.1 882.3 928.4 651.5OTHER MANUFACTURED GOODS 89 19.7 28.4 36.9 69.1 113.0 120.9 165.9 224.2 141.6OITHER BiOliESTIC GOODS 90 22.9 26.7 35.2 31.8 36.6 40.4 57.7 40.3 28.3
TOTAL DOMESTIC EXPORTS 91 1,736.0 29009,3 1,953.3 29382,1 3p261,2 2,925.0 3B899,8 4t223,3 2.053.6
RE-EXPORTS 92 33.8 31.9 33.8 50.7 80.1 74.2 79.3 88.0 55.2
TOTAL EXPORTS 93 1,769.9 2,041.2 1,987.1 2,432.7 3,341.3 2,999.2 3,979.1 4,311.3 2109.91
BUNKER SALES (2) 94 64.9 93.2 85.8 140.7 275.0 278.5 374.3 326.1 159.2
- NOT AVAilABlE
(l) INCLUDING TEXTIllE YARN, FABRICS I MADE-UP ARTICLES(2) INCLUDED IN EXPORTS OF NFS IN THE BALANCE OF PAYMENTS
SOuJRCE I CENTRAL STATISTICAL OFFICE (CSO)
TABlE MTS/3h/2
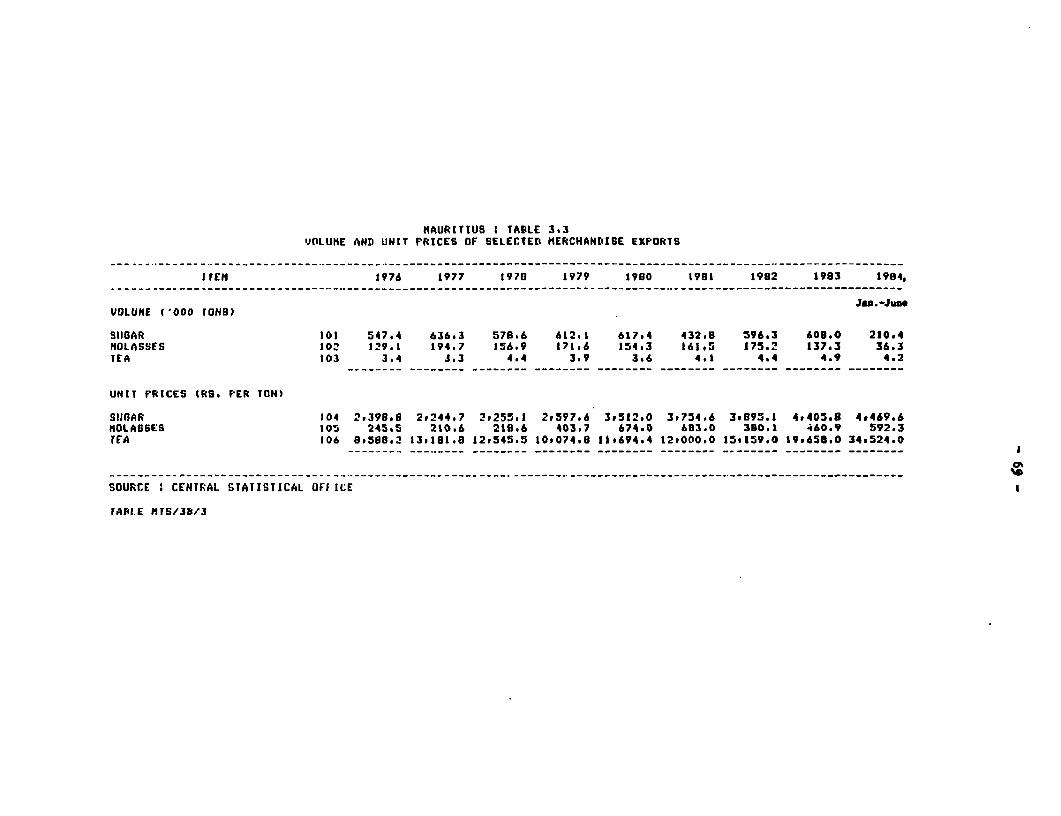
MAURITIUS t TABLE 3.3VnLUME AND UNIT PRICES OF SELECTED MERCHANDISE EXPORTS
ITEM 1I76 1977 1970 1979 1980 1981 1992 1983 1984,
Jan.-JuneVOLUME ('000 IONS)
SIIGAR 101 547.4 636.3 578.6 612.1 617.4 432.8 596.3 609.0 210.4MOLASSES 102 129.1 194.7 156.9 171.6 154.3 161.5 175.2 137.3 36.3TEA 103 3.4 J.3 4.4 3.9 3.6 4.1 4.4 4.9 4.2
UNIT PRICES IRS. PER TON)
SIIOAR 104 2,398.0 2t244,7 2,255.1 2,597.6 3i512.0 3.754.6 3,995.1 4,405.9 4.469.6MOLASSES 105 245.5 210.6 218.6 403.7 674.0 693.0 390.1 460.9 592.3TEA 106 8,588.2 13.281.8 12.545.5 10.074.9 11,694.4 12,000.0 15,159.0 19,659.0 34.524.0
SOURCE : CENTRAL STATISTICAL OFFICE
rADLE MTS139/3

MAURITIUS I TABLE 3.4MERCHANDISE IMPORTS AT CURRENT PRICES (CIF)
(RS MILLION)
-,,-------------------------------------------------._----------__-----------__------------------------------------
IrEn 1976 1977 1978 1979 1990 1981 1982 1993 1984---------------..-----------..---------------------------------------- __-----._-------------__-_------________------
Jan.-June *
FOOD AND BEVERAGES 111 586.6 693.1 806.1 879.4 1,239.7 10371.1 1*411.6 1,288.0 762.2
RICE 112 130,5 106.1 163.9 147.4 237.3 277.2 297.4 210.1 116.9UHEAT FLOUR 113 71.0 79.8 78.8 85.6 168.8 204.3 215.6 176.3 106.0MEAT I MEAT PREPARATIONS 114 31.0 50.1 58.0 104.6 104.7 99.8 119.6 115.8 50.4FISHI - FRESH I PRESERVES II5 31.0 49.7 57.8 65.5 85.0 99.9 84.7 76.0 51.1ANInAL A VEGETABLE OIL 116 81.0 79.1 86.4 96.1 129.6 149.1 156.6 155.0 124.2MILC A CREAM 117 63.2 89.1 85.7 91.1 97.4 143.7 114.4 157.5 97.2FRUITS I VEGETABLES 119 14.3 24.1 26.2 81.6 1SS. 1,46.3 101.6 124.7 72.3OTIIER FOOD 119 145.7 183.1 226.3 179.7 236.0 227.0 301.0 249.8 135.9BEVERAGE I TOBACCO 120 18,9 32.0 23.0 27,8 25,8 24.8 20.7 22.8 10.3
OTHER CONSUMER 0ooos 121 169.0 205.0 252.0 283.9 319.6 284.8 321.7 342.9 181.5
PETROLEUM PRODUCTS 122 206.3 274.4 274.6 507.9 6455 S84.3 907.4 954.2 497.4 -
GASOLINE 123 40.6 51.9 52.6 74.5 102.0 129.0 150.4 144.2 74.3DISTILLATE FUELS 124 78.5 86.8 90.8 197.6 229.0 250.7 299.1 291.5 155.2OFrEER PETROLEUMH PRODUCTS 125 87.2 131.7 131.2 245.7 315.5 504.6 457.9 518.5 267.9
INTERMEDIATE GOODS 126 866.6 19103.3 1.171.3 1.409.6 1777.9 1*699.3 1.907,9 19946.4 1.262.0
CRUDE INEDIBLE HATERIALS (I'127 64.0 95.6 105.4 129.4 211.2 239.0 260.8 227.3 135.8FERTILIZERS 129 21.8 30.) 24.0 35.7 41.2 70.2 55.7 60.6 25.0CIHEMICAL PRODUCTS 129 146.0 182.5 177.7 233.7 275.8 283.9 347.8 341.5 196.5TEXTILES 130 213.0 293.7 290.7 297.0 386.3 438.0 484.2 592.5 498.2CEMENT 131 71.3 94.6 112,2 137,6 194.1 136.2 167.4 163.4 81.9IRON A STEEL 132 96.8 122.4 131.0 170,4 200.6 130.5 130.5 136.7 79.9MANUFACTURE OF METAL 133 78.0 99.3 105.7 131.8 136.6 102.6 116.6 110.6 57.4OTHER INTFRMEDIATE 134 185.7 1950O 224.6 274.0 332.2 298.9 344.Y 313.9 197.3
CAPITAL GOODS 135 580.0 679.0 572.4 553.7 730.7 737.3 499.6 624.4 359.4
HACHINERY (NON-ELECTRIC) 136 25892 254,0 304.8 262,? 238.5 241,1 :54 * 275.4 158.4MACHINERY (EIECTRIC) 137 192.1 256.6 169.2 151.1 210.0 154.1 IS'6.8 150.1 82.5TRANSPORT EGIIIF. I PARTS 138 132.7 161,8 90.0 100.8 139.4 184.6 B.ab 79.5 48.4OTHER CAPITAl Goons 139 7.0 6.6 B.4 38.9 151.8 157.5 133.5 120.4 70.1
TOTAL IMPORIS 140 2.408.5 2,950.9 3,076.4 3.634.4 4,721,4 4,976.8 5,048.2 5-155.Y 39062.6
- NOT AVAILABLE
(I) EXCEPT FUELS
SOURCE I CENTRAL STATISTICAL OFFICE
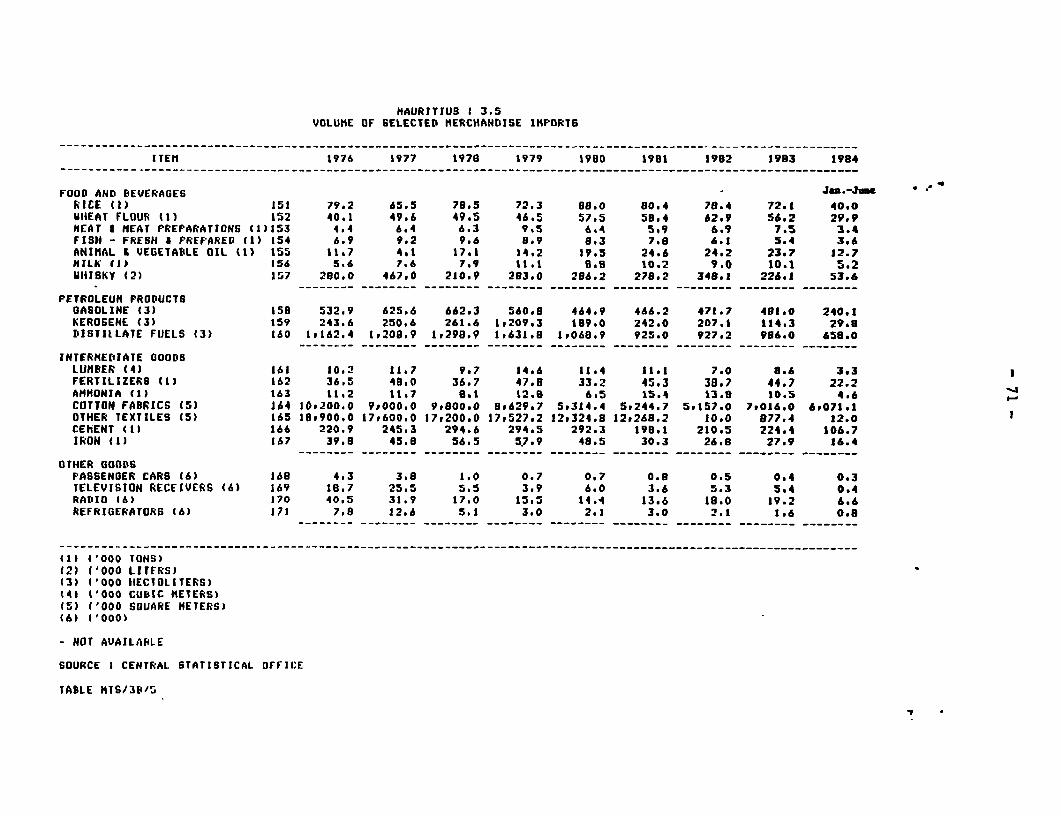
MAURITIUS 1 3.5VOLUME OF SELECTED MERCHANDISE IMPORTS
--------------------------------------------------------- __-_____------------__-----------------------------------
ITEM 1976 1977 1978 1979 1980 1981 1982 1983 1984
FOOD AND BEVERAGESRICE (1) 151 79.2 65.5 78.5 72.3 89.0 80.4 70.4 72.1 40.0UWhEAT FLOUR (1) 152 40.1 49.6 49.5 46.5 57.5 58.4 62.9Y 56.2 29.9MEAT A MEAT PREPARATIONS (1)153 4.4 6.4 6.3 9,5 6.4 5.9 6.9 7.5 3.4FISH - FRESH I PREFARED (1) 154 6.9 9.2 9.6 8.9 8.3 7.9 6.1 5.4 3.6ANIMAL L VEGETABLE OIL (1) 155 11.7 4.1 17.1 14.2 19.5 24.6 24.2 23.7 12.7MILK (1) 156 5.6 7.6 7.9 11.1 5.8 10.2 9.0 10.1 5.2WiISKY (2) 157 280.0 467.0 210.9 253.0 256.2 278.2 348.1 226.1 53.6
PETROLEUM PRODUCTSGASOLINE (3) 158 532.9 625.6 662.3 560.S 464.9 466.2 471.7 481.0 240.1KEROSENE (3) 159 243.6 250.6 261.6 1.209.3 189.0 242.0 207.1 114.3 29.HDISTILLATE FUELS (3) 160 1,162.4 1,209.9 1.298.9 1.631.8 1,068.9 925.0 927.2 986.0 659.0
INTERMEDIATE GOODSLUMBER (4) 161 10.2 11.7 9.7 14.6 11.4 11.1 7.0 8.6 3.3FERTILIZERS (1) 162 36.5 48,0 36.7 47.8 33.2 45.3 38.7 44.7 22.2AMMONIA (1 163 I,.2 11.7 8.1 12.9 6.5 15.4 13.9 10.5 4.6COTTON FABRICS (5) 164 10,200.0 9,000.0 9,500.0 8.629.7 5,314.4 5,244.7 5,157.0 7.016.0 6,071.1OTHER TEXTILES (5) 165 18.900.0 17.600.0 17,200.0 17,527.2 12,324.8 12.268.2 10.0 877.4 12.0CEhENT (1) 166 220.9 245.3 294.6 294.5 292.3 199.1 210.5 224.4 106.7IRON (1) 167 39.8 45.9 56.5 5.7.9 48.5 30.3 26.8 27.9 16.4
OTHER GOODSPASSENGER CARS (6) 168 4.3 3.9 1.0 0.7 0.7 0.8 0.5 0.4 0.3TELEVISION RECEIVERS (6) 169 18.7 25.5 5.5 3.9 6.0 3.6 5.3 5.4 0.4RADIO (6) 170 40.5 31.9 17.0 15.5 14.4 13.6 18.0 19.2 6.6REFRIGERATORS (6) 171 7.9 12.6 5.1 3.0 2.1 3.0 2.1 1.6 0.8
(1) ('000 TONS)(2) ('000 LITERS)(3) ('000 HECIOLITERS)(43 ('000 CUBIC HETERS)(5) ('000 SQUARE METERS)(6) ('000)
- NOT AUAILAPLE
SOURCE I CENTRAL STATISTICAL OFFICE
TABLE MTS/3B85
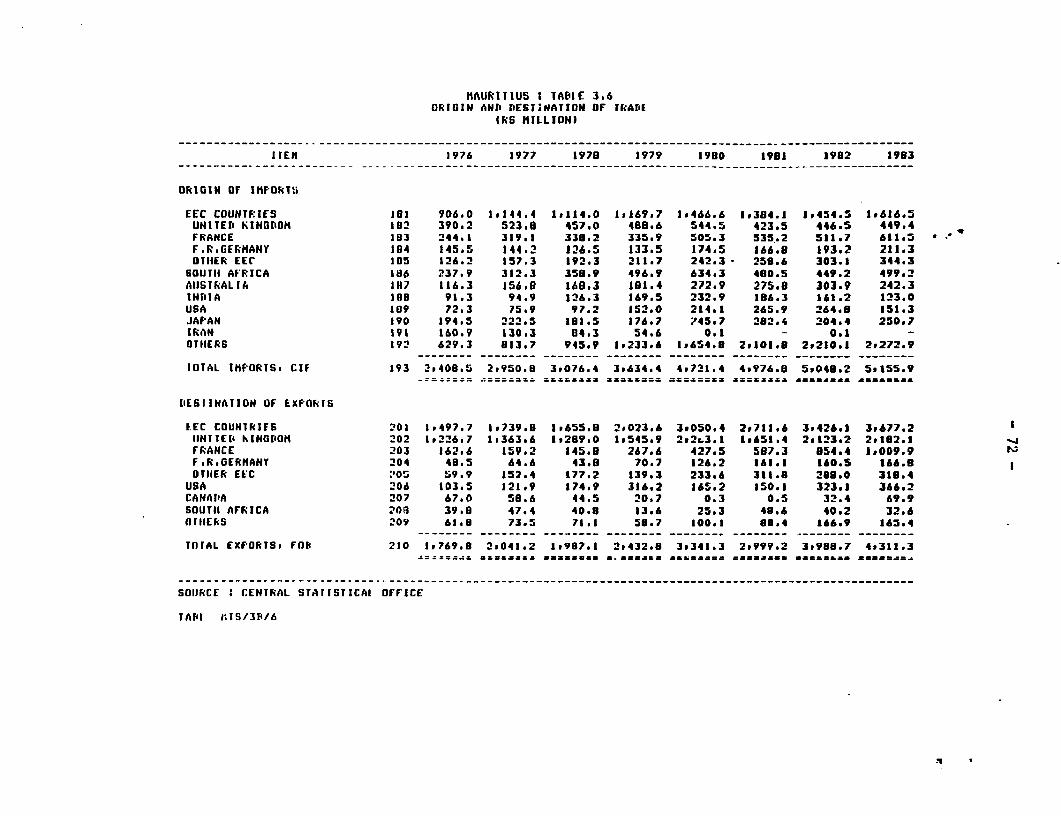
MAURITIUS I TABIE 3.6ORIGIN AND DESTINATION OF TRADE
IRS HILLIONI
IlEH 1976 1977 1978 1979 1980 1981 1982 1983
ORIGIN OF IHFOkT'i
EEC COUNTRIES 101 906.0 1.144,4 1*114.0 1,169.7 1a466.6 3.384.1 1,454.5 1,616.5UNITED KINSDOM 192 390.2 523.9 457.0 499.6 544.5 423.5 446.5 449.4FRANCE 193 244.1 319.1 338.2 335.9 505.3 535.2 511.7 611.5F.R.GERHANY 104 145.S 144.2 126.5 133.5 174.5 166.9 193.2 211.3OTIIER EEr I05 126.2 157.3 192.3 211.7 242.3- 259.6 303.1 344.3
SOLIIII ArFRICA 396 237.9 312.3 358.9 496.9 634.3 490.5 449.2 499.2AUISTRALIA 1H7 116.3 156.9 169.3 191.4 272.9 275.8 303.9 242.3INDIIA 188 91.3 94.9 126,3 169.5 232.9 196.3 161.2 123.0USA 109 72.3 75.9 97.2 152.0 214.1 265.9 264.8 151.3JAfAN 190 194.5 222.5 181.5 176.7 745.7 282.4 204.4 250.7IRAN 191 160.9 130.3 94.3 54.6 0.1 - 0.1 -OTIIERS 192 629.3 913,7 945.9 1,233.6 13654.8 2,101.8 2,230.1 2,272.9
IOTAL INPORTS9 CIF 193 2.408.5 2.950.8 39076.4 3,634.4 4,721.4 4,976.9 5,048.2 5s155.9
DESIINATION OF EXPOkTS
FEC COUNJRIFS 201 3,497.7 13739.9 3,655.9 2,023.6 3,050.4 2,711.6 39426.1 3,677.2IINITEI KINGDOH 202 1,226.7 1,363.6 13289.0 1,s45.9 2p2L3.1 1651s.4 2,123.2 2,182.1FRANCE 203 162.6 159,2 145.9 267.6 427,5 597.3 954.4 1.009.9F.R.GERMANT 204 48.5 64.6 43.8 70.7 126.2 161.1 360.5 166.9OTHER EtC :,O' 59.9 152.4 177.2 139.3 233.6 311.8 288.0 310.4
USA 206 103.5 121.9 174.9 316,2 165.2 150.1 323,1 366.2CANAIIA 207 67.0 58.6 44.5 20,7 0.3 0.5 32.4 69.9SOUTH AFRICA 208 39.9 47.4 40.8 13.6 25.3 48.6 40,2 32.60IIHERS 209 63.9 73.5 71.1 58.7 100.1 88.4 166.9 165.4
TOFAL EXPORTS. FOE 210 3,769.8 2,041.2 3,987.1 2,432.8 3.341.3 2.999.2 3,988.7 4,311.3::=,:=:===a== =o======= =. =s==a= .=as ====a== =a====&.a za=-=
SOURCE : CENTRAL STA1ISTICAI OFFICE
TAnL. AIT5/34/6
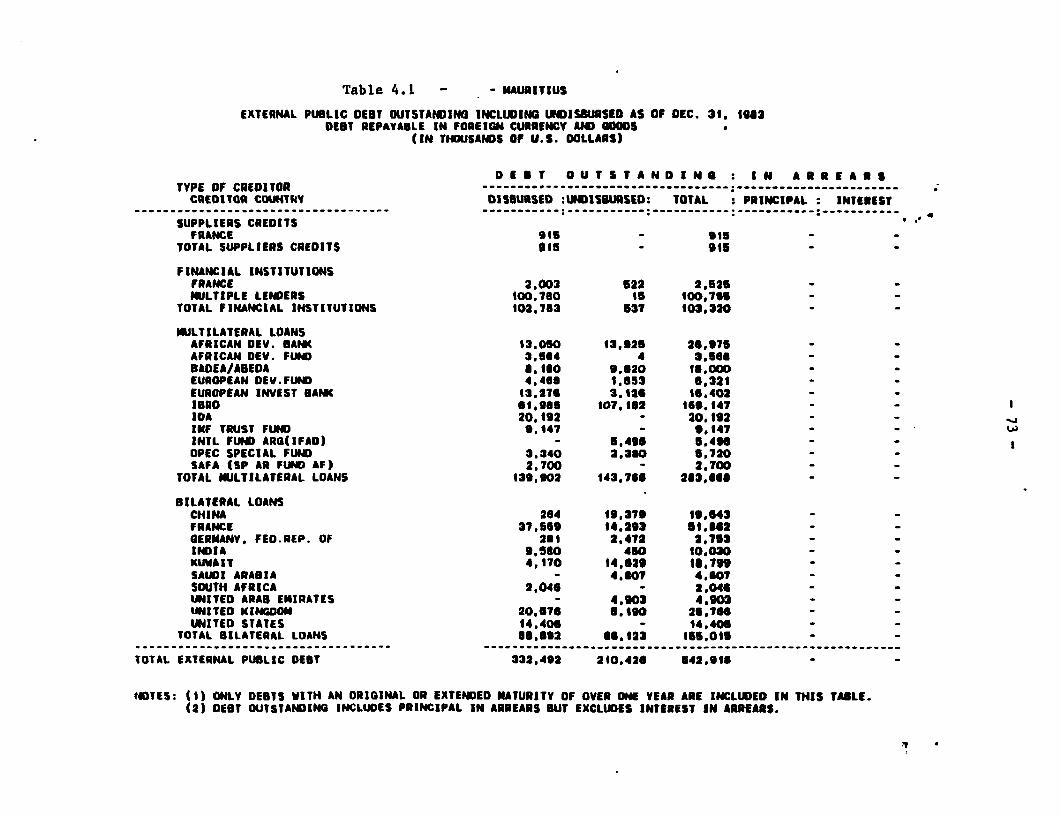
Table 4.1 - - MAURITIUS
EXTERNAL PUBLIC DEBT OUTSTANDINa INCLUDING UNDISSUSED AS OF DEC. 31, 1082DEBT REPAYABLE IN FOREIGN CURRENCY AND GOODS
(IN THOUSANDS OF U.S. DOLLARS)
D E B T O U T S T A N D I N S I N A RaR Ea R STYPE OF CREDITOR ---......................... ____ ...___ -_ -___-__-___--_---_--
CREDITOR CUTIRY DISSURSED :UNDISBURSED: TOTAL PRINCIPAL INTEREST
SUPPLIERS CREDITS . .
FRANCE 915 - 315 -TOTAL SUPPLIERS CREDITS SIB - 915 -
FINANCIAL INSTITUTIONSFRANCE 2,003 522 2.525 -MULTIPLE LENDERS 100.780 15 100,795 -
TOTAL FINANCIAL INSTITUTIONS 102,763 537 103,320 -
MULTILATERAL LOANSAFRICAN DEV. BAN 13.00 13.925 26,975 -AFRICAN DEV. FUND 3.164 4 2,56 --BADEA/ABEDA *.1S0 9,820 13,0 --EUROPEAN OEV.FUND 4.468 1.853 6,321 -EUROPEAN INVEST BANK 13.276 3.126 16.402 -hlog 61.315 107.12 160.147 -IDA 20.132 - 20,192 -IMF TRUST FUND 9147 - 9.147 -INTL FUND ARG(IFAD) - 5.496 5436 --OPEC SPECIAL FUND 3.340 2.320 5.720 -SAFA (SP AR FUND AF) 2.700 - 2,70 -0
TOTAL MULTILATERAL LOANS 1239.02 143,766 223,4 - -
BILATERAL LOANSCHINA 264 13.279 19643 FRANCE 37.519 14.293 S11162 -GERVANY. FED.REP. OF 2 1 2.472 2.753 -INDIA 93.10 450 10,00 -3KUWAIT 4,170 14.629 18.79 -_SAWI ARABIA - 4.907 4.0? _-SOUTH AFRICA 2,046 -2046 -UNITED ARAB EMIRATES - 43903 4.90 --UNITED KINGDOM 20.576 3.190 2.176 --UNITED STATES 14.406 - 14.406
TOTAL BILATERAL LOANS S8.832 6. 123 155.015
TOTAL EXTERNAL PUBLIC DEBT 332.492 210,426 542.913 -
NOTES: (1) ONLY DEBTS WITH AN ORIGINAL OR EXTENDED MATURITY OF OVER ONE YEAR ARE INCLUDED IN THIS TABLE.(2) DEBT OUTSTANDING INCLUDES PRINCIPAL IN ARREARS BUT EXCLUDES INTEREST IN ARREARS.
?*
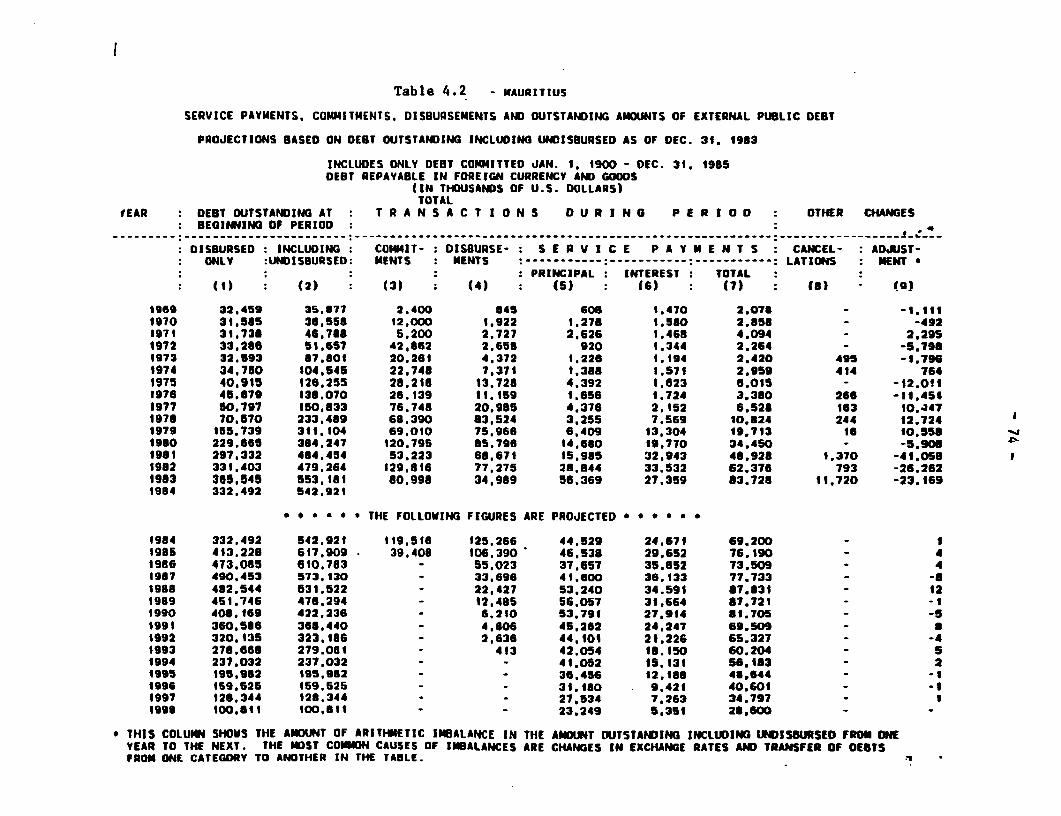
Table 4.2 - MAURITIUS
SERVICE PAYMENTS. COMMITHENTS. DISBURSEMENTS AND OUTSTANDING AMOUNTS OF EXTERNAL PIMLIC DEBT
PROJECTIONS BASED ON DEBT OUTSTANDING INCLUWING UNOISBURSED AS OF DEC. 31. 1953
INCLWES ONLY DEBT COMMITTED dAN. 1. 1900 - DEC. 31. 1985DEBT REPAYABLE IN FOREIGN CURRENCY AND GOOOS
(IN THOUSANDS OF U.S. DOLLARS)TOTAL
fEAR OEBT OUTSTANDIN AT T R A N S A C T I ON S D U R I N G P E R I : OTR CHANGES: BEGINNING OF PERIOD
D DISBURSED: INCLUOING COMMIT-: DISBURSE- : S E R V I C E P A V N E N T S CANCEL- : ADJUST-: ONLY :UNDISBURSED: MENTS : MENTS :-----------:T-----------:-------- LTONS : RENT *
:PRINCIPAL: INTEREST: TOTAL: (I) : (2) (3) (4) (5) (6) (7() (- t
1969 32.459 35.077 2.400 845 609 1.470 2.079 - -1.1111970 31,535 36.558 12.000 1.922 1.278 1.530 2.858 - -4921971 31.733 46,708 5.200 2.727 2.626 1.468 4.094 2.2951972 33,286 51.S657 42,662 2.659 920 1,344 2.264 - -5.7981973 32.593 671801 20.261 4.372 1.226 1.194 2.420 495 -1.7961974 34,750 104,545 22,743 7.371 1.381 1.571 2.959 414 7641975 40,915 126.255 28,218 13.728 4.392 1.623 6.015 - -12.0111976 45.679 138.070 26.139 11.159 1.656 1.724 3.380 266 -11.4511977 50,797 150.833 76.748 20.955 4.376 2.152 6.528 163 10.1471978 70.570 233.489 68,390 83.524 3.255 7,569 10.824 244 12.7241979 155.739 311.104 69.010 75.966 6.409 13.304 19.713 16 10.5581980 229.665 384.247 120.795 6S.796 14.680 19.770 34.450 - -5,9061981 297,332 484.454 53.223 68.671 15.985 32.943 49.928 1.370 -41.05I1992 331,403 479.264 129.816 77.275 28,344 33.532 62.376 793 -26.2621983 365.545 553.181 80.998 34.989 56.369 27,359 83.726 11.720 -23.1691984 332.492 542.921
* * * * * # THE FOLLOWING FIGURES ARE PROJECTED * * *
f984 332,492 542.92t 119.516 125.266 44.529 24.671 69.200 - 11985 413,228 617.909 39.408 106.390 46.538 29.652 76.190 - 41986 473.085 610.783 - 55.023 37.657 35.152 73.509 - 41957 490.453 573.130 - 33.696 41.600 36.133 77.733 - -31993 482.544 531.522 - 22.427 53.240 34.591 87.831 - 121989 451.746 478.294 - 12.485 56.057 31.664 87.721 - -11990 406.169 422.236 - 6.210 53.791 27.914 81.705 - -51991 360.586 366.440 - 4.306 45.262 24,247 69.509 - a1992 320.13S 323.186 - 2.636 44.101 21.226 65.327 - -4t993 278.668 279.081 - 413 42.054 18.150 60.204 - 51994 237.032 237.032 - - 41.052 15.131 56.133 - 21995 195,902 195.982 - - 36.456 12,139 48.644 - -11996 15,525 459,525 - - 31.160 9.421 40.601 - -11997 128.344 128.344 - - 27.534 7.263 34.797 _ I1999 100.l11 ¶00.811 - - 23.249 5.351 26.600 - -
* THIS COLU1N SHOWS THE AWOUT OF ARITHMETIC IMBALANCE IN THE AIXONT OUTSTANDING INCLWDING WElISBRSED FROM ONEYEAR TO THE NEXT. THE MOST COMMON CAUSES OF IMBALANCES ARE CHANGES IN EXCHANGE RATES AND TRANSFER OF OEBTSFROM ONE CATEGORY TO ANOTHER IN THE TABLE.
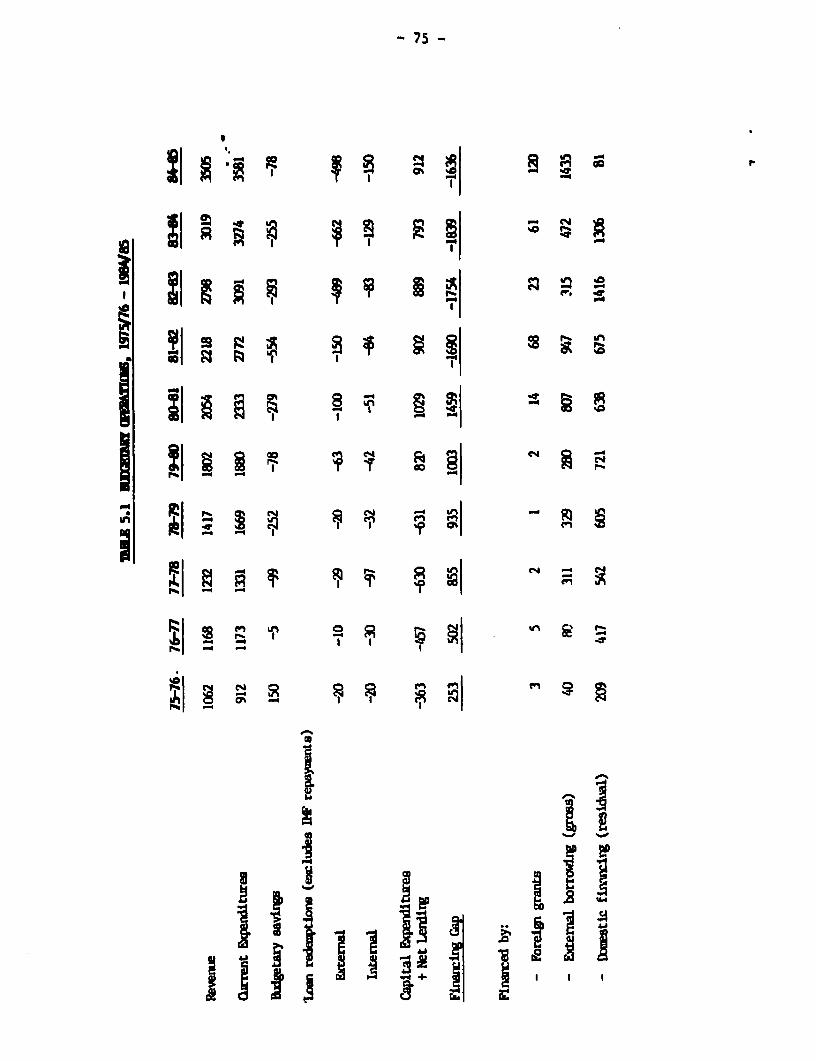
- 75 -
I 11 X R R R 9 | I1- r4
~~~~~~~ I~~~~~~~~~~~~n
8I~~~~~~~o~~~c
I~~~~~~~~~~~~~~~~I
g 1 g # e g 1 sI
.,~~~~I4 .1 @ wi
-._! i'-iiii iiiR FX1
i| f8 N p ol M2 @ i1 - e £ ,,,~~~~~~~I I
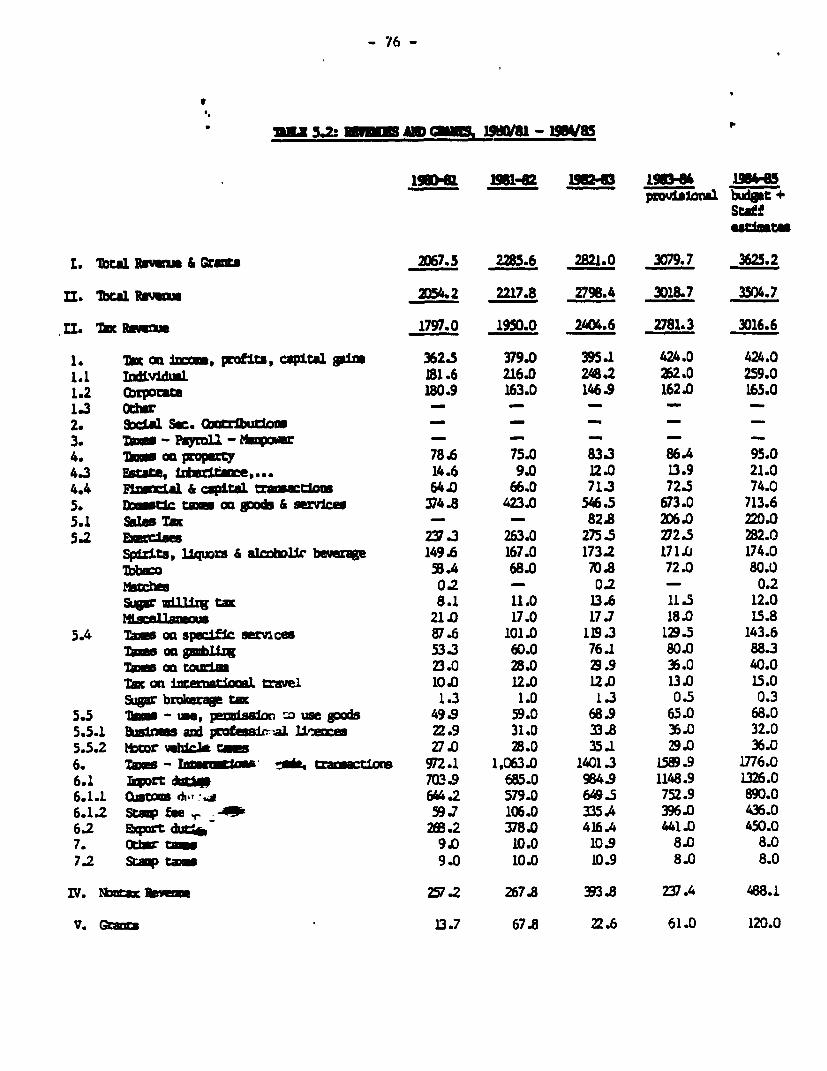
- 76 -
* MM 5.2: AM GWU 1 S - 1SS
15H 3-MU 1198l-4 1345p 1vilonm buipt +
Stdf
1. cal R Hum & Gra 2067.S 2285.6 2821.0 3079.7 362.2
II. Th1 RaM 2054.2 2217.8 2796.4 30187 350A4.7
XI. TmK RsuM 1797.0 1950.0 2404.6 2781.3 3016.6
1. hlc on ia, Profits, cqaia pim 362.5 379.0 395.1 424.0 424.01.1 Irvvldu&L 181.6 216.0 248.2 262.0 259.01.2 Oporat 180.9 163.0 146.9 162.0 165.01.3 Odu - - -2. SDC SaC. rlh rou - _3. a Paycol2. - ] - - - - -
4' - ur an paprcy 78.6 75.0 833 86.4 95.04.3 Easta, lChzlatuo,... 14.6 9.0 12.0 13.9 21.04.4 F1U1al & cpital t i 64.0 66.0 71.3 72.5 74.05. -Utic tCan am& smrvlce 374.8 423.0 546.5 673.0 713.65.1 Slas Tax - - 82.8 2D6.0 220.05.2 ENzcia 237.3 263.0 275.5 272.5 282.0
piz:Lta, 1iqurs & A1 Li bsvinae 149.6 167.0 173.2 17170 174.0T-oi nS 68.0 70.8 72.0 80.0
0.2 - 0.2 - 0.25 izl1g tac 8.1 11.0 13.6 11.5 12.0111ll. 21.0 17.0 17.7 18.0 15.8
5.4 Tur oan sp4flc s ces 87.6 101.0 119.3 129.5 143.6T n piabllz 53.3 60.0 76.1 80.0 88.3
Turan n twri 23.0 28.0 73.9 36.0 40.0Tm1z otEral CC1Oa a Ve1 10.0 12.0 12.0 13.0 15.0
Sup brOwIF trn C 1.3 1.0 1.3 0.5 0.35.5 T1_ - me, pmaSLo to ueg Ods 49.9 59.0 68.9 65.0 68.05.5.1 Bslamsu and1 pcofinslx-'.aJ. U1Jmem 22.9 31.0 33.8 36.0 32.05.5.2 MoIror wdCJa 27.0 28.0 35.1 29.0 36.06. Turs- I.nrn -- it. =aims 972.1 1,063.0 1401.3 JS.9 1776.06.1 Iiort & 703.9 685.0 984.9 1148.9 1326.06.1.1 Qistoar dw ' .a 644.2 579.0 649.5 752.9 890.06.1.2 Stuw fee -_ 59.7 106.0 335.4 396.0 436.06.2 EW rtduC. 2M.2 378.0 416.4 441.0 450.07. ote t_ 9.0 10.0 10.9 8.0 8.07.2 SEw trnS 9.0 10.0 10.9 8.0 8.0
IV. NM== pl 257.2 267.8 393.8 237.4 488.1
V. G:a=B 13.7 67.8 22.6 61.0 120.0
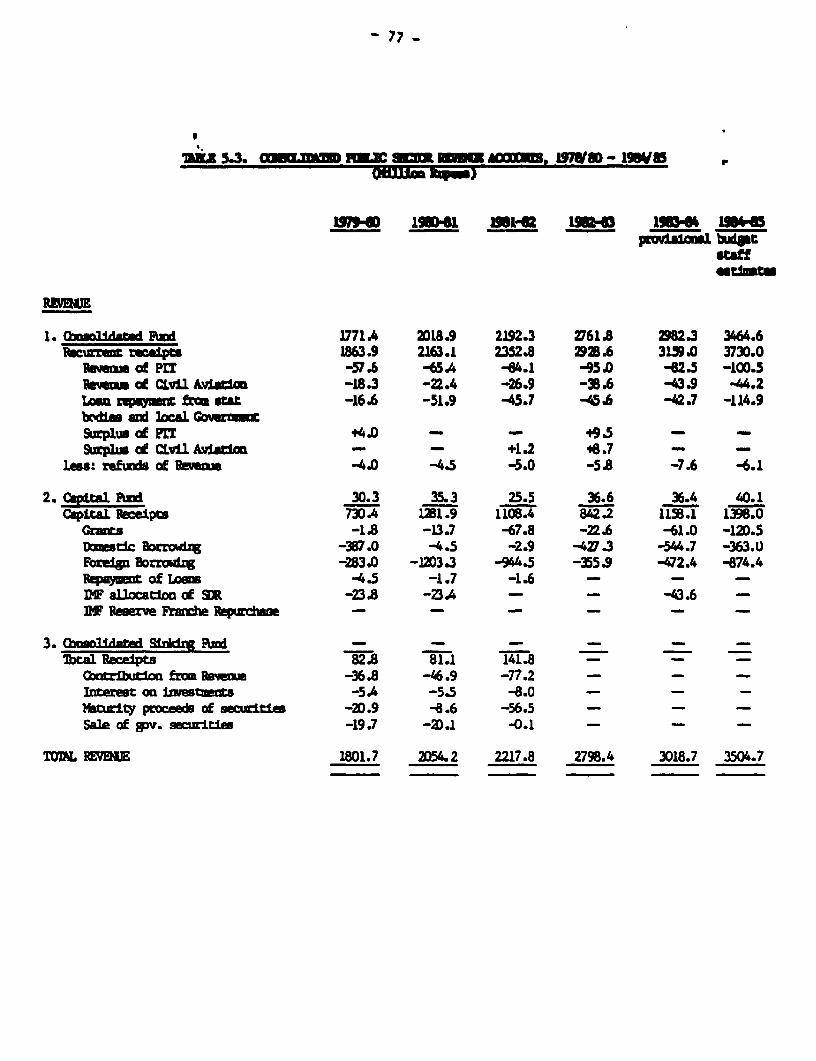
-7 -
'333 5.3 ~ in JC . W7D8 - 1985
51p4O 1UM41 1 1- 19U 19P4 191S.6- b
staffatiast.
R~DE
1. r-FoLldatad Pmu 1771 A 2018.9 2192.3 2761.8 2982.3 46.6lacurwmt mCe1pC 1863.9 2163.1 23528 293.6 3159.0 3730.0
PE _me of PET -57.6 45 A -04.1 -5.0 -82.5 -100.5Ra of CLAviact -18.3 -22.4 -26.9 -38.6 -43.9 -44.2
oan rqmyp fra stat -16.6 -51.9 -45.7 -45.6 -42.7 -114.9bodUms ad local Qwi Supl1u Of PrT 44.0 - - 49.5 -iplzs of Civil vladnm - - +1.2 48.7 - -
le: refums of 1u_m* -4.0 -4.5 -5.0 -58 -7.6 -6.1
2. C 1tai 30.3 30.3 35.3 25.5 36.6 36.4 40.1Capital laceipts 730.4 12S1.9 1108.4 842.2 1158.1 1398.0
Grants -1.8 -13.7 -67.8 -22.6 61.0 -120.5Dltic 8 0orrowi -387.0 -4.5 -2.9 -47.3 -544.7 -363.UFoze-lg Borromex -283.0 -1203.3 -94.5 -35539 -472.4 -874.4RApwym.tof Loom -4.5 -1.7 -1.6 - - -
M llocti of SOR -23.8 -ZA - - -43.6 -
DV PueeR,e FRzhe ichurDu - - - - - -
3. O1xludated S1kzg Fu - - - - -
Dtal Receipts 82.8 81.1 141.8 - - -
0,nhIbut1on frz bAN -36.8 -L46.9 -77.2 - - -
ntemt on imuests -5.4 -5.5 -8.0 - - -
Maturity procees of securities -vD.9 -8.6 f-565 - -
Saeaof gv. suriti -19.7 -).1 -0.1 - - -
TtllL REVEN1E 1801.7 2054.2 2217.8 2798.4 3018.7 3504.7
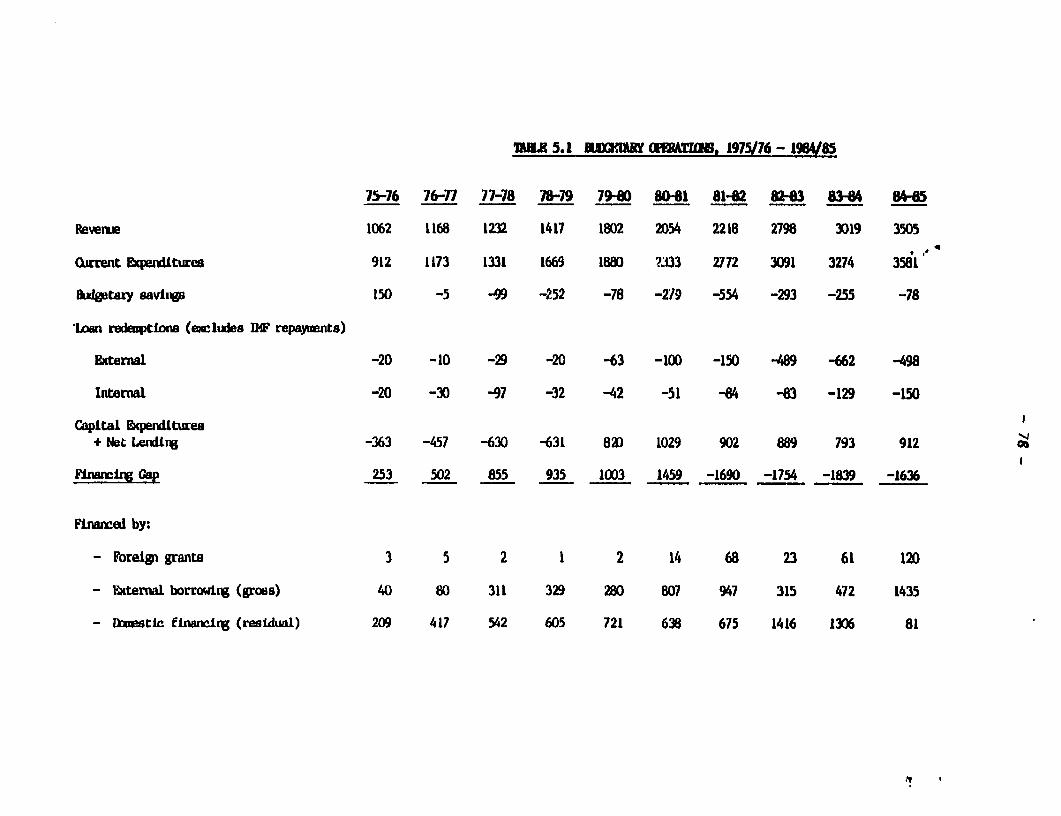
S 5.1 M1Ui (BSATID, 1975/76 - L%485
75-76 76-7_ 77-78 78-79 79-0 80-81 81-2 3 83-84 8
Revenue 1062 1168 1232 1417 1802 2054 2218 2798 3019 3505
0rrent pwnUtures 912 1173 1331 1669 1e0 ?:33 2772 3091 3274 358l
&4getary savi1i 150 -5 -99 -252 -78 -2/9 -554 -293 -255 -78
'lon redemtlons (ecludes IW repaymnts)
External -20 -10 -29 -20 -63 -100 -150 -489 -662 -498
Internal -20 -30 -97 -32 -42 -51 -84 -83 -129 -150
Capital F(pendltures+ Net LRndiig -363 -457 -630 -631 83) 1029 902 889 793 912
Financtng Gap 253 502 855 935 1003 1459 -1690 -1754 -1839 -1636
Financal by:
- Fore1gi grants 3 5 2 1 2 14 68 23 61 120
- Rxternal borrowiln (groes) 40 80 311 329 280 807 947 315 472 1435
- Ibjetic financirg (residual) 209 417 542 605 721 638 675 1416 1306 81

noU 5.5: nmrMQ'%A Cm~FWTG
Cw D ra m FU&EIM 1L979/80-- 19W81
1979-0 190-1 1961-62 19- 193- 19 5
1. Gerral Public Services 332.6 430.2 511.8 524.2 580.0 635.2
2. Defense 17.7 20.9 27.4 30.7 33.3 34,4
3. FAxati nn 343.8 411.3 460.8 532.9 536.8 557.1
4. Health 187.8 219.5 244.8 271.2 282.5 308.4
5, Social Security & Welfare 273.8 316.9 372.0 450.4 506.3 547.9
6. Iousirg and other CamLiity Amnitim 18.1 9.7 19.2 20.4 20.6 22.3
7. Other C mlmaty aid Social 16.3 17.9 18.2 20.2 21.5 25.9
8. Fcomalc Services8.1 Ceneral administration... 13.9 12.5 17.5 21.8 26.8 36.98.2 Agrlc. for fish 78.0 86.9 74.0 96.3 123.3 122.88.3 Min. mm. constr. - - 5.5 - - -8.4 Elec. gas, steam, water 12.1 21.6 12.6 - - -8.5 Roads 7.3 7.5 6.9 6.9 9.0 11.08.6 WI3terways 2.7 3.3 - 1.1 1.0 1.48.7 Other transports com kunications 1.9 2.3 3.5 3.6 3.9 4..B Oliwr econ. services 6.1 5.3 6.6 6.8 16.4 15.0
9.0 Otxr PurposesPublic debt interests 343.1 462.0 642.2 773.4 858.7 1024.3Local authoritles 94.4 101.9 119.4 141.3 143.5 154.8Suba, on rice and flowr 130.0 203.0 230.0 190.0 110.0 80.0
Tbtal Expendittwm 1879.6 2332.7 2772.4 3091.2 3273.6 3581.5

- 80 -
1E 5.6 PHJC ST -IIFA F93I0EIL ACMMNS
79-80 80-8 81-2 82-83 8&3-8 (estlute)
Persoml Ieh 159 182 216 248 262 253(bporate tal 118 181 163 147 162 165
am to N ¢ticoal. Pi Fund 91 113 127 143 156 172es an CapItAl T xa o 78 88 85 94 94 103
SalTs - - - 83 206 210
OVIPr tan d admetic gxxd aid servc 319 375 423 464 467 494iort 636 704 685 985 149 1326Ebwot t. 287 268 378 416 441 450Total m e 1688 1911 2077 2580 2937 31891txa~ treger (1) 2V2 238 276 324 254 424Th1l Gov 1eemt 1910 2149 2353 2904. 3191 3613
897 1044 1215 132 1428 1521W-e ai salari 248 318 339 379 426 466Goods ad Sexvices 326 .34 600 714 779 929Int Paymets 416 534 632 644 616 636Sidi ad (2) 1887 233J 2786 3065 3249 3552
Qzreit Account +23 -181 -433 -161 -58 461
Ch flwr of PRubc 3ierjx sEs (1) (2) 57 73 90 141 L1B 247Fa;lgn Dbt nrtIzachx (3) -63 -100 -150 -489 -662 -628Capita]L ediures -835 -1114 -1077 -1011 -891 -1429
FLumcia Gop -818 -1322 -1570 -1520 -1453 -1749Elnmzcd by-.
- 2 14 68 23 61 20- (fss foe4g borroilg 280 807 947 315 472 1510- NiCt dtic fimrKcg 536 501 555 1182 921 119
(1) Net m interest and divBinxl paid by publl enerprise to Qbvert.(2) rtt of rfr frs gverin to public ei=erprises.(3) Ew=l,e IMF ream, s(4) Dbes not Izw1h si1o ars I .
S : MEm Staff esdtne

- 81 -
DUE 5J.1
0W3111a mM )
peraUrg Surpli GE ) - Cqital Ffr.x1xtE!=z1se (Cook bmlds) or Datd.idM FzrdLtue
(-)
AgIcuJ±ural lurIierIrg td (1) -3.0 40.2 +3.2
Caitral EetCicrLty Bzd (1) +51.8 63.0 +11.2
Cea1 h&Ri!rg Actlrity +7.5 46.2 48.1 +34.4
Ce,traL Water AutiDrity -27.6 +11.0 65.7 -e2.3
Dvlpe ok x atl +11.8 40.2 0.5 +11.5
M=lgatiou AUtbty -0.7 - 4.3 +5.0
'A sE Bami libr p. +1.5 +2.9 1.7 -2J7
MmitL= Malm tiximEty +21.8 - 21.8 0.0
MzBitLzs Met AxDrty -0.1 - 40.1
5azitLus Ssar ibm. Corp. - - 110.3 +110.3
Nt1otl Tramport Gorprat:o, (2)
Tea I elopmnt A±h,rity -27.7 2.3 i30.0
Nwelle Fraxe Tea Estate -0.5 - - 40.5
Post Telegrah Tphce +21.0 -4.0 17.0
CaVlAviatlon +4.2 +3.3 7.5
TL +460.0 +19.6 342.4 +252.8
(1) Flg'z far AI'1tiKHa1 l ig } oacd and Git1 Eic±ty Bond am interj1ated frizactals booed ane al yew.
(2) NbD Weratl% at tiat thin.
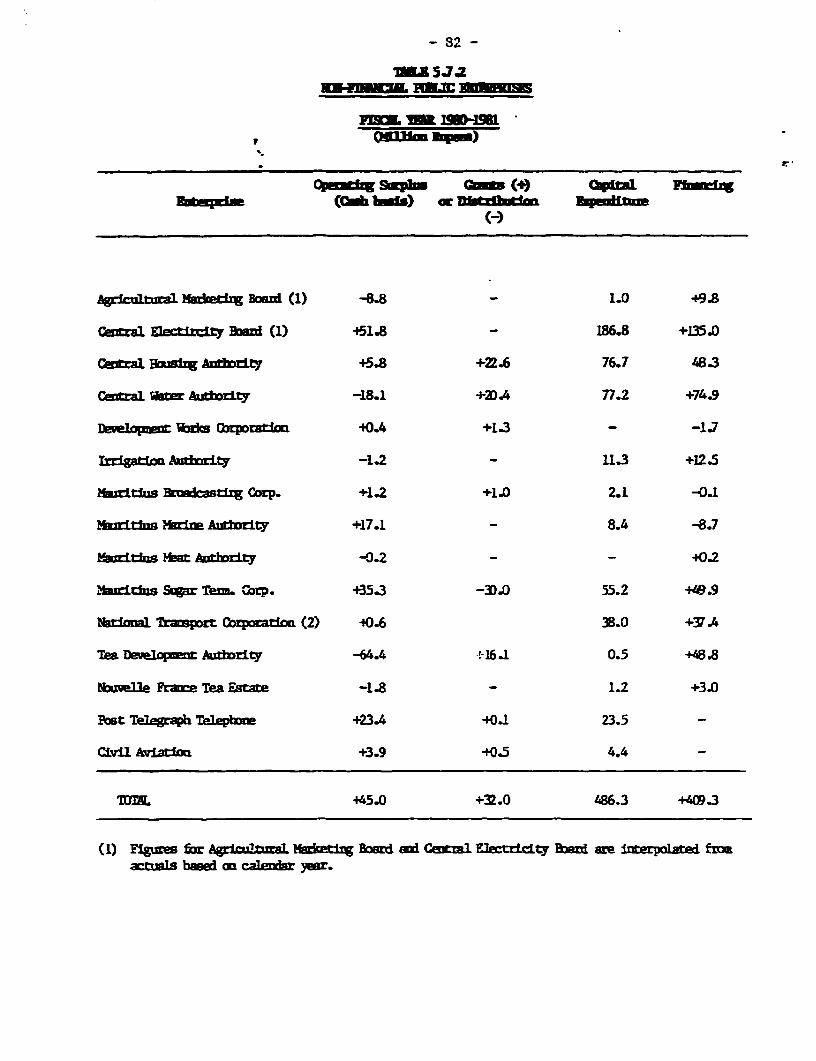
- 82 -
-aom (Emh admE) cc fm
t )~~~~~~~~~-
Agricultizal Y(ewitP4 g Board (1) -8.8 1.0 49.8
Cenra Bausii Autdioity +5.8 +22.6 76.7 48.3
Ceatal aaAudctty -18.1 +2D A 77.2 +74.9
1 Fvelpi2r Works Cbrporatkm 40.4 +1.3 - -1.7
frrIalia Autddorty -1.2 11.3 +12.5
?kwcitins akmastiz_ corp. +1.2 +1.0 2. -0.1
Nm=zitbjsM Loe Autbority +17.1 8.4 -8.7
MMCt[US MMs LatnDuty -0.2 - 40O.2
MmwiCtus Smear Temn. COup. 435.3 -3D.0 55.2 -.49.9
Nlatimul Tramport (bxporatiom (2) 40.6 38.0 +37 A
Tea I eweoment AUtiDrity --64.4 1-~16 .1 0.5 +4a8.8
Nome.U1e France Tea Estate -1.8 1.2 +3.0
Rat Telegraph Telephxe +23.4 40.1 23.5 -
Qvil Aviatloc +3.9 ( 0.5 4.4
TOM 445.0 +.0 486.33
(1) Figur fa Agiculturat Mketizg Board and Ceml Mectidty Boezd are ir+erpolated fromatu]Ws base on cal +3-r-
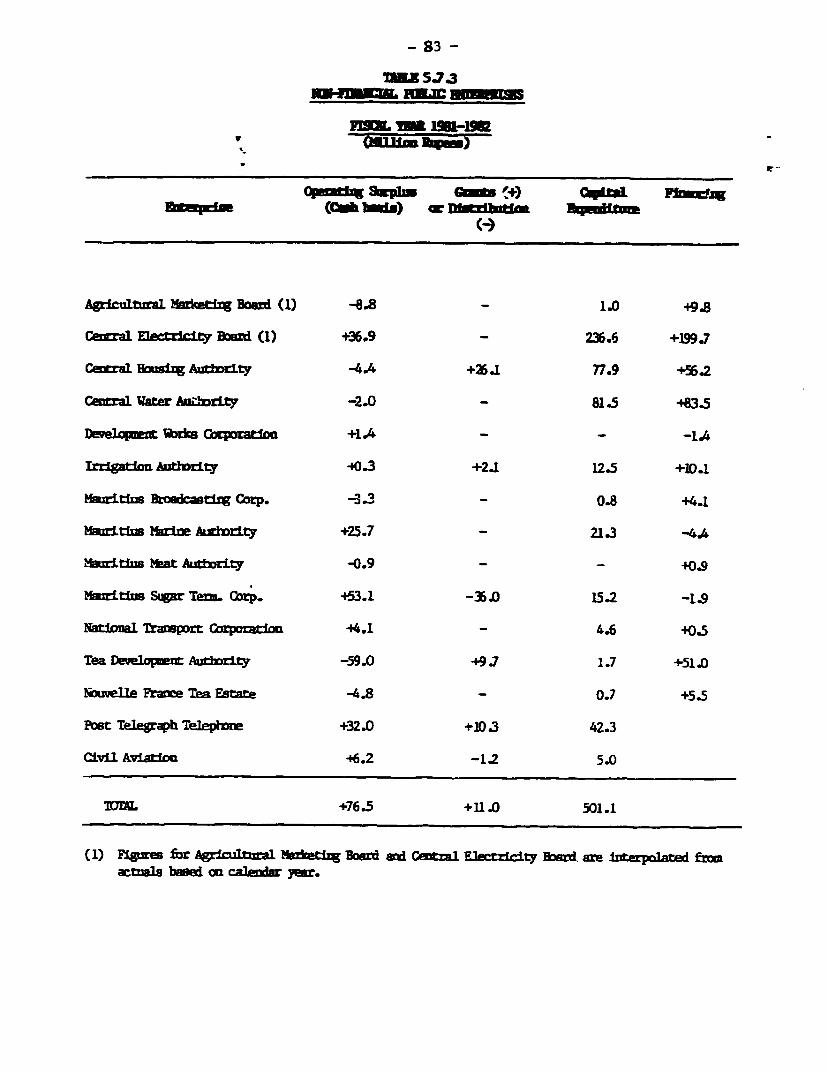
- 83 -
fM3 5.73-M E HE= C
- mdanw (C' bind) or INSUON ..(e)
AgicuLtu!aI. M.iIctiz Board (1) -6.8 1.0 49.8
Central Mctricity Bzd (1) +36.9 236.6 +199.7
Central u±zMAucDrity -4.4 +1 77.9 +6.2
Cencral Water AiiDrity -2.0 81.5 483.5
Developmet Wo)Ek CtporatiLL +1.4 - -1.4
Irr4iton. Authrity 40.3 +2.1 12.5 +10.1
KfariS ts ow tirg COEp. -3.3 - 0.8 +4.1
Mq.tz Mas ine AutLority +25.7 21.3 -4.4
MaTrit's M4.at Autodrty -0.9 - +0.9
Maritli S&gar Tem. Corp. 453.1 -36.0 15.2 -1.9
NatlmaL Trazuprt Corpoatim 4.1 - 4.6 +0.5
Tea leLopmet Authority -59.0 -4-97 1.7 +51.0
Fouvelle Fre Tea Este -4.8 - 0.7 +5.5
Post Telepaph Telepho +32.0 +10.3 42.3
CiLvl Aviatlon 46.2 -1.2 5.0
TOM +76.5 +U.0 501.1
(1) Figur for ApicUtaL YetiVg Boad and CezaI Electicity v me i4terpolte fomactuals based an ca3enr yr.

- 84 -
UES5JA
EML IZ
9 oimm~~sph - m at
(Cob bob) c (e _
AgrlIeutitkg Bond (1) -19.8 +13.5 1.3 +7.6
Cearal Eectistity Bmad (1) -460.7 +10 6 279.8 +X8.5
G1tnJ. fus1i Autki± ty (3) -7.2 - 44.0 +51.2
Central Water Authwity (3) n.a. 76.2 +76.2
De el.opt Works (bCrporatio -7.7 48A .5 -0.2
motionAuthrity (3) -6.0 10.6 +16.6
Hmzritius ku~Icast1zg Corp. -7.3 +2k 1.2 +5.9
M.z' tll 14mzm Authsrity +29.1 - 14.8 -14.3
L -i Ciz Meat Azdwrity -1.3 - +1.3
Huwithus supr Tn- Corp. 462.1 -45.0 3.7 -13.4
Natlonal Tr art Corporatim *9.6 - 3., -6.1
Tea Develoenent AuDriDty -62.3 +6.5 1.6 +57.4
NIriele f le; Tea Estate (na.) -
Post Te.egaph Telepbon 441.4 -9.5 31.9
CiviL Aviation +16.0 -8.7 7.3 -
mm +107.3 -21.6 476.4 +390.7
(1) FigPY for 7gricu1tuzl3 mmrketizg Bou ad Caetml Ectricity Board are interpolated fxmatum& beasx m cale r w.
(3) Capita] fpe i figure trtly in gDVernt t hbg

- 85 -MZ 5J.5
-L
(Cz beds) or
Agz¢icultiwaI N,etlrg Board (1)(2) -20.0 +15.0 1.5 46.5
Central Elscfrvity Board (1) 461.1 +38 +169.0 44.1
Central aEm1g Audirity (2) (3) -10.0 - 25.0 +30
Cencral Water AutDrity (3) n. 57.6 +57.6
lopelnc Ubzs Corporation (2) -15.0 +5.0 57.6 +10.0
-Ar:l Atbrit (3) (2V . 6.0 - 7.0 +13.0
Mazritim koaast±g Corp. (2) -7.0 +2.5 1.2 +5.7
Mazitius Maim Autblrity +24.6 - 24.3 -. 3
Kairitiu mat A utdrity -2.2 -- +2.2
MaiwLCiu SuarTMmL Carp. (2) +70.0 -45.0 44. -21.0
Nartial Trnsporr oorporacnti 46.8 - 24.8 +18.0
Tea 1De1opu2zt AudDrity -16.9 +4.1 5.0 +17.8
Nbm1]a FramSe Tea Estate (na.)
Pkst Telgraph Teapbio +30.2 +6.2 36.4 -
Civil Aviatim +21.7 +2.3 50.0 -
TUOL +157.3 +19.9 405.8 +
(1) Figum for AgricUtDal Mzketirg Board and Cacral Eletridcty Board ce iterpcla f.wtuu]s bainal m calr plr.
(2) estited
(3) Caital exem figure parly in grwrmt budgt
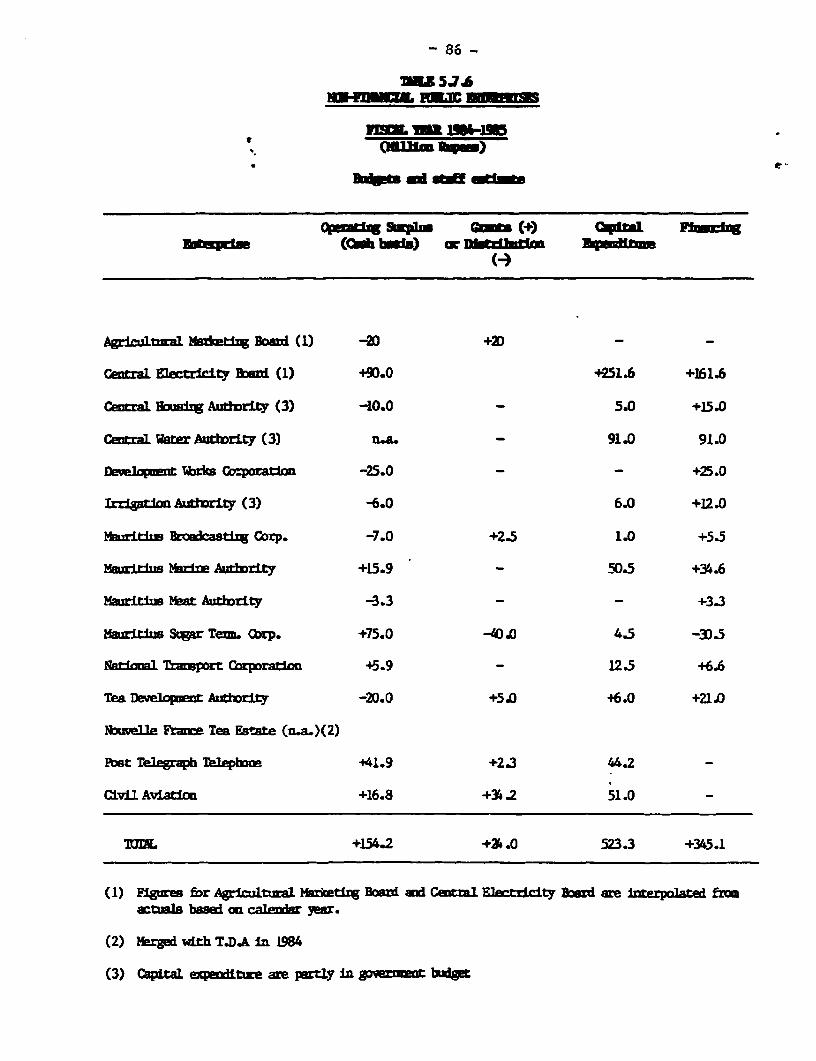
- 8s -
DU 5 J
Bobwpd09 (Cw bd) orqahrl =;
uE PtlMiarktbg &mud ( 1) m 2 2
Cental E3etricity B11x (1) +F90.0 +251.6 | 161-6
Cnral Hosk Audmrity t3) -10.0 -5.0 *F15.0
Cetal WatrAuhority (3) no& - 91.0 91.0
110Plat Wod -Swatlm -25.0 - +25 .0
Triaion Auority (3) -6.0 6.0 +12.0
MOurai,tiU &OadCSt CDrp. -7.0 +2.5 1.0 + 5.5
;qwtrit< DeAXl. .-9-i5 +34.6
Mrlauritisma &dri -3.3 - + i3-3
;arii S*pr Tem Corp. +75.0 40Mz0 4.5 -3D5
Natiel }rmgrt t}mrpatLn 4.9 - 12.5 +6.6
Tea Dmedqnit ALt rity -20.0 +5-0 -6.0 +210
Nouvelle Fraime Tea EstatE (ra.)(2)
PostTelegraph TepO -41.9 +2.3 44.2
Civil Avlata 1 +16.8 +342 5.0)
MXUL +154.2 +;g*0 523.3 +345.1
(1) Elgu r Agricultl M(1t)0g B n ri16 Bord are In6oat fmaactul bus an cal geAr
(2) 1re wLh TD.A in 1984
CaztalW erAcrty (3) .la -y91091 b.0
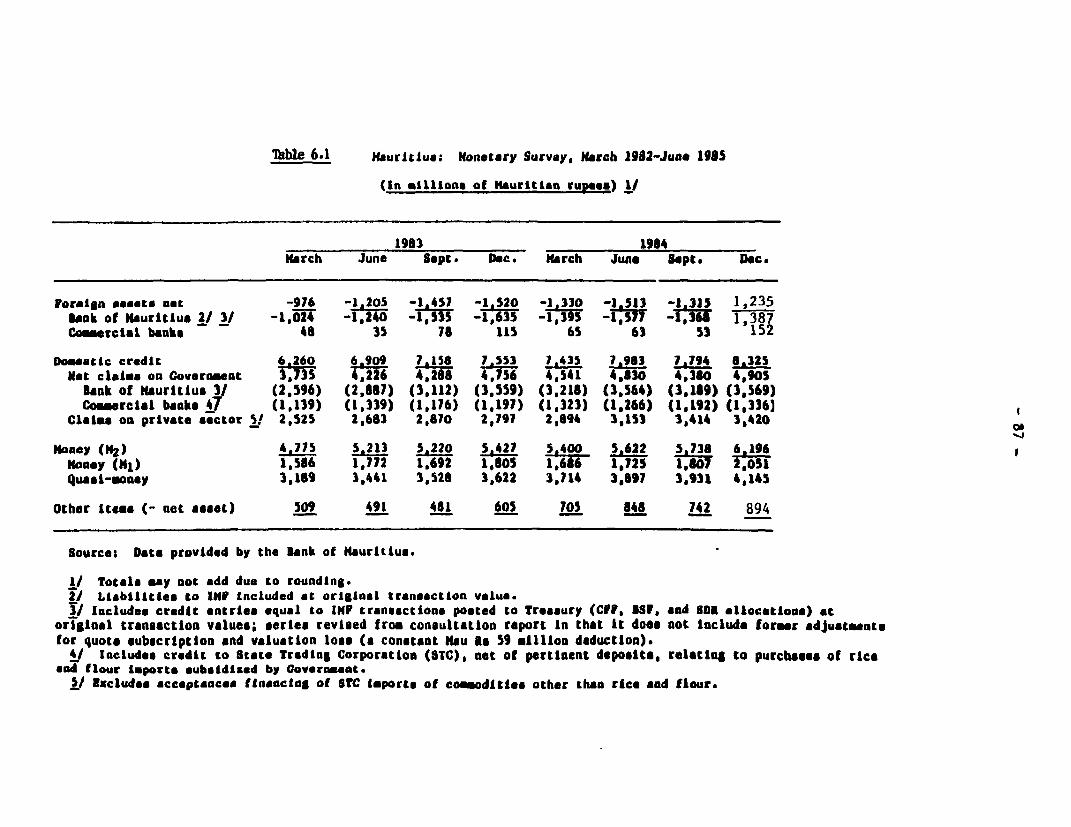
ThaI 6.1 hauritlus: Monetary Survey, Merch 1982-June 1985
(in millions of Hauritian ruuple) 1/
1983 1934March June Sept. Dec. March June Sept. Dec.
Voralin *assts not -976 -1,20S -1,A57 -1520 -1 330 -15.13 -1 315 1,235Baok of Mauritius 2/ 3/ -1,024 -1,240 -1,535 -1,635 -1,9 -1,577 -T1IU 1,387Co ercial beaks 48 35 78 11S 65 63 53 152
Domestic credit 6.260 6.909 7.15a 6 ss3 1435 93 7.794 6.325met claim an Goverment 3,73S 4,226 4,288 4,756 4,S41 4,830 4,380 4,905
Dank of Kauritius 3/ (2,596) (2,887) (3,112) (3,S59) (3,218) (3,564) (3,189) (3,569)Comerciel banks i7 (1.139) (1,339) (1,176) (1,191) (1,323) (1.266) (1,192) (1,336)
ClaiaJ on prlvate sector S! 2,525 2,683 2,670 2,797 2,694 3,153 3,414 3,420-jHoaey (H2 ) 4577, 5 213 5.220 8.421 S,400 5L622 5 738 6.196
Haney (Mj) 1,566 1.772 1.692 1,805 1,686 1,725 2,051quasi-money 3,189 3,441 3,528 3,622 3,714 3,897 3,931 4,145
Other Iteas (- net aseot) 509 491 481 605 705 848 742 894
Sources Data provided by the Bank of Hauritius.
1/ Totals may oat add due to rounding.2/ Liabilities to IMF Lncluded at original transection value.3/ Includes credit entries equal to IF transactions posted to Treasury (Cl?, USF, and SDR allocatioan) at
original transaction values; eeries reviled from consultation report In that it does not Include former adjustweatofor quote eubicription and valuation loss (a constant Hsu as 59 million deduction).
4/ lncludes credit to State Trading Corporation (STC), not of pertlaent depolts, relating to purchases of riceagd flour imports submidimed by Governmsat.St *xcludes acceptancee finnacing of STC imports of coeo dities other than rice and flour.
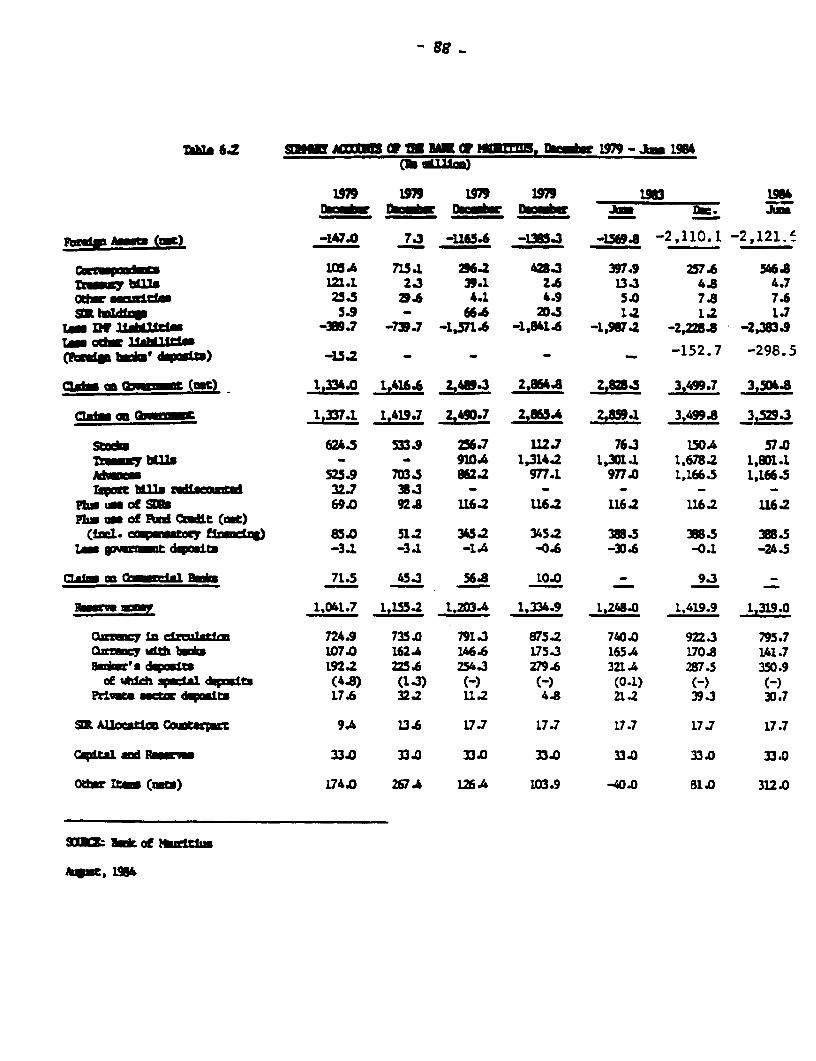
- es _
Tdaml 6.Z SH AU W =MMEC MUN I=, DN 1979 - Jk 1984
197 197 19 179 1983 1964- D_ D _ ziDi.
Fo_" AM (MO -147.0 7.3 -11W. -U3 -L-M. -2,110.1 -2,121.t
_ _ IO1A 715.1 36.2 428.3 397.9 257.6 546.8?.NwybfNl 121.1 2.3 39.1 2.6 133 4.8 4.7Otwur sm. 25.5 29.6 4.1 4.9 5.0 7.8 7.6
S t 5.9 - 66.6 205 1.2 1.2 1.7T 1, ilabi.Ulm -389.7 -73-.7 -1,571.6 -1,841A -L,92 -2,2.8 -2,383.9
TMt n -152 - - - _ -152.7 -298.5
CLdw m _ (tNt) 1,334.0 1,416.6 2,48.3 2,8644 2,8.5 3,499.7 3,504.8
______an _x__ __ 1,337.1 1,419.7 2,48.7 2,86A 2,9.1 3,4998 3,52.3
62A.5 533. 256.7 112.7 763 150A 57.0Tu bIll - - 910A 1,314.2 1,3014 1,678.2 1,01.l,.,,. 525.9 7033 862.2 977.1 977.0 1,166.5 1,166.5,tau W an in - 32.7 383 _ - - -
h u of gm 69.0 92.8 1U62 U62 116. 2 116 .2 116.2Phs um of SWd lui1t (as)
(!n.1. cwamuoty f1u) 85.0 51.2 345.2 345.2 388.5 m3.5 388.5l_ pait d±t -34 -3.1 -IA 0.6 -30.6 -0.1 -24.5
*ai n1a1 71.5 45.3 56.8 10.0 - 9.3
FAMm 1,041L.7 1,05.2 1,203.4 1,334.9 1,246.0 1,419.9 L,31s9.0
amuEyl indngtm 724.9 735.0 7913 875.2 740.0 922.3 795.70mramL7 wM bmake 107.0 162A 146.6 1753 165U4 170.8 141.J1aRr'sde n 192.2 225.6 254.3 279.6 321 4 2B7.5 350.9
Of id& Sa1 dop=.±tg (4.8) (13) (-) ( -) (O1L) C-) ( -)Pri vatc dq 17.6 32.2 112 4.8 Z1.2 39.3 30.7
9S |AUoca1Cetic 9.4 13.6 17.7 17.7 L7.7 17.7 17.7
Cqa1f- !md P _me 33.0 33.0 3.0 33.0 33.0 3.0 330
O0u 1t (tm) 174.0 267.4 126 103.9 -40.0 81.0 312.0
C Of mbw1X1s
**,. L19
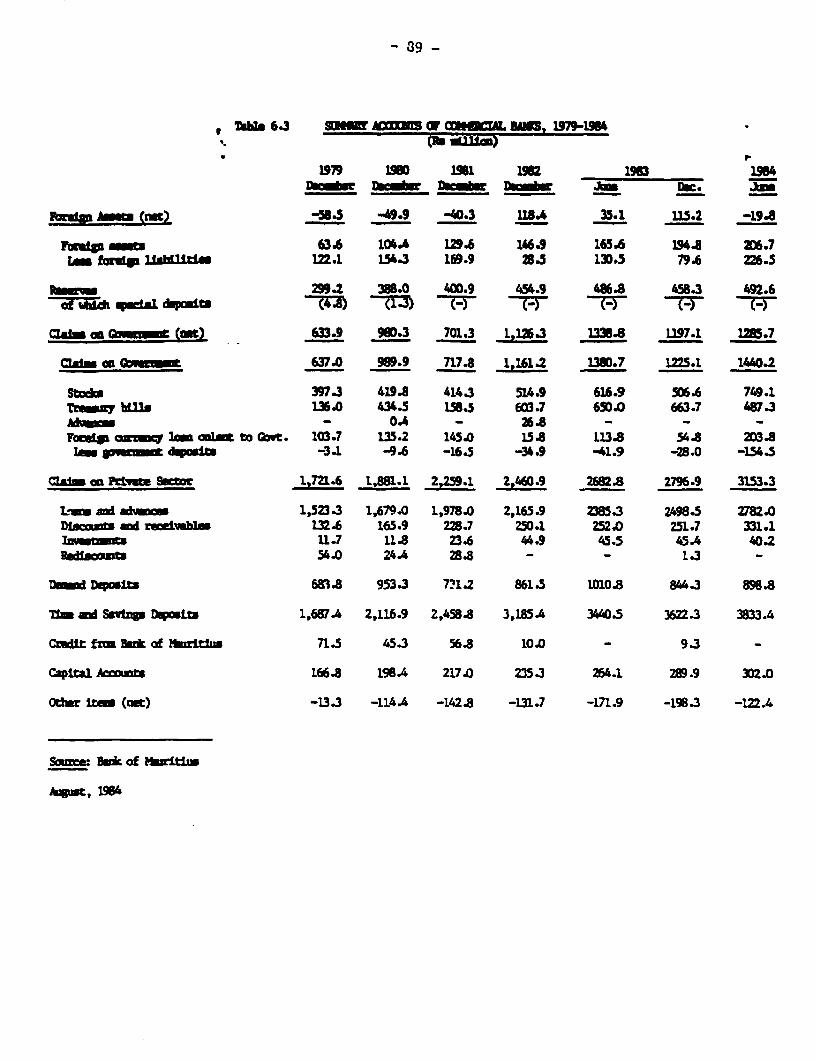
- 39 -
, b1a 6. M UO MDJCL BAn, 1979-1984
1979 1960 1981 1962 1963 19U'DocEdD -Kb IS6o smw i Dec. im
Fa _dip )ANto -56.5 (49.9 -40.3 118. 35.1 115.2 -19.8
FoSso ants 63.6 104A 129.6 14.9 165.6 194.8 67T, f . Ilt _ 122.1 154.3 169.9 3.5 130.5 79.6 226.5
pa.u -- 299.2 388.0 400.9 454.9 486.8 458.3 492.6of wbI& d-p' mita ( -3) -m -3 -
raj am m (00t) 633.9 980.3 701.3 1,126.3 133.8 97.1 12.7
Cd en O 637.0 989.9 717.8 1,161.2 1380.7 1225.1 1440.2
Stodu 397.3 419.8 414.3 514.9 616.9 506.6 749.1TrommuLbi2.u 136.0 434.5 1585 603.7 650.0 663J 487.3A _ OA- 0 - 26.8 - - -Focetgl _ wm Im m t t tvt. 103.7 1 35.2 145.0 15.8 113.8 54.8 203.8I_m p- dpat -3.1 -9.6 -16.5 -34.9 -41.9 -2B.0 -lS4 S
::1 a Pdrte 9mtg 1 1,881.1 2,259.1 2,460.9 2682.8 2796.9 3153.3
Lwm -ad ad 1,5233 1,679.0 1,978.0 2,165.9 23853 2498.5 2782.0DLwzmita ad r1 emb1 132.6 165.9 228.7 250.1 252.0 251.7 331.1
-nvesume U.7 11.8 23.6 44.9 45.5 45.4 40.2Phd1 wtu 54.0 24.4 28.8 - - 1,3 -
aDwm Dhts 6a.8 9533 7'1.2 861.5 1010.8 844.3 898.8
- ad SovInp DW*Lta 1,687.4 2,16.9 2,458.8 3,185. 3440.5 36223 3833.4
Cralt f hk of laul±in 71.5 453 56.8 10.0 - 93 -
Capitul kam 166.8 1984 217.0 235.3 264.1 289.9 302.0
Otler It (o ) -133 -1144 -142.8 -331.7 -171.9 -1983 -122.
smz_e Iw of Dmrtidz
b, 1984
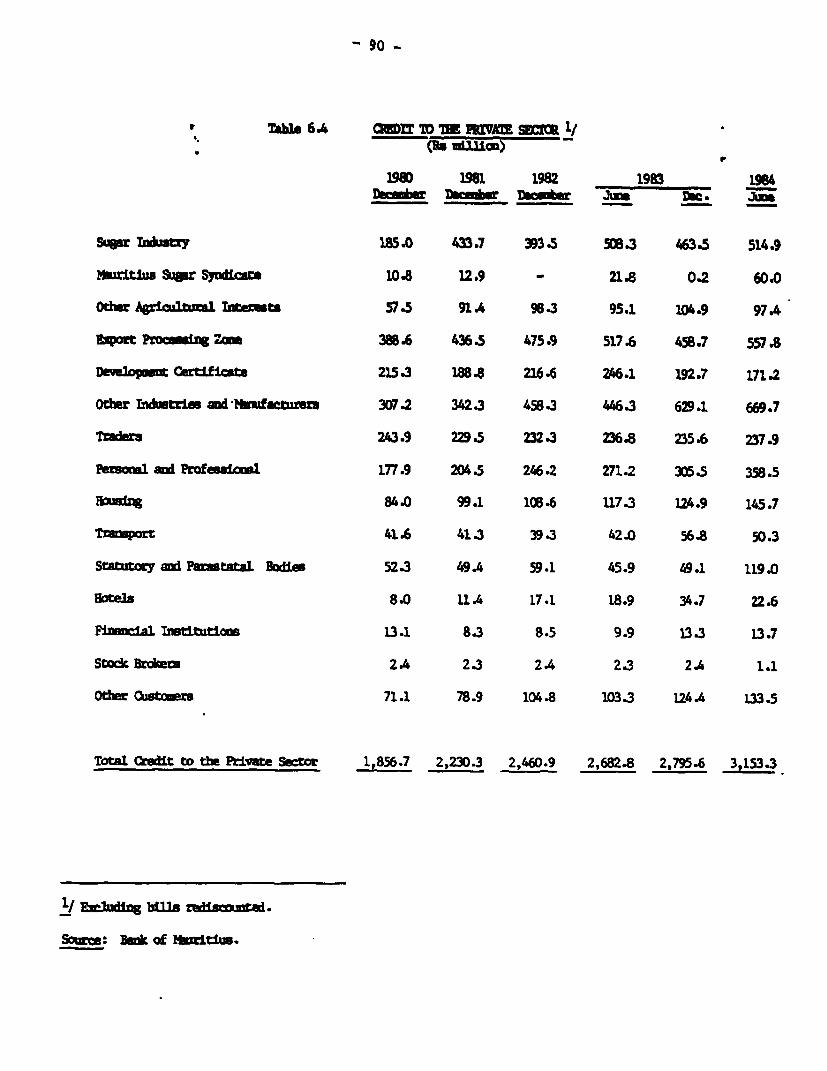
- 0-
Table 6.4 A5DSTO PRIYAM Si 1M I(Re W=a1ni
198D 1981 1982 1983 1964Doebur i mcnmr J * Jim
SIpr Tn"U7 185.0 433.7 393.5 58.3 463.5 514.9
MLtlu 9r Syndicste 10.8 12.9 - 21.8 0.2 60.0
OthrApkaltxal Inteits 57.5 91.4 96.3 95.1 104.9 97.4
bpo!t Proiflgme 388.6 436.5 475.9 517.6 458.7 557.8
v l CArtIfate 215.3 18 .8 216.6 246.1 192.7 171.2
Ofiur T rRi and 307.2 342.3 458.3 446.3 629.1 669.7
pUders 243.9 229.5 232.3 236.8 235.6 237.9
Pemml anl Profesain 177.9 204.5 246.2 271.2 305.5 358.5
FMSing 864.0 99.1 108.6 117.3 124.9 145.7
TMiuport 41.6 41 3 39.3 42.0 56.8 50.3
S1utory ParauttataJ Bodi 52.3 49.4 59.1 45.9 49.1 119.0
Hotels 8.0 11 17.1 18.9 34.7 22.6
Flrndal Intiturlam 13.1 83 8.5 9.9 133 13.J
Stock Brz 2A.4 2.3 2.4 2.3 24 1.1
Otber Custamra 71.1 78.9 104.8 103.3 1244 L33.5
Total Ceeit to the Private Sector 1p856.7 2,230.3 2,460.9 2,682.8 2,795.6 3,153.3
1/ ftS1z,H bills ze&Lscmmrm.
Some: BlKk of MxltSLu.

- 91 -
(VW qaPM6.a
_bi AM Aw Jun JlAn_A1976 1979 110 111 IU 1S3 1984
1. EUW
IN*.. ... ... . . . 0940 9M 10.10 W 1240 um. uLum(U) bdam "4u ... ... ... ... 9.3 9.7 IOJn 10-75 U.D3 U.23 11.15
2. C_dal a(1) Wm Pi~ ... .. . ... ... 10.00 12 1.7UJ 140 14.0 14. 1z.CI) f, Iam I. ... ... ... - 10.25 10.2 11.2 11.25 .2.75 2.7S 11.75
CUt) Cf commalWA we ... ... - 104 023 12.0 UJ0 14.0 14.0 1200(1') C da. NM
(qyiimhIa D colm m d mua bA*M) ... ... ... ... 1a.0 16. 1750 17 J0 x 19.0 L7.D
(v) Wu he kaag hpinm
(lie Putab go Iia din 12 End Edno m d_ 24 wW) ........... ... 1...Il0 L3w 14.73 I4*J5 x x x
Cb) t1(fe Ada M WAO 24 Mi) UAO 14. 13.50 1.S5 z x x
(VI) lem. ad Pnidamill and 11 a_uh ioo l 100 1tZAO 1550 15 .0 x 8. 17.
a. tth 03md OCUolL bw "(I) cm LA .....tmu) ... ... ... 700 Om 9.0 9.0 11.M 14.00 12u
(Li) aidt him. Cac. *od--im ... ... ... L2.00 L6.0 17.0 17.50 17.50 16.0 1530CLU) ,mu a o ... ... ... ... U=Q 14. zo 14.0 m0 1540 L5.0D 14.50(IV) Hbankssoda-l" ... ... ... ... 10.25 10.25 12.0 LA 15.50 L.50 14.50
u(1. n (1)
1. Swiw .... ... ... ... ... ... 6.50 7.50 9g 9+ 9 9 8.50
2. Find Duuita(i) i 3 md... ... ... ... ... 6.75 7.75 9.5 91. 9.2 9.5 9.5
(U) upm*1zU ads up co ... 7.0 8.00 9.50 9.50 9.50 930 9.5(U1) -m 6 xu ad wp t 2 u ... 7.50 8.50 10.mlom 1o. 100 I= 10.(IV) &1 2 E1 d si to8o 8.30 9m 10.0 la 10.50 '.0 10.50 10.50(v) b.uq l8 I d u 2. Oa ... 9.50 9.75 112 11.25 1L. II 11. .2 41.5
(vi) oW 24 -m ad to 36 -u ... 10.25 10.50 12. o 12. 12.00 1m2. 12.(VII) ba's36 s n d uD h8 ... 11 0 x x x x x K
(vUA) OM04 8 Mods ... ... ... ... ... I x x x K x x
M.
1. Neada(1) Up to #A. 6,00 ) ... ... *= 3 11. . 16.00 16.00 1b.00 16.00 L6.-O
(U) Ovwr Mm. 6,000 (t_.) ... ... ... 9.00 11.00 14.00 14.00 14.00 L4.00 14.00
2. m fft S (1) nd la 35.0.. ... ... ... 9.0D 10.50 12-14 12-14 12-14 12-14 12-14
(U) oWr PA. 35.0. ... ... ... 10.00 12. 14.0 4. 14.00 L4.0 14.00
U. C ft 2s Cttos i 79m.
a W1-%l to .LI1 11gM. for NdisC. at te eW of ,HmwUA.
-,pIlmbl. to ut 9,witalz g tam Ed waLi pt 1iPu I - like
Ver ALtm- et Ed 'qab1* PInam. to .dim _ r e.. adIadmLAiV umrml hluidf' a kveIn mat Ca .flmbo Ed to 1mwrt.
- ppSmbla to bmsan me1 GA ad bke,!Ai ftm du ON& of 1urgtdn.
xM ma flEd.
now tepm .Ned am dq'mi aM SlLfa (Lra.L *m amnl) rat - fm4- 1, 1979.
5=: Om* rf mtoi
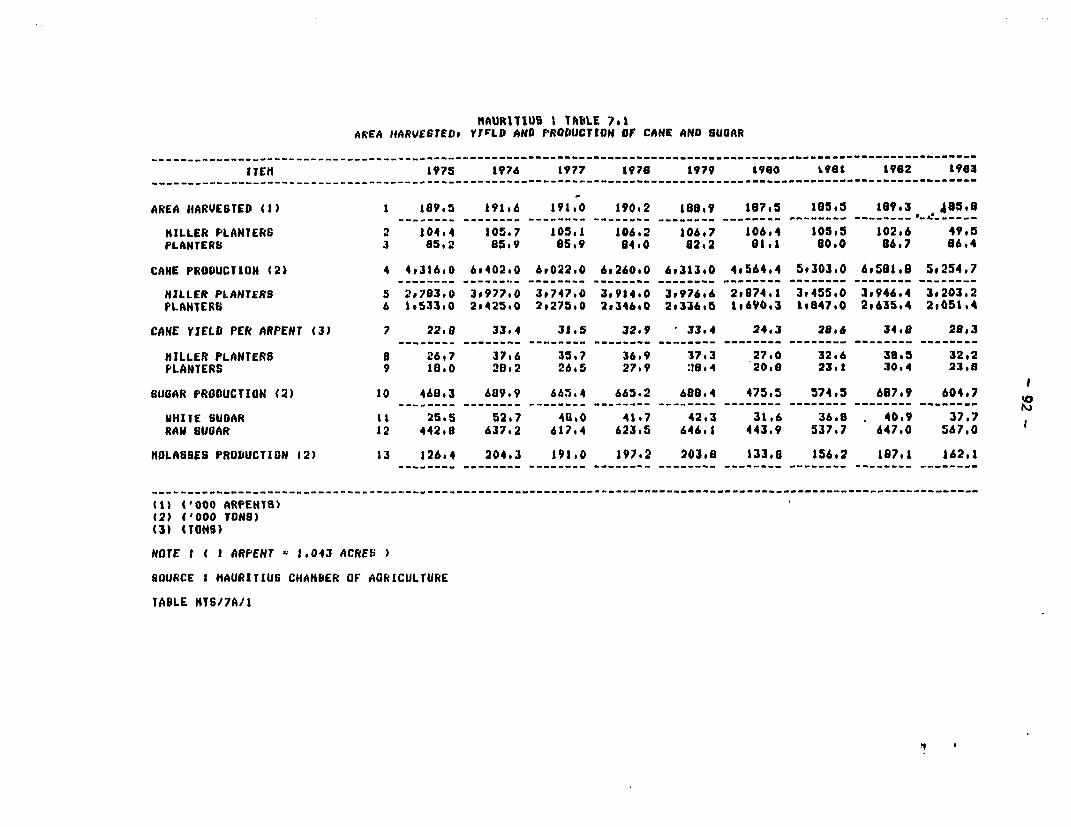
HAURIIIUS I ThMLE 7,1AREA HARVESTED# VIFLD AND PRODUCTION OF CANE AND SUGAR
ITEH 1975 1P76 1977 1978 1979 1990 test 1962 1963
AREA HARVESTED (1) 1 189.5 191,6 191.0 190o2 188,9 187,5 18955 169.3 485.8
MILLER PLANTERS 2 104.4 105*7 10.1 10.:2 106,7 106l 4 105.5 102.6 49.5PLANTERS 3 85,2 85.9 85.9 S4.0 82.2 81.1 80.0 86.7 86,4
CANE PRODUCTION (2) 4 4,316,0 6.402s0 6.022,0 6.260,0 6.313,0 4,564.4 50303.0 6,581.8 50254.7
HILLER PLANTERS S 2,793.0 3,977,0 30747,0 3,914.0 3 976,A 2.974o1 3,455,0 3.946,4 31203.2PLANTERS 6 1.53340 2,425.0 2,275.0 2.346,0 2,336,5 1,690.3 1,847,0 2,635,4 2,051,4
CANE YIELD PER ARPENT (3) 7 22.@ 33.4 3lJ5 32. ' 33.4 24.3 29,6 34,8 28,3
MILLER PLANTERS a 26,7 37.6 357 36:9 37.3 27,0 3266 3S.5 32,2PLANTERS 9 180. 25.2 2A.5 27,9 :!8o4 20,9 23.1 30.4 23.8
SUGAR PRODUCTION (2) 10 468.3 68999 665,4 665.2 688.4 475,5 574,5 697,9 604.7
WHITE SUOAR 11 25,5 52.7 48,0 41.7 42.3 31.6 36.8 . 40.9 37.7RAW SUGAR 12 442.8 637,2 617,4 623.5 646.1 443.9 537.7 647.0 567,0
MOLASSES PRODUCTION 12) 13 126.4 204.3 191.0 197.2 203,9 133,9 156I 2 197.1 162,1
(1) ('000 ARPENTS)(2) ('000 TONS)(31 (TONS)
NOTE I ( I ARPENT - 1.043 ACRES
SOURCE I DuAURITIUS CHANBER OF AGRICULTURE
TABLE ATS/7A/l
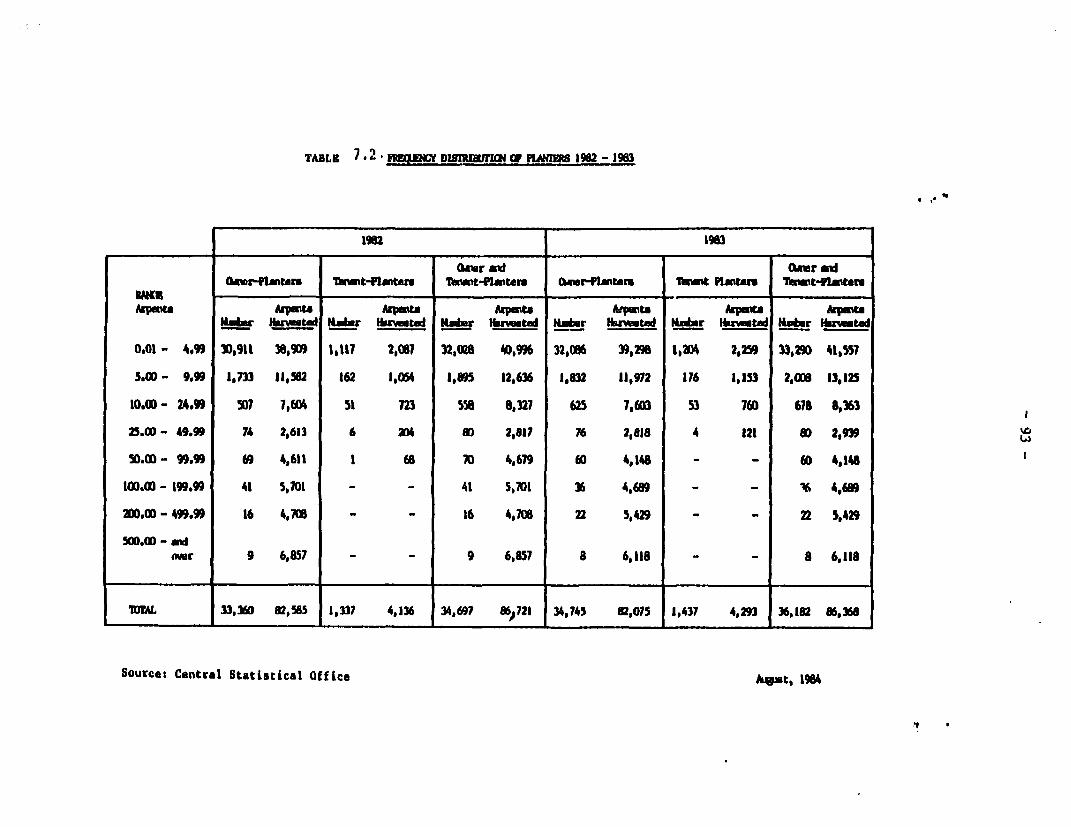
TABLg 7 .2 - (1F DM=WRlK O f I.S 1962 - 1963
1902 1963
(ar a-i OAer adOamr-Plaieru ¶im~t-#1antars Ih'at-Ulatagu £ur-I'm~tezm bTwnt Katam Thwti-Ulantar
hqac .ISI __~~L .xst .il . _, . . _ aatk h - ~~~~~~~~~~~~~~~~~~~~"Wt kPot' 4 At k
34.lr Ilg~ta1 Radr 1 xw_td NR tr IHzvtad Hlbr Hlnmtcd MAduer HIbztad Mw&r Humtud
0.01 - 4.99 30,911 381909 1,117 2,087 32,008 4),996 32,006 39,298 1Z£Y 2,259 33,20 4,557
5.0O- 9.99 1,733 1,582 162 1,054 1,895 12,636 1,832 11,972 136 1,153 2,008 13,125
10.00- 2MM9 50J 7,I' 51 723 556 8,327 625 7,603 53 760 678 8,363
25.00 - 49.99 74 2,613 6 3)4 OD 2,817 76 2,818 4 321 OD 2,939
50.0- 99.99 69 4,611 1 68 70 4,679 60 4,148 - - 60 4,148
100.00 - 199.99 41 5,701 - _ 41 5,701 36 4,689 - -_ 4,689
200.00 - 499,99 16 4,708 _ _ 16 4,708 22 5,429 - - 22 5,429
9 6,857 - - 9 6.857 8 6,118 - - 8 6,118
mUL 33,360 82,585 1,337 4,136 34,697 86721 34,745 a2,075 1,437 4293 36,182 8s6,368
Sourcea Central Statlitical Office haWt, 1964
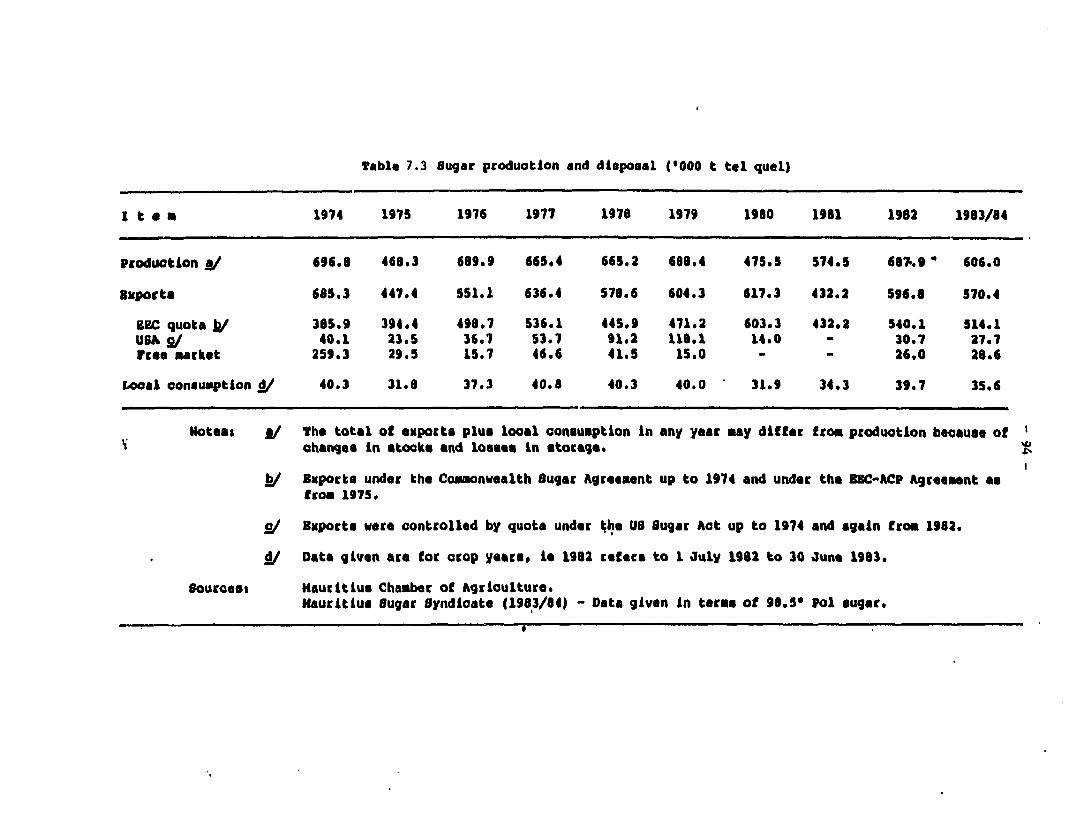
Table 7.3 Sugar production and dispoagl ('000 t tel quel)
I t * m 1974 1975 1976 1977 1970 1979 1980 1981 1982 1983/84
Paroduction j/ 696.8 468.3 689.9 665.4 665.2 688.4 475.5 574.5 6876.9 * 606.0
Ekports 685.3 447.4 551.1 636.4 578.6 604.3 617.3 432.2 596.8 570.4
USC quota k/ 38S.9 394.4 498.7 536.1 445.9 471.2 603.3 432.2 540.1 514.1
Uh W/ 40.1 23.5 36.7 53.7 91.2 116.l 14.0 - 30.7 27.7
Free macket 259.3 29.5 15.7 46.6 41.5 15.0 - - 26.0 28.6
Local consumption / 40.3 31.8 37.3 40.8 40.3 40.0 31.9 34.3 39.7 35.6
Noteas $ f Tho total of exports plus local consumption in any year may difter from production because of
changes in stocks and losses in stocage.
k/ Exports under the Commonwoalth Sugar Agreement up to 1974 and under the EBC-ACP Agreement an
fcom 1975.
s/ Exports were controlled by quota under 4he US Sugar Act up to 1974 and again fcom 1982.
g/ Data given aeo lot acop yearcs il 1982 refocr to I July 1962 to 30 June 1983.
sourcess Hauritius Chamber of Agriculture.Hauritius Sugar syndicate (1983/84) - Data given in terms of 90.S Vol sugar.

.~~~~~~~~~~~~~~~~5
90L hO OIL 109 016 £11 iii ILO tit fitLl 109lE 61t 199 1?inf il tl 691 tit 901 OIL 969 l1&PUSISI
Ste It Til OL o6f to too TLe 10g P1s 9t to6 0S L £eg 1t 6 601 to Lot *6 pit es iloi-qlI1IF et - I of O ofX 0 @1¢ IT tit of '41 cc cL cc tit EtX 16i cc t 11 tti of Ie oqni
tot St Ott I t Itti e &LSO t il IC Lrt Il c SO et lto 6 01 it 196 DE US 0s wulI 123?O uo"9to tli 1t1 11 it 099 It ttC 91 OPlCt I tOft S L Lt COS 1t etS It lOt St tIil16tW
SOL 91 piI 6ST *es 91 Ott l lot tt t ttL Ot OCCI 091 L91 ttt PI LS OC Hivi *1U'
Lgi II pit 0FL $s IL Ill BP 511F 9 Too of Lit 5 6t? tooitIse 101 £91 £1 il L9 too Isn
t£1 of tot 6! Ott *1 311 it IS! It lOP It Ott 1it IOtt 0! tot Et M tt 19 e0 SenOu,1Utit ti 9St ? sit Itl TLC Ct OIL 6t Ss ? 9 1U et Lu of too St £6 CC O9g tS dth43 fl"ee
. .~ ~ ~ ~ ~ ~ ~ ~ ~ '
S61 tOt 9IL 0i 101 I1 CT0 101 tLL 1C 09 911 Oll 60! 109 911 Oft Ct! 9Lt Ott tOO I1C tw1ic-qi¶gSLOt C t9it tot Ot Goo00 Ot III ii et; ot II It Its tt-- 1t6 It CL it Ot it uyqnv is wolunI 10 2£t 95 St 510 Io 161 3t l Ot Ott It ti it 095 ti lo0 1 Mt 9! 9[9 St w1wsM O 91 PT11 I 0 LI ILL 91 169 C1 CtL 91 CII LI 6t1 LI lot 91 41l It 619 of TIP 1M31 IC 63£ Et tit 9! 161 Et Iot Pt 90 It Off Ic ee6 Ic 91e Lc 0l o 1 1ot L OT1T *onULLL LUE ILSI Of itS t IOS t ll St Ot l E £T Et L0E I 01t 0 tit IP t Ii9t M90 1t n13 uO *4010tOt *t OLO Ot ttO CC tot LI t it 960 It tie Oi Ltl it 91 0t 09? tt CPT 6t ea" 30fm uowUP Cc t910 St 91t 11 16t cI Oto 91 CC 1 tt SC St fit S 9 1f 91 Ise it go t *I9WUWIIUOil 61 91t 61 too it 01 it 9te o1 6it it 061 it tOt 0r too Or 91 11 911 t*oqwo 1o
4"1
t0O loI1 %Il 10L OtLI ISO l Olt I tl ttI OLI 116 991 OfL t1 I tILl tIl 901 9tt 191 livol-q"S69 *I fig 1 LSO C t 691 It log II ItL 11 0C 9 1 LOt 01 016 CC Ilt 91 tit It *p"n °llocot CC oft 0O *LI IC tot 11 it1 IC 91 L t1t It 616 PC I0, ItC 6f1 of S0o of u@IouV IlgOO Pt Ocp It 100 C tot Ci Ig0 IT 1M1 ft PLO St ISt C 1fo Lt 6of of 110t l netiC Of 'SLO LI DoS 1t SOt 91 9tt It PLC tt Ott St tSU t 9 901t OLS It *st tt 12845u/3ISIo'I 001Oil 61 316 It GIL t 9I 991 to9 9* 0o6t oftit to £0 tot01 91 911 61 *CO cc *A OISI610 tC ttL 91 Olt 91 0 *1 Olt 01 c1g005 t £19 it tot et too It t 91 91£ ec 'li nvW
DSwJOAV tCIl 98S1 lft 0cs1 Gist IL£6 t£OI 9SlI 1L61 HtlI
ISnb Tel 'SSuuo7 N 'CI-.pLg UOlUi pUt Illy Aq uollonpoid inskg V,j olqw&
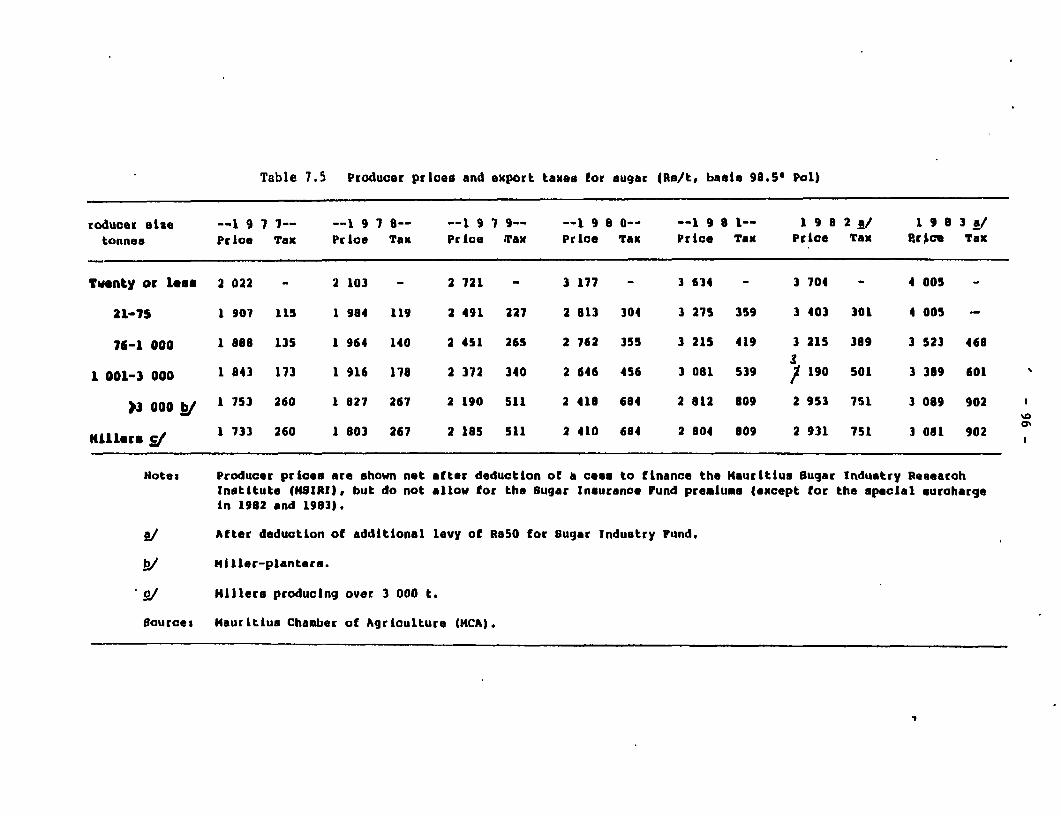
Table 7.5 Producer prices and export taxes for sugat (Ra/k, basis 98.5' Pol)
toducer size --I 9 7 1-- --I 9 7 1-- --I 9 7 9-- -- 1 9 8 0-- --1 9 8 1-- 1 9 8 2 J 1 9 8 3/tonnes Price Tax Price Tax Price Tax Price Tax Price Tax Price Tax P.rAcG Tox
Twenty oleos 2 022 - 2 103 - 2 721 - 3 177 - 3 634 - 3 704 - 4 005 -
21-7S 1 907 115 1 94 119 2 491 227 2 813 304 3 275 359 33403 301 4005
76-1 000 1 888 135 1 964 140 2 451 265 2 762 355 3 215 419 3 215 389 3 523 466
1 001-3 000 1 843 173 1 916 178 2 372 340 2 646 456 3 081 539 190 501 3 389 601
)3 0oo l 1 753 260 1 827 267 2 190 511 2 418 684 2 812 809 2 953 751 3 089 902
HIllers s( 1 733 260 1 803 267 2 185 511 2 410 684 2 804 809 2 931 751 3 081 902
Notes Producer prices are shown net after deduction of a cess to finance the Hauritium Sugar Industry Researchinstitute (NSIRI), but do not allow for the Sugar Insurance Fund premiums (except for the special wurchargeIn 1982 and 1983).
a/ After deduction of additional levy of RaSO for Sugar Industry Fund.
W/ Miller-planters.
' 9/ Millers producing over 3 000 t.
Sources Hauritius Chamber of Agriculture (HCA).
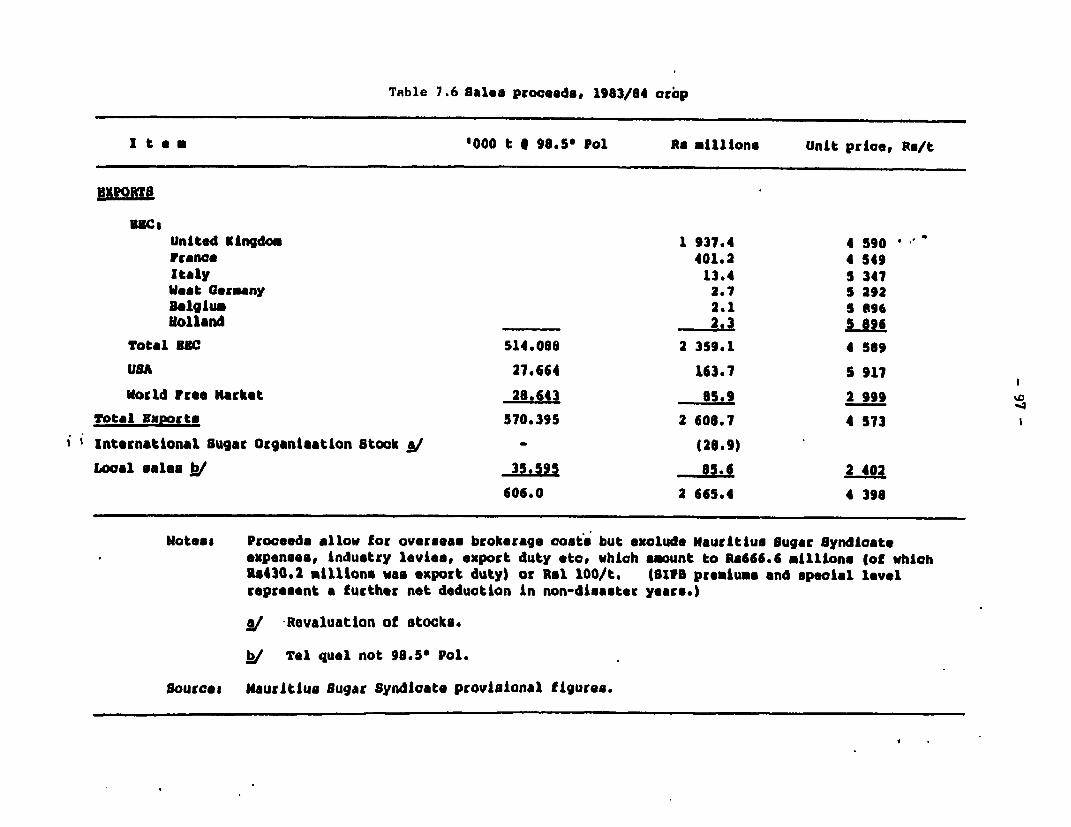
Table 7.6 Sales proceeds# 1983/84 crop
I t** '000 t 0 98.5 Pol Rs millions Unit pciae, Rs/t
United Kingdon 1 937.4 4 590rtance 401.2 4 549Italy 13.4 5 347West Germany 2.7 5 292Belgium 2.1 5 896Holland 2.3 5 .96
Total INC 514.0S 8 2 359.1 4 589
USA 27.664 163.7 5 917
World rce. Market 28.643 85.9 2 999
Total BXnrt8 570.395 2 600.7 4 573 1
international Sugar Organisation Stook g/ - (28.9)
Local sales k 35.595 8S.6 2 402
606.0 2 665.4 4 398
Notes$ Proceeds allow for overseas brokerage cost' but exclude Nautitium ugacr Syndicateexpenses, Industry levies, export duty *tc, which *awunt to Rs666.6 millions (of which3s430.2 millions war export duty) or Rol 100/t. (81ID premiums and special levelreptesent a further net deduction ln non-diumater years.)
if Revaluation of stocks.
~f Tel quel not 98.50 Pol.
Sources Mauritiua Sugar Syndicate provisional figures.

MAURITIUS I TAbLE 7.7
FOODCROPS 1 AREA (ARPENTS) AND PRODUCTION (TONS)*
1900 1981 1902 1983ITEM ------------------------------------------------------------------------
AREA PROD. ARA PROD. AREA PBND. AeA jROD.
* ..
VEGETABLES
B'EANS 31 771 1.123 554 835 469 730 598 860CUCUMBER 32 271 1.399 242 1.323 281 1.695 266 1.475PUMPK'IN 33 339 29172 129 978 167 1255 137 1.040GROUNDNUTS 34 683 1.071 1.324 1.854 1.310 1,940 1.468 1,910HAIZE 3s 773 732 1.041 1.081 1,2B5 1.375 988 1.200FOIATOES 36 1.674 11,694 1,629 15,999 1,500 13,500 1,746 14,910TOHATOES 37 l,460 6o121 1.577 6,739 1.930 9,530 2,110 11.550CABBAGE 38 289 3v416 229 2,125 208 2,415 231 2,455ONIONS 39 485 2,196 - 518 2,295 501 2,190 280 1,685OTHER VEGETABLES 40 1,665 6.643 1,571 6,558 1,6O4 70380 1,648 7.145
FRUITS
BANANAS 41 605 2.625 602 4,415 770 6,415 775 7.075OTHER FRUITS 42 64 258 86 476 80 535 57 425
TOTAL 43 9.087 39,650 9702 45,178 10,104 49,960 10,304 51,730==aa.A ==. = ul===SS=n =.====n.== =wlaZn= ==.=as= n= = =onsc==
( I ARfENT a 1.043 ACRES I
SOURCE S CEITRAL STATISTICAL OFFICE
TABLLE nTS/7A/3
.9
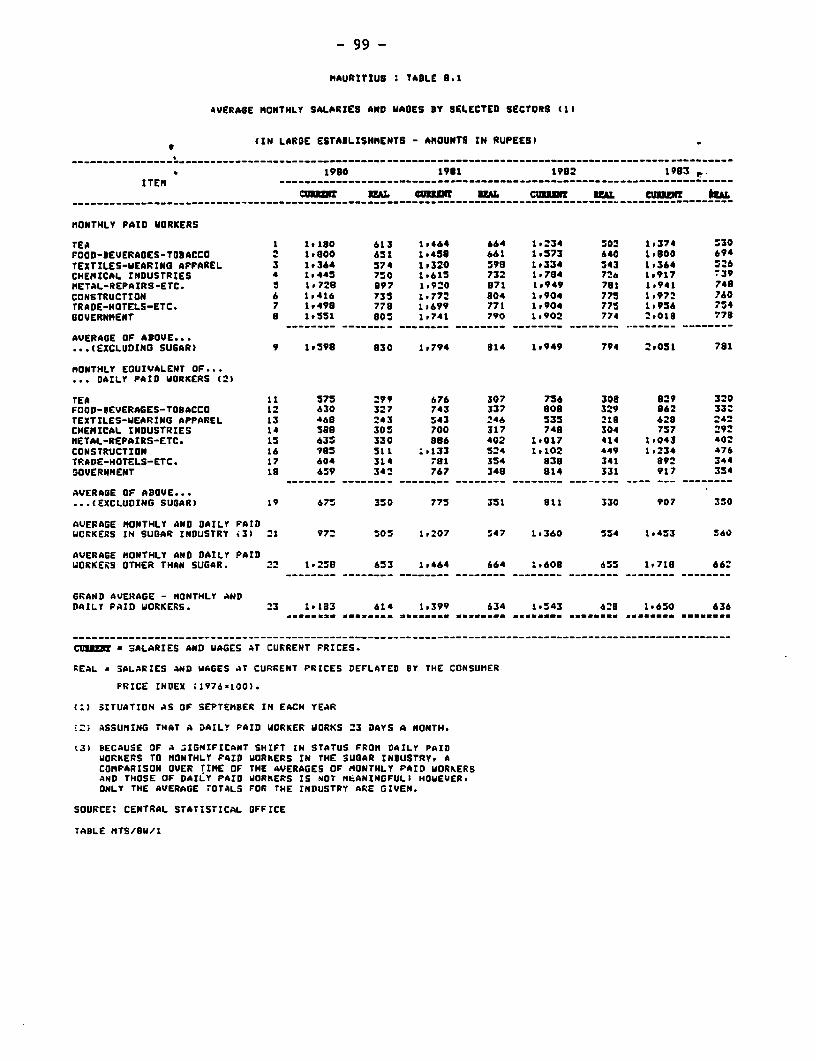
- 99 -
MAURITIUS : TABLE 8.1
AVERAGE MONTHLY SALARIES AND WAGES BY SELECTED SECTORS (1)
(IN LARGE ESTABLISHMENTS - AMOUNTS IN RUPEES)
* 1900 1981 1982 1993 eITEM
wumw wax euur tax CUn mar. Con hax------------------------------------ … …_ -_-- …_ _ --- _ ----- _… _ ---- L_ … k_
MONTHLY PAID WORKERS
TEA 1 1S180 613 1.464 664 I.234 502 19374 :30FOOD-DEVERAGES-TDBACCO 2 1.900 651 1,458 661 1.S73 640 1.900 694TEXTILES-WEARING APPAREL 3 1,364 574 1,320 599 1334 543 1.364 526CHEMICAL INDusrRIES 4 1.445 750 1,615 732 1.784 72* 1,917 T39
METAL-REPAIRS-ETC. 5 1.728 697 1.920 971 1.949 791 1.941 748CONSTRUCTrON 6 1.416 735 1.772 804 1.904 775 1.972 760TRADE-HOTELS-ETC. 7 1.498 779 1.699 771 1.904 775 1.956 754GOVERNMENT 9 1.551 905 1.741 790 19902 774 2.019 779
_ ---- ----- -_--_--_--__-- _-- -- _- ------ --_ -- -- - -- _- _------ --------- --- __-_- -- --
AVERAGE OF ABOVE...--- EXCLUDING SUGAR) 9 1P598 830 1P794 814 L.949 794 2,051 791
MONTHLY EOUIVALENT OF...... DAILY PAID WORKERS (2)
TEA 11 575 299 676 307 756 308 829 320FOOD-lEVERAGES-TOBACCO 12 630 327 743 337 909 329 862 332TEXTILES-SEARING APPAREL 13 468 243 543 246 535 219 629 242CHEMICAL rNDUSTRIES 14 5s8 305 700 317 748 304 757 292METAL-REPAIRS-ETC. 15 635 330 986 402 1.017 414 1.043 402CONSTRUCTION 16 7985 Sl i.i33 524 1.102 449 1.234 476TRADE-HOTELS-ETC. 17 604 314 ,791 354 939 341 892 344GOVERNMENT 19 659 342 767 348 814 331 917 354
-- - -- -- --- --- --- -------- _- __- ---- _-_-_- - -_- - - - -- -- _-- _---- ---- - -_- -_-- -- -- -
AVERAGE OF ABOVE....(EXCLUDING SUGAR) 19 675 350 775 351 911 330 907 350
AVERAGE MONTHLY AND DAILY PAIDWORKERS IN SUGAR INDUSTRY i3) 21 972 505 1p207 547 19360 554 2.453 560
AVERAGE MONTHLY AND DAILY PAIDWORKERS OTHER THAN SUGAR. 22 1.258 653 1P464 664 1.608 655 1,718 662
-------- -------- ------- _- -------- ------- _ - ------ _------- _----- -
GRAND AVERAGE - MONTHLY ANDDAILY PAID WORKERS. 23 1.183 614 1.399 634 1.543 629 1.650 636
-asma. a..a ..... ..... … …. ......
COURET * SALARrES AND WAGES AT CURRENT PRICES.
REAL a SALARIES AND WAGES AT CURRENT PRICES DEFLATED BY THE CONSUMER
PRICE INDEX (1976.100).
51) SITUATION AS OF SEPTEMBER IN EACH YEAR
5^; ASSUMING THAT A DAILY PAID WORKER WORKS 23 DAYS A MONTH.
(3) BECAUSE SF A IGNIFICANT SHIFT IN srATUS FROM DAILY PAIDWORKERS TO MONTHLY PAID WORKERS rN rHE SUGAR INDUSTRy. ACOMPARISON OVER rIME OF THE AVERAGES OF MONTHLY PAID WORKERSAND rHOSE OF DAILY PAID WORKERS Is NOT MIIANINGFUL; HOWEUER.ONLY THE AVERAGE TOTALS FOR THE INDUSTRY ARE GIVEN.
SOUfRCE: CENTRAL STATISTICAL OFFICE
TABLE MTS/95/l
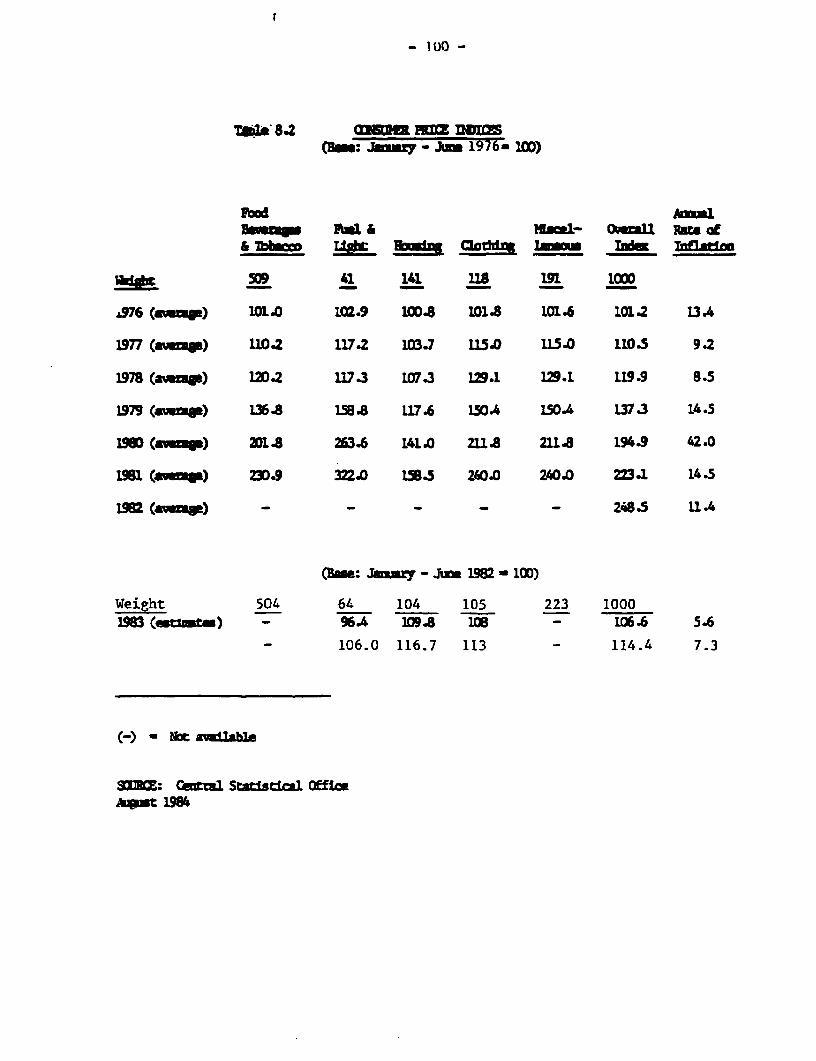
- lIJO -
Taga 8.2 ca5U PR= Du(Be: Jam.iny - JUS 1976m 10)
Fbod Anm.1IN PaL & Mimi- Oi.taf Na of
0 M509 41 141 l1 191 1000
LJ76 (awup) 101.0 m.9 1008 101.8 101.6 10.2 13.A
1977 (awup) 1102 117.2 10.7 l5.0 115.0 110.5 9.2
l978 (awup) 120.2 1173 107.3 L".1 129.1 119.9 8.5
1979 (aump) 136.8 ss8.8 117.6 SOA 150.4 137.3 14.5
198 (awup) 201d 263.6 141.0 211.8 211.8 194.9 42.0
11 ( ) 2.9 322.0 lS.5 240.0 240.0 223.1 14.5
19G2C(wF) - - - - - 248.5 11.4
(EB: Jamry -. Am 1982 - 100)
Weieht 504 64 104 105 223 10001983 (ectim) - 96.4 109.8 108 - 106.6 5.6
- 106.0 116.7 113 - 114.4 7.3
C-) - Nt aeaba
SMJK: Cet1 Statisrle1 Off shWut 1984

- 101 -
tMLE 8.3: DISTRIBUTION OF HOUSEHOLD INCOME, 1979
------ Household Inco oe-Income Range Cu-ulative Cumulative(Rs per month) Percentage Percentage Percentage Percentage
0 - 150 2.8 2.8 0.1 0.1
150 - 300 4.2 7.0 0.6 0.7
300 - 500 4.7 11.7 1.2 1.9
500 - 750 21.2 32.9 8.4 10.3
750 - 1,000 20.2 53.1 11.2 21.5
1,000 - 1,500 18.8 71.9 14.9 36.4
1,500 - 2,000 10.3 82.2 11.4 47.8
2,000 - 3,000 9.1 91.3 14.5 62.3
3,000 and over 8.7 10 .0 37.7 100.0
100.0 100.0
SOURCE: Central Statistical Office
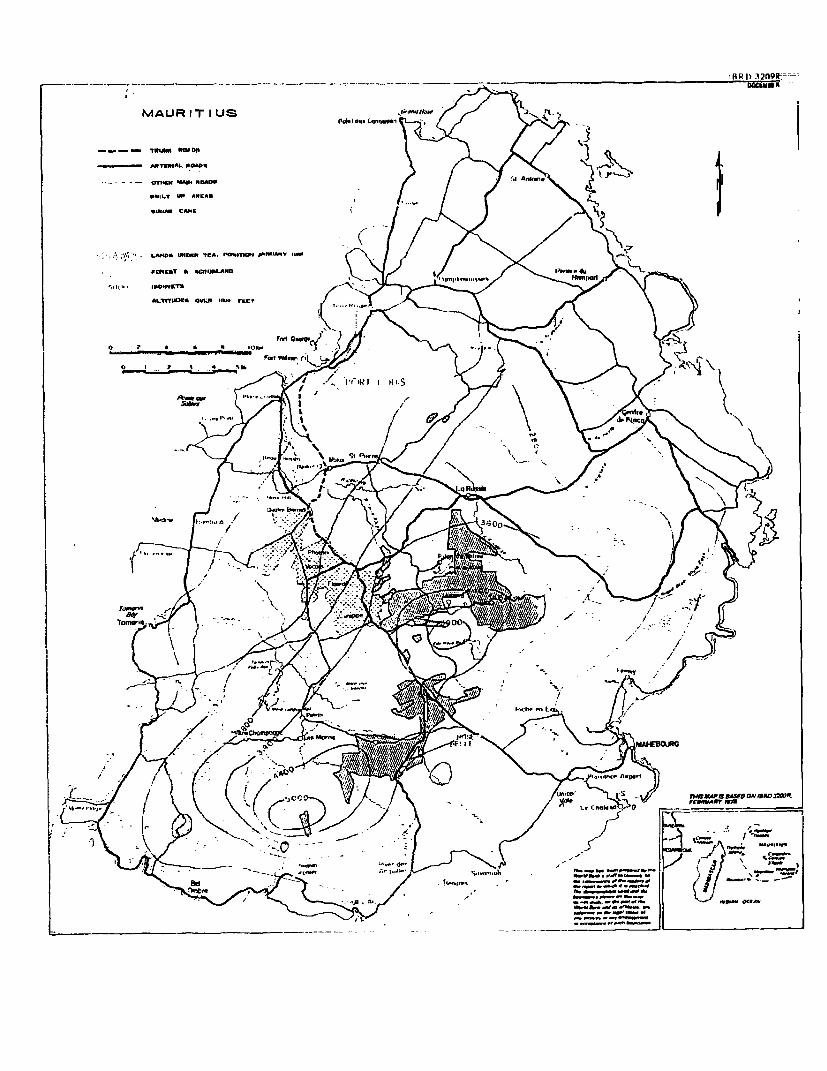
_ ___ ._ _ _ _ ____ _ __ ___ _ _ _ _ ____ _ _ __ __ _ _ __ _ _ t R 11 3 2I0RR w)°209R- -
MAUR IT I US
YUIROAbO__- p.,mA MOW,
- ThEW " MA *8*04
MUILT UP ^AWA
%U~.M CAPL
LA-: .: MD T:. .O %T"m JA",-AV l A/
I.UPEIT A SENURLAINI
ALTUDtS oULS 1N- mc,
K~~~ A, rT-. -
° > 4 a " , o r i G gX j , > yI
II I;s~~~~~~~~~
St cv6_p IPEIJA
W/ ' ' '^,' N ' - > l l t , 4 l -S / fFT, si-- IF / \ - 9
X A 1A/---' X, X\o~~~~~~~~~~~~~~~~~~~~~~~~~~..t14-s °' \ xt S t^--rte;_/ J tx 7 \\ <~~a
~~~~~~~~~~~~~~~~~~~~~~MAHE7 ,.'', RG
FT / i
1~~~~~~~~~~~~~~~~~~~~~~~~~~~~~~~~~~~~~~~. O_C.. :',