Embed Size (px)
Citation preview

September 10, 2010
Document of the World Bank
Report N
o. 51815-BF B
urkina Faso Prom
oting Grow
th, Com
petitiveness and Diversifcation
Vol II
Report No. 51815-BF
Burkina FasoPromoting Growth, Competitiveness and Diversifi cationCountry Economic Memorandum
PREM 4Africa Region
(In Three Volumes) Volume II: Sources of Growth - Key Sectors for Tomorrow
Pub
lic D
iscl
osur
e A
utho
rized
Pub
lic D
iscl
osur
e A
utho
rized
Pub
lic D
iscl
osur
e A
utho
rized
Pub
lic D
iscl
osur
e A
utho
rized
Pub
lic D
iscl
osur
e A
utho
rized
Pub
lic D
iscl
osur
e A
utho
rized
Pub
lic D
iscl
osur
e A
utho
rized
Pub
lic D
iscl
osur
e A
utho
rized

ii
GOVERNMENT FISCAL YEAR January 1 – December 1
CURRENCY EQUIVALENTS
Currency Unit : CFA Franc (CFAF) 1 US$ : CFAF 441.89
WEIGHTS AND MEASURES
Metric System
ABBREVIATIONS AND ACRONYMS
AFD French Development Agency AfDB African Development Bank AICB Association interprofesionnelle du coton du Burkina ANVAR Agence Nationale de Valorisation des Résultats de la Recherche ARTEL Telecommunication Regulatory Agency AZ Anglo Zimele BCEAO Central Bank of West African States BNLA La Direction de la Brigade Nationale de Lutte Anti-fraude de l’Or (National
Brigade Against Fraud in the Gold Sector) BUMIGEB Bureau des Mines et de la Géologie du Burkina (Bureau of Mines and
Geology of Burkina Faso) CAS Country Assistance Strategy CAS-PR Country Assistance Strategy Progress Report CEAS Centre Ecologique Albert Schweitzer CEM Country Economic Memorandum CFAA Country Financial Accountability Assessment CFAF Franc of the African Financial Community CID Computerized Expenditure Circuit CIE Government Integrated Accounting Software CNRST National Center for Scientific and Technological Research (Centre national
de la Recherche Scientifique et Technologique) COGES Health Management Committee CONAGESE National Council for Environmental Management CPAR Country Procurement Assessment Report CSPs Community Health Centers CRA Regional Agriculture Chambers CSO Civil society organization CSPs Community Health Centers DAAF Directorate of Administrative and Financial Affairs DCMP Central Directorate for Public Procurement DEP Directorate for Planning and Studies DGB Directorate General for the Budget DGCCOP Directorate General for International Cooperation DGE Directorate General for the Environment DGMGC(DGM)
Direction Générale des Mines, de la Géologie et des Carrières (Directorate General of Mines, Geology, and Quarries)
DGTCP Directorate General of the Treasury and Public Accounts DHS Demography and Health Survey DSA Debt Sustainability Analysis

iii
DTIS Diagnostic Trade Integration Study ECOWAS Economic Community of West African States EIA Environmental Impact Assessement EITI Extractive Industries Transparency Initiative EMP Environmental Management Plan ENEP Teachers Training Colleges EU European Union FASOCOTON Private Cotton Company FRSIT Fire Service Improvement Team GAMA Environmental Management in Artisanal Mining (Peru) GDP Gross Domestic Product GNP Gross National Product GoB Government of Botswana GTZ German Technical Cooperation HIPC Heavily Indebted Poor Countries HIPC-AAP HIPC Accountability Assessment and Action Plan ICA Investment Climate Assessment ICRR Implementation Completion and Results Report ICT Information, Communication and Telecommunications IDA International Development Association IFC International Finance Corporation IGAME L’Inspection Générale des Activités Minières et Energétiques (Inspection
General of Mining and Energy Activities) IGE General State Inspectorate IGF General Finance Inspectorate IMF International Monetary Fund INERA National Institute for the Environment and Agronomic Research INGO International non-governmental organization INSD National Institute of Statistics and Demography IRCT Cotton and Textile Research Institute IRD Institut de Recherche pour le Développement IRSAT Research Institute for Applied Science and Technology (Institut de
Recherche en Sciences Appliqués et de Technologie) JSAN Joint Staff Advisory Note LDP Letter of Development Policy MAMS Maquette for MDG Simulations MDGs Millennium Development Goals MDRI Multilateral Debt Relief Initiative MEBA Ministry of Basic Education and Literacy MEDEV Ministry of Economy and Development MEF Ministry of Economy and Finance MMCE Ministère des Mines, des Carrières et de l’Energie MnO2 Manganese Dioxide MOH Ministry of Health MTEF Medium-Term Expenditure Framework NGO Non-governmental Organization OECD Organisation for Economic Cooperation and Development ONAPAD National Poverty and Development Observatory ONATEL National Telecommunication Company OPA Producer Organization ORCADE Organisation pour le Renforcement des Capacités de Développement P2O5 Phosporous Pentoxide

iv
PAMS Poverty Analysis Macroeconomic Simulator PAP Priority Action Plan PAFASP Projet d’Appui aux Filières Agro-sylvo-Pastorales PDDEB Ten-year Basic Education Development Plan PER Public Expenditure Review PNDS National Health Care Development Plan PNDSA National Program for the Development of Agricultural Services PNGT National Program for the Management of Territory PRECAGEME Le Projet de Renforcement des Capacités Nationales du Secteur Minier et de
Gestion de l'Environnement PRGB Budget Management Reform Plan PRGF Poverty Reduction and Growth Facility PRSC Poverty Reduction Support Credit PRSP Poverty Reduction Strategy Paper PRSP-APR Poverty Reduction Strategy Paper Annual Progress Report ROSC Report on the Observance of Standards and Codes SBI Sustainable Budget Index (Botswana) SDR Special Drawing Rights SITARAIL Société Internationale de Transport Africain par Rail SME Small and Medium-sized Enterprises SMEELP Small and Medium Enterprise and Empowerment Program (Mozambique) SIGASPE Budget Payroll Management System SOCOMA Private Cotton Company SOFITEX Largest Cotton Company SONABEL National Electricity Company SONABHY National Petroleum Product Distribution Company SOPAFER Société de Gestion du Patrimoine Ferroviaire du Burkina SP-PPF Permanent Secretariat for the Supervision of Financial Policies and Programs STC-PDES Technical Secretariat for the Coordination of Social and Economic
Development TOD Decentralization Laws TOFE Government Financial Operation Table UNDP United Nations Development Program UNIDO United Nations Industrial Development Organization UNPCB National Union of Cotton Producers of Burkina Faso VAT Value Added Tax WAMU West African Monetary Union WAEMU West African Economic and Monetary Union WHO World Health Organization
Vice President: Obiageli K. Ezekwesili
Country Director: Madani Tall Sector Director: Marcelo Giugale Sector Manager: Miria Pigato
Task Team Leader: Gilles Alfandari
v
TABLE OF CONTENTS FOR VOLUME II
VOLUME II – SOURCES OF GROWTH - KEY SECTORS FOR TOMORROW ............................ 1
The Cotton Sector: Performance, Crisis and the Way Forward ........................................................... 1Sector Overview ................................................................................................................................... 1Performance and Constraints ................................................................................................................ 2Institutional and Policy Framework .................................................................................................... 23Looking Forward: Major Issues in Strengthening the Sector ............................................................. 30Conclusions and Policy Recommendations ........................................................................................ 42
Intensifying Agro-Pastoral Production ................................................................................................ 43Sector Overview ................................................................................................................................. 43Performance and Constraints .............................................................................................................. 44Growth and Diversification Strategies ................................................................................................ 49Agricultural Export Promotion through Growth Poles ....................................................................... 60Import Substitution: Milk and Rice .................................................................................................... 61Intensification, Value Chains and Innovation ..................................................................................... 63Conclusions and Policy Recommendations ........................................................................................ 69
The Mining Sector: Current Situation and Prospects ......................................................................... 72Sector Overview ................................................................................................................................. 73Performance and Constraints .............................................................................................................. 79Mining Policy and Institutional Framework ....................................................................................... 86Sustainable Development and Industrial Mining ................................................................................ 91Conclusions and Policy Recommendations ........................................................................................ 95
An Emerging Tourist Destination ........................................................................................................ 98Sectoral Overview ............................................................................................................................... 98Binding Constraints to Growth in the Tourism Sector ..................................................................... 107Conclusions and Policy Recommendations ...................................................................................... 109
List of Appendices
Appendix 7: Possible Mining Deposits of Economic Interest .................................................................. 111 Appendix 8: Investors in the Mining Sector ............................................................................................. 112
List of Tables
Table 2- 1 Total Value Added Per Capita from the Cotton Sector, 2006 ..................................................... 6Table 2- 2:Cost of Production of Lint Cotton. Regional Comparison, 2005 ................................................ 7Table 2- 3: Net Per Capita Budgetary Contribution of the Cotton Sector, 2006 .......................................... 7Table 2- 4: Demographic Linkages of Cotton Production, 2005-2006 ......................................................... 8Table 2- 5: Poverty Rate in the Cotton Zones, 1998 and 2003 ................................................................... 10Table 2- 6: Key Cotton Sector Indicators, 1985-2008 ................................................................................ 12Table 2- 7: Decomposing Seed Cotton Production Growth into Area and Yield Components .................. 15Table 2- 8: Trends in the World Cotton Production ................................................................................... 16Table 2- 9: Cotton to Textile Value Chain .................................................................................................. 17Table 2- 10: FASOTEX’s Production Costs ............................................................................................... 18Table 2- 11: Summary of Cotton’s Sector Performance and Budgets by Farmer Type and Country ......... 19Table 2- 12: Cost-Benefit Analysis in Different Villages of Burkina......................................................... 20
vi
Table 2- 13: Grade Classification of Lint Cotton, 1996-2005 (% of total lint quantity) ........................... 22Table 2- 14: Sofitex Cotton Quality, 2005 - 2010 ...................................................................................... 22Table 2- 15: Cost of Equipment, 2005-2006 ............................................................................................... 34Table 2- 16: Strengths, Weaknesses, Opportunities and Threats (SWOT) Analysis, by Sectors ............... 45Table 2- 17: Growth Strategy and Agricultural Diversification Objectives for Burkina Faso ................... 49Table 2- 18: Estimates of the Value of Live Animal Exports from Burkina Faso, 1999-2005 .................. 54Table 2- 19: Price Difference of Shea Butter across Different Markets ..................................................... 57Table 2- 20: Exports of Fresh and Dried Mangoes from Burkina Faso, ..................................................... 58Table 2- 21: Contribution of Irrigated Agriculture to Burkina Faso’s Economy (2004) ............................ 63Table 2- 22: Critical Actions for Accelerated Agricultural Diversification ................................................ 70Table 2- 23: Operating Gold Mines (December 2008) ............................................................................... 74Table 2- 24: Gold Mines under Construction ............................................................................................. 74Table 2- 25: Estimated Gold Exports in Ounces and US$ million, 2008-2015 .......................................... 75Table 2- 26: Estimated Exports of Non-Gold Minerals in Tonnes and US$ million, 2009-2015 ............... 76Table 2- 27: Value Added by the Industrial Mining Sector (US$ millions) ............................................... 77Table 2- 28: Provisional Mining Employment during Exploitation (Working Mines, Mines under Construction, and Advanced Projects) ........................................................................................................ 78Table 2- 29: Estimated Tax Revenues Generated by the Mining Sector (US$ millions) ........................... 79Table 2- 30: Employment Generated by Mining Activities ........................................................................ 82Table 2- 31: Infrastructure Provision by Mines in Burkina Faso ................................................................ 92Table 2- 32: Burkina Faso and Key Tourism Destinations in Africa ......................................................... 99Table 2- 33: Average Spending ................................................................................................................ 101Table 2- 34: Destination competitiveness, 2009 ....................................................................................... 102Table 2- 35: Lodging Capacity ................................................................................................................. 102Table 2- 36: Road Network in Burkina Faso ............................................................................................ 103
List of Figures
Figure 2- 1: Annual Yields (kg/ha) of Seed-Cotton in Burkina Faso ........................................................... 3Figure 2- 2: Yields (kg/ha) of Lint Cotton in the World and in West-Africa ............................................... 4Figure 2- 3: Evolution of the Ratio of Producer Price/Cotlook Index, 1995-2000 ....................................... 9Figure 2- 4: Share of Cotton in Burkina’s Export Earnings ....................................................................... 13Figure 2- 5: Production of Seed Cotton, 1985-2007 ................................................................................... 14Figure 2- 6: Monthly and Annual Cotton Prices- Cotlook A Index- .......................................................... 16Figure 2- 7: Ginning Ratio .......................................................................................................................... 21Figure 2- 8: Evolution of the Cotton Sector ................................................................................................ 26Figure 2- 9: World-Food Prices Index and Food Consumer Price Index in Burkina Faso ......................... 47Figure 2- 10: Farm-Gate Prices (USD/mT) Trends for Several Subsistence Products ............................... 48Figure 2- 11: Farm-Gate Prices (USD/mT) Trends for Several Rent Products .......................................... 49Figure 2- 12: Exports of Onions from Burkina Faso, ................................................................................. 53Figure 2- 13: Trends in Burkina Sesame Exports, 1995-2004 .................................................................... 56Figure 2- 14: Arrivals to Burkina Faso (in’000s)........................................................................................ 98Figure 2- 15: Travel and Tourism (direct + indirect revenues, % GDP) .................................................... 99Figure 2- 16: Non Resident Arrivals, by month ........................................................................................ 100Figure 2- 17: Source Markets and Reasons for Visits ............................................................................... 100Figure 2- 18: Visitors’ Preferences ........................................................................................................... 101Figure 2- 19: Handicraft Exports .............................................................................................................. 104

vii
List of Boxes Box 2- 1: GPCs and Domestic Arrears ....................................................................................................... 30Box 2- 2: Overview of Cotton Sub-sector Performance and Development in India ................................... 35Box 2- 3: Floriculture in Kenya .................................................................................................................. 58Box 2- 4: Coffee in Rwanda ....................................................................................................................... 59Box 2- 5: Burkina Irrigation Strategy Potential Impact-Analysis Using the Social Accounting Matrix .... 64Box 2- 6: The Innovation Paradigm ............................................................................................................ 67Box 2- 7: CEAS: A Successful Innovation Experience .............................................................................. 68Box 2- 8: Trade Fairs – A Key Vector in the Dissemination of Innovation ............................................... 68Box 2- 9: Development of SMEs at Mozal, Mozambique .......................................................................... 85Box 2- 10: The Botswana Diamond Fund .................................................................................................. 90Box 2- 11: Sustainable Development at Essakane ...................................................................................... 95Box 2- 12: A comparative overview of safari tourism in Burkina Faso, Benin and Kenya ..................... 107 List of Maps
Map 2- 1: Cotton-Producing Zones in Burkina Faso .................................................................................. 14Map 2- 2: Elephant Range in West Africa ................................................................................................ 105


1
VOLUME II – SOURCES OF GROWTH - KEY SECTORS FOR TOMORROW
2.1 Agriculture, particularly cotton and livestock, and mining have been key sectors in Burkina Faso’s economic development since the 1994 CFAF devaluation. Economic growth in the last decade has been fuelled in part by livestock and mining, which have grown by an average of over 12 percent a year since 1994. Moreover, agriculture employs around 85 percent of the working-age population. This economic structure has not fundamentally changed over time and is likely to remain so for another decade at least. This section assesses in detail growth performance in these sectors and potential bottlenecks for further growth. Nevertheless, the tertiary sector, led by transport, telecommunications and financial services, has been the largest contributor to GDP growth over the period. More recently, tourism has been emerging as a sub-sector presenting growth potential.
THE COTTON SECTOR: PERFORMANCE, CRISIS AND THE WAY FORWARD
Sector Overview
2.2 Cotton has played a crucial role in the recent economic performance of Burkina Faso. Approximately 250,000 households and 3 million people depend either directly or indirectly on cotton production for their livelihood, and nearly one person out of six earns cash income from cotton cultivation. The sector represents 50-65 percent of the country’s export earnings. Over the past decade, cotton production has increased by an average of 10 percent per annum, making Burkina the largest producer of cotton in Sub-Saharan Africa. During the peak production campaign in 2005-2006, Burkina produced a total of 751,000 tons of seed cotton. The focus on cotton production has allowed an increase in cereal production – maize, in particular – that is cultivated in rotation with cotton and benefits from the residual effects of fertilizers used for cotton. Since 1994, cereal production has increased by 51 percent.
2.3 However, in spite of important reforms, the cotton sub-sector is facing enormous difficulties that are primarily due to a combination of the decline of the world cotton price and a cumulative appreciation of the Franc CFA vis-à-vis the US dollar. In addition, the absence of an adequate price setting mechanism to align the domestic producer price more closely with the international cotton price has caused substantial financial difficulties for Burkinabè cotton companies and put the sector under financial stress. Recently, the Government, in conjunction with cotton companies and producers, adopted a more performing price mechanism, and they are currently working together to address the current short-term financial crisis of the sector.
2.4 Beyond the difficulties emphasized by the evolution of the international market and despite reforms implemented recently, the cotton sector is facing internal issues that are having a severe impact on its competitiveness and profitability. The long-term competitiveness of the Burkinabè cotton sector has been called into question as productivity and

2
efficiency decline while other more productive producers1, such as Brazil, expand their market share. Land productivity has remained essentially constant since the mid-1980s. Well-equipped farms in Burkina Faso yield two tons of seed cotton per hectare. However, the national average is only one ton per hectare, because yields are very low in many small farms that are not properly equipped. The land productivity in Burkina is 30 percent lower than in Vietnam, 2 times lower than in Egypt, and almost 4 times lower than in China.
2.5 Without further domestic reforms, the sector can no longer be the major stimulus for growth and poverty reduction. Indeed, even if the world market conditions become more favorable, either in response to reduction of OECD subsidies, demand stimulus, or some supply constraints, it is likely that the most efficient cotton producing countries will increase their volumes of production, and thereby prevent Burkina Faso from increasing its share in the world market. Burkina needs to reinforce its competitiveness through the improvement of yields and the reduction of production costs along the circuit of production, transport and marketing. Despite the reforms that have already been realized, the sector still suffers from institutional, organizational and operational limits.
Performance and Constraints
2.6 The land extensive model may be unsustainable. Despite the decline in the total area planted in 2007 (393,000 hectares due to the Government attempt to withdraw from subsidizing fertilizers), the land extensive model is systemic in Burkina Faso, with production areas growing at the same rate as the population (3 percent). As mentioned hereinafter, cotton offers to farmers a certain security, despite price decrease due to different factors: (i) the price is guaranteed, (ii) the cotton company will buy the whole production, and (iii) the relatively speed with which producers receive their incomes. The Government’s Schéma National d’Aménagement du Territoire (SNAT, 2009), that presents a comprehensive diagnostic of the country’s social and economic challenges, emphasized, however, the limits to mismanaged spatial growth and the risks of the land extension model in relation to sustainable development. First, the land extensive model enhances societal issues like spatial saturation, with social externalities such as community pressures and conflicts regarding land tenure. Second, the extensive model raises macroeconomic and microeconomic problems, such as the over-dependence of the national economy to the performance of the cotton sector and farm households’ reliance in government input subsidies. Third, the model develops major pedological and environmental problems, such as (i) soil alteration and erosion due to inaccurate agricultural and agronomic practices, (ii) lands being not enough left lying fallow, and more generally (iii) a striking lack of integration between agriculture and livestock farming; leading to an under-use of manure that could potentially build up soil properties and improve yields.
1 Admittedly, the production environment vary widely from country to country (essentially due factors such as the role of the State, subsidies, exchange rate policies, input supply and technologies) and comparing Burkina Faso with other dominant exporters (such as Zimbabwe) could be viewed as a worthless exercise. Burkinabè cotton, however, competes with others on an asymmetric and quickly changing world market. As a matter of fact, because Burkina Faso is a key actor of the cotton market, benchmarking analysis are of relevance for the country, and those will be used several times in this chapter.

3
2.7 Increasing yields is a crucial objective to boost the cotton sector competitiveness and to stimulate growth. Yields are a key variable of the profitability equation. Increasing yields stands out as an important objective among the very few options for restoring cotton’s contribution to shared growth. As shown on Figure 2-1, world lint cotton yields rose at an average rate of about 3.5 percent per year or 14 kg/ha/year between 1980-1981 and 2008-2009, hitting a new record at least once every three years. This was dragged by improved agronomic practices and the biotechnology adoption in countries such as India and the United States of America. These improvements are expected to continue rising in 2008/2009 and are projected at 794 kg/ha (+3 percent) (ICAC, 2008). In Burkina Faso, but also in Mali, Benin and Chad, lint yields, which increased significantly until 1987, have since leveled off. If cotton yields were to continue to stagnate or even decrease, the prospect for increasing the quantity of cotton exports would have to depend on the unsustainable extensification system (see above). But yields decrease is a multidimensional problem. In addition to various exogenous factors like rainfall, causes of yields stagnation include (i) a decline in ground fertility, (ii) outdated technical practices, equipment and extension services, (iii) the lack of management of the soil and (iv) the lack of incentives for producers to carry out technical recommendations.
Figure 2- 1: Annual Yields (kg/ha) of Seed-Cotton in Burkina Faso
Source: Data from Ministère de l’Economie et des Finances. Note: The data relate to the agricultural season t/t+1. Thus 2001 means 2001/2002
2.8 A diversification strategy must target marginal farmers exiting from cotton. Cotton is no longer profitable for small farmers who are not able to reach a minimum profitable seed cotton yield of 900kg/ha (Labaste, 2008). Although those farmers already partially diversified their production out of cotton towards cereals for their home-consumption, cotton producers continue to participate in the cotton economy as it is often their only option for regular and secure cash income and for input procurement. These farmers consequently owe heavy debts, penalize competitive producers and endanger the survival of the whole sector. The gradual institutional reforms in the sector between 1998 and present have failed to address this constraint. Nouvé and Wodon (2009) showed that the GDP could experience a slight increase by 0.2 to 0.3 percent if the decrease in cotton seed production is offset by an equivalent production increase in other sub-sectors of agriculture, apart from breeding livestock. In addition, Zonon etal. (2009) showed that rice and maize are substantial sources of diversification to foster growth.
y = 9,2962x +921R² = 0,4312
800850900
95010001050110011501200
1990
1992
1994
1996
1998
2000
2002
2004
2006
Annual yield (kg/ha)
Annual yield
Linear trend

4
This exit strategy is all the more relevant as cotton has a snowball effect on other crops’ production: cotton producers have been used to growing crops (rotations with cotton) and they have learned to use fertilizers and plant-care products. Consequently, they often obtain better yields in their food-producing operations than non-producers of cotton.
Figure 2- 2: Yields (kg/ha) of Lint Cotton in the World and in West-Africa
Source: International Cotton Advisory Committee (ICAC)
2.9 The cotton sector performance can be appraised through 4 key elements: (i) the overall financial performance of cotton companies, (ii) the budgetary contribution of the cotton sector on the Burkinabè economy, (iii) the contribution of the sector to producer welfare and (iv) the share of cotton in Burkina’s export earnings.
The financial crisis of the Burkinabè Cotton Sector
2.10 Burkina cotton companies are in the midst of a financial crisis catalyzed by unrealistic producer prices between the 2004-05 season and the present. The companies have accumulated a deficit over three million (2004-05, 2005-06 and 2006-07) close to 80 billion FCFA. In March 2007, the three purchasing companies were in precarious financial positions. SOCOMA and FASO COTON were able to pay back their short term credit for the previous seasons using cash advance from their parent companies. SOFITEX, however, was only able to repay its 2004-05 loan in January 2007. As a consequence, local and international banks were hesitant to extend SOFITEX any financing for the 2006-07 season.
2.11 The cotton companies had to recapitalize in order to avoid being forced to file for bankruptcy based on OHADA2’s regulations. For SOFITEX, the decision was taken to raise the capital from CFAF4.4 billion to CFAF38.8 billion in January 2007. The Government agreed
2 Organisation pour l'Harmonisation en Afrique du Droit des Affaires
5
to finance its 35 percent of the shares, and made an advance to UNPCB to cover its 30 percent of the shares. However, DAGRIS decided to withhold from the recapitalization. In order to meet the 75 percent minimum capital subscription mandated by the OHADA law3, the Government decided to subscribe for another 30 percent out of the portion due from DAGRIS. Thus, the state is now the majority shareholder, with 65 percent. The sector has thus come full circle back to a de facto state monopoly, erasing most of the previous gains made through the reform. The Government would like to sell the 30 percent portion of the shares to a private shareholder and is now looking for another strategic private partner.
2.12 Another burden on government finance was the need to provide a guarantee of CFAF50 billion to the commercial banks in order for SOFITEX to have access to bank loans with which to finance its 2007 season. Moreover, the future of the two new private companies is also quite uncertain, which further complicates the landscape of the Burkinabè cotton sector. They face fewer obstacles than SOFITEX with regard to access to a bank loan, because they are backed by their parent companies. However, they both lost more than three-quarters of their capital, and need to be re-capitalized in order to survive – which is not looked on favorably by their parent companies.
Macroeconomic Impact of the Cotton Sector on the Burkinabè Economy
2.13 Two indicators are used to assess the impact of the cotton sector on the economy: the first is per capita value-added by the sector, and the second is per capita net budgetary contribution of the sector. Total value-added is the sum of value-added at the farm and value-added at the ginning stage. Producer level value-added is the gross value of seed cotton production net of non-labor production costs. Non-labor production costs include fertilizers and pesticides. An alternative definition also includes the costs of animal traction and motorized services. The value-added by ginning is the total free-on-truck (FOT) value of lint and seed net of the purchase cost of seed cotton and all non-labor and non-tax costs.
2.14 The two value-added measures are presented in Table 2-1. For purposes of assessing the relative significance of the outcomes for Burkina, two other countries are included: Mali (the one time greater performer in Sub-Saharan Africa) and Zimbabwe (a different, market-based cotton system with few buyers). Value-added is calculated using the two possible formulas. As the differences between the two sets of values are not tremendous, the first definition is used – where the costs of hired services are not deducted – for the following comments. In 2006, cotton added a total value of US$146.5 million to the economy in Burkina, larger than either Mali or Zimbabwe. The impact on the economy can be further assessed by translating the figures into per capita equivalents. The resulting calculations show that cotton contributes US$10.52 to per capita income in Burkina, almost the double that of Mali and 66 percent more than that of Zimbabwe. Any effort to raise per capita income from cotton activity and thereby contribute to lower the incidence of poverty would require strong actions in the areas of productivity gains and cost saving, because the cotton production costs incurred in Burkina appear to be higher than in most other countries (Table 2-1). However, Table 2-2 shows that the FOB ginning cost of cotton (net of non-tax and non-labor production costs) is quite competitive in Burkina Faso in comparison to other cotton-producers in West Africa.
3 1 percent of the shares is owned by a private domestic investor and will be maintained.

6
2.15 The world price of cotton fiber is certainly a key determinant of value-added to the economy, but it is strongly exogenous. The world price of cotton in US$ has been on a declining trend since 1995 (see below). When taking into account the exchange rate, the resulting price in CFAF has experienced a downward trend coupled with strong inter-annual fluctuations. If the world price of the first quarter of 1996 had prevailed in 2006 and was used in the above calculations, the value-added per capita would have nearly doubled, all else being the same.
Table 2- 1 Total Value Added Per Capita from the Cotton Sector, 2006 Burkina Mali Zimbabwe Value added at the farm level Seed cotton yield (kg/ha) 1100 1011 800 Seed cotton price (US$/kg) 0.33 0.32 0.29 Gross value per ha (US$) 359 324 232 Minus … … Input costs (US$/ha) 165 160 90 … Hired services (US$/ha) 35 31 25 Value added per ha (US$), I 195 164 142 Value added per ha (US$), II 160 133 117 Ginning ratio 42% 42% 41% Value added per kg lint (US$), I 0.42 0.39 0.43 Value added per kg lint (US$), II 0.35 0.31 0.36 Value added at ginning level Free on Truck value per kg lint (US$) 1.13 1.1 1.13 Minus… … price paid to farmer per kg lint (US$) 0.78 0.75 0.67 … other non-tax, non-labor cost (US$) 0.3 0.39 0.22 Value added per kg lint (US$) 0.05 -0.04 0.24 Total value added Total value added per kg lint (US$), I 0.47 0.35 0.67 Total value added per kg lint (US$), II 0.40 0.27 0.60 Production (,000 mT lint) 311 186 123 Total value added (‘000 US$), I 146,513 64,188 118,265 Total value added (‘000 US$), II 123,222 50,609 117,466 Population, 2005 (‘000) 13,933 11,611 13,120 Total value added per capita (US$), I 10.52 5.53 6.31 Total value added per capita (US$), II 8.84 4.36 5.59
Source: World Bank, ESSD Africa Region. Draft Final Report. September 6, 2007. Excerpt from Table 19, p. 116. Notes: For the value added figures, formula I does not take into account the cost of hired services, while formula II does.

7
Table 2- 2:Cost of Production of Lint Cotton. Regional Comparison, 2005
SODECOTON
(Cameroun) SONAPRA (Benin)
SOFITEX (Burkina
Faso)
CMDT (Mali)
SODEFITEX (Senegal)
SOCOMA
(Burkina Faso)
COTONTCHAD (Tchad)
CFAF/kg of lint cotton FOB cost of production
without depreciation and financial
charges 643 596 610 690 710 598 729 FOB cost of production
with financial charges 649 653 649 730 725 670 765
FOB cost of production 679 668 676 755 767 739 799
Source: Géocoton (former CFDT), 2010. Notes: SOFITEX, 2010. Latest data available.
2.16 Per capita net budgetary contribution. In some countries, such as Zimbabwe, the cotton sector contributes positively to the government budget. In Burkina Faso, the cotton sector siphons public resources. As indicated in Table 2-3, the Government must pay the equivalent of 0.81 US$ per capita for the sector to produce the 10.52 US$ per capita value-added. To generate one dollar of value-added, the Government must spend approximately 10 cents. In Mali, the cost to the Government is much higher – the equivalent of 50 cents for every dollar in value-added. Whether these costs are sustainable for Burkina is to be considered. In 2006, while the cotton sector faced a series of exogenous shocks, these costs and their impact on the ginning companies took a serious toll on the economy.
Table 2- 3: Net Per Capita Budgetary Contribution of the Cotton Sector, 2006 Burkina Mali Zimbabwe Total direct and indirect taxes paid (‘000 US$) 4,261 2,883 2,312 Budgetary transfers received (‘000 US$) -15,550 -31,620 0 Net budgetary contribution (‘000 US$) -11,289 -28,737 2,312 Population, 2005 (‘000) 13,933 11,611 13,120 Net budgetary contribution/capita (US$) -0.81 -2.47 0.18
Source: World Bank, ESSD Africa Region. Draft Final Report. September 6, 2007. Excerpt from Table 20, p. 117.
Contribution to Producer’s Welfare 2.17 In Burkina Faso, the activity of cotton farming has strong demographic linkages because (i) the sector offers a certain security to producers, (ii) producing cotton gives peasants access to input and, (iii) the sector is subsidized. It is estimated that approximately 277,000 farms operate with a total of 2 million active people and 3 million people who depend directly on the activity (Table 2-4). The accumulation of productive assets is tightly linked to the capacity of the cotton farm to generate sufficient cash to lift the household out of poverty. Each of the 88,000 manual farmers (those who use hand tools for the key farming operations) operates on an average of 1.45 ha and earns an average net return of CFAF33,000 or a little more than CFAF5,000 per person. By contrast, the fully-equipped farm (animal traction is used at all major

8
stages of farming, except harvesting) operates on an average of 6.8 ha and earns an average net return of CFAF400,000, or about CFAF25,000 per person (five times the earning of a manual farm).
Table 2- 4: Demographic Linkages of Cotton Production, 2005-2006 Typology of farms
Manual Partially equipped Fully equipped Total
Demographics
Number of farms 88,031 122,331 66,909 277,271
Number of persons per farm 6.4 11.4 16.1 10.9
Total people per farm type 563,398 1,394,573 1,077,235 3,035,207
Total number actives per farm type 369,73 917,483 722,617 2,009,830
Total number of literate persons 105,637 281,361 153,891 540,889
Farming data
Area on cotton, average per farm (ha) 1.45 3.04 6.80
Total farm area, average per farm (ha) 2.94 8.82 13.11
Yield of cotton (kg/ha) 790 1,120 1,280 1,050
Total seed cotton production 43,167 273,513 395,220 712,000
Share of total production per farm type (%) 6 38 56 100
Share of total cotton farm population (%) 19 46 35 100
Returns of cotton
Total net return per farm (CFAF) 33,463 141,342 400,540 169,028
Total net return per capita (CFAF) 5,229 12,399 24,878 15,507 Source: Burkina Faso, 2007. SOFITEX data and author’s calculations.
2.18 Producer share of the world price. The pricing of lint cotton directly affects the income received by the producer. Currently, the price received by the producer is directly linked to the international price through the price smoothing scheme (see section on pricing). Earlier on, price setting had followed patterns not directly related to the world price. In Figure 2-3, the ratio of producer price to Cotlook index is depicted along with its levels in current CFAF and in constant 1995 prices. Data are available for the period 1995-2000. The producer share increased from 30 percent at the beginning of the 1990s to nearly 60 percent in 1999-2000. In 2001-2002, the producer received 70 percent of the Cotlook index. The emergence of the National Union of Cotton Producers of Burkina Faso (UNPCB) is generally seen as one of the reasons for the increase in the producer share.

9
Figure 2- 3: Evolution of the Ratio of Producer Price/Cotlook Index, 1995-2000
Source: ICAC.
2.19 Poverty incidence. Agriculture impacts poverty reduction through the interactions between: (i) productivity growth; (ii) returns to producers; (iii) employment of the labor force; and (iv) food prices. According to Lipton (2004, cited by Byerlee, Diao and Jackson, 2005), there are two key conditions for poverty to decrease as a result of these interactions. First, agricultural productivity per unit of labor must increase to raise farm income, but land productivity must increase faster for employment and rural wages to increase (this assumes land scarcity). Second, increased total factor productivity (TFP) in agriculture must result in a decrease in real food prices, but TFP must increase faster than the decline in food prices, in order for farm profitability to rise and for poor consumers to benefit.
2.20 This conceptual framework can be used to look at the impact of the cotton sector on poverty in Burkina Faso. To have a significant positive impact on poverty, productivity gains in the cotton sector should come as a net addition to agricultural productivity gains. Indeed, according to conventional wisdom, there is a complementary relationship between production of cotton and the cereals in the cotton growing regions. First, cereal production benefits from the residual effects of fertilizer applied on cotton, which is a result of the rotation system between cotton and cereals. Second, the know-how accumulated by cotton producers from the extension services of the cotton companies is passed on to cereal producers. Third, cotton producers have access – through the UNPCB – to fertilizer for their cereal. As if to underscore these complementarities, the yield of maize has increased by 200 percent during the past 20 years, and production increased six-fold between 1980 and 2003 in the cotton zone.
2.21 The available rural poverty data indicate that growth in cotton production has not had a sizable effect on reducing poverty in Burkina Faso. The INSD micro data show that from 1998-2003 poverty increased by 1 percentage point for the country as a whole, and by 11

10
points in one of the major cotton zones, Boucle du Mouhoun (Table 2-5). Even in the Hauts-Bassins, the cotton zone with the lowest incidence of poverty, the rate of poverty increased by 2.3 points. These outcomes, which have arisen at a time when the production of cotton has been on a rise, warrant some questions: (i) Is the progress observed not enough to induce a downward trend in poverty?; (ii) Have farmers given up something else in order to foster the observed growth in cotton?; and (iii) Are the end points of the comparison period (1998 and 2003) representative of the average changes?
Table 2- 5: Poverty Rate in the Cotton Zones, 1998 and 2003
Regions Headcount ratio 1998 Headcount ratio 2003 change Hauts Bassins 32.5 34.8 +2.3 Cascades 25.1 39.1 +14 Boucle du Mouhoun 49.3 60.4 +11.1 Burkina 45.3 46.4 +1.1
Source: INSD.
2.22 Another concern is the poverty impact of cotton price fluctuations. Past analyses have looked at the impact of a drop in cotton prices on the economy. In November 2006, the Burkina Inter-professional Cotton Association (AICB) adopted a revised mechanism for producer prices. This mechanism was applied in 2007-2008, and the producer price for cotton seed was fixed at 145 CFAF/kg. The price in 2006-2007 had been 165 CFAF/kg. There had been estimates that this level of price reduction could lead to an increase in the level of poverty by 3.5 percentage points. However, historical evidence has shown that other factors, such as the quantity of cotton production, dilute the impact of a price reduction on the level of poverty. For example, the nominal price received by cotton producers from 1998-2003 was marginally reduced from 180 to 175 CFAF/Kg. Solely on the basis of this price change, the incidence of poverty among cotton producers was expected to increase by about one percentage point (the impact could be slightly larger if the change in price is expressed in real terms). However, the incidence of poverty among cotton growers fell by 7 percentage points between 1998 and 2003. This fact shows the existence of other factors, in addition to prices, that affect the status of poverty among cotton producers.
2.23 Analysis of the impact of changes in producer prices is complex, especially when the effects on the overall economy are taken into account. Microeconomic simulations of the impact of producer prices on poverty generally give partial results that do not take into account the macroeconomic effects of price changes. These effects are often difficult to measure. However, the use of an intersectoral model – such as the SAM-based Keynesian type multipliers – can lead to a better understanding of the different interactions at stake.
2.24 A decline in producer prices is synonymous with a drop in profitability of cotton and in income at the producer level. According to economic theory, this should lead to a drop in cotton production. But for several reasons, including the role of cotton as a means of access to credit and inputs, producers often do not reduce their production in the event of a fall in prices. Their ability to increase production is also limited. However, in the medium-term, if producer prices adjust to the low world prices, it is possible that some producers will stop the production of cotton. This could negatively affect GDP, exports, poverty and other macro and micro indicators of the economy. However, the extent of these impacts might be less important than

11
expected, because producers could reallocate their resources to other agricultural products. This alternative would mitigate the effects associated with the reduction of prices, and would have the advantage of enhancing food production and, therefore, food security. Despite the historical significance of cotton in the development process of Burkina Faso, progress in this area would probably not be large enough to significantly reduce poverty.
2.25 The data generally indicate that the incidence of poverty among cotton producers is of the same magnitude as in the population at large. According to the 2003 households’ survey, the share of poor people among cotton producers is 45.5 percent compared to 46.4 percent for the general population. Simulations show that cotton is no longer profitable for smaller farmers who settle below a yield level of 900 kg/ha. Consequently, an effective strategy for rural development lies beyond the cotton sector.
2.26 One probable explanation of the weak relationship between cotton production and poverty reduction is the instability of the sector as an income generating source. 2004-2005 was a good production year, and producers earned an unusually high profit. Aggregate earnings were CFAF91 billion, which was the highest ever reached. Two years later, the net aggregate returns dropped more than fourfold, reaching only CFAF20 billion. These large swings indicate that accumulation may not be a feasible choice and that producers may have no real alternative but to live year-to-year.
Share of Cotton in Burkina’s Export Earnings
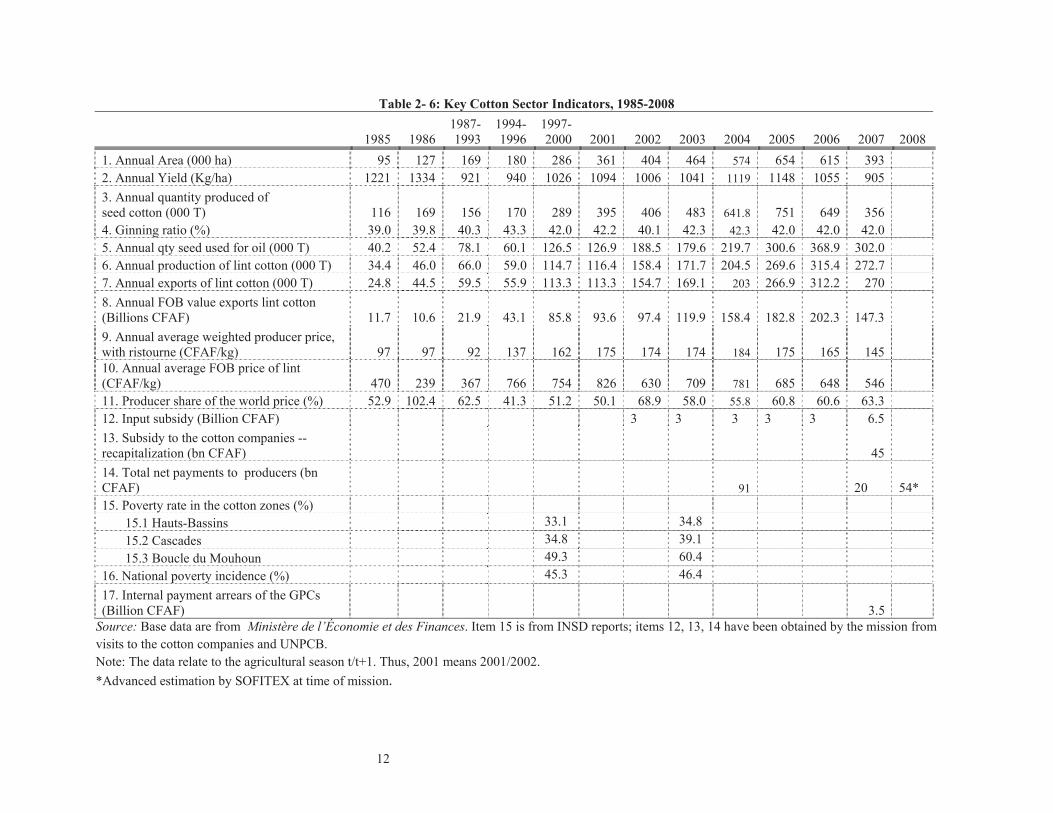
2.27 Exports: Cotton is the number one commodity exported by Burkina Faso. Expressed in current CFAF, exports increased from CFAF12 billion in 1985-1986 to over CFAF200 billion in 2006-2007 (Table 2-6). Exports started hitting significant levels when they crossed the 100 billion mark in 2003. However, the 2007 fertilizer price increase caused a drop by 27 percent compared to the previous year. The value of exports is a product of seed cotton production, the ginning ratio and international prices – and its significant increase is mostly due to the gains in production.
12
Table 2- 6: Key Cotton Sector Indicators, 1985-2008
1985 1986 1987-1993
1994-1996
1997-2000 2001 2002 2003 2004 2005 2006 2007 2008
1. Annual Area (000 ha) 95 127 169 180 286 361 404 464 574 654 615 393 2. Annual Yield (Kg/ha) 1221 1334 921 940 1026 1094 1006 1041 1119 1148 1055 905 3. Annual quantity produced of seed cotton (000 T) 116 169 156 170 289 395 406 483 641.8 751 649 356 4. Ginning ratio (%) 39.0 39.8 40.3 43.3 42.0 42.2 40.1 42.3 42.3 42.0 42.0 42.0 5. Annual qty seed used for oil (000 T) 40.2 52.4 78.1 60.1 126.5 126.9 188.5 179.6 219.7 300.6 368.9 302.0 6. Annual production of lint cotton (000 T) 34.4 46.0 66.0 59.0 114.7 116.4 158.4 171.7 204.5 269.6 315.4 272.7 7. Annual exports of lint cotton (000 T) 24.8 44.5 59.5 55.9 113.3 113.3 154.7 169.1 203 266.9 312.2 270 8. Annual FOB value exports lint cotton (Billions CFAF) 11.7 10.6 21.9 43.1 85.8 93.6 97.4 119.9 158.4 182.8 202.3 147.3 9. Annual average weighted producer price, with ristourne (CFAF/kg) 97 97 92 137 162 175 174 174 184 175 165 145 10. Annual average FOB price of lint (CFAF/kg) 470 239 367 766 754 826 630 709 781 685 648 546 11. Producer share of the world price (%) 52.9 102.4 62.5 41.3 51.2 50.1 68.9 58.0 55.8 60.8 60.6 63.3 12. Input subsidy (Billion CFAF) 3 3 3 3 3 6.5 13. Subsidy to the cotton companies -- recapitalization (bn CFAF) 45 14. Total net payments to producers (bn CFAF) 91 20 54* 15. Poverty rate in the cotton zones (%) 15.1 Hauts-Bassins 33.1 34.8 15.2 Cascades 34.8 39.1 15.3 Boucle du Mouhoun 49.3 60.4 16. National poverty incidence (%) 45.3 46.4 17. Internal payment arrears of the GPCs (Billion CFAF) 3.5
Source: Base data are from Ministère de l’Économie et des Finances. Item 15 is from INSD reports; items 12, 13, 14 have been obtained by the mission from visits to the cotton companies and UNPCB. Note: The data relate to the agricultural season t/t+1. Thus, 2001 means 2001/2002. *Advanced estimation by SOFITEX at time of mission.

13
Figure 2- 4: Share of Cotton in Burkina’s Export Earnings
Source: Labaste, 2008.
Outcome Indicators for the Sector
2.28 Extensive growth: The production of seed cotton in Burkina Faso has experienced an upward trend since the mid-1980s (see Figure 2-5). In 1985 Burkina produced 116,000 tons of seed cotton. In 1986, production was 169,000 tons (Table 2-7). Over the next nine years (1987-1996) there was a near stagnation at about 160,000 tons per year. Production picked up in an unprecedented way starting in 2001/2002, when it reached 395,000 tons. Cultivated areas reached 360,000 ha. These are principally in the South West, which is part of the most important West African cotton basin, which Burkina shares with Mali and Côte d’Ivoire (Map 2-1). In 2005-2006 production in Burkina reached its highest level ever – 751,000 tons. The area planted also reached its highest level that year – 654,000 ha.
2.29 During the period from 1985-2007, farm level production increased at an average annual rate of 7.5 percent. A breakdown of the period into two sub-periods (1985-1994 and 1995-2007) shows that progress has been uneven. In the sub-period of 1985-1994, seed cotton production experienced a near stagnation with an average annual growth rate of 0.4 percent (Table 2-6). Growth has been much stronger during the last decade – nearly 10 percent annually. This strong push made Burkina Faso the largest cotton producer in Sub-Saharan Africa in 2005-2006.
2.30 Breaking down the quantities harvested into their yield and area components, it appears evident that most of the observed growth of seed cotton production is due to area expansion. Total area planted has grown very fast. From 1985-1993, the average was 130,000 ha/per year. From 2003-2006, the average was more than 570,000 ha/per year. Following an increase in the price of fertilizer, the average dropped down to 393,000 ha in 2007. This expansion in area amounts to an annual growth of 7.3 percent, which accounts for 97 percent of the growth in production from 1985-2007. During the most recent sub-period – 1995-2007 – total area grew by an average of 9.7 percent per year, accounting for 98 percent of the growth in production. Thus, extensification rather than intensification characterizes the model of cotton

14
growth in Burkina Faso. As the long-term yield data show, land productivity has experienced a very flat trend over the 20 years since the mid-1980s (Figure 2-5).
Figure 2- 5: Production of Seed Cotton, 1985-2007
y = 22.632x + 20.695R² = 0.6855
0
200
400
600
800
Production of seed cotton (1000 MT)
Production seed cotton (1000 T)
Linear (Production seed cotton (1000 T) )
Source: UNPCB
Map 2- 1: Cotton-Producing Zones in Burkina Faso
Source: ECOWAS/SWAC-OECD, 2006.

15
Table 2- 7: Decomposing Seed Cotton Production Growth into Area and Yield Components Mean annual
growth rate 1985-2007 (%)
Mean annual growth rate
1985-1994 (%)
Mean annual growth rate
1995-2007 (%) Quantity of seed cotton 7.5 0.4 9.9 Area 7.3 4.7 9.7 Yield/ha 0.2 -4.3 0.2
Source: Computed from UNPCB annual raw data, using a semi-log regression.
2.31 Two potentially damaging problems emerge in the statistical analysis of cotton production in Burkina Faso. The first is the lack of progress in land productivity, as documented above. This may be due to an insufficient response by farmers to problems of soil fertility management and insect control. The second is the severe volatility of the sector as evidenced by the fluctuations in area planted and production harvested during the past three campaigns. Area planted by farmers – which proxies the attractiveness of cotton production – has plummeted from 615,000 ha in 2006-2007 to 393,000 ha in 2007-2008. This resulted in a 45 percent loss in production, which also reflects a decline in yield. This episode underscores the fragility of gains in the sector and how rapidly such gains can be eroded, and the role for anticipation in managing the cotton sector.
A Low Competitiveness Due to a Difficult External Context 2.32 World cotton prices are at historic lows and put the sector under pressure. Cotlook A Index-(“Cotton Outlook”) -average of the cheapest five quotations from a selection of the main upland cottons traded internationally- declined consistently during the 80’s, 90’s and two thousand’s periods. According to the United Nations Conference on Trade and Development (UNCTAD)4, several factors contributed to drive cotton prices down during the last twenty years, including: (i) a rise in cotton production that increased from 19 million tons in the 1990-91 season to 20.7 million tons in 1991-92, due to the increasing supply from China, whose production rose from 3.8 million tons in 1989-90 to 5.7 million tons in 1991-92, (ii) the declining demand, more especially in the former Soviet Union during the early 90’s, (iii) the effect of direct subsidies (particularly at the end of the 90’s), that led the price to reduce by almost one half between 1994-95 (1.75 US$/kg) and 2001/02 (1 US$/kg). As far as recent times are concerned, a noticeable decline in the Cotlook A index occurred between 2008 and 2009 (the index averaged US$ 1.22/kg during January-April 2009, 27 percent lower than the corresponding 2008 average of US$ 1.70/kg), mostly reflecting weak global demand due to the aftershocks of the financial crisis. The International Cotton Advisory Committee (ICAC) expects annual prices to remain at low levels on a 10-year horizon, and consequently affect the survival of cotton production, processing and trade and, above all, endanger nationwide macroeconomic stability.
2.33 Reasons for current decline include reduced production costs, resulting from technological improvements on the supply side, stagnant per capita consumption, and competition from synthetic products. Although the financial crisis is likely to hit harshly the cotton sector in Burkina Faso due to the reduction in global export demand (export quantities decreased from 194,000mT in 2007/08 to 156,000mT in 2008/09, Table 2-8), reductions in production costs have also been associated with yield increases (world average), from 300 kilograms per hectare in the early 1960s to about 700 kilograms per hectare in 2005. This yield
4 http://www.unctad.org/infocomm/anglais/cotton/prices.htm

16
increase reflects the introduction of improved varieties and increased use of irrigation and chemical fertilizers. Synthetic products currently account for about 40 percent of total fiber consumption (down from 65 percent in the early 1960s). The spread of genetically modified (GM) seed technology in developing countries (area allocated to GM cotton reached 48 percent during 2008/09, corresponding to 54 percent of global production), with adoption rates exceeding 90 percent (in South-Africa, Australia and the US) and precision farming in developed countries is expected to reduce the costs of production even further.
Figure 2- 6: Monthly and Annual Cotton Prices- Cotlook A Index- (a) monthly prices (US$/kg), (b) annual prices (US$/kg)
Source: World Bank, 2009.
Table 2- 8: Trends in the World Cotton Production
Source: World Bank, 2009

17
A Modest Competitiveness Due to the Low Performance of the Downstream Segments of the Cotton Filière
2.34 Burkina Faso remains predominantly an exporter of cotton lint, cotton seed and a small portion of raw fabric. In terms of export potential for cotton-extended products, their share of exports remains relatively small and concentrated on less value-added items, with cotton seed oil and cottonseed respectively ranking as the 7th and 8th largest export items in the country; and textile as the 15th largest export item of the country with an export share less than 0.3 percent of total export. In order for Burkina Faso to move to higher stages in the cotton to textile value chain, it is worthwhile to have a look at the activities performed at each stage of the processing of cotton to textile, and derive the competitiveness for each stage in terms of structure cost and existing constraints.
Table 2- 9: Cotton to Textile Value Chain
Process Cotton Picking Spinning, Winding Weaving, Knitting Processing
waste Dyeing,
Finishing Design,
Manufac.
Product Cotton Lint
Cotton Yarn Fabric, African Prints Non woven
fabric Textile Garment
Capacity 273,000 mT 3,400 mT N/A N/A 1,000 mT N/A
Firms (location)
SOFITEX FASOCOTON
SOCOMA
FILSAH
FASOTEX Artisan groups
BELCOT (shut down)
FASOTEX
Artisan groups
Constraints High Input Cost especially for electricity and transportation
- High competition (Neighboring countries, China)
- Design, Marketing Value Added Low High
Source: Authors.
2.35 One of the striking characteristics of Burkina Faso’s cotton-textile-apparel value chain is that the middle portion of the value chain (weaving mills, knitting units, and dyeing and finishing units) is missing. This lacuna prevents the industry from migrating to products with higher value-added. The domestic and sub-regional market for artisanal fabric is certainly no larger than 800-1,000 mT per annum and is not expected to grow as young generations’ preference shifts to non-traditional clothes. UAP-GODE, an artisanal group that employs some 20 female weavers who produce traditional fabrics, and Groupement Garga are expected to remain small-scale and present very limited potential for expansion as demand from European and U.S. markets are limited for those products. Although Groupement Garga is still operational in Koudougou, most traditional weaving groups in Burkina Faso have shut down due to limited demand and high costs associated with the import of chemicals and dyes required for the production of African prints. The informal character of the African print sector makes it difficult to gather accurate information on costs related to some items. However, the following cost estimate was presented by FASOTEX, a major formal African prints bag producer created in 2005.
2.36 High chemical inputs costs are also substantial constraints to develop downstream activities. Table 2-10 shows that 90 percent of FASOTEX’s costs are sucked away by fabric and chemicals/dyes, 90 percent of which are imported from Belgium (SomaColor and Alchem). The remaining 10 percent comes from Ouagadougou (Coprochim). In addition to high chemical

18
costs, finishing operations also require FASOTEX to use a lot of water for washing and bleaching processes. High cost of imported input items adversely impacts competitiveness of a sector already threatened by a decreasing demand and fierce competition on world markets.
Table 2- 10: FASOTEX’s Production Costs Items CFA per one bag USD per one bag Proportion
Raw material (fabric) 291.5 0.72 0.53 Chemical products/dyes 203.5 0.50 0.37 All others 55 0.14 0.1 Total Cost 550 1.35
Source: Authors’ calculation, Data from USAID5
The Stratification of Farmers Impedes Optimal Performance of the Filière 2.37 Stylized aspects of farmers’ stratification are (i) important performance gaps between large and small farmers and, (ii) high rates of illiteracy.
2.38 In Burkina Faso, the unit cost of production increases as one moves from the top producers (group 1, large farmers, high yields) to the poor and less efficient ones (group 3, small farmers, low yields). Table 2-11 presents summary crop budget by farmer type and country. The groups of farmers are those identified by focus group discussions (combining areas and yields criteria) in seven of the sample countries (Tschirley et al., 2009). The focus is on the use of labor and the costs of seed cotton production across groups and countries, so as to compare Burkina Faso’s performance with other countries across Africa. In Burkina and other African countries, there is a positive correlation between farm size, yields and the costs of inputs and labor. Large and medium Burkinabè farmers experience high net margins whereas small farmers’ net profits are not economically desirable. In average, large and medium Burkinabè farmers enjoy higher profitability than other African countries, whereas small farmers, in Burkina and elsewhere, struggle to obtain net returns.
5 This latter category includes workers’ salaries and overhead, depreciation, financial costs, and office equipment/furnishings, Calculated exchange rate: 1 CFA Franc BCEAO = 0.002463 US Dollar, as of July 19, 2008

19
Table 2- 11: Summary of Cotton’s Sector Performance and Budgets by Farmer Type and Country Burkina Faso Cameroon Mali Mozambique Tanzania Uganda Zambia Zimbabwe Group 1 (large farmers) Yields (kg/ha) 1,350 1,259 1,429 1,519 1,125 2,188 1,200 1,750Seed cotton price (USD/kg) 0.33 0.32 0.32 0.21 0.28 0.25 0.25 0.31Gross revenue (USD/kg) 441.45 339.10 452.99 322.03 314.06 547.00 300.00 542.50Cost of input (USD/ha) 172.89 141.44 168.61 36.50 35.83 111.11 31.07 236.85Cost of hired services (USD/ha) 28.52 48.83 33.69 22.25 54.18 72.22 17.06 32.98Cost of hired labor (USD/ha) 0 0 0 0 122.90 116.27 150.71 65.10Gross margin, excluding labor (USD/ha) 240.04 208.83 250.69 263.28 224.06 363.67 251.87 272.67Cost per kg (USD) 0.22 0.32 0.21 0.15 0.22 0.19 0.20 0.21Net margin (USD/ha) 140.34 -1.86 156.24 91.93 71.16 137.55 56.16 173.82Group 2 (medium farmers) Yields (kg/ha) 1,100 1,120 1,011 935.0 750.0 1,125 1,050 800.00Seed cotton price (USD/kg) 0.33 0.32 0.32 0.21 0.26 0.25 0.25 0.29Gross revenue (USD/kg) 359.70 355.04 320.49 198.22 196.88 281.25 262.50 232.00Cost of input (USD/ha) 164.89 132.76 159.58 36 18 8.33 31.07 90.08Cost of hired services (USD/ha) 34.55 15.91 31.30 4.76 40.83 71.11 39.36 25.38Cost of hired labor (USD/ha) 0 0 0 116.80 42.71 62.50 109.52 35.85Gross margin, excluding labor (USD/ha) 160.26 206.37 129.61 157.46 138.05 201.81 192.07 116.55Cost per kg (USD) 0.26 0.32 0.27 0.28 0.24 0.21 0.21 0.27Net margin (USD/ha) 70.95 -4.32 51.29 -59.44 15.33 44.67 45.41 19.33Group 3 (small farmers) Yields (kg/ha) 750.0 1,09 711 438 600 600 563 565Seed cotton price (USD/kg) 0.33 0.32 0.32 0.24 0.24 0.25 0.25 0.21Gross revenue (USD/kg) 245.25 345.53 225.39 103.91 144 150 140.75 119.78Cost of input (USD/ha) 156.89 141.44 146.04 5.50 48.55 20.41 8.33 13.50Cost of hired services (USD/ha) 75.87 11.61 23.10 1.04 0 9.93 71.11 0.80Cost of hired labor (USD/ha) 0 0 0 0 0 28.57 5.21 6.70Gross margin, excluding labor (USD/ha) 12.49 192.48 56.25 97.37 95.45 119.66 61.31 105.48Cost per kg (USD) 0.41 0.33 0.32 0.23 0.26 0.35 0.38 0.29Net margin (USD/ha) -62.06 -18.21 -0.19 2.37 -10.80 -58.91 -72.34 -41.78
Source: Tschirley et al., 2009

20
2.39 Best producers of cotton are operating on large surfaces of land, but overall performance remains constrained by high rates of illiteracy. The starting point when comparing farmers is that there will always be some farmers who, by superior skill or hard work and by asset accumulation do well, thereby producing high yields and achieving good returns. How well producers do also depend on soil fertility. Table 2-12 shows that, in average, large operations are making a net profit at recent (2007) producer prices. Those large farms can therefore be considered as the best producers, while smaller producers struggle to match the market value of their own labor (Labaste, 2007). Table 2-11 shows that gross income per hectare is considerably higher than for the smaller ones. The production cost per kilogram including labor ranges from CFAF 108 for large farms to CFAF 174 for the smaller ones. However, fully-mechanized large farms do not enjoy higher profitability than non-mechanized large farms employing animal traction. Mechanized farms’ productivity and scale gains are offset by high maintenance, oil and lubricant costs. The rate of illiterate producers remains high and jeopardizes farmers’ performance. Table 2-3 showed that 18.7 percent of persons are literate in manual farms, 20 percent of persons are literate in partially equipped farms and 14 persons are literate in fully equipped farms. Illiteracy is a barrier to the modernization of exploitations, to the introduction of a more elaborate support, to technological innovations and is the cause of an under-efficient use of production tools and inputs. In addition, it has a direct impact on the functioning of producers’ organizations and the circulation of information.
2.40 Building human capital is necessary to raise farmers out of farm mismanagement. UNPCB is well aware of the illiteracy problem, and is undertaking different measures to curb it. It is collaborating with the Programme d’Appui aux Filières Agro-sylvo-pastorales (PAFASP) on a project that aims at training GPC members in literacy and basic farm management.
Table 2- 12: Cost-Benefit Analysis in Different Villages of Burkina
Type Motorized Large (non-motorized)
Medium (non-motorized)
Small (non-motorized)
Yield 1,500 1,375 1,100 700Income (165 FCFA/kg) 247,500 226,875 181,500 115,500Inputs On Credit 91,800 84,475 84,615 76,535Income After Payment Of Credit 155,700 142,400 96,885 38,965Tractor And Animal Traction Cost 51,721 13,874 16,781 3,314Hired Services 0 0 0 21,000Total Cost Excluding Labor 143,521 98,349 101,396 100,849Income Excluding Labor 103,979 128,526 80,104 14,651Number Of Man-Days Required 96 101 89 75Net Income Including Labor 56,114 78,188 35,530 -23,005Total Cost Including Labor 128 108 133 174
Source: Labaste, 2007.
Ginning ratios and quality issues are significant factors of the competitiveness equation 2.41 Ginning ratio (kg of lint cotton per 100kg of raw cotton). Research in Burkina has led to a significant increase in the ratio of transformation of seed cotton into lint. This ratio increased from 33 percent in the 1960s, to 39 percent in the 1980s, to a current average of 42 percent (Figure 2-7). However, this ratio has remained constant since the 90’s. Because it is the lint that is traded internationally, increasing the ginning ratio is crucial for achieving good returns.

21
Figure 2- 7: Ginning Ratio
Source: Base data from Ministère de l’Economie et des Finances Note: The data relate to the agricultural season t/t+1. Thus 2001 means 2001/2002
2.42 Lint quality. In Burkina, the quality of seed cotton is usually quite good in terms of length (Table 2-14). However, the quality of seed cotton falls short in terms of color and ripeness, which are two key criteria for judging the quality of cotton lint. The problem is mainly due to unreliable transport and inadequate warehousing facilities. Cotton lint quality depends not only on the quality of the seed but also on harvesting practices and ginning operations. A recent World Bank study assessed the quality of Burkinabè cotton. The main findings are summarized below:
Grading system of seed cotton: Seed cotton is classified into three grades. In Burkina, like other African countries, there is a tendency to overestimate grade 1 cotton. The reasons are twofold: (i) the agents in charge of grading would rather avoid conflict with farmers; and (ii) the agents may collect personal benefits from deliberately overgrading a pile of cotton.
SOFITEX – the largest of the ginning companies – performs the grading of all ginned cotton. The first stage consists of a manual and visual classification, which is then confirmed by laboratory tests.
Evolution of quality over the past ten years: In 1992, SOFITEX launched a quality improvement program, which has led to a considerable improvement in quality despite the concomitant increase in production. There are significantly fewer instances of contamination by foreign bodies and stickiness as a result of this program. The proportion of lint cotton classified at the highest standard (0) was in the range of 9-17 percent in the mid-1990s. By 2009-2010, the proportion had increased to 32 percent (Table 2-13).
y = 0,0795x +41,2R² = 0,1509
20
30
40
50
1990
1992
1994
1996
1998
2000
2002
2004
2006
Ginning ratio (%)
Ginning ratio
Linear trend

22
The substantial proportion of SOFITEX cotton with grade “0” standard and the good reputation of the “Burkina brand” endowed lint cotton with FOB prices (West Africa ports) that are often higher than the Cotlook A index. It should be noted that between the 2003/2004 and 2008/2009 seasons, these factors accounted for a capital gain of around CFAF18 billion as SOFITEX earnings.
2.43 The major quality threat is the contamination by foreign bodies. The first contamination risk occurs in the field when collection is delayed for such reasons as competing cotton and cereal harvests. The polyethylene bags used to collect cotton are sources of contamination, because the polyethylene threads often slide into the fiber of the cotton. Low lint quality is symptomatic of several dysfunctions along the cotton chain, including the grading process. International cotton merchants place a high premium on grading reliability. Lack of grading reliability may result in lower prices. The quality of cotton is basically the same among the African countries that export cotton. However, in 2006-2007, the average premium of the quotation for the top type of each country in Cotton Outlook over the Cotlook A Index ranged from 1-7 cents per pound. Zambia and Zimbabwe received the highest premium; Tanzania and Mozambique the lowest; Burkina was in between at 3 cents per pound. Several other countries in the world are facing such polyethylene contamination problems (see Box 2-2 about India), showing that the space for quality improvement and quality control with improved technologies is vast.
2.44 In order to reduce the presence of polyethylene foreign matters in the lint cotton, SOFITEX has recently implemented sound quality actions, such as the use of new packaging bags (multi-layer technology). This corrective action has brought satisfaction among most of SOFITEX demanding customers, namely Dreyfus, Cargill Cotton, Glencore, Noble Cotton, Olam, Ecom or Reinhart.
Table 2- 13: Grade Classification of Lint Cotton, 1996-2005 (% of total lint quantity)
STD 98/ 99
99/ 00
00/ 01
01/ 02
02/ 03
03/ 04
04/ 05
05/ 06
06/ 07
07/ 08
08/ 09
09/ 10
0 11.0 16.5 12.0 16.7 15.0 12.5 24.3 25.7 14.3 52.2 52.4 32.1 1 32.2 34.0 45.0 47.2 41.5 38.6 39.5 49.4 45.5 32.6 36.4 48.2 2 51.5 44.1 41.8 35.0 39.8 42.8 29.8 24.0 35.9 12.7 10.2 19.2 3/4 5.4 5.4 1.2 1.1 3.8 6.2 6.5 0.9 4.3 0.5 1 0.4
Source: SOFITEX 2010
Table 2- 14: Sofitex Cotton Quality, 2005 - 2010
04/05 05/06 06/07 07/08 08/09 09/10
percent 1.1/8
70.2 81.2 87.9 96.5 92.6 84.2
percent 1.2/32
23.3 17.8 7.7 3 6.33 15.3
Source: SOFITEX, 2010

23
Institutional and Policy Framework Conceptualizing the Links between Organization and Performance
2.45 The cotton sectors in Africa can be classified into five types which fall into two broad categories: market-based vs. regulated sectors (Tschirley and al, 2009).
2.46 Market-based systems: In these sectors, competition is allowed in the purchase of seed cotton. There are two sub-systems, which are differentiated from each other according to the number of buying firms in operation: (i) competitive systems; and (ii) concentrated systems. Competitive systems allow for many buyers. Tanzania – which has more than thirty buyers – falls into this category. Concentrated systems allow for only a few buyers. Zambia and Zimbabwe – which have one dominant buyer, one large competitor and two to three very small buyers – fall into this category.
2.47 Regulated systems: In these sectors, competition is not allowed in the purchase of lint cotton. They are further classified into three sub-systems: (i) national monopolies: (ii) local monopolies; and (iii) hybrid systems. In a national monopoly, there is only one cotton buyer. Examples include Cameroon, Mali, Chad and Senegal (in the latter, the monopoly is a private firm). In a local monopoly, there is more than one cotton buyer, but each firm is assigned a specific geographic area of activity. The typical case is the Burkina system. In a hybrid system, there is more than one regulated buyer and competition is allowed between buyers. Benin evolved from a national monopoly to a hybrid system. Uganda evolved from a competitive to a hybrid system.
2.48 The major differences between market-based and regulated systems can be described in reference to two dimensions: coordination and competition. In market-based systems, vertical coordination is achieved through the price mechanism. In regulated systems – such as the ones in Burkina and Mali – vertical coordination is assured from the producers all the way up to the ginnery and to the export market. Horizontal coordination is used in systems that have many firms. It involves coordination among different players at one level of the system. The conceptual point of view is that in the real world, there are trade-offs between coordination in this sense and competition. The typology presented above can be used to predict what type of performance outcome can be expected for each type of system in each of the two dimensions.
2.49 According to Poulton et al. (2004), there are four critical functions that cotton sectors are expected to play in SSA: (i) the provision of input credit to producers; (ii) the maintenance of quality control; (iii) the maintenance of a high quality research system and effective extension of the resulting research knowledge and products; and (iv) the provision of an attractive seed cotton price. The study finds that in the absence of a strong high-capacity government regulatory authority as is the case of Burkina, the sector structure should: (i) be a good provider of inputs through credit; (ii) maintain a high quality standard of the product; and (iii) maintain a successful research system that works through an effective extension system.
2.50 Cotton research in Burkina is currently spearheaded by the National Institute for the Environment and Agronomic Research (INERA), which works in partnership with the cotton companies. This partnership has thus far produced good results. INERA works in the areas of plant genetics, agronomy, plant pathology and pest control, and the socioeconomic aspects of cotton production. Extension work is carried out by technicians in each cotton

24
company. These technicians work with UNPCB structures and farmers to guarantee the technical quality of the cotton.
The Cotton Sector Reform of Burkina Faso and the Current Structure of the Sector 2.51 Policymakers in Burkina have been liberalizing the industry since 1991. The agenda was built on earlier reforms that aimed: (i) to transfer supply chain management functions from the Government to stakeholders (cotton companies and producer groups); and (ii) to introduce competition at the ginnery level. At that time, most cotton sectors in West Africa were undergoing a financial crisis, which was largely due to the overvaluation of the CFA franc. Devaluation of the CFA franc occurred in 1994. There were three main ideas behind the reform: (i) to restructure the failing farmer organizations through which group credit was channeled for input purchases; (ii) to take steps aimed at building competitiveness for the sector in the context of an unfavorable exchange rate; and (iii) to redirect the role of the Government toward the provision of public goods and regulatory tasks.
2.52 Burkina Faso opted for a gradual reform approach, which took nearly 14 years to materialize. The implementation of the reform process started in 1998, which was seven years after the decision to liberalize the sector. Initially SOFITEX was a parastatal monopoly in which: (i) the Government held 65 percent of the shares; (ii) the French company for textile development (CFDT) held 34 percent; and (iii) private banks held 1 percent. Eventually, ginning was spilt into three companies with SOFITEX having a dominant market share. Producers were given stakeholders rights in the ginning companies and participate as full actors in the overall management of the sector. However, the reform fell short of establish a truly contestable cotton sector.
2.53 In preparation for the new structure of the sector, SOFITEX made an important institutional change in 1996: it created cotton producer associations. The Groupements de Producteurs du Coton (GPC) replaced the GVs (Groupements Villageois) that failed in 1992. A typical GPC includes about 30 members, and is required to produce a minimum of 40 mT seed cotton in aggregate. The creation of the GPCs was intended to transform the activity of cotton production into a professional business by improving efficiency in seed cotton marketing and handling of inputs and credit. The GPCs were further aggregated: (i) at the department level into UDPCs (Union Départementale des Producteurs de Coton); and (ii) at the Province level into UPPC (Union Provinciale des Producteurs de Coton). In 1998, the UPPC federated into the apex6 structure of cotton producers: the National Union of Cotton Producers of Burkina Faso (UNPCB). Following these preparatory phases, two additional steps led to the model of a liberalized sector in 2004. The path describing the successive structures of SOFITEX and the current organizational structure is depicted in Figure 2-8.
2.54 Step 1: In 1999, the Government sold nearly half of its shares in SOFITEX to UNPCB. At that point, The Government held 35 percent of SOFITEX shares. The remaining shares were divided as follows: DAGRIS (a private firm; formerly CFDT) held 34 percent; UNPCB held 30 percent; and local banks held 1 percent. The Government transferred responsibility for supply chain management to UNPCB through: (i) an Interprofessional Agreement (Accord interprofessionnel) between UNPCB and SOFITEX that was enacted
6 Apex organization refers to an umbrella group including many associations and organizations.

25
through government decree; and (ii) the creation of a cotton sub-sector management committee (Comité de gestion). The management committee was composed of 12 members – seven represented producers, three were from SOFITEX, and two represented the Government. It was intended as a caretaker organization, to be disbanded at the arrival of new private cotton companies. It is the enforcement body behind the Interprofessional Agreement. Its duties include: (i) pricing inputs; (ii) setting the purchase price and premiums for seed cotton; (iii) administering the Price Support Fund for pricing risk mitigation; and (iv) overseeing the producer-supported national research agenda and road maintenance program.
2.55 Step 2: The creation of two private companies, FASO COTON and SOCOMA, through the sale of assets previously owned by SOFITEX. This was intended to be the final step in the reform. The new entities were selected through a competitive bidding process. The companies began operation in 2004. They worked under eight-year contracts, which afforded them exclusive purchase rights in the central and eastern sections of Burkina’s cotton production belt. These areas represented 15 percent of national cotton output – 10 percent for the SOCOMA zone and 5 percent for Faso Coton.

26
Figure 2- 8: Evolution of the Cotton Sector
?
SOFITEXState: 65%Prod.:34%Other: 1%
SOCOMA
FASO COTON
SOFITEXState: 35%DAGRIS: 34%Producers: 30%Other: 1%
SOCOMA
FASO COTON
SOFITEXState: 35%DAGRIS (CFDT):34%Producers: 30%
Share in Cotton Sector: Share in Cotton
Sector: 10%
Share in Cotton Sector:
SOFITEXState: 65%CFDT: 34%Other: 1%
CFDT 100%
Before1975
1975 - 1998
1999 - 2003
2004 - 2006
Since 2007
2009-

27
2.56 In 2004, the Interprofessional Agreement of 1999 was amended to include the two new private cotton entities. The revised agreement7 included representatives of the new companies to the Comité de gestion. It called for the creation of an Interprofessional Association, which would have the following responsibilities: (i) coordination of research; (ii) seed supply; (iii) selection of new varieties; (iv) technical specification of pesticides; (v) extension; (vi) quality standards and control for lint; and (vii) road maintenance. It also equalized cotton prices across the three zones. In order to coordinate their actions, the three cotton companies created a professional association, the Association professionnelle des sociétés cotonnières du Burkina (APROCOB). APROCOB and UNPCB collaborated to create an interprofessional association to manage the sector, the Association interprofessionnelle du cotton du Burkina (AICB). However, the key to the interprofessional management of the sector rests with the interprofessional agreement (Accord interprofessionnel), which was updated in November 2006. This agreement was established between UNPCB and APROCOB. It rules all types of relations between the producers and the cotton companies, including: (i) the delivery by companies to producers of inputs and other services, such as advisory; (ii) the obligations to sell regarding all seed cotton sold to companies – together with the price setting mechanism; and (iii) the organization of production campaigns.
2.57 This mode of privatization has faced its critiques. SOFITEX weighed heavily in the resulting structure and the Government was still present in the sector through its shares in SOFITEX. Therefore, important decision-making affecting the sector was still being made by the Government through SOFITEX. In fact, not much changed in the way that SOFITEX was run – the producers were too dependent on the Government, and lacked the expertise to act as strategic partners. The assumption that the producers would constitute a check on both SOFITEX management and the Government’s intervention by having a more strategic view of the sector did not materialize, due to their lack of capacity. Moreover, DAGRIS continued to play its traditional role in the sector. This middle-of-the-way type liberalization of the sector was partially responsible for the crisis that overtook the sector starting in 2006-2007.
The Crisis of the Burkina Cotton Sector
2.58 The cotton sector of Burkina has experienced a tremendous push these past ten years. As discussed above, it is currently undergoing a severe financial crisis that threatens its survival. This crisis has cast doubt on the ability of recently reformed institutions to respond to the twin challenges of declining world lint prices and appreciating domestic currencies. The cumulative deficit since 2004-2005 has reached CFAF 80 billion (US$158 million) – mostly owed by SOFITEX. This deficit is beyond the regulating capacity of the price smoothing mechanism. The crisis has several root causes: (i) the domestic producer price has been set too high compared to the world price; (ii) the difficulty to anticipate the sharp drop of cotton prices on the international marketprevented the cotton companies to cover themselves through prudent actions, such as reducing operating costs, hedging against exchange rate fluctuations, and aligning with
7 Known in French as Protocole d'accord portant cahier des charges applicable aux opérateurs de la filière coton.

28
the international price; (iii) the cotton companies were overconfident in the ability of the Government to finance their deficits and (iv) an enabling environment continuously challenged by high energy and transport costs. That overconfidence resulted from an erroneous interpretation of the September 2004 Protocol between the state, the producers and the companies.
Managing Price Risk: the New Price Smoothing Mechanism
2.59 In 1999, the cotton sector adopted a price support mechanism, which was amended in 2004 with the founding of the two new private companies. When SOFITEX was a monopoly, profits and losses of the cotton sector were calculated after closing the books of the company. If profits were made in a given year, producers received a ristourne the following year. The price support was based on a floor price of CFAF175 per kg of seed cotton. In 2004-2005, the entire price support fund was exhausted due to declining world prices. This made it impossible for the fund to cover the shortfalls of the three cotton companies for the 2004-2005 and the 2005-2006 seasons. In 2006, AICB adopted a new price mechanism that incorporated a drop in the unsustainable producer price.
2.60 In the new price mechanism, the floor producer price is aligned with the world price. It is based on having the producers and the ginning companies share the FOB lint price, with the producers taking on 60 percent and the ginning companies taking on the remaining 40 percent. The objective is to reduce the amplitude of yearly fluctuations in producer prices. The mechanism does not intend to eliminate the fluctuations, or to modify the trend. This is why the fonds de soutien (support fund) evolved into what is now the fonds de lissage (price smoothing fund). The formula used in the smoothing scheme protects the cotton companies from incurring losses due to overpricing.
2.61 For the 2006-2007 campaign, a new floor price of CFAF165 per kg of seed cotton was obtained by applying the revised mechanism. As always, the floor price is announced in early April and producers are paid upon delivery at the floor price after deducting the cost of inputs. If the actual price exceeds the floor price announced in April of year t, producers receive a supplement in May of year t+1, before the end of the cotton year during which the profit had been generated. This reform was appreciated by all parties concerned: producers, cotton companies and partners.
2.62 However, despite this lower floor price, the ginning companies still had a shortfall of CFAF11 billion in the 2006-2007 campaign, with a production of 650,000 tons. This was due to an overshot in the forecasted world lint price – which implied an overestimation of the seed cotton price by 18 CFAF/kg. It was then suggested that the seven-year moving average used to compute the reference price be replaced by a five-year moving average.8
2.63 From the information above, it is clear that the price mechanism is a key component of the survival and prosperity of the cotton sector. Section 4 looks at
8 This makes the forecast more likely to be in line with the observed price, by relying on two rather than three annual forecasts from time t of the forecast, and using two rather three years of past prices, with the most remote price being more likely to depart from current prices.

29
alternative price settings that give incentives to the producers while protecting the ginning companies.
Group Credit Lending and Its Resilience in Time of Crisis
2.64 Like the cotton companies, the Groupements de producteurs du Coton (GPCs) are impacted by a severe financial crisis. Since the drought year of 2007-2008, several of the GPCs have accumulated internal arrears. In August 2008, UNPCB conducted a census of the GPCs to estimate the total internal debt. The combined debt due to members of the GPCs was evaluated at CFAF3.5 billion – representing payment due to the best producers of the sector, who managed to produce enough to pay for the input credit of the failed producers. At issue is whether this debt should be cleared through government intervention.
2.65 Finding a sustainable solution to the internal arrears is essential, because the group lending system (Caution Solidaire) is central to the success of the cotton sector. A field visit to three GPCs in two villages of the zone of Bobo-Dioulasso in November 2008, confirmed that the functioning and centrality of the system is well understood by the GPCs (Box 2-1). One good sign of the working of the system is that there is no external payment pending (i.e. there is no aggregate payment pending that the producers owe to the cotton companies). Defaulting is not widespread – the internal deficit is due to some producers. Therefore, an effort to improve management at the GPC level should be pursued, by seeking to increase capacity including human capital build-up.
2.66 By penalizing the competitive producers, the existence of unsuccessful producers threatens the survival of the whole sector. Clearly, weather played a role in the failure of production in the 2007-2008 campaign. However, in future interventions, care should be taken to mitigate moral hazard by sending a signal that lack of competitiveness will not be rewarded. The competitive producers should be compensated quickly lest they lose interest in the GPC, but it would be ill-advised to unconditionally clear the debts of those who are in arrears. One way out of this crisis would be for the Government to effectively reimburse the arrears, considering the total sum paid as advances to the debtors that should eventually be paid back. Within each GPC, the debtors that are known to have been victims of natural calamities would be dealt with on a case-by-case basis. Their debt could be pardoned or reduced to prevent them from abandoning the activity. Once repayment is secured, one possibility would be for UNPCB to use the total amount as a starting insurance scheme to address future drought or other natural disaster related losses. This should be done before the start of the 2009-2010 cotton campaign in order to prevent an eventual discouragement of the competitive producers and their withdrawal from cotton production.

30
Box 2- 1: GPCs and Domestic Arrears On November 27 and 29, 2008, a field trip was organized to visit three GPCs in the cotton zone of Bobo-Dioulasso. One of the GPCs is located in Kouro, which is east of Bobo. The other two GPCs are located in Bama, which is west of Bobo. The GPC in Kouro had no internal arrears. One of the GPCs in Bama had minor problems, and the other had major problems. Kouro has a total of five GPCs. The one visited has 28 members. It has a combined area cultivated of 79 ha, of which the largest producer has 9 ha, and the smallest, 1 ha. Following the 2007-2008 season, the group had a total of CFAF700,000 due in arrears, which had been cleared thanks to other income earning activities, which were enhanced by the close proximity to Bobo. Complete payment was obtained through frequent reminders to those who owed, coupled with threats to seize their assets in the case of non-payment by a set date. Bama has a total of 18 GPCs. The first one visited has 33 members, from a starting total of 65 in 1998. In 2007-2008, it had a combined area cultivated of 75 ha, which increased to 89 ha in 2008-2009. The area per farm ranges from 0.75 ha to 7 ha. Following the 2007-2008 season, the goup had a total of CFAF265,000 due in arrears, of which 142,000 had been cleared by the time of the visit. The second GPC visited in Bama has 56 members (which is bigger than the average), of which 19 owe CFAF880,000 to the others. This deficit was proportionally shared among the surplus producers. The ristourne helped clear CFAF105,000. The balance of CFAF775,000 was still pending at the time of the visit. The mission gathered that the good producers were impatient to get reimbursed, and one of them – who was present at the meeting – was expressing sorrow and concern over the situation. Four lessons were articulated from the field trip:
(i) The producers have mastered the group lending system over the course of its ten years of operation. Following a training session by UNPCB, the amount of input credit and the maximum acreage allowed for each producer is now based on past individual performance (the producer’s average yield over the past three campaigns and current arrears). The risk of bad debt has thus been reduced and the overall management of the group lending system has tended to improve.
(ii) The concept of mutual solidarity has wonderfully played its role as illustrated in the three cases visited. Those producers that have flourished have, indeed, accepted to forego their earnings for the survival of the group.
(iii) Although the total sum of internal arrears owed by certain GPCs is huge (CFAF3.5 billion), the number of GPCs that have problems in a given village is not very big. The total number of GPCs with internal difficulties is estimated to be 5 percent of the total in the zone under SOFITEX.
(iv) After the Government announced in July-August, 2008 that it would intervene to pay off the debt, the effort by individual GPC members to clear the arrears faltered somewhat, according to the members of the GPCs.
Looking Forward: Major Issues in Strengthening the Sector
2.67 The Burkinabè cotton sector is undergoing a severe crisis and needs to adapt in order to become more resistant to future shocks on the world market or from within the domestic system. Two key actions are strongly recommended: (i) the reform process needs to be reoriented and completed; and (ii) measures to increase land productivity urgently need to be put into action. Other recommended actions include risk management, adding value to the system, and looking for alternatives for the less productive producers, a category named as “marginal producers” hereafter.
Revisiting the Institutional Set Up of the Sector
2.68 As demonstrated in the sections above, the current structure of the cotton sector in Burkina is unlikely to bring about significant progress. In 1999, the sector made an important innovation by involving producers as shareholders of SOFITEX. It was expected that the input of those producers would improve management and

31
governance of the company. However, no significant improvement materialized because the producers lacked the capacity and the needed leverage to reorient SOFITEX actions. DAGRIS is a traditional partner with little incentive for a commercial-type management of the company, and in any case, it was assured revenues from various conventions. . Furthermore, SOFITEX has taken excessive risks. These include: (i) betting on an unpredictable rise in world prices; (ii) proposing or accepting an unsustainable producer price; and (iii) waiting too long (in 2005 and 2006) to start selling its lint cotton, because it expected a price increase which did not materialize. Just like Côte d’Ivoire and FASO COTON, SOFITEX has tried to upgrade its capacity to transfer risks through market instruments on small amounts of outputs. SOFITEX usedinstruments such as “the minimum guaranteed price” and “sales in US dollars” to protect itself against exchange rate risks. However, these operations have brought unconvincing results to SOFITEX during the period of continuous decline in prices on the market. Since 2008, IVOIRE COTON and FASO COTON have also stopped implementing those market techniques due to inconclusive results.
2.69 The privatization of 2004 has not brought any important change in the SOFITEX behavior. Because SOFITEX dominates the sector with 85 percent of total production, the model in Burkina Faso is very close to the case of a national monopoly. Those systems have been characterized by impressive outcomes, but they are subject to instability and to an unsustainable financial structure (Tschirley et al, 2009). The withdrawal of DAGRIS has only made matters worse, because the state now owns 65 percent of the shares.
What Are the Alternative Solutions in Terms of an Organizational Structure?
2.70 The priority actions for the future in the cotton sector should revolve around the following three issues: (i) improving sector management and profitability; (ii) improving long-term sustainability of the sector, and (iii) minimizing the risks of placing a financial burden on the Government.
2.71 The current crisis provides an opportunity to revisit the different alternatives for restructuring SOFITEX and reorganizing the sector to achieve these objectives.
2.72 Option 1: Selling the 30 percent of the shares that were formerly held by DAGRIS to another private investor. This would take the sector back to the structure it had in 2004. However, finding a private investor other than the firm that acquired DAGRIS is unlikely, because SOFITEX does not distribute dividends. And even if a private investor does come into the equation, the Government remains a dominant actor through its control over SOFITEX. This scenario has serious limitations.
2.73 Option 2: Selling 51 percent of the shares to a private investor. Burkina’s cotton is well known for its high quality, and the future outlook for the sector is probably good, given the possible upturn of the trend in world prices. Moreover, the future potential provided by the adoption of Bt cotton should help producers experience higher incomes and encourage them to increase production. The political stability of the country constitutes an important asset. Private investors might be very tempted to enter the cotton sector in Burkina Faso, if they were assured a majority shareholder position and the position to leverage and ensure good returns on their investment. One major risk for the
32
resulting structure is that SOFITEX would remain in a dominant position. Therefore, the system might still behave like a private monopoly. Moreover, in 2012, the clause restricting the zone for each company’s activity will be terminated, and all will be free to operate over the entire territory. In the absence of anti-trust laws, there is a risk of anti-competitive behavior on the market.
2.74 Option 3: Privatizing SOFITEX into two or three smaller companies. This option, which has been considered by Mali and Côte d’Ivoire, would avoid the pitfalls described above. This option has proven to be robust in Côte d’Ivoire, where the new system adjusted to the war and remains active. It reduces the risks associated with a private monopoly, and limits the need for government intervention in times of crisis. In Burkina, it would allow for greater competition (from 2012 onward), and improve returns to farmers. A major risk would involve the difficulty of delivering critical functions, such as input distribution, research and extension, and the grading of lint quality. However, the current system in Burkina Faso implies that with three cotton companies, mechanisms could be set up through the inter-profession to assure that these services are delivered in a convenient manner. Furthermore, this option could potentially decrease SOFITEX accrued economies of scale, particularly in procurement. This option could also lead to the proliferation of administrative structures generating additional functioning costs.
2.75 Option 4: Selling off part of the government shares of SOFITEX on the stock market. If the Government decides to sell off its surplus shares, it could be done by listing SOFITEX on a regional stock market. This option would likely mean that SOFITEX: (i) would be liable to a more rigorous management in order to achieve positive returns; (ii) would publicize its accounts; and (iii) would have access to new sources of financing. The downside is that issuing stocks on the regional stock market would not bring in any new private expertise, as would be the case with a private investor. Plus, the problem of the size of SOFITEX would still remain. In any case, issuing stocks on the stock market would probably have only a limited impact on the global efficiency of the sector, in the absence of a strategic partner.
2.76 In any case, there is a clear need for a strategic partner to bring in new skills to the company. Whatever the option chosen, the presence of a strategic, technical partner as a shareholder in SOFITEX would provide an essential piece of the new structure. This technical partner would bring in expertise: (i) in financial and risk management (exchange rate, climatic risk); (ii) in sales maximization (through the use of various selling options); and (iii) in attracting external financing.
Why Reforms Have Failed to Improve the Productivity of the Cotton Sector? 2.77 --In spite of reforms, production system as not fundamentally changed As shown in Table 2-10, cotton is no longer profitable for small farmers who are not able to reach a minimum profitable yield of 900kg/ha. Nevertheless, these farmers continue to participate in the cotton economy as it is often their only option for regular and secure cash income or input procurement, and the activity of cotton farming has strong demographic linkages. In spite of the gradual institutional changes in the sector between 1998 and present, reforms have failed to improve the overall productivity, essentially due to shortcomings such as: (i) initiatives to equip farms and reach better yields, (ii) the lack

33
of competitive farmers new to cotton, arriving in the sub-sector (many of which are migrants from Northern Burkina), sometimes threatening the survival of the sector due to poor yields and consequent heavy debts, (iii) the lack of incentives for agricultural diversification, that would allow small farmers to move from cotton and (iv) the rate of illiterate producers which is a barrier to the modernization of exploitations and to a sound financial management of farms. As far as the extension services are concerned, SOFITEX’s extension staff of 450 agents in 1990 has dramatically fallen to 310 in 2007, for seven regions and eighteen extension zones, each with only three cotton specialists. Every zone includes ten to fifteen sectors, each with its cotton technical agents (agent technique coton). The entry of the two new private companies has not really changed the extension system, as the former SOFITEX extension network was merely transferred to the new companies in their respective zones. However, along with the provision of traditional extension services, the Agence Française de Developpement (AFD) and other donors are funding the development of advisory services on farm management with a holistic approach on cropping patterns for farmers associations and SOFITEX. As a consequence of shortcomings in the reform process, the extensive production system has followed its upward trend in parallel to world price decreases, and part of the national budget has been siphoned by the price setting mechanism and public bailouts to SOFITEX.
Increasing Seed Cotton Productivity through Technology Transfer
2.78 Enhancing technology transfer through research, development and extension: Enhancing the productivity of the cotton sector would require improving both research and extension services. Although the ongoing research system has performed well enough to boost the sector under past circumstances, the current lag of Burkina on the scale of worldwide productivity will only be reduced through a careful, goal-oriented research and extension system. The following three observations point to the role that research should play in the cotton sector: (i) without research support, Burkinabè farmers are unlikely to close the yield gap with more advanced cotton producers; (ii) farmers will find cotton less and less attractive if its international price continues to decline due to productivity gains in other producing areas, and if diverting food grains to energy production puts pressure on food prices; and (iii) soils are becoming poorer in Burkina Faso – without new technology, cotton production will not remain viable. These threats can be eased by: (i) using appropriate fertilizer inputs; (ii) pushing on the biotechnology front; and (iii) improving integrated soil-water-fertilizer management techniques.
Updating fertilizer formulas. The technical packages currently used in Burkina are based on in-depth soil analysis done from 1965-1970 by the Cotton and Textile Research Institute (IRCT). There has been little change in fertilizer formulas since that time. According to Gaborel and Houngnibo (2005), nitrogen-enriched formulas would be more effective than the current formulas, but extension services would need to be significantly strengthened in order to ensure their efficient use. Unique formulas that are nitrogen-enriched may not appeal to farmers, because those formulas are specific to cotton and enable no diversion to the fertilization of food crops. However, these unique formulas are of great interest with regard to strengthening yields. Moreover, they are likely to be the most adequate fertilizer approach in low rainfall and short season zones.

34
Improve seed variety with biotechnology. Worldwide, the latest improvements in seed variety have been made through the introduction of Genetically Modified (GM) cotton (see the example of India, Box 2-2). In Burkina Faso, significant research has been conducted recently to screen cotton varieties developed in other countries with the Bt gene. Burkina Faso is the only West African country that has officially conducted research on Bt cotton. The results of three rounds of tests suggest that the Bt gene could significantly improve the cotton chain’s performance. According to preliminary results, introduction of the Bt gene into cotton could help reduce insecticide costs by reducing the number of sprays required from 6 to 1-2. Another potential source of savings would be the increase in yield. Station results suggest that yields could increase by 15-35 percent without affecting fiber quality (length, resistance and whiteness). Burkina Faso aims to the use of Bt cotton on a large scale in all its cotton producing zones in 2010/2011. As far as SOFITEX is concerned, 8,000ha were sown in 2008/2009 and 130,000 in 2009/2010. SOFITEX aims at sowing 95 percent of its cotton production zones in 2010/2011.
Further develop soil-fertilizer-water integrated management programs. It is becoming more and more critical for producers to adopt integrated soil-fertilizer-water management programs. The organic matter content of the soil must be increased through the use of manure or compost. The fertility of that manure and compost requires application of the appropriate dosages of mineral fertilizer. The efficiency of that fertilizer would increase with appropriate water control devices to prevent soil washout and erosion. Currently, the low use of soil and water conservation techniques in the cotton zone is really problematic. Through the PAFASP program, UNPCB has received funding to promote the use of conservation devices. Research will play a critical role in demonstrating the impact of the integrated management of fertility, and extension will be required to increase the extent and pace of adoption. Field visits to the degraded and recovered areas in the northern parts of the country could incorporate into an extension program aimed at getting farmers to adopt new practices. When land conservation includes the transport of foreign material such as rocks, incentives in the form of equipment such as carts, oxen, and donkeys should be put in place in order to jump start the process. However, equipment costs in Burkina Faso remain very high (Table 2-15).
Table 2- 15: Cost of Equipment, 2005-2006
Cost 000 CFAF
Pair of oxen 250
Multiculteur toolbars 150
seed drill 110
Cart 240
Total 750 . Source: SOFITEX, 2005

35
Box 2- 2: Overview of Cotton Sub-sector Performance and Development in India
India is the world’s second-largest cotton producer, consumer, and exporter in the world. With recent technological advances and market liberalization, India has emerged as a major player in the world cotton market. Textile manufacturing is India’s second-largest industry (behind only agriculture), employing over 35 million people. Growth in India’s textile industry has been spurred by the opening up of world markets, particularly since the expiration of the World Trade Organization (WTO) Multi-Fiber Agreement at the end of 2004. Since 2003/04, India’s cotton consumption has grown 35 percent, from 13.5 million bales to a forecast of 22.5 million bales in 2009/10, dragged by a strong economic growth over the past decade. This growth has been outpaced by the 105 percent increase in production resulting from improved yields. India has thus enjoyed a surplus of production over consumption since 2003/04, contributing to its emergence as one of the world’s top exporters of raw cotton. India devotes more land to cotton than any other country and claimed 30.4 percent of the world’s total cotton acreage in 2008/09, compared with 20.5 percent for China and 9.9 percent for the United States. India’s cotton yield, at 523 kilograms per hectare (kg/ha), lags behind the world average of 766 kg/ha. However, recent years have seen significant improvements in Indian yield and production due to the introduction of genetically modified (GM) seed. Since commercial planting of GM seed was first permitted in 2002/03, its use has expanded to cover the majority of Indian cotton acreage — an estimated 80 percent in 2009/10. As the use of GM seed has spread, Indian yields have risen 74 percent (from 301 kg/ha in 2002/03 to 523 kg/ha in 2008/09), and the cotton harvest has grown 61 percent (from 14.0 to 22.5 million bales). Apart from GMOs, several development initiatives are explaining the success of the cotton value chain, such as: (i) the adoption of scientific agronomic practices by farmers, (ii) the greater application of Integrated Pest Management (IPM) technology and effective check on pest and disease infestation, (iii) the increase in the area under irrigation, (iv) the development of good quality seeds by the private sector, (v) increased awareness about efficient handling of cotton from harvesting to bale packaging, (vi) the modernization of ginning and pressing factories, (vii) the traditional method of testing cotton by visual inspection giving way to scientific testing on high volume instruments (HVI) machines and (viii) development efforts by the Technology mission Cotton Corporation of India (a mission created by the government to direct, coordinate, and fund initiatives to raise the productivity and quality of Indian cotton and strengthen returns to growers), the Cotton Association of India and other NGOs. In India, there is no direct subsidy to the cotton farmers. However, under the mechanism of price support policy, the Government of India has been yearly announcing the minimum support prices for various varieties and grades of cotton grown in different parts of the country. This price support policy has assured remunerative prices to the cotton farmers of the country, which enabled them to sustain their continued interests in cotton cultivation. Despite strong growth, an ongoing issue with Indian cotton exports is contamination. In the latest (2007) survey by the International Federation of Textile Manufacturers, the six most contaminated cottons tested were from India. Likely sources of contamination are hand-picking, where foreign matters (such as polypropylene strands from picking bags) may be accidentally introduced, and ginning, where seed coats may not be adequately removed, and wire or metal can break off machinery and remain embedded within the fibers. The key factor affecting Indian exports in 2008/09, however, was not contamination, but government involvement in the pricing of cotton. In late summer 2008, the Indian government increased the guaranteed minimum support price for cotton by 30 percent to 50 percent. When cotton prices collapsed in 2008, it became more profitable for Indian farmers to sell their cotton to the government than to sell it on the domestic or international market. Consequently, Indian cotton exports fell drastically (by 68 percent), from 7.0 million bales in 2007/08 to 2.0 million bales in 2008/09. Source: ICAC and Cotton Incorporated Supply Chain, 2009.
2.79 The issue of farm capital formation: Farm level capitalization remains low in Burkina Faso, even in the cotton belt. A study by the SOFITEX M&E unit suggests that:

36
(i) 28 percent of all farms owned no equipment, and either farmed manually or rented equipment if they could afford it; (ii) 38 percent of all farms were only partially equipped. This implies that more than 60 percent of farmers in the cotton zone were either poorly equipped or unequipped. The cost of equipment – illustrated in Table 2-13 – is one factor that limits capital buildup. Fully-equipped farms have much higher land productivity, and much greater potential to remain viable when world prices are low. Therefore, there is a need to develop initiatives to equip farms.
Risk Management
2.80 As demonstrated above, the cotton sector is threatened by major risks that may take a toll on the sector if not dealt with in an appropriate fashion. The three sources of risks are: (i) weather-related risk; (ii) output price risk; and (iii) input price risk.
Weather-related Risk 2.81 Burkina Faso’s rain-fed cotton system is subject to major weather risk. The materialization of weather-related risk (drought) is usually a significant loss in yields, or in some cases a total crop failure. The consequence is an increase in individual indebtedness among farmers. If drought causes widespread covariant losses, entire GPCs may be unable to reimburse their creditors – leading to external arrears, which are even more problematic than internal arrears. Farmers who fall victim to drought-related losses in a given year are likely to lower their expectations for the following year – implying a decrease in the area planted. Therefore, a drought year may be followed by a low production year due to acreage withdrawal. In Burkina Faso, droughts have occurred twice during the last ten years – in 2001 and 2007. This history calls for risk protection measures.
2.82 Agriculture insurance: Can insurance effectively mitigate weather risk in the agriculture sectors of developing countries? Senegal has established an insurance scheme. In 2008, the Senegalese Government decided to support the system by paying 50 percent of the risk premium. By covering large areas, insurance companies may be able to limit the impact of covariant risk usually observed in the agricultural sector. Complete crop failure everywhere in Burkina is a rare occurrence. Alternatives to insurance include: (i) having the state intervene when disaster strikes; and (ii) setting up a trust fund that compensates victims.
2.83 Burkina Faso’s vision is to implement an agriculture insurance mechanism against weather risks within a year. This insurance will endow farmers with a guarantee against climatic shocks that would mitigate indebtedness risks.
Output Price Risk
2.84 The instability and downward trend of the international price of cotton poses a serious threat to the survival of the cotton industry in Burkina and other African developing countries. Because of subsidies enacted in the developed world and the rise of cotton substitutes, there are supply-side and demand-side forces that tend to depress prices. When producers receive less income due to falling world prices, they may choose to produce less cotton or stop producing altogether, depending on the extent of the fall.

37
Ravry et al. (2006) have established three price levels, each of which represents a level of discouragement for cotton farmers:
At the first level, the FOB lint price is CFAF640, and the producer price is CFAF160/kg. At this price, cotton is no longer competitive compared to alternative crops. However, producers may continue producing due to the lack of alternatives. Small, marginal farmers become more impoverished, although there is only a slight drop in aggregate production.
At the second level, the FOB lint price is CFAF600, and the producer price is 140-150 CFAF/kg. At this level, cotton is no longer a feasible choice for small producers. They exit from production. Only larger farms continue to operate, but they tend to diversify away from cotton and to use less inputs per unit of land. Aggregate production falls, and with it comes a social fracture.
At the third level, the FOB price is only CFAF560, and the producer price is 126 CFAF/kg. At this point, no producers find it profitable to grow cotton. Production stops and the sector crashes.
2.85 In the absence of any external intervention, it is easy to imagine a situation in which no more cotton is being produced in Burkina Faso. Therefore, the price support mechanism is a key piece for ensuring the sustainability of the cotton sector, pending the structural reforms that are needed to make the sector more productive. However, other measures for mitigating output price risk exist and need to be taken by the cotton companies.
2.86 Market instruments: The use of forward sale could have enabled companies like SOFITEX to avoid being forced to sell at prevailing unfavorable world prices. If the correct market instruments had been used, it is estimated that: (i) the cotton sector could have earned CFAF 39 /kg above the realized lint price over the past 12 years; and (ii) the surplus could have been CFAF 68 /kg over the past five years. However, the feasibility of the use of market instruments needs to be investigated in relation to the financial rules set within the UEMOA context.
2.87 Coping with risk at the farm level: Farmers diversify by planting other crops or by investing in off-farm activities. However, the drawback of diversification at this level is that it is a survival strategy and it can trap people in poverty (see the section on diversification as an alternative for small cotton farmers). The usual use of social relations to cope with risk does not work well with price risk, which affects everybody in the circle, unless the farmer solicits help from someone who earns their living from another activity. Farm-level risk coping mechanisms may not be effective if a huge drop in price occurs.
Input Price Risk
2.88 Starting with the 2002-2003 agricultural season, the Burkinabè Government has been subsidizing inputs targeted to the cotton sector. The intervention was initially triggered by the crisis in Côte d’Ivoire, which disrupted the traditional supply channel through the port of Abidjan. Since 2002, the Government has been maintaining the subsidy in an environment of increasing international fertilizer prices. Initially, the subsidy was CFAF2-3 billion. It reached CFAF6.5 billion in 2008-2009, following the

38
hike in world commodity prices. A puzzling fact is that the Government has never stated an explicit input policy. Therefore, the risk for the cotton sector is that the Government may, at any time, stop intervening. Under current conditions, this would be a major threat to the sector. For example, during the 2007-2008 campaign, the Government initially backed out from intervening. This caused the companies selling fertilizer to raise their prices by 15 percent. The immediate response from farmers was a dramatic drop in areas planted. The Government eventually revoked its decision and offered a subsidy, but it was too late – the decrease in the amount of surface sown to cotton was already sealed for the year.
2.89 There are two main causes of high fertilizer prices in West Africa: (i) very low demand compared to other parts of the world, such as Asia; and (ii) lack of regional production facilities. The rest of the world applies an average of 100 kg of fertilizer per ha of cropped land. In Sub-Saharan Africa, the rate of application is only 8kg. With regard to pesticides, the rate in Africa is less than 1 kg/ha, and West Africa accounts for only 10 percent of the African market, which is concentrated in northern Africa. With regard to commercial seeds, Africa accounts for only 10 percent of the world market, and those seeds are concentrated in southern and northern Africa (IFDC, 2004).
2.90 Despite these overarching problems, Burkinabè farmers could save 20-30 percent of what they are currently paying for fertilizers (IFDC, 2004). These cost reductions could be achieved by improving the procurement mechanism, and by professionalizing input transport and distribution.
2.91 Improving the effectiveness of procurement. Inputs are supplied each year by national and international providers, in a tenders bid mode. The terms of the tenders specify the types of input needed and the characteristics of the companies sought to supply the market. In the current inter-professional set-up of the cotton sector in Burkina Faso, each cotton company has the responsibility to procure the commercial inputs and make them available to producers in its operation zone. Each company proceeds through an independent international tenders bid. Then an equalizing mechanism is used to deduce a single producer price for inputs at a national level.
2.92 The terms of the tenders include the requirement from the successful bidder to supply the inputs on the basis of a 270-day waiting period for payment. This amounts to a nine month credit, which carries with it some cost in the form of interest. This way of proceeding is not appealing to most input suppliers. As illustrated above, the size of the market is small. The joint effect of these situations is typically an unusually high cost for providing these nine-month credits. The only bidders that may be comfortable with these conditions will hold monopoly (or oligopoly) power and charge high prices, including the rents.
2.93 One hypothesis is that the few international firms that participate in the bidding process may adopt collusive behavior – a negation of the competition sought in the process. In the case of Burkina Faso, the same two or three suppliers are commissioned every year, and among them they share the total market size. These suppliers are located in the neighboring coastal countries, and they also supply fertilizers to these neighboring countries. There is a positive side to this system in the credit

39
arrangement mentioned above, but there are drawbacks in terms of prices. In fact, the suppliers know each other and collusion in this case may be a winning game for all of them.
2.94 Buying fertilizer when it is cheaper: A reform easier to implement would be to exploit the seasonality of the fertilizer price. Just like all oil products, fertilizer prices may vary by up to 30 percent at different times of the year. The off-peak season for fertilizer should be targeted for the placing of the bids. Currently, the fertilizer is purchased when it is the most expensive on the world market, to save on storage costs. Changing the period of procurement would imply a longer storage period before planting. Therefore, the net gain would depend on the cost of storage relative to the decrease in average fertilizer cost. If village level reliable storage facilities could be set up, the cost of longer storage could become minimal over time. UNPCB has already come up with a proposal along these lines, known by the slogan “One Union of Cotton Producers, One Shop”.
2.95 What should the official stand of the Government be in the area of inputs? In the short-run, before the suggestions above can be considered and materialized, there is a need to pursue the actions that will ensure that the sector continues functioning. The actions recommended are:
The Government should officially commit itself to the subsidy until there is a more widespread adoption of the Bt cotton, under which the use of pesticides will be substantially reduced. Without the subsidy, the sector may become unviable under a negative shock to the lint market, or an unexpected hike in input prices.
The system of tenders bid with the existing coastal companies should be retained, because it has more advantages than disadvantages. The financial situations of the cotton companies do not allow any of them to have access to additional bank loans with which to finance the inputs.
2.96 An input price assessment comparing prices paid by farmers in Asian or Latin America countries, such as Brazil, Malaysia, and Vietnam could help sector stakeholders in Burkina better define their pricing policies.
Adding Value: Valorization of Cotton Seed By-Products
2.97 Thus far, the strategy in the cotton sector has omitted the issue of cotton seed and its by-products, oil and cake. According to a recent World Bank study (Tschirley et al, 2009) this neglect should be reconsidered because two factors point to the rise of new market opportunities for these by-products. First, the seed cotton industries in Africa have generally lagged behind world standard in capturing the benefits of cotton seed by-products. Second, the markets for these products are changing fast, due to increased demand for edible oil and animal feed.
2.98 In the 2005-2006 growing season, Burkina Faso produced 350,000 mT of cotton seed, of which two-thirds was processed into oil and cake by industrial and semi-industrial operations. SN SITEC is the largest Burkinabè seed oil processor by volume, with an annual capacity of 20,000 mT of oil. It is owned by SOFITEX, DAGRIS and a number of private individuals. SN SITEC produces refined oil, cakes, animal feeds and soap. Burkina Faso has more than 10 newly established small or

40
medium-scale seed oil processors, which produce both refined and unrefined oil, but SN SITEC accounts for roughly half of the cotton seed processing activity in the country (Gergely, 2008). Burkina’s domestic vegetable oil consumption is estimated to be 50,000 mT – its domestic cotton seed oil production is 31,000 mT.
2.99 SOFITEX currently sells most of its seed output to SN SITEC. The cottonseed price doubled from 40 CFAF/kg between 2003/04 and 2006/07 to 82 CFAF/kg in 2007/08 and 2008/09 (Baffes, 2010). SOCOMA also sells most of its seeds to SN SITEC. Setting of the price of the seed lower than that break even price would yield high profits to the oil producers. Using cost data available from SODECOTON (Cameroon) and applying them to SN CITEC, Gergely (2008) finds that the break even price on seeds for the company is CFAF67/kg which, under the current market circumstances, is likely to reduce te profit margin of the oil producers. .
2.100 The lack of transparency in the seed processing sector needs to be dealt with. Currently, the producers’ association is advocating change in the sharing of the price of the seed. If effective regulations are put in place, it would make the seed processing sector more transparent and open to competition, and bring about an increase in the price of cotton seed. That, coupled with a new price sharing mechanism between the ginning companies and the producers, would allow for an increase in the domestic producer price irrespective of the level of the international price. This would ease off the pressure of the international lint prices on the viability of the cotton sector. By taking into account the other by-products (animal feed), the opportunity for modifying the domestic farmer price would further increase.
Diversification: Giving Alternatives to Producers
2.101 Diversification has always been an element of the farm livelihood strategies in Burkina Faso. It has two main modes: (i) diversification within agriculture, through the choice of different crops to farm (this strategy is widely used in Burkina Faso because some farmers cultivate small plots of cotton and use part of the cotton fertilizers for their cereal fields); and (ii) diversification outside of agriculture. It is used as either a risk management mechanism or an income enhancing mechanism. As a risk management mechanism, it is generally used by poor, small farmers who are wary of putting all their eggs in the same basket. As an income enhancing mechanism, it is generally used by more successful farmers who choose to invest in the nonfarm sector in order to maximize the returns from their earnings in the farm sector. For example, McMillan, Nana and Savadogo (1991) found that the most successful farmers of the Volta Valley Association (AVV) scheme in the village of Linoghin were investing in various trades in Ouagadougou, which is 40 km to the west. The most successful farmers of another AVV village, Mogtedo V3, migrated to the newly opened Kompienga area (with the building of a dam) to start new businesses backed by farming.
2.102 Marginal cotton farmers are characterized as having a high probability of falling short of covering their costs. The diagnostic analysis of Burkina’s cotton sector (Gergely, 2008) shows that these marginal farmers: (i) lack equipment; (ii) farm small-sized cotton plots (0.88 ha/farm9 compared to 6.47 ha/farm for fully-equipped animal 9 When considering total farm size, the disparities do persist: the marginal farm size is 2.94 ha compared to 13.11 ha for the fully-equipped farm.

41
traction households); and (iii) face very low yields (700 kg/ha compared to 1,375 kg/ha for fully-equipped farms). These poor farms account for 27.8 percent of the total farm population. For these farmers, the advantages of having access to the package that comes with cotton cultivation may be the main reason for growing cotton – not profitability from cotton per se. The cotton system behaves as if these marginal producers operated under the shadow of the better performers, due to the group liability scheme of the credit extended to farmers. Therefore, they constitute a kind of deadweight for the whole system.
2.103 Marginal cotton farmers might be better off by producing other crops. Within agriculture, alternatives to cotton include: (i) sweet peas, groundnut, sesame, soybean, and cassava in rain-fed systems: and (ii) vegetables, white potato, fruits in dry season cropping. Livestock and fishery are also good alternatives. There are many non-farm activities that provide opportunities for diversification. The biggest deterrent is the initial investment. A well-tooled policy is needed to facilitate marginal farmers’ migration to this area. The targeting mechanism should be designed so that the performing cotton farmers find little benefit from leaving the activity.
2.104 The impact of marginal farmers exiting from cotton must be offset by a migration towards other crops to sustain national growth. As discussed previously, it is likely that the instability and downward trend of international prices of cotton poses a serious threat to both the filière and growth, with farmers exiting from cotton production. For instance, Nouvé and Wodon (2008) have shown that a 25 percent decline in cotton-fibre production would result in a GDP decrease of approximately 1.7 percent if the fall in cotton seed production is not offset by a rise in other agricultural sub-sectors. The GDP, however, could experience a slight increase by 0.2 to 0.3 percent if the decrease in cotton seed production is offset by an equivalent production increase in other sub-sectors of agriculture, apart from breeding livestock (because of its weaker multiplier effect on employment, a reassignment of the resources towards the breeding, with the detriment of cereal agriculture and other agricultural branches, would have more severe consequences in terms of job losses). A reduction of cotton production of 25% would particularly have a negative impact on the economy (production, added value, income of households and employment) if the resources released by the reduction of the cotton production are not reallocated in other agricultural sectors. If those resources are reallocated to other agricultural sectors, the impact on the economy, in particular the added value and the income of households, would be significantly positive. However, the strong interest of farmers in cotton is due to the absence of price setting mechanism or other incentives for other agricultural crops.
2.105 Rice and maize are substantial sources of diversification for farmers exiting from cotton production. Zonon et al. (2009) have established 6 levels of crop performance (from the lowest score 0 to the highest score 5) to illustrate the best diversification choices for farmers exiting from cotton. Each level represents a combination of filière performance (based on its profitability, its efficiency and risk) and the market demand for the crop (current and assumed on a 5 years horizon). Rice and maize appear to be sound sources of diversification (rice and maize score 5 on the classification scale) due to the growing urban demand for these crops, the changes in households’ diets towards maize and rice, and the increasing demand for maize to feed

42
suburban livestock. However, millet and sorghum, in spite of their key contribution to households’ food and nutritional security, are inadequate candidates for diversification due to their low integration in large scale agricultural markets.
Conclusions and Policy Recommendations
2.106 The Burkinabè cotton sector is at a crossroads, and there is a need for sound choices to be made in order for the sector to continue operating. There are short-to-medium term choices to insure survival, and medium-to-long run actions to effect progress and sustainability, as follows:
Replenish the cotton smoothing fund.
Facilitate equipment ownership among farmers.
Increase the use of organic fertilizer spurred by the extension of manure pit construction throughout the cotton zone.
Accompany loss-making farmers exiting from cotton (training, developing the commercialization and the value chains of alternative crops’ such as rice and maize, investing in land intensification).
Progressively reduce the involvement of the Government in the sector and put more emphasis on its regulatory function.
Bring in a strategic technical and financial partner for SOFITEX, possibly through equity participation, to improve its overall management and strengthen up its financial standing.
To reduce the impact of exchange rate and commodity price volatility, the Cotton ginning companies should:
o Institutionalize a trade finance regimen that offsets US Dollar import payments against US Dollar export proceeds prior to currency conversion into CFAF.
o Access more systematically the futures markets to announce its producer price.
o Access to insurance mechanisms against natural agricultural risks could be done through the establishment of mutual funds, saving and insurance systems, including weather index-based insurance for farmers.

43
INTENSIFYING AGRO-PASTORAL PRODUCTION
Sector Overview
2.107 Agriculture is the engine of Burkina Faso’s economy. The crop, livestock, forestry and fishery sector is an important component of Burkina Faso’s economy in terms of: (i) its contribution to the creation of wealth and rural employment; (ii) its contribution to food and nutritional security; and (iii) its large share in total exports. The agriculture sector: (i) employs around 85 percent of the working population; (ii) represents nearly 40 percent of the GDP – 25 percent for crops, 12 percent for livestock, and 3 percent for forestry and fishery: and (iii) accounts for approximately 80 percent of the country’s export earnings. As was illustrated in detail in the previous chapter, cotton is the major crop in Burkina Faso. This section will illustrate in detail the agriculture sector as a whole.
2.108 Burkina Faso has an estimated 9 million hectares in arable lands, which represents one-third of the country’s land. Approximately 3.5 million out of those 9 million hectares – around 39 percent – are used for agricultural purposes each year. Moreover, growth in agriculture has positive downstream effects on the secondary and tertiary sectors. However, agriculture sector production is essentially characterized by an extensive low-productivity system. There are approximately 1.3 million smallholder farmers (3 to 6 ha, with three to five farmers) in the country, 87 percent of which practice subsistence agriculture and extensive livestock keeping activities. Smallholder farmers have limited access to credit, markets, and advisory services. In addition, there is limited integration between agriculture and livestock.
2.109 Between 2001 and 2008, growth in agriculture reached around 5 percent per annum, exceeding the country’s high population growth of 2.8 percent. However, this relatively favorable performance masks three major structural weaknesses in the sector. First, agricultural growth has been based on area expansion rather than on productivity gains. The agriculture sector is presently plagued by the predominance of low-productivity subsistence farming – a practice that cannot be sustained due to fast-approaching spatial saturation and land degradation. Crop productivity as measured through yield/ha has been stagnant for the past two decades and remains low. This is due to the very low-level use of productivity-enhancing technologies, most importantly reliable water supply, fertilizer and improved seeds. Clearly, potential yield gains are significant for almost all crops. Second, agricultural output fluctuates widely from year-to–year, because it is mostly based on the practice of rain fed and tradable crops. Agricultural output is extremely vulnerable to weather risks and highly dependent on international commodity (especially cotton, maize and rice) and input (fertilizer) prices. Third, climate change may increase the effects of the already significant weather risks, and therefore the vulnerability of the sector to natural and other external shocks. Harnessing the potential of the sector would require a concerted effort to intensify production and diversify into high-value agriculture products for export, while making agriculture more resilient to climate shocks. Key challenges to intensifying agricultural productivity include: (i) enhancing, developing, and distributing yield enhancing technologies; (ii) improving agricultural water management; (iii) developing risk

44
minimization and mitigation schemes; (iv) improving and integrating natural resource management; and (v) strengthening land tenure.
2.110 The Poverty Reduction Strategy Paper (PRSP) was completed in 2000 and revised in 2003; both of these documents emphasize the important contribution of agricultural to economic growth and poverty reduction in Burkina Faso. The Rural Development Strategy (RDS) was issued in 2003. The RDS targets the sustainable growth of the rural sector, as the preferred mechanism for ensuring greater food security and promoting genuine rural development.
2.111 As seen in the previous chapter, cotton has remained the main source of cash income for smallholder farmers since the 1980s. It is the most organized supply chain – the best source for providing inputs, credit, and a reliable market to farmers. However, since 2005, the sector has faced repeated crises that indicate its fragility to exogenous shocks. Despite the tremendous resources invested by the Government to save the sector from bankruptcy (more than US$150 million), cotton companies are still struggling to recover their competitiveness and provide profitable resources to farmers. It is critical that Burkina Faso diversify its production base, in order to reduce its vulnerability to international price fluctuations and take advantage of new opportunities for high-value products for which the country has a comparative advantage.
Performance and Constraints
Strengths, Weaknesses, Opportunities and Threats (SWOT) Analysis of the Agriculture Sector
2.112 The Burkinabè agriculture sector benefits from two important strengths: (i) its endowment in rich vegetal and ecological capital – even if weather conditions are not optimal; and (ii) its extensive road, railway, and airport infrastructure – although the density and quality of rural roads is weak. 2.113 However, numerous weaknesses plagued the sector. These include: (i) volatile price fluctuation cause insecurity for producers, (ii) high rate of illiteracy, and low productivity of the labor force; (iii) high factor costs; (iv) fiscal burden on inputs and packaging materials and products; (v) weak and aged infrastructure and storing facilities; (vi) weak management capacities of producers, processors, exporters and professional organizations; (vii) precarious financial situation of sector agents, who have unhealthy dependence on advanced financing by importers; (viii) high indebtedness and weak investment capacities; (ix) weak negotiating capacities vis-à-vis banks, importers and transporters; (x) limited organization of major filières; and (xi) unorganized promotion of markets.
2.114 Amidst these weaknesses, there are key opportunities for a strengthened performance of the sector like the new strategic vision which emphasizes quality and efficiency. Following the global food price crisis, there has been a renewed emphasis on public investments in the agriculture sector, at both the national and regional levels – and private actors in the sector stand to benefit from this increased supply of public goods. Furthermore, because it is a low chemical input agricultural country, Burkina Faso has the opportunity to be a niche player in the organic produce markets. The country is most

45
likely to benefit from these opportunities if some of the major threats to the agriculture sector are removed, or at a very least, effectively managed.
2.115 Major external and structural threats are putting the sector under pressure. They include: (i) unfavorable climatic conditions; (ii) insufficient and overly expensive export logistics, including air freight and packaging; (iii) potential barriers to trade corridors from political instability in neighboring countries; (iv) competition in export markets from neighboring countries with ambitious export development plans; (v) lack of access to European markets; (vi) dominance of regional exports by informal channels; and (vii) absence of effective export financing systems (Table 2-14 presents detailed SWOT analyses of major key sub-sectors).
Table 2- 16: Strengths, Weaknesses, Opportunities and Threats (SWOT) Analysis, by Sectors
Product Strengths Weaknesses Opportunities Threats Cotton A producers’ organization
(UNPCB) growing stronger Efficient cotton company (SOFITEX) Involvement of banking system Steady growth of high-quality cotton fiber Well-organized marketing system
High costs of inputs and lack of equipment Stagnation of yields since 1985-1986 Dependence on export prices UNPCB is the weakest partner in the cotton trade organization
Availability of financing for research and extension Privatization of the sector Stable macroeconomic environment Introduction of genetically modified cotton
Soil and environment degradation Lower export prices Extension of cultivated area Weather risk
Fruits andvegetables
Strong demand within the sub region Import capacity to produce organic and dried products Strong knowledge of the sector Existence of professional organizations
Genetic degeneracy of grown varieties Strong parasitology Difficulties respecting export contracts Poor respect of the technical itinerary
Increase of the European demand Increase of the demand for organic and dried products Existence of certified (Bio and EUREPGAP) orchards Strong national policy to develop horticulture
Low maintenance of infrastructures and equipment Strong competition of sub regional countries Inappropriate policies with regard to aerial transport Presence of the white fly
Cattle/beef
Increase production Slaughterhouses being renovated CFAF15-16 billion per year in terms of gross income Major contributor to the 12 percent of livestock’s GNP
Poor technical knowledge Lack of warehouses and cold facilities Poor control of norms Too many intermediaries Lack of technical competencies
Existence of a regional market Demand from Egypt
Degradation of slaughtering conditions Unfavorable fiscal environment
Poultry Strong internal and external demand Provide quick cash to households Existence of more than
Importance of disease such as Avian flu Lack of specific slaughterhouses Lack of a professional
Increasing local demand due to urban demographic growth Strong sub regional demand
Avian flu (H5N1)

46
100 roaster units Conducted all over the country
organization Inappropriate transportation conditions
Sesame Diversified uses (agro-food, cosmetics) Easy to grow—accessible by poor households Existence of several processing enterprises (SOPRADEX, SOCOPA)
Lack of data on prices, production, quantities exported Poor productivity Commercial quality
Possibility of improving the productivity Growth of exports
Competition from Asian countries Salmonella contamination undermines product quality
Cereals Increase in production Existence of a professional organization Represents 10 percent of GNP Represents 88 percent of 3.5 million ha exploited each year by 900,000 poor households
Unsteady production capacity Poor productivity Poor production, processing, and commercialization Weak organization of marketing
Growth perspectives estimated at 2.86 percent per year (2,950,000 tons in 2010)
Locust infestation Erratic rainfall
Cowpeas Grown by 70 percent of producers Accessibility to poor households Increase of production in recent years
Low adoption of the existing technologies Poor use of agricultural inputs Weak organization of marketing Weak organization of actors Language and currency barriers
Possibility of using improved varieties High demand from Ghana and Nigeria
Weather risk
Rice Existence of favorable conditions for rice production Strong women groups in rice processing and marketing
Lack of adequate technologies for processing Low adoption of existing technologies for productivity enhancement Weak organization of actors
Government commitment to develop the sector Strong urban demand Good quality of local rice
Weather risk
Milk Favorable conditions for livestock development and existence of an important stock An opportunity to increase women income
High seasonality in production Too little production of milk/ cow for the local species, Extensive production system based on transhumance of cattle Weak advisory services Difficulty of herders to access adequate animal feed and sanitation
High demand for milk in the urban and rural areas Increase prices of imported milk Good quality of local milk Government commitment to develop the sector
Epizooties
Source: Authors. The Unpredictability of Prices Volatility: A Major Weakness of the Sector
2.116 Domestic food prices have fluctuated erratically over the last fifteen years, reflecting important sensibility to commodity prices volatility. Figure 2-9 illustrates the fluctuations of the food consumer price index (food CPI) versus the world food

47
prices. It shows that prices in Burkina Faso are historically dependant on world food prices. In 2008, the economy of Burkina Faso responded to the worldwide crisis about the food prices with high domestic prices. Between May 2007 and May 2008, the IMF Food Price Index jumped 40 percent. In the same period, the International Labor Organization (ILO) food CPI increased 60 percent. After the September 2008 financial crash, the prices remained high although Burkina’s food CPI has experienced a sensitive decrease since the last quarter of 2008, after having reached a historic peak. It remains too early, however, to have a sound insight into the impact of the financial crisis on Burkinabè agricultural markets.
2.117 Rice and groundnut are less sensitive to price volatility than millet, sorghum and maize. Market prices of maize, sorghum and millet increased at the same rate from CFAF 75 to CFAF 125 between 1997 and 2006, whereas rice and groundnuts experienced constant prices over the same period (at an average of CFAF 225 for rice and CFAF 200 for groundnut) showing less sensibility to commodity price volatility (Ministère de l’Agriculture, de l’Hydraulique et des Resources Halieutiques -MAHRH, 2009).
Figure 2- 9: World-Food Prices Index and Food Consumer Price Index in Burkina Faso (in dollar, 2000=100)
Source: Author calculations, with data from (i) IMF, International data statistics to obtain World Food Prices and (ii) International Labor Organization to obtain a Food CPI.
2.118 Producer prices for subsistence crops have also experienced substantial changes between 1990-91 and 2006-07. According to the Rapport d’Evolution du Secteur Agricole et des Conditions de Vie des Ménages au Burkina Faso (MAHRH,
-40
-30
-20
-10
0
10
20
30
40
50
60
70
02 03 04 05 06 07 08 09
Food CPI, Burkina Faso World Food Prices
annual growth rate, %

48
2009), the 1991-2007 period can be divided into four successive cycles (Figure 2-10). First, the one between 1990 and 1994 that is characterized by a drop in overall prices of cereals. Second, the period that followed the devaluation of the CFAF between 1995 and 1996, during which compensation to farmers increased significantly. Third, the period between 1997 and 2000 during which prices dropped significantly and fourth, the period between 2001 and 2006, where Burkina Faso has witnessed significant price fluctuations.
Figure 2- 10: Farm-Gate Prices (USD/mT) Trends for Several Subsistence Products
between 1990-91 and 2006-07
Source: FAO Stat, 2009.
2.119 Producer prices of commercial crops have fluctuated differently over the last fifteen years. The price of groundnut has been declining significantly since 1996. From USD 300 per mT in 1996, the price of peanuts experienced a fall of about 90 percent, down to USD 140 per mT. This price has remained since 2002. On the other hand, the price of sesame experienced a 137 percent increase, with prices that have risen from USD 200 in 2000 to USD 550 in 2006 (FAO, 2009).
050100150200250300350400450500550
1990 1992 1994 1996 1998 2000 2002 2004 2006
fonio
maize
millet
rice
sorgho

49
Figure 2- 11: Farm-Gate Prices (USD/mT) Trends for Several Rent Products between 1990-91 and 2007-08
Source: FAO Stat, 2009. Growth and Diversification Strategies
2.120 Key crop and livestock products can be positioned with respect to one of the following three growth and diversification strategies in Burkina Faso: (i) food security and poverty reduction; (ii) exports in regional and international markets through a growth pole approach; and (iii) import substitution.
Table 2- 17: Growth Strategy and Agricultural Diversification Objectives for Burkina Faso Food security and
poverty reduction Growth/exports Import
substitution Regional Markets
International markets
Crops - traditional cereals (millet, sorghum, maize)
- onion - tomato - cowpea
- cotton - fruits (mangoes) and vegetables - sesame - shea nut - green bean - cashew
- rice
Livestock - short cycle species (poultry, sheep and goats)
- cattle/beef - hides and skins - milk
Source: Authors. Addressing Food Security and Poverty Reduction through Domestic Growth 2.121 Burkina Faso is characterized by chronic food insecurity. According to the national household survey, more than 38 percent of households had difficulty satisfying their food needs in 2007. Historically, Burkina Faso has relied mostly on extensive agriculture to meet its population’s food needs. However, in the past two decades, its
0
100
200
300
400
500
600
700
800
1990 1992 1994 1996 1998 2000 2002 2004 2006
Groundnut
sesame

50
population has grown at nearly 3 percent per year while crop productivity has stagnated. This is a major reason for the lack of improvement in the country’s food security status. Cereal yields still average less than one ton of grain per hectare. Livestock production, which is largely practiced under extensive pastoral and agro-pastoral conditions, displays equally low productivity. Food security varies greatly from year-to-year, because large annual fluctuations in rainfall lead to erratic cereal production quantities. Because Burkina is a net importer, its food security has also been significantly affected by the recent surge in food prices worldwide.
2.122 In December 2003, the Burkinabè Government adopted a new Rural Development Strategy (SDR). In 2007, the Government produced the Green Revolution Document. The latter acknowledges the need for renewed emphasis on food security. In the wake of rising food prices, in 2008 the Government prepared an Emergency Plan for Food Security in order to mitigate the impact of the food price crisis. Accordingly, the Government has taken a number of short-term measures to deal with the immediate effects of rising food prices. These measures include: (i) tax relief on high consumption food items, such as rice and milk; (ii) distribution of seeds and fertilizer to farmers; and (iii) use of safety nets in the health and education sectors.
2.123 Food security issues in rural areas need to be addressed both from the demand and the supply sides. In taking the aforementioned short-term measures, the Government has recognized that these are necessary steps, but not sufficient to address the structural aspects of food insecurity. Therefore, the Government decided to complement those short-term measures with dedicated efforts to improve the productivity and post-harvest conditions of food crops and animal products, and to facilitate their access by those segments of the rural population that are most impacted by food insecurity. The current emphasis is on: (i) increasing food crops and livestock production and productivity, including the reduction of food production risks; and (ii) improving access of rural households to food supplies.
2.124 Traditional cereals (millet, sorghum and maize) along with root and tubers are staple food security crops. Short-cycle livestock species (poultry and sheep and goats) along with game animals and fish are major sources of animal proteins. A large share of the production of these crop and animal staples are consumed within farm households. However, a small share of households is net seller of food products in response to the demand of both urban dwellers and rural households that are net food buyers. In addition to being a food crop, maize is also a cash crop. It contributes to monetize the rural economy and helps households respond to small cash needs, particularly during periods when alternative cash sources are nonexistent. Poultry, sheep and goats are also sources of cash; they play a major role in poverty reduction.
2.125 Livestock-related activities provide incomes (partially or totally) for 86 percent of the population. Smallholders account for about 95 percent of total meat production, 95 percent of total milk production, and 60 percent of total egg production. Growing urbanization and rising per capita income – with a target of 4 percent annual growth – have led to greater domestic demand, coming on top of export demand. Supply has not coped well with this situation.

51
2.126 Poultry: The Burkinabè poultry sub-sector consists of a “modern” and a “traditional” domain, both of which are dominated by two species of animals, chicken (76 percent) and guinea fowl (19 percent). Recent surveys place the total combined yearly income of rural and urban traditional poultry production at over CFAF10 billion, with the urban share estimated at less than 10 percent. Traditional poultry products are sold on the internal market, mostly in urban areas. Traditional poultry products are also sold on the regional market, in Benin, Côte d’Ivoire, and Togo, where these products from Burkina Faso are much appreciated (including the pouletbicyclette, a Burkina label). Traditional poultry farming is part of the livelihood strategies of almost all agro-pastoral households, and to a lesser extent of pastoral households. Poultry commodity chains have a three-tiered typology that consists of producers, traders, and processors. Poultry product collectors gather their merchandise at the village level and from rural marketplaces. They transport it to areas where consumption is concentrated, and to exporters. Processors are mainly those involved in roasting or grilling poultry products. Butchering takes place on the spot on-farm or on demand from clients in marketplaces under inappropriate hygienic conditions, with inadequate infrastructure leading to substantial losses. Further losses occur during transportation and processing. Except for the purely commercial operations, poultry commodity chains are not very organized, due mostly to the fact that, for rural households, traditional poultry farming remains largely a secondary activity. Significant progress has been made recently regarding the prophylaxis for poultry, through several projects and with the support of NGOs that have been training voluntary village veterinarians. However, the recent outbreak of avian flu in West Africa is a serious threat to the development of the Burkinabè poultry sector. Exports in Regional and International Markets 2.127 Fruits and vegetables: The Government’s current emphasis is on increasing productivity and diversification in commercial and export-oriented agriculture, including fruits and vegetables supply chains. Burkina Faso has a comparative advantage in producing and exporting a number of non-traditional crops. These include fruits such as mangos, and vegetables such as onions, tomatoes, potatoes and beans for the coastal and European countries where the demand is high. It also includes sesame for European and Arabic countries, and cowpeas for the sub-regional markets including Nigeria. Although these crops represent only a small share of the current value of agricultural production and exports, their markets offer substantial potential for growth. They are usually labor intensive – therefore, they offer significant employment creation and income opportunities. The fruits and vegetables sector was once considered extremely promising, because agro-climatic conditions in Burkina Faso are particularly favorable to production. Burkina had succeeded in penetrating the global market, including Europe, particularly for green beans. However, the recent performance of this sub-sector has been disappointing. Production and exports have declined. Competitor countries, such as Kenya, Senegal and Morocco, modernized their production methods and organized themselves for undertaking the necessary collective actions. Burkina Faso has thus far been unable: (i) to increase productivity in order to remain competitive; (ii) to adapt its production to meet the changing preferences of European consumers; or (iii) to meet the increasingly stringent quality/safety standards required by markets in developed

52
countries. A recent study conducted by the German Agency for Technical Cooperation (GTZ) on fruits and vegetables export possibilities for Burkina Faso recommended that the country focus more on the export of processed products, such as dry or frozen fruits and vegetables. These products would be less adversely affected by the country’s landlocked position
Exports Targeting Regional Markets
2.128 Cowpeas: The cowpea commodity chain has grown substantially since the 1990s, due mostly to urban and external demand and consumption. Coastal West African countries especially, are chronically short of cowpeas – mainly, but not limited to Nigeria, Côte d’Ivoire, and Ghana. Nigeria accounts for about half of the total regional demand. Clearly, there is good export potential. In the medium-term, demand for cowpeas is expected to lead to production increases of between 8,000 and 10,000 metric tons per year in Burkinabè rural areas. Since 1999, cowpeas have been explicitly identified in the Strategic Operational Plan (Plan Stratégique Opérationnel; PSO) of the Strategic Outlook Paper (Document d’Orientation Stratégique; DOS) for the agriculture sector. Cowpea production could in certain parts of the country play a major role in rural poverty reduction. In order to attain a production level of 600,000 metric tons per year by 2010, the Government has set a target of 7 percent annual growth in output. There are no local organizations that specifically include actors in the traditional (mixed-farming systems) cowpea commodity chains. Cowpea storage and preservation activities are handled through a proxy indicator of the degree of specialized expertise of the different actors. Cleaning and phytosanitary techniques are practiced systematically, and are well known throughout the country. However, they make use of a wide range of products of sometimes unreliable quality. Post-storage losses are experienced chiefly by traders – they are not frequent at the household level.
2.129 Onions: Burkina has potential for onion production and export in the sub-region. Several factors make onion production attractive, in particular: (i) the existing production technique relatively well managed by the local producers; (ii) the potential for breed and productivity improvement; (iii) the resistance during transport: (iv) the existence of low-cost preservation technologies; (v) the existence of efficient marketing channels in the sub-region; (vi) good knowledge of the sub-regional market by the existing operators; (vii) the existing irrigation potential; (viii) an enabling legal and regulatory framework both at national and regional levels (UEMOA, CEDEAO); and (viii) low levels of parasitized production. Nevertheless, Burkina’s onion exports to Côte d’Ivoire, Ghana, and Togo are negligible (130 tonnes in 2005, around 2,218 tonnes in 2006 and 2,269 tonnes in 2007) (Figure 2-12). Moreover, having in view the competition from other sub-region producers, particularly Niger, Burkina has difficulties to gain significant market shares in the neighboring countries. The main constraints to this value chain development are primarily related to the production, the preservation and the quality of onions. The low yields (20mT/ha) make onion export less competitive compared to the European ones (up to 40mT/ha) (PAFASP, 2009). In addition, the warehousing, packaging and transport conditions are poor, leading to high loss rates along the value chain. Furthermore, improving the onion quality, which is highly dependent on the onion intrinsic characteristics and size, would contribute to make this value chain more competitive.

53
Figure 2- 12: Exports of Onions from Burkina Faso, Net Weight in mT and FOB value (CFAF)
Source: PAFASP, 2009.
Livestock2.130 The Burkinabè cattle/beef sub-sector is extremely important. Burkina Faso is the second highest exporter of livestock products – essentially live cattle but also sheep and poultry – behind Mali, on the regional market (WAEMU). Exports have stagnated since 2000, and there has been an actual decline in live animal exports since the beginning of the crisis in Côte d’Ivoire. The export of meat, chilled or frozen, is hampered by inadequate preservation facilities and competition from other countries. Exports mainly target the West Africa region. Ghana and Côte d’Ivoire are the biggest importers of Burkina’s live animals, followed by Nigeria, Niger, Togo and Benin. The rates of return from cattle exports to Niger and Nigeria are estimated to be 50-100 percent higher than the returns from the domestic market.
2.131 Cattle/beef production faces a serious supply gap. Closing this gap will require: (i) increased productivity per hectare in extensive systems, or (ii) increased productivity per animal in intensive systems, through improved nutrition, breeding, and animal disease control. The number and average weight of animals would be increased by a move toward more intensive livestock farming in a more controlled environment. This would involve using a combination of small holder plots and larger irrigated farms.

54
Transportation conditions – especially in the case of road transportation – ought to be improved to ensure optimal commercialization and delivery of livestock. These efforts would need to be supplemented by improved professional standards and overall organization in livestock exporting sectors. Public-private partnerships (PPPs) and stronger inter-professional associations could focus on improving the quality of live animals by: (i) providing farmers with skills and production incentives; and (ii) supporting the preservation and storage of animal feed for the dry season. Improved sector organization could then lead to the necessary increase in information supply and market studies. The Burkinabè Government would need to take measures to reduce illegal levies and other forms of border corruption in an effort to maximize animal exports in the short and medium-term.
Table 2- 18: Estimates of the Value of Live Animal Exports from Burkina Faso, 1999-2005
Year Heads Exported Value of Exports (in billions of CFAF) Cattle Sheep Goats Cattle Sheep Goats Total
1999 112 102 159 137 103 822 15.12 3.31 1.95 20.38 2000 148 036 192 272 124 573 22.08 4.21 1.77 28.06 2001 205 510 207 775 197 232 32.14 4.65 2.84 39.63 2002 173 011 181 307 140 672 28.32 4.22 2.32 34.86 2003 129 503 94 455 125 573 19.41 2.03 1.78 23.22 2004 140 704 156 381 153 294 21.10 3.44 2.45 26.99 2005 180 761 258 590 216 446 27.11 5.68 3.46 36.25 Sources: Revised MRA data (herd strength) and FOB prices estimated by the authors of the DTIS.
2.132 Better compliance with the sanitary and phytosanitary requirements of the World Trade Organization is crucial to sub-sectoral growth. Those requirements regarding live animals are based on Livestock International Organization (OIE) guidelines and standards. Those requirements regarding animal products are based on Codex Alimentarius guidelines and standards. The Burkinabè Government is urged to keep monitoring the country’s adherence to ECOWAS standards for meat processing and classification. At this stage, the authorities are advised to enforce implementation of those standards while ensuring product traceability.
2.133 The Government’s specific strategy for the livestock sector is described in the Work Plan and Investment Program for the Livestock Sector (PAPISE), and in the revised full PRSP. The PAPISE is a national framework for livestock action plans and investment programs that was prepared by the Ministry on Animal Resources in 2000. The Government, with support from the World Bank and the Food and Agriculture Organization, sought to modernize the sector and intensify transformation efforts to “increase livestock’s contribution to national poverty reduction and growth objectives.” In particular, the Government has recently made sizable investments to modernize and expand the slaughterhouses in Ouagadougou and Bobo-Dioulasso, which should help to boost meat production and exports.
2.134 There are good opportunities for moving up the value-chain of beef exports. The Government has set as a target to export 10 percent of the current live animal exports in the form of beef. This policy option has been analyzed by Ouattara

55
(2008) in a scenario that assumes that 10 percent of animals traditionally exported on the hoof would be exported in the form of meat. The results indicate that such an increase in slaughtering rate output would increase both total production and GDP by 0.8 percent. The DTIS has assessed that Côte d’Ivoire and Ghana offer the best export potentials, with additional market opportunities of up to 30,000 tons of meat in other West-African countries. The development of a solid meat export strategy requires financial and technical private sector inputs. Technical expertise and marketing skills stemming from the private sector are likely to push for innovation and pave the way for more valuable human capital.
Exports Targeting International Markets
2.135 Oilseeds: The oilseeds sector includes groundnuts, shea nuts, sesame, and cashew nuts. It is known for having the highest potential in terms of export share of production and export opportunities to international markets. Oilseeds also have a strong potential to contribute to job creation and poverty reduction. Sesame and cashew nuts have demonstrated the greatest potential for export, as a result of efforts by private-sector exporters to organize targeted production as assessed in the recent DTIS.
2.136 Sesame: Sesame is traditionally cultivated throughout Burkina Faso. The highest concentrations are in the Mouhoun belt, which accounts for approximately 65 percent of total national production. Other important sesame producing regions are the East, the Hauts-Bassins, Cascades, and the Centre-North. Sesame is planted in rain-fed areas. It does not require much water – 250-600 millimeters are sufficient. It is considered an “easy” crop. Nevertheless, both area planted and yields achieved per hectare remain low – around 300-400 kg. This is largely due to unreliable external markets. Current levels of total annual sesame production range from 10,000-15,000 metric tons in an average year, with huge differences from one year to the next. The sector strategy notes and the Action Plans on the oilseed sub-sector by the Ministries of Agriculture and of Commerce (JITAP Project, ONAC, 2003) served as the documentary base for this review. The oilseed sub-sector appears to be facing major constraints, specifically: (a) low level of professionalization of operators and export networks, (b) predominance of the informal sector in the processing of oil seeds, and (c) problems with regard to product standards and sanitary conditions (CASEM, 2005).
2.137 Figure 2-13 indicates trends in Burkina’s sesame exports from 1995-2004. Doubts remain regarding the private sector’s capacity to further integrate vertically and become a more significant international market player. However, past analyses have noted that sesame exports, which are currently focused on the EU market, could represent a valuable niche for expansion to East-Asian markets – such as Japan, South Korea and even China – where demand is strong (Figures 2-13).
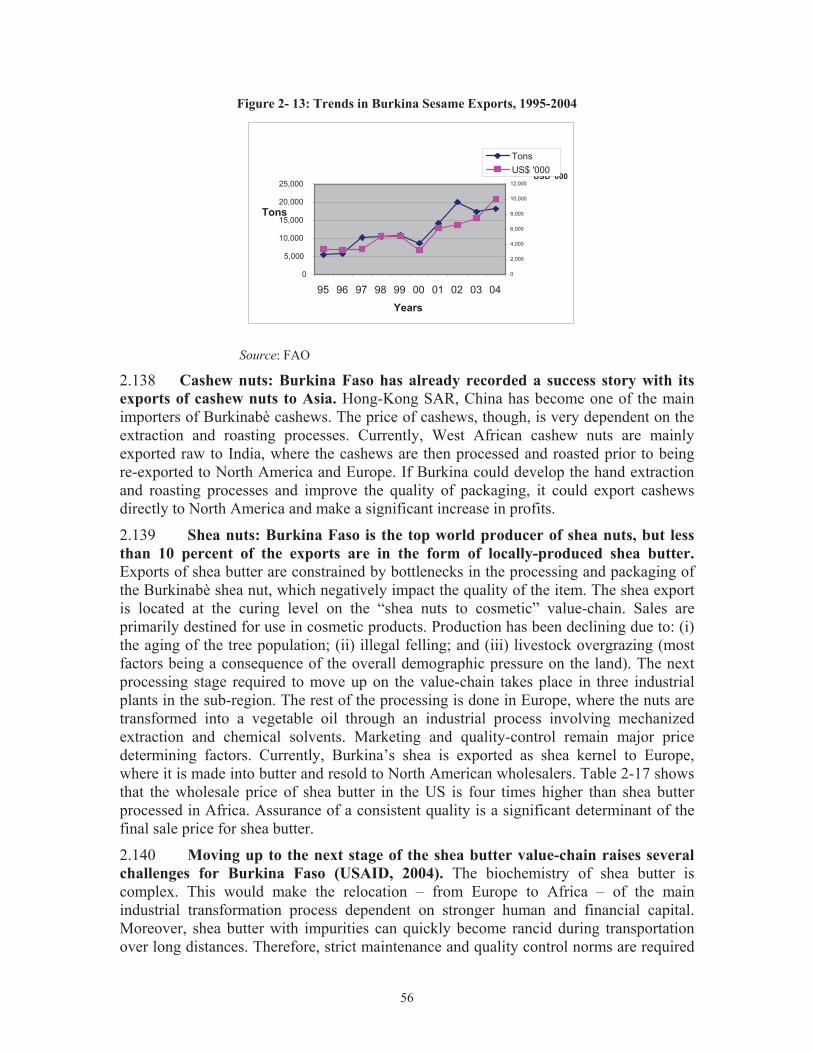
56
Figure 2- 13: Trends in Burkina Sesame Exports, 1995-2004
Source: FAO
2.138 Cashew nuts: Burkina Faso has already recorded a success story with its exports of cashew nuts to Asia. Hong-Kong SAR, China has become one of the main importers of Burkinabè cashews. The price of cashews, though, is very dependent on the extraction and roasting processes. Currently, West African cashew nuts are mainly exported raw to India, where the cashews are then processed and roasted prior to being re-exported to North America and Europe. If Burkina could develop the hand extraction and roasting processes and improve the quality of packaging, it could export cashews directly to North America and make a significant increase in profits.
2.139 Shea nuts: Burkina Faso is the top world producer of shea nuts, but less than 10 percent of the exports are in the form of locally-produced shea butter. Exports of shea butter are constrained by bottlenecks in the processing and packaging of the Burkinabè shea nut, which negatively impact the quality of the item. The shea export is located at the curing level on the “shea nuts to cosmetic” value-chain. Sales are primarily destined for use in cosmetic products. Production has been declining due to: (i) the aging of the tree population; (ii) illegal felling; and (iii) livestock overgrazing (most factors being a consequence of the overall demographic pressure on the land). The next processing stage required to move up on the value-chain takes place in three industrial plants in the sub-region. The rest of the processing is done in Europe, where the nuts are transformed into a vegetable oil through an industrial process involving mechanized extraction and chemical solvents. Marketing and quality-control remain major price determining factors. Currently, Burkina’s shea is exported as shea kernel to Europe, where it is made into butter and resold to North American wholesalers. Table 2-17 shows that the wholesale price of shea butter in the US is four times higher than shea butter processed in Africa. Assurance of a consistent quality is a significant determinant of the final sale price for shea butter.
2.140 Moving up to the next stage of the shea butter value-chain raises several challenges for Burkina Faso (USAID, 2004). The biochemistry of shea butter is complex. This would make the relocation – from Europe to Africa – of the main industrial transformation process dependent on stronger human and financial capital. Moreover, shea butter with impurities can quickly become rancid during transportation over long distances. Therefore, strict maintenance and quality control norms are required
0
5,000 10,000 15,000 20,000 25,000
95 96 97 98 99 00 01 02 03 04
Years
Tons
0
2,000
4,000
6,000
8,000
10,000
12,000USD '000
TonsUS$ '000

57
in order to preserve the butter during transportation. Small Burkinabè shea producers are burdened by a lack of management expertise and limited access to financing. This has reduced their ability to build durable links with a highly segmented and rapidly evolving niche market, in which timely provision of a cosmetic product in compliance with international standards is a must. Additional constraints include: (i) shortage of information on production; (ii) strong international competition; (iii) lack of inter-professional organization; (iv) shortage of operators in the sector; (v) inadequate packaging and technical support to farmers; and (vi) high vulnerability to weather hazards.
Table 2- 19: Price Difference of Shea Butter across Different Markets
Region In Africa In US$ With Quality
Assurance In Luxury Containers
Shea Butter $0.75/Kg $3/kg $10-15/kg $250/kg Source: USAID, 2004: The Shea Butter Value Chain.
2.141 Green beans: the country moved from a brief period of success to the current situation of collapse. In the 90’s, this industry was occupying a leading position in the total value of vegetable exports (CEM, 2001). Agro-climatic conditions are particularly favorable to production, and Burkina Faso had shortly succeeded in penetrating the global market, including Europe. However, this value chain has been suffering from specific constraints, specifically: (i) insufficient agricultural research to improve yields and production’s quality, (ii) weakness of quality controls before export, leading to a loss of trust amongst demanding European markets, (iii) important freight costs, which amounts 54 percent of CIF value (CEM, 2001), (iv) dramatic decreasing exports in spite of the important development potential of the commodity, and (v) absence of effective financing systems from the enterprises of the green beans value chain. Thus, it is evident that high quality combined with low freight costs can result in high returns. This is supported by the well-known success of the floriculture sub-sector in Kenya and the coffee sub-sector in Rwanda (Boxes 2-3 and 2-4).
The Mango Value Chain: A Promising Potential2.142 Exports of fresh and dried mangoes have significantly increased over the last 3 years, suggesting potential for diversification and growth. In 1980, Burkina was one of the largest producers of mangoes from West Africa, along with Côte d’Ivoire and Senegal. Nevertheless, the country lost its leadership position. However, the label “Burkina” represents a quality standard, but mangoes are now bought in Burkina to supplement the mangoes from other countries. In 2007, the exports of fresh mangoes to the EU markets were mostly supplied by Côte d’Ivoire (15,000mT/year), Senegal (4,000mT/year) and Mali (3,500mT/year) (PAFASP, 2009). Since 2005, as shown in Table 2-18, mango exports have been steadily increasing, mainly serving European markets (France and Germany).The recent performance has been triggered by innovative activities, such as the production of bio mangoes, dried mangoes and mango juice (PAFASP, 2009).

58
Table 2- 20: Exports of Fresh and Dried Mangoes from Burkina Faso, FOB Value (CFAF ‘000) and Net Weight in mT
Quantity (mT) FOB Value (CFAF ‘000) Year 2005 2006 2007 2005 2006 2007
World 5,468,118 6,891,915 7,398,170 835,058 1,273,487 2,022,727 Source: PAFASP.
2.143 However, the mango value chain is facing important challenges that impede its competitiveness between other world’s exporters. First, the high costs of logistics and the lack of adequate storage infrastructure nearby the areas of mango production are constraining exports (such as the airport of Bobo-Dioulasso which is not equipped with cold storage facilities); second, the infestation of mango trees by the fruit fly have worrisome effects, with losses reaching on average more than 50% and sometimes up to 80% (PAFASP, 2009). In addition to pesticides solutions (that are not applicable to organic productions), the national research center of Burkina (INERA) and the Centre de Cooperation Internationale pour la Recherche Agronomique (CIRAD) have been developing disinfestations techniques such as the thermic treatment of fruits (water batches over 45°C), and fruitful decontamination rates were obtained. Internally, the sub-sector suffers from a number of constraints, more specifically taxes on inputs and infrastructures (roads, irrigation, outdated storage facilities).
Box 2- 3: Floriculture in Kenya Kenya's horticultural sector currently ranks as one of the economy’s fastest growing industries, the third largest foreign exchange earner after tourism and tea. This has been reflected in virtually year on year expansion in fruit, vegetable and flower export, where growth has been particularly consequential. Kenya cut-flower exports are expanding annually, at 10–15 percent per year. They have grown tenfold during 1978–98. Cut flowers are now the country’s second largest source of foreign exchange in agriculture (after tea), providing employment to an estimated 50,000 workers. By far the largest proportion of Kenyan flower exports is supplied to Europe where Kenya has surpassed Colombia and Israel as largest supplier. Within Europe, the Netherlands is the leading destination followed by the United Kingdom and Germany. The industry consists mostly of medium to large-scale operations and clusters, with a few dominating producers. Two of these occupy around 250 hectares of land and employ over 5,000 workers each. Although there are an estimated 5,000 flower farms in Kenya, three-quarters of the exports are supplied by about 25 large and medium-scale operations. Larger size enables firms to integrate and move up the value chain by offering value-added production and supply chain management to supermarkets. In addition, producers have developed new marketing channels, in particular long term direct linkages with European buyers. The direct trade with large UK retail chains has increased during the last decade reaching approximately 1/3 of total exports in 2004. But still approximately 2/3 of exports are supplied to the Dutch auction halls and most of larger operations supply both the auctions and the European supermarkets. The reasons of success can be explained by: (i) relatively little government intervention making the sector largely private sector driven, notwithstanding the creation of the Horticultural Crops Development Authority (HCDA) institution to promote and coordinate the industry, (ii) relatively high and steady profit margins, (iii) the ability of Kenyan firms to capitalize on the increasing globalization of flower production and trade, (iv) the fact that Europe knows an off-season for flower production, (v) steadily increasing European and North-America demand, (vi) maintenance of high quality standards through compliance with codes of practices, traceability, due diligence and ethical trading. Source: Riisgaard, 2008; Whitaker and Kolavalli, 2004.

59
2.144 The European market of processed-mangoes, such as dried mangoes, is a niche market with a substantial growth potential. Dried mangoes are used in the formulation of cereals and aperitifs products that are widely consumed in European markets. Fostering agro-processing represents a promising value-adding complement to the mango filière.
Box 2- 4: Coffee in RwandaBefore 2001, Rwanda was an unknown producer in the specialty and high-value coffee sector. Today, it is a sought-after supplier of specialty coffees to Europe and to the United States of America. Coffee was introduced in Rwanda in 1904 and was first exported in 1917; it was quickly seen as a major source of income for the country. In 1933, the cultivation of coffee was made compulsory, and, in 1963, the Government of Rwanda (GoR) passed laws making it illegal to uproot coffee trees. Because of coffee’s historical role as a principal source of foreign exchange for the country (averaging 56.7 percent of all exports in the 1990s) and its broad political support, the state was heavily involved in all stages of production, including marketing and dry milling. In 1990, Rwanda exported 45,000 metric tons of coffee. Nearly all production of coffee ceased, however, during the genocide of 1994. Regionally, Rwanda competed with its southern neighbor Burundi, yet Burundi’s coffee was considered to be slightly better in quality than that of Rwanda. Neither country produced coffee that was considered specialty grade, as did in Ethiopia and Kenya. Despite the fact that some of the coffee grown in Rwanda, such as the Bourbon varietal, had specialty-grade potential, all of Rwanda’s coffee was considered below commodity-grade, and, when exported, was only used by roasters in blends of low-end, mass-produced coffee destined for Europe and the United States. Within the value chain, the GoR supported the coffee industry by establishing OCIR-CAFÉ (Office Nationale de Cultures Industrielles-Café) and through it, distributed seedlings, fertilizer, phytosanitary products, and other inputs to growers for free, or at dramatically reduced prices. Growers would apply the inputs to their crops, harvest, and sell semi-washed beans to RWANDEX, the monopoly responsible for dry milling and exporting coffee. The GoR was a majority owner of RWANDEX, and set the prices that growers received from their coffee sales. In fact, the GoR continued to set prices for coffee up until 1998. Though coffee producer associations existed in Rwanda, they were agents of the state that distributed inputs and did little else. In response to the steady declines in production, quality, and export revenue, the GoR and its donor partners (more especially USAID) began strategy sessions aimed at improving Rwandan coffee’s positioning in world markets. These sessions resulted in coffee-sector liberalization strategies which, when implemented, began the task of improving Rwandan coffee. Armed with market information, the private sector learned that higher-value coffee was very attractive to global markets, that organoleptic tests indicated Rwanda had significant potential to produce specialty coffee, and that Rwanda could compete with higher-end producers such as Guatemala, Ethiopia, and Kenya. To move from being considered a commodity-grade to a specialty-grade coffee producer, its coffee-producing sector needed to address three key areas: (i) increase production, since production levels were insufficient to attract global demand, (ii) improve quality and, (iii) promote the Rwandan brand. Through these interventions, Rwanda was effectively able to reposition its coffee and compete in higher-grade/higher-priced sectors. July 2002 saw the country’s first sales of commercial volumes of specialty coffee, including a sale of 33 mT to Community Coffee in the U.S. By March of the following year, privately financed and operated wet-mill facilities produced fully washed coffee. Production and quality continued to increase, and after visits to and from trade-show buyers, Rwandan specialty coffee made its first sale to Starbucks Coffee Corporation in June 2004. Source: Jones and Webber, 2009.

60
Agricultural Export Promotion through Growth Poles
2.145 Burkina can rely on a dual export diversification strategy that targets regional and international markets. The most competitive exports in the West Africa regional markets are onions, tomatoes, cowpeas and cattle/beef. Maize is another regional export, but maize also has an important food security role in the economy. Exports of maize are part of a larger West African trade basin that includes coastal markets in the south and northern markets in Niger and Mali. In addition to cotton, Burkina Faso also has comparative advantages in exports of mangoes, sesame, and shea nut products. The country experienced a short period of effectiveness with green beans (see below). However, Burkina is still trading at a lower level of the value chain for most of these products. Similarly, export performance of the hides and skins sector has been limited, and prospects for a breakthrough are limited because of monopolistic control on exports, artisanal processing, low quality, and atomistic supply.
2.146 The Government of Burkina has the vision, through the Schéma National d’Aménagement du Territoire (SNAT), to position Burkina on a new sustainable development path, capitalizing on its existing opportunities. The Government’s SNAT presents a comprehensive diagnostic of the country’s social, economic and geographic challenges. It provides a strategic road-map and recommendations for economic growth and diversification in the context of rural development under the Poverty Reduction Strategy. Diversification is addressed as a national priority so as to escape from the excessive dependence of cotton and food staples. Among other sources of identified growth (irrigation, tourism, mining), the Government of Burkina Faso has initiated a policy of diversifying export revenue sources through agribusiness and agro-processing, that have been identified as essential sectors for diversification, with important growth potentials in cotton oil, fruit and vegetable processing, meat, leather and skins. In order to do so, the country would build on advantages while alleviating key constraints, which include: (i) improving infrastructures for the effectiveness of supply chain; (ii) establishing support mechanisms for commerce; (iii) facilitating access by economic actors to resources (finances, production inputs, technology etc); (iv) promoting an enabling environment for business, (v) support to small and medium agro-processing industries. The Government has also initiated the development of an integrated institutional platform (Conseil Presidentiel pour l’Investissement, Agence de promotion des Investissements, Maison de l’Entreprise du Burkina) for reforms to release constraints to the investment climate. Burkina Faso was recently classified amongst the top ten performers in the world in the World Bank Doing Business 2010 report.10
2.147 This current approach to diversification is evolving around a spatially concentrated growth pole. The SNAT highlights the Government’s intention to develop spatially concentrated regional growth poles in objectively identified areas of growth potential which demonstrate favorable characteristics for high-value agricultural production, irrigated agriculture and agro-processing. The growth pole approach provides an ideal opportunity for the country to implement a National Strategy on Export Promotion and the national policy on quality standards. Specific strategies on export 10 Good performance was achieved in relation to the management of construction permits (with a +42 change in rank between 2008 and 2009) and property registration (with a +49 change in rank between 2008 and 2009) (Doing Business 2010).

61
promotion, quality, standards and norms and a new industrialization policy must be implemented to achieve those goals. International markets, and increasingly regional markets as well, are very competitive and very demanding in terms of quality and reliability of delivery, and this will represent a considerable challenge for domestic producers.
2.148 The “Bagré Centered Growth Pole Project” is a sound example of a growth pole project aiming to develop commercial agriculture in Burkina Faso. The Bagré “development area” was developed in association with a dam primarily focused on the production of electricity for the national grid. The actual potential for irrigated area below the dam is about 31,000 ha of which 7,400 ha can be irrigated through gravity irrigation, the balance requiring pumping. The area directly concerned with potentially irrigable land below the dam, called the “zone de concentration” (ZC), covers about 50,000 ha and has been declared “zone d’utilité publique”. The potential for developing the Bagré sub-region as an agro-industrial growth pole has the following advantages: (i) considerable and so far largely untapped availability of water and multiple areas that can be brought under irrigation, (ii) potential for developing other activities, such as fish farming and livestock production, (iii) the availability of electricity supply, (iv) existing road infrastructure and reasonable access to large consumer domestic and regional markets (Ouagadougou, Ghana, Togo and Niger), (v) the existing policy and legal framework establishing Bagré as a Zone d’utilité publique which enhances access to land for investors. Some of the existing constraints, such as the land tenure security to private investors have been addressed. For example, Burkina has just passed a new land law which provides land tenure security through long-term lease. In addition, the operational system to facilitate the granting of such leases will be put in place under the growth pole project auspices.
Import Substitution: Milk and Rice 2.149 The Burkinabè agriculture sector has the potential to play a key import substitution role. Burkina spends close to US$40 million annually in rice and milk imports. There is a belief that this food import bill can be reduced through: (i) increased investment in irrigation; and (ii) the introduction of improved genetic material in cattle breeding via artificial insemination.
2.150 Milk: National milk production does not fully cover the country’s demand, which is estimated at 500,000 tons of milk equivalent per year. This, despite the fact that the country has a large population with strong pastoral traditions, particularly with regard to milk and meat production. Milk and dairy product imports represent an important drain on the country’s foreign exchange resources – estimated at approximately CFAF9 billion each year. There are important opportunities and potentials to improve the productivity of milk production units in the country. This could be done through: (i) the introduction of a better performing breed; and (ii) the emergence of a specialized private sector that is able to stimulate the emergence of a more dynamic milk production and processing sector.
2.151 Improving milk production is a direct response: (i) to the increasing urban demand for milk and dairy products; and (ii) to the need to increase the profitability of peri-urban milk processing units through a regular and sufficient supply of milk.

62
In rural areas, the milk production challenges are: (i) to specialize part of the herd into dairy production functions; and (ii) to improve hygiene and sanitary norms.
2.152 Rice: Rice imports amount to close to US$20 million annually. Rice production is concentrated in agro-ecological zones that have higher rainfalls – particularly, above the 800 mm annual rainfall level. Major producing zones – which combined account for more than 60 percent of national production – are located in the Centre-Est, Hauts-Bassins, Mouhoun, and Cascades regions. Rice holds a special place in Burkinabè agriculture sector policy, because of its strategic role in the economy. Rice is grown all year long and rice imports require a substantial outflow of foreign exchange.
2.153 The major actors of the rice value-chain include producers, processors and traders. The number of rice producers is marginal compared to the overall agricultural population. Consequently, the contribution of rice to the GDP is also limited (0.3 percent). Rice producers can be categorized in three major groups, based on the water-intensity of the production. The three groups are: (i) rainfed systems; (ii) lowland systems; and (iii) irrigated systems. Rainfed systems are the least water intensive. Lowland systems are based on developed or non-developed lowlands that are cultivated after the water has receded. Irrigated systems are the most water-intensive, and work by either gravitation or pumping. Rice producers are generally smallholder farmers, with the largest farms averaging 3 ha per household and small farms hardly covering a half hectare per household. According to official estimates, more than 112,000 households are involved in rice production. Lowland systems account for 77 percent of rice production; rainfed systems account for 17 percent; and irrigated systems account for 7 percent, with 6 percent by gravitation and 1 percent by pumping.
2.154 Rice processing is done at two levels: (i) by women processors whose role also involves the collection of paddy on-farm, the milling, and the marketing of the milled rice; and (ii) by semi-industrial and industrial rice milling units. Women processors, estimated at 9,000-15,000, handle more than half (52 percent) of total rice production in Burkina Faso. They rely on small (artisan) milling equipment at the village level. Most industrial units are concentrated in the Southern half of the country – particularly in Bobo Dioulasso and in the Sourou Valley – but a new milling unit (SIMAO) has been built in Ouagadougou. The milled rice is sold by women processors, who also act as primary collectors of paddy. However, there is a small group of collectors who represent less than 5 percent of the market. The collectors work with processors and traders. In most urban centers, local rice is marketed together with imported rice. There are different types of sellers, including wholesalers, semi-wholesalers, and retailers.
2.155 The conditions for rice production in Burkina Faso present a number of good opportunities, but also major challenges. Opportunities relate to the existence of production and processing infrastructure – dams, developed irrigated lands, storing facilities, and under-utilized milling capacities. However, some of this infrastructure is dated and in need of retooling. The quality of milled rice depends substantially on the drying process – a lack of adequate drying areas is a major constraint to production. In addition, there is limited access to production zones due to a lack of rural roads that are useable all year round. In order to achieve a sustainable growth in rice production, there is an urgent need to: (i) reinforce producers’ capacities; (ii) secure access to land; (iii) improve soil fertility management and the overall management of irrigated areas; (iv)

63
find alternatives to the high cost pump-based irrigation system; (v) improve pest management and input delivery; and (vi) maintain a price incentive for producers. Rice processing would benefit from improved financing and improved quality management.
Intensification, Value Chains and Innovation
Irrigation
2.156 Burkinabè agriculture cannot develop without the contribution of irrigation, because of its high dependence on climatic conditions, and the resultant food insecurity. In addition, sustained investments in irrigation are essential in order to cope with: (i) a growing demand for food fueled by a high population growth (close to 3 percent per year); and (ii) high pressure on agricultural land. Close links exist between irrigation and economic growth. Irrigation enables farmers to make up for water shortages, particularly during critical vegetative phases. It helps attain the expected yield and provide stable incomes to producers. It also ensures the continuity of production during the dry season – thereby contributing to strengthening food security and increasing incomes in farming households.
2.157 Nevertheless, the use of irrigation is currently limited in Burkina Faso. Irrigated agriculture contributes to less than 0.4 percent of the GDP (about one percent of the agricultural GDP), slightly more than 0.3 percent of exports, and about 0.3 percent of tax receipts (Table 2-19). Since 2004, the Government has implemented a more aggressive policy for the sustainable development of irrigated agriculture (SNDDI). The goal is to develop around 60,000 ha of irrigated land by 2015 (Box 2-5).
Table 2- 21: Contribution of Irrigated Agriculture to Burkina Faso’s Economy (2004)
GDP in factor cost Exports Production
taxes VAT and other taxes Import taxes
Economic value in (CFAF billion) 2 515.8 289.9 40.0 154.5 79.5 Irrigated agriculture sectors 0.36% 0.34% 0.19% 0.28% Onion sector 0.13% Mango sector 0.51% 0.04% Beef sector 6.89% 2.22% 1.98% 29.89% 5.26% Poultry sector 2.10% 0.23% 0.02% 0.19% Cotton 3.07% 0.33% Other agriculture sectors 19.93% 7.56% 0.55% 3.45% Slaughter industry 1.6% 0.0% 28.2% 4.5% 0.1%
Other sectors of the economy 65.4% 89.6% 69.6% 64.8% 90.7%
Source: MCPEA, 2004 and SimSIP_SAM.

64
Box 2- 5: Burkina Irrigation Strategy Potential Impact- An Analysis Using the Social Accounting Matrix
Government’s irrigation policy: In 2004, the Government issued a new policy for the sustainable development of irrigated agriculture (SNDDI). The strategy aims at developing around 60,000 ha by 2015, broken down as follows: (ii) rehabilitation of 5,000 ha of large and medium–scale plots; (ii) development of 17,000 ha of large–scale plots (Bagré, Sourou, Soum, Samendéni) and 3,000 ha of medium–scale plots; (iii) development of 15,000 ha of small–scale plots managed by communities and 15,000 ha of private irrigation; and (vi) 5,000 ha of low lands.
Irrigation is a major opportunity for diversification: Crops grown using irrigation in Burkina include: (i) cereals – mostly rice and a bit of maize; (ii) vegetables – dominated by onions and tomatoes, also traditional small farm-to-market products (such as cabbage and eggplants) and green beans for export., iii) fruits – there is a growing demand for irrigated fruit plantations, in particular, banana, papaya and citrus fruit plantations.
Vegetables represent between 5,000 and 6,000 ha, depending on the season. The output is approximately 75,000 tons of market-garden produce, of which 25,000 tons are onions. Fruit represents roughly 12,000 ha, including 6,800 ha of mango, 700 ha of banana and 4,500 ha of citrus and other species (papaya). The production trend and the demand for fruits and vegetables are not well known, but are significant. In particular, mango output is approximately 120,000 tons. Demand for fruit at the national level is expected to grow at a sustainable pace close to that of urban growth – around 5 percent.
Simulation of impacts of irrigation policies: Irrigated agriculture in 2004 accounted for 0.4 percent of national GDP and for 1.1 percent of agricultural value-added. Its contribution to exports was only 0.34 percent. By contrast, the non-irrigated sectors contributed 10 percent to exports. Irrigation generates only 0.19 percent of tariff revenues from production.
The potential impact of national irrigation policy on production sectors is significant. Total national production would increase by 5.7 percent, and GDP would increase by 6.4 percent (Ouattara, 2008). There would be a 28 percent increase in rice production, 12 percent in maize, and over 50 percent in fruits – there would be an almost four fold increase in market-garden produce. Because of upstream and downstream spillover effects, production in the other sub-sectors would also increase, but by a relatively small percentage in comparison to the aforementioned sectors. Production in the livestock sub-sectors would increase by 5 percent – at the same time this would cause a 6 percent increase in the slaughter industry. There would be a 5 percent increase in the food industries, 7 percent in the trade sector, and 5 percent in the transport sector. Source: Authors. Agro-processing
2.158 Agro-processing represents a promising value-adding complement to agriculture. Positive results have already been achieved through small-scale but innovative agro-processing initiatives in areas such as dried mangoes, syrup, mango jams, mango vinegars and juicing. The main companies most involved in this sector are DAFANI, NOOMDE, UCOBAM, GLOSAD and Délicio. The Government’s strategy identifies light manufacturing as a sector with potential and favors the development of regional poles or growth clusters with support from donors. Burkina lacks the necessary industrial infrastructure for manufacturing development in high-potential areas, and factor costs are high. Therefore, a targeted approach represents a cost-effective opportunity to promote light industry. Other challenges that need to be addressed are related to: (i) insufficiently skilled and semi-skilled labor; (ii) low factor productivity; (iii) inadequate investment promotion policies; and (iv) the low capacity of manufacturing firms to consistently deliver particular quantities of a set standard, (v) the lack of post-harvest conservation treatments to extend products’ shelf-life and to reduce substantial losses existing in many filières. For instance, the milk value chain could be strengthened downward with: (i) an improved management of the milk collection towards

65
the milk-processing units thanks to the expansion and strengthening of cold chain processes, (ii) the improvement of pasteurization processes to improve preservation and to ensure milk integrity and quality.
Addressing Quality Issues to Enhance Value Chain Competitiveness
2.159 There are a number of essential steps recommended for Burkina in order to promote quality and competitive export products. These steps are: (i) scaling-up innovation in food production; (ii) implementing post-harvest and processing technologies; (iii) developing public-private partnership advisory services; (iv) setting-up an effective system for input delivery; (v) improving marketing and access to credit activities; and (vi) improving the agricultural business environment.
2.160 There are key constraints in the following areas with regard to scaling-up Burkina’s export potential in agriculture and animal husbandry: (i) supply; (ii) processing; (iii) quality control; (iv) packaging; and (v) storage. As a result of irregular supply, prices for raw materials often fluctuate. Cleaning and sorting operations before shelling are painstaking, as are cleaning and washing operations after shelling. Shelling machines are either not adapted or not available. Spare parts for shelling or milling machines are expensive. There is no technology for the bolting and rolling of flour; driers do not work properly. The absence of adequate quality control results in the frequent presence of foreign matters and impurities – such as stones and sand – in processed products. More specifically, several quality management fundamentals are missing all along the agricultural value chain, therefore jeopardizing trust with demanding European wholesalers, such as: (i) the absence of sound food safety controls due to the lack of application of the Hazard Analysis & Critical Control Point (HACCP) methodology to prevent the agricultural products from being contaminated with microbiological, physical and chemical hazards that could lead to serious food borne diseases, (ii) the lack of compliance with the hygiene and manufacturing good practices, (iii) the underdevelopment of commercial quality standards and norms enhancing agribusiness and competitiveness (such as, for instance, GLOBALGAP standards, ISO11 9001 standards for quality management, ISO 22000 standards for food safety management or the sound compliance with FAO’s codex alimentarius guidelines and standards), and (iv) the absence of a written and well documented traceability. Secondary processing operations – such as steam cooking, roasting and dolo baking – are often long and tedious, thereby limiting production. Inappropriate packaging is an even bigger problem – it limits the shelf life of products and causes a loss of some organoleptic properties, such as fragrance, flavor, and taste. Raw materials and finished products (rolled products, ordinary flour, weaning flour) get infested by weevils after a few months of storage due to poor conditions and the absence of benchmarks for setting expiry deadlines for consumption. Waste management is yet another challenge faced by the sector.
11 International Standard Organization.
66
Innovation: An Engine for Growth and Competitiveness
2.161 Technological innovation in processed agricultural products is available, but not sufficiently reliable and accessible (Coulibaly, 2008). Experts stress the fact that technologies exist in Burkina, but are largely unused due to dissemination problems and market failures (Box 2-6). Because of the absence of appropriate technologies, the quality of processed commodities very often leaves much to be desired.
2.162 Local food industries are still at an embryonic stage. The three companies most involved in this sector are SODPAL, CTRAPA, and GMB. The sector is dominated by many informal micro-enterprises that lack both the appropriate technologies and a workforce trained in hygiene and quality. Box 2-7 illustrates the key factors of success, and assesses how the experience of CEAS could inspire a restructuring of the technology dissemination system at the national level. Other studies call for research on food quality and preservation. Most processing units lack professionalism and are insufficiently or poorly equipped. Adequate training opportunities and a better organization of players are necessary to address supply, quality and marketing related drawbacks.
2.163 For Burkina-Faso, improving technical capacities and enhancing innovation. There has been progress in access to basic education. Nevertheless, technical training opportunities – such as regional programs aimed at building the methodological and practical capacities of national laboratories and related R&D staff in agro-business – remain weak. For example, package designers have all too often failed to improve the costly and poor-quality packages that constitute a serious impediment to firms’ competitiveness. The development of a national quality system, through a public capacity-building task force regarding quality, food safety and hygiene audits would assist beneficiaries such as public and private institutions, agricultural cooperatives and small scale agro-industries to implement and develop their quality strategies. The development and use of ICT and trade fairs (Box 2-8) would further support the dissemination of information on available technologies

67
Box 2- 6: The Innovation Paradigm
Burkina Faso has relied mostly on extensive agriculture to meet its food security needs. In the past two decades, crop productivity has stagnated and even decreased for some commodities. Cereal and cowpea yields are still on average below one ton of grain per hectare. Horticulture production yields are at half of potential. Livestock production – largely practiced under extensive pastoral and agro-pastoral conditions – displays equally low-productivity.
Farmers still operate using traditional low-performing practices, despite the fact that research has generated many high-performing technologies. The latter remain to a large extent on the shelves. Therefore, the gap between farmers’ yields and results obtained by research is still extremely important – a very rough order of magnitude for this gap is one metric ton per ha for cereal crops.
The main constraints to technology adoption for productivity increase has to do with: i) lack of access to improved technology packages, particularly with regard to financial resources; ii) lack of inputs available at close proximity; and iii) inadequacy of advisory services – in particular, the disintegration of the national extension services. In 2008, the Government adopted: (i) a new strategy for the delivery of advisory services that promote private and public services; and (ii) a new law for seed multiplication and fertilizer and pesticide delivery to farmers aligned with the ECOWAS common regulatory framework. The challenge for the Government is to quickly process the implementation of these laws and strategies. The development of agricultural value-chains also faces issues related to processing, quality control, packaging and storage. Technological innovation in processed agricultural products is available, but it is insufficiently reliable and accessible. The sub-sector is mostly dominated by small-scale and informal micro-enterprises that do not have the appropriate capacities and equipment, and are lacking a workforce trained adequately in hygiene and quality.
Research institutions do exist in Burkina, but they are inadequately funded and they are struggling to address the key issues. Public research institutions include: (i) the National Institute for the Environment and Agronomic Research (INERA); (ii) the National Agricultural Research Institute; (iii) the Research Institute for Applied Science and Technology (IRSAT); (iv) the National Agricultural Post Harvest and Processing Institute; (v) the National Center for Scientific and Technological Research (CNRST); (vi) the Fire Service Improvement Team (FRSIT); and (vii) Agence Nationale de Valorisation des Résultats de la Recherche (ANVAR). Private research organizations include the Centre Ecologique Albert Schweitzer (CEAS), a Swiss NGO that has contributed to the emergence of dried mango production.
Box 2-7 illustrates key factors of success, and assesses how the experience of CEAS could inspire a restructuring of technology dissemination at the national level. Adequate training opportunities and improved organization are necessary in order to address supply, quality, and marketing.
Source: Authors.

68
Box 2- 7: CEAS: A Successful Innovation Experience
The Swiss NGO CEAS has been working in Burkina since 1982. It has greatly contributed to the emergence of viable units in the field of dried mangoes. Its primary goal is to help resolve the ecological and economic crisis afflicting the western Saharan region by providing alternative solutions to environmental degradation and poverty through the promotion of small players in the local economy. EAS conducts research and development activities in the fields of craft utility, ecological- agriculture and agro-processing. As corollary to this activity, it provides training to ensure the transfer of technology and assists developers in the marketing of their products. It is made up of three departments: (i) the Department of Appropriate Technologies (DTA), which develops technologies; (ii) the Department of Agro-Ecology (DAE), which is responsible for agro-ecology and environmental protection; and (iii) the Department of Agro-Processing (DAT), which develops techniques for processing agricultural products and fruits. The DAT has developed technologies and popularized techniques in: (i) the field of agro-food processing – fruit and vegetable drying techniques; aromatic plants; production of syrup, jam, fruit juice and fruit pastes; production of vinegar; and (ii) the field of non-food technologies – manufacturing soap and producing shea butter. A Coordinator oversees the activities of the three departments while the Documentation and Communication Support Service (SADOC) caters to promotion. The strength of CEAS lies in strong and effective dissemination methods. It coordinates all the operations necessary for the successful use of innovations that it has made public. CEAS has facilities for the various research and training programs. It has developed several technologies currently in use in Burkina. These include: (i) solar water heaters; (ii) gas dryers; (iii) water pumps; (iv) soap manufacturing techniques; (v) pest control; (vi) soil fertility management; (vii) production techniques for farm-to-market products and fruits; (viii) incubation of eggs for poultries; (ix) beekeeping; and (x) equipment for textile crafts. CEAS’ method of work is equally remarkable. It initiates research on a given technology, develops it, tests it and sends the technology package to its partners. The technology package includes the chain to develop a product or a given technology, and the activity test of a small industrial unit and/or a viable trade. CEAS ensures that its partners can assume ownership of the technology, by providing training and diverse support and technical follow-up. This includes equipment maintenance, quality control, training, retraining and research opportunities. CEAS also has a quality control laboratory. The structure has: (i) developed a network of some thirty semi-industrial units for the drying of fruits and vegetables; and (ii) initiated a number of producers into the practice of organic farming. Partner enterprises have been organized into economic interest groups (GIEs), so that they can have autonomous management.
Given the increase in production, CEAS has also supported enterprises in the search for business opportunities. CEAS has been able – through the European Fair Trade Association, the tropical Whole Food and Claro – to draw attention to dried products labeled in Burkina. This has enabled the country to make a commercial breakthrough in the Fair Trade and on the traditional market. CEAS has continued to assist companies in areas such as: (i) the promotion of quality insurance standards; (ii) the organization and control of organic certification; (iii) the introduction of new technologies for more efficient drying; (iv) training; and (v) support for marketing. Today, dried mangoes account for approximately US$2 million of Burkina’s export earnings.
Source: Authors.
Box 2- 8: Trade Fairs – A Key Vector in the Dissemination of Innovation
Burkina Faso has developed trade fair attendance as a key promotional activity for emerging agro-businesses, with a clear focus on innovation. These fairs provide opportunities for agro-businesses to develop important contacts and become better known within the sector. For example, BOMBA TECHNO, a private research and development structure, was able to present its products in the Food Day, which was a fair organized in Ouagadougou. The products it displayed included bissap wine, pearl millet whisky, lianas juice, guava liquor, Bandji, and essential oils. BOMBA eventually won the National Assembly prize. It also won the first prize for processing at Banfora. At SIAO fairs and the Cashew nut and Cassava Fair, BOMBA presented the possibilities of transforming cashew nuts into jam, syrup, wine, almonds, cashew butter, vinegar, juice and alcohol. It also presented possibilities for the diversification of cassava production into attiéké, gari, and cassava milk. However, in the absence of potential big clients, these fairs need to be viewed as spring boards for a clearer and broader vision of what is at hand. Hence, BOMBA TECHNO did not enter into any contracts as a result of participating in the aforementioned fairs. Source: Authors.

69
Conclusions and Policy Recommendations
2.164 For the coming decades, the agriculture sector will certainly remain the most relevant engine for Burkina to achieve its targeted economic growth and food security goals. The value-chain approach is the most comprehensive tool available to address agricultural development in a sound and sustained manner. The supply-chain approach should be combined with a growth-pole approach in order to yield more benefits.
2.165 Despite the current difficulties faced by the cotton sector, the Government should continue to support this supply-chain with the objective of improving its competiveness and its profitability to farmers. Cotton farmers regularly obtain less than one ton per ha to exit cotton cultivation. The strategy for the cotton sector should be to provide better incentives to those farmers.
2.166 The main emphasis of the government strategy should be on developing selected supply-chains tailored to its objectives related to food security, growth and import substitution. The most promising supply–chains include: (i) cereals and short-cycle livestock products for food security; (ii) onions, tomatoes, and cattle/beef exports in regional markets; (iii) mangoes, sesame and shea nuts exports in international markets; and (iv) rice and milk to address import substitution.
2.167 Table 2-20 summarizes critical actions recommended to enable accelerated development of these promising value-chains. The key actions are: (i) to reinforce the capacities of supply-chain actors; (ii) to address the technology gap; and (iii) to improve the infrastructure. The Government should improve the investment climate in the sector.
2.168 The priority actions that would enable Burkina to fulfill its potential and enhance the country’s competitiveness can be summarized as follows:
Implement the rural land tenure legislation adopted by the Government.
Extend irrigation and improve the rural roads network, especially the ones connecting farms to markets.
Support the adoption of technology packages to increase productivity: improved seeds, fertilizers, and manure.
Computerize and network farmers with local and global markets to improve management and marketing.
For each crop, identify a private operator to play the role of Supply-Chain Leader and assist with inputs provision and technological guidance to farmers.
Implement standardization and promote quality by: o developing processing techniques (shelling, color sorting, etc.); o shifting to a more industrialized treatment process to enlarge production scale beyond raw seeds.
Transform FASONORM to create a specialized standardization and certification institute, driven by the private sector.
Pilot commodity and weather risk-management instruments.

70
Table 2- 22: Critical Actions for Accelerated Agricultural Diversification Crop/livestock products
Capacity/expertise of agents
Technology Infrastructure
Crops Traditional cereals (sorghum, millet, maize)
Reinforce capacity to adopt technologies Reinforce capacities to manage surplus and deficits Reinforce strategic capacities (early warning) Reinforce national food security system capacities
Transfer of existing technology package to boost production
Warrantage Restructuring Cereal Banks General warehouse receipt
Rice Strengthen organizational capacity of actors to increase competiveness in local market
Technologies to increase productivity and for small-scale processing by women
Irrigation infrastructure Road network
Onions Reinforce the capacity of supply-chain actors and the creation of an inter-profession Support participation of Burkina in the development of a sub-regional trade integration with Niger and Mali
Introduction of improved Storage technology and processing of dry onion
Large-scale storage warehouse with inventory credit in the main production zones (privately managed) Irrigation infrastructure
Tomatoes Reinforce the capacity of supply-chain actors and the creation of an inter-profession
Processing of dry tomatoes Tomato processing plant Irrigation infrastructure
Green beans Support the settlement of medium and large-scale commercial farmers on the main irrigation areas and their connection to markets
Improve the handling system
Irrigation Infrastructure Cold storage
Cowpeas Strengthen producers organization Develop a trade strategy to address costal countries’ markets
Disseminate existing technologies and develop improved post-harvest technologies
Warrantage Restructuring Cereal Banks General warehouse receipt
Sesame Strengthen Improved seeds and post- Processing units

71
organizational capacity of the supply-chain actors, Development of Private-Public Partnerships
harvest technologies
Mangoes Capacity to respond to market demand Improvement of fruit terminal management
Research and development to respond to new varietal demand and increase yield of existing varieties; Introduce improved processing technologies
Infrastructure for mango processing (drying, pulp, juice, jam, etc.) Secure access to land Road network
Shea nuts Strengthening the grassroots organizations, and the structuring of the actors to address the international markets
Research to improve processing technology for shea nuts
Livestock Short-cycle species (poultry, sheep and goats)
Strengthen actors organization to increase production and access to national markets
Develop a sustained annual vaccination campaign strategy, and improved feed technologies
Slaughterhouse for poultry privately owned or managed
Cattle/Beef Strengthen actors’ capacities to: (i) access high-value upscale markets through improved fattening (ii) secure larger share of low-value “bulk” regional markets
Meat cuts to increase value-added
Private management and upgrade of Ouagadougou slaughterhouse and new PPP slaughterhouse in Bobo. Export infrastructure to respond to upscale meat market
Milk Strengthen organizational capacity of the supply-chain actors Development of Private-Public Partnerships
Improved animal breeding to increase quantity of milk produced per cow Improved quality of processed products
Development of private milk processing units
Hides and skins Improve the actors’ capacity to access international markets
Research to work on improving quality of imported skins

72
THE MINING SECTOR: CURRENT SITUATION AND PROSPECTS
2.169 The strategy for growth and poverty reduction in Burkina Faso places a central role on the development of the private sector throughout the economy, but particularly in those sectors which are capable of both producing important linkages to other activities and providing skill development that is transferable to other sectors. The mining sector, in light of its recent development, is seen as an important pillar of this strategy. It is important, therefore, to explore in depth how the potential of this sector along with its spinoff activities can be optimized in the medium term in order to improve the performance of economic growth with equity.
2.170 Currently, Burkina Faso is endowed with a modern legal and regulatory framework for the development of the mining sector. This framework, which is favorable to mining investments, has encouraged a large number of mining companies to pursue exploration activities, several of which have led to the discovery of exploitable deposits. Four mining companies have begun mineral exploitation of gold (Tarpako, Youga, Mana, Kalsaka), others are at an advanced stage of mine construction (Belahouro, Perkoa, Essakane, Kiéré), and still others are undertaking feasibility studies (Tambao, Bissa). Gold production by industrial mines has begun and, while currently at modest levels, could easily be the most important export of Burkina Faso within five years, particularly if prices remain at or near current levels of about US$1,000 per ounce. Production of Burkina Faso’s other most important minerals, zinc and manganese, depends on prices reaching at least their historic trend levels of about $2000/tonne and $200/tonne, respectively. Currently zinc prices are above US$2,000/tonne and it is likely that construction of the Perkoa zinc mine will resume in early 2010. The future of the large manganese mine at Tambao will depend heavily on a sustained global recovery from the financial crisis.
2.171 There is still considerable progress to be made on the institutional framework for the mining sector. The titling of various types of mining permits under the cadastre is well-developed—as can be seen by the increase in the number of active exploration permits from 95 in 2004 to 344 in 2008, 219 of which belong to international companies. However, many other functions of the Ministry of Mines and Energy are seriously understaffed and lacking in equipment to undertake their functions. To date there has not been any inspections undertaken of the working mines with respect to their environmental or socio-economic behavior and, in fact, the de facto monitoring and enforcement strategy is to rely on the good will of the mining companies and the vigilance of NGOs.
2.172 In addition, there is no strategic plan to try and increase the participation of Burkinabès in the mining industry, either directly or through sub-contracting. While the Mining Code calls on companies to steadily increase the number of Burkinabè workers—and they have all gotten off to a good start in that regard for unskilled and semi-skilled jobs—it is not clear how Burkinabès will be trained to take higher skilled jobs. More importantly, although mining companies claim to be buying as many local inputs as possible, there is currently lacking any systematic plan for identifying the types

73
of goods and services—and associated training—that Burkinabè entrepreneurs could reasonably be expected to supply in the short- and medium-term.
2.173 In this same context the contribution of the mining sector to sustainable local community development is largely being left to the good will of the mining companies, with some pressures from NGOs. There does not seem to be any systematic attempt to take advantage of infrastructure needs of the mining companies to extend such facilities to local areas, which in turn could be critical for the successful development of small and medium enterprises (SME) as suppliers to the mines. The situation again is primarily one in which the mining companies have responded to an assortment of uncoordinated pressures and provide various concrete benefits to the local communities, mostly schools and health care facilities. Only in two cases (Essakane and Perkoa) there is a strategic plan in this regard being formulated before production begins.
2.174 Similarly, the macroeconomic implications of the rapid growth in tax and foreign exchange revenues generated by the mining sector and its spinoffs may require new policy and institutional initiatives by the Government of Burkina Faso. While the first steps towards the implementation of the Extractive Industries Transparency Initiative (EITI) have been taken,12 it will soon be important for the Government to formulate a plan as to how it will use the increased fiscal revenues to further the development of the country—and avoid the natural resource curse so common to mineral dependent countries—as well as how it will manage the likely fluctuations in such revenues generated by the mining sector. In particular, while, as part of the West African franc zone, fluctuations in foreign exchange revenues will not directly impact upon Burkina Faso’s foreign exchange rate, they will have internal inflationary impacts that could affect the competitiveness of other industries as well as the prices of consumer goods.
Sector Overview
2.175 The large amount of exploration that has taken place in the last decade has resulted in a significant number of discoveries of promising deposits, some of which are already under exploitation. Moreover, geographically, the deposits that are being exploited or have a high potential are widely dispersed throughout the country.13 The exploitation of one manganese and four gold deposits began in 2008-09, while construction of four other mines (gold, zinc) is underway. The existing state of knowledge for the various minerals is discussed below. The investors in the sector are listed in Appendix 8.
Gold
2.176 Gold constitutes 61 percent of currently known discoveries and almost all—336 of 344—valid mining exploration permits. Seven exploitation permits have also been granted for gold mines, of which four mines with total reserves of 76.4 tonnes or 2.5 million ounces of gold began production in 2008-09, as can be seen in Table 2-21.
12 Burkina Faso became an EITI Candidate Country on May 15, 2009. 13 The Government has produced a high quality map showing the current distribution of deposits in Burkina Faso.

74
2.177 Construction of three other gold mines is underway, as shown in Table 2-22. Of special note is Essakane, a world class deposit with reserves estimated at 120 tonnes or 3.5 million ounces of gold, and the potential for significant other findings in the area.
2.178 In addition, there are an estimated 99 tonnes of geological reserves in Bissa Zand Koom (75 tonnes) and Bondigui (24 tonnes). Moreover, there are a large number of other deposits of economic interest for which a feasibility study has not been done (Table A7.1, Appendix 7).
Table 2- 23: Operating Gold Mines (December 2008)
Locality of deposits Companies Reserves (tonnes)
Construction commencement date
Total investment (US$ million)
Taparko/Bouroum SOMITA (High River gold)
26.2 February 2005 120
Kalsaka Kalsaka Mining SA (Cluff Mining)
8.8 June 2005 52
Youga Burkina Mining Company (Etruscan)
15.1 October 2005 92
Mana Mana Minéral SA (SEMAFO)
26.3 May 2007 120
Total 76.4 384 Source: MMCE, mining companies
Table 2- 24: Gold Mines under Construction Locality of deposits Companies Reserves
(tonnes) Construction commencement date
Total investment (US$ million)
Inata (production expected in 04/09
Gold Belt/Resolute
31.1 2007-2008 120
Essakane (production expected in 2010)
IAMGOLD 100 August 2008 352
Guiro STREMCO 3.3 February 2009 2 Total 134.4 474 Source: Mining companies
Manganese Deposits
2.179 There are two confirmed deposits:
Kiéré with reserves of 600,000 tonnes with an average of 44 percent of Manganese Dioxide (MnO2). Commercial exploitation began on December 15, 2008. Investment is estimated at US$ 2.8 million.
Tambao with reserves of 19 million tonnes with an average of 50 percent to 54 percent MnO2. The prefeasibility study indicates an investment need of US$ 844 million, including US$ 350 million for the construction of a rail line from Kaya to Tambao.

75
Zinc Deposits
2.180 The only known deposit is Perkoa, evaluated at 624,000 tonnes of zinc metal. Nantou mining began construction of the mine in March 2006, but the drastic fall in the price of zinc (70 percent from 2007) made profitability questionable and the development was placed on care and maintenance. However, with the recovery in zinc prices since April 2009, it is likely that construction will recommence in early 2010. Realized investment by December 2008 was US$ 30 million.
Copper Deposits
2.181 Three deposits are known but with average grade of less than 1 percent copper. The most important of these, at Gaoua in the south of the country, is currently under evaluation. Preliminary estimates of profitable copper reserves at Gaoua (at over US$3000/t) are 725 million pounds of copper and an attached 1.17 million ounces of gold.
Phosphate Deposits
2.182 Three deposits are known, all in the East of the country. The Kodjari deposit in Tapoa province contains 65 million tonnes of reserves with an average grade of 26 percent of phosphorous pentoxide (P2O5).
Potential Mining Exports for 2008-2015
2.183 The outlook on mineral production in the short- and medium-term is centered on gold (four producing mines, three under construction, and three with high potential by 2015); zinc (the Perkoa mine under construction); and manganese (the Kiéré mine has began production and a pre-feasibility study has been undertaken for Tambao). Depending on the results expected from a feasibility study and the evolution of prices, a copper mine could be envisaged in the medium-term but is not likely to occur before 2015.
Outlook on Gold Production Table 2- 25: Estimated Gold Exports in Ounces and US$ million, 2008-2015
Location 2008 2009 2010 2011 2012 2013 2014 2015 Total by mine
TAPARKO 29 000 55 000 106 000 106 000 106 000 106 000 106 000 106 000 720000 KALSAKA 60 000 60 000 60 000 60 000 60 000 60 000 60 000 420000 YOUGA 45 000 86 000 90 000 107 000 104 000 104 000 104 000 104 000 744000 MANA 74 000 130 000 141 000 141 000 141 000 141 000 141 000 141 000 1,050,000 INATA 53 000 70 000 70 000 70 000 70 000 70 000 403000 ESSAKANE 140 000 350 000 350 000 350 000 350 000 350 000 1890000 GUIRO 9 000 10 000 12 000 12 000 12 000 55 000 BISSA 100 000 130 000 160 000 390000 BANFORA 50 000 60 000 70 000 80 000 260000 GAO:UA 150 000 150 000 300000 Orpaillage 16 000 21 000 22 000 23 000 24 000 25 000 25 000 25 000 181000 Yearly total (oz)
164 000 352 000 612 000 866 000 915 000 1028 000 1218 000 1258 000 6413 000
Export Revenues (US$ millions) (US$1000/oz except 2008 - $750/oz)
123 352 612 866 915 1028 1218 1258 6.372billion
Source: MMCE, Mining companies.

76
2.184 The estimations on gold production are based on the projections of the four producing mines (Taparko by SOMITA, Kalsaka by Kalsaka Mining, Youga by BMC and Mana by Mana Mineral SA), three mines under construction (Inata by Gold Belt/Resolute, Essakane by IAMGOLD, and Guiro by STREMCO), and on the reserves in three high potential deposits (Bissa by High River Gold, Banfora by Gryphon and Gaoua by Volta Resources). Added to the above is the production of artisanal mining (l’orpaillage) estimated at 500 kilograms or 16,000 ounces of gold in 2008 with a steady increase. The projected gold exports to 2015 are in Table 2-23 above.
2.185 The table above indicates that just on the currently known reserves and modest estimates for the high potential sites, during 2008-2015 Burkina Faso could be expected to export 6.41 million ounces of gold (about 198 tonnes) with an approximate value of US$ 6.37 billion at US$ 1000 per ounce (US$750 in 2008).
Outlook for Other Minerals
2.186 The estimates of the production of other minerals are based on projections for the zinc mine at Perkoa and the manganese mines at Kiéré and Tambao. Projected production and exports are in Table 2-24 below.
Table 2- 26: Estimated Exports of Non-Gold Minerals in Tonnes and US$ million, 2009-2015
Locality, mineral, and price per tone
Export quantity (tonnes) and Value of exports (US$ millions)
2009 2010 2011 2012 2013 2014 2015
Perkoa Zinc (US$2000/tonne)
Quantity of exports
35,000 70,200 70,200 70,200 70,200
Value of exports 70 140 140 140 140 Kiéré Manganèse (US$200/tonne)
Quantity of exports
30,000 30,000 30,000 30,000 30,000
Value of exports 6 6 6 6 6 6 6
Tambao-Manganèse-(US$200/tonne)*
Quantity of exports
1,000,000 1,000,000
Value of exports14
200 200
Total value of exports per year (US$ million)
6 6 76 146 146 346 346
Source: Mining companies * Estimates for Tambao are based on a pre-feasibility study.
2.187 Table 2-24 shows zinc and manganese prices rising to their long-run trends, which they were approaching in October 2009, although considerably below prices in 2007. Note that current (Nov.2009) prices for zinc are $2200/tonne and 27 month future prices for zinc are $2267/tonne (there is no active futures market for manganese).
14 Similar to zinc, the price of manganese fell to US$136 per tonne, but for Tambao, with its high logistics costs, to be profitable, the company that commissioned the prefeasibility study indicated that the price would have to be US$200 per tonne, which it currently is approaching.

77
With the opening of the mine in Tambao, exports from non-gold metals are projected to total US$ 1.01 billion between 2008 to 2015. Thus, from all metals, on (mostly) proven and high potential reserves, Burkina Faso could have approximately US$ 7.4 billion in mineral exports from 2008 to 2015. A recent IMF forecast estimates that the export of non-mineral goods and services from Burkina Faso will be approximately US$ 800 million in 2011, while our estimates predict approximately US$ 942 million in mineral exports in 2011 (IMF, 2008).
Value Added Generation and Distribution
2.188 Given the combination of high capital intensity and wide price variations, the value added generated by a mine is tied very strongly to the current price and, thus, can vary widely from year to year. In low price years, in fact, it is likely that the value added created through subcontractors and multiplier effects would dominate the value added created directly by the mine.
2.189 Information on value added in the mining sector is limited although data from the Essakane and Kalsaka mines suggests that at a price US$1000 per ounce of gold, value added would be between US$550 and US$600 per ounce (or 55 percent to 60 percent of export value). In Table 2-25, it is assumed that for all gold mines the value added is equivalent to 55 percent of export value. Given the moderate prices for zinc and manganese, value added is assumed to be 25 percent of export value for these metals. Row 4 estimates the value added of subcontractors to the mines plus standard multiplier effects. An overall multiplier of two is used, based on the results reported in McMahon and Remy (2001) for Latin America where multipliers ranged from 1.42 for a small mine to 5.7 for a very large mine. The last row compares the total value added generated by the mining sector—including linkage and multiplier effects—with projections made by the IMF (2008) on the total value added generated in Burkina Faso.
Table 2- 27: Value Added by the Industrial Mining Sector (US$ millions) 2008 2009 2010 2011 2012 2013 2014 2015 Gold mines 68 194 337 476 503 565 670 692 Other mines 0 1 2 19 37 37 87 87 Total mines direct 68 195 339 495 540 602 757 779 Multiplier effects (including value added of subcontractors) 68 195 339 495 540 602 757 779 Total mines direct and indirect Memorandum item:
136 390 678 990 1080 1204 1514 1558
Percentage of total value added for Burkina Faso (in %) 1.9 5.3 8.7 11.8 12.1 12.8 NA NA Source: Authors’ calculations and IMF (2008).
Employment and Wage Bill in the Industrial Mining Sector
2.190 Direct employment is mostly concentrated in exploration, construction, and exploitation. In 2008 there were about 7,000 exploration related jobs in Burkina Faso, if an average of 20 workers per active permit is assumed. Second, there were between 2,500 and 3,500 jobs in construction. Typically construction takes one to three years with large variations in employment over this period. For example, in December 2008, there were 1,300 construction jobs at Essakane, an amount that will peak at near 2,000 jobs in mid-2009. Third, there are the full-time ‘permanent’ positions during exploitation. Table 2-26 presents estimates on employees in producing mines in the medium-term. The projected total permanent employment is 3,350 jobs in producing mines or about 10,000 formal sector jobs in mining companies involved in exploration

78
and exploitation, assuming that the current levels of exploration continue. At any given point in time, this number could be considerably higher due to construction jobs. For several of the mines, data was extracted on the number of positions held (or expected to be held) by Burkinabè nationals and by residents of local communities. The latter mostly fill unskilled jobs. In producing mines, Burkinabè nationals currently fill 95 percent of the positions.
2.191 There is only limited data on the wage bill in the industrial mining sector but based on information provided by the Essakane and Youga mines, in the gold sector salary costs are about US$40 per ounce of gold produced—about 10 percent of operating costs. This leads to an estimation of a wage bill in the gold sector of about US$ 17 million in 2009, peaking at US$50 million in 2015 (based on export figures in Table 2-24). As employment in the gold sector is about two-thirds of total employment in projected operating mines in 2015, a total wage bill of between US$60 million and US$70 million can be further estimate in mines under exploitation. That figure is likely to be at least doubled if employment in prospecting and mines under construction is taken into account.
Table 2- 28: Provisional Mining Employment during Exploitation (Working Mines, Mines under Construction, and Advanced Projects)
Companies Employment Mine life (yrs) Burkinabès Expats Total Locals
Producing Mines
SOMITA (Taparko)
432 23 455 NA 7
BMC (Youga)
298 20 318 175 7
SEMAFO (Mana)
386 32 418 137 7
Kalsaka Mining (Kalsaka)
260 05 265 NA 7
Subtotal 1376 80 1456 (312) - Mines under construction
SMB (Inata) 304 31 335 NA 7 IAMGOLD (Essakane)
400 50 450 144 10
NANTOU (Perkoa)
282 10 292 130 12
BM-SARL (Kiéré)
NA NA 57 NA 10
SMG (Guiro) 128 12 140 80 10 Subtotal 114 103 1284 (354) - Advanced Projects
Tambao NA NA 610 NA 20 Bissa NA NA NA NA NA Gaoua NA NA NA NA NA
Subtotal NA NA 610 NA NA Total 2490 183 3350 (666) - Source: Mining companies and McMahon (2009).
Tax Revenues Generated by the Mining Sector
2.192 Currently, the mining sector is not a major contributor to tax revenues in Burkina Faso. Its direct contributions are expected be about 1.3 percent of tax revenue in 2008 (Table 2-27). However, that situation is soon likely to change dramatically and it may directly contribute to almost 18 percent of tax revenue by 2011, or about 26.5 percent if the indirect effects on revenues are included as explained below.

79
2.193 Table 2-27, relying on broad assumptions, attempts to give some idea of the revenues that could be expected from the mining sector. Tax estimates are notoriously less robust in the mineral sector where there are often large variations in prices. Moreover, in the case of Burkina Faso, taxation of the mining sector on a large scale is a new challenge for the fiscal authorities, and it is far from certain how collection will turn out.
2.194 Accordingly, in Table 2-27 for 2008 and 2009, other taxes are assumed to be twice royalties, for 2010 to 2012 they are three times royalties and for 2013 to 2015 they are 3.5 times royalties. It is also assumed that the Government of Burkina Faso receives 25 percent of additional gold receipts when gold is over $750 per ounce.15 Row 2 is calculated using these assumptions. However, the impact of the mining sector on tax revenues is likely to be much larger than this figure as it does not include any taxes paid by sub-contractors or the taxes generated by the multiplier effects of consumer spending and higher incomes. Row 4 assumes that these are equivalent to 50 percent of the direct taxes generated by the sector, with the total contribution in row 5. Finally, these are compared to forecasts for total tax revenue made by the IMF (2008) from 2008 to 2011.
Table 2- 29: Estimated Tax Revenues Generated by the Mining Sector (US$ millions) 2008 2009 2010 2011 2012 2013 2014 2015 Royalties 4 11 19 28 32 35 47 48 Other taxes 7 43 94 139 153 188 240 247 Total mining sector tax payments
11 54 112 167 185 223 287 295
Other taxes generated by mining activity
6 27 56 8l4 92 111 144 148
Total taxes paid on and generated by mining activities
17 81 169 251 277 334 431 443
Percentage of total tax revenues
1.8 8.3 17.3 26.5 NA NA NA NA
Source: McMahon (2009) and IMF (2008). Performance and Constraints
2.195 Despite the impressive performance of the mining sector in Burkina Faso described above, its future expansion and contribution to the country’s economy could be limited if several constraints are not overcome. These challenges focus on the sector’s expansion and how to ensure that mining does not become an enclave type activity in the country. The first constraint is related to reducing the costs of mineral production while the second is to integrating the mining sector with other industrial activities in the country.
15 For example, if gold is US$1000 per ounce, the Government of Burkina Faso receives an extra US$(1000-750)*.25 or US$62.5 per ounce.

80
Infrastructure and Competitiveness
2.196 Competitiveness in the mining sector is often difficult to evaluate as it is a combination of the quality of the deposit (“the rent”), location and access to infrastructure, fiscal regime, and technological efficiency. In the case of the new mines in Burkina Faso, the fiscal regime is similar to most other countries—perhaps more generous than most for gold—and there is no reason to believe that companies operating there will not be near the technological frontier, but most mines face geographical and infrastructure challenges.
2.197 Given the relatively small size of the country, most existing or potential mines can not be said to be in remote locations, but they all incur additional costs due to the landlocked nature of Burkina Faso. This factor is less important for gold mines, where the amounts to ship out are quite small, although it does increase construction costs. More important than location is the lack or poor state of transport, power, and water infrastructure. All the mines have to spend a large amount of money to obtain power, and base metal producers face very large transport costs to ship out their product, whether by road or by rail. In fact, the potential large manganese mine in Tambao can sometimes be seen as an infrastructure project more than a mining project. Power for most new mines will be in the area of 15 cents/kWh, compared to about 6 cents/kWh in Ghana.
2.198 The recent study by the Ministry of Economy and Finance (2008) on territorial planning puts a heavy emphasis on the development of the rail system for the country, including the development of a rail line to the north of the country with potential synergies to the Tambao mine. As most of the currently known high potential mineral deposits run along the southwest-northeast axis of the country, there also seems to be an opportunity to develop road or rail links joining Côte d’Ivoire and Niger through Burkina Faso.
2.199 There is only limited evidence on the overall competitiveness of new and potential mines in Burkina Faso. Mining Review Africa (2006) refers to the Perkoa zinc mine as a mid-cost producer. Data from Perkoa confirms that it would be profitable at about US$ 180 per tonne. Before the recent decline in zinc prices, there were many mines operating at costs over US$200 per tonne, particularly in China. Operating costs at IAMGOLD’s Essakane mine are foreseen to be about US$356/oz, which is in the lower quartile of production costs for gold mines around the world, with total production costs being about US$ 450/oz versus between US$ 550 and US$ 600, on average. Note, however, that power will account for about 30 percent of operating costs at Essakane, which cuts significantly into profits and fiscal revenues. SEMAFO’s mine in Mana reports operating costs of US$357/oz, while Mining Journal (2008) reports that the Kalsaka mine is profitable at US$525/oz, suggesting that both of these mines are also in the lower quartile of production costs for gold mines.
2.200 In sum, at or near current gold prices, many gold mines will be competitive in Burkina Faso despite the poor infrastructure, although the same may not be true for the base metal mines, unless their prices continue their upward trend. Moreover, it is highly likely that in the not too distant future the viability of several mining sites, including gold, will be jeopardized by the high infrastructure related costs in the country.

81
Employment and Training in Industrial Mining
2.201 In light of the very large investments and financing needed for even the relatively modest-sized gold mines that one currently finds in Burkina Faso, it will be necessary to depend largely on foreign-owned companies for the foreseeable future. Consequently, the most important benefits that industrial mining is going to bring to the people of Burkina Faso is employment, either directly in the mines, indirectly through sub-contracting and other linkage effects, or even more indirectly through the expenditure of the new fiscal revenues by government agencies. In addition, there will likely be large multiplier effects generated by the consumption and investment expenditures of the various categories of workers above.
2.202 The amount and types of employment will to a certain extent be influenced by the skill base of the population and the types of training they receive. Over time, it is likely that for a given amount of direct mine employment, the amount of indirect employment will increase over time as new skills are developed and more opportunities are identified and taken advantage of.
Employment
2.203 There are six main categories that need to be considered when discussing employment in the industrial mining sector. First, there is the employment created during exploration, which was earlier estimated at about 7,000 jobs, but can vary considerably. Second, there is employment during construction, which will include company employees but often be dominated by workers from sub-contracted companies. Third, there are the permanent employees during exploitation. Fourth, there are the employees belonging to sub-contracting companies during exploitation. Fifth, there are the jobs created in the informal sector as people gravitate towards the mines and provide a diversity of services, particularly with respect to commerce, lodging, and entertainment. Sixth, there are jobs in the more formal services, some of which are likely to be part of the public sector, such as health, education, water and electricity, and general government services. Table 2-28 roughly estimates the number of jobs created by the industrial mining sector under various assumptions.
2.204 There are three scenarios in Table 2-28—low employment, average employment and high employment. In addition, the total number of jobs generated by the mining sector is calculated using an employment multiplier of two and four. In the low employment scenario, metal prices stay low except for gold prices, which are assumed to be moderate. Exploration falls off but all the currently operating or under construction gold mines are operating. Neither Tambao nor Perkoa are operating. In the average price scenarios, gold prices are moderate and other metals are on trend, so both Tambao and Perkoa are operating as well as all the gold mines in previous scenario. Exploration is similar to current levels. In the high employment scenario, gold prices are high and other metal prices are significantly above trend. Exploration is high and two or three other gold mines have also opened. The construction figures are driven by the same prices.

82
Table 2- 30: Employment Generated by Mining Activities Employment Scenarios Low
employment Scenario
Average employment scenario
High employment scenario
Exploration 3000 6000 9000 Construction (total) 1000 3000 5000 Exploitation – mine employees 2500 3500 4500 Exploitation – employment with sub-contractors (domestic)
2500 5250 9000
Multiplier Impact (2) 18,000 35,500 55,000 Total – Multiplier of 2 27,000 52,750 82,500 Multiplier Impact (4) 36,000 71,000 110,000 Total Multiplier of 4 45,000 88,250 137,500
Source: Authors’ calculations.
2.205 In the absence of any data on the total number of sub-contracting employment, it is assumed as is often the case that there are two or three times as many jobs created through sub-contracting than in the mine itself (McMahon and Remy, 2001). Currently security and restaurant services are the most important sources of national and local employment during exploitation. In the low employment scenario, the assumption is that there is one national sub-contracted worker for each mine employee. In the average and high employment scenarios, between 1.5 and 2 national subcontracted workers are assumed for each mine employee, respectively. For these scenarios to develop, it will likely take proactive programs by the public and private sectors in order to increase significantly the types of goods and services provided by national sub-contractors.
2.206 The two final categories, lumped together, likely contain the most employment of all. They include the employment in new businesses—private and public—generated by the consumption and investment demand of the workers in the mines and sub-contractors. Included in this demand are schooling, health services, and social services, including utilities and basic government services. It is often difficult to calculate this multiplier—unless the mine was built in an uninhabited area—and certainly too early to determine what this ‘multiplier’ is in Burkina Faso. Nevertheless, it is likely in the neighborhood of four or five.16 In Table 2-28, multipliers of two and four are used for expository purposes.
2.207 Clearly, even excluding employment generated due to increased government tax revenues and spending outside of the areas of the mines’ influence, the industrial mining sector is going to generate considerable employment in Burkina Faso. In the scenarios in Table 2-28, this figure ranges from 27,000 jobs—low metal prices, low sub-contracting employment, and low employment multiplier—to 137,500 jobs—high metal prices, strong sub-contracting employment, and high employment multiplier. The true number of jobs created in Burkina Faso will depend on global factors outside of its control (including oil prices) but also domestic factors such as
16 One difficulty in calculating the employment multiplier is that in a country like Burkina Faso, the opening of a mine will attract a large number of people to the region, resulting in a large amount of petty commerce, much of which could be considered underemployment. Some estimates in the literature are: South Africa—4.0 (Granville 2001); Albert Oil Sands—3.57 (Timilsina et al, 2005); Xolobeni Mineral Sands, South Africa—4.2 (web site); and Western Australia—4.0 (Clements et al, 1996).

83
infrastructure quality and accessibility and the availability of semi-skilled and skilled workers. Well-targeted training programs can help to fill this need.
Training
2.208 As noted above (Table 2-26), most of the direct employment in the mines is national—95 percent on average—and almost 40 percent of that is local residents. Employment of local residents is overwhelmingly in unskilled positions. For all mines, there are few local residents with the skills needed to work in the mines, so companies have recruited preferably nationals to fill the unskilled positions. In general, there is a strong need for training to increase the number of Burkinabès benefiting from the mining sector.
2.209 It is possible to group the training needs of Burkinabès for work in the mining sector and related activities in four large groups: (1) literacy and work skills17 training to enable workers to fill unskilled positions; (2) training to work in a trade or semi-skilled position, which could range from two months to one year, often in stages—e.g. welders, masons, plumbers—and may also include work skills training; (3) professional training—e.g. engineer, geologist, manager; and (4) training for sub-contractors (SMEs) and their workers to increase their capacity to provide goods and services to the mining industry. This last category would contain elements of the first two categories, with a strong emphasis on product quality management.
2.210 Currently in Burkina Faso, the first category of training is only being offered on a significant scale at Essakane and Perkoa, the two largest mines that are in the construction or exploitation stage. Training is offered because there is a large demand for unskilled labor in these mines that cannot be filled by the existing base of literate workers in the mines’ localities. Essakane and Perkoa are also the leaders in category 2 training, although all of the mines are making some efforts in this regard.
2.211 Training for category 3 involves university level training, some of which can be offered in Burkina Faso (management, geologists), but most of which would currently have to be obtained outside of the country. The main nearby options in this regard are Ghana (Tarkwa, Obwassi), Niger (Niamey, Agadez), and Morocco (Casablanca, Rabat, Marrakech). While on quality and cost effectiveness, Ghana appears to be the best option, the language problem would likely rule this out for many potential candidates. External training would depend largely on the availability of scholarships. Currently none of the mining companies are sponsoring such programs but there is some possibility of funding through a number of donors, such as the World Bank, the European Community, and the Canadian International Development Agency.
2.212 Training for SMEs under category 4 is currently not taking place in any systematic way, although there is some overflow of the training courses offered by Essakane into sub-contracting firms and Perkoa is providing training directly to sub-contractors.
2.213 There is a great deal of scope for the provision of more training in all four categories. At very low cost, the first type of training could be broadened with
17 Work skills training refers to short courses to accustom workers to the demands and discipline required to work in a highly regimented formal sector workplace.

84
financing from the mining companies, aid agencies and bilateral donors and implementation by NGOs. With respect to trades, the first step would be to make realistic projections of the demand for the various skills so as to avoid oversupply. This would require more systematic information from mining companies as to their needs. Such courses could be undertaken as public-private partnerships by the mining companies and the Government. In many cases they would likely be most effective as co-operative type programs, where, for example, workers receive training for two months, work at a mine for two months, followed by two months more training.
2.214 The critical question with respect to professional training is whether, if currently unavailable, such offerings should be developed at universities in Burkina Faso. Given what is currently known about the mining possibilities in Burkina Faso, the demand for such workers would not be high enough to justify this solution. It would be more cost effective to offer scholarships, particularly in cooperative type programs, where students could study for certain periods of time, followed by stints of work in the mining companies. Support for the students could come from various sources, including the mining companies, and could include partial repayment—such as occurs in Mali and Niger—given that the candidates are likely to earn relatively high salaries when their training is completed.
2.215 The last category of training, targeted at sub-contractors, is in some ways the most important and most complicated of the four. It is important as many of the skills developed through this training and the sub-contracting activities in general will be transferable to other industries. It is complicated as it can be difficult to target what types and amounts of training and who should receive this training. The first step would be to gather information on the needs of the mining sector in the short-, medium- and long-run. Then training courses would need to be designed in specific skill areas. Third, many sub-contractors are likely to require financial help to move forward as well as technical help in the area of quality control. The Maison de l’Entreprise could play a lead role in organizing these various types of assistance to the sub-contracting sector.
2.216 Currently mining companies report that they buy considerable inputs from Ghanaian firms. It would be interesting to analyze what Ghanaian firms are able to supply to the mining sector that Burkinabè firms currently are not. A medium-run target of a major training effort for SMEs would be to close that gap.
2.217 Burkina Faso can learn a great deal on generating business and employment in SMEs by studying good practices in other countries, such as Chile, South Africa and Mozambique. The very large Escondida copper mine in the Atacama Desert of northern Chile may be the best example in a developing country of a company dedicated to employing local people and procuring from local businesses. As discussed in Castillo et al. (2001), it not only provides extensive training for local people to prepare them for mine employment, the company (i) trains individuals in work habits and attitudes in order to help them adjust to permanent employment in a large industrial complex; and (ii) trains employees and managers in small and medium-sized companies in the mining industry in order to help them improve the quality and costs of their goods and services. In the latter case, this has often resulted in suppliers to Escondida becoming suppliers across the large Chilean mining sector.

85
Box 2- 9: Development of SMEs at Mozal, Mozambique
2.218 The Anglo Zimele (AZ) Empowerment Initiative is a program established in 1989 by Anglo American South Africa, which is primarily focused on backward linkages through the development of SMEs. AZ provides skills development and strategic knowledge, including guidance on corporate governance, to the firms it supports, as well as investment funds where necessary. It is primarily involved with historically disadvantaged South Africans. While AZ is heavily involved in each firm it supports at the beginning, once it can stand alone, it sells off its stake in the company. During 2005, for example, AZ invested in 10 new empowerment ventures. These included ScanMin Africa, which supplies and supports real-time analyzers for mining and mineral beneficiation processes, Springbok Trucking Company, Langa Lethu, a security and risk management company, and Tyre Corporation, a tire manufacturer. Currently AZ is investing in 39 SMEs that employ over 3,000 people.18
2.219 It is noteworthy that when Mozal in Mozambique opened the first of its two aluminum smelters, it did not count a single local SME among its suppliers. Five
18 Information on Anglo Zimele can be found at: http://www.zimele.co.za/.
The Mozal smelter in Mozambique, near Maputo, was built by BHP Billiton in 2000 with a large expansion in 2003, Mozal II. It is a large smelter with a capacity of 550,000 tonnes per year. Mozal has brought substantial socioeconomic benefits to its local area and Mozambique in general. These include:
At peak employment, 9,000 construction jobs at Mozal I and 6,000 at Mozal II; Mozal has 1,100 permanent jobs; Mozal I through linkages has created another 2,500 jobs (IFC, 2004);
BHP-Billiton spends US$35-40m per year on purchases from Mozambican companies; from 2002-07, the number of
local suppliers increased from 40 to 250; US$330m contribution to GDP in 2004 (10%) and US$8m in taxes; Through the Mozal Community Development Trust, BHP-Billiton spends 1 percent of pre-tax profits on community initiatives, US$ 2 million in 2002; Over 8,000 students have benefited from educational upgrades, including 40 new classrooms and a new secondary school; Through the Small and Medium Enterprise and Empowerment Program (SMEELP), 28 companies benefited from US$5m in contracts from 2001-03; Through Mozlink service, by 2005 local SMEs won US$11m in contracts (Thomas, 2005); and Big increase in quality and quantity of local infrastructure.
Success with SMEs mostly came with Mozal II, as Mozal I had failed to develop effective linkages to the local economy. The main reasons were: (i) contracts were ‘bundled’, including components that local SMEs could not fulfill; and (ii) contracts were in English. With SMEELP (and later Mozlink), Mozal II developed a specialized program that identified contracts that could be sourced locally, trained local entrepreneurs on tendering, and provided training and mentoring to SMEs (Thomas, 2005). By 2007, SME performance in the areas of quality, management, maintenance and safety improved by 20% on average (Jaspers and Mehta, 2007). The case of Mozal shows that there can be substantial indirect benefits generated by a highly capital intensive industry such as an aluminum smelter. It is important for national and local governments to work closely with the owner of the smelter to identify possibilities, including human capital shortages and related training needs. It is particularly important for the company to have an active involvement with SMEs in order that they deliver the high quality inputs required by the smelter’s operations. In addition, if local infrastructure is only dedicated to the smelter, it will be difficult for SMEs to have the required efficiency. Source: Authors.

86
years after the beginning of a major training effort, 250 SMEs were supplying Mozal (Box 2-9).
Mining Policy and Institutional Framework
2.220 While mining policy for Burkina Faso is fairly modern, it does have some shortcomings. More importantly, the institutions charged with implementing the mining code and regulations are very understaffed and in need of considerable capacity building. Finally, given the likely importance of the mining sector to the overall economy of Burkina Faso, it is important that the Ministry of Finance and the Treasury are prepared to manage the likely large increase in export and fiscal revenues and their fluctuations.
The 1996 Declaration of Mining Policy 2.221 There are three important considerations missing in this declaration. The first is that there is no explicit reference to local communities and their participation in either the process or the benefits of an industrial mine. While the introduction does mention provincial benefits, the relations with landholders and the spin-off effects of mining, these are not elaborated on or discussed at all in the section on the mining code. Accordingly, the right of communities to benefit from a mine in their locality is vague at best, and the right to participate in the planning process is completely absent.
2.222 Second, along a similar line, there is no strong statement about the importance for the Government (in public-private partnerships where appropriate) to undertake policies and programs—including but not limited to SME and infrastructure development—that will enable the private sector to take full advantage of the benefits associated with the development of the mining sector.
2.223 Third, while there is a brief section on fiscal revenues, it is not put in the context of risk sharing. Mining is a very risky business and it would be useful to highlight this characteristic, indicating that it is important to design a fiscal system that shares in the benefits on the upside and shares in the risk on the downside.
Mining Code
2.224 The National Assembly of Burkina Faso passed significant revisions to the country’s Mining Code in May 2003. The revisions included lower tax and administrative requirements for small-scale mines and for projects in the exploration phase; improved financial assistance for small-scale miners; restriction of state ownership to 10 percent in large-scale mining projects; a ban on state ownership of small-scale mines; lower taxes on income from transferable securities; and reduced tariffs on fuel and lubricants. Most stakeholders are satisfied with the Mining Code and its implementing regulations, although there is one major exception on the side of civil society as well as an implementation problem that has been raised to the Government by the mining companies.
2.225 The most severe problems associated with the Code are due to the lack of capacity of the Directorate General of Mines, Geology, and Quarries (DGMGC) to implement the laws and regulations. The DGMGC is responsible for the conception, elaboration and coordination of the application of the policies of the Ministry in the domain of mines, geology and quarries. It is particularly in the DGMGC that the lack of manpower and supplies is dramatically insufficient for the volume of work that it would

87
normally be expected to accomplish. In fact, while certain neighboring countries, such as Niger, Mali or Ghana have more than 100 agents in their equivalent office, the DGMGC of Burkina Faso has only 11 agents The Code also has two other potential deficiencies with respect to the design and management of fiscal revenues.
2.226 With respect to civil society, the biggest deficiency in the Code is an inadequate protection of the rights of local communities, with respect to both the benefits that they should expect to receive and their involvement in the planning process of the mine at all stages. In particular, tripartite discussions are needed before the mine is built that should consider how the mine will affect the nearby communities, how the said communities can best benefit from the mine with respect to sustainable development, and how institutions will be created to follow-up on these commitments. In the largest projects, a fund could be included for local community development to help better mobilize the contribution of mining operations to their host and surrounding communities, but given the short expected lifetime and the relatively small size of some of the mines; this should not be a mandatory condition of mine development. At least one mine, Essakane, has taken it upon itself to follow such a process during the construction of the mine, and another one, Mana, has recently circulated a terms of reference for a similar process, even though exploitation has already begun.
2.227 The major concern of the mining companies—besides the lack of a presence of Government inspectors—is the VAT rebate system on imports (equal to 18 percent) of mining equipment. While a directive in March 2007 indicates that 70 percent of VAT must be reimbursed within 40 days, the delays on the rebates continue.19 A significant part of the problem is that there are several checks along the way in order to reduce fraud. For example, when activity in the mining sector began to grow rapidly in the early 1990s, there was an extraordinary increase in exploration permits, many of which were likely obtained in order to fraudulently receive VAT exemption for other businesses.
2.228 Another concern of the mining companies is that investment is depreciated on a fixed schedule, which for mines with shorter life expectancies, is often much longer than the lifetime of the mine. Consequently, mining companies would like to be able to depreciate their investment over a maximum time of the expected lifetime of the mine.
2.229 Another important issue is the design of a mining sector fiscal system to share the risks and benefits of mining production over the cycle. Currently the most important taxes on the mining companies are royalties, fixed at 3 percent, and corporate income tax. However, for companies with a lifetime of less than ten years, accelerated depreciation and other incentives will diminish the overall impact of the latter. The Government is also a 10 percent shareholder in all industrial mining ventures, which means that it gets 10 percent of dividends, but given the pliability of dividends, these amounts are not likely to be very important. Fixed royalties, especially for precious metals (and petroleum), are becoming less and less common around the world. Accordingly, a sliding scale royalty that would take account of both the upside and downside of the metals markets would likely be more appropriate for Burkina Faso. At the same time, the Government could consider a different treatment of base metal 19 See Circulaire of March 9, 2007 from Finance and Budget Ministry, No 425/MFB/CAB.
88
companies, which have very large logistic costs, and precious metals like gold, which do not. For example, any increase in the price of zinc or manganese could be offset by a rise in the price of oil, if the latter meant a large increase in the cost of the transportation of their products to markets.
2.230 The management of fiscal revenues over the business cycle is important, given the large fluctuations in the surplus generated by the mining sector. The Government could find itself in a situation of large swings in fiscal revenues if it does not save some of the mining generated fiscal revenues during the good mining years to use in the downturn phases of the business cycle.
Macroeconomic Challenges of the Mining Sector Boom
2.231 The mining sector can contribute significantly to value added, export revenues and fiscal revenues in Burkina Faso. In the context of the global economic downturn experienced since the summer of 2008, and in retrospect of the past experiences of mineral and petroleum booms, some of the positive developments assumed here might be reversed. Whatever the future evolution of world metal prices and world demand for such commodities, there can be exchange rate pressures, difficulties in managing the increased variation in fiscal and export revenues, and political economy/corruption issues due to the point source nature of these large increases in revenues; that is, mining companies have to mine where the minerals are and cannot easily flee to another country. Managing large increases and fluctuations in export and fiscal revenues can raise technical challenges. The EITI process, on which Burkina Faso has made some progress, constitutes one viable channel to improve transparency in the management of mineral resources, especially in light of the boom recently recorded by the sector.
2.232 It was shown above that the export and fiscal revenues generated by the mining sector are expected to grow rapidly in coming years. Within five or six years, it is expected that minerals, dominated by gold, will be the top foreign exchange earner of Burkina Faso, and could be over 50 percent of export earnings by 2011. Moreover, by 2011 it is projected that 17.7 percent of total fiscal revenues will be generated directly by the mining sector, a figure that rises to 26.5 percent when the spinoff effects are included, particularly taxes paid by subcontractors. Given the fluctuations that can occur in mineral prices, often in a cyclical manner, this positive news suggests that export and fiscal revenues in Burkina Faso could soon be subject to significant fluctuations. Moreover, in a new mining country like Burkina Faso the quantity produced of the different metals is likely to be subject to wide variations as new exploitations come on line and other mines are closed. Consequently, the Government may face significant swings in fiscal revenues and foreign exchange reserves if it does not manage closely the volatile mining generated fiscal revenues and foreign exchange proceeds.
2.233 In Burkina Faso, large fluctuations in export revenues are unlikely to have a severe Dutch-disease impact as in many other countries, given that it is a member of the West African franc zone, with a fixed exchange rate to the euro. In particular, the large increase of inflows would not result in an appreciation of the exchange rate, negatively impacting other export-oriented businesses. But a large increase in foreign exchange flows would likely have inflationary implications that could impact on low

89
income earners. Hence, some type of stabilization fund could help diminish these negative effects as well as provide a source of foreign exchange in years when the exports are down, whether due to developments in the mining sector or other important sources of economic activity.
2.234 The much graver problem could be caused by fluctuations in fiscal revenues. If a downturn in metal prices, for example, has an important impact on the level of fiscal revenues, the fall in government spending will reinforce the negative repercussions for the economy. Governments tend to adjust their spending and commitments to the level of fiscal revenues. When revenues fall dramatically, a Government often finds it very difficult to adjust its current spending—particularly on salaries. This can result in large budget deficits or large cuts in investment projects, infrastructure maintenance and operating expenditures. Nevertheless, with respect to fiscal earnings, it is not clear that mineral revenues will be so dominant as to require a new institutional setup. It is noteworthy, however, that based on the cost structure at Essakane, if gold were US$ 7500 per ounce, using the same methodology as Table 2-27, total tax revenues of the Government would fall by approximately 13 percent in 2011.
2.235 Accordingly, it is important that the Government begin to think of the possibility of a stabilization fund for implementation in the medium-run. Typically, the resources in such a fund are deposited in foreign financial instruments in order to lessen repercussions on the foreign exchange rate and provide a ready source of foreign exchange in a downturn. There is a growing body of knowledge on the use of such fiscal stabilization funds around the world, albeit mainly with petroleum. In the case of mining, Chile has a large experience with its copper stabilization, which is triggered by the price of copper and, with recent changes, the growth in national income with respect to its trend. In order to manage its diamond revenues, Botswana began a stabilization fund shortly after independence to great success (Box 2-10).

90
Box 2- 10: The Botswana Diamond Fund Botswana is often cited as an African success story. From 1966 to 2007, GDP and GDP per capita grew at an average of 9.85 percent and 7.5 percent, respectively. While the discovery of world class diamond deposits played an important role in Botswana’s economic growth, many other countries have had similar ‘good luck’ and fared poorly. Botswana’s success is largely due to the way in which it has managed the mineral revenues, which in turn is one indicator of the good governance that the country has enjoyed since independence, ranking near the 75th percentile on the 6 country indicators used by Kaufmann et al (2008), versus the 30th percentile for Sub-Saharan Africa as a whole. Since the beginning of the large increase in mineral revenues (mostly from diamonds) the Government of Botswana (GoB) has put surplus revenues into a mineral fund, formerly called the Pula Fund in 1996. These revenues are exclusively invested in foreign currency denominated assets, including public equity and fixed income instruments. In poor years—low diamond prices, droughts—the GoB draws on the Fund, which in addition acts as an exchange rate stabilizer. How is the GoB determining what revenue is surplus? Unsurprisingly, there is a great demand to use mineral wealth for public sector projects. However, all proposed projects must go through a cost-benefit analysis. The number of adopted programs is limited as the GoB uses conservative estimates for the expected social and economic benefits and places a heavy emphasis on the ability to meet recurrent costs in the future. Moreover, no accepted project can be amended without the unanimous approval of the legislature. Investment decisions also take into account the absorptive capacity of the economy, the availability of skilled labor often being the main constraint (Sarraf and Jiwanji, 2001). In 1996, the GoB went one step further with the creation of the the Sustainable Budget Index (SBI). Under the SBI, mineral revenue can only fund investment expenditure, which is defined to include recurrent spending on education and health (human capital). All other recurrent spending (about 70 percent of the total) must be funded from other tax sources (Iimi, 2006). Source: Authors. Extractive Industries Transparency Initiative (EITI)
2.236 Burkina Faso has fulfilled all five steps needed to become a candidate country for membership in EITI. On May 15, 2009, it was granted Candidate Status by the international EITI Secretariat and Board. These criteria are: (i) issue a government announcement of interest; (ii) commit to work with all stakeholders; (iii) set up the legal framework by establishing multi-stakeholder committees; (iv) appoint a director of the secretariat for implementation; and (v) compose and publish a Work Plan. The Government has announced a substantial contribution for EITI in the amount of some US$400,000 and is assisted by the World Bank on implementation in close collaboration with bilateral and multilateral agencies. Civil society stakeholders such as Revenue Watch and Publish What You Pay have been invited to join the initiative to the satisfaction of the international community.
2.237 With four gold mines having opened just last year, it is much too early to make any definitive assertions on how well EITI will function in Burkina Faso. Information on the amounts of royalties being paid by mining companies is available from the Government, but is not published on a regular basis. Given that Burkina Faso only joined the process early in 2008, progress can be overall characterized as speedy. It took Guinea, for example, almost 3 years to pass through the five required steps for

91
candidacy. Of great interest, is the real engagement expressed by all three categories of stakeholders (civil society, Government of Burkina Faso, and private mining companies) to all work together to ensure the success of the EITI initiative in Burkina Faso.
Sustainable Development and Industrial Mining 2.238 Local communities are concerned by the negative environmental and social externalities associated with mining projects and require benefits and jobs in compensation. These have traditionally taken the form of infrastructure and social services that would be provided by governments in richer societies. 2.239 Mines have a finite life. Historically, more often than not, a poor community that saw incomes and living standards rise dramatically during the lifetime of the mine soon found itself poor after mine closure. Consequently, the emphasis around the world by local and national governments has been on programs and projects that will enhance the sustainable development of the communities in the locality of the mine, partly so that more people will benefit from the mine’s impact during its lifetime, but mostly so that the community will continue to thrive after the mine’s closure. This generally means an emphasis on the development of skills and industries that will eventually be transferrable to other types of activities. In regions where local governance is weak, mining companies inevitably end up playing an important role in the funding or delivery of such programs. It is important to note that, if local communities to not believe that they are receiving sufficient benefits from the mining, operation they frequently will take actions that will stop or slow down construction and exploitation, often with support of NGOs, both domestic and international. Nevertheless, in designing programs and projects, it is important to consider the geographic viability of the community when the mine closes as well as the expected duration of mining activities in the area. In very remote and inhospitable areas, for example, it is not likely that a manufacturing center would thrive when mining ceases, so local development projects should focus on building the capacity of the workers rather than, for example, developing an industrial cluster.
Social and Infrastructure Benefits to Communities and Regions
2.240 As can be seen in Table 2-29 most mines are offering aspects of the traditional ‘social’ infrastructure often associated with mining communities. These include schools or classrooms, health clinics, access to water, and sporting facilities. None of the mines are providing the services associated with these facilities to a significant extent, except in cases where training is related to mine employment, as presented earlier.
2.241 There are often substantial infrastructure developments associated with industrial mining developments, particularly electricity, roads and rail. Mines have significant power needs, especially if any beneficiation or smelting is involved, and need roads or rail to get inputs in and production out. However, in the case of Burkina Faso, with one very significant exception—see Tambao manganese below—, the infrastructure externalities may be somewhat limited for the existing mines and those that are high probability in the next five years. Table 2-29 above lists the main infrastructure developments and possibilities associated with the existing and highly probable mines in Burkina Faso.

92
Table 2- 31: Infrastructure Provision by Mines in Burkina Faso Social Infrastructure Water Electricity Transport Comments Mana Local Community Fund
(not operating yet) Planned Own &
village Local roads improvement
Will do community plan
Youga Maternity ward, dispensary, classrooms, outdoor market Fund but not running yet
Yes, get details Link to Ghana power grid (112 km)
Local roads improvement
Kiéré Clinic, school, old age home, sports field
Own; no local provision
Repaired 27 km road to main link
Small mine
Essakane Relocation ($23m for towns), sanitation, 2 schools, kindergarten, health clinic, police station, 7 mosques & 2 churches, slaughterhouse, market areas, will have 200k Fund per year starting 2010
Piped to towns with 17 stations
Own (25 MW); no local provision
Maintain 80 kms of dirt road; built 20 kms of local dirt roads
Has done community plan; provides extensive training
Perkoa School, clinic (to be constructed), literacy center
Yes, dam has been built by the Government to support project and local requirements for 20 km radius of mine.
Own; some local provision
Local roads improvement; Tar remaining 30 kms of road to Ouagagadougou.
Doing community plan; training programs that will be expanded
Tambao NA NA NA 250 km rail line (planned)
At feasibility stage.
Source: Mining companies (December 2008)
2.242 With respect to electricity, the main reasons for the low impact of the mining sector on power infrastructure are the high cost and unreliability of electricity in Burkina Faso and the limited reach of the power grid. Some companies have no choice but to build their own generating stations as the cost of linking to the grid is prohibitive. Other companies are building their own generating stations as it is cost-effective even when they are reasonably close to the grid. In one case, the Youga gold mine near the Ghanaian border, a 112 kilometer power line (mostly in Ghana) was built to link up to the Ghanaian grid, where power is approximately half the price of Burkina Faso’s power.
2.243 Some of the companies will be providing power to the communities in their immediate vicinity, normally within a five kilometer radius, but it is not clear that even these limited externalities will persist past the lifetime of the mines. In the case of Youga, extending the power line to the main town in the area, Zabré, 23 kilometers away, was at some point envisaged, but to date this has not happened.
2.244 The largest externalities from mining developments often come from opening up roads and railway lines. In essence, the mine can make, for example, the building of a railway line viable because of the high demand to transport ore to its markets. However, as gold mines dominate Burkina Faso’s mining sector, and the end product is not bulky—and can even be shipped out by helicopter in some mines—these externalities are limited. Base metals have much greater infrastructure demands but the

93
zinc mine at Perkoa is near the railhead and the manganese mine at Kiéré is too small to justify large infrastructure expenditure.
2.245 The very important exception is the potential manganese mine at Tambao, which would require a massive railroad investment—in the area of US$ 350 million—to ship from 500,000 to 1,000,000 tonnes of ore per year for approximately 20 years. This rail line of 250 kilometers from Kaya to Tambao would both open up the northern area of the country and join Ouagadougou to the proposed west-east railway line that is being proposed from Dori to Niamey20 or, alternatively it could be extended by 110 kilometers to Niamey. In addition to the mine’s needs, the benefits of a rail line to Tambao include the opening of export markets for farmers, passenger service, tourism, and a transport infrastructure for a potential manganese mine, Ansongo, approximately 100 kilometers northeast in Mali.
2.246 All of the new and expected mines will do local road improvements that will help the local communities, but none of these will provide a major link to a previously unconnected area.21 There are, however, large opportunities for the existing railway to Abidjan to expand its service and rolling stock, and presumably, improve its existing infrastructure. However, mining companies have noted that the prices charged by SITARAIL are prohibitively high. In the cases of Kiéré manganese and Perkoa zinc this means that they will be using trucks, adding to the already high levels of truck traffic going through southern Burkina Faso and Ghana. Roads are not an option for Tambao given the large amount of ore to be transported, and the high railway tariffs could act as a significant detriment to the launching of the mine.
2.247 In sum, while the infrastructure externalities of most of the new and expected mines are relatively small, the rail line to Tambao could have very large spin-offs. Nevertheless, there are some possibilities for cooperation between the Government (or private sector actors) and the mining companies to enhance the benefits obtained from infrastructure developments, particularly with respect to upgrading the existing rail facilities (which are owned by the Government and leased to SITARAIL) and rural electrification.
Sustainable Development of Local Communities
2.248 For sustainable local community development it is essential to go beyond a hit and miss approach in which the mine (or more rarely the central Government) provides benefits in a non-systematic manner, often to those who are the most aggressive or well-connected. Accordingly, well before mine construction begins, it is necessary that representatives of the mine, central (or regional) government, and local communities hold extensive discussions on how the local community can move to a sustainable development path. As local communities often have little knowledge of what a path could look like, they will often need extensive assistance from NGOs or other civil society organizations (CSOs). 20 A feasibility study undertaken by ECOWAS has determined that a Kaya-Dori-Niamey rail line would be the most profitable new railway project in West Africa. 21 The most significant road development is the repair of the 27 kilometer road from Kiéré to Boni by Burkina Manganese.

94
2.249 Once a consensus is reached on a community development plan, mechanisms must be put in place for its implementation and to monitor the results. It will be necessary to have regular meetings on its progress and make adjustments where necessary. There will also need to be some type of dispute resolution mechanism when inevitable disagreements arise on implementation and distribution of benefits.
2.250 While the mining company will initially be the main financier of the local community sustainable development plan, it is important that over time this responsibility shifts to local governments and CSOs. In fact, some mining taxes could be earmarked to go directly for sustainable development programs and infrastructure projects, including staffing.22
2.251 Given the incipient nature of an important industrial mining sector in Burkina Faso, this sector has gotten off to a reasonably good start with respect to local community development. All mining companies seem to have engaged their local communities in an important way and have provided some of the basic infrastructure needed for local community development. Moreover, most if not all companies are hiring as many local workers and buying as many local products as possible.
2.252 However, only in the cases of Essakane and Perkoa have there been extensive tripartite discussions on a long-term community plan of action and the type of training programs that are essential to start the process. These include literacy, work skills, and large-scale training in trades, enough to supply the mines and sub-contractors. Box 2-11 outlines the main elements of the strategy at the Essakane locality.
2.253 The main weakness for the affected communities is the lack of significant infrastructure development beyond the immediate needs of the mines. As currently planned, there will be no new or improved roads linking communities to the rest of Burkina Faso, little new electrification, and, except in the case of Tambao, no new rail lines. It seems likely that the only way for this crucial stepping stone for sustainable development to proceed is for some of the tax revenues generated by the mining activities to be directed towards the regions where the mines are located, perhaps in the context of public-private partnerships.
22 Currently the only tax earmarked for local communities is 10% of the land tax, which in the case of Essakane, the largest mine, is only US$ 10,000 per year.

95
Box 2- 11: Sustainable Development at Essakane The Essakane gold mine in north central Burkina Faso, owned and operated by IAMGOLD of Canada (who bought the mine at the beginning of 2009 from Orezone), is the largest mining project foreseen in Burkina Faso over the medium run, with an expected value of output of about US$ 350 million per year from 2010 to 2020 and 1,000 full-time employees. The mine location is on a former (declining) artisanal mining area and there was a substantial town on the site. 11,000 people had to be relocated. From the beginning there has been substantial communication with the local communities. In 2007 a council was formed that brought all the stakeholders together, including representatives of five NGOs. A consensus was reached on what could be done to assure that the community would be put on a sustainable development path and a consultation committee was set up to monitor progress. Currently IAMGOLD has a team of 30 people involved on community development issues. IAMGOLD has an open door policy with respect to community problems and tries to fix them immediately. If an agreement can not be reached (which has yet to happen), there are two higher levels of dispute settlement. First, a council is held that includes the local mayors and imams. Second, there is a grievance committee that includes members of parliament, the local governor, and company and union representatives. The five NGOs act as observers and currently IAMGOLD is trying to formalize the relationship with one of them to act as an ombudsperson. To date the main elements of the sustainable development plan are the creation of the first full town in Burkina Faso with an urban plan, including 17 stations with piped water; literacy training; a $2 million fund to develop SMEs, some of which could act as suppliers to the mine; and a wide program in training in various trades that are needed by the mine during construction or exploitation—currently over 500 people trained—but also have a wide variety of other applications, including skills needed by sub-contractors to the mine. During exploitation there will be a budget of $200,000 per year for local development programs. A tripartite committee will agree on priorities and one condition of any grant is that the local government will be able to run and maintain any accompanying public facilities. While local roads are being improved, the town will not benefit directly from IAMGOLD’s dedicated power plant (25 MW), due to the expense and the inability at this time for most local people to afford the expensive power (about 16 cents/kWh). As the economy prospers this situation could change. While the Essakane area has gotten off to a good start with respect to sustainable community development, the main weaknesses are power and transport infrastructure, neither of which is currently on schedule for dramatic improvements. As the region harbors a substantial population, mostly dependent on farming if not working in mine related activities, there are strong arguments in favor of using some of the tax revenues generated by the mine to bolster the local infrastructure, including a paved road to Dori, 70 kilometers away, and eventually links to the mine’s power grid. Source: Authors. Conclusions and Policy Recommendations
2.254 The mining sector is clearly set to be a fundamental source of growth in years to come for Burkina Faso, being a significant provider of employment, value added, fiscal revenues, foreign exchange, and almost any other commonly used measure of economic activity. This outcome should remain despite the unfolding global financial crisis, as the mining boom is led by gold, the price of which has remained strong so far and is susceptible to remain so as a refuge commodity. The possibility of significant base metals production—zinc, manganese and, perhaps, copper—has been impacted negatively by the crisis. However, in the short-run this has been partly offset by the large drop in oil prices for the economy in general and gold mining in particular,

96
where oil purchases account for about 30 percent of operational costs (mostly related to power generation). If base metal prices return to trend, within five years metals will dominate the exports of Burkina Faso and be an important contributor to fiscal revenues. If the crisis amplifies and commodity prices continue to fall, Burkina is expected to continue to export significant quantities of gold at well above break-even price.
2.255 Nevertheless, the mining sector still faces important challenges. The policy framework for the sector has undergone a rapid transformation in recent years, but there are still some weaknesses that need to be addressed. The institutional weaknesses in implementing the Mining Code and accompanying regulations are, however, the main deficiency, and strengthening the budget allocation and re-staffing the DGM would help improve the regulation of the sector.
2.256 Despite this lack of oversight, although there are certainly pressures from domestic and international NGOs, the industrial mining companies can be said to have behaved in a range from acceptable to very well. Most employees in all mining companies during construction and exploitation have been Burkinabè, and there have been strong efforts to hire people from the locality of the mine. In addition, companies appear to have done as much subcontracting as feasible from Burkinabè companies. All the mining companies have built some types of social infrastructure and the larger ones have been active in social programs.
2.257 Nevertheless, except at the level of some of the individual companies, there is no strategic plan to try and increase the mining sector’s value added and the participation of Burkinabès in the mining industry, either directly or through sub-contracting. While the Mining Code calls on companies to steadily increase the number of Burkinabè workers, it is not clear how Burkinabès will be trained to take higher skilled jobs. More importantly, there is currently lacking any systematic plan for identifying the types of goods and services—and associated training—that Burkinabè entrepreneurs could reasonably be expected to supply in the short-term and medium-term.
2.258 Only the owners of the two largest mines, both under construction, have begun the process of laying the foundation for sustainable local community development. This has largely been on the initiative of the mining companies and NGOs, as central government involvement has been minimal once the mining contract is signed. In particular, there does not seem to be any systematic attempt to take advantage of infrastructure needs of the mining companies to extend such facilities to local areas, which could be critical for sustainable development, partly through its impact on the development of SMEs as suppliers to the mines.
2.259 There also seems to have been little thought given to the macroeconomic implications of the rapid growth in tax and foreign exchange revenues generated by the mining sector and its spinoffs. While the first steps towards the implementation of the EITI have been taken, it will soon be important for the Government to formulate a plan as to how it will use the increased fiscal revenues to further the development of the country—and avoid the natural resource curse so common to mineral dependent countries—as well as how it will manage the likely fluctuations in such revenues generated by the mining sector.
2.260 The analysis identifies the following most urgent recommendations:

97
Revise the 2003 Mining Code and the 1996 Mining Policy Declaration to: o Streamline fiscal measures in the mining sector, particularly through a
sliding scale royalty with different schedules for base metals versus precious metals, mine lifetime depreciation, and with a revamp of the process for VAT rebates.
o Improve provisions on sustainable local community development, including mandatory tripartite discussions between industrial mining companies, central and local governments, local stakeholders and communities;
o Target a share of mining sector revenues to local community development funds.
Consider the creation of a mineral revenue stabilization fund fully compatible with long-term fiscal sustainability goals.
Strengthen capacities of the Direction Générale des Mines (DGM) in light of its ever increasing workload.
Set up an information service—possibly through the Chamber of Commerce—with respect to the goods and services required by the mining companies during construction and exploitation. Endow this service with a registry of Burkinabè companies that provide these types of goods and services. Complement this service by adapting existing training modules at the Maison de l’Entreprise to enhance SMEs’ capacity as sub-contractors to mining companies, with a particular focus on quality issues.
Establish a scholarship program for the development of professionals in the mining sector—with potential funding from the mining companies, donors, and the Government—and facilitate exchanges with other countries. Most effective programs usually are of a cooperative type, where students move back and forth between classroom and on-the-job instruction.
Enhance consultations between mining companies and the Government to better address cooperation opportunities (including through PPPs), particularly for infrastructure development, territorial planning and sustainable community development.

98
AN EMERGING TOURIST DESTINATION
2.261 Burkina Faso has been successfully building a reputation over the last years as an emerging tourism destination, due to its stable political environment and a wide range of natural and cultural assets. Despite its landlocked geographical position at the center of Western Africa, the country was able to gain global notoriety with its Pan-African film festival (FESPACO), alternating with its regional handicrafts fair (SIAO) the following year, and has multiplied the number of cultural events, while still primarily catering to the MICE (meetings, incentives, conferences and events) target market. Should key constraints to sector growth be removed as described below, this chapter argues that by exploiting its natural assets, the country could reasonably increase annual revenue from visitors’ exports by over US$100 million around 2015, a 150 percent increase from their 2007 level.
Sectoral Overview 2.262 In 2006, international arrivals reached 264,000 visitors (or 73 percent of the total 360,000 travelers), principally coming from Europe and other African countries. This number has increased by 13.6 percent annually between 2000 and 2006 (Figure 2-14), or well above the 3.7 percent global average estimated by the World Tourism Organization for the same period. When compared with regional destinations already well-established in the tourism circuits, Burkina Faso is showing very strong gains over the last ten years in visitors exports23 (Table 2-30).
Figure 2- 14: Arrivals to Burkina Faso (in’000s)
Source: DRST
2.263 Data from the World Travel & Tourism Council (WTTC) indicate that overall travel and tourism consumption24 for Burkina Faso reached US$311 million
23 Spending by inbound international visitors. 24 Or the value of products and services that have been consumed by visitors, including (i) personal travel and tourism; (ii) business travel by government and industry; (iii) government expenditures by agencies and departments providing visitor services (museums, natural parks, immigration, customs); and (iv) visitor exports.
126 129 149 163222 245 264 288 31549 54
6877
95112
132
40 56
2000 2001 2002 2003 2004 2005 2006 2007 (e) 2008 (f)
ResidentsInternational visitors

99
Travel & Tourism (% GDP)
1.3%
2.6%
3.5%
3.6%
4.0%
4.4%
9.7%
1.9%
2.8%
4.6%
4.0%
4.3%
5.1%
9.8%
Burkina
Benin
Kenya
Senegal
Tanzania
South Africa
Namibia
20062003
in 2006, a 13 percent increase from the previous year. This would be equivalent to 1.9 percent of GDP, or comparatively less in relative terms than regional neighbors Benin or Senegal, with respectively 2.8 percent and 4 percent of GDP (Figure 2-15).
Table 2- 32: Burkina Faso and Key Tourism Destinations in Africa Tourism & Travel exports
(10-yr real growth) Estimated 2006 visitors exports
($m, current) Senegal 3.1% $375.3 Tanzania 3.8% $949.8 Kenya 3.9% $1,181.0 South Africa 3.9% $9,000.0 Burkina Faso 5.8% $68.1
Source: WTTC, 2008
Figure 2- 15: Travel and Tourism (direct + indirect revenues, % GDP)
Source: WTTC (2008)
2.264 Positioning: Despite the lack of comprehensive sectoral data, business travelers seems to represent the key segment of international visitors to Burkina Faso, with about 70 percent of the market share over the last years. This mix is largely attributed to the many alternating regional conferences and seminars organized in the capital city, particularly with the large crowds attending the SIAO in October/November in even years and FESPACO in February in off years (Figure 2-16).
2.265 In terms of source markets, European visitors represent the largest market segment (with French arrivals accounting for over half of that total), followed by African travelers. Altogether these two source markets equal to about 65 percent of the total arrivals (or almost 90 percent of all international visitors) (Figure 2-17). Local tourism is also rapidly increasing across the country, with official statistics reporting a number that has nearly doubled from 2003 (53,000 visitors) to 95,000 visitors in 2006.

100
Figure 2- 16: Non Resident Arrivals, by month
Source: DRST/MCTC
Figure 2- 17: Source Markets and Reasons for Visits
Source: DRST
2.266 Visitors’ preferences: Spending patterns between foreign and local tourists in Burkina differ when looking at the length of stay and choice of accommodation (Figure 2-18). In 2006, lodging expenditures for residents and non-residents totaled an estimated US$64 million, with 41 percent of that amount going to 4-star hotels, 30.1 percent on 3-star properties, 16.5 percent on 2-stars and the residual (11.5 percent) being spent in either 1-star or unrated establishments. Average daily spending was about US$63 per visitor, and totaled an estimated US$332 per international visitor in 2006 (Table 2-31).
Reasons for visits (2005)
Medical, 1%
Business, 69%
Vacation, 15%
Others, 4%
Religious, 1%
Family, 9%
Arrival by source markets (2006) Total arrivals = 264,000 international visitors
Africa, 41%
Overseas nationals,
3%
Asia, 3%
Americas, 6%
Europe, 47%
12,000
16,000
20,000
24,000
28,000
Jan Feb Mar Apr May Jun Jul Aug Sep Oct Nov Dec
20042006

101
Figure 2- 18: Visitors’ Preferences
Source: DRST/MCTC
Table 2- 33: Average Spending 2002 2003 2004 2005 2006 Total of night stays (all visitors) 638,513 672,298 767,246 961,662 998,610 Average hotels occupancy rate 60.0% 59.1% 64.0% 69.0% 65.0% Average stay (all visitors), in days 3.2 3 2.5 2.9 2.8 Daily spending per visitor ($US) $60.63 $71.64 $74.47 $79.23 $62.63 Direct Tourism revenues, in US$ m equivalent
$37.3 $48.2 $56.8 $53.1 $63.1
Source: DRST/MCTC 2.267 Overall competitiveness of the destination: the following table provides an overview of the general competitiveness of the country in regards to selected regional destinations. It shows that despite higher entry costs (air ticket, visa), Burkina Faso is still relatively competitive with costs associated with local stay. As is the case in the majority of the other regional West-African markets, airline services for the long-haul markets are dominated by a single European carrier Burkina Faso. In the larger, more mature tourism markets within Eastern Africa, this competition comes naturally from other major legacy carriers, but also because of the presence of a strong national airline and the competitive pressures set by quality international charter airlines.
Average nights per stay, by type of visitor
5.3
2.8
2.0
6.9
5.0
4.0
2.9
2.53.1
1.9
1.4
1.9
2003 2004 2005 2006
Non-residentsAverageResidents
Stay per type of lodging, 2006
9%
25%16%
28%31%
19%13%
5%
31%23%
0%
100%
Residents Non-Residents
not rated
1 stars
2 stars
3 stars4 stars

102
Table 2- 34: Destination competitiveness, 2009 Regional comparators, 2009 Burkina
FasoMali Senegal Kenya South
AfricaSSA
averageAverage US$ fares, in Dec. (Long haul):ParisLondonNew YorkFrankfurt
$1,161$$1,109$1,617$1,038
$1,077$1,010$1,626$1,394
$841$889$1,394$918
$865$732$1,310$650
$909$837$1,119$798
N/A
Average US$ fares, in Dec. (Short haul):DakarJohannesburgDubaiNairobi
$1,845$1,109$1,624$1,447
$1,572$1,364$1,597$1,394
$1,337$1,312$1,635
$1,125$657$657
$1,427
$915$650
N/A
Selected costs indicators, local stay:Room tax (%) 18% 18% 18% 16% 14% 13.28%UN per diem (USD) $191 $253 $242 $257 $147 $203.20Visa fee (USD) $80 $27 $15 $50 $37 $48.50Park entrance fees (USD) $10.64 $9 $10.80 $60 $16 $13.30Source: World Bank SSA Tourism database (forthcoming)
2.268 Lodging and labor force: Capacity for the lodging infrastructure in Burkina Faso is skewed towards the two largest cities, Ouagadougou and Bobo-Dioulasso, where 60 percent of the whole country’s rooms are located (Table 2-32). Moreover, Ouagadougou has the only 5-star and 4-stars hotels (3 units) in the country, while none of the 35 hotels in the secondary city are classified. In 2007, 7 new hotel projects were approved by the authorities in Burkina – a capacity increase by an additional 212 rooms, or about 400 beds equivalent.
Table 2- 35: Lodging Capacity Lodging capacity
(2007) Rooms Beds Rooms (% total) Beds (% total) Ouagadougou 2,613 4,919 45% 49%
Bobo Dioulasso 880 1,681 15% 17% Others 2,278 3,513 39% 35% Total 5,771 10,113 - -
Source: computation from DRST data
2.269 Hotels represent 76 percent of total employment for the sector, with 2,152 employees, or about 10 workers per accommodation site. Government data on employment ratio by category of establishment suggest a 0.7 factor for the 5 star hotel (7 workers for 10 rooms over one site), down to 0.3 factor for the 1 star properties. Entry mode for this workforce into this industry is principally by the way of on-the-job training, since none of the local hospitality training schools are able to meet international visitors’ standards. WTTC estimates in 2008 that the domestic tourism and travel industry25 represents 8,800 direct jobs, while its sector contribution to the Burkinabè economy as a whole is of about 43,400 jobs (or about 1 percent of total labor force).
2.270 Other hospitality infrastructure: An increasing number of restaurants, bars, nightclubs, and other leisure facilities have developed over the last few years in the capital city. Local financial institutions are also starting to offer better access to a growing
25 Which includes guides, taxis, rentals, tour operators and restaurants in addition to hotels.
103
network of ATMs linked with other international financial intermediaries, mainly in Ouagadougou. However, access to the financial network for visitors is very limited – at times inexistent – in remote secondary cities and rural areas.
2.271 Transport infrastructure: The tourism potential towards international visitors coming to Burkina Faso is in large part dependent on international and regional flights covering the country. There are currently 3 regular airlines with scheduled flights into Ouagadougou: Air Burkina (the domestic carrier, which is also providing a weekly flight to Bobo Dioulasso), Air France and Air Ivoire. The international airport in the capital city is scheduled to be privatized and the passenger terminal is undergoing an extension and renovation process to accommodate additional passengers. A new airport is planned to be built at Donsin, some 20 miles North-West of the capital.
2.272 Although visitors are able to rent private vehicles and independent guides or drivers in the main cities, travel outside Ouagadougou towards the rural areas can be difficult. Most of the classified road network linking Burkina Faso to its regional neighbors is paved and in good condition26 but it has not benefited from significant investment or maintenance lately. The most recent official data shown in Table 2-33 characterizes the total 15,272 km of the domestic classified road network as: paved roads (19 percent), secondary and unpaved roads (65 percent), and rural tracks (15 percent). 71 percent of the classified network is deemed in good or acceptable condition, a situation creating additional costs for any tourist planning to visit rural sites, particularly those around the national parks. Further aggravating the situation - and travel costs - is the security factor on a number of rural sites after dark, where a guard convoy may be needed to access remote areas. A rail network also exists, connecting Côte d’Ivoire and Burkina Faso, but was mainly used for freight traffic prior to the outbreak of the conflict in Côte d’Ivoire.
Table 2- 36: Road Network in Burkina Faso Road network in Burkina Faso km % of total in good or acceptable state Paved roads 2,976 19% 12% Unpaved roads 2,729 18% 16% Secondary roads (unpaved) 7,254 47% 39% Others 2,313 15% 3% Total network 15,272 100% 71%
Source: Republic of Burkina Faso, June 2008.
2.273 E-tourism. The informational content and infrastructure related to local tourism sites and operators in Burkina Faso are still at a very early stage of development: most of the promotional content for the country is provided by ONTB, although some local operators have recently emerged to fill this gap. International travelers increasingly require up-to-date information in order to evaluate a destination’s attractiveness nowadays (through maps, circuits, leisure spots, costs, guides, etc.), so as to organize their trips from abroad and then make secured bookings. This is currently only possible through major hospitality providers located in the two largest cities in Burkina Faso, who have investing into secured electronic reservation systems. Burkina also does not yet have an e-visa procedure for visitors, although a regional initiative had been discussed in the past with neighboring countries. But before engaging into a full-fledged e-tourism 26 Only the road to and from the Benin border remains in bad condition today.

104
strategy that would encompass promotional strategies, online reservation engines, electronic maps and circuits, etc., Burkina Faso ought to concentrate first on the tourism products where it has the greater comparative advantage and redefine its overall tourism strategy.
2.274 The handicrafts sector: Baskets, wooden handicrafts, sculptures, traditional masks and artifacts, leather goods, ethnic jewelry, musical instruments, stone carvings, etc. from Burkina Faso are increasingly gaining attention in export markets (Figure 2-19). Thanks to a permanent Handicrafts village in the capital city that is also the hosting point for SIAO, the regional handicrafts fair, a growing number of local artisans have been recognized in a few regional and international events and proved possible to mass produce quality handcrafted items for international buyers. The wooden products sent to European, and to a lesser extent, North American markets, have shown the greatest economic potential, as demonstrated by recent customs data. The World Bank, DTIS 2007a corroborates this potential and recommends further involving local private operators, in order to continue successful marketing towards foreign markets. A dynamic handicraft market, in tune with international consumers’ tastes, would also be beneficial to the tourism industry as a whole, such as is already the case in many South-East Asian and Latin American countries.
Figure 2- 19: Handicraft Exports
Source: DRST/MCTC
2.275 At a cultural crossroads: The richness of the cultural experience in Burkina Faso is embodied through the more than 60 ethnic groups spread across different regions of the country, and their living traditions carried over until today. One of the most known groups, the Dogons, principally found in Mali but also populating the northern part of Burkina Faso, have attracted the development of cultural circuits by international tour operators. Easier road access from Burkina to the Malian sites has created a key competitive advantage for the local industry in this segment of the market, and Malian officials estimate that more international visitors originate from Burkina Faso than Mali to visit the Dogon areas. The Mossi culture is also widely available as part of the cultural
$1.8$1.4
$2.3$1.7
$24.8$24.4
$34.5$34.0
$3.4$2.4
$-
$10
$20
$30
$40
2002 2003 2004 2005 2006
Handicraft exports, US$m
Handicrafts (totalexports)Wooden crafts

105
experience, such as the weekly ceremony at the palace of the Moro Naba in the capital city, Ouagadougou.
2.276 Other major cultural products of interest include the ruins in Lorepeni inscribed in 2009 on the UNESCO list of World Heritage, as well as four other sites submitted to the tentative list of World Heritage sites, such as, the funeral jars in Bourzanga, or several ancient stone carvings in Pobe Mengao. Close to Ouahigouya, a number of architectural vestiges from the Yatenga kingdom can also be visited. The attractions that draw the largest crowds are however focused on the arts scene, with the FESPACO film festival held every odd year while the largest international African handicrafts fair, the SIAO, is scheduled on the even years. The Semaine Nationale de la Culture is another important cultural event gathering in importance and held in the second largest city, Bobo-Dioulasso.
2.277 Untapped wildlife: Although less known on the international scene, the country’s rich wildlife offers visitors a range of choices in safari tourism, both small and big game hunting, and to a lesser extent, sport fishing. Most impressive are the results from the conservation efforts undertaken a few years back for a range of wildlife species: the last inventory undertaken by the IUCN in Burkina Faso documented the presence of close to 3,000 elephants in its national parks and protected areas – out of the estimated 5,000 -7,000 populating the West African region (UICN, 2003). These animals migrate along several regional corridors with other neighboring countries. Map 2-2 shows the location of their natural range in West Africa. Other big species that can be found year-round include the: African lion, hippopotamus, African wild boar, crocodile, buffalo, hippotrague, antelope, etc. There are 128 distinct species of mammals currently native to Burkina Faso, as well as 477 bird species. This remarkable wildlife biodiversity could enable the country to develop its own “Big five” list for marketing and positioning its industry towards the lucrative safari tourism market. A strategy geared towards this market segment will need to continue supporting and increasing the conservation programs already in place with the World Bank and a few NGOs to protect specific species against poaching, territory encroachment and habitat degradation.
Map 2- 2: Elephant Range in West Africa
Source: UICN, 2006

106
2.278 Inadequate institutional framework: The regulation for tourism activities in Burkina Faso is split between the Ministry of Culture, Tourism and Communications (MCTC) and the Ministry of Environmental Affairs. The former entity, through its Tourism Bureau (ONTB), is in charge of sectoral promotion and investment issues, while the latter manages all matters pertaining to the seven National Parks in the country, particularly concession rights to private operators. Under this institutional arrangement, there is not a central agency to organize, promote and regulate the sector as a whole despite its relatively small economic weight. Wildlife farms, hunting ranches and private concessions for national parks, which were originally managed by private operators or NGOs, are currently under the oversight of a newly established agency, OFINAP (Office National des Aires Protégées), without involvement from the ONTB. Under the previous private sector participation scheme, little investment was made by the private operators during the length of their concessions. As a result, many of the camp sites in several of the prime national parks have ceased to function due to lack of infrastructure rehabilitation.

107
Box 2- 12: A comparative overview of safari tourism in Burkina Faso, Benin and Kenya
Binding Constraints to Growth in the Tourism Sector 2.279 Tourism outlook. Despite the impact of the recent global economic downturn on
international travel, particularly in Africa, the potential for tourism to become an important economic value driver to Burkina Faso remains strong, building on the country’s natural tourism assets particularly if Burkina positions itself on the market
Burkina Faso Although not as well known on the global safari tourism circuit, Burkina can offer a vibrant wildlife to visitors interested in its national parks, in part because of better conservation measures in place. Safari tourism is centered in and around the parks of Nazinga, the W and Arly, where many large animals can be viewed, notably: elephants, lions, crocodiles, gazelles, antelopes, hippopotamuses, warthogs, etc. Some native species such as the leopard are considered endangered, while others, such as giraffes, have disappeared for some time now. In 2007, an estimated 6,500 visitors came to visit these parks, contributing to about US$175,000 in parks revenues, or about $28/person. Other fees are derived from hunting and fishing in concessioned areas. Due to a chronic lack of investments, accommodations with international standards that are located in the vicinity of any national park can only be found today in the ranch of Nazinga – although basic camping is another alternative to travelers for all the parks. This single tourist attraction accounted for an estimated 95% of all safari tourists in 2007, with an average stay of under 3 days per visitor and lodging rates of about $35/night. The 20+ accommodations on site are basic, with power supplied by gasoil generators and water piped from local boreholes. Despite operating under state budget, minimal investments in the park infrastructure has allowed for a steady increase in the number of visitors every year. Travel time from the capital city by car takes about 3 hours to reach Nazinga. Because of roads conditions, it is currently more convenient for international visitors to land in Niamey, Niger, to visit the larger parks of W or of Arly. Benin Benin shares common borders with other countries for two of its major parks, namely the park of W (shared with Burkina Faso and Niger) and the park of the Pendjari (known as Arly in Burkina). Both sites are also the focal points for the country’s safari tourism, with an estimated 7,000 visitors who came in 2007. Park revenues for the same year from safari visitors are estimated respectively at $108,000 for the W and $99,000 for the Pendjari – or a little over $29 per visitor. Over the last decade, a number of tourists originating from Burkina Faso rather prefer to spend the night in the Park of Pendjari instead, due to the presence of better quality and choice for lodging options on the Benin side. KenyaOne of the regional leaders in safari tourism, Kenya has successfully managed to put tourism at the top of its economic agenda over the last 20 years, to represent 10% of its GDP in 2007. First building on safari tourism products to international visitors, the country succeeded in increasing overall stay times by gradually adding complementary products in beach and cultural tourism offerings. Its diversification strategy mainly relied on the expertise and capital investment from international operators to quickly and efficiently build tourist-class lodging infrastructure. Its tourism strategy, built over several decades, still largely revolves around the “big five” animals that are symbolic of safari tourism in the country: Lions, Leopards, Elephants, Buffalos and Rhinos. Prior to the political crisis, almost 2m visitors came to Kenya, to spend about Kshs. 65bn ($US1 bn), or an average of $515/visitor/stay. Estimates for the Kenya national parks revenues, however, were at about $22,000. One notable difference in the Kenyan safari tourism experience has been its reliance on the promotion of charter flights connections with its major market sources.

108
niches most in demand: safari and cultural tourism. Should the key constraints described above be removed, it would not be unrealistic to expect visitors’ exports to grow from about US$68m in 2007 to over US$171m by 2015 under a low-case scenario.
2.280 Growth in this sector will particularly depend on improvements in the quality and capacity of lodging around key tourist sites and the set-up of direct charter flight service from European markets. Current bottlenecks to further growth in the tourism sector include a critical deficit in the country’s domestic infrastructure and the need to infuse real public-private partnerships in the development of tourist sites.
2.281 An inadequate infrastructure network. Despite a less than competitive landscape in the airline industry to bring international visitors into the country, the proximity of the major European markets for the country favorably benefits Burkina Faso in tapping its tourism potential. This is particularly true for the safari tourism segment, as none of its regional neighbors has yet established itself with a commanding grip in this market. Regional competitors are further away (Kenya, Tanzania, South Africa) and would also have a competitive disadvantage for the core traveler segment of Burkina Faso: francophone speakers.
2.282 However, in order to tap into this segment of the market, infrastructure investments must be made to improve road access to the closest and most economically viable sites. In that same logic, to extend the average visitor stay, a minimum infrastructure base must be put in place, to include at least: some upgraded lodging infrastructure on the prime tourist sites, the connection of these sites to the national power grid, and the availability of running water. In parallel, the security of travelers must be ensured in remote attraction sites for these investments to pay off in the long term.
2.283 Inefficient public-private arrangements. Despite earlier experimentation with public-private partnerships in the concessioning of national parks, these schemes were not optimal for sectoral development as the financial and technical obligations from each sides lacked sufficient clarity for implementation. In other cases, the selection process of private concessionaires could have undergone a more rigorous screening, as a number of the failed concessions simply did not have the experience or financial leverage to undertake all their obligations. Inversely for the case of national parks, a number of the international NGOs, with successful track records on conservation and revenue sharing schemes to local communities, did not get an extension to their concession terms. Since not all of these arrangements are economically viable to private operators, they must be revisited to ensure appropriate resource management in the long term.
2.284 Institutional framework alignment. With the decoupling of oversight to different national agencies, sectoral regulation and decision-making cannot reach a critical mass to become effective, particularly with regard to any decision to promote the safari tourism market. Besides the tourism and national park domain, other key functions must be brought together to revisit the tourism potential in Burkina Faso: roads access maintenance and planning, security to the interior, basic infrastructure, economic affairs (for the concessions terms and obligations).
2.285 Lack of transparency with the sectoral economic flows. The large percentage of unregistered and non-rated lodging establishments suggests that the choice to remain in
109
the informal domain could be due to restrictive government regulations. Furthermore, a number of private operators working in the tourism and travel domain, especially in or around protected wildlife areas, are not transparent with the local regulatory agencies with regard to their reporting requirements for visitors and other obligations.
2.286 Local capacity and norms. This constraint applies to the overall chain of professionals that are involved with the tourism sector. At the bottom of the chain, it would be necessary to ensure that the appropriate skills are available to enhance the value proposition of the tourist sites, in particular for those with high traffic potential. In a service industry that aim to increase both the total receipts from visitors and their length of stay, international standards of quality must be promoted to ensure hospitality infrastructure development in remote attraction sites. At the top of the chain, better control and regulation of new entrants into the hospitality market are needed, to ensure that the proposed projects have been subjected to the appropriate revue in terms of building norms and other engineering/technical requirements.
Conclusions and Policy Recommendations
2.287 The report recommends the following actions: 3
Develop a tourism master plan and prioritize the areas for development with clear attribution on the objectives (short and long term), the role for all the stakeholders, the priority poles of development (not more than two target segments), and a clear monitoring and evaluation tool to ensure the strategy is on track. In particular, this strategy will:
o Identify new, high potential, specialization niches, taking into account regional initiatives (African fashion fair in Niger, desert festivals in Mali);
o Devise appropriate incentives for quality entrants into specialized niches (for instance, building on FESPACO‘s global notoriety);
o Undertake value chain analyses to identify and address bottlenecks (visa requirements, administrative processes before and at arrival, promotion and marketing);
o Target a minimum number of sites with prime interest for the private sector and further develop the secondary sites once the first batch has produced some satisfactory demonstration effects;
o Review the incentives and reporting system particularly in the areas prone to natural resource abuse. Devise a clear control mechanism that enables both public agencies and private operators to verify that their partners’ obligations are effectively and timely implemented.
Revisit the current PPP framework in light of the past experience and set up adequate arrangements that would need to consider alternatively: the role of the public agencies (ONTB, OFINAP, etc.), the private sector (both local and international), local communities (to ensure linkages with the tourism industry and equitable distribution of economic flows in exchange of the access to their

110
land or for conservation initiatives), international donors (for the viable projects requiring greater levels of capital investments) and NGOs (in uneconomical or resource-sensitive areas).
Reform the tourism labor and training market, by reviewing the curriculum of local accredited schools in partnership with established, higher-end hospitality operators. Some of these partners would be willing to participate in industry training of new workers and are best placed to define the industry’s labor needs.
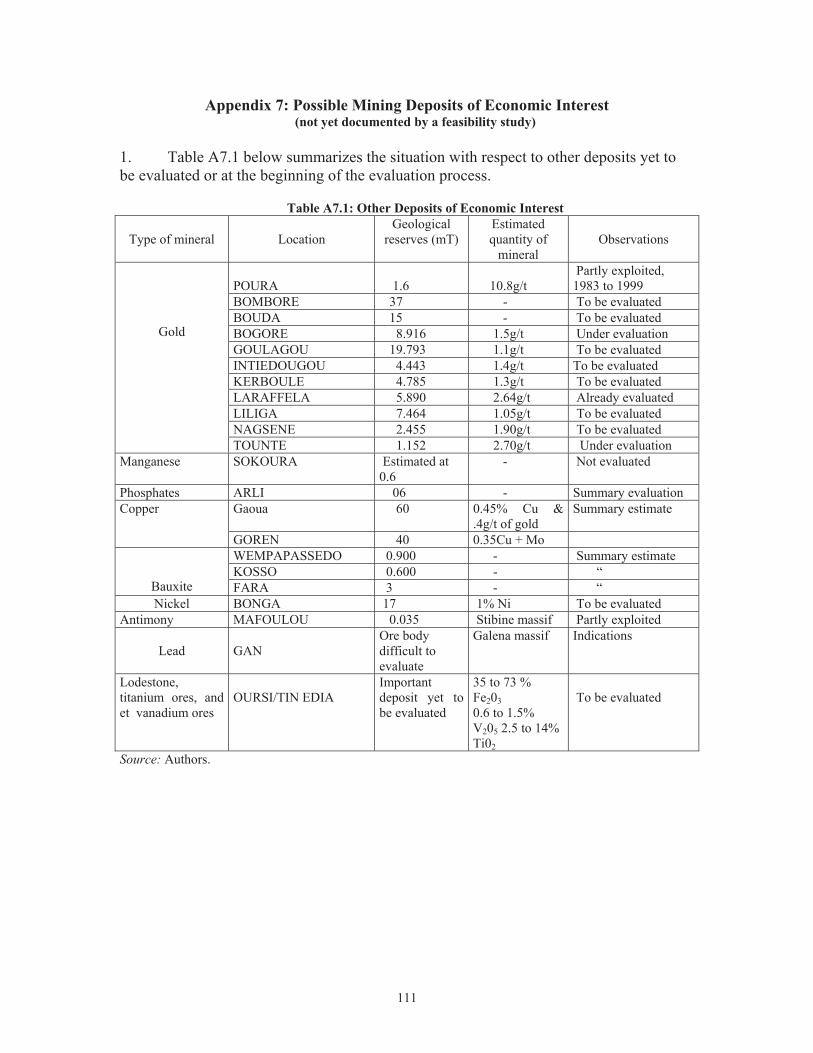
111
Appendix 7: Possible Mining Deposits of Economic Interest (not yet documented by a feasibility study)
1. Table A7.1 below summarizes the situation with respect to other deposits yet to be evaluated or at the beginning of the evaluation process.
Table A7.1: Other Deposits of Economic Interest
Type of mineral
Location Geological
reserves (mT) Estimated quantity of
mineral
Observations
Gold
POURA
1.6
10.8g/t
Partly exploited, 1983 to 1999
BOMBORE 37 - To be evaluated BOUDA 15 - To be evaluated BOGORE 8.916 1.5g/t Under evaluation GOULAGOU 19.793 1.1g/t To be evaluated INTIEDOUGOU 4.443 1.4g/t To be evaluated KERBOULE 4.785 1.3g/t To be evaluated LARAFFELA 5.890 2.64g/t Already evaluated LILIGA 7.464 1.05g/t To be evaluated NAGSENE 2.455 1.90g/t To be evaluated TOUNTE 1.152 2.70g/t Under evaluation
Manganese SOKOURA Estimated at 0.6
- Not evaluated
Phosphates ARLI 06 - Summary evaluation Copper Gaoua 60 0.45% Cu &
.4g/t of gold Summary estimate
GOREN 40 0.35Cu + Mo
Bauxite
WEMPAPASSEDO 0.900 - Summary estimate KOSSO 0.600 - “ FARA 3 - “
Nickel BONGA 17 1% Ni To be evaluated Antimony MAFOULOU 0.035 Stibine massif Partly exploited
Lead
GAN
Ore body difficult to evaluate
Galena massif Indications
Lodestone, titanium ores, and et vanadium ores
OURSI/TIN EDIA
Important deposit yet to be evaluated
35 to 73 % Fe203 0.6 to 1.5% V205 2.5 to 14% Ti02
To be evaluated
Source: Authors.

112
Appendix 8: Investors in the Mining Sector
1. Nine companies have acquired permits for industrial exploitation of gold, zinc and manganese, as listed in Table A8.1.
Table A8.1: Mining companies with exploitation permits 1 Société des Mines de Taparko (SOMITA-SA) 01 BP 2509 ; Tel 50 35 81 85 2 Burkina Mining Company (BMC) 08 BP 11 197 ; Tel 50 36 10 80 3 Kalsaka Mining Company 01 BP 2522 ; Tel 50 31 06 06 / 50 31 18 58 4 Essakane SA 09 BP 11 ; Tel 50 36 91 44 5 STREMCO 06 BP 9319 ; Tel 50 36 37 58 6 Mana Mineral SA 01 BP 390 ; Tel 50 36 95 92 7 Nantou Mining (Zinc) 01 BP 1463 ; Tel 50 31 66 35 Fax 50 31 70 97
8 Burkina Manganèse (SARL) 03 BP 7108 ; Tel / Fax : 50 30 51 52 / 50 30 19 31 /78 822828
9 Société des Mines de Belahouro 01 BP 3422 ; Tel 50 36 08 65 Source: Authors. 2. Two Burkinabè companies, Epsilon Gold and OREX, have obtained exploitation permits for semi-mechanized mining. 150 authorizations for exploitation permits for traditional artisanal mining have also been granted to small companies or individuals. Under PRECAGEME eight units for the processing of the ore of artisanal miners were installed. While this success was to be followed up the Government, since 2004 only three others have been entirely installed.
3. In total, 35 authorizations for exploitation of quarries have been granted to several firms. About 80 companies have received the 344 valid permits for the exploration of gold, zinc, manganese, and copper. Two other companies have obtained permits for prospecting for hydrocarbons.
4. The main local enterprises involved in the mining sector are : Afrigold Burkina SA, BEGE, Société Boudo Aristide, Bureau de consultations et de services (BCS), Yatenga Holding, SOMIKA, GMC, Société Nabaloum Patrice, Société Sanou Boubacar, Epsilon Gold Mines.
5. The principal foreign enterprises that are involved in the mining sector, either alone or with a local partner are, by country:
Canada: Mana Minerals SA, SEMAFO, IAMGOLD, Jilbey Gold Exploration, High River Gold Mines (West Africa Ltd), Gold belt Resources, Etruscan Resources Burkina Faso, Barrick Exploration African Ltd, River stone Resources Inc. South Africa: Rand Gold, Gold Fields, Meridian Resources, Birimian Pty Ltd. United States: ACC Burkina Faso, Caracal Gold Burkina Faso. Australia: Nantou Mining, Wura Resources, Resolute (West Africa Ltd), Wentworth Resources. United Kingdom: Cluff Mining.