Embed Size (px)
Citation preview

.-,:
c;)
REPORT NO. 2-
/,
1}1J3$~}'2.q."I7
. ..:.'
SOCIO-ECONOMIC AND, . / .," .•••••,- /. . //....... . /' .
MOGRAPIDC CHARACTERISTICS'./
/
./
,•
1--'--- .~ 111 PI~.8 I, C4
'I 1995 II Rpt.no.2'--~ --_.
BUTUANCIT
Republic of the PhilippinesNATIONAL STATISTICS OFFICE
Manila
/, ..?
/
,.I ." .••••
/. . /
/'.
./

."
CITATION:
National Statistics Office, 1995 Census of Population, Report NO.2 - 21 P(Dutuan City) Socio - Economic and Demographic Characteristics, Manila,March 1997.
,;-ISBN 971-562-567-3 r./ .....
'ISSN'~-,'-" .
0117-1453 • /. "~"--'-> /
\ I
L
. , ,:,
1995'~oIP~~ LIBRARY
fllt~g6REPORT NO. 2-2 : SOCIO-ECONOMIC 'AND 12-'1,'17
'I~.. . , .., I. "'tlNl.-\ \ EMOGRAPIDC CHARACTERIST
,./1, ' I /~I L-j ,"'J \I --- ,/~ \,'---), " >j I fj
'~l B1JlJ~ITI I.I "
~-- ~ __ ~_~~J') : .
Republic ofthe PhilippinesNATIONAL STATISTICS OFFICE
. ManilaMarch 1997

C.' ".," ~;',' ..i,,~,,"\'.!_;'l,"}(;:" .,~ It ..,•.. I'.'.;~"c '~.~'''.l.:'t..:<,.'.';.:.';.• , •••• iii," •••• r f' •.•...;1 .'" • ""'. -~ _ ' • ~ >"d.,~ . . . If' • 'II to _
... NATIONAL STATISTICAL COORDINATION BOARD.' 'jf"rr J" ,Wt'l.\ nl'lFn. ..;
•• O' n 1. _ . ,. ~ \j. \,Ji .
. ." Honorable CIELITO K HABITO. Chairman .
. "' ..",
••
". '~.',
.1"
:'.
. ..•.~,
NATIONAL STATISTICS OFFICE
Tomas P. AfricaAdministrator:
.; '. ~,.,
- .
, Nelia R. Marquez""~"I";!l"! I:'lD"""t't."'a{!'-1 ''''t'''~tl,~ ••• < •. (" , epu YY1 miniS ra or
':;:"'\~,f;<"" /VT"J""'~'~7~'-"''''Ol'i''' 'Af~"" __' _ 'Z')' 0.".,,, ,f';'1 !...t--~l ...:.•.J.2\,.._ .•..•. , .•.•.•;.n
l.lii~l!~a!>etbM. Go\{}~ 1.o.fl!.C,'ir;j,{~-Charge
Household Statistics Department
. ..
,-

FOREWORD
The interrelationship between population and development has alwaysbeen an important consideration when charting programs to achieve a betterquality of life. Programs for better health services, adequate nutrition, freeeducation, housing for all and social welfare to the needy can only be plannedproperly if adequate arid accurate data are available.
The results of the 1995 Census of Population, or POPCEN, providesupdated data not only at the national level but more importantly at the locallevel. While the POPCEN was conducted mainly to provide an updated basisfor the apportionment of the Internal Revenue Allocation (IRA) to the localgovernment units in the country, it remains a useful data source to chart thefuture of a community effectively .. The POPCEN may also be used as a gaugeto evaluate if plans and programs are implemented objectively.
This' report presents the population of the Philippines as of September 1,1995. It provides data at both the provincial and municipality levels. Itpresents, among others, the distribution of the population by various socio-demographic characteristics as well as a profile of the disabled persons by typeof disability and of the trade skill of the population.
This publication was made a reality by the more than 30,000 hired censusfield workers who toiled the sun and rain to count each and every individual inthe country for the mid-decade census. We salute them for their dedication tothis undertaking. Our deep appreciation also goes to our respondents from thenorthernmost island of Batanes to the southernmost island in Tawi-tawi and tothe various entities and individuals, both government and non-government, whocontributed their time and effort especially in the operations phase of thePOPCEN. The successful conduct of the 1995 POPCEN is a proof that it istruly a "CeNSOng Pambayan, Sandigan ng Kaunlaran."
Manila, PhilippinesMarch 1997
~~
'- -----T M S AFRICA
Ad ini rator

-,•
•
••
,
"
'I':'I:::! : '):)2ll:l!;1j~i"fjP!i~l;b!I:":~
i,()f,J.J:}';- .l.PG ?nccc.%?tfq "(;:'Juqnr.r Oi. f}J('; 1(.1U~'.bC)bCFJ ....; :7 ':-J 1:.LOf)l.. IP~-;~jf ::~
• ! ' '( "'1" Jr.. ~ .• t (1' . ( ('~l''''r'''1" I')' (If.,,'',.r~'"f 1•. ' ..••. 11••. - \ r IrC{;i'd:PI!f::'1 4-~'''.\> ~:\J~.• :..J!,.CI "t.~f.tl-.; 7t'.J':'-./' •• ;~Uh .' dJ(, ..t"':-.IJ,'n!U •.H~ ".1'')','-.:" \J.:. :~/'"
~~!(,/.fr1.l01i;; :'::.lJfiJi{;'~~!)uq !U(t'fl'.i~~fJ'JI;""fY}t1ti tC,l (.i.lIJJH;lJ~ ~i1;(fl U(iJj'-t-~O/\(-~l.lJJjJ:;Ur' !:',:).":• • .• , ..• . I • I
:..:qq}.J(~r.!J~~Jf)~:!!~;rTiJq Ol:.BS;(iUr.~ p.1 ~pC ~~(Jf1!p(;r).jj:JCI?r1'~PIU.q.!;J ..L:il,A.!-rfh\! ~!:!q ft..,... 1 'f' ,.... •
J,U,j:' nd(Jf:q:.i~:!;J?i" ()f!l. (I~GD !rnl;1.G(!~HjnlJ ~lf:O l~-:Ot:;;:.if) OrJL L~?.~l)jJ(IG1J~~~ \'U.1L'; ru.:., 1 • .' • • ,
, -~.:(~lqN,(H.yr.i.:: It.jJo (O;p-:~qrp:; ~r:.JJ:Hi<1 L;liU if) CO:!!!. (,:;(;1; ~Hlq f.;j>[ •.L1\ !£vI!/,!qn:ij !=.l
IIIJj~ jjfHJj'JC!1r.iOIJ !.•..3? I.U:-JOG!! :"t:-;~nlrf:,I,',jj, r,!j:;', fJ;ot(;.rIJ~:t!J "jO'f)[I('IIJlv:"';ff r.:',~.i?:l'~. _ '. • j., . .' . .' I. "
..• _ t T
'li~!!~!.'gpIPf/'. 1');.1f.j cJT',L;.rr.;'4J.~qr, i'J<!jj ULIpc. ,}C}Lhlj':rpOU'. "".,'.':-.ql' ,•... ", ,< - •... ~G' '" .~, •... ",. ~ , ~<'~~. i 'r. r .,...•.t"' ...• :..r "1 -n I I'«(..iJ.l,,.-,.: ....,,.)P:r. 'd ...Jl.~I: ..t. l.:~f~v.,"~r '-{'('!} :;'., ',1 .J; ..•.Ujf; "'C~J-J... (il .....Jf-JI~.. t IJ::-yJ.:~OUc~}':/. ;.1'. ;1-'
. ;Ji.r.~,~(~lJl(-"~!.lJ()1.iG'.(JiPl';L2' .rpC .g!?~J.~pfii~~)iJ ,-.It iph tl(Jbfq:,;I~{)iJ PJ.. /.Di.~()n~ ~_'(.\(,!rl-••• 'f 1.'( l('(''CJ Cl' 'I' PI"~' "lr ~'1 l r"C" • (, 'Jlf '-'})'" .,'" 'r "I"' t'~ 1 ();J(' II I..lJ,J/',-1"';{"' jH..d . -1-' , _!J..jJ '~i-....!J •.f.l/.!.J ....~•.•l ..ru I :. l!J!I ...!, Vl:~f .. 1.//'1'-- 14
.LV!:~,L(:.bOL!bL(.::~(;lJr;;:.fp~.bobn!~.Jr.~Ol~0t rl1(~!~pq!tJl;~!jl::;~:;;""j)!. (f.~::~r,lj..:[;(,:!
, I ':"~"1' - ~-. .. -. . J r 1 I rl'; I! . r' .• 1.. r- _. A - . ", •• "( II~'. .~r-. r .:.. 'J I 'J';" ("I" '() •. t' /"". r:' f'r'; f'", ,:"-':. I ";-'f:'.1-."; 1.1, •.';.,1 ',I.tl .:,. .•: !) •..:. 1"\;.;.•:.:1!c.:". 11'.. :,:,-l-,.l)lj1.::,.~-': ../:!" ~~'. !~' ;.),_'.11O.~., ..! ,Jr.' ,l.) .• '.J.:o
i';'(ji,Cl~Ud.JClJf rnJ~.f%!iJ .fpc. connn}.,' !~~.f;u.n;~Jl:~~{fl?r;t'qq:..rr~' 2Ui!.LCG !,O C}r2Lf {!;r...
tJ!. ~!jt; 'J1)1)~)LL~OUJJ1Gl.n Of. f.pr; IIJ;t;:1.lJ31 H(.r,G~Hl;... \l110(;;:!~~t)1J '(.n{\{} {J; '~:JG j\.,'CSI
~'.:1.(~1'll\pqG r~G b(}hCEVl itS! ~~':)l.i(F;C!{:,q jjJ.-,~,u::. 'r\: !JFH,lf}t"; ~rlJ f1bq~:fGf~p,121.::
rr!:.rrH':.'.(j q~ff:! !l0f {JUI). nr fJ1:';. i.i~;~O!Y.q:!f,,4(.j':p-nr :flOl!; !'Jd;(;:.f:~;U!J/. ';:;f rpr-. !U~~::!j
.Lrr.. i.G~fl!'c. ()t.rp~;. If)(;,2 CG!J:.~;.!c or b~)Lill:~n~{;u'OL b()bCE/.' LL(j/,~(F::~:
1 .... )[.)("1,- ,r '-(!c.r1'<rr.~ t'1"f~.l.~r,r'l~l;r -F'f'\;.~"Jlr {"f,'{"'l'lt"I'".'1.'.•.•.•. if' ;{:,,1 ,;, •..•Il~ •.~, .•.•1_1.1 ',H.••..•••,.,v;;.r \j.J.,:_, •.u '-""-~_J'-'l),l... '
{~il,:H-::';lI()~.!' UOO;':!Ur..' IVt, 8';l"~I:;O ~:OCFrJ'":.I\,...,'1,l~iLG if) IT,JG Jj(.(.Qi, c.:JU O!jTl~'" p\:; Lf~~ii!Jr.rl. , . 1... j, , ,t. . 'I' r::. • " If:n~'i;:r/, o~, !~{(:;. l;iJJL1.9I.!.!~~t(l':. J)(.I.f:;~' lH;'Jlf}J ~~..L:'~CCf' :JqGn~!af~:UiiCL~[:(n.!.,:ti.r..c
jceij -:nJ ~iJ!br)Lr.H;rr (,{)1J..:~qGLSPf)'.! {l,i'~:J :,.r;~ji.\:il~'"i.JJ.~',7~.i~JUj:'r,ll ~H:!;'!(:;j.,-:. ~J' fJf.[.t(:.•-, I ' IJ.iJG !lJrr;u.r.rJ!!(dJ%iJ~!J P(;fH-.~f~d. ;Jot,P;',iI~OU ".HJCj q::,'.(;!{}l.Hjj(,:':i i.;'.~;', -:;::./t:',.',~
••
/
• CONTENTS
EXPLANATORY NOTE
Page
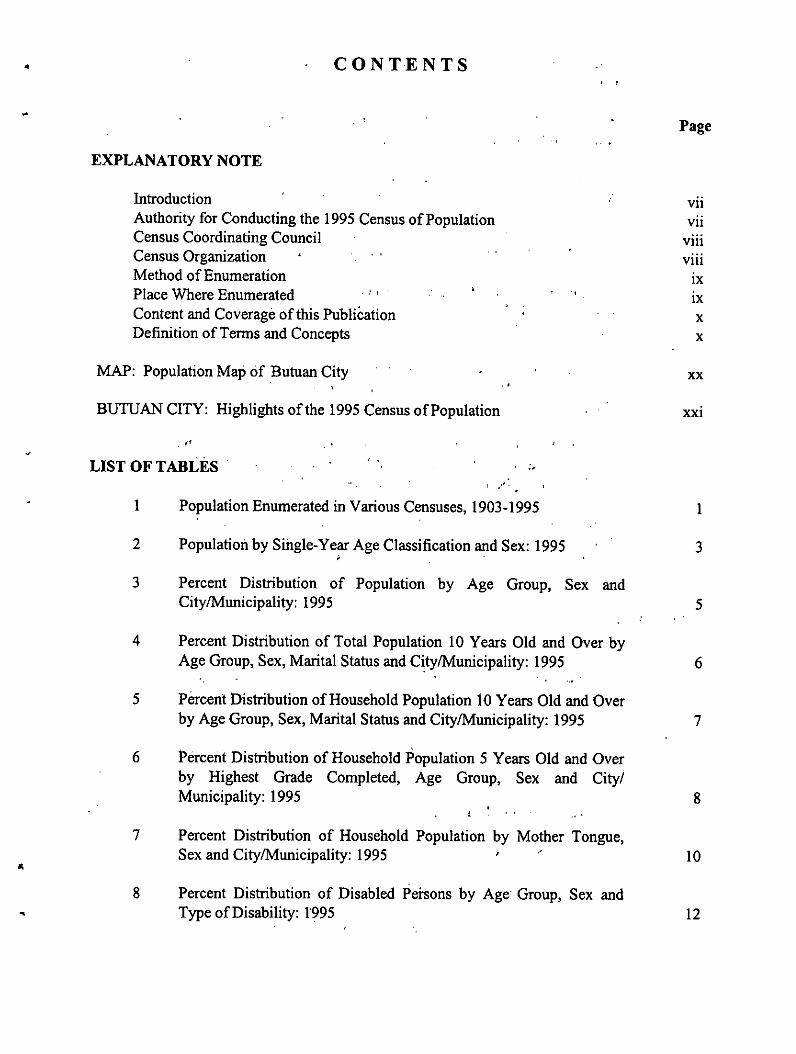
IntroductionAuthority for Conducting the 1995 Census of PopulationCensus Coordinating CouncilCensus OrganizationMethod of EnumerationPlace Where Enumerated ." ,Content and Coverage of this PublicationDefinition of Terms and Concepts
MAP: Population Map of Butuan City
BUTUAN CITY: Highlights of the 1995 Census of Population
VllVllVlllviii
IX.,IX
X
X
xx..XXI
. "LIST OF TABLES'
, ..,'.
"
I
2
3
4
5
6
7
8
Population Enumerated in Various Censuses, 1903-1995
Population by Single-Year Age Classification and Sex: 1995
Percent Distribution of Population by Age Group, Sex andCitylMunicipality: 1995
Percent Distribution of Total Population 10 Years Old and Over byAge Group, Sex, Marital Status and CitylMunicipality: 1995
Percent Distribution of Household Population 10 Years Old and Overby Age Group, Sex, Marital Status and CitylMunicipality: 1995
Percent Distribution of Household Population 5 Years Old and Overby Highest Grade Completed, Age Group, Sex and City/Municipality: 1995
.. '
Percent Distribution of Household Population by Mother Tongue,Sex and CitylMunicipaiity: 1995
Percent Distribution of Disabled Persons by Age Group, Sex andType of Disability: 1995
I
3
5
6
7
8
10
12
9
10
11
12
13
14
15
16
Percent Distribution of Household. Population by Relationship to theHousehold Head and Household Size: 1995
Percent Distribution of Households by Age Group and Sex ofHousehold Head, Household Size: 1995
Percent Distribution of Overseas Workers lOY ears Old and Over byAge Group, Highest Grade Completed and Sex: 1995
Percent Distribution of Household Population 15 Years Old lmd Ov~rby Trade Skill Group (Major), Age Group and Sex: 1995
Percent Distribution of Household Population 15 Years Old and Overwith Trade Skill by Trade Skill Group (Major and Minor), Manner ofAcquisition and Sex: 1995
Percent Distribution of Household Population 15 Years Old and Over 'Who Worked At Anytime in the Past Year by Industry Group(Major), Age Group and Sex: 1995 " '
Percent Distribution of Household Population 15 Years Old and OverWho Worked At Anytime in the Past Year by Industry Group (Major "and Minor), Highest Grade Completed and Sex: 1995
Percent Distribution of Household Population 15 Years Old and OverWho Worked At Anytime in the Past Year by Industry Group (Majorand Minor), Sex and Class of Worker: 1995
:'i
14
15
17
18
20
23
25
31
APPENDICES, , .;! '_.,",0<
A Batas PambansaB1g. 72 (Providing for the Taking of an Integrated, Census Every TenYear~.Beginning in the Year NineteenHundredand Eighty and for Other Purposes) . 39
B c, :Population byProvinclJ and Highly-Urbanized ,City,Philippines:.•. SlJPtember 1, 1995.' , ., 41
C List of Unpublished Tables 44
D
E
;. ,',
Listing Sheet (CP Form 1)
Household Questionnaire (CP Form 2)
", f'
, '
46
47 "
F Institutional Population Questionnaire (CP Form 3) 48••

• .~.-'.\"'\I', ••~f,"\...u .•• ","', ?on,EXPLANATORY NOTE1995 Census of Population
Introduction
• , ,j, ~ '''1'\ .\" #. f"/rt'.', n I .
,In September' 1995, the NatIOnal.'. •• ,.'L"\.';of!" t II -~. .• .• If',
StatIstIcs Office conducted ,the 1995 Censust." ., ,r' -', .-" -., .. "I("'~ Ir~' 'I. II/f .•••
of Population (POPCEN). This nationwideJ "'. ':." -,.' / ')1 -1-:, !I '~11undertakmg IS the 10th populatIon censusconducted in ihe co'i1l1try~ "1"'~ .-,"'l'C, q.";t I' ,~. ~ 01 " 1.11" 1:»)1 •.Ji,d h) L.. ,w-f~:"_L
"".f'ql' Like) the' 1990' 'ce~sus;l! th~ (i 99'S. ' •• eo. q ~ ,-If. -'-,f,rt"l'l •. ~'I" '.-r"I!,!POPCEN ISdesigned to take an mventory of
I .I~' , . r "._ j 1.!.( .j' .~'."f!I' ••-' ,tl ''11
the total populatIon m the Phllippmes and to.collec( 'inforrn~tiori': "'>about ,I "Iih~ircharacteristics. j.tht'data t~;Ii' 'pr\)~iii(! Ian
t,,.., '" .,', : I. .'I~F ,0': "\' .-,"" . -updated basIs for the apportIOnment of the
"""'.!. ,',' .t" .ll,"n.,_. )~r"'."",.',If"'h/~"Internal Revenue AllocatIOn (IRA) to local!!gotemmeI{t -ii~itsV'and'for h~e'~n;'atioI{~fRe~legislative area's:sti~h;':~~JiegioAI;~'Jp;o~i'~6"hs,
n~~?!.fipal,i~\es..,I;\~~dH ..•?a;~l}~ay:sn or .theconversion of a mUnicipalIty mto a cIty.~Th'e''''ceiis~s'.of' p~pulati'on ';i'ih~'''so~rc~'l" fb.',r:11 1('" 1'1,,, 't.', .~l' 'n};. ~.•.. ,,~, i' .. ,,'n-;-information on the' siie"and ~distributiori of
;';" 'J 'J -,'1",:1" '~"P";J .. ' ""'1'\1 , .,(1" /f'the population as well as mformatlon aboutnth~~~'deitlographic: ' socia:I,~r~~todomi2iO~dhIlt <1;,,' I .il,,' .. T~!L,nr "') "~.~..-~ ' ','r~i';'lcullUral charactenstlcs. These mformatIon
50ale ~itai "for'~'makirig"!iatii)ri'rl '~pI~ns)rand~p~ogrm;sfo~developmerii:-h.~1(~I;.~"!'~l;l.
Jttlll:r.,,(. {f.:J:J.
Pursuant to the provision of Batas"J..l .••••. t ';',l"~"""; ~. ".,lf~,} u'n "lnlPambansa" BIg. 72, a final report on the~,t' 'r.,. 1'1""1 ,j I,f'~,'" "")',ltn' "'di"1~'population count, and number of households
l ,.' :"11'.' It, [:'I:I('j ~'I~ ~111","H' IT:":' ~f' FFj(.r)at the barangay level was submItted to the
/"'~II'::"I '~Ol .c)".t.-"n~'r\;'fJ('.' -,;-0' I" WH'President and declared offiCial, for all
:-W'-~fT ,'n hiJl.' .••.1. °11 '~,i Jl-. CJ:";-"\} r....f •...•~ Jpurposes, under ProclamatIon No. 849 dated'LA~g~~'Ci4;"199~1:-2(..~',...G"lJ ;.In1 ""C:~:lPIU
, 1., ,V'1 ~. uf')' :>."IJira'f1"J gim~51? jrf:t OJ
1101'?k. bm; "!l'Jlltat.1um'['oyiL!'JflnoJmlHn~.~ 'Of: '~' 3G"" jdt"'o E~r:~~l~h!lT:r;t.•...•."Authonty for) ~ond.uctlDg .••.the ,)9?5C fP 1't'" J I,,~..J'U<)',rlIJensus 0 opu a IOn 1)(1
r':Jt.n~_, f, ...•'JI •.,~1 ."1.1 .•~ :)::;J~.& f s:Ir.~rfTUnder Commonwealth Act No. 591,
(\'.:;o[f 'n1'.J\ nl." If""') f\ I!~ t.'. "1"';"',~I'l '"lU:i
the Bureau of the Census and ~tatlstlcs (now
.W
iiit"i; " ••.
,..
,.t",r~l()\ ""IJt'" .lih'too } 1£1'11"" lNational Statistics Office) is authorized toprepare for and undertake all, censuses ofI. J:., '" 't ,I -I i I "~' /' '.. ," " •.population, agnculture, .. mdustry". and.• -:1" -' ,.Ul,,{'I._h}l ) :.",",".IJ} 'l.o ••....ll) .t. t 'vcommerce.""'f)) rU/.J~) ',:ql'.'l.iH,Il .•,'I.) bitt! ~ ).)"11~..,I' .'} i ,~J'), d' "UfJ' ''''iO, i f• oj, ~~t~s 'f.~~.ba~sa.~Blg. ,72, t~~!~h _w~s.passed on June 11, 1980, further accorded
\1., ":- It'" /'-'-' . I"~ 4" -(..' r
•the National Statistics Office the authority tol~ "II • , - 1'-\.'~1.'"r. U "f'''' lHll, ."~ l) I••Jl. ' .conduct populatIon censuses every ten years~'11 ;f!I',-, .b,IU ' " .,\,.: '~II'I •.'I ':•.~~ 1\.,"begmnmg m 1980 WithOut prejudice to the
:; ••.• I ,'JI:! r""'}" .,1: .•..• -' I,J~b ". ~
undertakmg of, speclal censuses on:"1" :" '~di' .)"';'11 \).:..r,. JIll l.',jPI ~,L r""" .J(t'{;': .
1~~,rd.l~~.1~:~l~~'~1!P~~S~~,)i.~o.w~,~rcJ~~r~?~~}n,gan other sectors as may be approved by theNational Economic and Develop~e~tAuthority (NEDA). ,
":H]J l.L'-li h.lll:-){(:Il.' 1J.:..1.:.H1r furq :uI I
...100] ,,""'T.:") ir,lJfi' rul'-J Jllr ,to 1u'It:T:~d,.More .recently, ,Executlve ,Order No.
r,n"~I,vd. ::IItJ ,'ill -, I I ~ '-'1 .1-.... If}" nCI'.II;t.>121, otherwise known as the ReorganizatIOn1(. I!'-~'~J"L~::'j , .~;::l: n\ I:~-':'II.I,r'J,IU(
Act of the PhllIppme Statlstlcal System..?!~ i,~ i •...,(11 ~.hDf1(" .1' ..... '':'',H,U ~ .1""'1...' i •• '
which was passed on January 30, 1987,v' "r'~'~ .H."•..••.•.! .'~" ~•• '.;. ,,/;1''; 'JJI,-declared that the NSO shall be the major
~( ••• :' ;'"Jt"lt-.•nrrnt, , ;~;I:;:;~'ll"":";'1 ~"11 _~".:l:.:I1\"J'.I
I~~~H,S));~}a~~~cy, ;7~P~.~:~~tll~Ior,~~J;1,~.r.a~I~g:~~R.eJ]LP~~l'J?,~~\e,~\~m,\~~,;I~~?v~~~~~,~!n.gsuch censuses and surveys as emay be
If''"1;'.~ ."I1-... il •.•. ').1'. Iun-',. <_:.JJ,/!" '•.•.•.(•.'.;l
I~~s,I~~~d)y the .• ~~t.~~~al".•.St~~~\~:aJCoordmatlOn Board (NSCB).
~ril ••.s v~J~t>VGI"I ':ltd l(} 1~_,if:O t:"')tJ~~;J..':1.')') )~i-....dqr- ....,•..f~O."/fIP"" " I
On May 30,1993, the NSCBapproved the conduct. of .a mid-decade"poplil~tigf1'r:J..Jc~J~~~'IUl:t1;f~~h". NSCB'.' . .rJ~lf:.':t.~P?'• ~ . '~I ., ...~g I'"' .•ff,' 1-'Resolution G6~93. The 1995 POPCEN 'was,HJ.;rr",H" ,. r.i .• J •• ..,LN~ rJ-'.'l: ...lfr'n'- 'if. ,.~.
under the overall'supervlslon of. the NSCB,\'fl"'. r .•"-u.... ~I' "{j" ."','''c - , )''', ("'whicn'is chaired bY-the Director General.of11-''1J.'Ju'''''''' ~:)uu;.,,~. 10 j ••••••. 'G. .1],;,,1" ••;ll' ••.••
IJlrne •.~,~£1\rH(l~~~.,.I~SC;J~,.,,~,~~be:~hJPconSIsts of representatlves (undersecretary
~.•rl~:"~'"I;""~f'''nt .• :' lli •~:.t.,),':' ~ ~n:"lHI' Jf';"" 'j\ I
level) of the vanous executlve departments,.t,:\.:;.r'r ":fI r.;'- b,JJ",t, T'''J:'~'''' 'ljI'";'r''' .tl P"'"
mcludmg the ,Admmlstrator of the NSO.1,.--.. •• "J.'t.,'~.J1;!\, ....).J-..,., ...•.•... '/;.1"1 .•'With "respect, to the .POPCEN, the NSO?,r I'J",::':~ '--J,-¥L .•~!.~I" TJ.:)fl'~} ,!. , '!IUi r' ,Administrator IS the Executlve Officer of theNSCB ... 1J..J({1 J:lUJ.lU :~"'Ul\)J.I.',.';..,. J

..,..
Census Organization
VIll
,ii
Explanatory Note
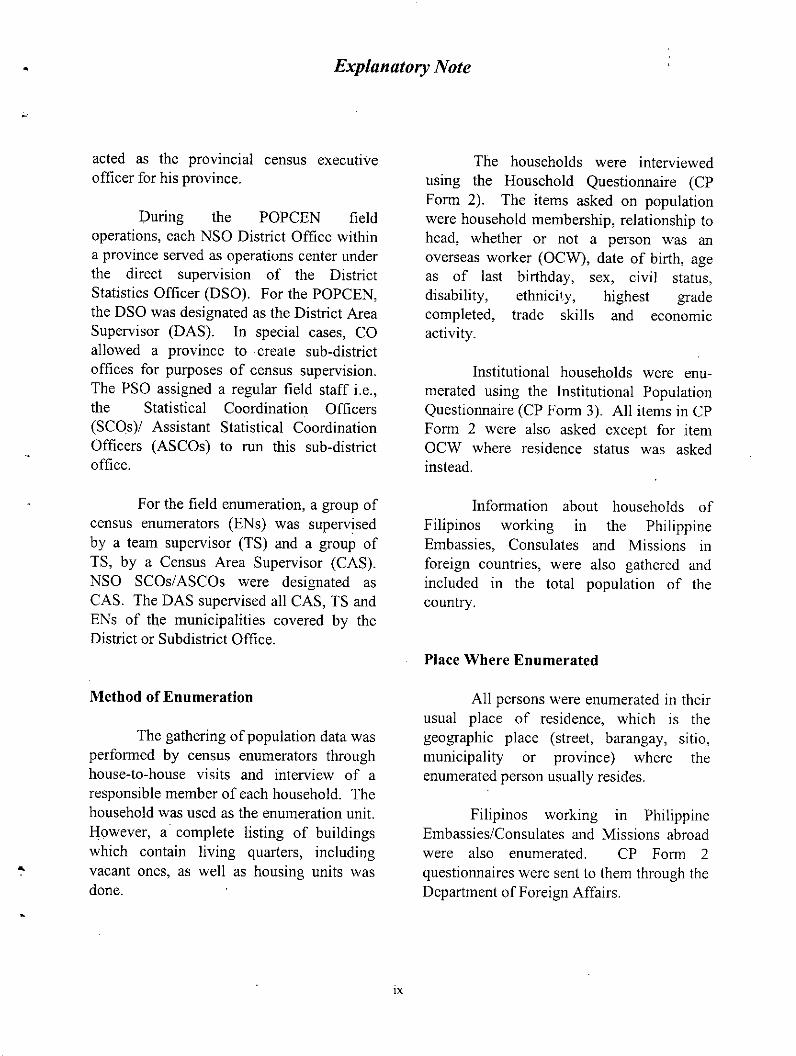
acted as the provincial census executiveofficer for his province.
During the POPCEN fieldoperations, each NSO District Office withina province served as operations center underthe direct supervision of the DistrictStatistics Officer (DSO). For the POPCEN,the DSO was designated as the District AreaSupervisor (DAS). In special cases, COallowed a province to create sub-districtoffices for purposes of census supervision.The PSO assigned a regular field staff i.e.,the Statistical Coordination Officers(SCOs)/ Assistant Statistical CoordinationOfficers (ASCOs) to run this sub-districtoffice.
For the field enumeration, a group ofcensus enumerators (ENs) was supervisedby a team supervisor (TS) and a group ofTS, by a Census Area Supervisor (CAS).NSO SCOs/ASCOs were designated asCAS. The DAS supervised all CAS, TS andENs of the municipalities covered by theDistrict or Subdistrict Office.
Method of Enumeration
The gathering of population data wasperformed by census enumerators throughhouse-to-house visits and interview of aresponsible member of each household. Thehousehold was used as the enumeration unit.However, a complete listing of buildingswhich contain living quarters, includingvacant ones, as well as housing units wasdone.
IX
The households were interviewedusing the Household Questionnaire (CPForm 2). The items asked on populationwere household membership, relationship tohead, whether or not a person was anoverseas worker (OCW), date of birth, ageas of last birthday, sex, civil status,disability, ethnicity, highest gradecompleted, trade skills and economicactivity.
Institutional households were enu-merated using the Institutional PopulationQuestionnaire (CP Form 3). All items in CPForm 2 were also asked except for itemOCW where residence status was askedinstead.
Information about households ofFilipinos working in the PhilippineEmbassies, Consulates and Missions inforeign countries, were also gathered andincluded in the total population of thecountry.
Place Where Enumerated
All persons were enumerated in theirusual place of residence, which is thegeographic place (street, barangay, sitio,municipality or province) where theenumerated person usually resides.
Filipinos working in PhilippineEmbassies/Consulates and Missions abroadwere also enumerated. CP Form 2questionnaires were sent to them through theDepartment of Foreign Affairs.

1995 Census o/Population
Content and Coverage of this Publication
POPCEN Report No. 2 containssixteen (16) tables. on the .populationcharacteristics. Figures on. demographic(age, sex, civil status, disability, ethnicityand household size, education (highest gradecompleted), trade skills, economiccharacteristics (industry and class of worker)are based on the household population.
Aside from the Philippine volume, aseparate report is published either for aprovince ot. highly-urbanized city. . Tofacilitate access to these reports, analphanumeric code, wherein the alphabeticcode represents the region to which aprovince or highly-urbanized city belongs isprovided.
Aside from the. published tables,unpublished tables are available to users incomputer print-outs or in diskettes (seeAppendix C for the list of unpublishedtables).
DEFINITION OF TERMS ANDCONCEPTS
Barangay
A barangay is the. smallest politicalunit in the country. Generally, itsenumeration is assigned to one enumerator.For enumeration purposes; a large barangayis usually divided into parts and each part iscalled an enumeration area (EA).
For purposes of the 1995 POPCEN,the list of barangays, as of September 1,
x
1995, as prepared by the NSCB TechnicalWorking Group on GeographicClassification, was used as basis for thegeographic codes utilized. A total of 41,919barangays were covered in this census.
.';,...
Usual Place of Residence
This term refers to the geographicplace (street, barangay,. municipality, orprovince) .where the enumerated personusually resides. As a rule, it is the placewhere he sleeps most of the time, hence, itmay. be the same as or different from theplace where he was found at the time of thecensus.
Household
A household. is a social. unitconsisting of a person living alone or groupof persons who. .
1. sleep in the sarrle housing unit; lind
2. have a common arrangement in thepreparation and. consumption offood.
In rtlostcases, a household. consistsof persons who ate related by kinship ties,like parents .and their children. In someinstances, several generations of familial tiesare represented in one household while, stillin others, even distant relatives are membersof the household:
Household helpers, boarders, andnon-relatives are considered as members of
••
•

• Explanatory Note
the household provided they sleep in thesame housing unit and have commonarrangement for the preparation andconsumption of food and do not usually gohome to their family at least once a week.
8. Ocean-going and inter-island!coastal vessels
9. Refugee camps
A group of unrelated individuals, asin the case of a group of students orworkers,who decide to rent a place and makecommon arrangements for the preparationand consumption of their food constitutesone household.
Institutional Population
Institutional population comprisespersons who are found living in institutionalliving quarters. They may have their ownfamilies or households elsewhere but at thetime of the census they are committed orconfined in institutions, or they live ininstitutional living quarters and are usuallysubject to .a common authority ormanagement, or are bound by either acommon public objective or a commonpersonal interest.
The following were considered asinstitutional living quarters:
I. Hotels, lodging houses,dormitories
2. Hospitals and nurses' homes3. Welfare institutions ..4. Corrective and penal institutions5. Convents, nunneries, seminaries
and boarding schools6. Military camps and stations7. Logging, mining and construc-
tion/public works camps
xi
•
Persons Enumerated as Members of theHousehold
The following were counted andenumerated as members of the household:
I. Persons whose usual place of residenceis the place where the household livesand who are present at the time of visitof the enumerator, except those bornafter 12:01 A.M., September I, 1995.
2. Family members who are overseas andwho are away at the time of the censusare considered members of thehousehold.
3. Persons whose usual place of residenceis the place where the household livesbut are temporarily away at the time ofthe census for any of the followingreasons:
• on vacation,business/pleasuretrip or training somewhere in thePhilippines and are expected tobe back within six (6) monthsfrom time of departure;
• on vacation, business/pleasuretrip or study/training abroad andare expected to be back within ayear from time of departure;

1995 Census of Population
• working or, attending school insome other., place but comeshome at least.once a week;
• confined in hospitals for a periodof not more than six (6) monthsat the time of enumeration exceptwhen they are confined asinmates in mental hospitals,leprosaria or leper colonies, drugrehabilitation centers, etc.;
• detained in national/provincial/city/municipal jails or in militarycamps for a period of not morethan six (6) months at the time ofenumeration;
• training with the Armed Forcesof the Philippines if training isnot more than six (6) months;
• on board coastal, inter-island orfishing vessels within Philippineterritories; or
• on board ocean-going vessels butare expected to come home.
4. Boarders/lodgers of the household oremployees of household-operated busi-nesses who do not usually go to theirrespective homes weekly.
5. Citizens of foreign countries, excludingmembers of diplomatic missions andnon-Filipino members of internationalorganizations, ,but including FilipinoBalikbayans who have resided or areexpected to reside in the Philippines formore than a year from his arrival.
xii
6. Persons temporarily staying with thehousehold who .have no usual' 'place ofresidence or wh<)' are not certain to' beenumerated elsewhere.
Persons Enumerated as Members of theInstitutional Population'
The following persons were enume-rated as members o(the iIistitutioInil popu-lation:
1. Permanent lodgers in boarding nouses
'2. Dormitory residents who do not.go homeat least once a week
3. Hotel residents who have stayed morethan 6 months at the time of the census
4. Boarders in residential houses, providedthat,theirnumber is ten (10) or more.
5. Patients' in hospitals who are confinedfor more than 6 months
6. Wards in orphanages
7. Inmates ofpehal colonies or prison cells
8. Priest and seminarians' iil seminaries,nuns in convents
9. Soldiers residing iIi military camps
10.Workers in mining and similar camps
The following persons wereexcluded as membets of the institutional

Explanatory Note
-.
population but were included In thehouseholds to which they belong:
I. Military officials and members of theirhouseholds who have housing unitswithin military camps.
2. Managers (and members of theirhouseholds) of refugee camps,dormitories, hotels, hospitals, etc., whooccupy and regularly use as their placeof abode living quarters in theinstitutions that they manage.
3. Priests who, together with their relativesand/or household help, occupy andregularly use as their place of abode aliving quarter in the church or seminary.
Persons Excluded from the Enumeration
The following persons wereexcluded from enumeration even if theywere within the territorial jurisdiction of thePhilippines at the time of the POPCENenumeration:
I. Foreign ambassadors, ministers, consulsor other diplomatic representatives, andmembers of their families (exceptFilipino and non-Filipino employeeswho have been residents of thePhilippines prior to said employment);
2. Citizens of foreign countries livingwithin the premises of an embassy,legation, chancellery or consulate;
xiii
3.. Citizens of foreign countries who arechiefs or officials of internationalorganizations like United Nations (UN),International Labor Organizations (ILO),Asian Development Bank (ADB), Foodand Agricultural Organization (FAO),the US Agency for InternationalDevelopment (USAID) who are subjectto reassignment to other countries aftertheir tour of duty in the Philippines, andmembers of their families;
4. Citizens of foreign countries togetherwith non-Filipino members of theirhouseholds, who are students or who areemployed, or have business in thePhilippines but who are expected to stayin the country for less than a year fromarrival;
5. Citizens of foreign countries andFilipinos with usual place of residence ina foreign country who are visiting thePhilippines and who have stayed or areexpected to stay in the country for lessthan a year from arrival;
6. Citizens of foreign countries in refugeecamps/vessels; and
7. Residents of the Philippines on vacation,pleasure or business trip, study ortraining, etc., abroad who have beenaway from the Philippines for more thana year from departure.
Persons working for' them or livingwith them were also enumerated based onthe rules of enumeration.

1995 Census of Population
Respondent
A respondent IS any responsibleadult member of the -household whofurnished the _'information or answers toquestions during the interview/enumeration.
Head of Household
The person responsible for the careand organization of the household isgenerally considered . as -the - head ofhousehold. He/She - usually provides thechiefsource of income for the household.
In the case of a household consistingof two or more unrelated persons sharing thesame cooking facilities and means, the headis usually the eldest male or female in thegroup regarded as such by .the othermembers.
Relationship to the Household Head
Data on the relationship to the headof household provides an indication of thetypical relationship - .among .. householdmembers. Each member of the householdhas a specific relationship to the. head byvirtue of his -presence in the household.Such relationship mayor may not be basedon kinship; The members of the householdare classified as follows:
Spouse. of the Head - a _,man/womanmarried to and living with the head.It includes legal marriages as well asconsensual relationships.
- i
xiv
Son/Daughter - children of the headregardless of age ormarital status.
-Stepson/Stepdaughter- a spouse's child_in a previous marriage.
Son-in-law/Daughter-in-law thehusband' or wife -of the -son ordaughter of the head.
Grandson/Granddaughter - child of theson or daughter of the head.
Father/Mother - refers to the parents ofthehead.
Brother/Sister - refers to the head's own- brother or sister.
Uncle/Aunt - a brother, sister or cousinof the headl spouse's parents.
Nephew/Niece - the child of the brother,sister or cousin 'of the head.
Other Relative -include such relatives asparents-in-law, cousins, grandeparents, sisterslbrothers-in-law, etc.
Non-Relative - any person in thehousehold who is not related to thehead.
Boarder - members of the householdwho are related to the head by bloodor affinity bilt who are boarders.
Domestic -Helper- - members of thehousehold who are related to thehead by blood or affinity but who arehousehold helpers.

Explanatory Note
Overseas Workers
An overseas worker is a householdmember who is currently out of the countrydue to overseas employment. He or she mayor may not have a specific work contract or
"may be presently at home on vacation buthas an existing overseas employment toreturn to, "TNT" workers are included if thehousehold still considers them as membersand if they mention their names when youask about the names of household members,However, immigrants are excluded,
Age and Date of Birth
Data on the age of the populationwere obtained by asking the month and yearof birth and the age itself of an individualbefore September I, 1995,
Birth Registration
This was asked to know whether thebirth of an individual was registered with theLocal Civil Registrar (LCR),
Civil Status
This refers to the personal status ofeach individual in reference to the marriagelaws or customs of the country, This wasasked to all persons 10 years old and over asof the date of visit. A person in this agegroup is classified as single, legally married,widowed, separated! divorced, common-law/live-in or civil status unknown, based onthe following definitions:
xv
Single - a person who has never beenmarried,
Legally Married - a person married in acivil or religious ceremony, eitherliving together with spouse at thetime of the POPCEN visit ortemporarily living apart because thespouse is employed elsewhere or isin the armed forces, etc,
Widowed - a married person whosespouse has died and who has notremarried up to the time of thePOPCEN visit.
Separated/Divorced - a person who ispermanently separated from his/herspouse, legally, or whose marriagehas been annulled or dissolved andcan remarry,
Common-law/Live-in - person cohabitingor living consensually with anotheras husband I and wife without thebenefit of a legal marriage,
Unknown - person whose civil status isunknown to the respondent.
Disability
Disability refers to any restriction orlack of ability (resulting from animpairment) to perform an activity in themanner or within the range considerednormal for a human being. Impairmentsassociated with disabilities may be physical,mental or sensory motor impairment such aspartial or total blindness and deafness;
1995 Census of Population
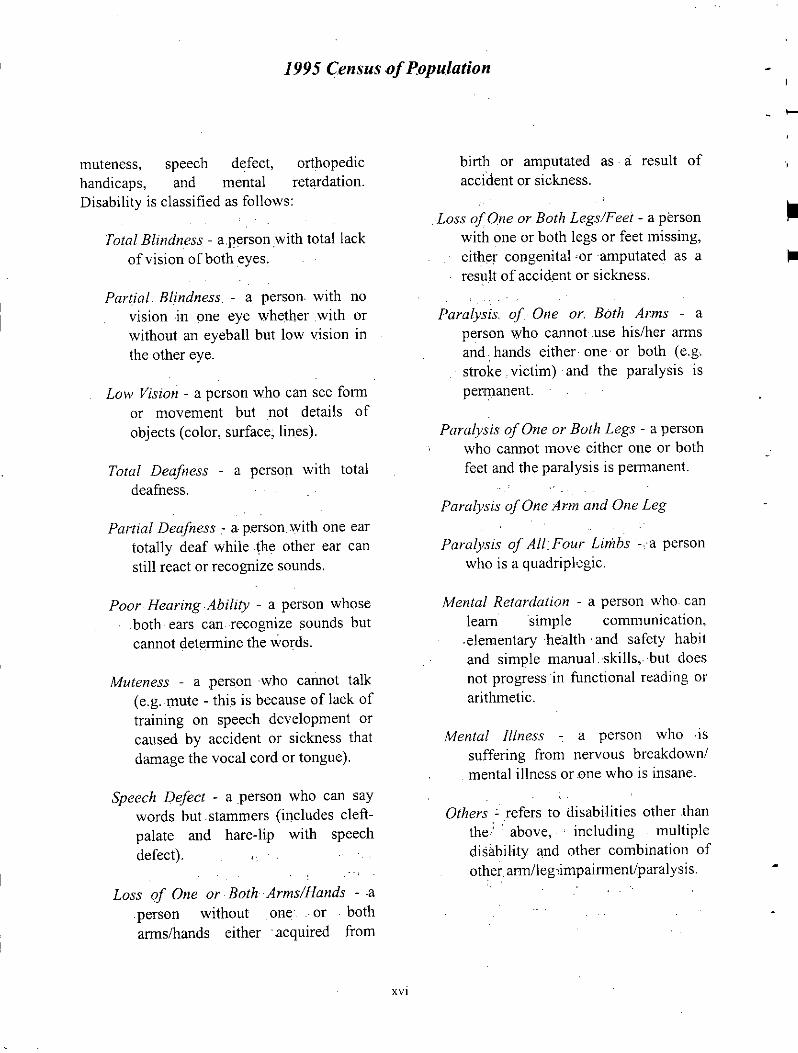
muteness, speech defect, orthopedichandicaps, and mental retardation.Disability is classified as follows:
Total Blindness - a,person ,with total lackof vision of both eyes.
Partial Blindness,- a person with novision in one eye whether with orwithout an eyeball but low vision inthe other eye.
Low Vision - a person who can see formor movement but not details ofobjects (color, surface, lines).
Total Deafness -a person with totaldeafness.
Partial Deafness, a person with one eartotally deaf while ,the other ear canstill react or recognize sounds.
Poor Hearing Ability - a person whoseboth ears can recognize sounds butcannot determine the words.
Muteness - a person who cannot talk(e.g. mute "this is because of lack oftraining on speech development orcaused by accident or sickness thatdamage the vocal cord or tongue).
Speech Defect - a person who can saywords but stammers (includes cleft-palate and hare-lip with speechdefect). ,
Loss of One or Both Arms/Hands - .aperson without one" or botharms/hands either' acquired from
XVI
birth or amputated as a: result ofaccident or sidness.
,Loss a/One or Both Legs/Feet - a personwith one or both legs or feet missing,either congenital -or amputated as aresult of accident or sickness.
Paralysis. of One or. Both Arms - aperson who cannot ,use, his/her armsand, hands either one or both (e.g., stroke. victim) and the paralysis ispermanent.
Paralysis of One or Both Legs - a personwho cannot move either one or bothfeet and the paralysis is permanent.
Paralysis of One Arm and One Leg
Paralysis of All. Four Limbs -.a personwho is a quadripkgic.
Mental Retardation - a person who- canleamsimple communication,.elementary health .and safety habitand simple manual skills, but doesnot progress in functional reading orarithmetic.
Mental Illness , a person who .issuffering from nervous breakdown/mental illness or one who is insane.
Others : refers to disabilities other thanthe: : above,' . including multipledisability and other combination ofother, arm/leg,impairment/paralysis.
••

Ethnicity
Explanatory Note
Trade Skill
In the POPCEN, ethnicity of anindividual is synonymous to the mothertongue or the language/dialect spoken athome at earliest childhood. Data wereobtained only for Filipino citizens. Filipinoswho have acquired foreign citizenship wereconsidered foreign nationals and theirethnicity were not recorded.
Highest Grade Completed
Highest grade completed refers tothe highest grade or year completed inschool, college or university as of SeptemberI, 1995. Data on highest grade completedfurnish material for a comparison of thepresent educational levels of the adultpopulation with the present and anticipatedfuture requirements of manpower for varioustypes of economic activities.
A person's highest grade completedis categorized as:
None - did not undergo formalschooling
Elementary - grade I to grade 7High School - I st year to 4th yearHigh School GraduatePostsecondary - I to 2 yearsCollege Undergraduate - I st year to 6th
yearCollege GraduatePost- baccalaureate - refers to any
course for which an undergraduatedegree is required. Masters anddoctoral degree students andgraduates fall under this category.
XViI
Trade skill refers to technical/.vocational ability or knowledge developedor acquired which will enable an individualto generate income to meet at least theirbasic needs (e.g., at least food needs).
Trade skill further means an acquiredand practiced ability to competently carryout a task or job, usually of a manual innature, in. any industrial craft or artisanoccupation which is officially andtraditionally recognized as requiring specialqualifications which can only be acquiredthrough lengthy experience, and practical ortheoretical instructions. In the POPCEN,trade skills include vocational skills,agriculture skills, technical skills, foodtrades and fishery art.
Economic Activity
One of the major objectives of thePOPCEN is to gather information that canserve as a basis for constructing a statisticalframe for the conduct of data collectionactivities regarding the informal sector.Towards this end, data on economic activityby . industry classification and class ofworker were obtained.
ECOJlOmic activity refers to theproduction of goods and provision ofservices primarily to generate income or as ameans of livelihood. A person is said to be,economically active if he/she is engaged inthe following:

1995 Census of Population
1. Production of goods and servicesnormally intended for sale on themarket at a price that isdesignated to cover their cost ofproduction;
2. Production of goods and serviceswhich are not normally sold at aprice intended to cover their costof production such asgovernment service, private non-profit services to households,domestic services rendered byone household to another; and
3. Types of production for ownconsumption and fixed capitalformation for own use including:
• production of primaryproducts (from agriculture,forestry, fishing, mining andquarrying) for ownconsumption
• processing of primary com-modities by their producers tomake goods for their own use
• production for own con-sumption provided they arealso produced for the market
• own-account construction ofworks and fabrication of toolsdwelling units, buildings, andsimilar, instruments,containers which have anexpected life of use of at leastone year (fixed assets)
XVlll
A person who works for pay either incash or in kind, for payor profit in ownbusiness, farm or enterprise or without payon own family farm or business is said to beeconomically active. For the POPCEN,he/she is said to be engaged in an economicactivity if he/she worked for at least onehour in any week in the past twelve months.
Class of Worker
An individual engaged in aneconomic activity can be classifiedaccording to employer-employeerelationships or for whom or where he/sheworks, as follows:
1. Worked for private household(domestic services) - a person whoworks in a private household for payin cash or in kind.
2. Worked for private business/enter-prise/farm - a person who works in aprivate business/enterprise/farm forpay, in cash or in kind. This classincludes not only persons workingfor a private firm but also thoseworking for a religious group,missionary, unions, and non-profitorganizations.
3. Worked for government/governmentcorporation - a person who worksfor the government or a governmentcorporation or any of itsinstrumentalities.
4. Self-employed without any paidemployee - a person who works for

Explanatory Note
profit or fees in own business, farm,profession or trade without any paidemployee. This includes workerswho work purely on commissionbasis and who may not have regularworking hours.
5. Employer in own farm or business -a person working in his ownbusiness, farm, profession or tradehas one or more regular paidemployees, including paid familymembers. Domestic helpers, fa.milydrivers and other household helperswho assist in the family operatedbusiness, regardless of time spent inthis activity, are NOT hiredemployees in the enterpriselbusiness;hence a farm or business proprietorwho is assisted purely by suchdomestic help is not considered anemployer and would be classified incategory 4 above.
6. Worked with pay on own family-operated farm or business - a personwho works in family-operated farmor business and receives cash or afixed share of the produce aspayments for his service.
XIX
7. Worked without any pay on ownfamily operated farm or business - amember of the family who workswithout pay in a farm or businessoperated by another member livingin the same household. The roomand board and any cash allowancegiven as incentives are not countedas compensation for these familyworkers.
Industry
Industry refers to the nature orcharacter of the business or enterprise or theplace wherein the person works.
The industry classifications utilizedin the POPCEN are consistent with thosedefined in the Philippine StandardClassification of all Economic Activities(PSIC). Examples of industries are palayfarming, poultry rmsmg, metallic oremining, food and beverage manufacturing,wholesale and retail trade, governmentservices, and domestic services.

~ ..
~ ..•.. " •...'."'.,.,,".'.'.'.".".'.•'"\\
.'~.,
~.' r--....~. f .....'-.-..! >-1 ' -'"', ,\. ~-- . ~ .-"f...' ' '". '<-'.' . .M&ndamo '.'.:'. '. Oenkle:S '--? ,,_. )
...... ~
t1 ~ Lean talel12 - SiikaIurW.
13 - tbnBbon
14 - GoIdlIn RIbbon15- RolohSalman18 - SiIIlngon
17-"-18 • Obrwo
18-_
20 - ..Io&e RImI
21-_
22 - Holy IWJ i.23 - Maon
24-Ilan_
25-_
Population MapButuan City: 1995
1 dot • tel •••••
A9usan del Norte
•• •

Butuan City
Highlights of the 1995 Census of Population
Population Size
• The total population of Butuan City,as of September 1, 1995, was247,074 persons. The 1995population increased by 19,245persons over the 1990 figure (withMay 1, 1990 as reference date). The1995 census figure is about 30 timesthe population of the city in 1903(Figure 1).
the population of the city is expectedto double in 45 years, increasing byabout 5,000 persons every year orabout 15 persons per day.
Number and Size of Households
• The number of households in the cityrose to 46,596 in 1995, or an increaseof 5,975 households over the 1990figure.
Population Growth
1903' 1918 1939 HI48 1960 1970 1975 1980 1990 1995
Censal Year
Figure 1Population Enumerated In Various Censuses,
Butu8n City: 1903.1995
Population (In '0001
250
200
150
100
50
II- I III I I I II I II I I
• The average household size declinedfrom 5.6 persons in 1990 to 5.3persons in 1995. This means that forevery 100 households, the totalnumber of members decreased by 30persons.
Age-Sex Composition
• Male population outnumbered theirfemale counterparts. The sex ratio(number of males for every 100females) of the city in 1995 was102.1. In 1990, the sex ratio wasrecorded at 101.4.
• Butuan City grew at the rate of 1.53percent annually in the first half ofthe nineties. This is 1.29 percentagepoints lower than the annualgeometric census growth rate duringthe eighties. If the average annualgrowth rate continues at 1.53 percent,
• The age-sex structure of thepopulation of Butuan City in 1995forms a pyramid shape with a broadbase. Children under 5 years oldmade up 14.1 percent of the totalpopulation of the city.

1995 Census of Population - ,
2 0 2 4 ePercent to total population
Figure 2Age-5ex Population Pyramid,
Butuan City: 1995
••2!l 30
Percent
10
Sin" ••
LtgallyMarrlld
Wld_d
Sepll1lwdlDIVorced
CommonLawfllve-ln
Figure 3Household Population 10 Years Old & Over
by Marital Status and Sex,Butuan City: 1995
household population 10 years oldand over, lower by 0.7 percentagepoint than the 1990 figure (47.5percent). Likewise, the proportion ofnever-married persons decreased,from 48.3 percent in 1990 to 46.2percent in 1995. The widowed (3.6percent) registered almost the samepercentage as that in the 1990 census(3.3 percent). Those in consensualunion constituted 2.4 percent, upfrom 0.2 percent in 1990.
• There was a higher 'percentage ofsingle men (48.8 percent) thanwomen (44.0 percent). On the otherhand, a higher percentage ofwidowed persons was reportedamong females (5.5 percent) thanamong males (1.7 percent).
Female
85.•• -64
75.79
70.74Male
65-611
A •• -64, ,,-59
• SO-54
45-49,, •••••0 35-39
U 30-34P 25.211
20.24
15-19
10-14
5~O~
• In 1995, the overall dependency ratiowas 74.8. This means that for every100 persons aged 15 to 64 years,there were about 75 dependents - 70persons aged 0 to 14 years (youngdependents) and five persons aged 65years and over (old dependents). In1990, this ratio was 76.6.
• The population less than 15 years oldconstituted 40.0 percent of the totalpopulation. The age group 15 to 64years old made up 57.2 percent whilethe elderly population or those aged65 years old and over, 2.8 percent ofthe total population.
Marital Status Highest Grade'Completed
• In 1995, legally married personsaccounted for 46.8 percent of the
• About two out of five persons (42.4percent) 7 years old and over in 1995
xxii1'7;;

Butuan City: Highlights
attended or completed elementaryeducation. Close to one-third (32.1percent) reached or completedsecondary education (high school),9.2 percent were collegeundergraduates, and 8.9 percentwere at least academic degreeholders. Those who had noeducation made up 2.6 percent.
Figure 4Household Population 7 Years Old & Over by Highest
Grade Completed, Butuan City: 1995
Not Stated
Academic DegreeHolder & Higher
College
Post secondary
High School
Pro-,ehool
o 5 10 15 ~ ~ ~ ~ ~ ~
Percent
Mother Tongue
• Cebuano was the most widely spokenlanguage/dialect by the populationduring the earliest childhood. Of thetotal household population, 72.6percent spoke Cebuano at the earliestchildhood. This is lower by 14.8percentage points compared to the1990 figure.
• Persons who spoke Butuanon duringthe earliest childhood made up 12.8
xxiii
percent, while those who spokeBoholano accounted for 4.2 percent.
Type of Disability
• There were 2,767 persons, or 1.1percent of the total population,reported to have some type ofdisability. Low vision was th~ mostcommon type of disability affecting20.2 percent of all persons withdisability. Partial blindness (10.0percent) and partial deafness (8.4percent) followed.
Figure 5Population by Type of Disability,
Butuan City: 1995
Partlalblindness10.0%
Partialdeafness8.4%
MentalretardatlO'n
7.8%
Paralysl, ofone or both
legs7.1%
Household Head
• Majority of the household headswere males (89.3 percent). Amongmales, headship rate peaks at ages 30to 39 years (31.7 percent), whileheadship rate for females was highest

1995 Census of Populaiion
at the ages' 50 td 59 years (24.8percent): ':
Figure 6Headship Rate by Age Group and Sex,
Butuan City: 1995
80+
70.79A
I• 60 •••0
50-59'Gi 40.049•u 30-39 :p
'120-29I,
<20
0 5 10 15 2. 25 30 S5
Percent
Overseas Worker
• The number of overseas workers in8utmiiJ. City in 1995 (920 persons)was. almost triple the' numberreported in the 1990 census (324persons).' More than half (52.8percent) of these overseas workerswere males.
• A large percentage of the overseasworkers in 1995 were in the ages 25to 39 years (55.0 percent). In 1990,the percentage in. this age group was53.7 percent
• Almost two out of five (37.2.percent)overseas workers .were academicdegree holders. This is lower by 6.9
xxiv
percentage' points compared to' the1990 figure (44.1 percent). Thosewith secondary education (highschool) .and with some years incollege made up 'the next largestproportions with 21.1' percent and15.0 percent, respectively. Thesefigures are higher than the 1990figures of 16.0 'percent and ILlpercent, respectively. The percentageof overseas workers without anygrade completed, registered at 1.3percent in 1995 .
Trade Skill
• Of the total household population 15years old and oyer, 12,060 persons,or 8.2 percent, were reported to' havesome trade skill. More than three-fourths (76.6 percent) were maIes.
• Of the population reported ,to havesome trade skill, those who had skillin driving and mobile machineryoperation displayed the highestpercentage (22.4 percent). . Thoseskill~d in mining, .construction andrelated trades followed at 13.6. '. . . .percent The. least were in the.catj::gory 'stationary plant and relatedoperation' (1.3 percent) •.
• Nearly two-thirds (65.4 percent) ofthose with trade skill acquired itthrough experience/apprenticeship,while .24.3 p,ercent acquired itthrough schooling! training.

Butuan City: Highlights
Type of Industry
• The largest percentage of thehousehold population 15 years oldand over who worked anytime in thepast year were engaged in services
Figure 7Household Population 15 Years Old & OVer WhoWorked Anytime In the Past Year by Industry
Group, Butuan City: 1995
Manufacturing8.8%
Construction5.0%
Services Not stated39.8% 0.2%
xxv
(39.8 percent). Persons engaged inagriculture, fishing and forestry madeup 27.3 percent while those engagedin trade, 16.4 percent.
Class of Worker
• More than one-third (38.2 percent) ofthose reported to have worked anytime in the past year were workingfor private business, enterprise orfarm. Those who were self-employed in their own farm orbusiness without any paid employeemade up 24.9 percent. Those in thegovernment or government-ownedcorporations, and those who wereemployers in own farm or businessregistered the same proportion at10.3 percent.

.\ .
.' ..>'""":'.
,..
~-,.
I
,.
" l'.-.,
:'.
,.
-.".
;."

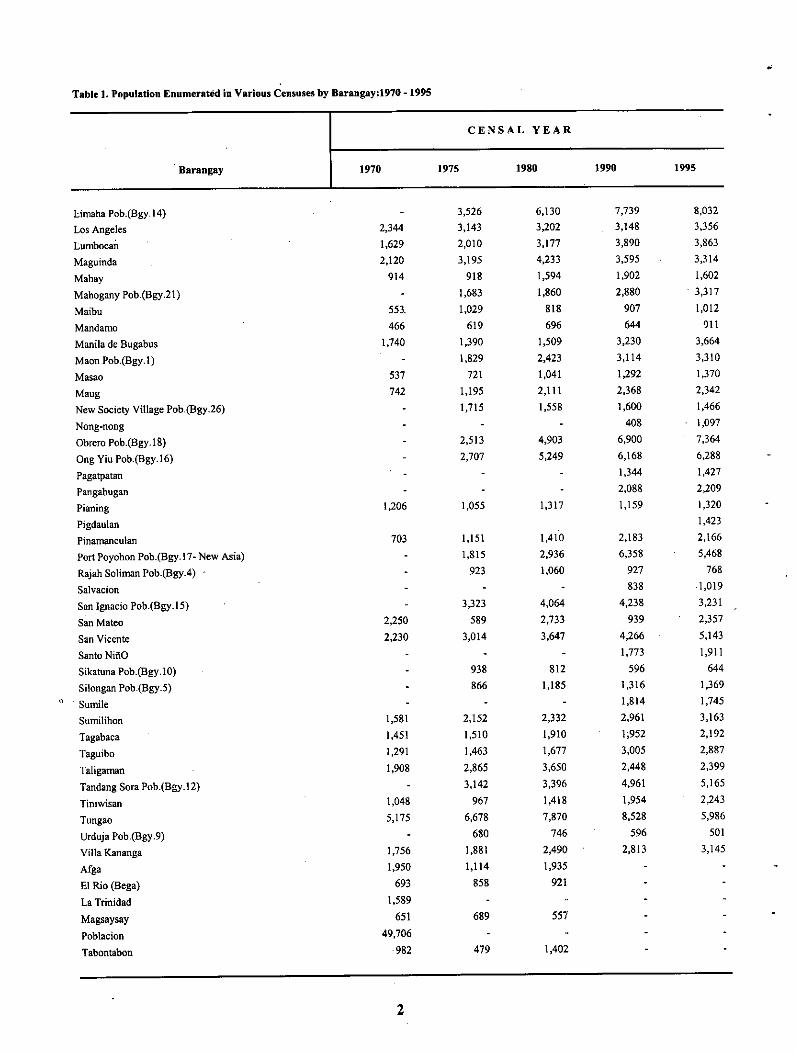
Table 1. Population Enumerated in Various Censuses by Barangay:1970 -1995
CENSAL YEAR
Barangay 1970 1975 1980 1990 1995
BUTUANCITY 131,094 132,682 172,489 227,829 247,074
Agao Pob.(Bgy.3) 1,338 1,356 1,228 884Agusan Pequefto 4,242 3,435 4,486 4,189 4,366Ambago 932 774 1,231 2,403 3,683Amparo 1,394 2,052 1,820 1,657 1,490Ampayon 2,971 3,427 4,428 7,518 8,888Anticala 2,037 1,976 4,355 2,829 3,244Antonga1on 1,855 2,015 2,388 3,114 3,189Aupagan 1,072 940 1,445 1,371 1,384BaanKM3 8,564 1,737 2,602 3,910 5,859Baan Riverside Pob. (Bgy.20) 3,036 3,225 5,565 6,252Babag 467 846 1,058 1,362 1,548Bading Pob. (Bgy.22) 1,116 1,767 4,496 4,678Bancasi 684 977 1,064 2,340 3,253Banza 1,852 1,930 1,970 2,526 2,787Baobaoan 616 628 620 914 1,072Basag 1,728 1,326 1,922 2,289 2,339
Bayanihan Pob.(Bgy.27) 708 706 3,032 3,009Bilay 846 571 1,131 2,027 1,290Bit-os 1,185 1,308 1,369 1,865 1,916Bitan-agan 1,429 2,041 1,317 1,223 1,358Bobon 686 660 721 877 1,023Bonbon 1,641 2,144 2,569 2,941Bugabus 544 856 998 1,277 1,114Bugsukan 958 1,127Buhangin Pob.(Bgy.l9) 2,229 2,752 3,858 . 4,377
Cabcabon 679 975 1,324 1,206 1,385
Camayahan 9~9 981 1,272 '1,437 934Dagohoy Poh.(Bgy.7) 1,385 1,523 1,851 1,727Dankias 449 605 825 954 1,044
De Oro 1,269 1,373Diego Silang Pob.(Bgy .6) 2,144 2,148 1,809 1,623Don Francisco 865
Doongan 822 1,421 1,747 4,600 6,200
Dulag 1,180 1,177
Dumalagan 1,160 1,295 1,392 1,.t{)9 1,671
Florida 477 2,648 2,353
Golden Ribbon Pob.(Bgy.2) 3,568 4,338 4,774 5,416
Holy Redeemer Pob.(Bgy.23) 2,599 4,597 5,505 7,422Humabon Pob.(Bgy.ll) 760 697 564 632lmadejas Pob.(Bgy.24) 815 1,077 1,673 1,906
Jose Rizal Pob.(Bgy.25) 2,109 2,158 5,588 5,848
Kinamlutan 853 989 1,265 1,538 1,654
Lapu-Lapu Pob.(Bgy.8) 1,816 2,206 1,998 1,723
Lemon 524 690 1,232 1,131 1,249
Leon Kilat Pob.(Bgy.13) 860 471 694 890
Libertad 5,299 5,281 7,370 11,762 14,722
1
•Table 1. Population Enumerated in Various Censuses by Barangay:1970 -1995
CENSAL YEAR
Barangay 1970 1975 1980 1990 1995
l:.imaha Pob.(Bgy.14) 3,526 6,130 7,739 8,032
Los Angeles 2,344 3,143 3,202 3,148 3,356
Lumbocan 1,629 2,010 3,177 3,890 3,863
Maguinda 2,120 3,195 4,233 3,595 3,314
Mahay 914 918 1,594 1,902 1,602
Mahogany Poh.(Bgy:21) 1,683 1,860 2,880 3,317
Maibu 551 1,029 818 907 1,012
Mandamo 466 619 696 644 911
Manila de Bugabus 1,740 1,390 1,509 3,230 3,664
Maon Pob.(Bgy.l) 1,829 2,423 3,114 3,310
Masao 537 721 1,041 1,292 1,370
Maug 742 1,195 2,111 2,368 2,342
New Society Village Pob.(Bgy.26) 1,715 1,558 1,600 1,466
Nang-nong 408 1,097
Obrero Pob.(Bgy.18) 2,513 4,903 6,900 7,364
Ong Yiu Pob.(Bgy.16) 2,707 5,249 6,168 6,288
Pagatpatan 1,344 1,427
Pangabugan 2,088 2,209
Pianing 1,206 1,055 1,317 1,159 1,320
Pigdaulan 1,423
Pinamanculan 703 1,151 1,410 2,183 2,166
Port PoyoheD Pob.(Bgy .17 - New Asia) 1,815 2,936 6,358 5,468
Rajah Soliman Pob.(Bgy.4) 923 1,060 927 768
Salvacion 838 1,019
San Ignacio Pob.(Bgy.l5) 3,323 4,064 4,238 3,231
San Mateo 2,250 589 2,733 939 2,357
San Vicente 2,230 3,014 3,647 4,266 5,143
Santo NinO 1,773 1,911
Sikatuna Pob.(Bgy.l 0) 938 812 596 644
Silongan Pob.(Bgy.5) 866 1,185 1,316 1,369
" Sumile 1,814 1,745
Sumilihon 1,581 2,152 2,332 2,961 3,163
Tagabaca 1,451 1,510 1,910 1;952 2,192
Taguibo 1,291 1,463 1,677 3,005 2,887
Taligaman 1,908 2,865 3,650 2,448 2,399
Tandang Sora Pob.(Bgy.12) 3,142 3,396 4,961 5,165
Tiniwisan 1,048 967 1,418 1,954 2,243
Tungao 5,175 6,678 7,870 8,528 5,986
Urduja Pob.(Bgy.9) 680 746 596 501
Villa Kananga 1,756 1,881 2,490 2,813 3,145
Afga 1,950 1,114 1,935
EI Rio (Bega) 693 858 921
La Trinidad 1,589
Magsaysay 651 689 557
Poblacion 49,706
Tabontabon 982 479 1,402
2

BUTUANCITY
Table 2. Population by Single-Year Age Classification and Sex. 1995
Total Population Household PopulationSingle-Year AgeSexes I I .Sexes I IClassificatiC'D Both Male Female Both Male Female
BtJ'I'tJAN CITY
All Ages 247,074 124,811 122,263 246,223 12",,277 In,946
Under 1 6,9062 3,647 3,295 6,935 3,6U 3,291
1 6,520 3,349 3,171 6,515 3,347 3,1682 7,115 3,714. 3,401 7,115 3,714 3,4013 7,138 3,698 3,440 7,135 3,695 3,440< 7,066 3.663 3,403 7,060 3,659 3,f01
5 7,176 3,6"6 3,530 7,171 3,6"2 3,5:19• 7,0404 3,607 3,437 7,0",0 3,605 3,4357 6,845 3, fo39 3.406 6,837 3,436 3,4018 6,681 3,386 3,295 6,673 3,380 3,293, 6,104 3,156 2,9U 6,102 3,156 2,94.6
10 5,963 3,066 2,897 5,958 3,061 2,89711 5,916 2,982 2,934 5,914 2,982 2,93212 6,142 3,118 3,02" 6,134 3,110 3,02413 6.012 2,965 3,047 6,008 2,961 3,0471< 6,114 2,992 3,122 6,107 ~,ggO 3,117
15 6,310 3,116 3,194 6,302 3,111 3,19116 5,826 2,866 2,960 5,802 2,852 2,95017 5,5406 2,763 2,783 5,501 2,736 2,76518 5,342 2,643 2,699 5,284 2,614 2,67019 4,809 2,368 2,441 4,728 2,320 2,408
20 4,771 2,326 2,445 4,695 2,277 2,41821 4,251 2,087 2,164 4,187 2,050 2,13722 4,372 2,167 2,205 4,322 2,131 2,19123 4,3069 2,147 2,202 4,309 2,119 2,1902< 3,955 1,973 1,982 3,920 1,953 1,967
25 4,398 2,220 2,178 4,366 2,201 2,1652' 3,934 1,967 1,967 3,900 1,942 1,95827 3,780 1,887 1,893 3,765 1,876 1,88928 3,657 1,787 1,870 3,642 1,779 1,86329 3,613 1,812 1,801 3,603 1,807 1,796
30 3,929 2,015 1,914 3,910 2,004 1,90631 3,467 1,726 1,741 3,450 1,710 1,74032 3,655 1,792 1,863 3,640 1,779 1,86133 3,315 1,658 1,657 3,30C 1,6069 1,655,. 3,OCO 1,53fo 1,506 3,030 1,527 1,503
35 3,777 1,998 1,779 3,769 1,992 1,77736 3,078 1,586 1,0692 3,070 1,581 1,C8937 2,905 1,C80 1,425 2,897 1,476 1,012138 2,854 1,481 1,373 2,844 1,474 1,37039 2,665 1,306 . 1,359 2,661 1,304 1,357
<0 2,866 1,464 1,402 2,862 1,.62 1,.00n 2,418 1,225 1,193 2,411 1,219 1,192<2 2,569 1,297 1,272 2,562 1,292 1,270., 2,190 1,128 1,062 2,188 1,127 1,061« 1,932 '81 951 1,928 97' ,n•• 2,537 1,351 1,186 2,531 1,348 1,183<. 1,888 95< ,,. 1,88. 951 933<7 1,765 887 878 1,762 88. 87'<8 1,856 92' 927 1,853 927 '"n 1,573 80< 769 1,570 801 76.9
50 1,668 889 779 1,663 88. 77751 1,331 '73 658 1,328 671 '5752 1,50. 774 730 1,504 774 73053 1,601 833 7.8 1,600 833 767•• 1,322 '4' '7' 1,318 .« '74
55 1,510 739 771 1,509 738 77156 1,2.5 61. '" 1,2.3 615 '2857 1,176 .2< 552 1,175 "4 55158 1,214 .« 570 1,210 .<2 56859 1,127 571 556 1,126 570 556
3

1995 CENSUS OF POPULATiON •Table 2. Population by single-Year Age Classification and Sex: 1995 - Continued
~Total population Household population
Single-Year AgeSexes I 1 Both sexesl IClassification Both Mal. Pemale Mal. Female
•0 1,260 ••• 5" 1,257 "5 5'2 •., .'2 n' 3•• .11 n' 3.7.2 '27 ••• '61 '22 "5 '57.3 75' 37. 37. 75' 37. '376
•• 711 34' 3.5 710 345 3.5
'5 '73 510 ••3 .72 50' ••3
•• 530 247 2.3 52' ••• 2.3'7 537 270 2'7 53' 270 2"
•• 571 312 25' 571 312 25'
•• '5. 231 227 '5. 231 227
70 5'5 252 313 564 251 313 .
71 342 15. 18' 342 15. ,.,12 357 ,., 17' 357 ,., 17.73 337 ". ,.. 337 ,.. ,..74 301 13. 163 301 13. "3
75 35. '.5 173 35. '.5 1737' "0 73 117 '.0 73 11777 174 7' •• 174 7' ••7. 192 .5 107 192 .5 107
7' 132 .2 70 132 '2 70
.0 19' U 110 19' •• 110., 123 57 •• 123 57 ••82 11. 5. ., '119 5. "•3 12. 62 •• 12• '2 •••• .0 n •• •• .0 ••.5 •• .0 •• •• .0 •••• 3' 17 ,. 3. 17 19.7 35 14 21 35 14 21
•• ,. 12 • ,. 12 ••• .23 15 • 23 15 •.0 20 5 15 20 5 15
" 10 • • 10 • •'2 • 3 • • 3 •93 15 11 • 15 11 ••• 11 5 • 11 5 •'5 • • • ••• 2 1 1 2 1 197•• 1 1 1 1
••100101 and over 1 1 1 1
4

BUTUANCITY
Table 3. Percent Distribution of Population by Age Group, Sex and City/Municipality: 1995
Total population Household PopulationAge Group andCity/MUnicipality Percent to Total Percent to Total"-.r Sexes I I "-.r Sexes I Male I FemaleBoth Mal. Female Both
BUTOAN CITY
All Ages 247 ,074 100.00 50.52 49.48 2U,223 100.00 50.47 49.53
'Onder 1 6.94.2 2.81 1.48 1.33 6,935 ::1:.82 1.48 1.341 • 27,839 11. 27 5.84 5.43 27,825 11.30 5.85 5.455 • 33,850 13.70 6.98 6.73 33,823 13.74 6.99 6.7410 14 30,14,7 12.20 6.12 6.08 30,121 12.23 6.13 6.1015 19 27,833 11.27 5.57 5.70 27,617 11.22 5.54 5.6820 2. 21,69S 8.78 4.33 t.t5 21,433 8.70 4.28 " .4325 2' 19,382 7.84 3.92 3.93 19,276 7.83 3.90 3.9330 ,. 17,406 7.04 3.53 3.51 17,334 7.04 3.52 3.5235 ,. 15,279 6.18 3.18 3.01 15,241 6.19 3.18 3.0140 •• 11,975 4.85 2.47 2.38 11,951 4.85 2.47 2.38•• •• 9,619 3.89 1.99 1. 90 9,600 3.90 2.00 1. 9050 54 7,"26 3.01 1.54 1.U 7,413 3.01 1. 55 1. 4655 5' 6,272 2.54 1.29 1.25 6,263 2.54 1. 30 1. 2560 54 4,46" 1.81 0.92 0.89 4,454 1.81 0.92 0.8965 6. 3,069 1.24 0.64 0.61 3,066 1.25 0.64 0.6170 74 1,902 0.77 0.36 0.41 1. 901 0.77 0.36 0.4175 7' 1,046 0.42 0.19 0.23 1,046 0:42 0.20 0.23.0 •• 65' 0.26 0.12 0.14 653 0.27 0.12 0.1485 and over 271 0.11 0.05 0.06 271 0.11 0.05 0.06
5

1995 CENSUS OF POPULATION
Table 4. Percent Distribution of Total population 10 Years. Old and Over by Age Group, Sex and Marital Status: 1995
MAR:I'I'A L S TAT U S (Percent to Total)Age Group and Sex Tcital_?opulat~OD
10 Years 014 Single Legally Separatedl Commou- U separatedland Over Married Divorced Law/Live-in
BUTUAN CITY
Both Sexes 178,443 82,804 83,202 6,40S 1,487 ",322 223• to Total 100,00 46.40 46.63 3.59 0.83 2.42 0.12
10 1< 30,147 16.70 0.16 0.01 0.01 0.0215 19 27,833 14.72 0.61 0.02 0.02 0.20 0,03
20 ,. 21,698 8.22 3.32 0.02 0.07 0.51 0.0225 29 19,382 3.64: 6.59 0.06 0.10 O •.•S 0.02
30 ,. 17,406 1. 50 7.69 0.11 0.12 0.33 0.0135 " 15,279 0.66 7.31 0.17 0.14 0.28 0.0140 44 11,975 0.36 5.81 0.22 0.10 0.2145 49 9,619 0.21 ".61 0.30 0.09 0.1650 54 7,426 0.13 3.50 0.38 0.06 0.0955 " 6,272 0.10 2.83 0.46 0.05 0.07'0 64 4;464 0.07 1.87 0.47 0.04 O.O!!65 ,. 3,069 0.03 1.17 0.46 0.02 0.03 0.0170 74 1,902 0.03 0.62 0.38 0.01 O.Ol75 7' 1,046 0.02 0.29 0.26 0.01 0.0180 84 654 0.01 0.16 0.1985 and over 271 0.01 0.06 0.08
Male 89,506 43,699 41,485 1,541 5'79 2,129 73• to Total 50.16 2".49 23.25 0.86 o .:!2 1.19 0.04
8.39 0.07 0.01 •10 14 15,12315 1. 13,756 7.49 0.16 0.01 0.01 0.04 0.0120 24 10,700 4.62 1.11 0.01 0.02 0.23 0.0125 2' 9,673 2.21 2.92 0.02 0.04 0.2330 34 8,725 0.90 3.75 0.03 0.05 0.1635 3. 7,851 0.38 3.77 0.05 0.05 0.1440 44 6,095 0.20 3.01 0.05 0.0" 0.1245 4' 4,925 0.11 2.U 0.08 0.05 0.1050 54 3,815 0.07 1. 92 0.07 0.03 0.0555 5' 3,194 0.05 1. 57 0.10 0.02 0 ..04'0 64 2,270 0.03 1.09 0.10 0.01 0.0365 ,. 1,570 0.01 0.73 0.11 0.01 0.0270 74 8.7 0.01 0.38 0.09 0.0275 7' 481 0.19 0.07 0.0180 84 302 0.11 0.0585 and over 12. 0.04 0.03
Female 88,937 39,105 41,717 4,864 .08 2,193 150% to Total 49.84 21. 91 23.38 2.73 0.51 1.23 0.08
10 14 15,024 8.31 0.09 0.01 0.0115 1. 14,077 7.23 0.46 0.01 0.01 0.16 0.0220 24 10,998 3.60 2.21 0.02 0.05 0.28 0.0125 2. 9,709 loU 3.67 0.05 0.06 0.22 0.0130 34 8,681 0.60 3.94 0.08 0.07 ,0.17 0.0135 3. 7,428 0.28 3.54 0.12 0.08 0.13 0.0140 44 5,880 0.16 2.80 0.17 0.06 0.1045 49 4,694 0.10 2.18 0.23 0.05 0.0750 54 3,611 0.06 1.58 0.30 0.04 0.0455 5' 3,078 0.05 1.26 0.35 0.03 0.03'0 64 2,194 0.04 0.78 0.37 0.02 0.0265 ,. 1,499 0.02 0.45 0.35 0.01~ 0.0170 74 1,005 0.02 0.24 0.29 0.0175 7' 565 0.01 0.10 0.1980 84 352 0.01 0.05 0.1485 ~ over 142 0.01 0.02 0.06
6

BUTUANCITY
Table 5. Percent DistributiOn of Household Population 10 Years Old and Over by Age Group, Sex, Marital Status andCity/Municipality: 1995
Household MAR :rT A L S T A T U S (Percent to Total)Age Group, Sex and populationCity/Municipality 10 Years Old single Legally Widowed separated! Common- UDknown
and.Over Married Divorced Law/Live-in
BUTUANCITY
Both Sexes 177,640 82,1601 83,057 6,399 1,-t82 4,316 222• to Total 100.00 46.25 46.76 3.60 0.83 2.U 0.12
10 1. 30,121 16.76 0.16 0.01 0.01 0.0215 19 2',617 14.66 0.61 0.02 0.02 0.20 0.0320 24 21,433 8.12 3.32 0.02 0.07 0,51 0.0225 29 19,276 3.61 6.61 0.06 0.10 0.46 0.0130 34 17,334 1.49 7.71 0.11 0.12 0.33 0.0135 39 15,241 0.65 7.H 0.17 0.14 0.28 0.01• 0 •• 11,951 0.35 5.83 0.22 0.10 0.2145 .9 9,600 0.21 -t",63 0.31 0.10 0.1750 5' ',413 0.13 3.52 0.38. 0.06 0.0955 " 6,263 0.10 2.84 0.46 0.05 0.07'0 •• 4,454 0.07 1 :87 0.48 0.04 0.0565 '9 3,066 0.03 1.18 0.46 0.02 0.03 0.0170 74 1,901 0.03 0.63 0.39 0.01 0.0275 79 1,046 0.02 0.30 0.26 0.01 0.01'0 •• 653 0.01 0.16 0.1985 and over 271 0.01 0.06 0.08
Male 88,999 43,313 41,369 1,540 57' 2,126 73• to Total 50.10 24.38 23.29 0.87 .0.33 1.20 0.04
10 1. 15,104 8.41 0.07 0.0115 19 13,633 7.45 0.16 0.01 0.01 0.04 0.0120 24 10,530 4.56 1.11 0.01 0.02 0.23 0.0125 29 9,605 2.20 2.92 0.02 0.04 0.2330 34 8,669 0.89 3.75 0.03 0.05 0.1635 39 7,827 0.38 3.78 0.05 0.05 .0.14•0 •• 6,079 0.19 3.02 0.05 0.04 0.12•• .9 4,913 0.11 2.43 0.08 0.05 0.1050 54 3,808 0.07 1. 93 0.07 0.03 0.0555 59 3,189 0.05 l.S8 0.10 0.02 0.04'0 •• 2,267 0.03 1.09 0.10 0,01 0.0365 '9 1,568 0.01 0.73 0.11 0;01 0.0270 7' '9' 0.01 0.38 0.09 0.0275 79 481 0.19 0.07 0.01'0 •• 301 0.11 0.0585 and over 129 0.04 0.03
Female 88,641 38,851 41,688 4,859 90. 2,190 149% to Total 0&9.90 21. 87 23.47 2.74 0.51 1.23 0.08
10 14 15,017 8.34 0.09 0.01 0.0115 19 13,984 7.21 0.46 0.01 0.01 0.16 0.0220 24 10,903 3.56 2.22 0.02 0.05 0.28 0.0125 29 9,671 1.42 3.69 0.05 0.06 0.22 0.0130 34 8,665 0.60 3.96 0.08 0.07 0.17 0.0135 39 7,414 0.28 3.56 0.12 0.08 0.13 0.01• 0 •• 5,872 0.16 2.81 0.18 0.06 0.1045 .9 4,687 0.10 2.19 0.23 0.05 0.0750 54 3,605 0.06 1.59 0.30 0.04 0.0455 59 3,074 0.05 1.26 0.35 0.03 0.03'0 •• 2,187 0.04 0.78 0.37 0.02 0.0265 '9 1,498 0.02 0.45 0.35 0.01 0.0170 74 1,005 0.02 0.25 0.29 0.0175 79 565 0.01 0.11 0.19'0 •• 352 0.01 0.05 . 0.1485 and over 142 0.01 0.02 0.06
7

1995 CENSUS OF POPULATION
Table 6. Percent Distribution of Household Population 5 Years Old and OVer by Highest Grade Completed. Age Group,Sex and City/Municipality: 1995
Highest Grade Completed,Sex and City/Municipality
BUTTJAN CITY
HouseholdPopula-
. tion 5Years Oldand OV'er
Percentto
Total Total
A G • G R 0 U P (Percent Distribution)
0.71 100.00
100.00 100.006.60 100.00
3.36 100.00
50.23 100.00
3.45 100.00
1.73 100.00
0.37 100.00 .22.71
Both Sexes
No Grade Completed
Pre-Scbool
Elementary1st - 4th Grade5th - 7tb Gnd~
High SchoolundergraduateGraduate
Post-SecondaryUndergraduateGraduateCollege UndergraduateAcademic Degree HolderPost-Baccalaureate
Not Stated
Male
No Grade Completed
Pre-School
Blementary1st • 4th Grade5th - 7th Grade
High scboolUndergraduateGraduate
Post.SecondaryundergraduateGraduate
College Undergraduate
Academic Degree Holder
Post-Baccalaureate
Not Stated
Female
No Grade CompletedPre.School
Elementary1st - 4th Grade5th • 7th Grade
High SchoolUndergraduateGraduate
Post-SecondaryUndergraduateGraduate
College Undergraduate
Academic Degree Holder
Post-Baccalaureate
Not Stated
211,463
13,951
7,110
85,14443,41041,734
63.24537.08426.1614,898
.924,006
18.066
17,217
3361,496
106,218
7,294
3,650
44.48723,38121,106
30,67617,75912,917
2.599526
2,0739,124
7,503
16'721
105,245
6.6573,460
40,65720,02920,628
32,56919,32513,244
2.29936'
1,933
8,942
9,714
172
775
40.2620.5319.74
29.9117.5412.37
2.320.421.89
8.54
8.14
0.16
21.0411.069.98
14.518.406.111.230.250.98
4.31
3.55
0.08
0.34
49.77
3.151.64
19.239.479.75
15.409.146.26
1.090.170.91
4.23
4.59
0.08
100.00100.00100.00
100.00100.00100.00
100.00100.00100.00
100.00
100.00
100.00
100.00100.00100.00
100.00100.00100.00
100.00100.00100.00
100.00
100.00100.00
100.00
100.00
100.00:\,00.00
100.00100.00100.00
100.00100.00100.00
100.00100.00100.00
100.00
100.00
100.00
3.3939.01
16.60
0.250.49
22.53
3.43
38.48
15.75
0.220.42
22.33
3.35
39.58
17.49
0.280.56
3.3323.92
32.95
1. 432.80
9.76
3.39
24.13
31.371.412.68
10.26
3.26
23.69
34.62
1.452.94
9.29
3.23
8.8t
32.49
3.787.41
5.08
3.239.34
32.11
3.466.59
5.83
3.23
8.29
32.89
4.128.37
4.39
3.1':;
3.31
8.876.50
12.75
3.14
3.18
3.70
9.97
6.1111.63
3.74
3.13
2.88
7.72
6.9214.05
2.58
2.891.81
3.23
6.5612.700.16
2.41
2.97
2.08
3.97
6.3912.050.11
2.50
2.80
1.52
2.46
6.7413.470.21
2.32
2.821.18
1.28
6.6511.861.23
2.54
2.88
1.41
1.646.47
11.241.18
2.91
2.75
0.92
0.90
6.8612.591. 29
2.19
2.800.73
0.65
.6.668.354.91
0.100.17
2.01
2.81
0.93
0.71
6.398.254.33
0.100.18
1.80
2.79
0.51
0.58
6.968.465.500.100.17
2.19
2.900.69
0.56
6.374.208.63
0.841.44
2.67
2.93
0.690.79
6.274.688.030.751. 29
1.80
2.87
0.69
0.32
6.483.639.250.931.57
3.48
8

BUTUANCITY
Table 6. Percent Distribution of Household Population 5 Years Old and Over by Highest Grade completed. Age Group, Sex and- Continued City/Kunicipality. 1995 - Continued
Highest Grade completed.Sex and City/Municipality
BUTtrAM CITY
"A G B G R 0 U P (Percent Distribution)
35 andover
Both SexesNo Grade Completed
Pre-School
Blementary1st - 4th Grade5th - 7th Grade
High ScboolundergraduateGraduate
Post-SecondaryUndergraduateGraduate
College Undergraduate
Academic Degree Bolder
Post-Baccalaureate
Not Stated
Male
No Grade COmpleted
Pre-School
Elementary1st • 4th Grade5th - 7th Grade
High SchoolUndergraduateGraduatePost-SecondaryUndergraduateGraduate
College undergraduate
Academic Degree Bolder
Post-Baccalaureate
Not Stated
Female
No Grade Completed
Pre-School
Elementary1st - 4th Grade5th - 7th Grade
High SchoolundergraduateGraduate
Post. SecondaryUndergraduateGraduate
College Undergraduate
Academic Degree Holder
Post-Baccalaureate
Not Stated
2.84
0.570.25
4.612.546.773.075.24
2.67
2.79
0.64
0.27
4.682.956.61
2.614.51
2.64
2.90
0.50
0.23
4.532.066.93
3.515.91
2.71
2.89
0.590.18
2.811.743.925.679.66
2.54
2.81
0.62
0.27
2.982.034.025.208.98
2.36
2.96
0.56
0.09
2.621.403.82
6.1110.29
2.71
2.98
0.720.25
2.321.583.10
6.5210.780.48
0.200.340.17
0.23
2.21
2.93
0.66
0.30
2.671. 893.53
5.939.980.360.190.190.19
0.25
2.50
3.03
0.78
0.20
1.951.222.66
7.0711. 500.59
0.220.550.16
0.20
1.94
2.74
0.520.17
1. 721.192.28
6.299.122.28
0.160.670.05
1. 27
2.34
2.69
0.58
0.16
2.001.412.65
5.918.821. 90
0.120.380.05
0.93
2.08
2.80
0.45
0.171.420.941. 89
6.659.392.64
0.221.090.05
1.62
2.58
9
2.60
0.470.11
1.440.981.91
5.195.245.11
0.632.240.27
4.72
2.67
2.58
0.47
0.16
1.711. 252.23
5.095.794.13
0.351.140.14
3.72
3.33
2.630.480.061.130.661.595.274.736.060.963.830.41
5.75
2.06
2.50
0.58
0.081.300.971.64
4.194.014.461.674.481.05
7.27
0.16
1.14
2.46
0.59
0.08
1.541.251. 85
4.184.423.861.393.420.87
6.01
0.15
0.97
2.54
0.57
0.09
1. 040.631.43
4.213.635.042.006.011.24
8.56
0.16
1. 29
2.240.46
0.071.100.761.45
3.332.943.89
2.594.482.17
7.81
0.34
1.20
2.18
0.53
0.11
1.251.011.52
3.343.183.55
2.273.042.07
6.66
0.25
1. 53
2.29
0.38
0.03
0.940.481.38
3.332.724.212.966.56:L28
8.98
0.40
0.90
10.142.09
0.255.173.277.15
13.5710.7517.56
23.6826.6823.02
25.0713.631.79
6.22
9.912.06
0.30
5.763.917.81
13.1711.1116.00
23.0527.0022.05
24.44
11.85
1.83
6.24
10.36
2.13
0.204.532.536.48
13.9510.4219.09
24.4026.2324.06
25.71
15.01
1. 74
6.19
9.12
1.560.10
5.632.998.37
11.839.11
15.70
22.4620.7422.84
13.55
18.196.55
4.95
9.04
1.75
0.08
6.033.408.94
11. 549.01
15.03
25.0923.5725.4713.60
17.58
7.93
3.61
9.19
1. 35
0.125.192.507.80
. 12.119.20
16.36
19.4916.6720.02
13.50
18.65
5.23
6.19
8.201.4.0
0.30
5.242.727.87
10.24.7.82
13.67
18.7817.0419.1711. 52
17.76
12.804..81
8.161.47
0.36
5.473.078.14
10.698.04
14.3318.1617.4918.33
11.2517.14
10.37
4.85
8.23
1.34
0.234.992.327.59
9.827.62
13.03
19.4916.3920.0711. 81
18.24
15.12
4.77
29.2511.55
1. 59
30.4620.7040.60
29.1523.7236.85
29.8123.3231.25
28.56
49.9378.87
19.12
29.629.87
1.56
29.2020.2839.07
31.4924.694.0.84.
29.4023.7630.82
33.14
53.0379.88
18.72
28.89
13.381. 62
31.8321.1942.1726.9522.8332 .97
30.2722.6831. 71
23.88
47.53
77.91
19.48

1995 CENSUS OF POPULATION
Table. 7. Percent Distribution of Household Population by Mother Tongue, Sex and City/MUnicipalitYI 1995
Mother Tongue and Percent to Total Percent DistributionCity Municipality
I I Sexes I IBoth Sexes Male Pemale Both Male Female
BUTUAN CITY
TOTAL 246,223 124,277 121,946• to TOTAL 100.00 50.47 49.53 100.00 50.47 -U.S3
Abaknon • • • 100.00 66.67 33.33Ahurlin • • 100.00 100.00Aklanon 0.01 0.01 0.01 100.00 57.14 402.86Apayao • • • 100.00 50.00 50.00Badjao, Soma nilaut 0.01 0.01 • 100.00 81.25 18.75Bagobo 0.01 • • 100.00 42.11 57.89Balangao • • • 100.00 50.00 50.00Bantoanon • • • 100.00 50,00 50.00Bikol 0.06 0,,04 0.03 100.00 55.70 H.3DBobolano 4.25 2.20 2.05 100,00 51.71 U,29Bontok 0.02 0.01 0.01 100,00 45.28 54.72Buk-idnon 0,03 0.01 0.01 100.00 50.00 50.00Butuanon 12.75 6.47 6.28 100.00 50.75 49.25Caviteno Chavacano 0.01 0.01 • 100.00 62.50 37.50Cebuano 72.60 36.43 36.17 100.00 50.18 49.82Cotabateno - Chavacano 0.09 0.05 0.04 100.00 52.19 47.81Davao - Chavacano 0.09 0.04 0.04 100.00 50.00 50.00Davaweno 0.13 0.06 0.07 100.00 44.34 55.66Dibabawon • • 100.00 100.00Gaddang 0.01 • • 100.00 42.86 • 57.14Hamtikanon 0.01 • • 100.00 53.33 46.67Hiligaynon, Ilonggo 1.02 0.56 0.46 100.00 54.76 45.24Ibaloi • • • 100.00 50.00 50.00Ibanag • • • 100.00 75.00 25.00Ifugao • • • 100.00 90.91 9.09Ilanun 0.01 0.01 • 100.00 73.08 26.92Ilocano 1.00 0.53 0.47 100.00 52.95 47.05Ilongot 0.09 0.05 0.04 -100.00 54.38 45.62Isamal Kanlaw • • 100.00 100.00Isinai • • • 100.00 40.'00 60.00Itawis • • • 100.00 54.55 45.45Ivatan!Itbayat • • • 100.00 50.00 50.00I'wak • • • 100.00 28.57 71.43Jama Mapun • • 100.00 100.00Kagayanen 0.05 0.02 0.02 100.00 52.68 47.32Kalagan • • • 100.00 50.00 50.00Kalamianen • • • 100.00 50.00 50.00Ka1inga • • 100.00 100.00Kamayo 0.14 0.06 0.08 100.00 43.23 56.77Kamigin 0.11 0.06 0.05 100.00 52.48 47.52Kankanai • • 100.00 100.00Kankaney • • • 100.00 60.00 40.00Kapampangan 0.03 0.02 0.01 100.00 68.25 31. 75Karaga 0.01 0.01 • 100.00 57.14 42.86Kasiguranin • • 100.00 100.00Kolibugan • • 100.00 100.00HaguindanllG 0.01 0.01 • 100.00 59.26 40.74Mamanwa • • • 100.00 66.67 33.33Mandaya 0.01 • 0.01 100.00 37.04 62.96Mangyan 0.01 • • 100.00 35.71 64.29Manobo 0.37 0'.18 0.19 100.00 48.25 51. 75MarllDIlO 0.57 0.29 0.29 100.00 50.07 49.93Masbateno b.29 0.15 0.14 100.00 51. 35 48.65Matigslllug • • 100.00 100.00Molbog • • 100.00 100.00Negrito 0.01 0.01 • 100.00 64.71 35.29Palawan • • 100.00 100.00Pangasinan 0.01 0.01 0.01 100.00 55.56 44.UPinalawan • • • 100.00 75.00 25.00Rombloanon 0.01 0.01 • 100.00 72.22 27.78Sama Dilaya 0.01 0.01 0.01 100.00 50.00 50.00Sama{Samal) • • • 100.00 44.014 55.56Sambal • • • 100.00 50.00 50.00sangil!sangir • • 100.00 100.00Subanon • • • 100.00 66.67 33.33Subanun 0.01 0.01 • 100.00 60.87 39.13Sulod • • 100.00 100.00surigaonon 1.56 0.74 0.82 100.00 47.60 52.40Tagalog 0.81 0.45 0.36 100.00 55.17 44.83Tagbanwa • • • 100.00 50.00 50.00Talaandig • • 100.00 100.00Tausug 0.10 0.05 0.04 100.00 54.17 45.83Ternateno - Chavacano • • 100.00 100.00
10

"'...•.••....-.....~<;.1~;:.,:.- :,.':~~:. tp'~j~,
~~','='f\
BUTUANCITY LI B itA R Y \'\., .....,. '"",.~ •• '" "'••••••••.••• ~ ""',...., ••• ',. ",. ~b~.3SC!lO. - .
Percent to Total Percent Distribution "-.,,~,Mother Tongue and.City MUnicipality
Both Sexes Male Female Both Sexes
Tinggian • • • 100.00 33.33 66.67Tiruray 0.01 • • 100.00 47 .37 52.63T'boli • • • 100.00 60.00 40.00\lb. • • • 100.00 50.00 50.00Waray 0.69 0.38 0.31 100.00 54.76 45.24Yak"" 0.01 • • 100.00 47.83 52.17Yogad. • • 100.00 100.00zUlboangeno e Chavacano 0.11 0.06 0.05 100.00 51.29 48.71Chinese 0.11 0.06 0.05 100.00 57.76 42.24BngUsh 0.02 0.01 0.01 100.00 58.62 41.38Other Local Dialects 2.50 1.28 1.22 100.00 51.12 48.88Other Poreign Languages 0.02 0.01 0.01 100.00 62.22 37.78Not Stated. 0.12 0.06 0.06 100.00 50.34 49.66
Table 7. Percent Distribution- Continued.
* percentage of less than 0.01
11

1995 CENSUS OF POPULATION
Table B. Percont Distribution of Disabled Persons by Age Group, s.x and Type of DiBability. 19!JS
Type of Disability and Sex25-29
BUTUAN c:rnBoth Sexes 2,767 100.00 100.00 0.36 3.87 5.57 6.69 6.32 5.78 5.42
Total blinclness 114 4.12 100.00 0.88 1.75 ).,51 3.51 3.51 5.26 2.63Partial blindness '" 10.01 100.00 0.36 :L17 6.50 3.61 8.66 3.25 3.61I.ow vision '58 20.17 100.00 0.36 0.90 1.61 1.08 I." 1. 61Total deafness 70 2.53 100.00 :2086 5.71 1.43 2.86Partial deafness '" 8.38 100,00 1.72 13. " 3.45 4.31 2.59 2.16 0.86poor bearing ability 75 2.71 100.00 1.33 1.33 5.33 9.33 8.00 6.67 6.67MutenelUI 127 4.59 100.00 14.96 15.75 14.96 13.39 7.87Speech defect 1•• 5.20 100.00 0.69 18.75 15.28 15.28 11.11 6.94 7.64IooIUIof one or both ems/bands 50 1.81 100.00 4.00 6.00 2.00 8.00 4.00 12.00Loss of one or botb legs/feet 50 2.13 100.00 6.78 8.47 11.86 5.08 8.47Paralysis of one or both arms " 1.66 100.00 15.22 2.17Paralysis of one or both legs 107 7.12 100.00 2.54 3.05 6.09 5.58 11.17 12.69Paralysis of one arm and one 1•• 148 5.35 100.00 1.35 1.35 2.70 2.70 3.38 4.05Paralysis of all four limbs 40 1.45 100.00 5.00 10.00 7.50 2.50 5.00Mental retardation 21' 7.77 100.00 5.58 11.63 15.81 15.35 10.23 9.77Mental 111ness 153 5.53 100.00 1.31 3.92 8.50 8.50 15.03 13.07Otbers '" 9.47 100.00 0.76 4.58 8.40 7.63 8.02 6.11 5.73
Mol. 1,480 53.49 100.00 0.27 4.32 5.54 7.16 6.28 6.22 5.&1Total blindnell8 48 1.73 100.00 2.08 2.08 6.25 4.17 l.25 2.08Partial blindness a, 5.24 100.00 3.45 5.52 2.76 8.97 2.07 2.76Low vision '" 8.78 100.00 0.41 1.65 1.23 1.23 1.23Total deafness " 1.23 100.00 5.88 5.88Partial deafness 130 4.70 100.00 0.77 17.69 3.08 4.62 2.31 0.77 0.77Poor bearing ability 47 1.70 100.00 2.13 2.1] 6.38 10.64 8.51 6.38 4.:i16Muteness " 2.U 100.00 1].04 14.49 10.14 15.94 10.14Speecb defect ?7 2.78 100.00 16.88 18.18 22.08 11.69 6.U 6.49Loss of one or botb arms/hands " 1.41 100.00 2.56 :il.56 7.69 5.1] 15.38Loss of one or both legs/feet 4. 1.45 100.00 5.00 7.50 7.50 5.00 5.00Paralysis of one or botb arms " 1.05 100.00 1].79 3.45Paralysis of one or botb legs 12' 4.52 100.00 3.20 3.20 4.80 5.60 11. 20 12.00Paralysis of one arm and one 1•• n 3.29 100.00 1.10 1.10 3.30 2.20 3.30 4.40Paralysis of all four limbs " 0.94 100.00 3.85 15.38 11.54 3.85 3.85Mental retardation 11' 4.30 100.00 5.88 11.76 16.81 15.13 13.45 9.24Mental illness " 2.82 100.00 2.56 5.13 7.69 10.26 16 .67 16.67Others a. 5.06 100.00 0.71 3.57 7.14 7.86 8.57 7.86 5.00
Pemale 1,287 4&.51 100.00 0.47 3.34 5.59 6.14 6.37 5.28 5.21Total blindness •• 2.]9 100. DO 1.52 1.52 3.03 6.06 4.55 3.03Partial blindness 132 4.77 100.00 0.76 0.76 7.58 4.55 8.33 4.55 4.55Low vision 31' 11.38 100.00 0.63 1.27 1.59 0.95 2.54 1.90Total deafness 36 1.30 100.00 5.56 5.56 2.78Partial deafness 1.' 3.69 100.00 2.94 8.82 3.92 3.92 2.94 3.92 0.98Poor bearing ability " 1.01 100.00 3.57 7.14 7.14 7.14 10.71Muteness 58 2.10 100.00 17.24 17.24 20.69 10.34 5.17Speech defect 67 2.42 100.00 1.U 20.90 11.94 7.46 10.45 7.46 8.96I.oaa of one or both arms/hands II 0.40 100.00 9.09 18.18 9.09 9.09Loss of one or both legs/feet " 0.69 100.00 10.53 10.53 21. 05 5.26 15.79Paralysie of one or both arms 17 0.61 100.00 '" 17.65Paralysis of one or both legs " 2.60 100.00 1.39 2.78 8.33 5.56 11.11 13.89Paralysis of one arm and one leg 57 2.06 100.00 1.75 1.75 1.75 3.51 3.51 3.51Paralysis of all four limbs 14 0.51 100.00 7.14 7.14Mental retardation " 3.47 100.00 5.21 11.46 14.58 15.63 6.25 10.42Mental illness 75 2.71 100.00 2.67 9.33 6.67 1] .33 9.33Others 122 4.41 100.00 0.82 5.74 !L84 7.38 7.38 4.10 6.56
12

BUTUANCITY
Table 8. Percent Distribution of Disabled Persons by Age Group, Sex and Type 0 f Disability, 1995 - Continued
Type of Disability and Sex- 741 75 - 79 80 toover
BDTOAN CITY
Both Sexes 5.53 t.tS 5.S:a 6.29 5.35 7.77 7.73 7.37 5.46 3.83 6.40Total blindness 7.02 2.63 4.39 7.02 9.65 7.02 7.89 9.65 7.89 4.39 11.4.0Partial blindness 5.0S 6.86 5.05 5.05 4.33 10.11 7.22 7.58 8.30 3.97 8.30Ioowvision 1.43 1.97 6.81 9.86 10.;12 13.98 15.05 12,01 7.53 5.56 8.06Total deafness 2.86 4.29 4.29 8.57 2.86 8.57 10.00 7.14 8.57 15.71 14.29Partial deafness :i1.S9 :iI.59 5.17 3.88 4.31 4.74 6.47 8.19 9.05 8.19 15.95Poor bearing ability 2.67 4.00 1. 33 1.33 2.67 5.33 9.33 13.33 !J. 33 12.00Muteness 5.51 6.30 5.51 3.94 3.15 3.15 4.72 0.79Speeeh defect 6.25 4.17 2.78 2.08 2.08 1.39 1.39 3.47 0.69Loss of one or both arms/hands 10.00 2.00 8.00 6.00 8.00 12.00 8.00 6.00 4.00~oss of one or both legs/feet 8.47 5.08 11.86 1.69 5.08 5.08 13.56 1. 69 6.78Paralysis of one or both arms 10.87 2.17 10.87 8.70 8.70 13.04 10.87 10.87 6.52Paralysis of one or both lags 7.11 '1.06 6.09 7.61 5.08 7.61 5.08 6.09 5.08 1.52 3.55Paralysis of one arm and one 1•• 4.05 3.38 4.05 8.11 8.78 13.51 17.57 11.49 8.78 3.38 1. 35Paralysis of all four limbs 5.00 10.00 2.50 5.00 2.50 15.00 12.50 7.50 2.50 7.50Mental retardation 13.02 5.58 6.05 1.40 1.40 0.93 0.93 0.93 1.4.0Mental illness 12.42 11.11 7.84 6.54 1.31 3.27 3.92 1.96 0.65 0.65Others 4.96 4.96 6.87 8.78 3.05 7.25 3.05 6.11 3.44 4..20 6.11
Male 5.14 4.73 5.34 7.03 5.41 8.24 7.16 6.96 5.00 4.05 5.54
Total blindness 10.42 8.33 12.50 10.42 4.17 4.17 10.42 4.17 8.33 4.17Partial blindness 4.14 7.59 5.52 6.21 4.14 12.41 6.21 3.45 8.28 5.52 11.03Low vision 0.41 1.65 4.53 10.29 11. 93 15.64 15.23 12.76 6.58 7.82 7.41Total deafness 2.94 5.88 2.94 8.82 .2.94 2.94 11.76 8.82 8.82 14.71 17.65Partial deafness 2.31 1.54 4.62 4.62 5.38 5.38 8.46 7.69 8.46 5.38 16.15Poor hearing ability 4.26 4.26 2.13 2.13 2.13 8.51 10.64 12.77 10.64 2.13Muteness 5.80 8.70 7.25 5.80 1.45 2.90 4..35Speech defect 1.30 3.90 3.90 2.60 1.30 1.30 2.60 1.30Loss of one or both arms/hands 10.26 2.56 5.13 7.69 5.13 15.38 7.69 7.69 5.13Loss of one or both legs/feet 10.00 5.00 15.00 2.50 7.50 5.00 15.00 2.50 7.50Paralysis of one or both arms 17 •.24 3.45 10.34 10.34 20.69 6.90 6.90 6.90Paralysis of one or both legs 8.80 4.80 5.60 8.80 ,L80 8.80 4.80 3 •.20 5.60 0.80 4.00Paralysis of one arm and one 1•• 3.30 3.30 3.30 7.69 12.09 13.19 18.68 12.09 8.79 2.20Paralysis of all four limbs 3.85 11.54 3~85 7.69 7.69 15.38 7.69 3.85Mental retardation 10.08 5.04 5.04 2.52 1.68 0.84 1.68 0.84Mental illness 11. 54 10.'.26 3.85 6.41 2.56 3.85 2.56Others 2.86 7.14 7.14 9.29 2.86 7.86 3.57 7.14 2.14 5.00 4.29
Female 5.98 4.12 6.37 5.44 5.28 7.23 8.39 7.85 5.98 3.57 7.38
Total blindneBS 4.55 4.55 1.52 3.03 9.09 9.09 10.61 9.09 10.61 1.52 16.67Partial blindness 6.06 6.06 4.55 3.79 4.55 7.58 8.33 12.12 8.33 2.27 5.30~ow vision 2.22 2.22 8.57 9.52 8.89 12.70 14.92 11.43 8.25 3.81 8.57Total deafness 2.78 2.78 5.56 8.33 2.78 13.89 8.33 5.56 8.33 16.67 11.11Partial deafness 2.94 3.92 5.88 2.94 2.94 3.92 3.92 8.82 9.80 11.76 15.69Poor hearing ability 3.57 3.57 7.14 14.29 7.14 28.57Muteness 5.17 3.45 3.45 1.72 5.17 3.45 5.17 1.72Speech defect 11. 94 4.48 1.49 1.49 4.48 1.49 1.49 4.48Loss of one or both arDUl/hands 9.09 18.18 18.18 9.09Loss of one or both legs/teet 5.26 5.26' 5.26 5.26 10.53 5.26Paralysis of one or both arms 11.76 5.88 23.53 17.65 17.65 5.88Paralysis of one or both legs 4.17 2.78 6.94 5.56 5.56 5.56 5.56 11.11 4.17 2.78 2.78Paralysis of one arm and one 1•• 5.26 3.51 5.26 8.77 3.51 14.04 15.79 10.53 8.77 5.26 3.51Paralysis of all four limbs 7.14 7.14 7.14 28.57 7.14 7.14 21.43Mental retardation 16.67 6.25 7.29 .1.04 1.04 2.08 2.08Mental illneBS 13.33 12.00 12.00 6.67 2.67 8.00 1.33 1. 33 1.33Others 7.38 2.46 6.56 8.20 3.28 6.56 2.46 4.92 4.92 3.28 8.20
13

1995 CENSUS OF POPULATION
Table 9. Percent Distribution of Household Population by Relationship to the Household Bead and. HouseholdSize I 1995
HOUSEHOLD S I Z B (Percent DiBtribution)Relationship toHousehold Head.
BtJTl1AN CITY
HouseholdPopulation
Percentto
Total Total I 1 I 2 T 3 I • I 5
Total
HeadSpouseSonDaughterStepliODStepdaughterSon-in-la•••Daughter-in-la •••CrandsonGranddaughterratherMotherBrotherSistertJIlcleAuntNephewNieceOther RelativeNon-RelativeBoarderDomestic Helper
246,223
46,59639,37266,67359,917."•••1,1731,1074,946",656n.1,2461,5401,296
78••1,7631,8215,4693,172n.2,998
100.0018.9215.9927.082C.360.280.25O.foB0.C52.011.890.190.510.630.530.03O.OC0.720.7fo2.221.290.191.22
100.00100.00100.00100.00100.00100.00100.00100.00100.00100.00100.00100.00100.00100.00100.00100.00100.00100.00100.00100.00100.00100.00100.00
0.552.92
2.98
7.865:980.61O.foB0.720.660.260.271.291.33O. Bfo1.775.13C.172.56
1.870.881.903.372.311.20
7.36
12.9712.01C.524.205.35.••.620.601.5.5.525.183.997.879.558.807.69$.894.5C5.16C.46B.016.934.20
12.7216.8017.2510.9010.6711.719.903.674.708.018.638.82
11.0011.9512.7310.2611.117.77
10.329.519.309.878.67
16.2417.1618.3616.1016.4015.0314.037.509.49
10.4310.7217.8615.4113.31lfo.5119.2318.8911.7413.8412.7613.0812.1815.""
RelaUOAsh!p toHousehold Bead.
BtJ'I'U1t.N CITY
•H 0 0 S B H 0 L D S I Z B (perCeAt DiBtribution)
13 fI over
Total
HeadSpouseSonDaughterStepsonStepdaughterSon-in-lawDaughter-in-lawGrandsonGranddaughter'atherMotherBrotherSistertn:l.cleAuntNephewNieceOther RelativeNOD-RelativeBoarderDomestic Helper
16.89
14.8716.2618.4118.4618.2119.8013.7314.1812.6611.8616.1816.6914.6117.1317.9511.1116.2215.9815.2113.3411.7617.34
14.3210.81 .11.Bfo16.3916.3915.3217.0015.8614.8114.0712.5217.""15.1713.6413.1214.1012.2213.6716.6415.5213.1512.3914.04
11.47
7.578.39
13.6513.5314.6011.8812.9616.4412.3312.5214.5013.6411.3610.6511.5415.5614.0712.6311.6310.8114.2912.71
14
6.743.964.367.827.999.39
10.0711. 5112.1010.179.547.566.987.147.02
10.2613.339.C77.479.607.948.617.14
2.282.514.955.054.194.46
10.238.678.158.934.834.984.353.702.563.336.356.106.774.225.466.40
2.751.321.433.153.23~.173.147.766.055.966.193.992.654.092.311.28
5.794.343.893.974.413.27
1.65
0.730.821.741.751.451.165.805.064.06•. 572.312.172.212.241.283.333.572.6!J3.553.853.992.77
2.03
0.7C0.811.751. 861.883.3010.146.687.348.011.681.692.663.631.282.224.933.955.198.957.776.80

BUTUANCITY
Table 10. Percent Distribution of Number of Households by Age Qroup and Sex of Household Head, Household Size: 1995
Age Group of H QUBI: H o L D S I Z • (Percent Distribution)Household Head and Sex Number otHouseholds All Hhs ,
SU'l'tJAN CI'l'Y
Both Sexes
All Ages 46,596 100.00 2.92 7.86 12.97 16.80 17.16 14.87Below 20 '.7 0.62 0.11 0.19 0.16 0.05 0.04 0.02., •• 7,033 15.09 0.59 1.85 3.57 4.00 2.63 1.4230 3. 13,882 2!L79 0.46 1.39 2.92 5.12 6.17 5.51" •• 11,136 23.90 0.43 1,05 1.91 2.97 3.86 4.11" S. 7,814 16."
O. '"1.15 1.96 :i1.54 2.67 2.39., ,. 4,502 !L66 0.49 1.32 1.61 loU 1.36 1.0970 7' 1,558 3.34 0.27 0.73 0.65 0.53 0.36 0.28., •• •• S 0.61 0.06 0.14 0.15 0.08 0.06 0.0485 and over " a.,n 0.03 0.06 0.0"' 0.02 0.02 0.01
•••.1.
All Ag •• 41,590 8!L26 1.89 6.08 10.95 15.06 15.78 13.89Below 20 'll 0.45 0.08 0.13 0.14 0.04 0.02 0.02., •• 6,635 14.24
O. '" 1.67 3.36 3.85 2.53 1.383' 3' 13,167 28 ..'Z6 0.35 1.16 :1.63 4.88 5.93 5.32., •• 10,088 21.65 0.31 0.76 1.52 :1.57 3.53 3.85" •• 6,571 14.10 0.29 0.76 1.45 2.09 2.33 2.12" " 3,509 7.53 0.24 0.93 1.22 1.15 1.11 0.9270 79 1,128 2.U 0.11 0.51 0.47 0.40 0.27 0.23., •• '09 0.45 0.02 0.11 0.12 0.06 0.05 0.0385 and over 7' 0.15 0.02 0.05 0.03 0.01 0.02 0.01Female
All Age. 5,006 10.74 1.03 1.78 2.02 1.'4 1.39 0.98Below 20 76 0.16 0.04 0.06 0.02 0.01 0.0220 29 3•• 0.85 0.12 0.17 0.21 0.15 0.10 0.033' 3. 71S 1.53 0.11 0.23 0.29 0.24 0.25 0.19., •• 1,048 2.25 0.12 0.29 0.38 0.40 0.33 0.26" •• 1,243 2.67 0.18 0.39 0.51 0.45 0.35 0.26" " "3 2.13 0.24 0.39 0.39 0.33 0.25 0.1770 79 03' 0.92 0.16 0.21 0.18 0.13 0.09 0.05., •• 76 0.16 0.04 0.03 0.03 0.03 0.01 0.0185 and over '7 0.06 0.02 0.01 0.01 0.01
15
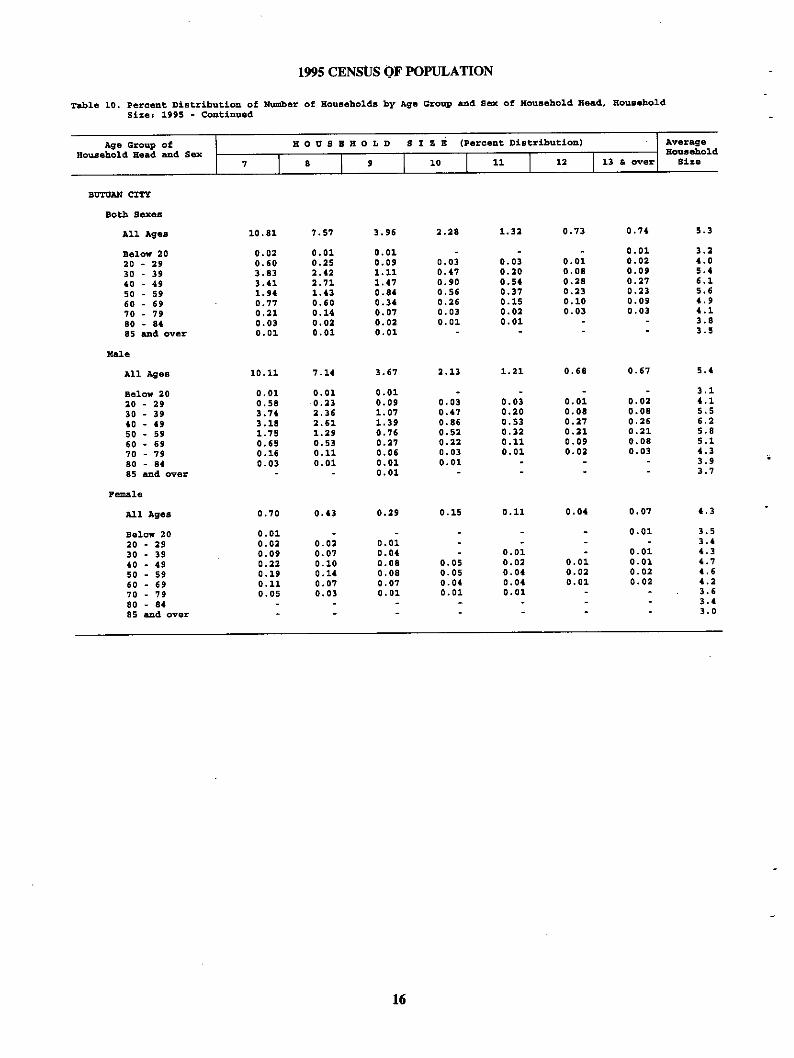
1995 CENstJS OF POPULATION
Table 10. Percent Distribution of Number of Households by Age Croup and Sex of Household Head, HouseholdSizel 1995 - Continued
Age Croup of HOUSBHOLD S I Z • (Percent Distribution) AverageHousehold Head and Sex
I I I 113Household
7 S I , I 10 II 12 &. over Size
BU'l'OANCITY
Both Sexes
All Ages 10.81 '.57 3.96 2.28 1.32 0.73 0.74 5.3
Below 20 0.02 0.01 0.01 0.01 3.220 29 0.60 0.25 0.09 0.03 0.03 0.01 0.02 4.030 39 3.83 2.12 1.11 0.47 0.20 0.08 0.09 5.440 4' 3.41 2.71 1.t7 0.90 0.5' 0.28 0.27 '.150 59 1.94 1.43 0.801 0,56 0.37 O.:13 0.23 5.''0 " 0.77 0.60 0.3" 0.26 0.15 0.10 0.09 4.'70 " 0.21 0.14 0.07 0.03 0.02 0.03 0.03 4.1'0 '4 0.03 0.02 0.02 0.01 0.01 3.'85 and over 0.01 0.01 0.01 3.5
Male
All Ages 10.11 7.14 3.67 2.13 1.21 0.68 0.67 5.4
Below 20 0.01 0.01 0.01 3.120 29 0.58 0.:13 0.09 0.03 0.03 0.01 0.02 4.130 39 3.'. 2.36 1.07 0.47 0.20 0.08 0.08 5.5•0 •• 3.18 2.61 1.39 0.86 0.53 0.27 0.26 '.250 5' 1.75 1.29 0.76 0.52 0.32 0.21 0.21 5 .•'0 " 0.65 0.53 0.27 0.22 0.11 0.09 0.08 5.170 " 0.16 0.11 0.06 0.03 0.01 0.02 0.03 4.3•0 •• 0.03 0.01 0.01 0.01 3.'85 and over 0.01 3.7
Pemale
All Ages 0.70 O.U 0.29 0.15 0.11 O.Ot 0.07 4.3
BelOlf' 20 0.01 0.01 3.520 29 0.02 0.02 0.01 3.430 39 0.09 0.07 O.Ot 0.01 0.01 4.340 •• 0.22 0.10 0.08 0.05 0.02 0.01 0.01 4.750 59 0.19 0.16 0.08 0.05 O.ot 0.02 0.02 4.''0 " 0.11 0.07 0.07 O.Ot O.Ot 0.01 0.02 4.270 " 0.05 0.03 0.01 0.01 0.01 3. ,•0 •• 3.485 and over 3.0
16

BUTUANCITY
Table 11. Percent Distribution of Overseas Workers 10 Years Old and Over by Age Group, Higbest Grade completed. and Sex, 1995
HigheBt Grade Completedand Sex
BUTUM C:lTY
920 100.00 100.00Both Sexes
NO Grade completedPre-School
12 1.30 100.002.61 5.65
8.3314.24
16.67
21.4.1
8.33
17.07
25.0016 .52
8.339.02 13.48
33.33
15.00 100.00
37.17 100.000.11 100.00
0.65 100.0052.83 100.00
0.43 100.00
22.07 100.00
0.11 100.00
0.43 100.00
47.17 100.00
0.87 100.00
7.61 100.00
15.11 100.00
Bl_entary1st - 4th Grade5th ~ 7th Grade
High ScboolundergraduateGraduate
Post-SecondaryundergraduateGraduate
College undergraduateAcademic Degree BolderPost~BaccalaureateNot Stated
Mal.
No Grade COmpleted
Pre-ScboolBlementary
1st • 4th Grade5th - 7th Grade
Higb ScboolundergraduateGraduatePost-SecondaryUndergraduateGraduate
Oollege undergraduateAcademic Degree BolderPost-Baccalaureate
Not StatedFemale
NO Orade CompletedPre-School
Blementary1st - 4th Grade5th - 7th Grade
High SchoolUndergraduateGraduatePost.Secondaryt1DdergraduateGraduate
COllege UndergraduateAcademic Degree BolderPost-Baccalaureate
10'337l".7511'
1231011'
'""21
•••••53
""82285'7l5
""
'"1
•8
511<"112'765
525'770
139
11.303.597.72
21. 098.1512.9313.371.0912.28
5.762.073.70
8.913.045.87
7.720.547.17
7.39
5.541.524.02
12.175.117.07
5.650.545.11
100.00100.00100.00
100.00100.00100.00
100. DO100.00100.00
100.00100.00100.00
100.00100.00100.00
100.00100.00100.00
100.00
100.00100.00100.00
100.00100. DO100.00
100.00100.00100.00
15.3821.2112.68
4.1210.67
2.47
18.8726.3214.712.4.47.14
2.76
11.7614.2910.81
5.3612.77
12.5012.1212.68
12.3721.336.72
5.800.29
83.334.53
16.9815.7917.65
10.9821.435.56
0.49
75.00
6.91
12.50
7.847.148.11
13.3921.287.69
11.43
6.736.067.0418.0417.3318.49
14.6310.0015.0419.57
12.28
10.4925.00
5.6610.532.94
7.3210.715.5611.2720.0010.61
16.18
10.84
lB.43
12.50
7.84
10.81
25.8921.2829.23
19.23
21.28
22.86
14.39
9.626.0611.27
12.376.6715.97
35.7750.0034..51
21.74
25.15
100.0016.67
19.96
13.2110.5314.7110.9810.7111.1136.6240.0036.36
16 .18
20.69100.00
25.0023.04
12.50
5.88
8.1113.394.2620.00
34.6260.0031.91
27.14
31.65
10.5812.129.86
11.34.9.3312.61
17.0730.0015.93
20.2921.05
19.55
25.00
9.4315.795.88
9.767.14.11.11
18.3140.0016 .67
25.00
25.12
14.29
25.00
11.767.1413.51
12.5010.6413.85
15.3820.0014.89
15.71
15.11
8.653.0311. 27
12.379.3314..29
17.0710.0017.70
13.0423.10
21.19
25.00
9.43
14.71
20.7317.8622.22
19.72
21. 21
17.65
26.60
11.29
7.84.7.148.11
6.254.267.69
13.4620.0012.77
8.57
17.99
6.739.095.639.798.0010.92
9.7610.62
10.14.
9.06
7.82
5.665.265.88
9.763.5712.96
8.45
9.09
13.24
5.91
10.37'
7.8414..295.419.8210.649.23
11.54
12.77
7.14
13.67
29.8130.3029.58
19.5917.3321.01
5.696.19
9.42
9.06
13.9925.00
20.7515.7923.5328.0521.4331.48
5.63
6.06
11.76
10.34
12.90
37.50
39.2250.0035.1413.3914.8912.31
5.776.38
7.14
7.19
Not Stated 2 0.22 100.00
17
100.00

1995 CENSUS OF POPULATION
Table 12. Percent Distribution of Household population 15 Years Old and Over by Trade Skill Group (Major),Age Group and Sexl 1995
MA J 0 R T R A D B SKI L LHousehold
Age Group population No Mining, Metal, Precision, Other Craftsand Sex 15 Years Old Trade Constnction, Kachinery, Handicraft, ",,4
and Over Skill and Related and Related printing and Related TradesTrades Trades Related Trades
BUTtJANCXTY
Both Sexes 147,519 135,459 1,635 1,125 '31 88'% to Total 100.00 91.82 1.11 0.76 0.16 0.60
15 19 18.7:Z 18.4.1 ,0.04 0.02 0.01 0.02•• •• 14.53 13.75 0.09 0.08 0,01 0.05
'5 ., 13.07 11.85 0.14 0.12 0.03 0.053. " 11.75 10.46 0.18 0.13 0.02 0,07
35 " 10.33 !i1. 08 0.16 0.12 0.02 0.09
•• •• 8.10 '.OS 0.13 0.11 0.02 0.09
" •• 6.51 5.71 0.12 0.07 0.01 0.075. " 5.03 4.n 0.10 0.04 0.01 0.0655 " ,'"25 3.82 0.06 0.06 0.01 0.06,. " 3.02 2.77 0.05 0.02 0.01 0.03
65 " 2.08 1. 95 0.03 0.01 0.027. " 1.29 1.26 0.01 0.01
75 " 0.71 0.68 0.018. 8' 0.66 0.4385 and over 0.18 0.18
MAl. 73,895 66,661 1,579 1,111 16. •••• to Total 50.09 43.83 1.07 0.75 0.11 0.30
15 19 9.24 9.03 0.03 0.02 0.02
•• •• 7.14 6.55 0.09 0.08 0.01 0.04
'5 ., 6.51 5.57 0.14 0.11 O. 02 0.043. " 5.8S 4.87 0.17 0.13 0.02 0.04
35 " 5.31 4.34 0.15 0.12 0.01 0.044. •• 4.12 3.32 0.12 0.10 0.01 0.04
" •• 3.33 2.70 0.12 0.07 0.01 0.035. " 2.58 2.13 0.10 0.04 0.01 0.02
55 " 2.16 1.8S 0.06 0.04 0.01 0.01,. " 1.54 1.34 0.05 0.02 0.01'5 " 1. 06 0.98 0.02 0.01 0.017. " 0.61 0.58 0.0175 " 0.33 0.31 0.018. 8' 0.20 0.2085 cd over 0.09 0.08
"smale 73,626 70,798 5' 16 67 ..,\: to Total n.91 67.99 0.04 0.01 0.05 0.30
15 19 9.48 9.38 0.01 0.01
•• •• 7.39 7.20 0.01'5 ., 6.56 6.28 0.01 0.023. " 5.87 5.58 0.01 0.0335 " 5.03 4.74 0.01 0.01 0.05•• •• 3.98 3.76 0.01 0.05
" •• 3.18 3;02 0.045. " 2.44 2.30 0.0455 " 2.08 1.98 0.02,. " 1.U 1.42 0.0265 " 1.02 0.97 0.017. " 0.68 0.6775 " 0.38 0.318. •• 0.26 0.2485 and over 0.10 0.09
18

BUTUANCITY
Table 12. Percent Distribution of Household Population 15 Years Old and Over by Trade SkillGroup (Major). Age Croup and Sexl 1995 - Continued
MAJO R '1' R A D B S R X L L
Age Group Stationary Machine Driving andand Sex Plant and Operation and Nobile Other Skills Not StatedRelated Assembly Machinery
Operations Operation
B1lTUAN eXTY
Both Sexes 152 U3 2,706 4,646 ,.,• to Total 0.10 0.33 1.83 3.15 0.13
15 19 0.04 0.16 0.0220 ,. 0.01 0.03 0.15 0.33 0.0225 2' 0.02 0.05 0.28 0.50 0.0230 ,. 0,02 0.06 0.29 0.51 0.0235 " 0.01 0.05 0.32 0.47 0,0140 •• 0.01 0.040 0.27 0.34 0.01'5 U 0.01 0,03 0.22 0.25 0.0150 5' 0.01 0.03 0.12 0.2355 5' 0.01 0.02 0.08 0.17.0 •• 0.01 0.04 0.10'5 ., 0.01 0.01 0.04 0.0170 7< 0.01 0.01 0.0175 7' 0.01.0 ••.5 and over
Mal. 13. 405 2,674 2,660 63• to Total 0.09 0.27 1.81 1. 80 0.04
15 19 0.0. 0.09 0.0120 ,. 0.01 0.03 0.15 0.18 0.0125 2' 0.02 0.05 0.48 0.28 0.0130 34 0.02 0.05 0.29 0.28 0.0135 " 0.01 0.04 0.32 0.2740 •• 0.01 0.03 0.27 0.21•• U 0.01 0.03 0.22 0.1450 50 0.01 0.02 0.12 0.1455 5' 0.01 0.08 0.10.0 •• 0.01 0.04 0.07'5 " 0.01 0.01 0.0270 7< 0.01 0.0175 7' 0.01•0 ••.5 and over
Female 14 •• 32 1,986 123% to Total 0.01 0.06 0.02 1.35 0.08
15 19 0.07 0.0120 2< 0.15 0.0125 2' 0.01 0.01 0.22 0.0130 34 0.01 0.23 0.0135 " 0.01 0.20 0.0140 •• 0.01 0.14 0.0145 U 0.01 0.1150 50 0.01 0.0955 5' 0.07•0 •• 0.03'5 ., 0.02 0.0170 7< 0.0175 7' 0.01•0 ••.5 and. over .,.
19

1995 CENSUS OF POPULATION
Table 13. Percent Distribution of HouseholdPopulation 15 Years Old and over with Trade Skill by Trade Skill Group (Major andMinor. Manner of Acquisition and SeXl 1995
NotStated
TYPE OF ACQUISITION (Percent Distribution)
TotalPercenttoTotal
TotalMajor and Minor
Trade Skill Group and Sex
BUTUAN CITY
BOTH SEXES
Mining, COnstruetion and Related TradesMining, Shotfiring, Stone-CUtting and CarvingBuilding Frame COnstruction and RelatedTrades
Building Construction Finishing and RelatedTradesPainting and Related Trades
Metal Machinery and Related TradesMetal Molding, Welding Sbeet-Metal works.Structural Metal Preparing and RelatedTrades
Blacksmithing. Tool-Making and RelatedTrades
Machinery Mechanics. Fitting and RelatedTrades
Blectrical and Electronic: Bquipment Mechanicand Fitting
12,060
1,635B7.71."l77
1,125276
30".'53
100.00
13.560.728.05
3.3:11.47
9.332.29
0.25
3.03
3.76
100.00
100.00100.00100.00
100.00
100.00
100.00100.00
100.00
100.00
100.00
24..31
5.878.054..63
8.50
5.65
4.3.7316.30
6.67
4.6.45
60.71
65.4.2
84..0451. 7285.38
84.75
90.96
51.3878.99
66.67
49.45
35.10
2.63
2.2631.030.21
1.25
1.69
0.27
0.66
7.64
7.839.209.78
5.50
1.69
4..624.71
26.67
4.10
3.53
Precision, Handicraft, Printing and RelatedTrades
Precision Works in Metal and Related Tradespottery, Glass Fo~ing and Related TradesHandicraft Works in Wood Textile, Leatherand Related Materials
Printing/Binding and Related Trades
Other Crafts and Related TradesFood and Related Products ProcessingWood Treating, Cabinet Making and RelatedTrades
Textile and Ga~ent TradesLeather and Shoemaking Trades
Stationary-Plant and Related OperationsMining-and Mineral-Processing PlantOperation
Metal Processing-Plant OperationGlass, Ceramics and Related Plant OperationWood-Processing and Papermaking plantOperation
Chemical-Processing Plant Operationpower-Generating and Related Plant OperationAutomated Assembly-Line and IndustrialRobot Operation
Machine Operation and AssemblyMetal and Mineral products ProcessingMachine Operation
Chemical products Machine OperationRubber and Plastic Products MachineOperation
wood Products Machine OperationTextile and Leather Products MachineOperation
Food and Related Products ProcessingMachine Operation
AssemblingOther Machine Operation and Assembling
Driving.and Mobile Machinery OperationLocomotive-engine Driving and RelatedWorks .-
Motor Vehicle OperationAgricultural and Other Mobile-Plant OperationShip's Deck Crowing and Related Works
Other SkillsPhysical Science and Engineering AssociatesSkills
Life Science and Health Associate ProfessionalSkills
Other Related Associate Professional SkillsClerical SkillsServicing SkillsAgriculture and Fishery Skills
Not Stated
23l
i.
"72l22.8623720l.""l52•
5385
•27lS
."'72718
l1652
57
3S
'"2,7061,053
1,5542772
4.,646l42
257
.3l741
2,218857
l86
1.92
0.160.150.60
1.01
7.351.971.67
3.560.16
1.260.07
0.040.020.70
0.070.220.12
4.090.39
0.220.15
0.960.430.47
0.291.17
22.448.73
12.890.220.60
38.521.18
2 .13
3.576.1418.397.11
1.54
100. 00
100.00100. 00100.00
100.00
100.00100.00100.00
100.00100.00
100.00100.00
100.00100.00100.00
100.00100.00100.00
100.00100.00
100.00100.00
100.00100.00
100.00
100.00100.00
100.00100.00
100. 00100.00100.00
100.00100.00
100.00
100.00100.00100.00100.00
100.00
26.41
21. 0538.8922.22
27.87
24..6016.0310.45
36.835.26
24.34.12.50
60.0033.3.3.16.47
22.2244.4426.67
20.0825.53
33.3316.67
6.9025.00
29.82
28.5719.15
13.4112.54
10.5514.8187.50
33.7174.65
79.77
76.1071.7913.9310.04
66.23
78.9550.0066.67
66.39
68.1776.7982.59
55.9484..21
69.0875.00
40.0066.6781.18
66.6737.0466.67
71.2061. 70
51. 8538.89
87.0773.08
56.14
65.7175.89
81.6783.38
83.9177.789.72
54.1117.61
14.01
18.5621.4673.6267.79
0.54
0.43
1.39
1. 020.841.49
0.93
0.6612.50
1.622.13
16.67
5.26
2.86
0.410.38
0.393.70
5.32
0.39
0.930.135.2814.47
6.93
11.119.72
5.74
6.216.335.47
6.2910.53
5.92
2.35
11.1.118.526.67
7.1010.64.
14.8127.78
6.031.92
8.77
2.864.96
4.513.70
5.153.702.78
6.877.75
5.84
4.416.617.177.70
99.46
20

BUTUANCITY
Table 13. Percent-Distribution of Household Population 15 Years Old and Over with Trade Skill by Trade Skill Group (Major andMinor) Manner of Acquisition and Sexl 1995 • Continued
NotStated
TYPB OF ACQUISITION (Percent Distribution)
Total
Percentto
TotalTotal
Major and MinorTrade Skill Group and Sex
MALE
Mining, Construction and Related TradesMining. Sbotfirlng, Stone-Cutting and CarvingBuilding FraPe Construction and Related
TradesBuilding Construction Pinishing and Related
TradesPainting and Related Trades
Metal Machinery and Related TradesMetal Molding. Welding Sheet-Metal Works,
Structural Metal Preparing and RelatedTrades
Blacksmithing, Tool-Making and RelatedTrades
Machinery Mechanics, Fitting and RelatedTrades
Eleetrical and Electronic: Bquipment Mechanicand Fitting
9,2341,579
78.35
'95173
1,11127'
30
'63<.,
76.57
13.090.657.753.28
1.42
9.212.26
0.253.01
3.69
100.00100.00100.00100.00100.00
100.00100.00100.00
100.00
100.00
100.00
1!I.23
5.837.6!14.608.35
5.8543.3816.12
6.67
46.28
60.22
71.1285. SO48.7287.70
85.3290.64.
51. 6779.12
66.6749.59
35.51
3.062.3434.620.211.27
1.750.27
0.67
6.586.338.977.495.06
1. 75
4.684.76
26.67
4.13
3.60
Precision, Handicraft, Printing and RelatedTrades
Precision Works in Metal and Related TradesPottery, Glass Fo~ing and Related TradesHandicraft Works in Wood Textile, ~eather
and Related MaterialsPrinting/Binding and Related Trades
Other Crafts and Related TradesFood and Related Products ProcessingWood Treating, Cabinet Making and Related
TradesTextile and Garment TradesLeather and Shoemaking Tr4des
Stationary-Plant and Related OperationsMiningMand Mineral-Processing Plant
OperationMetal ProcessingMPlant OperationGlass, Ceramics and Related Plant OperationWood-Processing and Papermaking Plant
OperationChemical-Processing Plant OperationPower-Generating and Related Plant OperationAutomated Assembly-Line and Industrial
Robot Operation
16<
1913.,"••012117313315
1387,,78,2615
1. 36
0.160.110.33
0.76
3.651.001.421.100.12
1.140.06
0.020.020.65
0.050.220.12
100.00
100.00100.00100.00
100.00
100.00100.00100.00100.00100.00
100.00100.00
100.00100.00100.00
100.00100.00100.00
20.1221.0538.4612.5020.65
1'.7710.74.9.36
26.326.67
25.3614..29
100.0033.3316.67
16.6746.1526.67
71.95
78.9553.8575.0071.74
78.1883.4784.21
65.4180.00
68.8471.43
66.6782.05
66.6738.4666.67
1. 590.831.75
2.26
0.7214.29
7.93
7.6912.50
7.61
5.454.964.686.02
13.33
5.07
1.28
16.6715.386.67
Machine Operation and AssemblyMetal and Mineral Products Processing
Machine OperationChemical Products Machine OperationRubber and Plastic Products Machine
OperationWood Products Machine OperationTextile and Leather Products Machine
OperationFood and Related Products Processing
Machine OperationAssemblingOther Machine Operation and Assembling
Driving and Mobile Machinery OperationLocomotive-engine Driving and Related
WorksMotor Vehicle OperationAgricultural and Other MobileMPlant OperationSbip's Deck Crewing and Related Works
Other SkillsPhysical Science and Engineering Associates
SkillsLife Science and Health Associate Professional
SkillsOther Related Associate Professional SkillsClerical SkillsServicing SkillsAgriculture and Fishery Skills
Not Stated
<os.,255
11213
36
33136
2,6741,043
1,53825'E
2,660124
58
212203
1,34473.
63
3.360.37
0.210.04
0.930.11
0.30
0.271.13
22.178.65
12.750.210.56
i2.061.03
0.48
1.761. 68
11.145.96
0.52
100.00100.00
100.00100.00
100.00100.00
100.00
100.00100.00
100.00100.00
100.00100.00100.00
100.00100.00
100.00
100.00100.00100.00100.00
100.00
20.4924.44.
J..i.0020.00
7.1'23.08
38.89
30.3019.85
13.2012.4.6
10.4712.0086.7623.8073.39
77 .59
69.3468.9710.34.9.87
72.1064.44
48.0060.00
87.5076.92
47 .22
63.6475.00
81.8283.41
83.9480.0010.2960.3418.55
15.5225.0022.6674.0366.62
1.59
20.00
2,78
3.03
0.410.38
0.394.00
8.:n
1.42
7.5116.13
6.428.89
16.00
5.36
11.11
3.035.15
4.563.74
5.204.002.947.598.06
6.904.258.378.117.37
98.41
21

1995 CENSUS OF POPULATION
Table 13. Percent Distribution of Household population 15 Years Old and over with Trade Skill by ~rade Skill 'Group. (Major andMinor) ~nner of ~Cqui8itioD and Sex. 1995 - Continued
NotStated
TYPB OP AcgUISI'I'ION (Percent Distribution)
TotalPercent
toTotal
TotalMajor and Kinor
Trade Skill Group and Sex
FEKALB
Mining, Construction and Related TradesMining. Sbotfiring. Stone-Cutting and CarvingBuilding Frame Construction and RelatedTradesBuilding Construction Pinishing and RelatedTrades
Painting and Related TradesMetal Machinery and Related Trades
Metal Molding, Welding Sheet-Metal Works,Structural Metal Preparing and RelatedTrades
Blacksmithing. Tool-Making and RelatedTrades
Machinery Mechanics, Fitting and RelatedTrades
Blectrical and Electronic Bquipment Mechanicand Fitting
2,826
",36
5
14,
0.460.070.30
0.04
0.050.120.02
0.020.07
100.00100.00100.00100.00
100.00
100.00
100.00100.00
100.00
100.00
40.917.1411.115.56
20.00
71.4333.33
66.67
87.50
46.8242.8677 .7825.00
40.00
100.00
28.5766.67
33.33
12.50
1.20 11.0850.0011.1169.44
40.00
Precision, Handicraft, Printing and RelatedTrades
Precision Works in Metal and Related TradesPottery, Glass Forming and Related TradesHandicraft Works in Wood Textile, Leather
and Related MaterialsPrinting/Binding and Related Trades
Other Crafts and Related TradesFood and Related Products ProcessingWood Treating, Cabinet Making and Related
TradesTextile and Garment TradesLeather and Shoemaking Trades
Stationary-plant and Related OperationsMining-and Mineral-Processing Plant
OperationMetal Processing~Plant OperationGlass, Ceramics and Related Plant OperationWood-Processing and Papermaking Plant
OperationChemical~Processing Plant OperationPower-Generating and Related Plant OperationAutomated Assembly~Line and Industrial
Robot Operation
67
532
30
'"11'30
'"•141,,1
0.56
0.040.27
0.253.700.960.25
2.450.03
0.120.01
0.02
0.06
0.020.01
100.00
100.00100.00
100.00100.00100.00100.00
100.00100.00
100.00100.00
100.00100.0.0
100.00100.00
41. 79
40.0034.38
50.00
34.3021. 5516.67
41.55
14.29
14.29
33.33
52.24
40.0056.25
50.00
58.3069.8373.33
51.69100.00
71.43100.00
100.00
71.43
66.67
1.49
3.13
0.450.86
0.34
4.4.8
20.006.25
6.957.7610.00
6.42
14.29
14.29
100.00
Machine Operation and AssemblyMetal and Mineral Products Processing
Machine OperationChemical Products Machine OperationRubber and Plastic Products Machine
Operation •Wood Products Machine OperationTextile and Leather products Machine
OperationFood and Related Products Processing
Machine OperationAssemblingOther Machine Operation and Assembling
Driving and Mobile Machinery OperationLocomotive-engine Driving and Related
WorksMotor Vehicle OperationAgricultural and Other MObile~Plant OperationShip's Deck crewing and Related Works
Other SkillsPhysical Science and Engineering Associates
SkillsLife Science and Health Associate Professional
SkillsOther Related Associate Professional SkillsClerical SkillsServicin~ SkillsAgriculture and Pishery Skills
Not Stated
B8,,13
•"",5
321016,•
1,98618
'"'"53887.138
123
0.730.02
0.020.11
0.030.32
0.17
0.020.04
0.270.080.130.020.03
16.470.151.65
1.824.467.251.14
1. 02
100.00100.00
100.00100.00
100.00100.00
100.00
100.00100.00100.00100.00
100.00100.00100.00
100.00100.00
100.00
100.00100.00100.00100.00
100.00
18.1850.00
15.38
'25.64
14.29
31.,2520.00
18.7550.00
100.00
46.9883.33
80.40
82.6572.8619.4510.87
67.05
100.0030.77
75.0071. 79
71.43
100.00100.00
68.7580.00
81. 2550.00
45.7711.11
13.57
12.3321. 0073.0073.91
4.55
15.38
9.52
1.36
0.50
0.460.191.835.80
10.2350.00
38.46
25.002.56
4.76
5.895.56
5.53
4.575.955.729.42
100.00
22

BUTUANCITY
Table 14. Percent Distribution of Household. Population 15 Years and Over Who Worked At Anytime in the Past Year byIndustry Group (Major), Age Group and Sex: 1995
A G • .0 R 0 'tJ P (Percent Distribution)Major Industry Group Percent
and Sex Total toTotal
Total 35 - 3.
BUTUAN CITY
Both Sexes 77,30&6 100.00 100.00 7.09 11.21 14.36 14.50 13.7.1
Agricul ture, Hunting and 21,134 27.32 100.00 6,tS B.89 12.;01:6 13.01 12.68Forestry
Fishing 1,149 loU 100.00 9.05 12.18 12.88 12.62 H.36Mining and Quarrying •• 0.13 100,00 '6.12 11. 22 14 .29 16.33 15.31KaDufacturing 6,825 8.82 100,00 4.97 1.1.90 16.70 15.79 15.30Blectricity, Gas " Water 62' 0.81 100.00 1.43 8.90 15.10 19.71 20.51Construction 3,854 4.98 100.00 4.28 11.03 16.84 16.66 13.96Trade 12,695 16.4:1 100.00 5.55 11.31 14.66 15.07 13.96Services 30,795 39.81 100.00 9.01 12.64 14.90 14.69 13.77Not Stated 167 0.22 100.00 11.98 11. 38 11.38 14.37 14.37
Ha1. 50,688 65.53 100.00 5.42 10.45 14.86 15.19 14.31
Agricu1 ture, Hunting and 16,524 21.36 100.00 6.19 9.08 12.76 13.37 12.91Forestry
Fishing 1,076 1.39 100.00 9.39 12.45 13.20 12.92 14.31Mining and Quarrying 88 0.11 100.00 6.82 10.23 13.64 17.05 13.64Manufacturing 5,359 6.93 100.00 5.02 11. 51 '17.22 16.76 15.11Blectricity, Gas " Water 562 0.73 100.00 1.42 8.01 1:&.99 19.22 21.71Construction 3,736 4.83 100.00 4.15 10.95 17.02 16.70 13.81Trade 5,272 6.82 100.00 5.18 11.67 15.99 15.57 14.42Services 17,987 23.26 100.00 5.03 10.90 15.50 15.93 15.22Not Stated 8. 0.11 100.00 10.71 10.71 8.33 21.43 9.52
Female 26,658 34.47 100.00 10.27 12.65 13.41 13.19 12.58
Agriculture, Hunting and 4,610 5.96 100.00 7.38 8.20 10.tS 11.69 11. 82Forestry
Fishing 73 0.09 100.00 4.11 8.22 8.22 8.22 15.07Mining and Quarrying ,. 0.01 100.00 20.00 20.00 10.00 30.00Manufacturing 1,466 1. 90 100.00 4.77 13.30 14.80 12.28 15.96Blectricity, Gas " Water 67 0.09 100.00 1.49 16.42 32.84 23.88 10.45Construction 118 0.15 100.00 8.47 13.56 11.02 15.25 18.64Trade 7,423 9.60 100.00 5.82 11.06 13.71 14.71 13.63Services 12,808 16.56 100.00 14.60 15.10 14.06 12.95 11.73Not Stated 83 0.11 100.00 13.25 12.05 14.46 7.23 19.28
23

1995 CENSUS OF POPULATION
Table 14. Percent Distribution of Haus"ehold Population 15 Years and' Over who Worked At Anytime ~D the Past ,YearI-
by Industry Group (Major), Age Group and Sexi 1995 Continued
A G B G R o U p (Percent Distribution)Major :Industry Group
-=:J -"Iand Sex •• - •• 65 7. 75 andover
BUTUAN CITY ~Both Sexes 10.97 8.94 6.76 5.401 3.40 1.92 0.95 0.75 I
Agriculture, Hunting and 10,(7 8.54 7.86 7.35 5.U 3.59 1.92 1.53Pores try
Pishing 10.01 9.31 6.61 S.U' 1.39 ]'.26 1.408 0.35Mining and Quarrying 12.24 5.10 14.29 3.06 1.02 1'.,02Manufacturing 11.47 8.91 6.58 4.62 2.02 1.04 0.41 ..0.29
Bleet:deity, Go. & Water 14.63 9.70 3.97 3.66 1.75 0.32 0.16 0.16Construction 10.35 9.34 '.03 5.19 3.14 1.30 0.49 0.39Trade 10.83 9.28 6.80 5.37 3.42 ::2.04 0.96" 0.75Services 11.32 9.02 6.04 4.41 2.34 1.02 0.45 0.38Not Stated 5.99 9.58 6.59 ".79 ".19 ;L99 0.60 1. 80
Male 11.27 9.03 6.80 5.U 3;"0 2.03 0.99 0.77
Agriculture. Hunting and 10."5 8.48 7."3 7.06 5.22 3.57 1. 92 1.54Forestry
Fishing 9.76 9.11 6.41 4.83 3.53 2.32 1. 39 0.37Mining and Quarrying 12.50 5.68 14.77 3.41 1.14 1.1-4Manufacturing 11.07 8.75 6.49 4.78 1.81 0.88 0.39 0.21Blectricity, Gas Ii, Water 15.84 10.32 ".09 3.7" 1.96 0.36 0.18 0.18Construction 10.39 9.48 6.99 5'.11 3.21 1.3" 0.48 0.37Trade 10'.51 8.93 6.41 ".4.6 3.03 2.28 0.97 0.59Services 12."5 9.50 6.47 4.73 2.41 1.05 0."3 0.39Not Stated 7.14. 11.90 ".76 5.95 1.19 01.76 L19 2.38
Female 10.40 8.79 6.69 5.35 3.38 1.72 0.86 0.71
Agriculture, Hunting and 10.54 8.72 9.39 8.42 6.29 3.67 1.93 1.48Forestry
Fishing 13.70 12.33 9.59 15.07 1. 37 1. 37 2.7"Mining and Quarrying 10.00 lO.OOManufacturing 12.96 9.4.8 6.89 ".02 2.80 1.U 0.48 0.61Blectricity, Gas ~ Water ".4.8 ".48 2.99 2.99Construction 9.32 5.08 8.'" 7.63 0.85 0.85 0.85Trade 11. 06 9.52 7.07 6.02 3.69 1.87 0.96 0.86Services 9-.74 8.36 .5.U 3.96 2.26 0.98 O. '" 0.36Not Stated ".82 7.:13 8.43 3.61 7.23 1.20 1.20
24

BUTUANCITY
Table 15. Percent Distribution of Household Population 15 Years Old and OVer Who Worked At Anytime in the Past Year by Industry Group(Major and Minor). Highest Grade Completed and SeXl 1995
H'IGH • S T GRADE CO MPLBTBD (Percent Distribution)Major and Minor PercentIndustry Group Total to Blementa:r:y High School
and. Sex Total Total No Grade Pre-Completed School Grade 1 Grade Under- I Graduate
1 - • , - 7 graduate
BUTUAN CITY
BOTH SEXES 77.346 100.00 100.00 1.49 0.13 11.29 22.45 15.97 17.93
Agriculture, Bunting aod 21,134 27.32 100.00 2.88 0.38 25.75 36.54 16.52 10.56Forestry
Palay Farming 7,664 9.91 100.00 2.13 0.25 20.33 37.83 18.14 13.28Corn Farming 3,467 4.48 100.00 3.40 0.40 34.18 36.40 14.22 7.36Coconut Farming 1,018 1.32 100.00 2.55 0.29 26.82 35.17 15.91 10.41Banana Farming 2,608 3.37 100.00 3.53 0.65 30.41 37.54 14.99 7.29Sugarcane Farming 35 0.05 100.00 2.86 11. 43 34.29 22.86 5.71Farming of Anilllais 42' 0.55 100.00 1.88 14.32 34.98 13.38 14.08Other Agricultural Crops 5,367 6.94 100.00 3.61 0.50 28.15 36.20 17.09 8.701
and ServicesHunting and Forestry '" 0.71 100.00 1.09 10.38 21. 86 13.48 23.86
Fishing 1,149 1.49 100.00 1.83 0.09 22.11 35.60 14.62 12.97Fishing 1,149 1.49 100.00 1.83 0.09 22.11 35.60 14.62 12.97
Mining and Quarrying " 0.13 100.00 1.02 7.14 15.31 14.29 26.53Metallic Ore Mining 58 0.07 100.00 1.72 3.45 20.69 12.07 29.31Non-Metallic Mining and 40 0.05 100.00 12.50 7.50 17.50 22.50
Quarrying
Manufacturing 6,825 8.82 100.00 0.66 0.01 4.89 19.19 18.43 26.02Food and Beverage 1,356 1.75 100.00 0.74 0.07 6.56 21. 53 17.55 23.67Manufacturing
Tobacco Manufacture " 0.03 100.00 4.00 4.00 4.00 24.00 20.00Textiles, Wearing Apparel, 653 0.90 100.00 0.29 3.61 20.78 21.65 26.98I.eather
Paper and Publishing and 248 0.32 100.00 0.81 :2002 6.85 18.55 21.37Printing
Petroleum, Chemicals, 86 0.11 100.00 3.49 9.30 5.81 19. ?7Rubber and Plastic
Non-Metallic Mineral 77 0.10 100.00 5.19 14.29 12.99 20.78Products
Basic Metal and Fabricated 142 0.18 100.00 4.93 21.13 15.49 28.17Metal Products
Wood, Cork, Cane, 2,821 3.65 100.00 0.71 4.11 18.96 18.72 29.49__ 00
Furniture Manufacturing 576 0.74 100.00 0.87 8.16 415.00 22.74 21. 01and Repair
Machinery 367 0.47 100.00 0.27 5.72 13.90 13.62 25.61Transport Bquipment 134 0.1? 100.00 0.75 41.24 20.90 11. 94 21. 64Other Manufacturing 300 0.39 100.00 1.00 4.33 16.33 18.67 20.33
Blectricity, Gas and Water '29 0.81 100.00 1.59 2.38 9.70 11.13 19.24Blectricity, Gas and Water '29 0.81 100.00 1.59 2.38 9.70 11.13 19.24Supply
Construction 3,854 4.98 100.00 1.01 0.03 9.76 27.43 21. 90 20.71Construction 3,854 4.98 100.00 1.01 0.03 9.76 27.43 21. 90 20.71
Trade 12,695 16.41 100.00 1.26 0.02 5.74 17.74 15.82 24.30Wholesale and Retail Trade 12,695 16.41 100.00 1.26 0.02 5.74 17.74 15.82 24.30
Services 30,795 39.81 100.00 0.87 0.04 5.05 14.65 14.47 18.35Repair of Motor Vehicles, 1,182 1.53 100.00 0.59 4.65 17.94 18.10 27.50Personal and HouseholdGood.
Restaurants and Hotels 1,312 1.70 100.00 1.22 3.35 14.48 17.76 27.29Transport Bquipment 5,545 7.17 100.00 0.58 0.05 7.32 21.91 21. 59 25.01Post and Communication 29' 0.38 100.00 0.68 1.02 3.39 2.03 13.22Financial Intermediation 90' 1.17 100.00 0.55 0.44 3.54 3.76 15.91Real Estate and Renting 273 0.35 100.00 0.73 7.69 10.99 9.89 16.85Private Business 3,800 4.91 100.00 0.68 3.97 13.34 11.47 20.29Government Services 7,339 9.49 100.00 0.31 0.84 3.02 3.49 9.58Private Education, Health 1,752 2.27 100.00 0.17 0.80 3.77 3.20 5.88and Social Work
Other Community, Social aod 1,895 2.45 100.00 1.06 0.11 6.12 15.88 14.83 21. 64Personal ServicesActivities
Domestic Services 6,497 8.40 100.00 2.05 0.12 10.4? 26.55 26.43 21.01
Not Stated 167 0.22 100.00 1.80 9.58 17.96 23.95 16.77
25

1995 CENSUS OF POPULATiON
Table 15. Percent Distribution of Bousehold Population 15 Years Old and OVer Who Worked At Anytime in tbe Past Year by Industry Group(Major and Minor). Bigbest Grade Completed and Sexi 1995
H X G H B , T GRADB COMPLBTBD (Percent Distribution)Major and Minor Percent1l1oustry Group Total to Elementary High School
and Sex Total Total No Grade Pre-Completed Scbool- Grade I Grade under- I Graduate
1-4 5-7 graduate .
MALE 50,688 65.53 100.00 1.4.9 0.14 12.82 24.21 16.35 18.50
Agriculture. Runting aod 16,524 21.36 100.00 2.76 0.36 25.89 36.32 16.35 10.65Forestry
Palsy Parming 6.367 8.23 100.00 2.03 0.20 20.46 37.96 17 :87 13.07Corn Farilling 2,521 3.26 100,00 3.4.5 0.40 35.30 36.10 13.37 7.ltCoconut Farming 800 1. 03 100.00 2.38 0.25 27.13 34.00 16.63 10.63Banana FaJ:1lling 1,876 :1:.43 100.00 3.68 0.69 32.30 36.89 14.61 6.93Sugarcane Farming 2S 0.04 100.00 3.57 10.71 35.71 21.43 7.14FaJ:1llingof AniJna1s 321 0.42 100.00 1. 25 15.26 36.45 13.40 13.71Other Agricultural Crops 4,112 5.32 100.00 3.43 0.51 28.23 35.89 17.05 8.88
and ServicesHunting and Forestry 4" 0.65 100.00 1.20 9.82 21. 64 14.03 24.45
Fishing 1,076 1. 39 100.00 1.67 0.09 22.49 36.15 15.15 12.83Fishing 1,076 1.39 100.00 1. 67 0.09 22.49 36.15 15.15 12.83
Mining and Quarrying 88 0.11 100.00 1.14 7.95 17.05 15.91 27.27Metallic Ore Mining 53 0.07 100. 00 1. 89 3.77 22.64 13.21 28.30Non.Metallic Mining and 35 0.05 100.00 14.29 8.57 20.OJ) 25.71
Quarrying
Manufacturing 5,359 6.93 100.00 0.69 0.02 5.28 19.74 18.51 26.48Food and Beverage 812 1.05 100.00 0.74 0.12 8.00 23.65 16.75 20.94Manufacturing
Tobacco Manufacture 21 0.03 100.00 4.76 4.76 23.81 14.29Textiles, Wearing Apparel, 259 0.33 100.00 0.39 4.25 19.31 19.31 30.89Leather
Paper and Publishing and 107 0.24 100.00 1.07 2.67 7.49 20.32 22.99Printing
Petroleum. Chemicals. 64 0.08 100.00 4.69 12.50 6.25 21. 88Rubber and Plastic
Non-Metallic Mineral 68 0.09 100.00 5.88 16.18 11;76 22.06Products
Basic Metal and Fabricated 134 0.17 100.00 5.22 22.39 14.93 28.36Metal Products
Wood, Cork, Cane, 2,586 3.34 100.00 0.66 4.18 19.64 19.41 29.62BambooFurniture Manufacturing 514 0.66 100.00 0.97 8.56 24.71 22.76 22.96and Repair
Machinery 355 0.46 100.00 0.28 5.92 13.80 13.80 25.92Transport Equipment 120 0.16 100.00 0.83 1.67 22.50 12.50 23.33Other Manufacturing 2J9 0.31 100.00 1. 26 5.02 17.57 20.08 21.76
Electricity, Gas and Water 562 0.-73 100.00 1.25 2.67 10.68 11. 74 21.00Electricity, Gas and Water 562 0.73 100.00 1.25 2.6" 10.68 11. 74 21. 00Supply
Construction 3.736 4.83 100.00 0.96 0.03 9.88 28.00 22.27 20.82Construction 3,736 4.83 100.00 0.96 0.03 9.88 28.00 22.27 20.82
Trade 5,272 6.82 100.00 1. 33 0.02 5.56 17.07 15.59 23.05Wholesale and Retail Trade 5,272 6.82 100.00 1.33 0.02 5.56 17.07 15.59 23.05
Services 17,987 23.26 100.00 0.72 0.04 5.5"8 15.49 14.89 21.72Repair of Motor Vehicles, 1,131 1.46 100. 00 0.53 4.77 18.04 18.48 27.67Personal and HouseholdGoods
Restaurants and Hotels 555 0.72 100.00 1. 26 2.34 14.77 18.38 28.83Transport Bquipment 5,424 7.01 100.00 0.59 0.06 7.45 21. 98 21. 66 25.22post and Communication 203 0.26 100.00 0.99 1.48 3.94 2.46 16.75Financial Intermediation 53. 0.70 100.00 0.37 0.37 3.90 5.01 23.01Real Estate and Renting 148 0.19 100.00 0.68 6.08 8.78 12.16 21. 62Private Business- 2,513 3.25 100.00 0.60 4.18 14.05 12.65 21. 53Government Services 3,677 4.75 100.00 0.38 1. 50 4.57 5.06 15.75Private Bducation, Health 645 0.83 100.00 1.71 6.67 6.05 10.23and Social Work
Other conummi ty, Social and 1, 065 1.38 100.00 0.75 0.19 6.48 13.99 14.08 23.47Personal ServicesActivitiesDomestic Services 2.087 2.70 100.00 2.06 0.10 13.37 26.55 21.56 21. 08
Not Stated 84 0.11 100.00 1.19 9.52 17.86 22.62 19.05
26

BUTUANCITY
Table 15. Percent Distribution of Household Population 15 Years Old ana OVer Who Worked At Anytime in the Past Year by Industry Group(Major and Minor), Highest Grade Completed and Sex, 1995
H I G H • S T GRADE C OMPLBTB 0 (Percent Distribution)Major and Minor PercentIndustry Group Total to Blementary High School
and Sex Total Total No Grade Pra-Completed School Grade I Grade Under- I Graduate
1 - 4 , - 7 graduate
FEMALE :16,658 34.47 100.00 1.50 0.11 8.37 19.11 15.24 16.84Agriculture. Hunting snd 4,610 5.96 100.00 3.30 0.46 25.25 37.31 17.14 10.22Forelltry
Palay Farming 1,297 1.68 100.00 2.62 0.46 19.66 37.16 l!l.43 14.34Corn P'anrlng ,,, 1.22 100.00 3.:018 0.42 31.18 37.21 16.49 7.93Coconut Parming >1, 0.28 100.00 3.21 0.46 25.69 39.45 13.30 9.63Banana Farming 732 0.95 100.00 3.14 0.55 25.55 39.21 15.98 8.20Sugarcane Parming 7 0.01 100.00 14.29 28.57 28.57Parming of Animals 10' 0.14 100.00 3.81 11.43 30.48 13.33 15.24Otber Agricultural Crops 1,255 1.62 100.00 4.22 0.48 27.89 37.21 17.21 8.29and. ServicesHUnting and.Porestry 50 0.06 100. 00 16.00 24.00 8.00 18.00
Pisbing 73 0.09 100. 00 4.11 16.44 27.40 6.85 15.07l'iBhing 73 0.09 100. 00 4.11 16.44 27.40 6.85 15.07Mining and.Quarrying 10 0.01 100. 00 20.00Metallic Ore Mining , 0.01 100.00 40.00Non-Metallic Mining and , 0.01 100.00QuarryingManufacturing 1,466 1.90 100. 00 0.55 3.48 17.19 18.14 24.35Food. and.Beverage ,.. 0.70 100.00 0.74 'loU 18.38 18.75 27.76Manufacturing
Tobacco Manufacture • 0.01 100.00 25.00 25.00 50.00Textiles, Wearing Apparel, ." 0.56 100.00 0.23 3.23 21.66 23.04 24.65LeatherPaper and. Publishing and. " 0.08 100. 00 4.9:11 13.11 16.39PrintingPetroleum, Chemicals, " 0.03 100.00 4.55 13.64Rubber and PlasticNon-Metallic Mineral , 0.01 100.00 :112.22 11.11
• ProductsBasic Metal and rabricated • 0.01 100.00 :115.00 :115.00Metal ProductsWood, Cork, Cane, '35 0.30 100. 00 1.:liB 3.40 11.n 11.06 2B.09>_0
Furniture Manufacturing " O.OB 100. 00 4.B4 :117.42 22.5B 4.84and.Repa:l.rMachinery " 0.02 100.00 16.67 B.33 16.67Transport Equipment 14 0.02 100.00 7.14 7.14 7.14 7.14Other Manufacturing " 0.08 100.00 1.64; 11.48 13.11 14.15
Blectricity, Gas and.Water " 0.09 100. 00 4.48 1.49 5.97 t.4B:Itlectricity,Gas and.Water " 0.09 100.00 4.48 1.U 5.97 4.48SupplyConltructioD 118 0.15 100. 00 :1.54 5.93 9.32 10.11 16.95Con.tructioD 118 0.15 100.00 2.54 5.93 9.32 10.17 16.95Trade 7,4:113 9.60 100. 00 1.21 0.03 5.B7 IB.21 15.98 25.aWholesale and Retail Trade 7,423 9.60 100.00 1.21 0.03 S.B7 18.21 15.98 :115.19Servic •• 12,BOB 16.56 100. 00 1.09 0.05 4.31 13.45 13.BB 13.62
Repa:l.rof Motor Vehicle., 51 0.07 100.00 1.96 1.915 15.69 9.BO :113.53Per.onal and BouuholdGood.
Restaurant. end Hotels 757 0.9B 100.00 1.19 4.10 14.27 17.31 :116.16Transport Bquipment 1>1 0.16 100.00 1.65 19.01 18.18 15.70Po.t and Communicetion " 0.12 100.00 2.17 1.09 5.43Jinancial Intermediation ". 0.47 100.00 0.B2 0.55 3.01 1.91 5.46Real Bstate and Renting 135 0.16 100.00 O.BO 9.60 13.60 7.:110 11.:110Private Business 1,2B7 1.66 100.00 0.B5 3.57 11.97 9.17 17.87Gove~nt Services 3,662 41.73 100.00 0.25 0.19 1.417 1.91 3.39Privete Bducation, Health 1,107 1.413 100.00 0.27 0.27 2.0B 1.54 3.34and Social WorkOther Community, Social and 830 1.07 100.00 1.45 5.66 18.31 15.7B 19.2BPersonal ServicesActivitiesDame.tic Service. 41,410 5.70 100.00 2.041 0.141 9.09 26.5S 2B.7) 20.98
Not Stated 83 0.11 100.00 2.41 9.641 18.07 25.30 141.46
27

1995 CENSUS OF POPULATION
Table 15. Pereent Distribution of Rousehold Population 15 Years Old and over Who Worked At Anytime in the PastYear by Industry Group (Major and Minor), Highest Grade Completed and Sexl 1995 - Continued
Major and MinorH I G H •• T G R A D' COKPLB T • D {Percent Distribution}
Industry Group Post Secondary Collegeand Sex Poet Not
Under- \ Graduate Under- I Graduate Bllccaiaureate Statedgraduate graduate
-.
R1ITUAN CITYROTH .""". 0.63 3.18 !L69 16.019 0.37 0.38
Agriculture, Hunting =d 0.31 1.00 3.32 2.26 0.05 0.43ForeatryPalay J'arming 0.33 1.15 4.11 2.10 0.09 0.27COm Farming 0.20 0.4.6 2.31 0.81 0.26COconut Fanning 1.28 4.32 2.65 0.59Banana Farming 0.19 0.54 2.30 1.9:3 0.04 0.61SUgarcane Farming 2.86 8.57 11.43Farming of Animals 0.4.7 1.88 7.04 10.80 O.:l3 0.94Otber Agricultural Crope 0.45 0.93 2.09 1.57 0.02 0.65
and ServicesHunting and forestry 0.55 4.01 10.56 14.03 0.18
Fisbing 0.44 1.65 4.87 5.40 0.09 0.35Fishing 0.44 1.65 4.87 5.40 0.09 0.35
Mining and Quarrying 1.02 2.04 11.22 21.43 c.Metallic Ore Mining 1.72 3.45 10.34 17.24Non-Metallic Mining .nd 12.50 27.50
QuarryingManufacturing 0.97 4.22 12.76 12.32 0.12 0.40
Pood and Beverage 0.59 3.91 12.39 11.80 0.07 1.11ManufacturingTobacco Manufacture 4.00 4.00 36.00Textiles, Wearing Apparel, 0.87 4.33 11.11 9.52 0'.14 0.72LeatherPaper and Publishing and 1.21 6.45 18.15 24.60PrintingPetroleum, Chemicals, 2.33 3.49 15.12 39.53 1.16Rubber and Plastic ,
Non-Metallic Mineral 5.19 14.29 27.27Products
Basic Metal and Fabricated 2.11 4.23 15.49 8.45Metal ProductsWood, Cork, Cane, 1.06 3.83 12.66 10.21 0.18 0.07BambooYurniture Manufacturing 0.52 1.56 11.98 7.81 0.35and Repair
Macbinery' 1.91 9.54 11.99 17.17 0.27Transport Bquipment 8.96 17.16 16.42Other Manufacturing 1.00' 4.00 13 .67 20.00 0.67
Blectricity, Gas and Water 1.91 10.65 16.53 26.55 0.16 0.16Blectricity, aas and Water 1.91 10.65 16.53 26.55 0.16 0.16Supply
Construction 0.83 2.23 7.55 8.10 0.26 0.21Construction 0.83 2.23 7.55 8.10 0.:16 0.21
Trade 0.61 3.66 13.75 16.56 0.12 0.42Wbole.l!la1e.nd Retail Trade 0.61 3.66 13.75 16.56 0.12 0.42
Services 0.73 4.27 12.01 28.42 0.79 0.34Repair of Motor Vehicles, 2.12 8.12 11.68 9.05 0.25Personal and HC?useholdGood.Restaurants and Botels 0.69 3.66 15.78 15 •••7 0.15 0.15Transport Bquipmsnt 1.08 4.15 9.52 8.46 0.32Post and Communication 1.69 17.63 15.59 44.41 0.34Financial Intermediation 0.33 5.08 15.03 54.25 0.55 0.55Real Istate and Renting 0.73 4.03 17.95 30.04 0.73 0.37Private Business 0.79 ".95 16.76 27.08 0.37 0.29Government .Services 0.49 4.48 14.33 61.14 1.87 O.Hprivate Bducation, Bealth 0.23 5.76 8.56 67 .29 4.17 0.17and Social Work
Other Community •.Social .nd 0.84 4.59 13.98 20.26 0.47 0.21personal ServicesActivitiesDomestic Services 0.55 1.94 7.54 2.92 0.02 0.40
Not Stated 1.20 5.39 10.78 11.98 0.60
28

BUTUANCITY
Table 15. Percent Distribution of Household Population 15 Years Old and.~r Who Worked At Anytime in the PastYear by Industry Group (Major and Minor), Highest Grade Completed and SeXI 1995 - Continued
H X G H H S T GR. D " COMPI.B T " D (Percent Distribution)Major and MinorIndustry Group Post Secondary College
and Sez PCllt NotOD.der- I Graduate Onder- I Graduate Baccalaureate Statedgraduate graduate
NAL" 0.72 3.06 9.86 12.19 0.28 0.37
Agriculture, Bunting and 0.34 1.07 3.51 2.25 0.05 0.45Forestry
Palay Panning 0.38 1.19 4.22 2.:Z0 0.11 0.30Corn 'arming 0.24 0.48 2.42 0.87 0.24Coconut Faming 1.25 4.35 2.88 0.63Banana Farming 0.16 0.53 :2. 35 1.28 0.59Sugarcane Parming 3.57 10.71 7.14Farming of Animals 0.31 1.25 7.17 9.66 0.31 1.25Other Agricultural Crops 0.46 1.07 2.21 1.56 0.71
and ServicesBunting and Forestry 0.60 4.01 11.02 13.03 0.20
Fishing 0.28 1.77 4.83 4.28 0.09 0.37Fishing 0.28 1.77 4.83 4.28 0.09 0.37
Mining and Quarrying 1.14 2.27 11.36 15.91Metallic Ore Mining 1.89 3.77 11.32 13.21Non-Metallic Mining ~d 11.43 20.00
QuarryingManufacturing 0.97 4.05 13.02 10.80 0.11 0.32
Fool1 anl1Beverage 0.86 3.U 12.19 11.95 1.11MIlnufacturingTobacco Manufacture 4.76 4.76 42.86Textiles, Wearing Apparel, 3.47 11.20 10.42 0.39 O.HLeather
Paper and Publishing and 1.07 6.42 20.32 17.&5PrintingPetroleum, Chemica18. 3.13 3.13 10.94. 35.94 1.5&Rubber and plastic
Non-Metallic Mineral 2." 14.71 2&.4.7Products
r Basic Metal and FabriclI.ted 2.24. 4.48 15.67 &.72Metal Products
Wood, Cork, Cane, 0.93 3.n 12.95 8.74 0.15 0.08a_oFurniture MIlnufacturing 0.58 1.5& 12.06 5.45 O.l'And Repair
MIlchinery 1.97 '.58 12.11 16.34 0.28Transport Bquipment 10.00 16.&7 12.50Other Manufacturing 1.2& 3.35 13.81 15.06 0.84
Blectricity, Gaa and Water 2.14 11.l' 18.15 20.64 0.18 0.18Blectricity, Gas and Water 2.14 11.3' 18.15 20.64 0.18 0.18SUpply
Construction 0.83 2.11 7.49 7.23 0.16 0.21Construction 0.83 2.11 7.49 7.23 0.16 0.21
Trade 0.74 3.4.1 14.78 17.91 0.11 0.44Wholesale and Retail Trade 0.74 3.41 14.78 17.91 0.11 0.44
Services 0.'& 4..49 13.84 21.31 0.62 0.32Repair of Motor Vehicles, 2.21 8.13 11.32 8.58 0.27Personal anl1HouseholdGoodsRestaurants and Hotels 1.2& 3.06 15.50 14.5'Transport lquipment 1.11 4.1' 9.42 8.00 0.33Post and Communication 1.91 20.69 14..2S1 3&.'5 0.49Pinancial Intermediation 0.37 4.45 18.00 43.41 0.'3 0.19Real Bstate and Renting 0.68 2.70 20. '5 25.00 0.68 0.68Private BUlline.' 0.'6 4.22 16." 24.04 0.52 0.28Government Services 0.&3 4.81 20.45 44.79 1.66 0.41Private Bducation, Health 0.31 3.57 12.87 54.57 3.72 0.31and Social Work
Other CODlIlIUnity,Social and 0.85 4..51 15.12 19.53 0.75 0.28Personal ServicesActivitiesDomestic Servicea 0.77 2.30 8.82 3.07 0.34
Not Stated. 7.14 11.'0 9.52 1.19
29

1995 CENSUS OF POPULATION
Table 15. Percent Distribution,of Housebold Population IS Years Old and Over Who Worked At Anytime in tbe PastYear by Industry Group (Major and Minor). Higbest Grad~ Completed and ~exl 1995 - Continued
H I G H B S T G H • D B CO M P 10 B THO (Percent Distribution)Major and MinorIndustry Group Post Secondary College
and Sex\ Oraduate
Post NotUnder- under- I Graduate Baecalaureate Statedgraduate graduate b,,'
'IlMALB 0.45 3.4.1 9.36 24.66 0.56 0.39
Agriculture. Bunting snd O.:Z:l: 0.76 2.65 2.30 0.04 0.37lI'orestry
Paley Pa:t1l\ing 0.08 0.93 3.55 1.62 0.15Corn Parming 0.11 0.4:1 2.01 0.63 0.32Coconut Farming 1.38 ".59 1.83 0.46Banana I'arming 0.27 0.55 2.19 3.55 0.14 0.68Sugarcane Farming 28.57'arming of Animals 0.95 3.81 6.67 14.:1:9Other Agricultural Crops 0.40 0.48 1.67 1.S9 0.08 0.49
and ServicesBunting aDd Forestry 4.00 6.00 :1:4.00
Fishing :1:.74 5.48 21.92Fishing 2.74 5.49 21.92
Mining and Quarrying 10.00 70.00Metallic Ore Mining 60.00Non-Metallic Mining and 20.00 80.00
QuarryingManufacturing 0.95 4.94 11.90 17.97 0.14 0.69
Food and Beverage 0.19 4.23 12.69 11.59 0.19 1.10ManufacturingTobacco ManufactureTextiles, Wearing Apparel. 1.39 4.at 11.06 8.99 0.92LeatherPaper and publishing and 1.64 6.56 11.49 45.90PrintingPetroleum, Chemicals, 4.55 27.27 50.00Rubber and Plaatic
Non-Metallic Mineral 22.22 11.11 33.33Products
Basic Metal and Fabricated 12.50 37.50 ,Metal Products
Wood, Cork, Cane, 2.55 5.U 9.36 26.39 0.43BambooFurniture Manufacturing 1.61 11.29 27.42&n4 Repair 9.33Machinery 8.33 41.67Tranaport Equipment 21.43 50,00Other Manufacturing 6.56 13.11 39.34
Blectricity, aaa and Water 4.48 2.99 76.12Blectricity, aas and Water 4.49 "2.99 76.12SUpply
Construction 0.85 5.U 9.32 35.59 3.39Construction 0.85 S.U 9.32 35.59 3.39
Trade 0.53 3.84 13.01 15.60 0.12 0.40Wh01ellele •• d Retail Trade 0.53 3.84 13.01 15.60 0.12 0.40
Services 0.41 3.95 9.44 38.41 1.02 0.37Repair of Motor Vehicles, 7.84 19.61 19.61Personal and HouseholdaoodsRelltaurantlland Hotels 0.26 t.l0 15.98 16.12 0.26 0.26Transport Kquipment 2.48 14.05 28.93Post and communication 1.09 10.87 19.48 60.87rinancial Intermediation 0.27 6.01 10.66 70.22 1.09Real Blltate and Renting 0.80 5.60 14.40 3"6.00 0.80Private Business 0.17 6.37 16.32 33.02 0.08. 0.31Government Servicell 0.35 4.15 8.19 77 .55 2.08 0.46Private Education, Health 0.18 7.05 6.05 74.71 t.43 0.09and Social workOther community, Social snd O.st t.70 12.53 21.20 0.12 0.12Personal ServicesActiviUe'game,tic Service. 0.45 1.77 6.9t 2.86 0.02 0.43
Not Stated 2.41 3.61 '.14 14.46
30

--
BUTUANCITY
Table 16. Percent Distribution of Household Population 15 Years and Over Who Worked At Anytime in the Past Year byIndustry Group (Major and Minor), Sex and Class of worker I 1995
CLASS 0 F II' 0 R K • • (Percent Distribution)Percent
Major and Minor Total to Worked for Worked for worked for 8e1£-Industry Group Total Total Private Private Government! e!IIployed
and Sex Household Business/ Government WithQut(Domestic Bnterprise/ Corporation AnyPddServices) Fa= Employee
BOTUAN CITY
Both Sexes 77.346 100.00 100.00 8.09 38.21 10.26 24..'4Agriculture, Hunting and 21,1301 27.32 100.00 0.77 25.03 1.15 27.35
ForestryPalay Panning 7.664 9.91 100.00 0.26 33.05 1.64 28.16Corn Farming 3,467 4.48 100.00 1.56 13.38 0.23 24.08Coconut Farming 1,018 1.32 100.00 0.49 18.76 0.59 35.36Banana Farming 2,608 3.37 100.00 0.38 13.61 1.65 21.47Sugarcane Farming 35 0.05 100.00 2.86 51.43 11.43. 14.29Farming of Animals .., 0.55 100.00 0.47 22.54 1.41 46.01Other Agricultural Crops
and Services 5,367 6.94 100.00 1.29 24.05 0.34 29.79Hunting and Forestry 5" 0.71 100.00 0.18 62.11 5.83 12.39
Fishing 1,149 1.49 100.00 0.17 42.21 0.35 33.86Fishing 1,149 1.49 100.00 0.17 42.21 0.35 33.86
Hining and Quarrying " 0.13 100.00 66.33 2.04 n.43Metallic Ore Mining " 0.07 100.00 72.41 3.45 17.24Non-Metallic Mining 40 0.05 100.00 57.50 27.50
and QuarryingManufacturing 6,825 8.82 100.00 0.62 75.71 0.38 15.50
Food and Beverage 1,356 1. 75 100.00 0.66 69.91 0.52 21.76Manufacturing
Tobacco Manufacture 25 0.03 100.00 4.00 88.00 4.00Textiles, Wearing Apparel, '" 0.90 100.00 0.58 34.49 47.19
LeatherPaper and Publishing and ,.. 0.32 100.00 69.35 0.40 18.55
PrintingPetroleum, Chemicals,
Rubber and Plastic " 0.11 100.00 1.16 89.53 1.16 4.65Non-Metallic Mineral 77 0.10 100.00 53.25 16.88
ProductsBasic Metal and Fabricated
Metal Products ,.. 0.18 100.00 0.70 76.06 0.70 14.79Wood, Cork, Cane, 2,821 3.65 100.00 0.18 90.39 0.21 5.39
BambooFurniture Manufacturing 576 0.74 100.00 1.39 64.93 0.35 18.92
and RepairMachinery 367 0.47 100.00 1.09 79.84 1.91 11.44Transport Equipment 134 0.17 100.00 5.22 73.88 13.43Other Manufacturing 300 0.39 100.00 0.67 ~1.33 0.33 10.00
Electricity, Gas and Water '" 0.81 100.00 0.95 77 .58 8.11 10.17Electricity, Gas and Water '" 0.81 100.00 0.95 77 ..58 8.11 10.17
SUpply
Construction 3,854 4.98 100.00 2.65 75.95 1.40 16.74Construction 3,854 4.98 100.00 2.65 75.95 1.40 16.74
Trade 12,695 16.41 100.00 0.40 33.10 0.16 50.54Wholesale and Retail Trade 12,695 16.41 100.00 0.40 33.10 0.16 50.54
Services 30,795 39.81 100.00 19.11 35.27 24.45 15.82Repair of Motor Vehicles,
Personal and HouseholdGood, 1,182 1.53 100.00 1.18 60.66 0.34 25.38
Restaurants and Hotels -1,312 1. 70 100. 00 0.91 58.16 0.23 17.53Transport Equipment ~.5,545 7.17 100.00 1.06 51.04 0.78 42. 06Post and Communication - 295 0.38 100..00 0.34 83.73 13 .22 1.69Financial Intermediation :, ,as 1.17 100.00 0.77 82.43 6.52 4.86Real Estate and Renting ""j 273 0.35 100.00 0.73 35.53 2.56 38.83Private Business .I~'-3, 800 4.91 100.00 0.97 54.84 1.61 28.58Government Services ,. '_r7, 339 9.49 100. 00 0.26 1.46 97.57 0.48Private Education, Health ..l'
and Social Work -1,752 2.27 100.00 0.57 88.93 3.88 3.48Other Community, Social
and Personal Services 1,895 2.45 100.00 4.54 55.25 2.69 30.03Activities
Domestic Services 6,497 8.40 100. 00 86.79 10.25 0.52 1. 59
Not Stated 167 0.22 100.00 3.59 41. 92 3.59 26.95
31

1995 CENSUS OF POPULATION
Table 16. Percent Distribution of Household Population 15 Years and OYer Who Worked ,At Anytime ~n, the Past ,Year byIndustry Group (Major and MinOr>". Sex and Class of Worker I 1995 _ Continued, ;
c " A S S 0 F WaR II::• R (Percent Distribution)Percent
Major and Minor Total to Worked for" Worked for Worked for Self-IndustrY Group Total Total Private Pr.ivate OOVernmentl employed
and Sex Household Busil3.ess/ Government Without(Domestic J:nterprisel Corporation Any PaidService.s) : F~rm Bmployee
-.
Male 50,688 65.53 100.00 4.14 44.32 8.01 24.95
Agriculture, Bunting and 16.524 21. 36 100.00' 0.83 26.96 0.91 29.33Forestry
Palay Farming 6,367 8.23 100.00 0.27 33.97 1.23 29.65Corn Farming 2,521 3.26 100.00 1.94 15.51 0.24 28.68Coconut Farming 800 1.03 1.00.00 0.50 20.50 0.38 38.63Banana Farming 1,876 2.43 1.00.00 0.32 14.55 1.01 23.99Sugarcane Farming 28 0.04 100.00 3.57 57.14 10.71 17.86Farming of Animals 321 0.42 100.00 0.62 23.05 0.93 46.11Other Agricultural Crops 4,112. 5.32 100.'00 1.39 25.54 0.27 30.74
and ServicesHunting and Forestry '99 0.65 100.00 0.20 .6~. 93 5.61 12.02
Fishing 1,076 1.39 100.00 0.19 42.94 0.37 33.74Fishing 1,076 1.39 100.00 0.19 42.94 0.37 33.74
Mining and Quarrying 88 .0.11 100.00 69.32 2.27 19.32Metallic Ore Mining 53 0.07 100.00 73.58 3.77 15.09Non-Metallic Mining 35 0.05 100.00 62.86 25.71
and Quarrying
Manufacturing 5,359 6.93 100.00 0.56 81. 62 0.43 11.23Food and Beverage 812 1.05 100.00 0.74 74.75 0.86 17.61
Manufacturing ;, 0.03Tobacco Manufacture 100.00 90.48 4.76Textiles, Wearing Apparel, 25. 0.33 100.00 0.77 42.86 35.52
LeatberPaper and Publisbing and 187 0.24 100.00 74.33 0.53 17.65
Printing •Petroleum, Chemicals, 64 0.08 100.00 92.19 1.56 3.13Rubber and Plastic
Non-Metallic Mineral 68 0.09 100.00 57.35 17.65 "ProductsBasic Metal and Fabricated 134 0.17 100.00 0.75 77 .61 . 0.75 13.43
Metal ProductsWood, Cork, Cane, 2,586 3.34 100.00 0.19 90.95 0.19 5.38B_~Furniture Manufacturing 514 9.66 100.00 1.36 68.68 0.19 18.68
and RepairMachinery 355 0.46 100.00 0.85 80.85 1.97 10.70Transport Equipment 120 0.16 100.00 4.17 79.17 9.17Otber Manufacturing 239 0.31. 100.00 0.42 87.45 7.11
Electricity, Gas and Water 562 0.73 100.00 1.07 76.33 8.19 11. 03Electricity, Gas and Water 562 0.73 100.00 1.07 76.33 8.19 ~1. 03
Supply•Construction 3,736 4.83 100.00 2.70 76.15 1.23 16.94
Construction 3,736 4.83 100.00 2.70 76.15 1.23 16.94
Trade 5,2n 6.82 100.00 0.25 42.34 0.13 43.19Wholesale aod Retail Trade 5,272 6.82 100.00 0.25 42.34 0.13 43.19
Services 17,987 23.26 100.00' 10.07 42.05 21. 00 21.28Repair of Motor Vehicles, 1,131 1.46 100.00 1.15 61.45 0.35 25.29
Personal and HouseholdGoods
Restaurants and Hotels 555 0.72 100.00 o.n 66.67 0.18 11. 35Transport Equipment 5,424 7.01 100.00 1.07 50.98 0.76 42.29post and Communication 203 0"26 100.00 83.25 13.30 2.46Financial Intermediation 539 0.70 100.00 0.56 83.67 6.31 5.01Real Estate and Renting 148 0.19 100.00f 1. 35 39.86 4.05 35.14Private Business 2,513 3.25 100.00 0.92 57.10 1.51 28.61Government Services 3,677 4.75 100.00 0.16 1.69 97.31. 0.65Private Education, Health 645 0:83 100.00 0.62 89.77 1.09 4.50
and Social Work 2.07Otber Community, Social 1,065 1.38 100.00 1.69 62.25 26.10and personal ServicesActivities
Domestic Services 2,087 2.70 100.00 80.50 15;'09 0.91 2.40
Not Stated 84 O.ll 100.00 1.19 51.19 2.38 25.00
32

.'
BUTUANCITY
Table 16. Percent Distribution of Household Population 15 Years and Over Who Worked At Anytime in the Past Year byIndustry Group (Major and Minor). Sex and Class of Worker. 1995 ~ Continued
C LAS S 0 V WaR IC B R (Percent Distribution)Percent
Major and Minor Total to Worked for Worked for Worked for Self.Industry Group Total Total Private Private Government{ employed
and Sex Household Business/ Government Without(Domestic Bnterprise/ Corporation Any PaidServices) Va= Bmployee
Female 26.658 34.47 100.00 15.59 26.60 14.55 24.91
Agriculture. Hunting and 4.610 5.96 100.00 0.54 18.09 2.00 20.26Forestry
Palay Farming 1,297 1. 68 100.00 0.23 28.53 3.70 20.82Corn Farming '" 1. :012 100.00 0.53 7.72 0.21 11. 84coconut Farming 218 0.28 100.00 0.46 12.39 1.38 23.39Banana Farming 732 0.95 100.00 0.55 11. 20 3.28 15.03Sugarcane Farming 7 0.01 100.00 28.57 14.29Farming of Animals lOS 0.14 100.00 20.95 2.86 45.71Other Agricultural Crops 1,255 1. 62 100.00 0.96 19.20 0.56 26.69
and ServicesBunting and Forestry 50 0.06 100.00 34.00 8.00 16.00
Fishing 73 0.09 100.00 31.51 35.62Fishing 73 0.09 100.00 31.51 35.62
Mining and Quarrying 10 0.01 100.00 40.00 40.00Metallic Ore Mining S 0.01 100.00 60.00 40.00Non-Metallic Mining S 0.01 100.00 20.00 40.00
and Quarrying
Manufacturing 1,466 1.90 100.00 0.82 54.09 0.20 31.11Food and Beverage S44 0.70 100.00 0.55 62.68 27.94
ManufacturingTobacco Manufacture • 0.01 100.00 25.00 75.00Textiles, Wearing Apparel, 43. 0.56 100.00 0.46 29.49 54.15
LeatherPaper and Publishing and 51 0.08 100.00 54.10 21. 31
PrintingPetroleum, Chemicals, 22 0.03 100.00 4.55 81.82 9.09
Rubber and Plastic: Non-Metallic Mineral 0.01 100.00 22.22 11.11
ProductsBasic Metal and Fabricated 8 0.01 100.00 50.00 37.50
Metal Productswood, Cork, Cane, 235 0.30 100.00 84.26 0.43 5.53
BambooFUrniture Manufacturing 62 0.08 100.00 1.61 33.87 1.61 20.97
and RepairMachinery 12 0.02 100.00 8.33 50.00 33.33Transport Equipment 14 0.02 100.00 14.29 28.57 50.00Other Manufacturing 61 0.08 100.00 1.64 57.38 1.64 21. 31
Electricity, Gas and Water " 0.09 100.00 88.06 7.46 2.99Blectricity, Gas and Water " 0.09 100.00 88.06 7.46 2.99
Supply
Construction 118 0.15 100.00 0.85 69.49 6.78 10.17COnstruction 118 0.15 100.00 0.85 69.49 6.78 10.17
Trade 7,423 9.60 100.00 0.51 26.54 0.18 55.76Wholesale and Retail Trade 7,423 9.60 100.00 0.51 26.54 0.18 55.76
Services 12,808 16.56 100.00 31.82 25.76 29.30 8.15Repair of Motor Vehicles, 51 0.07 100.00 1. 96 43.14 27.45
Personal and HouseholdGoods
Restaurants and Hotels "7 0.98 100.00 1. 06 51. 92 0.26 22.06Transport Equipment 121 0.16 100.00 0.83 53.72 1.65 31. 40Post and Communication " 0.12 100.00 1.09 84.78 13 .04Financial Intermediation 366 0.47 100.00 1.09 80.60 6.83 4.64Real Estate and Renting 125 0.16 100.00 30.40 0.80 43.20Private Business 1,287 1. 66 100.00 1.09 50.43 1. 79 28.52Government Services 3,662 4.73 100.00 0.35 1.23 97.84 0.30Private Education, Health 1,107 1.43 100.00 0.54 88.44 5.51 2.89
and Social WorkOther Community, Social 830 1.07 100.00 8.19 46.27 3.49 35.06
and Personal ServicesActivities
Domestic Services 4,410 5.70 100.00 89.77 7.96 0.34 1.20Not Stated 83 0.11 100.00 6.02 32.53 4.82 28.92
33

1995 CENSUS OF POPULATION
Table 16. Percent Distribution of Household Population 15 Years and OVer Who Worked At Anytime in thePast Year by Industry Group (Major and Minor), Sex and Class of Worker. '1995 - Continued
C LAS S o • w 0 R Ie B • (Percent Listribution)
Major and Kinor Worked Witb •. Worked WithoutIndustry Group BIlIployer In Pay :InOwn pay In own Not
and 'Sex Own Farm or Family Operated Pamily Operated ReportedBusiness Farm or business Farm or Bu,loess
-.
SUTUAN eXTY
Both Sexes 10.28 0.4.6 6.93 0.83
Agriculture. Hunting and :23.29 0.60 20.85 0.96Forestry
paley Parlning 18.42 0.76 16.48 1.23Corn Faming 29.16 0.81 30.14 0.63Coconut Farming 22.99 20.73 1.08Banana Farming 30.67 0.46 30.79 0.96Sugarcane Farming' 11.43 8.57Varming of Animals 23.24 0.94 4.23 1.17Other Agriculturai Crops 23.70 0.26 19.71 0.86
and ServicesHunting and Porestry 16.58 1.82 1.09
Pishing 15.32 0.35 7.05 0.70Pishing 15.32 0.35 7.05 0.70
Mining and-Quarrying 4.08 ,L08 2.04Metallic Ore Mining 1.72 3.4:5 1.72Non-Metallic Mining 7.50 5.00 2.50
and Quarrying
Manufacturing 4.70 0.44 1.73 0.92Food and Beverage 4.79 0.15 1.47 0.74
ManufacturingTobacco Manufacture 4.00Textiles, Wearing Apparel, 11.40 1.30 3.46 1.59
Leather •Paper and Publishing and 8.87 0.40 1.61 0.81Printing
Petroleum, Chemicals, 2.33 1.16 ,Rubber and Plastic
Non-Metallic Mineral 12.99 6.49 10.39Products
Basic Metal and Fabricated 2.82 0,70 4.23Metal Products
Wood, Cork, Cane, . 1.91 0.11 0.74 1.06Bambon 9.38;purniture Manufacturing 0.69 3.65 0.69and Repair
Machinery 3.81 0.82 0.54 0.54Transport Hquipment 5.97 1.~9Other Manufacturing 3.33 0.67 2.67 1.00
Electricity, Gas and water 1.91 0.16 0.16 0.95Electricity, Gas and water 1.91 0.16 0.16 0.95
Supply
Construction 1.45 0.23 0.44 1.14Construction 1.45 0.23' 0.44 1.14
Trade 10.38 0.69 3.77 0.95Wholesale and Retail Trade 10.38 0.69 3.77 0.95
Services 3.68 0.32 0.79 0.56Repair of Motor Vehicles, 8.29 0.93 2.03 1.18
Personal and HouseholdGoods
~estaurants and Hotels 16.77 0.99 4.80 0.61Transport Equipment 3.25 0.18 0.72 0.92
Post and Communication 0.68 0.34Financial Inter.mediation 3.20 0.66 0.44 1.10Real Bstate and Renting 18.68 0.73 1.83 1.10Private Business 10.76 1.03 1.71 ' 0.50Governllient Services 0.01 0.22Private Education, Health 2.23 0.23 0.29 0.40
and Social WorkOther Community, Social 4.70 0.16 1.16 1.48
and Personal ServicesActivities
Domestic Services 0.25 0.15 0.20 0.25
Not Stated 5.99 5.99 11.98
34

."
BUTUANCITY
Table 16. Percent Distribution of Household Population 15 Years and Over Who Worked At Anytime in thePast Year by Industry Group (Major and Minor), Sex and Class of Worker I 1995 - Continued
C L It. S S o • WORX •• (Percent Distribution)Major and Minor Worked With Worked withoutIndustry Group EIIlployer In Pay In own Pay In Own Not
and Sex Own Farm or P'amily Operated Family Operated ReportedBusiness Farm or business Farm or Business
Nal. 10.92 0.41 6.40 0.85Agriculture. Bunting and 23.51 0.56 16.97 0.93Forestry
Palay I'arming 18.05 0.63 15.06 1.15Corn Farming 28.72 0.99 23.36 0.56Coconut Parming 21.50 17.25 1.25Banana Farming 35.66 0.37 23.35 0.75SUgarcane Farming 10.71Farming of Animals 23.99 1.25 3.43 0.62Other Agricultural Crops 24.78 0.17 16.12 1.00
and ServicesHunting and Forestry 14.23 1.80 1.20
Fishing 15.80 0.28 5.95 0.74Fishing 15.80 0.28 5.95 0.74
Mining and Quarrying 3.41 3.41 2.27Metallic Ore Mining 1.89 3.77 1.89Non-Metallic Mining 5.71 2.86 2.86
and QuarryingManufacturing 3.73 0.35 1.27 0.80
Food and Beverage 4.56 0.12 0.74 0.62Manufacturing
Tobacco Manufacture 4.76Textiles, Wearing Apparel, 13.90 2.32 3.86 0.77
LeatherPaper and Publishing and 5.88 0.53 0.53 0.53
PrintingPetroleum, Chemicals, 1.56 1.56
Rubber and Plastic: Non-Metallic Mineral 13.24 4.41 7.35
ProductsBasic Metal and Fabricated 2.99 0.75 3.73
Metal ProductsWood, Cork, Cane, 1.59 0.04 0.62 1.04
BambooFurniture Manufacturing 6.61 0.58 3.11 0.78
and RepairMachinety 3.66 0.85 0.56 0.56Transport Equipment 5.83 1.67Other Manufacturing 2.93 1.67 0.42
Electricity, Gas and Water 2.14 0.18 1.07ElectricitYJ Gas and Water 2.14 0.18 1.07
Supply
Construction 1.26 0.21 0.35 .1.15Construction 1.26 0.21 0.35 1.15
Trade 9.56 0.74 2.81 0.99Wholesale and Retail Trade 9.56 0.74 2.81 0.99
Services 3.95 0.24 0.77 0.64Repair of Motor Vehicles, 7.96 0.88 1.86 1.06
Personal and HouseholdGood.
Restaurants and Hotels 16.04 0.54 3.78 0.72Transport Equipment 3.10 0.17 0.70 0.94Post and CommUnication 0.49 0.49Financial Intermediation 2.60 0.37 0.19 1.30Real Estate and Renting 16.22 2.03 1.35Private Business 9.71 0.48 1.19 0.48Government Services 0.03 0.16Private Education, Health 2.95 0.16 0.31 0.62
and Social WorkOther C~nity, Social 5.07 0.19 1.22 1.41
and Personal ServicesActivities
Domestic Services 0.38 0.24 0.38 0.10
Not Stated 7.14 3.57 9.52
35

1995 CENSUS OF POPULATION
Table 16. Percent Distribution of Household Population 15 Years and OVer Who -Worked At Anytime in thePast Year by Industry Group (Major and Minor), Sex-and Class of Worker I 1995 - Continued
.. C LAS S o • W 0 R II: B R (Percent Distribution)
Major and Minor Worked With worked.WithoutIndustry Group. Employer :In - Pay -In.Own Pay'1:o own Not
and Sex Own Fa:t1ll or .Pan\ily Operated Fam1ly Operated ReportedBusiness Farm or business Farm or Business
-.I
~
Female 9.06 0.56 7.95 0.78
Agriculture, Buting ~d 22.54 0.74 34.77 1.06Porestry
Palay Farming 20.28 1. 39 23.44 1.6:.ii1Corn Farming 30.34 0.32 U,20 0.85Coconut Parming 28.44. 33.49 . 0.46Banana Farming 17.90 0'.68 49.B6 1.50Sugarcane Farming 14'.29 42.86Farming of Animals 20.95 6,67 2.86Other Agricultural Crops 20.16 0.56 31.47 0.40
and ServicesBunting and Forestry 40.00 2.00
Fbhing 8.22 1.37 23.29Fishing 8.22 1. 37 23.29
Mining and Quarrying 10.00 10.00Metallic Ore MiningNon-Metallic Mining 20.00 20.00
and Quarrying
Manufacturing 8.25 0.75 3.41 1.36Food and Beverage 5.15 0.18 2.57 0.92
ManufacturingTobacco ManufactureTextiles, Wearing Apparel, 9.91 0.69 3.2:3 2.07
LeatherPaper and Publishing and 18.03 4.92 1.64
Printing •Petroleum, Chemicals, .4.55Rubber and Plastic
Non-Metallic Mineral 11.11 22.22 ,33. J3 ~Products
Basic Metal and Fabricated 12.!S0Metal Products
Wood, Cork, -Cane, 5.53 0.85 2.13 1.28',""",,0Furniture Manufacturing 32.26 1.61 8.06and Repair
Machinery 8.33Transport Bquipment 7.14Other Manufacturing 4.92 3.28 6-.56 3.28
Blectricity, Gas and Water 1.49Blectricity, Gas and Water 1.49
SUpply
COnstruction 7.63 0.85 3.39 '0.85Construction 7.63 0.85 3.39 0.85
Trade 10.97 0.66 .4.46 0.93Wholesale and "Retail Trade 10.97 0.66 4.46 0.93
Services 3.29 0.42 0.81 0.45Repair-of Motor Vehicles, 15.69 1. 96 5.88 3.92
Personal and HouseholdGoods
Restaurants and Hotels 17.31 1.32 5.55 0.53Transport Bquipment 9.92 0.83 1. 65Post and CommUnication 1.09Financial Intermediation 4.10 1.09 0.82 0.82Real Bstate and Renting 21. 60 1.60 1.60" 0.80Private Business . 12.82 2.10 2.72 0.54Government' Services . 0.27Private Bducation, Health 1.81 0.27 0.27. 0.27
and Social WorkOther Community, Social 4.22 0.12 1. 08 1.57
and Personal ServicesActivities
Domestic Services 0.18 0.11 0:11. 0.32
Not Stated 4.82 8.43 14.46
•
36

.'

-I
--
.a .,'
. ..',.- . ~...
"

:
APPENDIX A
BATAS PAMBANSA BLG. 72
PROVIDING FOR THE TAKING OF AN INTEGRATED CENSUS EVERY TEN YEARSBEGINNING IN THE YEAR NINETEEN HUNDRED AND EIGHTY, AND FOR OTHERPURPOSES.
SECTION 1. A national census of population and other related data shall be taken every decadebeginning in 1980, in accordance with plans prepared by the National Census and Statistics Office,without prejudice to the undertaking of special censuses on agriculture, industry, commerce, housing andother sectors as may be approved by the National Economic and Development Authority.
SECTION 2. There is hereby created the National Census Coordinating Board to be composedof the Minister of Economic Planning, as Chairman, the Minister of Human Settlements, the Minister ofthe Budget, the Minister of the Justice, the Minister of National Defense, the Minister of Labor, the.Minister of Finance, the Minister of Education and Culture, the Minister of Public Works, the Minister ofTransportation and Communications, the Minister of Public Highways, the Minister of Agriculture, theMinister of Natural Resources, the Minister of Public Information, and the Minister of LocalGovernment and Community Development, as members, with the Executive Director of the NationalCensus and Statistics Office as Executive Officer of the Board.
The census shall be under the supervision and coordination of the National Census CoordinatingBoard which shall issue such rules and regulations as maybe be necessary for the successful undertakingand completion of the censuses provided in this Act.
SECTION 3. There shall be established a provincial, city and municipal census board in eachprovince, city and municipality, as the case may be, which shall provide such facilities and assistance asmay be required by the National Census Coordinating Board. The boards shall"be under the supervisionand control of the National Census Coordinating Board.
SECTION 4. Th~ Provincial Census Board shall be composed of the Provincial Governor, asChairman, and the Division Superintendent of Schools, or in the case of provinces with more than oneschool division, the Division Superintendent designated by the National Census Coordinating Board, asVice Chairman, the District Highway Engineer, or in the case of provinces which have two or morehighway engineering districts, the one that may be designated by the National Census CoordinatingBoard, the Provincial Commander of the Philippine Constabulary, the Provincial Development Officer,the Provincial Assessor, and the Provincial Agriculturist, as members, with the Provincial Census Officeras the Executive Officer.
The City Census Board shall be composed of the Municipal mayor, as Chairman, and the DistrictSupervisor, the Municipal Agriculturist, the Station Commander, the Municipal Treasurer, and the.Municipal Development Officer, as members, with the Municipal Census Officer/Census Supervisor asthe Executive Officer.
The Municipal Census Board shall be composed of the Municipal Mayor, as Chairman, and theDistrict Supervisor, the Municipal Agriculturist, the Station Commander, the Municipal Treasurer, andthe Municipal Development Officer, as members, with the Municipal Census Officer/Census Supervisoras the Executive Officer.
39

APPENDIX A
SECTION 5. The National Census Coordinating Board and the local census boards may callupqn any ministry. bureau, office, agency or instrumentality of the Government for any assistance in theperformance of their duties. .
SECTION 6. The first day of May of every regular census year is hereby designated as thereference date for the census. The collection of data will be by enumeration and the respondent shall bethe head or any responsible member of the household.
SECTION 7. Public school teachers shall be employed for enumeration work and for suchservices shall be paid an honorarium as may be determined by the National Census Coordinating Boardbut in no case not less than two hundred-fifty pesos and shall receive service credits equivalent to thenumber of days rendered in census work. Other government employees whose services are engaged forcensus work shall be entitled to such allowances as shall be prescribed by the National CensusCoordinating Board payable from census funds. The census herein taken at the barangay level shall becertified to by the corresponding barangay captain.
SECTION 8. Before the end of the year 1980 and of every census ihereafter, a count of thepopulation by province, city, municipality and barangay shall be published by the National Census ofStatistics Office. The fmal population count as determined from the processed census returns shall beconsidered official for all purposes upon proclamation by the President (Prime Minister).
SECTION 9. Data gathered pursuant to this Act shall not be used as evidence in any court orpublic office for or against any person, except in a criminal case for violation of Section 10 of this Act,nor shall such data be divulged to any person except to authorized employees of the National Census andStatistics Office, acting in the performance of their duties; nor shall such data be published except in theform of summaries or statistical tables in which no reference to an individual shall appear. Any personviolating any provision of this Section shall be punished by a fine of not more than five hundred pesos orby imprisonment of not more than six months, or both.
SECTION 10. Any respondent as provided for in Section 6 who unjustifiably refuses to furnishthe infortnation called for in the sus questionnaire, or knowig,gly certifies or gives data or informationwhich shall prove to be materially untrue in any particular, shall be guilty of an offense under this Actand shall, upon conviction, be punished by a fine of not more than five hundred pesos or byimprisonment of not more than three months, or both.
SECTION 11. The amount necessary for the holding of censuses shall be charged to theappropriations available for the purpose in the corresponding Appropriations Acts.
SECTION 12. This Act shall take effect upon its approval.
Approved, June II, 1980
(SGD.) FERDINAND E. MARCOS
40
. I'-
•

TOTAL POPULATION, HOUSEHOLO POPULATION AND NUMBER OF HOUSEHOLDSFOR ALL REGIONS, PROVINCES AND HIGHLY URBANIZED CmES: AS OF SEPTEMBER " 19--
REGION/PROVINCE/HIGHLY URBANIZED CITYTOTAL HOUSEHOLD INSTITUTIONAL NUMBER OF
POPULATION POPULATION POPULATION HOUSEHOLDS
PHILIPPINES 68,616.536 01 68,431,213 b/ 182,493 13,508,055 cJ 5.07 2.32
NATIONAL CAPITAL REGION 9,454;040 9,411,697 42,343 1,965,299 4.74 3.30
MANILA 1,664,761 1,645,876 8,885 347,173 4.74 0.62CITY OF MANDALUYONG 288,870 285,584 1,288 81,098 4.87 2.75MARIKINA 357,231 355,865 1,366 73,617 4.83 2.68CITY OF PASIG 471,075 470,421 654 104,242 4.51 3.22QUEZON CITY 1,989,419 1,978,933 10,488 415,788 4.78 3.34SAN JUAN 124,187 123,773 414 25,694 4.82 -0.40CALOOCAN CITY 1,023,189 1,021,917 1,182. 216,122 4.75 5.64MALABON 347,484 347,447 37 74,657 4.65 4.13NAVOTAS 229,039 228,949 90 49,471 4.83 3.82VALENZUELA 437,165 436,059 1,106 94,377 4.62 4.81LAS PI~AS 413,086 412,040 1,046 82,818 4.99 6.37CITY OF MAKA TI 484,176 482,857 1,319 100,922 4.78 1.25CITY OF MUNTINLUPA 399,848 388,962 10,884 80,981 4.80 7.02PARA~AQUE 391,296 390,539 757 82,892 4.72 4.57PASAYCITY 408,610 407,101 1,509 86,253 4.72 1.96PATEROS 55,288 55,227 59 11,377 4.85 1.37
~ TAGIG 381,350 380.087 1,263 79,219 4.80 6.93
REGION 1 - ILOCOS 3,803,890 3,799,153 4,737 740,136 5.13 1.30
ILOCOS NORTE 482,851 481,804 1,047 99,653 4.83 0.84ILOCOS SUR 545,385 544,527 858 108,329 5.03 0.90LA UNION 597,442 598,645 797 118,994 5.10 1.61PANGASINAN 2,178,412 2,176,377 2,035 416,160 5.24 1.42
REGION 2. CAGAYAN VALLEY 2,538,035 2,529,938 6,097 509,574 4.96 1.51
BATANES 14,180 14,118 64 3,128 4.51 -1,08CAGAYAN 895,050 893,891 1,359 179,098 4.99 1.43ISABELA 1,180,721 1,157,840 3,081 233,203 4.96 1.35NUEVA VIZCAYA 334,985 333,518 1,447 67,719 4.93 2.01QUIRINO 131,119 130,973 148 26,428 4.96 2.63
REGION 3 - CENTRAL LUZON 6,932,570 6,923,137 9,433 1,365,990 5.07 2.12
BATAAN 491,459 490,450 999 98,499 4.98 2.72BULACAN 1,784,441 1,781,120 3,321 389,613 4.95 3.24NUEVA ECIJA 1,505,827 1,503,448 2,379 300,345 5.01 2.61PAMPANGA (excludes Angel6ls City) 1,401,756 1,401,218 538 255,303 5.49 1.48Angeles City. 234,011 233,552 459 48,852 4,98 -0.21TAR LAC 945,810 945,258 552 185,477 5.10 1.80ZAMBALES (excludes Olongapo City) 389,512 388,732 780 80,918 4.80 0.98Olongapo City. 179,754 179,349 405 38,983 4,80 .1.35
, REGION 4 - SOUTHERN TAGALOG 9,940,722 9,914,575 26,147 1,990,077 4,98 3.53
~ AURORA 159,621 158,968 653 31,340 5.07 2.55BATANGAS 1,658,567 1,656,721 1,846 318,539 5.20 2.20CAVITE 1,610,324 1,602,932 7,392 323,532 4.95 6.47LAGUNA 1,631,082 1,628,853 2,229 337,018 4.83 3.32MARINDUQUE 199,910 199,677 233 40,812 4,89 1.41OCCIDENTAL MINDORO 339,605 338,019 1,588 67,314 5.02 3.50ORIENTAL MINDORO 608,616 607,934 682 119,197 5.10 1.91
41

APPENDIXBTOTAL POPULATION, HOUSEHOLO POPULATION ANO NUMBER OF HOUSEHOLDS <
FOR ALL REGIONS, PROVINCES AND HIGHLY URBANIZED CITIES: AS OF SEP1iEMBE~ 1, 1995-,
TOTAL HOUSEHOLD INSTITUTIONAL NUMBER OF AVERAGE GROWTHREGION/PROVINCE/HIGHLY URBANIZED CITY POPULATION POPULATION POPULATION HOUSEHOLDS HOUSEHOLD RATE
SIZE
PALAWAN 640,486 633,584 6,902 124,928 5.07 3.67
QUEZON (excludes Lucena City) 1,369,992 1,368,304 1,688 272,508 4.98 2.03
Lucena City • 177,750 176,801 949 36,556 4.64 3.15
RIZAL 1,312,489 1,310,733 1,756 268,685 4.86 5.68
ROMBLON 244,654 244,423 231 49,748 4.91 1.36
REGION 5 - BICOL 4,325,307 4.319,172 6,136 817,998 5.28 1,91
ALBAY 1,005,315 1,003,719 1,596 187,728 5.35 2.01
CAMARINES NORTE 439,151 438,477 674 84,561 5.19 2.20
CAMARINES SUR 1,432,596 1,430,167 2,431 266,030 5.40 1,75
CATANDUANES 202,464 202,243 221 38,322 5.28 1.50
MASBATE 653,852 653,641 211 128,860 5.07 1.64
SORSOGON 591,927 690,925 1,002 113,497 5.21 2.35
REGION 6 - WESTERN VISAYAS 5,776,938 5,765,943 10,995 1,104,161 5.22 1.30
AKLAN 410,539 409,742 797 79,128 5.18 1,43
ANTIQUE 431,713 431,078 635 64,365 5.11 1.14
CAPIZ 624,469 623,949 520 119,886 5.20 1.26
GUIMARAS 126,470 126,296 174 23,811 5.30 1.31 •ILOILO (excludes 110110City) 1,415,022 1,413,734 1,288 266,722 5.30 1.05
Iloilo City * 334,539 332,133 2,406 64;811 5.12 1.47 :
NEGROS OCCIDENTAL (exclude. Becolod City) 2,031,841 2,028,561 3,260 387,234 5.24 1.34
BacoJod City • 402,345 400,450 1,895 78,195 5.12 1.88
REGION 7 - CENTRAL VISAYAS 5,014,588 4,995,539 19,049 995,871 5.02 1.65
BOHOL 994,440 992,312 2,128 191,657 5.18 0.89
CEBU (excludes Cebu City & Mandaue City) 2,064,101 2,057,463 6,638 407,269 5.05 2.01
Cebu City. 662,299 664,839 7,460 134,986 4.85 1.54
Mandaue City • 194,746 194,290 455 40,941 4.75 1.46
NEGROS ORIENTAL 1,025,247 1,022,924 2,323 205,131 4.99 1.94
SIQUIJOR 73,756 73,711 45 15,697 4.64 -0.04
REGION 8. EASTERN VISAYAS 3,386,917 3,358,178 8,739 660,807 5.06 1.84
BILIRAN 132,209 132,126 83 25,646 5.16 2.15
EASTERN SAMAR 362,324 361,332 992 67,67g 5.35 1.80
LEYTE 1,611,251 1,506,508 4,743 301,158 5.00 1.89
NORTHERN SAMAR 464,195 453,467 728 85,364 5.31 3.21
SAMAR 589,373 587,883 1,490 116,493 5,Og 1.88
SOUTHERN LEYTE 317,565 316,862 .703 65,567 4,83 ~.26
REGION 9. WESTERN MINDANAO 2,794,659 2,787,500 7,159 533,643 5.22 2.42
BASILAN 296,665 294,g69 596 66,137 5.35 4.12
ZAMBOANGA DEL NORTE 770,697 769,147 1,550 147,246 5,22 2.46
ZAMBOANGA DEL SUR (exclude. Zembcanga City) 1,217,268 1,214,154 3,104 230,592 5.27 1.88
Zamboanga City • 511,139 509,230 1,909 100,668 6,06 2.75
•REGION 10 - NORTHERN MINDANAO 2,483,272 2,476,694 6,678 478,730 5.17 2.32 •
BUKIDNON 940,403 937,734 2,889 175,286 5.35 2.05
CAMIGUIN 68,039 67,912 127 13,474 5.04 1.08
MISAMIS OCCIDENTAL 458,965 457,950 1,015 91,410 5,01 1.48
MISAMIS ORIENTAL (excluda. Cagayan de Oro Clly) 587,551 586,914 637 114,473 5,13 2,12
Cagayan de Oro City • 428,314 426,184 2,130 84,085 5,07 4,44
42
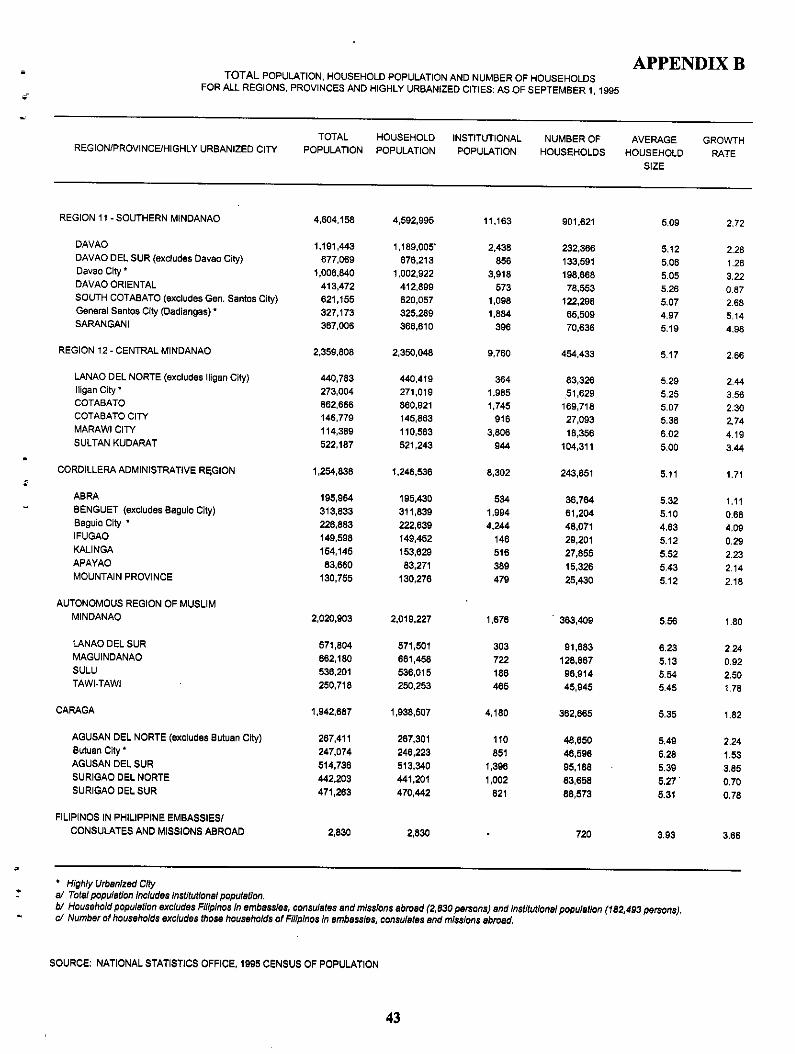
TOTAL POPULATION, HOUSEHOLD POPULATION AND NUMBER OF HOUSEHOLDSFOR ALL REGIONS, PROVINCES AND HIGHLY URBANIZED CITIES: AS OF SEPTEMBER " 1995
APPENDIXB
REGION/PROVINCE/HIGHLY URBANIZED CITYTOTAL
POPULATIONHOUSEHOLD
POPULATION
43
INSTITUTIONALPOPULATION
NUMBER OFHOUSEHOLDS
AVERAGE
HOUSEHOLD
SIZE
GROWTHRATE

APPENDIXC
LIST OF UNPUBLISHED TABLES-.
Table
RI
R2
R3
R4
R5
R6
R7
R8
Total Population by Age Group, Sex and Region: 1995
Total Population 10 Years Old and Over by Age Group, Sex, Marital Status andRegion: 1995
Household Population 10 Years Old and Over by Age Group, Sex, Marital Status andRegion: 1995
Household Population 5 Years Old and Over by Highest Grade Completed, AgeGroup, Sex and Region: 1995
Household Population by Mother Tongue, Sex and Region: 1995
Disabled Persons by Age Group, Sex, Type of Disability and Region: 1995
Household Population by Relationship to the Household Head, Household Size andRegion: 1'995
Number of Households by Age Group and Sex of Household Head, Household Sizeand Region: 1995
R9 Overseas Workers 10 Years Old and Over by Age Group, Highest Grade Completed,Sex and Region: 1995
RIO Household Population 15 Years Old and Over by Trade Skill Group (Major), AgeGroup, Sex and Region: 1995
Rll Household Population 15 Years Old and Over with Trade Skill by Trade Skill Group(Major and Minor), Manner of Acquisition, Sex and Region: 1995
RI2 Household Population 15Years Old and Over Who Worked Anytime in the Past Yearby Industry Group (Major), Age Group, Sex and Region: 1995
RI3 Household Population 15 Years Old and Over Who Worked Anytime in the Past Yearby Industry Group (Major and Minor), Highest Grade Completed, Sex and Region:1995
RI4 Household Population 15Years Old and Over Who Worked Anytime in the Past Yearby Industry Group (Major and Minor), Highest Grade Completed, Sex and Region:1995
RI5 Household Population 15Years Old and Over Who Worked Anytime, in the Past Yearby Industry Group (Major and Minor), Sex, Class of Worker and Region: 1995
PI Disabled Persons by Age Group, Sex, Type of Disability and Province: 1995
P2
P3
Household Population by Relationship to the Household Head, Household Size andProvince: 1995
Number of Households by Age Group and Sex of Household Head, Household Sizeand Province: 1995
44
•

•
•
•
P4
P5
P6
P7
P8
P9
MI
M2
M3
M4
M5
M6
M7
M8
APPENDIXC
LIST OF UNPUBLISHED TABLES(Continued)
Overseas Workers 10 Years Old and Over by Age Group, Highest Grade Completed,Sex and Province: 1995
Household Population 15 Years Old and Over by Trade Skill Group (Major), AgeGroup, Sex and Province: 1995
Household Population 15 Years Old and Over with Trade Skill by Trade Skill Group(Major and Minor), Manner of Acquisition, Sex and Province: 1995
Household Population 15 Years Old and Over Who Worked At Anytime in the PastYear by Industry Group (Major), Age Group, Sex and Province: 1995
Household Population 15 Years Old and Over Who Worked At Anytime in the PastYear by Industry Group (Major and Minor), Highest Grade Completed, Sex andProvince: 1995
Household Population 15 Years Old and Over Who Worked At Anytime in the PastYear by Industry Group (Major and Minor), Sex, Class of Worker and Province: 1995
Total Population by Age Group, Sex and City/Municipality: 1995
Total Population 10 Years Old and Over by Age Group, Sex, Marital Status andCity/Municipality: 1995
Household Population 10 Years Old and Over by Age Group, Sex, Marital Status andCity/Municipality: 1995
Household Population 5 Years Old and Over by highest Grade Completed, AgeGroup, Sex and City/Municipality: 1995
Household Population by Mother Tongue, Sex and City/Municipality: 1995
Disabled Persons by Age Group, by Sex, Type of Disability and City/Municipality:1995
Household Population 15 Years Old and Over Who Worked At Anytime in the PastYear by Industry Group (Major and Minor), Highest Grade Completed, Sex andCity/Municipality: 1995
Percent Distribution of Household Population 15 Years Old and Over Who Worked AtAnytime in the Past Year by Industry Group (Major), Age Group, Sex andCity/Municipality: 1995
45

APPENDIXD
CPFonnl Republic althe Philippines serial Number
september 1, 1995 NATIONAL STATISTtCS OFFICEManila 698994
NSCB Approval No.A04n-R161-PN 1995 e....... '" p.l"d" ••••
Expires on May 6, 1996 USTING SHEET 1'0,0 __ of __ pages.
GEOGRAPHIC IDENTIFICATION CONFIDENTIALITY CERTIFICATION
Province OJ This census is outhorized .. I her~~y certify lhO!!he listing of households specified below
OJ by Commonwealth Act No, 591 was completed and the dolo set forth were obtained by me
O1y/Munidpol\1y and Executive Order 121. personally in accordance with the instructions.
ITO All informafion ;, held
Barangay strictly CONADENTIAL.
EANo. OJSignature over p~nted nome of EN ' Dote signed
Dole Building Housing House- Inslitu- Nome of Household Head ..I.U"" of Serial Unif hold tionol 0' Address POPulalion Count Remarks
No. Visit Number 5efial Serial serial NomefType oflnsl1tulion
Number Number NumberlFVACANlHOUS!'lGUNIT.\'I/RITEVHU. H<TERHOuseNUMB,RANO l:NC1RClEENlllIESIN,COIS.9,10&11FORIFVACANlBUIUlING,VMrEV8lOO, STREETNAMEORNAMl:OFsmo N511TVIIONAlPOPUlATION
Tolal : 'Male ;1 Female
j1w;K I~ra:, :<OJ';'- '7 'is: ~~.ff&fJW' i0"'~8=:":'~ 3im:~""";&-', Ii /1WJF,,--, "',",°80, ~:=~ti:(Jl ,~, %% ... ; " ~, 01):, W
01 .
02
03
04
05
06
07
08.
09
10
11
12
.
13
1.
15..
16
17
18
19 1
20;
21
22
23
2. .
25
TololNo. Total Household POpj.JJolion.
TolollnsfiMional Population
46
-,

l1NE
NUMBE•
Dale oa:ompllshed
1Pl"
._-of •••••• «......,
"""" •-::;::;:::,?LL Ol
Ll- 02
LL 03
LL 04
LL 05
LL 06
LL 07
"
"""~.'"""'""rn
, ,, ,, ,, ,
, ,, ,
, ,, ,
, ,, ,
, ,, ,, ,, ,
, ,, ,
--141
"""_.ony~....,-~•••••••."""-"""""'""'""""., ro
2 NO. GO TO
"''''''' '"""""
SlgnaluTe over printed nome of EN
I hereby certify that the enumeration of thehousehold specified below was completed and thedata set forth were obtained by me personally inaccordonce W'iththe instructions.
Poge __ of __ pages
Af1esfed to and reviewed by:
-"""., """""'".......,, ""''''''''""""""".•••""'"1Pl312
,..•...•.
LLLLLL
LL
LL
LL
LL
LL
-_ ..•.---,..,.",HOC
(PIli
ENTERCOOE.
'"""'""'"'
Final ResultofVislt
Total No. ofVisils
Une No. of Respondent _
Children 8eIow 15 Yrs. Old
TotolFemoles
2
LLLLLL
LL
LL
LLLLLL
......,
___ TOIol HH Members
Total Moles
5 SAQ 7 O!hers, specify6 Household No! AroundlNo Respondenf Around
2
LL
LL
LL
LL
LL
LL
LL
LL
,,
,,
,,
3 Refused.-
, ,
'",,,,
,,
,,
""", """'onyproblemwf1h_."",""'''''''''-/egs.- onns orany_of••••
knpairmenIs?
'"""'''''''., .,2 NO.SKIP
lOPlO
a.o•••••_.
""",~'"""'""'rn
•cMJsIu/I.Is?
OaleofVlsU"""-
•...•.."""1 Completed2 Portly Completed
""
Republic of the PhilippinesNA110NAL STATISI1CS 0fRCE
Manila
1995 ~ tJ/ 1'''f ••(et*n
HOUSEHOlD QUESTIONNAIREINIBMEW IIKOOD
•••
lSbs_sbirlhmgs--~.#>elCR'?
""MCKUNE.
_.--''''''~o,-"'"-.
"""
Ago
41
JtDEE
,.,,.
,,
,,,,
,,
,,
31
, ,
, ,
-romlSEECOOES"rn
--•••••••_. ,,.k"""""'...-
""""
Clly/Municipul~
Address
Enumeration Area No.
Household Serial No.
W>o is /he '-d Qffhls household?
WIo 0ff11he per$OflS uswIly resJdiI>ghereosol5eplemberl1995'!
un INtHE FOWlWING OIIDEIIM'RITEFAlMVN.w.EFIRSll
'''''SPOUSE Of TH: flEIlDNEVER-MAAll£D CItlDREN OF t£.olDISPOlJSI'
lOlDEST TO YOUNGESIIEVEll-MAlllMO Q-/lDREN OF f£AOlSPOUSE
KlUlEST10'1'OlA'lGESllOTHER MEMBERS
L1NE
NUMBE•
01
03
CPFonn2September 1, 1995
02
07
06
NSCB Approval No.A04n-R162-PN
04
Expires on Maya, 1996
05
OB
< Ari~GnrtJllwP/ItSQIIS#IdJ~ ~~<1!- t1»I~htwe""'liiwI? '
~~'"~,~"'~,::z~,:.1' ii~;l0';;< ~';,«'~~ ,;L2~'.., ~",;<'~'.

itI
~•1
,
..'
//
..~.
.' , -/. . , .';"i .,1
Republic of the PhiIipplne:sNAnoNAL STAT1ST1CSOFRCE
___ 01 __ •••••
Me"'"
1995~ ~ 1'" .feU""
INSTIlUTlONAl POPUlAnON QU5I1ONNA1R£
CPFonn3 GEOGRAPHICI1l£NI1FICATION ~- -- INTIlM1WRECORIl CBlll>lCATION
September 1. 1995 VIslt~.. . _ . .... --- - ,j I heWy certify !hot !he enumcro1ion of Ihi- I-L 1 - • • •••••••••
NSCB Approval No. ""'- - """"'"""" •••••••• I>oloW ...,I DatBofVlslI ---- ---- TolalNo. oflAslls --- completed and !he dtJta set b1h were obtoIncd by
A04n.Rl63-PN ••••••••• """""" ---- ---- ---- rfloI ReslA!oflJl$ll --- me personolty In occordcmce w11h!he Jnstrudlons..Enumeroflon An!o No. --------_._----- """'''''''' ---- ---- ---- Lb:! f'b. of ~ ---
bpIres on Mat 8, 1996 trsIilUlond lMng <Marler IlC» SN -~------_. RMuIlolVISh ---- ---- ---- TOd_ ---, '- -- T""''''''' SlgncJkIm<M!rpm1ad name 01 EN """'~-Type!olll.Q CSEE~ ------------
""'" ---- ---- ---- TOd_ ---NlmeollO T'mo ChIIdreIl8clow 15~_ Old Af1aSIedlO~~by.
....." _of"'"H<Mol'N\.rTtJf!ren:! $It!O!l t«I'MOI tbnil ~ SIlIcl ,- .- , SAO 7~$pl!(l1y._- .- 6 No Respondenl ArOund•••••••••••SIgnalure ~ prtntc!dnarTIlIof IS
AlLl'ERSONS 0 5 YfARS OlD AND OYER
•••••• -.. ••• ••• "" ..-.. - '":.::::::: ,-- --s••••• s•••••I ,.,.., _".~ Imd'>g'" Ie ~ MIg
_. -- _. •_.
0- -".'" _. , rthdfJl'IIJNg/r'!s1 --- .•.-~~ ",,"-~"ooIIt1Itft:Jd l
I__ a.rtJf~L,",P' --' --'''' --'''''' -~--' ,..."." -- -' -- -- _ ... ....,.,... .•... ......~. ,-~"',.., ="'- ...•, ••• -- --, "'--' ",....., ...- ..- -- .....,.•.•..
N . """" ""- -, -•.. F HOI" 1lJPN) • -- --- -''''''' N
E -- (Nml COllE97. ....,.,.. ""- E---' .......- _"'I>epas1 .qpg«I"'~
N,.. ...-~ FIlJPN),A$lt.:.
__ I
N.::t'':ttm ..- --U "'- ~ UM 1St THENM'iS f.waV tuNE. FIl!STIOFAU ""N«RS OF """"""- """ """ -, .""""""- J!'Ol£. £NT81W """"""- """"""- """""". M
• THEN!ifItUTlONAI. POFU.A1lON •• THE(lllD[lI' lISTIO ~ "'''''''' 1'YE5,.0«cr;; """. """. _ ••... od""", •••• N4fJSI':I'TOPl3 I """"'" , '" "'''''''' •THEO:X:Oroflli!3lDDlCE SlAM. •••• ""- I .... '" """"'''''''- .- ••••••• 2 NO.GOTO ••••E , ""'" ""'" I '" .- , """""'" ..- E, •••• 2 NO.SI:F TO """""", ..- ,
" •••,-I " I
~ , , LL LL LL I • IT01 • ~ , ", "
01
~ I • LL LL LL I • IT., •. ~ , ", "
.,~ , • LL LL LL , • LL03 •. ~ , " • "
03
~~l- I .. LL LL LL , • LI••• •. =-- , " • " ••-- ~l-l- I • LL LL ,,,LL , • LIOS • ~ , " • "
OS
~.~, • LL LL LL , • LL06 •. ~ , " , "
06
~.~, • LL LL LL , • LL07 •. ~ , "
, "07
~~ ., • LL LL LL , • LL03 • -- , " • "
03
••••~ , • LL LL LL , • LL09 •. _ C • " • "
09
- -- , • lL LL LL , • LL10" 10•. ~ • " • "
1ft~n'IOM'" lOrncmbo:ri';tis~1iIq ~ 1. Y-.._gnoIwJlQOlt:. • No,
" "
00..•.

0," .- OOQll~
I":."-~ j~ .•. -- ~ LIBRARY ti./ 1995 ~ 01 'PD/ZediJiifJ#."
/,- ", / IIIP!M ~" -/~
REPORT NO. 2
Abra 2 - I N Kalinga 2.48 NAgusan del Norte 2 - 2 P La Union 2.49 AAgusan del Sur 2 - 3 P Laguna 2.50 DAldan 2 - 4 F Lanao del Norte 2 - 51 LAlbay 2 - 5 E Lanao del Sur 2.520Angeles City 2.6C Leyte 2 - 53 HAntique 2 -7 F Lucena City 2 - 54 DApayao 2.8 N Maguindanao 2 - 55 0Aurora 2.9 D Mandaue City 2.56 GBacolod City 2.10 F Marawi City 2 - 57 LBaguio City 2 -liN Marinduque 2 - 58 DBasilan 2 -12 1 Masbate 2 - 59 EBataan 2 -13 C Misamis Occidental .2.60JBatanes 2 -14 B Misamis Oriental 2 - 61 JBatangas 2.15D Mountain Provi~ 2 - 62 NBenguet 2 -16 N National Capitaltegion 2 - 63 MBiliran 2-17H Negros Occidenc,.l 2 - 64_F~~
" ,Bohol 2 -18 G Negros Oriental ~-'65GBukidnon 2 -19 J Northern Samar , (2-66H
,~ Bulacan
J
2 -20 C Nueva Ecija '2 - 67 CButuan City 2,,21 P Nueva Vizcaya 2'.68 BCagayan 2 :22 B Occidental Mine 2.69.DCagayan de Oro City 2 -23 J Olongapo City 2 -70 CCamarines Norte 2 -24 E Oriental Mindo; 2 - 71 D
~
JCamarines Sur 2.25 E Palawan 2.72DCamiguin 2 -26 J Pampanga 2 - 73 CCapiz 2 -27 F Pangasinan 2 -74 ACatanduanes ~ 2 -28 E Quezon 2 - 75 D• qCavite 2.29D Quirino 2.76 BCebu
,2.30 G Rizal 2-77D
Cebu City oj 2.31 G Romblon 2.78 DCotabato ...•. -1~):!L__ Samar 2.79 H, -~,Cotabato City - 2.80 K-..Davao }I .....
2 - 81 G._1Jth
Davao City 2.35 K Sorsogon 2 - 82 EDavao del Sur 2 - 36 K South Cotabato . 2 - 83 KDavao Oriental 2 - 37 K Southern Leyte 2-84HEastern Samar ' 2. 38:H Sultan Kudara! 2 - 85 LGeneral Santos City 2.39K. . Sulu 2.860Guimaras 2.40 F Surigao del Norte 2.87 Plfugao 2 - 41 N Surigao del Sur 2.88 PlIigan City 2 - 42L Tarlac 2 "89 C•'1'" 1I0cos Norte 2 - 43 A . , Tawi-Tawi. . 2.900"\
-'\. 1I0cosSur 2 -.44 A Zambales 2.~I.c\ •~Iloilo ~ 2.45 F Zarnboanga City /', 2 '921 •",/ '. '';;s• Iloilo City 2.46 F Zamboanga del Norte I 2-93~ •Isabela . 2 - 47 B Zamboanga del Sur 2.941
(.L,.'. - -- -,' '., .