Embed Size (px)
Citation preview

Report No. 15898-PH
PhilippinesEducation Financing and Social Equity:A Reform AgendaJune11, 1996
Human Resources Operations DivisionCountry Department IEast Asia ancl Pacific Region
Document of the World Bank
Pub
lic D
iscl
osur
e A
utho
rized
Pub
lic D
iscl
osur
e A
utho
rized
Pub
lic D
iscl
osur
e A
utho
rized
Pub
lic D
iscl
osur
e A
utho
rized

CURRENCY EQUIVALENTS(As of April 1, 1996)
Currency Unit = PesoUS$1.00 = Pesos 25US$0.04 = Peso 1.00
WEIGHTS AND MEASURES
1 Meter (m) = 3.28 Feet (ft)I Kilometer (km) = 0.62 miles
FISCAL YEAR
January I - December 31
ABBREVIATIONS AND ACRONYMS
COA Central Office for AuditingDECS Department of Education, Culture and SportsESC Educational Service ContractingGASTPE Government Assistance to Students and Teachers in
Private EducationIRA Internal Revenue AllotmentLGC Local Government CodeLGU Local Government UnitMOOE Maintenance and Other Operating ExpendituresNCR National Capital RegionNEDA National Economic Development AgencyNGO Non Governmental OrganizationNMYC National Manpower and Youth Council (renamed TESDA)PTA Parent-Teacher AssociationPY Project YearSUC State University and CollegeTEI Teacher Education InstitutionTFS Tuition Fee Supplements

Table of Contents
I. Summary and Recommendations ........................................... 1
1.1 Summary ......................................... 11.2 Recommendations ......................................... 5
II. Education Finance ........................................... 9
2.1 Central Government Financing ......................................... 92.2 Local Government Financing ........................................ 212.3 Private Financing ........................................ 242.4 Synthesis ........................................ 26
III. Major Issues...................................................................................................................29
3.1 Education and Poverty ........................................ 293.2 Fiscal Decentralization and Equity ........................................ 333.3 Social Targeting ........................................ 363.4 Public Versus Private Education ........................................ 453.5 Cost-Effectiveness In Public Education ........................................ 53
Annex 1: Poverty and Regional Equity in Basic Education .......................................... 60Annex 2: Selective Evidence on Local Education Financing .......................................... 70
This report is based on sector work conducted in 1994-95, as part of the identification of a Third Elementary EducationProject. The report has been prepared by Antoine Schwartz (PSP, Senior Economist), with the assistance of ArbenBakllamaja (consultant), and Francoise Delannoy (EA1IR, Task Manager). William McCleary (EAIDR) guided thecompletion of the report; Birger Fredriksen (AF5CO) and Emmanuel Jimenez (PRDPH) were the peer reviewers.Special thanks go to Vajeera Dorabawila (consultant) for statistical support, and to Gay Santos (PSP) for wordprocessing.
i

List of Tables
Table 2.1 Central Government Education Expenditure Recent Trends ......................................9Table 2.2 Evolution Of Government Education Financing 1985-95,
By Category Of Exp enditure ................................................ 11Table 2.3 Teacher Remuneration Intra-Sectoral Distribution Of Expenditure .......................... 12Table 2.4 Government Financing, By Level And Type Of Education Administrative
Versus Operational Expenditures ......................................................... 14Table 2.5 Functional Distribution Of The 1994 DECS Budget ................................................. 15Table 2.6 Actual Versus Budgeted DECS Expenditure Recurrent Expenditure Per Student ... 17Table 2.7 Recurrent Expenditure Per Student ......................................................... 19Table 2.8 Evolution Of Per Student MOOE In Basic And Tertiary Education ........................ 20Table 2.9 LGU Education Financing By Expenditure Category (% Distribution) ................... 22Table 2.10 Total Expenditure By Level Of Education And Source Of Financing (1994) .......... 26Table 2.11 Changing Pattern Of Education Financing 1986-94 .................................................. 27Table 3.1 Family Income, School Participation And Completion ............................................. 29Table 3.2 Reasons For Not Attending School (Lowest 30% P.C. Income Group) ................... 31Table 3.3: Comparative Nutrition & Health Indicators .......................................................... 32Table 3.4: School Performance: Eastern Visayas Region Vs. NCR ........................................... 33Table 3.5: DECS Resource Allocation: E. Visayas Region Vs. NCR ......................................... 37Table 3.6 School Staffing Characteristics: E. Visayas Vs. NCR ............................................... 42Table 3.7 Unit Recurrent Cost Of Public And Private Schools
By Level Of Education (1994) .46Table 3.8 Unit Operating Costs As Percentage Of GNP Per Capita: Philippines Versus
Comparators In The Region ..................... 47Table 3.9 Private/Public Unit Cost Ratios ..................... 48Table 3.10 Comparative School Performance Indicators In Basic Education
(Private/ Public Performance Ratios) .49Table 3.11 Cost Sharing In Public Education, 1986-94 (Government And Private
Shares In % Of Total Unit Cost) .51Table 3.12 Teaching Versus Non-Teaching Decs Staff In 1992, By Level Of Education
(Percent Of Distribution) .................................................. 56
Box 3.1: Relative Incidence Of Private Educational Costs .................................................. 52
List of Figures
Figure 2.1 Evolution of Per Student Recurrent Expenditure by Level of Education ............... 18Figure 3.1 Poverty and Elementary School Completion (1991) ................................................ 30Figure 3.2 Regional Income and Per Student SEF Expenditure (1994) .................................... 35Figure 3.3 Government Basic Education Expenditure Per Student (1994) and Poverty
Incidence by Region .38
ii

I. Summary and Recommendations
1.1 Summary
1. This report is primarily, but not exclusively, concerned with the financing of publicelementary and secondary education. Both levels, referred to as basic education, are. theresponsibility of the Department of Education, Culture and Sports (DECS). In addition to theDECS budget, central government resource allocations for the education sector as a whole includebudget appropriations for State Universities and Colleges (SUCs), and for the National Manpowerand Youth Council (NMYC) responsible for non-formal manpower training and skills upgradingprograms. Basic education absorbs over 90 percent of DECS' operational budget.
2. Constitutionally, education in the Philippines commands the highest priority in the inter-sectoral allocation of Central Government resources. In reality, several factors have contributed tolimit the volume of effectively available budget resources: an extended period of slow economicgrowth; insufficient public resource mobilization; the heavy burden of the national debt; and theincreasing transfer of central government resources to Local Government Units (LGUs) since theenactment of the new Local Government Code of 1991. Net of debt service and Internal RevenueAllotment (IRA) to LGUs, budget allocations for education absorb close to 30 percent of totalavailable resources. This is a high proportion by international standards, even though it representsless than 3 percent of GNP. Overall, the prospective growth of government funding for the sectorthus depends on future overall improvements in economic and fiscal management, rather than onincreased allocations from the national budget.
3. At the same time, expansion of the public education system and the need for essentialquality improvements, many of which mandated by Congress, generate substantial incrementalfinancing requirements. The growing tension between available resources and financing needsunveils itself in two ways: (i) a gradual erosion of recurrent non-personnel expenditure per student,particularly in basic education (Table 2.8); and (ii) increasing cost-sharing for public educationservices by households and LGUs. The first trend primarily affects the quality of education deliveryin public schools. The second has potentially adverse equity implications with regard to thedistribution of educational outcomes among regions and population groups.
4. Financing constraints in public elementary and secondary schools are reflected insteadily rising student/teacher ratios and inadequate funding for essential non-salary operatingexpenses. Relative to student enrollment, budget allocations for Maintenance and Other OperatingExpenditure (MOOE) are incompatible with delivery of quality education. Moreover, a substantialportion of DECS' budget appropriations for MOOE is channeled to the administration rather than tooperations. At the school level, LGUs and parental contributions thus appear to be the principalsources of MOOE financing.

5. So far, education spending from private and LGU sources has amply compensated theshortfall in central government financing. Since the mid-1980s, more than half of the increase innational spending on education originated from private sources (Table 2.11). Education expenditurefrom all sources combined thus represented 6 percent of GNP in 1994, altogether a substantialcommitment of national resources. At issue, therefore, are the distribution, composition and qualityof this national investment, rather than its magnitude.
6. Private financing flows both to private and public schools. Private schools, accountingfor a substantial share of post-elementary student enrollment (33 and 79 percent at the secondaryand tertiary level respectively), are a vital element of private sector involvement in education. Overthe past decade, however, the role of the private sector as co-financier of the public educationsystem has expanded more rapidly than private education itself. It is this phenomenon that deservesparticular attention in view of its underlying efficiency and equity implications (Section 3.4).
7. Parents in the Philippines, eager to capitalize on relatively high private returns, showgreat willingness to invest in their childrens' education. In such an enabling environment,Government's role is to promote social equity in access to quality education, particularly at theelementary level, without discouraging private sector involvement. The evidence, however, showsthat Government has failed to sustain adequate funding for public elementary education, whilesimultaneously increasing subsidization of higher education institutions. As a result, the bulk of theincrease in cost-recovery for public education has been concentrated at the elementary level, wherehouseholds now shoulder close to one-third of the total cost, compared to only about 10 percent inthe mid-1980s (Table 3.11).
Equity
8. There is a fundamental equity problem in basic education, particularly at the elementarylevel, with potentially serious long-term consequences for the poor and the country's developmentprospects. At the elementary level, where the school infrastructure is extensively developed andopportunity costs are still relatively low, poverty affects school completion rather than initialaccess. Overall, one out of three children entering first grade does not complete the elementarycycle. Underlying this national average are such extremes as near-universal completion in the mostaffluent areas, and over 70 percent non-completion in the poorest provinces in Mindanao and theVisayas. Surveys among out-of-school children confirm the strong incidence of economic factorson school participation, particularly among post-elementary age groups (13-24). Malnutrition andpoor health care are also important factors preventing active school participation among the poor.
9. There is evidence of significant regional differentials in the quality of educationalservices provided in public schools. The poor receive a lower quality education, not only becausethey attend public rather than private schools, but also because the quality of public education iscomparatively lower in poor areas. Quality differentials are strongly related to the regionaldistribution of educational inputs, particularly as regards teaching and school management. Forinstance, the poorest regions have the highest proportion of inexperienced teachers, as well as thehighest proportion of schools without principal, and school districts without supervisor.
2
10. Fiscal decentralization and devolution have generated winners and losers among LGUs,essentially because the incremental cost of devolved services bears little relation with thedistribution of extra income. Although public education has not been devolved to LGUs, financingconstraints at the central level are de-facto leading to selective decentralization of educationfinancing. Winners among LGUs have resources available for extra support to public schools.They do so voluntarily, each according to means. As a result, there is a danger that the educationquality gap between rich and poor areas will increase.
11. Present criteria and procedures underlying DECS' regional budget appropriations do notaim at counterbalancing the regressive impact of fiscal decentralization on local educationfinancing, not to speak of redressing initial inequities. An overriding issue, in this context, is thelack of a coherent DECS strategy for actively targeting resources towards the most pressing needs,the most disadvantaged areas or population groups. The issue is essentially political. Thereappears to be great reluctance on the part of the national and local legislature to face theimplications of the country's considerable geographical, cultural and social diversity, and acceptdiscriminatory use of national resources for the sake of addressing priority regional needs. As aresult, DECS is largely deprived of the authority and control required for effective social targeting.
12. Ineffective targeting is apparent in all budget categories. The absence of a truly coherentnational strategy for the expansion of the public school system, and DECS' lack of effective controlof locally financed school construction, often lead to unplanned additional claims on the recurrentbudget. This, in turn, further reduce DECS' flexibility for effective expenditure targeting. Severalallocation rules, particularly as regards sector staffing, are based on nation-wide student enrollmentcharacteristics. These rules are applied uniformly throughout the country, regardless of specificlocal circumstances, actual needs and priorities, and tend to favor urban over rural areas.
13. Social targeting has inspired the creation of the GASTPE program (GovernmentAssistance to Students and Teachers in Private Education), funded through the DECS budget, toenable youth from lower income households to attend private high-schools and colleges. The bulkof the program's support, channeled through tuition fee supplements (TFS) for students, andeducational service contracting (ESC) with private schools, is aimed at the secondary level.Although innovative in design, and impressive in size, the program has a major flaw. For a givenbudget allocation, the GASTPE program has essentially sought to maximize the number ofbeneficiaries -- these currently represent about half of total private secondary enrollment. As aresult, the benefits are substantially below the actual cost of private schools. This has twoconsequences: (i) TFS students are required to pay the difference between subsidy and actual cost,which eliminates a large segment of the target population; and (ii) the better private schools, unableto collect their full operating cost from ESC beneficiaries, are withdrawing from the scheme.
14. The "nationalization" of village highschools in 1988 was another attempt at socialtargeting. Village highschools, previously funded by LGUs, practiced a significant degree of cost-recovery through tuition and other fees. Nationalization, which entailed elimination of all fees, wasthe expression of the guarantee of free universal access to basic education adopted in the 1987
3
Constitution. The measure generated a sharp increase in financing requirements. Since then,Government has been unable to adequately sustain this additional commitment.
Cost-Effectiveness
15. In view of the relatively low levels of unit recurrent expenditure, there does not seem tobe ample room for immediate cost savings in the operation of the public education system. In thelonger term, the most promising venue for increasing the cost-effectiveness of the system is toimprove its internal efficiency, with particular focus on the country's lowest performing schooldivisions and districts. However, this requires substantial initial investment in qualityimprovements.
16. There is scope, however, for reducing the cost to the national budget of the ratherinefficient State Universities and Colleges, essentially by promoting much higher cost recovery foreducational services, and giving them greater financial autonomy. Management and financialdecentralization would also make these institutions more responsive to the specific needs of thevarious regions, hence foster the external efficiency of their program offerings.
17. Thirdly, special efforts need to deployed to improve the effectiveness of budgetaryprocesses in DECS. At present, the expenditure monitoring system is weak. The recording ofactual expenditure commitments does not match the detailed format of initial budgetappropriations. It is therefore difficult to monitor the actual implementation of specific budgetprograms and objectives. A particular concern, in this respect is whether and to what extent MOOEappropriations, a large proportion of which is not directly allocated to operations, are eventuallyused for the intended purpose.
Government Strategy
18. Government's education strategy, the result of an extensive national consultation effort,is essentially directed at improving the quality of basic education, with major emphasis on theelementary cycle where achieving universal completion is a must. A major, and potentially costlyissue to be resolved, in this context, is the need to increase the length of the secondary cycle fromfour to five years. A beginning has been made with the rationalization of budget support for theState Universities and Colleges, but without appreciable savings. Subsidization remains input-rather than performance-based.
19. Government is conscious of the equity issues facing the public education system. So far,these are essentially being addressed through the Presidential Task Force for the Fight againstPoverty, with the participation of DECS. The task force has designed a development strategy for20 Priority Provinces, with an integrated basic education component (See Annex 1, Figure 2). Thisis certainly a commendable first step. It is to be hoped, however, that this strategy will not lead toneglect of poverty-related education priorities in non-selected provinces, or foster uniform
4

approaches to widely different regional needs and circumstances.1 Moreover, the sustainability ofthe adopted strategy will only be assured if criteria and procedures for recurrent budgetappropriations are adjusted accordingly.
1.2 Conclusions and Recommendations
20. Inadequate government funding has led to a substantial increase in cost-recovery inpublic schools, particularly at the elementary level. Public schools today are relatively moreexpensive for lower income households than private schools are for upper income households. Inview of the rather inequitable distribution of income in the Philipines, / the emerging imbalancebetween public and private education financing affects a relatively large segment of the population.Continued reliance on private sources to meet the shortfall in central government financingtherefore increasingly requires compensatory measures to protect the poor.
21. Overall, student enrollment at the elementary level is lagging behind the rate ofpopulation growth. At the same time, enrollment in public elementary schools is growing at a muchlower rate than in private schools, suggesting that the private cost burden may have reached acritical level for lower income households. There are three venues to reduce this burden: (i)improving the efficiency of education delivery (see Section 3.5), so as to reduce the need for extrafinancial contributions from parents; (ii) increasing cost-sharing with LGUs where further possible,with selective targeting of central budget support towards disadvantaged areas; and (iii) directsubsidization of private costs for children from the poorest households.
22. Providing free access to secondary schooling of adequate quality would require asubstantial increase in government funding. Cost-recovery at that level need therefore not bereduced. However, greater and, above all, more effective support for students from lower incomehouseholds is a must. In this respect, public school fees should be regularized, notwithstanding theconstitutional guarantee of free access. At the tertiary level, both the extent of cost-recovery and thecost-effectiveness of programs and operations ought to be targeted for drastic improvement.
23. Government's sector objectives call for considerable additional resources to be channeledto public elementary and secondary schools, particularly in view of the need for lightening the costburden of school participation to the poor. Since education already absorbs a substantial part of thenational budget, the required additional resources will have to be mobilized primarily through:
* Reallocating resources within the overall education sector budget towards basiceducation;
These issues are being are being addressed in the proposed Third Elementary Education Project, identified jointly by DECS and theWorld Bank, which would promote bottom-up participatory planning processes geared to meet specific needs in targeted areas. Thelatter would not be limited to the 19 priority provinces.2 According to the 1991 Family Income and Expenditure Survey, 39 percent of households have a per capita income below thepoverty threshold (47 percent of rural households). See The Philippines: A Strategy to Fight Povert. World Bank Report No.14933-PH, November 1995.
5

* Reassessing expenditure priorities for central government funding in the sector;
* Raising the cost-effectiveness of DECS' operations and programs.
In the implementation of the national education agenda, moreover, DECS should aim atmaximizing the social returns of its activities and programs by seeking more effective ways oftargeting resources towards priority needs.
Increasing available resources
24. Increasing resource availability for DECS can be achieved in two ways; i.e., by: (i)increasing DECS' share in the total education sector budget; and (ii) rationalizing expenditurewithin DECS' budget.
(a) A first step for DECS to gain more financial room for addressing priority needs in thesector would be to devolve some of its present responsibilities (e.g. school constructionand maintenance) to LGUs. DECS would provide selective compensatory financing todisadvantaged LGUs. This support would have to be granted in ways that do notdiscourage local taxation efforts, nor the extent of local resource commitment toeducation -- an Education Resource Equalization Fund, providing matching grants,might be considered in this context
(b) The burden of State Universities and Colleges on the central government budget ought tobe substantially reduced, and the savings reallocated to basic education (DECS). Thiscould be achieved by promoting fuller cost recovery, decentralized financing, and greaterfinancial autonomy for these institutions. Continued subsidization from the nationalbudget should be selective, reflecting national priorities, rather than across the board, andbased on output performance rather than input criteria. Equity considerations would ofcourse require higher cost recovery to be accompanied by compensatory adjustments inexisting scholarship and student loan programs. Since many SUCs are the product oflocal initiative, serving regional needs, such adjustments, to a large extent, could be co-financed by LGUs.
(c) DEC S' elementary and secondary school construction program, to the extent that it is notdevolved to LGUs, needs to be reassessed, considering the fact that not every barangayneeds or can accommodate an elementary school, nor every municipality a highschool.At the elementary level, expansion of the school network is clearly becoming a lowerpriority than proper maintenance of the existing stock, a relatively large part of which isin dilapidated condition. Moreover, construction activities likely to be financed fromother sources need to be taken into account and coordinated, if only to minimize thelikelihood of unexpected subsequent claims on DECS' recurrent budget. Evidencefurther indicates that substantial savings, as well as quality gains, could be realized, by
6
entrusting the implementation and supervision of construction activities to localauthorities and PTAs.
(d) Rationalizing budget management processes in DECS is a necessary condition forachieving greater cost-effectiveness in the various programs and operations. Inparticular, better coordination between budget preparation and execution, moretransparency in budget commitment and disbursement procedures, and more functionaland systematic monitoring of actual expenditure are needed to insure that strategic sectorobjectives are being met. In a continuous perspective, improving budget managementprocesses would also contribute to reduce the incidence of stop-go financing patterns thathave adversely affected various educational programs and operations over the years.
Effective targeting of available resources
25. With more resources at its disposal, DECS should strive to: (i) consolidate and sustainpresent quantitative achievements in basic education; and (ii) move towards nation-wideimplementation of its quality improvement strategy, particularly at the elementary level; while (iii)targeting a higher proportion of expenditure towards the most disadvantaged areas and populationgroups. Social targeting will be most difficult, because it is a politically sensitive topic in anycountry, and because DECS, at present, does not have sufficient control over the use its ownresources. While one should obviously strive for what is politically feasible, there are nonethelessseveral improvements that appear to be implementable within the prevailing constraints.
(a) In general, and wherever possible, DECS should attempt to improve the extent andefficiency of expenditure targeting, away from the prevailing principle of strictproportionality -- i.e., per student, per teacher, or per classroom allocations, or otherstandard norms applied throughout the country -- towards addressing priority needsidentified at the basis of the education system. This implies deconcentration of sectormanagement, program budgeting and execution.
(b) Overall, budget appropriations for MOOE ought to be increased substantially, both atelementary and secondary levels. Regional allocations, however, should again be basedon actual needs. In operations, expanded provisions for MOOE should flow directly toschools. This will prove to be an essential condition for successful implementation ofDECS' stated strategy towards empowering school principals.
(c) Prevailing norms underlying sector staffing and allocation of educational inputs tend tohave an adverse impact on cost-effective use of available resources. With regard tostaffing, for instance, student per class criteria used for the attribution of teacherpositions promote padding of student enrollment declared by schools. It isrecommended that a thorough assessment of such rules and their effects be conducted, inorder to identify possible remedial changes.
7

(d) Improving the quality and retention of public elementary schools is rightly one of thecornerstones of Government's fight against poverty, hence the first priority in terms ofintrasectoral allocation of additional resources. Nonetheless, funding for secondaryeducation needs to be increased as well, and quite substantially so if, in addition toquality improvement, the Constitution's commitment to free universal access to basiceducation is to be sustained. Moreover, raising learning achievements to internationalcollege-entrance standards will eventually require the secondary cycle to be lengthenedfrom four to five years. In view of the financing needs of the public secondary educationsystem, the justification for government subsidization of private secondary schoolsthrough the GATSPE program would seem questionable.
(e) There appears to be a rather large salary differential between teachers in teachingpositions and teachers in non-teaching positions, in favor of the latter. Teachers arepromoted into non-teaching positions on the basis of seniority and, in principle, of merit.As a result, teaching tends to lose its most qualified practitioners. It may thus beworthwhile to consider extending career opportunities within the teaching profession.
(f) The justification of the GATSPE program, in its present form, needs to be reassessed. Inany case, if this program is to benefit students from lower income households, and toprovide access to private education of acceptable quality, it might be wiser to increasethe level of subsidization per student, even if it means reducing the number ofbeneficiaries. Means testing for the selection of beneficiaries is a must.
(g) There is convincing evidence of a strong adverse impact of economic factors on schoolparticipation rates. Out-of-school youth represents as much as 18 percent of the 7-12 agegroup. A case can therefore be made for subsidizing elementary school participation forchildren from the poorest households, in order to reduce the private cost of education.
(h) Surveys also reveal a relatively high incidence of health-related reasons for non-participation among elementary school age children. Systematic institutionalization ofschool-based feeding and preventive health care programs in the poorest areas thereforeought to be considered.
8

II. Education Finance
2.1 Central Government Financing
26. Constitutionally, education commands the highest priority in the inter-sectoral allocationof government resources.3 At first view, however, the education sector4 appears to receive a rathermodest share of the national budget (Table 2.1): 13-14 percent of total expenditure (15-16 percentof recurrent expenditure) in the period 1991-93. Two factors account for this outcome: (i) theheavy burden of the national debt; and (ii) increasing Internal Revenue Appropriations (IRA) toLocal Government Units (LGUs) since the enactment of the new Local Government Code of 1991.Debt servicing absorbed over 40 percent of the national budget in that period, and the incidence ofIRA transfers increased from 4 percent of the budget in 1991 to about 12.4 percent in 1993. Net ofthese two obligations, budgetary allocations to education represented 28 percent of effectivelyavailable government resources; altogether an appreciable level of commitment.
Table 2.1 Central Government Education Expenditure al
Million Pesos % of National BudgetYear Current 1993 ExI. Debt & % of GNP
Prices Prices Total IRA
1985 8,371 16,961 10.5 15.1 1.51986 14,046 28,235 12.7 19.5 2.41987 15,730 30,484 13.0 33.5 2.31988 20,716 36,895 15.2 33.7 2.61989 26,741 42,221 15.5 32.0 2.91990 32,922 45,772 15.1 31.4 3.01991 32,873 38,492 13.3 28.4 2.61992 36,633 39,422 13.6 26.2 2.61993 38,015 38,015 13.5 28.8 2.51994 b/ 46,184 42,377 14.3 31.4 2.61995 55,324 47,440 14.0 26.0 2.8
Sources: DECS, DBM, NSCB; 1994 General Appropriation Act, 1995 General Appropriation Bill.a/ DECS, SUCs and NMYC combined (actual expenditure).b/ Estimate.
27. The actual volume of resources available for education financing has also been limited asa result of inadequate resource mobilization, which so far kept government revenues at a relativelymodest proportion of national income. All in all, the ratio of government education expenditure toGNP, about 2.5 percent on average through 1991-93, is among the lowest in the East Asia region.
3The 1987 Philippine Constitution indeed prescribes that education should be guaranteed the largest appropriation from the nationalbudget.41.e., the combined budget of DECS, the State Universities and Colleges (SUCs), and the National Manpower and Youth Council(NMYC).
9

Finally, an extended period of low economic growth (about 1.2 percent p.a. on average between1989 and 1993) further constrained the level of available government resources.
Recent Trends
28. The evolution of government education financing since the early 1980s mirrors the sharpups and downs of the Philippine economy in that period: (i) severe adjustment and fiscal austerityduring the first half of the 1980s; (ii) rapid economic expansion throughout the remainder of thedecade following the demise of the Marcos regime; (iii) recession and renewed fiscal austerity inthe early 1990s; and (iv) recovery since 1994 onwards.
29. The effects of economic adjustment and fiscal austerity during the first half of the 1980swere severely felt in the education sector. Government spending for education declined by about30 percent in real terms during that period, and was down to 1.5 percent of GNP in 1985. Thefinancial crisis affected the quality and, to a lesser extent, the expansion of the public educationsystem. Enrollment in public schools continued to increase at all levels, but at substantially lowerrates than during the previous decade. The slowdown was particularly significant at the elementarylevel, where the growth of enrollment fell below the rate of population growth. Real salaries ofteaching staff declined dramatically, both in absolute terms and relative to comparable public andprivate sector employment.
30. From the very beginning, the Aquino Administration initiated a drastic increase inresource allocation to the sector, from less than 10 percent of the national budget in 1985 to 15.5percent in 1989.5 Total government expenditure for education increased almost fourfold during theremainder of the decade, reaching 3 percent of GNP in 1990. A substantial part of this increase wasabsorbed by upward salary adjustments. Under the 1989 Salary Standardization Law, teachers'basic salaries were upgraded by 76 percent. This adjustment was subsequently extended to the restof the civil service, so that the relative position of teachers was only moderately improved.
31. Two important measures further contributed to increase sector financing requirements inthat period. First, in 1988 DECS took over the operation of village high-schools, previously fundedby LGUs. This "nationalization" was essentially inspired by concern for the relatively low qualityof educational services delivered in those schools, and by the commitment towards universal freeaccess to basic education (i.e., including the secondary cycle) expressed in the 1987 Constitution.Moreover, it was feared that the uncontrolled proliferation of these schools would lead to therecruitment of less qualified teachers. Village high-schools practiced a significant degree of cost-recovery through tuition and other fees. The abolition of such fees in the nationalized schoolsgenerated a considerable additional increase in public secondary enrollment. The financialconsequences of this measure were reflected in a four-fold increase in DECS spending onsecondary education between 1987 and 1990.6
5Measured in terms of effective govemment resources (i.e., net of debt service and IRA), the share of education peaked at 33.7gercent in 1988.
From P1.5 billion in 1987 (10 percent of the total education budget) to P6.7 billion (20 percent of the education budget) -- see Table2.2.
10

32. Secondly, a program for Government Assistance to Students and Teachers in PrivateEducation (GASTPE) was launched in 1989. The GASTPE programn was essentially designed toprovide financial assistance to students from lower income families enrolling in private highschoolsand tertiary institutions. The program started with an appropriation of P590 million (2.5 percent ofDECS' 1989 recurrent budget). Funding was gradually increased to P953 million in 1993, butdeclined afterwards.
33. The nationalization of village highschools in 1988, and the inception of the GASTPEprogram in 1989, are estimated to have absorbed about 40 percent of the total 1985-89 increment inthe DECS budget. The latter was so generous, however, that ample room was left for expansion ofother outlays, both recurrent and capital (Table 2.2). Incremental allocations for maintenance andother operating expenses (MOOE), for instance, far exceeded the overall growth in publicenrollments -- in real terms, MOOE per student grew by about 17 percent per year in that period.
Table 2.2 Evolution of Government Education Financing 1985-95,by Category of Expenditure a
1985-89 1989-93 1993-95 1985-95I. Average Real Growth p.a.:
Total Education 25.6 -2.6 11.7 10.8
DECSPersonnel Services 26.9 -1.4 13.6 12.1MOOE W 21.4 2.0 5.6 10.1Total Recurrent Exp.cl 27.2 -1.1 11.5 12.0(Same, per student) (22.8) (-3.1) (9.0) (8.9)Capital Expenditure 47.0 -26.6 28.9 8.4Total 28.2 -2.4 11.9 11.9
1985 1989 1993 1995II. Distribution of DECS Exp. (%):
Personnel Services 83.2 80.0 82.6 84.7MOOE 12.6 10.1 12.1 10.7GASTPE - 2.6 3.0 1.5Total Recurrent Expenditure 95.8 92.7 97.7 96.9Capital Expenditure 4.2 7.3 2.3 3.1Total 100.0 100.0 100.0 100.0
Sources: see Table 2.1Total education includes the SUCs and NMYC. Actual expenditures for 1985-93 and estimated actual for 1994-95.
b/ Excluding GASTPE.et Including GASTPE.
34. Recession and renewed fiscal austerity in the early 1990s brought an end to the rapidexpansion of government's education sector spending. Allocations to the education sector fell backto 13-14 percent of total government expenditure throughout 1990-93, equivalent to 2.6 percent ofGNP. Total expenditure for education, in real terms, declined on average by 2.6 percent per yearbetween 1989 and 1993, and the overall cost of DECS personnel services by 1.6 percent per year.
11

The volume of MOOE per student is on a downward trend since 1990. Capital outlays underwentdrastic cuts, both in 1992 and 1993.
35. The pace of education spending picked up again in 1994, essentially as a result of newgovernment-wide salary adjustments. On balance, a considerable improvement in the sectorfinancing situation has thus been achieved during the last decade. Nevertheless, in view of thebleak initial conditions, it appears unlikely that this improvement was sufficient, overall, to fullymeet the growing quantitative and qualitative needs of the public education system. There are fourareas of concern, in this respect: (i) the rapid increase in salaries; (ii) the erosion of MOOE; (iii) thechaotic year-by-year evolution of the various categories of expenditure; and (iv) the adverse impactof fiscal decentralization on DECS' effective budgetary resources.
36. Salaries. Overall, the total compensation package of teachers recorded a fourfoldincrease between 1985 and 1995, equivalent to a 5 percent annual improvement in real income.Although this compares favorably with the 1.4 percent growth of per capita GDP achieved duringthe same period, the evidence suggests that the remuneration level of public school teachers is stillrelatively moderate (Table 2.3). Not suprisingly, therefore, the raise in basic teacher salaries andother compensations granted in 1994 and 1995 are part of a longer term package, with additionaladjustments in the pipeline. Taking into account normal wage drift and incremental recruitrnent,this could end up boosting DECS' wage bill to an even much larger extent. Crucial non-salaryoutlays are thus at risk of being crowded out under the mounting pressure of personnel costs.
Table 2.3 Teacher Remuneration
Ratio of Teacher Salary' to:Poverty Threshold Minimum Wage GNP per Capita
1985 .9 1.1 2.01988 1.2 1.6 2.41991 1.1 1.3 2.41994 1.2 1.3 2.5
Source: DECS; Philippine Statistical Yearbook; World Bank.aStarting salary elementazy teacher (including various allowances)
37. MOOE. On a per student basis, this category of expenditure has been on a downwardslide since 1990. The overall recovery in government education spending in 1994 did not interruptthis trend. And although budget appropriations for MOOE suggest a sizable increase for 1995, pastdiscrepancies between budget allocations and actual spending raise some doubt as to whether thebudgeted increase has been fully realized. In total, MOOE per student declined by as much as 34percent in real terms between 1991 and 1994. This erosion of earlier achievements is a source ofconcern, as it may have significant adverse impacts on school maintenance and the provision ofessential educational inputs. In addition, there are serious questions as to the proportion of MOOEactually reaching down to the school level.
12

38. Stop-go financing patterns. Underlying the evolving trends illustrated in Table 2.2, arerather wide year-to-year fluctuations in expenditure patterns, particularly as regards capitaloperations and MOOE. The resulting unpredictability of funding levels frustrates rationaleducational planning efforts, and is a major impediment for effective sector management.
39. Fiscal decentralization. Rising IRA transfers to LGUs have exacerbated DECS'resource constraint. According to the new Local Government Code of 1991, the financialresponsibility for school construction and maintenance in basic education was to be devolved toLGUs. So far, however, there has been no formal devolution of educational services. With centralgovernment resources diminished by IRA transfers, DECS should therefore have received anincreasing share of available resources to sustain adequate delivery of basic education services to arapidly growing school age population. Moreover, considerable investments are required (manymandated by Parliament) to improve the quality of those services. In reality, the requiredproportional adjustment in resource allocation to education did not materialize. Instead, the shareof the national budget (net of debt service and IRA) accruing to DECS declined from 27 to 23percent between 1990 and 1992, and remained since then within this margin. As a result, earliercommitments, such as free secondary education, are becoming increasingly difficult to sustaineffectively.
Intra-sectoral Distribution of Expenditure
40. Regrouping the various education-related components of the government budget into areliable breakdown of expenditure by level and type of education is a cumbersome operation.Public elementary and secondary education is, in principle, financed through DECS. However,there are also elementary and secondary schools attached to teacher training faculties in StateUniversities and Colleges (SUCs), which are funded trough direct budget appropriations. SUCs,moreover, also offer vocational and technical courses which do not normally belong to highereducation. DECS also transfers resources to private schools at the secondary and tertiary level(GASTPE).
41. With these caveats in mind, the intrasectoral breakdown of education expenditure isshown in Table 2.4. About 85 percent of central government appropriations for education arechanneled through DECS. Most of the rest is absorbed by the State Universities and Colleges(SUCs), which are funded through direct appropriations. Since 1991, minor but rapidly growingfinancing is also being allocated to the National Manpower and Youth Council (NMYC2, which isessentially responsible for non-formal manpower training and skills upgrading programs.
42. DECS' share of total education financing has remained virtually constant throughout1987-94. Neither repeated hefty salary adjustments,9 nor the nationalization of village highschools,
7Since 1993, the volume of IRA transfers from central government to LGUs is roughly equal to the entire public education budget8Minor amounts of education sector financing, essentially for on-the-job staff training, can further be identified in the respectivebudget allocations of several Departments. These are omitted here.9Normally, under constant relative staffing patterns, a proportional wage increase in two sub-sectors should raise the fundingrequirements of the most labor-intensive one relative to the other. On the whole, DECS (i.e., basic education) is considerably morelabor-intensive than the SUCs -- personnel expenditure were absorbing 75 and 66 percent of the respective budgets in 1994.
13

or the establishment of the GASTPE program, have managed to raise DECS' share in thegovernment's total education budget. On the other hand, the establishment of NMYC did not alterDECS' share either; so far, this new claim on public resources has been at the expense of the SUCs.This uncommon rigidity in the global distribution of education finance suggests tension between
prevailing resource appropriation rules and procedures, on the one hand, and rapidly evolvingsector circumstances and needs, on the other. It is a first indication that DECS may not have beengranted sufficient additional resources to meet the new commitments entrusted to it in that period.
Table 2.4 Government Financing, by Level and Type of Education(% Distribution)
1 1987 1988 1989 1990 1991 1992 1993 1994
Elementary 60.0 56.6 42.3 40.4 41.9 50.8 54.1 55.5Secondary i 9.8 18.5 21.3 20.2 18.3 14.8 15.9 16.7Tertiarya, b 16.8 16.9 17.7 18.0 16.1 16.4 17.6 16.4Vocational d 2.1 1.2 .7 .6 3.1 3.0 3.3 3.3Other d- .0 .0 .0 .4DECS Central Adm. 11.3 6.8 18.0 20.8 20.6 15.0 9.1 7.7
Overall Total 100.0 100.0 100.0 100.0 100.0 100.0 100.0 100.0(o.w. Total DECS) (84.9) (85.0) (84.5) (84.4) (86.5) (85.9) (84.7) (85.1)
Source: 1987-94 General Appropriations Acts1989-90 SUCs Expenditure Program
v Including GASTPE from 1989 onwards.b/ SUCs, plus DECS-managed tertialy institutions.C/ DECS-managed programs, plus NMYC from 1991 onwards.d/ Pre-school and non-fornal programs (DECS).
43. Over the medium term, the nationalization of LGU-funded highschools has notdramatically altered the intra-sectoral distribution of resources. The final outcome, however, is thenet result of two counterbalancing rounds of adjustment. First, the share of secondary educationshot up from an initial 10 percent to 18.5 percent in 1988, and up to 21 percent the year after. Thissudden increase was matched by a decline in the share of elementary education, from 60 to 42percent. In those two years, DECS' regional operations budget increased by P7.8 billion. As muchas P4.1 billion of this increment (52 percent) was allocated to public secondary education, whichaccounted for only 21 percent of DECS-controlled student enrollment.'0 From 1990 onward, theincreasingly severe constraints facing DECS' budget affected primarily secondary education, andthe respective shares of sector resources moved back towards their original level. Theseconsecutive rounds of adjustment illustrate DECS' difficulty in balancing conflicting budgetclaims.
°After nationalization of village high-schools.
14

44. Table 2.4 also shows a strong upsurge in the portion of sector resources absorbed byDECS' central administration. This phenomenon largely reflects the salary adjustmentsimplemented under the 1989 Salary Standardization Law. These adjustments were administered onthe DECS central administration budget for several years, before being integrated in the accounts ofthe various central and regional administrative units. Likewise, varying personnel benefits over andabove basic salaries are centrally administered.
Administrative versus Operational Expenditures
45. What proportion of Government education expenditure actually benefits educationdelivery at the school level? Out of DECS' 1994 total budget appropriation (P37.3 billion), a littleover 6 percent was allocated for General Administration, of which 4 percent at the regional level(Table 2.5). Altogether, 92 percent of the DECS budget is allocated for regional operations, which,in principle, represents the resources available to schools and other educational institutions. On thewhole, there does thus not appear to be much wastage in terms of administrative and other notstrictly operational expenditure. The detailed breakdown of DECS expenditure, however, raises anumber of issues.
Table 2.5 Functional Distribution of the 1994 DECS Budget (in %)
Personnel Transfers MOOE Capital TotalServices Expenditure Expenditure
I. GeneralAdministrationCentral 2.8 0.8 1.6 2.3Regional 1.5 25.6 1.9 4.0
Sub-total 4.3 .8 27.2 1.9 6.3
II. OperationsCentral b/ 0.6 9.0 8.8 3.0 1.8Regional 95.1 90.2 64.0 95.1 91.9(o.w. unallocated) (.6) (12.5) (5.5) (28.1) (4.8)
Sub-total 95.7 99.2 72.8 98.1 93.7
III. Total Budget 100.0 100.0 100.0 100.0 100.0(same in million P.) (28,188) (777) (3,182) (4,556) (37,333)
Source: 1994 General Appropriation Acta/ Essentially the GATSPE program (90% of total transfers), which is specified under Regional
Operations.b/ General operations and operations support.
15

46. First, of the total of P34.3 billion reserved for regional operations, P1.8 billion (5percent) was not allocated to specific educational institutions at divisional and district levels. Thismay not seem much. It is, nonetheless, considering that this margin is almost entirely concentratedin non-personnel expenditure categories. Altogether, unallocated funds represent over 21 percentof non-personnel expenditure earmarked for regional operations. Spending of about 30 percent ofregional appropriations for capital expenditure, and 14 and 9 percent of appropriations for transfersand MOOE respectively, is apparently at the discretion of DECS' regional administration. A sourceof concern, in this respect, is that the utilization of these unallocated funds may escape DECScontrol given the relatively weak expenditure monitoring system in place.
47. A second issue concerns the high proportion of the total resource appropriation forMOOE which is retained in the regional administration. Overall, less than 60 percent of budgetedMOOE funding is earmarked for specific operations. The phenomenon is particularly striking inelementary education, where as much as one-third of budgeted MOOE funding is set aside for theregional administration. About three-quarter of MOOE funds allocated to the regionaladministration (P725 million) were in principle reserved for elementary education. Under theprevailing budget system, however, it is difficult, if at all possible, to ascertain whether and to whatextent these funds are eventually used for the intended purpose".
48. Concerns about the lack of transparency in the functional allocation and utilization of theDECS budget are underscored by the apparent pattern of actual versus budgeted expenditure (Table2.6). Overall, there appears to be a systematic tendency towards underspending, which averaged 6percent of DECS total budget allocation in the 1991-93 period. Underspending is particularlymarked at the central level, for all categories of expenditure. It is most visible with respect topersonnel services, where substantial amounts are reserved on the central administration budget tocover the estimated cost of staff promotions and other personnel obligations during the fiscal year.A large portion of this cost does not materialize, essentially because staff fail to qualify forpromotion. To a varying, but relatively minor extent, unused balances also reflect the fact thatDBM, as a rule, does not release the totality of the funds appropriated by Congress. Capitaloperations, finally, are funded according to a revolving two-year cycle, and unused balancesconstitute "continuing appropriations" for the next fiscal year. Over a longer period, however, thisprocedure does not explain the considerable margin of underspending on the capital budget.
" There have also been several changes in budget format and nomenclature over the years. As a result, it is rare that relevantindicators can be observed consistently, over a sufficient period of time. In addition, the recording of actual expenditurecommitments does not match the detailed format of initial budget appropriations. It is therefore difficult to monitor the actualimplementation of specific budget programs and objectives.
16

Table 2.6 Actual versus Budgeted DECS Expenditure
Obligation/Allotment Ratio (1991-93 Average)Personnel MOOE Capital TotalServices Expenditure Expenditure
Centrala/ .505 .859 .807 .659Regionala/ .999 M9 231 .
Total Budget .950 .959 .777 .940
Source: DECSat General administration and operations combined.
49. With regard to MOOE, funding allocated to DECS' regional offices appears to be fullyutilized. Funding retained in the central administration, however, is under-utilized by as much as14 percent. Concern about the extent to which DECS' MOOE funding actually reaches schools wasfirst raised during field visits to elementary schools and meetings with local governmentrepresentatives (see Annex 2). At the school level, maintenance and other non-personnel operatingexpenses were found to be almost entirely financed from LGU and PTA sources. A limited surveyof household education expenditures'2 also confirms that there are significant private costs toattending of public schools (see Section 2.3).
Recurrent Expenditure Per Student
50. The evolution of per student recurrent expenditure at the successive levels of theeducation system (Figure 2.1) underscores government's difficulty in balancing competing claimson its resources. Spurred by the nationalization of village highschools, unit expenditure at thesecondary level increased by about 130 percent in real terms between 1987 and 1989. A substantialgain was also recorded at the tertiary level (42 percent), whereas elementary education, with amarginal five percent increase, was clearly the residual sub-sector. During the 1990-93 recession,however, elementary education appears to have been effectively protected from the consequencesof fiscal retrenchment, whereas much of the earlier achieved gains in unit spending at secondaryand tertiary levels were lost (at both levels, real per student expenditures in 1993 were down toabout 60 percent of their 1990 level).' 3
12Fund for Assistance to Private Education (FAPE), Cost-effectiveness of Education in the Philippines: Comparative Analysis ofPublic and Private School Programs (draft, March 1995).3In contrast to elementary and secondary education, where the growth of student enrollment is fairly steady, the pattem of unitrecurrent expenditure at the tertiary level is to a large extent also a reflection of fluctuations in student enrollment. Nonetheless, thereappears to be a significant downward trend in per student budget allocations.
17
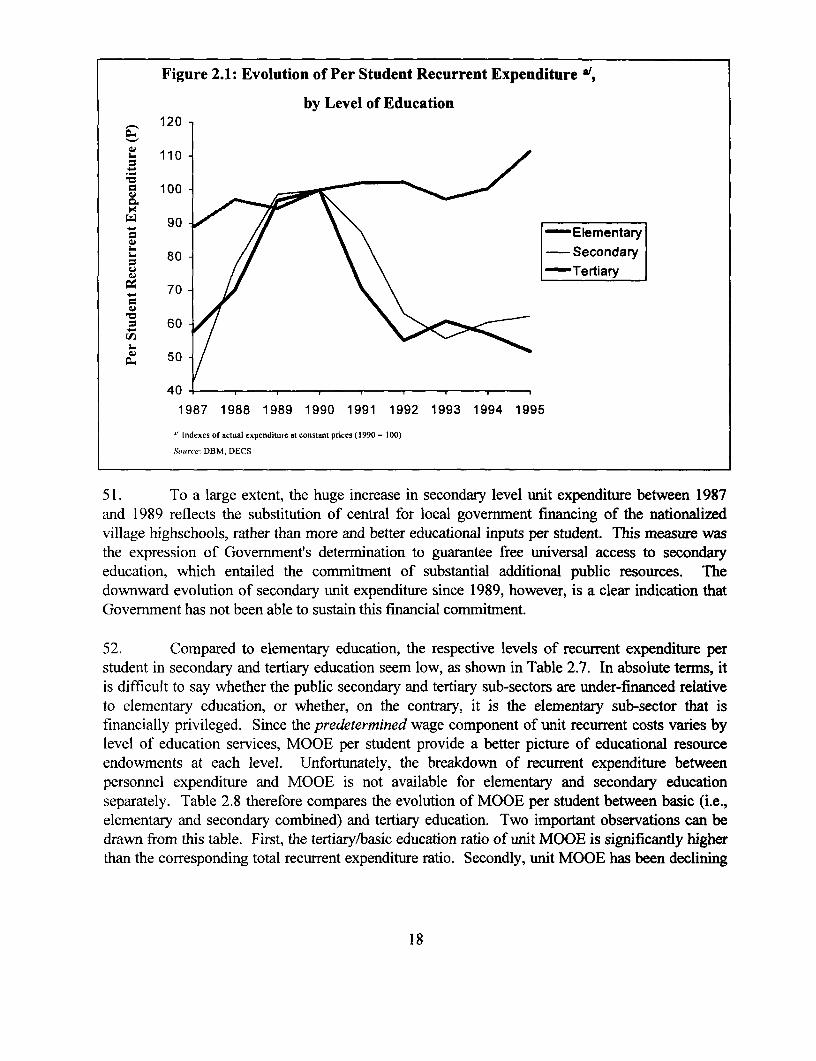
Figure 2.1: Evolution of Per Student Recurrent Expenditure a
by Level of Education120 -
3- 110-
= 100 -
-Elementary
3 80 -// \ \ -Secondary
-, Tertiary70-
60-
P6o 50-/. . . . . .
40
1987 1988 1989 1990 1991 1992 1993 1994 1995
Indexes of actual expenditure at constant prices (1990 = 100)
Suurce: DBM, DECS
51. To a large extent, the huge increase in secondary level unit expenditure between 1987and 1989 reflects the substitution of central for local govenmment financing of the nationalizedvillage highschools, rather than more and better educational inputs per student. This measure wasthe expression of Government's determination to guarantee free universal access to secondaryeducation, which entailed the commitment of substantial additional public resources. Thedownward evolution of secondary unit expenditure since 1989, however, is a clear indication thatGovernment has not been able to sustain this financial commitment.
52. Compared to elementary education, the respective levels of recurrent expenditure perstudent in secondary and tertiary education seem low, as shown in Table 2.7. In absolute terms, itis difficult to say whether the public secondary and tertiary sub-sectors are under-financed relativeto elementary education, or whether, on the contrary, it is the elementary sub-sector that isfinancially privileged. Since the predetermined wage component of unit recurrent costs varies bylevel of education services, MOOE per student provide a better picture of educational resourceendowments at each level. Unfortunately, the breakdown of recurrent expenditure betweenpersonnel expenditure and MOOE is not available for elementary and secondary educationseparately. Table 2.8 therefore compares the evolution of MOOE per student between basic (i.e.,elementary and secondary combined) and tertiary education. Two important observations can bedrawn from this table. First, the tertiary/basic education ratio of unit MOOE is significantly higherthan the corresponding total recurrent expenditure ratio. Secondly, unit MOOE has been declining
18

steadily since the early 1990s, both in basic and tertiary education, but much more so in the formerthan in the latter. 14
Table 2.7 Recurrent Expenditure per Student 9
1989 1995A B A B
Elementary 2,281 1.0 2,698 1.0Secondaryb/ 4,224 1.9 2,673 1.0Tertiary 32,005 14.0 17,155 6.4
A: In Pesos, at 1993 pricesB: Ratio to unit expenditure at the elementary levelSource: DBM, DECSa/ Based on actual expenditure for 1989 and budgeted expenditure for 1995b/ Including vocational/technical education
53. In real terns, 1994 unit MOOE in basic education was down to one-third of the 1990level. In nominal terms, it was equivalent to about US$7 per student (P184). This is extremely lowby regional standards, particularly when considering that:
(a) A substantial portion of that amount, being absorbed by DECS' central and regionaladministration, does not reach schools;
(b) The underlying unit MOOE figure for elementary education is likely to be significantlylower; and;
(c) There is a rather wide variation in per student budget allocations for MOOE amongschool divisions and districts.
54. In DECS' 1994 budget, MOOE appropriations for regional operations were equivalent toP125/student (US$5) for elementary schools, ranging between less than P50/student andP300/student among school divisions. For secondary education, the corresponding nationalaverage was P235/student (US$9.4), also with wide differences between divisions. At both levels,such meager MOOE allocations are incompatible with delivery of quality education.
14The 1991-94 tertiary/basic education ratio of unit MOOE averages 13, compared to 8 for the total recurrent expenditure ratio, thelatter declining from 8.5 in 1991 to 7.7 in 1994, and the former increasing from 11 to about 21 in the same period.
19

Table 2.8 Evolution of per Student MOOEI/in Basic and Tertiary Education
Basic Tertiary RatioYear (1) j (2) (2)/(1)
(In Peso, at 1993 prices)
1987 388 n.a.1988 293 n.a.1989 369 n.a.1990 510 n.a. --
1991 491 5,437 11.11992 378 4,151 11.01993 363 4,837 13.31994 184 3,766 20.51995 212 3,387 15.0
Source: DBM, DECSa/ See Table 2.7
55. The erosion of unit MOOE was much less severe at the tertiary level. Government-financed MOOE at the tertiary level averaged about US$164 per student in 1994, 21 times the levelof basic education. This amount may be on the low side, considering that less than half of SUCs'operating budget is spent on educational services. On the other hand, it may be more thanadequate, in view of the fact that SUCs have considerable potential for raising additional revenues.
Conclusion
56. Central Government commitment to education, as measured by the share of the Nationalbudget allocated to the sector, has increased substantially since the mid-1980s. Several factors,however, have contributed to limit the volume of effectively available budget resources: anextended economic recession in the early 1990s; a relatively low rate of public resourcemobilization; the heavy burden of the national debt; and increasing IRA transfers to LGUs. TotalGovernment spending on education thus represents only a modest 2.5-3 percent of GDP, eventhough it accounts for a major portion of the National Budget.
57. As a result, there is a growing imbalance between the limited resources at the center andthe rapidly increasing financing requirements of the public education system. This imbalance isparticularly critical in basic education, where the continuing erosion of DECS' per studentexpenditure for MOOE threatens the quality of education delivery in public schools. The shortfallin DECS' resources is largely counterbalanced through a rising incidence of education financingfrom LGU and private sources, which is examined in the following two sections.
20

2.2 Local Government Financing
58. Traditionally, local government has always played a role in the financing of publiceducation. This role was greatly reduced after the nationalization of village high-schools in 1988.Starting in 1991, however, fiscal decentralization gave LGUs financial latitude'5 for a renewedcommitment, as local officials quickly recognized the broad popularity of additional spending oneducation. Education expenditure from local government sources thus recorded a fourfold increasein the three years following the enactment of the new Local Government Code (LGC), from aninitial P.7 billion in 1990 to P2.9 billion in 1993. LGUs' contribution to total public financing ofeducation rose from a modest 2 percent in 1990 to 7 percent in 1993.16
59. The bulk of the increase in education spending by LGUs has been financed through theSpecial Education Fund (SEF), which is yearly replenished from the proceeds of local real estatetaxes. The new LGC mandates that a minimum percentage of local proceeds from real estate taxesbe allocated to the SEF. Part of LGU revenues are thus earmarked for education, and it mighttherefore be argued that the spectacular increase in local education financing was the result ofnational legislation rather than local commitment. Ultimately, however, the absolute arnount ofresources allocated to the SEF depends on the extent and effectiveness of the local taxation effort.Moreover, local education financing from non-earmarked general funds has also been risingsignificantly, albeit not as rapidly as SEF outlays.'7
60. Municipalities account for almost half of local education expenditure, followed by citiesand provinces -- 45, 37 and 18 percent respectively in 1993. Cities allocate the highest proportionof their budget to education -- 9 percent in 1993, compared to 8 and 6 percent respectively formunicipalities and provinces. The difference in commitment between cities and municipalities,although relatively small, appears to be systematic. In 1990, prior to the enactment of the newLGC, municipalities were in fact devoting a somewhat higher proportion of their budget toeducation than cities. The situation was immediately reversed in 1991, reflecting the fact that fiscaldecentralization has so far favored cities over municipalities.
61. The pattern of LGUs education spending is characterized by a striking degree ofcomplementarity with central government spending. Whereas in recent years an increasing share ofthe central education budget is being absorbed by personnel expenditure, to the neglect of otherrecurrent and capital expenditure, LGUs allocate three-quarter of their education budget for non-personnel expenditure (Table 2.9). Provincial schoolboards, in particular, are playing anincreasingly important role in targeting extra MOOE funding towards priority needs within theirjurisdiction, to supplement the deficient and inadequately targeted funding from the central budget.Over the period 1991-93, provinces spent over two-third of their education budget for MOOE.Municipalities basically assume the same responsibility.
Is5The total budget of LGUs doubled in the 1990-93 period.161t is estimated to have reached 9 percent in 1995.
17At present, education expenditure absorbs only about 2 percent of LGUs' combined general budget.
21

Table 2.9 LGU Education Financing by Expenditure Category(% Distribution)
Provinces Municipalities Cities All LGUs1991-93 1990 1991-93 1991-93 1991-93
1990 Average Average 1990 Average 1990 Average
Personnel Services 21.6 11.6 31.4 24.7 34.8 28.3 30.9 24.1MOOE 59.2 67.2 40.6 43.8 52.8 32.9 48.1 43.0Capital Expenditure 19.2 21.2 28.0 31,5 14.4 38.8 21.0 32.9
Total 100.0 100.0 100.0 100.0 100.0 100.0 100.0 100.0(same, in Million P.) (124.1) (304.7) (337.9) (855.8) (248.7) (803.9) (710.7) (1,964.3)
Source: COA, Financial Statements and Other Schedules (1990-92), Annual Financial Report of Local Govemments, 1993
62. Among LGUs, cities spend the lowest proportion of their education budget on MOOE,and the highest both for personnel and capital expenditure. Concerning MOOE and capitalexpenditure, cities' diverging behavior appears to accommodate the discriminatory outcome ofDECS' regional budget allocation norms. DECS distributes its MOOE funding largely on a perstudent basis, which tends to favor densely populated urban areas. School construction, on theother hand, is primarily targeted to barangays and municipalities without schools, thus favoringrural areas.
63. The rapid build-up of LGU revenues has led to a generalized increase in local educationfinancing -- i.e., of all expenditure categories in each class of LGU. From a distributionalperspective, however, a number of noteworthy adjustments appear to have taken place. Mostimportantly, there has been a considerable increase in the share of local education financing goingto capital operations -- an average of 33 percent during the 1991-93 period, compared to 21 percentin 1990. This increase coincided with the collapse of centrally financed capital expenditure after1991. The two factors combined led the share of LGUs in total government-financed capitaloutlays in the education sector to climb from 4 percent in 1990, to over 40 percent in 1993.Substitution of local for central financing of capital expenditure was predominantly an urbanphenomenon, cities' combined capital outlays soaring from P31 million (12 percent of their totaleducation spending) in 1990, to P427 million (44 percent of total) in 1992.
64. Similarly, increasing local spending for MOOE has coincided with the stagnation ofMOOE allocations from the central education budget after 1991. As a result, locally financedMOOE has gained considerable importance. It was equivalent to 17 percent of total publicspending for MOOE in 1993, compared to only 6 percent in 1990. Overseeing the relativeevolution of central and local capital expenditure and MOOE, one may thus conclude that theenactment of the 1991 LGC has led to a significant decentralization of education financing, albeitunplanned and unacknowledged. In fact, the new LGC does include school construction andmaintenance among public services to be devolved to LGUs, but central government has so farbeen unwilling to relinquish this responsibility. The evidence, however, shows that devolution ofcapital operations and MOOE is already an ongoing process.
22

65. All staff in the public education system is, in principle, to be paid by central government.LGUs, nonetheless, assume a small, but rising part of the overall wage burden. LGU outlays forpersonnel services in the education sector serve essentially three purposes: (i) supplementing thesalaries paid by central government; (ii) paying the salaries of newly recruited teachers until theyare integrated in the DECS payroll; and (iii) recruiting permanent teachers over and above theschool staffing norms applied by DECS. Supplementing teacher salaries is unconstitutional'8 . It isnonetheless a widespread practice among LGUs, particularly in urban areas, aiming to attract andretain qualified teachers. Red tape and extensive delays in DECS/DBM approval of new teachingpositions, and subsequent absorption of new appointees on the central payroll, force LGUs tobridge the gap for increasing periods of time. Finally, the "students per teacher" norms used byDECS for the allotment of extra teacher positions has been increasing steadily over time, reflectinggrowing budget constraints. If they can afford it, LGUs therefore hire extra teachers so as to havesmaller classes, or avoid the necessity of multi-grade teaching in under-enrolled schools.
66. For these reasons, local personnel expenditure for education doubled in 1992, and roseby a further 33 percent to P675 million in 1993. This level was equivalent to 2.2 percent of totalpublic outlays for personnel services in the sector, compared to slightly under one percent in 1990.Relative to total education spending by LGUs, however, the incidence of personnel expenditure hasbeen gradually declining, averaging 24 percent through 1991-93, compared to 31 percent in 1990.
67. An intriguing phenomenon, in this context, is that virtually the entire 1991-93 increase inLGUs' personnel expenditure for education was financed through the SEF, as shown below (inmillion P.):
1991-92 1992-93 1991-93Total increase in LGUsEd. personnel expenditure 264.0 169.1 433.1Source of financing:
SEF 167.8 229.1 396.9General Fund 96.2 - 60.0 36.2
In 1993, moreover, SEF funding was substituted for general funding of education personnelservices.19 Since the SEF is specifically earmarked for MOOE and capital outlays, there must becompelling reasons for LGUs to switch to SEF financing for personnel expenditure. More detailedand recent evidence is needed to permit a meaningful interpretation of this phenomenon. Oneshould hope, however, that it is not a precursory sign of increasing wage competition among LGUsto attract and retain competent teachers.
68. Compared to central government, budget execution among LGUs is weak, as evidencedby a rather wide margin of underspending. Overall, the ratio of actual expenditure to budgetappropriations for education averaged over 70 percent over the 1991-93 period. In terms of thetotal education budget, the extent of underspending is about the same for the three LGU classes.
'8The Philippines' Constitution prescribes that there should be equal pay for equal work.19General funding of LGUs for education personnel outlays recorded a decline of P60 million, which was matched by an additionalincrease in SEF funding for the same purpose.
23

There are sizable differences in performance, however, between recurrent and capital operations.The 1991-93 expenditure/appropriation ratio averaged 80 percent for the former (85 and 78 percentfor personnel services and MOOE respectively), but only 55 percent for the latter. DECS'implementation performance for capital operations, although far from satisfactory, is much better(78 percent over the same period). Since capital operations are eventually to be devolved to LGUs,this is an issue that requires serious attention.
Conclusion
69. The rapid build-up of LGU revenues under the ongoing fiscal decentralization processhas led to a generalized increase in local financing of public schools. This increase is largelyconcentrated on MOOE and capital operations, where the shortfall in DECS financing is mostcritical. With respect to capital operations, LGUs have a significantly worse implementation recordthan DECS. The eventual devolution of such operations to LGUs therefore requires the causes ofthis unsatisfactory performance to be identified and adequately resolved.
2.3 Private Financing20
70. The private sector contributes directly to the financing of the education system in threeways, namely through: (i) household financing of private schools; (ii) household financing of costsrelated to attendance of public schools; and (iii) voluntary contributions, both to private and publicschools, including payments related to income generating activities by schools. There are noregular statistics of these financial flows; estimates are therefore tentative.
Private Schools
71. The important role of private education in the Philippines, particularly at the post-elementary level, is well known. Of roughly 18 million students presently enrolled at all levels ofthe education system, over one-fifth are in private schools. This proportion has remainedremarkably stable since the early 1980s, albeit with some variation between the successive cycles.
72. Based on a recent comparative cost study conducted by FAPE (Fund for Assistance toPrivate Education) among private and public schools at the different levels of the educationsystem,21 it is estimated that private financing of private education totaled about P29 billion in1994, distributed as follows:
20 The assessment of private contributions to education in this section exludes the opportunity cost of school attendance.21FAPE (1995)
24

(P.million) (%) (P.million) (%)
Elementary 3,666 12.8 Tuition & other fees 17,000 59.6Secondary 8,944 31.3 Other private costs 22 9,163 32.1Tertiary 15,935 55.8 Voluntary contributions 2,382 8.3
Total 28,545 100.0 Total 28,545 100.0
As can be expected, more than half of total private outlays is for tertiary education, and almost 60percent consists of tuition and other school fees. Voluntary contributions play a significant role.Total financing, serving close to 4 million private school students, is equivalent to an averageprivate contribution of P7,300 per student.
73. According to an earlier World Bank sector study,23 the corresponding total for 1986 wasabout P5.3 billion, for 3 million students (P1,750 per student). This estimate may be somewhat onthe low side since it does not appear to include voluntary contributions. Taking this into account, aswell as the rate of inflation and the increase in private enrollment in the intervening eight years,these two estimates imply a real increase in private financing per private school student of about 7percent per year.
Private Financing of Public Schools
74. The above mentioned FAPE study shows that there are significant private costs toattending public schools, particularly at the secondary level. Altogether, private financing of publiceducation adds up to about P21 billion in 1994, detailed as follows:
(P.million) (%) (P.million) (%)
Elementary 12,573 60.1 Tuition & other fees 5,037 24.1Secondary 6,505 31.1 Other private costs 15,342 73.3Tertiary 1,849 8&8 Voluntary contribution 548 2.6
Total 20,927 100.0 Total 20,927 100.0
The contrast with private education is striking. Tuition and other school fees account for arelatively modest portion of total private financing since basic education is in principle free andtertiary education heavily subsidized. Other school related costs supported by parents make up thebulk of private financing of public education. This is essentially the counterbalancing item for theshortfall in public financing: schools are nominally free, but several schooling costs are de-factoprivatized. Voluntary contributions are marginal, particularly on account of tertiary institutions,which deploy little efforts to attract them. The distribution of financing by level of education is the
22Other school related items financed by households, such as books, educational materials, and transportation, but excluding schooluniforms and boarding.23 The Philippines Education Sector Study (Report no. 7473-PH, World Bank, December 1988)
25

mirror image of the distribution of public enrollment, hence the opposite picture of privateeducation.
75. Private financing of public education in 1994, for a total enrollment of almost 14 millionstudents, is equivalent to P1,540 per student. The corresponding World Bank estimate for 1986was P210 per student. In real terms, the difference implies a 16 percent rate of increase in privatefinancing per public student -- i.e., more than twice the corresponding rate of increase for privateschools.
Conclusion
76. As already mentioned, both the 1994 and 1986 estimates are tentative, and not too muchsignificance should be attached to the absolute numbers. Nonetheless, a fundamental conclusionemerges from the relative growth of private financing for public versus private schools. Privateschools are, and continue to be a vital element of private sector involvement in education.However, it is the growing importance of the private sector as a co-financier of the public educationsystem that deserves particular attention in view of the underlying efficiency and equityimplications (see Section 3.4).
2.4 Synthesis
77. Having successively reviewed the various sources of education financing in thePhilippines, a global synthesis is provided in Table 2.10, covering total (recurrent and capital)expenditure.24 Altogether, the Philippines spent a little over 100 billion on education in 1994,equivalent to about 6 percent of GNP. This estimate is probably somewhat on the low side, to theextent that it does not include the cost of non-degree skills development programs offered in privateinstitutions, nor the private cost of pre-school education and early childhood development.
Table 2.10 Total Expenditure by Level of Educationand Source of Financing (1994)
Source of Financing (in million Pesos)Level of Education Central Gov't. Local Gov't. Private Total
Elementary 29,756 2,965 16,222 48,943Secondary a/ 9,436 932 15,337 25,705Tertiary 10-2 70 _137 17,973 28,380
Total 49,462 4,034 49,532 103,028
Source: General Appropriation Act 1994; COA Annual Financial Report
Local Government 1993; FAPE; mission estimates.i/Including vocational/technical education
24For the sake of comprehensiveness, the table includes all minor education items, mostly vocational and in-service training progransoffered by the various Government Departments. These items, totaling P422 million, are included in tertiary education.
26

78. The World Bank's 1988 Education Sector Study estimated total recurrent expenditurefor education at 3.2 percent of GNP in 1986, which compares to 5.4 percent in 1994 whenexcluding capital expenditure from the present estimate. This rough comparison underscores thetremendous increase in the national investment in educational development that took place since theend of the Marcos period.
79. More than half of the total increase in recurrent education expenditure through 1986-94came from private sources, so that the share of Government (central and local) declined from 61 to48 percent (Table 2.11). Noteworthy, in particular, is the substantial increase in the proportion ofprivate financing going to the elementary level, at the cost of tertiary education. The oppositeevolution took place with regard to government financing, where the nationalization of villagehighschools has reduced the share of elementary education. The latter remains nonetheless high bycomparative standards.
Table 2.11 Changing Pattern of Education Financing '/, 1986-94(% Distribution)
Source of FinancingGovemment Private Total
1986 1994 1986 1994 1986 19941. Distribution of
Financing by Source (%!:Elementary 67.5 63.1 22.5 32.7 49.8 47.2Secondary 17.5 20.9 31.2 31.0 22.9 26.2Tertiary 15.0 16 0 46 3 36 3 27.3 26.6
Total 100.0 100.0 100.0 100.0 100.0 100.0
II. Distribution ofFinancing by Level (%!:Elementary 82.2 63.6 17.8 36.4 100.0 100.0Secondary 46.3 37.9 53.7 62.1 100.0 100.0Tertiary 33.1 28 5 66.9 715 100.0 100.0
Total 60.5 47.6 39.5 52.4 100.0 100.0
Memo itemsTotal in million P. (1994 25,181 44,912 16,417 49,532 41,598 94,444
prices)
Source: 1994, see Table 2. 10; 1986, The Philippines Education Sector Study (World Bank, December 1988).a' Recurrent expenditure only
80. Both the differential growth rate and diverging sub-sectoral evolution of government andprivate expenditure have led to some significant changes in the overall pattern of educationfinancing. Whereas government accounted for 82 percent of total elementary education financing in
27

1986, its share was reduced to 64 percent by 1994. At the other end, the decline in government'sshare of tertiary education financing was relatively minor (from 33 to 29 percent).
Conclusion
81. From a rather depressed condition in the mid-1980s, the commitment of nationalresources for education has now reached a comparatively high level by international standards.This investment is reflected in relatively high quantitative educational achievements: near universalentry into primary education, and secondary and tertiary enrollment rates far in excess of theaverage for the East-Asia Region.2 5 Qualitative returns, however, leave much to be desired.Educators are concerned with the low level of learning outcomes and cohort survival rates (seeSection 3.1). These weaknesses are increasingly seen as impediments to successful integration inthe global economy.
82. From a social equity point of view, the distributional pattern of education financing was,and remains efficient -- i.e., the private sector's share of total financing is rising at each successivelevel of the education system, as the implicit extent of government subsidization declines. A causefor concern, however, is that this distributional pattern has become less progressive since 1986.Moreover, the private sector contribution to the national investment in education has grown toexceed the Government contribution. The equity implications of these changes are explored inSection 3.4.
25 According to the Bank's 1995 World Development Report, 74 versus 52 percent at the secondary level, and 28 versus 5 percent atthe tertiary level, in I 992.
28

III. Major Issues
3.1 Education and Poverty
83. There is a pervasive link in the Philippines between educational outcomes, bothquantitative and qualitative, and the incidence of poverty. Annex 1 presents the results of a cross-sectional analysis of this relationship, based on detailed data for 97 provinces and cities withprovincial status.26 The analysis focuses on three sets of linkages, for public elementary andsecondary schools respectively: (i) the relation between poverty and school participation; (ii) therelation between poverty and the regional distribution of educational resources; and (iii) the relationbetween school staffing characteristics and schooling outcomes. The main findings aresummarized in this section, with comparative indicators for two regions: the National CapitalRegion (NCR), which has both the highest average family income and the lowest incidence ofpoverty in the country, and the Eastern Visayas region, which are at the other end of the scale(Table 3. 1).
Table 3.1 Family Income, School Participation and Completion
East. Visayas NCR
Average Family Income (P 1,000) 38.5 138.3
Poverty Incidence (%) 40.7 14.9
Gross enrollment rate:Elementary 98.0 112.0Secondary 55.0 95.0Tertiary 16.0 34.0
Completion rate:Elementary 54.0 97.0Secondary 64.0 75.0
Sources: DECS, 1989/90
84. At the elementary level, where the school infrastructure is extensively developed andopportunity costs are still relatively low, income levels have a moderate, though significant, impacton participation. Nonetheless, the latest population census (1990) revealed that 1.7 millionelementary school-age children were not attending school (18% of the 7-12 age group), adisproportional number of which in the poorest areas. More important at this level, however, is thelink between family income and completion rates. Overall, one out of three children entering thefirst grade does not complete the cycle. Underlying this national average are such extremes as near-universal completion in the most affluent areas (mostly in and around NCR), and over 70 percentnon-completion in the poorest provinces in Mindanao and the Visayas. Figure 3.1, wherein
26These are generally equivalent to one of DECS' school divisions.
29

provinces and cities at various average income level are plotted against the correspondingelementary school completion rates, provides a vivid illustration of this relation.
Figure 3.1: Poverty and Elementary School Completion (1991)"
100 O 00 ~~~~~~~~~~~0
80~~~~~~~~~~ 60 %°O %
00 0O
O 40 00
60 ~~~~~~~~~0 10
o 0~~~~~~~~~oC
U 20
0~~~~~~~~
A 40 60 cn R 1d80 100 dO 14an 160
Average Family Income (P. 000)'The regression line is estimated as: In(l- CR) = a In Fl + b, where CR = completion rate, and Fl = averagefamily income and R2
= .49
85. With rising opportunity costs, the impact of income differentials on school participationis more significant at the secondary and tertiary levels. Inversely, the relation between income andschool completion becomes weaker, once initial supply/demand constraints to access are overcome.The ratio of highest to lowest completion rates among provinces and cities is about two at the
secondary level, compared to almost four at the elementary level. This typical pattern ofenrollment and completion rates is illustrated in Table 3.1 for the two outlying regions on theaverage family income scale. Elementary enrollment rates in both regions turn out to be prettyclose, but the completion rate in the most affluent region is about twice that in the poorest. Thereverse situation prevails at the subsequent level, with the enrollment rate in the Eastern Visayasregion over 40 percent below the NCR level, but completion rates in both regions only 15 percentapart. A further widening of the differential in enrollment rates can be observed at the tertiary level.
86. The strong incidence of economic factors on school participation is evident from theresults of a recent survey of out-of-school youth among the lowest 30% income group ofhouseholds (Table 3.2). According to this survey, the high cost of education and the need to
30

contribute to the famnily income account for almost half of non-attendance in the 13-16 age group,and over two-third in the 17-24 group.
Table 3.2 Reasons for Not Attending School(lowest 30% p.c. income group)
Percent of Respondents in Age Group: a
(7-12) yrs. (13-16) yrs. (17-24) yrs.
Inaccessibility of school 14.2 (17.8) 4.4 (6.0) 2.1 (2.0)High cost of education 10.1 (8.9) 22.0 (25.6) 22.2 (22.2)Illness/disability 7.5 (7.8) 3.8 (5.1) 2.1 (2.0)Working/lookingforwork b 9.0 (11.4) 25.4 (31.1) 46.6 (55.4)Lack of interest 59.2 (54.1) 44.4 (32.2) 27.0 (18.4)
Source: Alejandro N. Herrin and Rachel H. Racelis. Monitoring the Coverage of Public Programs on Low-incomeFamilies: Philippines. 1992 (NEDA, 1994).
a/ Corresponding values for females are indicated between brackets.b/ Including housekeeping.
87. A major reason for non-attendance is an apparent "lack of interest" in education,particularly in the 7-12 and 13-16 age groups and among males. This particular reason, however,does not lend itself to unambiguous interpretation. Lack of interest in schooling may be theoutcome of supply-related factors, such as inadequate curricula, unqualified teachers, and lack oflearning materials. Low quality and relevance of education, combined with low growth of modernsector employment, may fuel a perception of low private returns to investment in education amongparents, and adversely affect their attitude towards schooling. By the same token, lack of interestmay reflect specific poverty-related constraints. Irregular class attendance due to competing work-related activities, for instance, affects children's ability to cope with the learning process. This maycause them to loose interest, and eventually to drop out of school altogether. Malnutrition mayhave the same outcome.
88. Malnutrition likely accounts for a significant proportion of the professed lack of interestamong children from the poorest 30 percent of households. Firstly, a similar survey of out-of-school youth conducted in 1988. covering all income groups, shows a much lower incidence of lackof interest as stated reason for non-attendance.27 Secondly, the relatively high percentage of 7-12age children not attending school because of illness or disability is in itself a reflection ofwidespread malnutrition and poor hiealth care among the poor. Thirdly, the health and nutritionsituation in the Philippines compares rather unfavorably with regional standards. as well as withcountries in the same range of per capita GNP, as shown in Table 3.3. The evidence thus suggeststhat school-based preventive health maintenance and feeding programs in the poorest areas may berequired.
27The 1988 survey covers the 7-24 age group without further breakdowin. The proportion of out-of-school youth for reason of "lackof interest" averages 22.2 percent nation-wide, compared to 33.4 percent for the same age group in the 1992 survey of the lowest 30percent income group. A noteworthy outcome of the 1988 survey, in this particular context, is the much higher proportion of childrenlacking interest in rural than in urban areas (26 versus 16 percent).
31

Table 3.3: Comparative Nutrition & Health Indicators al
PHL EAP LMI
Prevalence of malnutrition (% under -5) 34 25 17
Low birthweight babies (%) 15 10 1 1Infant mortality (p. 1,000 live birth) 40 39 45Under -5 mortality (p. 1,000 live birth) 50 49 59Life expectancy at birth (yrs.) 65 68 68
Population/physician 8,120 3,990 2,230Population/hospital bed 780 553 516
Source: World Development Report 1994; Social Indicators of Development 1994.a/ PHL = Philippines; EAP = East Asia & Pacific; LMI = Lower middle-income countries
89. Compared to other reasons for non-attendance, inaccessibility of schools plays a minorrole at post-elementary levels (Table 3.2). It is somewhat of an issue at the elementary level, butone that does not appear to be related to poverty per-se. Analysis of the results of a 1992 school-mapping survey (Annex 1) shows that there is no connection between the proportion of Barangayswithout elementary school in each school division and the incidence of poverty. Nor does thereappear to be any relationship between divisional participation rates and the proportion of Barangayswithout elementary school.
90. Non-completion is certainly also a result of inadequate quality of educational servicesdelivered in public schools. There is evidence of substantial, and widening, quality differentials inbasic education between prosperous and poor regions in the Philippines (see Annex 1). Meanscores in terminal examinations in public elementary and secondary schools, for instance, aresignificantly higher in the NCR than in the Eastern Visayas region (Table 3.4).
91. As a rule, private schools score higher than public schools, both in terms of completionrates and test results. It is interesting to note, however, that the poorer a region the higher theperformance differential between private and public schools. This suggests that regional qualitydifferentials tend to be larger among public than among private schools. In other words, the poorreceives a lower quality basic education, not only because he attends a public school, but alsobecause the quality of public schools is comparatively lower in the poorest regions. Thisphenomenon is essentially related to the inequitable distribution of essential educational inputs,both quantitatively and qualitatively, among the various regions and between rural and urban areas(see Section 3.3).
32

Table 3.4: School Performance: Eastern Visayas Region vs. NCR
East. Visayas NCR
Elementary level:Mean NEAT scores (public) a/ 61 71Idem, ratio private/public scores 1.47 1.37
Ratio private/public completion rate 1.67 1.03
Secondary level:Mean NCEE ratings b/ 461 523Idem, ratio private/public ratings 1.11 1.21
Ratio private/public completion rate 1.29 .99
Source: DECS' National Elementary Achievement TestbI National College Entrance Examination
Conclusion
92. Improving the quality and retention of public schools ought to be a fundamentalcomponent of Government's fight against poverty. The priority is at the elementary level, where avast majority of children from poor families do initially access the public school system, but asubstantial proportion of them eventually drops out prematurely, without having acquired theminimum literacy and numeracy skills required for productive participation in economicdevelopment. A key factor of the "Asian Miracle", which the Philippines seek to emulate, was theachievement of universal primary education, not just in terms of access but also of successfulcompletion. The Philippines Government is fully aware of the situation, and intends to makeimprovement of the quality of basic education a cornerstone of its overall strategy to fight poverty.
3.2 Fiscal Decentralization and Equity
93. The fiscal decentralization process initiated by the new 1991 Local Government Codehas triggered a rapidly increasing role of LGUs in the financing of public education. Relative toneeds, however, the incidence of local education financing is rather unevenly spread. Fiscaldecentralization and devolution have generated winners and losers among LGUs, essentiallybecause the incremental cost burden of devolved services bears no relation with the distribution ofIRA transfers.
94. Although education services have not been formally devolved to LGUs, under-financingof the public basic education system from the central government budget is de-facto leading toselective decentralization of education financing. Winners among LGUs have resources available
33

for extra support to public schools. They do so voluntarily, each according to means, by payingsalary supplements to teachers, hiring extra teachers to reduce class size below DECS' steadilyincreasing school staffing norrn (see Section 3.3), and providing extra financing for schoolmaintenance, equipments, supplies and other operating costs, as well as for classroom construction(see Annex 2).
Special Education Fund
95. The Special Education Fund (SEF) is the largest source of local education financing.Since this fund is maintained from the local proceeds of the real estate tax, one might expect themagnitude of SEF resources available to LGUs to depend largely on the relative distribution ofwealth among the country's widely different rural and urban areas. In this respect, the availabledata show that there is foremost a major imbalance in SEF endowment between the NCR and therest of the country. The NCR alone, with only 10 percent of total enrollment in public schools,accounted for half of national SEF expenditure in 1993. By contrast, SEF expenditure in thecombined five Mindanao regions, which account for 25 percent of total public enrollment,accounted altogether for only 10 percent of national SEF expenditure. Assuming that the bulk ofSEF financing is for basic education (i.e., elementary and secondary schools), it was equivalent toabout P890 per student in the NCR, while averaging only P70 per student in Mindanao.2
96. Leaving aside the NCR, variations in SEF expenditure per student among regions areless extreme, and, surprisingly, only tentatively related to wealth differentials (Figure 3.2). Most ofthe low-income regions also had below average SEF expenditures per student in 1993. However,there are a number of interesting outlyers. For instance, unit SEF expenditures were almost at parwith the national average (excluding NCR) both in Central Luzon (region III) and CentralMindanao (region XII), even though average family income is the highest in the former region(P76,000) and one of the lowest in the latter (P44,000). Similarly, Cagayan Valley (region II) isclose to the national average (excluding NCR) as far as income is concerned, but it hadcomparatively high unit SEF expenditures (P264 per student).
28 According to the 1991 FIES, the average annual family income in the NCR is P138,000, with a poverty incidence of 15 percent,compared to P47.000 and 52 percent respectively in Mindanao.
34

Figure 3.2: Regional Income and Per Student SEF Expenditure (1994) '
300 -TL
250-
'- 200-
:3 t 5 0 ~~~~~~~~~~~~~~~~~ . ~~~~IV150
VIX
VILL L XCLAn XC1) I V 0
50
0 ARMM
4o s4b 50 5 6 6 6b 70 7b
Average Regional Family Income (P 000)
Elementary and secondary levels are combined. The vertical and horizontal lines cutting the figure into 4 quadrants reflect the nationalaverage value of the respective variables. NCR region with SEF expenditure per student of 878 and family income of 138,000 is excluded.The Philippines' 15 administrative regions, most denoted by roman numbers, are defined in Figure 3.3. ARMM stands for theAutonomous Region of Muslim Mindanao.
97. The evidence thus suggests that regional variations in SEF endowment are perhaps asmuch related to variations in taxation rates and efficiency, as to differences in the relative size ofthe tax base. It also indicates, therefore, that there may be room for increasing local contributionsto education financing through greater effectiveness in real estate tax collection, even in some of theless affluent provinces. In the long haul, however, local tax reforms and improvements in taxadministration are likely to exacerbate rather than ease revenue disparities among LGUs. Someequalization mechanism at the center may therefore be required, to even out the most flagrantregional disparities.
General Funds
98. As far as the distribution of the IRA among LGUs is concerned, the 1991 LocalGovernment Code, by significantly reducing the population size criterion in favor of equal sharingand, to a lesser degree, land area, tends to strengthen the financial situation of less populated,predominantly rural areas. However, the extra financial burden of devolved responsibilities andservices by Central Government may weaken this advantage, and reinforce existing disparities. Thenet outcome, however, is unlikely to even out disparities in SEF endowment among LGUs.
99. Much remains to be learned about LGUs' willingness and ability to commit resources toeducation, over and above the statutory minimum level of earmarked SEF funding -- which is itselfthe outcome of the prevailing local taxation effort. Without formal devolution of educationalresponsibilities, local financial commitment to education remains indeed entirely voluntary.
35

Nonetheless, tentative evidence (Annex 2) suggests that the willingness to invest local resources ineducation is high, even though the ability may vary according to means. This is also confirmed bya cross-sectional analysis of local education financing in 1991 among 1,239 municipalities,29
showing education expenditures per student to be significantly correlated with average per capitaincome, the local taxation effort, and per capita IRA entitlement.
Conclusion
100. There seems to be room for further increase in education financing by LGUs,particularly where the local tax collection effort can be strengthened and where IRA proceeds haveso far exceeded the incremental cost of the simultaneous devolution of services from the center.Fiscal decentralization, however, has contributed to broaden initial disparities among LGUs interms of their capacity for supplementing the shortfall in DECS financing. Local taxationimprovements are likely to further sharpen those disparities. There is thus a real danger that thisprocess will increase the quality gap of public education between rich and poor LGUs, andtherefore widen regional differences in school completion rates and learning outcomes.
3.3 Social Targeting
101. Given its limited resources, relative to rapidly growing needs, DECS should increasinglyseek to target its financing towards the most disadvantaged LGUs, population and/or incomegroups. It may also have to devolve some financial responsibilities to the most affluent LGUs.What is currently the pattern of DECS' resource allocation in this respect?
102. Table 3.5 compares the relative magnitude of 1994 central budget allocations for the twooutlying regions on the family income scale. The comparison hardly needs commenting. It isinteresting to note, however, that allocations per school, even more than per student, tend to favorthe most affluent and urbanized region. Evidently, schools in the latter benefit inherently fromeconomies of scale, which are not taken into account in the regional budget allocation criteria.
103. The reality is that present norms underlying DECS' regional budget appropriations donot aim at counterbalancing the regressive impact of fiscal decentralization on local educationfinancing, not to speak of redressing initial disparities in schooling outcomes. Analysis of theDECS 1994 budget shows that per student allocations for MOOE among Divisions are confinedwithin a relatively narrow range, both at the elementary and secondary levels, independently ofactual needs (see Annex 1, Figures 3 and 4). NCR Divisions, which are being granted asubstantially higher per student allocation than most other Divisions, are again a notoriousexception.
29Benjamin J. Diokno, "Devolution and Education Finance" (draft, University of the Philippines. 1994).
36

Table 3.5: DECS Resource Allocation: E. Visayas Region vs. NCR
East. Visayas NCR
1. Per Student Allocation (P.)Elementary level:Recurrent expenditure 2,451 2,527Maintenance & other operating exp. 117 209Secondary levelRecurrent expenditure 1,525 2,982Maintenance & other operating exp. 175 344
II. Per School Allocation (P. 1,000)Elementary level:Recurrent expenditure 427 4,741Maintenance & other operating exp. 20 392Secondary level:Recurrent expenditure 806 11,231Maintenance & other operating exp. 93 1,294
Source: DECS, 1994 General Appropriation Act
104. Figure 3.3 illustrates the extent to which the regional distribution of governmentexpenditure for basic education is biased against the poorest regions. It shows central and localgovernment recurrent expenditure per public school student30 for the country's 14 administrativeregions, ranked in ascending order of poverty incidence (measured on the right-hand vertical scale).Clearly, the lack of a coherent DECS strategy for actively targeting resources towards the mostpressing needs, the most disadvantaged areas or population groups is an overriding issue in thiscontext. The issue is essentially political. Continuous interference by the national and locallegislature, both in the appropriation and execution of the education budget, is depriving DECS ofthe control required for effective social targeting. With a few exceptions, the outcome of thispermnanent tension between the legislative and executive branches of government is the generalizedapplication of regional resource sharing criteria, without adequate reference to local circumstances,actual needs, and specific cost factors.31 The uncertain quality of education statistics and theirineffective use for education management, as well as critical weaknesses in the monitoring of thebudget implementation process tend to compound the problem.
30 Local recurrent expenditure are limited to those financed through the SEF. The breakdown of these expenditures by level ofeducation is unavailable. Assuming that most of this financing goes to basic education, per student expenditure therefore relates tothe combined total of public elementary and secondary school enrollment in each region.31 A minor component of DECS' central MOOE budget is being allocated to each region on the basis of a development index whichreflects regional differences in poverty incidence, literacy, participation rate and educational achievement level. It is unclear,however, how these resources are further distributed among Divisions and Districts. Overall, this modest element of social targetingdoes not appear to be noticeable at the school level.
37

Figure 3.3: Government Basic Education Expenditure Per Student (1994),and Poverty Incidence, By Region
4000 -- 60
350050
~.3000 012500401
01
1 000 30 0~~~~~~~~~~~~~~~~~~~~~~~1
x 1500- 20
NCR III CAR IV VIII Vil 11 VI xi I X KX V XIIRegion
=Central Government _Local Government(SEF) - Poverty Incidence
l- Ilocos Region V- Bicol Region IX-Western Mindanao CAR- Cordillera Administrative Region
1- Cagayan Valley Vl-Westem Visayas X-Northen Mindanao NCR- National Capital Region
111- Central Luzon VII-Cenitral Visayas XI-Southern Mindanao
IV-Southein Tagalog VIII-Eastein Visayas XII-Cental Mindanao
School Construction
105. The national school construction program is a case in point. Reflecting the country'sconstitutional commitment to free public basic education, a political slogan is that there ought to beone public elementary school in every barangay throughout the country, and one public secondaryschool in every municipality.32 This slogan represents a major investment program, a significantpart of which is not really necessary, hence diverting scarce resources from urgent priorities. Notevery barangay needs or can accommodate a school, and there is little evidence that lack ofimmediate access is constraining actual school attendance. Moreover, it is estimated that aboutone-third of the existing stock of elementary classrooms is in urgent need of rehabilitation orreconstruction.33
106. Even then. the proportion of barangays without school in each division is at least onecriterion of relative needs, albeit a rather crude one, that can be applied for regional allocation ofDECS' capital budget. The reality of school construction, however, is often different. In oneregion, for instance, the DECS Regional Office had established a plan, based on a bottom-upassessment of priority needs, for the distribution of the 1994 school construction budget among the
32As of earlv 1994. there were altogether close to I 1,600 barangays (27 percent of all barangays) without elementary school.3'DECS recorded 69.959 unused elementary classrooms in 1994. Dilapidated buildings appear to be one of the main reasons forthese "excess" classrooms. which continue to be inventoried by school principals to boost their budget claims.
38

various divisions. The region's provincial Governors, however, decided to split the budget evenly.As a result, the least populated province received more than it could effectively accommodate.3 4
107. Another example, in this context, is the introduction of a legislative proposal in theSenate, early 1994, with new rules for the distribution of DECS' school construction budget amongcongressional districts.35 The bill's explanatory note states that the distribution of school buildingfunds in the previous year had been inequitable, on account of the fact that one-third ofcongressional districts were allocated amounts in excess of the available average appropriation perdistrict. To remedy this situation, the bill typically proposes that capital outlays be allocated amonglegislative districts as follows: (i) 25 percent equally; (ii) 50 percent proportionally on the basis ofpopulation size; and (iii) the remaining 25 percent "to be allocated through DECS on the basis ofeach legislative district's needs and requirements".
108. It is interesting to note that the above distribution formula is identical to the one adoptedin the 1991 Local Government Code for the distribution of IRA, with DECS' authority beingreduced to the equivalent of the "land area" component. The proposal thus amounts to devolutionof three-quarter of DECS' present responsibility for school construction to legislative districts. Inthis respect, it reaffirms the original intent of the 1991 Local Governnent Code. On the whole, thebill is symptomatic of a reluctance to face the implications of the country's considerablegeographic, cultural and social diversity, and accept discriminatory use of national resources for thesake addressing priority regional needs. A positive element, however, is that DECS is at least givenexplicit authority to allocate its remaining capital budget according to needs, which could providean initial basis for more pro-active social targeting strategies.
109. Part of school construction is executed outside DECS' capital investment program,financed essentially through the SEF or other discretionary public funds.36 The absence of a trulycoherent national strategy for the expansion of the public school system, and DECS' lack ofeffective control of school construction at the local level, have critical implications for DECS'recurrent budget. Every new classroom requires a teacher and other recurrent commitments whicheventually have to be absorbed in the DECS budget. Uncontrolled expansion, whether financedtihrough DECS' capital budget or not, therefore leads to unplanned additional claims on therecurrent budget. This, in turn, reduces DECS' flexibility for effective expenditure targeting.
110. Moreover, such additional claims may become increasingly difficult to meet, andultimately threaten the quality and sustainability of the public education system. Indicative of sucha threat are the real decline in DECS' per student MOOE allocations, and the increasing number andduration of "extension teachers" remaining on LGU payrolls (see Annex 2).
34To date, this province has not been allocated sufficient resources to operate the new classrooms.35Ninth Congress of the Republic of the Philippines, Second Regular Session, S. No. 1631. 1994."'Each congressman, for instance, is being allocated a so-called Countryside Development Fund from the national budget, which hemay spend at his discretion. Typically, these funds are divided equally among congressional districts (presently about US$1 millioneach). An unknown proportion of these funds are used for school construction.
39

School Staffing
ill. Several uniformly applied staffing rules currently affect the relative quality of publicelementary and secondary education in rural versus urban areas (see Annex 1). For instance, thecriteria used for the allocation of new teacher positions3 7 force schools in less populated areas tooperate classrooms in multi-grade teaching mode. This is in itself cost-effective and desirable, butthe fact that teachers have not been adequately trained for such a demanding teaching practice tendsto turn it into a disadvantage. Local school authorities with the means of hiring additional teachersoften do so to avoid having to operate multi-grade classrooms.
112. Similarly, the rules underlying the attribution of slots for school heads tend to favor moredensely populated areas.38 Only 25 percent of public elementary schools nationwide are managedby a ranking school principal. But in the NCR, all schools have a principal,39 whereas in theEastern Visayas region only 14 percent of schools do. Head teachers, the next in line schoolmanagers, cover another 22 percent of schools, leaving over half of the country's public elementaryschools under the care of a teacher in-charge, the lowest level of school management. Regionally,however, the proportion of schools managed by a teacher in-charge ranges from zero in the NCR toas high as 73 percent in the ARMM.
113. Empirical research on effective schools has brought to light the important role ofcompetent school management in securing quality education. For the Philippines, this is confirmedby a recent study of learning achievements in elementary schools,4 0 which found, among otherrelevant factors, that the heads of high performing schools occupy the rank of principal. The cross-regional analysis documented in Annex 1 (Tables 5, 6 and 7) also shows a significant positivecoinection between the proportion of schools headed by a ranking principal and elementarycompletion rates. Even more significantly, the analysis shows the odds for elementary schools tobe headed by a ranking principal to increase with provincial income levels.
114. Teachers in charge are largely exempted from teaching duties. They represent altogetherabout 6 percent of the total stock of teachers. But again, this loss of teaching staff to administrativeduties ranges from zero in the NCR to twice the national average in the ARMM, Eastern Visayas,and CAR. This phenomenon contributes to raise actual student/teacher ratios in the poorest schooldivisions above the level implied by the conventional school statistics.
- At the elemiientary level. for instance. DECS applies the following norm for the approval of new teacher slots on the central payroll:classes of less than 15 pupils do not qualify for a teacher; classes of 15 to 55 pupils are entitled to one teacher; an extra teacher slot isapproved when the number of pupils exceeds 55. The norm is uniformly applied throughout the country.3 Both at elementary and secondar, levels. only schools with more than II teachers are awarded a principal. Above this minimum,the rank of a principal also increases as a fLunction of the number of teaching positions. Schools with 8-10 teachers are headed by ahead teacher", and schools with less than 8 teachers by a 'teacher in-charge". Head teachers are recruited among senior teachers
with experience as teacher in-charge, and principals among senior head teachers. In addition to seniority, promotion through theranks depends on the accumulation of in-service training credit points, and for principals also on pupil pertormance and communityrelations.3 In fact there are more principals than schools in the NCR (574 versus 469 in 1991/92).40Patricia B. Licuanan. A Comparative Study of High Perfonning and Low Performing Elementary Schools (Ateneo de ManilaLiniversity. 1995)
40

115. In addition, the seniority, hence qualifications and experience, of school principals is onaverage significantly higher in the more wealthy regions, particularly NCR, than in the others. Thesame applies with regard to the distribution of teacher qualifications; the proportion of lowestranking, hence least experienced staff in the teaching corps tends to be highest in the poorestregions. A case in point is the appointment of master teachers. the highest ranking teaching staff,who have responsibility for providing pedogogical counselling and support to their juniorcolleagues. DECS' rule is that the allocated number of master teacher positions should not exceed10 percent of the number of teachers in each school division. Nationwide, the actual proportion ofmaster teachers at the elementary level (9.1 percent in 1991/92) appears to conform to the rule, butit is well below the national average in some of the country's poorest region and well above inothers.
116. The misdistribution of master teachers is even more evident when related to the numberof schools in each region. In principle, each school should have a master teacher, but the divisionalceiling set by DECS, combined with the difficulty of reassigning staff across school divisions, doesnot make this uniformly feasible. Nationally, there are three master teachers for every fourelementary schools, an overall shortage of 25 percent. The NCR has on average more than 4master teachers per elementary school, whereas there is only one master teacher per 3 schools intwo of the poorest regions (ARMM and Eastern Visayas).
117. The discriminatory consequences of the uniform application of all these staffing rules aresummarized in Table 3.6 for the two benchmark regions. The detailed cross-regional analysis inAnnex I further supports the conclusion that DECS' school staffing norms favor the more affluentschool districts in the country and that they account to a significant degree for the perpetuation ofregional differences in educational achievements.
118. Raising the quality of school management through empowerment of school heads,increasing both their decision-making authority and their accountability for school outcomes, is animportant element of DECS' emerging strategy towards improvement of the quality of basiceducation. Greater parity in the relative distribution of qualified managerial staff is required,however, if decentralization of management authority is to be a success. It may otherwisecontribute to widen existing regional disparities in the quality of public education services.
119. DECS' ongoing policy of phasing out the function of District Supervisor, in the contextof the government-wide effort at streamlining the bureaucracy, is a related issue. This policyweakens the system's management capability at the basis, thus appearing at odds with the aim ofdecentralized sector management. In the absence of a district supervisor, his function is being takenover by a coordinating elementary school principal, usually the most senior principal in the district.The function being a full-time job, the acting district supervisor has to leave the day-to-daymanagement of the school to the most senior teacher. The policy thus leads to a de-facto loss of themost experienced school managers equivalent to the number of departing district supervisors, and,in turn, to a corresponding loss of experienced teachers.4 Although the policy applies in principle
4 Each performing at a higher hierarchic level without corresponding promotion. which explains why the measure is vastlyunpopular.
41

equally to all regions, the evidence indicates that the poorest and outlying areas are at adisadvantage.
Table 3.6 School Staffing Characteristics: E. Visayas vs. NCR
Elementary Level Secondary Level(1991/92) (1992/93)
East. NCR East. NCRVisayas Visayas
Average no. of students per:School 174 1,876 529 3,766Classroom 28 59 n.a. ni.a.Teacher 29 32 34 27
Average no. of teachers per:Principal 43 46 85 169Master Teacher 24 13 35 26
Average no. of master teachers per School .3 4.4 .4 5.0% lowest level:
Principals 82 49 51 7Teachers 63 52 84 67
% of schools headed by:Principals 15 100 18 89Teachers In-Charge 65 0 36 0
Source: DECS
120. DECS' ongoing policy of phasing out the function of District Supervisor, in the contextof the government-wide effort at streamlining the bureaucracy, is a related issue. This policyweakens the system's management capability at the basis, thus appearing at odds with the aim ofdecentralized sector management. In the absence of a district supervisor, his function is being takenover by a coordinating elementary school principal, usually the most senior principal in the district.The function being a full-time job, the acting district supervisor has to leave the day-to-daymanagement of the school to the most senior teacher. The policy thus leads to a de-facto loss of themost experienced school managers equivalent to the number of departing district supervisors, and,in turn, to a corresponding loss of experienced teachers. 4 3 Although the policy applies in principleequally to all regions, the evidence indicates that the poorest and outlying areas are at adisadvantage.44
421n the combined Bulacan and Valenzuela divisions. both contiguous to Metro-Manila and relatively affluent, there were 32 districtsupervisors in function for a total of 40 districts. In the Benguet division. in the Cordillera region, only 5 of the 14 schoo! districtshave an actual supervisor.43Each performing at a higher hierarchic level without corresponding promotion, which explains why the measure is vastlyunpopular.441n the combined Bulacan and Valenzuela divisions, both contiguous to Metro-Manila and relatively affluent, there were 32 districtsupervisors in function for a total of 40 districts. In the Benguet division, in the Cordillera region, only 5 of the 14 school districtshave an actual supervisor.
42

Government Assistance for Private Education
121. Social targeting has inspired the creation of the GASTPE programs (GovernmentAssistance to Students and Teachers in Private Education), funded through the DECS budget, toenable youth from lower income households to attend private highschools and colleges. GASTPEsupport at the secondary level is channeled through two different schemes: Tuition FeeSupplements (TFS), and Educational Service Contracting (ESC). The TFS scheme subsidizes aP290 portion of annual tuition fees for students enrolled in private highschools. The TFS programwas allocated P187 million for the 1994/95 schoolyear, for 644,000 beneficiaries (41 percent oftotal private enrollment at that level).
122. ESC is an innovative financing scheme designed to enable students to enroll inparticipating private schools, in communities where there is no public highschool, or where there isexcess enrollment in existing public highschools.45 Private schools participate on a voluntary basis,and must meet certain quality criteria. The ESC subsidy amounts to P1,500 per year, paid directlyto the school. This amount was apparently determined on the basis of the average per student costof public schools, but it is in reality considerably below the actual cost of both public and privateschools. Qualifying students may enroll in more expensive schools, but have to pay the costdifference. ESC funding totals P280 million in 1994/95, for 187,000 secondary students (12percent of private enrollment).
123. GASTPE plays a considerably less prominent role at the tertiary level. It consists of:
(a) A TFS scheme similar to the one for secondary schools -- P 10,000 per student, for about17,650 beneficiaries in 1994/95 (1.5 percent of private enrollment at that level).
(b) The Study Now Pay Later student loan scheme -- also P10,000 per student, for 2,890beneficiaries (.2 percent of private enrollment).
(c) A College Faculty Development Fund -- P29 million for 550 beneficiaries.
124. Total funds allocated for GASTPE programs increased from P686 million in 1989/90 toP849 million in 1992/93, but remained at that level in the next year, and declined to about P700million for the current schoolyear. Meanwhile, the share of support to secondary educationdeclined from 75 to 48 percent in 1992/93, and was raised again to 67 percent in 1994/95. Withinthis component, the size of ESC increased steadily at the expense of the TFS scheme. The reverseis taking place at the tertiary level, tuition fee supplements gradually displacing the student loanscheme.
125. How effectively is GASTPE targeted to lower income groups? From a regionaldistribution perspective, GASTPE might be seen as an example of successful targeting. Regional
45Student enrolled in public schools beyond the maximum allowable class size of 55 are considered "overflow" students, eligible forfree enrollment in a private school.
43

allocation of GASTPE funding by and large favors the poorest regions. Relative to total privateenrollment, elementary and secondary combined, the 1994/95 allocation for the highest incomeNCR amounts to about P30 per student, compared to almost P484 for the lowest income EasternVisayas region. GASTPE thus subsidizes a higher proportion of private enrollment in the latterregion than in the former.
126. At the grassroots level, however, a DECS commissioned survey of ESC beneficiaries46provides mixed findings with respect to targeting effectiveness. Half of the responding parents of
student beneficiaries were either farmer (26 percent) or jobless (23 percent), with another 11percent labeled as semi-skilled workers. The reported income of a vast majority of respondentfamilies would appear to have been below the poverty line. Most likely, however, family incomewas considerably under-reported. As much as 20 percent of respondents reported to have no fixedincome, which may be characteristic for farmers and self-employed but not necessarily related topoverty. More importantly, the reported educational attainment of parents were significantly abovethe national average for low-income households, which seems at odd with the reported incomeprofile.47
127. The essential admission criterion for ESC beneficiaries is to have been declaredoverflow students. Although preference is in principle to be given to students from lower incomefamilies, the procedure in itself does not guarantee that this happens. Since Government has aconstitutional obligation to provide free secondary education, any applicant qualifies for ESCregardless of family income. The above mentioned DECS study identifies a number of problemsrelated to the selection of ESC grantees, which tend to confirm the intrinsic weakness of theselection process. Apparently, students declare themselves "overflow" without being officiallycertified as such. This practice is implicitly encouraged by private school principals who personallyselect ESC grantees without the required certification of overflow. On the other hand, there are alsoprincipals of public highschools who do not declare overflow students when class size exceeds thelimit.
128. Another drawback of the present GASTPE system is the rather low level of subsidizationrelative to actual costs per student. The TFS subsidy obviously only benefits students who canafford to pay the substantial unsubsidized portion of total costs. The ESC scheme does not covertotal costs either. First, it only covers tuition fees, leaving textbooks and other school fees at thecharge of students. Secondly, the imposed tuition fee ceiling of P1,500 is unrealistically low (seeSection 3.4), leaving the difference with actual fees again at the charge of ESC grantees.Altogether, the unsubsidized cost of private school attendance remains prohibitive for students fromthe poorest families. The sarne holds for the tertiary GASTPE programs.
46See "Government Subsidy to Private Secondary Education: A Review and Assessment", Secondary Education DevelopmentProject, Research Monograph No. 2 (DECS, 1992). This study was in part based on a nation-wide survey of 640 participatinghighschools with 3,395 student beneficiaries, and a random control sample of 946 non-ESC students. The survey was conductedduring the 1991/92 schoolyear.47Of the ESC parent respondents, 19 percent had less than elementary school completion, and 52 percent less than secondarycompletion. For the total 15-64 age population, the corresponding achievements were 21 and 41 percent respectively (NSO, 1992Labor Force Survey). For the lowest three income decile of the 15-64 age population, however, these achievement levels were 26 and61 percent respectively (NSO/NEDA, 1992 Socio-Economic Survey of Special Group of Families).
44

129. With respect to ESC, finally, there is also evidence that the low tuition fee ceiling, aswell as reported substantial delays in the payment of the subsidy, has discouraged qualified privatehighschool from continuing their participation in the program. There is thus a danger that the ESCscheme, in its present form, fosters the emergence of a third tier secondary schooling system: i.e.,private but low quality highschools for subsidized students from lower income groups.
130. It seems that so far, with a given budget allocation, GASTPE has essentially sought tomaximize the number of student beneficiaries. These indeed represent a substantial, and in someregions even imposing, proportion of private enrollment. If GASTPE is to benefit the poor,however, the selection of beneficiaries ought to rely on effective means testing. It might also bewiser to increase the level of subsidization, even if it means reducing the overall number ofbeneficiaries. More effective targeting criteria for the selection of beneficiaries is also needed.
Conclusion
131. DECS' regional budget appropriations are based on conventional resource sharing normsand criteria without adequate reference to local circumstances, actual needs, and specific cost-factors. As such, the overly centralized budget process fails to address priority needs at theperiphery. Lack of effective control over the appropriation and execution of its own budget alsolimits DECS' scope for more pro-active social targeting strategies, aimed at reducing existingregional disparities in schooling outcomes. The GASTPE program, subsidizing access to privateeducation, was an innovative social targeting initiative. For this program to be truly pro-poor,however, means testing ought to become a key criterion in the selection of beneficiaries.
3.4 Public Versus Private Education
132. As discussed in Section 2.4, education financing from private sources plays an importantrole in the Philippines, both with respect to private and public schools. This direct privatecontribution is to a large extent the counterpart of a relatively inefficient public resourcemobilization effort, reinforced by the rather weak progressivity in national taxation. The questionmay therefore be raised whether the distribution between public and private education financing isappropriate, from a social equity point of view.
133. The following analysis is based on 1994 estimates of the per student cost (unit cost) ofeducational services in public and private schools at the respective levels of education. For betterunderstanding of relevant recent changes, these estimates are compared with corresponding unitcost estimates for 1986, documented in the World Bank's 1988 Education Sector Study.Conceptually, both sets of estimates are roughly comparable, combining central government andLGU budget data, school-based data, and relevant information from household surveys.
45

Unit Recurrent Costs
134. The total cost of educational services consists of: (i) the operating cost of schools; (ii)direct private costs other than school fees (transportation, books and pedagogical supplies, etc.);4and (iii) the cost of DECS' sector management and operational support (curriculum development,student examination, school inspection, etc.), serving both public and private education.49 Estimatesof the average recurrent cost per student in public and private education are shown in Table 3.7.
Table 3.7 Unit Recurrent Cost of Public and Private Schoolsby Level of Education (1994)
LevelElementary Secondary Tertiary
Unit Cost (P.):Public 4,085 4,846 24,870Private 4,580 6,101 14,170
Public/private ratio .89 .79 1.76
Ratio to publicelementary level:
Public 1.00 1.19 6.09Private 1.12 1.49 3.47
Source: Table 2. 10; DECS
135. A first conclusion emerging from these numbers is that private education is somewhatmore expensive than public education at the elementary and secondary level (12 and 26 percentrespectively). Public tertiary education, however, is considerably more costly (76 percent) than itsprivate equivalent. Secondly, public and private unit costs are moderately progressive from onelevel to the next; the cost of secondary education exceeds that of public elementary education by a20-50 percent margin, while the cost of one tertiary student would accommodate 3 to 6 publicelementary students. Thirdly, relative to per capita GNP, both private and public unit operatingcosts are comparatively low, particularly at the secondary level (Table 3.8). At the tertiary level,the unit operating cost of public institutions lies somewhere between the levels prevailing inIndonesia and Korea in the mid-1980s, but substantially below the resource commitment ofMalaysia in the early 1990s. On the other hand, the unit cost of private tertiary education in thePhilippines is not only far below its public equivalent, but also below regional norms.
48Unit costs, as defined in this section, exclude the cost of school uniforms, meals and boarding, as well as the opportunity cost ofstudents' forgone earnings.49Tlis cost is distributed pro-rata of enrollment in public and private schools at the respective education levels.
46

Table 3.8 Unit Operating Costs as Percentage of GNP per capita:Philippines versus Comparators in East-Asia
Philippines (1994) Comparators
Malaysia Indonesia I Korea Asia
Public Private (1992) (mid- 1980s)
Elementary 12 ]I 14 13 17 1 0Secondary 15 1 5 25 23 23 1 9Tertiary 85 40 171 9 1 71 149
Source: Philippines (1994) and Malaysia (1992) - World Bank; other - Mingat and Tan,Education in Asia (World Bank 1992).
a/ Unit operating costs of public educationwi Bangladesh, China, India, Indonesia, Korea, Malaysia, Nepal, Philippines, Sri Lanka and Thailand
136. Private education in the Philippines is widely considered to be both less costly and ofbetter quality than public education.50 This perception had a major impact in shaping governmentpolicy towards private education, from reluctant acceptance and overregulation to activepartnership and support (as reflected, for instance, in the GATSPE program). Leaving aside thequality aspect for the time being, the 1994 unit cost estimates provide grounds for challenging thisview. First, as shown in Section 2.1, budgetary constraints since the early 1990s have led to asignificant decline in unit MOOE expenditure, particularly at the secondary and tertiary levels.Moreover, there is ample evidence that the operating cost of private schools has caught up withpublic schools, particularly as regards teacher salaries.5' Deregulation of tuition fees charged byprivate schools has reinforced this tendency. This is also confirmed by the respective growth ofunit operating cost in private and public schools between 1986 and 1994, as shown below.
Implicit 1986-94 annual growth of unit operating costs(in %, at constant prices)
Private Public
Elementary 7.6 4.5Secondary 10.6 2.7Tertiary 18.9 8.2
5°The World Bank's 1988 education sector study, among other studies, made a strong contribution to the general understanding andacceptance of the evidence in this respect.51A recent comparative study of salary levels for a selection of matching public and private sector occupations found substantiallyhigher remuneration packages for private school teachers and principals than for their public counterparts [study by The WyattCompany (Philippines) for the World Bank, October 1994]. Although the private sample appears to be somewhat biased towardselite schools, this finding is confirmed by other sources.
47

137. Secondly, unit cost comparisons between public and private education in the Philippinesusually focus on school operating costs only, overlooking the cost of other privately financedschool inputs. As might be expected, such direct social costs are substantially higher for privatethan for public schools. Private elementary school students spend almost twice as much on school-related inputs than their public school counterparts. Thus, while the unit operating cost of publicelementary schools is indeed higher than that of private elementary schools, the differential impactof direct social costs more than bridges the gap (Table 3.9).
Table 3.9 Private/Public Unit Cost Ratios
Level of Education Operating Cost Direct Social Cost a' Total Unit Cost1986 1994 1986 1994 1986 1994
Elementary .70 .89 4.87 1.85 1.15 1.12Secondary .66 1.18 1.46 1.42 .83 1.26Tertiary .22 .47 1.30 1.47 .36 .57
Source: See Table 2.11; DECS.a/ Cost of privately financed school inputs other than school fees (books and school supplies, contributions to PTA. transportation).
138. Table 3.9 compares the private/public ratios of unit operating costs, direct social costsand total unit costs for 1986 and 1994. The comparison shows that relative costs in elementary andtertiary education have not changed; elementary education has remained more expensive in theprivate sector, purely on account of the private-public direct costs differential; and tertiaryeducation remained more expensive in the public sector, whether in terms of operating or totalcosts. A crucial change, however, has taken place at the secondary level, where the cost of privateschooling was below its public equivalent in 1986 but now exceeds it. Since the private/publicratio of direct social costs hardly changed during that period, this shift is obviously the combinedoutcome of upward adjustment of private school fees and financing constraints with regard topublic highschools.
139. Unlike in secondary and tertiary education, there has been a sharp decline in theprivate/public ratio of direct social costs at the elementary level, from about 5 in 1986 to 2 in 1994.This suggests that cost containment in public elementary schools, imposed by governmentfinancing constraints, has to a significant extent been mitigated through an increasing recourse todirect parental financing. At aggregate level, this phenomenon is reflected in the earlier findings ofan increasing proportion of private education financing benefiting public education (Section 2.3),and of an increasing share of elementary education financing originating from private sources(Section 2.4).
140. That private elementary and secondary schools, on the whole, have higher unit costs thanpublic schools does not necessarily mean that the latter are also more cost-effective. This dependson the relative internal efficiency of public and private schools, as well as on the relative quality ofeducation delivery, as measured by learning achievements. From this perspective, public educationdoes not compare favorably with its private counterpart (Table 3. 10).
48

Table 3.10 Comparative School Performance Indicators inBasic Education
(Ratio of Private to Public Indicators)
Performance Indicators Elementary Secondary
Internal Efficiency (1990/9 1):Repetition rate .36 .55Drop-out rate .64 .60Completion rate 1.48 1.05
Final Examination Scoresa/ 1.40 1.10
Total Unit Cost (1994) 1.12 1.26
Source: DECS' Elementary: NEAT (National Elementary Achievement Test) 1993/94;Secondary: NCEE (National College Entrance Examnination) 1992/93.
141. All school performance indicators favor private education,52 but less so at the secondarylevel. Thus, the total cost of producing one elementary graduate, presumably with a higher level oflearning achievement, may well prove to be lower in private than in public schools, even though theannual per student cost of school attendance is somewhat higher. This, however, is most unlikelyto be the case at the secondary level, given the narrower margin in school performance and thelarger difference in unit costs.53
142. Cost-effectiveness is an issue in the public elementary cycle, as will be argued in thenext section, but privatization is obviously not a realistic option. The issue is different at thesecondary level, where public and private sector compete for student enrollment. Government hasthe constitutional obligation of guaranteeing universal access to secondary education. It does soboth by operating public highschools, and by subsidizing students to attend private schools. Thepublic system is of lower quality than its private counterpart. At the same time, however, its totalprivate cost (school fees and direct costs) is about 60 percent below the private sector equivalent.The more affordable parental cost of public school attendance is largely reflected in the fact thatpublic secondary enrollment has been growing much more rapidly than private enrollment -- 6.5and 1.5 percent p.a. respectively since the nationalization of LGU-operated highschools.
143. Under those circumstances, one may wonder whether the premises underlyinggovernment's subsidization of private secondary school students are still rational. On average, theannual subsidy of P1,500 granted under the GASTPE Educational Service Contracting scheme
52Education statistics show that this is generally true both across regions and throughout the years.53Student cohort analysis shows the number of schoolyears required for one private school graduate to be only slightly below thepublic school equivalent (6-7 percent, both at elementary and secondary level). This is essentially because reported repetition ratesare very low, both in private and public schools. Failing students seem to drop out of school altogether rather than repeat grades.School statistics. however, are highly unreliable and most of the detailed data required for this type of analysis are unavailable.
49

covers only 40 percent of the operating cost of private secondary schools. As argued in thepreceding section, this is either a loosing proposition for the schools, if forced to accept students atthis rate, or prohibitive for lower income households, if they are required to pay the difference.Similarly, the P290 Tuition Fee Supplement granted to 40 percent of students enrolled in privatehighschools covers merely 5 percent of the total private cost of school attendance, a futile assistancewhen it comes to the poor. A case can therefore be made for GASTPE funding to be reallocated topublic secondary education, where it would make a first contribution towards improving qualityand securing affordable access for children from lower income households.
144. The substantial public-private unit cost differential at the tertiary level is more difficult tointerpret because this sub-sector is far less homogeneous, in terms of the types of institutions andcourses offered, than the preceding cycles. The public tertiary sub-sector, for instance, includes theUniversity of the Philippines, which is both the most prestigious and costly higher educationinstitution in the country. The chartered State Universities and Colleges (SUCs) also have acomparatively high concentration of student enrollment in high-cost disciplines, such as medicineand science. Private institutions, on the other hand, tend to concentrate in less costly fields, such aslaw, accounting and business. While cost-effectiveness is certainly an important issue in publictertiary education (see Section 3.5), unit cost comparisons with the private sub-sector are onlymeaningful at disaggregated level.
Cost Sharing in Public Education
145. A major part of the 1986-94 increase in unit costs in the public education system appearsto have been charged to households, both in terms of fees and other private costs (Table 3.11). Atthe elementary and secondary level, government's contribution to unit cost financing grew by 40and 30 percent respectively, whereas parental contributions increased five-fold at the elementarylevel, and almost two-fold at the secondary level. Tertiary education is again an exception; not onlywas the overall increase in unit cost higher than at the preceding levels, but most of the increasewas also financed by Government, with only a nominal adjustment in parental contributions.
146. As the evidence in Table 3.1 1 indicates, Government now subsidizes a higher percentageof unit costs in tertiary education than it does at the elementary level. At the secondary level, therate of Government subsidization has fallen below 60 percent. Paradoxically, Government's failureto sustain adequate funding for secondary education implies that today, on average, parents assumea higher share of the cost burden than prior to the nationalization of local highschools.
147. Since access to public education is supposed to be free at elementary and secondarylevels, it is not surprising that most of the increase in private costs has been in the form of directcosts other than school-based fees. The latter account for only 20-25 percent of the overall 1986-94increase in private costs in basic education. The distinction between fees and other direct privatecosts thus appears to be flexible. It seems that part of the shortfall in government funding ofschools' operating cost, which cannot legitimately be recovered through fees, is being shifted into
50

the realm of other direct private costs.54 This conclusion also finds support in the fact that privatenon-fee costs rose more rapidly in public than in private schools, where there are fewer constraintson increasing fees.55
Table 3.11 Cost Sharing in Public Education, 1986-94(Government and private shares in % of total unit cost)
Financing Sources 1986 1994 1994 Index(1986 = 100)
I. Elementary:Government 87.9 69.1 139Households 10.6 30.4 507
Fees (-) (4.9) (-)Other Private Costs (10.6) (25.5) (392)
Total b 100.0 177(id. in P., 1994 prices) (2,305) (4,085)
11. Secondary:Government 66.5 57.3 132Households 33.5 42.5 195
Fees (12.6) (10.1) (123)Other Private Costs (20.9) (32.4) (238)
Total b 100.0 100.0 154(id. in P. 1994 prices) (3,155) (4.846)
III. Tertiary:Government 73.9 78.1 193Households 26.1 17.9 125
Fees (13.3) (8.1) (111)Other Private Costs (12.8) (9.8) (140)
Total b 100.0 100.0 183(id. in P., 1994 prices) (13, 615) (24,870)
Source: See Tables 2.10 and 2.11.U/The World Bank's 1988 Education Sector Study did not record any school fees in public
elementary schools in 1986.
148. The argument can be made that, even in public elementary schools, parents areapparently willing to pay some price for educational services, and that this is no burning issue aslong as those services remain affordable for lower income households. The evolution of studentenrollment at the elementary level, however, suggests that this may no longer be the case. Thegrowth of elementary enrollment is lagging behind the rate of population growth. At the same
For instance, the Manila Bulletin of June 14, 1995, reports that the Govemor of Bulacan Province "... has wamed publicelementary and highschool teachers in this province against collecting unauthorized fees and other kinds of contributions fromstudents ...". The waming was aired after several complaints had been received that "...some teachers were requiring the students toFay exhorbitant fees supposedly needed before enrollment...'.5In 1986, parents were paying about five time more for non-fee items in private than in public elementary schools; this ratio is
estimated to have dropped to two by 1994. The same tendency is apparent at the secondary level, albeit to a much lesser extent.
51

time, enrollment in public elementary schools has been growing at a much lower rate than inprivate schools (1.4 versus 3.7 percent p.a. respectively over the period 1987-93). The evidence onthe incidence of economic factors on school participation discussed in Section 3.1 (Table 3.2) isalso a warning sign in this respect.
149. What is the relative incidence of the private cost of educational services, from theperspective of households opting for public or for private education? According to the 1991 FamilyIncome and Expenditure Survey, average family expenditures for education in the lowest incomedecile represented less than 5 percent of the corresponding average in the highest income decilewhere families are most likely to send their children to private schools. Given the inequality ofincome distribution, however, both levels of education spending represented about the sameproportion of total family income. The relative cost incidence of public and private education isfurther explored in Box 3.1. The analysis suggests that, in spite of government subsidization, theprivate cost burden of public education is higher for lower income households than the cost ofprivate education is for the better-off households.
BOX 3.1: Relative Incidence of Private Educational Costs
According to the Philippines' 1991 Family Income and Expenditure Survey (FIES), average familyexpenditures in the first seven income deciles were below, the national average, while family expenditures in theupper three income deciles were above this average. It is assumed, for the sake of the analysis, that the secondgroup of households (the better-offs) are those most likely to tsent their children to private schools, whereaschildren from the first group would normally attend public schools. Under this assumption, one may relate therespective private cost of:public and private schools to the average expenditure of both groups of households.
Extrapolating the 1991 household survey data to 1994 on the basis of the intervening nominalgrowth of per capita: GNP, average expenditures of famnilies in the first seven income deciles are estimated atP46,140, and at P168,630 for families in the upper three deciles. The private cost of public and private schools,expressed as a percentage of the average expenditures of each :group of households, are shown below.
Private annual cost per. student in % of average family expenditure
Public schools for Private schools forlowest 7 deciles upper 3 deciles
Elementary 2.7 2.6Secondary 4.5 3.3Tertiary 9.6 7.0
Conclusion
150. There has been a substantial de-facto increase in cost-recovery in the public basiceducation system, particularly at the elementary level. As a result, it would appear that today publicschools are more expensive for lower income households than private schools are for upper incomehouseholds. In view of the rather inequitable distribution of income in the Philippines, moreover,the present imbalance between public and private financing of education is to the disadvantage of a
52

relatively large segment of the population. Continued reliance on private sources to fill the shortfallin central government financing increasingly requires compensatory measures to protect the poor.
151. In the public education system, there is foremost a need to reduce the private cost ofelementary schooling, with special focus on the poorest areas in the country. There are threevenues to achieve this objective:
(a) Improving the cost-effectiveness of education delivery in elementary schools (seeSection 3.5), so as to reduce the need for extra financial contributions from parents;
(b) Increasing cost-sharing with LGUs, where further possible, with more selective targetingof central government financing towards disadvantaged areas; and
(c) Selective direct subsidization of private costs for children from the poorest households.
152. Cost-recovery at the secondary level need not necessarily be reduced, but selectivesubsidization for children from lower income households is a must. To that end, cost-recoveryought to be regularized notwithstanding the constitutional guarantee of free access. At present,guaranteeing affordable access to quality secondary education seems to require a higher level ofgovernment resource commitment, part of which for investment in expansion of the publicenrollment capacity. At the tertiary level, obviously, both the cost-effectiveness of operations andthe extent of cost-recovery are targets for drastic improvement.
3.5 Cost-effectiveness in Public Education
153. Priority needs for additional funding of public schooling have been identified withrespect to the following objectives: (i) improving the quality of elementary education, withparticular emphasis on greater availability of resources at the school level; (ii) expansion ofenrollment capacity and quality improvements at the secondary level; (iii) improving the equity ofthe system, by reducing the private cost of basic education for lower income households; and, morespecifically, (iv) special support for basic education in priority provinces targeted underGovernment's poverty reduction program. Eventually, the secondary cycle will have to belengthened from four to five years, which will require a considerable additional commitment ofresources.
154. Current budget appropriation levels are insufficient for DECS to satisfactorily meet thosepriority needs. However, given the prevailing global resource constraints, and in view of theemerging imbalance in cost-sharing between Government and households in basic education,improving the cost-effectiveness of basic education seems the most realistic option. Greater cost-effectiveness works on two fronts: generating savings for alternative use, and raising the retums perunit of expenditure. Several issues related to cost-effectiveness have already been raised in theforegoing. Briefly summarized:
53

(a) The need for improving the effectiveness of budgetary processes in DECS, particularlyfor strengthening budget implementation monitoring. A particular concern in thisrespect is the extent to which budget appropriations for MOOE, a large proportion ofwhich is not directly allocated to operations, are eventually used for the intendedpurpose.
(b) The need for increasing the extent, and improving the efficiency of expenditure targetingby DECS towards priority needs identified at the basis of the education system. Thiswould require decentralization of sector management. Redesign or reallocation of theGASTPE program also falls in this category.
(d) The need for achieving better coordination of expenditure programs and objectivesbetween DECS and local school boards (provincial and municipal) in order to achievemore effective joint targeting of priority needs. The issue is particularly relevant withregard to school construction, where local initiatives may have unexpected recurrentfinancing implications for DECS.
155. In the long run, the most promising venue for raising the cost-effectiveness of the systemis of course to improve its internal efficiency, with particular focus on the country's lowestperforming school divisions and districts. This, however, requires considerable initial investmentin quality improvement.56 In the immediate, the following options for easing DECS resourceconstraints warrant further consideration: (i) reducing the cost of the SUCs to central government,which would make it possible to increase DECS' share in the total education sector budget; (ii)rationalizing DECS' staff deployment; and (iii) devolving DECS' remaining responsibilities forschool construction and maintenance to LGUs. The basis for these recommendations is provided inthe remainder of this section.
State Universities and Colleges
156. The case has already been made in the preceding section for much higher, if not fullcost-recovery for educational services provided in SUCs. So far, prevailing regulations andprivileged budgetary treatment of these institutions have stifled incentives towards cost-recovery, aswell as for greater financial autonomy. Unlike private tertiary institutions, SUCs have yet to startmobilizing private financing for research and extension services.
157. The combined budget of SUCs, more than anything else, illustrates their lack of cost-effectiveness. In 1994, the operating costs of higher and advanced education services provided bySUCs accounted for less than 40 percent their total recurrent budget, the rest being absorbed byadministration (33 percent), support for auxiliary, research and extension services (8 percent), theoperation of non-tertiary education services (elementary, secondary, non-formal, and technicianeducation, altogether 5 percent), and recurrent costs associated with projects (15 percent).
561t is the intention of the World Bank to provide financial support for quality improvement at the elementary level through a ThirdElementary Education Project. identified and prepared jointly with DECS.
54

158. Rationalization of the SUCs stands high on the Government agenda. The recent creationof an inter-departmental Commission for Higher Education, which de-facto relieves DECS fromthe overall management responsibility for this sub-sector, hopefully paves the way for reform. Onanother front, DBM stopped scrutinizing the budget proposals submitted by SUCs in 1993, andstarted to grant them flat subsidies based on enrollment and other criteria, instead of providing line-by-line financing. This is a first step, but it still amounts to indiscriminate input-based financing,instead of promoting cost-effectiveness based on specific output performance criteria.
159. The establishment of SUCs, at the charge of the national budget, is usually motivated bylocal interests. It seems therefore appropriate to decentralize the financial responsibility for theseinstitutions, and granting them full autonomy for independent resource mobilization.Decentralization would have the additional benefit of making SUCs more responsive to the specificneeds of the various regions, hence fostering the external efficiency of their course offerings.Continued subsidization from the national budget would remain desirable where SUC-deliveredservices serve a national interest that is not or insufficiently covered by the private sector. Eventhen, it would have to be selective rather than across the board, based on output performance ratherthan input criteria. Equity considerations would require higher cost recovery to be accompanied bycompensatory adjustrnents in scholarship and student loan programs. To a large extent, suchadjustments could be co-financed by LGUs.
160. The outlined strategy would gradually reduce, and eventually eliminate the burden ofSUCs on the national budget. These savings would have to retained in the education sector, toincrease DECS' resource basis. In all fairness to the SUCs, however, it has to be acknowledged thattheir inadequate cost-effectiveness is in part due to the sub-standard leaming achievements ofhighschool graduates. Therefore, according to experts, the first two years of higher educationinclude inordinate amounts of remedial secondary level instruction. This thus clearly an area ofjoint responsibility for DECS and SUCs, with potentially significant mutual benefits.
DECS Staff Deployment Norms and Practices
161. DECS had a total of 437,600 staff in 1994, slightly less than in at the beginning of thedecade. Total DECS staff can be broken down into three categories: teaching teachers, teachers innon-teaching positions, and other non-teaching personnel (Table 3.12). Teaching teachersaccounted for 88 percent of total in 1992, the remaining position being almost equally split betweenthe other two categories. Central administration staff in the Office of the DECS Secretary accountsfor a rather modest .5 percent of total DECS personnel.
55

Table 3.12 Teaching versus Non-Teaching DECS Staff in 1992, by Level of Education(% Distribution)
TeachersTeaching Non-teaching Non-teachers Total Staff
Elementary a/ 89.8 6.2 4.0 100.0Secondary a/ 85.4 5.4 9.2 100.0Tertiary b/ 66.0 2.5 31.5 100.0Office of the Secretary 27.1 32.9 100.0
Total Staff 87.8 6.0 6.2 100.0(same in P. 000) (389.4) (26.5) (27.3) (443.2)
Source: DECS (the breakdown of tertiary level staff is based on mission estimates.v/ The proportion of teaching staff varies among regions, between 85 and 93 percent at the elementary level, and between 72 and 94
percent at the secondary level.bl Excluding SUCs.
162. The proportion of non-teaching staff (teachers and others) is somewhat higher at thesecondary than at the elementary level (15 versus 10 percent respectively). Such rates do notsuggest an excessive burden of non-teaching staff on the DECS payroll.57 At the regional level,however, there are rather wide disparities in the proportion of non-teaching staff, particularly insecondary education.58 This may reflect prevailing institutional rigidities with respect to thereassignment of teachers,59 both teaching and non-teaching, across school divisions. Relaxing theimpediments to greater regional mobility of teachers, if politically feasible, would certainlycontribute to achieving a more efficient use of available teacher resources.
163. Although there is no major explicit diversion of teachers into non-teaching positions,there is evidence of teachers in teaching positions assigned part- or full-time to administrative orother support functions in school or, to a lesser extent, at the district office. Local designation, asthis practice is called, appears to be limited to regular and master teachers in elementary schools.Nationally, it affects over one-fifth of this teaching force, again with considerable regionalvariations. According to 1990/91 DECS data, the percentage of teachers with local designationranged between 10 percent (of which 7 percent at school level) in the Western Mindanao region,and as much as 38 percent (31 percent in school) in the Ilocos region.
164. Local designation may to some extent may reflect a shortage of regular administrativeand support personnel in schools and district offices. This is suggested by the fact that in 1990/91teachers with local designation made up 80 percent of total personnel in administrative and support
57The very small DECS-managed tertiary sub-sector (essentially non-chartered colleges) is an exception.58The proportion of non-teaching staff ranges between 6 and 28 percent in secondary education, compared to a 7-15 percent range atthe elementary level.59The Magna Carta for Public School Teachers, enacted in 1966, stipulates that "... no teacher shall be transferred without his consentfrom one station to another." In principle, the law gives the school superintendant, at the divisional level, the authority fortransferring teachers where such is required by the exigencies of the services. His decisions, however, are open for appeal to DECS'central administration.
56

functions in elementary schools, and 60 percent in district offices. A parallel interpretation may bethat administrative demands on schools and district offices, particularly as regards reportingobligations to higher levels in the DECS hierarchy, are excessive.
165. Whatever the interpretation, the fact is that a substantial part of the teaching force iseither temporarily or permanently diverted from actual teaching. Since there is no information onteacher time allocated to non-teaching activities, it is impossible to quantify the overall loss inteaching time generated by local designation. More productive use of available teachers haspotential for cost-savings. This is therefore an issue that warrants further investigation.
166. Another issue, in this context, is the large apparent salary differential between teachingand non-teaching staff in the DECS hierarchy, as illustrated below.
DECS 1992 Average Basic Salary Ratios(teaching teacher 100)
Regional Office of DECSOperations Secretary
Teaching teachers 100Non-teaching teachers 147 158Other non-teaching staff 72 107
167. Teachers are promoted into non-teaching positions and correspondingly higherremuneration rates after several years of teaching services. The above ratios thus reflect normnalcareer patterns rather than discriminatory remuneration rates. The present salary structure providesnonetheless a strong incentive for teachers to eventually move out of their profession. Teachingthus tends to loose its most experienced practitioners. It may therefore be worth to considerextending career opportunities within the teaching profession.
168. DECS school staffing norms not only puts rural and underpopulated areas at adisadvantage, as argued in Section 3.3, they also tend to promote padding of student enrollmentdeclared by schools. Per student, per teacher, and per classroom regional resource allocationnorms, applied for most non-personnel items on DECS' budget reinforce this tendency.60
169. In addition, the combined system of sector staffing and resource allocation norms hasfostered a preference for large schools. It may also explain some of the reluctance towards smallermulti-grade schools, perceived as under-privileged in terms of attribution of operating resourcesand educational inputs. This attitude also prevails in low population density rural areas, where slowgradual creation of relatively costly 6-classroom schools is preferred to a more rapid networkextension of smaller schools with multi-grade classrooms. Much of the annual school buildingprogram thus consists of adding classrooms to existing schools. In addition, a sizable stock of
60 References to this issue regularly surface in the context of elementary education. Whether it is also relevant at the secondary levelis, at this stage, unknown.
57

dilapidated classrooms, which are no longer in use, are nonetheless kept on the books andperiodically reported to DECS in expectation of more favorable resource attributions.6 '
170. There is an urgent need for a thorough in-depth survey of teaching, administrative andsupport staff deployed in elementary schools, and possibly highschools, with a view to assessinghow and to what extent DECS' operational staff might be used more effectively. The study shouldalso provide a comprehensive assessment of the efficiency and equity of existing allocationprocesses with regard to school inputs, with particular focus on the prevailing system of staffdeployment and career development norms and practices.
School Construction
171. Centralized responsibility for financing and execution of school construction andmaintenance a particularly wasteful proposition in the highly diversified context of the Philippines.Long chains of command between central resource appropriation and local execution, with multipleintermediate level decisions and weak coordination between planning and executing agencies, oftenlead to final outcomes not matching effective needs.
172. Uniform standard architectural designs are being used throughout the entire country,which causes many cost-raising adaptation problems in specific regions. Similarly, a single unitprice norm determines budgetary allocations for school construction, irrespective of site location.Where actual construction costs are above the norm, essentially where difficult access increasestransportation costs, school construction stops as soon as this cost reaches the fixed financial ceilingand school buildings remain uncompleted.
173. Locally financed and executed school construction, by contrast, generally proves to beless costly, of better quality, and more suitably adapted to local circumstances. Local involvementin school construction and maintenance have the additional benefits of strengthening communitycommitment towards the school, and of providing some income-generating activity for localcraftsmen.
174. All in all, there is a strong case, on grounds of cost-effectiveness, for decentralization ofschool construction and maintenance. Full devolution of this responsibility to LGUs, which is inline with the intent of the 1991 LGC, would have the added benefit of freeing DECS resources foruse in priority alternatives. Selective compensatory support would have to be provided tofinancially disadvantaged LGUs. Ways of granting this support without discouraging local taxationefforts, or resource commitment to education, need to be identified.LGUs. Ways of granting thissupport without discouraging local taxation efforts, or resource commitment to education, need tobe identified.
61According to 1994 DECS estimates, there is an "excess" of reported elementary classrooms, accounting for as much as 23 percentof the total stock. Discounting these unused classrooms raises the national students/classroom ratio from 33 to 42. Not all excessclassrooms are dilapidated, though, as there may be other reasons for their not being used.
58

Conclusion
175. Government's education strategy, the result of an ongoing extensive nationalconsultation effort, is essentially directed at improving the quality of basic education, withparticular emphasis on the elementary cycle where achieving universal completion is a must. Amajor, and potentially very costly issue to be addressed, in this context, is the need to increase thelength of the secondary cycle, which is presently limited to four years. A begin has been made withthe rationalization of budget support for the SUCs, but without appreciable savings. Subsidizationremains input- rather performance-based. Government is also conscious of the social equity issuesfacing the public education system. It is addressing these in the context of its Social ReformAgenda, presently targeting 20 of the poorest provinces (see Annex 1).
176. Government's objectives call for considerable additional resources to be made availableto public elementary and secondary schools, particularly in view of the need to lighten the directcosts of school participation for the poor. Since the allocation of public funds to the educationsector already absorbs a substantial part of the national budget, the required additional resourceswill have to be mobilized primarily through reallocations within the overall education sectorbudget, and by raising the cost-effectiveness of DECS operations.
59

Annex 1: Poverty and Regional Equity in Basic Education
Introduction ............................................................. 61Poverty versus School Participation ............................................................. 62Poverty and Educational Inputs ............................................................. 66School Staffing Characteristics and Schooling Outcomes ............................................................. 67
List of Tables
Table 1: Poverty and Public Education ............................................................. 63Table 2: Physical Access, Poverty, and Elementary Participation ............................................... 64Table 3: Poverty and School Participation (1991) ............................................................. 65Table 4: Poverty and Elementary School Staffing Characteristics School Staffing
Characteristics and Schooling Outcomes ............................................................. 67Table 5: Elementary School Completion, as a Function of Provincial School Staffing
Characteristics ............................................................. 68Table 6: Elementary School Completion, as a Function of Regional School Staffing
Characteristics ............................................................. 69
List of Figures
Figure 1: Average Family Income versus Poverty Incidence (1991) ........................................... 62Figure 2: Poverty and Elementary School Completion (1991) ..................................................... 65Figure 3: Poverty Incidence and MOE Per Student In Elementary Education,
Philippines (1994) ............................................................ 66Figure 4: Poverty Incidence Versus MOE/Stud. In Secondary Education, 1994
Regional School Staffing Characteristics ............................................................. 66
60

Annex 1
POVERTY AND REGIONAL EQUITY IN BASIC EDUCATION
Introduction
1. This annex documents the results of a regional cross-section analysis of the connectionsbetween public education and poverty in the Philippines. The analysis focuses on three sets oflinkages, both for elementary and secondary education:
a) the relation between poverty and school participation;
b) the relation between poverty and the regional distribution of educational inputs; and
c) the relation between school staffing characteristics and schooling outcomes.
The findings provide much of the empirical basis underlying some of the issues raised in ChapterIII.
2. Admittedly, this type of analysis is at times somewhat ambiguous when it comes tointerpreting the direction of causality between two phenomena -- e.g., poverty and educationaloutcomes. In the main, however, the purpose of the analysis is to establish that there are relevantpoverty-related educational characteristic, which call for more elaborate policy analysis.
3. The analysis combines four sources of information: (i) DECS education statistics; (ii) the1990 Family Income and Expenditure Survey (FIES); (iii) the 1991 Population Census; and (iv)DECS and LGU budget data. The unit of observation is, in principle, the province -- in total 97observations, including 20 cities with provincial status. In the administrative structure of the basiceducation system, the province is generally equivalent to a DECS school division. In a number ofcases, regressions are based on regional data -- i.e., 15 observations.
4. Two alternative measures of poverty have been used throughout the analysis: averagehousehold income, and the percentage of households below the poverty line. The former measureyields uniformly more significant regression outcomes. Two factors, most probably jointlypertinent, may explain this phenomenon. First, the provincial poverty incidence data are based onregional poverty lines, the computation of which is open for several inaccuracies and biases.Secondly, average household income is likely to reflect the influence of relevant developmentalvariables beyond the strict measurement of poverty. '
5. There is nonetheless a relatively strong correlation between average family income and theincidence of poverty,2 as shown in Figure 2. Expectedly, however, the link between the twoalternative measures of poverty weakens as the average level of income increases. Distributional
For instance, the overall level of economic development, employment diversification out of agriculture, urbanization,social attitudes towards education.
2 lnP =-1.03nF + 7.77 R2 =.64(11.6)
where P = % of households below the poverty line, and F = average farnily income.
61

considerations, in the context of poverty, become obviously prevalent at the upper income levels(see Annex Figure 1). The results presented in this annex are based on average family income, butthe corresponding outcomes with the percentage of households below the poverty line as povertymeasure are available on request.
Figure 1: Average Family Income versus Poverty Incidence (1991)
80 -
70 - co0
r.0~~~~~~~
~~~~ 0~~0. 0
r. 50 - o\ou~~~~~~~~~~~~
40 -o °
0 0
> 30- 008
C.
20 - o o _ _*10 -~~~~~~~~
0 -~~~~~~~
0 20 A 60 ao do0 * 10
Average Family Income (P 000)
Poverty versus School Participation
Public versus private school attendance
6. Private education plays a very important role in the Philippines, particularly at thesecondary and tertiary levels. As a first step it is therefore interesting to explore the relationshipbetween income levels and the distribution of enrollmnent between public and private schools. TableI shows the correlation between the share of public education in total enrollment (dependentvariable) and average family income.
62

Table 1: Poverty and Public Education
% Public/Total Average Family Income (P. 000)
Enrollment (1990) Coeff. T-Stat. R2
Elementary cycle -.21 11.85 .60
Secondary cycle -.23 4.33 .17
7. At the secondary level, where the share of public enrollment varies between 25 and 100percent with a relatively weak but significant impact of income differentials, private schools are indirect competition with public schools for the global student market.' At the elementary level,however, public schools clearly represent the main, if not the only education opportunity for thepoor. This justifies government's strategic focus on elementary education, emphasized in thepresent analysis.
School mapping
8. Until recently, it was thought that lack of physical access to schools was the main factorlimiting the participation of children from lower income households in elementary schooling. Apopular slogan, therefore, was that there should be one elementary school in every barangaythroughout the country. The evidence does not support this view. The percentage of barangayswithout elementary school is available for each of the 97 provincial units, varying between 0 and 68percent. Regression of this data with average household income, on the one hand, and with
2elementary school participation rates, on the other hand, shows that the regional distribution ofelementary schools bears little or no relation with poverty, nor with school participation (Table 2).
School participation
9. At any point of time, youth may be prematurely out of school (i.e., non-participating) eitherbecause it never entered school in the first place, or because it dropped out, temporarily ordefinitively, before completing the cycle. Whereas participation rates are a global indicator of thisdual phenomenon, completion rates3 are a more direct measure of school effectiveness in retainingstudents, once in school. In the present context, completion rates are thus an important, albeit crude,indicator of school participation outcomes. The relation between income and, respectively, schoolparticipation and school completion is shown in Table 3. Strictly speaking, the causality of thisrelation is undetermined. In the long term, human capital theory would identify school participationand completion as determinants of income. In this paper's medium term policy focus, however,income is the independent variable.
Government subsidization of private secondaiy education through the GATSPE program, although criticized in Chapter IIIfrom a point of view of social targeting efficiency, may have some impact in this respect.
2 School participation rates are the proportion of the population in a given school-age group reported to be actually attendingschool. Unlike enrollment rates, which are based on school data and subject to overreporting, participation rates are derivedfrom the population census.The proportion of new entrants who ultimately complete the school cycle.
63

Table 2: Physical Access, Poverty, and Elementary Participation
% Barangays w/o Elementary School
Dependent Variable Coeff. T-Stat. R2
(a) Participation rate (1991) .04 .90 .01
Average Household Income
Coeff. T-Stat. R12
(b) % Barangays w/o elementary school .21 1.30 .02(1993)
10. The effect of regional income differentials on school participation appears to be aboutequally significant at the elementary and secondary level. The nature of this effect, however, isfundamentally different in each cycle. At the elementary level, where access has already beenshown to be a relatively minor constraint, poverty affects school participation essentially throughlow school retention of students from lower income households, as evidenced by the very strongcorrelation between income and school completion. Comparatively, the relation between incomeand school completion is rather marginal at the secondary level, suggesting that financialconstraints limiting access are a more important factor underlying income-related participationdifferentials. This is also confirmed by the results of recent surveys of out-of-school youth (seeChapter III, Table 3.2).
11. These findings have important policy implications. Raising the retention of elementaryschools in the poorest areas through quality improvements in educational services and schoolmanagement are a top priority. Achieving universal elementary education in the Philippines is notso much a matter of expanding school enrollment capacity, but rather of making sure that childrenwill complete the cycle after admission, and have a qualitatively relevant learning experience. Atthe secondary level, on the other hand, effective targeting of scholarships or school subsidies wouldappear to be a higher priority.
12. The above results have also strategic implications for social targeting. This is illustrated inFigure 2, which plots average household income against elementary completion rates. The graph isdivided in four quadrants by the national average of both variables. The lower left quadrant thuscontains provinces with both income and completion rates below the national average. These arethe areas which require priority targeting of educational resources. Although poor, the areas in theupper left quadrant show comparatively favorable educational outcomes. This is a reminder thatgovernment strategy ought to be differentiated across areas according to circumstances and needs.The education component in government's overall anti-poverty strategy thus requires a higherweight in the lower than in the upper left quadrant.
64

Table 3: Poverty and School Participation (1991)
Average Household Income
Dependent variable Coeff. T-Stat. |R2
A. Participation rateElementary cycle .18 5.05 .25Secondary cycle .20 4.74 .23
B. Completion rateElementary cycle .38 8.63 .44Secondary cycle .15 3.58 .12
13. The targeting framework shown in Figure 2 is particularly relevant in the context of thePhilippines, where government has adopted a Social Reform Agenda targeting 19 priorityprovinces for special anti-poverty support, including prominently for elementary education. Most ofthese officially targeted provinces, indicated in dark in Figure 2, are located in the lower leftquadrant.
Figure 2: Poverty and Elementary School Completion (1991)
1000
90- o 0 o °o o o90~~~~~~~~~
0 0 Q Cb ° O°
80 - d 0 000E _ 0 00
70 - 0 ((l
o0 0'-' 70 0~~~ 0 m
~00 40
0 0 - ~
r-650
4 0 ~* 00
0
300
0 20 40 60 80 100 130 1410 18'0
Average Family Income (P 000)
65

Poverty and Educational Inputs
Financial allocations
14. Figures 3 and 4, for public elementary and secondary education respectively, plot provincialMOOE allocations per student from the DECS 1994 budget against the incidence of poverty. Atboth levels, but particularly at the elementary, per student MOOE allocations are confined within arelatively close range, and apparently unrelated to actual needs. There are a number of prominentoutliers, many of which in the NCR region, which are being granted substantially higher per studentMOOE allocations than the national average. The evidence illustrates the lack of a coherent DECSs trategy for actively targeting resources towards the most pressing needs, the most disadvantagedareas or population groups.
Poverty Incidence and MOOE per Student, 1994
Figure 3: Elementary Education Figure 4: Secondary Education
1511
3(K) * 5)1)
0
251) 4110
v 2)4) :1}) -@
_l S 31-1*:(°21}@ *S -!|1511 30*
X,. ., *0 2011 ~ : ........ 2 .h s*1 i (xl
O I 21) 3( 40) 51) 64) i ll A Il , 2 ) ! 1 ) 4( 51 OIl 7X) SO
P-sr nc~idce P-oy Inciden:
School management and teaching staff
15. DECS applies student-based school staffing norms for teachers and principals, both withregard to the number and professional grading of staffing positions granted to elementary andsecondary schools. These norms are, documented in the main text, are uniformly appliedthroughout the country and tend to favor urban, and generally more affluent areas. This subsectiondocuments for the public elementary education system6 how such norms affect regional schoolstaffing characteristics at varying income levels.
16. Table 4 shows the correlation between the following school staffing ratios and averagehousehold income:
6The analysis was also carried at the secondary level. The results, although less significant at the provincial level but much more soat the regional level (n=15), tend to confirm the findings for primaly schools, both as regards linkages with income and schooloutcomes.
66

* school principals / schools* school principals / classrooms* school principals / teachers* highest ranked principals / total principals* teachers / classrooms* highest ranked teachers / total teachers
The underlying hypothesis is that these staffing characteristics affect the quality and effectivenessof school and classroom management at the local level, and, ultimately, schooling outcomes.
Table 4: Poverty and Elementary School Staffing Characteristics (1992)
Average Household Income
Dependent variable: Coeff. T-Stat. R2
principals/school .23 9.91 .51principals/classroom .05 5.14 .22principals/teacher .02 2.14 .05highest/total principals .15 7.34 .36teachers/classroom .05 5.79 .26highest/total teachers .03 1.67 .03
17. The above results confirm income-related imbalances in the regional distribution ofelementary school staff, both as regards numbers and professional experience, with lower incomeregions suffering the greatest shortages. The relationship is particularly significant with respect toschool principals.
School Staffing Characteristics and Schooling Outcomes
18. Having shown how both school completion and the quantitative and qualitative distributionof school staff correlate positively with income, this section explores the relationship betweenschool staffing characteristics and elementary completion rates (see Table 5). Staffing is only one ofseveral inputs determining the quality of education and, ultimately, schooling achievements. But isa very important one and the inference is that equity in the regional distribution of educationalinputs is a condition for achieving regional equity in schooling outcomes.
19. Elementary school completion (dependent variable) is taken as a measure of schoolingoutcomes. Admittedly, is does not measure actual learning achievements. But is does saysomething about the ability of schools to retain students long enough to meet any given learningachievement standard. This is the main concern of this analysis, which justifies the choice of thisindicator.7
7 The pass rate in the final graduation examination has been used as alternative measure of schooling outcomes. Because ofthe uneven quality of the examination material and varying scoring criteria, this indicator does not measure studentlearning achievement either.
67

20. The evidence, however crude and partial, thus strongly suggests that more effectivetargeting of available educational resources towards the poorest areas is needed, in order to reduceregional gaps in schooling outcomes in the country. The results confirm the important role ofschool principals in this respect. This is particularly significant in view of DECS', Bank-supported,strategy towards decentralization of school management.
Table 5: Elementary School Completion, as a Function of Provincial School StaffingCharacteristics a
R 2
xl X2 X3 X4 X5 adjusted
.14 .25(6.52) _ _ _ _ _ _ _ _ _ _ _
.33 .20____________ (5 .62)_ _ _ _ _ __ _ _ _ _ _ _
.08 .10 .18 .06 .33(3.11) (2.99) (2.84) (1.33)
.18 .13 .08 .09 .29(1.84) (4.21) (.79) (1.86)
XI = principals/school X4 = principal/teacherX2 = principals/classroom X5 = highest/total teachersX3 = highest/total principals
a The t-statistic is given between brackets under coefficient.
21. The analysis is repeated at the regional level with even more significant results (see Table6), suggesting that, in some policy aspects, a regional approach superimposed on provincialtargeting might be desirable. This is notably the case with respect to school staffing, where legalrestrictions severely limit the ability of school authorities of transferring staff across administrativeregions.
68

Table 6: Elementary School Completion, as a Function ofRegional School Staffing Characteristics"
Xi X2 X3 X4 adjusted
.13 .51(3.78) (3°5) _
.35 .40_ _ _ _ _ _ _ _ _ _ _ _(3 .0 9) _ _ _ _ _ _ _ _ _ _ _ _
.43 .12(1.66)
.24 .06___________ (1.36)
.05 .29 .49 .16 .80(.56) (1.17) (3.54) (1.53).11 .10 .55 .77
(1.44) (.45) (3.91).07 .19 .26 .57
(.55) (.53) (1.83).14 .47 .10 .79
(6.15) (3.37) (1.07).43 .49 .19 .81
(6.58) (3.72) (2.17)
XI = principals/school X3 = principal/teacherX2 = highest/total principals X4 = highest/total teachers
a The t-statistic is given between brackets under coefficient
69

Annex 2
SELECTIVE EVIDENCE ON LOCAL EDUCATION FINANCING
1. The following information is based on field visits, including meetings with: (i) theprovincial authorities and DECS representatives of the Bulacan school division; (ii) the municipalauthorities Mayor and DECS representatives the Valenzuela division (Metro-Manila); (iii) the staffof DECS' regional office for the Cordillera Administrative Region (CAR), as well as SchoolSuperintendents, District Supervisors and School Principals for the Benguet and Baguio Divisionsin that region; (iv) the Mayors of the Kabayan and Kibungan municipalities in Benguet province;and (v) the Principal, teaching staff. and PTA representatives of an elementary school in LaTrinidad (Capital of Benguet Province).
2. Bulacan and Valenzuela, both in the vicinity of the National Capital Region, are among themost affluent school divisions; so is the Baguio Division in CAR. Average family income inBenguet province is close to the national average -- with pockets of severe poverty in outlyingmountainous districts, but about 40 percent below the national average in the CAR's Mountainprovince.
Extension teachers
3. There is ample evidence of locally paid elementary and secondary school teachers, largelythrough the SEF-funded budget of provincial and municipal schoolboards, but also through LGUgeneral funds, and even by PTAs.1 These teachers are usually called "extension teachers", areference to new teaching positions generated by expansion in enrollment capacity. Extensionteachers are usually financed locally until integrated in the DECS payroll, which normally shouldhappen before the start of the next schoolyear. In reality, teachers remain on local payrolls formuch longer periods of time, if not indefinitely.
4. In Bulacan province, out of 163 new elementary teacher slots allocated by DECS for1993/94, only 56 were actually filled, of which 18 locally financed. Similarly, at the secondarylevel, only 8 additional positions had been allocated, but 60 new teacher were actually recruited, alllocally financed. The estimated need for additional teachers in Bulacan is based on much lowerstudent/lteacher norms than those applied by DECS. This is also the case in Valenzuela, where 15elementary and 20 secondary teachers are on the municipal payroll.
5. Extension teachers are no less prevalent in CAR, where there have been major DECS andlocally financed investments in new school construction. There are presently 20 extension teacherson the provincial schoolboard budget in Benguet, and 7 in Mountain province. In 1993, moreover,
The use of SEF and general LGU resources for the payment of teacher salaries is, in principle, a violation of the 1991 LGUcode. With regard to SEF, the practice is officially condoned. Teachers paid through LGU's general funds, mostly out of a20 percent portion earmarked for "development" purposes, are not labeled as such.
70

UNICEF funded 14 extension teachers in the region; there were great difficulties in getting theseteachers integrated in the DECS budget after UNICEF funding stopped. In Kibungan, one amongthe poorest municipalities in Benguet, the PTA is currently paying two extension teachers because
2of delays in DECS' approval of extra positions for new classrooms. Two teachers were also on thePTA payroll in the elementary school visited by the mission in La Trinidad, and three more areneeded. New classrooms in both Kibungan and La Trinidad were not financed by DECS.
6. Even in Benguet province, however, locally paid extension teachers may not be just africtional phenomenon. Examples were given of quasi-permanent employment contracts withmunicipal schoolboards, which may reflect local concern about the DECS staffing norms,particularly the desire to avoid multi-grade teaching.3
Teacher salary supplements
7. Many LGUs pay salary supplements to attract or retain teachers. These supplements,usually financed from LGU general funds, are expressed as a percentage of the DECS basic salary.Supplement rates vary widely across the country, from zero in the poorest LGUs to over P1,000 permonth in the most affluent areas around the National Capital. The Bulacan division pays aP800/month supplement, Valenzuela P900/month.4 In the Cordillera Region, on the other hand, nosupplement is being granted in the Mountain division and most of the Benguet division, and onlyP300/month in Baguio City.5
8. These regional salary differentials lead to inequitable outcomes, reflected in the regionaldistribution of the most qualified and experienced teachers (see Annex 1).6 Moreover, it may leadto wasteful use of available teaching staff. For instance, there is an excess of 7,000 teacher in theManila division, but these refuse to be reassigned to the adjacent Quezon City division, where thereis a shortage, apparently because salary supplements in Quezon City are lower.
School construction
9. Even in the case of DECS financed school construction, it is the responsibility of LGUs toprovide, mostly to purchase, an adequate schoolsite. DECS' school construction program for theCAR is quite important. Altogether, the region was allocated P94 million from DECS' 1994 capital
2 The Kibungan municipality (population 14,000) has a schoolboard budget of P50,000, too little for even one extensionteacher.
3 The Itogo municipal schoolboard (total 1994 budget of P1.8 million) has been paying 7 teachers for over seven years; inthe Taban municipality, the schoolboard (budget of P.8 million) is financing 5 teachers for the last five years; and theBugias municipality is paying 7 extra teachers, also for over five years.
4 Rumor has it that local teacher salary supplements in the National Capital Region are actually much higher than officiallyadmitted. In Makati, the most affluent school division in the Nation, the supplement is persistently said to fully equal theDECS basic salary.
5 Some extra benefits may likely be provided directly from PTA funds in the relatively better endowed municipalities.In Kibungan, an isolated municipality with rather hazardous terrain, teachers receive a special hardship allowance fromDECS.
6 Teachers can not be reassigned outside a school division against their wish. They may, however, voluntarily apply toa position in another division.
71

budget (3.1 percent of total regional appropriations for 1.9 percent the national population), ofwhich P88 million for school construction.
10. Locally financed school construction, however, is also important. The KabayanMunicipality was awarded P700,000 in 1993 and P240,000 in 1994 from the provincial SEF forthat purpose. The Kibungan municipality, on the other hand, received P460,000 from the provincialcountry-side development fund for the construction of a two-classroom elementary school in 1993,and was also awarded one complete elementary school through a congressional insertion initiative.It is interesting to note, in this context, that all school construction in Kibungan was executed bygovernment, whereas in Kabayan contracts are often awarded to PTAs, which is much cheaper andprovides some labor income to PTA members. There are apparently less strings attached to localSEF funding than to congressional funds.
11. In La Trinidad, the elementary school visited by the mission received P5 million from theprovincial SEF in 1994 for the addition of a home economics building, and had a new six-classroom building under construction with about P2 million financing from the country-sidedevelopment fund.
Other local education expenditures
12. According to the Bulacan school authorities, as much as 80 percent of maintenance andother operating expenses (MOOE) are financed by DECS, another 10 percent by local government,and the rest from private sources (including PTAs). In Benguet province, however, the mayors ofKabayan and Kibungan stated that their municipality were not receiving any MOOE funding fromDECS. The SEF appears to be the main source of MOOE funding, at least in that region. Abouthalf of the SEF-funded municipal and provincial schoolboard budgets are in fact spent on repairand maintenance of the local school infrastructure.
13. Both in Kabayan and Kibungan (population 10,400 and 14,000 respectively), the municipalschoolboard has a total budget of about P50,000, most of which goes for MOOE. General funds aretoo limited to permit any extra spending on education, but significant ad-hoc contributions arereceived from the provincial schoolboard --for instance, P35,000 in 1993 for Kibungan. In LaTrinidad, a relatively affluent municipality, the elementary school PTA collected P18,000 in fees in1994 from about 700 members, and an additional P55,000 through various fundraising activities. Italso receives member contributions in the form of materials and labor. The PTA pays the school'swater and electricity bills, as well as for basic repair and maintenance of the facilities. The schoolalso has special "class" PTAs which are responsible for proper maintenance of specific classrooms -- one such PTA installed electricity in a renovated classroom. In addition, the school receivedP55,000 from the municipal; schoolboard for classroom repairs. All in all, one can not escape theimpression that even within the same division, some public schools are better off than others.
14. Ironically, an additional source of local financing are school principals and teachers, whounanimously declare their out-of-pocket expenses for basic classroom necessities to be about threetimes higher than their official "choke allowance" (P500 per year for teachers).
72


Report No: 1539 P HType: S