Embed Size (px)
Citation preview

July 25, 2014
REPORT ON
Colliery Dams, Nanaimo, BC Dam Stability
REPO
RT
Report Number: 1314470516-009-R-Rev0
Distribution: 2 copies – City of Nanaimo 2 copies – Golder Associates Ltd.
Submitted to: Toby Steward City of Nanaimo Nanaimo City Hall 455 Wallace Street Nanaimo, BC V9R 5J6

REPORT ON COLLIERY DAM STABILITY
Executive Summary
A geotechnical review of the stability of the Lower Colliery dam has been carried out to assess the existing stability of the dam, performance under design earthquake loadings and post-earthquake stability of the residual dam section.
The analyses were carried out to bracket several conditions and to accommodate uncertainties in dam stratigraphy and soil properties. The following analyses were carried out:
Deformation of the dam stability under dynamic loading was estimated using the finite difference program FLAC to determine the performance of the dam under seismic (earthquake) loading for the 2,475 and 10,000 year return period events. Further detail on this analysis is provided in Appendix A.
Seismic structural assessments of the concrete core wall were carried out to estimate the extent of cracking and structural distress that would occur as a result of the deformations calculated by the FLAC analyses. Further detail on this analysis is provided in Appendix B.
Limit equilibrium analyses including seepage analyses to determine post-seismic performance of the dam based on the findings from the above dynamic analysis.
Post-earthquake piping and erosion resistance analyses were carried out for the survived dam.
The existing conditions at the dam are as follows:
The Layer 1 fill - Cinders and Slag, currently exists at the angle of repose for the material (approx. 1.5 horizontal (H) to 1 Vertical (V) and under dry conditions the fill is stable. On the downstream slope of the dam, there is evidence of some local sloughing on the steeper upper portions of this fill which is probably associated with precipitation runoff. The lower Layer 3 – Sand and Gravel, has been constructed and compacted in place and is more resistant to seepage and infiltration. There is no visual evidence of surface sloughing on this part of the downstream slope.
The upstream rockfill slope of the dam inside the reservoir would be expected to be stable under the submerged conditions that exist. In a rapid drawdown case where drainage does not occur out of the fill, some surface sloughing may be expected. This does not appear to have occurred since construction of the dam.
In-situ. investigations have shown the impervious concrete dam core to be in good condition (Golder 2014a), and adequately connected to the dam foundation and abutments. Seepage flow is evident downstream of the dam toe but is considered to be minor and any piping potential due to internal erosion would be expected to be accommodated by the sand and gravel berm (Layer 3) constructed in the 1980s.
July 25, 2014 Report No. 1314470516-009-R-Rev0 i

REPORT ON COLLIERY DAM STABILITY
The results of 2D dynamic analyses (FLAC) indicate that the dam would undergo large deformations in the upstream and downstream shells when subjected to the 2,475-year and 10,000-year ground motions. The downstream shell undergoes displacements in excess of 4 m in the very loose Layer 1 (cinder and slag fills) when subjected to the 10,000-year ground motions. Driven by the unbalanced inertial forces, the concrete wall tends to rotate towards the reservoir, but the vertical settlement is not large enough to trigger over-topping failure at normal water level in the reservoir.
The results of the structural analyses indicate that the potential for the toppling of the concrete core in the seismic event is extremely low. This is because the upper 5 to 7 m of the concrete core remains within the elastic range or experiences a small nonlinearity (minor cracking). The mid-section of the wall experiences significant nonlinearity with high strains developing in the bars and large cracks will develop. This part of the concrete core is buttressed by rockfill and consequently the wall will remain in place but significant damage and cracking will occur. The FLAC results were used to predict deformation characteristics of the concrete core and sectional analysis of the wall were based on the computed shear and bending moment demand with cracks estimated to open up to 25-65mm.
The seismic analyses have shown that the dam will not fail by overtopping due to loss of freeboard (due to dam settlement, downstream slope failure, or core toppling) and therefore the potential for loss of containment and rapid release of the reservoir due to this failure mode is low. However, it is evident that significant damage will occur to the concrete core which will affect the integrity of the structure. To assess the post-earthquake stability of the dam, additional analyses were undertaken to assess the dam performance. Analyses of the stability and piping considered that the concrete core had been completely compromised such that it had no influence in limiting reservoir seepage into the downstream dam fills. In the post-earthquake stability analyses, a number of analytical scenarios were developed which considered the following:
The key variable affecting the post-earthquake seepage behavior, which was the possible presence of an upstream fine grained sediment layer (Layer 4). To account for this uncertainty, sensitivity analyses were conducted with and without Layer 4 (Scenarios 1 / 2 (with the layer) and 3 / 4 (without the layer)).
The FLAC analyses showed that the downstream fills (Layer 1) undergo significant deformations, while the post-seismic stability analyses (Scenarios 1 and 3) indicate that the further instability would likely occur within Layer 1 due to groundwater pressures developing in the downstream shell caused by damage to the concrete core. The analyses indicated that this layer would likely slump, and therefore, additional stability runs were carried out assuming that Layer 1 has failed (Scenarios 2 and 4).
Additional uncertainties, such as the hydraulic conductivity of the rock fill (Layer 2) were accommodated by varying the hydraulic conductivity of this layer within the scenarios.
Where failure and slumping of the of the downstream slope (Layer 1) of the dam occurs, a stratigraphy similar to that shown in Figures 2 and 4 (Scenario 2 and 4) is anticipated, with the phreatic surface dropping significantly within the resultant post-earthquake dam section as the confining effects of Layers 1 and 3 are removed. Under this condition the new downstream dam surface is stable where an upstream fine grained sediment layer is likely present and marginally stable under the severely conservative assumption that this layer does not exist, the hydraulic conductivity of the rockfill is at the upper end of its anticipated range, and that the concrete core has been damaged to such an extent that it has ceased to function.
July 25, 2014 Report No. 1314470516-009-R-Rev0 ii

REPORT ON COLLIERY DAM STABILITY
Post-earthquake dam stability was also assessed for piping and erosion, which, should they occur, would be expected to result in a longer term deterioration and potential failure of the dam. These analyses were carried out for Scenario 4, which represents the most severe case for through-dam seepage. Critical seepage flows for the post-earthquake dam section were analysed, for flows exiting through the rockfill along the dam slope as shown on Figure 4A. It was found that that the seepage through the dam was within tolerable levels and below a level where erosion would typically develop. It is therefore considered to be unlikely that significant erosion will be generated by surficial flow along the rockfill surface of the post-earthquake dam section. Similarly, seepage exit gradients were also analyzed and compared to typical critical values where experience has indicated that if exceeded, erosion of a rockfill might be expected. Seepage analysis of the post-earthquake section indicates that actual seepage gradients slightly exceed the critical exit gradient. Therefore, under the following conservative assumptions (Scenario 4), some erosion (piping) might be expected.
In summary the analyses which considered the most severe and conservative assumptions for soil properties, stratigraphy and damage of the concrete core (Scenario 4), have shown that the downstream slope of the survival dam section is marginally stable and that severe surface sloughing and piping erosion of downstream rockfill due to reservoir flow through the residual dam section will be limited. The likely failure mode of the dams is therefore expected to be that of severe leakage and slow deterioration due to piping and erosion, rather than sudden reservoir release. The findings from this analysis have been used to develop the failure probabilities applied in the risk assessment (Golder, 2014c).
July 25, 2014 Report No. 1314470516-009-R-Rev0 iii

REPORT ON COLLIERY DAM STABILITY
Table of Contents
1.0 INTRODUCTION ............................................................................................................................................................... 1
1.1 Scope of Work ..................................................................................................................................................... 1
2.0 INTERPRETED DAM STRATIGRAPHY........................................................................................................................... 1
3.0 DAM STABILITY .............................................................................................................................................................. 2
3.1 Existing Static Conditions .................................................................................................................................... 2
3.2 Dynamic Seismic (FLAC) Analysis ...................................................................................................................... 3
3.3 Seismic Structural Analysis ................................................................................................................................. 3
3.4 Post Earthquake Dam Static Stability .................................................................................................................. 4
3.4.1 Scenario 1 ...................................................................................................................................................... 6
3.4.2 Scenario 2 ...................................................................................................................................................... 6
3.4.3 Scenario 3 ...................................................................................................................................................... 6
3.4.4 Scenario 4 ...................................................................................................................................................... 7
3.4.5 Discussion ...................................................................................................................................................... 7
3.5 Post Earthquake Piping and Erosion ................................................................................................................... 8
4.0 CLOSING .......................................................................................................................................................................... 9
5.0 REFERENCES ................................................................................................................................................................ 10
TABLES Table 1: Hydraulic Conductivity Values for Dam Embankment Layers ...................................................................................... 5
Table 2: Soil Properties .............................................................................................................................................................. 5
Table 3: Downstream Slope Stability Analyses .......................................................................................................................... 7
FIGURES Figure 1: Existing Dam Stratigraphy Seepage and Stability Analysis with Upstream Sediment
Figure 2: Exposed Rockfill Dam Stratigraphy Seepage and Stability With Upstream Sediment
Figure 3: Existing Dam Stratigraphy Seepage and Stability Analysis No Upstream Sediment
Figure 4: Exposed Rockfill Dam Stratigraphy Seepage and Stability Analysis No Upstream Sediment
July 25, 2014 Report No. 1314470516-009-R-Rev0 iv

REPORT ON COLLIERY DAM STABILITY
APPENDICES APPENDIX A Technical Memorandum on Dynamic Soil-Structure Interaction Analysis of The Colliery Dam, Nanaimo, Vancouver Island, British Columbia
APPENDIX B Middle and Lower Colliery Dams Structural Assessment of Concrete Core Walls
July 25, 2014 Report No. 1314470516-009-R-Rev0 v

REPORT ON COLLIERY DAM STABILITY
1.0 INTRODUCTION Golder Associates Ltd. (Golder) has been retained by the City of Nanaimo (CON) to be part of the Colliery Dam Technical Committee (TC). The Colliery Dam Technical Committee's mandate is to identify an environmentally minimally invasive, cost- and time-effective remediation solution for the Colliery Dam system that meets safety standards and the respective objectives of the City of Nanaimo, Snuneymuxw First Nation (SFN), the Colliery Dam Park Preservation Society (CDPPS) and the community.
This report provides a summary of the dam stability studies which have been undertaken by Golder and its sub consultants. These studies have been carried out in support of risk assessment work, dam safety studies and dam remediation design. Separate reports have been prepared which outline separate work carried out by Golder for the project, which should be read in conjunction with this report for a more complete understanding of the project.
This report should be read in conjunction with the “Information and Limitations of This Report” which is included following the text of this report. The reader’s attention is specifically drawn to this information, as it is essential that it is followed for the proper use and interpretation of this report.
1.1 Scope of Work This report addresses static and dynamic 2D stability analyses which were carried out on the Lower Colliery Dam to assess the existing and future performance of the embankment dam as follows:
Deformation of the dam under dynamic loading was estimated using the finite element program FLAC to determine the performance of the dam under seismic (earthquake) loading for the 2475 and 10,000 year return period events. Further detail on this analysis is provided in Appendix 1.
Seismic structural assessments of the concrete core were carried out to estimate the extent of cracking and structural distress that would occur as a result of the deformations calculated by the FLAC analyses. Further detail on this analysis is provided in Appendix 2
Limit equilibrium analyses to assess post-seismic performance of the dam based on the findings from the seismic assessment.
Post earthquake piping and erosion resistance analysis for the survived dam.
2.0 INTERPRETED DAM STRATIGRAPHY Topographic and bathymetric survey information provided to Golder by the City of Nanaimo indicates that the Lower Colliery Dam has a maximum height of approximately 23.5 m (crest elev. 73.6 m), with upstream and downstream slopes of approximately 2.5 to 3.0 Horizontal (H):1 Vertical (V) and 1.5 to 2.0H:1V respectively. Normal operating level of the reservoir is at an elevation of 71.5 m, approximately 2.1 m below the crest of the dam. A seepage trench extends along the toe of the dam, at an elevation of approximately 50 m.
July 25, 2014 Report No. 1314470516-009-R-Rev0 1

REPORT ON COLLIERY DAM STABILITY
The condition and distribution of the fills comprising the Lower Colliery Dam was determined by the previous site investigation carried out in the 1970’s, EBA’s 2009 test pitting investigation (EBA, 2010), Willis Cunliffe and Tait’s 1980 as-built report of dam rehabilitation (Golder, 2014a), and the recent 2014 geotechnical and geophysical investigations (Golder, 2014a). Interpretation of the borehole and geophysical results has indicated that in addition to the 1.2 m thick concrete core wall, the existing embankment is comprised of zoned fills of various composition and interpreted as varying from rockfill, fine grained soil, coal ash/slag and sand and gravel. These ash and sand and gravel fill materials had been placed following original construction both to widen the crest and for dam upgrading purposes. For analysis, the embankment fills and zones have been subdivided into the following five general stratigraphic units:
Loose end dumped random ash cinders and slag (Layer 1 – Cinders and Slag).
Loose heterogeneous rockfill and random variable fill (Layer 2 – Rockfill and Random Variable Fill).
Compacted sand and gravel fill (Layer 3 – Sand and Gravel).
Loose upstream sediments, up to 1 m inferred thickness (Layer 4 – Upstream Sediments).
Loose fine-grained fill (Layer 5 – Fine Grained Fill).
The stratigraphic boundaries between these fill materials are shown in Figures 1 to 4. These boundaries are inferred based on available information, and may differ from actual stratigraphic conditions.
The soil properties and design parameters used in the stability assessment were based on laboratory testing and established published soil properties for typical materials and are also shown on Tables 1 and 2.
3.0 DAM STABILITY 3.1 Existing Static Conditions The original embankment fills would appear to have been constructed essentially by end dumping with minimum compaction. The upstream fill against the core wall is comprised of rockfill which exists at about an inferred 1.5 to 2.0:1V slope. The downstream face of the dam consists in the upper part of cinders and slag, constructed at a slope of approximately 1.5(H):1(V). The lower slope was placed in the 1980s as a berm and consists of compacted sand and gravel fill at about 2.0H:1V.
Dry end dumped fill will develop a slope at the angle of repose for the material (the maximum slope or angle at which loose dry cohesionless material remains stable) and is dependent on the internal frictional resistance of the material. It is considered that the Layer 1 fill currently exists at the angle of repose for the material. Under dry conditions the fill is stable unless conditions change such as water infiltration from precipitation or seepage through the materials. On the downstream slope of the dam, there is evidence of some local sloughing on the steeper upper portions of this fill which is probably associated with precipitation runoff. The lower Layer 3 – Sand and Gravel, has been constructed and compacted in place. Therefore this layer would be expected to be dense and have a high internal frictional resistance. Further the material exists at a flatter slope than the upper Layer 1 fills. Consequently the lower downstream slope of the dam consisting of Layer 3 is more stable than the steeper upper Layer 1 slope and more resistant to seepage and infiltration, there is no visual evidence of surface sloughing on this part of the downstream slope.
July 25, 2014 Report No. 1314470516-009-R-Rev0 2

REPORT ON COLLIERY DAM STABILITY
The upstream rockfill slope of the dam inside the reservoir would be expected to be stable under the submerged conditions that exist. In a rapid drawdown case where drainage does not occur out of the fill, some surface sloughing may be expected. This does not appear to have occurred since construction of the dam.
In-situ. investigations have shown the impervious concrete dam core to be in good condition (Golder 2014a), and adequately connected to the dam foundation and abutments, such that internal seepage through the bedrock foundation and dam is limited. However, minor seepage flow is evident downstream of the dam toe. Wet areas noted immediately along the toe of the dam are not concentrated and there are no indications of high seepage exit velocities or transported sediment and internal embankment erosion. In addition, the Layer 3 – Sand and Gravel, placed and compacted in the 1980s serves as a filter to fine-grained, internal dam materials, and thereby limits the potential for internal erosion and piping of the embankment fills. Consequently any seepage flows expected through limited cracking and construction joints in the concrete dam core are not likely to have the potential for internal erosion that will affect the stability of the embankment fills.
3.2 Dynamic Seismic (FLAC) Analysis The results of 2D dynamic soil-interaction analyses of the Lower Colliery Dam indicate that the dam would undergo large deformations in the upstream and downstream shells when subjected to the 10,000-year and 2,475-year ground motions. The downstream shell undergoes displacements in excess of 4 m in the very loose Layer 1 – Cinder and Slag fills, exhibiting ravelling-type failure when subjected to the 10,000-year ground motions. Driven by the unbalanced inertial forces, the concrete wall tends to rotate towards the reservoir, but its vertical settlements are not large enough to trigger over-topping failure at normal water level in the reservoir. When a plastic moment capacity was imposed on the concrete wall, the computed displacements were larger. This result is consistent with the expected performance.
In order to support the development of feasible dam remediation options, as assessment of the seismic performance of the one of the Lower Dam remediation options (the Hardened Option) was carried out. The Hardened Option involves, the construction of a soil-cement zone over the entire downstream shell, to some 2 to 3 m depth, to protect against over-topping flows. The FLAC analyses showed that the performance of the dam was improved with limited distortions occurring in the downstream shell.
A detailed reporting of the methodology and results of the dynamic analysis is included in Appendix A.
3.3 Seismic Structural Analysis The results of the seismic-structural analyses indicate that the potential for the core wall toppling is extremely low. This is because the upper 5 to 7 m of the core wall remains within the elastic range or experiences a small nonlinearity. The mid-section of the wall experiences significant nonlinearity with high strains developing in the bars and large cracks will be present. This part of the core wall is buttressed by rockfill and consequently the wall will remain in place but significant damage and cracking will occur. The FLAC results were used to predict deformation characteristics of the wall and sectional analysis of the wall was based on the computed shear and bending moment demand with cracks estimated to open up to 25-65 mm.
Detailed analyses and results are included in Appendix B.
July 25, 2014 Report No. 1314470516-009-R-Rev0 3

REPORT ON COLLIERY DAM STABILITY
3.4 Post Earthquake Dam Static Stability It should be appreciated that the dam is over 100 years old and though current information on its condition established by previous and current investigations, have gone a long way in defining the constituent zoning and composition of the dam, there are still uncertainties with respect to material types and properties and internal layering. In order to assess the post-earthquake stability of the dam, it was necessary to develop potential failure scenarios for the dam considering the available information and uncertainties, the expected performance of the core wall (based on the dynamic analyses) and the properties of the soils that comprise the embankment. In the post-earthquake stability analyses, a number of analytical scenarios were developed which considered the following:
The key variable affecting the post-earthquake seepage behavior, which was the possible presence of an upstream fine grained sediment layer (Layer 4). To account for this uncertainty, sensitivity analyses were conducted with and without Layer 4 (Scenarios 1 / 2 (with the layer) and 3 / 4 (without the layer)).
The FLAC analyses showed that the downstream fills (Layer 1) undergoes significant deformations, while the post-seismic stability analyses (Scenarios 1 and 3) indicate that the further instability would likely occur within Layer 1 due to groundwater pressures developing in the downstream shell caused by damage to the concrete core. The analyses indicated that this layer would likely slump, and therefore, additional stability runs were carried out assuming that Layer 1 has failed (Scenarios 2 and 4).
Additional uncertainties, such as the hydraulic conductivity of the rock fill (Layer 2) were accommodated by varying the hydraulic conductivity of this layer within the scenarios.
For all analyses it was assumed that the post-earthquake concrete dam core had cracked, which compromised the integrity of the core such that reservoir water was seeping through the barrier and saturating the downstream fills (i.e., the analyses assumed the core did not exist).
The seepage and stability analyses were carried out using the commercially available seepage and slope stability analysis software package, GeoStudio (Seep/W and Slope/W) Version 7.20 by GeoSlope International Ltd.
A detailed summary of the scenarios and the assumed properties are provided in Tables 1 and 2. The parameters were based on visual observations of dam fills, grain size distribution laboratory tests on samples recovered from boreholes, the 1980 as-built report and review of published data for similar soils. The key parameter affecting seepage through the dam was found to be the hydraulic conductivity of the rock fill (Layer 2) and the possible presence of the upstream sediments (Layer 4). As indicated previously, uncertainty related to the presence of Layer 4 was assessed based on sensitivity studies; similarly upper and lower bound values for the hydraulic conductivity of Layer 2 were developed and the influence of this parameter was assessed in the sensitivity runs (see Table 1).
July 25, 2014 Report No. 1314470516-009-R-Rev0 4

REPORT ON COLLIERY DAM STABILITY
Table 1: Hydraulic Conductivity Values for Dam Embankment Layers
Scenarios Figure Number
Hydraulic Conductivity (m/s)
Cinders and Slag (Layer 1)
Rockfill and
Random Variable
Fill (Layer 2)
Sand and
Gravel (Layer 3)
Upstream Sediments (Layer 4)
Fine Grained
Fill (Layer 5)
Bedrock
1. Post Earthquake with No Loss of Downstream Face – Upstream Sediment Condition
1 5 x 10⁻⁶ 1 x 10⁻³ 5 x 10⁻⁵ 1 x 10⁻⁶ 1 x 10⁻⁷ 1 x 10⁻⁹
2. Post-Earthquake with Loss of Downstream Face – Upstream Sediment Condition
2 5 x 10⁻⁶ 1 x 10⁻² 5 x 10⁻⁵v 1 x 10⁻⁶ 1 x 10⁻⁷ 1 x 10⁻⁹
3. Post-Earthquake with No Loss of Downstream Face – No Upstream Sediment Condition
3 5 x 10⁻⁶ 1 x 10⁻³ 5 x 10⁻⁵ N/A 1 x 10⁻⁷ 1 x 10⁻⁹
4. Post-Earthquake with Loss of Downstream Face – No Upstream Sediment Condition
4 5 x 10⁻⁶ 1 x 10⁻² 5 x 10⁻⁵ N/A 1 x 10⁻⁷ 1 x 10⁻⁹
Table 2: Soil Properties
Stability Parameter Stratigraphic Unit
Cinders and Slag (Layer 1)
Rockfill and Random Variable Fill (Layer 2)
Sand and Gravel (Layer 3)
Unit Weight (kN/m3) 18.5 20 19 Drained Angle of Friction (°) 33 40 35 Cohesion (kPa) 0 0 0
July 25, 2014 Report No. 1314470516-009-R-Rev0 5

REPORT ON COLLIERY DAM STABILITY
3.4.1 Scenario 1 Analyses carried out where an upstream sediment layer is assumed to exist against the upstream face of the dam, and where the downstream face of the dam is intact (Figure 1A) indicate that seepage flow through the existing dam section is approximately 1.4x10⁻⁴ m3/s per m of dam width. At an elevation of approximately 57 m, the calculated phreatic surface daylights along the downstream face of the dam, indicating that a portion of subsurface dam seepage would exit and flow along the downstream face below this point. Under this condition the stability analysis shown on Figure 1B indicates that the minimum Factor of Safety (FoS) against a shear failure considering the phreatic surface developed from the seepage analysis is 0.85 indicating that the surface shown in green on the figure is unstable and will slump. Therefore, Scenario 2 was developed, based on the assumption that Layer 1 had slumped and was removed from the dam section (with the slumped material forming a buttress at the base of the slope).
3.4.2 Scenario 2 On Figure 2 where an upstream sediment layer is assumed to exist against the upstream face of the dam, the seepage flow through the exposed rockfill embankment is estimated to be approximately 1.5x10⁻⁴ m3/s per m of dam width. The marginal increase in dam seepage flow over that of Scenario 1 is attributed to the loss of the confining effects of the lower hydraulic conductivity Layers 1 and 3. The calculated phreatic surface is estimated to daylight near the toe of the dam. Therefore, as shown on Figure 2A the post-slide downstream face of the dam under these conditions would be expected to be unsaturated, with little to no surficial flow along the downstream face. The stability analysis shown on Figure 2B indicates that the minimum FoS is approximately 1.5 which indicates that the dam is essentially stable (no slumping, no piping) under this condition.
3.4.3 Scenario 3 On Figure 3, a conservative condition where the presence of an upstream sediment layer on the upstream face of the dam is not assumed to exist, the seepage flow through the dam is estimated to be approximately 3.7x10⁻⁴ m3/s per m of dam width. The calculated phreatic surface daylights along the downstream face of the dam at an elevation of approximately 70 m, indicating that a portion of subsurface dam seepage would exit and flow along the downstream face below this location as shown on the figure. The stability analysis shown on Figure 3B indicates that the minimum FoS is approximately 0.21 which indicates that that the original fill surface shown in green on the figure is unstable and will slump under this condition. Therefore, Scenario 4 was developed, based on the assumption that Layer 1 had slumped and was removed from the dam section (with the slumped material forming a buttress at the base of the slope).
July 25, 2014 Report No. 1314470516-009-R-Rev0 6

REPORT ON COLLIERY DAM STABILITY
3.4.4 Scenario 4 On Figure 4, a conservative condition where the presence of an upstream sediment layer on the upstream face of the dam is not assumed to exist, the estimated seepage flow through the exposed rockfill embankment is approximately 3.9x10⁻² m3/s per m of dam width. The increase in dam seepage flow from Scenario 3 is attributed to the loss of the confining effects of the lower hydraulic conductivity of Layers 1 and 3. At an elevation of approximately 67 m, the calculated phreatic surface daylights along the downstream face of the dam, indicating that a portion of subsurface dam seepage would exit and flow along the downstream face below this point. Under this condition the stability analysis shown on Figure 3B indicates that the minimum FoS is approximately 0.9 which indicates that that the surface shown in green on the figure, although marginally stable, may be expected to slump although this slump may not be sufficient to cause loss of freeboard and overtopping of the dam.
The results of the stability analyses are summarized on Table 3.
Table 3: Downstream Slope Stability Analyses Modelling Condition Figure Number Factor of Safety
Scenario 1 - Post Earthquake with No Loss of -Downstream Face – Upstream Sediment Condition 1B ~0.8
Scenario 2 - Post Earthquake with Loss of Downstream Face – Upstream Sediment Condition 2B ~1.5
Scenario 3 - Post Earthquake with No Loss of Downstream Face – No Upstream Sediment Condition 3B ~0.2
Scenario 4 - Post Earthquake with Loss of Downstream Face – No Upstream Sediment Condition 4B ~0.9
3.4.5 Discussion In summary the results of the post-earthquake stability analyses, where the downstream face of the dam remains intact, indicate that under existing stratigraphic conditions, a slope failure impacting a portion of the crest of the existing dam, would generally be limited to Layers 1 and 3, with the slip surface along the Layers 1 and 2 contact. Due to the high phreatic surface in this scenario, the majority of the calculated slide mass would be saturated, contributing to the FoS values less than unity both with and without the presence of a fine grained upstream sediment layer (Layer 4).
Where failure and slumping of the downstream slope of the dam occurs, a stratigraphy similar to that shown in Figures 2 and 4 is anticipated, with the phreatic surface dropping significantly within the resultant post-earthquake dam section as the confining effects of Layers 1 and 3 are removed. It is considered that the phreatic surface will be controlled by the extent and elevation of the debris of the failed material at the toe of the exposed rockfill. Under this condition the new downstream dam surface is stable where an upstream fine grained silt layer is likely present and marginally stable under the severely conservative assumption that the silt layer does not exist.
July 25, 2014 Report No. 1314470516-009-R-Rev0 7

REPORT ON COLLIERY DAM STABILITY
3.5 Post Earthquake Piping and Erosion Critical flow along a slope face, generated by daylighting seepage, can lead to instability of the downstream slope materials, producing erosion and shallow slides, progressively cutting deeper into the materials. Post-earthquake performance of the dam after saturation and subsequent failure of the downstream slope of the dam will be contingent on the resistance of the remaining fills (Layer 2 – Rockfill and Random Variable Fill) to piping and erosion from continual seepage through the cracked concrete core wall. The exit gradients from the seepage must be resisted by the rockfill particles to prevent material movement which would contribute to de-stabilization of the fill and slope failure.
Seepage flow and erosion of the rockfill is controlled by factors including:
Placement conditions - whether the rockfill was dumped or compacted;
The average gradient in the rockfill;
The exit height of the phreatic surface and the exit gradient;
The discharge flow;
The specific gravity of the rock fragments;
The gradation and shape of the rock fragments; and
Downstream slope angle.
To conservatively assess the post-earthquake long-term stability of the dam embankment, the effects of seepage and surficial erosion of the downstream face were considered assuming that there was no silt sediment layer (Layer 4) on the upstream face of the dam and where the downstream face of the dam has slumped (Scenario 4). Published data from hydraulic tests and performance evaluations from case studies has indicated that for slopes of about 1.5H:1V permissible flows through loose rockfill are of the order of 0.4 m3/s/m with dominant rock size of the order of 0.6 m (Cruz,Materon and Freitas 2009). For these conditions, assuming a dominant rockfill particle size of about 0.3 m (considered to be a more realistic estimate of the rock size at the Lower Dam), a maximum permissible flow of 0.08 m3/s/m was estimated. Although the review considered the conservative assumption that an upstream sediment layer was not included, it is pointed out that such a situation is believed to be an unlikely representation of the conditions that exist at the dam. Over the years sediment will likely have been deposited on the upstream surface to such an extent as has been modelled in Scenario 1 and 2. However, considering this flow estimate to be an upper bound and comparing it to the seepage for Scenario 4 (Figure 4A), where the seepage was estimated to be 0.04 m3/s/m, it can be seen that the seepage is within tolerable levels and below a level where erosion would typically develop. It is therefore considered unlikely that significant erosion will be generated by surficial flow along the rockfill surface of the post-earthquake dam section.
Critical seepage exit gradients were also analyzed as per Cruz,et al (2009), where experience has indicated that if exceeded, piping of rockfill might be expected to occur. Based on the available geotechnical information for Layer 2 – Rockfill and Random Variable Fill, a critical seepage gradient of approximately 0.3 was estimated considering a 2.0H to 1V slope, a friction angle of 40 degrees and a submerged unit weight of 11.2 kN/ m3.
July 25, 2014 Report No. 1314470516-009-R-Rev0 8

REPORT ON COLLIERY DAM STABILITY
Seepage analysis of the post-earthquake section with downstream slope slumping and no fine-grained sediment (Layer 4) on the upstream face, indicates that actual seepage gradients vary between approximately 0.4 and 0.5, and slightly exceed the critical exit gradient. Therefore with a downstream dam slope of the order of 2H:1V some piping erosion would be expected under the following most severe and conservative conditions:
The core is completely compromised and totally ineffective;
There is no fine grained upstream layer i.e., Scenario 4); and
Where seepage through the dam would daylight along the remainder of the downstream slope.
4.0 CLOSING We trust that the contents of the report meet with your current requirements. Should you have questions or need clarification of contents, please do not hesitate to contact the undersigned.
GOLDER ASSOCIATES LTD.
Chase Reid, EIT Herb Hawson, P.Eng. Junior Geological Engineer Senior Geotechnical Engineer, Principal
Reviewed by:
Bruce Downing, P.Eng Principal
CR/HHH/BRD/do
Golder, Golder Associates and the GA globe design are trademarks of Golder Associates Corporation.
o:\final\2013\1447\13-1447-0516\1314470516-009-r-rev0\1314470516-009-r-rev0 nanaimo stability analysis 25jul_14.docx
July 25, 2014 Report No. 1314470516-009-R-Rev0 9
ORIGINAL SIGNED ORIGINAL SIGNED
ORIGINAL SIGNED

REPORT ON COLLIERY DAM STABILITY
5.0 REFERENCES Cruz, Paulo T., Bayardo Materón, and Manoel Freitas. Concrete Face Rockfill Dams. São Paulo, Brasil: Oficina
De Textos, 2009.
EBA, Engineering Consultants, Ltd. 2010. “Seismic Hazard Assessment Middle and Lower Chase Dams”
Golder Associates Ltd. 2014a. “Factual Geotechnical Report on Colliery Dams Remediation Project”, April, 2014.
Golder Associates Ltd. 2014b. Report on “Colliery Dams Remediation Project – Hydrology and Hydraulics”, July 2014.
Golder Associates Ltd. 2014c. Report on “Colliery Dams Remediation Project – Risk Assessment”, July 2014.
Silveira, A. A note on critical hydraulic gradient. Solos e Rochas – Revista Brasileira de Geotechnia, v. 6, n. 2, 1983.
Thomas, H. H. Flow through and over rockfills. The engineering of large dams. New York: John Wiley & Sons, 1976.
July 25, 2014 Report No. 1314470516-009-R-Rev0 10

REPORT ON COLLIERY DAM STABILITY
IMPORTANT INFORMATION AND LIMITATIONS OF THIS REPORT Standard of Care: Golder Associates Ltd. (Golder) has prepared this report in a manner consistent with that level of care and skill ordinarily exercised by members of the engineering and science professions currently practising under similar conditions in the jurisdiction in which the services are provided, subject to the time limits and physical constraints applicable to this report. No other warranty, expressed or implied is made.
Basis and Use of the Report: This report has been prepared for the specific site, design objective, development and purpose described to Golder by the Client. The factual data, interpretations and recommendations pertain to a specific project as described in this report and are not applicable to any other project or site location. Any change of site conditions, purpose, development plans or if the project is not initiated within eighteen months of the date of the report may alter the validity of the report. Golder cannot be responsible for use of this report, or portions thereof, unless Golder is requested to review and, if necessary, revise the report.
The information, recommendations and opinions expressed in this report are for the sole benefit of the Client. No other party may use or rely on this report or any portion thereof without Golder’s express written consent. If the report was prepared to be included for a specific permit application process, then upon the reasonable request of the client, Golder may authorize in writing the use of this report by the regulatory agency as an Approved User for the specific and identified purpose of the applicable permit review process. Any other use of this report by others is prohibited and is without responsibility to Golder. The report, all plans, data, drawings and other documents as well as all electronic media prepared by Golder are considered its professional work product and shall remain the copyright property of Golder, who authorizes only the Client and Approved Users to make copies of the report, but only in such quantities as are reasonably necessary for the use of the report by those parties. The Client and Approved Users may not give, lend, sell, or otherwise make available the report or any portion thereof to any other party without the express written permission of Golder. The Client acknowledges that electronic media is susceptible to unauthorized modification, deterioration and incompatibility and therefore the Client cannot rely upon the electronic media versions of Golder’s report or other work products.
The report is of a summary nature and is not intended to stand alone without reference to the instructions given to Golder by the Client, communications between Golder and the Client, and to any other reports prepared by Golder for the Client relative to the specific site described in the report. In order to properly understand the suggestions, recommendations and opinions expressed in this report, reference must be made to the whole of the report. Golder cannot be responsible for use of portions of the report without reference to the entire report.
Unless otherwise stated, the suggestions, recommendations and opinions given in this report are intended only for the guidance of the Client in the design of the specific project. The extent and detail of investigations, including the number of test holes, necessary to determine all of the relevant conditions which may affect construction costs would normally be greater than has been carried out for design purposes. Contractors bidding on, or undertaking the work, should rely on their own investigations, as well as their own interpretations of the factual data presented in the report, as to how subsurface conditions may affect their work, including but not limited to proposed construction techniques, schedule, safety and equipment capabilities.
Soil, Rock and Groundwater Conditions: Classification and identification of soils, rocks, and geologic units have been based on commonly accepted methods employed in the practice of geotechnical engineering and related disciplines. Classification and identification of the type and condition of these materials or units involves judgment, and boundaries between different soil, rock or geologic types or units may be transitional rather than abrupt. Accordingly, Golder does not warrant or guarantee the exactness of the descriptions.
July 25, 2014 Report No. 1314470516-009-R-Rev0 11

REPORT ON COLLIERY DAM STABILITY
Special risks occur whenever engineering or related disciplines are applied to identify subsurface conditions and even a comprehensive investigation, sampling and testing program may fail to detect all or certain subsurface conditions. The environmental, geologic, geotechnical, geochemical and hydrogeologic conditions that Golder interprets to exist between and beyond sampling points may differ from those that actually exist. In addition to soil variability, fill of variable physical and chemical composition can be present over portions of the site or on adjacent properties. The professional services retained for this project include only the geotechnical aspects of the subsurface conditions at the site, unless otherwise specifically stated and identified in the report. The presence or implication(s) of possible surface and/or subsurface contamination resulting from previous activities or uses of the site and/or resulting from the introduction onto the site of materials from off-site sources are outside the terms of reference for this project and have not been investigated or addressed.
Soil and groundwater conditions shown in the factual data and described in the report are the observed conditions at the time of their determination or measurement. Unless otherwise noted, those conditions form the basis of the recommendations in the report. Groundwater conditions may vary between and beyond reported locations and can be affected by annual, seasonal and meteorological conditions. The condition of the soil, rock and groundwater may be significantly altered by construction activities (traffic, excavation, groundwater level lowering, pile driving, blasting, etc.) on the site or on adjacent sites. Excavation may expose the soils to changes due to wetting, drying or frost. Unless otherwise indicated the soil must be protected from these changes during construction.
Sample Disposal: Golder will dispose of all uncontaminated soil and/or rock samples 90 days following issue of this report or, upon written request of the Client, will store uncontaminated samples and materials at the Client’s expense. In the event that actual contaminated soils, fills or groundwater are encountered or are inferred to be present, all contaminated samples shall remain the property and responsibility of the Client for proper disposal.
Follow-Up and Construction Services: All details of the design were not known at the time of submission of Golder’s report. Golder should be retained to review the final design, project plans and documents prior to construction, to confirm that they are consistent with the intent of Golder’s report.
During construction, Golder should be retained to perform sufficient and timely observations of encountered conditions to confirm and document that the subsurface conditions do not materially differ from those interpreted conditions considered in the preparation of Golder’s report and to confirm and document that construction activities do not adversely affect the suggestions, recommendations and opinions contained in Golder’s report. Adequate field review, observation and testing during construction are necessary for Golder to be able to provide letters of assurance, in accordance with the requirements of many regulatory authorities. In cases where this recommendation is not followed, Golder’s responsibility is limited to interpreting accurately the information encountered at the borehole locations, at the time of their initial determination or measurement during the preparation of the Report.
Changed Conditions and Drainage: Where conditions encountered at the site differ significantly from those anticipated in this report, either due to natural variability of subsurface conditions or construction activities, it is a condition of this report that Golder be notified of any changes and be provided with an opportunity to review or revise the recommendations within this report. Recognition of changed soil and rock conditions requires experience and it is recommended that Golder be employed to visit the site with sufficient frequency to detect if conditions have changed significantly.
Drainage of subsurface water is commonly required either for temporary or permanent installations for the project. Improper design or construction of drainage or dewatering can have serious consequences. Golder takes no responsibility for the effects of drainage unless specifically involved in the detailed design and construction monitoring of the systems.
July 25, 2014 Report No. 1314470516-009-R-Rev0 12

PROJECT No.
DESIGN
CADD
CHECK
REVIEW
PHASE No. ----
REV. SCALE
TITLE
PROJECT
04JULY14
CAR
13-1447-0516
CITY OF NANAIMO LOWER COLLIERY DAM
NANAIMO, BC
CAR 04JULY14
04JULY14 HH
NTS
EXISTING DAM STRATIGRAPHY
SEEPAGE AND STABILITY ANALYSIS
WITH UPSTREAM SEDIMENT
FIGURE 1
FIGURE 1A – SEEPAGE ANALYSIS
POST EARTHQUAKE SECTION WITH NO LOSS OF DOWNSTREAM FACE
AND CONSIDERING LAYER 4 – UPSTREAM SEDIMENT
FIGURE 1B – STABILITY ANALYSIS
POST EARTHQUAKE SECTION WITH NO LOSS OF DOWNSTREAM FACE
AND CONSIDERING LAYER 4 – UPSTREAM SEDIMENT
Failure Surface and
Corresponding Factor of
Safety

PROJECT No.
DESIGN
CADD
CHECK
REVIEW
PHASE No. ----
REV. SCALE
TITLE
PROJECT
04JULY14
CAR
13-1447-0516
CITY OF NANAIMO LOWER COLLIERY DAM
NANAIMO, BC
CAR 04JULY14
04JULY14 HH
NTS
EXPOSED ROCKFILL DAM STRATIGRAPHY
SEEPAGE AND STABILITY ANALYSIS
WITH UPSTREAM SEDIMENT
FIGURE 2
FIGURE 2A – SEEPAGE ANALYSIS
POST EARTHQUAKE SECTION WITH LOSS OF DOWNSTREAM FACE
AND CONSIDERING LAYER 4 – UPSTREAM SEDIMENT
FIGURE 2B – STABILITY ANALYSIS
POST EARTHQUAKE SECTION WITH LOSS OF DOWNSTREAM FACE
AND CONSIDERING LAYER 4 – UPSTREAM SEDIMENT
Failure Surface and Corresponding Factor of Safety
(assume confined to upper half of embankment due to
buttress of failed Layers 1 and 3 material
Dam Section with Layers 1
and 3 Prior to Downstream
Slope Failure
Dam Section with Layers 1
and 3 Prior to Downstream
Slope Failure

PROJECT No.
DESIGN
CADD
CHECK
REVIEW
PHASE No. ----
REV. SCALE
TITLE
PROJECT
04JULY14
CAR
13-1447-0516
CITY OF NANAIMO LOWER COLLIERY DAM
NANAIMO, BC
CAR 04JULY14
04JULY14 HH
NTS
EXISTING DAM STRATIGRAPHY
SEEPAGE AND STABILITY ANALYSIS
NO UPSTREAM SEDIMENT
FIGURE 3
FIGURE 3A – SEEPAGE ANALYSIS
POST EARTHQUAKE SECTION WITH NO LOSS OF DOWNSTREAM FACE
NO UPSTREAM SEDIMENT LAYER
FIGURE 3B – STABILITY ANALYSIS
POST EARTHQUAKE SECTION WITH NO LOSS OF DOWNSTREAM FACE
NO UPSTREAM SEDIMENT LAYER
Failure Surface and
Corresponding Factor of
Safety

PROJECT No.
DESIGN
CADD
CHECK
REVIEW
PHASE No. ----
REV. SCALE
TITLE
PROJECT
04JULY14
CAR
13-1447-0516
CITY OF NANAIMO LOWER COLLIERY DAM
NANAIMO, BC
CAR 04JULY14
04JULY14 HH
NTS
EXPOSED ROCKFILL DAM STRATIGRAPHY
SEEPAGE AND STABILITY ANALYSIS
NO UPSTREAM SEDIMENT
FIGURE 4
FIGURE 4A – SEEPAGE ANALYSIS
POST EARTHQUAKE SECTION WITH LOSS OF DOWNSTREAM FACE
NO UPSTREAM SEDIMENT LAYER
FIGURE 4B – STABILITY ANALYSIS
POST EARTHQUAKE SECTION WITH LOSS OF DOWNSTREAM FACE
NO UPSTREAM SEDIMENT LAYER
Failure Surface and Corresponding Factor of Safety
(assume confined to upper half of embankment due to
buttress of failed Layers 1 and 3 material
Dam Section with Layers 1
and 3 Prior to Downstream
Slope Failure
Dam Section with Layers 1
and 3 Prior to Downstream
Slope Failure

REPORT ON COLLIERY DAM STABILITY
APPENDIX A Technical Memorandum on Dynamic Soil-Structure Interaction Analysis of The Colliery Dam, Nanaimo, Vancouver Island, British Columbia
July 25, 2014 Report No. 1314470516-009-R-Rev0

This Technical Memorandum presents the results of dynamic soil-structure interaction analyses carried out to assess the seismic behaviour of the Lower Colliery Dam when subjected to the shaking levels corresponding to 10,000-year (equivalent to the Maximum Credible Earthquake (MCE)) and 2,475-year return periods. The Colliery Dam Complex, located in Nanaimo, BC, has a high seismic hazard exposure. The methodology followed and parameters used in the analyses together with the results including key findings are presented herein.
This Technical Memorandum addresses only the seismic analysis completed for the Lower Colliery Dam. Other detailed information such as the geotechnical investigations completed at the site, laboratory testing, etc. are presented in separate reports/memoranda.
This Technical Memorandum should be read in conjunction with the “Information and Limitations of This Report” which is included following the text of this report. The reader’s attention is specifically drawn to this information, as it is essential that it is followed for the proper use and interpretation of this report.
1.0 BACKGROUND The Middle and Lower Colliery Dams are located in the Colliery River Valley within the City Park known as Colliery Dam Park. The Lower Colliery Dam is located downstream of the Middle Colliery Dam, and was constructed in 1910 to supply water for the nearby Harewood Colliery when it was in full production. Previously, both dams were assigned “Extreme” consequence categories (CDA Guidelines (2007, revised in 2013)) – more recently the classification has been conditionally reduced to Very High for the Lower Dam and High for the Middle Dam.
DATE July 16, 2014 REFERENCE No. 1314470516-007-TM-Rev0
TO Bruce Downing
CC Herb Hawson
FROM Mahmood Seid-Karbasi and Upul Atukorala EMAIL [email protected]
DYNAMIC SOIL-STRUCTURE INTERACTION ANALYSIS OF THE COLLIERY DAM NANAIMO, VANCOUVER ISLAND, BRITISH COLUMBIA
Golder Associates Ltd.
500 - 4260 Still Creek Drive, Burnaby, British Columbia, Canada V5C 6C6 Tel: +1 (604) 296 4200 Fax: +1 (604) 298 5253 www.golder.com
Golder Associates: Operations in Africa, Asia, Australasia, Europe, North America and South America
Golder, Golder Associates and the GA globe design are trademarks of Golder Associates Corporation.

Bruce Downing 1314470516-007-TM-Rev0 July 16, 2014
The Colliery River Valley is narrow with steep slopes within the park boundaries with exposed conglomerate bedrock and till on the abutments. Some thin colluvium has been noted at the base of the valley slopes. Soft/loose unconsolidated channel deposits are present at the base of the valley between the two dams and downstream of Lower Colliery Dam; they are of limited lateral extent due to the narrow and steep sided nature of the river valley. They appear to only be present when the valley bottom flattens below steeper reaches of the channel where bedrock is exposed. Borehole investigations were completed at both dams in 1978 and information on the downstream shell material present in each dam has been collected. Some limited supplementary investigations were carried out as part of the current study (in 2014) to collect additional data on the concrete core and downstream shell materials. The results of this investigation are presented in a separate report.
The Lower Colliery Dam is a rock fill dam with a 1.2 m thick, vertical, concrete core wall. Mine/process waste material was placed on the downstream face of the dam sometime after construction with an additional toe berm/filter layer placed over the lower half of the downstream face in 1980. The lower dam is approximately 24 m high with a crest length of about 77 m. The width of the dam crest varies from about 5m at the right abutment to more than 20 m at the left abutment. The upstream and downstream embankments slope at 2.2H:1V and 1.8H:1V, respectively.
The Lower Colliery Dam is mainly comprised of rock/random fill in U/S and D/S shells that are separated by the concrete core wall as seepage cut-off for the dam. The rockfill placed in the lower portion of the D/S shell is overlain with fills comprising cinders and slag, which change to a mixture of sand and gravel at the D/S toe. The dam is founded on strong conglomerate bedrock sloping at about 4 to 18 degrees with the horizontal direction.
The materials of the dam-foundation system were characterized based on limited available geotechnical data from previous work (i.e., Golder 1978) and the investigations carried out during the current study in 2014.
In 2010, at the direction of the BCMOE Dam Safety Branch, EBA Engineering completed a seismic analysis of the two dams considering seismic ground motions with a return period of 3,000-yrs (EBA, 2010). In the current assessment, dynamic analyses were carried out for two different shaking levels; i.e., 10,000-yr and 2,475-yr return periods to assess the performance of the dam-foundation system. The intent of the analyses was to assess the seismic performance of the Lower Colliery Dam for earthquake ground motions that correspond for the “High” through to the “Extreme” Consequence Classifications as a means to assess failure modes of the dams and as input to the quantitative risk assessment for the project.
2.0 SCOPE OF WORK The scope of work consisted of developing a 2D soil-structure interaction model to assess the seismic response of the Lower Colliery Dam using the public domain computer code FLAC (V6, Itasca, 2008). The main focus of the analyses was to assess the seismic stability of the dam and estimate the anticipated deformations of the concrete core under strong seismic shaking that corresponds to a 10,000-yr return period. Analyses were also carried out for strong shaking that corresponds to a 2,475-yr return period.
2/15

Bruce Downing 1314470516-007-TM-Rev0 July 16, 2014
The following key work tasks were completed as part of the assessment:
Review available information from previous dam seismic assessment (EBA, 2010) and other studies completed by Golder (1978) together with data from recent geotechnical/geophysical investigations (Golder, 2014) carried out in the concrete wall and D/S dam shell.
Estimate the seismic hazard for the 10,000-yr return period at the dam site from studies already completed by BC Hydro for similar dams in the region, in the absence of a detailed study and considering that time is of the essence.
Develop a 2D Soil-Structure Interaction response model taking into consideration the material parameters established for the concrete core by the structural specialist Dr. Mahmood Rezai, P. Eng. to multiple levels of ground shaking to explore in detail the deformations in the core and shells of the dam.
3.0 SEISMIC GROUND MOTIONS The seismicity at the site results from the offshore subduction of the Juan de Fuca Plate beneath the North America Plate. The ground motion parameters applicable for the dynamic analysis of the Lower Colliery Dam were established based on studies already completed by EBA Engineering in 2010, and the most recent (2012) seismic hazard assessments completed by BC Hydro for several of the nearby dams such as John Hart, Comox, and Puntledge Dams. The project schedule did not permit the completion of a comprehensive site-specific seismic hazard assessment.
EBA Engineering retained CAN Engineering to develop input firm-ground motion parameters and applicable acceleration time-histories as input to the studies they completed in 2010. EBA Engineering completed their analyses considering ground motions that correspond to a return period of 3,000-yrs.
“Firm-ground” peak horizontal accelerations applicable for a return period of 10,000-yrs were estimated by combining all available data on PGA as a function of the annual probability of exceedance. Based on the available data, the PGA that corresponds to a return period of 10,000-yrs is established as approximately equal to 0.8 g (see Figure 3-1a). The Uniform Hazard Response Spectrum (UHRS) established for the Lower Colliery Dam is shown on Figure 3-1b. This spectrum was established by uniformly scaling the spectrum developed by CAN Engineering to a PGA = 0.8 g. Shown in the same figure is the spectrum established for John Hart Dam by BCH (2012). The spectra are generally similar in shape when plotted in the Log10 (T) - Log10 (Sa) space.
In the absence of a site-specific seismic hazard assessment, the input acceleration time-histories developed for the EBA study were uniformly scaled relative to the PGA to establish the input motions for the 2,475-yr and 10,000-yr return period ground motions.
Figure 3-2 shows the modified acceleration time-history of CC0 earthquake for “firm-ground” condition used in these analyses. This time-history has a response spectrum that closely resembles the average response spectrum provided by CAN Engineering.
3/15

Bruce Downing 1314470516-007-TM-Rev0 July 16, 2014
4.0 DAM BODY AND FOUNDATION CHARACTERIZATION The geotechnical conditions at the Lower Colliery Dam site were established using data collected from the different geotechnical investigations completed at the site. These included boreholes drilled and test pits excavated in the valley beneath the dam body by Golder in 1978 and 2014. The details of the investigations, test results, and the key findings are reported separately. The 2014 investigations also included downhole shear wave velocity measurements, GPR profiling of the concrete core to investigate the possible presence and spacing of rebar, as well as recovering concrete core samples for detailed inspection and strength testing.
The available information suggests that the Lower Colliery Dam is founded on strong conglomerate bedrock with an average shear wave velocity (Vs) greater than 760 m/s. The Dam body is inferred to consist of five (5) distinct material zones:
Zone 1: Rockfill and Random Fill (Downstream) – these fills have been encountered in the downstream shell of the dam placed to a maximum elevation of about + 72 m forming a slope of about 1.9H:1V.
Zone 2: Rockfill (Upstream) – these fills exist immediately upstream of the core and are assumed to be similar to the rockfill found in Zone 1 described above. They extend to a maximum elevation of +71 m forming a slope of about 2.5H:1V.
Zone 3: Granular fills consisting of Cinders and Slag on top of the downstream rockfill shell (Zone 1). These extend to the dam crest elevation at +73.6 m forming a slope of 1.8H:1V.
Zone 4: Sand and gravel berm at the downstream toe.
Zone 5: Fine-grained fills in the middle of the dam body extending to a maximum elevation of about +58.0 m.
The 1.2 m wide concrete core wall located in the center of the dam serves as a seepage cut-off wall. The rockfill embankments both upstream and downstream of the concrete wall provide lateral confinement and support for the core wall. The upstream fills are about 2.0 m lower than the downstream fills. The configuration of the different fill zones are depicted in Figure 4-1.
A sixth material zone, labelled as Zone 6, was introduced when considering a possible remedial option involving strengthening the upper 2 to 3 m of the downstream shell to permit overflow conditions. The materials comprising Zone 6 were assumed to have been strengthened by mixing and forming soil-cement zones to provide increased material resistance to erosion as well as increased stiffness and strength.
4.1 Zone 1: Coarse-Grained Rockfill and Random Variable Fill (Downstream) This zone in the Lower Colliery Dam is comprised of coarse-grained rockfill and random variable fill materials placed during from original construction of the dam in 1911. Very limited data is available on the quality and in-situ. relative density of rockfill from the investigations completed to date. Some Standard Penetration Tests (SPT) were carried out during the 1978 investigation. The measurements indicate erratic blow counts influenced by the material size. The SPT N values are not considered to be representative of the in-situ. relative density and has been used with caution in the engineering analyses carried out. The coarse-grained rock fill materials are not susceptible to excess pore water pressure generation and/or liquefaction during earthquake loading.
4/15

Bruce Downing 1314470516-007-TM-Rev0 July 16, 2014
4.2 Zone 2: Coarse-Grained Rockfill (Upstream) No information is available on the condition and in-situ. relative density of the rockfill upstream of the core wall. For purposes of the dynamic analysis of the dam, these coarse-grained rockfill materials were assigned parameters similar to Zone 1. Similar to Zone 1 fills, these coarse-grained rock fill materials are not susceptible to excess pore water pressure generation and/or liquefaction during earthquake loading.
4.3 Zone 3: Cinders and Slag Fill (Downstream) Cinders, ash, slags and sands from mining works have been placed on top of Zone 1 Rockfill and Random Variable Fills by end-dumping to flatten the downstream shell slope. This zone is about 5m thick at the dam crest and extends to the lower part of the downstream shell. This zone consists of very loose sandy soils with N-value of 1 to 4 blows/0.3 m. This zone was characterized as a material exhibiting “sand-like” behavior with an equivalent (N1)60 of 3 blows/0.3 m.
These fills are inferred to be in a moist to dry state, and as such, they are not expected to undergo liquefaction and generation of excess pore water pressures in a manner similar to water saturated loose granular fills as a result of earthquake loading.
4.4 Zone 4: Coarse-Grained Soil, Sand and Gravel A sand and gravel berm has been constructed at the downstream toe of the dam in 1980 to buttress the slope and provide lateral support. The fills consist of mine process waste materials. The as-built drawings indicate that a toe berm/filter layer has been constructed at the interface between Zones 2 and 3.
This zone has been inferred to consist of medium dense granular soils with an equivalent SPT (N1)60 of 20 blows/0.3m.
It is envisaged that the Zone 3 soils are not prone to generation of excess pore water pressure and liquefaction during earthquake shaking.
4.5 Zone 5: Fine-grained Fills Fine-grained fill materials have been encountered in one of the boreholes (SH14-05) drilled during the 2014 investigation. No information is available on the in-situ. relative density of these soils.
For purposes of the seismic analyses completed herein, the dynamic properties of the fine-grained materials comprising Zone 5 were assumed to be the same as those in Zone 1.
4.6 Zone 6: Strengthened Downstream Shell for Overflowing Strengthening the upper 4 to 5 m of the cinder and slag fills using soil-cement mixing techniques has been considered as an option to permit overtopping/overflowing of the dam during the PMF. The proposed improvement will result in increased stiffness and strength of the upper 4 to 5 m of soil comprising the downstream face, as well as to make the system brittle in comparison to the unimproved ground. The impact of this improved zone on the overall dynamic response of the rockfill zones and the concrete core wall was evaluated by assigning appropriate properties for the subject material zones.
5/15

Bruce Downing 1314470516-007-TM-Rev0 July 16, 2014
4.7 Dam Foundation The upstream and downstream shells and the concrete seepage cut off wall comprising the dam are inferred to be directly founded on bedrock that slopes at about 3H:1V towards downstream. The recent investigations (reported separately) indicate that the foundation consists of strong conglomerate bedrock. The foundation is inferred to be intact and no seepage issues have been observed or noted during the dam safety reviews.
4.8 Water Conditions The water level was established at NWL of the reservoir (i.e., elevation of +71.5 m) for the upstream shell of the dam. In the downstream shell, the inferred water level was taken at the top of the bedrock surface, with no water flowing through the downstream shell, a condition that has been supported based on piezometric observations.
5.0 METHODOLOGY The response of the dam-foundation system to earthquake shaking was evaluated in two stages. In the first stage, the dam body and its foundation were analyzed under gravity loads (i.e., in the static mode) with the steady state water level that corresponds to the pool at NWL in order to establish the pre-earthquake stress state within the material zones comprising the dam body. Thereafter, the analysis was switched to the dynamic mode. Considering the coarse-grained nature of the materials comprising the dam, generation of excess pore water pressures and liquefaction are not anticipated in these materials. Hence, the seismic response analyses were carried out using a total stress-based approach.
The dynamic analysis of the dam was conducted using the computer code FLAC (V6, Itasca, 2008). FLAC is a commercially available finite difference computer code with the capability to perform stress-deformation analysis of soil-structure systems when subjected to combined static and dynamic loads. It has several built-in widely used constitutive models (e.g., elastic and Mohr-Coulomb) and also the possibility to implement user-defined constitutive models.
The dynamic response of the dam was assessed for a 2D cross section of the dam, which corresponds to the deepest section of the valley (see Factual Geotechnical Report for dam plan and sections, Golder, April 2014). Plane strain conditions were assumed and 3D effects resulting from the valley geometry were ignored.
The earthquake ground motions were applied as time-histories of shear stresses at the base of the model with a compliant (i.e., “quiet”) boundary condition at the base. The dam was extended some 50 m and 90 m upstream and downstream of the core wall and free-field boundaries were imposed along the left and right hand boundaries. The time-histories of shear stresses were established from the “outcropping” earthquake acceleration time-history records (i.e., without any overburden effects).
6.0 FLAC MODEL AND SOIL PARAMETERS The 24 m-high Lower Colliery Dam with its foundation (bedrock) was discretized using a finite difference grid comprising 30 x 95 zones in the vertical and horizontal directions, respectively. The nominal thickness of the material zones was 1 m. The model extended about 30m from the upstream and downstream toe areas of the dam, over a total length of 140 m.
6/15
Bruce Downing 1314470516-007-TM-Rev0 July 16, 2014
Geo-materials
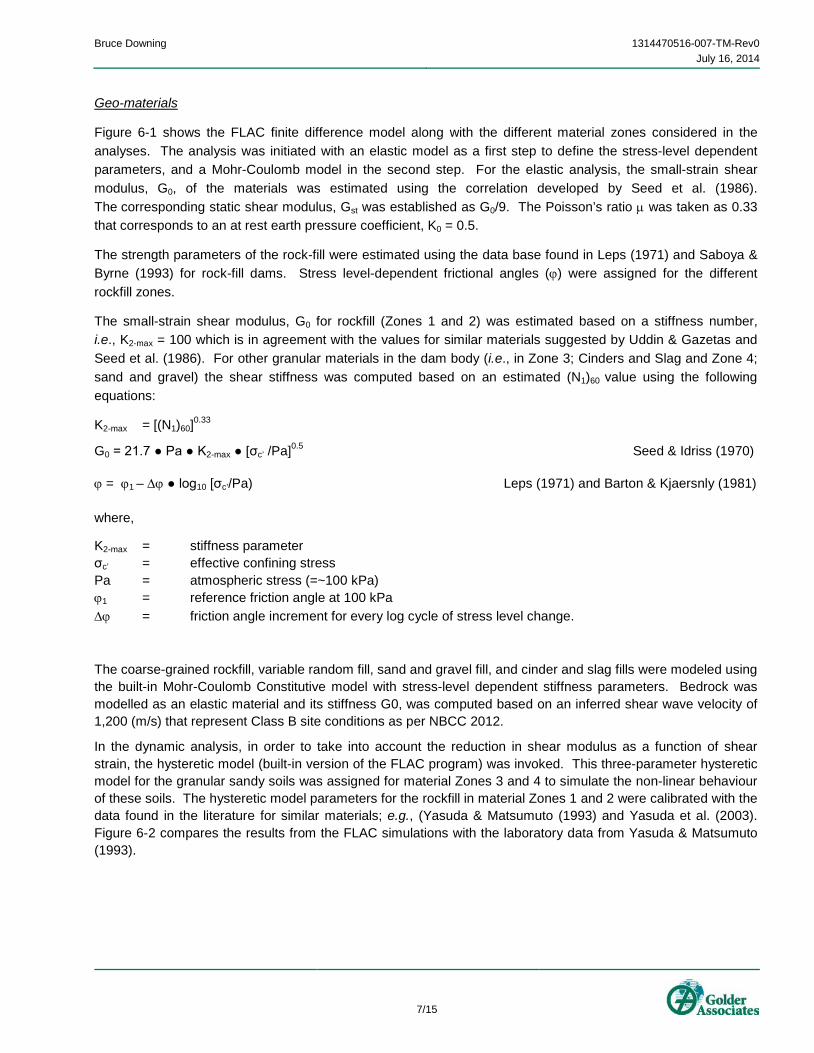
Figure 6-1 shows the FLAC finite difference model along with the different material zones considered in the analyses. The analysis was initiated with an elastic model as a first step to define the stress-level dependent parameters, and a Mohr-Coulomb model in the second step. For the elastic analysis, the small-strain shear modulus, G0, of the materials was estimated using the correlation developed by Seed et al. (1986). The corresponding static shear modulus, Gst was established as G0/9. The Poisson’s ratio µ was taken as 0.33 that corresponds to an at rest earth pressure coefficient, K0 = 0.5.
The strength parameters of the rock-fill were estimated using the data base found in Leps (1971) and Saboya & Byrne (1993) for rock-fill dams. Stress level-dependent frictional angles (ϕ) were assigned for the different rockfill zones.
The small-strain shear modulus, G0 for rockfill (Zones 1 and 2) was estimated based on a stiffness number, i.e., K2-max = 100 which is in agreement with the values for similar materials suggested by Uddin & Gazetas and Seed et al. (1986). For other granular materials in the dam body (i.e., in Zone 3; Cinders and Slag and Zone 4; sand and gravel) the shear stiffness was computed based on an estimated (N1)60 value using the following equations:
K2-max = [(N1)60]0.33
G0 = 21.7 ● Pa ● K2-max ● [σc’ /Pa]0.5 Seed & Idriss (1970)
ϕ = ϕ1 – ∆ϕ ● log10 [σc’/Pa) Leps (1971) and Barton & Kjaersnly (1981)
where,
K2-max = stiffness parameter σc’ = effective confining stress Pa = atmospheric stress (=~100 kPa) ϕ1 = reference friction angle at 100 kPa
∆ϕ = friction angle increment for every log cycle of stress level change.
The coarse-grained rockfill, variable random fill, sand and gravel fill, and cinder and slag fills were modeled using the built-in Mohr-Coulomb Constitutive model with stress-level dependent stiffness parameters. Bedrock was modelled as an elastic material and its stiffness G0, was computed based on an inferred shear wave velocity of 1,200 (m/s) that represent Class B site conditions as per NBCC 2012.
In the dynamic analysis, in order to take into account the reduction in shear modulus as a function of shear strain, the hysteretic model (built-in version of the FLAC program) was invoked. This three-parameter hysteretic model for the granular sandy soils was assigned for material Zones 3 and 4 to simulate the non-linear behaviour of these soils. The hysteretic model parameters for the rockfill in material Zones 1 and 2 were calibrated with the data found in the literature for similar materials; e.g., (Yasuda & Matsumuto (1993) and Yasuda et al. (2003). Figure 6-2 compares the results from the FLAC simulations with the laboratory data from Yasuda & Matsumuto (1993).
7/15

Bruce Downing 1314470516-007-TM-Rev0 July 16, 2014
Concrete Core Wall
The 1.2 m thick concrete core wall was modeled using beam elements that interacted with the rockfill zones via interface elements. The seismic response of the concrete core wall was evaluated for two scenarios:
1) Considering elastic behavior (i.e., unlimited yield moment capacity); and
2) Imposing a limit on the yield moment capacity (Mp) = 600 kNm to account for tensile cracking threshold of the concrete wall.
The following additional properties were assigned to the concrete core wall:
Young’s Modulus, Emin = 1.13e7 kPa.
Thickness of the wall = 1.2 m (uniform from top to bottom).
Base of the wall = embedded in rockfill.
The concrete wall sectional properties were provided by Dr. Mahmood Rezai, P. Eng. following review of the laboratory testing completed on select concrete core samples.
A summary of the input parameters established for the different zones is provided in Table 1 below.
Table 1: Material Properties Used in FLAC Analyses
Material Zone Unit
Weight (kN/m3)
(N1)601
(blows/0.3m) K2-
max ϕ’
(Deg.) ∆ϕ1
(Deg.) G0
2
(kPa) B3
(kPa) E
(kPa)
3) Rockfill/Random Fill (Zones 1, 2, and 5) 20.0 ---- 1004 40 5.0 Var. 2.67●G ----
4) Cinders and Slag Fills (Zone 3) 18.5 3 29 33 ---- Var. 2.67●G ----
5) Sand and Gravel (Zone 4) 19.0 20 54 35 ---- Var. 2.67●G ----
6) Conglomerate Bedrock 26.0 ---- ---- ---- ---- 3.8e6 ---- ----
7) Concrete Wall5 23.0 ---- ---- ---- ---- ---- ---- 1.13e7
8) Cement-Stabilized Region (Zone 6)6 20.0 ---- ---- ---- ---- 4.2e5 2.67●G 500●UCS
Notes: 1 Representative (N1)60 values inferred from limited previous data. 2 Small strain shear modulus, G0, of dam body zones were estimated based on G0 = 21.7 K2-max.Pa.(σ’m /Pa)0.5 3 Bulk modulus, B was estimated for condition of K0=0.5 4 Rock fill stiffness parameters were estimated based on assumed K2-max = 100 5 A plastic moment of 600 kNm was assigned in some of the analyses carried out 6 Soil-cement strength and stiffness properties were estimated based on UCS=2000kPa and E=500 ● UCS, respectively
8/15

Bruce Downing 1314470516-007-TM-Rev0 July 16, 2014
7.0 RESULTS The results of the dynamic simulations carried out for the Lower Colliery Dam are presented and discussed in the following sections.
7.1 As-Is conditions The dynamic response of the Lower Colliery Dam was assessed for ground motions corresponding to 10,000-yr and 2,475-yr return periods. The first series of runs were carried out for “as-is” conditions of the dam without implementing any remedial measures. This section presents the results of the dam for “as-is” conditions.
The pre-earthquake in-situ. stress state established for the Lower Colliery Dam is shown in Figure 7-1 in terms of total and effective vertical stress contours.
The computed seismic response of the dam for the 10,000-yr ground motions is presented in Figure 7-2 in terms of lateral displacements induced in the different zones at the end of shaking. The results indicate that large displacements in the order of several meters occur in both the U/D and D/S shells of the dam. The computed permanent displacements are larger in the D/S direction than in the U/S direction.
The very loose cinders and slag fill show large downstream movements in excess of 5 m indicating ravelling and possible shallow slope failure. The U/S shell shows a classical circular mass movement over the bedrock. The U/S and D/S slopes both appear to move independently in opposite directions relative to the concrete core wall. The results also indicate that the crest of the dam has settled from its original pre-earthquake position (i.e., elev. 73.5 m) by about 2 m. Figure 7-3 shows the residual bending moments and displacements in the concrete wall at the end of shaking. As may be seen, the wall moves towards the reservoir rotating almost uniformly about the heel. As a result, high bending moments are induced in the lower part of the wall. The wall also undergoes a vertical displacement of about 150 mm; insufficient to result in a loss of free board with the reservoir level at normal operating level.
The transient displacements and bending moments induced in the wall during strong shaking are higher than the residual values as the inertia effects of the earthquake no longer exist at the end of shaking. Figure 7-4 shows the time-history of lateral displacement of a structural node at the top of the wall along with that at the base of the model (input motion). It shows that the maximum transient displacements in the wall can be as high as 1.2 m.
A second set of analyses were conducted with a plastic moment of 600 kNm for the concrete wall to account for the threshold cracking tensile stress due to its flexural behavior. Limiting the plastic moment capacity of the wall resulted in larger lateral displacements of the wall. The maximum bending moment was limited to the plastic moment capacity of the wall. Figure 7-5 shows the contours of lateral displacements of the dam along with the distribution of the induced displacements and bending moments in the concrete core wall.
The results indicate that large displacements of the dam shell relative to the wall have resulted in some slippage at the interface between the wall and rockfill. Figure 7-6 shows the distorted mesh superimposed on the initial mesh in the vicinity of the wall. As can be seen, some misalignment of the geo-material elements on both sides of the wall is evident in the deformed mesh. This indicates that slippage has occurred along the wall-dam shell contact surfaces during earthquake shaking.
9/15

Bruce Downing 1314470516-007-TM-Rev0 July 16, 2014
A third set of analyses were carried out for shaking corresponding to the 2,475-year return period that corresponds to a PGA = 0.5 g. The deformation pattern of the dam and concrete wall were similar.
Table 2 summarizes the results of the different seismic analyses carried out for the Lower Colliery Dam in terms of the concrete core wall displacements computed.
Table 2: Summary of Results of Dynamic FLAC Analyses, As-Is Condition
Shaking Level Concrete Wall Plastic Moment Capacity (kNm)
Computed Horizontal Displacement of the Concrete Wall (mm) At the End of Shaking
Horizontal Vertical 10,000-yr Ground Motions ----- ~1,100 ~140 10,000-yr Ground Motions 600 ~1,785 ~185 2,475-yr Ground Motions ----- ~440 ~60 2,475-yr Ground Motions 600 ~820 ~70
7.2 ASSESSMENT OF REMEDIATED OPTION (HARDENED OPTION) In order to assess seismic performance, one of the options that is being considered as a remediation measure for the Lower Colliery Dam has been considered in this analysis. This option is to harden the downstream shell of the dam in order to allow the dam to be over-topped during the flood events. This option includes strengthening the upper 2 to 3 m of the downstream shell which currently consists of Cinder and Slag fills. This is anticipated to be achieved using a cut and fill technique. The concrete core wall and the cement stabilized zone will be separated/isolated by an approximately 1.0 m wide zone of compressible clay-type material (e.g., vermiculite) to minimize the potential “hammering” effect during strong shaking. Figure 7-7 illustrates the FLAC model of the dam-foundation system with various material types used in this series of analyses.
The soil-cement zone was assigned a uniaxial compression strength of 2 MPa in the analyses and was modelled using Mohr-Coulomb Constitutive model with a cohesion of 1,000 kPa (1/2 of UCS). The stiffness parameters of this zone were estimated based on FHWA guidelines proposed for such materials (Bruce, 2000). Published modulus reduction and damping curves for soil-cement stabilized zones were used in the analyses (e.g., Saxena et al. 1988 and Acar & El-Tahir, 1986 and Pestana et al. (2006)). Figure 7-8 compares the FLAC simulation of the modulus reduction curve and damping ratio with those obtained from laboratory tests reported by Saxena et al. (1988).
The soft isolator zone was treated as an elastic material with much lower stiffness compared to that of the adjacent geo-material zones in order to minimize their interaction with the concrete wall (i.e., minimal strength for wall-isolator interface).
Figure 7-9 shows the contours of the computed lateral displacements for the improved case along with the induced displacement and bending moment distributions in the concrete wall when subjected to the 10,000-yr ground motions. As can be seen, the displacements of the downstream shell are reduced significantly due to the high strength of the soil-cement material. The soil-cement stabilized zone also acts as a shear key at the toe of the dam which assists the stability. The upstream slope displacements, however, remained unchanged from the previous analyses. The isolator zone behind the concrete wall facilitates independent movement of the wall and improved the stability of the downstream shell by allowing the formation of a gap between the wall and the geo-material as depicted in Figure 7-10.
10/15

Bruce Downing 1314470516-007-TM-Rev0 July 16, 2014
Analyses were carried out imposing a plastic moment of 600 kNm for the concrete wall. Figure 7-11 shows contours of the lateral displacements for this case along with the induced displacement and moment distributions in the concrete wall when subjected to the 10,000-yr ground motions.
The results indicate that the deformation pattern of the wall is essentially the same as for the dam in the as-is condition.
8.0 CONCLUSIONS AND LIMITATIONS The results of 2D dynamic soil-interaction analyses of the Lower Colliery Dam indicate that the dam would undergo large deformations in the upstream and downstream shells when subjected to the 10,000-yr and 2,475-yr ground motions without any remedial measures in place or under “as-is” conditions. The downstream shell undergoes displacements in excess of 4 m in the very loose Cinder and Slag fills exhibiting shallow failure when subjected to the 10,000-yr ground motions. Driven by the unbalanced inertial forces, the concrete wall tends to rotate towards the reservoir, but its vertical settlements are not large enough to cause loss of freeboard in the reservoir. When a plastic moment capacity was imposed on the concrete wall, the computed displacements were larger. This result is consistent with the expected performance. The plastic moment capacity is controlled by the tensile cracking stress.
The seismic performance of the remediated dam (Hardened Option - the construction of a soil-cement zone over the entire downstream shell to some 2 to 3 m depth), improved with limited distortions occurring in the downstream shell and did not change the impacts to the concrete core wall.
The results of dynamic analyses reported herein correspond to one cross section of the Lower Colliery Dam taken at the deepest section of the valley. Limited information was available to simulate the stress-deformation response of the coarse-grained rockfill comprising the downstream shell. The material parameters and the in-situ state of the coarse-grained rockfill on the upstream side were assumed to be similar to those in the downstream shell. All of the analyses correspond to 2D plane strain conditions, and ignored the 3D effects of the valley across which the dam is built.
GOLDER ASSOCIATES LTD.
Mahmood Seid-Karbasi Upul Atukorala Geotechnical Engineer, Ph.D. Principal, Ph.D., P.Eng.
MSK/UDA/do
11/15
ORIGINAL SIGNED ORIGINAL SIGNED

Bruce Downing 1314470516-007-TM-Rev0 July 16, 2014
Attachments: Figure 3-1: Spectral Acceleration and PGA vs. Return Period for Similar Dam Sites
Figure 3-2: CC0 Earthquake Acceleration Time History
Figure 4-1: Dam Cross-Section Lower Colliery Dam (As-Is Conditions)
Figure 6-1: FLAC MODEL of Dam-Foundation System As-Is Conditions
Figure 6-2: Modulus Reduction and Damping Curves for Rockfill FLAC Simulation vs. Laboratory Data
Figure 7-1: Contours of Total and Effective Vertical Stresses Pre-Earthquake Condition
Figure 7-2: Contours of Lateral Displacements End of Shaking MDE Demand-Motion:CC0
Figure 7-3: Distribution of Moment and Lateral Displacement along the Concrete Wall-No Plastic Moment Capacity End of Shaking MDE Demand-Motion:CC0
Figure 7-4: Time Histories of Displacements At Top of the Wall and Base of the Model MDE Demand-Motion:CC0
Figure 7-5: Contours of Lateral Displacements End of Shaking- Wall with Plastic Moment Capacity MDE Demand-Motion:CC0
Figure 7-6: Original and Distorted Mesh at the Dam Crest around the Concrete Wall with Plastic Moment Capacity End of Shaking, MDE Demand-Motion:CC0
Figure 7-7: FLAC MODEL of Dam-Foundation System Improved Case - D/S Soil Cement
Figure 7-8: Modulus Reduction and Damping Curves Soil-Cement Materials FLAC Simulation vs. Laboratory Data
Figure 7-9: Contours of Lateral Displacements End of Shaking – Improved Case, No Plastic Moment MDE Demand-Motion:CC0
Figure 7-10: Separation of Concrete Wall and Isolator at Dam Crest No Plastic Moment Capacity End of Shaking, MDE Demand-Motion: CC0
Figure 7-11: Contours of Lateral Displacements End of Shaking – Improved Case, with Plastic Moment MDE Demand-Motion:CC0
o:\final\2013\1447\13-1447-0516\1314470516-007-tm-rev0\1314470516-007-tm-rev0- flac dynamic analysis 16jul_14.docx
12/15

Bruce Downing 1314470516-007-TM-Rev0 July 16, 2014
9.0 REFERENCES EBA, Engineering Consultants, Ltd. 2010. “Seismic Hazard Assessment Middle and lower Chase Dams”
Golder Associates Ltd. 2014. “Factual Geotechnical Report for Colliery Dams Remediation Project, Nanaimo, BC”
Hardin, B. O., and Drenvich, V. P. 1972. “Shear Modulus and Damping in Soils: Design Equations and Curves”, ASCE Journal of the Soil Mechanics and Foundation Engg. Division, V. 98(SM7), pp. 667-692.
Seed H. B., and Idriss, I. M. 1970. “Soil Moduli and Damping Factors for Dynamic Response Analyses”, Report No. EERC 70-10, Earthquake Engineering Research Center, University of California, Berkeley.
Seed, H. B., Wong, R. T., Idriss, I. M., Tokimatsu, K. 1986. “Moduli and Damping Factors for Dynamic Analyses of Cohesionless Soils”, ASCE Journal of the Geotechnical Engg., V. 112(GT11), pp. 1016-1032.
Barton, N., and Kjaernsli, B. 1981. “Shear Strength of Rockfill”, ASCE Journal of the Geotechnical Engineering Division, V. 107(GT7): 873-891.
Saboya J.F. and Byrne. PM. 1993 “Parameters for Stress and Deformation Analysis of Roekfilll Dams”, Canadian Geotechnical Journal, V. 30, pp.690-701.
Uddin N. and Gazetas, G. 1997. “Dynamic Response of Concrete-Faced Rockfill Dams to Strong Excitation”, ASCE Journal of the Geotechnical Engineering Division, V. 1210(GT2): 185-197.
Seed, H.B., Seed, R.B., Lai, S.S. and Khamenehpour, B. 1985. “Seismic Design of Concrete-Face Rockfill Dams”, In Proceedings, Symposium on Concrete-Face Rockfill Dams- Design, Construction and Performance, ASCE, New York, N.Y. pp. 459-478.
Leps, T.M. 1970. ”Review of Shear Strength of Rockfill”, ASCE Journal of the Soil Mechanics and Foundation Engg. Division, V. 96(SM4), pp. 1159-1170.
Yasuda, N. and Matsumuto, N. 1993. “Dynamic Deformation Characteristics of Sands and Rockfill Materials”, Canadian Geotechnical Journal, V. 30, pp.747-757.
Yasuda, N. Yamaguchi, Y. and Matsumuto, N. 2003. “Dynamic Deformation and Strength Properties of Rockfill Materials”, In Proceedings, International Congress on Large Dams, ICOLD, Montreal, Q83-R34 V. 3, pp. 577-594.
ITASCA, 2008. “Fast Lagrangian Analysis of Continua (FLAC)”, Version 6, User’s Guide. Itasca Consulting Group, Inc.
Acar, Y. B., and El-Tahir, E. A. 1986. “Low strain dynamic properties of artificially cemented sand”. ASCE Journal of Geotechnical Engineering, 112, pp.1001 - 1015.
Pestana, J.M., and Salvati, L. A. 2006. “Small-Strain Behavior of Granular Soils. I: Model for Cemented and Uncemented Sands and Gravels”. ASCE Journal of Geotechnical and Geoenvironmental Engineering,132, pp. 1071-1081
13/15

Bruce Downing 1314470516-007-TM-Rev0 July 16, 2014
IMPORTANT INFORMATION AND LIMITATIONS OF THIS REPORT Standard of Care: Golder Associates Ltd. (Golder) has prepared this report in a manner consistent with that level of care and skill ordinarily exercised by members of the engineering and science professions currently practising under similar conditions in the jurisdiction in which the services are provided, subject to the time limits and physical constraints applicable to this report. No other warranty, expressed or implied is made.
Basis and Use of the Report: This report has been prepared for the specific site, design objective, development and purpose described to Golder by the Client. The factual data, interpretations and recommendations pertain to a specific project as described in this report and are not applicable to any other project or site location. Any change of site conditions, purpose, development plans or if the project is not initiated within eighteen months of the date of the report may alter the validity of the report. Golder cannot be responsible for use of this report, or portions thereof, unless Golder is requested to review and, if necessary, revise the report.
The information, recommendations and opinions expressed in this report are for the sole benefit of the Client. No other party may use or rely on this report or any portion thereof without Golder’s express written consent. If the report was prepared to be included for a specific permit application process, then upon the reasonable request of the client, Golder may authorize in writing the use of this report by the regulatory agency as an Approved User for the specific and identified purpose of the applicable permit review process. Any other use of this report by others is prohibited and is without responsibility to Golder. The report, all plans, data, drawings and other documents as well as all electronic media prepared by Golder are considered its professional work product and shall remain the copyright property of Golder, who authorizes only the Client and Approved Users to make copies of the report, but only in such quantities as are reasonably necessary for the use of the report by those parties. The Client and Approved Users may not give, lend, sell, or otherwise make available the report or any portion thereof to any other party without the express written permission of Golder. The Client acknowledges that electronic media is susceptible to unauthorized modification, deterioration and incompatibility and therefore the Client cannot rely upon the electronic media versions of Golder’s report or other work products.
The report is of a summary nature and is not intended to stand alone without reference to the instructions given to Golder by the Client, communications between Golder and the Client, and to any other reports prepared by Golder for the Client relative to the specific site described in the report. In order to properly understand the suggestions, recommendations and opinions expressed in this report, reference must be made to the whole of the report. Golder cannot be responsible for use of portions of the report without reference to the entire report.
Unless otherwise stated, the suggestions, recommendations and opinions given in this report are intended only for the guidance of the Client in the design of the specific project. The extent and detail of investigations, including the number of test holes, necessary to determine all of the relevant conditions which may affect construction costs would normally be greater than has been carried out for design purposes. Contractors bidding on, or undertaking the work, should rely on their own investigations, as well as their own interpretations of the factual data presented in the report, as to how subsurface conditions may affect their work, including but not limited to proposed construction techniques, schedule, safety and equipment capabilities.
Soil, Rock and Groundwater Conditions: Classification and identification of soils, rocks, and geologic units have been based on commonly accepted methods employed in the practice of geotechnical engineering and related disciplines. Classification and identification of the type and condition of these materials or units involves judgment, and boundaries between different soil, rock or geologic types or units may be transitional rather than abrupt. Accordingly, Golder does not warrant or guarantee the exactness of the descriptions.
14/15

Bruce Downing 1314470516-007-TM-Rev0 July 16, 2014
Special risks occur whenever engineering or related disciplines are applied to identify subsurface conditions and even a comprehensive investigation, sampling and testing program may fail to detect all or certain subsurface conditions. The environmental, geologic, geotechnical, geochemical and hydrogeologic conditions that Golder interprets to exist between and beyond sampling points may differ from those that actually exist. In addition to soil variability, fill of variable physical and chemical composition can be present over portions of the site or on adjacent properties. The professional services retained for this project include only the geotechnical aspects of the subsurface conditions at the site, unless otherwise specifically stated and identified in the report. The presence or implication(s) of possible surface and/or subsurface contamination resulting from previous activities or uses of the site and/or resulting from the introduction onto the site of materials from off-site sources are outside the terms of reference for this project and have not been investigated or addressed.
Soil and groundwater conditions shown in the factual data and described in the report are the observed conditions at the time of their determination or measurement. Unless otherwise noted, those conditions form the basis of the recommendations in the report. Groundwater conditions may vary between and beyond reported locations and can be affected by annual, seasonal and meteorological conditions. The condition of the soil, rock and groundwater may be significantly altered by construction activities (traffic, excavation, groundwater level lowering, pile driving, blasting, etc.) on the site or on adjacent sites. Excavation may expose the soils to changes due to wetting, drying or frost. Unless otherwise indicated the soil must be protected from these changes during construction.
Sample Disposal: Golder will dispose of all uncontaminated soil and/or rock samples 90 days following issue of this report or, upon written request of the Client, will store uncontaminated samples and materials at the Client’s expense. In the event that actual contaminated soils, fills or groundwater are encountered or are inferred to be present, all contaminated samples shall remain the property and responsibility of the Client for proper disposal.
Follow-Up and Construction Services: All details of the design were not known at the time of submission of Golder’s report. Golder should be retained to review the final design, project plans and documents prior to construction, to confirm that they are consistent with the intent of Golder’s report.
During construction, Golder should be retained to perform sufficient and timely observations of encountered conditions to confirm and document that the subsurface conditions do not materially differ from those interpreted conditions considered in the preparation of Golder’s report and to confirm and document that construction activities do not adversely affect the suggestions, recommendations and opinions contained in Golder’s report. Adequate field review, observation and testing during construction are necessary for Golder to be able to provide letters of assurance, in accordance with the requirements of many regulatory authorities. In cases where this recommendation is not followed, Golder’s responsibility is limited to interpreting accurately the information encountered at the borehole locations, at the time of their initial determination or measurement during the preparation of the Report.
Changed Conditions and Drainage: Where conditions encountered at the site differ significantly from those anticipated in this report, either due to natural variability of subsurface conditions or construction activities, it is a condition of this report that Golder be notified of any changes and be provided with an opportunity to review or revise the recommendations within this report. Recognition of changed soil and rock conditions requires experience and it is recommended that Golder be employed to visit the site with sufficient frequency to detect if conditions have changed significantly.
Drainage of subsurface water is commonly required either for temporary or permanent installations for the project. Improper design or construction of drainage or dewatering can have serious consequences. Golder takes no responsibility for the effects of drainage unless specifically involved in the detailed design and construction monitoring of the systems.
15/15

PROJECT No.
DESIGN
CADD
CHECK
REVIEW
PHASE / TASK No.
REV. SCALE
TITLE
PROJECT
NTS
Spectral Acceleration
and
PGA vs. Return Period for Similar Dam Sites
FIGURE 3-1
RE
VIS
ION
DA
TE
: B
Y: F
ILE
:
CITY OF NANAIMO
COLLIERY DAMS
NANAIMO, BC
----
20 May 14
20 May 14
U.A
--
U.A.
13-1447-0516
0.01
0.1
1
10
0.01 0.1 1 10
PG
A (
g)
T (sec.)
Colliery Dams (2475-yr)
Colliery Dams (3000-yr)
John Hart (10,000-yr)
Comox (10000-yr)
Punledge (10000-yr)
John Hart_Scaled (10000-yr)
Colliery Dams (Extrapolated. 10000-yr)
1a)
PGA vs. Return Period
1b)
Response Spectrum

PROJECT No.
DESIGN
CADD
CHECK
REVIEW
PHASE / TASK No.
REV. SCALE
TITLE
PROJECT
NTS
CC0 Earthquake
Acceleration Time History
FIGURE 3-2
RE
VIS
ION
DA
TE
: B
Y: F
ILE
:
CITY OF NANAIMO
COLLIERY DAMS
NANAIMO, BC
----
20 May 14
20 May 14
U.A
--
U.A.
13-1447-0516

A 2014-02-21 ISSUED FOR REVIEW A.C. M.R. - -
DAM CROSS-SECTIONLOWER COLLIERY DAM (AS-IS CONDITIONS)
CITY OF NANAIMOCOLLIERY DAMSNANAIMO, B.C.
4-1
TITLE
PROJECT
SCALEDESIGN
PROJECT No. FILE No.
CADD
CHECK
REVIEW
REVISION DESCRIPTION CADD CHK RVWDESDATEREV
\\gol
der.g
ds\g
al\A
bbot
sfor
d\Ac
tive\
Year
201
3\14
47\1
3-14
47-0
516
(Cha
se D
ams
- City
Of N
anai
mo)
\DR
AFTI
NG
\220
0\PR
OD
UC
TIO
N\S
UPE
RC
EDED
\201
4-03
-26\
1314
4705
16_2
200-
02.d
wg
| La
yout
: Lay
out1
-AN
SI_B
_FIG
UR
E_LA
ND
SCAP
E |
Mod
ified
: mat
robe
rtson
02/
28/2
014
5:41
PM
| Pl
otte
d: m
atro
berts
on 0
6/24
/201
4
13-1447-0516 /2200 1314470516_2200-02
AS SHOWNM.S.K. 2014-05-27
M.R. 2014-02-19
M.S.K. 2014-05-27
U.A. 2014-05-27
FIGURE5 10 150
METRESSCALE A
A1
SCALE A CROSS-SECTION A-A'
LITHOLOGY GRAPHIC LEGEND
REFERENCES
PROFILE LEGEND
LEGEND
1. BATHYMETRIC AND TOPOGRAPHIC DATA FROM CITY OF NANAIMO, CAD FILE: ACAD-C003-0 (BOUND).dwg, DATED: DECEMBER 20, 2013.2. TOPOGRAPHIC DATA FROM HEROLD ENGINEERING, CAD FILE: collier park lower dam 2003.dwg, DATED: OCTOBER 20, 2003.3. WILLIS CUNLIFFE TAIT & COMPANY LTD., PDF FILE: Appendix C - 1980 Repairs As-builts.pdf, DATED: JULY 1978.4. SEISMIC HAZARD ASSESSMENT MIDDLE AND LOWER CHASE DAMS. (EBA 2010)
BH1(Offset 0m N)
BOREHOLE RECORD SHOWINGSOIL CONDITIONS
DENOTES OFFSET FROMSECTION LINE
DENOTES STANDARDPENETRATION TEST (N Value)
EXISTING GROUND SURFACE
INFERRED STRATIGRAPHY BOUNDARY?
16
22
CINDERS AND SLAG FILL
RANDOM VARIABLE FILL
ROCKFILL
CONCRETE
FINE GRAINED FILL
BEDROCK

Pro
ject
No
. X
XX
-XX
XX
Dra
wn
: X
XX
Revie
wed
: _
__
D
ate
: 0
0-0
0-0
0
F
ile
Lo
cati
on
: N
:\F
INA
L\…
…………..PPT
PROJECT
REV.
TITLE
SCALE.
PHASE / TASK No. PROJECT No.
DESIGN
CADD
CHECK
REVIEW
M.S.K -
U.A.
0000.0000
-
FIGURE 6-1
FLAC MODEL of Dam-Foundation System
As-Is Conditions
13-1447-0516
27 MAY 14
27 MAY 14
FLAC (Version 6.00)
LEGEND
8-May-14 18:26
step 103059
-2.807E+01 <x< 1.276E+02
-2.021E+01 <y< 1.354E+02
Material
1.000E+00
3.000E+00
4.000E+00
5.000E+00
Grid plot
0 2E 1
-0.100
0.100
0.300
0.500
0.700
0.900
1.100
1.300
(*10^2)
-0.100 0.100 0.300 0.500 0.700 0.900 1.100(*10^2)
JOB TITLE : SEISMIC EVALUATION OF Colliery Dams-Lower Chase Dam, Nanaimo, Van Island-BC
Rockfill – Random Fill
Cinders
Sand & Gravel Fill
Bedrock (Conglomerate)
Distance m
Ele
vation (
*10)
m
Concrete Wall
Fr
ee
Fie
ld
Fr
ee
Fie
ld
Compliant Base
CITY OF NANAIMO
COLLIERY DAMS
NANAIMO, BC

PROJECT No.
DESIGN
CADD
CHECK
REVIEW
PHASE / TASK No.
REV. SCALE
TITLE
PROJECT
NTS
Modulus Reduction and Damping Curves for Rockfill
FLAC Simulation vs. Laboratory Data
FIGURE 6-2
RE
VIS
ION
DA
TE
: B
Y: F
ILE
:
CITY OF NANAIMO
COLLIARY DAMS
NANAIMO, BC
----
27 May 14
27 May 14
U.A
--
U.A.
13-1447-0516

PROJECT No.
DESIGN
CADD
CHECK
REVIEW
PHASE / TASK No.
REV. SCALE
TITLE
PROJECT
NTS
Contours of Total and Effective Vertical Stresses
Pre-Earthquake Condition
FIGURE 7-1
RE
VIS
ION
DA
TE
: B
Y: F
ILE
:
CITY OF NANAIMO
COLLIERY DAMS
NANAIMO, BC
----
27 May 14
27 May 14
U.A
--
U.A.
13-1447-0516
a) Total Vertical Stress
b) Effective Vertical Stress
FLAC (Version 6.00)
LEGEND
28-May-14 18:55
step 132183
-2.792E+01 <x< 1.277E+02
-2.010E+01 <y< 1.355E+02
Effec. SYY-Stress Contours
-6.00E+02
-5.00E+02
-4.00E+02
-3.00E+02
-2.00E+02
-1.00E+02
0.00E+00
Contour interval= 1.00E+02
Boundary plot
0 2E 1
-0.100
0.100
0.300
0.500
0.700
0.900
1.100
1.300
(*10^2)
-0.100 0.100 0.300 0.500 0.700 0.900 1.100(*10^2)
JOB TITLE : SEISMIC EVALUATION OF Colliery Dams-Lower Chase Dam, Nanaimo, Van Island-BC
(kPa)
FLAC (Version 6.00)
LEGEND
28-May-14 18:45
step 132183
-2.792E+01 <x< 1.277E+02
-2.010E+01 <y< 1.355E+02
YY-stress contours
-7.00E+02
-6.00E+02
-5.00E+02
-4.00E+02
-3.00E+02
-2.00E+02
-1.00E+02
0.00E+00
Contour interval= 1.00E+02
Boundary plot
0 2E 1
-0.100
0.100
0.300
0.500
0.700
0.900
1.100
1.300
(*10^2)
-0.100 0.100 0.300 0.500 0.700 0.900 1.100(*10^2)
JOB TITLE : SEISMIC EVALUATION OF Colliery Dams-Lower Chase Dam, Nanaimo, Van Island-BC
(kPa)

PROJECT No.
DESIGN
CADD
CHECK
PHASE / TASK No.
REV. SCALE
TITLE
PROJECT
REVIEW
FIGURE 7-2
REVISION DATE: BY: FILE:
NTS
Contours of Lateral Displacements
End of Shaking
MDE Demand-Motion:CC0 ---
27 MAY14
U.A
M.S.K
--
013-1447-0516
27 MAY14
27 MAY14
CITY OF NANAIMO
COLLIERY DAMS
NANAIMO, BC
FLAC (Version 6.00)
LEGEND
28-May-14 19:56
step 1619376
Dynamic Time 2.5000E+01
-2.821E+01 <x< 1.275E+02
-1.739E+01 <y< 1.383E+02
X-displacement contours
-2.00E+00
-1.00E+00
0.00E+00
1.00E+00
2.00E+00
3.00E+00
4.00E+00
5.00E+00
6.00E+00
Contour interval= 1.00E+00
X-displacement contours
Contour interval= 1.00E+00
Minimum: -2.00E+00
Maximum: 6.00E+00
Grid plot
0 2E 1
0.000
0.200
0.400
0.600
0.800
1.000
1.200
(*10^2)
-0.100 0.100 0.300 0.500 0.700 0.900 1.100(*10^2)
JOB TITLE : Seismic Evaluatin of Colliery Dams-Lower Chase Dam, Nanaimo, Vancouver Island-B
(m)
Distance m
Ele
va
tio
n
(m)

PROJECT No.
DESIGN
CADD
CHECK
PHASE / TASK No.
REV. SCALE
TITLE
PROJECT
REVIEW
FIGURE 7-3
REVISION DATE: BY: FILE:
NTS
Distribution of Moment and Lateral Displacement
along the Concrete Wall-No Plastic Moment Capacity
End of Shaking
MDE Demand-Motion:CC0 ---
27 MAY14
U.A
M.S.K
--
013-1447-0516
27 MAY14
27 MAY14
CITY OF NANAIMO
COLLIERY DAMS
NANAIMO, BC
FLAC (Version 6.00)
LEGEND
9-May-14 16:00
step 1619376
Dynamic Time 2.5000E+01
-2.792E+01 <x< 1.277E+02
-1.717E+01 <y< 1.384E+02
X-displacement contours
-2.00E+00
-1.00E+00
0.00E+00
1.00E+00
2.00E+00
3.00E+00
4.00E+00
5.00E+00
6.00E+00
Contour interval= 1.00E+00
Grid plot
0 2E 1
Moment on
Structure Max. Value
0.000
0.200
0.400
0.600
0.800
1.000
1.200
(*10^2)
-0.100 0.100 0.300 0.500 0.700 0.900 1.100(*10^2)
JOB TITLE : Seismic Evaluatin of Colliery Dams-Lower Chase Dam, Nanaimo, Vancouver Island-B
Concrete Wall:
M_max = 600 kN.m
xdis_max = 1.11 m
Distance (m)
Ele
va
tio
n (1
0^1
)
(m)
Concrete Wall
Displacement / Moment

PROJECT No.
DESIGN
CADD
CHECK
PHASE / TASK No.
REV. SCALE
TITLE
PROJECT
REVIEW
FIGURE 7-4
REVISION DATE: BY: FILE:
NTS
Time Histories of Displacements
At
Top of the Wall and Base of the Model
MDE Demand-Motion:CC0 ---
27 MAY14
U.A
M.S.K
--
013-1447-0516
27 MAY14
27 MAY14
CITY OF NANAIMO
COLLIERY DAMS
NANAIMO, BC
FLAC (Version 6.00)
LEGEND
29-May-14 12:51
step 1619376
Dynamic Time 2.5000E+01
HISTORY PLOT
Y-axis :
5 X displacement( 25, 1)
243 X Displacement (Nd 19)
X-axis :
2 Dynamic time
4 8 12 16 20 24
-1.000
-0.800
-0.600
-0.400
-0.200
0.000
JOB TITLE : Seismic Evaluatin of Colliery Dams-Lower Chase Dam, Nanaimo, Vancouver Island-B
Base Displacement
Top of Wall Displacement
C.
Time (sec.)
X-d
is (
m)

PROJECT No.
DESIGN
CADD
CHECK
PHASE / TASK No.
REV. SCALE
TITLE
PROJECT
REVIEW
FLAC (Version 6.00)
LEGEND
9-May-14 15:35
step 1665090
Dynamic Time 2.5000E+01
-2.821E+01 <x< 1.275E+02
-1.713E+01 <y< 1.386E+02
X-displacement contours
-2.00E+00
0.00E+00
2.00E+00
4.00E+00
6.00E+00
8.00E+00
Contour interval= 2.00E+00
Grid plot
0 2E 1
Moment on
Structure Max. Value
# 1 (Beam ) -5.960E+02
Structural Displacement
Max Value = 1.785E+00
0.000
0.200
0.400
0.600
0.800
1.000
1.200
(*10^2)
-0.100 0.100 0.300 0.500 0.700 0.900 1.100(*10^2)
JOB TITLE : Seismic Evaluatin of Colliery Dams-Lower Chase Dam, Nanaimo, Vancouver Island-B
Concrete Wall
Displacements/ Moments
FIGURE 7-5
REVISION DATE: BY: FILE:
NTS
Contours of Lateral Displacements
End of Shaking- Wall with Plastic Moment Capacity
MDE Demand-Motion:CC0
---
27 MAY14
U.A
M.S.K
--
013-1447-0516
27 MAY14
27 MAY14
CITY OF NANAIMO
COLLIERY DAMS
NANAIMO, BC
Distance (m)
Ele
va
tio
n (
10
^1)
(m)
FLAC (Version 6.00)
LEGEND
9-May-14 15:35
step 1665090
Dynamic Time 2.5000E+01
-2.821E+01 <x< 1.275E+02
-1.713E+01 <y< 1.386E+02
X-displacement contours
-2.00E+00
0.00E+00
2.00E+00
4.00E+00
6.00E+00
8.00E+00
Contour interval= 2.00E+00
Grid plot
0 2E 1
Moment on
Structure Max. Value
# 1 (Beam ) -5.960E+02
Structural Displacement
Max Value = 1.785E+00
0.000
0.200
0.400
0.600
0.800
1.000
1.200
(*10^2)
-0.100 0.100 0.300 0.500 0.700 0.900 1.100(*10^2)
JOB TITLE : Seismic Evaluatin of Colliery Dams-Lower Chase Dam, Nanaimo, Vancouver Island-B
(m) Concrete Wall:
M_max = 596 kN.m
xdis_max = 1.78 m

PROJECT No.
DESIGN
CADD
CHECK
PHASE / TASK No.
REV. SCALE
TITLE
PROJECT
REVIEW
FIGURE 7-6
REVISION DATE: BY: FILE:
NTS
Original and Distorted Mesh at the Dam Crest
around the Concrete Wall with Plastic Moment Capacity
End of Shaking, MDE Demand-Motion:CC0
---
27 MAY14
U.A
M.S.K
--
013-1447-0516
27 MAY14
27 MAY14
CITY OF NANAIMO
COLLIERY DAMS
NANAIMO, BC
FLAC (Version 6.00)
LEGEND
9-May-14 15:43
step 1665090
Dynamic Time 2.5000E+01
1.909E+01 <x< 4.260E+01
5.396E+01 <y< 7.747E+01
X-displacement contours
-1.00E+00
0.00E+00
1.00E+00
2.00E+00
3.00E+00
4.00E+00
5.00E+00
Contour interval= 1.00E+00
Grid plot
0 5E 0
Exaggerated Grid Distortion
Magnification = 0.000E+00
Max Disp = 4.727E+00
Beam plot 5.600
6.000
6.400
6.800
7.200
7.600
(*10^1)
2.200 2.600 3.000 3.400 3.800 4.200(*10^1)
JOB TITLE : Seismic Evaluatin of Colliery Dams-Lower Chase Dam, Nanaimo, Vancouver Island-B
U/S
Concrete Wall Elements Dis-Alignment
due to Slippage along Wall

Pro
ject
No
. X
XX
-XX
XX
Dra
wn
: X
XX
Revie
wed
: _
__
D
ate
: 0
0-0
0-0
0
F
ile
Lo
cati
on
: N
:\F
INA
L\…
…………..PPT
PROJECT
REV.
TITLE
SCALE.
PHASE / TASK No. PROJECT No.
DESIGN
CADD
CHECK
REVIEW
M.S.K -
U.A.
0000.0000
-
FIGURE 7-7
FLAC MODEL of Dam-Foundation System
Improved Case - D/S Soil Cement
13-1447-0516
27 MAY 14
27 MAY 14
CITY OF NANAIMO
COLLIERY DAMS
NANAIMO, BC
FLAC (Version 6.00)
LEGEND
30-May-14 11:50
step 96165
-2.792E+01 <x< 1.277E+02
-2.020E+01 <y< 1.354E+02
Material-Types
1.000E+00
3.000E+00
4.000E+00
5.000E+00
6.000E+00
7.000E+00
Grid plot
0 2E 1
-0.100
0.100
0.300
0.500
0.700
0.900
1.100
1.300
(*10^2)
-0.100 0.100 0.300 0.500 0.700 0.900 1.100(*10^2)
JOB TITLE : SEISMIC EVALUATION OF Colliery Dams-Lower Chase Dam, Nanaimo, Van Island-BC
Rockfill – Random Fill
Cinders
Sand & Gravel Fill
Bedrock (Conglomerate)
Soil–Cement
Isolator Column
FLAC (Version 6.00)
LEGEND
30-May-14 10:01
step 96165
-2.792E+01 <x< 1.277E+02
-2.020E+01 <y< 1.354E+02
EX_ 2 Values
1.000E+00
3.000E+00
4.000E+00
5.000E+00
6.000E+00
7.000E+00
Grid plot
0 2E 1
-0.100
0.100
0.300
0.500
0.700
0.900
1.100
1.300
(*10^2)
-0.100 0.100 0.300 0.500 0.700 0.900 1.100(*10^2)
JOB TITLE : SEISMIC EVALUATION OF Colliery Dams-Lower Chase Dam, Nanaimo, Van Island-BC
Distance m
Ele
va
tio
n (
*10
) m
Concrete Wall Isolator Soil-Cement
Fr
ee
Fie
ld
Fr
ee
Fie
ld
Compliant Base

PROJECT No.
DESIGN
CADD
CHECK
REVIEW
PHASE / TASK No.
REV. SCALE
TITLE
PROJECT
NTS
Modulus Reduction and Damping Curves
Soil-Cement Materials
FLAC Simulation vs. Laboratory Data
FIGURE 7-8
RE
VIS
ION
DA
TE
: B
Y: F
ILE
:
CITY OF NANAIMO
COLLIERY DAMS
NANAIMO, BC
----
27 May 14
27 May 14
U.A
--
U.A.
13-1447-0516
a) Modulus Reduction Curve
b) Effective Vertical Stress
FLAC (Version 6.00)
LEGEND
30-May-14 14:06
step 40000
Dynamic Time 4.0000E+00
Table Plot
Laboratory
FLAC
-40 -35 -30 -25 -20 -15
(10 )-01
0.300
0.400
0.500
0.600
0.700
0.800
0.900
1.000
JOB TITLE : Modulus reduction curve - lab vs FLAC
G/G
0
γ (%)
FLAC (Version 6.00)
LEGEND
30-May-14 14:03
step 40000
Dynamic Time 4.0000E+00
Table Plot
Laboratory
FLAC
-40 -35 -30 -25 -20 -15
(10 )-01
0.400
0.800
1.200
1.600
2.000
(10 ) 01
JOB TITLE : Damping ratio curve - lab vs FLAC
γ (%)
D (
%)

PROJECT No.
DESIGN
CADD
CHECK
PHASE / TASK No.
REV. SCALE
TITLE
PROJECT
REVIEW
FIGURE 7-9
REVISION DATE: BY: FILE:
NTS
Contours of Lateral Displacements
End of Shaking – Improved Case, No Plastic Moment
MDE Demand-Motion:CC0
---
27 MAY14
U.A
M.S.K
--
013-1447-0516
27 MAY14
27 MAY14
CITY OF NANAIMO
COLLIERY DAMS
NANAIMO, BC
FLAC (Version 6.00)
LEGEND
30-May-14 13:23
step 1766489
Dynamic Time 2.5000E+01
-2.792E+01 <x< 1.277E+02
-2.020E+01 <y< 1.354E+02
X-displacement contours
-2.00E+00
-1.50E+00
-1.00E+00
-5.00E-01
0.00E+00
5.00E-01
Contour interval= 5.00E-01
X-displacement contours
Contour interval= 5.00E-01
Minimum: -2.00E+00
Maximum: 5.00E-01
Grid plot
0 2E 1
Structural Displacement -0.100
0.100
0.300
0.500
0.700
0.900
1.100
1.300
(*10^2)
-0.100 0.100 0.300 0.500 0.700 0.900 1.100(*10^2)
JOB TITLE : Seismic Evaluatin of Colliery Dams-Lower Chase Dam, Nanaimo, Vancouver Island-B
(m)
Concrete Wall
Displacement / Moment
Concrete Wall:
M_max = 1,541 kN.m
xdis_max = 1.38 m
Distance (m)
Ele
va
tio
n (
*10
) (m
)

PROJECT No.
DESIGN
CADD
CHECK
PHASE / TASK No.
REV. SCALE
TITLE
PROJECT
REVIEW
FIGURE 7-10
REVISION DATE: BY: FILE:
NTS
Separation of Concrete Wall and Isolator at Dam Crest
No Plastic Moment Capacity
End of Shaking, MDE Demand-Motion: CC0
---
27 MAY14
U.A
M.S.K
--
013-1447-0516
27 MAY14
27 MAY14
CITY OF NANAIMO
COLLIERY DAMS
NANAIMO, BC
FLAC (Version 6.00)
LEGEND
19-May-14 10:51
step 1766489
Dynamic Time 2.5000E+01
1.383E+01 <x< 4.721E+01
4.999E+01 <y< 8.338E+01
X-displacement contours
-2.00E+00
-1.75E+00
-1.50E+00
-1.25E+00
-1.00E+00
-7.50E-01
-5.00E-01
-2.50E-01
0.00E+00
Contour interval= 2.50E-01
Grid plot
0 1E 1
Moment on
Structure Max. Value 5.250
5.750
6.250
6.750
7.250
7.750
8.250
(*10^1)
1.750 2.250 2.750 3.250 3.750 4.250(*10^1)
JOB TITLE : Seismic Evaluatin of Colliery Dams-Lower Chase Dam, Nanaimo, Vancouver Island-B
U/S
Concrete Wall
Separation of the
Concrete Wall and
Isolator

PROJECT No.
DESIGN
CADD
CHECK
PHASE / TASK No.
REV. SCALE
TITLE
PROJECT
REVIEW
FLAC (Version 6.00)
LEGEND
30-May-14 15:55
step 1712795
Dynamic Time 2.5000E+01
-2.778E+01 <x< 1.278E+02
-2.006E+01 <y< 1.355E+02
X-displacement contours
-2.00E+00
-1.50E+00
-1.00E+00
-5.00E-01
0.00E+00
5.00E-01
Contour interval= 5.00E-01
X-displacement contours
Contour interval= 5.00E-01
Minimum: -2.00E+00
Maximum: 5.00E-01
Structural Displacement
Max Value = 1.762E+00
Moment on
Structure Max. Value
# 1 (Beam ) -5.967E+02-0.100
0.100
0.300
0.500
0.700
0.900
1.100
1.300
(*10^2)
-0.100 0.100 0.300 0.500 0.700 0.900 1.100(*10^2)
JOB TITLE : Seismic Evaluatin of Colliery Dams-Lower Chase Dam, Nanaimo, Vancouver Island-B
Distance (m)
Ele
va
tio
n (
*10
) (m
)
FIGURE 7-11
REVISION DATE: BY: FILE:
NTS
Contours of Lateral Displacements
End of Shaking – Improved Case, with Plastic Moment
MDE Demand-Motion:CC0
---
27 MAY14
U.A
M.S.K
--
013-1447-0516
27 MAY14
27 MAY14
CITY OF NANAIMO
COLLIERY DAMS
NANAIMO, BC
Concrete Wall:
M_max = 597 kN.m
xdis_max = 1.762 m
Concrete Wall
Displacement / Moment
FLAC (Version 6.00)
LEGEND
30-May-14 15:55
step 1712795
Dynamic Time 2.5000E+01
-2.778E+01 <x< 1.278E+02
-2.006E+01 <y< 1.355E+02
X-displacement contours
-2.00E+00
-1.50E+00
-1.00E+00
-5.00E-01
0.00E+00
5.00E-01
Contour interval= 5.00E-01
X-displacement contours
Contour interval= 5.00E-01
Minimum: -2.00E+00
Maximum: 5.00E-01
Structural Displacement
Max Value = 1.762E+00
Moment on
Structure Max. Value
# 1 (Beam ) -5.967E+02-0.100
0.100
0.300
0.500
0.700
0.900
1.100
1.300
(*10^2)
-0.100 0.100 0.300 0.500 0.700 0.900 1.100(*10^2)
JOB TITLE : Seismic Evaluatin of Colliery Dams-Lower Chase Dam, Nanaimo, Vancouver Island-B
(m)

REPORT ON COLLIERY DAM STABILITY
APPENDIX B Middle and Lower Colliery Dams Structural Assessment of Concrete Core Walls
July 25, 2014 Report No. 1314470516-009-R-Rev0

E Q - T e c E n g i n e e r i n g L t d . Structural Innovation and Technology
NOTICE
This document is for the private information and benefit only of the client for whom it was prepared and for the particular purpose previously advised to EQ-Tec Engineering Ltd. ["EQ-Tec"]. The contents of this document are not to be relied upon or used, in whole or in part, by or for the benefit of others without prior adaptation and specific written verification by EQ-Tec.
Particular financial and other projections and analysis contained herein, to the extent they are based upon assumptions concerning future events and circumstances over which EQ-Tec has no control, are by their nature uncertain and are to be treated accordingly. EQ-Tec makes no warranties regarding such projections and analysis.
EQ-Tec and its corporate affiliates and subsidiaries and their respective officers, directors, employees and agents assume no responsibility for reliance upon this document or any of its contents by any party other than EQ-Tec's client.
M idd le and Lower Co l l i e r y Dams
S t r uc tu r a l Ass es sm ent o f Conc r e te Co r e
Wa l l s
July 2014
For:
Go lde r Ass oc i a t es L t d .

E Q - T e c E n g i n e e r i n g L t d .
Input by: Bruce Downing, P.Eng.
Upul Atukorala, Ph.D., P.Eng.
Mahmood Seid-Karbasi, Ph.D., P.Eng.
EQ-Tec Engineering Ltd. Team
Overall Coordination
and Review by: Mahmoud Rezai, Ph.D., P.Eng.
EQ-Tec Engineering Ltd.

E Q - T e c E n g i n e e r i n g L t d .
Middle and Lower Colliery Dams - Structural Assessment of Concrete Core Walls TOC - i
July 2014
T a b l e o f C o n t e n t s
1 I n t r o d u c t i o n 2
2 S c o p e o f w o r k 3
3 I n p u t P a r a m e t e r s f o r F L A C 3
4 F L A C A n a l y s i s R e s u l t s – L o w e r C o l l i e r y D a m 4
5 S e c t i o n a l A n a l y s i s – L o w e r C o l l i e r y D a m C o r e W a l l 6
6 C o n c r e t e C o r e W a l l P e r f o r m a n c e – L o w e r C o l l i e r y D a m 8
7 S e c t i o n a l A n a l y s i s – M i d d l e C o l l i e r y D a m C o r e W a l l 8

E Q - T e c E n g i n e e r i n g L t d .
Middle and Lower Colliery Dams - Structural Assessment of Concrete Core Walls Page 1
July 2014
Executive Summary
EQ-Tec Engineering Ltd. was retained to carry out a structural assessment of the concrete core
walls for the Middle and Lower Colliery Dams.
Golder carried out FLAC analyses of a metre wide section of the Lower Colliery Dam including
modelling the concrete wall, as equivalent beam element. The elastic and inelastic properties of the
concrete wall section were provided by EQ-Tec to Golder for implementing in the model.
The results of FLAC analyses indicated that the wall will undergo a number of inelastic cycles
resulting in large cracks opening in the core wall; the crack width were estimated to be in the range
of 25-65mm wide. The location of the cracks, however, were limited to the mid-section of the wall.
The results also indicated large demand at the base of the wall resulting in loss of integrity of the
wall (e.g. significant damage at wall bedrock interface). Once the base of the wall experiences a
significant damage the wall will then move in tandem with the adjacent rock fill material. The overall
movement at the base of the wall during a seismic event, however, was small (less than 100mm);
Golder took this condition into account in their assessment of the post seismic (following cracking)
behaviour of the dam to ensure this does not result in sudden loss of strength and failure of rock fill
material on the downstream of the Lower Colliery Dam.
There is a concern for the potential failure of the Middle and Lower Colliery Dam core walls during a
seismic event and, as a result, the possibility of the upper section of the walls dislodging and falling
into the reservoir (toppling). This could potentially result in a sudden release of water and eventual
failure of the rock fill material and potential flooding of the areas downstream of the Lower Colliery
Dam. The results of this study indicates that the possibility of the core walls toppling over is
extremely low. This is because the upper 5-7m of the walls does not undergo a significant
nonlinearity and thus the chance of failure is very low.

E Q - T e c E n g i n e e r i n g L t d .
Middle and Lower Colliery Dams - Structural Assessment of Concrete Core Walls Page 2
July 2014
1 I n t r o d u c t i o n
Golder Associates Ltd. (Golder) has retained EQ-Tec Engineering Ltd. (structural/seismic
consultant) to conduct a structural assessment of the concrete core walls for the Middle and Lower
Colliery Dams.
The Middle and Lower Colliery Dams are located in the southern part of the City of Nanaimo
constructed circa 1911. The Lower Colliery Dam was constructed of earth and rock fill with 1.2m
thick concrete core wall; the Middle Colliery Dam was also constructed of earth and rock fill with
about 0.6m thick concrete core wall. A 3D view of the Colliery Dams are shown in Figure 1.
Figure 1: Plan view of the Middle and Lower Colliery Dams
Representative cross-sections of the Middle and Lower Colliery Dams are shown in Figure 2.
Figure 2: Representative Cross-sections of the Middle (top, from EBA report) and Lower (bottom,
from Golder) Colliery Dams
Middle Colliery Dam Lower Colliery Dam

E Q - T e c E n g i n e e r i n g L t d .
Middle and Lower Colliery Dams - Structural Assessment of Concrete Core Walls Page 3
July 2014
2 S c o p e o f w o r k
Our scope of work included:
Lower Colliery Dam
o Development of the structural input parameters for concrete cores to be
implemented in structural inputs for the FLAC model,
o Review of FLAC analysis results for various load cases,
o Sectional analysis of the concrete core wall and interpretation of crack
development (spacing and width) within the concrete core,
o Interpretation/analysis of the potential for toppling of the core wall,
Middle Colliery Dam
o Sectional analysis of the concrete core wall and interpretation of crack
development (spacing and width) within the concrete core,
o Interpretation/analysis of the potential for toppling of the core wall,
This is to be based on EBA FLAC modelling results,
3 I n p u t P a r a m e t e r s f o r F L A C
The concrete core wall for the Lower Colliery Dam was modelled, as an equivalent beam element
one metre wide and 1.2 m thick in FLAC model developed by Golder. The boundary condition at the
base of the core wall was assumed as both fixed (i.e. embedded in bedrock) and pinned (i.e.
embedded in rock fill) for sensitivity analyses. Initial analyses considered the concrete wall
embedded into bedrock. Subsequent analyses considered the wall pinned to bedrock that is thought
to better reflect field conditions.
The beam element was assigned both elastic and elasto-plastic properties. The concrete core test
data provided by Golder was used to determine the concrete properties. The effective modulus of
elasticity of concrete was considered as 23,000 MPa and 11,000 MPa, as upper and lower bounds,
respectively. Concrete Mass Density (average of dry and wet) was considered as 2300 kg/m3. The
concrete Poisson’s Ratio was considered as 0.17. The compressive strength of concrete ranged
from about 25MPa to 50 MPa in laboratory tests. A value of 30 MPa was used for this assessment.
For the elasto-plastic model of the beam element in FLAC model representing the core wall cross-
section for the Lower Colliery Dam, an estimate of plastic moment capacity of the wall section was
made. The report by EBA (Seismic Hazard Assessment – Middle and Lower Colliery Dams, 2010)
indicated that no reinforcement will likely be present within the concrete core walls of the dams. The
report by Klohn Crippen Berger in 2013 (Lower Dam – Rebar Detection) has indicated the presence
of twisted bars at approximately 750mm (30 in.) on centre in both horizontal and vertical directions.
The work by Golder using concrete coring through the full depth of the dam using Televiewer and
Ground Penetrating Radar (GPR) has confirmed the presence of rebar throughout the core wall.
Our experience working on seismic upgrade of various buildings indicates that cold-twisted bars
were used in early years of 19th century. Reinforcing bars, as we know them today, came about in

E Q - T e c E n g i n e e r i n g L t d .
Middle and Lower Colliery Dams - Structural Assessment of Concrete Core Walls Page 4
July 2014
1900. The American Society for Testing and Materials (ASTM) adopted standard specification A 15
for concrete reinforcing bars in 1911. Reinforcing bars were plain and deformed, or cold-twisted.
Structural grade (minimum fy = 235 MPa or 33 ksi) was normally available.
As such, we assumed a minimum two bars (equivalent to 25M bar) within a meter length of the
Lower Colliery Dam core wall to evaluate the plastic moment capacity of the wall. A probable plastic
moment capacity of 600 kN.m was provided to be used in the FLAC analyses.
4 F L A C A n a l y s i s R e s u l t s – L o w e r C o l l i e r y D a m
The FLAC analysis assuming elastic properties for the core wall using upper and lower bound
values for the concrete modulus of elasticity provided comparable bending and shear demand for
the case of core wall embedded in bedrock (i.e. the results were about 10-15% higher for the upper
bound concrete modulus of elasticity). As such, the FLAC analyses for various load cases were only
carried out using the low modulus of elasticity for concrete to consider the effect of cracking and
softening in the wall.
Initially, the base of concrete core wall was assumed to be fully fixed (i.e. embedded in bedrock).
This resulted in bending moment and shear demand at the base of the wall about 10 times that of
the capacity of the core wall indicating the wall will lose its integrity at the base following the first
large cycle of base acceleration and likely shifting and moving with the adjacent rock fill material in
the subsequent cycles. Golder took this condition into account in their assessment of the post
seismic (following cracking) behaviour of the dam.
With this conclusion the subsequent FLAC analyses were carried out assuming the base of the wall
is pinned/rolling (i.e. embedded in rock fill) and that the displaced history of the wall at the base is
compatible to that of the rock fill material.
The initial FLAC runs were carried out for a Maximum Credible Earthquake (MCE or 1/10,000 return
period), but later on the input earthquake ground motion was adjusted to reflect a 1/2475 return
period.
Figure 3 illustrates the elastic bending moment response history along the height of the concrete
core wall together with the displaced profile of the wall for pinned/rolling base boundary condition
and 1/2475 input ground motion. The computed maximum moment demand is about 3.5 times that
of the probable plastic moment capacity of the wall occurring at about the lower third point of the
wall or about 7m from the base of the wall. The peak lateral displacement at the top of the wall is
about 0.5 m corresponding to the permanent displacement of the wall/dam. It is noted that the
displaced shape of the wall under reversed cycles is biased towards the reservoir indicating the
bending moment demand will be within the elastic range (but higher than the cracked moment) for
cycles towards the downstream of the dam.

E Q - T e c E n g i n e e r i n g L t d .
Middle and Lower Colliery Dams - Structural Assessment of Concrete Core Walls Page 5
July 2014
‐2500
‐2000
‐1500
‐1000
‐500
0
500
1000
Core W
all M
oment History (kN
.m)
Wall ElevationEL 73.6 m EL 54.6 m
‐0.6
‐0.5
‐0.4
‐0.3
‐0.2
‐0.1
0
0.1
0.2
Core W
all Lateral D
isplacement History (m)
Wall ElevationEL 73.6 m EL 54.6 m
Figure 3: Elastic moment response history along the height of the concrete core wall together with
the displaced profile of wall (1/2475 return period)
For a comparative study, the FLAC analysis was run for the elasto-plastic case, where the core wall
was assigned a probable plastic moment capacity of 600 kN.m and pinned/rolling base boundary
condition and 1/2475 input ground motion. Figure 4 illustrates the bending moment response history
along the height of the concrete core wall together with the displaced profile of the wall.

E Q - T e c E n g i n e e r i n g L t d .
Middle and Lower Colliery Dams - Structural Assessment of Concrete Core Walls Page 6
July 2014
‐800
‐600
‐400
‐200
0
200
400
600
Core W
all M
oment History (kN
.m)
Wall ElevationEL 73.6 m EL 54.6 m
‐1
‐0.8
‐0.6
‐0.4
‐0.2
0
0.2
Core W
all Lateral D
isplacement History (m)
Wall ElevationEL 73.6 m EL 54.6 m
Figure 4: Bending moment response history along the height of the concrete core wall together with
the displaced profile of wall (1/2475 return period)
The formation of plastic hinges along the mid-section of the wall is pronounced in Figure 4 in mid to
lower sections of the wall. The displaced profile of the wall shows distinct change in the curvature of
the wall starting around the mid-section of the wall.
5 S e c t i o n a l A n a l y s i s – L o w e r C o l l i e r y D a m C o r e W a l l
The results of FLAC analyses were used to predict deformation characteristics (crack spacing and
crack widths) of the Lower Colliery Dam core wall based on the computed shear and bending
moment demand. Figure 5 illustrates the results of sectional analysis for a metre length of the wall
cross-section for the case where the rebar is just starting to yield (about 0.15 to 0.2% strain). The
figure shows the longitudinal strain in mm/m and stress for the rebar and concrete in MPa, as well
as the crack width in mm, internal forces and the moment-axial demand (note that the shrinkage
Zone of yielding/plastic hinges forming

E Q - T e c E n g i n e e r i n g L t d .
Middle and Lower Colliery Dams - Structural Assessment of Concrete Core Walls Page 7
July 2014
and thermal strains are ignored in this case). The results indicates that the wall starts to yield at a
moment demand of about 490 kN.m assuming two twisted bars within a meter length of the wall.
It is noted that the crack width is small at the onset of yielding; however, as the demand increases,
so, does the strain in the rebar and crack width.
Figure 5: Sectional analysis of Lower Colliery Dam core wall at about onset of rebar yielding
As the demand increases and the vertical bars are subjected to higher strains, the crack width will
widen. Figure 6 shows the results of sectional analysis for a metre length of the wall when the wall is
subjected to demand past the yield strength of rebar to its limit states (this demand occurs for both
1/2475 and 1/10,000 return periods). As can be seen from Figure 6, at about 4% longitudinal strain
the crack width widens to about 40 mm. Our sectional analysis indicates that pushing the wall
further will results in crack width widening to 60-70 mm. It is noted that at these high strains the
compression zone is rather small with concrete compressive stresses reaching about 25 MPa. It is
noted that the level of accuracy presented in this work, given the nature of the input/output
parameters, is not within a few millimetres. The estimated range of validity of these results could be
+/- 50%.
1.2m
(%)
MPa
MPa MPa
1.5

E Q - T e c E n g i n e e r i n g L t d .
Middle and Lower Colliery Dams - Structural Assessment of Concrete Core Walls Page 8
July 2014
Figure 6: Sectional analysis of Lower Colliery Dam core wall at 2% rebar strain
6 C o n c r e t e C o r e W a l l P e r f o r m a n c e – L o w e r C o l l i e r y D a m
There is a concern for the potential failure of the Lower Colliery Dam core wall during a seismic
event and, as a result, the possibility of the upper section of the wall dislodging and falling into the
reservoir (toppling). This could potentially result in a sudden release of water and eventual failure of
the rock fill material and potential flooding of the areas downstream of the dam. This concern is not
valid, as the results of FLAC and sectional analyses indicate that the possibility of the Lower Colliery
Dam core wall toppling over is extremely low. This is because the upper 5 to 7 m of the concrete
core wall generally remains in the elastic range of the wall cross section or experiences a small
nonlinearity. The mid-section of the wall experiences significant nonlinearity with high strains
developing in the bars and large cracks. This part of the core wall, however, is locked in between
the rock fill material and unless, there is a significant instability where the rock fill material will be
washed away during a seismic event (highly unlikely), the wall will remain in-place albeit with
significant damage and cracks opening as large as 25-65 mm.
7 S e c t i o n a l A n a l y s i s – M i d d l e C o l l i e r y D a m C o r e W a l l
Golder requested that EQ-Tec review the potential of wall toppling over for the Middle Colliery Dam
considering there is a rebar present in the core wall. It is noted that the report by EBA (April 2010)
indicates that the concrete core wall with no reinforcement exposed on the upstream face of the
Middle Colliery Dam is expected to topple during the design seismic event with development of an
overtopping failure and uncontrolled discharge of the Middle Colliery reservoir.
MPa
MPa MPa
(%)

E Q - T e c E n g i n e e r i n g L t d .
Middle and Lower Colliery Dams - Structural Assessment of Concrete Core Walls Page 9
July 2014
While there are no clear evidence that the rebar is present in the core wall of the Middle colliery
Dam, it is quite reasonable to assume that there is rebar in the 0.6m thick wall, as the two dams
were built at the same time. The results of FLAC analyses carried out by EBA were used to
compute the sectional characteristics (crack spacing and crack widths) of the Middle Colliery Dam
core wall. Figure 7 illustrates the results of sectional analysis for a metre length of the wall for the
case where a single rebar was assumed to be present.
It can be observed that the probable moment capacity of the wall at onset of yielding (about 0.2
mm/m; note that the plot shows about 0.4% longitudinal strain) is 129 kN.m. The maximum demand
tabulated by EBA FLAC analysis is 137 kN.m developed in the mid-section of the wall. This clearly
indicates that there will be a nominal yielding in the rebar and that the wall will have adequate
capacity to resist the tabulated demand.
On this basis that there will be at least a single vertical bar present within a metre length of the
Middle Colliery Dam core wall, the possibility of the upper section of the wall failing and falling into
the reservoir is extremely low.
Figure 7: Sectional analysis of Middle Colliery Dam core wall
0.6m
MPa
MPa MPa
(%)
MPa

Golder Associates Ltd. 500 - 4260 Still Creek Drive Burnaby, British Columbia, V5C 6C6 Canada T: +1 (604) 296 4200