Embed Size (px)
Citation preview

Level one Market Study Report
Report submitted to Geodetics
THE CONSULTANT
Martin Ombima, P.O.BOX 2696 40100 Kisumu Tel +254721710323/0786710323 Email: [email protected]

July 14, 2016
Page 2
Table of Contents A SUMMARY OF THE STUDY AND THE KEY OBSERVATIONS ...................................................................... 3
SECTION A: THE PROFILE OF THE RESPONDENTS ..................................................................................... 5
SECTION B: PRODUCTION ........................................................................................................................ 6
SECTION C: SELLING ............................................................................................................................... 12
SECTION D: AGRICS CLIENT SATISFACTION: ............................................................................................ 21
July 14, 2016
Page 3
A SUMMARY OF THE STUDY AND THE KEY OBSERVATIONS
This study was conducted among 249 respondents equally spread amongst four administrative
counties of Kakamega, Busia, Siaya and Bungoma but divided into six regions within the four
counties, one in each county, and three in Kakamega (Kakamega North, Kakamega East and
Butere). For the sake of this study, we will have six regions of Kakamega North, Kakamega East,
Butere, Busia, Bungoma and Siaya.
The study focused on broad areas including:
i. The profile of the responding farmer
ii. The production
iii. Selling of what is produced within the farm
iv. Agrics clients‟ certification
For each of the broad areas mentioned above data was collected, analyzed and conclusions made
on areas that interventions can be made by various stakeholders.
Under the profile of the respondents, researchers understanding of their characteristics have been
provided in tables and description made. A synopsis of the respondents reached from the six
regions have been provided, their gender, household characteristics, age, their land size, Agrics
products taken, household income, their wished and desire amongst others.
Under production, an understanding of the various crops that the respondents produce and the
farm inputs that are utilized has been established. An analysis on the agronomic services that
were utilized has also been made. An understanding on when various farming activities are
undertaken was also established. The following observations were made:
i. As an agronomic service, traction/mechanization in land preparation, most of the respondents
were not certified by the current service providers. This is an area that stakeholders and other
service providers can explore further on the possibility of providing this service. Note that the
respondents are ready to pay for it, and they are not satisfied by the current service providers
ii. On soil testing, 91% of the respondents seem not to understand the soil testing concept as an
agronomic service. This is a gap that stakeholders can come in to fill in the information gap, and
provide the soil testing service
iii. From the analysis, there doesn‟t seem to be a clear relation between climatic conditions/the
weather and land preparation. Majority of the farmers prepare their land in February, based on
experience alone. Stakeholders need to come in with very clear weather prediction information that can inform when land preparation should be done in relation to other factors.
iv. Scientifically, sowing should be informed by the availability/prediction of rain. There is need to
create a link between when the sowing is done and the actual climatic conditions. Stakeholders
need to come in to provide this accurate information on both short and long term weather forecast
to inform when sowing should be done. Stakeholders can also explore on a possibility of
providing information service using various means to inform when sowing should be done
Under selling, an understanding of various marketing components by the respondents was established.
The following observations were made:

July 14, 2016
Page 4
i. While analyzing responses, it was observed that there seem to be a gap in market information
awareness. The respondents don‟t seem to understand the value of selling their maize through a
buying centre. Stakeholder need to explore the possibility of sharing market information on the
best option for the farmers. There is a perception that small scale farmers cannot take their
products to the NC&PB stores, this needs to be demystified
ii. From the findings, exploitation and interference by the middle men emerged as a major issue in
the selling of the maize. The following suggestions can work towards reducing the problem
a. Work with the farmers to create more storage facilities at the household level
b. Encourage more farmers to form and join peer farmer organizations where they can
access information on markets and trends. Through these groups, they will have a higher bargaining power and reduce the interference by the middlemen
c. Strengthen the existing farmer groups/SACCOs which can act as selling and buying point
for the various products iii. On fertilizer advice, the analysis, indicates that Agrics is a major stakeholder on fertilizer
advisory service provision amongst the respondents. However, this stake is at 53%. There is need
to strategize on how the remaining 47% of the farmers in the region can be reached to improve
Agrics impact in the study area.
iv. On weather forecast, the study established that there is no major information service provider on
both short and long term weather forecast according to the respondents. This is an area that can be explored on how the farmers can benefit from this service
On Agrics clients‟ satisfaction, an understanding of Agrics clients‟ perception on various products was
established the following observations were made:
i. Most of the respondents value the quality of farm inputs that Agrics is providing. This was their
main motivating factor for joining the program.
ii. The analysis also observed that the major reason why former clients left is because they did not
receive the farm inputs and packages on time as they expected
Issues for follow on research:
From the study, a pattern is emerging on areas then need further interrogation. This mainly revolves
around the soil; where by the following questions need to be investigated further:
i. Soil Testing: Who is doing it? What are the costs involved? How well/effective can this be
delivered?
ii. Can a link be created between soil testing and mobile technology? Ie can a specific farmer‟s land/soil related information be able to be shared via an online/mobile platform? Are the farmers
willing to adopt this?
iii. Soil conditions advice-what is the best/effective mode of delivering this advice? Is there an opportunity for customizing this advice?
iv. How are soil conditions linked to the mode/technology used in land preparation? Farmers are
already paying for land preparation services, how can this be linked to soil testing and soil
condition information? v. How can soil testing and information on soil conditions be linked to fertilizer advice?

July 14, 2016
Page 5
SECTION A: THE PROFILE OF THE RESPONDENTS
The study reached out to a total of 247 respondents as broken down in the table below. Amongst the
respondents, the average number of individuals per household is 6.03. The household with the highest membership in this study was 15 and the least with 1.
On land ownership, the respondent with the smallest potion of land is 0.2 acres while the highest one
had 7.0 acres. The average land size amongst the respondents is 1.6 acres across the six counties.
A total of 96 current Agrics clients were interviewed. The study also reached out to 153 non Agrics
clients. Out of the 153 non Agrics clients, 58 were former Agrics clients
A total of 95 respondents are not current or former Agrics Clients.
Of the 96 current Agrics clients, 56% had been with the organization for one season, 37% for 2 seasons and 7% for 3
seasons. None of the respondents had been around for 4 sessions
Agrics product taken by the respondents:
55% of the respondents have taken the core package alone from
the Agrics, most of whom are grain farmers.
10% have taken the poultry package, mainly due to limitation on their land size most of them
have less than 0.5 acres of land.
38% have taken the core package, and another product
245 out of the 247 (98%) interviewed grow maize in their farms.
72% grow beans, where in most cases the beans and maize is intercropped
Household Income:
52% of the maize producers get 20-26 % of their household income from maize as a crop
Amongst the beans producers, 83% get 0-25% of their household income Vegetable contributes 0-25% of the household
income amongst 83% of the respondents who
grow vegetable Other sources of income at the household level
include: livestock (including Poultry), casual
labor, and other crops that have not been
mentioned above
Respondents Desire/Wish:
A total of 67% of the respondents wish to be involved in
land production activities by tilting their land. Out of this 67%, 31% would wish to increase their food production, 27% to
increase cash crop production, and 9% to increase the size of
their land for production.
Note that only 1% indicated that they wish to invest in storage facilities.
County Men Women Average acreage per household Average size of the Household
1. Kakamega N 16 28 1.7 6.5
2. Kakamega E 17 24 1.5 5.3
3. Butere 21 25 1.5 6.5
4.Bungoma 15 24 1.5 6.2
5. Busia 19 24 1.6 5.5
6. Siaya 11 23 1.3 6
Total 99 148
Age group % Interviewed
<20; 0
20-29; 8.90%
30-39; 30.20%
40-49; 33.20%
50-59; 16.90%
>60 10.10%
Maize Beans Vegetable Sugarcane Others
0-25% 28% 83% 54% 32% 28%
26-50% 52% 16% 38% 50% 53%
51-75% 16% 1% 9% 11% 13%
More than
76%
3% 0% 0% 7% 7%
Desire/Wish Respondents
Buy land 9%
Increase food crops 31%
Increase cash crops 27%
Cows and/or related facilities 16%
Poultry and/or related facilities 14%
Storage 1%
Other 3%

July 14, 2016
Page 6
SECTION B: PRODUCTION
A total of 98% of the respondents interviewed grow maize in their farms, with an average of 48% of their
land cultivated by maize.
72% of the respondents grow beans, this covering an average of 19% of their land. In most cases, beans
are intercropped with maize.
23% of the respondents indicated that they produce vegetable, covering an average of 21% of their total
land space
16% of the respondents indicated that they cultivate bananas, covering and average of 22% of their land
11% of the respondents who grow sugar cane, it covers an average of 41% of their land. It is also worth noting that all the respondent who cultivate sugarcane have at least 1 acre piece of land
82% of the respondents have allocated an average of 30% of their total land for livestock (including poultry) and living area
Most of the respondents indicated that they grow maize primarily for food/subsistence. Vegetable and sugarcane is mainly grown for cash.
Fertilizer utilization:
90% of the respondents use chemical fertilizer as key farm input. The highest amount of fertilizer
utilized by one farmer is 250kg, and the least is 2kgs.
6.4% of the farmers indicated that they had procured less than 10Kgs of fertilizers this season.
Most of these farmers (98%) have less than one acre of land
47.5% of the respondents utilize between 12-25kgs this season, each farmer utilizing an average
of 23.1 kgs this season alone
33.8% of the respondents procured between 26-50kgs
11.9% procured between 75 to 250 Kgs of fertilizer this season
Fertilizer quantity and supplier
Fertilizer supplier Number of farmers Average quantity in Kgs
1.Agrovet, 63 34.5
2.Agrics, 85 43.3
3.One Ace 19 37.4
4.Govt 44 47.2
5.other 5 32.5
Total 216
The Fertilizer supplier and the reasons for choosing:
The supplier where Fertilizer is bought
Agrovet Agrics One Acre Fund Government Others
Reason
for
choosing
supplier
1.Price, 30 5 1 34 3
2.Ease, 14 4 3 6 2
3.Quality, 12 72 12 3 0
4.Reputation 4 4 3 0 0
From the above table, most of the respondents (48%) who buy fertilizer from the Agrovet, do so
because of the price.

July 14, 2016
Page 7
For Agrics and One Acre Fund, their choice as a fertilizer supplier is informed by the quality of
the product, where 85% and 63% of the respondents indicated this for Agrics and Once Acre
Fund respectively. 77% of the respondents indicated that they chose the government as their fertilizer supplier
because of the price.
Certified seed (hybrid)
89% of the respondents indicated that they used
certified seeds this season. The average utilization
of certified seeds per respondent was 7.4Kgs.
The average utilization of certified seeds per acres
amongst the respondents is 1.6kgs per acre
The major suppliers of the certified seeds
amongst the respondents are Agrics (37%) and
the Agrovet (31%). From the study, 11.7% of the current Agrics clients interviewed buy seeds
from the Agrovet
The graph above, most of the respondents indicated that quality and price informs their choice of
certified seeds supplier. Their choice of sourcing certified seeds from the Agrovet and the government
is to a large extent informed by the price. The respondents who source their seeds from Agrics and
One Acre Fund, their decision is informed by the quality of the certified seeds
0
10
20
30
40
50
60
70
Agrovet Agrics One Acre Fund
Government Others
The supplier where Certified seeds are bought
Reason for chosing supplier 1.Price,
Reason for chosing supplier 2.Ease,
Reason for chosing supplier 3.Quality,
Reason for chosing supplier 4.Reputation
31%
37%
9%
16%
7%
Certified seeds supplier for the respondents
Agrovet Agrics One Acre Fund Government Others

July 14, 2016
Page 8
Agronomic services
Traction/mechanization (land Preparation) A total of 59.4% indicated that they used traction/mechanization as an agronomic service this season.
75.7% of the farmers who used this service paid for it, either as part of the core package, or
separately from other service providers
(individuals with tractors or ox drawn plough)
An average of Ksh 1,529.8 was paid for this
service per acre amongst the respondents who
paid cash money for this service
Most of the respondents (71%) indicated that
they get traction/mechanization services from other service providers.
On probing further on level of satisfaction for
the “other” land preparation service provider, it was established that 59% of the respondents are not satisfied by the kind of service that they are getting as
indicated in the figure below
Foll
The extension ad training courses are currently being offered by Agrics and other partners and most
of the respondents indicated that they are satisfied by this services.
Some respondents indicated that they pay ksh 200 for the trainings and extension services provided
by Agrics and One Acre Fund
5%
54%
31%
10%
Level of satisfaction on Traction/mechanization service provision by others
Very unsatisfied Unsatisfied Satisfied Very Satisfied
Agrics10%
One Acre Fund4%
Government
15%Others
71%
Traction/Mechanization (Land preparation) service providers
This is an area that stakeholders and other service providers can explore further on the possibility
of providing this service. Note that the respondents are ready to pay for it, and they are not
satisfied by the current service providers
Follow on studies need to focus on various technologies for adoption in land preparation

July 14, 2016
Page 9
Soil testing:
9.2% of the respondents indicated that they use soil testing as an agronomic service. 78.2% of the
respondents who used soil testing are from Busia County. 73.9% of the respondents who used the
soil testing agronomic service got it from Agrics and most of them indicated that they are satisfied by the service
No substantial reason was given for using this service
This service was also offered for free amongst the respondents
Land Preparation:
A summary on how the respondents prepare their land is provided in the table below:
How do the farmer know when to prepare land
Experience Community Extension services Training course Information service Others
when land
is
prepared
in
November 3 1 0 0 0 0
December 24 3 9 10 4 0
January 61 12 20 11 0 0
February 33 5 9 3 6 9
March 8 0 1 1 0 0
April 3 0 0 0 0 0
Total 132 21 39 25 10 9
This can be analyzed as in the graph below:
From the graph above, most of the respondents tilt their land in January (104), followed by
February (65) and December (50)
0
10
20
30
40
50
60
70
Experience Community Extension services
Training cource
Information service
Others
How do the farmer know when to prepare land
when land is prepared in November
when land is prepared in December
when land is prepared in January
when land is prepared in February
when land is prepared in March
when land is prepared in April
There seem to be a gap here: the respondents seem not to understand the soil testing concept as an
agronomic service. They don’t seem to see soil testing as an agronomic service, this is because they
could not give good reasons why they are using the service. This is a gap that stakeholders can come
in to fill in the information gap, and provide the soil testing service

July 14, 2016
Page 10
For most of the respondents, the decision on when to do land preparation is informed by
experience. Extension service and training comes in 2nd
and 3rd
in informing the decision on when
to prepare the land.
SOWING:
From the feedback that we got, 98% of the respondents sow their land in the months of March
and April this year.
The table below gives a summary on when the respondents indicated that they sow their land
compared to last year
Difference with last year
Same Early Late
Month when sowing
was done
March 103 26 33
April 4 8 35
From the table above, most of the respondents did the sowing of their farms in March, the same
period as last year
A significant number of respondents who sow in April indicated that this was late, thus, they were
meant to sow in March
A further analysis as to why most of the respondents indicated that they sow in march is given in
the graph below:
If the difference this year is:
Same Early Late
What informs the Farmers
decision on Sowing
Experience 48 9 12
Community 19 3 4
Extension services 23 4 8
Training course 12 10 2
Information Service 0 0 0
Other 1 0 7
From the table and graph above, you will notice that majority of the respondents are influenced
by experience while making the decision on when to sow their land.
0 10 20 30 40 50
Experience
Community
Extension services
Training course
Information Service
Other
Wh
at in
form
s th
e af
rmer
s d
ecis
ion
o
n S
ow
ing
If the differece this year is Late
If the differece this year is Early
If the differece this year is Same
From the above, there doesn’t seem to be a clear relation between climatic conditions/the weather
and when land is preparation. Majority of the farmers prepare their land in February, based on
experience alone. Stakeholders can come in with very clear weather prediction information that can inform when land preparation should be done in relation to other factors. This can be
provided inform of information

July 14, 2016
Page 11
This experience might not be based on any scientific data or understanding of whether patterns,
hence the farmers might be exposed to risks, considering the changes in climatic conditions-thus
relying on experience might not be accurate
It is worth noting that none of the farmers was influenced by information services in deciding
when to sow their land
Scientifically, sowing should be informed by the availability/prediction of rain. There is need
to create a link between when the sowing is done and the actual climatic conditions.
Stakeholders can come in to provide this accurate information on both short and long term
weather forecast to inform when sowing should be done. Stakeholders can also explore on a
possibility of providing information service using various means to inform when sowing
should be done

July 14, 2016
Page 12
SECTION C: SELLING
Out of all the 249 respondents who participated in this study, 209 are involved in maize production. 10%
of this number does not sell their maize. This 10% indicated that they produce
maize purely for subsistence purposes.
From the chat above, most of the respondents , 47%, indicated
that they sell their maize
between the 17-30th
week after harvest. The reason given for
this is cash need and price. You
will notice that this coincides with the time when the farmers
are preparing their land, and
procuring farm inputs for the
next season
Most of the respondents who
sell their maize within four weeks of harvest indicated that they do this because of need for cash and price. It is also worth
noting that most respondents sell their maize within four weeks but in tranches
Respondents who sell their maize between 5-16 weeks indicated that they do this for the cash need and price
From the respondents, less than 2% indicated that they sell their maize due to lower post-harvest
loss.
.
The respondents indicated that in
general their potential means of selling their surplus yield is as indicated in the
graph below:
The local market was identified to
be the most preferred option. This can be attributed to accessibility and ease of
access
Note that none of the respondents
indicated that they will have the online platform as a potential means of selling their yield
Regarding the options for selling their surplus yield (for maize) respondents ……. In the graph below:
18%
35%
47%
Period in weeks before selling maize
0-4 Weeks 5-16 Weeks 17-30 Weeks
0
20
40
60
80
100
120
Local market Buying center
Farm gate Online Not selling
where farmers expect to sell surplus yield
Option 1
Option 2
This implies that there is a gap
amongst the respondents when it
comes to understanding the market
systems

July 14, 2016
Page 13
A total of 50% of the respondents identified the local market as their preferred option for selling their
surplus produce
Selling at the farm gate was the most preferred second option for selling their surplus
As a second option, more respondents prefer not to sell
their surplus maize, than take it
to the local market and the
buying centre
The response patterns on the selection of the options for selling maize are the same for selling the bean.
Options for selling vegetable are slightly different where the majority of the respondents identified local
market as their option one and two.
0 50 100 150
Local market
Buying center
Buyers buying at farm gate
Online platform
Other: …..
Po
ten
tial
mea
ns
of
selin
g
surp
lus
yiel
d
Number of respondents
While analyzing at these responses, there seem to be a gap in market information awareness. The
respondents don’t seem to understand the value of selling their maize through a buying centre.
Geodetics can explore the possibility of sharing market information on the best option for the farmers.
There is a perception that small scale farmers cannot take their products to the NC&PB stores, this
need to be demystified

July 14, 2016
Page 14
PRICE:
The respondents shared their expected price per kilo of maize and beans as indicated in the chat below:
Price expectation for a big percentage of the respondents, for maize and beans, fall within the market
rate for these goods per kilo. This is an indication that most of the respondents are well informed about the current market rates for the goods that they are producing. This study queried further about
the sources of price information, and the results are indicated in the chat below:
Most of the respondents indicated the word of mouth and other buyers was their main sources of the expected market price.
The respondents who use the word of mouth, indicated that
they use it daily, and they find it to
be accurate and useful
Majority of the
respondents who use other buyers
as a source, indicated that they access this information both daily
and weekly. They find this source
to be accurate. A big percentage also indicated that this is a useful
source of the expected selling price
information. The table below
summaries this.
Frequency Accuracy Usefulness of the source
Word of Mouth Monthly 7 Very accurate 6 Very Useful 19
Weekly 67 Accurate 136 Useful 117
Daily 143 Not Accurate 34 Not so useful 34
Very Inaccurate 6 Very Unuseful 9
(Other) Buyer Monthly 16 Very accurate 1 Very Useful 7
Weekly 43 Accurate 75 Useful 68
Daily 63 Not Accurate 39 Not so useful 38
Very Inaccurate 5 Very Unuseful 7
The respondents were asked to rank their major marketing challenges that they experience in their areas. The findings are as indicated in the chat below:
0 20 40 60 80 100 120 140
15-40
45-70
75-100
120-160
Above 160
Don’t KnowEx
pec
ted
Pri
ce P
er K
g in
Ksh
Beans
Maize
4% 2%
18%
46%
30%
0%
Expected price information sources
News paper TV Radio
Word of Mouth (Other) Buyers Internet/App

July 14, 2016
Page 15
Most of the respondents indicated that middle men interference is the major marketing challenge that
they experience. This is in line with selling options that the farmers have, of selling at the local market and at the farm gate.
The interference by the middle men might have contributed to low
market price of crops, which the
respondents identified as the second
challenge in marketing their products
The study established that 48% of the respondents do not have grain storage
facilities. The lack of storage facilities can
press the farmer to sell their grain a few weeks after harvest since they fear the
post harvest loss due to lack of good
storage facilities. At this point, the market is usually flooded with maize, and the middlemen take
advantage and buy maize in bulk to sell to the millers
On farmer group or SACCO membership, only 38% of the respondents belong these groups. It was
established that only 4% of the respondents sell their produce through the organized farmer groups. This exposes them to exploitation by the middlemen
Regarding the selling price information, more than 70% of the respondents indicated that the reliability of the information and the frequency of updates need to be improved, while providing the
selling price information
12%
5%
45%
38%
0%
Marketing Challenges Experienced
Lack of transport to the market
Lack of road
Middle men interference
Low market price of crops
Lack of appropriate place in the market
From the above findings, exploitation and interference by the middle men is emerging as a major
issue in the selling of the maize. The following suggestions can work towards reducing the problem
i. Work with the farmers to create more storage facilities at the household level
ii. Encourage more farmers to form and join peer farmer organizations where they can
access information on markets and trends. Through these groups, they will have a
higher bargaining power and reduce the interference by the middlemen iii. Strengthen the existing farmer groups/SACCOs which can act as selling and buying
point for the various products
July 14, 2016
Page 16
Advisory services being utilized by the respondents
Fertilizer: While looking at advice used by the respondents on fertilizer, I analyzed two factors:
i. Type and amount of fertilizer to apply
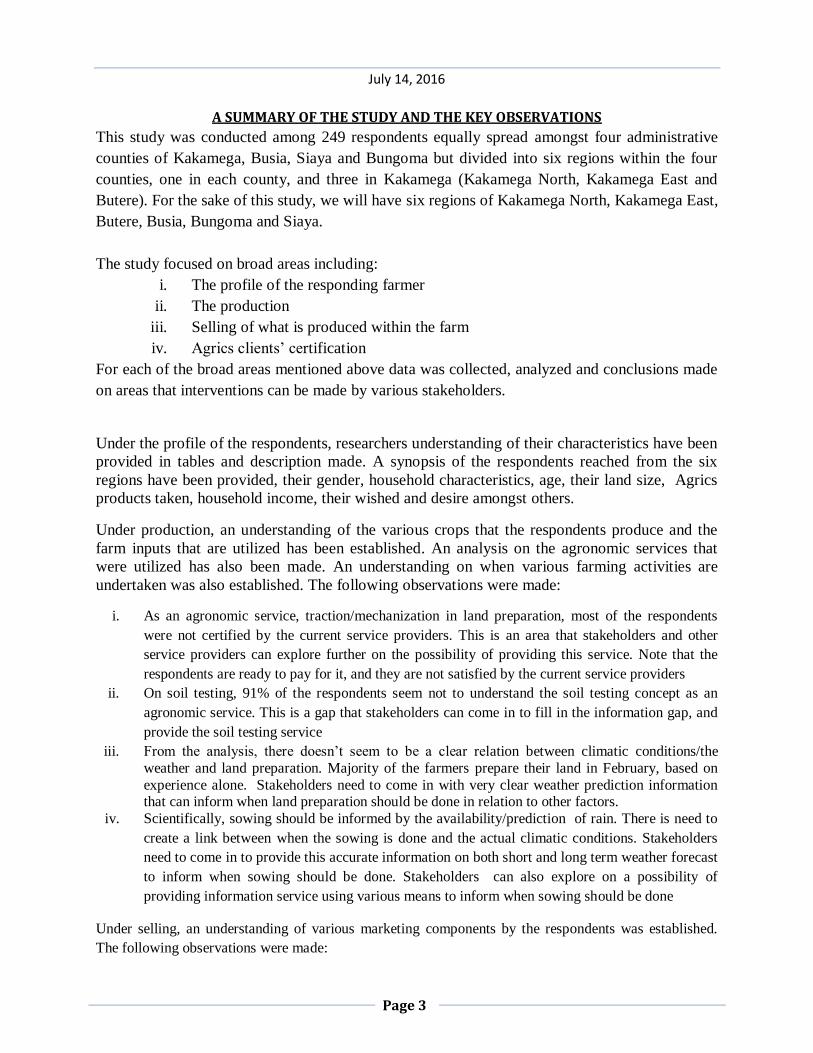
ii. When to apply the fertilizer Regarding advisory services on the type and amount of fertilizer, the study established that 90% of the
respondents use this service. Five different providers for this service are as indicated in the chat below:
Amongst the respondents who use
advice on type and amount of fertilizer to apply, 53% indicated that this advice was provided by
Agrics
For the respondents who get advice on type and amount of fertilizer to apply Agrics,
69% rated this at good and 29% at very good.
2% rated the service provided by Agric to be insufficient.
Amongst the respondents who got the
advice on type and amount of fertilizer to apply
from “other”, 71% rated this to be good, while 23% rated the quality of this advice to be
insufficient
Concerning when to apply the fertilizer, 82% of the respondents indicated that they use this advisory
service that is being provided by various stakeholders as indicated in the chat below:
Agrics provides advisory services on when to apply
fertilizer to 53% of the respondents who indicated
that they use this service. Amongst the beneficiaries
of this service from Agrics, 32% rated this service to
be very good, and 68% rated the service to be good.
The beneficiaries of “other” advisors on when to
apply fertilizer rated 67% of the advice as good.
18% and 5% of this advice was rated as insufficient and very bad respectively.
Agrovet2%
Agrics53%
One Ace8%
Govt10%
Other27%
Type and amount of fertilizer to apply advice providers
1%
53%
12%
12%
22%
Advice providers on when to apply fertilizer
Agrovet Agrics One Ace Govt Other
From the above analysis, it can be concluded that Agrics is a major stakeholder on fertilizer advisory
service provision amongst the respondents. However, this stake is at 53%. There is need to strategize on how the remaining 47% of the farmers in the region can be reached to improve Agrics impact in
the study area.

July 14, 2016
Page 17
Soil conditions
From all the respondents involved in this study (249), 28% indicated that they use this service. Among the
28% who use this service, 57% are from Busia county and 27% from Kakamega North. Advisory
service providers on soil conditions are provided in
the chat below:
Most of the clients from Busia who use advisory
service on soil conditions are not current Agrics
clients. Some of them are former Agrics clients
Amongst the respondents who got advisory service
on soil conditions from Agrics, 74% gives Agrics a rating of good, while 26% gives them a rating of
very good.
From the study, 79% of respondents who got this service, on soil conditions, from “other” service
providers, rated the advice as good.
Weather forecast
The respondents were asked if they use advisory service or information on both short and long term weather forecast. 27% of all the 249 respondents indicated that they use the short term weather forecast
advisory service. 26% indicated that they use long term weather forecast advisory service. A breakdown
on advisory services on long and short term weather forecast is provided in the chats below:
From the above chats, most of the respondents get information on weather from “other” sources not
included in the choices provided by this study. These include: Radio, Friends and relatives, amongst others.
55%
4%
7%
34%
Soil conditions advisory service providers
Agrics
One Ace
Govt
Other
The following needs to be taken into consideration:
There is need to interrogate further the advice that Agrics currently provide to farmers on soil conditions Need to map out other service providers on soil conditions to share lessons and experience
21%5%
3%71%
Information Provider on Short terms weather Forecast
Agrics One Acre Fund Government Others
21%5%
10%64%
Information Provider on long term weather forecast
Agrics One Acre Fund Government Others
July 14, 2016
Page 18
The government provides information on weather forecast, but more of the respondents indicated that
the information provided is for long term forecast.
Agrics and One care Fund seem to be targeting the same respondents with information on both long
and short term weather forecast.
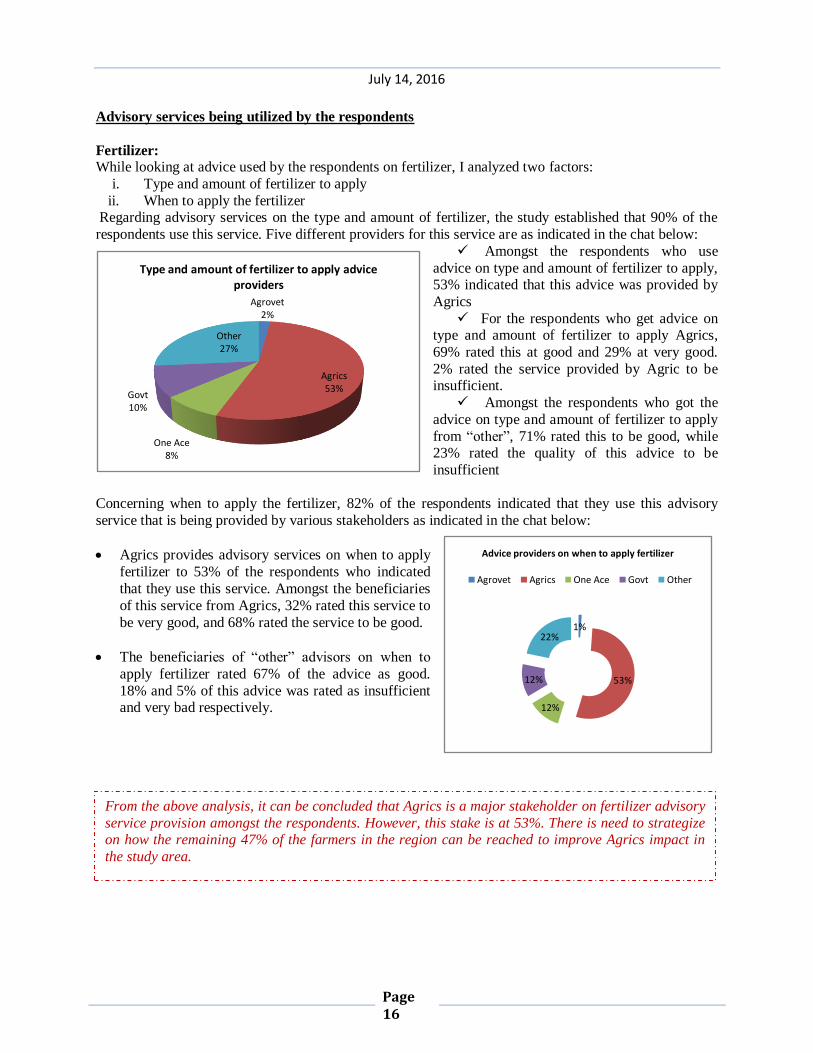
Market:
The study investigated the use of advisory services or information on the markets by the respondents. We
focused on three variables that include: i. Where to find the buyers
ii. Current market prices
iii. Future/expected market price development
From the study, it was established that 22% of all respondents involved in this study use advisory service
and information on the future/expected market price development. 26% of the respondents indicated that
they use advisory services on current market prices. Regarding advisory service or information on where to find buyer, 26% of all respondents indicated that they use this service. This study established the
information service providers for the three variables and presented in the chat below:
From the graph above, most of the respondents get information about where to find buyers, current market prices and expected market prices from “other” sources.
An average of 65% of the respondents who get this information from “other” providers rated the quality
of this information to be good. 31% rated the quality of this information provided by “others” as insufficient.
0
10
20
30
40
50
60
Agrics One Acre Fund Government Others
Advisory Service provider
Where to find buyers
Current Market Prices
Expected Market Price Development
Note that from the study, there is no major information service provider on both short and long term weather forecast according to the respondents. This is an area that can be explored on how the
farmers can benefit from this service
The analysis above indicates that more than 74% of the respondents do not use information or advisory services on where to find buyers, current market prices and expected market development.
This is a gap that needs to be breached

July 14, 2016
Page 19
Information that the respondents would like to have: All the respondents were asked on the information that they would like to have, but don‟t have access to it
now, or they are not using it at the moment. All the 18 items on the questionnaire were availed to the
respondents and they were requested to select what they would like to have, rank by importance and suggest how much they are willing to pay for the service.
The table below gives a summary of responses and how the ranking was done by importance.
Information that respondent
would like to have, but are not
using it at the moment
Number of
respondents who
would like to use
it
Number of
respondents who
ranked 1st
Number of
respondents who
ranked 2nd
Number of
respondents who
ranked 3rd
Soil Conditions 130 98 15 4
Plant diseases/health (Pest
control)
76 29 24 8
Seed varieties 73 38 18 9
Short term weather forecast 73 21 16 12
Long term weather forecast 74 17 15 12
Animal disease/health (Pest
control)
72 16 16 16
From the list of 18 information items, respondents selected what they would or would not like to have. For all items that at least 28% of the respondents indicated that they would like to use, a further analysis
was done to establish how they ranked the items by importance.
From this analysis, soil conditions was ranked first as information that the respondents would like to have
bur don‟t have access at the moment.
The table above lists the order in which the six information services was ranked by the respondents
involved in this study
Amount of money that the respondents are willing to pay for information: For the six items that were ranked top as earlier explained, the study sought to establish how much the
respondents are willing to pay.
This was established by analyzing the amount that had been indicated by the respondents who ranked the
information service as their first by importance.
In this analysis, I looked at the highest and lowest amount in Kenyan shillings that had been suggested by the respondents. I also got the average of the amount that all the respondents who ranked the information
service first for each of the top six categories of information as identified by the respondents. This is
summarized in the table below Highest amount in Ksh
that is willing to pay for
the service
Lowest amount in Ksh
that is willing to pay
for the service
Average for respondents
who ranked this as 1st are
willing to pay
Soil Conditions 3,000 0 345
Plant diseases/health (Pest control) 1,000 0 218
Seed varieties 500 0 140
Short term weather forecast 300 0 133

July 14, 2016
Page 20
Long term weather forecast 300 100 123
Animal disease/health (Pest control) 500 50 120
From the above table, under soil conditions, we realize that the average amount for respondents who
ranked 1st are willing to pay is Ksh 345, although the highest respondent is willing to pay ksh 3,000.
Having and understanding of these, can help in determining the price at which this service can be offered.
What the farmer would do if the main crop fails:
The respondents were asked to share on what they would do if their main crop failed. Their responses are
provided in the chat below:
From the above graph, only 26% of the respondents indicated that they will claim from insurance if their
main crop fails. This group consists of the current Agrics and non Agrics clients.
2%
9%
31%
9%
15%
26%
7%
Action to be done when main crop fail
Not repay input credit
Take a loan
Reduce cost of living (spend less on food, phone, etc)
Turn to family for money
Use saved money
Claim from insurance
Other
Act
ion
to
be
do
ne
wh
en m
ain
cro
p f
ail
Action to be taken when main crop fails
Data information and findings on information that the respondents would like to use and what they are willing to pay for needs to be interrogated further to inform future service provision or business
opportunities in this sector by various players.
On crop insurance, the study indicates that only 26% have insured their crops. There is still a huge
market for crop insurance across the six counties. Various stakeholders involved in crop insurance
need to interrogate this opportunity further.
July 14, 2016
Page 21
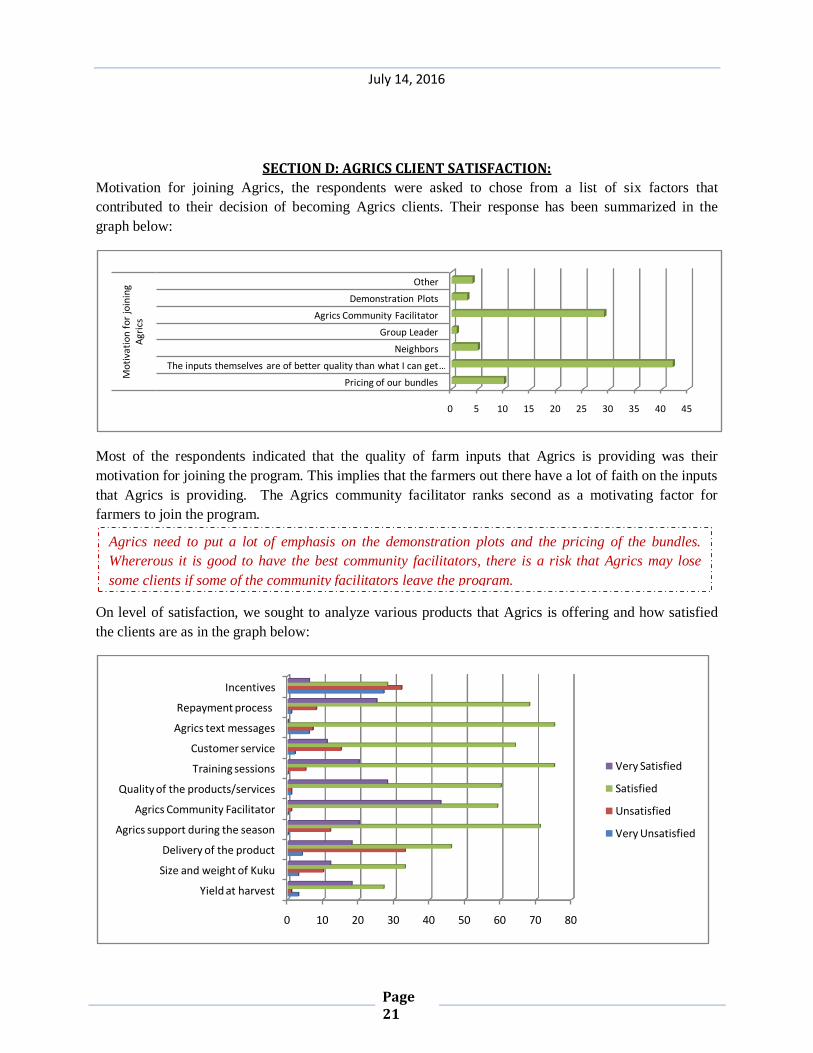
SECTION D: AGRICS CLIENT SATISFACTION:
Motivation for joining Agrics, the respondents were asked to chose from a list of six factors that
contributed to their decision of becoming Agrics clients. Their response has been summarized in the
graph below:
Most of the respondents indicated that the quality of farm inputs that Agrics is providing was their
motivation for joining the program. This implies that the farmers out there have a lot of faith on the inputs
that Agrics is providing. The Agrics community facilitator ranks second as a motivating factor for
farmers to join the program.
On level of satisfaction, we sought to analyze various products that Agrics is offering and how satisfied
the clients are as in the graph below:
0 5 10 15 20 25 30 35 40 45
Pricing of our bundles
The inputs themselves are of better quality than what I can get …
Neighbors
Group Leader
Agrics Community Facilitator
Demonstration Plots
Other
Mo
tiva
tio
n f
or
join
ing
Agr
ics
0 10 20 30 40 50 60 70 80
Yield at harvest
Size and weight of Kuku
Delivery of the product
Agrics support during the season
Agrics Community Facilitator
Quality of the products/services
Training sessions
Customer service
Agrics text messages
Repayment process
Incentives
Very Satisfied
Satisfied
Unsatisfied
Very Unsatisfied
Agrics need to put a lot of emphasis on the demonstration plots and the pricing of the bundles.
Whererous it is good to have the best community facilitators, there is a risk that Agrics may lose
some clients if some of the community facilitators leave the program.
July 14, 2016
Page 22
Most of the clients indicated that they are satisfied by Agrics products. The text messages, training
sessions and Agrics support during the season were the best offered services according to the respondents.
Incentives and the delivery of the product (trimming, process) had the highest number of respondents who indicated that they were unsatisfied.
Respondents were asked to give their opinion on their credit in relation to their yield as a result of interventions by Agrics. 43% believe that this is a good value worth about what they paid for. 32% think
that it is a poor value, worth less than what they paid for, while 25% believe that this is an exceptional
value, worth more than what they paid for.
On interaction with Agrics staff, respondents were asked how often they interact with Agrics‟ staff in the
field. 95% indicated that they interact on weekly basis, 4% on monthly, and 1% on daily basis.
On customer care, 16% of the respondents indicated that they had contacted the customer service.
Amongst the 84% that had not contacted customer service, 83% indicated that they are aware of the
customer service number.
From the 16% that had contacted the customer care, 75% indicated that their problems had been resolved
to complete satisfaction by the company or its representatives. 25% indicated that their problem was not
resolved.
From the study, 95% of the respondents indicated that they receive text messages from Agrics. Amongst
the text message recipients, 99% indicated that they find information from the text messages to be valuable.
Respondents were asked if they buy farm inputs on credit from other organizations. 46% of the respondents to this question indicated that they buy from other organizations on credit. Compared to
Agrics, 67% of the respondents who bought inputs from other organizations indicated that inputs from
Agrics were batter. 7% said that they were worse and 27% said that they are the same. Most of the
respondents mentioned quality a key factor that makes the Agrics products to be better than the rest.
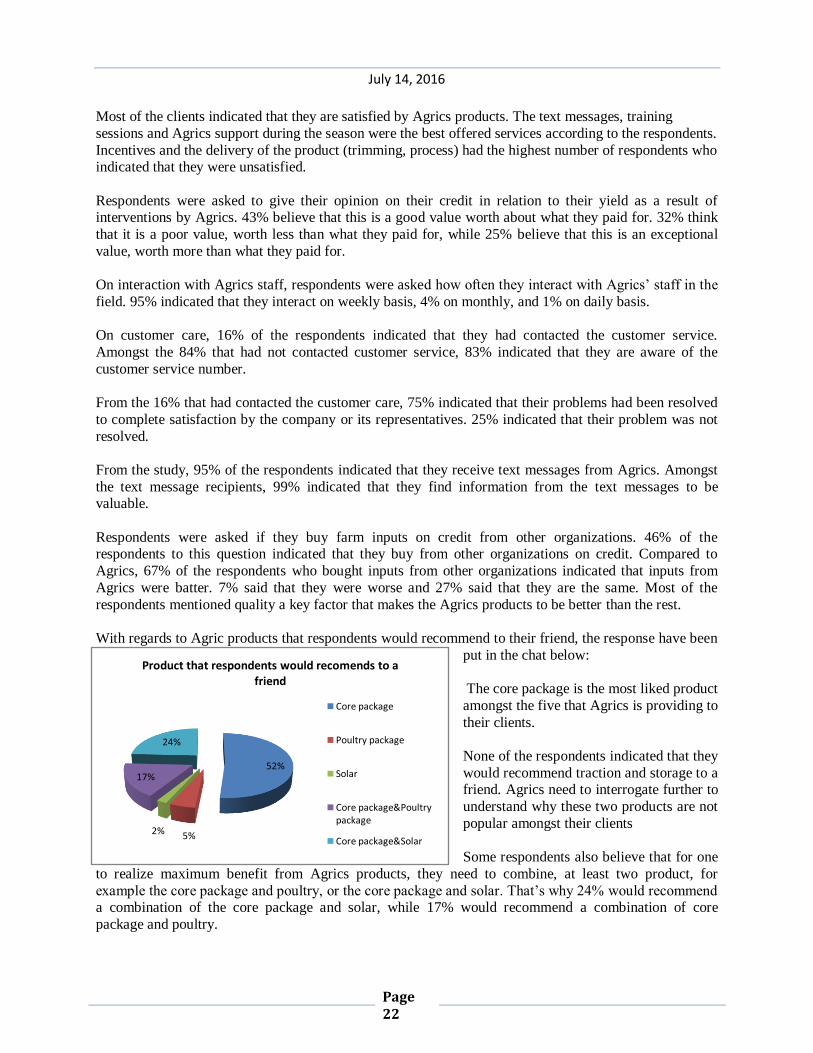
With regards to Agric products that respondents would recommend to their friend, the response have been
put in the chat below:
The core package is the most liked product
amongst the five that Agrics is providing to
their clients.
None of the respondents indicated that they
would recommend traction and storage to a friend. Agrics need to interrogate further to
understand why these two products are not
popular amongst their clients
Some respondents also believe that for one
to realize maximum benefit from Agrics products, they need to combine, at least two product, for
example the core package and poultry, or the core package and solar. That‟s why 24% would recommend a combination of the core package and solar, while 17% would recommend a combination of core
package and poultry.
52%
5%2%
17%
24%
Product that respondents would recomends to a friend
Core package
Poultry package
Solar
Core package&Poultry package
Core package&Solar

July 14, 2016
Page 23
Opinion of former Agrics Clients:
The study sought the opinion of the former Agrics clients to establish how they have progressed after parting ways with interventions that Agrics is currently implementing in the region.
We sought to establish why they exited from the program. The findings are summarized in the chat below:
From the chat above, you realize that the major reason why the clients left is because they did not receive
the farm inputs and packages on time as they expected.
Amongst the respondents, 19% had other reasons for exiting the program. This include: “I was new but
due to my delay of payment I was harassed” say Mebo from Butere; „I had more problems concerning
money‟; „I had my personal challenges/problems‟; „I was away during recruitment and had inadequate
land‟; „I had personal challenges will come back next year‟ amongst other reasons.
In comparison with other organizations, the former clients rated Agrics services as follows:
11%
6%
32%
7%4%
8%
13%
19%
Reasons for Exiting Agrics Program
I am happier on my own
I am better served by another organization
I did not receive inputs and packages on time
Your services and products were not at the standard I expected
I was unable to repay my debt
I thought it was too expensive
I had expected more yield increase
0 5 10 15 20 25 30 35 40
Yield at harvest
Delivery of the product (timing, process)
Agrics Community Facilitator
Training sessions
Agrics text messages
Incentives
Agr
ic p
rod
uct
Comparison of Agrics products with other programs by former clients
Very Satisfied
Satisfied
Usatisfied
Very Usatisfied