Embed Size (px)
Citation preview

IAEA/Al/019
REPORTOF THE
CONSULTANTS' MEETINGON
RAPID INSTRUMENTALAND SEPARATION METHODS
FOR MONITORING RADIONUCLIDESIN FOOD AND ENVIRONMENTAL SAMPLES
INTERNATIONAL ATOMIC ENERGY AGENCYVIENNA
5-9 SEPTEMBER 1988

Contents
I. Objectives of tha Consultants' Meeting
II. Agenda
III. List of Participants
IV. Highlights of the Meeting
Attachment I - ContributionsAttachment II - Recommendations of the Consultants

3
I. OBJECTIVES OF THE CONSULTANTS' MEETING
At an earlier Consultants' Meeting (15-19 December 1986, VIC, Vienna)for the IAEA programme on "Fallout Radioactivity Monitoring in Environment andFood (MEF)", it was recognized that the existing rapid methods havelimitations and that more research is needed. The experience gained from thepost Chernobyl activities revealed that there was a need to screen a largenumber of samples under these post accident situations as well as the need toget information quickly so that decisions about accident response and foodcontrol can be made. The participants of the Consultants' Meeting on MEFrecommended that the Agency "initiates a co-ordinated research programme (CRP)on collecting and developing, as necessary, rapid methods for measuringradioactivity in food and environmental samples to facilitate internationaltrade, for emergency cases, etc".
The purpose of the present Consultants' Meeting is to discuss thescope of the proposed CRP. In terms of methods, the CRP should cover bothinstrumental and radiochemical methods. It could include gamma-rayspectrometry, gamma screening, gross measurements of a, 8, and possiblyY activities, and radiochemical methods for the actinides and B emitters.The matrices of interest will need to be defined. The list given in theguidebook [1] could be used. This list, as well as the list of importantradionuclides, could be altered by the consultants. Some decisions will haveto be made on the types of accident situations to be covered. The simplestchoice would be to establish rapid methods based on the situation after theChernobyl reactor accident. However, the methods which would be developed onthis basis may not be applicable to other types of accidents. Information onother types of accidents and the radionuclides released in each case are givenin Annex VI of the guidebook (1J and can be used for guidance for thisdiscussion.
Some specifications of the derived level of measurement capability,accuracy, manpower and time limitations should be included. It should beemphasized that the development of rapid techniques should be made with aminimum sacrifice in reliability, practicability and economy. Thespecifications thus defined must not be so wide that the effort is diluted,nor so narrow that important areas are neglected.
Finally, it is intended that the Consultants will discuss in somedetail, based on their expertise in areas of instrumental or separationmethods, some possible techniques which might be useful in developing suitablerapid analytical methods and the identificaiton of some problems which requirefuture research and development.
It is also intended to discuss the report of the Grass EcosystemProject for the 1986 and 1987 collection periods, and to discuss what furtheractivities should be considered by this group.
Training programmes and production of radionuclide ReferenceMaterials pertinent to the analysis of foods and environmental samples as wellas intercomparisons which will be organized by the Agency's Analytical QualityControl Services (AQCS) should be discussed.
[1] IAEA TECHNICAL REPORTS SERIES No. 295 (STI/DOC/10/295), "Measurement ofRadionuclides in Food and the Environment - A Guidebook", IAEA, Vienna,1989
;y

II. AGENDA
Consultants' Meeting
on
Rapid Instrumental and Separation Methodsfor Monitoring Radionuclides in Food and Environmental Samples
Agency's Headquarters/ Vienna, Conference Room C07/IV5-9 September 1988
Monday, 5 September
09:00 Session I
- Opening of the meetingMr. P.R. Danesi, DIR-RIAL
- Introduction and ObjectivesMr. R. Schelenz, Scientific Secretary
- Election of Chairman- Presentations by Agency staff on their recent activities
related to the topics of the meeting
14:00 Session II
- Presentation by Consultants on their recent activitiesrelated to the topics of the meeting
Tuesday, 6 September
09:00 Session III
Chairman: Mr. R.W. PerkinsScientific Secretary: Mr. E.L. Cooper
- Grass Ecosystem Project- Discussion of the final draft report on the 1986 collection
period (Mr. R.W. Perkins)- Preliminary results for the 1987 collection period
(Mr. V. Strachnov)- Preparation of the final report for 1986
14:00 Session IV
- Grass Ecosystem Project (continued)- Preparation of the final report for 1986- Further activities

(o
Wednesday, 7 September
09;00 Session V
- Introduction to CRP (Mr. R. Schelenz, Scientific Secretary)
- Selection of Subgroup Members
- Subgroup I - Instrumental MethodsRapporteur: Mr. S. Prakash- Applicable matrices- Applicable radionuclides- Tentative procedures- Research needed
- Subgroup II - (Analytical) Separation MethodsRapporteur: Mr. R.W. Perkins
- Applicable matrices- Applicable radionuclides- Tentative procedures- Research needed
11:30 - Report of the rapporteurs of the Subgroups I,II
14:00 Session VI
- Discussion of Derived Intervention Levels (Mr. E.L. Cooper)- Discussion of "Design, Planning, Application and QualityControl of Methods for Rapid Measurements of Radioactivityin Food and Environmental Samples". (Mr. K. Buchtela)
- Subgroups - continued discussion
Thursday, 8 September
09:00 Session VII
- Reports from the Subgroups I and II
- General discussion
14:00 Session VIII
- Discussion in Subgroups I and II
- Draft reports to be submitted
Friday, 9 September
09:00 Session IX
- Final reports from the Subgroups I and II
- Final discussion- Recommendations- Final meeting report
2.Z
I I I . LIST OF PARTICIPANTS
External Participants
Mr. R.W. PerkinsDOE,, BattellePacific Northwest LaboratoriesRichland, Wa., 33952, USA
Mr. S. PrakashBhabha Atomic Research CenterRadiochemistry DivisionBombay, INDIA
Mr. G. IngraoENEA, Departimento Ambiente e Salutedell'UomoCRE CasacciaS.P. Anguillarese km. 30100100 Roma, ITALY
Tel.:9001-509-376-3467
Tel.:5514-910-2463Tlx: 1171017 BARC IN
Tel.: 396-304-84200Tlx: 613296 ENEACA I
Mr. T. RzymkowskiDirector, Central Laboratory for RadiologicalProtection01. Konwaliowa 703 194 Warsaw, POLAND
Mr. A. PietruszewskiCentral Laboratory for Radiological ProtectionUl. Konwaliowa 703 194, Warsaw, POLAND
Ms. C. KlusekEnvironmental Measurements Laboratory (EML)376, Hudson StreetNew York, NY 10014, USA
Mr. R. FalkNat. Institute of Radiation ProtectionEnvironmental LaboratoryP.O. Box 60204104 01 Stockholm, SWEDEN
Mr. O. PaakkolaFinnish Centre for Radiation andNuclear SafetyP.O. Box 2680010 Helsinki, FINLAND
Tel.: 11-16-16Tlx.: 812381
Tel.: 11-16-16Tlx.: 812381
Tel.: 9001-212-620-3231Tlx.: 710-581-4814
Tel.: 46-872-971-92Tlx.: 11-771 SAFERAD SFax: 46-872-971-08
Tel.: 3580-708-21Tlx.: 12-4956 STUKV SFFax: 3580-708-2416

Mr. K. BuchtelaAtominstitut der OesterreichischenUniversitatenSchiittelstr. 1151020 Vienna, AUSTRIA
Tel.: Austria-222/21-701
Mr. R. Schelenz, Scientific SecretaryInternational Atomic Energy AgencyDepartment of Research and IsotopesAgency's Laboratories SeibersdorfWagramerstr. 5P.O. Box 1001400 Vienna, AUSTRIA
Tel.: Austria 2254/2252-220Tlx.: 1-12645 or 1-13697Fax.: 43-222/23-45-64
participants of the IAEft
Mr. A.A. Abdel-Rassoul
Mr. E.L. Cooper
Mr. P.R. Danesi
Mr. B. Emmerson
Mr. A. Ghods
Mr. J. LaRosa
Mr. M. Makarewicz
Ms. M. Matyjek
Ms. R. Ogris
Mr. R. Ouvrard
Mr. R. Rosenberg
Mr. V. Strachnov
Department of Research and IsotopesHead, Physics/Chemistry/InstrumentationAgency's Laboratories Seibersdorf
Department of Research and IsotopesChemistry UnitAgency's Laboratories Seibersdorf
Cost free expert from CanadaChalk River Nuclear LaboratoriesChalk River, Ontario, Canada KOJ 1JO
Department of Research and IsotopesDirector, Agency's Laboratories Seibersdorf
Department of Nuclear Energy and SafetyRadiation Protection Section
Department of Research and IsotopesAgency's Laboratories SeibersdorfChemistry Unit
Department -.f Research and IsotopesAgency's Laboratories SeibersdorfChemistry UnitCost free expert from the U.S.A.
Department of Research and IsotopesAgency's Laboratories SeibersdorfChemistry Unit
IAEA FellowDepartment of Research and IsotopesAgency's Laboratories SeibersdorfChemistry Unit
Institute of Chemistry and Nuclear TechnologyDorodna 16Warsaw, Poland
Department of Research and IsotopesAgency's Laboratories SeibersdorfChemistry Unit
Department of Nuclear Energy and SafetyRadiation Protection Service Section
Department of Research and Isotopesindustrial Application and Chemistry Section
Department of Research and IsotopesAgency's Laboratories SeibersdorfAnalytical Quality Control Services (AQCS)Chemistry Unit

Mr. J.C. Veselsky Department of Research and IsotopesAgency's Laboratories SeibersdorfChemistry Unit
Mr. T. Watabe Department of Nuclear Energy and SafetyRadiation Protection Section
Ms. E. Wehrstein Department of Research and IsotopesAgency's Laboratories SeibersdorfChemistry Unit
Ms. E. Zeiller Department of Research and IsotopesAgency's Laboratories SeibersdorfChemistry Unit
H
I V . HIGHLIGHTS OF THE MEETING
1. Opening
Mr. P.R. Danesi opened the meeting and welcomed the 9 Consultantsoriginating from Austria, Finland, India, Italy, Poland, Sweden and the USA.He emphasized his wishes for a successful meeting and the future transfer ofinformation. Mr. R. Schelenz (Scientific Secretary) gave a general outline ofthe objectives of the meeting. The participants introduced themselves givinga brief resume of their professional background.
2. Election of the Chairman
Mr. 0. Paakkola was nominated as Chairman of the Consultants'Meeting. The par t ic ipants agreed and Mr. Paakkola accepted the chairmanship.
3. Presentation of Agency's Research
Mr. 0. Paakkola continued the Session beginning with fourpresentations by the staff of the Chemistry Unit of Agency's LaboratoriesSeibersdorf. Also invited to present a paper on The Development of DerivedIntervention Levels (DIL) was Mr. B.W. Emmerson. These presentations areincluded in attachment I.
4. Presentation of the Consultants' Research
Session II continued with the presentations of the recent activitiesof the consultants relevant tc rapid instrumental or separation methods forradionuclide analysis. These presentations are also included in attachment I.
5. Grass Ecosystem Project
In the two sessions relating to the Grass Ecosystem Project,Mr. R.W. Perkins agreed to act as Chairman and Mr. E.L. Cooper acted asScientific Secretary. The consultants considered the programme to be avaluable and unique means of obtaining analytical data regarding the Chernobyldebris. The report on the 1986 collection was revised by the representativesof the participating laboratories present. Mr. V. Strachnov presented thefirst look at the results available for the 1987 collections. The futureactivities of the Grass Ecosystem Project were then discussed. Therepresentatives from the participating laboratories together with the otherConsultants made the following recommendations:
1) The IAEA should continue with the Grass Ecosystem Project followingthe recommendations made at the previous meeting held 15 - 17 July1987 at Cadarache, France.
2) The samples should continue to be analyzed for gamma emitters, aswell as 9 0 Sr and transuranic radionuclides.
3) There should be no change in the sampling procedure.
4) The IAEA should continua to coordinate the project and analyze theintercoraparison results through its AQCS programme.
5) The report on the 1986 samples should be amended by the IAEA, asdiscussed at the meeting, and published as soon as possible.
6} When all the data for 1987 have been collected, the results should bedistributed to the participating sampling and analytical laboratories.
7) The IAEA should prepare a report on the 1987 results for acceptanceat the next meeting.
8) The reports for 1986 and 1987 should be distributed to theparticipating sampling and analytical laboratories.
9) The Consultants recognize an important relationship to the CRP onRapid Instrumental and Separation Methods for Monitoring Radio-nuciides in Food and Environmental Samples and recommend that anappropriate co-operation be maintained.
6. Discussions of the Subgroups
During the following days, the consultants went into a detaileddiscussion of the scope of the CRP and possible target areas of neededresearch. Two subgroups were formed. Five of the consultants (Prakash, asrapporteur, Rzymkowski, Pietruszewski, Falk, Ingrao) drafted the report of theinstrumental group; while four consultant (Perkins, as rapporteur, Paakkola,Buchtela, Klusek) drafted the document on separation methods. Each group wasassisted by various staff member from the Seibersdorf Laboratory includingMesr. R. Schelenz and P.R. Danesi. The introductory session, containinginformation common to both groups, on matrices of interest etc. was compiledby Mr. E.L. Cooper. The final recommendations of the Consultants on the scopeof the CRP is included as attachment II.
The Consultants were further aided in their discussions by twopresentations. Mr. E.L. Cooper presented summary tables of DerivedIntervention Levels (DILs) to aid the consultants in arriving at the desiredlevel at which the radionuclides should be measured as put forward in thespecifications. Mr. K. Buchtela presented for consideration a working paperon several aspects of what consitutes a rapid measurement. This presentationis included in attachment I.
7. Recommendations
1. The Consultants recommended that the Agency should initiate aCoordinated Research Programne on Rapid Instrumental and RadiochemicalSeparation Methods for the Analysis of Radionuclides in Food and EnvironmentalSamples to provide procedures for both emergency situations and routine foodand environmental radioactivity monitoring.
2. The methods should be developed or identified which optimizeefficiency and economy of rapid methods.
3. Chemical methods involving sample dissolution and radionuclideseparation should be streamlined, improved, or developed using state of theart approaches.
4. The Analytical Quality Control Services (AQCS) of the IAEA shoulddevelop and provide appropriate food and environmental samples to test thereliability of the new rapid analytical methods.
5. As suitable rapid analytical methods are developed, they should becompiled to form a guidebook which could be used for emergency monitoring aswell as for routine food and environmental radioassay and for trainingpurposes.
6. Training Courses in relevant fields on interregional, regional andnational basis should incorporate instructions in the new rapid analyticalmethods.
7. The Laboratories of the IAEA should maintain a capability in theperformance of rapid methods developed under the Coordinated ResearchProgramme and provide training for fellows from Member States.
8. The consultants recognize an important relationship to the GrassEcosystem Project and recommended that an appropriate co-operation bemaintained.
B. Summary
Interest in the release of radionuclides to the environment,especially to the foodchain, has been heightened by recent nuclear incidents.The assessment of any release of radioactivity demands rapid, reliable andpractical techniques. In the intermediate and late post-accident period,where the interest is in food control rather than evacuation and sheltering,rapid methods would be useful for screening purposes as well as providingtimely information and easing overload. Development of new methods would alsohave application for routine monitoring of environmental samples.
The rapid radiochemical and instrumental methods are intended topermit a determination of radionuclides at a concentration of at least oneorder of magnitude below those specified for food in the WHO publication"Derived Intervention Levels for Radionuclides in Food"t^l and the IAEApublication, "Safety Series 8i"f2L The rapid methods could include rapidscreening methods for determination of the approximate or gross radionuclidecontent in samples, very rapid methods for a more reliable determination orrapid methods for a reasonable accurate determination of the radionuclidecontent. The specifications for each type of method were outlined. It wasemphasized that the overall objectives of developing rapid methods should beachieved with the minimum sacrifice in reliability, practicality and economy.
[1] WORLD HEALYH ORGANIZATION, Derived Intervention Levels for Radionuclidesin Food, WHO, Geneva (1988)
[21 INTERNATIONAL ATOMIC ENERGY AGENCY, Derived Intervention Levels forApplication in Controlling Radiation Doses to the Public in the Event of aNuclear Accident or Radiological Emergency, Safety Series No. 81, IAEA,Vienna (1986).
Identification was made of some areas where further research work wasneeded. In the rapid instrumental field improvements are needed in gamma rayspectroscopy. New methods a>"e needed for the determination of 90gr/ 3JJand alpha emitters, and efficient methods are needed for handling largenumbers and sized samples, sample dissolution and radionuclide separationmethods. Mention was made of the need for improved methods of dissolution,streamlining of conventional preparation techniques, and the utilization ofspecialized techniques. Consideration should also be given to the applicationof methods of automation and robotics to the handling of large numbers ofsamples.

ATTACHMENT I
Contributions
Consultants' Meeting on Rapid Instrumental and Separation Methodsfor Monitoring Radionuclides in Food and Environmental Samples
Vienna, 5 - 9 September 1988
1) Determination of Some Alpha-emitting Actinides in SludgeOriginating from a Low Level Radioactivity Waste IncinerationFacility.J.J. LaRosa, M. Matyjek, A. Ghods, E. Cooper, J.C. Veselksy,R. Schelenz, IAEA, RIAL., Agency's Laboratories Seibersdorf,Vienna, Austria
2) The Determination of Uranium in Environmental Samples byFluorimetry.J.C. Veselsky, A. Ghods, IAEA, RIAL, Agency's LaboratoriesSeibersdorf, Vienna, Austria
3) The Determination of Sr-90 in Environmental Material Using anImproved Rapid MethodA. Ghods, J.C. Veselsky, S. 2hu, A. Mima, R. Schelenz, IAEA,RIAL, Agency's Laboratories Seibersdorf, Vienna, Austria
4) Evaluation of a-Spectrometers and Detectors for Low-LevelMeasurements.M. Matyjek, E. Cooper, J.J. LaRosa, A. Ghods, IAEA, RIAL,Agency's Laboratories Seibersdorf, Vienna, Austria
5) The Development of Intervention Levels for the Protection ofthe Public in the Event of a Major Nuclear Accident - Past,Present and Future.B. Emmerson, IAEA, NENS, Radiation Protection Section, Vienna,Austria
6) Possible Approaches for the Development of Rapid Instrumentaland Separation Methods for Monitoring Radionuclides in Food andEnvironmental Samples.R.H. Perkins, DOE, Battelle, Pacific Northwest Laboratories,Richland, Wa., USA
7) Activities Regarding the Monitoring of Radionuclides in Foodand Environmental Samples in the Department ENEA-PAS.G. Ingrao, ENEA, Rome, Italy
8) Estimate of the Caesium-137 Activity in Reindeer Meat byExternal Y~Measurements of Living Animal.R. Falk, National Institute for Radiation Protection,Stockholm, Sweden
9) Local Laboratory Network in Finland.O. Paakkola, Finnish Centre for Radiation and Nuclear Safety,Helsinki, Finland
31
10) Rapid Instrumental and Separation Methods for MonitoringRadionuclides in Pood and Environmental Samples, Activities ofthe Analytical Chemistry Division.C. Klusek, Environmental Measurements Laboratory (EML), NewYork, N.r., USA
11) Spectrometrical System for Monitoring Radionuclides inEnvironmental Samples in Poland.A. Pietruszewski and T. Rzymkowski, Central Laboratory forRadiological Protection, Warsaw, Poland
12) Some Activities of the Radiochemistry Section at theAtominstitut of the Austrian Universities related to RapidMethods for Monitoring Radionuclide in Food and EnvironmentalSamples.K. Buchtela, Atominstitut der Oesterreichischen Universitaten,Vienna, Austria
13) Radionuclides Correlations - Possible Uses.S. Prakash, Bhabha Atomic Research Center, Bombay, India
14) Design, Planning, Application and Quality Control of Methodsfor Rapid Measurement of Radioactivity in Food andEnvironmental Samples.K. Buchtela, Atominstitut der Oesterreichischen Universitaten,Vienna, Austria

DETERMINATION OF SOME ALPHA-EMITTING ACTINIDES IN SLUDGEORIGINATING FROM A LOW LEVEL RADIOACTIVITY
WASTE INCINERATION FACILITY
J. LaRosa, M. Hatyjek, A. Ghods, E. Cooper, J. Veselsky, R. Schelenz
International Atomic Energy Agency, Agency's LaboratoriesSeibersdorf, RIAL, P.O. Box 100, A-1400 Vienna, Austria
33

TABLE OF CONTENTS
Page
1. Introduction 1
2. Experimental 2
2.1 Characterization of ths Sludge 2
2.1.1 Sludge Description 2
2.1.2 Preliminary Analysis 2
2.1.3 Homogeneity Testing 4
2.2 Sampling, Spiking and Chemical Decomposition of Sludge . . . . 5
2.2.1 Series 1 5
2.2.2 Series 2 6
2.3 Radiochemical Separations in ACID-SOLUBLE Fractions 7
2.3.1 Anion Exchange Column Chromatography 9
2.3.2 Liquid-liquid Extraction with HDEHP 102.3.3 Calcium Oxalate Precipitation 112.3.4 Extraction with CMPO-TBP 122.3.5 Source Preparation for Alpha Spectrometry . 14
2.3.5.1 Electrodeposition 152.3.5.2 Coprecipitation 16.
2.4 Treatment of ACID-INSOLUBLE Fractions 17
2.5 Alpha Spectrometry 18
3. Data Analyses of Alpha Spectra 20
3.1 Series 1 Analyses 20
3.1.1 Pu fractions 20
3.1.2 Am-Cm fractions 21
3.2 Series 2 Analyses 22
3.2.1 Pu fractions 2A and 2B 22
3.2.2 Am-Cm fractions 2A and 2B 22
3.2.3 Analysis 2C 23
4. Results 24
5. Discussion 25
List of Tables
List of Illustrations
References
- I -
DETERMINATION OF SOME ALPHA-HHITTING ACTINIDES IN SLUDGEORIGINATING FROM A LOW LEVEL RADIOACTIVITY
WASTE INCINERATION FACILITY
J. LaRosa, M. Matyjek, A. Ghods, E. Cooper, J. Veselsky, R. Schelenz
1. Introduction
The primary objective of the Agency's actinide analysis group is to
test methods of actinide determination (especially Pu, Am and Cm) in food
and environmental samples. Suitable procedures can then be recommended
to Member States in order to meet both routine and emergency situations.
The recommended methods should be rapid (1 day or less), reliable,
adaptable to various conditions and should use materials and equipment
which are reasonably available.
The dedicated actinide analysis laboratory at IAEA-Seibersdorf was
brought into service in April 1988. Initial radiochemical separation
tests with Pu, Am and Cm tracers were carried out. As a result of these
studies, practical radiochemical work began on a contaminated sludge
material received from a Member State. This report describes the experi-
ence gained in analyzing this material for certain actinides.

- 2 -
2. Experimental
2.1 Characterization of the Sludge
2.1.1 Sludge Description
The sludge material was produced in a low level radioactive
waste incineration facility of a Member State. A spray scrubbing opera-
tion of combustion gases and particulate matter produced a liquid-solid
mixture which is referred to as sludge throughout this report. A sludge
sample weighing 1.5 kg was received for analysis of its Pu, Am and Cm
content. Although the chemical composition of the sludge was unknown, it
was later shown to contain significant amounts of Fe, Ni and Cr from the
corrosion of stainless steel construction materials. The pH of the dark,
opaque liquid was measured with wide range test paper and found to be
between 0 and 1. Qualitative gamma-ray spectrometry suggested the
presence of 2*1Am (60 keV) and indicated the presence of 6°Co, fcSZn,13^Cs and 137Cs.
In the initial handling, 232 g of liquid was poured out of the
sludge container and dried under a heat lamp to a solid residue weighing
125 g. Afterwards, it became apparent that there was a considerable
amount of heavy sediment at the bottom of the container. The dried
liquid sludge was used for a preliminary analysis (see next section).
The main analyses, however, were performed with samples taken from
well-suspended sludge material which had been tested for homogeneity of
gamma-ray radioactivities (see section 2.1.3).
2.1.2 Preliminary Sludge Analysis
A dried sludge sample of 1.7 g (corresponding to about 3.1 g
wet weight) was heated and digested for 2 hours with a mixture of 5 ml
each of 12M HC1 and 14M HNO3. The resulting suspension was evaporated to
near dryness, converted to chloride with several successive 3 ml addi-
tions of 12H HC1, diluted to about 20 ml of 2M HCl and filtered through
fast filter paper by gravity to separate dark-colored, insoluble materi-
al. The filtrate (including washings with 1M HCl) was 45 ml of clear,
green solution Al in about 1.5M HCl. The insoluble, filtered residue and

- 3 -
filter paper were evaporated together with an 8 ml mixture of 14M HNO3
and 12M HC10a (3:1) for 1.5 hours until HClOa fumes appeared, and then
fumed for 15 min with HClQa until no further change from a light yellow
color. To the cooled HClO^ (1-2 ml) and residue, 1 ml of 14M HNO3 and 8
ml H20 were added, and the contents were transferred to a plastic vessel.
This dilute EttJO3-HClOa solution was cloudy, but the addition of 1 ml of
23M HF to it immediately produced a clear solution A2. Solution A2 (10
ml) was put into a Teflon beaker, evaporated to concentrated HClOa and
fumed for 5 min to expel any SiFA and excess HF. The cooled HClOd
solution (1 ml) was diluted to 5 ml with water to give a clear solution
A3. The green filtrate solution Al was evaporated to near dryness and
the residue was dissolved in 15 ml of 1M HCl. It was combined with
solution A3 and diluted to 30 ml of 0.8M HCl to give the final clear,
lime-green solution A4.
One-tenth of solution A4 (3 ml) was taken for a group actinide
separation. This aliquot was diluted to about 25 ml with 1M HCl and
heated in the presence of 50 mg of hydroxylamine hydrochloride to reduce
all actinides except U and Pa to oxidation states of III or IV. After 5
min, there was a color change from lime-green to light blue-green. A
second addition of 50 mg of hydroxylamine hydrochloride and heating did
not produce any further color change. After addition of 50 micrograms of
Nd(III), the solution was transferred to a plastic centrifuge tube with
1M HCl rinses (total volume of 25 ml of 1M HCl). Then 5 ml of 23M HF was
added to precipitate NdF3 together with the actinides in oxidation states
III or IV. After 0.5 h, the NdF3 was suction filtered onto a 25 mm
diameter membrane filter (see section 2.3.5).
After drying in a vacuum desiccator for 10 min and mounting
onto an aluminum disk, the alpha activity of this sample in the range of
4 to 7 MeV was measured in an EGSG Ortec model no. 676 alpha spectrometer
with a 600 mm2 silicon surface barrier detector. The sample to detector
distance was about 5 mm and the pressure inside the chamber was < 0.03
mbar. Details of the alpha spectrometry system are presented in section
2.5. The alpha spectrum of this NdF3 sample after a 2303 minute count
showed three well-defined peaks of comparable intensity at energies of
about 5.1, 5.3 and 5.5 MeV. These alpha spectral peaks suggested the
presence of 2 M- a- l ap u (5.X5 MeV), 21oPo (5.30 MeV) or z"3Am (5.27 MeV) or
- 4 -
both, and 23sPu (5.49 MeV) or a*1Am (5.48 MeV) or both, respectively.
The calculated intensities of these peaks corresponded to activity
concentrations of about 20 to 55 Bq per kilogram of liquid sludge if 100%
chemical recovery was assumed.
On the basis of this preliminary sludge analysis, z*2Pu (4.89
MeV) and 2-1'1Cm (5.79 MeV) were selected as tracers for the radiochemical
yield determination of Pu and Am-Cm, respectively. (The solution chemis--
tries of Am and Cm, which are in the trivalent oxidation state under
usual conditions, are essentially identical. Therefore, it is possible
to use only aa'*Cm tracer for the radiochemical yield determination of
both Am and Cm species.) Vnese tracers were chosen because their alpha
particle energies bracket the region of interest, 5.1 to 5.5 MeV, as
indicated by the preliminary results.
2.1.3 Homogeneity Testing
Because of the Pu and Am activity concentration range of 20 to
55 Bq per kilogram of liquid sludge determined from the preliminary
analysis, it was desirable to work with sludge samplings of 5 to 50 g.
In order to test the homogeneity of the radioactivity in a suspension of
the remaining sludge (1.3 kg), four samples of about 10 g each were
withdrawn from the well-stirred sludge. The samples were transferred to
tared 100 ml plastic bottles, weighed and measured with a hyperpure Ge
gamma-ray detector having a 30% efficiency relative to N'a(Tl)I. The
intensities of the prominent gamma-ray photopeaks at 60 keV (a'aifim), 604
and 795 keV (13*Cs) and 661 keV (T3VCs) were measured. The results of
these measurements for the four samples are presented in Table 1.
From Table 1, it is seen that the relative standard deviations
of the photopeak intensities per gram of sample vary between 2.5 and
6.3%. The relative one sigma level counting statistics uncertainties
range between 0.4% for the 661 keV gamma ray to about 4.1% for the 795
keV gamma ray. Thus, for 10 g samplings, a random error of 2 to 6% due
to inhomogeneity of the material is expected.
3%
- 5 -
2.2 Sampling, Spiking and Chemical Decomposition of Sludge
Two samples of sludge suspension, designated as Series 1 and
Series 2, were removed from the main body of the sludge (1.3 kg) after
manually mixing for 5 minutes to suspend settled material. The first
sample (Series 1) of 32.8 g (wet weight) was taken 43 days before the
second sample (Series 2) of 4.08 g (wet weight).
Radiochemical yield tracers of aa2Pu and 2***Cm in HN03 solu-
tions were added to both sludge samples before any physical or chemical
processing of them was begun. Based on the results of the preliminary
analysis, 1.59 Bq of za3Pu (500 ul of solution in 3.5M HNO3) and 1.43 Bq
of 2**Cm (500 til of solution in 2H HNO3) were added to the 32.8 g of wet
sludge of Series 1. From the results of Pu and Am-Cm analyses of Series
1, the greater activities of 3.18 Bq of 2"Pu (1000 ul of 3.5H HNO3
solution) and 5.71 Bq of ""Cm (2000 nl of 2M HN03 solution) were added
to the 4.08 g wet sludge sample of Series 2. The 2*zPu tracer solution
was prepared by careful dilution of a sealed solution of US National
Bureau of Standards SRM 4334C ?'12Pu (31.75 Bq in 5 ml of 5M HNO3) to
10.00 ml in a volumetric flask with 2M HN03. The 2"Cm tracer solution
was prepared by successive dilutions of a sealed solution (1.428 x 10s Bq
in 5 ml of 1M HNO3) obtained from the Laboratoire de Hetrologie des
Rayonnements Ionisants (ORIS) in France to give a final activity
concentration of 2.86 Bq/ml in 100 ml of 2H HN03.
2.2.1 Series 1
The spiked sludge (32.8 g wet weight) in a porcelain evaporat-
ing dish was dried to a solid under a heat lamp for 6 hours and then
ashed at 500°C in an electric muffle furnace for 2 hours. The resulting
ash weighed about 6 g. It was transferred to a glass beaker for further
processing.
The chemical dissolution scheme of the ash is presented in
detail in Figure 1. After the last 14M HNO3 addition, solution #5 in a
Teflon beaker was evaporated to a thick green paste, which was
subsequently dissolved in 100 ml of 8M HN03 with heating and stirring.
3f
. - 6 -
Approximately 0-5 g of H3BO3 was added to complex any residual fluoride,
and the solution (150 ml) was transferred to a glass beaker.
After cooling and standing overnight at room temperature, a
gelatinous precipitate had formed and settled out from the clear, dark
green solution #6 (8M HNO3). The solution was carefully decanted into a
200 ml volumetric flask. The gelatinous residue was centrifuged and
washed twice with 15 ml portions of 8M HNO3, and the washings were added
to the volumetric flask. The solution was diluted to the mark with 8M
HNO3 and mixed thoroughly. This final solution of 200 ml in 8M HNOa was
designated the ACID-SOLUBLE fraction of sludge sample Series 1.
The gelatinous precipitate which had separated out from the 8M
HNO3 solution was filtered, washed, dried and ignited in an electric
muffle oven at 500°C for 1-2 h. This produced 2.13 g of a white, easily
powdered ash. This ash was designated the ACID-INSOLUBLE fraction of
sludge sample Series 1.
A total time of about 15 working days was required from the
removal of sludge sample Series 1 to the preparation of the final 200 ml
of 8H HNO3 solution (ACID-SOLUBLE fraction).
2.2.2 Series 2
The second spiked sludge sample (4.08 g wet weight) was dried
in a glass beaker for 4 hours until no liquid remained. The dried sample
was then wet-ashed without a dry-ashing step. The detailed chemical
dissolution scheme of the Series 2 sample is presented in Figure 2.
Perchloric acid was used in the wet-ashing procedure. In order to avoid
a possible metal perchlorate salt explosion, solution #4 (see Figure 2)
was not evaporated to dryness. The orange paste left after this step was
completely dissolved in 30 ml of warm 2M HNO3 and transferred with 2M
HNO3 rinses to a 50 ml volumetric flask. This final solution of 50 ml in
2H HNO3 and about 0.5M HC1O4 was designated the ACID-SOLUBLE fraction of
sludge sample Series 2.
- 7 -
The very small amount of brown residue (residue #2) was sus-
pended and suction filtered onto a 25 mm diameter, 0.2 \m (pore size)
membrane filter of Tuffryn HT-200 (Gelman Sciences, Inc.)- This sample,
which was subsequently dried in a vacuum desiccator and mounted for alpha
particle measurements, was designated as the ACID-INSOLUBLE fraction of
the sludge sample Series 2. (The dry mass of the residue was estimated
to be 5 to 10 mg.)
A total time of 4 working days was required from the taking of
sludge sample Series 2 to the preparation of the final 50 ml of 2M
HNO3-0.5M HC1CU solution (ACID-SOLUBLE fraction).
The difference in color of the ACID-SOLUBLE fractions of Series
1 (green solution) and Series 2 (orange solution) was attributed to the
presence of Cr(III) and Cr(VI), respectively, in these solutions.
(Chromium was present due to corrosion of stainless steel components.)
In Series 2, the final evaporation and HCld fuming produced the orange
dichromate species.
2.3 Radiochemical Separations in ACID-SOLUBLE Fractions
The radiochemical processing of the sludge samples was directed
towards producing separate purified Pu and Am-Cm sources suitable for
quantitative alpha-particle spectrometry. In most cases, a Th fraction
was also isolated to provide information on any Th isotopes present and
on the performance of the Pu separation from Am and Cm. The chemical
separation of Pu and Am was necessary because the detection signals from
the alpha particles of 23BPu[5.499 MeV (71%) and 5.457 MeV (29%)] were
not resolvable from those of 2"Am[5.486 MeV (86%) and 5.443 MeV (13%)]
with our spectrometry systems. Furthermore, for quantitative alpha
spectrometry sources are preferred in which the radioactive species have
been separated from all inert matrix material. In this way the optimum
sensitivity for radionucllde identification and quantitative measurement
is achieved with a combination of radiochemical purification and
well-prepared sources where spectral resolution is limited only by
detector and electronics characteristics.
- 8 -
Block diagrams of the radiochemical analysis procedures used
for aliquots of the ACID-SOLUBLE fractions of sludge samples Series 1- and
2 are presented in Figures 3 and 4, respectively. For Series 1, six
aliquots were taken for analysis, but only four of these analyses (1A
through ID) yielded results. Based on the first two analyses, it was
necessary to add additional amounts of 2a2Pu and z''*Cm spikes to the
later analyses (1C and ID) in order to adjust the activity concentrations
of the chemical yield tracers to be similar to those of the Pu and Am
species of interest. For Series 2, three aliquots were analyzed (2A, 2B
and 2C) and their results are also reported in this paper.
The major chemical processing steps used in the sludge analyses
with the ACID-SOLUBLE fractions of Series 1 and 2 (see Figures 3 and 4)
were as follows:
1) anion exchange column chromatography to produce separated
Pu, Th and Am-Cm fractions;
2) liquid-liquid solvent extraction of Am and Cm with
di-(2-ethylhexyl)phosphoric acid (HDEHP);
3) calcium oxalate precipitation between pH 2 and 3 to
coprecipitate Am and Cm oxalates;
4) liquid-liquid solvent extraction and supported liquid
phase extraction chromatography with a mixture of
n-octylphenyl-N.N-diisobutylcarbamoylmethylphosphine oxide
(CMPO) and tributylphosphate (TBP) for the separation and
purification of actinide fractions;
5) preparation of electrodeposited and NdF3 coprecipitated
sources for alpha spectrometry.
The ACID-INSOLUBLE fractions of Series 1 and 2 were also
investigated for the presence of alpha-emitting nuclides. A complete
discussion of the treatment of the ACID-INSOLUBLE fractions is deferred
until section 2.4. At this point, a more detailed discussion of the

- 9 -
major radiochemical techniques used with the ACID-SOLUBLE fractions is
presented.
2.3.1 Anion Exchange Column Chromatography
The primary radiochemical method used with nearly all of the
sludge analyses was the well-established technique of anion exchange
column chromatography. This technique allowed the separation of the Pu
component from aliquots of the dissolved sludge solutions (ACID-SOLUBLE
fractions) from Series 1 and 2. Under proper conditions, anionic
Pu(IV)-nitrate species are adsorbed onto the anion exchange resin from 8M
HNO3 while matrix components such as Fe(III), Cr(III) and Ni(II) as well
as Am(III), Cm(III)and Np(V) pass unadsorbed through the column. Only
Th(IV), U(VI) and possibly Pa(V) are adsorbed along with Pu(IV).
We adopted the anion exchange column chromatography procedure
of Holm and Ballestra [1] with only slight modifications. Four aliquots
of dissolved sludge solution from Series 1 (2 to 20 ml) and two aliquots
of dissolved sludge solution from Series 2 (2 ml each) were taken for Pu
separation by anion exchange column chromatography. The columns were
prepared from Dowex 1-X8 anion exchange resin, 100-200 mesh, chloride-
form (obtained from Sigma Chemical Co.). The resin, which had been
soaked in distilled water, was slurried into glass columns of about 1 cm
inside diameter with a glass wool plug at the bottom to a height of about
10 cm. A top layer of coarse quartz granules (0.2 to 0.5 mm diameter)
about 1 cm high was used to prevent disturbance of the resin during
solvent loading and washing operations. Then about 100 ml of 2H HNO3 was
passed through the column to convert the resin to nitrate form and to
wash out all of the chloride.
The dissolved sludge solution aliquots (ACID-SOLUBLE fractions
from Series 1 and 2) were adjusted to 8H in HNO3 (volumes 10 to 20 ml),
and solid NaN02 (0.2 to 0.5 g) was added to adjust Pu species to the
quadrivalent oxidation state. (The aliquots from dissolved sludge Series
2 in 2M HNO3 were first treated with 0.2 g of NH4I to reduce dichromate
to Cr(III) and Pu species to lower oxidation states. Then the iodide was
destroyed by boiling (conversion to I2 and volatilization). The solu-
tions were then made up to 20 ml of 8M HNO3 and 0.5 g NaNOz was added for

- io -
Pu oxidation state adjustment.) After 10 min to 1 h of standing, the
solutions were heated and boiled to destroy excess nitrite (which would
otherwise cause bubble formation in the resin column) and then cooled to
room temperature. The cooled 8M HNO3 solutions (10 to 20 ml) were loaded
onto the nitrate-form anion exchange columns (which had been conditioned
with 50 to 60 ml of 8M HN03 around 1 to 2 h before use) with 8M HNO3
rinses (15 ml) of containers. After the load solution and rinses had
passed into the resin, each column was washed with 50 to 70 ml of 8M HNO3
(in 4 or 5 portions) to remove any original feed solution and to elute
any U(VI) present. (The distribution coeffficients of U(VI) and Pu(IV)
between 8H HNO3 and strong base anion exchange resin are approximately
10T and 104, respectively.) This 8M HNO3 wash was collected along with
the feed 8M HNO3 solution in the same receiver, and this combined 8M HNO3
solution was designated as the Am-Cm fraction.
After the 8M HNO3 washing, 60 ml of 10 or 12M HCl was passed
through the columns to remove any Th(IV) which had adsorbed on the resin
as a nitrate complex along with Pu(IV). The Pu(IV) remained on the resin
as a chloride complex while Th(IV), which does not form a chloride
complex, was desorbed. The strong HCl washes were collected separately
as the Th fraction and sources for alpha spectrometry were prepared from
them (to be described later). The presence of actinides other than Th in
this column fraction provided information on the performance of the
chromatography column. (For example, the appearance of significant Pu
activity here would indicate a failure to absorb Pu quantitatively on the
resin. The presence of U would indicate an incomplete removal from the
resin during the 8M HNO3 washes.)
The Pu was finally removed from the column by eluting with 100
ml of 9M HCl - 0.1M NH«I. This reduces Pu species to Pu(III), which does
not form anionic complexes and is not adsorbed by the resin. The eluted
Pu was collected in a separate receiver as the Pu fraction for prepara-
tion of a source for alpha spectrometry.
2.3.2 Liquid-Liquid Extraction with HDEHP
The 8M HNO3 Am-Cm anion exchange column fractions of analyses
1A and 1C were prepared differently for the HDEHP extraction. In 1A, the

31
- n -8M HNO3 Am-Cm fraction was evaporated to dryness. The salt residue was
boiled with 100 ml of 0.3M HzSOa, and the solution was separated from
insoluble residue and adjusted to pH 2.2 to 2.5 with NHaOH addition. For
analysis 1C, the 8M HNO3 Am-Cm fraction was evaporated to 40 ml, diluted
with water and NHaOH was added to pH 11 (volume now 260 ml). The mixed
hydroxide precipitate was separated by centrifugation, redissolved in 20
ml of 8M HNO3 and evaporated nearly to dryness. The wet residue was
taken up in 100 ml of 0.3M H3S0a and adjusted to pH 2.2 to 2.5 with NHaOH
addition. From this point, the extraction chemistry of the Am-Cm frac-
tions 1A and 1C was identical. The dilute HaSO^ solution (pH 2.2 to 2.5,
volume 100 to 110 ml) was shaken in a separatory funnel with two 30 ml
portions of 20% HDEHP in toluene (by volume) to extract Am and On. The
organic phases were combined and washed twice with 30 ml of 0.07M HZSOA.
The Am and Cm were back-extracted by shaking twice with 30 ml portions of
9H HC1. Iron which had been extracted by the HDEHP along with the Am and
Cm was removed from the 9M HCl strip by shaking with 30 ml volumes of
diisopropyl ether until no further yellow color was observed in the ether
layer. The 9M HCl strip solution was then evaporated to dryness after
the addition of 1 to 2 ml of 5% NaHSO.,. The NaHSOa residue containing
the Am and Cm was then redissblved to prepare it for further purification
by supported liquid phase extraction chromatography using CMPO-TBP (see
section 2.3.4). In the case of analysis 1A, the dissolution of the
NaHSOa cake after evaporation left a small insoluble residue. Both the
supernate solution, which was further purified, and the residue contained
alpha-emitters. However, the presence of 2"1Am and s " d n could not be
definitely established in either fraction. In the case of analysis 1C, a
very good electrodeposited source was obtained with good spectral resolu-
tion leading to positive identification of 2J*1Am and z**Cm by alpha peak
energies.
2.3.3 Calcium Oxalate Precipitation
The coprecipitation of Am and Cm oxalates with Ca oxalate [1]
in the pH range of 2 to 3 was used as an alternative to the solvent
extraction with HDEHP. The 8M HNO3 Am-Cm fraction from the anion ex-
change column was evaporated to a salt residue and then converted to
chloride by repeated evaporation with 2-5 ml of 12M HCl. The chloride
residue was taken up in 100-150 ml of 1H HCl, 0.2 to 0.5 g NHZOH'HC1 was
- 12 -
added and the solution heated to destroy any oxidizing agents. To the
hot solution, 100 mg of Ca2t (as CaCl2) and 20 g of HzCz0^«2H20 crystals
were added and dissolved. Then about 15 to 18 ml of 13M NEUOH were added
in 1 ml increments over about 5 minutes until the pH was between 2.5 and
3 (tested with narrow range pH paper). During this time, calcium oxalate
crystals precipitated from the solution while metal ions like Fe, Cr, Ni
and Al were held in solution as oxalate complexes.
The dense calcium oxalate precipitate was easily filtered by
gravity or centrifuged, washed and re-dissolved in about 5 ml of 14M HNO3
with not digestion. After dilution to about 1M HNO3, a second calcium
oxalate precipitation was done with 20 g of fresh oxalic acid and adjust-
ment to pH 2,5 to 3. This second calcium oxalate was also filtered or
centrifuged, washed and re-dissolved by digesting with 5 to 10 ml of 14M
HN03 (and sometimes 1-2 ml of 12M HCiOa) to destroy oxalate completely.
The evaporated Ca residue was dissolved in 10 ml of 2M HN03/0.5M A1(NO3)3
and passed through a CMPO-TBP column for further purification of Am and
Cm (see next section) and in preparation for electrodeposition or
coprecipitation with NdF3.
2.3.4 Extraction with CMPO-TBP
The relatively new bi-functional extractant n-octylphenyl-N,N-
diisobutylcarbamoylmethylphosphine oxide (CMPO) is capable of complexing
and extracting trivalent actinides (as well as tetra- and hexavalent
actinides) with great selectivity from moderately concentrated (1-7M)
nitric acid solutions. Horwitz et. al. [2] have studied mixtures of CMPO
and tributylphosphate (TBP) in various diluents and developed the TRUEX
process for removing Am(III) and other actinides from transuranic-bearing
waste streams from nuclear fuel reprocessing plants.
Mixtures of the extractants CMPO and TBP were used in two
different applications in the sludge analysis. These were as follows:
1) A solution of 0.25M CMPO and 0.75M TBP in CHC13 was used
in the liquid-liquid solvent extraction of actinides from
an aliquot of Series 2 ACID-SOLUBLE sludge fraction.

33
- 13 -
2) A solution of 0.75M CHPO in TBP sorbed onto an inert
support was used in an extraction chromatography column to
provide a final purification step for Pu, Th and Am-Cra
fractions prior to source preparation for alpha
spectrometry.
In the first application, this CMPO-TBP solvent extraction
method was tested in analysis 2C as a more rapid alternative to the ion
exchange column method for separating actinides from the matrix solution.
One 5 ml aliquot from the 50 ml solution of the ACID-SOLUBLE fraction of
Series 2 (2M in HNO3 and Q.5M in HClOA) was shaken with 5 ml of 0.25M
CMPO/0.75M TBP in CHC13 for 1 min in a 50 ml, plastic capped centrifuge
tube, and then centrifuged for 2-3 min to separate phases. The organic
phase was carefully transferred with a pipet to a clean centrifuge tube.
It was then shaken successively with two 5 ml portions of 1M HN03 and
then two 5 ml portions of 0.1M NHaHC3Oa- All of the aqueous fractions
were analyzed for actinide activity by preparing NdF3 coprecipitated
sources, and Pu, Am and Cm were found to have extracted to a large degree
into the organic CMPO-TBP solution (see Results, section 3.1.5).
The second application of CMPO-TBP for the final purification
of anion exchange column fractions was used more extensively (see Figures
3 and 4). The supported liquid phase consisted of a solution of 0.75M
CMPO in TBP which was coated onto an inert support of Amberlite XAD-7
polyester beads, 100-120 mesh (0.69 ml of CMPO-TBP solution per 1 g of
purified XAD-7). A supported liquid phase extraction column (CMPO-TBP
column) was then prepared by loading a slurry of 0.5 g of coated XAD-7 in
water into a disposable glass Pasteur pipet (inside diameter = 5 mm,
barrel length = 100 mm, total length = 230 mm) containing a small glass
wool plug. The settled resin (height = 50 mm) was held in place by a 0.5
cm top layer of coarse quartz granules (0.2 to 0.5 mm diameter). A small
plastic 60° funnel (50 mm diameter) wss attached as a reservoir by means
of 1 cm piece of plastic tubing. The CMPO-TBP columns were conditioned
prior to use by passing 20 ml of 2M HNO3 followed by about 3 ml of 2M
HN03/0.5M Al(NO3)3 through the column bed.
The Pu and Th fractions from the anion exchange columns were
evaporated with an addition of 1 ml of 5% NaHSO^ and several additions of

- 14 -
14M HNO3 until only a white NaHSOa residue remained. This prevented the
Pu and Th activities from baking onto the glass surface of the beakers
[3]. This NaHSQd residue, when dissolved in 10 ml of 2M HN03/0.5M
A1(NO3)3, was ready to be passed through the CMPO-TBP column. In the
case of the Am-Cm fractions purified by coprecipitation with calcium
oxalate, the final calcium oxalate was dissolved in HNO3 and evaporated
down with several 14M HN03 additions to destroy oxalate. The calcium
nitrate residue was dissolved in 10 ml of 2M HN03/0.5M A1(NO3)3.
Trivalent Am and Cm and tetravalent Th species were presumably present in
the 2M HN03/0.5M A1(NO3)3 solution, and Pu species were also thought to
be predominately tetravalent. After passing the 10 ml of 2M HNO3/0.5M
A1(NO3)3 feed solution through the CMPO-TBP column to extract III-, IV-
and Vl-valent actinides, two-2 ml portions of 1M HNO3 were passed through
the column. This served to remove any adsorbed Fe(III) traces (sometimes
visible as a light yellow band near the top of the column) and also to
wash through unadsorbed species such as Ca(II) and Al(III). (The 0.5M
A1(NO3)3 increased the nitrate ion concentration and thereby enhanced the
extraction of the actinides into the CMPO-TBP phase.) The purified
actinides were then stripped from the CMPO-TBP column by 9 ml of 0.1M
NH«HC2O«, and this strip solution was delivered directly into a Teflon
cell for electrodeposition or into a plastic centrifuge tube for prepara-
tion of a NdF3 coprecipitated source. (Details of source preparation are
discussed in section 2.3.5).
2.3.5 Source Preparation for Alpha Spectrometrv
After the radiochemical purification procedures used with the
ACID-SOLUBLE sludge fractions, the final sources for alpha spectrometry
were prepared in one of the following two ways:
1) by electrodeposition of actinides from a sulfate medium
onto a stainless steel disk;
2) by coprecipitation of actinides with a NdF3 precipitate
and filtering onto a low-porosity membrane filter.
Electrodeposition has the advantage that it can produce sources
with the highest resolution (i.e., resolution limited only by detector

- 15 -
characteristics). The major disadvantages are (1) that it is sensitive
to the presence of even micrograms of impurities such as Fe, Al, Ti and
other elements which can form deposits that degrade the alpha spectral
resolution, and (2) that it requires the use of relatively expensive
regulated power supplies, some type of plating cells and costly Pt
electrodes. The method of coprecipitation with a rare earth fluoride has
the advantages that it is relatively fast, uses only simple filtering
equipment and tolerates even milligram amounts of impurities such as Fe,
Al and Ti. The major disadvantage is the reduced spectral resolution
compared to the electrodeposited type of source.
2.3.5.1 Electrodeposition
Electrodeposition was carried out in Teflon plating cells,
which are depicted schematically in Figure 5. The cell volume was
appropriate for 10 to 15 ml of solution with the Teflon cap in place.
The distance of the Pt wire electrode loop (about 6 to 7 mm diameter)
from the polished stainless steel disk (18 mm diameter, 0.6 mm thickness)
cathode was adjusted to about 10 mm. The diameter of the deposit area
was about 13 mm on the disk after electrodeposition.
A variant of the electrodeposition method of Kressin [3] was
used. Typically, the 0.1M NHdHC2Od strip eluate (9 ml) of a CMPO-TBP
column used for final purification of a Pu, Th, or Am-Cm fraction (see
previous section) was collected directly in an assembled plating cell.
Then 1.5 ml of 5% NaHSOa and 3 ml of 15% NazSOa solutions were added as
electrolytes and the solutions were mixed. The pH of the solution was
about 2.5. The Pt anode-Teflon cap assembly was put in place and the
current leads were attached to the cell. The power supply was adjusted
to limit the current to 1 ampere, and the voltage was typically around 9
to 12 volts. The electrodeposition at 1 ampere lasted for 2 to 3 hours,
at which point 2 ml of 4H KOH was added to "quench" the system (to
prevent re-dissolution of the deposited actinides after turning off the
voltage). Current was passed for 5 to 10 minutes after the KOH addition
to allow complete mixing. When the voltage was turned off, the cell was
immediately emptied, rinsed with distilled water several times and
disassembled. The stainless steel disk with deposit was rinsed with a
stream of distilled water, then with absolute ethanol, and air dried at
- 16 -
room temperature. These sources were used for alpha spectrometric
measurements without flaming.
2.3.5.2 Coprecipitation
The method of source preparation by coprecipitation of
actinides with NdF3 was taken from Hindman [4]. It was used with analy-
ses IB (Series 1) and 2C (Series 2) (see Figures 3 and 4).
In analysis IB, the Pu and Th fractions from the anion exchange
column were evaporated with 14M HNO3 several times after the addition of
2 ml of 5% NaHSO4. After the last evaporation, each NaHSO4 residue was
dissolved in 10 ml of 1M HC1, about 0.2 g of NH3OH«HC1 was added, and the
solution was heated to boiling to promote reduction of Pu species to
lower oxidation states (Th is always tetravalent in solution). The
cooled solutions were transferred to plastic 50 ml centrifuge tubes with
1M HC1 rinses, diluted to 25 ml with 1M HCl and 50 ug of Nd3* (100 \il of
0.5 mg/ml Nd in 0.2M HN03) were added to each solution. Then 5 ml of 23H
HF was added to each tube to precipitate NdF3. After 15 to 20 min, the
solution (the 70 ug of NdF3 precipitate was not visible) was filtered
through a substrate of about 140 ug of NdF3 on a 25 mm Tuffryn HT-200
(polysulfone) membrane filter with a 0.2 um pore size (Gelman Sciences
Co.). The tube was rinsed with about 5 ml of 2H HF and the rinse added
to the filtered sample. Lastly, a few ml of 2M HF and then 1 to 2 ml of
an 80% ethanol-water mixture (by volume) were used to wash the filtered
precipitate. Air was drawn through the filter for about 1 minute, then
it was demounted, dried in a vacuum desiccator for 0.5 to 1 h and mounted
with fast-drying glue onto an aluminum disk (diameter = 25 mm, thickness
= 0.5 mm) for alpha spectrometry.
In analysis 2C, the two 1M HNO3 strips (5 ml each) were diluted
to 30 ml with water and the two 0.1M NH4HCaOa strips (5 ml each) were
diluted to 30 ml with 1M HCl, 0.5 g of NHZOH-HC1 and 50 ug of Nd3* were
added to each, and 5 ml of 23M HF were added to precipitate NdF3
coprecipitating Pu, Th, Am and Cm (see Figure 4). The original aqueous
solution (after extraction) was treated similarly, but a substantial
gelatinous precipitate (probably CaFa) formed upon addition of 5 ml of
23M HF. This was re-dissolved in H3BO3 and 12M HCl (1 ml), iron
- 17 -
hydroxide was precipitated three times (to separate Pu, Th, Am and On
activities from Ca) and a final NdF3 was precipitated from the dissolved
iron hydroxide. All of these NdF3 sources were filtered and mounted for
alpha spectrometry in the manner described for those from analysis IB.
2.4 Treatment of ACID-INSOLUBLE Fractions
In Series 1, 0.47 g out of 2.13 g of the acid-insoluble ash
(see section 2.2.1 and Figures 1 and 3) was dissolved by means of a hic,h
temperature (- 1000°C) fusion with a few grams of KF in a Pt crucible.
This was followed by transposition to sulfate with H2SO4 according to the
method of Sill et. al. [5]. The solidified sulfate melt was dissolved
completely in 5 ml of 12M HC1 and 20 ml of water and made up to 50 ml of
about 1M HC1 in a volumetric flask. A 5 ml aliquot of this solution was
taken, 50 ng of Nd(III) were added, and it was diluted to 25 ml with 1M
HC1 and treated with 0.2 g NHzOH*HCl to reduce Pu species to lower
oxidation states. The subsequent attempt to prepare a NdF3
coprecipitated source by addition of 5 ml of 23M HF was accompanied by
visible cloudiness after 15 minutes. Upon centrifugation, a small
precipitate (probably CaFs and NdF3) was separated from the now clear
solution. The precipitate was dissolved in about 15 ml of water contain-
ing 0.3 g H3BO3 and 1 ml of 12M HCl. Tc this solution, 2 mg of Fe(III)
carrier was added, and iron hydroxide was precipitated three times (the
last time from about 120 ml of solution) to remove Ca. The final iron
hydroxide precipitate was filtered, washed, dissolved off the filter
paper (S&S No. 1505) with 5 ml of 12M HCl and 25 ml of water, and heated
with 0.5 g of NH2OH«HC1 reductant. This solution was transferred to a
plastic centrifuge tube and 5 ml of 23M HF was added (total solution
volume about 40 ml) to precipitate NdF3. This time no cloudiness was
observed after standing overnight, and the solution was filtered in the
usual manner to produce a NdF3 coprecipitated source for alpha
spectrometry (see section 2.3.5).
The ACID-INSOLUBLE fraction of Series 2 was so small (5 to 10
mg) that it was directly filtered onto a membrane filter and used as a
source for alpha spectrometry without further processing.

• * • *
#
- 18 -
2.5 Alpha Spectrometry
The alpha spectrometers used in the measurement of sources
prepared from sludge analyses Series 1 and 2 were the Tennelec model
TC257 and the EG&G Ortec model 676 units. Both of these NIM-module units
had built-in detector bias supplies and electronics for pulse shaping and
amplification. The biased amplifier signal outputs of the Tennelec and
Ortec spectrometers were selected with the 3 to 8 HeV and 4 to 7 MeV
ranges, respectively. These outputs were connected to an EG&G model 917
ADCAH multichannel buffer by means of an EGSG model 476-4 multiplexer.
The ADCAM system in turn communicated with an IBM PC-AT equipped with
multichannel analyzer emulation capability. The vacuum chambers of both
spectrometers were connected to an oil-filled, rotary vane vacuum pump
which evacuated to a pressure of 0.03 mbar. Both spectrometers contained
planar silicon surface barrier detectors supplied by their respective
manufacturers. The nominal sensitive areas of the detectors were 1000
mm2 (in the Tennelec unit) and 600 mmz (in the Ortec unit). The alpha
spectrum from each spectrometer was acquired in a 1024 channel memory
segment.
The experimentally measured energy gains of the Tennelec and
Ortec spectrometers were 5.07 and 3.32 keV/channel, respectively, in the
3-8 MeV (Tennelec) and 4-7 MeV (Ortec) ranges.
The resolution of both detection systems was measured in the
closest sample position (3 to 5 mm distance from the detector surface) at
a pressure of 0.03 mbar using a source of aizBi-ai2Po activity which was
electrostatically deposited onto a stainless steel disk (18 mm diameter)
exposed to gaseous 22ORn (thoron) [6]. This source provided a high
activity of zl2Po, which emits mono-energetic alpha rays of 8.784 MeV
energy; furthermore, the short half-lives of all of the deposited species
(21zPb, 10.6 h; a l 2Bi, 1.1 h; 31zPo, 0.3 us) ansured that there was no
long-lived recoil contamination of the detectors. The measured resolu-
tions of the detectors for the closest sample position at 0.03 mbar
pressure were 53 keV and 35 keV full width half maximum (FWHM) of the2xaPo 8.784 MeV alpha peak for the 1000 mm2 (Tennelec) and 600 mm*
(Ortec), respectively.
- 19 -
The energy calibration of the detectors was made experimentally
by measuring evaporated and electrodeposited sources of Z3aU-Z3-*U, Z4ZPu,23<3Pu, z"Am, zalAm and a*ACm. The plot of alpha energy vs. channel
number was linear for both detectors over the range of energies (4.0 to
6.0 MeV) studied, and a linear least squares fit to the data provided the
calibration parameters.
The alpha peak detection efficiencies of the detectors for both
electrodeposited and coprecipitated sources (see section 2.3.5) in the
closest sample counting position were measured by preparing standards of
known disintegration rates in the form of evaporated, electrodeposited
and coprecipitated sources. The evaporated and electrodeposited sources
were both prepared on 18 mm diameter stainless steel plates with the
active deposits confined to an area of about 13 ram diameter in both
cases. These included Z3au-Z3*u, " aPu, Z39Pu, zdlftm and 2 " C m deposits.
The active area of the 2'aaAm, z39Pu and za2Pu coprecipitated sources
(NdF3) was 23 mm in diameter. The alpha counting rates of standards of
the same nuclide and type of source were measured with a large area (26
cmz) proportional counter (Tennelec LB-4000 system) to ensure that the
disintegration rates were identical to within a one-sigma level relative
uncertainty of 2%.
The relevant characteristics of the alpha spectrometry systems
and the experimentally measured peak detection efficiencies are summa-
rized in Table 2. The resolutions of alpha peaks of Po, Th, Pu, Am and
Cm nuclides in all sources prepared from the sludge analyses of Series 1
and 2 were between 50 and 100 keV FWHM for both detectors.
Typical alpha spectra of sources prepared from purified Pu, Th
and Am-Cm fractions of the Series 1 and 2 sludge analyses are illustrated
by Figures 6 through 11.
- 20 -
3. Data Analyses of alpha Spectra
Digital alpha particle energy spectra were acquired in 1024
channels of memory for sources prepared from the radiochemically separat-
ed Puf Th and Am-Cm fractions of the ACID-SOLUBLE fractions of sludge
analysis Series 1 and 2 and also for the two sources prepared from the
ACID-INSOLUBLE fractions (see sections 2.3, 2.4 and 2.5). The data were
reduced by manual analysis of each spectrum. Peak areas were determined
by summing the number of counts in 60 to 100 channels depending on the
spectral resolution (peak FWHM). Blank and background corrections were
negligible in most cases. Corrections for the "tailing" of one peak
under another at lower energy had to be applied in many cases. The alpha
peak detection efficiencies of the systems were calibrated with evaporat-
ed, electrodeposited and NdF3 coprecipitated sources prepared from stock
solutions with known activities of various U, Pu, Am and Cm nuclides (see
section 2.5). The variation of peak detection efficiency as a function
of the number of channels used in computing the peak area was also taken
into account. Special problems in the data analysis of some spectra are
briefly discussed in zhe following paragraphs.
3.1 Series 1 Analyses
3.1.1 Pu fractions
In analyses 1A and IB, the activity concentrations of the z*zPu
radiochemical yield tracers were only about 5% of the :z33-2«°pu values of
the samples. The poor quality of the electrodeposited sources in both
cases decreased the spectral resolution and caused the very small z*zPu
alpha peak to lie on the low energy tail of the much larger Z 3 9- z* Dp u
peak (see Figures 6a and 6b). The contribution of the a39'2»°pu tail to
the 2*zPu peak was estimated by using the low energy tail of the z3BPu
peak in the same spectrum and adjusting for the slight difference in peak
areas. In analysis 1A, the area of the estimated tail contribution was
35% of the total area under the 2"*zPu peak; in analysis IB, it was 72%
because of the lower spectral resolution. This is the reason for the
very large relative uncertainties of 7% and 25% (one standard deviation)
in the radiochemical recoveries of the a""Pu tracer for analyses 1A and
IB, respectively (see section 4).
- 21 -
In analyses 1C and ID, the extra 2a2Pu spike that was added to
each 2 ml aliquot of the ACID-SOLUBLE fraction was 20 times the amount
that would have been present from the initial spiking of the sludge
sample. This additional spike made the concentration of 2ia2Pu much
closer to that of 239-2"lopu an,3 Z3Spu from the sample and thereby mini-
mized tailing problems (see Figure 7a). However, it lowered the sensi-
tivity of the analyses because of losses of Pu which might have occurred
in the sludge ashing and dissolution operations prior to the extra spike
addition.
3.1.2 Am-Cm fractions
In analysis 1A, positive identification of 2*1Am and a"Cm
could not be made in either the electrodeposited source or the insoluble
material filtered off prior to the CMPO-TBP column purification (see
section 2.3.2). This was because the alpha peaks were very broad and
consequently the tentative energy assignments uncertain. Therefore, a
result for the 2<11Ain activity concentration was not obtained here.
In analysis IB, the alpha peak energy assigments clearly
indicated the presence of z*1Am and 2**Cm (see Figure 8a). The '"Cm
peak intensity was only 1.5% of that of the ^'Am. However, the z*'*CSn
peak occurred at a higher energy than the 2illAm (unlike the case of 2-l2Pu
and "13-2'loPu). Thus, the relative uncertainty in the 2"Cm
radiochemical yield due to counting statistics could be made small by an
appropriately long counting time.
In analyses 1C and ID, the extra 2a*Cm spike added to each 2 ml
aliquot of the ACID-SOLUBLE fraction was again 20 times the amount that
would have been present from the initial spiking of the sludge sample.
The sensitivity of the 2alAm determination was therefore lowered in the
same way as discussed under the Pu analyses in 1C and ID previously.

- 22 -
3.2 Series 2 Analyses
3.2.1 Pu fractions 2A and 2B
In thesa analyses there appeared to be incomplete adjustment of
the Pu species to the tetravalent oxidation state before loading onto the
anion exchange column. This is supported by the appearance of 5.6% and
5.1% of the total 242Pu (and the other Pu isotopes) in the Th fractions
2A and 2B, respectively (see Figures 9a and 9b), and by the appearance of
11.2% and 7.6% of the ~azPn (and the other Pu isotopes) in the Am-Cm
fractions of 2A and 2B, respectively (see Figure 8b). The alpha spectra
of the Pu fractions appeared to be radiochemically pure. Both
electrodeposited Pu sources were very good, and the resolutions of the Pu
alpha peaks in the spectra were limited only by detector characteristics
in the particular sample geometry. In analysis 2A, a 0.8% relative
correction to the 23<3-a-iapu peak (from the 23BPu peak) and a 5.2% rela-
tive correction to the 2<l2Pu peak (from the 239-z'loPu peak) due to low
energy peak tailing were calculated. In analysis 2B, no corrections were
applied because the sharply defined alpha peaks were well resolved from
one another (see Figure 7b). This difference was due to (1) the smaller
gain of the spectrometer used for analysis 2B (3.32 keV/channel compared
to 5.07 keV/channel for analysis 2A) and (2) the higher resolution of the
smaller detector (600 mma vs. 1000 mm3) used in analysis 2B.
3.2.2 Am-Cm fractions 2A and 2B
In these analyses the 2*TAm and z"Cm alpha peaks were posi-
tively identified by energy in the alpha particle spectra (see Figure
8b). Due to the presence of small amounts of Pu in the Am-Cm fractions
(see section 3.2.1), corrections had to be applied for the contribution
to the 2*1Am peak from 23SPu (2.7% and 1.7% relative contributions for 2A
and 2B, respectively). There was also a contribution here from the
low-energy tailing of the 2"Cm peak into the 2"1Am peak (4.4% and 0.22%
relative contribution for 2A and 2B, respectively). Finally, in analyses
2A and 2B, a small peak from 21°Po was present on the low energy side of
the 2dlAm peak. However, this potential interference was avoided by
choosing the region of integration of the a*1Am peak to be just above the

• - 23 -
high energy limit of the 21°Po peak and by adjusting the peak detection
efficiency accordingly.
3.2.3 Analysis 2C
The results of this analysis are given special consideration
because of the novel and rapid radiocheraical procedure used here. In
analysis 2C, the actinide-loaded CHPO-TBP chloroform phase was contacted
first with two 1M HNO3 strips and then with two 0.1M NHdHCzOd strips (see
section 2.3.4). The alpha spectra of NdF3 sources prepared from these
strips (see section 2.3.5.2) are presented In Figures 10a through lib.
It is apparent from these spectra that the separation of Pu from Am and
Cm is quite good. The percentages of Pu and Am-Cm chemical recoveries in
each fraction (determined from the 2*2Pu and 2"Cm alpha peaks) are
presented in Table 3. The overall recoveries of Pu and Am-Cm are 78% and
93%, respectively, with apparently negligible amounts of these species
left in the original aqueous sludge solution after the CMPO-TBP extrac-
tion. The reason for the lack of Pu material balance is not known. One
possibility is incomplete stripping of Pu from the CMPO-TBP phase.
Another may be that some of the Pu existed in the V or VI oxidation state
and was not reduced and coprecipitated with the NdF3.
From the alpha spectra (Figures 10a and 10b), values for the
activity concentration of "'Am were calculated from both the first and
second 1M HNO3 strips. Small corrections to the 2alAm peak had to be
made for tailing from the 2"Cm peak (3.7% and 2.7% for the first and
second 1H HNO3 strips, respectively) and for the contribution from 23aPu
(1.6% and 6.7% for the first and second 1M HN03 strips, respectively).
Unlike analyses 2A and 2B, there was no evidence of 21°Po in these
spectra.
The activity concentrations of the Pu nuclides were calculated
from the first oxalate strip (Figure lla). An 18% relative correction
was applied to the 23SPu peak to take into account the contribution from2iaxAm (calculated from the z*'*Cm peak). Tailing corrections were also
applied: the relative contribution of the 23sPu + 2*aAm tail to the2 M'"°?a peak was 5.5%, and that of the 239'24OPu tail to the 2"Pu peak
was 8.3%.

- 24 -
4. Results
Table 4 presents the results of the Pu analyses for both Series
1 and 2 ACID-SOLUBLE and ACID-INSOLUBLE fractions. Similarly, Table 5
presents the associated Am and Cm results. The weighted average activity
concentrations for the ACID-SOLUBLE fractions of each series are computed
for a3SPu, 239-z'Iopu and 2ulAm. The corresponding average values overlap
in all cases within one standard deviation of the mean (total random
errors). It is noteworthy that the Pu and Am activity concentrations
determined in analysis 2C (the rapid CMPO-TBP solvent extraction method)
are in reasonably good agreement with the other values determined by the
slow but reliable methods of anion exchange chromatography and calcium
oxalate coprecipitation.
The activity concentrations associated with the ACID-INSOLUBLE
fractions are the result of a single determination for each series.
Since no chemical separations of Pu and Am-Cm were performed for them,
only a combined Z3BPu and 2alAm estimate is given in the tables. For
these reasons, the ACID-INSOLUBLE results are listed separately and not
combined with the ACID-SOLUBLE results.
- 25 -
5. Discussion
The main conclusions drawn from the experience gained in the
sludge analysis are as follows:
a) The dissolution of the sludge matrix is time consuming, and a
larger sample requires a longer time for chemical and physical
manipulations. A combination of dry ashing and wet digestion
is preferable compared to wet ashing using perchloric acid in
excess. The use of perchloric acid poses a significant safety
hazard and introduces some chemical problems. As an example of
the latter, the fuming perchloric acid oxidized chromium
species to dichromate, which then interfered with the oxidation
adjustment of Pu species to Pu(IV) just before the anion
exchange column step in analyses 2A and 2B. The use of a
Teflon-lined pressure digestion bomb in dissolving the residue
from the dry ashing step is worthy of consideration.
b) The anion exchange chromatographic separation of Pu from other
actinides and the complex matrix solution is relatively slow
but gives consistently high radiochemical yields and purities
for Pu. It is possible for the analyst to run several columns
simultaneously and to complete the loading, washing and strip-
ping of the Pu within one working day. However, plugging of a
column due to fine particulate matter in the feed solution is
very often encountered and is a distinct disadvantage for this
method.
c) The calcium oxalate coprecipitation of Am and Cm separates the
trivalent actinides from Fe, Al and phosphate but it is rela-
tively slow and requires a further separation of Am and Cm from
Ca before final source preparation. It appears to be more
reliable than the HDEHP solvent extraction which requires
careful pH adjustment and suffers from interference by iron
co-extraction.
d) The CMPO-TBP extractant sorbed on a solid support is very
useful as a final clean-up of the Pu, Th and Am-Cm fractions
- 85S3«.6B SECONDS20
- 26 -
prior to electrodeposition. It is also a convenient means to
separate Am and Cm from 100 mg of Ca (after Ca oxalate steps)
before a final NdF3 source preparation.
e) The liquid-liquid solvent extraction with CHPO-TBP in chloro-
form provides a rapid separation of actinides from the dis-
solved sludge in nitric acid solution. Trivalent Am and Cm are
further separated from Pu(IV) by 1M HNO3 strips of the organic
phase. The Pu is finally stripped from the organic phase by
0.1M NHaHC2Oa. Coprecipitation sources with NdF3 are easily
prepared from the strip solutions. The solvent extraction and
NdF3 source preparations can be performed within one working
day. The good quality of the alpha spectra lead to quantita-
tive analyses of both Pu and Am species. Iron (III) interferes
by extracting into the CMPO-TBP, and in sufficiently large
amounts, can prevent trivalent actinide extraction by saturat-
ing the extractant. A separation of Pu from Th must be devel-
oped (perhaps by reduction of Pu species to the trivalent state
and stripping with 1M HNOa) in case the sample contains consid-
erable amounts of Th activity. Further investigation of
actinide extraction using CMPO promises to provide rapid and
selective separation methods for a variety of important matrix
materials.
f) The coprecipitation of actinides with NdF3 to prepare a final
source for alpha spectrometry measurement is rapid (less than 1
h) and provides sources with acceptable energy resolution
(typically 60 to 100 keV FWHM with our spectrometry systems).
This method tolerates milligram amounts of such impurities as
Al, Fe, Ni, Ti and other metals. Rare earths and Ca give rise
to major interferences and must be absent. Although the
resolution is lower than with good electrodeposited sources (40
to 50 keV FWHM with our systems), the NdF3 coprecipitation
method is recommended over the electrodeposition method when
speed is necessary, the degree of purification is not suffi-
ciently good for electrodeposition or there is a very large
number of samples to be processed.
(oO
life*.
List of Tables
Table 1 Results of Homogeneity Testing of Sludge by Gamna-RaySpectrometry
Table 2 Characteristics of Alpha Spectromatry Systems UsedWith the Sludge Analyses
242 244Table 3 Distribution of the Recoveries of Pu and Cm Spike
Activities Among the Fractions of Analysis 2C
Table 4 Results of Analyses of Acid-Soluble and Acid-InsolubleSludge Fractions for Plutonium Nuclides
Table 5 Results of Analyses of Acid-Soluble and Acid-InsolubleSludge Fractions for Americium and Curium Nuclides
m a m
41
U
inu 1
a*m
0•-Ia
CM
+1
6391
mCM
+1
6079
enCM
+1
6111
CMCM
+1
6081
ini-i
+
6165
o4-1en91m
o4-1CM
CM
in
O
+1
m
o+1
• *
m
en-i-len<•
m
CO
d+1r»
d-l-lo>m
d+1CO
oor»
d+1
COvO
+iCM
inr»
in
PI
+1CO
o• *
+191
CM09
r-4
-T
+1-O
CM
>*•
cn+1( j i
«j
CM
4-1<cCMCO
hi
!
Ed
a
6mM
Sas
(A
a
>
•-4IS
3•H
•H
ai
na)
n•uwaioc3
o
bJJ(A
•H•o
(4J J(9
•O4)
O
41•O
"2IS
•a
%JJ
CAo
l l 4)ffl >
•H 41
U41
b
40 -HC ffl
JJ 41e c3 O
e41
4)
03
3.41 41
o a
(11
•a41
a{
4) *4)> g
2a)
TYPE - - 1 MCA # 2 SEGMENT f
TABLE 2
CHARACTERISTICS OF ALFBA SPECTROMETRY SYSTEMSUSED WITH THE SLUDGE ANALYSES3
Spectrometer type
Detector area (mm^)
Alpha energy range (MeV)
Best achievable resolution
TENUELEC
100Q
3.0 to 8.
53
TC 257
0
ORTEC
600
3.7 to
35
676
7.1
at closest sample positionFWHH(keV)
Detection efficiency atclosest sample position**(1):
Electrodeposited source(diameter = 13mm)
NdF3 co-precipitatedsource (diameter = 22mm)
36
30
25
21
Footnotes
a See sections 2.3.5 and 2.5 for additional details.
b Typical operating pressure was 0.03 nibar in spectrometer chambers duringmeasurements.
60241.78
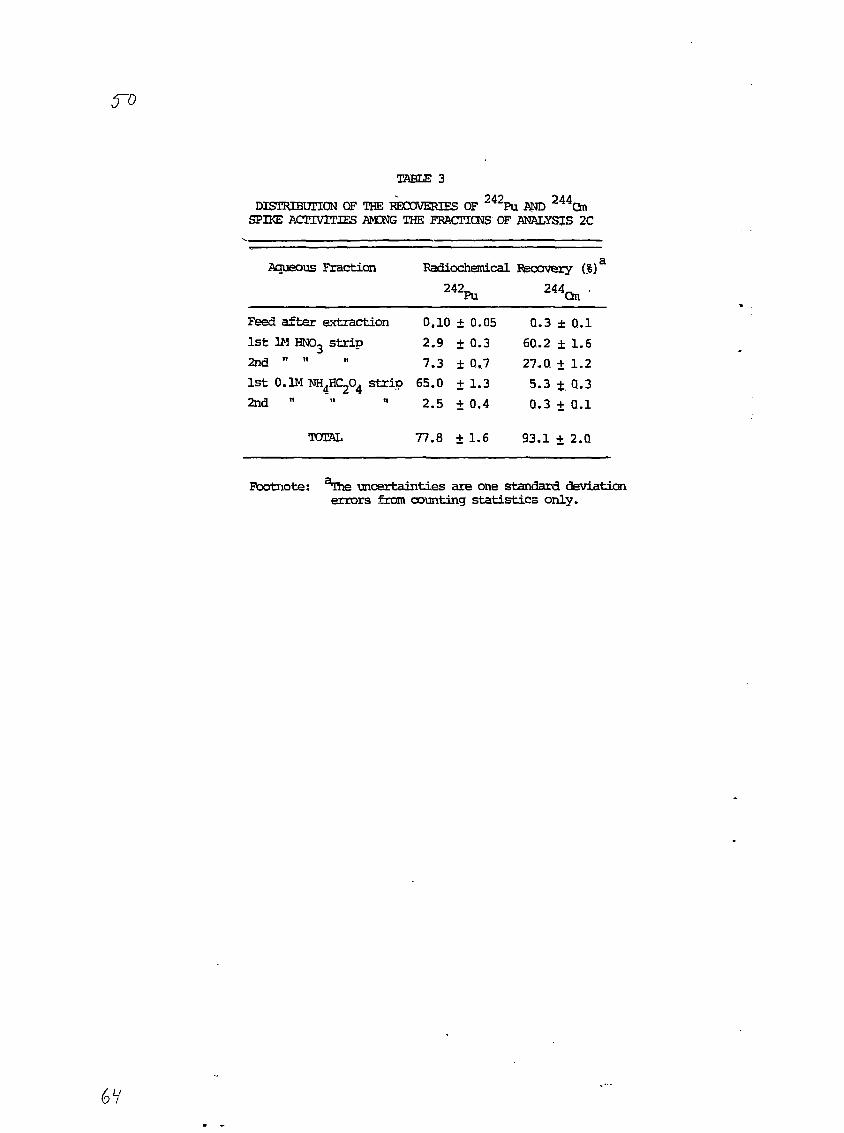
TABLE 3
DISTRIBUTION OF THE RECOVERIES OF 242Pu AND 2 4 4QnSPIKE ACTIVITIES AMCNG THE FRACTIONS OF .ANALYSIS 2C
Aqueous Fraction Radiochemical Recovery (.%)a
24 2 p u 244Cm
Feed after extraction 0,10 ± 0.05 Q.3 ± 0.1
1st 2JA HNO3 strip 2.9 + Q.3 60.2 ± 1.6
2nd " " " 7.3 + 0,7 27-Q + 1.2
1st 0.1M NH4HC_O4 strip 65.0 +1.3 5.3 + Q.3
2nd " " " 2.5 + 0,4 Q.3 + Q.I
TOTAL 77.8 ± 1.6 93.1 ± 2.0.
Footnote: aThe uncertainties are one standard deviationerrors from counting statistics only.
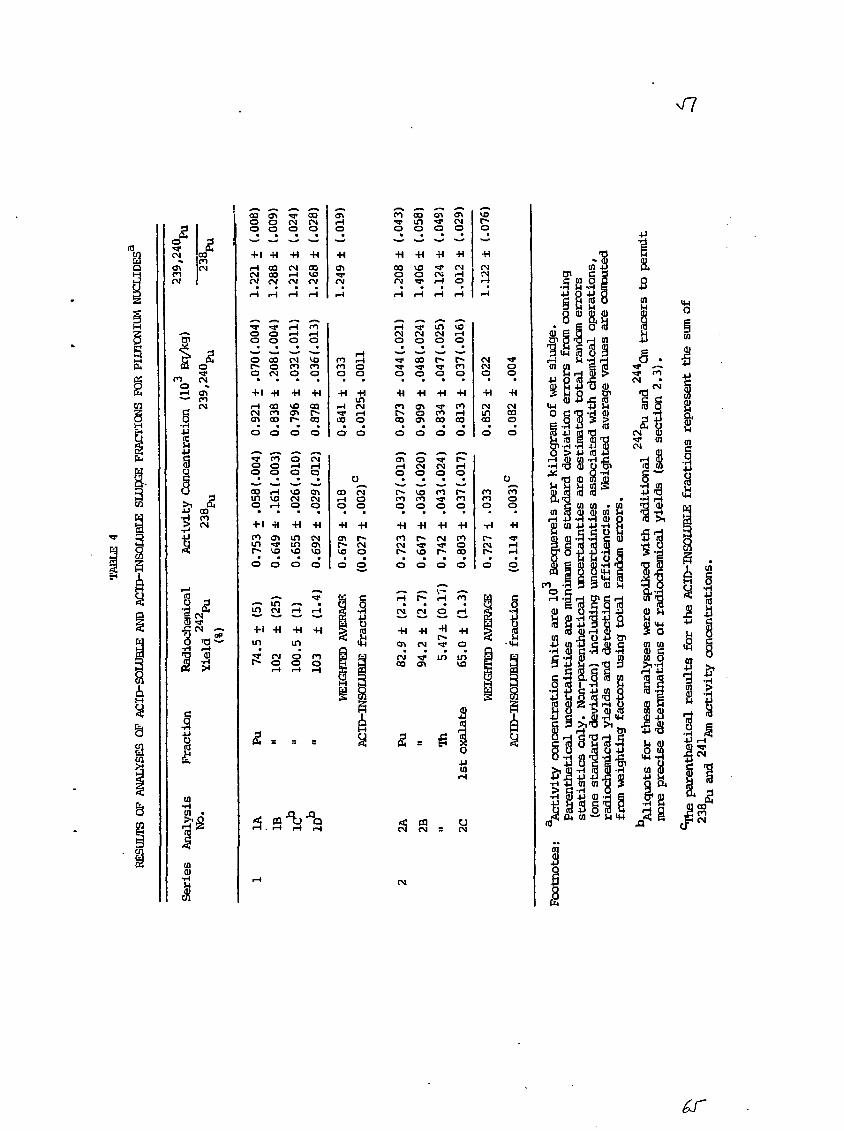
v/7
cnenCM
CM -->
1
(.008
+i221
[.009
44
288
(.024
44
212
(.028
44COVOcv
(.019
44
cnCM
rl rl
.004
070 (
+i
921
o
.004
208 (
-H
838
o
.011
032 (
44
796
o
.013
036 (
-H
878
Q
033
+i
841
o
0011
44
012£
o
.004
,05B(
4-1
.753
o
.003
161 (
41
649
o
.010
026 (
44
655
a
.012
029 (
44
692
o
018
44
679
a
n
002)
44
027
o
^- in —»in CM i-t
+1 -H -H -Hm in
. .*3* r>j o n[*• o a o
2
f*i oo cn•q- in To o o
-H -H 44 -H00 VO «3- CMO O CM r-\(N W H O
• • • •i-l iH i-» i-l
iH *3" in VOCM CN CN i - lO O O O
• • • •
^ » ^ ^ * f l
o o o o• • • •
44 44 -H 44r» o cn i-lco cn oo ooo o o o
tn
•H
cnCN03
•H
CM
cn
-n
i n
44oinVO
CM
VOr-o
44
CM
CMCMO
•H
CM
in03
3oa
CMCOo
.019
,037 (
44
,723
o
.020
,036 (
• »
,647
o
.024
,043(
•H
,742
o
.017
,037(
4H
,803
o
,033
T I
,727
o
o
.003)
44,114
o

i n
C[>
fl
> o
1 CMJ <-\
-1 -H
1 VQ
3 m-1 CM
in
ovorH
-H
O
CO
m
+1
m
CM
o
002)
+i02
7
o
o)IT
-H
CO00
CN
O
rH
+1
roCO
CM
CO
ocno
+1
CM
CM
00O
H
+1
CO
CM
cni-H
-H
rHKO
CN
O
003]
114
o
CN CN
CO O CO
+1CO
+1
CO t> 00© en
= : s
en o o o• • • •O rH i-l r-i
+1 -H +1 -Hcn co CM oao cn o r»cn cn \o CM
• s =
< ffl OCM CN CM S

List of Illustrations
Figure 1 Scheme of decomposition of sludge sample Series 1
Figure 2 Scheme of decomposition of sludge sample Series 2
Figure 3 Radiochemical analysis scheme of Series 1
Figure 4 Radiochemical analysis scheme of Series 2
Figure 5 Exploded diagram of Teflon electrodeposition cell
Figure 6 a) Alpha spectrum of Pu fraction from analysis 1Ab) Alpha spectrum of Pu fraction from analysis IB
Figure 7 a) Alpha spectrum of Pu fraction from analysis 1Cb) Alpha spectrum of Pu fraction from analysis 2B
Figure 8 a) Alpha spectrum of Am-Cm fraction from analysis IBb) Alpha spectrum of Am-Qm fraction from analysis 2B
Figure 9 a) Alpha spectrum of Th fraction from analysis 2Bb) Alpha spectrum of Th fraction from analysis 2A
Figure 10 a) Alpha spectrum of 1st 1M HNO, strip of analysis 2Cb) Alpha spectrum of 2nd 1M HNO, strip of analysis 2C
Figure .11 a) Alpha spectrum of 1st O.lM NH.HCLO. strip of analvsis 2Cb) Alpha spectrum of 2nd O.lM NHpK^O* strip of analysis 2C

in
*
I•K
in
Series 1 sludge sample (32.8g wet)
drv under
242 244,Pud.59 Bq), Cm(1.43 Bq)
heat lamp
S dried weight 22.6g!
ignite at 50CTC, 2h
I ash weight 6g|
acid digestion 4M HNO-,, 100 ml, 2h
! Solution =81 Residue #1!4M HNO.,, 150 mil
1
apor<
ml
ate
30% H
to 200
2°2
Solution125 ml
HNO3, HC1
ml
4*2
ignite at 500 Cacid digestions:
4M HNO3, 50 ml
12M HC1, 10 ml
u 23M HF, 50 ml
Residue #2l
Solution ft31M HNO,,, 120 ml
fusion: 2g Na,S_O_, 600 C" ' 2h
acid digestion: 8M HNO,,
15 ml + 100 ml H_O
Residue #3 I
NH.OH
solution!washes
to pH 9
(discard)
L+20 ml, 12M HC1
hydroxide jDrecio '
14M HNO3, 55 ml
12M HC1O4, 2 ml
12M H a , 10 ml10 ml
12M HC1 15 ml
f+10 ml, 23M HF
•flO ml, 12M HC1
Solution MA\25 ml, 6M HC11
Solution #5 ,j, H d , HF-.
250 ml 1
30%
evaporate with
Solution {t68M HNO3, 150 ml
10 ml
14M HN03 additions (3X) to thick paste
Residue #6
FINM, SOLUTIONACID-SOLQHLE FRftCTICN
8M HNO3, 200 ml
HtTO_, 30 ml
washesdry ash at 500 C, 1.5 h
FINAL RESIDLEACID-INSOLUBLE FRACTION
(2.13g ash)
Figure 1. Scheme of Decomposition of Sludge Sample Series 1

-rr
s.: I
0)
Series 2 sludge sample (4.08g wet)
j 242Pu(3.18 Bq),244Qn(5.71 Bq)
dry with hot plate j and heat lamp, 4 h
[dried weight 1.99g]
acid digestion
evaporate to
12M HC1,14M HNO.'3'
5 ml25 ml
12M HC1O4, 8 ml
fume 1 h
|orange paste]
filter
14M HNO-,, 4 ml'3'15 ml
and wash
-; Residue"#T1
0.5g
gelatinous
acid digestion:
12M HC1O
fume 1 h'4'
8 ml
2 ml
Solution #24M HC1O,, 8M HF
6 ml
2 ml
23M HF, 2 ml
Residue #2 I
filtermembrane
to dissolve
precipitate
Solution #341 ml
ontofilter
FINAL RESIDUEACID-INSOLUBLE FRACTION(5 to 10 mg dry weight)
evaporate to HC1O4, fume 0.5 h
2M HNO.,, 20 ml
20 ml
Solution #4HNO-, 0.5M HC1O.
50 ml
evaporate
Nf^OH-HCl, 2g
to HO.O.orange pastel
2M HNO3, 30 ml + rinses
FINAL SOLUTIONACID-SOLUBLE FRACTION
2M 3 , 0.5M HC1O4
50 ml
Figure 2 . Scheme of Deccnposition of Sludge Sarole Ser ies 2
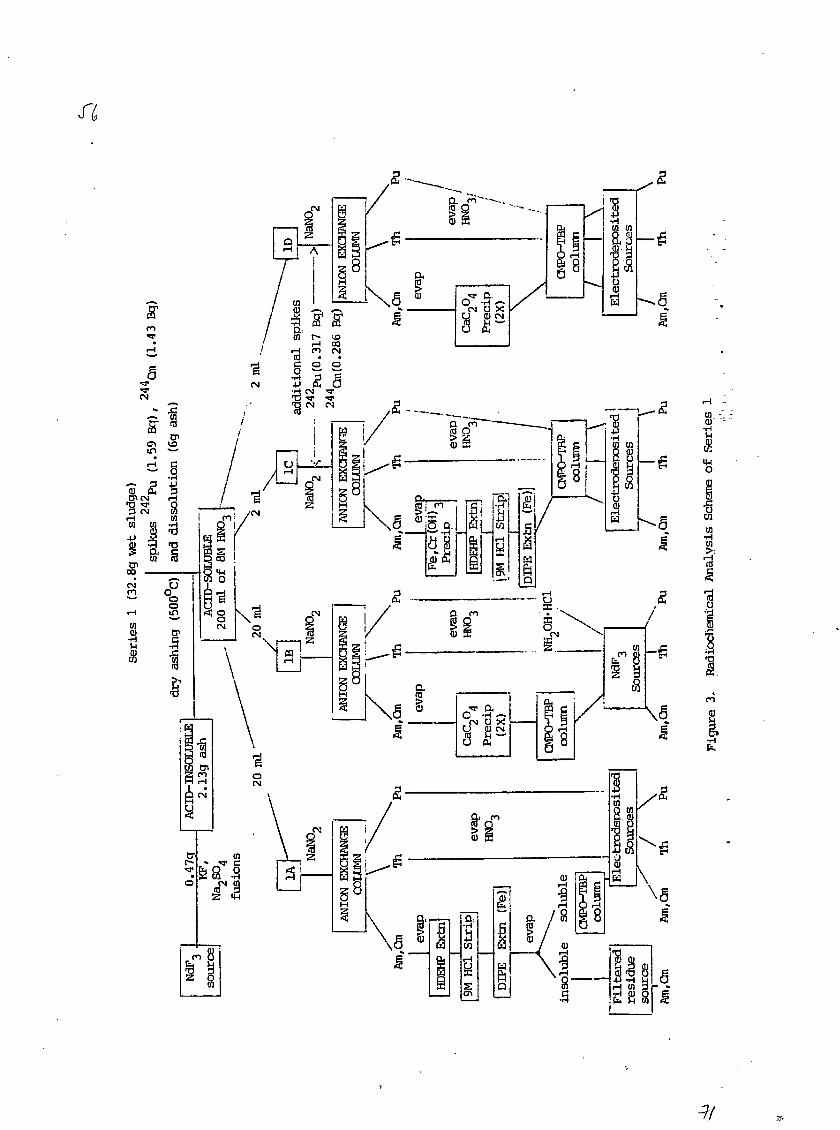
tn0)
1

N
a
CO
rn
s
Cio,
Str
i|
sTs
cp
)
I I C
2
en
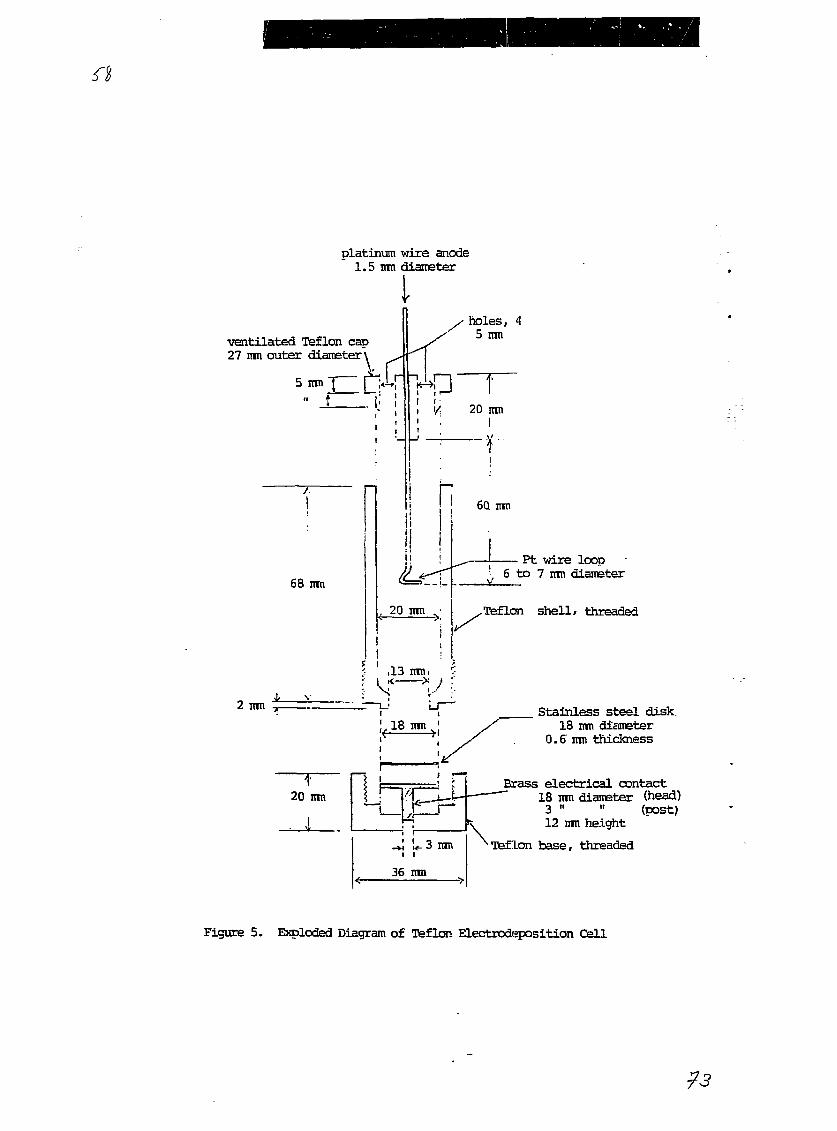
platinum wire anode1.5 ran diameter
ventilated Teflcm cap27 ran outer diameter
5 ran
68 ran
holes, 45 ran
i'/-. 20 ran
I
i i
I6Q ran
20 ran „•
f i
Pt wire loop6 to 7 irm diameter
„Teflon shell# threaded
,13 ran.
2 ran Stainless steel disk.18 ran diameter
0.6" ran thickness
Rrass electrical contact18 ran diameter (head)3 " " (post)12 ran height
Teflon base, threaded
Figure 5. Exploded Diagram of Teflon Electrodeposition Cell

.A-z.
TYPE - -1 MCA * 2 SEGMENT # 2REALTIME - 65237.16 SECONDS. LIVETIKE -DATA COLLECTED AT 14: 23: 00 OH 20-KAY-8B
85234.68 SECONDS
01HZDOU
20
10
239,240^
(5.15 -MeV)
a) Pu fraction - 1Aelectrodepositedsource
238, Pu (5.49 MeV)
96 keV
A: DRTEC67B.D59255 Sll
CHANNEL NUMBER
767 1023
TYPE • - 1 MCA • 2 SEGMENT * 1REALTIME - 60006.40 SECONDS. LIVETIME •DATA COLLECTED AT 14: 30: 00 ON 20-HAY-88
30
S0003.70 SEC0M3S
to\-zDOu
IS
-
(4.
(5.
87 keV
2 4 2Pu
89 MsV)J
9 2
15
IJ
Aft
MeV)
238
1
\J
b) Pu fraction -NdF, source
Pu (5.49 MeV)
- 92 keV
11, . ,
IB
A:TENN257.B32255 Sl l 767
CHANNEL NUMBER
1023
Figure 6. a) Alpha spectrum of Pu fraction from analysis 1A
b) Alpha spectrum of Pu fraction from analysis IB

REALTIME -1 Mio2B4.izSiicONOS.* LIVETIKE - £0283.58 SECONDSDATA COLLECTED AT 14: 33: CO DM 14-.KM-BB
ini -zDOu
k
40
20
242Pu(4.89 MeV)
I
a) Pu fraction - 1Celectrodepositedsource
239,240.Pu (5.15 MsV)
(5.49
- 89 keV
255 Sll
CHANNEL NUMBER
767 1023
TYPE - -1 HCA t 2 SESHEHT # 2HEALTIH£ - 16350.72 SECONDS. LIVETIME -DATA COLLECTEO AT 07: aa oo ON Z3-jun-aa
16359.50 SECONDS
X
cnHZDau
90239,240Pu (5.15 tteV)
242Pu (4.89 MeV)238.
b) Pu fraction - 2Belectrodepositedsource
'Pu (5.49 MBV)
- 43 keV
255 511 767 1023
A:0RTEC676.D75 CHANNEL NUMBER
Figure 7. a) Alpha spectrum of Pu fraction from analysis 1C
b) Alpha spectrum of Pu fraction from analysis 2B
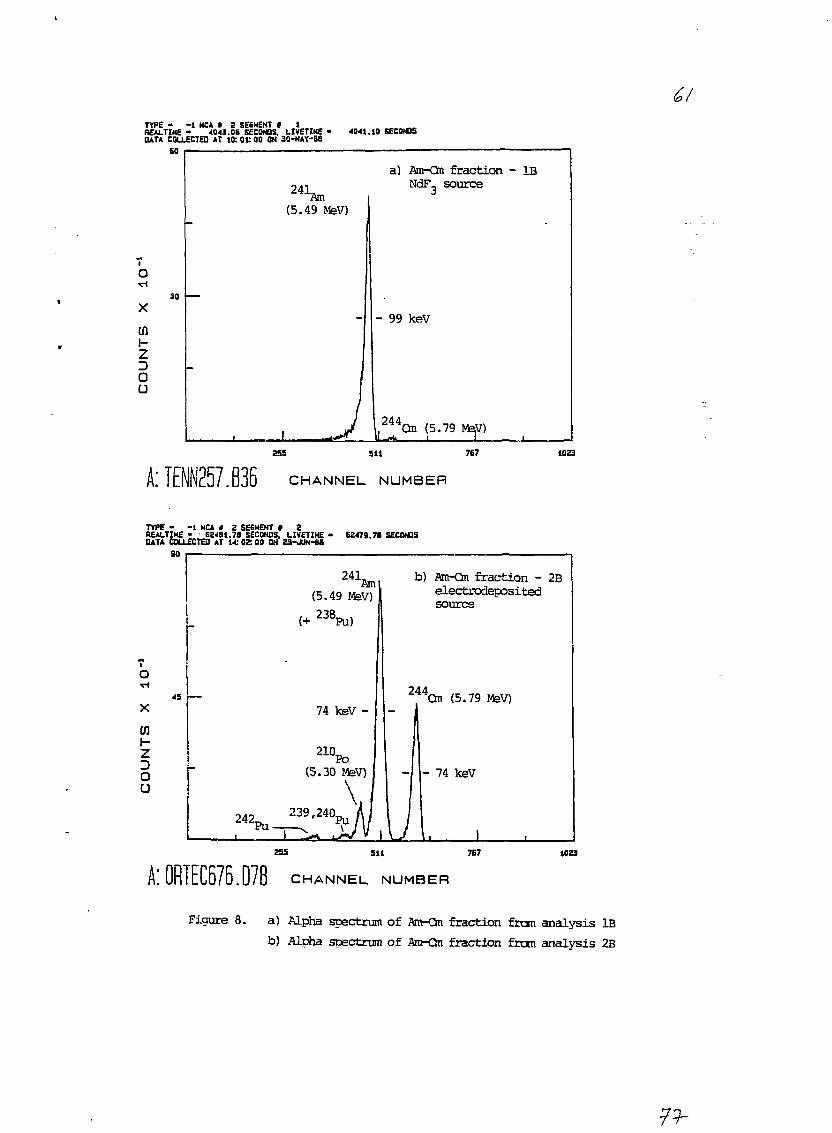
TYPE - -1 MCA • 2 SESMENT * 1REALTIME - 4D43.DE SECONDS. LIVETIME 'DATA COLLECTED AT 10: 01: 00 ON 30-ttAt-BB
SO
4041.10 SECONDS
eni -zDOu
30
Am(5.49 MeV)
a) Am-Qn fraction - IBNdF, source
- 99 keV
|2^4Qn (5.79 MBV)
A: TENN257.B36255 511 7E7
CHANNEL NUMBER
1023
TYPE - -1 MCA * 2 SESMENT * 2REALTIME • 62481.78 SECONDS. LIVETIHE • 62479.78 SECONDSDATA COLLECTED AT 14: 02 00 ON 23-JUN-8B
enzDOu
90
45
241Am
(5 .49 MeV)2 3 8 Pu)
74 keV -
2 1 0 P o( 5 . 3 0 MeV)
2 4 239 f240pu
Ml —; s. \J I •**• '
244
b) Am-Qn fraction - 2Belectrodepositedsource
!Qn (5.79 MeV)
- - 74 keV
255 511 767
A* 0RTECB7B. D78 C H A N N E L N U M B E R
1023
Figure 8. a) Alpha spectrum of Am-Qn fraction from analysis IB
b) Alpha spectrum of Am-Qn fraction from analysis 2B

TYPE • -1 MCA * 2 SEGMENT * 2REALTIME - 240342.10 SECONDS. UVFTIME 'OATA COLLECTED AT 12 25: 00 ON 23-tXK-BB
240241.70 SECONDS
eni -zDOu
40
20
210Vo(5.30 MsV)
a) Th fraction - 2Belectrodepositedsource
230,
- 40 keV
238.Pu
511 767 1023
A: 0RTECB76.D76 CHANNEL NUMBER
TYPE - -1 MCA * 2 SEGMENT * 1HEALTIHE - Z397B7.50 SECONDS. LIVETXME - 239797.10 SECONDSOATA COLLECTED AT IS 25: 00 ON 23-JUN-BB
X
C/l
2
30
IS
g I"u I1232,
(5.30 MeV)
230,
b) Th fraction - 2Aelectrodepositedsource
- 54 keV239,240 p u
2 4 2Pu \, | J | 238.234 n l Pu
.1
A: TENN257.B50255 Sit 767
CHANNEL NUMBER
1023
Figure 9. a) Alpha spectrum of Th fraction from analysis 2B
b) Alpha soectrum of Th fraction from analysis 2A
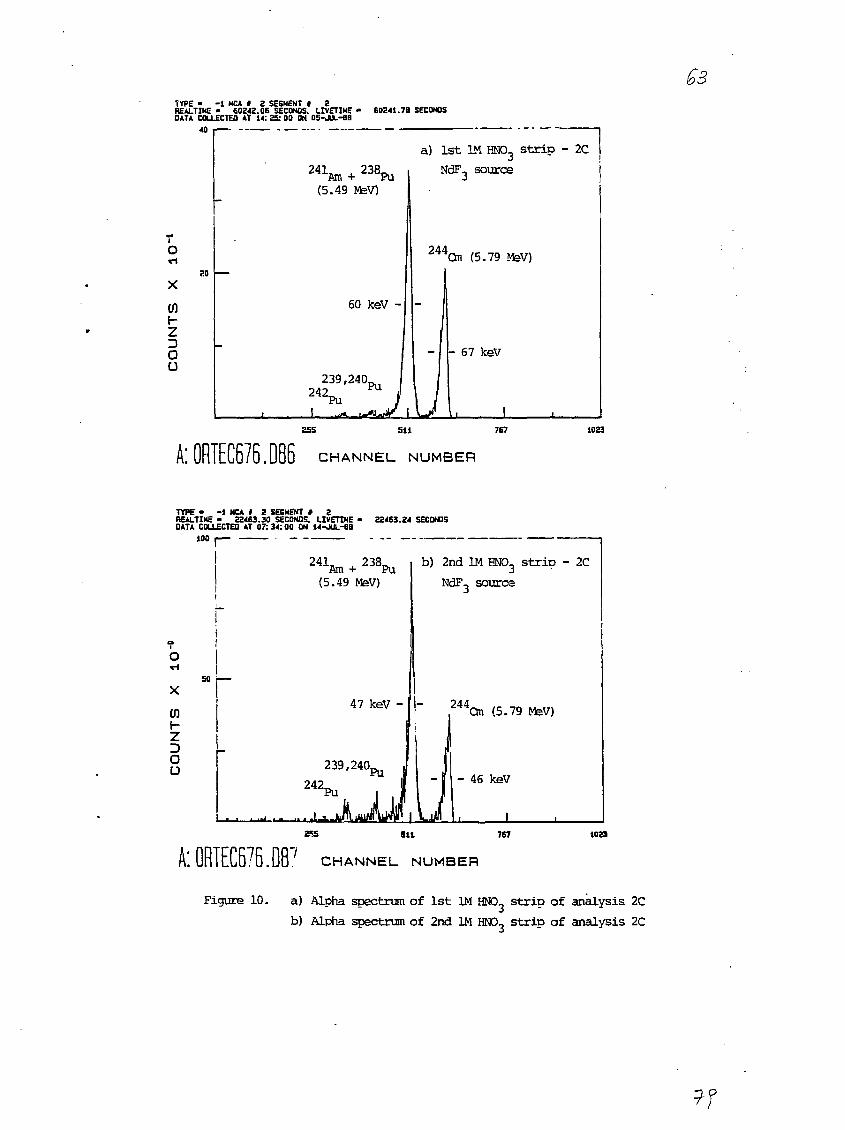
TYPE - -1 MCA I 2 SEGMENT # 2REALTIME • 60242.06 SECONDS. LIVETIME « 6D241.7B SECONDSDATA COLLECTED AT 14: 25: 00 OH 05-JUL-BB
I
o
01ZDau
241Am + 238Pu
(5.49 MeV)
r
60 keV -
-
239,240242Pu ** 1
a) 1st 1M HNO3 strip - 2C 1
NdF- source
244
• 1-u
On (5.79 MeV)
- 67 keV
A:0RTEC676.O86255 511 767
CHANNEL NUMBER
1023
TYPE • -1 MCA # 2 SEGMENT f 2REALTIME - 22463.30 SECONDS. LIVETIME •OATA COLLECTED AT 07: 34:00 ON 14-JUL-SB
22463.24 SECONDS
CDI -ZDOu
too
50
b) 2nd 1M HNO3 strip - 2C
NdF- source
47 keV - - 244, (5.79 MsV)
- tf - 46 keV
A: QRTEC676.Q8:235 111
CHANNEL- NUMBER
767 1023
Figure 10. a) Alpha spectrum of 1st 1M HNO. strip of analysis 2C
b) Alpha spectrum of 2nd 1M HNO, strip of analysis 2C
9f

TYPE - -1 MCA # 2 SEGMENT • 2REALTIME • 72748.48 SECONDS. LIVETINE • 72748.22 SECONDSDATA COLLECTED AT U: 5& 00 ON 05-JUL-BB
r-Z
au
a) 1st 0.1M NHjHC-O s t r ip - 2C
NdF3 source
10
23S
(5
2 4 2Pu(4.89 MeV)
62 keV - [
— J
,240,iru
.15 MeV)\ |
1
I2 3 8Pu +
/
244Qnu,.
241^Am
(5.79
J
(5.49 MeV)
MeV)
1
255 511 767
Ai 0RTECB7B. DB4 C H A N N E L N U M B E R
1023
TYPE • -1 MCA * 2 SEGMENT f 2REALTIME - 23640.38 SECONDS. LIVETIKE - 23640.36 SECONDSOATA COLLECTED AT 07:35: 00 ON 05-JUL-SB
o• e l
X
01
zDou
20
10
b) 2nd 0.1M NH
sources t r ip - 2C
239f240pu
(5.15 MeV)2 4 2 Pu_
(4.89 MeV)
in i
2 3 8Pu + 2 4 1 M (5.49 MeV)
On (5.79 IVteV)" —" 11
A:QRTECB76.D85255 511 767
CHANNEL. NUMBER
1023
Figure 11. a) Alpha spectrum of 1st 0.1M NH HCLO strip ofanalysis 2C 4 ^ 4 -
b) Alpha soectrum of 2nd 0.1M NH.HC-O. strip ofanalysis 2C 4 2 4

REFERENCES
[1] E. Holm and S. Ballestra, "Methods For Radiochemical Analysisof Plutonium, Americium and Curium" in Measurement ofRadionuclides in Food And The Environment: A Guidebook.Technical Reports Series No. 295, IAEA, Vienna (1989).
[2] E. P. Horwitz, D. G. Kalina, H. Diamond, G. F. Vandegrift andW. W. Schulz, Solvent Extr. Ion Exch. 3 (1985) 75-109.
[3] I. K. Kressin, Anal. Chem. 49 (1977) 842-5.
[4] F. D. Hindman, Anal. Chem. 55 (1983) 2460-1 and Anal. Chem 58(1986) 1238-41.
[5] C. W. Sill, K. W. Puphal and F. D. Hindman, Anal. Chem. 46(1974) 1725-37.
[6] E. L. Cooper, private communication; see also E. M. Morimotoand M. Kahn, J. Chem. Ed. 36 (1959) 269.
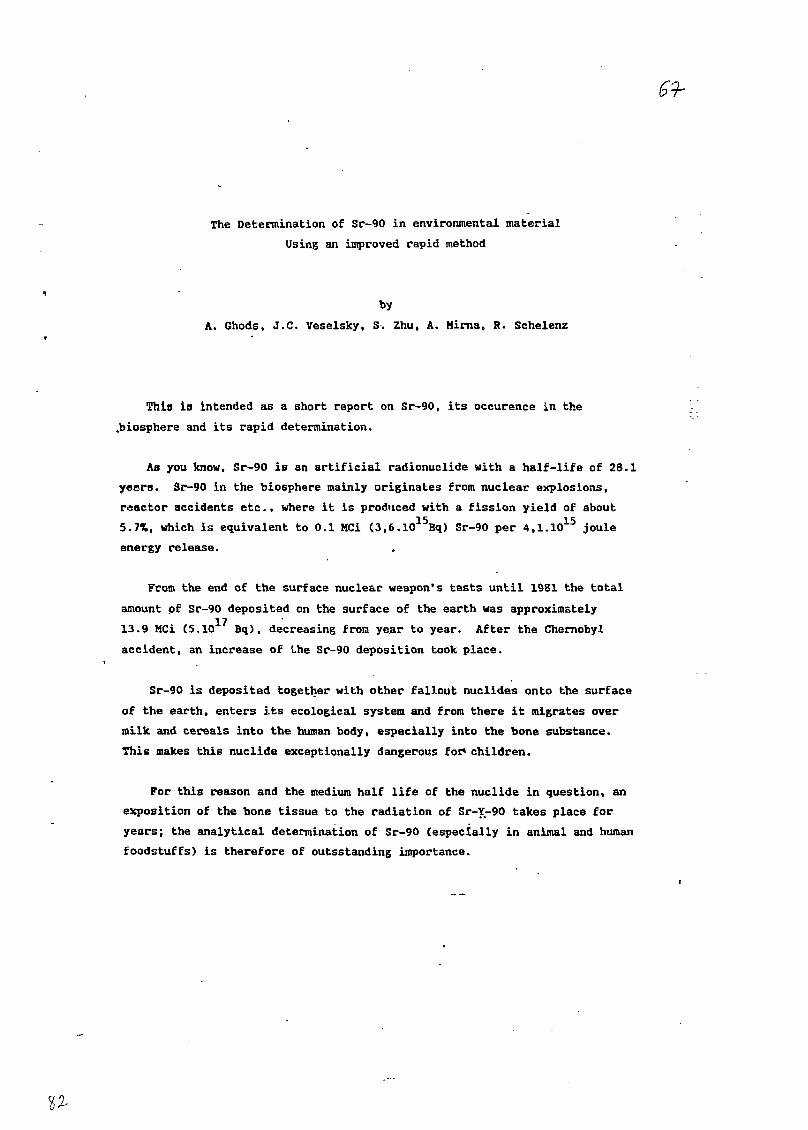
The Determination of Sr-90 in environmental material
Using an improved rapid method
by
A. Ghods, J.C. Veselsky, S. Zhu, A. Mima, R. Schelenz
Thio is intended as a short report on Sr-90, its occurence in the
.biosphere and its rapid determination.
As you know, Sr-90 is an artificial radionuclide with a half-life of 28.1
yeers. Sr-90 in the biosphere mainly originates from nuclear explosions,
reactor accidents etc., where it is produced with a fission yield of about
5. 7%, which is c
energy release.
5.7%, which is equivalent to 0.1 MCi (3,6.1015Bq) Sr-90 per 4,1.1015 joule
From the end of the surface nuclear weapon's tests until 1981 the total
amount of Sr-90 deposited on the surface of the earth was approximately
13.9 MCi (5.10 Bq), decreasing from year to year. After the Chernobyl
accident, an increase of Lhe Sr-90 deposition took place.
Sr-90 is deposited together with other fallout nuclides onto the surface
of the earth, enters its ecological system and from there it migrates over
milk and cereals into the human body, especially into the bone substance.
This makes this nuclide exceptionally dangerous foe* children.
For this reason and the medium half life of the nuclide in question, an
exposition of the bone tissue to the radiation of Sr-Y-90 takes place for
years; the analytical determination of Sr-90 (especially in animal and human
foodstuffs) is therefore of outsstanding importance.
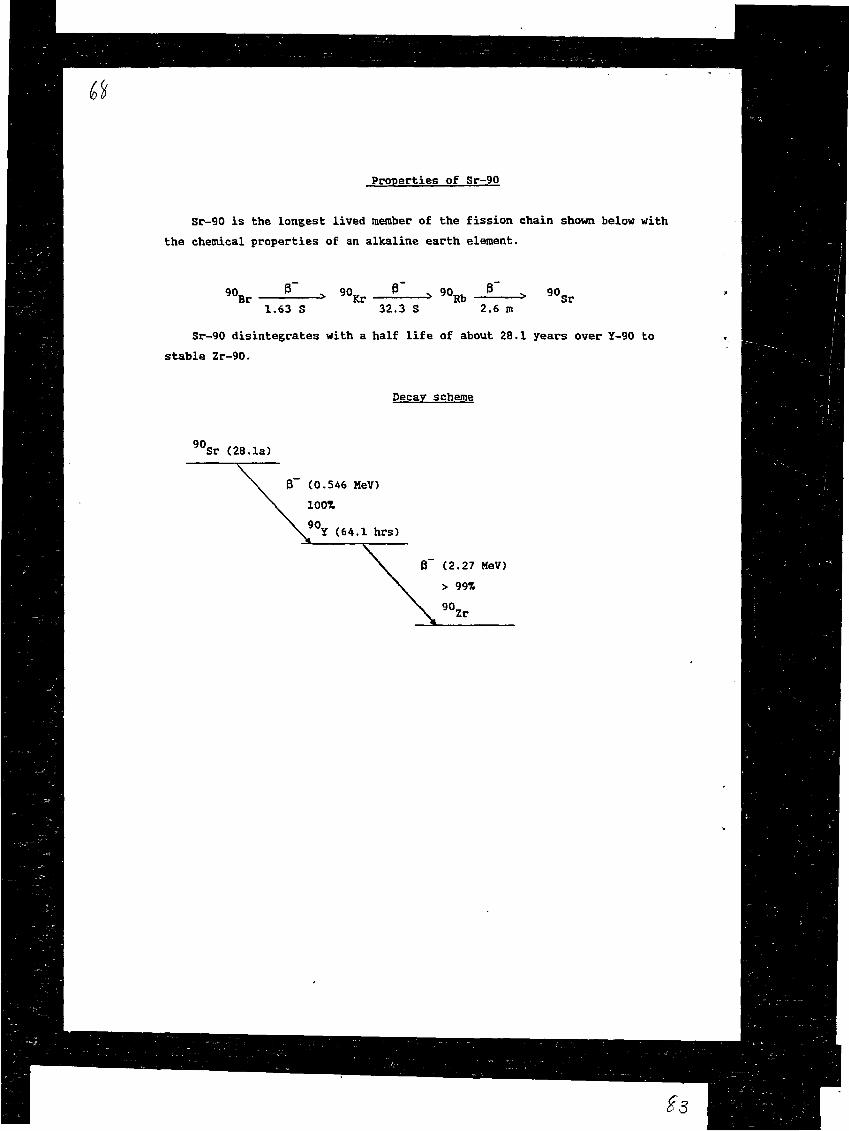
Properties of Sr-90
Sr-90 is the longest lived member of the fission chain shown below with
the chemical properties of an alkaline earth element.
90.Br
1.63 S90Kr
32.3 S 2.6 m
90Sr
Sr-90 disintegrates with a half life of about 28.1 years over Y-90 to
stable Zr-90.
Decay scheme
90Sr (28.1a)

Classification of the methods suitable for the determination of Sr-90 invarious materials.
Characteristics of the method Year ofpublication
Material to be analysed
Ca-Sr-separation by fuming 1957nitric acid, measurement of Y-90in a low level beta counter
Extraction of Y with HDEHP*, 1965purification of Y by strippingand extraction processes. Betacounting of Y-90
Ion exchange separation of 1967Ca from Sr, beta countingof Y-90
Separation of Sr-89, Sr-90 and 1975Y-90, LS and Cerenkov counting
Separation of Sr-89, Sr-90 and 1975Y-90, LS and Cerenkov counting
Isolation of Sr-Ca without 1976separation, Cerenkov counting
Extraction of Sr with dicyclohexyl 197718-crown-6
HDEHP extraction of Y-90 1978LS counting
Preconcentration of Sr-90 with 1979Sr carrier. Isolation of Yoxalate, Cerenkov counting.
Extraction of Sr with dicyclo- 1979hexyI-18-crown-6. Measurementof Sr with low level GM counter
Separation of Sr using standard 1979methods, Cerenkov measurement ofSr-89 and Y-90 without interferencefrom Sr-90
Separation of Sr, Cerenkov 1981counting of ingrowing Y-90
Milk, Bone, Tissue, Vegetation,Soil
Bone Ash
Milk, Vegetation, Meat, Fish,Rain Water, Oyster Shells
not specified
not specified
Water
Rocks, Minerals, Living Bodies
Plant and Animal Samples
Water
Milk
not specified
Biological Material
TBP** extraction of Y, 1983 Milkmeasurement with low levelbeta counter
Cs and Sr extraction using various 1984 Waste solutioncrown ethers in a mixture ofdinonyl naphthalene sulfonic acid,TBP and Kerosene
Extraction of Sr with dicyclo- 1985 Waste solutions-18-crown-6-hexane usingSr-85 tracer
Separation of Ca+Sr by ion 1986 Soilexchange, Ca from Sr by fumingnitric acid, measurement ofY-90 by beta counting
Extraction of Y with HDEHP*. 1986 Sea Waterremoval of interfering Th-234.Beta counting of Y-90
Extraction of Sr+Y with DBP***, 1986 WaterStripping of Y-90 with 1H HHO3,Cerenkov counting
Extraction of K followed by 1987 Milk.Geol. SamplesSr-extraction with 18-crown-6
*di(2-ethylhexyl)phosphoric acid**Tributylphosphate***Dibutylphosphate
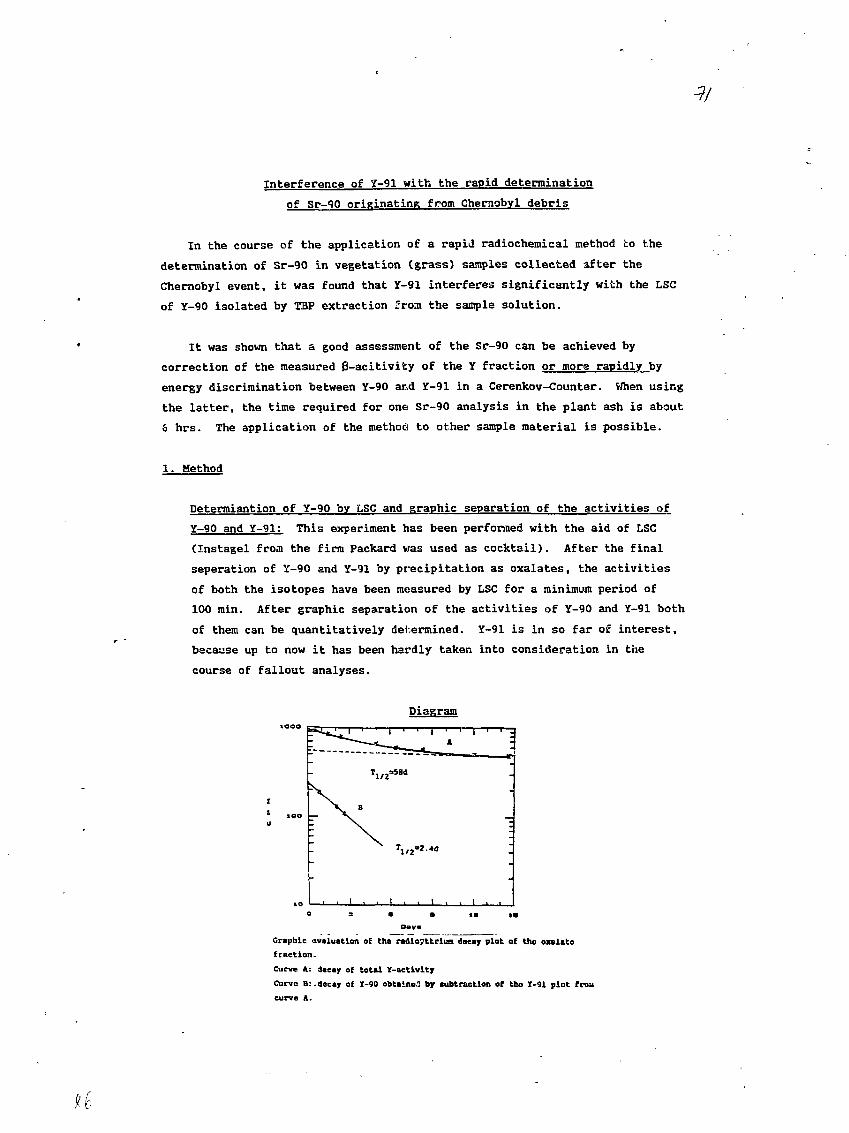
Interference of Y-91 with the rapid determination
of Sr-90 originating from Chernobyl debris
In the course of the application of a rapid radiochemical method to the
determination of Sr-90 in vegetation (grass) samples collected after the
Chernobyl event, it was found that Y-91 interferes significantly with the LSC
of Y-90 isolated by TBP extraction front the sample solution.
It was shown that a good assessment of the Sr-90 can be achieved by
correction of the measured B-acitivity of the Y fraction or more rapidly by
energy discrimination between Y-90 and Y-91 in a Cerenkov-Counter. When using
the latter, the time required for one Sr-90 analysis in the plant ash is about
6 hrs. The application of the method to other sample material is possible.
1. Method
Determiantion of Y-90 by LSC and graphic separation of the activities of
Y-90 and Y-91: This experiment has been performed with the aid of LSC
(Instagel from the firm Packard vras used as cocktail). After the final
seperation of Y-90 and Y-91 by precipitation as oxalates, the activities
of both the isotopes have been measured by LSC for a minimum period of
100 min. After graphic separation of the activities of Y-90 and Y-91 both
of them can be quantitatively determined. Y-91 is in so far of interest,
because up to now it has been hardly taken into consideration in the
course of fallout analyses.
Diagram
t o o
t o
V_ B
. . 1 . . 1 ,
1
—•
-2 *t
, 1
A :
t 1
-
>•
Graphic evaluation of tha radloyttriira decay plot of tho oralata
fraction.
Curve A: daeay of total Y-aetivlty
Curve B:,decay of Y-90 obtained by aubtraetion of tha Y-91 plot froa
curve A.
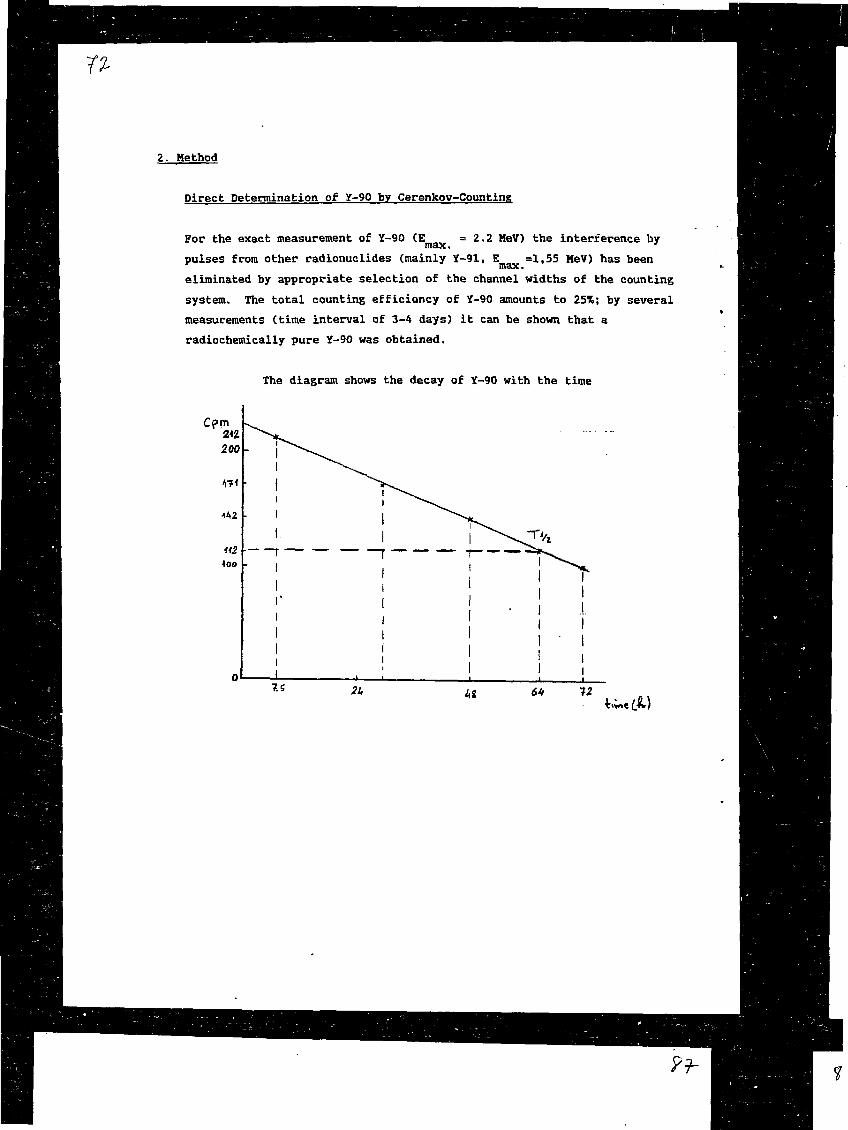
2. Method
Direct Determination of Y-90 by Cerenkov-Counting
For the exact measurement of Y-90 (E = 2.2 MeV) the interference by
pulses from other radionuclides (mainly Y-91, E =1,55 MeV) has been
eliminated by appropriate selection of the channel widths of the counting
system. The total counting efficiency of Y-90 amounts to 25%; by several
measurements (time interval of 3-4 days) it can be shown that a
radiochemically pure Y-90 was obtained.
The diagram shows the decay of Y-90 with the time

Table: ^-emission of 20 g grass ash before and after Y-oxalabe separation
y-emission of 20 g grass ash
Nuclide l**Ce 1 2 5Sb l°3Ru "^Cs " 7 C s 9 5Zr " m ,
Energy (KeV) 133.93 428.27 497.47 796.18 662.0 757.06 766.16
Net counts 5623 2954 26974 58414 145189 1550 6374
Error % 5.2 7.0 0.8 0.5 0.3 4.3 1.5
Y-emission of Yttrium oxalate from 20 g grass ash
Nuclide 1 0 3Ru 13*Cs 1 3 7Cs
Energy (KeV)
Net counts
Error %
497
36
105
.8
.2
795.
139
19.
9
5
661.7
569
6.6
The net counts correspond to the background of the instrument.
These experiments have been performed with the aid of Cerenkov counting.
We have applied this method also to the analyses of other biological material
and verified their results.
Tab: The results of our experiments compared to the results obtained byother laboratories
Sample IAEA Lab Seibersdorf Chemistry Unit Otherlaboratories
IAEA-152 Intercom- 6.5 - 8.1 Bq/kg 7.0-8.3 Bq/kgparison Milk Powder
IAEA-154 Intercom- 6.5 - 8.0 Bq/kg 6.0-8.0 Bq/kgparison Whey Powder
IAEA Soil-6 29.5 - 30.5 Bq/kg 30 - 31 Bq/kg
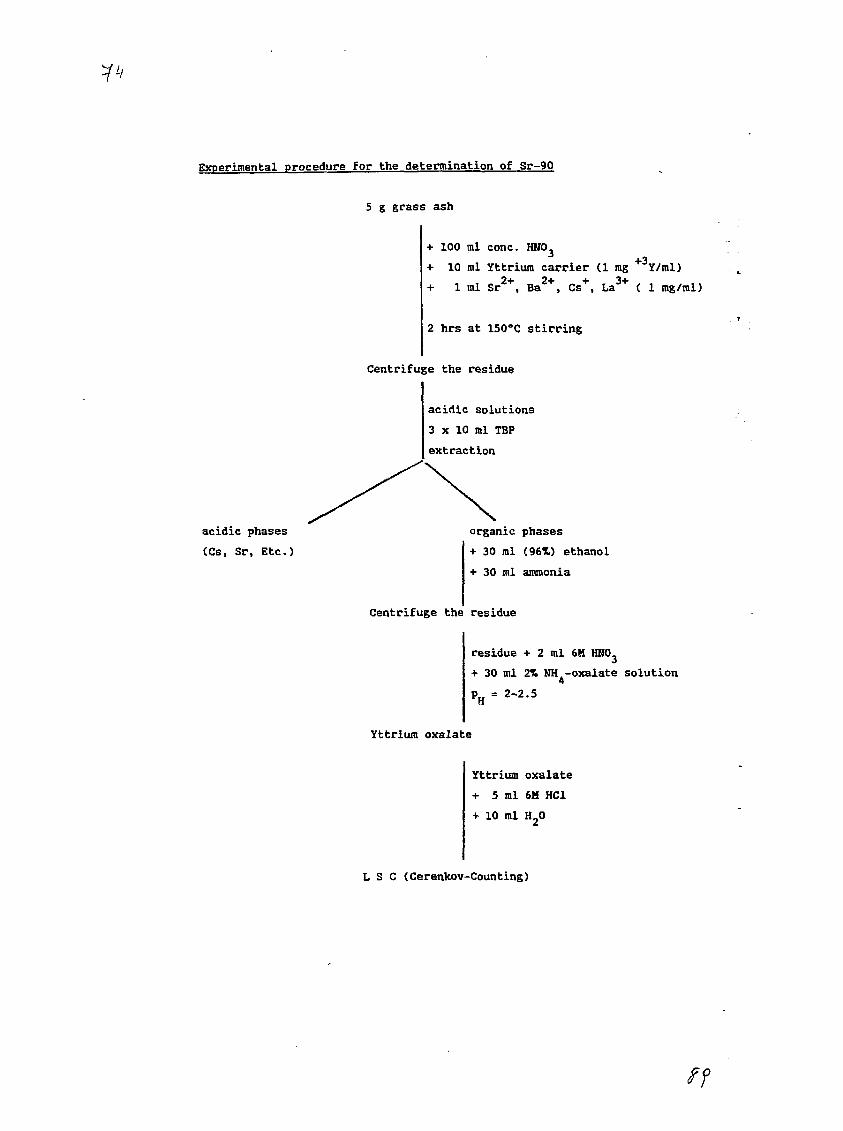
Experimental procedure for the determination of Sr-90
5 g grass ash
+ 100 ml cone. HNO.
acidic phases
(Gs, Sr, Etc.)
+ 10 ml Yttrium carrier (1 mg Y/ml)
+ 1 ml Sr2+, Ba2+, Cs+, La3+ ( 1 mg/ml)
2 hrs at 150°C stirring
Centrifuge the residue
acidic solutions
3 x 10 ml TBP
extraction
organic phases
+ 30 ml (96%) ethanol
+ 30 ml ammonia
Centrifuge the residue
residue + 2 ml 6M HNO.
+ 30 ml 2% NH -oxalate solution
PH = 2-2.5
Yttrium oxalate
Yttrium oxalate
+ 5 ml 6M HC1
+ 10 ml H2O
L S C (Cerenkov-Counting)
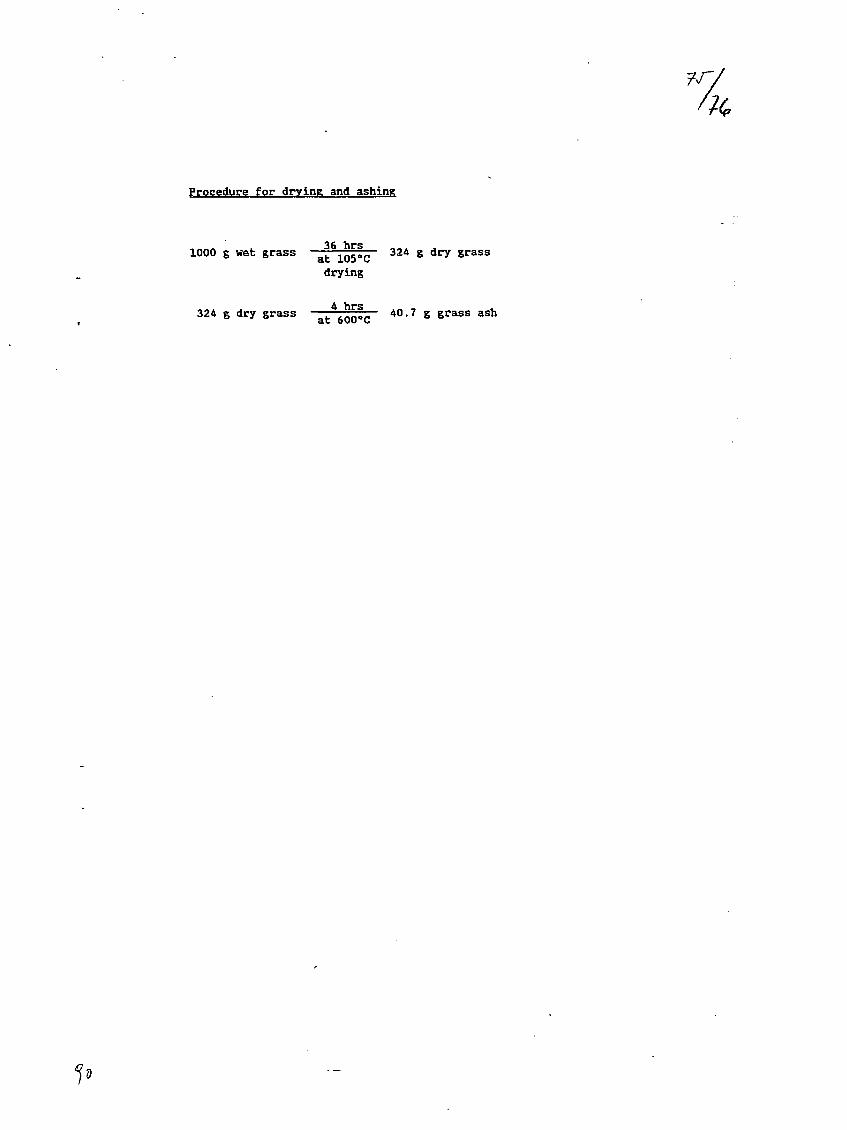
Procedure for drying and ashing
1000 g wet grass — 1 O 5 ° C 3 2 4 8 d r y g r a s s
drying
324 g dry grass t n " r 40.7 g grass ash
77
THE DETERMINATION OF URANIUM IN ENVIRONMENTAL SAMPLES BY FLUORIMETRY
by
J.C. Veselsky, A. Ghods
Because of the sometimes extremely low uranium content of environ-
mental material such as soil, water and materials of biological origin,
which can be in the region of ug U/g °r n8 U/g, analytical methods with
vary low detection limits are required. Methods like alpha spectrometry,
fission track methods and neutron activation analysis are in general use,
but less time consuming and cheaper techniques would be highly
desirable. For this reason some work was done in the IAEA Laboratory
Seibersdorf to utilize the low detection limits of fluorimetric
techniques for the determination of uranium in the materials mentioned
above.
Fluorimetry was introduced as a tool of quantitative uranium micro-
analysis in 1935 and aince that time greatly improved by the application
of modern electronic and laser techniques to the corresponding
instruments.
In principle the uranium to be measured is irradiated with UV light
and the emitted fluorescence radiation measured. In conventional fluori-
metry the uranium to be measured is embedded in a fused sample pellet
(alkali fluorides and carbonates or mixtures of them) which is then
irradiated and measured in an instrument called fluorimeter. More recent
developments lead to the use of pulsed UV laser beams (\=337nm) as
irradiation sources, the highly developed electronic systems of our days
permit a differentiation between the uranium fluorescence and parasitary
fluorescences by time discrimination. In some recent developments also
the electronic elimination of interfering quenching effects is possible,
thus circumventing the use of more complicated methods such as uranium
isolation, internal standards, sample dilution etc.
7 if
- 2 -
In the IAEA laboratory Seibersdorf conventional fluorimeters (System
Galvanek Morrison) as well as a pulsed laser fluorimeter (system Scintrex
UA-3) are available, but not yet the very recent constructions making
possible the purely instrumental elimination of quenching effects or the
measurement of certain rare earth elements (which require additional
tunable dye-lasers).
For the practical analytical work in the laboratory mainly the
Scintrex apparatus is used, which makes possible the measurement of
uranium in aqueous solutions down to a concentration of about 0.05ng U/ml.
In tap water, for example, the uranium can be directly determined without
any preconcentration step.
As an example for the determination of uranium in mineralic
substances a list of results obtained in the course of the uranium
analysis of several reference materials using different fluorimetric
methods developed in our laboratory shall be given, the detection limit
was found to be O.5y.g U/g (conventional fluorimetry) and 0.05ug U/g
(laser fluorimetry). For details see Table 1. The results of uranium
analyses in soil and lake sediment samples are listed in Table 2. The
method used was laser fluorimetry.
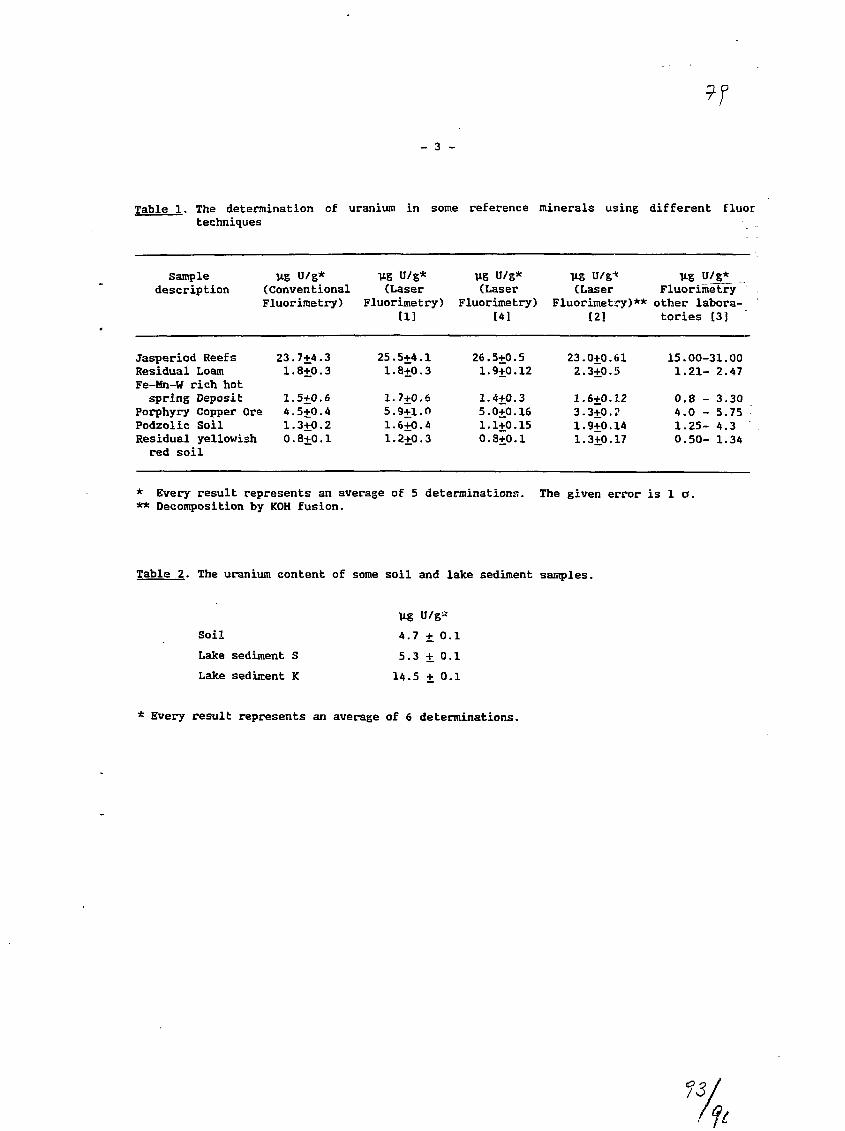
- 3 -
Table 1. The determination cf uranium in some reference minerals using different fluortechniques
Sample ug U/g* Ug U/g* Vg U/g*description (Conventional (Laser (Laser
Fluorimetry) Fluorimetry) Fluorimetry)tl] [4]
Ug U/g-* ug U/g*(Laser Fluorimetry
Fluorimetry)** other labora-[21 tories [3j
Jasperiod ReefsResidual LoamFe-Mn-W rich hot
spring DepositPorphyry Copper OrePodzolic SoilResidual yellowish
red soil
23.7+4.31.8+0.3
1.5+0.64.5+0.41.3+0.20.8+0.1
25.5+4.11.8+0.3
1.7+0.65.9+1.01.6+0.41.2+0.3
26.5+0.51.9+0.12
1.4+0.35.0+0.161.1+0.150.8+0.1
23.0+0.612.3+0.5
1.6+0.123.3+0.21.9+0.141.3+0.17
15.00-31.001.21-
0.8 -4.0 -1.25-0.50-
2.47
3.305.754 .31.34
* Every result represents an average of 5 determinations.** Decomposition by KOH fusion.
The given error is 1 a.
Table 2. The uranium content of some soil and lake sediment samples.
Soil
Lake sediment S
Lake sediment K
Ug
4.7 + 0.1
5.3 + 0.1
14.5 + 0.1
Every result represents an average of 6 determinations.

- 4 -
The use of laser fluorimetry for the determination of uranium in
biological material is just being developed. Compared to the other
methods in practical use it is very simple and consequently less time
consuming and gave already satisfactory results with the analysis of some
HBS standard samples, but the analysis of a series of other reference
samples has to be performed, before the method can be considered as
"reliable". Some of the results obtained up to now are listed in Table 3.
Table 3. The analysis of some biological standard materials for uranium
using laser fluorimetry
Certified Uranium content Uranium contentMaterial NBS number uranium found (ug/g) by found by other
content (vg/g) laser fluorimetry laboratories
Oyster tissue 1566 0.116 + 0.006 0.107 + 0.003 0.100 + 0.007 (5)0.111 + 0.003 (6)
Pine needles 1575 0.020 + 0.004 0.022 + 0.001 0.0145+ 0.006 (6)0.015 + 0.006 (7)0.018 + 0.006 (8)
Tomato leaves 1573 0.061 + 0.003 0.053 + 0.002 0.0502+ 0.0023(7)0.063 + 0.003 (8)
Citrus leaves 1572 < 0.15 0.027 + 0.001 0.0308+ 0.005 (5)
A detection limit for the new laser fluorimetric method cannot yet be
given, because it still needs some further development.
The same method will also be tried out for the determination of uranium in
bone ash. This bone ash is also analyzed by Isabel Fisenne (Environmental
Measurements Laboratory, Hew York) using an a-spectrometric method, so that
we have a test of our method also with the material mentioned above.

- 5 -
The laser fluorimetric method has been originally developed as a rapid
method for the determination of uranium in water (as mentioned above), one
analysis can be carried out in about 10-15 min. As a test material we are
frequently using the tap-water of our laboratory, which contains rather
constantly 4-5 ng U/ml. The method for the determination of uranium in
inorganic as well as biological material takes several hours per analysis,
depending on the type of the sample; if one has once the ash, the uranium
analysis does not take more than about 1/2 hour. The ashing procedure of the
biological substances is a relatively short one, because due to the high
sensitivity of laser fluorimetry, sample weights of < lg are sufficient. So
the whole methodology appears to us also well suited for rapid screening
tests of the above mentioned substances, waste-waters etc. for uranium
traces. The method is also a rather cheap one, the manpower requirements are
low and the laser fluorimeter is much cheaper than an a-spectrometer or a
nuclear reactor. A disadvantage of the technique is that it does not give us
the isotopic composition of the uranium. An outline of the method is given
in Table 4.
Table 4. Sample preparation for the determination of U-traces
Material
Inorganic: Decomposition of 100-150 mg sample with HWO./HF at 160°C (high
pressure vessel). Evaporation to dryness, uptake in 2ml HNO3
1:25 and 10ml salting solution (A1(HO >3 + Ca(HO3>2).
Extraction of the U with MIBK, backextraction with 0.001M HH03,
measurement in the laser fluorimeter.
Biological: Ashing of the substance (< lg) in the muffle furnace, fuming of
the residue with HClO . The white residue is then treated and
measured as described above.

- 6 -
The absolute detection limits for uranium of different methods are given
in Table 5:
Table 5• The detection limits of different methods for U
Method ng U mEq
a-spectrometry(various authors)
Neutron activationanalysis
Laser Fluorimetry
124.6.18
2
0.
88
15/5ml
0.1440.0580.0810.216
0.024
0.0018
The highest sensitivity available nowadays with special, home-made—18
fluorimeters is in the order of 10 g U which number can possibly be
further reduced by the use of resonance ionization mass spectrometric methods.
References
(1) Veselsky, J.C., Kwiecinska, B., Wehrstein, E., Suschny, 0.; Analyst 113
(March 1988) 451
(2) McHugh, J.B.; Anal. Lett. 15 (A12) 1009 (1982)
(3) US Geol. Surv., priv. comm.
(4) Nguyen D. Minn, J.C. Veselsky; Radiochim. Acta 43 (1988) 181
(5) H.S. Dang, A. Ghatt; Trans. Am. Nucl. Sci 59 (1986) 169
(6) A.R. Byrne, L. Benedik, Talanta 35 (1988) 161
(7) H. Dermelj, J. Novak. V. Ravnik, L. Kosta; J.Radioanalyt.Chem 44 (1978) 271
(8) E.S. Gladney, D.R. Perrin, W.K. Hensley; J.Radioanalyt.Chem 59 (1980) 249
EVALUATION OF a-SPECTROHETERS WITH SURFACE BARRIER DETECTORSFOR LOW-LEVEL MEASUREMENTS
Margareta Matyjek, E.L. Cooper,J. LaRosa, A. Ghods
1. Introduction
Alpha spectrometers are necessary tools for the identification ofactinides and the quantitative determination of their radioactivity. Theoperation characteristics of alpha spectrometry systems have to be known withrespect to resolution and counting efficiency. It is advantageous to do thisas quickly as possible.
This report presents the experience gained with several solid-statedetectors and alpha spectrometer units in the Chemistry Unit at the Agency'sLaboratories Seibersdorf.
2. Experimental Results
2.1 Alpha Spectrometry Systems
Table 1 presents the specific types of alpha spectrometers with solidstate detectors which were tested. The linear or biased amplifier signaloutput of each alpha spectrometer was connected via a multiplexer unit to anOrtec 917A ADCAM multichannel buffer system, which in turn communicated withan IBM PC-AT multichannel analyzer emulator. The resulting spectral data weremanipulated by software permitting disk storage, printing, plotting and simplepeak analysis (peak width and area, peak maximum). Vacuum down to 2 Pascalwas provided by rotary-vane mechanical pumps.
2.2 Resolution Tests of Solid State Detectors
The resolution of a detector is defined as the full width at halfmaximum (FWHM) of a peak from a mono-energetic alpha emitter. The resolutionis generally dependent on the detector characteristics and on the source-to-detector distance, but it is independent of the alpha-particle energy inthe range of about 4-9 MeV. In addition, the resolution is affected by typeand quality of the source of the alpha emitter. Alpha particle absorption inthe air between the source and detector and in the source material itself cancause deterioration of the resolution. Thus the performance of a given alphaspectrometry system (vacuum, detector and pulse amplification and shapingelectronics) must be experimentally determined for the particular type ofalpha source and geometric configuration that is used.
2.3 The Thoron Daughter Source
An extremely useful and rapid method for the determination of theresolution of a detector-spectrometer combination is based on the measurementof alpha particles emitted by a 212Bi- 212Po source. This source isproduced by the electrostatic collection of the charged decay products ofradon-220 (thoron) [E.M. Morimoto and M. Kahn, J. Chem. Ed. 36_, 269 (1959)].
ft

- 2 -
Radon 220 is produced in the natural thorium-232 decay series, andits decay products include the alpha emitters 212Bi and 212Po (see Fig.1). The advantages associated with a thoron daughter source for resolutionstudies are as follows:
(1) it provides a source of alpha particles that is easy to prepare;(2) it gives a "hot" source of short-lived daughters which eliminates the
risk of long-lived recoil contamination of the detector.(3) 2*2Po emits mono-energetic alpha particles with an energy of
8.78 MeV.(4) 212Bi and 2l2Po provide an energy calibration in a single source
at two different alpha-energies.
The thoron daughter source permits us to check the resolution of adetector easily within one day to see whether it meets the manufacturer'sspecifications.
A minor disadvantage is the observed coincidence summing of the2*2Bi beta particle and the 2^-2Po alpha particle due to the 0.3microsecond half-life of the 2^-2Po. With a very close sample-detectordistance a significantly high energy tail is associated with the 8.78 keValpha peak (see Fig.2). Nevertheless, the broadening of the peak FUHM fromthis alpha-beta summing is generally very small.
The effects of coincidence summing of the signals from the 6050 keValpha particle of 2l2Bi and the 40 keV conversion electron from thesubsequent transition to the ground state of 2°8xl are also observed and aremostly apparent in the alpha spectra of detectors with a resolution of lessthan 40 keV at the closest sample-detector distance (see Fig.3).
2.4 Results of Resolution Tests
The resolution (FWHM of the 2 l 2Po 8.78 keV alpha peak) versussample-to-detector distance (measured in detector diameters) is given forvarious detectors in Fig.4.
The Ortec and the Canberra PIPS detectors have the same nominal area(600 mm 2), but the thinner entrance window of the Canberra detector resultsin a substantially better resolution. The dramatic decrease in resolution(increase in FWHM) with decreasing sample-detector distance for the TennelecHE 500 mm2 detector is a consequence of its protective plastic coating.
2.5 Efficiency Calibrations
The counting efficiency of a semiconductor detector is independent ofalpha particle energy in the range of 4-9 MeV but is strongly dependent on thetype of source and source-detector geometry.
Three types of sources are generally used:
1) evaporated2) electrodeposited3) co-precipitated
- 3 -
The first type is simple to prepare from a pure tracer stocksolution. It is often difficult to use this technique with a sample that hasundergone radiochemical separation from a matrix because residual inactivematerial in the deposits cause significant absorption of alpha particles.Electrodeposited sources give adherent and uniform deposits under controlledconditions. This leads to optimum resolution in the alpha spectra. However,the procedure usually requires extensive sample purification, adjustablevoltage and current sources, costly platinum electrodes and typically severalhours of plating time. Also, the plating efficiency can sometimes beunpredictably variable.
The preparation of sources by co-precipitation (in this study using70 micrograms of HdF3> and filtration through a membrane filter is rapid andeasy; even milligram amounts of impurities such as Fe, Cr, Ti and othertransition metals can be tolerated. Some care must be taken to adjustactinides such as Pu to the trivalent or quadrivalent oxidation state. Suchco-precipitated sources are suitable for radiochemically separated samples.The spectral resolution is often sufficient for quantitative measurements evenif several isotopes are present (e.g., 2 A 2Pu, 239Pu and 2 3 8 P u ) .
The activities of identically prepared sources to be used asstandards should be checked with a gross alpha counter such as a thin-windowproportional counter, having a sensitive area significantly larger than thesource to minimize the effects of small differences arising from the method ofpreparation. The activities of electrodeposited sources can be measuredagainst evaporated sources having about the same diameter. Evenco-precipitated source activities can be checked against evaporated sources ifthe detector area is much larger than that of either source.
Various actinides such as 2A1Am, 2A2Pu, 243Am, 24*Cm, andcan be used to prepare efficiency calibration sources. It is our
experience that using more than one kind of nuclide to check the countingefficiency is very desirable to minimise systematic errors.
The counting efficiencies for sources prepared by evaporation arepresented in Table 2 for three different detectors.
Conclusions
(1) The detector resolution should be measured experimentally andcompared to the manufacturer's specifications. This can be done witha thoron daughter source (2*2Bi - 2^ 2Po), which is easilyprepared at a high activity level. Ho contamination arises fromlong-lived recoil nuclei.
(2) The alpha particle detection efficiency should be measured for eachtype of source with different nuclides. The sample geometry can beadjusted for maximum efficiency but usually at the expense ofresolution.
(3) The Canberra PIPS 600 mm2 detector displayed the best resolution ofall the detectors tested, and its resolution was nearly independentof sample-to-detector distance.

- 4
(4) The resolution of the Tennelec HE (Harmful Environment) 500 rnm^detector is significantly poorer than that of the other detectors asthe sample-to-detector distance is decreased. This is due to thespecial protective plastic coating. However, this type of cleanabledetector would be useful in situations where there is a corrosiveenvironment or a high probability of contamination from loose alphasources.
(5) The MdP3 co-precipitation method for source preparation has severaladvantages compared to the electrodeposition method. It may beprepared quickly (£ 0.5 hours) and requires only a suitable vacuumfiltration system. The method tolerates even milligram amounts ofAl, Fe, Hi, Ti and other impurities which interfere with theelectrodeposition methods. The resolution for alpha energies ispoorer by about a factor of 2 than that of very good electrodepositedsources. This resolution in general is sufficient for most of thealpha spectrometry requirements.
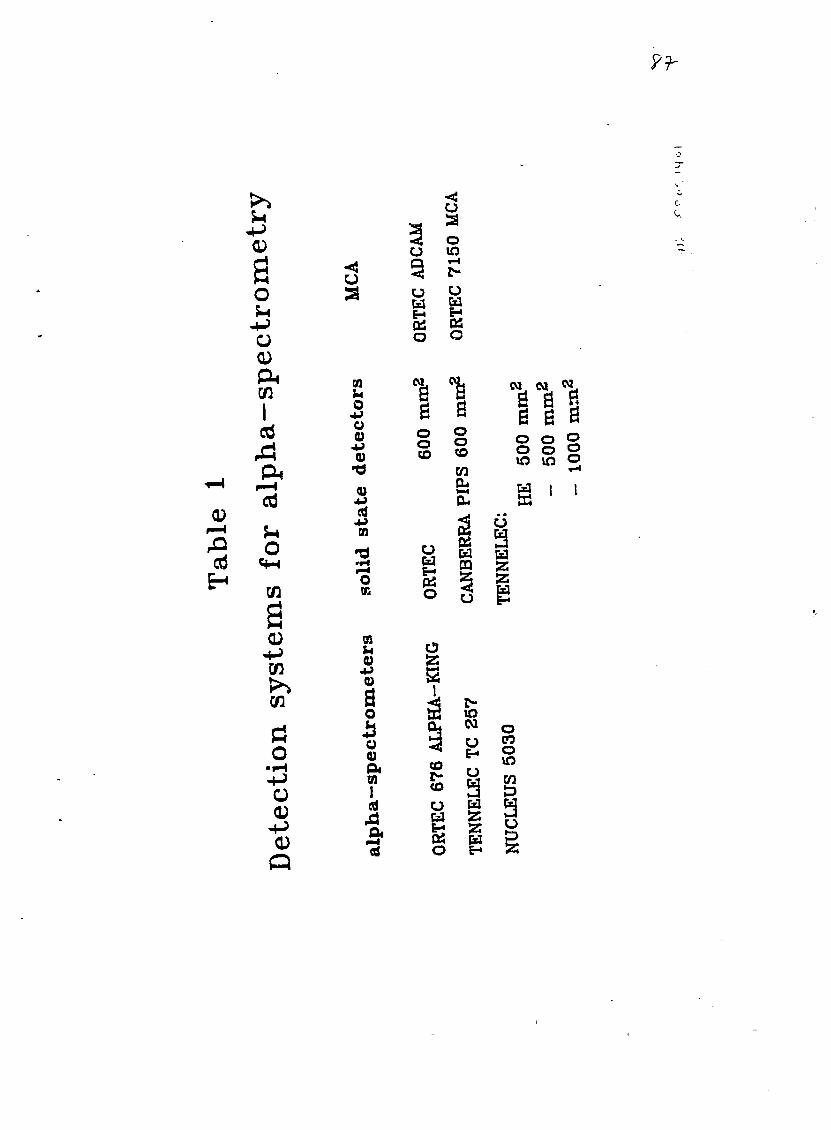
ao
o
3
1o
-a!O
o
enIctf
cd
o
mou0)
0)
cdm
• 4
o
en>>enaoO
en
aoJJoo0iin
5
i
CO
oEd
o
linw
TOO
3 1s aIZEd
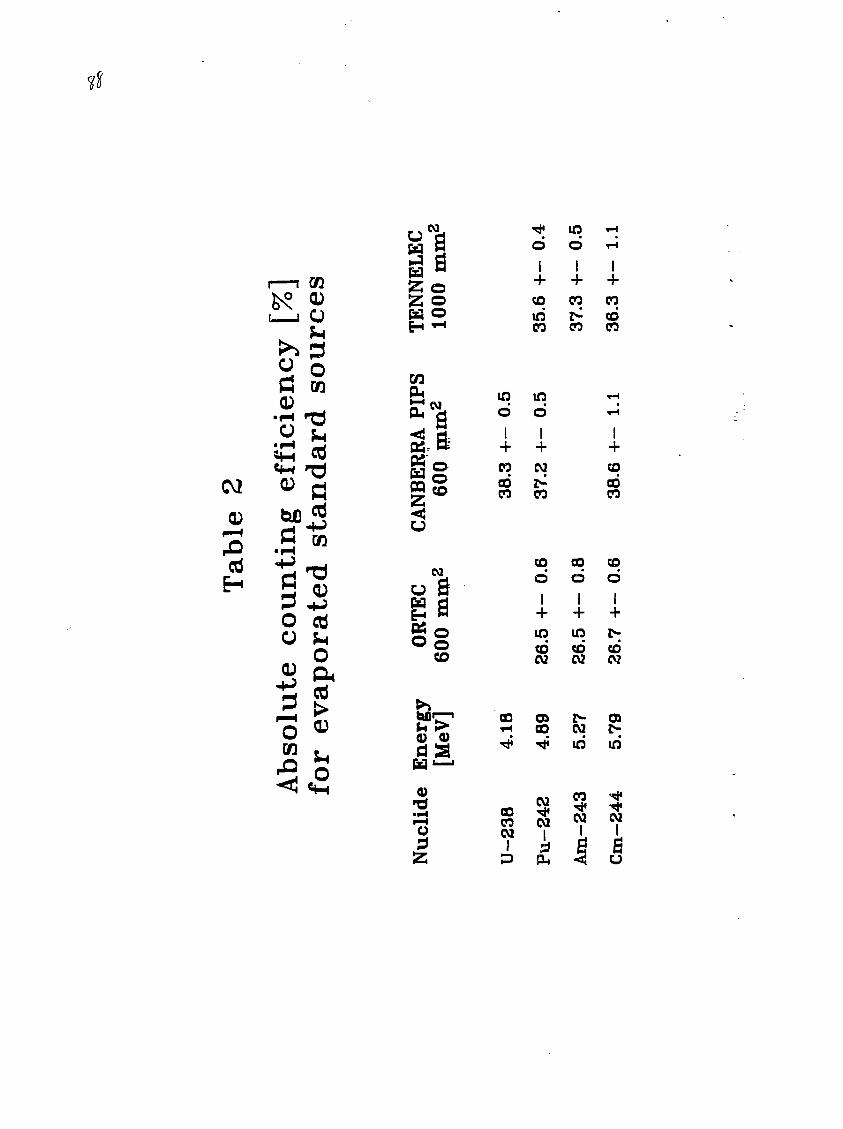
CM
i^ in H
d d 1-iI I I
CDO
d CD
•iH
2 ^• M cd
CM CO
CDi—i
cdadoCJ
CD
'or Q
sta
sJ
cd
op.cd
!H
O
w o
in
a. fttt'o
go
CD
dS
o
I
CO
cdCO
co co* •
inco
ind
CM
co
cooI
COCM
CO OS, -1 CO
CMCOCO
P Pi
CO
d
in inco02
CO
CM
CO
cb0 0 CO
CO
CO
co
CO
d
co
z> CBCM I*;in in
CM
£
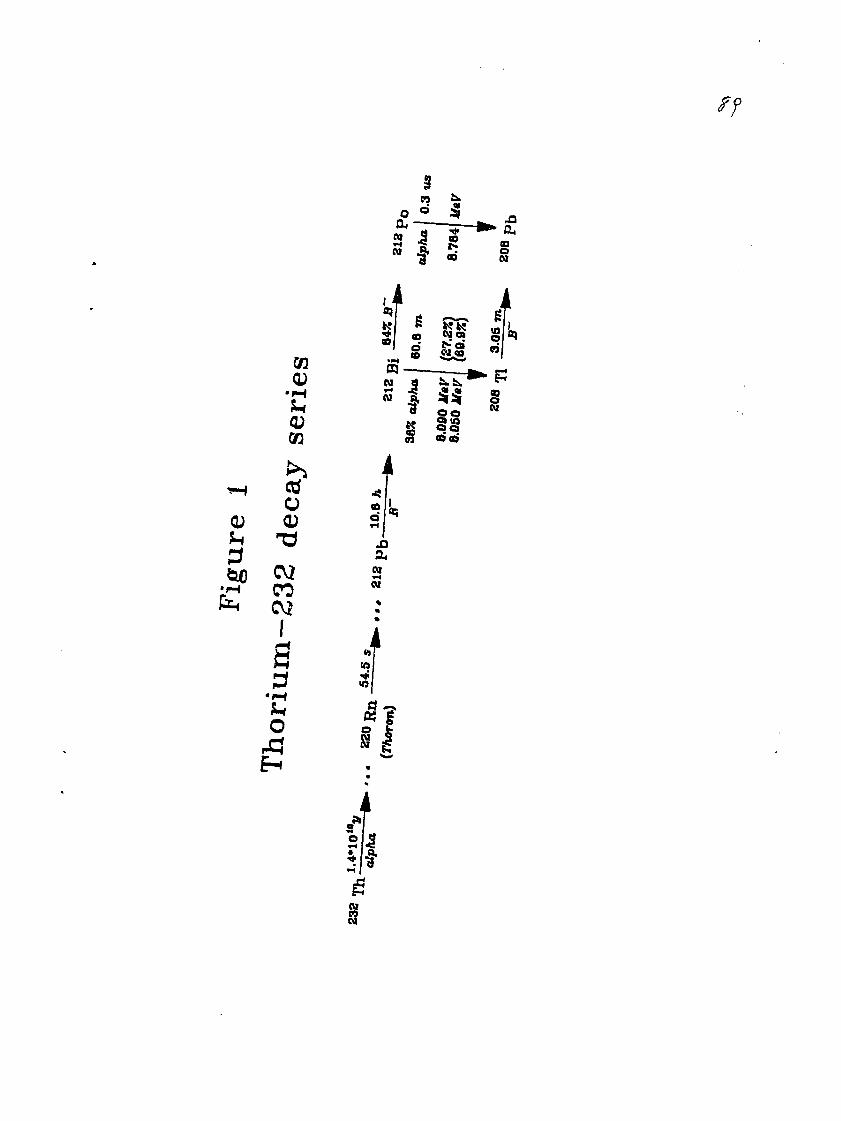
ff
V
GO0)
O<D
CMCO
I0
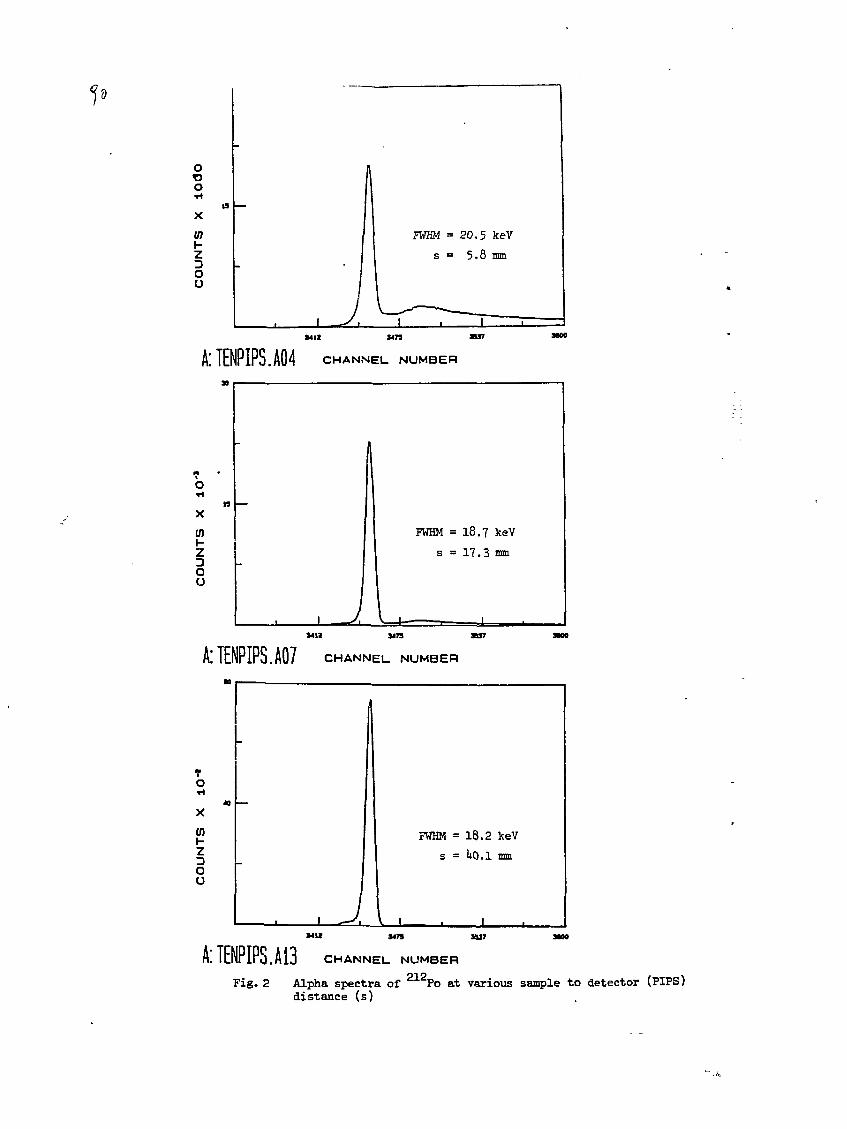
oo
mHZOu
FWHM = 20 .5 keV
s = 5.8 mm
A:TENPIPS.A04 CHANNEL NUMBER
O
(I)I -zou
FWHM = 18.7 keV
s = 17 .3 mm
A:TENPIPS.A07M M %m
CHANNEL NUMBER
TO
X
01
zou
FWHM = 1 8 . 2 keV
s = !*0.1 mm
A:TENPIPS.Ai3I UTi 1U7 MM
CHANNEL NUMBER
Fig.2 Alpha spectra of 212Po at various sample to detector (PIPS)distance (s)

inHZDQU
1/
2900
A: TENPIPS.AQ4 CHANNEL NUMBER
A:TENPIPS.A07 CHANNEL NUMBER
7O
(0H2
OU
A:TENPIPS.A13 CHANNEL NUMBER
Fig. 3 Alpha spectra of 212Bi at various sample to detector (PIPS) distance (s)
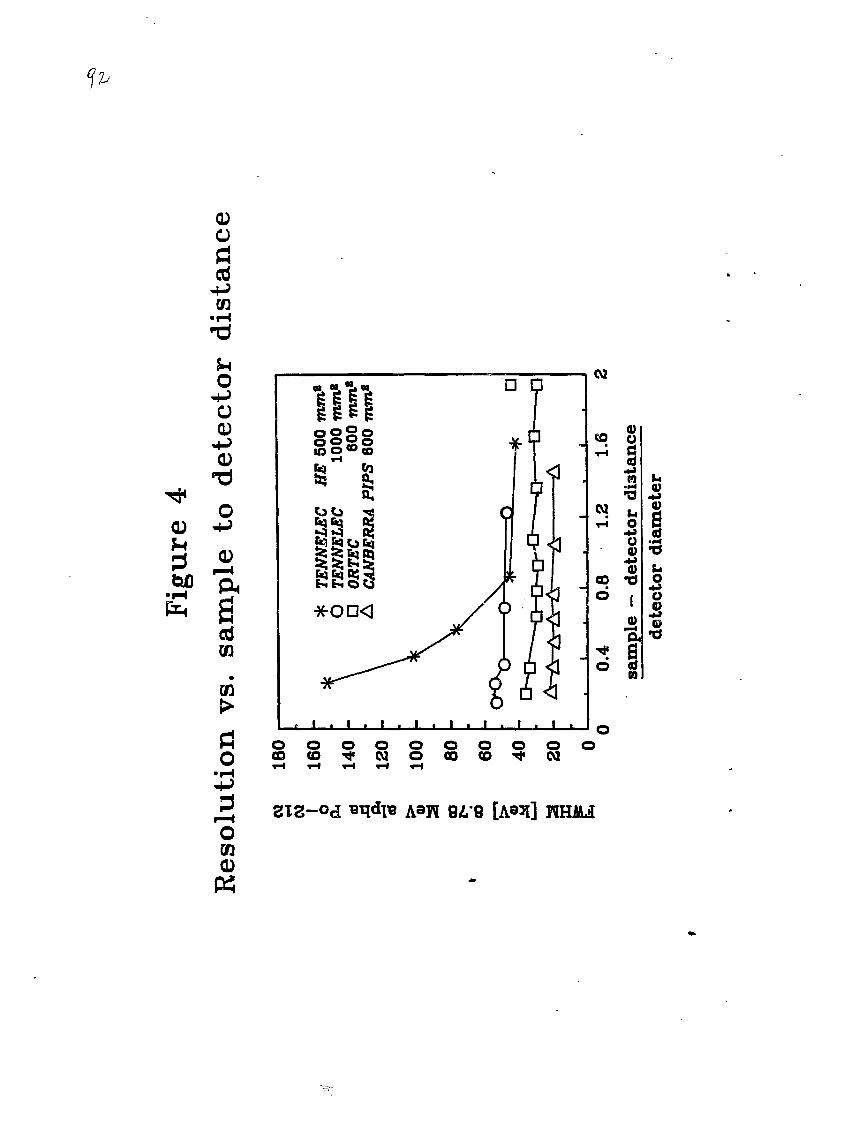
O
cd
cn
o
0)
o
0)
CQ
>
or
co§
1-1 O
0)CO X)6 I
o I
iOo0)
on
PS

INTERNATIONAL ATOMIC ENERGY AGENCY
INTERNATIONAL CONFERENCE ON RADIATIONPROTECTION IN NUCLEAR ENERGY
Sydney, Australia, 18-22 April 1988
IAEA-CN-51/ S3
THE DEVELOPMENT OF INTERVENTION LEVELS FOR THE
PROTECTION OF THE PUBLIC III THE EVENT
OF A MAJOR NUCLEAR ACCIDENT -
PAST, PRESENT AHD FUTURE
B.W. Emmerson
International Atomic Energy Agency
Vienna, Austria
This it a preprint of a paper intended for presentation at a scientific matting. Bacause of the provisional nature of itseonttnt and sincc changes of substance or datail may have to be made before publication, the preprint is made available on theundemanding that it will not be cited in the literature or in any way be reproduced in its present form. The views expressed andthe statements made remain the mporuibility of the named authord); the views do not necessarily reflect those of the govern-ment of the designating Member State(s) or of the designating organization(s). In particular, neither the IAEA nor any otherorganization or body tpontoring thit matting can be held rtzpomible for any material reproduced in this preprint.
A B S T R A C T
Since the mid-1950*s nuclear energy has played an increasing role inmeeting the world demand for electricity production. Although during thisperiod incidents and accidents have occurred, in most cases their effect wasconfined to the plant. Three accidents, however, were sufficiently serious asto involve off-site consequences for the public. The experience from eachcontributed significantly in the development of current emergency responsecriteria and planning arrangements at .the national and international level.This paper summarizes these contributions as they relate to the development ofintervention levels for the protection of the public in the event of anaccidental release of radioactive materials to the environment. It indicatesthe various measures taken by those countries that were affected by therelease from the Chernobyl accident and reviews the subsequent actions byrelevant international oganizations to provide more comprehensive guidance onapplying the principles of intervention and developing derived levels,particularly those aimed at controlling the consumption of contaminatedfoodstuffs, or their movement in international trade. Finally, it considersthe prospects for developing a more harmonized intervention approach based onthe guidance now being completed at the international level.
BACKGROUND
1. For over 35 years, nuclear energy has made a significant contributionto meeting the increasing world electricity demand, with a current installednet nuclear capacity of 298 GU(e> and a total operating experience of4600 reactor years [1]. No human enterprise can, however, be entirelyrisk-free and although the nuclear industry has developed and implementedstandards of safety that many other high technology industries have yet toemulate, it has elso recognized that no matter how low the probability of afailure leading to a significant accident might be, the possibility can neverbe entirely eliminated. Although incidents and accidents have occurred atplants both within and outside the nuclear fuel cycle during this period, withfew exceptions their effects have been confined within the plant; only asmall number have involved any consequential need to implement off-sitemeasures. Three of these, at Uindscale (which was not a nuclear power plant),Three Mile Island, and Chernobyl have had a significant impact at the nationaland international level on the development of emergency preparedness andresponse arrangements, including intervention criteria, for the protection ofthe public.
2. In an accident the source of exposure is, be definition, not undercontrol and therefore the system of dose limitation, recommended by theInternational Commission on Radiation Protection [2] and incorporated into theIAEA Basic Safety Standards [3], does not apply. Any consequent exposure canbe limited in axtent, if at all, only by some form of intervention. However,the principles underlying the system of dose limitation can form the basis forplanning this intervention. In particular, two of the three components of thesystem, namely "justification" and "optimization" have important roles inaiding intervention decisions; the third component, dose limits, is not,however, relevant. The aims of intervention levels are quite different fromthose of dose limits. The dose limits recommended by ICRP are meant to applyto the sum of the doses from a specified combination of sources, a combination
- 2 ~
which, among others, does not include exposures from nuclides present in theenvironment due to accidents. Intervention levels relate specifically to thecourse of action or protective measures being considered; the nature andtiming of their introduction will depend on the prevailing circumstances,including the extent of the potential hazard [Table 1]. The projected levelsof risk, at which they are introduced can be defined quantitatively in terms ofradiation dose, and are referred to, alternatively, as intervention levels(ILs) of dose, "emergency reference levels" (ERLs) or Protective Action Guides(PAGs). Their establishment is an important prerequisite in emergencyplanning, as it is upon these levels that any decision to implement protectivemeasures during an accident should be based. The levels are usuallyspecified in terms of dose equivalent, this being considered the suitabledosimetric quantity for expressing the stochastic risk to the individual.Should an intake of radioactive material be involved, then the quantity,committed dose equivalent, or, committed effective dose equivalent, is moreappropriate. The levels can also be expressed in terms of environmentalconcentrations and levels, (e.g. Bqa"3, Bqnr2, BqKg"1 or Gyh"1)(Table 2]. These "derived intervention levels" represent the practicalexpression of the intervention levels of dose and can be determined for therange of potentially important radionuclides that could be released to theenvironment in the event of a nuclear accident [Figure 1].
POST-WIHOSCALE
3. Although reference values to relate environmental radiation monitoringresults to potential dose were in use prior to the development of the nuclearpower Industry, these were primarily concerned with military or civil defensesituations, rather than the normal protection of the public, includingprotection against contamination of the food chain. It was the fire in theBo. 1 plutonium production reactor at Uindscale in 1957 [4] with its resultantrelease of 20,000 Ci of 1-131, together with other fission products, thatfirst highlighted the need for establishing pre-determined criteria upon whichto base the introduction of measures for the protection of the public in theevent of an accidental release of radioactive materials to the environment.Following the Uindscale accident, the United Kingdom Medical Research Councildeveloped and published recommended Emergency Reference Levels of dose for thewhole body, and for specific organs, together with guidance for determiningderived levels in air, milk and on pasture for a range of fission products[5]. The intervention level concept was subsequently adopted and extended atvarious national levels and by the relevant international organizations. Asummary of the intervention and derived levels applying in various countriesat the tine of the TMI accident is given in IAEA Safety Series Ho. 55 [6].
POST-THREE MILE ISLAHD
4. In contrast to the Uindscale accident, the meltdown at the Three MileIsland - Unit 2 - Huclear Power Plant in 1979 did not lead to any significantcontamination of the off-site environment [7]. However, it did result in agreater awareness of the potential for large off-site releases, and over thenext several years prompted a review of the existing guidance on theprinciples of intervention for the protection of the public and its furtherdevelopment at ths national and international level. The initial concept of asingle fixed value of dose at which to consider the introduction of aparticular protective measure began to give way to the more realistic andflexible one of a dose range within which to consider taking action. This led

- 3 -
to the now more generally agreed concept that there is a lower level of doseabove which the need to introduce relevant protective measures should beconsidered (and below which the risks associated with their introduction aregenerally considered to outweigh those associated with the radiation dose) anda higher level of dose at which the measures should almost certainly have beentaken. Where the predicted dose lies between these two levels, any decisionon whether or not to implement a particular protective measure must weigh thepotential risks and social costs that its introduction would involve against.the radiological risk that would otherwise pertain.
5. By the and of 198S guidance on emergency planning and preparedness,together with the principles and procedures for setting in-trvention levels,had been developed and published by the CEC (1982) [8], ICE? (1984) [91,WHO (1984) [10] and the "AEA (1985) (HI. The basic principles for planningintervention in the eV6»c of an accident had been formulated by ICRP as:
serious non-stochastic effects should be avoided by the introduction ofprotective measures to limit individual doses to levels below thethresholds for these effects;
- the risk from stochastic effects should be limited by introducingcountermeasures which achieve a positive net benefit to the individualsinvolved; and
the overall incidence of stochastic effects should be limited, as faras reasonably practicable, by reducing the collective dose equivalent.
The published guidance also included recommended numerical values for theupper and lower levels of dose on which to base the introduction of the keyprotective measures (sheltering, prophylaxis and evacuation) applicable to the•arly and intermediate phases of an accident [Table 3]. Although nointernationally agreed values for derived intervention levels existed, theguidance identified the environmental measurements or materials for which theywere needed, and the units to be used. Collectively, ttu . guidancerepresented a general international consensus on the principles forestablishing intervention levels for the protection of the public in the eventof a nuclear accident. However, the setting of intervention leveis forparticular circumstances remained the responsibility of the competent nationalauthorities. At the time of the Chernobyl accident a number of countries hadspecified intervention levels for use in conjunction with the emergencyresponse arrangements applying to their major nuclear installations, such asnuclear power plants; several, including the USSR (Table 4], had developedand published derived intervention levels for a range of radionuclides [12,13, 14].
POST-CHEBHOBYL
6. The accident at Chernobyl Huelear Power Plant on 26 April 198b has hada major impact on the overall approach to emergency response planning, both atthe national and international level, particularly as a result of thetransport of radioactive material over long distances within the northernhemisphere and its subsequent inhomogeneous deposition over very wide areas[IS]. Although a number of bilateral and multilateral agreements [16]relating to potential accidental transboundary releases of radioactivematerials existed where nuclear power plants were located close to the border
between neighbourinE countries,(te.g., Sweden-Denmark, Czechoslovakia-Austria)or within economic regions [e.g.. Council for Mutual Economic Assistance(CMEA), Commission of the European Communities (CEO], the type of accidentwhich could disperse readily measurable amounts of radionuclides across largeareas of Europe, with detectable amounts over much of the northern Hemisphere,bad not been taken Into account in any international guidance or nationalemergency response arrangements. Existing national monitoring arrangementsand the published guidance of the international organizations were aimed,primarily, at responding to relatively well defined releases originating fromsources at specific locations within national borders, rather than to thetransboundary consequences from contaminants originating from outside thecountry.
7. Those countries which were directly affected due to deposition requireda considerable effort during the initial assessment stage to identify theradionuclide composition and define the areas where the contamination levelwas sufficiently high as to warrant some form of protective action. Thereactions of national authorities varied widely, ranging from simplereinforcement of their normal environmental monitoring programmes without theintroduction of protective measures, to the banning of specified foodstuffsand, in one case, the provision of stable iodine as a precaution againstexcessive thyroid uptake of radioiodines [17], These differences in approachbetween countries, particularly with regard to the levels at which theprotective measures were introduced, cannot be explained either by thevariation in contamination levels or the predicted radiological consequences,nor by local differences in living or food habits. Certainly, a number ofadditional factors appear to have influenced the decision, the more importantof which were of a political or economic nature (such as the proximity ofelections, compensation for agricultural products, etc.) rather than meetingradiation protection objectives. Moreover, there was a considerablemisinterpretation of the existing radiation protection guidance; for example,mixing the rationale upon which intervention levels are based, with thatrelating to dose limits. Figure 2 illustrates the range in derivedintervention levels adepted by some 31 countries for Cs-134 and -137 forfoodstuffs. This wide variation in response by national authorities, togetherwith a lac!: of consistent and understandable advice to the public(particularly with respect to the potential contamination of food and theenvironment, and any resultant radiation doses and effects) undoubtedly causedmuch additional and unnecessary confusion and anxiety in a number of countries[18].
8. The immediate problem of advising on protection against radionuclidesmoving into the food chain identified an urgent international need for
* comprehensive guidance on princples, evaluation procedures and the setting ofspecific values in various environmental materials and foodstuffs at whichcontrols on their use or consumption may need to be introduced. In 1985 theIAEA had commenced preparation of a Safety Series document giving guidance onthe setting of derived intervention levels in foodstuffs cad environmentmaterials. Following the Chernobyl accident, this draft was revised to takeinto account some of the lessons learnt and provide a more practically-oriented document, including tabulated data for setting levels for a range offresh and preserved foodstuffs. It was published in December 1986 as SafetySeries Bo. 81 [19].
ft
- 5 -
REVIEW OF IMTERHATIOHAL GUIDAHCE
9. At the time of the Chernobyl accident, the published interventionguidance was mainly directed towards the introduction of protective measuresin the early and intermediate phases of an accident, when the main concern isavoiding non-stochastic effects and limiting the extent of stochastic risk toindividuals. However, even in a major' nuclear accident involving the releaseof large quantities of radioactive material into the atmosphere, the need forprotective measures to limit the individual risk (e.g. sheltering, use ofprophylactics, evacuation) will be restricted to within relatively shortdistances - probably not more than a few tens of kilometres - from the releasepoint. Conversely, because the released radioactive material will be dilutedin the atmosphere and subsequently dispersed over wide areas, the major partof the collective dose to populations resulting from such an accident will, ingeneral, be accumulated out to much greater distances. At these distances,the individual dose levels will be sustantially below those of concern fornon-stochastic effects or for significant individual stochastic risk.Nevertheless, the competent national authorities in those countries which lie•long the route of the dispersed radiaoctive material may still consider itprudent to attempt a further reduction of the individual stochastic risk, andof the collective dose detriment for their populations, by introducingprotective measures such as controls on food supplies and drinking water.
10. To avoid future repetition of the confusion which arose from the widelyvarying response actions, particularly the major differences in the levels atwhich protective measures were initiated, several of the international andintergovernmental organizations were requested by their governing bodies to,inter alia: review the adequacy of existing guidance on the application ofintervention dose levels, together with the criteria upon which numericalvalues of derived intervention levels are based; supplement this guidancewith numerical values of derived intervention levels (particularly forfoodstuffs); and seek better international harmonization on the rationale forestablishing derived intervention levels, particularly for the purpose ofassisting international trade. Over the past 18 months, considerable progresshas been achieved in each of these areas and there has been closeco-ordination between the relevant organizations concerned, in particular, theIAEA, the World Health Organisation (WHO), the U.S. Food and AgriculturalOrganization (FAO), the OECD-Muclear Energy Agency (HEA) and the CEC. Theaction taken by each of these organizations to meet its particularresponsibilities is summarized in the following sections.
IAEA
11. An IAEA Advisory Group met in February 1987 to review the currentguidance published by the Agency on intervention levels, taking into accountthe Chernobyl experience. It concluded that although the basic principles forthe protection of t**e public, as set out in IAEA Safety Series No. 72,remained valid, the fc-spporting guidance had been developed more in the contextof intervention within the general vicinity of an accident, rather than forapplication to an accident having an impact over long distances, upon largepopulations and extending over long periods of time. The advisory grouptherefore clarified and amplified several parts of the existing guidance andidentified areas where further guidance needs to be developed. The main areas
- 6 -
addressed were:
the criteria upon which to base the introduction of protective measuresto reduce the stochastic risk to the individual and to limit thestochastic health detriment for the exposed population (i.e., thecollective dose equivalent);
- the need to exclude exposures resulting from sources other hhan theaccident itself when determinlns the level of exposure at which tointroduce protective measures;
- the need to take into account the special requirements of populationgroups that may be at particular risk (such as pregnant women and thosehaving exceptionally high dietary intake of particular foodstuffs whichmay be contaminated) when determining the lsvei at which protectivemeasures should be introduced;
- the measures that may be necessary for controlling persons who are notexposed to radiation in the normal course of their employment, but whomay receive significant exposure due to their particular emergencyresponse duties (e.g., firemen, ambulance, police, etc.) or because ofthe accidental contamination of their working environment; and
- the criteria, based upon optimization principles, for developing alonger-term, internationally harmonized approach to the tradingproblems which may arise in the event of any future nuclear accidentinvolving the widespread contamination of foodstuffs.
12. For determining whether protective measures to reduce the collectivedose equivalent to the population would be warranted, the advisory groupdeveloped guidance on the application of the ICRP optimization principles forexamining the balance between the detriment avoided by the introduction of aprotective measure and the direct costs of its introduction. For the case offood contamination, preliminary optimization calculations by the Groupindicated that the optimum value of dosel/ for introducing the protectivemeasures is likely to lie between 1 and 10 mSv from food consumed in any oneyear; it is relatively independent of the accident sequence, the specificradionuclides involved and the size of the population likely to be affscted bythe protective measure. This level is consistent with the guidance alreadygiven in Safety Series Ho. 72, which recommends a value of 5 mSv as the levelof dose below which the introduction of protective measures would not bewarranted. The Advisory Group also noted that for the purposes of determininginterim intervention levels for application to the international trade infoodstuffs, an individual radiation dose level of S mSv per year would not beinconsistent with their preliminary calculations and conclusions.
13. It was ttrongly recommended that those responsible at the nationallevel for translating intervention dose levels into derived limits forregulatory purposes should exercise care to avoid incorporating pessimistic
Strictly speaking, the optimum value of the "committed effective doseequivalent".

ioj
- 7 -
assumptions which might well lead to a substantial departure from basicradiation protection standards, major inconsistencies in protection practice,and unnecessarily restrictive and costly protective measures. Fcr example,when setting derived intervention levels for application to internationaltrade in foodstuffs, it should be borne in mind that usually only a fractionof the total food basket is imported and that of this imported fraction only alimited amount is likely to come from the contaminated area. Generally,therefore, a derived intervention level need apply only to a percentage of thetotal food intake.
14. On the basis of the recommendations of the Advisory Group the IAEA willpublish a technical document (IAEA-TECDOC) in 1988 giving additional guidancein support of Safety Series Ho. 72. A revised edition of Safety Series Ho. 72is expected to be published in 1989, taking take into account commentsreceived on the TECDOC, together with any recommendations by ICRP resultingfrom the current review by an ICRP Committee 4 Task Group of the guidancegiven in its Publication 40. In its revised guidance, the IAEA aims todevelop a consistent approach for application to the three very differentpost-accident situations which may prevail, namely: (a) the situation in theimmediate vicinity of the accident site; (b) the situation where a country isaffected by direct deposition of radioactive maerials; and (c) the situationwhere the sole contribution to the radiation doses received within a countryis via imported foodstuffs or other imports. For the first situation, (a),the main emphasis will be on preventing the acute effects of an accident(caused by exposure to external radiation and by the inhalation of radioactivematerial) end limiting the risk of late effects (such as cancer) forindividuals (as opposed to the population as a whole). In the last situation,(c), the main emphasis will be on limiting the risk of adverse effects for theexposed population as a whole. In situation (b), which is intermediatebetween situations (a) and (c), it will be necessary to consider the risk ofadverse efects for individuals and for the population as a whole.
15. Because the guidance given in Safety Series Ho. 81 on the determinationof derived intervention levels will need to reflect these revisions, this toowill be revised and broadened to include those situations where the mainexposure pathway is via imported foodstuffs rather than direct deposition.Derived intervention levels will also be developed for other potentialexposure pathways, particularly those within the immediately affected area ofthe accident, such as roads, land surfaces, buildings and contaminatedclothing.
WHO
16. The prime interest of WHO is with health, and this is reflected in itsactivities relating to derived intervention levels. In April 1987 a WHOExpert Group reviewed various approaches for setting derived interventionlevels for foodstuffs and prepared draft guidelines which were subsequentlydistributed to governments for review, after taking into account commentsreceived, the guidelines were further reviewed and finalized by a Task Groupin September 1987.
17. In preparing the guidelines, it was recognized that it would not bepossible to obtain universal consensus on what constituted an "acceptable"health detriment, or to set values for derived intervention levels infoodstuffs purely on the basis of optimizing the costs of the radiation (i.e.,
11 f
- 8 -
health) detriment and the imposed protective measures. An important initialdecision therefore, was the level of exposure, expressed in terms of theabsorbed dose, upon which the derived intervention levels should be based.The Task Group recommended that 5 mSv be used as the reference level of dosefor this purpose. This is in line with the recommendations made by theInternational Commission on Radiological Protection on the accidentalcontamination of food [9], and with guidance published by WHO and IAEA [10,11], in which a dose equivalent commitment of 5 mSv in the first yearfollowing en accident was selected as the level below vhieh control measureswould not be warranted. In practice, the Individual dose in subsequent yearsis likely to be considerably less than that received in the first year, and nolower dose levels, or derived Intervention levels, for subsequent years arerecommended. Should, however, a particular situation result in no significantdose reduction in the second or third year, it would be for the competentauthorities to decide on any necessary action, based upon the specificcircumstances.
18. At a level of projected dose of S mSv, the predicted risk for fatalcancer over a lifetime (50 years) is 10"* (21. This degree of risk is notsignificantly different from that associated with exposure of populations indifferent parts of the world merely as a result of the natural backgroundradiation and its variation. It is also comparable with the level of exposureindoors due to inhalation of naturally occurring radon and its daughters,which in some areas exceeds 10 mSv. Although the degree of risk predicted foran exposure of 5 mSv is two or three orders of magnitude greater than thatachieved through current controls for normal operations at nuclear facilities,it was considered that a similar degree of control is not practicable in anaccident situation, when the authorities are faced with the need to take quickremedial action, which in itself, should not give rise to undue cost ordetriment to health. For the thyroid, an effective dose equivalent of 5 mSvwould imply a dose equivalent to this organ of 167 mSv when it is irradiatedalone. Given the potential of the thyroid to concentrate iodine, and theincidence of non-fatal cancer following thyroid irradiation, this dose isconsidered to be too high. A thyroid dose of 50 mSv was therefore recommendedto take account of these factors.
19. Kather than place sole reliance on individual protection criteria, itwas considered that an assessment of the total societal detriment should alsobe made to determine whether it can be reduced by setting a lower level ofindividual dose at which to intervene. The societal detriment is dependentupon the number of persons exposed and hence the collective dose. If thebasic 1CRP radiological protection principle of keeping doses "as low asreasonably achievable" (ALARA) is applied, then this societal detriment wouldbe reduced to the point where any further reduction could not be justified.This point is determined by applying the optimization technique developed byicn? = in which monetary costs are assigned both to the radiation detriment andto the imposed protective measure. The value of intervention level at whichthe cum of both of these costs (and hence the total negative impact uponsociety) is a minimum can then be calculated. Provided this calculated valueis less than the previously chosen reference level of do&e (5 mSv), it shouldbe used as the new basis for determining the derived intervention levelvalues. Conversely, if it is not less than the reference le--&1 af dose, thelatter valua would be retained and used. By applying the approach developedby the IAEA Advisory Group, as discussed in Section 12, th .• optimizationprocedure was also used to verify, in a general sense, that the choice of
5 mSv as the reference level of dose was realistic in economic terms.
- 9 -
20. The reference level of dose can be translated into correspondingradionuclide concentrations ir. foods (Bq/kg), from a knowledge of the averagefood consumption patterns within the country or region of concern. Thisinformation is expressed in terms of annual consumption for the major foodgroups such as cereals, vegetables, meat, etc. The WHO guideline values werecalculated by compiling global information on food consumption patterns; datafrom approximately 130 countries provided the basis for establishing eightdifferent regional food consumption patterns. Using the maximum regionalconsumption in the different food groups, a hypothetical global diet wasconstructed for foods consumed in quantities greater than 20 kg per person peryear. This value was chosen as the cut-off level, since for foods consumed inlesser quantities, extremely high contamination is necessary to reach thereference level dose. For calculation of the WHO guideline values for derivedintervention levels, a consumption of 550 kg of food and 700 litres ofdrinking-water per person per year was assumed.
21. While it is not possible to predict which radionuelides will bedischarged to the environment when developing generic response arrangements,those most likely to be of concern are: Strontium-90, Iodine-131,Caesiun-134, Caesium-137 and Plutonium-239. Although the presence of each ofthese radionuclides in food will produce a somewhat different dose wheningested in equal quantities, the radionuclides can be divided into two broadgroups. Within each group, the differences are sufficiently small to allowthe establishment of a single generic set of derived intervention levels. Thefirst group includes all of the actinides, such as Plutonium-239, for which ageneral dose-per-unit intake of 10~6 Sv/Bq has been prescribed, and thesecond embraces the remainder of the other above-mentioned radionuclides, suchas the radio-caesiums, for which the general dose-per-unit intake has been setat 10~8 Sv/Bq. These two dose-per-unit intake factors were used in thecalculation of the guideline values.
22. As one cannot predict which foods will be contaminated by whichradionuclides in the event of an accident, the WHO guideline values are basedon the premise that only one radionuclide is involved and only a single foodgroup is affected. The guideline values so calculated are presented inTable 5. In any given accident it is likely that more than one radionuclidewill contaminate foods in more than one food group. To provide for thiseventuality the methodology includes a general additivity formula whichapportions derived intervention values to accommodate multiple foodcontamination, thereby ensuring that the total dose does not exceed the S mSvreference level. While the guideline values would adequately protect thegeneral population, additional values are provided for infants; they coverfour radionuclides in milk or water, based on a consumption of 275 litres eachper year. These values are presented in Table 6 and were considered necessarysince the infant diet is restricted to only a few foods and because thedose-per-unit intake for Strontium-90 and Iodine-131 is higher in the infant.
23. The guidelines are intended to apply at the point of consumption and tothe form in which the food is consumed. Due to the complexity of the food weband because most people obtain the components of their diet from differentareas, only a fraction of the food consumed is likely to be contaminated at alevel corresponding to the level of contamination prevailing in the area inwhich they live. By applying the dose control criteria described above, theresulting mean doses are likely to be significantly lower than the chosenreference level of dose. In practice special, less restrictive, levels may
- 10 -
need to be considered for minor foodstuffs such as spices, herbs and tea,where vast quantities would need to be consumed before t:iey made a significantcontribution to the S mSv individual dose level.
24. The WHO guidelines are aimed at assisting public health decision-makerswho are not specialists in radiation protection to exercise responsiblejudgment. WHO considers that the guideline values would be of particular useto countries that do not have a nuclear power programme and have not,therefore, developed expertise in this area. They are also intended toprovide a basis for developing advice to FAO when setting control levels forcontamination in foodstuffs moving in international trade. The subject of theTask Group Eeport has been referred to the January 1988 meeting of the WHOExecutive Board with a view to elaborating a draft resolution for submissionto the next World Health Assembly. It is anticipated that WHO will publishthe guidelines by mid-1988 under the title "Derived Intervention Levels forBadionuelides in Food - Guidelines for Application After WidespreadRadioactive Contamination Resulting from a Major Radiation Accident" [20].
FAO
25. FAO has a general concern with promoting and advising on food qualityand consumer protection. In December 1986, in response to requests fromseveral FAO Member States for advice on actions which would need to be takenwith regard to the radionuclide contamination of foods, particularly thosemoving in international trade, FAO convened en Expert Consultation Group whichdeveloped and recommended "Interim International Radionuclide Action Levelsfor Foods" (IRALFs) [21]. The term "interim" was used to provide forperiodical review and possible revision in the light of experience and furtherknowledge. In developing these levels, (e.g., for Iodine-131, 400 Bq per kg;for Caesium-137, 500 Bq per kg in the first year and 100 Bq per kg insubsequent years) a relatively conservative approach was adopted in order toprovide wide margins of safety and be applicable internationally as widely aspossible to minimize unnecessary interruptions to international trade. Acommitted effective dose equivalent of S mSv for the first year of exposureand 1 mSv for succeeding years was used (50 mSv and 10 mSv, respectively, tospecific organs such as the thyroid), and the contaminated food item wasassumed to represent 100 percent of the total intake of the consumingindividual. In the absence of other relevant guideline levels, FAO proposedthat the ISALFs be applied to international shipments of food. It alsoconsidered that their application would, inter alia, help to protect thewelfare of agricultural and fisheries communities that might otherwise beaffected by such interruptions. The development of the FAO IRALFs was notintended to preclude the use of derived intervention levels in emergencysituations or the development of such levels by WHO and other relevantinternational organizations.
26. Following its distribution to all FAO Member States, the Report wasdiscussed at the 20th Session of the Food Additives and Contaminants Committeeof the Codex Aliasentarius Commission in March 1987 1/. However, as WHO had
The Codex Airmentarius Commission is the competent international bodyfor developing harmonized food standards, including limits on foodadditives or contaminants, aimed at the health protection of consumersand facilitating international trade.

not at this stage completed its preparation of guideline values for derivedintervention levels, the Report was submitted to the 17th Session of the CodexAlimentarius Commission in June 1987 for "information only". .As the result ofan FAO/WHO inter-Secretariat meeting in March 1988, a joint proposal on thelevels of radioactive contamination of foods aoving in international trade was•greed for submission to the Codex Alimentarius Commission Board inJuly 1988. It is expected that the proposals will then be widely distributedto FAO/WHO Member States prior to the March 1989 meeting of the CodexAlimentarius Food Additives and Contaminants Committee, which will considerthe proposals together with any comments received. The final proposals couldthen be adopted for official publication at the July X989 meeting of the CodexAlimentarius Commission. The proposed levels (and the initial IRALF values)are shown in Table 7 in comparison with the derived intervention levelsadopted by WHO and the CEC.
SEA
27. Following the Chernobyl accident HEA carried out an independentassessment of its radiological impact together with a critical review of theemergency response in NEA Member Countries. The results are published in anBEA report, "The Radiological Impact of the Chernobyl Accident in OECDCountries", which was prepared under the aegis of the HEA Committee onRadiation Protection and Public Health (CRPPH) and on the basis of informationprovided by those OECD countries which are Members of HEA [18]. The reviewrepresents a first step towards identifying those areas tr which attentionmust be given in order to learn from the reactions and experience resultingfrom the Chernobyl" accident.
28. HEA has also established a CRPPH Expert Group on Intervention Levelsfor Huclear Emergencies to review the emergency responses and correspond ingprimary and derived intervention levels adopted in its Member Countries,examine the potential for achieving generic derived intervention criteria, andprovide guidance towards enhancing the international harmonization of suchintervention levels. The Group has endeavoured to identify the key parametersinfluencing the decision-making process involved in managing accidentsituations and has considered the potential for a better harmonization of theradiation protection criteria which govern the decisions to implementprotective measures, including the possibility for harmonized numericalvalues. It has also considered the potential for applying the optimizationprocess in the development of generic intervention levels, and provided aninput to the work of the WHO Task Group in its development of guidelines forderived intervention levels. The HEA report is expected to be published in1988 [22].
CEC
29. Following the Chernobyl accident, levels for protection againstZodine-131 were recommended by the Commission early in May 1986. At the endof May, the CEC Council of Ministers agreed on »*"'""•" contamination levelsfor Caesium-134 and Caesium-137 in agricultural produce imported from outsidethe European Cominity; it also agreed that the levels to be used forinter-Community trade would not be lower [23]. Under Article 31 of theKUSATOM Treaty, provision is made for an Expert Group to advise the Commissionon Radiation Protection. In 1987, using a simplified food basket and grouping
- ?2 -
of isotopes, this Expert Group recommended a system of easily applied levelswhich could be used in any future accident. This would serve as a temporarymeasure until a detailed examination of the particular situation had been madein order to determine the need for controls more appropriate to the specificcircumstances. On the basis of the Expert Group's recommendations, theCommission formulated a proposal for a Council of Ministers regulation layingdown a two-stage system of maximum permitted radioactivity levels forfoodstuffs, drinking water and animal feodtsuffs which can be speedilyintroduced in the event of abnormal radioactivity levels or of a nuclearaccident [24].
30. When taking its decision on the Commission's proposal, the Councildecided that the values previously agreed upon by the Council (e.g., in theease of Caesium-134 and Caesium-137, 370 Bq per kg for milk and infant foods,and 600 Bq per kg for other fopdstuffs) should remain in force for a furthertwo year period. It also adopted a Regulation laying down the procedures fora. more permanent system which would provide for the automatic introduction ofmaximum permitted levels of radioactive contaminants in foodstuffs andfeedstuffs which may be placed on the market following a nuclear accident, orany other radiological emergency, involving food contamination. These levelswere based on the advice of the Expert Group and are shown in Table 7. Oncethe emergency system has been triggered, the levels would apply for a maximumperiod of three months, during which.time the Commission, having taken theadvice of the Expert Group, could set limmits specific to the particularcircumstances of the accident. The Regulation was published in the OfficialJournal of the European Communities on 30 December 1987 [25].
FUTURE HARMOKIZATIOH
31. Much of the public confusion end concern that followed the Chernobylaccident resulted from the inconsistent approach between countries, and insome instances within countries, in interpreting or applying the radiologicalcriteria on which the introduction of protective measures should be based.The lack of published guidance on the application of the interventionprinciples and the setting of derived intervention levels, particularly forsituations where the major concern is directed towards limiting the collectivedose, was undoubtedly a contributory factor. The progress made over the past18 months, as reviewed in this paper, indicates that much has been done toredress these omissions and there is now considerable common ground underlyingthe recommendations and guidance currently being developed by the relevantinternational and inter-governmental organizations. Hot only is there a broadconsensus on the principles that apply for setting the intervention levels ofdose, there is also good agreement on many, although by no means all, of thefactors to be applied when determining derived intervention levels,particularly for application in any optimization process.
32. Without doubt, the most important areas requiring further guidancerelate to the trading and consumption of contaminated foodstuffs. Whenconsidering the possibility of future harmonization however, it is essentialto distinguish between the levels that oust be established for the purpose ofimplementing protective measures aimed at avoiding or minimizing healthconsequences (either to individuals or to population groups) and those whichare necessary for minimizing any disruption in international trade. Althoughthe basic principles of intervention should be common to both, any controlregime established for the purpose of international trade has to be readily
/-v

- 13 -
understood and easily implemented by those who are not specialists inradiation protection. A single level (rather than a range) at which to takeaction, based on a minimum number of radionuclides and foodstuff groups (suchas the procedure now being jointly developed by FAO and WHO) would seem bestsuited for this purpose. The penalty for any simplified generic approach tospecifying action levels is that it may be necessary to assign moreconservative values to some of the input factors than would be warranted onstrict radiological protection grounds. Even so, the resulting enhanced costof the protection may well be considered an "acceptable" sacrifice whencompared with the benefits offered by a harmonized control for contaminatedfoodstuffs moving in international trade.
33. In contrast, the harmonization of derived intervention levels on whichto base the introduction of measures for the protection of the public,particularly with regard to the consumption of foodstuffs, may not be soreadily achieved. Although the guidance and levels shortly to be published byWHO ([Tables 5 and 6] have been developed in conjunction with otherinternational and inter-governmental organizations, not all countries orintergovernmental organizations may be prepared to adopt the recommendedlevels if they differ significantly from those already in use, particularlywhere these have been incorporated into national legislation. Even where abroad degree of harmonization can be achieved, sufficient flexibility mustalways be incorporated to take into account circumstances which are specificto the nature of the accident and of the particular area where the protectivemeasures may need to be introduced. Work on developing the principles for theprotection of the public in the event of a nuclear accident and setting thelevels at which to implement them has come a considerable distance since theWindscale accident. Although we have yet to reach the goal of a fullyharmonized intervention system, the progress and extent of internationalagreement already achieved indicates that the way is open.

Figure 1. Processes that Seed to be Modelled in EstablishingDerived Intervention Levels for Single Duelides
Relevant Derivedaccident mtiiainiionphase level (OIL)
EARLY
INTERMEDIATE
1
Cloudgammados* rate
Tim* integralOf Ihe nuclidtconcentrationin air
Gamma dateran abo«« acontaminatedmrface
DeooiKionconcentrationo< nuchdeon the ground
Orpontionconcentrationol nuclideon pasture
Exposurepathway Processes ic tM modelled/data
Interventionlevel ofdSH
Externalgemma dowfrom cloud
Rtllateprognom
Inhalationof elQud
Metebolismof inhaladnuclidf
External dataHot* lo skinfrom cloud
External betadose Iromdeponti on ikinand clothing
Otpoiuion o'airborne materialonto ikinand clothing
External gammadose fromdepositednuedde
Inhalation olrxtuioendeamaterial
Ingesnon ofanimal produce
Concentrationof nuchde•n foodttuffs
Ingestion offoodttuffi
Migration ofnuclideaway I'Omcontaminatedsurface
Resuspcnsionof dcpoiitcamaterial
Transfer ofoeposuednucfidesthrough food-ehain
Variation withtime of thenuchefeconcenirationin a foodstuff
habits andcharacieritiict. e.fl- age- breathing rate- dietary intake- time spent
"Kloori- shielding
provided bybmldingi
- agriculturalpractice!
- foodpreparationme P'ocminq
Intervention
level ofoose
Metabolismo'ingested
DIL = IL/DCF
where DIL is the derived intervention levelIL is the intervention level of dose, andDCF is a dose conversion factor which relates the two quantities
via the processes/models shown

- 15 -
Figure Z. Variation in Derived Intervention LevelsAnalysis of Values applyins i n
31 Countries at 31 Hay 1986Cs-134 and -13 7
milk
i E2
«6OO £1000O*iiv«d Intarvvntlon Levtl Bq/l of Bq/kg
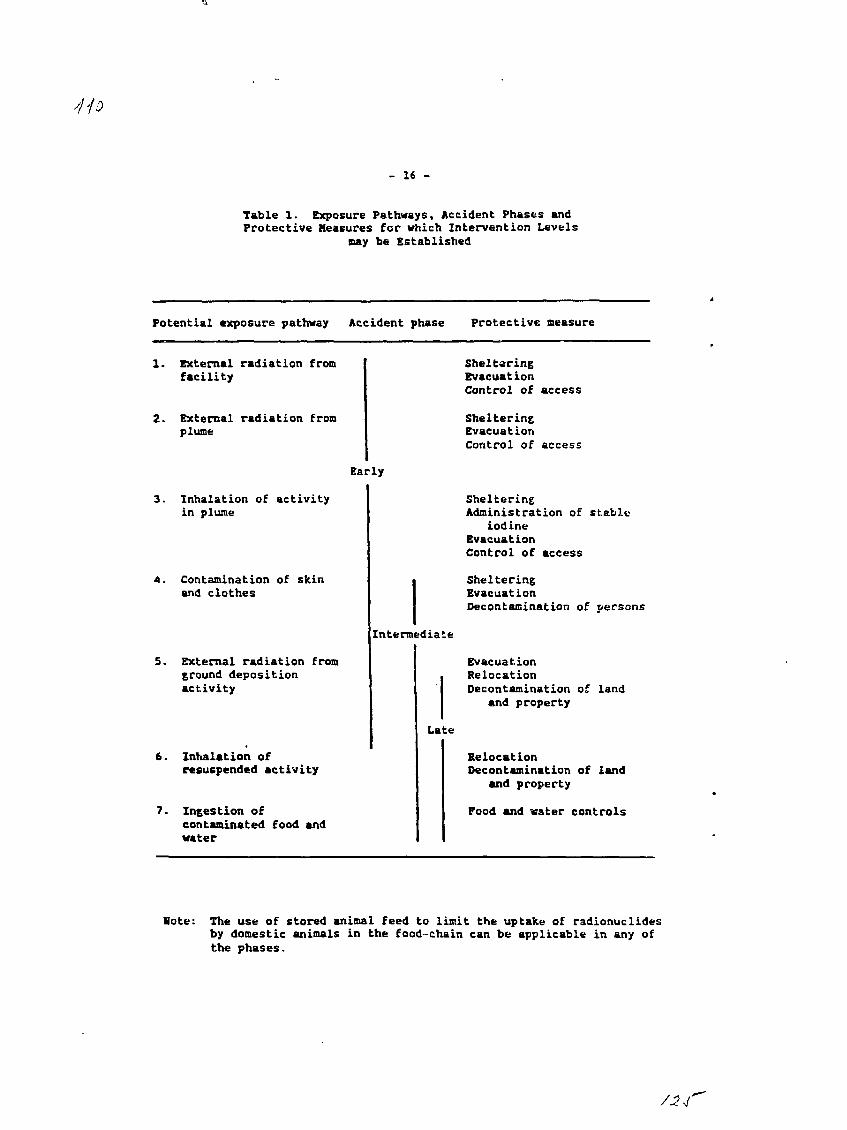
- 16 -
Table 1. Exposure Pathways, Accident Phases andProtective Measures for which Intervention Levels
may be Established
Potential exposure pathway Accident phase Protective measure
1. External radiation fromfacility
2. External radiation fromplume
3. Inhalation of activityin plume
4. Contamination of skinand clothes
5. External radiation fromground depositionactivity
6. Inhalation ofrcsuspended activity
7. Ingestion ofcontaminated food andwater
Early
Intermediate
Late
ShelteringEvacuationControl of access
ShelteringEvacuationControl of access
ShelteringAdministration of stable
iodineEvacuationControl of access
ShelteringEvacuationDecontamination of persons
EvacuationRelocationDecontamination of land
and property
RelocationDecontamination of land
and property
Food and water controls
Hote: The use of stored animal feed to limit the uptake of radionuclidesby domestic animals in the food-chain can be applicable in any ofthe phases.
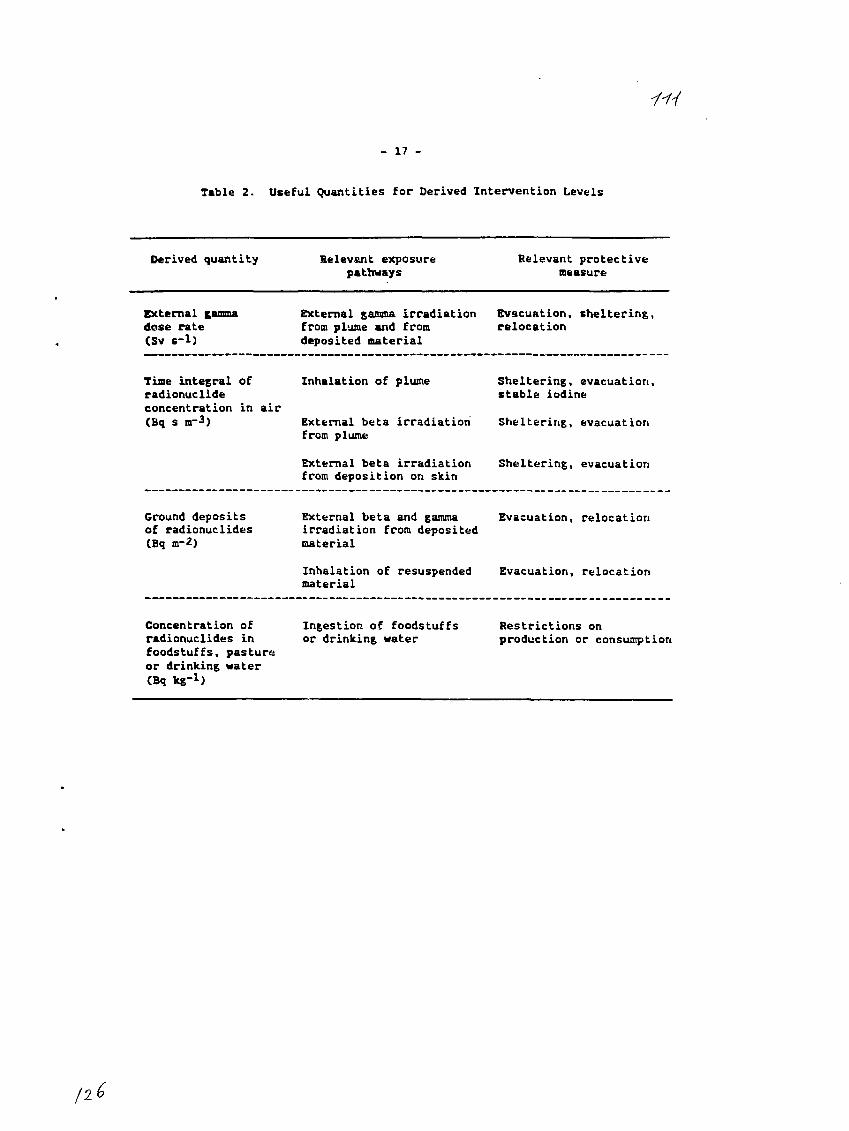
- 17 -
Table 2. Useful Quantities for Derived Intervention Levels
Derived quantity Relevant exposurepathways
Relevant protectivemeasure
External gammadose rate(Sv s-1)
External gamma irradiation Evacuation, sheltering,from plume and from relocationdeposited material
Time integral ofradionuclideconcentration in air(Bq s m-3)
Inhalation of plume
External beta irradiationfrom plume
External beta irradiationfrom deposition on skin
Sheltering, evacuation,stable iodine
Sheltering, evacuation
Sheltering, evacuation
Ground depositsof radionuclides(Bq m-2)
External beta and gamma Evacuation, relocationirradiation from depositedmaterial
Inhalation of resuspended Evacuation, relocationmaterial
Concentration ofradionuclides infoodstuffs, pastureor drinking water(Bq kg-1)
Ingestion of foodstuffsor drinking water
Restrictions onproduction or consumption
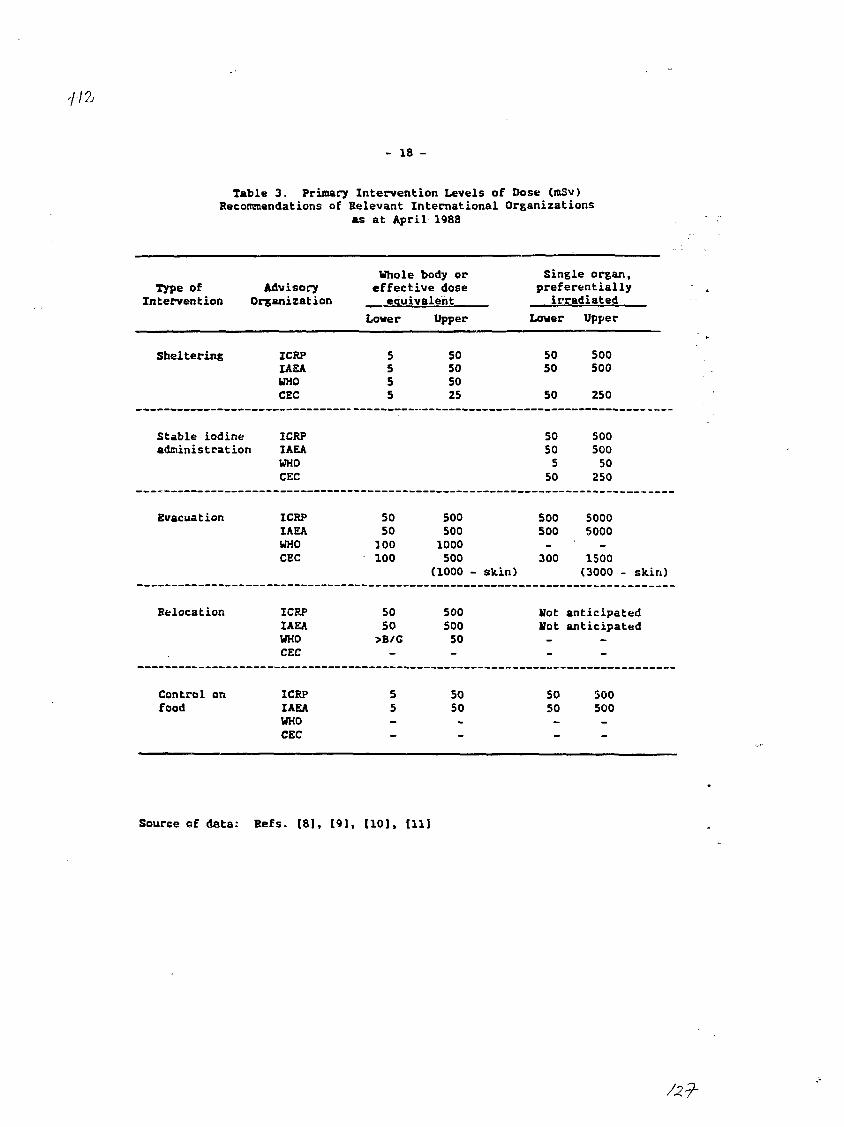
- 18 -
Table 3. Primary Intervention Levels of Dose (mSv)Recommendations of Relevant International Organizations
as at April 1988
Type of AdvisoryIntervention Organization
Sheltering
Stable iodineadministration
Evacuation
Relocation
Control onfood
ICRPIAEAWHOCEC
ICRPIAEAWHOCEC
ICRPIAEAWHOCEC
ICRPIAEAWHOCEC
ICRPIAEAWHOCEC
Whole body oreffective dose
equivalent
Lower
5555
5050100100
50SO>B/G-
55_
-
Upper
SO505025
5005001000500
(1000 -
50050050-
so50
-
Single organ,preferentially
irradiated
Lower
5050
50
5050550
500500_300
skin)
HotHot--
5050_
-
Upper
500500
250
50050050250
50005000_
1500(3000 - skin)
anticipatedanticipated
--
500500_
Source cf data: Refs. [8], [9], [10], [11]
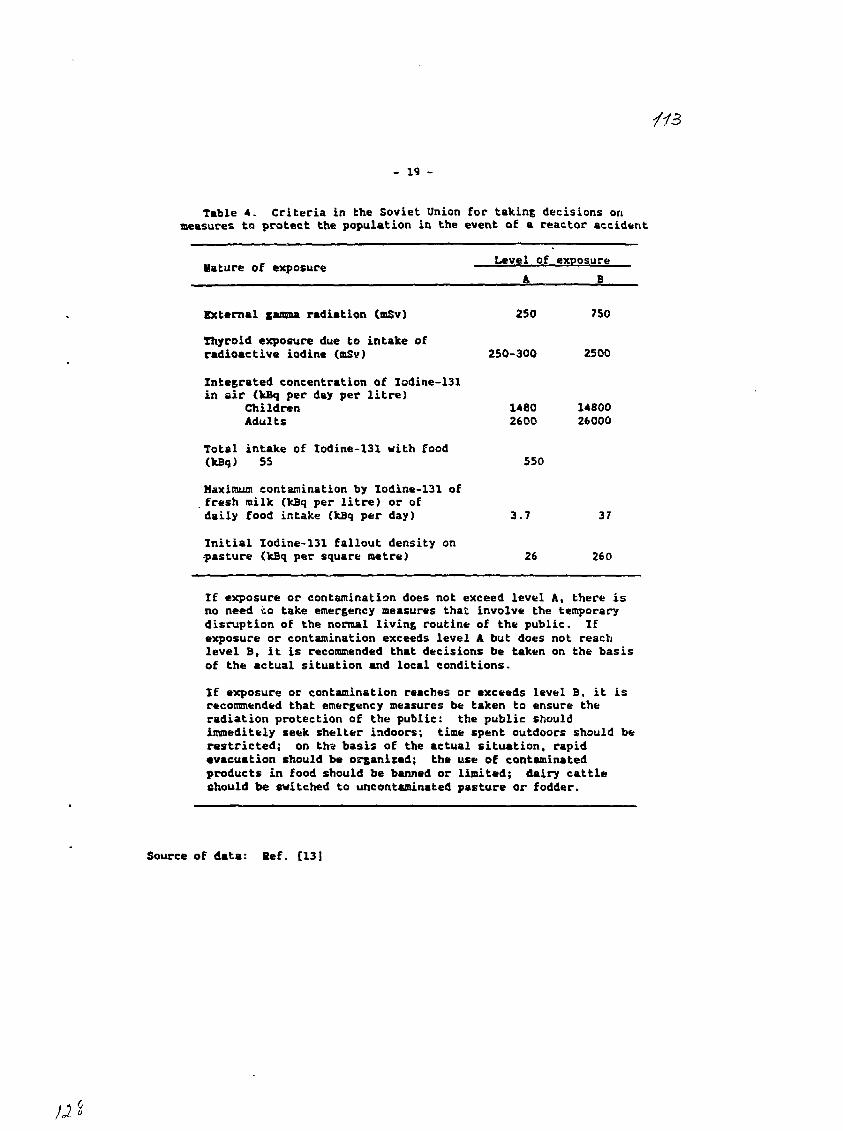
A
250
250-300
14802600
B
7S0
2500
1480026000
- 19 -
Table 4. Criteria in the Soviet Union for baking decisions onmeasures to protect the population in the event of a reactor accident
- Level of exposureMature of exposure
External gamma radiation (mSv)
Thyroid exposure due to intake ofradioactive iodine (nSv)
Integrated concentration of Iodine-131in air (kBq per day per litre)
ChildrenAdults
Total intake of Iodine-131 with food(kBq) 55 550
Maximum contamination by Iodine-131 offresh milk (kBq per litre) or ofdaily food intake (kBq per day) 3.7 37
Initial Iodine-131 fallout density on•pasture (kBq per square metre) 26 260
If exposure or contamination does not exceed level A, there isno need to take emergency measures that involve the temporarydisruption of the normal living routine of the public. Ifexposure or contamination exceeds level A but does not reachlevel B, it is recommended that decisions be taken on the basisof the actual situation and local conditions.
If exposure or contamination reaches or exceeds level B, it isrecommended that emergency measures be taken to ensure theradiation protection of the public: the public shouldimmeditely seek shelter indoors; time spent outdoors should berestricted; on th>a basis of the actual situation, rapidevacuation should be organized; the use of contaminatedproducts in food should be banned or limited; dairy cattleshould be switched to uncontamincted pasture or fodder.
Source of data: Bef. [13]
JJ- °

- 20 -
Table 5. WHO GUIDELINE VALUES FOR DERIVED INTERVENTION LEVELS IN FOODSTUFFS(Bq/kg)
Class ofradionuelide
Cereals Roots & Veg.tubers
Fruit Meat Milk Fish Drinkingwater
High doseper unitintakefactor
35 50 80 70 100 45 350
Low doseper unitintakefactor(10~8 Sv/Bq) 3500 5000 8000 7000 10 000 4500 35 000 700
TABLE g. WHO GUIDELINE VALUES FOR DERIVED INTERVENTION LEVELSIN MILK AND WATER FOR INFANTS8
Radionuclide
Strontium-90
Iodine-131b
Caesium-137
Plutonium-239
Value
160
1600
1300
7
(Bq/L)
1/
2/
2/
1/
1/
2/
Based on an assumed annualconsumption of 275 kg each of milkand water
Based on a mean life of 11.5 daysand an organ dose of 50 mSv to thethyroid
Applies to milk and water
Applies to milk only
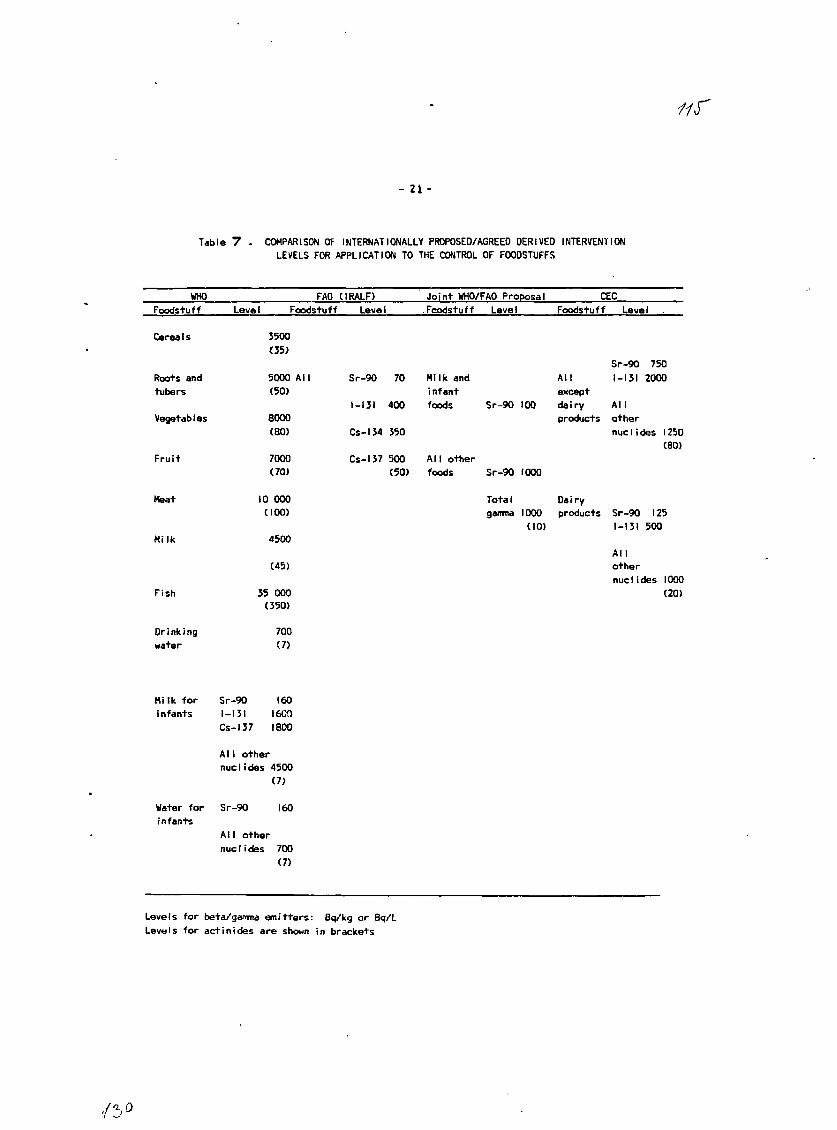
- 21-
Table 7 - COMPARISON OF INTERNATIONALLY PROPOSED/AGREED DERIVED INTERVENTIONLEVELS FOR APPLICATION TO THE CONTROL OF FOODSTUFFS
WHOFoodstuff
CereaIs
Roots andtubers
Vegetables
Fruit
Heat
Milk
Fish
Drinkingwater
FAOLevel Foodstuff
5500(35)
5000 All(50)
8000(80)
7000C70)
10 000(100)
4500
(45)
35 000(350)
700(7)
(IRALF)Level
Sr-90
1 — 131
Cs-134
Cs-137
70
400
350
500(50)
Joint WHO/FAO ProposalFeedstuff
Hi Ik andinfantfoods
Al1 otherfoods
Level
Sr-90 100
Sr-90 1000
Totalgamma 1000
(10)
CECFoodstuff
Allexceptdairyproducts
Dairyproducts
Level .
Sr-90 7501-131 2000
Allothernuctides 1250
(80)
Sr-90 1251—131 500
Allothernuc1 ides 1000
(20)
Hi Ik for Sr-90 160infants 1—131 I6C0
Cs-137 1800
All othernucI ides 4500
(7)
Water for Sr-90 160infants
A11 othernucI ides 700
(7)
Levels for beta/gamma emitters: Bq/kg or Bq/LLevels for actinides are shown in brackets
- 22 -
REFERENCES
1. INTERNATIONAL ATOMIC ENERGY AGENCY, Annual Nuclear Safety Review, 1987,IAEA, Vienna, 198S.
2. INTERNATIONAL COMMISSION ON RADIOLOGICAL PROTECTION, Recommendationsof the International Commission on Radiological Protection, Publication•o. 26, Pergamon Press, Oxford and New York, 1977.
3. INTERNATIONAL ATOKIC ENERGY AGENCY. Basic Safety Standards forEadiatlon Protection, Safety Series Be. 9, IAEA, Vienna, 1982.
4. COMMAND 302, The Accident at the Windscale Bo. 1 Pile on10 October 19S7, Atomic Energy Office, HMSO, London, 1957.
5. MEDICAL RESEARCH COUNCIL, Criteria for Controllint Radiation Doses tothe Public After Accidental Escape of Radioactive Material, HMSO,London, 1975.
6. INTERNATIONAL ATOMIC ENERGY AGENCY, Planning for Off-Site Response toRadiation Accidents in Nuclear Pacilities, Safety Series No. 55, IAEA,Vienna, 1981.
7. KEMENY, J.G., The President's Commission on the Accident at Three MileIsland, Pergamon Press, New York, 1979.
8. COMMISSION OF THE EUROPEAN COMMUNITIES, Radiological ProtectionCriteria for Controlling Doses to the Public in the Event of AccidentalReleases of Radioactive Materials; a Guide on Emergency ReferenceLevels of Dose from the Group of Experts Convened under Article 31 ofthe Euratom Treaty, Luxembourg, 1982.
9. INTERNATIONAL COMMISSION ON RADIOLOGICAL PROTECTION, Protection of thePublic in the Event of Major Radiation Accidents: Principles forPlanning, Publication No. 40, Psrgamon Press, Oxford and New York, 1984.
10. WORLD HEALTH ORGANISATION, Nuclear Power: Principles of Public HealthActions for Accidental Releases, WHO, Geneva, 1984.
11. INTERNATIONAL ATOMIC ENERGY AGENCY, Principles for EstablishingIntervention Levels for the Protection of the Public in the Event of aNuclear Accident or Radiological Emergency, Safety Series Ks, 72, IAEA,Vienna, 1985.
12. RATIONAL RADIOLOGICAL PROTECTION BOARD, Derived Emei-gancy ReferenceLevels for the Introduction of Countermeasures in the Early :.oIntermediate Phases of Emergencies Involving the Release of EadioaetiveMaterials to Atmosphere, BRPB-DL 10, HMSO, London, 1986.
13. ILYIN, L.A. and PAVLOVSKIJ, O.A., Radiological Consequences of (heChernobyl Accident in the Soviet Union and Measures Taken to Mitigatetheir Impact, IAEA Bulletin, Vol. 29, No. 4, IAEA Vienna, 1987.
- 23 -
14. WHITE, I.F., IIRPB Emergency Data Handbook, ReP. URPB-R182, HerMajesty's Stationery Office, London, 1986.
15. INTERNATIONAL ATOMIC ENERGY AGENCY, Summary Report on thePost-Accident Review Meeting on the Chernobyl Accident, Safety SeriesNo. 75-I1ISAG-1, IAEA, Vienna, 1986.
16. COUNCIL FOR MUTUAL ECONOMIC ASSISTANCE, Criteria for RadioactiveReleases from Nuclear Power Plants Requiring Other Countries to beInformed, Radiation Protection Series Bo. 18, CMEA, Moscow, 1984.(in Russian)
17. SALO, A., Radiation Levels in Europe after Chernobyl, Meeting of theEuropean Thyroid Association, July 1987.
13. NUCLEAR ENERGY AGENCY, The Radiological Impact of the ChernobylAccident in OECD Countries, OECD/NEA, Paris, 1987.
19. INTERNATIONAL ATOMIC ENERGY AGENCY, Derived Intervention Levels forApplication in Controlling Radiation Doses to the Public in the Eventof a Nuclear Accident or Radiological Emergency - Principles,Procedures and Data, Safety Series No. 81, IAEA, Vienna, 1986.
20. WORLD HEALTH ORGANISATION, Derived Intervention Levels forRadionuclides in Food, Guidelines for Application after WidespreadRadioactive Contamination Resulting from a Major Radiation Accident,WHO, Geneva, (to be published).
21. UN FOOD AND AGRICULTURE ORGANIZATION, Recommended Limits forRadionuclide Contamination of Foods, Report of an Expert Consultation,FAO, Rome, December 1986.
22. NUCLEAR ENERGY AGENCY, Critical Review of Intervention Levels forProtection of the Public Following Nuclear Accidents, OECD/NEA, Paris,(to be published).
23. COMMISSION OF THE EUROPEAN COMMUNITIES, Commission Recommendation of6 May 1986, Decision of 7 May 1986, and Regulations of 12, 16 and30 May 1986, on National Measures in Respect of Agricultural Products,Official Journal of the European Communities, Brussels, May 1986.
24. COMMISSION OF THE EUROPEAN COMMUNITIES, Proposal for a CouncilRegulation (EURATOM), COMC87) 281 final, Brussels, 16 June 1987.
25. COMMISSION OF THE EUROPEAN COMMUNITIES, Council Regulation (EEC)No. 3955/87, Brussels, 22 December 1987.

til
UJ
= 3
Z<CEasUJCD
o
• M inec <c© - iX Q.
fez 5 S 52 >- * 3-
Z O g o ©
E E "a. z r- eco o £: oJ E 5 ea> oe • "ui a , t/ta u. = z H-
(S
I
«" J 2
H- 3 UlZ U S *
O •O E
I- a \ii ui x
S S 2 . S £ = •U . E « » Z - < „V I Z * B O « » g= 2S Sut 1 I S
a. UJ S< w r LUUJ
u » a. au, ~i "- ce os
2 < 5 t Z "• S00 _1 o
o
J5 •* UJ a E[F of s z I§ I OS.Z- x _J _i w
UJ aa M•o a.
a K
LU^TUJecin<LU
LUEaee.^1™"
uLUa.
TABLE 1
f%0
t/1UJa
oa
UJ
©
UJ_Jeaft*
toinae.tOi—i
1-M
3aaz
X• ^^ ^
_i_i^
eeUJeajg**XI-
<
XI-
3uao1-4aE3**^m<
EeeUJca<j
V)3CH ^
aeH»s
•-^
z<u.oUJVI^3
>-ea
eeu.<r-to9E
>-UJX»—
•UJa^_Jo^zoa<eeC9zf-1-
XUJ
>-«cseiX
1 1 1
UJ
XI-
u.o>-z«cEu.ain^m
UJsUJee3to<UJ
1-uUJeeaUJ
<E
XCOt-4
Xaz
_J<
ceUJ
P""<E
eeUJM
UJ:>aEUJOS
a
e
y-<ee<a.UJCO
-J<1-4^^^^
ee^^a.<Xa3eeeMB
aUJ .
ce<uUJea
3OU
1-uUJeea^ca
aUJee^sin<t, iUJ
EUJea
zUJXt-
u
>-uX1-
t
toUJa_ j
o3i*^
a<Cb
IKUii-eu.aCOSEOtmt-<ee_^m
EWuzou
UJ
ea<i—
oz3a_i_iou.UJX
•
UJl-
3
auUJaa1-4aE31-4
<
XeeUJCD
U
in1-4
cet-z
3aa1-4^g
X3i-«_J_J>-eeUJBBSB1-4
Xt-UJX»-
za
ee3a
<cs
ee3in
UJX*-_ii ^^ ^zUJeeee3uUJee. <UJ3
XuX3
toUJa_JuZaa<ceUJ
u.u.oUI_JB.EXUJ
to3aXto
•
^ ^
CDa
• y
CJUJt—
tot«4
X»-
ea
>-cea_^m-eeaca<_J

/•v
Oil
CVI
X
menCM
CM
CO
in
Xus
•
o
M
ae•
xu.o
0)cs
— S
91On00
•
in
oen
inen
enCM
C\J
ao(A• F -
oIS
OS
mm
•1
i n enCM•H
1
i nf l
1E
inCO
i
trt
UJ
UJ to
UJ
UJ ca
-J UlUl -I
UJV)
uiU. H-O «
0Ui UJ
UJM LJ
asUJ
UJ
UJ
tsi
Ul
© — u.
UJ UJ1/1
e uM <
a.K UJ=> V)
uUJ
UJ
UJ
Ul
uic/t
LUato*Xaeea>-
oa•-<
s
his)
Z
aLU
a
eeLU
•CO
zLU
zUl
LU
LU
aCO
LU
h-
coUlto*
eeee
U l
O£LU
eeee#^CJ
X
to*
u_ J
uu.aH
AHO
_ j
<
CO
<
a
aee
Z to*to*
< LU
ID X
X COU LUto* Xx uiX -1
Q.LU Xt- a z< u o^ to*
•- a i-
o aLU X COee aa. N* ui
ee xLU o I—
X
ax
f t
Xato*
CJto*
oeLUX
LULU
CO
COCOLU_ i
CO
CO
ou-
oXLU
u a.uLU
to
aLU>_!aco eeco c
LU
aco
co "-*
aui
a
co
a
ui
Ul •—I
< a.X «u
LU Ulx ee
ui
co
oUlee •a. a
uiui ax a
CM
a.uiI—CO
XUlae
-j **< ee xu a u
O to*
o: a coa « i-Lk. O Z
to* L U
a os xI— LU LU
X -Ja < LULUa » oa z z< a •-*
I- a.to z eeI-* a ui
i- u.a a ee
U D. h to-
uLU
O _JH- «*S X
o.
Ulx arh- Oa ee
a uito* UJ
o ao a
to*C O
CO LU
a•-• oe
a uLU U!> -J_J LUoCO LUco eeto* ^
aco ato* to*
eeui a
Ul
CO f*O Ulto* to* B .—i ce LU< ee xx < i-O CJ O
LU
a. a •to* U
UJ oe cox a to*t- «J a
LU
co
aLUeeacoLU
COto*
LUCLai—atoto*
ato-
a
uLU
LL.
a
to*
u
UJto—
UJ
LU
a
aLUCO
aLU
roCMI
CVI
C\JI
COeeuiu
uiQ.
aoCO
oto*
a
oeLU
U
ee
a4-110L.o
in
4 *to.o
u
um
CL
egpan
01•u
IB
eaA
Ul10EO
J =
t
o
•°e.o
•inVserw6 .
eo0)
•Ba
JBj
ISf B -
• B»
IS
IS
IA• fB
sIS
i
•
a.LUco
UlI—
a
u
cu os en"o eat .-.u J=e inu isa. 3

UJ CO
eUJ• ^
• - •
~f(9ase
oCOUJB£
CO(UJXo
tart1—tart
tart
toggUJco
CO
LU
u. •-• as coe co o UJ
co u aH- o UJ ©•as a. to *-UJ asX CO U. XUJ tart O UB£ UJ
LU
aUJ
LUC9
SB^ h
wtartaa:aUJtart
J1COaso
u.oh-a=UJXLUatsCOUJ
x
oUJXaUJX
asou.coas«£UJp
BU.eeUJ
©a.
•JUJXUJee
UJ
1 ^
COtart
COX
tart
X
UJ
e
CO
asUJXUJi jUJ
UJu
»V)
«lUJ^ g
trt
COUJatart—1O
ea^^K
<
tart
CO
a
©CO
Xou.COUJ
a
u3asoaOS
aUJ^htart
-J1C93Eo_juX*~u.9
^*O
> •
eaUl_JfiQ^jtart
£UJCOaXh-
ass
acUJ
f-UJeo
ee(-Ul^j
CD
©
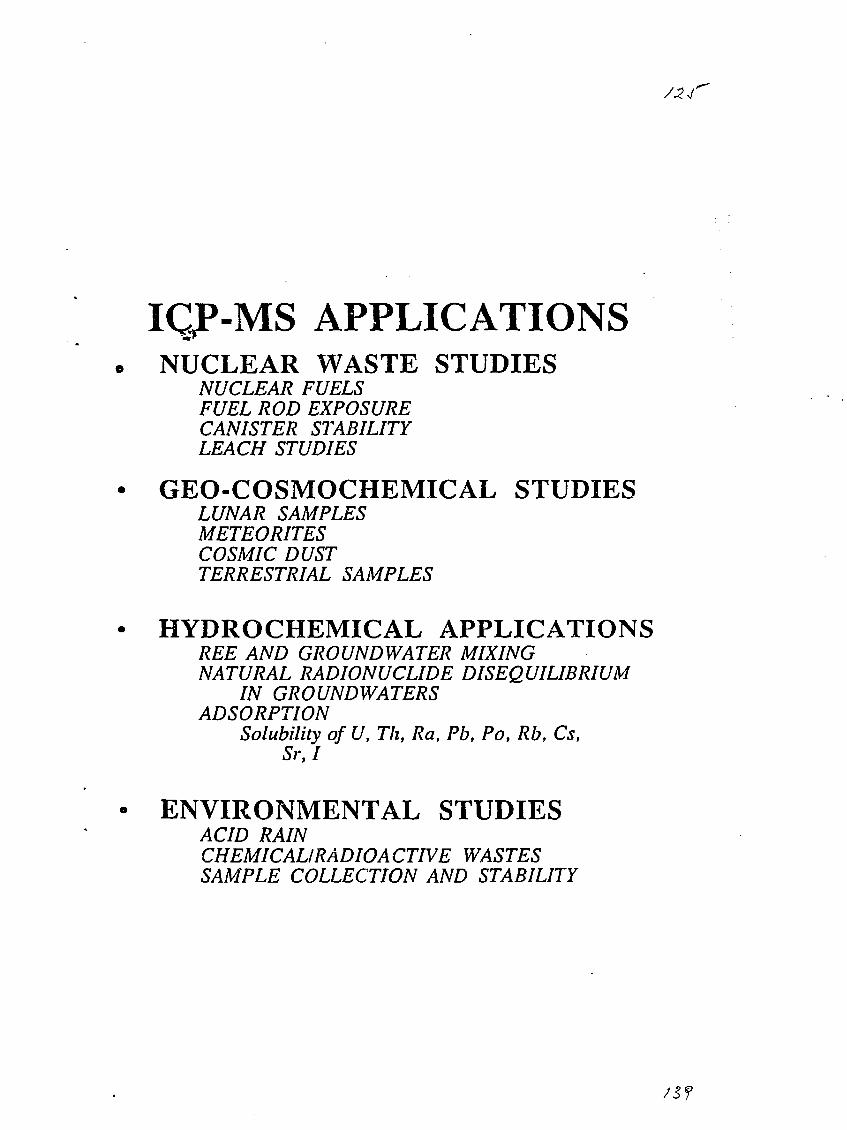
IQP-MS APPLICATIONSNUCLEAR WASTE STUDIES
NUCLEAR FUELSFUEL ROD EXPOSURECANISTER STABILITYLEACH STUDIES
GEO-COSMOCHEMICAL STUDIESLUNAR SAMPLESMETEORITESCOSMIC DUSTTERRESTRIAL SAMPLES
HYDROCHEMICAL APPLICATIONSREE AND GROUNDWATER MIXINGNATURAL RADIONUCLIDE DISEQUILIBRIUM
IN GROUNDWATERSADSORPTION
Solubility of U, Th, Ra, Pb, Po, Rb, Cs,Sr,I
ENVIRONMENTAL STUDIESACID RAINCHEMICAL/RADIOACTIVE WASTESSAMPLE COLLECTION AND STABILITY
/Sf
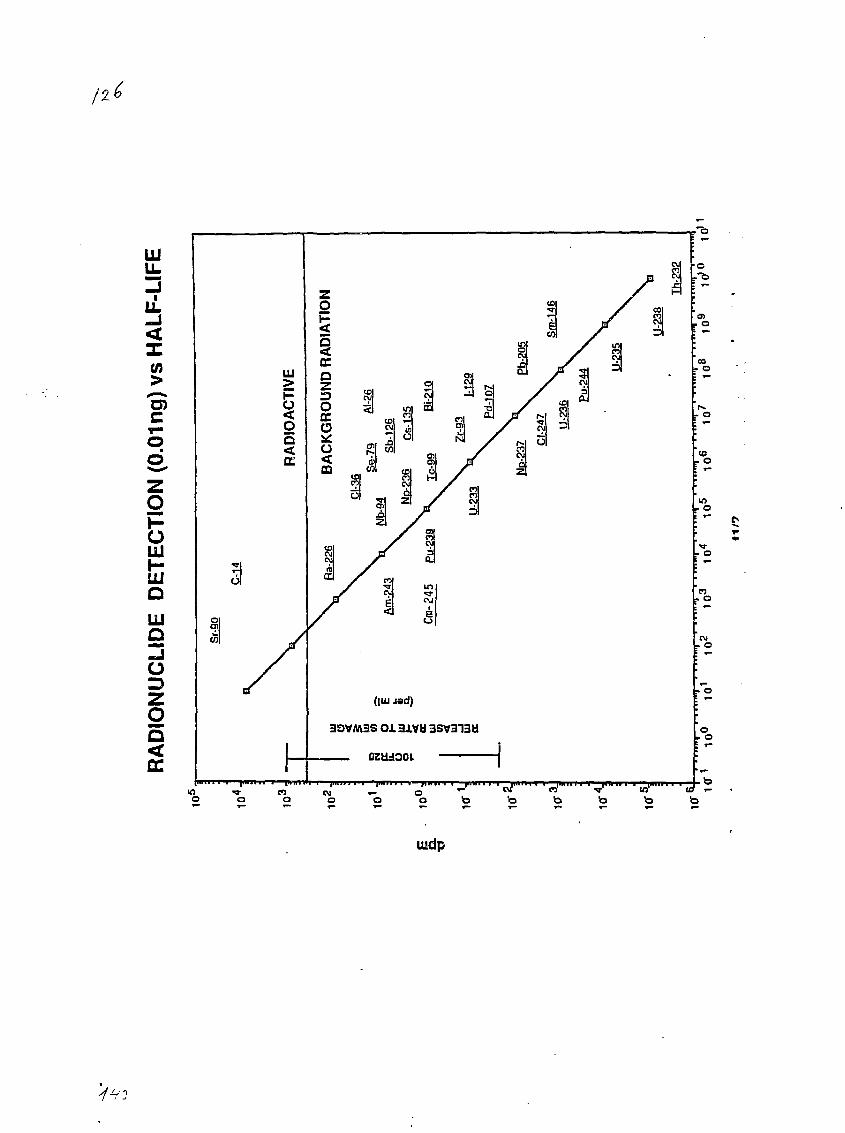
U.
tn
go
IDQZJO
=s
OQ<DC
3OVM3S O l 3J.VU 3SV313U
mdp
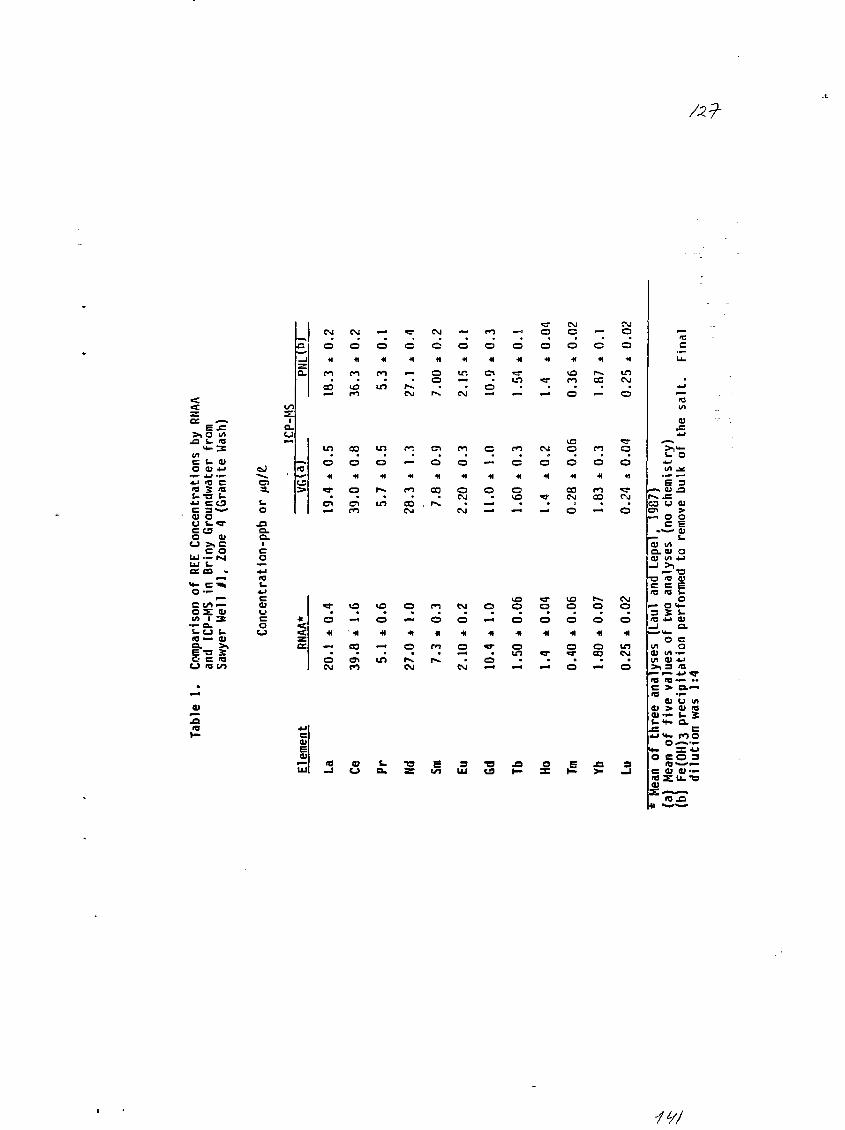
>i O
t- cu
4 J H C18 5 <Os_-a s_c acu ou t-^c tso cuo >>cc oLJ— MUJ i.o: m -
c in —o s: ajin • S'wo s-10 — CU
cu
uo
o4-1<o
cuu
CM
o
CO
CM
o
pn
CM
c
oo
a41
If.
oo41
oo
CM
c —o c41 M
en CO
O
d
mCM
CM —. — —
ino
CO
o ocn
d o —CM
o
oen
r . pn coCOCM
OUS
CM — —
oo41
COCM
— o
o
coo —
10od «-« ' -M
— S3
oCM
d
Cft
oCM
o•H
o
—• ooo4|
IDO
CMO
oM
o o00
inCM
— - I -H O -* O
Sin -ato

z
a
ot/5
OHu
A1ISN31NI 3AIXV13H
Activities regarding the monitoring of radionuclides infood and environmental samples in the departmentENEA-PAS.
G. Jngroo.ENEA-CRE Casaccia PAS-SCAMB CP.2400 00100 Roma, Italy.
The activities carried out in the field of artificial radioactivityin our department include the participation to the Italian national networkfor the routine monitoring of radioactive contamination in variouscompartments of the environment, particularly food products.Radioactivity measurements are also carried out on samples sent byvarious official authorities like the national health service or the customsoffice.
Various research programs are also carried out in this field. Oneprogram still in progress concerns the evaluation of the radiologicalimpact on a national scale of the Chernobyl accident. Measurements ofbody burden, by whole body counter, have and are being carried out onsubjects of the general Italian population. Fig. 1 (1) shows the meanCs-137 body burden, measured during September 1987, in variouslocations. Fig. 2 (2) shows the concentration as function of time ofCs-137, Cs-134 and 1-131 in milk samples collected in Bologna. Fig. 3 (2)shows the concentration as function of time of Cs-137 and Cs-134 in beefsamples collected in Bologna. The Cs-137 daily ingestion as function oftime, calculated measuring total mixed diets, is shown In fig. 4 (3).
Other studies regard the vertical migration in the soil oflong-lived radionuclides, the determination of transfer factors ofradionuclides through various compartments of the environment, inparticular those leading to the human food chain. Chemicr- separationmethods are being developed for the determination of Am-241 and C-14 invarious environmental matrixes.
Mathematical models for the transfer of radionuclides through theair-grass-mi Ik-meat food chain and for the estimate of the caesium bodyburden as function of the daily Intake are being developed and/or validated(4, 5).
Except for the determination of gamma emitters by nondestructive gamma-ray spectrometry, no rapid methods for themeasurements of radionuclides in food and environmental samples are
used up to now in our department. Nevertheless, equipment arid personnelare available to carry out detailed analyses on all types of food andenvironmental samples for the determination of the main rod ion ucl idesthat could be released in the environment during any type of accidentinvolving radioactive material.
The main facilities are located in the Casaccia research centre,near Rome. Similar facilities, although on a smaller scale, are alsoavailable in the laboratory located in the research centre of Bologna.
Description of the available facilities.
Gamma emitters measurement system.
The gamma spectrometric system is composed of two Camberra85 multichannel analysers connected to a PDP 11/23 computer. Eachanalyser is connected to four Ortee germanium detectors with a relativeefficiency of about 20* and a resolution of about 1.7-2.3 KeV at the 1332KeV peak. The Comberra computer program Spectran F Is used for theanalysis of the gamma spectra. Table 1 shows the detection limits forsome fission and activation radionuelides. The sample, a freeze dried totalmixed diet was measured in a 1 L Marinelli beaker for 2000 seconds.
Beta emitters measurement systems.
Beta anti-coincidence proportional counters are used for thedetermination of Sr-90 by measuring the extracted V-90.
Tritium is measured by liquid scintillation counting by means ofLKB low background liquid scintillation counters. Recently the ultra lowbackground (0.5 cpm, using teflon vials) liquid scintillation counter 1KBQuantulus has been acquired. This instrument allows the measurement ofvery low amounts of tritium avoiding the electrolytical enrichment. Theminimum detectable amount is 3.5 TU with 1600 minutes counting time.With this instrument, equiped with a pulse shape analyser, it will bepossible to measure Sr-90 and some alpha emitters.
Alpha emitters measurement system.
The alpha emitters radionuctides like Po-210 and the transuranicelements Pu-239,240 Am-241 are measured by an alpha spectromethcsystem. This system is composed of two multichannel analysers, eachconnected to three Ortec silicon surface-barrier detectors with an activesurface area of 3 cm2, a depletion depth of 300urn and a resolution ofabout 24 KeV.
Sample preparation.
The treatment of the samples varies considerably according to thetype of measurement to be carried out.
Gamma spectrometric measurements usually require no or verysimple treatment of the sample to be measured. The usual treatments,according to the matrix to be analysed and the levels of radioactivitypresent, include evaporation, drying at low temperature, grinding,homogenization.
The measurement of trit ium by liquid scintillation countingrequires the distillation and, for very low levels, the electrolyticalenrichment of eqnous samples. Non aqueous samples are f irst oxidated ina combustion chamber (6, 7).
The measurement of Sr-90 (6, 9) or transuranic elements 110,11)require long and sometimes complex radiochemical separations of thesamples. Different protocols are followed according to the type of matrixto be analysed.
References.
1) С. Melandri, CM. Castelleni, G. Tarroni, M. Formignani, E. Rampa, 6.Santon, S. Di Pietro. Determinazione dell'attività corporea di Cs-137 eCs-134 neila popolazione adulte di sesso maschile residente nellevarie regioni italiane. ENEA RT/PAS/88/3.
2) L Saivatori, L Moretti. ENEA PA3-C00RB0L .Private communication.3) G. Ingrao, F. Breuer, G.P. Santaroni. Contribution of ingestion to the
internal contamination of man due to the Chernobyl acident.Proceedings of the Second International Concerence on Low LevelMeasurements of Actinides and Long-Lived Radionuclides in Biologicaland Environmental Samples. Akita City, Japan May 1968 .
4) L. Monte. A dynamical model predicting the transport of 1-131 throughthe deposition-pasture-cow-milk pathway. ENEA RT/PAS/87/б.
5) L. Monte. Un modello stocastico per la valutazione del carico corporeodi Cs-137 nell'uomo. Enea RT/PAS/87/20.
6) G. Ingrao, P. Beiloni, G.F. Clémente, S. Di Pietro, G. Santori. Tritium andPlutonium content in the food chain in Italy. Proceedings of theconference on the Transfer of Radioactive Materials In the TerrestrialEnvironment Subsequent to an Accidental Release to the Atmosphere.Vol II 481-495. Dublin April 1983.
7) P. Belioni, G.F. Clémente, S. Di Pietro, G. Ingrao. Fallout tritium levelsin environmental samples in Italy. ENEA RT/PAS/85/20.
8) G. Bagliano, A. Baroces. Metodi radiochimici di determinazione delCs-137 e dello Sr-90 in campioni ambientali. CNEN RT/PR0T(77)1.
9) A. Barocas, A. Civica, M. Fantini, E. Soldano. Determinazione dello Sr-9Cin campioni vegetali. CNEN RT/PROT(80)26.
10)A. Delle Site, V. Marchionni, G. Santori. Un metodo sensibile per ladeterminazione del plutonio In campioni ambientali. CNENRT/PR0T(79)21.
11) A. Delle Site, V. Marchfonni. Methods used at CNEN for the analysis ofPu and Am-241 in marine samples. Proceedings of the conference onTechniques for Identifying Transuranic Speciation in AquaticEnvironments. IAEA Vienna 1981.

TABLE 1__ -- - - 1 * - - - - • • > * • ! ' 'r T- -
* ENEA - CA3ACCIA * 29-AUG-88 1.6'i OSi 28
>.«
s *
&*
SAMPLE: DIETA TRINO 11 1 5 - 5 - . . ' . ' . ' .'._ ..DATA COLLECTED ON 29-*UG-88 AT 1 5 : 2 0 : 0 0DECAYED TO 1 0 6 . DAYS, 3 .5000 HOURS BEFORE THE START OF COLLECT.'. .-..',Measuring time 2000 seconds
R A D I O N U C L I D E A N A L Y S I S R - E - R . O R T -^."-.V . . - - , '
T'-'v'"--1 NUCLIDE
AG-11QMAU-198BA-133BA-140BE-7BI-207CD-10?CE-13?CE-141CE-144CO-56CO-57CO-SSCO-60CR-51CS-134CS-136CS-137-FE-5?HF-1S1HG-2031-131K-40KR-S5MN-54NA-22NB-95NP-23? 'RU-103RU-lOiSB-124SB-125SC-46SE-75SN-113SR-S5TA-182TE-132XE-131M
• XE-133XE-133MY-S8ZN-65ZR-95
ACTIVITY CONCENTRATION IN pCi / K GDECAY
MEASURED ERROR CORRECTED ERROR
LLD<3.LLD<2.LLD<4.LLD<1.LLD<2.LLD<3.LLD<9.LLD<2.LLD<4.LLD<2.LLD<2.LLD<3.LLD<3.LLD<4.LLD<2.LLD<3.LLD<3.LLDC4.LLD<7.LLD<3.LLD<2.LLDO.
7.LLD<1 .LLDO.LLD<4.LLDOLLD<1LLD<2LLD<2LLD<2LLD<?LLD<4LLD<4LLD<2LLD<4LLD<1LLD<2LLD<1LLD<?LLD<2LLD<2LLD<SLLDO
69E+0191E+0165E+0114E+0260E+0274E+CU88E+0295E+0133E+0137E+0289E+01OPE+0134E+0196E+015SE+0230E+01.45E+01.02E+01.33E+01.50E+01.84E+01.0 3E+01.12E+03.05E+04.C9E+01.04E+01.35E+01.S?'E+02.89E+01.9SE+02.71E+01.6SE+01.45E+01.36E+01.3SE+01.66E+01.09E+02•34E+01
.25E+01
.45E+02
.92E+01
.43E+01
.37E+01
LLD<4.LLD<2.LLD<4.LLD<3.LLD<1.LLDO.LLD<1.LLD<5.LLD<4.LLDO.LLD<7.LLD<4.LLD<9.LLDO.LLDO.LLDO.LLD<9.LLD<4,LLD<3.LLD<1.LLD<1.LLD<2.
71E+03 7.LLD<1.LLDOLLD<4LLD<2LLD<7LLD<1LLDOLLD<9LLD<1LLD<1LLDO
• LLD<4LLD<1LLD<2LLD<2
LLD<1LLD<9LLD<5LLD<1LLD<1
95E+0107E+1378E+0160E+0403E+0376E+0116E+0302E+0120E+0207E+0249E+0106E+0138E+0115E+01.67E+03.A4E+01.90E+03,05E+01.81E+02.93E+02•3SE+02.79E+05.12E+03 +-1 .71E+03. 07E+04.91E+01.37E+01.71E+02.17E+15.87E+02.C.3E+02.19E+01.04E+02.07E+02.05E+01•siE+01 . ;.45E+02•07E+02.OiE+11.62E+05.20E+08.38E+16.82E+01.14E+02c84E+02
TOTAL 7.12E+03 +-1.71E+03 7.12E+03 +-1.71E+03
ERROR QUOTATION HT 2.00 SIGMftLLD CONFIDENCE LEVEL AT 75.0%
PEAKS f-JOT USED I'I ^
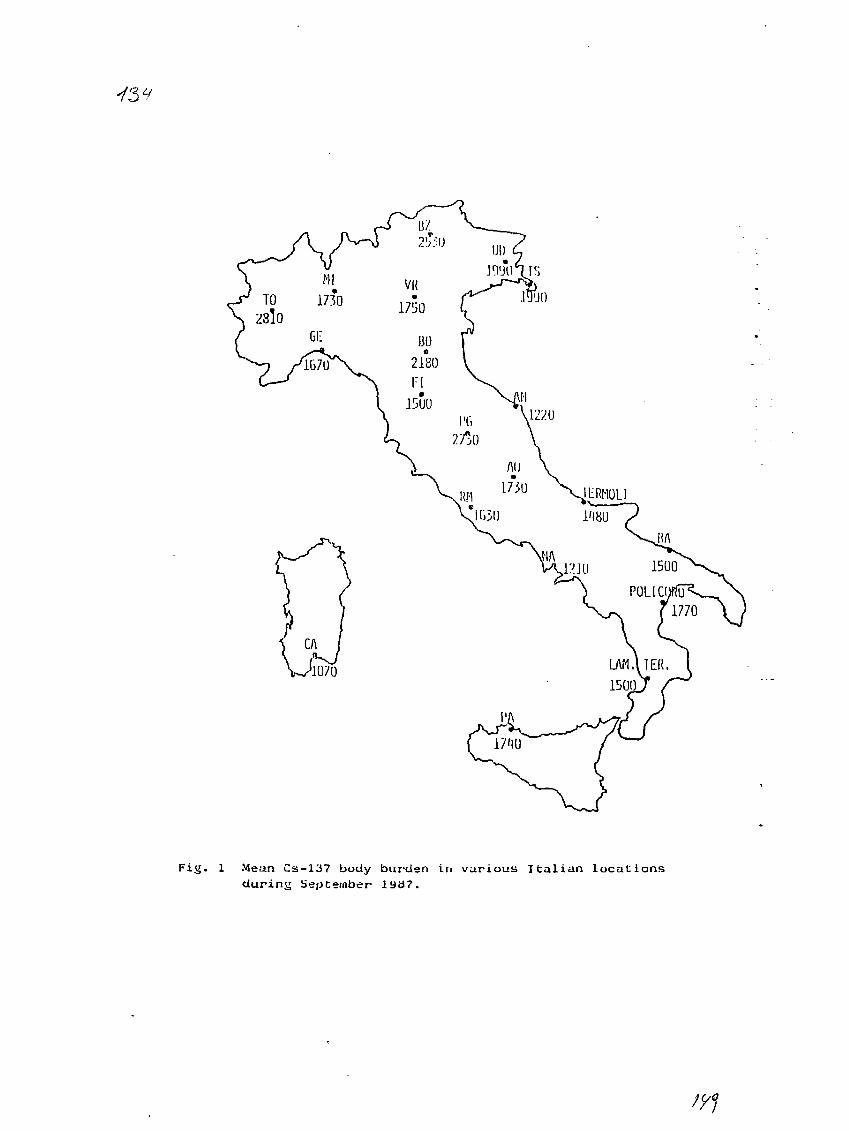
IERMOLI• v
1'I8U
Fig. 1 Mean Cs-137 body burden in various Italian locationsduring September 1 94J7 .

/3J-
/SO
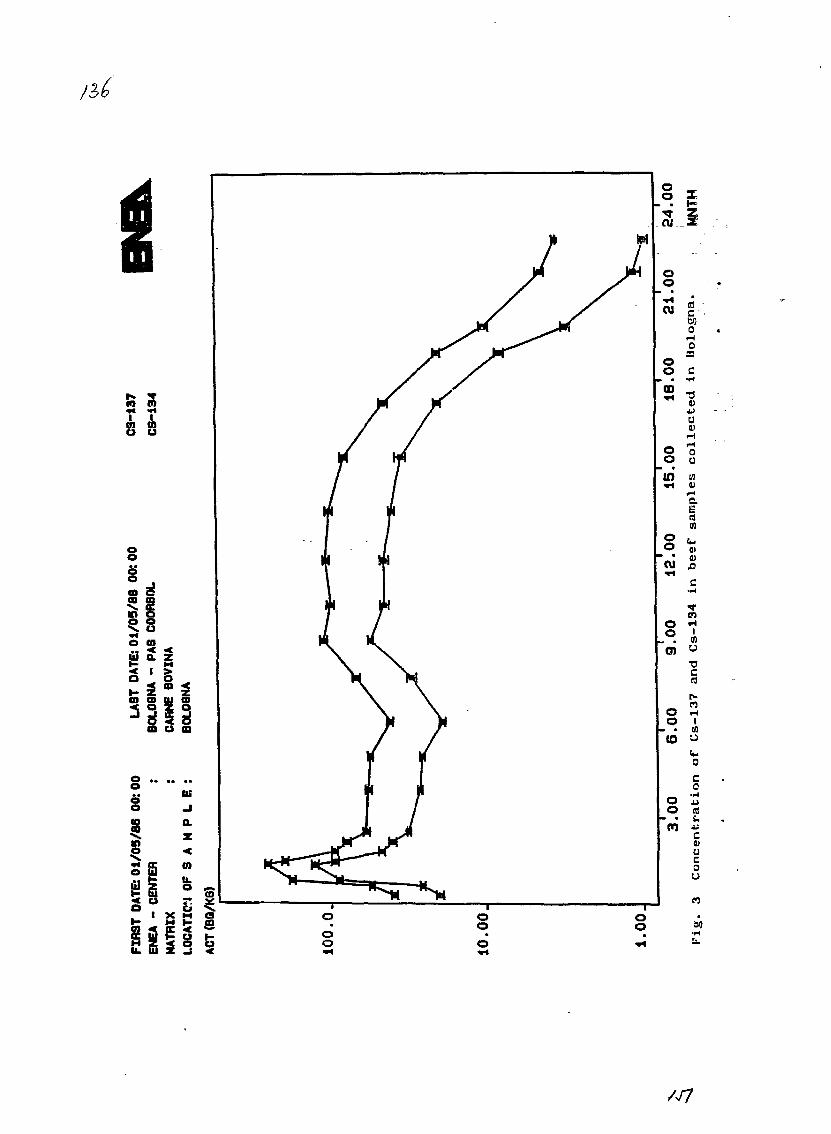
lit
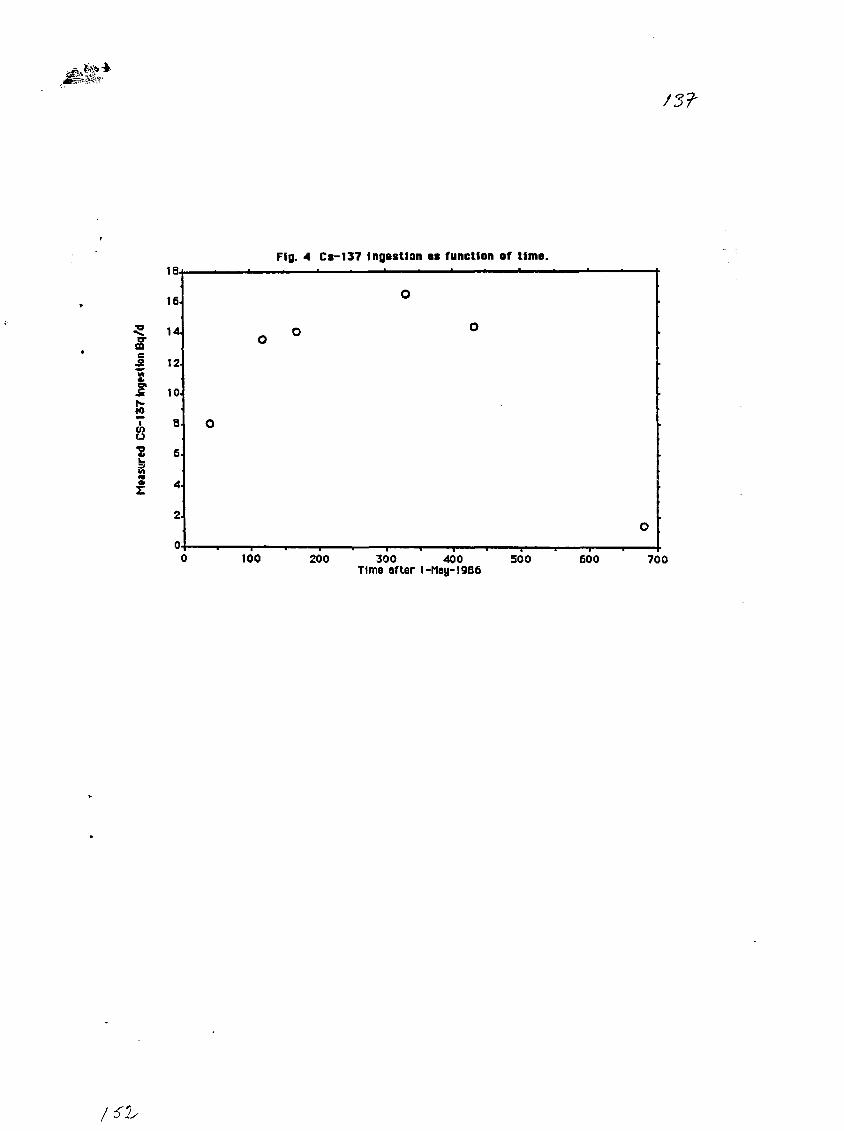
IM
I
16.
14
12
10
8
6
4
2
0
O
Fig. 4 Cs-137 fngestton as function of time.
O
0 °
O
100 200 300 400 500Time after 1-May-1986
600 700
/ 57s
ESTIMATE OF THE CESIUM-137 ACTIVITY IN REINDEER HEAT BT EXTERNALT-HEASUREHENT OF LIVING ANIMAL.
Rolf FalkNational institute of radiation protection
Stockholm, Swedenand
Gustav AkerblomSwedish Geological Co
Lulea,Sweden
Background
The fallout from the Chernobyl accident to certain regions innorthern Sweden has resulted in high concentrations of cesiura-137in reindeers living in these areas. As the reindeer to asubstantional fraction are feeding on lichen, the elevatedcesium-137 concentration in reindeer meat is expected to remainfor decades.
A simple and rapid measurement method is desirable for selectionof animal for slaughter or selecting animals for specialfoddering as the cesium-137 activity in the reindeer meat mayexeed the limit value for sale .
Methods and Results
A study vas performed by the Swedish Geological Co where thefeasibility of external y-dosemeasurement to assess the cesium-137 activity in reindeer meat was examined during the last monthsof 1986 .Reindeer is an anmial living in the mountain region ofScandinavia. The weight of the animal is 35 - 70 kg. Around90000 reindeers are slaughtered per year.
Measurements were carried out on about 130 animals. The externalY-measurements were performed with a commercialy availible y-instrument, normally used for geological surveys, (BGS-3,Scintrex, Canada). The instrument was held against the groin justin front of the animals hind leg and 20 seconds later theresponse of the instrument was read. The animal was thenslaughtered and meat samples were taken for laboratory analysisof the cesium-137 activty.
Figure 1 and 2 show the relation between measured y-doserate inuR/h and the cesium-137 activity in meat(Bq/kg). The actualbackground doserate (3 - 10 uR/h) is substracted. A y-doserat of1 uR/h corresponds roughly to an meat concentration of 100 Bq/kg.For fat animals a 20 X lower doserat and for thin animals a 20 Xhigher doserate was obtained.
As can be seen from figures 1 and 2 the is a linear correlationbetween y-doserate and meat activity but the scattering of thedata points is up to 30 X. The reason for this large scatteringwas examined and i.t was found that a substantional part of thescattering vas due to the fact that the meat samples were takenfrom different organs. A variation of up to SO X for the cesium-137 concentration in meat from different parts of the animal wasfound•
/rs
/3f
The method vas improved after this first study described aboveand during the period February - April 1988 a total of 650reindeers has been measured in 11 occations prior to slaughter.In addition foddered reindeer have been measured on two occationsto provide a basis for determining a suitable date for slaughter.
The instrument used is a y-defector connected to a fieldcomputer. The instrument which contain a 4 * 4 * 5 cm Nal(Tl)detector has been developed by The Swedish Geological Co in Mala.
The thighs and shoulders of the animal have been measured. It iseasier to hold the instrument steady and apply a near to constantpressure when measuring the shoulder opposed to the hindquarters. Measuring the front legs is also safer than measuringthe hind legs. Measuring the shoulder gives more realiblereadings and is faster.
A measuring period of 10 seconds has to be used to obtainreliable results within the 300 - 2000 Bq/kg interval. It vasfound that the measuring results are more reliable with a 10second measuring period than with a 60 second period.
The level and variation of the background radiation villinfluence the reliability of the measurements. It is therforenessessery to chose the measuring site with only small variationsin the background. In wintertime a frozen lake is a good choice.
Results from the study during April 1988 are given in fig 3.Additional information from this study can be found in Ref 1.
Conclusions
A rapid determination of the cesium-137 activity in meat can bedons by external r-measurement of living animals.Portable field instrument for measurement of reindeer has beendeveloped and the method has been used in the north of Sweden to
- select reindeer for slaughter in order to obtain cesiumactivity in reindeer meat below a treshold limit value.
- select reindeer for foddering when the cesiumactivity has to be within a minimum and maximum value.
- select reindeer for household needs in order to getcesium activity as low as possible.
After proper modification the method might be used for otheranimals or in other situations when a rapid measurement of largequantities of e.g. fresh foodstuff is needed.
Reference
1. G. Ahman and T. Sjostrom: The association between caesiumcontent in reindeer meat and external radiation from livingreindeer. A report from the Swedish Geological Co, 1988.

RESULTS FROM MEASUREMENTS OF GAMMA RADIATIONFROM LIVING REINDEERS, DECEMBER 1986
FIGURE 1
SO'
zo
10•
i i •
Harads "-;*IIA">* *
1O 2 O 5O 1OO ZOO
SWEDISH CEOUKICAl CO
SOO 1OOO 2OOO 5OOO 1OOOO
Cs-137 Bq/kg
RESULTS FROM MEASUREMENTS OFGAMMA RADIATION FROM LIVING REINDEERSDECEMBER 1986
FIGURE 2
1OO
ao
6 O
st
*
•
•:•
• o
•i •
t:o
•
•
"s °oo
•
8
o•
° o
o
CALFCOWBULL
5OOO 1OOOO
Cs-137 BQ/kg
<^>SWE0O1CEOU}GICAL CO

IIXs
AXWELL FIL - CKS.P6T X - EXTEBKSTB - CS 137
Bq/kgisa.ee
S1.88
8.00. EXTERNAL RADIATION 113.88 CPS
FIGURE 3
The relation betvsen external radiation from reindeerand the cesium-137 concentration found in reindeer meatfrom a slaughter in Brannas, Mala, on the 25th April 1988.The reindeer were from the Vapsten Lapp Community and havebeen foddered in the Alvdalen area. Measured vith a GAMMAGEOKAC. Background: 25 cps.

Rapid Instrumental and Separation Methods for
Monitoring Radionuclides in Food and Environmental
Samples.
Vienna 5 - 9 September
LOCAL LABORATORY NETWORK IN FINLAND
Olli Paakkola, Finnish Centre for Radiation and Nuclear
Safety, Helsinki, Finland
Laboratory network and the counter
During the nuclear weapons testing in early 1960's
monitoring of radioactivity in food was for the first
time systematically organised in Finland. Finnish Centre
for Radiation and Nuclear Safety, formerly named
Radiophysical Institute and later Institute of Radiation
Protection, was given the responsibility of ecting as the
central laboratory for environmental monitoring and research
on radioactivity. Since 1960 the Centre has been analyzing
radioactivity in foods. In mid 1960's some regional food
laboratories were obliged to get prepared to monitor also
radioactivity in food.
These laboratories, at present about 50, were first
equipped with a geiger counter. The laboratories are
now so called local laboratories in our radiation
monitoring laboratory network.
In about ten years it was evident that these geiger counters
were out-of-date and a time-consuming search for a new ,
simple and relatively cheap counter was initiated. When
analyzing scenarions of different nuclear accidents it
was realized that fallout from these accidents would most
probably always contain, in addition to beta emitters,
also gamma emitters. It was decided that old geiger
counters should be replaced with modern, simple integrating
gamma counters. These counters would be substantially
more effective than old counters. In 1981 Finnish Centre
for Radiation and Nuclear Safety decided to supply all
'/
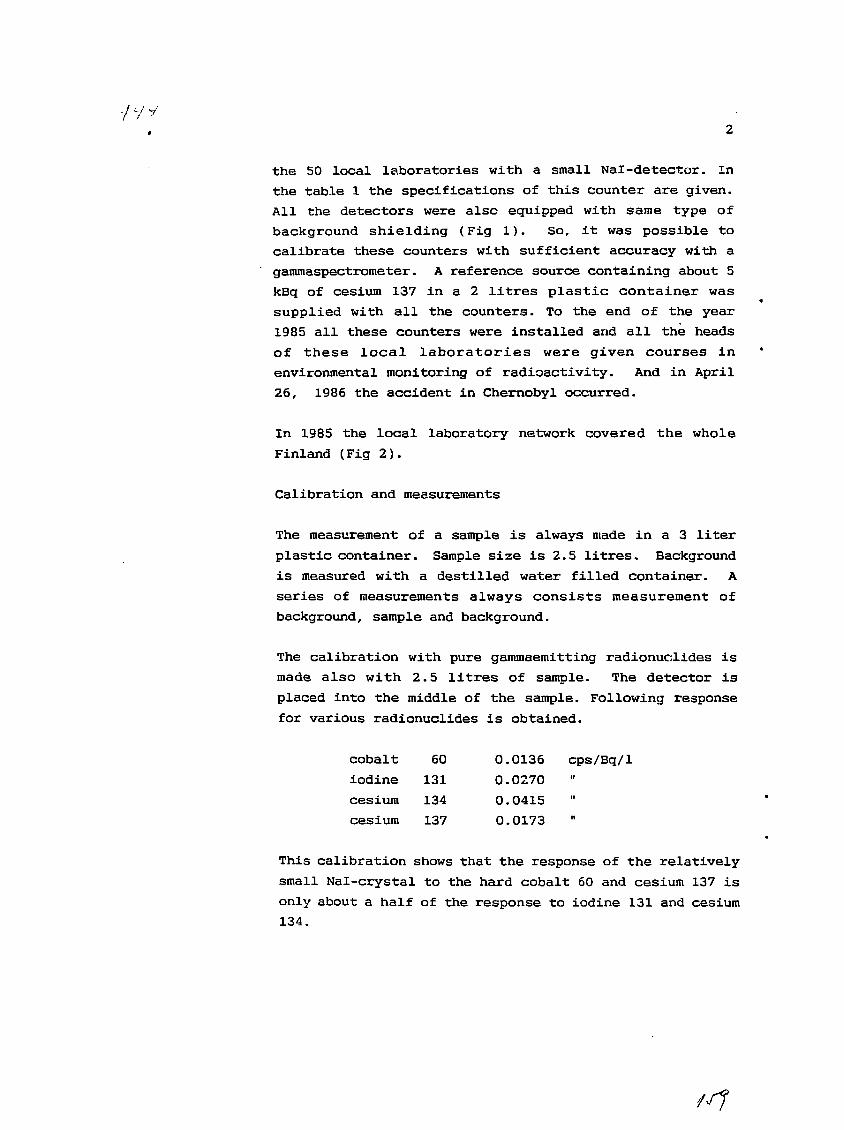
the 50 local laboratories with a small Nal-detector. In
the table 1 the specifications of this counter are given.
All the detectors were also equipped with same type of
background shielding (Fig 1). So, it was possible to
calibrate these counters with sufficient accuracy with a
gammaspectrometer. A reference source containing about 5
kBq of cesium 137 in a 2 litres plastic container was
supplied with all the counters. To the end of the year
1985 all these counters were installed and all the heads
of these local laboratories were given courses in
environmental monitoring of radioactivity. And in April
26, 1986 the accident in Chernobyl occurred.
In 1985 the local laboratory network covered the whole
Finland (Fig 2).
Calibration and measurements
The measurement of a sample is always made in a 3 liter
plastic container. Sample size is 2.5 litres. Background
is measured with a destilled water filled container. A
series of measurements always consists measurement of
background, sample and background.
The calibration with pure gammaemitting radionuclides is
made also with 2.5 litres of sample. The detector is
placed into the middle of the sample. Following response
for various radionuclides is obtained.
cps/Bq/1cobaltiodine
cesium
cesium
60131
134
137
0.01360.0270
0.0415
0.0173
This calibration shows that the response of the relatively
small Nal-crystal to the hard cobalt 60 and cesium 137 is
only about a half of the response to iodine 131 and cesium
134.

Two intercomparisons, with known radiocesium concentration
in milk powder, contaminated with Chernobyl fallout, has
been made in all local laboratories (Fig. 3). In this
intercomparison run milk powder with known, identical
activity was sent to all local laboratories. The results
are very good. With the exception of 3 - 5 results, all
other results were within 10 %. The matrix, milk powder,
has a lower density than calibration liquid. Thus the
results were about 10 % lower than the "true" value.
After the Chernobyl accident calibration factors were
frequently prepared for cesium 137, and during the first
2 months for iodine 131. Calibration factors made by
comparing the results for isotopic ratio from our
gammaspectrometric results with our own local laboratory
monitor. Results from local laboratories show a
surprisingly good agreement with the results of our own
countrywide program (Fig 4).
During a fresh fallout situation this type of integrating
gammameter is in the first weeks naturally only usable
for materials e.g. with limited number of radionuclides
for milk measurements. It can also be used for screening
different materials according to their gross gamma counts.
During the Chernobyl fallout these instruments were used
for measuring various other foods, too. This was possible
because main contaminants only were Cesium 134 and Cesium
137.
This full scale field test has shown that the choice of
our new type of gamma monitor was succesful.
At present we are testing some simple multichannel
spectrometers with a sodium iodine detector. These
gammaspectrometers are planned for some of the larger
food laboratories.

Table 1. Specifications of the local laboratory gamma counter,
manufactured by Mini-Instruments, Burnham on Crouch,
UK.
Counter. Mini-Assay, Type 6 - 2 0Size: 220mm wide x 150mm high x 150mm deep
Weight: 2 kg
Mains supply: 110 - 125, 220 - 250 volts AC 50/60Hz
Power consumption:
15 watts
EHT supply: 0 - 1500 volts adjustable by screwdriver through
front panel. Minimun load resistance 20 Megohms.
Connector: PET type 100 socket for both EHT supply and signal
input.
Readout: 5 x 10mm minitron lamp with overspill indication
and non-significant zero suppression giving a maximum
count of 99,999.
Highest regular
input pulse rate: 10 MHz typically 18 MHz.
Counting times
available: 1, 10, 20, 50, 100, 200, 500, 1000 seconds and
unlimited.
Timing accuracy: 100 kHz quartz crystal giving the above times to
an accuracy of better than 0.01 %.
Input sensitivity:
Negative pulses only not less than 50ns wide. Fixed
discriminator level of 50mV.
Input impedence: Approx. 3000 ohms.
Scintilliation Probe.
Type 5-41 (without lead shield)
Crystal. 19 x 23 mm sodium Iodide
Photomultiplier. EMI 9524 B
Background shield.
See Fig 1. Shield contains approximately 200 kg of
iron ore concentrate (FeO).
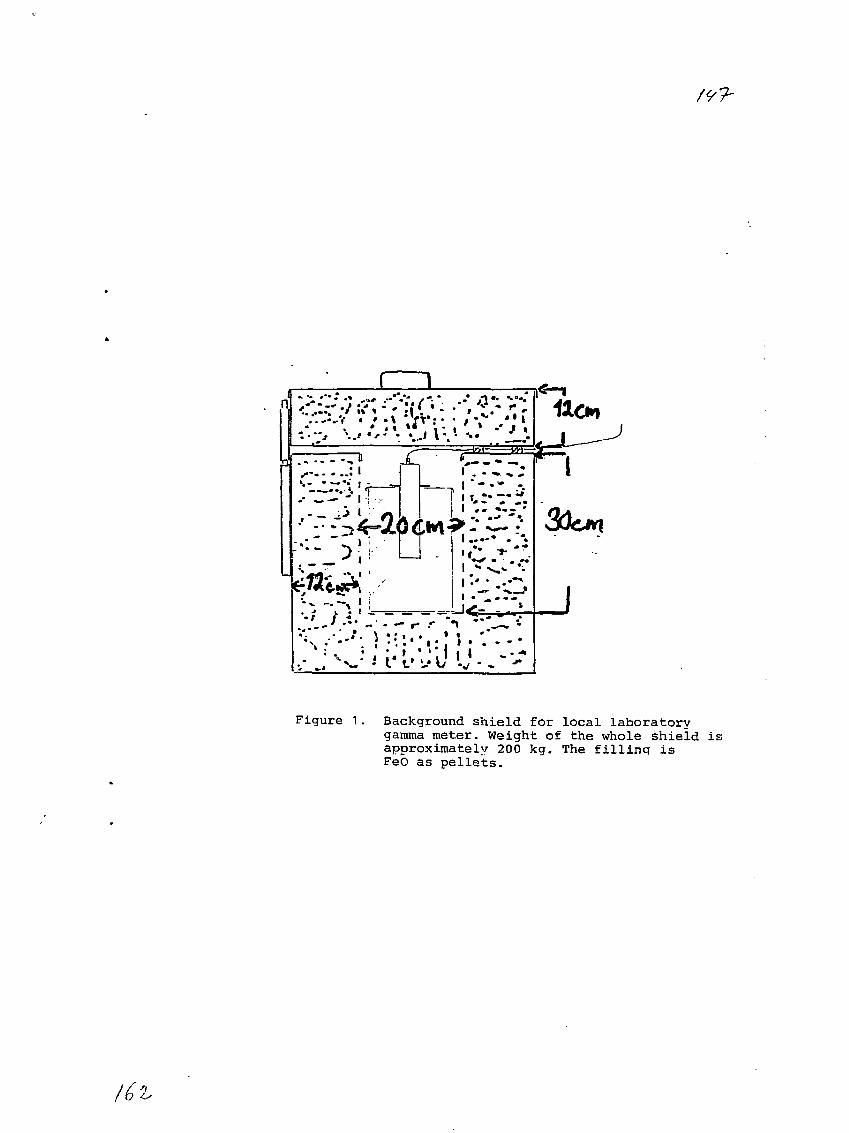
Figure 1. Background shield for local laboratorygamma meter. Weight of the whole shield isapproximately 200 kg. The fillinq isFeb as pellets.

TS v
Figure 2. Local laboratory network for radio-activity monitoring of food in Finland.Laboratories are normal food laboratoriesequipped with an integrating gamma monitor,

1987
•C nXOPOXH?
1988
Figure 3. Intercalibration results of local laboratorygamma monitors. All laboratories measuredmilk powder with same activity concentration.Measurements were made in 1987 and 1988.
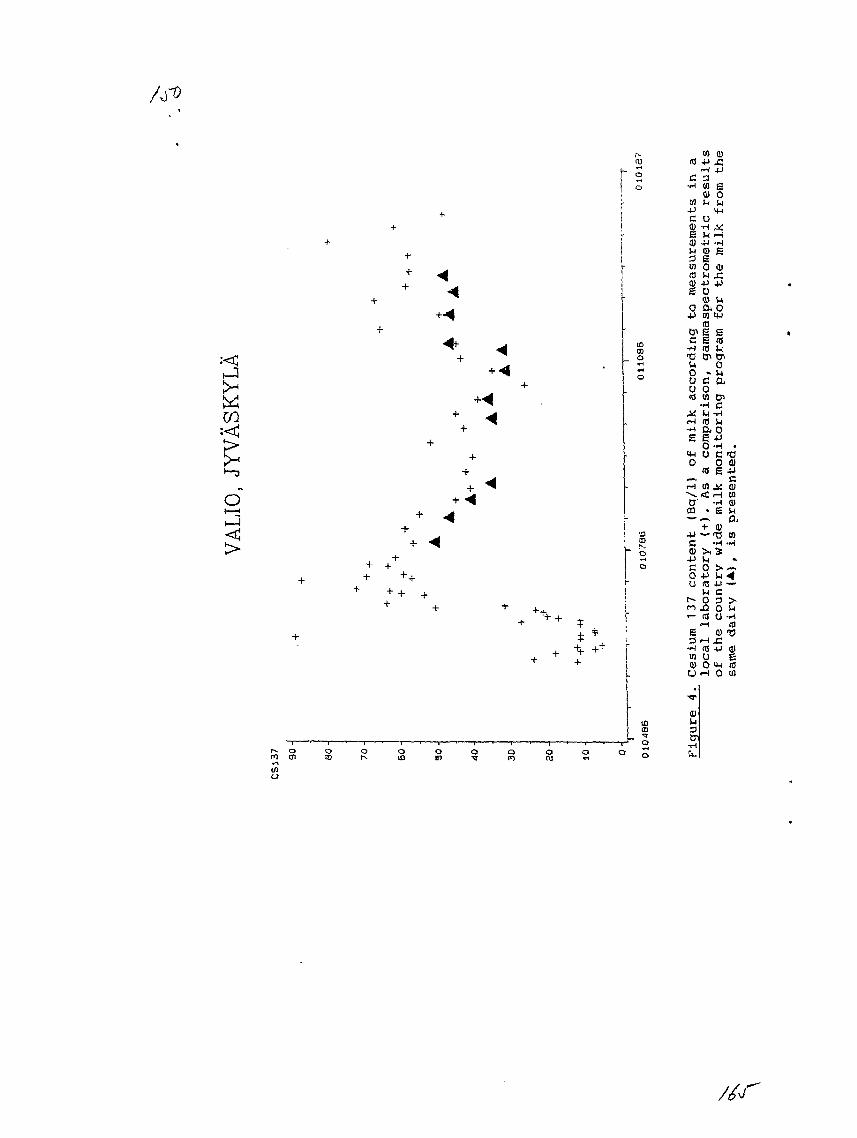
a
o
ID00O
! 3
rv om oi o
COoID
oin o
ru
(0 <])«S 4-1 . C
-H +JC 3
•H 1)1 g<D 0
w u u
C U
V tt> S
0 41
Q) 4J 4J
<U U
o cu o4 J tO tM
E E
01
C E (0•<-) fl J-l*C 0^ D(4 0O » Mo c av o(tf 0) O1
•H C
•H a oO -M •
t-t y c "Oo o <u
ID E 4J
— cto Jtf 0)
q
-p Mc oQ 4J
u <ct~ 0
<- nlE ^3 >H•H (Ctn o5> O
a)3
•H -M
4J —C3 >.0 HO -ri
(0
4-i a)g
O H>

Rapid Instrumental and Separation Methodsfor Monitoring Radionuclides in Food and Environmental Samples
Activities of the Analytical Chemistry Division, EML
The emphasis of the Analytical Chemistry Division is on improving thesensitivity, precision and efficiency of techniques related to the measurementof energy-related pollutants in the environment. Recent accomplishmentsrelated to this Consultants' Meeting include:
(1) The construction of a new gamma-ray spectrometer to reduce detectionlimits. A large germanium well detector surrounded by a Nal anti-coincidence guard was assembled to detect coincidence photon sum peaksand thereby reduce the limits of detection for some short lived fissionproducts (C. Sanderson)
(2) The development of an alternate preparation procedure for surface soilsamples to allow rapid processing and aliquoting when gamma rayspectrometric analysis for short-lived radionuclides is desired. Afterweighing the sample in the wet state (as received), the entire sample issieved through a steel mesh screen with square openings, 1.27 cm on edge.Rocks and pebbles of greater size are brushed and discarded. Vegetationand root mat are cut to a size (about 0.6 cm) that permits them to passthrough the sieve. The mixture of wet soil and vegetation is homogenisedby hand for several minutes before aliquots of about 100 g are removed.If desired, the remainder of the sample can then be dried and processedby standard drying procedures. (Krey et al., USDOE Report-460,p.155-213, 1986).
(3) The development of a cation and anion-exchange resin impregnated membranestack system to concentrate radionuclides while filtering large volumerainwater samples. After filtration, the filters are compressed into a 1cm cylinder and analyzed by gamma ray spectrometry (well detector) forrapid detection of fresh fission products. In addition this procedureallows for the determination of the soluble and particulate fraction ofthe sample. This method will replace a procedure which often involvedboiling a large volume sample down to a smaller volume. The boiling mustbe perform slowly and carefully to minimize losses. Volatileradioisotopes were partially lost during processing. (R. Larsen)
(4) The adaption of sequential radiochemical procedures for the determinationof Sr, U, Pu, Am and Cm in the analysis of glass fibre air filtersamples. These modification were needed to account for the high silicacontent of the matrix. The procedure is a fuming nitric acid separation
- 1 -
i » ^ / / U'jindi'-

+4of Sr, an anion exchange separation of the Fu nitrate complex from 8N
HNO., and a Aliquat extraction of the U that provides a residual fraction
containing the Am and Cm. (D. Bogen, paper in preparation)
(5) The development of a complete dissolution and analysis method for239 240
' Fu in large soil samples. It is believed that some forms of
fallout, e.g., where the source of contamination can produce highly
refractory or intractable particulates, do not yield their total
radioactive content to classical leaching methods. (Krey and Bogen,
Radioanal. and Nuclear Chem. 115:335-55, 1987)
Catherine S. Klusek
Environmental Measurements Laboratory
U.S. Department of Energy
376 Hudson Street
New York, NY 10014
- 2 -

AT3
759
IAZA Consultants Meeting or. " Rapid Instrumental and
Separation "ethods for Monitoring Radionuclides in
Food and Environmental Samples "
7ienna, 05 - 09 of Septeaber, 1988
IJ FOR MO2II2Oai2;G HADIO17n:LlIS3ni siTYHtoinscrrAL SA^PISS IS
Andraej Piatruszs'.vski and "adausz SsynkoTrs
Central Laboratory for Hadiological Protection , Warsaw
Konwaliowa St. 7 f Poland
September , 1988

A. Pietruszevvski, T. Rzymkowski
Central Laboratory for Radiological ProtectionPL-O3-.194 Warsaw, Konwalio~a 7, Poland.
Spectrometrical system for monitoring radionuclides
In environmental samples in Poland
Since the "beginning of '1923 there is carried on the governmental
programing in Poland of coordinated research in the field of
radiological protection. This programme, in rchich over 10
different institutes are involved is called "Radiological Protec-
tion and Huclear Safety" and i ts actual schedule is foreseen up
to 1990- Central Laboratory for Radiological Protection is the
coordinator of this prograr.se.
There are over 4-0 of separate projects in this programmewhich constitute 5 main tasks of this progrsr.se:
I . System of continuous radiological monitoring of the country.
I I . Assessment of radiological hazard to population from
natural and artificial radior.uclides in the environment.
I I I . ITuclear safety and radiological protection of nuclearfacili t ies.
IT. Technical means for personal radiological protection and
decontamination in case of nuclear accident.
V. Biological and medical problems of radiological protection.
The f i rs t task of this programme is modernization ofRadioactive Contamination Measurement Service network of over 14-0measurement stations located in different Institutes over Poland.These stations are equipped with measurements system for gammaand beta radioactivity counting and dose rate measurementsequipment.
Basing on experience gained during our activities in performing
radiological control after Chernobyl accident v;e decided to create ,
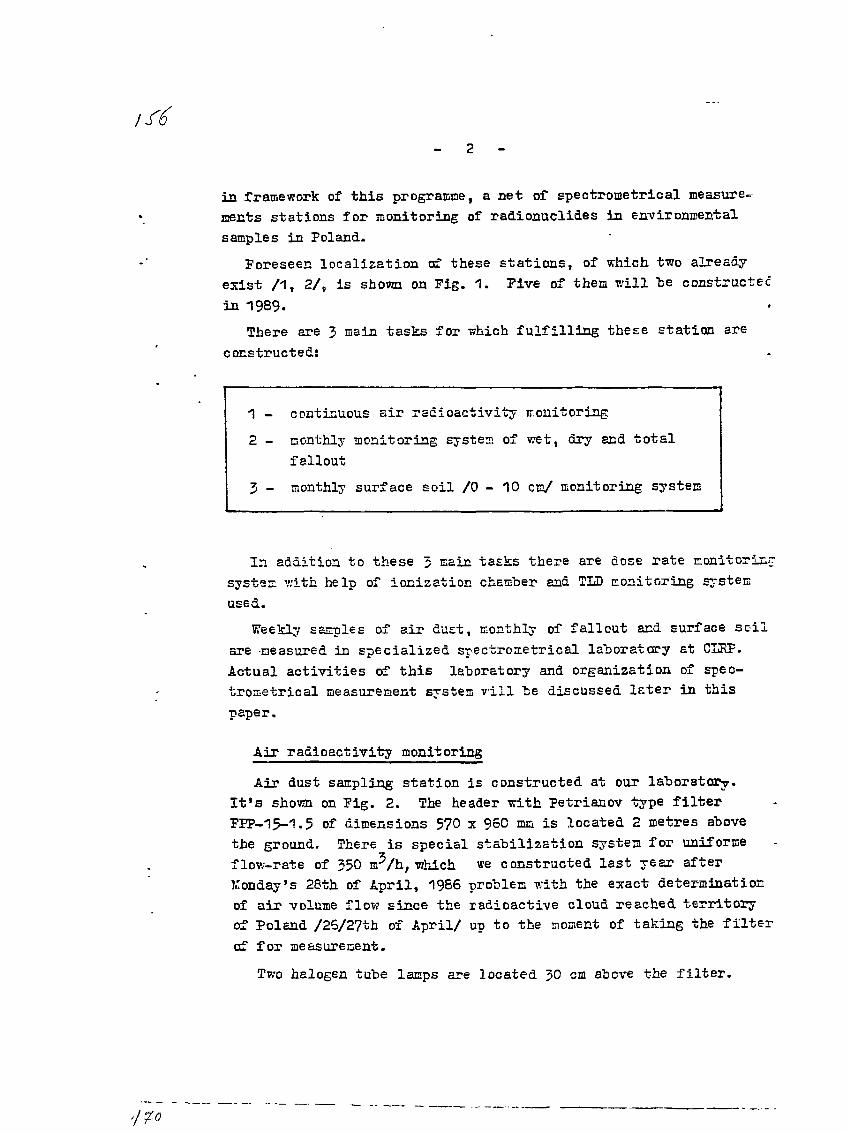
2 -
in framework of this programme, a net of spectrometrical measure-
ments stations for monitoring of radionuclides in environmental
samples in Foland.
Foreseen localization of these stations, of which two already
exist / 1 , 2/, is shown on Fig. 1. Five of then will be constructed
in 1989.
There are 3 main tasks for which fulfilling these station are
constructed!
1 - continuous air radioactivity monitoring
2 - nonthly monitoring system of wet, dry and total
fallout
3 - monthly surface soil /0 - 10 en/ monitoring system
In addition to these 3 main tasks there are dose rate
system with help of ionization chamber and TLD monitoring system
used.
Weekly samples of air dust, monthly of fallout and surface soil
are measured in specialized spectrometrical laboratory at CLRF.
Actual activities of this laboratory and organization of spec-
trometrical measurement system vi l l be discussed later in this
paper.
Air radioactivity monitoring
Air dust sampling station is constructed at our laboratory.
I t ' s shown on Fig. 2. The header Trith Fetrianov type f i l ter
FFF-15-1.5 of dimensions 5?0 x 960 mm is located 2 metres above
the ground. There is special stabilization system for uniforme
flov;-rate of 350 nr/h, which we constructed last year after
Konday's 28th of April, 1986 problem with the exact determination
of air volume flow since the radioactive cloud reached territory
of Poland /25/27th of April/ up to the moment of taking the f i l te r
of for measurement.
Two halogen tube lamps are located 30 cm above the f i l ter .

- 5 -
They are automatically switched on when the humidity controlsystem shows increase of humidity over determined level.That because of water layer on the surface of the f i l ter whichappears during rains or high humidity.
Over the f i l ter there ere 2 G-M counters located. They are
connected to integrator system which operates day and night and
the actual rsdioactivity level is dravm on the register.
Actually v;e Eount timer and power meter for the system to have
additional information on sampling data /Figs 2 - 4/-
We foresee to use Kal probe over f i l ter for continuous
spectrometrical monitoring of air dust collected and spec-
trometrical data collection, elaboration and presentation with
IBK/FC based !.!GA during sampling. That system is foreseen for
an emergency situation.
Each weekly sir senple is measured twice. First time forshort living decay products of Ea-226 and Th-232 determination.Hhe second time for presence of redionuclides of cosmogenic andartificial origin.
Following the procedure and some printouts for spectrometrical
air radioactivity control performed at our laboratory are
presented /Figs 5 - 7/-
Fallout collection and monitoring
Wet, dry and total fallout are collected for further spec-tronetrical measurements. Special sampling system 7.fith raindetector allows to collect in two separate containers wet and dryfallout. During the rain motor moves the cap from "wet" deposi-tion container over "dry" one. Rain detector is located on airoutlet from air dust sampler so immediately after i t stopsraining this detector is dried by outcoming with high speed airfrom air sampler /Fig. 2/.
These samples are collected and measured with spectroinetrical
EPGe detector system monthly.
Action foreseen: for monitoring of radioactive fallout during
accident situation we construct total fallout collection systea.
with preliminary automatical separation of different fractions -
unsoluble fractions as particulate matter with membrane filters
f?t

4
and soluble fractions with ion exchangers.
This problem we find very important and any IAEA crp activi-ties in this field and recommendations for radioactivity controllaboratories are welcome. This first-step of environmentalradioactivity monitoring for determination of soluble and unsella-ble radioactive elements fractions is of great importance forfurther estimation cf transfer factors' from food /grass/ to diet/milk, meat/ and any decisions during emergency situations.
Surface soil nonitoring
On each cf constructed stations there are special areas/ -v 10 n / for collection of Eurfsce soil. Actually soil samplesare collected monthly. In future we foresee to collect them4 or 2 times a year. Two layers are taken for measurements0 - 5 cm and 5 - 10 ca. Top layer with all grass on i t . I t isprohibited to cut crass at these squares and do anything thatvrill influence the structure of the soil . The purpose of these
measurements is the determination of deposition at controlledp
areas. Samples are collected from 0.1 m /30 x 53 cm/. At thebeginning of year profile 0 - 20 cm /each 2 cm layer/ iscontrolled at each station. At the beginning of 19&9 we foreseeto start research programme of radiological E2p of Poland.Surface soil 0 - 10 cm will be controlled on over 1000 places inPoland for natural and artificial radionuclides concentrationcontrol. Measurements will be performed in our Laboratory "ithEPGe detectors system in standard 0.5 1 Karinelli type beakers.Each sampling site will be parallelly controlled with TLDdetectors /Fig. 8/.
Spectrometrical measurement's system
All spectrometrical measurements of collected samples are
performed at Cliff.
The goal of these measurements is :
1 - continuous spectronetrieal monitoring of radioactive elementsconcentration in a i r , i ts deposition irith fallout on soilat defined sampling stations
- 5 -
2 - results of measurements are used for dose equivalent calcula-
tions and i t ' s continuous monitoring in nornal situation
on line
3 - sampling system is prepared for detection of radiological
accident
Keasurenent system in our laboratory is calibrated for all
possible geometries of samples of environmental origin
/volume 1 ml - 2 1, density 0.6 - 1.6 g/cm , powder, liquid
- in total for over 50 possible geometries used/.
Actually vre create, construct and organise such spetrometricalsystem of measurements at CLEF, that will enable us to performour work parallelly at 7 independent gamma detectors /3 x EPGe,Ge/Li/, EFGe-plansr, Si/Ld// and 4 alpha surface barrierdetectors. The diagram of this system is presented on Pic. §.Each lUCA-s has i ts OT.H PC computer. As not all of KCA-s that wehave now in cur Laboratory have internal programr.es for spectraelaboration we have created the transmission of full spectra datafrom each I'CA in our Laboratory to IB"/?C computers.
We have elaborated ourselves special programmes for these
computers for spectra presentation on computer screen and its
elaboration, such as is enabled by commercially available
programmes for modern l.'.CJL, as:
- presentation of spectra in color with help of IGA chart
- automatic peak search
- automatic peak identification based on analysis library for
different accident scenarios
- data storage on ED or diskette
- energetical calibration of spectra from different KCA-s
- i t has the data base library for different efficiencies of al lused in our laboratory detectors and measurement geometries
- multiplets of up to 6 photopeaks solution with presentationof resolved spectra on the screen
- prepares special reports on elaborated spectra and prepares
these data for transmission to and further elaboration withhead computer in our Laboratory /Fig. °A
6 -
For emergency situation reports from separate stajodsand computers are transmitted to "head" microcomputer where the;ypresented on the screen, printed and stored. This computer ieoutside measurement laboratory in "decision center". I t hasalso possibilities to get data from external computers by modem,telex or additional 4 Es-232 inputs.
ET?ectroaetrical measurement's data elaboration
The idea of al l performed measurements is:
The result of the spectrosetricsl measurement
performed aust be on line elaborated and
interpreted after the measurement.
The result of performed spectronetrical measurement is:
/a/ identification of radionuclides present;
/b / calculate activity concentration of identified
radionuclides;
/ c / add actual result of measurement to specified data base
file for actual /e.r . froc the beginning of the year/
table presentation;
/d/ data from automatically after the measurement actualized
data base file are used for graphic presentation and
calculation of dose equivalent which is also presented
in form of tables and graphs;
/ e / the final set of data base file foreseen is the actualized
percentage of permissible dose equivalent according to the
relevant state regulations.
Work on problems /d/ and / c / is actually carried on at our
Laboratory.
For identification of radionuclides present in sample v.-e
foresee tv.-o situations:
- normal one, v.hen we find typical spectrum; and
- a situation of radiological accident.
- 7 -
Here we foresee creation of specified data base system and
programs for the elaboration of gamma ray spectra. Normal
situation we will not discuss here, as these are well known
spectra and usually this one who Eeasure them and elaborate
know then "by heart.
The data base system that we work on nowdays has to be
prepared for emergency situation. So the procedure is as
follows:
/ 1 / to identify possible radiological emergency situations onthe territory of the country /e.g. distribution of radio-nuclides used for research and medical purposes overcountry, accident at research or power reactor, nuclearweapon hazard/;
/2 / to identjiy radionuclides that will be dispersed as theresult of identified types of possible accidents in thecountry /or those possible at i t ' s nearest boundaries/:
/ 3 / create spectra of expected radionucli^es composition in the
event of identified radiological accidents;
/4 / elaborate methods of analyses of these spectra for determi-nation of cost suitable lines that should be used todetermine separate radionuclides concentration and allnecessary corrections for interferences in different lines.
The result of this work will be specialised data base of
radionuclides composition, i t s ' gaiana lines library and
elaborated methods for analyse of different gacma-ray spectra
foreseen. All these for emergency situation of possible types
of radiological accidents at the country.
First two points are discussed and data presented in. IAEA
guide-book entitled "Measurement of Radionuclides in Pood and
the Environment" that was published this year. There are
collected informations on released to environment radionuclides
composition as the result of reactor meltdown at first Say, week
and long tars. The scce dsta sre presented for nuclear fuel
processing plf.nt and plutoniua fuel fabrication plant release.
This is one set of the data that we use for creation of
discussed here data base and dedicated programiing system.

16-
B
Tjjat is the point of interest of scientists working in
different laboratories to have such reference source for analysis
of ganma spectra of different origin. In frace work of coordi-
nated research programme of IAEA on rapid instrumental and
separation methods for radioactivity control this work on crea-
tion of such type of guide should be foreseen. •
In situ gar.sa-ray spectra measurements
Portable equipment Canberra 10 MCA and HPGe detector iscalibrated for control of surface contamination. Severalprograms for IBI.'/PC computer are elaborsted for the deterEina-tion of soil surface radioactivity control and dose rate calculc-;tions. This work is carried on at CL3P for several years andused for routine control of environment pollution. \7e find itvery useful for rapid on site determination of environmentpollution. Actually at our Institute -we construct mobile labora-tory for radiological control of the environment and. thisequipment and method is foreseen for this laboratory.
Alpha emitters measurements
All precise methods for alpha emitters measurecents need time.That's because of the tine spend for the previous radiocherdcalseparation of investigated radionuclides prior to measurements.Anyway simple quick method used "by us immediately afterChernobyl accident is recommended for the determination of thelevel of radioactivity of any alpha emitters present in airsamples.
These are measurements of Millipore type membrane f i l ters
with 20 - 50 m of air sucked. After short living radionuclides
from radium and thorium series decay i t was possible to determine
clearly with this method /at resolution of 100 - 150 keV for
5 KeV/ that plutoaium was absolutely "belov; 100 ,uBc/m^ and only
Cm-242 was found in the range of 200 /ttBq/m. .
Heferring the probleE of the alpha emitters measurements, 7:e
have constructed special electrolyser device, that allows us fcr
simultaneous electrodeposition of 7 samples at specified and
previously determined current of 1.1 A.
us
This instrument facilitates the work in preparation of discsseparated by ion-exchange procedure alpha-emitters.
Each working stand has the seine stabilized current of up to1.5 A during electrolysis. I t helps to avoid of such factorsfor electrolysis as:
- different distances between electrods:
- overheating of electrolyte;
- differences in electrolyte concentrations and in i ts volume.
Fhoto of this instrument is presented on Fig.10.
Grass sarnies analysis
Referring our activities in IAEA Grass Samples Programmefollovring problems v.-ere met in these measurements:
- determination of photopeaks useful for activity calculations:
_ determination of possible interferences for selectedphotopeaks or sny corrections needed for cascade desintegration/as e.c. for Cs-154/;
- corrections necessary for different densities of measuredsamples.
In following table we present selected photopeaks used forseparate isotopes activity determination in measured grasssamples:
Isotope
Ra-226Fb-214Bi-214Ac-228T1-208E-40Cs-134Cs-137Eb-125Hu-105
Ce-144Hu-103
Energy
185.9295,3 ,609.3 ,338.4 ,583.0 ,1460.8604.7 ,661.6427-9621.9
13J! 5497.8
351. S1120.3911.2 ,2614.4
, 795.9
Yields/half life
as recommended
, 1764.5 °y I A E A ^969-0 delivered
specificationwith grass
samples andthosepublished bySchaetzig andPr*HT*nrS<aT* / ^ n c / i ,
/9--P-
10 -
Interferences calculation;
/ I / For Ha-226 - 185.9 keT correction for U-235 /1S5-7 keV/content "basing on assumed equilibrium in TJ-235 /tf-238ratio of 0.715 %• I t was not possible with gammaspectrometry to get enough number of counts in 143.6 *
photopeak of U-235 or those from Pa-254M /1001 keV/ forprecise determination of correction for the exact countsnumber of Ba-226 in that photopeak. Bi-214 and Pb-214activity concentration values were used for justificationof Ra-226 content in those samples that were measuredsecond time six weeks after closing in hermetic container.
/ 2 / For Cs-137 - there was correction for Ag-110i2 contentwhich activity vras calculated fron &E4.7 keT line andnumber of impulses in 657.7 ksT energy region calculatedwith help of this data and efficiency curve for specifiedgeometry. I t was find that in 661 keV region 0.6 - 1 %of net peak area for separate samples were from Ag-HOn.
/ 3 / For 03-13* there ?;as .correction for sum effect of cascadedecay. Lines 1400 keV, 1168 keV and 1968 keV were usedfor correction factor determination. This factor was
• found 2.7 % for 604.7 keV photopeak and 4.5 % for 795.8 keVphotopeak for specified geometry of 60 nil volume cylindricalcontainer and HPGe detector of 15.4 % efficiency.
/ 4 / Ko correction was needed for different lines that were
separated with 2 keV range, as the resolution of
measurement system was 1.8 keV for Cs-137«
/ 5 / Problems were with precise determination of background
spectra as we found during these measurements that 's i t ' svariations influence the results of these measurements onvery low level. ITowdays we decide to have stabilized oldair flow inside shielding houses during the measurement toget rid of this problems^.
/6 / Corrections for detection efficiency curves for differentdensities of measured samples were needed and applied, as
the mass of measured samples varied from 15 to 40 g /grass/ .To achieve better efficiency measured samples of grass werepressed with 10 t press to the form of uniform cylindricaldiscs.
Pig . IJjANtf^m. ACT. Ty C0«E:/ rW l jW OF cs-
11
Research programme on wild animals meat radioactivity
measurements at CLRF
Since May, 1986 there is carried on research programme atour Laboratory on radioactivity monitoring of wild animale meat.Prom the territory of all country our Laboratory gets meatsamples of deers, wild boars, hares and elks.
Because of natural ray of feeding by v/ild animals, the resultsof such measurements can be of interest for participants ofthis meeting as they are strictly connected with grass samplesanalysis programme. Some graphs are presented of Cs-134/Cs-137radioactivity changes in time 1986/1988.
As this programme is being carried out nowadays only part ofresults of measurements /over 2?00 samples/ are elaborated andpresented. ?.'e intend to publish final results of v;hole researchproject in 1959 after full 3 years rose arch programme in thisfield. / ?ig. 13, 14 /

r^nnv^ vs ,. j-u J *— ~ - ^
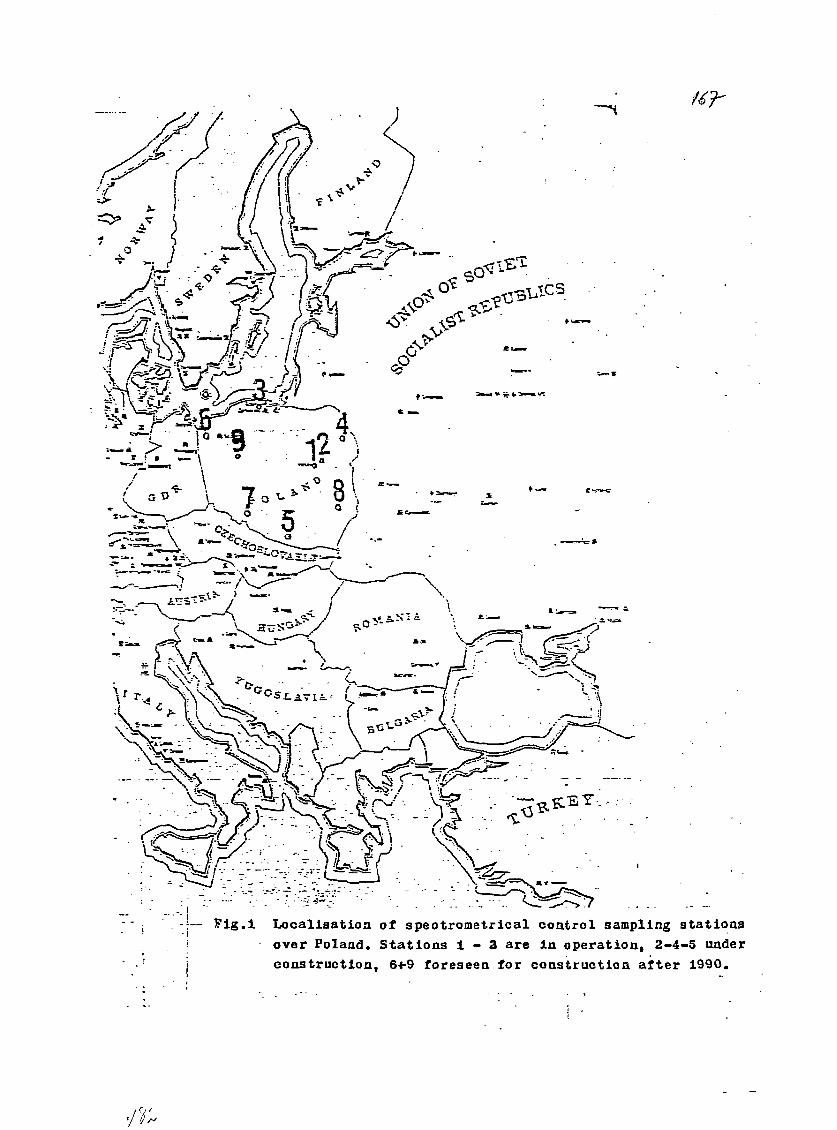
- F i g . l Localisation of spectrometrical control sampling stationsi over Poland. Stations 1 - 3 are la operation, 2-4-5 underi construction, 64-9 foreseen for construction after 1990.
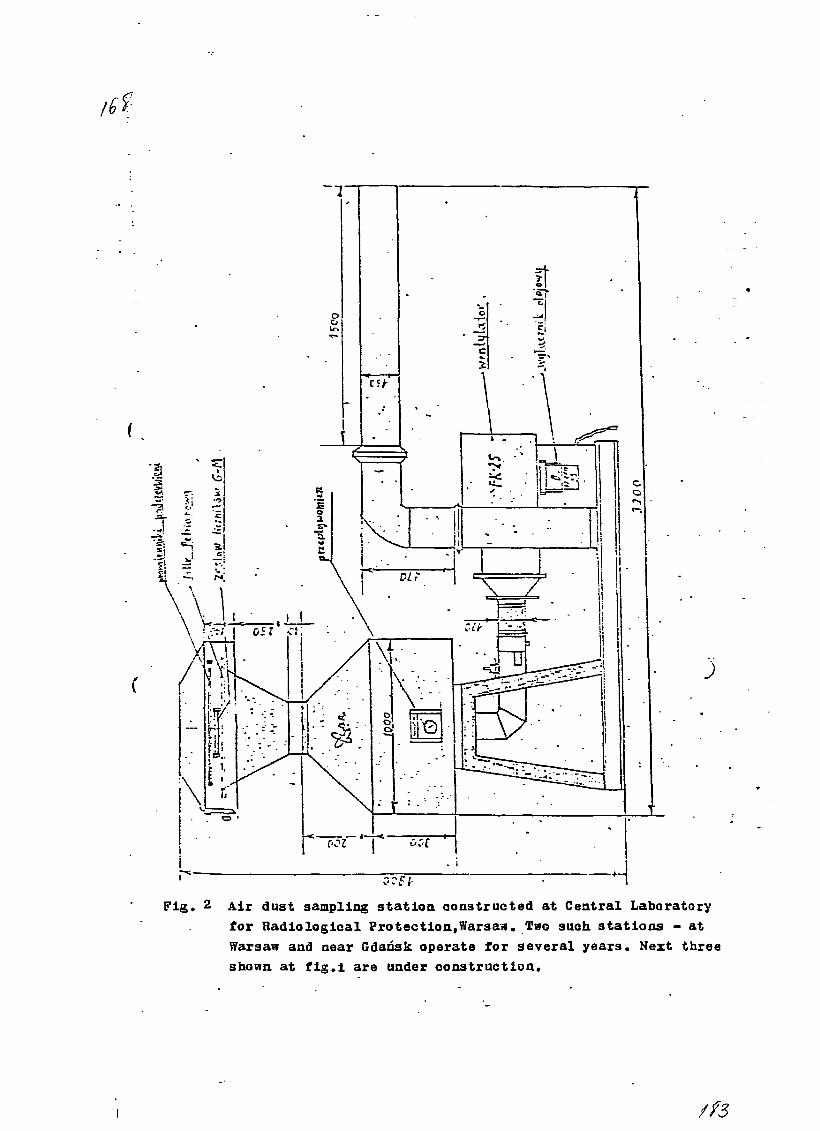
Fig. 2 Air dust sampling stat ion constructed at Central Laboratoryfor Radiological Protection,Warsa*. Tito such stat ions - atWarsaw and near Gdansk operate for several years. Next threeshown at f i g . l are under construction,

Fig. 3. Spectrometrical control sampling s ta t ion locatedat fcarnowieekie lake, near Gdansk — local i sat ion of f i r s tNPP in Poland.

,/fO
Fig.4 . Continuous monitoring system of air dust deposity on
sampling filter with G.M. counters.
c
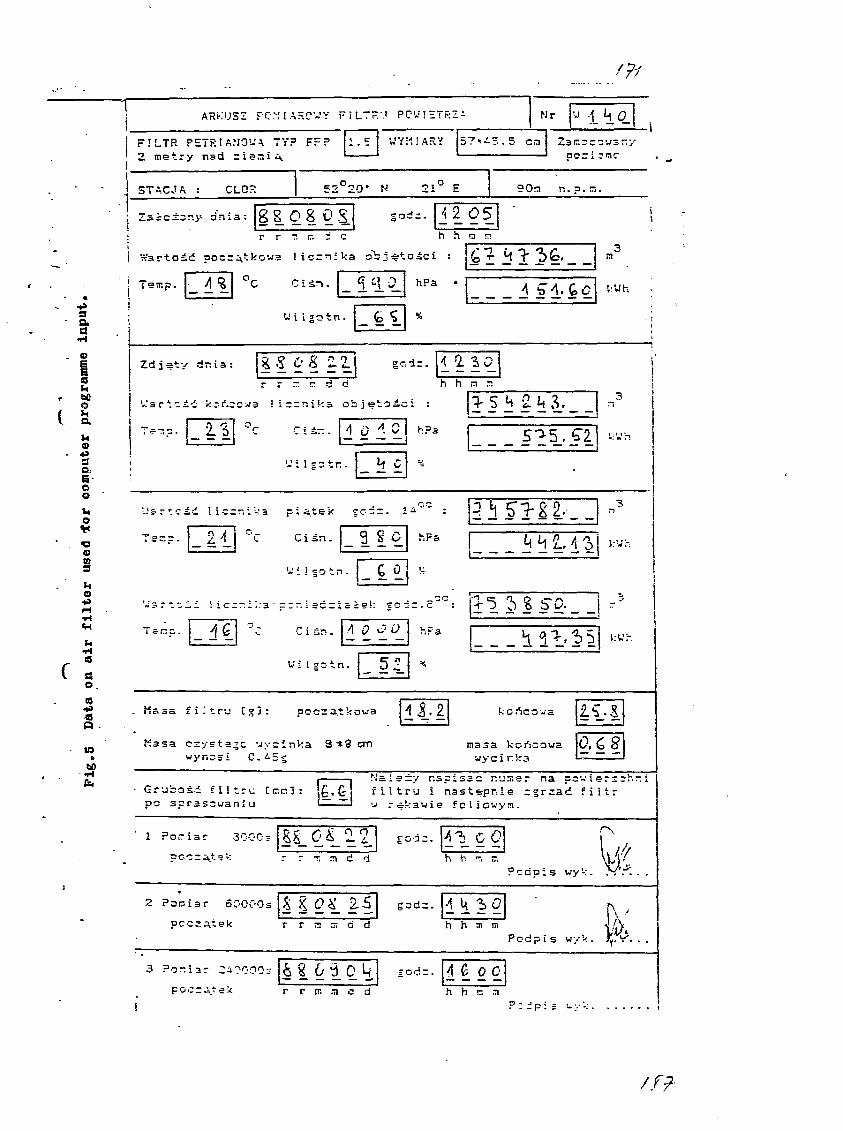
sQ.
auoua.
•
3E-©ouoS•osCD
hO
r :o.aaa
in
ARKUSZ PCMIAF.C'.'Y FILTH'1 PCwIETRZ-. Nr U .\ L[ 0
F!
ST
LTR PETP.tAMOVJmetry nad zie
ACJA : CLOH
A TY? FF p
52C 20' N
1ASY
21°
57"i=..
E
5 en
90. r..p.n.
Zaicisr.y dnia: S Q 8 0 S 4 2 05r r T. r: i c h h n n
l ic=n:ka d b j ^ t o i c i :
j Teirp. CiSn.
U I i so tn .
hPa4 S"1.to V.Uh
Zdjety dr.i3: 4 -2r r - r: d d
2.-6 0 ^ C
iccr-.ika piatek sdz.
Ciin. 3 H-
Ui Igotn . £ 0
hPs k'Jh
Ci
VI !
in. /
g o t n.
1 0
_5 2.
VX'r.
. liasa f i l t r u pocza.tkowa 43 .2
Kasa czysta^c vivcinV:a 3*3 anwyr.esi C. ^5§
kortcowawye irk3
Grubosi filt.ru Ctr.r.j:po sprasouaniu
Ns.!=±y r.arissc r.u.-sr na ==•-.-i errfiltru i nastepnie r§rza<f filtrw rekawie fcliovyai.
1 Poriar 300C3 2.2 1} COT - T, m d d h h a -.
?cdp : s vy1-:.
2 ?oni3r SOOOOs Z 2.5r r ni .— ci d h h m m -J'.
P c d p i s wyk.
3 ?o."iar C4?000r 8 6 3 0 ocr r tr. si d d h h n si
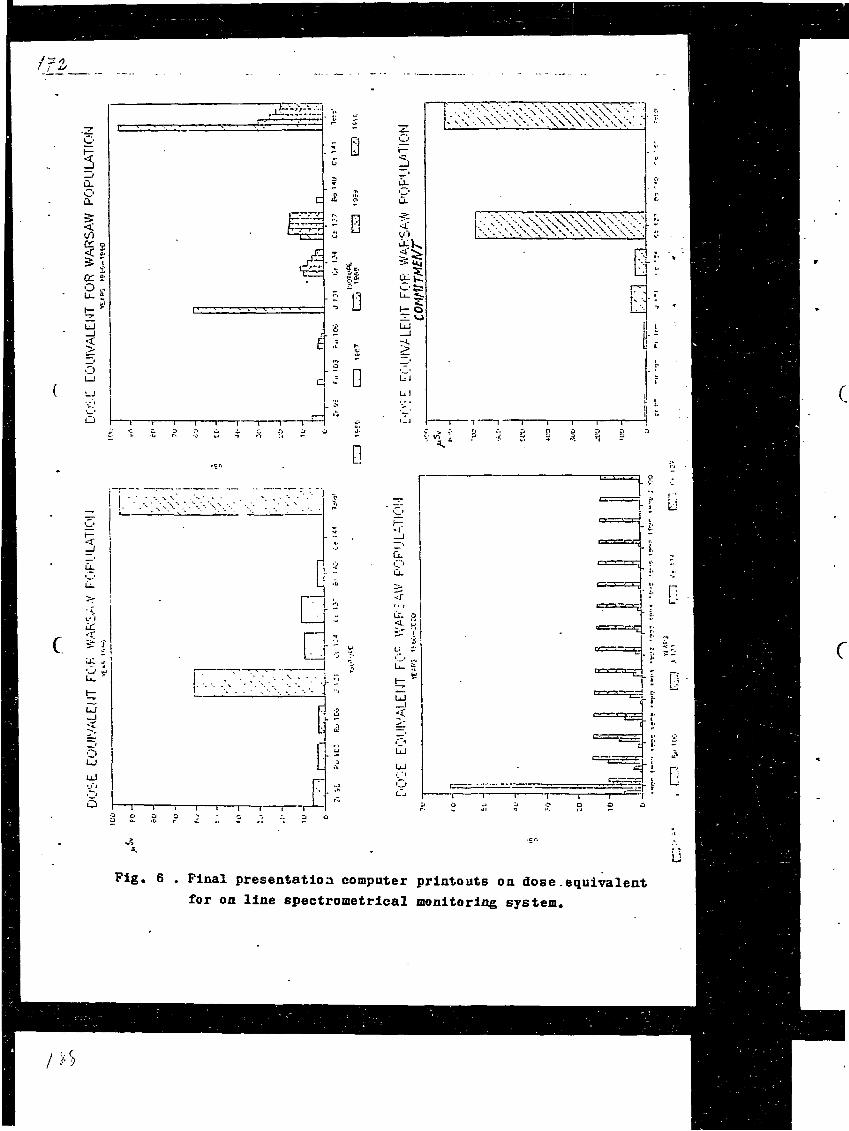
I
iH ;
O
LJ
v '
LJ
.J.' • • , "
1E
c
1 1— 1 —
£ s:
i a
D
1 "
f .•„
; - ' ?•
us
OLJ
UJ
• ' ; • .
"3
- I 1 - 1 1 r 1 —*—
il"
"3
-
**•
0 t\— VJUJ
- J .
>
L.I
o o
Fig. 6 . Final presentation computer printouts on dose equivalentfor on line spectrometrlcal monitoring system.
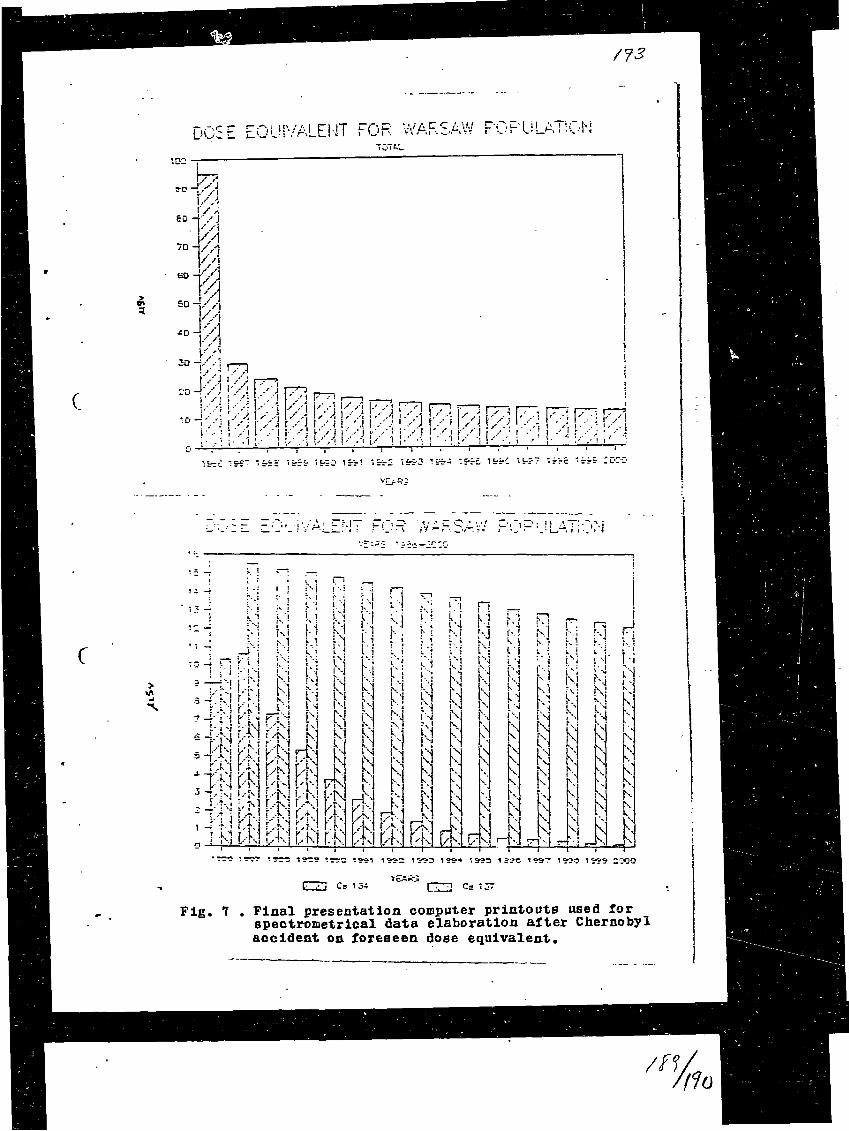
DOSE EQUIVALENT FOR WARSAW KOPULA'.'.ON
-o - • / i
60 —•' / j
'A70 -
50 -
X.Q - A, i>^
r/j r/j |-\--'j ' .••• i F T 1 • 1
/ - i L-^ !-•%•{ .--^ .-'-.. w YA VA z\ VA n VA ><mEm^mm. i: . ' \ ' - I l - ' l I A X A \ / . \ \ / \ \ / . \ \••'• \ A I - - ' - : i •:• V-VAV-
- s -~ ", c.i - "i u^-c i ccri •, ——i
c>
L- ,-j Cs I E 3
Fig. 7 Final presentation computer printouts used forspectrometrical data elaboration after Chernobylaccident on foreseen dose equivalent.

c
C _ 1_.
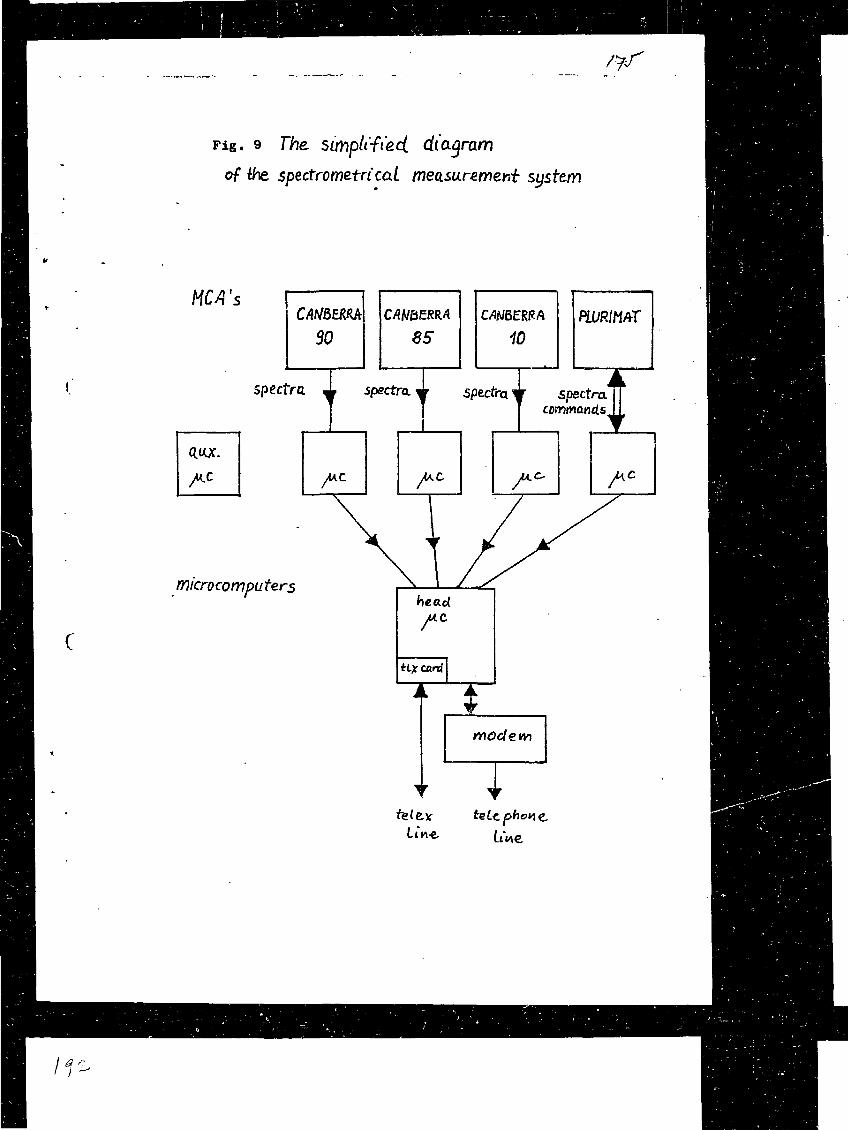
Fig. 9 The Simplified, di
of the. spectrometricai measurement system
HCA's
C
CAMERM
30CAmERRA
85CANBERRA
10PWRItiAT
spectra
microcomputers
tiYi-e.
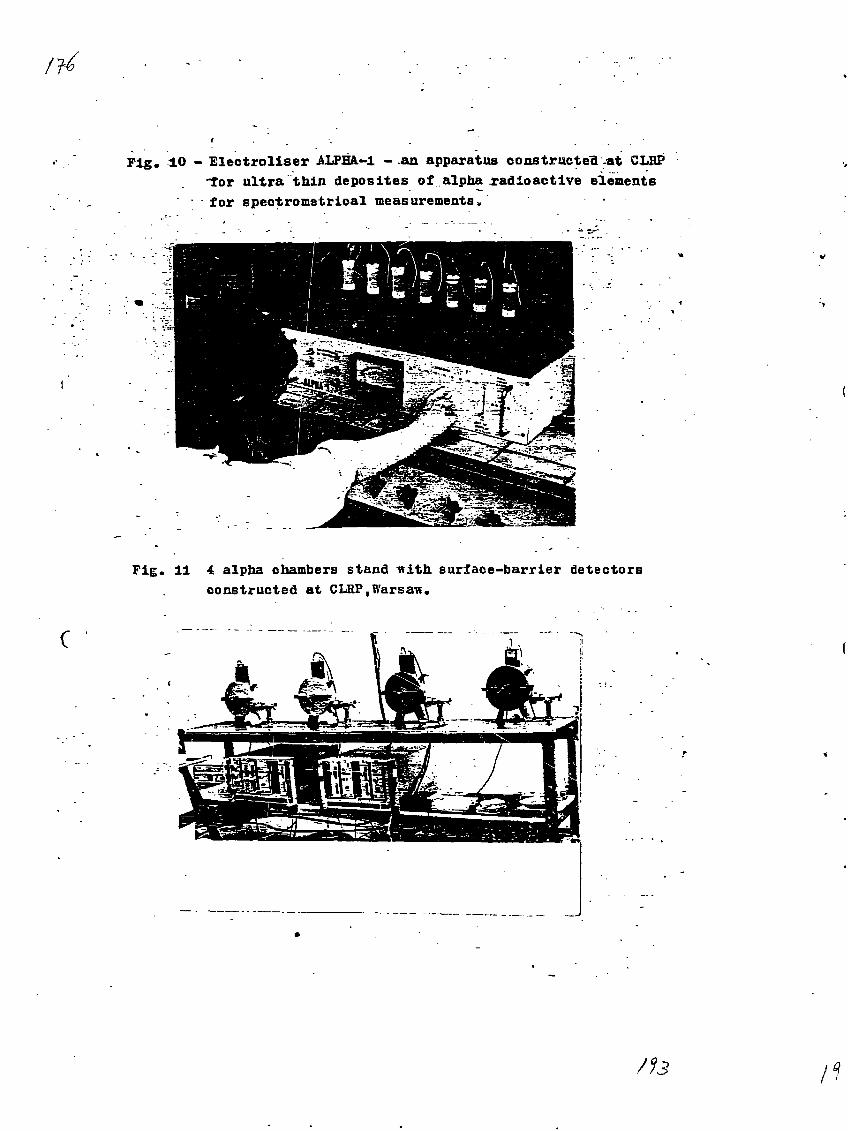
Fig. 10 - Electroliser ALPHA.-1 - a n apparatus constructed-at CLHPfor ultra thin deposites of alpha radioactive elements
' for spectromstrical measurements»' ' -
Fig. 11 4 alpha chambers stand tfith surface-barrier detectorsconstructed at CLRP.Warsaw.
c

•o on
to00o>«rt
X!
a<i
o
fci
UoQ.tn
V
B.EISSi
u•P1-1
^ t
1-1
o9aeB.
03*"*
urn
OsanIS
•i-t
•
tn
a
a
o
ao
i - lf - l
oo
(S
8}T3
r-ta
B
so©D
V IO
•a
ocox:
>»-Pna
•<-9
o-P
•tn
C4}
* 5« ^
ouav i
°nd}
n.>.
•*»
oV If i
o*"•fio
• p
»
o
•w
Z'<3ZZ\
/?-
Pig. AcTii/iTy OF C9-l3i| IM MEf
3REDNIE STEZENIA ROCZNE IZCTOPU Cs-H M'ES'E ÎV» If—*T
54
'-0 T-'V-'i
3c 4%':!
to y
30 -
20 -
,0-j
,'
S/,K
1937
DZilf!
1553
ZAJ*CE
. EtKS}
cÎ
aq
SREDNIE STEZENIA ROCZNE IZOTOPU Cs-137MIE31E ZWIEHZAT LESN/CH
SARNY.LUSIE.ja.ENIE
I El-«*)
RTTACHMEHT I I
aj
o.r
f.")
>
V..-'yAx \
^ . — I
•tQ
Id
CM-RM/34 (C)r e v . 2
lit
Some of the Activities of the Radiochemistry Section at the Atominstitute ofthe Austrian Universities related to Rapid Methods for MonitoringRadionuclides in Food and Environmental Samples.Karl BUCHTELA, Atominstitute of the Austrian Universities. -Consultant's meeting on Rapid Instrumental and Separation Methods forMonitoring Radionuclides in Food and Environmental Samples.5.- 9. Sept 1988
Food and environmental monitoring before 1986.Monitoring radionuclides in food and environmental samples is part of theroutine analysis programme since the implementation of the RadiochemistryGroup at the Atominstitute in 1960. In the surrounding of the laboratories ofthe Atominstitute environmental radioassay had to be carried out even beforeany work with radionuclides had been started. Results of our investigationswere always compared with the data obtained by Austrian governmentalauthorities in order to maintain a satisfying status of accuracy.Determination of radionuclides, gammaspectrometry and strontlum-90determinations in food had been made from Austrian crops to be exportedespecially to USSR.Taking part in a coordinated research programme together withenvironmental research facilities from Germany, CSSR, Yugoslavia. Rumania,Bulgaria, and USSR, i.e. all the countries along the Danube river, the Danubewater was continuously monitored for radionuclides. For these investigationseight continuous sampling devices had been designed, built and installed alongthe Danube river. Low level gamma-spectrometric measurement facilities hadbeen established, strontium-90 determinations had been carried out. Accuracyhad been tested by taking part in IAEA intercomparison runs. After havingoperated this monitoring system for several years It was handed over togovernmental authorities. At the laboratories of the Atominstitute theprogramme had later on been extended to sediments and fish of the Danube.
Methods for fast radiochemical separation and measurement procedures.Investigations related to fast radiochemical separation procedures for fissionproducts in environmental samples were carried out with the aim to enrichtrace amount of radionuclides from bulky aqueous samples.l-(Pyridylazo)-2-naphtol (PAN) had been used in laboratory test experimentsto separate fission products from aqueous samples. The separation for a
- Reactor Meltdown- Nuclear Fuel Reprocessing
number of elements can be successfully carried out even from large amounts ofsample material. That reagent is not very specific but the separation effect canbe limited to specific ions by proper adjustment of the acidity of the solution.Since May 1986 our laboratory tries to assist in the network of radioassayfacilities for the Austrian Ministry of Health and Environmental Protection. Inaddition radioactivity measurement devices had been set up in our laboratoryas part of a service for the public: The idea was, to provide a measurementfacility for food materials which had been produced for own consumption bysmall farmers and gardeners. The facility had been provided for measurementson a cost free basis. Measurements had been carried out using 1 1 Marinellibeakers on a 100 cm3 Geli-detector for high resolution gamma-spectroscopy.A Nal-detector system being calibrated by using this semiconductorspectrometric system had also been provided for rapid measurements. TheNal-detector system had been combined with a small multichannel analyzerset for a gammma energy region encompassing cesium-137 and cesium-134.Strontium-90 determinations in rainwater samples, collected during the firstdays of May 1986, had been carried out after radiochemlcal separation ofstrontium using the nitric acid method. Immediately after separation thesamples had been stored in a low level windowless counting tube andmeasured continuously. The first measurement provided results for the sumof the activities of the strontium radioisotopes, the observed increase inactivity provided approximate data for the yttrium-90 contribution within lessthan 36 hours after start of the separation. The same type of samples had alsobeen measured using low level liquid scintillation spectrometry. It should bepointed out that this method is unsuitable for low level radioactivitymeasurements in environmental samples and can only be used to determinestrontium-90 and strontium-89 at a level higher than 1 Bq per sample.Sample ashing was the most time consuming step of the procedure.
Uptake of cesium-137 by plants.Greenhouse experiments had been carried out during autumn and winter1986/87 to obtain data for cesium-uptake for a series of Austrian soils.Investigations dealt with the reduction of cesium uptake by proper soilmanagement, applying suitable fertilizer materials, by that adjusting acidityand improving quality of soil regarding nutrient ions and ions competing withcesium uptake.
CM-RM/32 (C)rev. 3

Fallout nuclides as radioactive tracers.Forests, having large surface areas and being exposed to air flow duringweather conditions, are efficient filters for air pollution. Compared to openfields, forest areas show a much higher filter efficiency and capacity regardingdry and wet deposits. As a result of this filter capability for air pollution, highlypolluted soil material can be found in the immediate vicinity of beech treesdue to deposition by stemflow water.It had been observed that the forest floor vegetation around trees wasdramatically reduced due to the pollution of stemflow water. Thereforedetailed investigations of the soil regions influenced by polluted stemflowwater were initiated.We used the fission products as radioactive tracers to label the pollution ofstemflow water.Soil patterns are similar for both, for the radionuclides cesium-137 andruthenium-103 from the Chernobyl accident, and cesium-137 from thenuclear weapon tests as well as for the metal ions lead and zinc from airpollution. The elements are adsorbed very near the soil surface in theimmediate vicinity of the tree trunk and show an exponential decrease withsoil depth.The deposition of the heavy metal ions is restricted to a small area in theimmediate vicinity of the tree. Obviously a large amount of heavy metal ions iswashed down during the beginning of rainfall in the first few litres of stemflowwater. Therefore these metal ions are deposited within a short distance fromthe trunk of the tree.As results of these investigations, high acidity of soil, dissolution of clayminerals, elution of nutrients, enrichment and translocation of heavy metalions, release of aluminium and manganese ions, and accumulation of organicmatter was observed in those regions where a high content of fallout wasdetermined.This should be an example for the use of fallout contamination for tracerexperiments for the investigation of environmental pollution.
Instrumental Methods
Instrura n m

S. Prakash
B.A.R.C, India
RADIONUCLIDES - CORRELATIONS
- POSSIBLE USES
Rapid methods are required for both
1. emergency situations
2. normal situations
In normal situations, if the level of activity is very low, sample sizes
must be large, and a separation of the individual radionuclide is
necessary.
One or two step separations may be needed for concentration and seise
decontamination followed by Y~ray spectroscopy.
The major difficulty encountered is the preparation of samples to a stage
where fast separation can be done.
For emergency situations most of the radionuclides are assayed by y-tny
spectroscopy, he
derived rapidly.
90spectroscopy, however, no information for actinides and Sr can be
Can information on these nuclides be obtained by or via gamma emitting
radionuclides?
One possible way is to examine the correlation between suitable pairs of
radionuclides:
141 144,, 239+240Ce or Ce vs Pu
141 144,, 90Ce or Ce vs Sr
140o 90,,8a vs Sr
ship of the size of the detector, shielding and location should be planned sothat all the gamma-emitting radionuclides of interest can be u n '
10%
CM-RM/20, page 2
Some correlations are shown, noteworthy in "?pite of widely different
locations + overslopes and intercept are small.
. v 1 4 4^ 2 3 9n 1 4 4^ 241Comparison with reactor inventory Ce vs Pu, Ce vs Am
95correlations are good, correlations with Zr are also good but data
are very limited.
Major fractionation takes place during release of radioactivity -
subsequent transport has a smaller effect.
WP0934k/SPrakash/ks
III. SEPARATION METHODS (H.W. Perkins)
An early estimate of possible radiation exposure to the public that
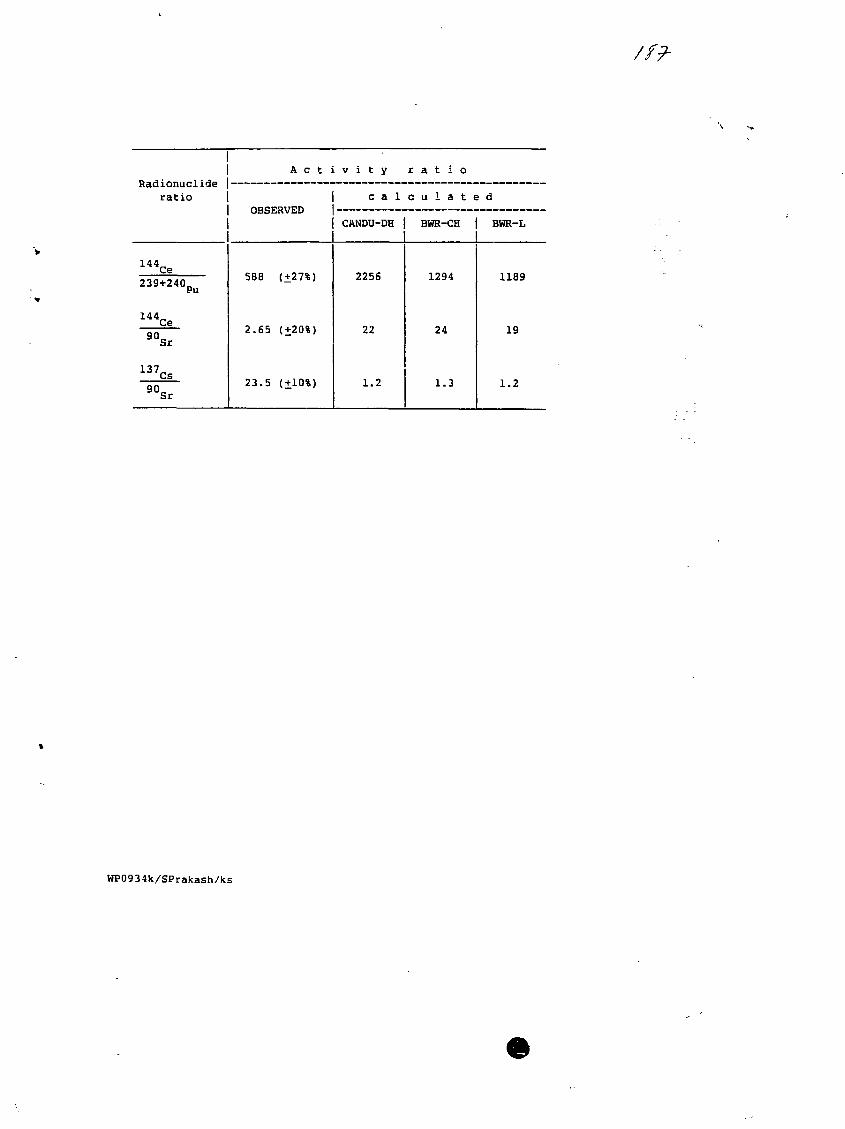
Radionuclideratio
144Ce
239+24(1Pu
1 4 4 C e9 0 S r
1 3 7 C s9 0 S r
A c t ]
OBSERVED
588 (+27%)
2.65 (+20%)
23.5 (+10%)
v i t y r a t i o
c a l c u l a t e d
'
CANDU-DH
2256
22
1 .2
BWE-CH
1294
24
1.3
BWR-L
1189
19
1 .2
WP0934k/SPrakash/ks

METHOD To
144

45 I©"

Draft for a working paper:
Design, Planning, Application, and Quality Control of Methods for RapidMeasurement of Radioactivity in Food and Environmental Samples.
Karl BUCHTELA.
What can be considered being a method for rapid measurement ofradioactivity in food and environmental samples?
1.)A procedure by which results for a single sample (or for a verysmall number of samples) can be obtained within a very shortperiod of time (a few hours maximum). It might be acceptablethat for this method
- continuous laboratory work- a lot of experience- rather high expenses
are necessary.
Such a method will be applied in emergency cases after an accident wheninformation has to be provided as fast as possible.
2.)A procedure which allows to handle a rather great number ofsamples simultaneously.Results are obtained within a rather short period of time (a fewdays maximum).example: 20 samples can be processed simultaneously, total timeconsumption 2 days).
Application:Information about many samples during control analyses forfood or during large scale investigations.Such methods may involve ion exchange procedures etc.

3 '•?
3.)Methods using automatic operating systems (e.g. robot systems.)These methods are applicable if lack of manpower is the mainproblem.
4.)Procedures which are extremely simple.They can be carried out by laboratory people with rather lowstandard of practical experience.Application:If a great number of samples have to be analyzed within a rathershort period of time and there is enough manpower available, butpractical experience is missing.
Application of new and unconventional procedures:
Scientists designing rapid methods should be encouraged to testunconventional procedures, which had been already successfully appliedin other fields.Examples:
Micorwave digestion (dissolution) of solid samples (for soil, •organic matter etc)
preconcentration by solvent extracton or complex precipitation,(instead of time consuming evaporation of aqueous samples)
Problem Oriented Rapid Methods.
Immediately after an accident the main radiation burden due tostrontium-radioisotopes is provided by the pathway of inhalation andingestion of rather insoluble material (aerosols, particulate matter etc):
strontium-90/Yttrium-90 3.16 . 10"9 Sv/Bqstrontium-89 2.3 . 10"9 Sv/Bqf (Sr90/Sr89) =.- 1.4
The effects of these radionuclides do not differ very much. To estimatethe detriment due to this intake, analyses may focus on the determinationof the sum of the activity of the strontium radioisotopes.
After some days according to the uptake of strontium-90 and strontium-89 with food, the main radiation burden is due to the intake of solublematerials:strontium-90/yttriurn-9Q 36 . 10"9 Sv/Bqstrontium-89 2.17 10"9 Sv/Bq
f (Sr90/SrS9) = 17
Now the effects of these radionuclides are very different. To estimate thedetriment due to this intake, analyses have to focus on the determinationof the strontium-90 activity .
There might be also other case^ for "scenario oriented" rapidmeasurement procedures,
guality control of Rapid Methods.
Rapid methods can be worked out in a "competent" laboratory
by staff members
by fellows to be trained under the supervision of staffmembers. These fellows later on implement these methods intheir home country.
or the methods are worked out by laboratories in developing countries.
In any case the new methods should be checked by another laboratory toexclude misunderstandings of the description of the method.
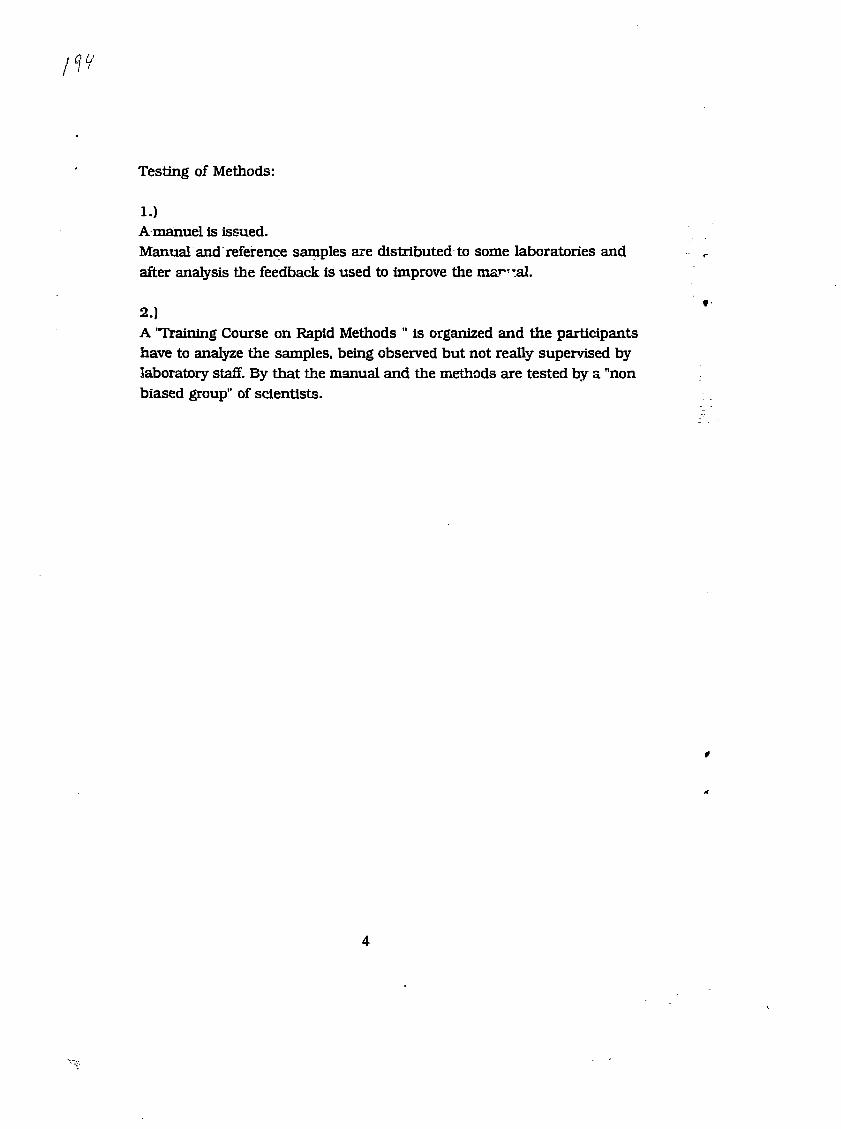
u
Testing of Methods:
1.)A manuel is issued.Manual and reference samples are distributed to some laboratories andafter analysis the feedback is used to improve the manual.
2.)A "Training Course on Rapid Methods " is organized and the participantshave to analyze the samples, being observed but not really supervised bylaboratory staff. By that the manual and the methods are tested by a "nonbiased group" of scientists.

ATTACHMENT II
Recommendations of the Consultants
on
Rapid Instrumental and Separation Methods for MonitoringRadionuclides in Food and Environmental Samples
I. Introduction
II. Instrumental Methods
III. Separation Methods
CM-RM/34 (C)rev. 2
RAPID INSTRUMENTAL AND SEPARATION METHODS FORMONITORING RADIONUCLIDES IN FOOD
AND ENVIRONMENTAL SAMPLES
I. INTRODUCTION
The assessment of any release of radioactivity to theenvironment is important for the protection of the public health,especially if the released radioactivity can enter the food chain. Theassessment demands rapid, reliable and practical techniques for theanalysis of various radionuclides.
It is envisioned that rapid methods would be required in theearly, intermediate and later post-accident periods. It was recognizedthat the early post-accident phase represents sampling and analysis toprovide rapidly needed information for evacuation and shelteringdecisions. It was considered that this phase of the accident wasadequately addressed by other groups within the Agency [1]. In theintermediate and later periods, rapid methods would be particularlyuseful for screening large numbers of food and environmental samples sothat the analytical facilities do not become overloaded. In theintermediate period, besides being employed for screening purposes, tapidmethods would also be used to provide timely information for making majordecisions related to food control. In addition to so-called rapidmethods, which require less human and instrument time, there is also aneed for methods which produce results quickly because many foodstuffsare perishable. It is also apparent that in the case of an accident withfar-reaching effects, such as the Chernobyl reactor accident, rapidmethods would be required to handle the high levels close to the sourceas well as lower levels farther from it, since the intervention levelswould be different.
At earlier Consultants' Meetings for the IAEA programme on"Fallout Radioactivity Monitoring in Environment and Food" it wasrecognized that the existing rapid methods have limitations and that moreresearch is needed. In order to establish a framework for a newCoordinated Research Programme (CRP) on Rapid Methods, the Agency held aConsultants' Meeting on "Rapid Instrumental and Separation Methods forMonitoring Radionuclides in Food and Environmental Samples" on 1988 Sept.5 to 9 in Vienna. This report has been produced from the deliberationsof this meeting.
Accident Scenarios to be Considered in the Work of the CRP
It was recognized that different types of accidents would yielddifferent mixtures of radionuclides and would present differentanalytical problems. However, it was felt that the number of scenarioshad to be limited in order to avoid diluting the effort of the CRP. Theconsultants felt that accidental releases from the following sources areof major concern:
[1] INTERNATIONAL ATOMIC ENERGY AGENCY, Monitoring for the ImmediateRadiation Protection of the Public Following a Major NuclearAccident or Radiological Emergency - Principles and Procedures,Report of the Advisory Group No. 497.2 (to be published).

- Reactor Meltdown- Nuclear Fuel Reprocessing- Plutonium Fabrication- Satellite Nuclear Power Source- Ship Reactor- Tritium Production Facility- Fusion Reactor- Industrial Radioisotope Sources- Medical Radioisotopes- Nuclear Materials Transport
Matrices of Interest
After a serious accident many different types of materialswould have to be sampled in order to assess the doses and makedecisions. The types of samples to be analyzed would depend very much onthe type of accident, thus it was felt that no priority should beassigned a priori. The types of samples can be divided into two broadcategories. Environmental samples include: air, water, soil, grass andsediment. Some of the samples would be used to estimate direct doses toman (e.g. through inhalation of airborne radioactivity) while otherswould allow the estimation of future doses through ingestion (e.g.grass). Relevant food types include: fresh vegetables and fruits, milk,cereals (including rice), roots and tubers, fish (including edible marineand fresh water organisms), meat, drinking water and beverages. Thislist includes all the food items considered by the IAEA [1,2] and WHO [3]in deriving intervention levels for food.
Analytical Quality Assurance
The consultants recognized that analytical quality assuranceshould be an integral part of the CRP. It was felt that the rapidmethods which are selected must be demonstrated to meet thespecifications by analysis of "unknowns" provided by the AnalyticalQuality Control Services of the IAEA. They must also be tested by otherlaboratories to ensure that the method descriptions are adequate and thatthe procedures meet the specifications.
Training
Although training as such would not be a part of the CRP, theConsultants felt that the need for training in general needed moreemphasis. It makes little sense to provide instruments and methodswithout ensuring that the personnel in the laboratories are adequatelytrained to do the work. Training should be provided through expertservices, fellowships and training courses. It was also stressed thatdocumentation for instruments, as well as methods should be reviewed bylaboratories doing routine analysis to ensure that the documentation isadequate.
[1] INTERNATIONAL ATOMIC ENERGY AGENCY, Derived Intervention Levels forApplication in Controlling Radiation Doses to the Public in theEvent of a Nuclear Accident or Radiological Emergency, Safety SeriesNo. 81, IAEA, Vienna (1986).
[2] Emmerson, B.W., The Development of Intervention Levels for theProtection of the Public in the Event of a Major Nuclear Accident -Past, Present and Future, IAEA-CN-51/85, Vienna (1988).
[3] WORLD HEALTH ORGANIZATION, Derived Intervention Levels forRadionuclides in Food, WHO, Geneva (1988).
CM-RM/32 (C)
rev. 3
II. INSTRUMENTAL METHODS (S. Prakash)
Rapid instrumental methods can broadly be divided into threecategories:
1) Methods for screening large number oC samples,2) Very rapid methods for assay of radionuclides,3) Sapid methods for assay of radionuclides.
Gamma spectroraetry, where applicable, is the best and mostcommonly employed instrumental method for rapid radionuclide analysis.Gamma spectrometry may provide an early indication of the nature andmagnitude of the accident:. Gross beta and alpha counting techniques mayalso provide early warning and additional information on the nature ofthe accident. For rapid routine monitoring at local laboratories samplescan be counted using Nal(Tl) detectors with one or more specified energybands.
After primary identification of an emergency situation, acontinuous monitoring of appropriate air filters, water samples andsurface deposition should be initiated to help in preparation of the planfor subsequent measurements in food and environmental samples. Themeasurements could represent hundreds of foods and environmentalsamples. This section outlines the criteria for "Rapid Instrumental"methods for monitoring radionuclides in those food and environmentalsamples which will be of greatest interest in the potential nuclearaccidents and are outlined in the Introduction. Suggestions for possibleinstrumental techniques where further research and development work isneeded are presented.
Relevant radionuclides
The types of radionuclides of interest will include activationproducts, fission products and actinides depending on the source of theradionuclide release. The mixture of the radionuclides will also dependon the type of accident. For example, in a reactor accident theradionuclides of interes*- =»re broadly classified into two groups from thepoint of time elapsed after the release:
1) radionuclides of importance for the first week89,90Sr, 95 Z r_ N b, 13.1- 140 B a_ L a r 134,137Cs a n d
actinides
2) radionuclides of long-term importance90Sr, 134,137Cs, 238,239,240pU/ 241Am# 242,244Cm
and 3H.
The most serious concern of the instrumentalist should beplaced on the serious accident situation. A comprehensive list ofradionuclides of importance based on different accident scenarios arepresented in [1].
[1] IAEA TECHNICAL REPORTS SERIES No. 295 (STI/DOC/10/295), "Measurementof Radionuclides in Food and the Environment - A Guidebook", IAEA,Vienna, 1989
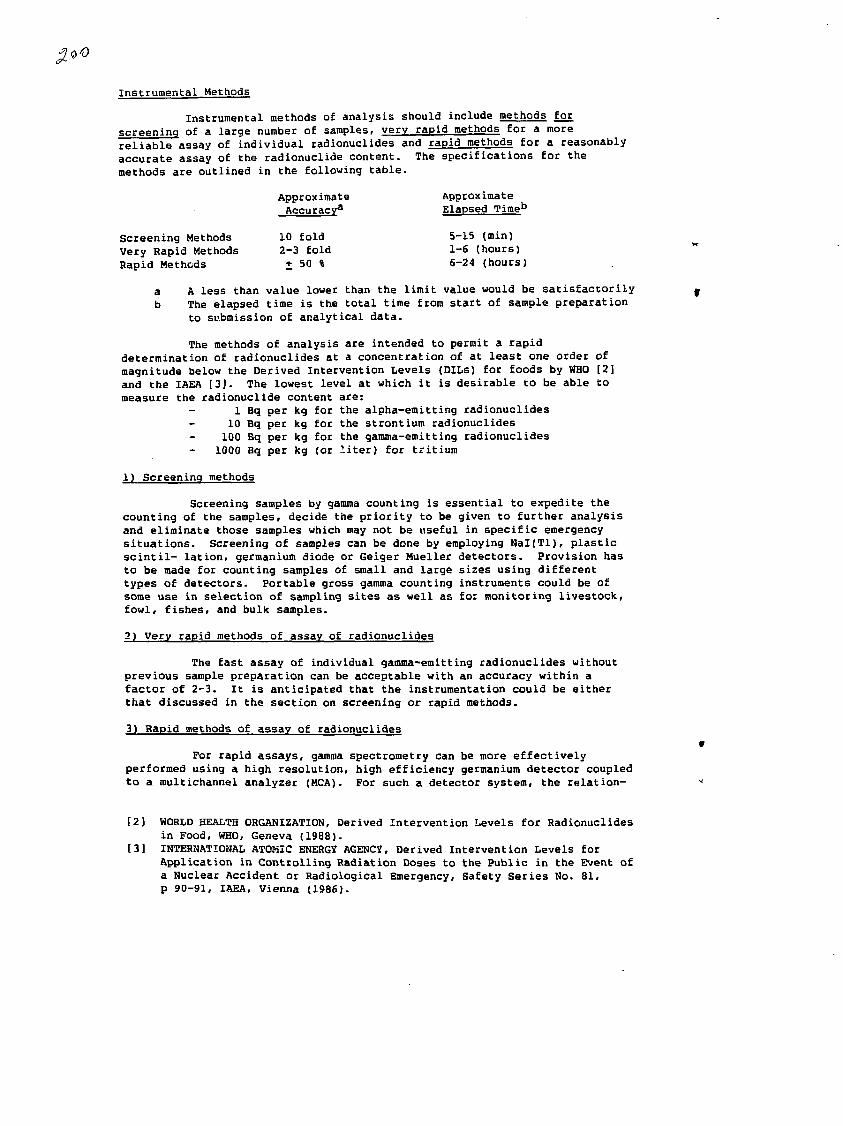
Instrumental Methods
Instrumental methods of analysis should include methods forscreening of a large number of samples, very rapid methods for a morereliable assay of individual radionuclides and rapid methods for a reasonablyaccurate assay of the radionuclide content. The specifications for themethods are outlined in the following table.
Approximate ApproximateAccuracya Elapsed Timeb
Screening Methods 10 fold 5-15 (min)Very Rapid Methods 2-3 fold 1-6 (hours)Rapid Methods + 50 % 6-24 (hours)
a A less than value lower than the limit value would be satisfactorilyb The elapsed time is the total time from start of sample preparation
to submission of analytical data.
The methods of analysis are intended to permit a rapiddetermination of radionuclides at a concentration of at least one order ofmagnitude below the Derived Intervention Levels (DILs) for foods by WHO [2]and the IAEA [3]. The lowest level at which it is desirable to be able tomeasure the radionuclide content are:
1 Bq per kg for the alpha-emitting radionuclides- 10 Bq per kg for the strontium radionuclides
100 Bq per kg for the gamma-emitting radionuclides1000 Bq per kg (or liter) for tritium
1) Screening methods
Screening samples by gamma counting is essential to expedite thecounting of the samples, decide the priority to be given to further analysisand eliminate those samples which may not be useful in specific emergencysituations. Screening of samples can be done by employing Nal(Tl), plasticscintil- lation, germanium diode or Geiger Mueller detectors. Provision hasto be made for counting samples of small and large sizes using differenttypes of detectors. Portable gross gamma counting instruments could be ofsome use in selection of sampling sites as well as for monitoring livestock,fowl, fishes, and bulk samples.
2) Very rapid methods of assay of radionuclides
The fast assay of individual gamma-emitting radionuclides withoutprevious sample preparation can be acceptable with an accuracy within afactor of 2-3. It is anticipated that the instrumentation could be eitherthat discussed in the section on screening or rapid methods.
3) Rapid methods of assay of radionuclides
For rapid assays, gamma spectrometry can be more effectivelyperformed using a high resolution, high efficiency germanium detector coupledto a multichannel analyzer (MCA). For such a detector system, the relation-
[2] WORLD HEALTH ORGANIZATION, Derived Intervention Levels for Radionuclidesin Food, WHO, Geneva (1988).
[3] INTERNATIONAL ATOMIC ENERGY AGENCY, Derived Intervention Levels forApplication in Controlling Radiation Doses to the Public in the Event ofa Nuclear Accident or Radiological Emergency, Safety Series No. 81,p 90-91, IAEA, Vienna (1986).

ship of the size of the detector, shielding and location should be planned sothat all the gamma-emitting radionuclides of interest can be quantitativelyassayed at the desirable measurement level with an uncertainty of the orderof 20-50 %.
One additional way to expedite the counting of large numbers ofsamples is the use of automatic sample changers. Such a development couldincrease the sample through put by a factor of 2 to 3.
Rapid Instrumental Radioassav
The following is a brief listing to identify some of the problemswhere further research and development work is needed.
Improvement of gamma-ray spectrometry
(1) Optimization of detector size with respect to minimizingcounting time and background and maximizing the accuracy andprecision.
(2) Possible use of X-ray and low energy gamma-ray measurements.(3) Application of new detector types.(4) Development of gamma-ray spectral analysis taking into account
different types of accident scenarios.(5) Methods of correction for density effects on counting
efficiency.
Instrumental methods for determination of ^Ogr, ^H and alpha-emitters
(6) Exploring the possible use of radionuclide correlations toobtain estimations of 90Sr and 239/240Pu etc_ i n t n e
samples already measured by gamma spectromety.
Methods of handling large numbers and sizes of samples
(7) Development of instruments suitable for screening andmeasurement of large size samples and in vivo measurements.
(8) Systematic evaluations and recommendation to improve theexisting food monitoring equipment.
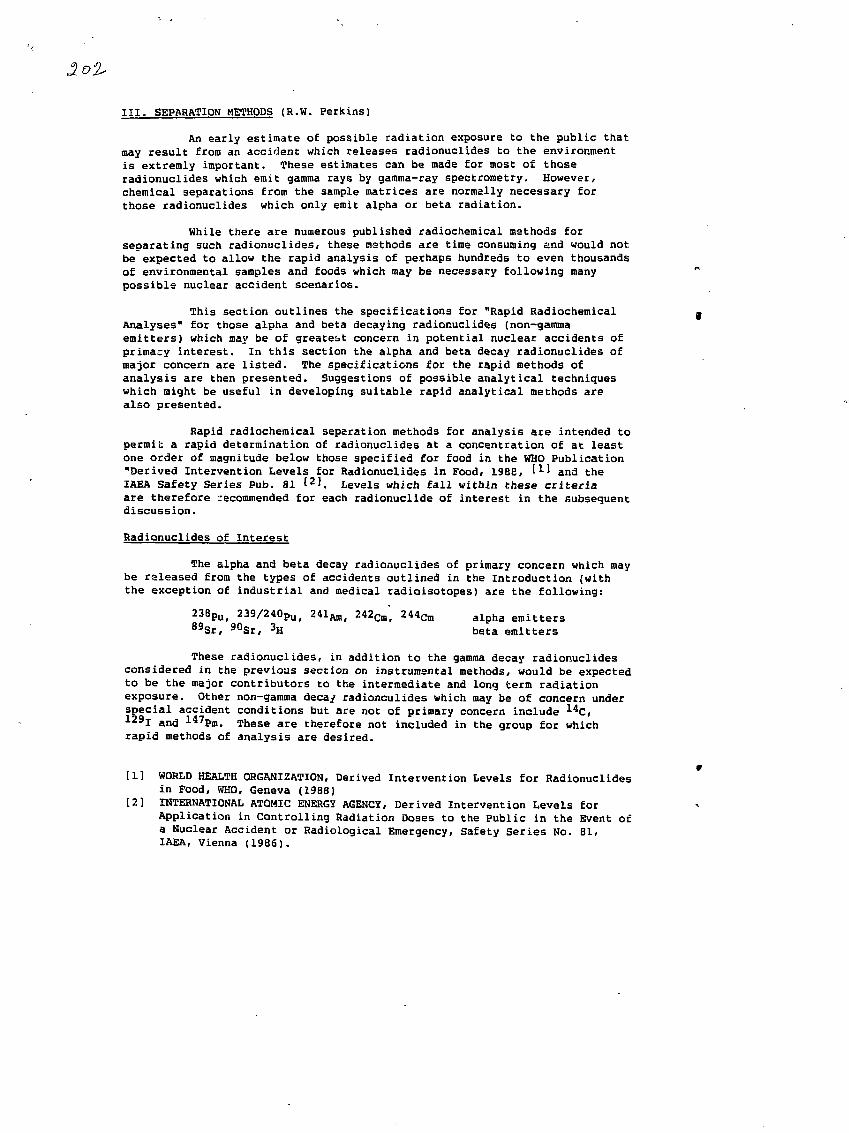
III. SEPARATION METHODS (R.W. Perkins)
An early estimate of possible radiation exposure to the public thatmay result from an accident which releases radionuclides to the environmentis extremly important. These estimates can be made Cor most of thoseradionuclides which emit gamma rays by gamma-ray spectroraetry. However,chemical separations from the sample matrices are normally necessary forthose radionuclides which only emit alpha or beta radiation.
While there are numerous published radiochemical methods forseDarating such radionuclides, these methods are time consuming and would notbe expected to allow the rapid analysis of perhaps hundreds to even thousandsof environmental samples and foods which may be necessary following manypossible nuclear accident scenarios.
This section outlines the specifications for "Rapid RadiochemicalAnalyses" for those alpha and beta decaying radionuclides (non-gammaemitters) which may be of greatest concern in potential nuclear accidents ofprimary interest. In this section the alpha and beta decay radionuclides ofmajor concern are listed. The specifications for the rapid methods ofanalysis are then presented. Suggestions of possible analytical techniqueswhich might be useful in developing suitable rapid analytical methods arealso presented.
Rapid radiochemical separation methods for analysis are intended topermit a rapid determination of radionuclides at a concentration of at leastone order of magnitude below those specified for food in the WHO Publication"Derived Intervention Levels for Radionuclides in Food, 198e, tLl and theIAEA Safety Series Pub. 81 f2'. Levels which fall within these criteriaare therefore recommended for each radionuclide of interest in the subsequentdiscussion.
Radionuclides of Interest
The alpha and beta decay radionuclides of primary concern which maybe released from the types of accidents outlined in the Introduction (withthe exception of industrial and medical radioisotopes) are the following:
238Pu, 239/240PU/ 241Ara, 242Cmf 244 C m a l p n a e m i t t e r s
89Sr, 90Sr, 3H beta emitters
These radionuclides, in addition to the gamma decay radionuclidesconsidered in the previous section on instrumental methods, would be expectedto be the major contributors to the intermediate and long term radiationexposure. Other non-gamma decay radionculides which may be of concern underspecial accident conditions but are not of primary concern include 1 4C,1 2 9I and 147Pm. These are therefore not included in the group for whichrapid methods of analysis are desired.
[1] WORLD HEALTH ORGANIZATION, Derived Intervention Levels for Radionuclides
in Food, WHO, Geneva (1988)[2] INTERNATIONAL ATOMIC ENERGY AGENCY, Derived Intervention Levels for
Application in Controlling Radiation Doses to the Public in the Event ofa Nuclear Accident or Radiological Emergency, Safety Series No. 81,IAEA, Vienna (1986).

Separation Methods
"Rapid Methods" of analysis should include rapid screening methodsfor determination of the approximate radionuclide content of samples, veryrapid methods for a more reliable determination of the radionuclide content,and rapid methods for a reasonably accurate determination of the radionuclidecontent. The specifications for the rapid methods are outlined in thefollowing table:
Rapid Method Specifications
Approximate Approximate ApproximateAccuracy8 Man Hours*-* Elapsed Time (hours)**
Rapid Screenings 10 fold 0.5 1Very Rapid Methods 2-3 fold 2 6Rapid Methods + 50 * 4 24
a A less than value lower than the limit value would be satisfactorilyb An indication of personnel requirements. Thus a lower value is very
desirable.c The elapsed time is the total time from start of sample preparation to
submission of analytical data.
The lowest level at which the methods must provide answers are 1 Bqper kg for the alpha decay radionuclides, 10 Bq per kg for the strontiumradionuclides and 1000 Bq per kg (or liter) for tritium.
In an actual accident, screening methods, if shown to be reasonablyfree of interference, may be sufficient. However, the more reliable analysisprovided by the very rapid and the rapid methods may be required for a smallor even a larger fraction of the samples.
Radionuclide Counting
Following the very rapid or rapid separation process, the separatedradionuclide or group of radionuclides must be counted quickly. It isassumed that the alpha decay radionuclides of Pu, Am and Cm will be measuredby alpha energy analysis, the 8^~^usr by low level beta counting and thetritium by liquid scintillation. Other methods which provide equivalent orgreater sensitivity can also be employed. It is also assumed that countingmethods will employ computer storage and processing of the count rate data.If computer controlled pulse hight selection of the counting data provides asignificant advantage/ it may also be employed.
Sample Dissolution and Radionuclide Separation Methods
It is recognized that the major time commitment in aradioanalytical procedure of environmental matrices is that for sampledissolution. Sample dissolution often requires several times as long assubsequent analysis of the radionuclides of interest.
For the sample screening problem, it is anticipated that sampledissolution will be avoided and sample preparation will be limited tomechanical manipulation of the sample.
The following suggestions for sample preparation and separationsmay be useful in developing rapid chemical separation methods.
(1) For a proposed screening method, it raay be sufficient tohomogenize the sample/ press to a specific density and volume/and make a direct alpha or beta count.
(2) Improved methods for dissolution of large food or" environmentalsamples are needed (e.g. utilization of microwave accelerateddigestors).
(3) For tnfe rapid and very rapid methods/ streamlining ofconventional separation techniques which will reduce the timerequirement would be helpful (e.g. use of precipitation/ ionexchange, or solvent extraction).
(4) Specialized techniques such as sorption, the use of selectiveseparation agents, electrophoresis, and membrane partitioningmay have specific applications.
(5) Novel techniques which have the potential of reducing the totaldissolution and/or separation time should be considered.
(6) Consideration of the applicability o£ the methods to automationor robotics so that large numbers of samples can be handled ina limited time could be beneficial.
(7) The overall objectives of developing rapid methods should beachieved with the minimum sacrifice in reliability,practicality and economy.